Acer Swift Edge 16 Ryzen 7 7840U Laptop im Test: Zen 4 CPU und 3.2K 120 Hz OLED Boost

Das Acer Swift Edge SFE16 hat kürzlich ein Update erhalten und unterstützt nun die allerneueste Zen 4 Ryzen 7 7840U-CPU im Vergleich zum Zen 3+ Ryzen 7 7735U, der nur wenige Monate zuvor veröffentlicht wurde. Das aktualisierte Modell hat außerdem ein neues Samsung OLED-Panel mit 120 Hz und 3,2K anstelle des 4K-Panels mit 60 Hz der Zen 3+-Konfiguration.
Abgesehen von den oben genannten Unterschieden bei CPU und GPU verwenden sowohl das Swift Edge SFE16 Zen 4 als auch das Swift Edge SFE16 Zen 3+ ein ähnliches Gehäuse mit ein paar Unterschieden, die wir in diesem Test anführen werden. Intern haben sich jedoch viele Aspekte des Motherboards geändert. Wir empfehlen daher einen Blick auf unseren Test über das Swift Edge SFE16 Zen 3+, um mehr über die physikalischen Eigenschaften des Modells zu erfahren.
Zu den Alternativen zum Swift Edge gehören andere leichte 16-Zoll-Ultrabooks wie das LG Gram 16, Samsung Galaxy Book3 Pro 16, Asus VivoBook 16 oder das Huawei MateBook 16s.
Mehr Acer-Testberichte:
Mögliche Konkurrenten im Vergleich
Bew. | Datum | Modell | Gewicht | Dicke | Größe | Auflösung | Preis ab |
|---|---|---|---|---|---|---|---|
| 88.6 % v7 (old) | 10 / 2023 | Acer Swift Edge SFE16 Ryzen 7 7840U R7 7840U, Radeon 780M | 1.2 kg | 13 mm | 16.00" | 3200x2000 | |
| 87.5 % v7 (old) | 06 / 2023 | Acer Swift Edge SFE16-42-R1GM R7 7735U, Radeon 680M | 1.2 kg | 13.95 mm | 16.00" | 3840x2400 | |
| 88 % v7 (old) | 08 / 2023 | Lenovo Slim Pro 9i 16IRP8 i9-13905H, GeForce RTX 4050 Laptop GPU | 2.2 kg | 18.2 mm | 16.00" | 3200x2000 | |
| 86.3 % v7 (old) | 05 / 2023 | Asus VivoBook Pro 16 i7-12700H, GeForce RTX 3050 Ti Laptop GPU | 1.9 kg | 20 mm | 16.00" | 2560x1600 | |
| 89.4 % v7 (old) | 04 / 2023 | Samsung Galaxy Book3 Ultra 16 i7-13700H, GeForce RTX 4050 Laptop GPU | 1.8 kg | 16.5 mm | 16.00" | 2880x1800 | |
| 86.4 % v7 (old) | 07 / 2022 | Huawei MateBook 16s i7 i7-12700H, Iris Xe G7 96EUs | 2 kg | 17.8 mm | 16.00" | 2520x1680 |
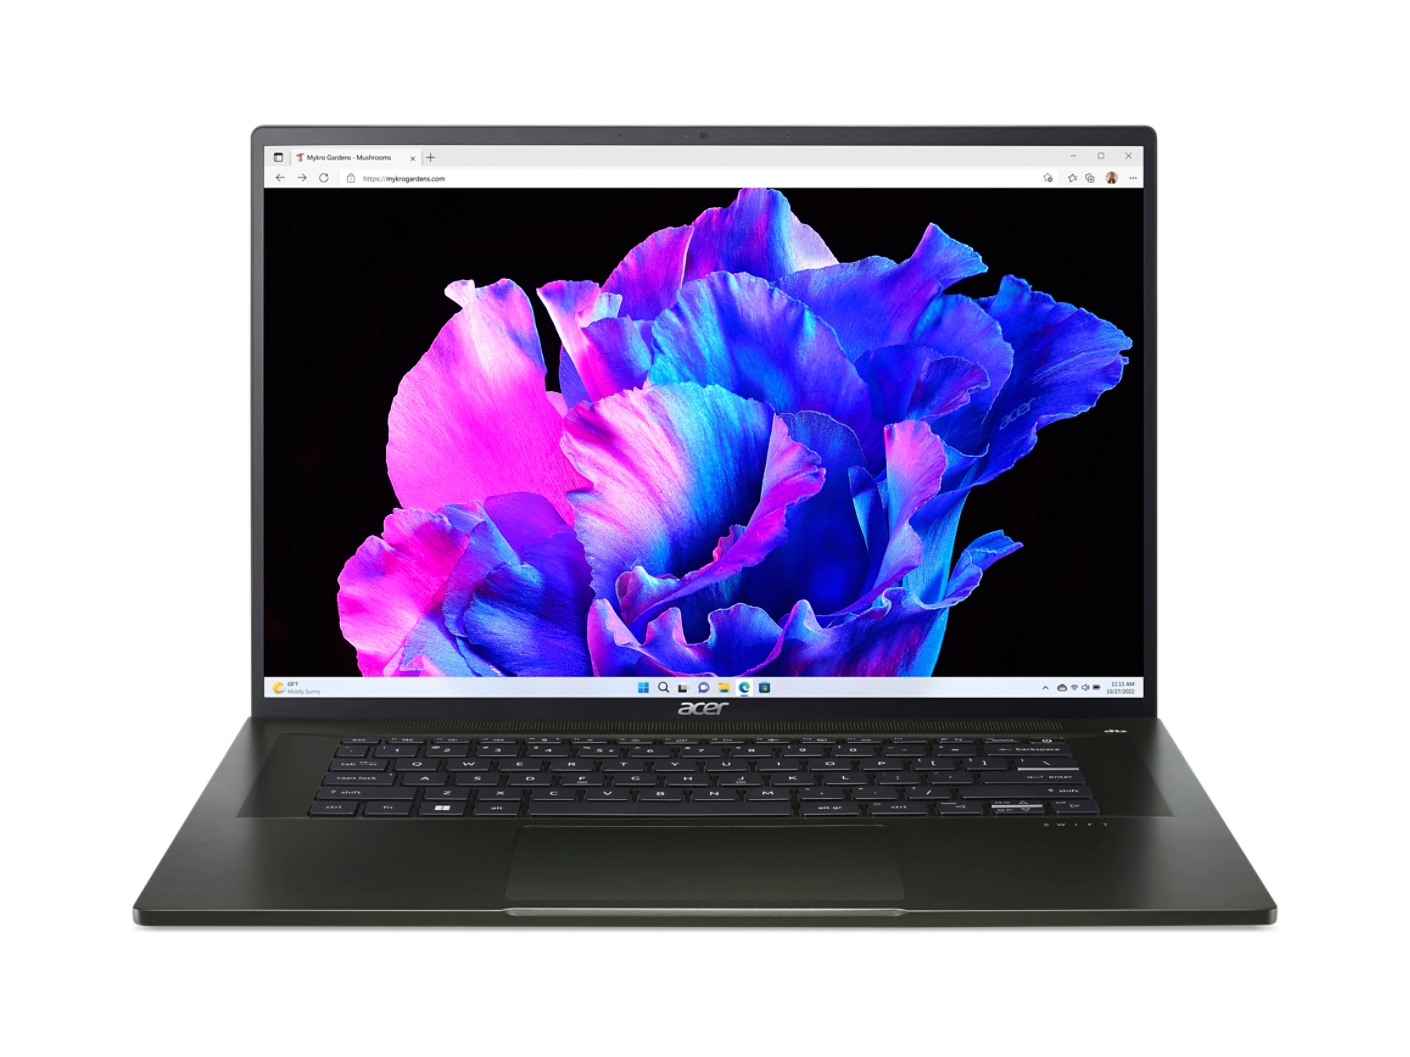
Gehäuse
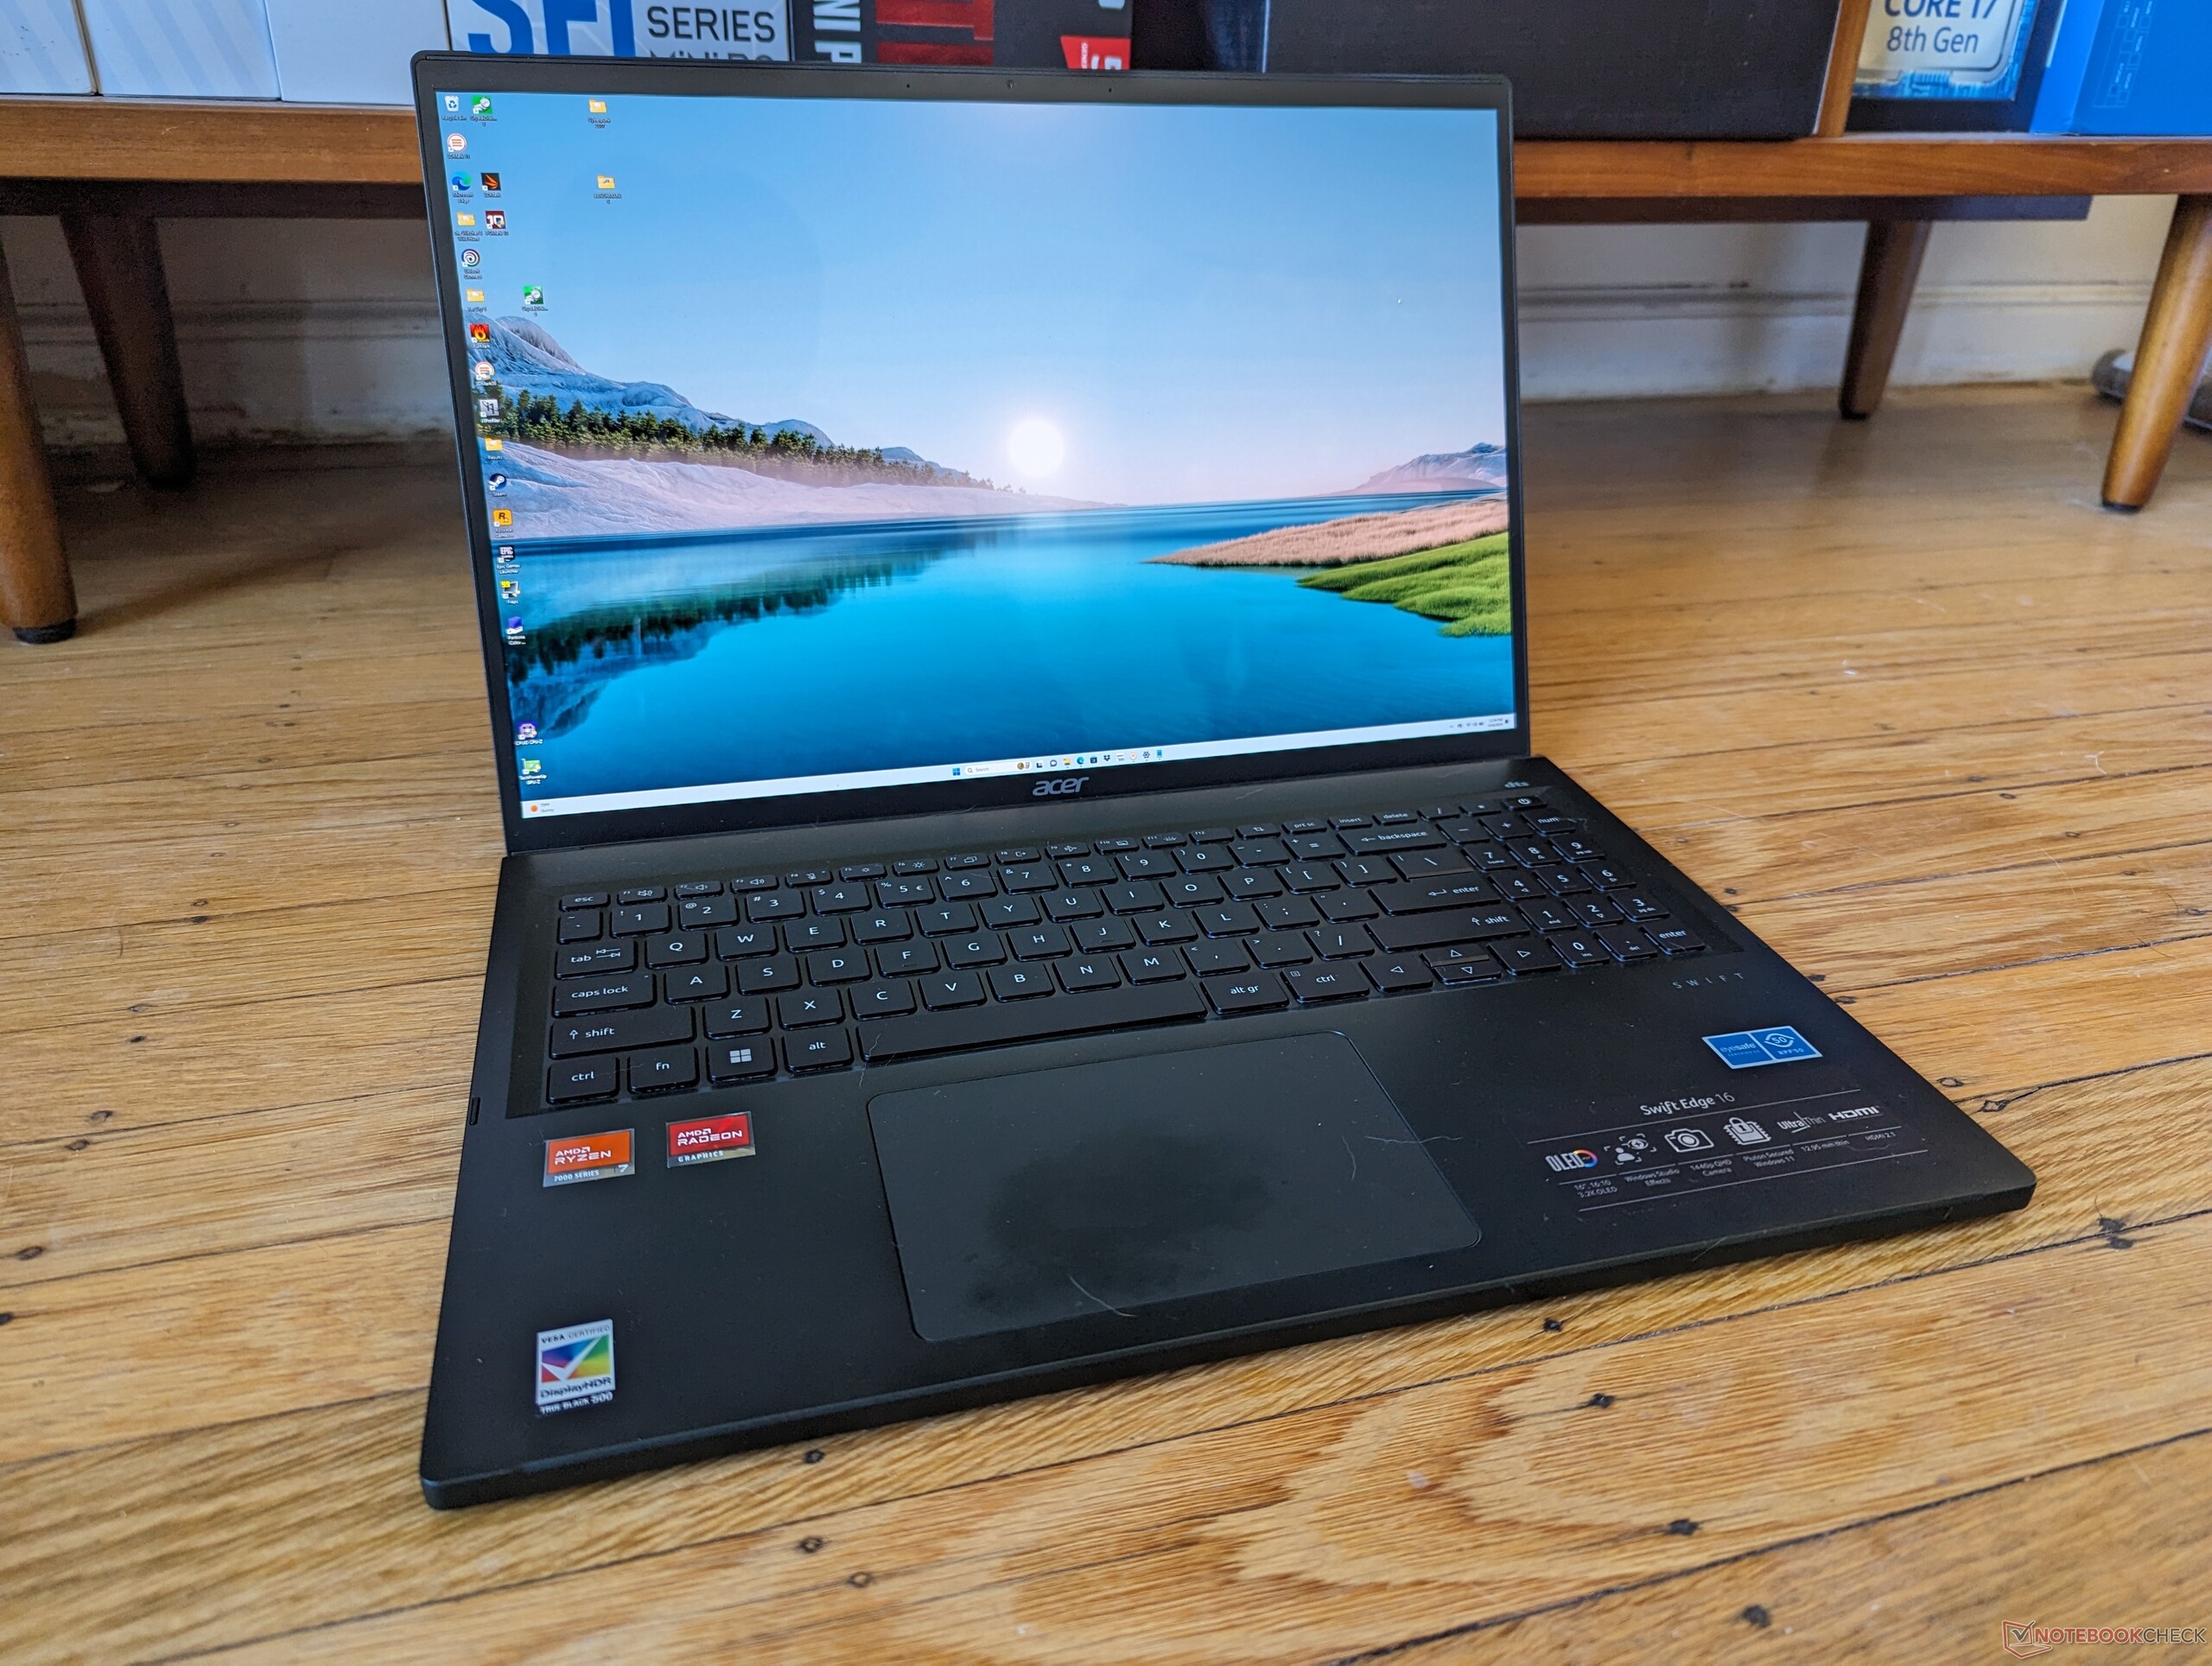
Der Swift Edge 16 Zen 4 mag auf den ersten Blick identisch mit dem Swift Edge 16 Zen 3+ aussehen, doch bei näherer Betrachtung fallen die äußeren Veränderungen auf. Erstens verfügt die neuere Version über einen Nummernblock, während dieser bei der Zen 3+ Version fehlte. Zweitens sind die Lüftungsgitter über der ersten Reihe der Tastatur verschwunden und die Vorderkante ist nun durchgehend ohne Einschnitte. Letzteres ist eine merkwürdige Änderung, da sich der Deckel dadurch schwerer öffnen lässt.
Abgesehen davon verwendet das Modell die gleichen glatten Magnesium- und Aluminiummaterialien, die gleichen Ports und deren Positionierung sowie das gleiche Clickpad. Die Abmessungen sind insgesamt minimal breiter und noch dünner.

SD-Kartenleser
Acer hat einen MicroSD-Leser hinzugefügt, der bei der Ryzen 7 7735U-Konfiguration noch fehlte. Allerdings sind die Übertragungsraten etwa 3x langsamer als bei den SD-Kartenlesern der Konkurrenzmodelle wie dem Asus VivoBook Pro 16 oder Samsung Galaxy Book3 Ultra 16.
| SD Card Reader | |
| average JPG Copy Test (av. of 3 runs) | |
| Lenovo Slim Pro 9i 16IRP8 (PNY EliteX-Pro60 V60 256 GB) | |
| Samsung Galaxy Book3 Ultra 16 (AV PRO microSD 128 GB V60) | |
| Asus VivoBook Pro 16 (AV Pro SD microSD 128 GB V60) | |
| Acer Swift Edge SFE16 Ryzen 7 7840U (AV Pro V60) | |
| maximum AS SSD Seq Read Test (1GB) | |
| Lenovo Slim Pro 9i 16IRP8 (PNY EliteX-Pro60 V60 256 GB) | |
| Samsung Galaxy Book3 Ultra 16 (AV PRO microSD 128 GB V60) | |
| Asus VivoBook Pro 16 (AV Pro SD microSD 128 GB V60) | |
| Acer Swift Edge SFE16 Ryzen 7 7840U (AV Pro V60) | |
Kommunikation
Das MediaTek-Modul hat ungewöhnlich langsame Übertragungsgeschwindigkeiten bei Wi-Fi 6, ähnlich wie wir es bei der Zen 3+ Konfiguration beobachtet haben. Die Wi-Fi 6E-Geschwindigkeiten sind ansonsten bei Verbindung mit unserem Asus AXE11000 6-GHz-Netzwerk ausgezeichnet.
Webcam
Die Webcam hat eine effektive Auflösung von 3,7 MP mit einer Aufzeichnungsrate von bis zu 1440p30 im Vergleich zu 2,1 MP und 1080p30 bei der Zen 3+ Konfiguration, was ein etwas schärferes Bild ergibt.
Es gibt immer noch keinen eingebauten Webcam-Privatsphärenauslöser oder IR-Unterstützung.


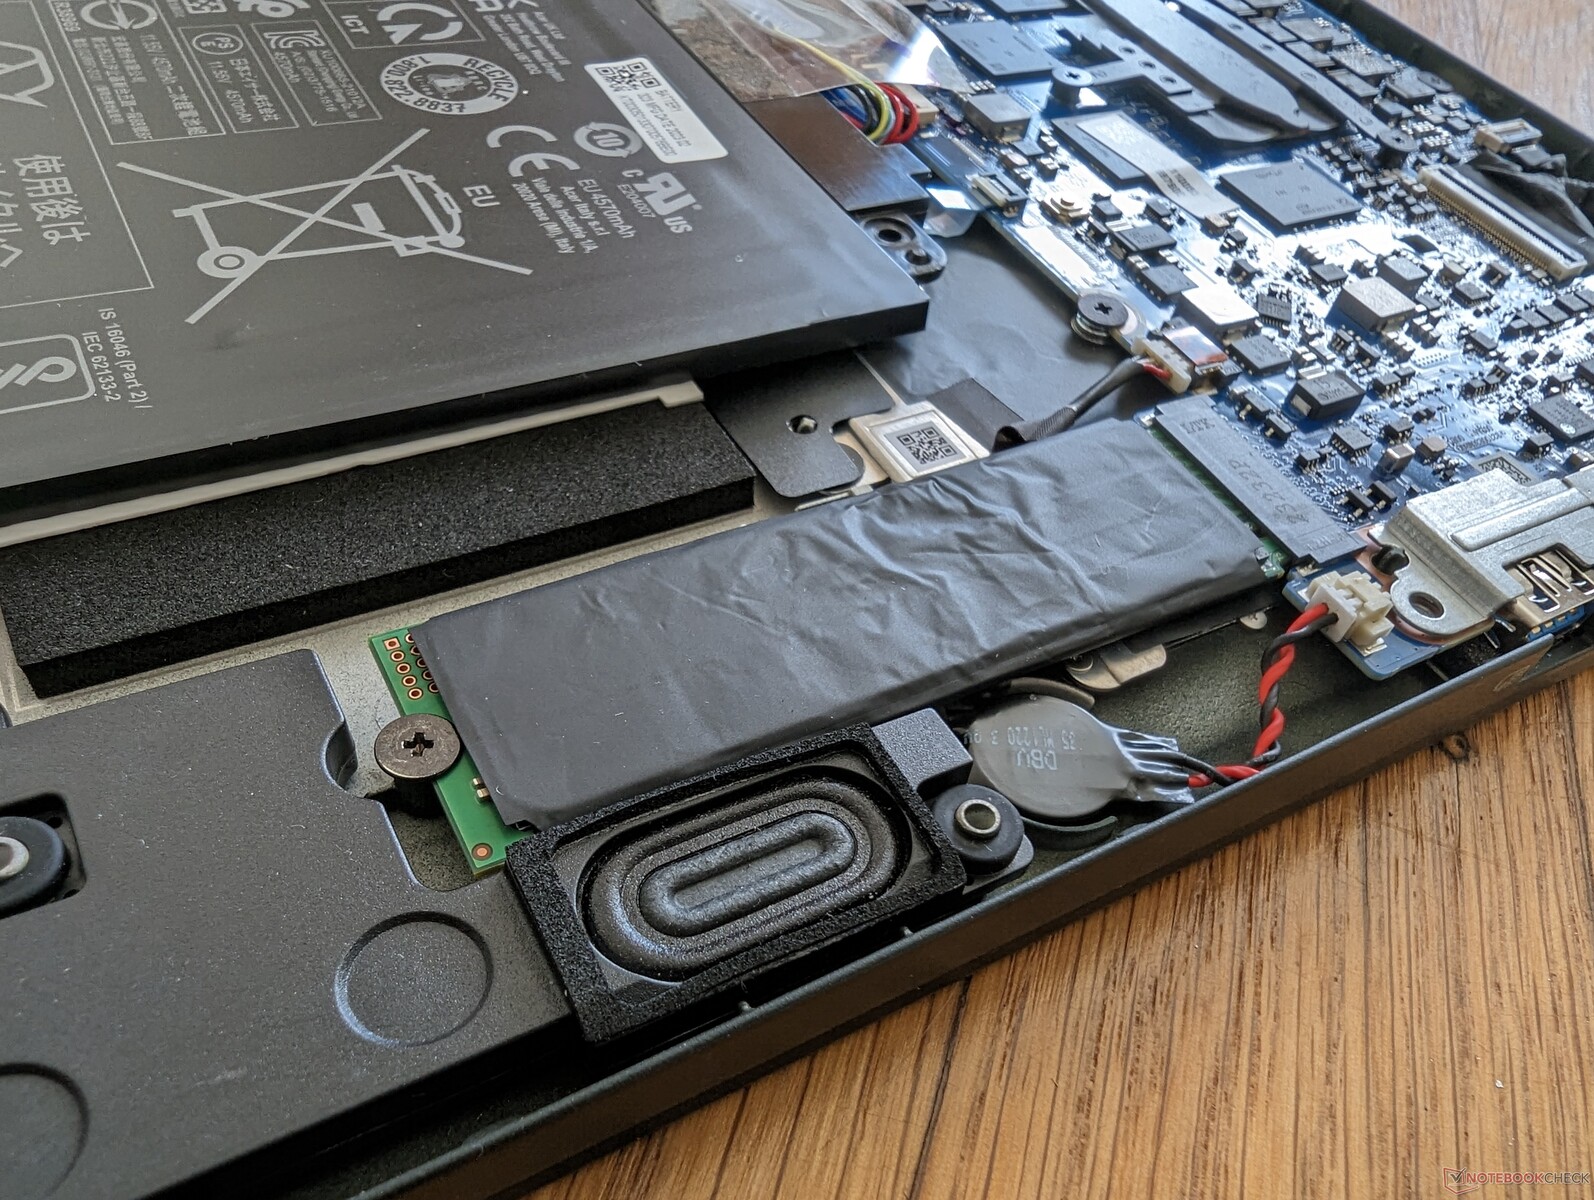
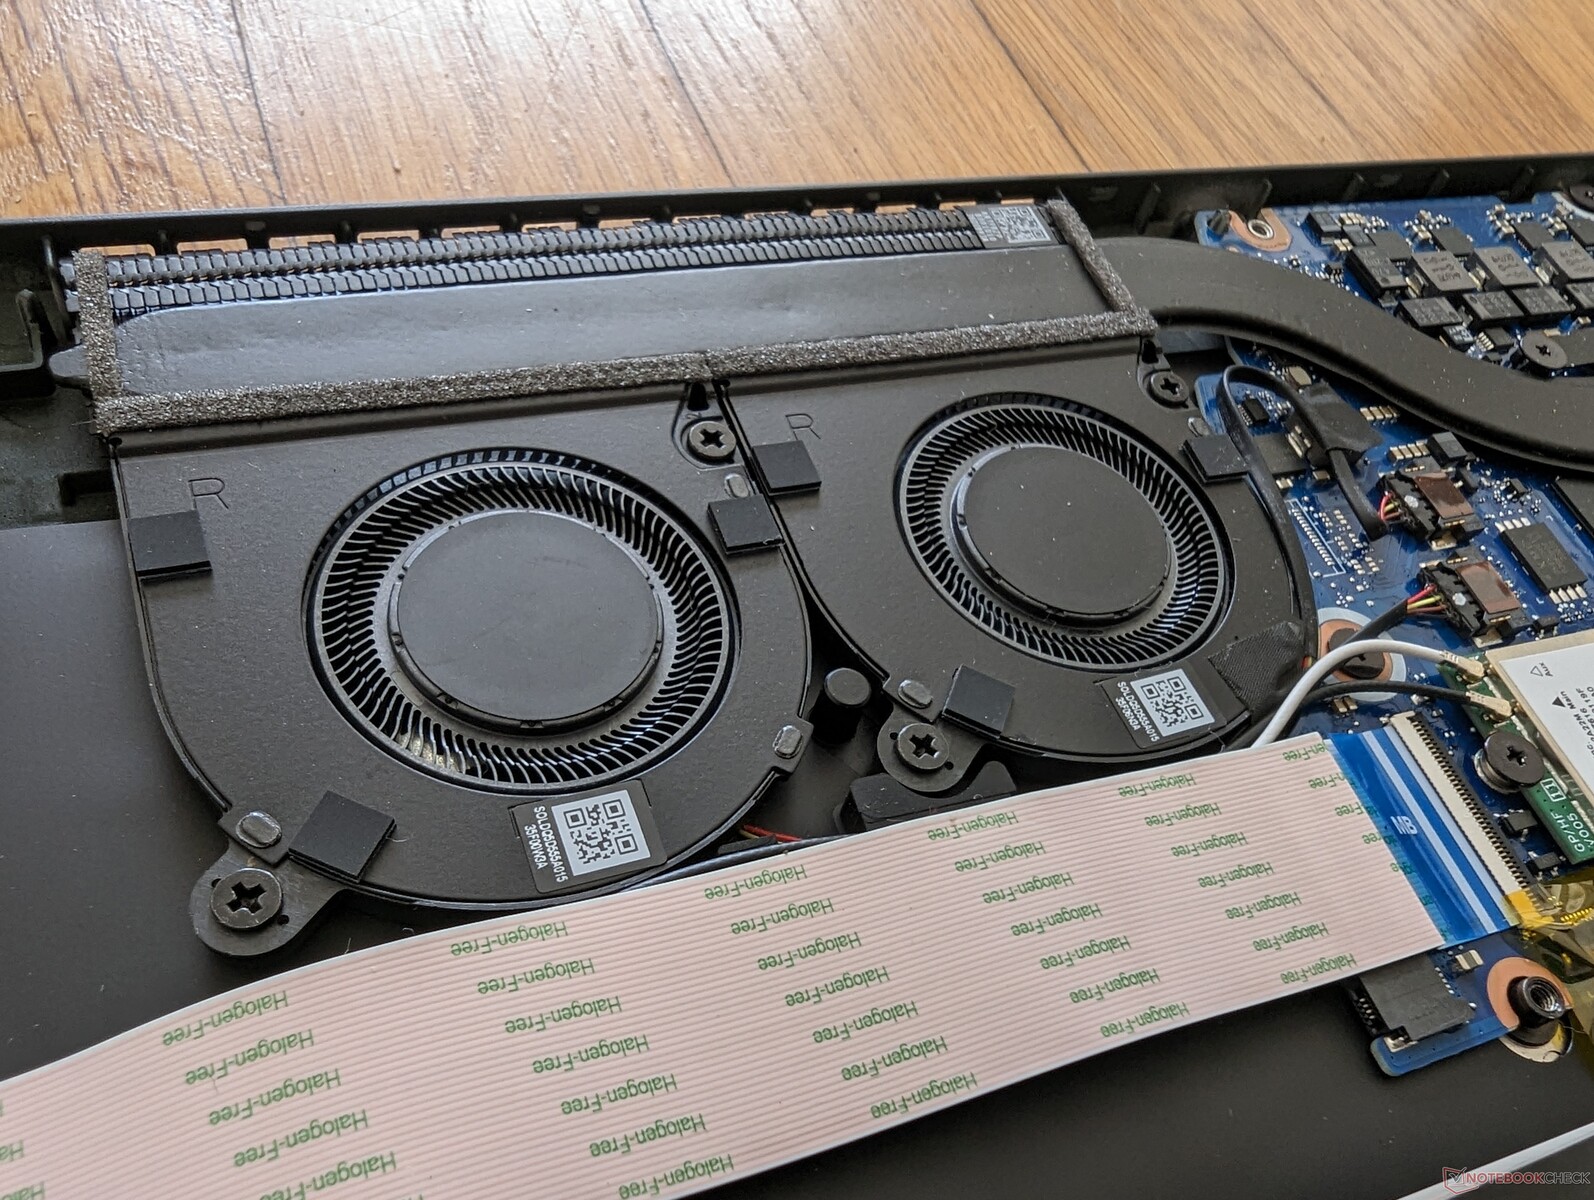
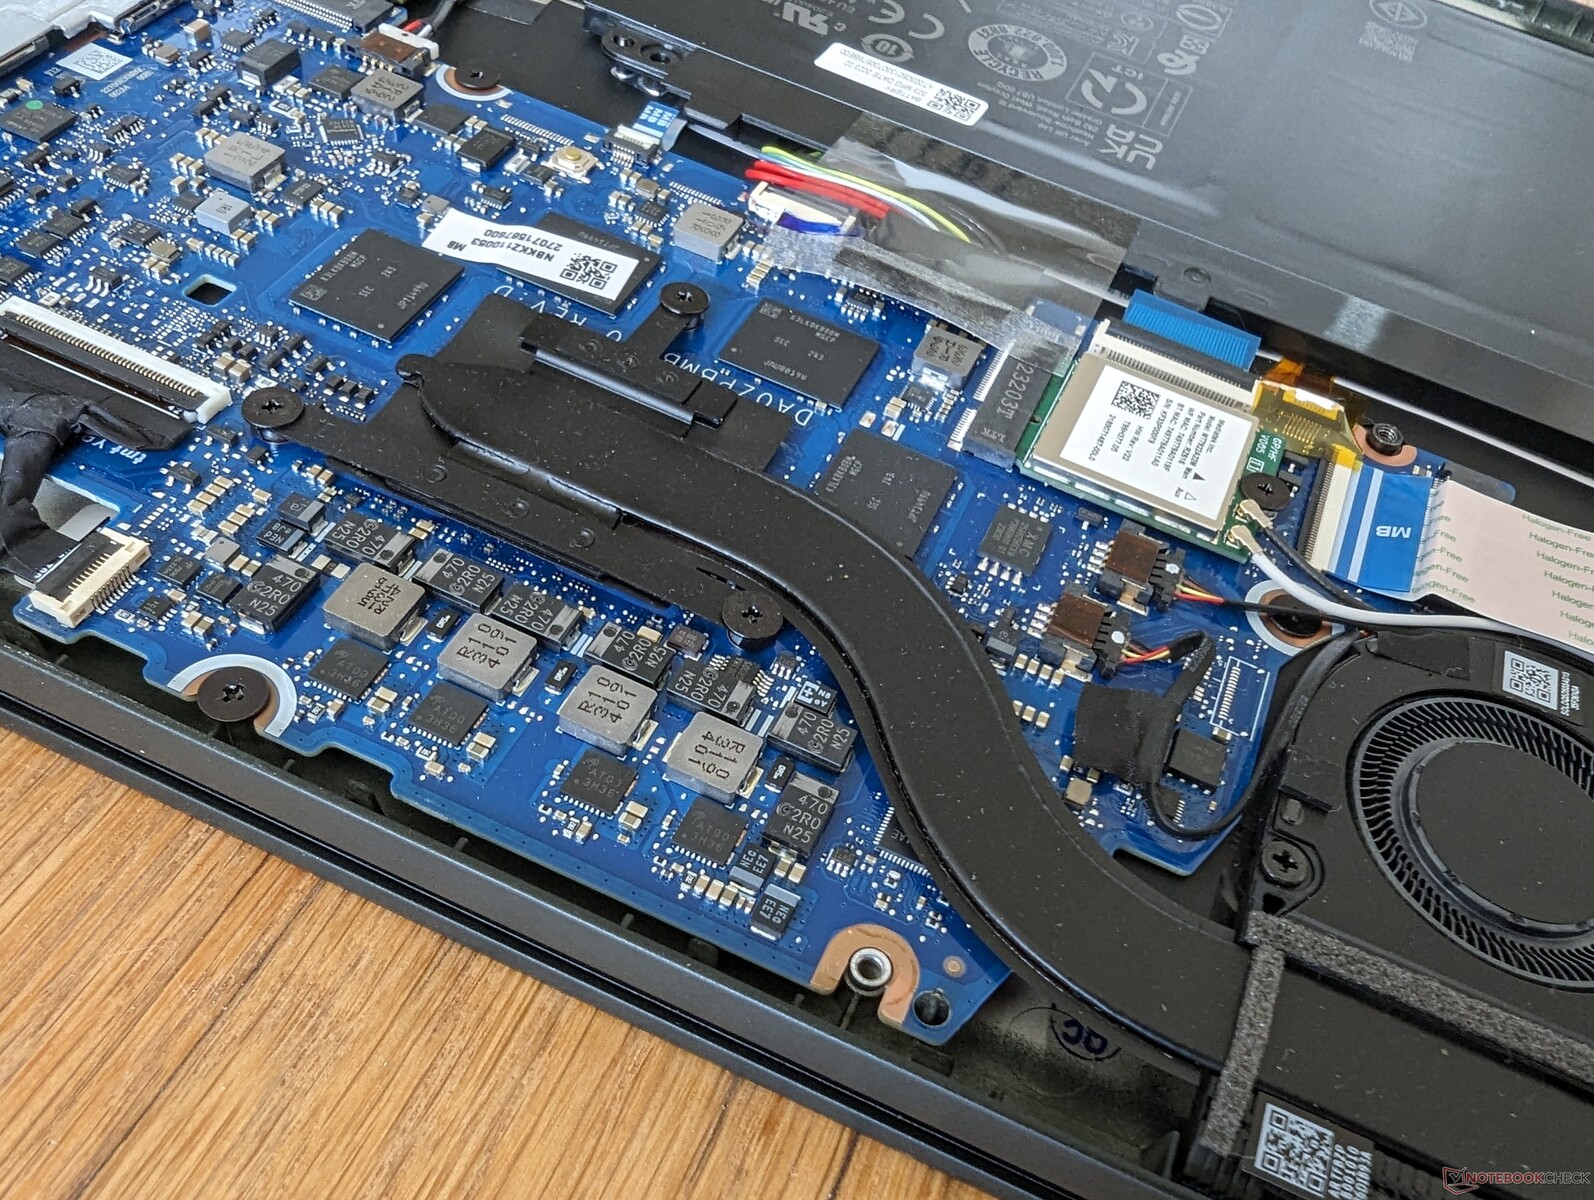
Wartung
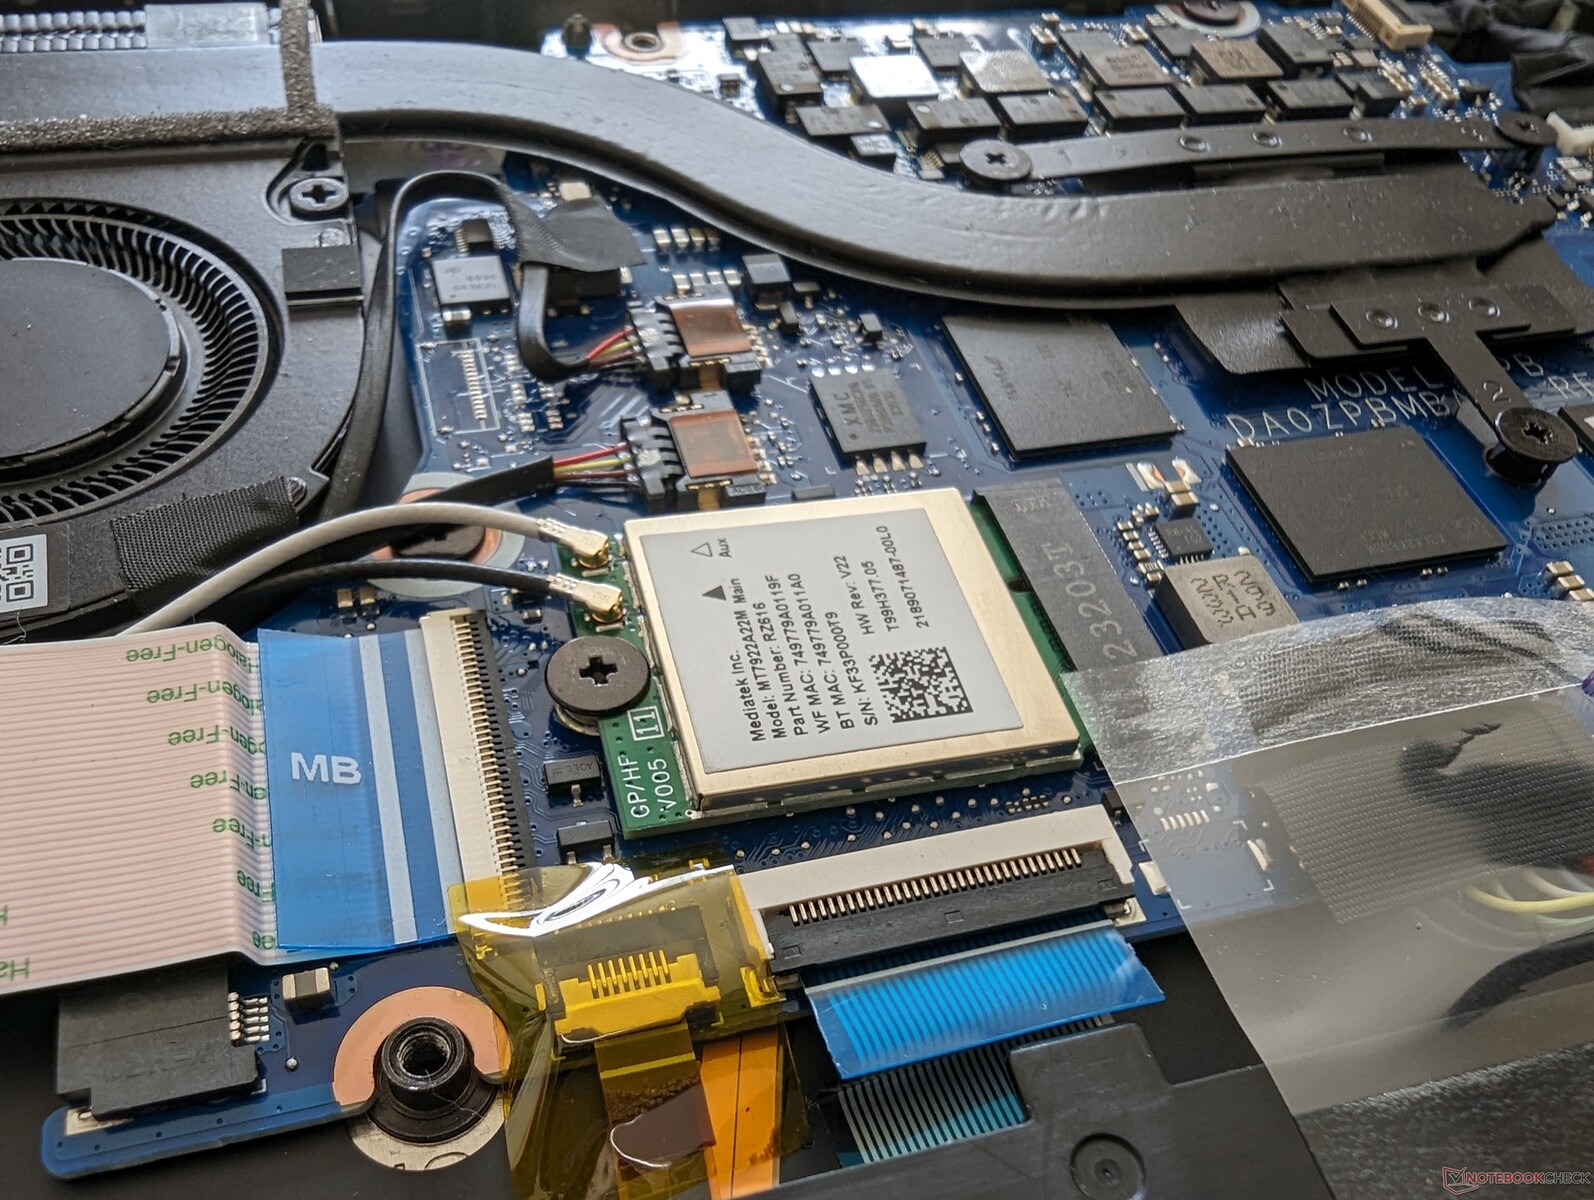
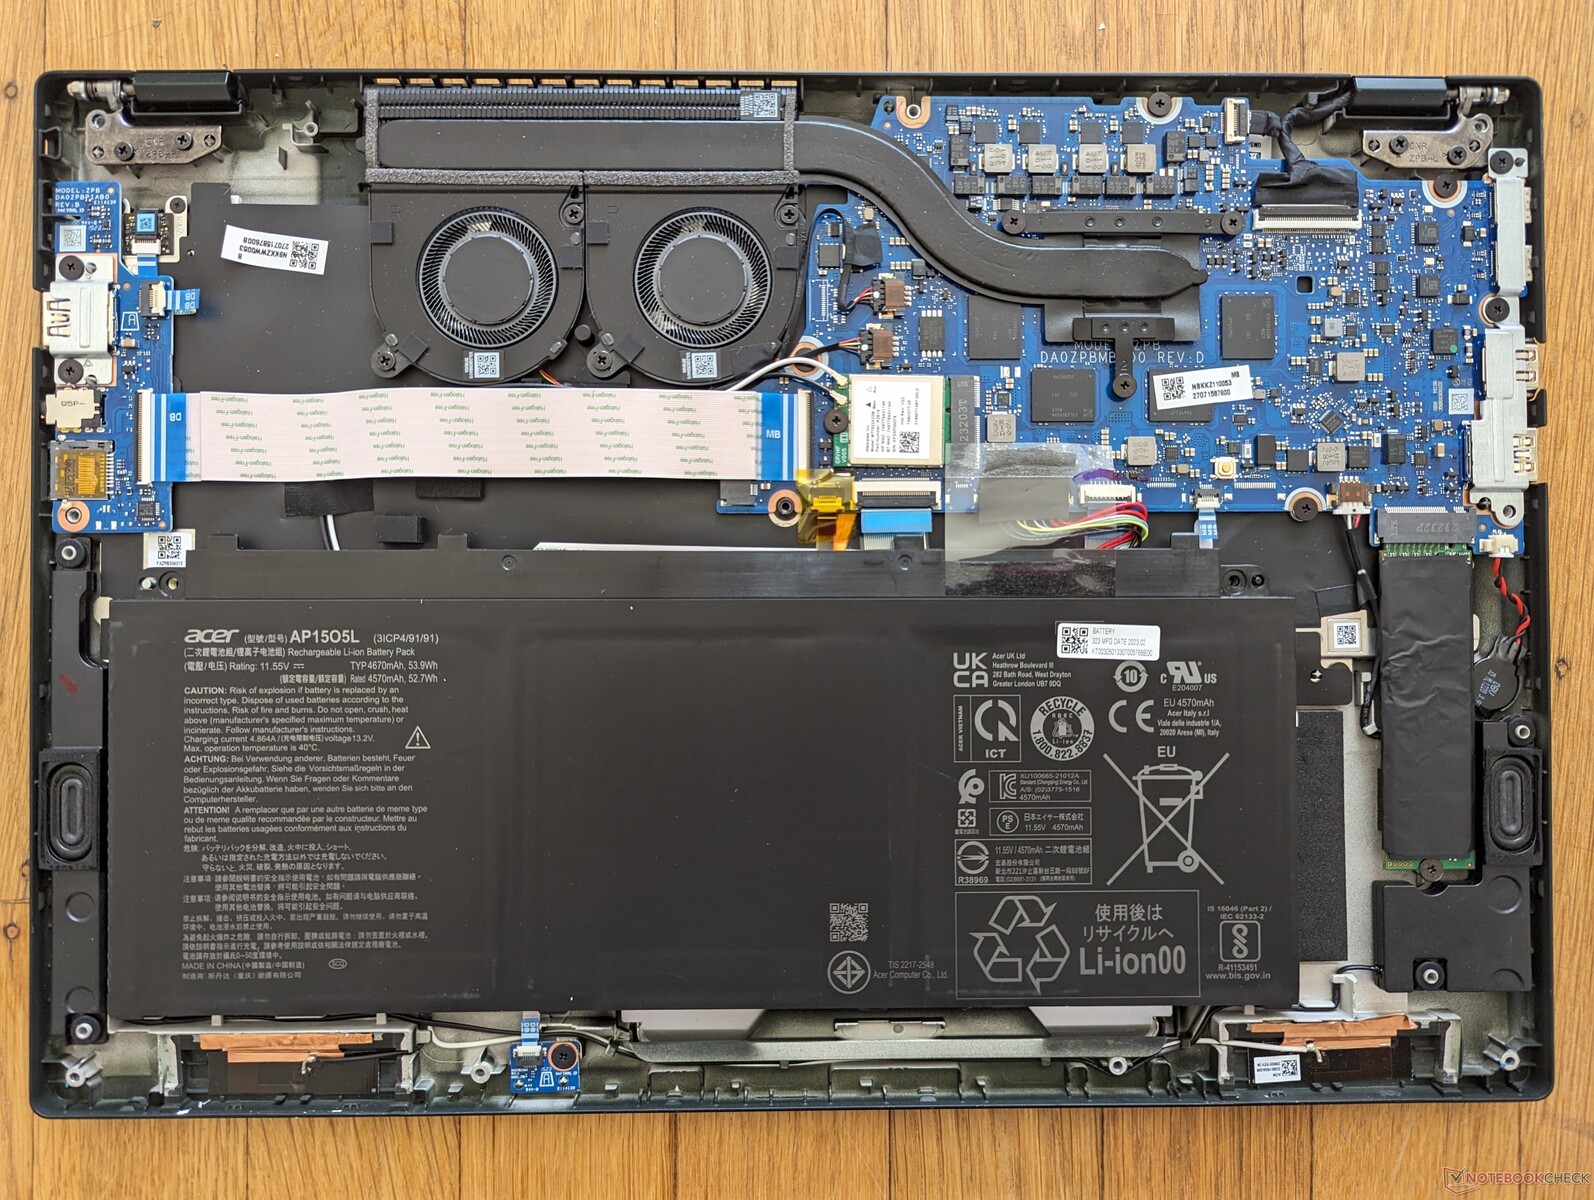
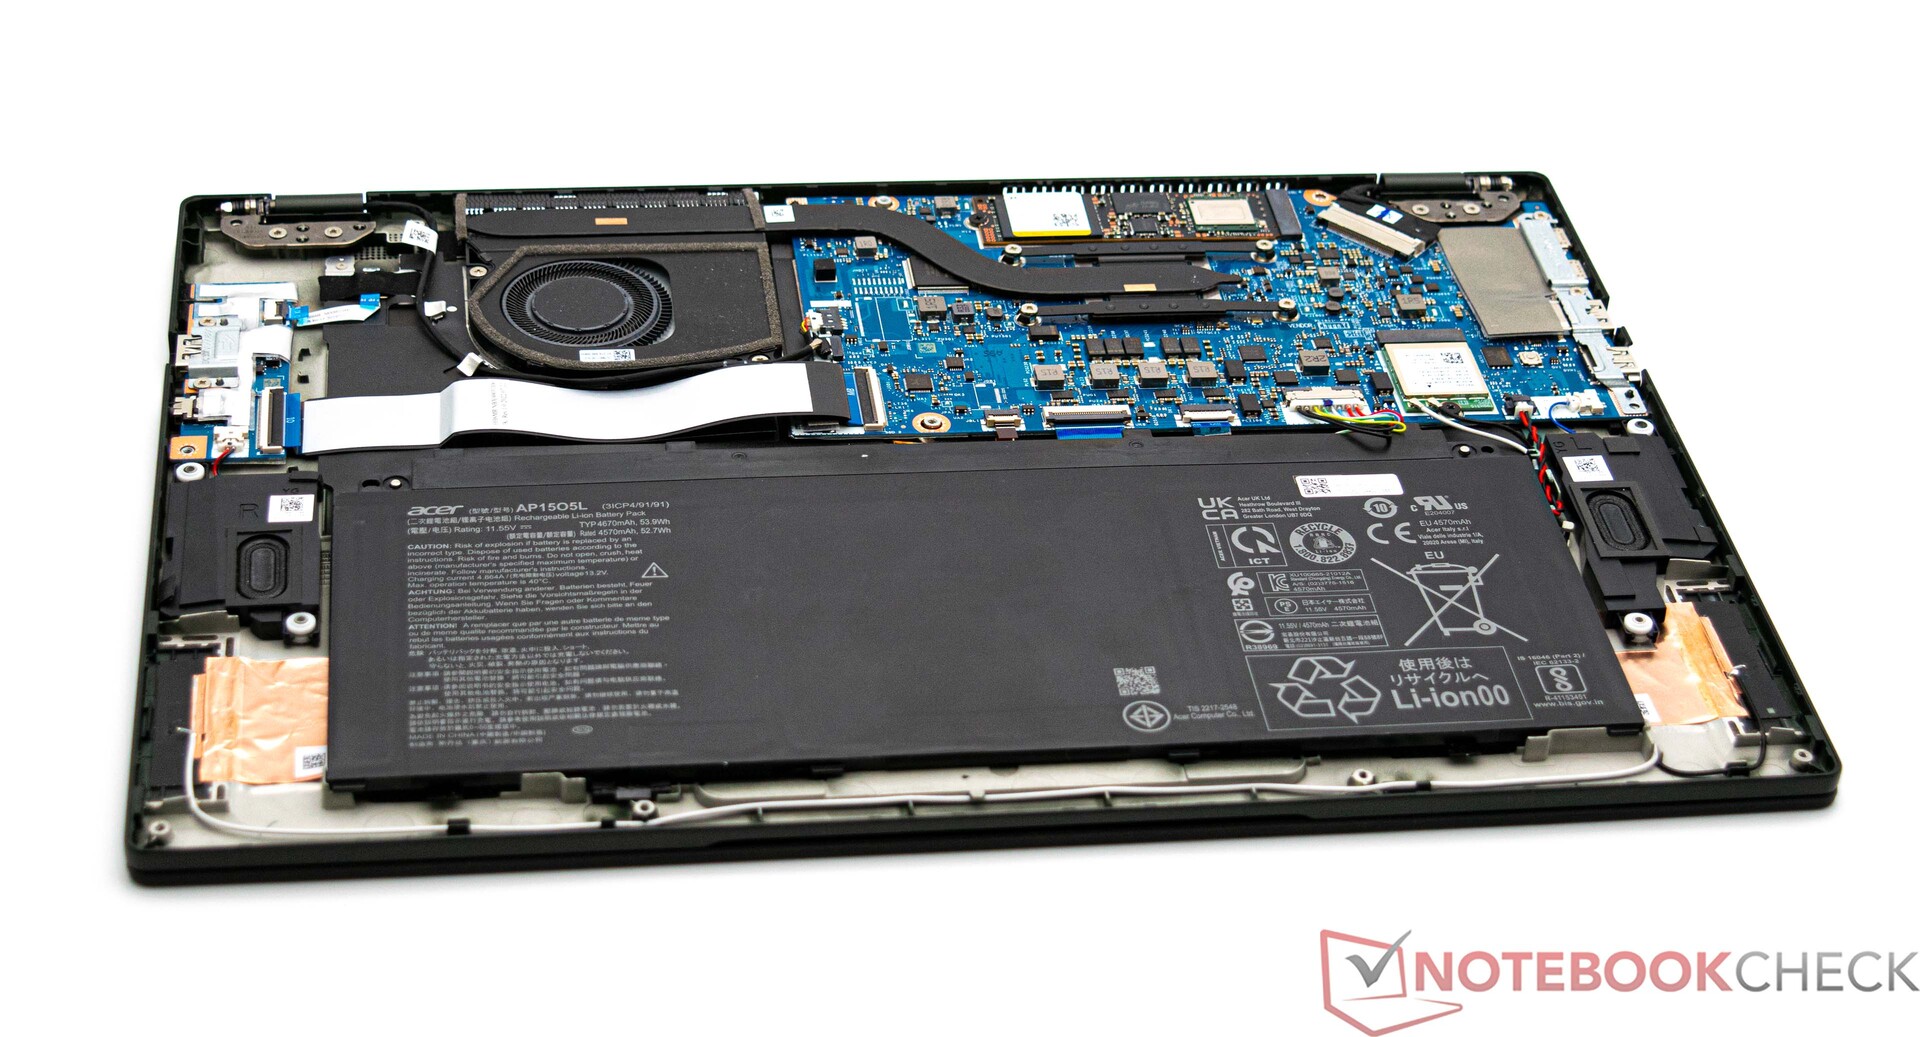
Die Bodenplatte lässt sich mit einem Torx-Schlüssel leicht öffnen. Die Lüfter und die Hauptplatine haben sich zwischen den Modellen mit Zen 3+ und Zen 4 erheblich verändert, wie die Bilder unten zeigen. Die SSD zum Beispiel liegt jetzt neben dem Akku.
Zubehör und Garantie
In der Verpackung befinden sich außer dem üblichen Papierkram und dem Netzteil keine weiteren Extras.
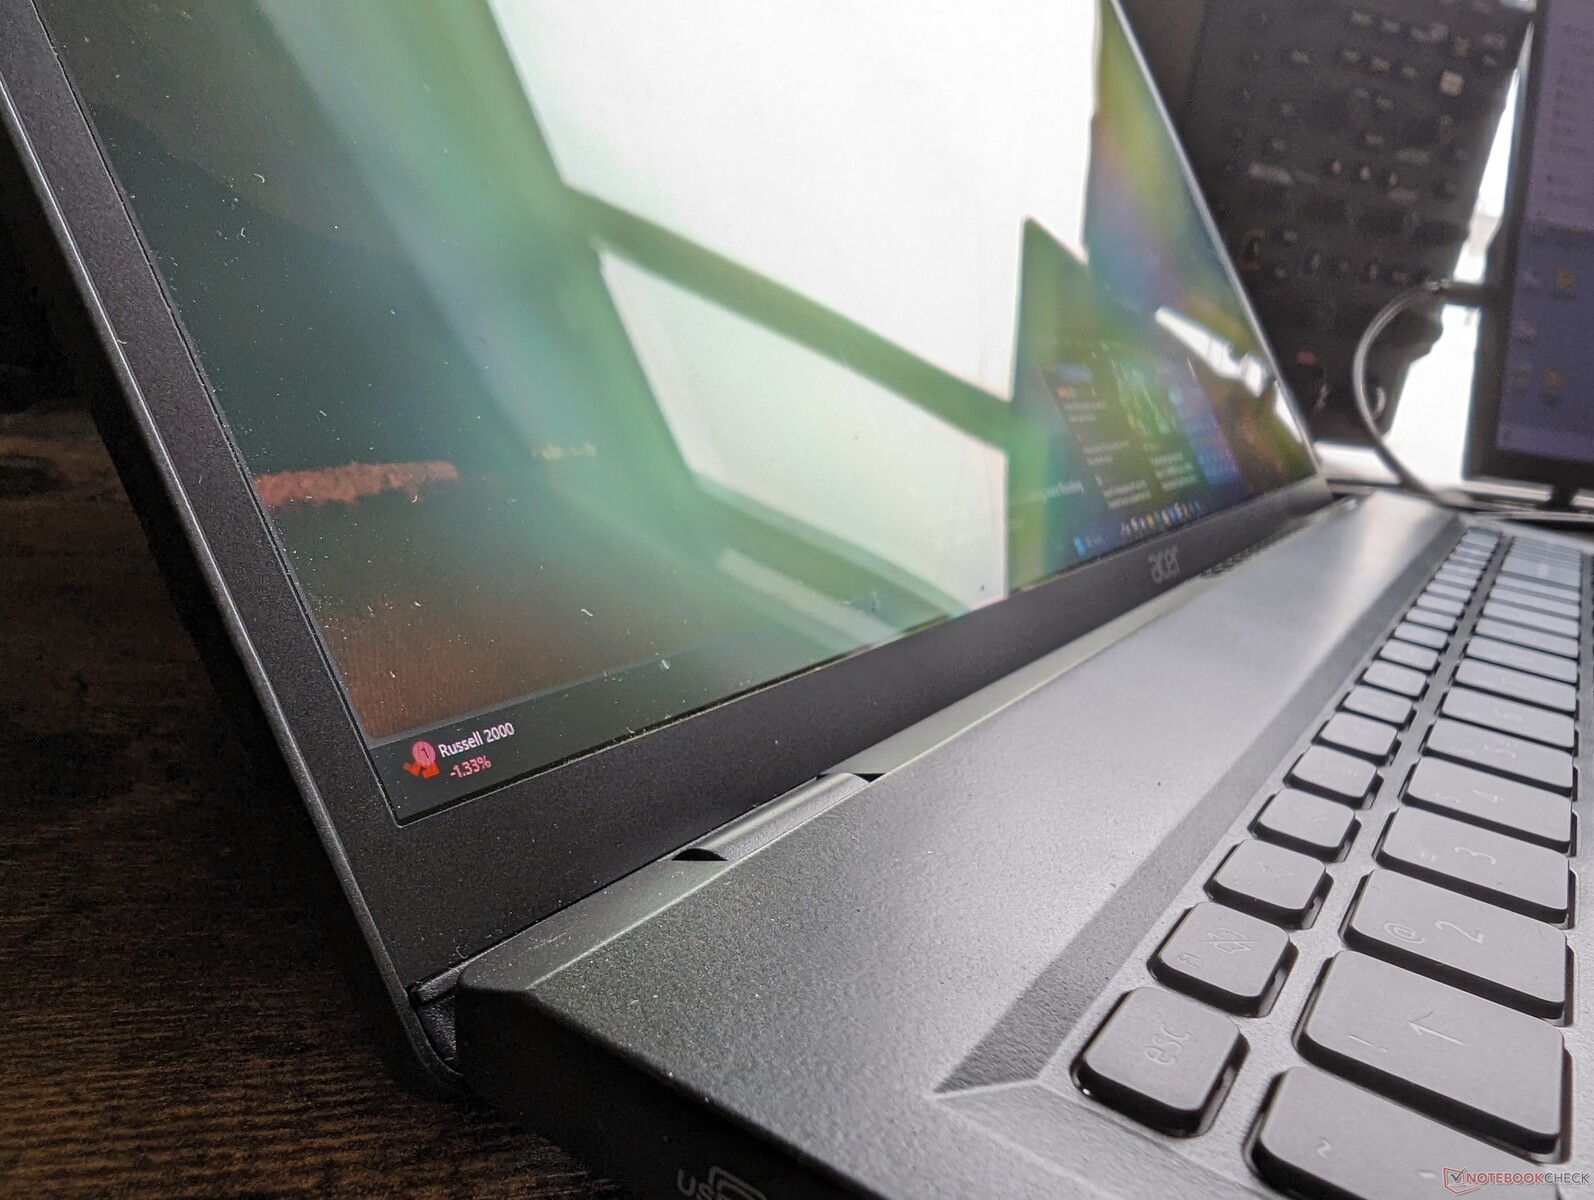
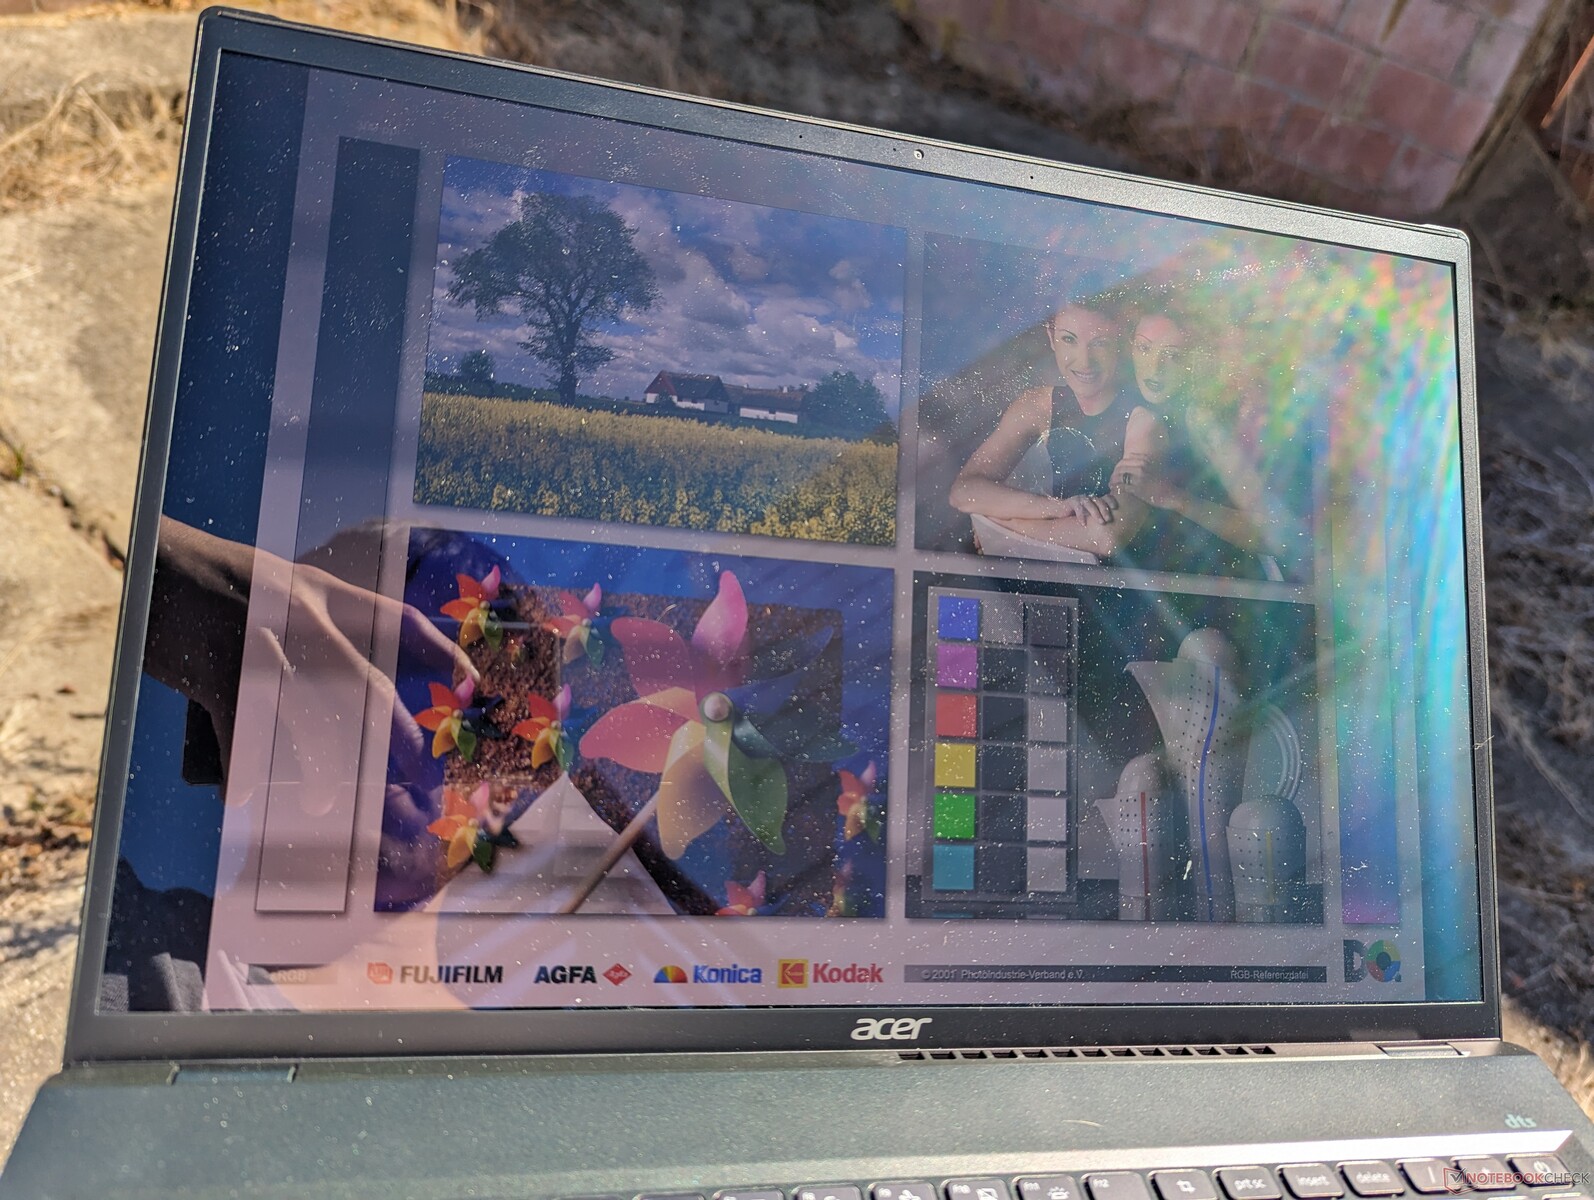
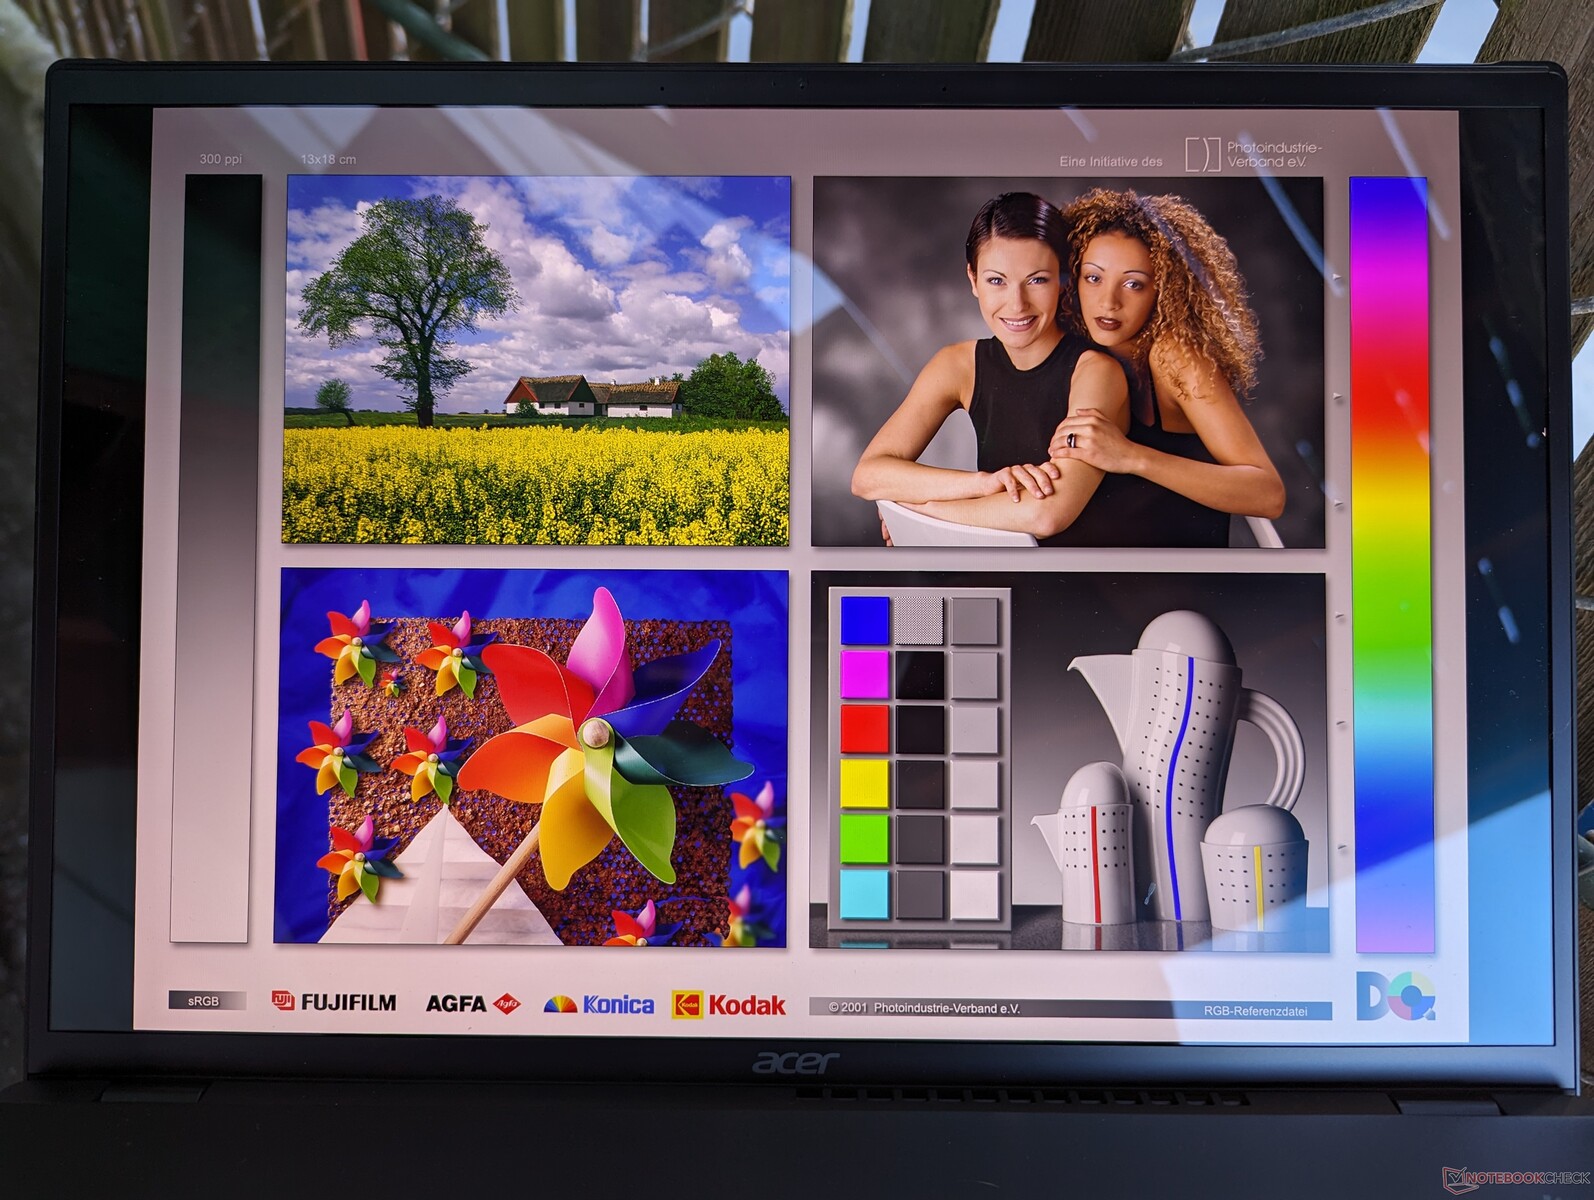
Display
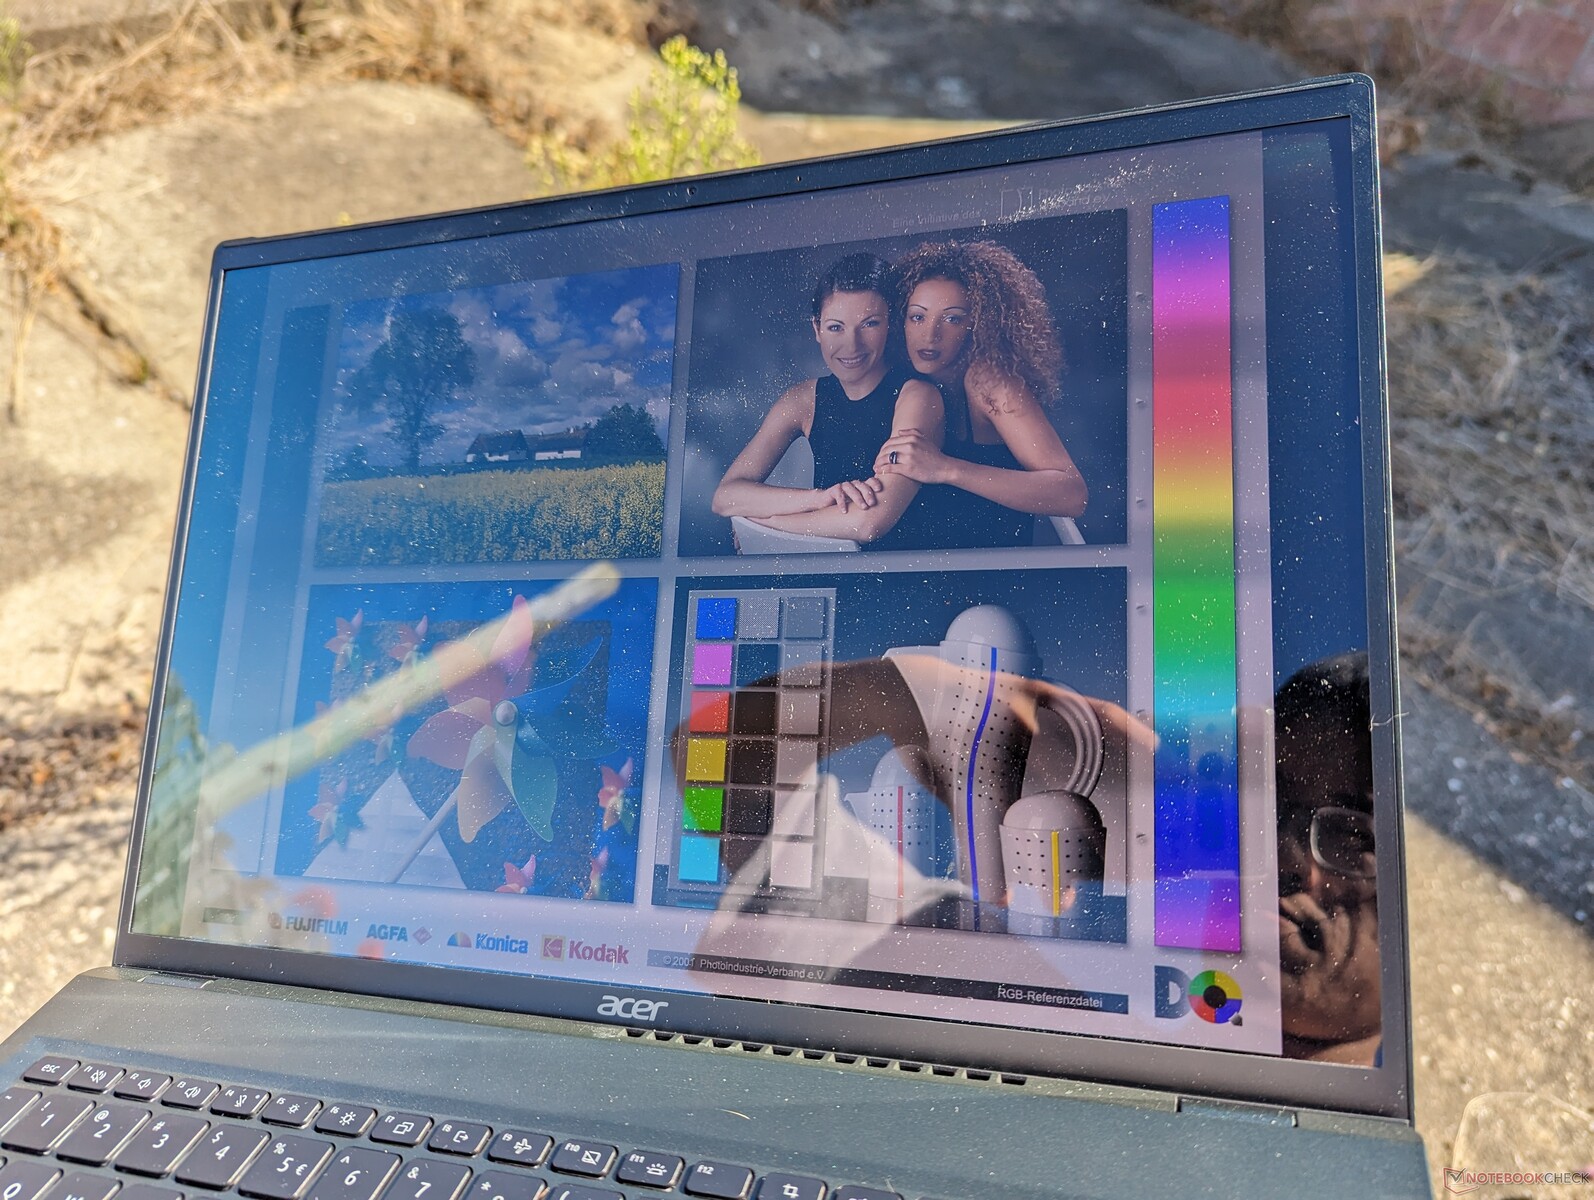
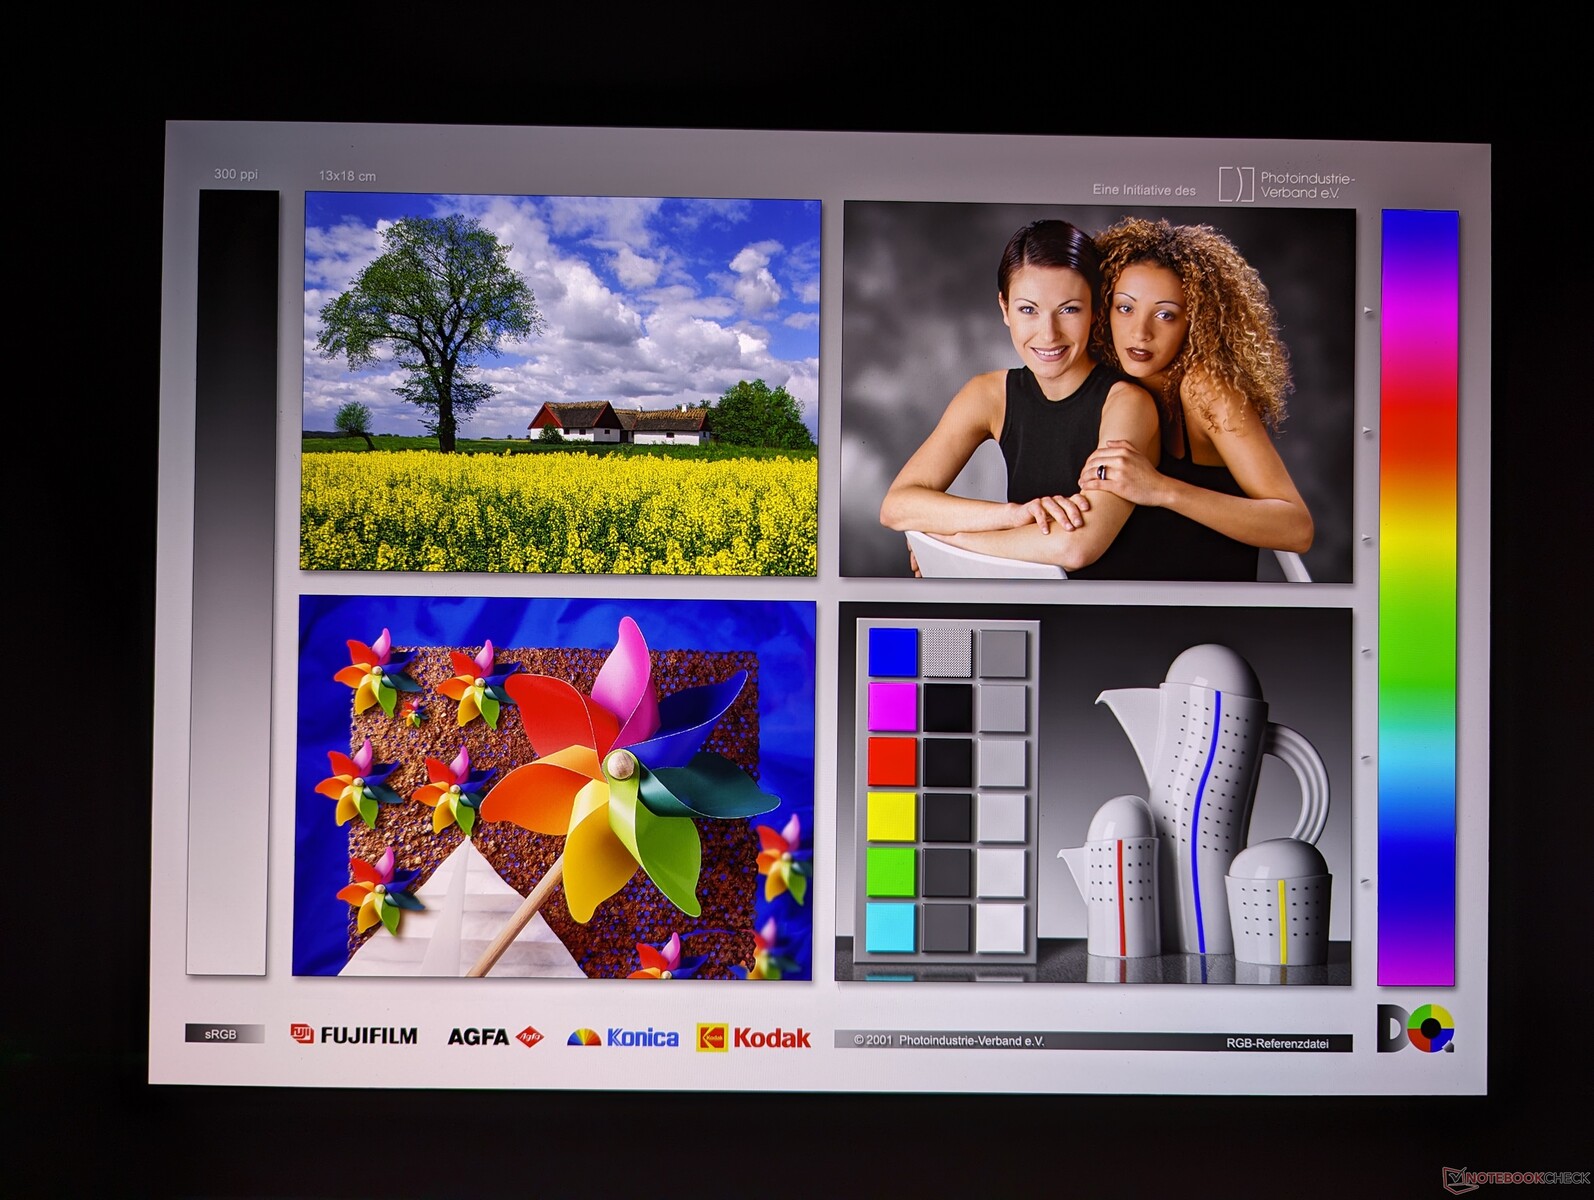
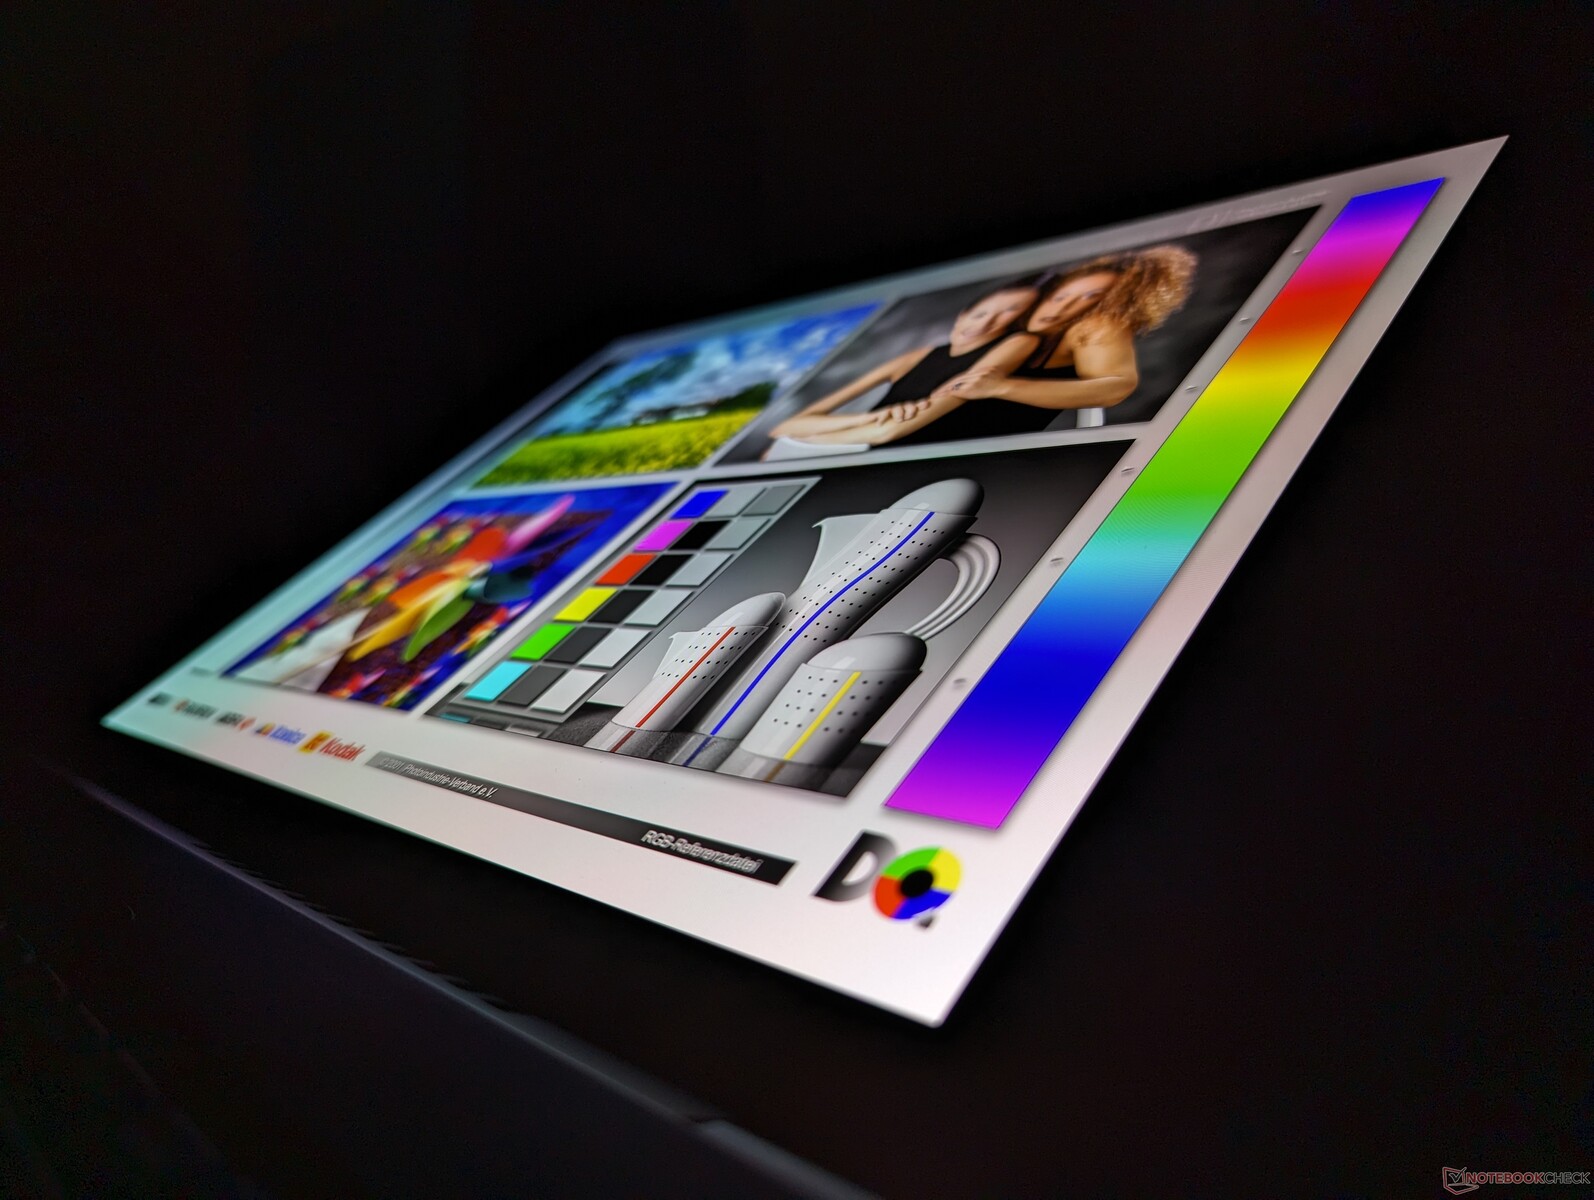
Unser Gerät wird mit einem OLED-Display mit 3200 x 2000 120 Hz anstelle des OLED-Displays mit 3840 x 2400 60 Hz in unserem früher getesteten Zen 3+ Swift Edge 16 geliefert. Die beiden Samsung-Panels bieten ansonsten ähnliche Farbabdeckungen, Helligkeitsstufen, Schwarzwerte und sehr schnelle Reaktionszeiten. Die Option mit der höheren Auflösung mag für bestimmte Anwendungen wie Excel oder Multitasking nützlicher sein, aber es ist schwer, wieder zu 60 Hz zurückzukehren, wenn man sich erst einmal an die schnellere 120-Hz-Bildwiederholrate unserer 3.2K-Option mit niedrigerer Auflösung gewöhnt hat. Für Spiele bedeutet die 120-Hz-Anzeige, dass Sie 40 FPS statt 30 FPS anpeilen können, ohne sich Sorgen über Screen Tearing machen zu müssen.

| |||||||||||||||||||||||||
Ausleuchtung: 98 %
Helligkeit Akku: 379.8 cd/m²
Kontrast: ∞:1 (Schwarzwert: 0 cd/m²)
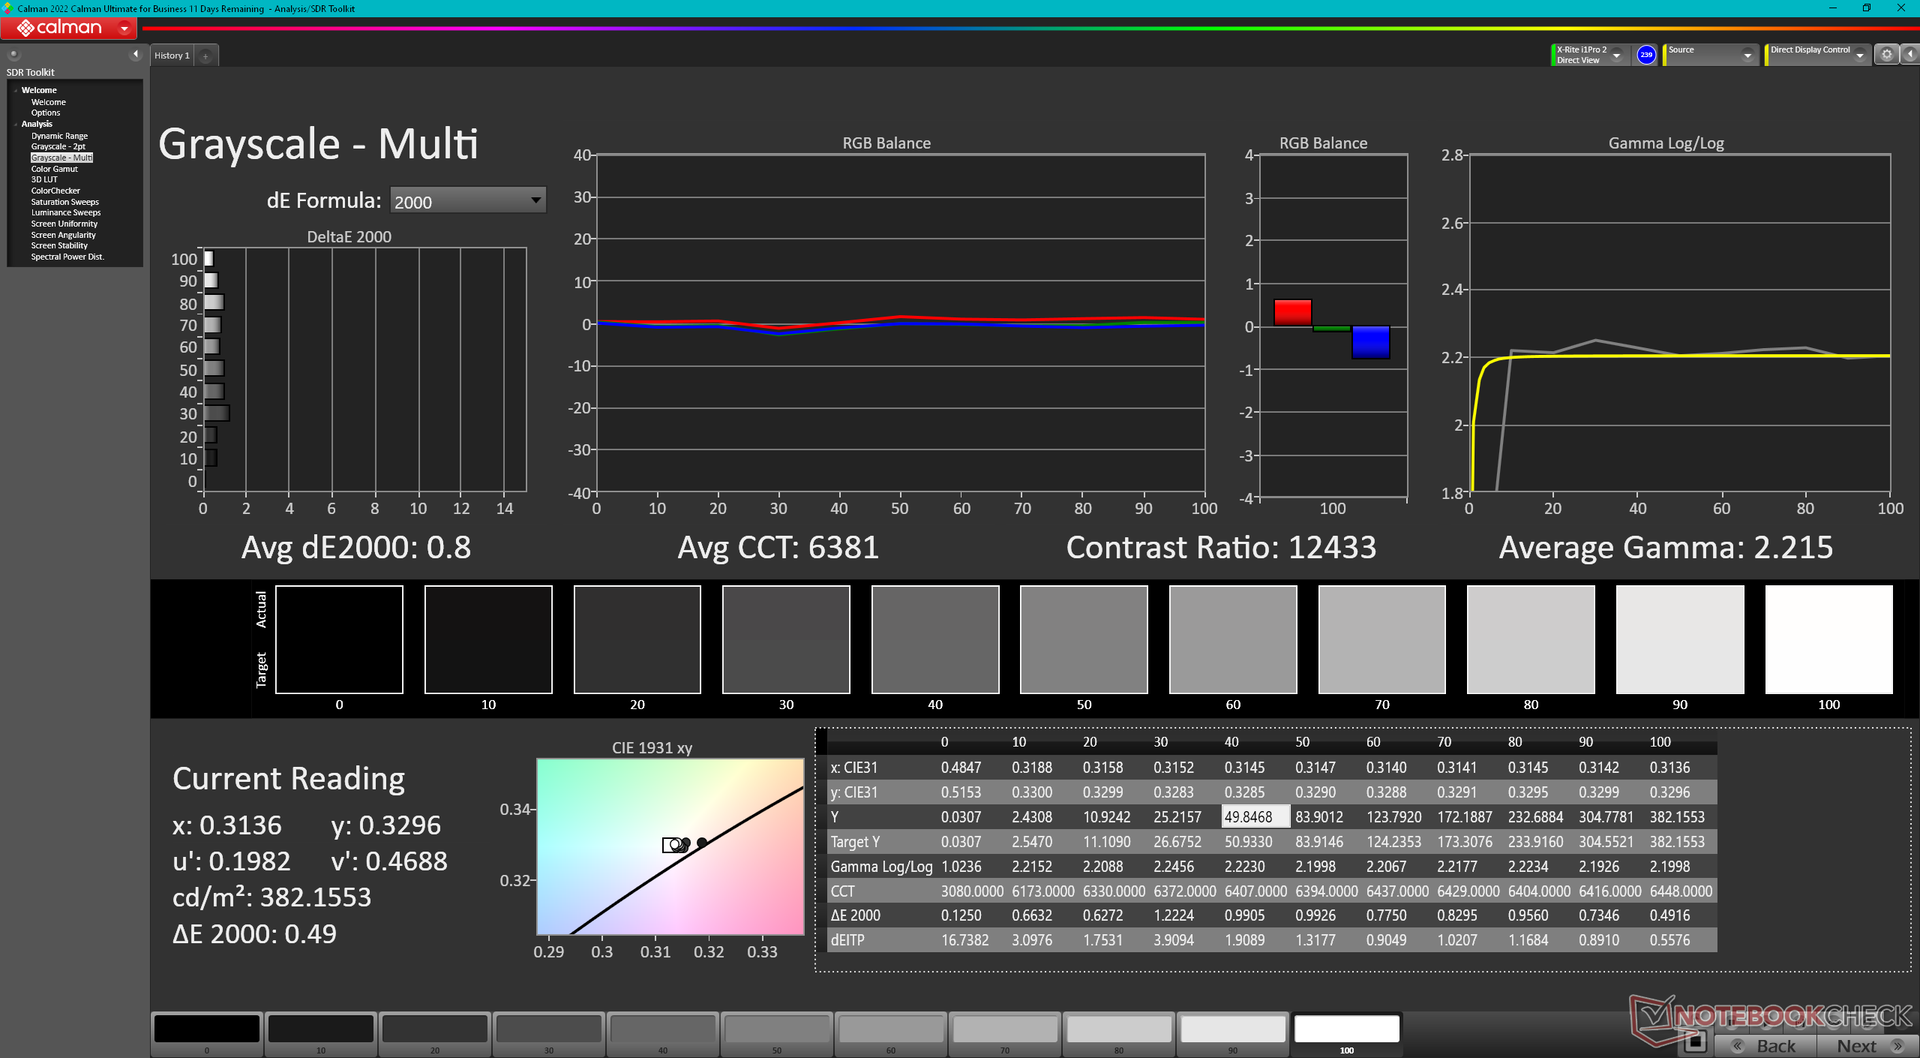
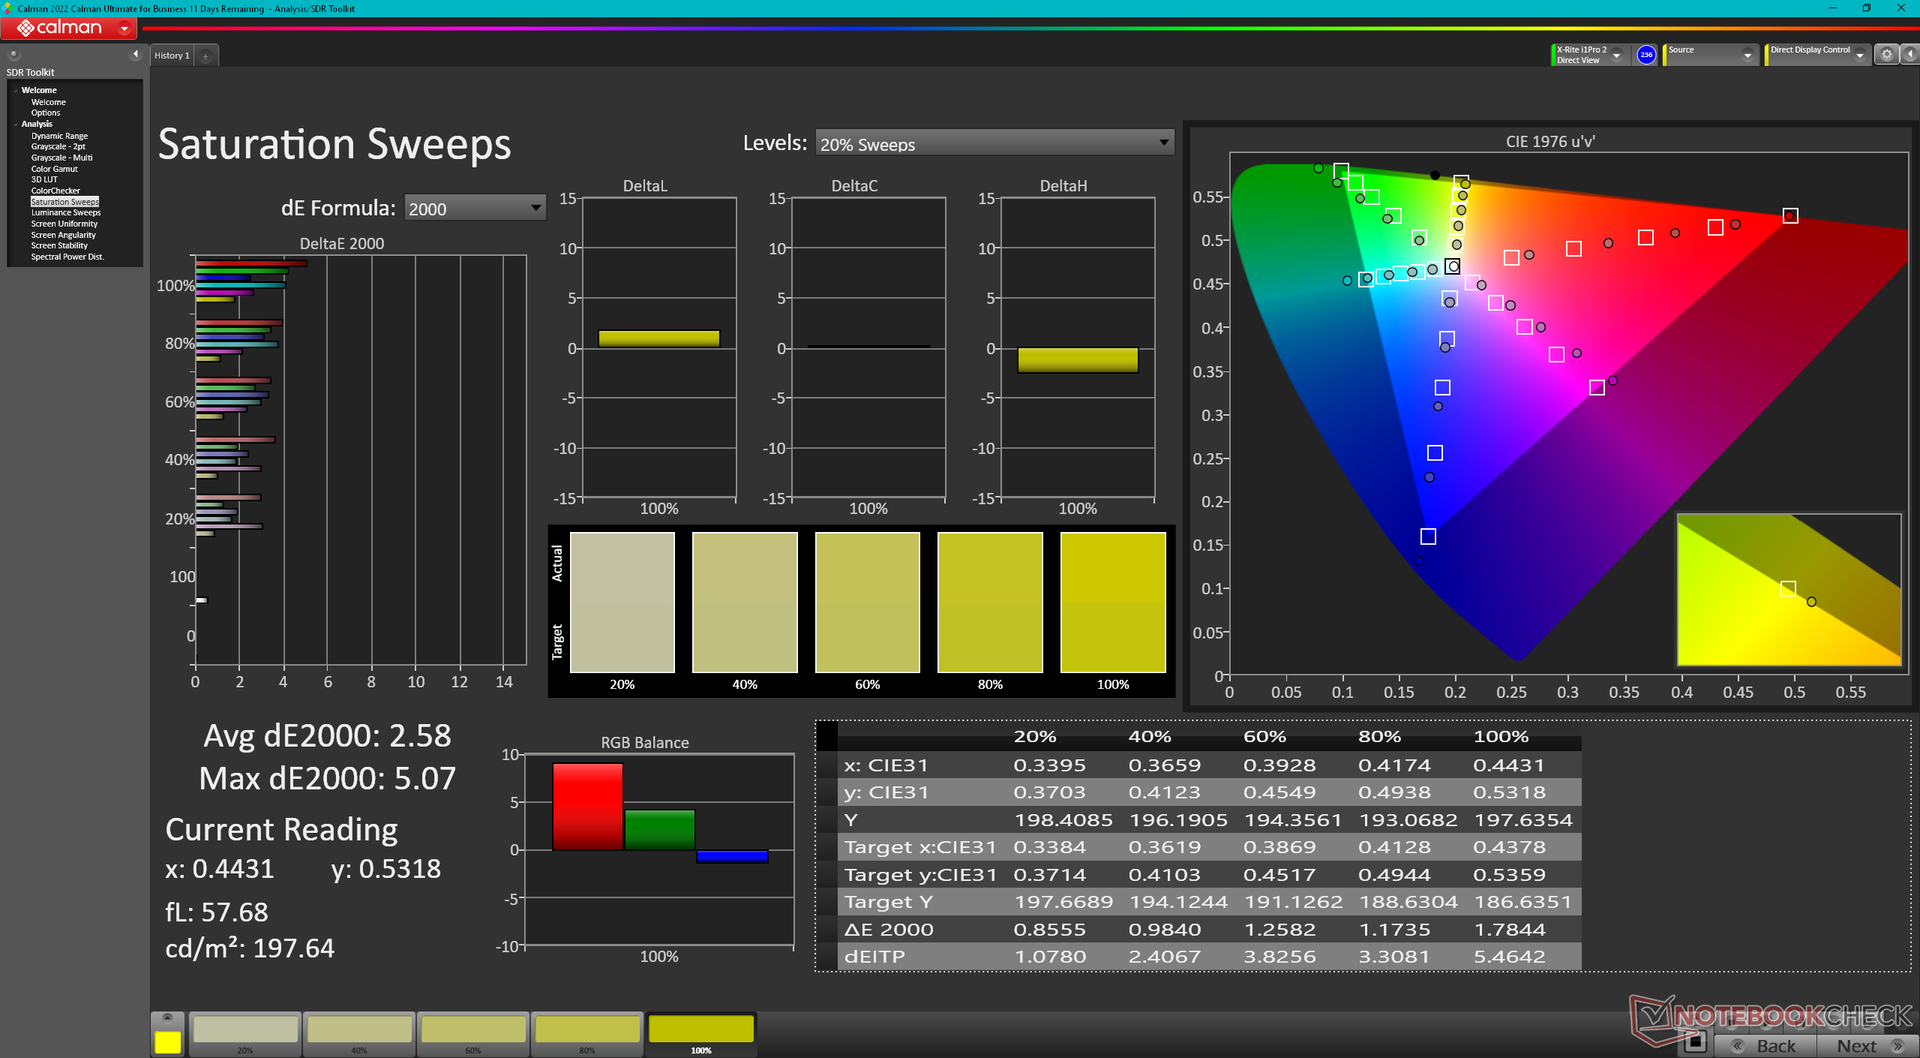
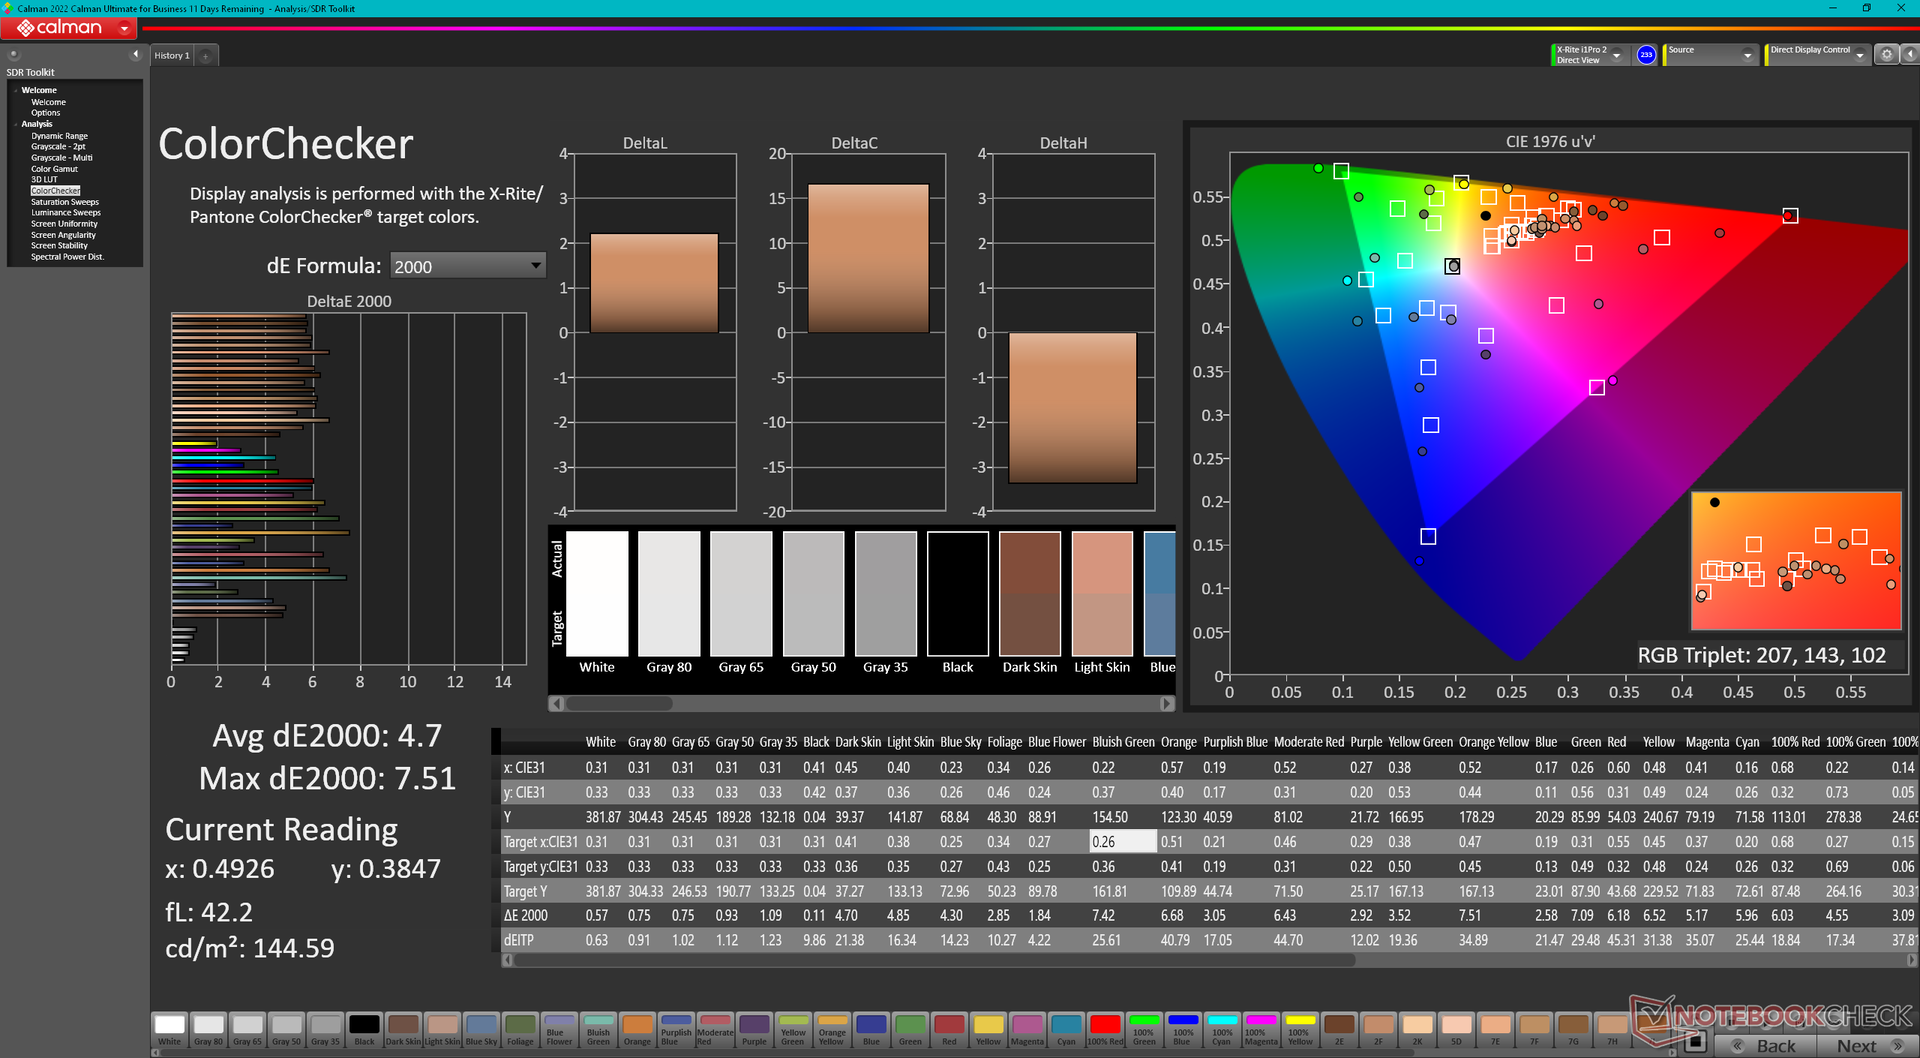
ΔE ColorChecker Calman: 4.7 | ∀{0.5-29.43 Ø4.72}
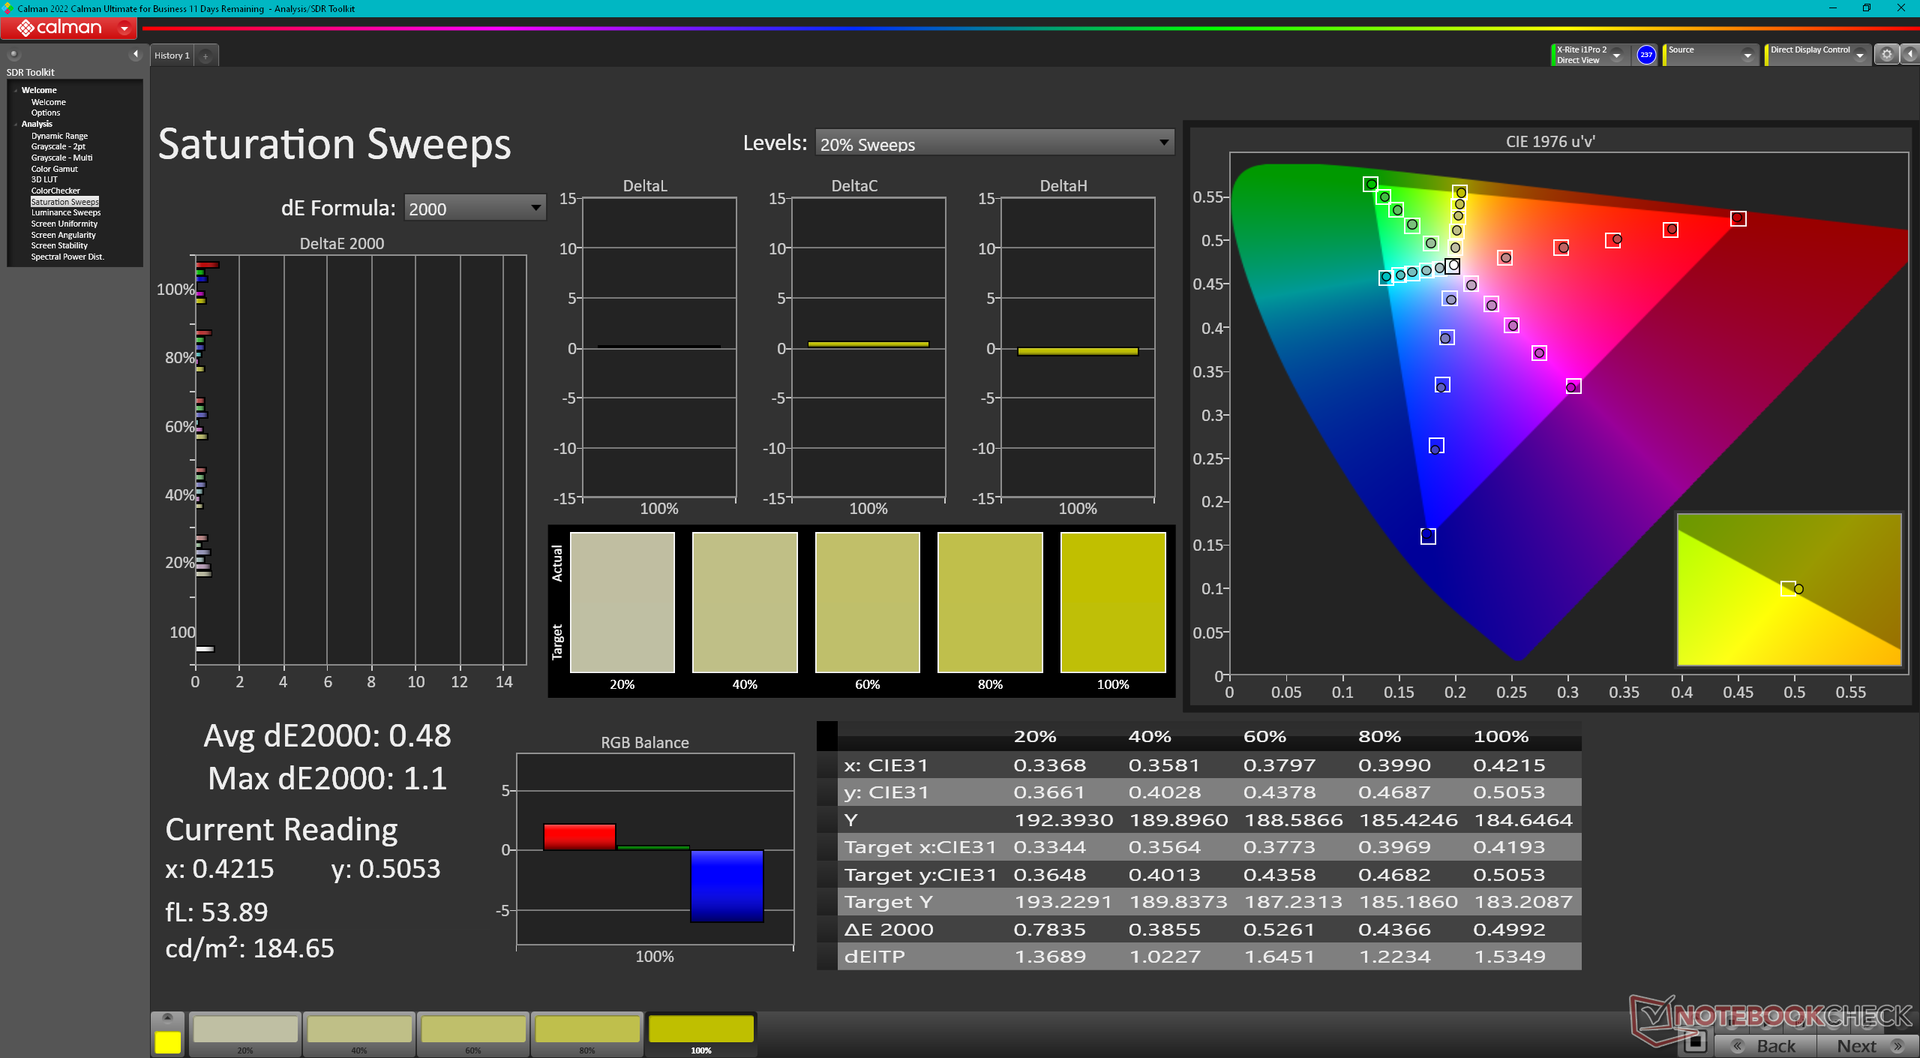
calibrated: 0.55
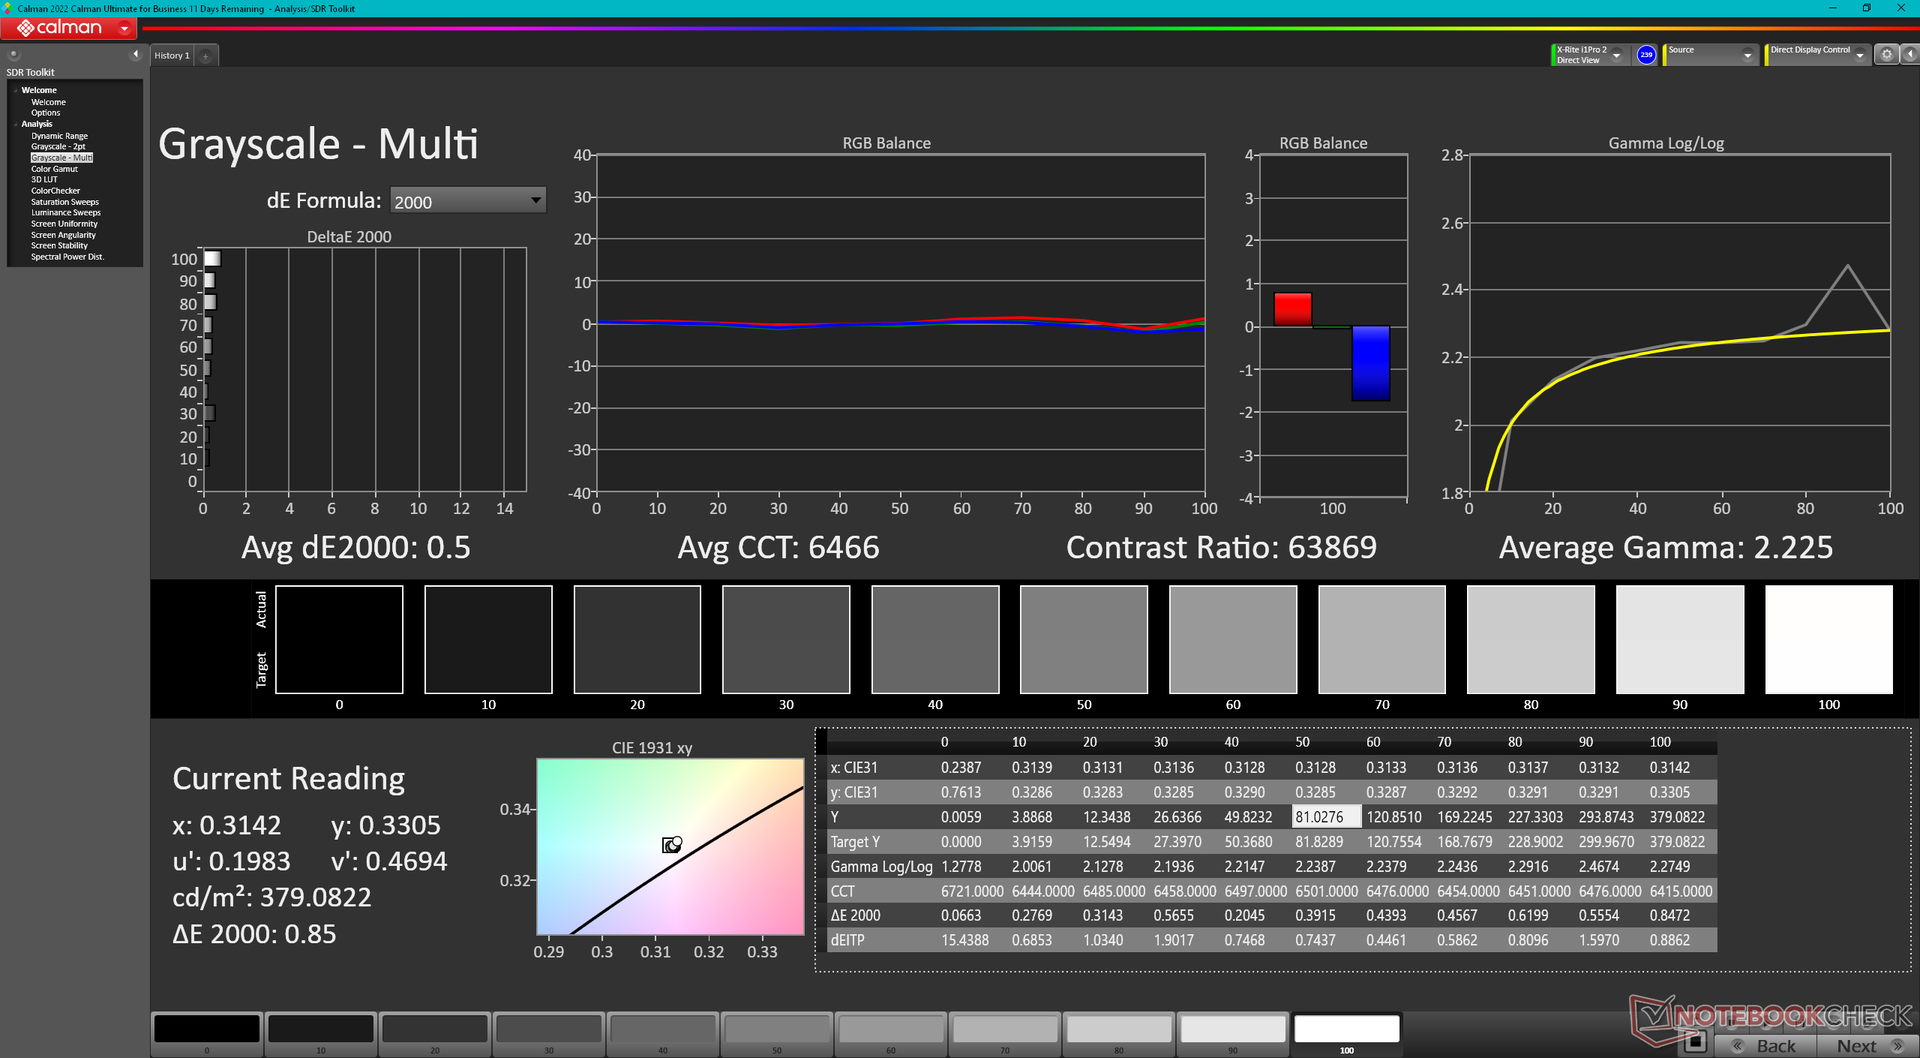
ΔE Greyscale Calman: 0.8 | ∀{0.09-98 Ø4.97}
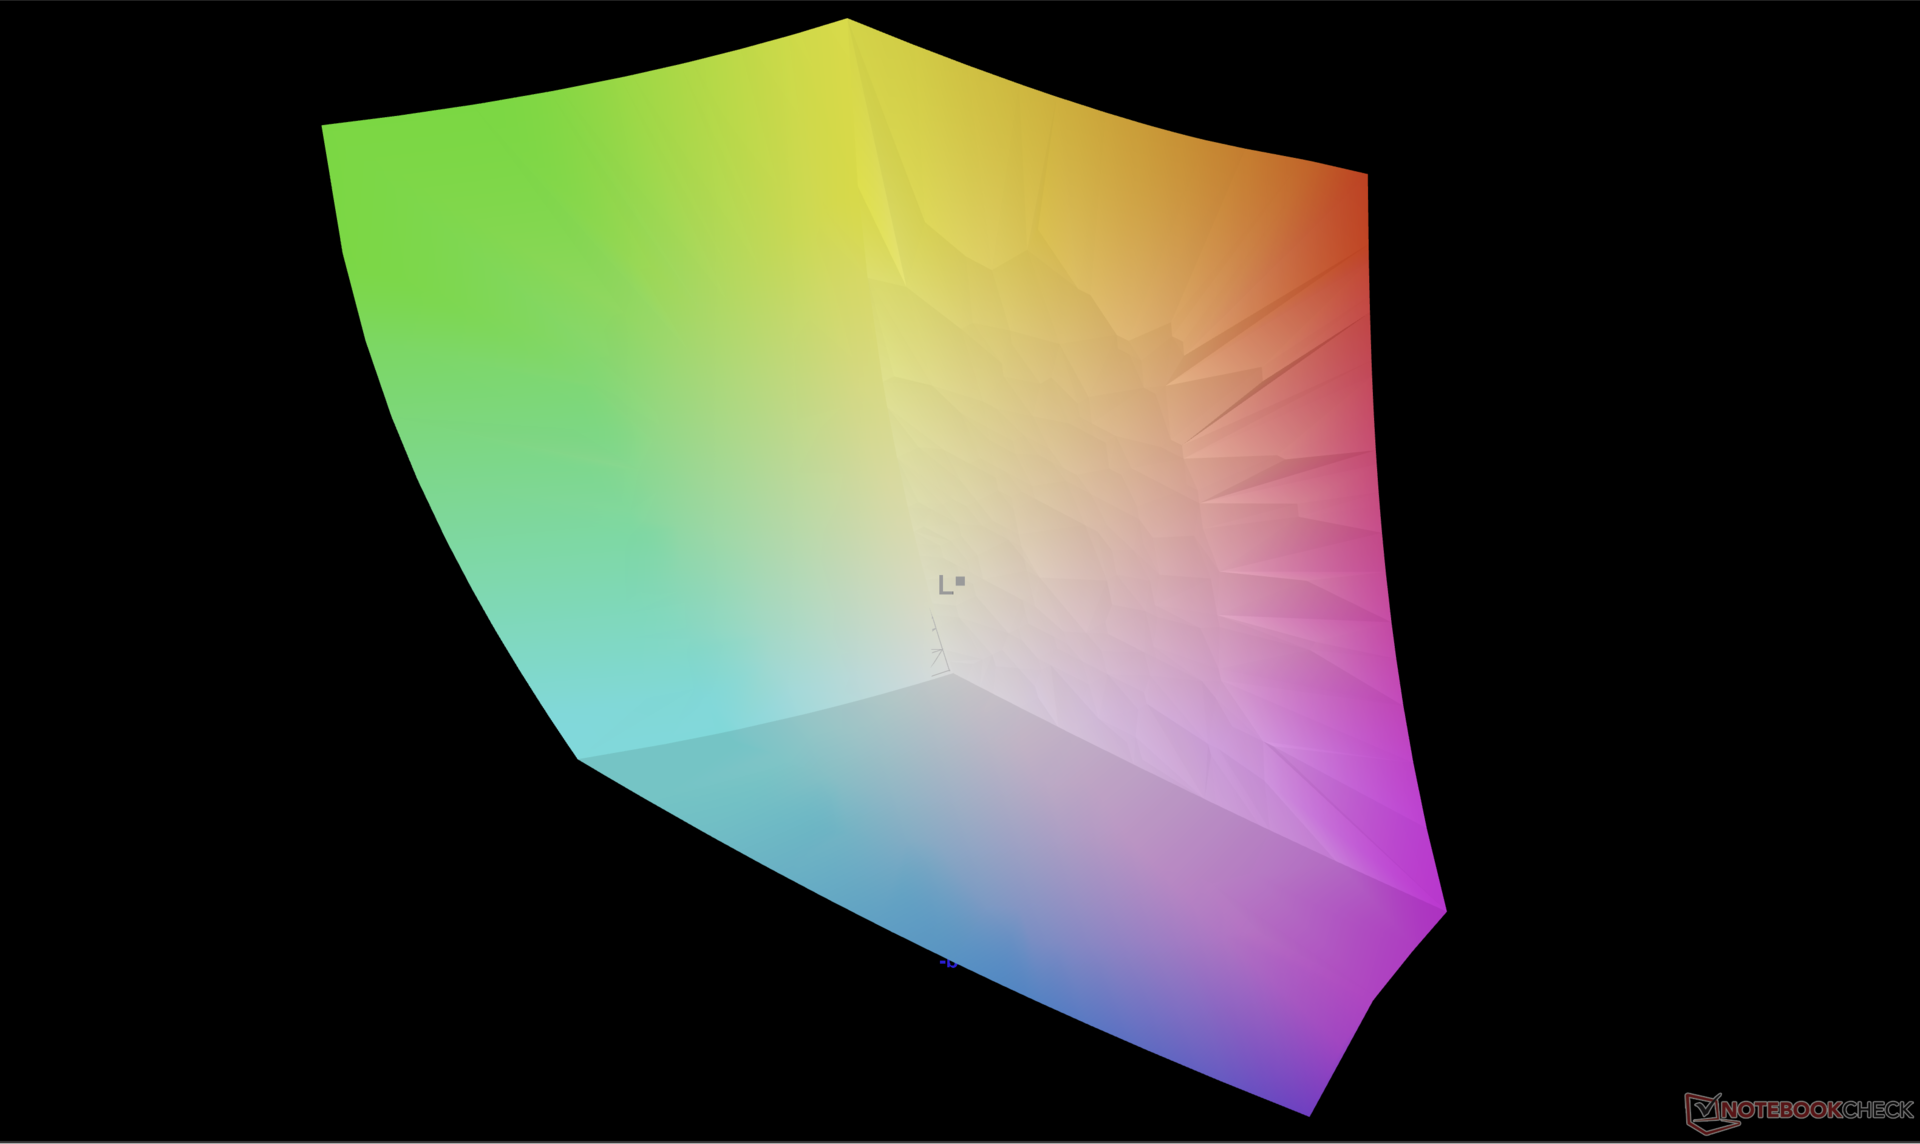
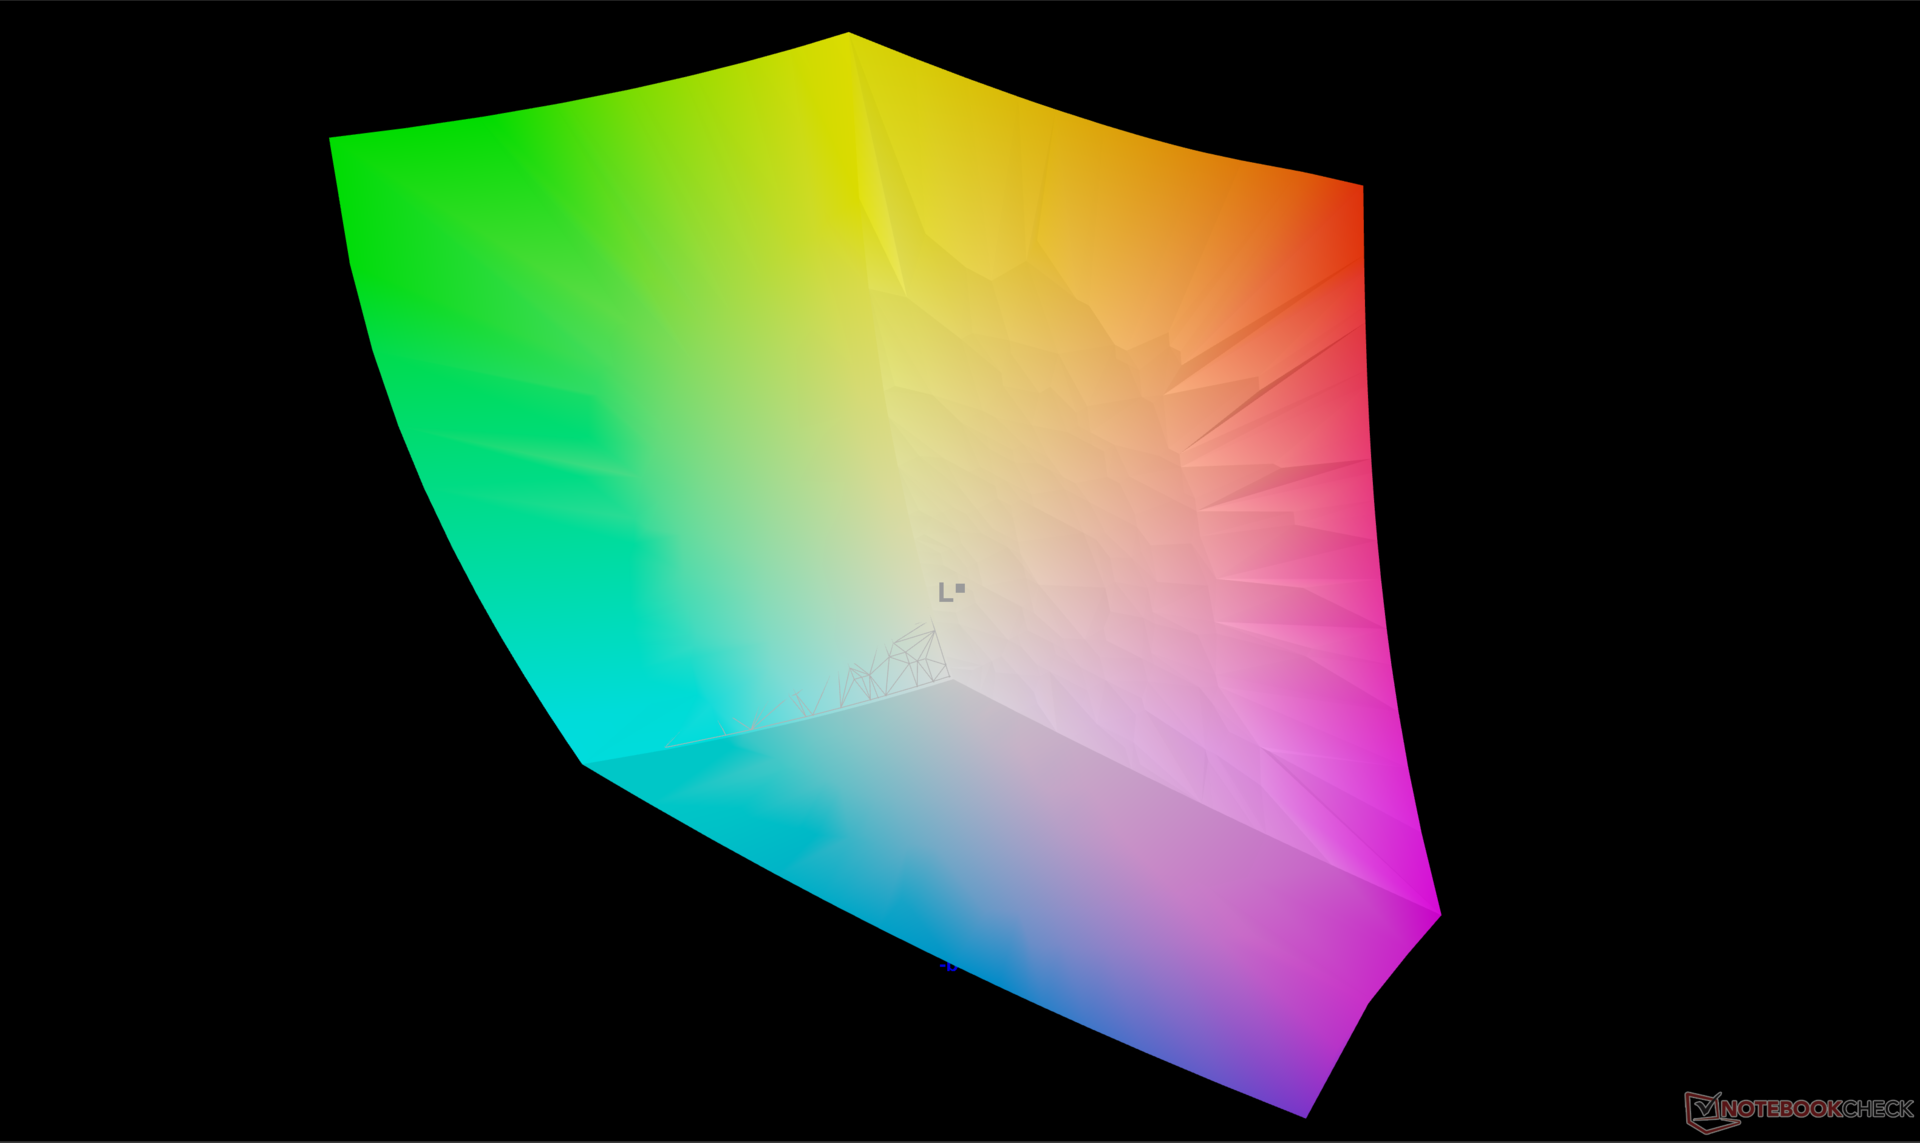
100% AdobeRGB 1998 (Argyll 3D)
100% sRGB (Argyll 3D)
99.9% Display P3 (Argyll 3D)
Gamma: 2.22
CCT: 6381 K
| Acer Swift Edge SFE16 Ryzen 7 7840U Samsung ATNA60BX03-0, OLED, 3200x2000, 16" | Acer Swift Edge SFE16-42-R1GM Samsung SDC4168, OLED, 3840x2400, 16" | Lenovo Slim Pro 9i 16IRP8 LEN160-3.2K, Mini-LED, 3200x2000, 16" | Asus VivoBook Pro 16 Au Optronics B160QAN02.L, IPS, 2560x1600, 16" | Samsung Galaxy Book3 Ultra 16 Samsung ATNA60CL03-0, AMOLED, 2880x1800, 16" | Huawei MateBook 16s i7 BOE XS TV160DKT-NH0, IPS, 2520x1680, 16" | |
|---|---|---|---|---|---|---|
| Display | -1% | -7% | -5% | -1% | -24% | |
| Display P3 Coverage (%) | 99.9 | 99.7 0% | 95.1 -5% | 98.5 -1% | 99.9 0% | 64.5 -35% |
| sRGB Coverage (%) | 100 | 100 0% | 99.9 0% | 99.9 0% | 100 0% | 96.7 -3% |
| AdobeRGB 1998 Coverage (%) | 100 | 97.2 -3% | 84.6 -15% | 86.1 -14% | 96.3 -4% | 66.6 -33% |
| Response Times | -226% | -1588% | -476% | 25% | -4192% | |
| Response Time Grey 50% / Grey 80% * (ms) | 0.57 ? | 2 ? -251% | 14 ? -2356% | 2 ? -251% | 0.49 ? 14% | 35.7 ? -6163% |
| Response Time Black / White * (ms) | 1 ? | 3 ? -200% | 9.2 ? -820% | 8 ? -700% | 0.65 ? 35% | 23.2 ? -2220% |
| PWM Frequency (Hz) | 238.8 | 239 ? | 5784 ? | 240 ? | ||
| Bildschirm | -66% | -198% | -42% | -49% | -3% | |
| Helligkeit Bildmitte (cd/m²) | 379.8 | 369 -3% | 627.4 65% | 504 33% | 400 5% | 311 -18% |
| Brightness (cd/m²) | 383 | 371 -3% | 618 61% | 465 21% | 399 4% | 319 -17% |
| Brightness Distribution (%) | 98 | 97 -1% | 95 -3% | 87 -11% | 93 -5% | 91 -7% |
| Schwarzwert * (cd/m²) | 0.19 | 0.35 | 0.03 | 0.17 | ||
| Delta E Colorchecker * | 4.7 | 2.3 51% | 5.84 -24% | 1.83 61% | 2.3 51% | 1 79% |
| Colorchecker dE 2000 max. * | 7.51 | 4.37 42% | 10.22 -36% | 5.51 27% | 4.15 45% | 1.7 77% |
| Colorchecker dE 2000 calibrated * | 0.55 | 2.87 -422% | 4.45 -709% | 1.34 -144% | 1.66 -202% | 0.8 -45% |
| Delta E Graustufen * | 0.8 | 1.83 -129% | 6.7 -738% | 3.02 -278% | 2.7 -238% | 1.5 -88% |
| Gamma | 2.22 99% | 2.39 92% | 2.77 79% | 2.39 92% | 2.266 97% | 2.15 102% |
| CCT | 6381 102% | 6392 102% | 5795 112% | 6688 97% | 7047 92% | 6432 101% |
| Kontrast (:1) | 3302 | 1440 | 13333 | 1829 | ||
| Durchschnitt gesamt (Programm / Settings) | -98% /
-77% | -598% /
-382% | -174% /
-105% | -8% /
-25% | -1406% /
-706% |
* ... kleinere Werte sind besser

Reaktionszeiten (Response Times) des Displays
| ↔ Reaktionszeiten Schwarz zu Weiß | ||
|---|---|---|
| 1 ms ... steigend ↗ und fallend ↘ kombiniert | ↗ 0.55 ms steigend | 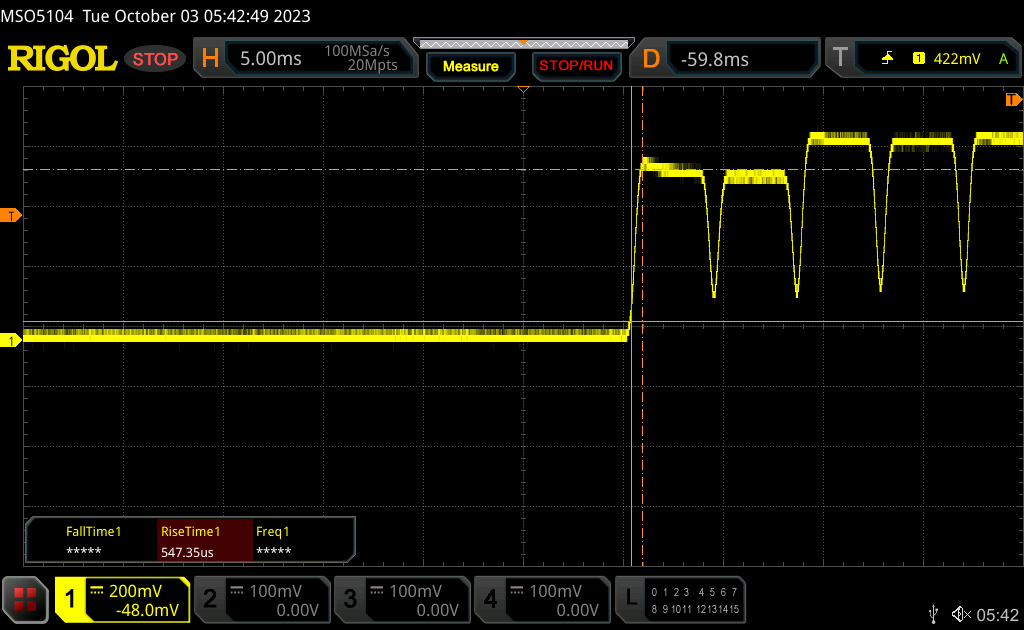 |
| ↘ 0.45 ms fallend | ||
| Die gemessenen Reaktionszeiten sind sehr kurz, wodurch sich der Bildschirm auch für schnelle 3D Spiele eignen sollte. Im Vergleich rangierten die bei uns getesteten Geräte von 0.1 (Minimum) zu 240 (Maximum) ms. » 4 % aller Screens waren schneller als der getestete. Daher sind die gemessenen Reaktionszeiten besser als der Durchschnitt aller vermessenen Geräte (19.8 ms). | ||
| ↔ Reaktionszeiten 50% Grau zu 80% Grau | ||
| 0.57 ms ... steigend ↗ und fallend ↘ kombiniert | ↗ 0.28 ms steigend | 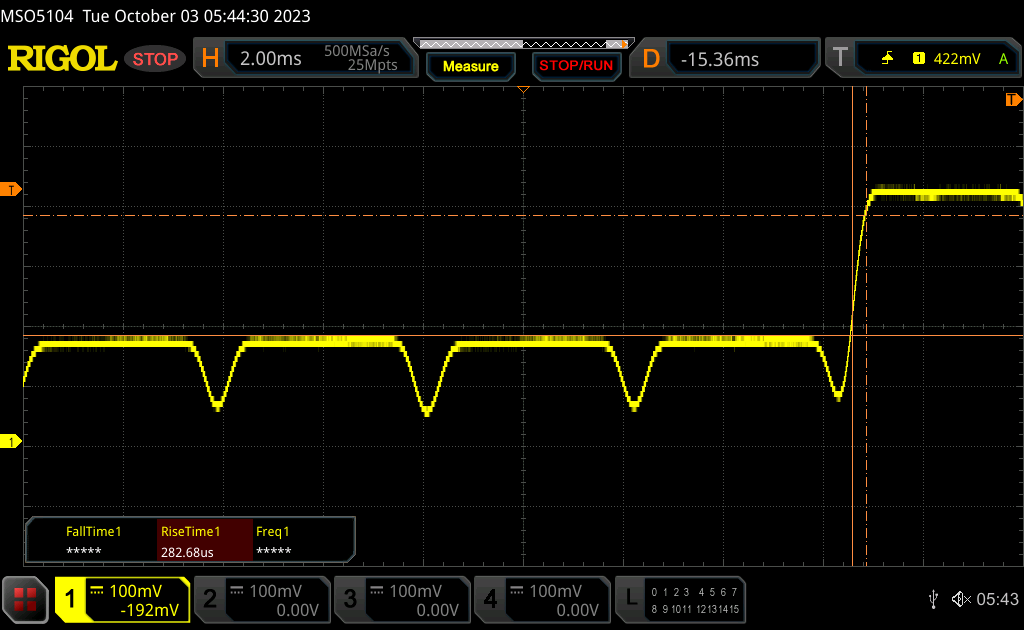 |
| ↘ 0.29 ms fallend | ||
| Die gemessenen Reaktionszeiten sind sehr kurz, wodurch sich der Bildschirm auch für schnelle 3D Spiele eignen sollte. Im Vergleich rangierten die bei uns getesteten Geräte von 0.165 (Minimum) zu 636 (Maximum) ms. » 1 % aller Screens waren schneller als der getestete. Daher sind die gemessenen Reaktionszeiten besser als der Durchschnitt aller vermessenen Geräte (31 ms). | ||
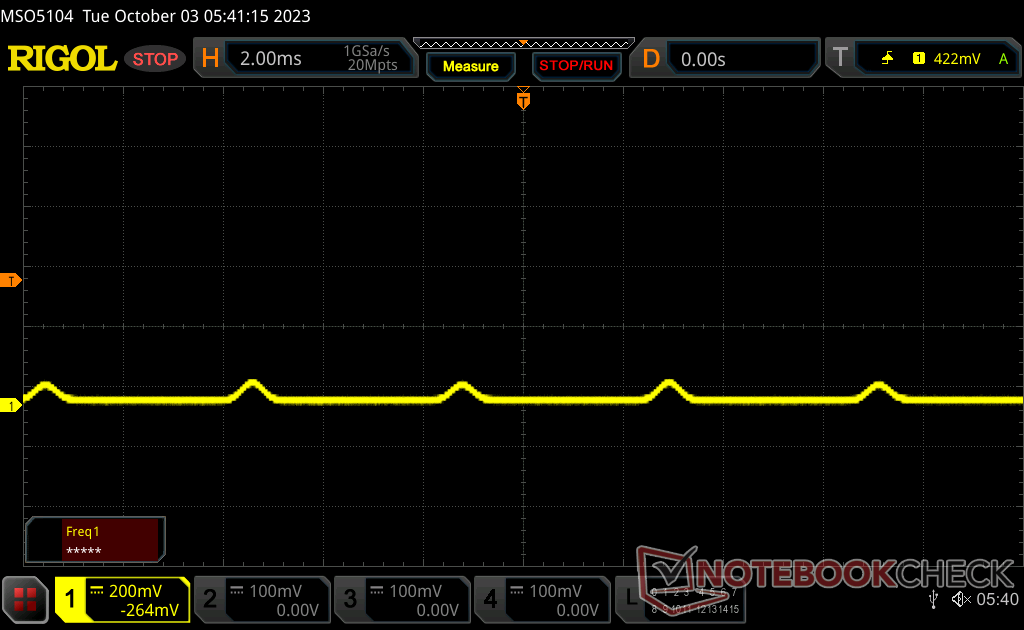
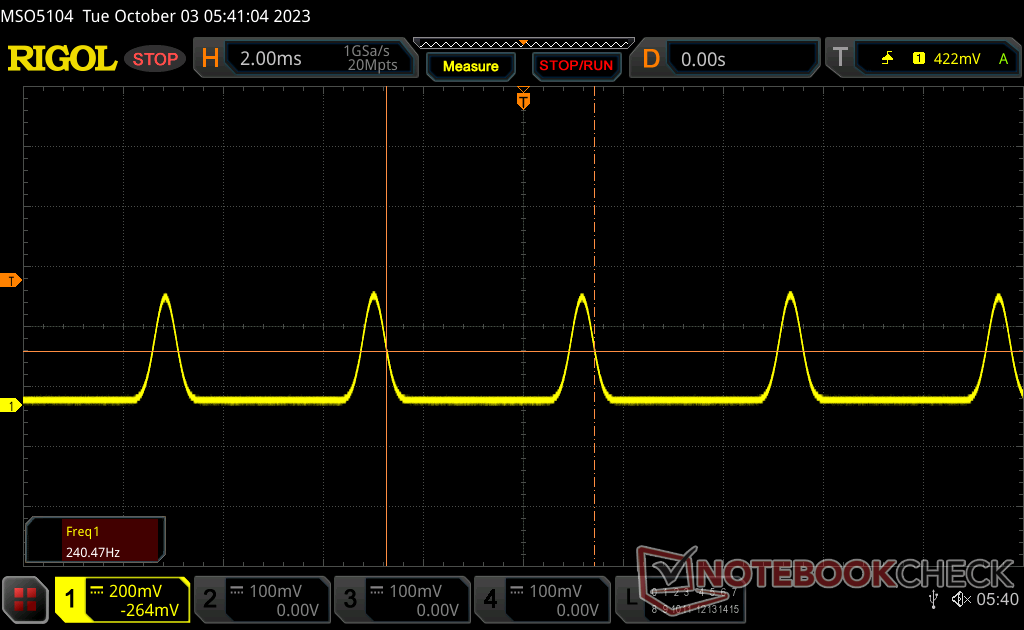
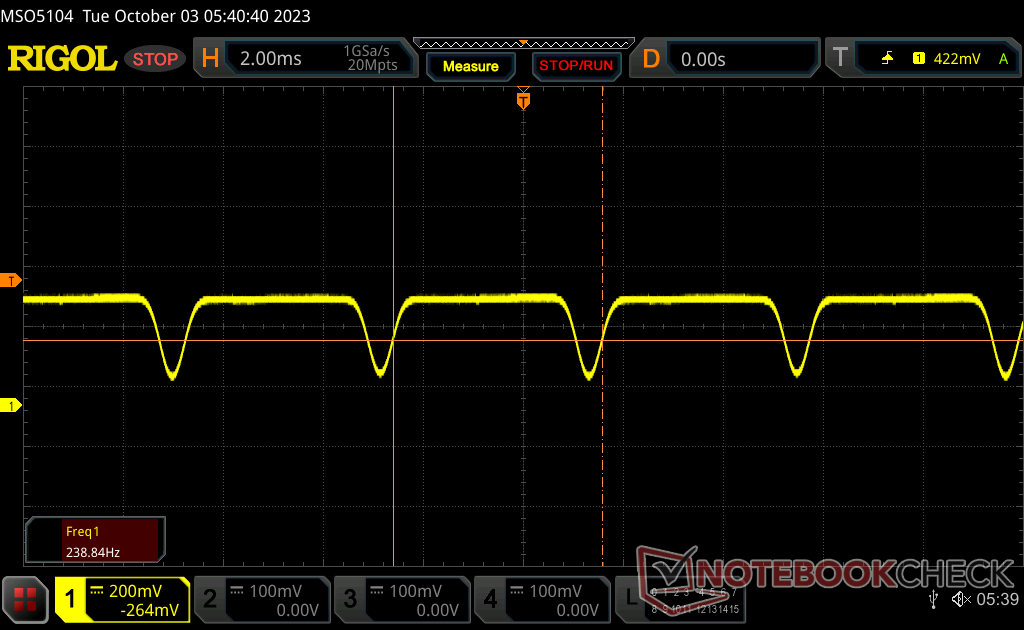
Bildschirm-Flackern / PWM (Pulse-Width Modulation)
| Flackern / PWM festgestellt | 238.8 Hz | 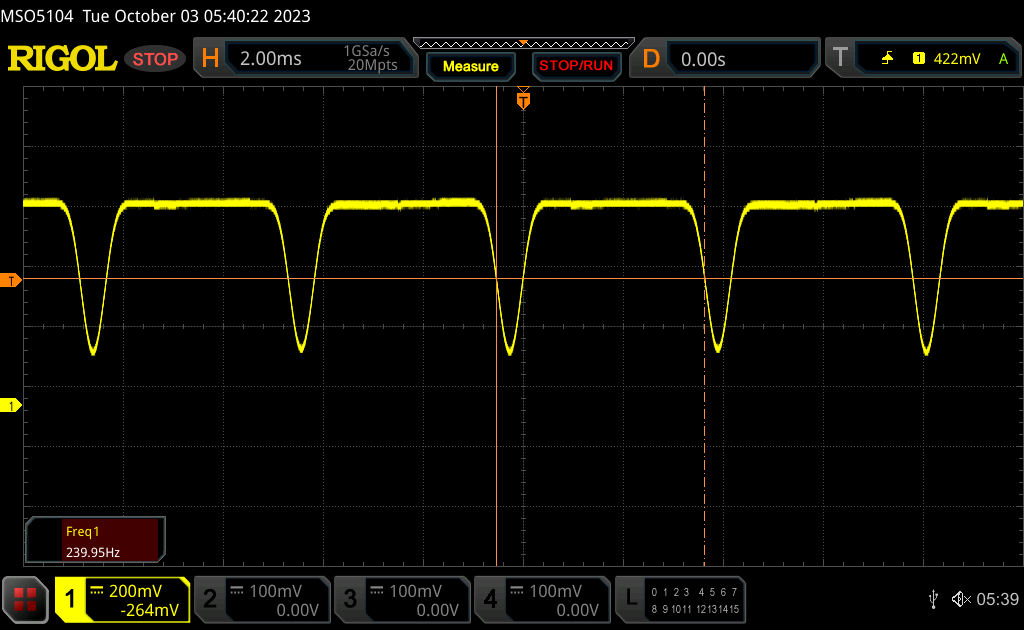 | |
Das Display flackert mit 238.8 Hz (im schlimmsten Fall, eventuell durch Pulsweitenmodulation PWM) . Die Frequenz von 238.8 Hz ist relativ gering und daher sollte es bei sensiblen Personen zu Problemen wie Flackern oder Augenbeschwerden führen. Im Vergleich: 52 % aller getesteten Geräte nutzten kein PWM um die Helligkeit zu reduzieren. Wenn PWM eingesetzt wurde, dann bei einer Frequenz von durchschnittlich 7769 (Minimum 5, Maximum 343500) Hz. | |||
Eine konstante Pulsweitenmodulation von 238 Hz ist bei allen Helligkeitsstufen vorhanden, sogar bei maximaler Einstellung. Das ist bei OLED-Displays von Smartphones und Laptops üblich.


Performance


Testbedingungen
Wir haben Windows in den Performance Modus versetzt, bevor wir die folgenden Benchmarks durchgeführt haben. Anders als bei der Asus VivoBook Serie liefert Acer keine spezielle Software für Leistungs- oder Displayanpassungen mit.
FreeSync wird auf dem internen Display nicht unterstützt.
Prozessor
Die Multi-Thread-Leistung liegt leicht, aber konstant hinter der der meisten anderen Laptops mit dem gleichen Ryzen 7 7840U. Das aktuelle AMD Framework Laptop 13.5 läuft zum Beispiel 15 Prozent schneller. Die Diskrepanz ist auf das schwächere Turbo-Core-Potenzial der CPU im Acer zurückzuführen, das aus der kleinen Kühllösung im Verhältnis zum großen 16-Zoll-Bildschirm resultiert. Die CineBench R15 xT-Ergebnisse sinken im Laufe der Zeit um bis zu 21 Prozent, wie unsere Vergleichsgrafik unten zeigt.
Die Gesamtleistung ist trotz der Drosselung sowohl bei Single- als auch bei Multi-Thread-Last immer noch um etwa 15 Prozent besser als die des Zen 3+ Ryzen 7 7735U im älteren Acer Swift Edge SFE16-42-R1GM.
Cinebench R15 Multi Loop
Cinebench R23: Multi Core | Single Core
Cinebench R20: CPU (Multi Core) | CPU (Single Core)
Cinebench R15: CPU Multi 64Bit | CPU Single 64Bit
Blender: v2.79 BMW27 CPU
7-Zip 18.03: 7z b 4 | 7z b 4 -mmt1
Geekbench 5.5: Multi-Core | Single-Core
HWBOT x265 Benchmark v2.2: 4k Preset
LibreOffice : 20 Documents To PDF
R Benchmark 2.5: Overall mean
| HWBOT x265 Benchmark v2.2 / 4k Preset | |
| Lenovo Legion Pro 5 16ARX8 | |
| Lenovo Slim Pro 9i 16IRP8 | |
| Lenovo Legion 5 Pro 16ARH7H RTX 3070 Ti | |
| Samsung Galaxy Book3 Ultra 16 | |
| Durchschnittliche AMD Ryzen 7 7840U (14.4 - 18.6, n=10) | |
| Acer Swift Edge SFE16 Ryzen 7 7840U | |
| Asus VivoBook Pro 16 | |
| Framework Laptop 13.5 13th Gen Intel | |
| Durchschnitt der Klasse Office (2.21 - 26, n=74, der letzten 2 Jahre) | |
| Acer Swift Edge SFE16-42-R1GM | |
| Lenovo IdeaPad Flex 5 16ABR G8 | |
| Microsoft Surface Laptop 5 15, i7-1255U | |
| Lenovo ThinkPad T14s G3 21BR00CDGE | |
| LG Gram 16Z90Q | |
| LG Gram 16 (2021) | |
Cinebench R23: Multi Core | Single Core
Cinebench R20: CPU (Multi Core) | CPU (Single Core)
Cinebench R15: CPU Multi 64Bit | CPU Single 64Bit
Blender: v2.79 BMW27 CPU
7-Zip 18.03: 7z b 4 | 7z b 4 -mmt1
Geekbench 5.5: Multi-Core | Single-Core
HWBOT x265 Benchmark v2.2: 4k Preset
LibreOffice : 20 Documents To PDF
R Benchmark 2.5: Overall mean
* ... kleinere Werte sind besser
AIDA64: FP32 Ray-Trace | FPU Julia | CPU SHA3 | CPU Queen | FPU SinJulia | FPU Mandel | CPU AES | CPU ZLib | FP64 Ray-Trace | CPU PhotoWorxx
| Performance Rating | |
| Lenovo Slim Pro 9i 16IRP8 | |
| Durchschnittliche AMD Ryzen 7 7840U | |
| Acer Swift Edge SFE16 Ryzen 7 7840U | |
| Samsung Galaxy Book3 Ultra 16 | |
| Asus VivoBook Pro 16 | |
| Acer Swift Edge SFE16-42-R1GM | |
| Huawei MateBook 16s i7 | |
| AIDA64 / FP32 Ray-Trace | |
| Durchschnittliche AMD Ryzen 7 7840U (17924 - 25901, n=11) | |
| Lenovo Slim Pro 9i 16IRP8 | |
| Acer Swift Edge SFE16 Ryzen 7 7840U | |
| Asus VivoBook Pro 16 | |
| Samsung Galaxy Book3 Ultra 16 | |
| Acer Swift Edge SFE16-42-R1GM | |
| Huawei MateBook 16s i7 | |
| AIDA64 / FPU Julia | |
| Lenovo Slim Pro 9i 16IRP8 | |
| Durchschnittliche AMD Ryzen 7 7840U (78360 - 109745, n=11) | |
| Acer Swift Edge SFE16 Ryzen 7 7840U | |
| Asus VivoBook Pro 16 | |
| Acer Swift Edge SFE16-42-R1GM | |
| Samsung Galaxy Book3 Ultra 16 | |
| Huawei MateBook 16s i7 | |
| AIDA64 / CPU SHA3 | |
| Lenovo Slim Pro 9i 16IRP8 | |
| Durchschnittliche AMD Ryzen 7 7840U (3519 - 4847, n=11) | |
| Acer Swift Edge SFE16 Ryzen 7 7840U | |
| Asus VivoBook Pro 16 | |
| Samsung Galaxy Book3 Ultra 16 | |
| Acer Swift Edge SFE16-42-R1GM | |
| Huawei MateBook 16s i7 | |
| AIDA64 / CPU Queen | |
| Lenovo Slim Pro 9i 16IRP8 | |
| Asus VivoBook Pro 16 | |
| Samsung Galaxy Book3 Ultra 16 | |
| Durchschnittliche AMD Ryzen 7 7840U (83206 - 114294, n=10) | |
| Acer Swift Edge SFE16 Ryzen 7 7840U | |
| Huawei MateBook 16s i7 | |
| Acer Swift Edge SFE16-42-R1GM | |
| AIDA64 / FPU SinJulia | |
| Durchschnittliche AMD Ryzen 7 7840U (11969 - 14822, n=11) | |
| Acer Swift Edge SFE16 Ryzen 7 7840U | |
| Lenovo Slim Pro 9i 16IRP8 | |
| Acer Swift Edge SFE16-42-R1GM | |
| Samsung Galaxy Book3 Ultra 16 | |
| Asus VivoBook Pro 16 | |
| Huawei MateBook 16s i7 | |
| AIDA64 / FPU Mandel | |
| Durchschnittliche AMD Ryzen 7 7840U (40720 - 58482, n=11) | |
| Lenovo Slim Pro 9i 16IRP8 | |
| Acer Swift Edge SFE16 Ryzen 7 7840U | |
| Acer Swift Edge SFE16-42-R1GM | |
| Asus VivoBook Pro 16 | |
| Samsung Galaxy Book3 Ultra 16 | |
| Huawei MateBook 16s i7 | |
| AIDA64 / CPU AES | |
| Durchschnittliche AMD Ryzen 7 7840U (53018 - 166333, n=11) | |
| Lenovo Slim Pro 9i 16IRP8 | |
| Huawei MateBook 16s i7 | |
| Samsung Galaxy Book3 Ultra 16 | |
| Asus VivoBook Pro 16 | |
| Acer Swift Edge SFE16 Ryzen 7 7840U | |
| Acer Swift Edge SFE16-42-R1GM | |
| AIDA64 / CPU ZLib | |
| Lenovo Slim Pro 9i 16IRP8 | |
| Samsung Galaxy Book3 Ultra 16 | |
| Asus VivoBook Pro 16 | |
| Durchschnittliche AMD Ryzen 7 7840U (801 - 1047, n=11) | |
| Acer Swift Edge SFE16 Ryzen 7 7840U | |
| Huawei MateBook 16s i7 | |
| Acer Swift Edge SFE16-42-R1GM | |
| AIDA64 / FP64 Ray-Trace | |
| Durchschnittliche AMD Ryzen 7 7840U (9347 - 13846, n=11) | |
| Lenovo Slim Pro 9i 16IRP8 | |
| Acer Swift Edge SFE16 Ryzen 7 7840U | |
| Asus VivoBook Pro 16 | |
| Samsung Galaxy Book3 Ultra 16 | |
| Acer Swift Edge SFE16-42-R1GM | |
| Huawei MateBook 16s i7 | |
| AIDA64 / CPU PhotoWorxx | |
| Lenovo Slim Pro 9i 16IRP8 | |
| Samsung Galaxy Book3 Ultra 16 | |
| Huawei MateBook 16s i7 | |
| Durchschnittliche AMD Ryzen 7 7840U (26206 - 38173, n=11) | |
| Acer Swift Edge SFE16 Ryzen 7 7840U | |
| Acer Swift Edge SFE16-42-R1GM | |
| Asus VivoBook Pro 16 | |
System Performance
CrossMark: Overall | Productivity | Creativity | Responsiveness
| PCMark 10 / Score | |
| Lenovo Slim Pro 9i 16IRP8 | |
| Acer Swift Edge SFE16 Ryzen 7 7840U | |
| Samsung Galaxy Book3 Ultra 16 | |
| Asus VivoBook Pro 16 | |
| Durchschnittliche AMD Ryzen 7 7840U, AMD Radeon 780M (5866 - 7157, n=10) | |
| Huawei MateBook 16s i7 | |
| Acer Swift Edge SFE16-42-R1GM | |
| PCMark 10 / Essentials | |
| Huawei MateBook 16s i7 | |
| Lenovo Slim Pro 9i 16IRP8 | |
| Acer Swift Edge SFE16 Ryzen 7 7840U | |
| Samsung Galaxy Book3 Ultra 16 | |
| Durchschnittliche AMD Ryzen 7 7840U, AMD Radeon 780M (9068 - 11081, n=10) | |
| Asus VivoBook Pro 16 | |
| Acer Swift Edge SFE16-42-R1GM | |
| PCMark 10 / Productivity | |
| Acer Swift Edge SFE16 Ryzen 7 7840U | |
| Lenovo Slim Pro 9i 16IRP8 | |
| Acer Swift Edge SFE16-42-R1GM | |
| Asus VivoBook Pro 16 | |
| Durchschnittliche AMD Ryzen 7 7840U, AMD Radeon 780M (7323 - 10099, n=10) | |
| Samsung Galaxy Book3 Ultra 16 | |
| Huawei MateBook 16s i7 | |
| PCMark 10 / Digital Content Creation | |
| Lenovo Slim Pro 9i 16IRP8 | |
| Samsung Galaxy Book3 Ultra 16 | |
| Asus VivoBook Pro 16 | |
| Acer Swift Edge SFE16 Ryzen 7 7840U | |
| Durchschnittliche AMD Ryzen 7 7840U, AMD Radeon 780M (7204 - 8987, n=10) | |
| Acer Swift Edge SFE16-42-R1GM | |
| Huawei MateBook 16s i7 | |
| CrossMark / Overall | |
| Huawei MateBook 16s i7 | |
| Acer Swift Edge SFE16 Ryzen 7 7840U | |
| Lenovo Slim Pro 9i 16IRP8 | |
| Asus VivoBook Pro 16 | |
| Samsung Galaxy Book3 Ultra 16 | |
| Durchschnittliche AMD Ryzen 7 7840U, AMD Radeon 780M (1256 - 1804, n=10) | |
| Acer Swift Edge SFE16-42-R1GM | |
| CrossMark / Productivity | |
| Huawei MateBook 16s i7 | |
| Acer Swift Edge SFE16 Ryzen 7 7840U | |
| Asus VivoBook Pro 16 | |
| Lenovo Slim Pro 9i 16IRP8 | |
| Durchschnittliche AMD Ryzen 7 7840U, AMD Radeon 780M (1261 - 1798, n=10) | |
| Samsung Galaxy Book3 Ultra 16 | |
| Acer Swift Edge SFE16-42-R1GM | |
| CrossMark / Creativity | |
| Lenovo Slim Pro 9i 16IRP8 | |
| Huawei MateBook 16s i7 | |
| Acer Swift Edge SFE16 Ryzen 7 7840U | |
| Asus VivoBook Pro 16 | |
| Samsung Galaxy Book3 Ultra 16 | |
| Durchschnittliche AMD Ryzen 7 7840U, AMD Radeon 780M (1251 - 1835, n=10) | |
| Acer Swift Edge SFE16-42-R1GM | |
| CrossMark / Responsiveness | |
| Huawei MateBook 16s i7 | |
| Acer Swift Edge SFE16 Ryzen 7 7840U | |
| Asus VivoBook Pro 16 | |
| Samsung Galaxy Book3 Ultra 16 | |
| Lenovo Slim Pro 9i 16IRP8 | |
| Durchschnittliche AMD Ryzen 7 7840U, AMD Radeon 780M (1082 - 1775, n=10) | |
| Acer Swift Edge SFE16-42-R1GM | |
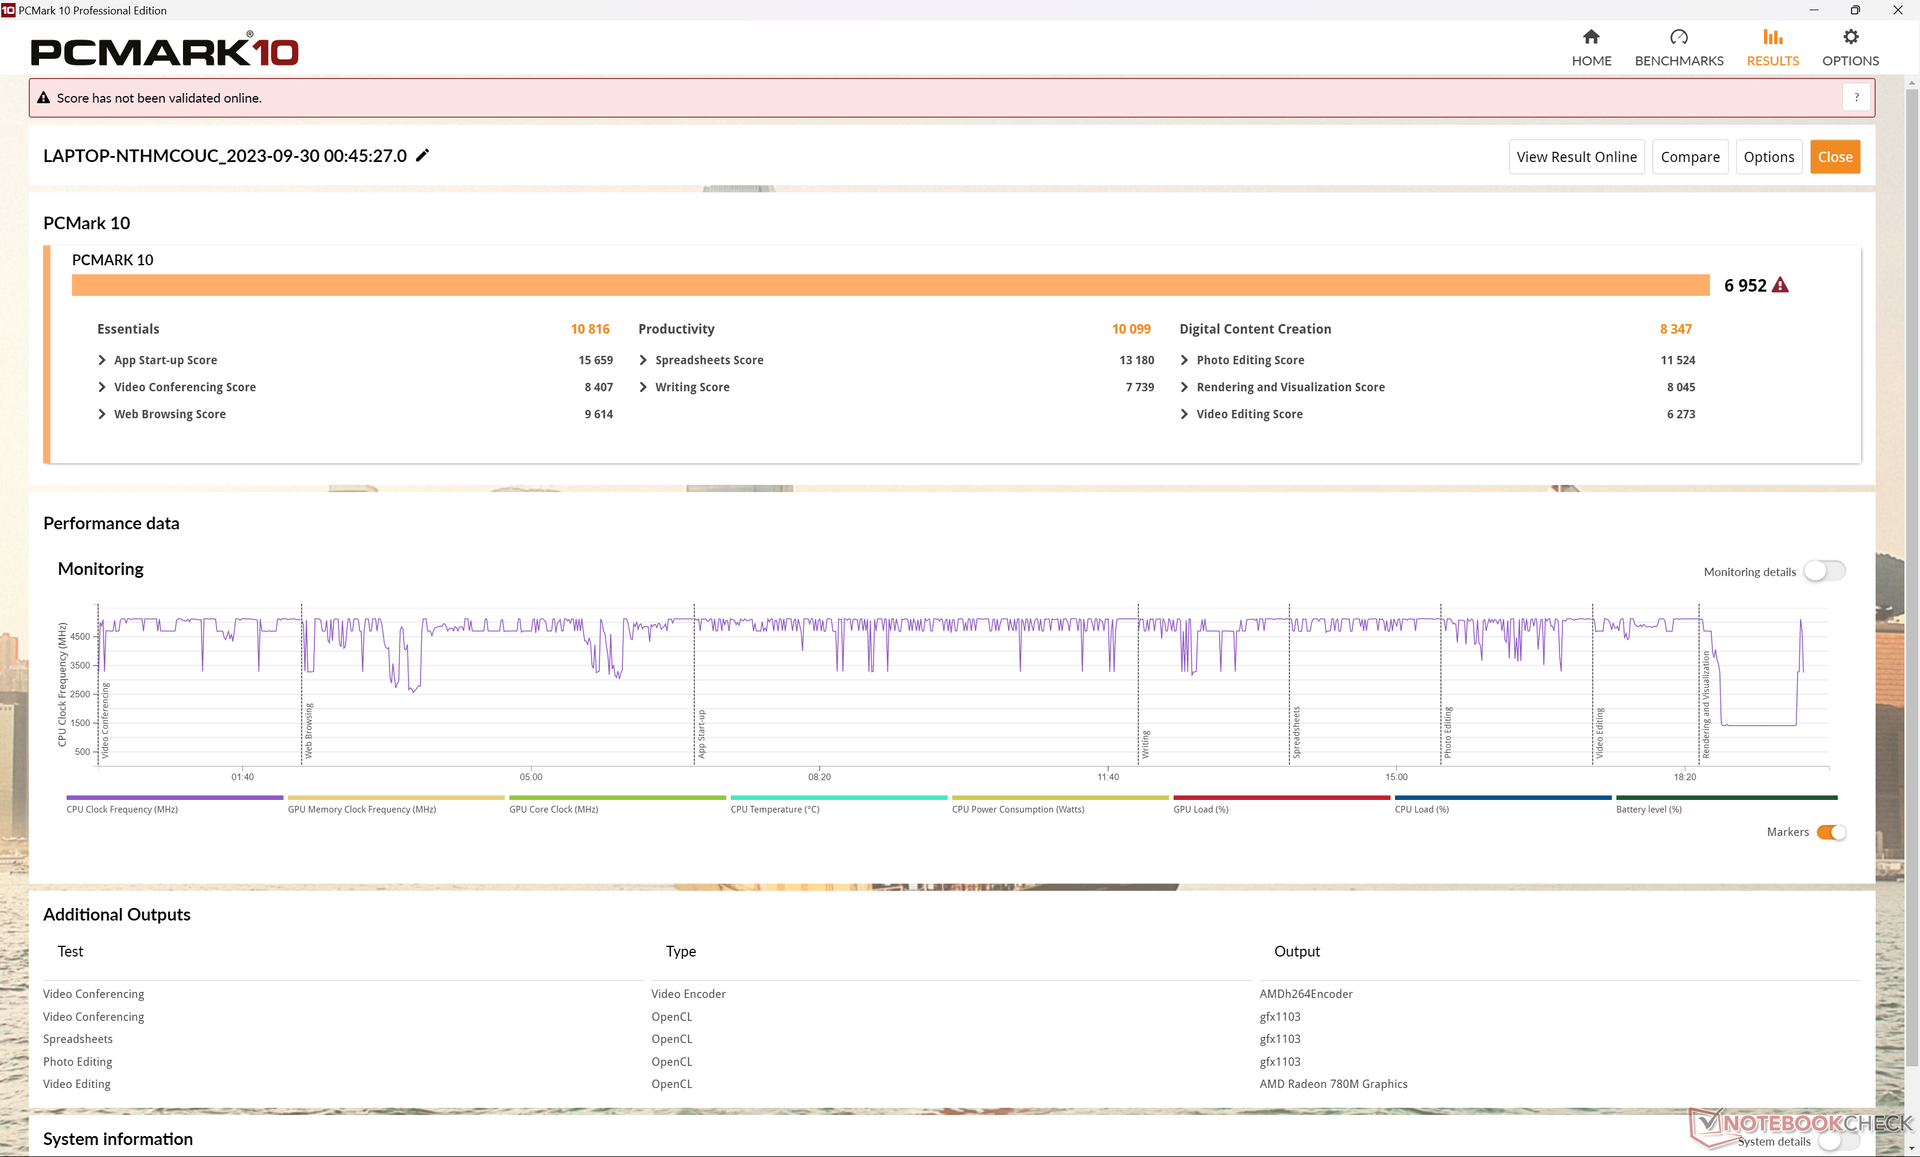
| PCMark 10 Score | 6952 Punkte | |
Hilfe | ||
| AIDA64 / Memory Copy | |
| Lenovo Slim Pro 9i 16IRP8 | |
| Samsung Galaxy Book3 Ultra 16 | |
| Huawei MateBook 16s i7 | |
| Acer Swift Edge SFE16 Ryzen 7 7840U | |
| Durchschnittliche AMD Ryzen 7 7840U (43255 - 70532, n=12) | |
| Acer Swift Edge SFE16-42-R1GM | |
| Asus VivoBook Pro 16 | |
| AIDA64 / Memory Read | |
| Lenovo Slim Pro 9i 16IRP8 | |
| Samsung Galaxy Book3 Ultra 16 | |
| Huawei MateBook 16s i7 | |
| Acer Swift Edge SFE16 Ryzen 7 7840U | |
| Durchschnittliche AMD Ryzen 7 7840U (37399 - 61602, n=11) | |
| Acer Swift Edge SFE16-42-R1GM | |
| Asus VivoBook Pro 16 | |
| AIDA64 / Memory Write | |
| Acer Swift Edge SFE16 Ryzen 7 7840U | |
| Lenovo Slim Pro 9i 16IRP8 | |
| Samsung Galaxy Book3 Ultra 16 | |
| Durchschnittliche AMD Ryzen 7 7840U (46797 - 92289, n=13) | |
| Huawei MateBook 16s i7 | |
| Acer Swift Edge SFE16-42-R1GM | |
| Asus VivoBook Pro 16 | |
| AIDA64 / Memory Latency | |
| Durchschnittliche AMD Ryzen 7 7840U (90 - 137.2, n=12) | |
| Acer Swift Edge SFE16 Ryzen 7 7840U | |
| Huawei MateBook 16s i7 | |
| Lenovo Slim Pro 9i 16IRP8 | |
| Acer Swift Edge SFE16-42-R1GM | |
| Samsung Galaxy Book3 Ultra 16 | |
| Asus VivoBook Pro 16 | |
* ... kleinere Werte sind besser
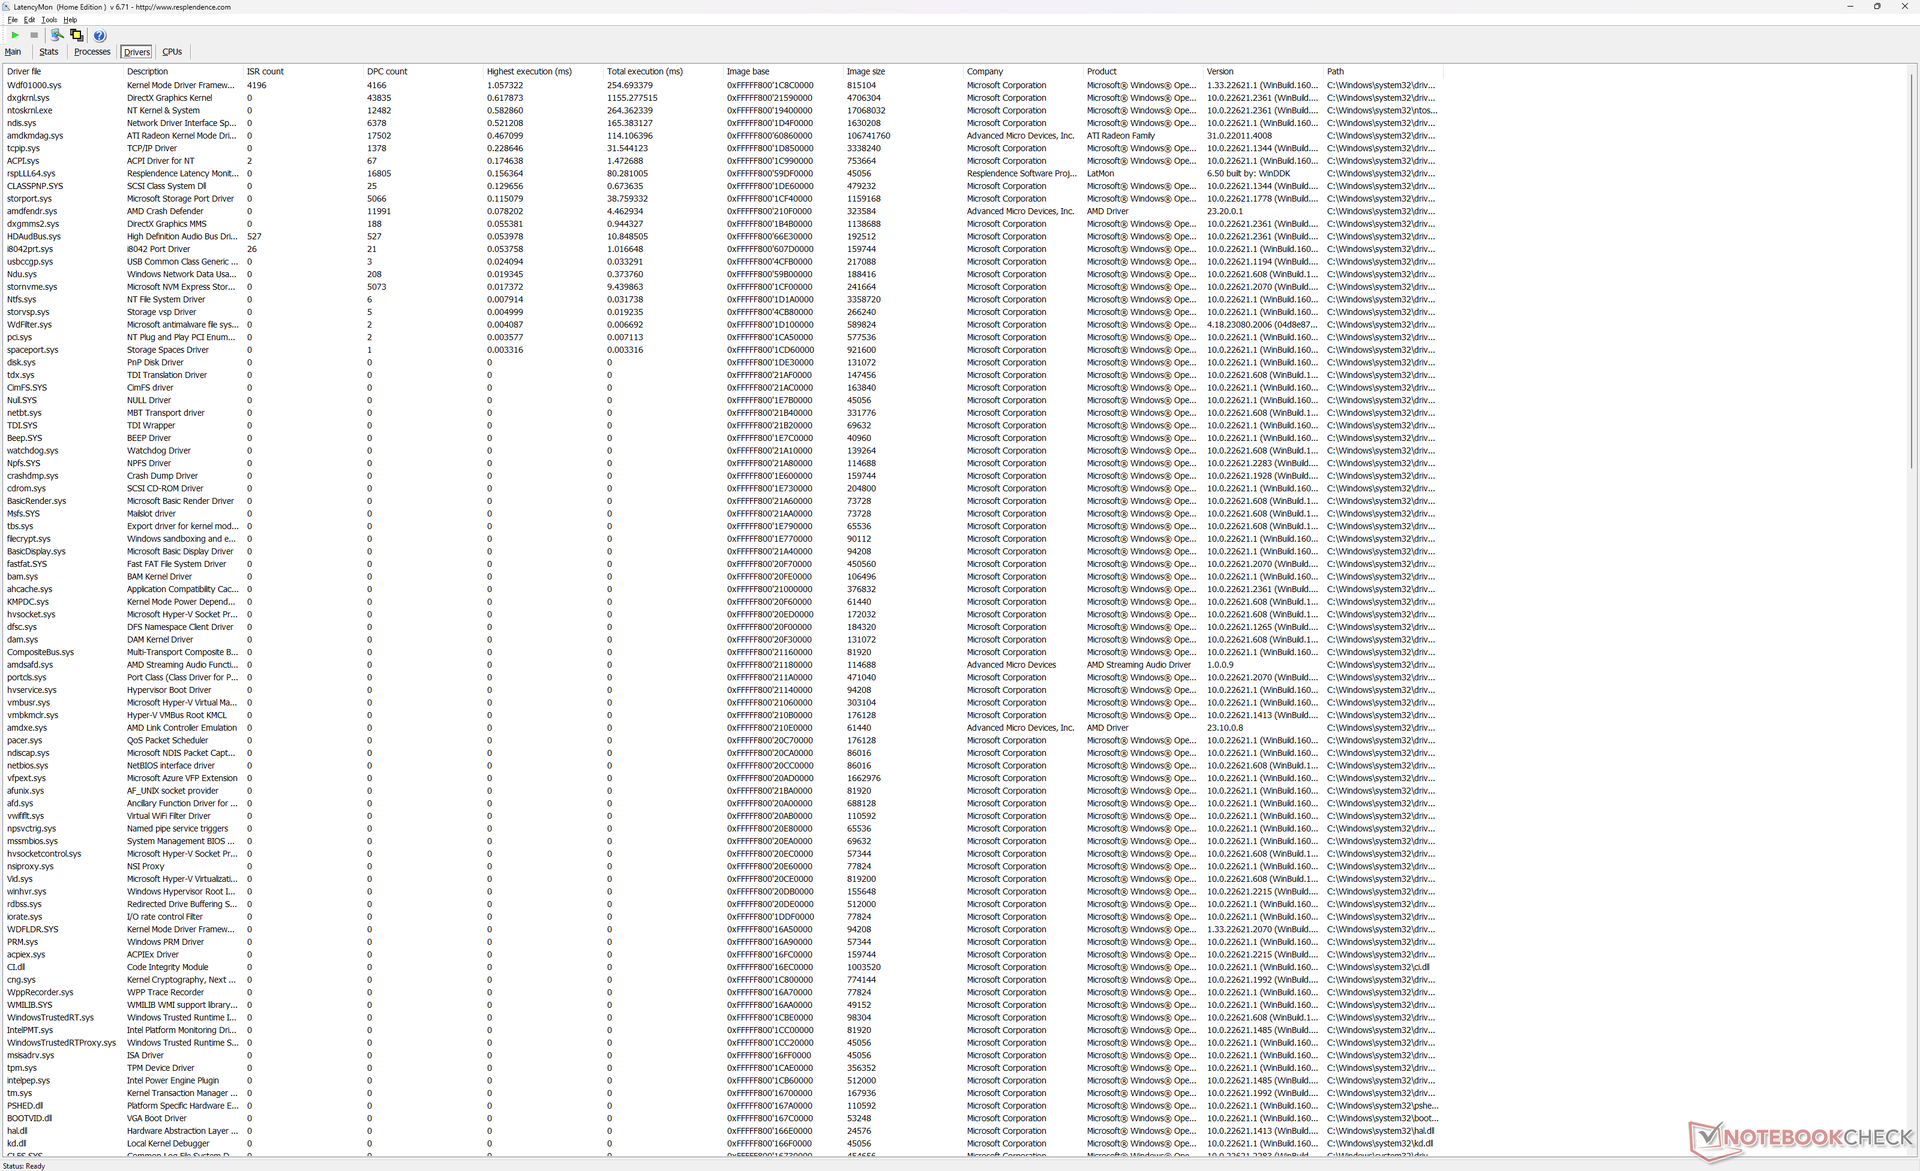
DPC-Latenzzeit
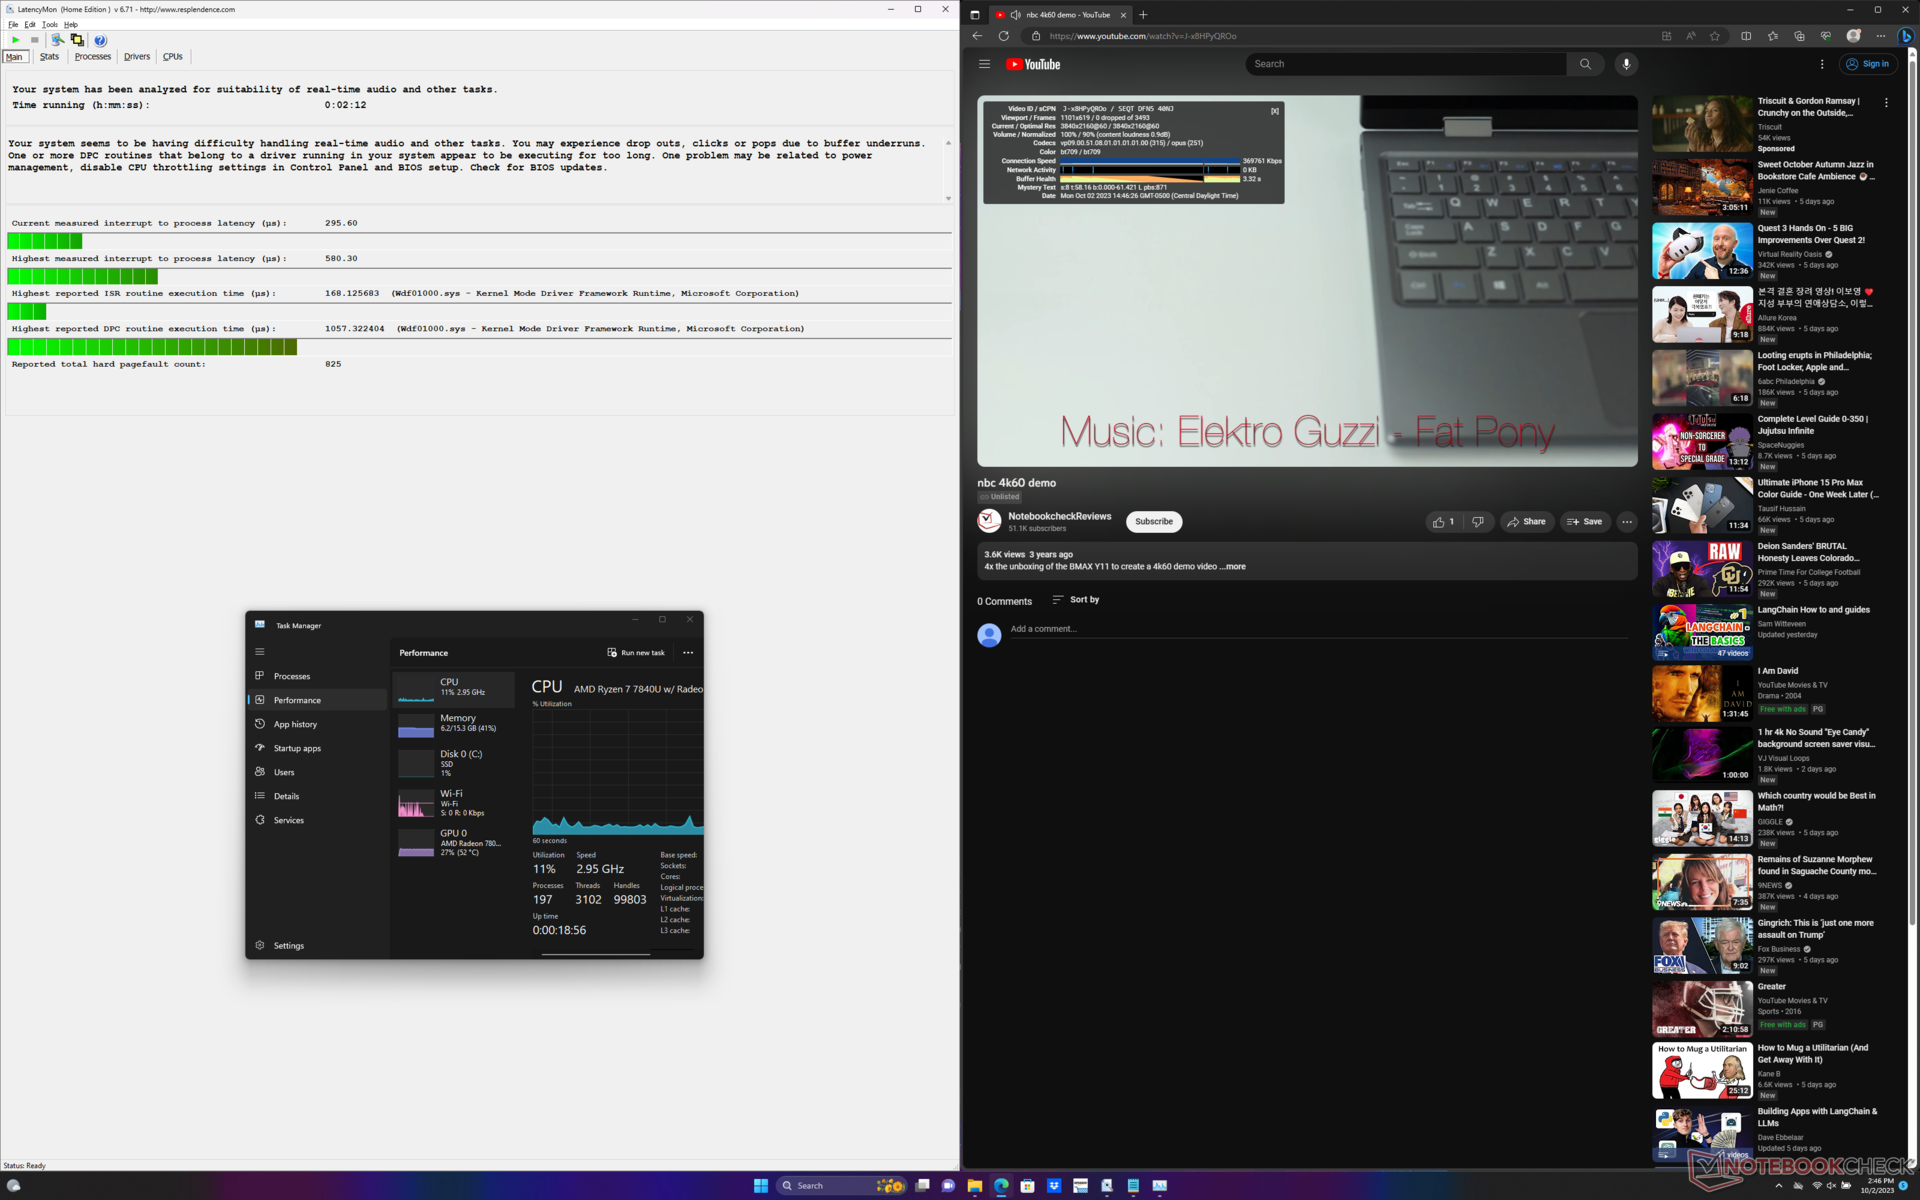
LatencyMon zeigt keine größeren DPC-Probleme beim Öffnen mehrerer Browser Tabs unserer Homepage. Die 4K-Videowiedergabe bei 60 FPS ist ebenfalls perfekt und es wurden keine Bildaussetzer festgestellt.
| DPC Latencies / LatencyMon - interrupt to process latency (max), Web, Youtube, Prime95 | |
| Samsung Galaxy Book3 Ultra 16 | |
| Acer Swift Edge SFE16-42-R1GM | |
| Asus VivoBook Pro 16 | |
| Lenovo Slim Pro 9i 16IRP8 | |
| Acer Swift Edge SFE16 Ryzen 7 7840U | |
* ... kleinere Werte sind besser
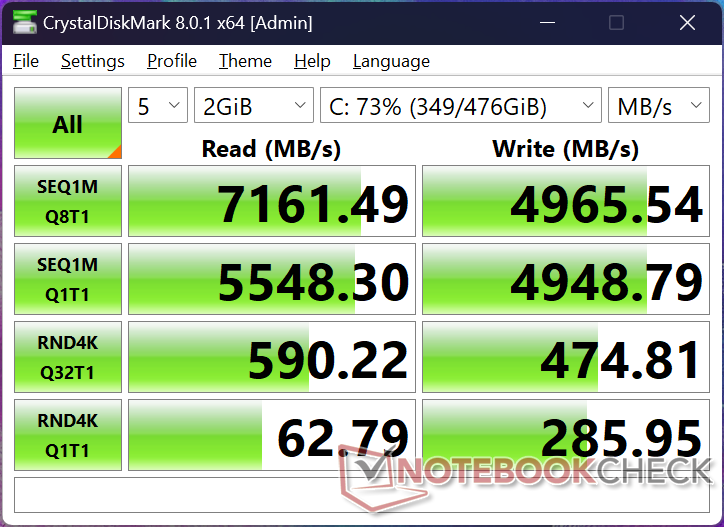
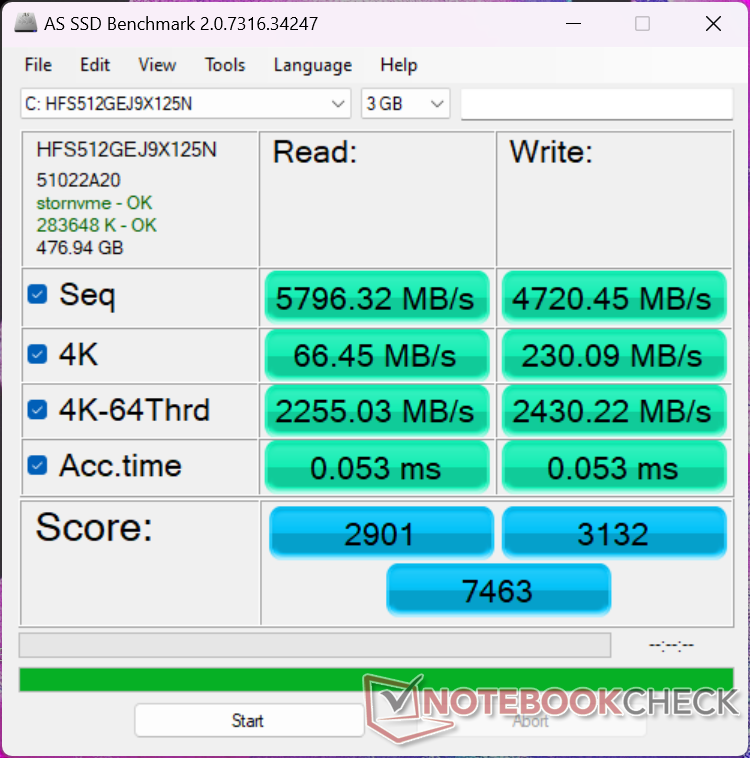
Speichergeräte
Unser Testgerät wird mit einer SK hynix HFS512GEJ9X125N ausgestattet, das auf dem Papier mit dem Samsung PM9A1 konkurriert. In der Realität jedoch drosselte das Laufwerk auf unserem Gerät bereits nach wenigen Minuten auf bis zu 3500 MB/s Stress wie die unten stehende Grafik zeigt. Dieses Verhalten wurde auch bei unserem älteren Swift Edge 16 beobachtet, was darauf schließen lässt, dass die Laufwerke unter unzureichender Kühlung oder Wärmeableitung leiden.

| Drive Performance Rating - Percent | |
| Acer Swift Edge SFE16 Ryzen 7 7840U | |
| Samsung Galaxy Book3 Ultra 16 | |
| Acer Swift Edge SFE16-42-R1GM | |
| Lenovo Slim Pro 9i 16IRP8 | |
| Huawei MateBook 16s i7 | |
| Asus VivoBook Pro 16 | |
* ... kleinere Werte sind besser
Disk Throttling: DiskSpd Read Loop, Queue Depth 8
GPU Performance
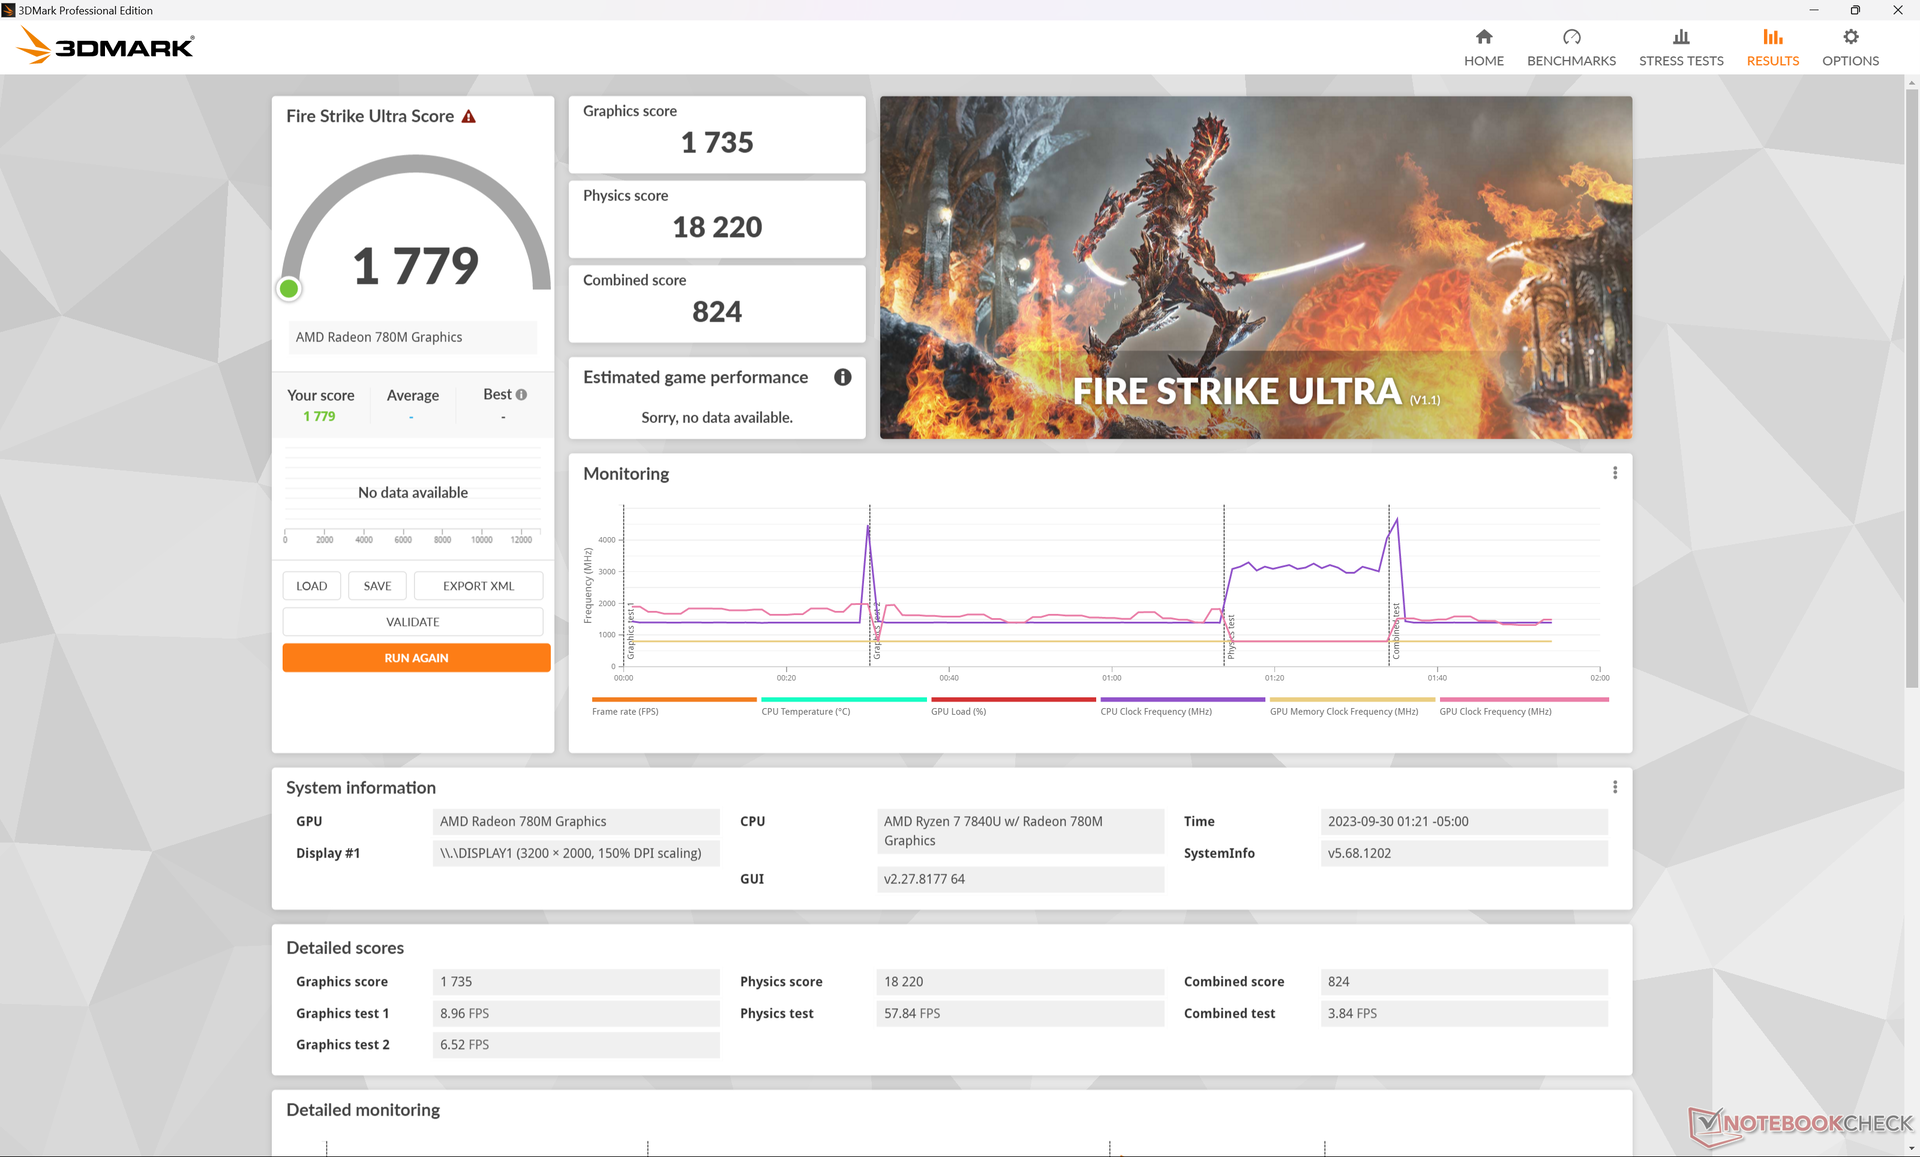
Die 2022 Radeon 680M war bereits eine enorme Steigerung gegenüber der früheren RX Vega-Serie, und so ist die 2023 Radeon 780M eher eine kleine Auffrischung mit nur marginalen Verbesserungen. In diesem Fall ist die Radeon 780M in unserem Acer nur ein paar Prozentpunkte schneller als die 680M in der Zen 3+ Konfiguration.
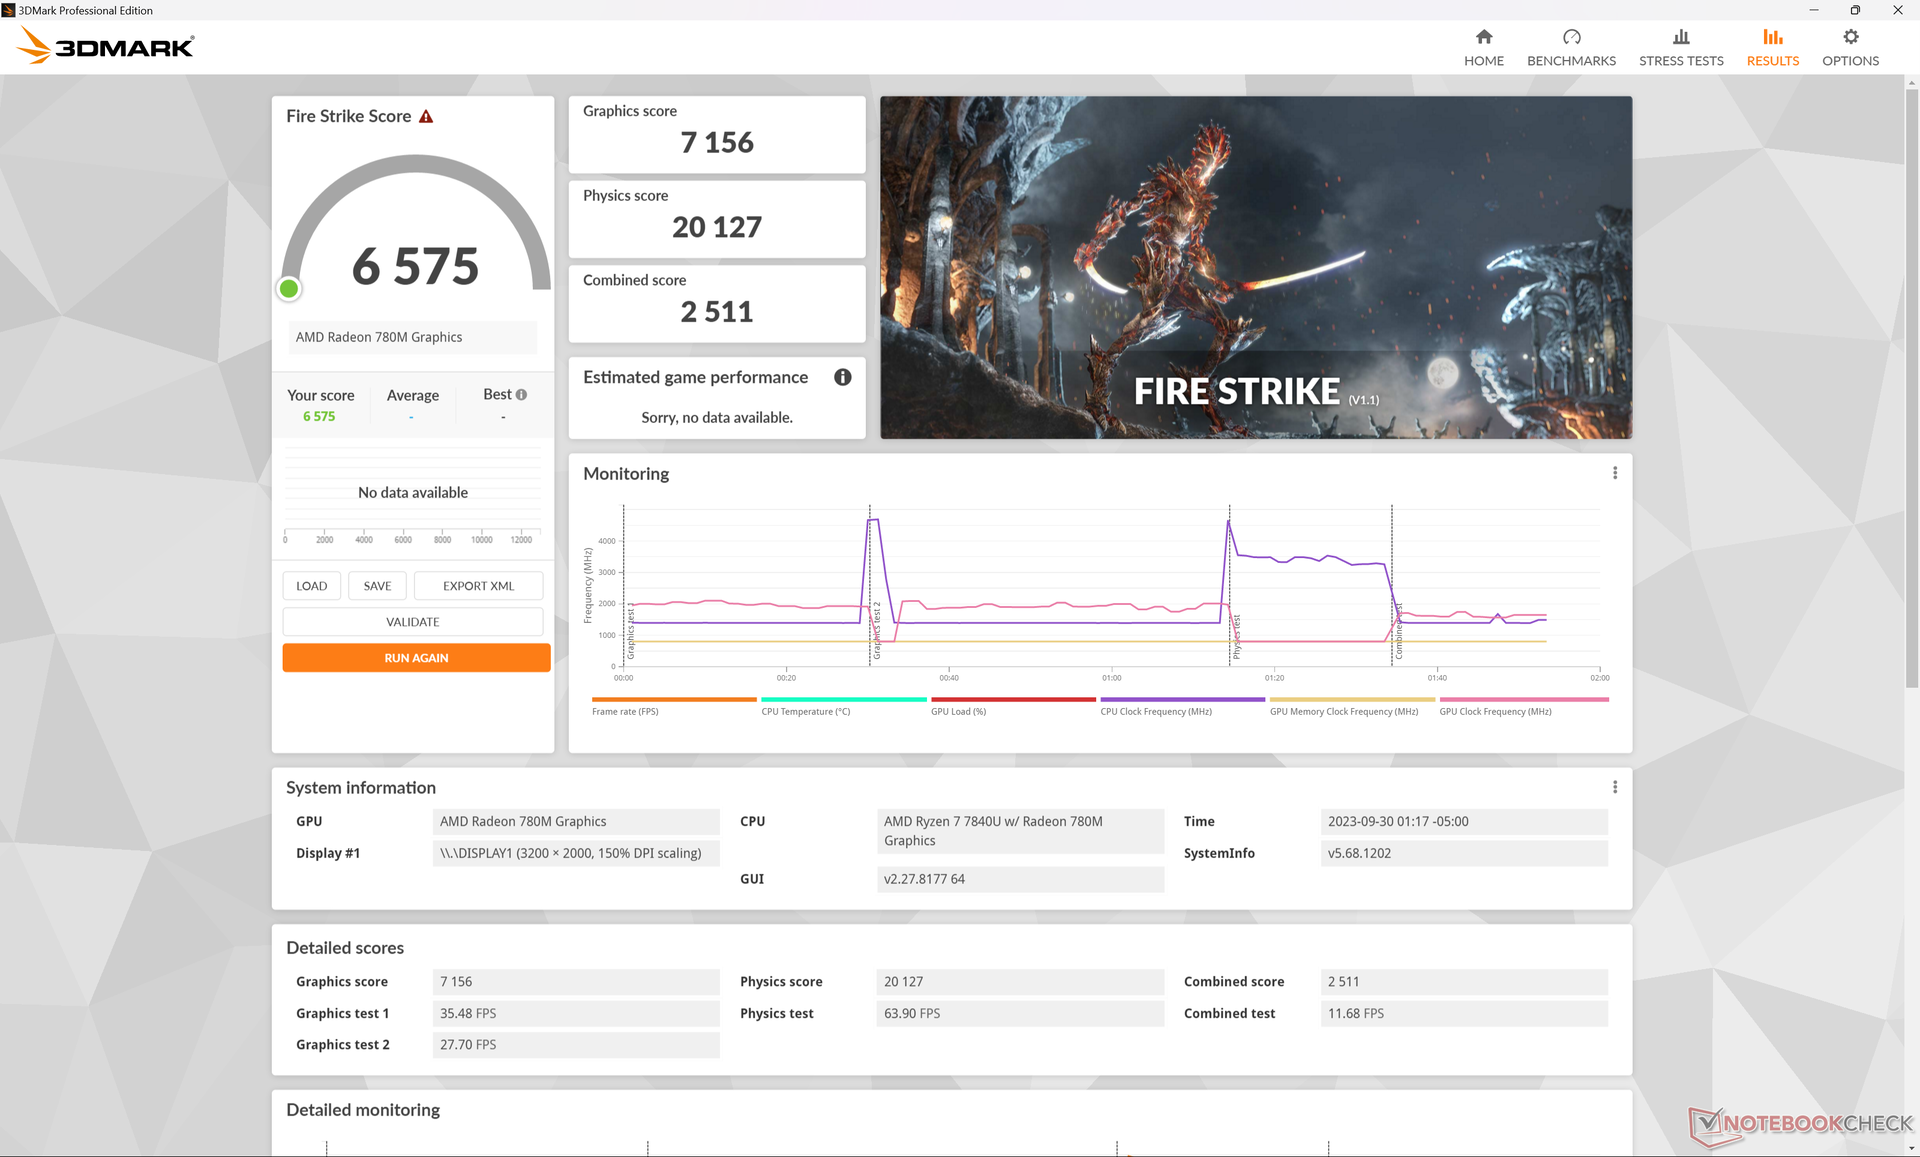
Die Einstellung des Systems auf den Modus "Ausbalanciert" anstelle des Modus " Performance " oder der Betrieb im Akkubetrieb wirkt sich auf die Gesamtleistung aus, wie unsere Fire Strike Ergebnistabelle unten zeigt.
| Energie-Profil | Grafik-Punktzahl | Physik-Punktzahl | Kombinierte Punktzahl |
| Performance Modus | 7156 | 20127 | 2511 |
| Ausgeglichener Modus | 4682 (-37%) | 15022 (-25%) | 1726 (-31%) |
| Batteriebetrieb | 4982 (-33%) | 14856 (-26%) | 1734 (-31%) |
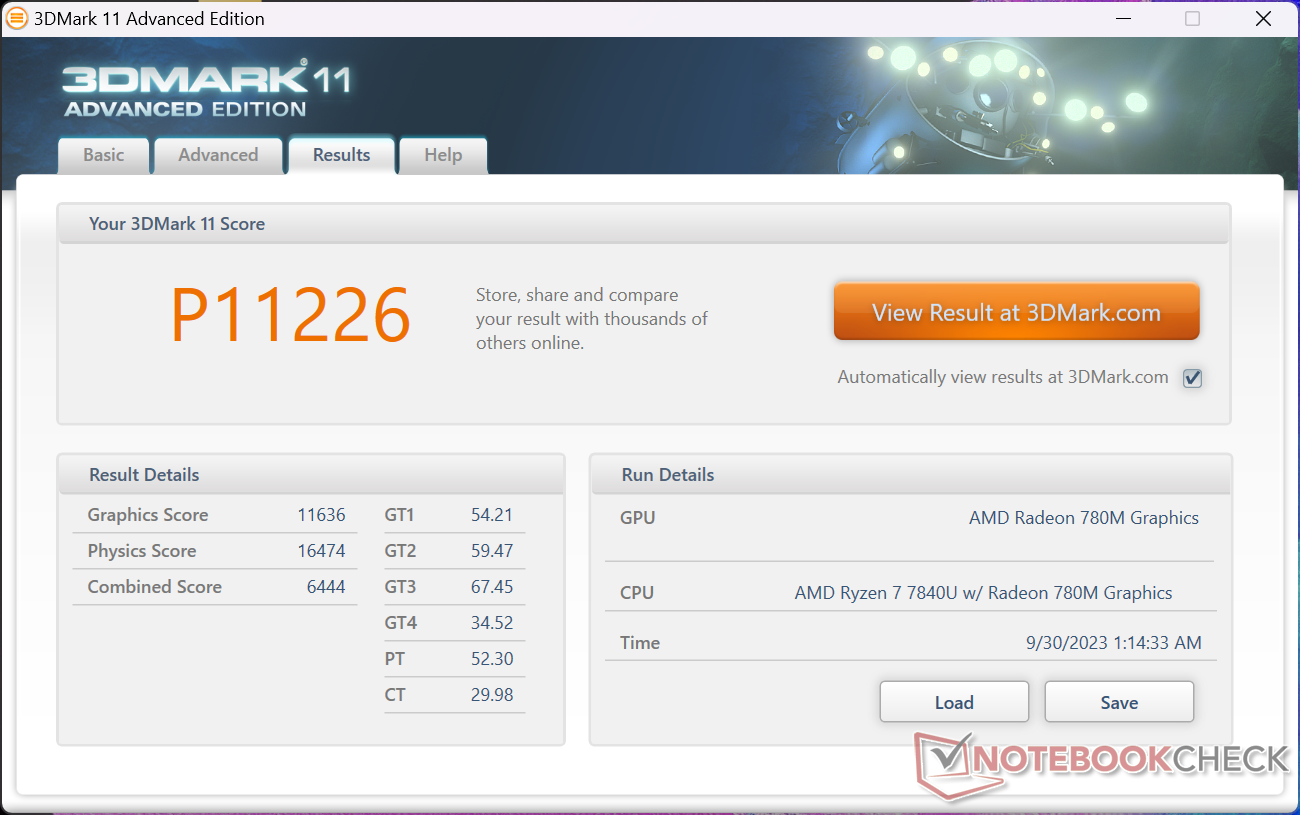
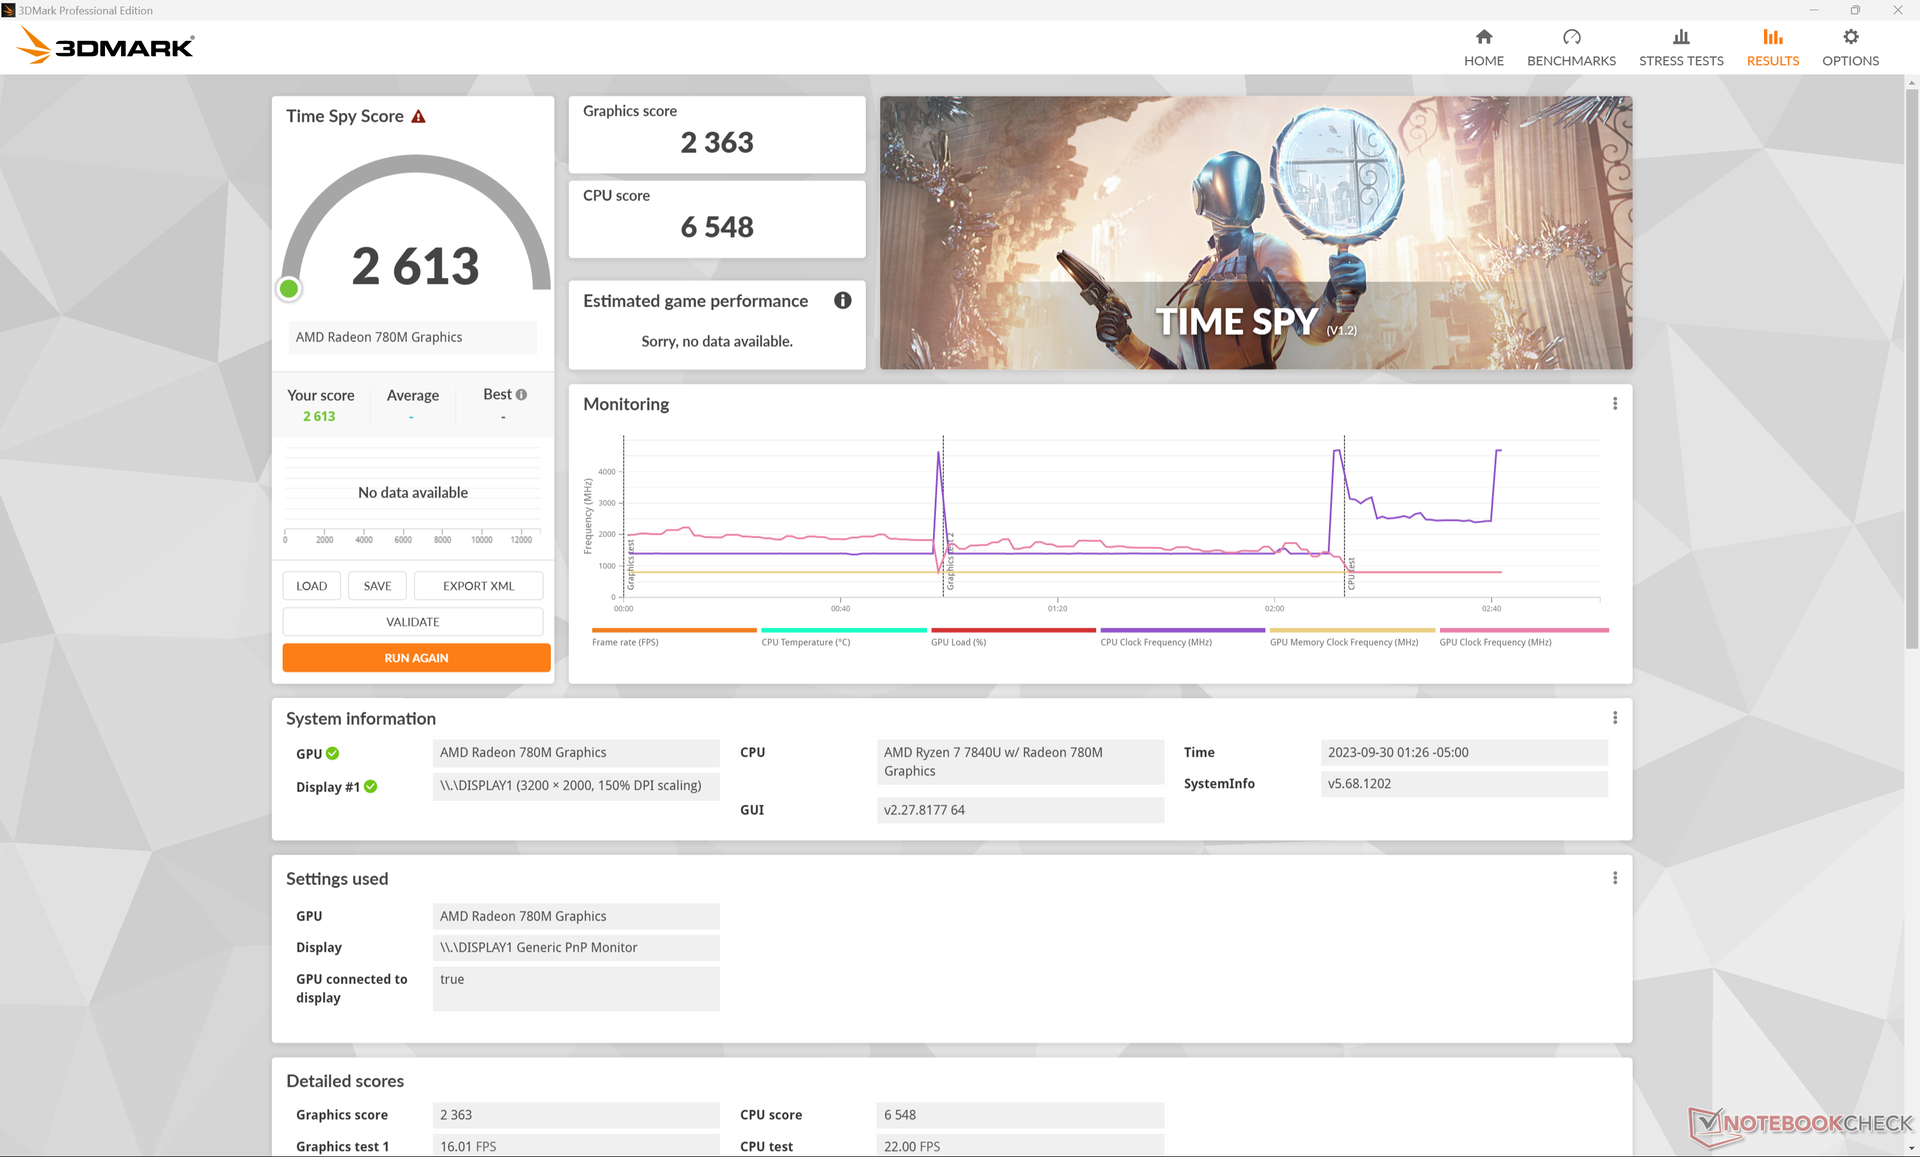
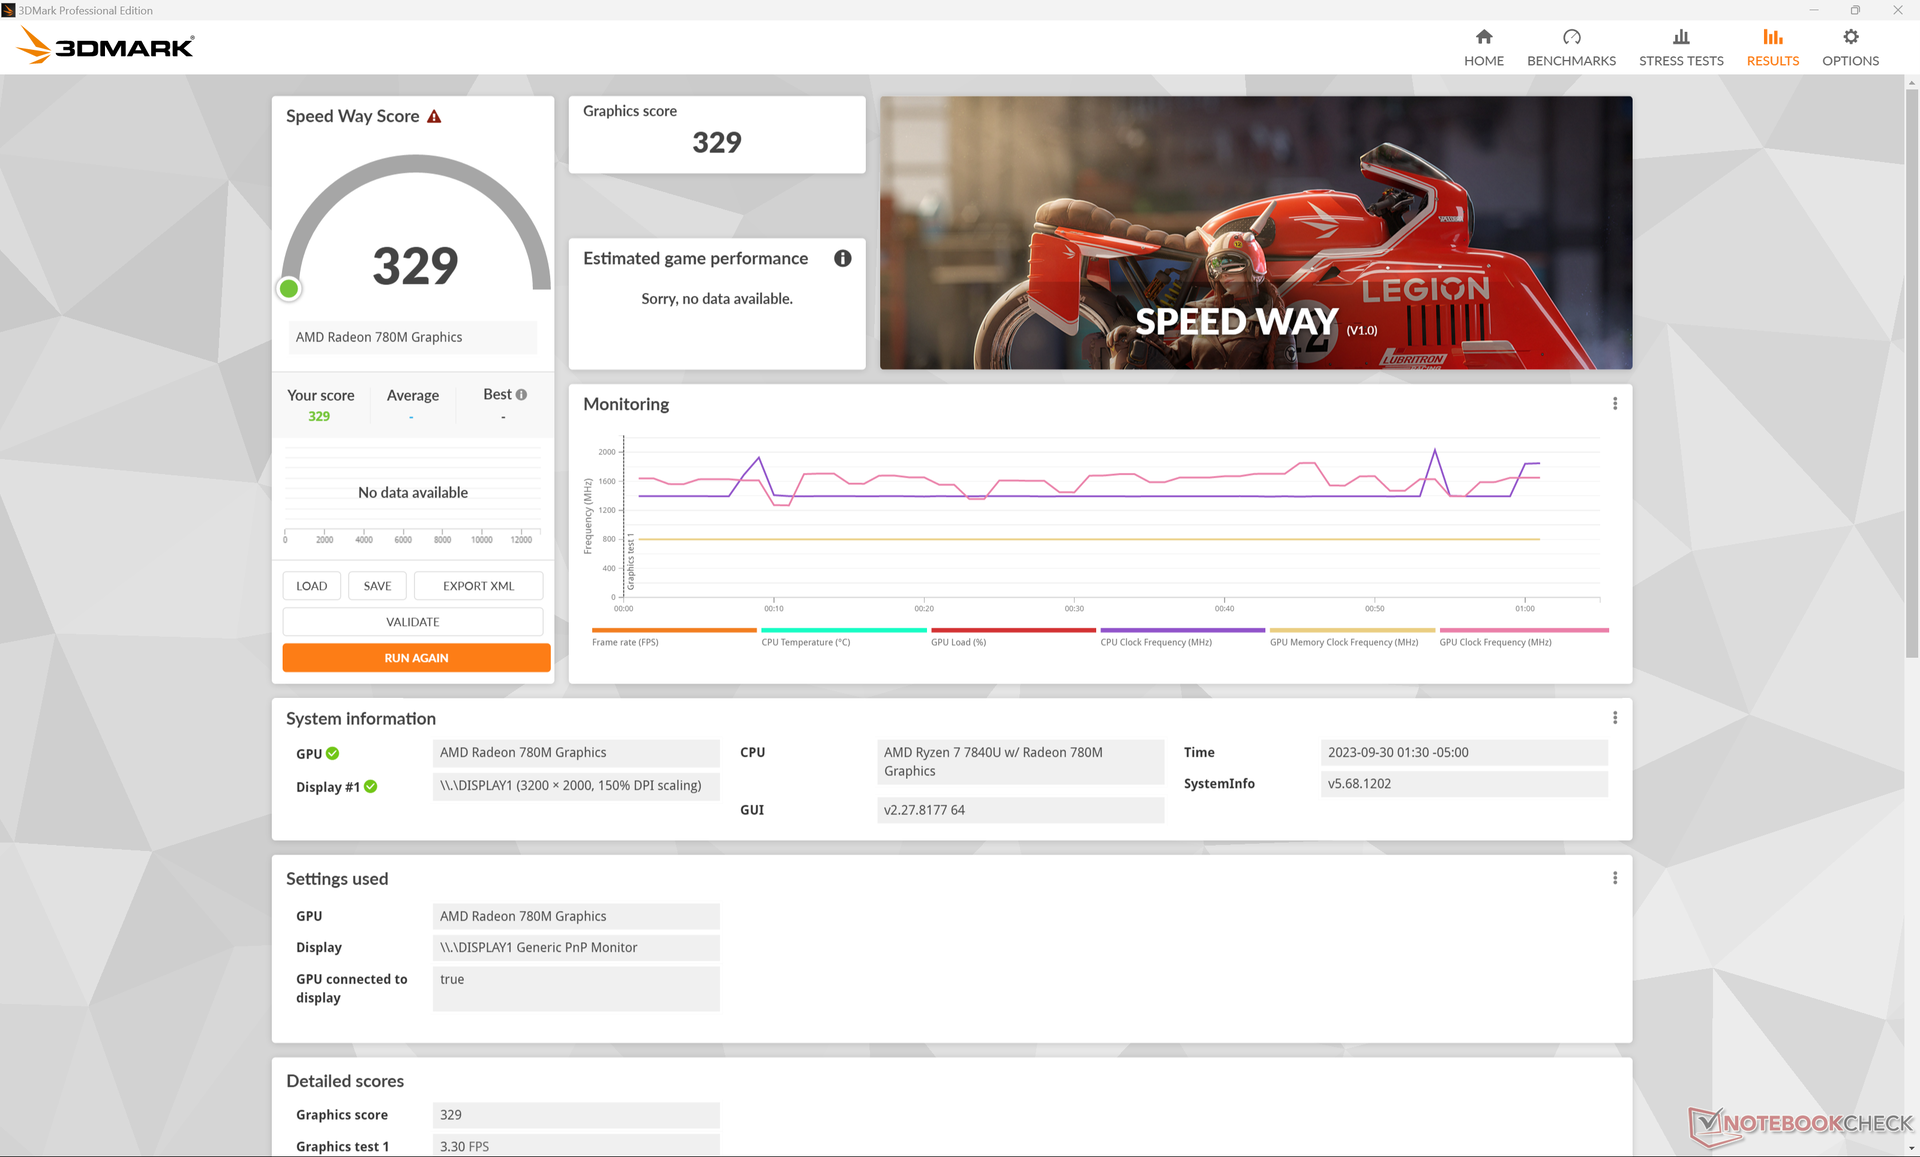
| 3DMark 11 Performance | 11226 Punkte | |
| 3DMark Fire Strike Score | 6575 Punkte | |
| 3DMark Time Spy Score | 2613 Punkte | |
Hilfe | ||
* ... kleinere Werte sind besser
Die GPU-Leistung wurde mit der Zeit ebenfalls gedrosselt, ähnlich wie wir es beim obigen CineBench R15 xT Loop-Test beobachtet haben. Im Leerlauf mit Witcher 3 starteten die Frameraten beispielsweise mit 45 FPS, bevor sie sich verlangsamten und im niedrigen 30-FPS-Bereich stabilisierten.
Witcher 3 FPS Chart
| min. | mittel | hoch | max. | |
|---|---|---|---|---|
| GTA V (2015) | 139.3 | 53.9 | 21 | |
| The Witcher 3 (2015) | 109.8 | 36.1 | 20.4 | |
| Dota 2 Reborn (2015) | 128.1 | 101.5 | 66.8 | 61.4 |
| Final Fantasy XV Benchmark (2018) | 50.5 | 27.4 | 21.2 | |
| X-Plane 11.11 (2018) | 49.1 | 37 | 30.3 | |
| Far Cry 5 (2018) | 53 | 28 | 26 | 24 |
| Strange Brigade (2018) | 139.8 | 60.6 | 49.5 | 41.3 |
| Cyberpunk 2077 1.6 (2022) | 26.7 | 20.8 | 17.3 | 15.9 |
| Tiny Tina's Wonderlands (2022) | 34.3 | 28.4 | 18.6 | 16.5 |
| F1 22 (2022) | 65.4 | 62.1 | 42.6 | 9.92 |
Emissionen
System-Rauschen
Das Lüftergeräusch hat sich gegenüber der Zen 3+ Konfiguration nicht wirklich verändert, obwohl sich die Anzahl der Lüfter geändert hat. Das ist bedauerlich, da der Lüfter in unserem Zen 3+ Testgerät unter Last häufig und laut pulsierte. Das Lüftergeräusch bewegt sich regelmäßig um die 28 dB(A) bei leisem Hintergrund von 24 dB(A), wenn man im Internet surft oder streamt, während es sich bei 41 dB(A) unter Last einpendelt, ähnlich wie zuvor.
Lautstärkediagramm
| Idle |
| 24.1 / 24.3 / 28 dB(A) |
| Last |
| 41 / 40.9 dB(A) |
 | ||
30 dB leise 40 dB(A) deutlich hörbar 50 dB(A) störend |
||
min: | ||
| Acer Swift Edge SFE16 Ryzen 7 7840U Radeon 780M, R7 7840U, SK hynix HFS512GEJ9X125N | Acer Swift Edge SFE16-42-R1GM Radeon 680M, R7 7735U, Micron 3400 1TB MTFDKBA1T0TFH | Lenovo Slim Pro 9i 16IRP8 GeForce RTX 4050 Laptop GPU, i9-13905H, Samsung PM9A1 MZVL21T0HCLR | Asus VivoBook Pro 16 GeForce RTX 3050 Ti Laptop GPU, i7-12700H, Intel SSD 670p SSDPEKNU010TZ | Samsung Galaxy Book3 Ultra 16 GeForce RTX 4050 Laptop GPU, i7-13700H, Samsung PM9A1 MZVL2512HCJQ | Huawei MateBook 16s i7 Iris Xe G7 96EUs, i7-12700H, Silicon Motion PCIe-8 SSD | |
|---|---|---|---|---|---|---|
| Geräuschentwicklung | -7% | -1% | -15% | -3% | 4% | |
| aus / Umgebung * (dB) | 23.4 | 25.7 -10% | 22.7 3% | 25.2 -8% | 25 -7% | 24 -3% |
| Idle min * (dB) | 24.1 | 25.7 -7% | 22.7 6% | 25.2 -5% | 26 -8% | 24 -0% |
| Idle avg * (dB) | 24.3 | 27 -11% | 22.7 7% | 25.2 -4% | 27 -11% | 25.2 -4% |
| Idle max * (dB) | 28 | 29.3 -5% | 27.5 2% | 25.2 10% | 28 -0% | 27.2 3% |
| Last avg * (dB) | 41 | 42.3 -3% | 28.9 30% | 55.1 -34% | 40 2% | 34.8 15% |
| Witcher 3 ultra * (dB) | 40.9 | 52.6 -29% | 39 5% | 34.8 15% | ||
| Last max * (dB) | 40.9 | 42.7 -4% | 52.5 -28% | 61.5 -50% | 41 -0% | 39 5% |
* ... kleinere Werte sind besser
Temperatur
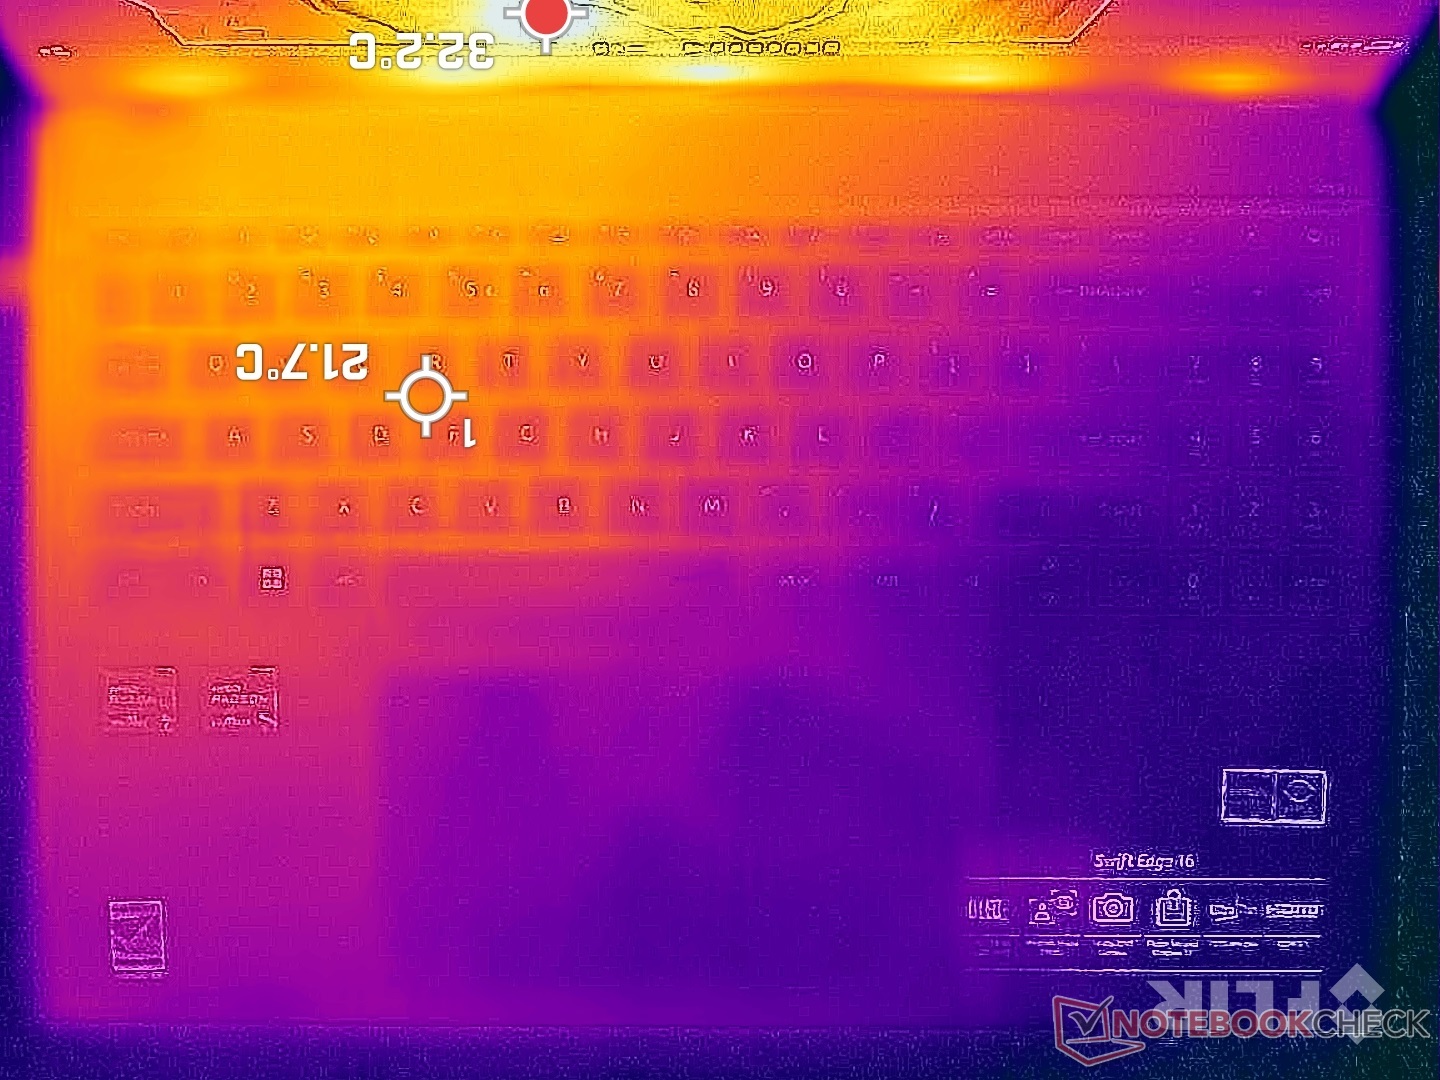
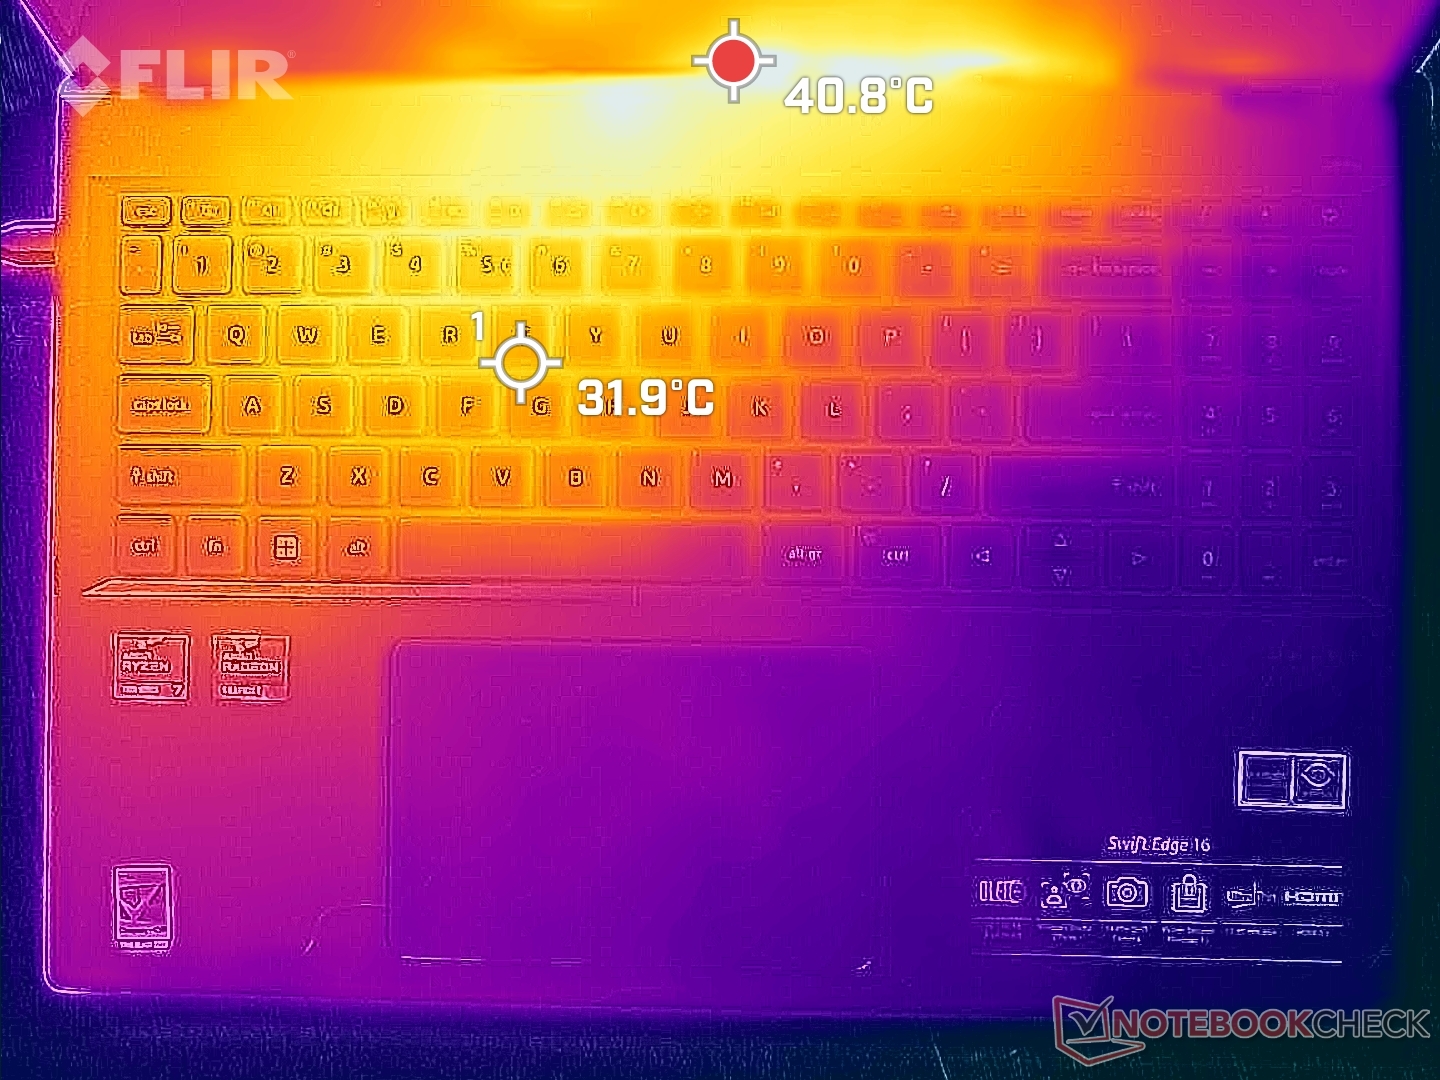
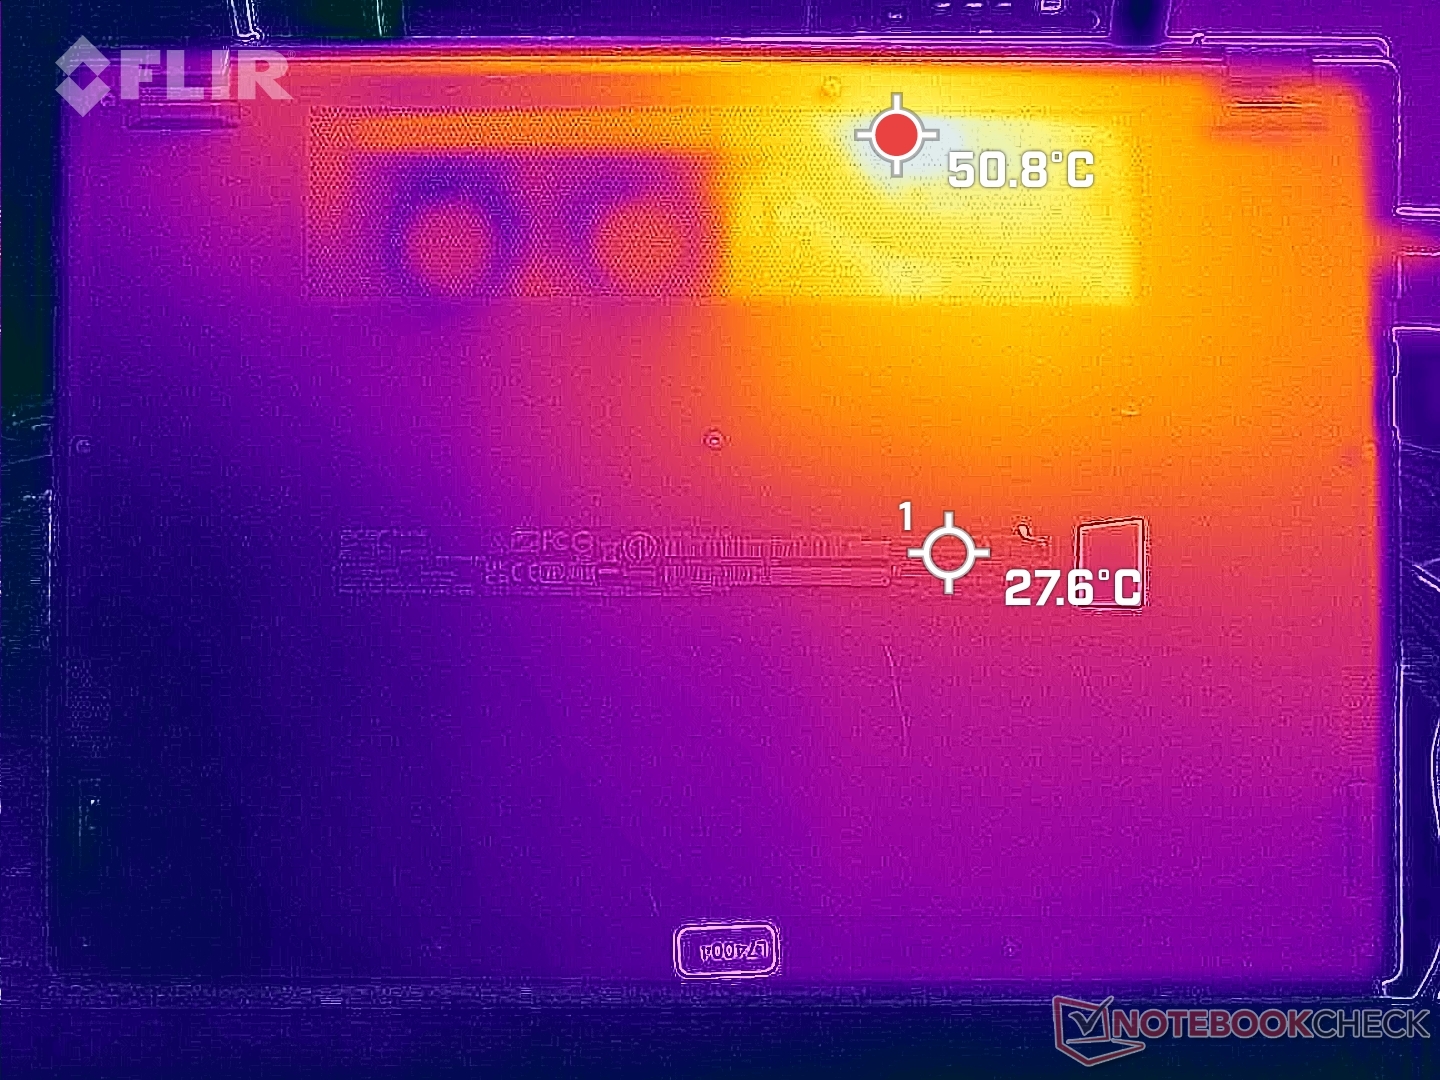
Die Oberflächentemperaturen sind nicht signifikant kühler oder wärmer als die, die wir mit der Ryzen 7 7735U-Konfiguration feststellten. Heiße Stellen auf der Unterseite erreichen immer noch über 50 °C in der Nähe der Lüftungsöffnungen, während die Oberseite in der Nähe der Scharniere je nach Winkel des Deckels zwischen 40 °C und 50 °C erreichen kann. Es ist unwahrscheinlich, dass die Hände diese heißen Bereiche beim Spielen für längere Zeit berühren.
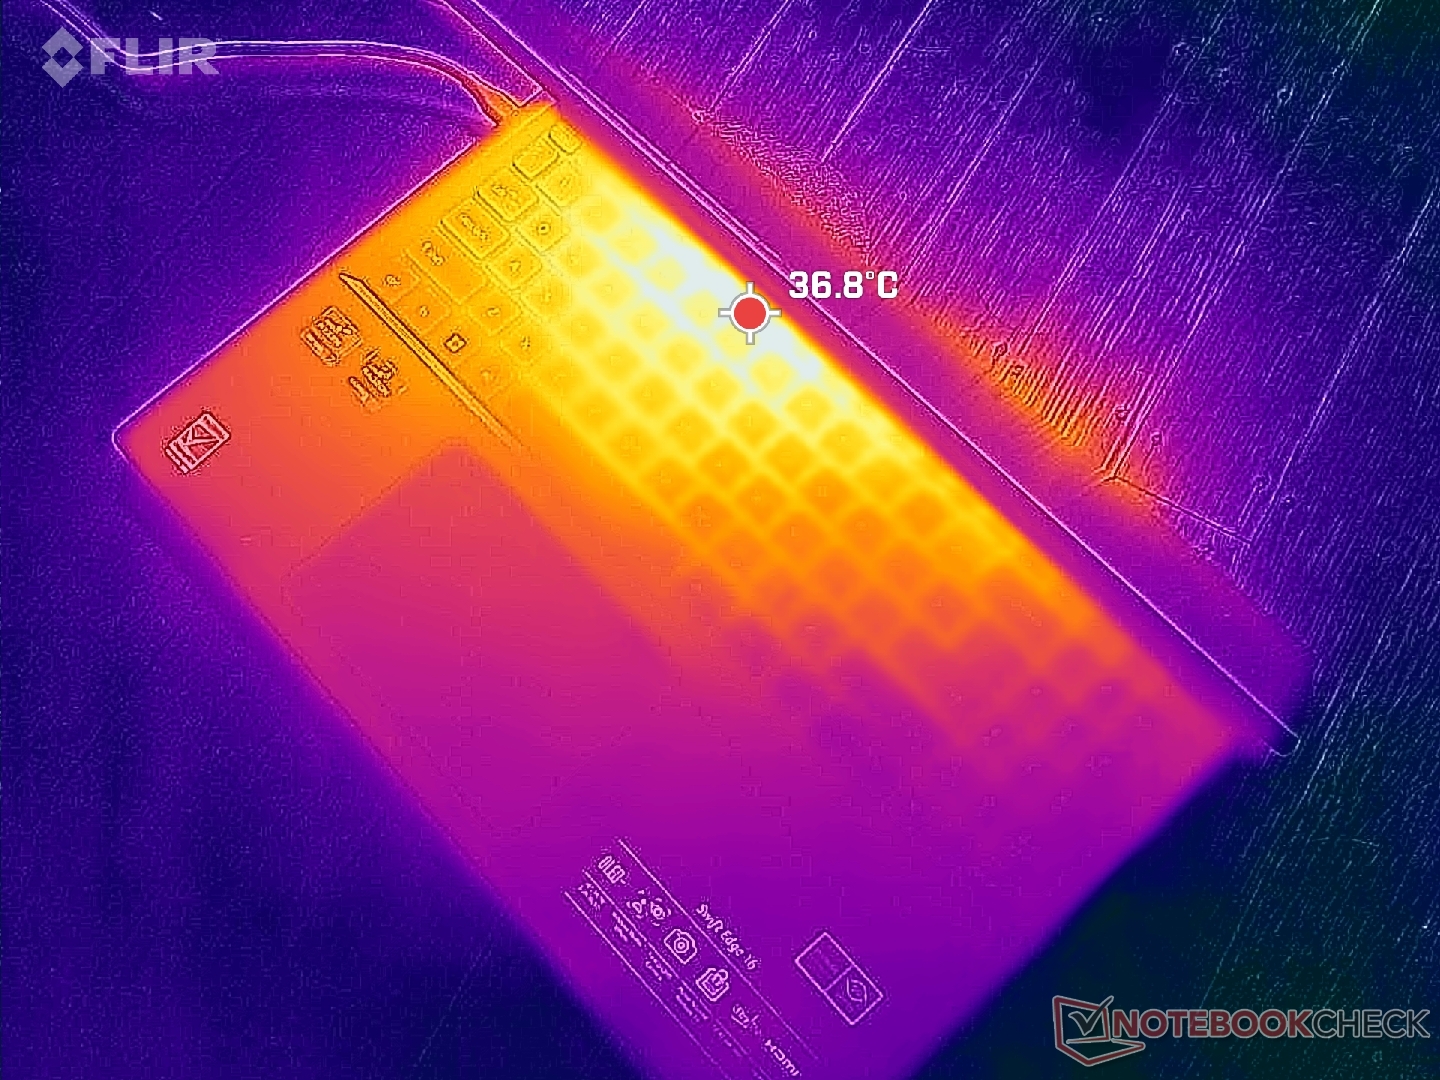

(±) Die maximale Temperatur auf der Oberseite ist 41.6 °C. Im Vergleich liegt der Klassendurchschnitt bei 34.3 °C (von 21.2 bis 62.5 °C für die Klasse Office).
(-) Auf der Unterseite messen wir eine maximalen Wert von 46.6 °C (im Vergleich zum Durchschnitt von 36.8 °C).
(+) Ohne Last messen wir eine durchschnittliche Temperatur von 27 °C auf der Oberseite. Der Klassendurchschnitt erreicht 29.5 °C.
(+) Die Handballen und der Touchpad-Bereich sind mit gemessenen 26.6 °C kühler als die typische Hauttemperatur und fühlen sich dadurch kühl an.
(±) Die durchschnittliche Handballen-Temperatur anderer getesteter Geräte war 27.5 °C (+0.9 °C).

| Acer Swift Edge SFE16 Ryzen 7 7840U AMD Ryzen 7 7840U, AMD Radeon 780M | Acer Swift Edge SFE16-42-R1GM AMD Ryzen 7 7735U, AMD Radeon 680M | Lenovo Slim Pro 9i 16IRP8 Intel Core i9-13905H, NVIDIA GeForce RTX 4050 Laptop GPU | Asus VivoBook Pro 16 Intel Core i7-12700H, NVIDIA GeForce RTX 3050 Ti Laptop GPU | Samsung Galaxy Book3 Ultra 16 Intel Core i7-13700H, NVIDIA GeForce RTX 4050 Laptop GPU | Huawei MateBook 16s i7 Intel Core i7-12700H, Intel Iris Xe Graphics G7 96EUs | |
|---|---|---|---|---|---|---|
| Hitze | -7% | 3% | -13% | 12% | 1% | |
| Last oben max * (°C) | 41.6 | 49.4 -19% | 37.8 9% | 44.2 -6% | 41 1% | 40.9 2% |
| Last unten max * (°C) | 46.6 | 44.7 4% | 44.8 4% | 53 -14% | 44 6% | 48.3 -4% |
| Idle oben max * (°C) | 30.4 | 34 -12% | 30.6 -1% | 32.1 -6% | 23 24% | 29.2 4% |
| Idle unten max * (°C) | 31 | 31.6 -2% | 31 -0% | 38.4 -24% | 26 16% | 30.4 2% |
* ... kleinere Werte sind besser
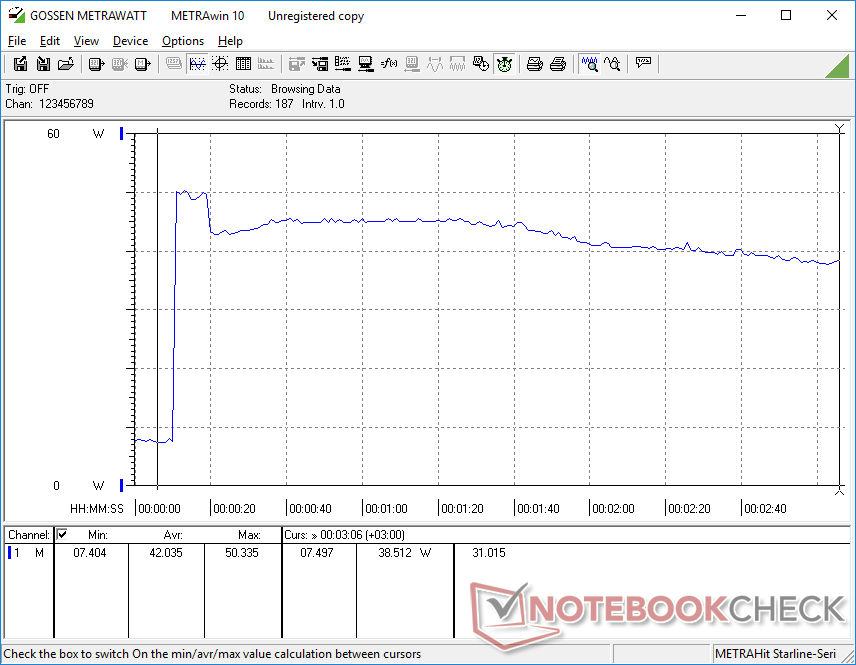
Stresstest
Das begrenzte Turbo-Core-Potenzial des Acer lässt sich bei Stresstests mit Benchmarks beobachten. Die Taktraten und die Leistungsaufnahme des Boards stiegen beim Stresstest mit Prime95 auf 3,5 GHz bzw. 30 W, bevor sie im Laufe der nächsten Minute kontinuierlich auf nur noch 2,3 GHz und 18 W fielen. Die Kerntemperatur stabilisierte sich bei relativ niedrigen 64 °C. Die Wiederholung dieses Tests auf dem AMD Framework Laptop 13.5 mit der gleichen CPU führte zu höheren Werten von 3,2 GHz, 35 W und 85 °C im Vergleich.
Die Kerntemperatur bei der Ausführung von Witcher 3 stabilisiert sich bei nur 56 °C, also etwa 15 °C kühler als auf dem oben genannten Framework. Es ist klar, dass das System niedrigeren Oberflächentemperaturen den Vorrang vor höherer Leistung einräumt.
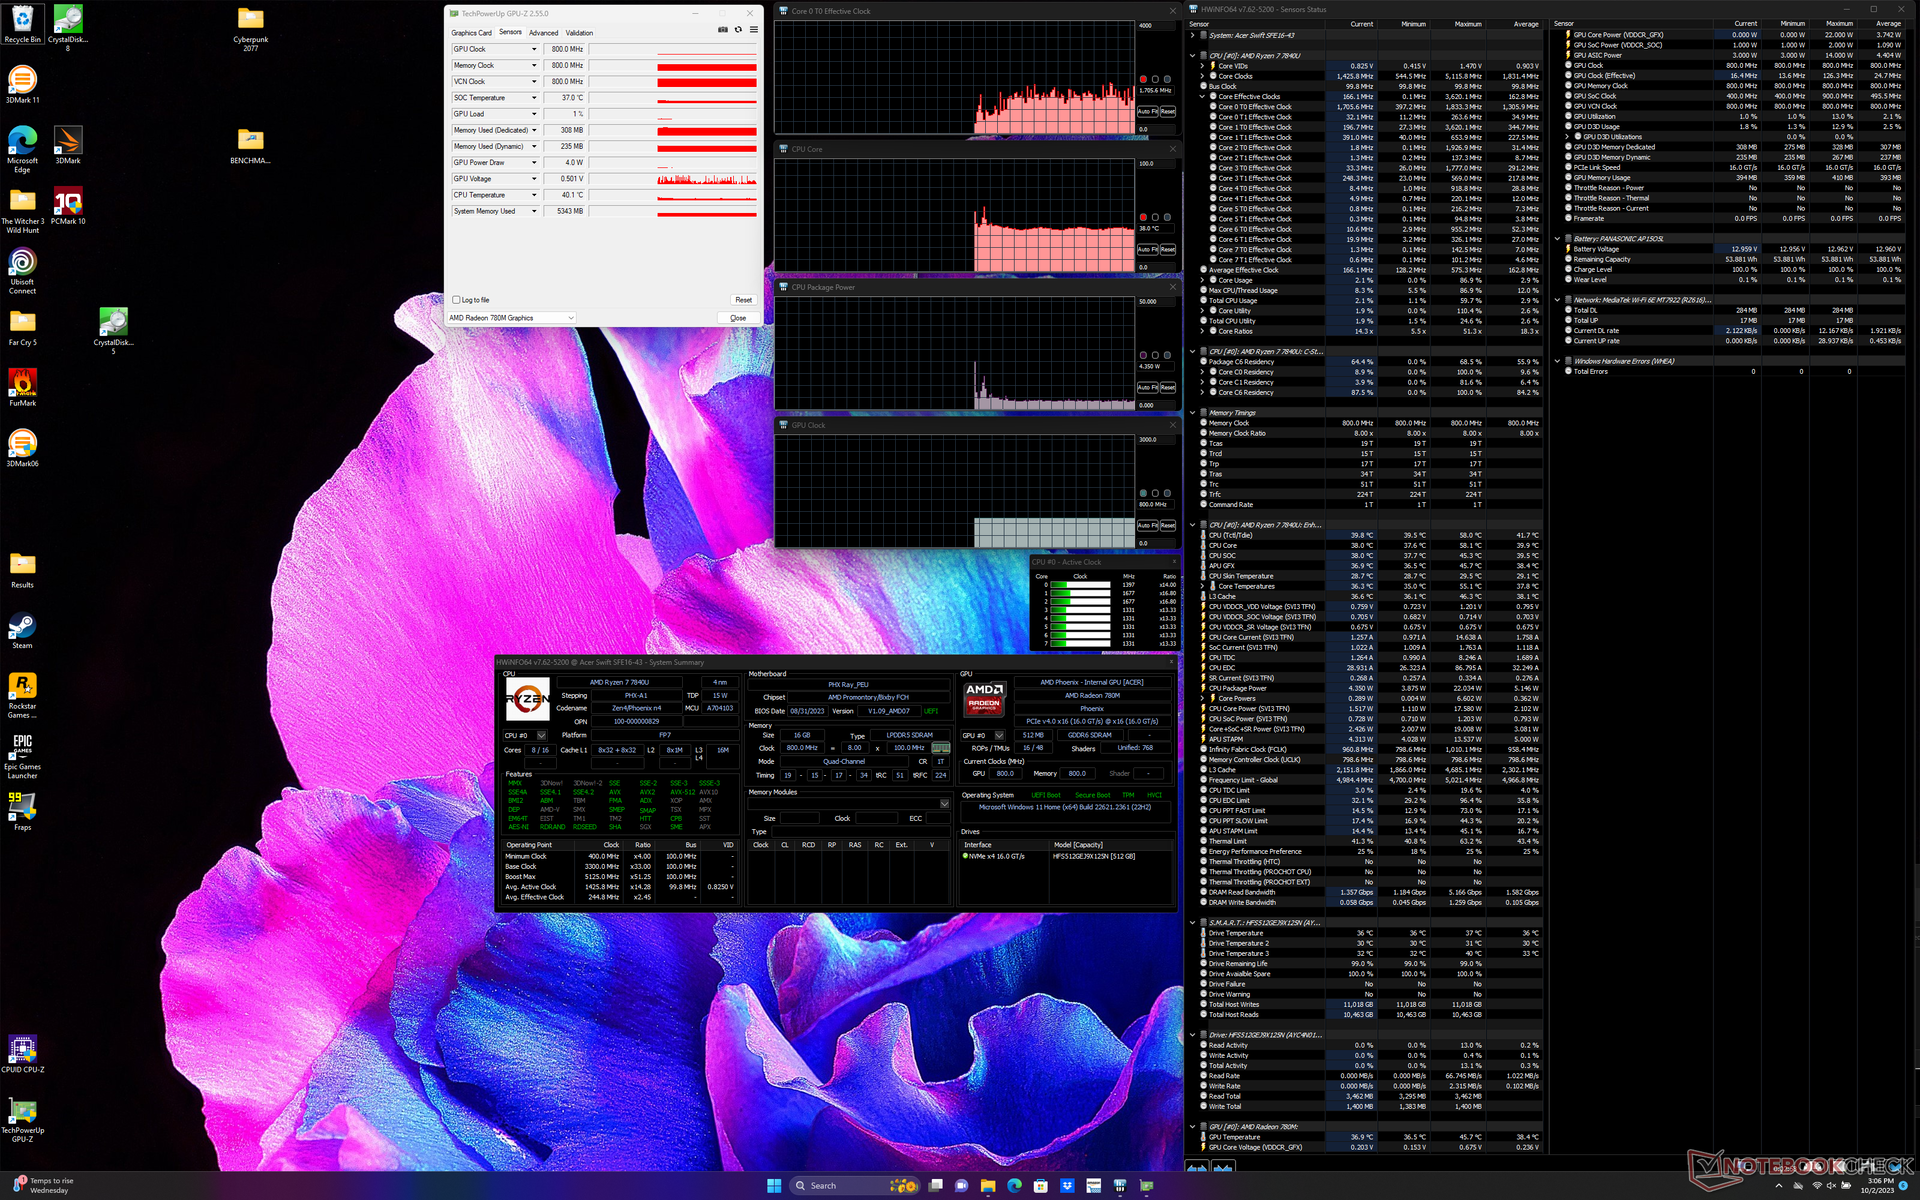
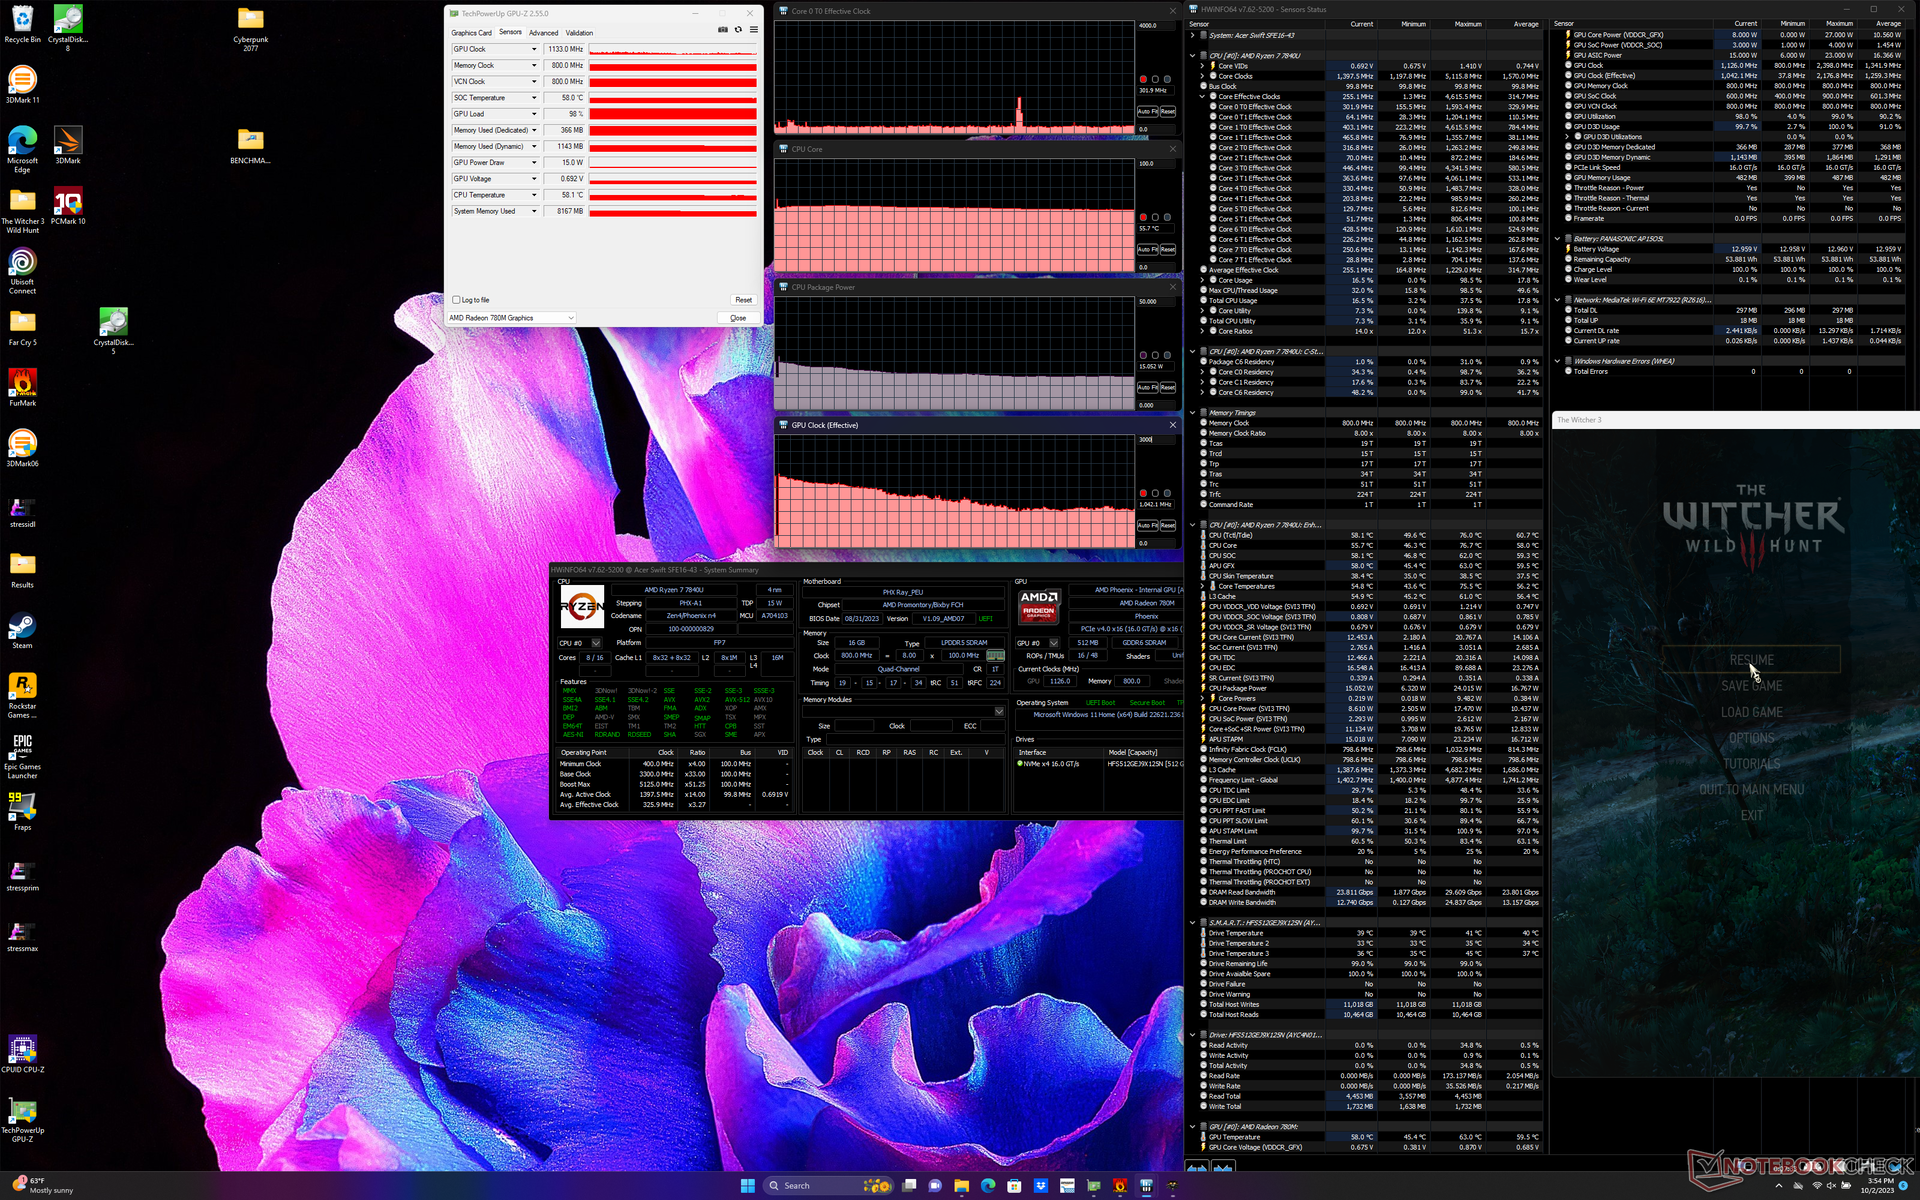
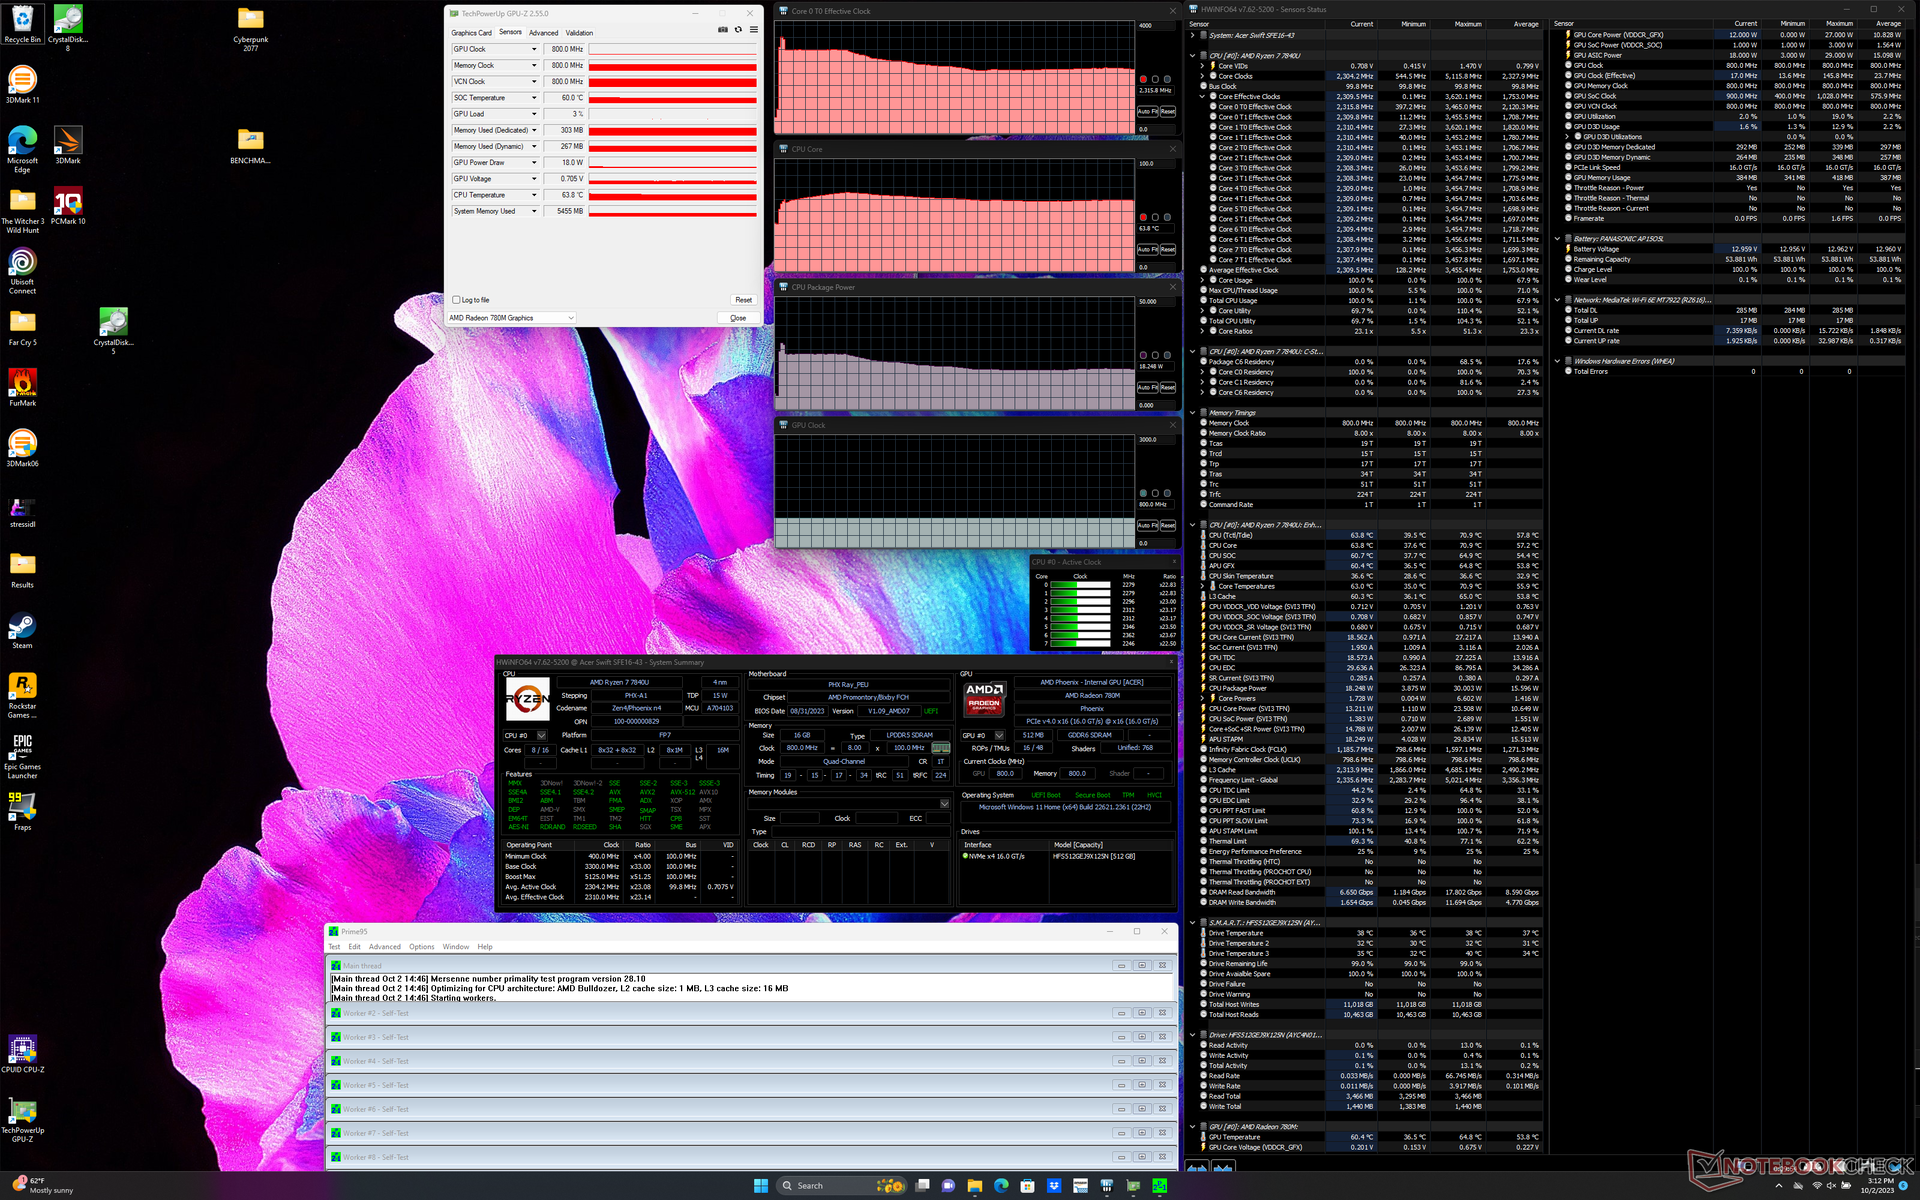
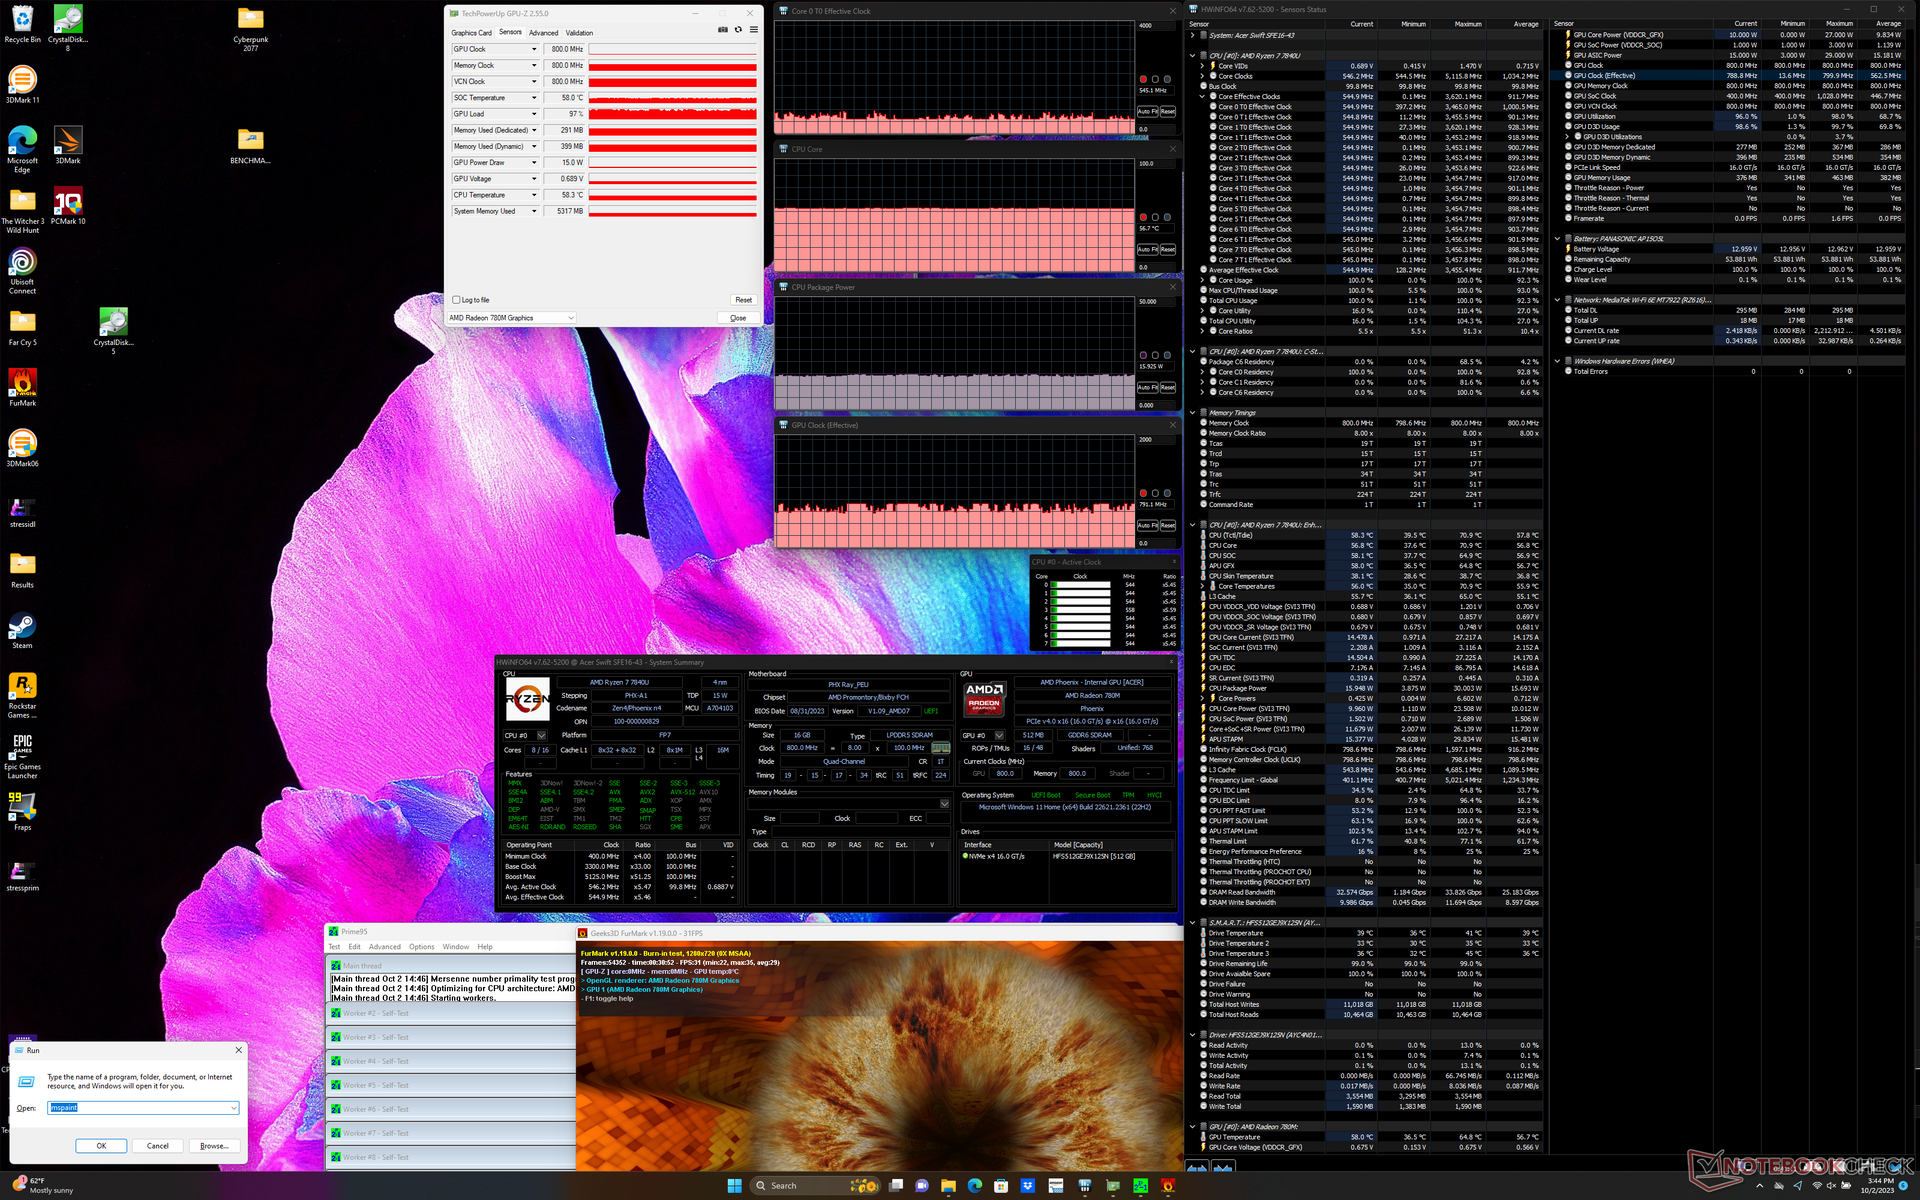
| CPU-Takt (GHz) | GPU-Takt (MHz) | Durchschnittliche CPU-Temperatur (°C) | |
| System Leerlauf | -- | -- | 38 |
| Prime95 Stress | 2.3 | -- | 64 |
| Prime95 + FurMark Stress | 0.5 | 791 | 57 |
| Witcher 3 Stress | 0.3 | 1042 | 56 |
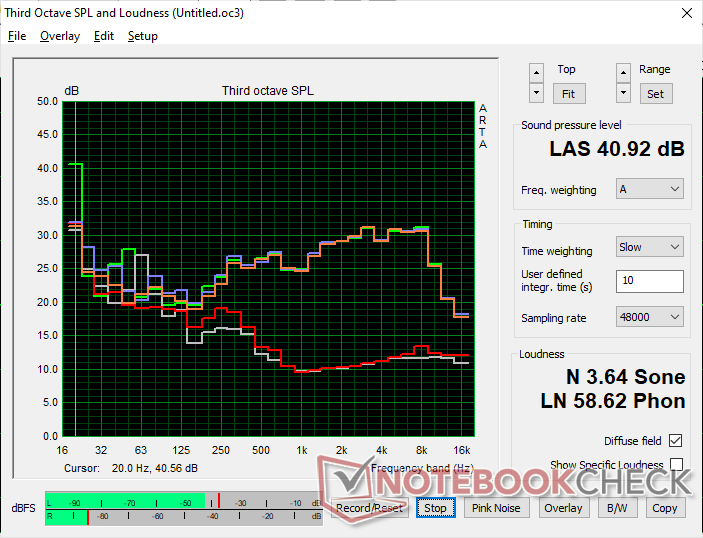
Lautsprecher
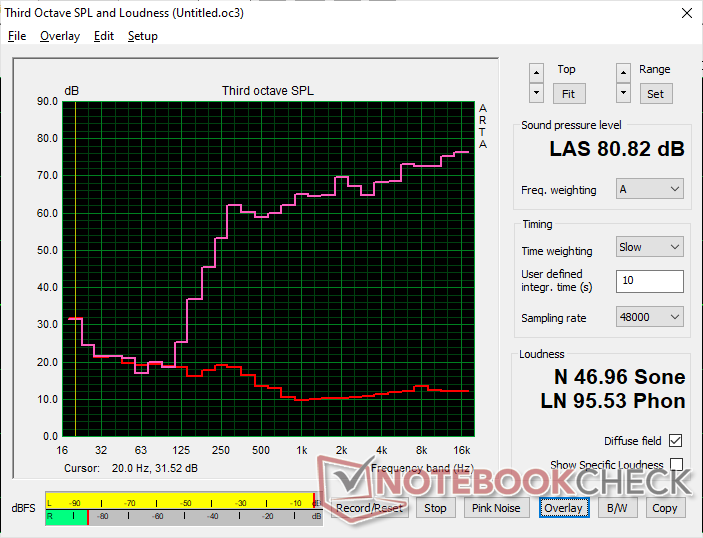
Acer Swift Edge SFE16 Ryzen 7 7840U Audio Analyse
(±) | Mittelmäßig laut spielende Lautsprecher (80.8 dB)
Bass 100 - 315 Hz
(-) | kaum Bass - 24.5% niedriger als der Median
(±) | durchschnittlich lineare Bass-Wiedergabe (14.2% Delta zum Vorgänger)
Mitteltöne 400 - 2000 Hz
(+) | ausgeglichene Mitten, vom Median nur 2.9% abweichend
(+) | lineare Mitten (3.5% Delta zum Vorgänger)
Hochtöne 2 - 16 kHz
(+) | ausgeglichene Hochtöne, vom Median nur 4.8% abweichend
(+) | sehr lineare Hochtöne (3.7% Delta zum Vorgänger)
Gesamt im hörbaren Bereich 100 - 16.000 Hz
(±) | hörbarer Bereich ist durchschnittlich linear (19.8% Abstand zum Median)
Im Vergleich zu allen Geräten derselben Klasse
» 41% aller getesteten Geräte dieser Klasse waren besser, 9% vergleichbar, 51% schlechter
» Das beste Gerät hat einen Delta-Wert von 7%, durchschnittlich ist 21%, das schlechteste Gerät hat 53%
Im Vergleich zu allen Geräten im Test
» 50% aller getesteten Geräte waren besser, 7% vergleichbar, 42% schlechter
» Das beste Gerät hat einen Delta-Wert von 4%, durchschnittlich ist 24%, das schlechteste Gerät hat 134%
Apple MacBook Pro 16 2021 M1 Pro Audio Analyse
(+) | Die Lautsprecher können relativ laut spielen (84.7 dB)
Bass 100 - 315 Hz
(+) | guter Bass - nur 3.8% Abweichung vom Median
(+) | lineare Bass-Wiedergabe (5.2% Delta zum Vorgänger)
Mitteltöne 400 - 2000 Hz
(+) | ausgeglichene Mitten, vom Median nur 1.3% abweichend
(+) | lineare Mitten (2.1% Delta zum Vorgänger)
Hochtöne 2 - 16 kHz
(+) | ausgeglichene Hochtöne, vom Median nur 1.9% abweichend
(+) | sehr lineare Hochtöne (2.7% Delta zum Vorgänger)
Gesamt im hörbaren Bereich 100 - 16.000 Hz
(+) | hörbarer Bereich ist sehr linear (4.6% Abstand zum Median
Im Vergleich zu allen Geräten derselben Klasse
» 0% aller getesteten Geräte dieser Klasse waren besser, 0% vergleichbar, 100% schlechter
» Das beste Gerät hat einen Delta-Wert von 5%, durchschnittlich ist 17%, das schlechteste Gerät hat 45%
Im Vergleich zu allen Geräten im Test
» 0% aller getesteten Geräte waren besser, 0% vergleichbar, 100% schlechter
» Das beste Gerät hat einen Delta-Wert von 4%, durchschnittlich ist 24%, das schlechteste Gerät hat 134%
Energieverwaltung
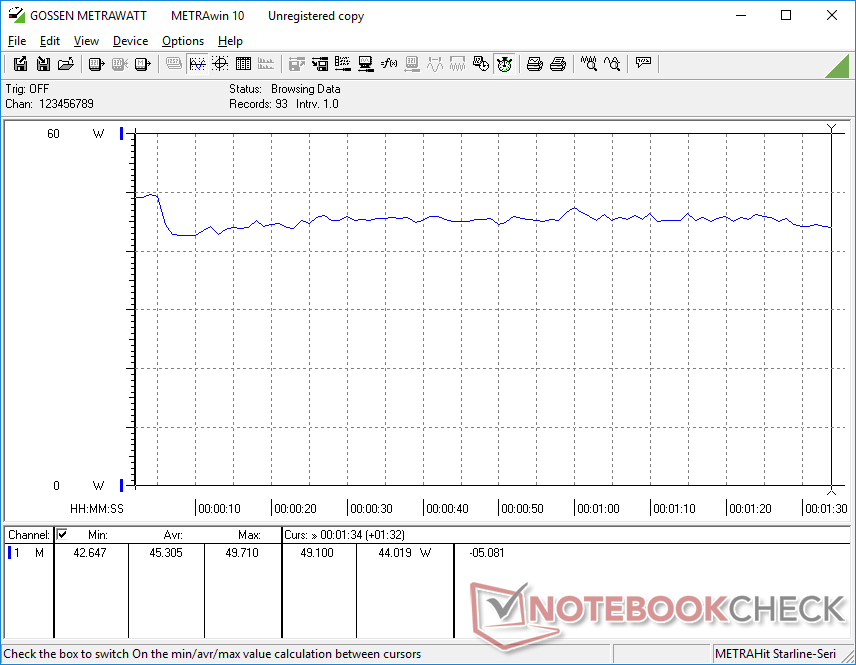
Stromverbrauch
Der Stromverbrauch im Leerlauf ist höher als bei den meisten anderen Laptops mit integrierter GPU, was auf die hohe Bildwiederholfrequenz von 120 Hz und das OLED-Panel unserer Acer-Konfiguration zurückzuführen ist, die bekanntermaßen stromhungriger sind als die üblichen 60 Hz IPS. Die Anzeige eines komplett weißen Bildes mit 120 Hz verbraucht bis zu 19 W, während es beim Framework Laptop 13.5 weniger als die Hälfte ist.
Umgekehrt war der Stromverbrauch beim Spielen aufgrund der Drosselungstendenzen des Prozessors niedriger als erwartet.


| Aus / Standby | |
| Idle | |
| Last |
|
Legende:
min: | |
| Acer Swift Edge SFE16 Ryzen 7 7840U R7 7840U, Radeon 780M, SK hynix HFS512GEJ9X125N, OLED, 3200x2000, 16" | Acer Swift Edge SFE16-42-R1GM R7 7735U, Radeon 680M, Micron 3400 1TB MTFDKBA1T0TFH, OLED, 3840x2400, 16" | Lenovo Slim Pro 9i 16IRP8 i9-13905H, GeForce RTX 4050 Laptop GPU, Samsung PM9A1 MZVL21T0HCLR, Mini-LED, 3200x2000, 16" | Asus VivoBook Pro 16 i7-12700H, GeForce RTX 3050 Ti Laptop GPU, Intel SSD 670p SSDPEKNU010TZ, IPS, 2560x1600, 16" | Samsung Galaxy Book3 Ultra 16 i7-13700H, GeForce RTX 4050 Laptop GPU, Samsung PM9A1 MZVL2512HCJQ, AMOLED, 2880x1800, 16" | Huawei MateBook 16s i7 i7-12700H, Iris Xe G7 96EUs, Silicon Motion PCIe-8 SSD, IPS, 2520x1680, 16" | |
|---|---|---|---|---|---|---|
| Stromverbrauch | 4% | -166% | -102% | -15% | -30% | |
| Idle min * (Watt) | 7.1 | 8.6 -21% | 16 -125% | 8.7 -23% | 3 58% | 6.8 4% |
| Idle avg * (Watt) | 10.1 | 7.7 24% | 30 -197% | 13.1 -30% | 5 50% | 13.2 -31% |
| Idle max * (Watt) | 18.6 | 9.3 50% | 30.4 -63% | 18.3 2% | 11 41% | 13.8 26% |
| Last avg * (Watt) | 45.3 | 47.9 -6% | 78.9 -74% | 116 -156% | 72 -59% | 75.2 -66% |
| Witcher 3 ultra * (Watt) | 39.5 | 46.3 -17% | 155.3 -293% | 117.6 -198% | 69.7 -76% | 56.1 -42% |
| Last max * (Watt) | 52.9 | 56 -6% | 180.4 -241% | 162 -206% | 108 -104% | 90.6 -71% |
* ... kleinere Werte sind besser
Power Consumption Witcher 3 / Stresstest
Power Consumption external Monitor
Akkulaufzeit
Die WLAN-Laufzeit ist um fast zwei Stunden kürzer als bei unserem vorherigen Gerät, selbst wenn beide auf dieselben Energieprofileinstellungen und Browserbedingungen eingestellt sind. Die 120 Hz Bildwiederholrate ist wahrscheinlich ein Faktor, der zu den Akkulaufzeitunterschieden beiträgt.
| Acer Swift Edge SFE16 Ryzen 7 7840U R7 7840U, Radeon 780M, 54 Wh | Acer Swift Edge SFE16-42-R1GM R7 7735U, Radeon 680M, 54 Wh | Lenovo Slim Pro 9i 16IRP8 i9-13905H, GeForce RTX 4050 Laptop GPU, 75 Wh | Asus VivoBook Pro 16 i7-12700H, GeForce RTX 3050 Ti Laptop GPU, 70 Wh | Samsung Galaxy Book3 Ultra 16 i7-13700H, GeForce RTX 4050 Laptop GPU, 76 Wh | Huawei MateBook 16s i7 i7-12700H, Iris Xe G7 96EUs, 84 Wh | |
|---|---|---|---|---|---|---|
| Akkulaufzeit | 30% | 18% | 30% | 71% | 45% | |
| WLAN (h) | 5.6 | 7.3 30% | 6.6 18% | 7.3 30% | 9.6 71% | 8.1 45% |
| Idle (h) | 10.9 | 18.2 | ||||
| H.264 (h) | 8.6 | 13.4 | 9.3 | |||
| Last (h) | 1.5 | 1.8 | 1.9 |
Pro
Contra
Fazit - Kleinere, aber bemerkenswerte Upgrades
Die Zen 3+ Swift Edge 16 war bereits eines unserer beliebtesten 16-Zoll-Notebooks, und die aktualisierte Zen 4-Konfiguration festigt unsere Meinung noch. Die verfügbare CPU- und vor allem GPU-Leistung ist angesichts des geringen Gewichts und des dünnen Profils sehr hoch. Das 3,2K OLED-Display mit 120 Hz ist eines der besten, das wir je bei einem Multimedia-Notebook für Textverarbeitung, Surfen, Videos und sogar Spiele gesehen haben. Wenn Sie die Leistung und Displayqualität maximieren und gleichzeitig das Gewicht so weit wie möglich minimieren möchten, dann trifft das Swift Edge 16 genau ins Schwarze.
Der Ryzen 7 7840U bietet eine ordentliche Leistungssteigerung gegenüber der bereits großartigen Ryzen 7 7735U Swift Edge 16 Konfiguration. Nutzer werden das 120-Hz-OLED und das geringe Gewicht lieben, aber die durchschnittliche Akkulaufzeit und die Leistungsdrosselung könnten manchen verärgern.
Abstriche ergeben sich, wenn man über die CPU und das Display hinaus schaut. Da das Notebook für seine Größe extrem leicht ist, mussten bestimmte Funktionen entfernt oder reduziert werden, wie z. B. die kleinere Kühllösung, die geringere Akkukapazität und das Fehlen von Gorilla Glass oder des Touchscreens. Infolgedessen läuft die CPU etwas langsamer als erwartet, die Akkulaufzeit ist nur durchschnittlich, die SSD drosselt unter Stress und das Display ist anfälliger für Verwindungen und Wackler als uns lieb ist. Auch die Erweiterbarkeit ist eingeschränkt, da der Arbeitsspeicher fest verlötet ist und nur eine interne SSD unterstützt wird.
Wenn Sie unbedingt die Leistung der CPUs der H-Serie und der GeForce RTX-GPUs benötigen, dann sollten Sie sich vielleicht das schwerere Swift X 16, das Asus VivoBook Pro 16 oder das Galaxy Book3 Ultra 16 stattdessen anschauen.
Preis und Verfügbarkeit
Das Acer Swift Edge SFE16 mit dem Ryzen 7 7840U ist in Deutschland bei Cyberport.de für 1.200 Euro bereits gelistet, aber noch nicht verfügbar.
Acer Swift Edge SFE16 Ryzen 7 7840U
- 06.10.2023 v7 (old)
Allen Ngo
Transparenz
Die Auswahl der zu testenden Geräte erfolgt innerhalb der Redaktion. Das vorliegende Testmuster wurde dem Autor vom Hersteller oder einem Shop zu Testzwecken leihweise zur Verfügung gestellt. Eine Einflussnahme des Leihstellers auf den Testbericht gab es nicht, der Hersteller erhielt keine Version des Reviews vor der Veröffentlichung. Es bestand keine Verpflichtung zur Publikation. Als eigenständiges, unabhängiges Unternehmen unterliegt Notebookcheck keiner Diktion von Herstellern, Shops und Verlagen.
So testet Notebookcheck
Pro Jahr werden von Notebookcheck hunderte Laptops und Smartphones unabhängig in von uns standardisierten technischen Verfahren getestet, um eine Vergleichbarkeit aller Testergebnisse zu gewährleisten. Seit rund 20 Jahren entwickeln wir diese Testmethoden kontinuierlich weiter und setzen damit Branchenstandards. In unseren Testlaboren kommt ausschließlich hochwertiges Messequipment in die Hände erfahrener Techniker und Redakteure. Die Tests unterliegen einer mehrstufigen Kontrolle. Unsere komplexe Gesamtbewertung basiert auf hunderten fundierten Messergebnissen und Benchmarks, womit Ihnen Objektivität garantiert ist. Weitere Informationen zu unseren Testmethoden gibt es hier.
Preisvergleich

