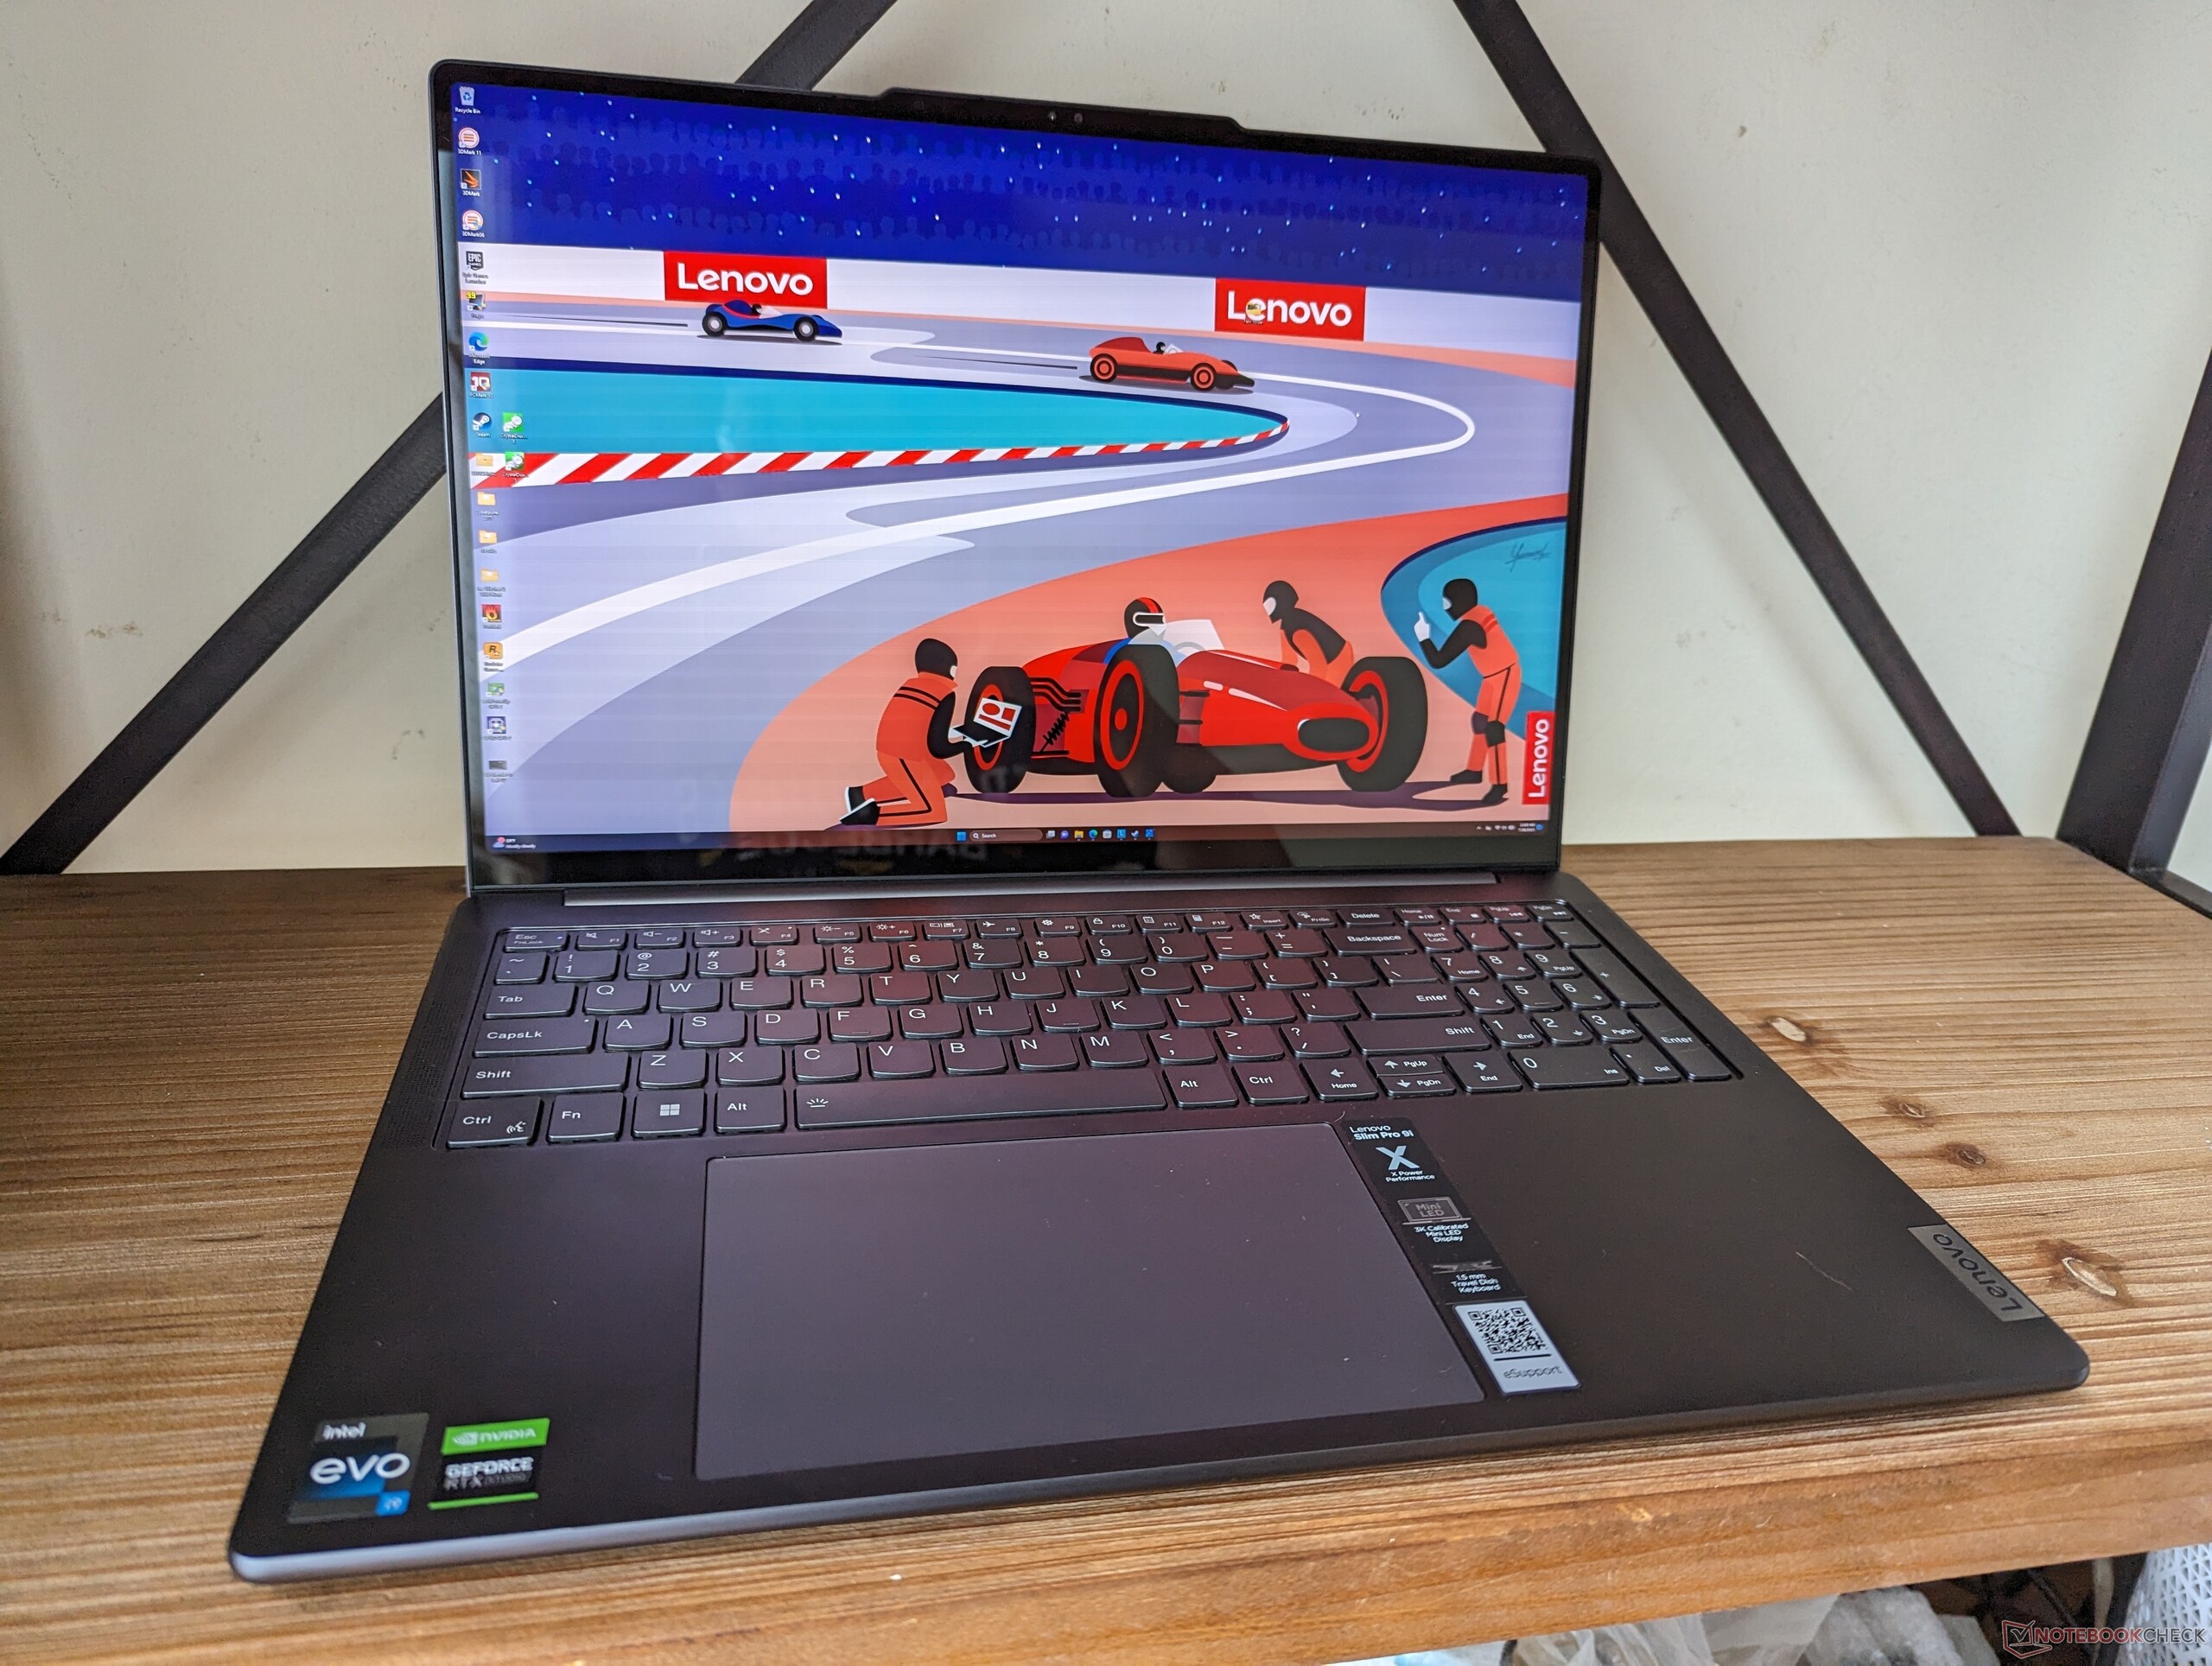
Lenovo Slim Pro 9i 16IRP8 Laptop Test: Die Apple-MacBook-Pro-16-Alternative

Das Lenovo Slim Pro 9i 16 G8 ist ein High-End-Notebook, das für die Erstellung von Inhalten und Multimedia-Zwecke entwickelt wurde. Es konkurriert mit 16-Zoll-Modellen, die auf die Content Creation ausgerichtet sind, wie das MSI CreatorPro Z16P, Apple MacBook Pro 16, HP Envy 16 oder das Asus ProArt StudioBook 16.
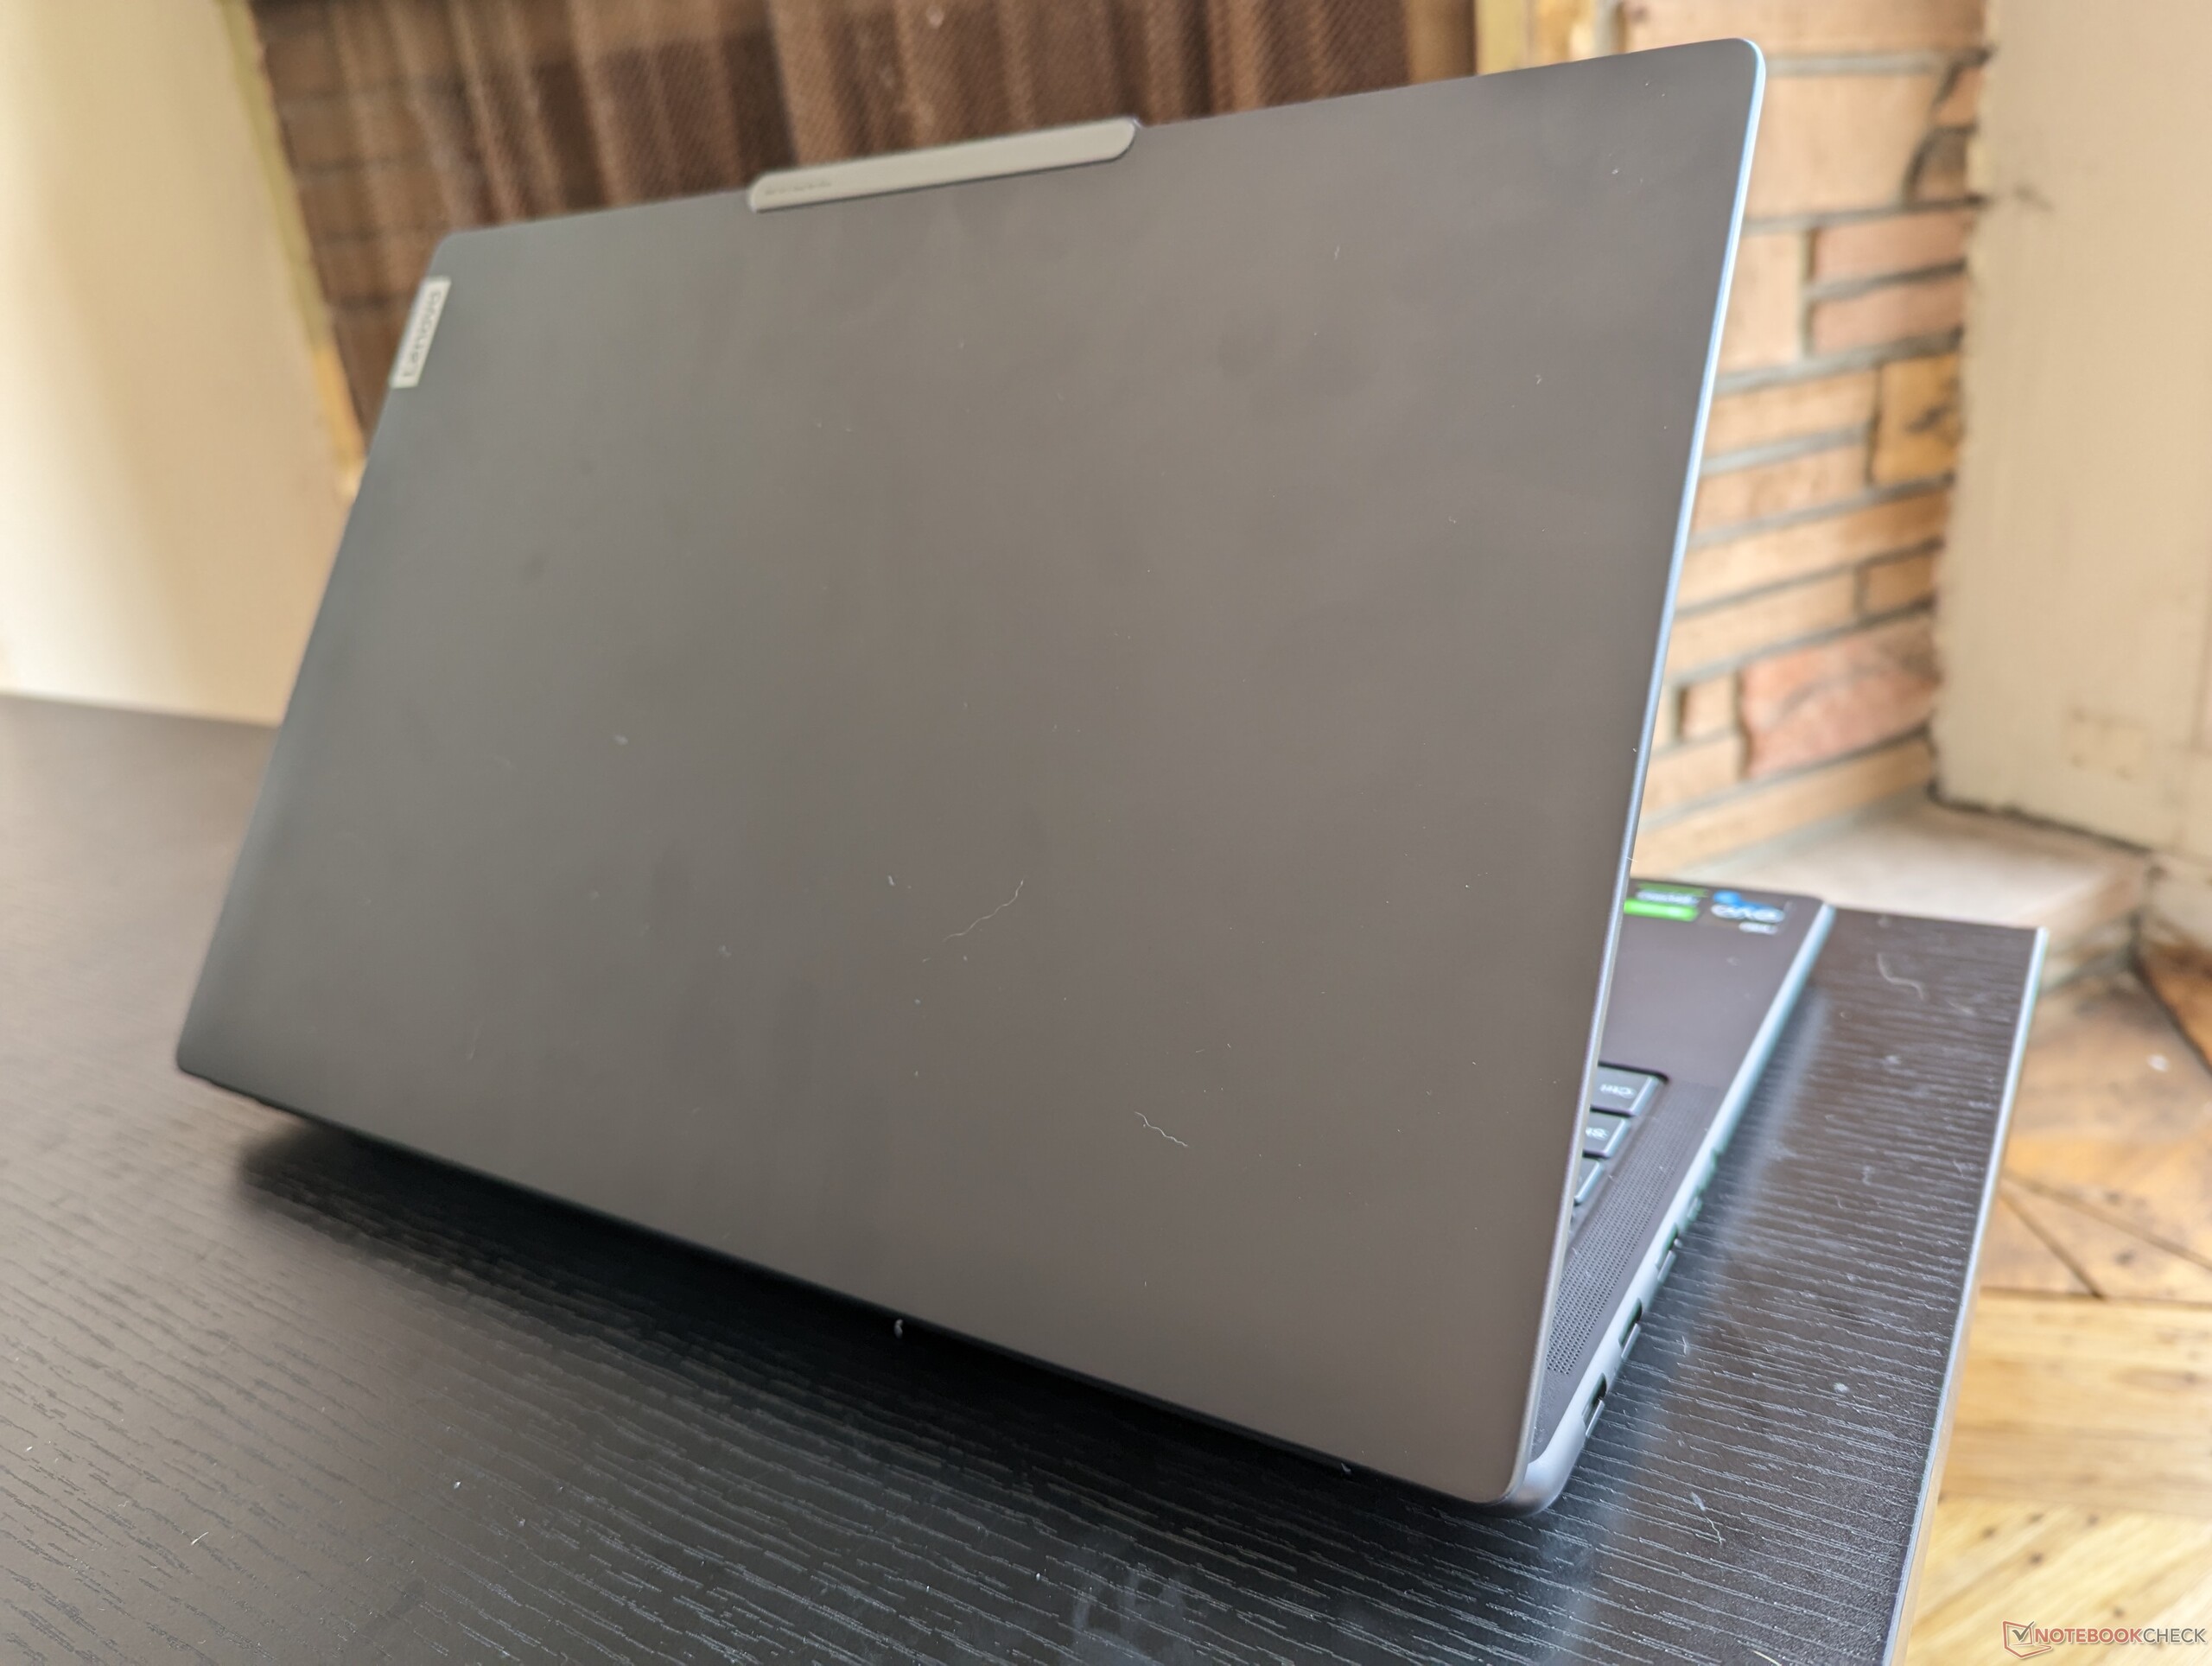
Verwirrend ist, dass der Name dieses Modells je nach Region unterschiedlich ist. In Europa ist es zum Beispiel als Yoga Pro 9i 16 bekannt, während es in Nordamerika Slim Pro 9i 16 heißt. Wir empfehlen einen Blick auf unseren Test über das Yoga Pro 9i 16, um mehr über die physischen Eigenschaften dieses Notebooks zu erfahren.
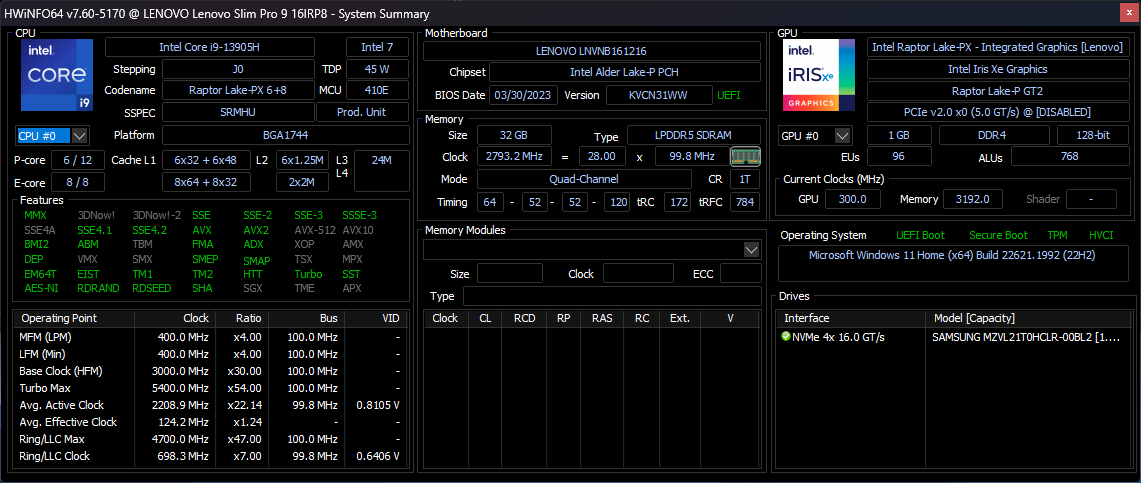
Unsere Testkonfiguration wird mit der ungewöhnlichen 13th Gen Raptor Lake Core i9-13905H CPU und 100-W-GeForce-RTX-4050 im Gegensatz zum Core i7-13705H und RTX 4060 auf unserem Yoga Pro 9i 16 ausgeliefert. Beide Konfigurationen werden ansonsten mit dem gleichen 3,2K (3.200 x 2.000) Mini-LED-Touchscreen mit vollen DCI-P3-Farben ausgeliefert.
Eine 14-Zoll-Version dieses Modells ist ebenfalls erhältlich und heißt Slim Pro 9i 14 oder Yoga Pro 9i 14.
Mehr Lenovo Bewertungen:
Mögliche Konkurrenten im Vergleich
Bew. | Datum | Modell | Gewicht | Dicke | Größe | Auflösung | Preis ab |
|---|---|---|---|---|---|---|---|
| 88 % v7 (old) | 08 / 2023 | Lenovo Slim Pro 9i 16IRP8 i9-13905H, GeForce RTX 4050 Laptop GPU | 2.2 kg | 18.2 mm | 16.00" | 3200x2000 | |
| 88.4 % v7 (old) | 07 / 2023 | Lenovo Yoga Pro 9 16-IRP G8 i7-13705H, GeForce RTX 4060 Laptop GPU | 2.2 kg | 18.2 mm | 16.00" | 3200x2000 | |
| 86.3 % v7 (old) | 05 / 2023 | Asus VivoBook Pro 16 i7-12700H, GeForce RTX 3050 Ti Laptop GPU | 1.9 kg | 20 mm | 16.00" | 2560x1600 | |
| 87.5 % v7 (old) | 06 / 2023 | Acer Swift Edge SFE16-42-R1GM R7 7735U, Radeon 680M | 1.2 kg | 13.95 mm | 16.00" | 3840x2400 | |
| 87.4 % v7 (old) | 08 / 2022 | Dell Inspiron 16 Plus 7620 i7-12700H, GeForce RTX 3050 Ti Laptop GPU | 2.1 kg | 18.99 mm | 16.00" | 3072x1920 | |
| 86.9 % v7 (old) | 10 / 2022 | HP Envy 16 h0112nr i7-12700H, GeForce RTX 3060 Laptop GPU | 2.3 kg | 19.8 mm | 16.00" | 3840x2400 |
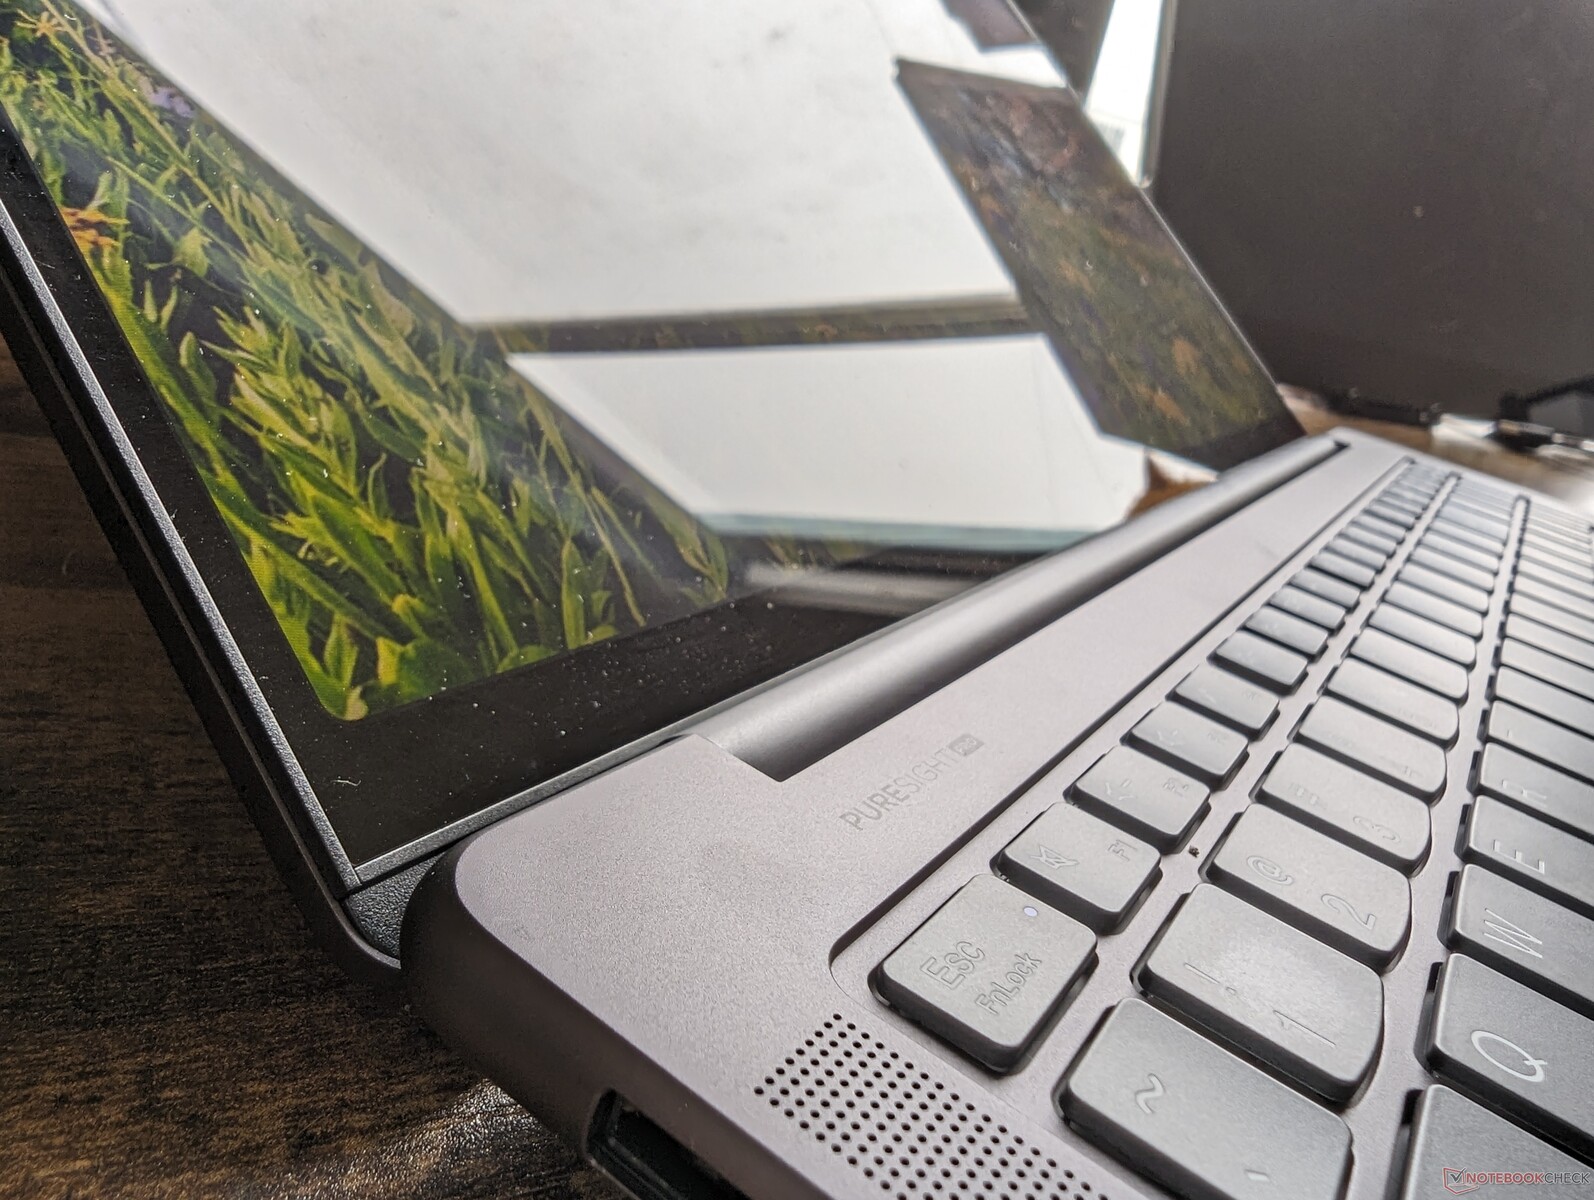
Gehäuse
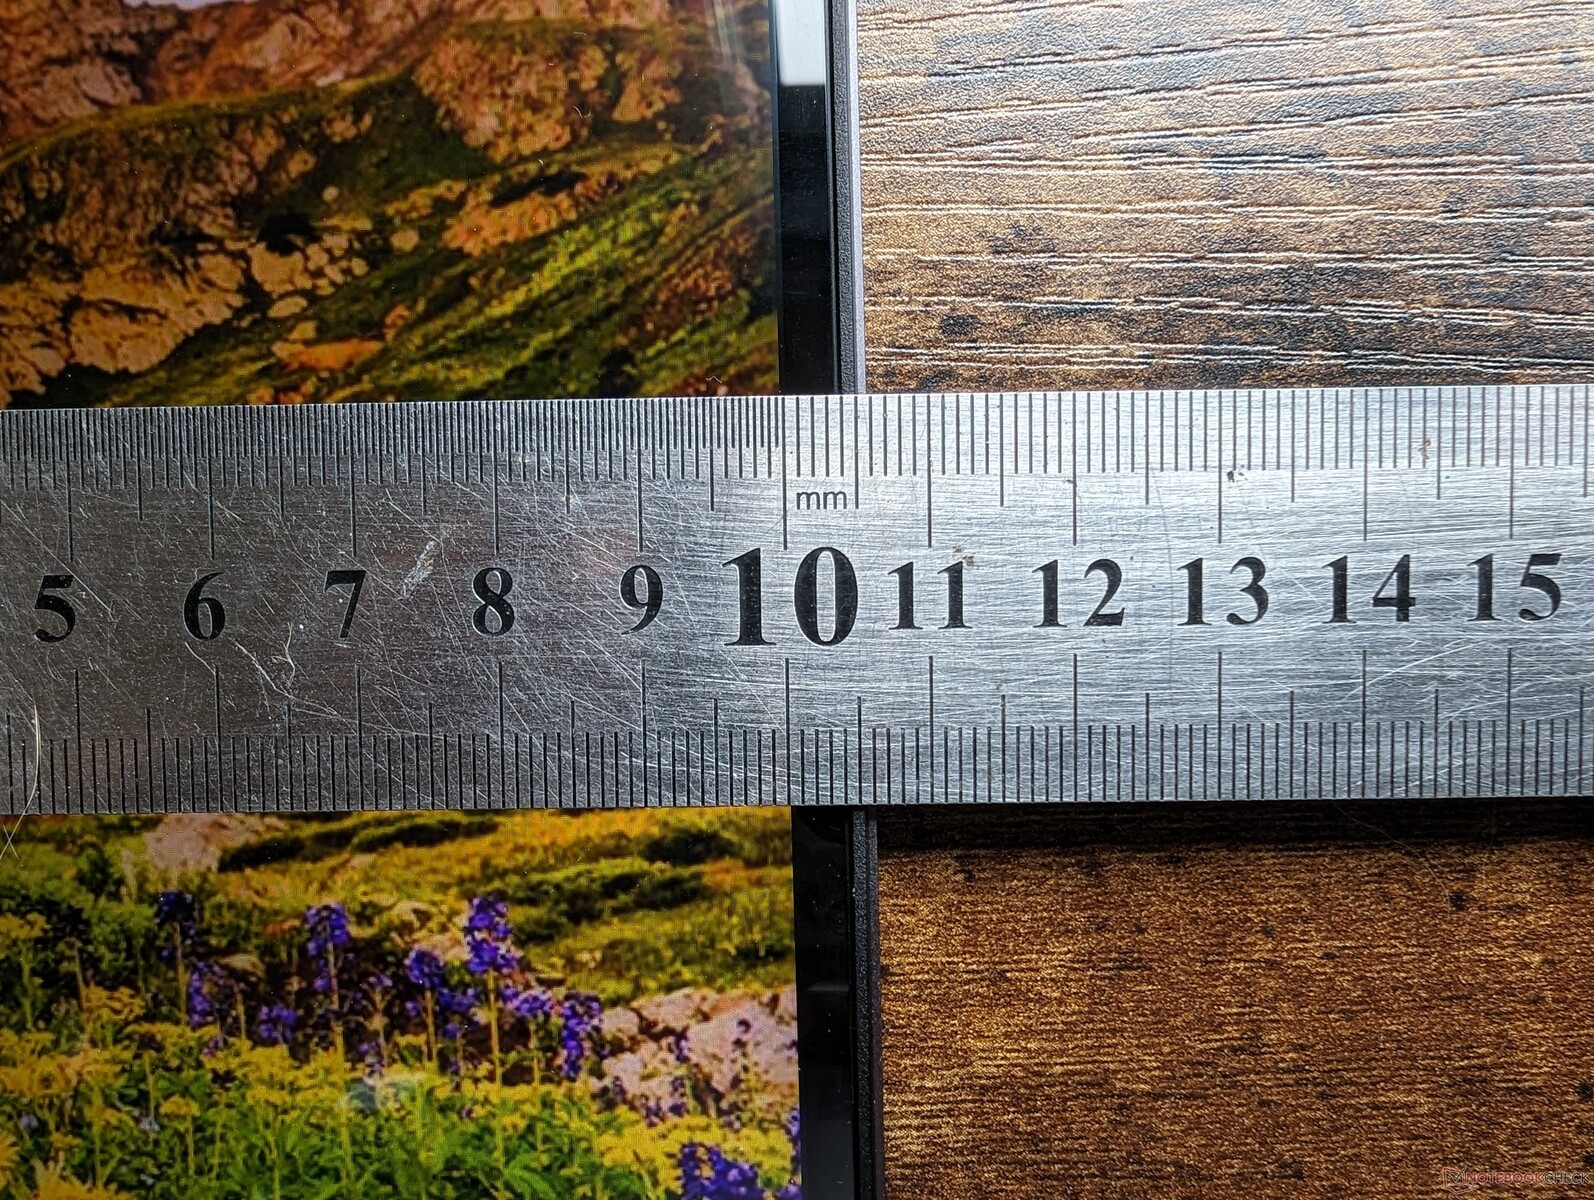
SD-Kartenleser
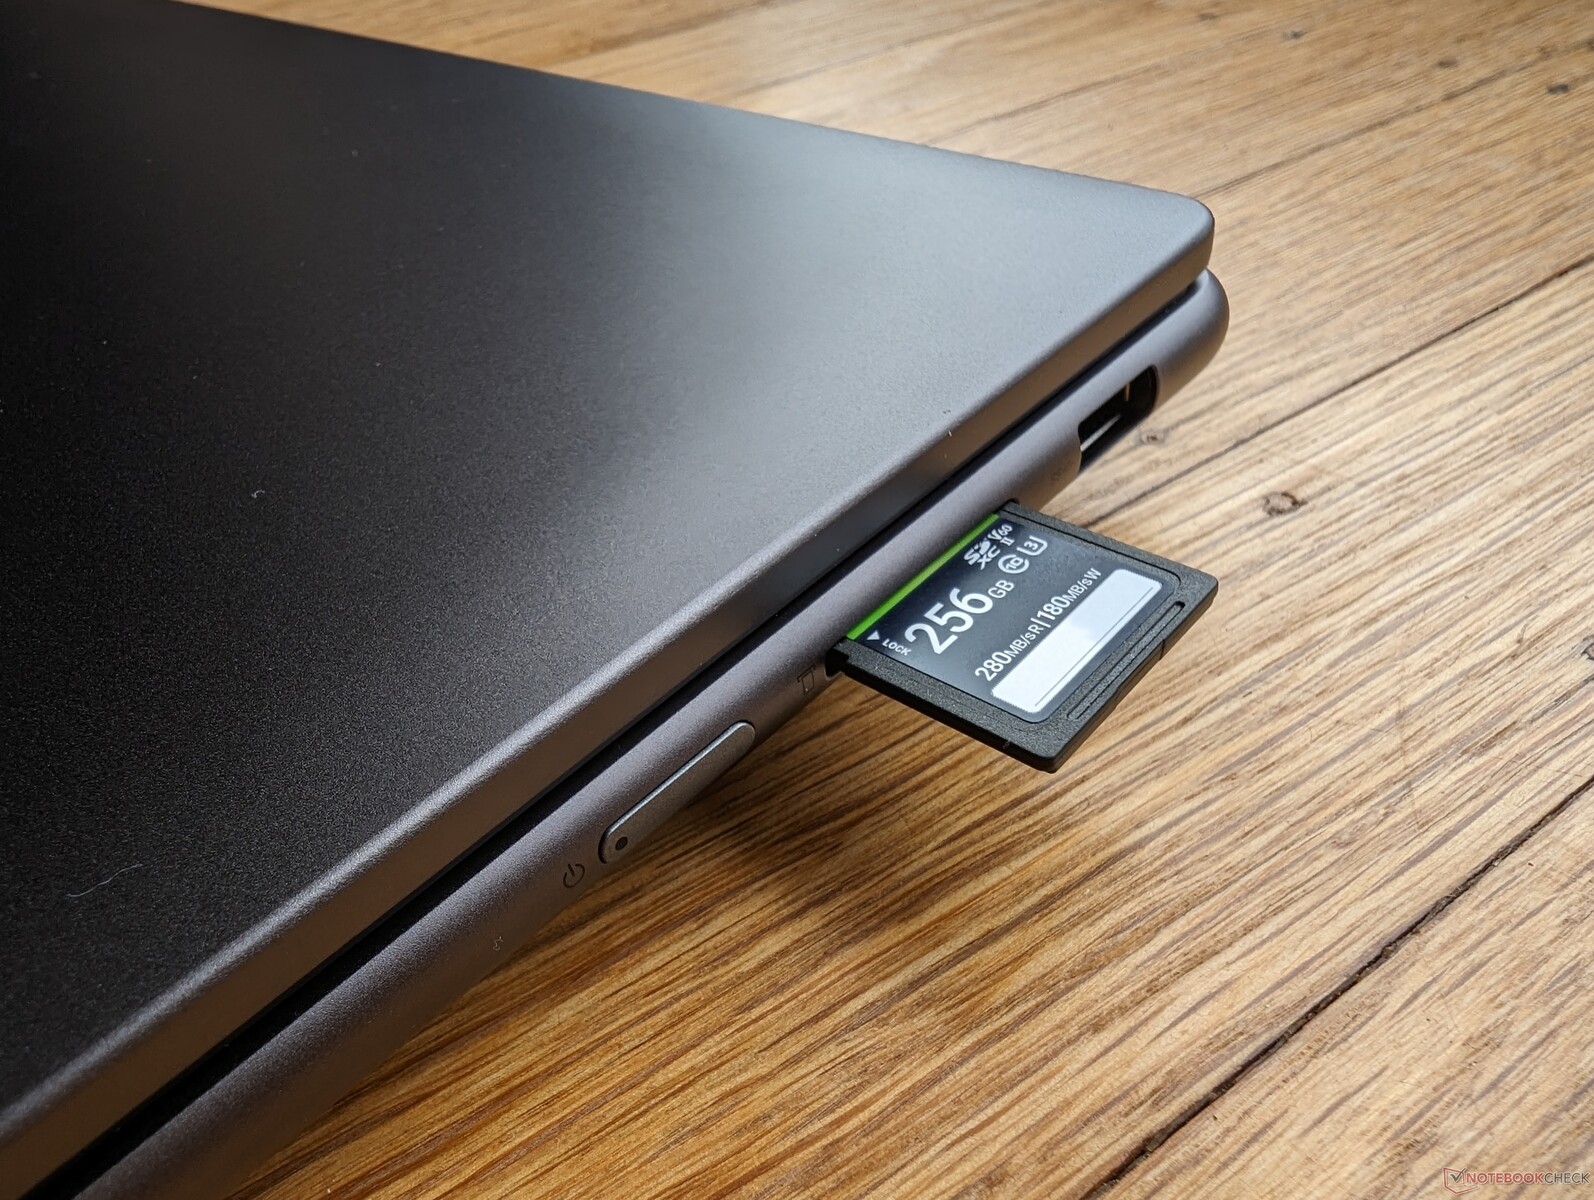
Die Übertragungsraten sind mit unserer PNY-EliteX-Pro60-V60-UHS-II-Testkarte durchschnittlich für diese Kategorie. Leider ist der Kartenleser des Lenovo sehr flach, sodass die SD-Karte beim Transport um mehr als die Hälfte ihrer Länge herausragt.
| SD Card Reader | |
| average JPG Copy Test (av. of 3 runs) | |
| Lenovo Slim Pro 9i 16IRP8 (PNY EliteX-Pro60 V60 256 GB) | |
| Lenovo Yoga Pro 9 16-IRP G8 (Angelibird AV Pro V60) | |
| Asus VivoBook Pro 16 (AV Pro SD microSD 128 GB V60) | |
| HP Envy 16 h0112nr (AV Pro SD microSD 128 GB V60) | |
| Dell Inspiron 16 Plus 7620 (Toshiba Exceria Pro SDXC 64 GB UHS-II) | |
| maximum AS SSD Seq Read Test (1GB) | |
| Lenovo Slim Pro 9i 16IRP8 (PNY EliteX-Pro60 V60 256 GB) | |
| HP Envy 16 h0112nr (AV Pro SD microSD 128 GB V60) | |
| Lenovo Yoga Pro 9 16-IRP G8 (Angelibird AV Pro V60) | |
| Asus VivoBook Pro 16 (AV Pro SD microSD 128 GB V60) | |
| Dell Inspiron 16 Plus 7620 (Toshiba Exceria Pro SDXC 64 GB UHS-II) | |
Kommunikation
| Networking | |
| iperf3 transmit AXE11000 | |
| Lenovo Yoga Pro 9 16-IRP G8 | |
| Asus VivoBook Pro 16 | |
| Lenovo Slim Pro 9i 16IRP8 | |
| Acer Swift Edge SFE16-42-R1GM | |
| iperf3 receive AXE11000 | |
| Lenovo Yoga Pro 9 16-IRP G8 | |
| Lenovo Slim Pro 9i 16IRP8 | |
| Acer Swift Edge SFE16-42-R1GM | |
| iperf3 transmit AXE11000 6GHz | |
| Lenovo Slim Pro 9i 16IRP8 | |
| Acer Swift Edge SFE16-42-R1GM | |
| HP Envy 16 h0112nr | |
| Dell Inspiron 16 Plus 7620 | |
| iperf3 receive AXE11000 6GHz | |
| Asus VivoBook Pro 16 | |
| Acer Swift Edge SFE16-42-R1GM | |
| Lenovo Slim Pro 9i 16IRP8 | |
| HP Envy 16 h0112nr | |
| Dell Inspiron 16 Plus 7620 | |
Webcam
Der 5-MP-Sensor ist von höherer Qualität als die Webcams der meisten anderen Laptops, bei denen 2 MP oder 1 MP noch üblich sind. Sowohl IR als auch ein Kamera-Kill-Schalter sind vorhanden.


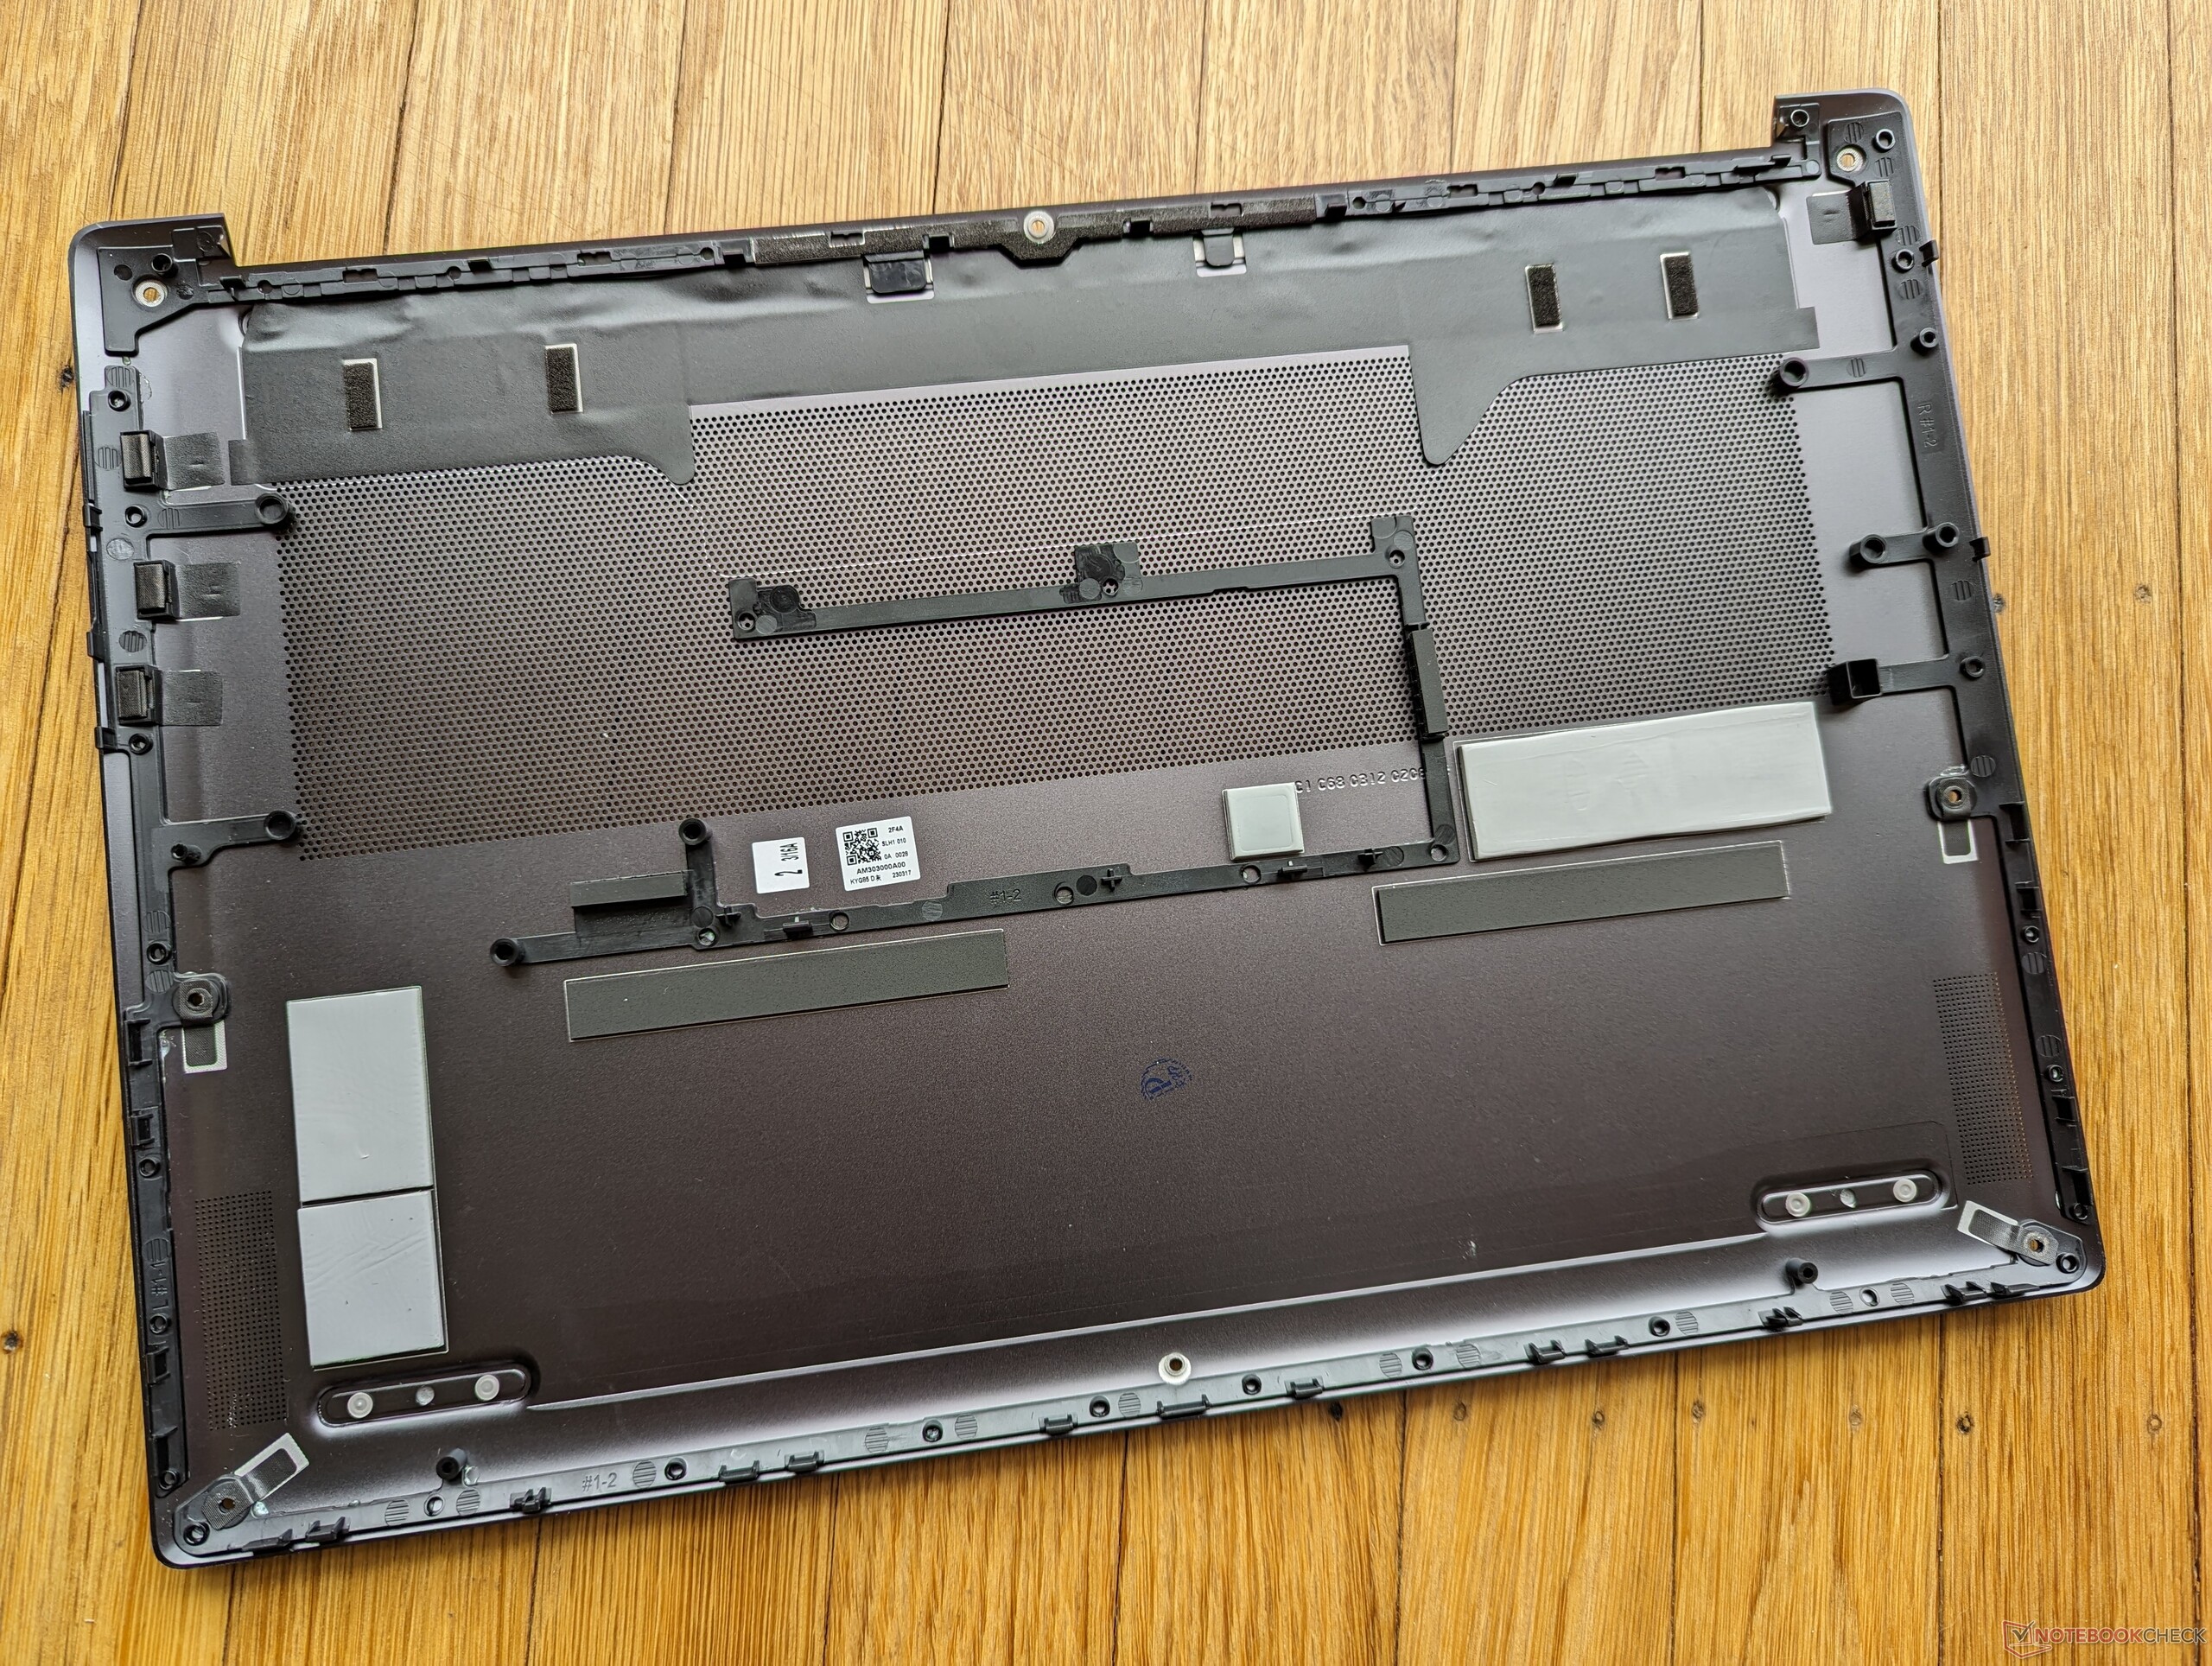
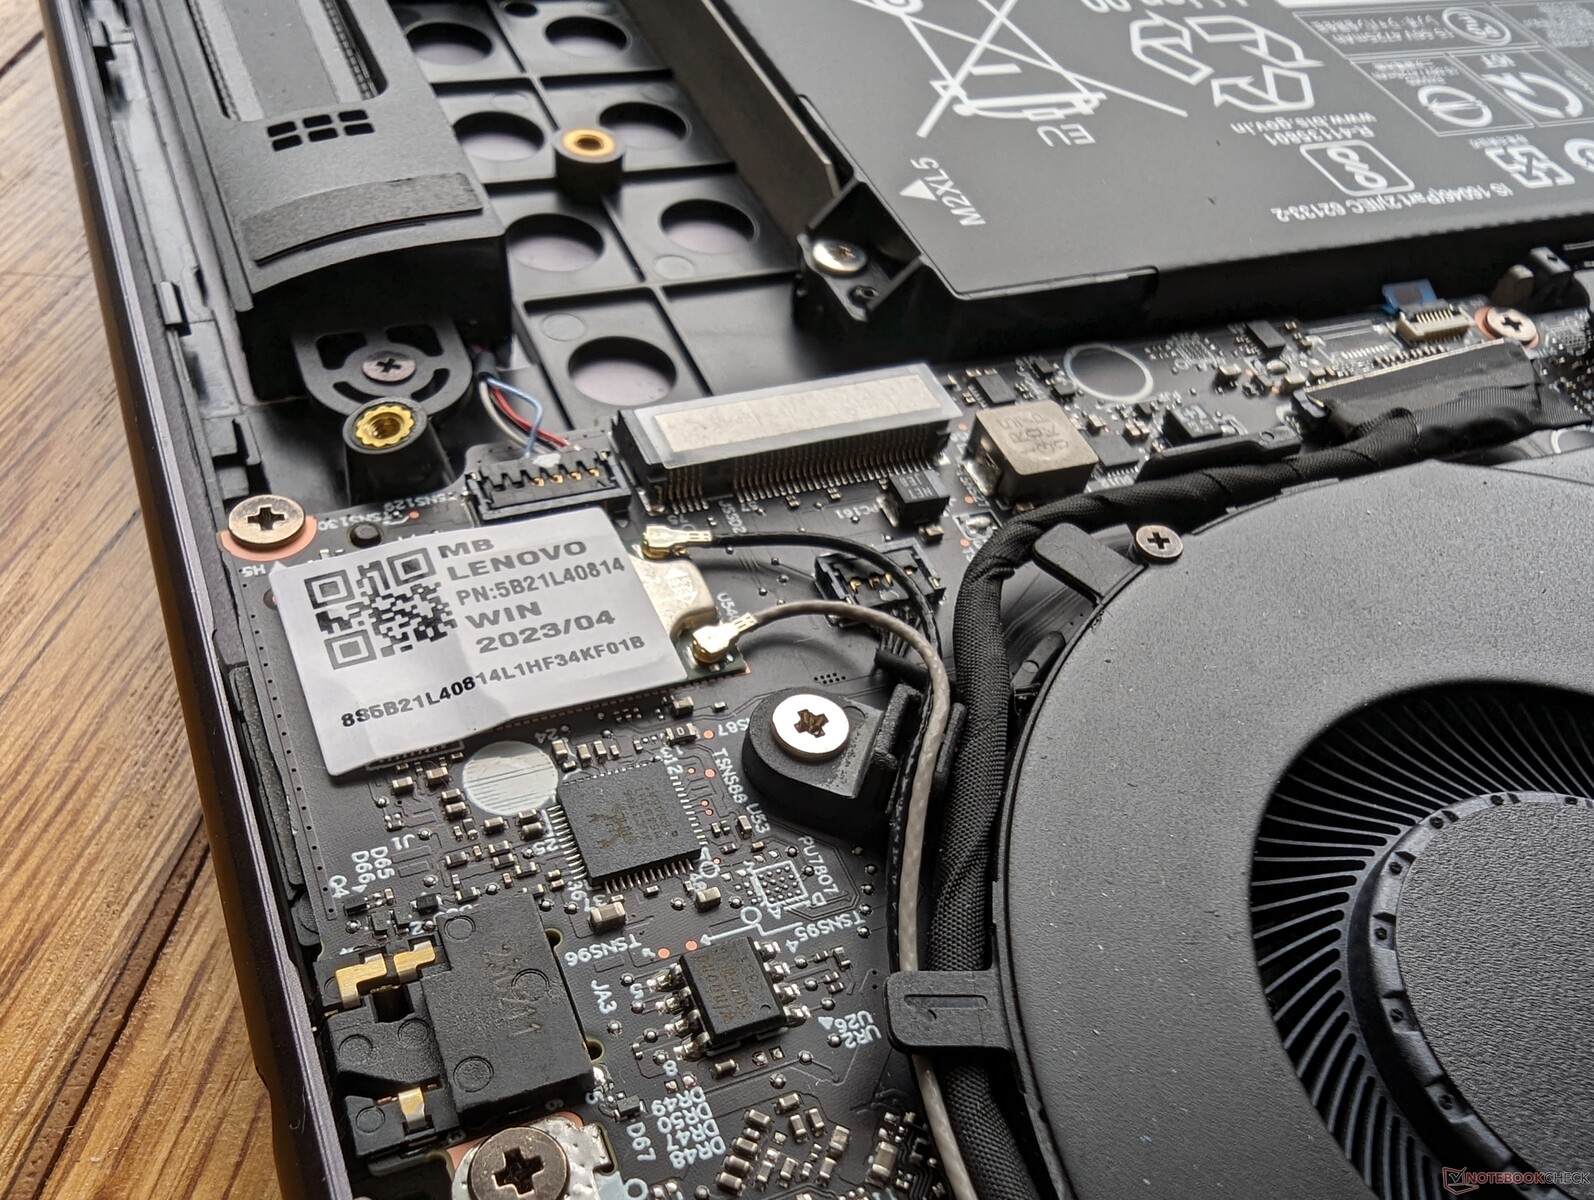
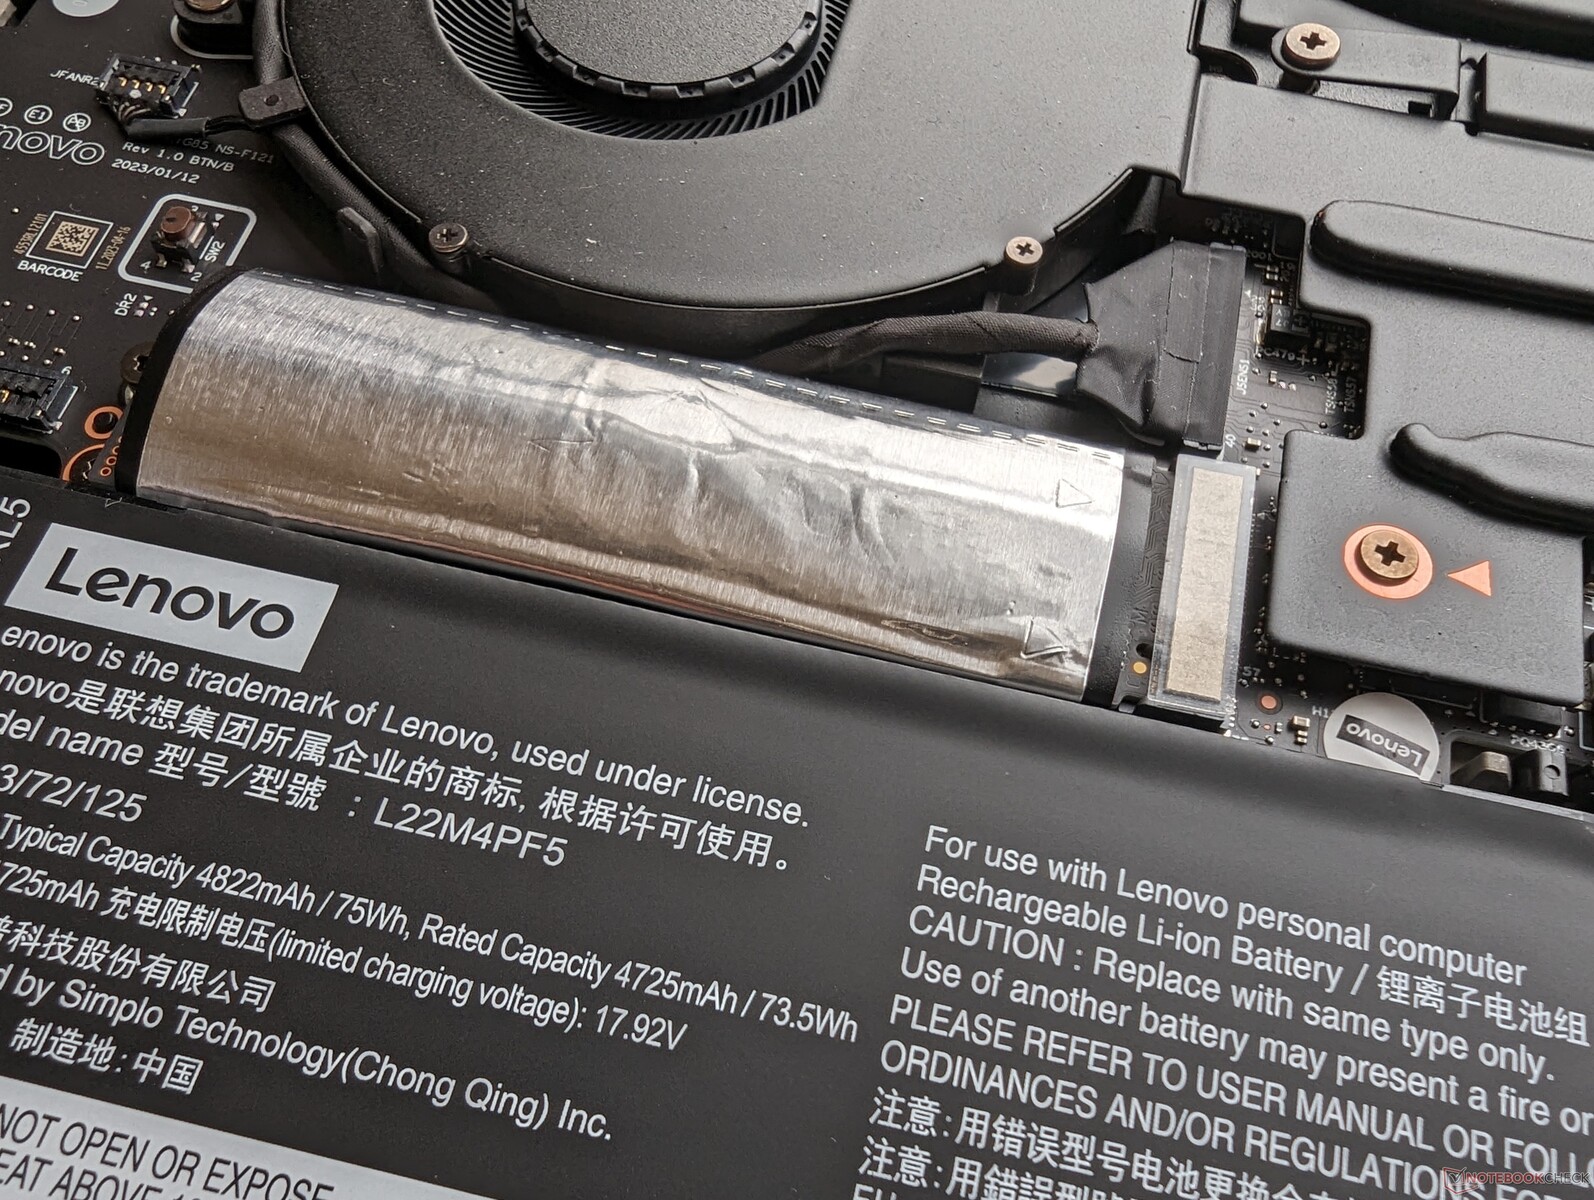
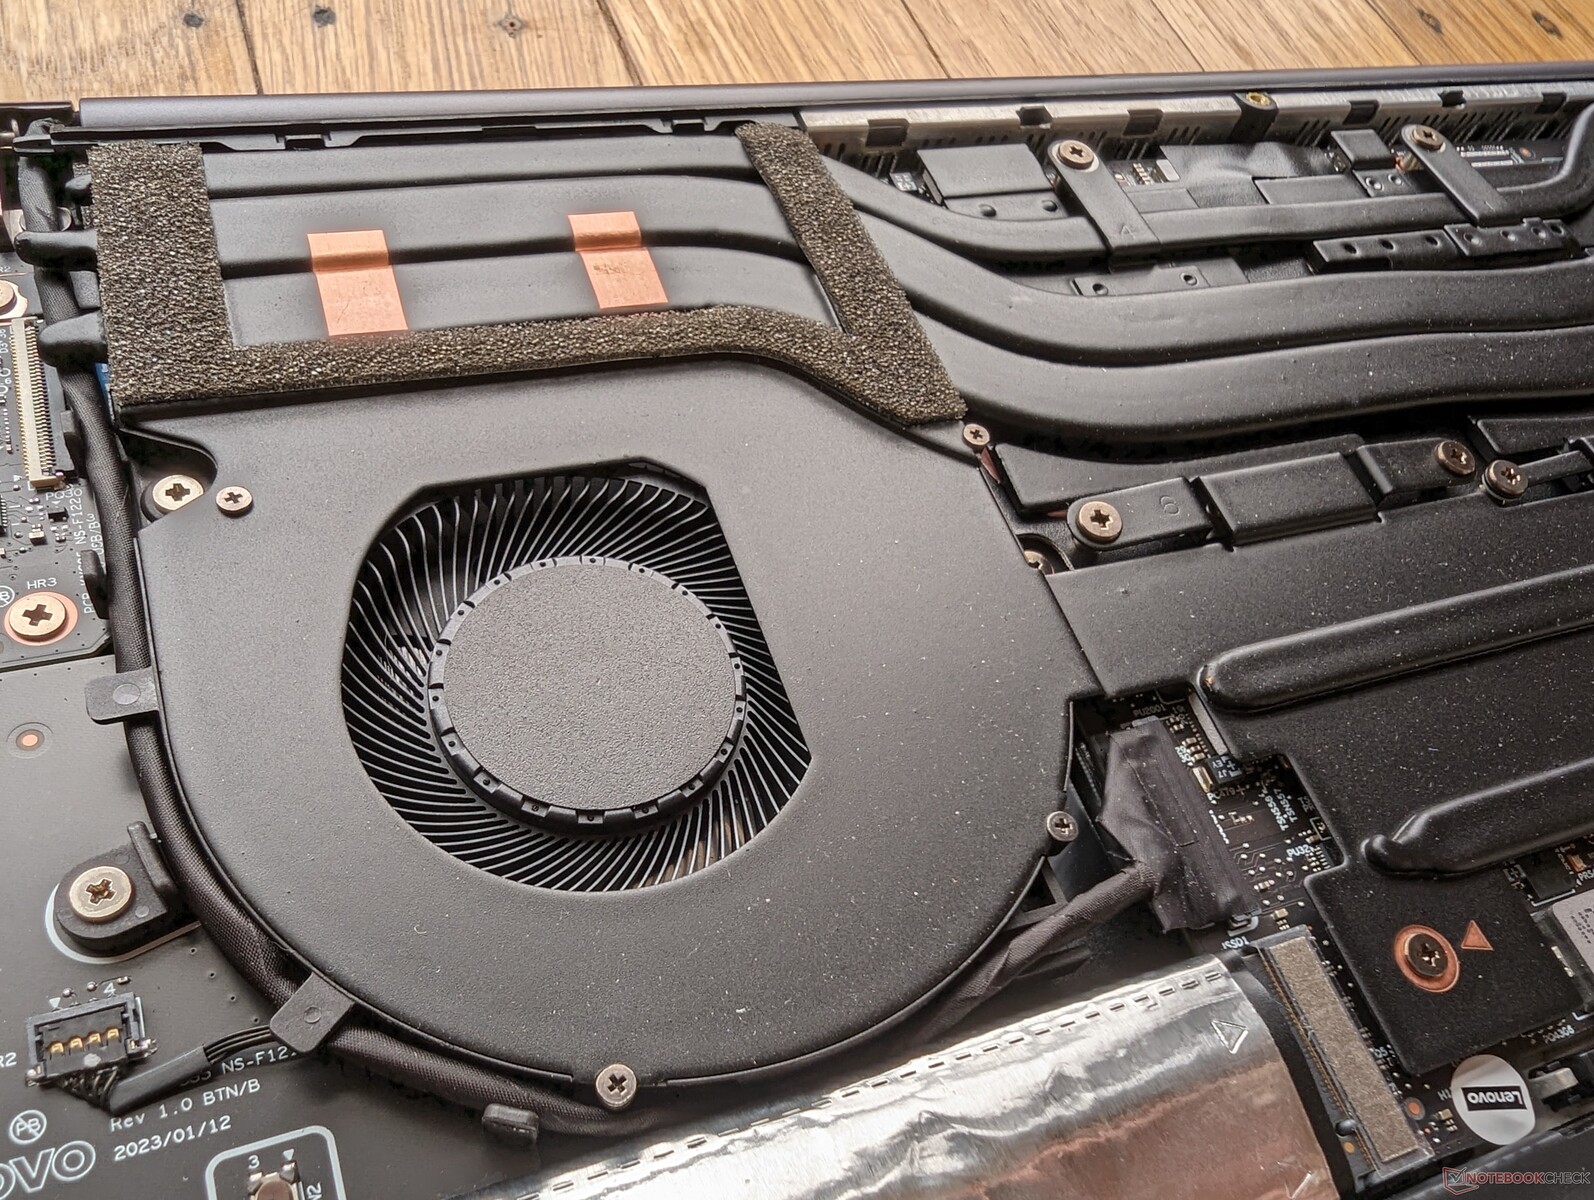
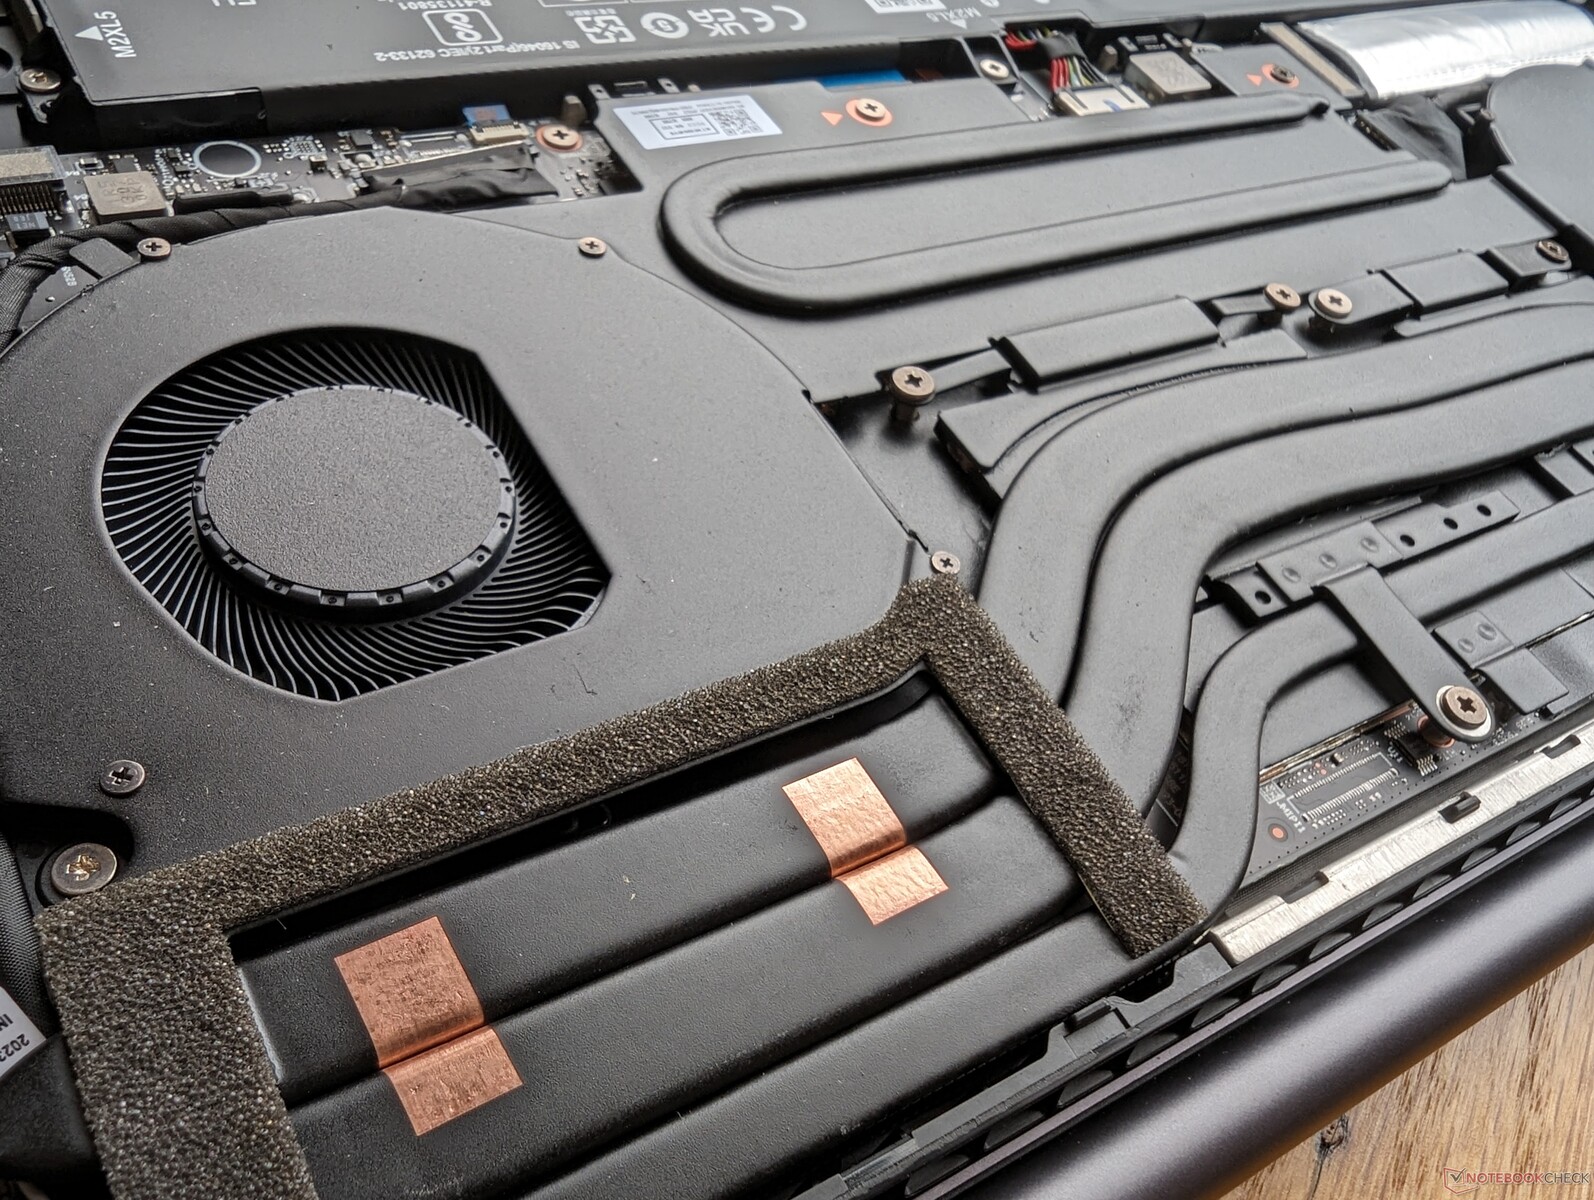
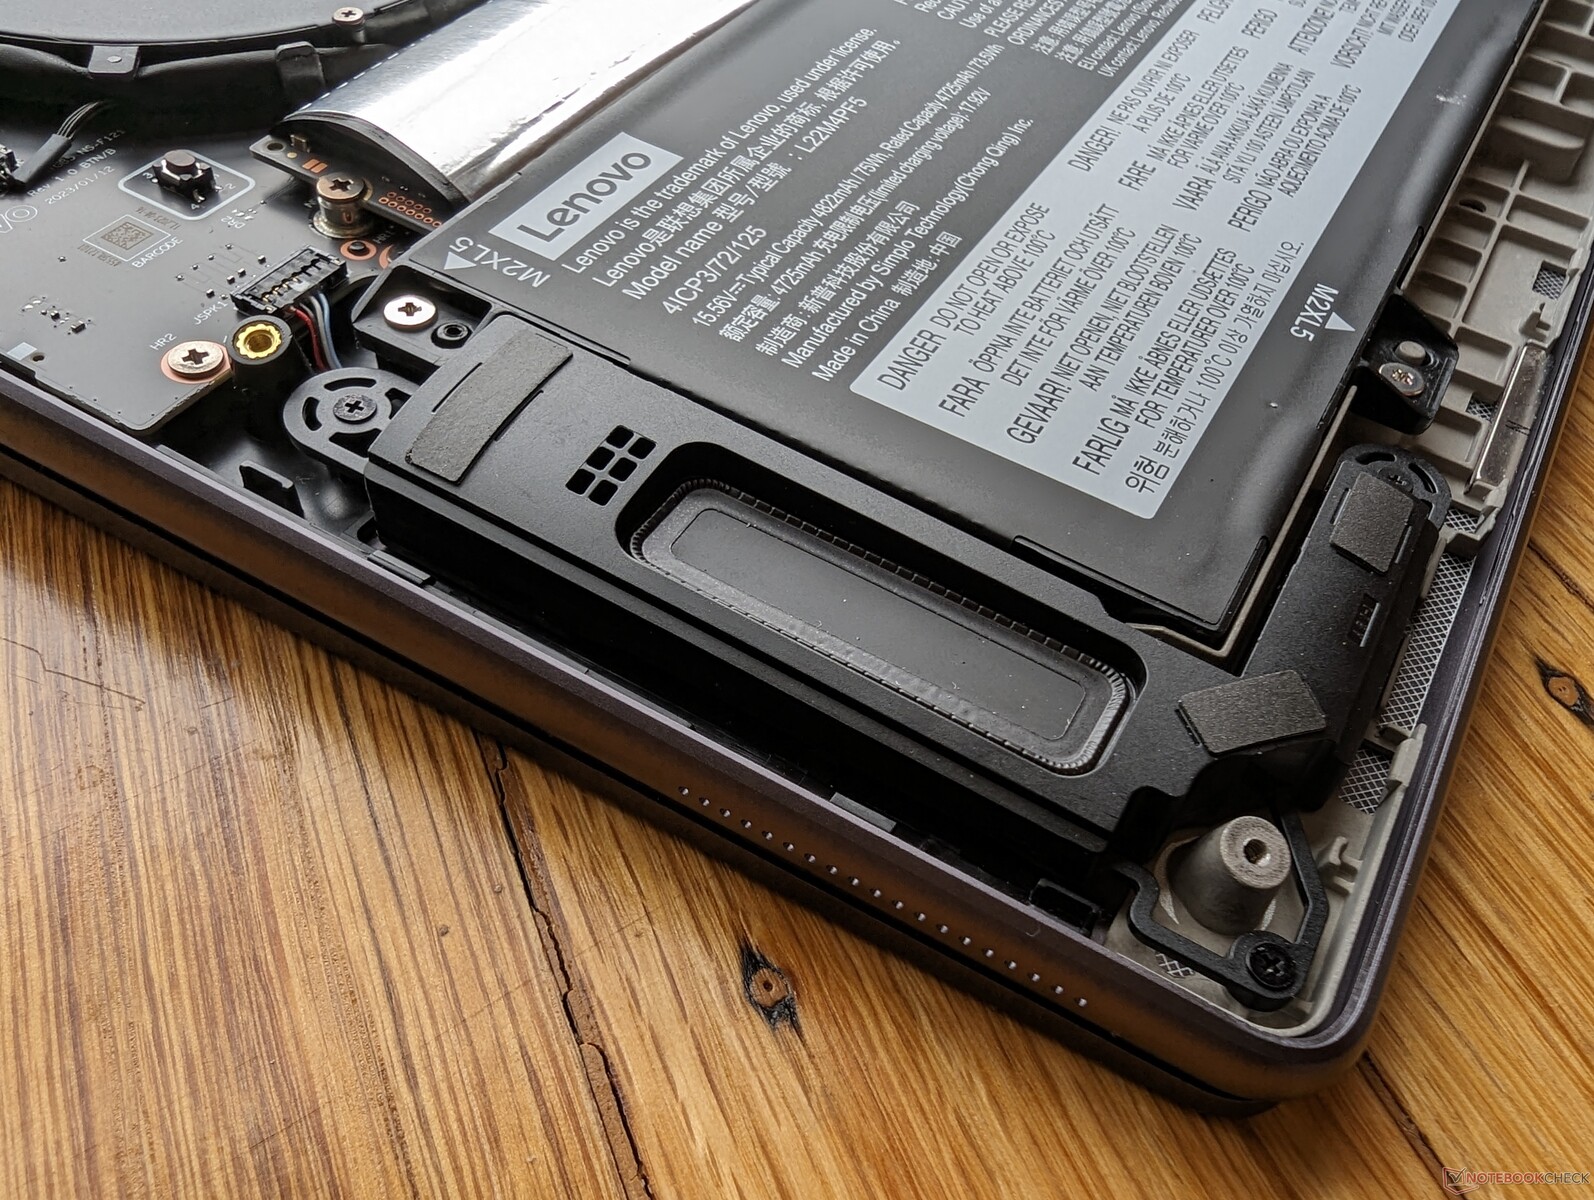
Wartung

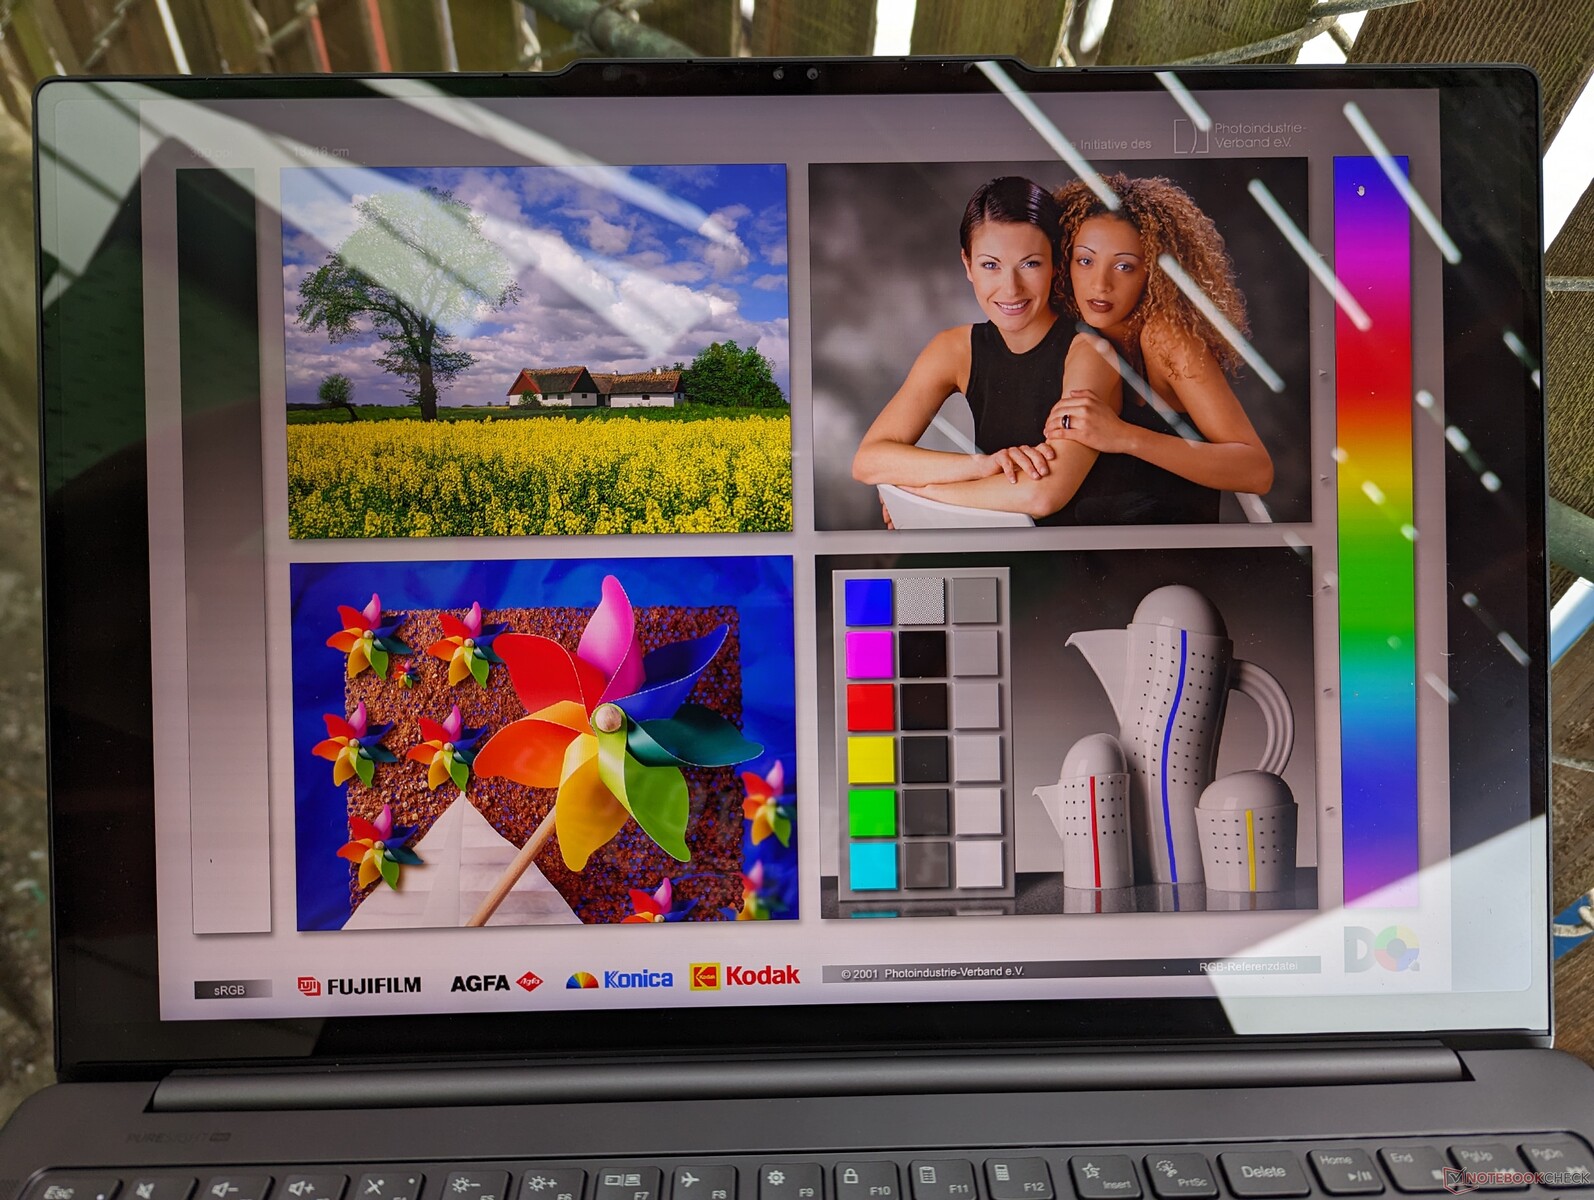
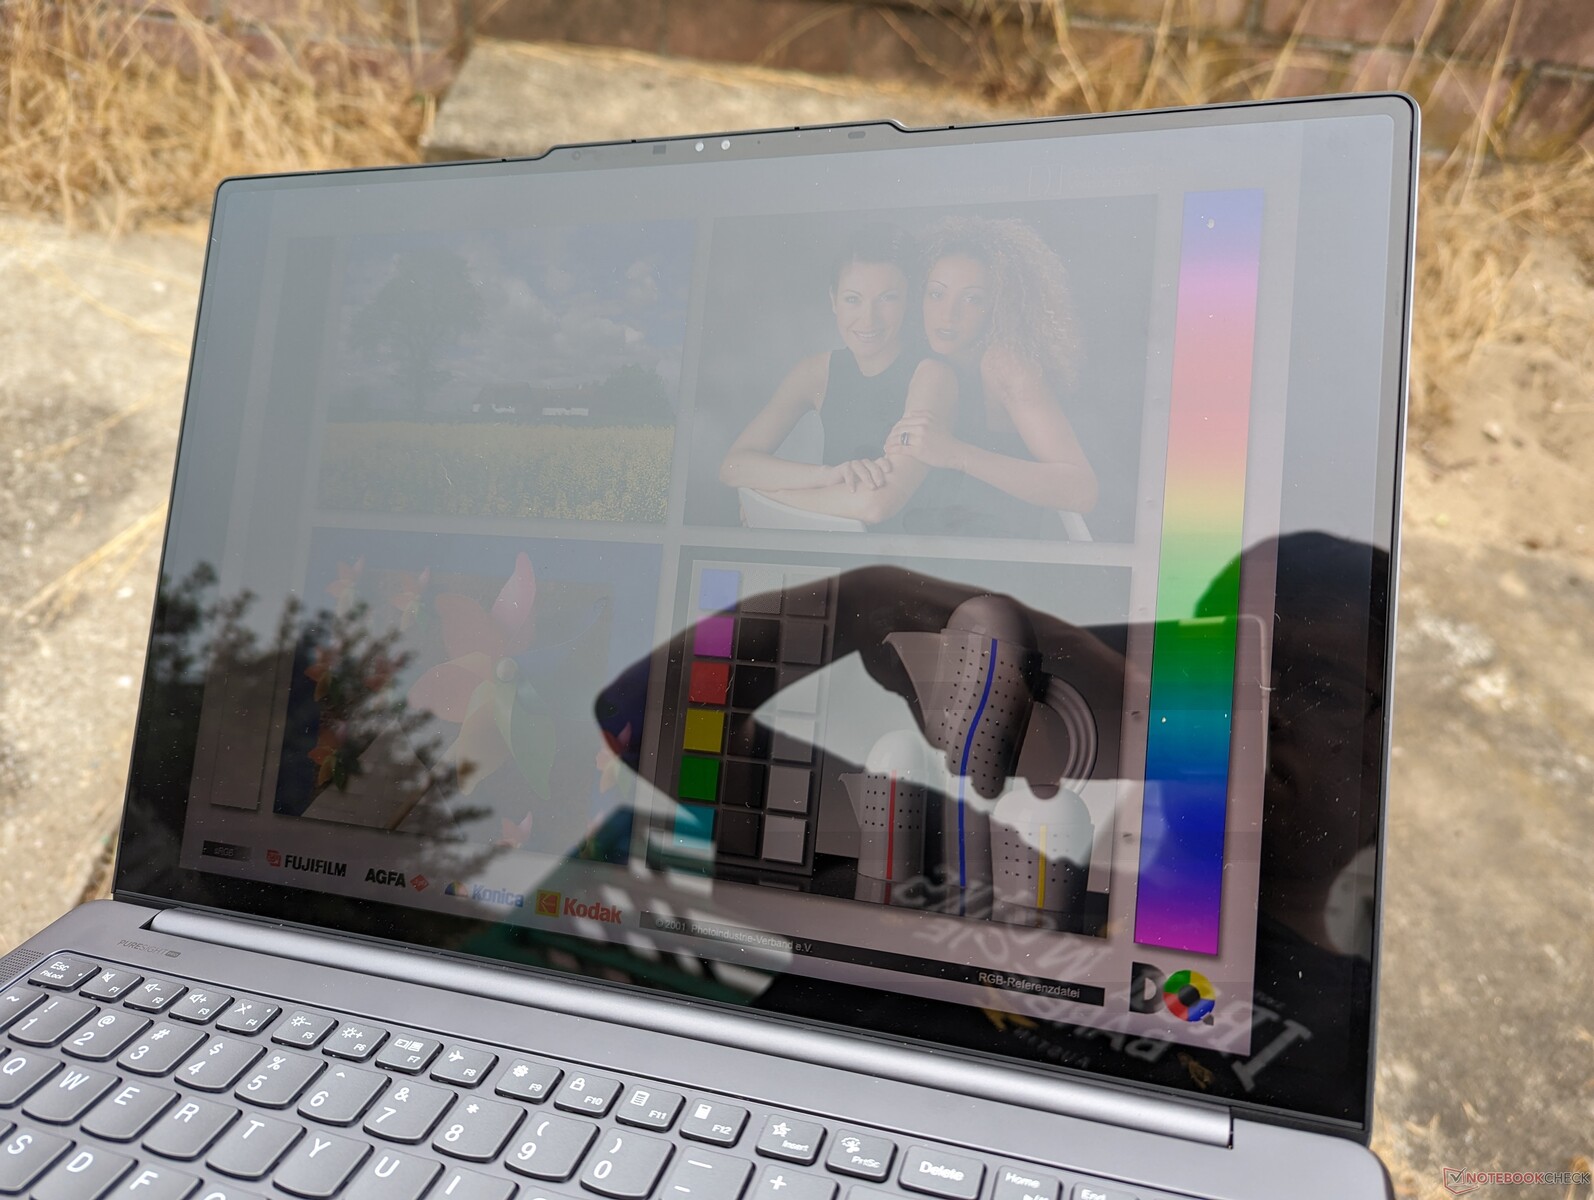
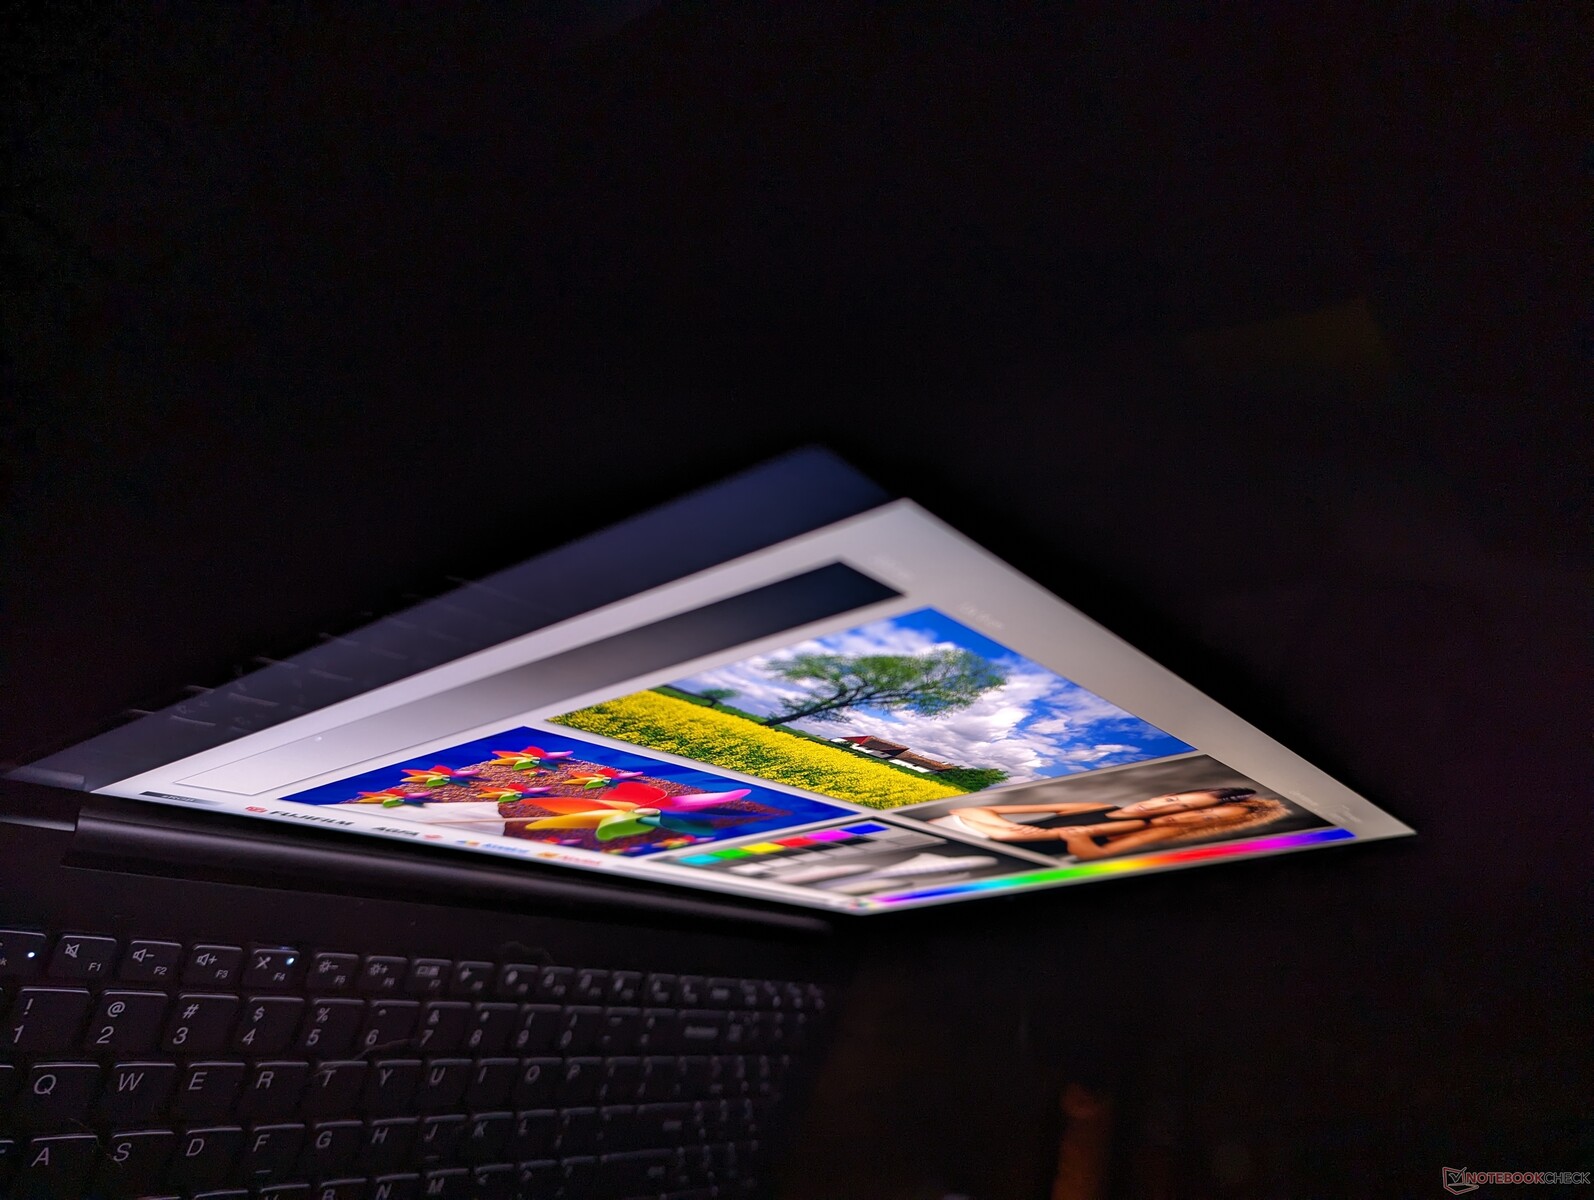
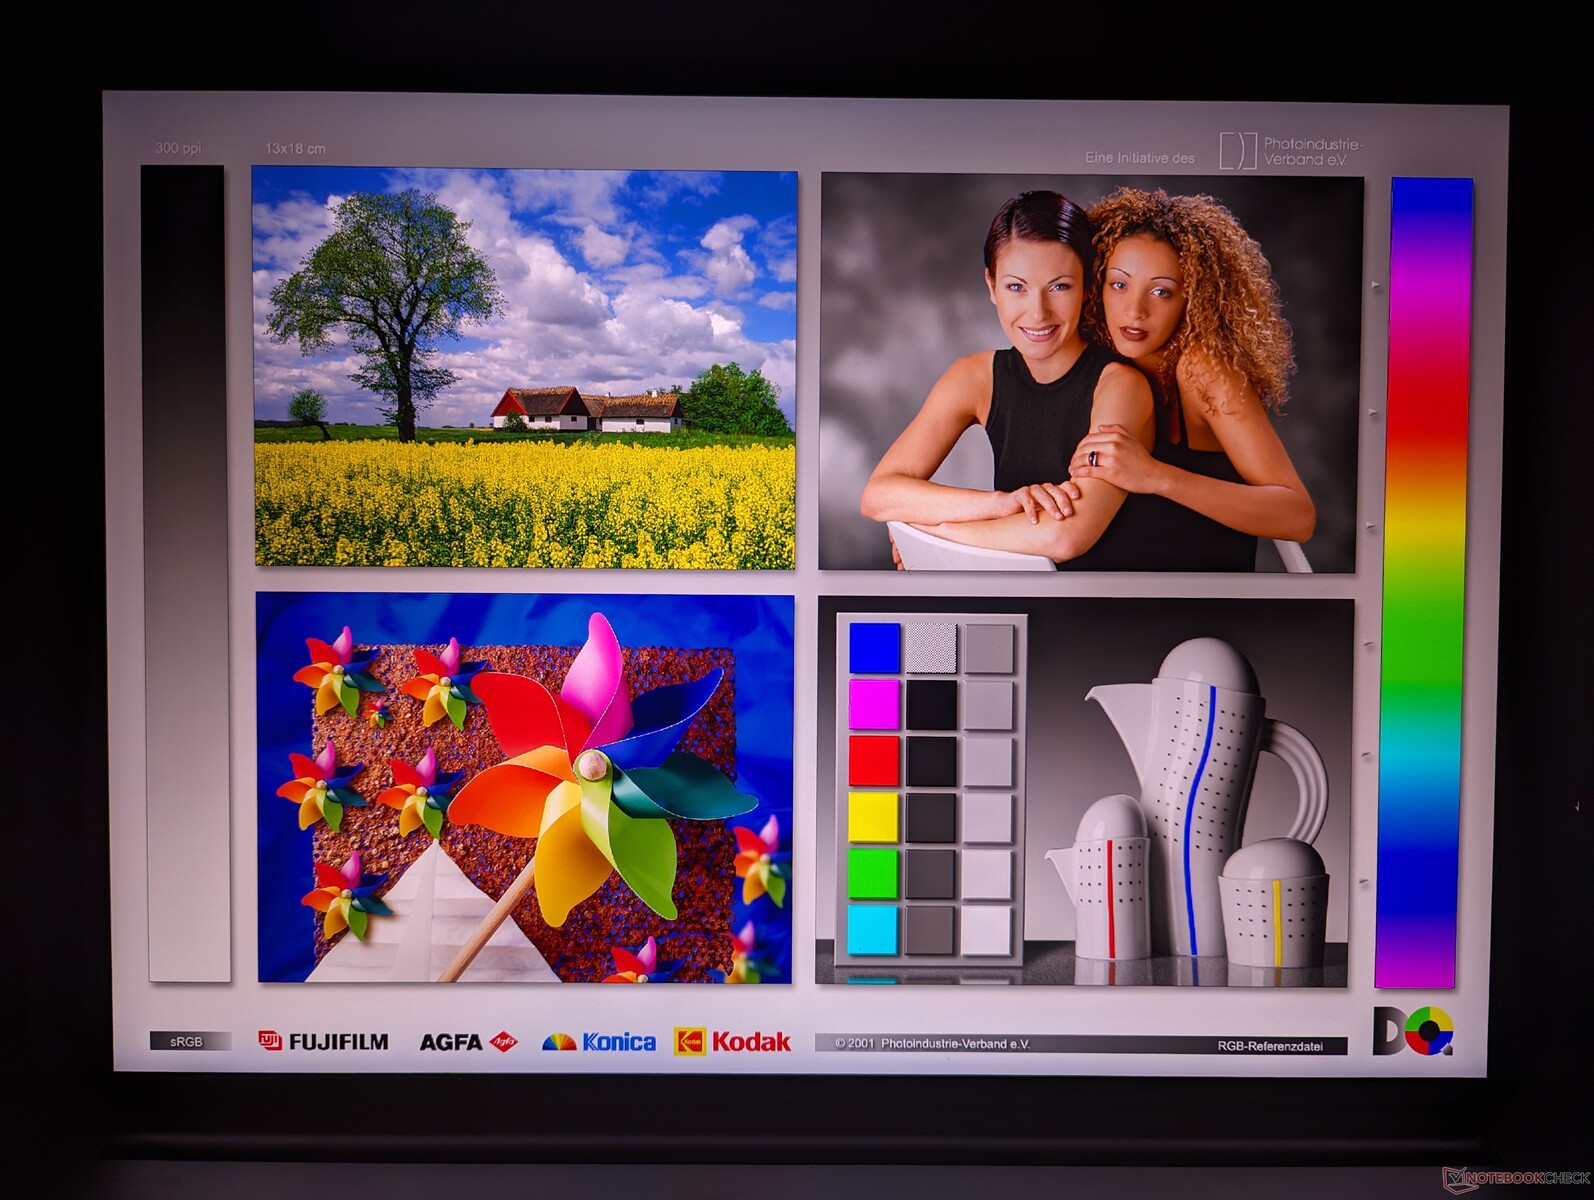
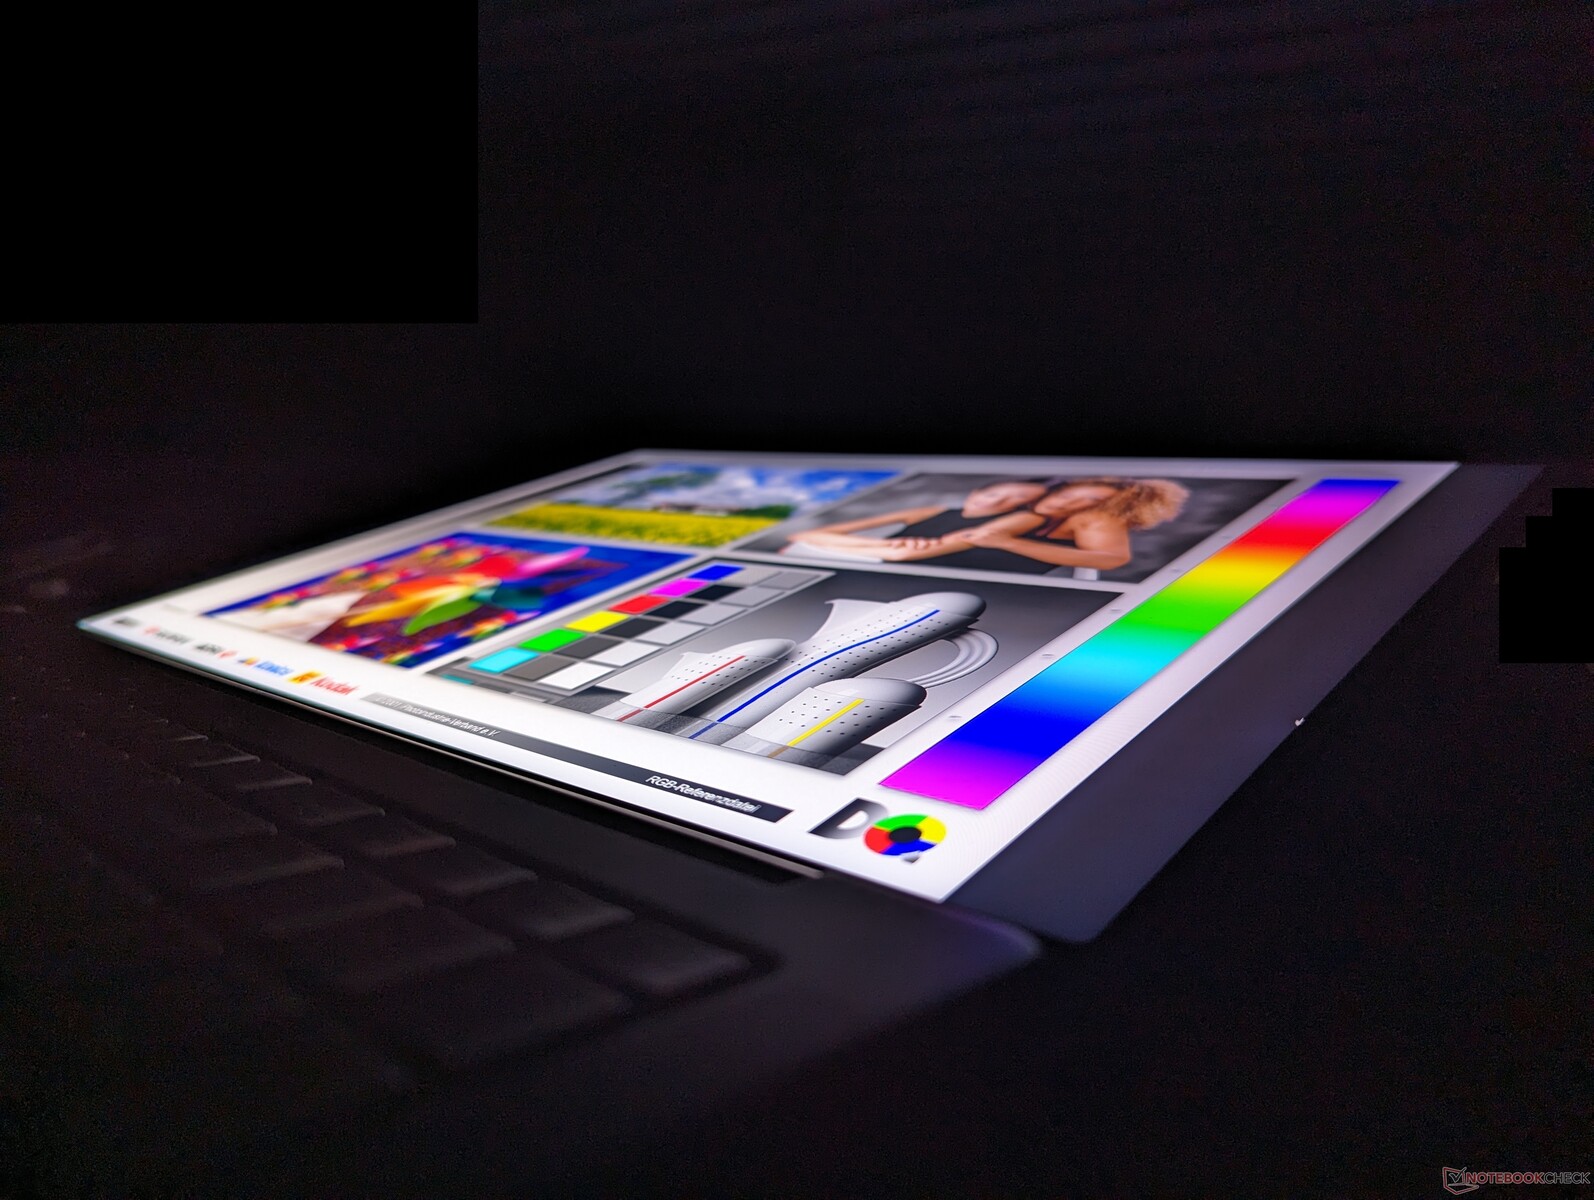
Display - 100 % DCI-P3, 165 Hz, Mini-LED, geringes blaues Licht, 3,2K
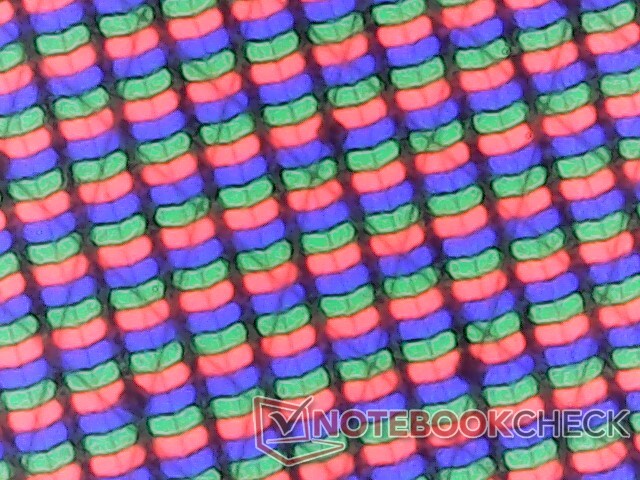
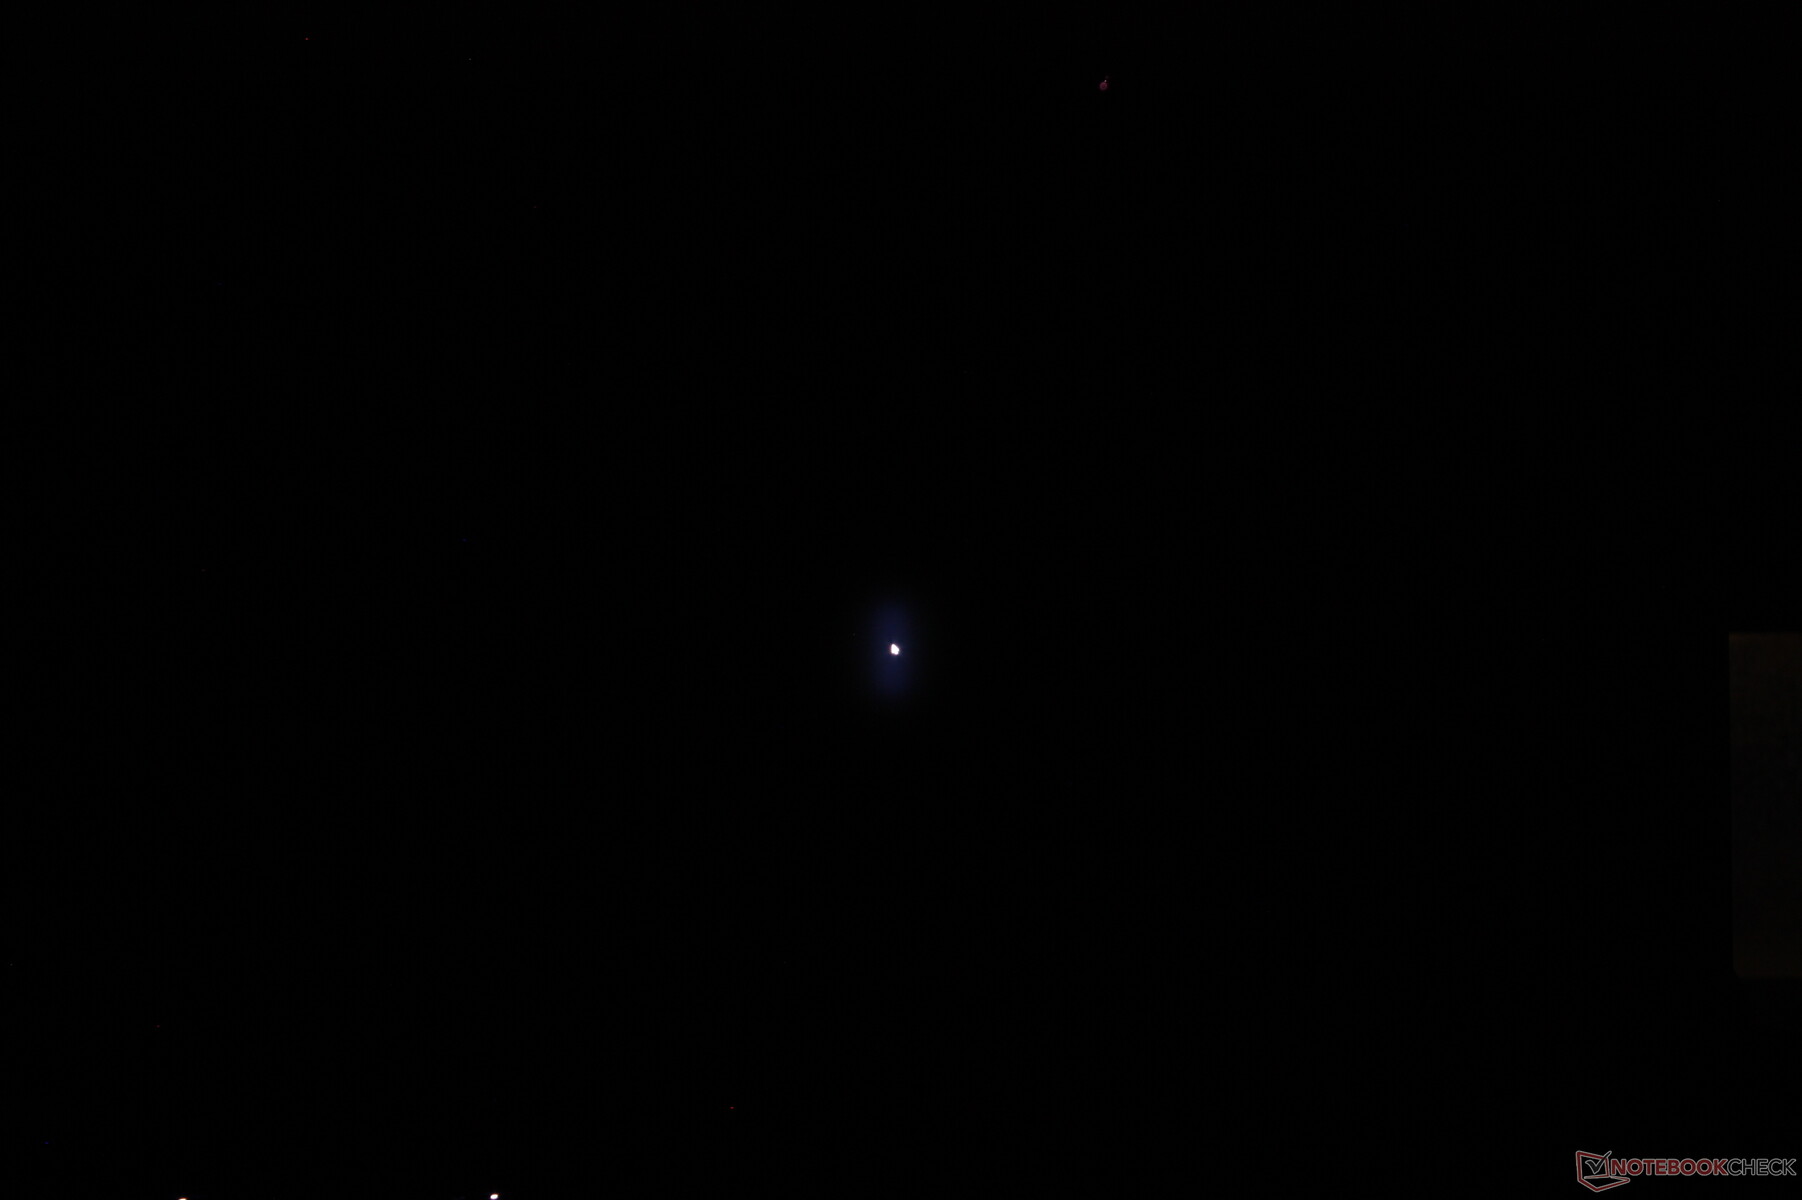
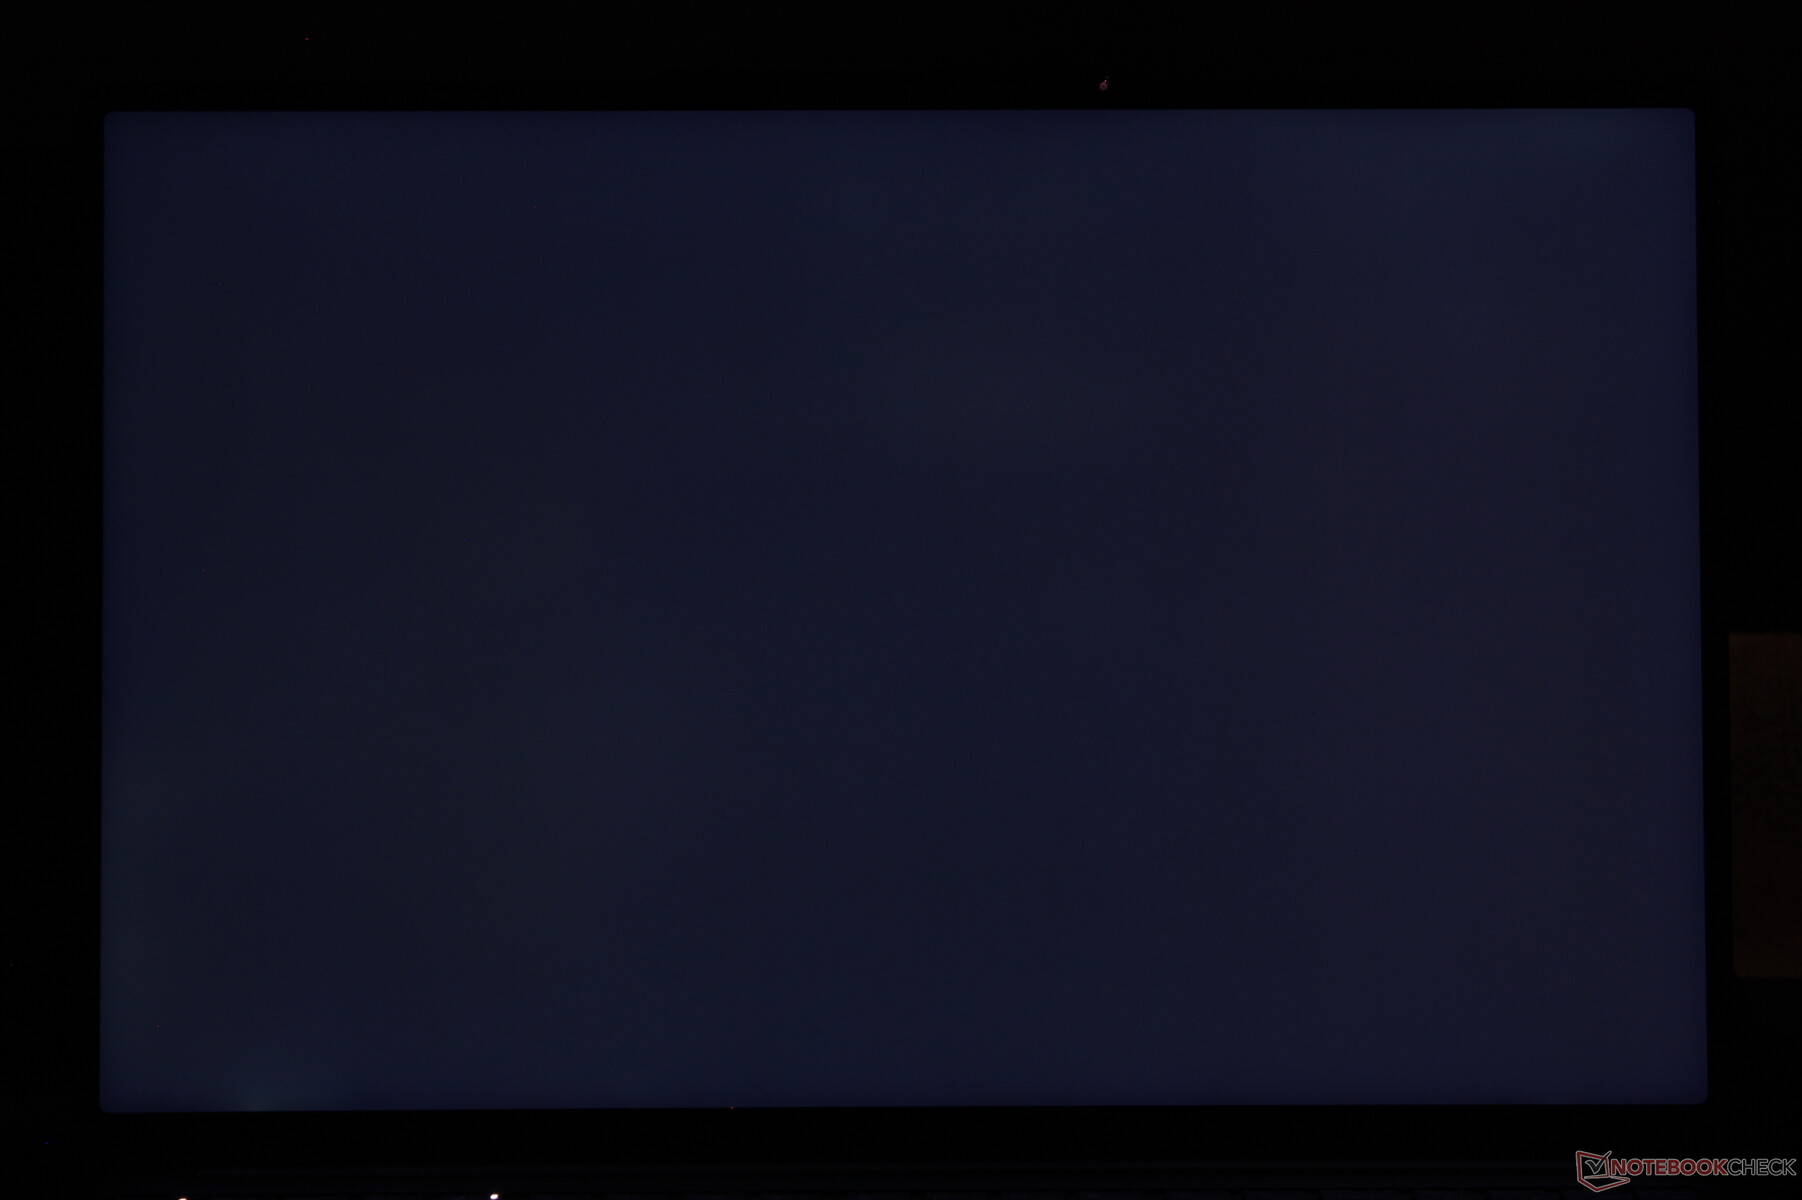
Mini-LED kombiniert die Vorteile von billigerem IPS und teurerem OLED. Es bietet die sehr schnellen nativen Bildwiederholraten von IPS mit der höheren maximalen Helligkeit von OLED über Local Dimming für lebendigere Farben. Der Nachteil ist jedoch ein auffälliger Halo-Effekt, wenn ein sehr helles Objekt vor einem sehr dunklen Hintergrund angezeigt wird. Unser Bildschirmfoto unten zeigt zum Beispiel einen weißen Mauszeiger vor einem komplett schwarzen Hintergrund. Auf einem OLED-Panel wäre der Mauszeiger gestochen scharf mit definierten Rändern, aber auf einer Mini-LED leuchtet er, da die lokale Dimmung nicht perfekt ist.
Die maximale Helligkeit ist auf etwa 600 Nits begrenzt, wenn ein komplett weißes Bild angezeigt wird. Wenn wir diesen HDR-Test durchführen, können wir jedoch eine höhere maximale Helligkeit von 1.330 Nits messen, was im Einklang mit Lenovos Angabe von 1.200 Nits ist.
| |||||||||||||||||||||||||
Ausleuchtung: 95 %
Helligkeit Akku: 627.4 cd/m²
Kontrast: 3302:1 (Schwarzwert: 0.19 cd/m²)
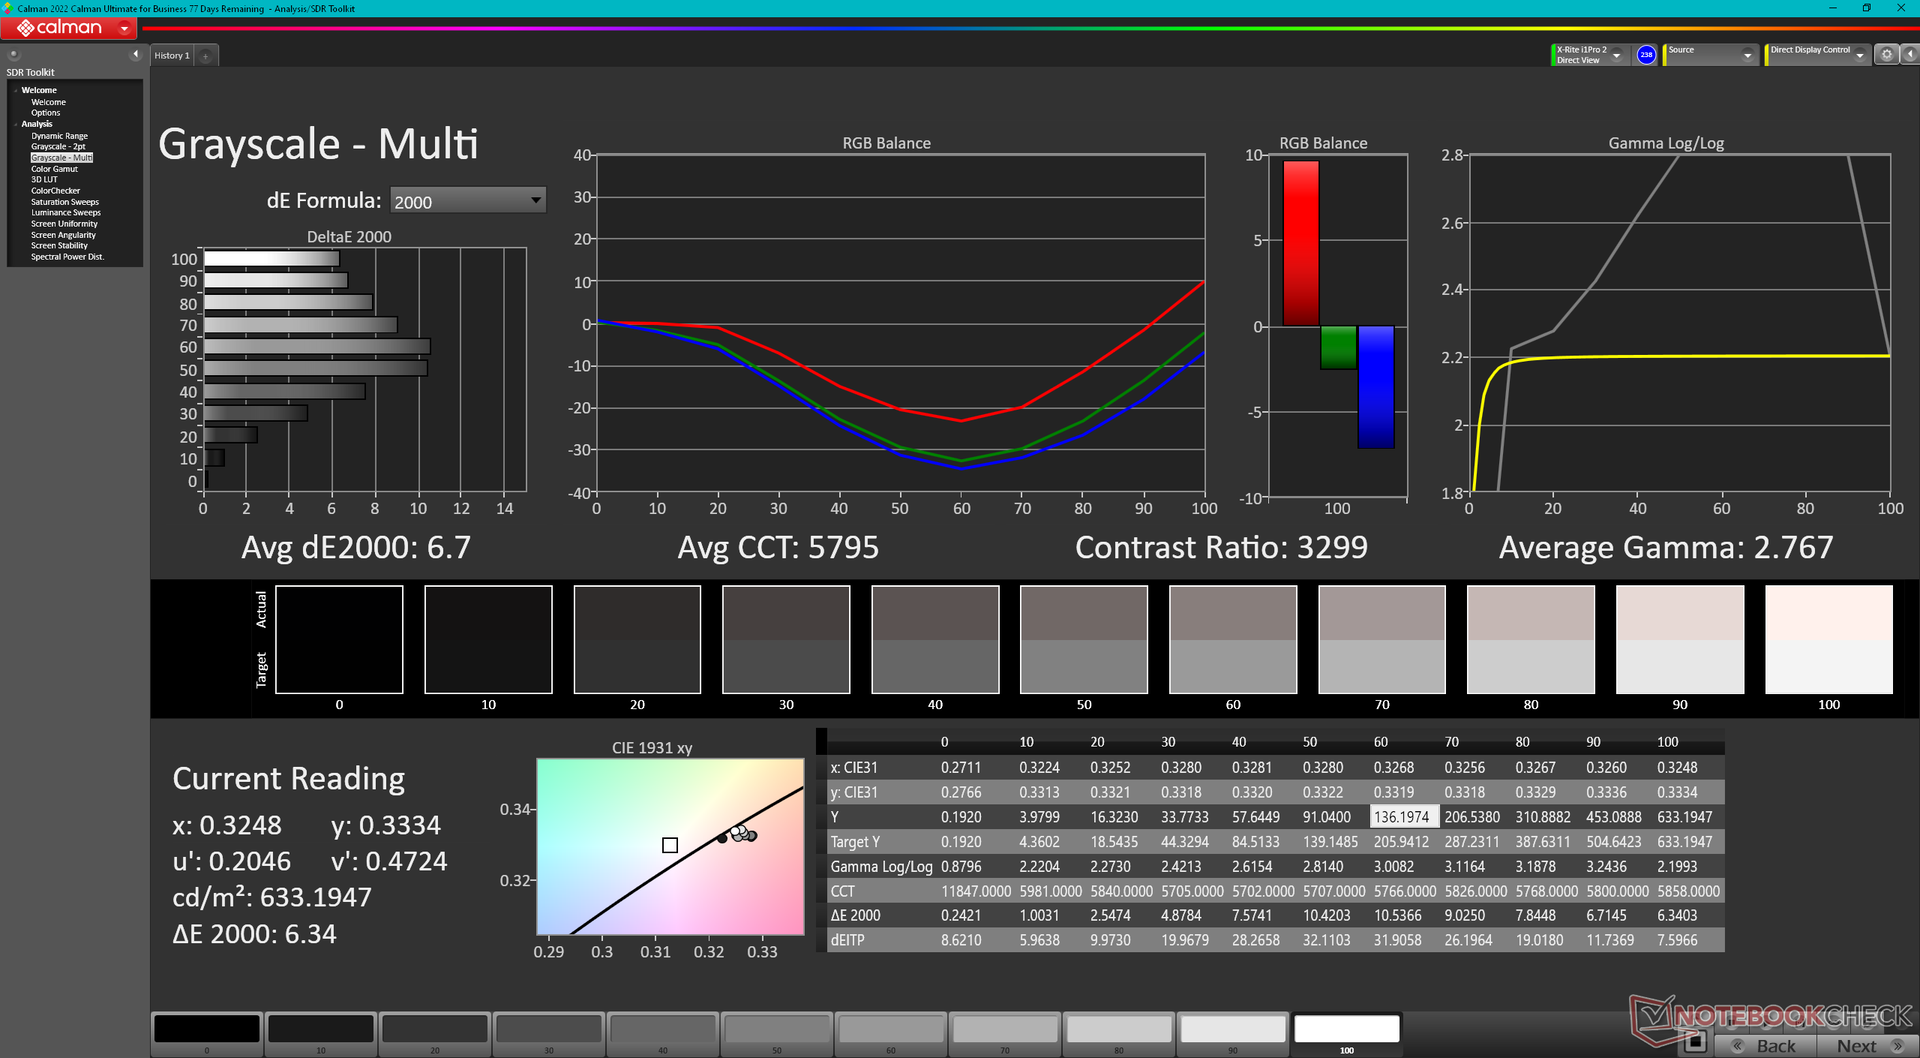
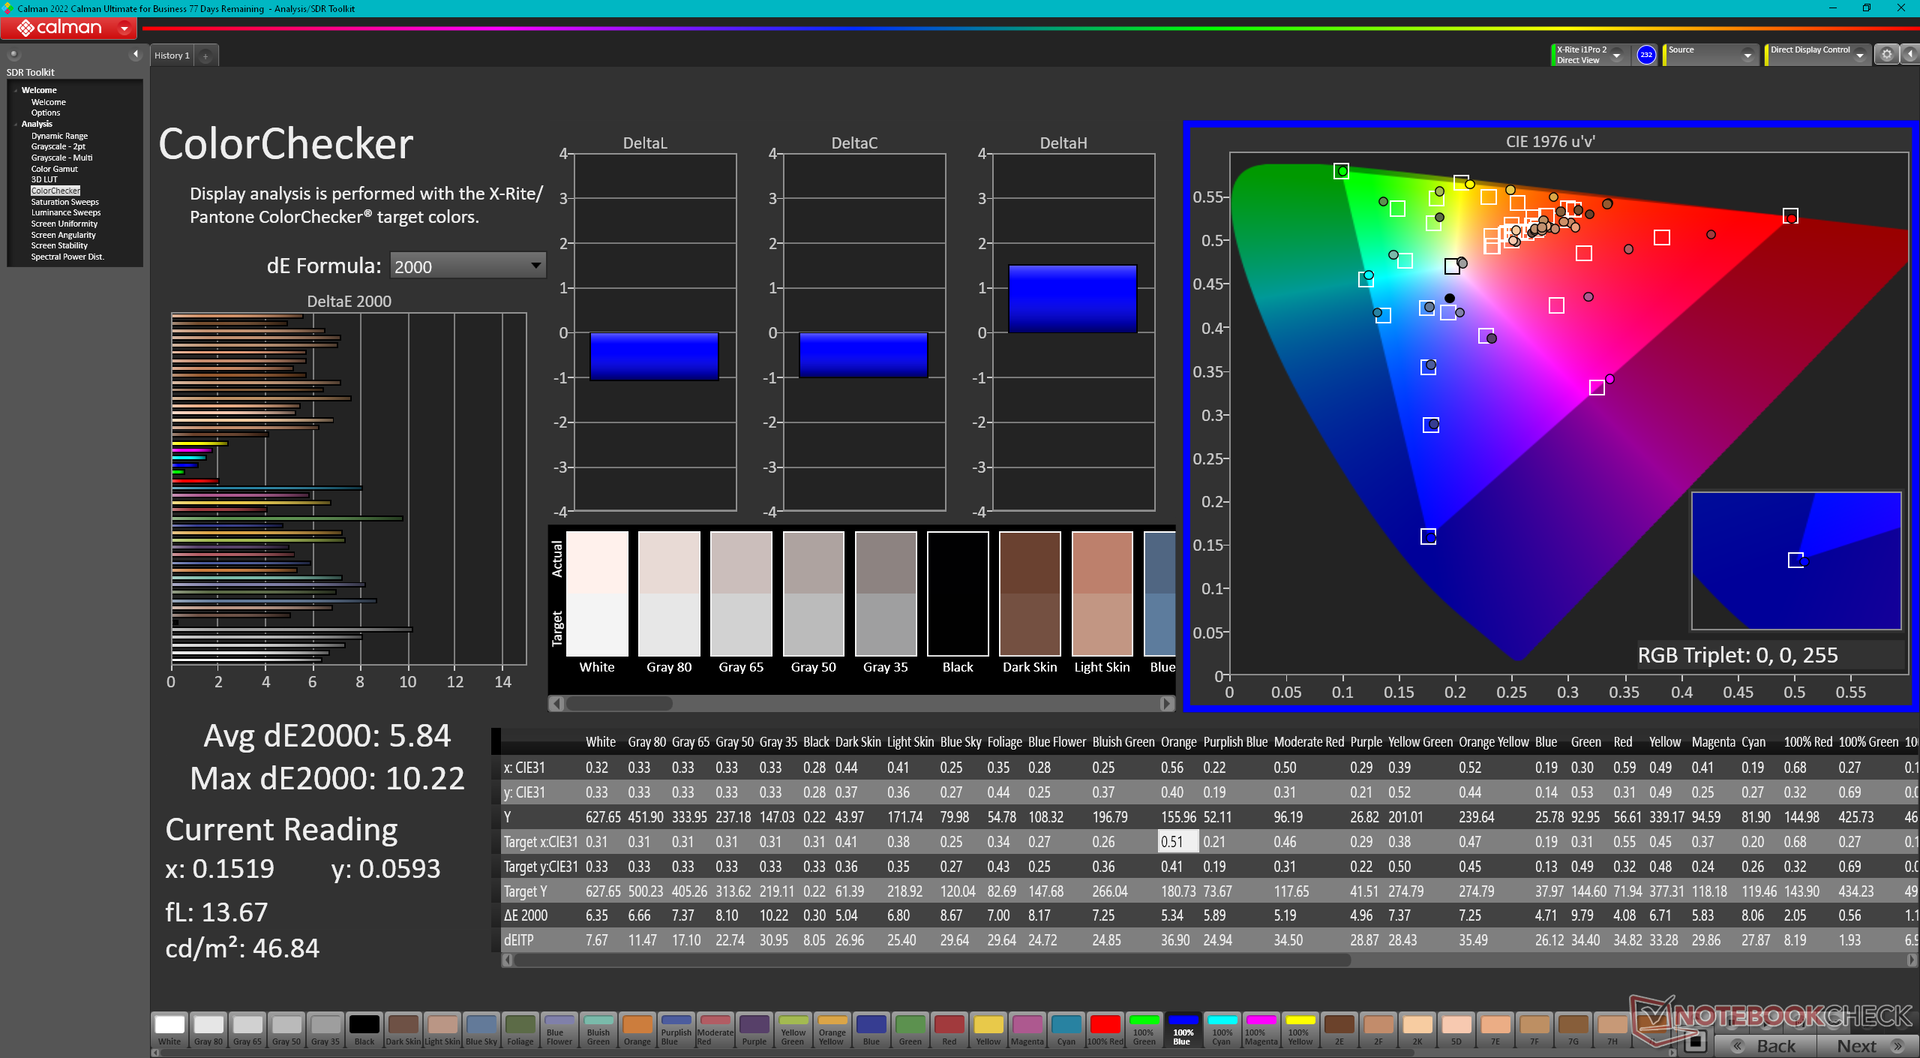
ΔE ColorChecker Calman: 5.84 | ∀{0.5-29.43 Ø4.73}
calibrated: 4.45
ΔE Greyscale Calman: 6.7 | ∀{0.09-98 Ø4.97}
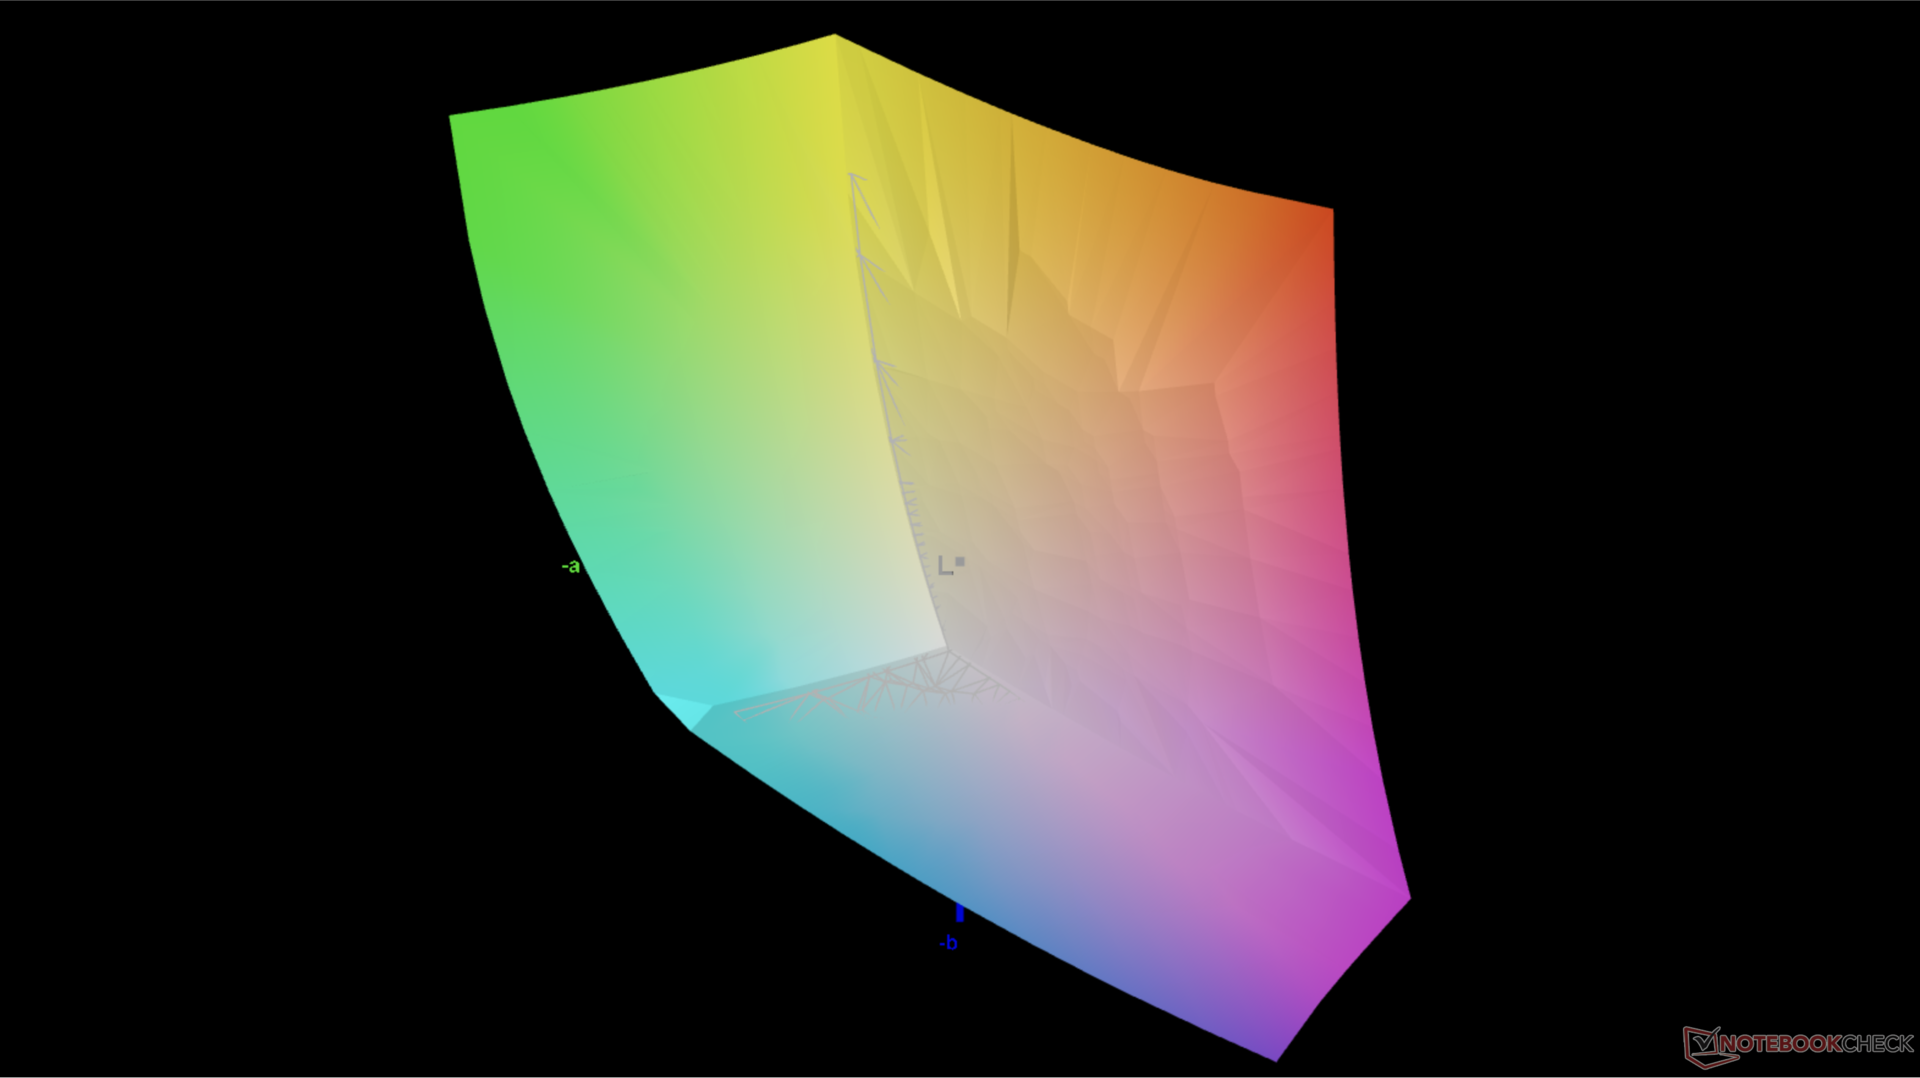
84.6% AdobeRGB 1998 (Argyll 3D)
99.9% sRGB (Argyll 3D)
95.1% Display P3 (Argyll 3D)
Gamma: 2.77
CCT: 5795 K
| Lenovo Slim Pro 9i 16IRP8 LEN160-3.2K, Mini-LED, 3200x2000, 16" | Lenovo Yoga Pro 9 16-IRP G8 LEN160-3.2K, Mini-LED, 3200x2000, 16" | Asus VivoBook Pro 16 Au Optronics B160QAN02.L, IPS, 2560x1600, 16" | Acer Swift Edge SFE16-42-R1GM Samsung SDC4168, OLED, 3840x2400, 16" | Dell Inspiron 16 Plus 7620 BOE NE16N41, IPS, 3072x1920, 16" | HP Envy 16 h0112nr Samsung SDC4174, OLED, 3840x2400, 16" | |
|---|---|---|---|---|---|---|
| Display | 5% | 2% | 7% | -13% | 3% | |
| Display P3 Coverage (%) | 95.1 | 97 2% | 98.5 4% | 99.7 5% | 70.8 -26% | 99.3 4% |
| sRGB Coverage (%) | 99.9 | 99.8 0% | 99.9 0% | 100 0% | 99.5 0% | 100 0% |
| AdobeRGB 1998 Coverage (%) | 84.6 | 95.1 12% | 86.1 2% | 97.2 15% | 73.2 -13% | 88 4% |
| Response Times | 0% | 50% | 77% | -188% | 83% | |
| Response Time Grey 50% / Grey 80% * (ms) | 14 ? | 14 ? -0% | 2 ? 86% | 2 ? 86% | 38 ? -171% | 2 ? 86% |
| Response Time Black / White * (ms) | 9.2 ? | 9.2 ? -0% | 8 ? 13% | 3 ? 67% | 28 ? -204% | 1.9 ? 79% |
| PWM Frequency (Hz) | 5784 ? | 5800 ? | 239 ? | 240.4 ? | ||
| Bildschirm | 24% | 5% | 21% | 9% | 17% | |
| Helligkeit Bildmitte (cd/m²) | 627.4 | 539 -14% | 504 -20% | 369 -41% | 288.9 -54% | 328.8 -48% |
| Brightness (cd/m²) | 618 | 546 -12% | 465 -25% | 371 -40% | 276 -55% | 332 -46% |
| Brightness Distribution (%) | 95 | 96 1% | 87 -8% | 97 2% | 92 -3% | 97 2% |
| Schwarzwert * (cd/m²) | 0.19 | 0.18 5% | 0.35 -84% | 0.26 -37% | ||
| Kontrast (:1) | 3302 | 2994 -9% | 1440 -56% | 1111 -66% | ||
| Delta E Colorchecker * | 5.84 | 1.4 76% | 1.83 69% | 2.3 61% | 1.88 68% | 1.53 74% |
| Colorchecker dE 2000 max. * | 10.22 | 2.1 79% | 5.51 46% | 4.37 57% | 4.37 57% | 6.04 41% |
| Colorchecker dE 2000 calibrated * | 4.45 | 1.34 70% | 2.87 36% | 0.42 91% | ||
| Delta E Graustufen * | 6.7 | 2.2 67% | 3.02 55% | 1.83 73% | 1.4 79% | 1.3 81% |
| Gamma | 2.77 79% | 2.19 100% | 2.39 92% | 2.39 92% | 2.3 96% | 2.18 101% |
| CCT | 5795 112% | 6479 100% | 6688 97% | 6392 102% | 6634 98% | 6362 102% |
| Durchschnitt gesamt (Programm / Settings) | 10% /
16% | 19% /
11% | 35% /
27% | -64% /
-24% | 34% /
25% |
* ... kleinere Werte sind besser

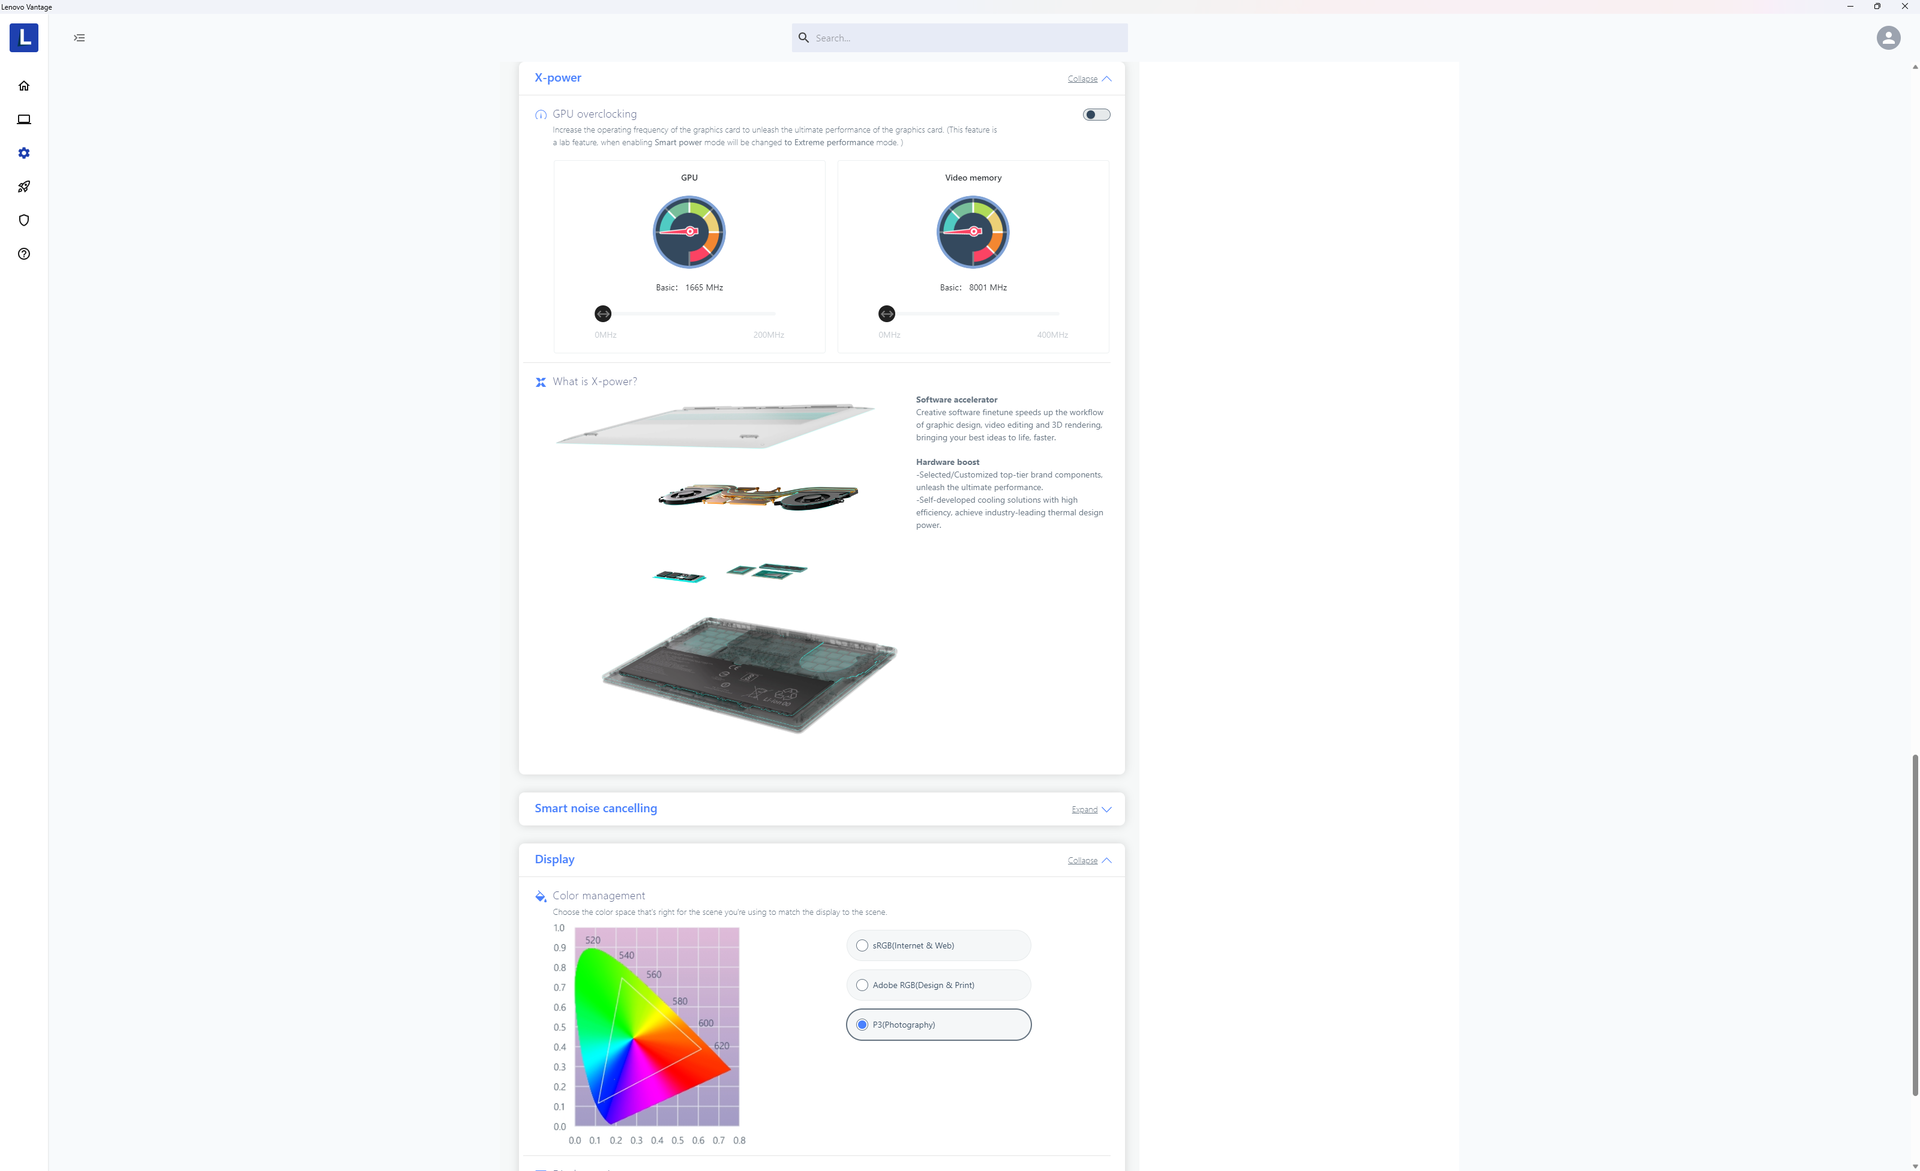
Die Farbtemperatur ist wärmer als erwartet, wenn der P3-Modus eingestellt ist. Anders als bei vielen MSI Modellen verfügt die Lenovo Vantage Software nicht über einen Schieberegler zur Anpassung der Farbtemperatur.

Reaktionszeiten (Response Times) des Displays
| ↔ Reaktionszeiten Schwarz zu Weiß | ||
|---|---|---|
| 9.2 ms ... steigend ↗ und fallend ↘ kombiniert | ↗ 2.2 ms steigend | 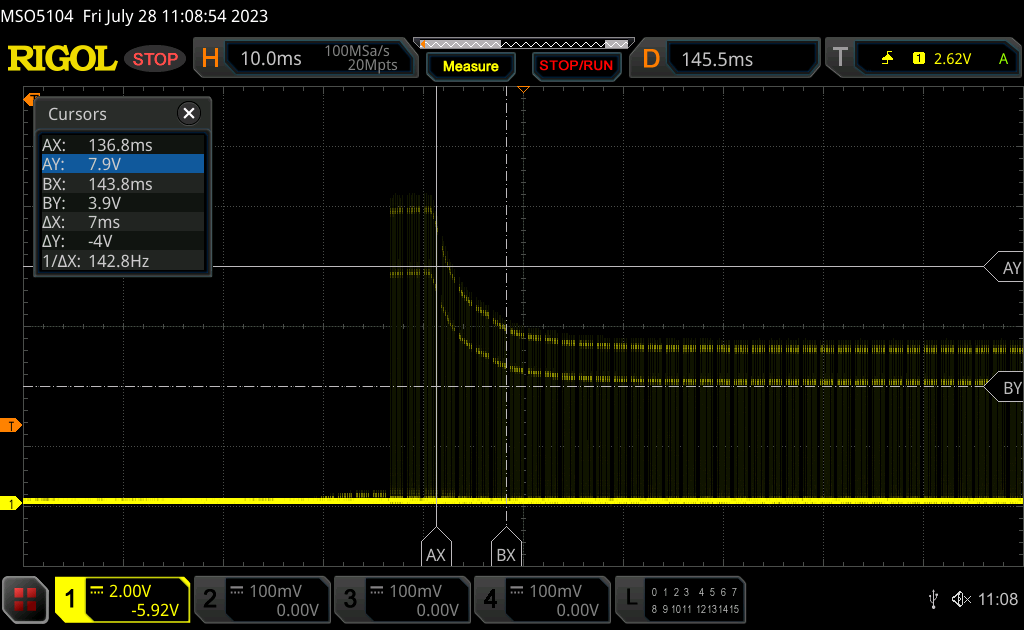 |
| ↘ 7 ms fallend | ||
| Die gemessenen Reaktionszeiten sind kurz wodurch sich der Bildschirm auch für Spiele gut eignen sollte. Im Vergleich rangierten die bei uns getesteten Geräte von 0.1 (Minimum) zu 240 (Maximum) ms. » 25 % aller Screens waren schneller als der getestete. Daher sind die gemessenen Reaktionszeiten besser als der Durchschnitt aller vermessenen Geräte (19.9 ms). | ||
| ↔ Reaktionszeiten 50% Grau zu 80% Grau | ||
| 14 ms ... steigend ↗ und fallend ↘ kombiniert | ↗ 7.4 ms steigend |  |
| ↘ 6.6 ms fallend | ||
| Die gemessenen Reaktionszeiten sind gut, für anspruchsvolle Spieler könnten der Bildschirm jedoch zu langsam sein. Im Vergleich rangierten die bei uns getesteten Geräte von 0.165 (Minimum) zu 636 (Maximum) ms. » 28 % aller Screens waren schneller als der getestete. Daher sind die gemessenen Reaktionszeiten besser als der Durchschnitt aller vermessenen Geräte (31.1 ms). | ||
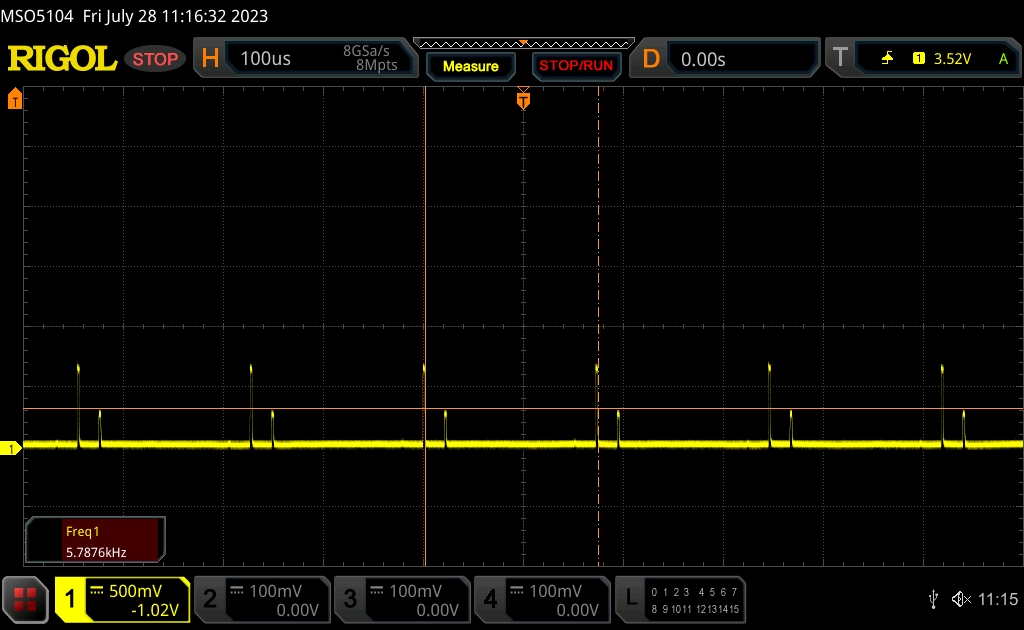
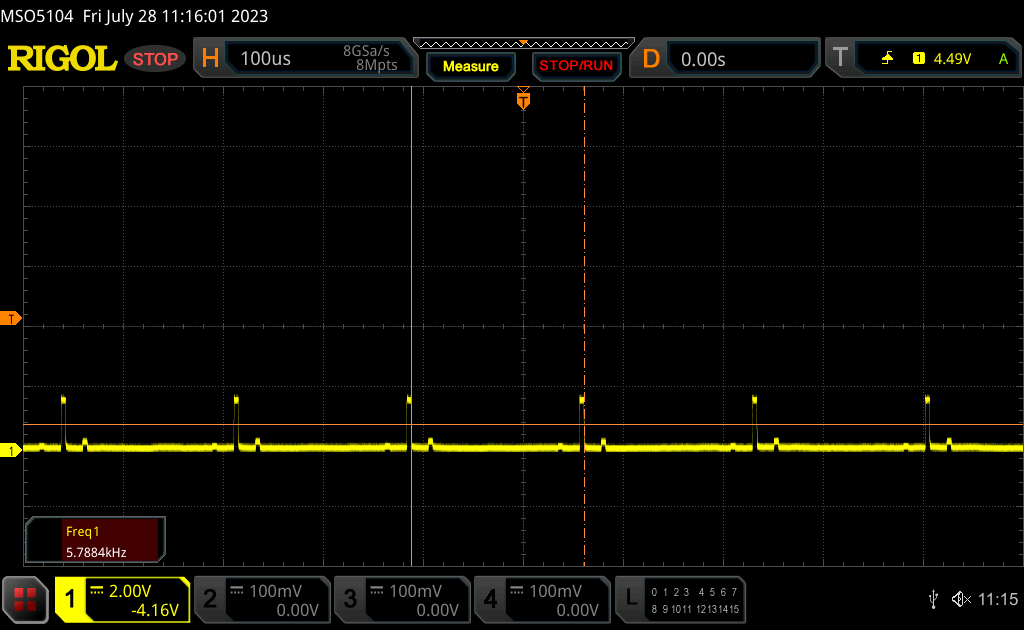
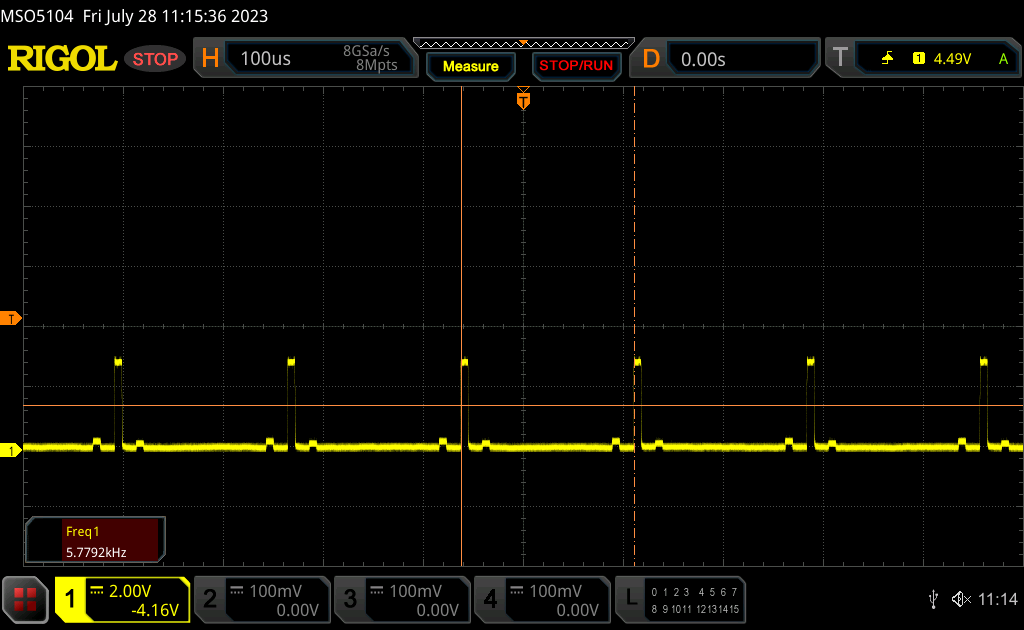
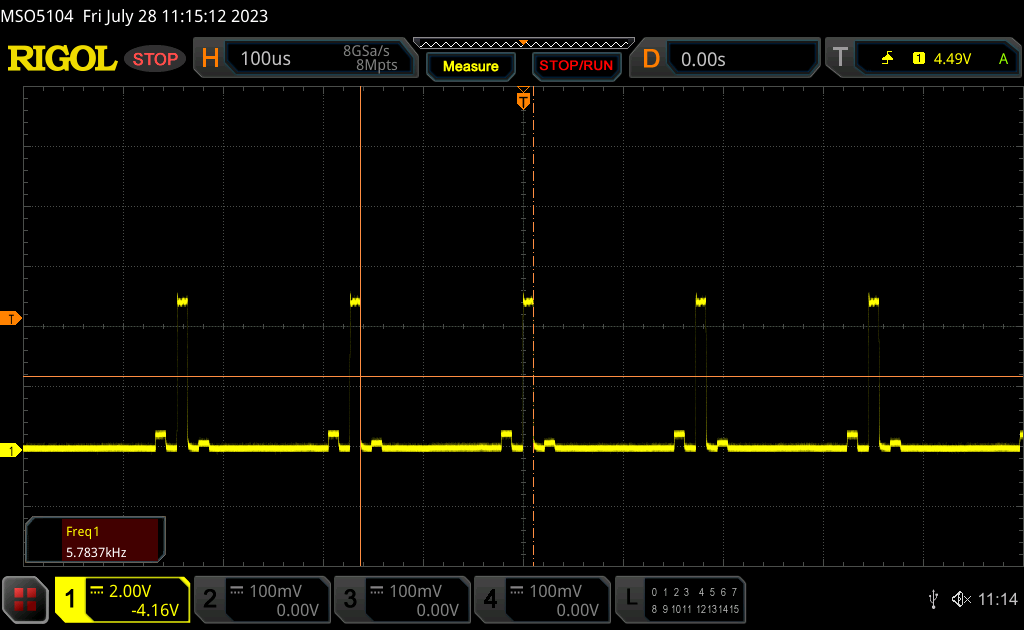
Bildschirm-Flackern / PWM (Pulse-Width Modulation)
| Flackern / PWM festgestellt | 5784 Hz | ≤ 100 % Helligkeit | 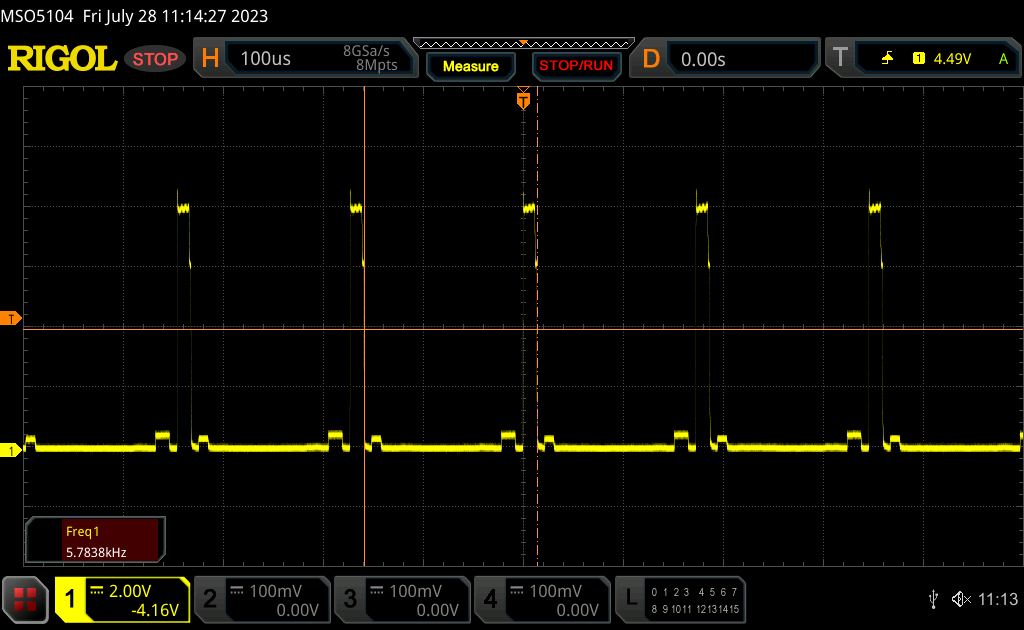 |
Das Display flackert mit 5784 Hz (im schlimmsten Fall, eventuell durch Pulsweitenmodulation PWM) bei einer eingestellten Helligkeit von 100 % und darunter. Darüber sollte es zu keinem Flackern kommen. Die Frequenz von 5784 Hz ist sehr hoch und sollte daher auch bei empfindlichen Personen zu keinen Problemen führen. Im Vergleich: 52 % aller getesteten Geräte nutzten kein PWM um die Helligkeit zu reduzieren. Wenn PWM eingesetzt wurde, dann bei einer Frequenz von durchschnittlich 7794 (Minimum 5, Maximum 343500) Hz. | |||
Das Flackern tritt im SDR-Modus bei allen Helligkeitsstufen auf. Allerdings ist die Frequenz mit 5.784 Hz relativ hoch, sodass es für die meisten Nutzer kein Problem darstellen sollte.
Performance - 13. Generation Raptor Lake-H

Testbedingungen
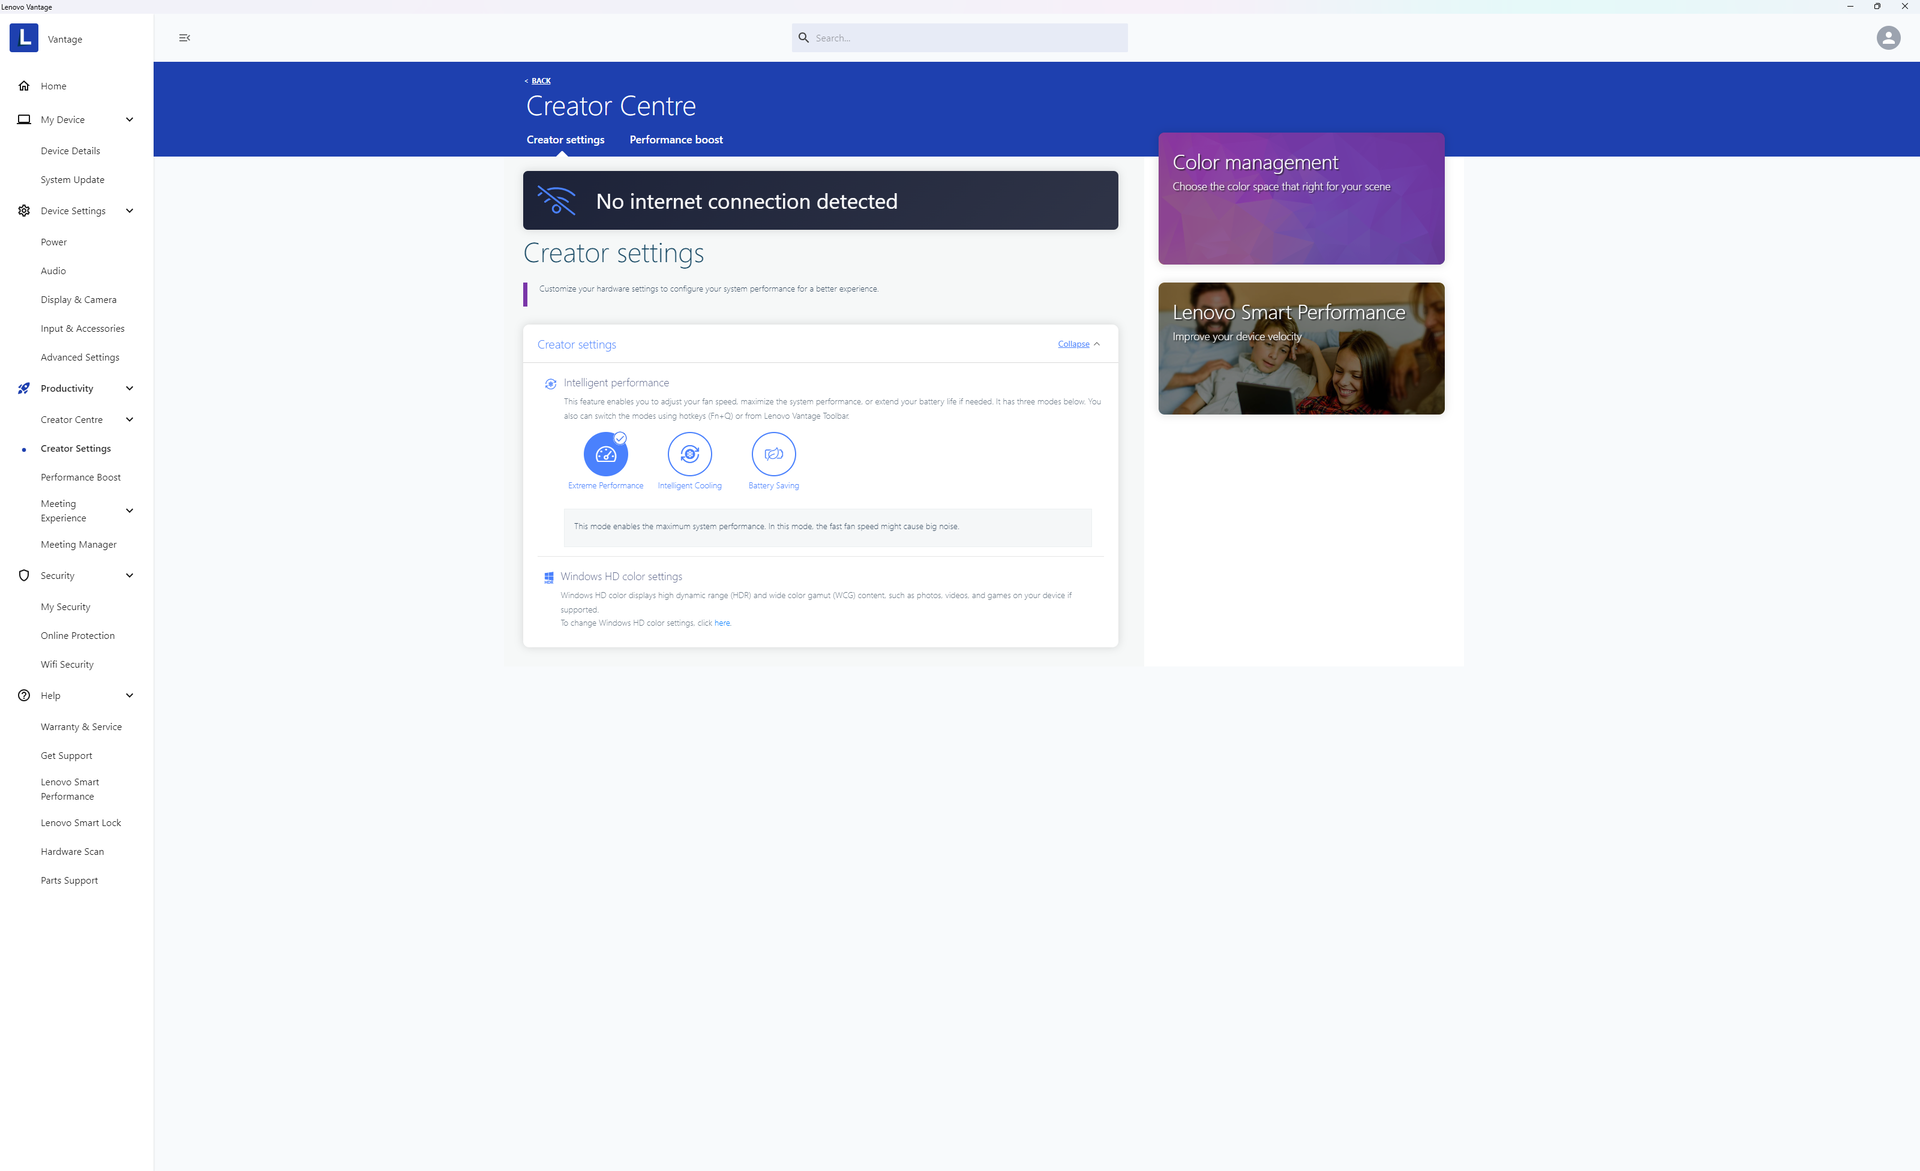
Wir haben unser Gerät über Windows auf den Modus Performance und über Lenovo Vantage auf den Modus Extreme Performance eingestellt, bevor wir die folgenden Benchmarks durchgeführt haben. Es ist ärgerlich, dass Lenovo die Vantage-Benutzeroberfläche ziemlich häufig umgestaltet, sodass sich alle Einstellungen in verschiedenen Untermenüs befinden, wenn man sie mit der gleichen Software auf anderen Lenovo Notebooks vergleicht.

Prozessor
Der Core i9-13905H kann schneller sein als der Core i7-13705H auf dem Papier, aber die Vorteile sind bestenfalls gering. Die Multi-Thread-Leistung ist fast identisch, während die Single-Thread-Leistung mit unserem Core i9 nur fünf bis zehn Prozent schneller ist.
Cinebench R15 Multi Loop
Cinebench R23: Multi Core | Single Core
Cinebench R20: CPU (Multi Core) | CPU (Single Core)
Cinebench R15: CPU Multi 64Bit | CPU Single 64Bit
Blender: v2.79 BMW27 CPU
7-Zip 18.03: 7z b 4 | 7z b 4 -mmt1
Geekbench 5.5: Multi-Core | Single-Core
HWBOT x265 Benchmark v2.2: 4k Preset
LibreOffice : 20 Documents To PDF
R Benchmark 2.5: Overall mean
* ... kleinere Werte sind besser
AIDA64: FP32 Ray-Trace | FPU Julia | CPU SHA3 | CPU Queen | FPU SinJulia | FPU Mandel | CPU AES | CPU ZLib | FP64 Ray-Trace | CPU PhotoWorxx
| Performance Rating | |
| Lenovo Slim Pro 9i 16IRP8 | |
| Durchschnittliche Intel Core i9-13905H | |
| Lenovo Yoga Pro 9 16-IRP G8 | |
| HP Envy 16 h0112nr | |
| Asus VivoBook Pro 16 | |
| Dell Inspiron 16 Plus 7620 | |
| Acer Swift Edge SFE16-42-R1GM | |
| AIDA64 / FP32 Ray-Trace | |
| Durchschnittliche Intel Core i9-13905H (17642 - 19900, n=3) | |
| Lenovo Slim Pro 9i 16IRP8 | |
| Lenovo Yoga Pro 9 16-IRP G8 | |
| Asus VivoBook Pro 16 | |
| Dell Inspiron 16 Plus 7620 | |
| HP Envy 16 h0112nr | |
| Acer Swift Edge SFE16-42-R1GM | |
| AIDA64 / FPU Julia | |
| Lenovo Yoga Pro 9 16-IRP G8 | |
| Lenovo Slim Pro 9i 16IRP8 | |
| Durchschnittliche Intel Core i9-13905H (89198 - 94350, n=3) | |
| Asus VivoBook Pro 16 | |
| Acer Swift Edge SFE16-42-R1GM | |
| Dell Inspiron 16 Plus 7620 | |
| HP Envy 16 h0112nr | |
| AIDA64 / CPU SHA3 | |
| Lenovo Slim Pro 9i 16IRP8 | |
| Lenovo Yoga Pro 9 16-IRP G8 | |
| Durchschnittliche Intel Core i9-13905H (3945 - 4296, n=3) | |
| Asus VivoBook Pro 16 | |
| Dell Inspiron 16 Plus 7620 | |
| HP Envy 16 h0112nr | |
| Acer Swift Edge SFE16-42-R1GM | |
| AIDA64 / CPU Queen | |
| Lenovo Slim Pro 9i 16IRP8 | |
| Lenovo Yoga Pro 9 16-IRP G8 | |
| Durchschnittliche Intel Core i9-13905H (94506 - 117697, n=3) | |
| Asus VivoBook Pro 16 | |
| HP Envy 16 h0112nr | |
| Dell Inspiron 16 Plus 7620 | |
| Acer Swift Edge SFE16-42-R1GM | |
| AIDA64 / FPU SinJulia | |
| Lenovo Slim Pro 9i 16IRP8 | |
| Lenovo Yoga Pro 9 16-IRP G8 | |
| Acer Swift Edge SFE16-42-R1GM | |
| Durchschnittliche Intel Core i9-13905H (10478 - 11328, n=3) | |
| Asus VivoBook Pro 16 | |
| Dell Inspiron 16 Plus 7620 | |
| HP Envy 16 h0112nr | |
| AIDA64 / FPU Mandel | |
| Durchschnittliche Intel Core i9-13905H (43922 - 48884, n=3) | |
| Lenovo Slim Pro 9i 16IRP8 | |
| Lenovo Yoga Pro 9 16-IRP G8 | |
| Acer Swift Edge SFE16-42-R1GM | |
| Asus VivoBook Pro 16 | |
| Dell Inspiron 16 Plus 7620 | |
| HP Envy 16 h0112nr | |
| AIDA64 / CPU AES | |
| HP Envy 16 h0112nr | |
| Lenovo Slim Pro 9i 16IRP8 | |
| Lenovo Yoga Pro 9 16-IRP G8 | |
| Durchschnittliche Intel Core i9-13905H (80275 - 86469, n=3) | |
| Asus VivoBook Pro 16 | |
| Dell Inspiron 16 Plus 7620 | |
| Acer Swift Edge SFE16-42-R1GM | |
| AIDA64 / CPU ZLib | |
| Lenovo Slim Pro 9i 16IRP8 | |
| Lenovo Yoga Pro 9 16-IRP G8 | |
| Durchschnittliche Intel Core i9-13905H (1154 - 1234, n=3) | |
| Dell Inspiron 16 Plus 7620 | |
| Asus VivoBook Pro 16 | |
| HP Envy 16 h0112nr | |
| Acer Swift Edge SFE16-42-R1GM | |
| AIDA64 / FP64 Ray-Trace | |
| Durchschnittliche Intel Core i9-13905H (9483 - 10804, n=3) | |
| Lenovo Slim Pro 9i 16IRP8 | |
| Lenovo Yoga Pro 9 16-IRP G8 | |
| Asus VivoBook Pro 16 | |
| Dell Inspiron 16 Plus 7620 | |
| HP Envy 16 h0112nr | |
| Acer Swift Edge SFE16-42-R1GM | |
| AIDA64 / CPU PhotoWorxx | |
| Durchschnittliche Intel Core i9-13905H (51720 - 60161, n=3) | |
| Lenovo Slim Pro 9i 16IRP8 | |
| Lenovo Yoga Pro 9 16-IRP G8 | |
| HP Envy 16 h0112nr | |
| Dell Inspiron 16 Plus 7620 | |
| Acer Swift Edge SFE16-42-R1GM | |
| Asus VivoBook Pro 16 | |
System Performance
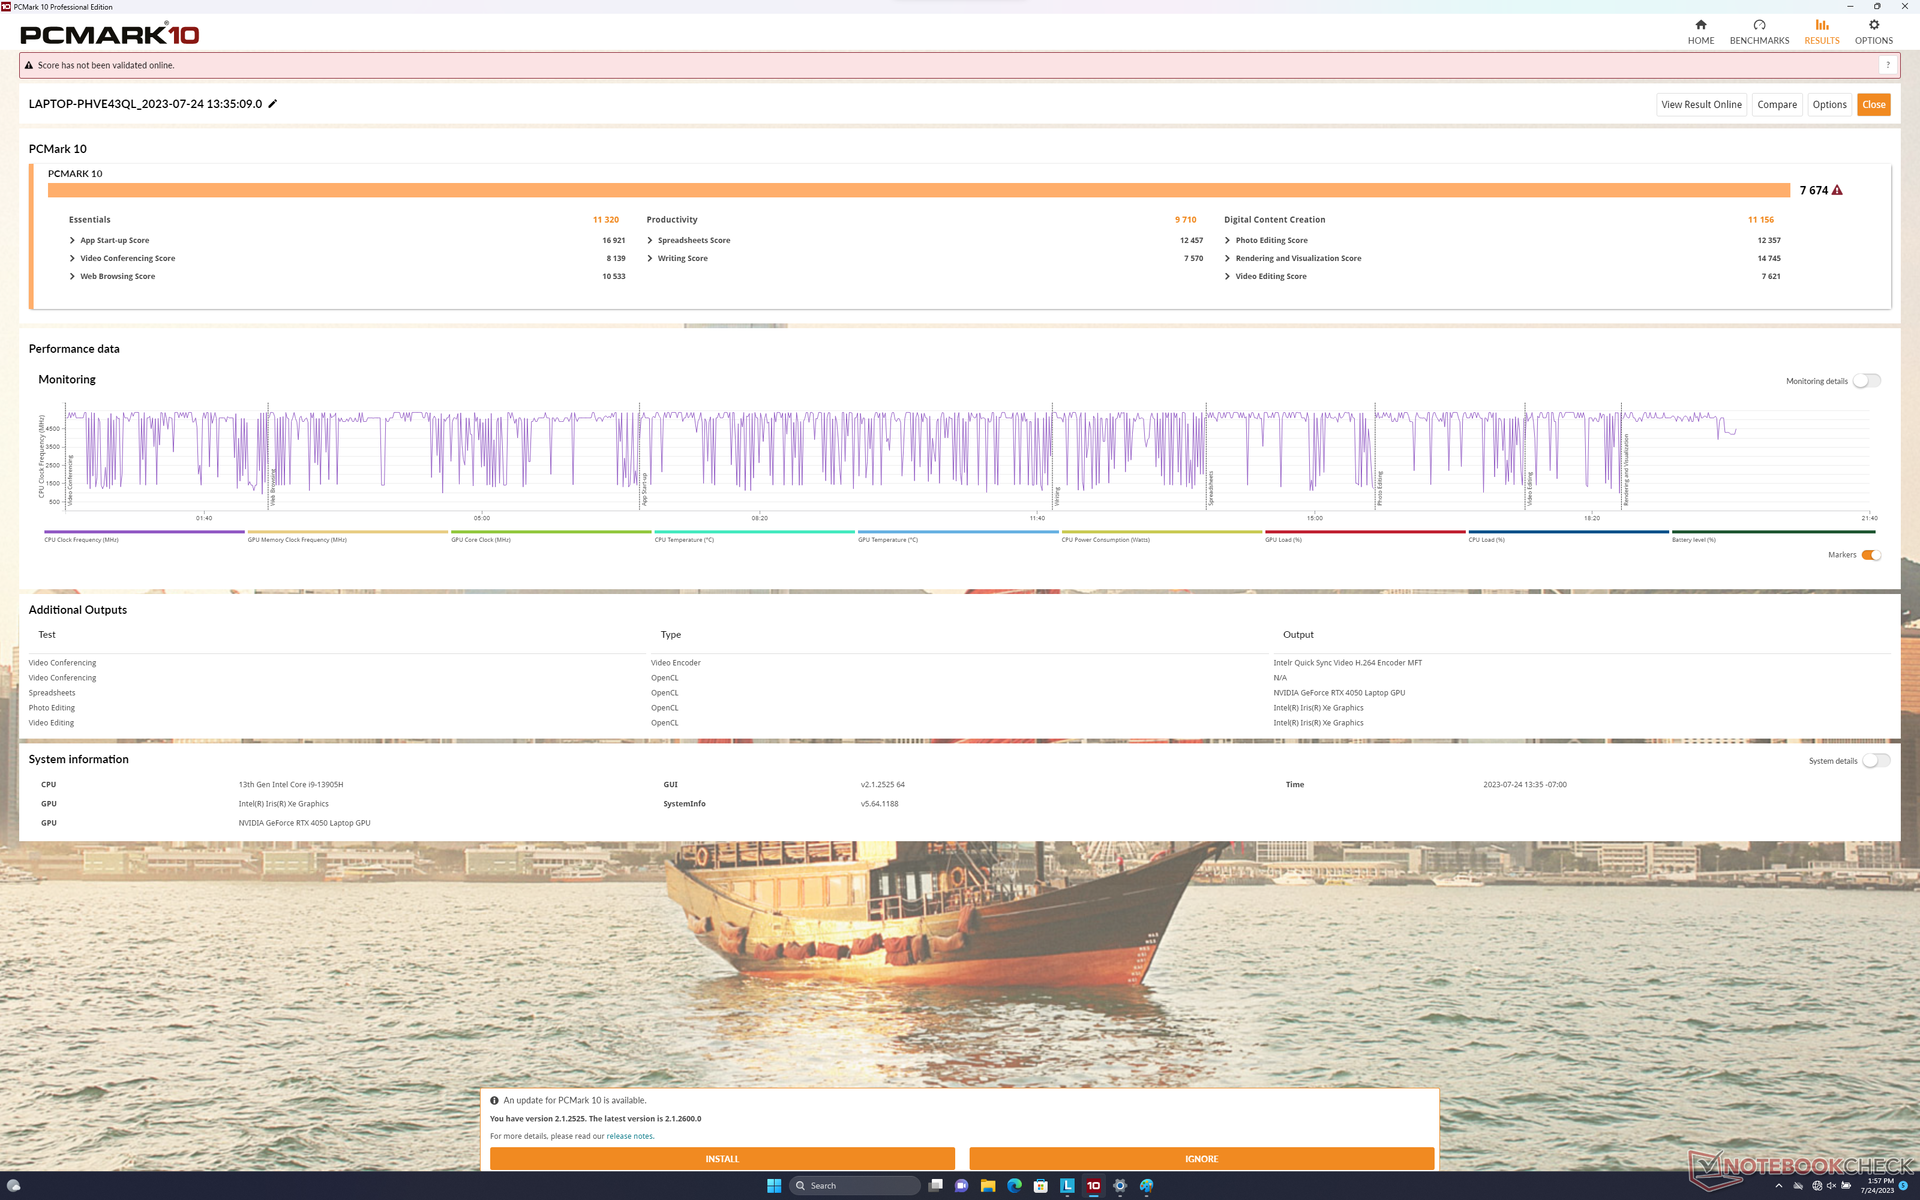
Während des Tests traten Probleme beim Aufwachen aus dem Ruhezustand und sogar ein BSOD auf. Beim Versuch, aus dem Ruhezustand aufzuwachen, blieb der Bildschirm manchmal leer, und ein kompletter Neustart war erforderlich, um zu Windows zurückzukehren.
CrossMark: Overall | Productivity | Creativity | Responsiveness
| PCMark 10 / Score | |
| Lenovo Slim Pro 9i 16IRP8 | |
| HP Envy 16 h0112nr | |
| Lenovo Yoga Pro 9 16-IRP G8 | |
| Dell Inspiron 16 Plus 7620 | |
| Asus VivoBook Pro 16 | |
| Acer Swift Edge SFE16-42-R1GM | |
| PCMark 10 / Essentials | |
| HP Envy 16 h0112nr | |
| Lenovo Slim Pro 9i 16IRP8 | |
| Lenovo Yoga Pro 9 16-IRP G8 | |
| Dell Inspiron 16 Plus 7620 | |
| Asus VivoBook Pro 16 | |
| Acer Swift Edge SFE16-42-R1GM | |
| PCMark 10 / Productivity | |
| Lenovo Slim Pro 9i 16IRP8 | |
| HP Envy 16 h0112nr | |
| Acer Swift Edge SFE16-42-R1GM | |
| Dell Inspiron 16 Plus 7620 | |
| Asus VivoBook Pro 16 | |
| Lenovo Yoga Pro 9 16-IRP G8 | |
| PCMark 10 / Digital Content Creation | |
| Lenovo Slim Pro 9i 16IRP8 | |
| Lenovo Yoga Pro 9 16-IRP G8 | |
| HP Envy 16 h0112nr | |
| Dell Inspiron 16 Plus 7620 | |
| Asus VivoBook Pro 16 | |
| Acer Swift Edge SFE16-42-R1GM | |
| CrossMark / Overall | |
| Lenovo Yoga Pro 9 16-IRP G8 | |
| HP Envy 16 h0112nr | |
| Lenovo Slim Pro 9i 16IRP8 | |
| Dell Inspiron 16 Plus 7620 | |
| Asus VivoBook Pro 16 | |
| Acer Swift Edge SFE16-42-R1GM | |
| CrossMark / Productivity | |
| HP Envy 16 h0112nr | |
| Lenovo Yoga Pro 9 16-IRP G8 | |
| Asus VivoBook Pro 16 | |
| Dell Inspiron 16 Plus 7620 | |
| Lenovo Slim Pro 9i 16IRP8 | |
| Acer Swift Edge SFE16-42-R1GM | |
| CrossMark / Creativity | |
| Lenovo Yoga Pro 9 16-IRP G8 | |
| Lenovo Slim Pro 9i 16IRP8 | |
| HP Envy 16 h0112nr | |
| Dell Inspiron 16 Plus 7620 | |
| Asus VivoBook Pro 16 | |
| Acer Swift Edge SFE16-42-R1GM | |
| CrossMark / Responsiveness | |
| Asus VivoBook Pro 16 | |
| HP Envy 16 h0112nr | |
| Lenovo Yoga Pro 9 16-IRP G8 | |
| Dell Inspiron 16 Plus 7620 | |
| Lenovo Slim Pro 9i 16IRP8 | |
| Acer Swift Edge SFE16-42-R1GM | |
| PCMark 10 Score | 7674 Punkte | |
Hilfe | ||
| AIDA64 / Memory Copy | |
| Durchschnittliche Intel Core i9-13905H (76905 - 88014, n=3) | |
| Lenovo Slim Pro 9i 16IRP8 | |
| Lenovo Yoga Pro 9 16-IRP G8 | |
| HP Envy 16 h0112nr | |
| Dell Inspiron 16 Plus 7620 | |
| Acer Swift Edge SFE16-42-R1GM | |
| Asus VivoBook Pro 16 | |
| AIDA64 / Memory Read | |
| Lenovo Yoga Pro 9 16-IRP G8 | |
| Durchschnittliche Intel Core i9-13905H (68837 - 79123, n=3) | |
| Lenovo Slim Pro 9i 16IRP8 | |
| HP Envy 16 h0112nr | |
| Dell Inspiron 16 Plus 7620 | |
| Acer Swift Edge SFE16-42-R1GM | |
| Asus VivoBook Pro 16 | |
| AIDA64 / Memory Write | |
| Lenovo Yoga Pro 9 16-IRP G8 | |
| Durchschnittliche Intel Core i9-13905H (89545 - 103259, n=3) | |
| Lenovo Slim Pro 9i 16IRP8 | |
| HP Envy 16 h0112nr | |
| Dell Inspiron 16 Plus 7620 | |
| Acer Swift Edge SFE16-42-R1GM | |
| Asus VivoBook Pro 16 | |
| AIDA64 / Memory Latency | |
| Lenovo Yoga Pro 9 16-IRP G8 | |
| Durchschnittliche Intel Core i9-13905H (101.4 - 134.8, n=3) | |
| Lenovo Slim Pro 9i 16IRP8 | |
| Acer Swift Edge SFE16-42-R1GM | |
| Dell Inspiron 16 Plus 7620 | |
| HP Envy 16 h0112nr | |
| Asus VivoBook Pro 16 | |
* ... kleinere Werte sind besser
DPC-Latenzzeit
LatencyMon zeigt DPC-Probleme beim Öffnen mehrerer Browser Tabs unserer Homepage. die 4K-Videowiedergabe bei 60 fps ist ansonsten ausgezeichnet, mit nur einem Frame-Abbruch während eines 60-Sekunden-Zeitfensters.
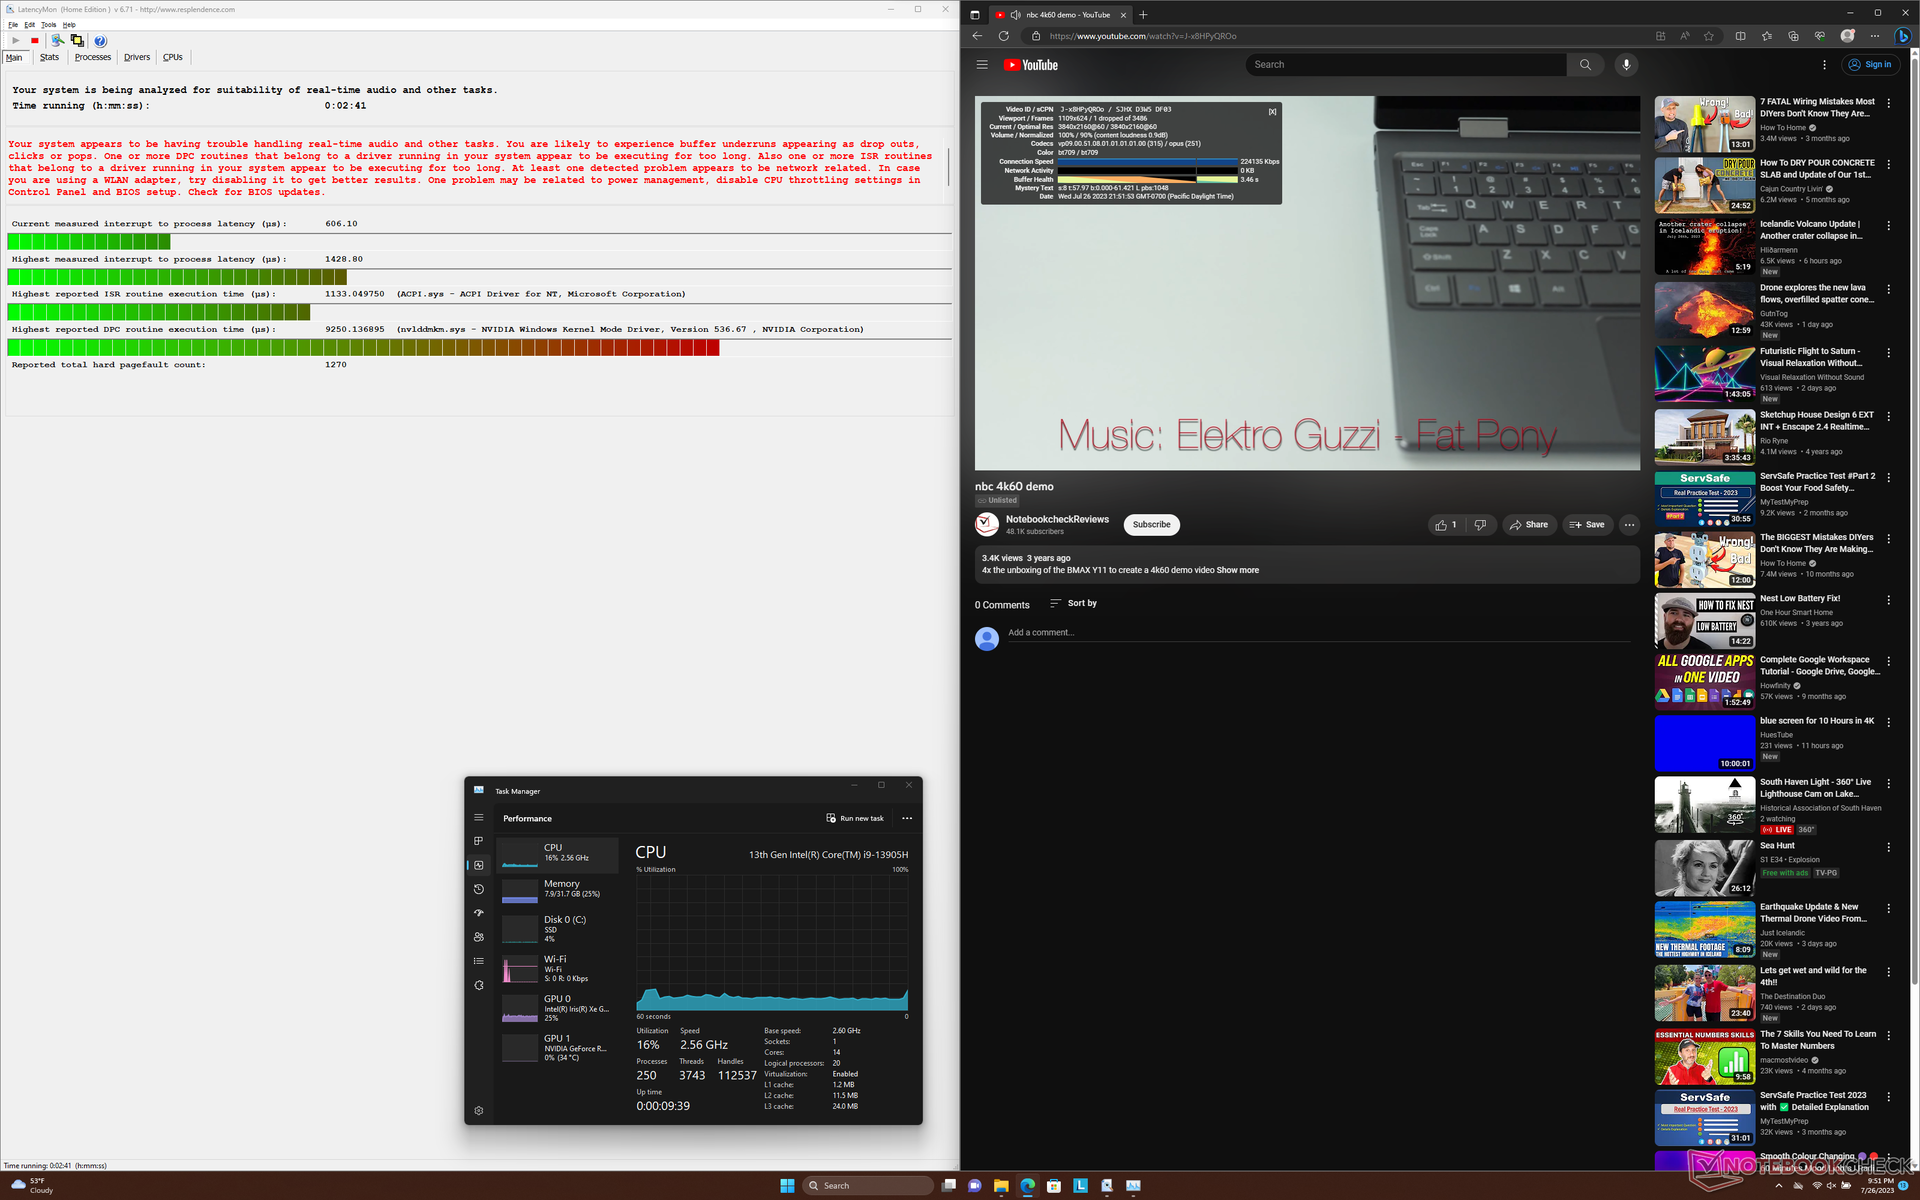
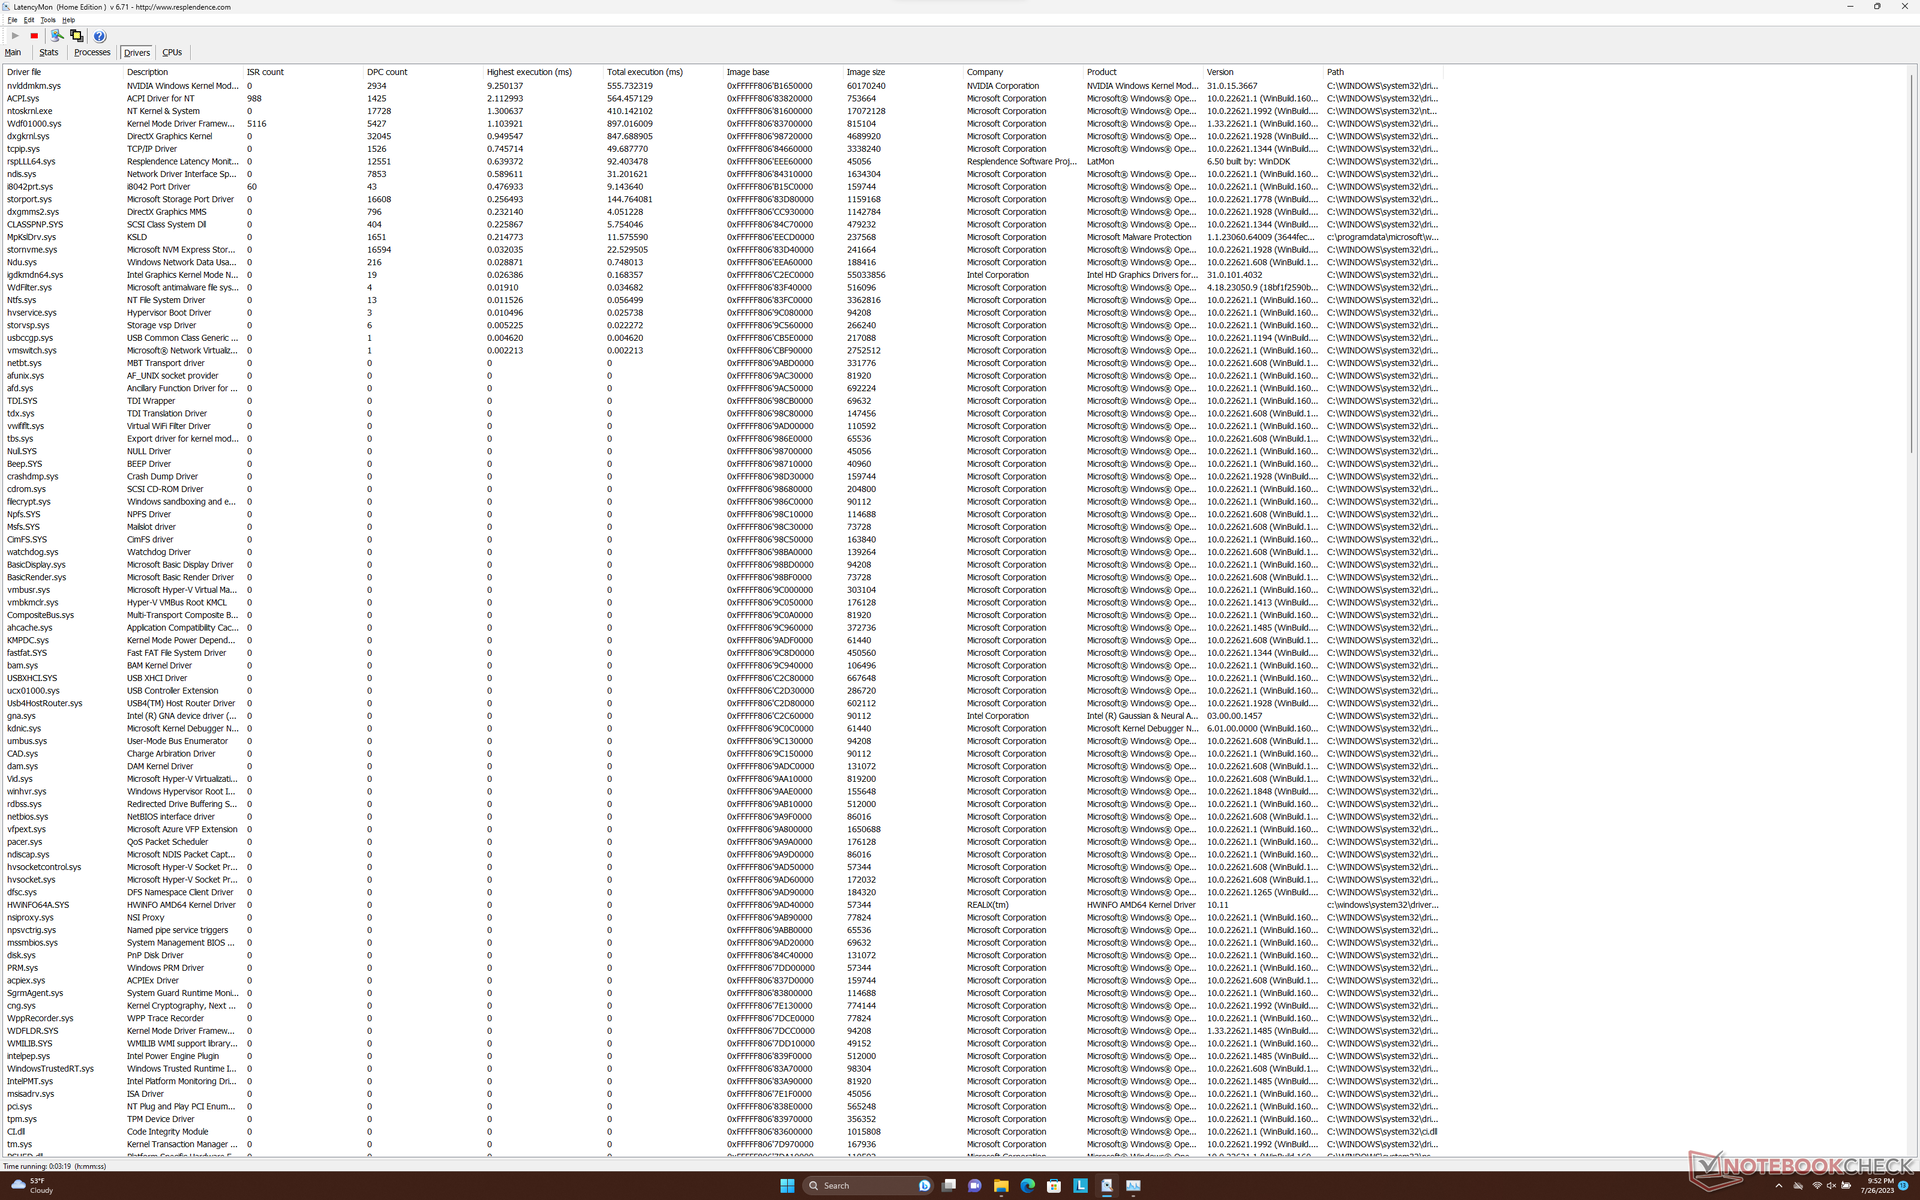
| DPC Latencies / LatencyMon - interrupt to process latency (max), Web, Youtube, Prime95 | |
| Lenovo Yoga Pro 9 16-IRP G8 | |
| Acer Swift Edge SFE16-42-R1GM | |
| Asus VivoBook Pro 16 | |
| Lenovo Slim Pro 9i 16IRP8 | |
| Dell Inspiron 16 Plus 7620 | |
| HP Envy 16 h0112nr | |
* ... kleinere Werte sind besser
Speichergeräte
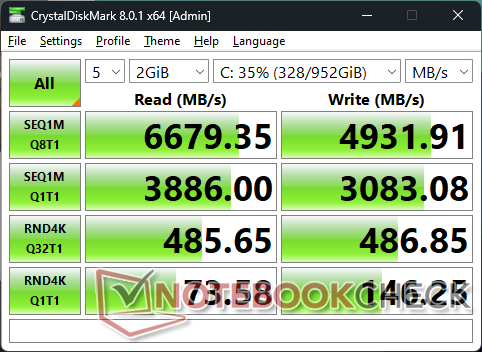
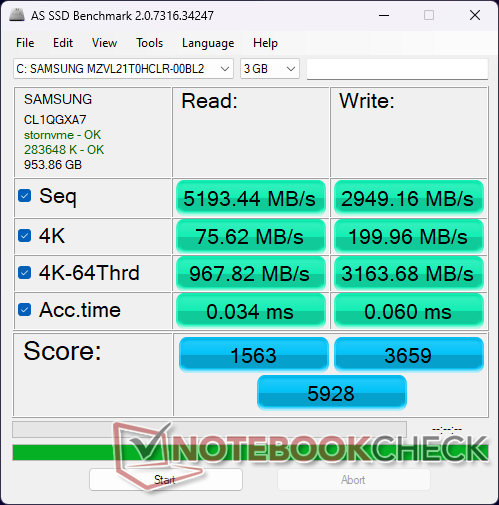


| Drive Performance Rating - Percent | |
| Acer Swift Edge SFE16-42-R1GM | |
| Lenovo Yoga Pro 9 16-IRP G8 | |
| Lenovo Slim Pro 9i 16IRP8 | |
| HP Envy 16 h0112nr | |
| Asus VivoBook Pro 16 | |
| Dell Inspiron 16 Plus 7620 | |
* ... kleinere Werte sind besser
Disk Throttling: DiskSpd Read Loop, Queue Depth 8
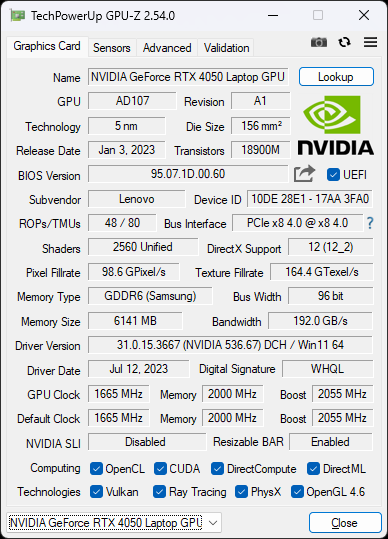
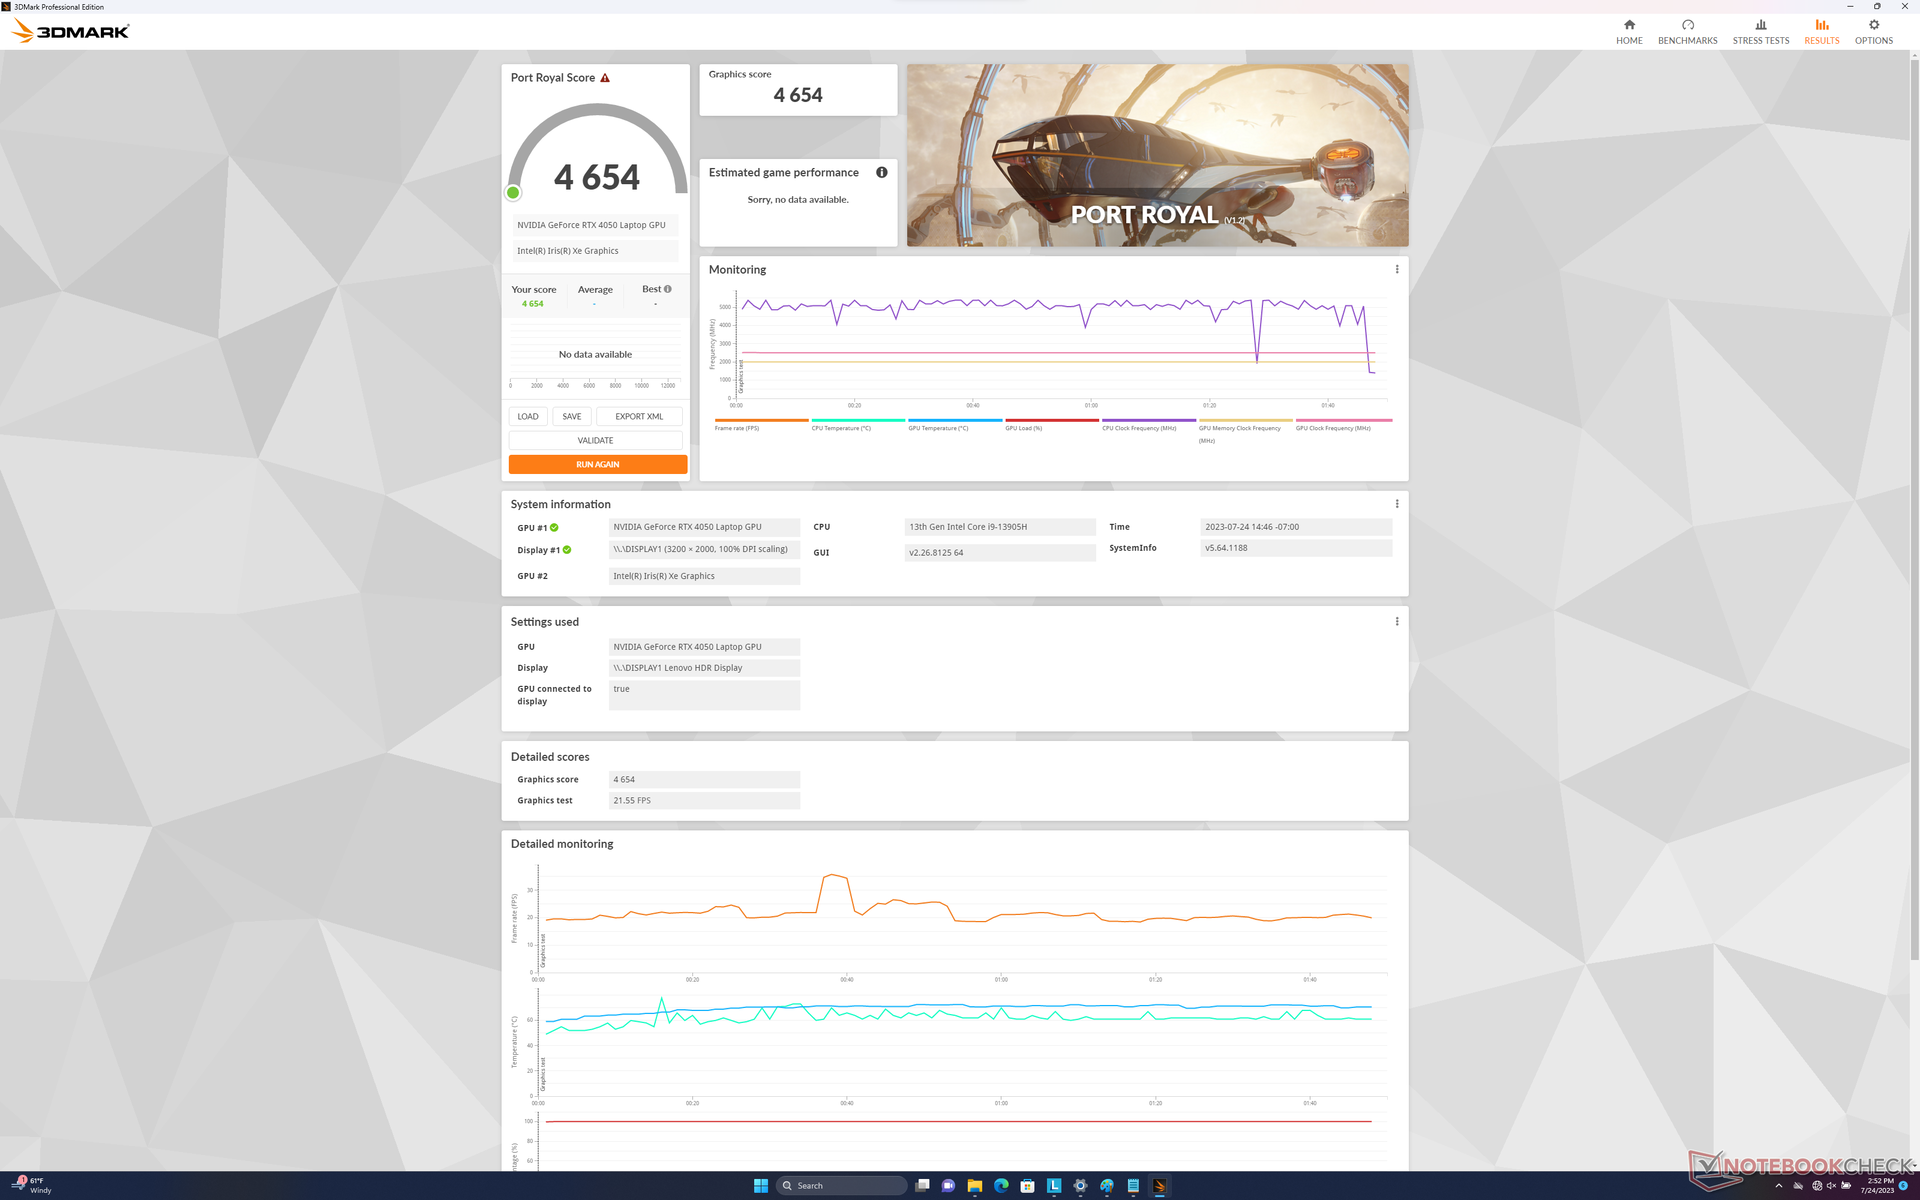
GPU-Performance
Die mobile GeForce RTX 4050 ist ein deutliches Upgrade gegenüber der enttäuschenden letztjährigen mobilen RTX-3050-Serie. Die reine Grafikleistung ist etwa 50 bis 60 Prozent schneller als bei der RTX 3050 Ti und liegt damit auf Augenhöhe mit der mobilen RTX 3060.
Durch die Aufrüstung auf die RTX-4060-Konfiguration wird eine Leistungssteigerung von etwa 20 Prozent erwartet.
Die Ausführung im Modus "Balanced" anstelle des Modus " Performance " wirkt sich leicht auf die Leistung aus, wie unsere Ergebnisse auf Fire Strike in der Tabelle unten zeigen.
| Leistungsprofil | Fire Strike Physik-Ergebnis | Grafik-Punktzahl | Kombinierte Punktzahl |
| Akku | 30.199 (-4 %) | 12.900 (-39 %) | 5.642 (-43 %) |
| Ausgewogen | 2.8925 (-8 %) | 20.047 (-6 %) | 7.581 (-24 %) |
| Performance | 31.606 | 21.212 | 9.969 |

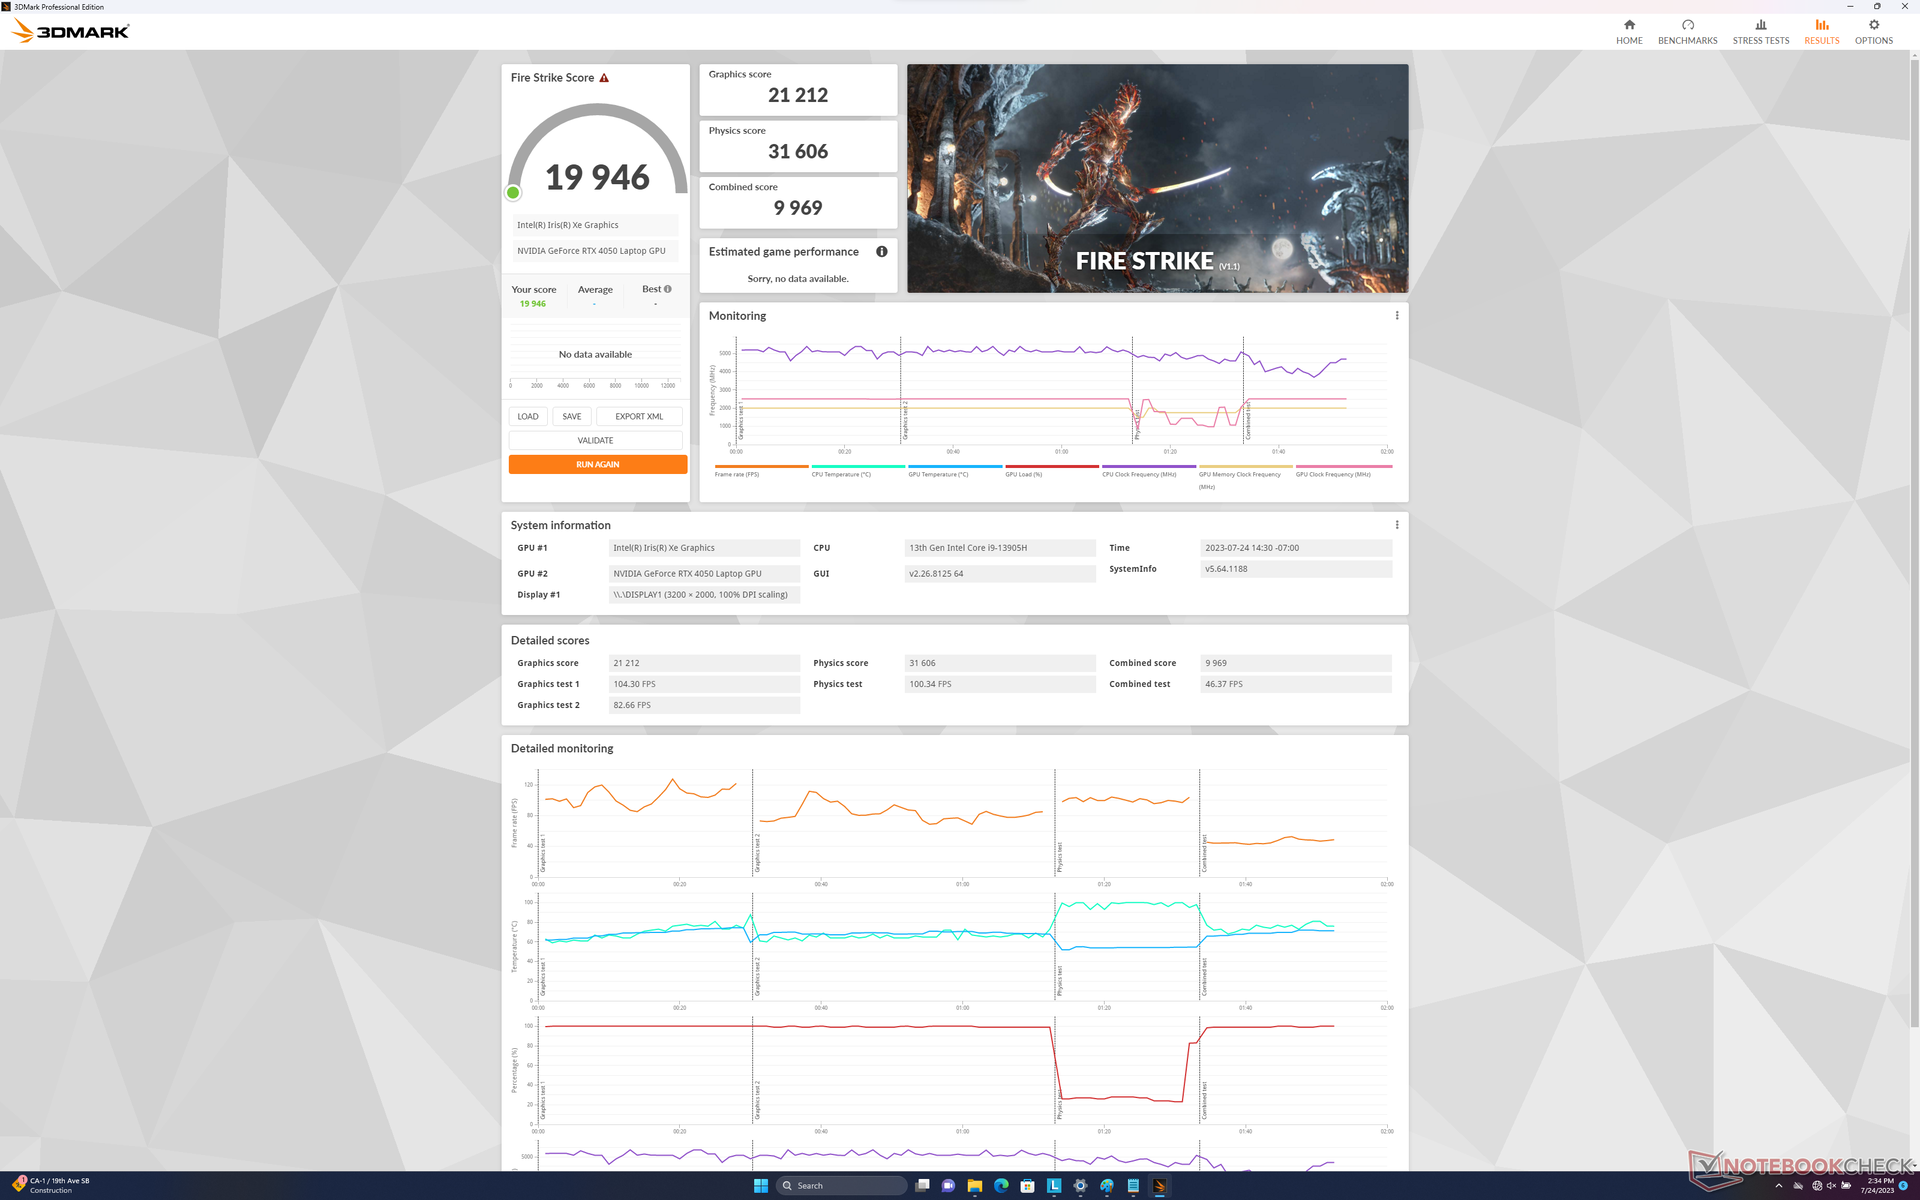

| 3DMark 11 Performance | 28168 Punkte | |
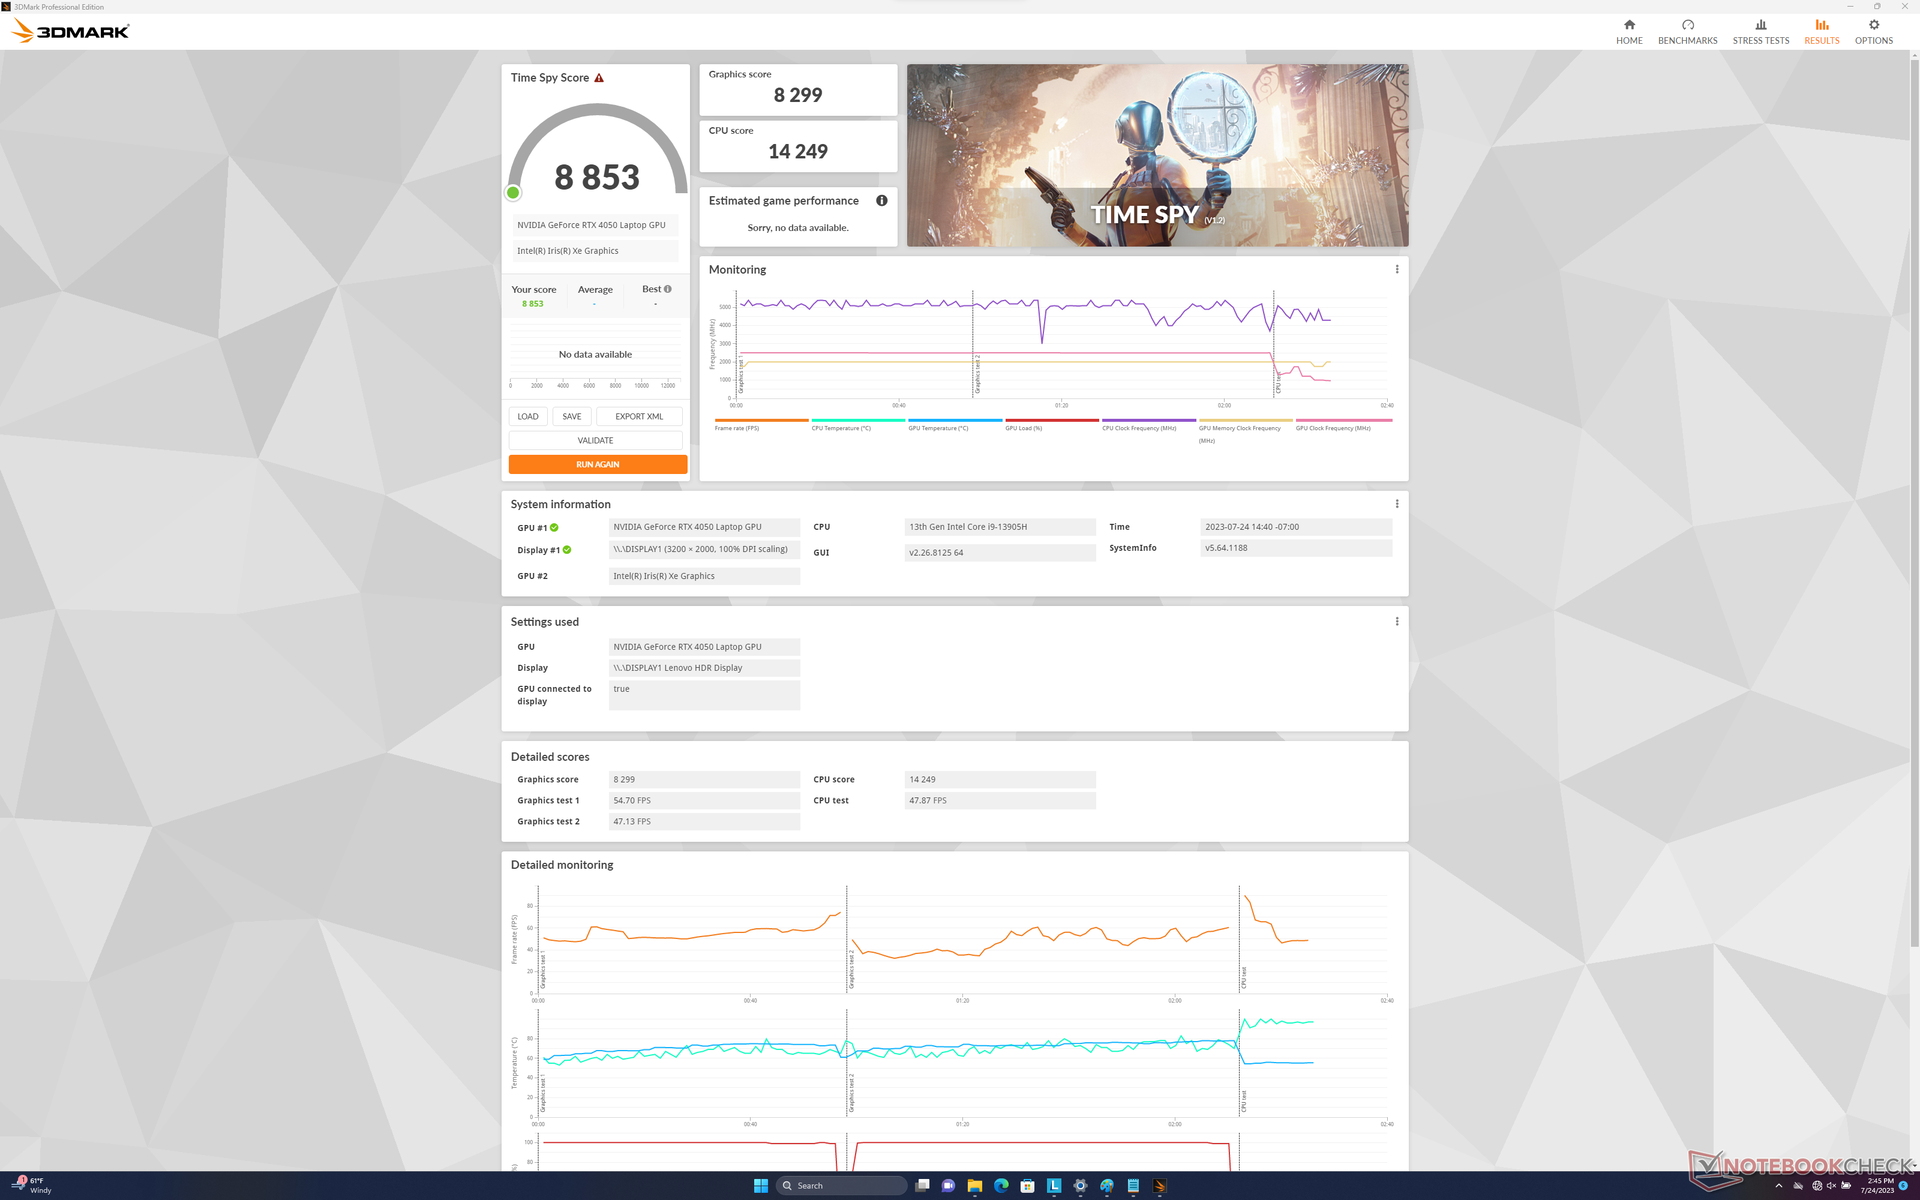
| 3DMark Fire Strike Score | 19946 Punkte | |
| 3DMark Time Spy Score | 8853 Punkte | |
Hilfe | ||
* ... kleinere Werte sind besser
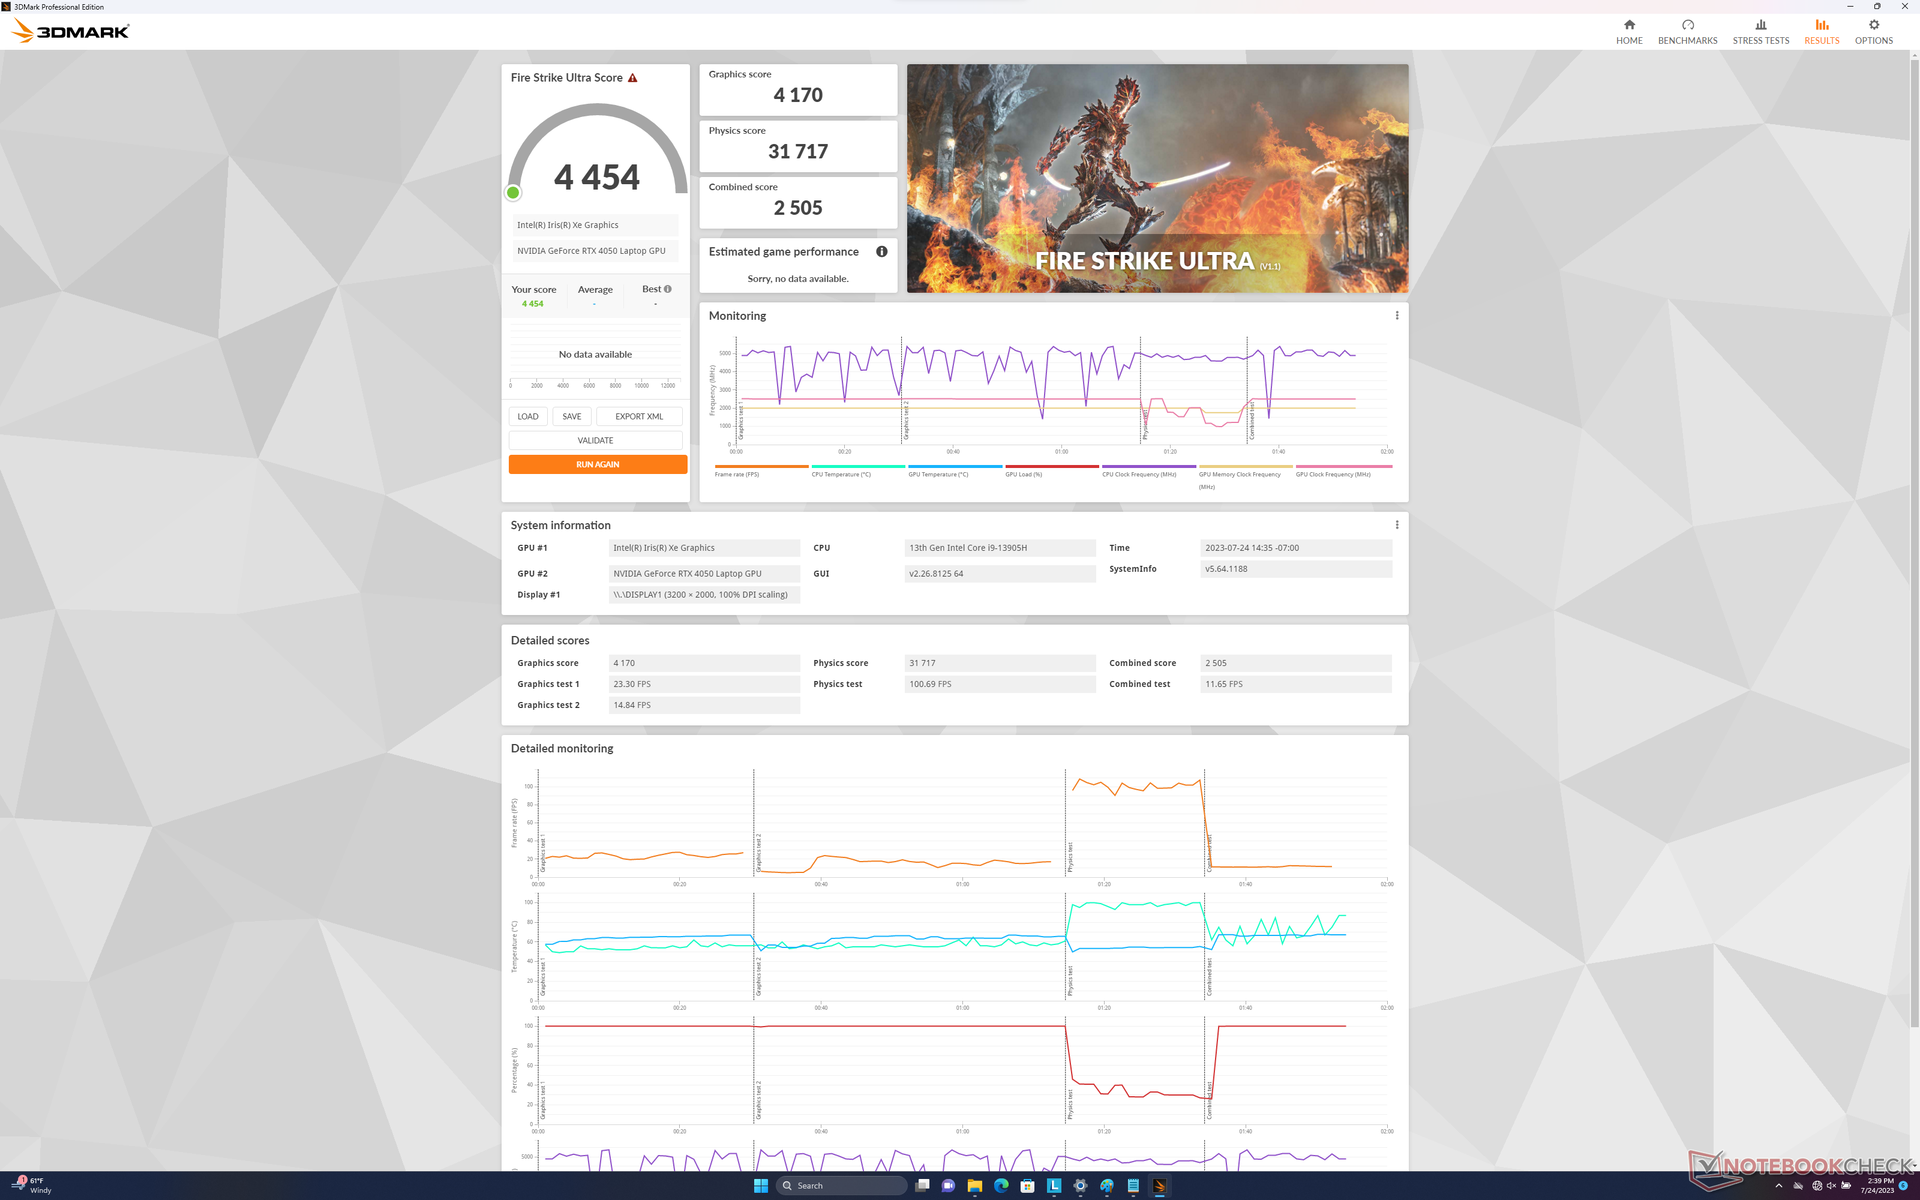
Spielen Performance
Obwohl es sich technisch gesehen nicht um einen Gaming Laptop handelt, ist das System mehr als fähig, die neuesten Titel sogar in der nativen QHD+-Auflösung zu spielen. Neuere und anspruchsvollere Titel wie Returnal können auf maximalen Einstellungen laufen, aber für erträglichere Frame-Raten wird DLSS empfohlen.
G-Sync wird auf dem internen Display leider nicht unterstützt.
Witcher 3 FPS Chart
| min. | mittel | hoch | max. | QHD | |
|---|---|---|---|---|---|
| GTA V (2015) | 183.7 | 180.6 | 167.8 | 96.8 | 67.5 |
| The Witcher 3 (2015) | 410.2 | 271.1 | 164.7 | 84.9 | 59.2 |
| Dota 2 Reborn (2015) | 180 | 162.5 | 155 | 138.6 | |
| Final Fantasy XV Benchmark (2018) | 186.9 | 118.6 | 83.5 | 60 | |
| X-Plane 11.11 (2018) | 153 | 130.6 | 103.2 | ||
| Strange Brigade (2018) | 429 | 202 | 164.7 | 144.1 | 96.3 |
| Cyberpunk 2077 1.6 (2022) | 121.3 | 105.9 | 78.7 | 64.1 | 38.5 |
| Tiny Tina's Wonderlands (2022) | 183.3 | 142.8 | 91.5 | 70.2 | 47.7 |
| F1 22 (2022) | 214 | 199.8 | 150.8 | 52.6 | 32.3 |
| Returnal (2023) | 64 | 63 | 59 | 52 | 34 |
Emissionen
System-Rauschen
Die Lüftergeräusche bewegen sich im Bereich von 25 bis 27 dB(A) vor einem leisen Hintergrund von 22,7 dB(A), wenn das Notebook mit wenig Last wie Browsern oder Videostreams läuft. Bei höherer Last, wie z. B. Spielen, werden die Lüfter jedoch immer lauter, bis sie mit maximal 52,6 dB(A) so laut sind wie viele Gaming-Notebooks.
Es ist erwähnenswert, dass das Lüftergeräusch erheblich auf nur 44,2 dB(A) sinkt, wenn Spiele im Modus "Ausbalanciert" statt im Modus " Performance " ausgeführt werden. Das geringere Lüftergeräusch kann daher je nach den Vorlieben des Nutzers den leichten Leistungsabfall wert sein.
Lautstärkediagramm
| Idle |
| 22.7 / 22.7 / 27.5 dB(A) |
| Last |
| 28.9 / 52.5 dB(A) |
 | ||
30 dB leise 40 dB(A) deutlich hörbar 50 dB(A) störend |
||
min: | ||
| Lenovo Slim Pro 9i 16IRP8 GeForce RTX 4050 Laptop GPU, i9-13905H, Samsung PM9A1 MZVL21T0HCLR | Lenovo Yoga Pro 9 16-IRP G8 GeForce RTX 4060 Laptop GPU, i7-13705H, Samsung PM9A1 MZVL21T0HCLR | Asus VivoBook Pro 16 GeForce RTX 3050 Ti Laptop GPU, i7-12700H, Intel SSD 670p SSDPEKNU010TZ | Acer Swift Edge SFE16-42-R1GM Radeon 680M, R7 7735U, Micron 3400 1TB MTFDKBA1T0TFH | Dell Inspiron 16 Plus 7620 GeForce RTX 3050 Ti Laptop GPU, i7-12700H, Kioxia BG5 KBG50ZNS512G | HP Envy 16 h0112nr GeForce RTX 3060 Laptop GPU, i7-12700H, Micron 3400 1TB MTFDKBA1T0TFH | |
|---|---|---|---|---|---|---|
| Geräuschentwicklung | -10% | -22% | -13% | -13% | -7% | |
| aus / Umgebung * (dB) | 22.7 | 24.7 -9% | 25.2 -11% | 25.7 -13% | 23.3 -3% | 22.8 -0% |
| Idle min * (dB) | 22.7 | 24.7 -9% | 25.2 -11% | 25.7 -13% | 25.7 -13% | 22.9 -1% |
| Idle avg * (dB) | 22.7 | 26.2 -15% | 25.2 -11% | 27 -19% | 26.1 -15% | 22.9 -1% |
| Idle max * (dB) | 27.5 | 26.2 5% | 25.2 8% | 29.3 -7% | 30.6 -11% | 30.5 -11% |
| Last avg * (dB) | 28.9 | 39.7 -37% | 55.1 -91% | 42.3 -46% | 46.2 -60% | 41.4 -43% |
| Witcher 3 ultra * (dB) | 52.6 | 53.2 -1% | 49.2 6% | 51.1 3% | ||
| Last max * (dB) | 52.5 | 53.2 -1% | 61.5 -17% | 42.7 19% | 49.4 6% | 51.4 2% |
* ... kleinere Werte sind besser
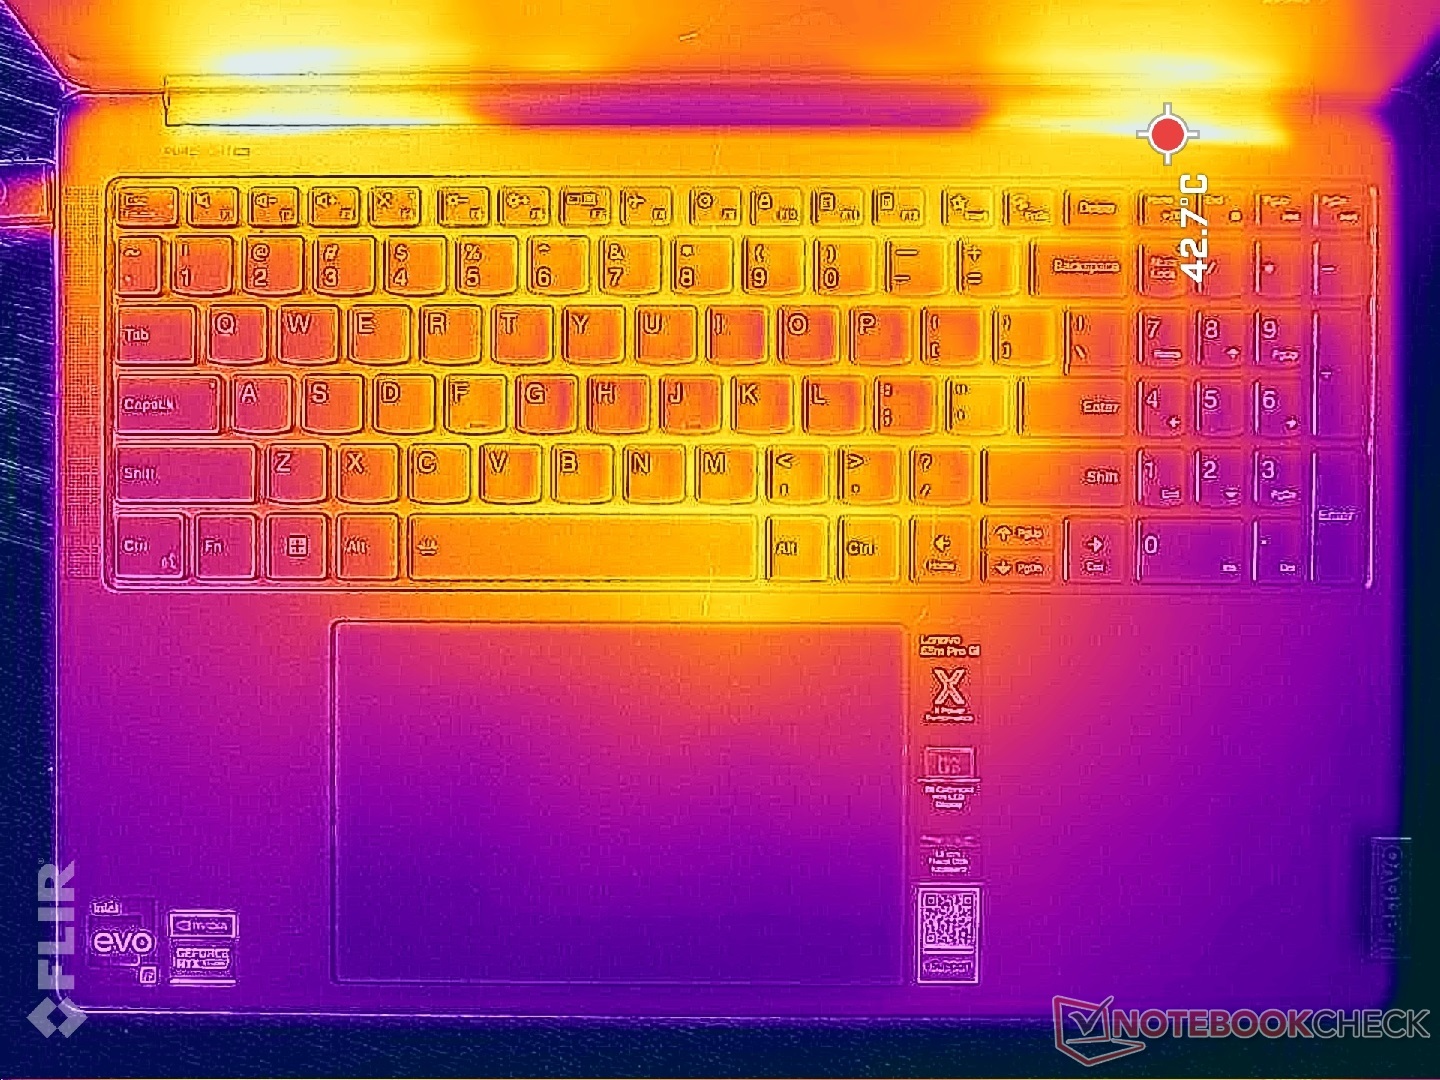
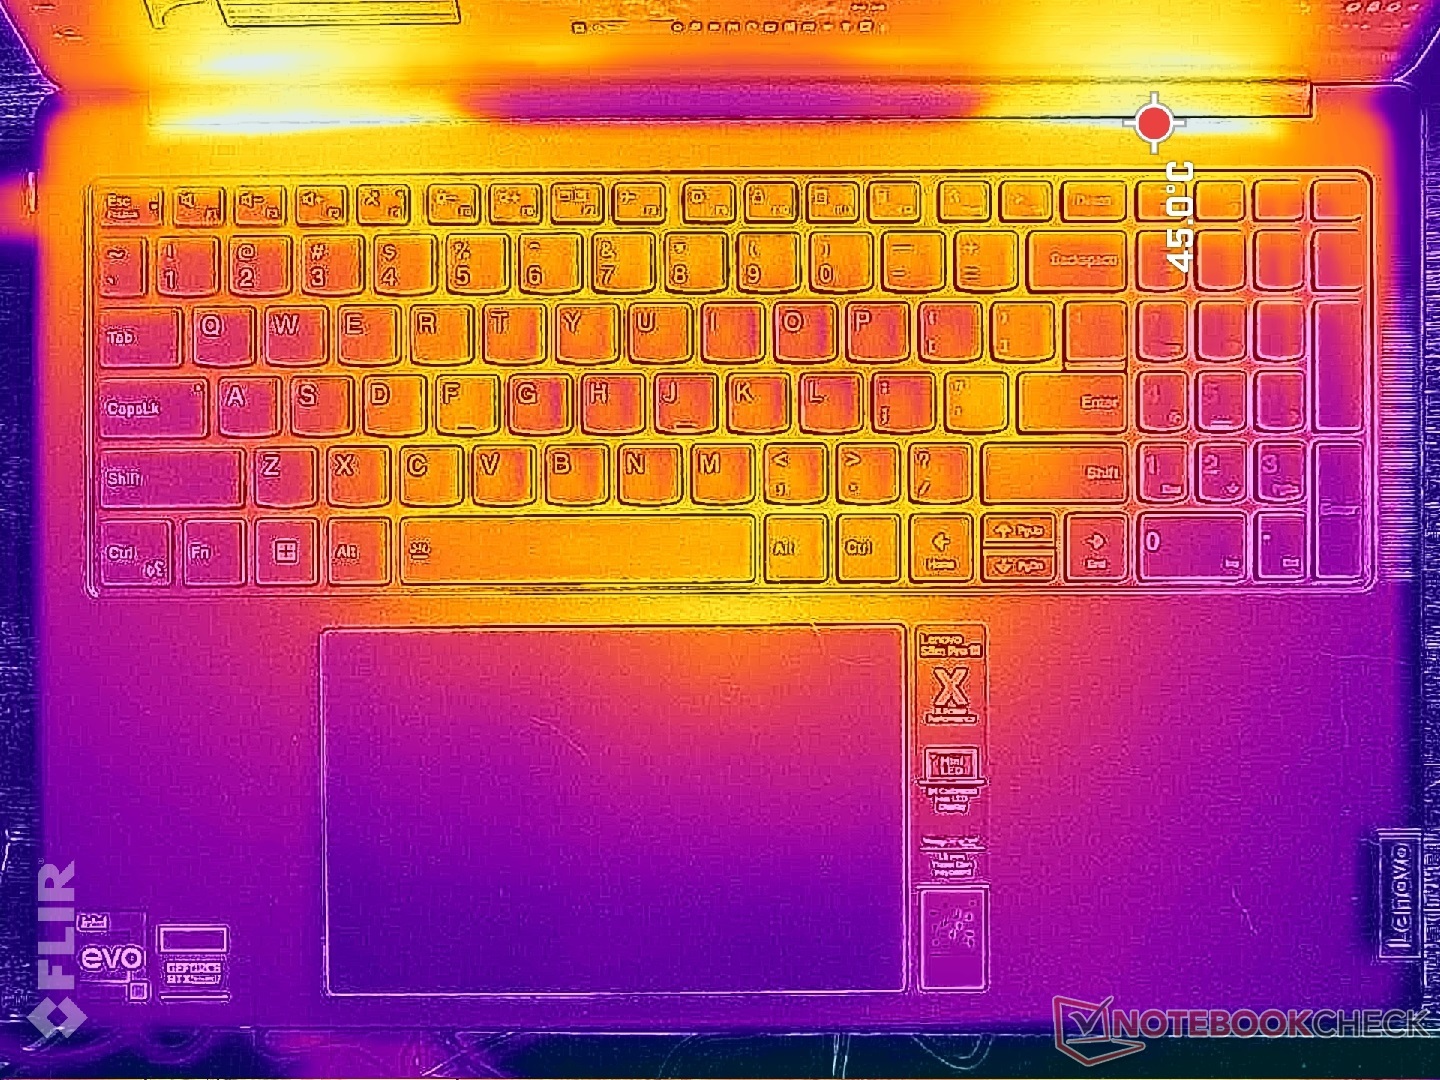
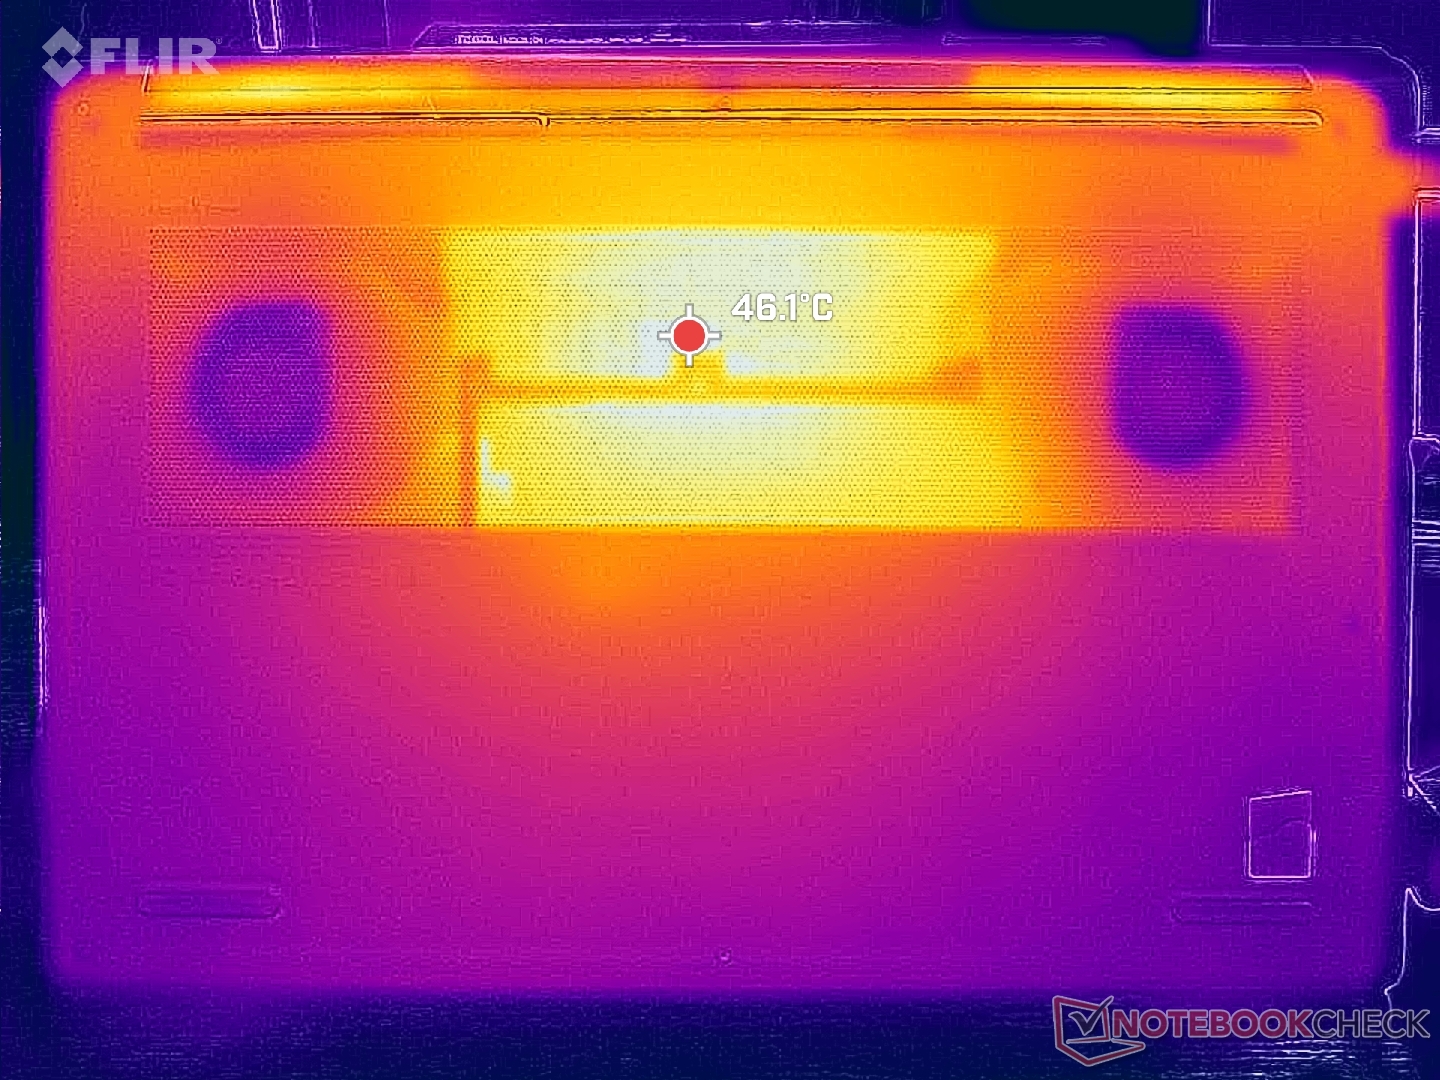
Temperatur
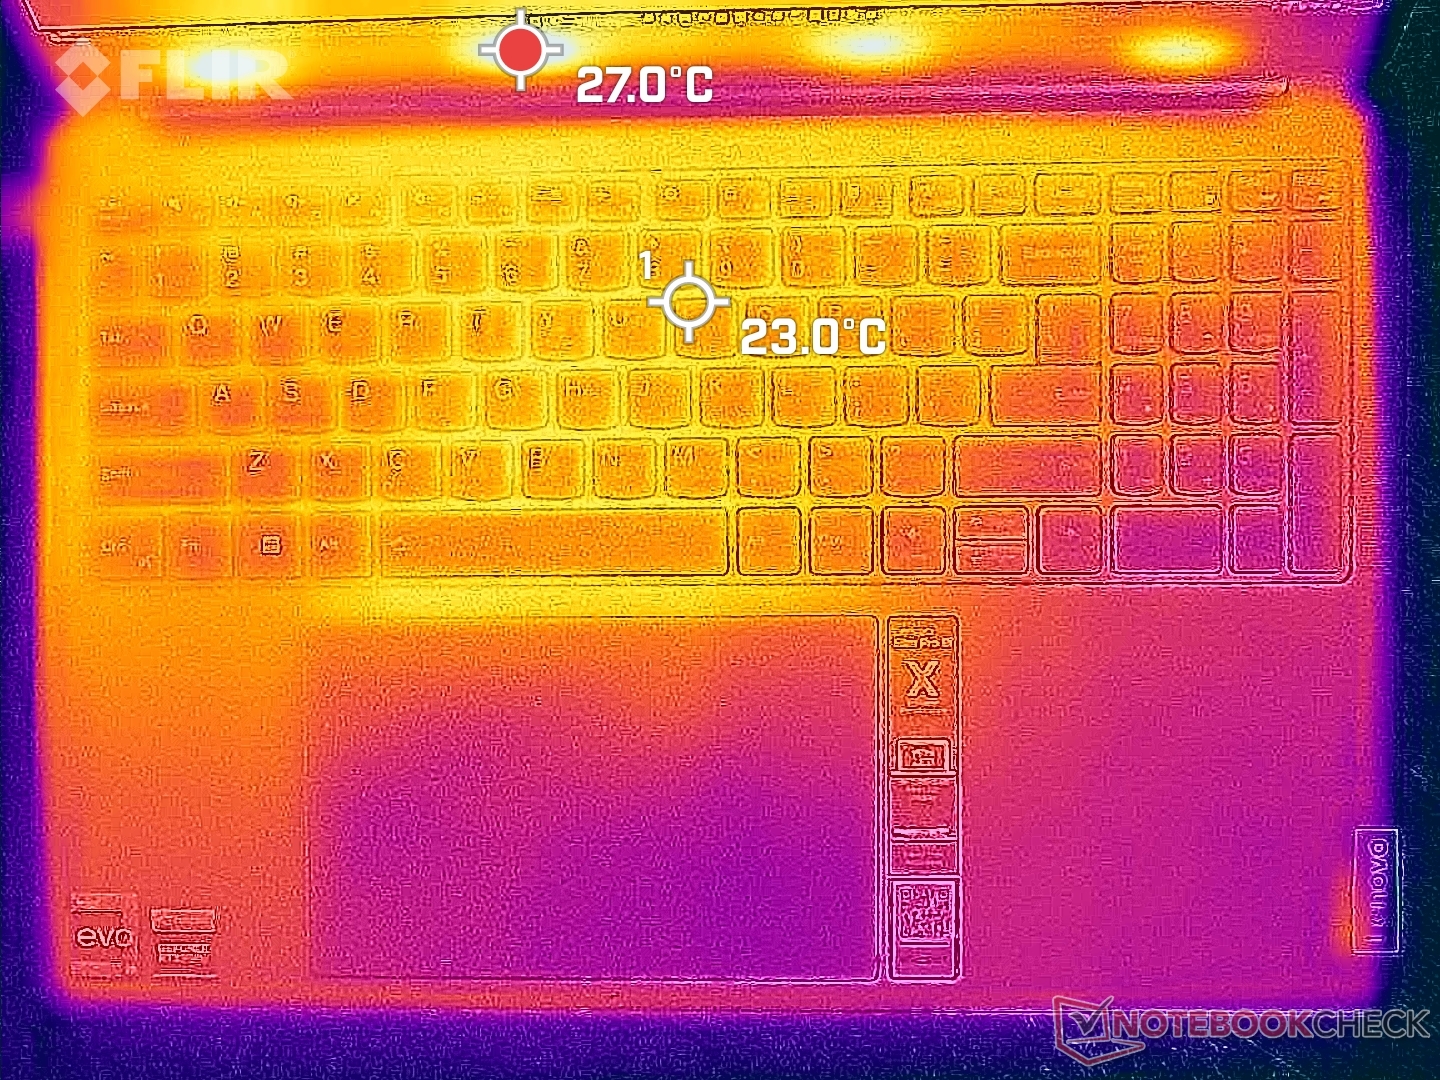
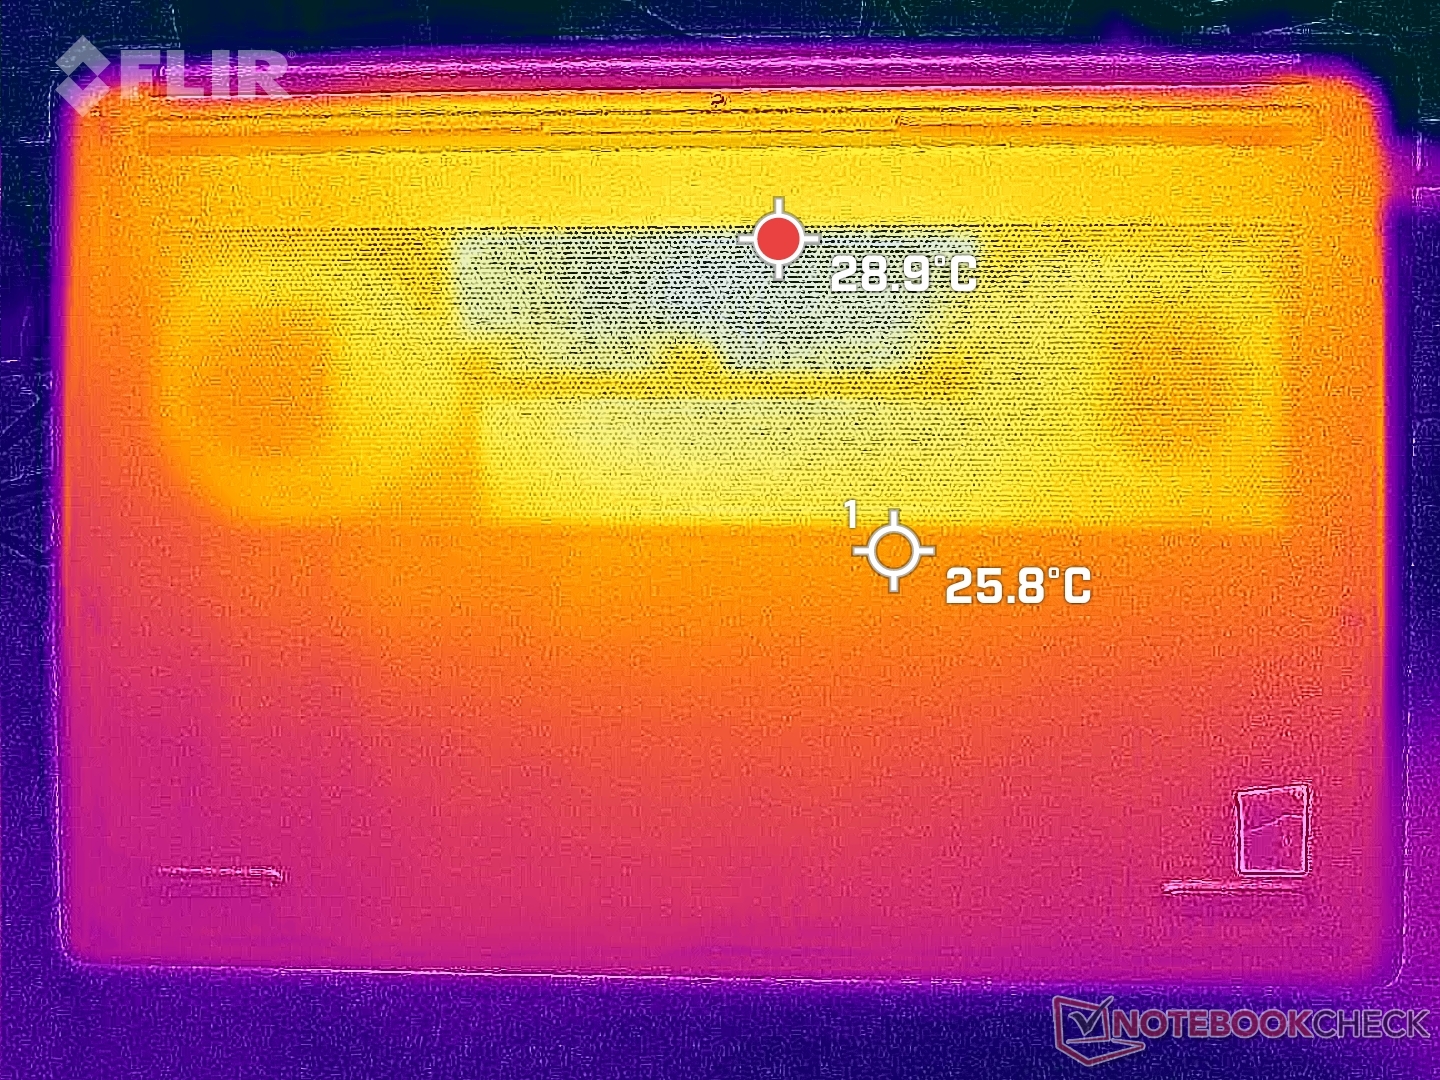
Die Oberflächentemperaturen sind in der Nähe der mittleren Bereiche am wärmsten, wo Hotspots über 38 °C auf der Oberseite und 44 °C auf der Unterseite erreichen können. Die Tastatur des Lenovo ist nicht so warm wie die des Inspiron 16 Plus 7620, wo die Mitte unter Last bis zu 50 °C erreichen kann.
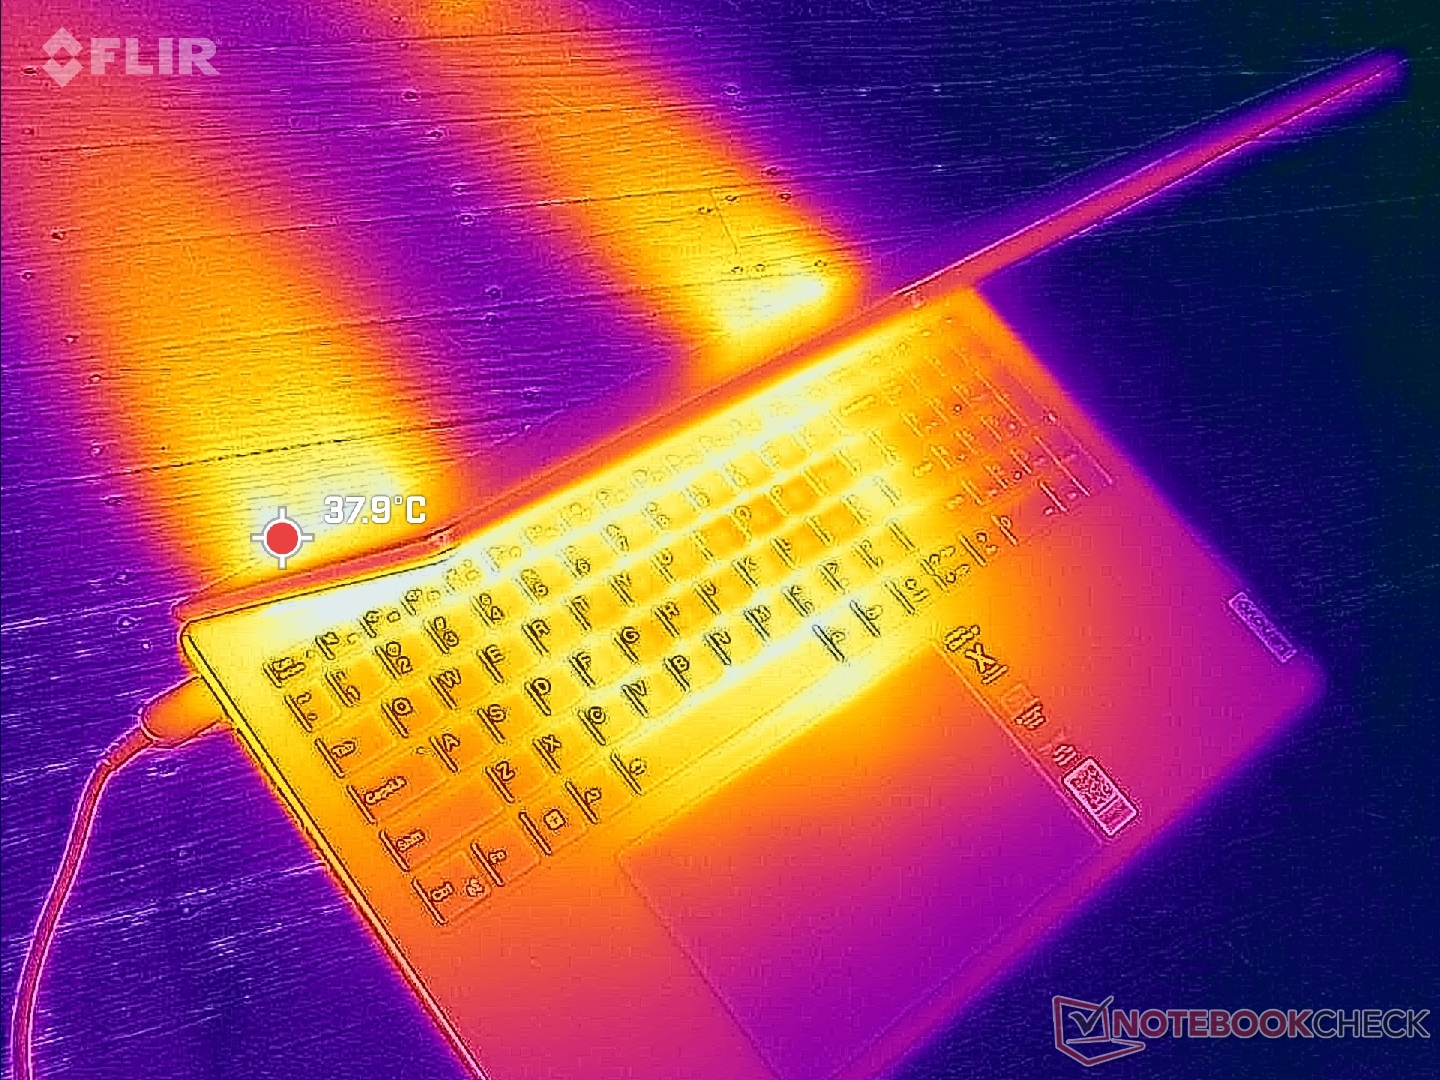

(+) Die maximale Temperatur auf der Oberseite ist 37.8 °C. Im Vergleich liegt der Klassendurchschnitt bei 36.8 °C (von 21 bis 71 °C für die Klasse Multimedia).
(±) Auf der Unterseite messen wir eine maximalen Wert von 44.8 °C (im Vergleich zum Durchschnitt von 39.1 °C).
(+) Ohne Last messen wir eine durchschnittliche Temperatur von 28.8 °C auf der Oberseite. Der Klassendurchschnitt erreicht 31.3 °C.
(±) Beim längeren Spielen von The Witcher 3 erhitzt sich das Gerät durchschnittlich auf 35.4 °C. Der Durchschnitt der Klasse ist derzeit 31.3 °C.
(+) Die Handballen und der Touchpad-Bereich erreichen maximal 32 °C und damit die typische Hauttemperatur und fühlen sich daher nicht heiß an.
(-) Die durchschnittliche Handballen-Temperatur anderer getesteter Geräte war 28.7 °C (-3.3 °C).

| Lenovo Slim Pro 9i 16IRP8 Intel Core i9-13905H, NVIDIA GeForce RTX 4050 Laptop GPU | Lenovo Yoga Pro 9 16-IRP G8 Intel Core i7-13705H, NVIDIA GeForce RTX 4060 Laptop GPU | Asus VivoBook Pro 16 Intel Core i7-12700H, NVIDIA GeForce RTX 3050 Ti Laptop GPU | Acer Swift Edge SFE16-42-R1GM AMD Ryzen 7 7735U, AMD Radeon 680M | Dell Inspiron 16 Plus 7620 Intel Core i7-12700H, NVIDIA GeForce RTX 3050 Ti Laptop GPU | HP Envy 16 h0112nr Intel Core i7-12700H, NVIDIA GeForce RTX 3060 Laptop GPU | |
|---|---|---|---|---|---|---|
| Hitze | 0% | -16% | -11% | -5% | -8% | |
| Last oben max * (°C) | 37.8 | 41.6 -10% | 44.2 -17% | 49.4 -31% | 46 -22% | 45.2 -20% |
| Last unten max * (°C) | 44.8 | 50 -12% | 53 -18% | 44.7 -0% | 45.8 -2% | 44 2% |
| Idle oben max * (°C) | 30.6 | 26.8 12% | 32.1 -5% | 34 -11% | 29.2 5% | 33.6 -10% |
| Idle unten max * (°C) | 31 | 27.9 10% | 38.4 -24% | 31.6 -2% | 31 -0% | 32.6 -5% |
* ... kleinere Werte sind besser
Stresstest
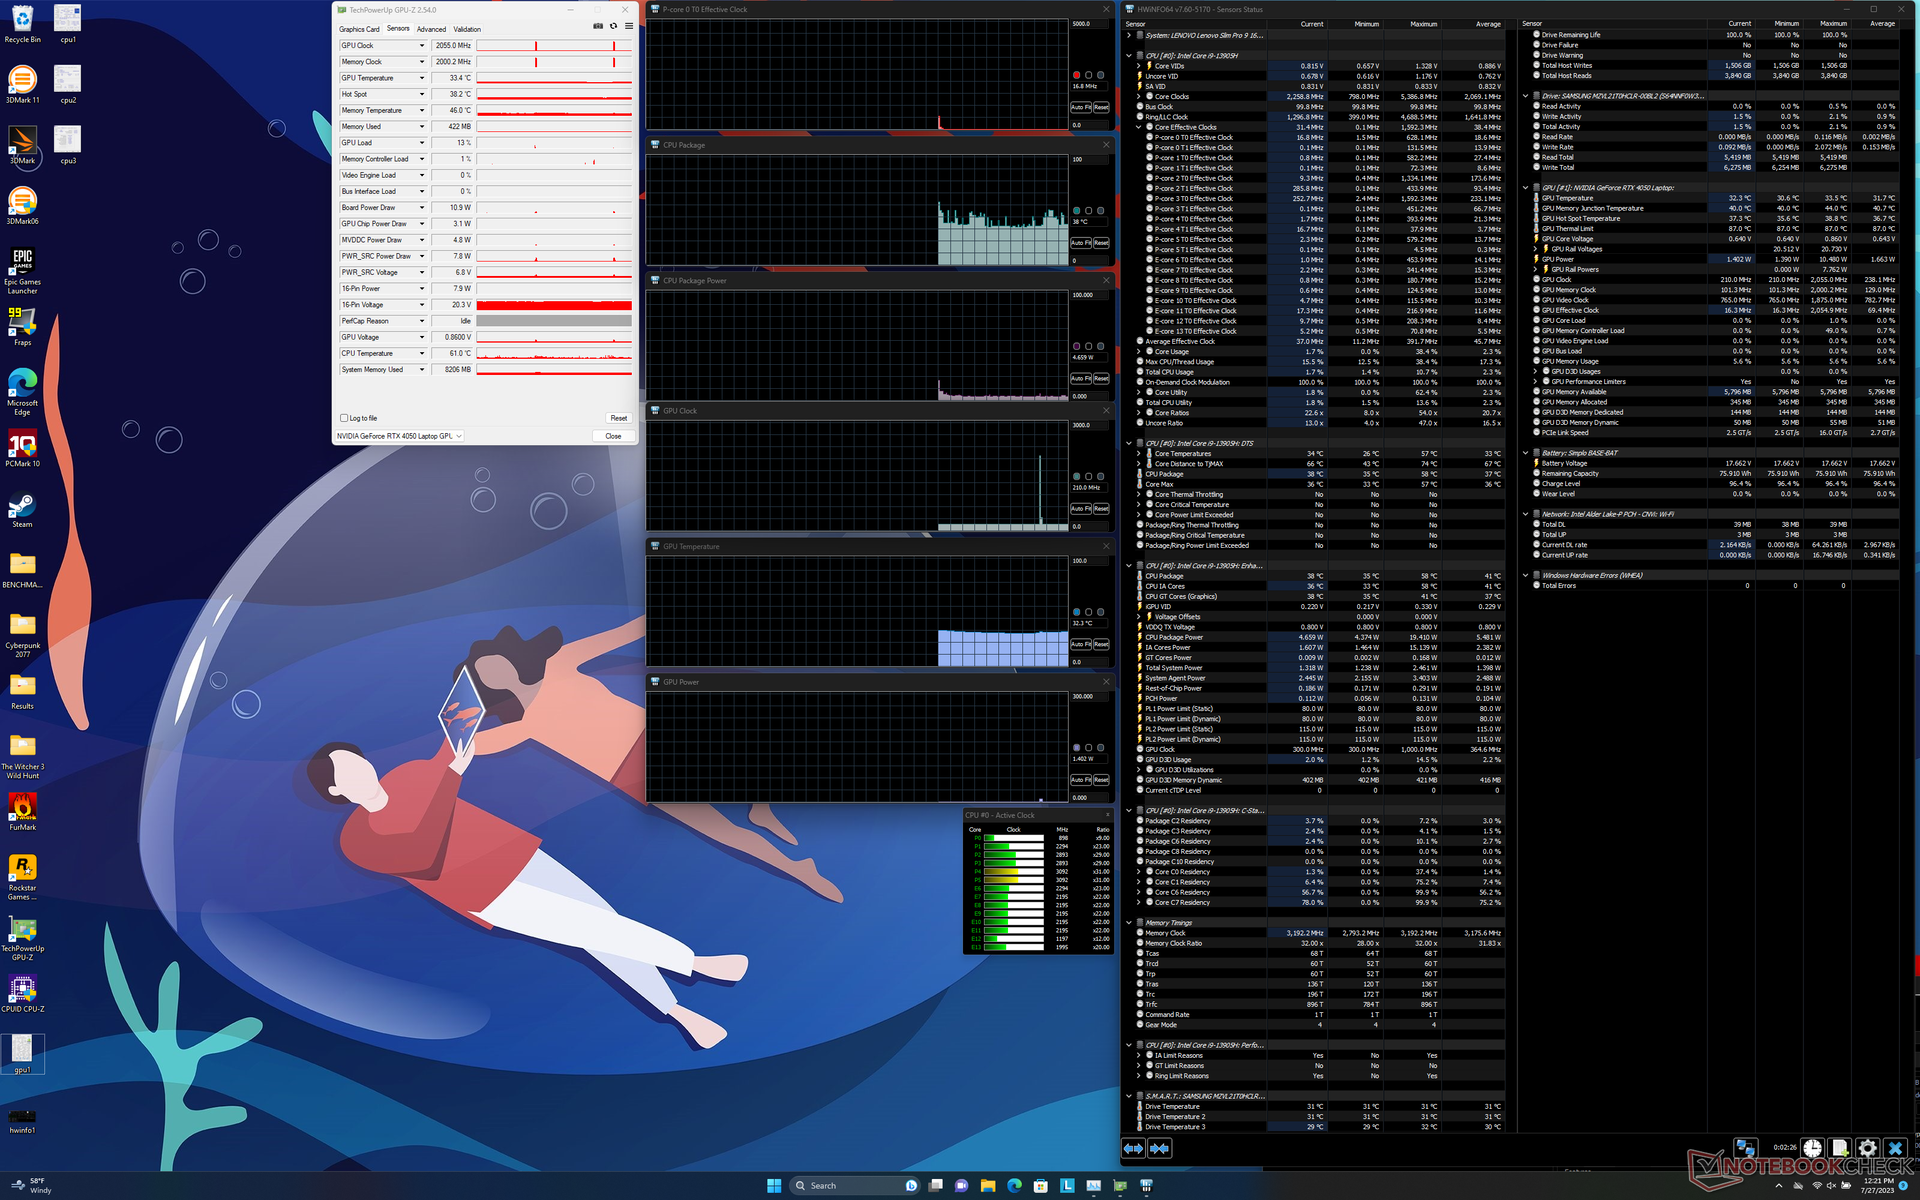
Die CPU wurde beim Start von Prime95 in den ersten 40 Sekunden auf 4 GHz, 120 W und 100 °C hochgefahren. Da 100 °C nicht ideal sind, sinken die Taktraten und die Leistungsaufnahme des Boards schnell auf nur 3,0 bis 3,2 GHz bzw. 85 W, um eine vernünftigere Kerntemperatur von 82 °C aufrechtzuerhalten. Die hohen Turbo-Boost-Taktraten des Core i9-13905H sind daher auf dem Slim Pro 9i aufgrund von Kühlungsbeschränkungen nicht haltbar.
Die Nvidia GPU stabilisiert sich bei 2.505 MHz, 70 °C und 72 W stabilisieren während Witcher 3 im Performance Modus läuft, verglichen mit 2.460 MHz, 62 °C und 56 W im Balanced Modus. Die Leistungsaufnahme der GPU kann in der Spitze 92 W erreichen, während das TGP-Ziel bei 100 W liegt.
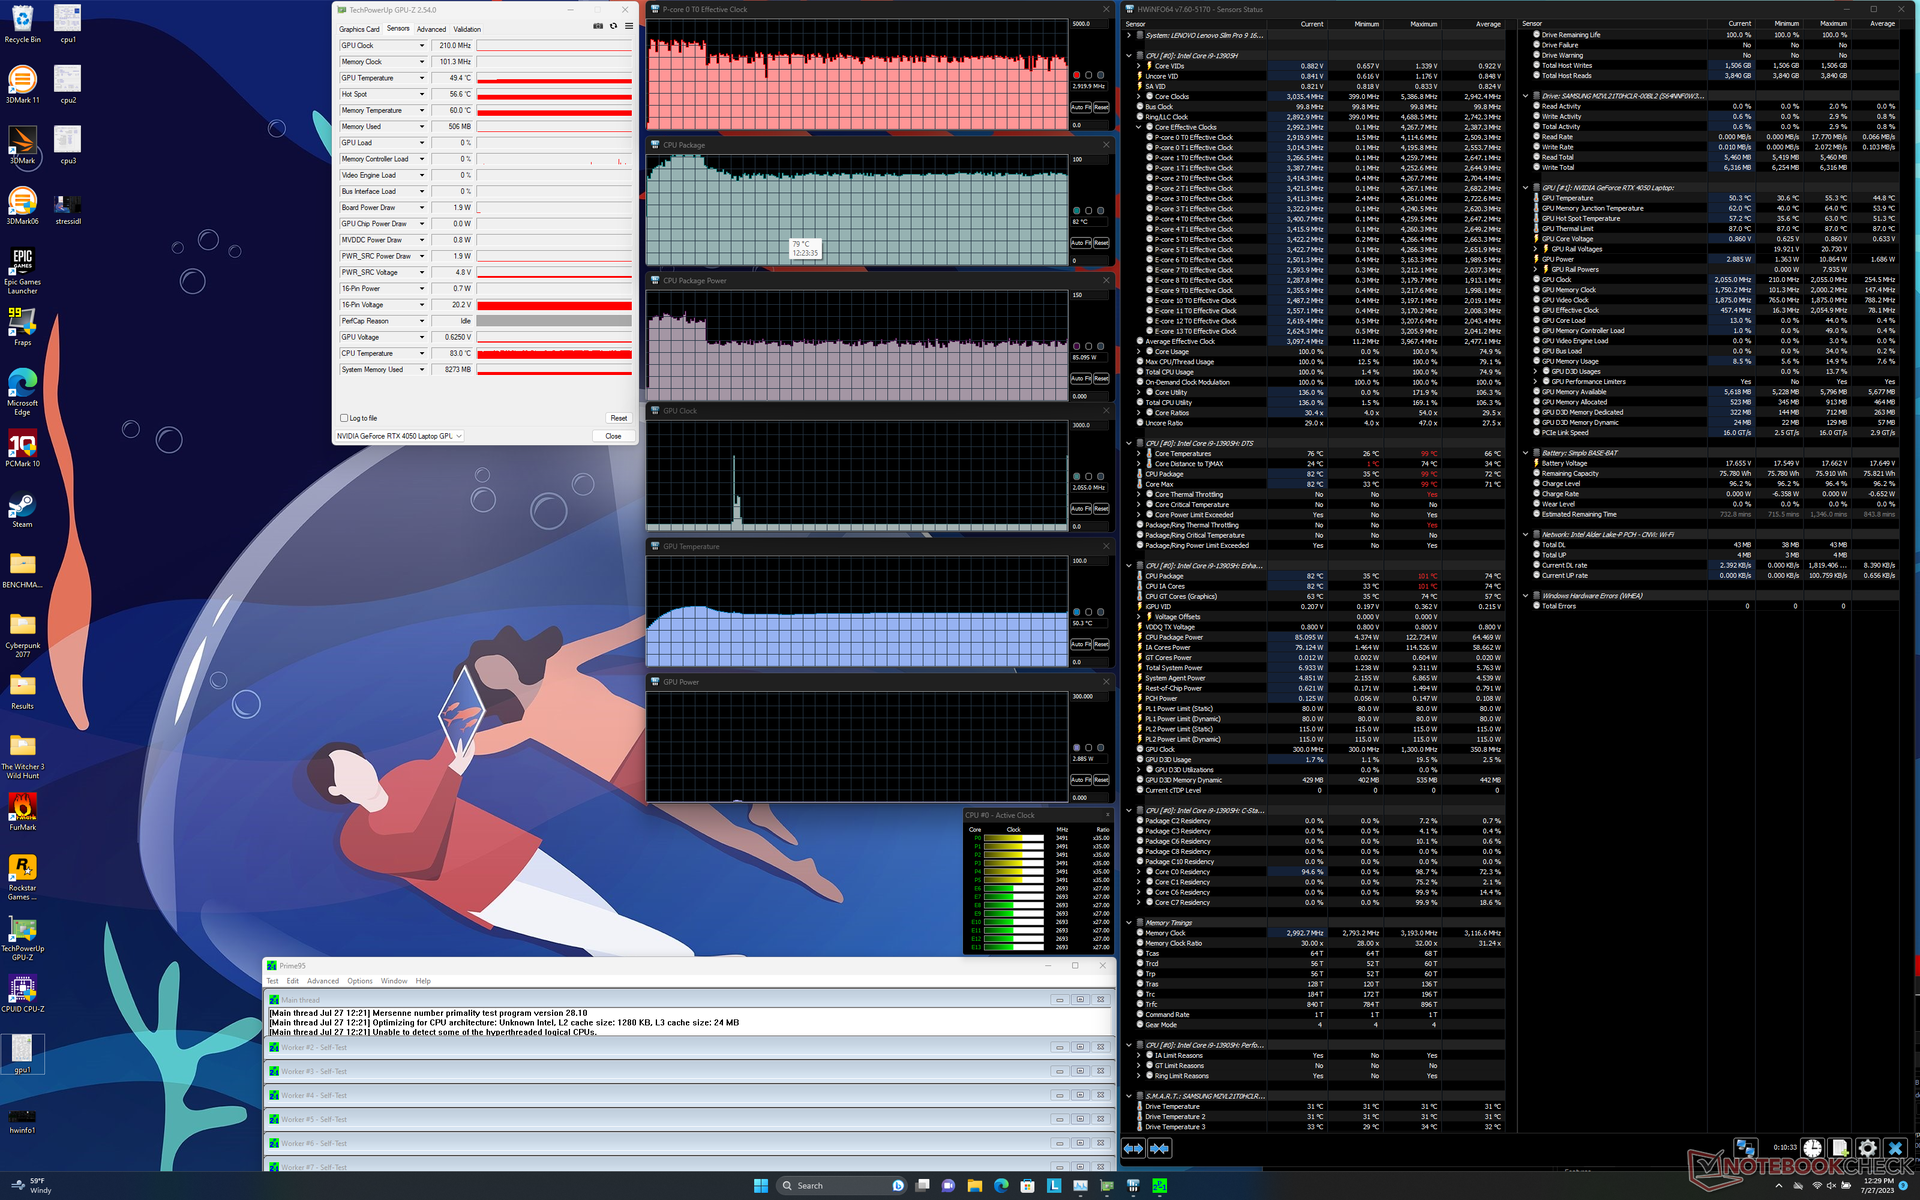
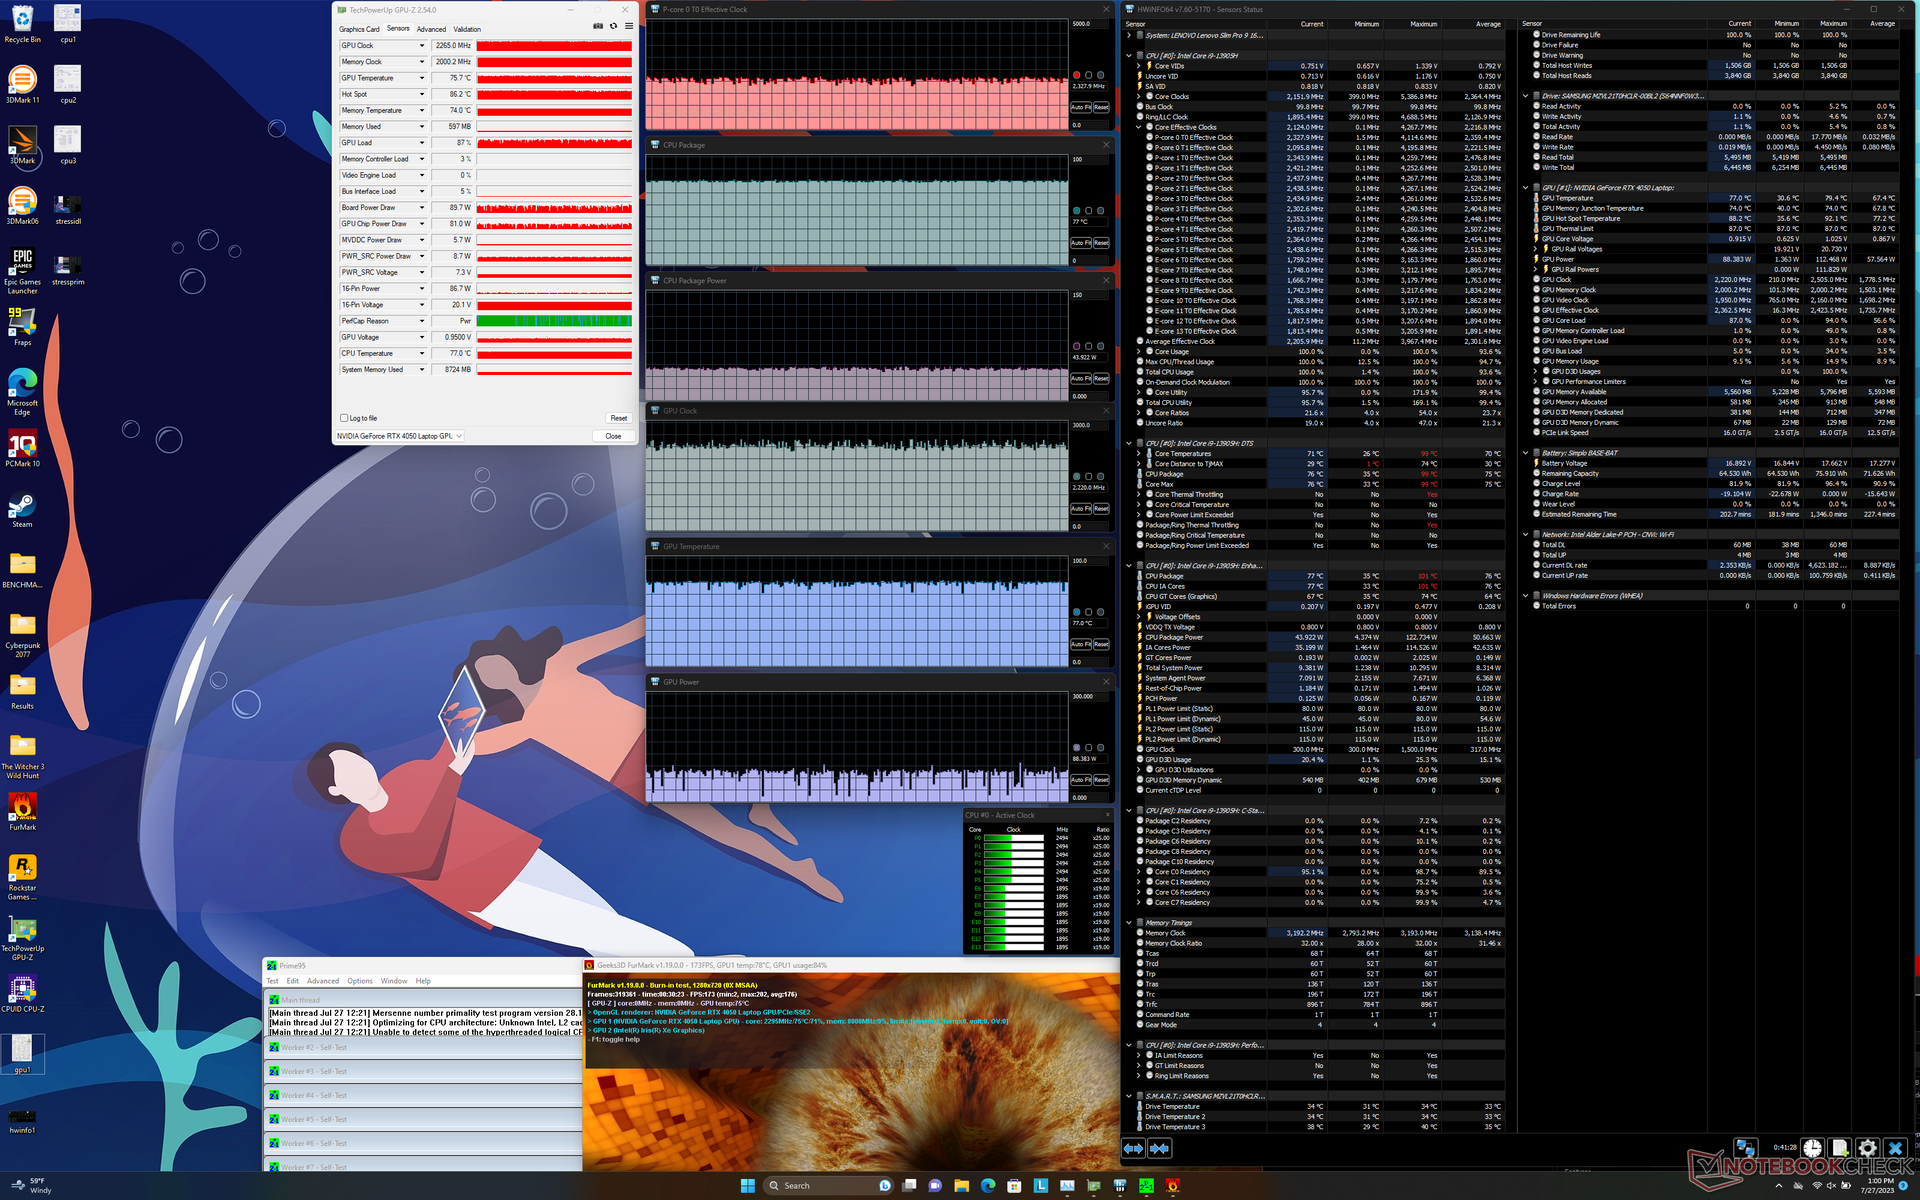
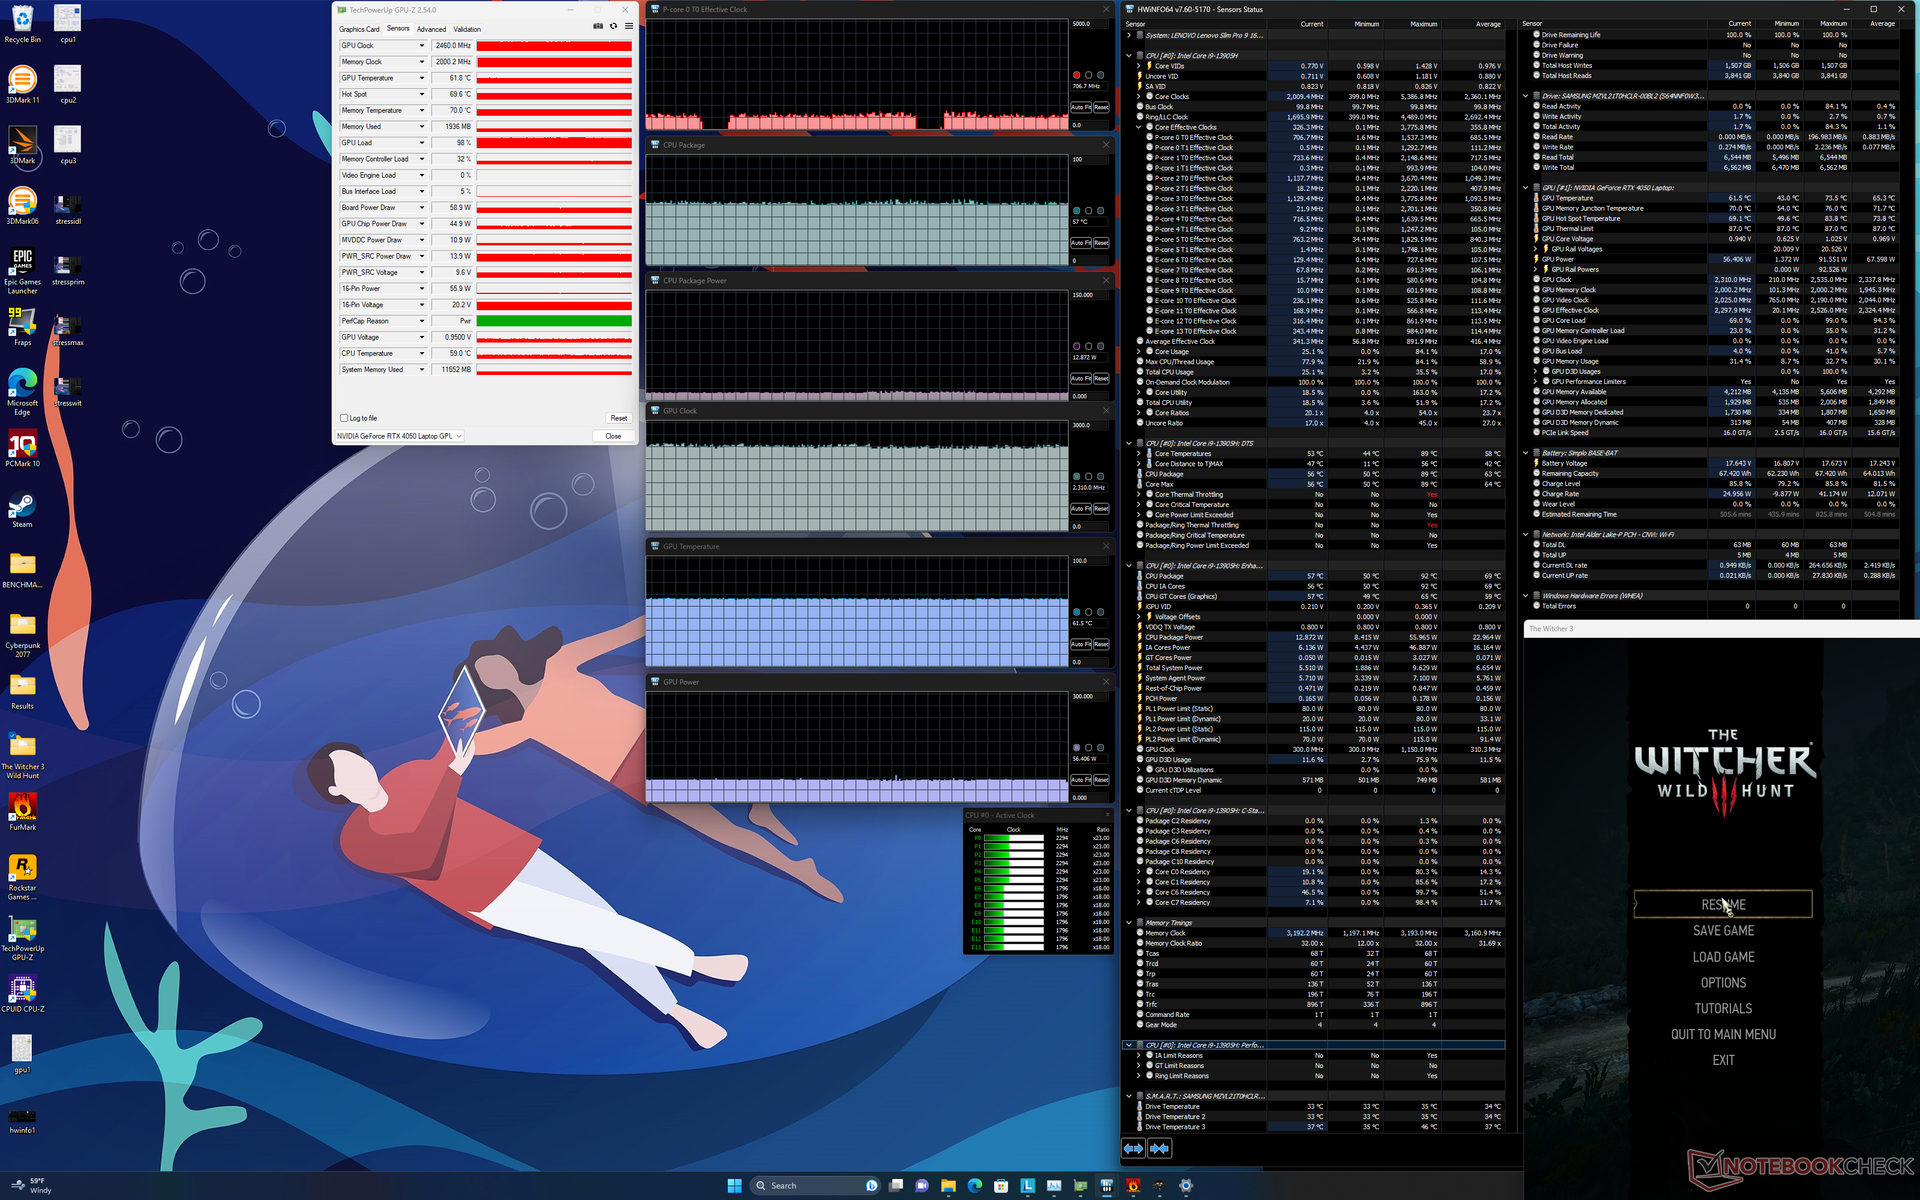
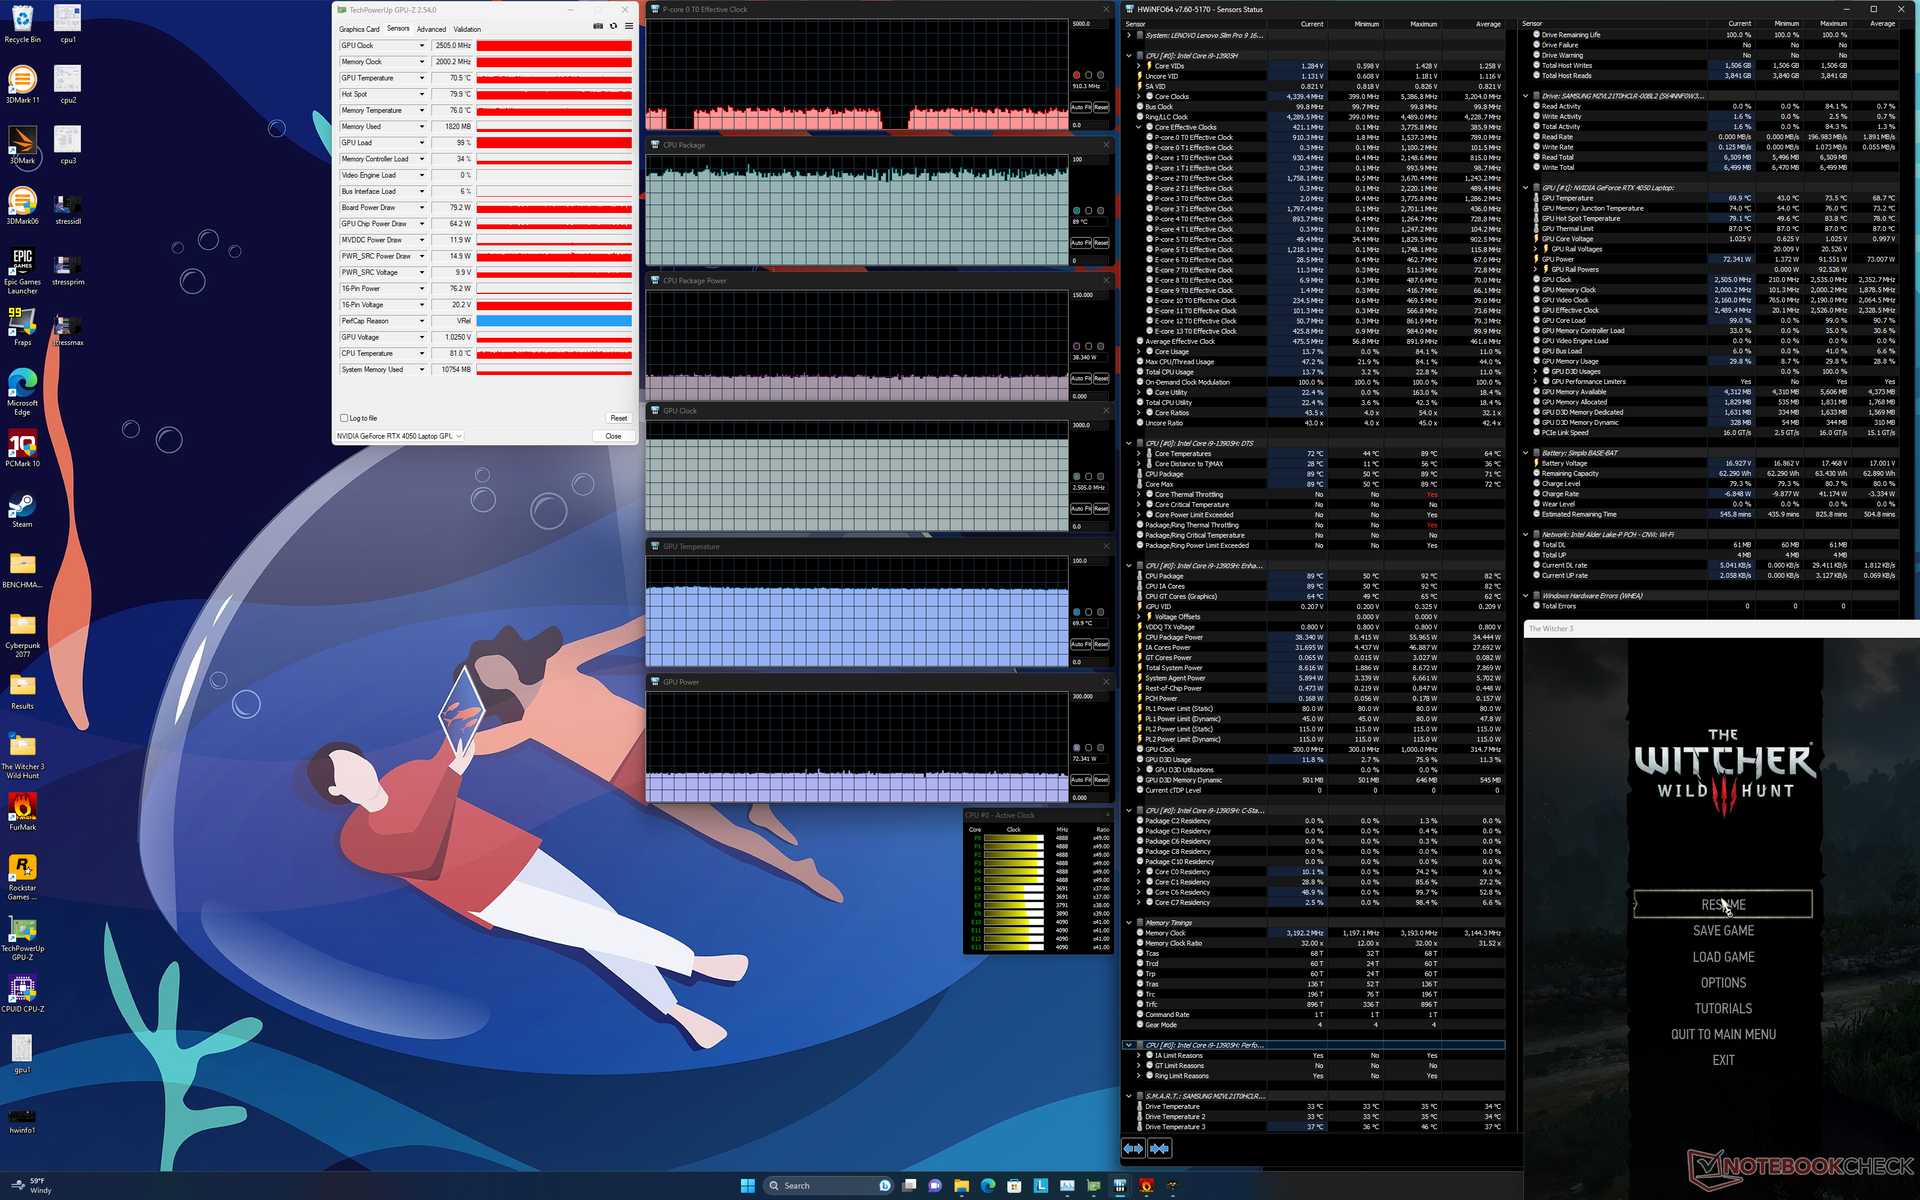
| CPU-Takt (GHz) | GPU-Takt (MHz) | durchschnittliche CPU-Temperatur (°C) | durchschnittliche GPU-Temperatur (°C) | |
| System Leerlauf | -- | -- | 38 | 32 |
| Prime95 Stress | ~3.0 | -- | 82 | 50 |
| Prime95 + FurMark Stress | ~2,4 | 2.265 | 77 | 77 |
| Witcher 3, Stress (Performance Modus) | ~0,9 | 2.505 | 89 | 70 |
| Witcher 3, Stress (Ausgewogener Modus) | ~0,7 | 2.460 | 57 | 62 |
Lautsprecher

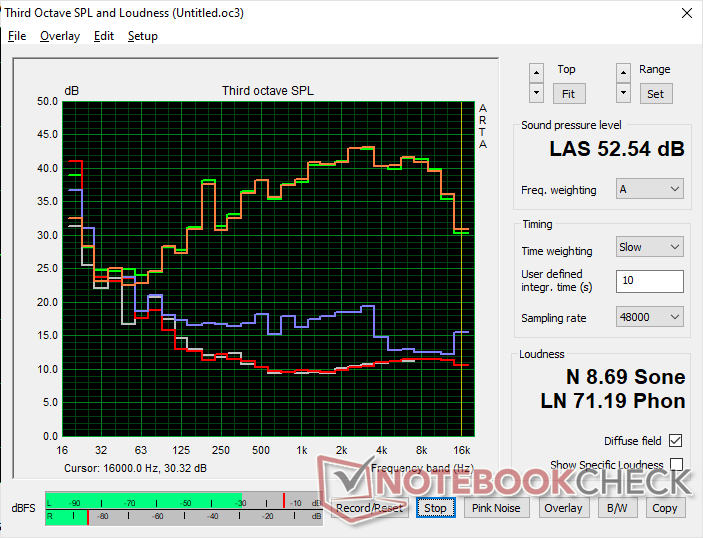
Lenovo Slim Pro 9i 16IRP8 Audio Analyse
(±) | Mittelmäßig laut spielende Lautsprecher (79.7 dB)
Bass 100 - 315 Hz
(+) | guter Bass - nur 2.8% Abweichung vom Median
(±) | durchschnittlich lineare Bass-Wiedergabe (8.9% Delta zum Vorgänger)
Mitteltöne 400 - 2000 Hz
(+) | ausgeglichene Mitten, vom Median nur 2.4% abweichend
(+) | lineare Mitten (4.9% Delta zum Vorgänger)
Hochtöne 2 - 16 kHz
(+) | ausgeglichene Hochtöne, vom Median nur 3.6% abweichend
(+) | sehr lineare Hochtöne (4.3% Delta zum Vorgänger)
Gesamt im hörbaren Bereich 100 - 16.000 Hz
(+) | hörbarer Bereich ist sehr linear (7.3% Abstand zum Median
Im Vergleich zu allen Geräten derselben Klasse
» 6% aller getesteten Geräte dieser Klasse waren besser, 1% vergleichbar, 94% schlechter
» Das beste Gerät hat einen Delta-Wert von 5%, durchschnittlich ist 17%, das schlechteste Gerät hat 45%
Im Vergleich zu allen Geräten im Test
» 1% aller getesteten Geräte waren besser, 0% vergleichbar, 99% schlechter
» Das beste Gerät hat einen Delta-Wert von 4%, durchschnittlich ist 24%, das schlechteste Gerät hat 134%
Apple MacBook Pro 16 2021 M1 Pro Audio Analyse
(+) | Die Lautsprecher können relativ laut spielen (84.7 dB)
Bass 100 - 315 Hz
(+) | guter Bass - nur 3.8% Abweichung vom Median
(+) | lineare Bass-Wiedergabe (5.2% Delta zum Vorgänger)
Mitteltöne 400 - 2000 Hz
(+) | ausgeglichene Mitten, vom Median nur 1.3% abweichend
(+) | lineare Mitten (2.1% Delta zum Vorgänger)
Hochtöne 2 - 16 kHz
(+) | ausgeglichene Hochtöne, vom Median nur 1.9% abweichend
(+) | sehr lineare Hochtöne (2.7% Delta zum Vorgänger)
Gesamt im hörbaren Bereich 100 - 16.000 Hz
(+) | hörbarer Bereich ist sehr linear (4.6% Abstand zum Median
Im Vergleich zu allen Geräten derselben Klasse
» 0% aller getesteten Geräte dieser Klasse waren besser, 0% vergleichbar, 100% schlechter
» Das beste Gerät hat einen Delta-Wert von 5%, durchschnittlich ist 17%, das schlechteste Gerät hat 45%
Im Vergleich zu allen Geräten im Test
» 0% aller getesteten Geräte waren besser, 0% vergleichbar, 100% schlechter
» Das beste Gerät hat einen Delta-Wert von 4%, durchschnittlich ist 24%, das schlechteste Gerät hat 134%
Energieverwaltung
Stromverbrauch
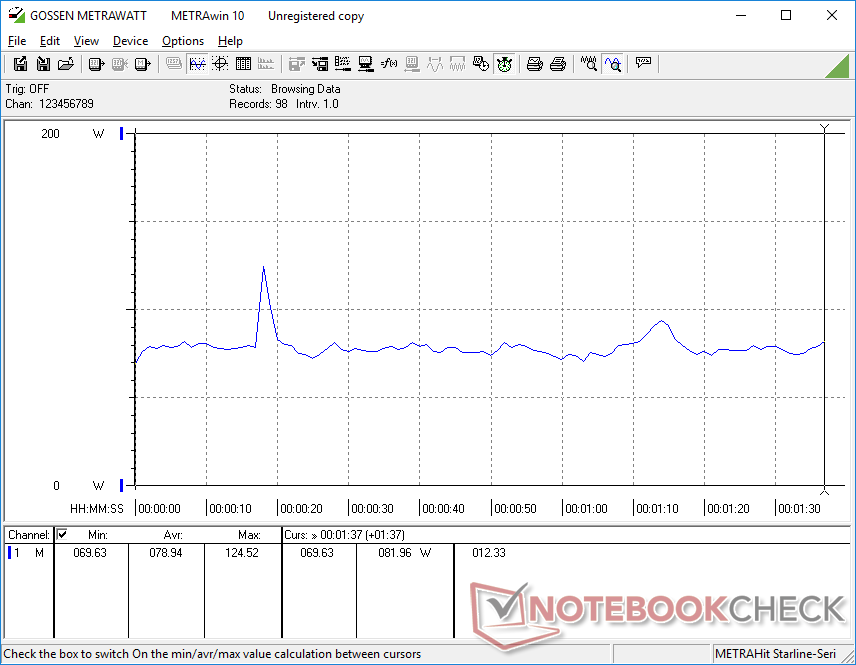
Die Leistungsaufnahme kann von 16 W bei minimaler Helligkeitseinstellung mit aktiver iGPU bis zu 30 W bei maximaler Helligkeitseinstellung mit aktivierter dGPU reichen. Es wird daher empfohlen, mehr auf die Helligkeitseinstellungen und Farben zu achten, wenn die Akkulaufzeit ein Anliegen ist, ähnlich wie bei OLED-Panels.
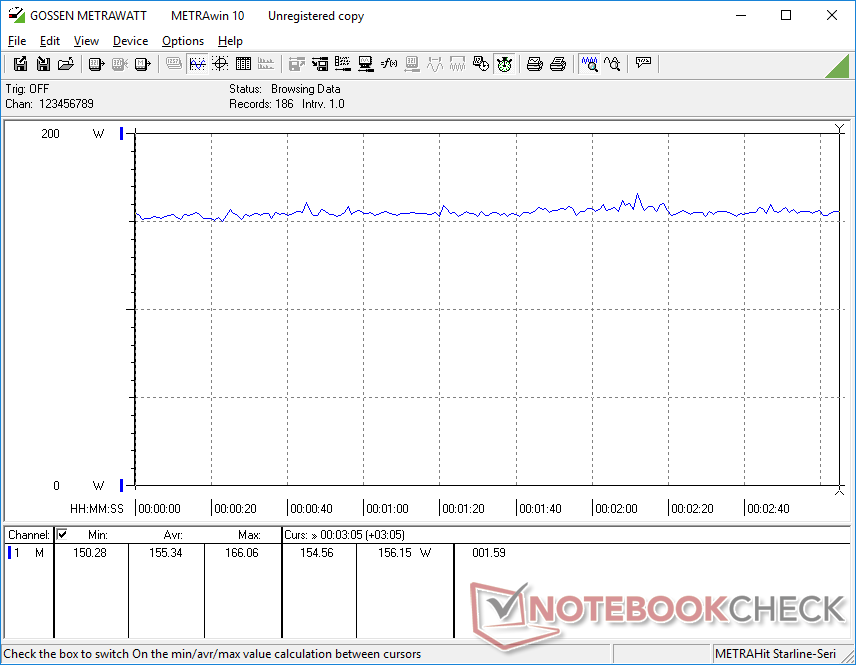
Der Stromverbrauch beim Spielen ist fast identisch mit dem, den wir beim Yoga Pro 9i gemessen haben, obwohl Letzteres eine bis zu 20 Prozent schnellere Grafikleistung bietet. Sowohl die RTX-4050- als auch die RTX 4060-Konfigurationen zielen auf jeweils 100 W TGP ab, was die ähnlichen Verbrauchswerte unter GPU-Last erklären würde.
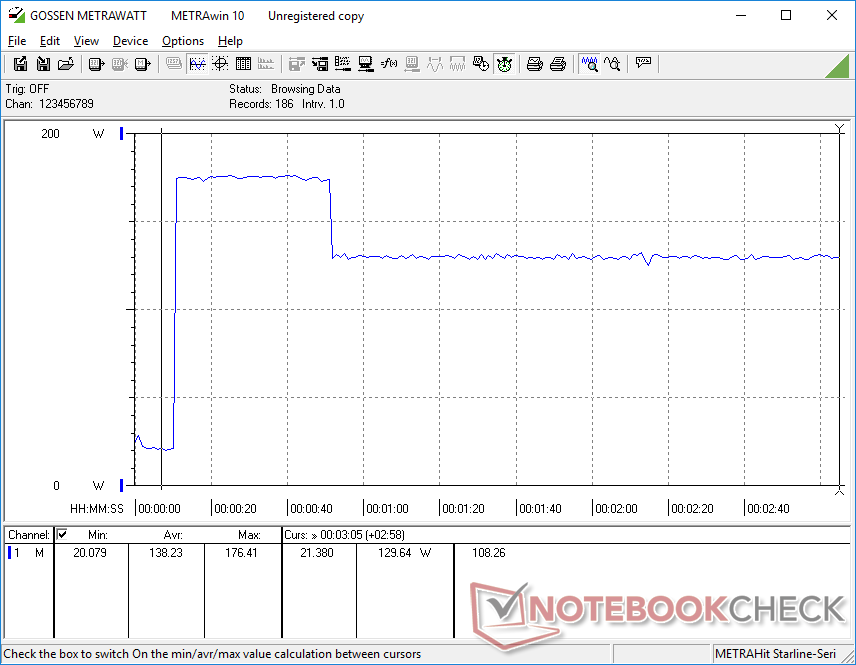
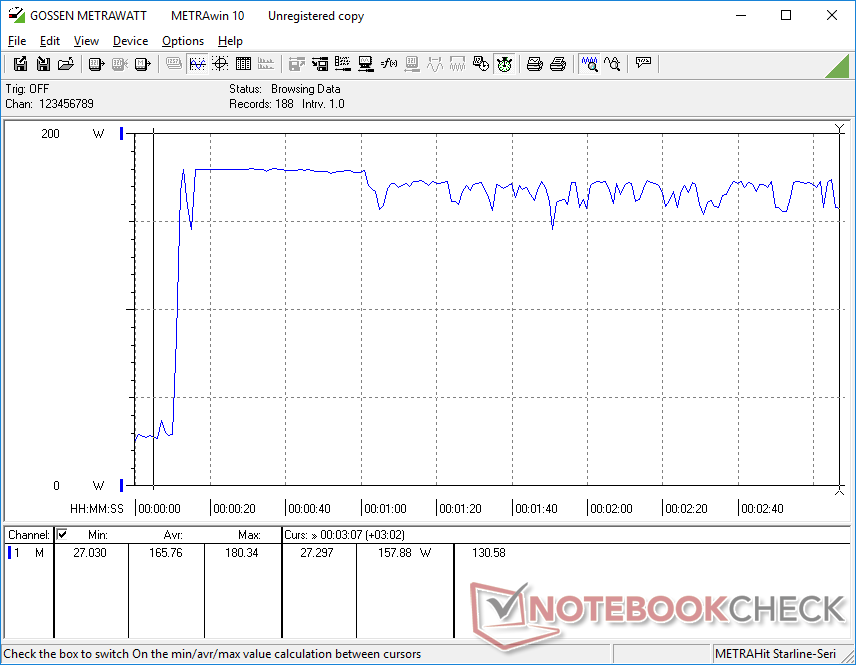
Unser Core i9-13905H erreicht beim Starten von Prime95 etwas höhere Spitzenwerte als der Core i7-13705H, bevor er sich schließlich auf ähnliche Werte einpendelt.
| Aus / Standby | |
| Idle | |
| Last |
|
Legende:
min: | |
| Lenovo Slim Pro 9i 16IRP8 i9-13905H, GeForce RTX 4050 Laptop GPU, Samsung PM9A1 MZVL21T0HCLR, Mini-LED, 3200x2000, 16" | Lenovo Yoga Pro 9 16-IRP G8 i7-13705H, GeForce RTX 4060 Laptop GPU, Samsung PM9A1 MZVL21T0HCLR, Mini-LED, 3200x2000, 16" | Asus VivoBook Pro 16 i7-12700H, GeForce RTX 3050 Ti Laptop GPU, Intel SSD 670p SSDPEKNU010TZ, IPS, 2560x1600, 16" | Acer Swift Edge SFE16-42-R1GM R7 7735U, Radeon 680M, Micron 3400 1TB MTFDKBA1T0TFH, OLED, 3840x2400, 16" | Dell Inspiron 16 Plus 7620 i7-12700H, GeForce RTX 3050 Ti Laptop GPU, Kioxia BG5 KBG50ZNS512G, IPS, 3072x1920, 16" | HP Envy 16 h0112nr i7-12700H, GeForce RTX 3060 Laptop GPU, Micron 3400 1TB MTFDKBA1T0TFH, OLED, 3840x2400, 16" | |
|---|---|---|---|---|---|---|
| Stromverbrauch | 12% | 22% | 61% | 29% | 10% | |
| Idle min * (Watt) | 16 | 10.9 32% | 8.7 46% | 8.6 46% | 6.8 57% | 10 37% |
| Idle avg * (Watt) | 30 | 22.6 25% | 13.1 56% | 7.7 74% | 9.6 68% | 10.9 64% |
| Idle max * (Watt) | 30.4 | 23.5 23% | 18.3 40% | 9.3 69% | 17 44% | 27.8 9% |
| Last avg * (Watt) | 78.9 | 84.6 -7% | 116 -47% | 47.9 39% | 117.5 -49% | 116.4 -48% |
| Witcher 3 ultra * (Watt) | 155.3 | 159.5 -3% | 117.6 24% | 46.3 70% | 113.1 27% | 133.7 14% |
| Last max * (Watt) | 180.4 | 177.3 2% | 162 10% | 56 69% | 137.4 24% | 209.8 -16% |
* ... kleinere Werte sind besser
Power Consumption Witcher 3 / Stresstest
Power Consumption external Monitor
Akkulaufzeit
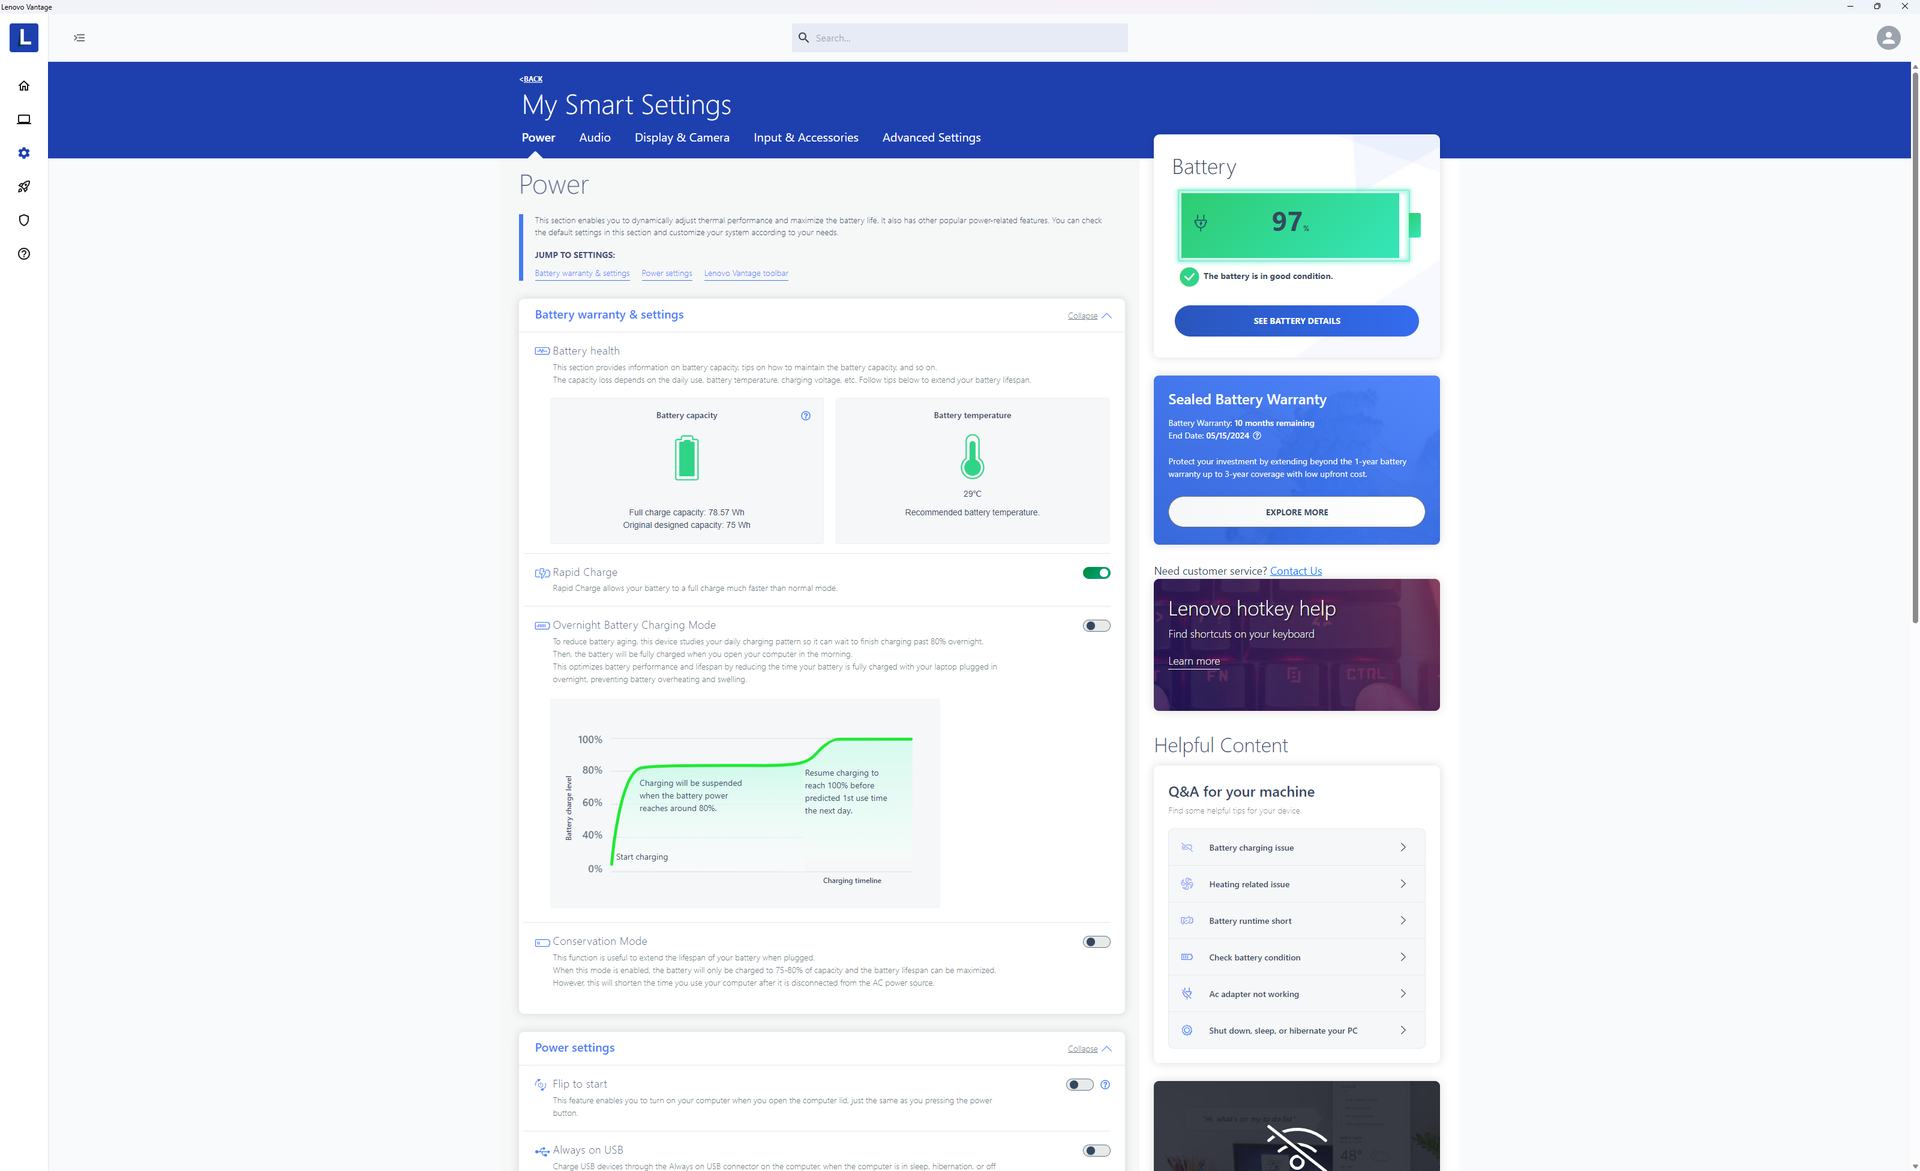
Die Laufzeiten sind im Wesentlichen identisch mit denen des Yoga Pro 9 16 und liegen bei etwa 6,5 Stunden Surfen in der realen Welt. Das Aufladen von leer auf voll dauert ca. 90 Minuten, selbst wenn Rapid Charge aktiviert ist.
Die Akkuladung kann abnehmen, wenn anspruchsvolle Aufgaben ausgeführt werden, auch wenn das Gerät an das Stromnetz angeschlossen ist. Während unseres einstündigen Prime95- und FurMark-Tests sank die Akkuladung beispielsweise von 100 auf 79 Prozent, was darauf hindeutet, dass das Modell von einem Netzadapter mit höherer Kapazität hätte profitieren können.
Bestimmte USB-C-Adapter können das System aufladen. Unser 130-Watt-USB-C-Adapter für das Dell XPS 15 scheint beispielsweise nicht kompatibel zu sein, während der 140-Watt-USB-C-Adapter von Lenovo ohne Probleme funktioniert.
| Lenovo Slim Pro 9i 16IRP8 i9-13905H, GeForce RTX 4050 Laptop GPU, 75 Wh | Lenovo Yoga Pro 9 16-IRP G8 i7-13705H, GeForce RTX 4060 Laptop GPU, 75 Wh | Asus VivoBook Pro 16 i7-12700H, GeForce RTX 3050 Ti Laptop GPU, 70 Wh | Acer Swift Edge SFE16-42-R1GM R7 7735U, Radeon 680M, 54 Wh | Dell Inspiron 16 Plus 7620 i7-12700H, GeForce RTX 3050 Ti Laptop GPU, 86 Wh | HP Envy 16 h0112nr i7-12700H, GeForce RTX 3060 Laptop GPU, 83 Wh | |
|---|---|---|---|---|---|---|
| Akkulaufzeit | -3% | 11% | 11% | 45% | 20% | |
| WLAN (h) | 6.6 | 6.4 -3% | 7.3 11% | 7.3 11% | 9.6 45% | 7.9 20% |
| H.264 (h) | 7.5 | 8.6 | ||||
| Last (h) | 0.7 | 1.5 | 1.2 | 1.6 | ||
| Idle (h) | 10.9 | 18.6 | 17.8 |
Pro
Contra
Fazit - Core i7 mit GeForce RTX 4060 ist der bessere Deal
Es sind derzeit mindestens zwei Konfigurationen des Slim Pro 9i 16 erhältlich: eine mit Core i7-13705H und GeForce RTX 4060 und eine mit Core i9-13905H und GeForce RTX 4050. Da die Preise für beide so ähnlich sind, ist die Core i7 mit RTX-4060-Option gegenüber der Core-i9-mi- RTX-4050-Option sehr zu empfehlen, da der Core i7 fast identische Leistungen wie der Core i9 erbringt. Der Wechsel von der RTX 4050 zur RTX 4060 bietet einen größeren und spürbareren Anstieg der Grafikleistung.
Die Konfiguration aus Core i7 und GeForce RTX 4060 ist die beste Wahl für diejenigen, die das Lenovo Slim Pro 9i 16 in Betracht ziehen.
Andere Aspekte des Modells sind vergleichbar mit Alternativen wie dem HP Envy 16 oder MacBook Pro 16 von den umfangreichen Anschlussmöglichkeiten bis hin zur insgesamt schnellen Leistung, dem geringen Gewicht und den angemessenen Abmessungen. Sie erhalten jedoch nicht den vom Benutzer erweiterbaren Arbeitsspeicher des Envy 16 oder das vorkalibrierte Display und die längere Akkulaufzeit des MacBook Pro.
Preis und Verfügbarkeit
Die exakt beschriebene Konfiguration ist derzeit nicht auf dem deutschsprachigem Markt erhältlich. Allerdings kann man das Lenovo Yoga Pro 9 mit Core i9-13905H und der höherwertigen GeForce RTX 4070 bei Cyberport für knapp 3.000 Euro beziehen. 2.421 Euro kostet die Variante mit Core i9-13905H und GeForce RTX 4060 direkt im Online-Store von Lenovo. Die im Artikel empfohlene Kombination aus Core i7-13705H und GeForce RTX 4060 wird online bei Lenovo für 2.191 Euro angeboten.
Lenovo Slim Pro 9i 16IRP8
- 10.08.2023 v7 (old)
Allen Ngo
Transparenz
Die Auswahl der zu testenden Geräte erfolgt innerhalb der Redaktion. Das vorliegende Testmuster wurde dem Autor vom Hersteller oder einem Shop zu Testzwecken leihweise zur Verfügung gestellt. Eine Einflussnahme des Leihstellers auf den Testbericht gab es nicht, der Hersteller erhielt keine Version des Reviews vor der Veröffentlichung. Es bestand keine Verpflichtung zur Publikation. Als eigenständiges, unabhängiges Unternehmen unterliegt Notebookcheck keiner Diktion von Herstellern, Shops und Verlagen.
So testet Notebookcheck
Pro Jahr werden von Notebookcheck hunderte Laptops und Smartphones unabhängig in von uns standardisierten technischen Verfahren getestet, um eine Vergleichbarkeit aller Testergebnisse zu gewährleisten. Seit rund 20 Jahren entwickeln wir diese Testmethoden kontinuierlich weiter und setzen damit Branchenstandards. In unseren Testlaboren kommt ausschließlich hochwertiges Messequipment in die Hände erfahrener Techniker und Redakteure. Die Tests unterliegen einer mehrstufigen Kontrolle. Unsere komplexe Gesamtbewertung basiert auf hunderten fundierten Messergebnissen und Benchmarks, womit Ihnen Objektivität garantiert ist. Weitere Informationen zu unseren Testmethoden gibt es hier.
Preisvergleich

