Neue CPU, alte Probleme: Lenovo ThinkPad X1 Yoga G8 Convertible im Test

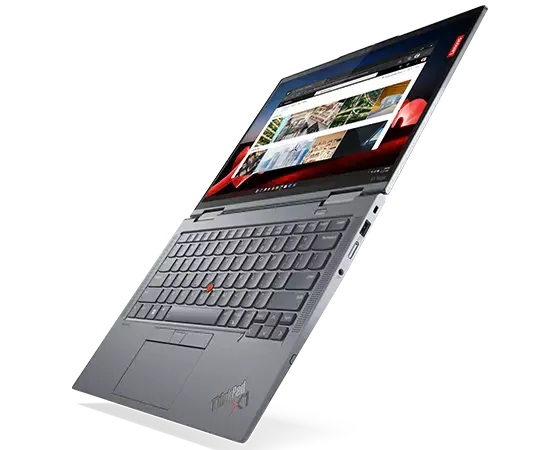
Im ThinkPad X1 Yoga G8 wird der Gen12-Alder-Lake-Prozessor des ThinkPad X1 Yoga G7 gegen neuere Gen13 Raptor-Lake-Optionen ausgetauscht. Ansonsten bleiben das Gehäuse und alle externen Merkmale gleich. Wir empfehlen daher unseren Test des Vorgängers und dem älteren ThinkPad X1 Yoga G6, um alle Details zu den physischen Merkmalen des aktuellen ThinkPad X1 Yoga G8 zu erfahren.
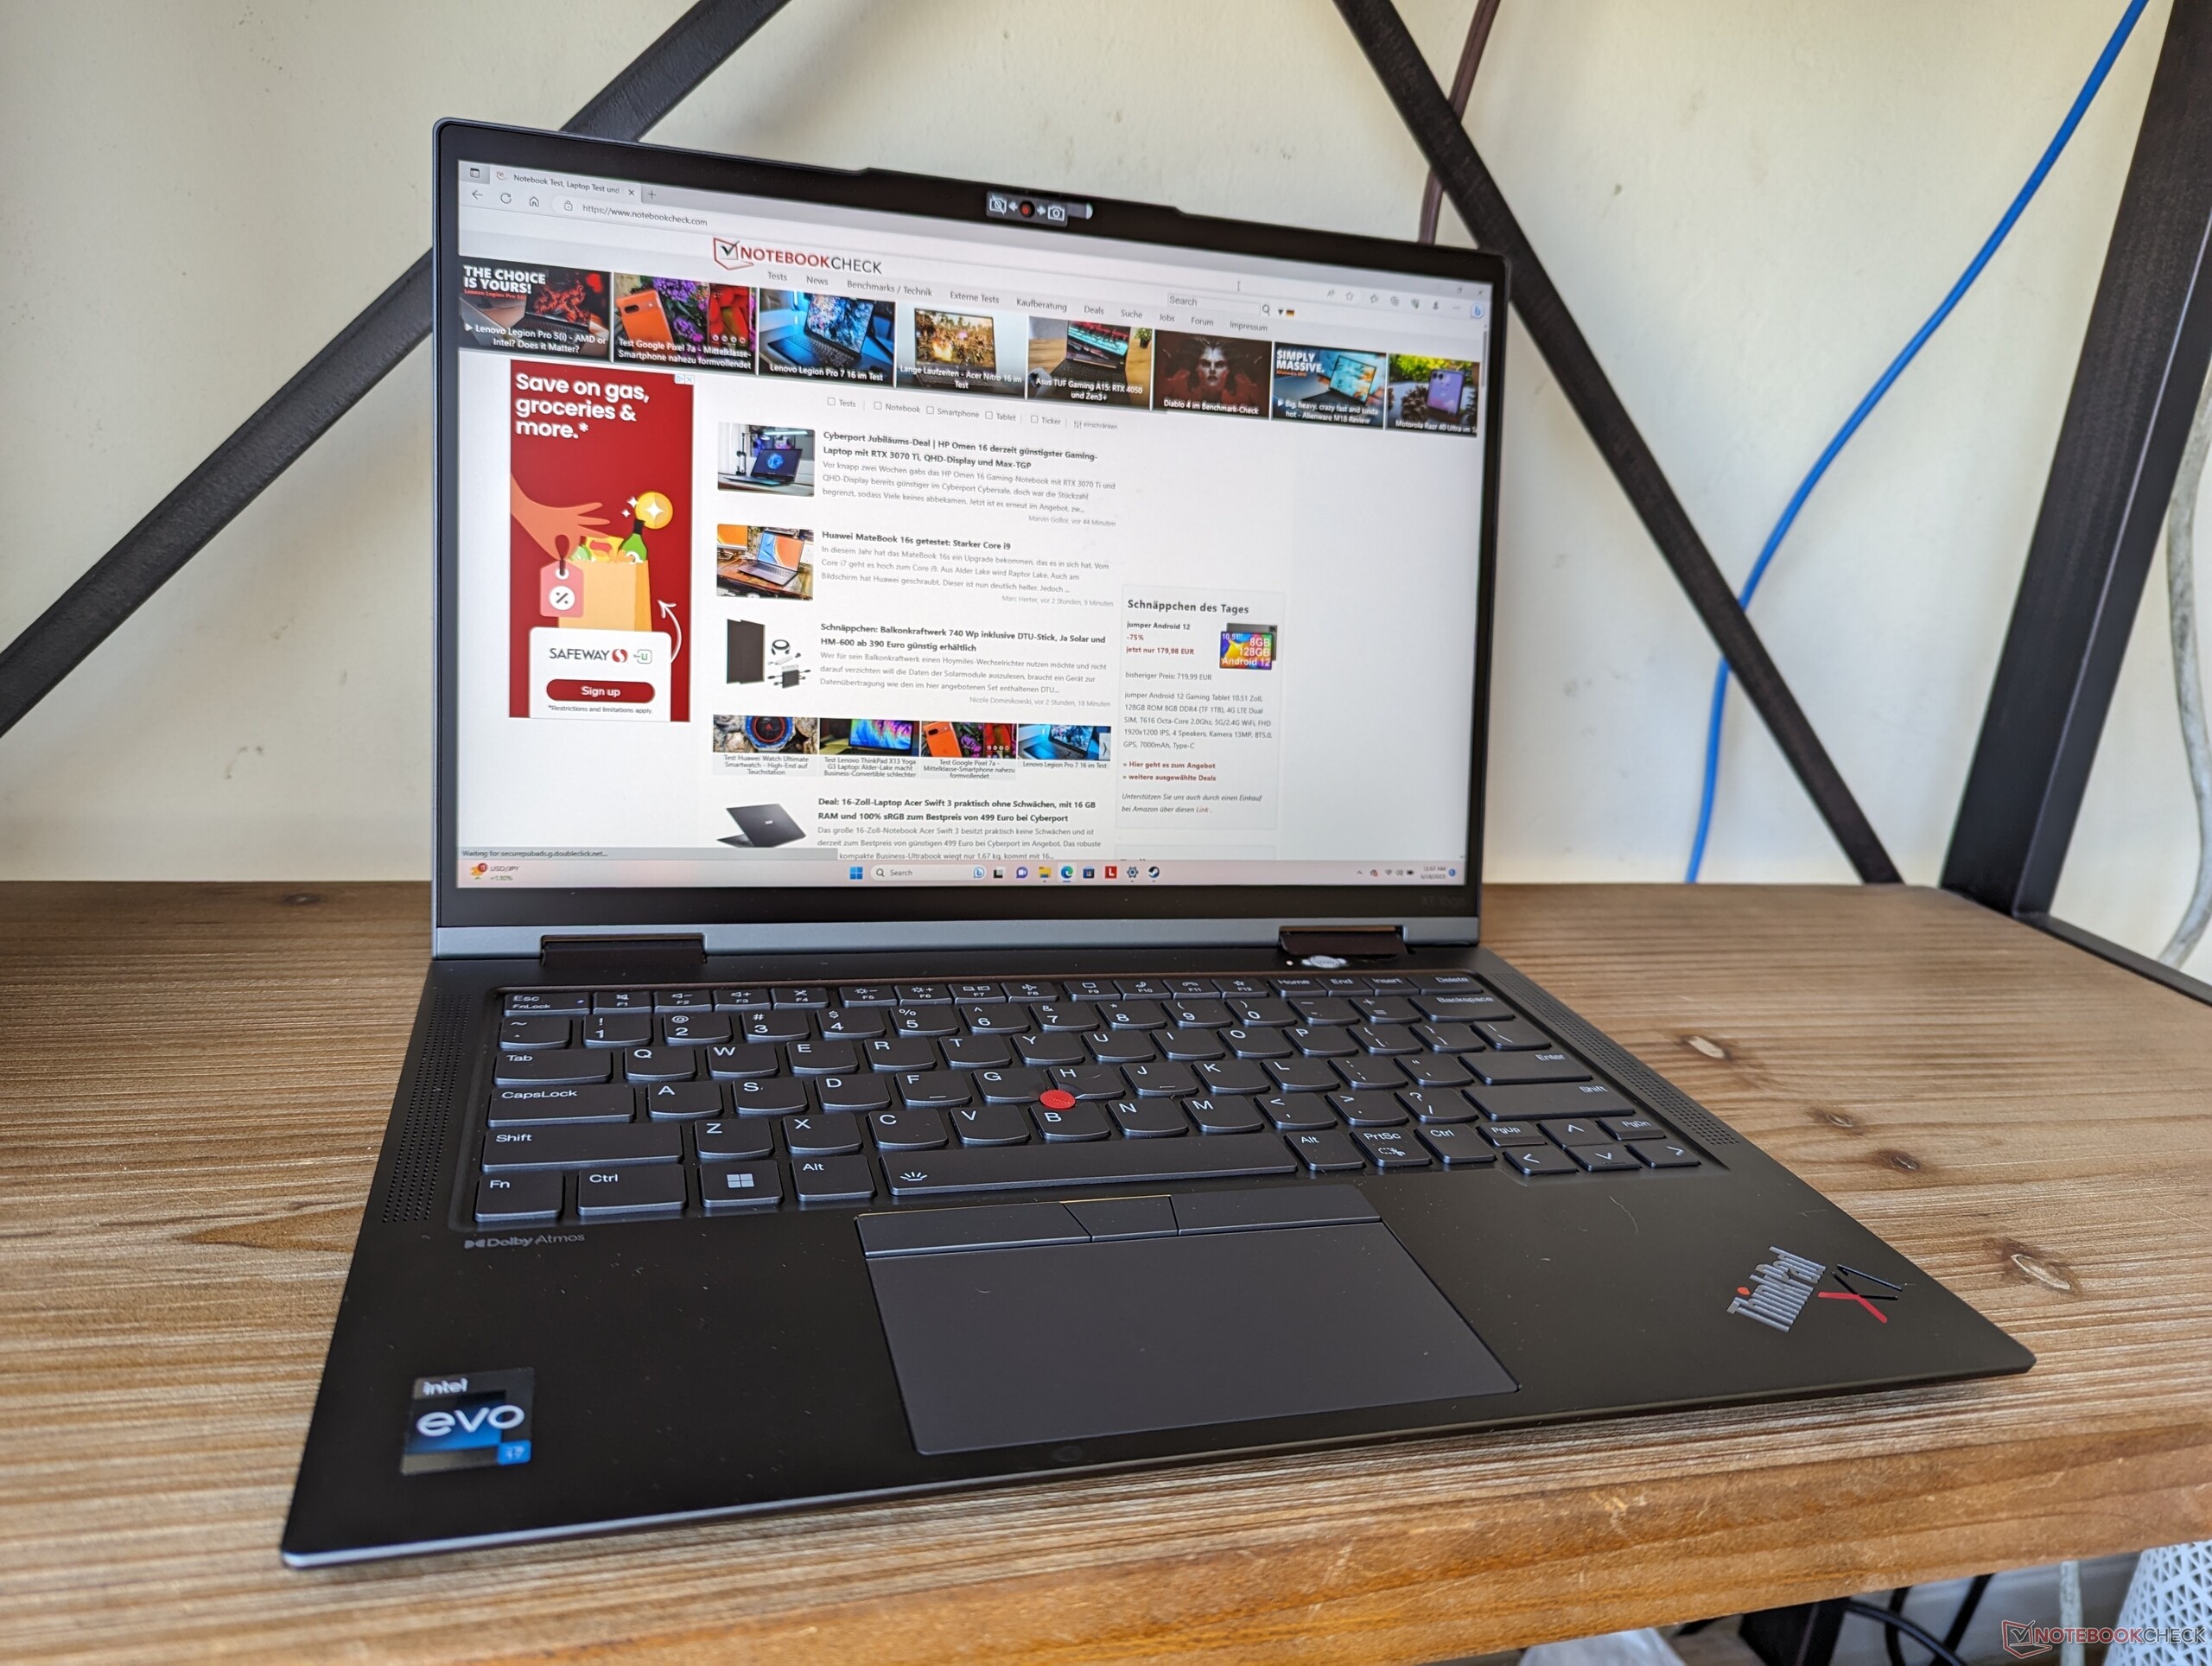
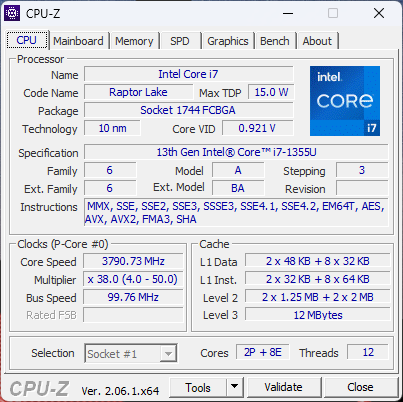
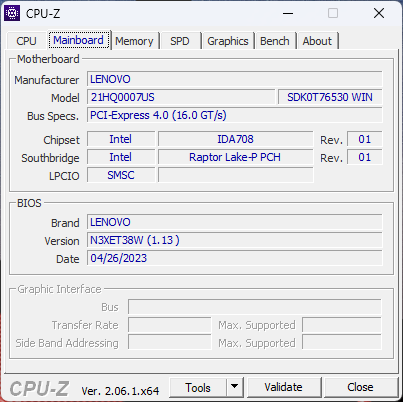
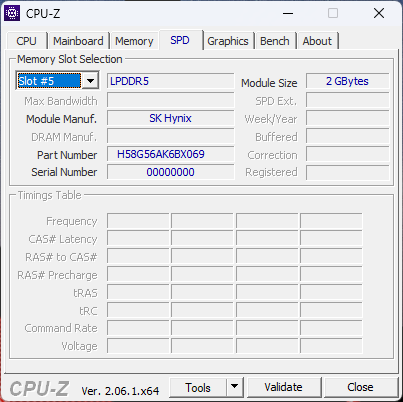
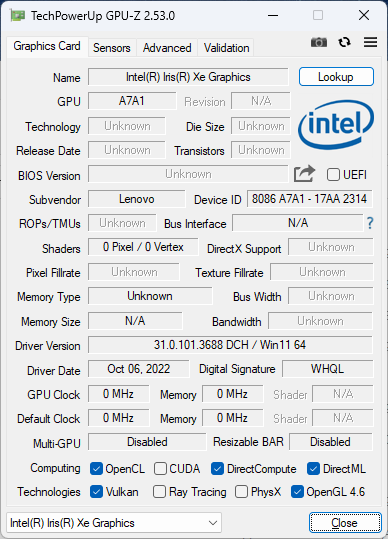
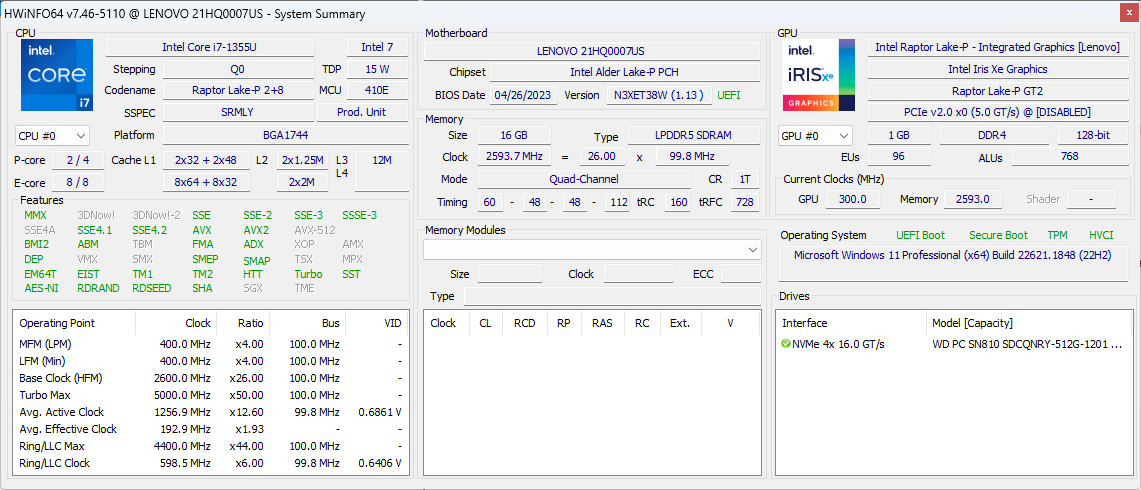
Unsere Testeinheit entspricht der mittleren Konfiguration, in ihr rechnet ein Core i7-1355U, dazu gibt es einen matten 16:10-IPS-Touchscreen in der Auflösung 1.920 x 1.200p. Das Paket kostet etwa 2.400 Euro. Während die Modelle mit Core i5-1335U eher das Lower-End darstellen, gibt es noch die Higher-End-Konfigurationen mit dem schnelleren Core i7-1370P sowie einem 2.400p-OLED-Panel und Nano-SIM. Letztere sind in Deutschland jedoch noch nicht verfügbar, die Preise noch nicht einsehbar. Alle SKUs sind ausschließlich mit der integrierten Iris Xe Graphics erhältlich.
Alternativen zum ThinkPad X1 Yoga G8 sehen wir in anderen High-End-14-Zoll-Business-Convertibles wie dem HP EliteBook x360 1040, dem Dell Latitude 9430 2-in-1 oder auch dem MSI Summit E14 Flip.
Weitere Lenovo-Tests:
Potentielle Konkurrenten im Vergleich
Bew. | Datum | Modell | Gewicht | Dicke | Größe | Auflösung | Preis ab |
|---|---|---|---|---|---|---|---|
| 90 % v7 (old) | 06 / 2023 | Lenovo ThinkPad X1 Yoga G8 i7-1355U i7-1355U, Iris Xe G7 96EUs | 1.4 kg | 15.53 mm | 14.00" | 1920x1200 | |
| 89.4 % v7 (old) | 05 / 2022 | Lenovo ThinkPad X1 Yoga G7 21CE002HGE i7-1270P, Iris Xe G7 96EUs | 1.5 kg | 15.53 mm | 14.00" | 1920x1200 | |
| 89.8 % v7 (old) | 08 / 2022 | Dell Latitude 9430 2-in-1 i7-1265U, Iris Xe G7 96EUs | 1.5 kg | 13.94 mm | 14.00" | 2560x1600 | |
| 87.5 % v7 (old) | 05 / 2022 | LG Gram 14T90P i5-1135G7, Iris Xe G7 80EUs | 1.2 kg | 17 mm | 14.00" | 1900x1200 | |
| 86.5 % v7 (old) | 05 / 2022 | Asus ZenBook Flip 14 UN5401QA-KN085W R7 5800H, Vega 8 | 1.4 kg | 15.9 mm | 14.00" | 2880x1800 | |
| 90.6 % v7 (old) | 03 / 2021 | HP EliteBook x360 1040 G7, i7-10810U i7-10810U, UHD Graphics 620 | 1.4 kg | 16.5 mm | 14.00" | 1920x1080 |
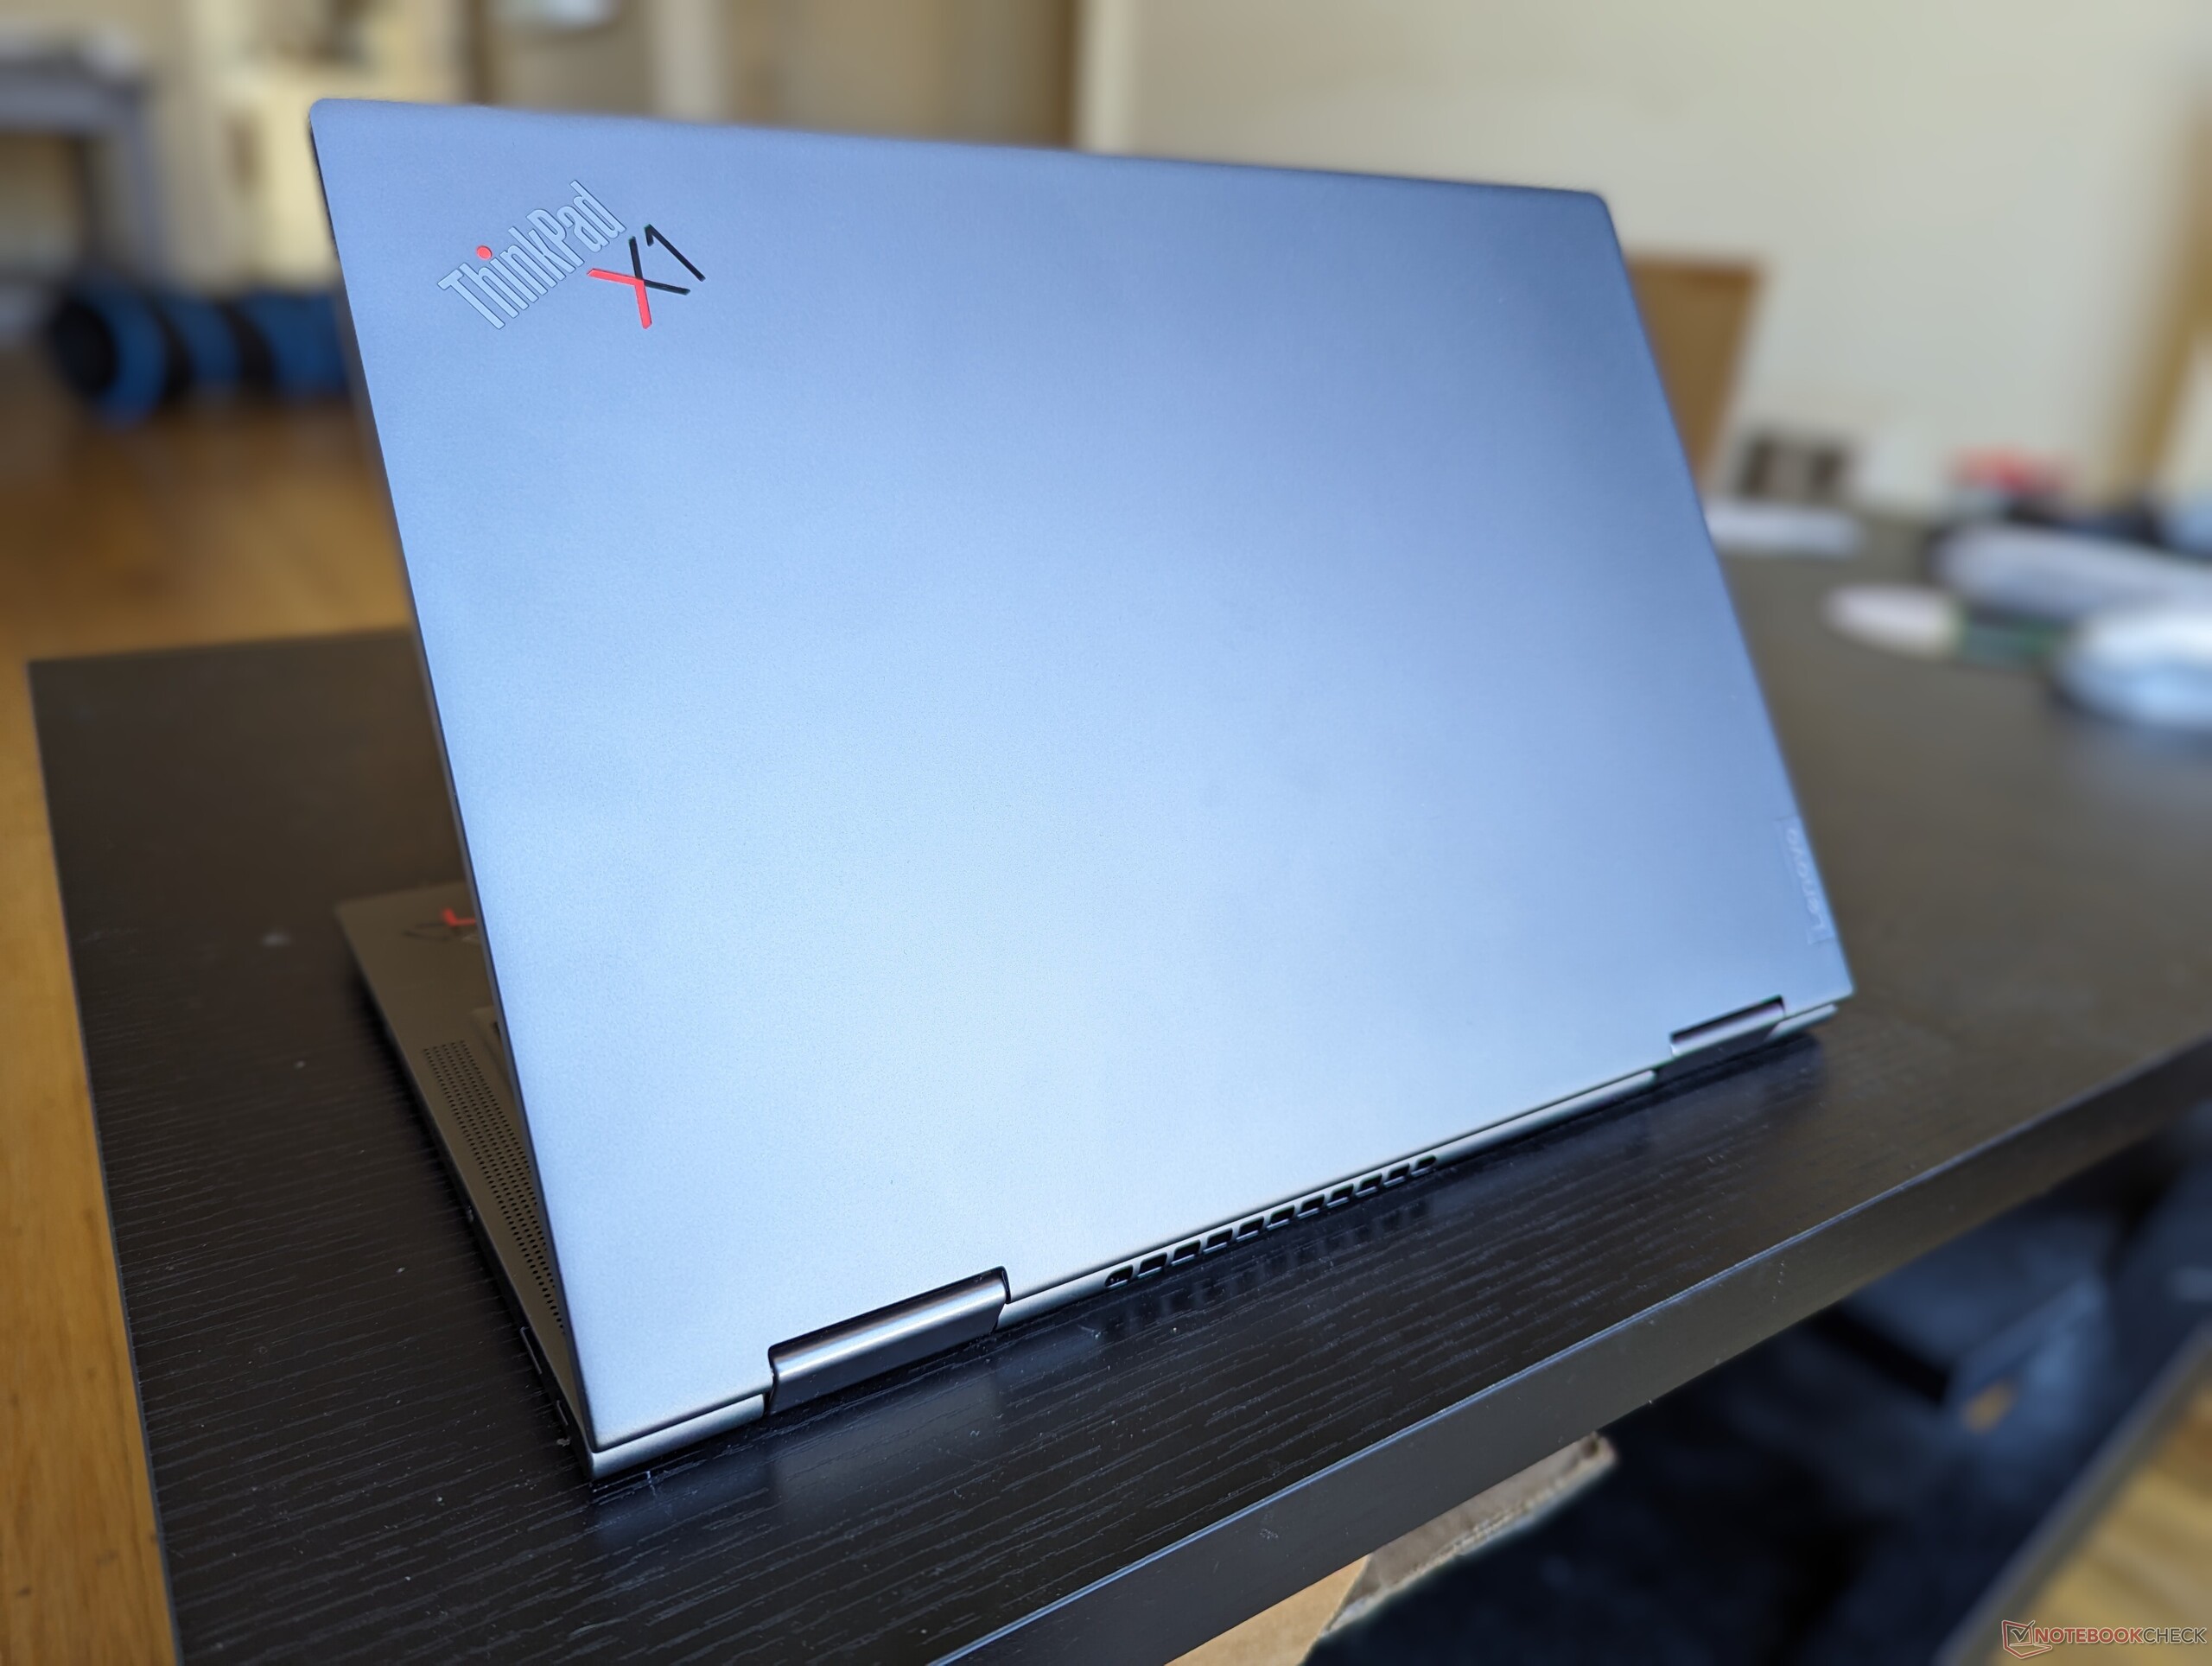
Gehäuse — Das exakt gleiche Design seit nun schon 3 Jahren
Kommunikation
| Networking | |
| iperf3 transmit AX12 | |
| Asus ZenBook Flip 14 UN5401QA-KN085W | |
| HP EliteBook x360 1040 G7, i7-10810U | |
| iperf3 receive AX12 | |
| Asus ZenBook Flip 14 UN5401QA-KN085W | |
| HP EliteBook x360 1040 G7, i7-10810U | |
| iperf3 transmit AXE11000 | |
| Lenovo ThinkPad X1 Yoga G8 i7-1355U | |
| LG Gram 14T90P | |
| iperf3 receive AXE11000 | |
| Lenovo ThinkPad X1 Yoga G8 i7-1355U | |
| LG Gram 14T90P | |
| iperf3 transmit AXE11000 6GHz | |
| Lenovo ThinkPad X1 Yoga G7 21CE002HGE | |
| Dell Latitude 9430 2-in-1 | |
| Lenovo ThinkPad X1 Yoga G8 i7-1355U | |
| iperf3 receive AXE11000 6GHz | |
| Lenovo ThinkPad X1 Yoga G7 21CE002HGE | |
| Dell Latitude 9430 2-in-1 | |
| Lenovo ThinkPad X1 Yoga G8 i7-1355U | |
Webcam
Das Modell setzt auch weiterhin auf eine 2-MP-Kamera, während das HP Spectre sowie die EliteBook-Serie bereits mit 5-MP- oder gar 8-MP-Sensoren ausgestattet sind.


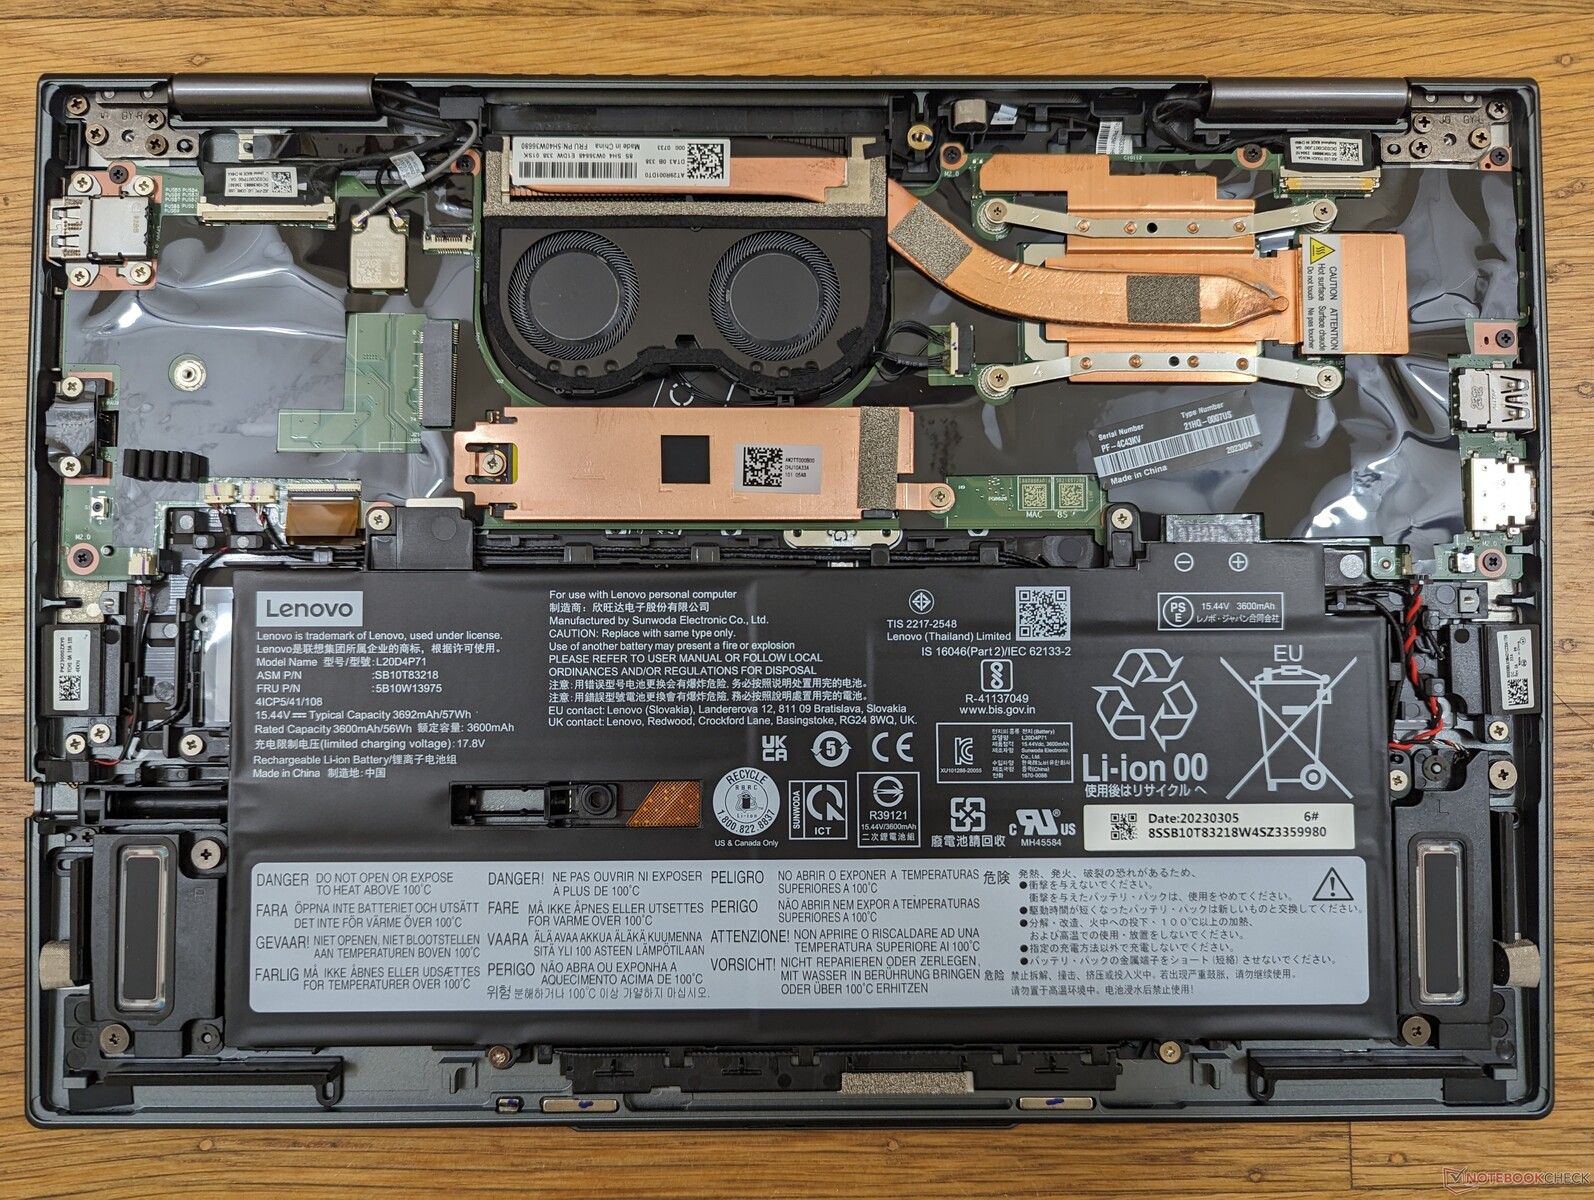
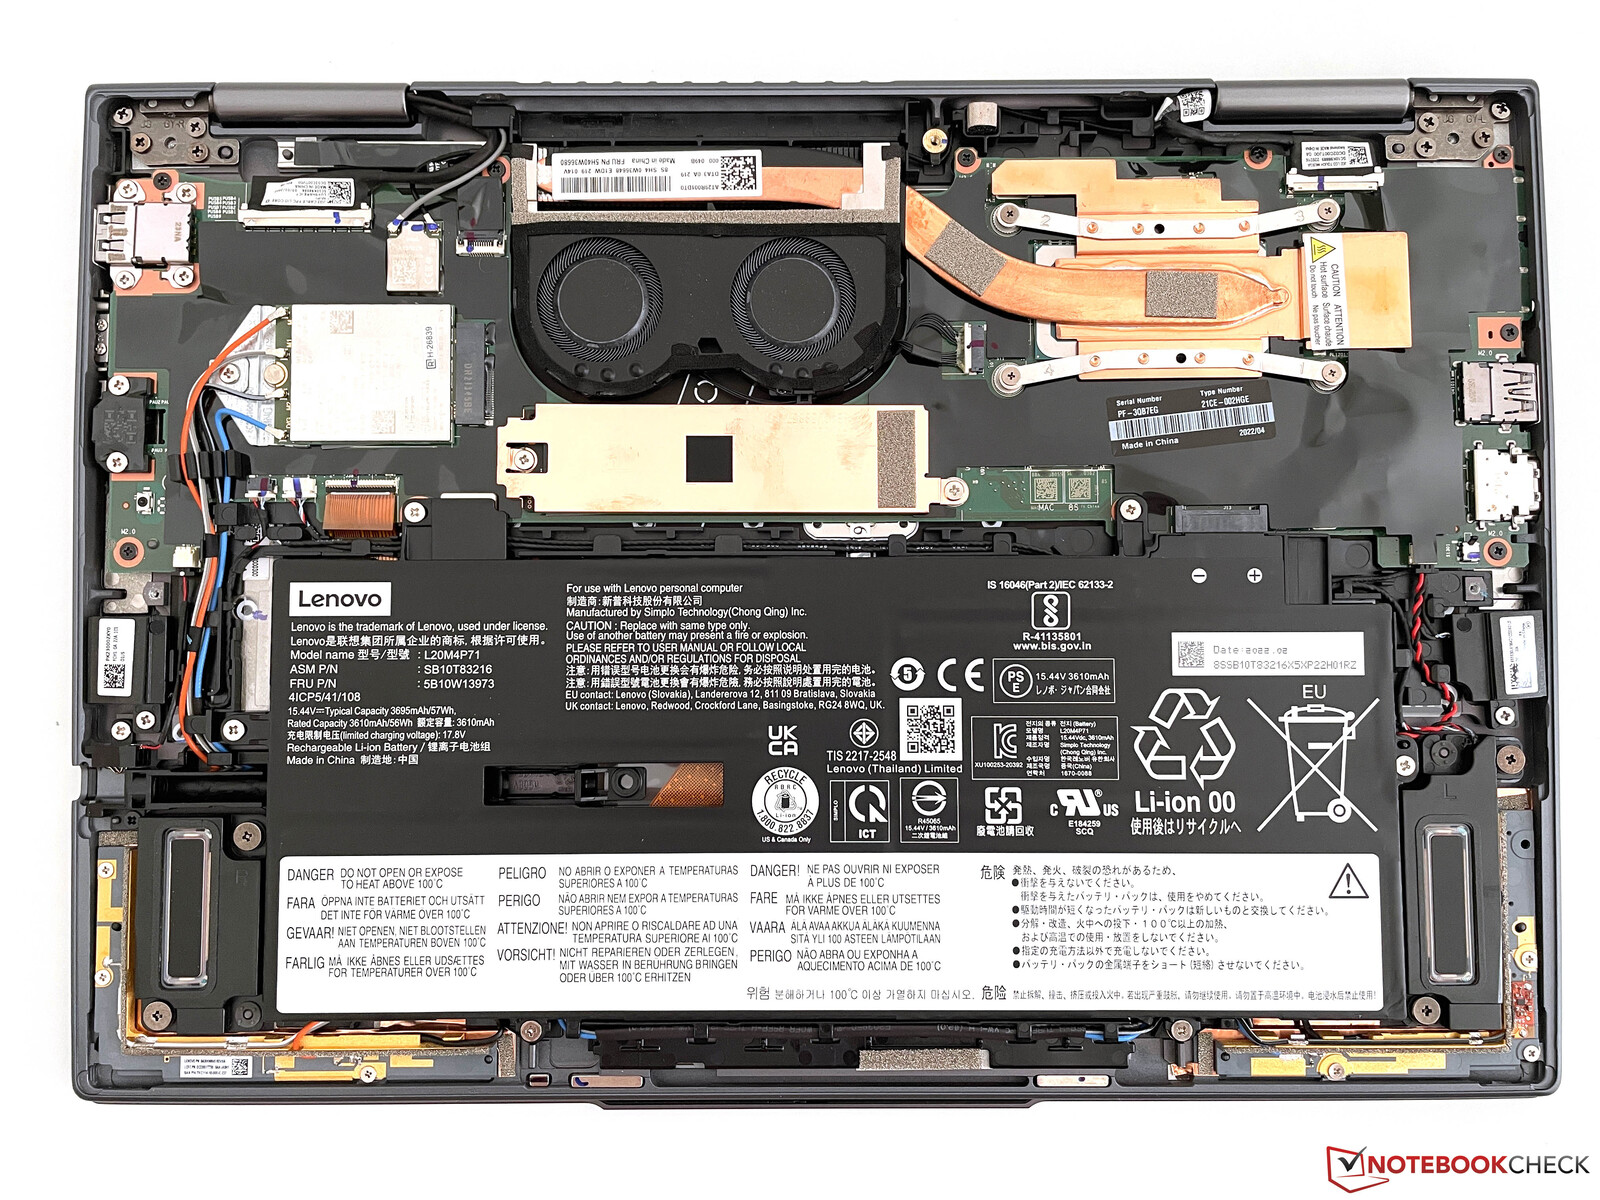
Wartung
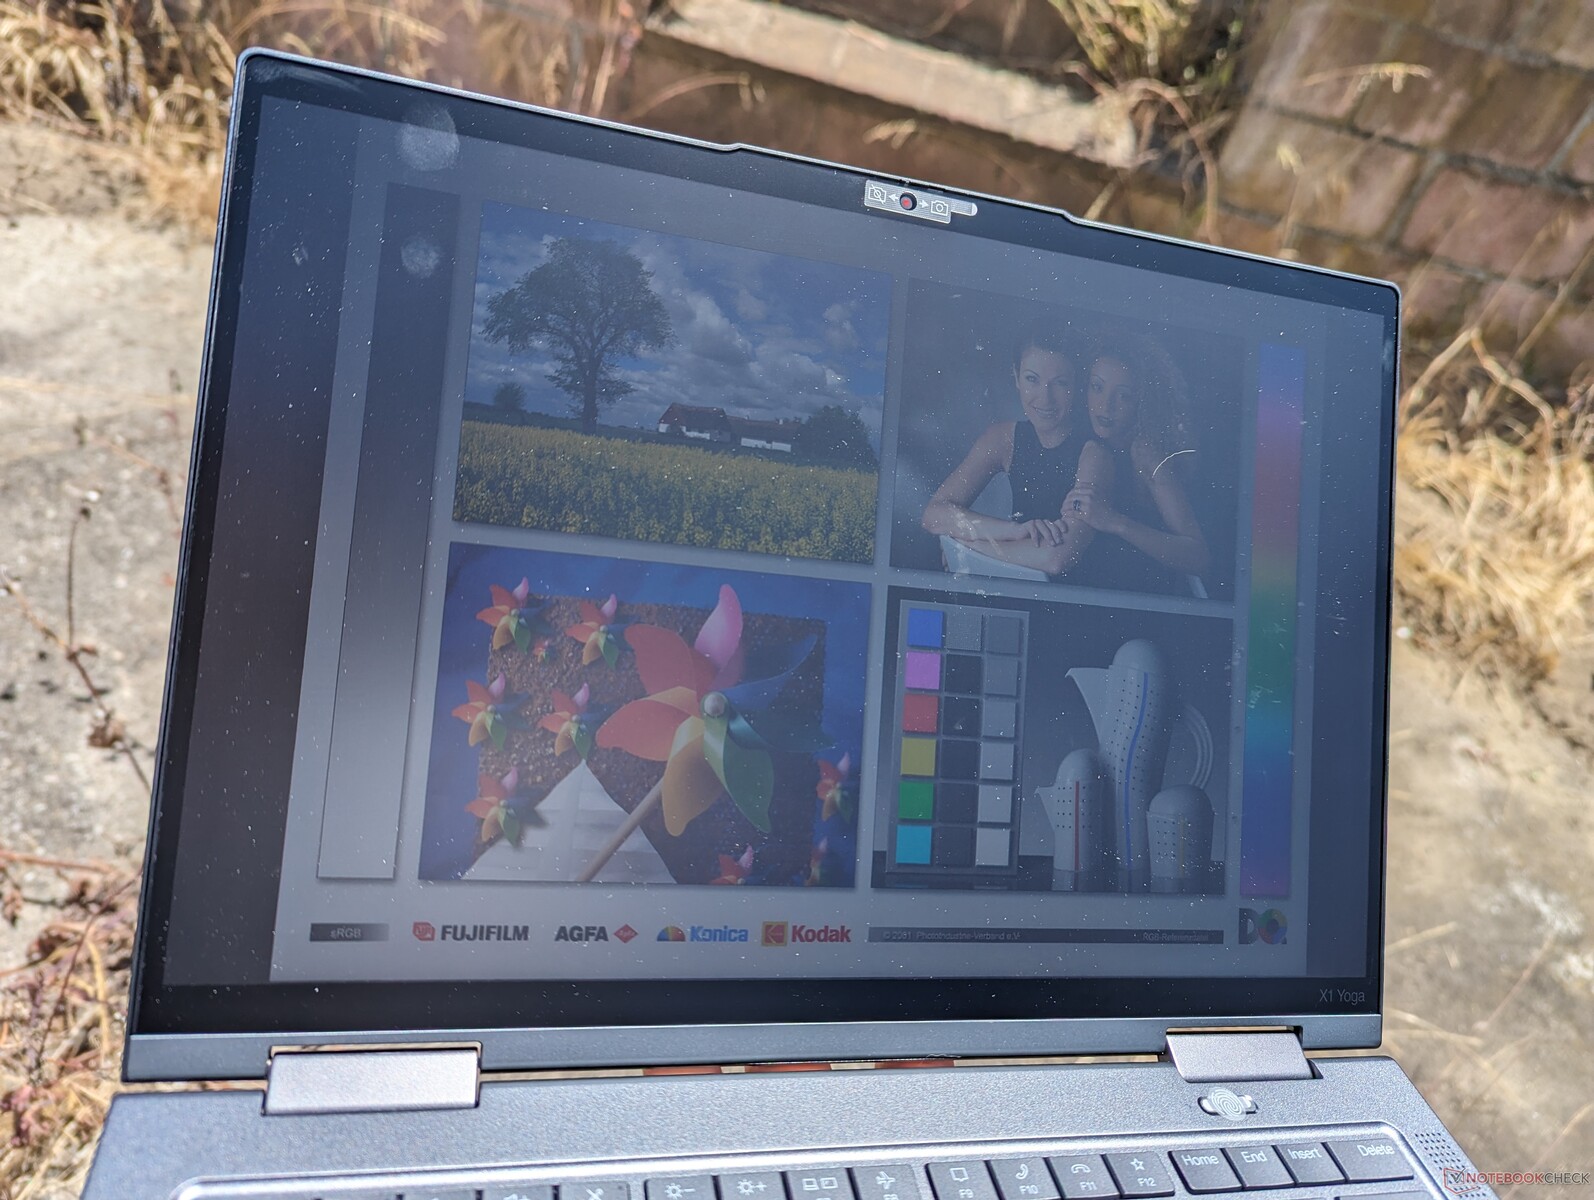
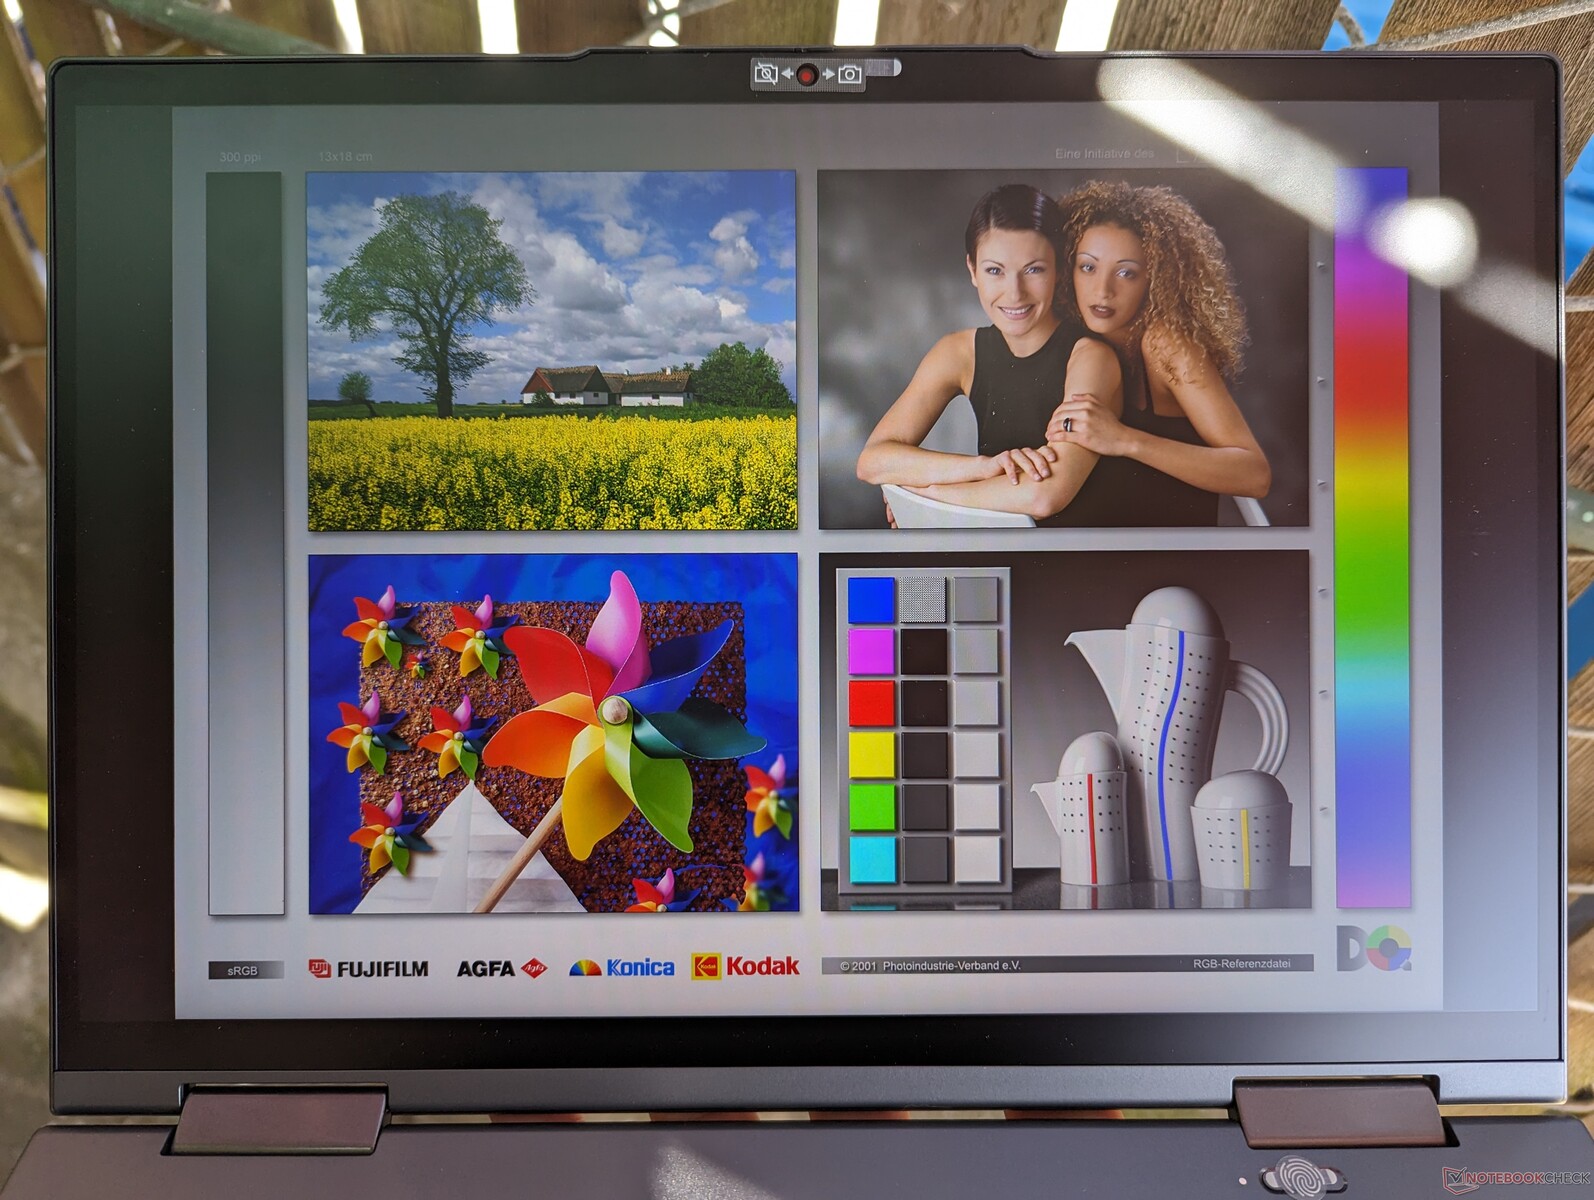
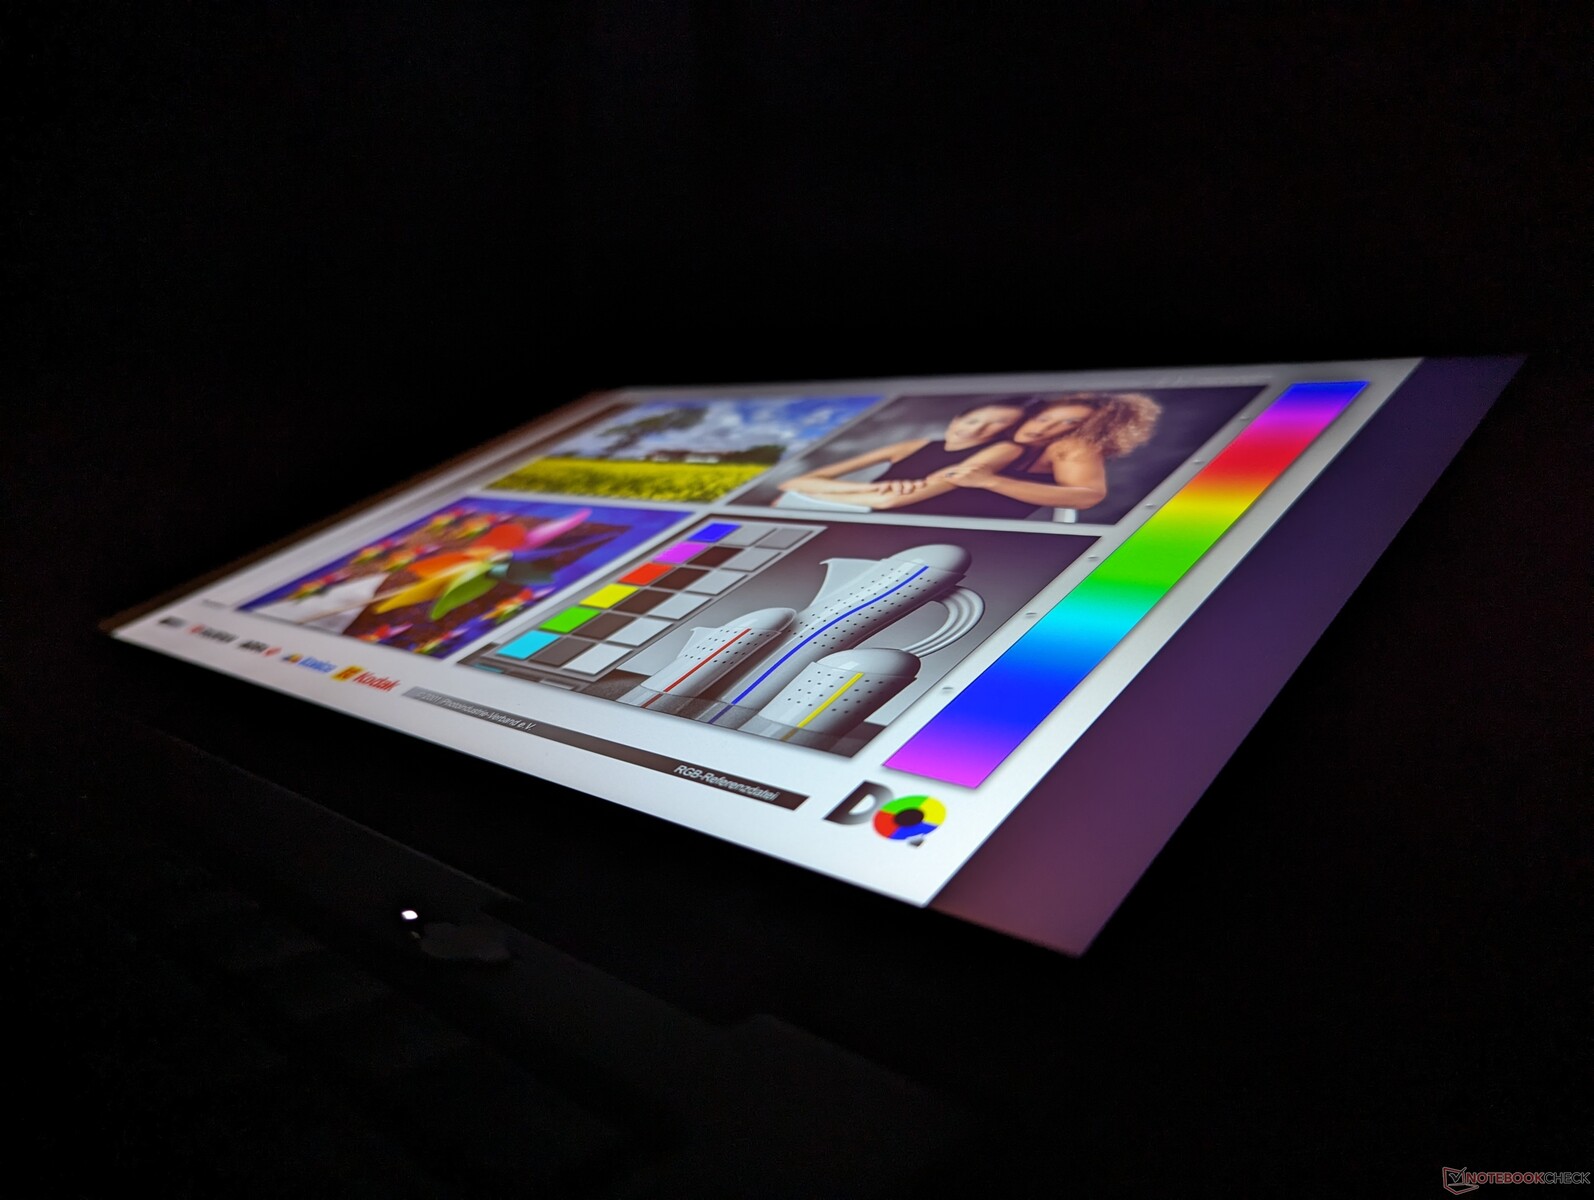
Display — 1.200p IPS oder 2.400p OLED
Im Yoga G8 sitzt ein anderes Panel als im Yoga G7 (BOE NE140WUM-N62 vs. MNE007JA1-1). Anders als der Namensunterschied vermuten lässt, bleiben die Kernwerte allerdings nahezu identisch, inklusive Reaktionszeiten, Helligkeit, Kontrast und Farbraumabdeckung.
Die teurere OLED-Option hingegen verdoppelt die Auflösung von 1.200p auf 2.400p und erhöht die Farbraumabdeckung von sRGB auf DCI-P3.
| |||||||||||||||||||||||||
Ausleuchtung: 87 %
Helligkeit Akku: 425.2 cd/m²
Kontrast: 1849:1 (Schwarzwert: 0.23 cd/m²)
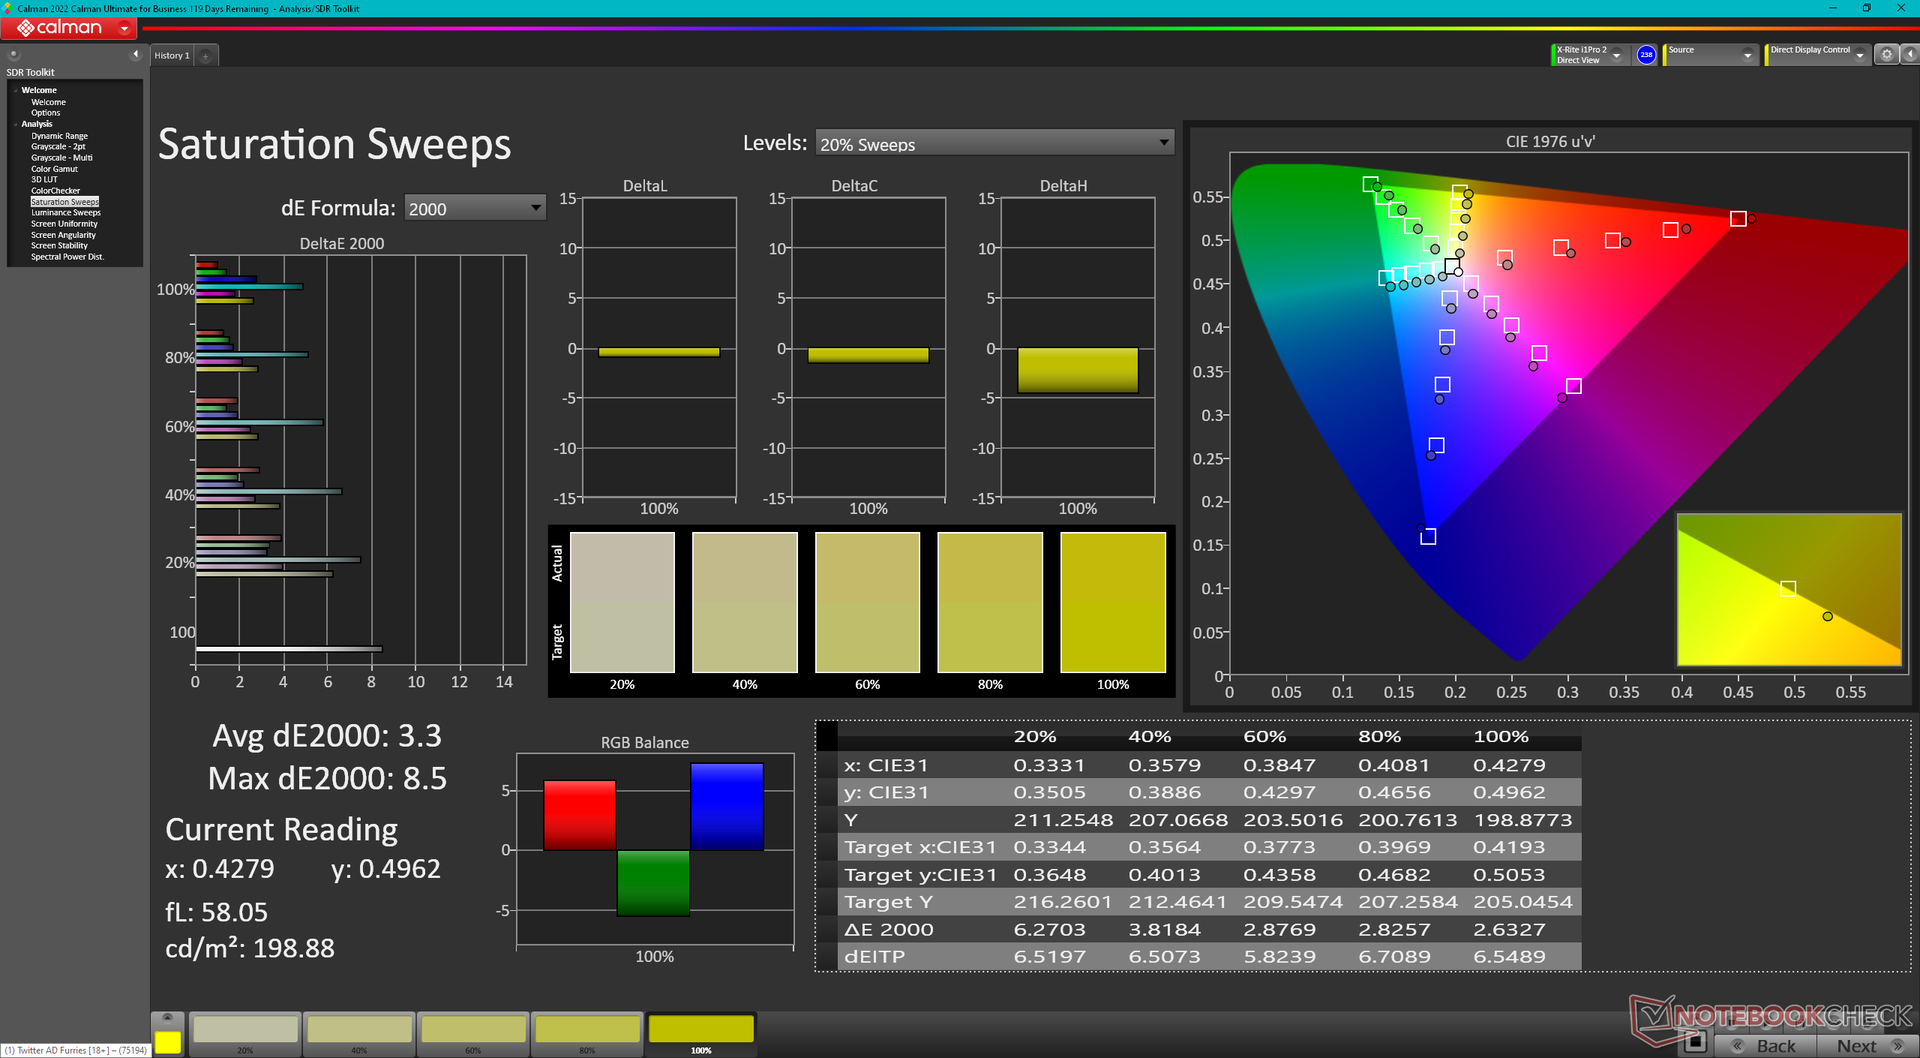
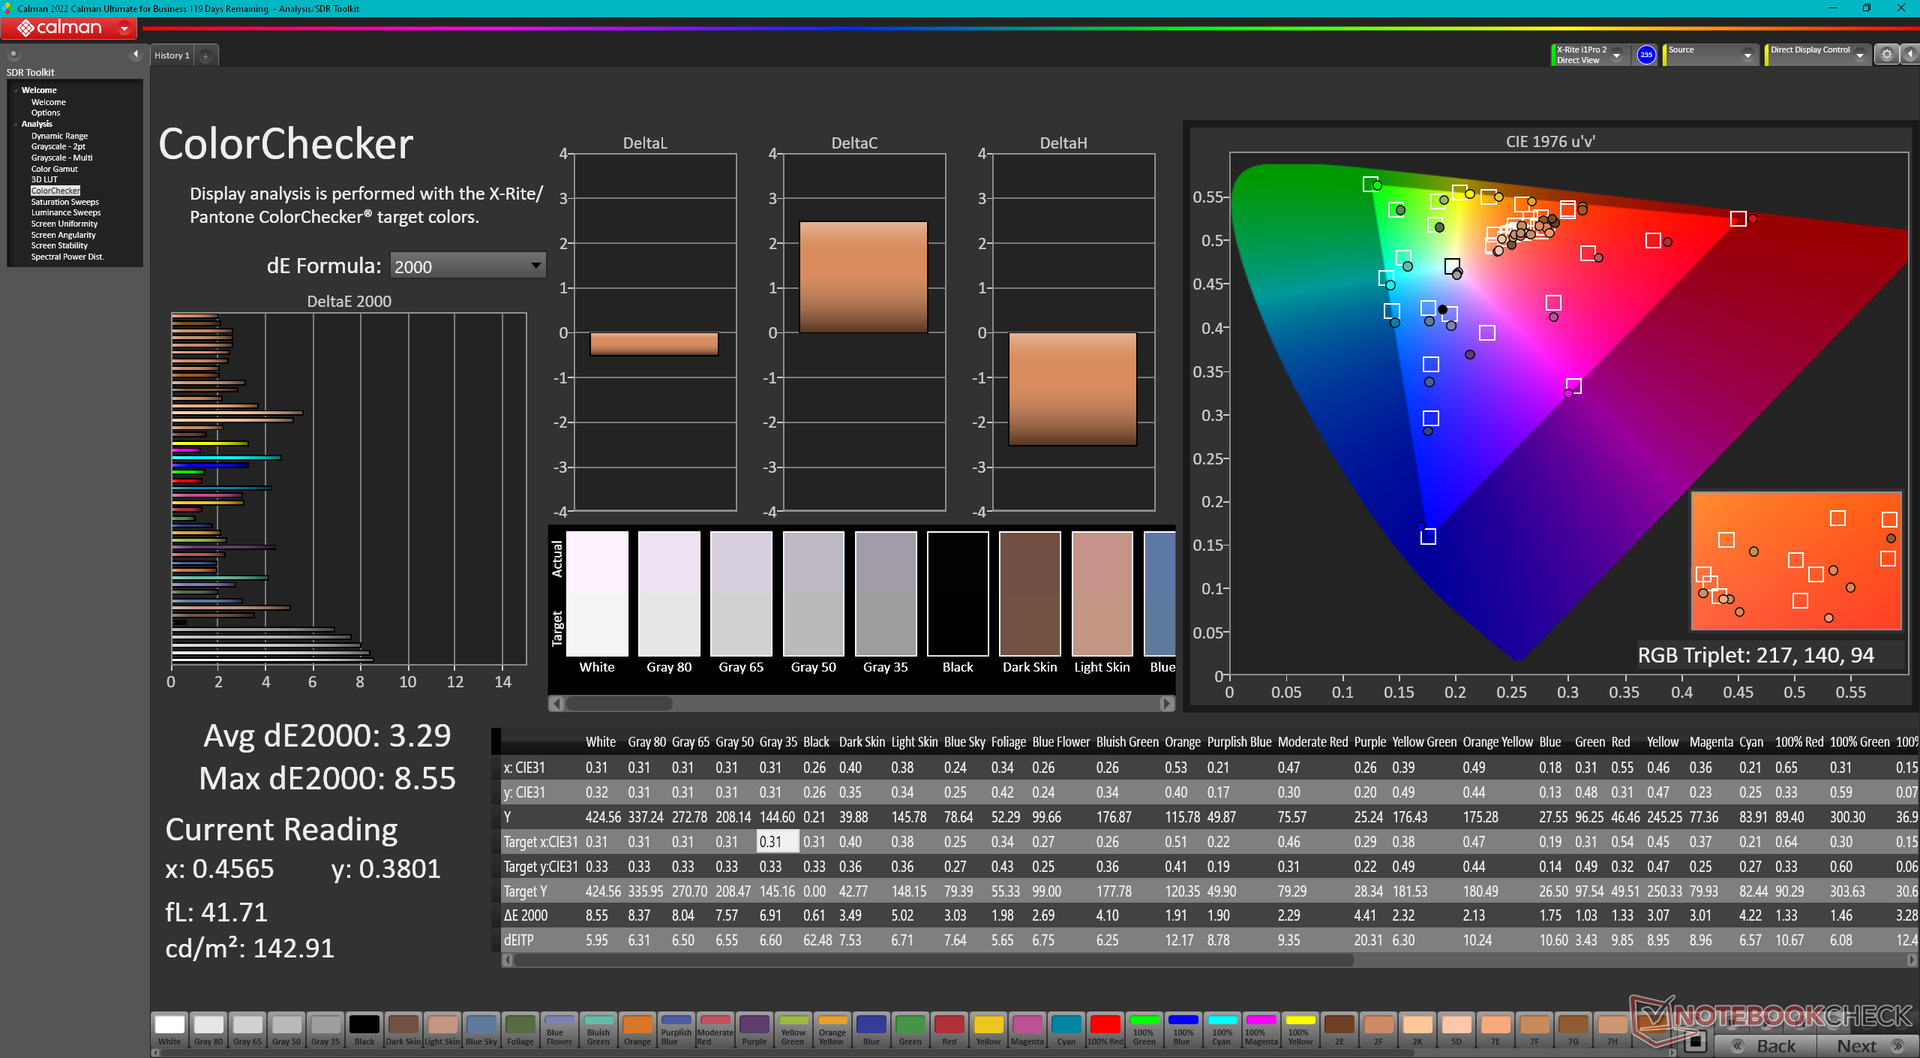
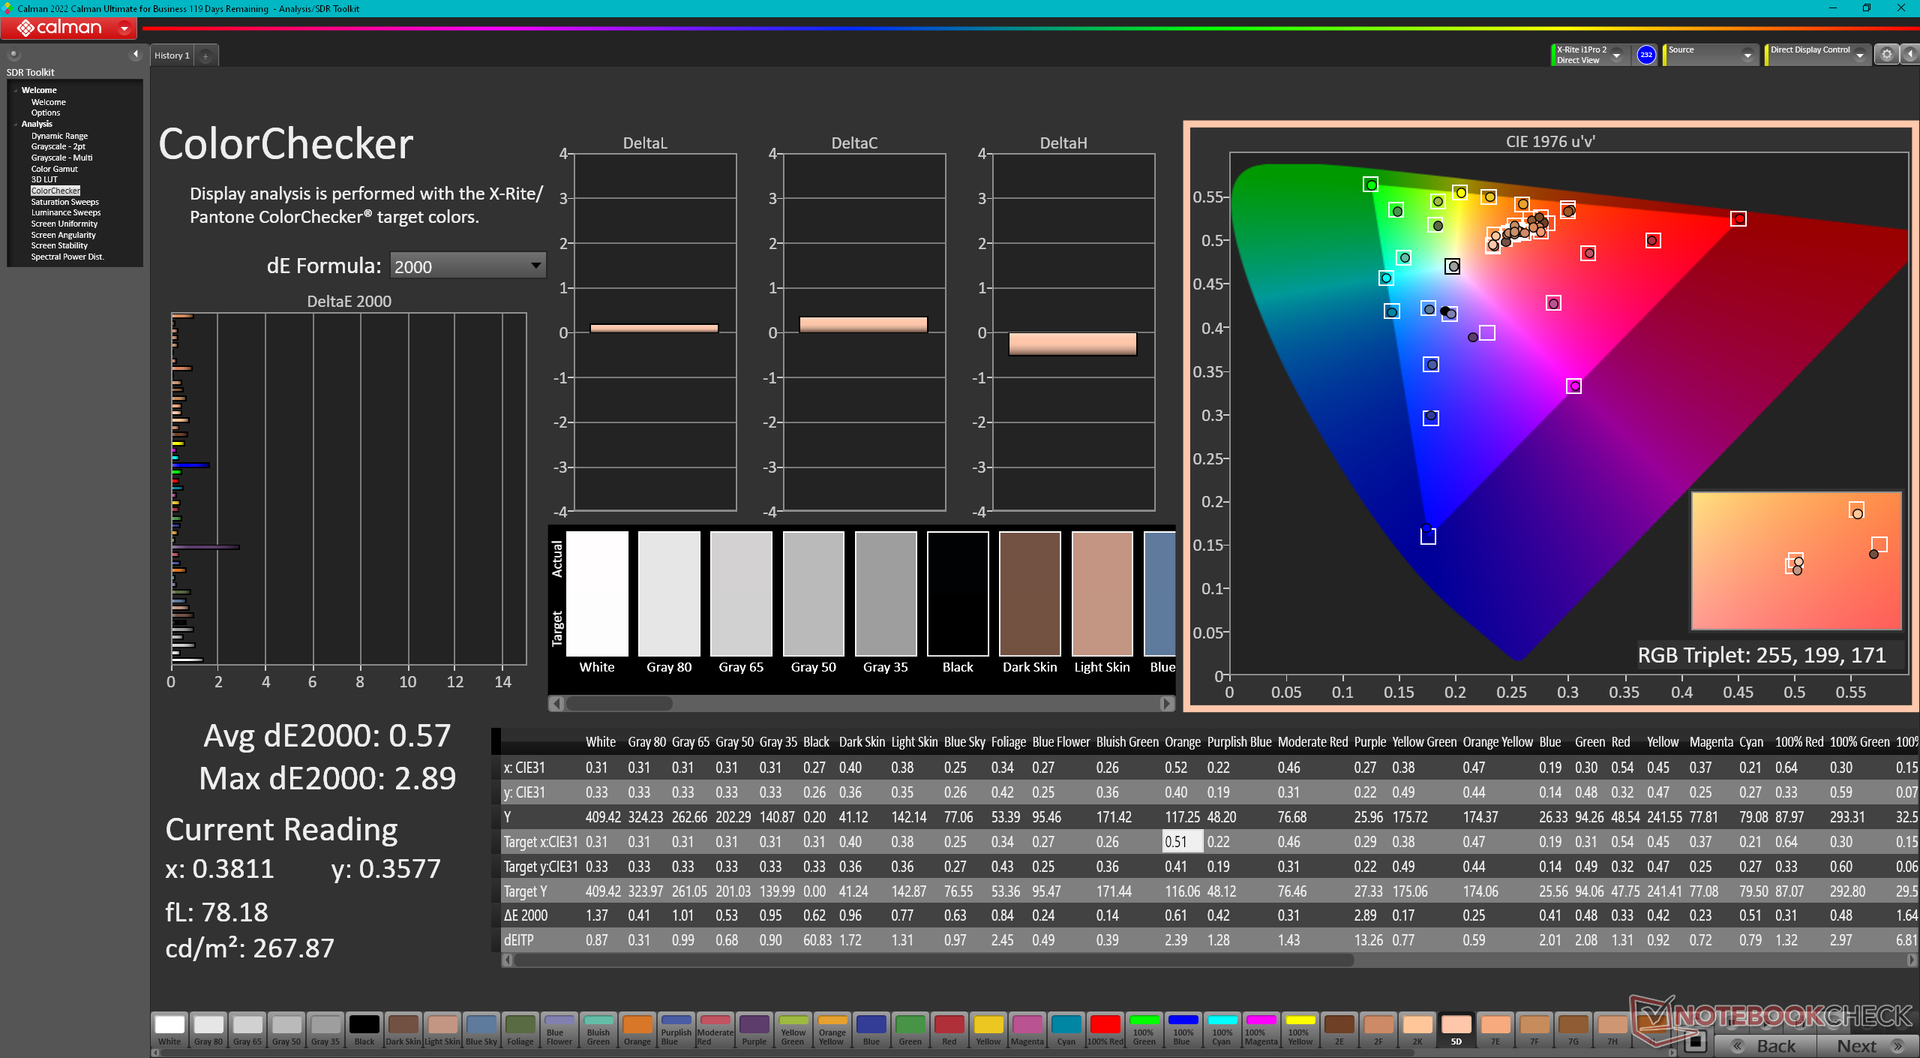
ΔE ColorChecker Calman: 3.29 | ∀{0.5-29.43 Ø4.72}
calibrated: 0.57
ΔE Greyscale Calman: 6.1 | ∀{0.09-98 Ø4.97}
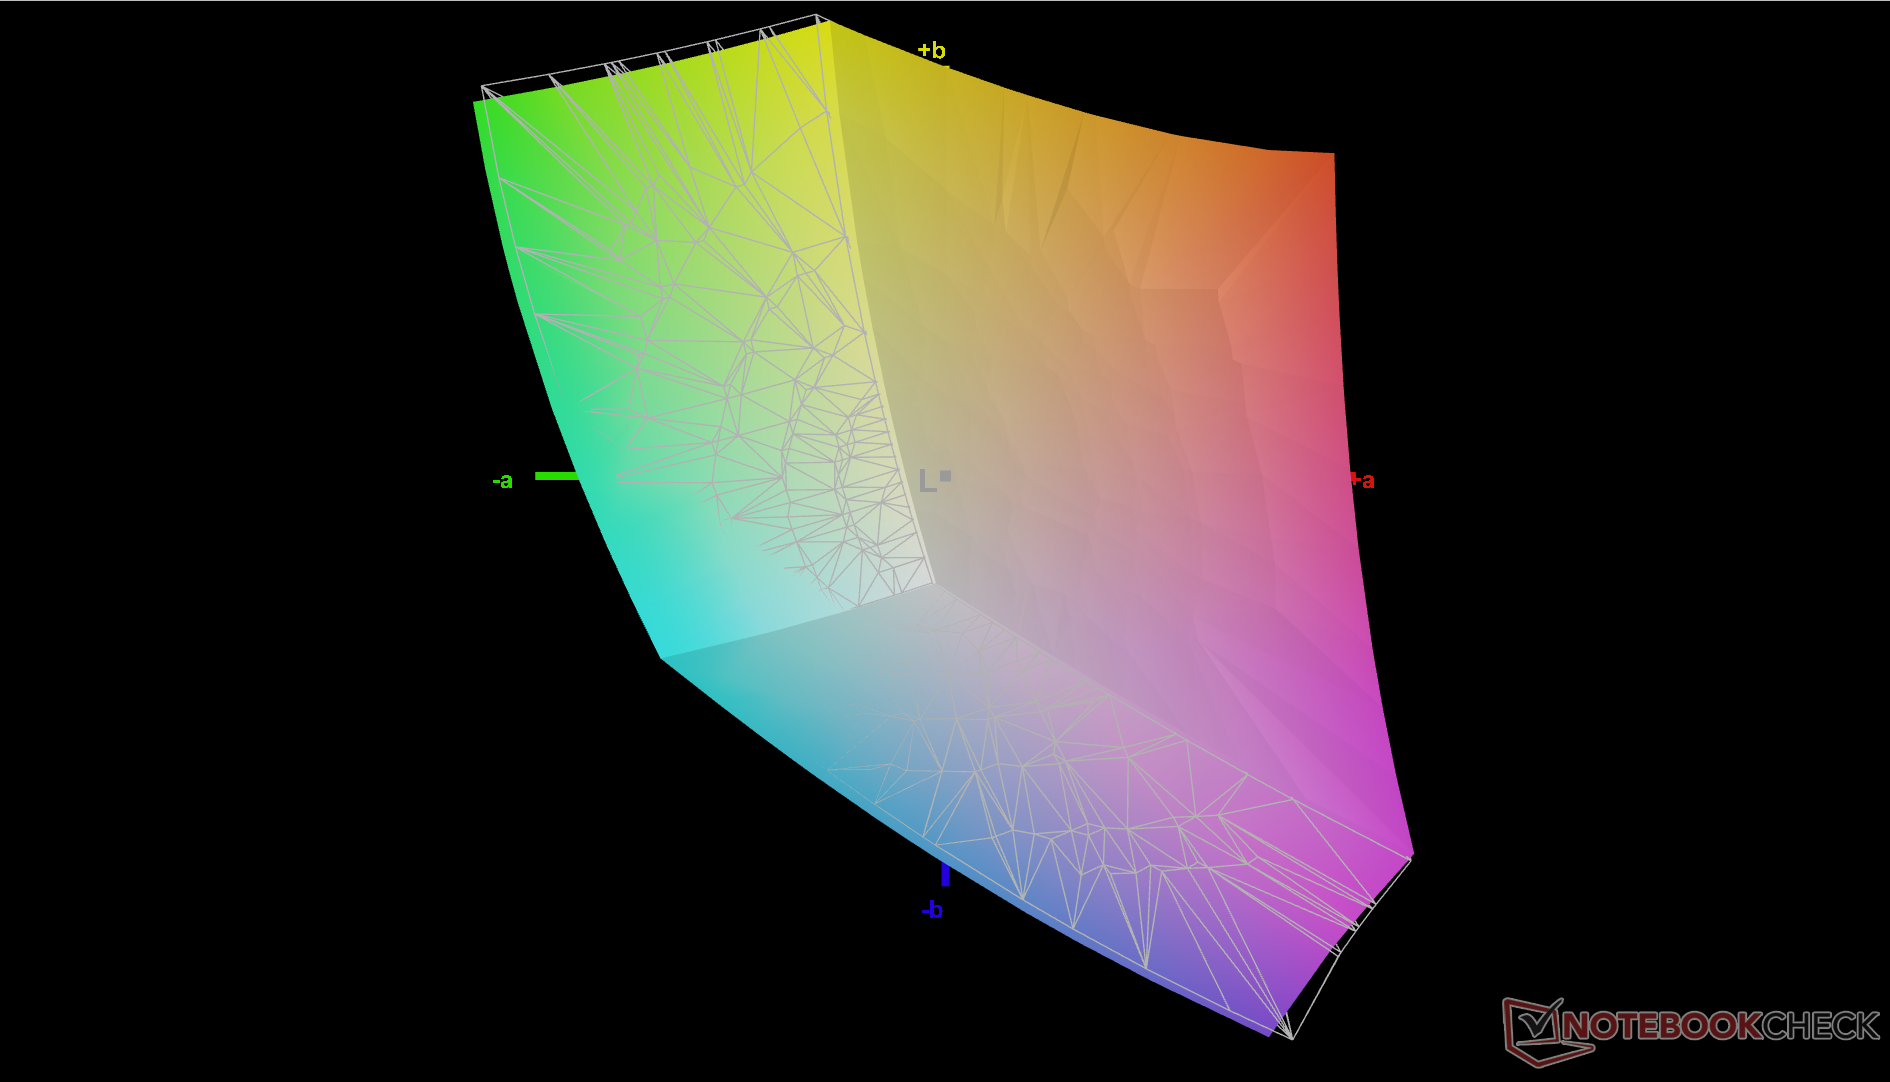
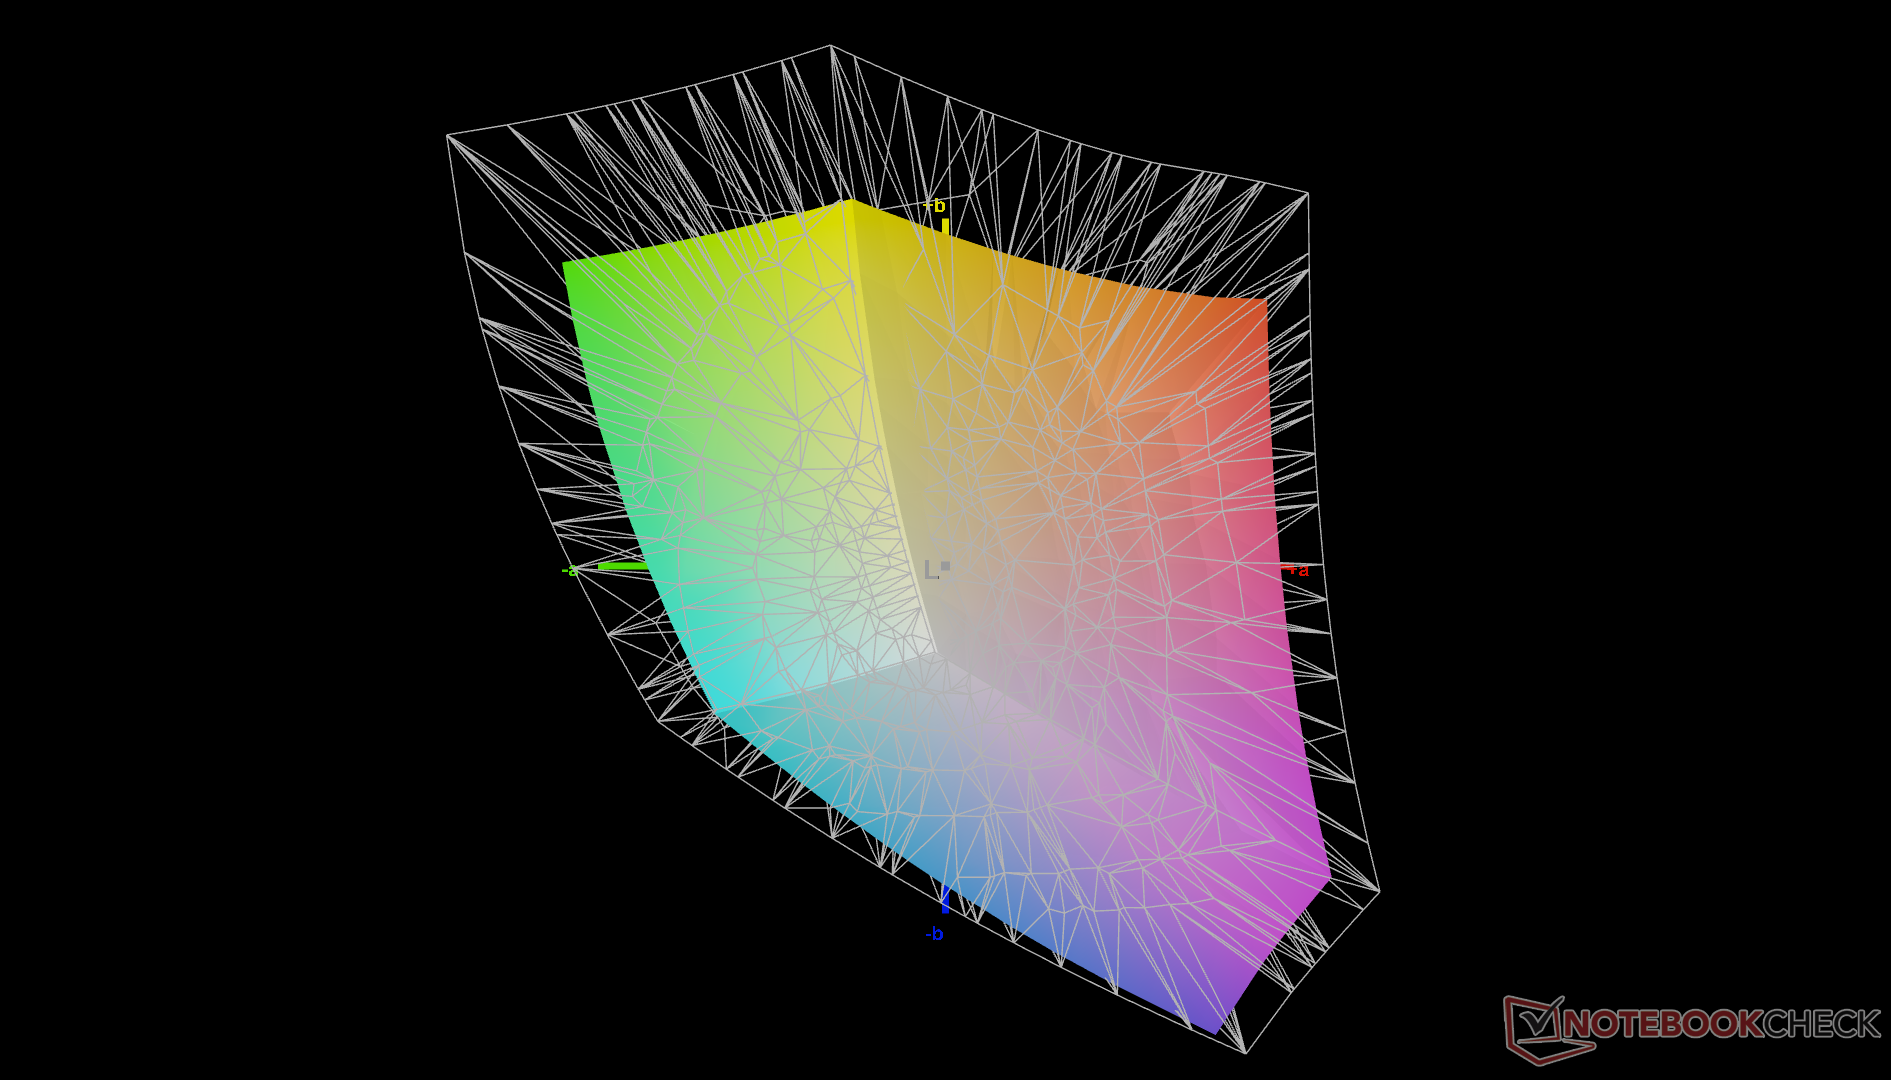
71.1% AdobeRGB 1998 (Argyll 3D)
98.6% sRGB (Argyll 3D)
69.3% Display P3 (Argyll 3D)
Gamma: 2.24
CCT: 6925 K
| Lenovo ThinkPad X1 Yoga G8 i7-1355U BOE NE140WUM-N62, IPS, 1920x1200, 14" | Lenovo ThinkPad X1 Yoga G7 21CE002HGE MNE007JA1-1, IPS, 1920x1200, 14" | Dell Latitude 9430 2-in-1 AU Optronics B140QAN, IPS, 2560x1600, 14" | LG Gram 14T90P LG Philips LP140WU1-SPA1, IPS, 1900x1200, 14" | Asus ZenBook Flip 14 UN5401QA-KN085W SDC4154, OLED, 2880x1800, 14" | HP EliteBook x360 1040 G7, i7-10810U BOE08A3, IPS, 1920x1080, 14" | |
|---|---|---|---|---|---|---|
| Display | 0% | 9% | 22% | 28% | -4% | |
| Display P3 Coverage (%) | 69.3 | 69.3 0% | 79.4 15% | 98.8 43% | 99.7 44% | 66.1 -5% |
| sRGB Coverage (%) | 98.6 | 99.7 1% | 100 1% | 100 1% | 100 1% | 95.5 -3% |
| AdobeRGB 1998 Coverage (%) | 71.1 | 71.3 0% | 79.4 12% | 98.6 39% | 68.1 -4% | |
| Response Times | 7% | -42% | -11% | 94% | -26% | |
| Response Time Grey 50% / Grey 80% * (ms) | 43.1 ? | 42 ? 3% | 63.6 ? -48% | 44 ? -2% | 2 ? 95% | 52.4 ? -22% |
| Response Time Black / White * (ms) | 24.9 ? | 22.4 ? 10% | 33.6 ? -35% | 30 ? -20% | 2 ? 92% | 32 ? -29% |
| PWM Frequency (Hz) | ||||||
| Bildschirm | 17% | 9% | -2% | -41% | -31% | |
| Helligkeit Bildmitte (cd/m²) | 425.2 | 371 -13% | 517.7 22% | 305.5 -28% | 366 -14% | 406.7 -4% |
| Brightness (cd/m²) | 381 | 363 -5% | 493 29% | 289 -24% | 369 -3% | 382 0% |
| Brightness Distribution (%) | 87 | 92 6% | 90 3% | 87 0% | 96 10% | 88 1% |
| Schwarzwert * (cd/m²) | 0.23 | 0.21 9% | 0.33 -43% | 0.27 -17% | 0.28 -22% | |
| Kontrast (:1) | 1849 | 1767 -4% | 1569 -15% | 1131 -39% | 1452 -21% | |
| Delta E Colorchecker * | 3.29 | 1.3 60% | 3.38 -3% | 3.31 -1% | 2.84 14% | 3.74 -14% |
| Colorchecker dE 2000 max. * | 8.55 | 2.6 70% | 6.25 27% | 6.12 28% | 5.29 38% | 5.92 31% |
| Colorchecker dE 2000 calibrated * | 0.57 | 0.8 -40% | 0.41 28% | 2.81 -393% | 2.18 -282% | |
| Delta E Graustufen * | 6.1 | 2.1 66% | 4 34% | 1.9 69% | 2.32 62% | 4.3 30% |
| Gamma | 2.24 98% | 2.15 102% | 2.13 103% | 2.04 108% | 2.44 90% | 2.19 100% |
| CCT | 6925 94% | 6759 96% | 6186 105% | 6706 97% | 6170 105% | 6781 96% |
| Farbraum (Prozent von AdobeRGB 1998) (%) | 61.6 | |||||
| Color Space (Percent of sRGB) (%) | 95.1 | |||||
| Durchschnitt gesamt (Programm / Settings) | 8% /
12% | -8% /
2% | 3% /
1% | 27% /
-1% | -20% /
-25% |
* ... kleinere Werte sind besser
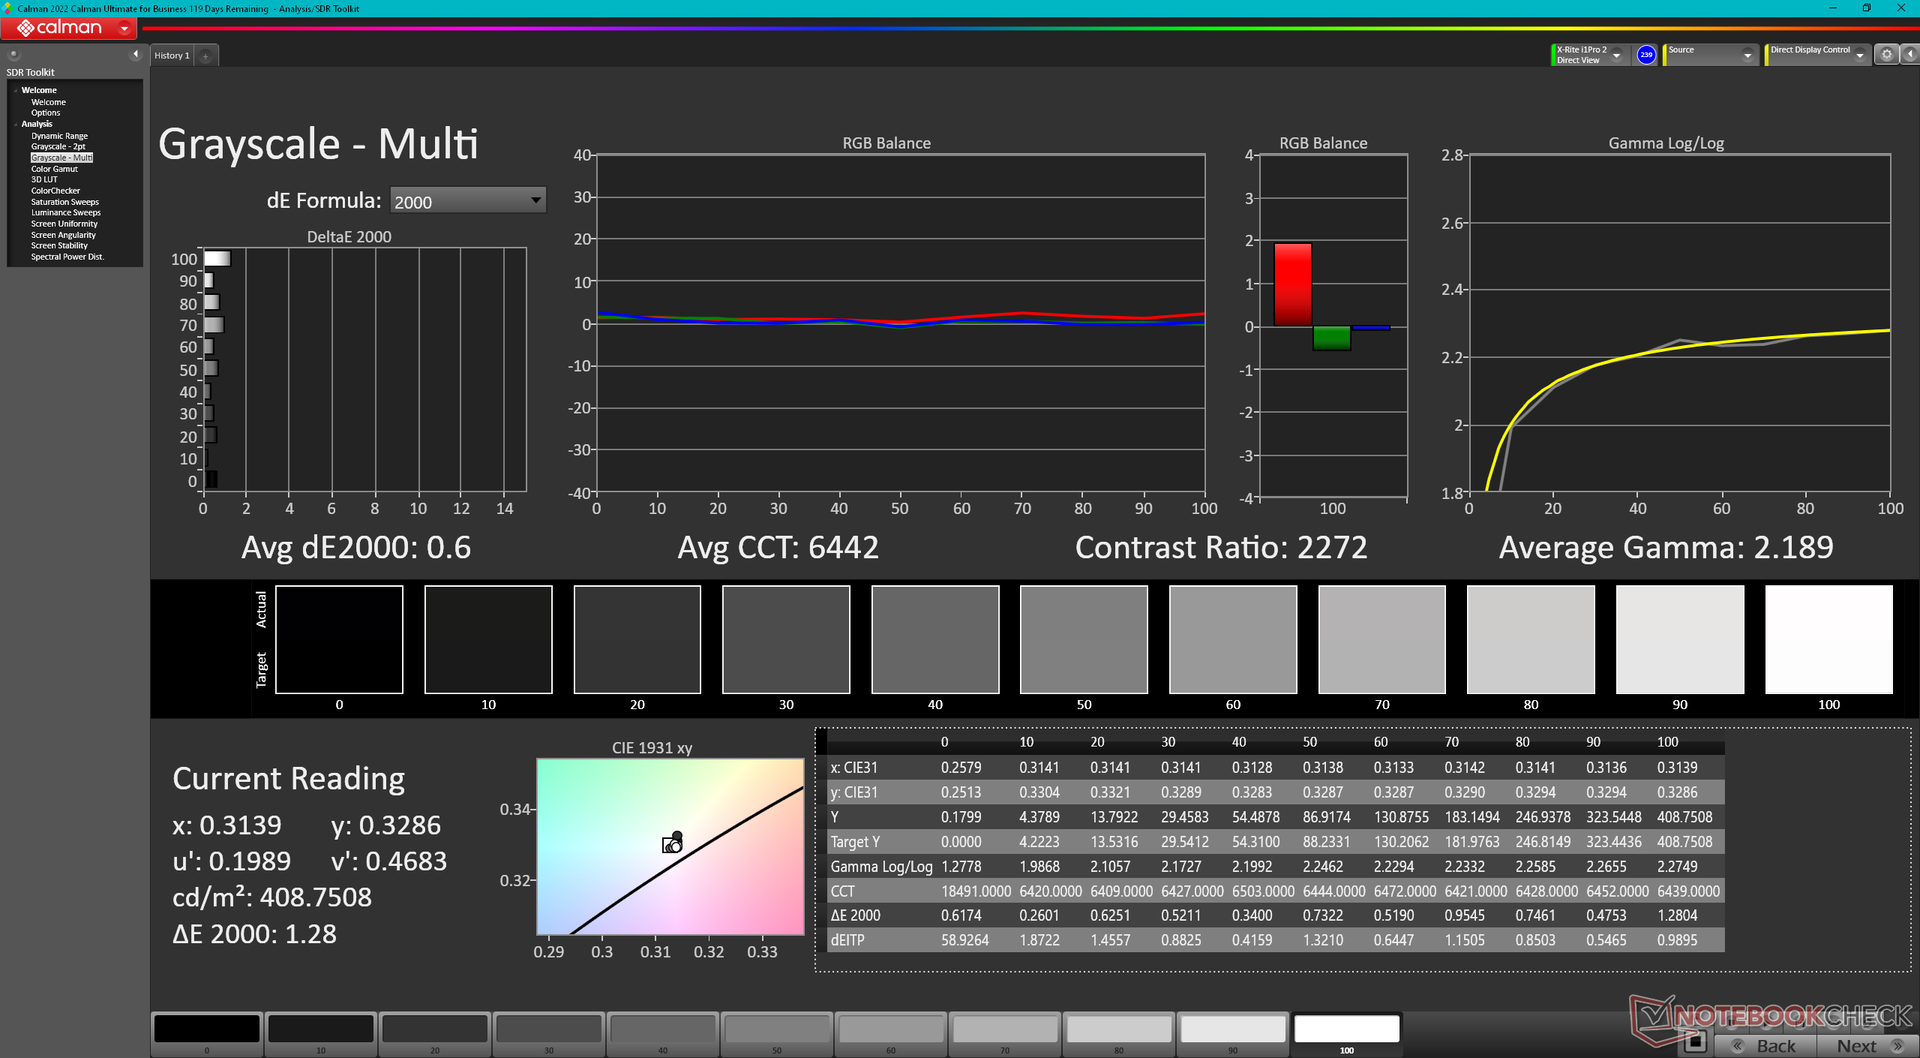
Ab Werk ist das Display nicht kalibriert. Unsere eigene Kalibrierung mit unserem X-Rite-Farbmessgerät verbessert die Abweichungen in den Graustufen und Farben von 6,1 und 3,29 auf nur noch 0,6 und 0,57. Wir empfehlen daher die Verwendung unseres kalibrierten ICM-Profils, welches weiter oben heruntergeladen werden kann.


Reaktionszeiten (Response Times) des Displays
| ↔ Reaktionszeiten Schwarz zu Weiß | ||
|---|---|---|
| 24.9 ms ... steigend ↗ und fallend ↘ kombiniert | ↗ 14.2 ms steigend | 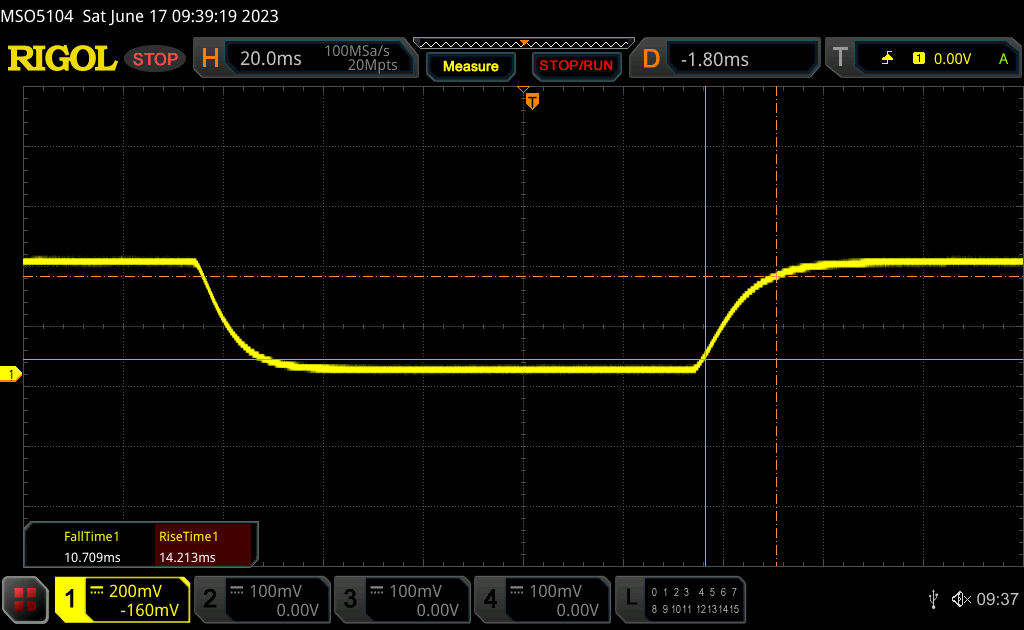 |
| ↘ 10.7 ms fallend | ||
| Die gemessenen Reaktionszeiten sind gut, für anspruchsvolle Spieler könnten der Bildschirm jedoch zu langsam sein. Im Vergleich rangierten die bei uns getesteten Geräte von 0.1 (Minimum) zu 240 (Maximum) ms. » 59 % aller Screens waren schneller als der getestete. Daher sind die gemessenen Reaktionszeiten schlechter als der Durchschnitt aller vermessenen Geräte (19.8 ms). | ||
| ↔ Reaktionszeiten 50% Grau zu 80% Grau | ||
| 43.1 ms ... steigend ↗ und fallend ↘ kombiniert | ↗ 20.7 ms steigend | 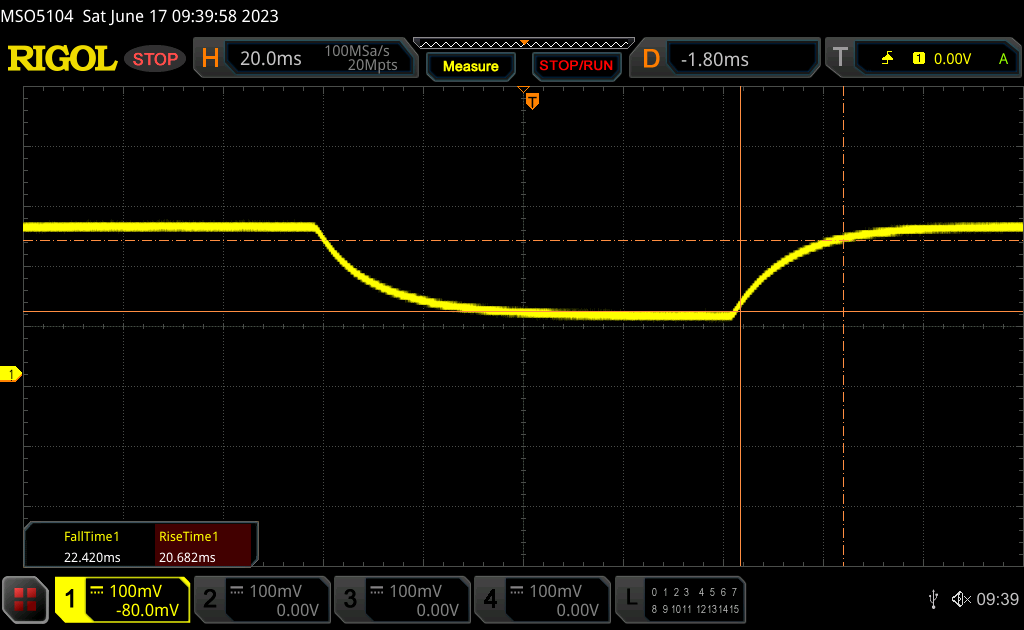 |
| ↘ 22.4 ms fallend | ||
| Die gemessenen Reaktionszeiten sind langsam und dadurch für viele Spieler wahrscheinlich zu langsam. Im Vergleich rangierten die bei uns getesteten Geräte von 0.165 (Minimum) zu 636 (Maximum) ms. » 72 % aller Screens waren schneller als der getestete. Daher sind die gemessenen Reaktionszeiten schlechter als der Durchschnitt aller vermessenen Geräte (31 ms). | ||
Bildschirm-Flackern / PWM (Pulse-Width Modulation)
| Flackern / PWM nicht festgestellt | 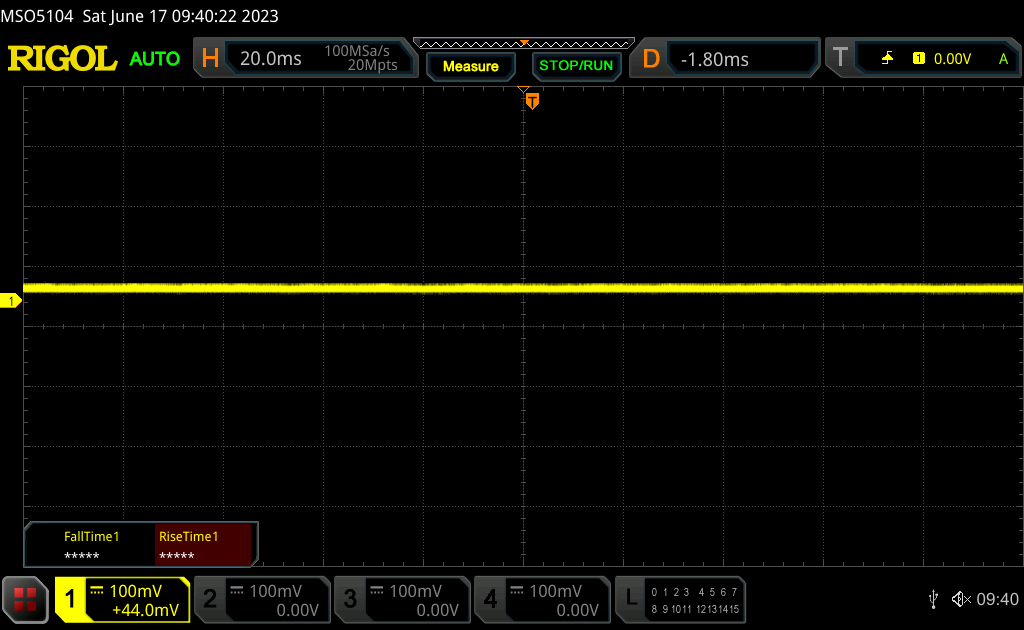 | ||
Im Vergleich: 52 % aller getesteten Geräte nutzten kein PWM um die Helligkeit zu reduzieren. Wenn PWM eingesetzt wurde, dann bei einer Frequenz von durchschnittlich 7763 (Minimum 5, Maximum 343500) Hz. | |||


Leistung - Neue CPU mit ganz neuen Problemen
Testbedingungen
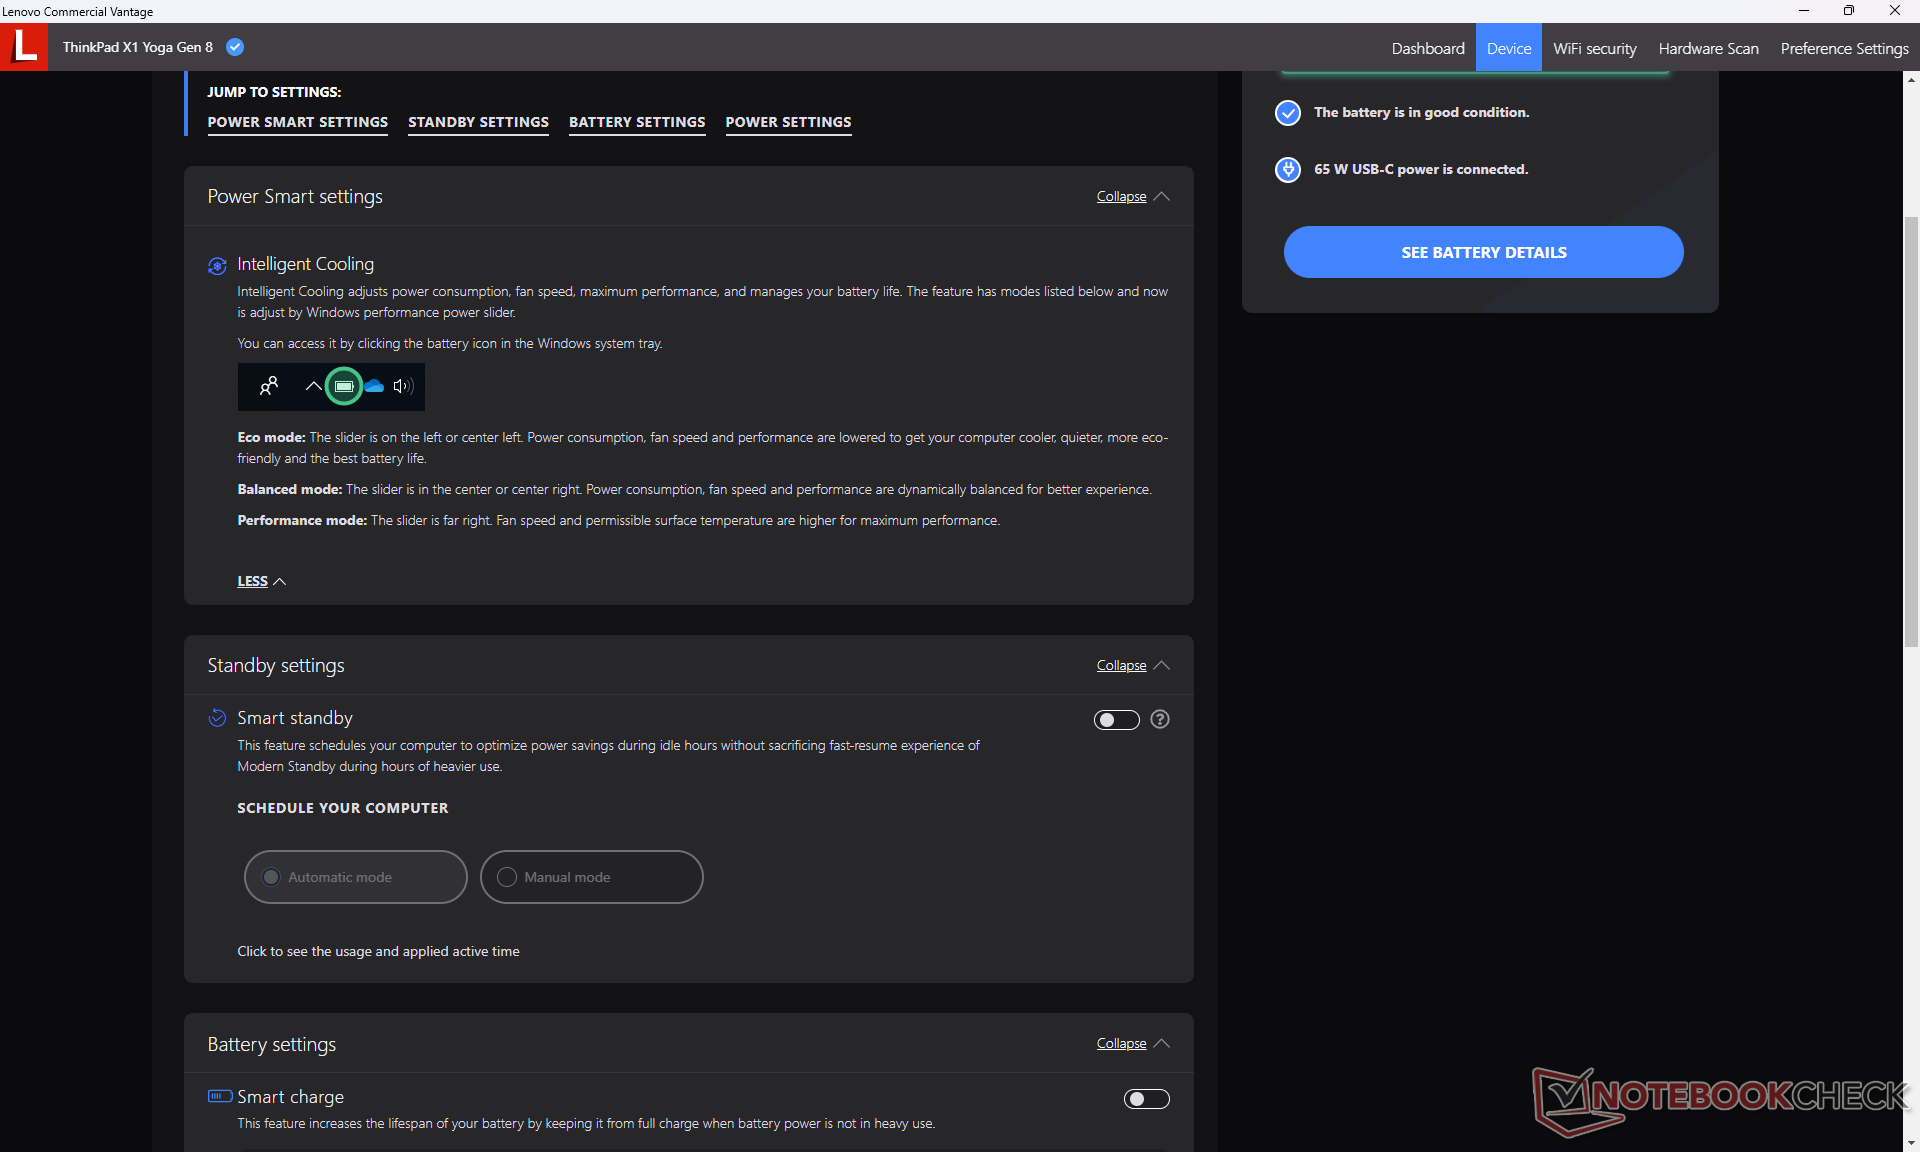
Vor den Benchmarktests versetzen wir den Laptop in den Windows Leistungsmodus. Anders als andere Hersteller bietet Lenovo zusätzlich zu den vorhandenen Windows-Profilen keine speziellen Leistungsprofile an, was die Einstellungsmöglichkeiten für den Nutzer vereinfacht.
Prozessor
Die CPU-Leistung liegt etwa 15 bis 20 Prozent oberhalb der des enttäuschenden Core i7-1270P im letztjährigen Yoga G7 und das obwohl in unserem Yoga G8 nur eine Core-U-CPU sitzt. Entscheidet man sich für den stärkeren Core i7-1370P, so dürfte das die Multi-Core-Leistung um etwa 35 Prozent steigern, angesichts unserer Erfahrungen mit dem Framework Laptop. Setzt man hingegen auf den schwächeren Core i5-1335U, so dürfte dies einen Leistungsverlust von etwa 20 Prozent zur Folge haben, basierend auf unseren Erkenntnissen vom Acer Aspire 5 Spin 14. Allerdings ist es mehr als unwahrscheinlich, dass die Higher-End-Option mit Core i7-1370P wirklich signifikante Leistungssteigerungen für das Yoga G8 ermöglicht, denn im Laufe des Tests haben wir schon mit dem Core i7-1355U ein starkes Drosselverhalten beobachtet, wie wir im Abschnitt Stresstest weiter unten darlegen.
Cinebench R15 Multi Loop
Cinebench R20: CPU (Multi Core) | CPU (Single Core)
Cinebench R23: Multi Core | Single Core
Cinebench R15: CPU Multi 64Bit | CPU Single 64Bit
Blender: v2.79 BMW27 CPU
7-Zip 18.03: 7z b 4 | 7z b 4 -mmt1
Geekbench 5.5: Multi-Core | Single-Core
HWBOT x265 Benchmark v2.2: 4k Preset
LibreOffice : 20 Documents To PDF
R Benchmark 2.5: Overall mean
* ... kleinere Werte sind besser
| Blender | |
| v3.3 Classroom HIP/AMD | |
| Lenovo Yoga 7-14ARB G7 | |
| v3.3 Classroom OPTIX/RTX | |
| Lenovo ThinkPad T14 G3-21AJS00400 | |
| v3.3 Classroom CUDA | |
| Lenovo ThinkPad T14 G3-21AJS00400 | |
| v3.3 Classroom CPU | |
| Dell Latitude 9430 2-in-1 | |
| Durchschnittliche Intel Iris Xe Graphics G7 96EUs (336 - 1259, n=109) | |
| HP EliteBook 840 G9 | |
| Lenovo ThinkPad T14 G3-21AJS00400 | |
| Lenovo ThinkPad X1 Yoga G8 i7-1355U | |
| Lenovo Yoga 7-14ARB G7 | |
| Asus ROG Zephyrus G14 GA402XY | |
* ... kleinere Werte sind besser
AIDA64: FP32 Ray-Trace | FPU Julia | CPU SHA3 | CPU Queen | FPU SinJulia | FPU Mandel | CPU AES | CPU ZLib | FP64 Ray-Trace | CPU PhotoWorxx
| Performance Rating | |
| Asus ZenBook Flip 14 UN5401QA-KN085W | |
| Dell Latitude 9430 2-in-1 | |
| Lenovo ThinkPad X1 Yoga G8 i7-1355U | |
| Durchschnittliche Intel Core i7-1355U | |
| LG Gram 14T90P | |
| Lenovo ThinkPad X1 Yoga G7 21CE002HGE | |
| AIDA64 / FP32 Ray-Trace | |
| Asus ZenBook Flip 14 UN5401QA-KN085W | |
| Dell Latitude 9430 2-in-1 | |
| Lenovo ThinkPad X1 Yoga G8 i7-1355U | |
| Durchschnittliche Intel Core i7-1355U (5673 - 8424, n=18) | |
| LG Gram 14T90P | |
| Lenovo ThinkPad X1 Yoga G7 21CE002HGE | |
| AIDA64 / FPU Julia | |
| Asus ZenBook Flip 14 UN5401QA-KN085W | |
| Lenovo ThinkPad X1 Yoga G8 i7-1355U | |
| Dell Latitude 9430 2-in-1 | |
| Durchschnittliche Intel Core i7-1355U (29580 - 42706, n=18) | |
| LG Gram 14T90P | |
| Lenovo ThinkPad X1 Yoga G7 21CE002HGE | |
| AIDA64 / CPU SHA3 | |
| Asus ZenBook Flip 14 UN5401QA-KN085W | |
| Dell Latitude 9430 2-in-1 | |
| Lenovo ThinkPad X1 Yoga G8 i7-1355U | |
| Durchschnittliche Intel Core i7-1355U (1529 - 2200, n=18) | |
| LG Gram 14T90P | |
| Lenovo ThinkPad X1 Yoga G7 21CE002HGE | |
| AIDA64 / CPU Queen | |
| Asus ZenBook Flip 14 UN5401QA-KN085W | |
| Dell Latitude 9430 2-in-1 | |
| Lenovo ThinkPad X1 Yoga G8 i7-1355U | |
| Durchschnittliche Intel Core i7-1355U (21547 - 66907, n=18) | |
| Lenovo ThinkPad X1 Yoga G7 21CE002HGE | |
| LG Gram 14T90P | |
| AIDA64 / FPU SinJulia | |
| Asus ZenBook Flip 14 UN5401QA-KN085W | |
| Lenovo ThinkPad X1 Yoga G7 21CE002HGE | |
| Dell Latitude 9430 2-in-1 | |
| Lenovo ThinkPad X1 Yoga G8 i7-1355U | |
| Durchschnittliche Intel Core i7-1355U (4045 - 5426, n=18) | |
| LG Gram 14T90P | |
| AIDA64 / FPU Mandel | |
| Asus ZenBook Flip 14 UN5401QA-KN085W | |
| Dell Latitude 9430 2-in-1 | |
| Lenovo ThinkPad X1 Yoga G8 i7-1355U | |
| Durchschnittliche Intel Core i7-1355U (14596 - 21627, n=18) | |
| LG Gram 14T90P | |
| Lenovo ThinkPad X1 Yoga G7 21CE002HGE | |
| AIDA64 / CPU AES | |
| Asus ZenBook Flip 14 UN5401QA-KN085W | |
| LG Gram 14T90P | |
| Dell Latitude 9430 2-in-1 | |
| Durchschnittliche Intel Core i7-1355U (31432 - 75408, n=18) | |
| Lenovo ThinkPad X1 Yoga G8 i7-1355U | |
| Lenovo ThinkPad X1 Yoga G7 21CE002HGE | |
| AIDA64 / CPU ZLib | |
| Asus ZenBook Flip 14 UN5401QA-KN085W | |
| Lenovo ThinkPad X1 Yoga G8 i7-1355U | |
| Dell Latitude 9430 2-in-1 | |
| Durchschnittliche Intel Core i7-1355U (454 - 684, n=18) | |
| Lenovo ThinkPad X1 Yoga G7 21CE002HGE | |
| LG Gram 14T90P | |
| AIDA64 / FP64 Ray-Trace | |
| Asus ZenBook Flip 14 UN5401QA-KN085W | |
| Dell Latitude 9430 2-in-1 | |
| Lenovo ThinkPad X1 Yoga G8 i7-1355U | |
| Durchschnittliche Intel Core i7-1355U (2991 - 4453, n=18) | |
| LG Gram 14T90P | |
| Lenovo ThinkPad X1 Yoga G7 21CE002HGE | |
| AIDA64 / CPU PhotoWorxx | |
| Dell Latitude 9430 2-in-1 | |
| Lenovo ThinkPad X1 Yoga G8 i7-1355U | |
| LG Gram 14T90P | |
| Durchschnittliche Intel Core i7-1355U (21800 - 46154, n=18) | |
| Lenovo ThinkPad X1 Yoga G7 21CE002HGE | |
| Asus ZenBook Flip 14 UN5401QA-KN085W | |
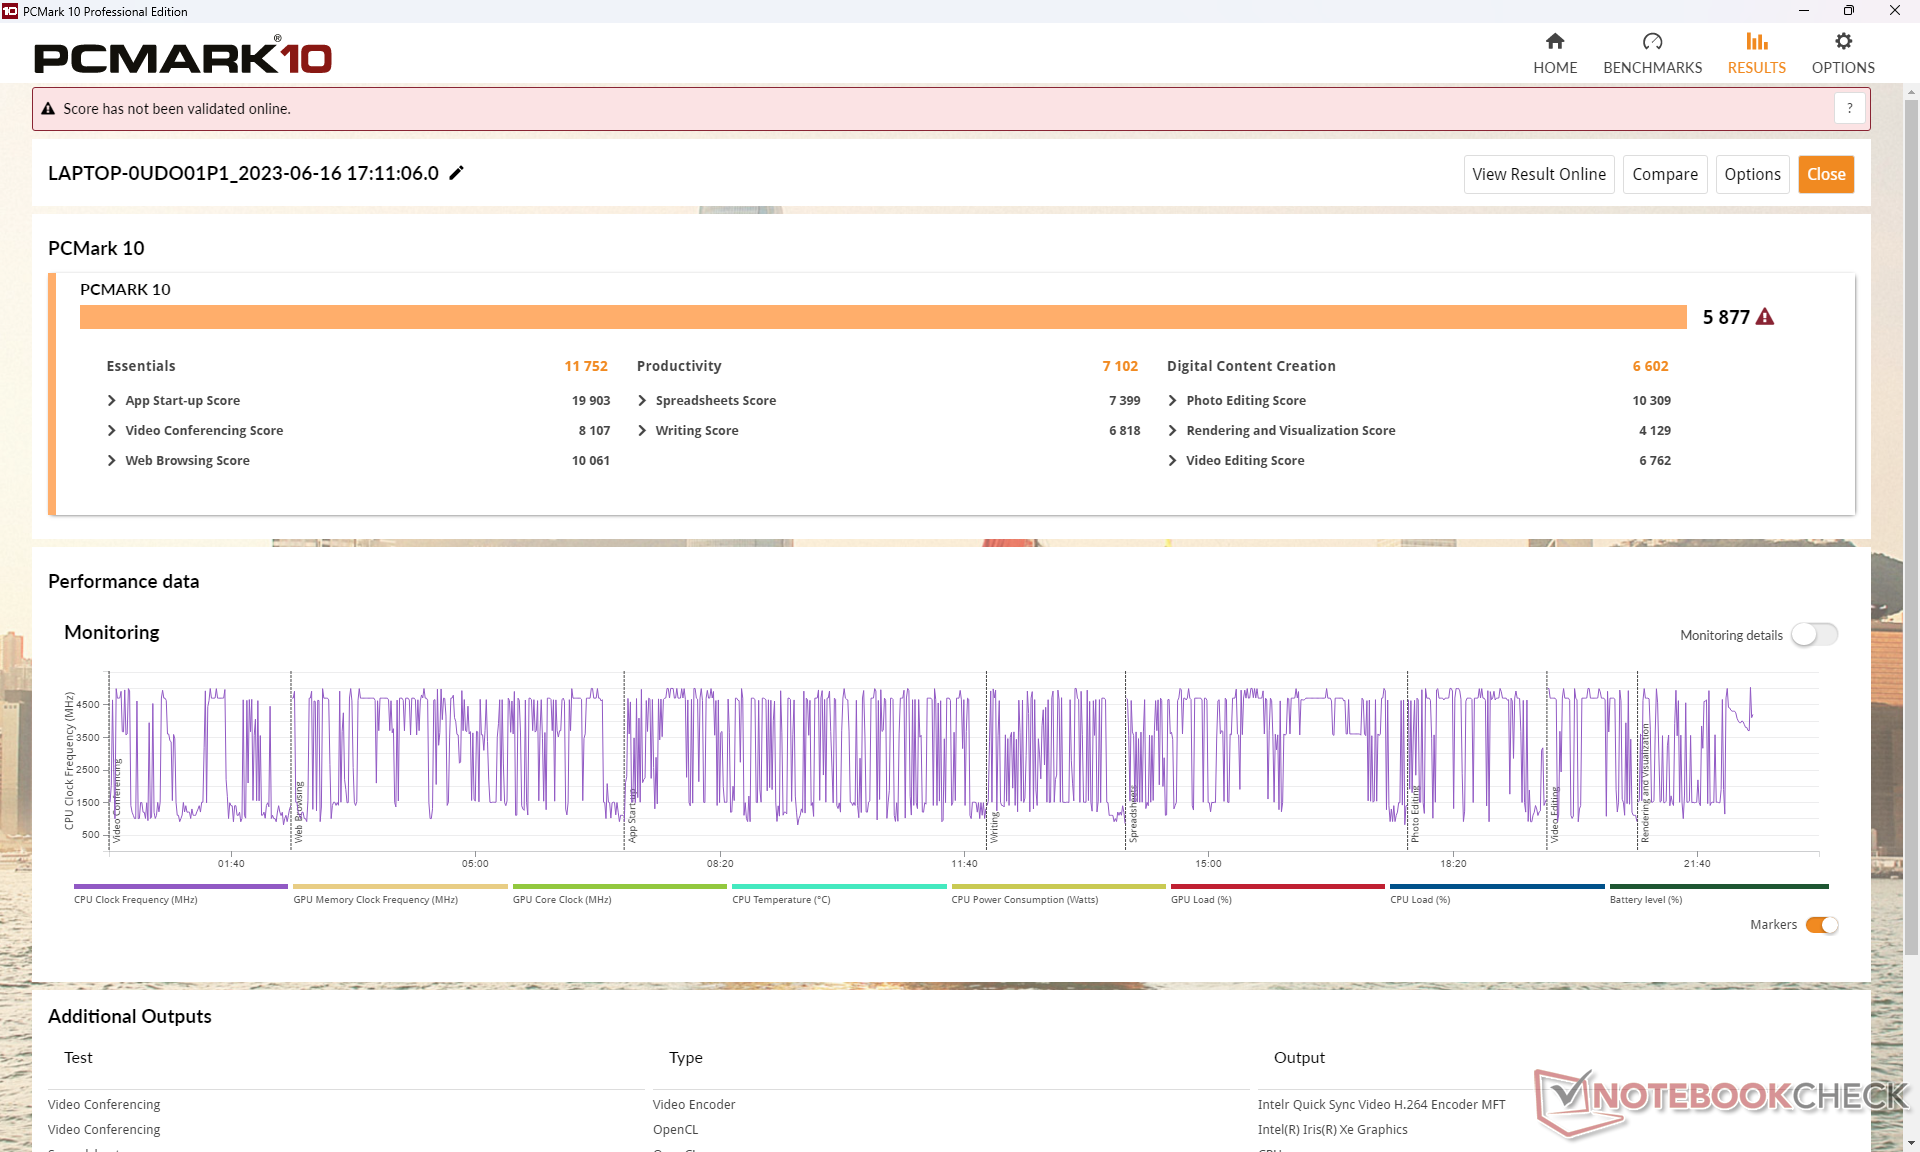
Systemleistung
CrossMark: Overall | Productivity | Creativity | Responsiveness
| PCMark 10 / Score | |
| Asus ZenBook Flip 14 UN5401QA-KN085W | |
| Lenovo ThinkPad X1 Yoga G8 i7-1355U | |
| Durchschnittliche Intel Core i7-1355U, Intel Iris Xe Graphics G7 96EUs (5455 - 5933, n=15) | |
| Lenovo ThinkPad X1 Yoga G7 21CE002HGE | |
| Dell Latitude 9430 2-in-1 | |
| LG Gram 14T90P | |
| HP EliteBook x360 1040 G7, i7-10810U | |
| PCMark 10 / Essentials | |
| Lenovo ThinkPad X1 Yoga G8 i7-1355U | |
| Lenovo ThinkPad X1 Yoga G7 21CE002HGE | |
| Durchschnittliche Intel Core i7-1355U, Intel Iris Xe Graphics G7 96EUs (10203 - 11822, n=15) | |
| Dell Latitude 9430 2-in-1 | |
| Asus ZenBook Flip 14 UN5401QA-KN085W | |
| LG Gram 14T90P | |
| HP EliteBook x360 1040 G7, i7-10810U | |
| PCMark 10 / Productivity | |
| Asus ZenBook Flip 14 UN5401QA-KN085W | |
| Durchschnittliche Intel Core i7-1355U, Intel Iris Xe Graphics G7 96EUs (6763 - 7536, n=15) | |
| HP EliteBook x360 1040 G7, i7-10810U | |
| Lenovo ThinkPad X1 Yoga G8 i7-1355U | |
| Dell Latitude 9430 2-in-1 | |
| Lenovo ThinkPad X1 Yoga G7 21CE002HGE | |
| LG Gram 14T90P | |
| PCMark 10 / Digital Content Creation | |
| Lenovo ThinkPad X1 Yoga G8 i7-1355U | |
| Lenovo ThinkPad X1 Yoga G7 21CE002HGE | |
| Asus ZenBook Flip 14 UN5401QA-KN085W | |
| Durchschnittliche Intel Core i7-1355U, Intel Iris Xe Graphics G7 96EUs (5723 - 6712, n=15) | |
| Dell Latitude 9430 2-in-1 | |
| LG Gram 14T90P | |
| HP EliteBook x360 1040 G7, i7-10810U | |
| CrossMark / Overall | |
| Lenovo ThinkPad X1 Yoga G7 21CE002HGE | |
| Lenovo ThinkPad X1 Yoga G8 i7-1355U | |
| Dell Latitude 9430 2-in-1 | |
| Durchschnittliche Intel Core i7-1355U, Intel Iris Xe Graphics G7 96EUs (1478 - 1643, n=15) | |
| LG Gram 14T90P | |
| CrossMark / Productivity | |
| Lenovo ThinkPad X1 Yoga G7 21CE002HGE | |
| Lenovo ThinkPad X1 Yoga G8 i7-1355U | |
| Dell Latitude 9430 2-in-1 | |
| Durchschnittliche Intel Core i7-1355U, Intel Iris Xe Graphics G7 96EUs (1444 - 1665, n=15) | |
| LG Gram 14T90P | |
| CrossMark / Creativity | |
| Lenovo ThinkPad X1 Yoga G7 21CE002HGE | |
| Lenovo ThinkPad X1 Yoga G8 i7-1355U | |
| Dell Latitude 9430 2-in-1 | |
| Durchschnittliche Intel Core i7-1355U, Intel Iris Xe Graphics G7 96EUs (1563 - 1732, n=15) | |
| LG Gram 14T90P | |
| CrossMark / Responsiveness | |
| Lenovo ThinkPad X1 Yoga G7 21CE002HGE | |
| Dell Latitude 9430 2-in-1 | |
| Durchschnittliche Intel Core i7-1355U, Intel Iris Xe Graphics G7 96EUs (1217 - 1681, n=15) | |
| Lenovo ThinkPad X1 Yoga G8 i7-1355U | |
| LG Gram 14T90P | |
| PCMark 10 Score | 5877 Punkte | |
Hilfe | ||
| AIDA64 / Memory Copy | |
| Dell Latitude 9430 2-in-1 | |
| Lenovo ThinkPad X1 Yoga G8 i7-1355U | |
| LG Gram 14T90P | |
| Lenovo ThinkPad X1 Yoga G7 21CE002HGE | |
| Durchschnittliche Intel Core i7-1355U (35017 - 71600, n=18) | |
| Asus ZenBook Flip 14 UN5401QA-KN085W | |
| AIDA64 / Memory Read | |
| Lenovo ThinkPad X1 Yoga G7 21CE002HGE | |
| LG Gram 14T90P | |
| Dell Latitude 9430 2-in-1 | |
| Lenovo ThinkPad X1 Yoga G8 i7-1355U | |
| Durchschnittliche Intel Core i7-1355U (38551 - 73377, n=18) | |
| Asus ZenBook Flip 14 UN5401QA-KN085W | |
| AIDA64 / Memory Write | |
| Lenovo ThinkPad X1 Yoga G8 i7-1355U | |
| Durchschnittliche Intel Core i7-1355U (35910 - 93342, n=18) | |
| LG Gram 14T90P | |
| Dell Latitude 9430 2-in-1 | |
| Lenovo ThinkPad X1 Yoga G7 21CE002HGE | |
| Asus ZenBook Flip 14 UN5401QA-KN085W | |
| AIDA64 / Memory Latency | |
| Durchschnittliche Intel Core i7-1355U (72.2 - 346, n=18) | |
| Asus ZenBook Flip 14 UN5401QA-KN085W | |
| Dell Latitude 9430 2-in-1 | |
| Lenovo ThinkPad X1 Yoga G8 i7-1355U | |
| LG Gram 14T90P | |
| Lenovo ThinkPad X1 Yoga G7 21CE002HGE | |
* ... kleinere Werte sind besser
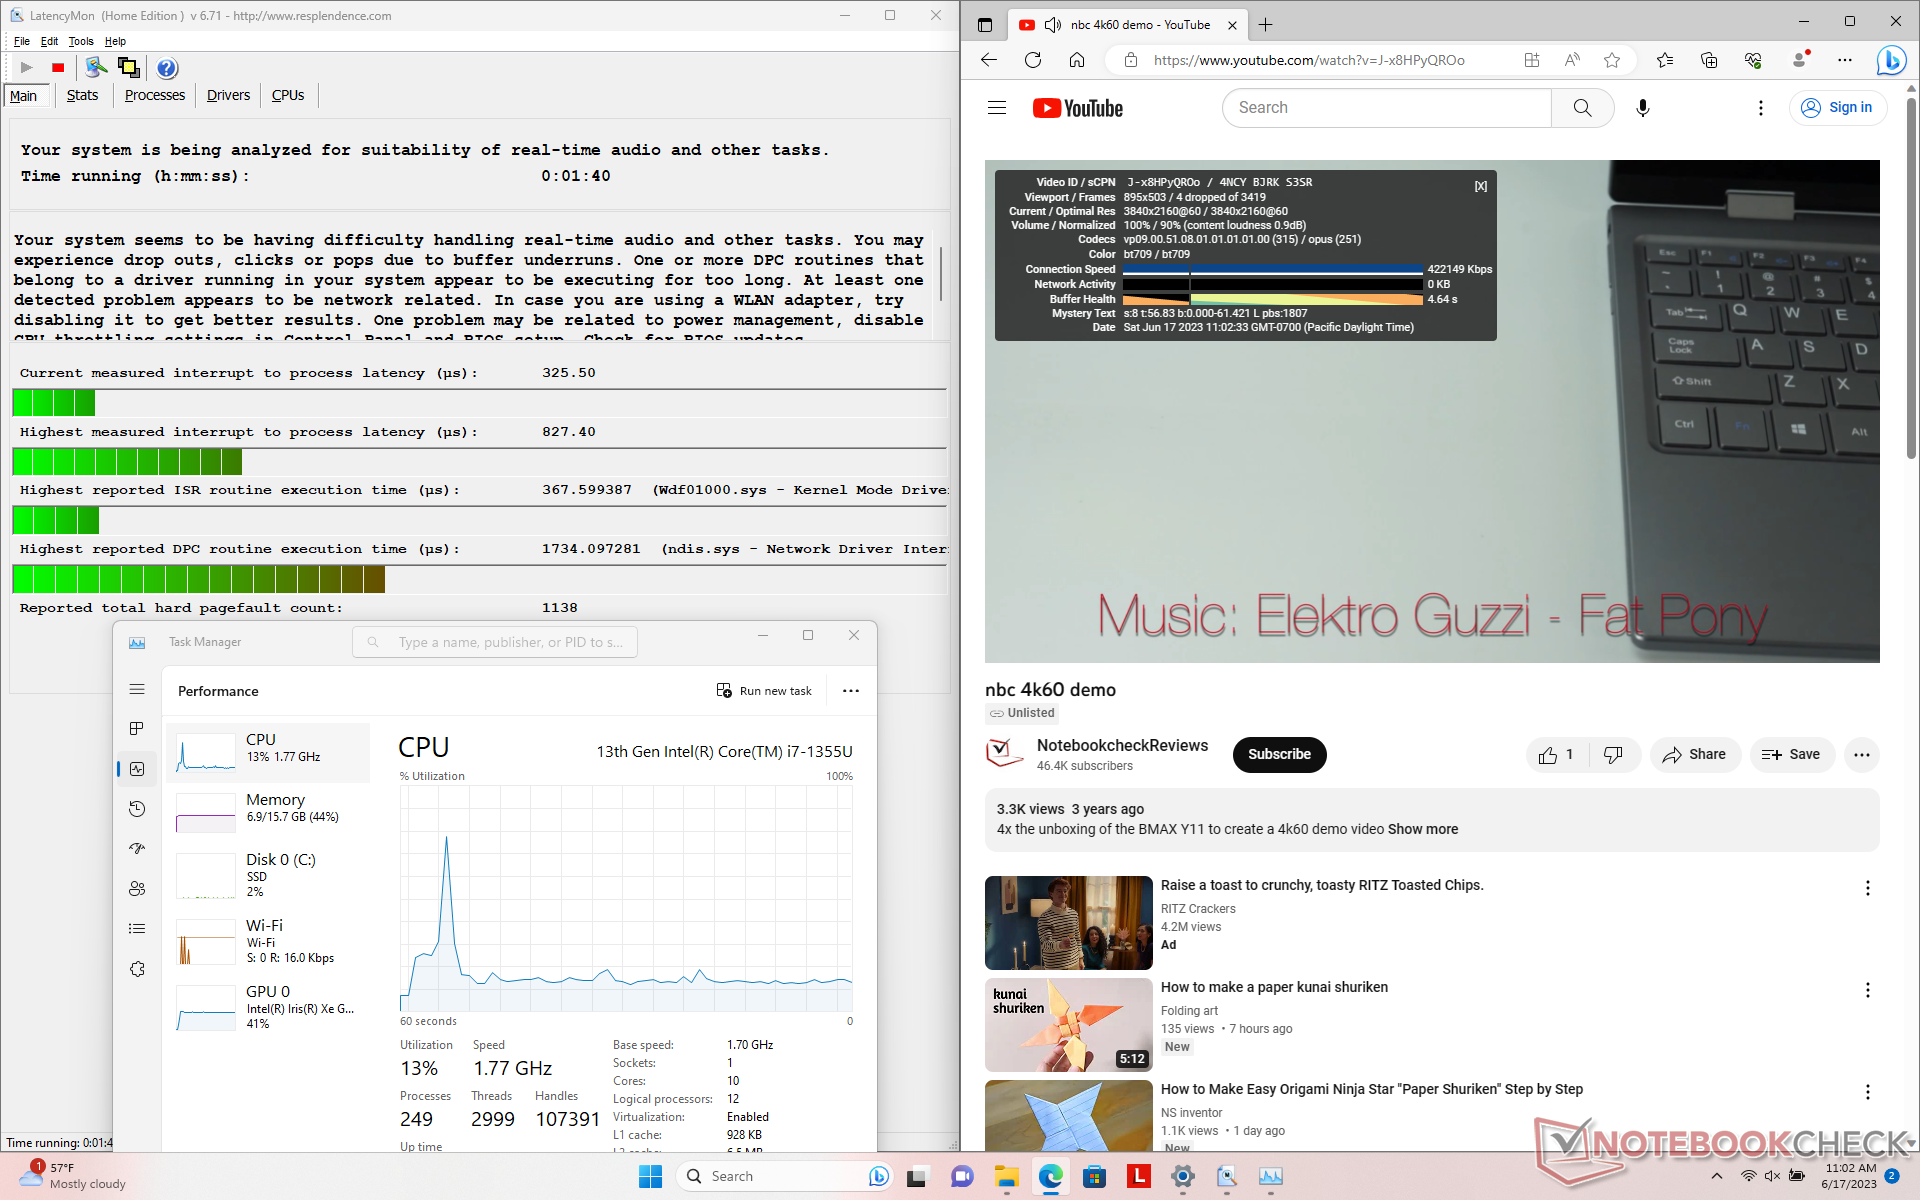
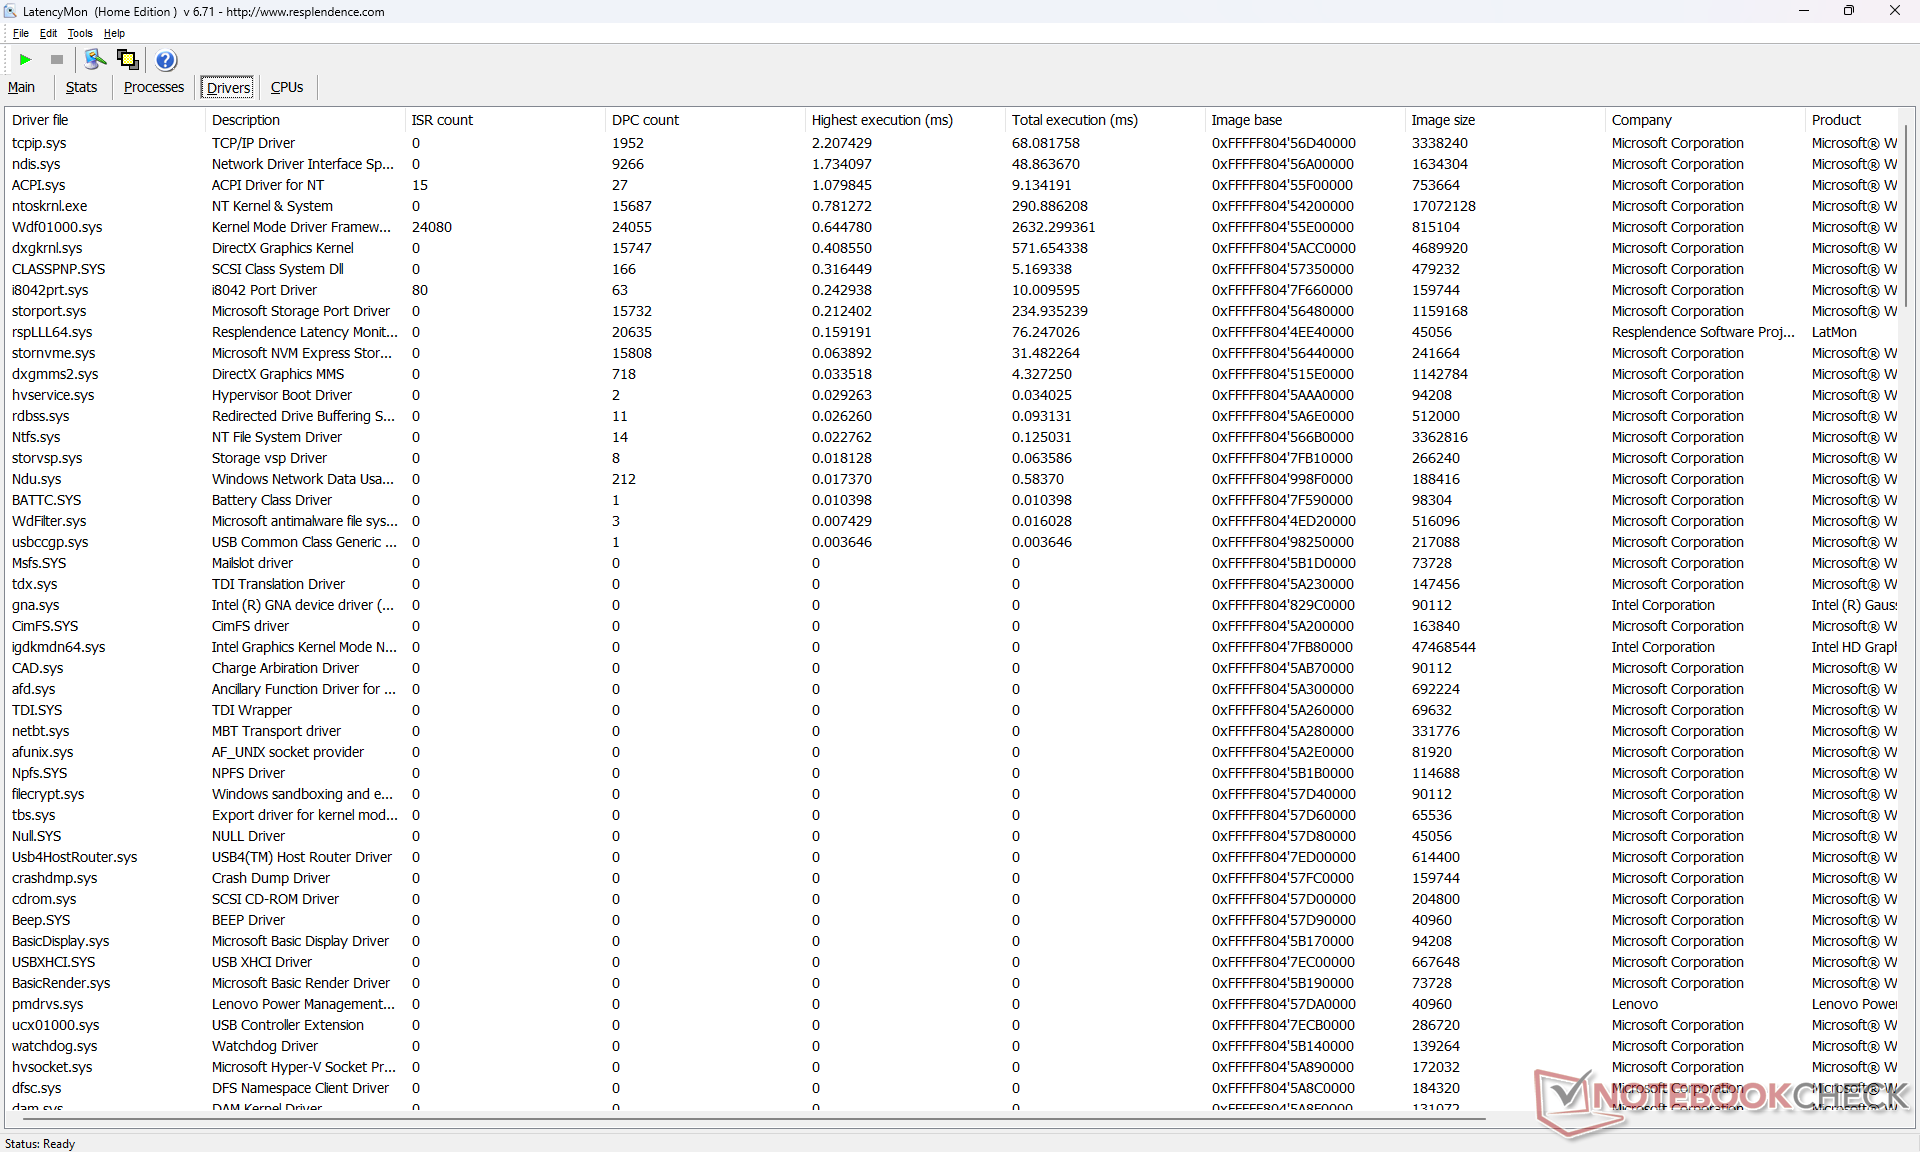
DPC Latency
Beim Öffnen mehrerer Browsertabs auf unserer Homepage zeigt uns das Tool LatencyMon DPC-Probleme an. Auch die Wiedergabe unseres einminütigen 4K/60-fps-YouTubevideos läuft nicht ganz rund, es werden 4 ausgelassene Bilder festgestellt.
| DPC Latencies / LatencyMon - interrupt to process latency (max), Web, Youtube, Prime95 | |
| HP EliteBook x360 1040 G7, i7-10810U | |
| Lenovo ThinkPad X1 Yoga G7 21CE002HGE | |
| LG Gram 14T90P | |
| Asus ZenBook Flip 14 UN5401QA-KN085W | |
| Lenovo ThinkPad X1 Yoga G8 i7-1355U | |
| Dell Latitude 9430 2-in-1 | |
* ... kleinere Werte sind besser
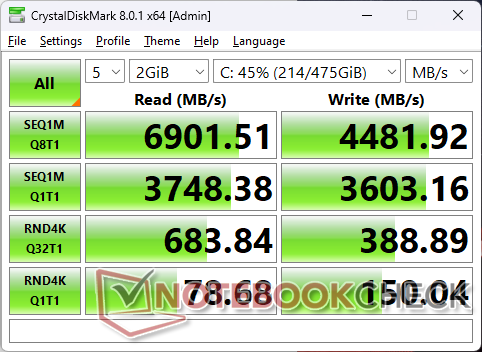
Massenspeicher
Anstelle einer Samsung PM9A1 wie im letztjährigen ThinkPad X1 Yoga G7 sitzt nun eine Western Digital SN810 im Yoga G8. Ihre Leistung liegt insgesamt unter der der Samsung-SSD, insbesondere beim Lesen und Schreiben kleinerer Blöcke.


* ... kleinere Werte sind besser
Disk Throttling: DiskSpd Read Loop, Queue Depth 8
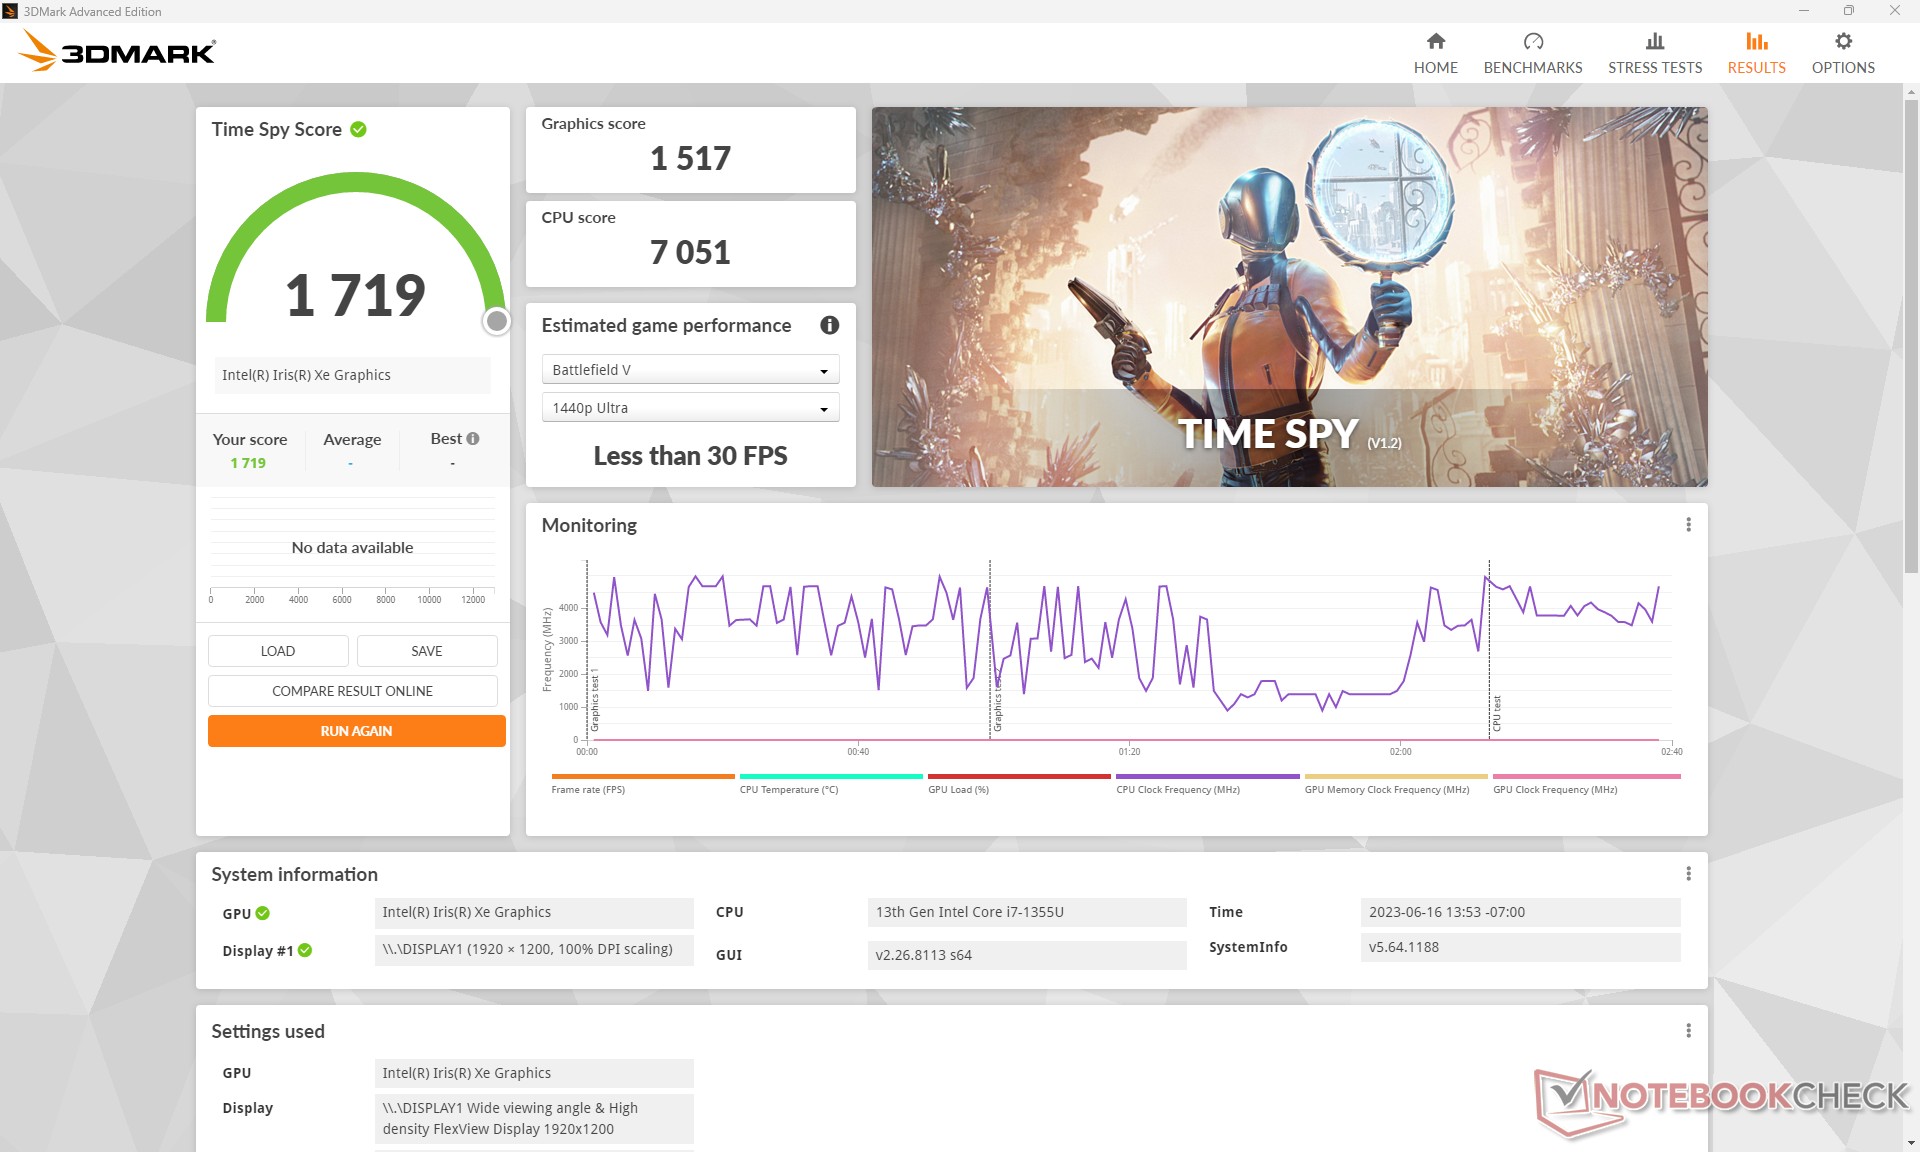
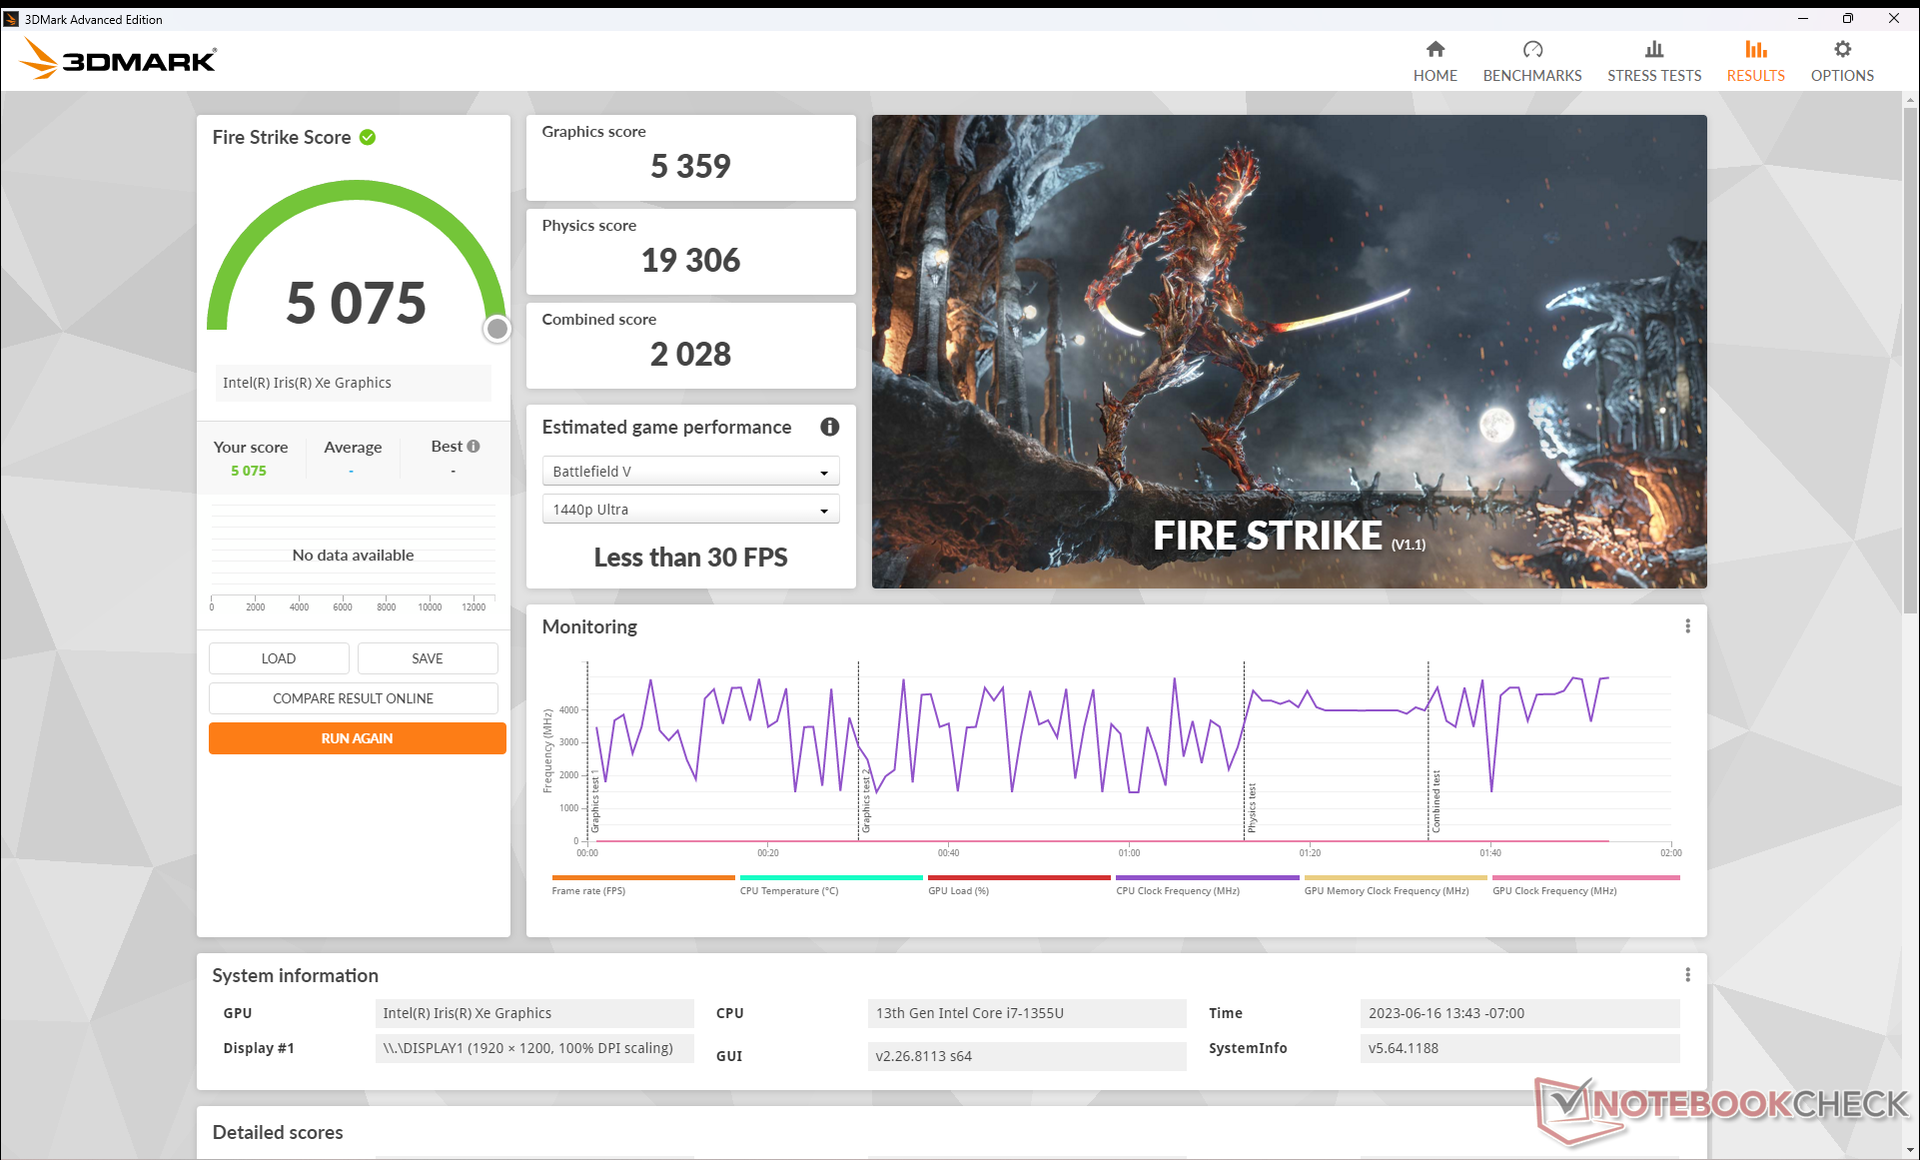
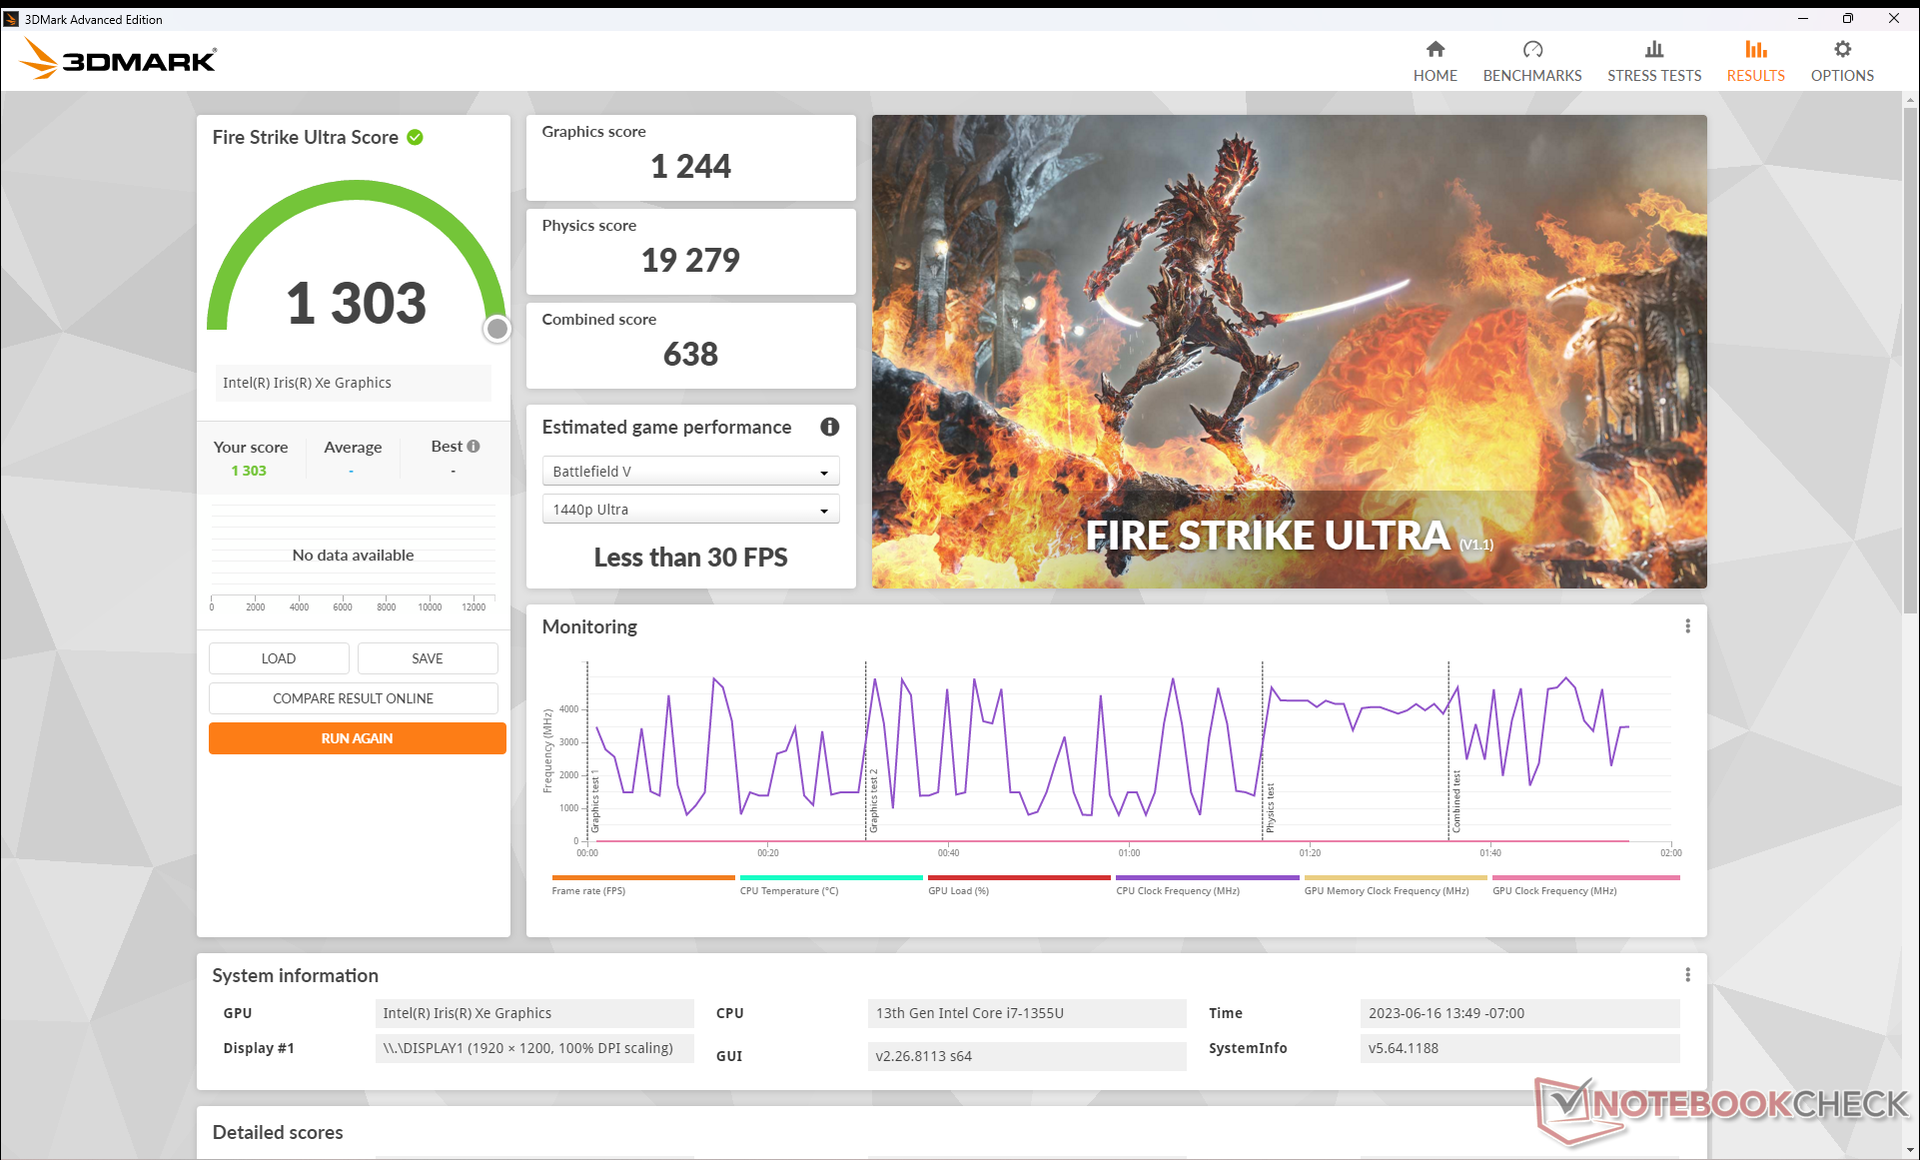
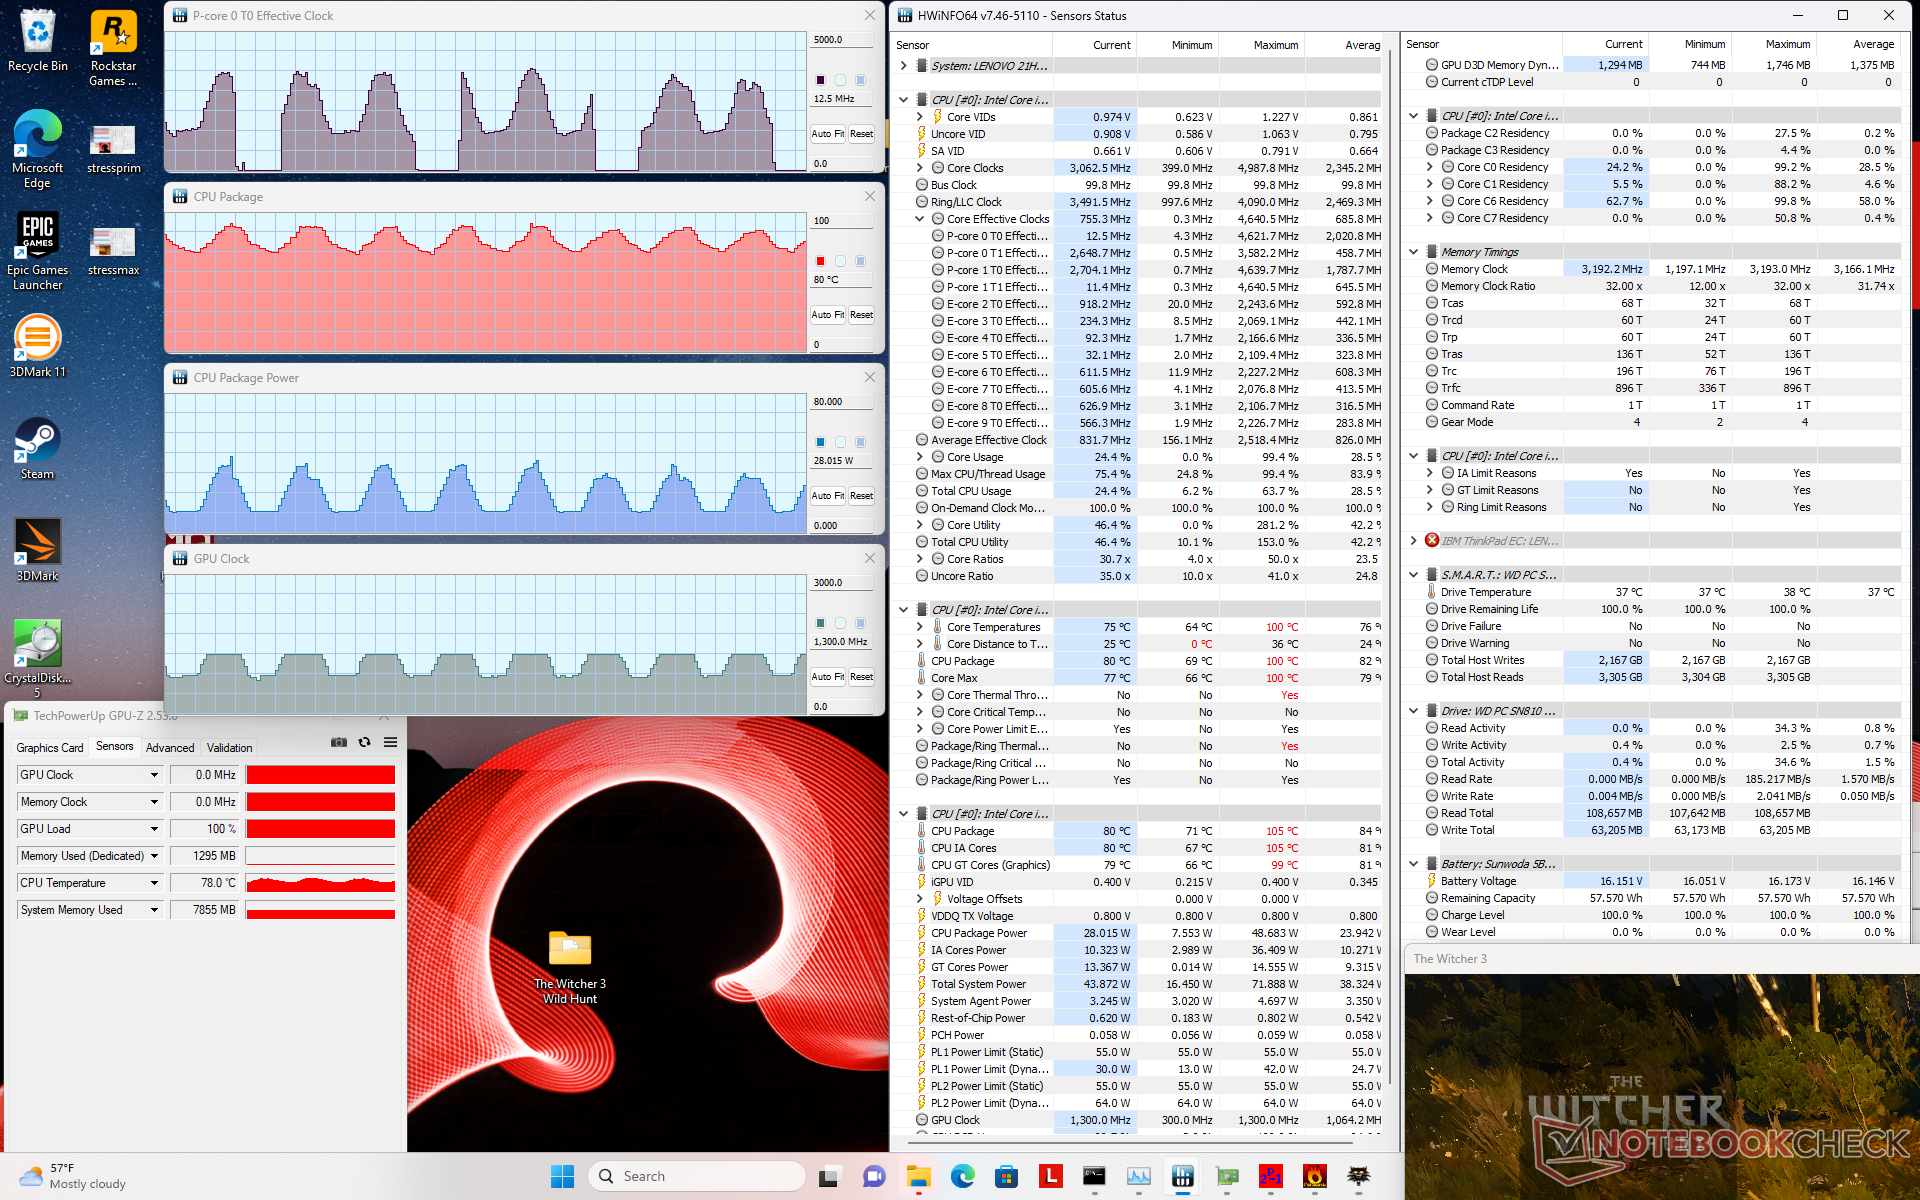
Grafikleistung — Gealterte Iris Xe
Die Grafikleistung bleibt leider die gleiche wie im letzten Jahr, da sich die integrierte Iris Xe 96 EUs nicht verändert hat. Zusätzlich scheint die Leistung im neuen Modell eher noch schwächer zu sein, da das System zum Drosseln tendiert. Beispielsweise schwankt die Framerate in Witcher 3 (Idle, ohne aktives Spielen) zwischen 50 und 90 FPS, die GPU-Taktraten sind insgesamt sehr inkonstant.
Bestimmte Titel wie Returnal verweigern sogar den Start.
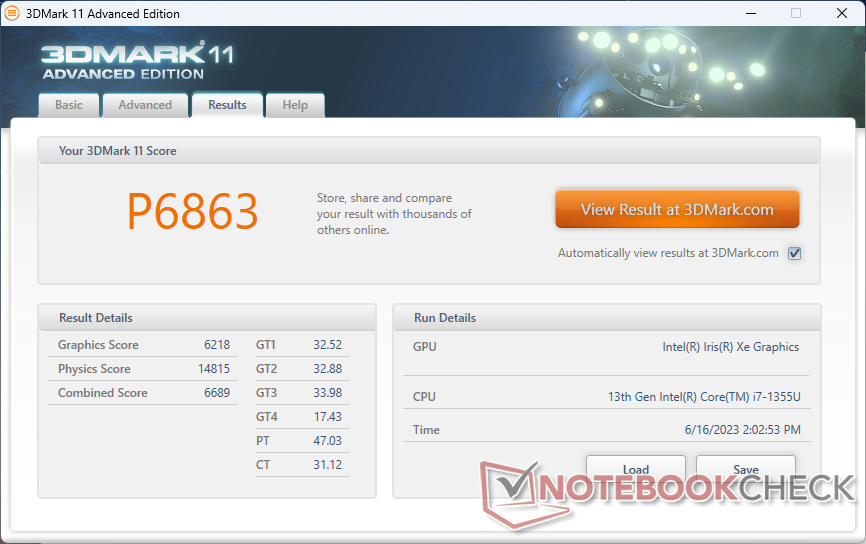
| 3DMark 11 Performance | 6863 Punkte | |
| 3DMark Fire Strike Score | 5075 Punkte | |
| 3DMark Time Spy Score | 1719 Punkte | |
Hilfe | ||
| Tiny Tina's Wonderlands | |
| 1280x720 Lowest Preset (DX12) | |
| Asus ROG Zephyrus G14 GA402XY | |
| Durchschnittliche Intel Iris Xe Graphics G7 96EUs (25.9 - 67.3, n=32) | |
| Lenovo ThinkPad X1 Yoga G8 i7-1355U | |
| 1920x1080 Low Preset (DX12) | |
| Asus ROG Zephyrus G14 GA402XY | |
| Durchschnittliche Intel Iris Xe Graphics G7 96EUs (22.3 - 53, n=32) | |
| Lenovo ThinkPad X1 Yoga G8 i7-1355U | |
| 1920x1080 Medium Preset (DX12) | |
| Asus ROG Zephyrus G14 GA402XY | |
| Durchschnittliche Intel Iris Xe Graphics G7 96EUs (17 - 40.1, n=30) | |
| Lenovo ThinkPad X1 Yoga G8 i7-1355U | |
| 1920x1080 High Preset (DX12) | |
| Asus ROG Zephyrus G14 GA402XY | |
| Durchschnittliche Intel Iris Xe Graphics G7 96EUs (10.6 - 24.1, n=29) | |
| Lenovo ThinkPad X1 Yoga G8 i7-1355U | |
| 1920x1080 Badass Preset (DX12) | |
| Asus ROG Zephyrus G14 GA402XY | |
| Durchschnittliche Intel Iris Xe Graphics G7 96EUs (8.4 - 18.4, n=26) | |
| Lenovo ThinkPad X1 Yoga G8 i7-1355U | |
Witcher 3 FPS Chart
| min. | mittel | hoch | max. | |
|---|---|---|---|---|
| GTA V (2015) | 100.1 | 88.7 | 23.4 | 10 |
| The Witcher 3 (2015) | 96.8 | 35 | 35.9 | 10.2 |
| Dota 2 Reborn (2015) | 112.7 | 91.3 | 51.4 | 65.6 |
| Final Fantasy XV Benchmark (2018) | 40.5 | 23.9 | 16.2 | |
| X-Plane 11.11 (2018) | 46.2 | 34.4 | 31.4 | |
| Strange Brigade (2018) | 83.5 | 36.6 | 29 | 22.7 |
| Cyberpunk 2077 1.6 (2022) | 16.8 | 13.7 | 10.3 | 9.2 |
| Tiny Tina's Wonderlands (2022) | 24.2 | 19.5 | 13 | 10.3 |
| F1 22 (2022) | 40.1 | 36.9 | 26.5 | 20.1 |
Emissionen - Alles unverändert
Systemlautstärke
Auch die Lüfterlautstärke orientiert sich am G7 vom letzten Jahr. Bei vielen niedrigen Lasten bleibt der interne Lüfter vergleichsweise still, beim Surfen oder Videostreaming säuselt er mit ruhigen 25,6 dB(A) gegen eine Hintergrundlautstärke von 22,7 dB(A) vor sich hin. Anspruchsvollere Lasten wie Gaming erhöhen die Lautstärke auf 36 dB(A) oder bis zu 42 dB(A) wenn das High-Performance-Profil ausgewählt wird. Das entspricht in etwa der maximalen Lautstärke im Latitude 9430 2-in-1.
Lautstärkediagramm
| Idle |
| 22.8 / 22.8 / 22.8 dB(A) |
| Last |
| 29.4 / 42 dB(A) |
 | ||
30 dB leise 40 dB(A) deutlich hörbar 50 dB(A) störend |
||
min: | ||
| Lenovo ThinkPad X1 Yoga G8 i7-1355U Iris Xe G7 96EUs, i7-1355U, WDC PC SN810 512GB | Lenovo ThinkPad X1 Yoga G7 21CE002HGE Iris Xe G7 96EUs, i7-1270P, Samsung PM9A1 MZVL2512HCJQ | Dell Latitude 9430 2-in-1 Iris Xe G7 96EUs, i7-1265U | LG Gram 14T90P Iris Xe G7 80EUs, i5-1135G7, Samsung SSD PM981a MZVLB512HBJQ | Asus ZenBook Flip 14 UN5401QA-KN085W Vega 8, R7 5800H, Intel SSD 600p SSDPEKKW512G7 | HP EliteBook x360 1040 G7, i7-10810U UHD Graphics 620, i7-10810U, Samsung SSD PM981a MZVLB512HBJQ | |
|---|---|---|---|---|---|---|
| Geräuschentwicklung | -4% | -8% | -4% | -17% | -6% | |
| aus / Umgebung * (dB) | 22.7 | 22.7 -0% | 23.7 -4% | 25.4 -12% | 26 -15% | 25.2 -11% |
| Idle min * (dB) | 22.8 | 22.7 -0% | 23.7 -4% | 25.5 -12% | 26 -14% | 25.2 -11% |
| Idle avg * (dB) | 22.8 | 22.7 -0% | 23.7 -4% | 25.5 -12% | 26 -14% | 25.2 -11% |
| Idle max * (dB) | 22.8 | 27.1 -19% | 23.7 -4% | 25.5 -12% | 27.3 -20% | 25.2 -11% |
| Last avg * (dB) | 29.4 | 34.5 -17% | 35.1 -19% | 28.3 4% | 39.8 -35% | 30 -2% |
| Witcher 3 ultra * (dB) | 35.5 | 34.5 3% | 43.3 -22% | 35 1% | ||
| Last max * (dB) | 42 | 38.7 8% | 43 -2% | 35 17% | 42.4 -1% | 38.1 9% |
* ... kleinere Werte sind besser
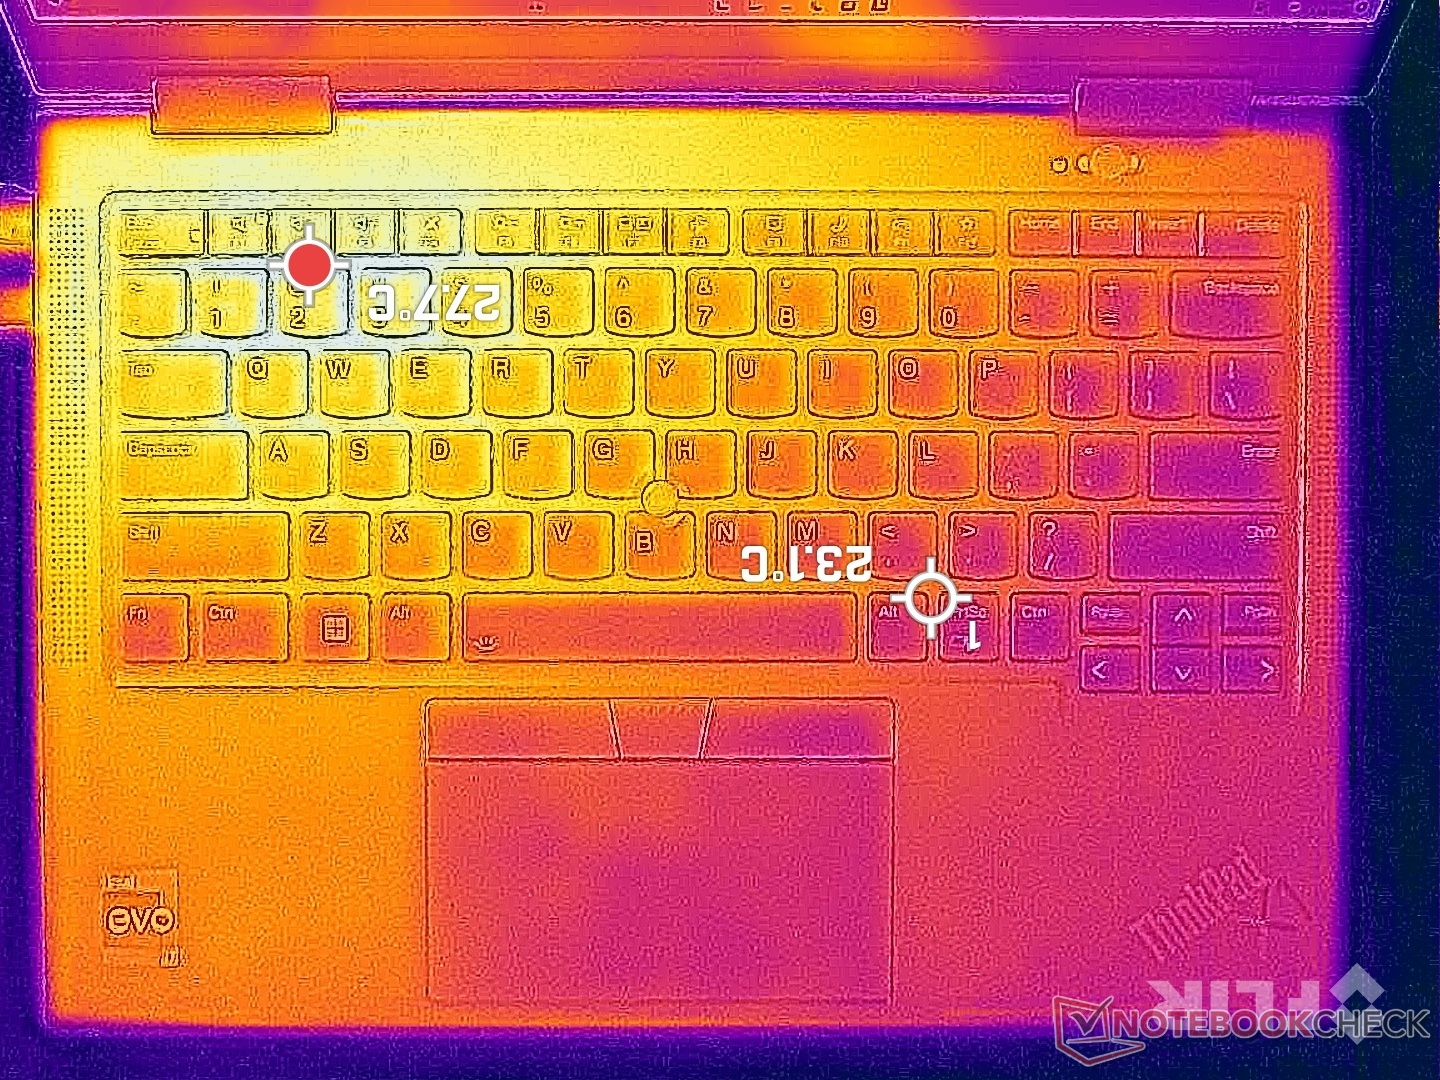
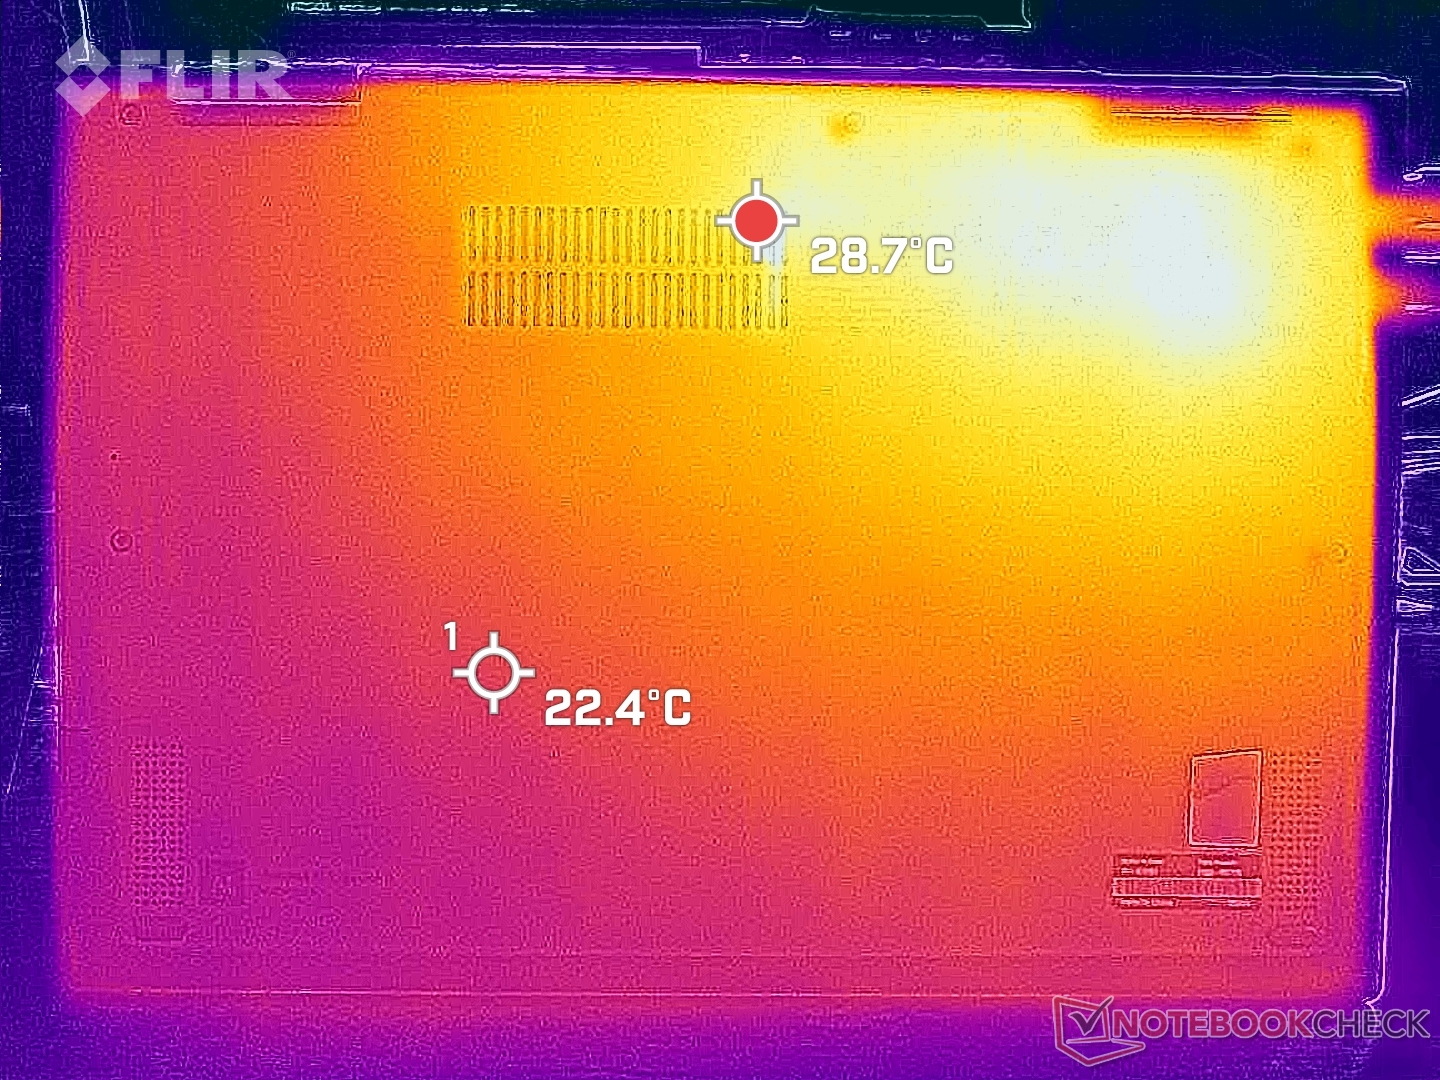
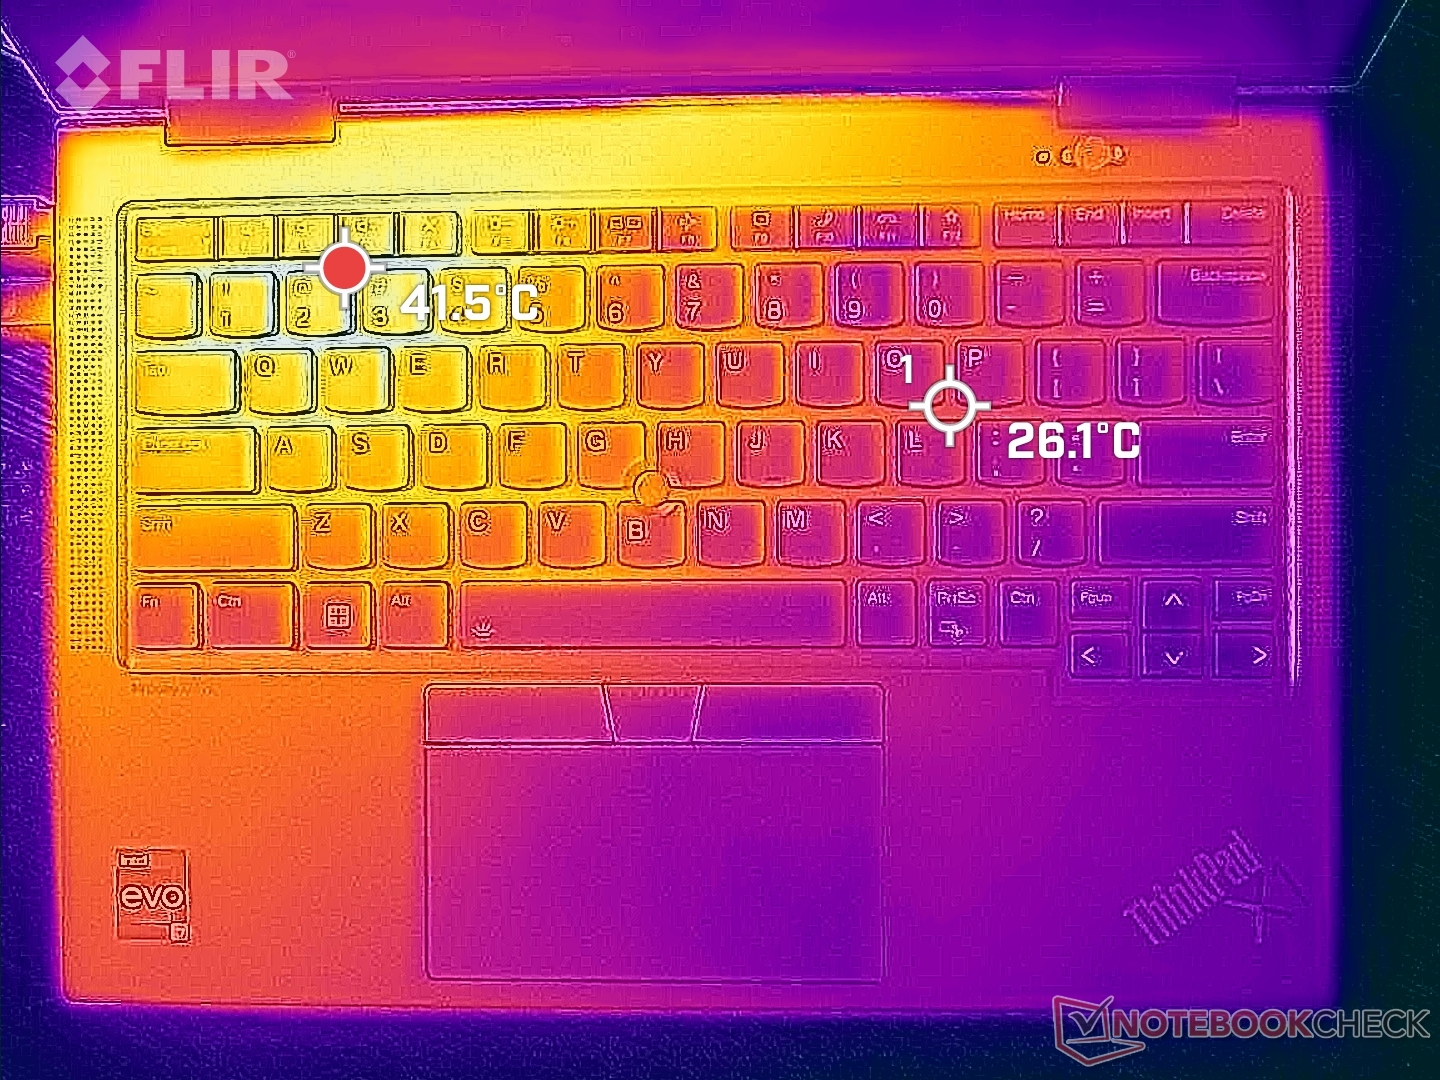
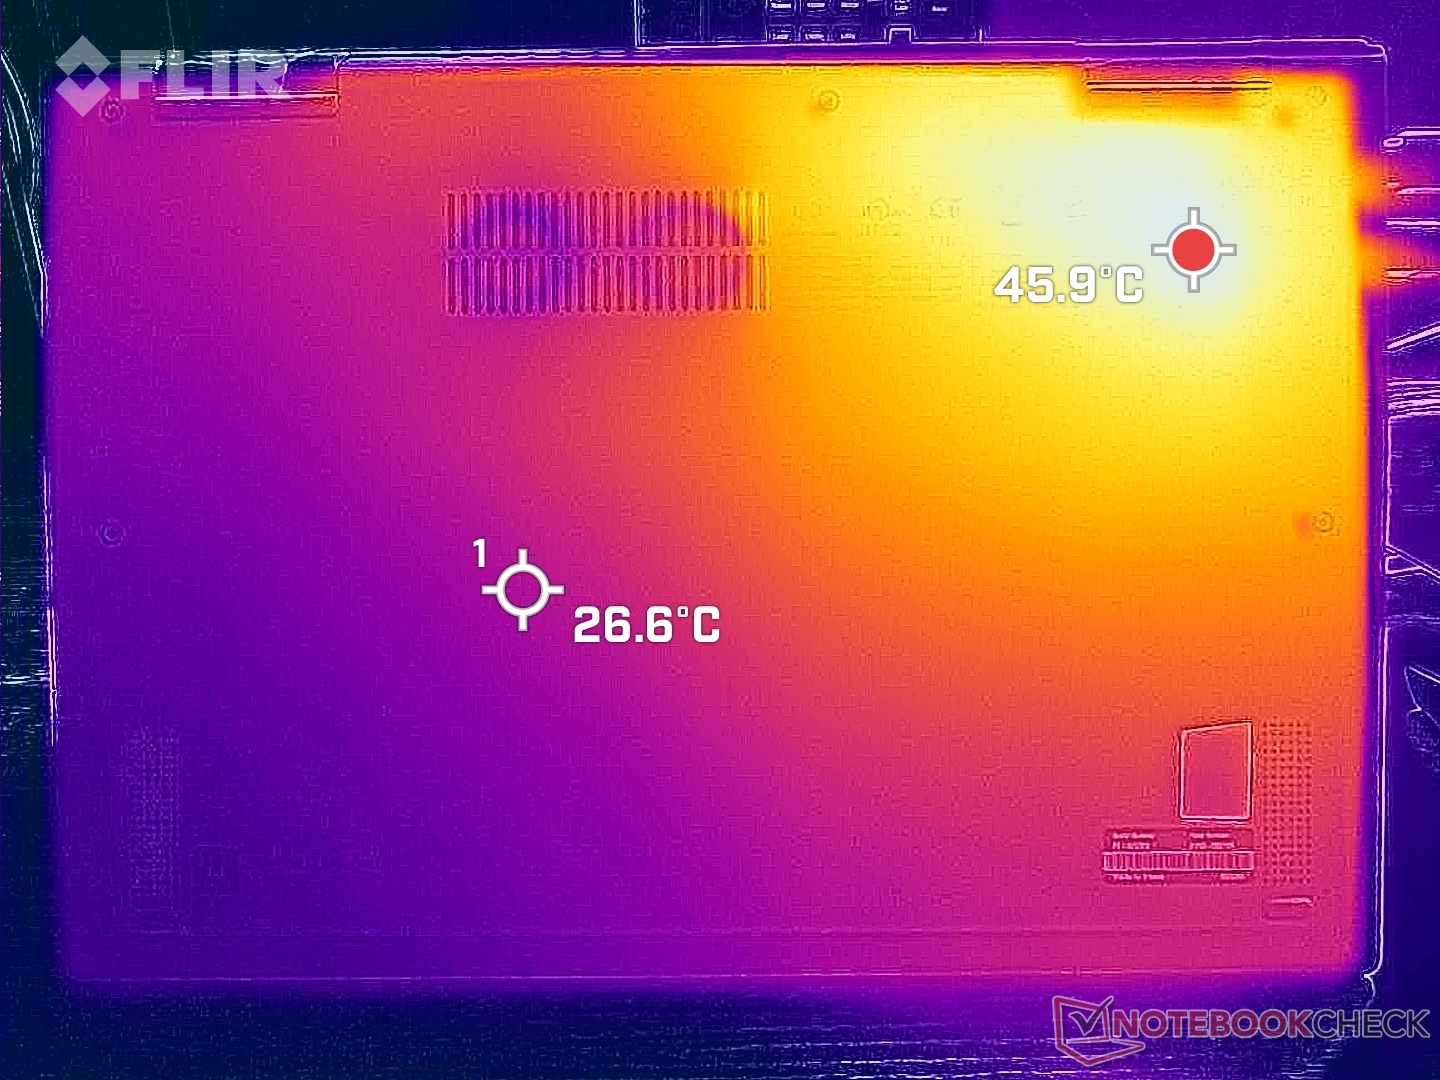
Temperatur
Durch die Positionierung des Kühlsystems im Inneren wird die linke Hälfte des Laptops stets wärmer als die rechte Hälfte. Hot Spots liegen bei bis zu 42 °C auf der Ober- und bis zu 46 °C auf der Unterseite, verglichen mit den beidseitig 40 °C eines Dell Latitude 9430 2-in-1.
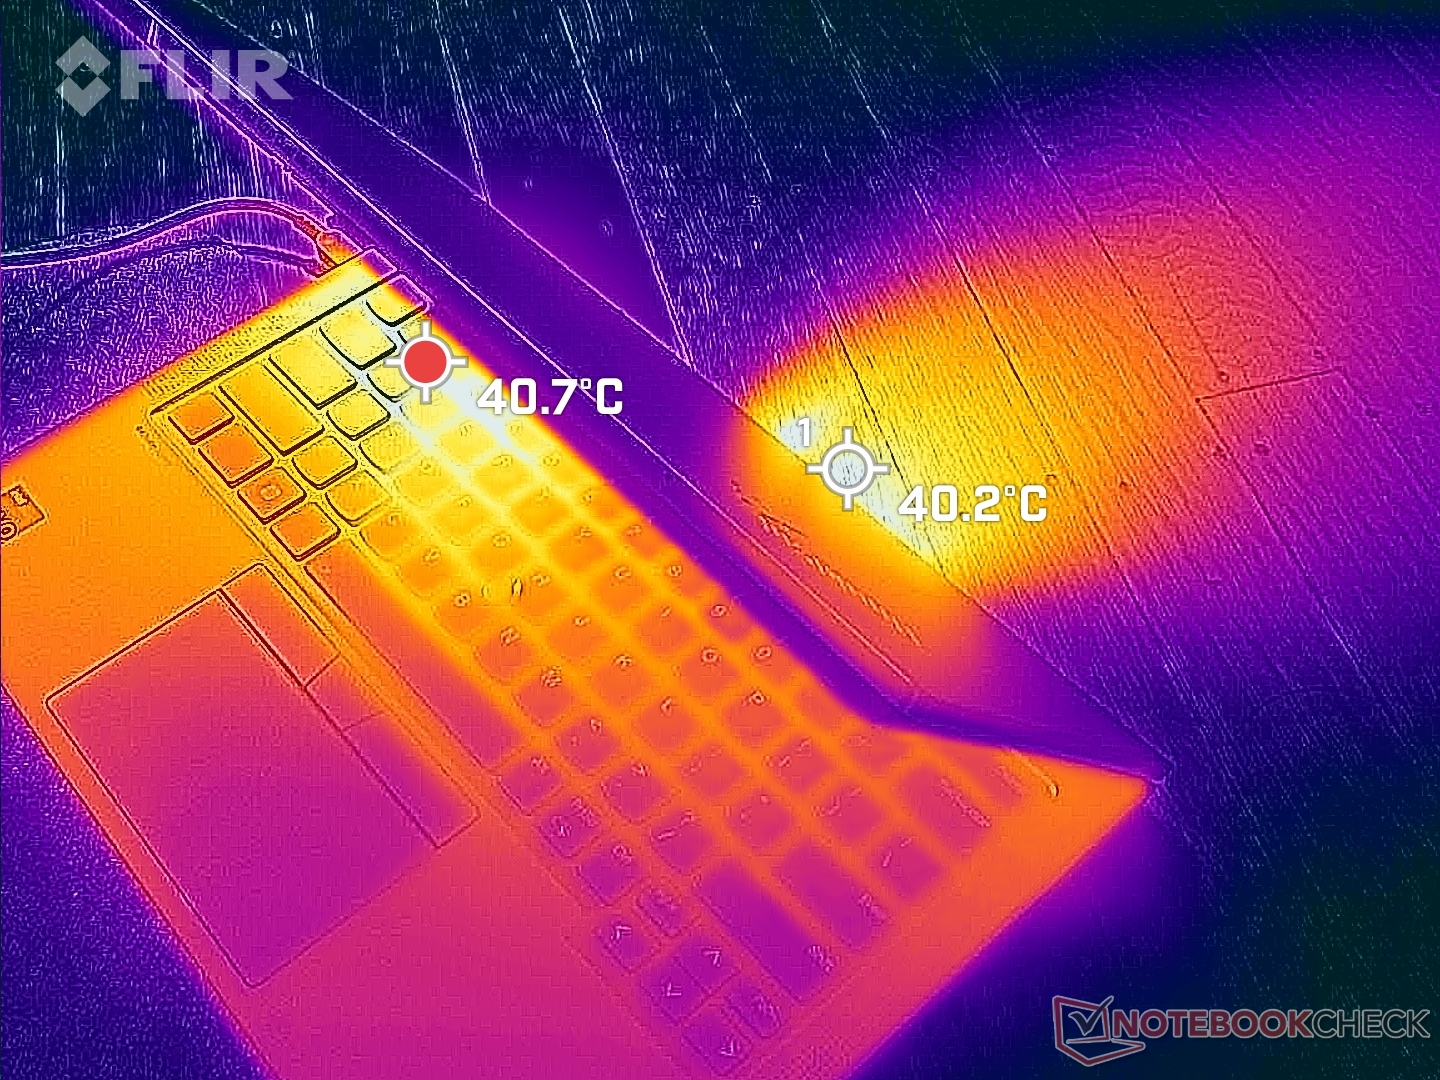
(±) Die maximale Temperatur auf der Oberseite ist 41.6 °C. Im Vergleich liegt der Klassendurchschnitt bei 35.4 °C (von 19.6 bis 60 °C für die Klasse Convertible).
(-) Auf der Unterseite messen wir eine maximalen Wert von 47.6 °C (im Vergleich zum Durchschnitt von 36.9 °C).
(+) Ohne Last messen wir eine durchschnittliche Temperatur von 28.4 °C auf der Oberseite. Der Klassendurchschnitt erreicht 30.3 °C.
(+) Die Handballen und der Touchpad-Bereich erreichen maximal 32 °C und damit die typische Hauttemperatur und fühlen sich daher nicht heiß an.
(-) Die durchschnittliche Handballen-Temperatur anderer getesteter Geräte war 28 °C (-4 °C).
| Lenovo ThinkPad X1 Yoga G8 i7-1355U Intel Core i7-1355U, Intel Iris Xe Graphics G7 96EUs | Lenovo ThinkPad X1 Yoga G7 21CE002HGE Intel Core i7-1270P, Intel Iris Xe Graphics G7 96EUs | Dell Latitude 9430 2-in-1 Intel Core i7-1265U, Intel Iris Xe Graphics G7 96EUs | LG Gram 14T90P Intel Core i5-1135G7, Intel Iris Xe Graphics G7 80EUs | Asus ZenBook Flip 14 UN5401QA-KN085W AMD Ryzen 7 5800H, AMD Radeon RX Vega 8 (Ryzen 4000/5000) | HP EliteBook x360 1040 G7, i7-10810U Intel Core i7-10810U, Intel UHD Graphics 620 | |
|---|---|---|---|---|---|---|
| Hitze | 8% | 19% | 15% | -7% | 10% | |
| Last oben max * (°C) | 41.6 | 43.3 -4% | 39.2 6% | 41.6 -0% | 42.7 -3% | 36.6 12% |
| Last unten max * (°C) | 47.6 | 45.1 5% | 44.8 6% | 46.2 3% | 53.1 -12% | 46.2 3% |
| Idle oben max * (°C) | 30.6 | 26.5 13% | 21.4 30% | 22.6 26% | 32.9 -8% | 25.8 16% |
| Idle unten max * (°C) | 33.2 | 27.6 17% | 22.4 33% | 23.2 30% | 35.2 -6% | 29.8 10% |
* ... kleinere Werte sind besser
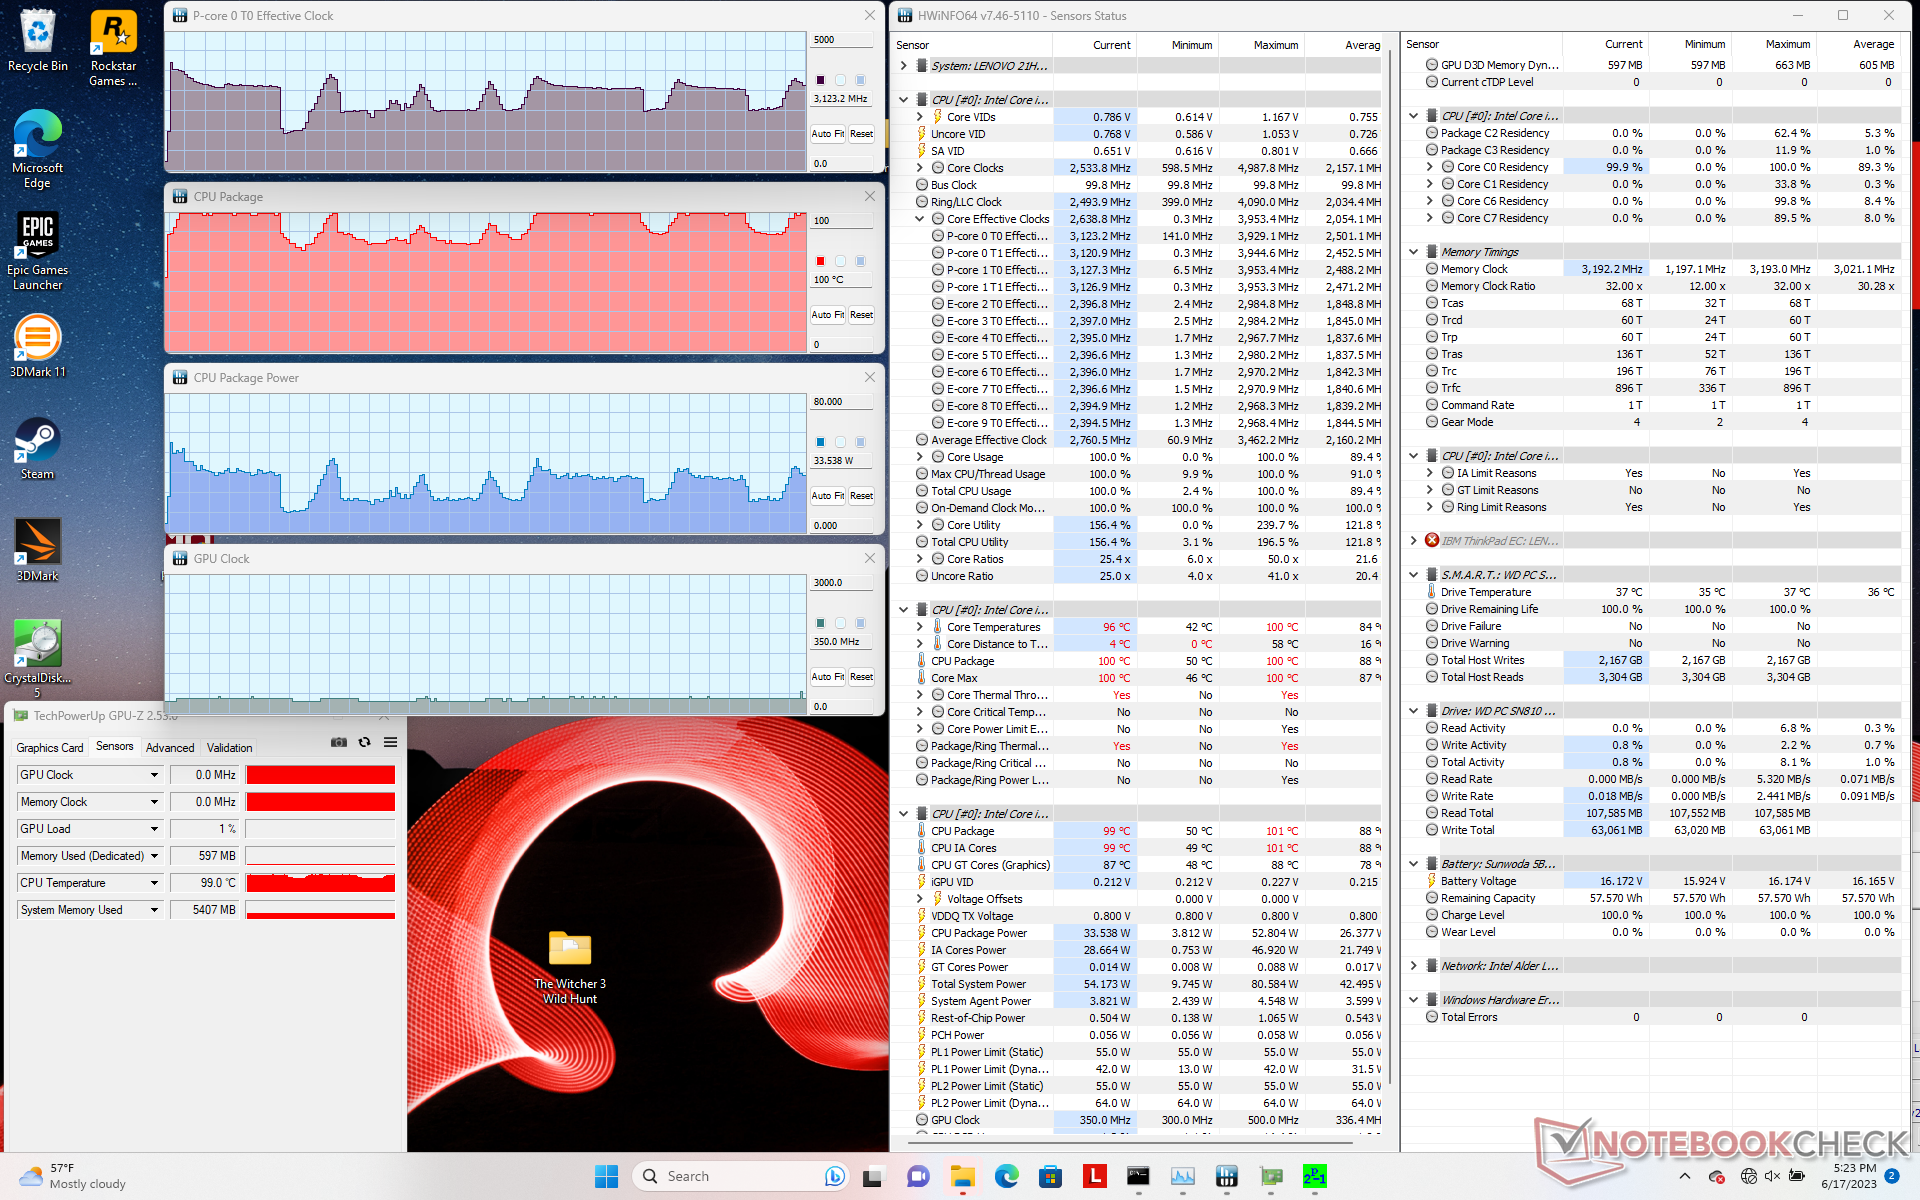
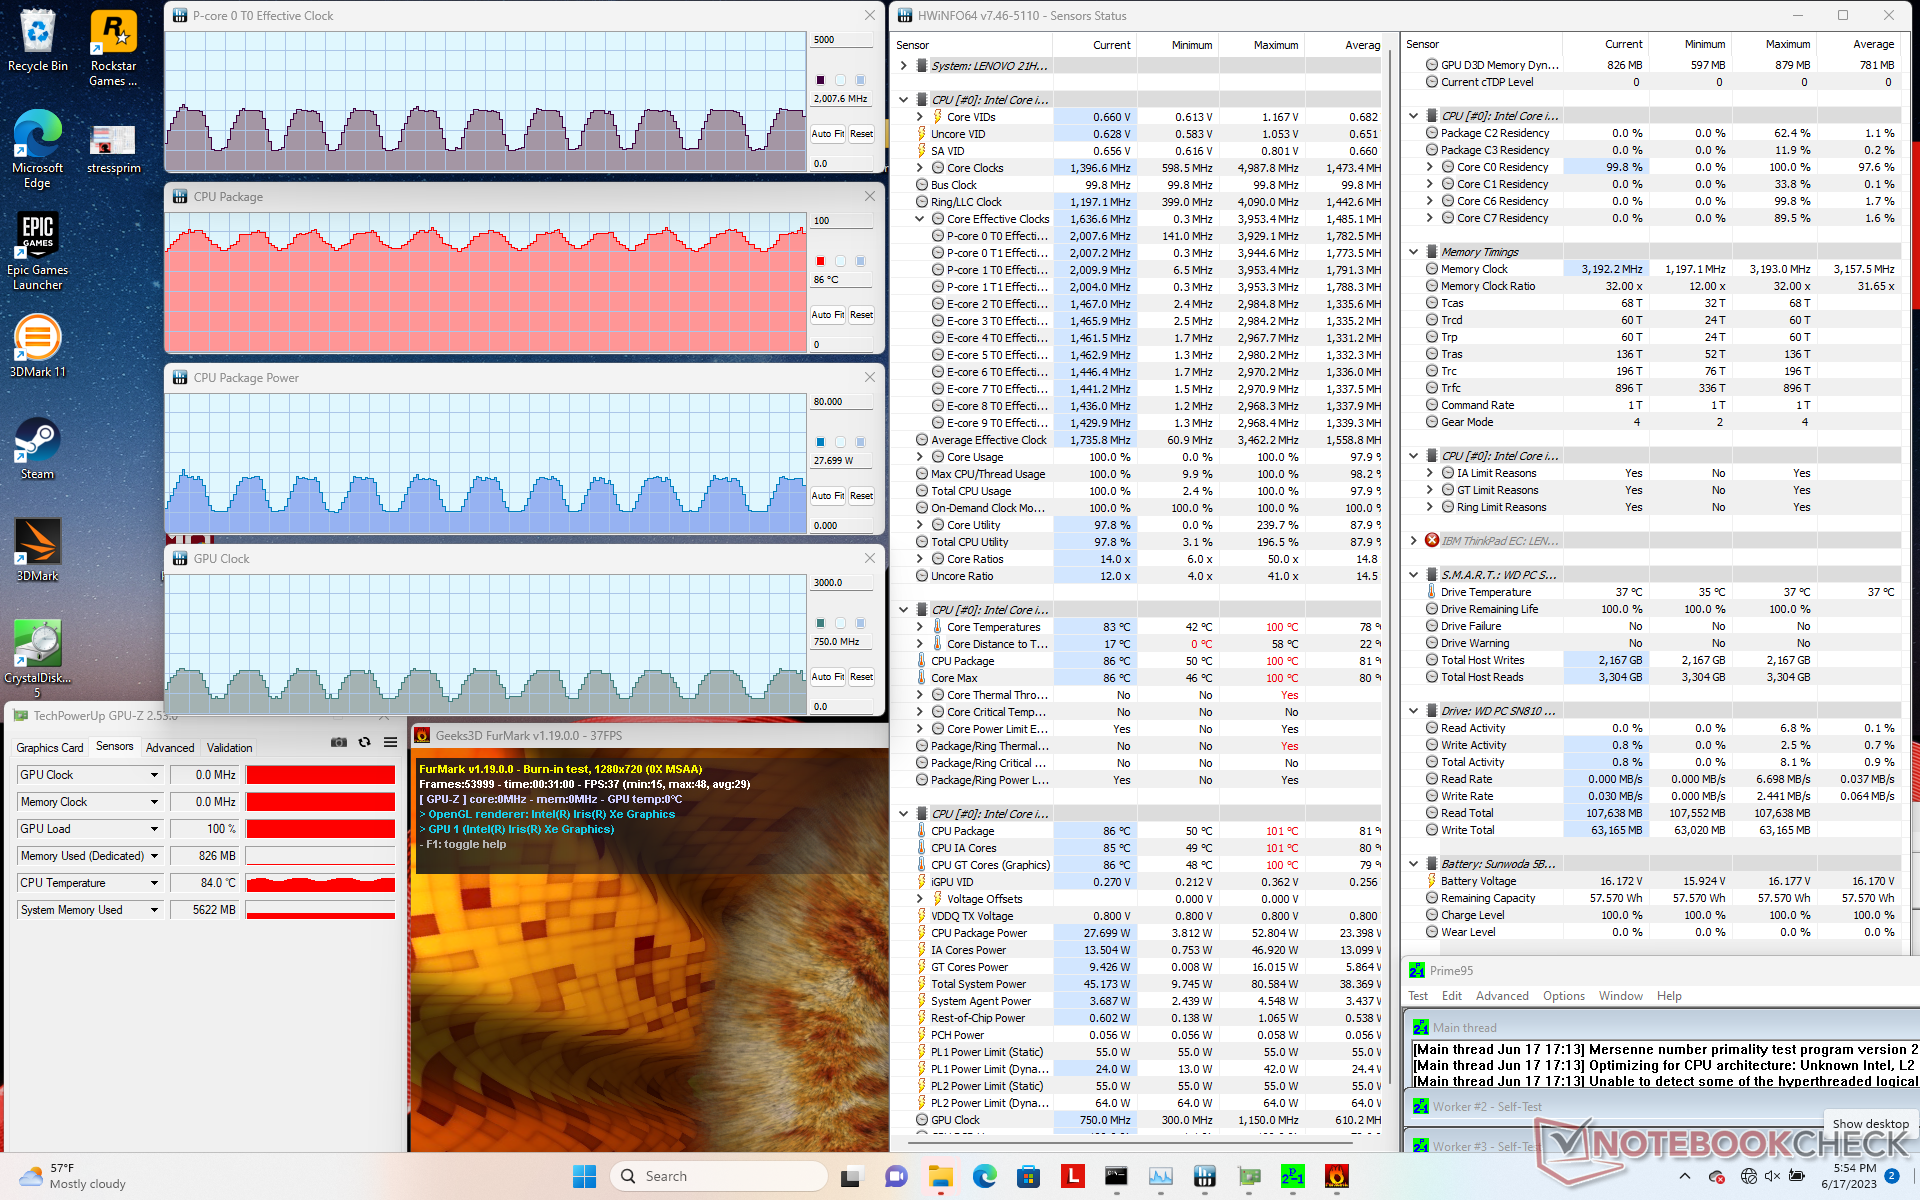
Stresstest
Beim Starten von Prime95 bosstet die CPU für nur etwa eine Sekunde auf 4 GHz und 53 W hoch, dann erreichen die Kerne eine Temperatur von 100 °C. Anschließend beginnen Taktraten, Leistungsaufnahme und Kerntemperaturen zu pendeln, und zwar zwischen 1,4 und 3,5 GHz, 13 bis 44 W und 74 bis 100 °C. Dieses Verhalten unterscheidet sich von den meisten anderen Core-U-Laptops, diese haben deutlich stabilere Taktraten und Temperaturen.
Unter Witcher 3 pendeln die GPU-Taktraten und Temperaturen zwischen 800 bis 1.300 MHz sowie 73 bis 91 °C. Dieses starke Pendelverhalten führt zu instabilen Frameraten beim Gaming, was auch der Witcher-3-Frameraten-Graph weiter oben aufzeigt.
Beim Gaming abseits der Steckdose wird die Leistung nicht weiter eingeschränkt. Ein weiterer Durchgang 3DMark 11 führt zu einem nahezu identischen Score.
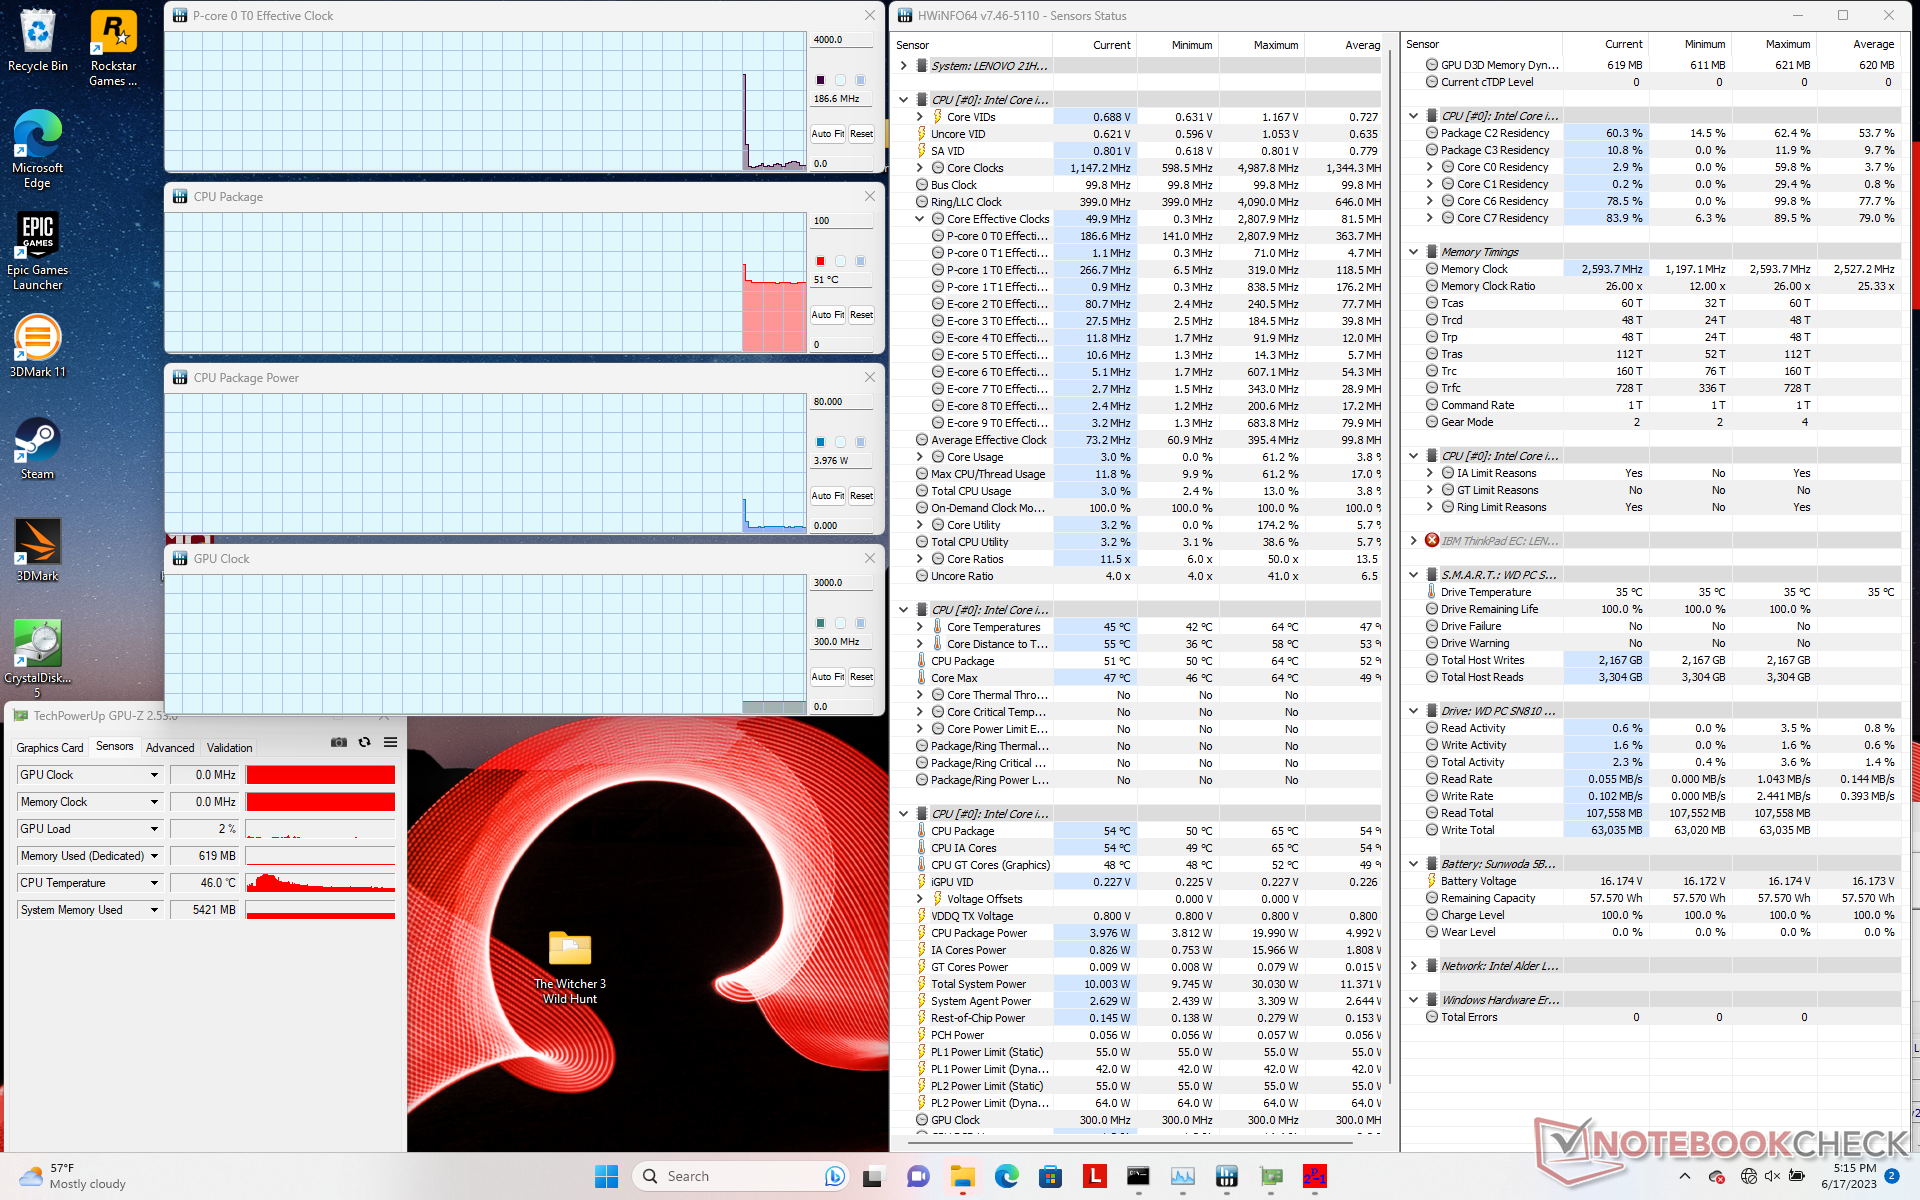
| CPU Takt (GHz) | GPU Takt (MHz) | Durchschnittliche CPU-Temperatur (°C) | |
| Idle | -- | -- | 51 |
| Prime95-Stress | 1,4 - 3,5 | -- | 74 - 100 |
| Prime95 + FurMark-Stress | 0,8 - 2,6 | 350 - 1000 | 73 - 91 |
| Witcher-3-Stress | 1,5 - 3,7 | 800 - 1300 | 73 - 91 |
Lautsprecher
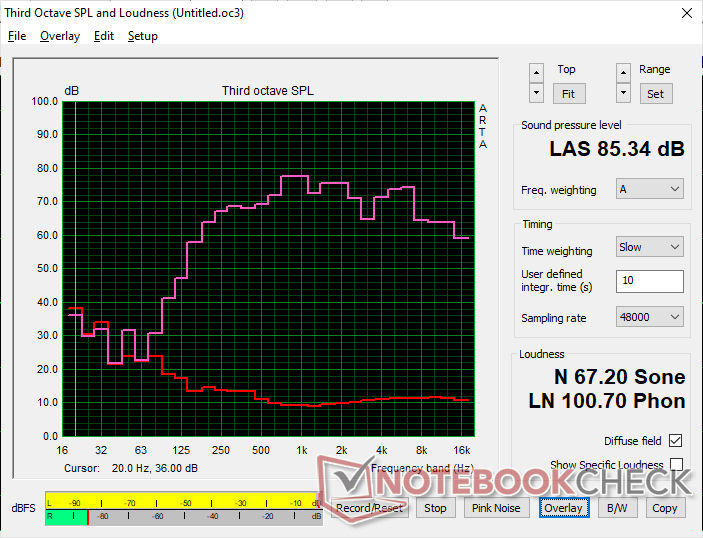
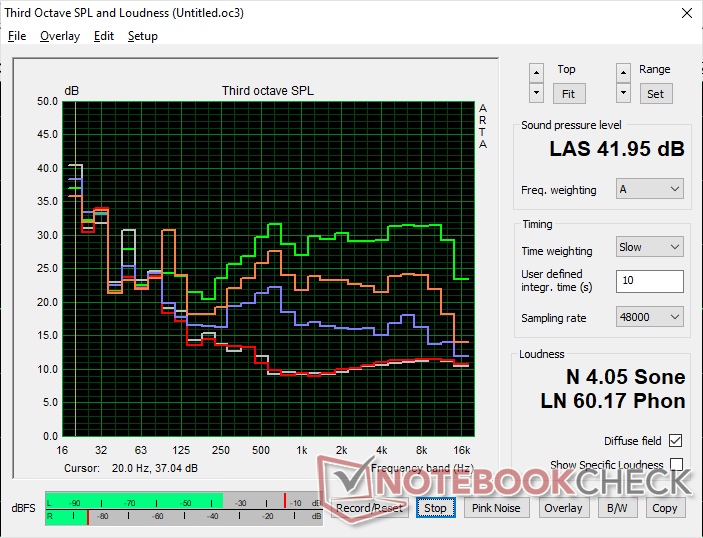
Lenovo ThinkPad X1 Yoga G8 i7-1355U Audio Analyse
(+) | Die Lautsprecher können relativ laut spielen (85.3 dB)
Bass 100 - 315 Hz
(±) | abgesenkter Bass - 10.9% geringer als der Median
(±) | durchschnittlich lineare Bass-Wiedergabe (11% Delta zum Vorgänger)
Mitteltöne 400 - 2000 Hz
(±) | zu hohe Mitten, vom Median 5.1% abweichend
(+) | lineare Mitten (4% Delta zum Vorgänger)
Hochtöne 2 - 16 kHz
(+) | ausgeglichene Hochtöne, vom Median nur 4.1% abweichend
(±) | durchschnittlich lineare Hochtöne (7.7% Delta zum Vorgänger)
Gesamt im hörbaren Bereich 100 - 16.000 Hz
(+) | hörbarer Bereich ist sehr linear (11.7% Abstand zum Median
Im Vergleich zu allen Geräten derselben Klasse
» 10% aller getesteten Geräte dieser Klasse waren besser, 4% vergleichbar, 86% schlechter
» Das beste Gerät hat einen Delta-Wert von 6%, durchschnittlich ist 20%, das schlechteste Gerät hat 57%
Im Vergleich zu allen Geräten im Test
» 8% aller getesteten Geräte waren besser, 3% vergleichbar, 89% schlechter
» Das beste Gerät hat einen Delta-Wert von 4%, durchschnittlich ist 24%, das schlechteste Gerät hat 134%
Apple MacBook Pro 16 2021 M1 Pro Audio Analyse
(+) | Die Lautsprecher können relativ laut spielen (84.7 dB)
Bass 100 - 315 Hz
(+) | guter Bass - nur 3.8% Abweichung vom Median
(+) | lineare Bass-Wiedergabe (5.2% Delta zum Vorgänger)
Mitteltöne 400 - 2000 Hz
(+) | ausgeglichene Mitten, vom Median nur 1.3% abweichend
(+) | lineare Mitten (2.1% Delta zum Vorgänger)
Hochtöne 2 - 16 kHz
(+) | ausgeglichene Hochtöne, vom Median nur 1.9% abweichend
(+) | sehr lineare Hochtöne (2.7% Delta zum Vorgänger)
Gesamt im hörbaren Bereich 100 - 16.000 Hz
(+) | hörbarer Bereich ist sehr linear (4.6% Abstand zum Median
Im Vergleich zu allen Geräten derselben Klasse
» 0% aller getesteten Geräte dieser Klasse waren besser, 0% vergleichbar, 100% schlechter
» Das beste Gerät hat einen Delta-Wert von 5%, durchschnittlich ist 17%, das schlechteste Gerät hat 45%
Im Vergleich zu allen Geräten im Test
» 0% aller getesteten Geräte waren besser, 0% vergleichbar, 100% schlechter
» Das beste Gerät hat einen Delta-Wert von 4%, durchschnittlich ist 24%, das schlechteste Gerät hat 134%
Energiemanagement - Sogar schwächer als der Vorgänger
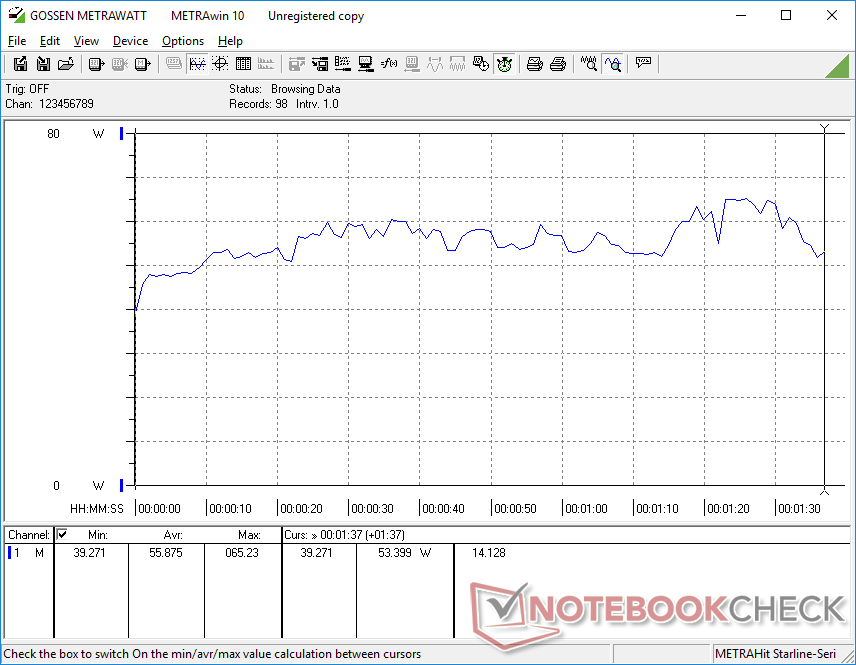
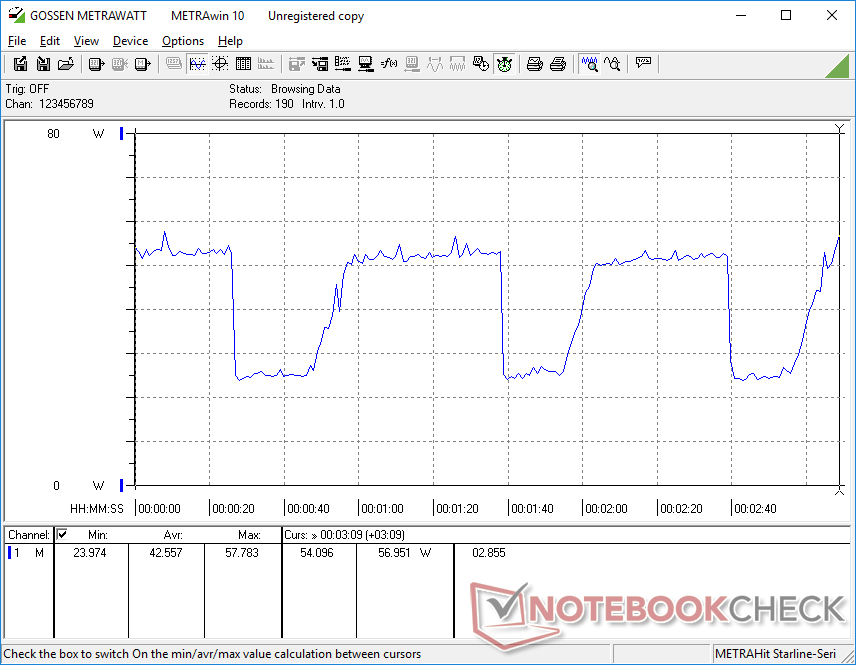
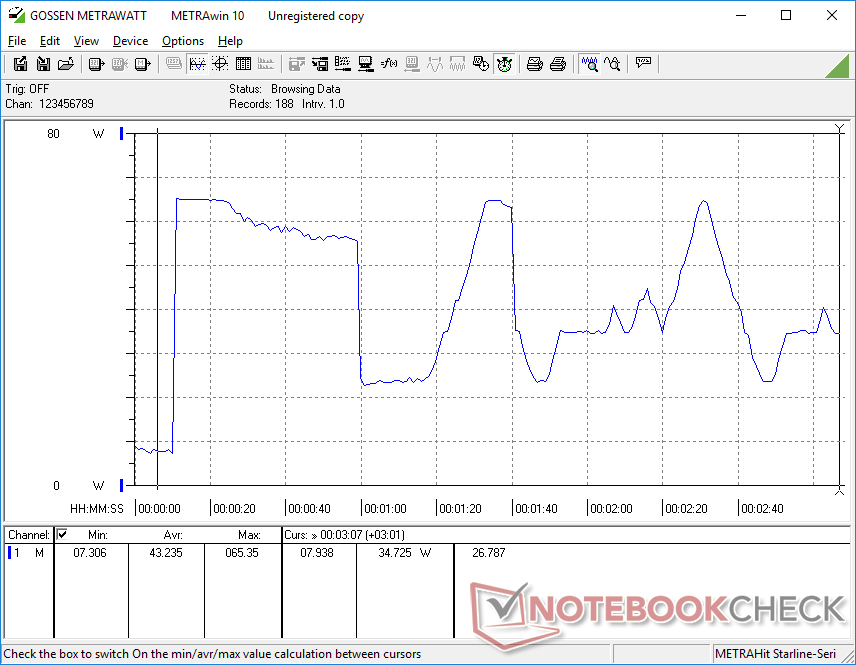
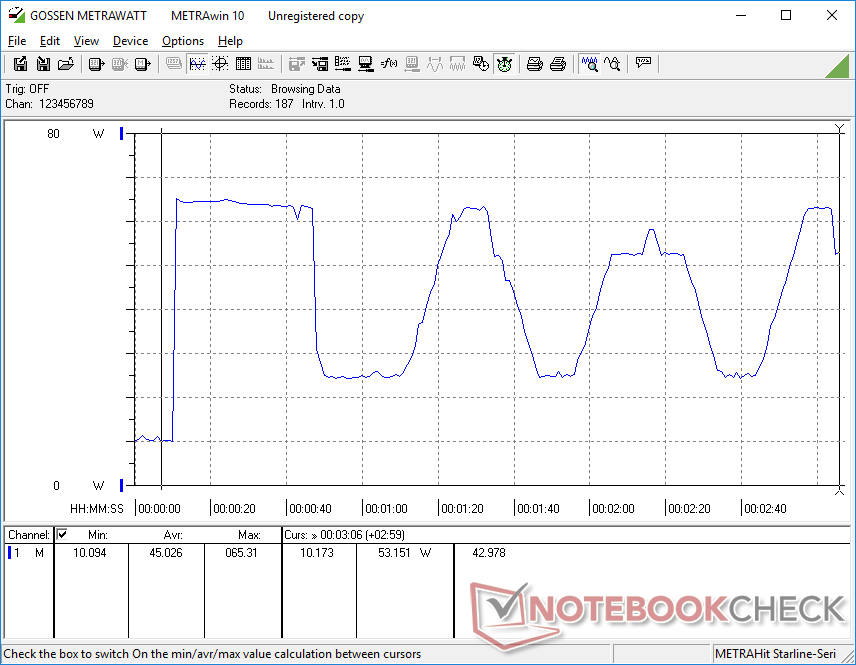
Energieverbrauch
Unter geringen Lasten bleibt der Verbrauch im Vergleich zum Vorjahr, trotz der effizienteren Core-U-CPU, konstant. Bei anspruchsvolleren Lasten wie Gaming oder Prime95 pendelt der Verbrauch, wie im Graph angezeigt, während der Verbrauch im ThinkPad X1 Yoga G7 deutlich stabiler war. Das Pendelverhalten im Verbrauch spiegelt unsere Messwerte für Taktraten und Leistungsaufnahme im Abschnitt Stresstest weiter oben wider.
| Aus / Standby | |
| Idle | |
| Last |
|
Legende:
min: | |
| Lenovo ThinkPad X1 Yoga G8 i7-1355U i7-1355U, Iris Xe G7 96EUs, WDC PC SN810 512GB, IPS, 1920x1200, 14" | Lenovo ThinkPad X1 Yoga G7 21CE002HGE i7-1270P, Iris Xe G7 96EUs, Samsung PM9A1 MZVL2512HCJQ, IPS, 1920x1200, 14" | Dell Latitude 9430 2-in-1 i7-1265U, Iris Xe G7 96EUs, , IPS, 2560x1600, 14" | LG Gram 14T90P i5-1135G7, Iris Xe G7 80EUs, Samsung SSD PM981a MZVLB512HBJQ, IPS, 1900x1200, 14" | Asus ZenBook Flip 14 UN5401QA-KN085W R7 5800H, Vega 8, Intel SSD 600p SSDPEKKW512G7, OLED, 2880x1800, 14" | HP EliteBook x360 1040 G7, i7-10810U i7-10810U, UHD Graphics 620, Samsung SSD PM981a MZVLB512HBJQ, IPS, 1920x1080, 14" | |
|---|---|---|---|---|---|---|
| Stromverbrauch | -3% | 9% | 12% | -38% | 25% | |
| Idle min * (Watt) | 2.9 | 4.2 -45% | 2.9 -0% | 2.8 3% | 6.4 -121% | 1.6 45% |
| Idle avg * (Watt) | 5.4 | 6.9 -28% | 5.8 -7% | 5.5 -2% | 9.4 -74% | 4.5 17% |
| Idle max * (Watt) | 9.6 | 7.6 21% | 6.6 31% | 6.4 33% | 10.7 -11% | 5.2 46% |
| Last avg * (Watt) | 55.9 | 36.2 35% | 49.2 12% | 45.4 19% | 52.2 7% | 41.7 25% |
| Witcher 3 ultra * (Watt) | 42.6 | 43.2 -1% | 35.3 17% | 34 20% | 53 -24% | |
| Last max * (Watt) | 65.3 | 63.5 3% | 63.1 3% | 65.9 -1% | 69 -6% | 70.8 -8% |
* ... kleinere Werte sind besser
Energieverbrauch Witcher 3 / Stresstest
Energieverbrauch mit externem Monitor
Akkulaufzeit
Die Laufzeiten haben sich seit dem letzten Jahr nicht verlängert, teils können sie sogar kürzer ausfallen. In unserem WLAN-Test kommt das G8 auf annähernd 7 Stunden, während das ThinkPad X1 Yoga G7 beinahe 9 Stunden durchhält.
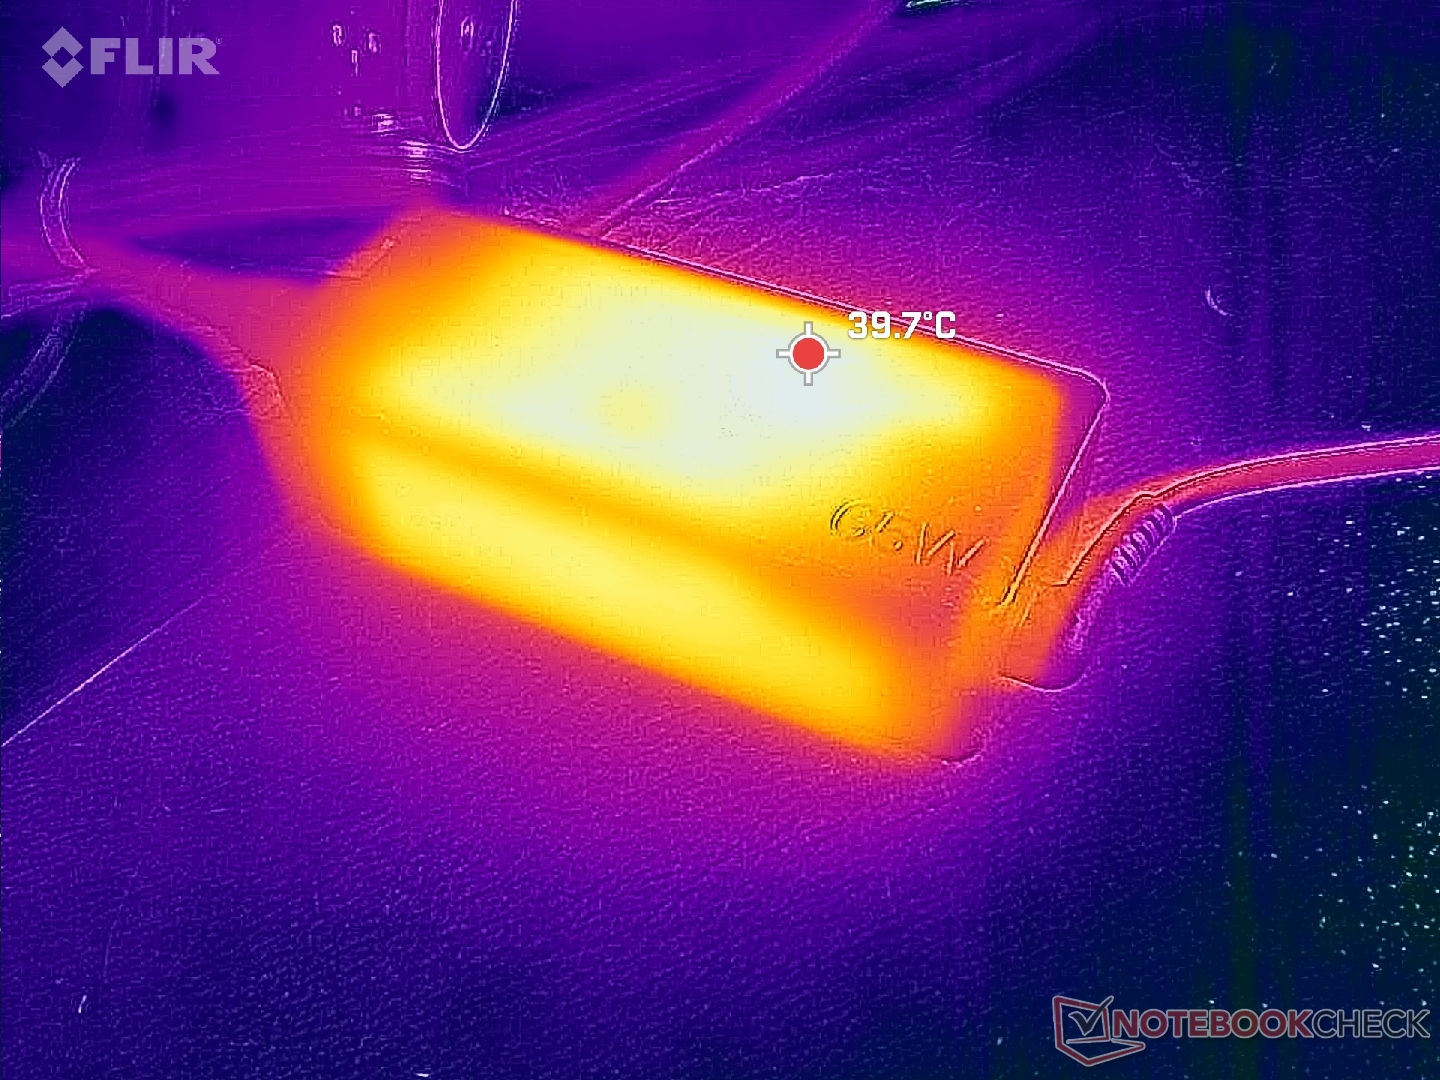
In etwa 90 Minuten ist der leere Akku vollständig wieder aufgeladen.
| Lenovo ThinkPad X1 Yoga G8 i7-1355U i7-1355U, Iris Xe G7 96EUs, 57 Wh | Lenovo ThinkPad X1 Yoga G7 21CE002HGE i7-1270P, Iris Xe G7 96EUs, 57 Wh | Dell Latitude 9430 2-in-1 i7-1265U, Iris Xe G7 96EUs, 60 Wh | LG Gram 14T90P i5-1135G7, Iris Xe G7 80EUs, 72 Wh | Asus ZenBook Flip 14 UN5401QA-KN085W R7 5800H, Vega 8, 63 Wh | HP EliteBook x360 1040 G7, i7-10810U i7-10810U, UHD Graphics 620, 78.6 Wh | |
|---|---|---|---|---|---|---|
| Akkulaufzeit | 33% | 91% | 81% | 30% | 181% | |
| WLAN (h) | 6.7 | 8.9 33% | 12.8 91% | 12.1 81% | 8.7 30% | 18.8 181% |
| H.264 (h) | 12.2 | 9 | ||||
| Last (h) | 1.7 | 2.4 | 2.3 | 2.1 | 5.6 | |
| Idle (h) | 27.8 | 62.8 |
Pro
Contra
Fazit — Ein Thinkpad-X1-Yoga-Jahr zum Auslassen
Manchmal können jährliche Updates eine signifikante Verbesserung darstellen, wie beispielsweise der Sprung vom 2020er ThinkPad X1 Yoga zum 2021er ThinkPad X1 Yoga G6. Leider erweist sich das 2023er ThinkPad X1 Yoga G8 im Vergleich zum 2022er ThinkPad X1 Yoga G7 eher als Schritt zur Seite. Das kleine Plus in der CPU-Leistung ist natürlich willkommen, aber die instabilen CPU-Turbo-Boost- und GPU-Taktraten machen den theoretischen Vorteil zunichte.
Das ThinkPad X1 Yoga G8 unternimmt wenig, um sich vom sehr guten ThinkPad X1 Yoga G7 positiv abzuheben.
Abseits der CPU gibt es keine nennenswerten Änderungen. Wer den CPU-Boost nicht für die eigenen Workloads benötigt, erhält mit dem ThinkPad X1 Yoga G7 quasi die gleiche Erfahrung für weniger Geld. Das bedeutet nicht, dass das ThinkPad X1 Yoga G8 ein schlechtes Convertible wäre, immerhin ist das Yoga G7 noch immer sehr gut, aber wir hätten uns schon ein paar Verbesserungen gewünscht, beispielsweise eine höher auflösende Webcam, eine längere Akkulaufzeit, einen SD-Reader oder ein 1000-Nit-Panel, um besser gegen die Konkurrenz wie dem Dell Latitude 9430 2-in-1 oder der HP Elite Serie gerüstet zu sein.
Preis und Verfügbarkeit
Lenovo selbst liefert das Yoga G8 ab 2.329,01 Euro, zur Auswahl stehen aktuell vier Modelle, der Preis geht hoch bis auf deutlich über 3.000 Euro.
Lenovo ThinkPad X1 Yoga G8 i7-1355U
- 19.06.2023 v7 (old)
Allen Ngo
Transparenz
Die Auswahl der zu testenden Geräte erfolgt innerhalb der Redaktion. Das vorliegende Testmuster wurde dem Autor vom Hersteller oder einem Shop zu Testzwecken leihweise zur Verfügung gestellt. Eine Einflussnahme des Leihstellers auf den Testbericht gab es nicht, der Hersteller erhielt keine Version des Reviews vor der Veröffentlichung. Es bestand keine Verpflichtung zur Publikation. Als eigenständiges, unabhängiges Unternehmen unterliegt Notebookcheck keiner Diktion von Herstellern, Shops und Verlagen.
So testet Notebookcheck
Pro Jahr werden von Notebookcheck hunderte Laptops und Smartphones unabhängig in von uns standardisierten technischen Verfahren getestet, um eine Vergleichbarkeit aller Testergebnisse zu gewährleisten. Seit rund 20 Jahren entwickeln wir diese Testmethoden kontinuierlich weiter und setzen damit Branchenstandards. In unseren Testlaboren kommt ausschließlich hochwertiges Messequipment in die Hände erfahrener Techniker und Redakteure. Die Tests unterliegen einer mehrstufigen Kontrolle. Unsere komplexe Gesamtbewertung basiert auf hunderten fundierten Messergebnissen und Benchmarks, womit Ihnen Objektivität garantiert ist. Weitere Informationen zu unseren Testmethoden gibt es hier.
Preisvergleich

