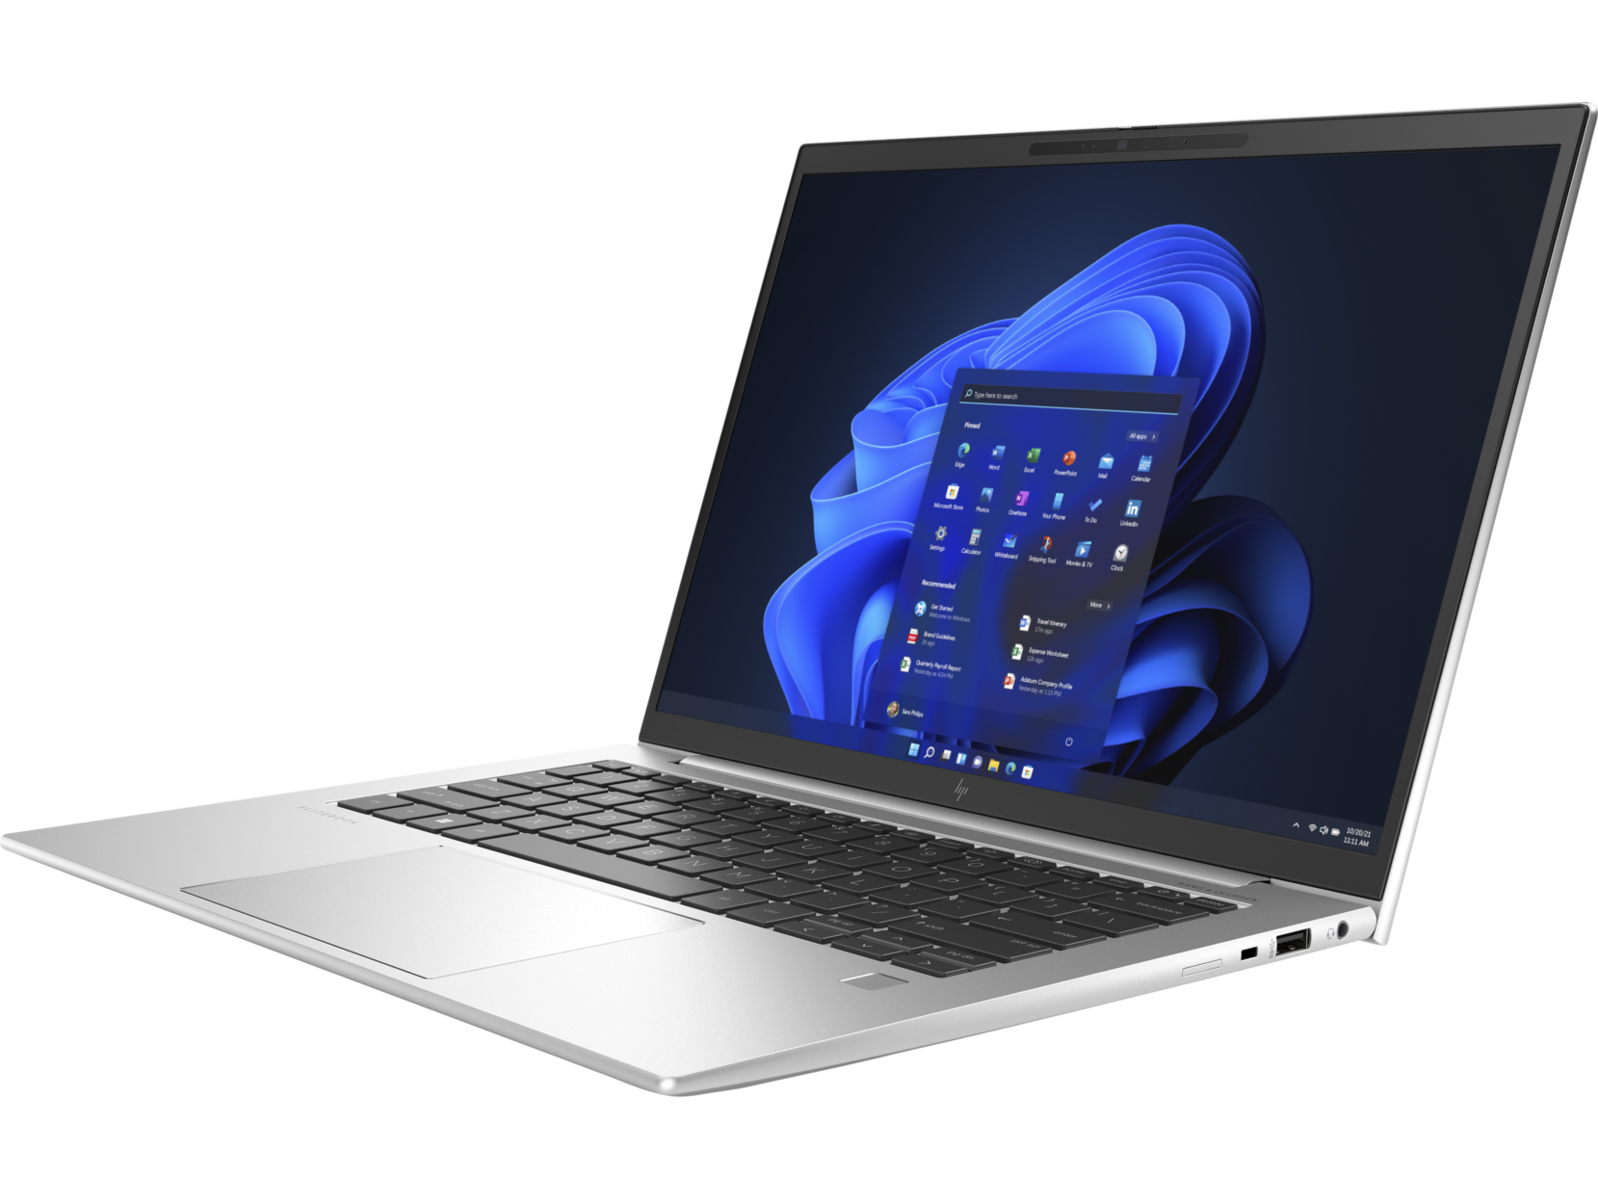
HP EliteBook 840 G9 Laptop Test: Die Alternative zum Lenovo ThinkPad X1 Carbon
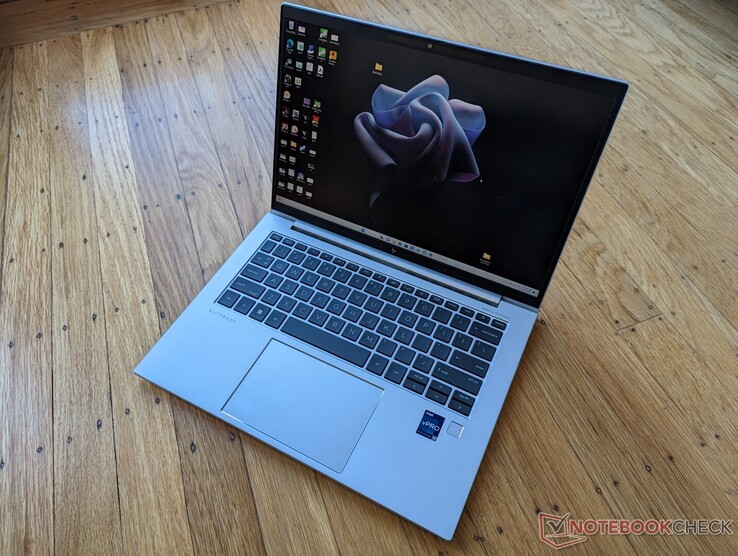
Das EliteBook 840 G9 ist die Intel Version des EliteBook 845 G9, das wir kürzlich in zwei verschiedenen Konfigurationen getestet hatten. Auf dieser Test Seite konzentrieren wir uns auf die Leistung der EliteBook-840-G9-Core-i7-1280P-Konfiguration. Details zu Gehäuse, Tastatur, Bedienbarkeit und anderen physikalischen Eigenschaften finden Sie auf unserer bestehenden AMD-Test-Seite.
Die Auswahl an SKUs ist viel größer als bei den meisten Consumer-Notebooks, da das EliteBook viel mehr optionale Funktionen integriert. Die CPUs reichen vom Core i5-1250P bis zum Core i7-1280P, von 250-Nit- bis 1.000-Nit-Displays und von 8 bis 64 GB Arbeitsspeicher neben anderen Zusatzoptionen wie hier aufgezeigt. Unser spezielles Testgerät ist mit der höchsten Stufe Core-i7-1280P-Prozessor ausgestattet, aber mit einem 400-Nit-Display und 16 GB RAM für knapp 3.000 US-Dollar.
Alternativen zum EliteBook 840 G9 sind andere 14-Zoll-Business-Subnotebooks der Spitzenklasse wie das Lenovo ThinkPad X1 Carbon Gen 10 oder das Dell Latitude 9430 oder das Latitude 7420.
Mehr HP Bewertungen:
Mögliche Konkurrenten im Vergleich
Bew. | Datum | Modell | Gewicht | Dicke | Größe | Auflösung | Preis ab |
|---|---|---|---|---|---|---|---|
| 88.7 % v7 (old) | 12 / 2022 | HP EliteBook 840 G9 i7-1280P, Iris Xe G7 96EUs | 1.5 kg | 19 mm | 14.00" | 1920x1200 | |
| 88.6 % v7 (old) | 07 / 2022 | HP EliteBook 845 G9 6F6H6EA R9 PRO 6950HS, Radeon 680M | 1.5 kg | 19.3 mm | 14.00" | 1920x1200 | |
| 89.8 % v7 (old) | 08 / 2021 | HP EliteBook 840 Aero G8 3E4Q6AA i7-1185G7, Iris Xe G7 96EUs | 1.2 kg | 17.9 mm | 14.00" | 1920x1080 | |
| 90.2 % v7 (old) | 12 / 2022 | Lenovo ThinkPad X1 Carbon G10 Core i7-1265U i7-1265U, Iris Xe G7 96EUs | 1.2 kg | 15.36 mm | 14.00" | 1920x1200 | |
| 86.6 % v7 (old) | 10 / 2022 | LG Gram 14Z90Q i5-1240P, Iris Xe G7 80EUs | 980 g | 16.8 mm | 14.00" | 1920x1200 | |
| 90.1 % v7 (old) | 04 / 2022 | Dell Latitude 7420 JW6MH i5-1145G7, Iris Xe G7 80EUs | 1.3 kg | 17.3 mm | 14.00" | 1920x1080 |
Gehäuse - wie beim EliteBook 845 G9
Obwohl das Gehäuse optisch identisch mit dem EliteBook 845 G9 ist, reicht ein kurzer Blick auf die USB-C-Anschlüsse entlang der linken Kante, um die beiden Modelle leicht voneinander zu unterscheiden. Das 840 G9 hat ein Thunderbolt-Label neben dem Anschluss, während das AMD betriebene 845 G9 die Kennzeichnung aufgrund der fehlenden Unterstützung komplett weglässt.
Für die Wartung stellt HP eine vollständige Videoanleitung zur Verfügung, in der von Anfang bis Ende erklärt wird, wie man jede wichtige Komponente des Modells ausbaut und ersetzt. Wir hoffen, dass andere große Hersteller dies in Zukunft nachahmen werden, um den Endbenutzern das Rätselraten zu ersparen.
Kommunikation
Die meisten 840-G9-Konfigurationen sind mit einem Standard-Intel-AX211 ausgestattet, da es sich schließlich um eine Intel basierte Serie handelt. Im Gegensatz dazu verwendet das AMD betriebene 845 G9 einen Qualcomm Fast Connect 6900, um die gleiche Wi-Fi-6E-Funktionalität zu bieten. Die Gesamtleistung ist bei unseren Tests mit einem Asus-AXE11000-Router zwischen den beiden vergleichbar.
WAN ist optional mit der Wahl zwischen einem Intel XMM 7560 R+ LTE oder dem 5000 5G.
| Networking | |
| iperf3 transmit AX12 | |
| Dell Latitude 7420 JW6MH | |
| HP EliteBook 840 Aero G8 3E4Q6AA | |
| iperf3 receive AX12 | |
| Dell Latitude 7420 JW6MH | |
| HP EliteBook 840 Aero G8 3E4Q6AA | |
| iperf3 receive AXE11000 6GHz | |
| LG Gram 14Z90Q | |
| HP EliteBook 845 G9 6F6H6EA | |
| HP EliteBook 840 G9 | |
| Lenovo ThinkPad X1 Carbon G10 Core i7-1265U | |
| iperf3 receive AXE11000 | |
| HP EliteBook 840 G9 | |
| Lenovo ThinkPad X1 Carbon G10 Core i7-1265U | |
| iperf3 transmit AXE11000 | |
| Lenovo ThinkPad X1 Carbon G10 Core i7-1265U | |
| HP EliteBook 840 G9 | |
| iperf3 transmit AXE11000 6GHz | |
| HP EliteBook 845 G9 6F6H6EA | |
| Lenovo ThinkPad X1 Carbon G10 Core i7-1265U | |
| HP EliteBook 840 G9 | |
Webcam
Die 5-MP-Webcam ist vielleicht nicht so scharf wie die 8-MP-Webcam des aktuellen Dragonfly Folio G3, aber sie ist immer noch deutlich besser als die 1-MP- oder 2-MP-Webcams der meisten anderen Laptops. HP ist in dieser Hinsicht der Zeit weit voraus.
Ein Webcam-Slider-Shutter (Standard) sorgt für mehr Privatsphäre, während der IR-Sensor für Hello Unterstützung optional ist.


Zubehör und Garantie
Außer dem Netzteil und dem Papierkram befinden sich keine weiteren Extras in der Verpackung. Das Standard-Garantiefenster beträgt enttäuschenderweise nur ein Jahr im Vergleich zu drei Jahren bei den meisten konkurrierenden Dell-Latitude-Modellen.
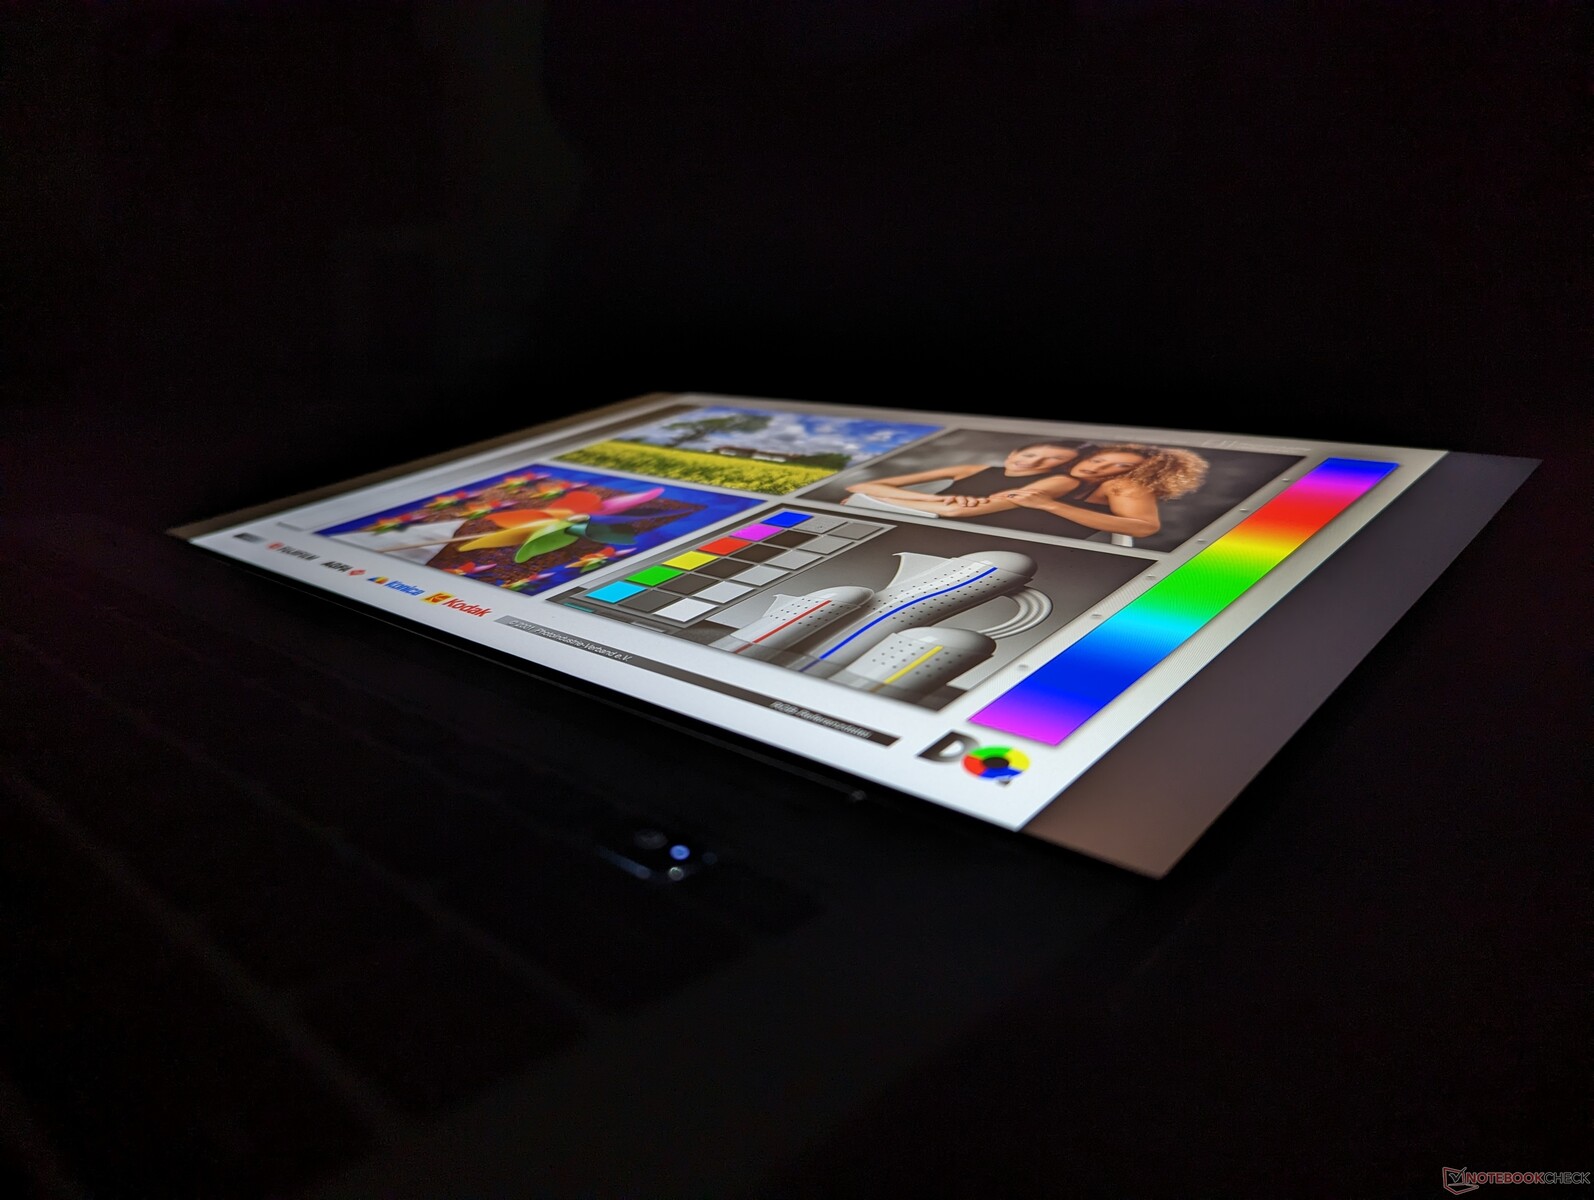
Display - Tolle Farben, langsame Reaktionszeiten
HP bietet sieben verschiedene Panel-Optionen an:
- 250 Nits, kein WWAN
- 250 Nits, WWAN
- 400 Nits, wenig blaues Licht, kein WWAN
- 400 Nits, niedriges blaues Licht, WWAN
- 250 Nits, Touchscreen, kein WWAN
- 1.000 Nits, niedriges blaues Licht, Sure View, WWAN
- 250 Nits, Touchscreen, WWAN
- 1.000 Nits, niedriges blaues Licht, Sure View, kein WWAN
Unsere Messungen unten beziehen sich nur auf die fettgedruckte Option oben. Interessant ist, dass es sich bei allen um 1.920x1.200 matte IPS-60-Hz-Bildschirme handelt, ohne OLED-Option. Leider ist Sure View an die 1.000-Nit-Option gebunden, ob die Nutzer das wollen oder nicht. HP sagt, dass das 1000-Nit-Panel erforderlich ist, damit Sure View Reflect funktioniert, und daher können beide nicht getrennt werden.
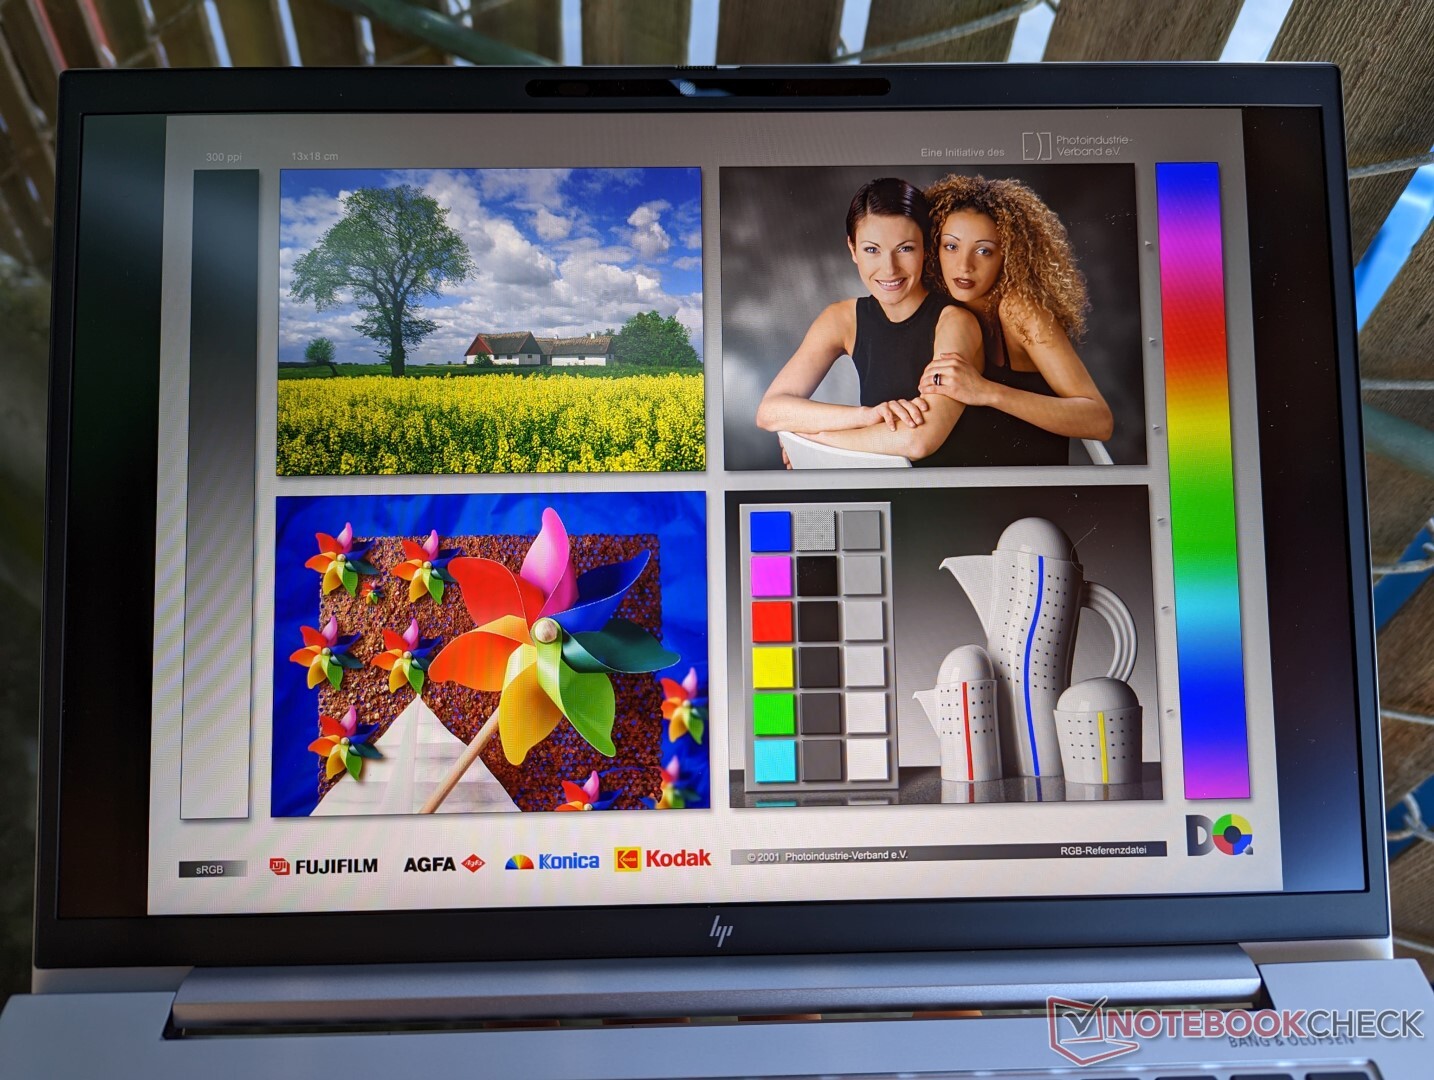
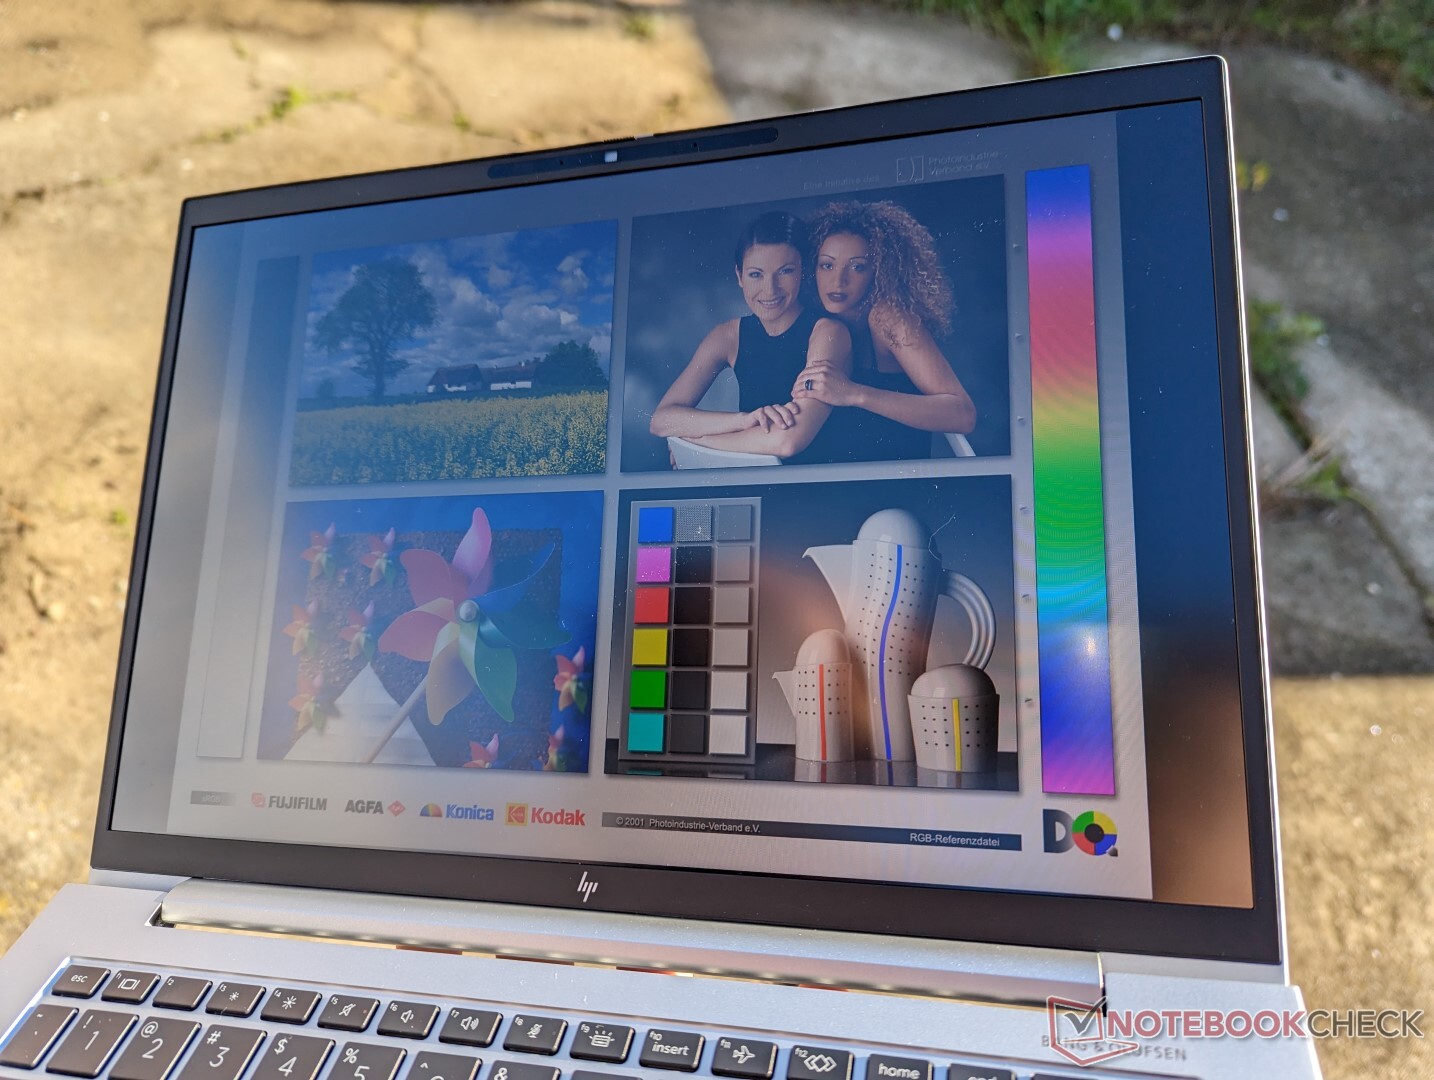
Abgesehen von den oben genannten Einschränkungen ist das Chi-Mei-Panel auf unserem Gerät ein qualitativ hochwertiges Panel in Bezug auf Farbabdeckung und Kontrast. Sein größtes Manko ist die sehr langsame Schwarz-Weiß- und Grau-Grau-Reaktionszeit für spürbares Ghosting. Obwohl dies bei Büro- oder Business-Laptops nicht unüblich ist, sind sie hier so langsam, dass sie beim Surfen im Internet oder beim Videostreaming stören.
| |||||||||||||||||||||||||
Ausleuchtung: 86 %
Helligkeit Akku: 391.3 cd/m²
Kontrast: 1223:1 (Schwarzwert: 0.32 cd/m²)
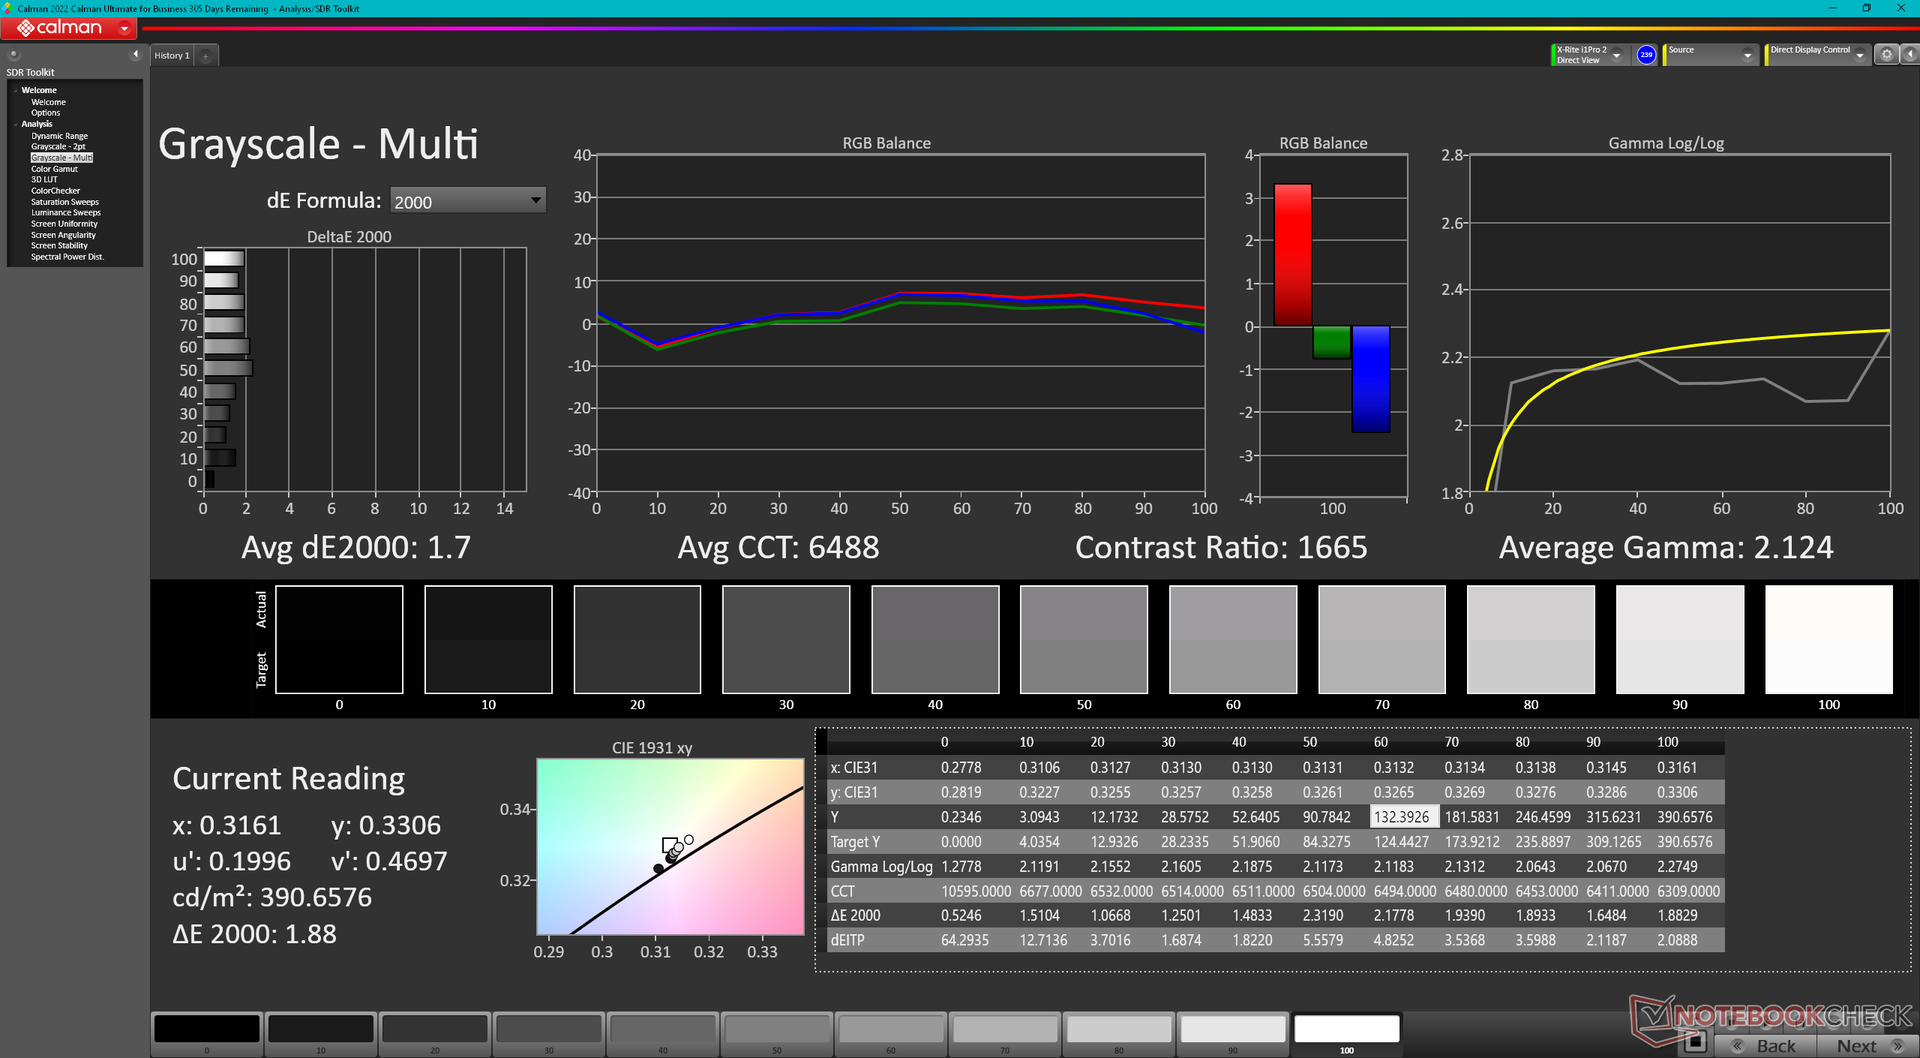
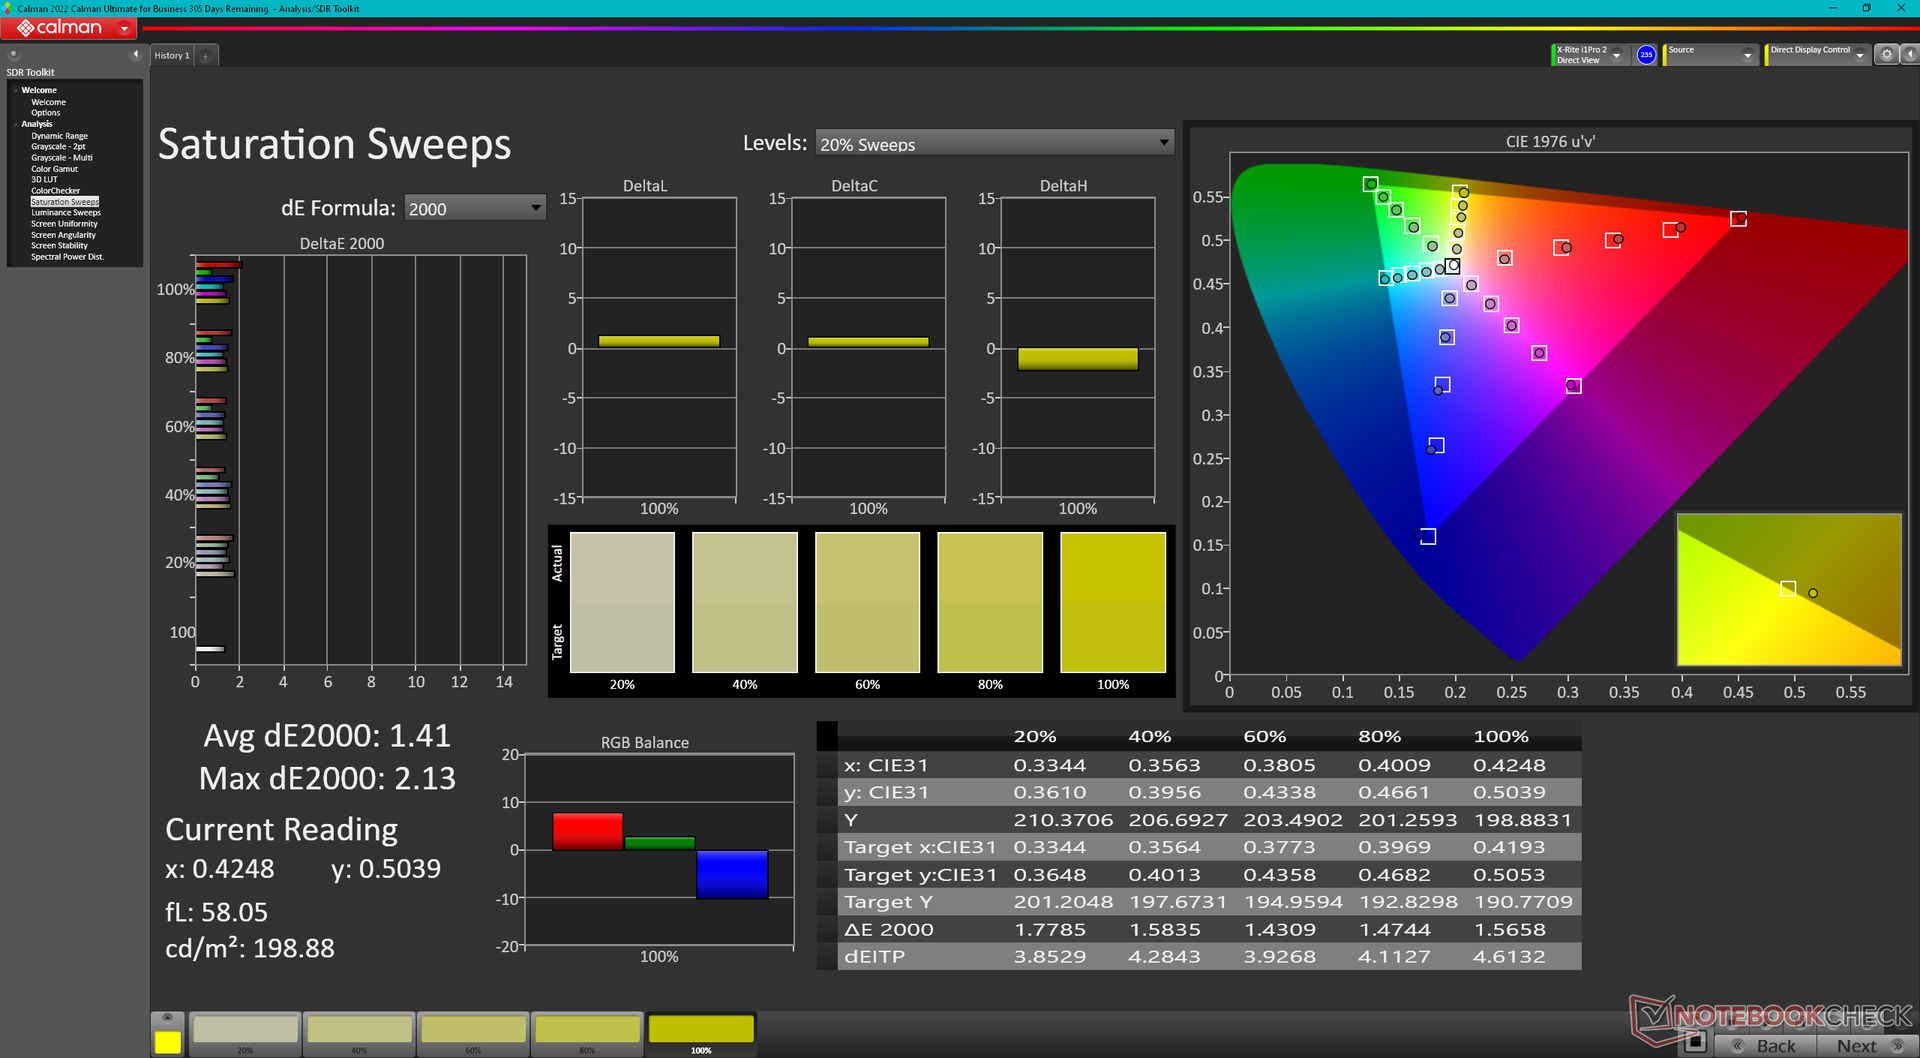
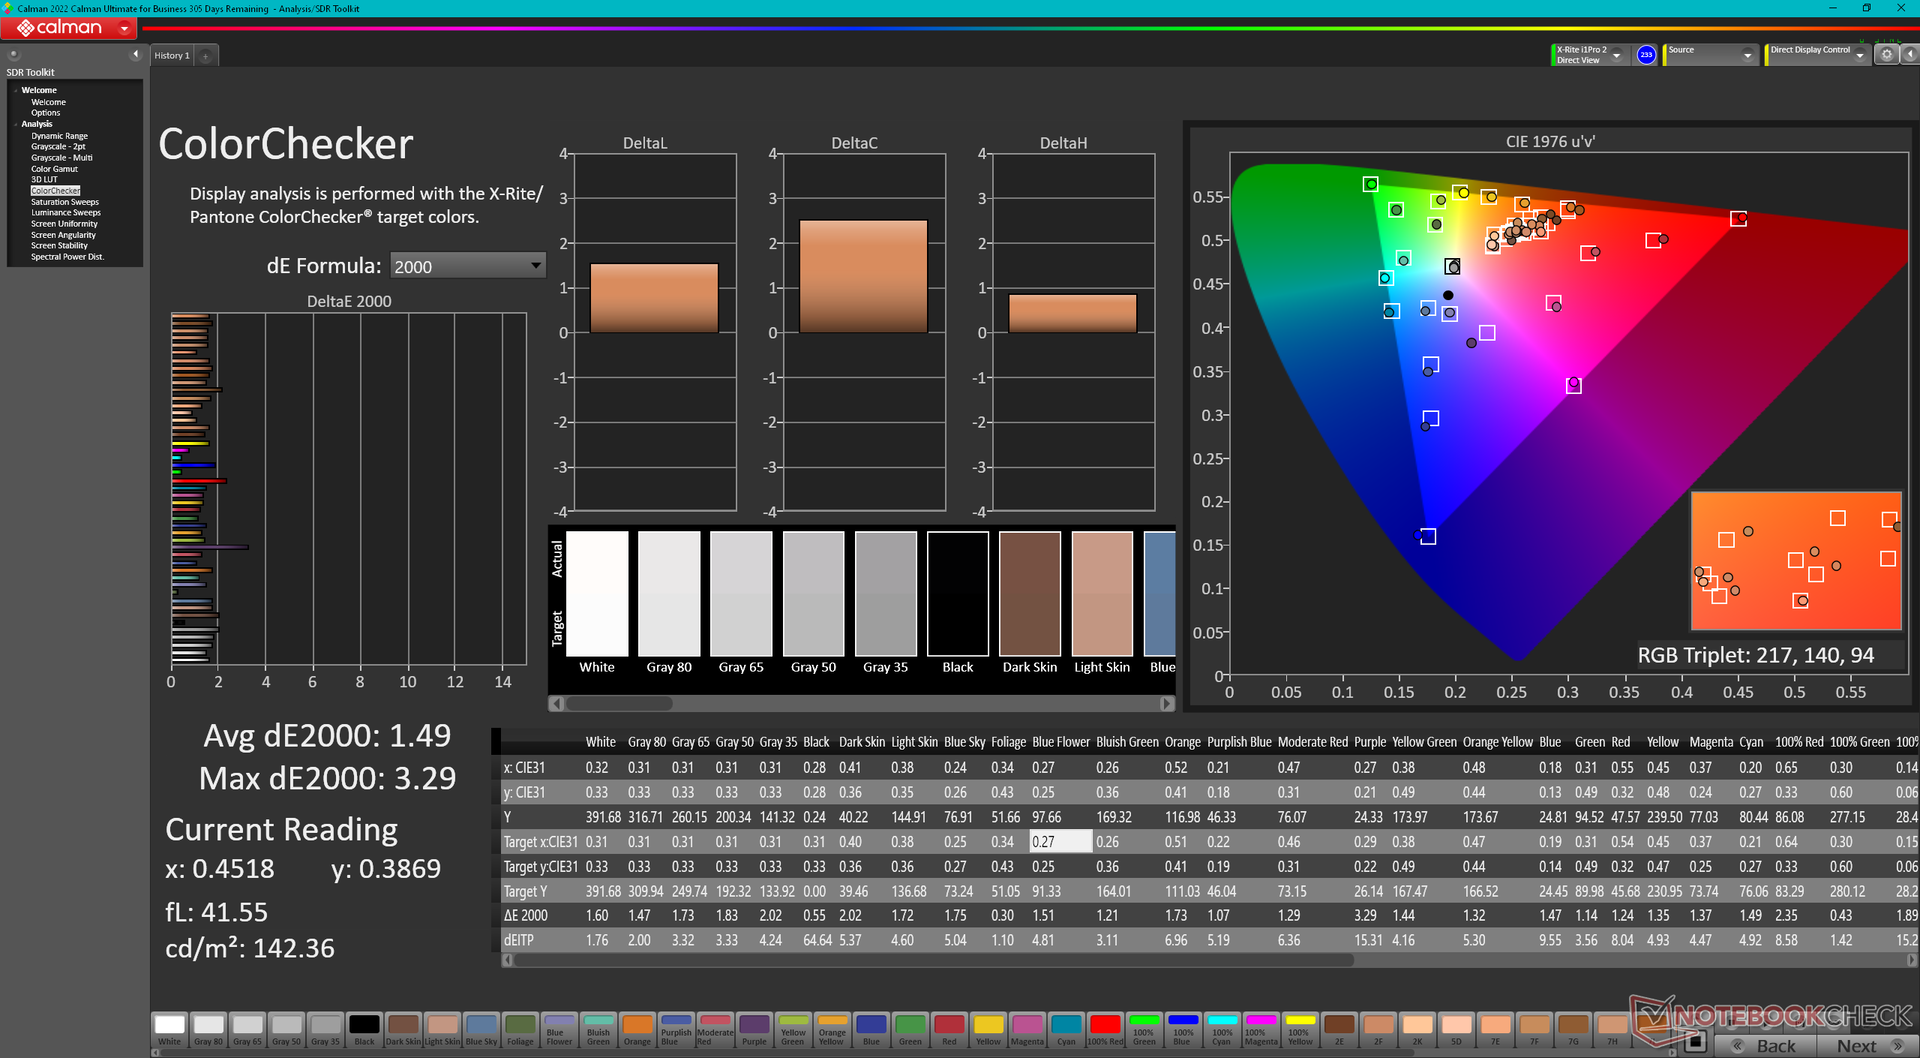
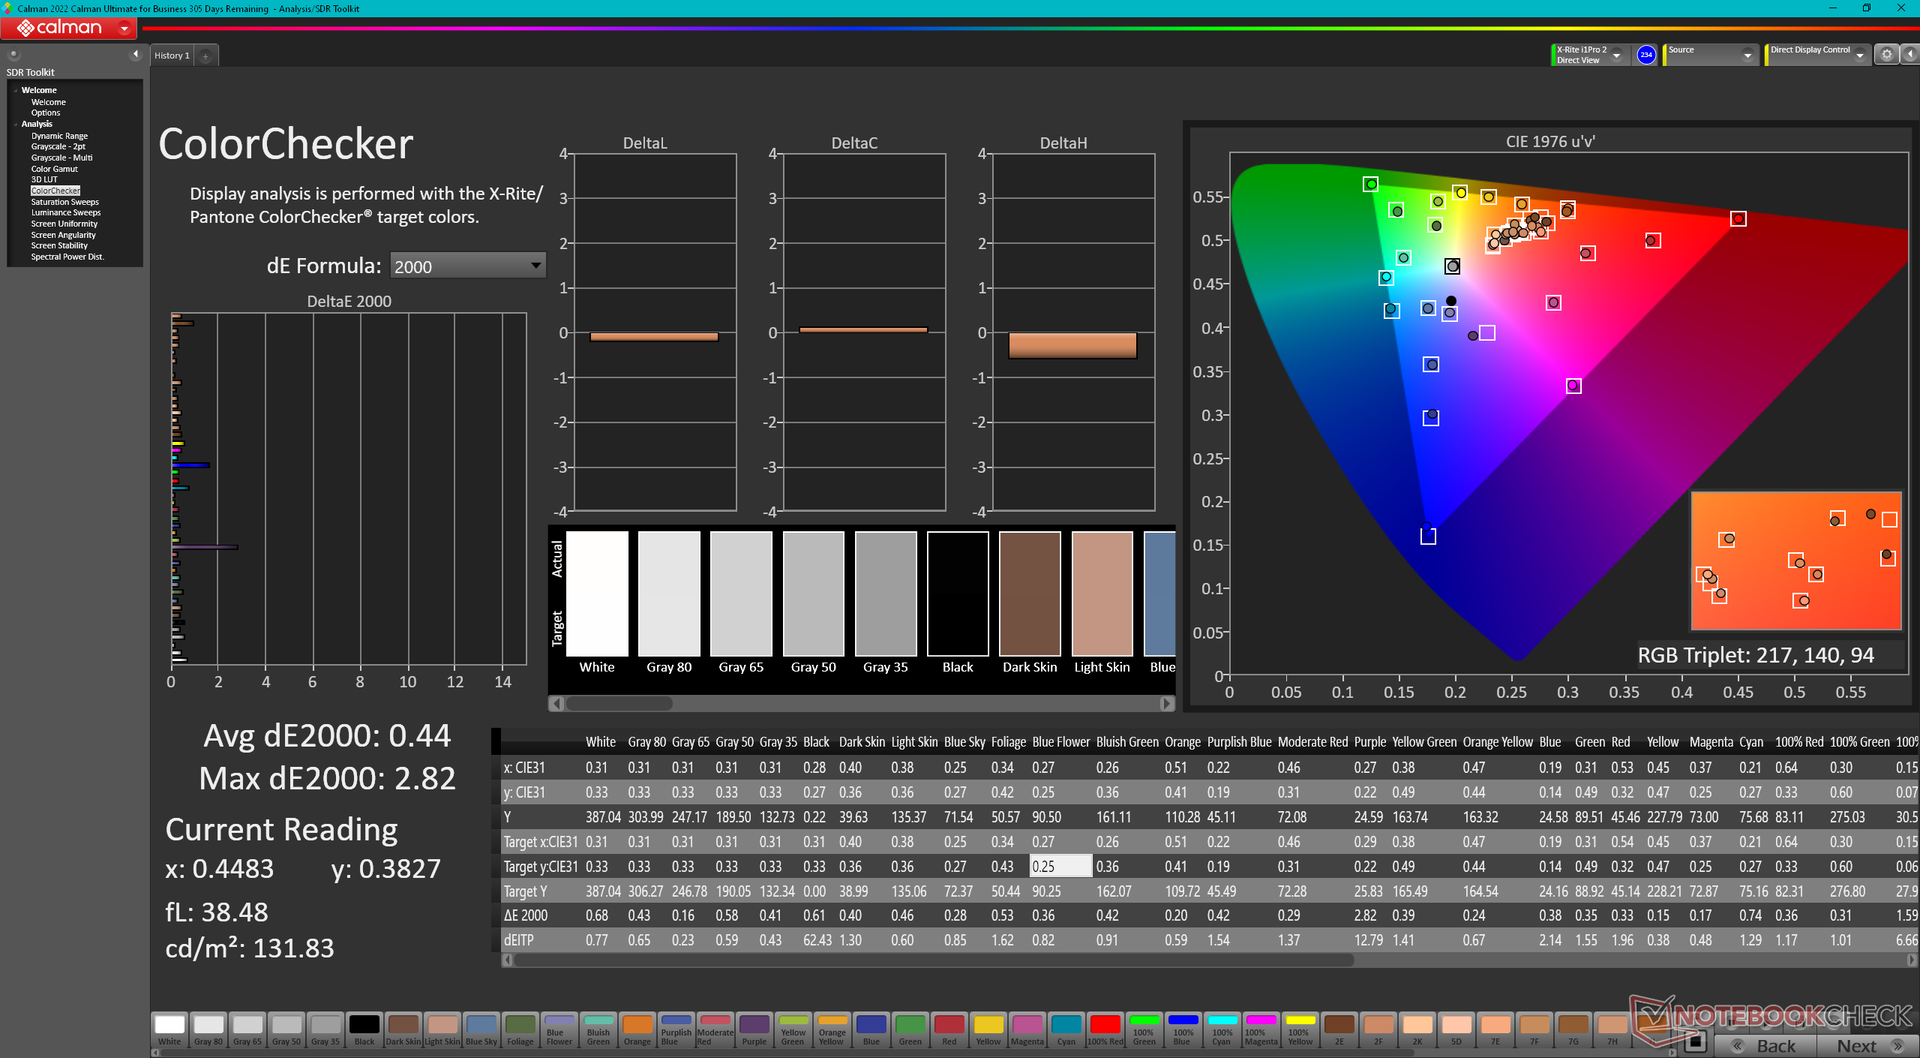
ΔE ColorChecker Calman: 1.49 | ∀{0.5-29.43 Ø4.72}
calibrated: 0.44
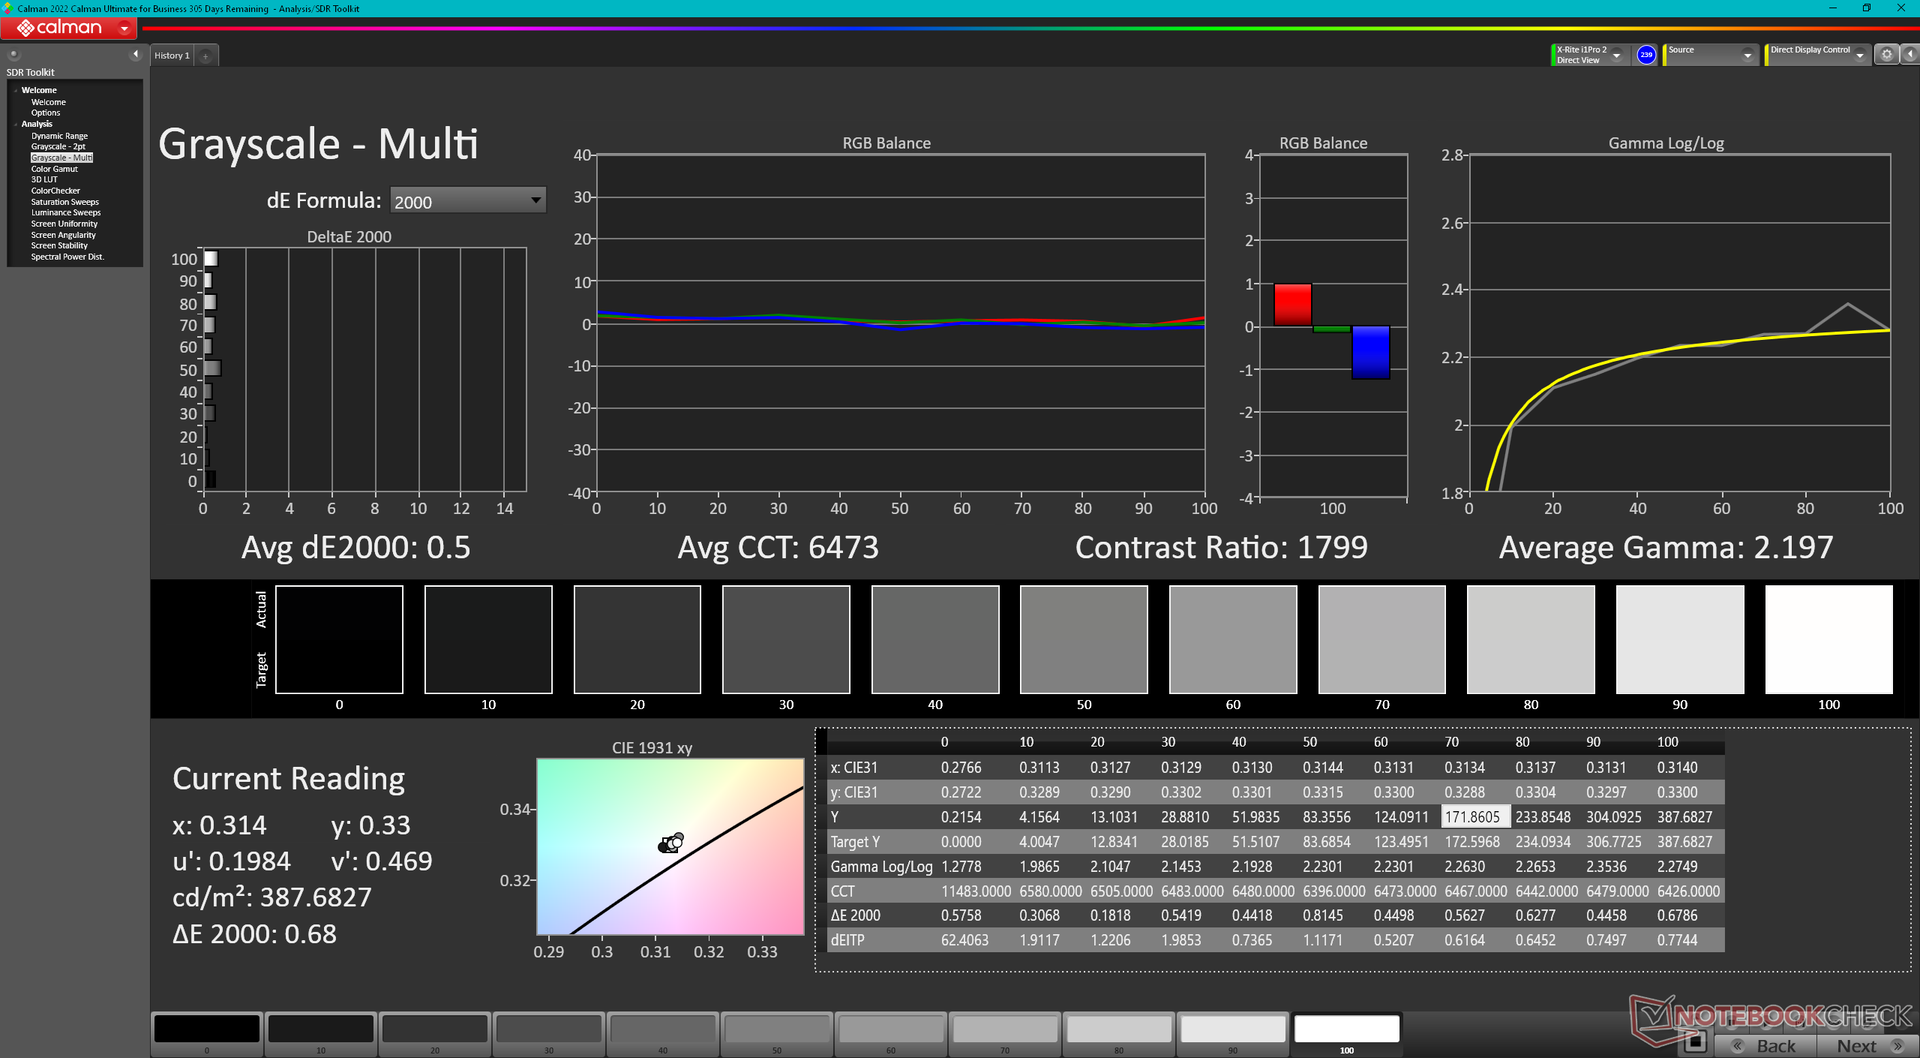
ΔE Greyscale Calman: 1.7 | ∀{0.09-98 Ø4.97}
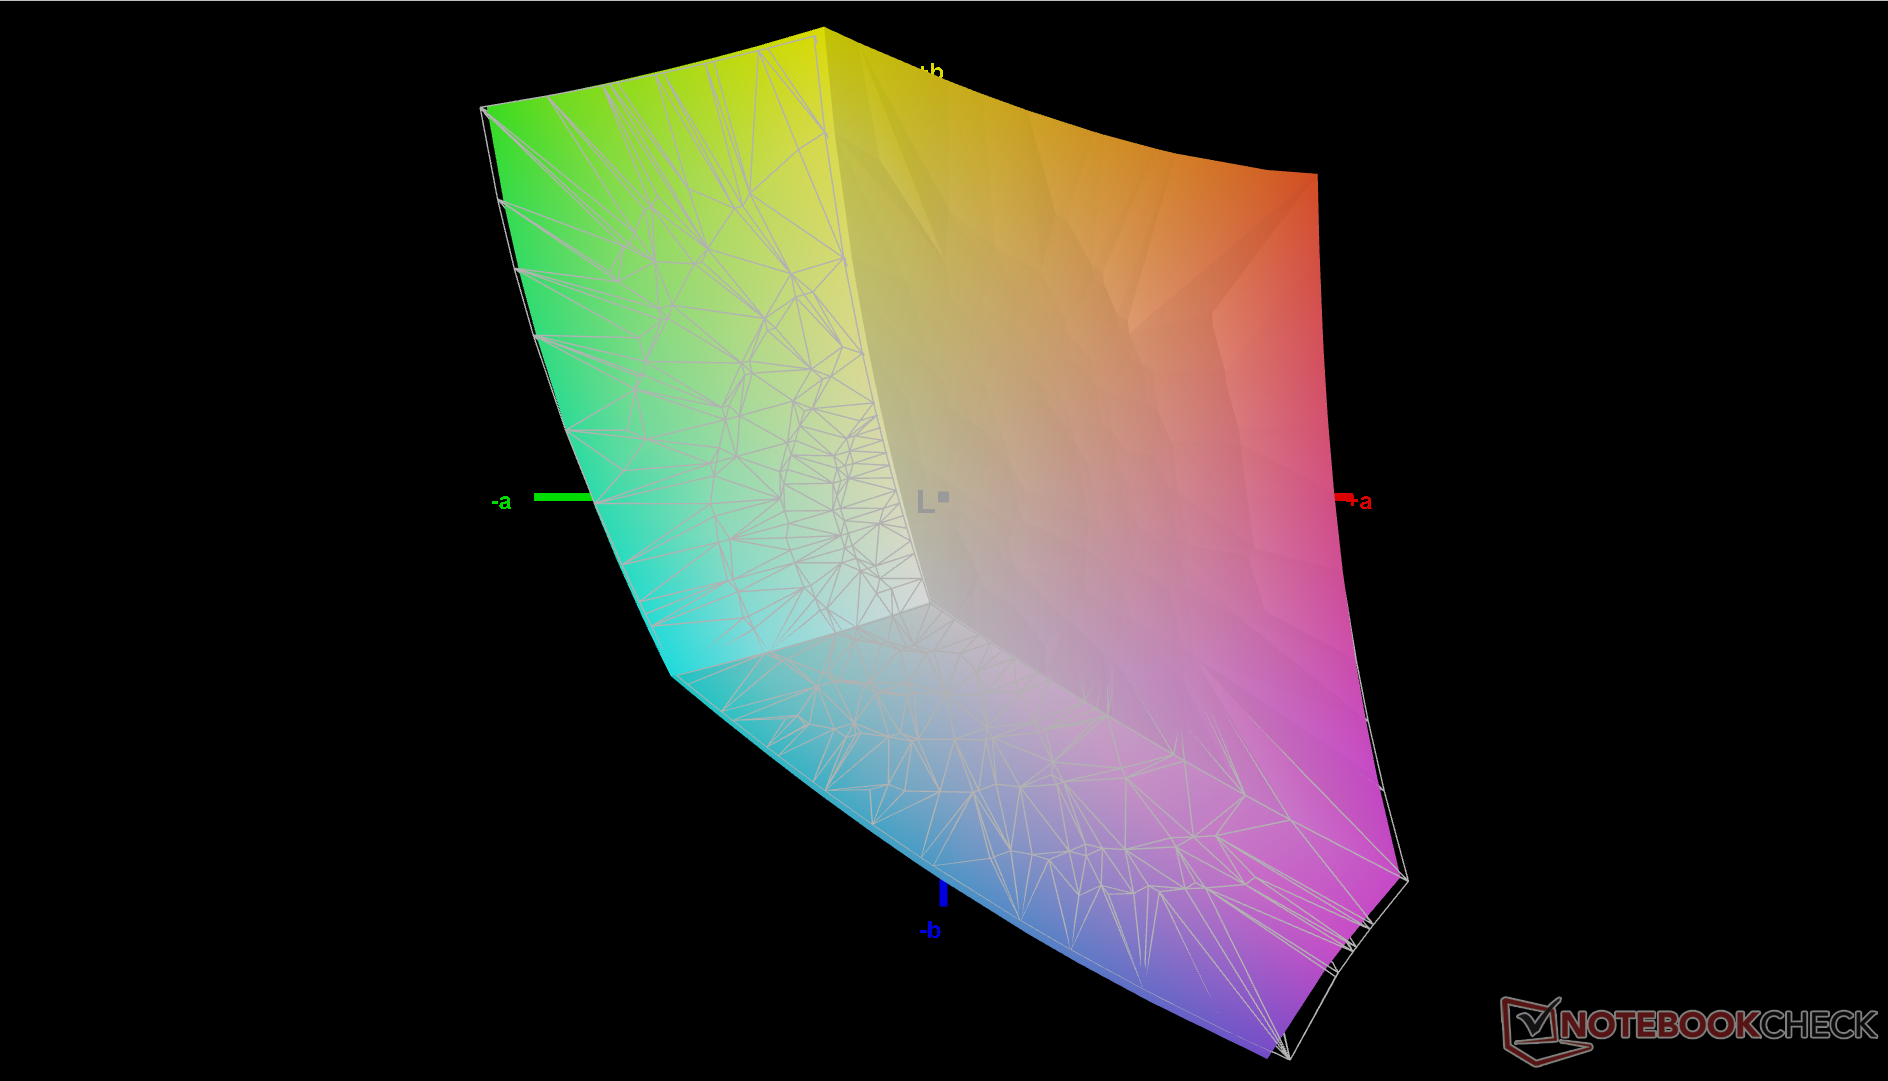
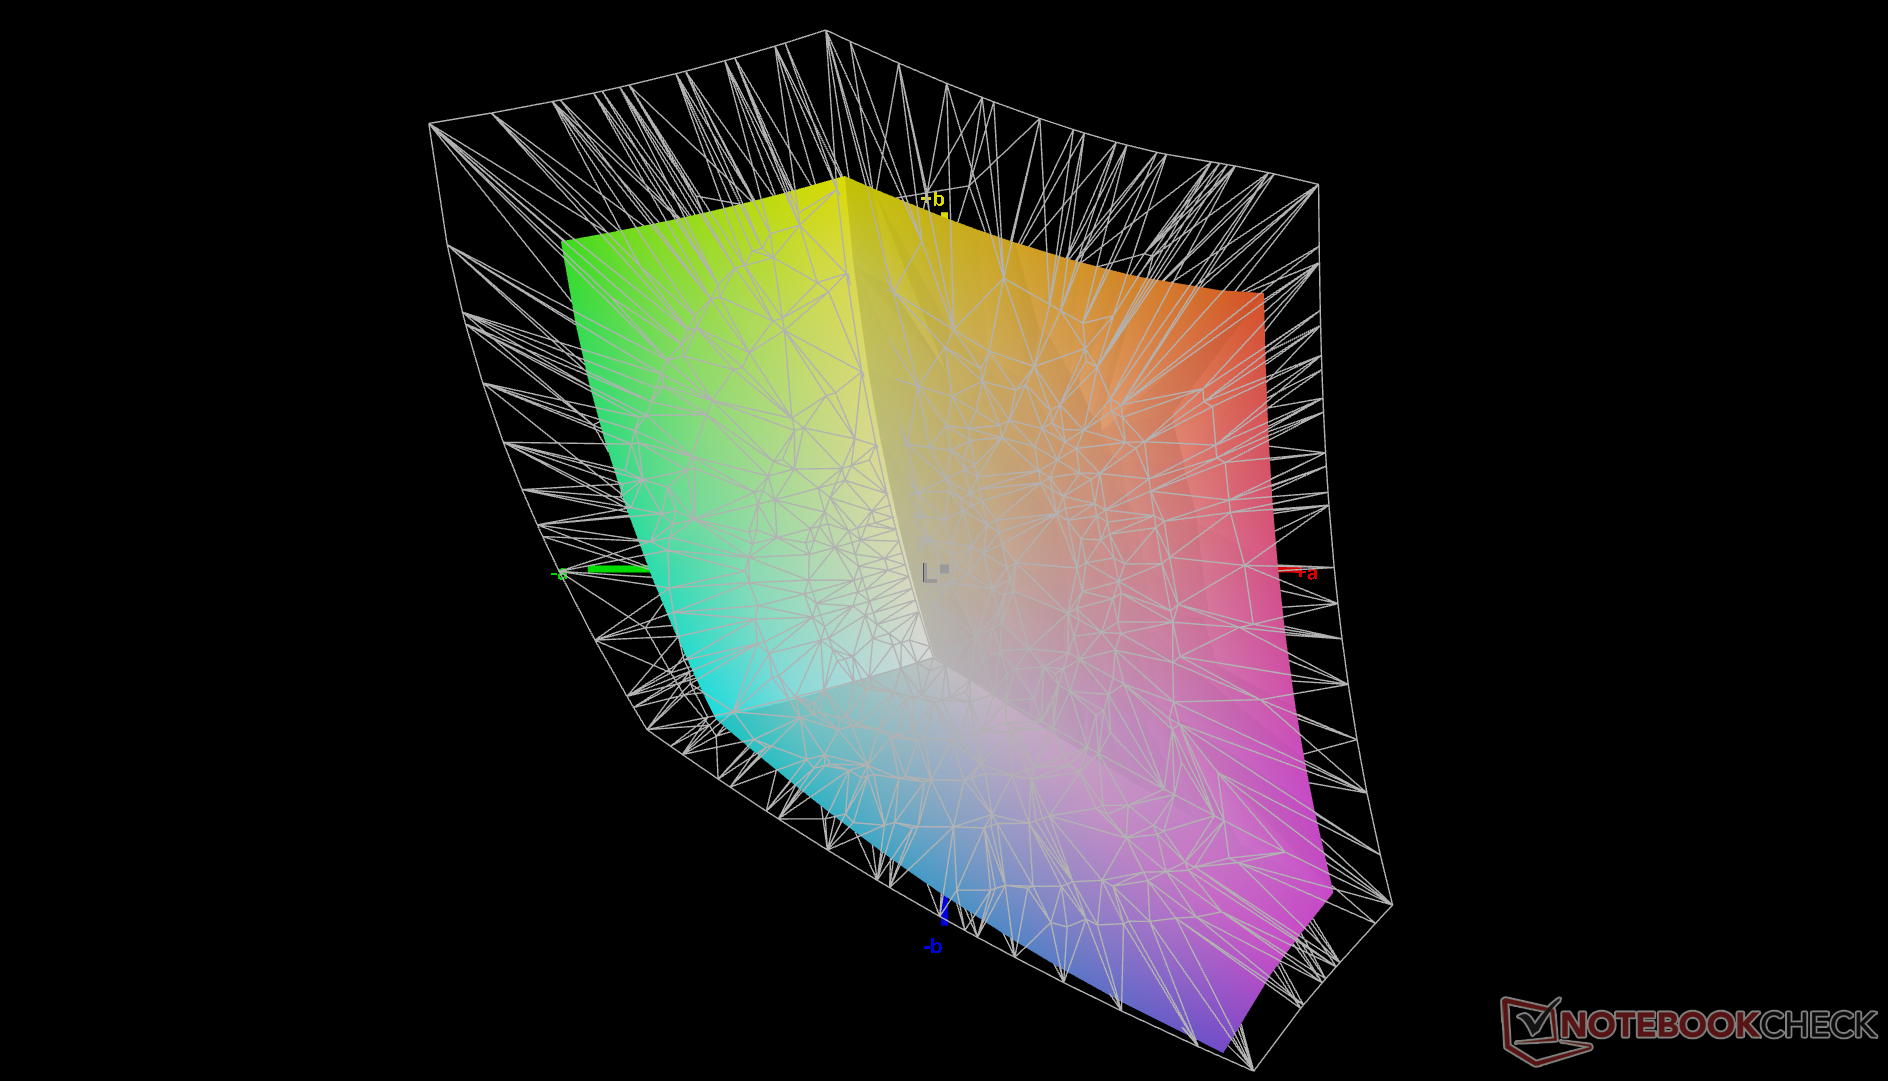
69.7% AdobeRGB 1998 (Argyll 3D)
98.7% sRGB (Argyll 3D)
67.6% Display P3 (Argyll 3D)
Gamma: 2.12
CCT: 6488 K
| HP EliteBook 840 G9 Chi Mei CMN1435, IPS, 1920x1200, 14" | HP EliteBook 845 G9 6F6H6EA InfoVision X140NV4J, IPS, 1920x1200, 14" | HP EliteBook 840 Aero G8 3E4Q6AA AU Optronics AUO068B, IPS, 1920x1080, 14" | Lenovo ThinkPad X1 Carbon G10 Core i7-1265U R140NW4D R0, IPS, 1920x1200, 14" | LG Gram 14Z90Q LG LP140WU1-SPF1, IPS, 1920x1200, 14" | Dell Latitude 7420 JW6MH Chi Mei CMN1416 CHF07 140HCG, IPS, 1920x1080, 14" | |
|---|---|---|---|---|---|---|
| Display | 1% | -0% | 1% | 23% | 0% | |
| Display P3 Coverage (%) | 67.6 | 69 2% | 68 1% | 68.7 2% | 98.4 46% | 68 1% |
| sRGB Coverage (%) | 98.7 | 99 0% | 97.6 -1% | 99.5 1% | 99.9 1% | 99 0% |
| AdobeRGB 1998 Coverage (%) | 69.7 | 70 0% | 69.3 -1% | 70.2 1% | 85.9 23% | 70 0% |
| Response Times | 54% | 33% | 12% | 38% | 31% | |
| Response Time Grey 50% / Grey 80% * (ms) | 66 ? | 31 ? 53% | 48 ? 27% | 55.2 ? 16% | 47.5 ? 28% | 55 ? 17% |
| Response Time Black / White * (ms) | 46.4 ? | 21 ? 55% | 28.8 ? 38% | 43.2 ? 7% | 24.5 ? 47% | 26 ? 44% |
| PWM Frequency (Hz) | ||||||
| Bildschirm | -41% | -69% | -5% | -63% | -6% | |
| Helligkeit Bildmitte (cd/m²) | 391.3 | 678 73% | 466.4 19% | 421.9 8% | 341 -13% | 408 4% |
| Brightness (cd/m²) | 368 | 745 102% | 426 16% | 420 14% | 305 -17% | 378 3% |
| Brightness Distribution (%) | 86 | 69 -20% | 84 -2% | 87 1% | 87 1% | 86 0% |
| Schwarzwert * (cd/m²) | 0.32 | 0.33 -3% | 0.32 -0% | 0.29 9% | 0.26 19% | 0.22 31% |
| Kontrast (:1) | 1223 | 2055 68% | 1458 19% | 1455 19% | 1312 7% | 1855 52% |
| Delta E Colorchecker * | 1.49 | 3.56 -139% | 2.84 -91% | 1.69 -13% | 3.11 -109% | 1.54 -3% |
| Colorchecker dE 2000 max. * | 3.29 | 7.23 -120% | 4.73 -44% | 3.55 -8% | 8.29 -152% | 2.72 17% |
| Colorchecker dE 2000 calibrated * | 0.44 | 1.05 -139% | 2.27 -416% | 0.5 -14% | 0.83 -89% | 1.08 -145% |
| Delta E Graustufen * | 1.7 | 4.93 -190% | 3.7 -118% | 2.8 -65% | 5.3 -212% | 1.95 -15% |
| Gamma | 2.12 104% | 2.63 84% | 2.13 103% | 2.13 103% | 2.037 108% | 2.33 94% |
| CCT | 6488 100% | 7114 91% | 6886 94% | 6442 101% | 7571 86% | 6806 96% |
| Durchschnitt gesamt (Programm / Settings) | 5% /
-18% | -12% /
-40% | 3% /
-2% | -1% /
-30% | 8% /
0% |
* ... kleinere Werte sind besser
Das Display ist bereits gut kalibriert ab Werk mit durchschnittlichen Graustufen- und Farb-DeltaE-Werten von nur 1,7 bzw. 1,49. Eine Kalibrierung des Panels mit einem X-Rite-Colorimeter würde diese Werte sogar noch weiter verbessern, wie die Screenshots unten zeigen, aber das wird für die meisten Nutzer nicht notwendig sein. Unser kalibriertes ICM-Profil ist oben verfügbar, falls Sie es ausprobieren möchten.

Reaktionszeiten (Response Times) des Displays
| ↔ Reaktionszeiten Schwarz zu Weiß | ||
|---|---|---|
| 46.4 ms ... steigend ↗ und fallend ↘ kombiniert | ↗ 24.4 ms steigend | 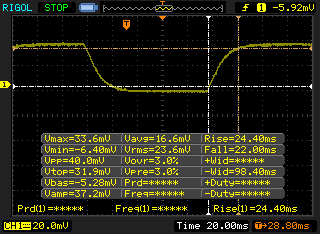 |
| ↘ 22 ms fallend | ||
| Die gemessenen Reaktionszeiten sind langsam und dadurch für viele Spieler wahrscheinlich zu langsam. Im Vergleich rangierten die bei uns getesteten Geräte von 0.1 (Minimum) zu 240 (Maximum) ms. » 99 % aller Screens waren schneller als der getestete. Daher sind die gemessenen Reaktionszeiten schlechter als der Durchschnitt aller vermessenen Geräte (19.8 ms). | ||
| ↔ Reaktionszeiten 50% Grau zu 80% Grau | ||
| 66 ms ... steigend ↗ und fallend ↘ kombiniert | ↗ 35.2 ms steigend | 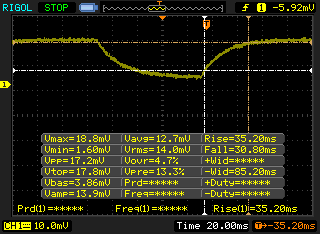 |
| ↘ 30.8 ms fallend | ||
| Die gemessenen Reaktionszeiten sind langsam und dadurch für viele Spieler wahrscheinlich zu langsam. Im Vergleich rangierten die bei uns getesteten Geräte von 0.165 (Minimum) zu 636 (Maximum) ms. » 98 % aller Screens waren schneller als der getestete. Daher sind die gemessenen Reaktionszeiten schlechter als der Durchschnitt aller vermessenen Geräte (31 ms). | ||
Bildschirm-Flackern / PWM (Pulse-Width Modulation)
| Flackern / PWM nicht festgestellt | 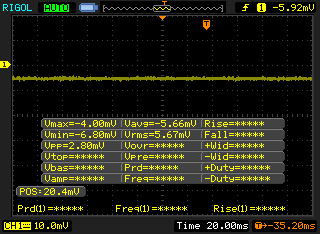 | ||
Im Vergleich: 52 % aller getesteten Geräte nutzten kein PWM um die Helligkeit zu reduzieren. Wenn PWM eingesetzt wurde, dann bei einer Frequenz von durchschnittlich 7769 (Minimum 5, Maximum 343500) Hz. | |||


Performance - Schnellste Core-i7-P-Series-Option
Testbedingungen
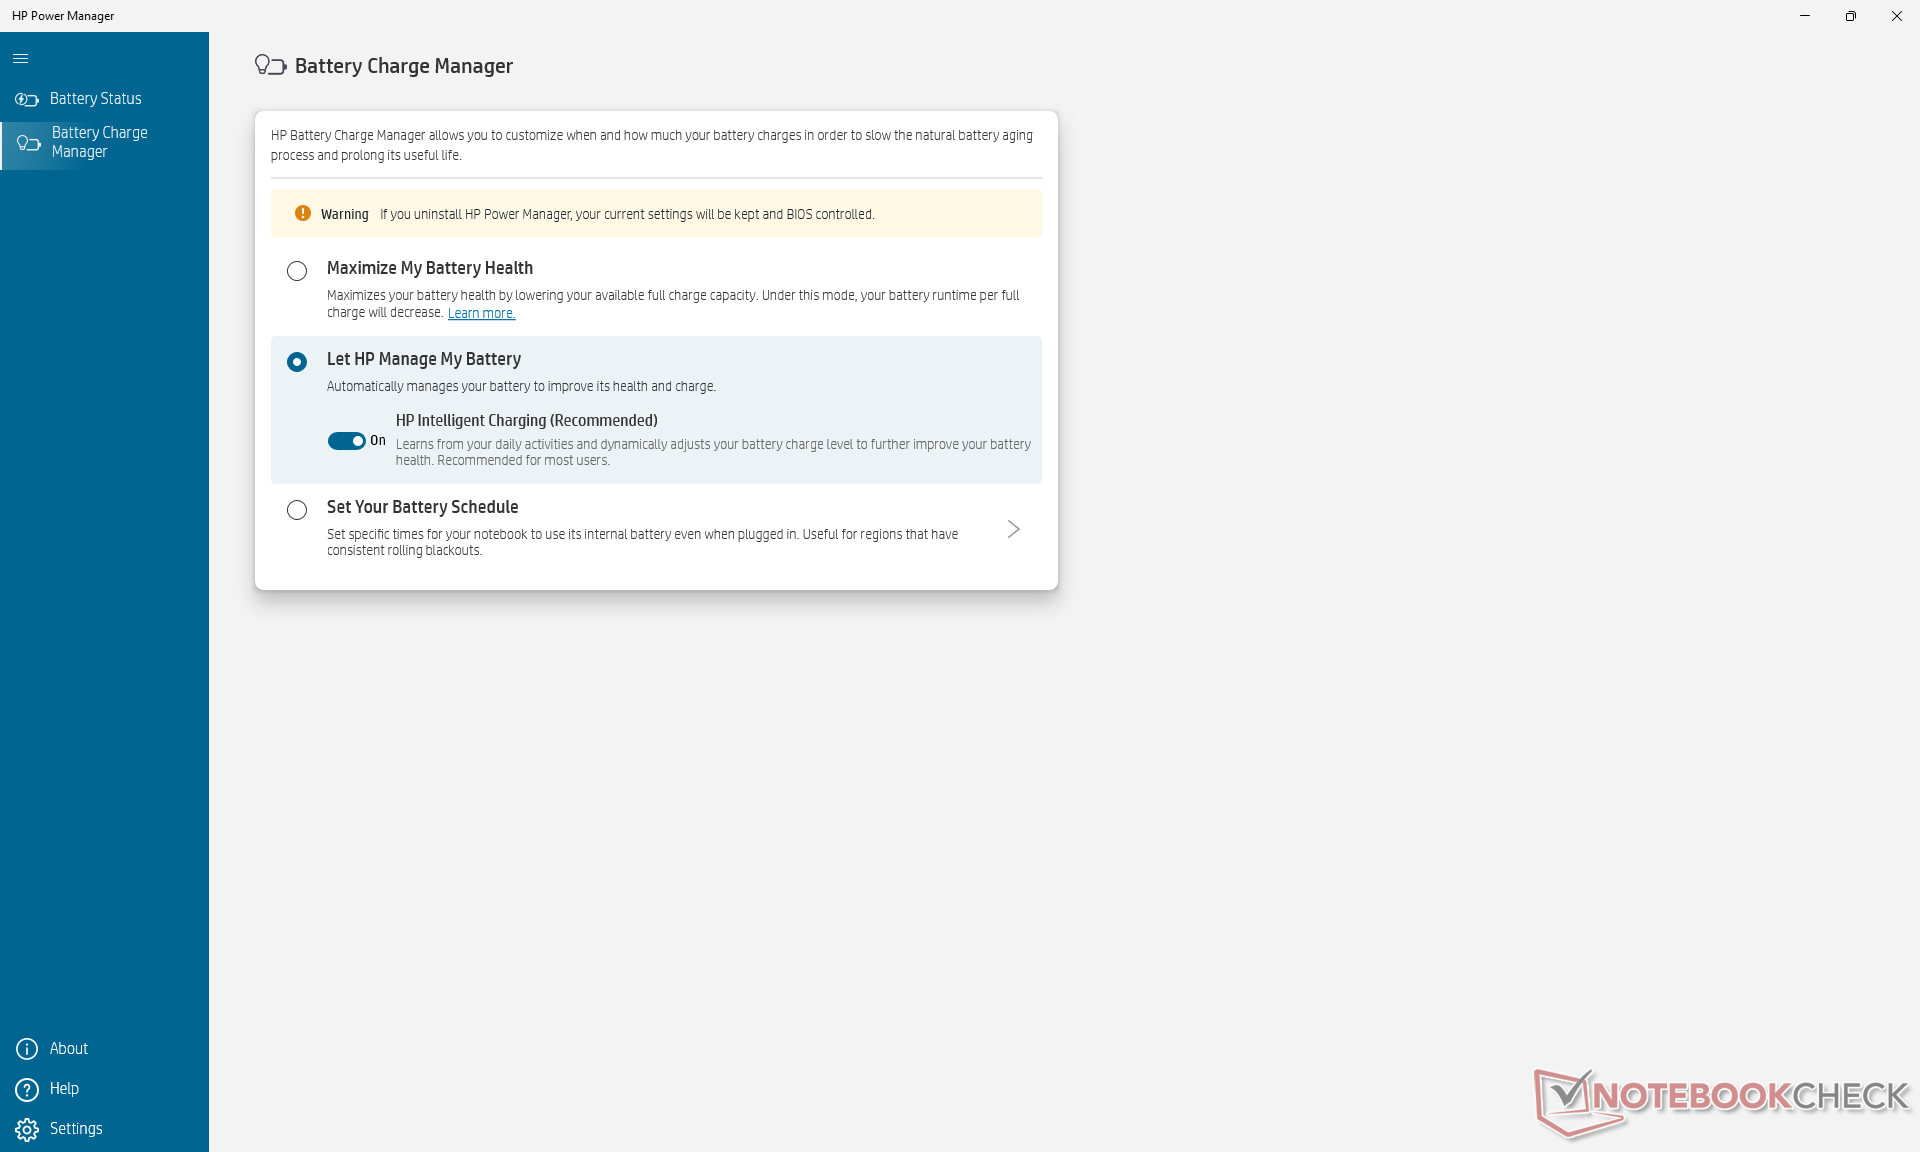
Wir haben unser Gerät über Windows auf den Modus "Beste Leistung" eingestellt, bevor wir die folgenden Benchmarks durchgeführt haben. Seltsamerweise enthält die vorinstallierte Power-Manager-App keine zusätzlichen Energieeinstellungen, anders als wir es beim Dragonfly Folio G3 beobachtet haben.
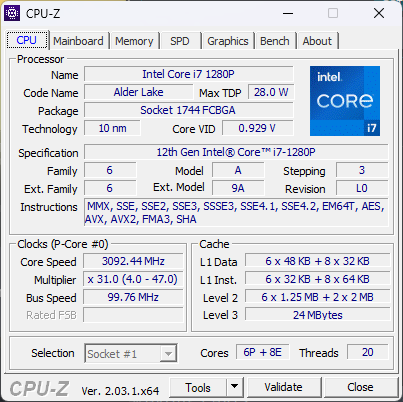
Prozessor
Die CPU-Leistung ist aufgrund des begrenzten Turbo-Boost-Potenzials des Systems eine gemischte Sache. Wenn man beispielsweise den CineBench R15 xT in einer Schleife laufen lässt, fällt der anfängliche Score von 1.992 Punkten nach nur einem Durchlauf deutlich auf 1.458 Punkte, was einem Leistungsabfall von 27 Prozent entspricht. Dieser Abfall ist steiler als bei den meisten anderen Notebooks, darunter auch vielen Modellen der Core-U-Serie. Im Vergleich dazu zeigt der Ryzen 9 PRO 6950HS im EliteBook 845 G9 während des gesamten Stresstests konstante Leistungsergebnisse.
Viele andere Laptops mit dem gleichen Core i7-1280P CPU sind aufgrund ihrer stärkeren Kühllösungen in der Lage, eine schnellere Leistung als unser HP zu bieten. Das größere MSI Summit E16 Flip kann zum Beispiel eine 25 bis 50 Prozent schnellere Multi-Thread-Leistung als unser EliteBook 840 G9 bieten.
Cinebench R15 Multi Loop
Cinebench R23: Multi Core | Single Core
Cinebench R15: CPU Multi 64Bit | CPU Single 64Bit
Blender: v2.79 BMW27 CPU
7-Zip 18.03: 7z b 4 | 7z b 4 -mmt1
Geekbench 5.5: Multi-Core | Single-Core
HWBOT x265 Benchmark v2.2: 4k Preset
LibreOffice : 20 Documents To PDF
R Benchmark 2.5: Overall mean
* ... kleinere Werte sind besser
| Blender - v3.3 Classroom CPU | |
| LG Gram 14Z90Q | |
| Lenovo ThinkPad X1 Carbon G10 Core i7-1265U | |
| Durchschnittliche Intel Iris Xe Graphics G7 96EUs (336 - 1259, n=109) | |
| HP EliteBook 840 G9 | |
* ... kleinere Werte sind besser
AIDA64: FP32 Ray-Trace | FPU Julia | CPU SHA3 | CPU Queen | FPU SinJulia | FPU Mandel | CPU AES | CPU ZLib | FP64 Ray-Trace | CPU PhotoWorxx
| Performance Rating | |
| HP EliteBook 845 G9 6F6H6EA | |
| Durchschnittliche Intel Core i7-1280P | |
| HP EliteBook 840 G9 | |
| Lenovo ThinkPad X1 Carbon G10 Core i7-1265U | |
| Dell Latitude 7420 JW6MH | |
| HP EliteBook 840 Aero G8 3E4Q6AA | |
| LG Gram 14Z90Q | |
| AIDA64 / FP32 Ray-Trace | |
| HP EliteBook 845 G9 6F6H6EA | |
| Durchschnittliche Intel Core i7-1280P (7466 - 13068, n=6) | |
| HP EliteBook 840 G9 | |
| Lenovo ThinkPad X1 Carbon G10 Core i7-1265U | |
| Dell Latitude 7420 JW6MH | |
| HP EliteBook 840 Aero G8 3E4Q6AA | |
| LG Gram 14Z90Q | |
| AIDA64 / FPU Julia | |
| HP EliteBook 845 G9 6F6H6EA | |
| Durchschnittliche Intel Core i7-1280P (38904 - 66081, n=6) | |
| HP EliteBook 840 G9 | |
| Lenovo ThinkPad X1 Carbon G10 Core i7-1265U | |
| Dell Latitude 7420 JW6MH | |
| HP EliteBook 840 Aero G8 3E4Q6AA | |
| LG Gram 14Z90Q | |
| AIDA64 / CPU SHA3 | |
| HP EliteBook 845 G9 6F6H6EA | |
| Durchschnittliche Intel Core i7-1280P (1826 - 2992, n=6) | |
| HP EliteBook 840 G9 | |
| Dell Latitude 7420 JW6MH | |
| Lenovo ThinkPad X1 Carbon G10 Core i7-1265U | |
| HP EliteBook 840 Aero G8 3E4Q6AA | |
| LG Gram 14Z90Q | |
| AIDA64 / CPU Queen | |
| HP EliteBook 845 G9 6F6H6EA | |
| HP EliteBook 840 G9 | |
| Durchschnittliche Intel Core i7-1280P (80180 - 100358, n=6) | |
| LG Gram 14Z90Q | |
| Lenovo ThinkPad X1 Carbon G10 Core i7-1265U | |
| HP EliteBook 840 Aero G8 3E4Q6AA | |
| Dell Latitude 7420 JW6MH | |
| AIDA64 / FPU SinJulia | |
| HP EliteBook 845 G9 6F6H6EA | |
| Durchschnittliche Intel Core i7-1280P (5880 - 8571, n=6) | |
| HP EliteBook 840 G9 | |
| Dell Latitude 7420 JW6MH | |
| Lenovo ThinkPad X1 Carbon G10 Core i7-1265U | |
| HP EliteBook 840 Aero G8 3E4Q6AA | |
| LG Gram 14Z90Q | |
| AIDA64 / FPU Mandel | |
| HP EliteBook 845 G9 6F6H6EA | |
| Durchschnittliche Intel Core i7-1280P (18907 - 32766, n=6) | |
| HP EliteBook 840 G9 | |
| Dell Latitude 7420 JW6MH | |
| Lenovo ThinkPad X1 Carbon G10 Core i7-1265U | |
| HP EliteBook 840 Aero G8 3E4Q6AA | |
| LG Gram 14Z90Q | |
| AIDA64 / CPU AES | |
| Dell Latitude 7420 JW6MH | |
| HP EliteBook 840 Aero G8 3E4Q6AA | |
| Durchschnittliche Intel Core i7-1280P (40691 - 99367, n=6) | |
| HP EliteBook 845 G9 6F6H6EA | |
| HP EliteBook 840 G9 | |
| Lenovo ThinkPad X1 Carbon G10 Core i7-1265U | |
| LG Gram 14Z90Q | |
| AIDA64 / CPU ZLib | |
| HP EliteBook 845 G9 6F6H6EA | |
| Durchschnittliche Intel Core i7-1280P (540 - 880, n=6) | |
| HP EliteBook 840 G9 | |
| Lenovo ThinkPad X1 Carbon G10 Core i7-1265U | |
| Dell Latitude 7420 JW6MH | |
| HP EliteBook 840 Aero G8 3E4Q6AA | |
| LG Gram 14Z90Q | |
| AIDA64 / FP64 Ray-Trace | |
| HP EliteBook 845 G9 6F6H6EA | |
| Durchschnittliche Intel Core i7-1280P (4006 - 7184, n=6) | |
| HP EliteBook 840 G9 | |
| Lenovo ThinkPad X1 Carbon G10 Core i7-1265U | |
| Dell Latitude 7420 JW6MH | |
| HP EliteBook 840 Aero G8 3E4Q6AA | |
| LG Gram 14Z90Q | |
| AIDA64 / CPU PhotoWorxx | |
| Durchschnittliche Intel Core i7-1280P (36663 - 48416, n=6) | |
| Lenovo ThinkPad X1 Carbon G10 Core i7-1265U | |
| HP EliteBook 840 G9 | |
| Dell Latitude 7420 JW6MH | |
| HP EliteBook 840 Aero G8 3E4Q6AA | |
| LG Gram 14Z90Q | |
| HP EliteBook 845 G9 6F6H6EA | |
System Performance
Die PCMark Ergebnisse sind mit der AMD Version vergleichbar, mit Ausnahme des Produktivitätstests, wahrscheinlich weil der Ryzen 9 PRO 6950HS eine schnellere Multi-Thread-Rohleistung bietet, wie die obigen Benchmarks zeigen.
CrossMark: Overall | Productivity | Creativity | Responsiveness
| PCMark 10 / Score | |
| HP EliteBook 840 G9 | |
| HP EliteBook 845 G9 6F6H6EA | |
| Durchschnittliche Intel Core i7-1280P, Intel Iris Xe Graphics G7 96EUs (5410 - 5994, n=4) | |
| Lenovo ThinkPad X1 Carbon G10 Core i7-1265U | |
| LG Gram 14Z90Q | |
| Dell Latitude 7420 JW6MH | |
| HP EliteBook 840 Aero G8 3E4Q6AA | |
| PCMark 10 / Essentials | |
| HP EliteBook 840 G9 | |
| Lenovo ThinkPad X1 Carbon G10 Core i7-1265U | |
| Durchschnittliche Intel Core i7-1280P, Intel Iris Xe Graphics G7 96EUs (9719 - 10920, n=4) | |
| Dell Latitude 7420 JW6MH | |
| LG Gram 14Z90Q | |
| HP EliteBook 840 Aero G8 3E4Q6AA | |
| HP EliteBook 845 G9 6F6H6EA | |
| PCMark 10 / Productivity | |
| HP EliteBook 845 G9 6F6H6EA | |
| HP EliteBook 840 G9 | |
| Lenovo ThinkPad X1 Carbon G10 Core i7-1265U | |
| Durchschnittliche Intel Core i7-1280P, Intel Iris Xe Graphics G7 96EUs (6301 - 7453, n=4) | |
| HP EliteBook 840 Aero G8 3E4Q6AA | |
| Dell Latitude 7420 JW6MH | |
| LG Gram 14Z90Q | |
| PCMark 10 / Digital Content Creation | |
| HP EliteBook 845 G9 6F6H6EA | |
| HP EliteBook 840 G9 | |
| Durchschnittliche Intel Core i7-1280P, Intel Iris Xe Graphics G7 96EUs (6450 - 7180, n=4) | |
| Lenovo ThinkPad X1 Carbon G10 Core i7-1265U | |
| LG Gram 14Z90Q | |
| Dell Latitude 7420 JW6MH | |
| HP EliteBook 840 Aero G8 3E4Q6AA | |
| CrossMark / Overall | |
| HP EliteBook 840 G9 | |
| Durchschnittliche Intel Core i7-1280P, Intel Iris Xe Graphics G7 96EUs (1677 - 1773, n=4) | |
| Lenovo ThinkPad X1 Carbon G10 Core i7-1265U | |
| HP EliteBook 845 G9 6F6H6EA | |
| Dell Latitude 7420 JW6MH | |
| CrossMark / Productivity | |
| HP EliteBook 840 G9 | |
| Durchschnittliche Intel Core i7-1280P, Intel Iris Xe Graphics G7 96EUs (1585 - 1709, n=4) | |
| Lenovo ThinkPad X1 Carbon G10 Core i7-1265U | |
| HP EliteBook 845 G9 6F6H6EA | |
| Dell Latitude 7420 JW6MH | |
| CrossMark / Creativity | |
| Durchschnittliche Intel Core i7-1280P, Intel Iris Xe Graphics G7 96EUs (1849 - 1928, n=4) | |
| HP EliteBook 840 G9 | |
| Lenovo ThinkPad X1 Carbon G10 Core i7-1265U | |
| HP EliteBook 845 G9 6F6H6EA | |
| Dell Latitude 7420 JW6MH | |
| CrossMark / Responsiveness | |
| HP EliteBook 840 G9 | |
| Durchschnittliche Intel Core i7-1280P, Intel Iris Xe Graphics G7 96EUs (1394 - 1746, n=4) | |
| Lenovo ThinkPad X1 Carbon G10 Core i7-1265U | |
| Dell Latitude 7420 JW6MH | |
| HP EliteBook 845 G9 6F6H6EA | |
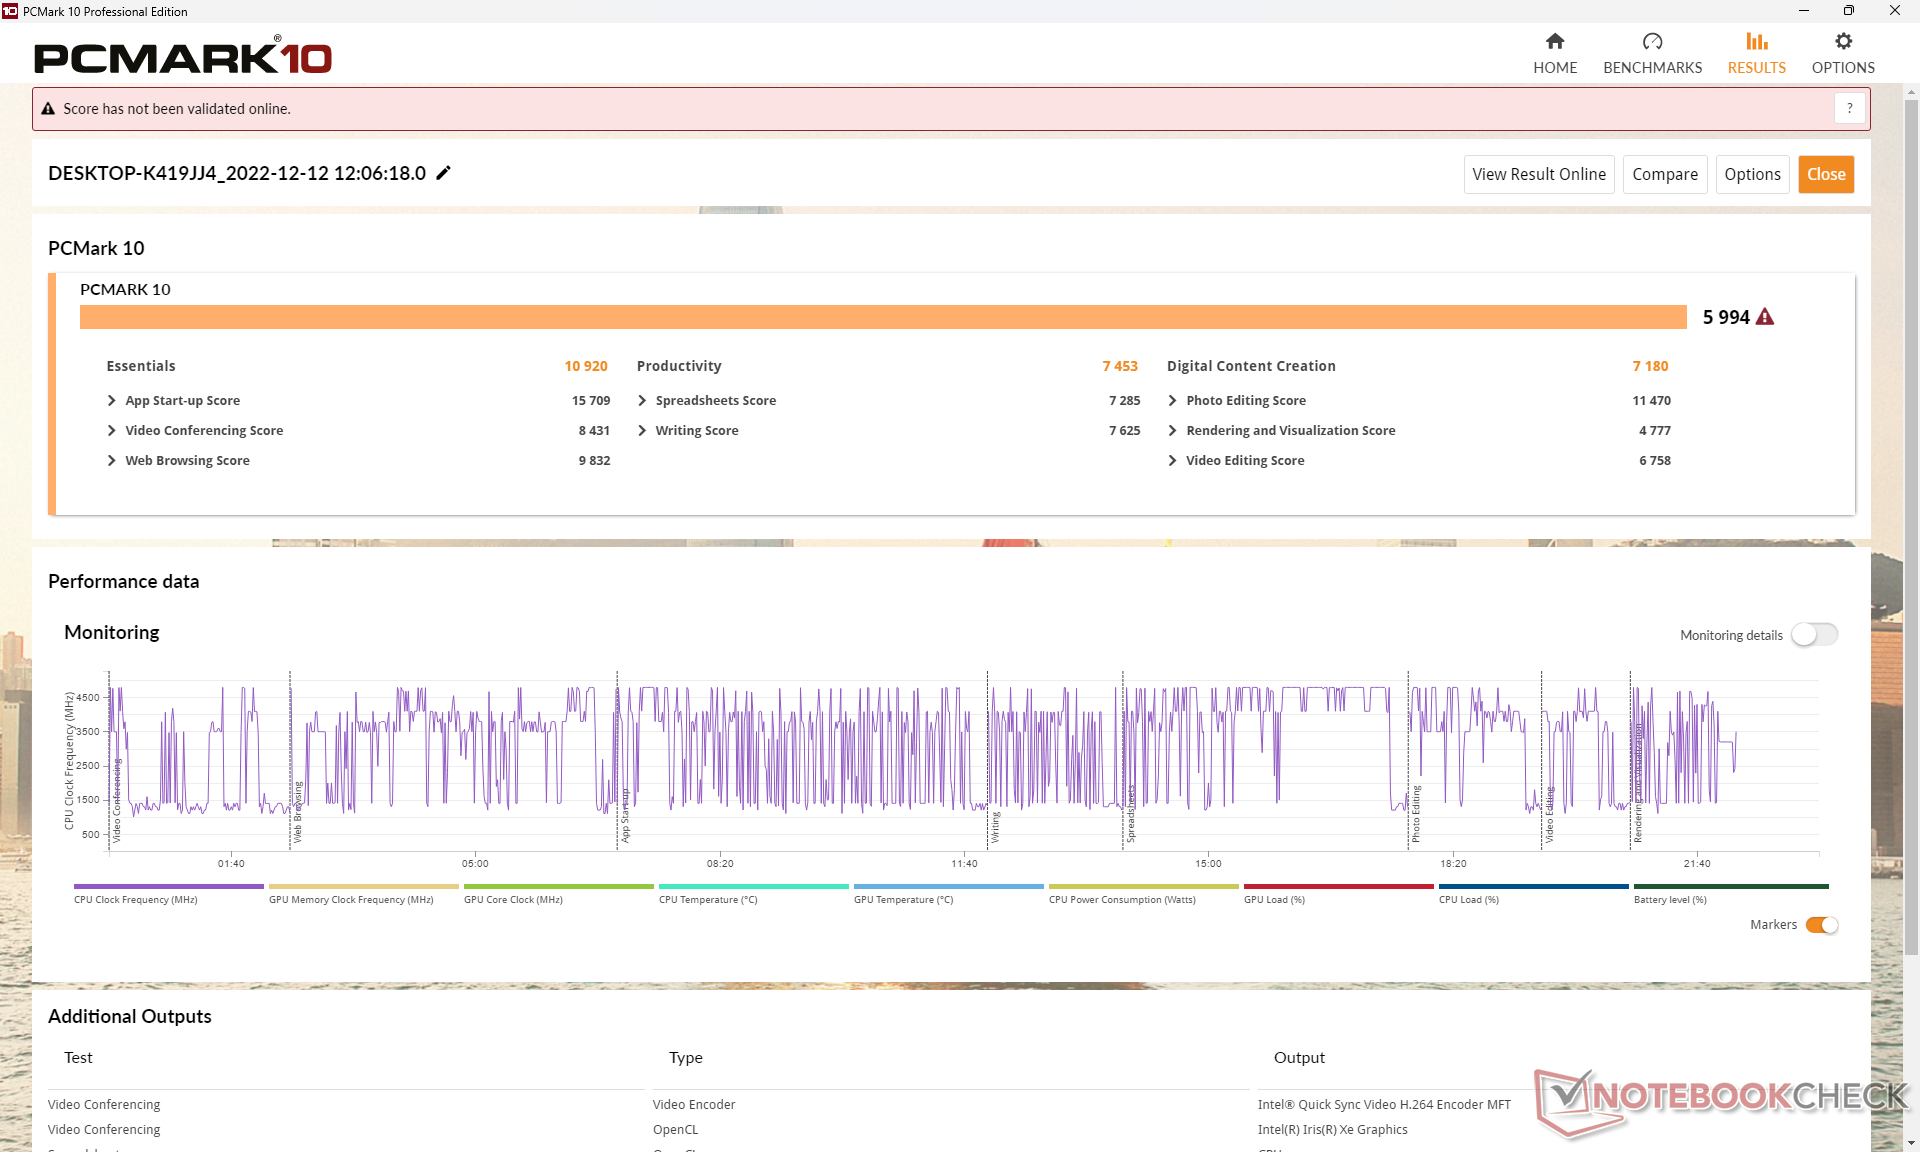
| PCMark 10 Score | 5994 Punkte | |
Hilfe | ||
| AIDA64 / Memory Copy | |
| Durchschnittliche Intel Core i7-1280P (56337 - 73486, n=6) | |
| Lenovo ThinkPad X1 Carbon G10 Core i7-1265U | |
| Dell Latitude 7420 JW6MH | |
| HP EliteBook 840 G9 | |
| LG Gram 14Z90Q | |
| HP EliteBook 840 Aero G8 3E4Q6AA | |
| HP EliteBook 845 G9 6F6H6EA | |
| AIDA64 / Memory Read | |
| LG Gram 14Z90Q | |
| Lenovo ThinkPad X1 Carbon G10 Core i7-1265U | |
| Durchschnittliche Intel Core i7-1280P (63221 - 73719, n=6) | |
| HP EliteBook 840 G9 | |
| Dell Latitude 7420 JW6MH | |
| HP EliteBook 840 Aero G8 3E4Q6AA | |
| HP EliteBook 845 G9 6F6H6EA | |
| AIDA64 / Memory Write | |
| Durchschnittliche Intel Core i7-1280P (58729 - 68247, n=6) | |
| Lenovo ThinkPad X1 Carbon G10 Core i7-1265U | |
| LG Gram 14Z90Q | |
| HP EliteBook 840 G9 | |
| Dell Latitude 7420 JW6MH | |
| HP EliteBook 840 Aero G8 3E4Q6AA | |
| HP EliteBook 845 G9 6F6H6EA | |
| AIDA64 / Memory Latency | |
| LG Gram 14Z90Q | |
| Durchschnittliche Intel Core i7-1280P (93.1 - 153.3, n=6) | |
| HP EliteBook 845 G9 6F6H6EA | |
| Dell Latitude 7420 JW6MH | |
| HP EliteBook 840 G9 | |
| Lenovo ThinkPad X1 Carbon G10 Core i7-1265U | |
| HP EliteBook 840 Aero G8 3E4Q6AA | |
* ... kleinere Werte sind besser
DPC-Latenzzeit
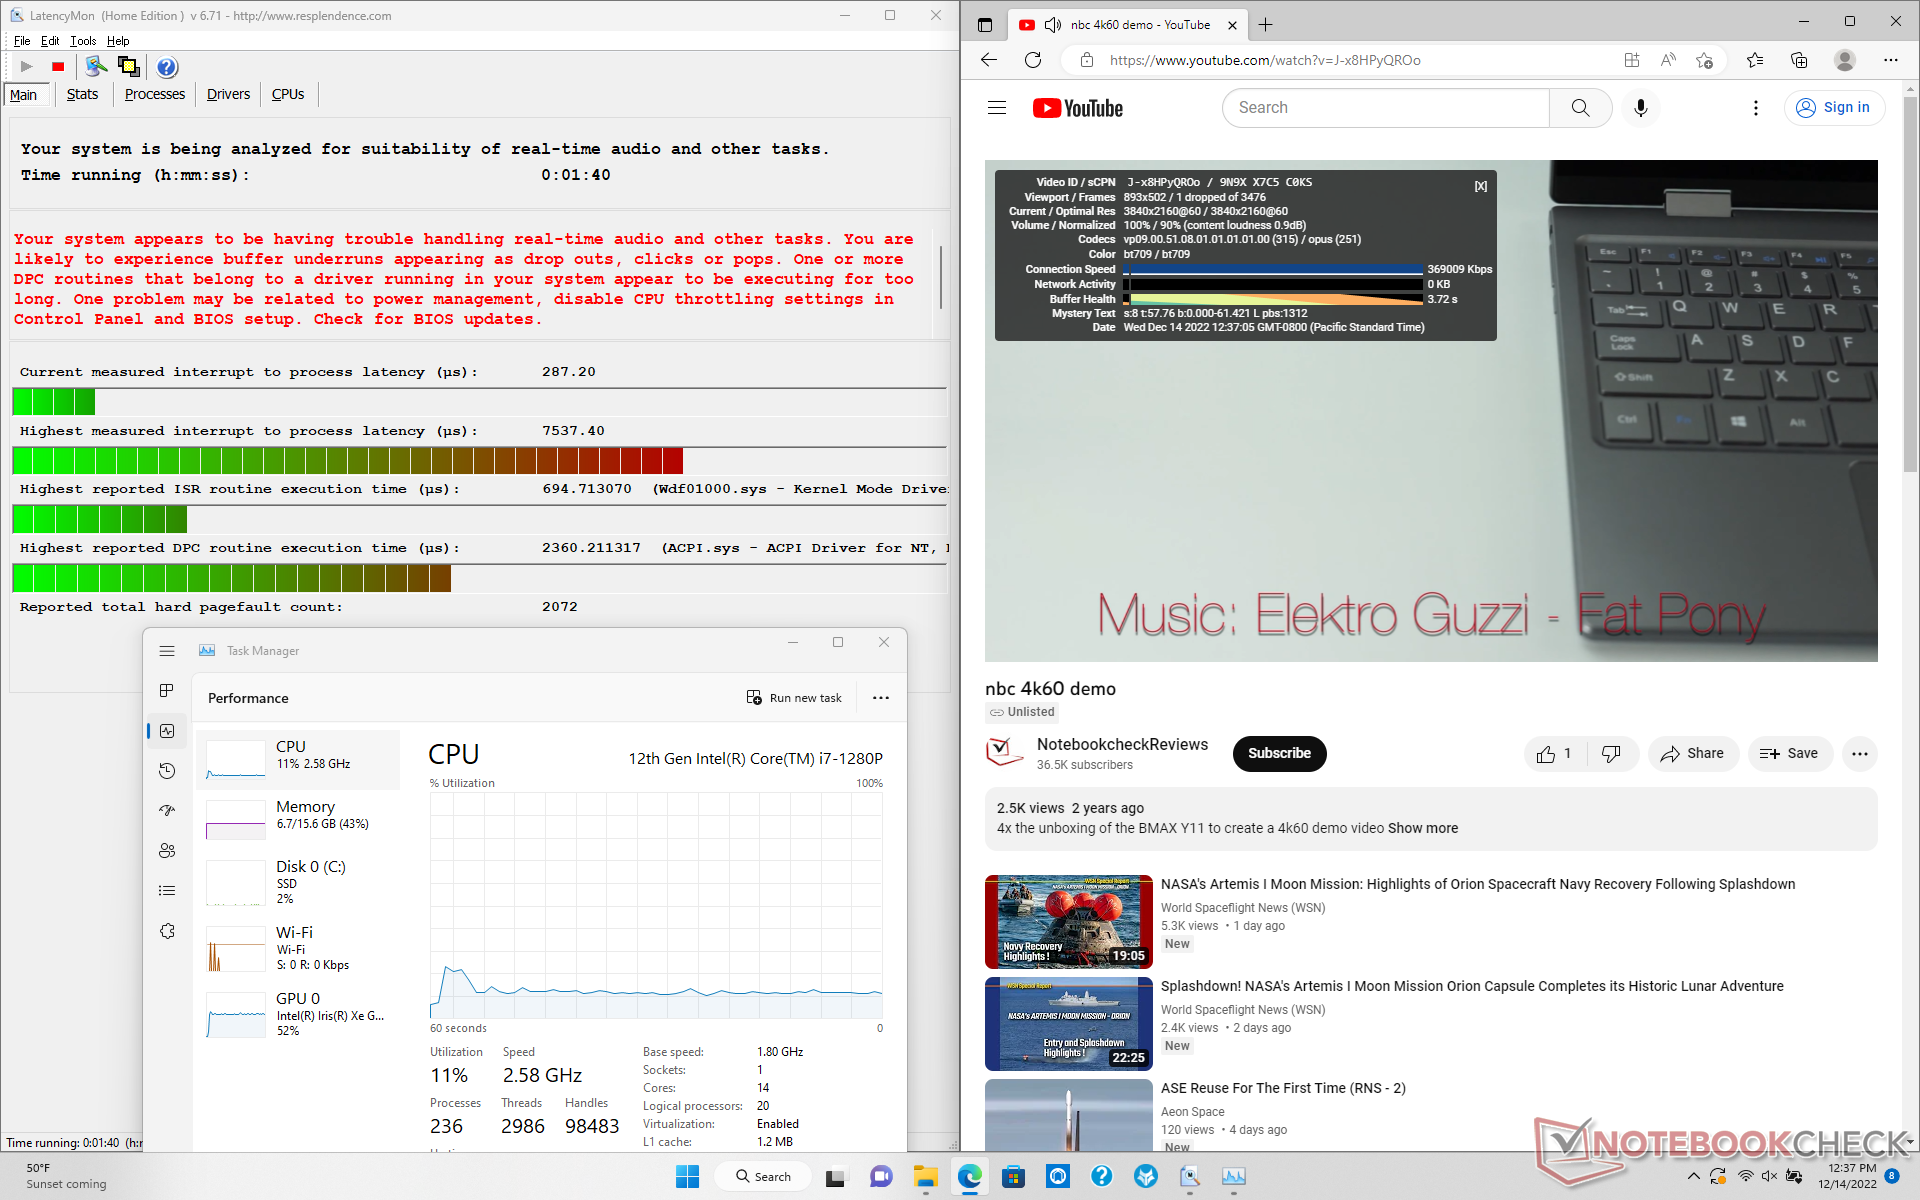
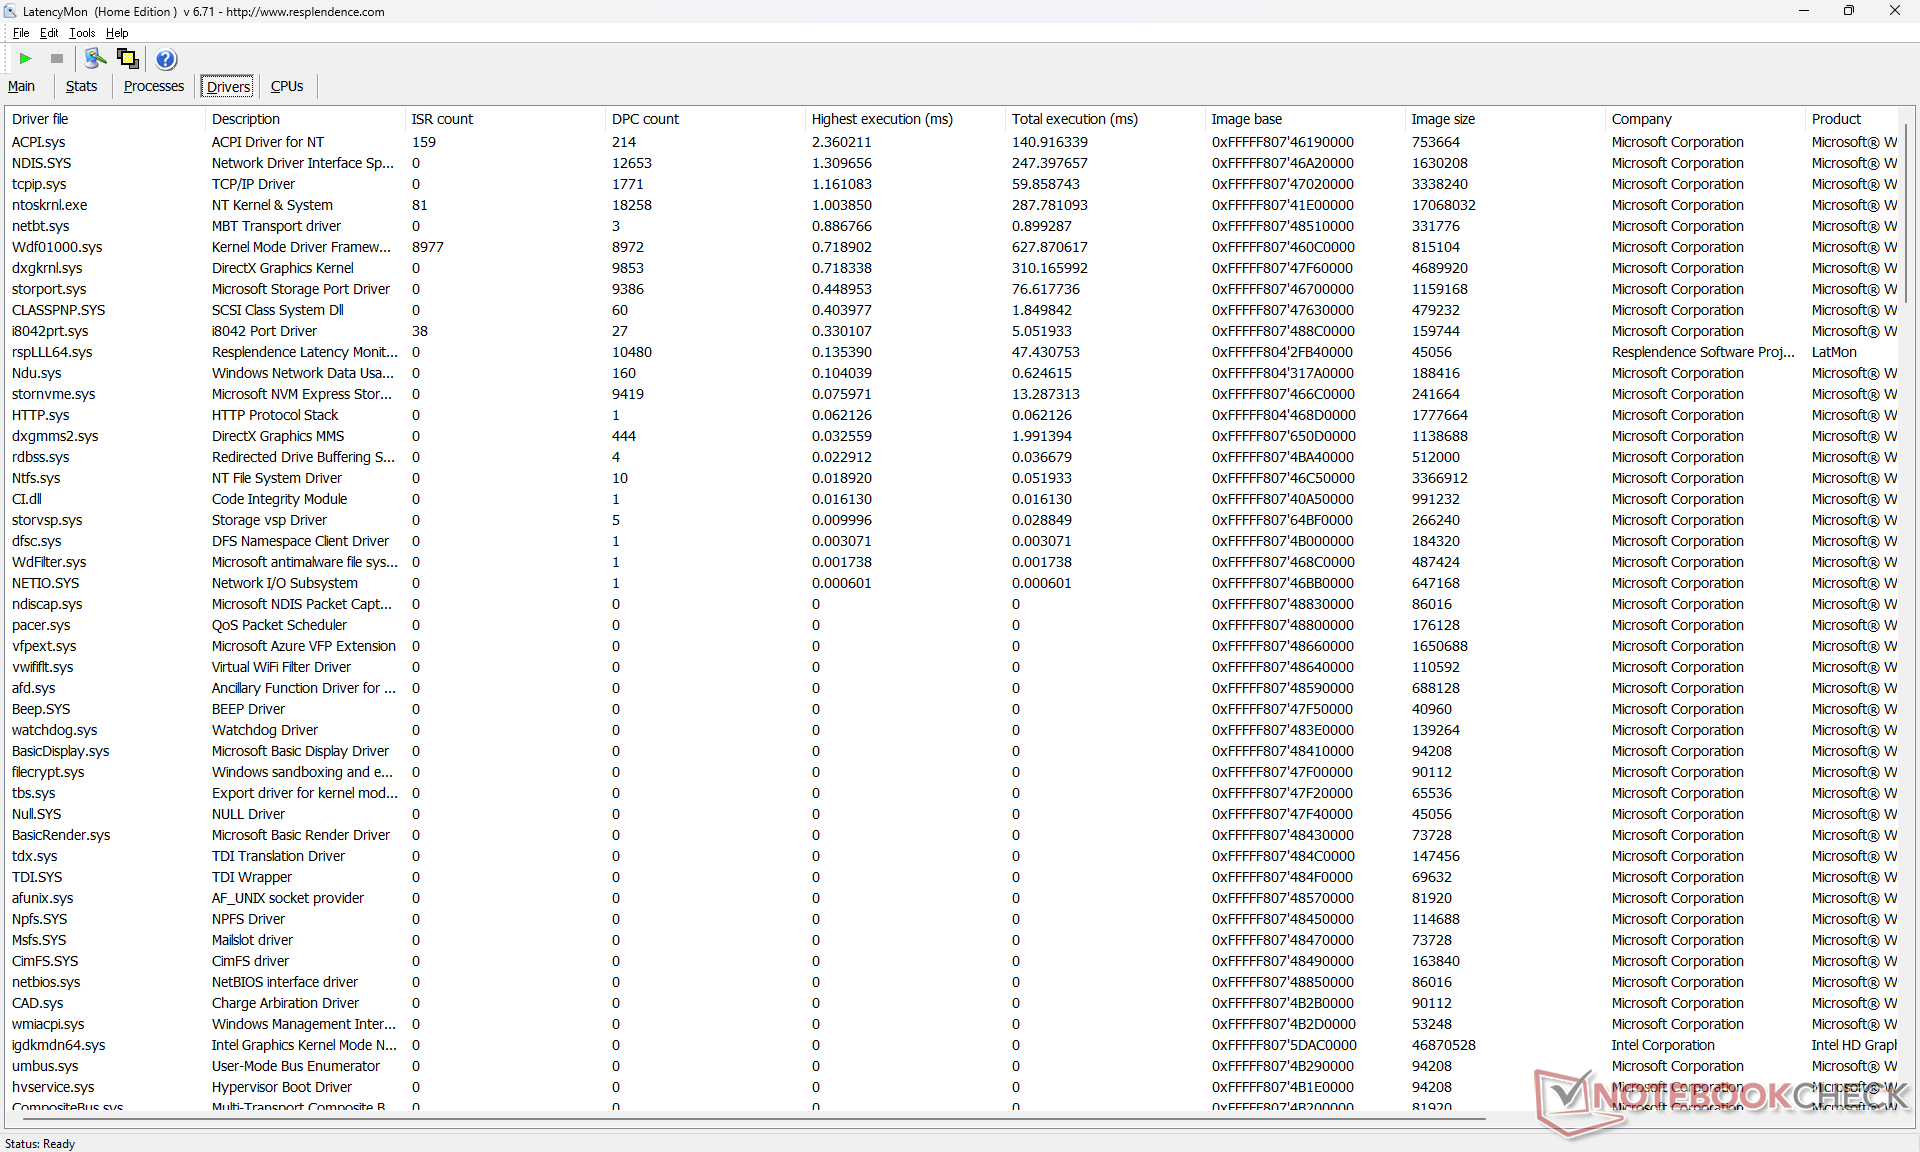
LatencyMon zeigt DPC-Probleme beim Öffnen mehrerer Browser Tabs auf unserer Homepage. die 4K-Videowiedergabe bei 60 fps ist ansonsten nahezu perfekt, mit nur einem einzigen Frame-Verlust beim Start unseres Testvideos.
| DPC Latencies / LatencyMon - interrupt to process latency (max), Web, Youtube, Prime95 | |
| HP EliteBook 840 G9 | |
| HP EliteBook 840 Aero G8 3E4Q6AA | |
| Lenovo ThinkPad X1 Carbon G10 Core i7-1265U | |
| HP EliteBook 845 G9 6F6H6EA | |
| LG Gram 14Z90Q | |
| Dell Latitude 7420 JW6MH | |
* ... kleinere Werte sind besser
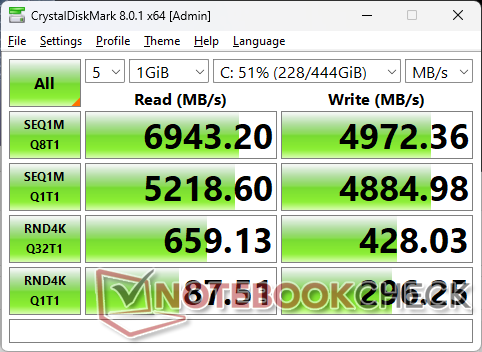
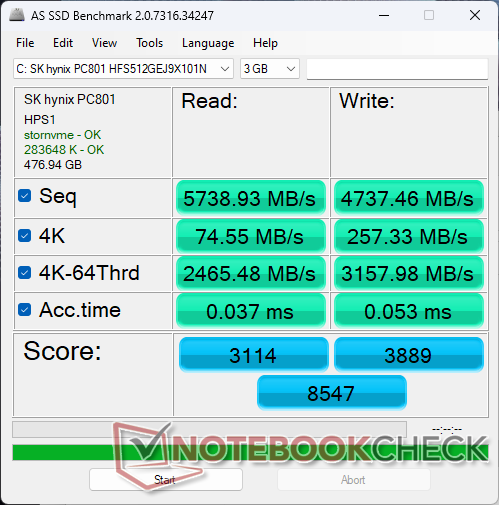
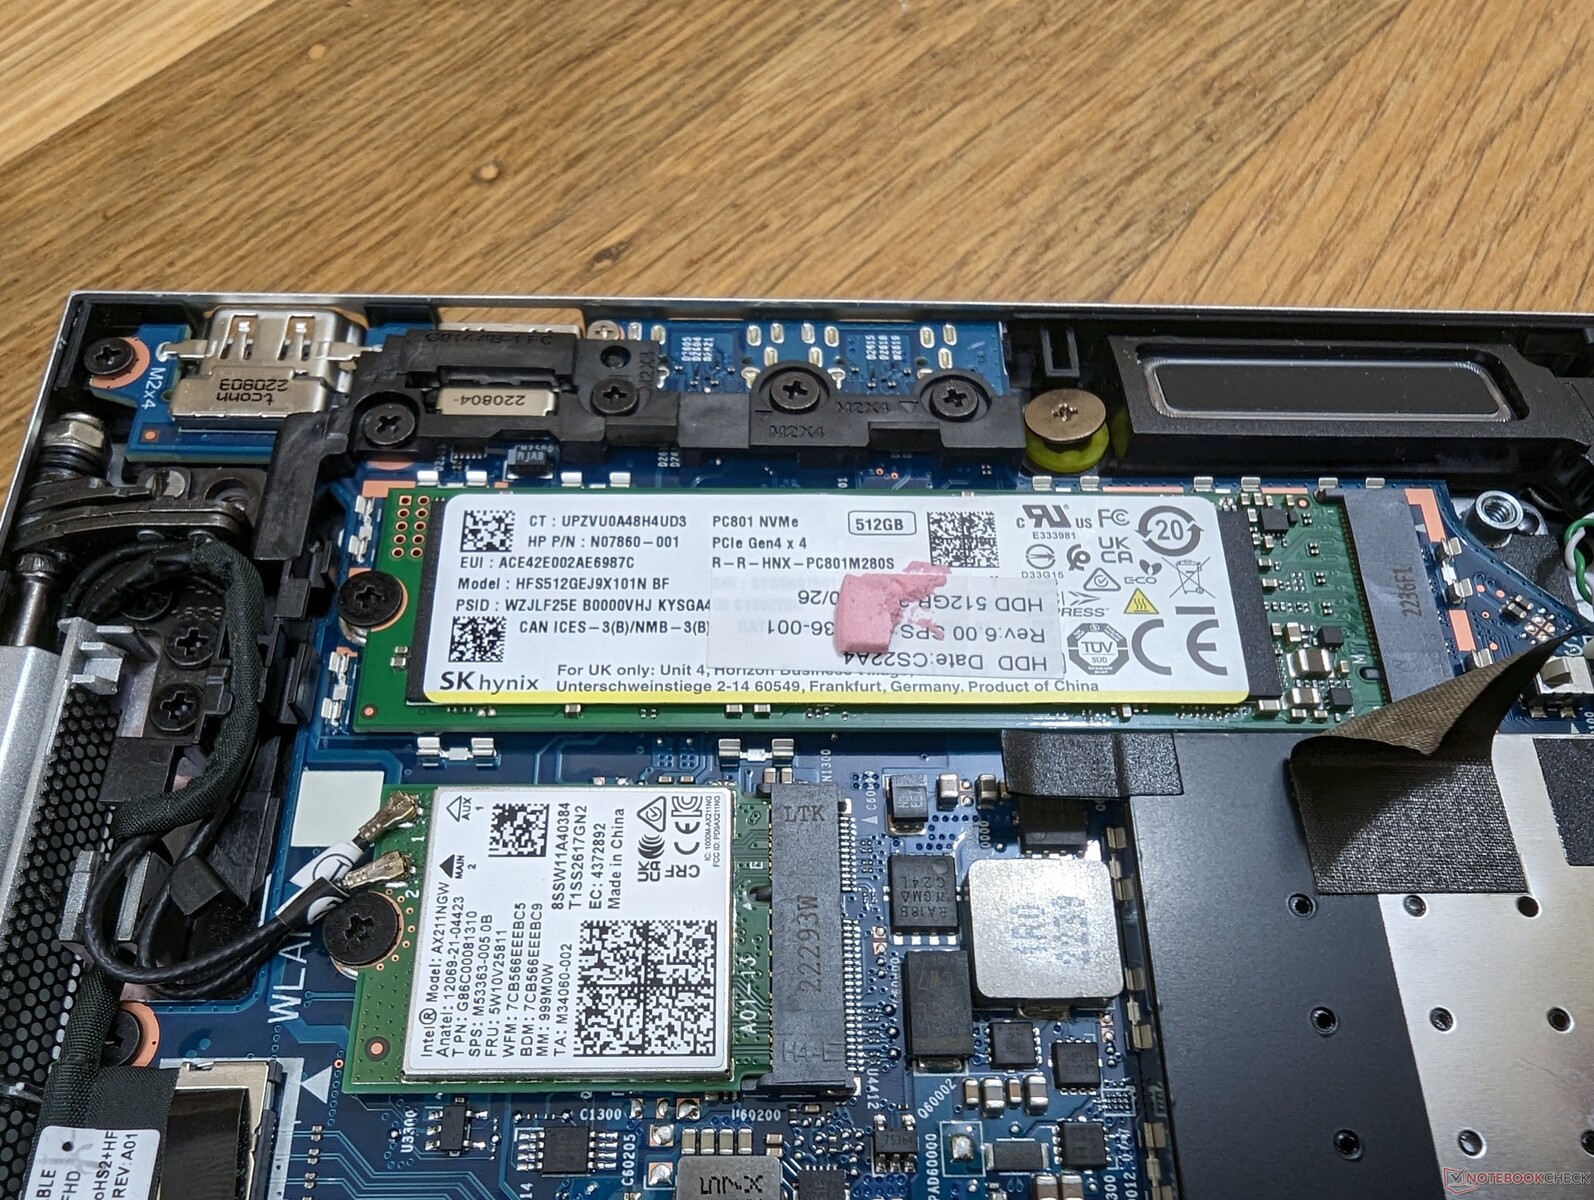
Speichergeräte
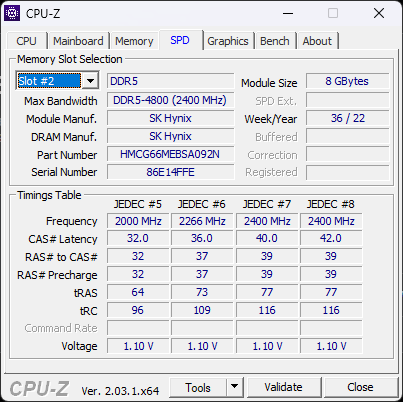
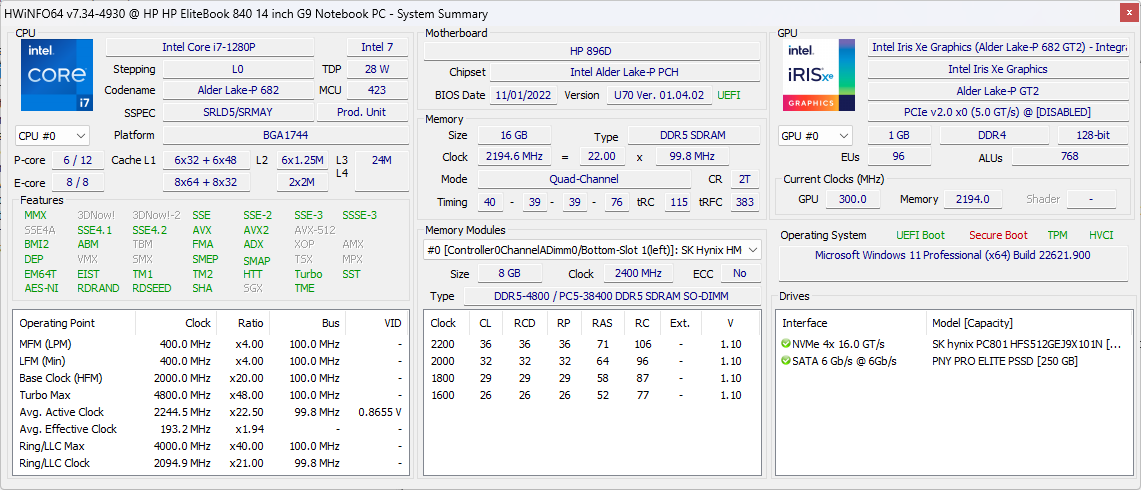
Unser Gerät wird mit einer 512 GB SK hynix PC801 PCIe4 x4 NVMe SSD ausgeliefert, die sequenzielle Lese- und Schreibraten von bis zu 7.000 MB/s bzw. 5.000 MB/s erreicht. Allerdings sind die anhaltenden Leseraten mit 5.800 MB/s etwas langsamer, wahrscheinlich aufgrund von Temperaturbeschränkungen.

| Drive Performance Rating - Percent | |
| HP EliteBook 840 G9 | |
| LG Gram 14Z90Q | |
| HP EliteBook 845 G9 6F6H6EA | |
| Lenovo ThinkPad X1 Carbon G10 Core i7-1265U | |
| HP EliteBook 840 Aero G8 3E4Q6AA | |
| Dell Latitude 7420 JW6MH | |
* ... kleinere Werte sind besser
Disk Throttling: DiskSpd Read Loop, Queue Depth 8
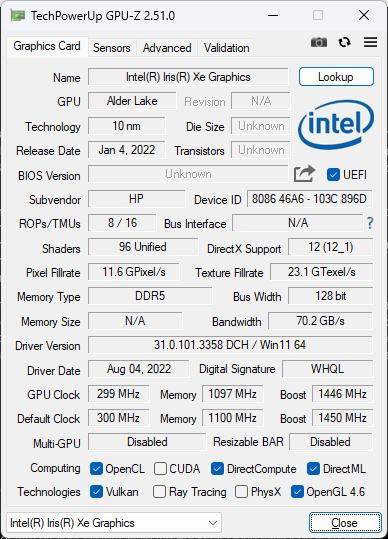
GPU Performance - Überdurchschnittlich gute Iris Xe 96 EUs
Obwohl der Core i7-1280P die gleiche integrierte Iris-Xe-96-EUs-GPU wie beim Core i7-1165G7 oder Core i7-1265U verwendet, ist die Grafikleistung beim HP etwas schneller, da die Core-P-CPU eine höhere Wärmehülle hat. Nutzer können daher mit 15 bis 25 Prozent schnelleren Bildraten rechnen als bei einem durchschnittlichen Iris-Xe-96-EU-Laptop. Ein Downgrade auf eine Core-i5-Konfiguration mit der Iris Xe 80 EUs führt zu einem Rückgang der Grafikleistung um 20 bis 30 Prozent.
Interessanterweise übertrifft unsere Intel GPU die konkurrierende Radeon 680M im EliteBook 845 G9, obwohl die Radeon 680M in anderen Laptops wie dem Lenovo Yoga 7 14 schneller laufen kann. Es ist klar, dass der integrierte Radeon Grafikprozessor im EliteBook unterdurchschnittlich ist.
(Update vom 20. Dezember 2022: Das Testgerät EliteBook 845 G9 war mit Single-Channel-Speicher ausgestattet, was die Grafikleistung beeinträchtigte. Das Leistungsdefizit kann durch den Einbau eines zweiten RAM-Sticks behoben werden)
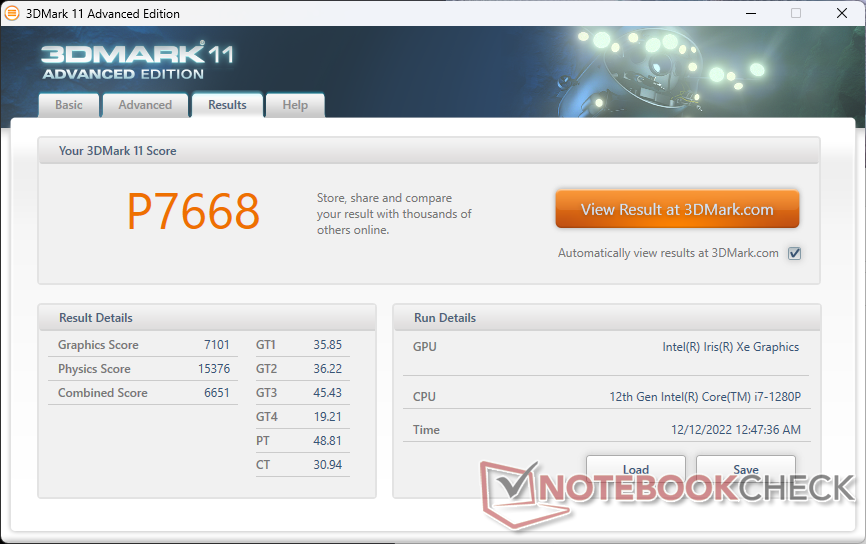
| 3DMark 11 Performance | 7668 Punkte | |
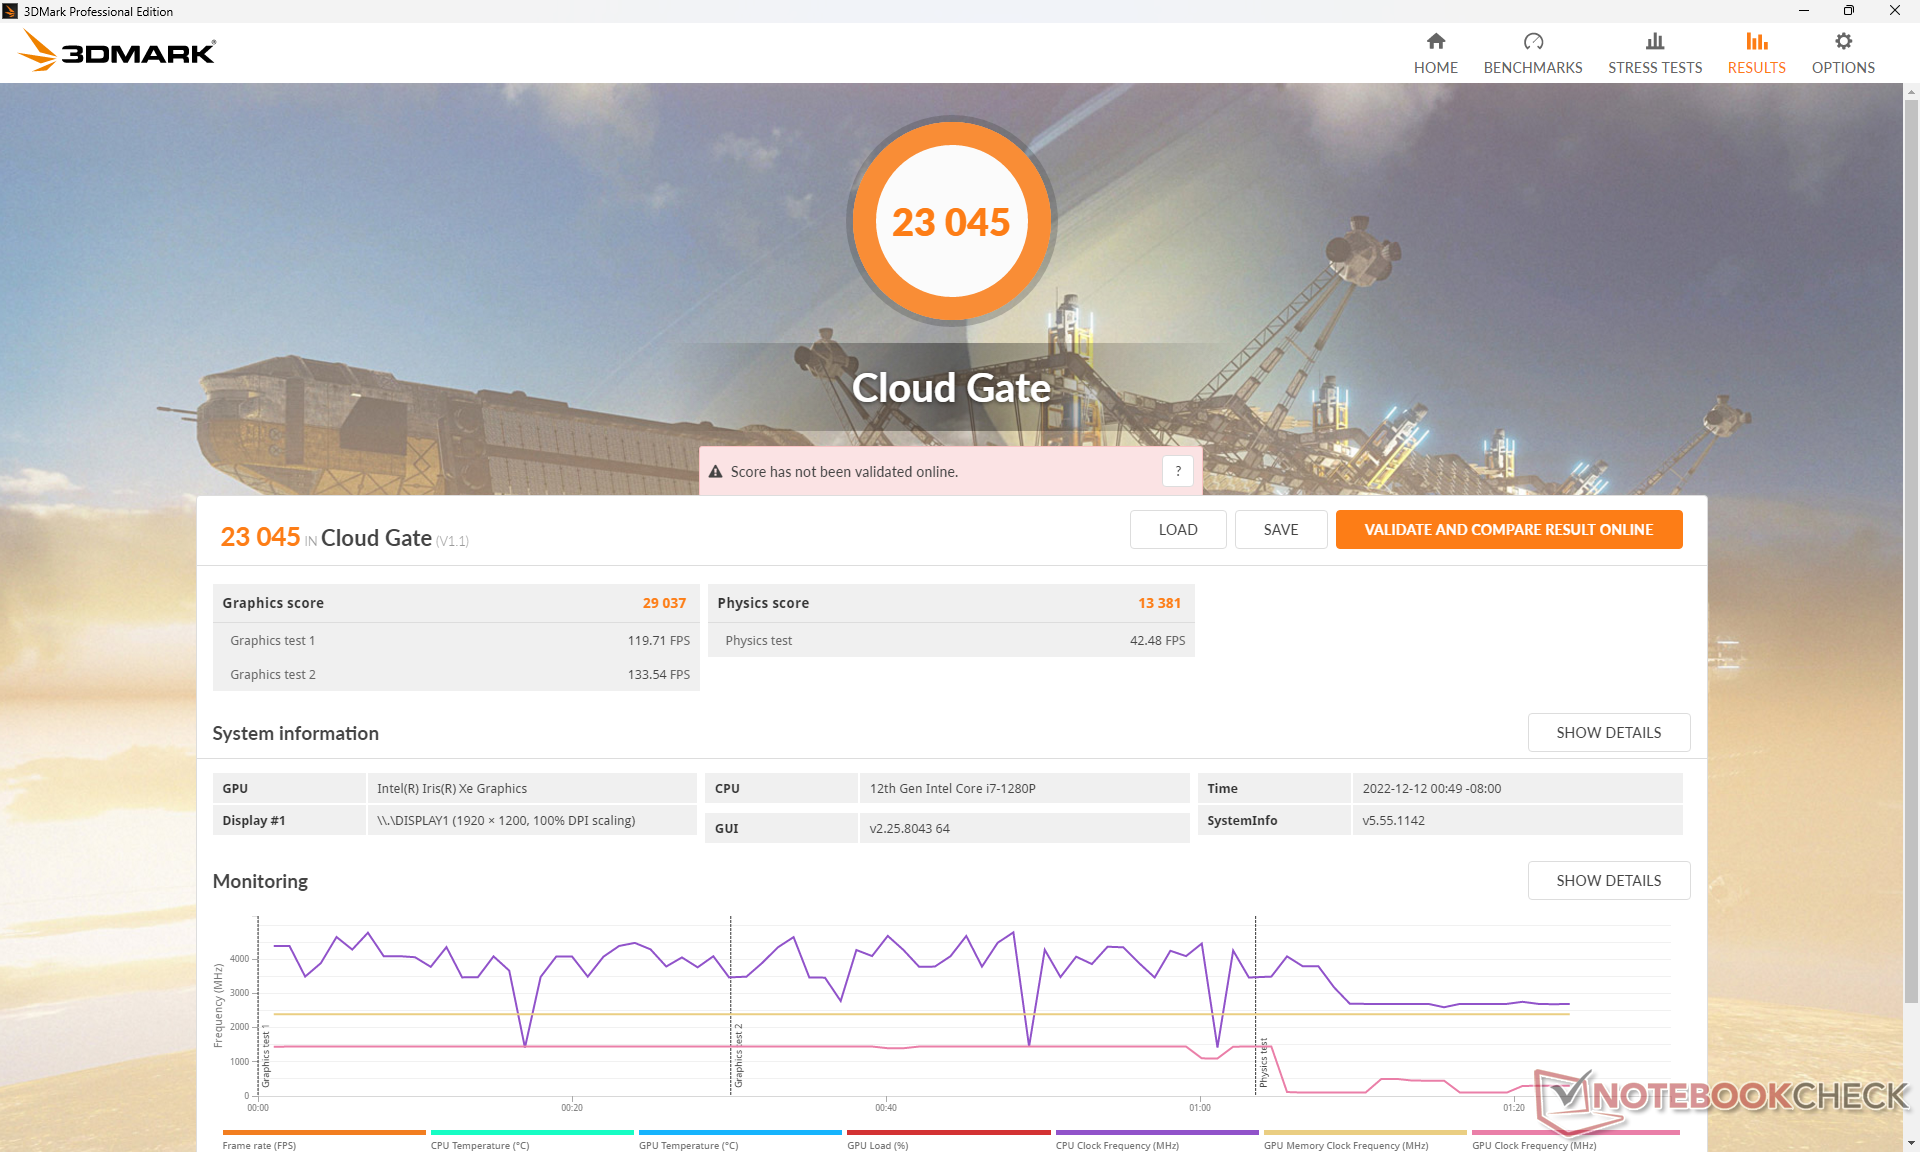
| 3DMark Cloud Gate Standard Score | 23045 Punkte | |
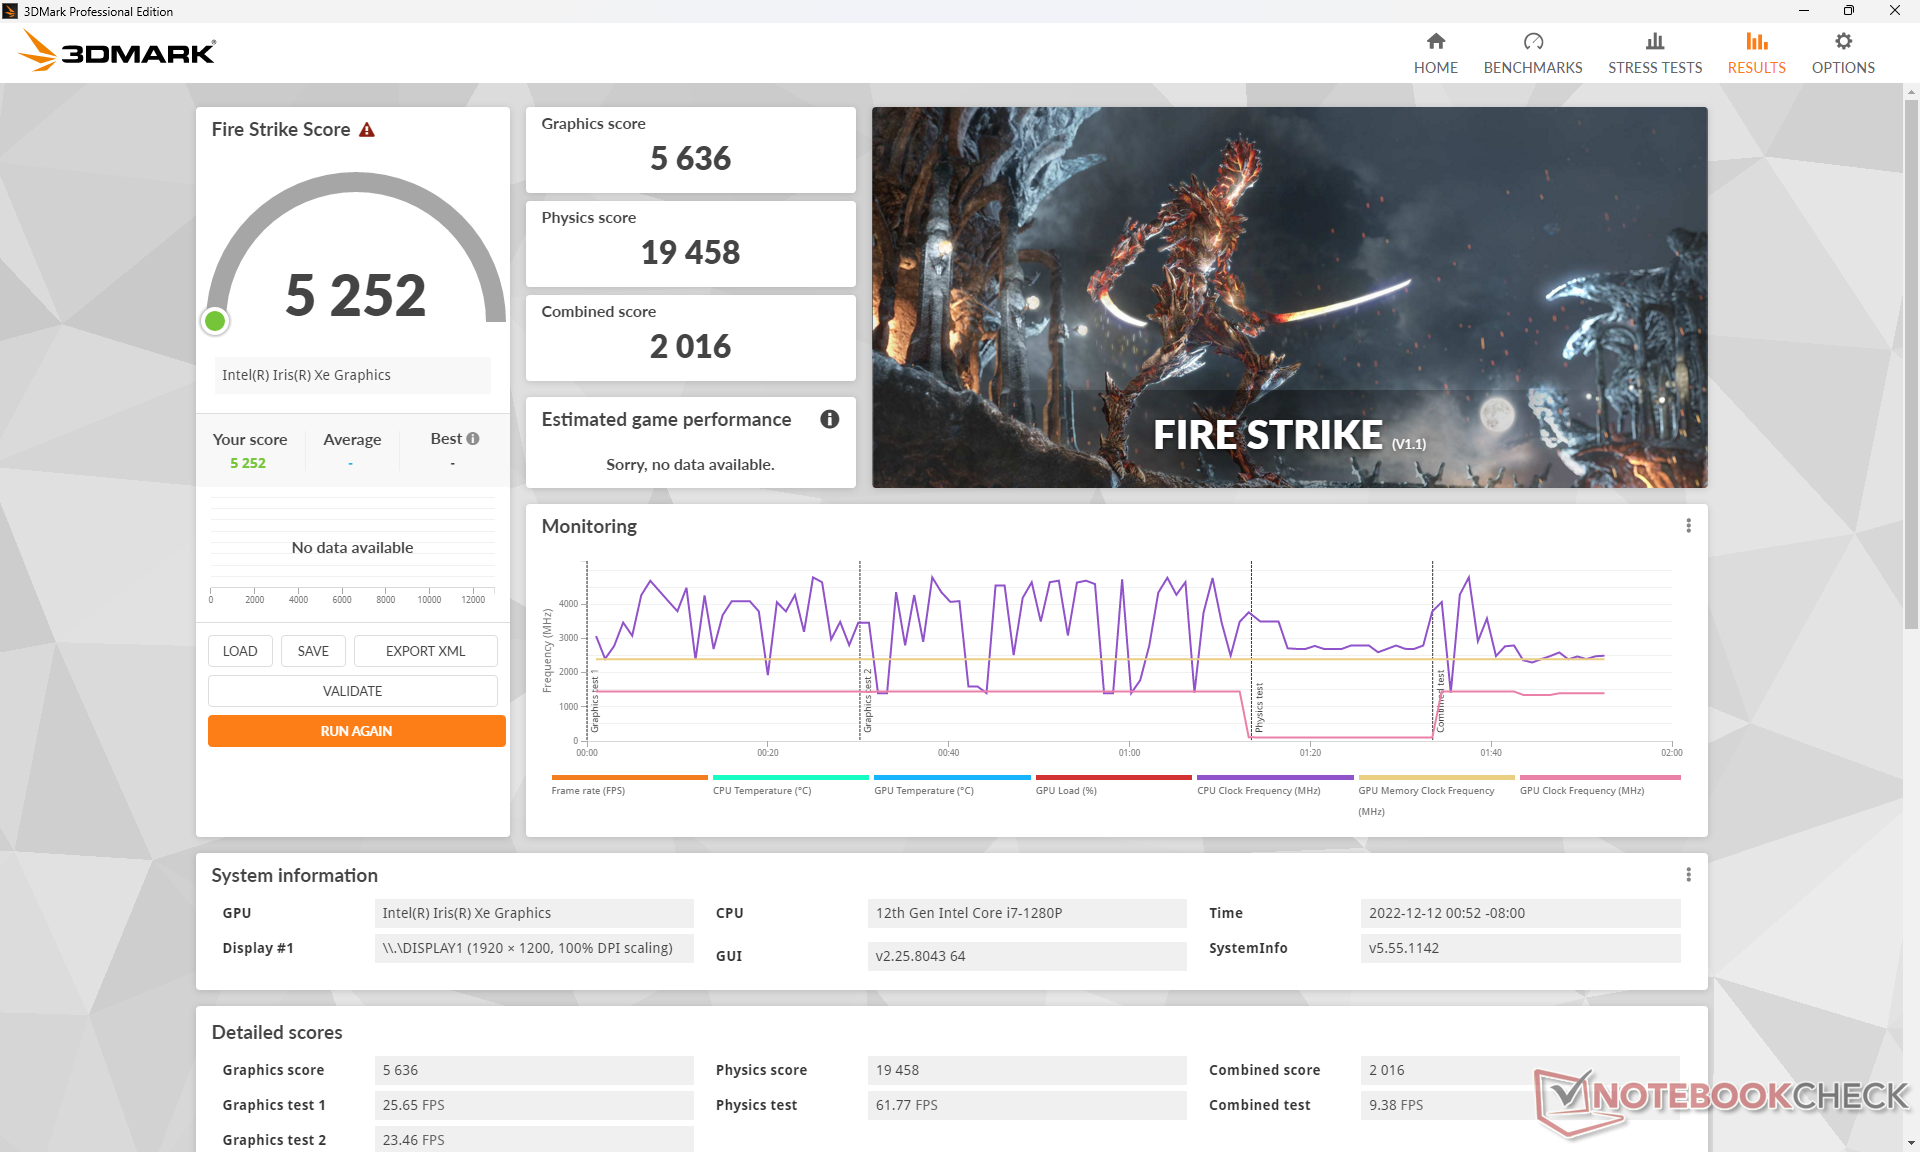
| 3DMark Fire Strike Score | 5252 Punkte | |
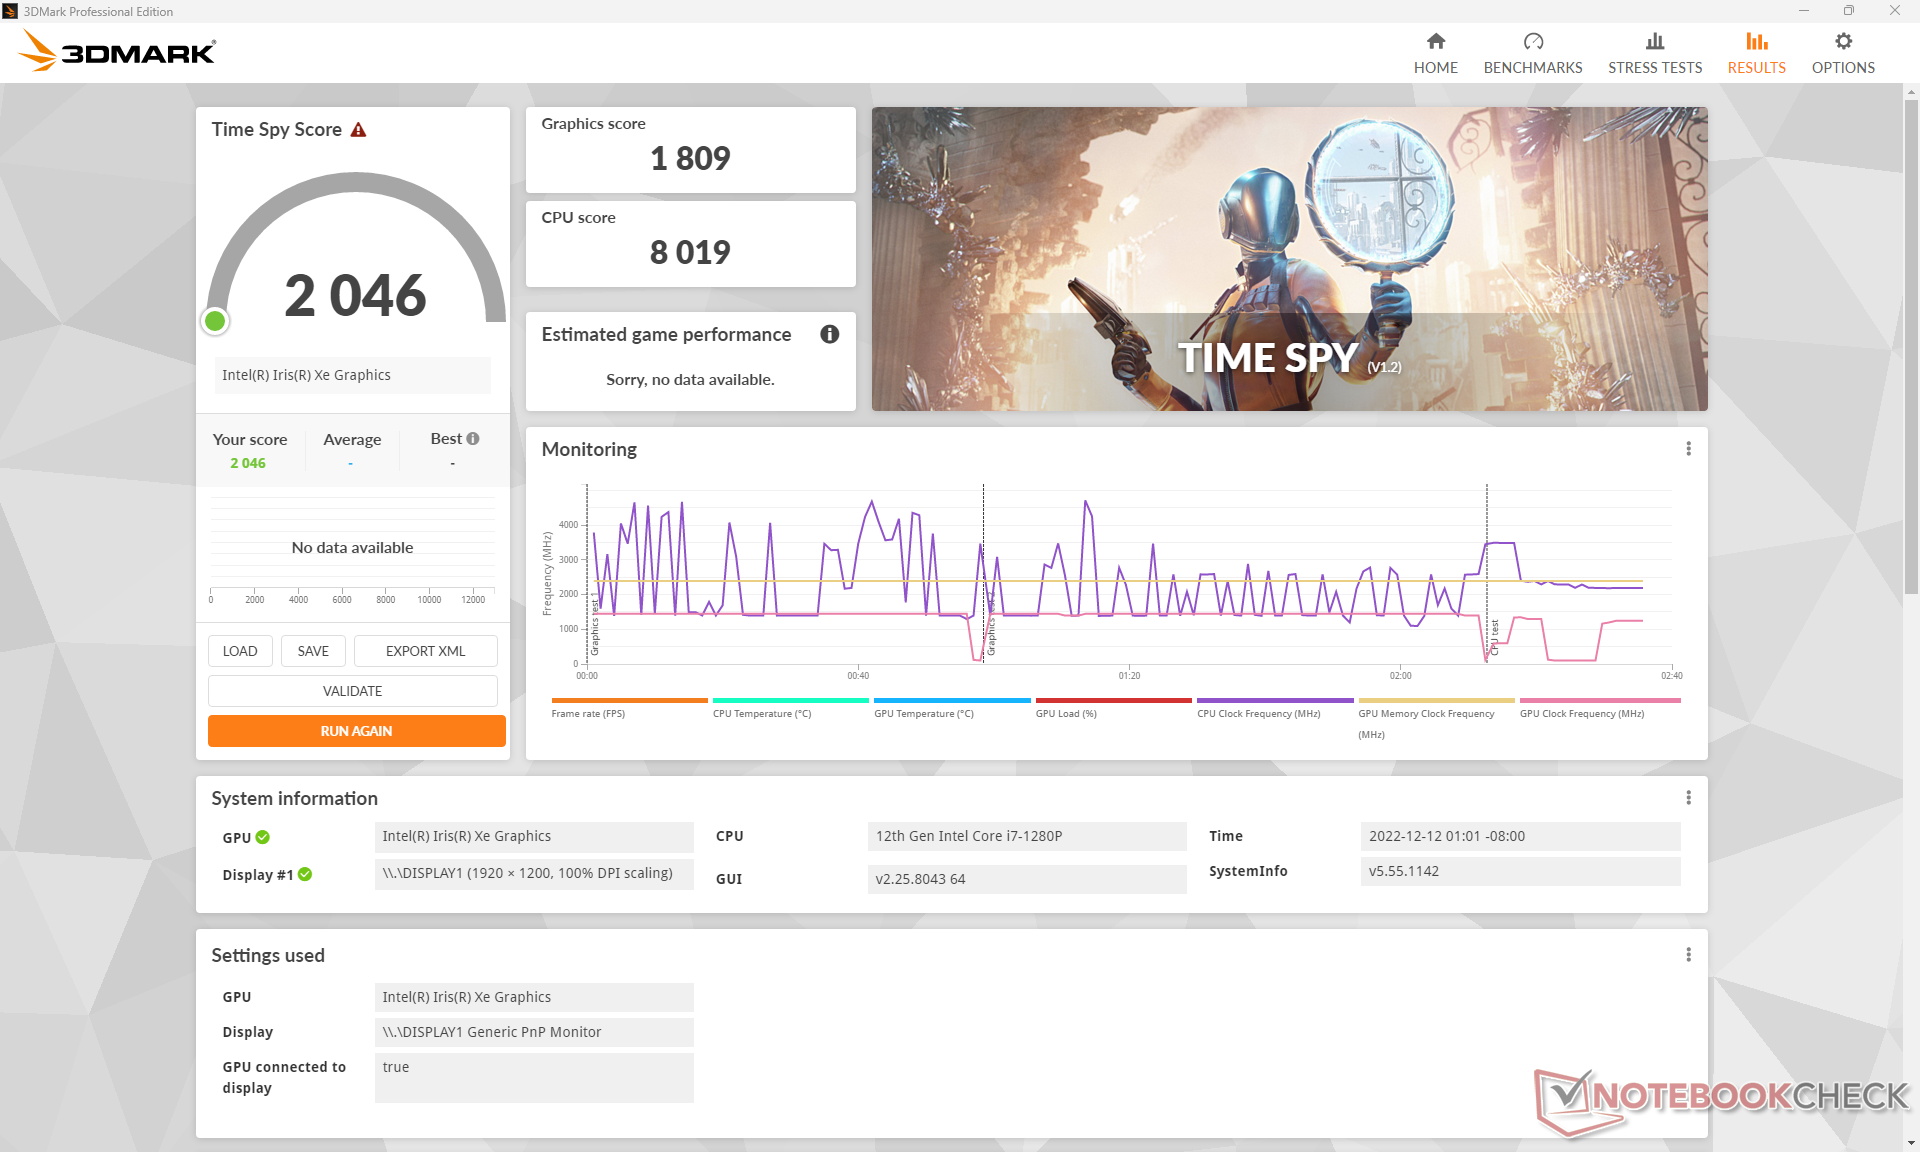
| 3DMark Time Spy Score | 2046 Punkte | |
Hilfe | ||
Witcher 3 FPS Chart
| min. | mittel | hoch | max. | |
|---|---|---|---|---|
| GTA V (2015) | 108.6 | 97.3 | 23.4 | 10.2 |
| The Witcher 3 (2015) | 100.1 | 59.3 | 35 | 16.4 |
| Dota 2 Reborn (2015) | 108.3 | 84.9 | 68.8 | 61.8 |
| Final Fantasy XV Benchmark (2018) | 46.9 | 26.1 | 18.4 | |
| X-Plane 11.11 (2018) | 46.1 | 34.5 | 33.7 | |
| Strange Brigade (2018) | 95.1 | 43.4 | 35.9 | 27.4 |
| Cyberpunk 2077 1.6 (2022) | 19.6 | 16.8 | 13 | 10.8 |
Emissionen - Kühl und leise
System-Rauschen
Das Lüftergeräusch und das Verhalten sind ähnlich wie bei der AMD Version des Modells. Der interne Lüfter leistet hervorragende Arbeit, wenn es darum geht, bei höherer Last so lange wie möglich im Leerlauf zu bleiben. Wenn man zum Beispiel die erste Benchmark-Szene des 3DMark 06 einmal durchläuft, beträgt das Lüftergeräusch nur 32 dB(A) bei einem leisen Hintergrund von 24 dB(A). Nach wiederholten Durchläufen stabilisiert sich der Lüfter schließlich bei etwa 39 dB(A) mit nur temporären Impulsen von bis zu 45 dB(A). Insgesamt ist das Lüftergeräusch lauter als das, was wir im letzten Jahr beim EliteBook 840 Aero G8, das eine langsamere CPU der 11. Generation der Core-U-Serie verwendet.
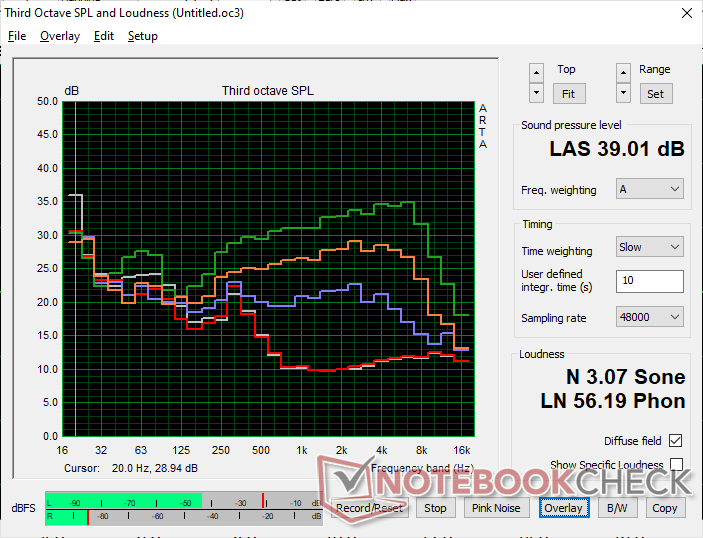
Lautstärkediagramm
| Idle |
| 24.5 / 24.5 / 26 dB(A) |
| Last |
| 32.3 / 44.7 dB(A) |
 | ||
30 dB leise 40 dB(A) deutlich hörbar 50 dB(A) störend |
||
min: | ||
| HP EliteBook 840 G9 Iris Xe G7 96EUs, i7-1280P, SK hynix PC801 HFS512GEJ9X101N BF | HP EliteBook 845 G9 6F6H6EA Radeon 680M, R9 PRO 6950HS, WDC PC SN810 1TB | HP EliteBook 840 Aero G8 3E4Q6AA Iris Xe G7 96EUs, i7-1185G7, SK Hynix PC711 512GB HFS512GDE9X073N | Lenovo ThinkPad X1 Carbon G10 Core i7-1265U Iris Xe G7 96EUs, i7-1265U, Kioxia BG5 KBG5AZNV1T02 | LG Gram 14Z90Q Iris Xe G7 80EUs, i5-1240P, Samsung PM9A1 MZVL2512HCJQ | Dell Latitude 7420 JW6MH Iris Xe G7 80EUs, i5-1145G7, SK Hynix BC711 HFM512GD3HX015N | |
|---|---|---|---|---|---|---|
| Geräuschentwicklung | -5% | 13% | 3% | -1% | -8% | |
| aus / Umgebung * (dB) | 24.3 | 25.5 -5% | 24.1 1% | 23.2 5% | 25 -3% | 25.3 -4% |
| Idle min * (dB) | 24.5 | 25.5 -4% | 24.2 1% | 23.2 5% | 26 -6% | 25.3 -3% |
| Idle avg * (dB) | 24.5 | 25.5 -4% | 24.2 1% | 23.2 5% | 27 -10% | 25.3 -3% |
| Idle max * (dB) | 26 | 25.5 2% | 24.2 7% | 23.2 11% | 28 -8% | 25.3 3% |
| Last avg * (dB) | 32.3 | 38.1 -18% | 26.9 17% | 38.6 -20% | 35 -8% | 44.9 -39% |
| Witcher 3 ultra * (dB) | 39 | 27.9 28% | 38.5 1% | 36 8% | ||
| Last max * (dB) | 44.7 | 44 2% | 29.9 33% | 38.3 14% | 36 19% | 44.9 -0% |
* ... kleinere Werte sind besser
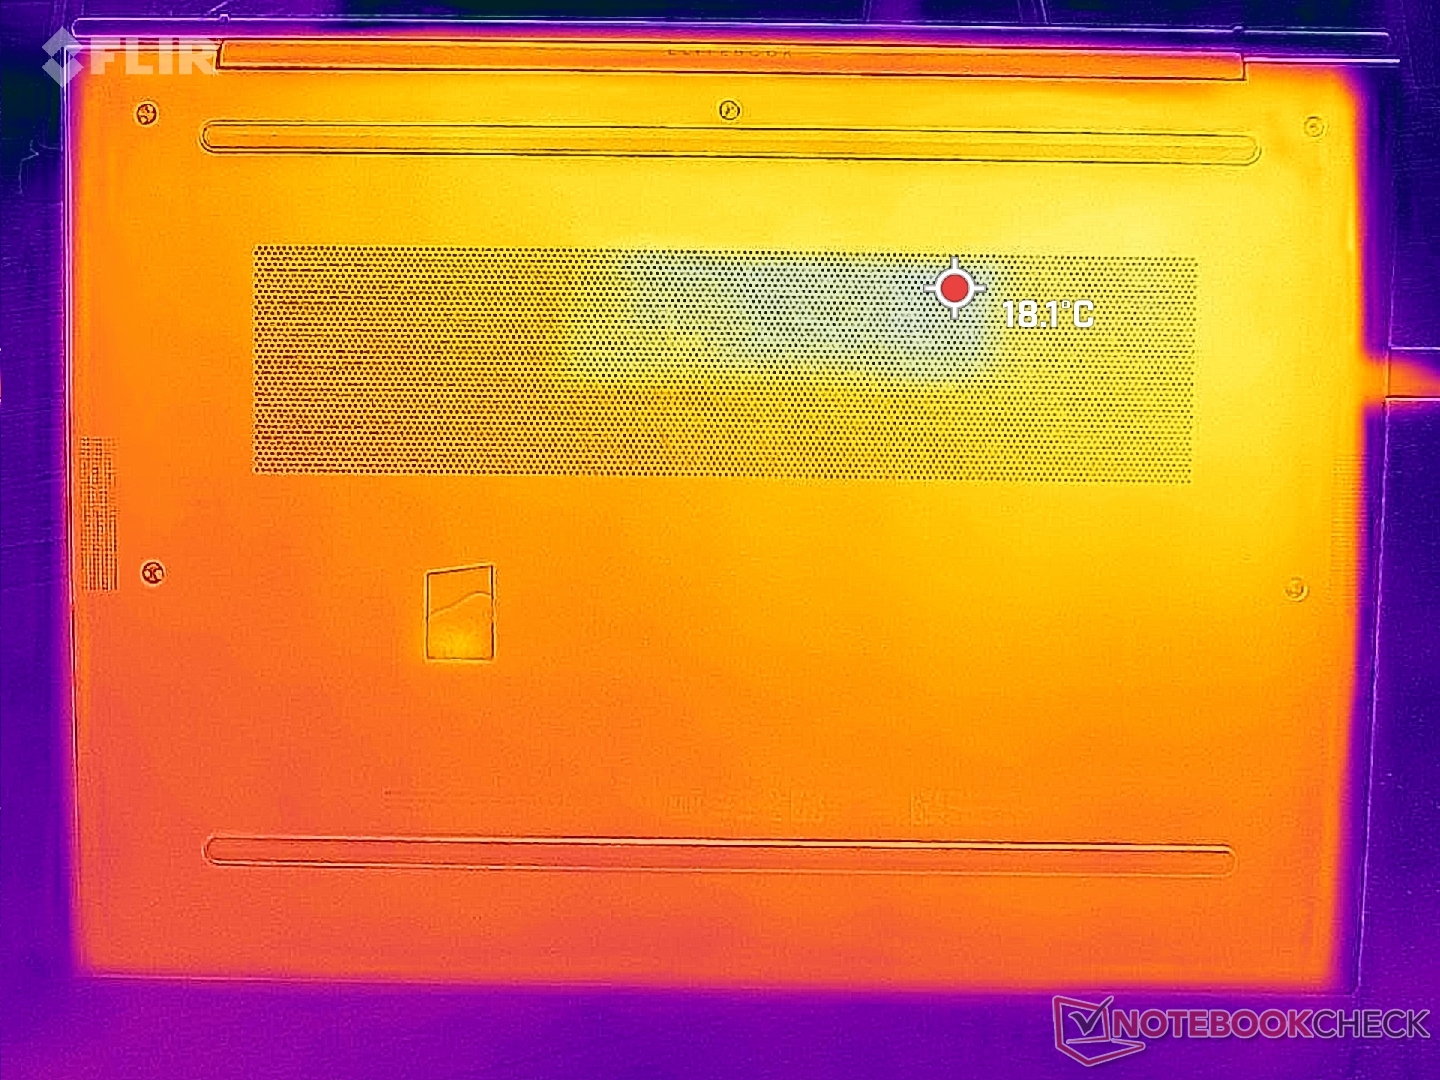
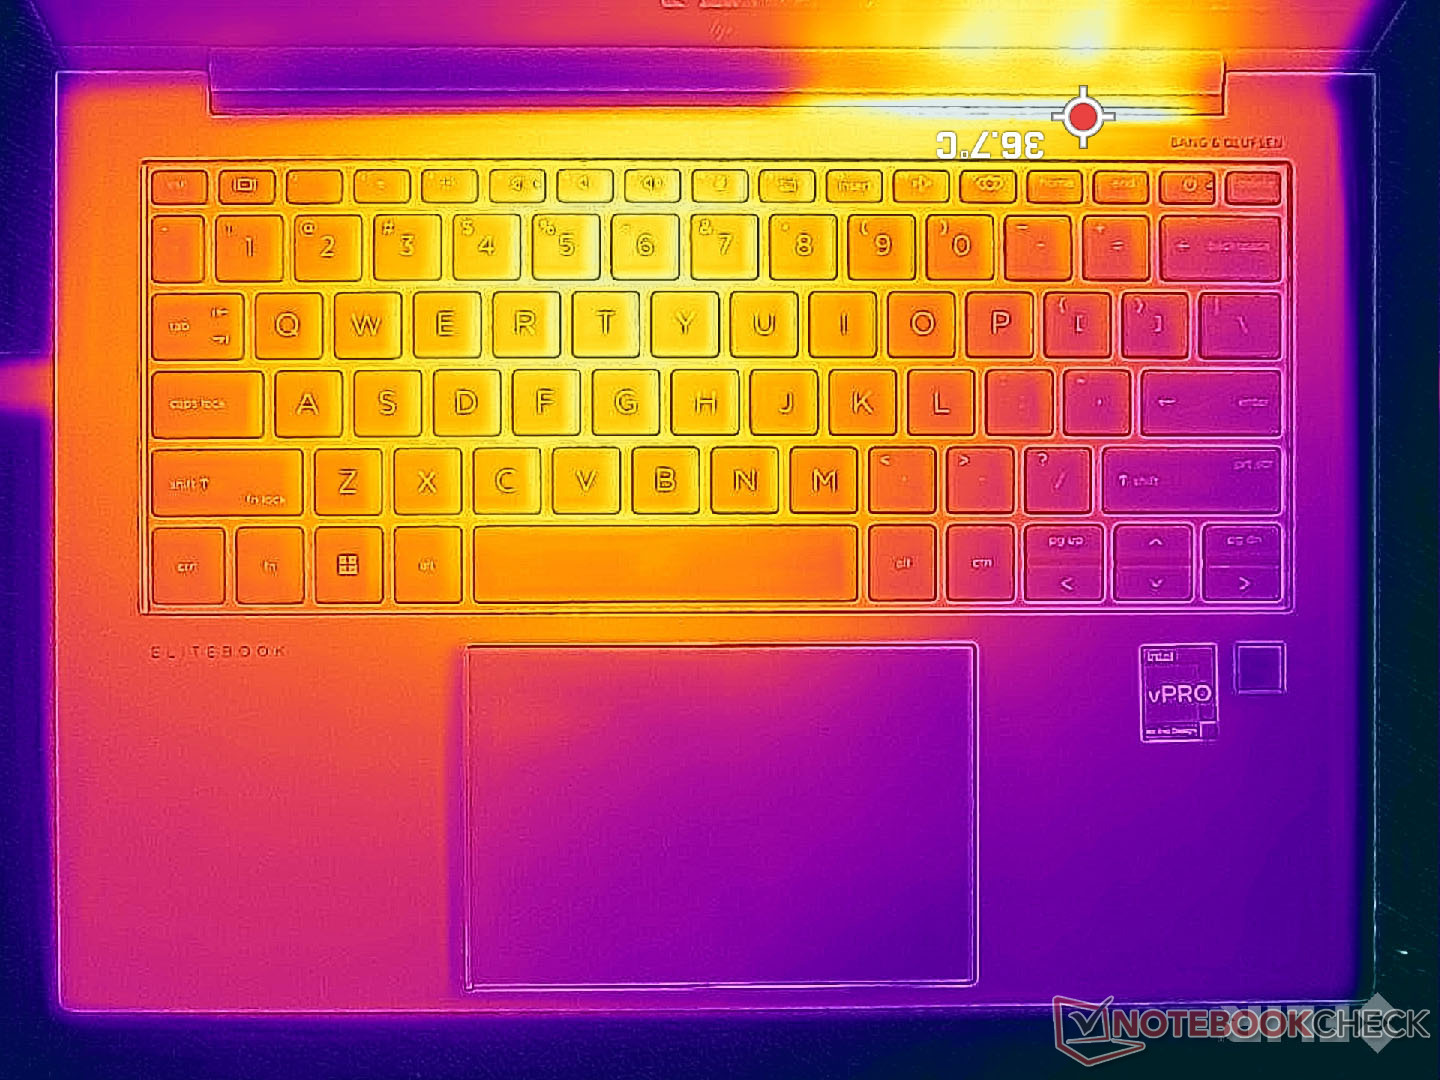
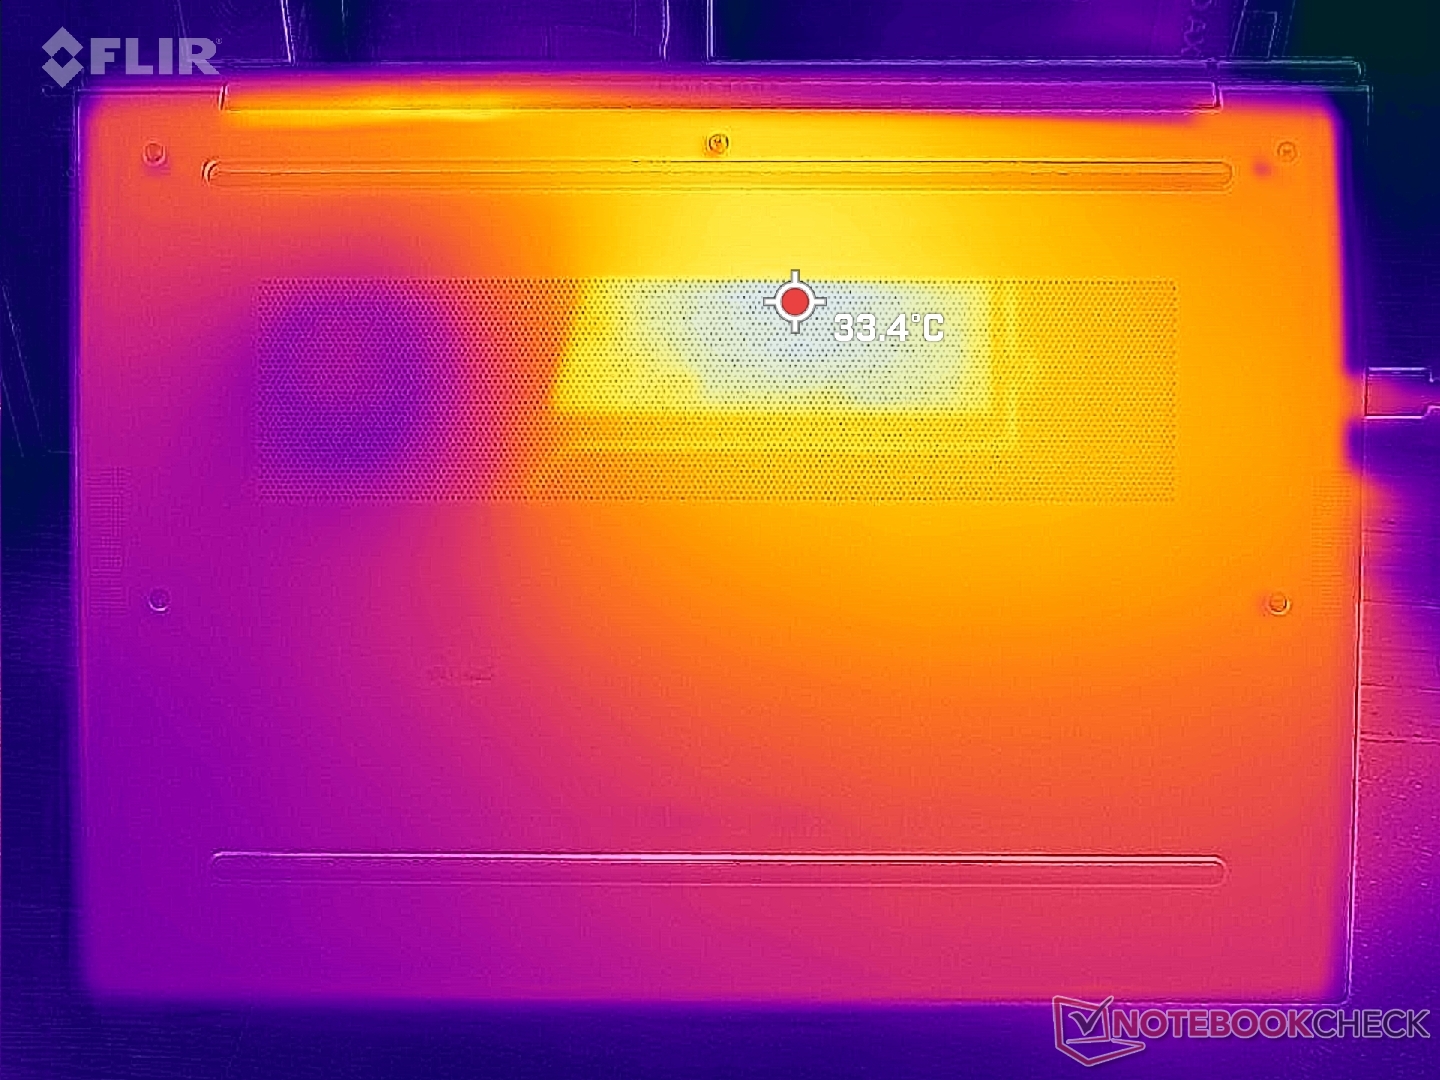
Temperatur
Die Oberflächentemperaturen sind zur Mitte hin am wärmsten, wo Hotspots auf der Tastatur und der Unterseite etwa 33 °C bzw. 36 °C erreichen können, verglichen mit knapp über 40 °C beim ThinkPad X1 Carbon Gen 10. Das System wird nie unangenehm warm auf der Haut.
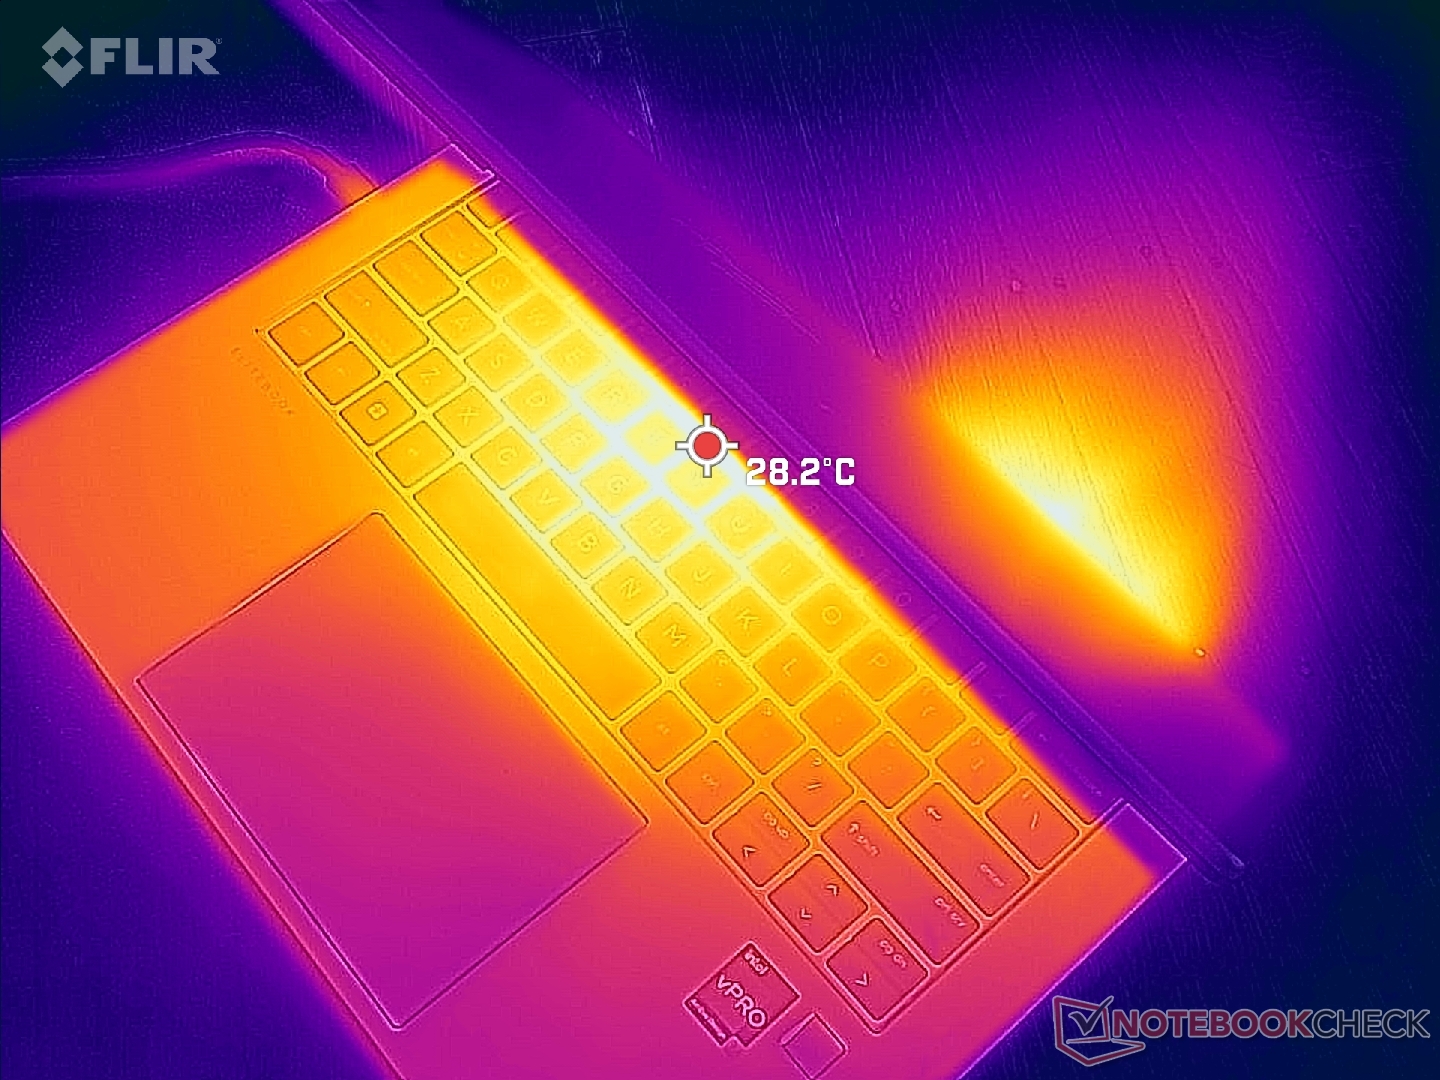
(+) Die maximale Temperatur auf der Oberseite ist 32.8 °C. Im Vergleich liegt der Klassendurchschnitt bei 34.3 °C (von 21.2 bis 62.5 °C für die Klasse Office).
(+) Auf der Unterseite messen wir eine maximalen Wert von 36.6 °C (im Vergleich zum Durchschnitt von 36.8 °C).
(+) Ohne Last messen wir eine durchschnittliche Temperatur von 20.7 °C auf der Oberseite. Der Klassendurchschnitt erreicht 29.5 °C.
(+) Die Handballen und der Touchpad-Bereich sind mit gemessenen 23.2 °C kühler als die typische Hauttemperatur und fühlen sich dadurch kühl an.
(+) Die durchschnittliche Handballen-Temperatur anderer getesteter Geräte war 27.5 °C (+4.3 °C).
| HP EliteBook 840 G9 Intel Core i7-1280P, Intel Iris Xe Graphics G7 96EUs | HP EliteBook 845 G9 6F6H6EA AMD Ryzen 9 PRO 6950HS, AMD Radeon 680M | HP EliteBook 840 Aero G8 3E4Q6AA Intel Core i7-1185G7, Intel Iris Xe Graphics G7 96EUs | Lenovo ThinkPad X1 Carbon G10 Core i7-1265U Intel Core i7-1265U, Intel Iris Xe Graphics G7 96EUs | LG Gram 14Z90Q Intel Core i5-1240P, Intel Iris Xe Graphics G7 80EUs | Dell Latitude 7420 JW6MH Intel Core i5-1145G7, Intel Iris Xe Graphics G7 80EUs | |
|---|---|---|---|---|---|---|
| Hitze | -42% | -42% | -13% | -26% | -18% | |
| Last oben max * (°C) | 32.8 | 49.4 -51% | 39.2 -20% | 41.2 -26% | 43 -31% | 37.1 -13% |
| Last unten max * (°C) | 36.6 | 48 -31% | 51.2 -40% | 41 -12% | 45 -23% | 38.7 -6% |
| Idle oben max * (°C) | 21.6 | 30.8 -43% | 33 -53% | 23.2 -7% | 27 -25% | 27.3 -26% |
| Idle unten max * (°C) | 22.2 | 31.4 -41% | 34 -53% | 23.4 -5% | 28 -26% | 28.1 -27% |
* ... kleinere Werte sind besser
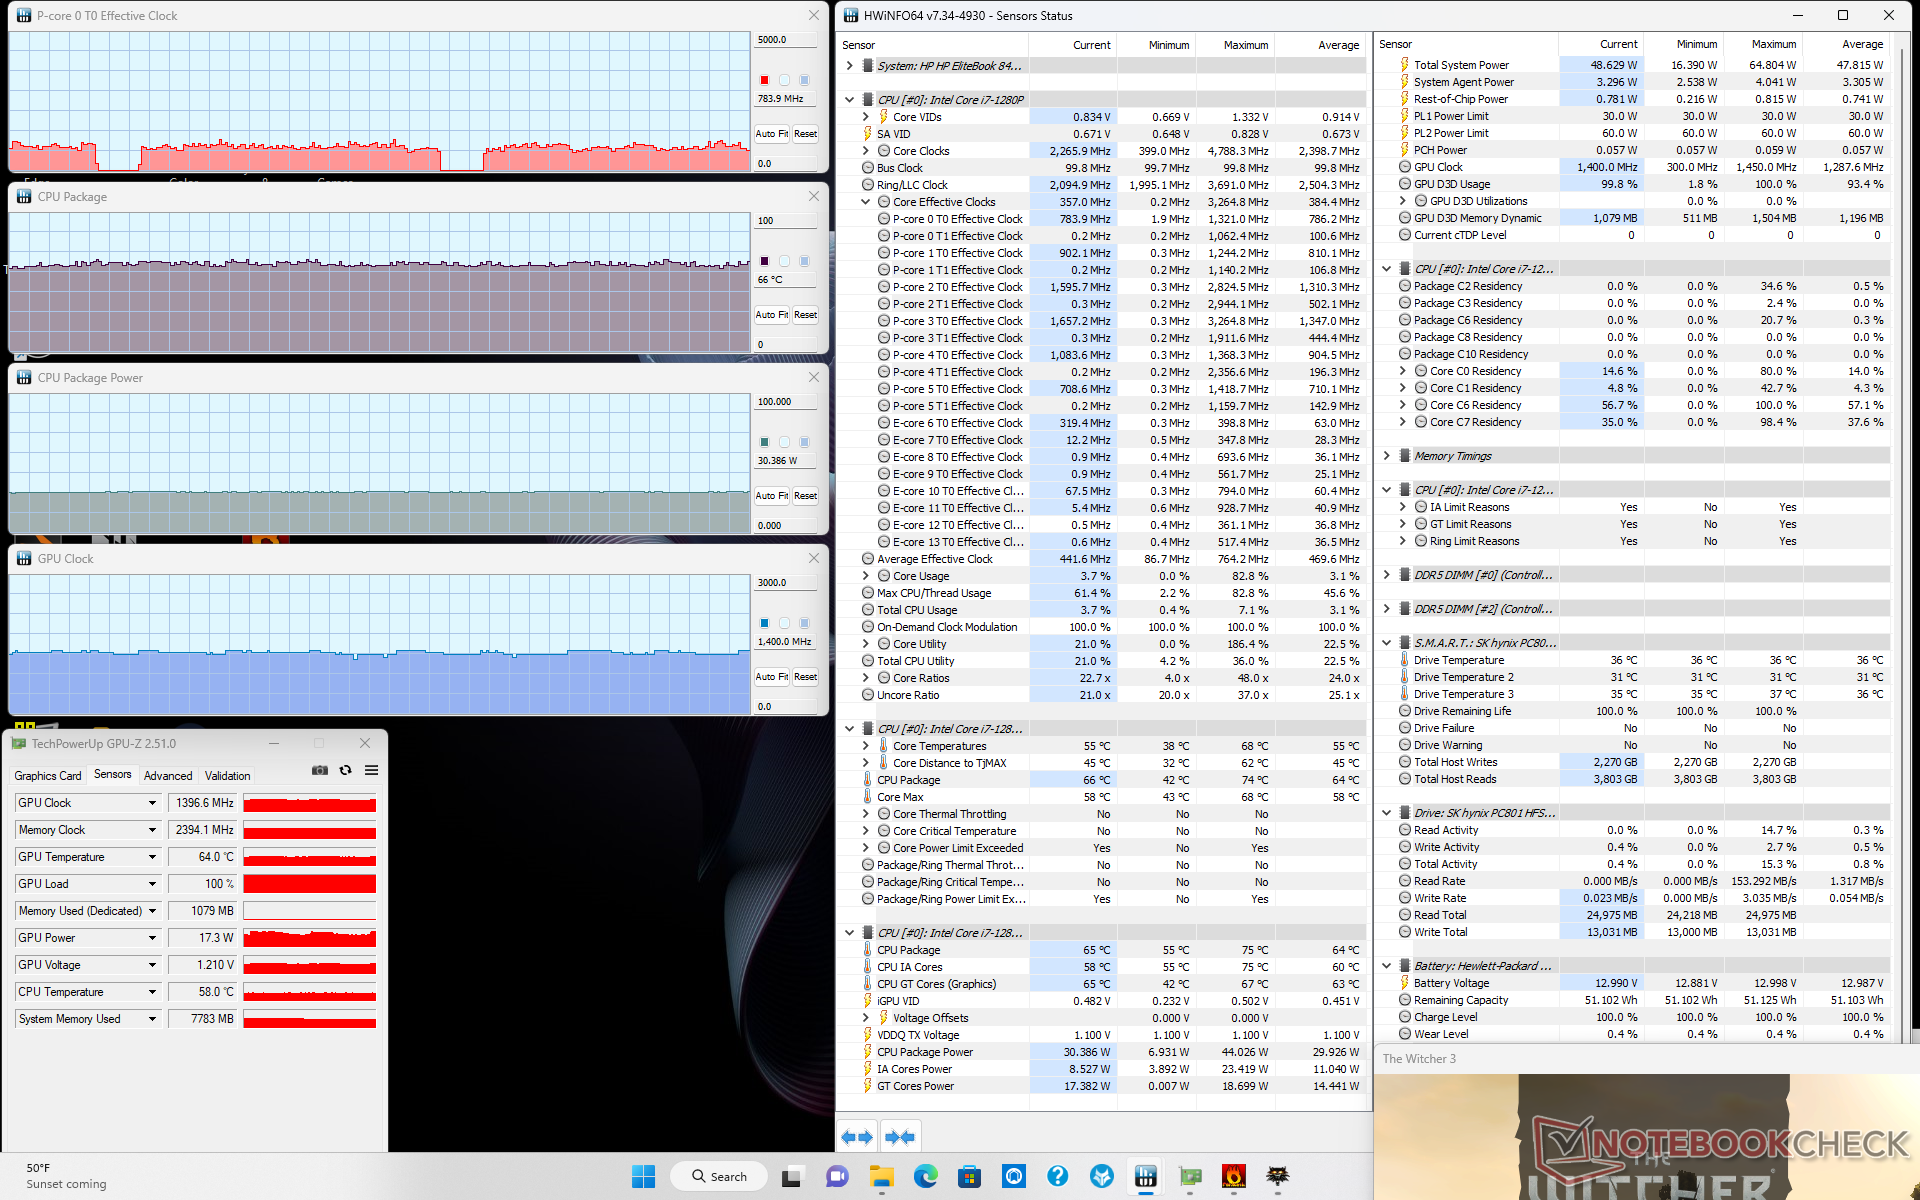
Stresstest
Wenn Prime95 läuft, fährt die CPU für etwa 20 Sekunden oder bis zu einer Kerntemperatur von 86 °C auf 3 GHz und 60 W hoch. Danach sinkt sie auf nur 1,6 GHz und 30 W, um eine kühlere Kerntemperatur von 65 °C aufrechtzuerhalten. Es ist schade, dass es keine Option gibt, die Temperaturgrenze für höhere anhaltende Taktraten anzuheben, da die CPU hier im Vergleich zu den meisten anderen Laptops mit dem gleichen Core-i7-1280P-Prozessor unterdurchschnittlich ist.
Die GPU-Taktraten und die Temperatur im Betrieb mit Witcher 3 stabilisieren sich bei 1.397 MHz bzw. 66 °C, verglichen mit 1.097 MHz und 65 °C beim Dragonfly Folio G3, das mit der gleichen integrierten GPU ausgestattet ist. Die höheren Taktraten tragen dazu bei, dass sich das EliteBook in Sachen Grafikleistung von den meisten Core-U-Laptops abhebt.
Der Akkubetrieb reduziert die Leistung leicht. Ein 3DMark-11-Test im Akkubetrieb ergibt Physik- und Grafik-Scores von 13.157 bzw. 6.717 Punkten, verglichen mit 15.376 und 7.101 Punkten im Netzbetrieb.
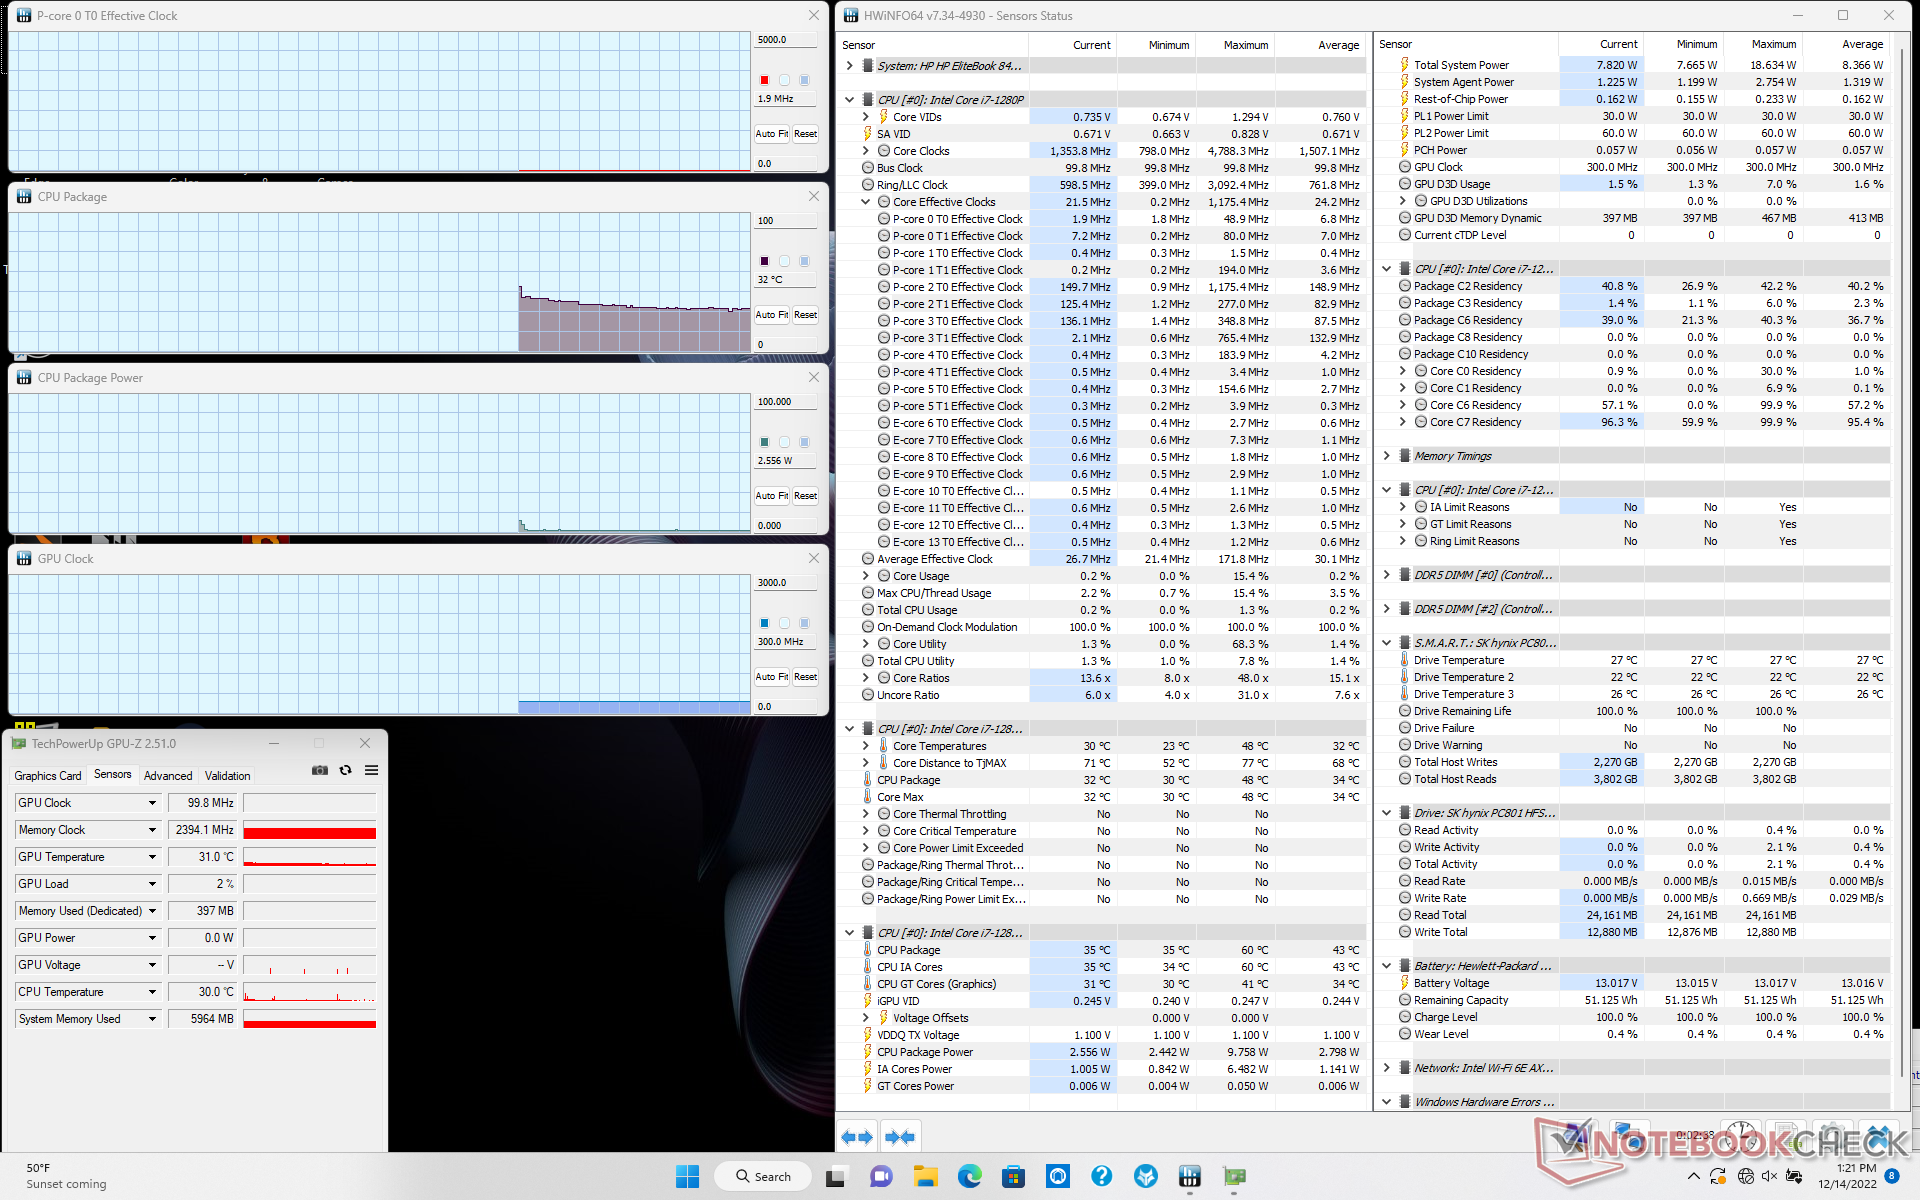
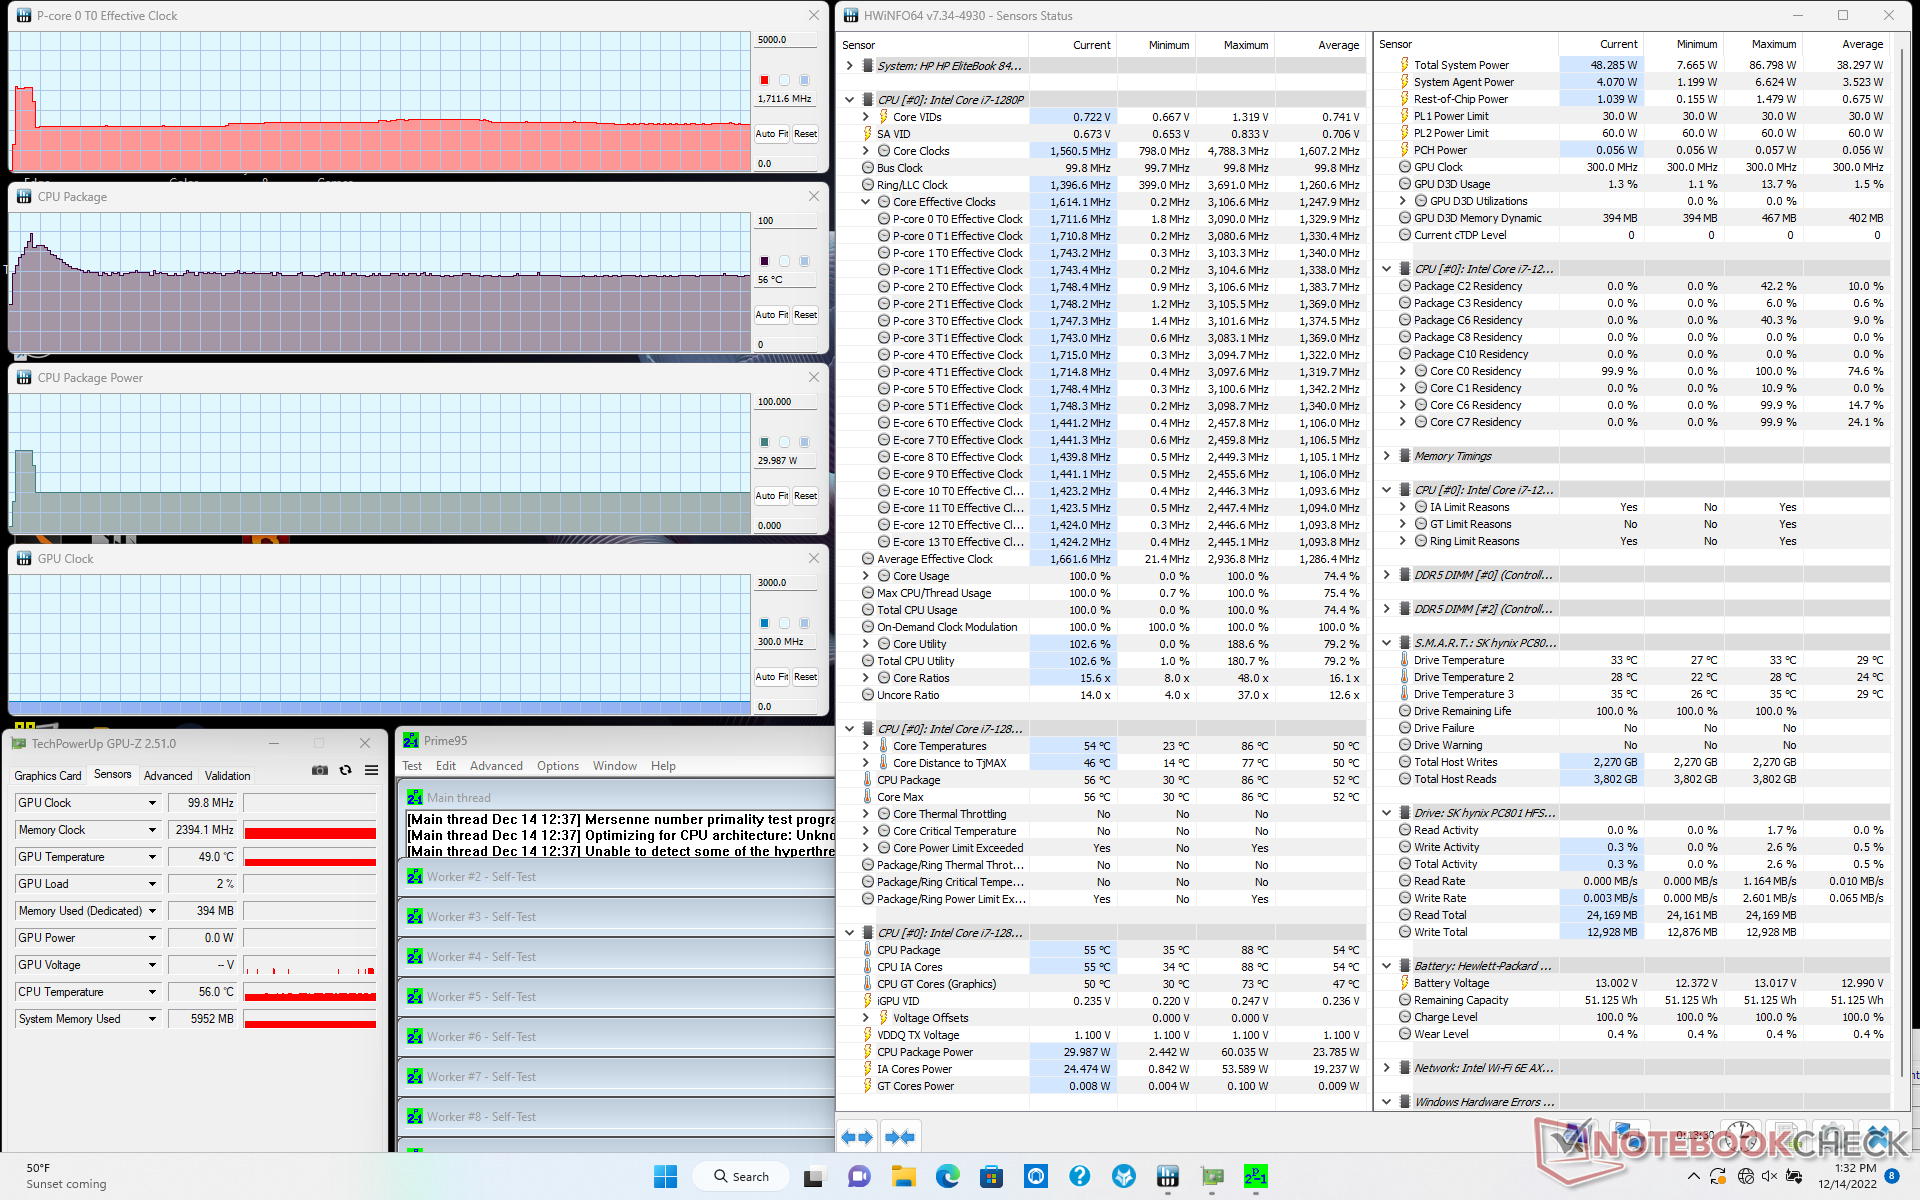
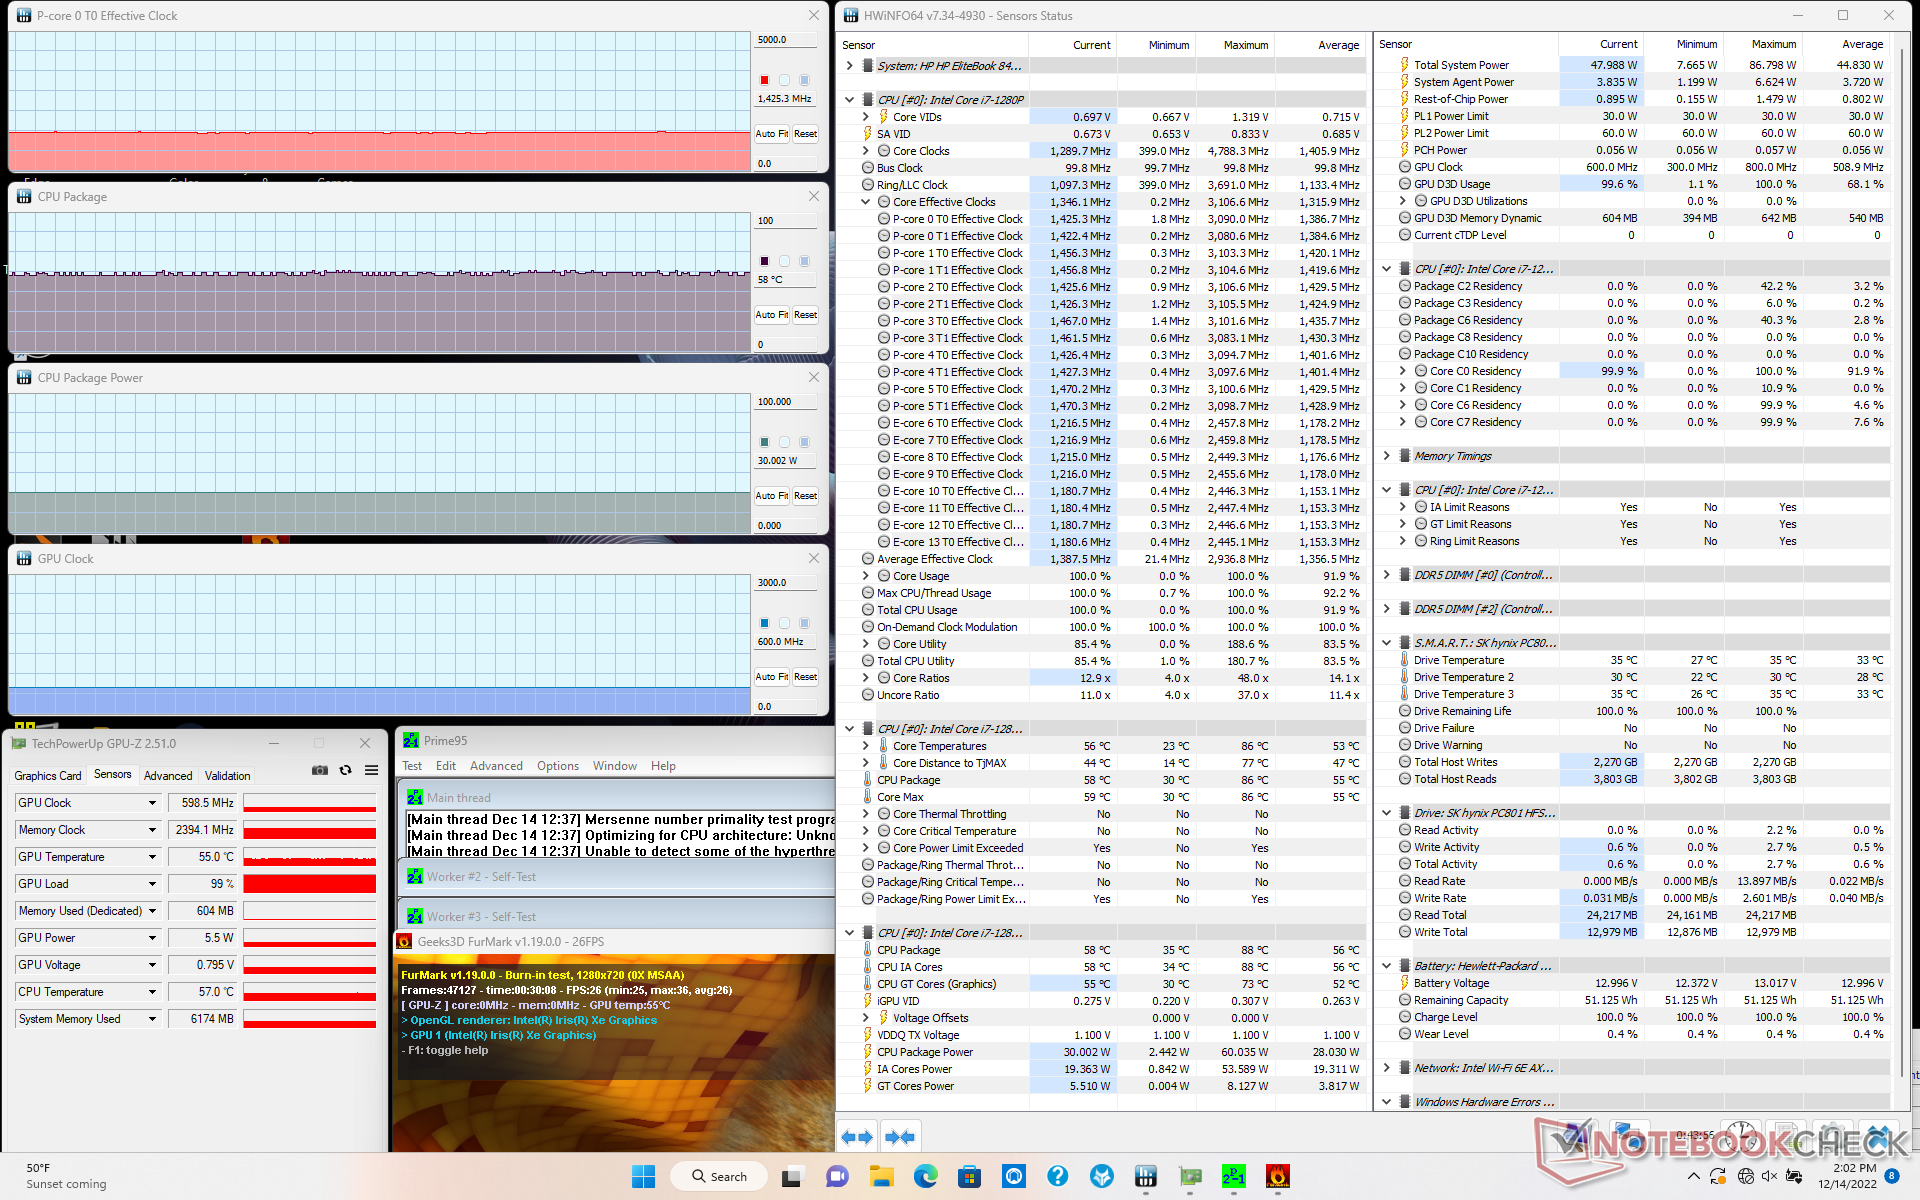
| CPU-Takt (GHz) | GPU-Takt (MHz) | durchschnittliche CPU-Temperatur (°C) | |
| System Leerlauf | -- | -- | 32 |
| Prime95, Stress | 1.7 | -- | 56 |
| Prime95 + FurMark, Stress | 1,4 | 599 | 58 |
| Witcher 3, Stress | ~0.8 | 1.397 | 66 |
Lautsprecher
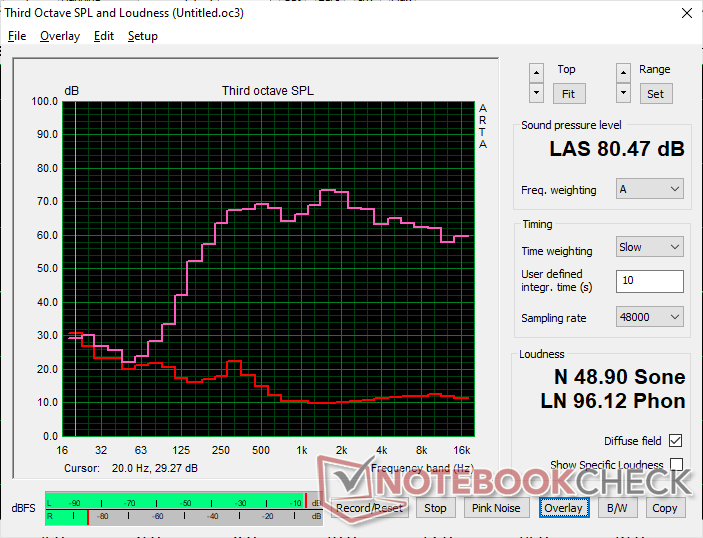
HP EliteBook 840 G9 Audio Analyse
(±) | Mittelmäßig laut spielende Lautsprecher (80.5 dB)
Bass 100 - 315 Hz
(±) | abgesenkter Bass - 12.6% geringer als der Median
(±) | durchschnittlich lineare Bass-Wiedergabe (12.4% Delta zum Vorgänger)
Mitteltöne 400 - 2000 Hz
(+) | ausgeglichene Mitten, vom Median nur 4.6% abweichend
(+) | lineare Mitten (3.9% Delta zum Vorgänger)
Hochtöne 2 - 16 kHz
(+) | ausgeglichene Hochtöne, vom Median nur 2% abweichend
(+) | sehr lineare Hochtöne (3.9% Delta zum Vorgänger)
Gesamt im hörbaren Bereich 100 - 16.000 Hz
(+) | hörbarer Bereich ist sehr linear (12.9% Abstand zum Median
Im Vergleich zu allen Geräten derselben Klasse
» 6% aller getesteten Geräte dieser Klasse waren besser, 2% vergleichbar, 92% schlechter
» Das beste Gerät hat einen Delta-Wert von 7%, durchschnittlich ist 21%, das schlechteste Gerät hat 53%
Im Vergleich zu allen Geräten im Test
» 12% aller getesteten Geräte waren besser, 3% vergleichbar, 85% schlechter
» Das beste Gerät hat einen Delta-Wert von 4%, durchschnittlich ist 24%, das schlechteste Gerät hat 134%
Apple MacBook Pro 16 2021 M1 Pro Audio Analyse
(+) | Die Lautsprecher können relativ laut spielen (84.7 dB)
Bass 100 - 315 Hz
(+) | guter Bass - nur 3.8% Abweichung vom Median
(+) | lineare Bass-Wiedergabe (5.2% Delta zum Vorgänger)
Mitteltöne 400 - 2000 Hz
(+) | ausgeglichene Mitten, vom Median nur 1.3% abweichend
(+) | lineare Mitten (2.1% Delta zum Vorgänger)
Hochtöne 2 - 16 kHz
(+) | ausgeglichene Hochtöne, vom Median nur 1.9% abweichend
(+) | sehr lineare Hochtöne (2.7% Delta zum Vorgänger)
Gesamt im hörbaren Bereich 100 - 16.000 Hz
(+) | hörbarer Bereich ist sehr linear (4.6% Abstand zum Median
Im Vergleich zu allen Geräten derselben Klasse
» 0% aller getesteten Geräte dieser Klasse waren besser, 0% vergleichbar, 100% schlechter
» Das beste Gerät hat einen Delta-Wert von 5%, durchschnittlich ist 17%, das schlechteste Gerät hat 45%
Im Vergleich zu allen Geräten im Test
» 0% aller getesteten Geräte waren besser, 0% vergleichbar, 100% schlechter
» Das beste Gerät hat einen Delta-Wert von 4%, durchschnittlich ist 24%, das schlechteste Gerät hat 134%
Energieverwaltung
Stromverbrauch
Unsere Vergleichstabelle unten zeigt, dass die AMD Version anspruchsvoller ist als unser Intel Gerät. Die Diskrepanz ist jedoch größtenteils auf das 1000-Nit-Panel unserer AMD Version zurückzuführen, während unsere Intel Version ein weniger anspruchsvolles 400-Nit-Panel verwendet. Im Leerlauf auf dem Desktop bei maximaler Helligkeit verbrauchen die Intel- und AMD Geräte etwa 9 bzw. 18 W. Wenn man dies berücksichtigt, werden die Unterschiede im Stromverbrauch zwischen den beiden Modellen trotz aller Leistungsunterschiede geringer.
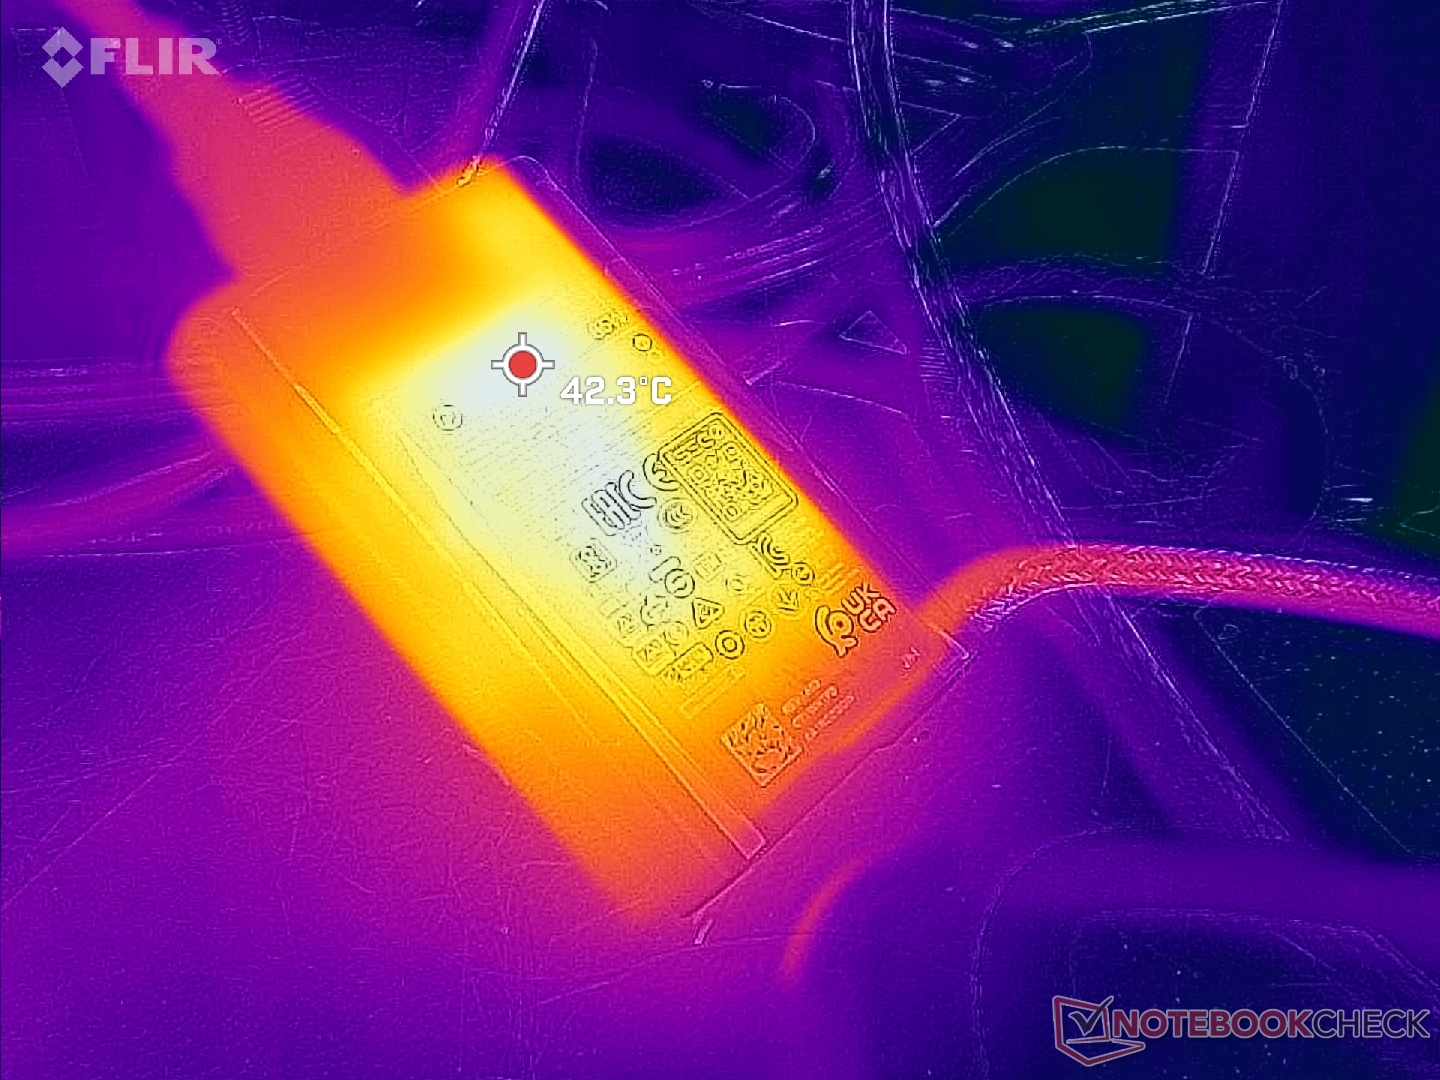
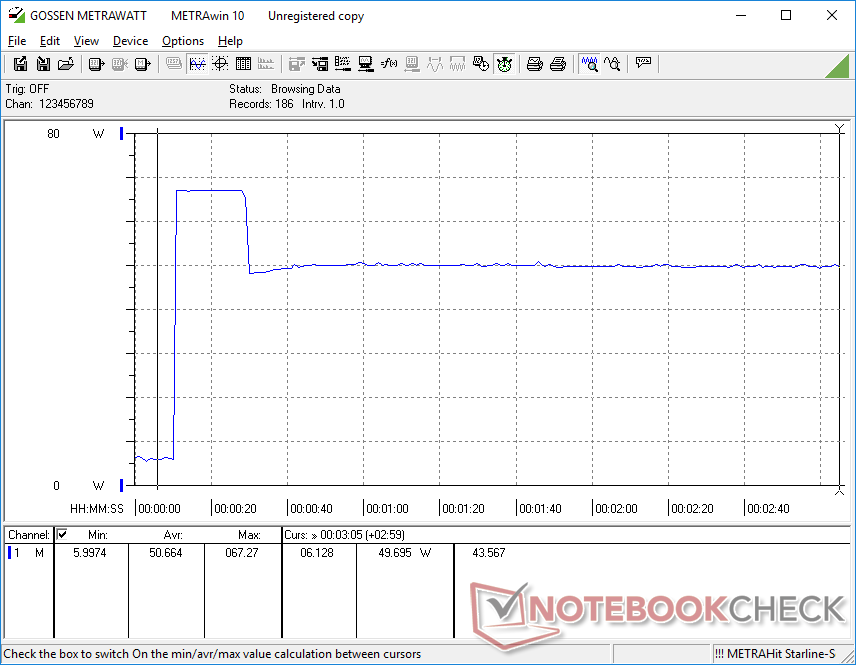
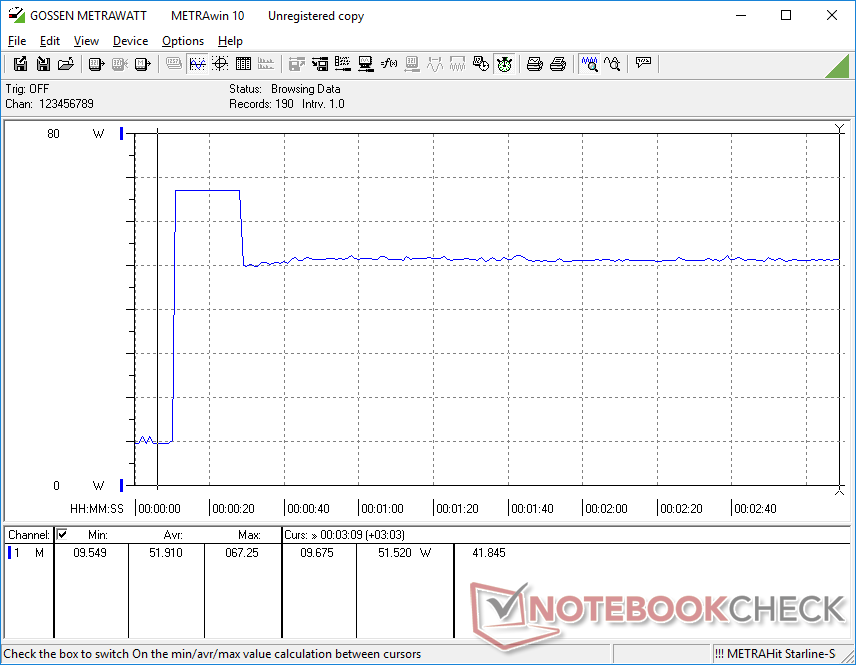
Mit dem kleinen (~8,8 x 5,3 x 2,1 cm) 65-W-Netzteil konnten wir unter Prime95 Stress eine maximale Leistungsaufnahme von 68 W messen. Wie die folgenden Grafiken zeigen, ist dieser Wert aufgrund der thermischen Einschränkungen nur vorübergehend.
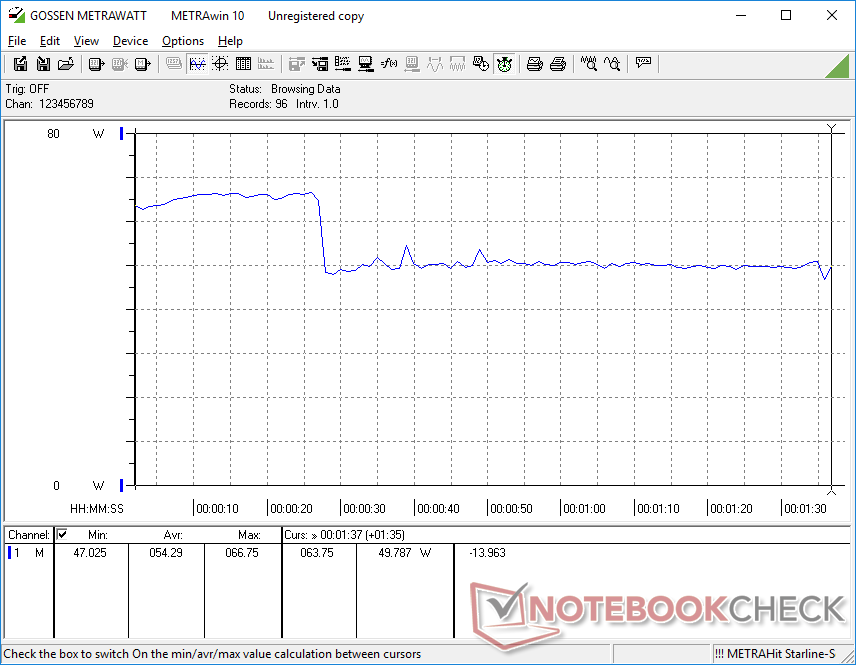
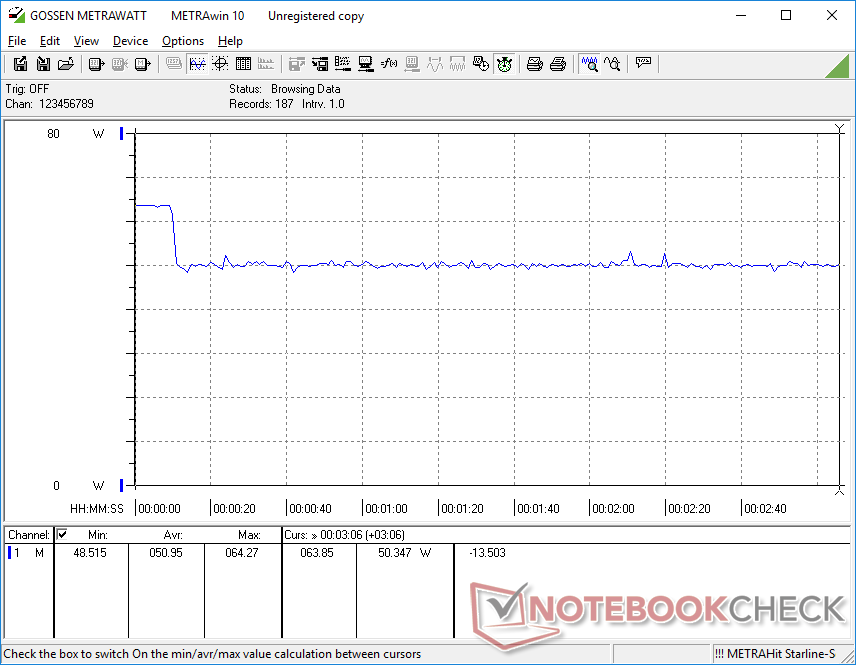
| Aus / Standby | |
| Idle | |
| Last |
|
Legende:
min: | |
| HP EliteBook 840 G9 i7-1280P, Iris Xe G7 96EUs, SK hynix PC801 HFS512GEJ9X101N BF, IPS, 1920x1200, 14" | HP EliteBook 845 G9 6F6H6EA R9 PRO 6950HS, Radeon 680M, WDC PC SN810 1TB, IPS, 1920x1200, 14" | HP EliteBook 840 Aero G8 3E4Q6AA i7-1185G7, Iris Xe G7 96EUs, SK Hynix PC711 512GB HFS512GDE9X073N, IPS, 1920x1080, 14" | Lenovo ThinkPad X1 Carbon G10 Core i7-1265U i7-1265U, Iris Xe G7 96EUs, Kioxia BG5 KBG5AZNV1T02, IPS, 1920x1200, 14" | LG Gram 14Z90Q i5-1240P, Iris Xe G7 80EUs, Samsung PM9A1 MZVL2512HCJQ, IPS, 1920x1200, 14" | Dell Latitude 7420 JW6MH i5-1145G7, Iris Xe G7 80EUs, SK Hynix BC711 HFM512GD3HX015N, IPS, 1920x1080, 14" | |
|---|---|---|---|---|---|---|
| Stromverbrauch | -80% | 5% | -8% | -5% | 8% | |
| Idle min * (Watt) | 2.2 | 6.4 -191% | 3.2 -45% | 2.8 -27% | 3 -36% | 2.7 -23% |
| Idle avg * (Watt) | 5.3 | 12.4 -134% | 5.4 -2% | 6 -13% | 6 -13% | 6 -13% |
| Idle max * (Watt) | 8.5 | 18 -112% | 6.9 19% | 10.9 -28% | 12 -41% | 7.6 11% |
| Last avg * (Watt) | 54.3 | 63 -16% | 38.9 28% | 51.8 5% | 40 26% | 37 32% |
| Witcher 3 ultra * (Watt) | 51 | 63.6 -25% | 37 27% | 51.6 -1% | 36.5 28% | 33.2 35% |
| Last max * (Watt) | 67.3 | 68 -1% | 66.5 1% | 55.6 17% | 63 6% | 65 3% |
* ... kleinere Werte sind besser
Power Consumption Witcher 3 / Stresstest
Power Consumption external Monitor
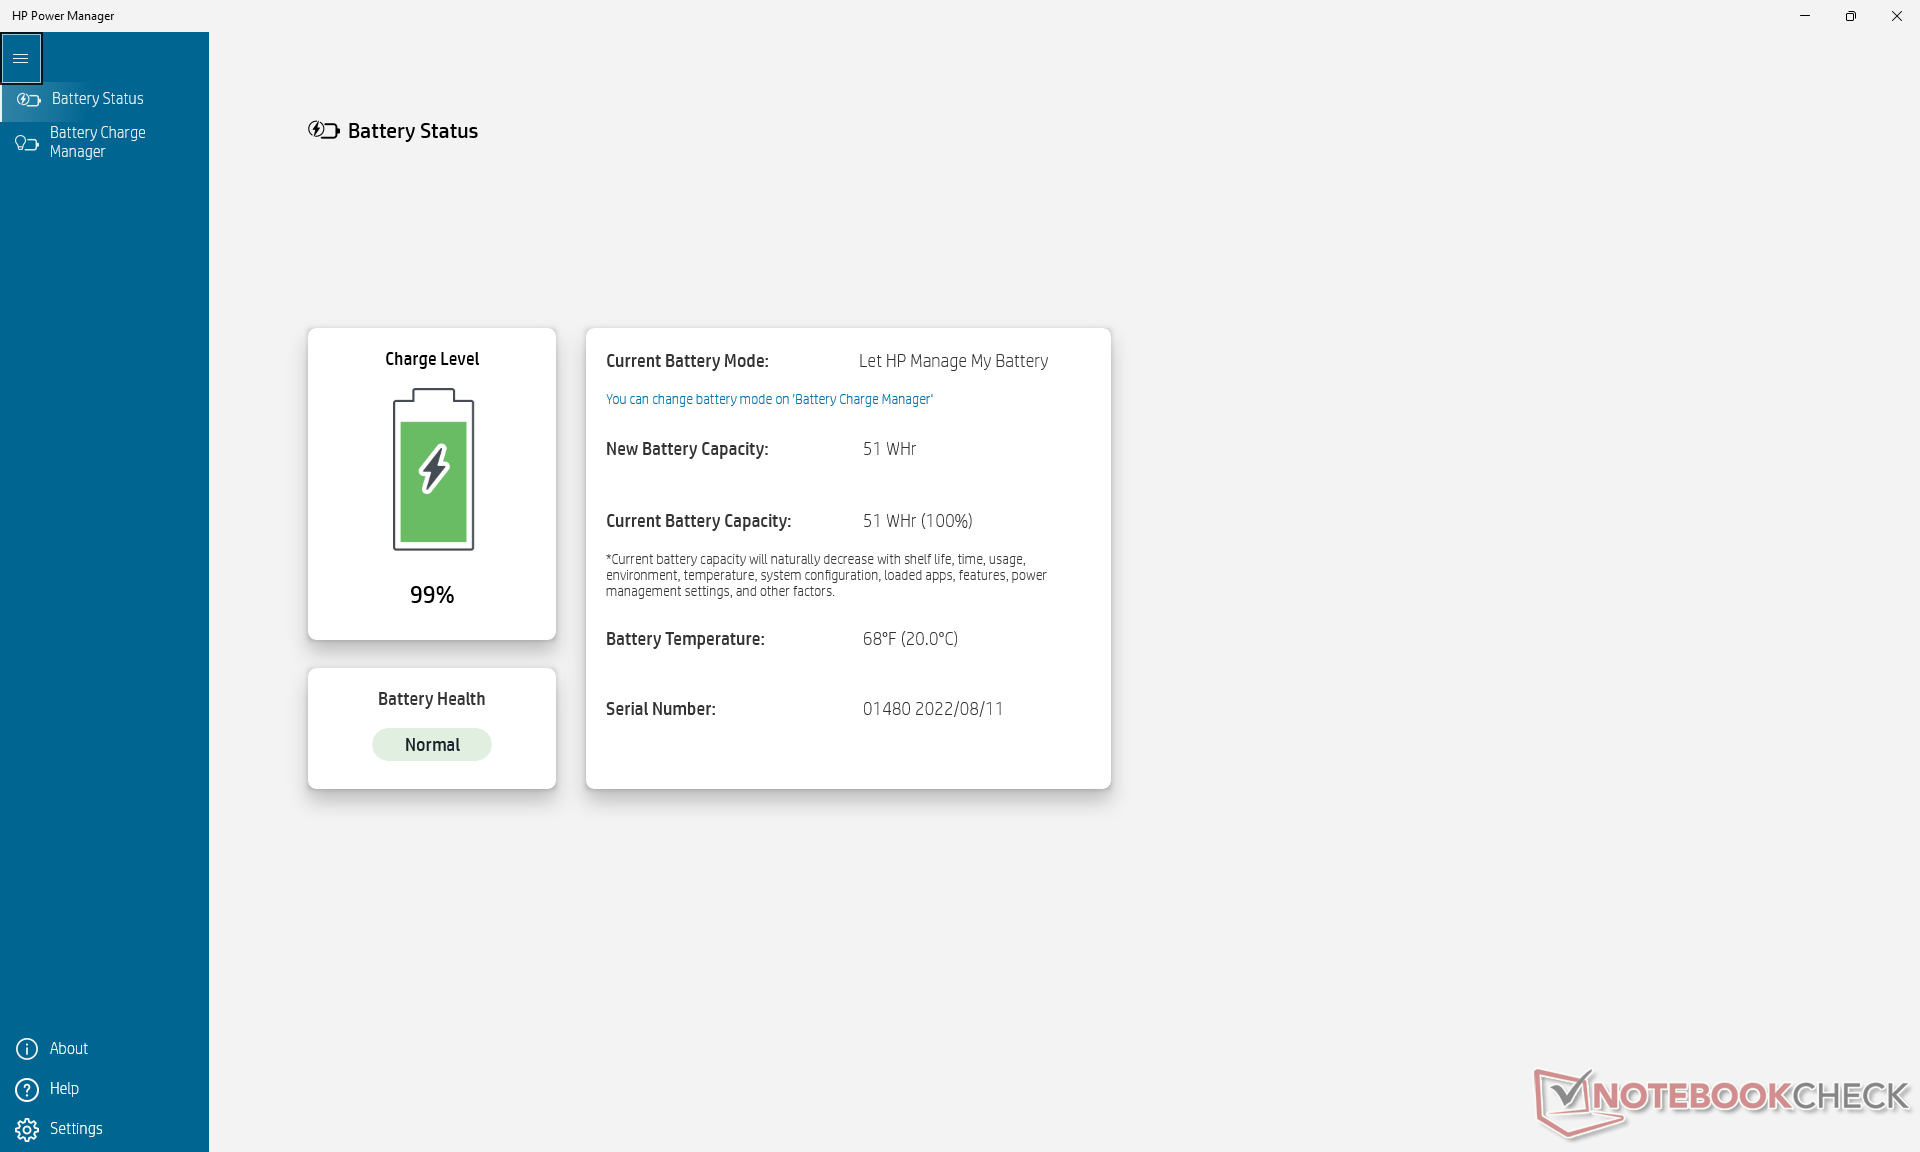
Akkulaufzeit - Ein bisschen kürzer als AMD
Die WLAN-Laufzeit ist fast zwei Stunden kürzer als beim AMD EliteBook 845 G9, wenn beide auf 150 Nit Helligkeit und das Energieprofil "Ausbalanciert" eingestellt sind. Dennoch sollten 7,5 Stunden ununterbrochenes Surfen für die meisten Nutzer zufriedenstellend sein.
Das Aufladen vom leeren zum vollen Akku dauert etwa 90 Minuten. USB-C-Ladegeräte von Drittanbietern werden technisch unterstützt, aber bei vielen ist nicht garantiert, dass sie funktionieren, wenn ihre Ausgangspegel nicht mit dem mitgelieferten HP-Ladegerät (20 V/3,25 A) übereinstimmen.
| HP EliteBook 840 G9 i7-1280P, Iris Xe G7 96EUs, 51 Wh | HP EliteBook 845 G9 6F6H6EA R9 PRO 6950HS, Radeon 680M, 51 Wh | HP EliteBook 840 Aero G8 3E4Q6AA i7-1185G7, Iris Xe G7 96EUs, 53 Wh | Lenovo ThinkPad X1 Carbon G10 Core i7-1265U i7-1265U, Iris Xe G7 96EUs, 57 Wh | LG Gram 14Z90Q i5-1240P, Iris Xe G7 80EUs, 72 Wh | Dell Latitude 7420 JW6MH i5-1145G7, Iris Xe G7 80EUs, 63 Wh | |
|---|---|---|---|---|---|---|
| Akkulaufzeit | 22% | 50% | -13% | 57% | 86% | |
| WLAN (h) | 7.6 | 9.3 22% | 11.4 50% | 6.6 -13% | 11.9 57% | 14.1 86% |
| Last (h) | 1.3 | 2.5 | 2.8 | 2.6 | ||
| Idle (h) | 24.8 | 28.9 | 23.5 |
Pro
Contra
Fazit - Vorteile und Nachteile
Kann sich das Core i7-1280P EliteBook 840 G9 gegen das Ryzen 9 Pro 6950HS EliteBook 845 G9 behaupten? In Bezug auf das reine CPU-Potenzial ist das AMD Modell die bessere Wahl, da seine Leistung nicht so stark gedrosselt wird wie beim Intel Modell. Welche Option die bessere ist, hängt also davon ab, wie CPU- oder GPU-intensiv Ihre spezifischen Arbeitslasten sind.
Abgesehen von den Prozessorunterschieden ist die Akkulaufzeit beim AMD Modell länger, während das Intel Modell von der Thunderbolt-Unterstützung profitiert. Es ist bedauerlich, dass Sure View bei allen 1000-Nit-Panel-Optionen obligatorisch ist, da einige Benutzer die Datenschutzfunktion aufgrund ihrer Auswirkungen auf die Bildqualität selbst im ausgeschalteten Zustand nicht wünschen. Für zukünftige Modelle würden wir uns Panels mit schnelleren Reaktionszeiten wünschen, um Ghosting zu reduzieren, und vielleicht eine höhere Obergrenze für die Kerntemperatur, um mehr Turbo-Boost-Leistung aus der Intel CPU herauszukitzeln.
Preis und Verfügbarkeit
HP liefert jetzt das EliteBook 840 G9 ab 2.200 US-Dollar für die Basiskonfiguration oder für rund 3.000 US-Dollar für unsere spezielle Testkonfiguration. Die Preise können jedoch viel niedriger beginnen für vorkonfigurierte SKUs ohne alle vom Benutzer auswählbaren Anpassungen.
HP EliteBook 840 G9
- 17.12.2022 v7 (old)
Allen Ngo
Preisvergleich

