Core i7-1265U vs. Core i5-1250P: Lenovo ThinkPad X1 Carbon Gen 10 Laptop Test
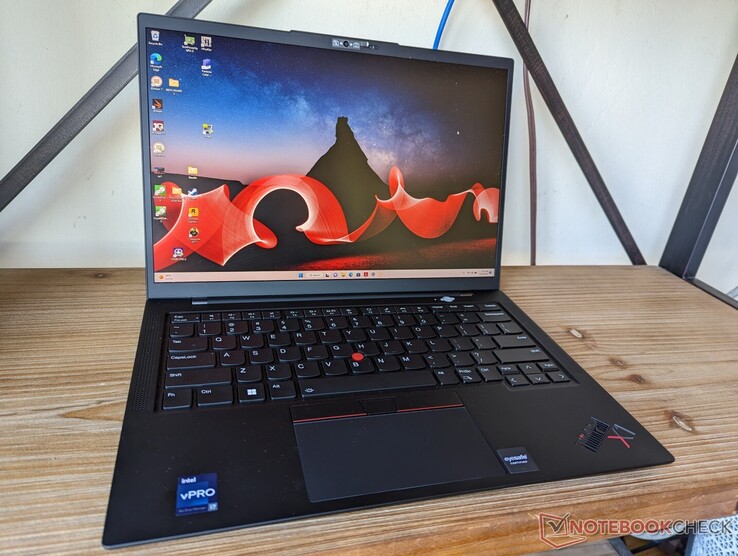
Das ThinkPad X1 Carbon G10 ist das neueste ultraleichte Business-Notebook von Lenovo mit Intel Core-U und Core-P CPUs der 12. Die Optionen reichen vom Core i5-1240P bis zum Core i7-1280P oder vom Core i5-1235U bis zum Core i7-1265U.
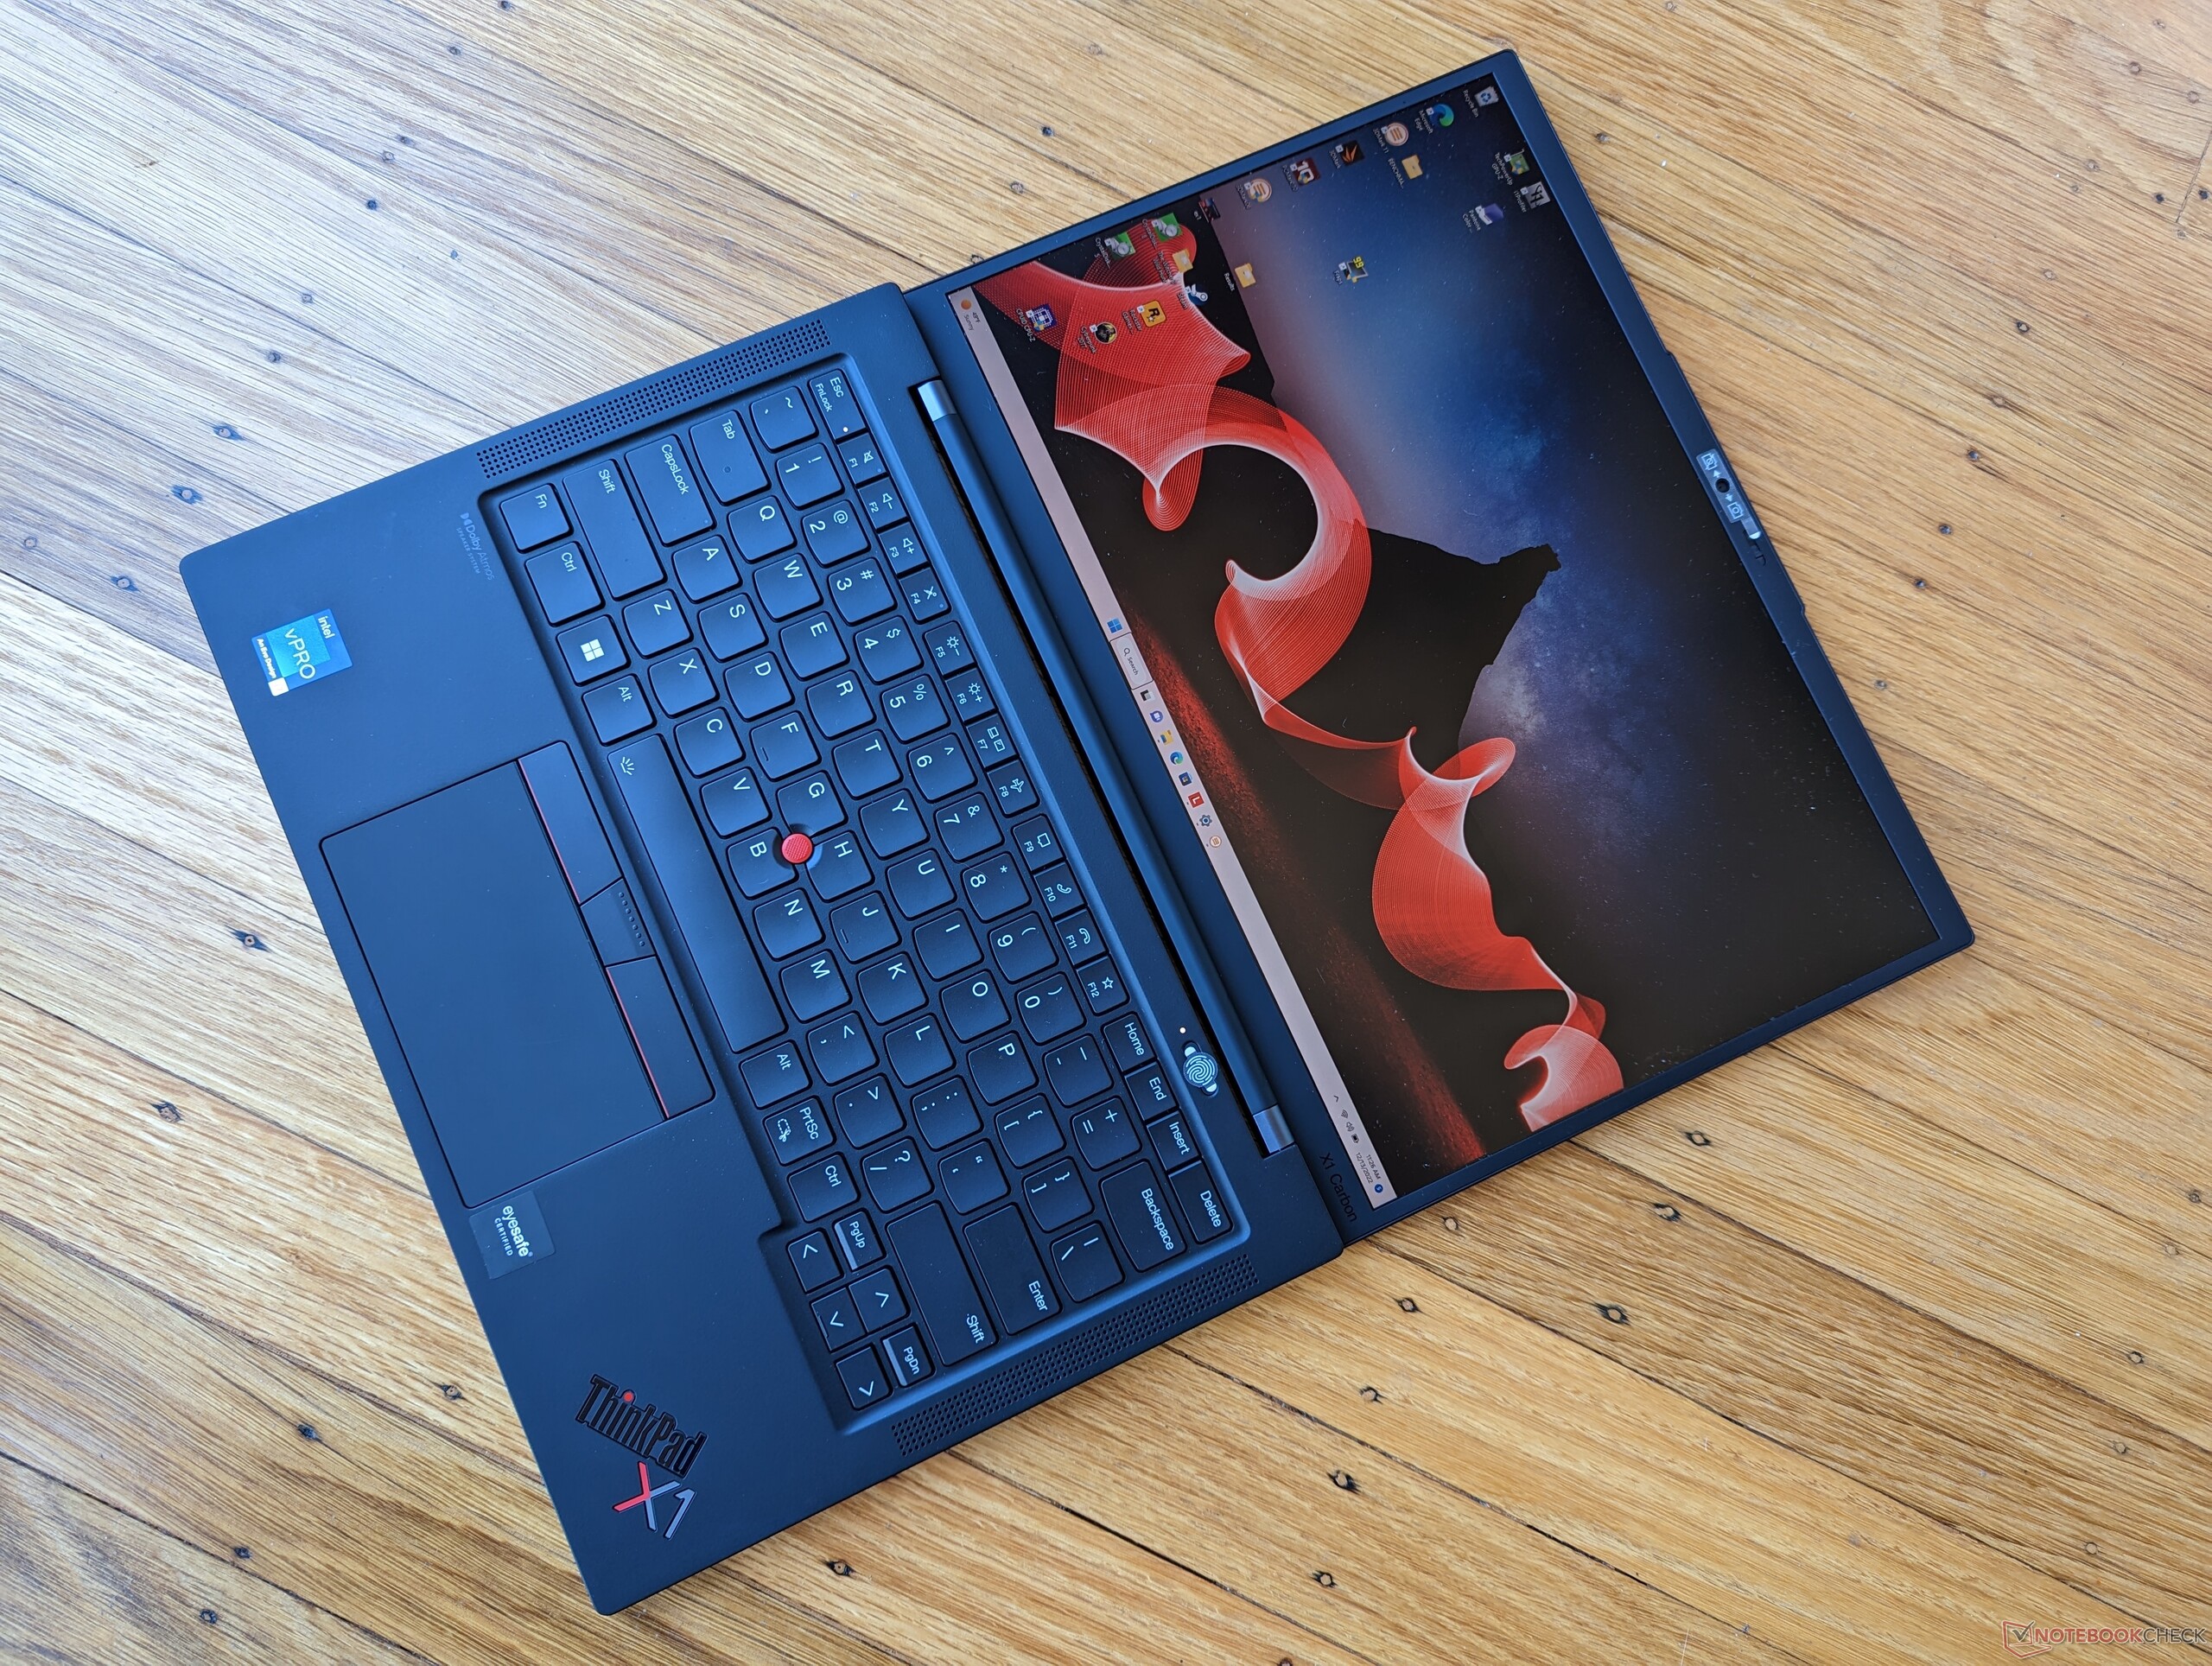
Vor kurzem haben wir die Version Core i5-1250P getestet, nun liegt unser Fokus auf der Core-i7-1265U-Version des ThinkPad-X1-Carbon-G10-Modells. Sehen Sie sich unseren Test der Core-P-Version an, um mehr über das Gehäuse, die Anschlüsse, die Tastatur und andere physische Merkmale des Modells zu erfahren.
Zu den Konkurrenten des ThinkPad X1 Carbon G10 gehören andere High-End-Business-Subnotebooks wie das Dell Latitude 7420, das Asus ExpertBook B1, das HP EliteBook 845 G9 oder die MSI-Summit-Serie.
Mehr Lenovo Testberichte
Mögliche Konkurrenten im Vergleich
Bew. | Datum | Modell | Gewicht | Dicke | Größe | Auflösung | Preis ab |
|---|---|---|---|---|---|---|---|
| 90.2 % v7 (old) | 12 / 2022 | Lenovo ThinkPad X1 Carbon G10 Core i7-1265U i7-1265U, Iris Xe G7 96EUs | 1.2 kg | 15.36 mm | 14.00" | 1920x1200 | |
| 90.2 % v7 (old) | 06 / 2022 | Lenovo ThinkPad X1 Carbon G10 21CC001RGE i5-1250P, Iris Xe G7 80EUs | 1.2 kg | 15.36 mm | 14.00" | 1920x1200 | |
| 88.6 % v7 (old) | 11 / 2022 | HP EliteBook 845 G9 6F6H9EA R5 PRO 6650U, Radeon 660M | 1.4 kg | 19 mm | 14.00" | 1920x1200 | |
| 86.6 % v7 (old) | 10 / 2022 | LG Gram 14Z90Q i5-1240P, Iris Xe G7 80EUs | 980 g | 16.8 mm | 14.00" | 1920x1200 | |
| 90.1 % v7 (old) | 04 / 2022 | Dell Latitude 7420 JW6MH i5-1145G7, Iris Xe G7 80EUs | 1.3 kg | 17.3 mm | 14.00" | 1920x1080 | |
| 83.9 % v7 (old) | 11 / 2021 | Asus ExpertBook B1 B1400CEAE, i5-1135G7 i5-1135G7, Iris Xe G7 80EUs | 1.5 kg | 19.2 mm | 14.00" | 1920x1080 |
Gehäuse
Kommunikation
| Networking | |
| iperf3 transmit AX12 | |
| Asus ExpertBook B1 B1400CEAE, i5-1135G7 | |
| Dell Latitude 7420 JW6MH | |
| iperf3 receive AX12 | |
| Dell Latitude 7420 JW6MH | |
| Asus ExpertBook B1 B1400CEAE, i5-1135G7 | |
| iperf3 receive AXE11000 6GHz | |
| LG Gram 14Z90Q | |
| Lenovo ThinkPad X1 Carbon G10 21CC001RGE | |
| Lenovo ThinkPad X1 Carbon G10 Core i7-1265U | |
| iperf3 receive AXE11000 | |
| HP EliteBook 845 G9 6F6H9EA | |
| Lenovo ThinkPad X1 Carbon G10 Core i7-1265U | |
| iperf3 transmit AXE11000 | |
| Lenovo ThinkPad X1 Carbon G10 Core i7-1265U | |
| iperf3 transmit AXE11000 6GHz | |
| Lenovo ThinkPad X1 Carbon G10 21CC001RGE | |
| Lenovo ThinkPad X1 Carbon G10 Core i7-1265U | |
Webcam


Zubehör und Garantie
Im Karton befinden sich außer dem Netzteil keine weiteren Extras. Beim Kauf in den USA gilt eine einjährige Vor-Ort-Herstellergarantie.
Display
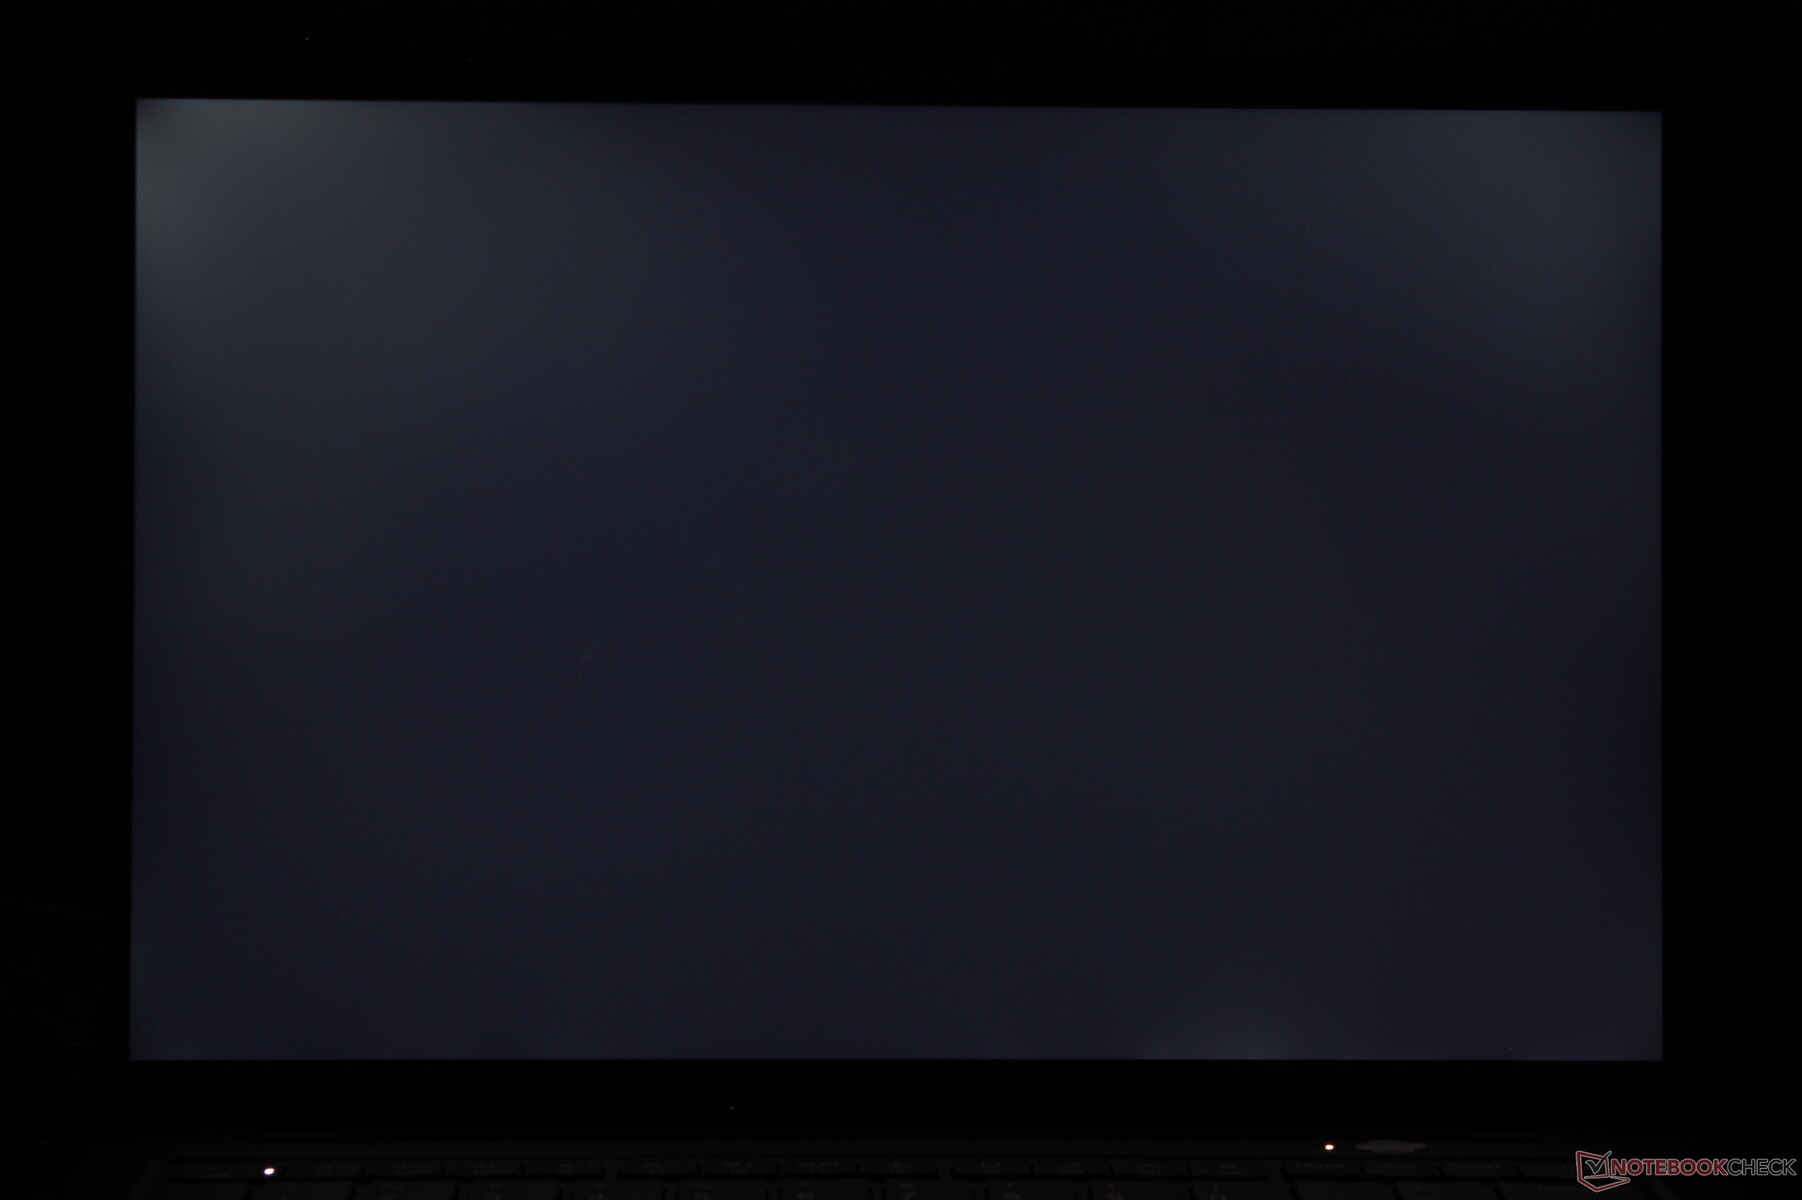
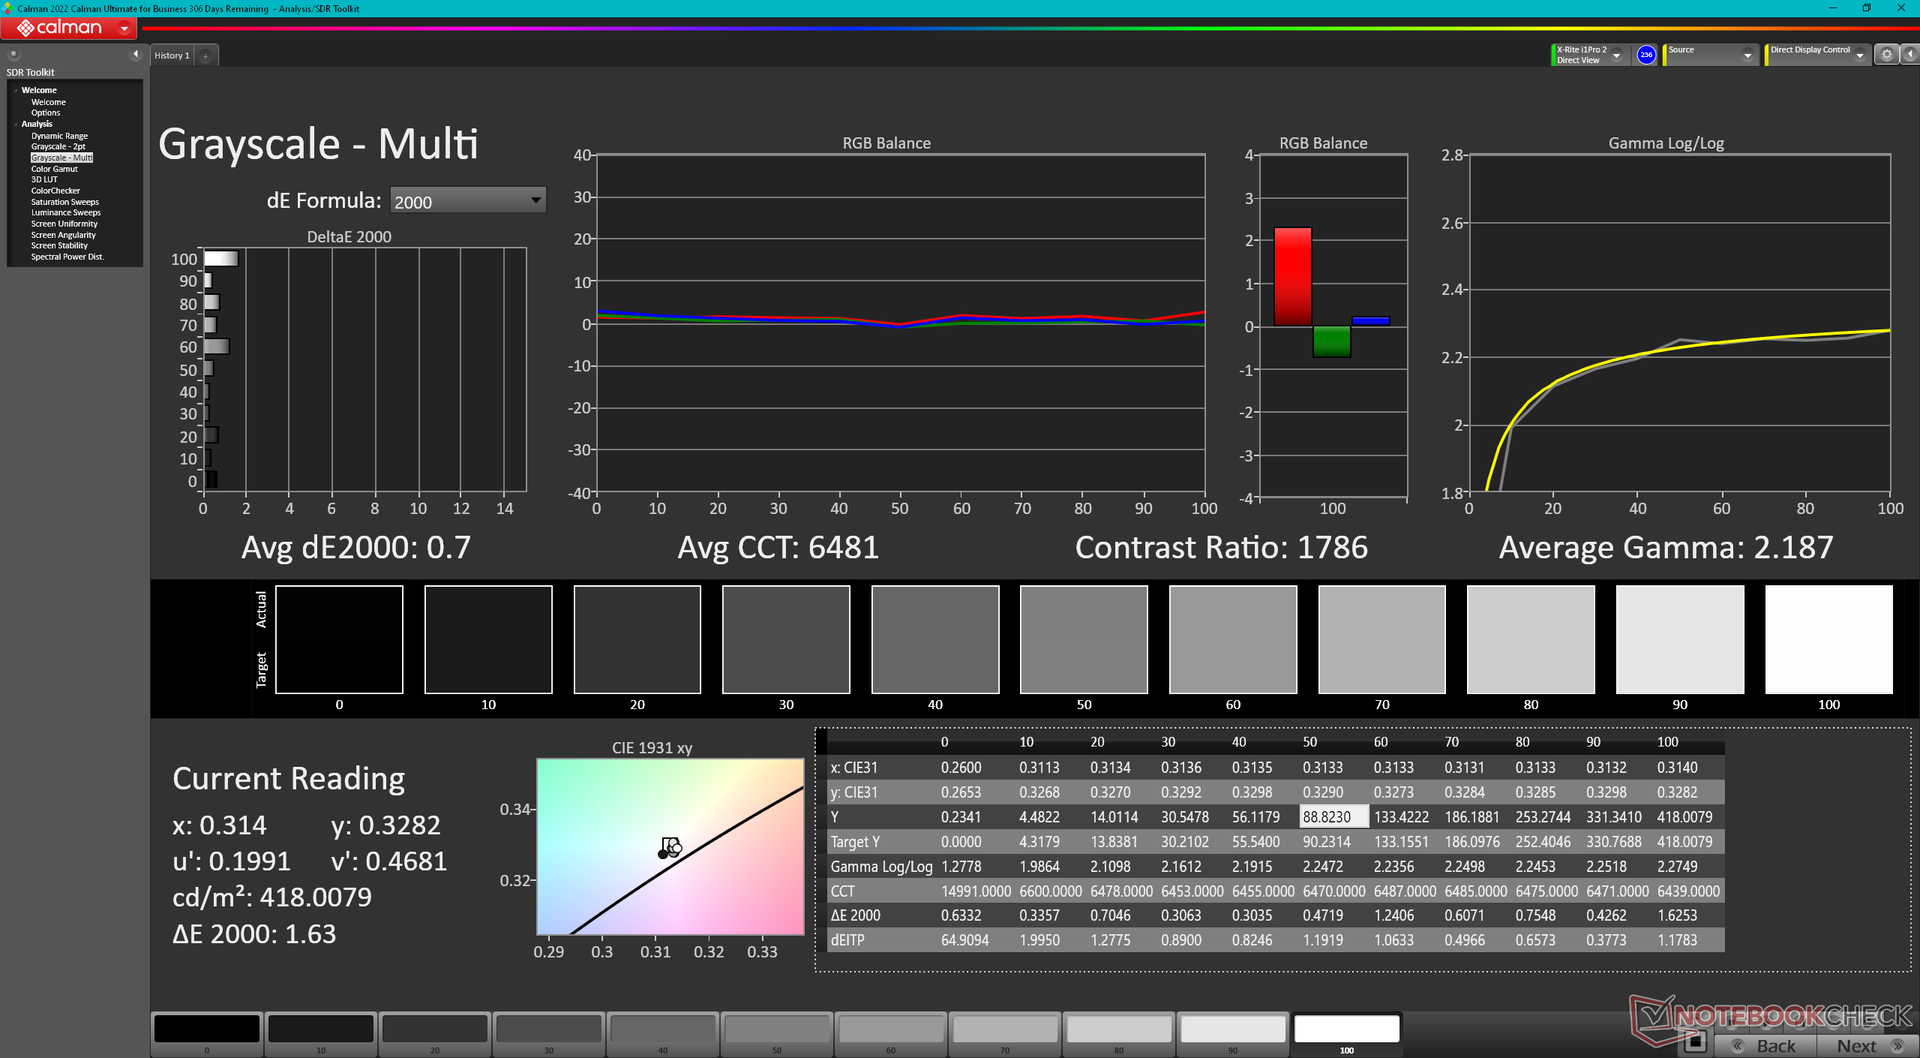
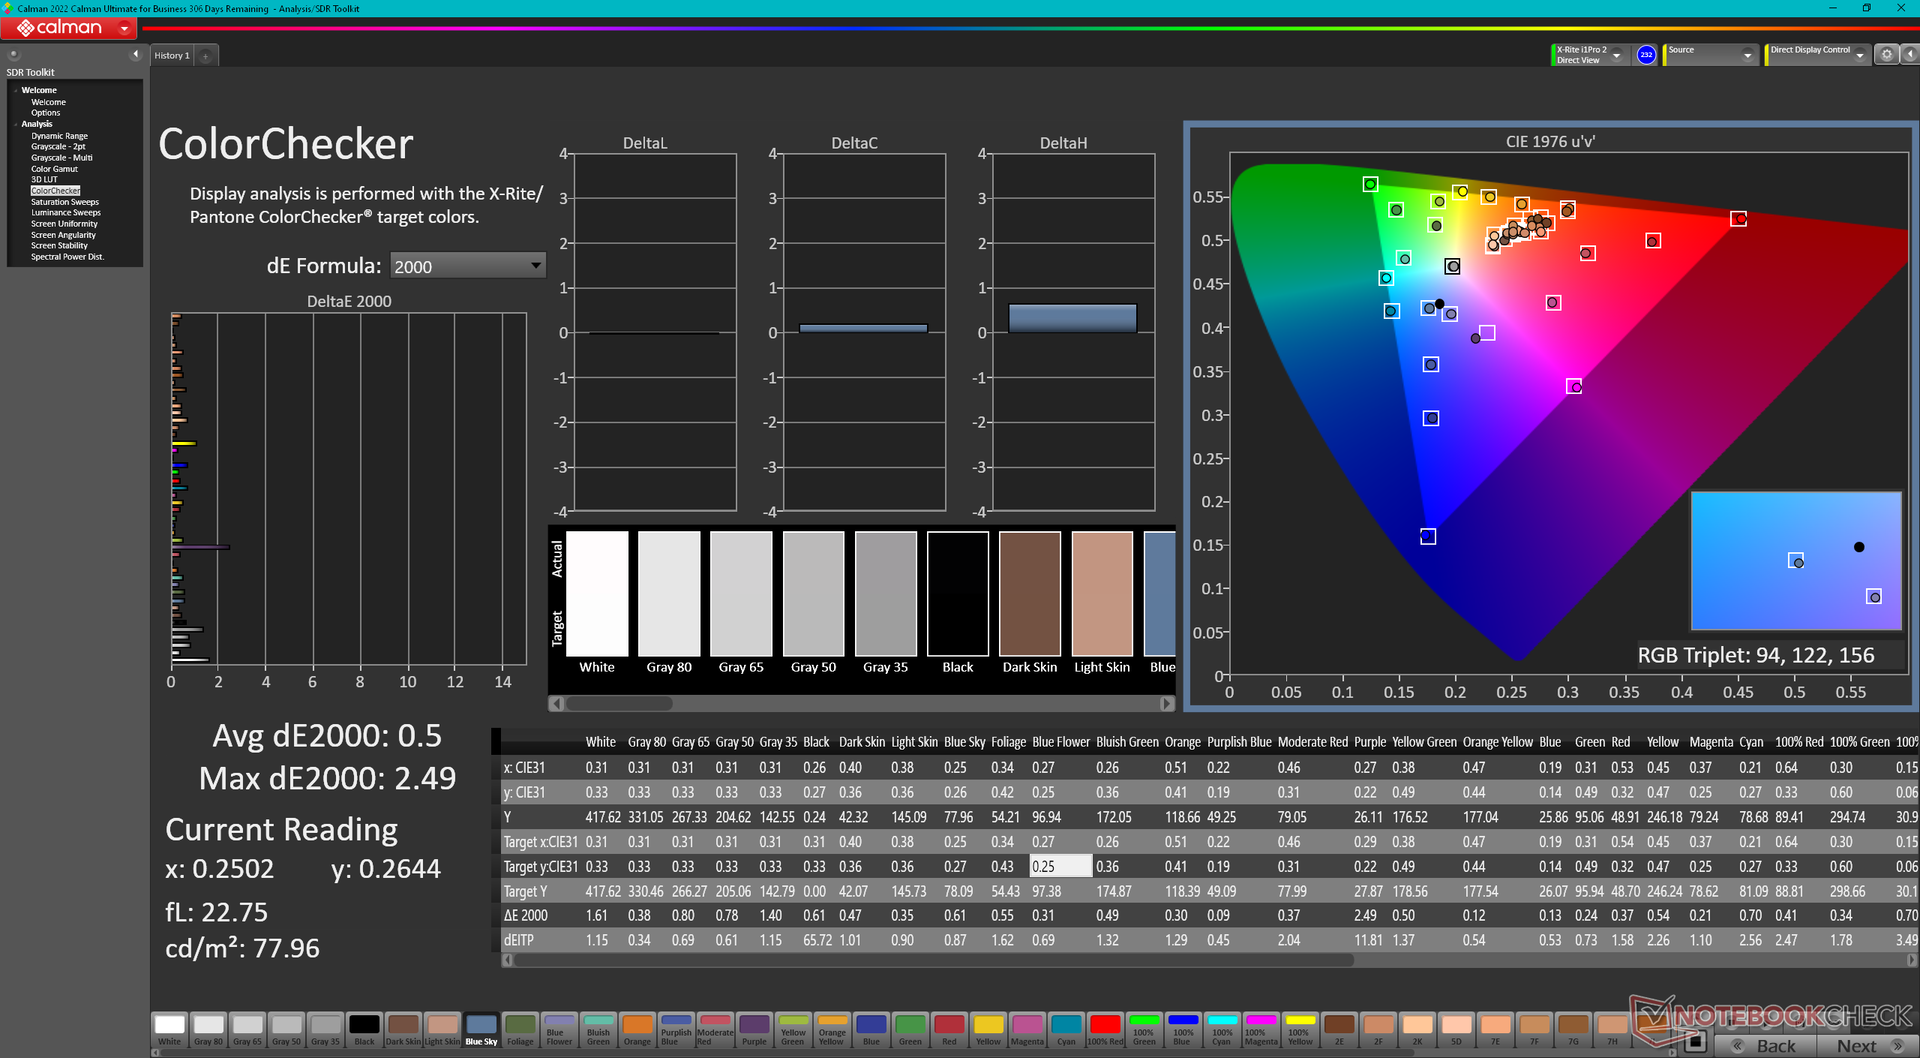
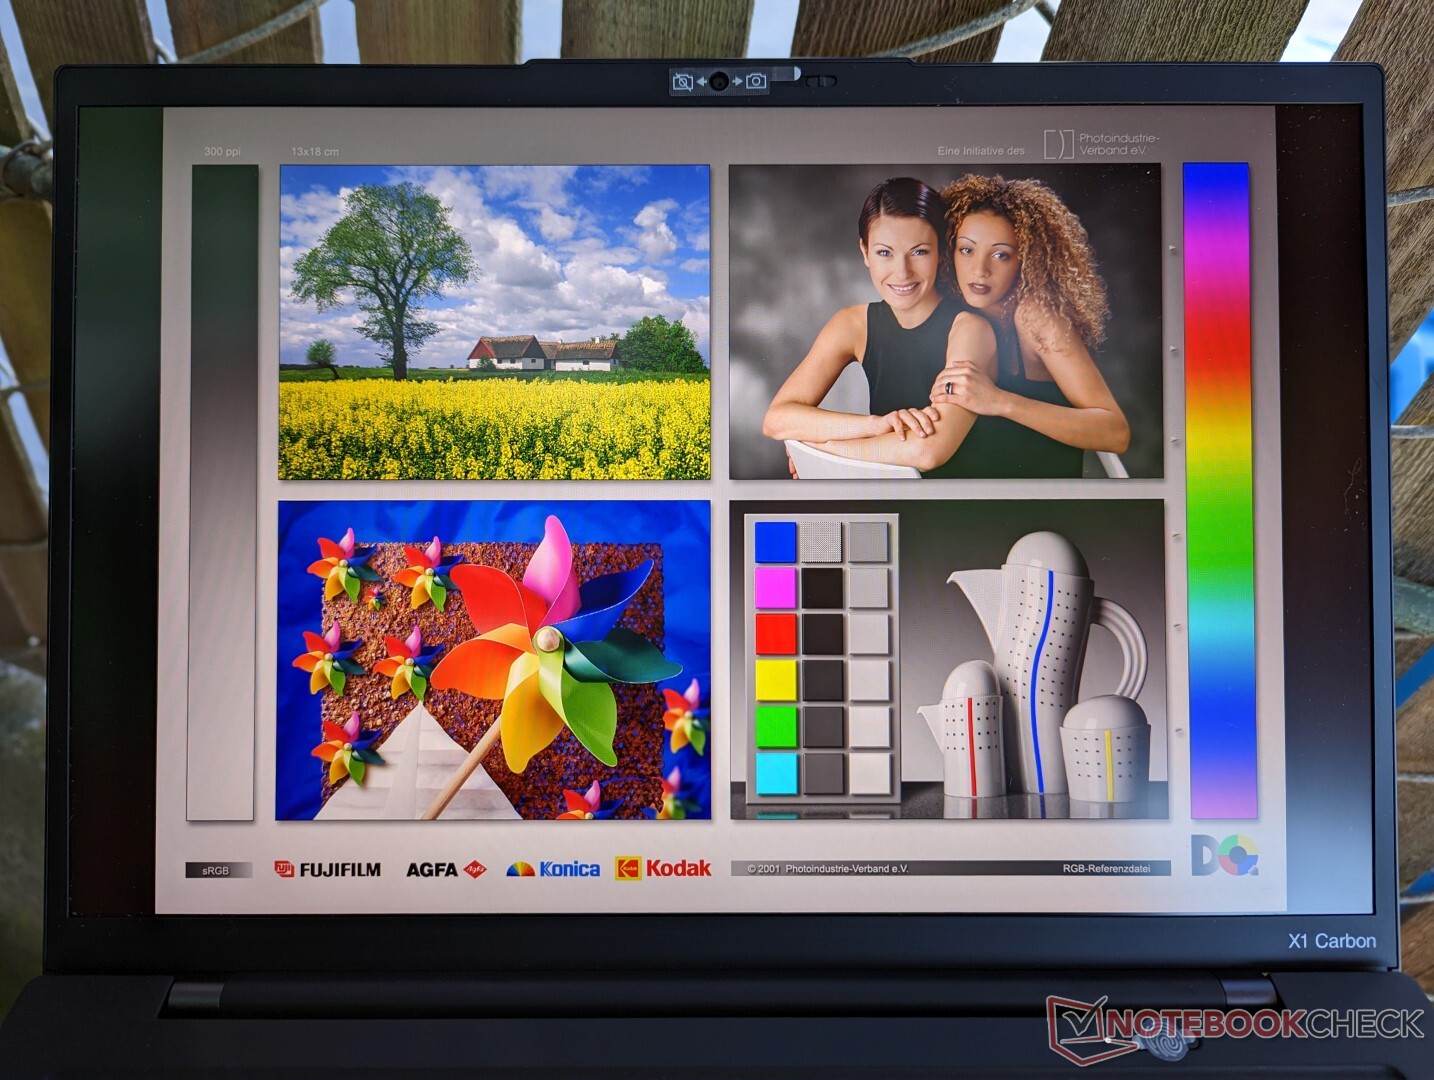
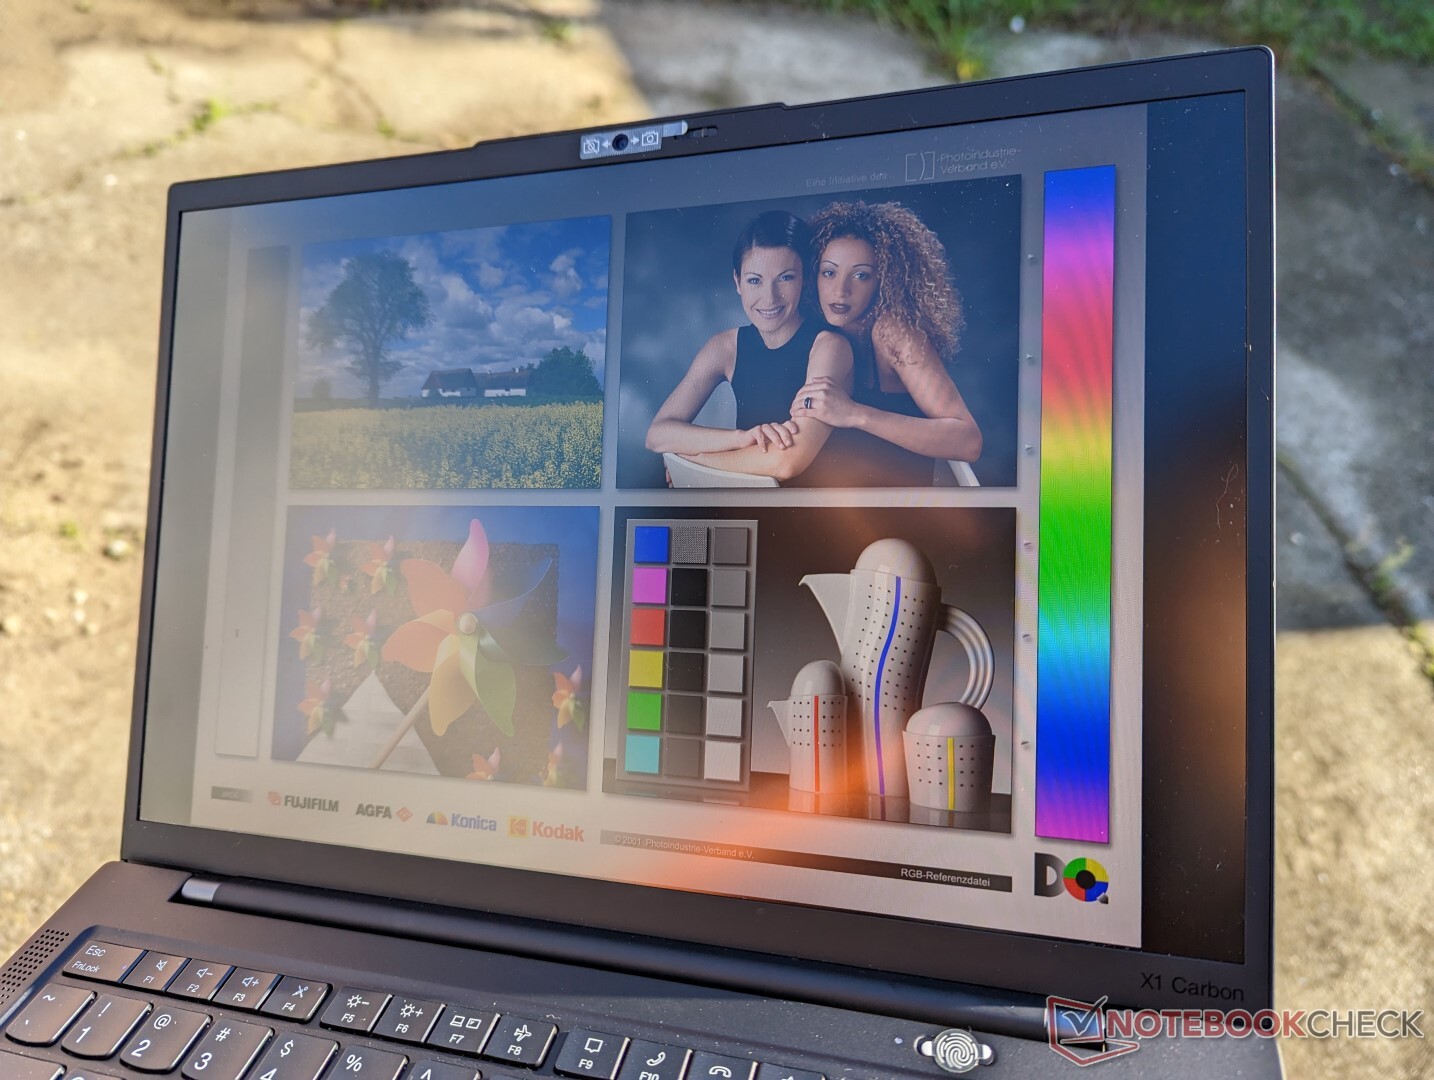
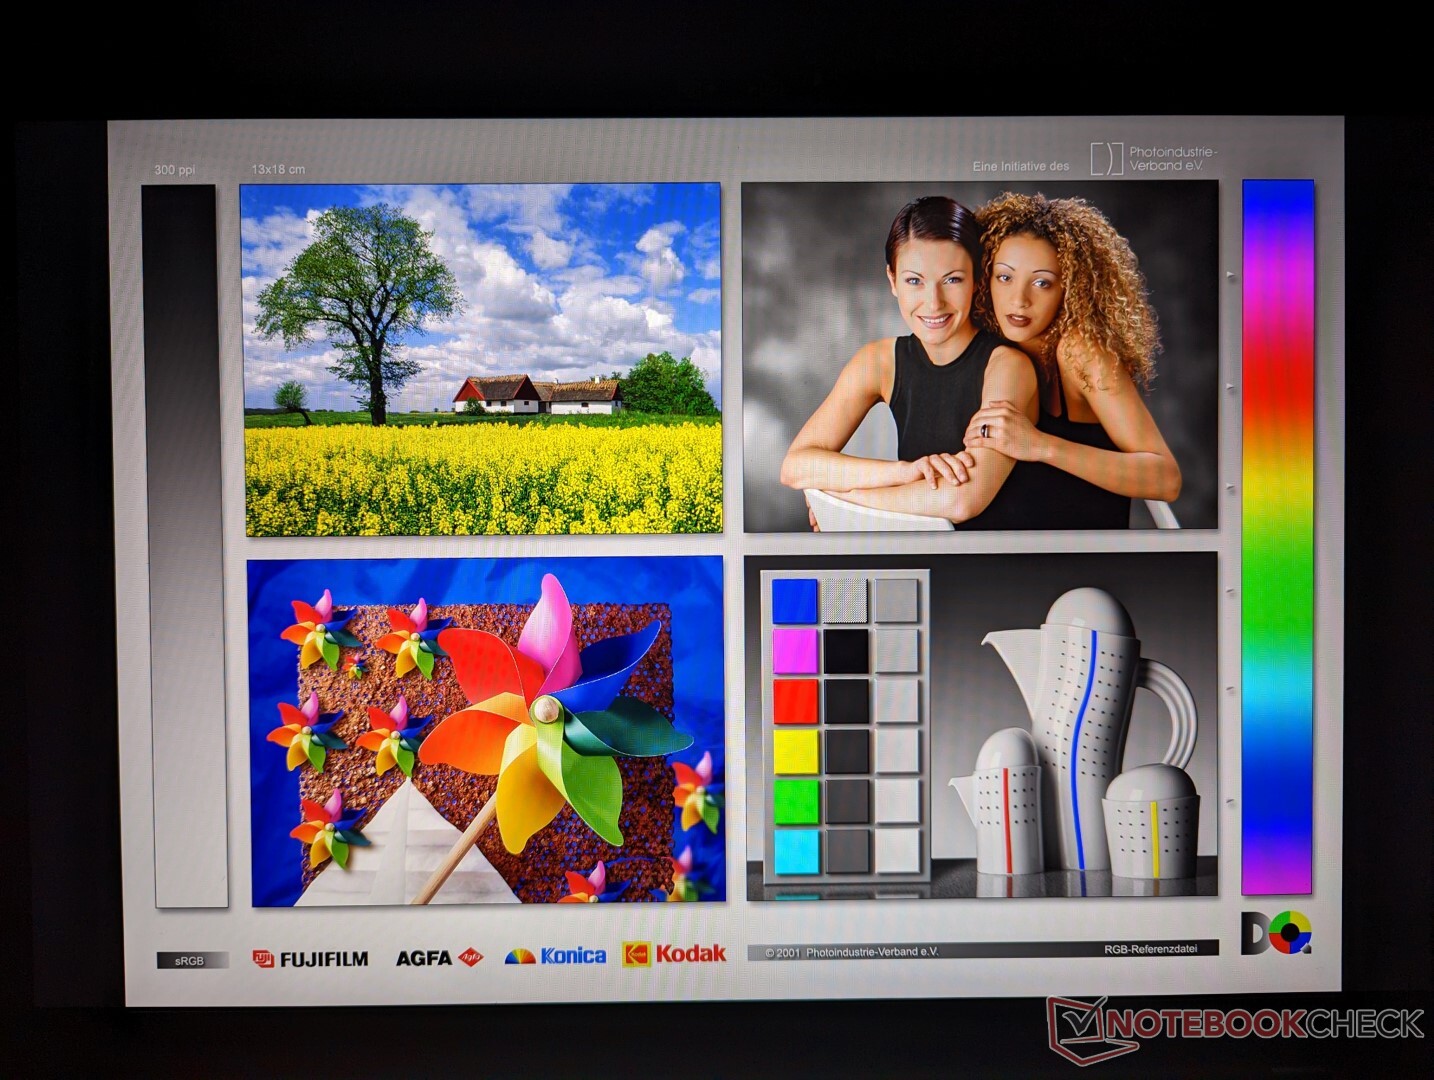
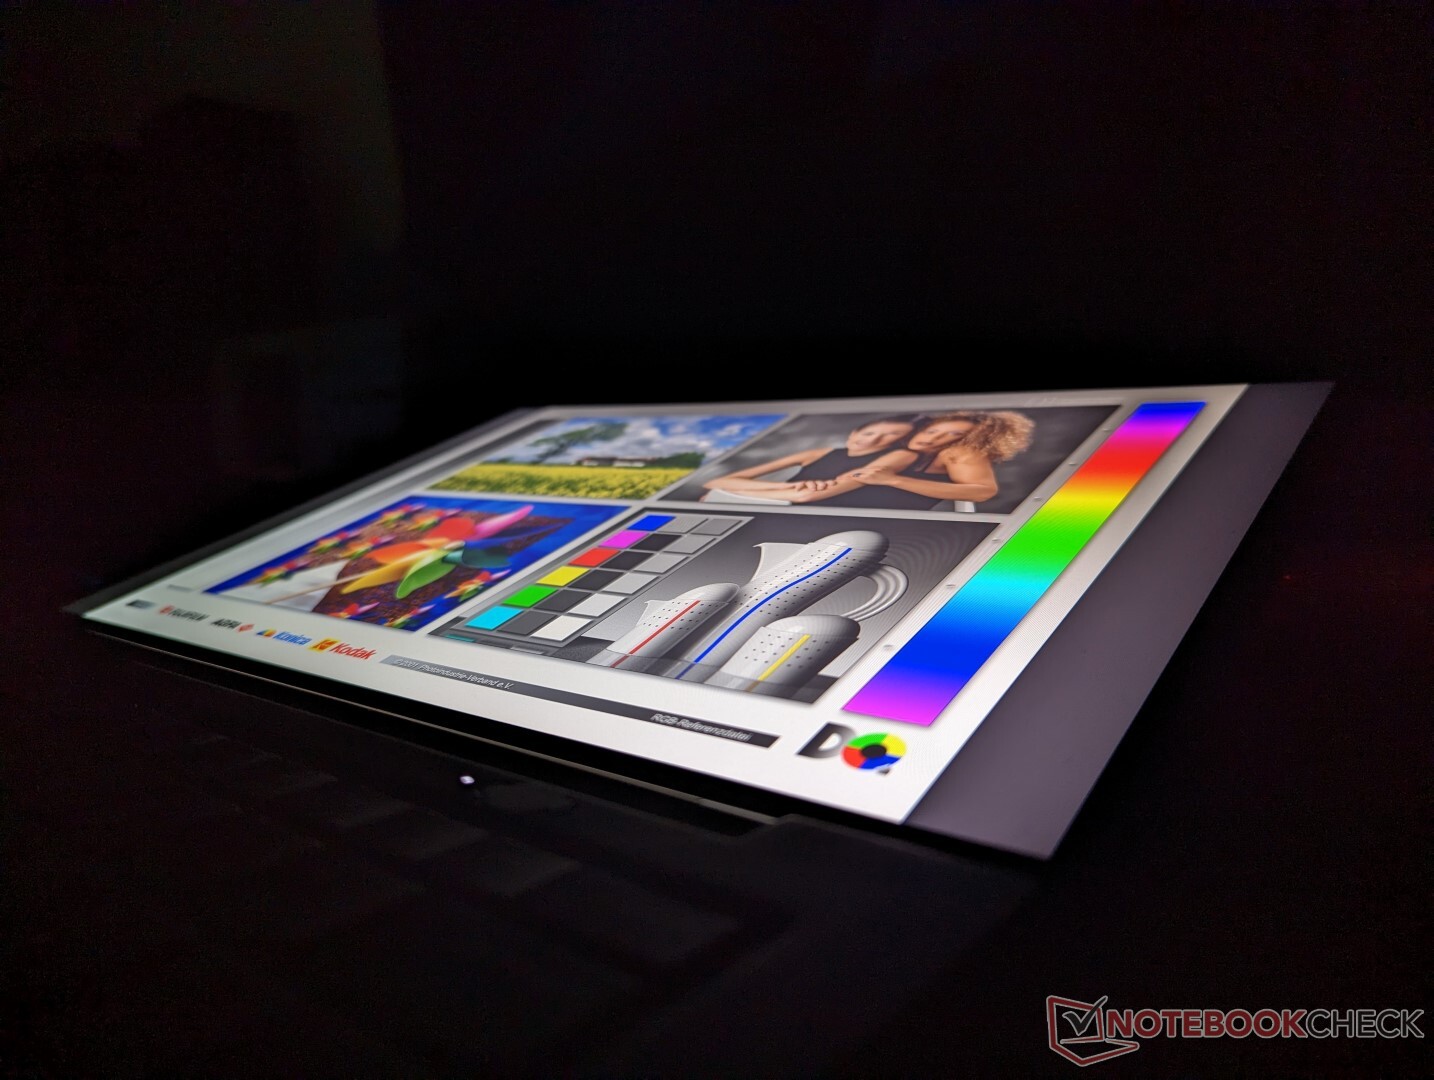
Interessanterweise verwendet unser Core-U-Gerät ein 1.200p-IPS-Panel von IVO anstelle des B140UAN02.1-Panels von AU Optronics, das in unserem Core-P-Gerät verwendet wird. Obwohl beide den sRGB-Bereich Standard vollständig abdecken, scheint das IVO-Panel langsamere Reaktionszeiten und ein schlechteres Kontrastverhältnis als das AUO-Panel zu bieten, wie unsere Messungen unten zeigen. Ghosting ist daher auf dem IVO-Panel deutlicher zu erkennen.
Das IVO-Panel hat jedoch auch einige Vorteile: Die Hintergrundbeleuchtung auf unserem Test ist im Durchschnitt etwas heller und weist im Gegensatz zum AUO-Panel unserer Core-P-Konfiguration keine Pulsweitenmodulation auf. Benutzer, die empfindlich auf Bildschirmflackern reagieren, könnten daher das IVO-Panel bevorzugen. Leider gibt es keine Möglichkeit zu wissen oder zu garantieren, welches der beiden Panels Sie erhalten, wenn Sie online bestellen.

| |||||||||||||||||||||||||
Ausleuchtung: 87 %
Helligkeit Akku: 421.9 cd/m²
Kontrast: 1455:1 (Schwarzwert: 0.29 cd/m²)
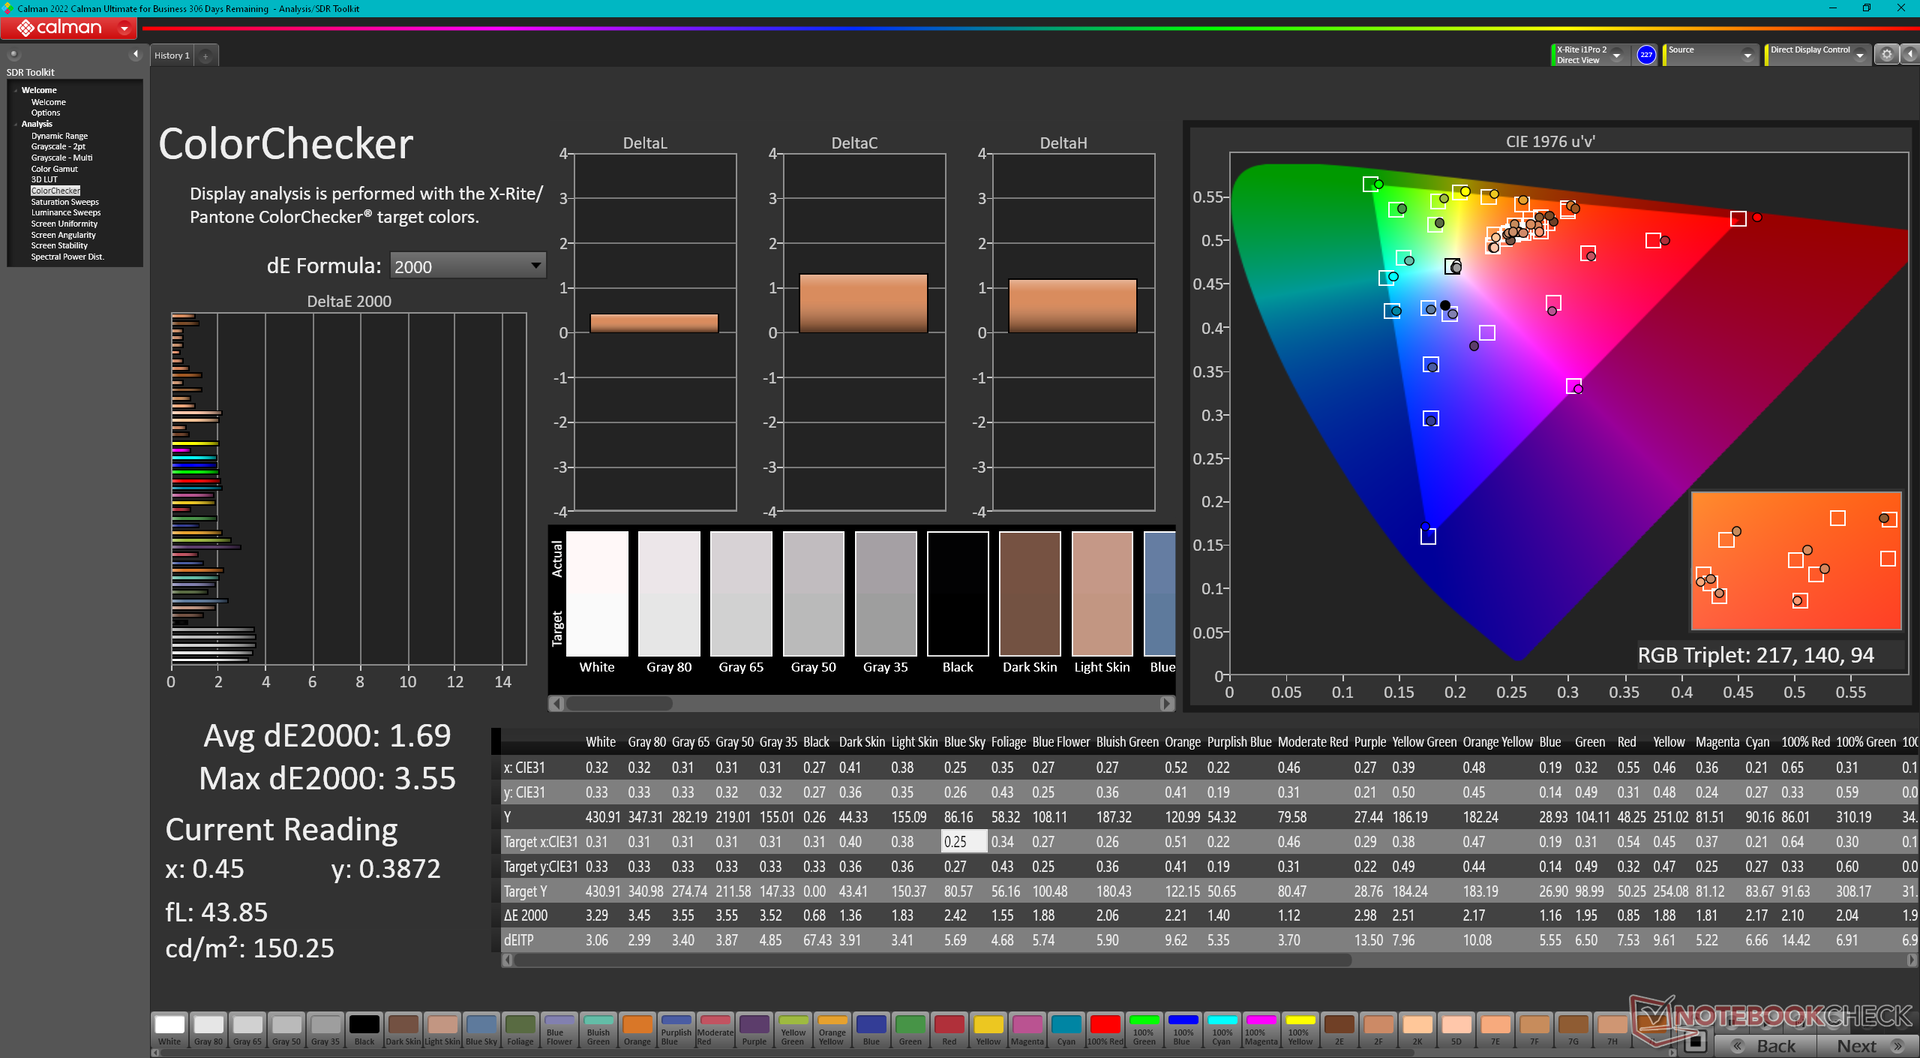
ΔE ColorChecker Calman: 1.69 | ∀{0.5-29.43 Ø4.72}
calibrated: 0.5
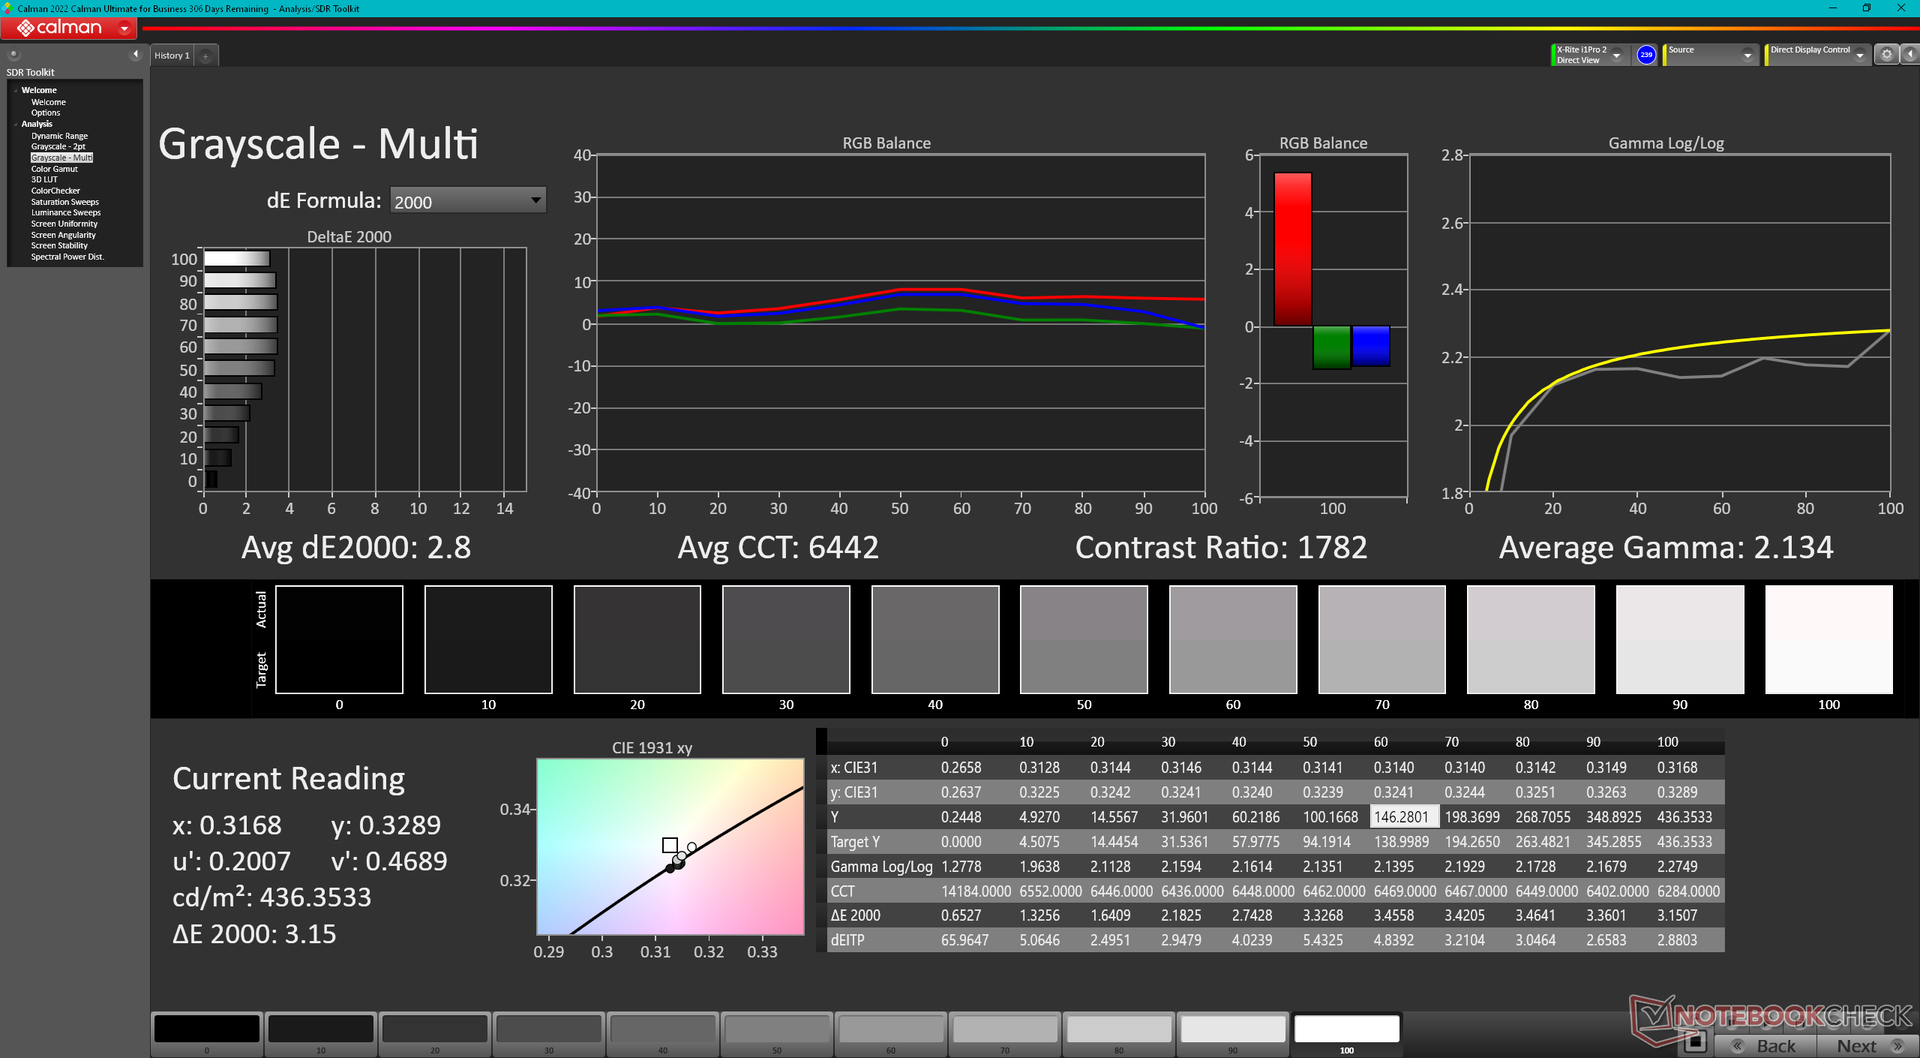
ΔE Greyscale Calman: 2.8 | ∀{0.09-98 Ø4.97}
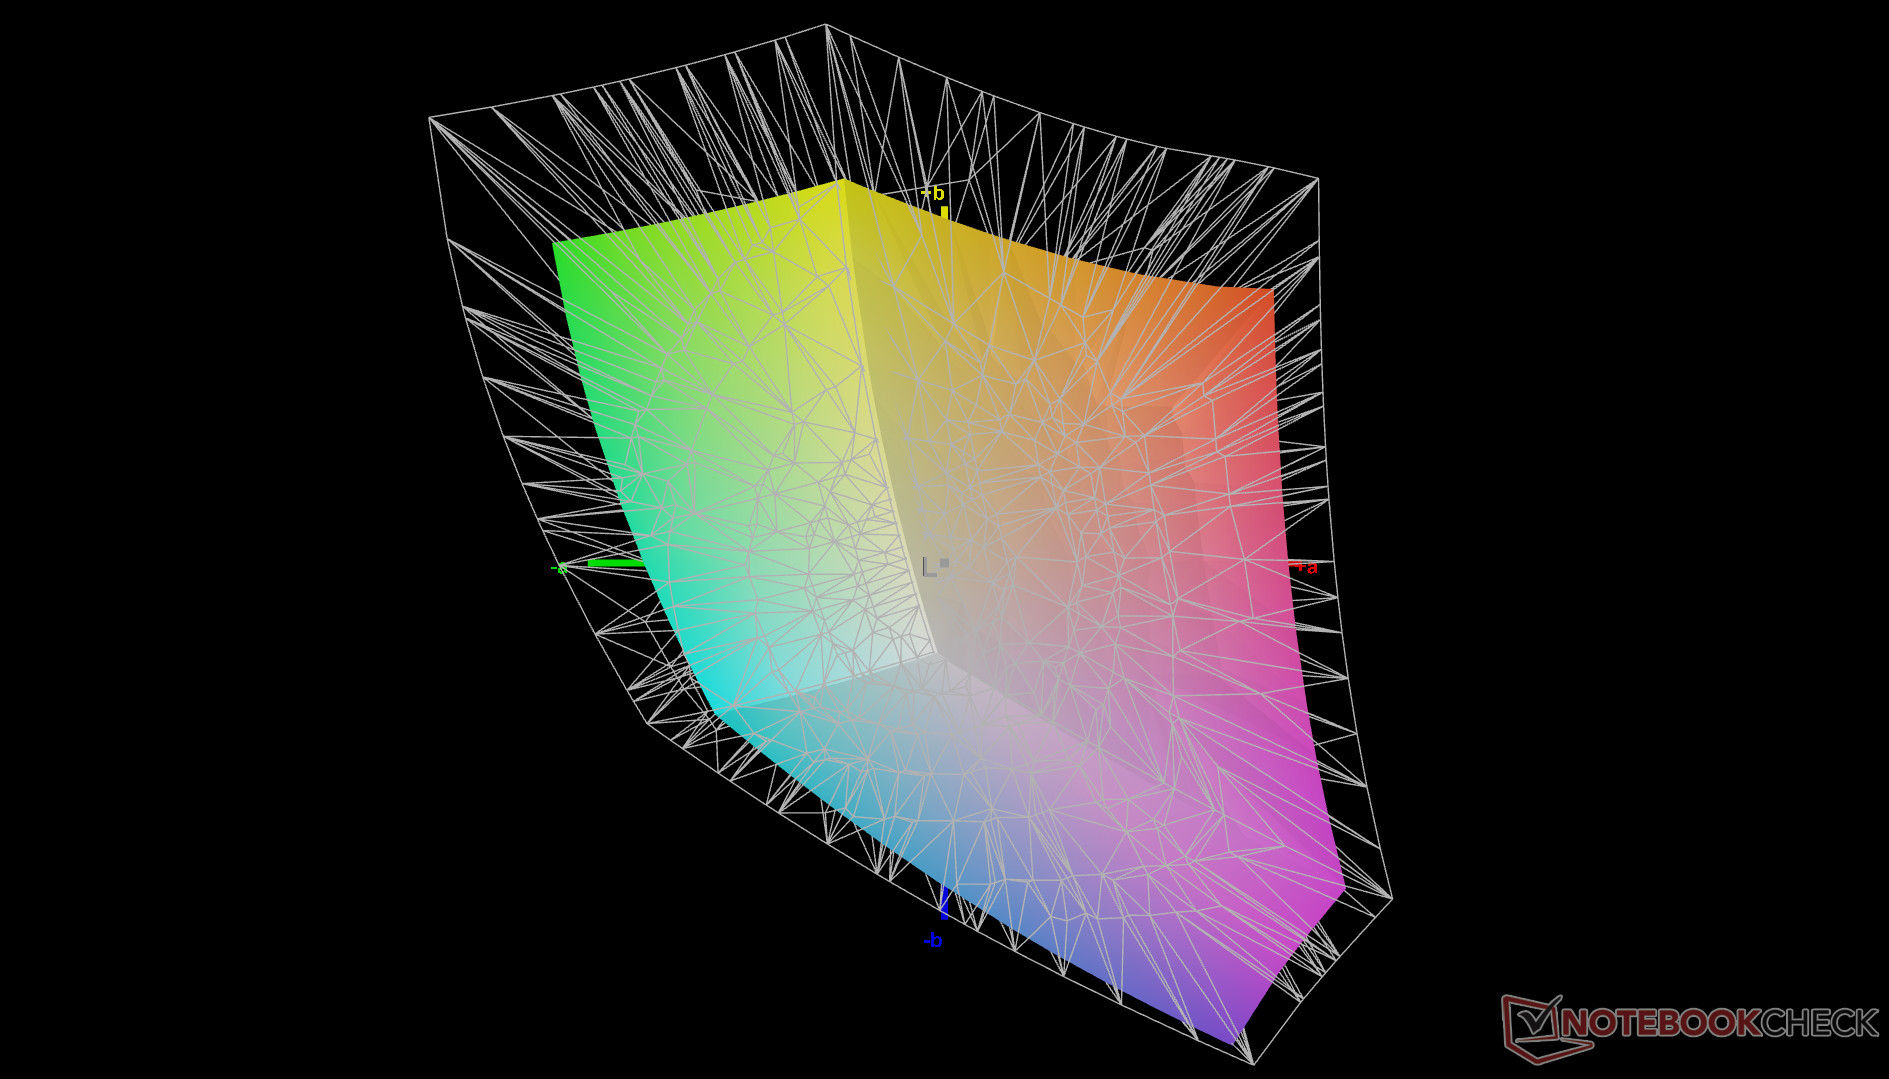
70.2% AdobeRGB 1998 (Argyll 3D)
99.5% sRGB (Argyll 3D)
68.7% Display P3 (Argyll 3D)
Gamma: 2.13
CCT: 6442 K
| Lenovo ThinkPad X1 Carbon G10 Core i7-1265U R140NW4D R0, IPS, 1920x1200, 14" | Lenovo ThinkPad X1 Carbon G10 21CC001RGE B140UAN02.1, IPS LED, 1920x1200, 14" | HP EliteBook 845 G9 6F6H9EA AUOA49A, IPS, 1920x1200, 14" | LG Gram 14Z90Q LG LP140WU1-SPF1, IPS, 1920x1200, 14" | Dell Latitude 7420 JW6MH Chi Mei CMN1416 CHF07 140HCG, IPS, 1920x1080, 14" | Asus ExpertBook B1 B1400CEAE, i5-1135G7 Chi Mei CMN14D4, IPS, 1920x1080, 14" | |
|---|---|---|---|---|---|---|
| Display | 6% | 7% | 22% | -1% | -37% | |
| Display P3 Coverage (%) | 68.7 | 74.6 9% | 75.4 10% | 98.4 43% | 68 -1% | 42.8 -38% |
| sRGB Coverage (%) | 99.5 | 98.6 -1% | 100 1% | 99.9 0% | 99 -1% | 63.9 -36% |
| AdobeRGB 1998 Coverage (%) | 70.2 | 76.5 9% | 76.6 9% | 85.9 22% | 70 0% | 44.3 -37% |
| Response Times | 31% | 16% | 29% | 20% | 41% | |
| Response Time Grey 50% / Grey 80% * (ms) | 55.2 ? | 45.5 ? 18% | 58.8 ? -7% | 47.5 ? 14% | 55 ? -0% | 35.2 ? 36% |
| Response Time Black / White * (ms) | 43.2 ? | 24 ? 44% | 26.7 ? 38% | 24.5 ? 43% | 26 ? 40% | 23.2 ? 46% |
| PWM Frequency (Hz) | 53050 ? | 25000 ? | ||||
| Bildschirm | -49% | -23% | -47% | -2% | -168% | |
| Helligkeit Bildmitte (cd/m²) | 421.9 | 372 -12% | 408 -3% | 341 -19% | 408 -3% | 256 -39% |
| Brightness (cd/m²) | 420 | 362 -14% | 402 -4% | 305 -27% | 378 -10% | 239 -43% |
| Brightness Distribution (%) | 87 | 94 8% | 92 6% | 87 0% | 86 -1% | 83 -5% |
| Schwarzwert * (cd/m²) | 0.29 | 0.18 38% | 0.24 17% | 0.26 10% | 0.22 24% | 0.23 21% |
| Kontrast (:1) | 1455 | 2067 42% | 1700 17% | 1312 -10% | 1855 27% | 1113 -24% |
| Delta E Colorchecker * | 1.69 | 3.4 -101% | 2.09 -24% | 3.11 -84% | 1.54 9% | 6.2 -267% |
| Colorchecker dE 2000 max. * | 3.55 | 6.7 -89% | 5.09 -43% | 8.29 -134% | 2.72 23% | 18.2 -413% |
| Colorchecker dE 2000 calibrated * | 0.5 | 1.8 -260% | 1.56 -212% | 0.83 -66% | 1.08 -116% | 3.8 -660% |
| Delta E Graustufen * | 2.8 | 4.3 -54% | 1.7 39% | 5.3 -89% | 1.95 30% | 5 -79% |
| Gamma | 2.13 103% | 2.13 103% | 2.138 103% | 2.037 108% | 2.33 94% | 1.97 112% |
| CCT | 6442 101% | 6158 106% | 6628 98% | 7571 86% | 6806 96% | 7364 88% |
| Durchschnitt gesamt (Programm / Settings) | -4% /
-26% | 0% /
-11% | 1% /
-21% | 6% /
2% | -55% /
-110% |
* ... kleinere Werte sind besser
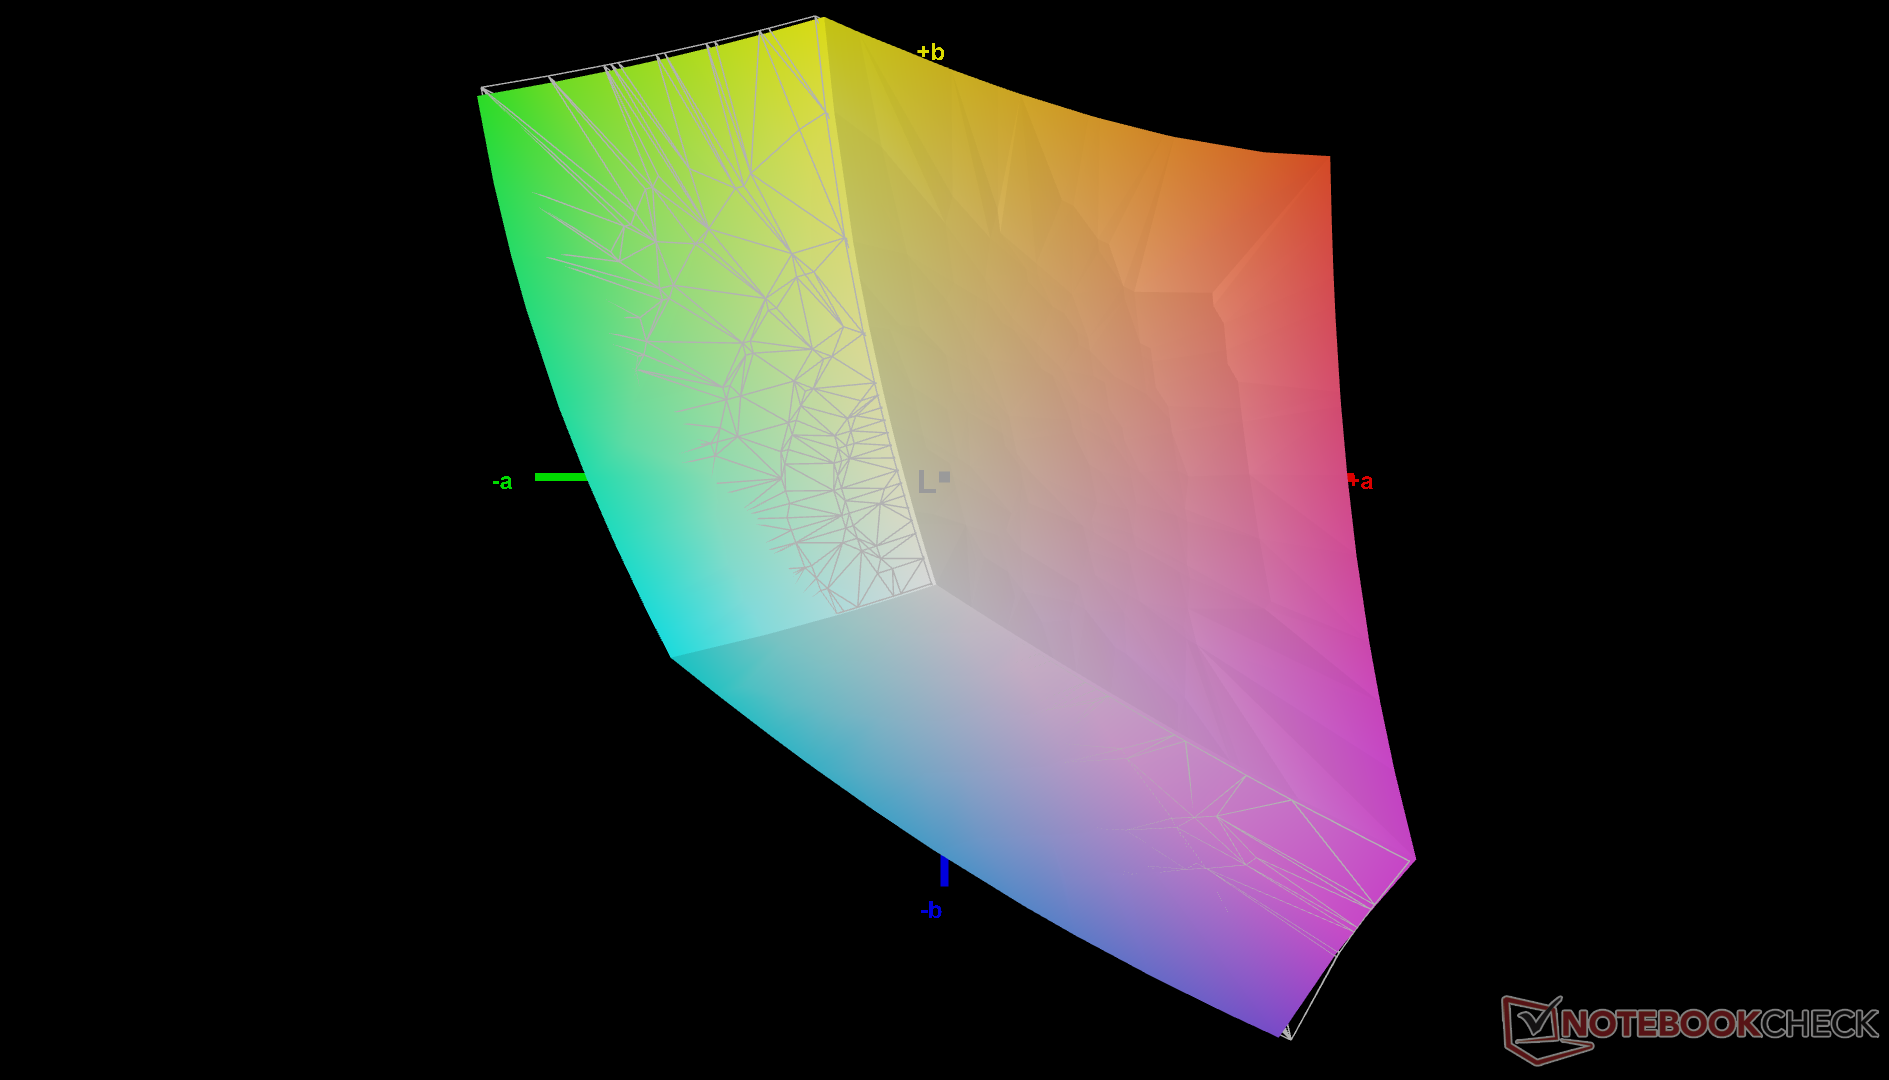
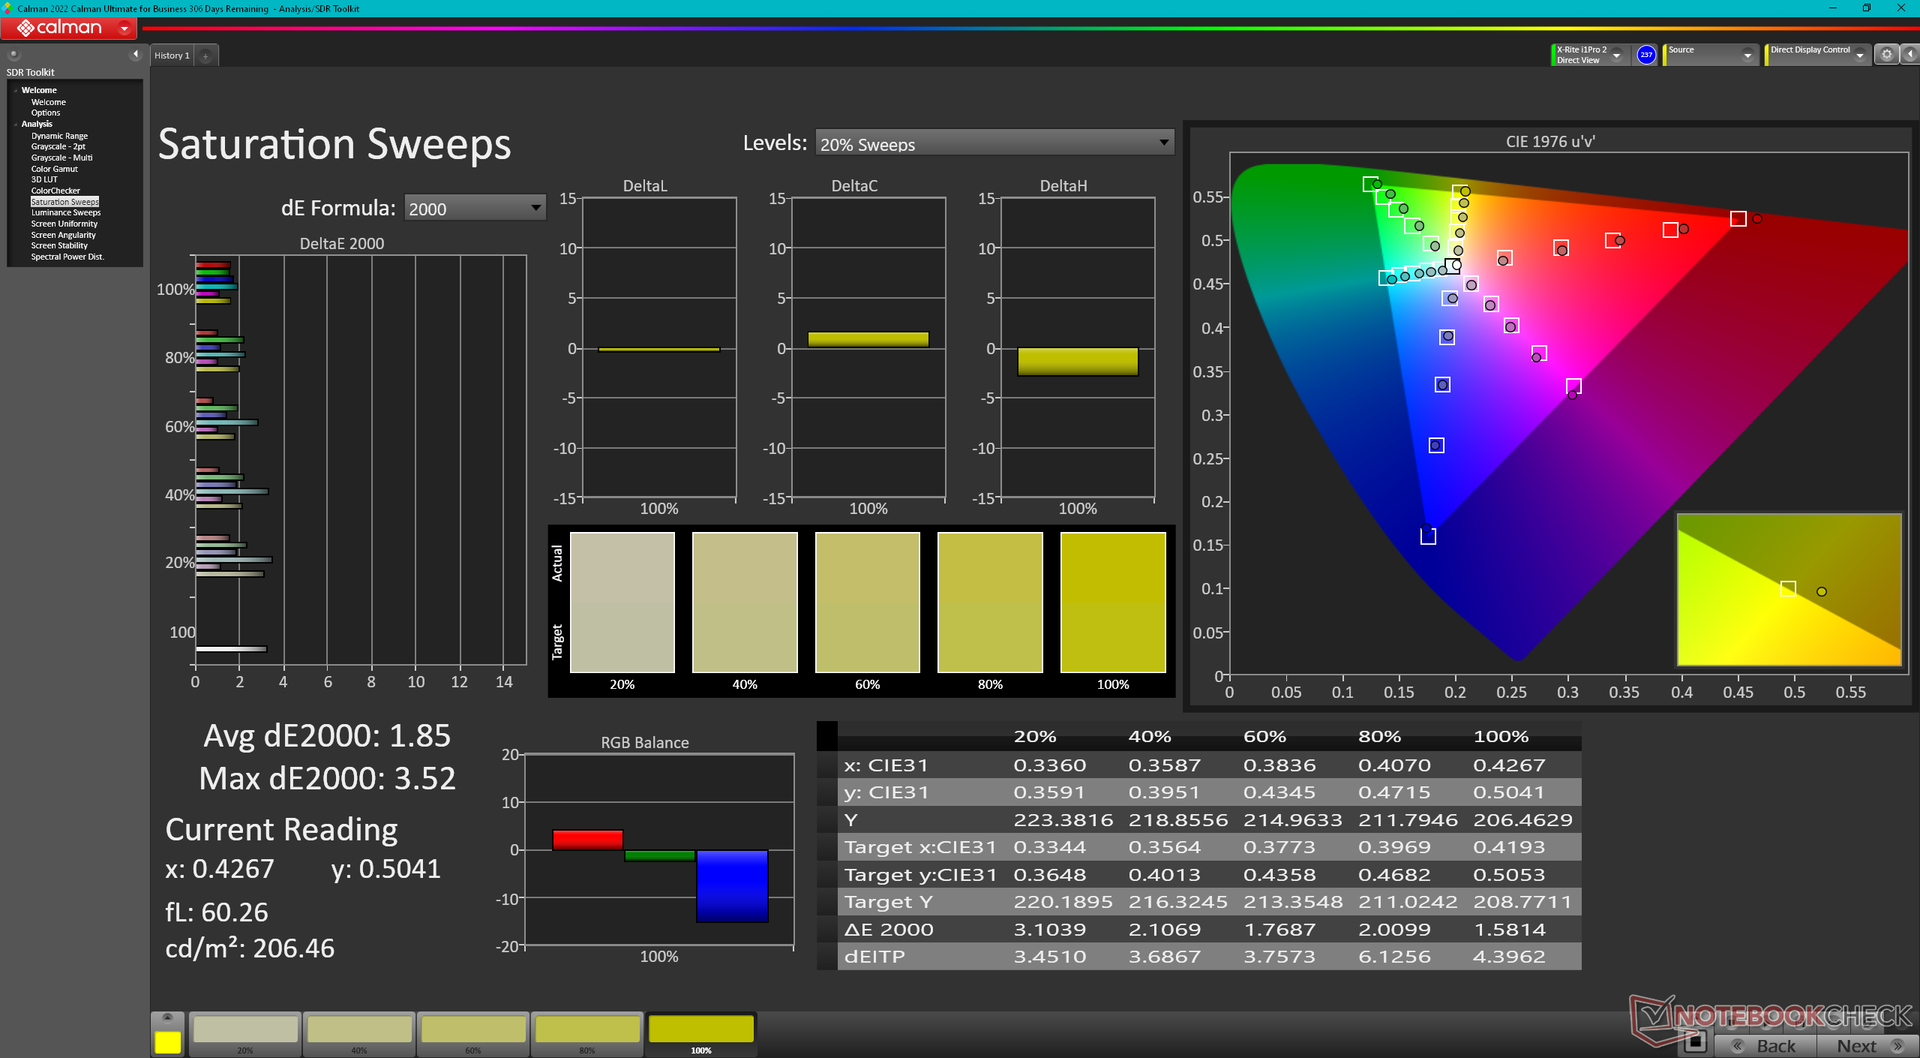
Das Panel ist bereits gut kalibriert ab Werk mit durchschnittlichen Graustufen- und Farb-DeltaE-Werten von nur 2,8 bzw. 1,69. Unsere eigene X-Rite-Kolorimeter-Kalibrierung würde diese Durchschnittswerte noch weiter auf jeweils <1 verbessern, aber das wird für die meisten Benutzer nicht notwendig sein. Unser kalibriertes ICM-Profil ist für Nutzer, die es ausprobieren möchten, oben kostenlos verfügbar.

Reaktionszeiten (Response Times) des Displays
| ↔ Reaktionszeiten Schwarz zu Weiß | ||
|---|---|---|
| 43.2 ms ... steigend ↗ und fallend ↘ kombiniert | ↗ 22 ms steigend | 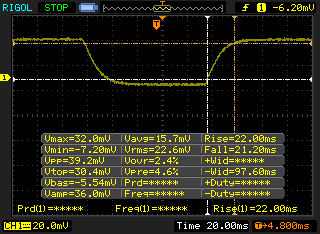 |
| ↘ 21.2 ms fallend | ||
| Die gemessenen Reaktionszeiten sind langsam und dadurch für viele Spieler wahrscheinlich zu langsam. Im Vergleich rangierten die bei uns getesteten Geräte von 0.1 (Minimum) zu 240 (Maximum) ms. » 98 % aller Screens waren schneller als der getestete. Daher sind die gemessenen Reaktionszeiten schlechter als der Durchschnitt aller vermessenen Geräte (19.8 ms). | ||
| ↔ Reaktionszeiten 50% Grau zu 80% Grau | ||
| 55.2 ms ... steigend ↗ und fallend ↘ kombiniert | ↗ 28.4 ms steigend | 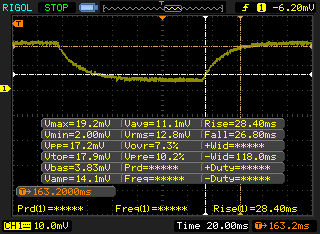 |
| ↘ 26.8 ms fallend | ||
| Die gemessenen Reaktionszeiten sind langsam und dadurch für viele Spieler wahrscheinlich zu langsam. Im Vergleich rangierten die bei uns getesteten Geräte von 0.165 (Minimum) zu 636 (Maximum) ms. » 92 % aller Screens waren schneller als der getestete. Daher sind die gemessenen Reaktionszeiten schlechter als der Durchschnitt aller vermessenen Geräte (31 ms). | ||
Bildschirm-Flackern / PWM (Pulse-Width Modulation)
| Flackern / PWM nicht festgestellt | 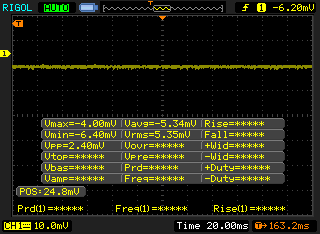 | ||
Im Vergleich: 52 % aller getesteten Geräte nutzten kein PWM um die Helligkeit zu reduzieren. Wenn PWM eingesetzt wurde, dann bei einer Frequenz von durchschnittlich 7781 (Minimum 5, Maximum 343500) Hz. | |||

Performance - Intel 12. Generation
Testbedingungen
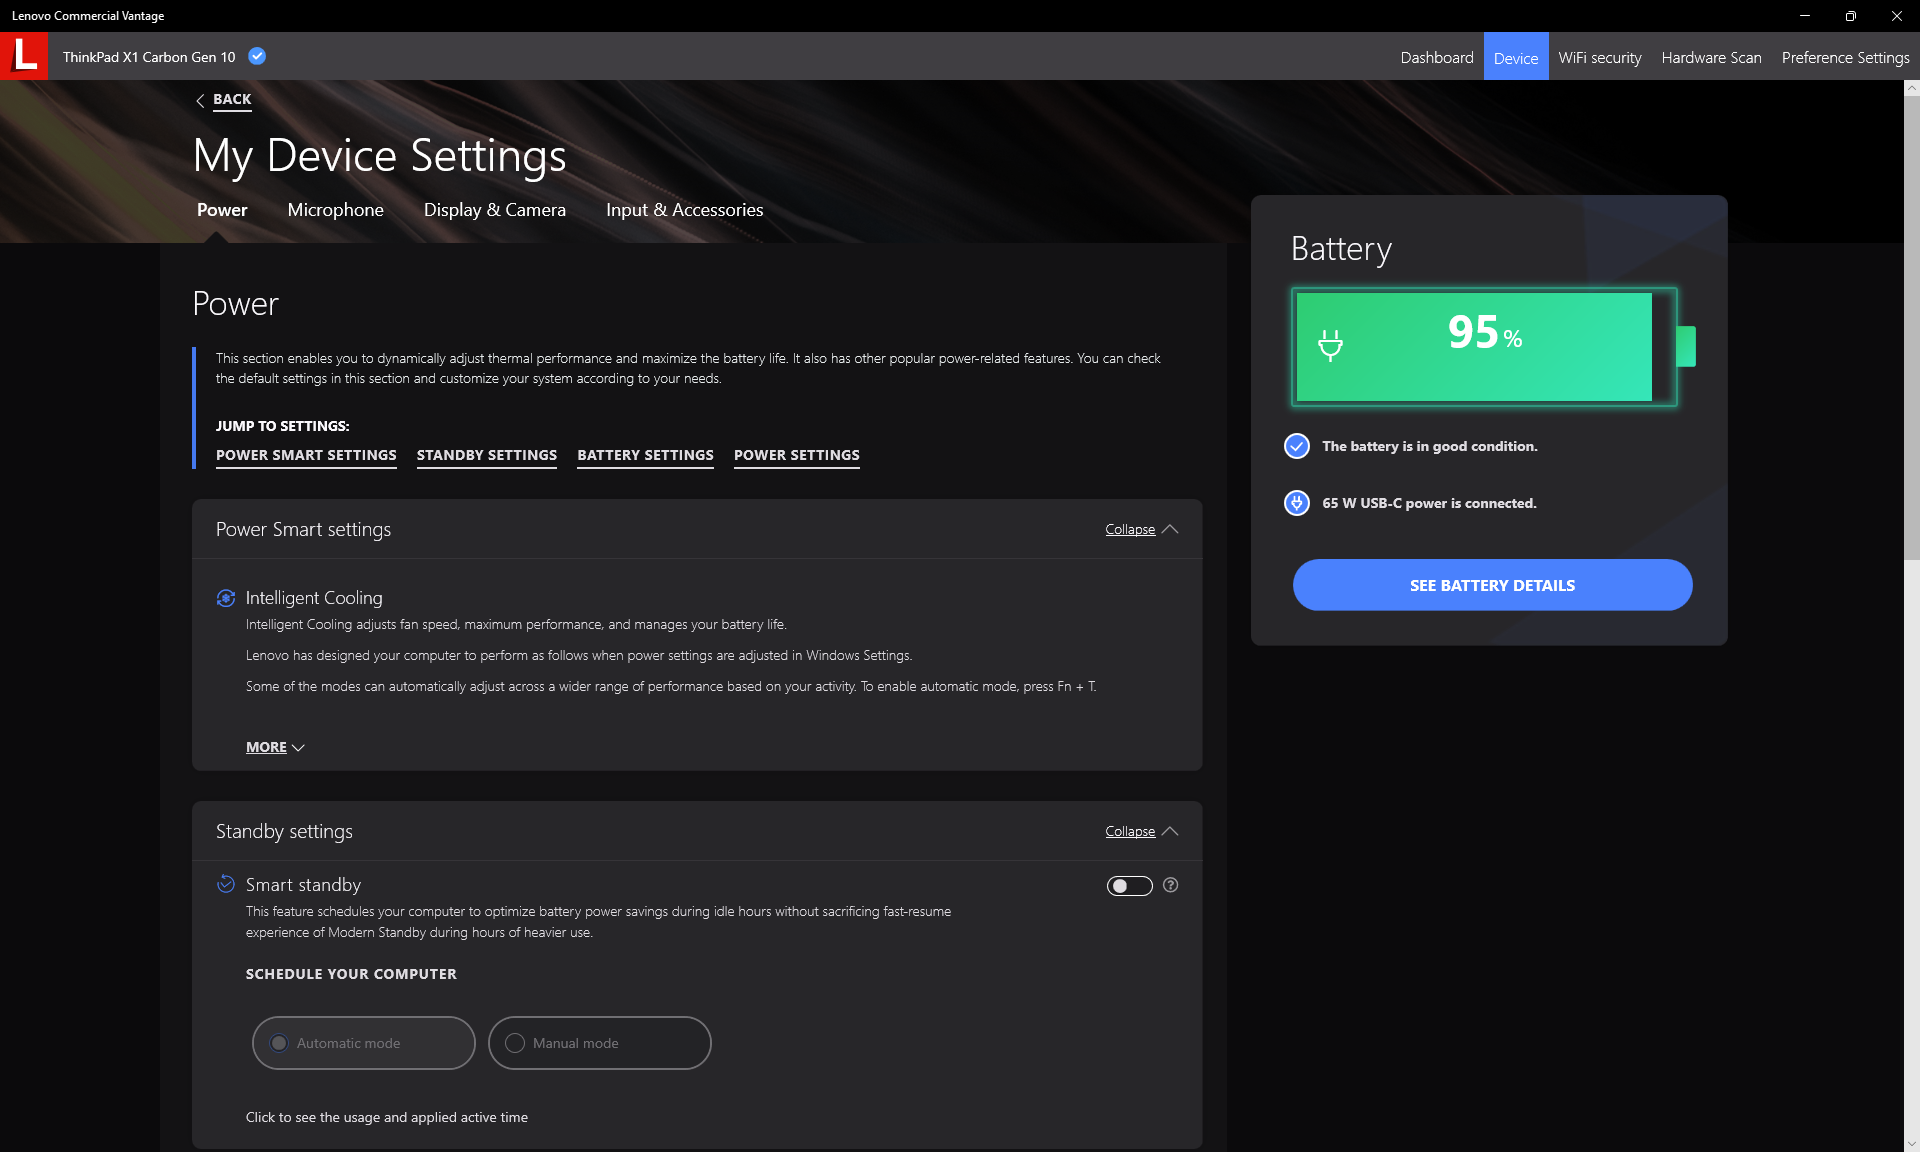
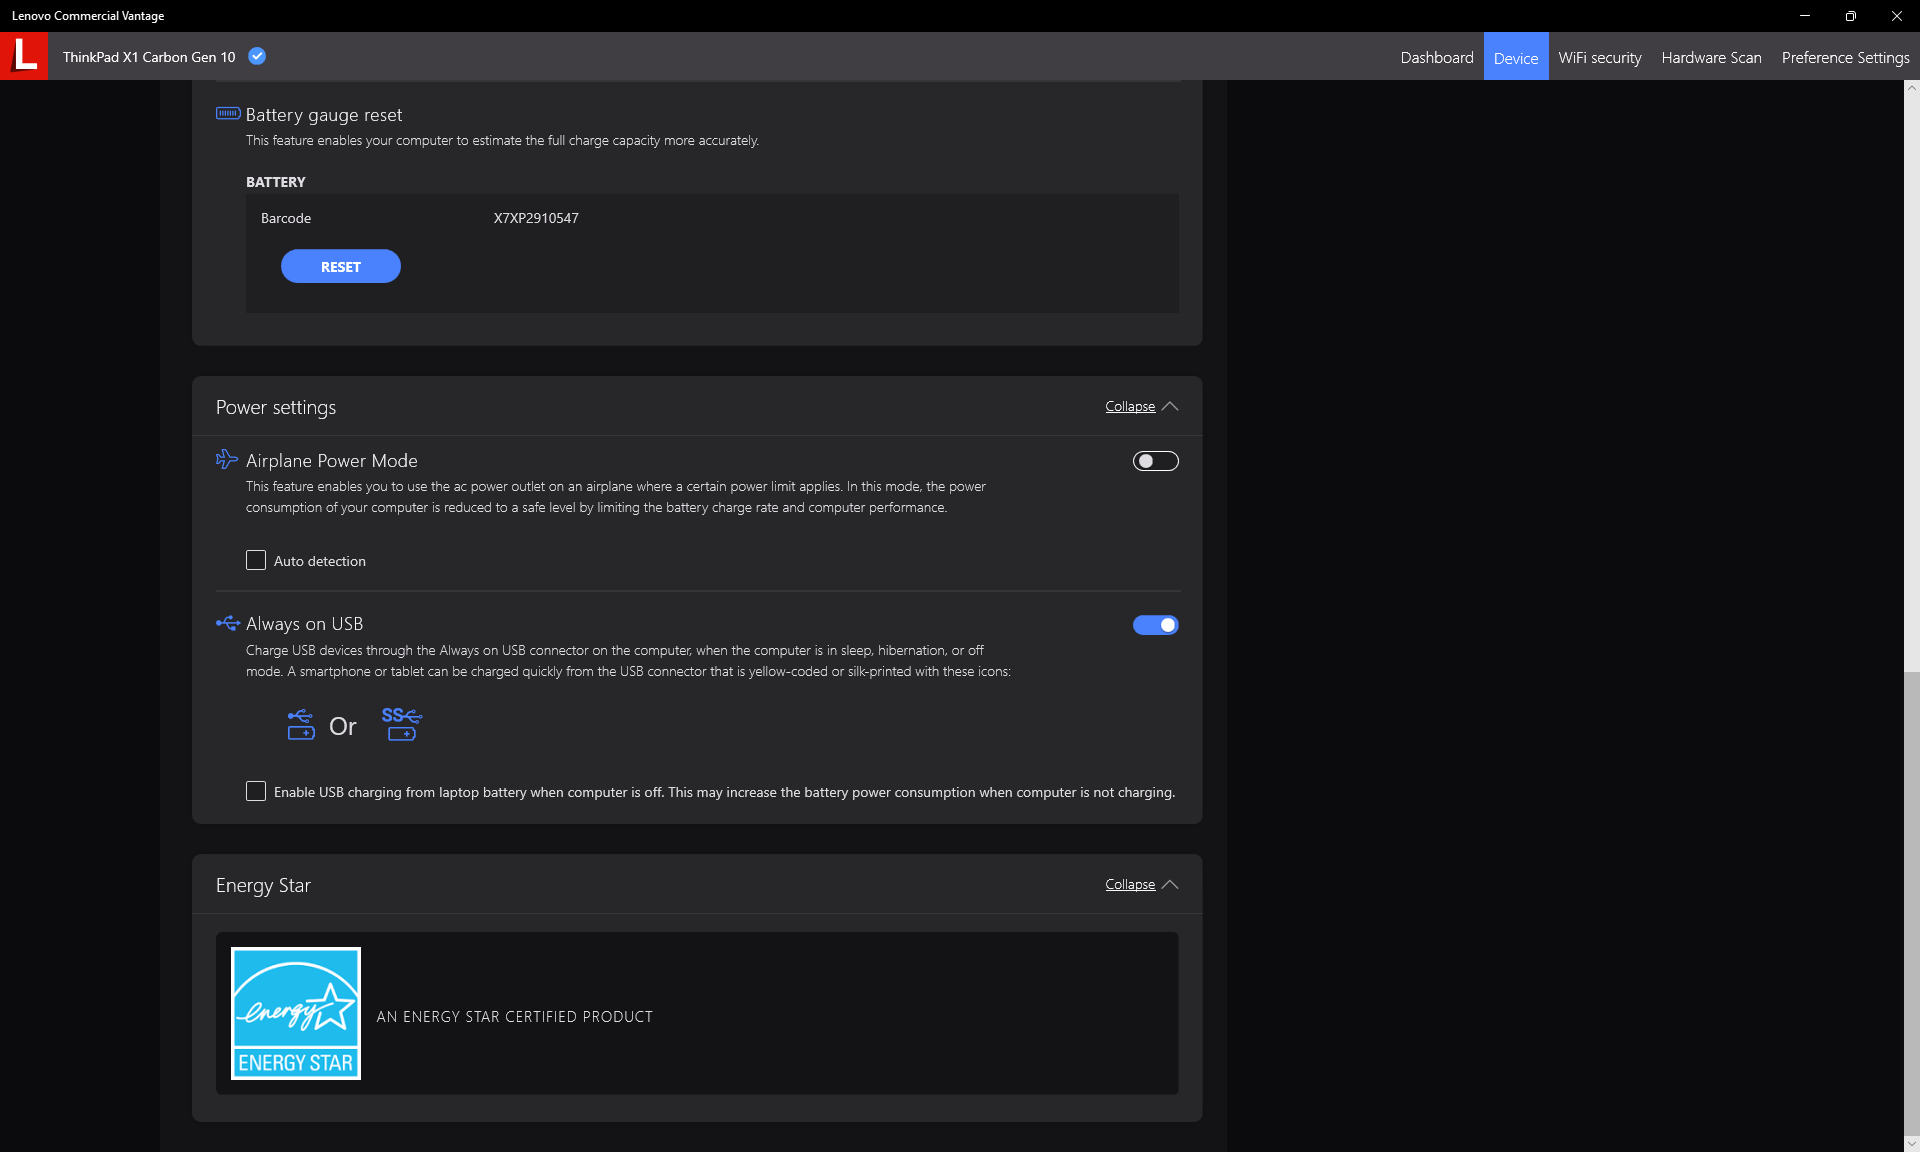
Wir haben unser Gerät über Windows auf den Modus "Beste Leistung" eingestellt, bevor wir die folgenden Benchmarks durchgeführt haben. Die vorinstallierte Vantage Software enthält keine Energieprofiloptionen, wobei die intelligente Kühlung standardmäßig aktiviert ist, wie der Screenshot unten zeigt.
Prozessor
Wenn wir CineBench R15 xT in einer Schleife laufen lassen, ist unser Core i7-1265U etwas langsamer als der Core i5-1250P zu Beginn des Tests. Im weiteren Verlauf des Loop-Benchmarks überholt der i7-1265U jedoch den i5-1250P, wie unser Vergleichsdiagramm unten zeigt. Diese Ergebnisse deuten darauf hin, dass der Core i5-1250P eine höhere anfängliche Turbo-Boost-Leistung haben kann als unser i7-1265U, aber dass die Gewinne nur von kurzer Dauer sind.
Das soll nicht heißen, dass die Core-P-SKUs vermieden werden sollten. Ein Upgrade auf die höchste Core-i7-1280P-Konfiguration kann zum Beispiel die Multi-Thread-Leistung um 50 bis 60 Prozent gegenüber unserem Core i7-1265U steigern, basierend auf unseren Erfahrungen mit dem Yoga Slim 9 14.
Cinebench R15 Multi Loop
Cinebench R23: Multi Core | Single Core
Cinebench R15: CPU Multi 64Bit | CPU Single 64Bit
Blender: v2.79 BMW27 CPU
7-Zip 18.03: 7z b 4 | 7z b 4 -mmt1
Geekbench 5.5: Multi-Core | Single-Core
HWBOT x265 Benchmark v2.2: 4k Preset
LibreOffice : 20 Documents To PDF
R Benchmark 2.5: Overall mean
Cinebench R23: Multi Core | Single Core
Cinebench R15: CPU Multi 64Bit | CPU Single 64Bit
Blender: v2.79 BMW27 CPU
7-Zip 18.03: 7z b 4 | 7z b 4 -mmt1
Geekbench 5.5: Multi-Core | Single-Core
HWBOT x265 Benchmark v2.2: 4k Preset
LibreOffice : 20 Documents To PDF
R Benchmark 2.5: Overall mean
* ... kleinere Werte sind besser
* ... kleinere Werte sind besser
AIDA64: FP32 Ray-Trace | FPU Julia | CPU SHA3 | CPU Queen | FPU SinJulia | FPU Mandel | CPU AES | CPU ZLib | FP64 Ray-Trace | CPU PhotoWorxx
| Performance Rating | |
| HP EliteBook 845 G9 6F6H9EA | |
| Lenovo ThinkPad X1 Carbon G10 Core i7-1265U | |
| Dell Latitude 7420 JW6MH | |
| Durchschnittliche Intel Core i7-1265U | |
| Asus ExpertBook B1 B1400CEAE, i5-1135G7 | |
| Lenovo ThinkPad X1 Carbon G10 21CC001RGE | |
| LG Gram 14Z90Q | |
| AIDA64 / FP32 Ray-Trace | |
| HP EliteBook 845 G9 6F6H9EA | |
| Asus ExpertBook B1 B1400CEAE, i5-1135G7 | |
| Lenovo ThinkPad X1 Carbon G10 Core i7-1265U | |
| Dell Latitude 7420 JW6MH | |
| Durchschnittliche Intel Core i7-1265U (2619 - 8178, n=10) | |
| LG Gram 14Z90Q | |
| Lenovo ThinkPad X1 Carbon G10 21CC001RGE | |
| AIDA64 / FPU Julia | |
| HP EliteBook 845 G9 6F6H9EA | |
| Lenovo ThinkPad X1 Carbon G10 Core i7-1265U | |
| Durchschnittliche Intel Core i7-1265U (12909 - 41649, n=10) | |
| Asus ExpertBook B1 B1400CEAE, i5-1135G7 | |
| Dell Latitude 7420 JW6MH | |
| LG Gram 14Z90Q | |
| Lenovo ThinkPad X1 Carbon G10 21CC001RGE | |
| AIDA64 / CPU SHA3 | |
| HP EliteBook 845 G9 6F6H9EA | |
| Asus ExpertBook B1 B1400CEAE, i5-1135G7 | |
| Dell Latitude 7420 JW6MH | |
| Lenovo ThinkPad X1 Carbon G10 Core i7-1265U | |
| Durchschnittliche Intel Core i7-1265U (824 - 2183, n=10) | |
| Lenovo ThinkPad X1 Carbon G10 21CC001RGE | |
| LG Gram 14Z90Q | |
| AIDA64 / CPU Queen | |
| LG Gram 14Z90Q | |
| Lenovo ThinkPad X1 Carbon G10 21CC001RGE | |
| HP EliteBook 845 G9 6F6H9EA | |
| Durchschnittliche Intel Core i7-1265U (63615 - 67065, n=10) | |
| Lenovo ThinkPad X1 Carbon G10 Core i7-1265U | |
| Dell Latitude 7420 JW6MH | |
| Asus ExpertBook B1 B1400CEAE, i5-1135G7 | |
| AIDA64 / FPU SinJulia | |
| HP EliteBook 845 G9 6F6H9EA | |
| Lenovo ThinkPad X1 Carbon G10 21CC001RGE | |
| Dell Latitude 7420 JW6MH | |
| Lenovo ThinkPad X1 Carbon G10 Core i7-1265U | |
| Asus ExpertBook B1 B1400CEAE, i5-1135G7 | |
| Durchschnittliche Intel Core i7-1265U (3105 - 5135, n=10) | |
| LG Gram 14Z90Q | |
| AIDA64 / FPU Mandel | |
| HP EliteBook 845 G9 6F6H9EA | |
| Dell Latitude 7420 JW6MH | |
| Asus ExpertBook B1 B1400CEAE, i5-1135G7 | |
| Lenovo ThinkPad X1 Carbon G10 Core i7-1265U | |
| Durchschnittliche Intel Core i7-1265U (6967 - 20804, n=10) | |
| LG Gram 14Z90Q | |
| Lenovo ThinkPad X1 Carbon G10 21CC001RGE | |
| AIDA64 / CPU AES | |
| Asus ExpertBook B1 B1400CEAE, i5-1135G7 | |
| Dell Latitude 7420 JW6MH | |
| HP EliteBook 845 G9 6F6H9EA | |
| Lenovo ThinkPad X1 Carbon G10 Core i7-1265U | |
| Durchschnittliche Intel Core i7-1265U (19489 - 42966, n=10) | |
| Lenovo ThinkPad X1 Carbon G10 21CC001RGE | |
| LG Gram 14Z90Q | |
| AIDA64 / CPU ZLib | |
| HP EliteBook 845 G9 6F6H9EA | |
| Lenovo ThinkPad X1 Carbon G10 Core i7-1265U | |
| Lenovo ThinkPad X1 Carbon G10 21CC001RGE | |
| Durchschnittliche Intel Core i7-1265U (314 - 632, n=10) | |
| Dell Latitude 7420 JW6MH | |
| Asus ExpertBook B1 B1400CEAE, i5-1135G7 | |
| LG Gram 14Z90Q | |
| AIDA64 / FP64 Ray-Trace | |
| HP EliteBook 845 G9 6F6H9EA | |
| Lenovo ThinkPad X1 Carbon G10 Core i7-1265U | |
| Asus ExpertBook B1 B1400CEAE, i5-1135G7 | |
| Dell Latitude 7420 JW6MH | |
| Durchschnittliche Intel Core i7-1265U (1473 - 4376, n=10) | |
| LG Gram 14Z90Q | |
| Lenovo ThinkPad X1 Carbon G10 21CC001RGE | |
| AIDA64 / CPU PhotoWorxx | |
| Lenovo ThinkPad X1 Carbon G10 Core i7-1265U | |
| Dell Latitude 7420 JW6MH | |
| Durchschnittliche Intel Core i7-1265U (20213 - 47031, n=10) | |
| Lenovo ThinkPad X1 Carbon G10 21CC001RGE | |
| LG Gram 14Z90Q | |
| HP EliteBook 845 G9 6F6H9EA | |
| Asus ExpertBook B1 B1400CEAE, i5-1135G7 | |
System Performance
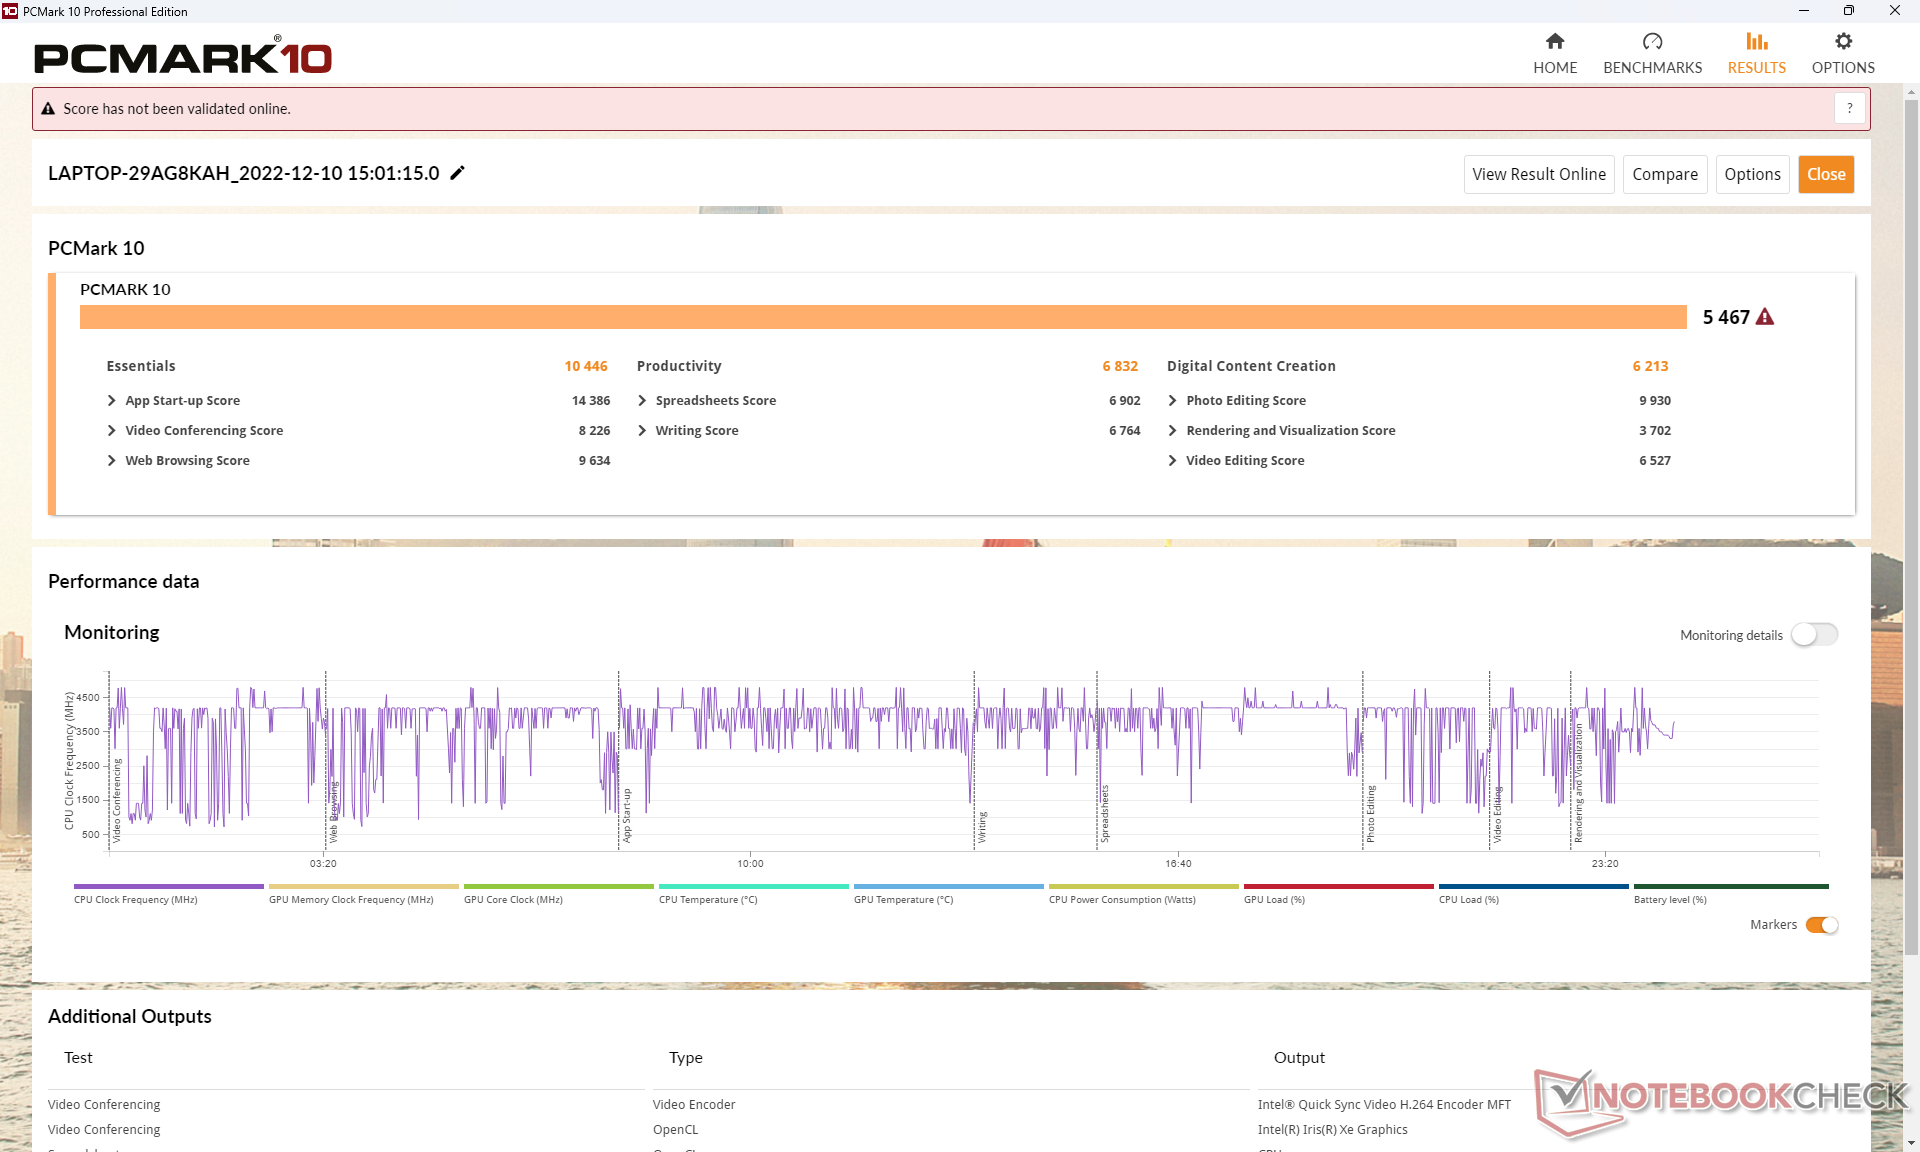
Die Ergebnisse des PCMark 10 sind durchweg besser als die des ThinkPad X1 Carbon G10 mit Core i5 P, vor allem im Untertest "Digital Contention Creation", wo die Grafikleistung am wichtigsten ist.
CrossMark: Overall | Productivity | Creativity | Responsiveness
| PCMark 10 / Score | |
| HP EliteBook 845 G9 6F6H9EA | |
| Lenovo ThinkPad X1 Carbon G10 Core i7-1265U | |
| Durchschnittliche Intel Core i7-1265U, Intel Iris Xe Graphics G7 96EUs (4753 - 5766, n=7) | |
| Lenovo ThinkPad X1 Carbon G10 21CC001RGE | |
| LG Gram 14Z90Q | |
| Dell Latitude 7420 JW6MH | |
| Asus ExpertBook B1 B1400CEAE, i5-1135G7 | |
| PCMark 10 / Essentials | |
| Durchschnittliche Intel Core i7-1265U, Intel Iris Xe Graphics G7 96EUs (9278 - 11418, n=7) | |
| Lenovo ThinkPad X1 Carbon G10 Core i7-1265U | |
| Lenovo ThinkPad X1 Carbon G10 21CC001RGE | |
| Dell Latitude 7420 JW6MH | |
| HP EliteBook 845 G9 6F6H9EA | |
| LG Gram 14Z90Q | |
| Asus ExpertBook B1 B1400CEAE, i5-1135G7 | |
| PCMark 10 / Productivity | |
| HP EliteBook 845 G9 6F6H9EA | |
| Lenovo ThinkPad X1 Carbon G10 Core i7-1265U | |
| Durchschnittliche Intel Core i7-1265U, Intel Iris Xe Graphics G7 96EUs (5828 - 7311, n=7) | |
| Lenovo ThinkPad X1 Carbon G10 21CC001RGE | |
| Dell Latitude 7420 JW6MH | |
| LG Gram 14Z90Q | |
| Asus ExpertBook B1 B1400CEAE, i5-1135G7 | |
| PCMark 10 / Digital Content Creation | |
| Lenovo ThinkPad X1 Carbon G10 Core i7-1265U | |
| HP EliteBook 845 G9 6F6H9EA | |
| Durchschnittliche Intel Core i7-1265U, Intel Iris Xe Graphics G7 96EUs (5127 - 6330, n=7) | |
| LG Gram 14Z90Q | |
| Lenovo ThinkPad X1 Carbon G10 21CC001RGE | |
| Dell Latitude 7420 JW6MH | |
| Asus ExpertBook B1 B1400CEAE, i5-1135G7 | |
| CrossMark / Overall | |
| Lenovo ThinkPad X1 Carbon G10 Core i7-1265U | |
| Lenovo ThinkPad X1 Carbon G10 21CC001RGE | |
| Durchschnittliche Intel Core i7-1265U, Intel Iris Xe Graphics G7 96EUs (1301 - 1615, n=7) | |
| Dell Latitude 7420 JW6MH | |
| CrossMark / Productivity | |
| Lenovo ThinkPad X1 Carbon G10 Core i7-1265U | |
| Lenovo ThinkPad X1 Carbon G10 21CC001RGE | |
| Durchschnittliche Intel Core i7-1265U, Intel Iris Xe Graphics G7 96EUs (1230 - 1586, n=7) | |
| Dell Latitude 7420 JW6MH | |
| CrossMark / Creativity | |
| Lenovo ThinkPad X1 Carbon G10 21CC001RGE | |
| Lenovo ThinkPad X1 Carbon G10 Core i7-1265U | |
| Durchschnittliche Intel Core i7-1265U, Intel Iris Xe Graphics G7 96EUs (1413 - 1706, n=7) | |
| Dell Latitude 7420 JW6MH | |
| CrossMark / Responsiveness | |
| Lenovo ThinkPad X1 Carbon G10 Core i7-1265U | |
| Lenovo ThinkPad X1 Carbon G10 21CC001RGE | |
| Durchschnittliche Intel Core i7-1265U, Intel Iris Xe Graphics G7 96EUs (1193 - 1521, n=7) | |
| Dell Latitude 7420 JW6MH | |
| PCMark 10 Score | 5467 Punkte | |
Hilfe | ||
| AIDA64 / Memory Copy | |
| Lenovo ThinkPad X1 Carbon G10 Core i7-1265U | |
| Lenovo ThinkPad X1 Carbon G10 21CC001RGE | |
| Durchschnittliche Intel Core i7-1265U (40212 - 72204, n=10) | |
| Dell Latitude 7420 JW6MH | |
| LG Gram 14Z90Q | |
| HP EliteBook 845 G9 6F6H9EA | |
| Asus ExpertBook B1 B1400CEAE, i5-1135G7 | |
| AIDA64 / Memory Read | |
| LG Gram 14Z90Q | |
| Lenovo ThinkPad X1 Carbon G10 21CC001RGE | |
| Lenovo ThinkPad X1 Carbon G10 Core i7-1265U | |
| Durchschnittliche Intel Core i7-1265U (41808 - 69493, n=10) | |
| Dell Latitude 7420 JW6MH | |
| HP EliteBook 845 G9 6F6H9EA | |
| Asus ExpertBook B1 B1400CEAE, i5-1135G7 | |
| AIDA64 / Memory Write | |
| Lenovo ThinkPad X1 Carbon G10 Core i7-1265U | |
| LG Gram 14Z90Q | |
| Lenovo ThinkPad X1 Carbon G10 21CC001RGE | |
| Durchschnittliche Intel Core i7-1265U (41382 - 76027, n=10) | |
| Dell Latitude 7420 JW6MH | |
| HP EliteBook 845 G9 6F6H9EA | |
| Asus ExpertBook B1 B1400CEAE, i5-1135G7 | |
| AIDA64 / Memory Latency | |
| LG Gram 14Z90Q | |
| Dell Latitude 7420 JW6MH | |
| Durchschnittliche Intel Core i7-1265U (74.6 - 112.4, n=10) | |
| HP EliteBook 845 G9 6F6H9EA | |
| Lenovo ThinkPad X1 Carbon G10 Core i7-1265U | |
| Asus ExpertBook B1 B1400CEAE, i5-1135G7 | |
| Lenovo ThinkPad X1 Carbon G10 21CC001RGE | |
| Lenovo ThinkPad X1 Carbon G10 21CC001RGE | |
* ... kleinere Werte sind besser
DPC-Latenzzeit
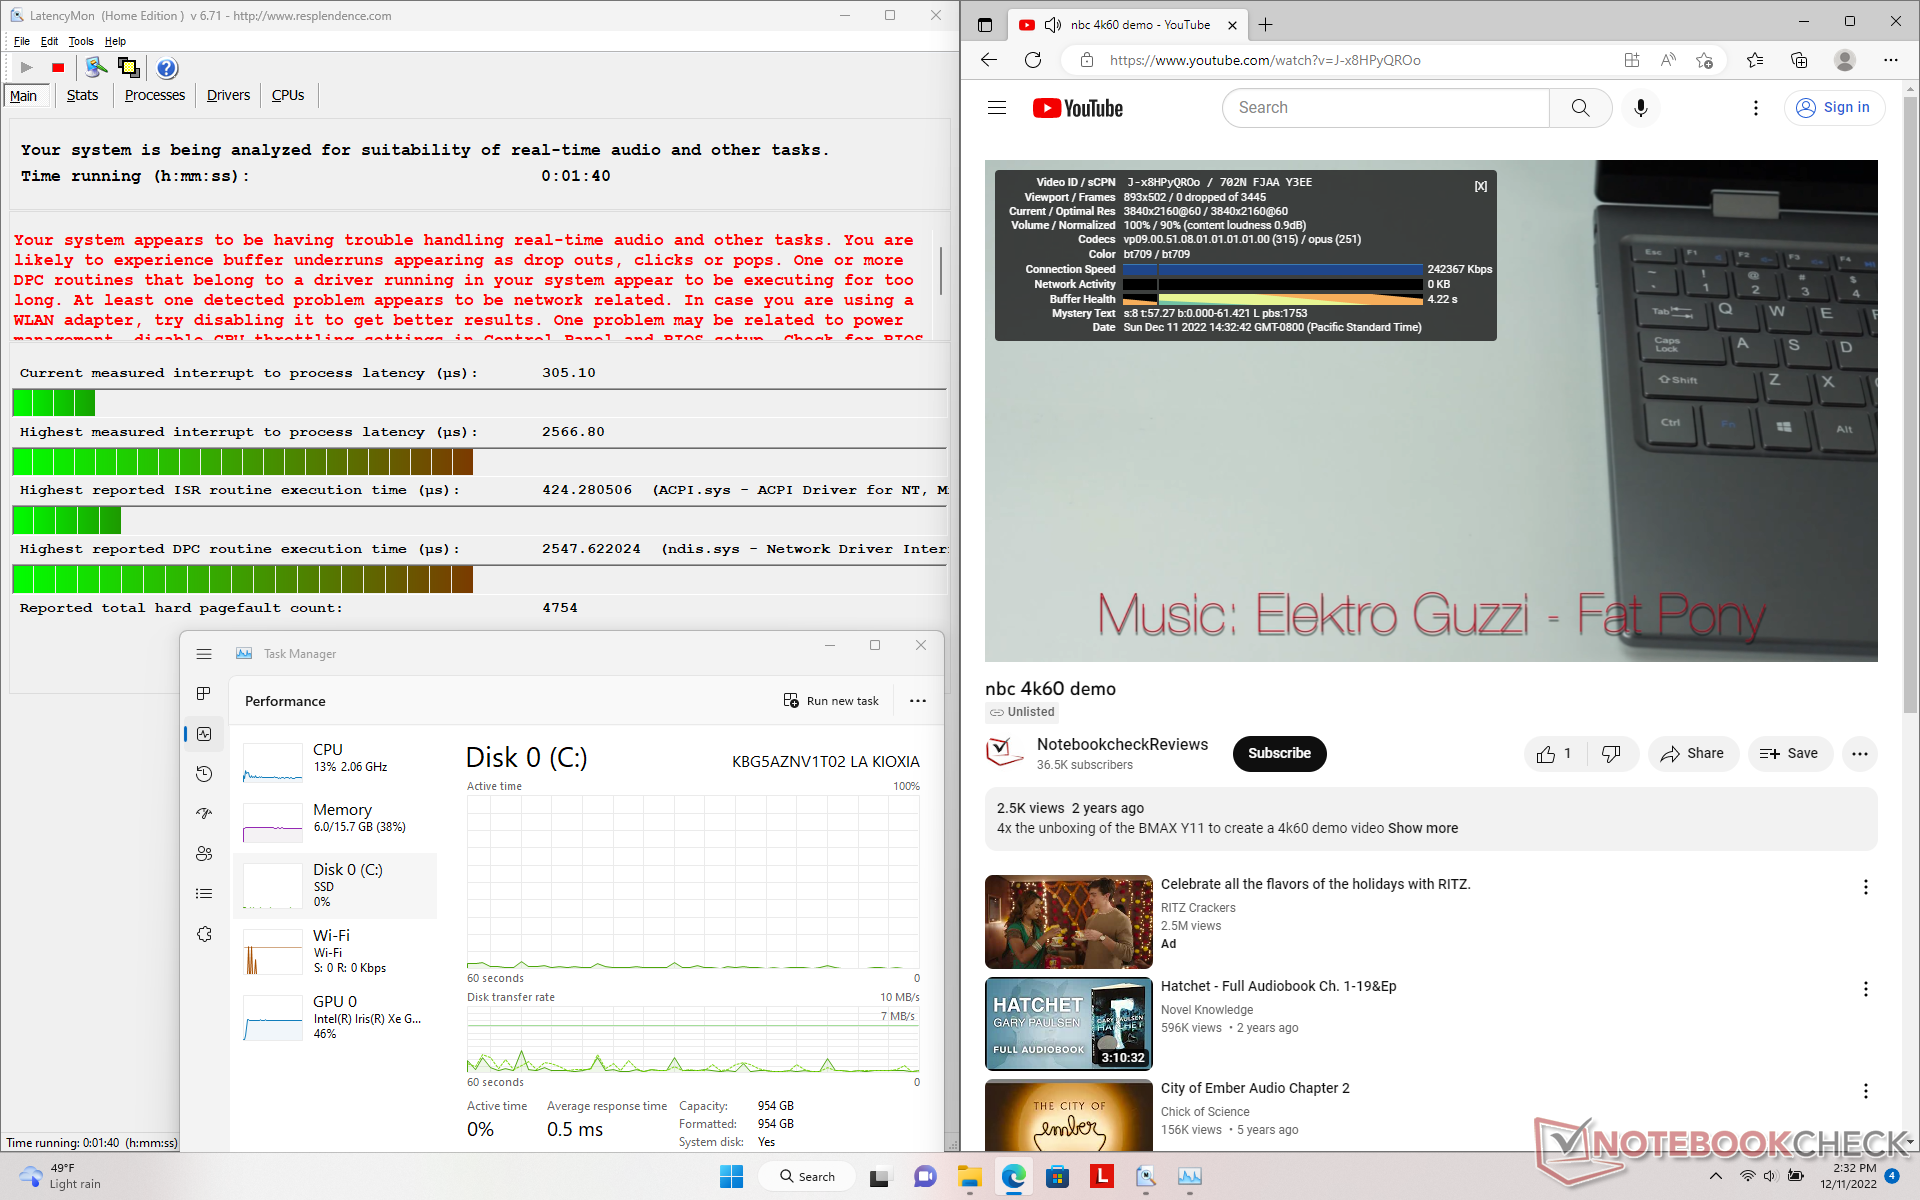
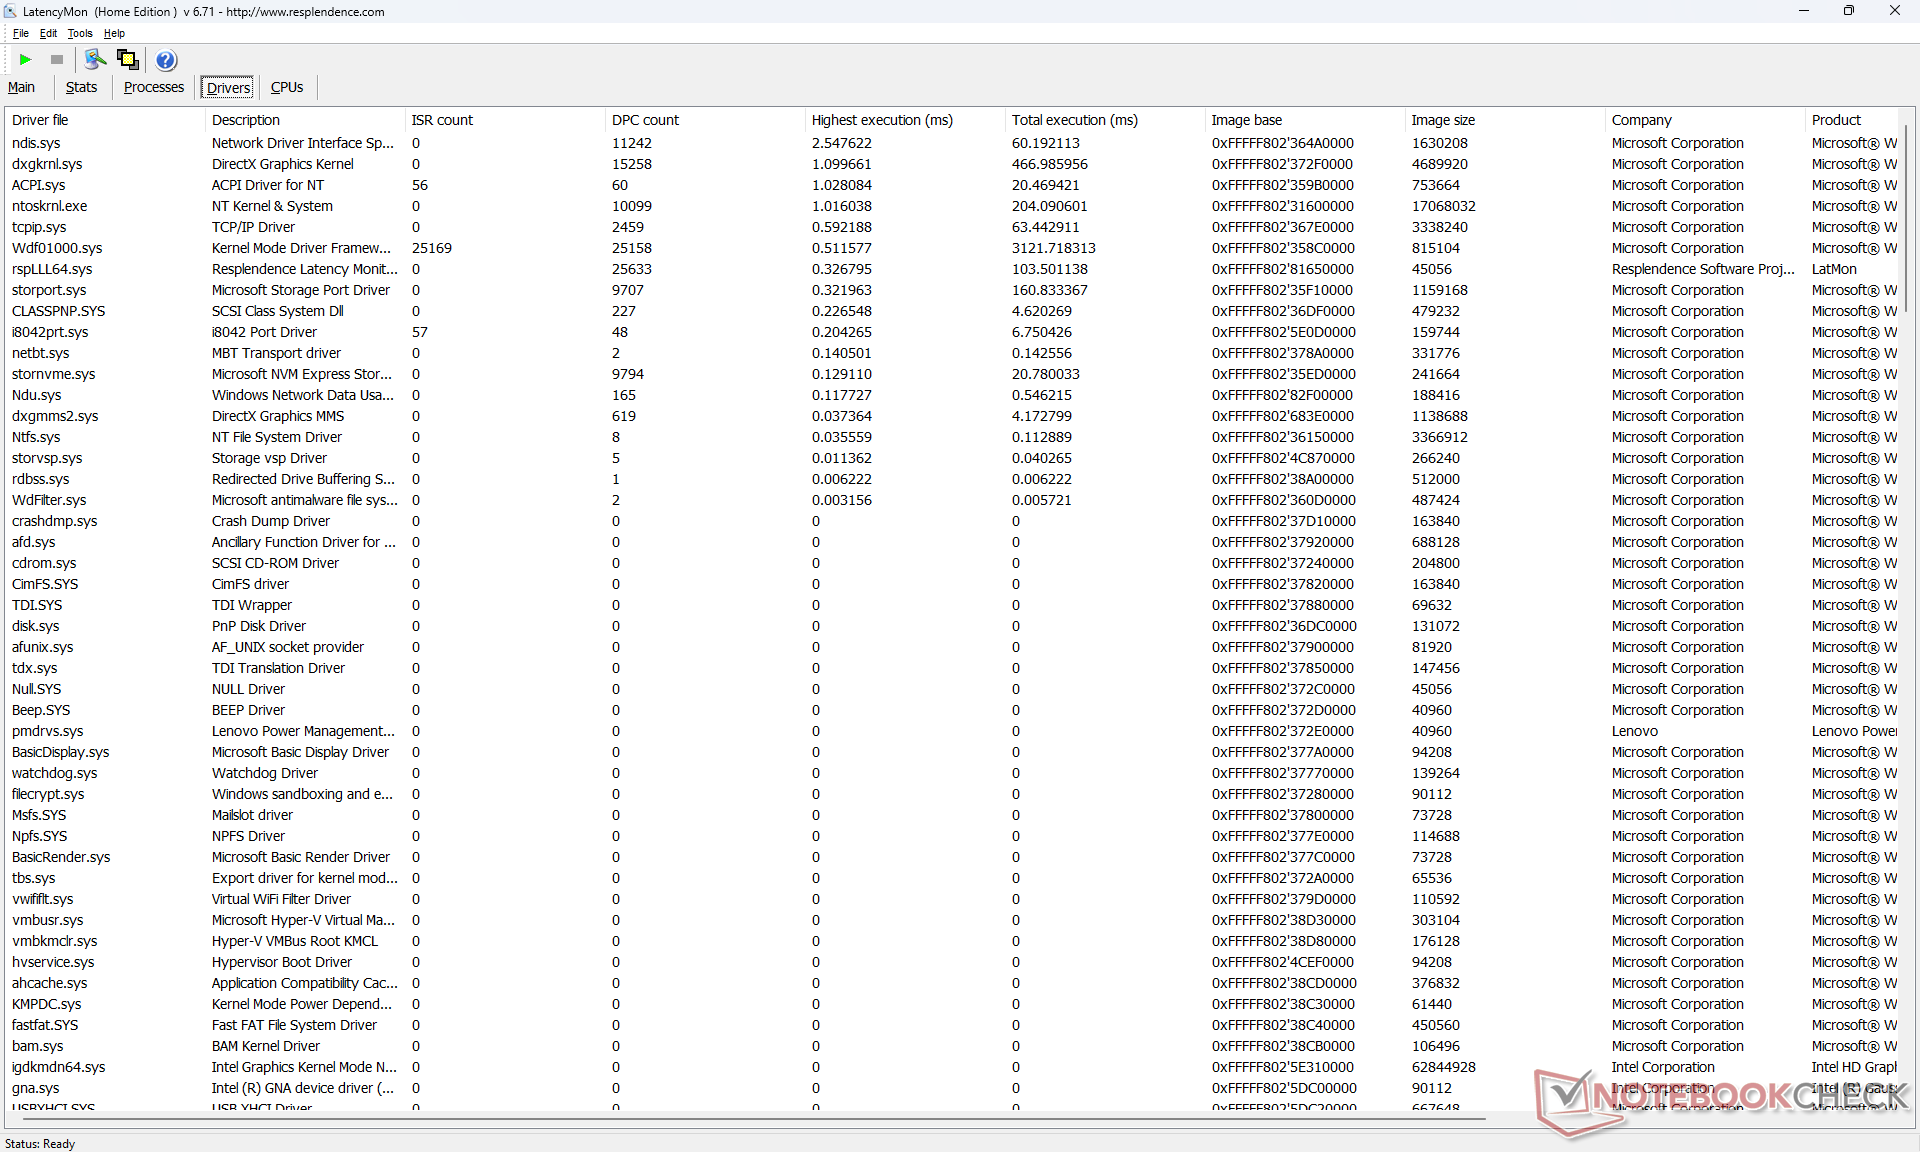
LatencyMon zeigt DPC-Probleme beim Öffnen mehrerer Browser Tabs unserer Homepage. Die 4K-Videowiedergabe bei 60 fps ist ansonsten perfekt mit geringer CPU-Auslastung und ohne Bildausfälle.
| DPC Latencies / LatencyMon - interrupt to process latency (max), Web, Youtube, Prime95 | |
| Lenovo ThinkPad X1 Carbon G10 Core i7-1265U | |
| Lenovo ThinkPad X1 Carbon G10 21CC001RGE | |
| HP EliteBook 845 G9 6F6H9EA | |
| Asus ExpertBook B1 B1400CEAE, i5-1135G7 | |
| LG Gram 14Z90Q | |
| Dell Latitude 7420 JW6MH | |
* ... kleinere Werte sind besser
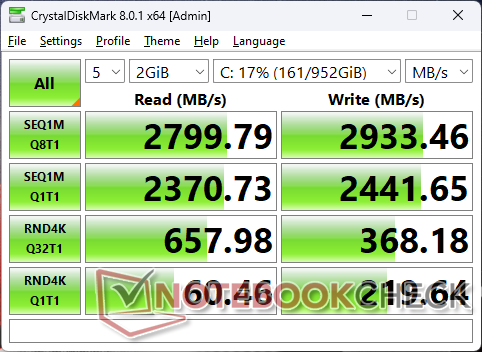
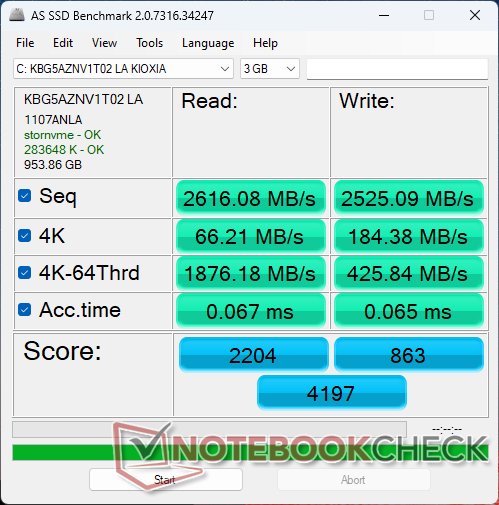
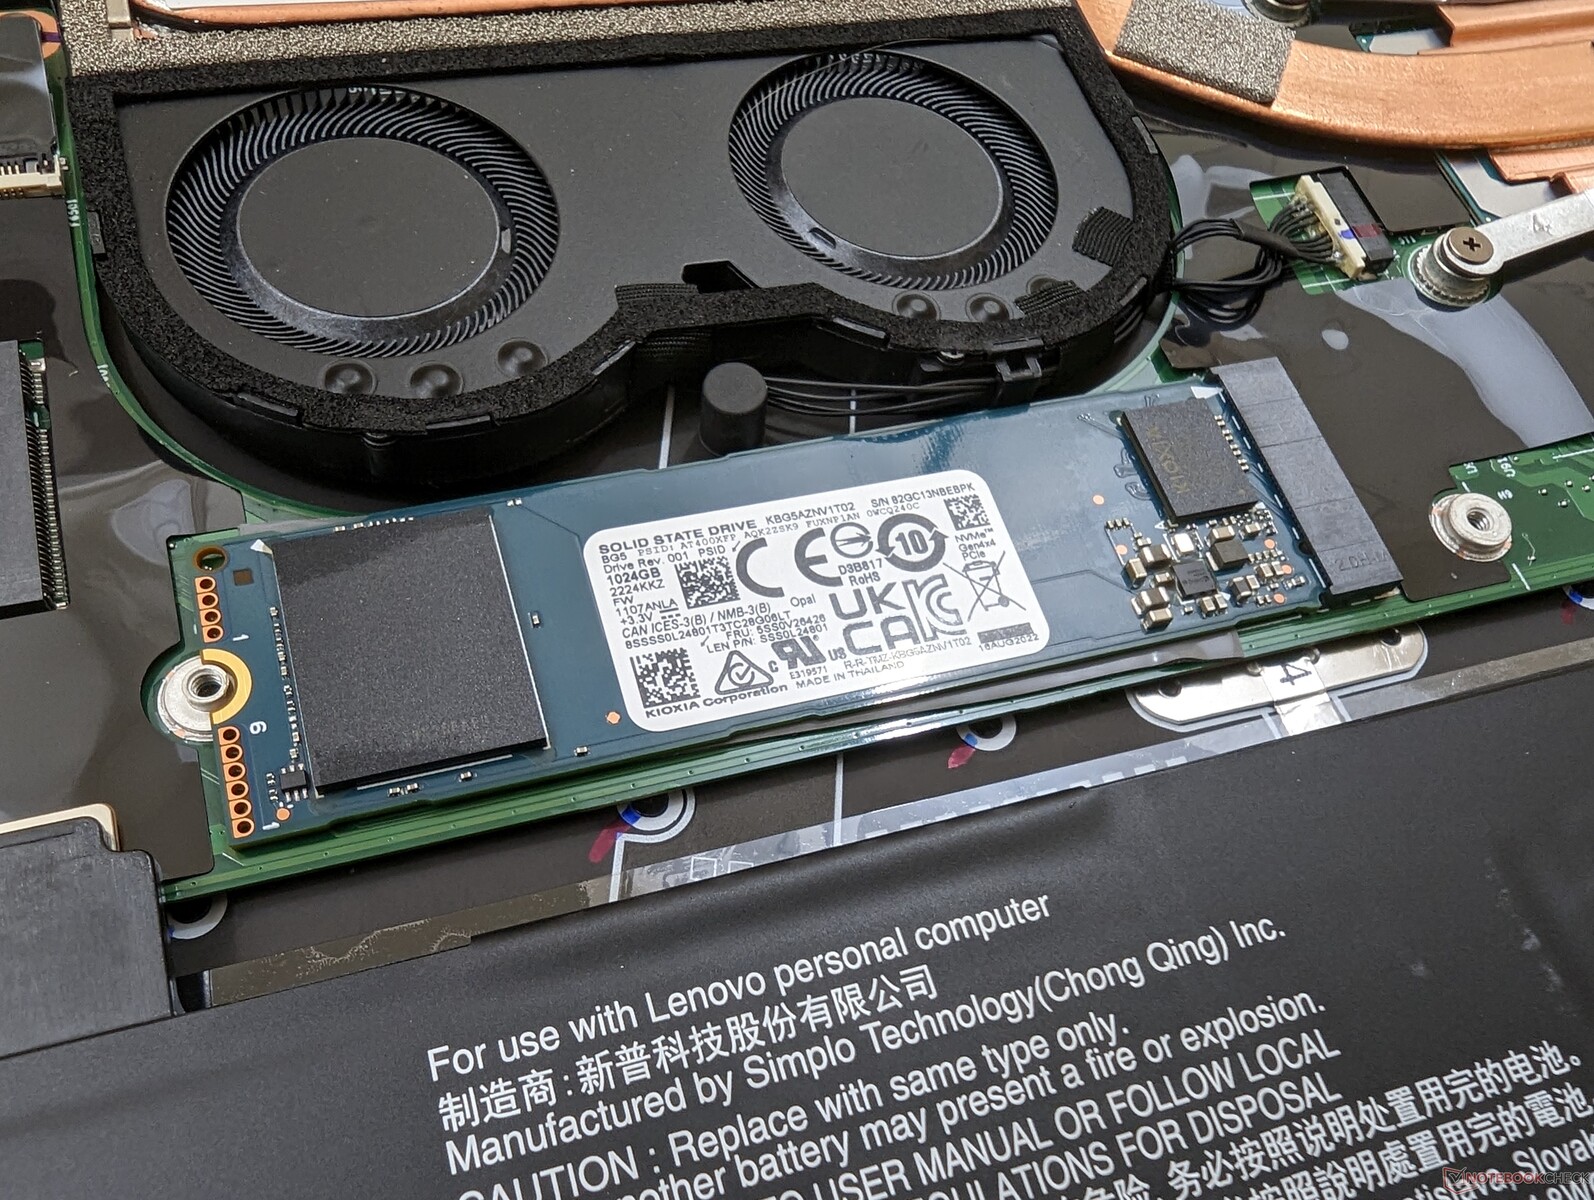
Speichergeräte - nur ein Laufwerk
Unser Gerät wird mit einer 512 GB PCIe3 x4 Kioxia NVMe SSD ausgeliefert, auch wenn das System PCie4-x4-Laufwerke unterstützt. Die Übertragungsraten sind konstant und ohne größere Leistungsdrosselung, anders als wir es bei der PCIe4-x4-Samsung-Festplatte in unserer Core-P-Konfiguration beobachtet haben. Dies deutet darauf hin, dass die meisten PCIe4-x4-NVMe-SSDs in diesem ThinkPad aufgrund von Temperaturproblemen ohnehin nicht über längere Zeit mit ihren höchsten Geschwindigkeiten laufen können.

* ... kleinere Werte sind besser
Disk Throttling: DiskSpd Read Loop, Queue Depth 8
GPU Performance
Die Grafikleistung kann 20 bis 40 Prozent schneller sein als bei den Iris-Xe-80-EUs in der Core-i5-1250P-SKU des gleichen ThinkPad-X1-Carbon-G10-Modells.
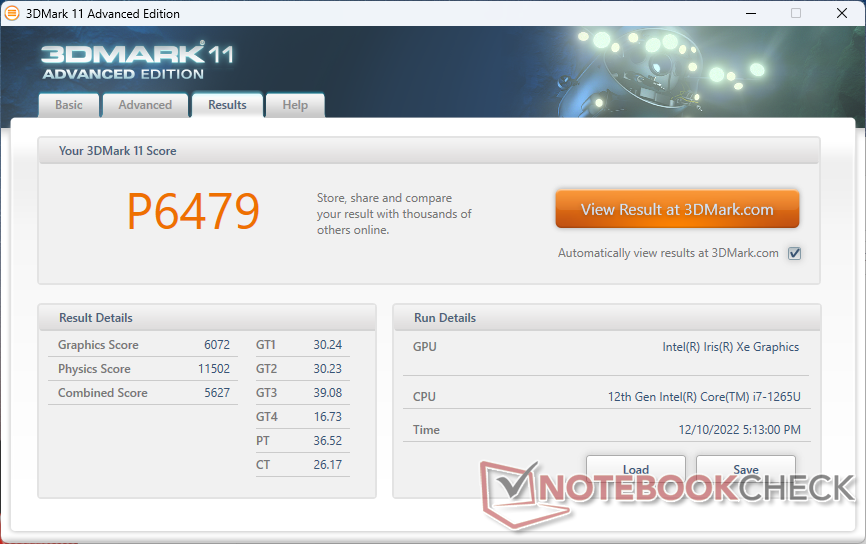
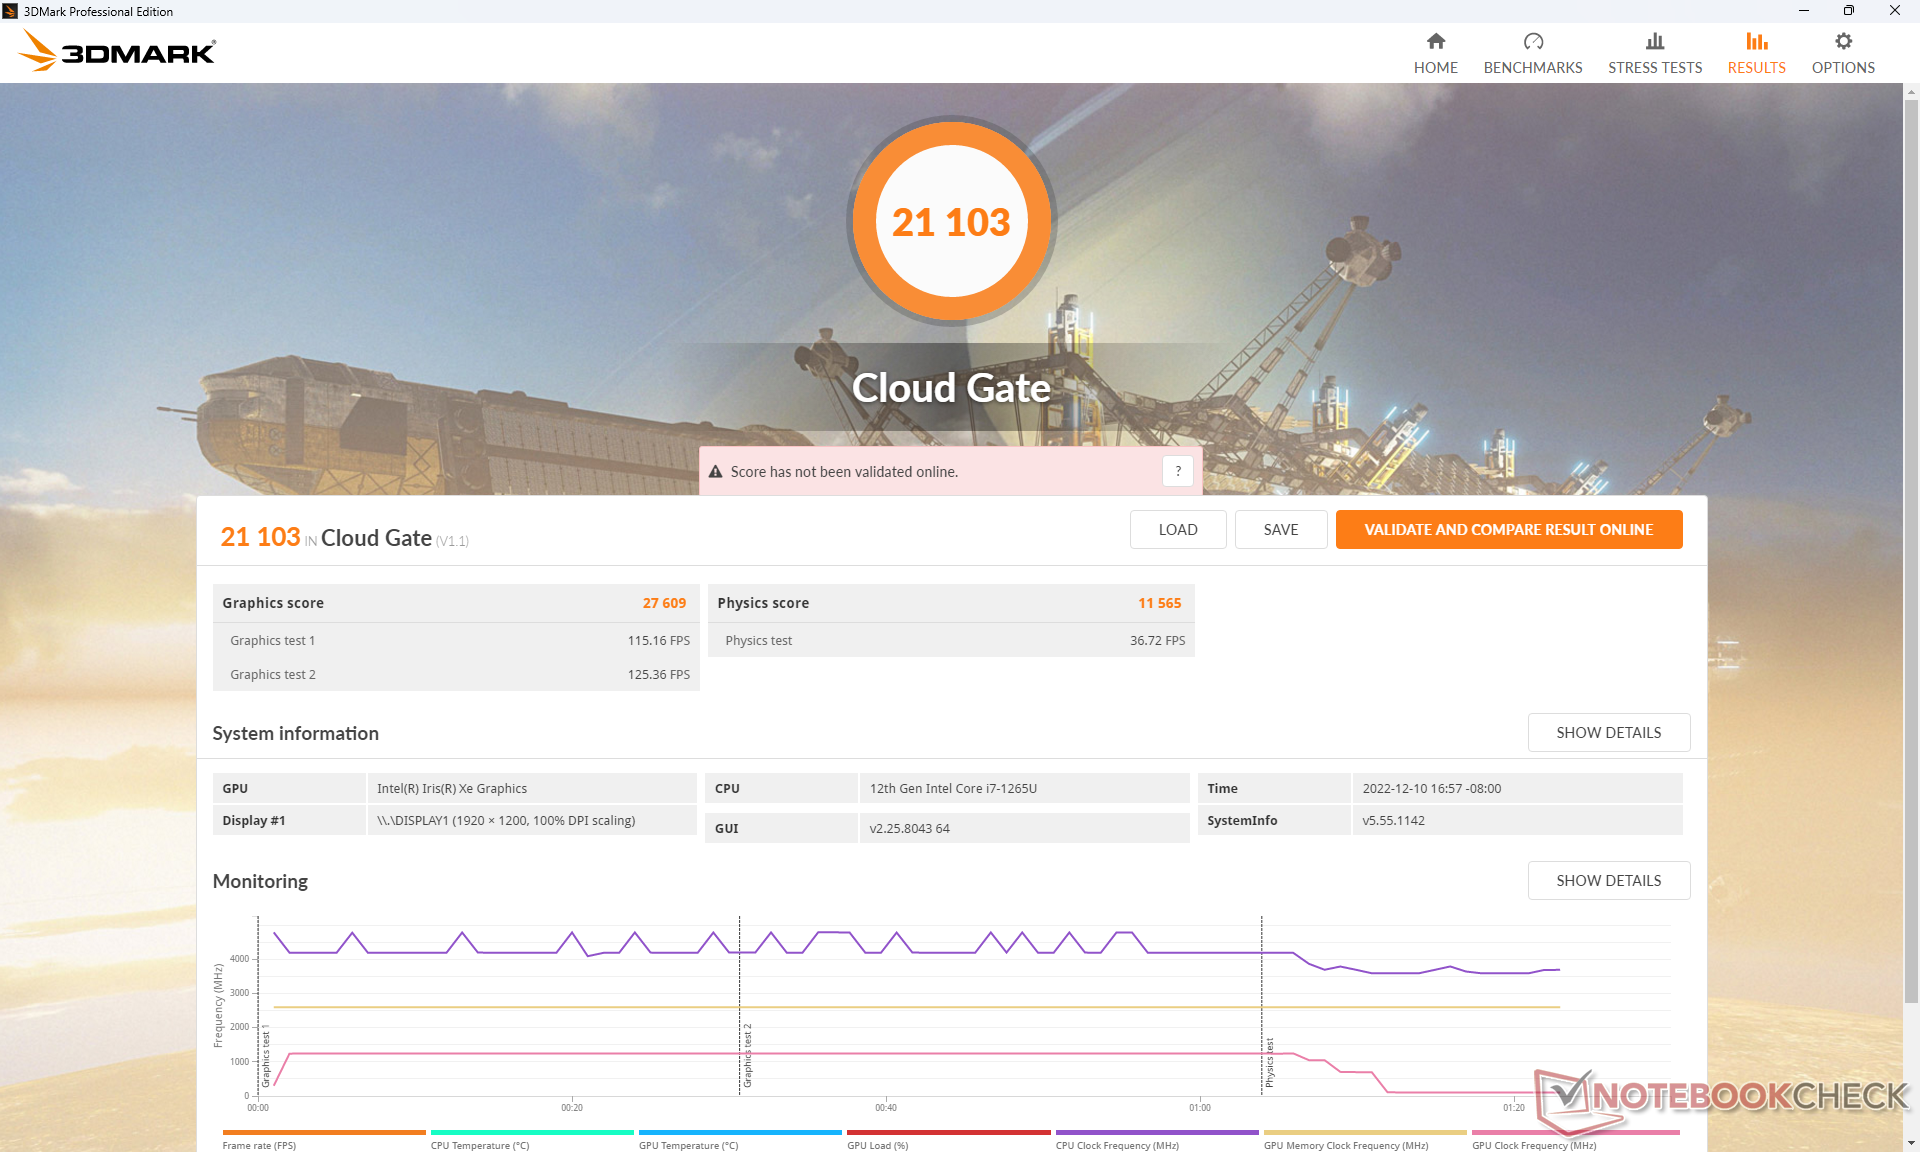
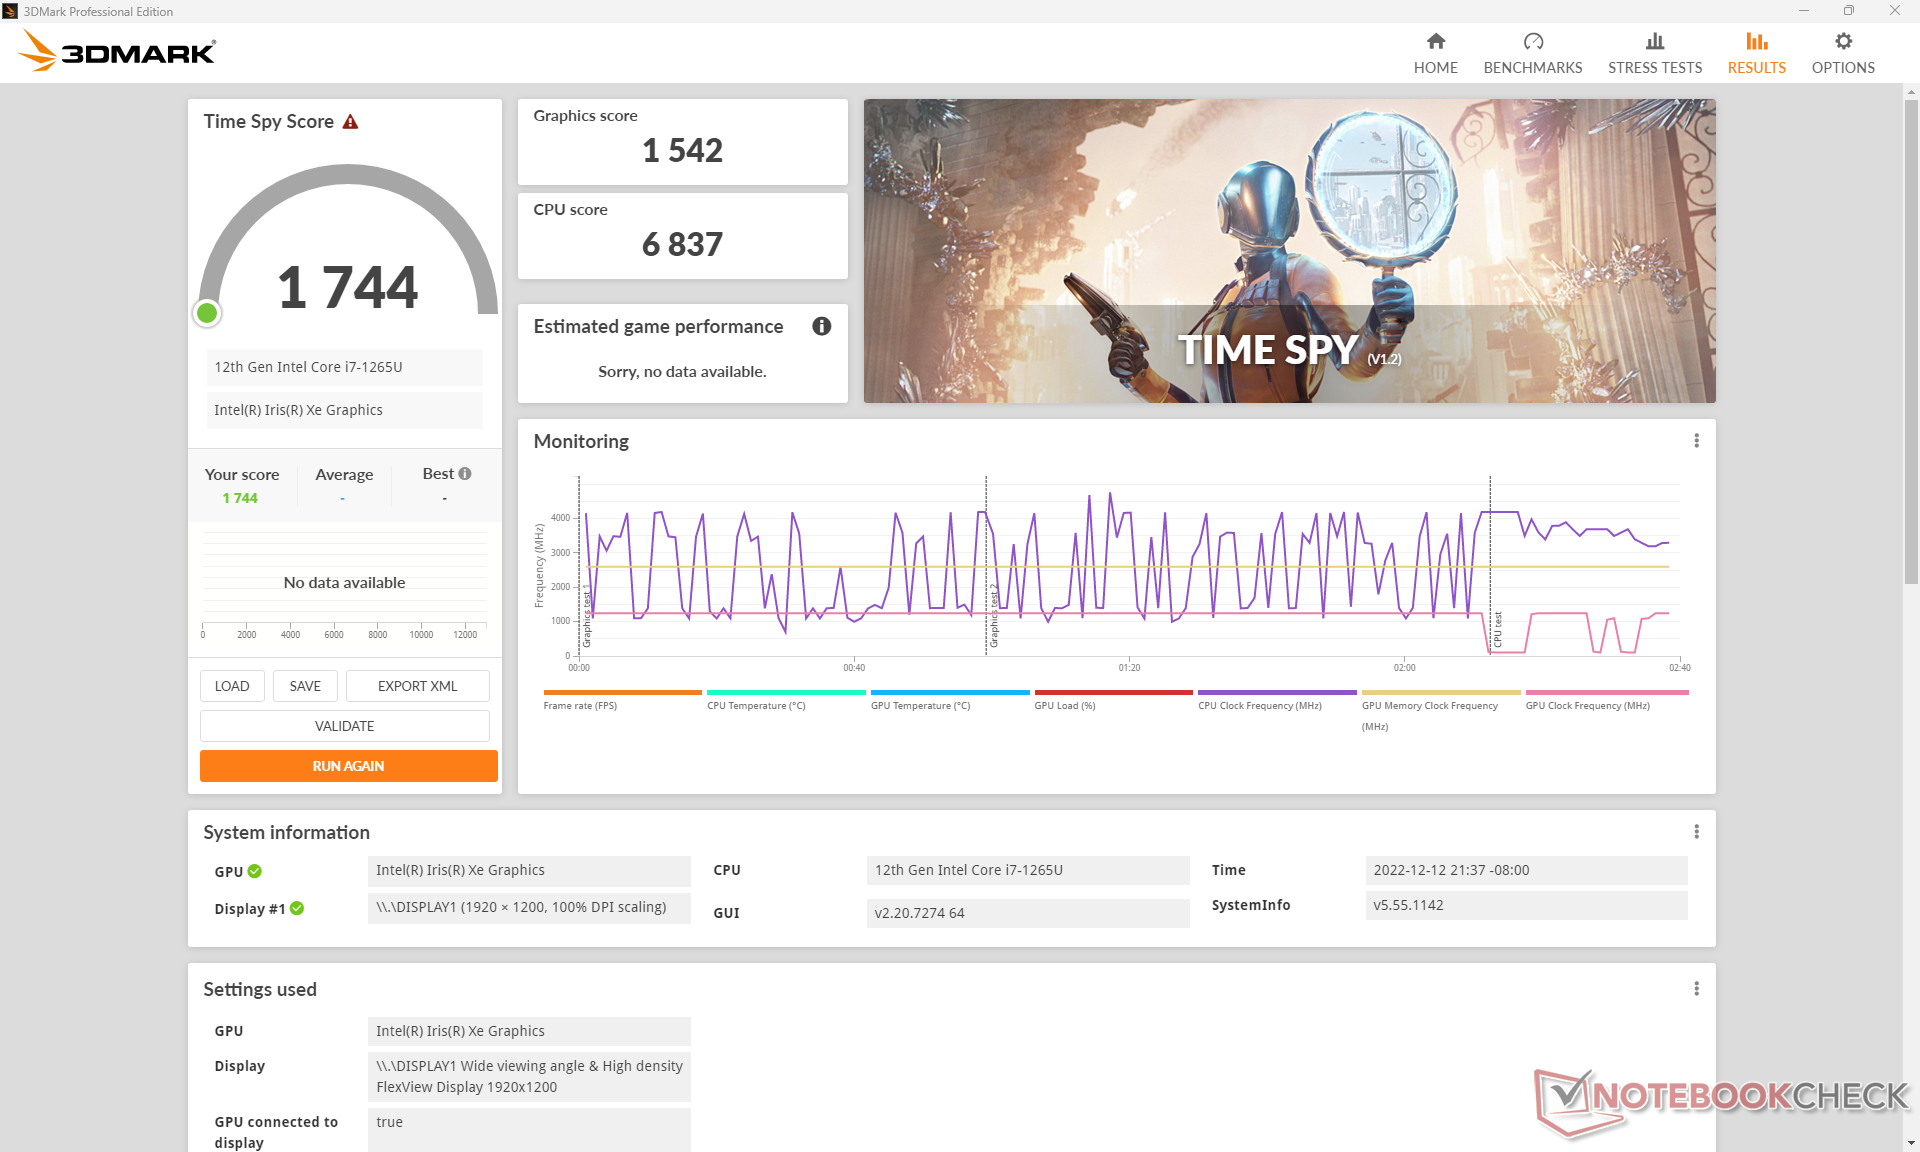
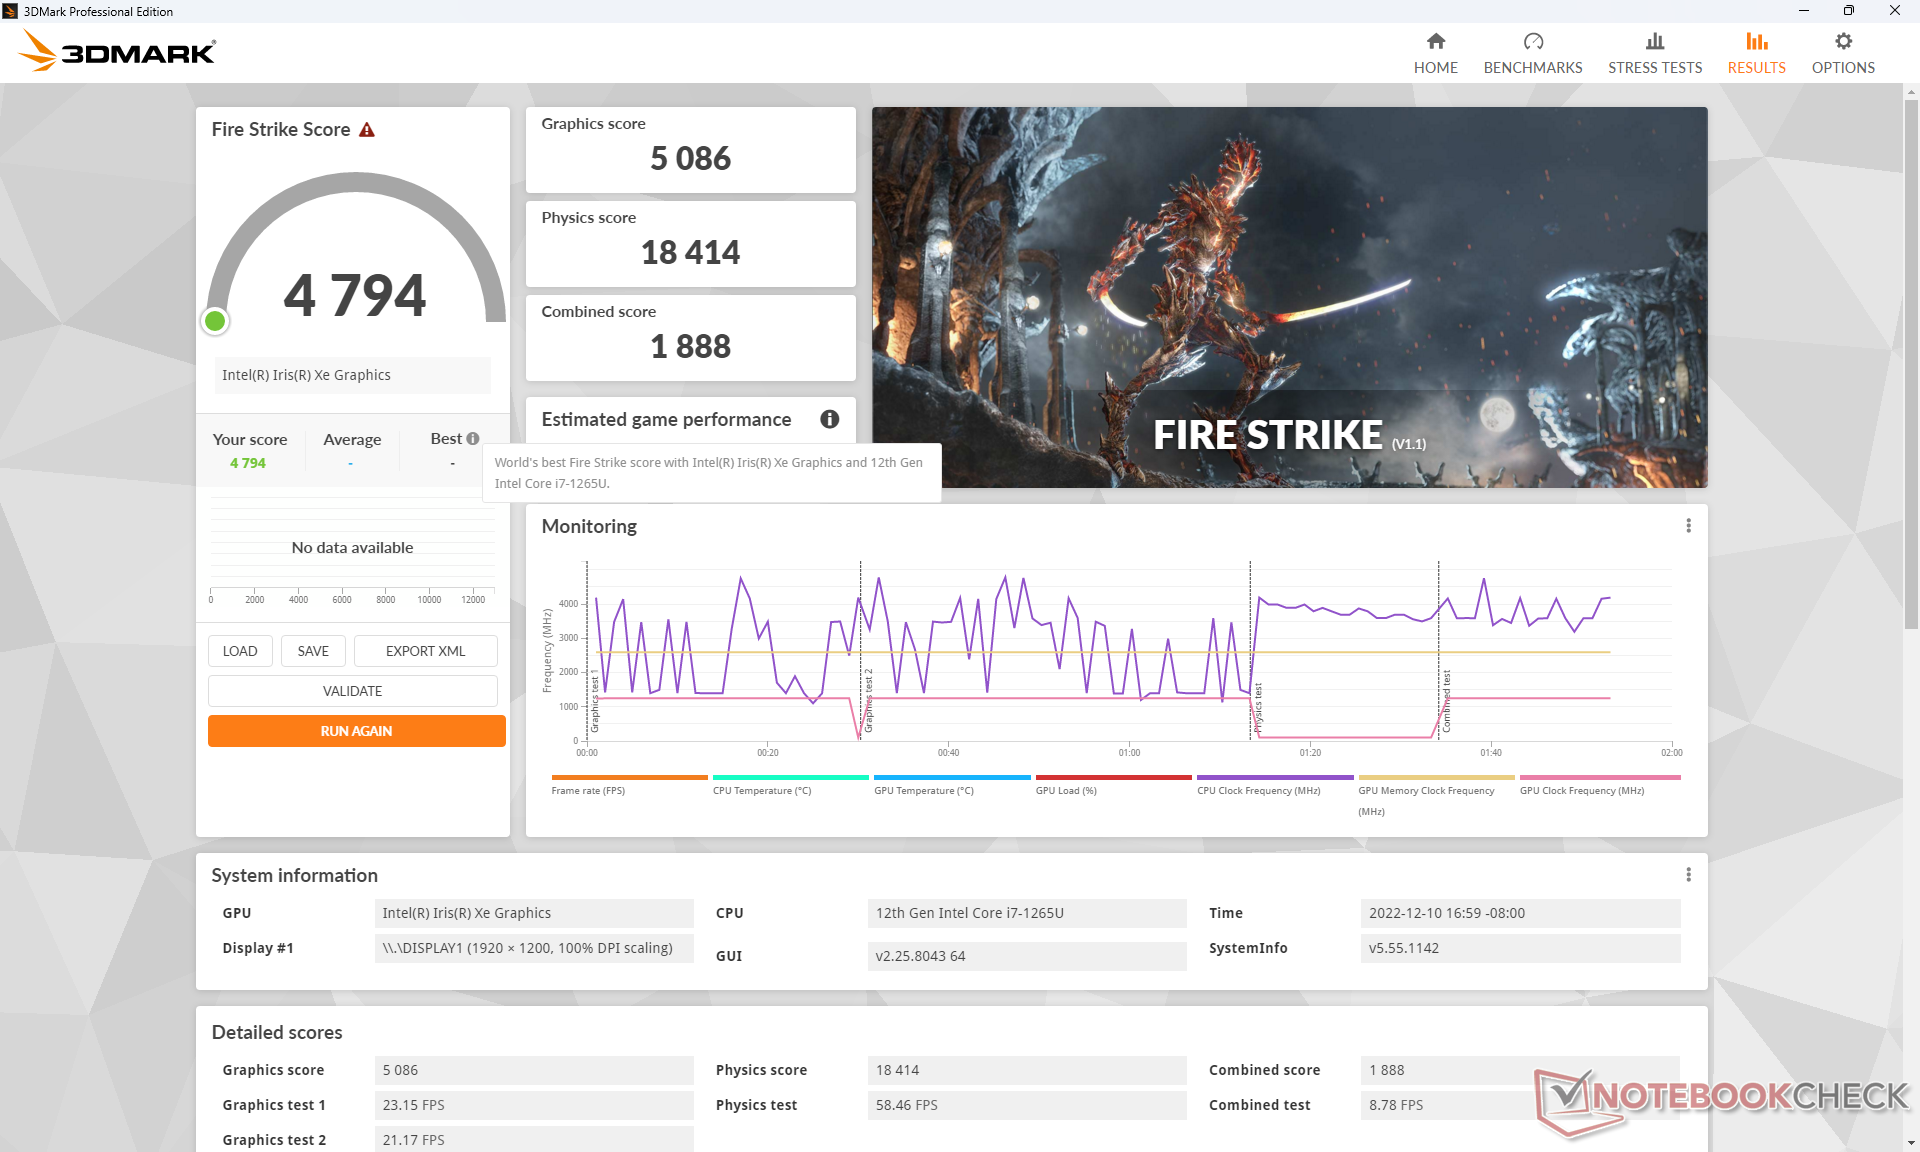
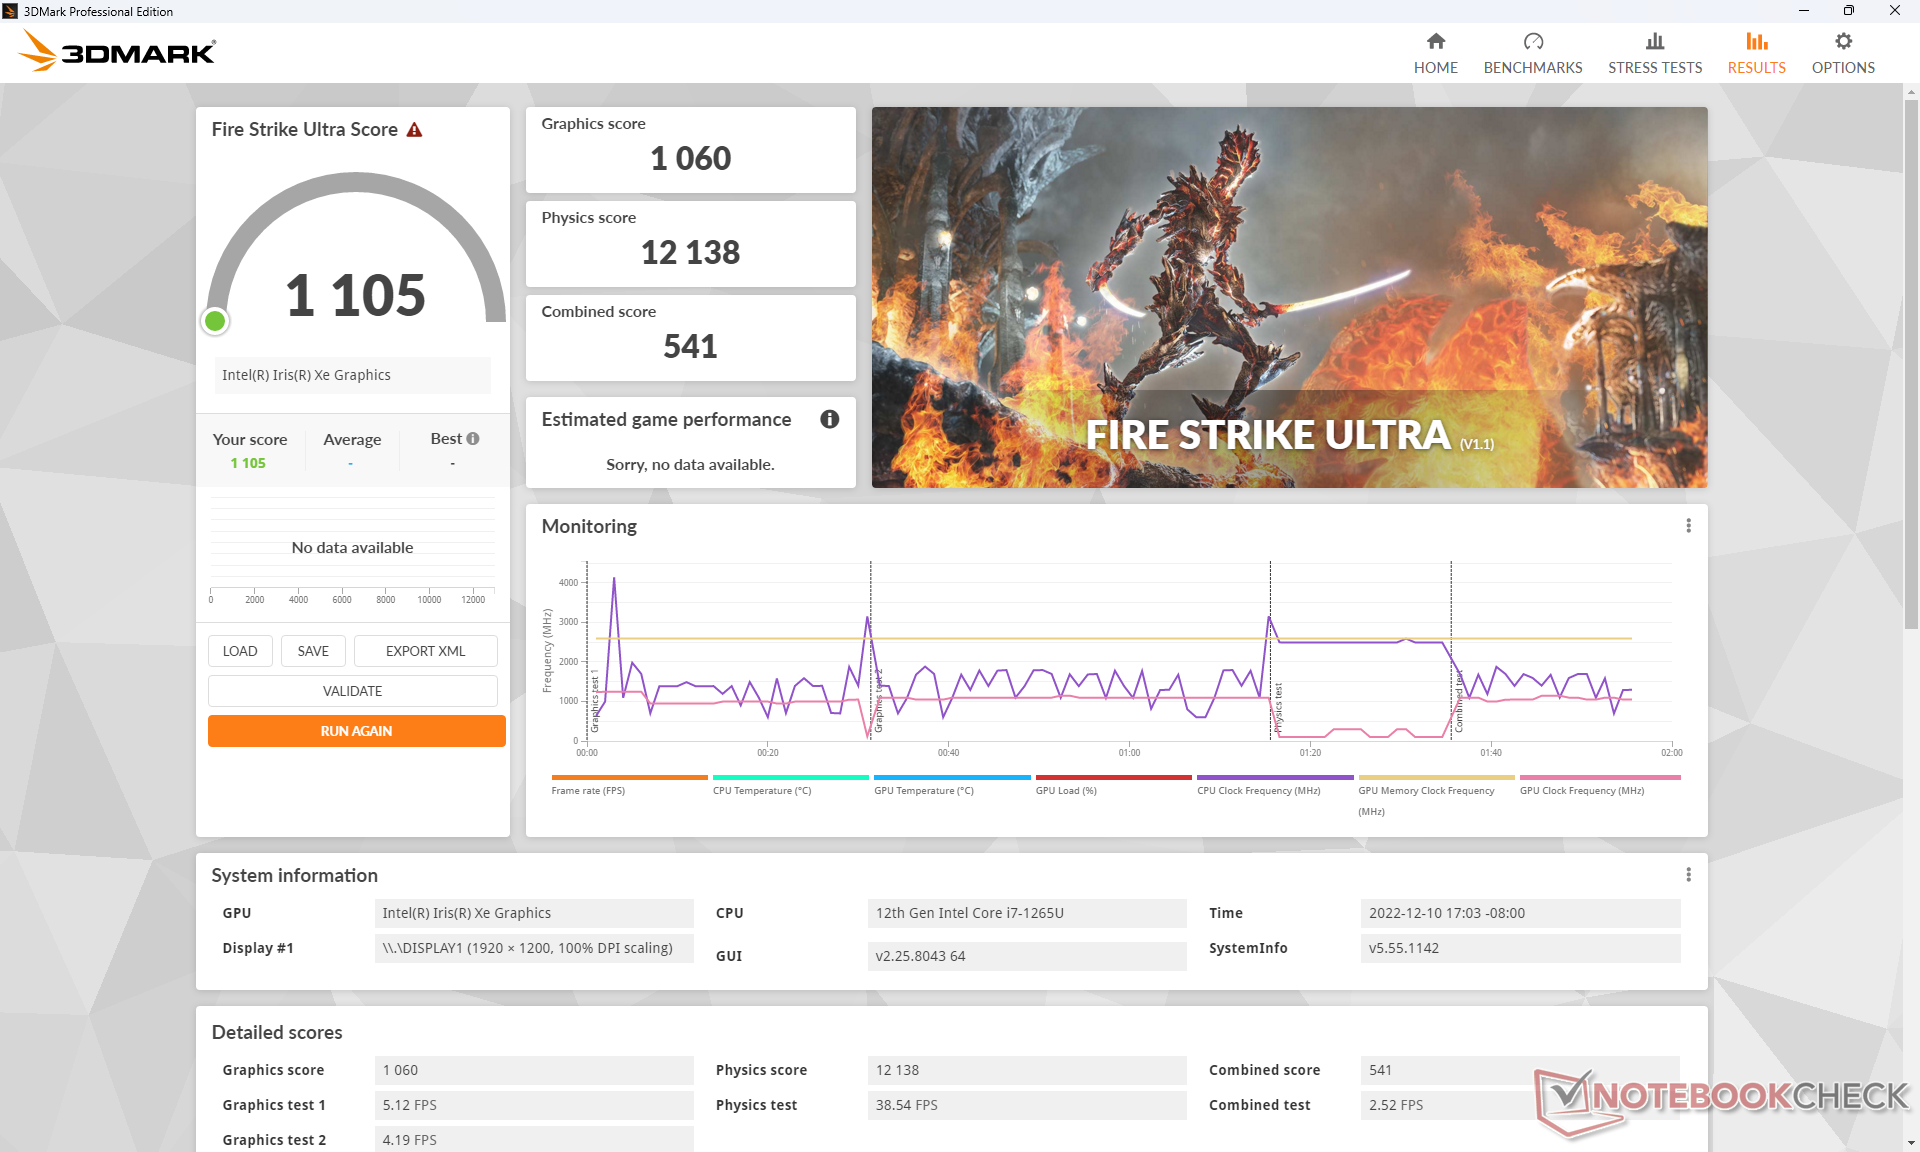
| 3DMark 11 Performance | 6479 Punkte | |
| 3DMark Cloud Gate Standard Score | 21103 Punkte | |
| 3DMark Fire Strike Score | 4794 Punkte | |
| 3DMark Time Spy Score | 1744 Punkte | |
Hilfe | ||
Witcher 3 FPS Chart
| min. | mittel | hoch | max. | |
|---|---|---|---|---|
| GTA V (2015) | 108.4 | 88 | 22.2 | 9.7 |
| The Witcher 3 (2015) | 95.6 | 60.3 | 33.9 | 15.4 |
| Dota 2 Reborn (2015) | 106.8 | 82 | 65.9 | 59.8 |
| Final Fantasy XV Benchmark (2018) | 43.7 | 23.6 | 16.5 | |
| X-Plane 11.11 (2018) | 40.4 | 35 | 31.3 | |
| Strange Brigade (2018) | 89.6 | 38.5 | 30.3 | 24.3 |
| Cyberpunk 2077 1.6 (2022) | 21.9 | 18 | 13.6 | 10.9 |
Emissionen
Systemgeräusche - ein bisschen lauter
Das Lüftergeräusch ist insgesamt lauter als bei der Core-i5-Core-P-Konfiguration. Obwohl das System bei niedriger Last sehr leise ist, neigen die beiden internen Lüfter dazu, bei höherer Last wie dem 3DMark 06 schneller zu werden. Wir konnten ein maximales Lüftergeräusch von fast 39 dB(A) beim 3DMark 06 oder Witcher 3 feststellen verglichen mit 36 dB(A) bei der Core-P-SKU.
Lautstärkediagramm
| Idle |
| 23.2 / 23.2 / 23.2 dB(A) |
| Last |
| 38.6 / 38.3 dB(A) |
 | ||
30 dB leise 40 dB(A) deutlich hörbar 50 dB(A) störend |
||
min: | ||
| Lenovo ThinkPad X1 Carbon G10 Core i7-1265U Iris Xe G7 96EUs, i7-1265U, Kioxia BG5 KBG5AZNV1T02 | Lenovo ThinkPad X1 Carbon G10 21CC001RGE Iris Xe G7 80EUs, i5-1250P, Samsung PM9A1 MZVL2512HCJQ | HP EliteBook 845 G9 6F6H9EA Radeon 660M, R5 PRO 6650U, Samsung PM991 MZVLQ512HBLU | LG Gram 14Z90Q Iris Xe G7 80EUs, i5-1240P, Samsung PM9A1 MZVL2512HCJQ | Dell Latitude 7420 JW6MH Iris Xe G7 80EUs, i5-1145G7, SK Hynix BC711 HFM512GD3HX015N | Asus ExpertBook B1 B1400CEAE, i5-1135G7 Iris Xe G7 80EUs, i5-1135G7, WDC PC SN530 SDBPNPZ-512G | |
|---|---|---|---|---|---|---|
| Geräuschentwicklung | 6% | -2% | -5% | -12% | 4% | |
| aus / Umgebung * (dB) | 23.2 | 22.81 2% | 24 -3% | 25 -8% | 25.3 -9% | 23.8 -3% |
| Idle min * (dB) | 23.2 | 22.81 2% | 24 -3% | 26 -12% | 25.3 -9% | 23.8 -3% |
| Idle avg * (dB) | 23.2 | 22.81 2% | 25 -8% | 27 -16% | 25.3 -9% | 23.8 -3% |
| Idle max * (dB) | 23.2 | 22.81 2% | 26 -12% | 28 -21% | 25.3 -9% | 26.5 -14% |
| Last avg * (dB) | 38.6 | 31.59 18% | 34 12% | 35 9% | 44.9 -16% | 28.6 26% |
| Witcher 3 ultra * (dB) | 38.5 | 35.59 8% | 38 1% | 36 6% | 30.6 21% | |
| Last max * (dB) | 38.3 | 35.47 7% | 38 1% | 36 6% | 44.9 -17% | 37.4 2% |
* ... kleinere Werte sind besser
Temperatur
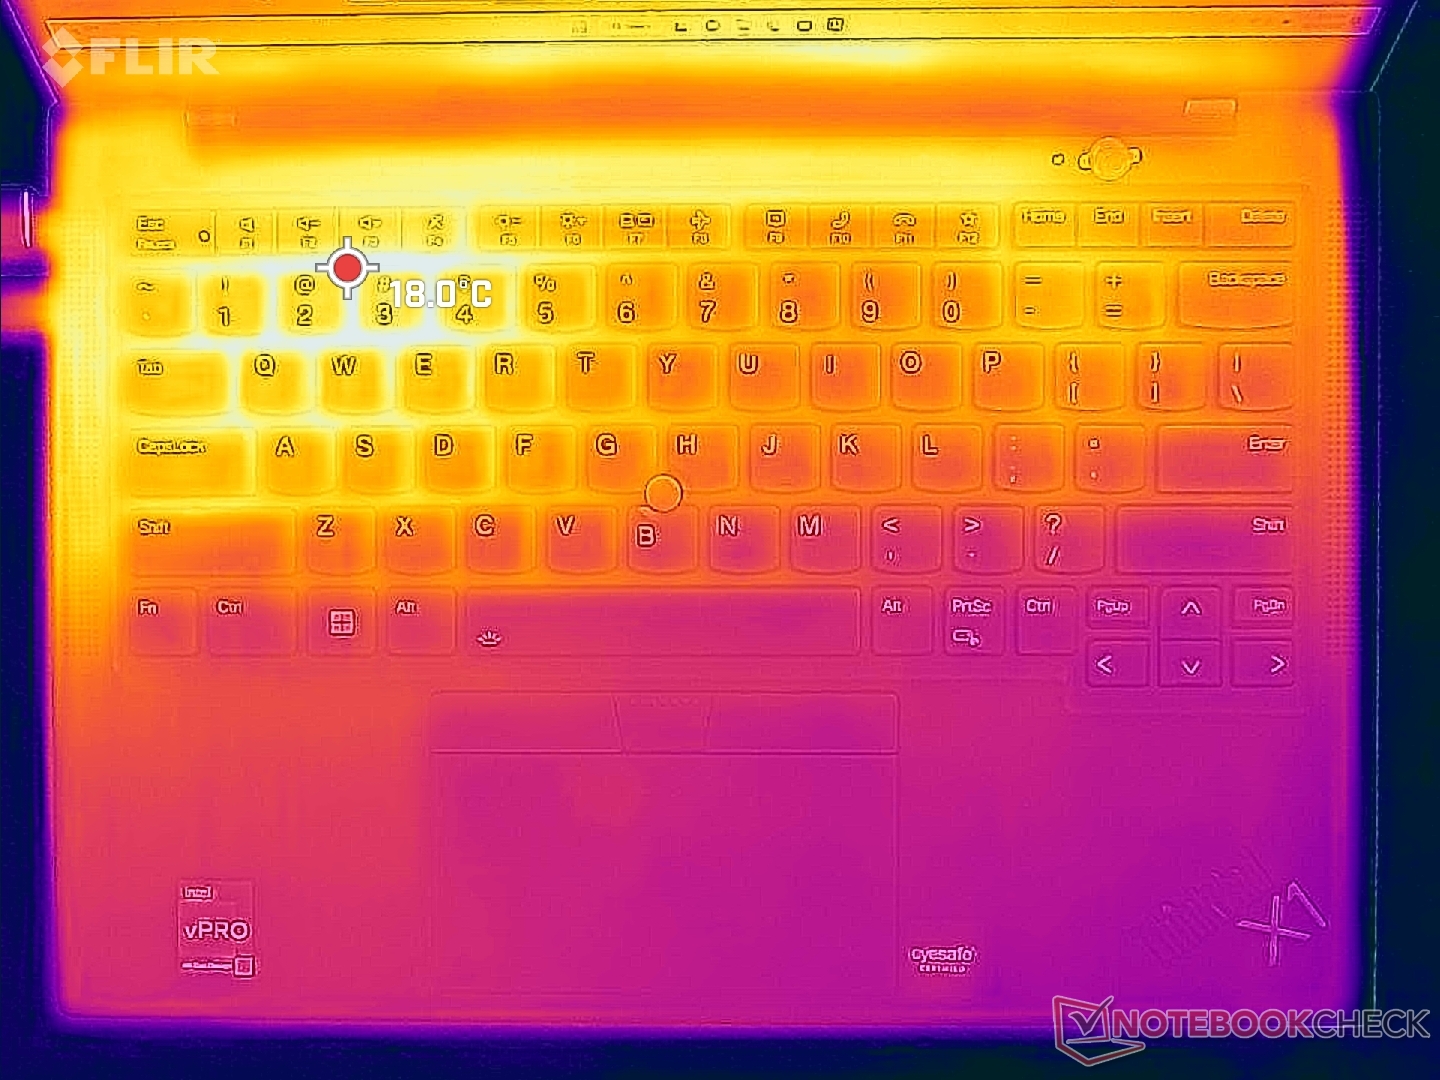
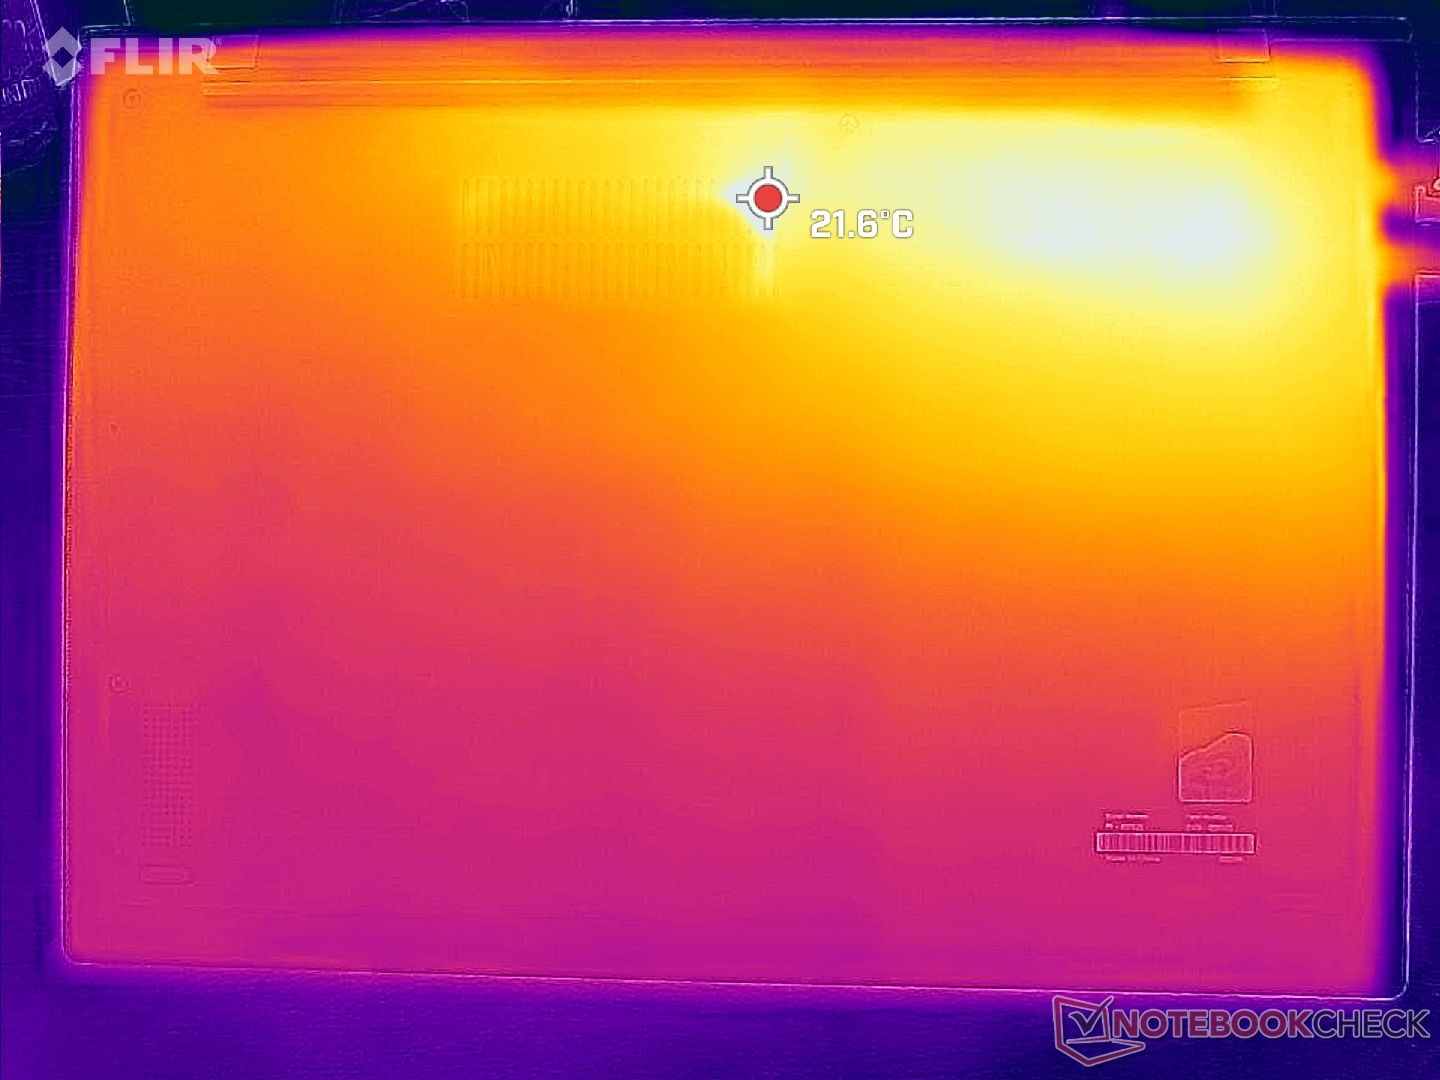
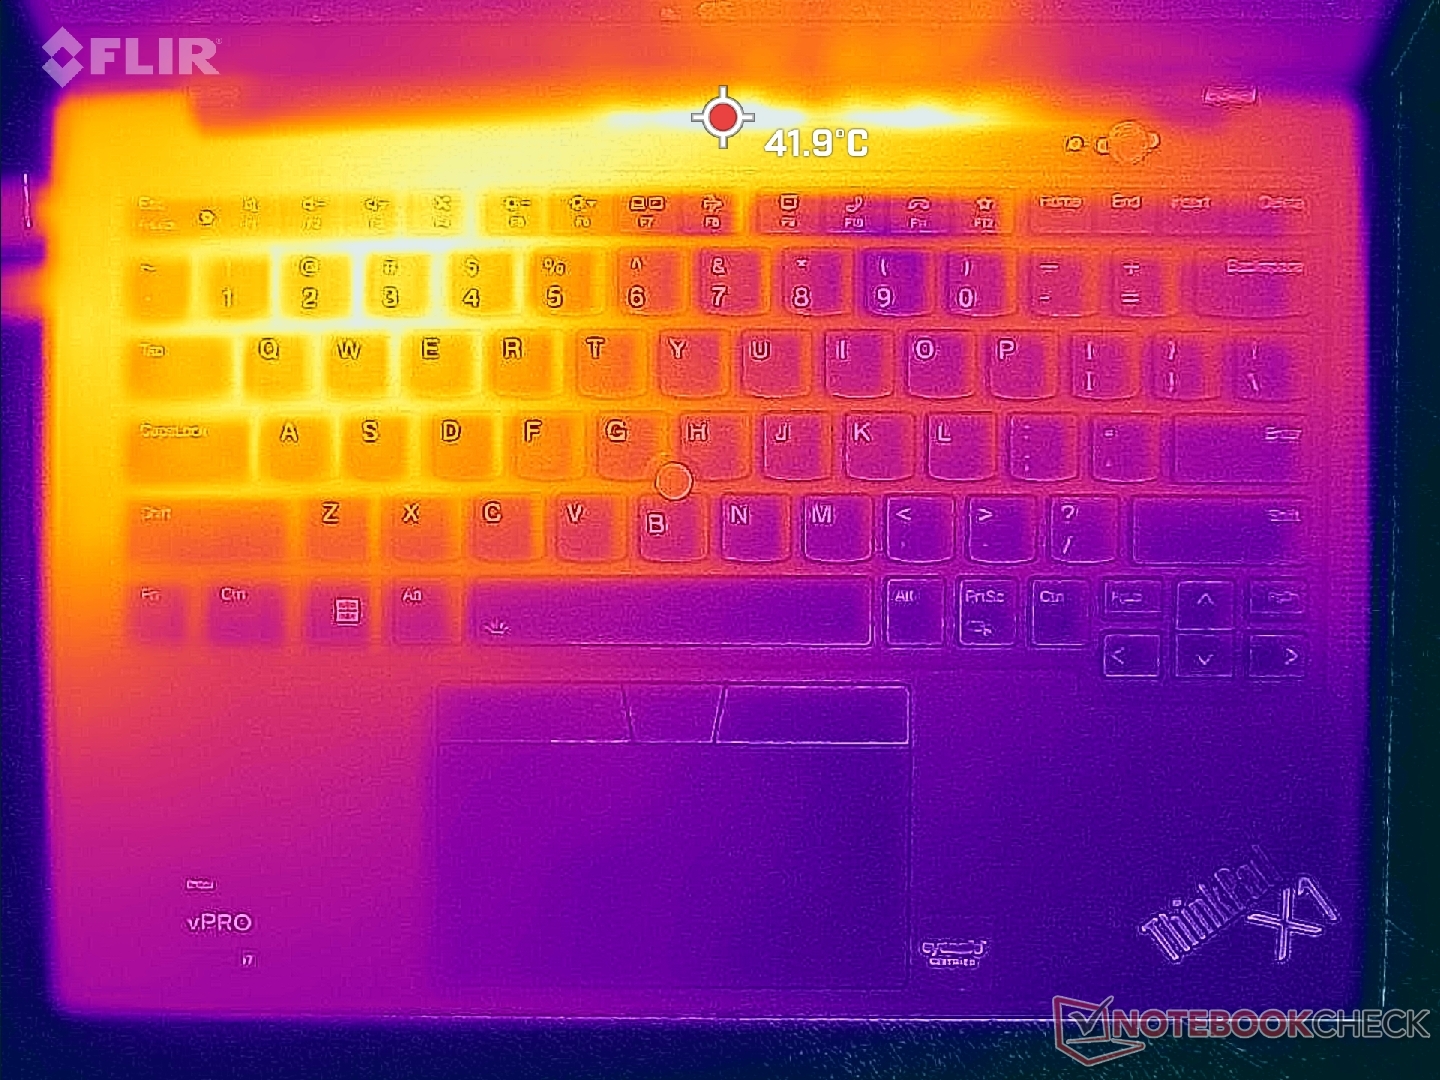
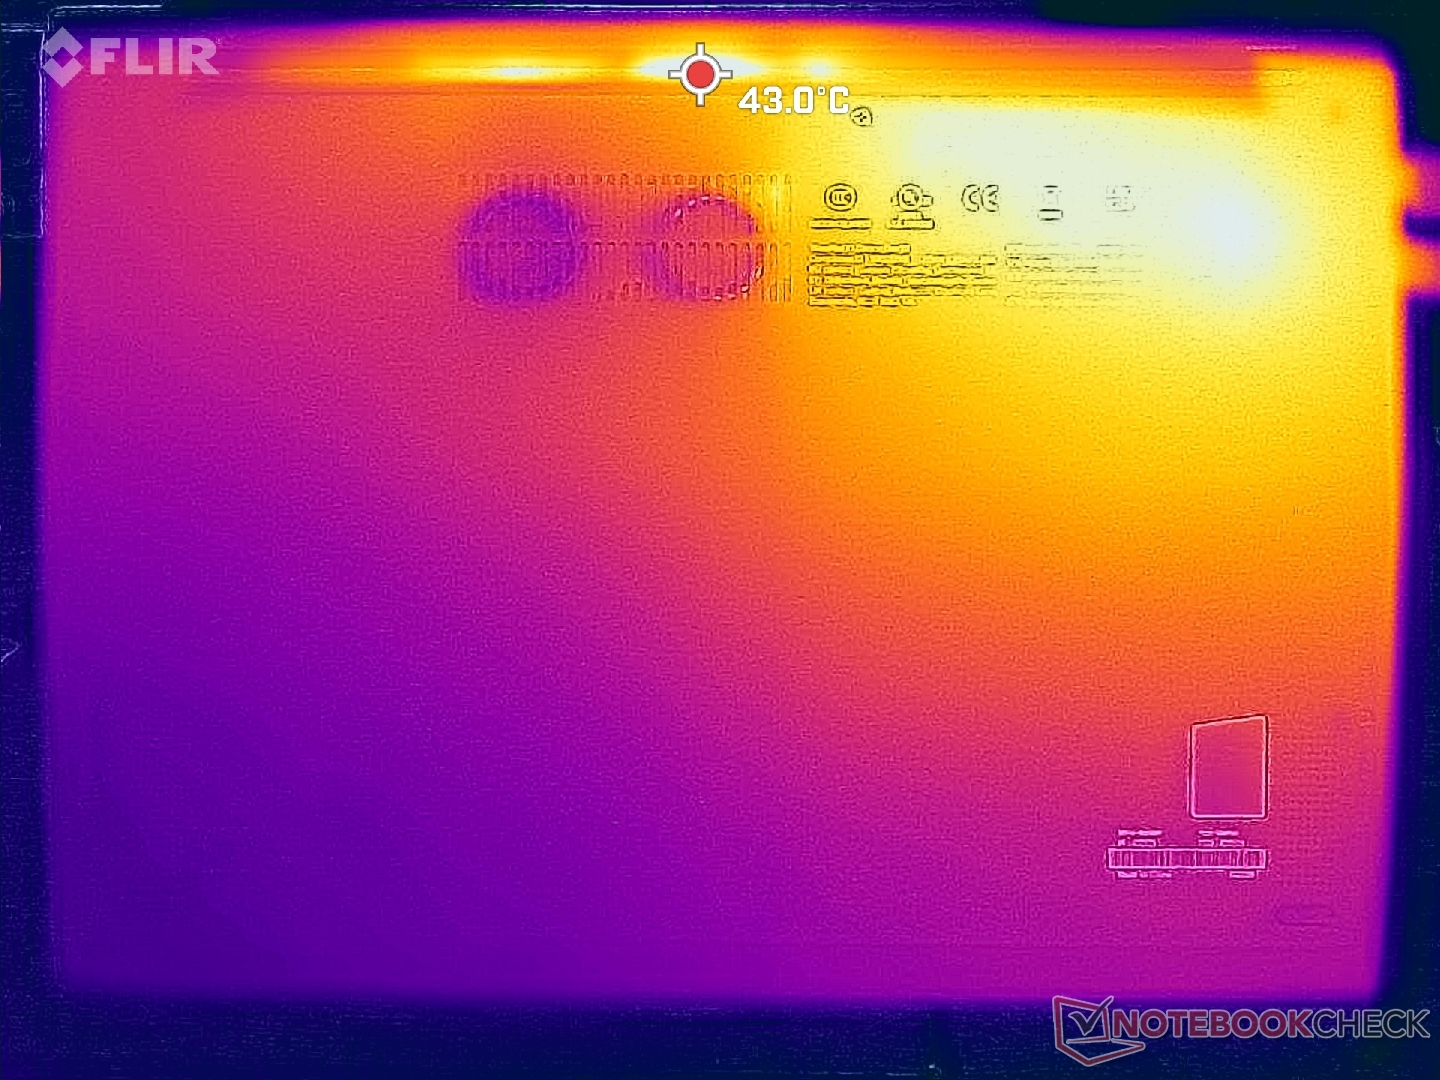
Die Oberflächentemperaturen sind auf der linken Hälfte des Laptops aufgrund der Positionierung der Kühllösung und des Prozessors immer wärmer als auf der rechten. Tatsächlich kann der Hot Spot auf dem Tastaturdeck bis zu 42 °C warm sein, während es auf der Handballenablage nur 20 °C sind. Die Temperaturen sind jedoch trotz der Leistungsunterschiede immer noch mit denen des Core-P-betriebenen X1 Carbon G10 vergleichbar.
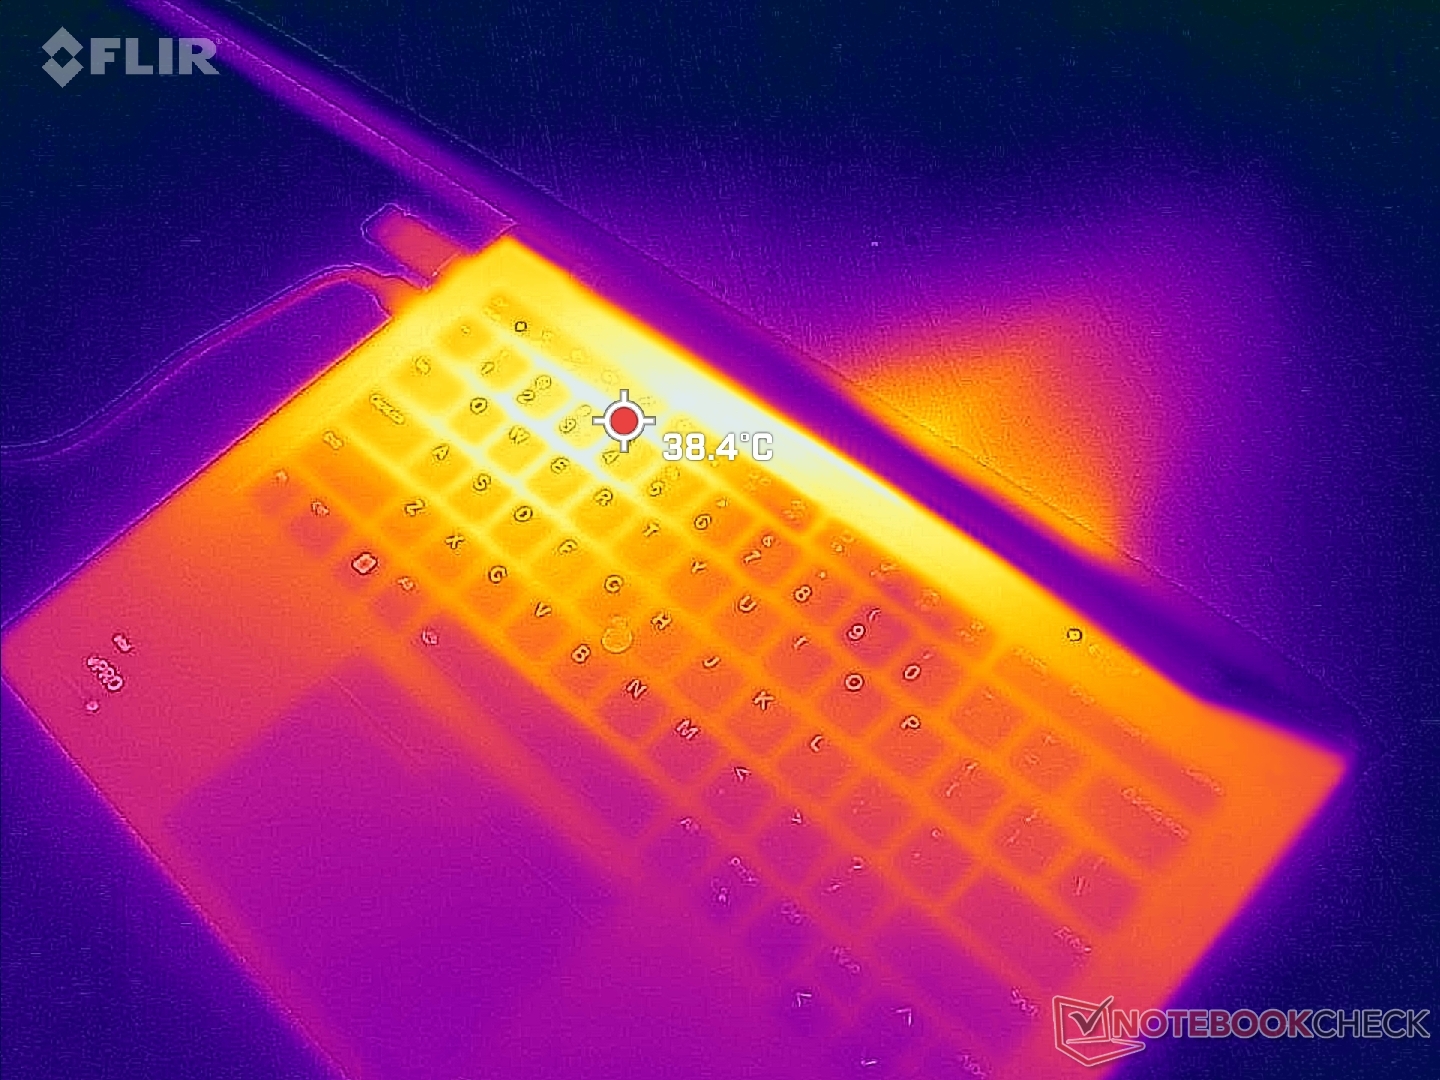
(±) Die maximale Temperatur auf der Oberseite ist 41.2 °C. Im Vergleich liegt der Klassendurchschnitt bei 34.3 °C (von 21.2 bis 62.5 °C für die Klasse Office).
(±) Auf der Unterseite messen wir eine maximalen Wert von 41 °C (im Vergleich zum Durchschnitt von 36.8 °C).
(+) Ohne Last messen wir eine durchschnittliche Temperatur von 21.4 °C auf der Oberseite. Der Klassendurchschnitt erreicht 29.5 °C.
(+) Die Handballen und der Touchpad-Bereich sind mit gemessenen 25.2 °C kühler als die typische Hauttemperatur und fühlen sich dadurch kühl an.
(+) Die durchschnittliche Handballen-Temperatur anderer getesteter Geräte war 27.5 °C (+2.3 °C).
| Lenovo ThinkPad X1 Carbon G10 Core i7-1265U Intel Core i7-1265U, Intel Iris Xe Graphics G7 96EUs | Lenovo ThinkPad X1 Carbon G10 21CC001RGE Intel Core i5-1250P, Intel Iris Xe Graphics G7 80EUs | HP EliteBook 845 G9 6F6H9EA AMD Ryzen 5 PRO 6650U, AMD Radeon 660M | LG Gram 14Z90Q Intel Core i5-1240P, Intel Iris Xe Graphics G7 80EUs | Dell Latitude 7420 JW6MH Intel Core i5-1145G7, Intel Iris Xe Graphics G7 80EUs | Asus ExpertBook B1 B1400CEAE, i5-1135G7 Intel Core i5-1135G7, Intel Iris Xe Graphics G7 80EUs | |
|---|---|---|---|---|---|---|
| Hitze | -23% | -12% | -13% | -6% | -15% | |
| Last oben max * (°C) | 41.2 | 45 -9% | 44 -7% | 43 -4% | 37.1 10% | 41.7 -1% |
| Last unten max * (°C) | 41 | 44 -7% | 45 -10% | 45 -10% | 38.7 6% | 54.3 -32% |
| Idle oben max * (°C) | 23.2 | 31.2 -34% | 27 -16% | 27 -16% | 27.3 -18% | 26 -12% |
| Idle unten max * (°C) | 23.4 | 33.2 -42% | 27 -15% | 28 -20% | 28.1 -20% | 27.1 -16% |
* ... kleinere Werte sind besser
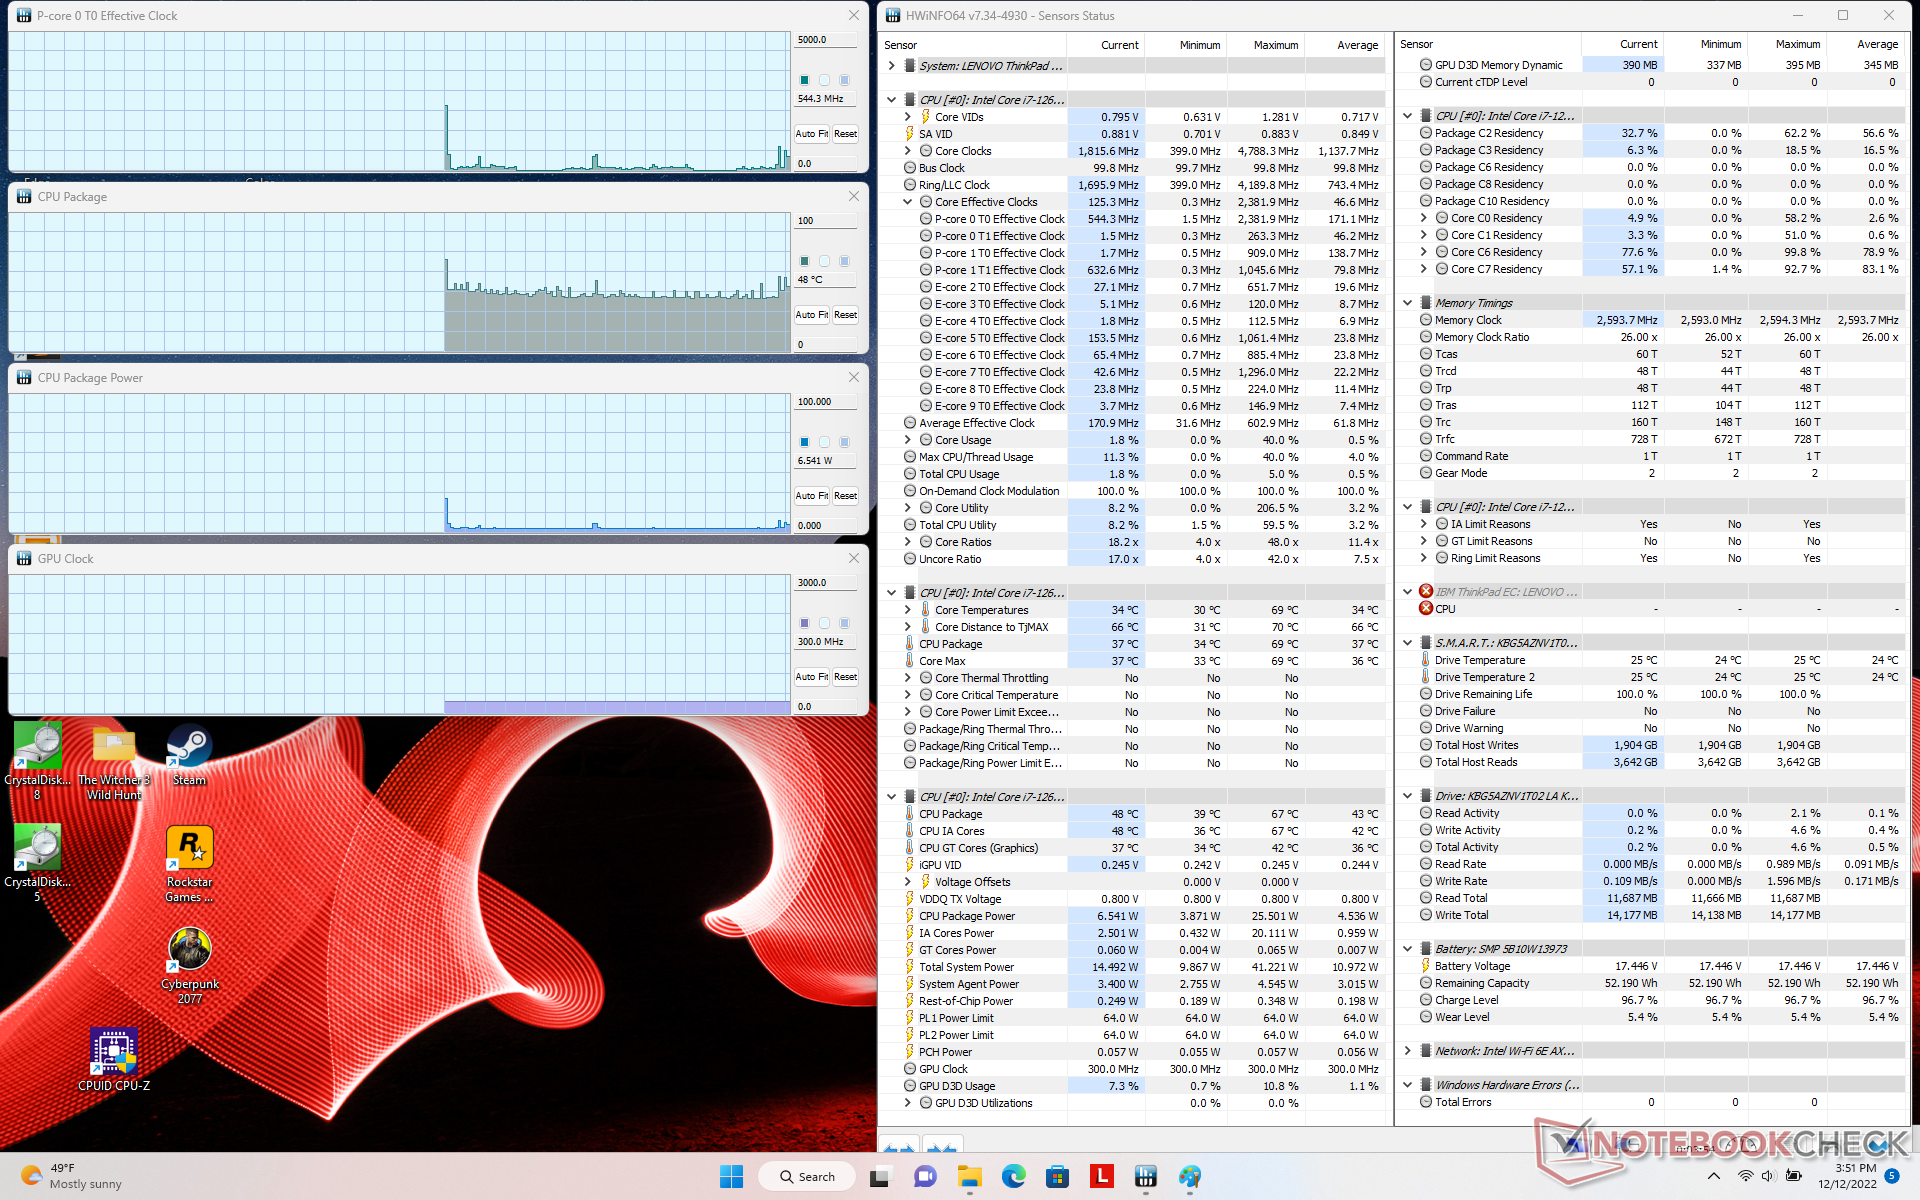
Stresstest
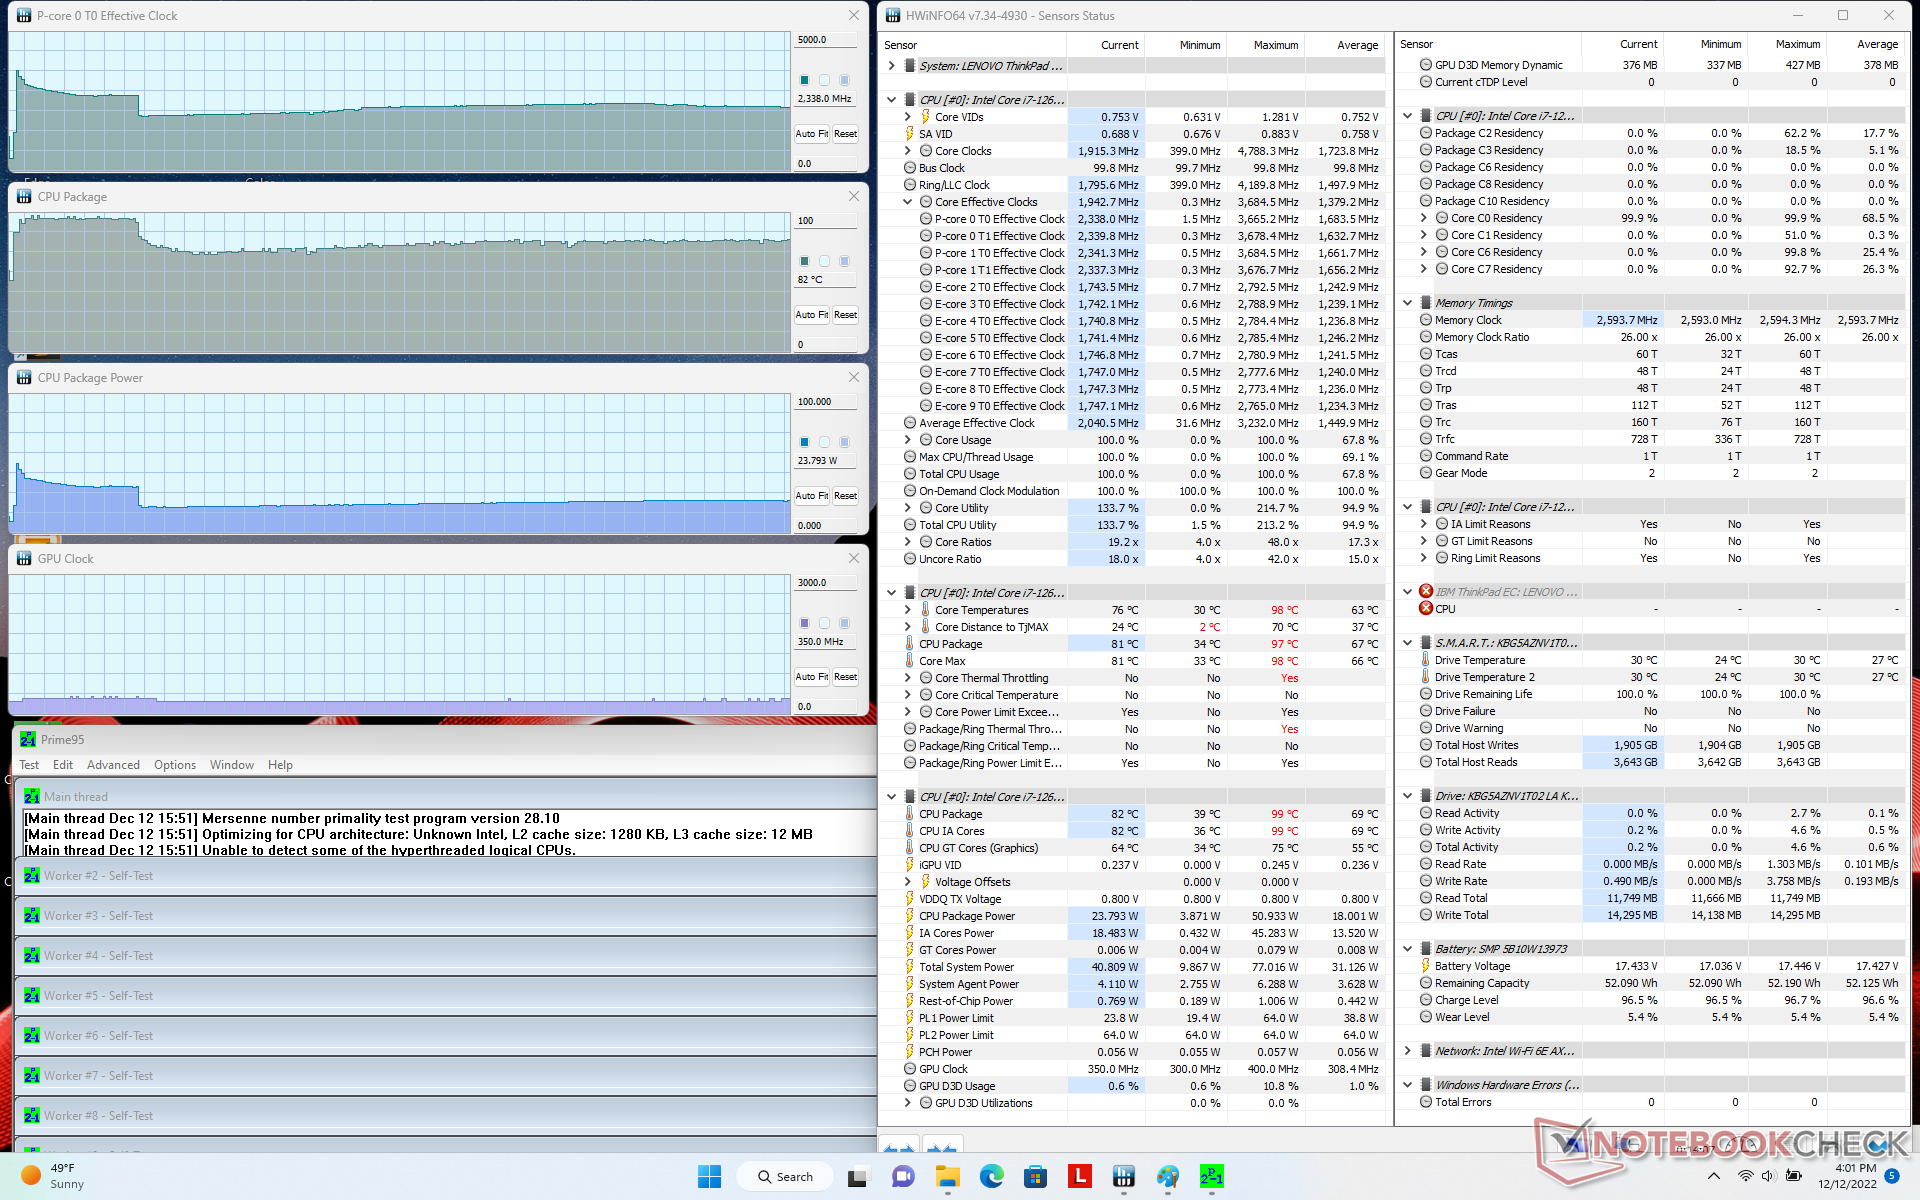
Unter Prime95 stieg die CPU nur für ein paar Sekunden auf 3,7 GHz, 51 W und 98 °C an. Die Taktrate und die Leistungsaufnahme sinken dann auf 2,7 GHz bzw. 35 W, bis sie sich schließlich nach einigen Minuten bei 2,3 GHz, 24 W und 82 °C stabilisieren. Der Anstieg der Kerntemperatur auf fast 100 °C zeigt, dass die Kühllösung nicht ausreicht, um die Turbo-Boost-Leistung zu maximieren.
Der Akkubetrieb scheint die CPU- oder GPU-Leistung nicht wesentlich zu beeinträchtigen. Ein 3DMark-11-Test im Netz- und dann im Akkubetrieb würde fast keine Unterschiede in den Endresultaten zeigen.
| CPU-Takt (GHz) | GPU-Takt (MHz) | durchschnittliche CPU-Temperatur (°C) | |
| System Leerlauf | -- | -- | 46 |
| Prime95, Stress | 2,3 | -- | 82 |
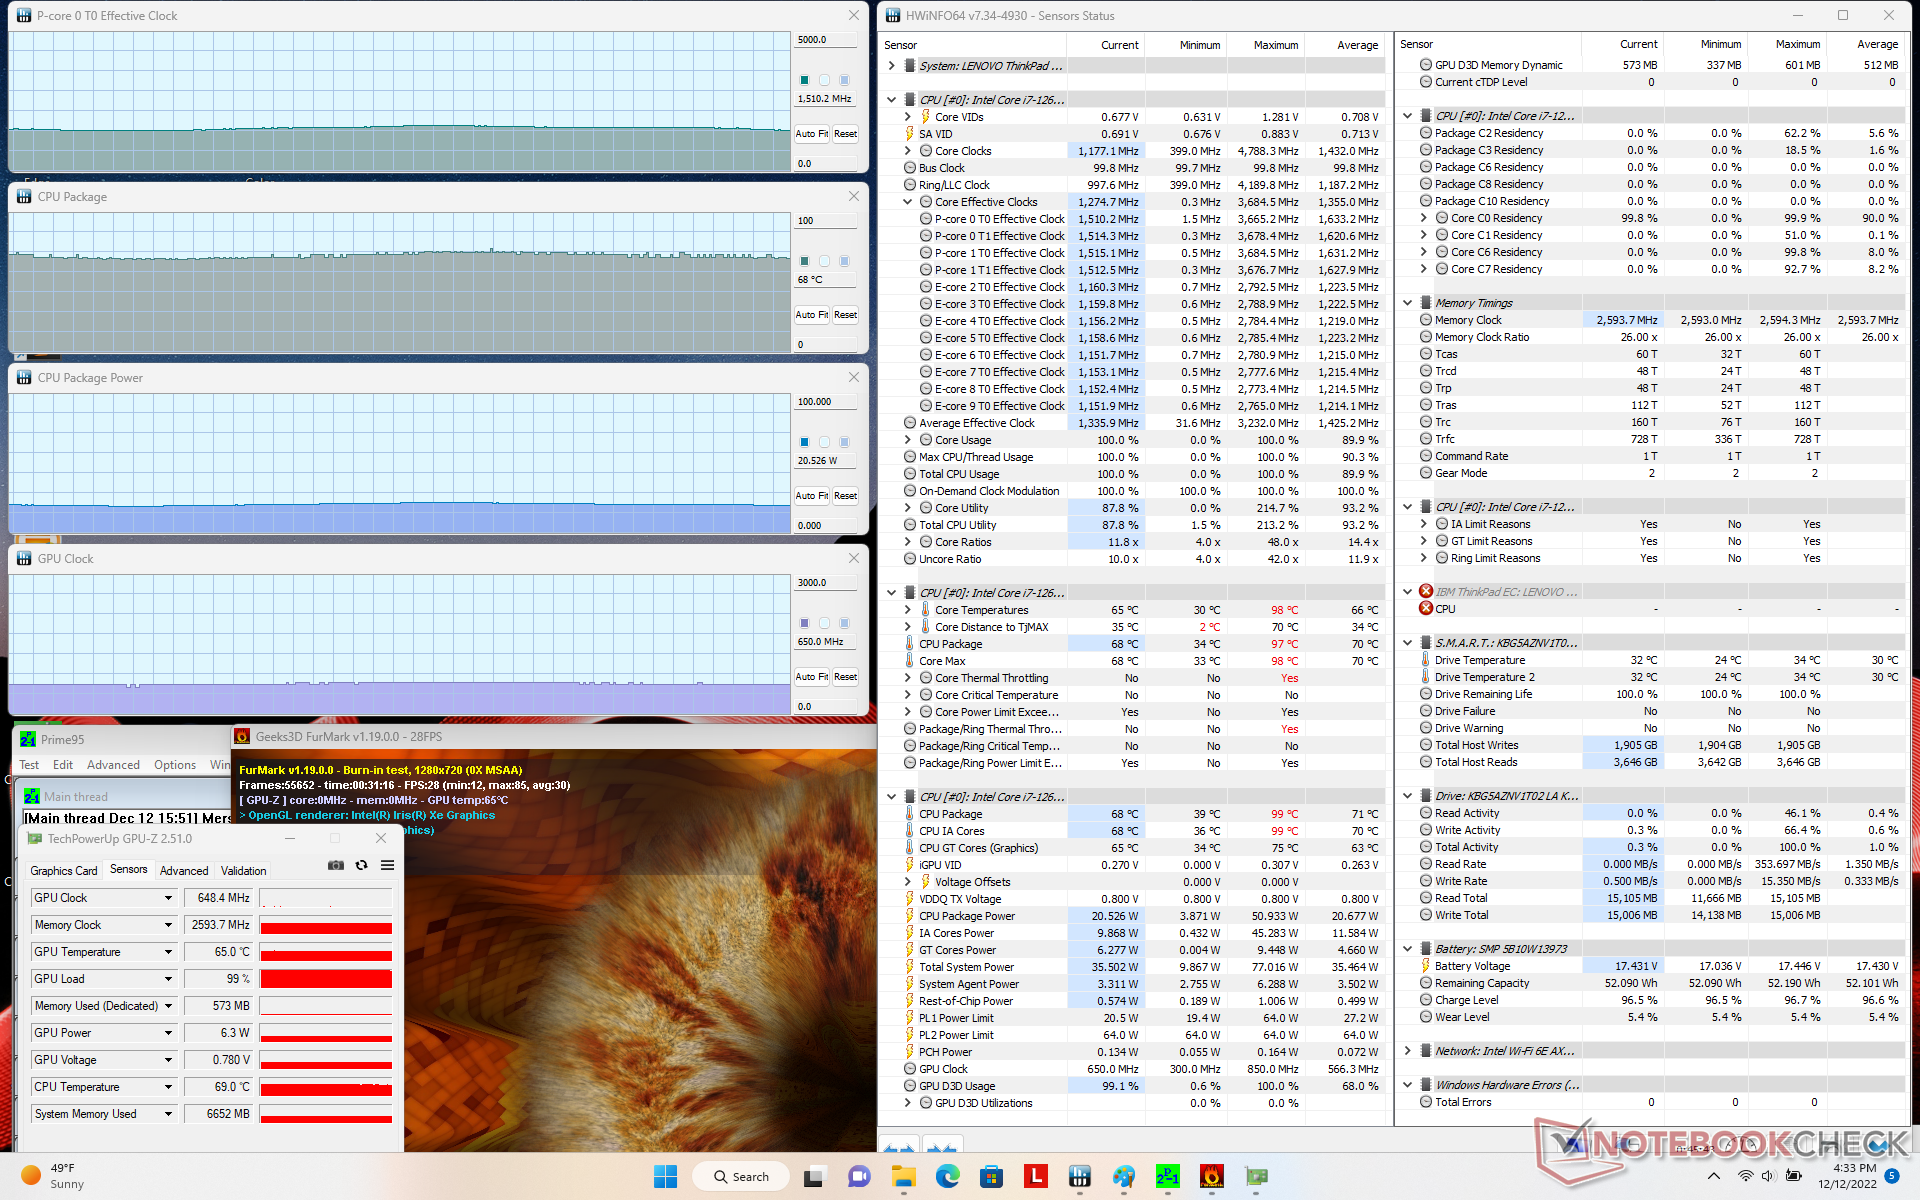
| Prime95 + FurMark, Stress | 1,5 | 648 | 68 |
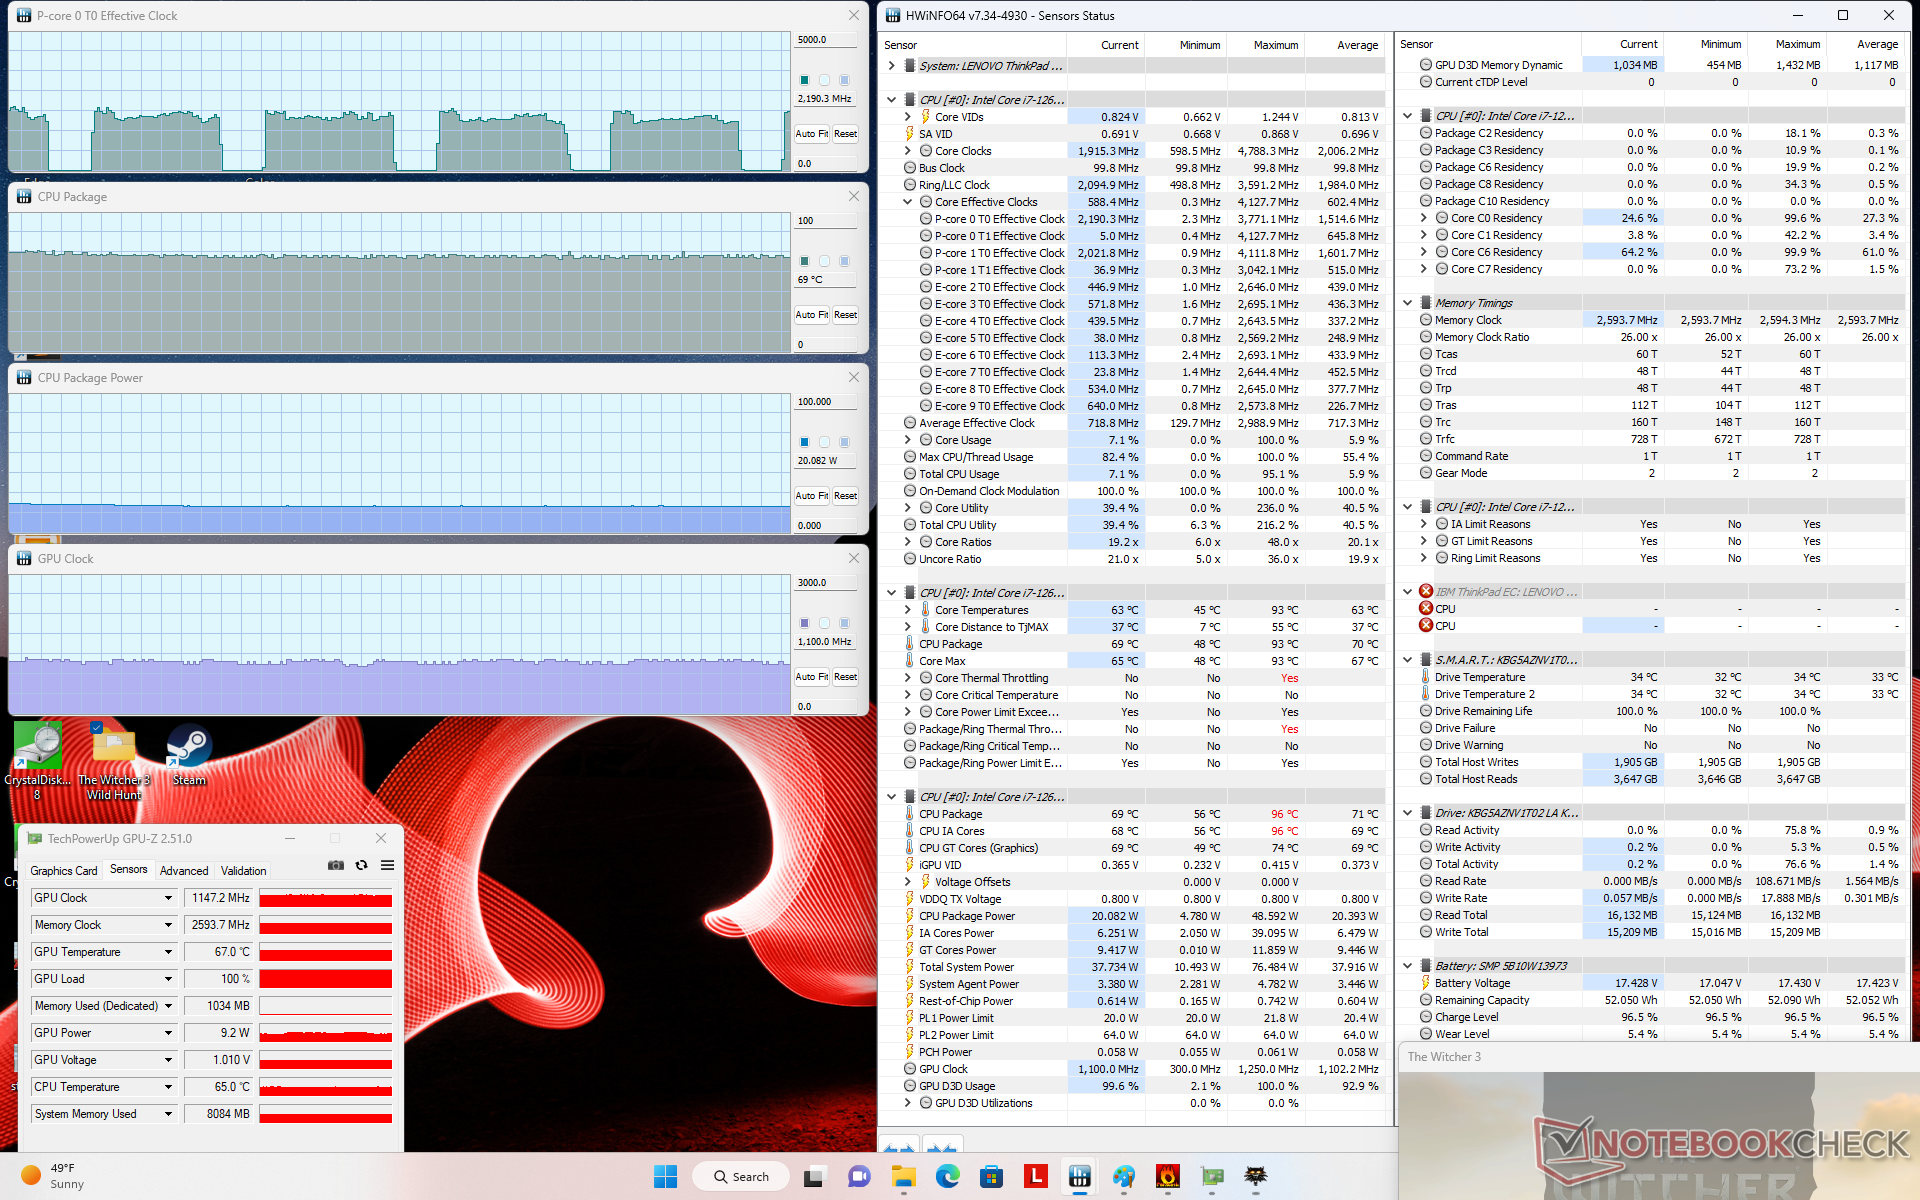
| Witcher 3, Stress | ~2,2 | 1147 | 69 |
Lautsprecher
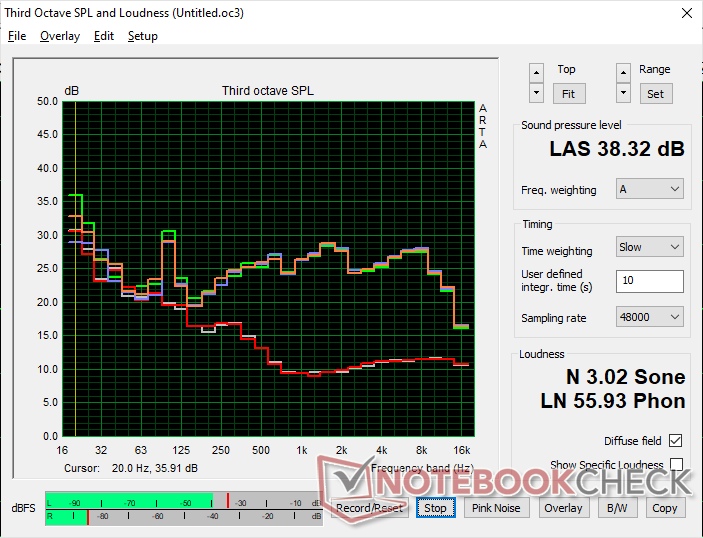
Lenovo ThinkPad X1 Carbon G10 Core i7-1265U Audio Analyse
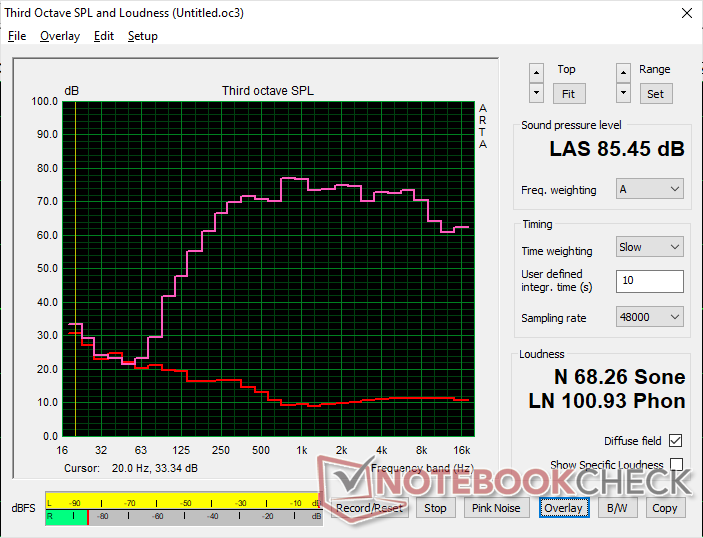
(+) | Die Lautsprecher können relativ laut spielen (85.5 dB)
Bass 100 - 315 Hz
(±) | abgesenkter Bass - 13.4% geringer als der Median
(±) | durchschnittlich lineare Bass-Wiedergabe (11.3% Delta zum Vorgänger)
Mitteltöne 400 - 2000 Hz
(+) | ausgeglichene Mitten, vom Median nur 3.2% abweichend
(+) | lineare Mitten (3.3% Delta zum Vorgänger)
Hochtöne 2 - 16 kHz
(+) | ausgeglichene Hochtöne, vom Median nur 2.7% abweichend
(+) | sehr lineare Hochtöne (4.4% Delta zum Vorgänger)
Gesamt im hörbaren Bereich 100 - 16.000 Hz
(+) | hörbarer Bereich ist sehr linear (10.8% Abstand zum Median
Im Vergleich zu allen Geräten derselben Klasse
» 2% aller getesteten Geräte dieser Klasse waren besser, 1% vergleichbar, 97% schlechter
» Das beste Gerät hat einen Delta-Wert von 7%, durchschnittlich ist 21%, das schlechteste Gerät hat 53%
Im Vergleich zu allen Geräten im Test
» 6% aller getesteten Geräte waren besser, 2% vergleichbar, 92% schlechter
» Das beste Gerät hat einen Delta-Wert von 4%, durchschnittlich ist 24%, das schlechteste Gerät hat 134%
Apple MacBook Pro 16 2021 M1 Pro Audio Analyse
(+) | Die Lautsprecher können relativ laut spielen (84.7 dB)
Bass 100 - 315 Hz
(+) | guter Bass - nur 3.8% Abweichung vom Median
(+) | lineare Bass-Wiedergabe (5.2% Delta zum Vorgänger)
Mitteltöne 400 - 2000 Hz
(+) | ausgeglichene Mitten, vom Median nur 1.3% abweichend
(+) | lineare Mitten (2.1% Delta zum Vorgänger)
Hochtöne 2 - 16 kHz
(+) | ausgeglichene Hochtöne, vom Median nur 1.9% abweichend
(+) | sehr lineare Hochtöne (2.7% Delta zum Vorgänger)
Gesamt im hörbaren Bereich 100 - 16.000 Hz
(+) | hörbarer Bereich ist sehr linear (4.6% Abstand zum Median
Im Vergleich zu allen Geräten derselben Klasse
» 0% aller getesteten Geräte dieser Klasse waren besser, 0% vergleichbar, 100% schlechter
» Das beste Gerät hat einen Delta-Wert von 5%, durchschnittlich ist 17%, das schlechteste Gerät hat 45%
Im Vergleich zu allen Geräten im Test
» 0% aller getesteten Geräte waren besser, 0% vergleichbar, 100% schlechter
» Das beste Gerät hat einen Delta-Wert von 4%, durchschnittlich ist 24%, das schlechteste Gerät hat 134%
Energieverwaltung
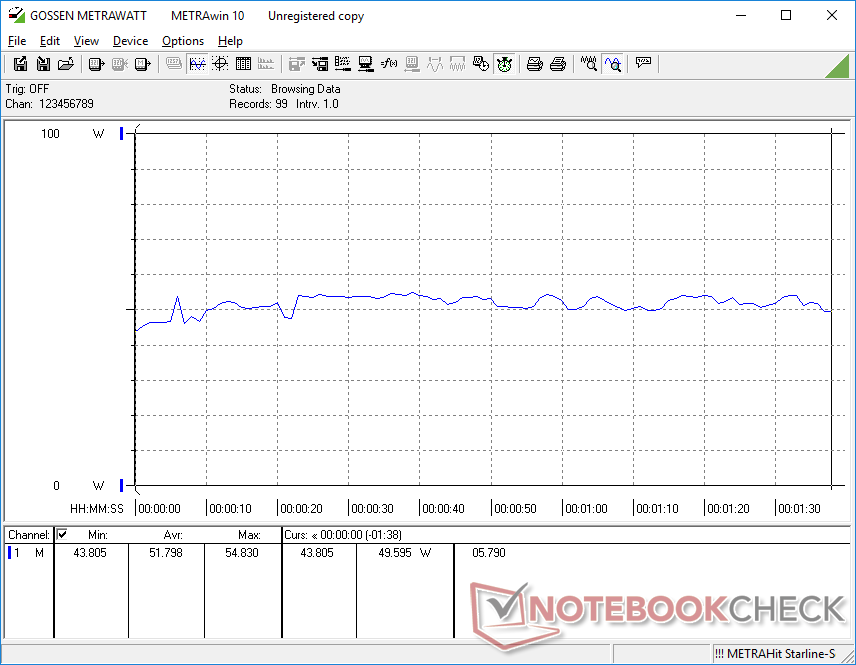
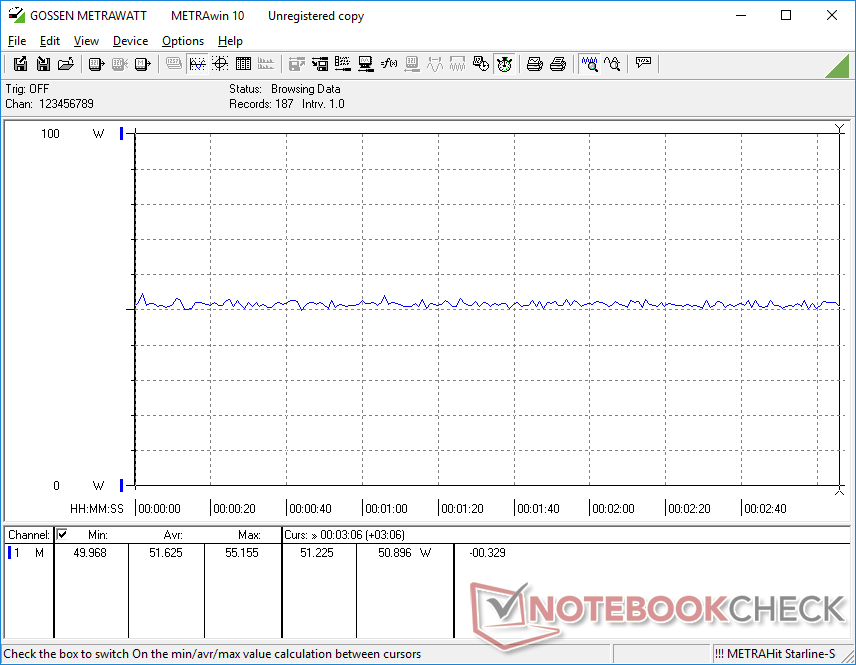
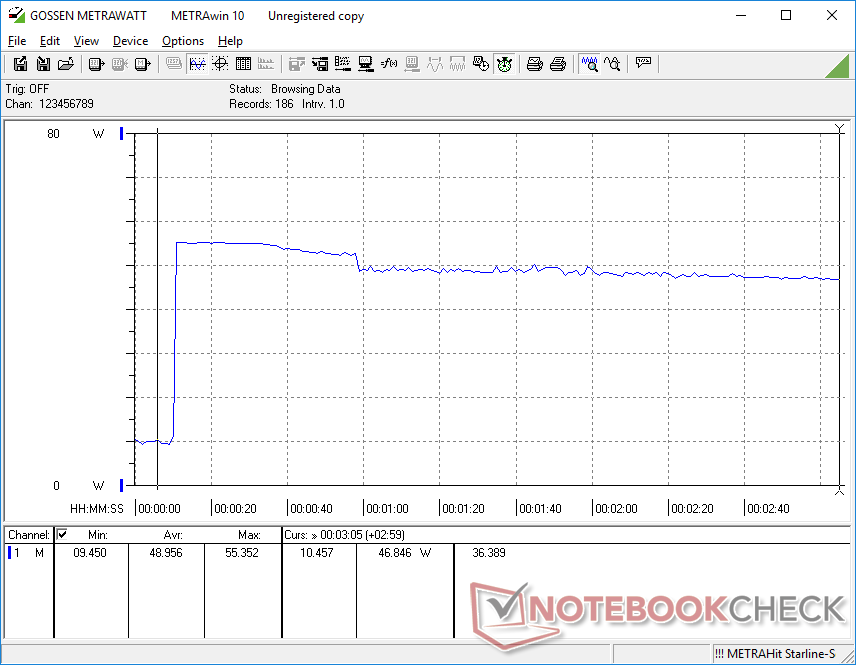
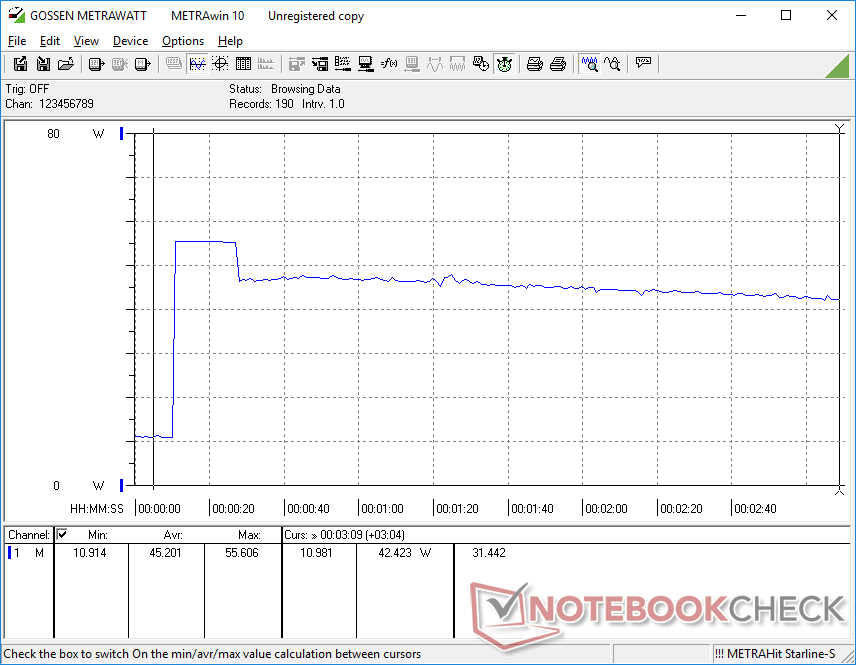
Stromverbrauch - Anspruchsvoller
Unser Core i7-1265U-Gerät ist bei höherer Last um etwa 40 bis 80 Prozent anspruchsvoller als unser Core i5-1250P-Gerät, was mit unseren oben aufgezeichneten schnelleren CPU- und GPU-Ergebnissen übereinstimmt. In der Tat kann diese spezielle Core-i7-U-Konfiguration anspruchsvoller sein als die meisten 14-Zoll-Business-Notebooks ohne diskrete Grafik.
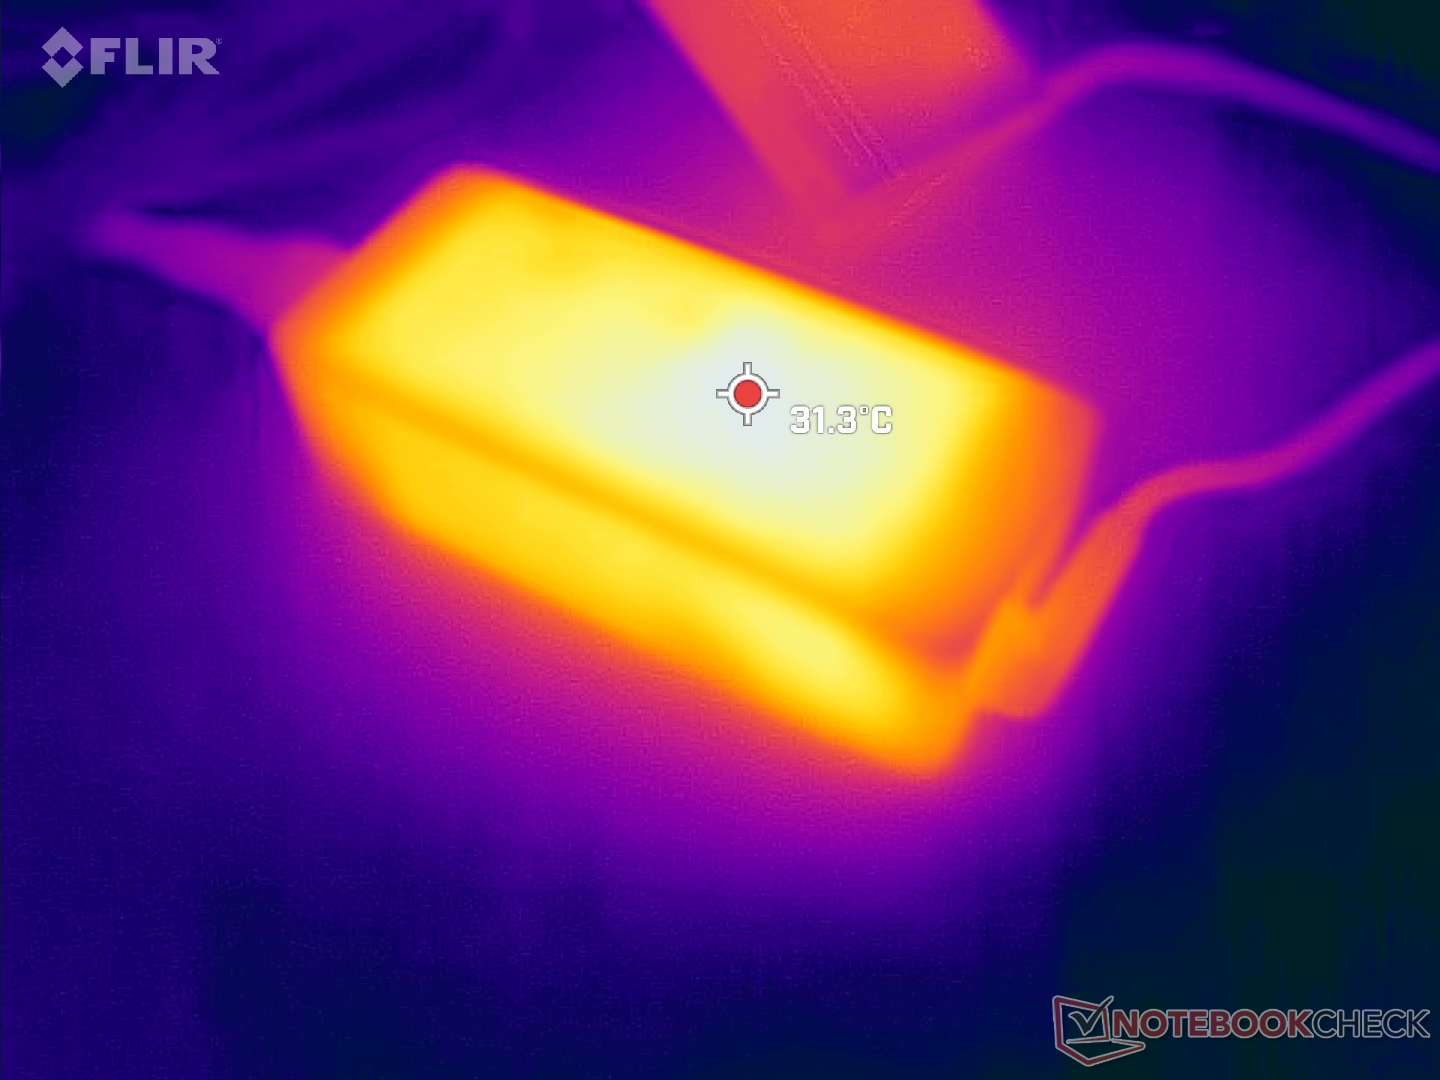
Wir konnten eine maximale Leistungsaufnahme von 56 W aus dem kleinen (~10,8 x 4,7 x 3 cm) 65-W-USB-C-Netzteil aufzeichnen, wenn wir Prime95 Stress anlegen, wie unsere Screenshots unten zeigen. Dies ist niedriger als die 63 W, die wir bei der Core i5-1250P-Konfiguration gemessen haben, da letztere von einer höheren anfänglichen Turbo-Boost-Leistung profitiert, wie in unseren CineBench-Ergebnissen oben zu sehen ist.
| Aus / Standby | |
| Idle | |
| Last |
|
Legende:
min: | |
| Lenovo ThinkPad X1 Carbon G10 Core i7-1265U i7-1265U, Iris Xe G7 96EUs, Kioxia BG5 KBG5AZNV1T02, IPS, 1920x1200, 14" | Lenovo ThinkPad X1 Carbon G10 21CC001RGE i5-1250P, Iris Xe G7 80EUs, Samsung PM9A1 MZVL2512HCJQ, IPS LED, 1920x1200, 14" | HP EliteBook 845 G9 6F6H9EA R5 PRO 6650U, Radeon 660M, Samsung PM991 MZVLQ512HBLU, IPS, 1920x1200, 14" | LG Gram 14Z90Q i5-1240P, Iris Xe G7 80EUs, Samsung PM9A1 MZVL2512HCJQ, IPS, 1920x1200, 14" | Dell Latitude 7420 JW6MH i5-1145G7, Iris Xe G7 80EUs, SK Hynix BC711 HFM512GD3HX015N, IPS, 1920x1080, 14" | Asus ExpertBook B1 B1400CEAE, i5-1135G7 i5-1135G7, Iris Xe G7 80EUs, WDC PC SN530 SDBPNPZ-512G, IPS, 1920x1080, 14" | |
|---|---|---|---|---|---|---|
| Stromverbrauch | 20% | 16% | 4% | 14% | 21% | |
| Idle min * (Watt) | 2.8 | 2.9 -4% | 3 -7% | 3 -7% | 2.7 4% | 3.2 -14% |
| Idle avg * (Watt) | 6 | 4.9 18% | 5 17% | 6 -0% | 6 -0% | 5.2 13% |
| Idle max * (Watt) | 10.9 | 6 45% | 9 17% | 12 -10% | 7.6 30% | 6.1 44% |
| Last avg * (Watt) | 51.8 | 29.3 43% | 41 21% | 40 23% | 37 29% | 25.2 51% |
| Witcher 3 ultra * (Watt) | 51.6 | 36.6 29% | 32.6 37% | 36.5 29% | 33.2 36% | 27.7 46% |
| Last max * (Watt) | 55.6 | 63.3 -14% | 50 10% | 63 -13% | 65 -17% | 64.3 -16% |
* ... kleinere Werte sind besser
Power Consumption Witcher 3 / Stresstest
Power Consumption external Monitor
Akkulaufzeit - Kürzere Laufzeit
Die WLAN-Laufzeit ist deutlich kürzer als die, welche wir bei der Core-P-Version des ThinkPad X1 Carbon G10 gemessen haben, wenn beide auf ein ähnliches Energieprofil und eine Helligkeit von 150 Nit eingestellt sind. Wir haben den Test sogar wiederholt, um sicherzugehen, aber die Ergebnisse verbesserten sich bei unserem Testgerät nicht. Wir erwarten nur 6,5 Stunden reale Surf-Nutzung im Vergleich zu über zehn Stunden bei der Core-P-SKU. Die kürzere Laufzeit deckt sich mit unseren oben genannten, insgesamt höheren Stromverbrauchswerten.
Das Aufladen von der leeren zur vollen Kapazität ist mit etwa 2,5 Stunden langsamer als erwartet.
| Lenovo ThinkPad X1 Carbon G10 Core i7-1265U i7-1265U, Iris Xe G7 96EUs, 57 Wh | Lenovo ThinkPad X1 Carbon G10 21CC001RGE i5-1250P, Iris Xe G7 80EUs, 57 Wh | HP EliteBook 845 G9 6F6H9EA R5 PRO 6650U, Radeon 660M, 51 Wh | LG Gram 14Z90Q i5-1240P, Iris Xe G7 80EUs, 72 Wh | Dell Latitude 7420 JW6MH i5-1145G7, Iris Xe G7 80EUs, 63 Wh | Asus ExpertBook B1 B1400CEAE, i5-1135G7 i5-1135G7, Iris Xe G7 80EUs, 42 Wh | |
|---|---|---|---|---|---|---|
| Akkulaufzeit | 55% | 83% | 80% | 114% | 5% | |
| WLAN (h) | 6.6 | 10.2 55% | 12.1 83% | 11.9 80% | 14.1 114% | 6.9 5% |
| H.264 (h) | 10.9 | |||||
| Last (h) | 2.4 | 2.8 | 2.6 | |||
| Idle (h) | 28.9 | 23.5 |
Pro
Contra
Fazit - Core i7 U schlägt Core i5 P
Die Core i7-1265U und Core i5-1250P Konfigurationen werden mit ähnlichen Speicher- und RAM-Kapazitäten jeweils für etwa 1.900 US-Dollar angeboten. Wenn Sie auf der Suche nach einer schnelleren Gesamt-CPU- und GPU-Leistung sind, dann ist die Core i7-1265U-Option zu empfehlen. Die Vorteile sind nicht unerheblich, denn allein der integrierte Grafikprozessor kann bis zu 40 Prozent schneller sein, während die CPU mit der Zeit viel weniger gedrosselt wird.
Die Core-i7-1265U-Version des ThinkPad X1 Carbon G10 ist deutlich schneller als die Core-i5-1250P-Version, allerdings auf Kosten einer kürzeren Akkulaufzeit.
Für eine längere Akkulaufzeit, einen geringeren Stromverbrauch und möglicherweise leisere Lüftergeräusche wäre die Core-i5-1250P-Variante jedoch die richtige Wahl. Das System hält ein paar Stunden länger durch als die Core-i7-1265U-Option, was manche Nutzer zu schätzen wissen. Ansonsten bekommen Sie mehr für Ihr Geld, wenn Sie sich für die Core-i7-1265U-Option entscheiden, wenn Akkulaufzeit weniger wichtig ist.
Preis und Verfügbarkeit
Die exakt von uns getestete Konfiguration ist derzeit auf Amazon für knapp unter 1.900 US-Dollar erhältlich. Lenovo bietet die Core-i7-1265U-Konfiguration derzeit nicht über seine offizielle Website an.
Lenovo ThinkPad X1 Carbon G10 Core i7-1265U
- 14.12.2022 v7 (old)
Allen Ngo
Preisvergleich

