Lenovo Yoga Slim 9 Test: Der wohl schnellste Evo Laptop

Lenovos Yoga Slim 9i ist ein 14-Zoll-Laptop mit 3K-90Hz-OLED-Display und schnellem Core i7-1280P von Intel, aber wer soll bei der Yoga-Reihe noch den Überblick behalten? Yoga 9, Yoga Slim 7i Pro, Yoga Slim 9i, Yoga 7, Yoga Slim 7 Carbon und Slim 7 ProX, die einen mit und die anderen ohne Convertible-Funktion. Fest steht: unser Yoga Slim 9i kommt als klassisches Clamshell-Laptop der oberen Mittelklasse mit High-End-Aspekten, welche man bereits beim ansprechendem 3D-Glas des Deckels entdecken kann. Der Begriff "Ultrabook" wird mittlerweile von Intel durch "Evo Laptop" abgelöst, dennoch bezeichnen wir es stellenweise weiterhin mit dem klassischen Begriff.
Im Vergleich zum Vorgänger kann man nun bis zu 32 GB verlöteten RAM wählen, unser Modell kommt mit 16 GB und schnellem 14-Kern-Prozessor von Intel, alternativ ist einzig der Core i5-1240P konfigurierbar. Eine AMD-Version wie beim Yoga Slim 7 gibt es nicht. Neben einer 1 TB großen PCIe-4.0-SSD setzt unser Modell auf ein 3K-OLED-Display mit 90 Hz, während man für 140 Euro mehr ein 4K-OLED-Display wählen kann, das allerdings mit 60 Hz refresht. Insgesamt wird für unsere Ausstattung 2.139 Euro fällig, Lenovo gewährt allerdings regelmäßige Rabatte, wie auch zum Zeitpunkt dieses Tests (-15 %).
Trotz vieler Stärken, stellt sich im Laufe unseres Testberichts heraus, dass einige Makel vom Vorjahresmodell übernommen wurden, während die Konkurrenz starke Geräte anführt: Asus' Zenbook S 13 OLED mit AMDs neuem Ryzen 6800U, Dells XPS 13 Plus und auch Apples MacBook Air mit M2-Chip, während sich Schenkers Vision 14 durch sein Design, einer dedizierten GPU und RAM-Slots etwas von unserem Testfeld absetzt. Ähnlich das Spectre x360 13.5 von HP, das mit seiner Convertible-Funktion und einem 3:2-Display aufwartet.
Weitere Lenovo-Testberichte:
mögliche Konkurrenten im Vergleich
Bew. | Datum | Modell | Gewicht | Dicke | Größe | Auflösung | Preis ab |
|---|---|---|---|---|---|---|---|
| 86.6 % v7 (old) | 09 / 2022 | Lenovo Yoga Slim 9 14IAP7 i7-1280P, Iris Xe G7 96EUs | 1.4 kg | 14.9 mm | 14.00" | 2880x1800 | |
| 92 % v7 (old) | 08 / 2022 | Apple MacBook Air M2 10C GPU M2, M2 10-Core GPU | 1.2 kg | 11.3 mm | 13.60" | 2560x1664 | |
| 90.3 % v7 (old) | 08 / 2022 | HP Spectre x360 13.5 14t-ef000 i7-1255U, Iris Xe G7 96EUs | 1.4 kg | 17 mm | 13.50" | 3000x2000 | |
| 90.1 % v7 (old) | 07 / 2022 | Asus Zenbook S 13 OLED R7 6800U, Radeon 680M | 1.1 kg | 14.9 mm | 13.30" | 2880x1800 | |
| 89.8 % v7 (old) | 05 / 2022 | Lenovo Yoga 9 14IAP7 82LU0001US i7-1260P, Iris Xe G7 96EUs | 1.4 kg | 15.25 mm | 14.00" | 2880x1800 | |
| 87.7 % v7 (old) | 01 / 2022 | Schenker Vision 14 i7-11370H, GeForce RTX 3050 Ti Laptop GPU | 1.1 kg | 15.6 mm | 14.00" | 2880x1800 | |
| 87.6 % v7 (old) | 06 / 2022 | Lenovo Yoga Slim 7i Pro 14IAP G7 i5-1240P, Iris Xe G7 80EUs | 1.3 kg | 14.6 mm | 14.00" | 2880x1800 | |
| 86.9 % v7 (old) | 07 / 2022 | Dell XPS 13 Plus 9320 4K i7-1260P, Iris Xe G7 96EUs | 1.2 kg | 15.3 mm | 13.40" | 3840x2400 | |
| 86 % v7 (old) | 08 / 2021 | Lenovo Yoga Slim 7 Pro 14ACH5 R9 5900HX, Vega 8 | 1.3 kg | 16.9 mm | 14.00" | 2880x1800 | |
| 84.2 % v7 (old) | 01 / 2021 | Lenovo IdeaPad Slim 9i 14ITL5 i7-1165G7, Iris Xe G7 96EUs | 1.3 kg | 14.6 mm | 14.00" | 3840x2160 |
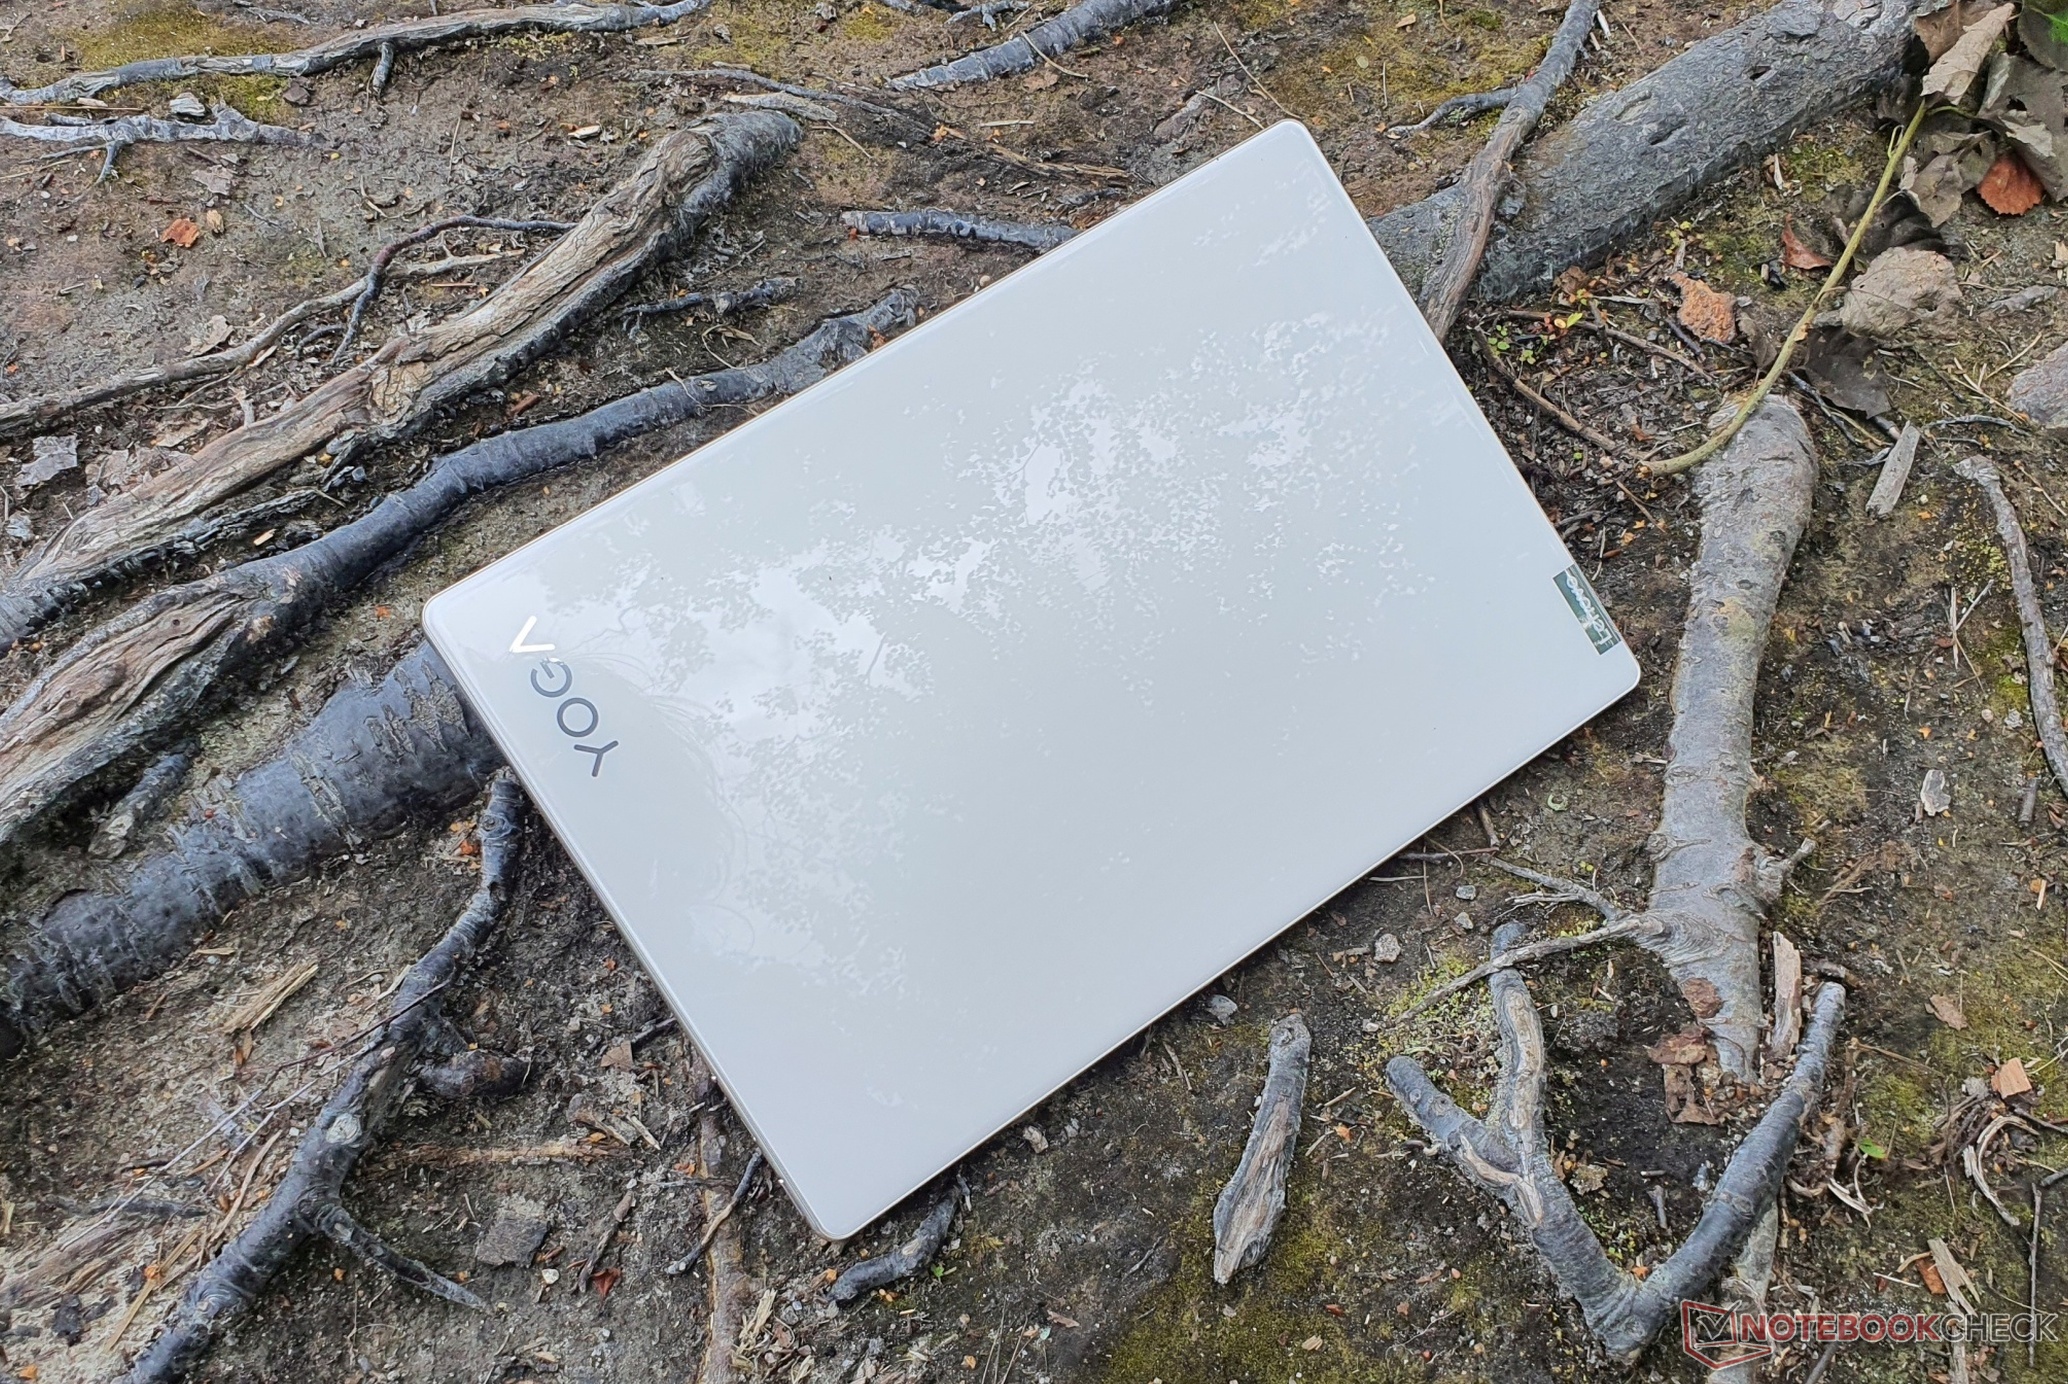
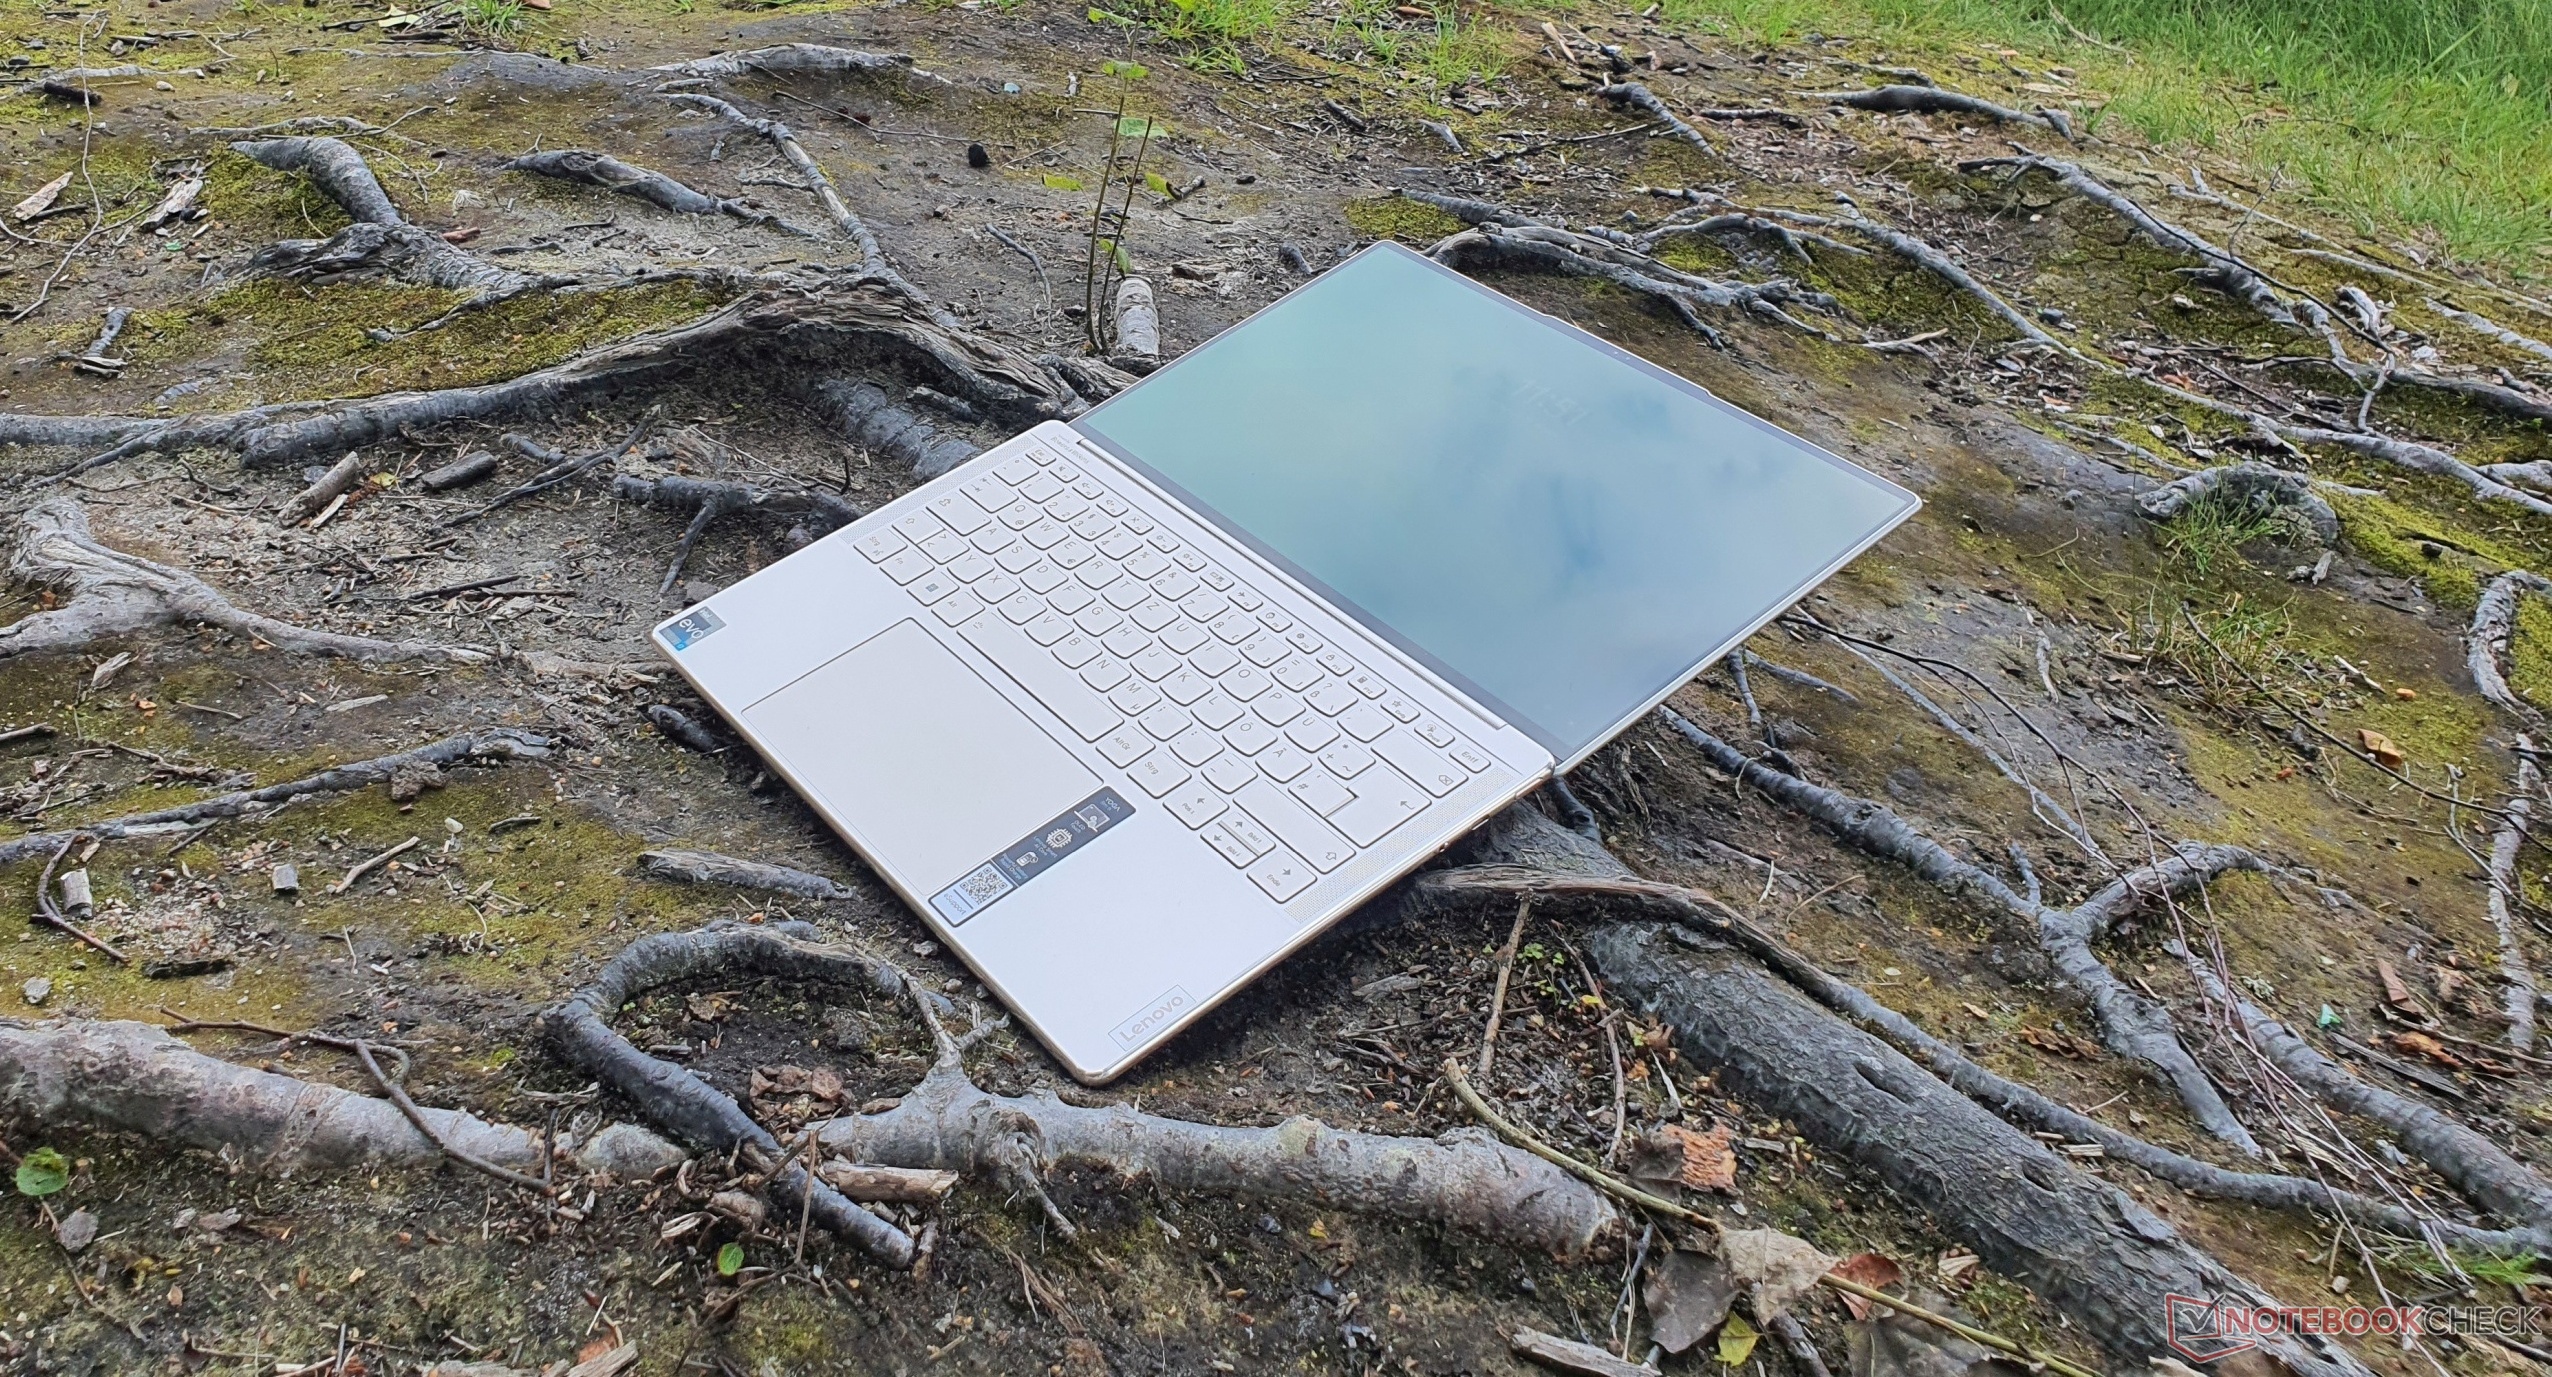
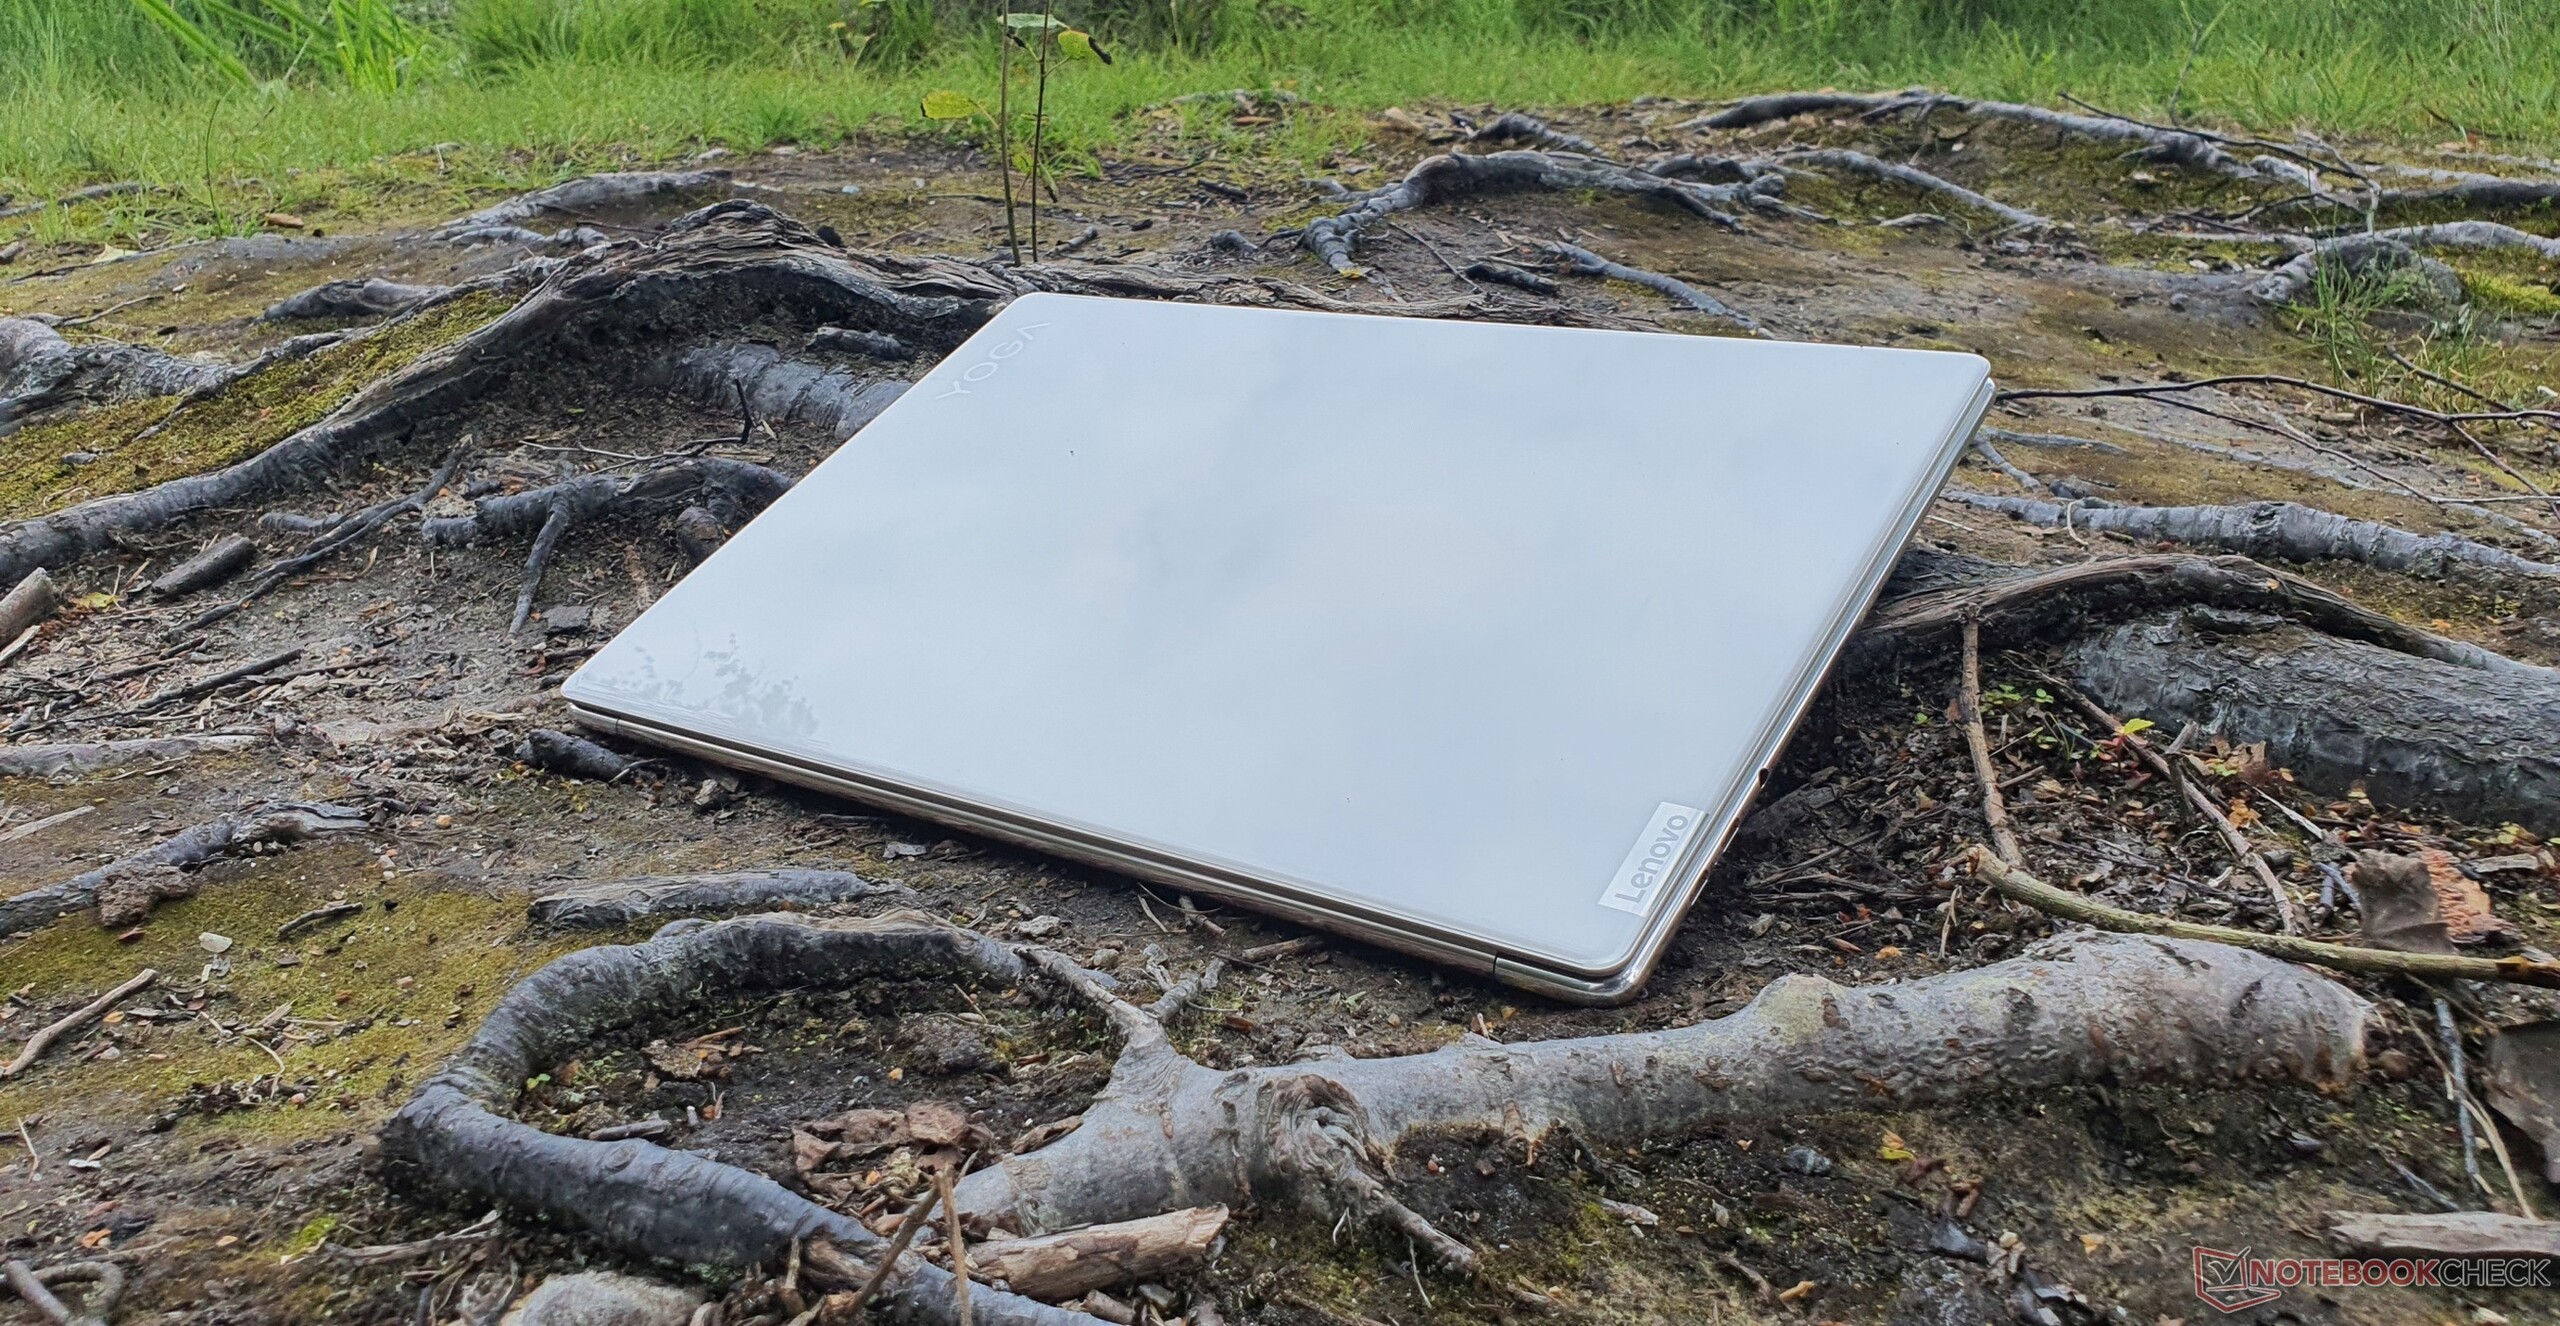
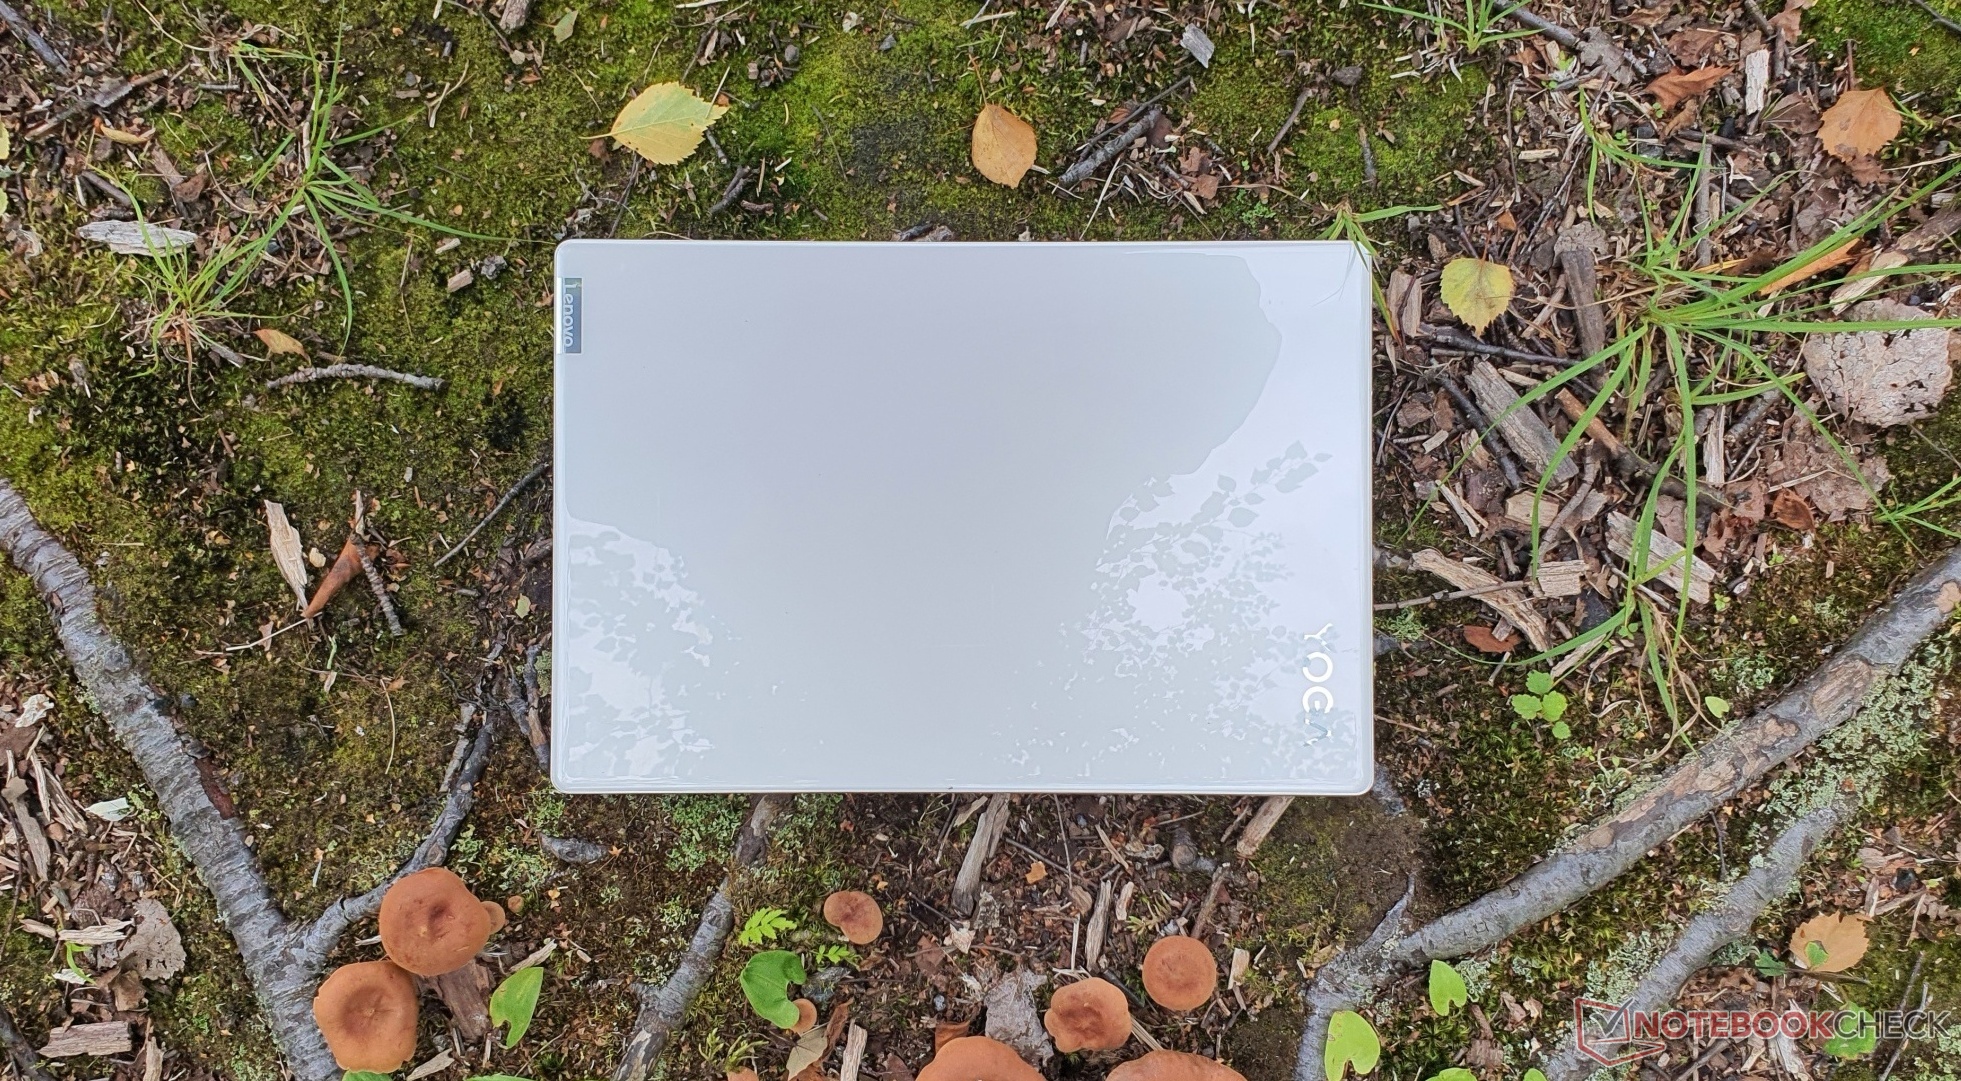
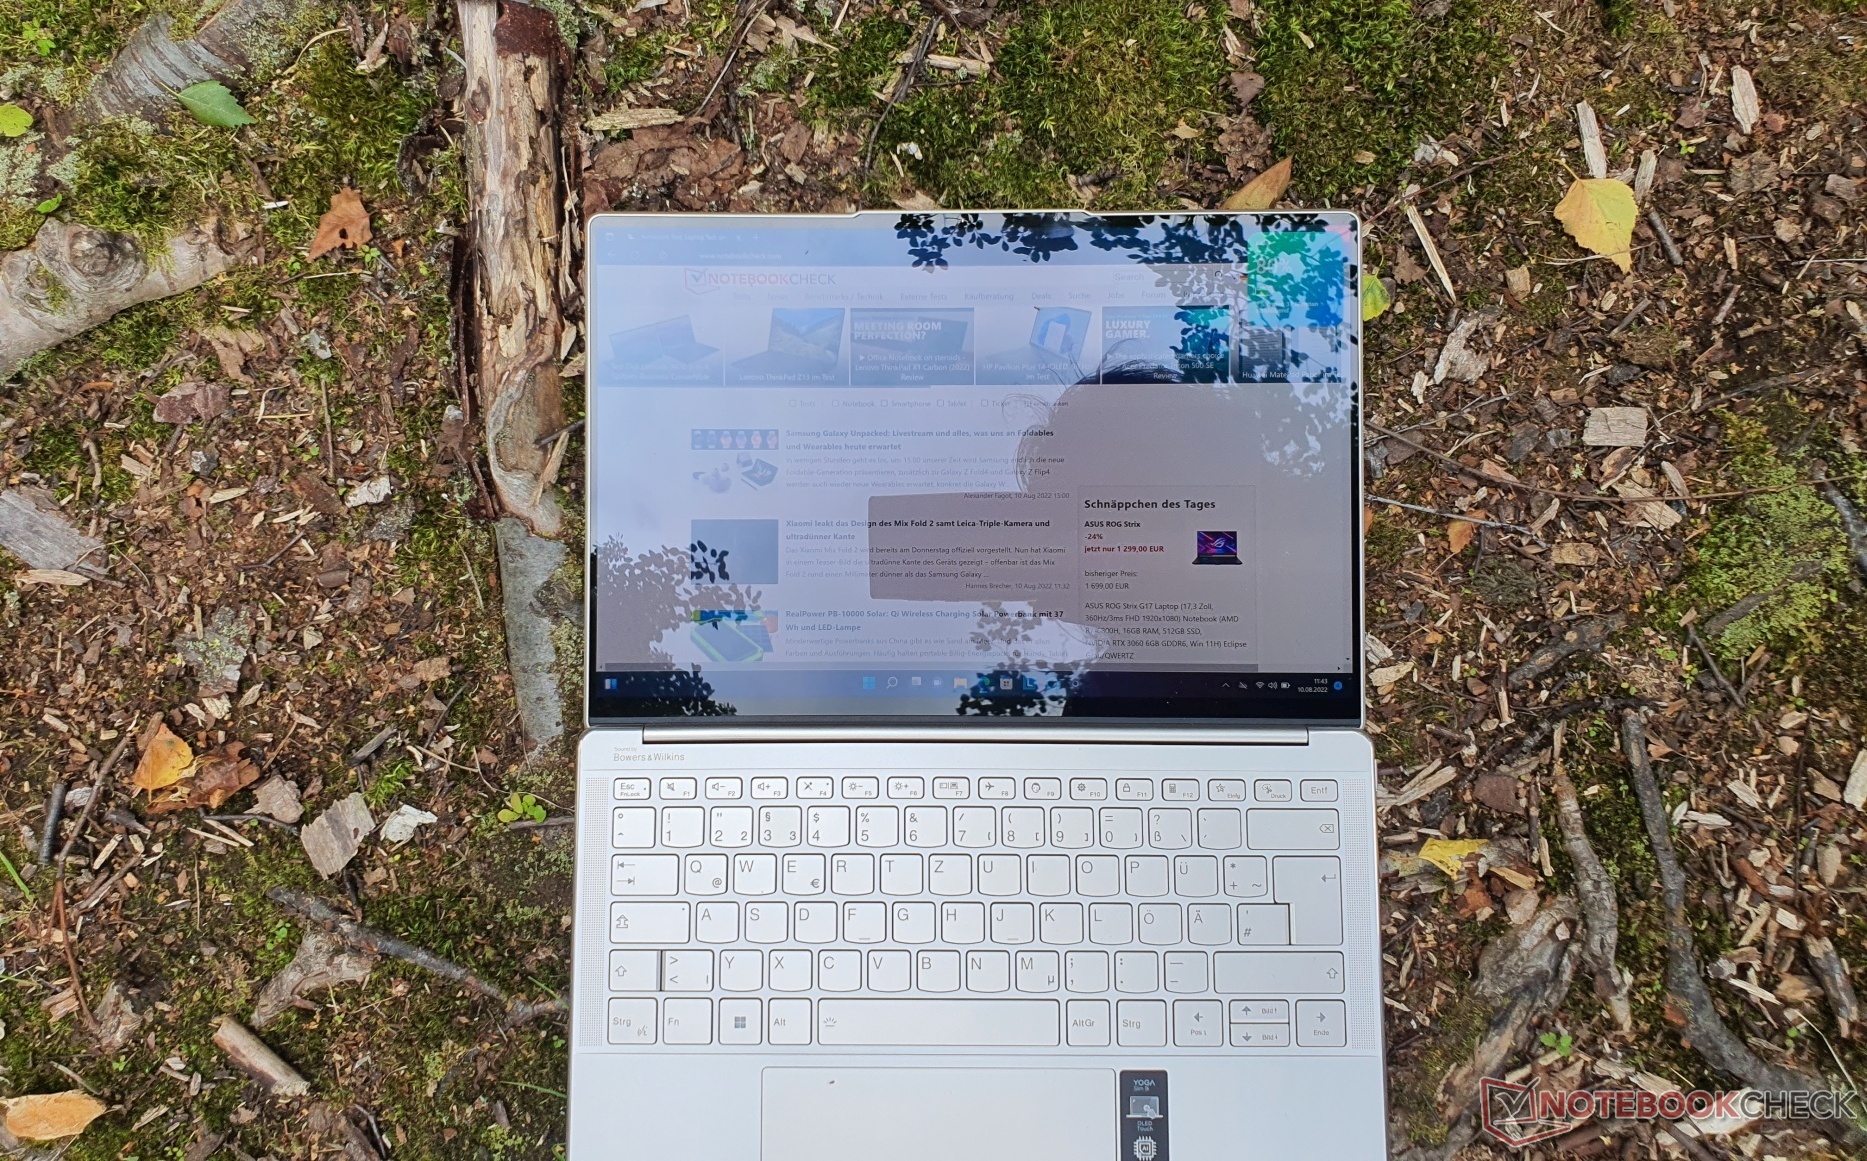
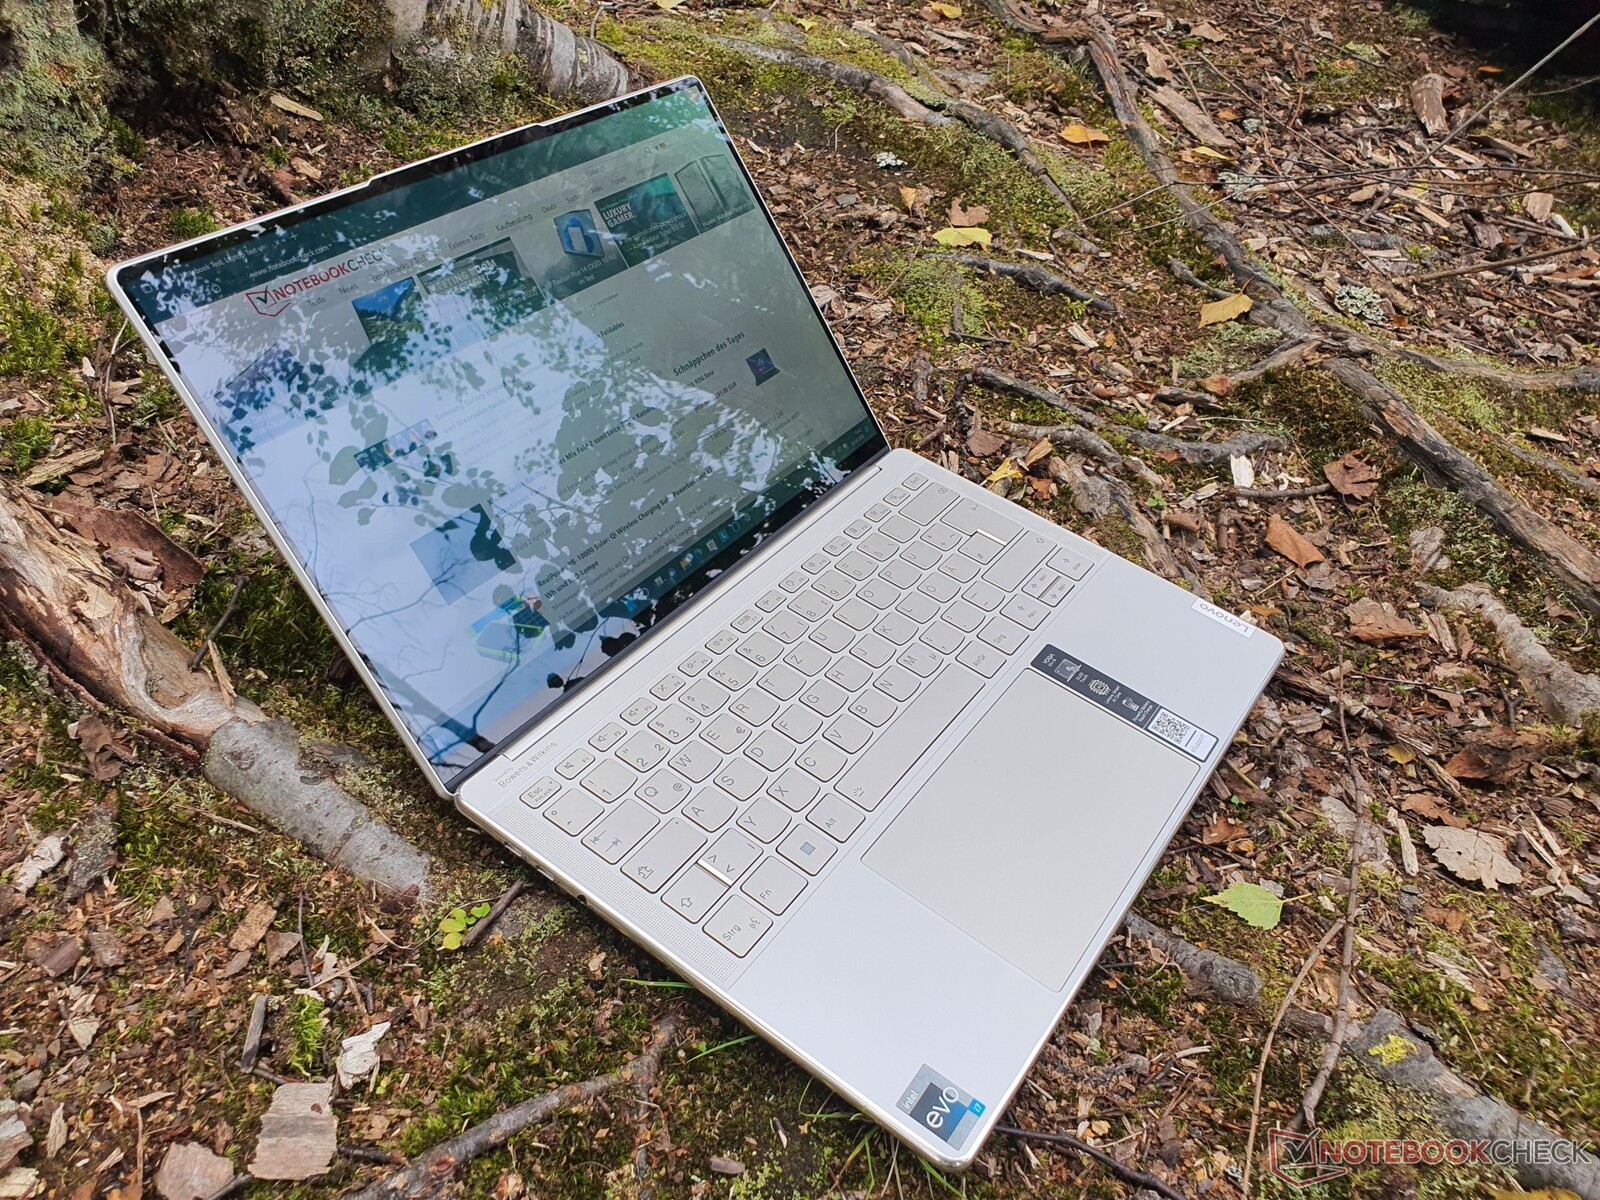
Gehäuse: 3D-Glas erinnert an Smartphone-Flagship
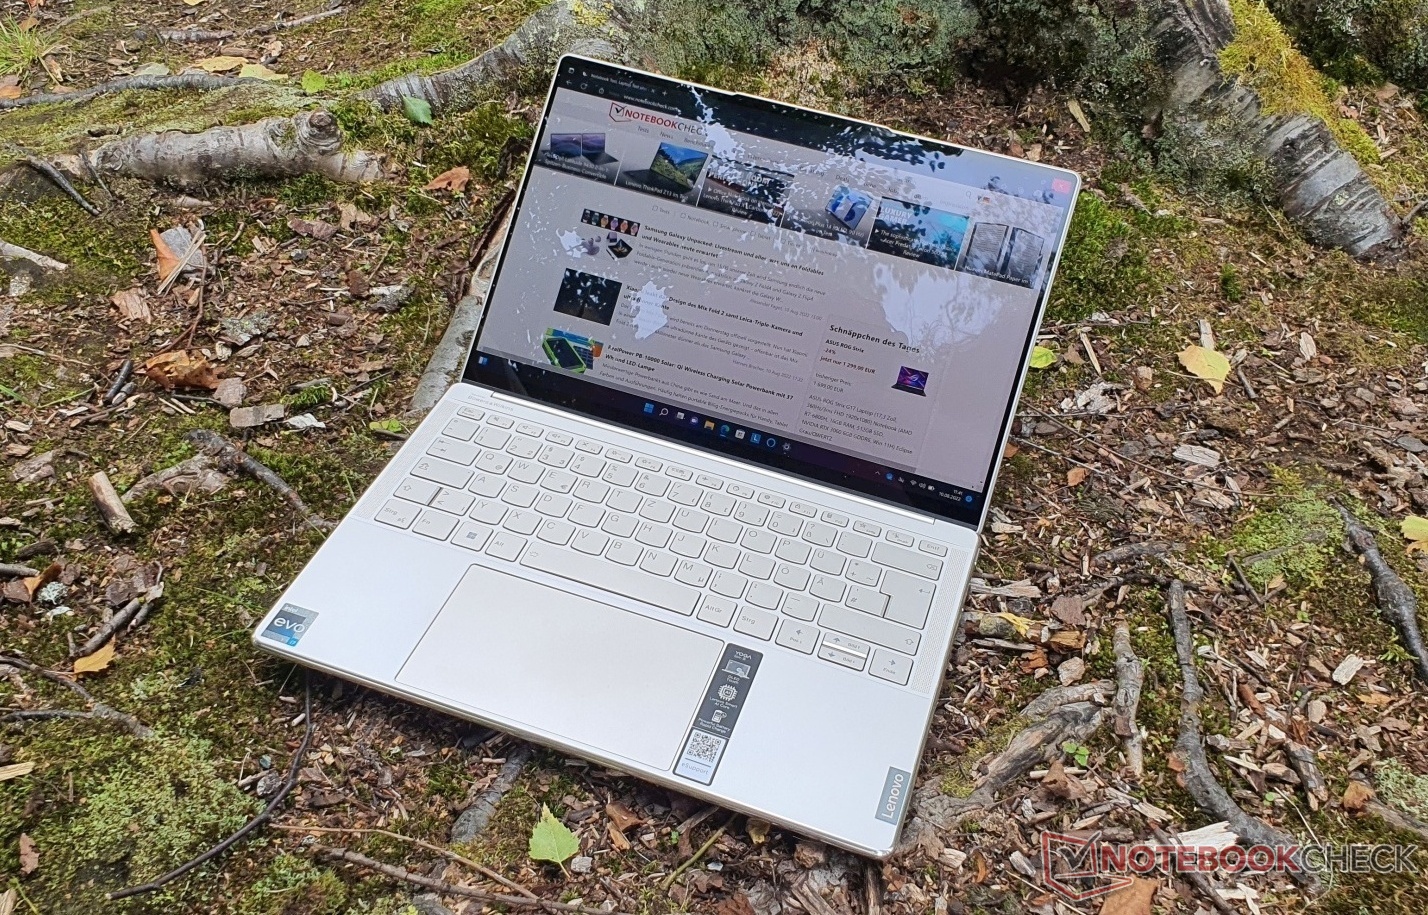
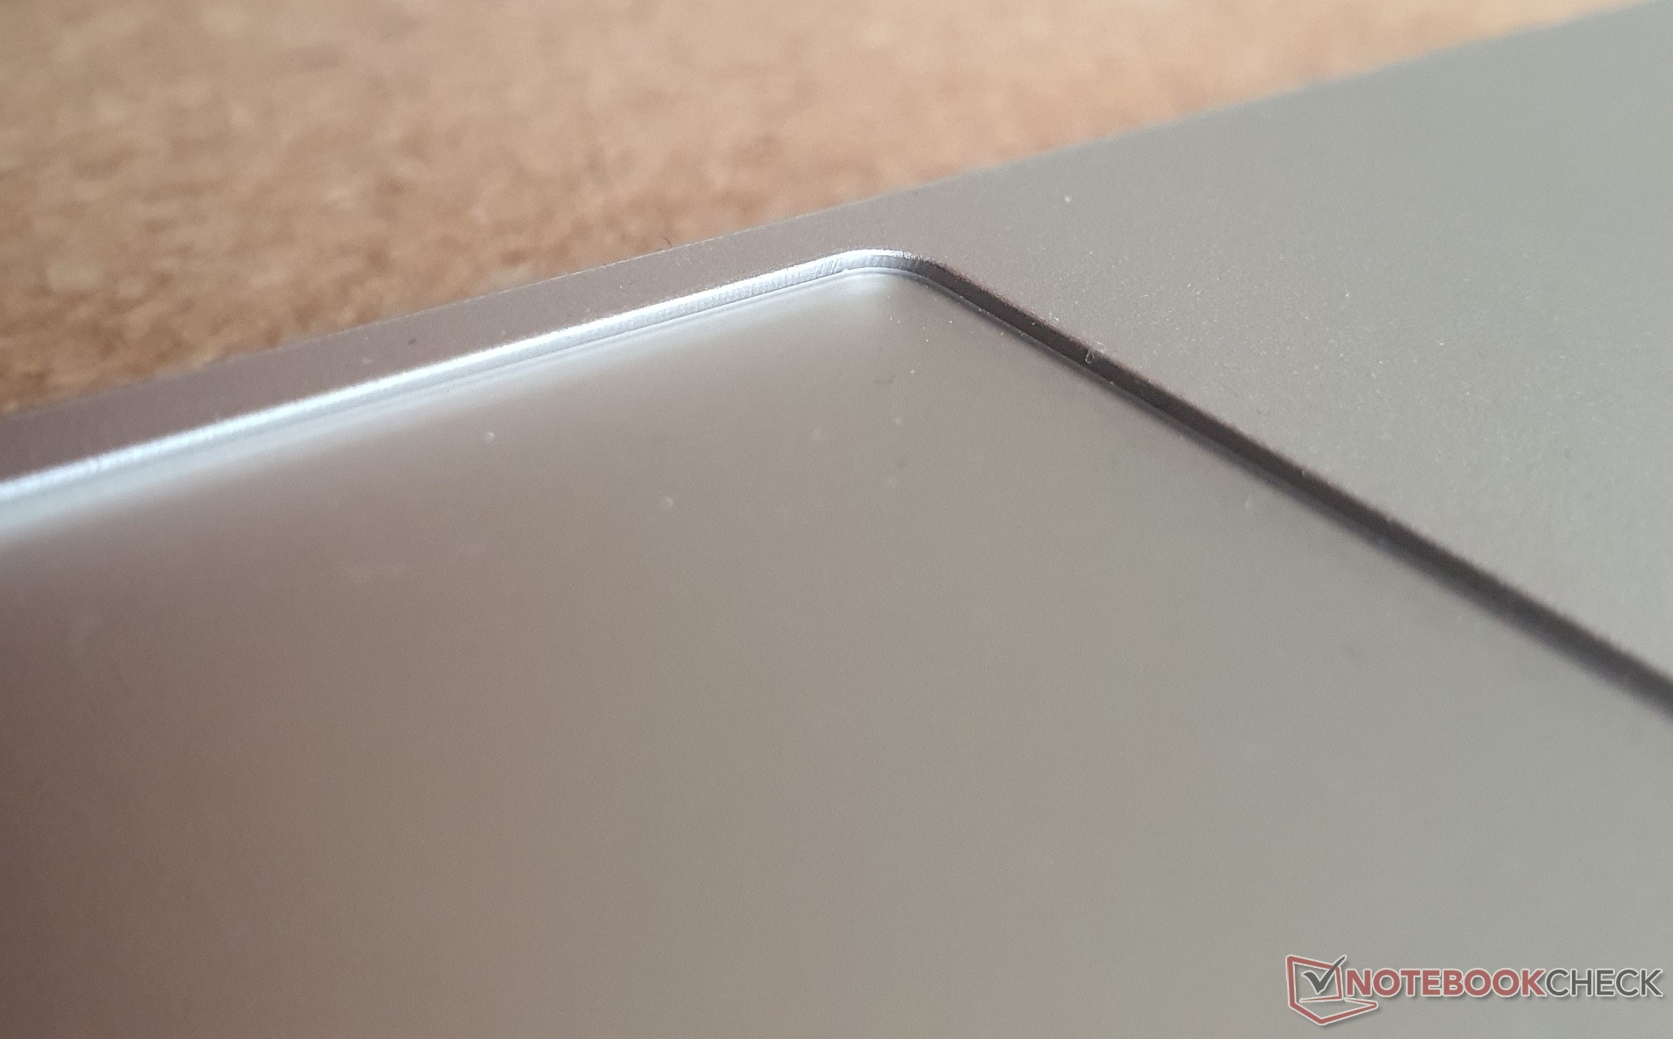
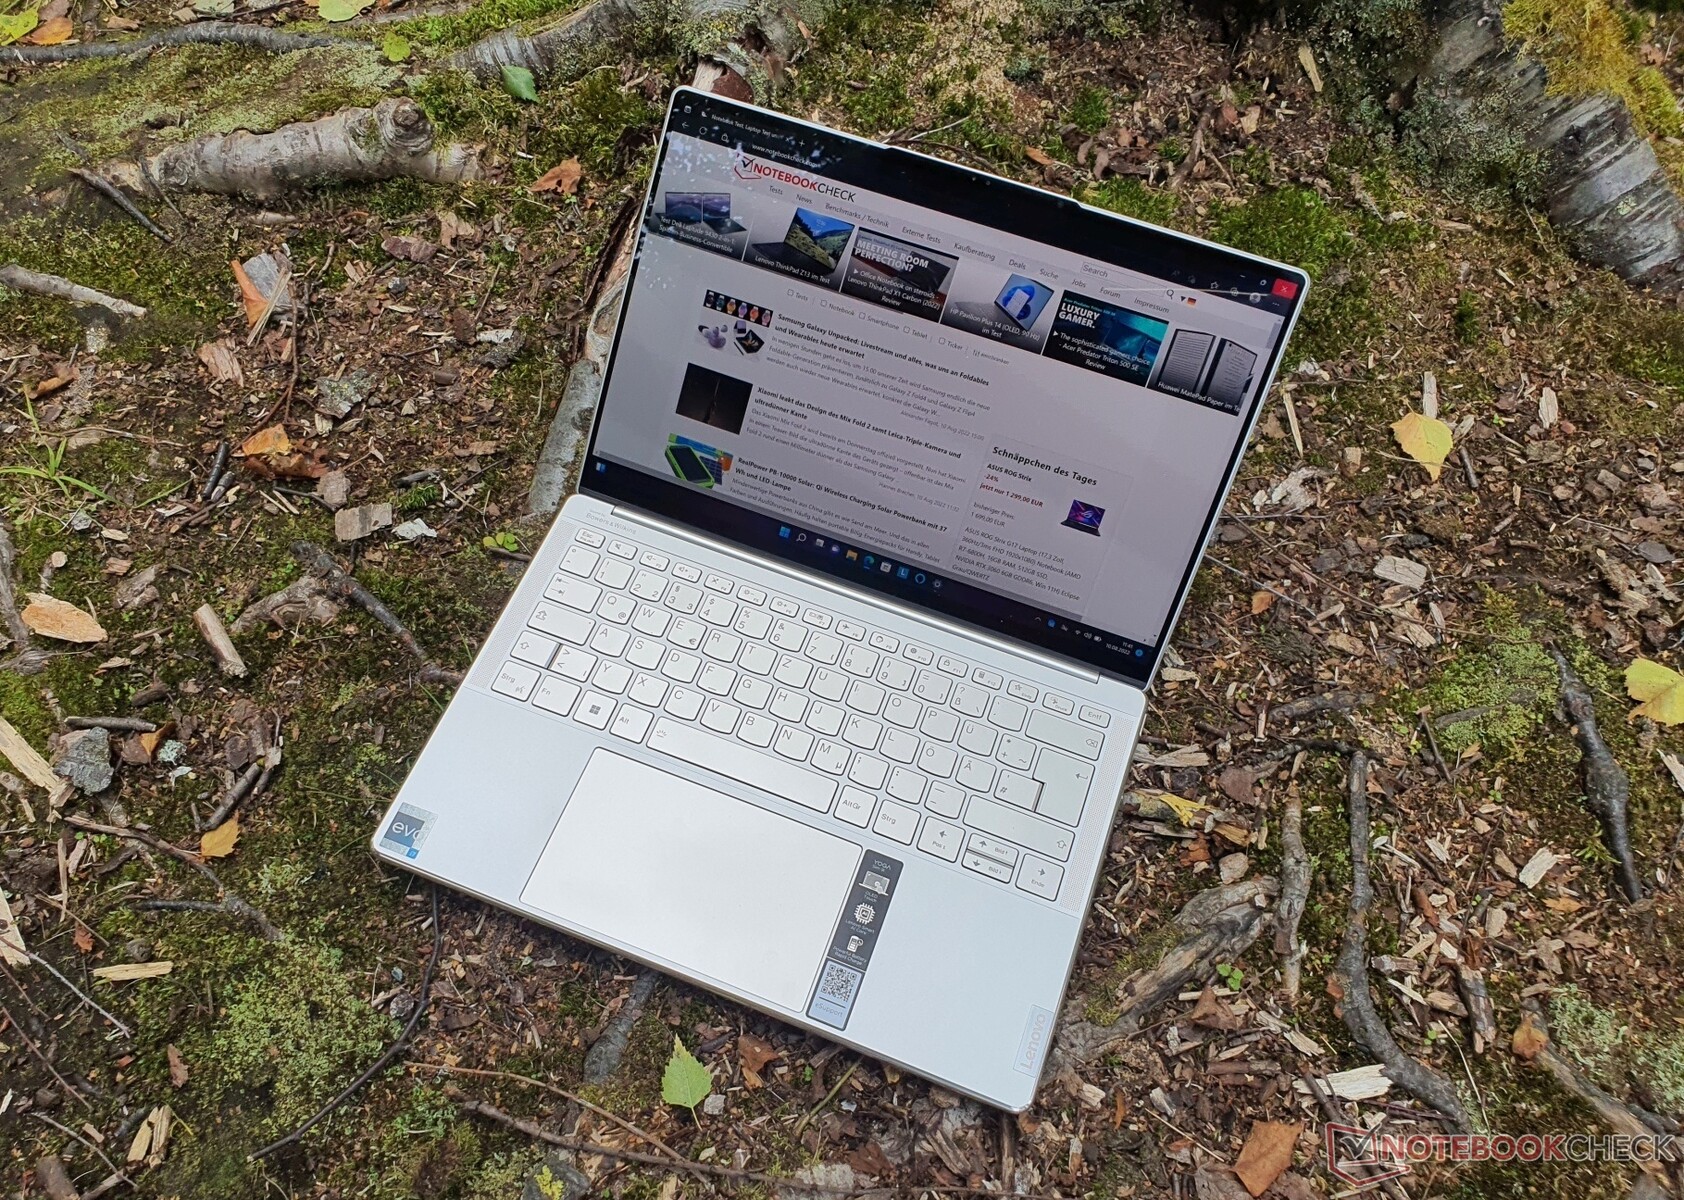
Die meisten würden das Gehäuse des Slim 9i als schick bezeichnen, mit einem ansprechenden sowie hochwertigen Design. Dazu trägt die aus 3D-Glas bestehende Oberfläche des Deckels bei, die stark an ein Smartphone-Flagship erinnert und Fingerabdrücken widersteht. Jedoch bleibt zu sehen, wie sich das Glas auf lange Sicht bewährt. Die Farbe bezeichnet Lenovo als "Oatmeal", allerdings ist diese in real deutlich heller als vom Haferflocken-Frühstück des Testers.
Die restliche Materialwahl fällt auf eine Aluminium-Legierung der 6000er-Serie mit Magnesium und Silikon, was dem Gehäuse eine eindrucksvolle Stabilität verleiht und sich weder Base noch Deckel verwinden lassen. Darüber hinaus sind die Scharniere sehr straff und halten das Display in jedem Winkel problemlos in Position, während das einhändige Öffnen dennoch möglich ist.
Die Haptik ist insgesamt gut, genau wie die Verarbeitung tadellos ist. Scharfe Kanten oder Spaltmaße gibt es keine. Subjektiv gesehen muss jeder selbst entscheiden, ob einem das Design zusagt, bei dem Lenovo in letzter Zeit zu runden Formen an allerlei Stellen neigt. Jedenfalls merkt man deutlich, ein High-End-Produkt in den Händen zu halten.
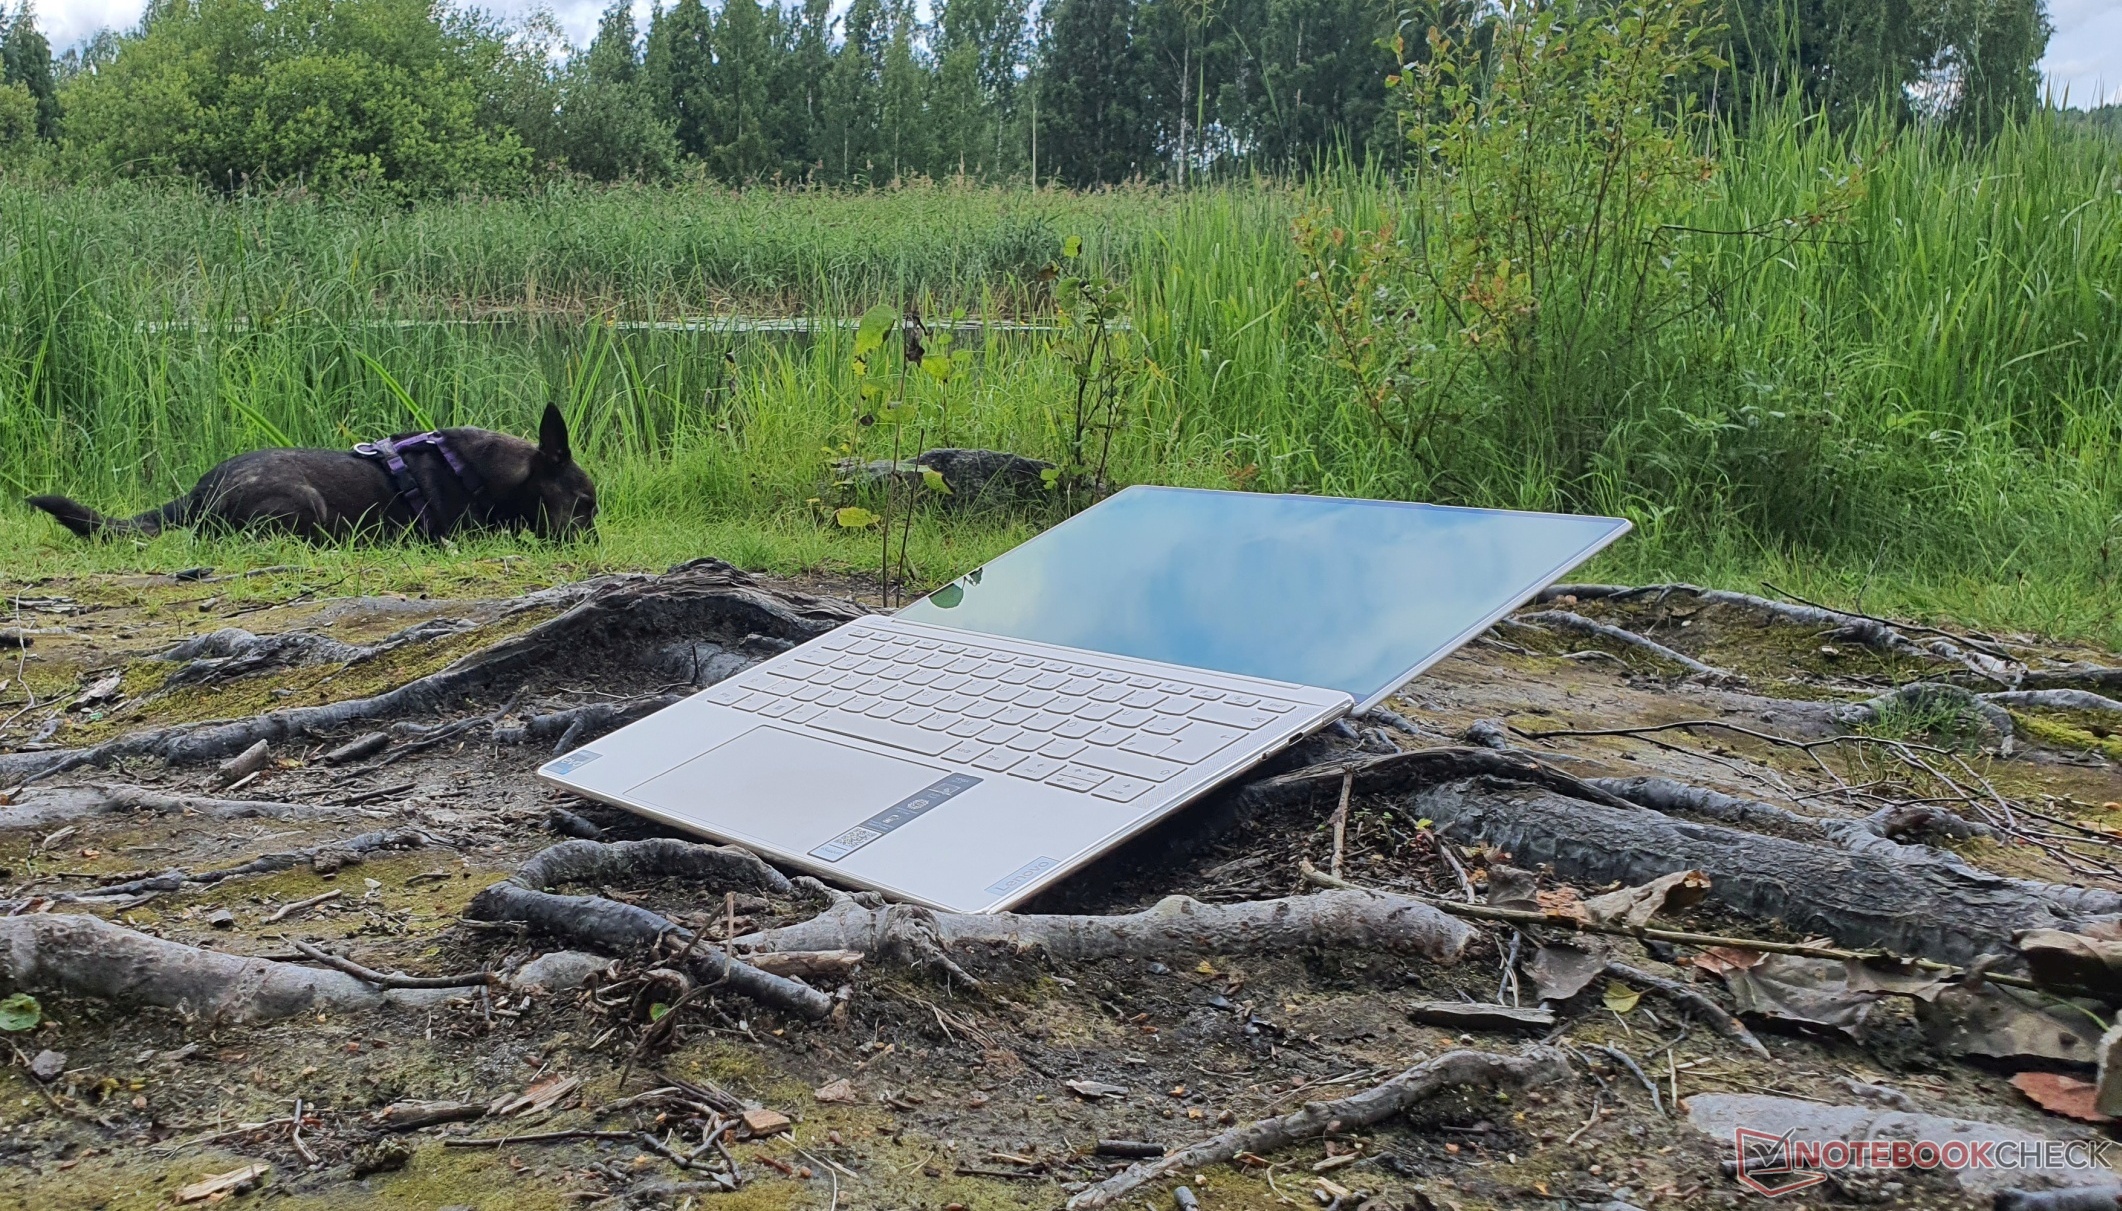
mit 1,39 kg ist das Gerät nicht so leicht wie etwa das Schenker Work 14 oder Asus' Zenbook S 13, aber für ein Ultrabook gerade noch im Rahmen. Der Vorgänger war 100 g leichter, was an seinem kleineren Akku liegt. Die geringe Bauhöhe von knapp unter 15 mm ist dafür umso angenehmer. Dünner ist mit 11,3 mm lediglich das 1,2 kg leichte MacBook Air M2. Die Stellfläche unseres 14-Zoll-Ultrabooks ist ziemlich gering, aber das XPS 13 Plus besitzt in unserem Vergleichsfeld die kleinste Stellfläche.
Ausstattung: Lenovo Yoga Slim 9 lädt von allen Seiten
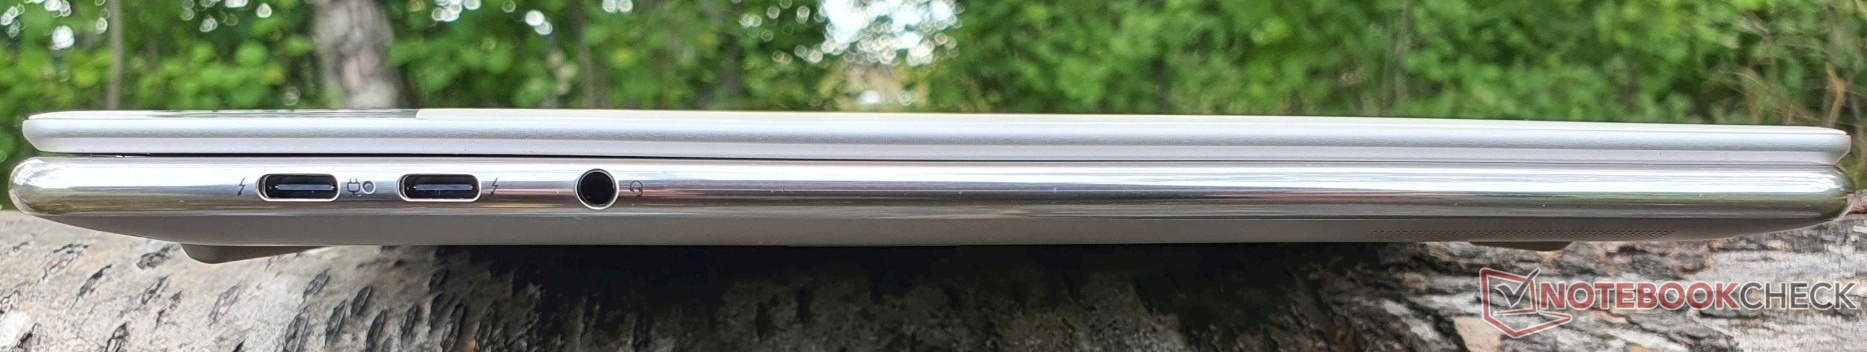
Im Gegensatz zur Convertible-Version verzichtet Lenovo beim Yoga Slim 9i auf einen USB-A-Anschluss. Immerhin sind insgesamt drei Thunderbolt-4-Ports verbaut, die naturgemäß DisplayPort 1.4 und das Laden unterstützen (Power Delivery 3.0 mit bis zu 100 Watt), demnach das Gerät praktischerweise beidseitig aufladbar ist.
Ansonsten bleibt nur noch der Kopfhöreranschluss. Für HDMI, USB-A und VGA muss der beigelegte USB-C-Hub verwendet werden, auf RJ-45 und einen SD-Kartenleser muss ohne eigenen Adapter jedoch verzichtet werden.
Kommunikation
Intels AX211 performt gut, entsprechend dem WiFi-6E-Standard und übertrifft die non-Slim-Version des Yoga 9i mit gleichem WLAN-Chip. Apples MacBook Air M2 müsste sich, fast schon traditionell, mit dem letzten Platz begnügen, wenn ihm nicht Realtek (Yoga Slim 7 Pro) mit noch langsamerem Transferraten herbeieilen würde.
Bluetooth 5.1 ist mit an Bord (Hardware-seitig eigentlich Version 5.3, was von Windows 11 allerdings noch nicht unterstützt wird.). WWAN existiert beim Yoga Slim 9 nicht.
Webcam
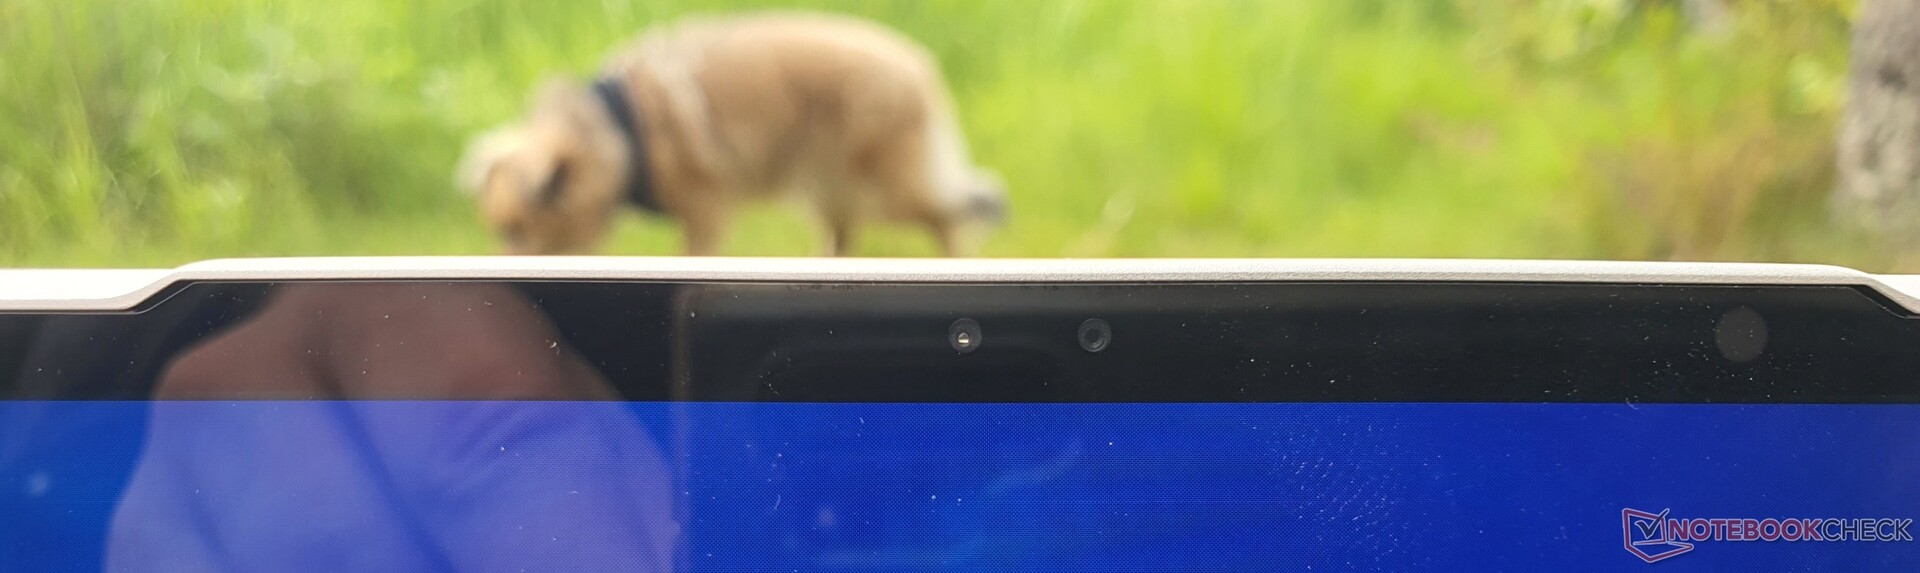
Die verbaute 1080p-Webcam, mit IR, für den Login per Windows Hello ist sicher ein Fortschritt zu 720p, dennoch lässt ihre Bildqualität insgesamt zu wünschen übrig.
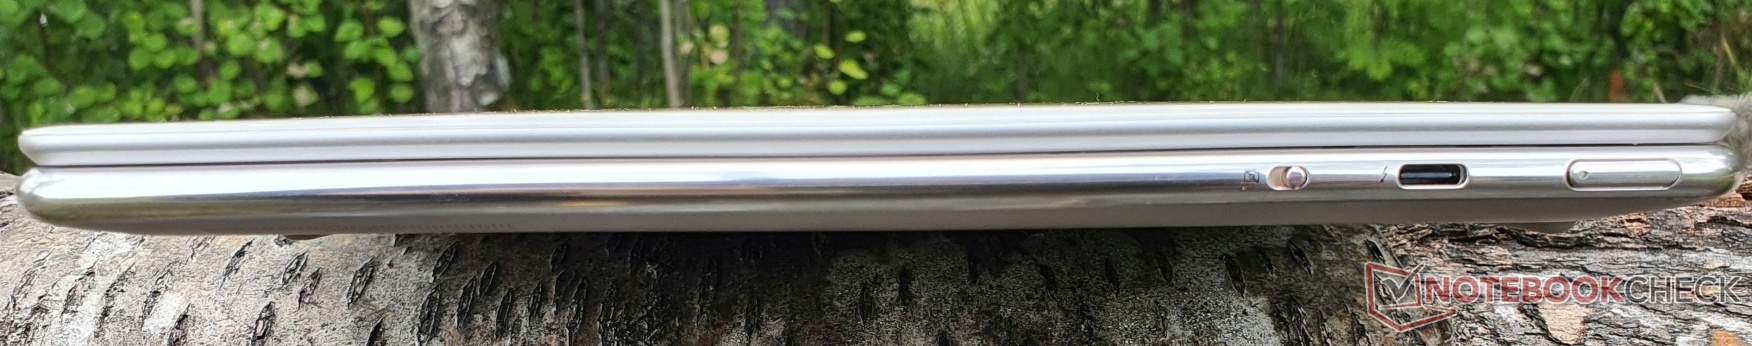
Immerhin liefern die Dual-Array-Mikrofone eine gute Qualität. Auf der rechten Geräteseite befindet sich ein Schalter zur elektronischen Deaktivierung der Webcam.


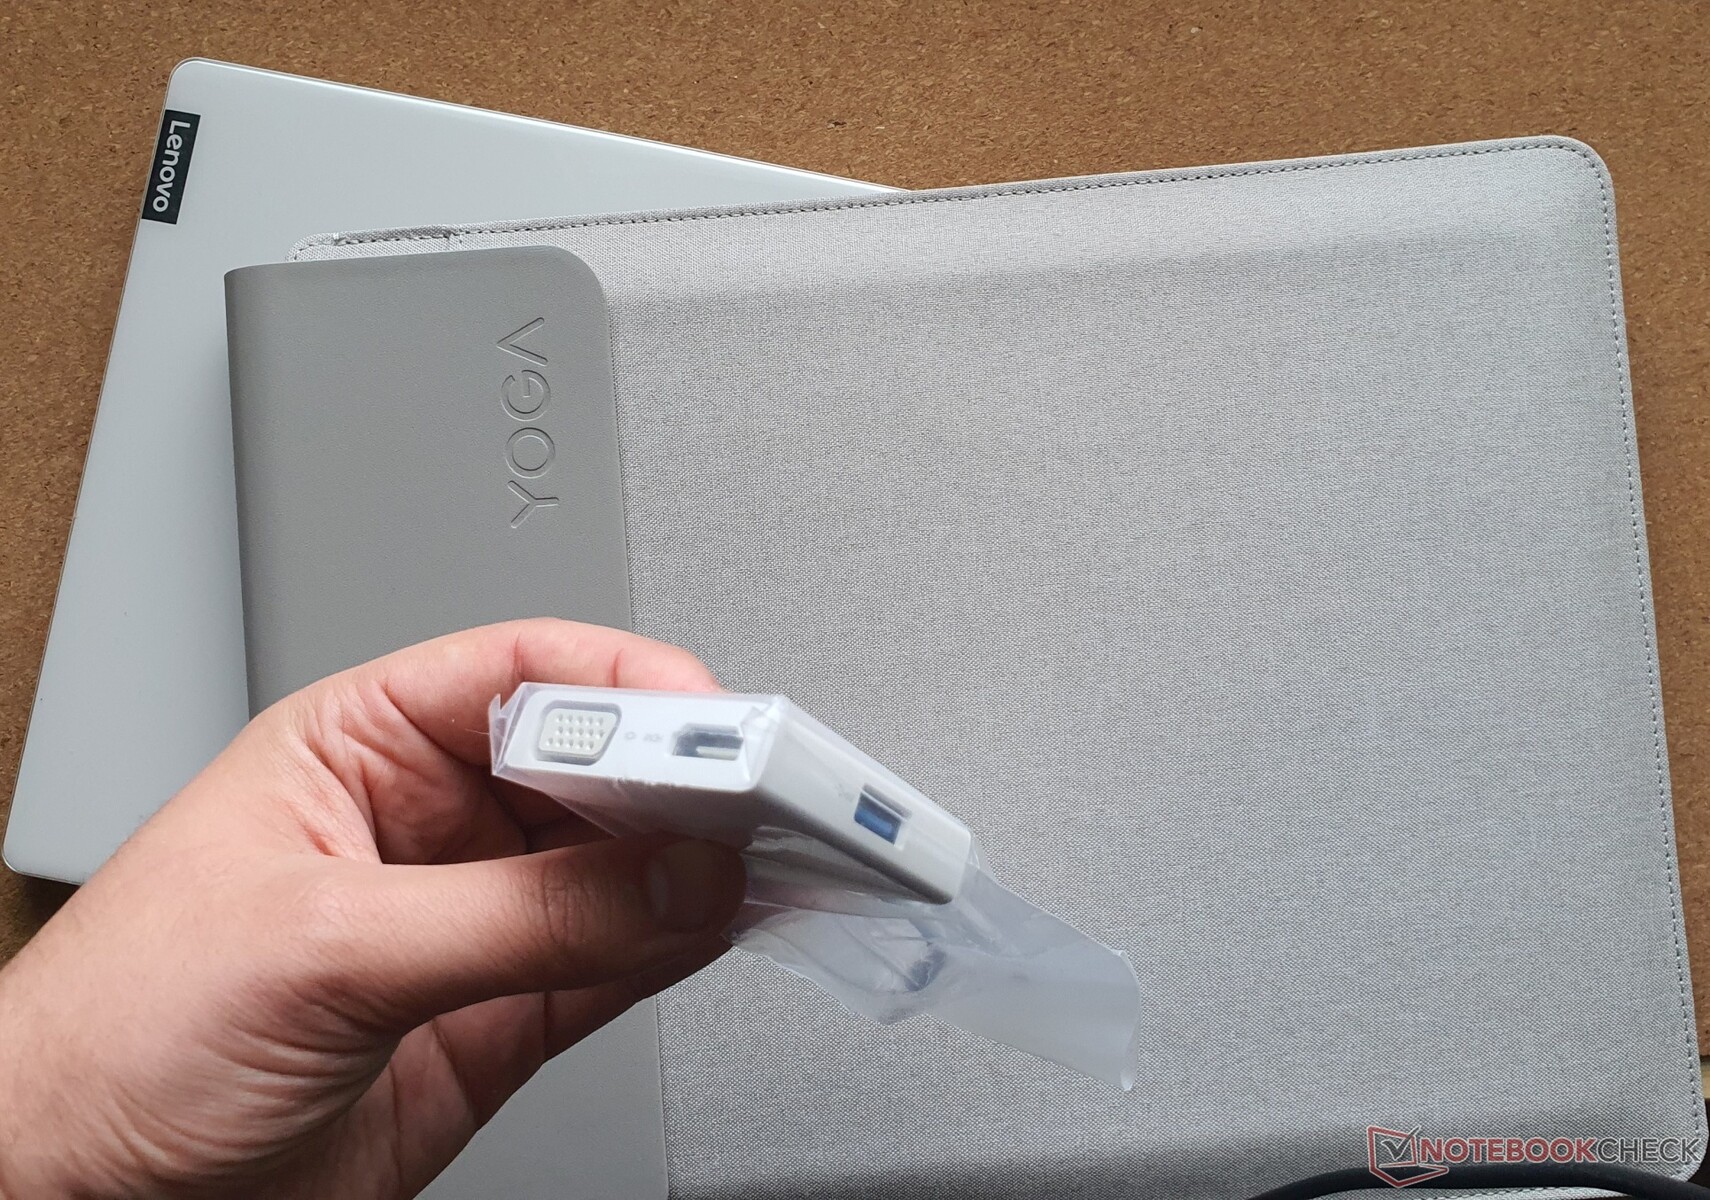
Zubehör
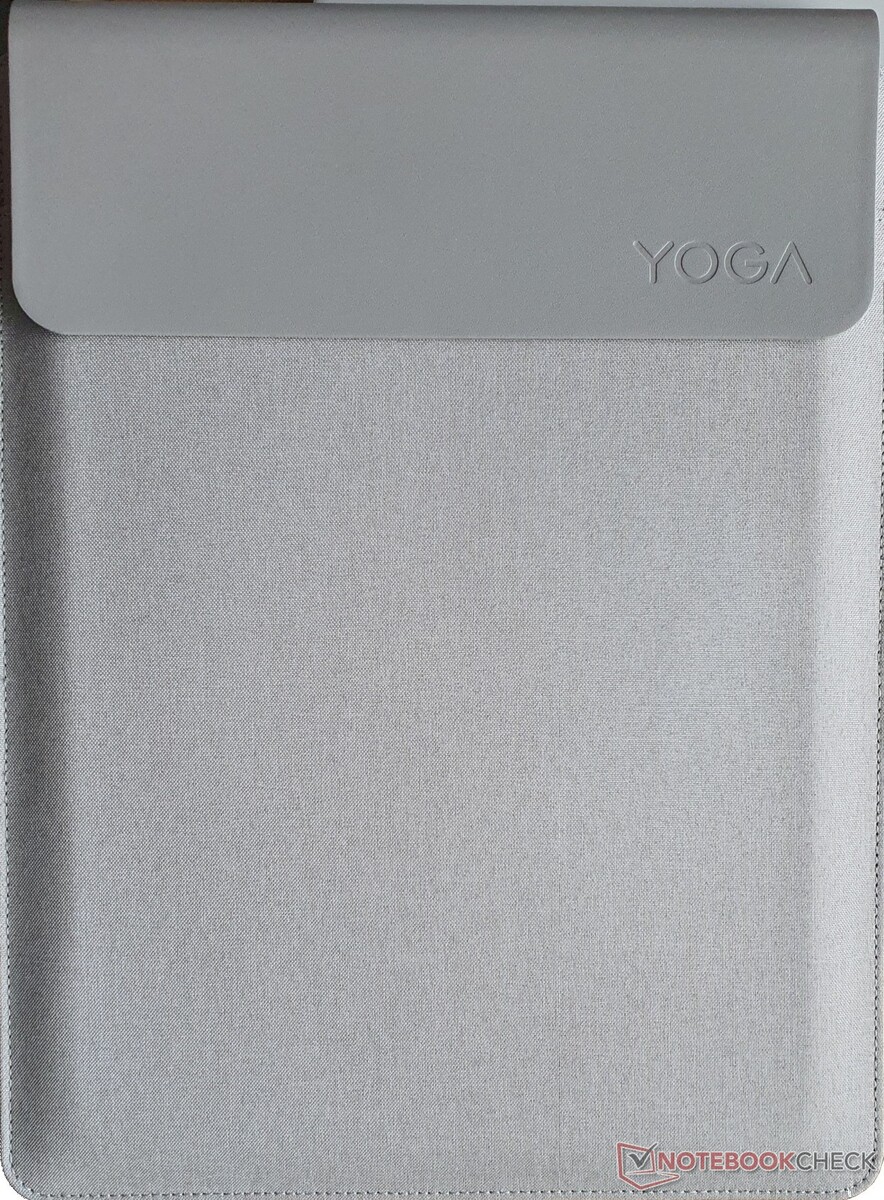
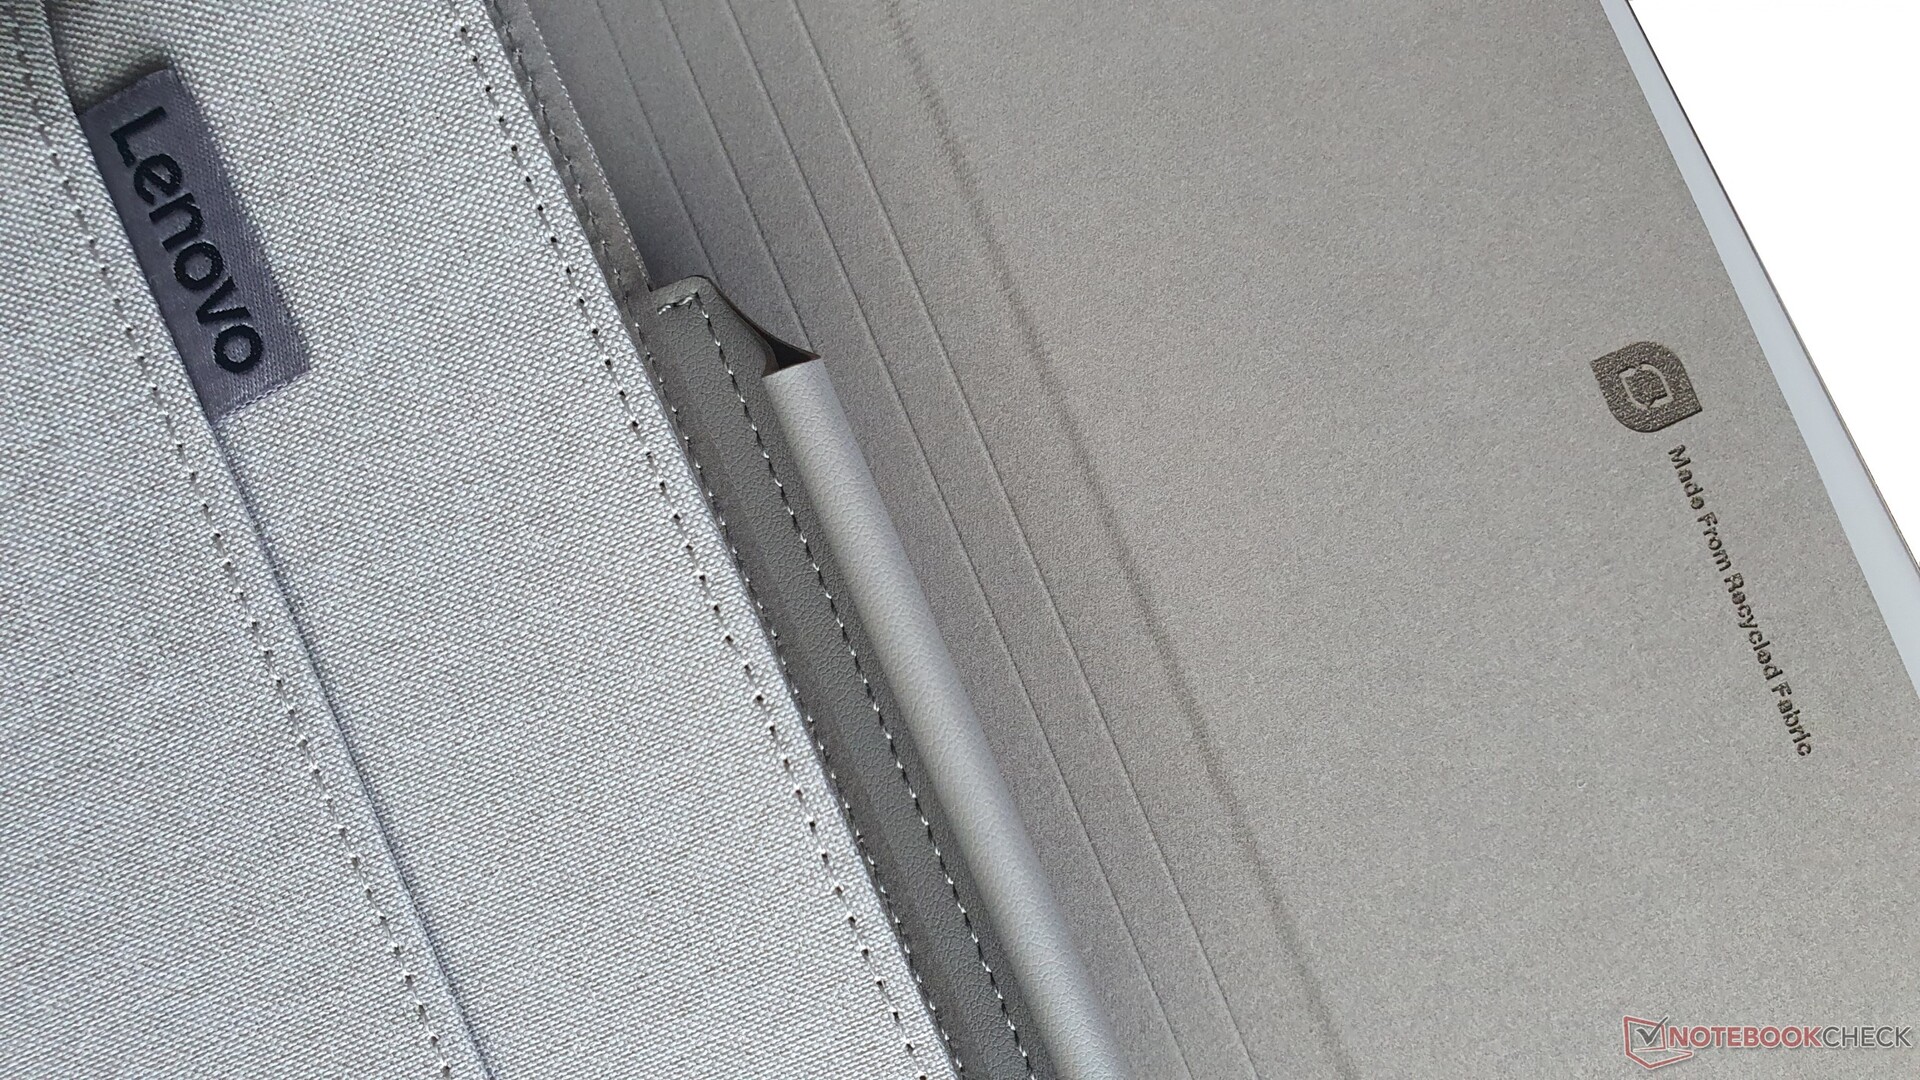
Neben dem 65-Watt-Netzteil ist ein USB-C-Hub mit HDMI, 1x USB-A und VGA im Lieferumfang enthalten. Dazu gehört auch immer eine mit Stoff beschichtete Schutzhülle aus recyceltem Material.
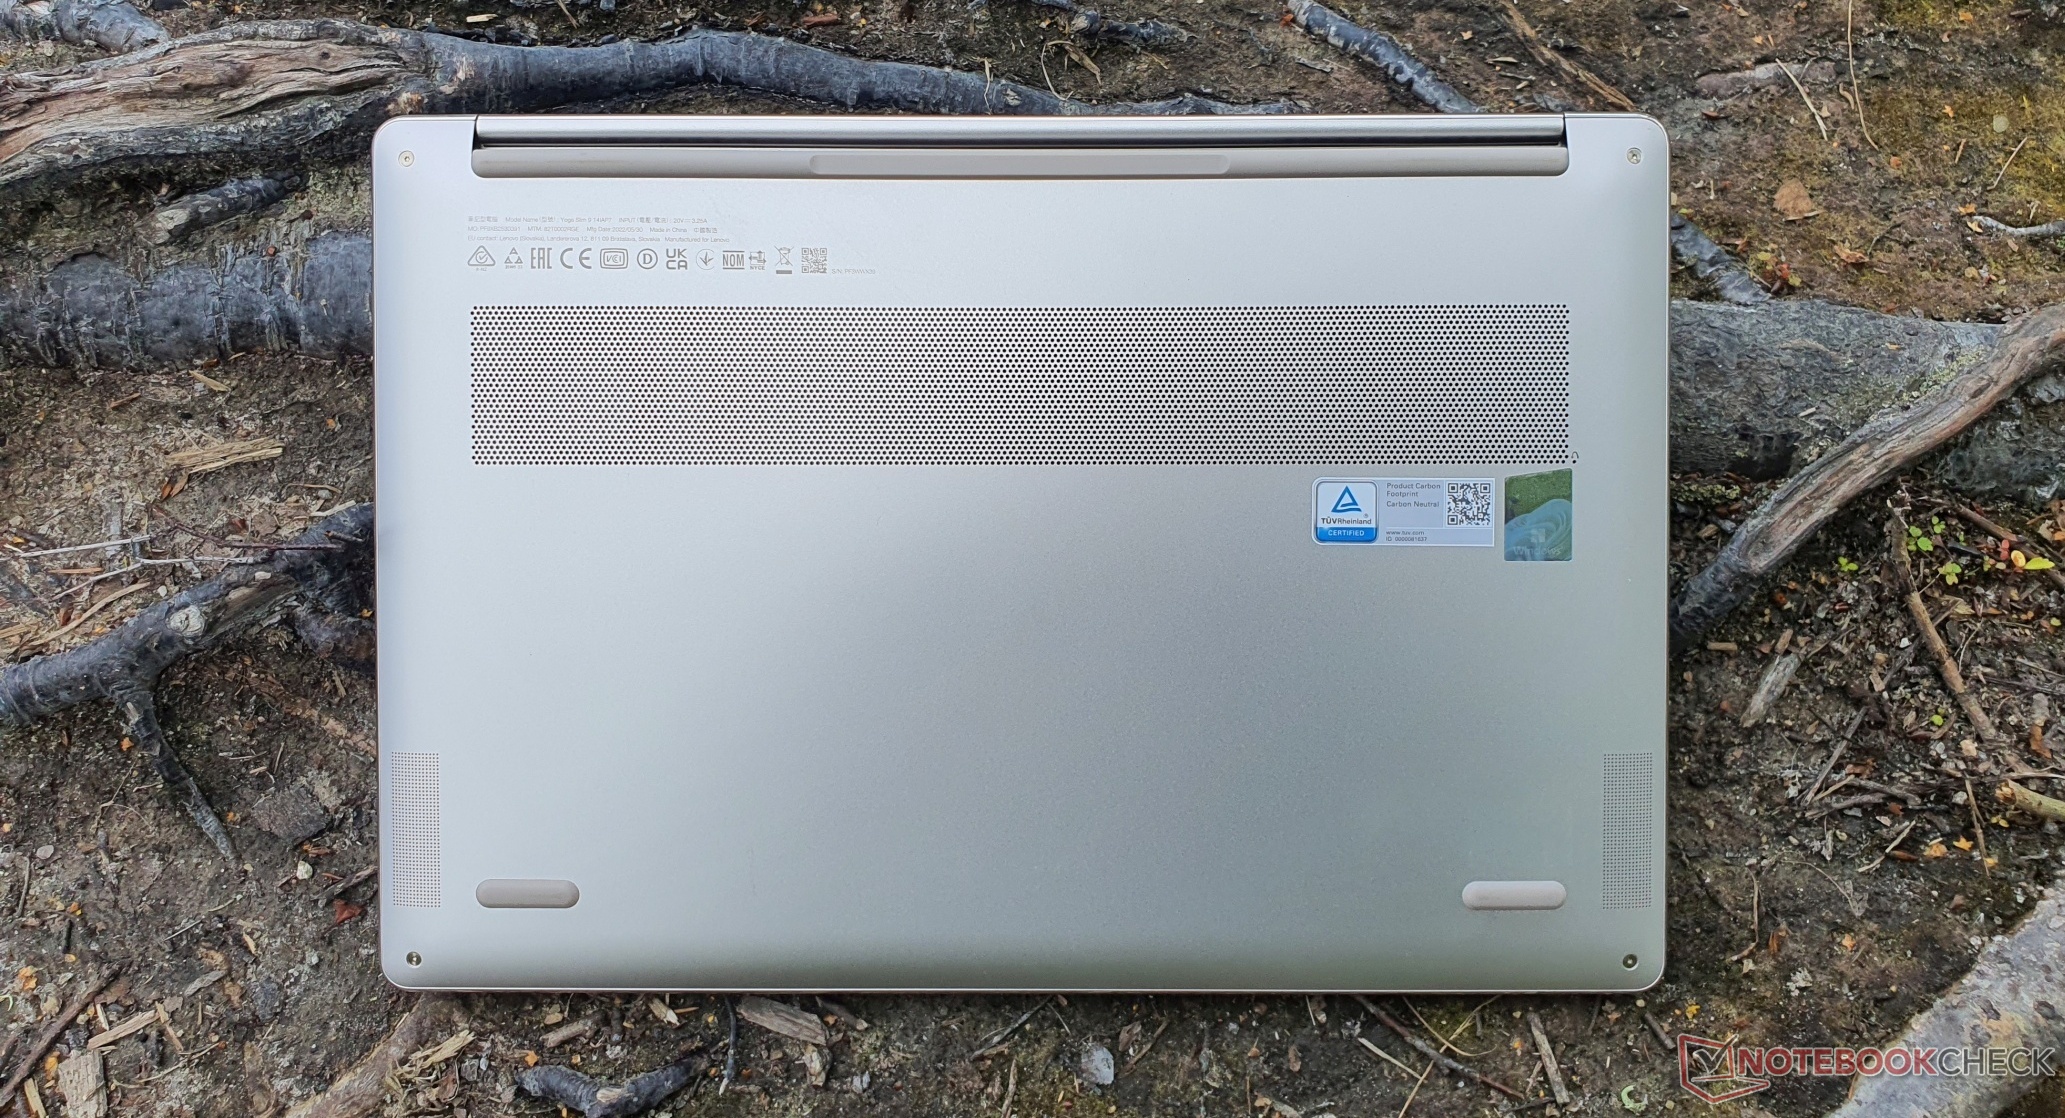
Auch die Verpackung besteht zu einem hohen Anteil aus recyceltem Material, während Lenovo den Laptop als weltweit ersten klimaneutral zertifizierten vermarktet, demnach dieser selbst aus recycelten Materialien hergestellt ist.
Wartung
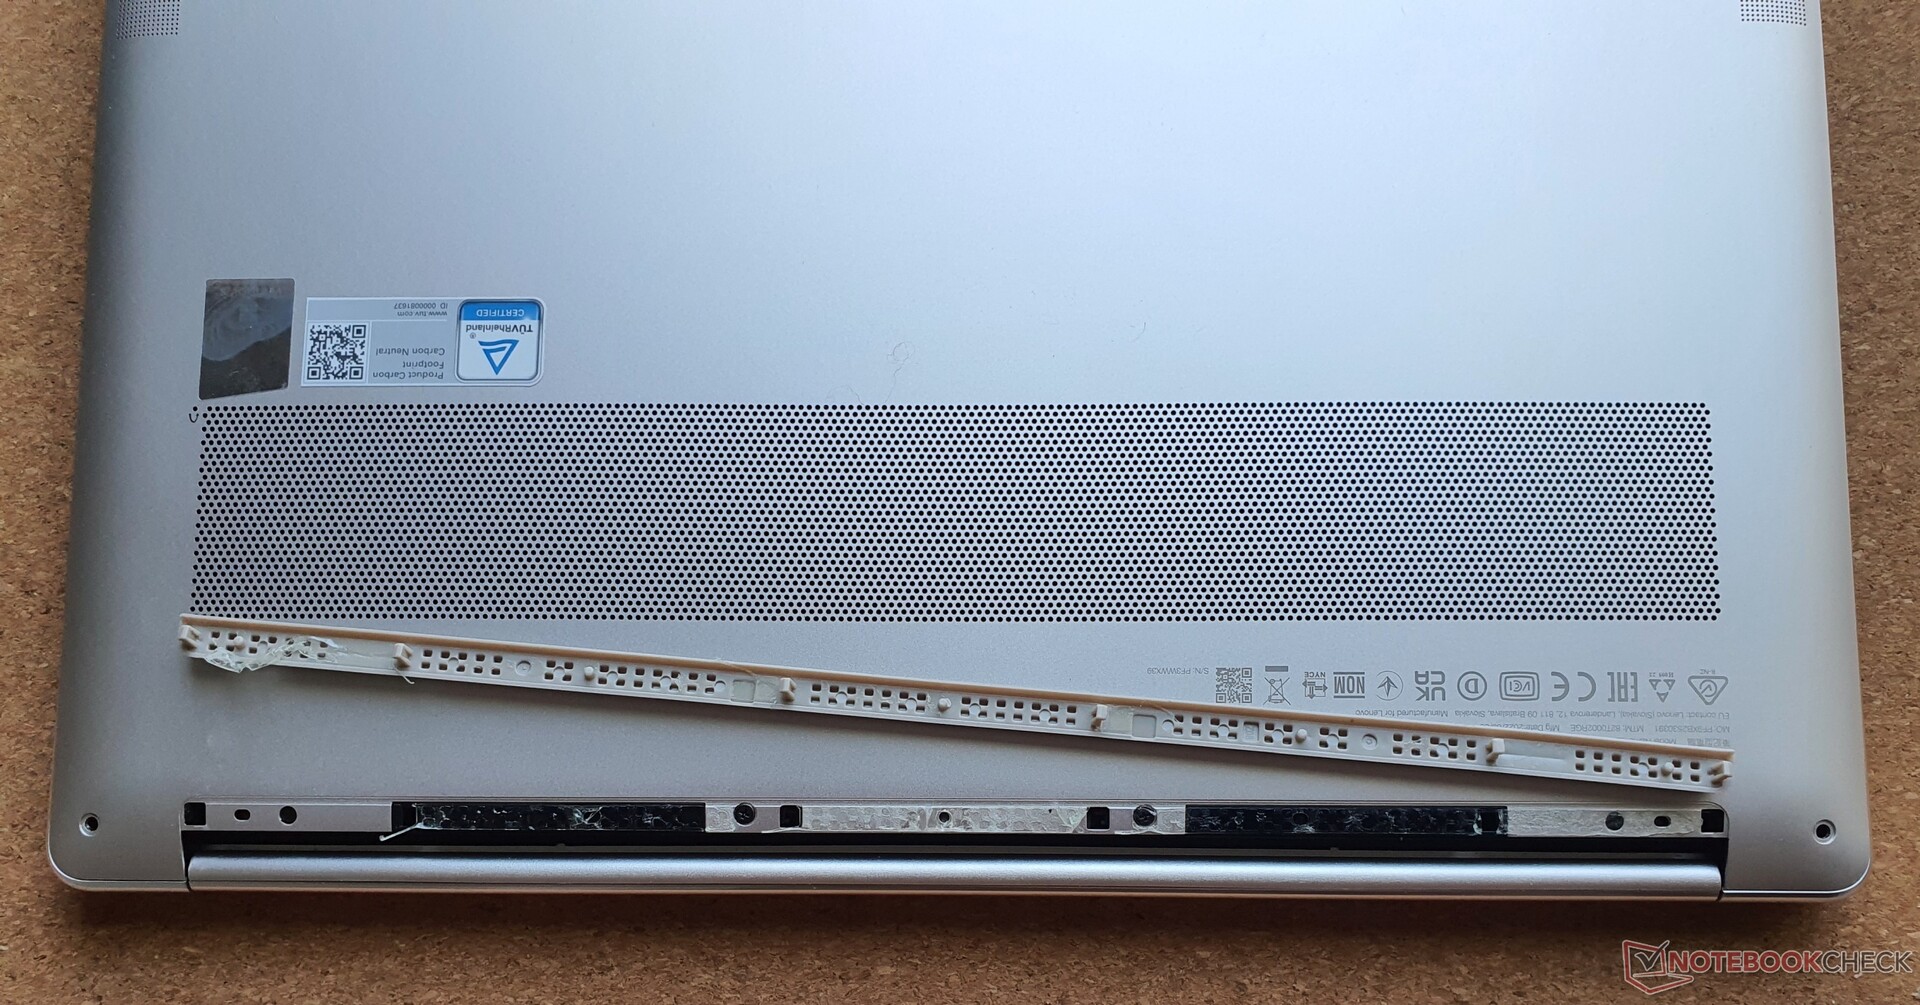
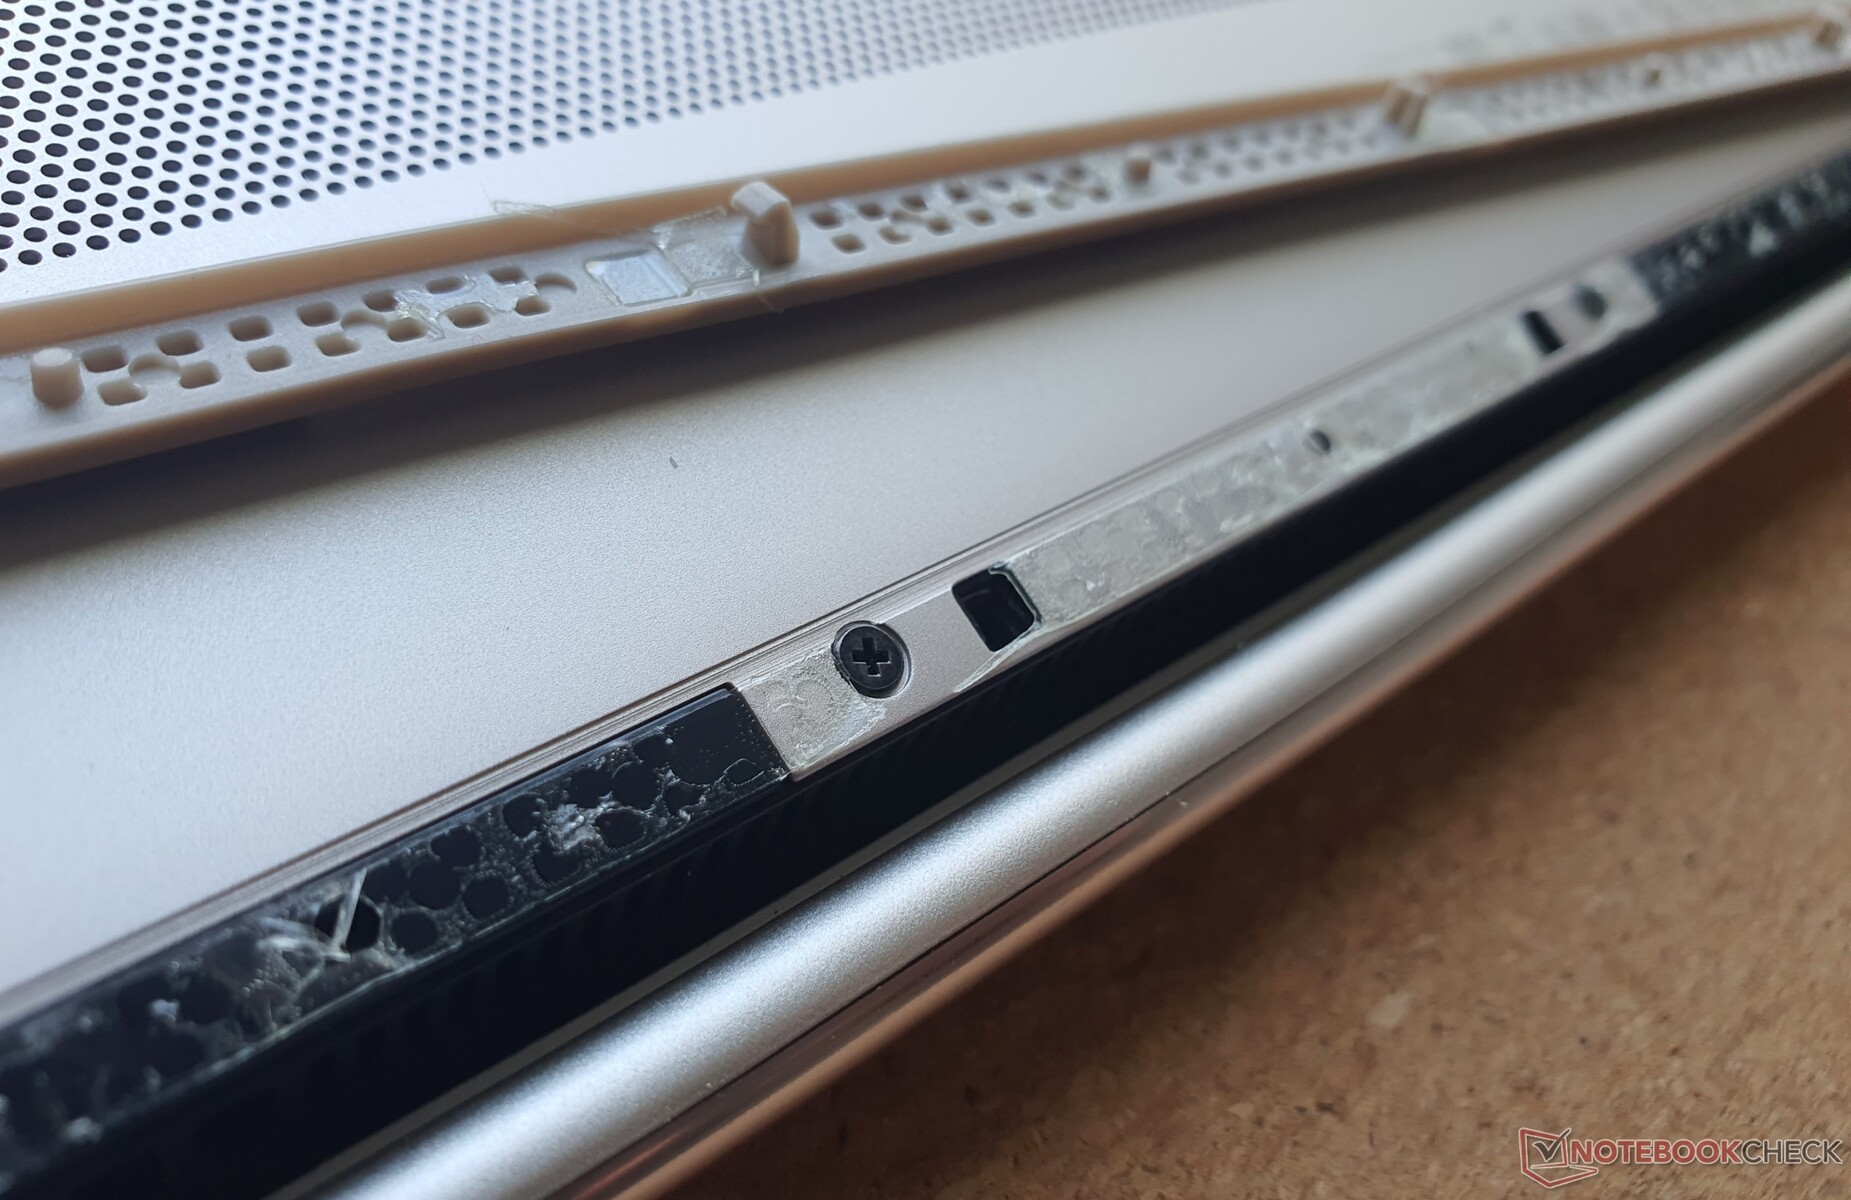
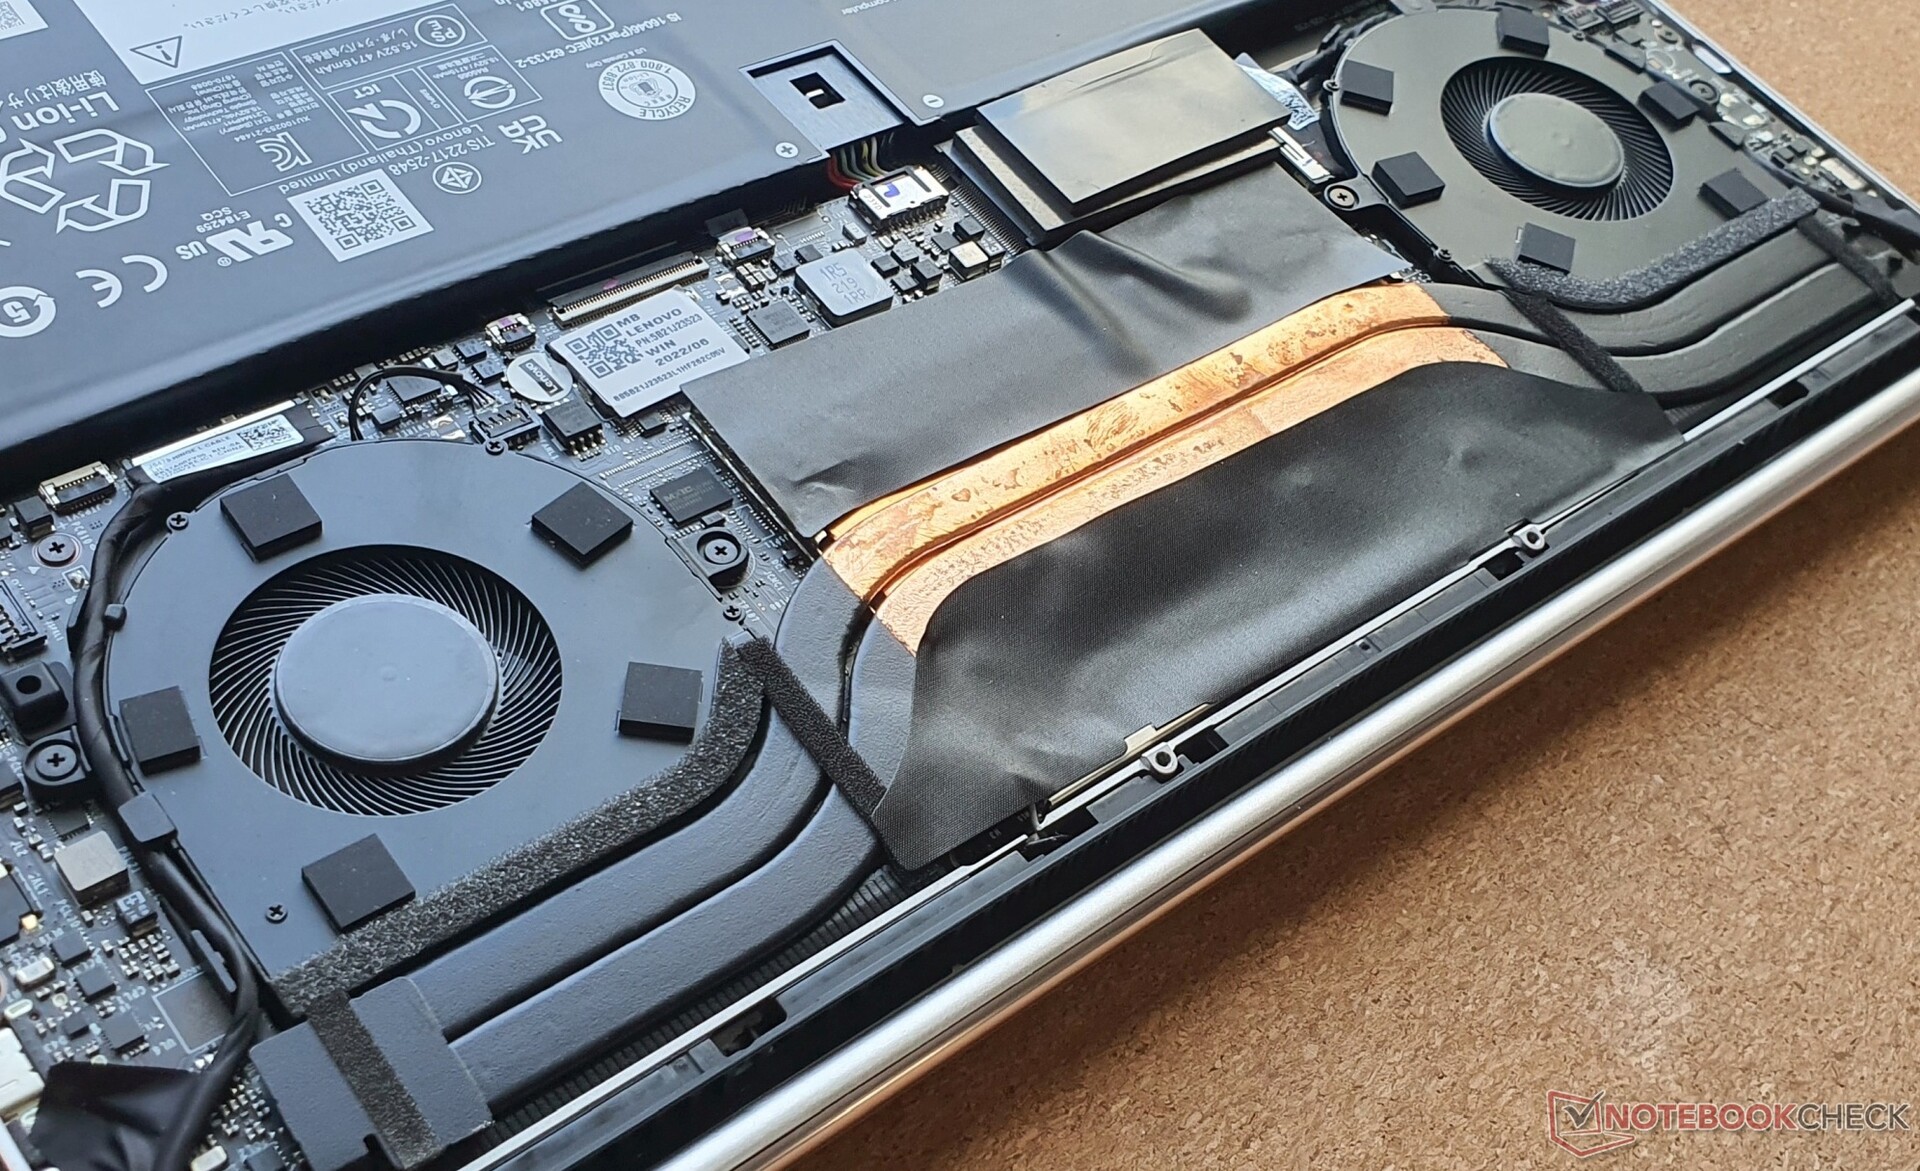
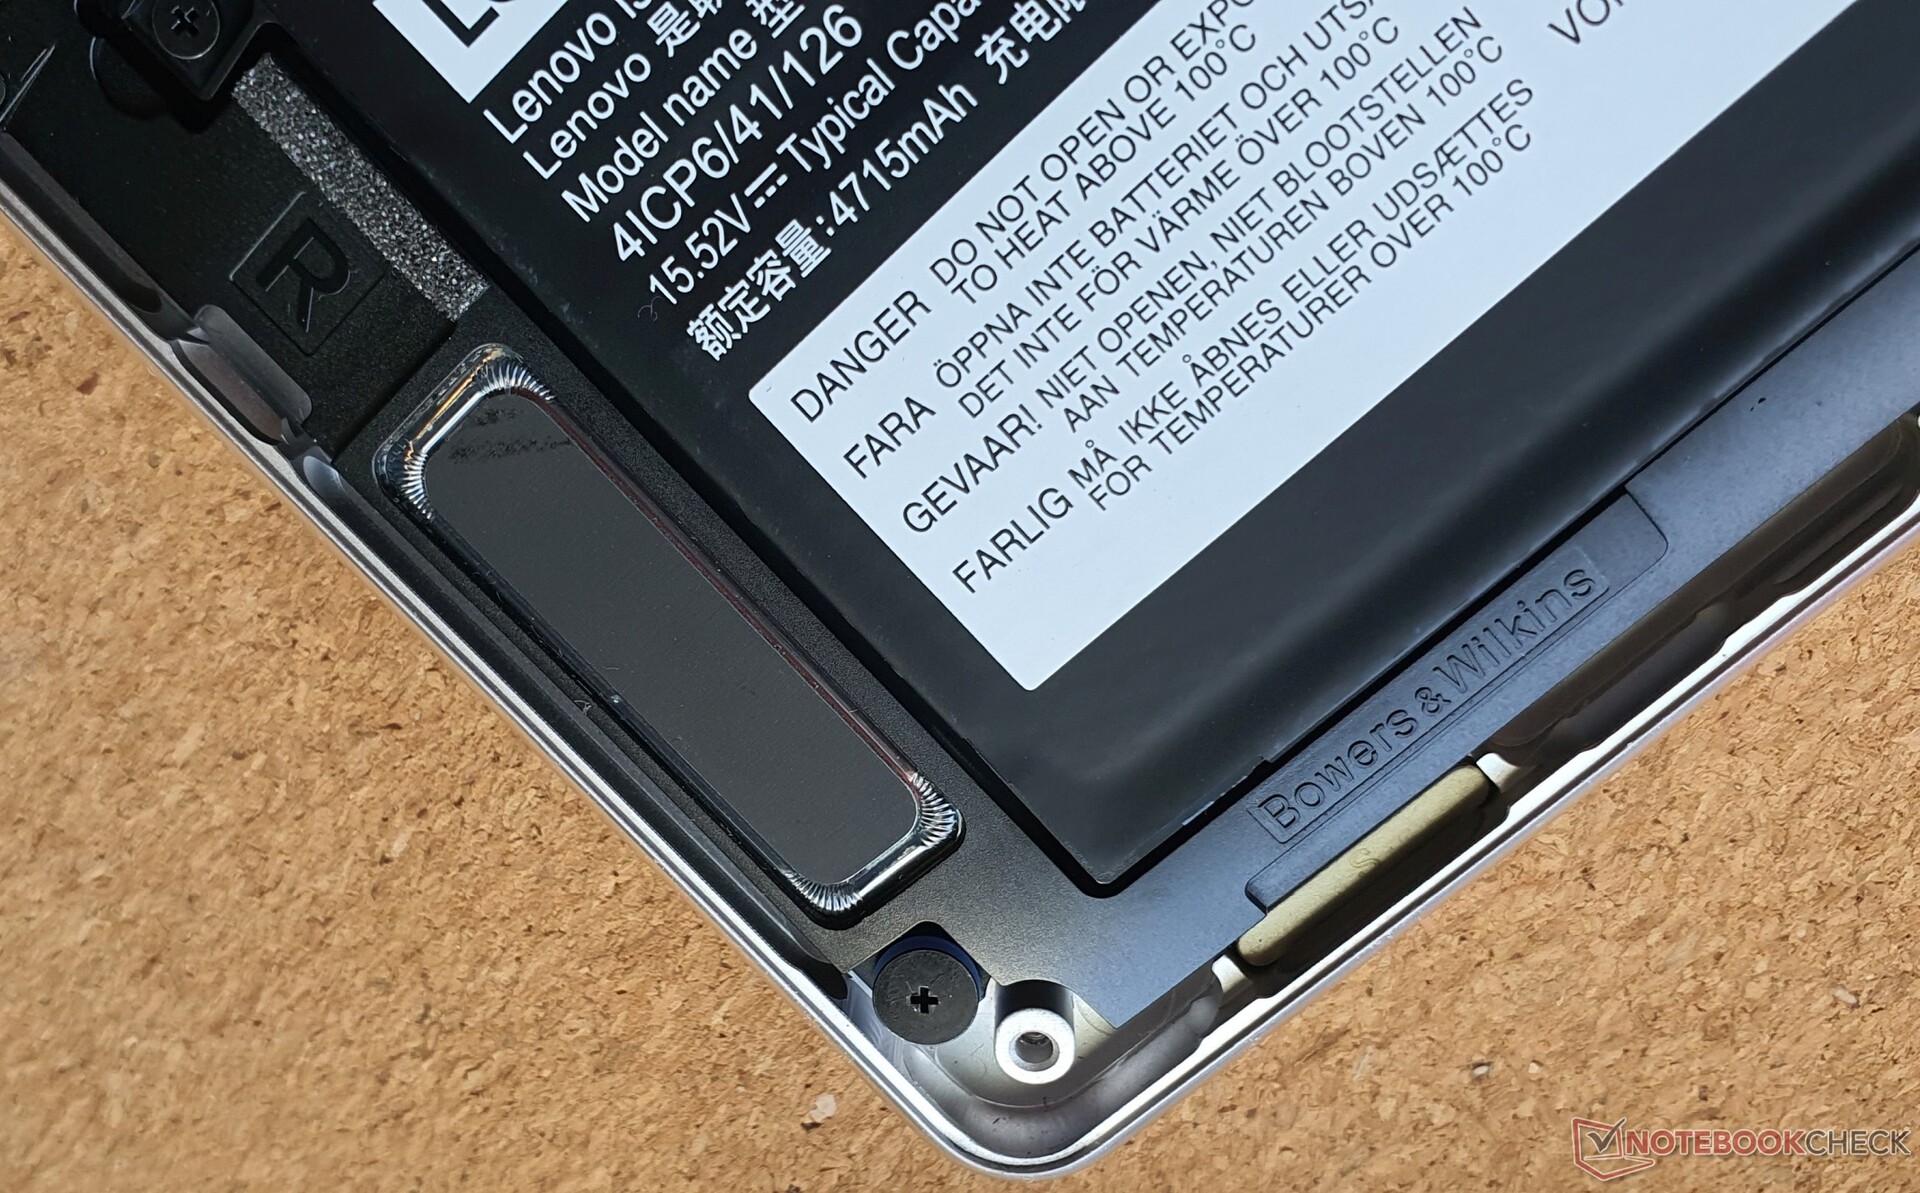
Nachdem man vier Torx-T4-Schrauben gelöst hat, mag man meinen, die Bodenplatte lösen zu können, zumindest mit einem Spudger (Kunststoffspatel). Allerdings verstecken sich unter dem Gummifuß drei Kreuzschlitzschrauben, jener aber ziemlich schwer zu entfernen ist, da er zusätzlich zu den starken Haken verklebt wurde und ein Brechen des Fußes ein durchaus realistisches Szenario ist.
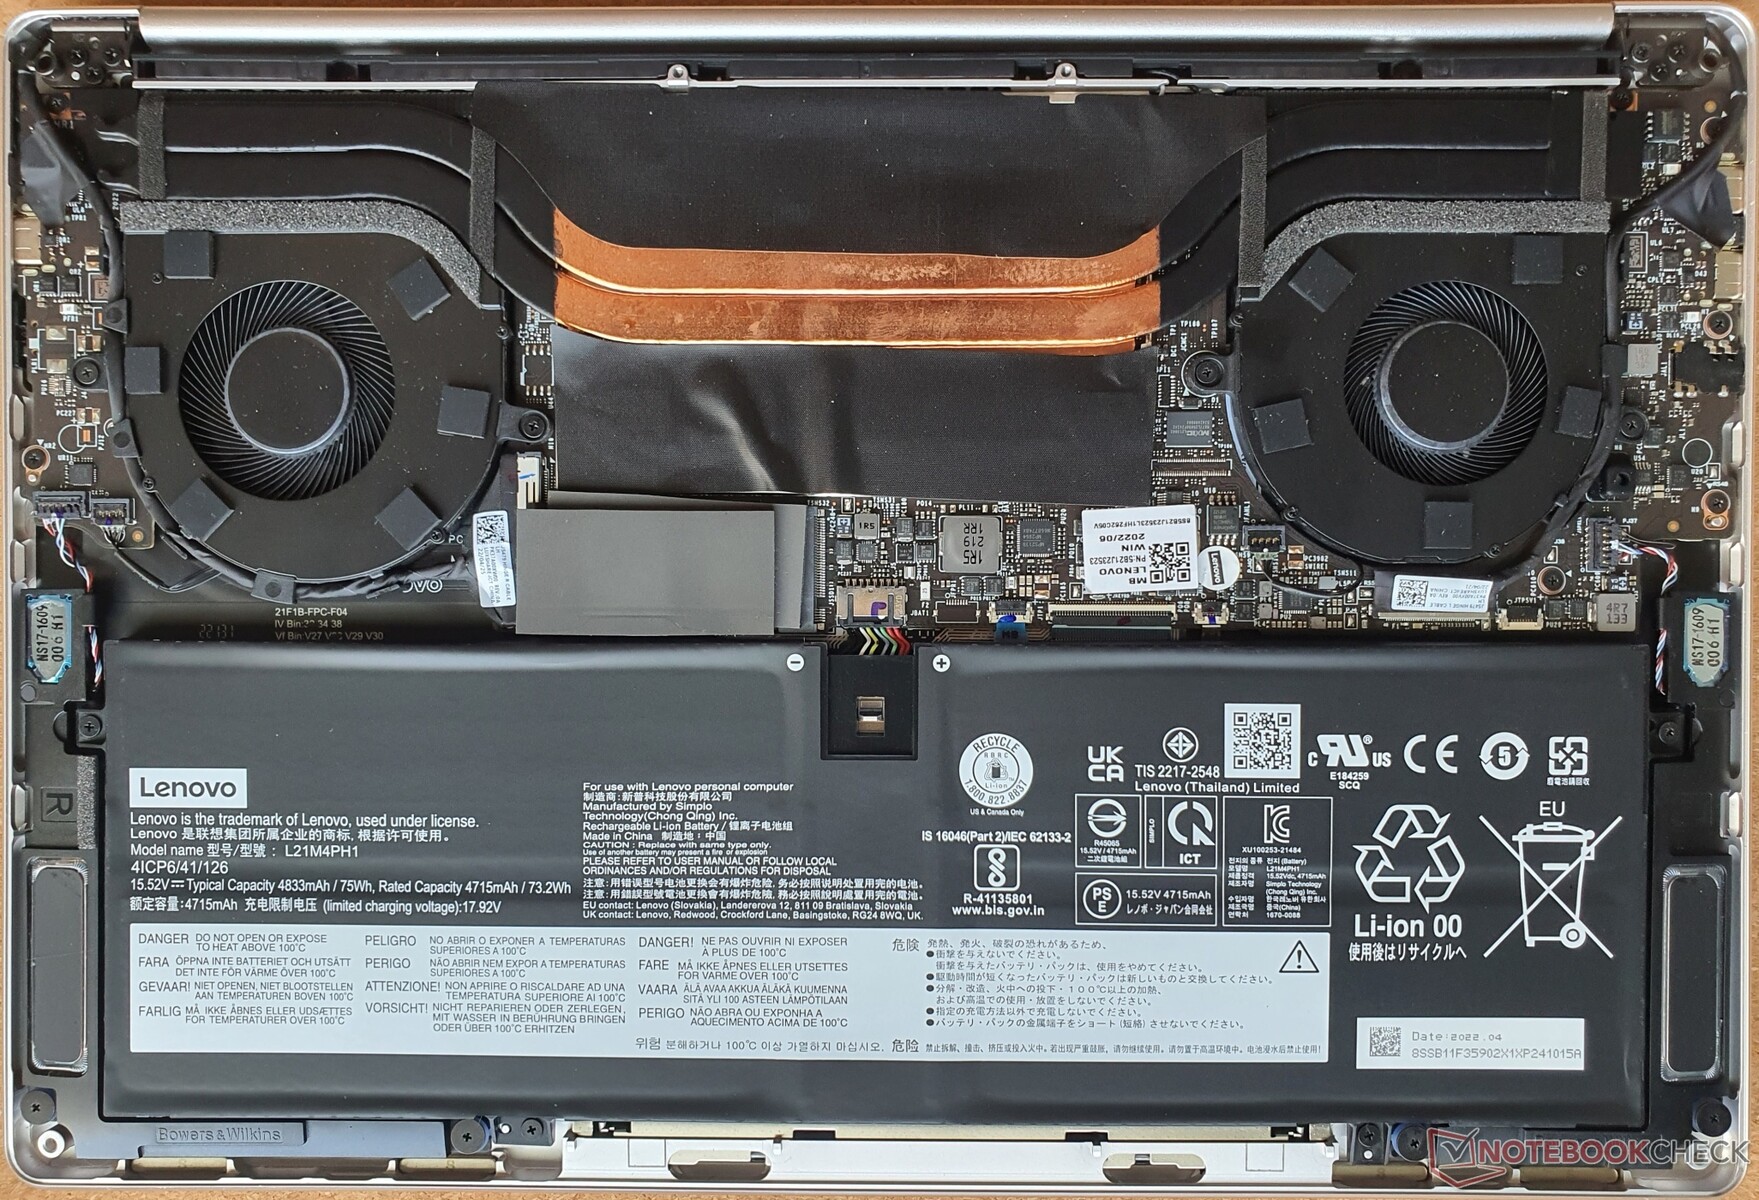
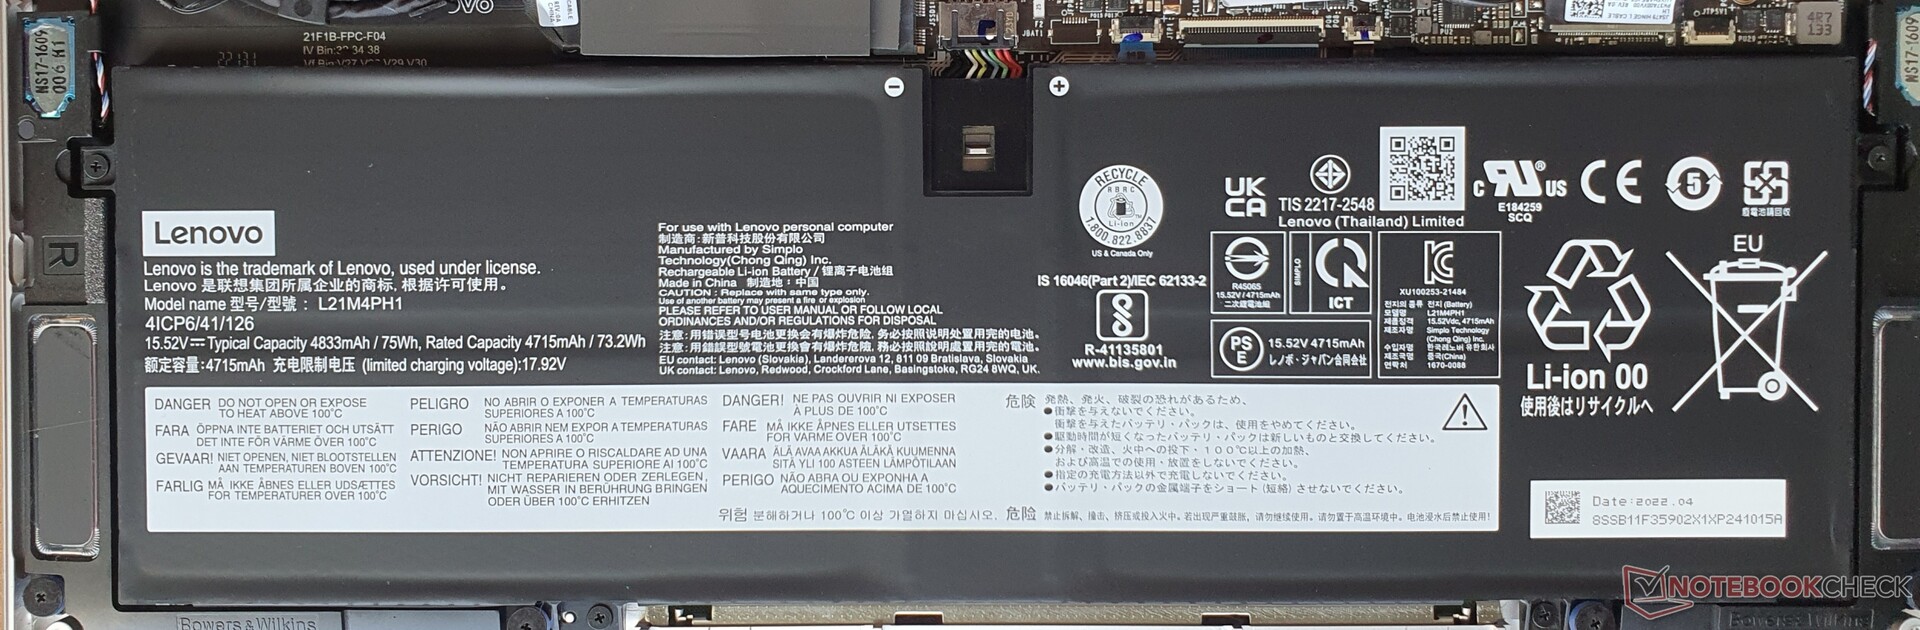
Dies gemeistert, gibt es aber ohnehin nicht viel im Inneren zu tun: Die verkürzte M.2-2242-SSD ist wechselbar, RAM und WiFi-Chip sind verlötet; der Akku und das Kühlsystem sind hingegen verschraubt und lassen sich demnach austauschen, respektive warten.
Garantie
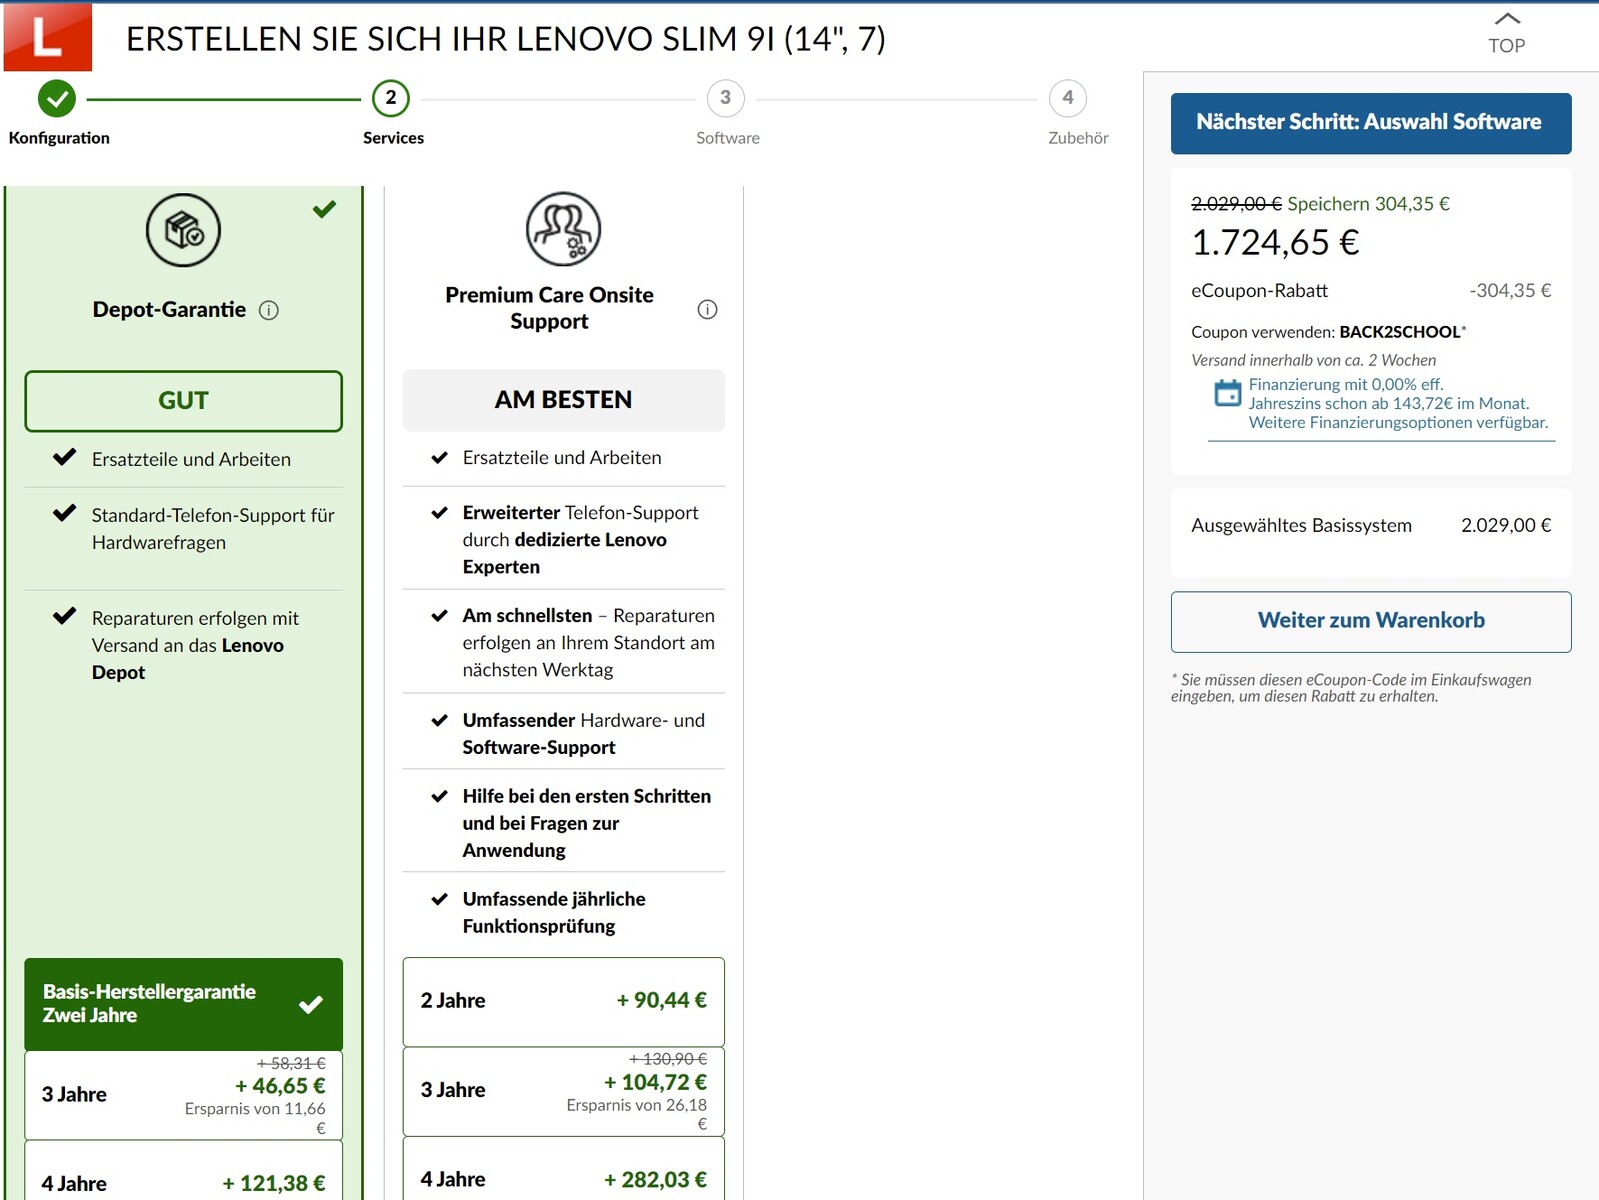
Lenovo gewährt für das Slim 9i 14 in Deutschland standardmäßig eine Garantie von 24 Monaten, erweiterbar auf bis zu 4 Jahren Depot-Service oder Premium Care.
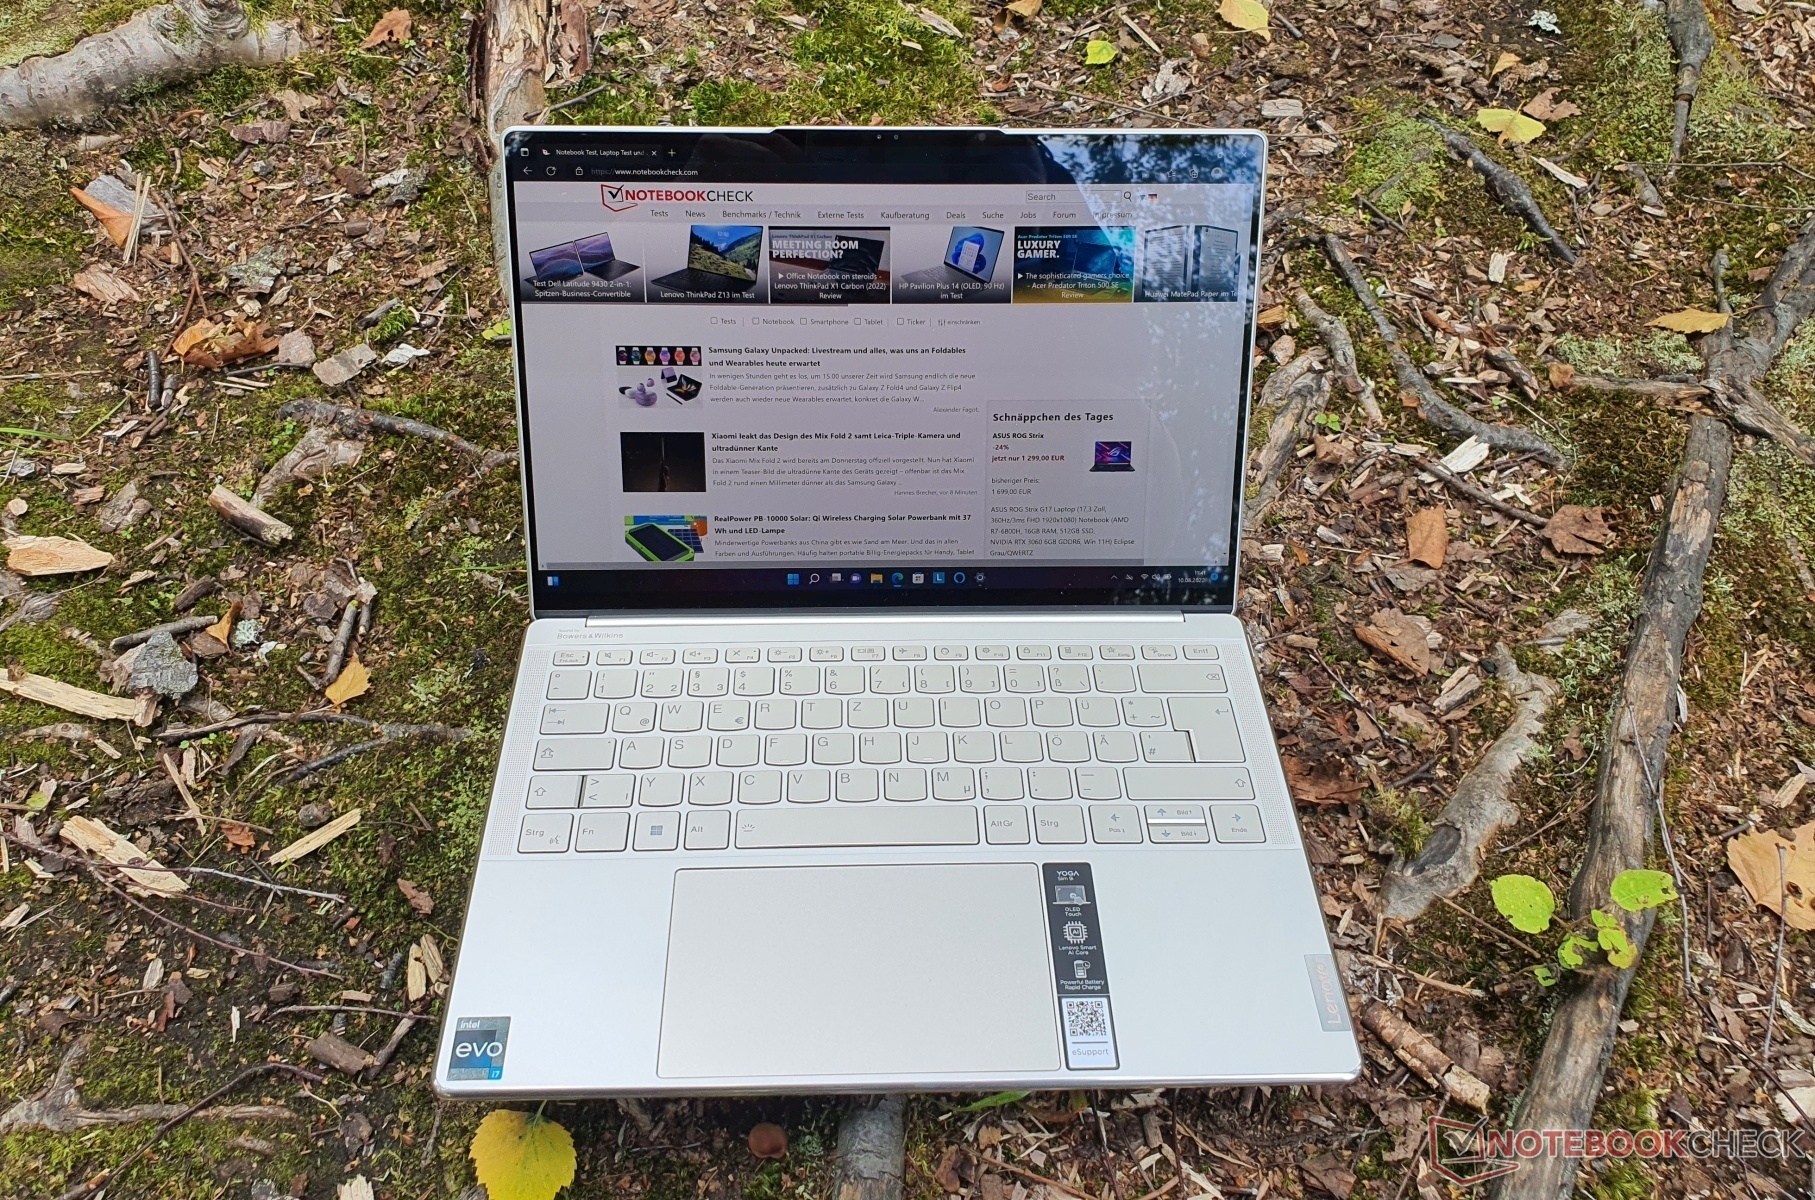
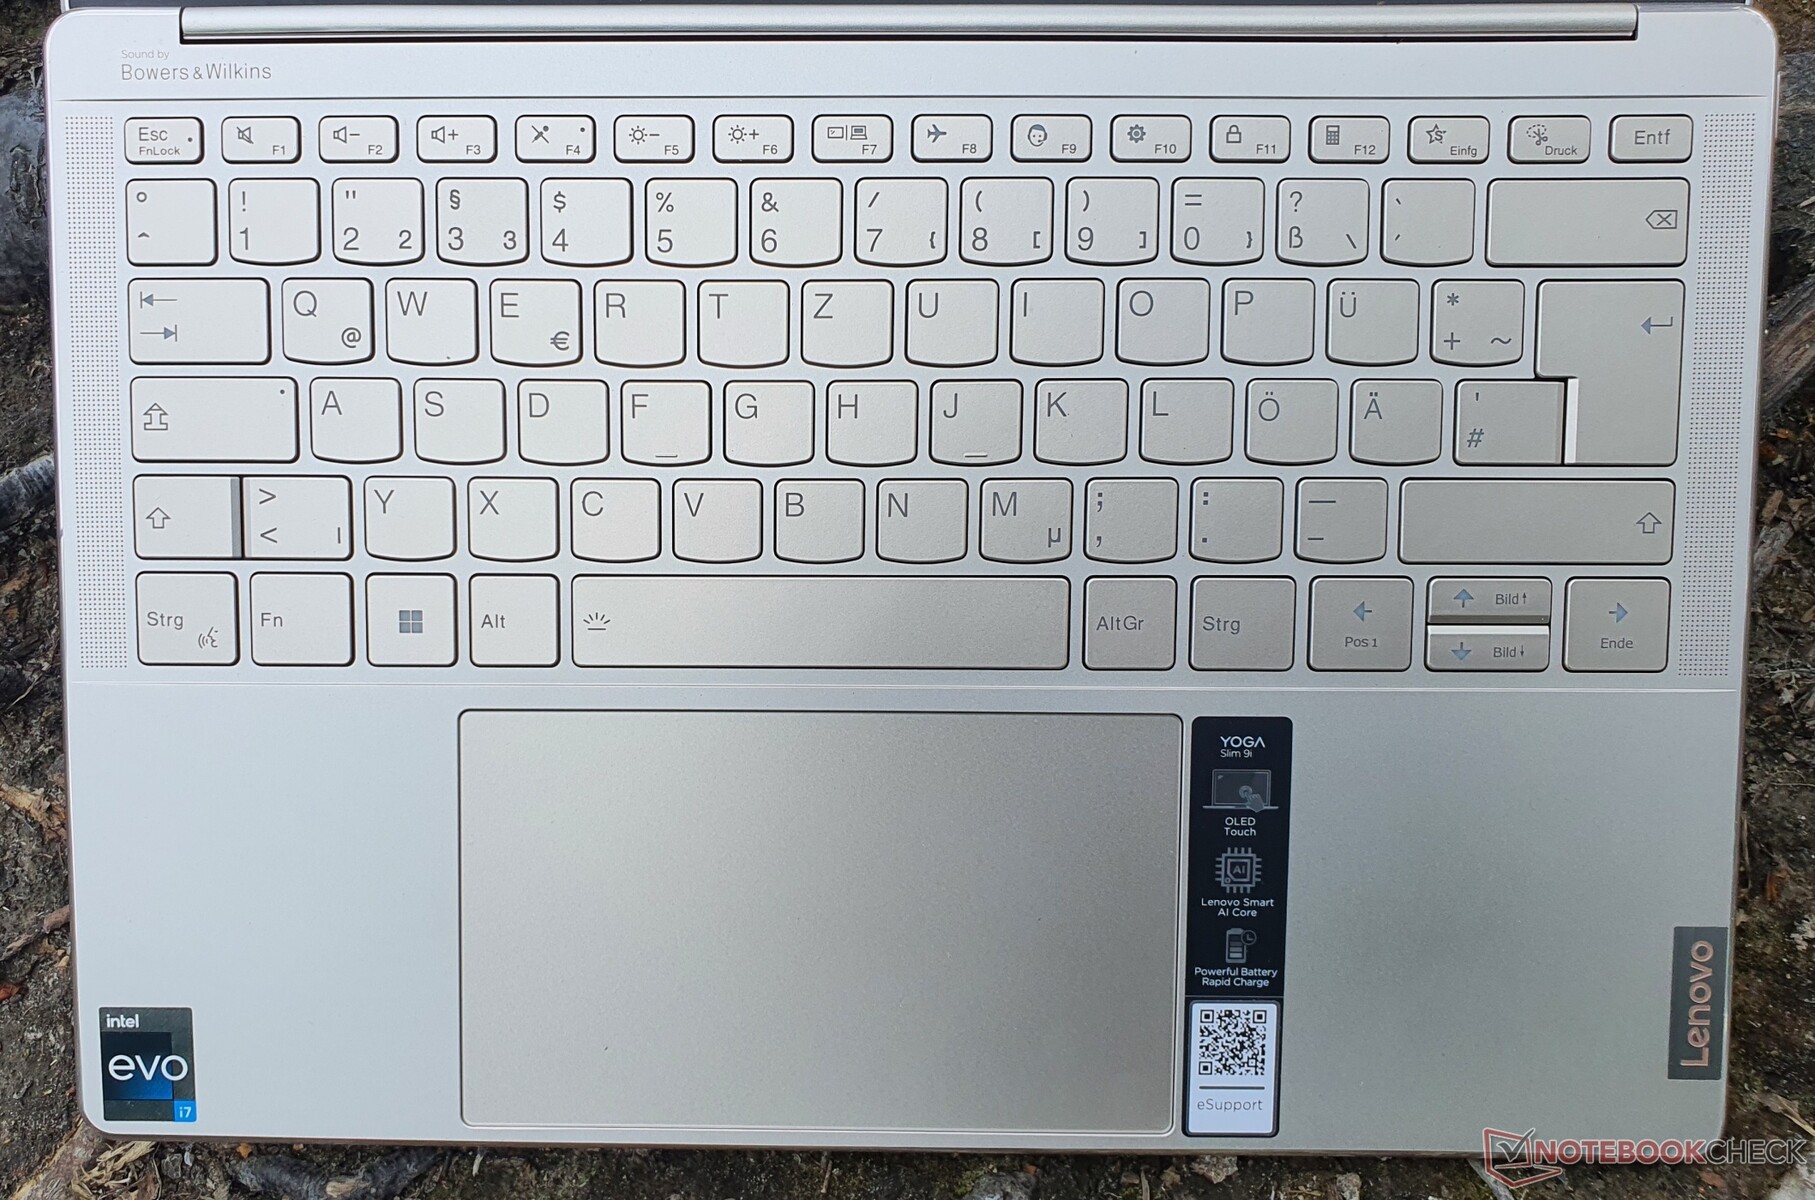
Eingabegeräte: Glas-Touchpad des Yoga Slim 9 mit Fehleingaben
Tastatur
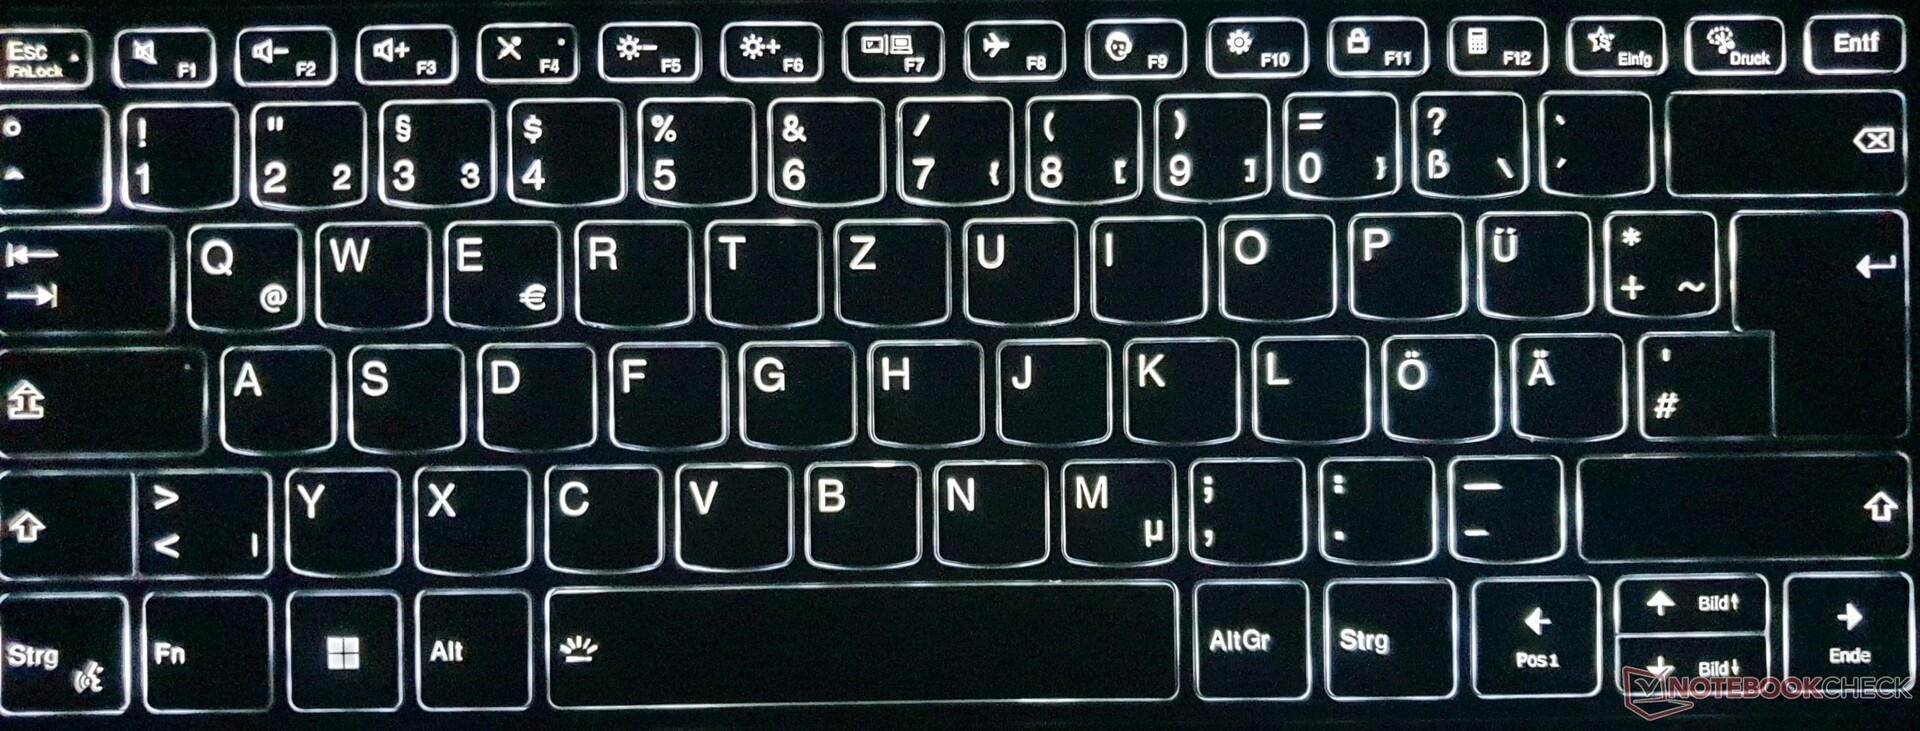
Lenovo verbaut eine Tastatur, die den IdeaPads aus der Mittel- und Einsteigerklasse entspricht. Der Hubweg ist mit geschätzten 1 bis 1,2 mm selbst für ein Ultrabook sehr gering, aber dank spürbarem Druckpunkt lässt es sich dennoch präzise und schnell auf den 16 x 15 mm großen Tasten tippen. Jemand, der einen deutlich längerem Tastenhub gewohnt ist, spürt jedoch vor allem den Tastaturboden.
Insgesamt gibt es bessere Tastaturen mit ähnlich kurzem Hub.
Das Layout ist insgesamt gut, aber mit den typischen Doppelbelegungen und Pfeil-nach-oben-/unten-Tasten in halber Höhe. Die Tasten "Pos1" und "Ende" fehlen ganz. Eine zweistufige Tastaturbeleuchtung wird geboten.
Touchpad & Touchscreen
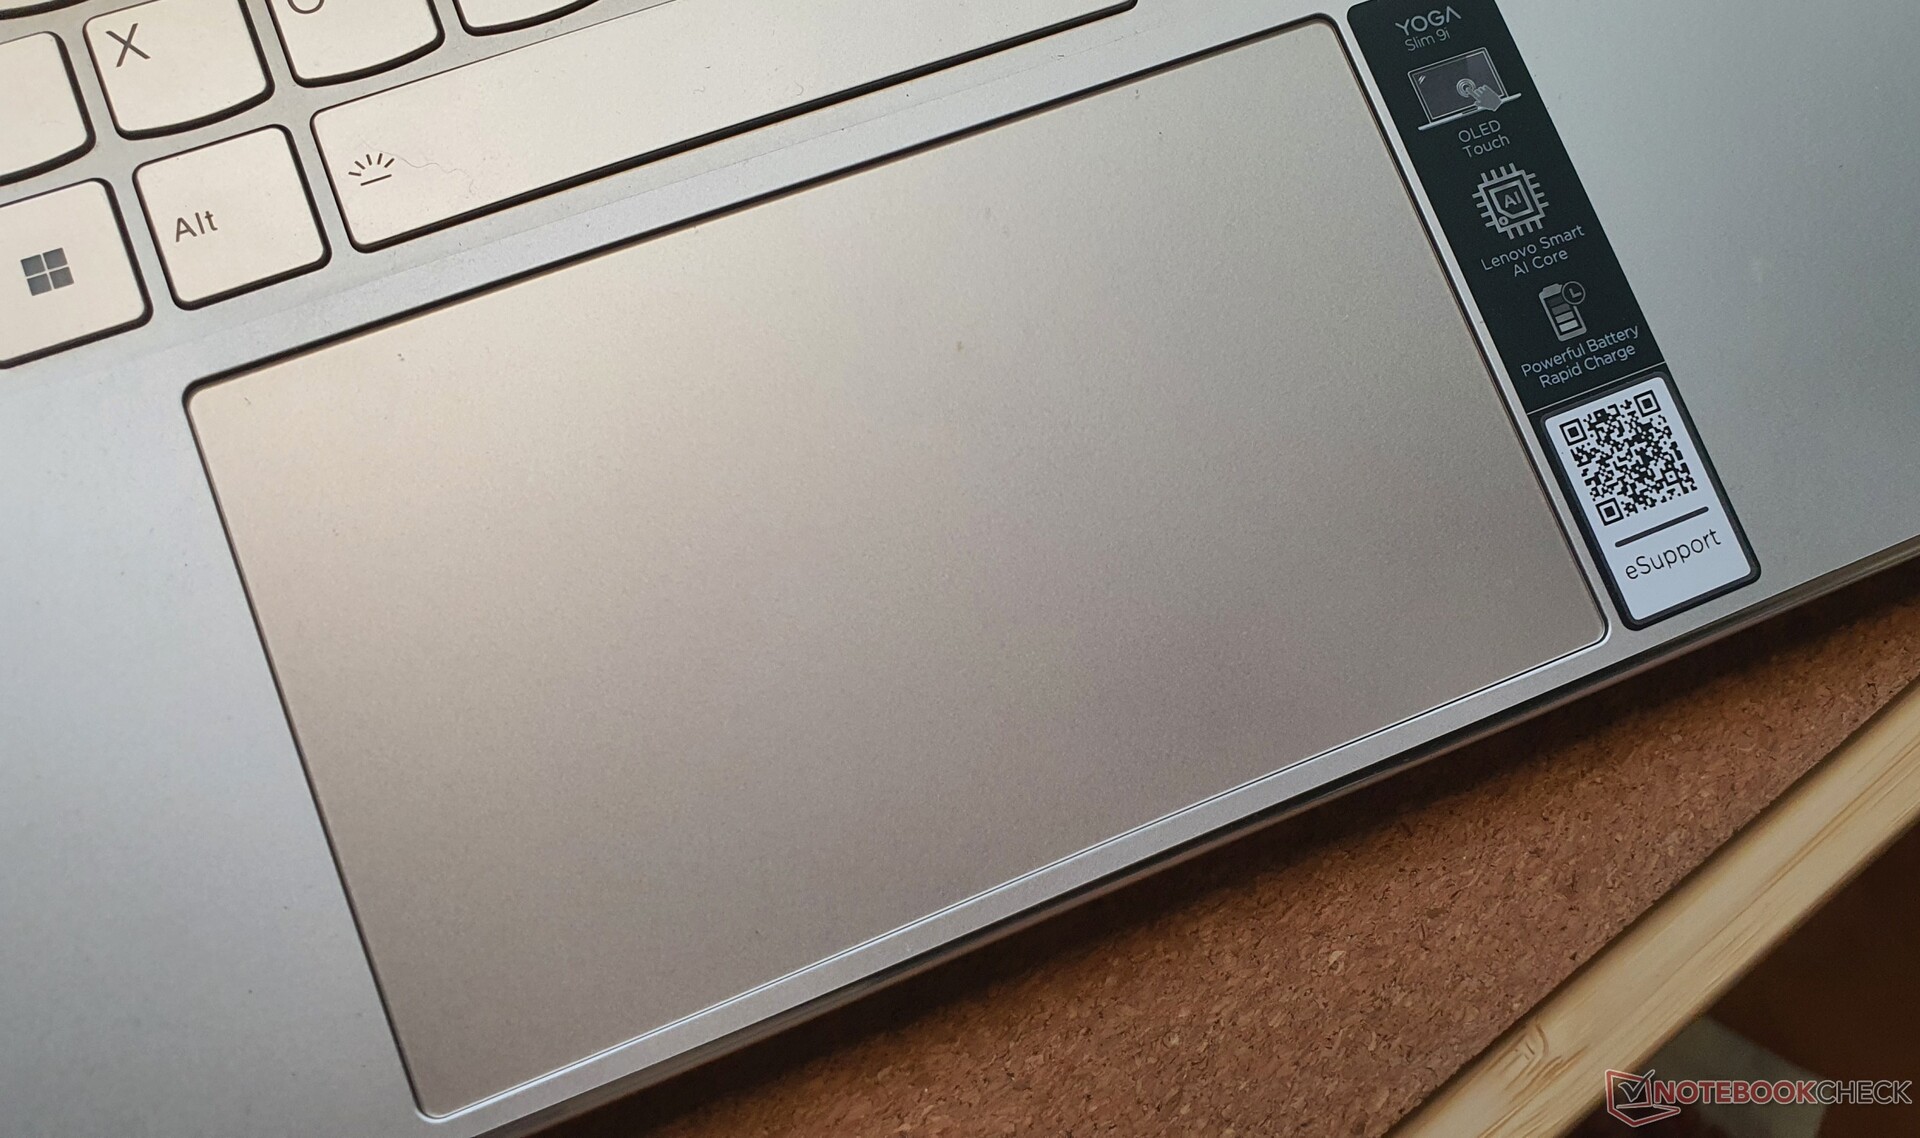
Kommen wir zu unserem Hauptkritikpunkt, dem Touchpad: Dieses besteht zwar aus Glas und ist mit 13,5 x 8 cm im Vergleich zum Vorgänger um ganze 50 % vergrößert worden, die Oberfläche ist jedoch rutschig, was häufig zu ungenauem Verhalten bis hin zu Fehleingaben führt, das zudem auch an der tiefen Einlassung des Touchpads liegt. Der Vorgänger besaß ein plan eingelassenes Touchpad und litt aufgrund dessen am anderen Extrem.
Auch das Scrollen kann sich sprunghaft gestalten, Drag-&-Drop-Aktionen werden stark erschwert und präzise Clicks sind selten möglich. Die integrierten Klicktasten besitzen zudem einen sehr kurzen Hub, mit ungenauem Feedback. Insgesamt eines der schlechteren Touchpads, die wir getestet haben.
Es empfiehlt sich daher eine Maus zu nutzen oder häufig auf den Touchscreen auszuweichen. Denn dieser ist sehr responsiv und genau, was ein angenehmes Scrollen, Drag-&-Drop, sowie Pinch-To-Zoom ermöglicht.
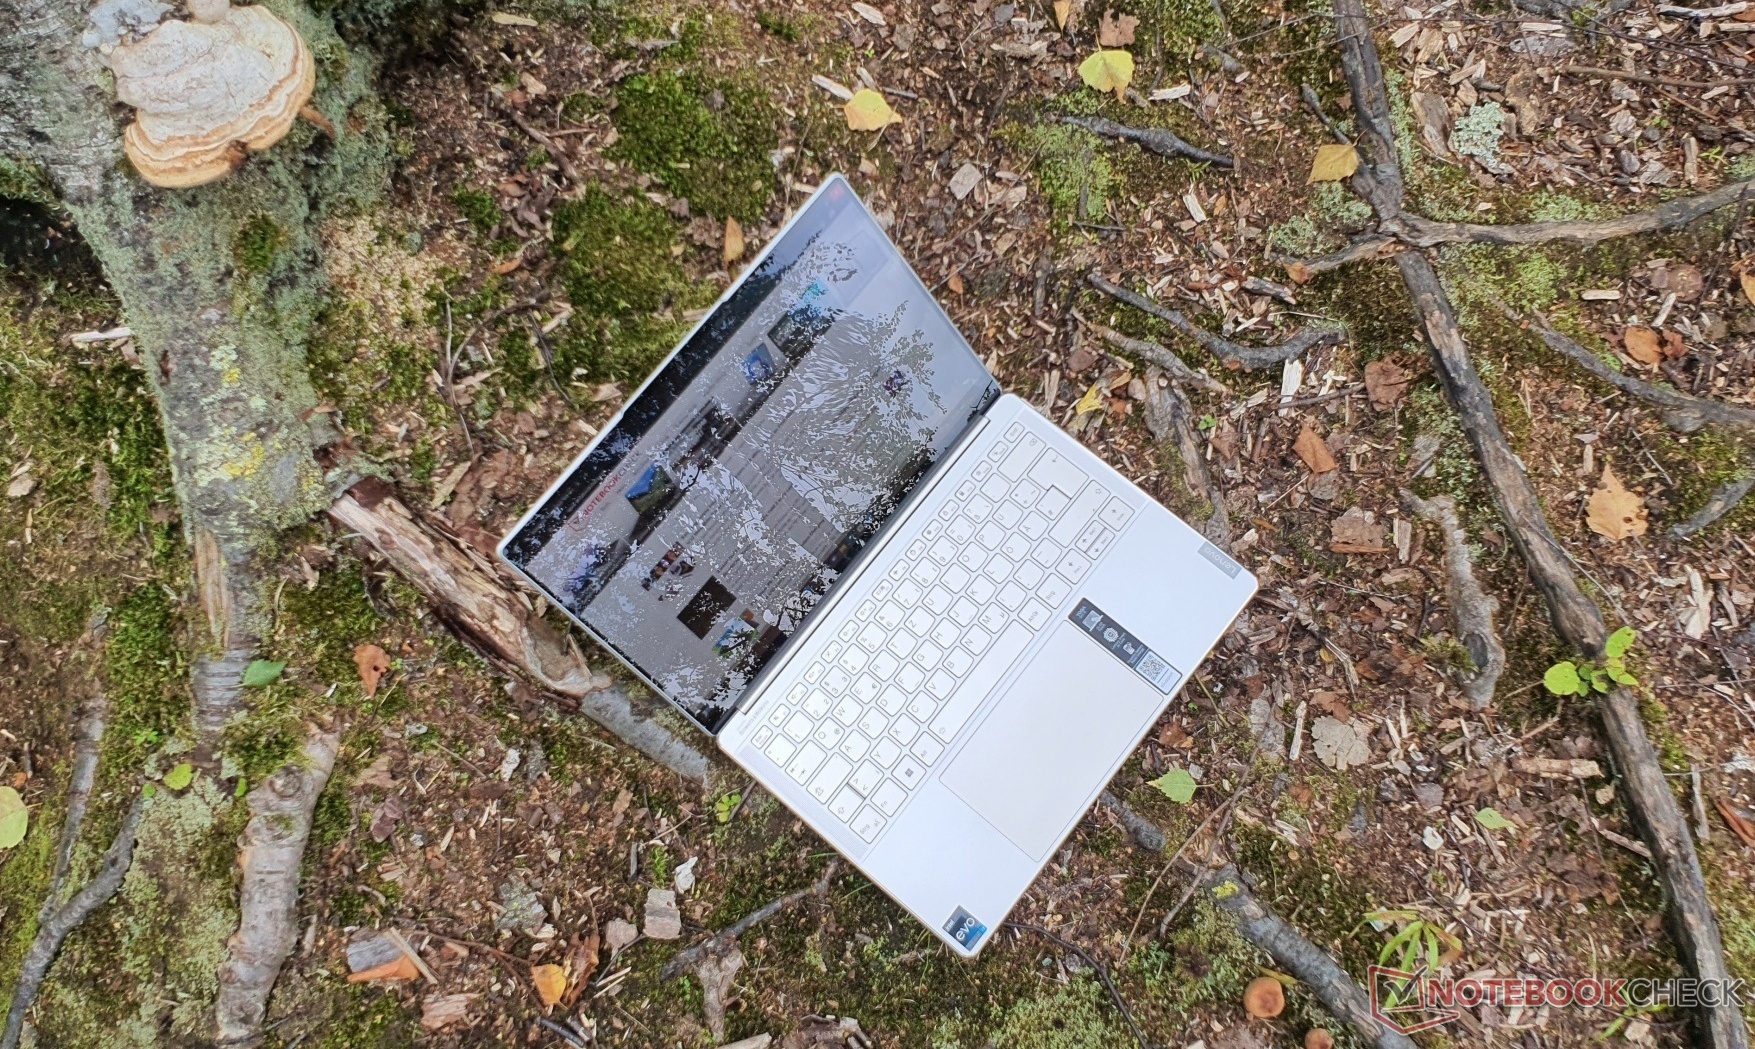
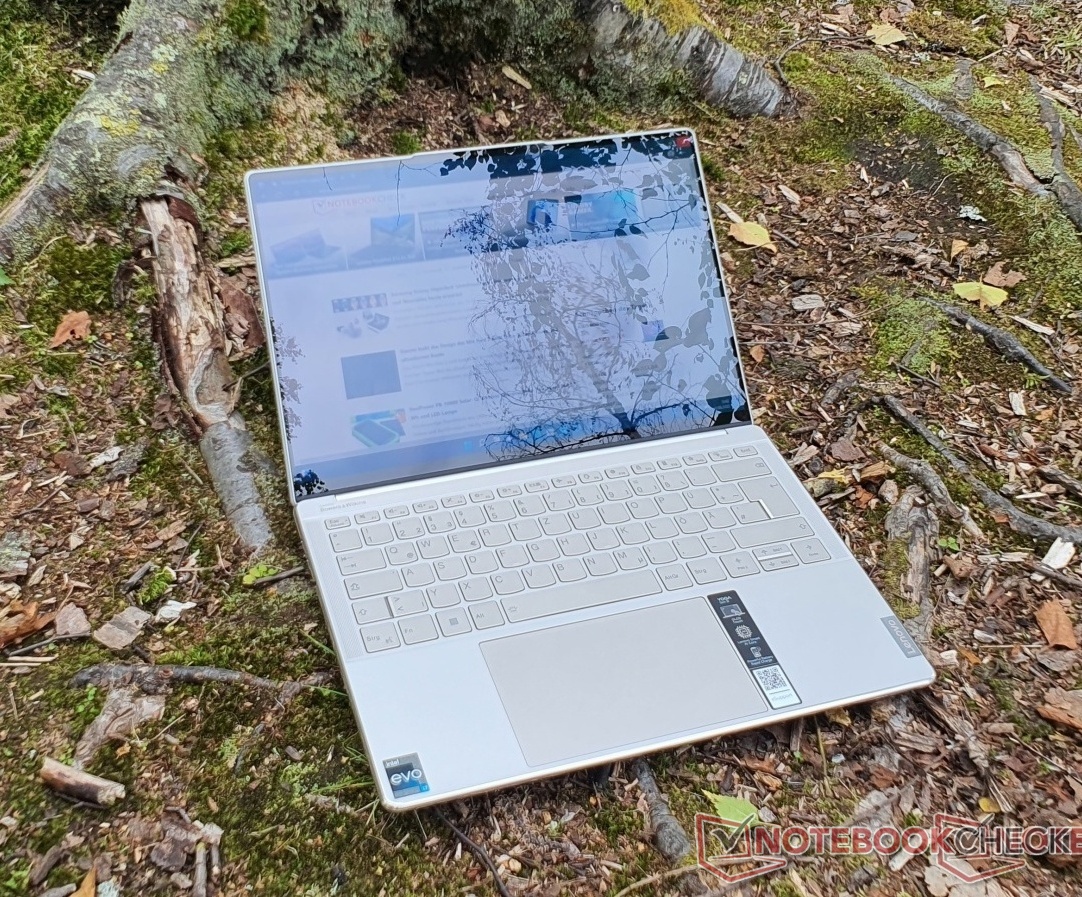
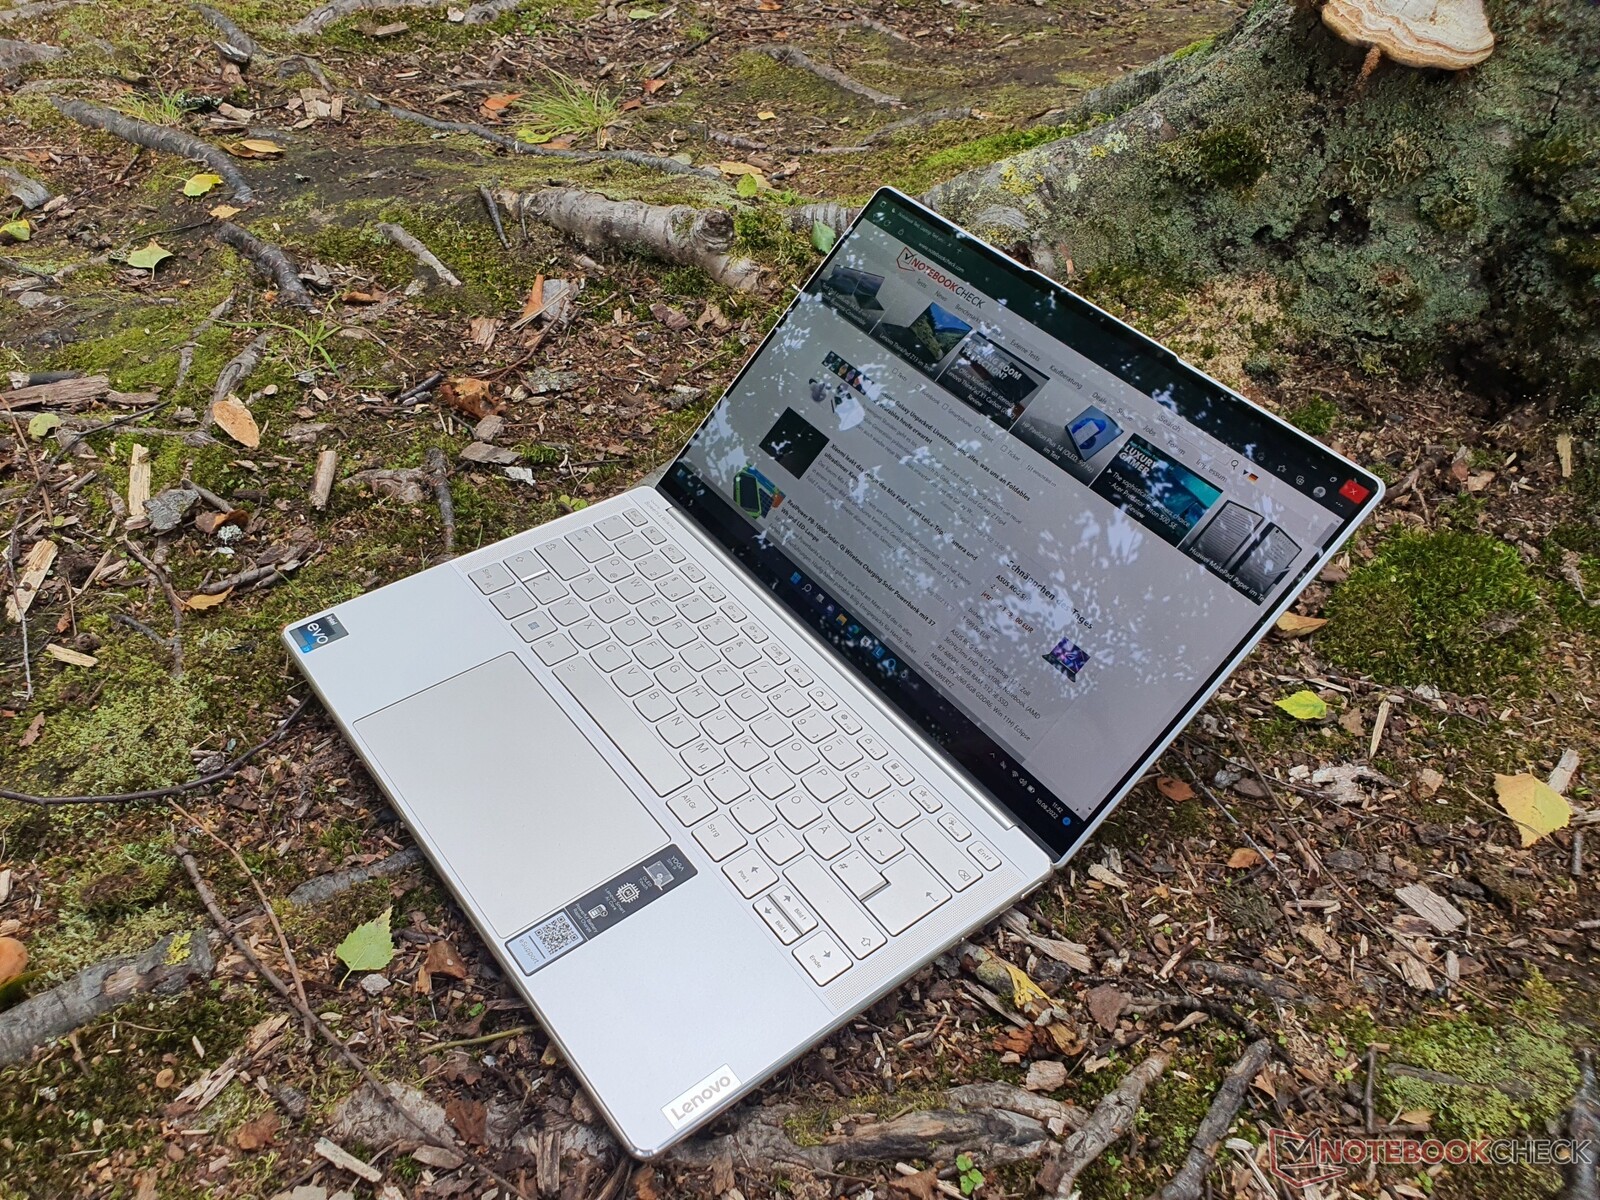
3K-OLED-Display mit 90 Hz, 2 ms und 100 % DCI-P3
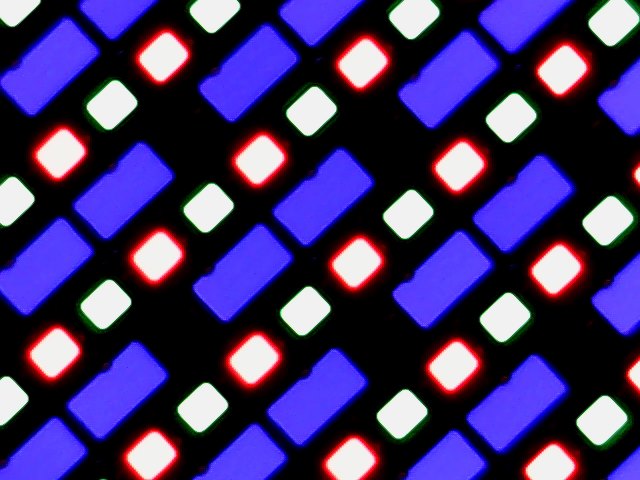
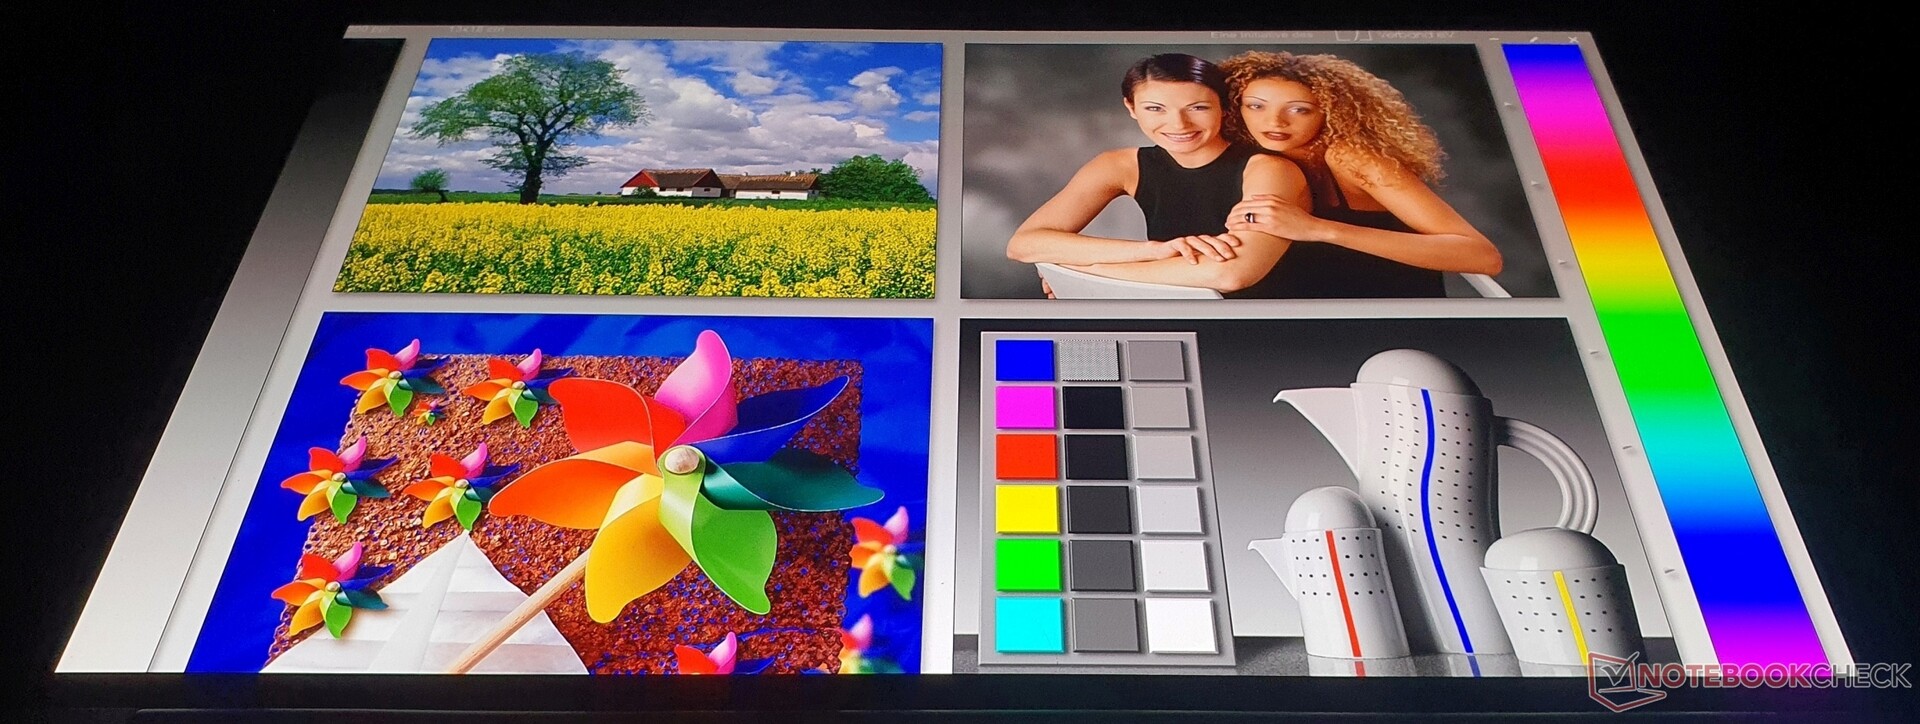
Das scharfe 16:10-OLED-Panel löst mit 2.880 x 1.800 Bildpunkten auf. Touch wird vom stark spiegelndem Display unterstützt, während die Möglichkeit zur Verwendung eines Eingabestifts seitens Lenovo nicht erwähnt wird. Die Bildwiederholrate beträgt 90 Hz, auch wenn an verschiedener Stelle von 60 Hz die Rede ist, jedoch Letzteres in Windows vor eingestellt ist.
Sowohl das Ziehen von Fenstern, als auch das Scrollen von Inhalten gestaltet sich dadurch sehr verzögerungsfrei. Die geringen Reaktionszeiten von 2 ms tragen dazu bei.
Das optional erhältliche 4K-OLED-Panel beschränkt sich hingegen auf 60 Hz und wirkt sich wohl noch etwas negativer auf die Akkulaufzeiten aus. Wir empfinden das 3K-Display bereits als sehr scharfes Top-End aller Displays. Es handelt sich dabei um das gleiche Panel wie beim Yoga-9-Convertible. Lenovo verspricht eine Helligkeit von 400 Nits, gemessen haben wir im Mittel 367 Nits, was für den Alltag in Innenräumen ausreichen sollte. Für den Outdoor-Einsatz ist das stark spiegelnde Display mit Glasoberfläche weniger geeignet. Jedoch lässt sie sich durchs Aktivieren von HDR500 etwas erhöhen, mit bis zu 617 Nits in der Spitze bei komplett weißem Hintergrund (nicht gemessen). Im Akkubetrieb muss in den Windows-HDR-Einstellung "für Bildqualität optimieren" angewählt sein.
Schwarzwert und Kontrast befinden sich OLED-typisch auf höchstem Niveau und Backlight Bleeding existiert daher naturgemäß nicht, da die selbst-leuchtenden Pixel kein Backlight bedürfen und bei schwarzem Bild komplett ausgeschaltet bleiben.
Apples MacBook Air M2 liegt unter den IPS-Displays unserem qualitativ am nächsten, während sich die OLED-Geräte, etwa die Zenbooks oder das HP Spectre, untereinander nichts nehmen. PWM-Flackern wurde bei einer Helligkeit bis 80% festgestellt, bei einer mittel bis hohen Frequenz von 357 Hz, die bei einigen wenigen Nutzern unangenehm sein kann.
| |||||||||||||||||||||||||
Ausleuchtung: 93 %
Helligkeit Akku: 361 cd/m²
Kontrast: 18050:1 (Schwarzwert: 0.02 cd/m²)
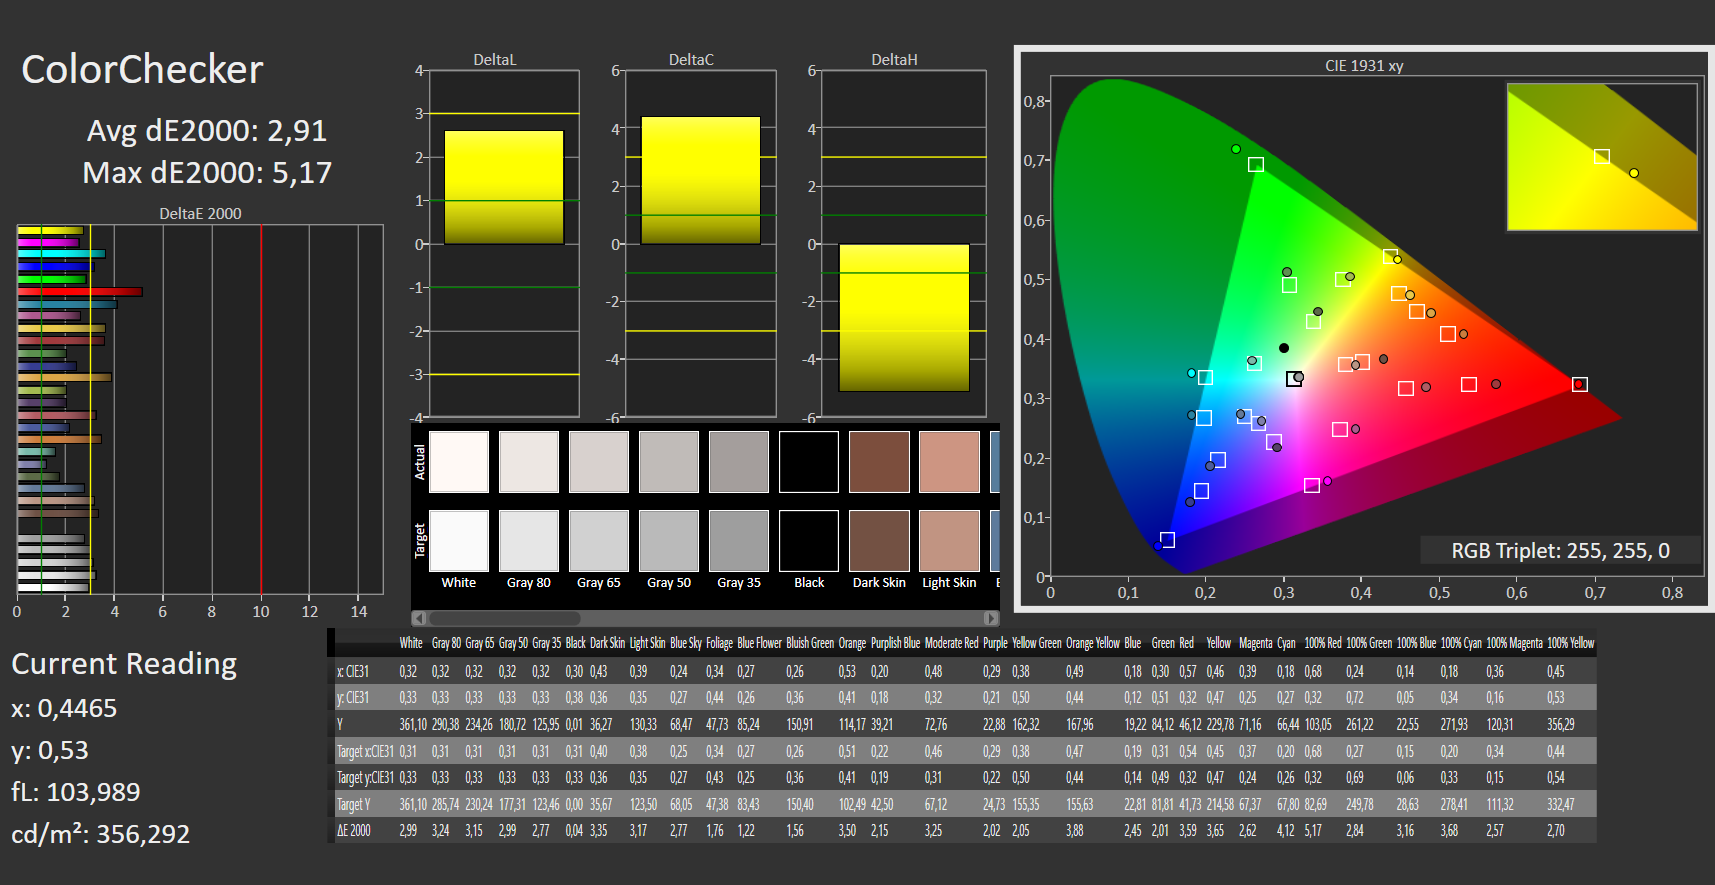
ΔE ColorChecker Calman: 2.91 | ∀{0.5-29.43 Ø4.72}
calibrated: 2.32
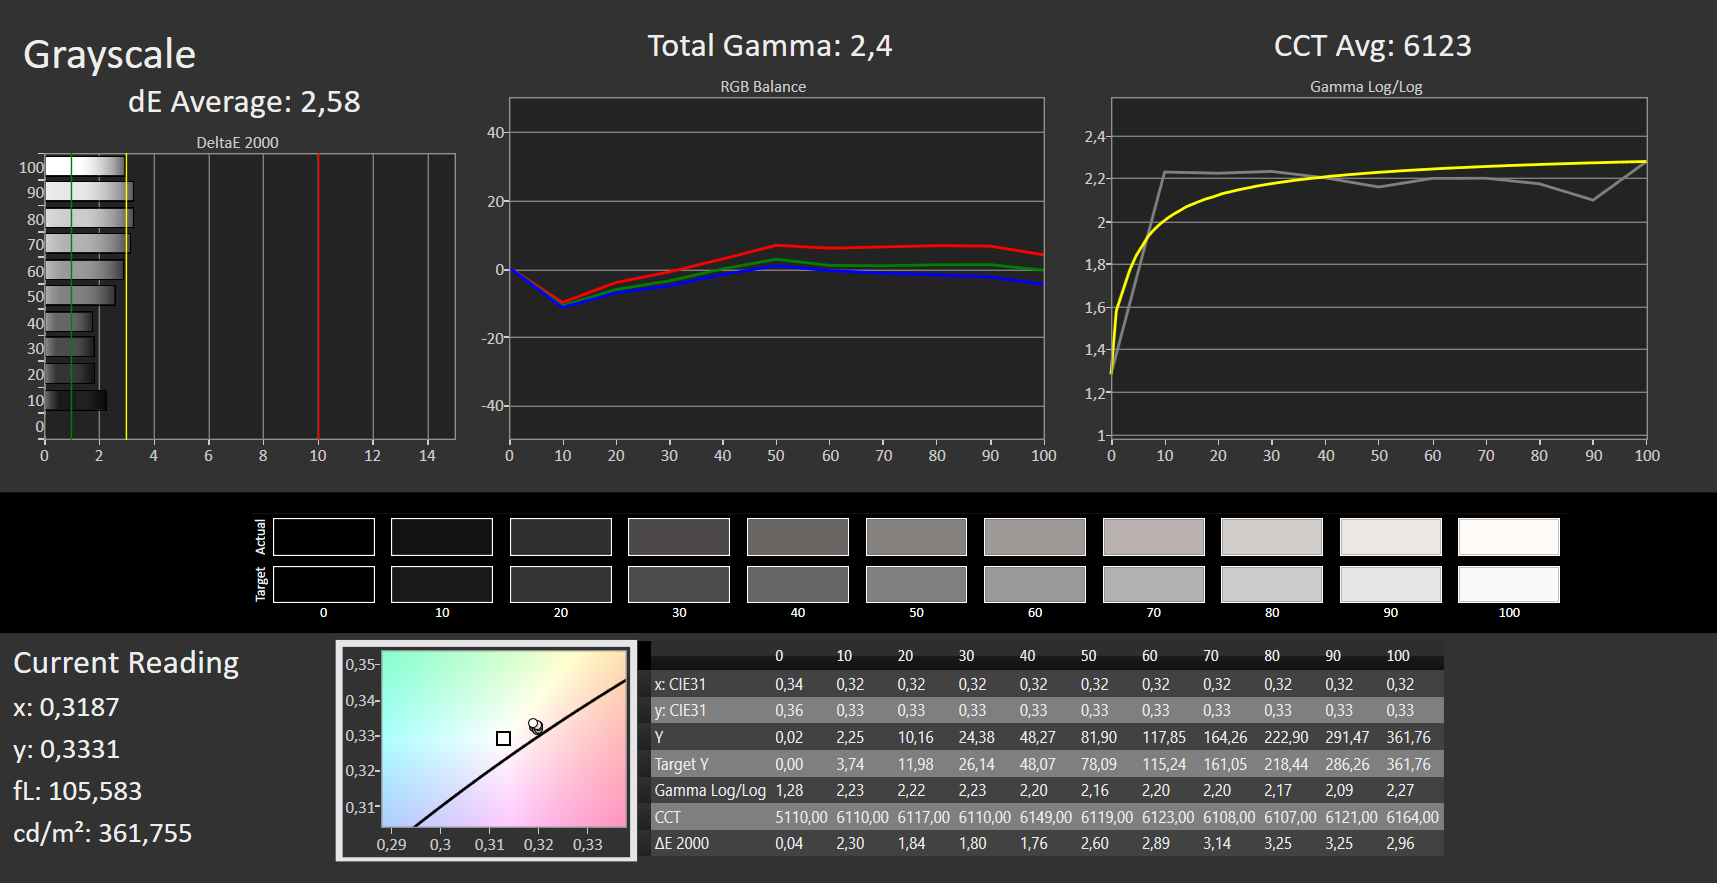
ΔE Greyscale Calman: 2.58 | ∀{0.09-98 Ø4.97}
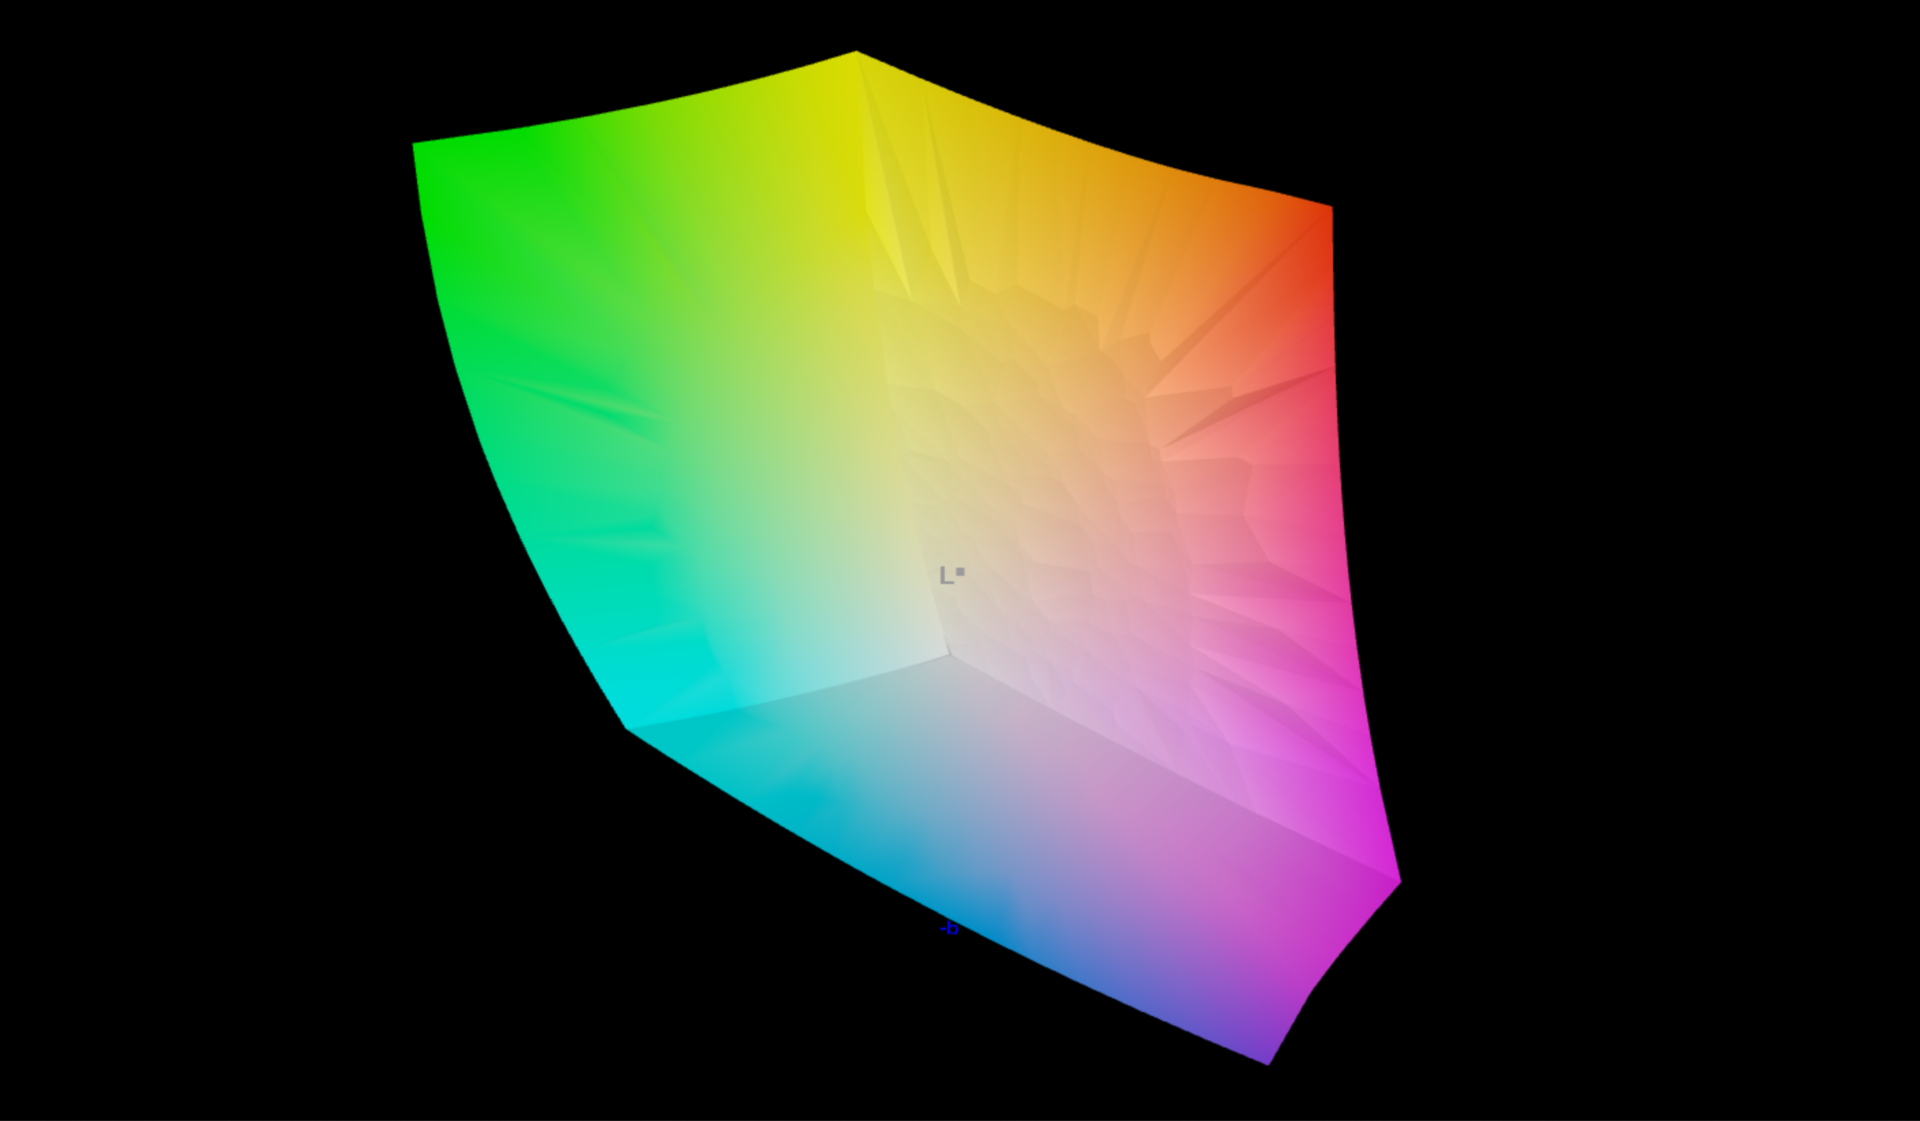
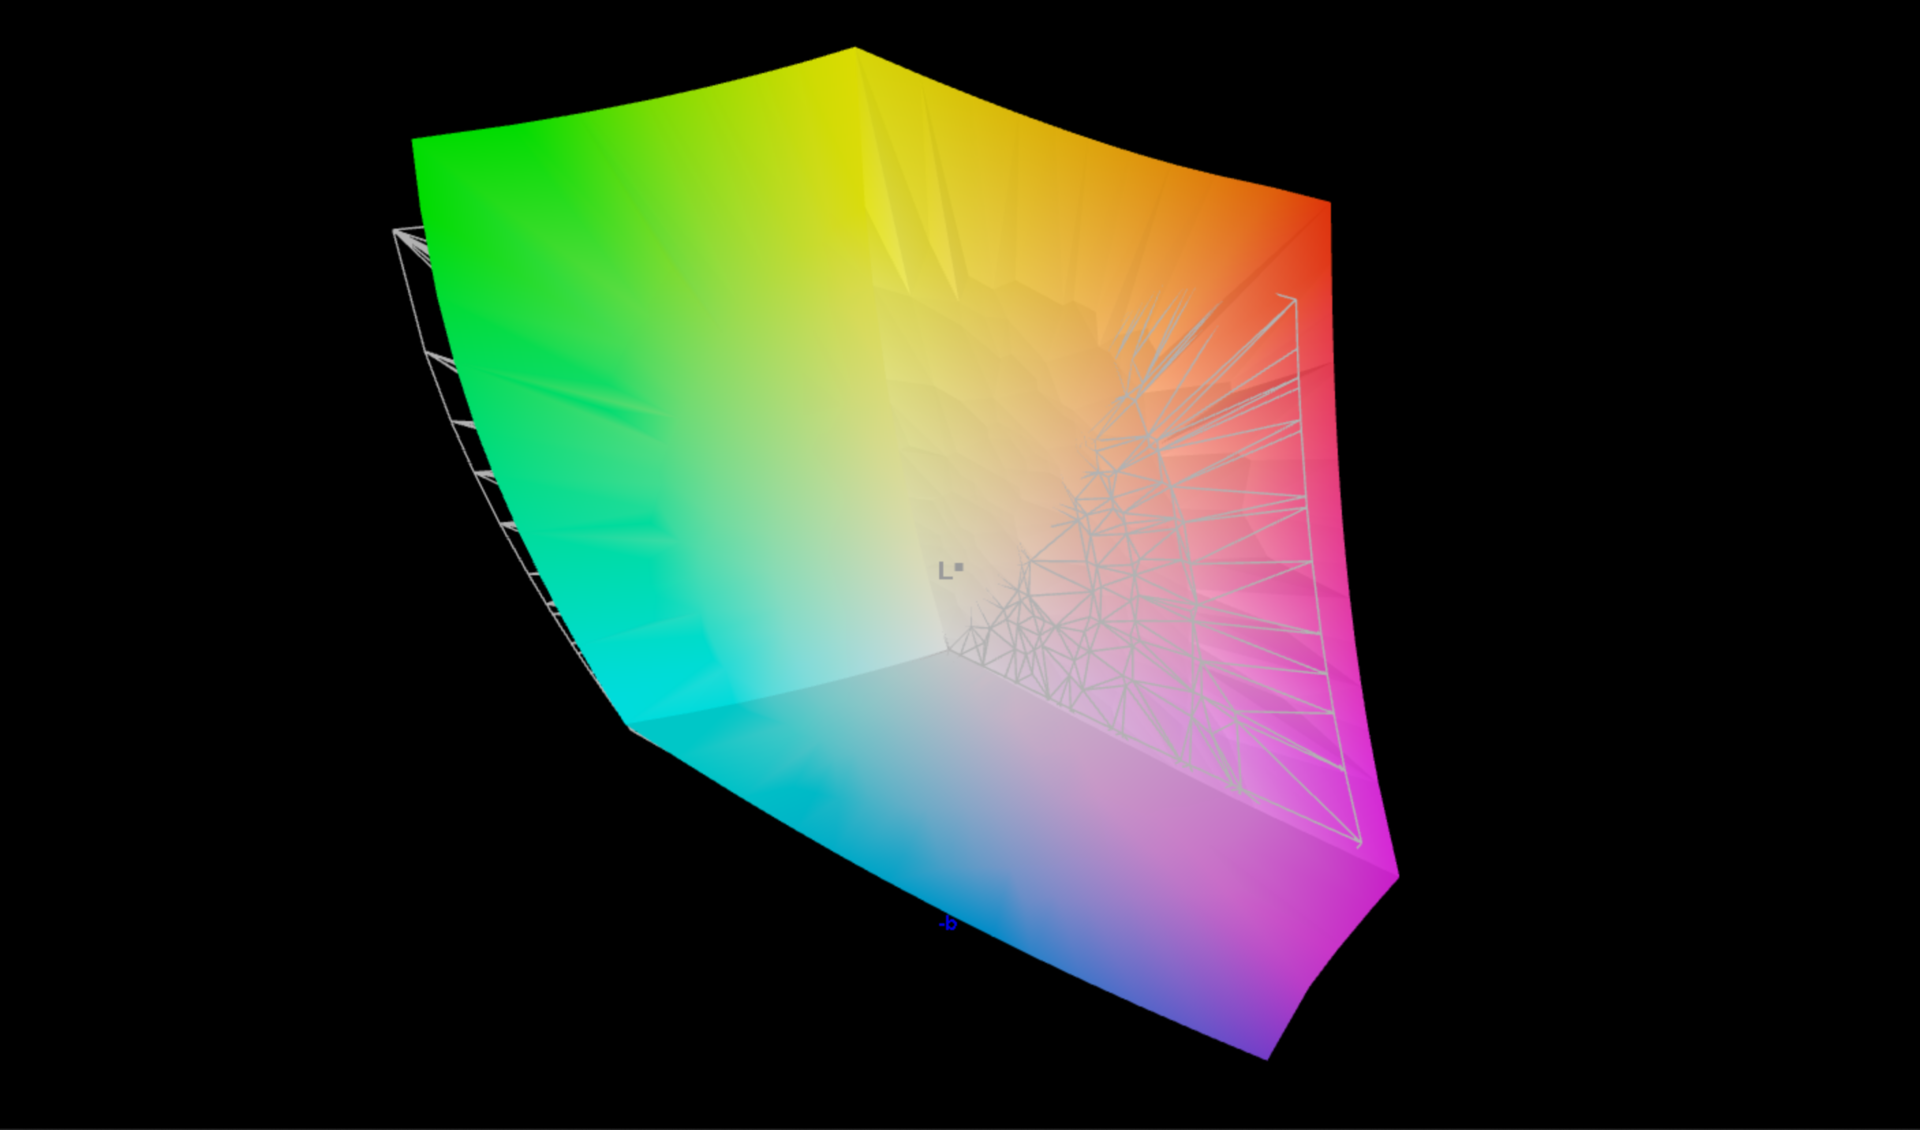
97.18% AdobeRGB 1998 (Argyll 3D)
99.98% sRGB (Argyll 3D)
99.61% Display P3 (Argyll 3D)
Gamma: 2.4
CCT: 6123 K
| Lenovo Yoga Slim 9 14IAP7 LEN140WQ+, OLED, 2880x1800, 14" | Lenovo Yoga 9 14IAP7 82LU0001US Lenovo LEN140WQ+, OLED, 2880x1800, 14" | Lenovo Yoga Slim 7i Pro 14IAP G7 LEN140WQ+, IPS, 2880x1800, 14" | Asus Zenbook S 13 OLED SDC4172, OLED, 2880x1800, 13.3" | HP Spectre x360 13.5 14t-ef000 SDC4160, OLED, 3000x2000, 13.5" | Schenker Vision 14 MNE007ZA1, IPS, 2880x1800, 14" | Dell XPS 13 Plus 9320 4K LQ134R1, IPS, 3840x2400, 13.4" | Apple MacBook Air M2 Entry IPS, 2560x1664, 13.6" | |
|---|---|---|---|---|---|---|---|---|
| Display | 1% | -14% | 0% | -2% | -16% | -15% | -4% | |
| Display P3 Coverage (%) | 99.61 | 99.8 0% | 77.7 -22% | 99.8 0% | 99.9 0% | 74.3 -25% | 76.5 -23% | 98.4 -1% |
| sRGB Coverage (%) | 99.98 | 100 0% | 100 0% | 100 0% | 100 0% | 97.6 -2% | 100 0% | 99.9 0% |
| AdobeRGB 1998 Coverage (%) | 97.18 | 98.7 2% | 78.4 -19% | 97.8 1% | 90.8 -7% | 75.7 -22% | 76 -22% | 87.6 -10% |
| Response Times | 40% | -1220% | 6% | -2% | -1370% | -1420% | -1345% | |
| Response Time Grey 50% / Grey 80% * (ms) | 2 ? | 1.2 ? 40% | 35.2 ? -1660% | 2.1 ? -5% | 1.9 ? 5% | 40.4 ? -1920% | 38.9 ? -1845% | 32.9 ? -1545% |
| Response Time Black / White * (ms) | 2 ? | 1.2 ? 40% | 17.6 ? -780% | 1.68 ? 16% | 2.16 ? -8% | 18.4 ? -820% | 21.9 ? -995% | 24.9 ? -1145% |
| PWM Frequency (Hz) | 357 ? | 347.2 ? | 240.4 ? | 60.2 ? | ||||
| Bildschirm | -23% | 4% | 15% | 3% | -131% | -145% | -180% | |
| Helligkeit Bildmitte (cd/m²) | 361 | 367.3 2% | 469 30% | 336 -7% | 351.7 -3% | 407 13% | 494 37% | 526 46% |
| Brightness (cd/m²) | 365 | 369 1% | 445 22% | 338 -7% | 351 -4% | 407 12% | 474 30% | 486 33% |
| Brightness Distribution (%) | 93 | 97 4% | 90 -3% | 99 6% | 87 -6% | 94 1% | 89 -4% | 87 -6% |
| Schwarzwert * (cd/m²) | 0.02 | 0.02 -0% | 0.25 -1150% | 0.28 -1300% | 0.38 -1800% | |||
| Kontrast (:1) | 18050 | 16800 -7% | 1628 -91% | 1764 -90% | 1384 -92% | |||
| Delta E Colorchecker * | 2.91 | 5.2 -79% | 3.5 -20% | 1.8 38% | 1.78 39% | 2.6 11% | 3.1 -7% | 1.3 55% |
| Colorchecker dE 2000 max. * | 5.17 | 8.04 -56% | 5.3 -3% | 3.8 26% | 6.14 -19% | 4.4 15% | 4.2 19% | 2.7 48% |
| Colorchecker dE 2000 calibrated * | 2.32 | 1.7 27% | 1.8 22% | 2 14% | 1.5 35% | 0.7 70% | ||
| Delta E Graustufen * | 2.58 | 2.8 -9% | 3.3 -28% | 0.9 65% | 2.3 11% | 2.7 -5% | 3.2 -24% | 2 22% |
| Gamma | 2.4 92% | 2.21 100% | 1.97 112% | 2.22 99% | 2.11 104% | 2.18 101% | 2.41 91% | 2.25 98% |
| CCT | 6123 106% | 5992 108% | 6512 100% | 6580 99% | 6683 97% | 6316 103% | 6189 105% | 6858 95% |
| Durchschnitt gesamt (Programm / Settings) | 6% /
-5% | -410% /
-205% | 7% /
11% | -0% /
1% | -506% /
-284% | -527% /
-299% | -510% /
-309% |
* ... kleinere Werte sind besser
Der AdobeRGB-Farbraum wird mit 97 % abgedeckt, was für eine ambitionierte Bildbearbeitung mehr als ausreicht. Vergleichsgeräte mit OLED-Panels erreichen meist ähnliche Werte und das MacBook Air schafft es trotz IPS-Panel, unserem Testgerät in dieser Hinsicht nahezu das Wasser zu reichen.

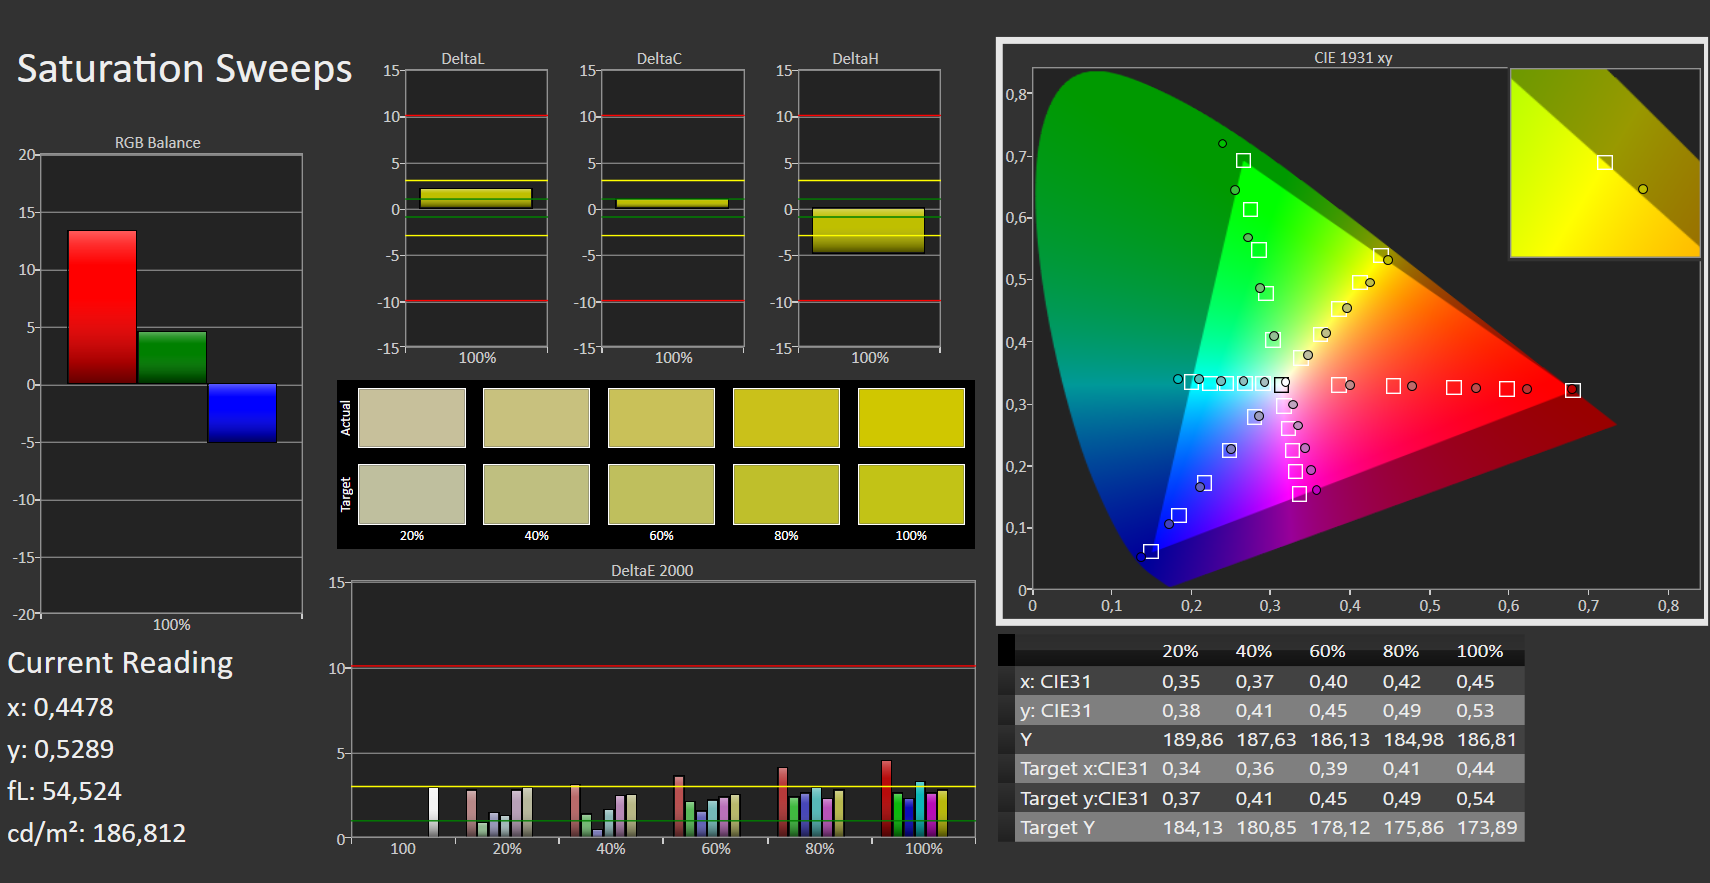
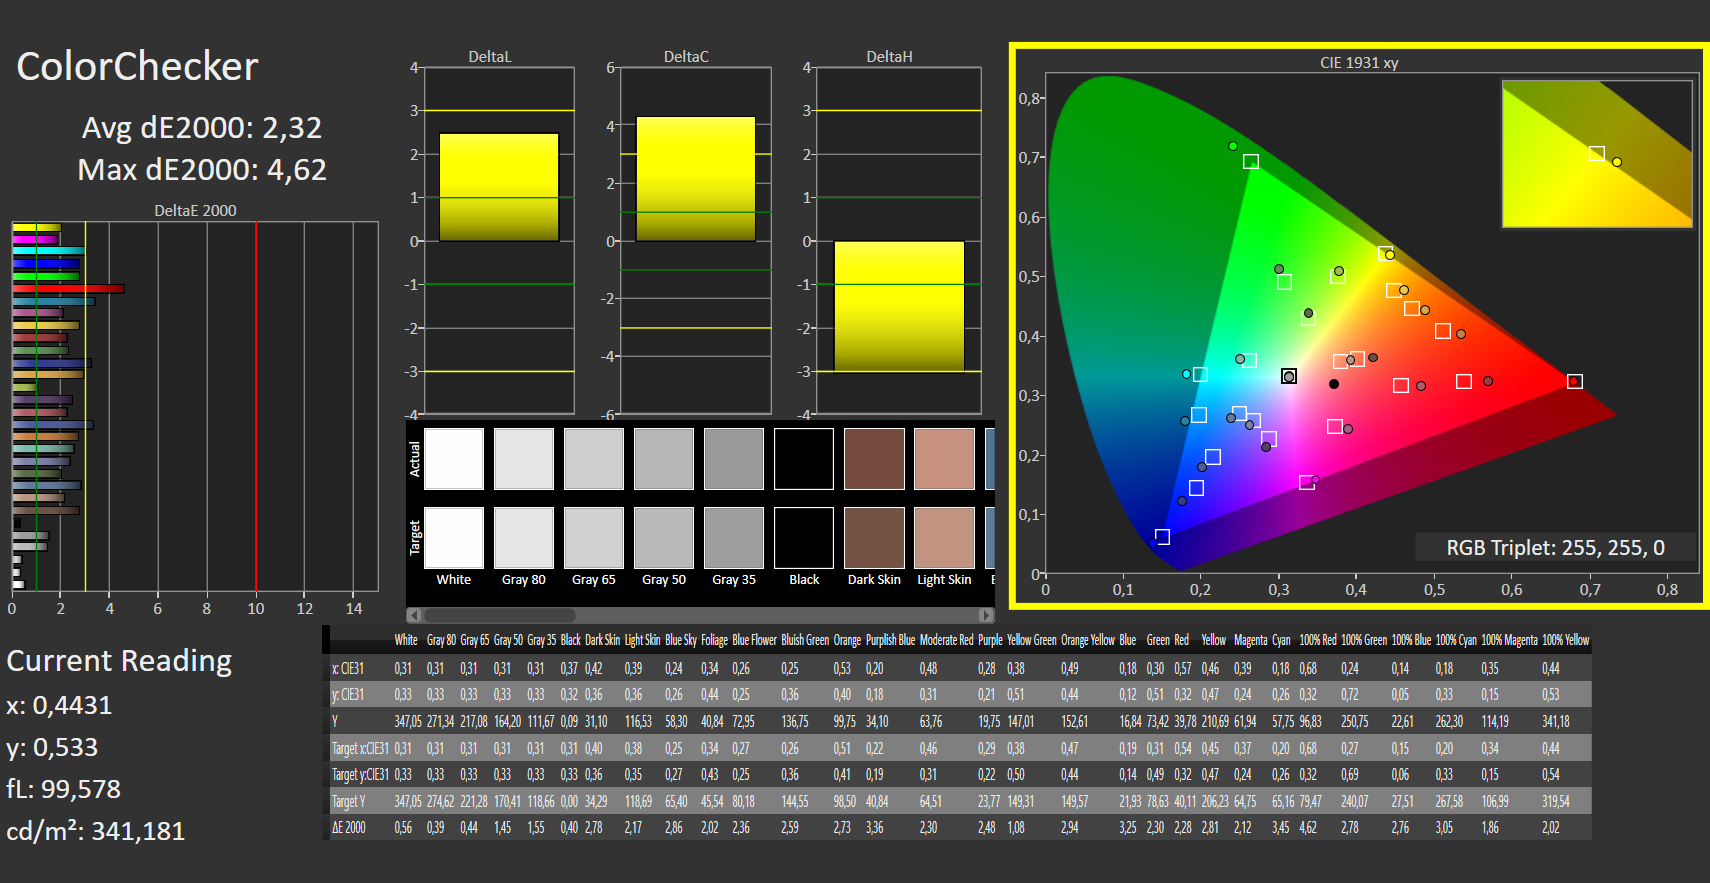
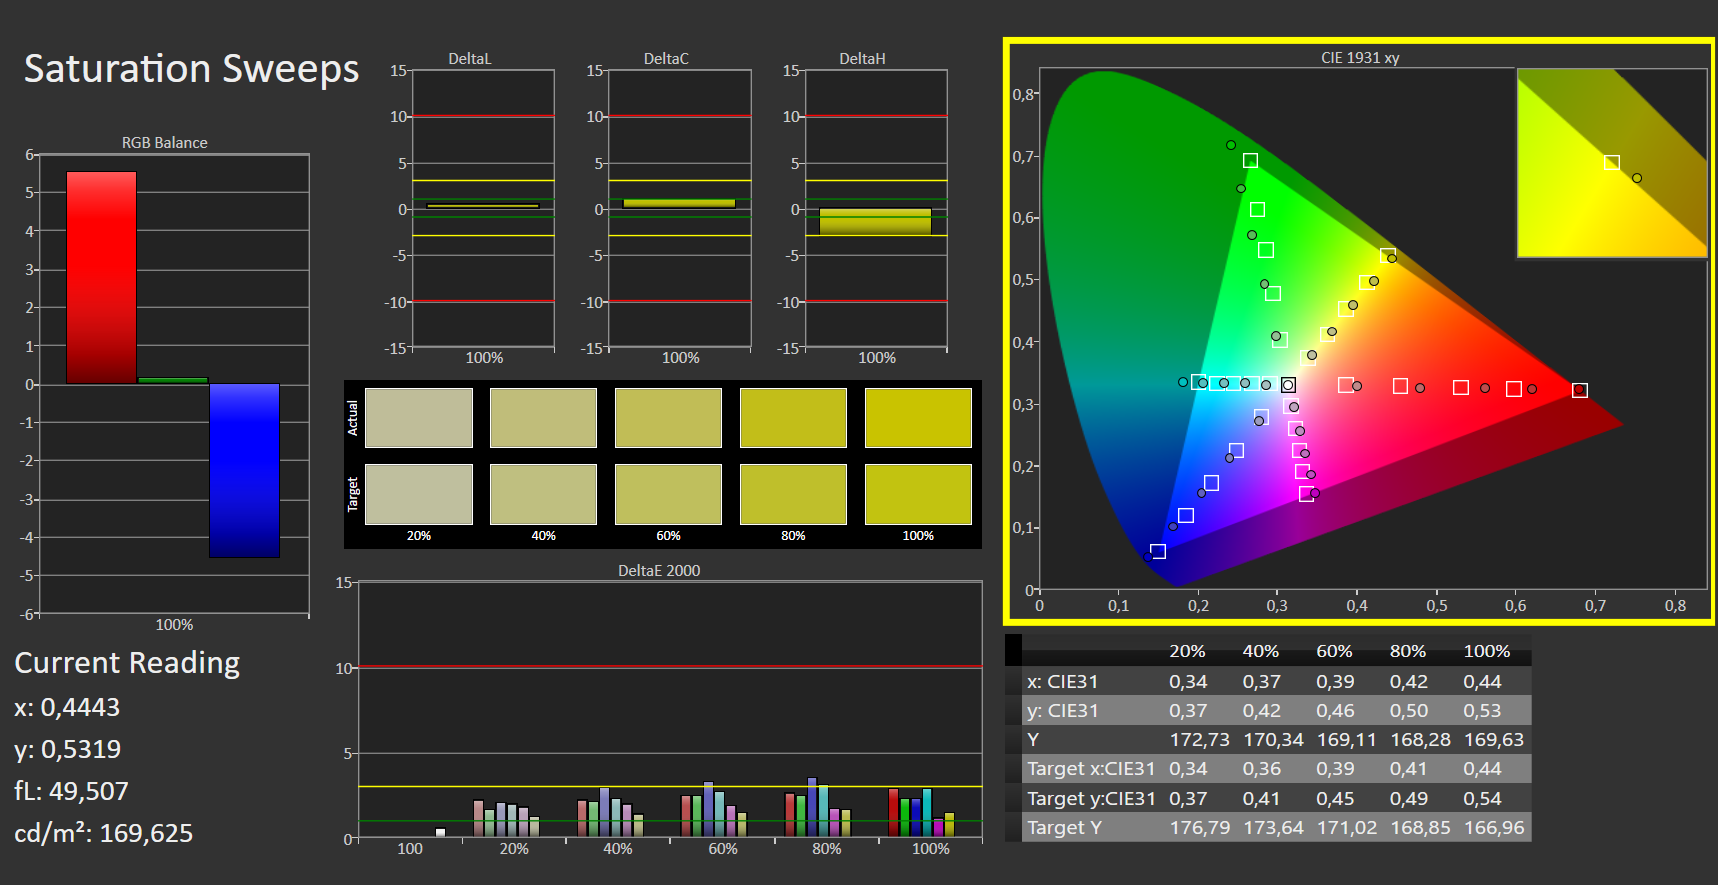
Allerdings weichen manche Farben teils deutlich vom Original ab, auch wenn der durchschnittliche DeltaE2000-Wert knapp unter der wahrnehmbaren Grenze von 3 bleibt. Besonders zu nennen sind dabei die Rottöne mit einem Wert von > 5. Auch ist das Bild insgesamt etwas mit Rot übersättigt.
Nach unserer Kalibrierung weichen die Rottöne immer noch stark ab, aber die anderen Farben liegen nun alle unter dem Grenzwert oder nur knapp darüber. Der Rotstich konnte immerhin beseitigt werden. Unser kalibriertes Farbprofil steht wie immer im Bereich neben der Ausleuchtungs-Grafik zum Download bereit.
Reaktionszeiten (Response Times) des Displays
| ↔ Reaktionszeiten Schwarz zu Weiß | ||
|---|---|---|
| 2 ms ... steigend ↗ und fallend ↘ kombiniert | ↗ 1 ms steigend |  |
| ↘ 1 ms fallend | ||
| Die gemessenen Reaktionszeiten sind sehr kurz, wodurch sich der Bildschirm auch für schnelle 3D Spiele eignen sollte. Im Vergleich rangierten die bei uns getesteten Geräte von 0.1 (Minimum) zu 240 (Maximum) ms. » 11 % aller Screens waren schneller als der getestete. Daher sind die gemessenen Reaktionszeiten besser als der Durchschnitt aller vermessenen Geräte (19.8 ms). | ||
| ↔ Reaktionszeiten 50% Grau zu 80% Grau | ||
| 2 ms ... steigend ↗ und fallend ↘ kombiniert | ↗ 1 ms steigend |  |
| ↘ 1 ms fallend | ||
| Die gemessenen Reaktionszeiten sind sehr kurz, wodurch sich der Bildschirm auch für schnelle 3D Spiele eignen sollte. Im Vergleich rangierten die bei uns getesteten Geräte von 0.165 (Minimum) zu 636 (Maximum) ms. » 10 % aller Screens waren schneller als der getestete. Daher sind die gemessenen Reaktionszeiten besser als der Durchschnitt aller vermessenen Geräte (31 ms). | ||
Bildschirm-Flackern / PWM (Pulse-Width Modulation)
| Flackern / PWM festgestellt | 357 Hz | ≤ 80 % Helligkeit |    |
Das Display flackert mit 357 Hz (im schlimmsten Fall, eventuell durch Pulsweitenmodulation PWM) bei einer eingestellten Helligkeit von 80 % und darunter. Darüber sollte es zu keinem Flackern kommen. Die Frequenz von 357 Hz ist relativ hoch und sollte daher auch bei den meisten Personen zu keinen Problemen führen. Empfindliche User sollen laut Berichten aber sogar noch bei 500 Hz und darüber ein Flackern wahrnehmen. Im Vergleich: 52 % aller getesteten Geräte nutzten kein PWM um die Helligkeit zu reduzieren. Wenn PWM eingesetzt wurde, dann bei einer Frequenz von durchschnittlich 7763 (Minimum 5, Maximum 343500) Hz. | |||
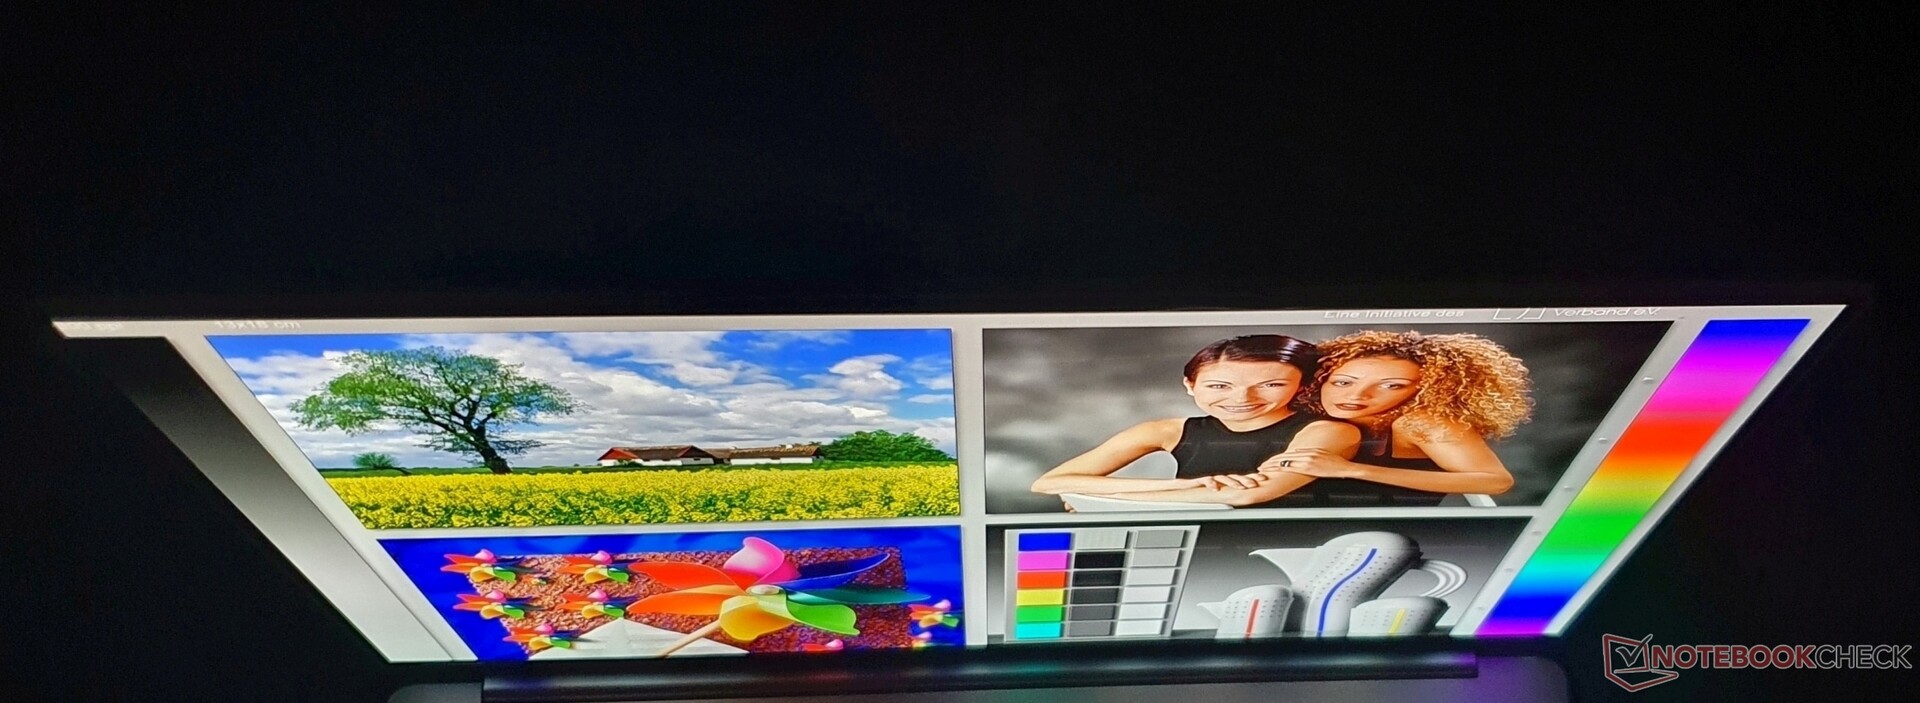
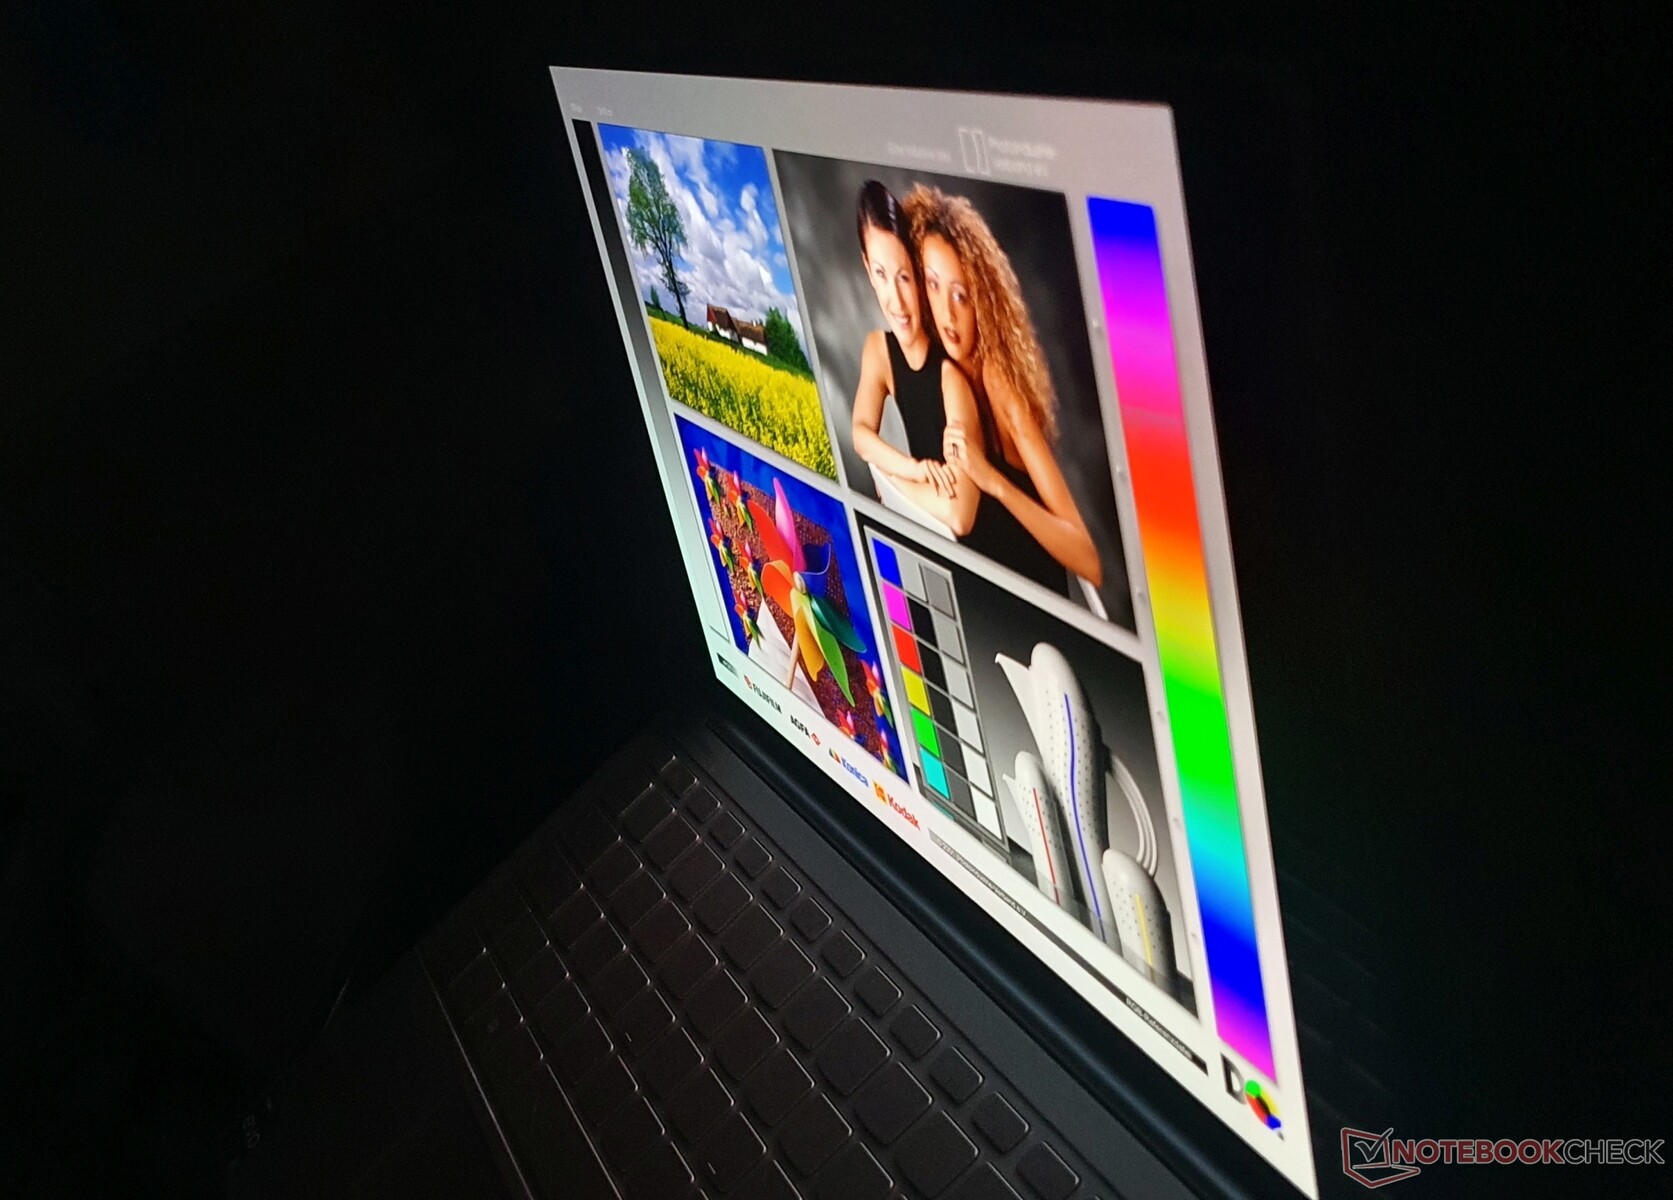
Draußen bleibt das Display nur im Schatten gut ablesbar, direkte Sonneneinstrahlung sollte man meiden, da das Display stark spiegelt und 363 Nits an Helligkeit nicht genug entgegenwirken. Eine matte IPS-Ausführung findet man etwa im Yoga Slim 7i Pro.
Die Blickwinkel des OLED-Displays bleiben so stabil, wie es selbst IPS nicht schafft.
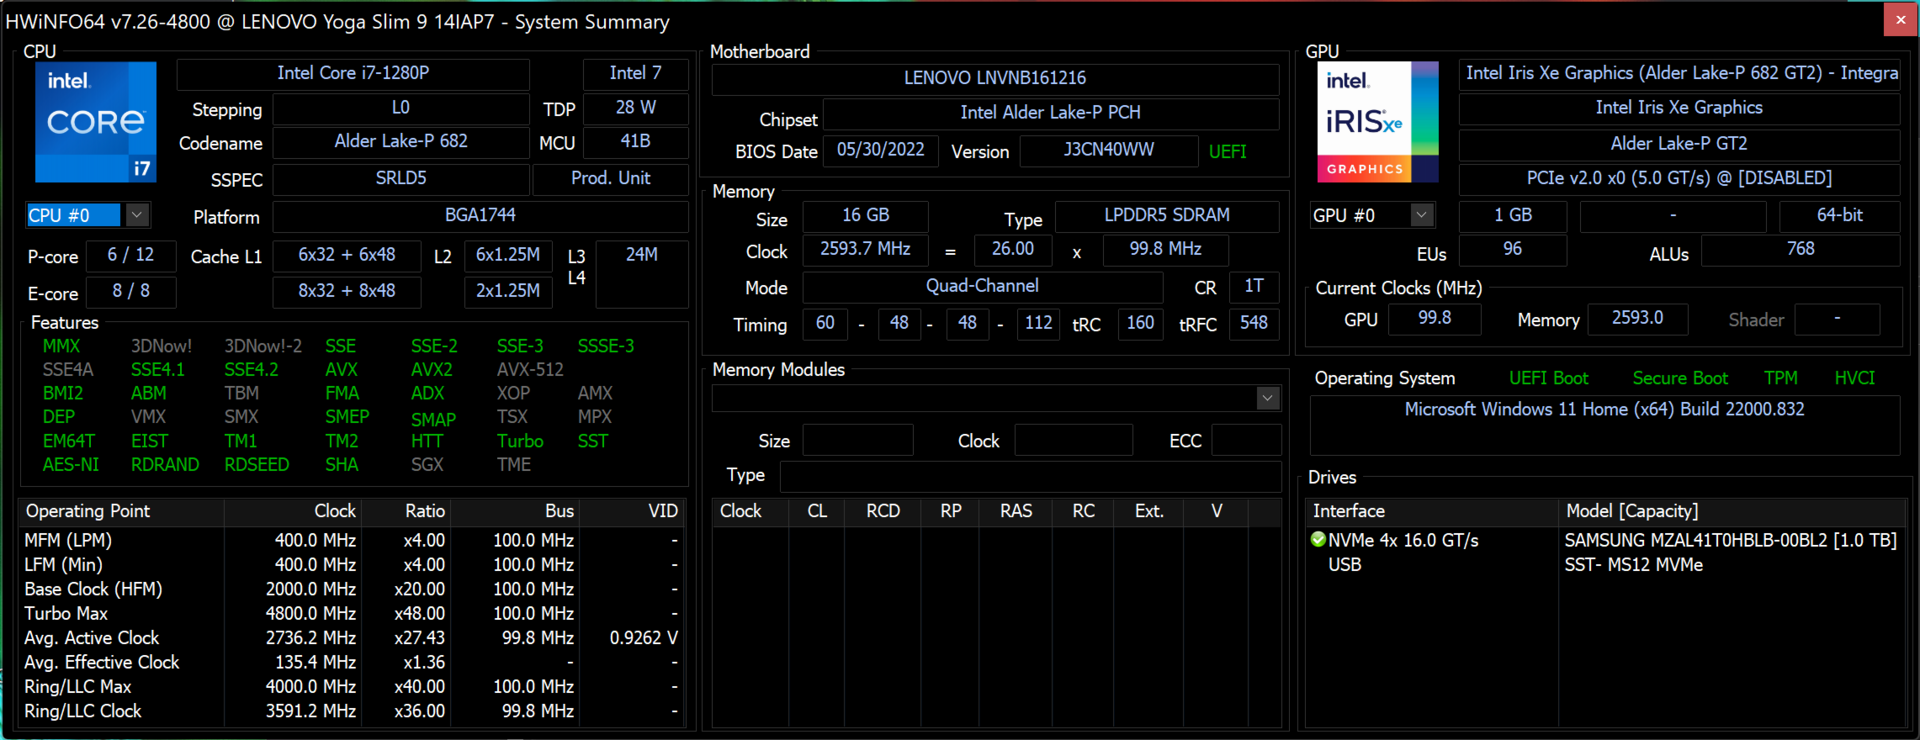
Leistung: Intel Core i7-1280P entfaltet seine Leistung
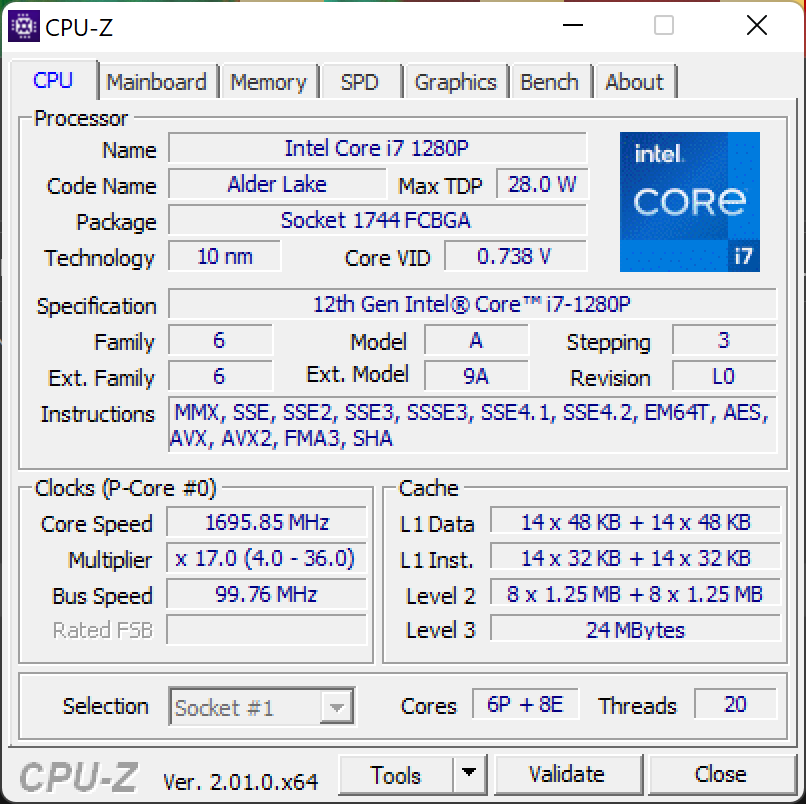
Für anspruchsvolle Videobearbeitung ist das Yoga Slim 9i ohne dedizierte Grafikeinheit nicht konzipiert, auch wenn der Core i7-1280P mit seinen 6 Performance- und 8 Effizienz-Kernen theoretisch schnell genug rechnet, um gelegentliches 4K-Rendern zu ermöglichen. Intels Core i5-1240P stellt die einzige Alternative für das Yoga Slim 9 dar und spart einem 150 Euro, während man mit Leistungseinbußen von 15 bis 20 % rechnen muss.
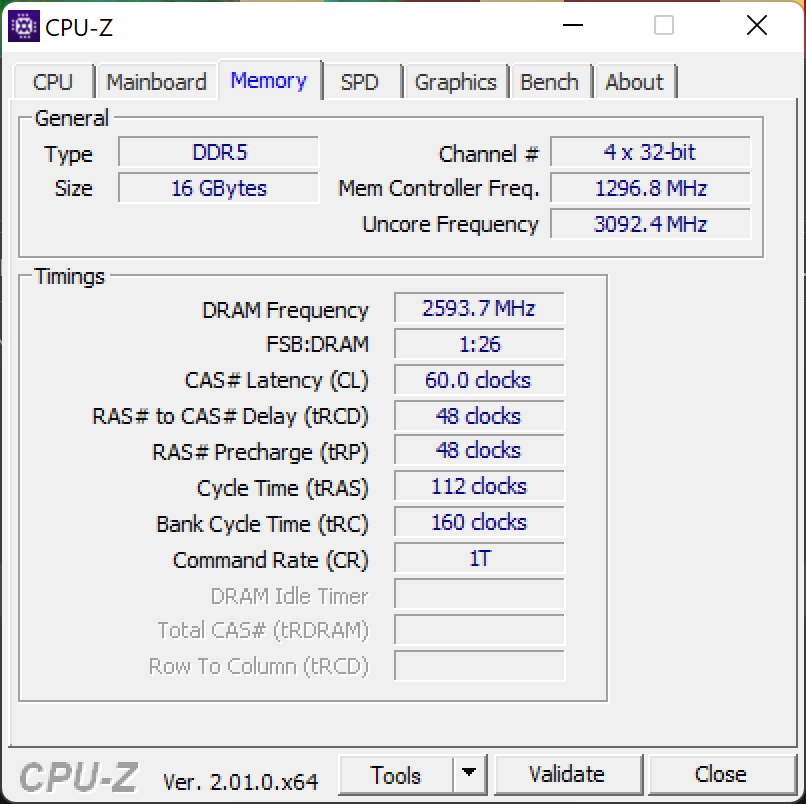
Der fest verlötete, 16 GB große, im Dual-Channel betriebene LPDDR5-5200-RAM reicht für Alltagsaufgaben aus, 32 GB sind für hungrigere Aufgaben eine Option.
Testbedingungen
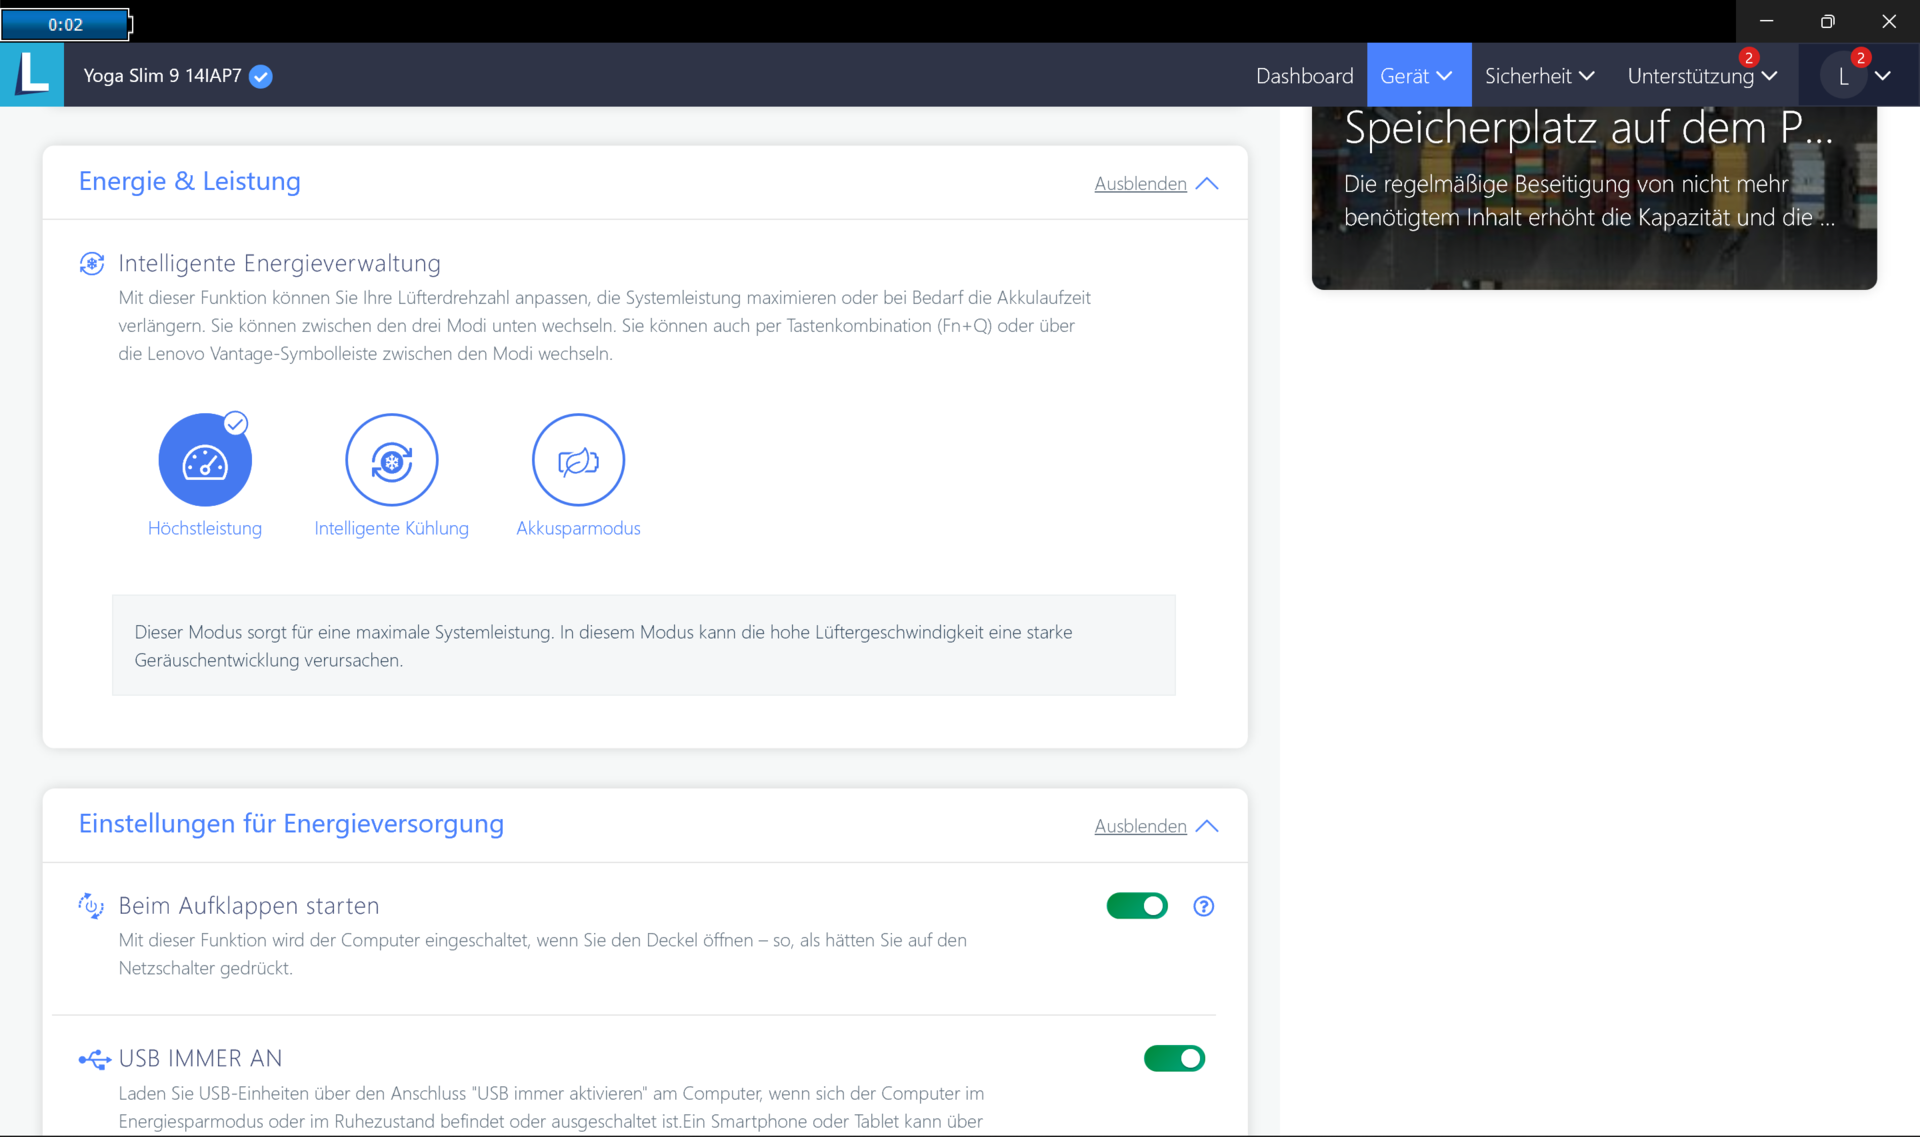
Lenovos Vantage-Software bietet drei Leistungsmodi: "Höchstleistung", "Intelligentes Kühlen" und "Energiesparen". Die leistungsbezogenen Tests führten wir im Höchstleistungsmodus durch.
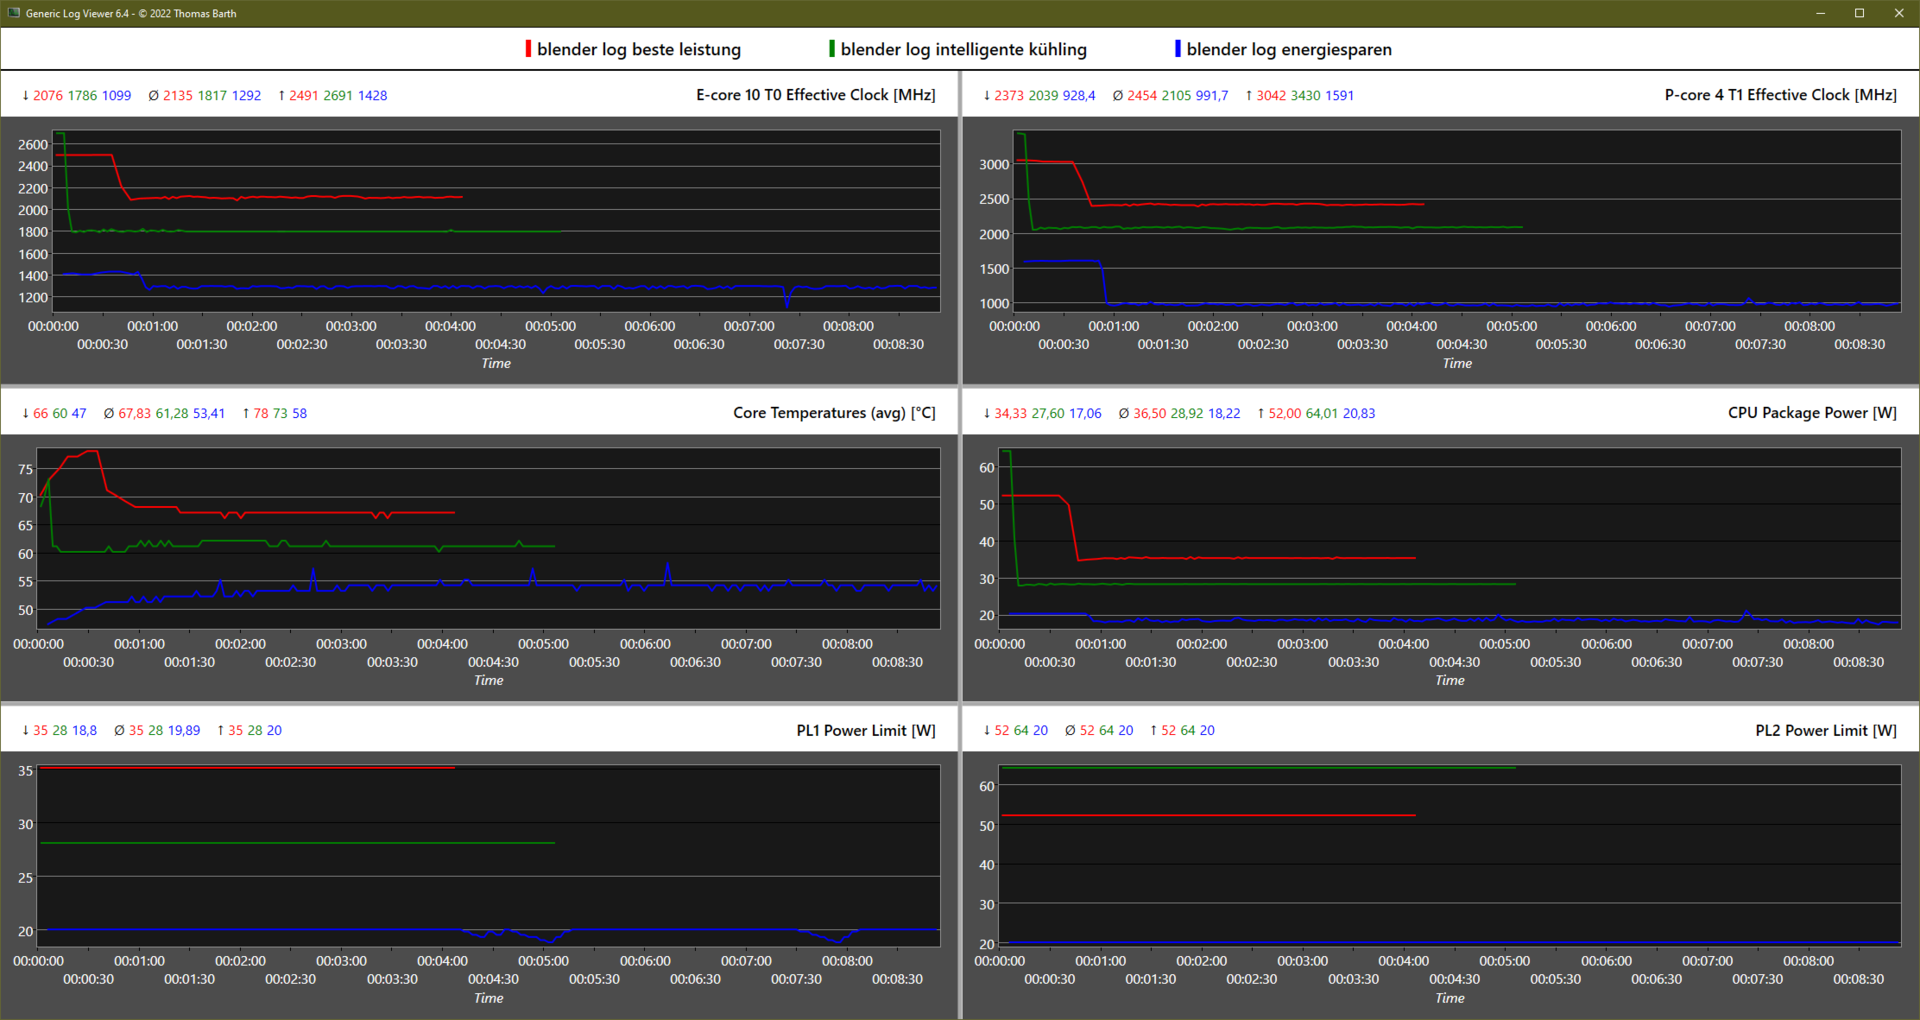
| Mode | PL1 (watts) | PL2 (watts) |
|---|---|---|
| Highest Performance | 35 | 52 |
| Intelligent Cooling | 28 | 64 |
| Energy Saving | 18 | 20 |
| Battery Power | 15 | 15 |
Prozessor
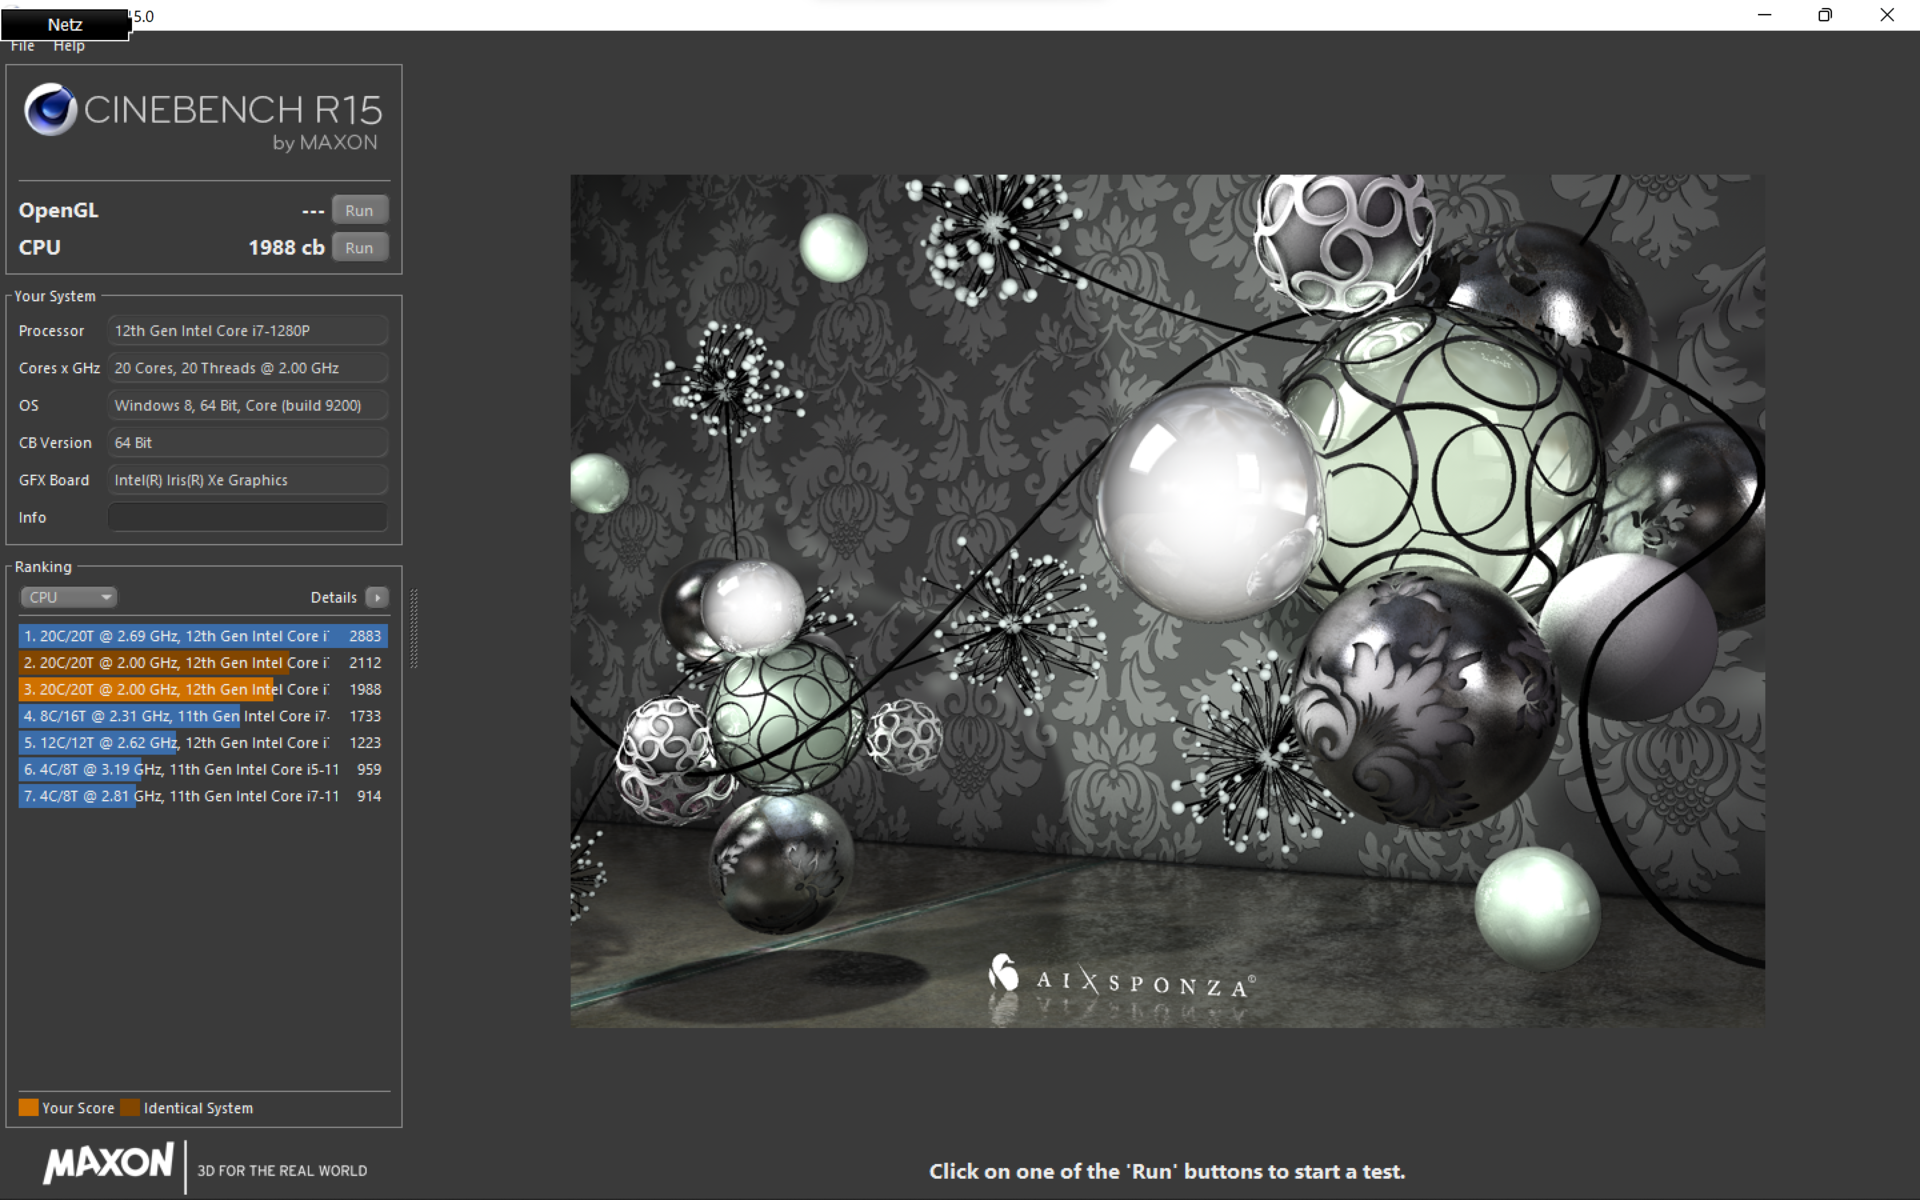
Der verbaute Intel Core i7-1280P ist ein 14-Kern-Prozessor, mit einer TDP von 28 W. Erfreulicherweise darf dieser im Lenovo Yoga Slim 9 dauerhaft 35 Watt beanspruchen (PL1) und 40 Sekunden lang sogar 52 Watt (PL2). Im Modus "Intelligente Kühlung" liegt das PL2 sogar bei 64 Watt, wird dort aber für nur 15 Sekunden aufrechterhalten.
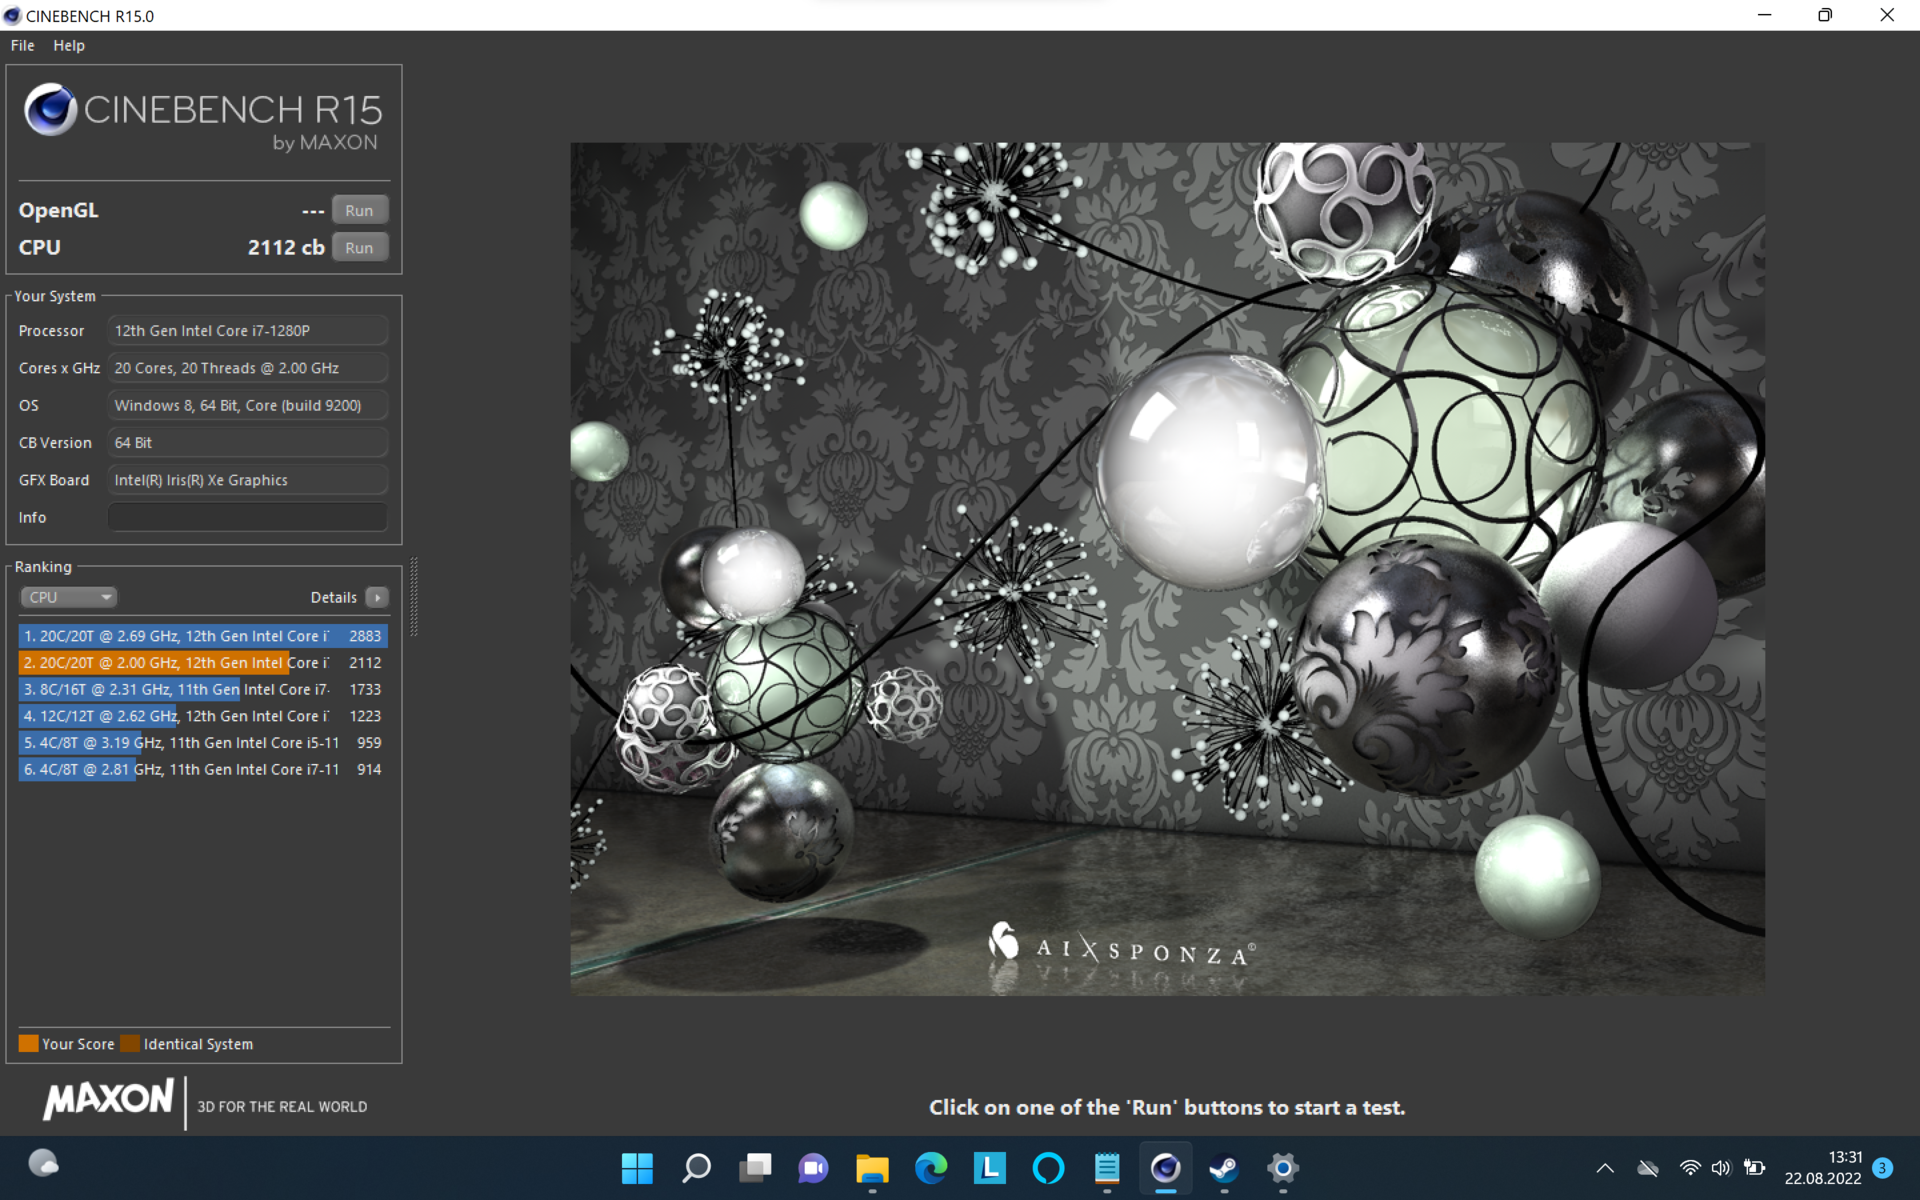
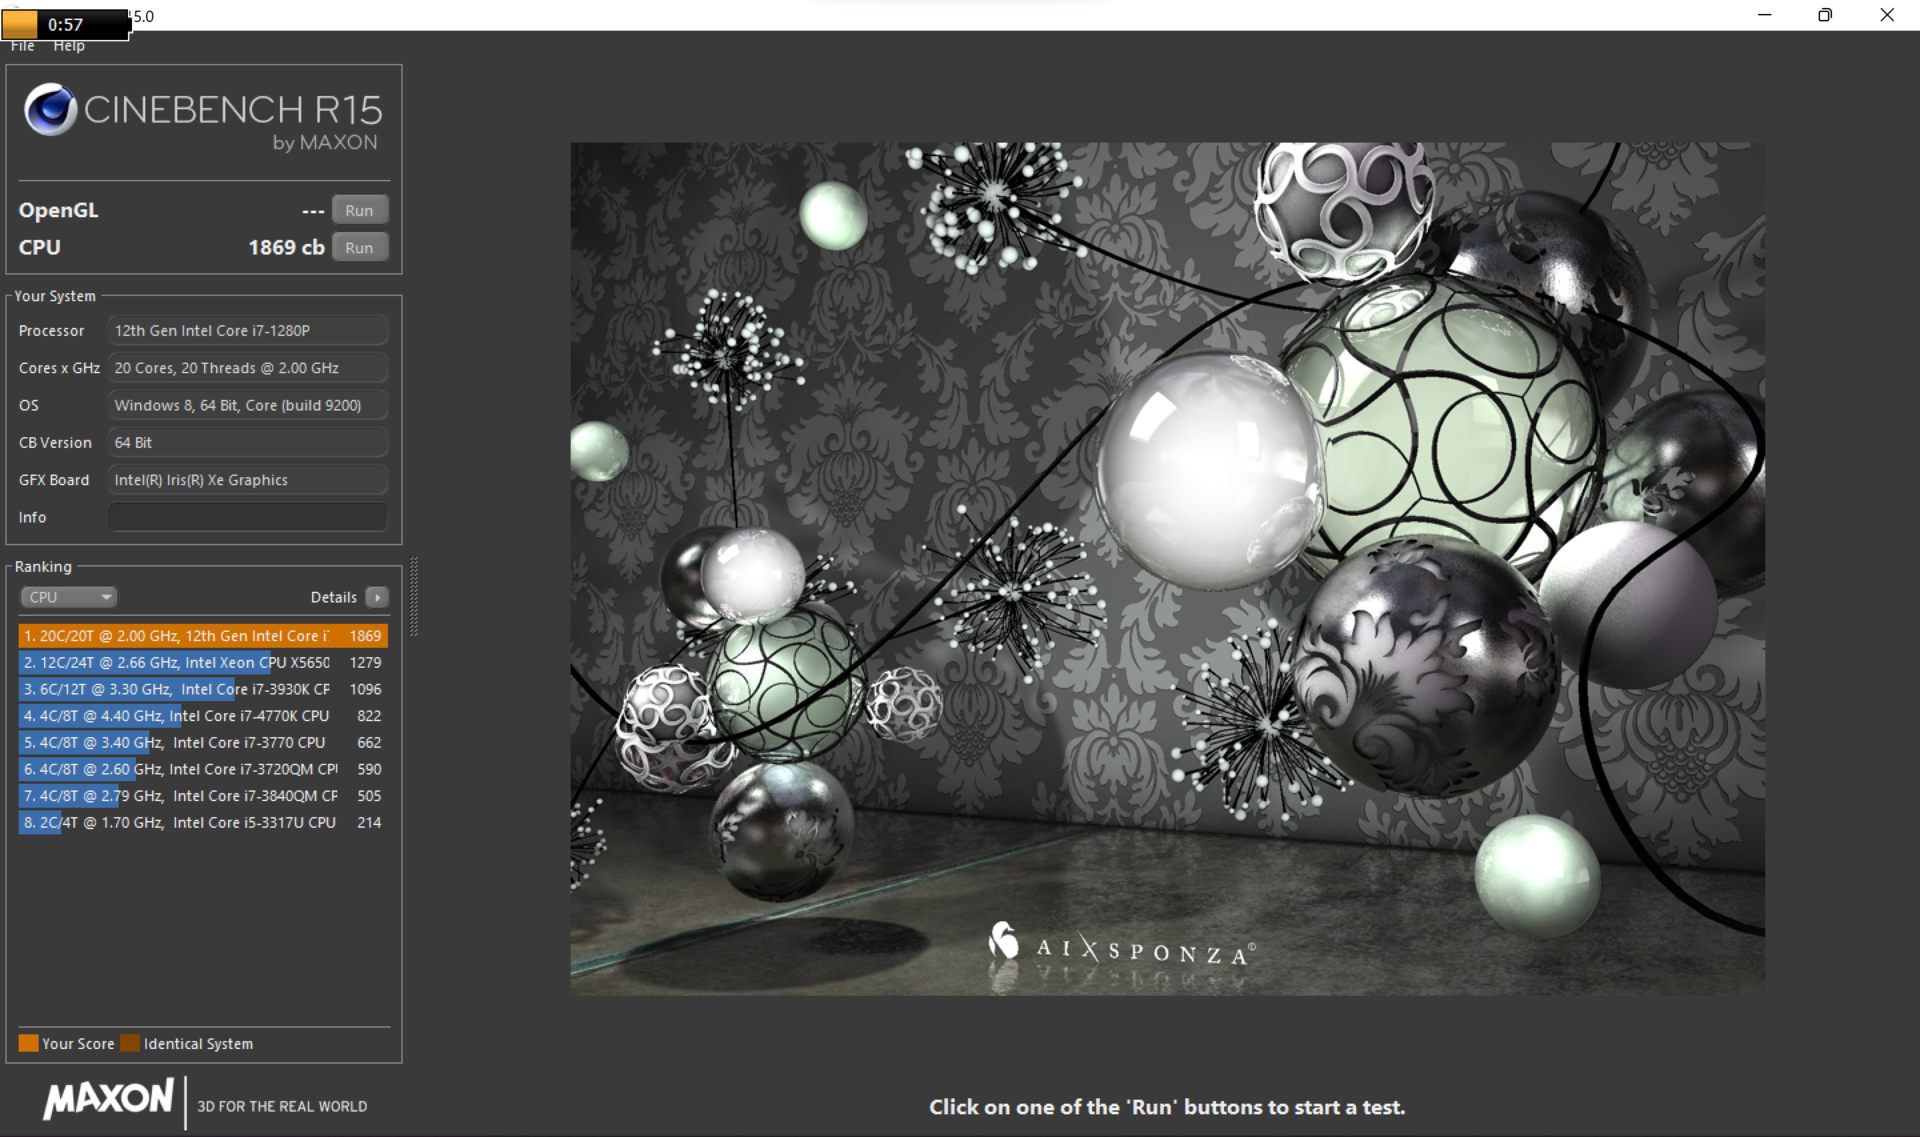
Diese Einstellungen führen zu überaus sehenswerten Ergebnissen: So quittiert CB R15 seinen ersten Durchlauf mit 2.113 Punkten, das sogar oberhalb des 45 W starken AMD Ryzen 9 5900HX im Yoga Slim 7 Pro (2021) liegt. Auch der Ryzen 7 6800U wird mühelos geschlagen. Ab dem vierten Durchlauf pendelt sich unser Core i7 allerdings circa 10 % unterhalb AMDs 5900HX-CPU ein, während das Yoga Slim 9 im auf lange Lasten ausgelegte CB R23 weiterhin führt. Die Kühlleistung würde sogar noch mehr hergeben, was etwa das ähnlich dünne Slim 7i Pro beweist, indem es dauerhaft 50 Watt kühlt. Dieses besitzt jedoch keine Konfigurationen mit 14-Kern-CPU, weshalb es letztlich nicht schneller rechnet als unser Testgerät. Jedenfalls hätte solch ein hohes Power-Limit einen nahezu ungedrosselten Core i7-1280P zur Folge gehabt.
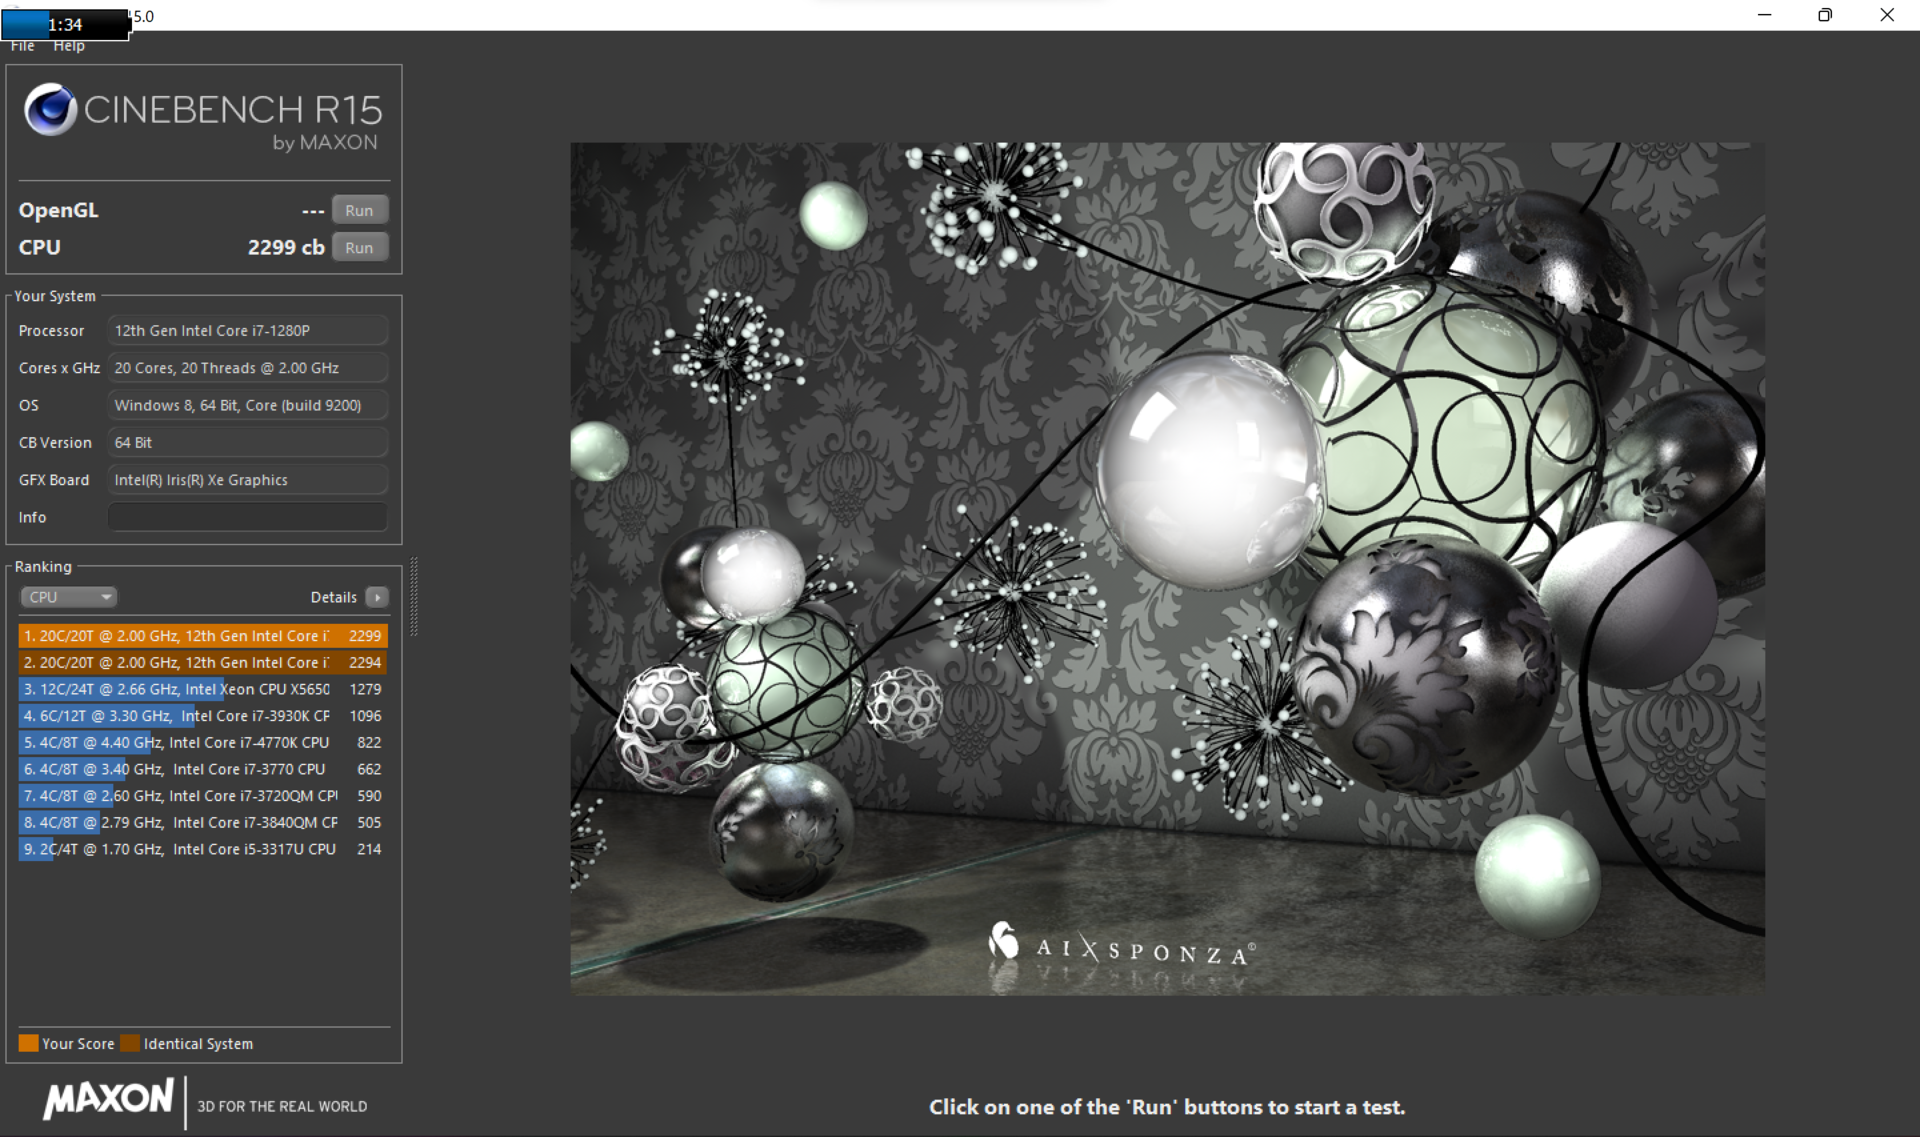
Wir überprüfen mit dem Tool "ThrottleStop" das maximale Potenzial, sodass beim ersten CB-R15-Lauf nun 2.333 Punkte bei durchgehenden 64 Watt erzielt werden (siehe Screenshot weiter unten), das einem Ultrabook bisher noch nicht gelang. Wir empfehlen hiermit aber ausdrücklich, das System nicht außerhalb der vom Hersteller gewählten Leistungsgrenzen zu betreiben. Wir fragen uns jedoch bei den mit den Voreinstellungen erreichten Temperaturen von nur 68 °C (35 W PL1), respektive 78 °C (52 W PL2), warum hier nicht dem Beispiel des Slim 7i Pro gefolgt wurde, um das schnellste 14-Zoll-Notebook zu kreieren. Dadurch würde es selbst mit den wuchtigeren, leistungsstärksten 14-Zoll-Gaming-Notebooks, Asus' Zenbook Pro 14 Duo und Alienware x14, je mit Core i7-12700H, bei der Langzeit-Performance gleichauf liegen. Dennoch dürfte es sich um das bisher wohl schnellste Ultrabook (oder Evo Laptop) handeln.
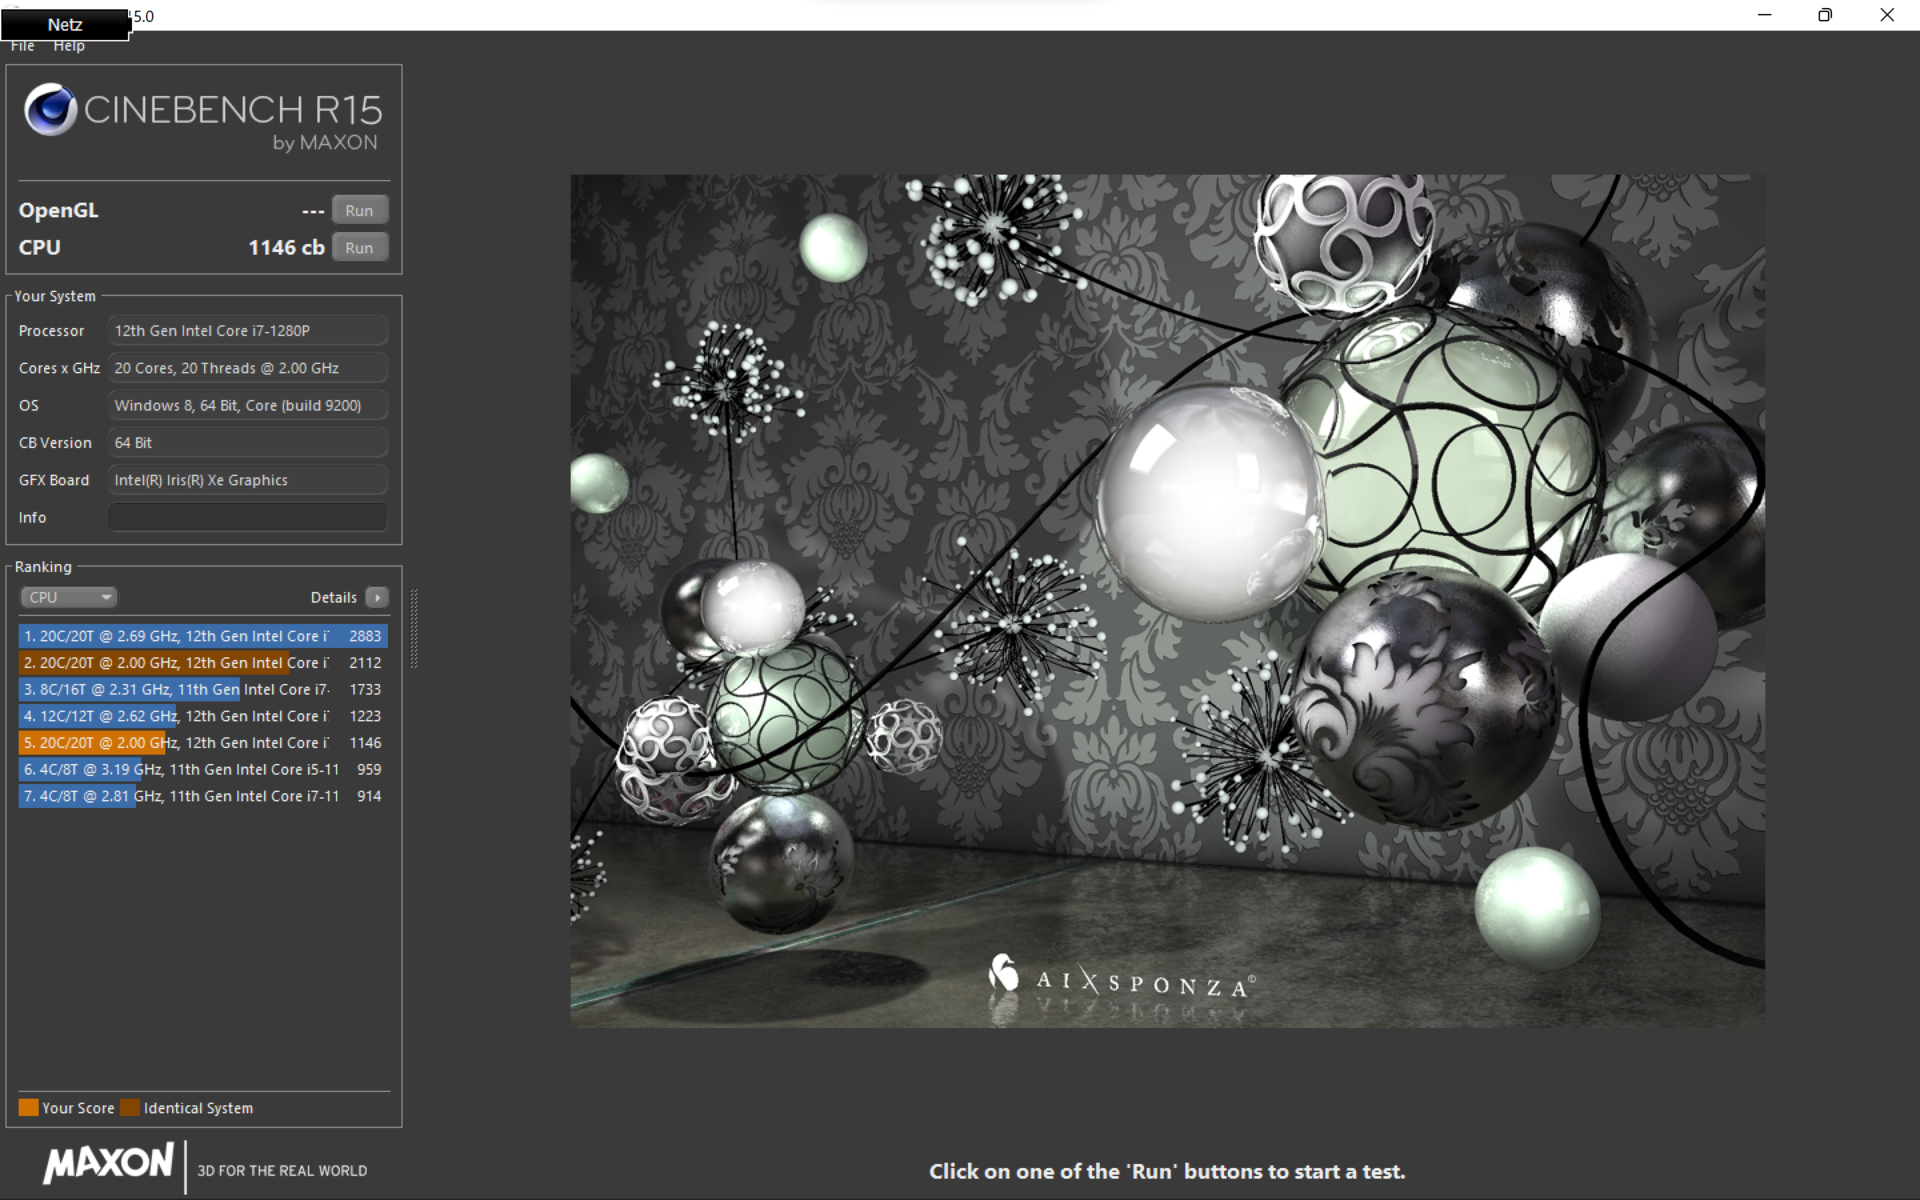
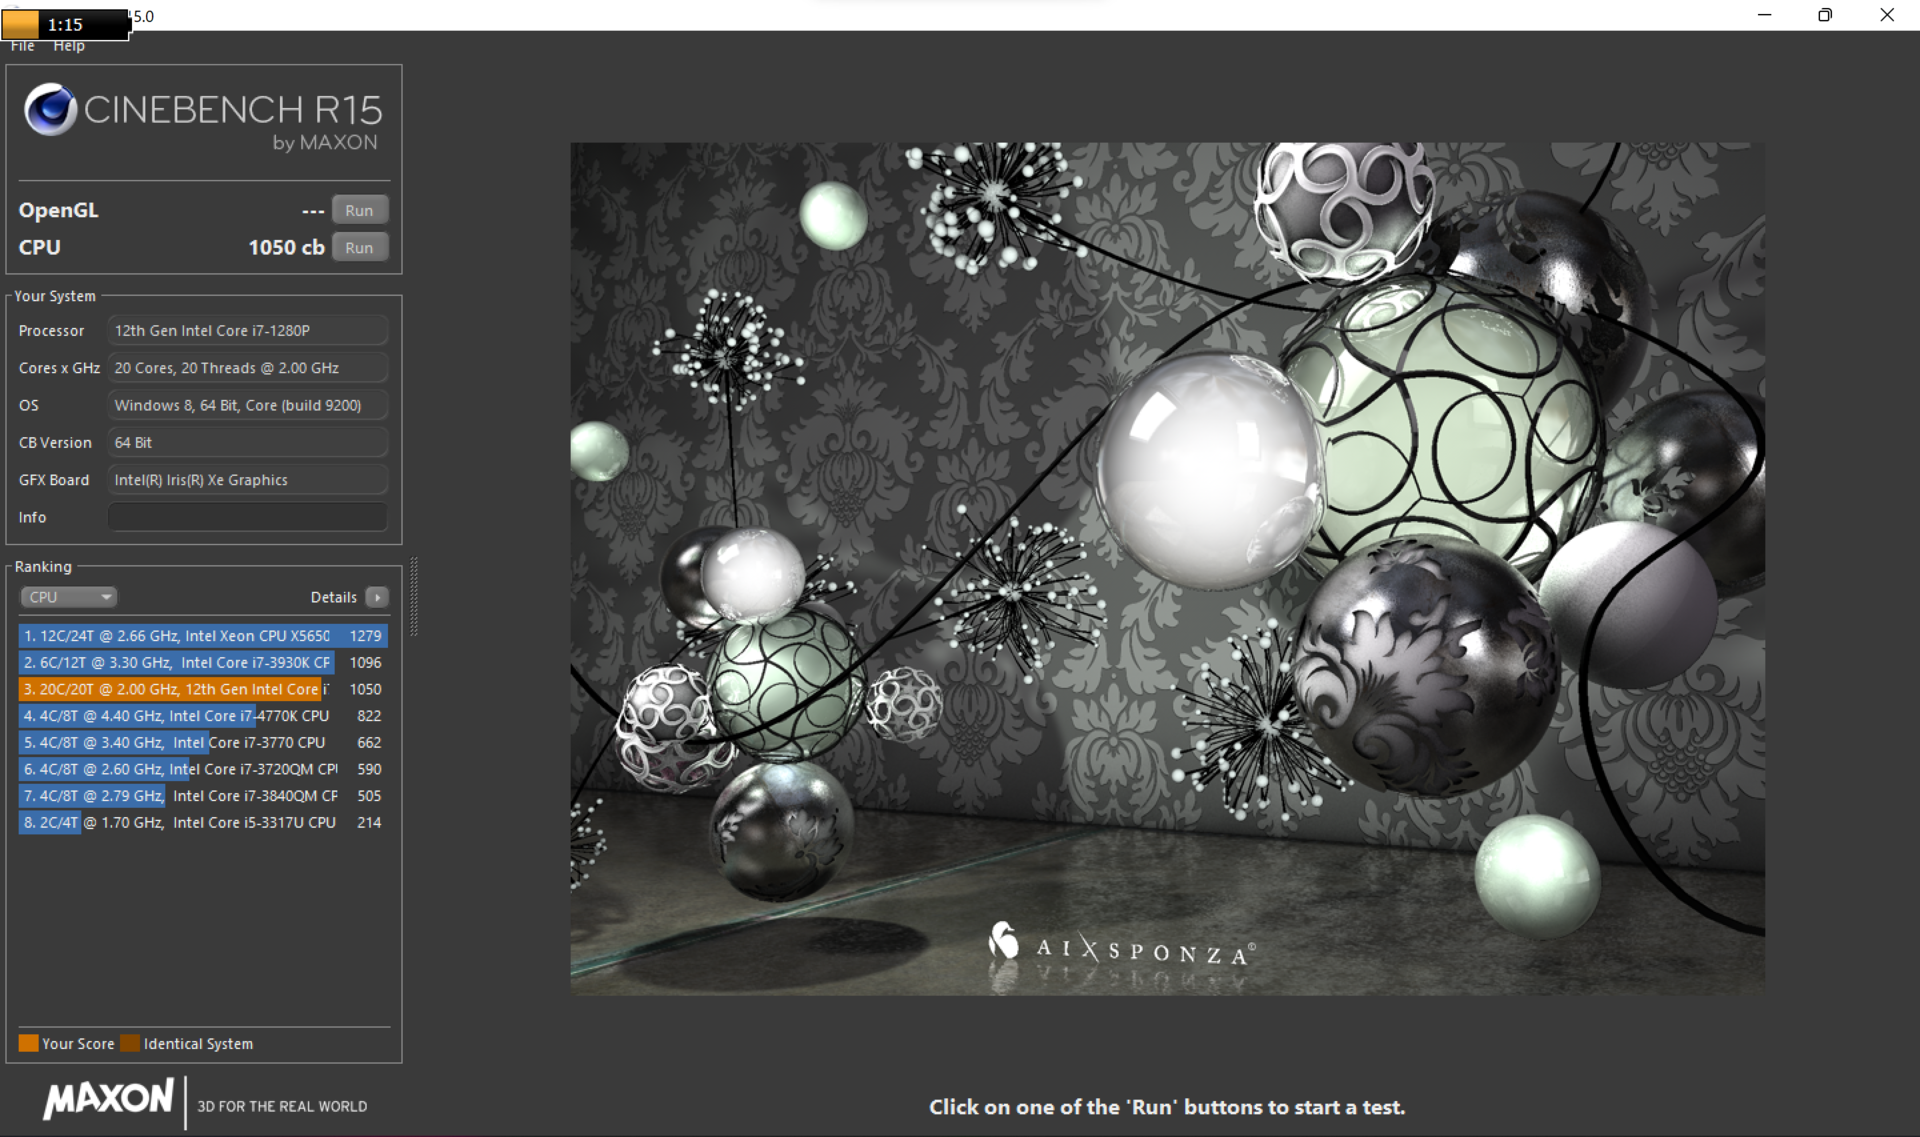
Im Akkubetrieb wird rigoros auf 15 Watt limitiert, was eine halbierten Leistung bedeutet.
Cinebench R15 Multi Dauertest
Cinebench R23: Multi Core | Single Core
Cinebench R20: CPU (Multi Core) | CPU (Single Core)
Cinebench R15: CPU Multi 64Bit | CPU Single 64Bit
Blender: v2.79 BMW27 CPU | v3.3 Classroom CPU
7-Zip 18.03: 7z b 4 | 7z b 4 -mmt1
Geekbench 5.5: Multi-Core | Single-Core
HWBOT x265 Benchmark v2.2: 4k Preset
LibreOffice : 20 Documents To PDF
R Benchmark 2.5: Overall mean
V-Ray Benchmark Next 4.10: CPU
V-Ray 5 Benchmark: CPU
| CPU Performance Rating | |
| Lenovo Yoga Slim 9 14IAP7 | |
| Lenovo Yoga Slim 7 Pro 14ACH5 -1! | |
| Durchschnittliche Intel Core i7-1280P | |
| Durchschnitt der Klasse Subnotebook | |
| Lenovo Yoga Slim 7i Pro 14IAP G7 -2! | |
| Lenovo Yoga 9 14IAP7 82LU0001US -3! | |
| Asus Zenbook S 13 OLED -2! | |
| Dell XPS 13 Plus 9320 4K -1! | |
| HP Spectre x360 13.5 14t-ef000 -1! | |
| Apple MacBook Air M2 10C GPU -7! | |
| Schenker Vision 14 -2! | |
| Lenovo IdeaPad Slim 9i 14ITL5 -1! | |
| Cinebench R23 / Multi Core | |
| Lenovo Yoga Slim 9 14IAP7 | |
| Lenovo Yoga Slim 7 Pro 14ACH5 | |
| Durchschnitt der Klasse Subnotebook (1555 - 21812, n=60, der letzten 2 Jahre) | |
| Durchschnittliche Intel Core i7-1280P (8632 - 14803, n=8) | |
| Lenovo Yoga Slim 7i Pro 14IAP G7 | |
| Asus Zenbook S 13 OLED | |
| Dell XPS 13 Plus 9320 4K | |
| Lenovo Yoga 9 14IAP7 82LU0001US | |
| Apple MacBook Air M2 10C GPU | |
| HP Spectre x360 13.5 14t-ef000 | |
| Schenker Vision 14 | |
| Lenovo IdeaPad Slim 9i 14ITL5 | |
| Cinebench R23 / Single Core | |
| Lenovo Yoga Slim 9 14IAP7 | |
| HP Spectre x360 13.5 14t-ef000 | |
| Lenovo Yoga 9 14IAP7 82LU0001US | |
| Durchschnitt der Klasse Subnotebook (358 - 2213, n=61, der letzten 2 Jahre) | |
| Dell XPS 13 Plus 9320 4K | |
| Durchschnittliche Intel Core i7-1280P (1609 - 1787, n=7) | |
| Lenovo Yoga Slim 7i Pro 14IAP G7 | |
| Apple MacBook Air M2 10C GPU | |
| Lenovo IdeaPad Slim 9i 14ITL5 | |
| Lenovo Yoga Slim 7 Pro 14ACH5 | |
| Asus Zenbook S 13 OLED | |
| Schenker Vision 14 | |
| Cinebench R20 / CPU (Multi Core) | |
| Lenovo Yoga Slim 9 14IAP7 | |
| Lenovo Yoga Slim 7 Pro 14ACH5 | |
| Durchschnitt der Klasse Subnotebook (579 - 8541, n=57, der letzten 2 Jahre) | |
| Durchschnittliche Intel Core i7-1280P (3283 - 5415, n=8) | |
| Lenovo Yoga Slim 7i Pro 14IAP G7 | |
| Asus Zenbook S 13 OLED | |
| Dell XPS 13 Plus 9320 4K | |
| Lenovo Yoga 9 14IAP7 82LU0001US | |
| HP Spectre x360 13.5 14t-ef000 | |
| Schenker Vision 14 | |
| Apple MacBook Air M2 10C GPU | |
| Lenovo IdeaPad Slim 9i 14ITL5 | |
| Cinebench R20 / CPU (Single Core) | |
| Lenovo Yoga Slim 9 14IAP7 | |
| Lenovo Yoga 9 14IAP7 82LU0001US | |
| HP Spectre x360 13.5 14t-ef000 | |
| Durchschnitt der Klasse Subnotebook (128 - 832, n=57, der letzten 2 Jahre) | |
| Dell XPS 13 Plus 9320 4K | |
| Durchschnittliche Intel Core i7-1280P (615 - 701, n=8) | |
| Lenovo Yoga Slim 7i Pro 14IAP G7 | |
| Schenker Vision 14 | |
| Lenovo Yoga Slim 7 Pro 14ACH5 | |
| Asus Zenbook S 13 OLED | |
| Lenovo IdeaPad Slim 9i 14ITL5 | |
| Apple MacBook Air M2 10C GPU | |
| Cinebench R15 / CPU Multi 64Bit | |
| Durchschnittliche Intel Core i7-1280P (1905 - 2332, n=7) | |
| Lenovo Yoga Slim 9 14IAP7 | |
| Durchschnitt der Klasse Subnotebook (327 - 3345, n=57, der letzten 2 Jahre) | |
| Lenovo Yoga Slim 7 Pro 14ACH5 | |
| Lenovo Yoga Slim 7i Pro 14IAP G7 | |
| Asus Zenbook S 13 OLED | |
| Dell XPS 13 Plus 9320 4K | |
| Dell XPS 13 Plus 9320 4K | |
| Lenovo Yoga 9 14IAP7 82LU0001US | |
| HP Spectre x360 13.5 14t-ef000 | |
| Apple MacBook Air M2 10C GPU | |
| Schenker Vision 14 | |
| Schenker Vision 14 | |
| Lenovo IdeaPad Slim 9i 14ITL5 | |
| Cinebench R15 / CPU Single 64Bit | |
| Durchschnitt der Klasse Subnotebook (72.4 - 322, n=57, der letzten 2 Jahre) | |
| Lenovo Yoga Slim 9 14IAP7 | |
| HP Spectre x360 13.5 14t-ef000 | |
| Lenovo Yoga 9 14IAP7 82LU0001US | |
| Dell XPS 13 Plus 9320 4K | |
| Lenovo Yoga Slim 7 Pro 14ACH5 | |
| Asus Zenbook S 13 OLED | |
| Durchschnittliche Intel Core i7-1280P (203 - 258, n=7) | |
| Lenovo Yoga Slim 7i Pro 14IAP G7 | |
| Schenker Vision 14 | |
| Apple MacBook Air M2 10C GPU | |
| Lenovo IdeaPad Slim 9i 14ITL5 | |
| Blender / v2.79 BMW27 CPU | |
| Apple MacBook Air M2 10C GPU | |
| Lenovo IdeaPad Slim 9i 14ITL5 | |
| Schenker Vision 14 | |
| HP Spectre x360 13.5 14t-ef000 | |
| Durchschnitt der Klasse Subnotebook (159 - 2271, n=58, der letzten 2 Jahre) | |
| Lenovo Yoga 9 14IAP7 82LU0001US | |
| Dell XPS 13 Plus 9320 4K | |
| Asus Zenbook S 13 OLED | |
| Lenovo Yoga Slim 7i Pro 14IAP G7 | |
| Durchschnittliche Intel Core i7-1280P (259 - 309, n=7) | |
| Lenovo Yoga Slim 9 14IAP7 | |
| Lenovo Yoga Slim 7 Pro 14ACH5 | |
| Blender / v3.3 Classroom CPU | |
| HP Spectre x360 13.5 14t-ef000 | |
| Apple MacBook Air M2 10C GPU | |
| Dell XPS 13 Plus 9320 4K | |
| Durchschnittliche Intel Core i7-1280P (490 - 741, n=7) | |
| Durchschnitt der Klasse Subnotebook (241 - 861, n=60, der letzten 2 Jahre) | |
| Lenovo Yoga Slim 9 14IAP7 | |
| 7-Zip 18.03 / 7z b 4 | |
| Lenovo Yoga Slim 7 Pro 14ACH5 | |
| Lenovo Yoga Slim 9 14IAP7 | |
| Durchschnittliche Intel Core i7-1280P (45292 - 53710, n=7) | |
| Asus Zenbook S 13 OLED | |
| Lenovo Yoga Slim 7i Pro 14IAP G7 | |
| Lenovo Yoga 9 14IAP7 82LU0001US | |
| Durchschnitt der Klasse Subnotebook (11668 - 77867, n=57, der letzten 2 Jahre) | |
| Dell XPS 13 Plus 9320 4K | |
| HP Spectre x360 13.5 14t-ef000 | |
| Schenker Vision 14 | |
| Lenovo IdeaPad Slim 9i 14ITL5 | |
| 7-Zip 18.03 / 7z b 4 -mmt1 | |
| Lenovo Yoga Slim 7 Pro 14ACH5 | |
| Lenovo Yoga Slim 9 14IAP7 | |
| Schenker Vision 14 | |
| Durchschnitt der Klasse Subnotebook (2643 - 6699, n=59, der letzten 2 Jahre) | |
| Durchschnittliche Intel Core i7-1280P (4995 - 5874, n=7) | |
| HP Spectre x360 13.5 14t-ef000 | |
| Asus Zenbook S 13 OLED | |
| Lenovo IdeaPad Slim 9i 14ITL5 | |
| Dell XPS 13 Plus 9320 4K | |
| Lenovo Yoga Slim 7i Pro 14IAP G7 | |
| Lenovo Yoga 9 14IAP7 82LU0001US | |
| Geekbench 5.5 / Multi-Core | |
| Lenovo Yoga Slim 9 14IAP7 | |
| Durchschnittliche Intel Core i7-1280P (9623 - 11811, n=7) | |
| Durchschnitt der Klasse Subnotebook (2557 - 17218, n=48, der letzten 2 Jahre) | |
| Lenovo Yoga 9 14IAP7 82LU0001US | |
| Dell XPS 13 Plus 9320 4K | |
| Lenovo Yoga Slim 7i Pro 14IAP G7 | |
| Apple MacBook Air M2 10C GPU | |
| HP Spectre x360 13.5 14t-ef000 | |
| Asus Zenbook S 13 OLED | |
| Lenovo Yoga Slim 7 Pro 14ACH5 | |
| Schenker Vision 14 | |
| Lenovo IdeaPad Slim 9i 14ITL5 | |
| Geekbench 5.5 / Single-Core | |
| Apple MacBook Air M2 10C GPU | |
| Durchschnitt der Klasse Subnotebook (726 - 2224, n=48, der letzten 2 Jahre) | |
| Lenovo Yoga Slim 9 14IAP7 | |
| Lenovo Yoga 9 14IAP7 82LU0001US | |
| Dell XPS 13 Plus 9320 4K | |
| HP Spectre x360 13.5 14t-ef000 | |
| Durchschnittliche Intel Core i7-1280P (1571 - 1802, n=7) | |
| Schenker Vision 14 | |
| Lenovo Yoga Slim 7i Pro 14IAP G7 | |
| Lenovo IdeaPad Slim 9i 14ITL5 | |
| Lenovo Yoga Slim 7 Pro 14ACH5 | |
| Asus Zenbook S 13 OLED | |
| HWBOT x265 Benchmark v2.2 / 4k Preset | |
| Lenovo Yoga Slim 9 14IAP7 | |
| Lenovo Yoga Slim 7 Pro 14ACH5 | |
| Durchschnitt der Klasse Subnotebook (0.97 - 25.1, n=57, der letzten 2 Jahre) | |
| Lenovo Yoga Slim 7i Pro 14IAP G7 | |
| Asus Zenbook S 13 OLED | |
| Durchschnittliche Intel Core i7-1280P (9.62 - 14.5, n=5) | |
| Dell XPS 13 Plus 9320 4K | |
| Lenovo Yoga 9 14IAP7 82LU0001US | |
| HP Spectre x360 13.5 14t-ef000 | |
| Schenker Vision 14 | |
| Lenovo IdeaPad Slim 9i 14ITL5 | |
| LibreOffice / 20 Documents To PDF | |
| Durchschnitt der Klasse Subnotebook (39.9 - 220, n=56, der letzten 2 Jahre) | |
| Asus Zenbook S 13 OLED | |
| Lenovo Yoga Slim 9 14IAP7 | |
| Lenovo Yoga Slim 7i Pro 14IAP G7 | |
| Durchschnittliche Intel Core i7-1280P (41 - 61.6, n=8) | |
| Lenovo IdeaPad Slim 9i 14ITL5 | |
| Lenovo Yoga Slim 7 Pro 14ACH5 | |
| Schenker Vision 14 | |
| Lenovo Yoga 9 14IAP7 82LU0001US | |
| Dell XPS 13 Plus 9320 4K | |
| HP Spectre x360 13.5 14t-ef000 | |
| R Benchmark 2.5 / Overall mean | |
| Lenovo IdeaPad Slim 9i 14ITL5 | |
| Schenker Vision 14 | |
| Durchschnitt der Klasse Subnotebook (0.4024 - 1.456, n=58, der letzten 2 Jahre) | |
| Asus Zenbook S 13 OLED | |
| Lenovo Yoga Slim 7i Pro 14IAP G7 | |
| Lenovo Yoga Slim 7 Pro 14ACH5 | |
| Dell XPS 13 Plus 9320 4K | |
| HP Spectre x360 13.5 14t-ef000 | |
| Durchschnittliche Intel Core i7-1280P (0.4505 - 0.512, n=7) | |
| Lenovo Yoga 9 14IAP7 82LU0001US | |
| Lenovo Yoga Slim 9 14IAP7 | |
| V-Ray Benchmark Next 4.10 / CPU | |
| Lenovo Yoga Slim 9 14IAP7 | |
| Lenovo Yoga Slim 7 Pro 14ACH5 | |
| Durchschnittliche Intel Core i7-1280P (11338 - 14127, n=4) | |
| Durchschnitt der Klasse Subnotebook (7903 - 22191, n=49, der letzten 2 Jahre) | |
| Asus Zenbook S 13 OLED | |
| Lenovo Yoga Slim 7i Pro 14IAP G7 | |
| Dell XPS 13 Plus 9320 4K | |
| Schenker Vision 14 | |
| Lenovo IdeaPad Slim 9i 14ITL5 | |
| V-Ray 5 Benchmark / CPU | |
| Lenovo Yoga Slim 9 14IAP7 | |
| Lenovo Yoga Slim 7 Pro 14ACH5 | |
| Durchschnitt der Klasse Subnotebook (5584 - 14978, n=16, der letzten 2 Jahre) | |
| Durchschnittliche Intel Core i7-1280P (6300 - 8790, n=5) | |
| HP Spectre x360 13.5 14t-ef000 | |
| Lenovo IdeaPad Slim 9i 14ITL5 | |
* ... kleinere Werte sind besser
AIDA64: FP32 Ray-Trace | FPU Julia | CPU SHA3 | CPU Queen | FPU SinJulia | FPU Mandel | CPU AES | CPU ZLib | FP64 Ray-Trace | CPU PhotoWorxx
| Performance Rating | |
| Lenovo Yoga Slim 7 Pro 14ACH5 | |
| Asus Zenbook S 13 OLED | |
| Lenovo Yoga Slim 9 14IAP7 | |
| Durchschnitt der Klasse Subnotebook | |
| Durchschnittliche Intel Core i7-1280P | |
| HP Spectre x360 13.5 14t-ef000 | |
| Lenovo Yoga Slim 7i Pro 14IAP G7 | |
| Schenker Vision 14 | |
| Lenovo Yoga 9 14IAP7 82LU0001US | |
| Dell XPS 13 Plus 9320 4K | |
| AIDA64 / FP32 Ray-Trace | |
| Lenovo Yoga Slim 7 Pro 14ACH5 | |
| Durchschnitt der Klasse Subnotebook (1135 - 32888, n=58, der letzten 2 Jahre) | |
| Asus Zenbook S 13 OLED | |
| Lenovo Yoga Slim 9 14IAP7 | |
| Durchschnittliche Intel Core i7-1280P (7466 - 13068, n=6) | |
| Schenker Vision 14 | |
| HP Spectre x360 13.5 14t-ef000 | |
| Lenovo Yoga Slim 7i Pro 14IAP G7 | |
| Dell XPS 13 Plus 9320 4K | |
| Lenovo Yoga 9 14IAP7 82LU0001US | |
| AIDA64 / FPU Julia | |
| Lenovo Yoga Slim 7 Pro 14ACH5 | |
| Asus Zenbook S 13 OLED | |
| Durchschnitt der Klasse Subnotebook (5218 - 123315, n=58, der letzten 2 Jahre) | |
| Lenovo Yoga Slim 9 14IAP7 | |
| Durchschnittliche Intel Core i7-1280P (38904 - 66081, n=6) | |
| HP Spectre x360 13.5 14t-ef000 | |
| Schenker Vision 14 | |
| Lenovo Yoga Slim 7i Pro 14IAP G7 | |
| Lenovo Yoga 9 14IAP7 82LU0001US | |
| Dell XPS 13 Plus 9320 4K | |
| AIDA64 / CPU SHA3 | |
| Lenovo Yoga Slim 7 Pro 14ACH5 | |
| Durchschnitt der Klasse Subnotebook (444 - 5287, n=58, der letzten 2 Jahre) | |
| Lenovo Yoga Slim 9 14IAP7 | |
| Durchschnittliche Intel Core i7-1280P (1826 - 2992, n=6) | |
| Asus Zenbook S 13 OLED | |
| Schenker Vision 14 | |
| HP Spectre x360 13.5 14t-ef000 | |
| Lenovo Yoga Slim 7i Pro 14IAP G7 | |
| Lenovo Yoga 9 14IAP7 82LU0001US | |
| Dell XPS 13 Plus 9320 4K | |
| AIDA64 / CPU Queen | |
| Lenovo Yoga Slim 7 Pro 14ACH5 | |
| Lenovo Yoga Slim 9 14IAP7 | |
| Durchschnittliche Intel Core i7-1280P (80180 - 100358, n=6) | |
| Asus Zenbook S 13 OLED | |
| Dell XPS 13 Plus 9320 4K | |
| Lenovo Yoga Slim 7i Pro 14IAP G7 | |
| Lenovo Yoga 9 14IAP7 82LU0001US | |
| HP Spectre x360 13.5 14t-ef000 | |
| Durchschnitt der Klasse Subnotebook (10579 - 95002, n=50, der letzten 2 Jahre) | |
| Schenker Vision 14 | |
| AIDA64 / FPU SinJulia | |
| Lenovo Yoga Slim 7 Pro 14ACH5 | |
| Asus Zenbook S 13 OLED | |
| Lenovo Yoga Slim 9 14IAP7 | |
| Durchschnittliche Intel Core i7-1280P (5880 - 8571, n=6) | |
| Durchschnitt der Klasse Subnotebook (744 - 18418, n=58, der letzten 2 Jahre) | |
| Lenovo Yoga Slim 7i Pro 14IAP G7 | |
| Lenovo Yoga 9 14IAP7 82LU0001US | |
| Dell XPS 13 Plus 9320 4K | |
| Schenker Vision 14 | |
| HP Spectre x360 13.5 14t-ef000 | |
| AIDA64 / FPU Mandel | |
| Lenovo Yoga Slim 7 Pro 14ACH5 | |
| Asus Zenbook S 13 OLED | |
| Durchschnitt der Klasse Subnotebook (3341 - 65433, n=58, der letzten 2 Jahre) | |
| Lenovo Yoga Slim 9 14IAP7 | |
| Durchschnittliche Intel Core i7-1280P (18907 - 32766, n=6) | |
| Schenker Vision 14 | |
| HP Spectre x360 13.5 14t-ef000 | |
| Lenovo Yoga Slim 7i Pro 14IAP G7 | |
| Lenovo Yoga 9 14IAP7 82LU0001US | |
| Dell XPS 13 Plus 9320 4K | |
| AIDA64 / CPU AES | |
| Lenovo Yoga Slim 7 Pro 14ACH5 | |
| Asus Zenbook S 13 OLED | |
| Schenker Vision 14 | |
| HP Spectre x360 13.5 14t-ef000 | |
| Durchschnittliche Intel Core i7-1280P (40691 - 99367, n=6) | |
| Lenovo Yoga Slim 9 14IAP7 | |
| Durchschnitt der Klasse Subnotebook (638 - 96917, n=58, der letzten 2 Jahre) | |
| Lenovo Yoga Slim 7i Pro 14IAP G7 | |
| Lenovo Yoga 9 14IAP7 82LU0001US | |
| Dell XPS 13 Plus 9320 4K | |
| AIDA64 / CPU ZLib | |
| Lenovo Yoga Slim 9 14IAP7 | |
| Lenovo Yoga Slim 7i Pro 14IAP G7 | |
| Lenovo Yoga Slim 7 Pro 14ACH5 | |
| Durchschnittliche Intel Core i7-1280P (540 - 880, n=6) | |
| Durchschnitt der Klasse Subnotebook (164.9 - 1379, n=58, der letzten 2 Jahre) | |
| Lenovo Yoga 9 14IAP7 82LU0001US | |
| Dell XPS 13 Plus 9320 4K | |
| Asus Zenbook S 13 OLED | |
| HP Spectre x360 13.5 14t-ef000 | |
| Schenker Vision 14 | |
| AIDA64 / FP64 Ray-Trace | |
| Lenovo Yoga Slim 7 Pro 14ACH5 | |
| Durchschnitt der Klasse Subnotebook (610 - 17495, n=58, der letzten 2 Jahre) | |
| Lenovo Yoga Slim 9 14IAP7 | |
| Asus Zenbook S 13 OLED | |
| Durchschnittliche Intel Core i7-1280P (4006 - 7184, n=6) | |
| Schenker Vision 14 | |
| HP Spectre x360 13.5 14t-ef000 | |
| Lenovo Yoga Slim 7i Pro 14IAP G7 | |
| Dell XPS 13 Plus 9320 4K | |
| Lenovo Yoga 9 14IAP7 82LU0001US | |
| AIDA64 / CPU PhotoWorxx | |
| Lenovo Yoga Slim 9 14IAP7 | |
| Durchschnitt der Klasse Subnotebook (6569 - 85600, n=58, der letzten 2 Jahre) | |
| Durchschnittliche Intel Core i7-1280P (36663 - 48416, n=6) | |
| HP Spectre x360 13.5 14t-ef000 | |
| Lenovo Yoga 9 14IAP7 82LU0001US | |
| Dell XPS 13 Plus 9320 4K | |
| Lenovo Yoga Slim 7i Pro 14IAP G7 | |
| Schenker Vision 14 | |
| Asus Zenbook S 13 OLED | |
| Lenovo Yoga Slim 7 Pro 14ACH5 | |
System Performance
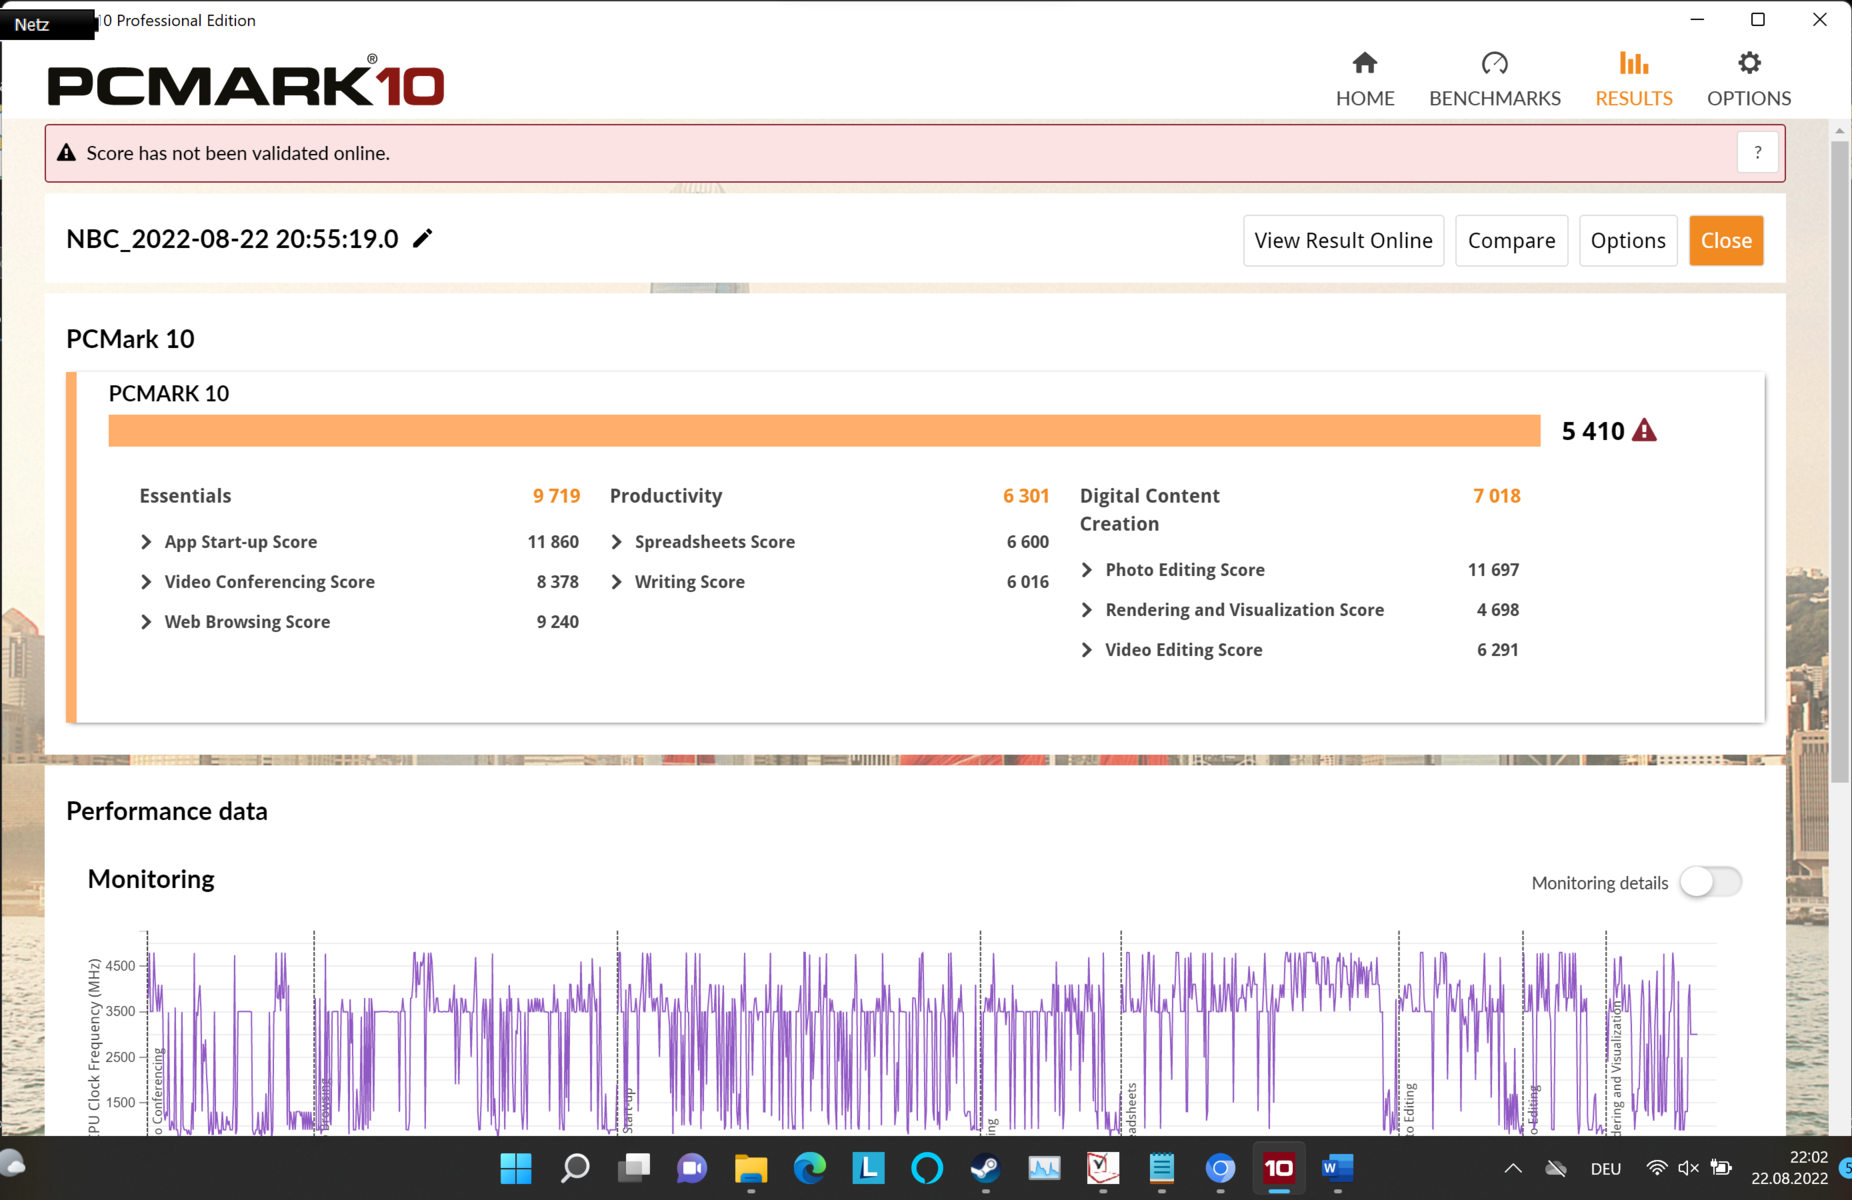
Im Crossmark führt das Yoga Slim 9 unser Vergleichsfeld an und auch bei den Websurfing-Benchmarks kann es sich oft den ersten Platz erringen. Im PCMark liegt die Leistung jedoch um 10 bis 15 % unter der von AMD-Geräten.
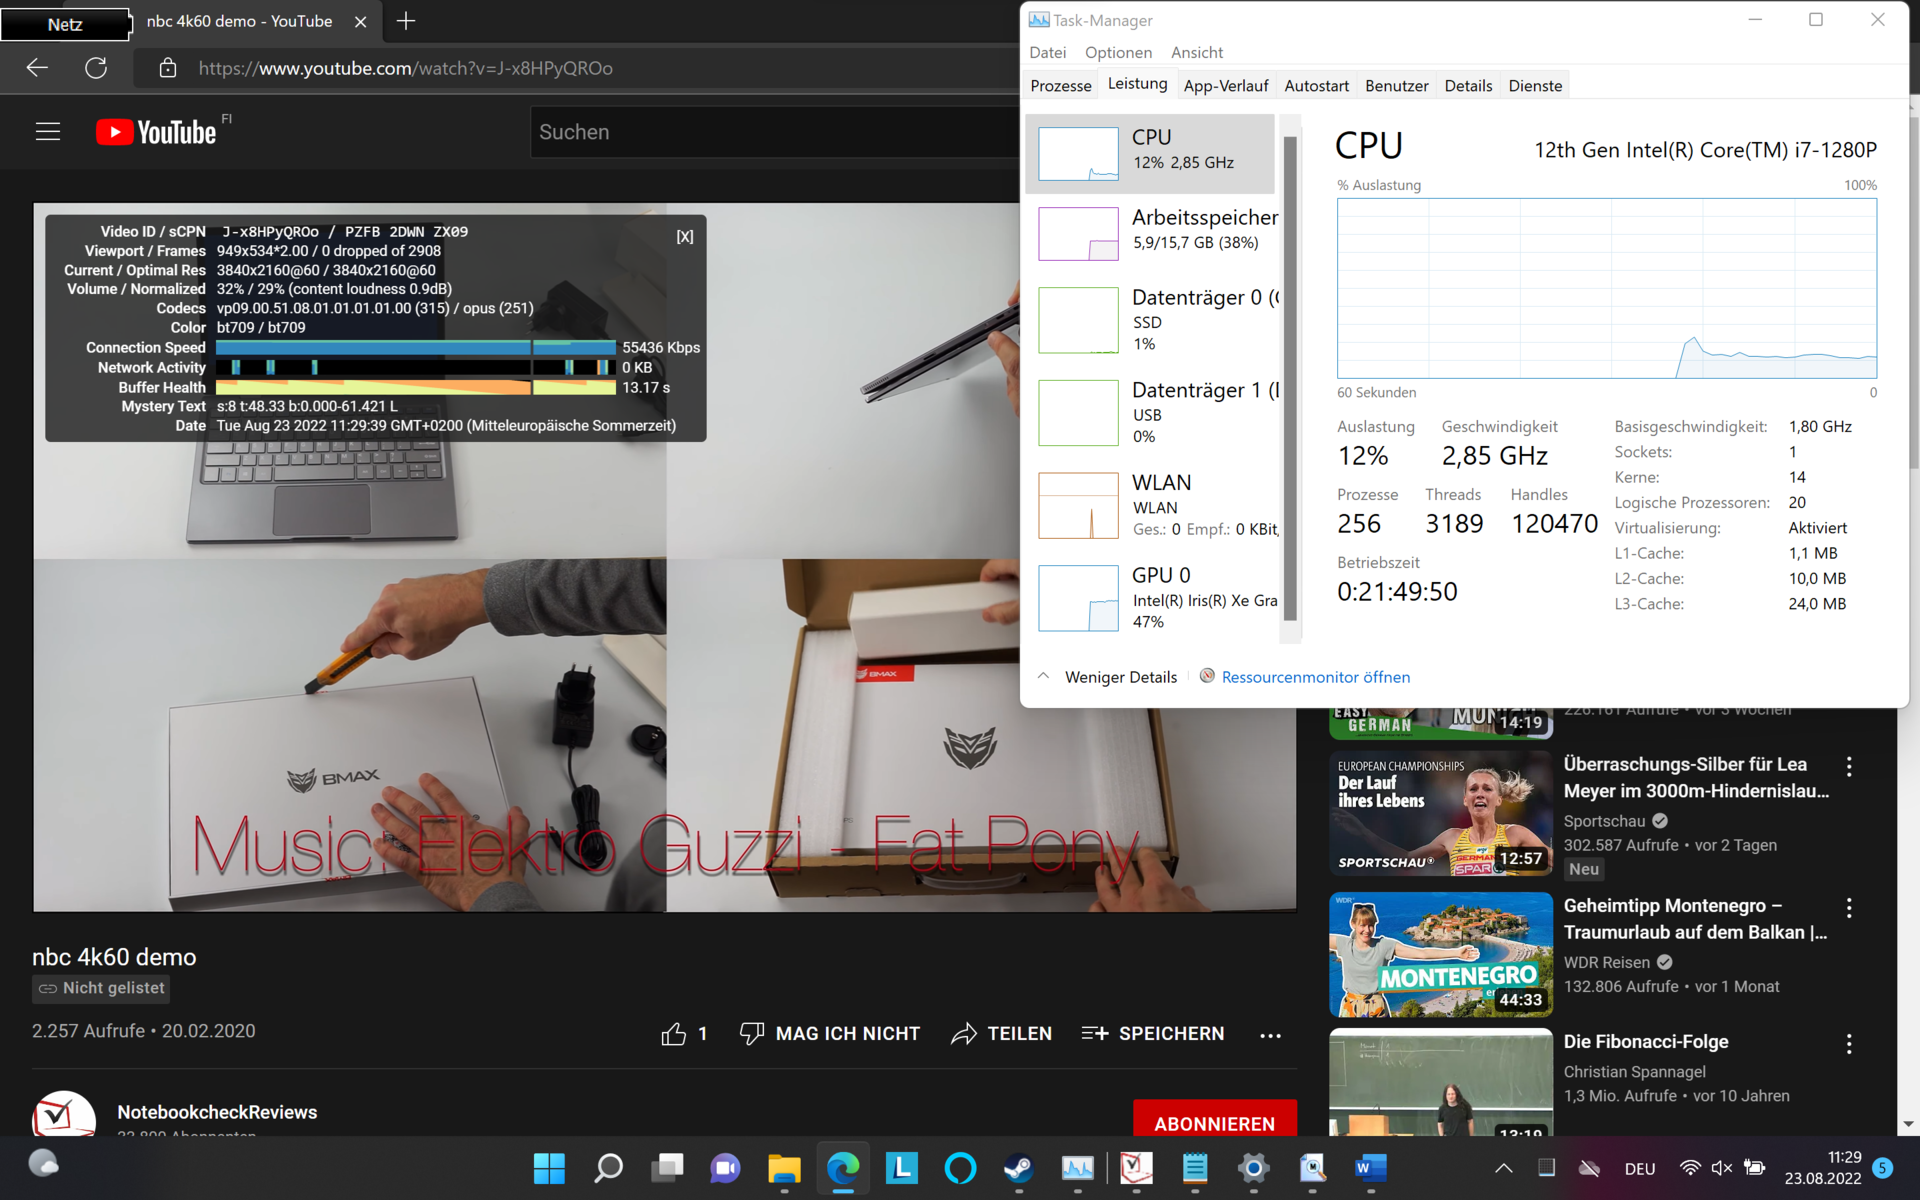
Die Alltags-Performance ist sehr gut, Anwendungen öffnen sich verzögerungsfrei und Web-Browsing mit multiplen Tabs, während des parallelen Abspielens eines 4K-YouTube-Videos, führt zu keinerlei Einschränkungen.
CrossMark: Overall | Productivity | Creativity | Responsiveness
Sunspider: 1.0 Total Score
Mozilla Kraken 1.1: Total
Speedometer 2.0: Result 2.0
Octane V2: Total Score
Jetstream 2: 2.0 Total
WebXPRT 3: Overall
WebXPRT 4: Overall
| PCMark 10 / Score | |
| Durchschnitt der Klasse Subnotebook (4920 - 9939, n=44, der letzten 2 Jahre) | |
| Lenovo Yoga Slim 7 Pro 14ACH5 | |
| Asus Zenbook S 13 OLED | |
| Schenker Vision 14 | |
| Durchschnittliche Intel Core i7-1280P, Intel Iris Xe Graphics G7 96EUs (5410 - 5994, n=4) | |
| Dell XPS 13 Plus 9320 4K | |
| HP Spectre x360 13.5 14t-ef000 | |
| Lenovo Yoga 9 14IAP7 82LU0001US | |
| Lenovo Yoga Slim 9 14IAP7 | |
| Lenovo Yoga Slim 7i Pro 14IAP G7 | |
| Lenovo IdeaPad Slim 9i 14ITL5 | |
| PCMark 10 / Essentials | |
| HP Spectre x360 13.5 14t-ef000 | |
| Lenovo Yoga 9 14IAP7 82LU0001US | |
| Lenovo Yoga Slim 7 Pro 14ACH5 | |
| Asus Zenbook S 13 OLED | |
| Dell XPS 13 Plus 9320 4K | |
| Durchschnitt der Klasse Subnotebook (8552 - 11646, n=44, der letzten 2 Jahre) | |
| Durchschnittliche Intel Core i7-1280P, Intel Iris Xe Graphics G7 96EUs (9719 - 10920, n=4) | |
| Lenovo IdeaPad Slim 9i 14ITL5 | |
| Lenovo Yoga Slim 7i Pro 14IAP G7 | |
| Lenovo Yoga Slim 9 14IAP7 | |
| Schenker Vision 14 | |
| PCMark 10 / Productivity | |
| Lenovo Yoga Slim 7 Pro 14ACH5 | |
| Durchschnitt der Klasse Subnotebook (5435 - 16606, n=44, der letzten 2 Jahre) | |
| Asus Zenbook S 13 OLED | |
| Schenker Vision 14 | |
| HP Spectre x360 13.5 14t-ef000 | |
| Dell XPS 13 Plus 9320 4K | |
| Durchschnittliche Intel Core i7-1280P, Intel Iris Xe Graphics G7 96EUs (6301 - 7453, n=4) | |
| Lenovo IdeaPad Slim 9i 14ITL5 | |
| Lenovo Yoga 9 14IAP7 82LU0001US | |
| Lenovo Yoga Slim 7i Pro 14IAP G7 | |
| Lenovo Yoga Slim 9 14IAP7 | |
| PCMark 10 / Digital Content Creation | |
| Durchschnitt der Klasse Subnotebook (5722 - 13779, n=44, der letzten 2 Jahre) | |
| Asus Zenbook S 13 OLED | |
| Lenovo Yoga Slim 9 14IAP7 | |
| Durchschnittliche Intel Core i7-1280P, Intel Iris Xe Graphics G7 96EUs (6450 - 7180, n=4) | |
| Lenovo Yoga Slim 7 Pro 14ACH5 | |
| Schenker Vision 14 | |
| Dell XPS 13 Plus 9320 4K | |
| Lenovo Yoga 9 14IAP7 82LU0001US | |
| Lenovo Yoga Slim 7i Pro 14IAP G7 | |
| HP Spectre x360 13.5 14t-ef000 | |
| Lenovo IdeaPad Slim 9i 14ITL5 | |
| CrossMark / Overall | |
| Durchschnittliche Intel Core i7-1280P, Intel Iris Xe Graphics G7 96EUs (1677 - 1773, n=4) | |
| Lenovo Yoga Slim 9 14IAP7 | |
| Dell XPS 13 Plus 9320 4K | |
| Durchschnitt der Klasse Subnotebook (365 - 2356, n=59, der letzten 2 Jahre) | |
| Lenovo Yoga 9 14IAP7 82LU0001US | |
| HP Spectre x360 13.5 14t-ef000 | |
| Schenker Vision 14 | |
| Lenovo Yoga Slim 7i Pro 14IAP G7 | |
| Apple MacBook Air M2 10C GPU | |
| Asus Zenbook S 13 OLED | |
| CrossMark / Productivity | |
| Durchschnittliche Intel Core i7-1280P, Intel Iris Xe Graphics G7 96EUs (1585 - 1709, n=4) | |
| Lenovo Yoga Slim 9 14IAP7 | |
| Dell XPS 13 Plus 9320 4K | |
| Durchschnitt der Klasse Subnotebook (364 - 2277, n=59, der letzten 2 Jahre) | |
| Schenker Vision 14 | |
| Lenovo Yoga 9 14IAP7 82LU0001US | |
| HP Spectre x360 13.5 14t-ef000 | |
| Asus Zenbook S 13 OLED | |
| Lenovo Yoga Slim 7i Pro 14IAP G7 | |
| Apple MacBook Air M2 10C GPU | |
| CrossMark / Creativity | |
| Durchschnittliche Intel Core i7-1280P, Intel Iris Xe Graphics G7 96EUs (1849 - 1928, n=4) | |
| Lenovo Yoga Slim 9 14IAP7 | |
| Dell XPS 13 Plus 9320 4K | |
| Durchschnitt der Klasse Subnotebook (372 - 2743, n=59, der letzten 2 Jahre) | |
| Lenovo Yoga 9 14IAP7 82LU0001US | |
| Apple MacBook Air M2 10C GPU | |
| HP Spectre x360 13.5 14t-ef000 | |
| Lenovo Yoga Slim 7i Pro 14IAP G7 | |
| Asus Zenbook S 13 OLED | |
| Schenker Vision 14 | |
| CrossMark / Responsiveness | |
| Durchschnittliche Intel Core i7-1280P, Intel Iris Xe Graphics G7 96EUs (1394 - 1746, n=4) | |
| Schenker Vision 14 | |
| Dell XPS 13 Plus 9320 4K | |
| HP Spectre x360 13.5 14t-ef000 | |
| Lenovo Yoga 9 14IAP7 82LU0001US | |
| Lenovo Yoga Slim 9 14IAP7 | |
| Durchschnitt der Klasse Subnotebook (312 - 1854, n=59, der letzten 2 Jahre) | |
| Lenovo Yoga Slim 7i Pro 14IAP G7 | |
| Asus Zenbook S 13 OLED | |
| Apple MacBook Air M2 10C GPU | |
| Sunspider / 1.0 Total Score | |
| Lenovo Yoga Slim 9 14IAP7 | |
| Durchschnittliche Intel Core i7-1280P, Intel Iris Xe Graphics G7 96EUs (n=1) | |
| Durchschnitt der Klasse Subnotebook (n=1der letzten 2 Jahre) | |
| Mozilla Kraken 1.1 / Total | |
| Asus Zenbook S 13 OLED | |
| Lenovo IdeaPad Slim 9i 14ITL5 | |
| Schenker Vision 14 | |
| Lenovo Yoga Slim 7 Pro 14ACH5 | |
| Lenovo Yoga Slim 7i Pro 14IAP G7 | |
| HP Spectre x360 13.5 14t-ef000 | |
| Lenovo Yoga 9 14IAP7 82LU0001US | |
| Dell XPS 13 Plus 9320 4K | |
| Durchschnittliche Intel Core i7-1280P, Intel Iris Xe Graphics G7 96EUs (526 - 548, n=5) | |
| Lenovo Yoga Slim 9 14IAP7 | |
| Durchschnitt der Klasse Subnotebook (234 - 1104, n=60, der letzten 2 Jahre) | |
| Apple MacBook Air M2 10C GPU | |
| Speedometer 2.0 / Result 2.0 | |
| Durchschnitt der Klasse Subnotebook (110 - 793, n=26, der letzten 2 Jahre) | |
| Apple MacBook Air M2 10C GPU | |
| Lenovo Yoga Slim 9 14IAP7 | |
| Durchschnittliche Intel Core i7-1280P, Intel Iris Xe Graphics G7 96EUs (n=1) | |
| Dell XPS 13 Plus 9320 4K | |
| Schenker Vision 14 | |
| Asus Zenbook S 13 OLED | |
| Octane V2 / Total Score | |
| Durchschnitt der Klasse Subnotebook (35801 - 142020, n=28, der letzten 2 Jahre) | |
| Lenovo Yoga Slim 9 14IAP7 | |
| Durchschnittliche Intel Core i7-1280P, Intel Iris Xe Graphics G7 96EUs (n=1) | |
| Dell XPS 13 Plus 9320 4K | |
| Apple MacBook Air M2 10C GPU | |
| Schenker Vision 14 | |
| Asus Zenbook S 13 OLED | |
| Jetstream 2 / 2.0 Total | |
| Durchschnitt der Klasse Subnotebook (117 - 476, n=28, der letzten 2 Jahre) | |
| Durchschnittliche Intel Core i7-1280P, Intel Iris Xe Graphics G7 96EUs (239 - 253, n=3) | |
| Dell XPS 13 Plus 9320 4K | |
| Lenovo Yoga Slim 9 14IAP7 | |
| Apple MacBook Air M2 10C GPU | |
| Asus Zenbook S 13 OLED | |
| Lenovo Yoga 9 14IAP7 82LU0001US | |
| Schenker Vision 14 | |
| WebXPRT 3 / Overall | |
| Apple MacBook Air M2 10C GPU | |
| Durchschnitt der Klasse Subnotebook (156 - 530, n=55, der letzten 2 Jahre) | |
| Lenovo Yoga 9 14IAP7 82LU0001US | |
| Dell XPS 13 Plus 9320 4K | |
| Durchschnittliche Intel Core i7-1280P, Intel Iris Xe Graphics G7 96EUs (283 - 290, n=5) | |
| Lenovo Yoga Slim 9 14IAP7 | |
| HP Spectre x360 13.5 14t-ef000 | |
| Lenovo Yoga Slim 7 Pro 14ACH5 | |
| Asus Zenbook S 13 OLED | |
| Schenker Vision 14 | |
| Lenovo Yoga Slim 7i Pro 14IAP G7 | |
| Lenovo IdeaPad Slim 9i 14ITL5 | |
| WebXPRT 4 / Overall | |
| Durchschnitt der Klasse Subnotebook (132 - 378, n=60, der letzten 2 Jahre) | |
| Durchschnittliche Intel Core i7-1280P, Intel Iris Xe Graphics G7 96EUs (245 - 257, n=5) | |
| Dell XPS 13 Plus 9320 4K | |
| Lenovo Yoga Slim 9 14IAP7 | |
| HP Spectre x360 13.5 14t-ef000 | |
| Apple MacBook Air M2 10C GPU | |
* ... kleinere Werte sind besser
| PCMark 10 Score | 5410 Punkte | |
Hilfe | ||
| AIDA64 / Memory Copy | |
| Durchschnitt der Klasse Subnotebook (14554 - 131023, n=58, der letzten 2 Jahre) | |
| Lenovo Yoga Slim 9 14IAP7 | |
| Lenovo Yoga 9 14IAP7 82LU0001US | |
| Dell XPS 13 Plus 9320 4K | |
| Durchschnittliche Intel Core i7-1280P (56337 - 73486, n=6) | |
| HP Spectre x360 13.5 14t-ef000 | |
| Lenovo Yoga Slim 7i Pro 14IAP G7 | |
| Asus Zenbook S 13 OLED | |
| Schenker Vision 14 | |
| Lenovo Yoga Slim 7 Pro 14ACH5 | |
| AIDA64 / Memory Read | |
| Durchschnitt der Klasse Subnotebook (15948 - 127174, n=58, der letzten 2 Jahre) | |
| Lenovo Yoga 9 14IAP7 82LU0001US | |
| Durchschnittliche Intel Core i7-1280P (63221 - 73719, n=6) | |
| Dell XPS 13 Plus 9320 4K | |
| Lenovo Yoga Slim 7i Pro 14IAP G7 | |
| Lenovo Yoga Slim 9 14IAP7 | |
| HP Spectre x360 13.5 14t-ef000 | |
| Schenker Vision 14 | |
| Lenovo Yoga Slim 7 Pro 14ACH5 | |
| Asus Zenbook S 13 OLED | |
| AIDA64 / Memory Write | |
| Durchschnitt der Klasse Subnotebook (15709 - 135141, n=58, der letzten 2 Jahre) | |
| Lenovo Yoga Slim 9 14IAP7 | |
| HP Spectre x360 13.5 14t-ef000 | |
| Lenovo Yoga 9 14IAP7 82LU0001US | |
| Durchschnittliche Intel Core i7-1280P (58729 - 68247, n=6) | |
| Dell XPS 13 Plus 9320 4K | |
| Lenovo Yoga Slim 7i Pro 14IAP G7 | |
| Asus Zenbook S 13 OLED | |
| Schenker Vision 14 | |
| Lenovo Yoga Slim 7 Pro 14ACH5 | |
| AIDA64 / Memory Latency | |
| Asus Zenbook S 13 OLED | |
| Durchschnittliche Intel Core i7-1280P (93.1 - 153.3, n=6) | |
| Lenovo Yoga Slim 9 14IAP7 | |
| HP Spectre x360 13.5 14t-ef000 | |
| Durchschnitt der Klasse Subnotebook (6.1 - 159.9, n=56, der letzten 2 Jahre) | |
| Lenovo Yoga Slim 7 Pro 14ACH5 | |
| Schenker Vision 14 | |
* ... kleinere Werte sind besser
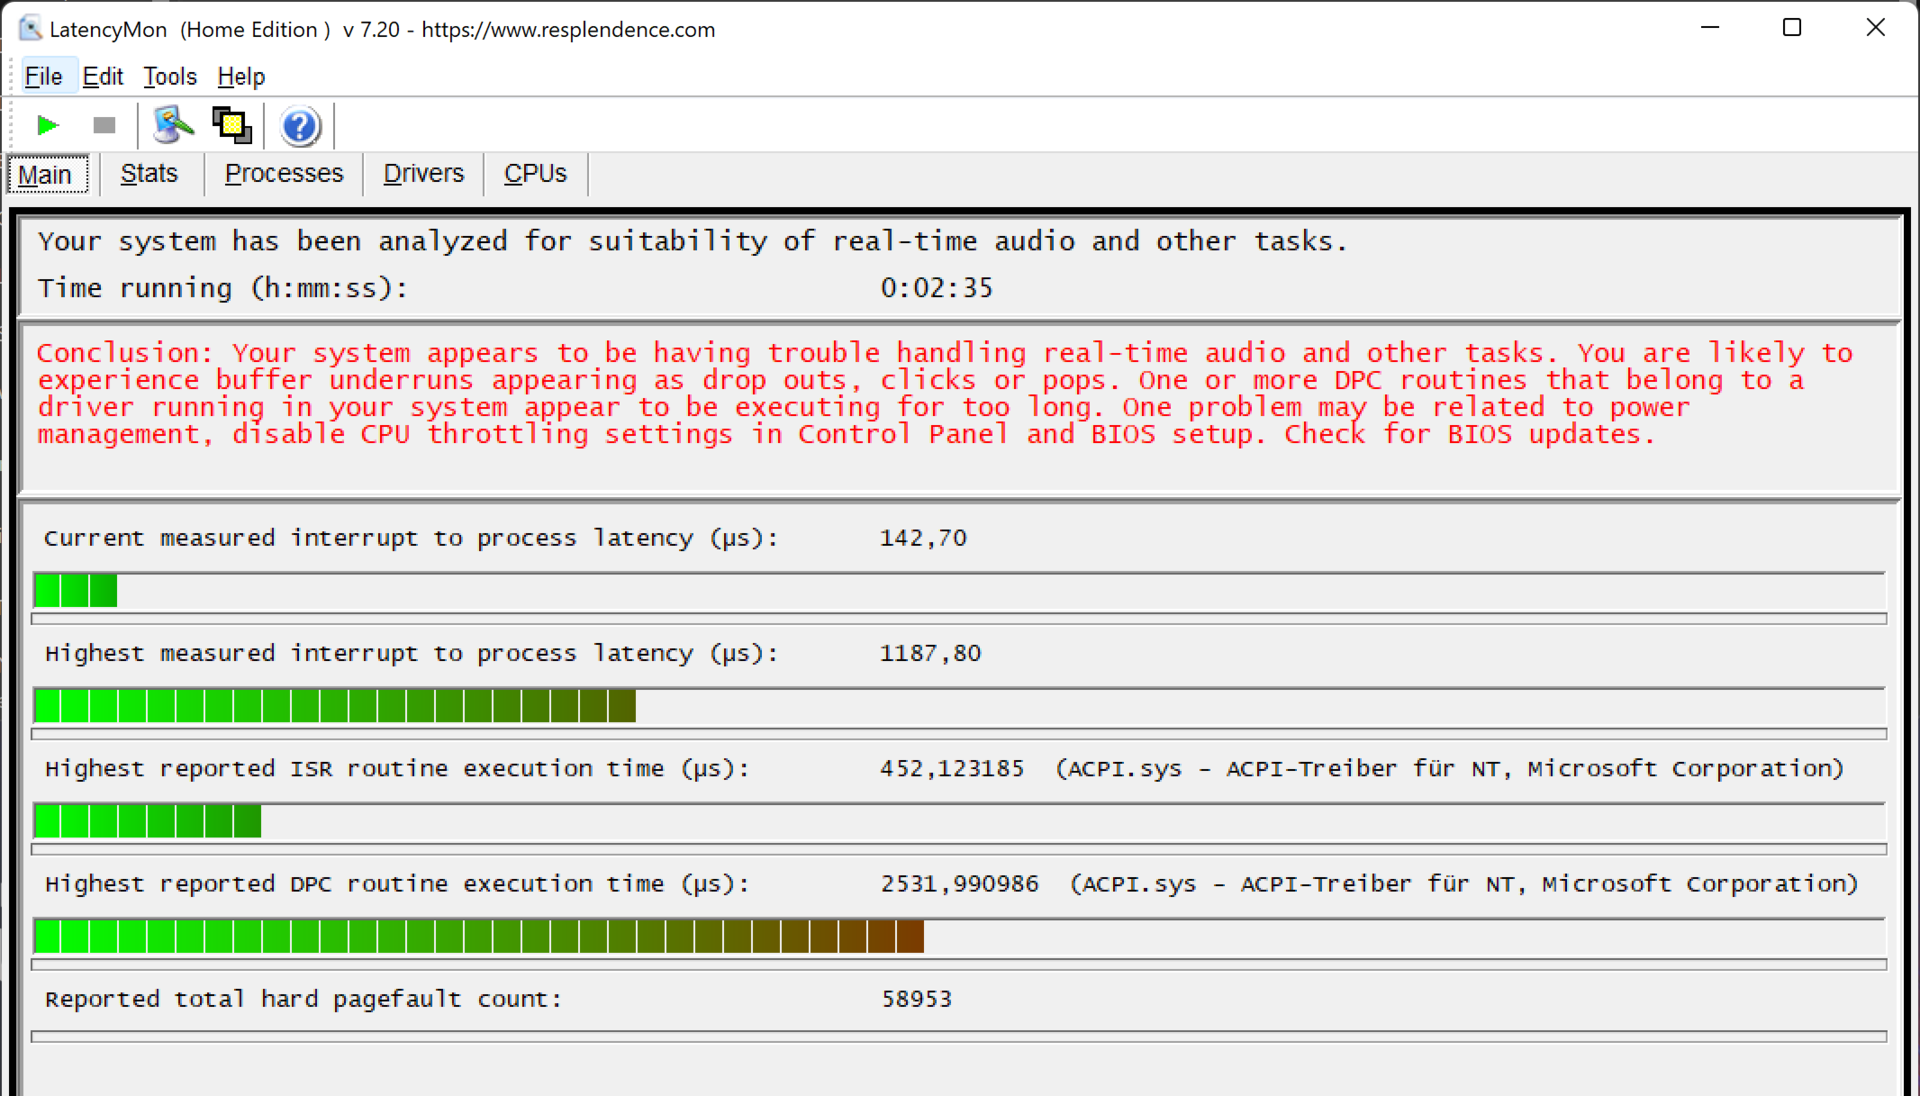
DPC-Latenzen
Wir stellen beim Yoga Slim 9i erhöhte Verzögerungen von bis zu 2.532 µs fest, hauptsächlich verursacht durch Windows ACPI-Treiber. Für Echtzeitarbeiten mit Audio und Video kann das zu Problemen führen. Zukünftige BIOS-Updates könnten dies verbessern.
Während der 4K-YouTube-Wiedergabe messen wir eine niedrige CPU-Auslastung von 12 %, bei der iGPU sehen wir allerdings die für Intel typisch hohen Werte nahe der 50 %.

| DPC Latencies / LatencyMon - interrupt to process latency (max), Web, Youtube, Prime95 | |
| Lenovo Yoga Slim 9 14IAP7 | |
| Lenovo Yoga 9 14IAP7 82LU0001US | |
| Schenker Vision 14 | |
| Lenovo IdeaPad Slim 9i 14ITL5 | |
| Lenovo Yoga Slim 7i Pro 14IAP G7 | |
| Dell XPS 13 Plus 9320 4K | |
| Asus Zenbook S 13 OLED | |
| HP Spectre x360 13.5 14t-ef000 | |
| Lenovo Yoga Slim 7 Pro 14ACH5 | |
* ... kleinere Werte sind besser
Massenspeicher
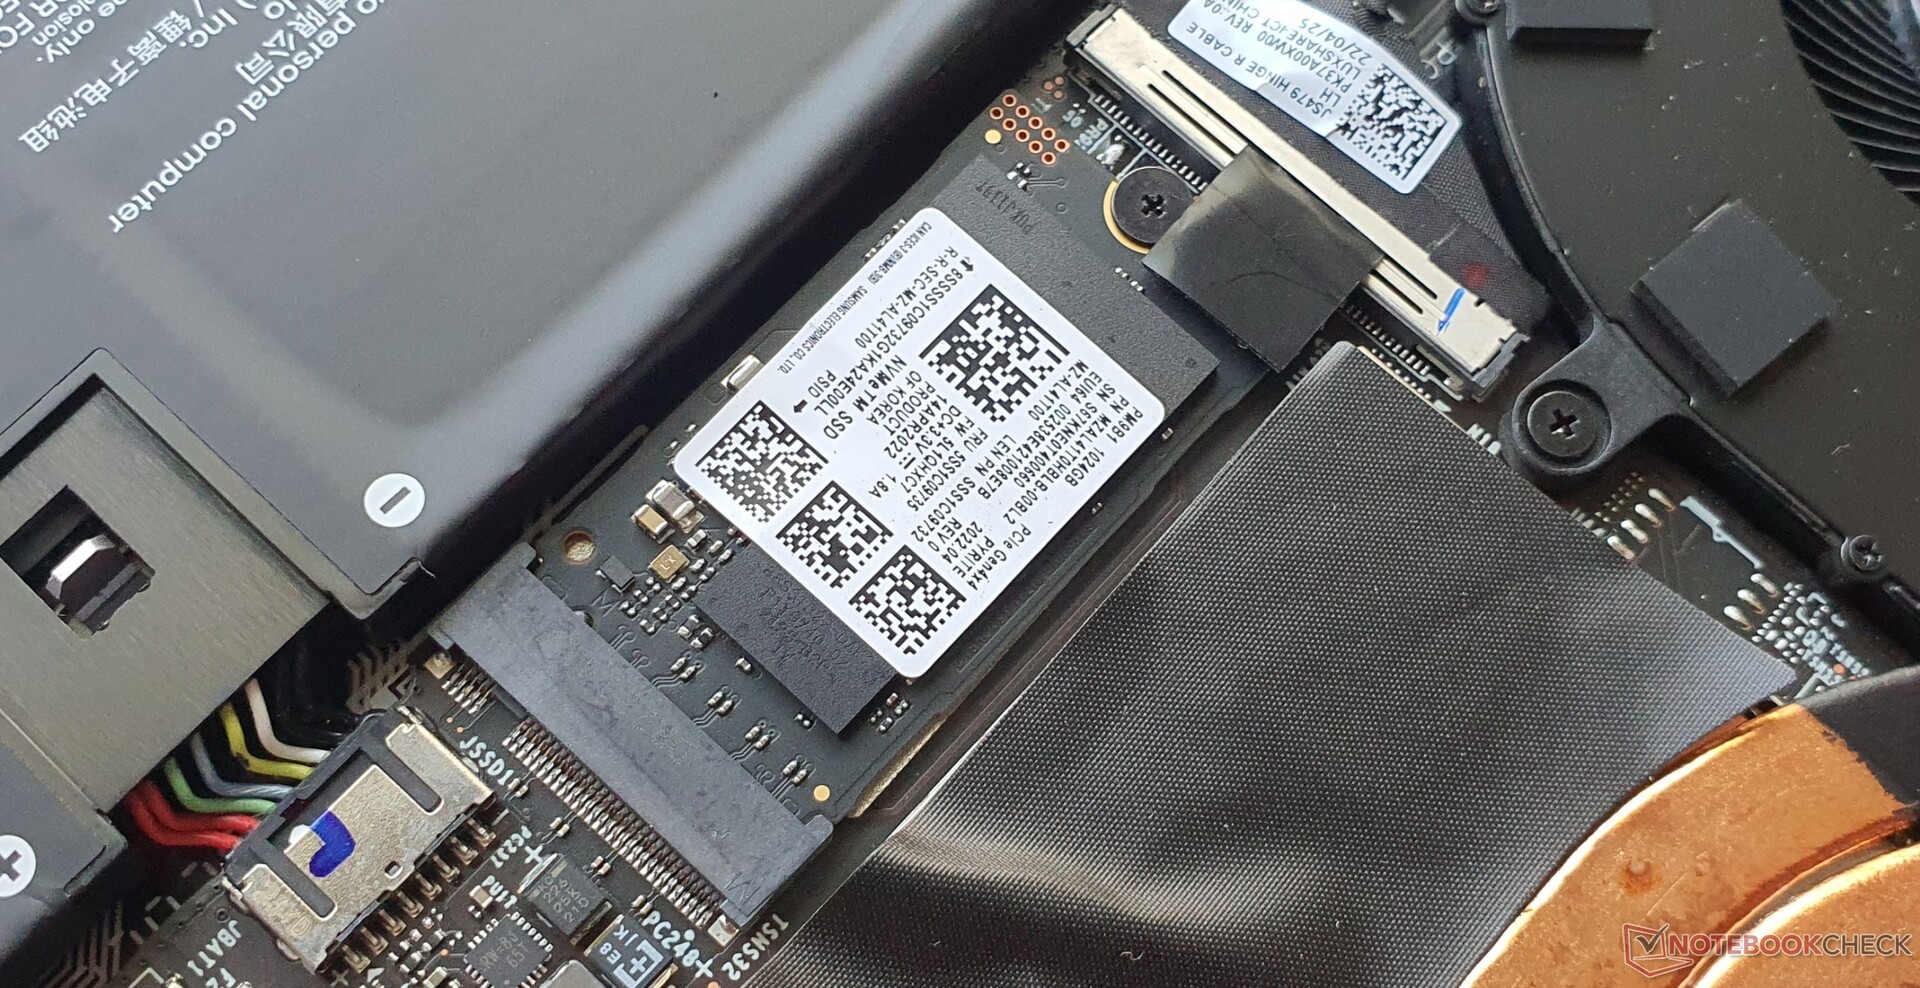
Samsungs 1 TB große PCIe-4.0-SSD (PM9B1) kommt im verkürzten M.2-2242-Format. Eine längere SSD lässt sich nicht einbauen, im Gegensatz zum Vorgänger.
Die Geschwindigkeiten sind nicht auf PCIe-Gen-4.0-Niveau, insgesamt aber alles andere als schlecht, wenngleich die Konkurrenz unseres Vergleichsfeldes nahezu allesamt schneller unterwegs ist. Einschränkungen hat man dadurch nicht zu erwarten, allenfalls beim Kopieren größerer Datenmengen.
Mittels zweier Wärmeleitpads wird Kontakt mit der metallenen Bodenplatte hergestellt, sodass eine gute Kühlung gewährleistet wird, resultierend in dauerhaft stabile Transferraten, gemessen durch die DiskSpd-Leseschleife.
| Lenovo Yoga Slim 9 14IAP7 Iris Xe G7 96EUs, i7-1280P, Samsung PM9B1 1024GB MZAL41T0HBLB | Lenovo Yoga 9 14IAP7 82LU0001US Iris Xe G7 96EUs, i7-1260P, Samsung PM9A1 MZVL2512HCJQ | Lenovo Yoga Slim 7 Pro 14ACH5 Vega 8, R9 5900HX, SK Hynix PC711 1TB HFS001TDE9X084N | Asus Zenbook S 13 OLED Radeon 680M, R7 6800U, Samsung PM9A1 MZVL21T0HCLR | Schenker Vision 14 GeForce RTX 3050 Ti Laptop GPU, i7-11370H, Samsung SSD 980 Pro 1TB MZ-V8P1T0BW | Dell XPS 13 Plus 9320 4K Iris Xe G7 96EUs, i7-1260P, Samsung PM9A1 MZVL21T0HCLR | HP Spectre x360 13.5 14t-ef000 Iris Xe G7 96EUs, i7-1255U, Micron 3400 1TB MTFDKBA1T0TFH | |
|---|---|---|---|---|---|---|---|
| AS SSD | 5% | 28% | 28% | 63% | 20% | 11% | |
| Seq Read (MB/s) | 3059 | 4937.99 61% | 2965 -3% | 4664 52% | 5367 75% | 4642 52% | 4851.77 59% |
| Seq Write (MB/s) | 1524 | 2030.74 33% | 2697 77% | 2179 43% | 3955 160% | 1930 27% | 1910.85 25% |
| 4K Read (MB/s) | 69 | 70.42 2% | 55.6 -19% | 63.64 -8% | 83.6 21% | 73.28 6% | 61.75 -11% |
| 4K Write (MB/s) | 190 | 157.21 -17% | 144.4 -24% | 151.15 -20% | 205.3 8% | 189.21 0% | 164.04 -14% |
| 4K-64 Read (MB/s) | 813 | 761.12 -6% | 1589 95% | 1174.58 44% | 2300 183% | 729.57 -10% | 974.07 20% |
| 4K-64 Write (MB/s) | 1829 | 2593.35 42% | 1733 -5% | 2732.34 49% | 811 -56% | 2338.23 28% | 2151.98 18% |
| Access Time Read * (ms) | 0.028 | 0.049 -75% | 0.032 -14% | 0.023 18% | 0.024 14% | 0.023 18% | 0.031 -11% |
| Access Time Write * (ms) | 0.039 | 0.076 -95% | 0.026 33% | 0.027 31% | 0.02 49% | 0.021 46% | 0.066 -69% |
| Score Read (Points) | 1188 | 1325 12% | 1941 63% | 1705 44% | 2920 146% | 1267 7% | 1521 28% |
| Score Write (Points) | 2171 | 2954 36% | 2147 -1% | 3101 43% | 1412 -35% | 2720 25% | 2507 15% |
| Score Total (Points) | 3911 | 4831 24% | 5073 30% | 5566 42% | 5763 47% | 4522 16% | 4672 19% |
| Copy ISO MB/s (MB/s) | 1752 | 2159.91 23% | 2218 27% | 1727.41 -1% | 3199 83% | 2105.8 20% | 2071.78 18% |
| Copy Program MB/s (MB/s) | 312 | 341.36 9% | 577 85% | 418.21 34% | 625 100% | 375.83 20% | 406.2 30% |
| Copy Game MB/s (MB/s) | 908 | 1038.5 14% | 1324 46% | 1112.95 23% | 1712 89% | 1081.29 19% | 1182.05 30% |
* ... kleinere Werte sind besser
* ... kleinere Werte sind besser
Dauerleistung Lesen: DiskSpd Read Loop, Queue Depth 8
Grafikkarte
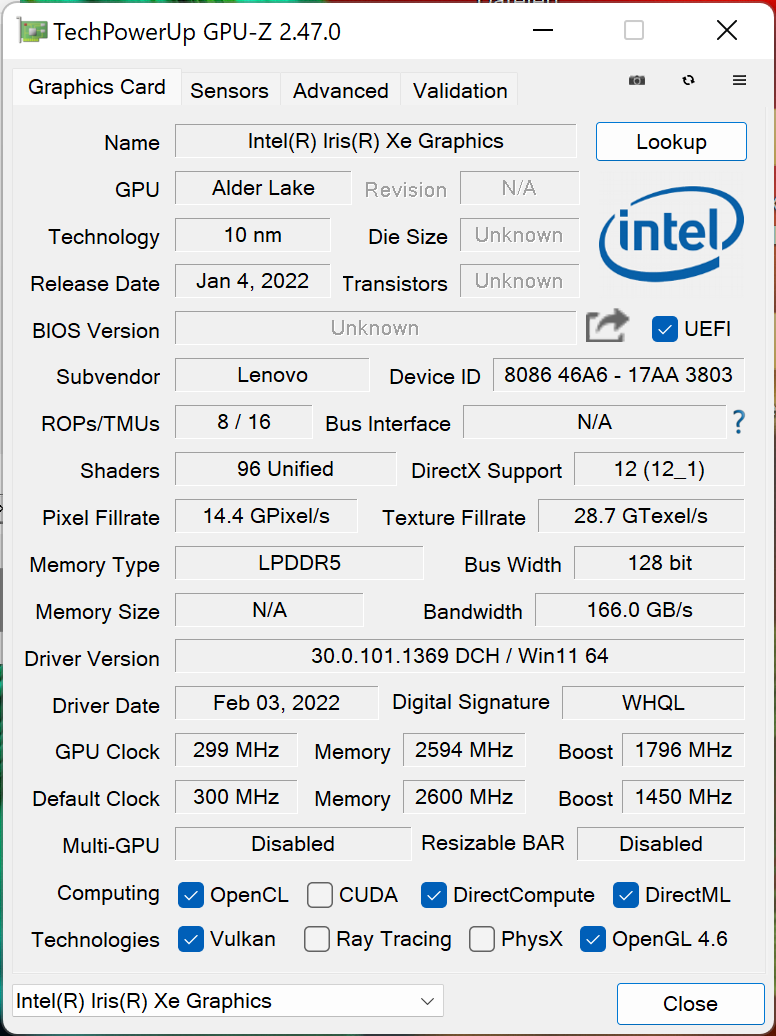
Anders als beim etwas größerem Yoga Slim Pro X 14 (Ryzen 7 6800HS + RTX 3050), verzichtet Lenovo beim Slim 9 auf eine dedizierte Grafiklösung, während Slim 7 Pro und Slim 7 Carbon 14 ebenfalls dedizierte Lösungen bieten. Intels Xe-Grafik schlägt sich aber nicht schlecht, wohl auch aufgrund des schnellen LPDDR5-5200-RAM.
Für Spiele reicht das allenfalls für mittlere Details, während ältere auch mal höhere Detailstufen zulassen. Letztendlich ist das Slim 9 allerdings nicht dafür konzipiert. Die Nvidia GeForce RTX 3050 im Schenker Vision 14 rechnet bereits doppelt so schnell, während AMDs neue Radeon 680M im Asus Zenbook S 13 im Durchschnitt um 15 % davon zieht.
Allerdings bietet bereits die CPU genug Dampf, um gelegentliches rendern in 4K zu erledigen. Im Akkubetrieb steht die volle Grafikleistung Intels iGPU zur Verfügung.
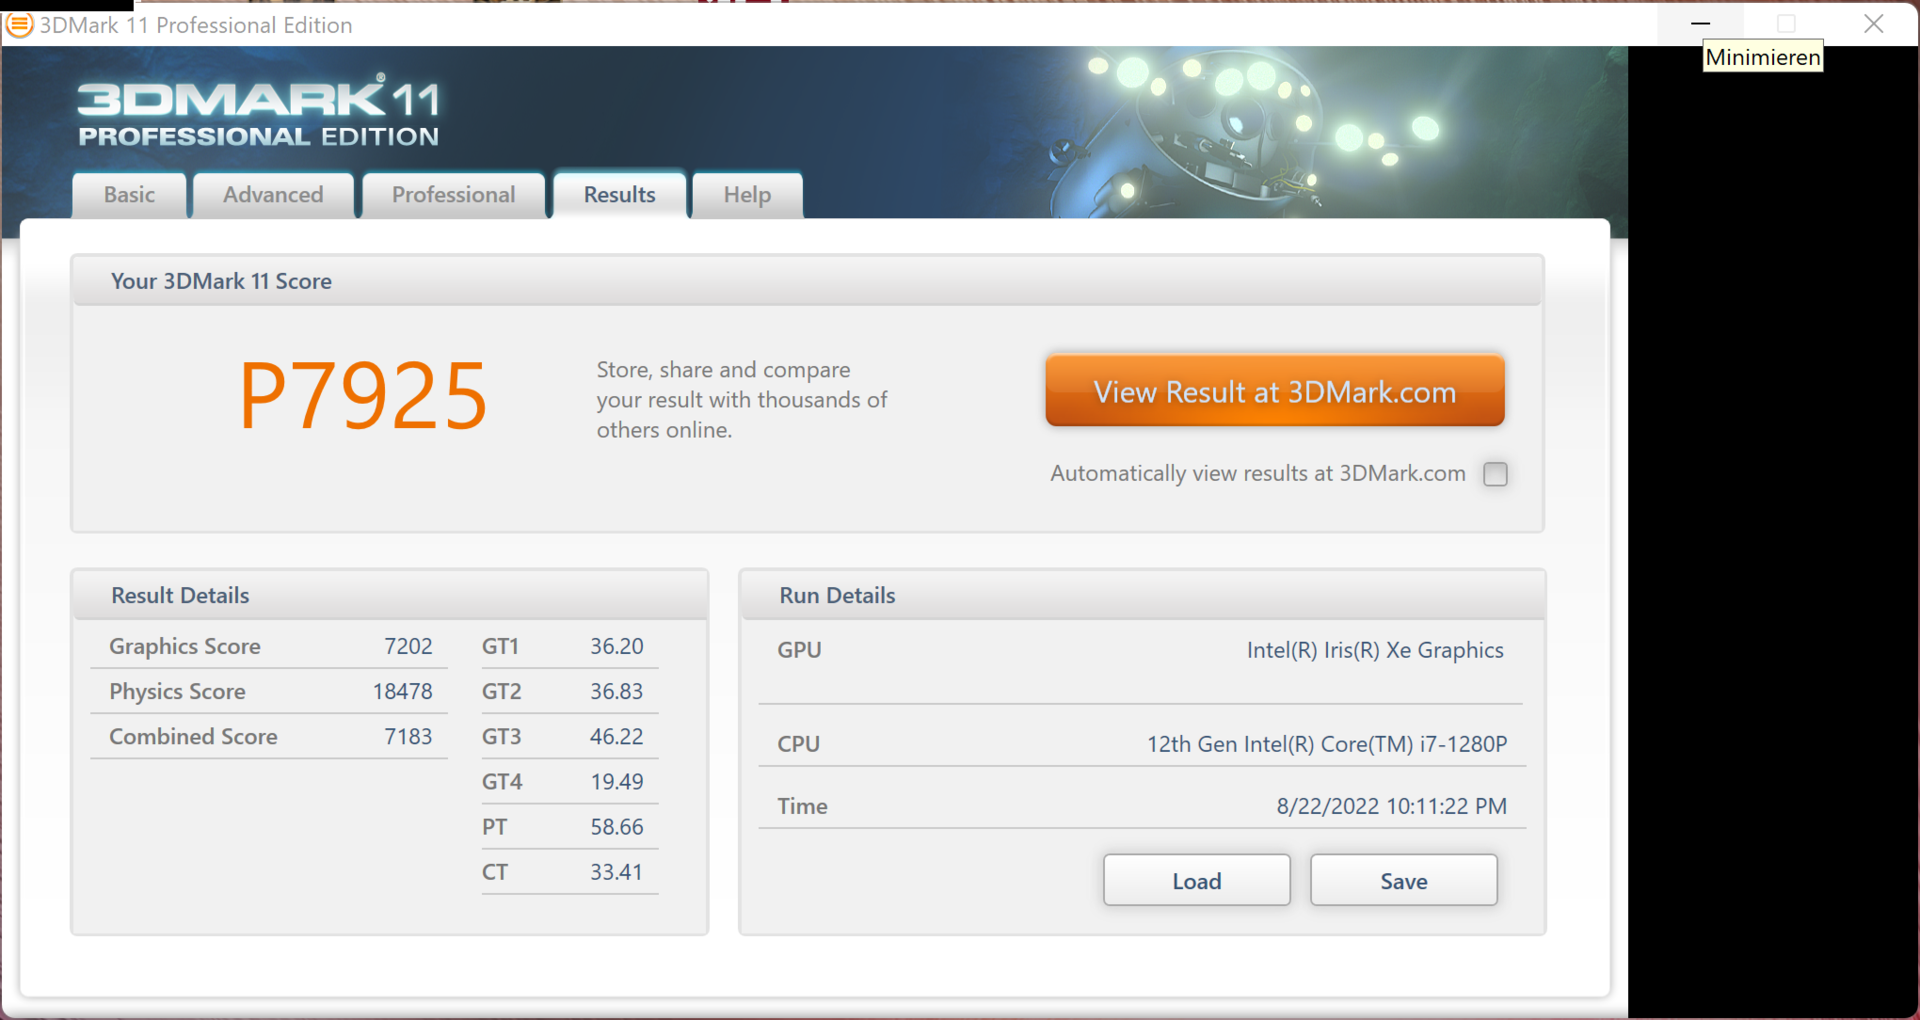
| 3DMark 11 Performance | 7925 Punkte | |
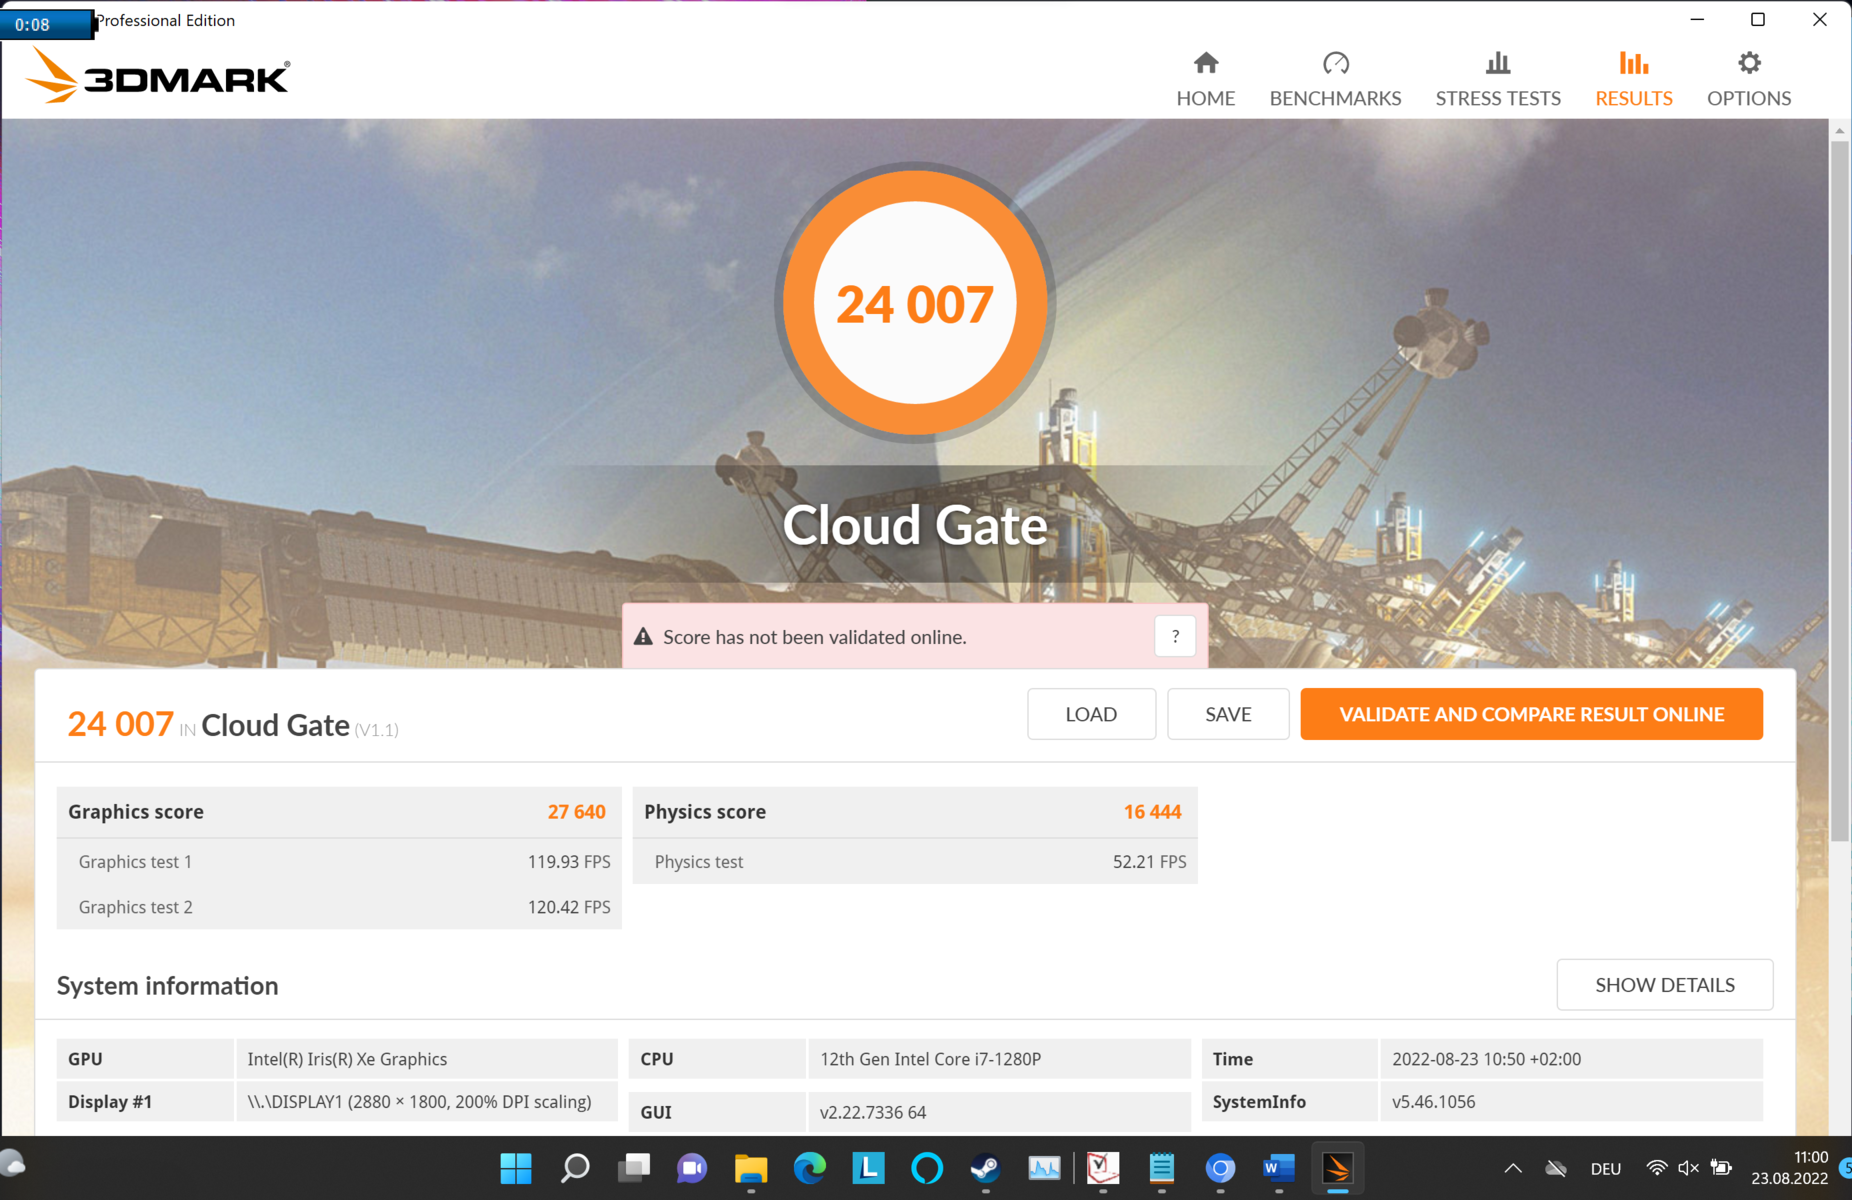
| 3DMark Cloud Gate Standard Score | 24007 Punkte | |
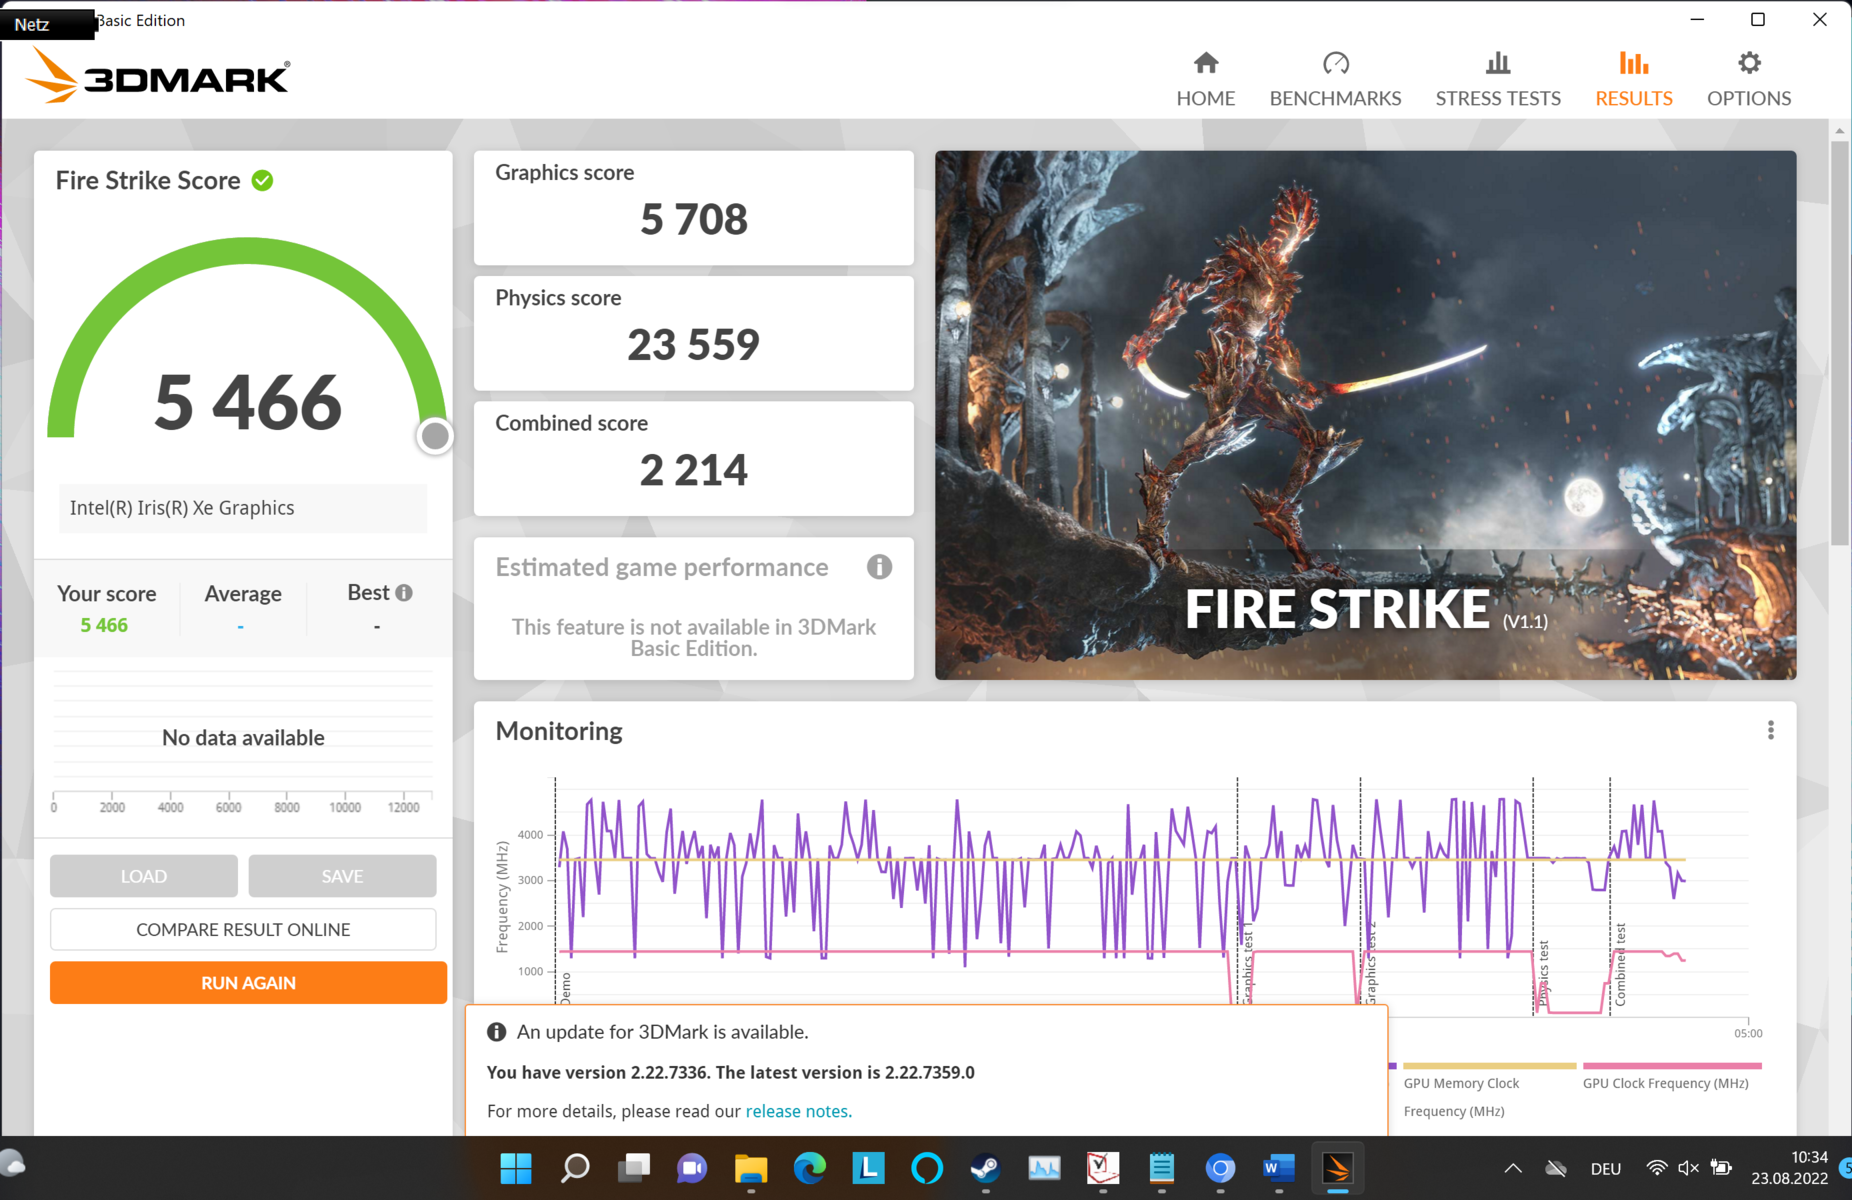
| 3DMark Fire Strike Score | 5466 Punkte | |
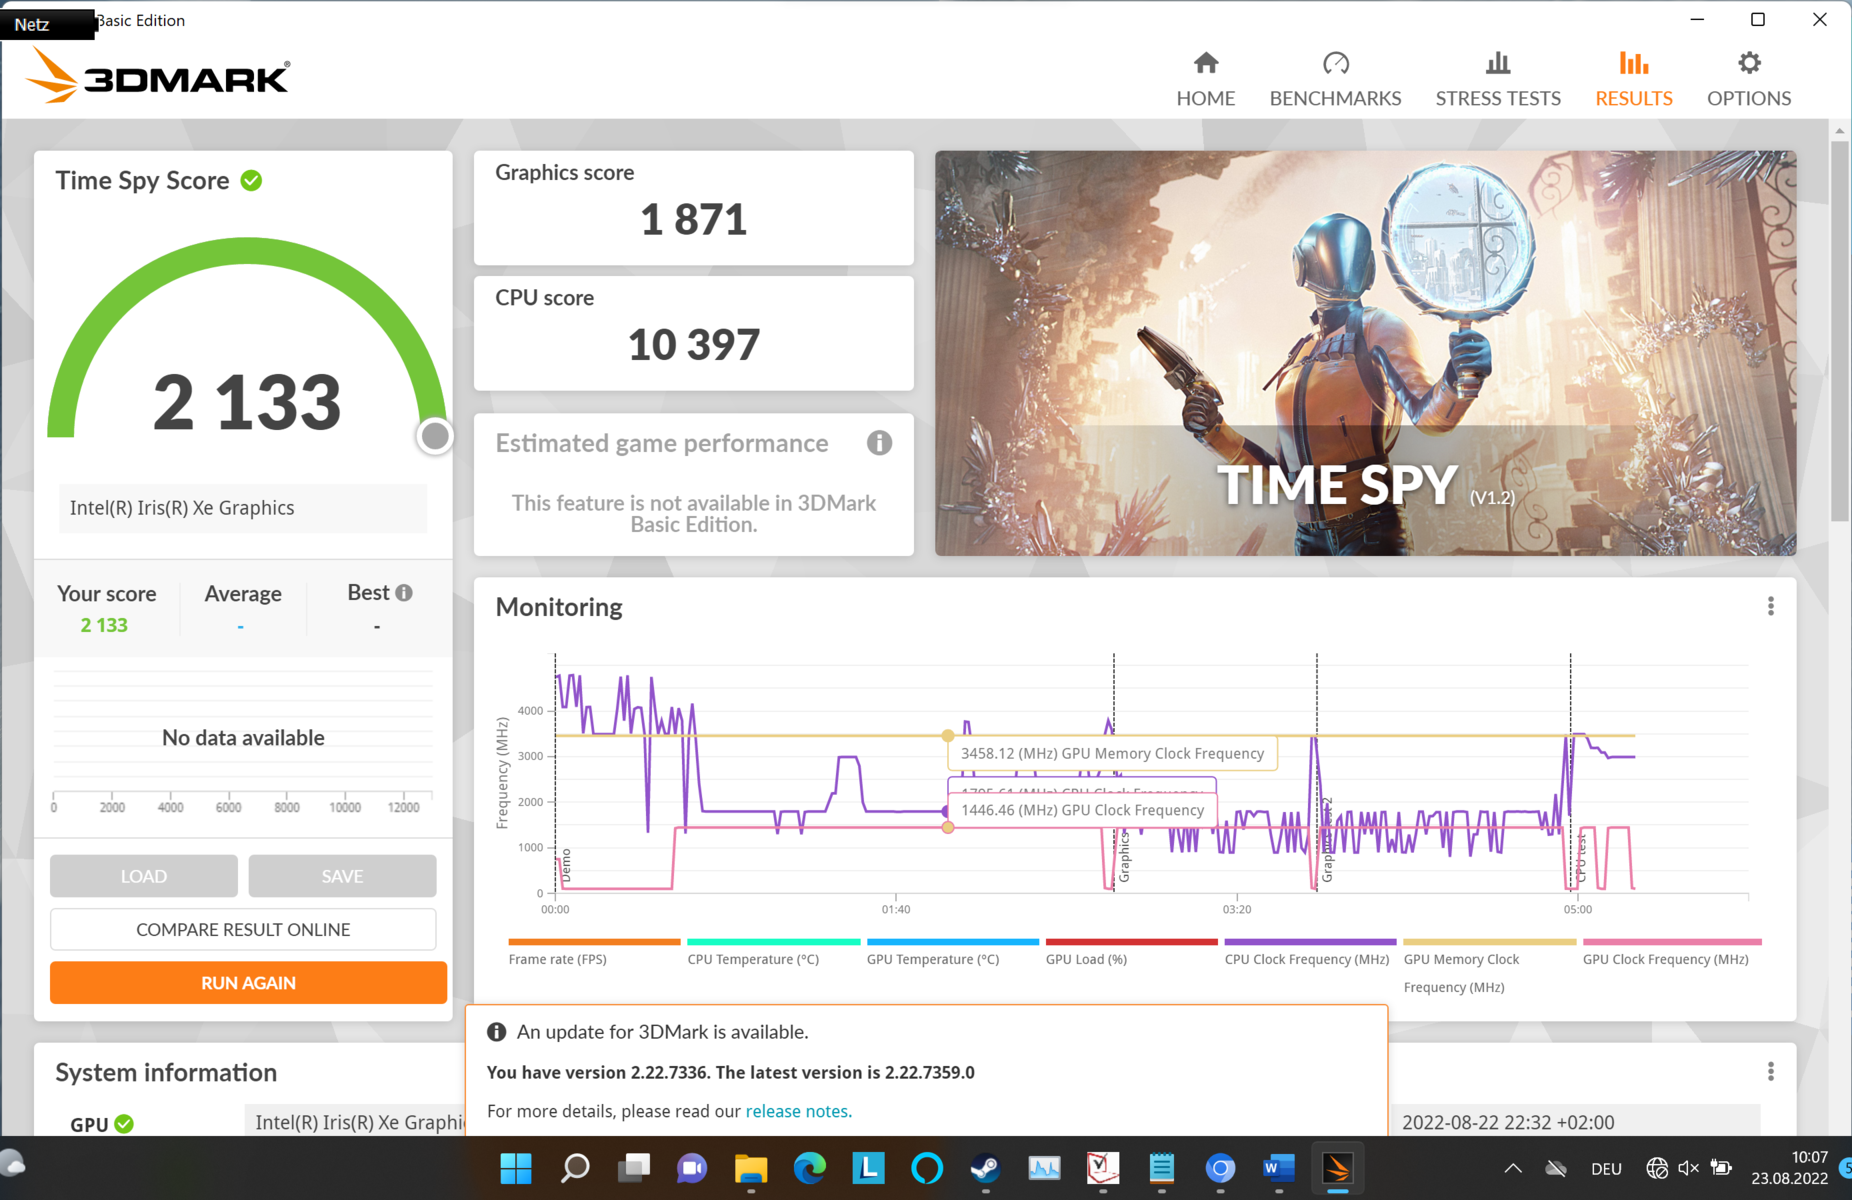
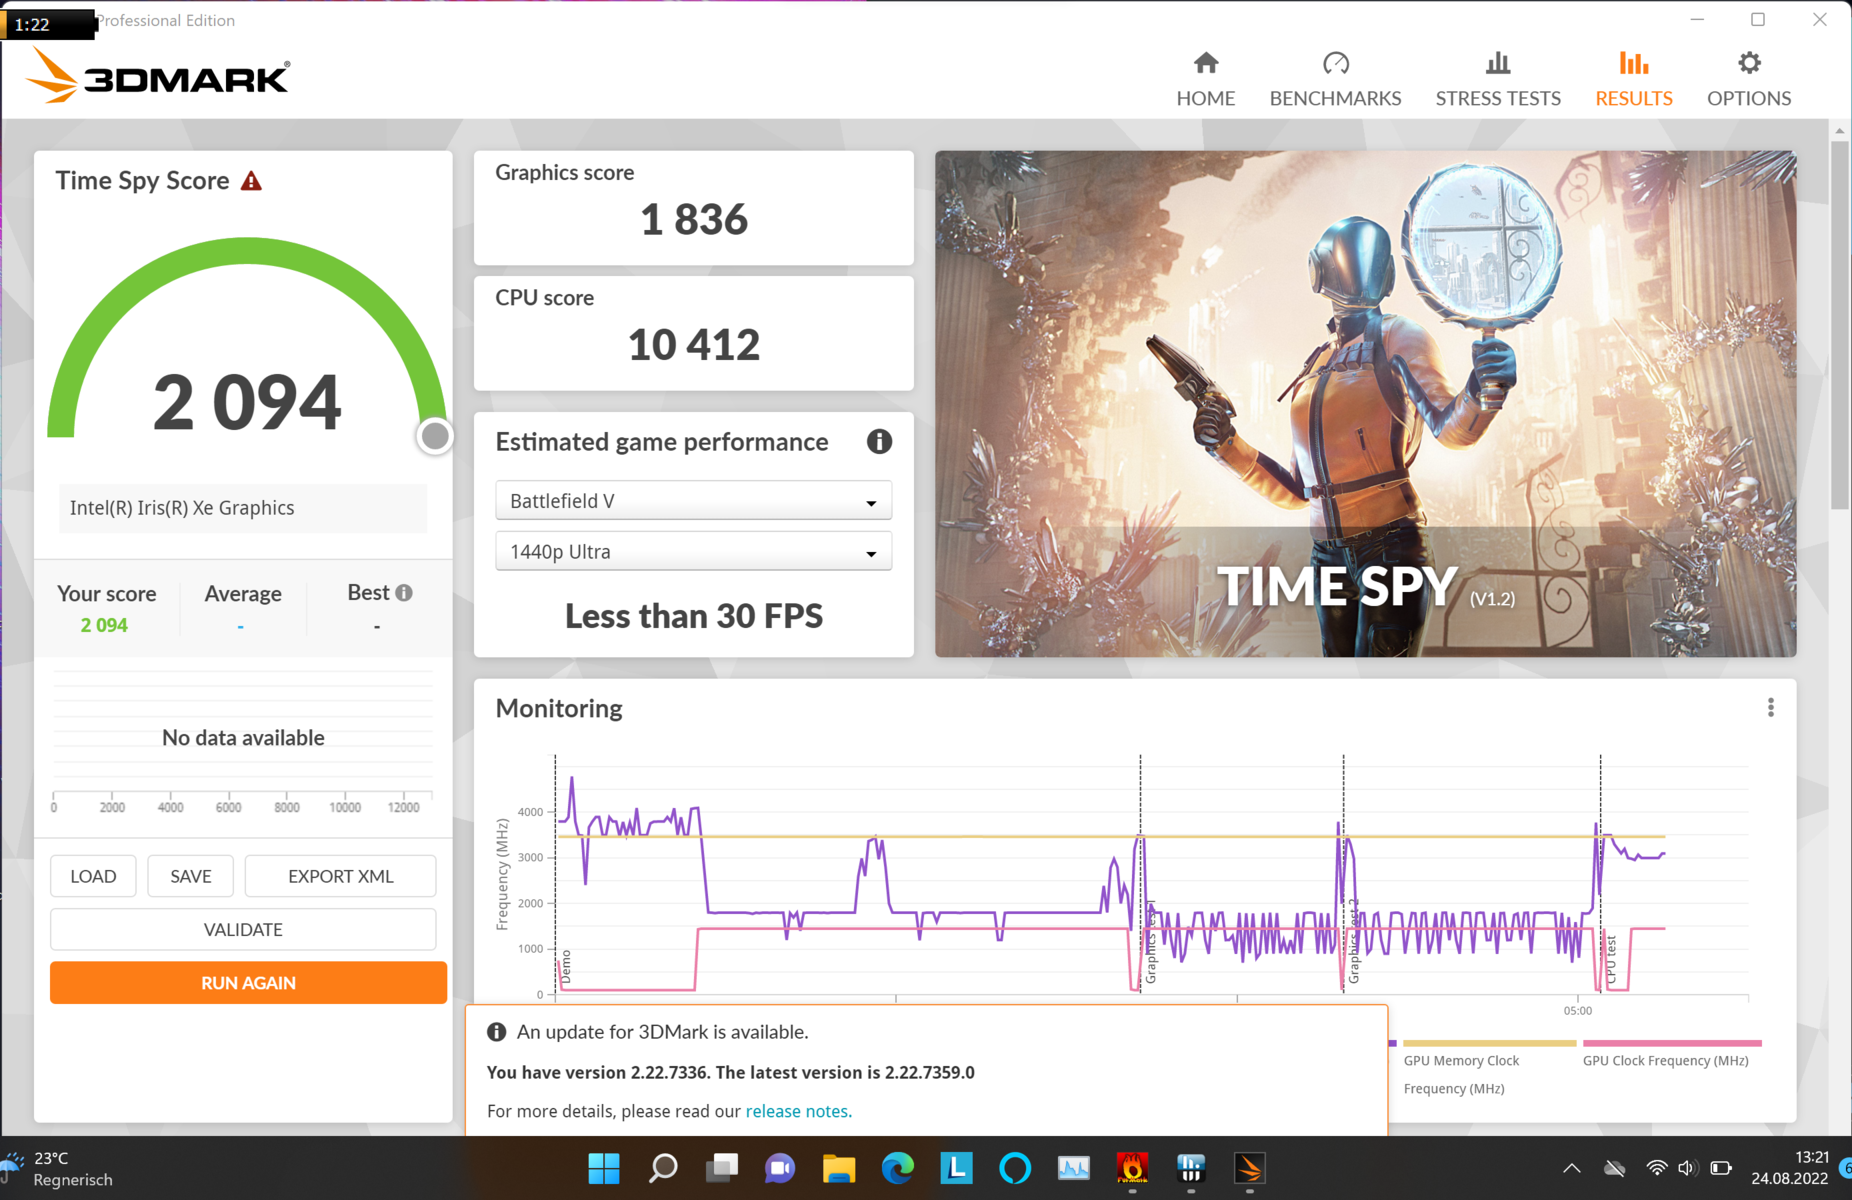
| 3DMark Time Spy Score | 2133 Punkte | |
Hilfe | ||
| Shadow of the Tomb Raider - 1920x1080 Medium Preset | |
| Durchschnitt der Klasse Subnotebook (16 - 54, n=7, der letzten 2 Jahre) | |
| Apple MacBook Air M2 10C GPU | |
| Lenovo Yoga Slim 9 14IAP7 | |
| Durchschnittliche Intel Iris Xe Graphics G7 96EUs (11 - 35.6, n=26) | |
| GRID Legends - 1920x1080 High Preset | |
| Lenovo Yoga Slim 9 14IAP7 | |
| Durchschnittliche Intel Iris Xe Graphics G7 96EUs (22.5 - 47.7, n=10) | |
| Lenovo Yoga Slim 7i Pro 14IAP G7 | |
Witcher 3 FPS-Diagramm
| min. | mittel | hoch | max. | |
|---|---|---|---|---|
| GTA V (2015) | 121.2 | 103.3 | 27.1 | 11.8 |
| The Witcher 3 (2015) | 96.7 | 62.6 | 34.7 | 16.4 |
| Dota 2 Reborn (2015) | 110.9 | 87.6 | 71.2 | 63.4 |
| Final Fantasy XV Benchmark (2018) | 50 | 28 | 0 () | |
| X-Plane 11.11 (2018) | 61.6 | 45.6 | 40.2 | |
| Far Cry 5 (2018) | 55 | 33 | 28 | |
| Strange Brigade (2018) | 99.3 | 47.8 | 37.9 | 30.8 |
| Shadow of the Tomb Raider (2018) | 49 | 26 | 24 | |
| GRID Legends (2022) | 66.6 | 53 | 40.2 |
Emissionen: Leises Ultrabook trotz 14 Kerne des i7-1280P
Geräuschemissionen
Im Leerlauf bleiben die Lüfter komplett stumm und auch das Verhalten beim Web-Browsing ist optimal. Denn selbst wer ein zügiges Surfverhalten mit multiplen Tabs pflegt, darf sich an einem komplett stummen Laptop erfreuen. Die starke CPU federt wohl auch viel ab, sodass im Surf-Szenario nie eine hohe Last erzeugt wird.
Unter voller Last drehen die Lüfter mit maximal 43,6 dB(A) ziemlich auf, behalten aber eine angenehme Geräusch-Charakteristik bei. Im Modus "Intelligente Kühlung" verhält sich der Laptop deutlich leiser, während weiterhin eine hohe Leistung abrufbar bleibt. Leider ist beim Laden des Notebooks ab und zu ein deutliches, dann dauerhaftes Fiepen vernehmbar, was jede Ladebuchse betrifft.
Noch leiser sind etwa HPs Spectre x360 13.5 und Apples passiv-gekühltes MacBook Air.
Lautstärkediagramm
| Idle |
| 26 / 26 / 28.2 dB(A) |
| Last |
| 43.6 / 43.5 dB(A) |
 | ||
30 dB leise 40 dB(A) deutlich hörbar 50 dB(A) störend |
||
min: | ||
| Lenovo Yoga Slim 9 14IAP7 Iris Xe G7 96EUs, i7-1280P, Samsung PM9B1 1024GB MZAL41T0HBLB | Lenovo Yoga 9 14IAP7 82LU0001US Iris Xe G7 96EUs, i7-1260P, Samsung PM9A1 MZVL2512HCJQ | Lenovo Yoga Slim 7 Pro 14ACH5 Vega 8, R9 5900HX, SK Hynix PC711 1TB HFS001TDE9X084N | Asus Zenbook S 13 OLED Radeon 680M, R7 6800U, Samsung PM9A1 MZVL21T0HCLR | Schenker Vision 14 GeForce RTX 3050 Ti Laptop GPU, i7-11370H, Samsung SSD 980 Pro 1TB MZ-V8P1T0BW | Dell XPS 13 Plus 9320 4K Iris Xe G7 96EUs, i7-1260P, Samsung PM9A1 MZVL21T0HCLR | HP Spectre x360 13.5 14t-ef000 Iris Xe G7 96EUs, i7-1255U, Micron 3400 1TB MTFDKBA1T0TFH | |
|---|---|---|---|---|---|---|---|
| Geräuschentwicklung | 12% | 7% | 11% | 3% | 5% | 15% | |
| aus / Umgebung * (dB) | 26 | 22.9 12% | 26 -0% | 24 8% | 24.3 7% | 24.4 6% | 23.5 10% |
| Idle min * (dB) | 26 | 23.3 10% | 26 -0% | 24 8% | 24.3 7% | 24.4 6% | 23.5 10% |
| Idle avg * (dB) | 26 | 23.5 10% | 26.5 -2% | 24 8% | 24.3 7% | 24.4 6% | 23.5 10% |
| Idle max * (dB) | 28.2 | 23.5 17% | 27.4 3% | 24 15% | 25.9 8% | 25.5 10% | 23.5 17% |
| Last avg * (dB) | 43.6 | 33.2 24% | 35 20% | 33.1 24% | 43.3 1% | 40.4 7% | 27 38% |
| Last max * (dB) | 43.5 | 44.6 -3% | 34.6 20% | 41.7 4% | 49.5 -14% | 45.5 -5% | 42.4 3% |
| Witcher 3 ultra * (dB) | 44.9 | 40.2 | 44.6 | 45.5 | 36.2 |
* ... kleinere Werte sind besser
Temperatur
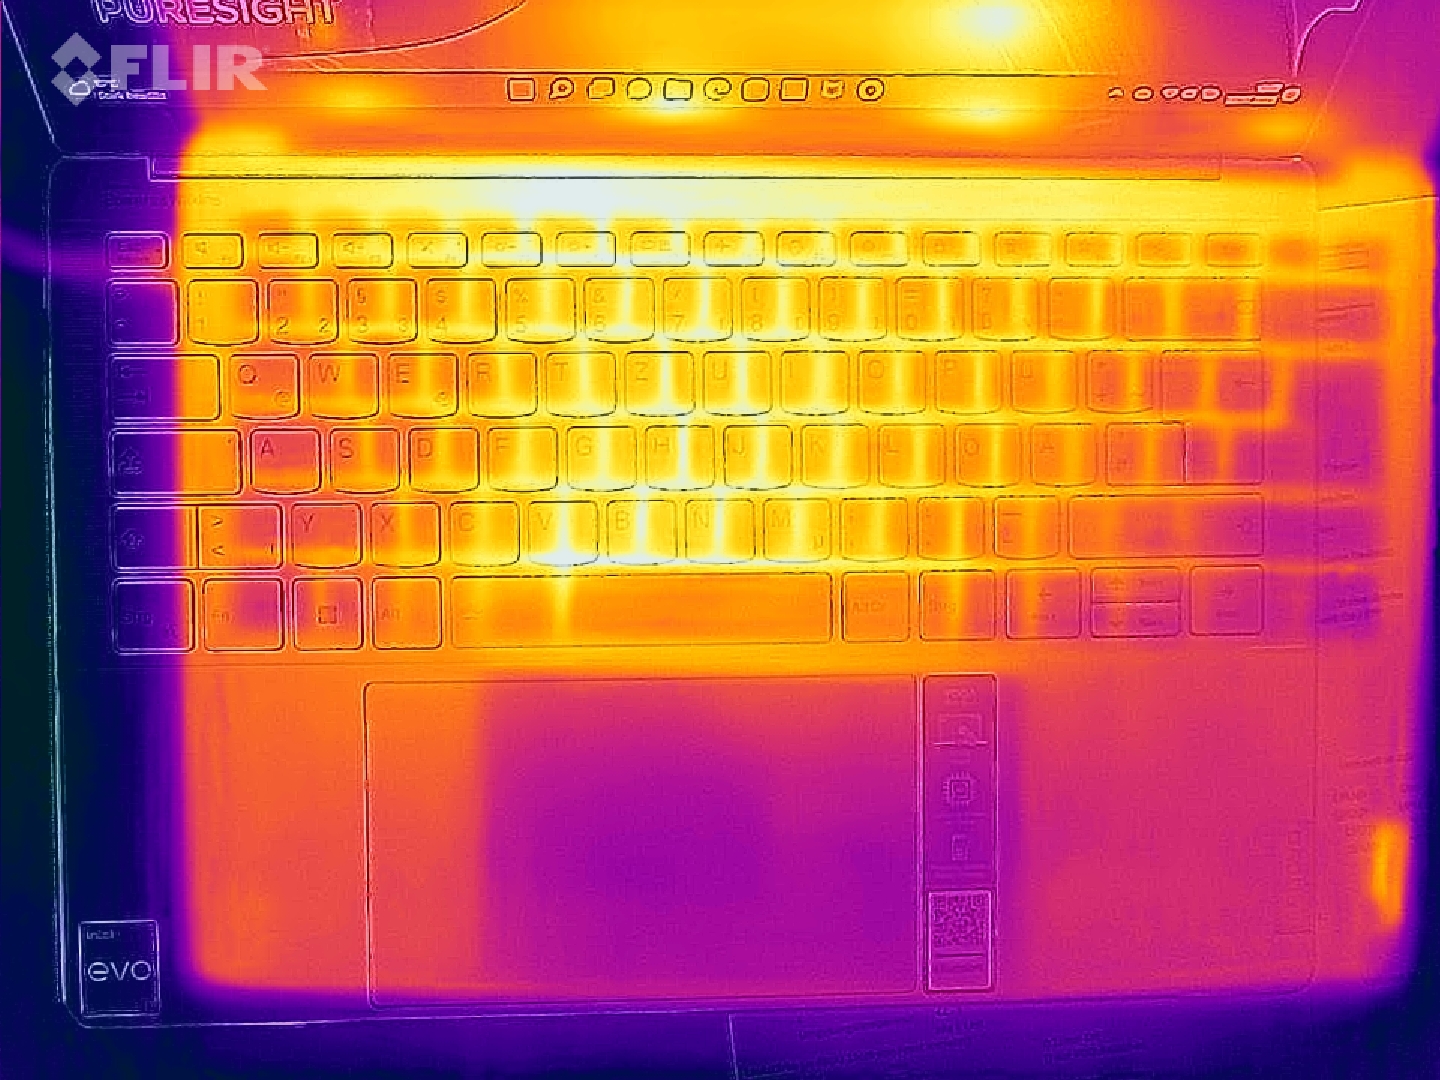
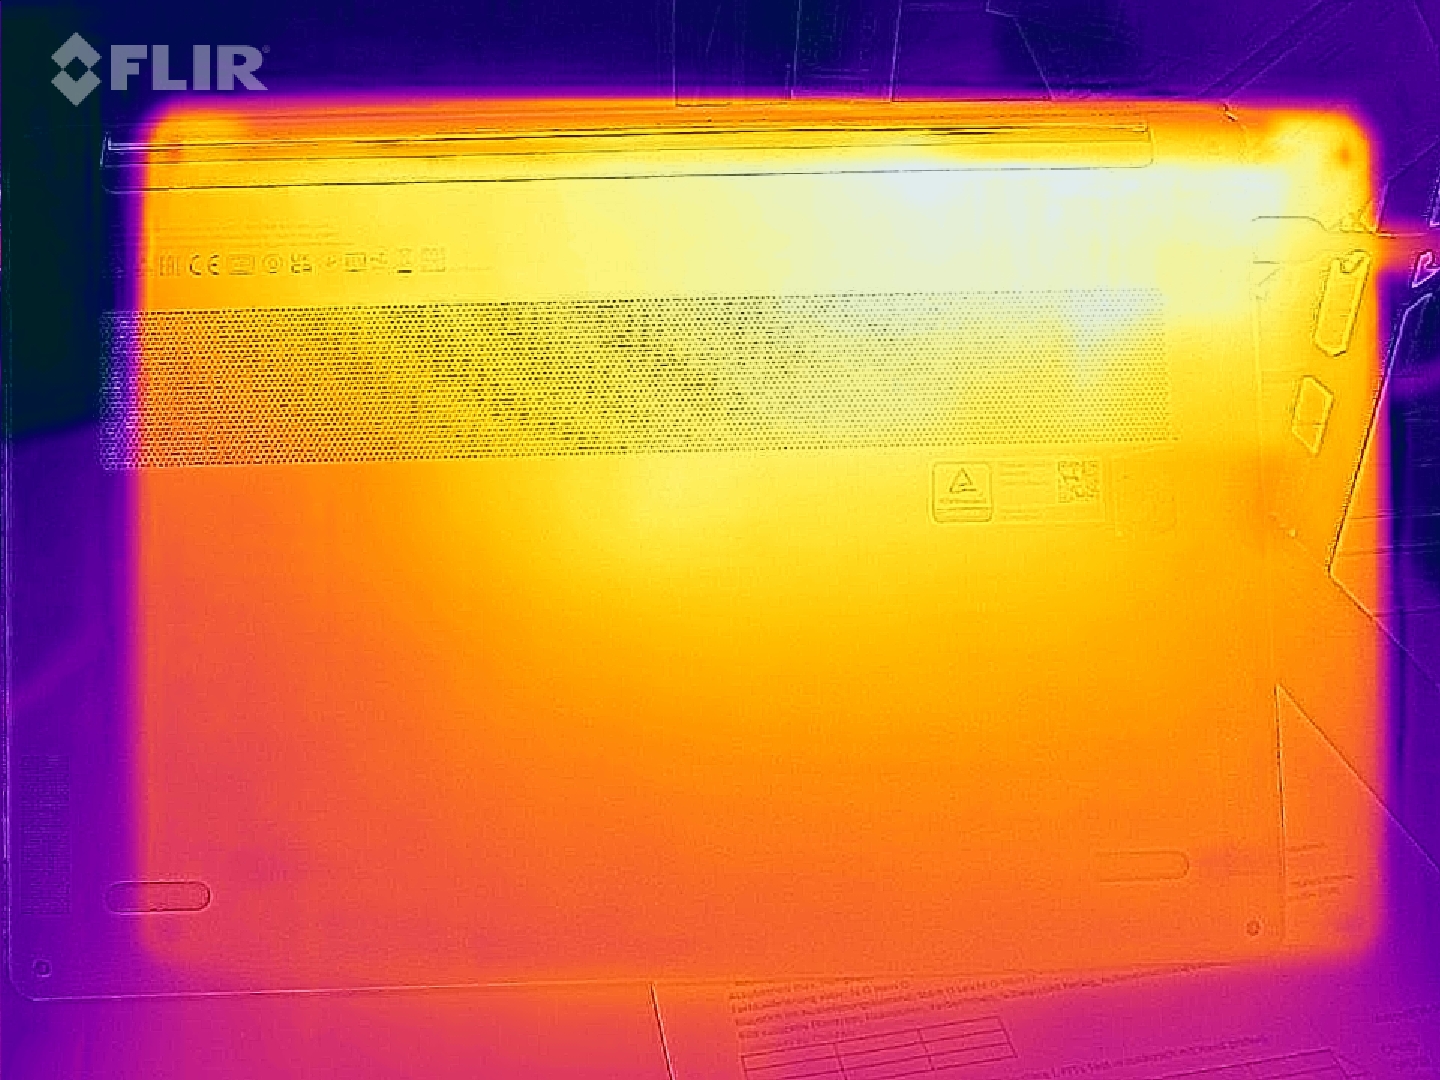
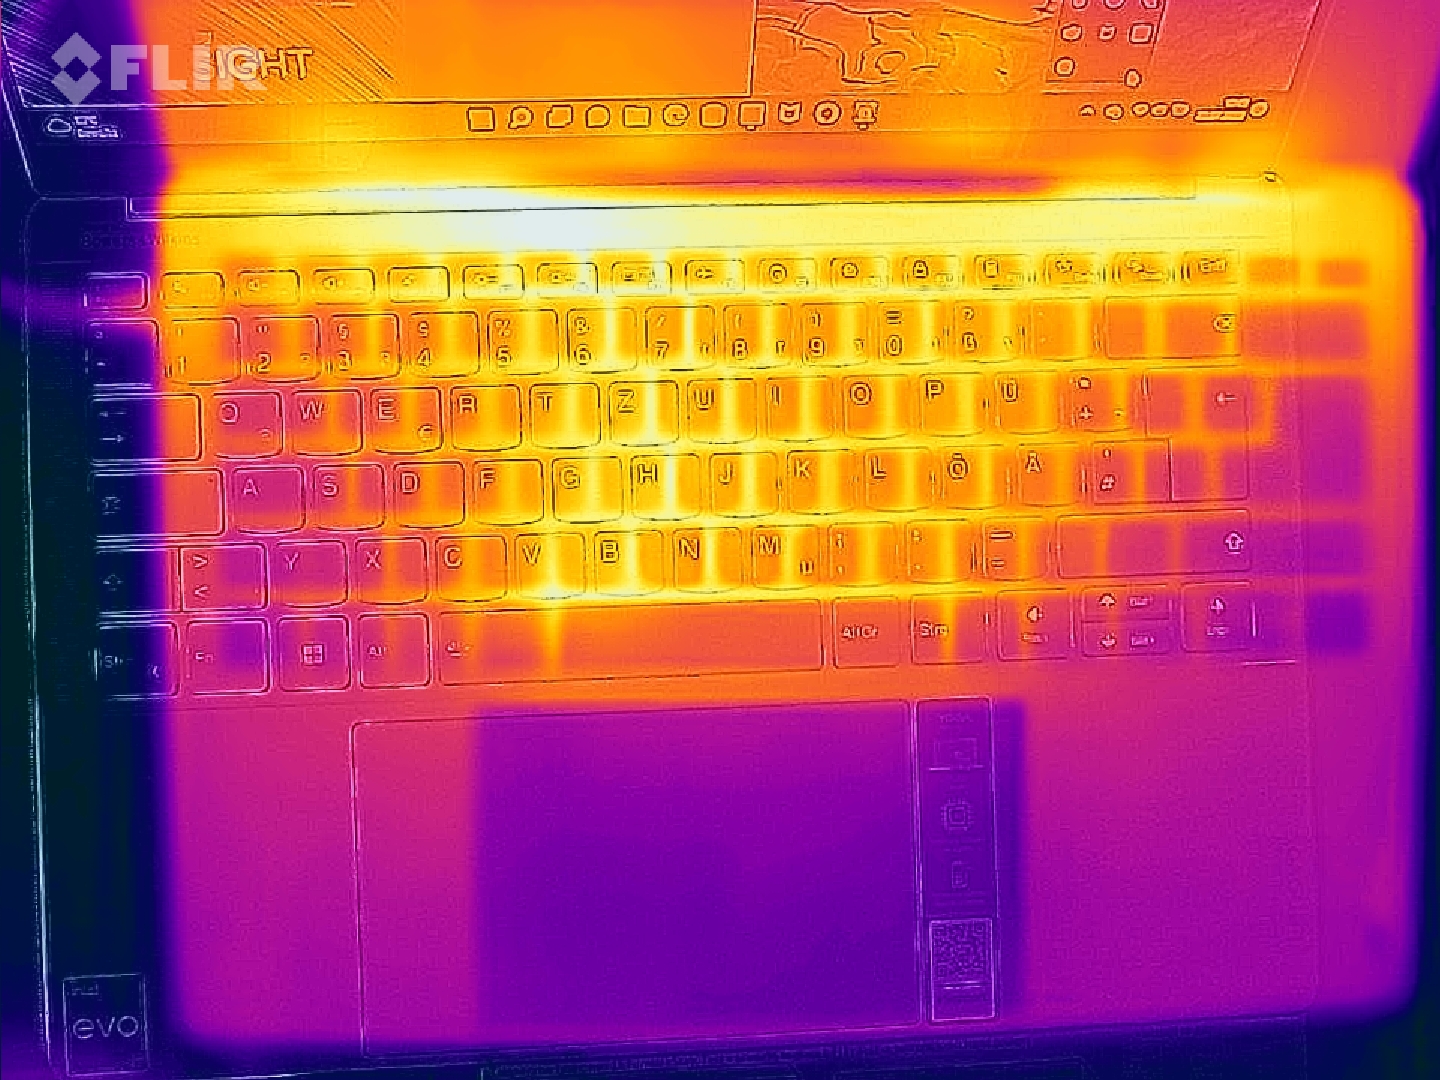
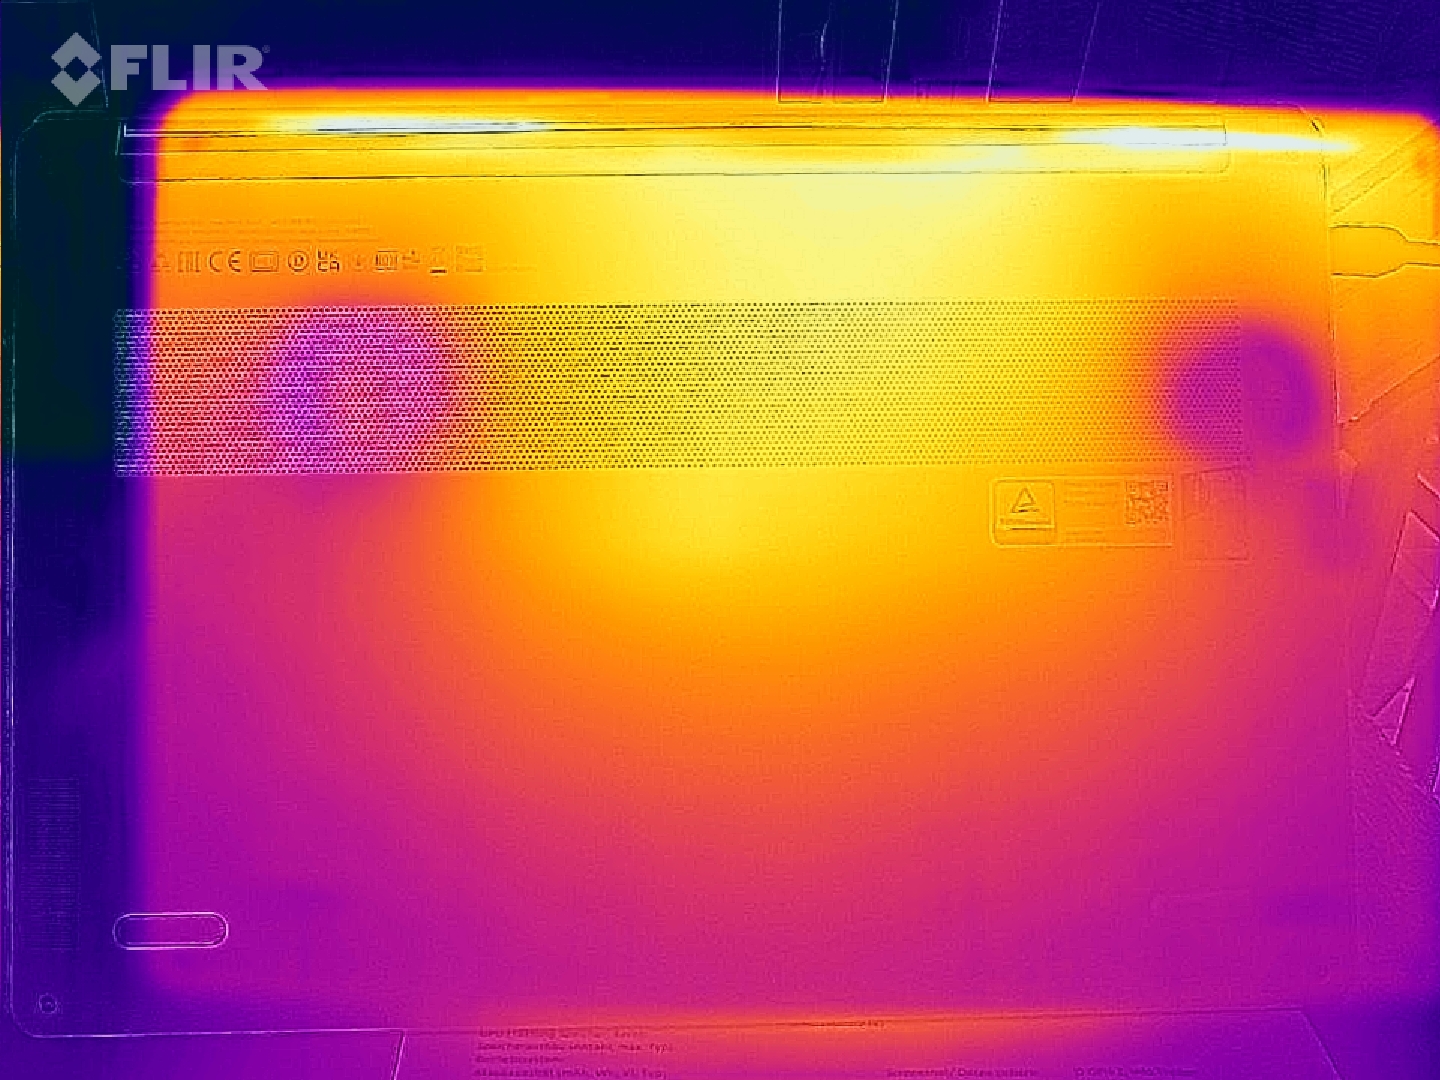
Trotz starker CPU bewegt sich das Yoga Slim 9 in erfreulich kühlen Gefilden, ohne jegliche Hotspots. Noch kühler bleibt das Spectre x360 13.5 mit Alder Lake-U Prozessor, während das MacBook Air eine ebenso gute Figur abgibt.
(±) Die maximale Temperatur auf der Oberseite ist 42.8 °C. Im Vergleich liegt der Klassendurchschnitt bei 35.9 °C (von 21.4 bis 59 °C für die Klasse Subnotebook).
(±) Auf der Unterseite messen wir eine maximalen Wert von 41.8 °C (im Vergleich zum Durchschnitt von 39.2 °C).
(+) Ohne Last messen wir eine durchschnittliche Temperatur von 29.6 °C auf der Oberseite. Der Klassendurchschnitt erreicht 30.8 °C.
(+) Die Handballen und der Touchpad-Bereich sind mit gemessenen 31.8 °C kühler als die typische Hauttemperatur und fühlen sich dadurch kühl an.
(-) Die durchschnittliche Handballen-Temperatur anderer getesteter Geräte war 28.2 °C (-3.6 °C).
| Lenovo Yoga Slim 9 14IAP7 Intel Core i7-1280P, Intel Iris Xe Graphics G7 96EUs | Lenovo Yoga 9 14IAP7 82LU0001US Intel Core i7-1260P, Intel Iris Xe Graphics G7 96EUs | Lenovo Yoga Slim 7 Pro 14ACH5 AMD Ryzen 9 5900HX, AMD Radeon RX Vega 8 (Ryzen 4000/5000) | Asus Zenbook S 13 OLED AMD Ryzen 7 6800U, AMD Radeon 680M | Schenker Vision 14 Intel Core i7-11370H, NVIDIA GeForce RTX 3050 Ti Laptop GPU | Dell XPS 13 Plus 9320 4K Intel Core i7-1260P, Intel Iris Xe Graphics G7 96EUs | Apple MacBook Air M2 10C GPU Apple M2, Apple M2 10-Core GPU | HP Spectre x360 13.5 14t-ef000 Intel Core i7-1255U, Intel Iris Xe Graphics G7 96EUs | |
|---|---|---|---|---|---|---|---|---|
| Hitze | -7% | 6% | -3% | -8% | 3% | 9% | 23% | |
| Last oben max * (°C) | 42.8 | 43.2 -1% | 41.6 3% | 47.9 -12% | 49.7 -16% | 41.1 4% | 44.7 -4% | 36.4 15% |
| Last unten max * (°C) | 41.8 | 45.6 -9% | 48.4 -16% | 56.1 -34% | 56 -34% | 48.8 -17% | 44.6 -7% | 37 11% |
| Idle oben max * (°C) | 32.7 | 34.6 -6% | 25.7 21% | 26.8 18% | 28.8 12% | 28 14% | 25.1 23% | 20.8 36% |
| Idle unten max * (°C) | 32.6 | 37 -13% | 27.8 15% | 27.3 16% | 30.6 6% | 29.3 10% | 25.3 22% | 22.6 31% |
* ... kleinere Werte sind besser
Stresstest
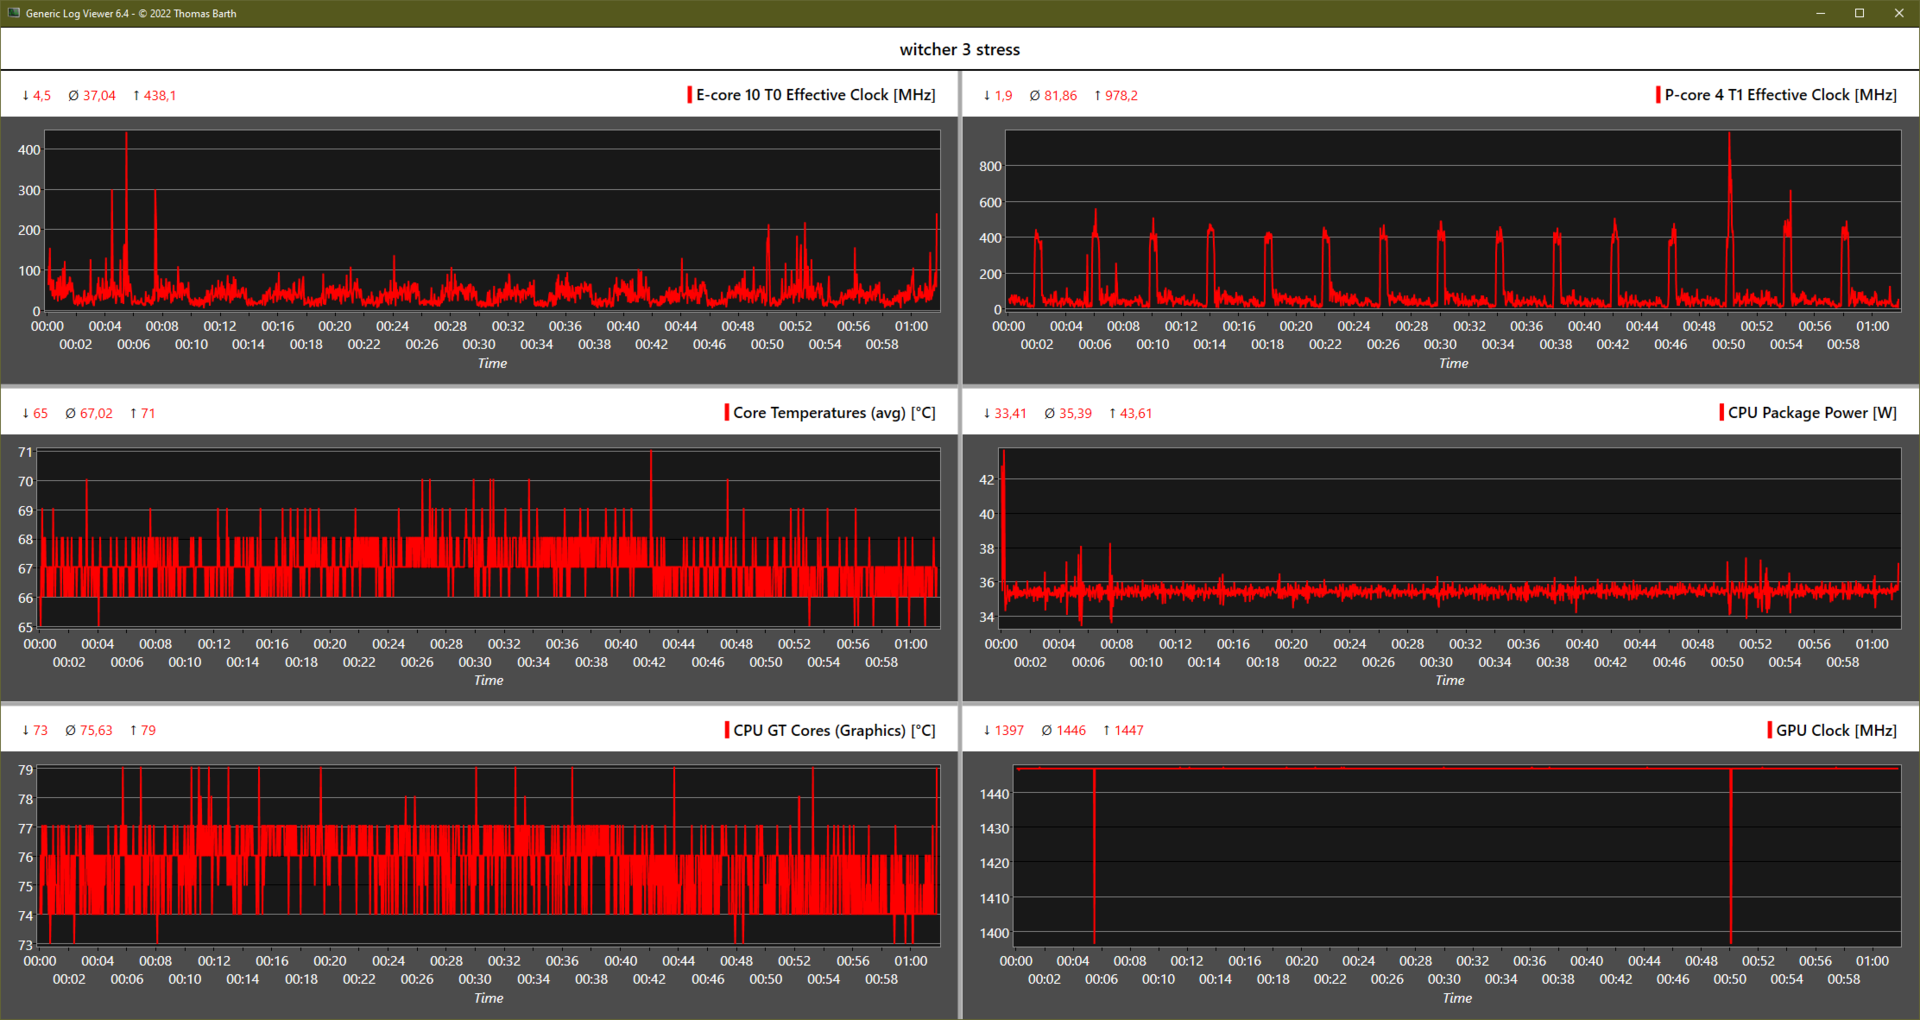
Im kombinierten Stresstest (Prime95 + Furmark) takten die P-Cores nur noch mit 750 MHz, was deutlich unter dem Basistakt liegt. Die Ursache ist die aufgeteilte Leistungsgrenze von 35 Watt, während die iGPU dabei priorisiert wird und dadurch immerhin noch einen Takt von 1.140 MHz aufrechterhalten kann.
Bei reinem GPU-Stress wird nahezu der volle Boost von 1.400 MHz erreicht. Bei reinem CPU-Stress liegen die P-Cores mit 2,1 GHz weiterhin unterm Basistakt von 2,4 GHz.
Das bedeutet, dass bei der 28-W-TDP niemals der von Intel spezifizierte Basistakt des Core i7-1280P erreicht werden kann. Ein sich dem einstündigen Stresstest anschließender 3D-Test zeigt keinerlei Einbußen.
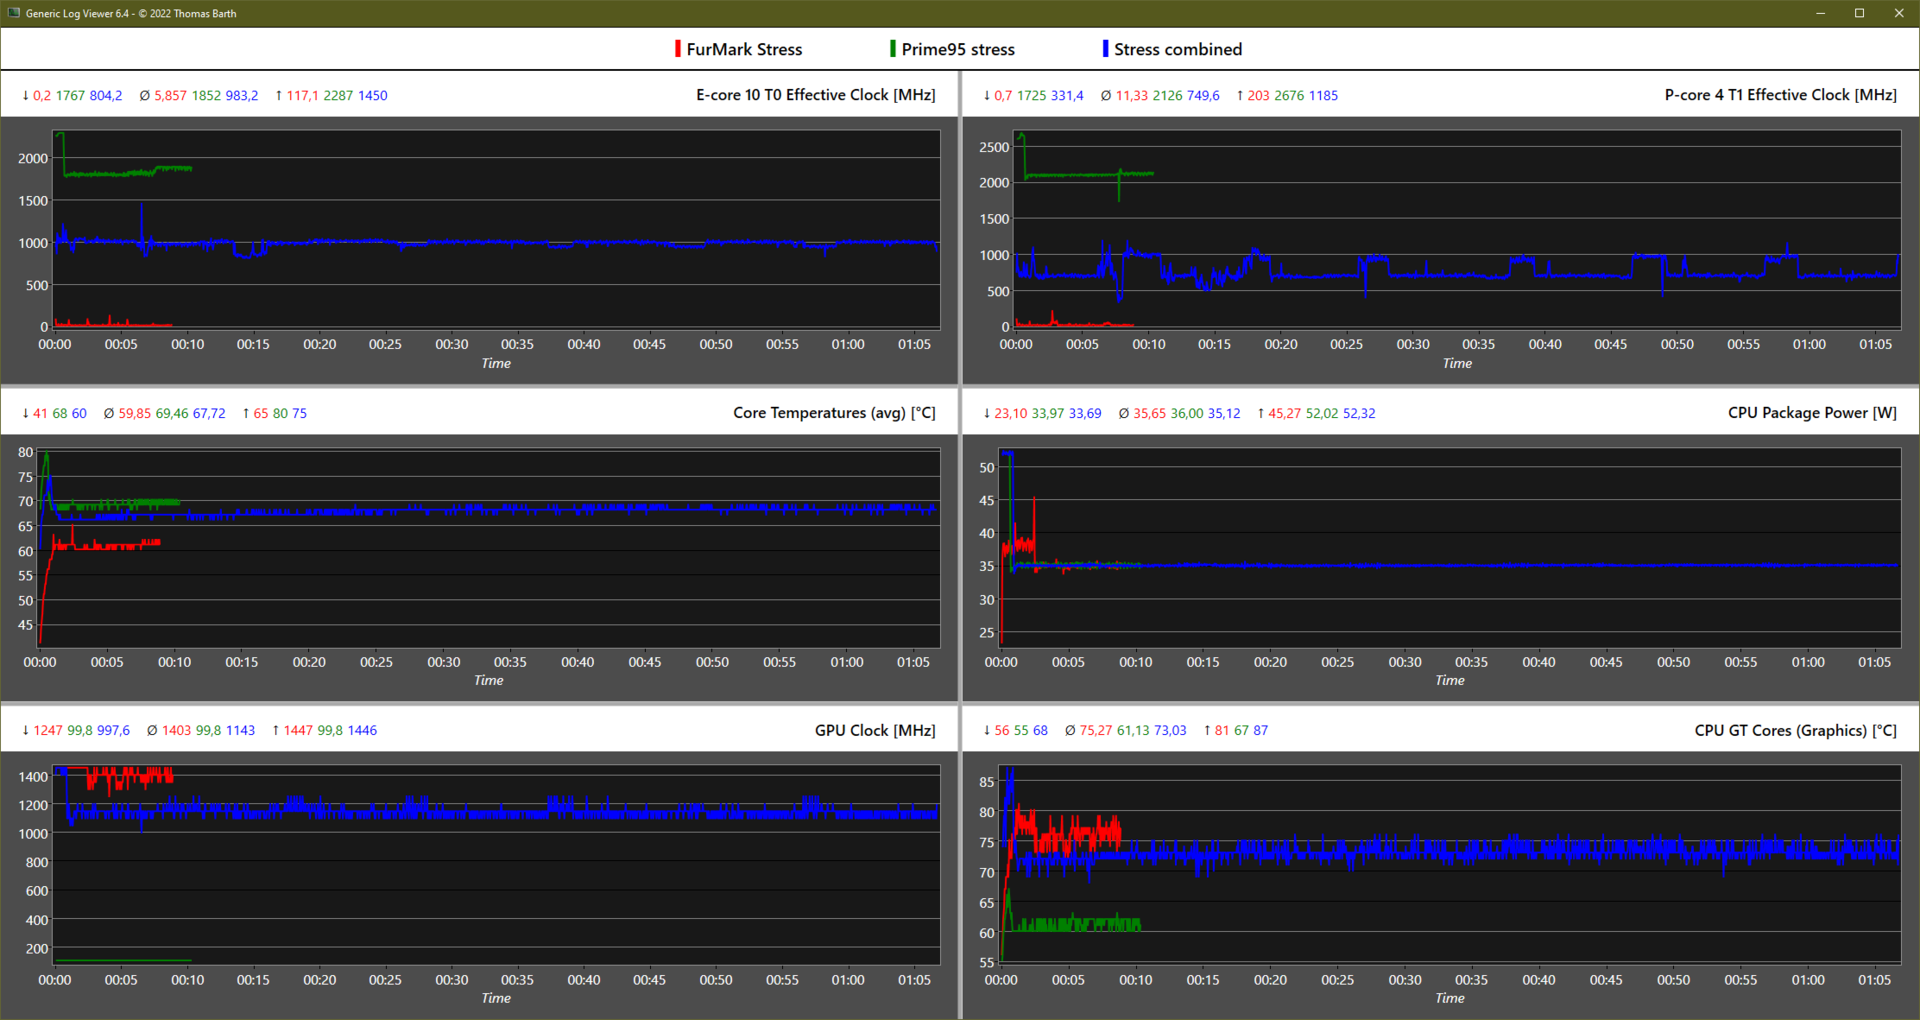
| CPU Clock P-Cores / E-Cores (MHz) | GPU Clock (MHz) | Average CPU Temperature (°C) | Average GPU Temperature (°C) | |
| System Idle | 16 / 5 | 100 | 42 | 43 |
| Prime95 Stress | 2.100 / 1.800 | 100 | 69 | 61 |
| Prime95 + FurMark Stress | 750 / 1.000 | 1.140 | 68 | 73 |
| FurMark Stress | 10 / 6 | 1.400 | 60 | 75 |
| Witcher 3 Stress | 80 / 37 | 1.445 | 67 | 76 |
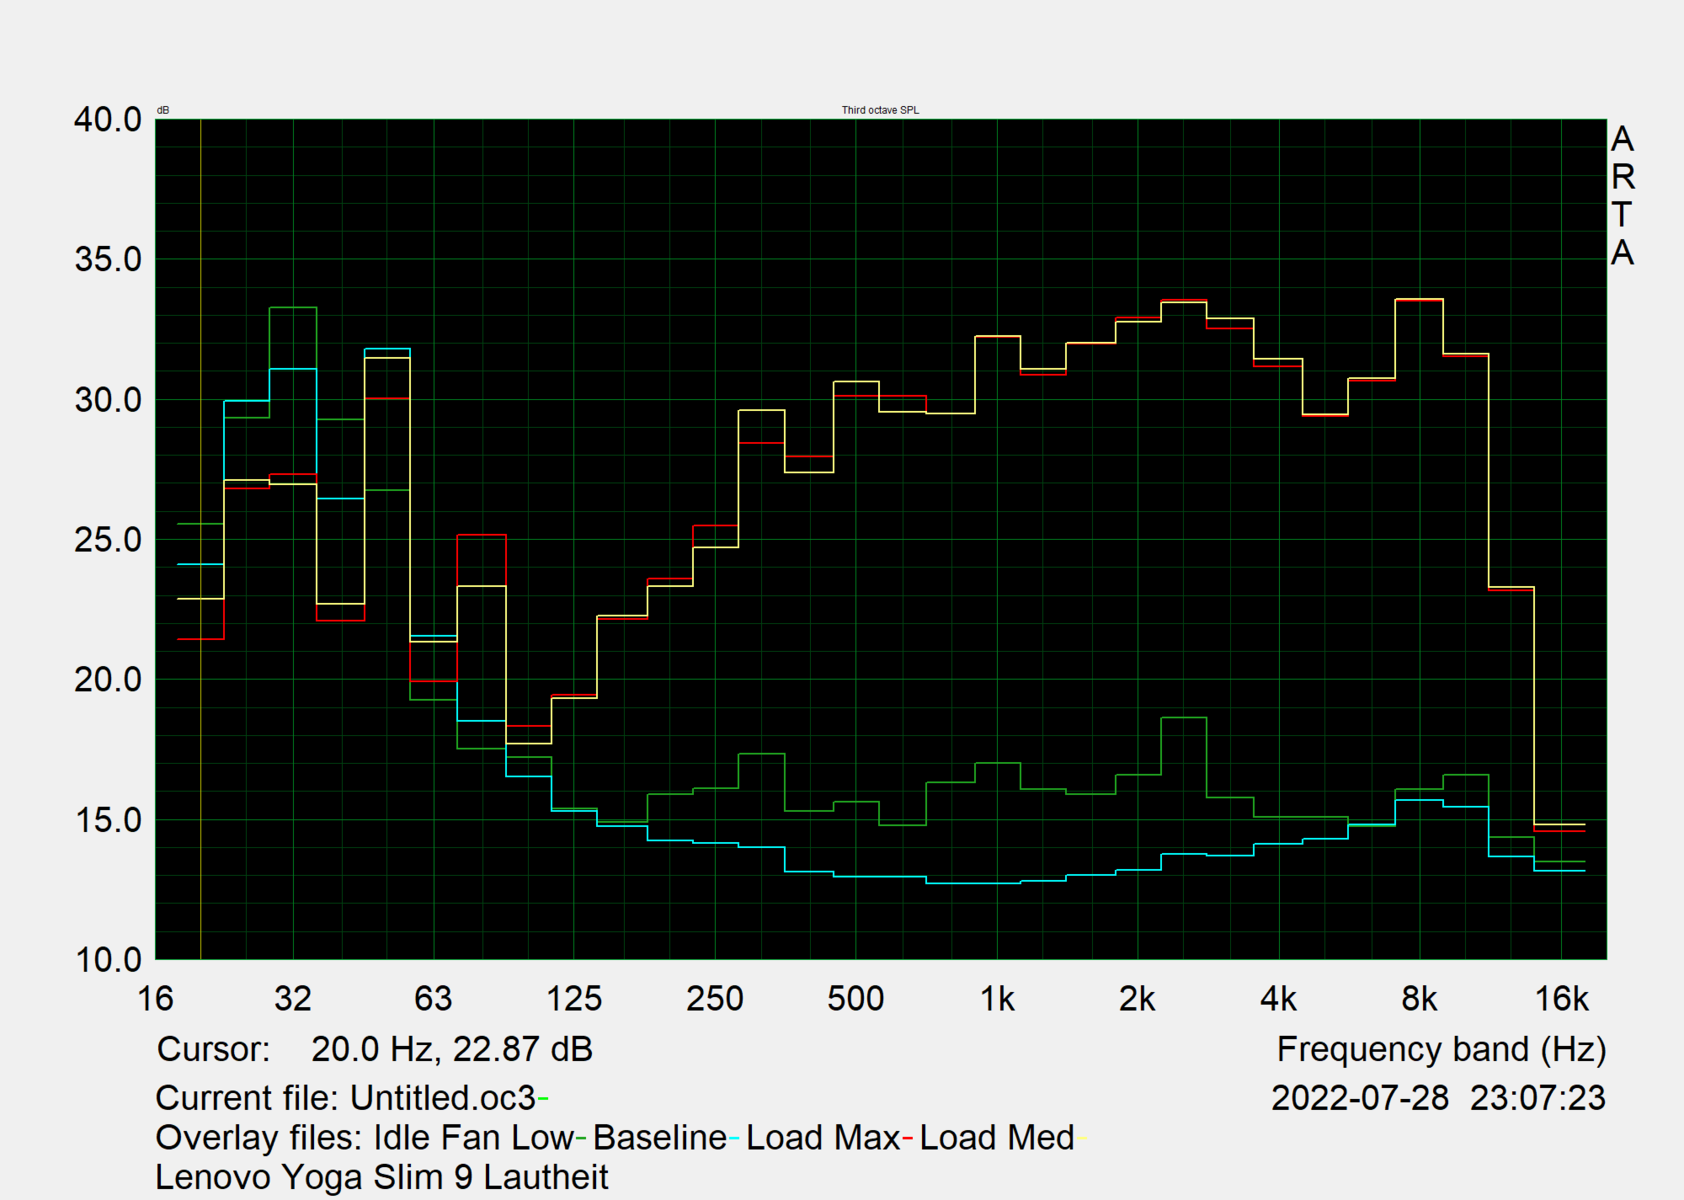
Lautsprecher
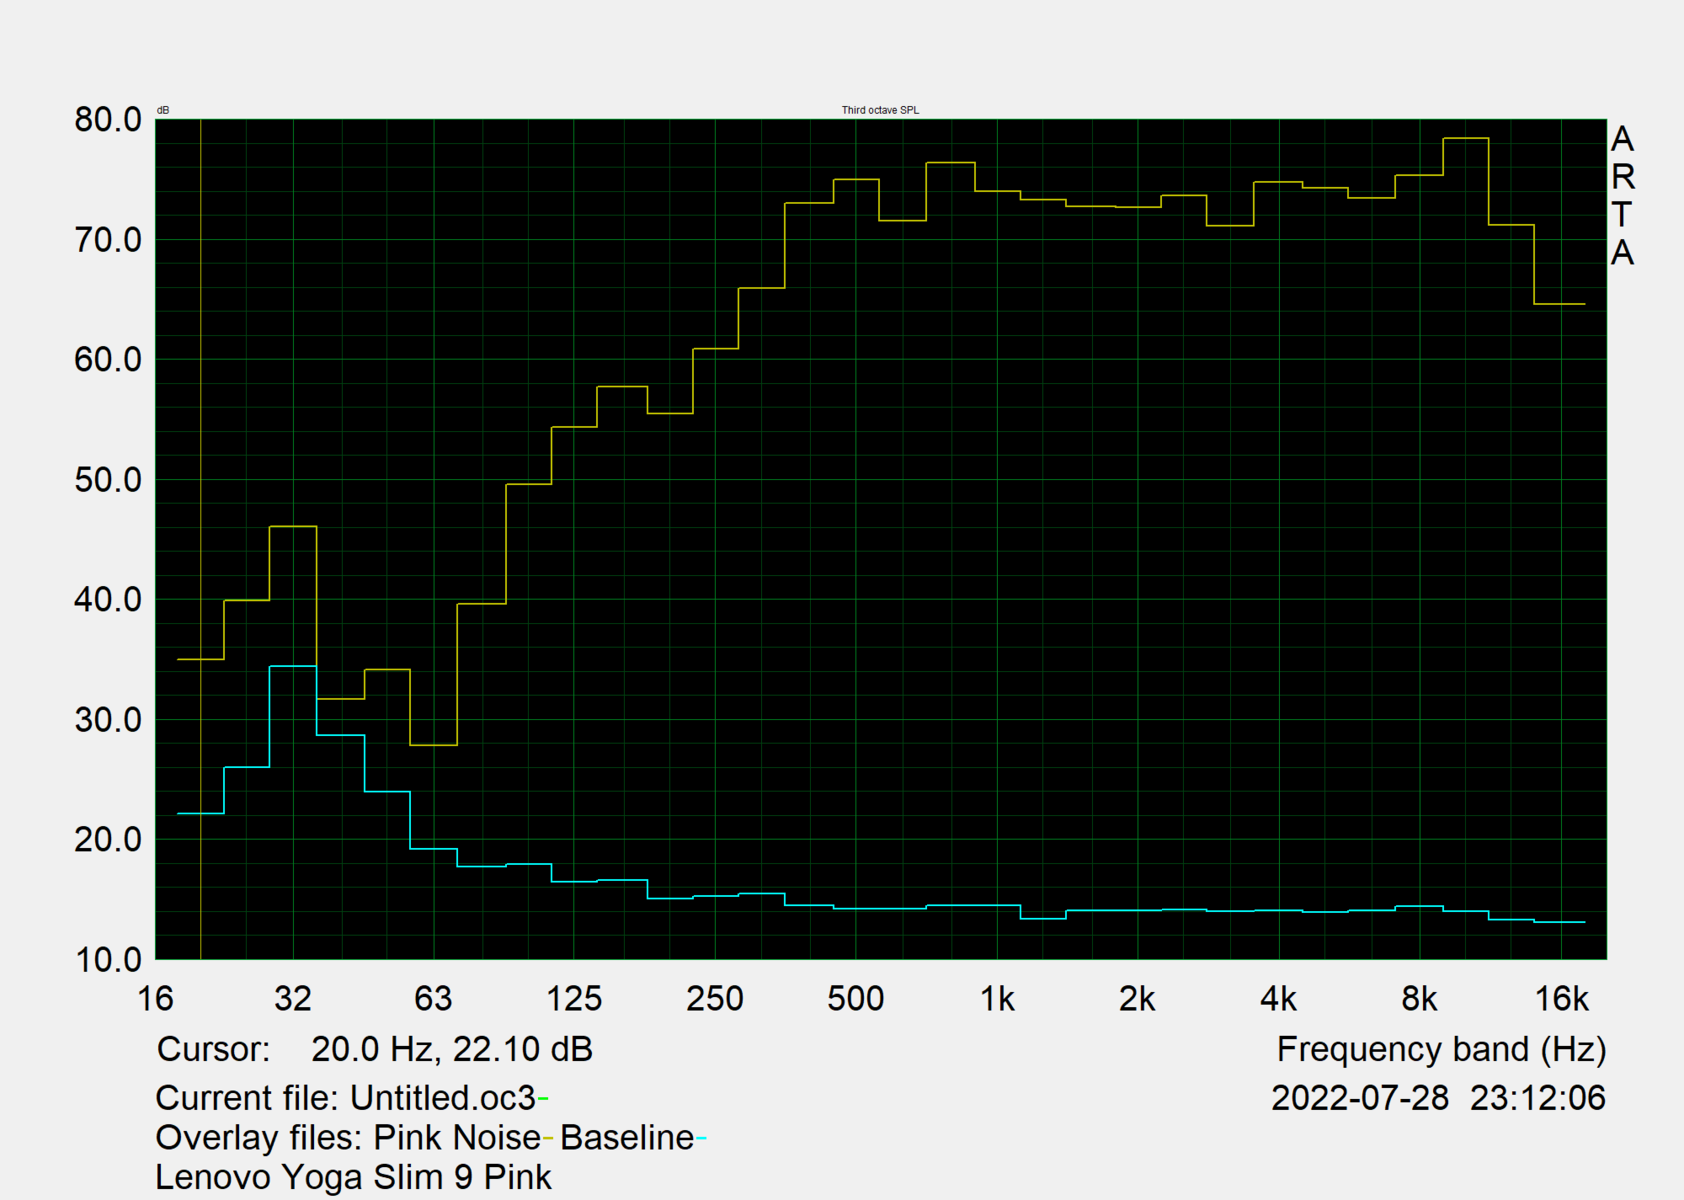
Die zwei 2-W-Hochtöner sowie zwei 3-W-Tieftöner von Bowers & Wilkins werden mit 78,4 db(A) laut genug, um ein normal großes Zimmer zu beschallen.
Mitten und Höhen werden ausgeglichen und sehr linear wiedergegeben, während auch der Bass, dank der Woofer, ausreicht. Den Sound nehmen wir als sehr ansprechend wahr, dieser 97 % der von uns getesteten Geräte überragt.
Externe Soundsysteme können per 3,5-mm-Klinke oder Bluetooth verbunden werden.
Lenovo Yoga Slim 9 14IAP7 Audio Analyse
(±) | Mittelmäßig laut spielende Lautsprecher (78.4 dB)
Bass 100 - 315 Hz
(-) | kaum Bass - 15.4% niedriger als der Median
(±) | durchschnittlich lineare Bass-Wiedergabe (8.8% Delta zum Vorgänger)
Mitteltöne 400 - 2000 Hz
(+) | ausgeglichene Mitten, vom Median nur 1.2% abweichend
(+) | lineare Mitten (4.5% Delta zum Vorgänger)
Hochtöne 2 - 16 kHz
(+) | ausgeglichene Hochtöne, vom Median nur 2.2% abweichend
(+) | sehr lineare Hochtöne (3.3% Delta zum Vorgänger)
Gesamt im hörbaren Bereich 100 - 16.000 Hz
(+) | hörbarer Bereich ist sehr linear (9.6% Abstand zum Median
Im Vergleich zu allen Geräten derselben Klasse
» 5% aller getesteten Geräte dieser Klasse waren besser, 2% vergleichbar, 93% schlechter
» Das beste Gerät hat einen Delta-Wert von 5%, durchschnittlich ist 18%, das schlechteste Gerät hat 53%
Im Vergleich zu allen Geräten im Test
» 4% aller getesteten Geräte waren besser, 1% vergleichbar, 95% schlechter
» Das beste Gerät hat einen Delta-Wert von 4%, durchschnittlich ist 24%, das schlechteste Gerät hat 134%
Apple MacBook Air M2 Entry Audio Analyse
(+) | Die Lautsprecher können relativ laut spielen (82.7 dB)
Bass 100 - 315 Hz
(±) | abgesenkter Bass - 12.2% geringer als der Median
(±) | durchschnittlich lineare Bass-Wiedergabe (12.6% Delta zum Vorgänger)
Mitteltöne 400 - 2000 Hz
(+) | ausgeglichene Mitten, vom Median nur 1.1% abweichend
(+) | lineare Mitten (3.1% Delta zum Vorgänger)
Hochtöne 2 - 16 kHz
(+) | ausgeglichene Hochtöne, vom Median nur 2.4% abweichend
(+) | sehr lineare Hochtöne (1.9% Delta zum Vorgänger)
Gesamt im hörbaren Bereich 100 - 16.000 Hz
(+) | hörbarer Bereich ist sehr linear (9.5% Abstand zum Median
Im Vergleich zu allen Geräten derselben Klasse
» 5% aller getesteten Geräte dieser Klasse waren besser, 2% vergleichbar, 93% schlechter
» Das beste Gerät hat einen Delta-Wert von 5%, durchschnittlich ist 18%, das schlechteste Gerät hat 53%
Im Vergleich zu allen Geräten im Test
» 4% aller getesteten Geräte waren besser, 1% vergleichbar, 95% schlechter
» Das beste Gerät hat einen Delta-Wert von 4%, durchschnittlich ist 24%, das schlechteste Gerät hat 134%
Energieverwaltung: Hoher Energiebedarf durch i7-1280P + OLED
Energieaufnahme
Die Leerlauf-Energieaufnahme ist ziemlich erhöht, was an der Kombination aus OLED-Display und Alder Lake-P liegen dürfte. Das Asus Zenbook S 13 schafft geringere Leerlauf-Aufnahmen trotz 3K-OLED-Panel, während das Lenovo Yoga 9 mit 12-Kern-CPU und gleichem OLED-Display eine ähnlich erhöhte Leerlauf-Aufnahme aufweist.
Das mitgelieferte 65-W-Netzteil ist ausreichend dimensioniert, um Dauerlast-Szenarien zu meistern. Lediglich initiale Turbo-Boost-Phasen können den verbauten Akku für eine kurze Zeit zusätzlich taxieren.
| Aus / Standby | |
| Idle | |
| Last |
|
Legende:
min: | |
| Lenovo Yoga Slim 9 14IAP7 i7-1280P, Iris Xe G7 96EUs, Samsung PM9B1 1024GB MZAL41T0HBLB, OLED, 2880x1800, 14" | Lenovo Yoga 9 14IAP7 82LU0001US i7-1260P, Iris Xe G7 96EUs, Samsung PM9A1 MZVL2512HCJQ, OLED, 2880x1800, 14" | Lenovo Yoga Slim 7i Pro 14IAP G7 i5-1240P, Iris Xe G7 80EUs, Samsung PM9A1 MZVL2512HCJQ, IPS, 2880x1800, 14" | Asus Zenbook S 13 OLED R7 6800U, Radeon 680M, Samsung PM9A1 MZVL21T0HCLR, OLED, 2880x1800, 13.3" | Schenker Vision 14 i7-11370H, GeForce RTX 3050 Ti Laptop GPU, Samsung SSD 980 Pro 1TB MZ-V8P1T0BW, IPS, 2880x1800, 14" | Dell XPS 13 Plus 9320 4K i7-1260P, Iris Xe G7 96EUs, Samsung PM9A1 MZVL21T0HCLR, IPS, 3840x2400, 13.4" | HP Spectre x360 13.5 14t-ef000 i7-1255U, Iris Xe G7 96EUs, Micron 3400 1TB MTFDKBA1T0TFH, OLED, 3000x2000, 13.5" | Apple MacBook Air M2 10C GPU M2, M2 10-Core GPU, Apple SSD AP1024Z, IPS, 2560x1664, 13.6" | Durchschnittliche Intel Iris Xe Graphics G7 96EUs | Durchschnitt der Klasse Subnotebook | |
|---|---|---|---|---|---|---|---|---|---|---|
| Stromverbrauch | 13% | 33% | 38% | -12% | 22% | 39% | 53% | 35% | 45% | |
| Idle min * (Watt) | 11.8 | 8 32% | 5.6 53% | 4.8 59% | 6.7 43% | 7 41% | 4 66% | 1.9 84% | 5.51 ? 53% | 3.83 ? 68% |
| Idle avg * (Watt) | 17.4 | 14 20% | 9.3 47% | 8.7 50% | 12.6 28% | 11 37% | 4.9 72% | 9.6 45% | 8.66 ? 50% | 6.62 ? 62% |
| Idle max * (Watt) | 22.4 | 14.4 36% | 9.6 57% | 10.1 55% | 15.4 31% | 11.4 49% | 12.5 44% | 9.7 57% | 10.9 ? 51% | 7.99 ? 64% |
| Last avg * (Watt) | 53 | 59.6 -12% | 49 8% | 45.6 14% | 85.7 -62% | 59.7 -13% | 48.1 9% | 32.4 39% | 45.6 ? 14% | 41.9 ? 21% |
| Witcher 3 ultra * (Watt) | 52.6 | 53.6 -2% | 38.2 27% | 42.4 19% | 83 -58% | 49.4 6% | 35.8 32% | 30.8 41% | ||
| Last max * (Watt) | 71 | 68.1 4% | 65.2 8% | 49.5 30% | 110.9 -56% | 63 11% | 65.2 8% | 35.7 50% | 67.8 ? 5% | 64.5 ? 9% |
* ... kleinere Werte sind besser
Energieaufnahme Witcher 3 / Stresstest
Energieaufnahme mit externem Monitor
Akkulaufzeit
In unserem WLAN-Test, bei einer Helligkeit von 150 Nits, mit ausgewähltem Balance-Profil von Windows sowie "Intelligente Kühlung" von Lenovo Vantage, deaktiviertem HDR und fixierten 60 Hz, kommen wir auf etwa 7 Stunden. Das ist nicht sonderlich lang, aber für die verbaute Hardware (3K-OLED-Panel + 14-Kern-Prozessor) noch vertretbar.
Das Ergebnis deckt sich mit dem des Yoga 9 2-in-1, das auf das gleiche Panel und einen Alder Lake-P 12-Kerner setzt. Etwas erstaunt hat uns das um nur 50 Minuten kürzere Resultat bei maximaler Helligkeit von circa 360 Nits.
Unser Gerät unterstützt unverständlicherweise kein Fast Charging, obwohl "Rapid Charge" beworben wird. Vollständig geladen ist das Yoga Slim 9 in knapp 2 Stunden.
| Lenovo Yoga Slim 9 14IAP7 i7-1280P, Iris Xe G7 96EUs, 75 Wh | Lenovo Yoga 9 14IAP7 82LU0001US i7-1260P, Iris Xe G7 96EUs, 75 Wh | Lenovo Yoga 7-14ARB G7 R7 6800U, Radeon 680M, 71 Wh | Asus Zenbook S 13 OLED R7 6800U, Radeon 680M, 67 Wh | Schenker Vision 14 i7-11370H, GeForce RTX 3050 Ti Laptop GPU, 53 Wh | Dell XPS 13 Plus 9320 4K i7-1260P, Iris Xe G7 96EUs, 55 Wh | HP Spectre x360 13.5 14t-ef000 i7-1255U, Iris Xe G7 96EUs, 66 Wh | Apple MacBook Air M2 10C GPU M2, M2 10-Core GPU, 52.6 Wh | Durchschnitt der Klasse Subnotebook | |
|---|---|---|---|---|---|---|---|---|---|
| Akkulaufzeit | -3% | 34% | 54% | -18% | 4% | 26% | 99% | 69% | |
| H.264 (h) | 8.4 | 12.7 51% | 15.2 81% | 6.8 -19% | 11 31% | 15.8 88% | 15.4 ? 83% | ||
| WLAN (h) | 7 | 6.8 -3% | 9.7 39% | 9.2 31% | 5.5 -21% | 6.9 -1% | 8 14% | 14.7 110% | 14 ? 100% |
| Last (h) | 1.6 | 1.8 13% | 2.4 50% | 1.4 -13% | 1.3 -19% | 2.2 38% | 1.969 ? 23% | ||
| Idle (h) | 20.4 | 28.6 ? |
Pro
Contra
Fazit: Lenovo baut das wohl schnellste Ultrabook mit Macken
Lenovo Yoga Slim 9 (2022): Ultrabook der Mittelklasse oder doch eher Oberklasse? Das Gebotene stimmt zumindest: ein gelungenes Design, samt Display-Deckel aus 3D-Glas, die robuste 6000er-Aluminium-Legierung beim Gehäuse und im Inneren ein leistungsfähiger 14-Kern-Prozessor, gepaart mit sehr schnellem RAM, einem brillanten 3K-OLED-Display mit 90 Hz, 100-prozentiger Abdeckung von DCI-P3 und HDR500.
Dazu kommen sehr gute Quad Speaker und eine brauchbare FHD-Webcam, während die Emissionen des kompakten Laptops gering bleiben, besonders in Anbetracht der gebotenen Höchstleistung, die in einem Ultrabook seinesgleichen sucht.
Lenovos Yoga Slim 9 ist das derzeit wohl schnellste Ultrabook, befeuert durch Intels Core i7-1280P, während die Emissionen dennoch gering bleiben, aber in Kombination mit dem hochauflösendem OLED-Panel mittelmäßige Akkulaufzeiten liefert.
Weniger gefallen hat uns das rutschige Touchpad, welches zu Fehleingaben neigt und der, selbst für ein Ultrabook, sehr geringe Tastenhub. Zudem wird einem die Wartung erschwert, während es ohnehin nur die verkürzte SSD wechselbar ist. Die Anschlüsse sind dürftig, auch wenn 3x Thunderbolt 4 sicherlich nicht das Schlechteste der Laptop-Welt darstellen. Der hohe Energiebedarf mit mittelmäßigen Laufzeiten, sowie das langsame Laden sind weitere Kompromisse, die man beim Yoga Slim 9 eingehen muss.
Längere Akkulaufzeiten und bessere Eingabegeräte bietet etwa das günstigere Asus Zenbook S 13. Das Yoga-Convertible bietet auch einige Vorteile, während HPs Spectre x360 13.5 ein 3:2-Display und ebenfalls bessere Eingabegeräte bietet.
Preis und Verfügbarkeit
Das Lenovo Yoga Slim 9i ist in der von uns getesteten Variante mit Intel Core i7-1280P, 16 GB LPDDR5-RAM, 1-TB-SSD und 3K-OLED-Display für 2.139 Euro auf der Lenovo-Website konfigurierbar. Zum Zeitpunkt dieses Testes gewährt Lenovo einen Rabatt von 15 %. Für das 4K-60Hz-OLED-Display zahlt man 140 Euro mehr, während sich durch die Wahl der CPU oder SSD einiges sparen lässt.
Lenovo Yoga Slim 9 14IAP7
- 06.09.2022 v7 (old)
Marvin Gollor
Preisvergleich
