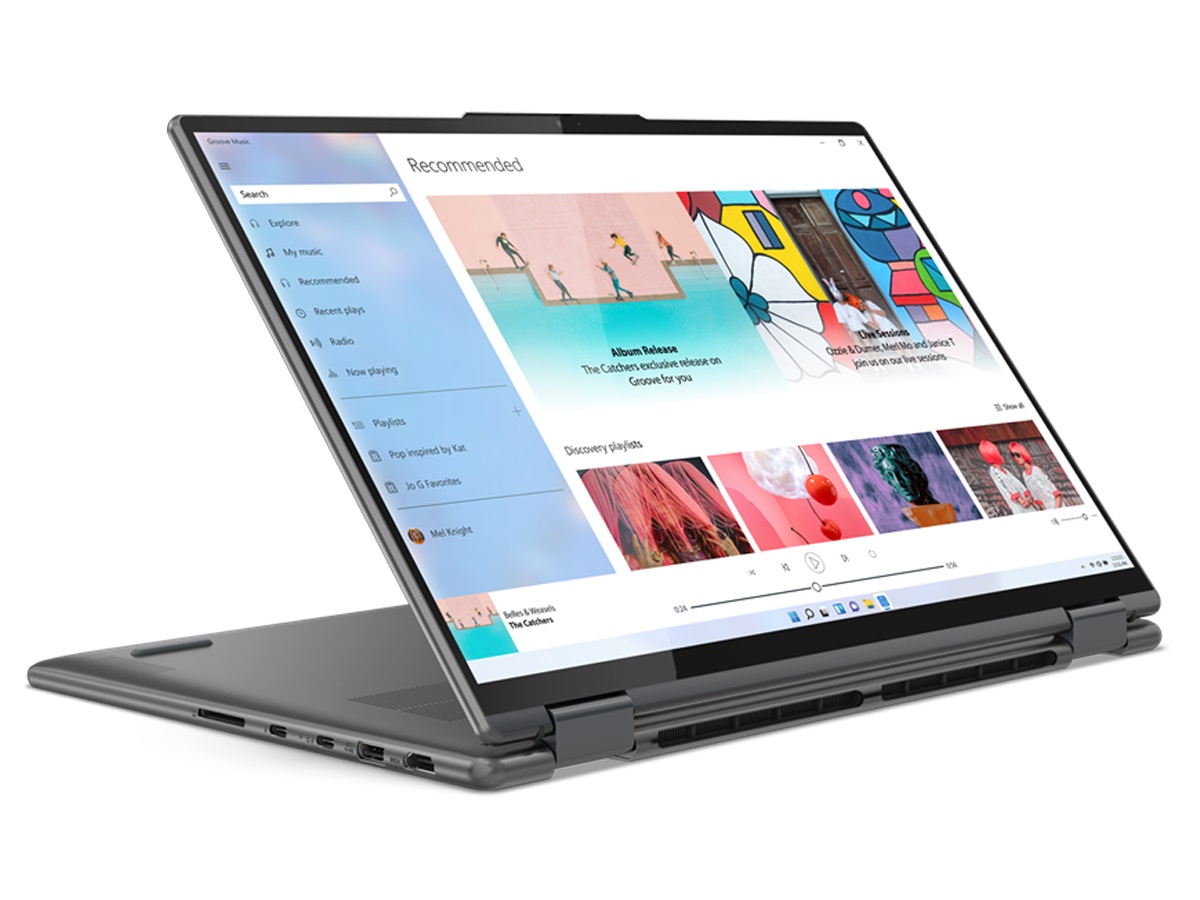
Lenovo Yoga 7 16 Gen 7 Bewertung: Massiver Convertible-Laptop mit 16 Zoll
Das Lenovo Yoga 7 16IAP7 ist ein oberes Mittelklasse- bis High-End-Convertible und das erste Yoga-Convertible mit 16 Zoll des Herstellers. Es ist auch bemerkenswert, dass es das erste 16-Zoll-Convertible mit Core i7-1240P-, Core i7-1260P- und Core i7-12700H-Konfigurationen mit der optionalen separaten Intel Arc A370M-GPU ist. Der Touchscreen ist ansonsten auf 2560 x 1600 IPS fixiert, ohne das andere Wahlmöglichkeiten vorhanden sind.
Unsere Testgerät ist mit dem Core i7-1260P und ohne separate Intel Grafik für ca. 1400 US$ eine der weniger umfangreichen Konfigurationen. Mögliche Alternativen sind die konkurrierenden 16-Zoll-Modelle wie beispielsweise das Dell Inspiron 16 7620 2-in-1, das LG Gram 16 2-in-1 oder das Huawei MateBook D 16. Es gibt nicht viele 16-Zoll-Convertibles auf dem Markt. Damit ist das Yoga 7 16IAP7 eine der wenigen Optionen.
Weitere Lenovo-Bewertungen:
Mögliche Konkurrenten im Vergleich
Bewertung | Datum | Modell | Gewicht | Laufwerk | Groesse | Aufloesung | Preis ab |
|---|---|---|---|---|---|---|---|
| 88.7 % v7 (old) | 08 / 2022 | Lenovo Yoga 7 16IAP7 i7-1260P, Iris Xe G7 96EUs | 2 kg | 19.2 mm | 16.00" | 2560x1600 | |
| 83.6 % v7 (old) | 07 / 2022 | Huawei MateBook D 16 2022 i7-12700H, Iris Xe G7 96EUs | 1.7 kg | 18.4 mm | 16.00" | 1920x1200 | |
| 85.7 % v7 (old) | 06 / 2022 | Dell Inspiron 16 7620 2-in-1 i7-1260P, Iris Xe G7 96EUs | 2.1 kg | 18.41 mm | 16.00" | 1920x1200 | |
| 86.2 % v7 (old) | 07 / 2022 | Acer Swift X SFX16-51G-5388 i5-11320H, GeForce RTX 3050 4GB Laptop GPU | 1.8 kg | 18.9 mm | 16.10" | 1920x1080 | |
| 86.3 % v7 (old) | 06 / 2021 | LG Gram 16 (2021) i7-1165G7, Iris Xe G7 96EUs | 1.2 kg | 16.8 mm | 16.00" | 2560x1600 | |
| 86.1 % v7 (old) | 09 / 2021 | Lenovo IdeaPad 5 Pro 16ACH R7 5800H, GeForce GTX 1650 Mobile | 2 kg | 17.5 mm | 16.00" | 2560x1600 |
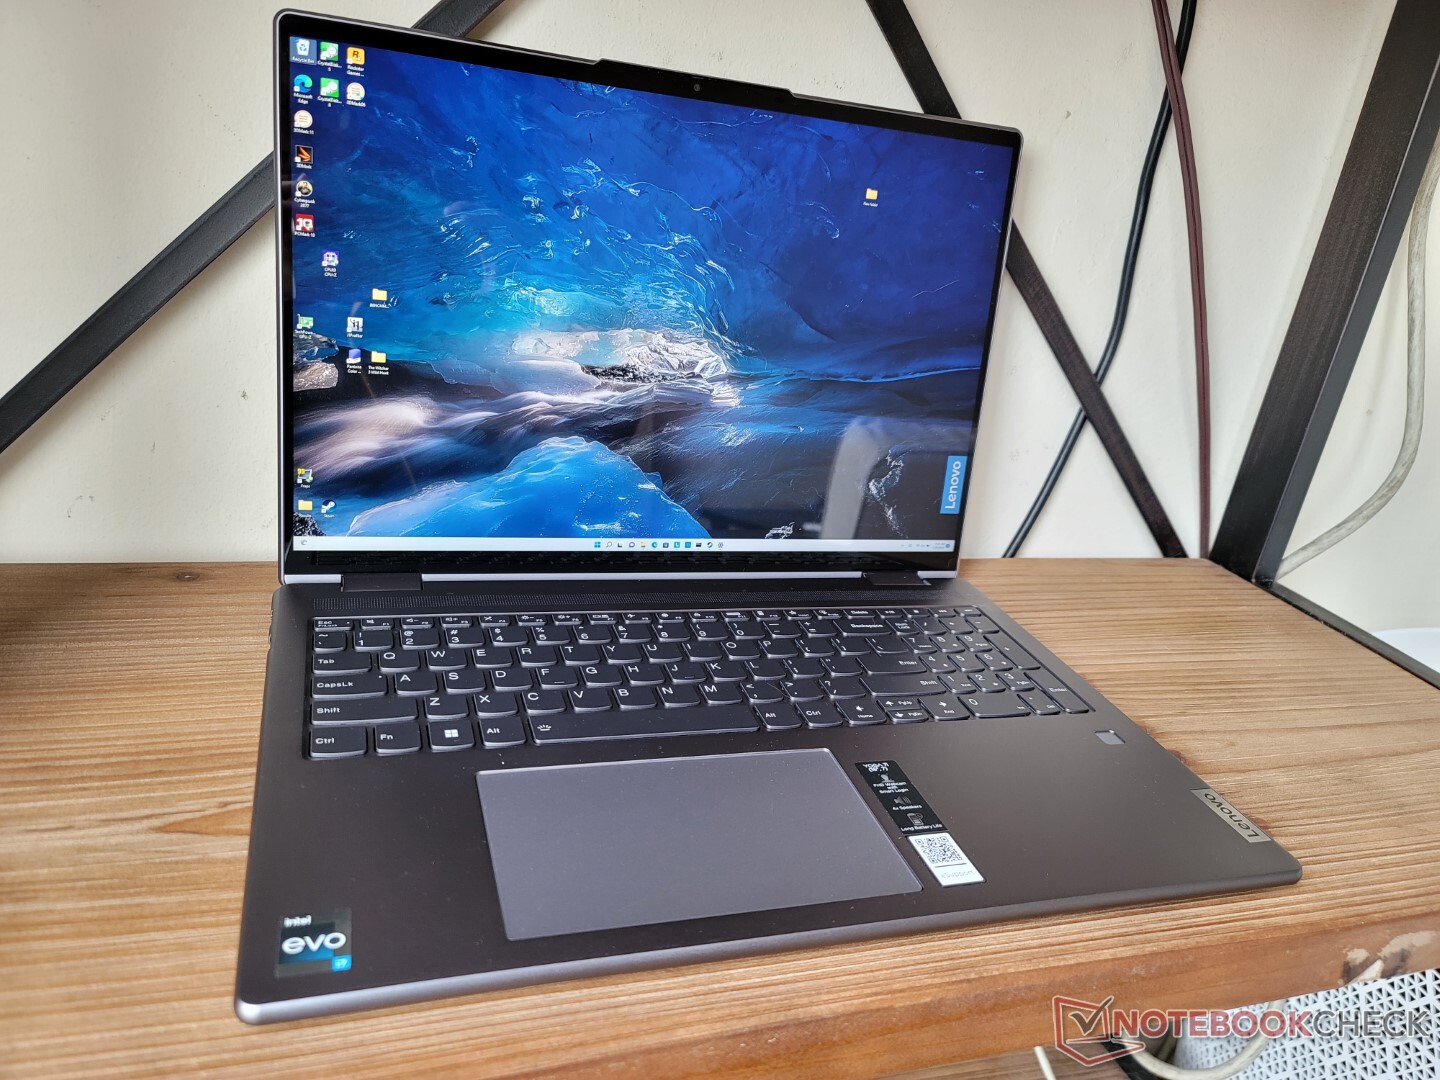
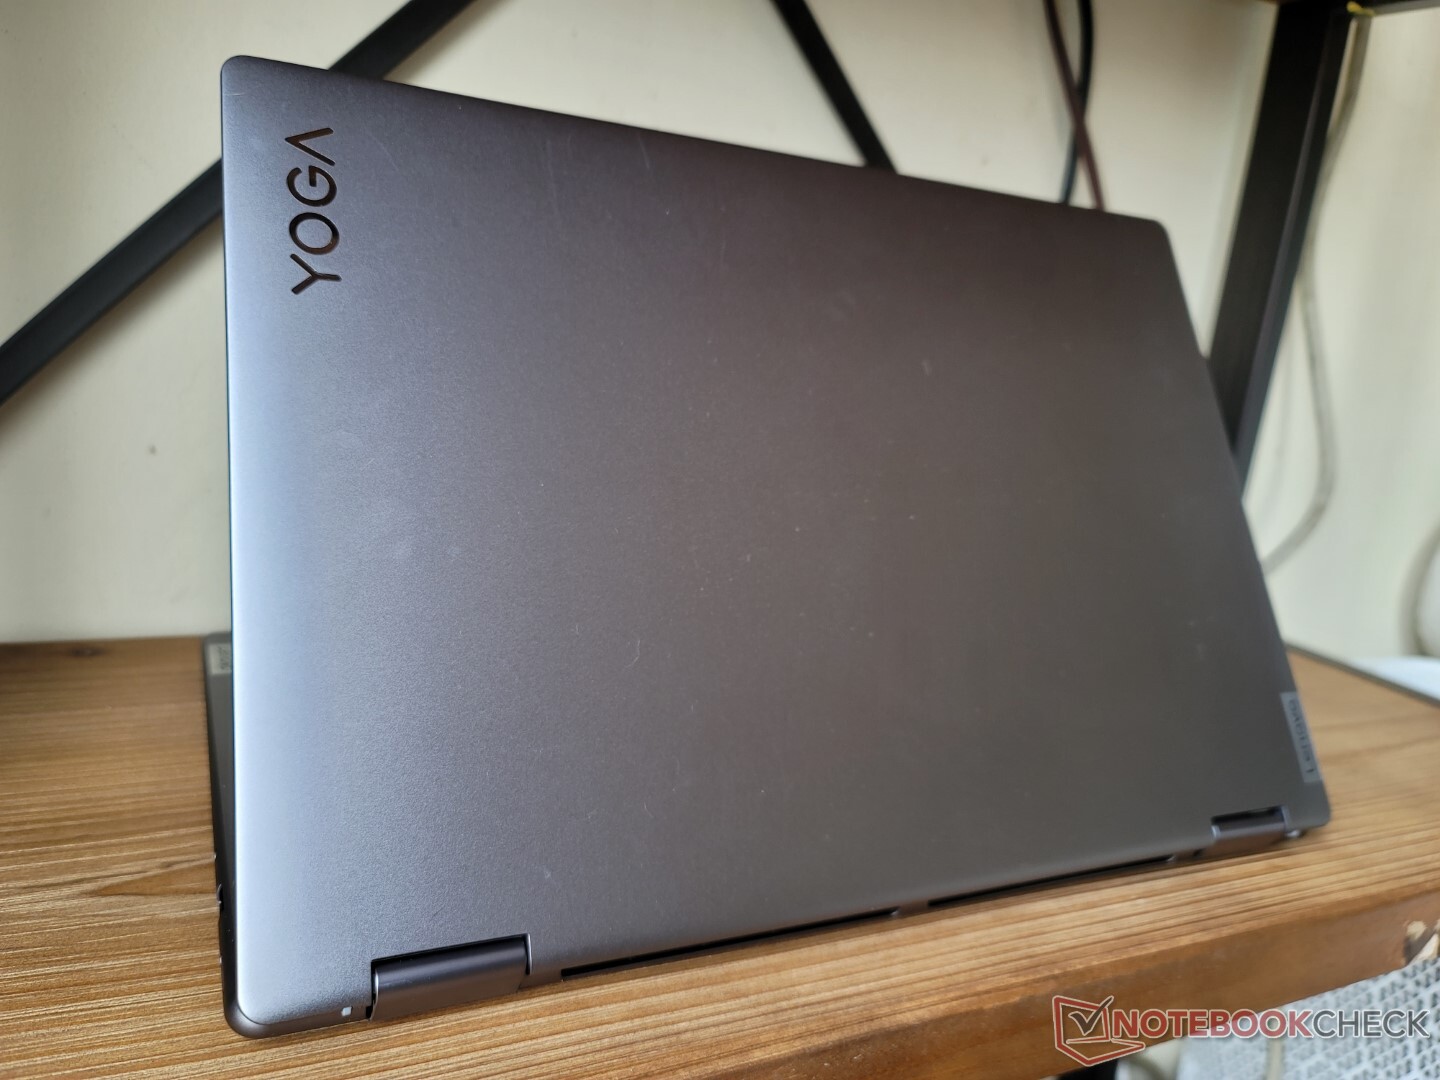
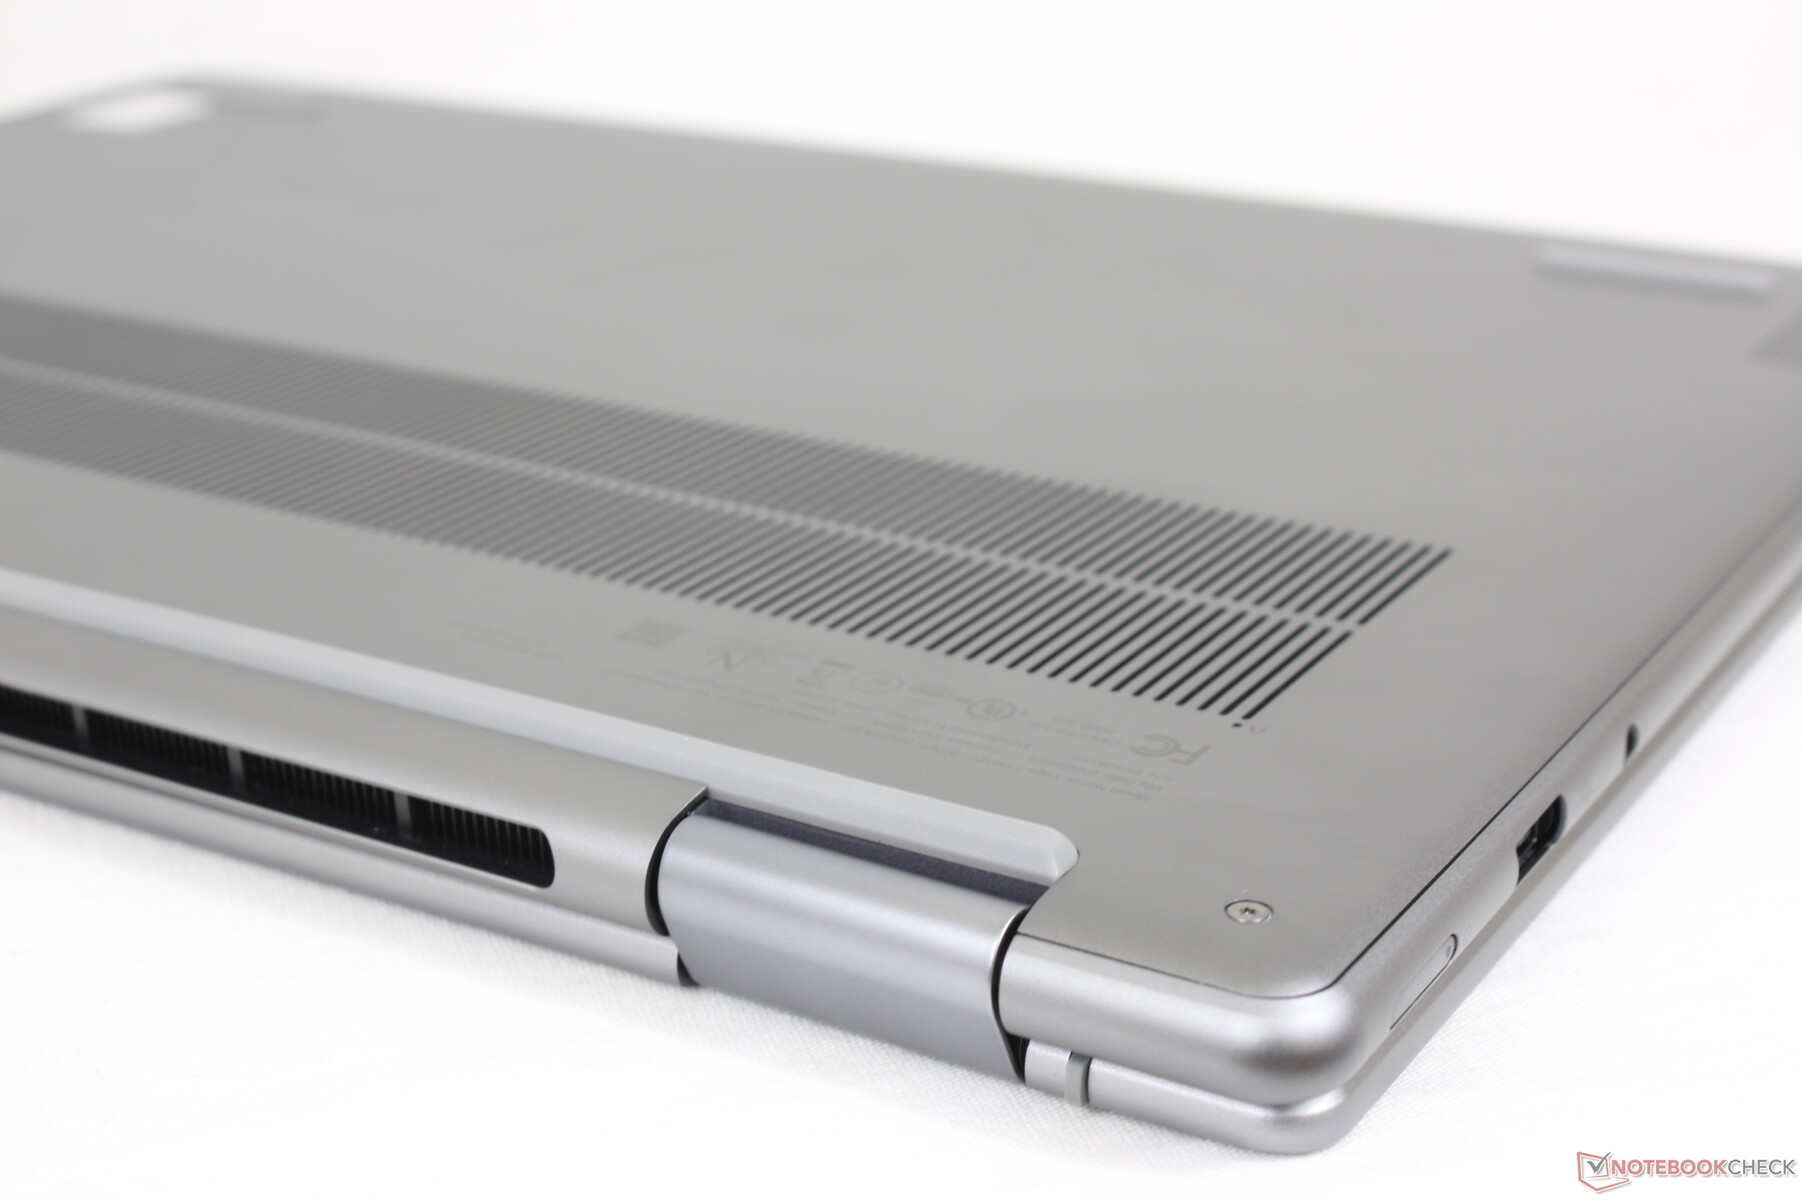
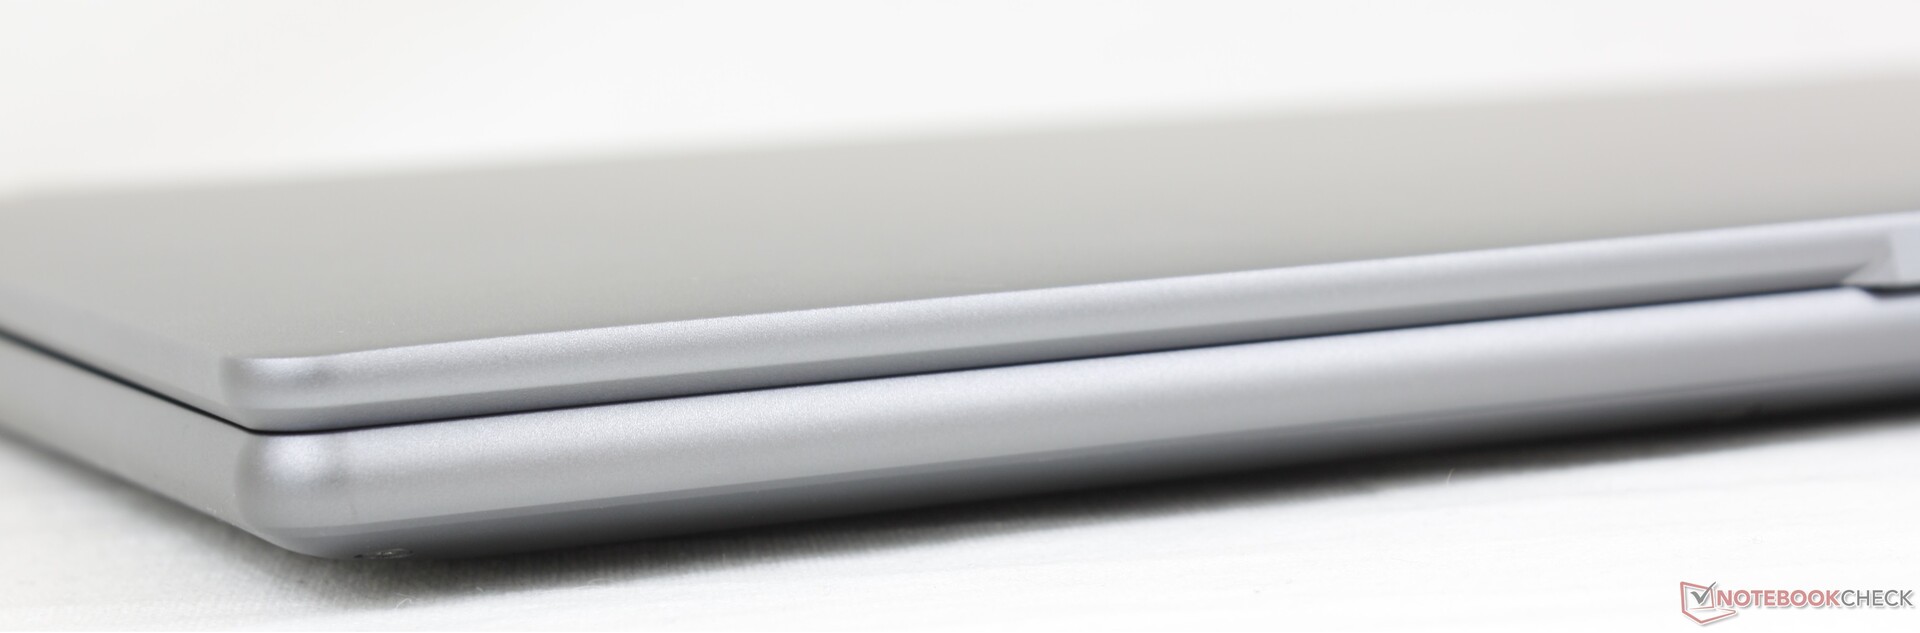
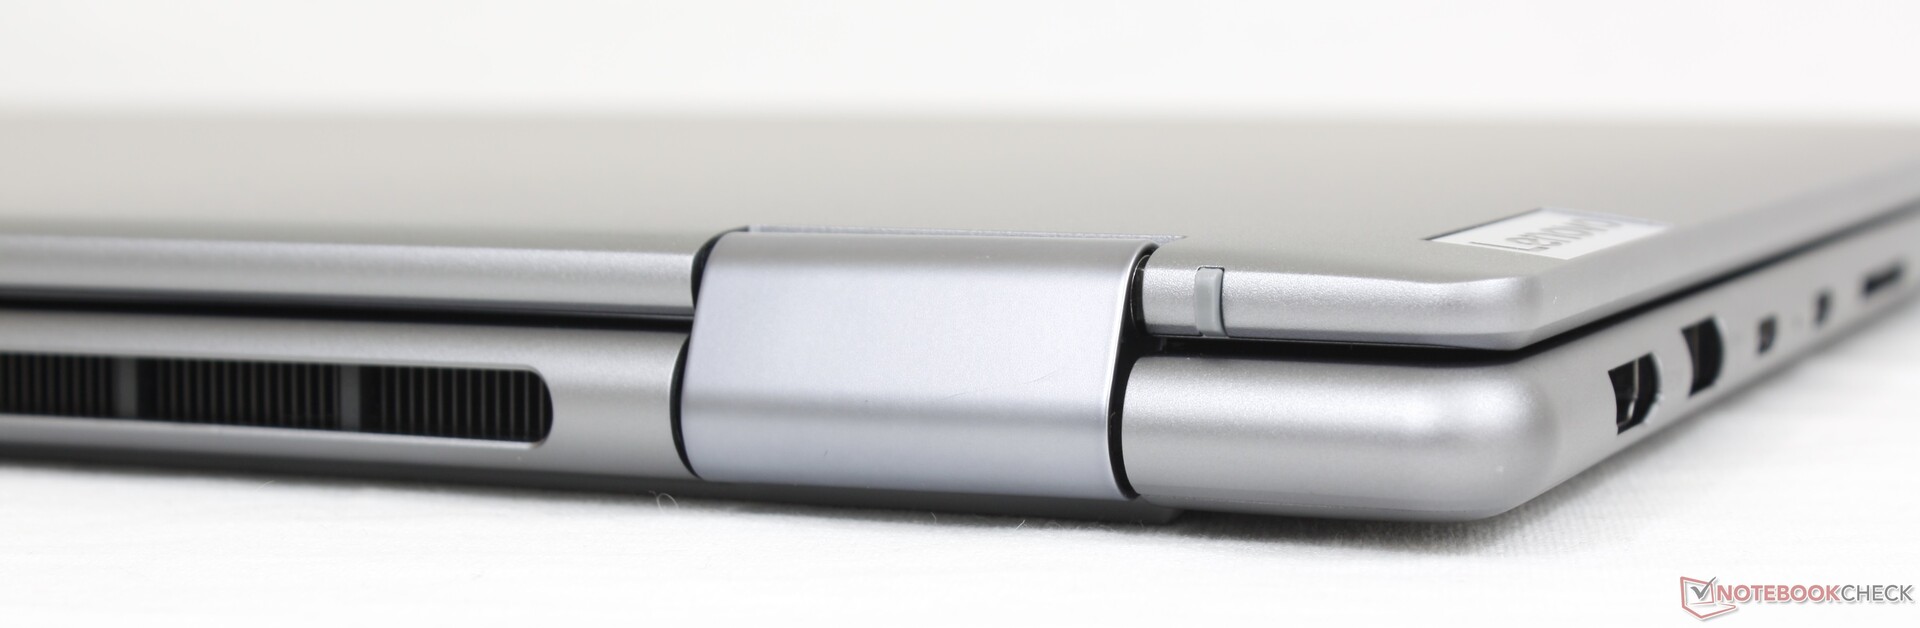
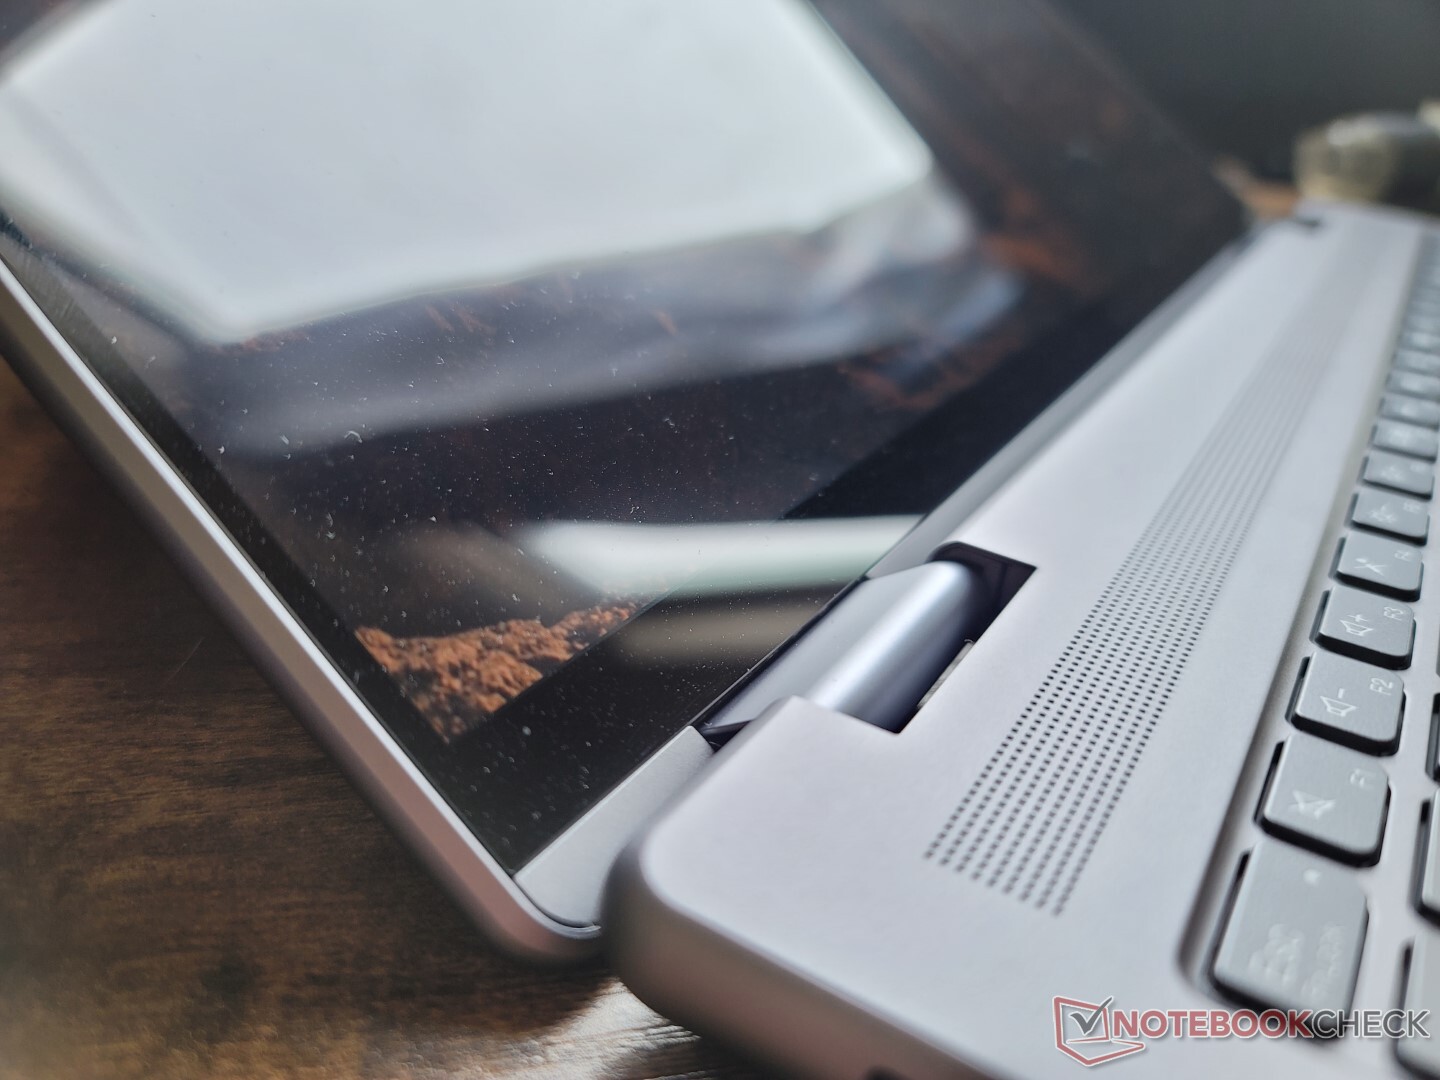
Gehäuse – glatt und rund
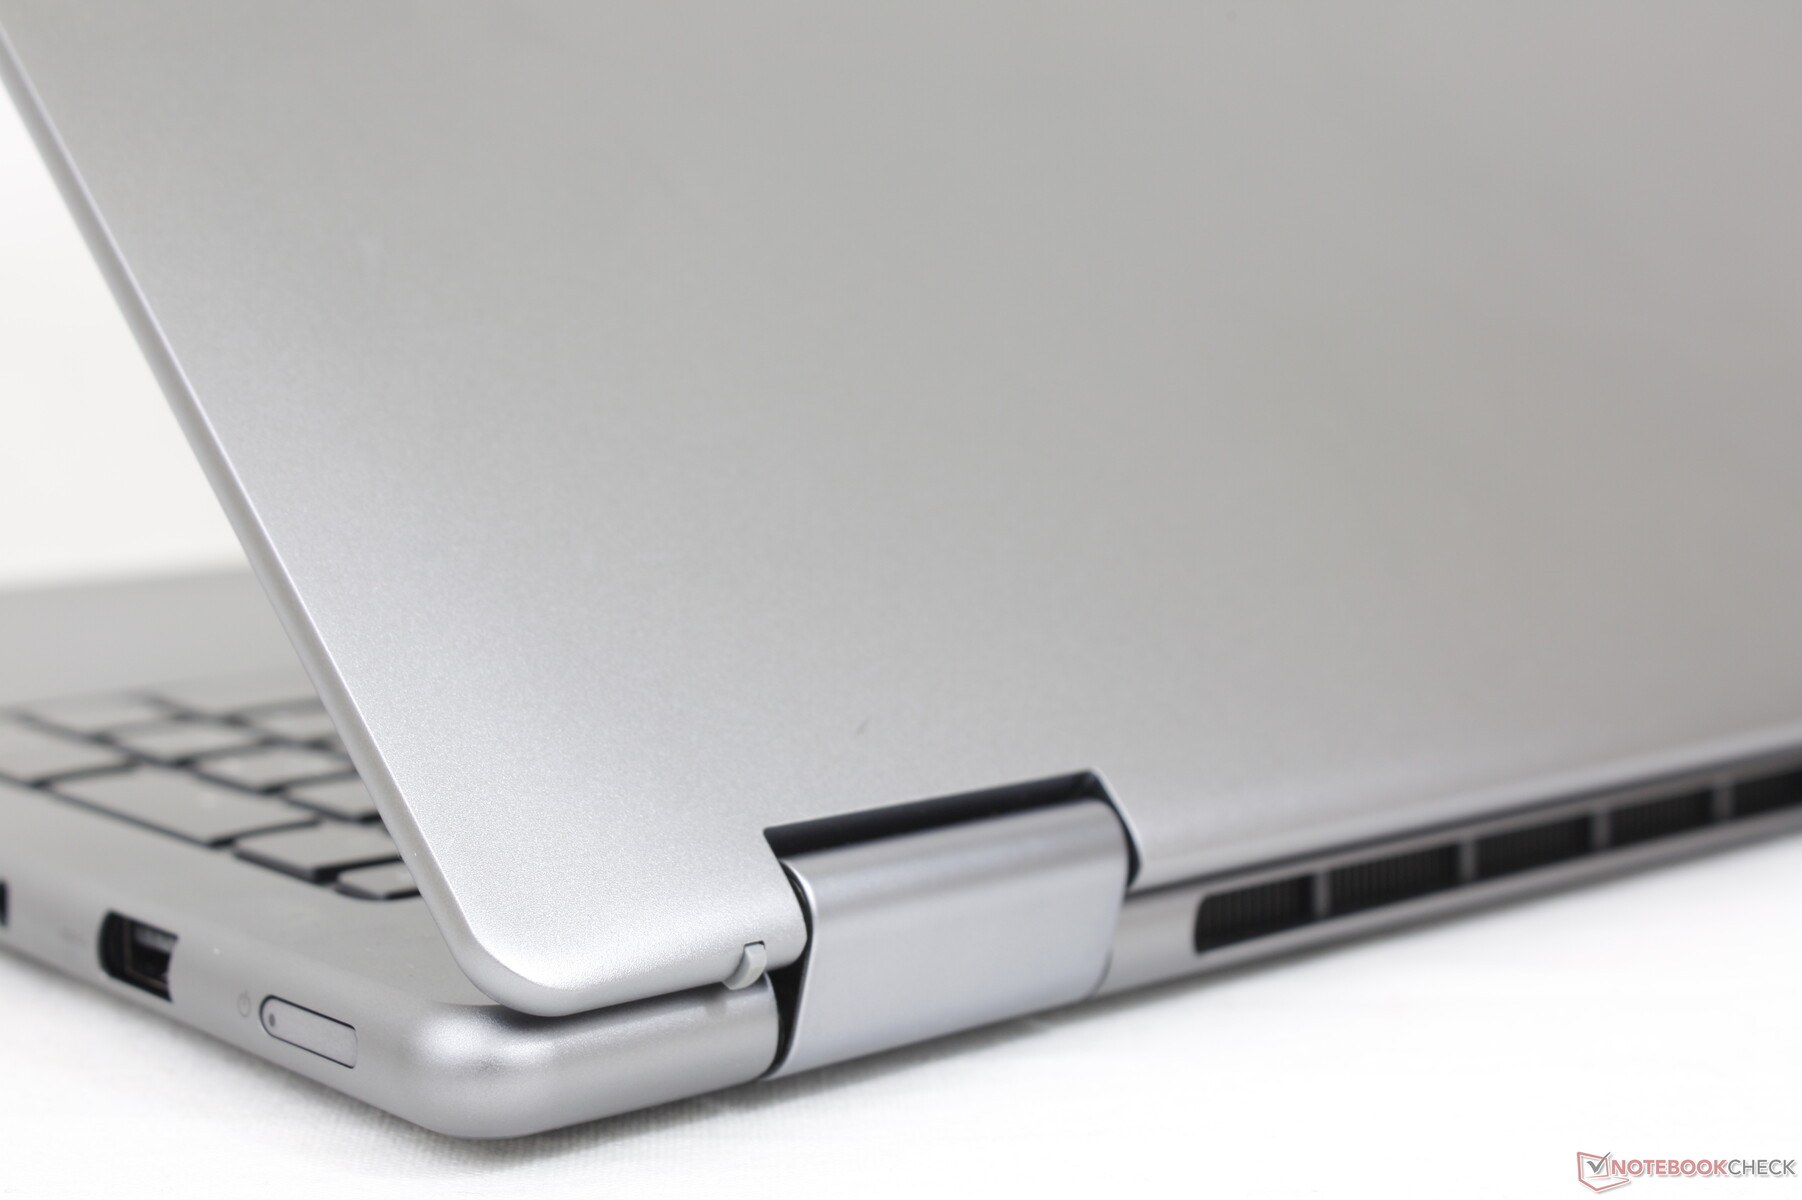
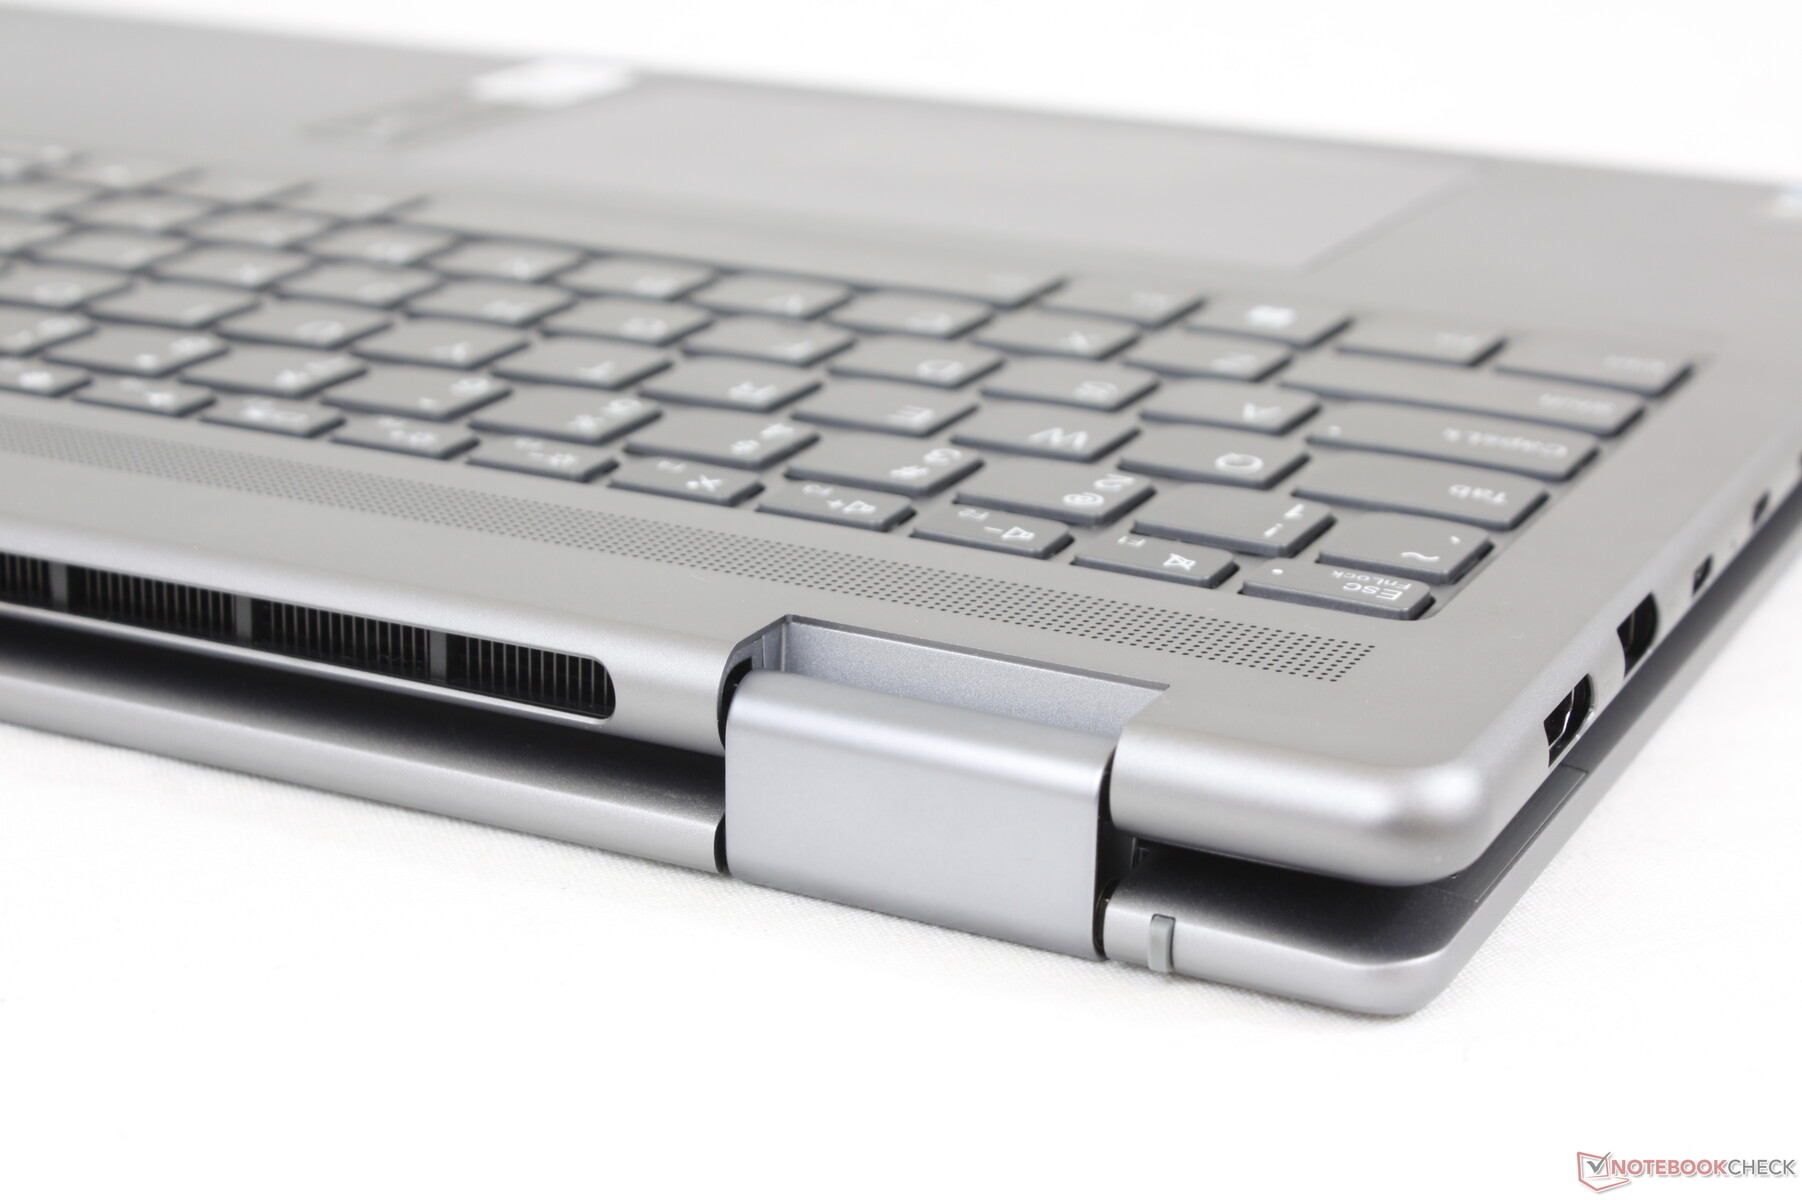
Optisch lässt sich das Gehäuse am besten als 16-Zoll-Version des Yoga 9 14IAP7 mit 14 Zoll beschreiben. Das Design zeichnet sich durch seine abgerundeten Kanten für ein konvexes Erscheinungsbild im Gegensatz zu den oft flachen Kanten der meisten anderen Laptops aus. Dadurch fühlt sich das gesamte Gerät besonders glatt an, da die abgerundeten Kanten und Ecken bei Berührung für einen reibungsloseren Übergang zum Rest des Laptops sorgen.
Was die Steifigkeit betrifft, machen sowohl der feste Metallboden als auch der feste Deckel einen soliden Eindruck. Ein minimales Knarren und Verdrehen ist zu beobachten. Wenn Druck auf die Tastaturmitte ausgeübt wird, führt dies jedoch zu deutlich mehr Nachgiebigkeit als beim konkurrierenden Dell Inspiron 16 7620 2-in-1, sodass noch Spielraum für Verbesserungen besteht.
Das System ist, auch wenn es sich um einen 16-Zoll-Formfaktor handelt, schwer. Die Modelle Acer Swift X SFX16, Huawei MateBook D 16 oder LG Gram 16 sind beispielsweise jeweils mehrere hundert Gramm leichter und haben die gleiche 16-Zoll-Bildschirmgröße. Man muss Lenovo zu Gute halten, dass das Yoga 7 16IAP7 zumindest hinsichtlich Dimension und Gewicht mit dem Inspiron 16 7620 2-in-1 vergleichbar ist.
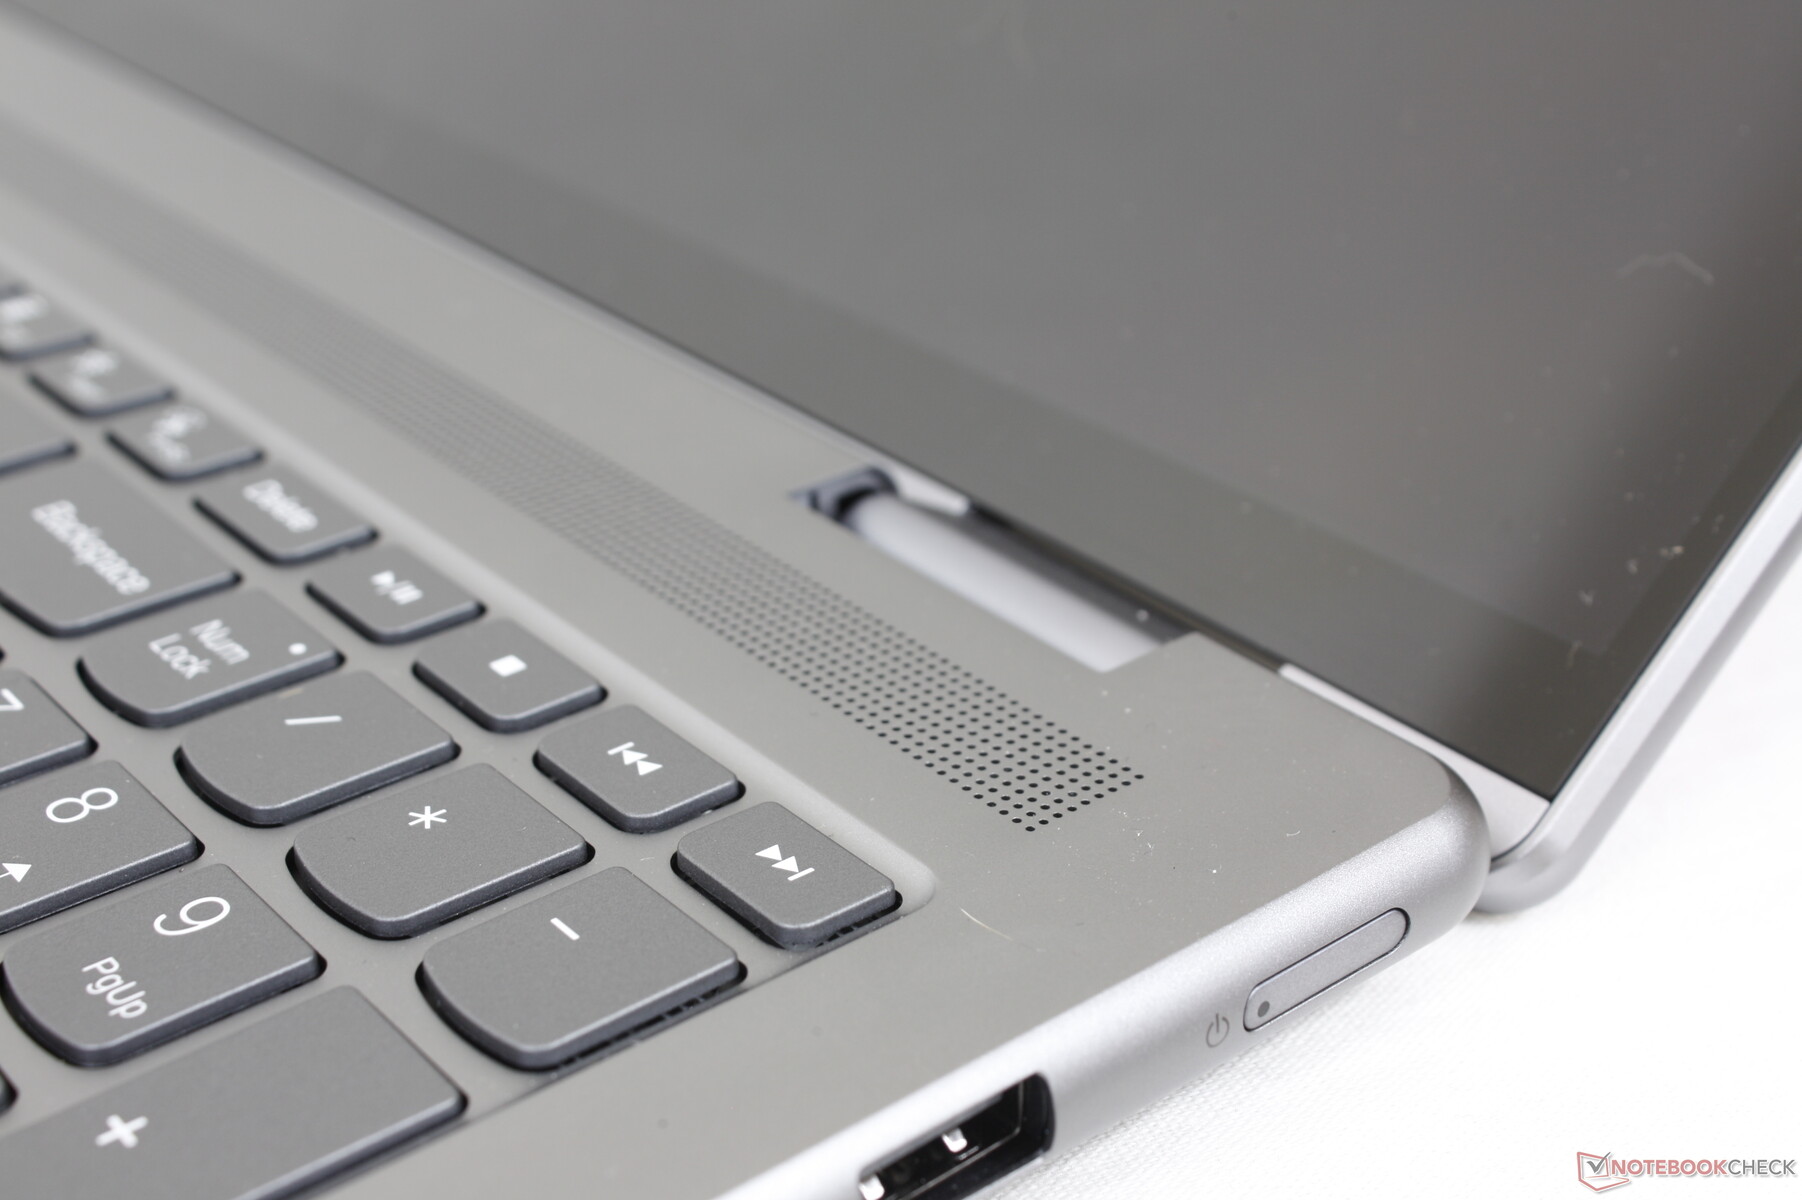
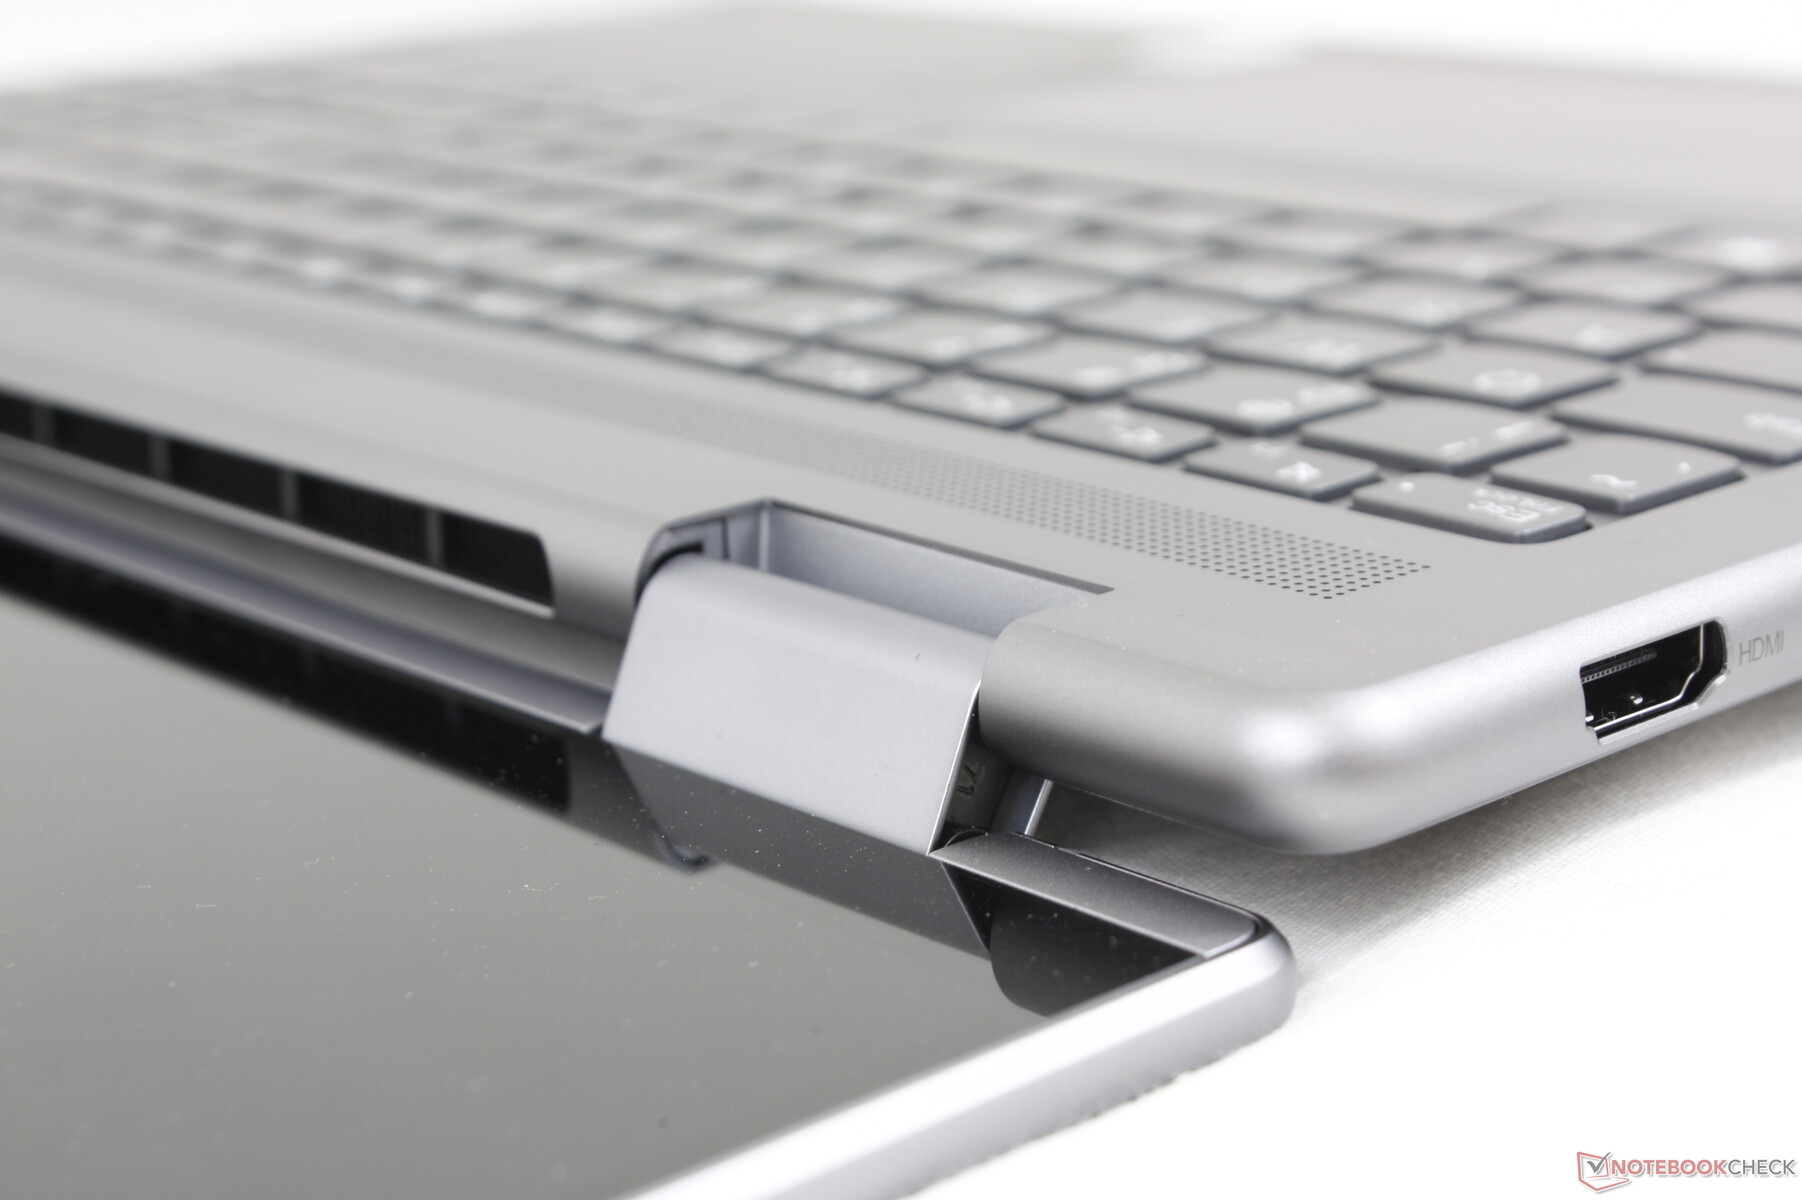
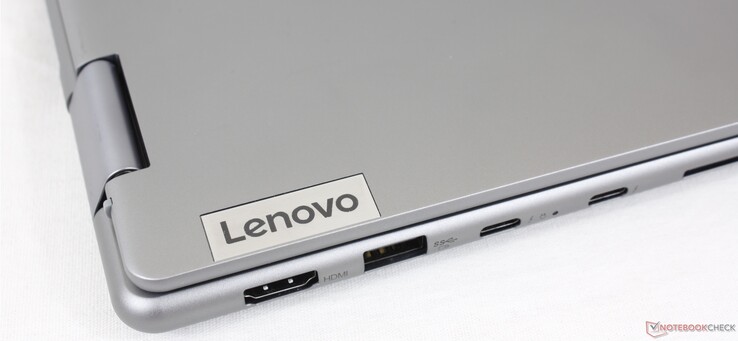
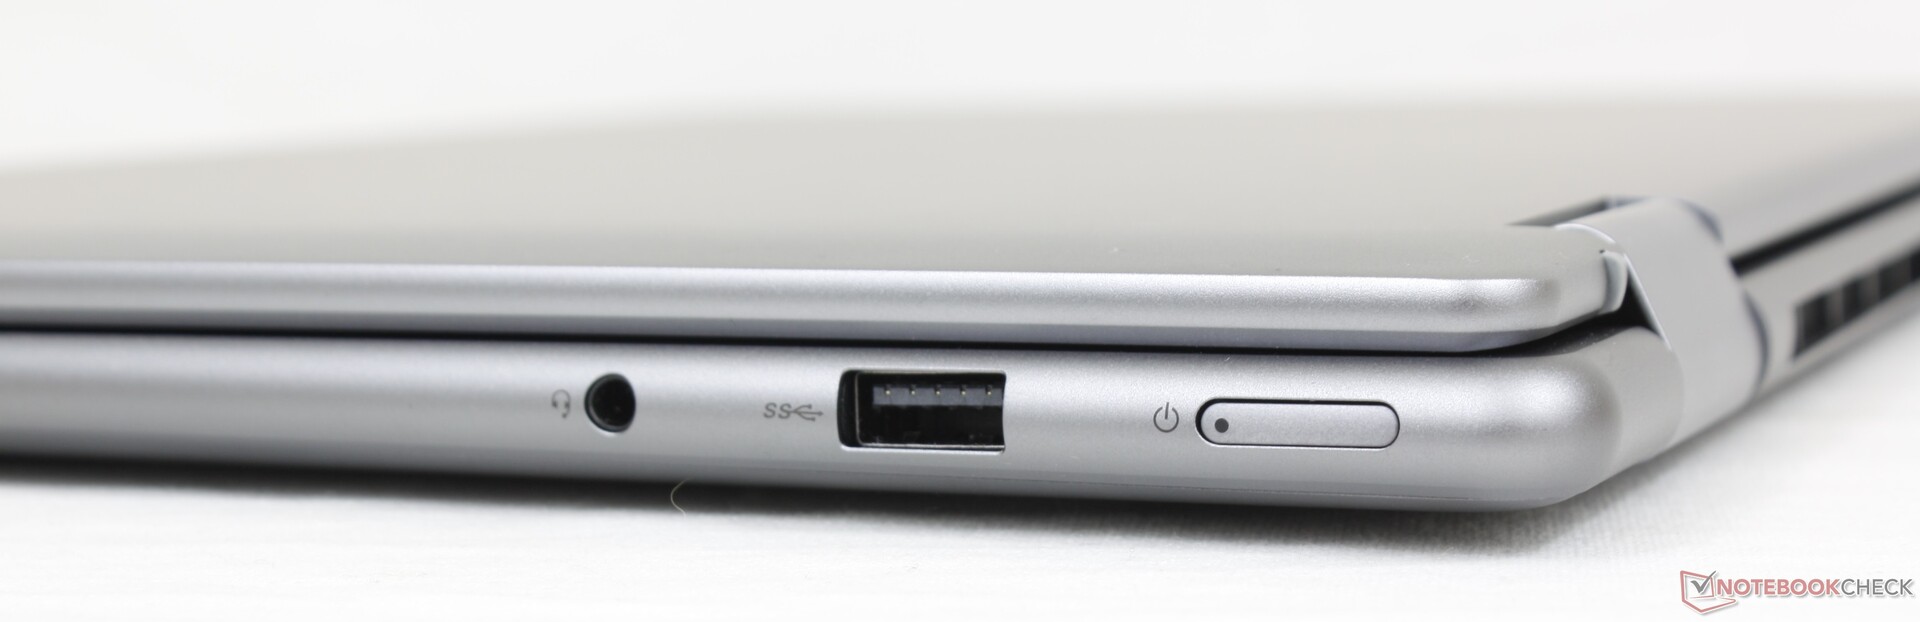
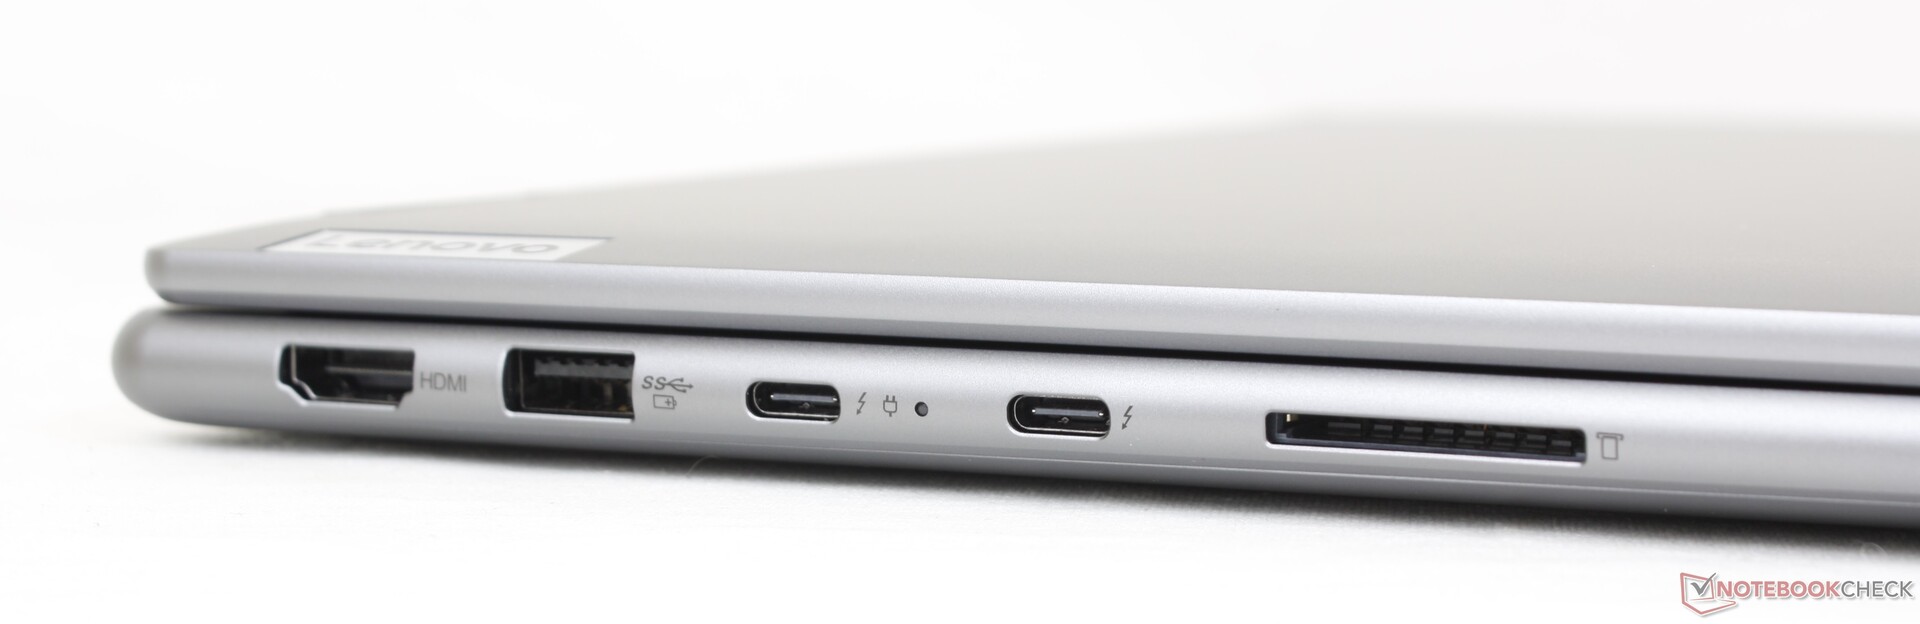
Konnektivität – Thunderbolt-4-Unterstützung
Die Portoptionen entsprechen genau denen des Dell Inspiron 16 7620 2-in-1 oder LG Gram 16. Tatsächlich ist sogar die Positionierung der Ports der des Dell-Modell nahezu identisch. Das MateBook D 16 bietet die gleichen Ports, wenn auch ohne Thunderbolt-Unterstützung.
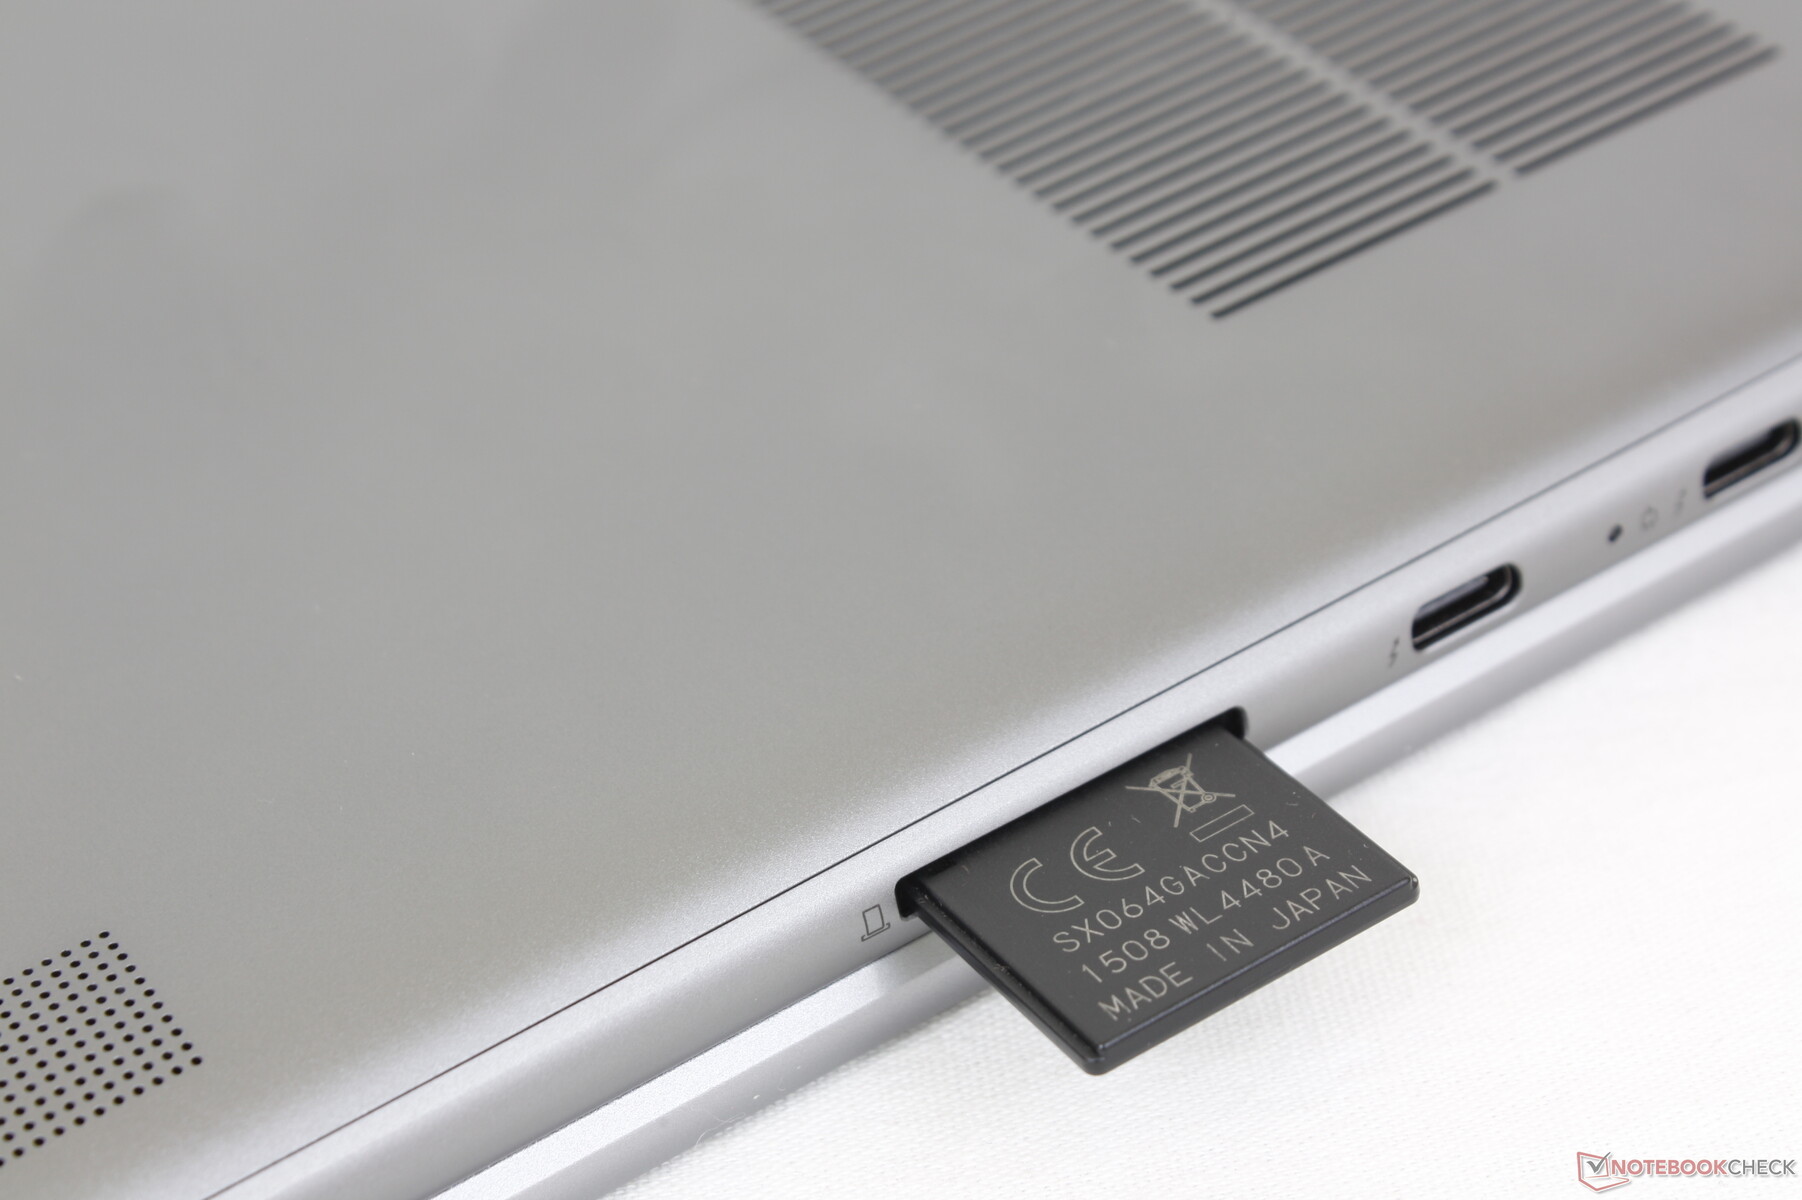
SD-Kartenleser
Die Übertragungsgeschwindigkeiten mit dem integrierten SD-Kartenleser liegen bei durchschnittlich rund 80 MB/s. Das Verschieben von 1 GB an Bildern von unserer UHS-II-Testkarte auf den Desktop dauerte etwa 12 Sekunden. Es ist erwähnenswert, dass der integrierte SD-Kartenleser im Gegensatz zu den meisten anderen Laptops über keine Feder verfügt.
| SD Card Reader | |
| average JPG Copy Test (av. of 3 runs) | |
| Lenovo Yoga 7 16IAP7 (Toshiba Exceria Pro SDXC 64 GB UHS-II) | |
| LG Gram 16 (2021) (Toshiba Exceria Pro M501 microSDXC 64GB) | |
| Lenovo IdeaPad 5 Pro 16ACH (AV PRO V60) | |
| Dell Inspiron 16 7620 2-in-1 (Toshiba Exceria Pro SDXC 64 GB UHS-II) | |
| maximum AS SSD Seq Read Test (1GB) | |
| LG Gram 16 (2021) (Toshiba Exceria Pro M501 microSDXC 64GB) | |
| Lenovo Yoga 7 16IAP7 (Toshiba Exceria Pro SDXC 64 GB UHS-II) | |
| Lenovo IdeaPad 5 Pro 16ACH (AV PRO V60) | |
| Dell Inspiron 16 7620 2-in-1 (Toshiba Exceria Pro SDXC 64 GB UHS-II) | |
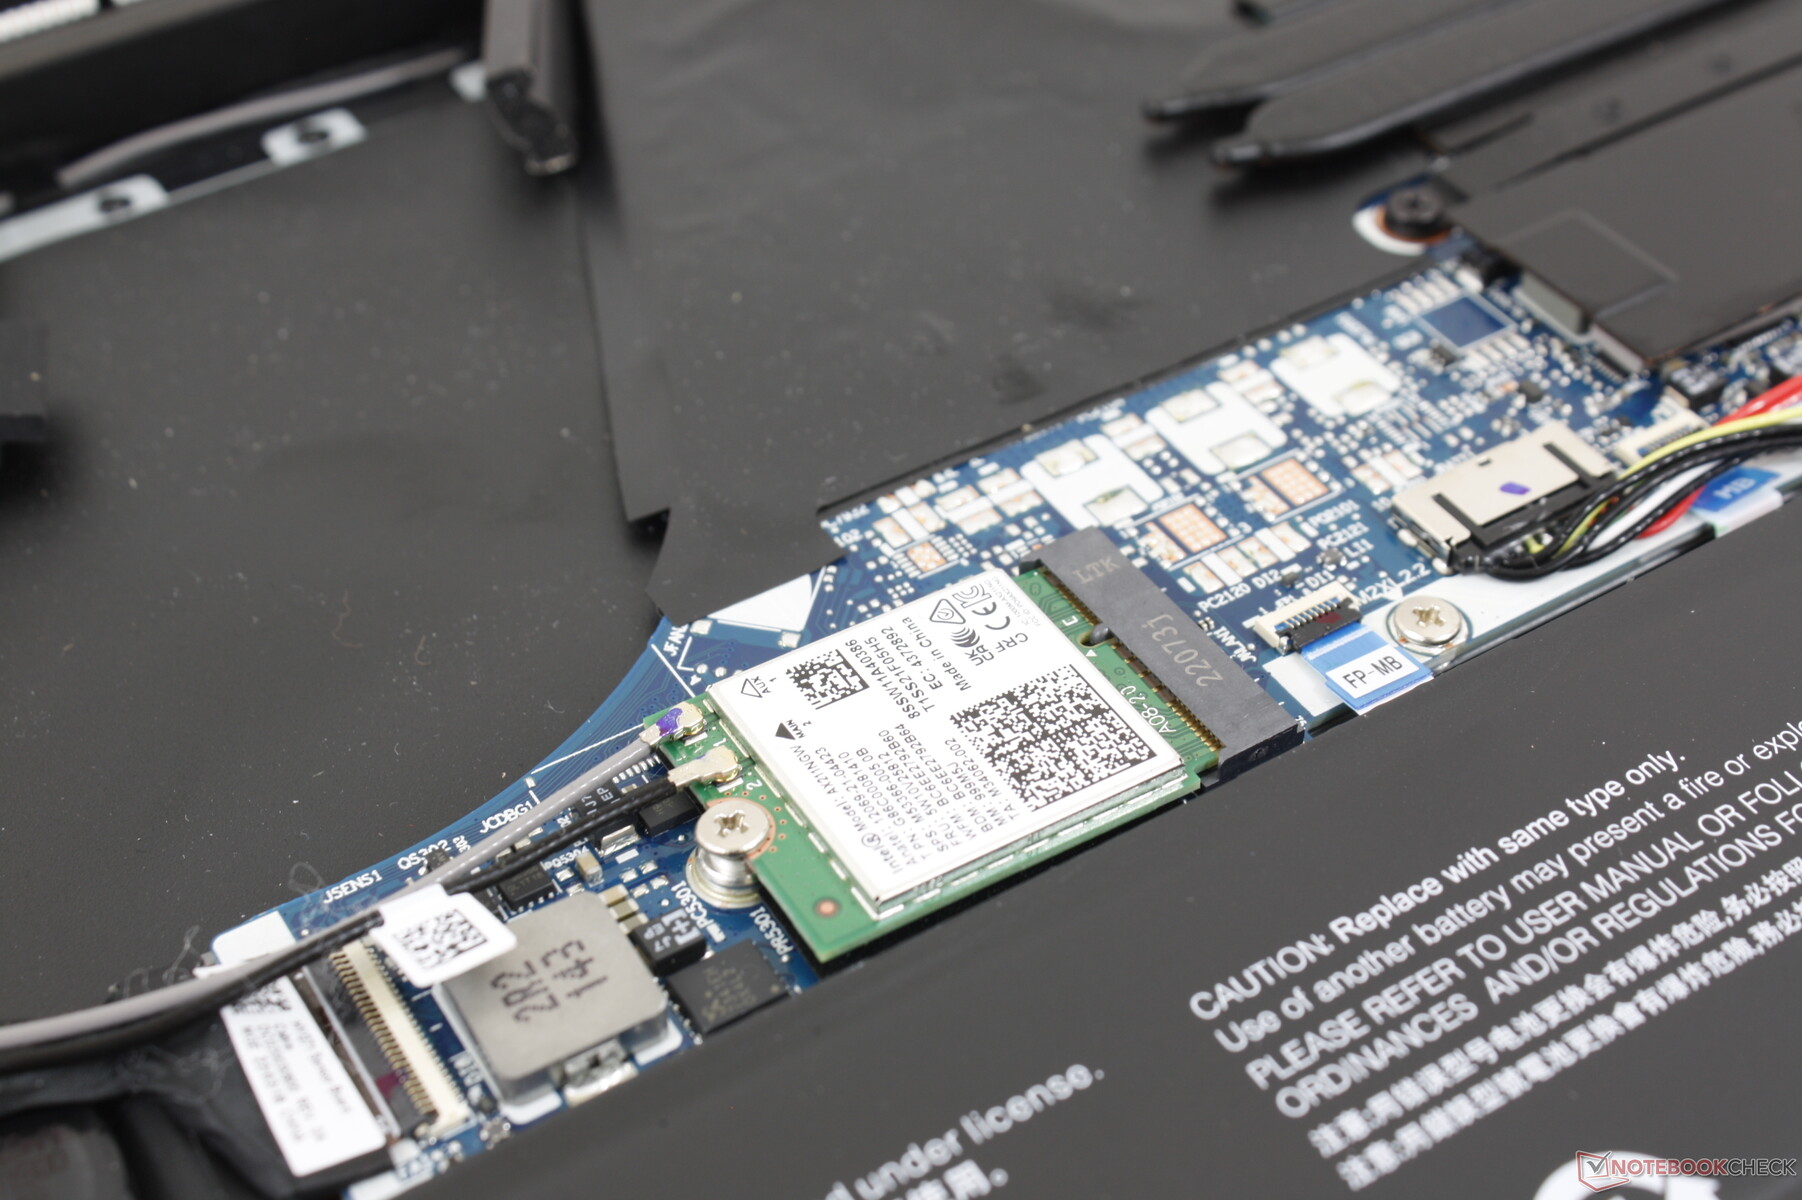
Kommunikation – Wi-Fi-6E-Unterstützung
Ein Intel AX211 verfügt standardmäßig über Wi-Fi-6E- und Bluetooth-5.2-Konnektivität. Wir konnten bei Verbindung mit unserem 6-GHz-Netzwerk stabile Übertragungsgeschwindigkeiten feststellen.
| Networking | |
| iperf3 transmit AX12 | |
| Acer Swift X SFX16-51G-5388 | |
| LG Gram 16 (2021) | |
| Lenovo IdeaPad 5 Pro 16ACH | |
| iperf3 receive AX12 | |
| Acer Swift X SFX16-51G-5388 | |
| LG Gram 16 (2021) | |
| Lenovo IdeaPad 5 Pro 16ACH | |
| iperf3 receive AXE11000 6GHz | |
| Lenovo Yoga 7 16IAP7 | |
| Dell Inspiron 16 7620 2-in-1 | |
| iperf3 transmit AXE11000 6GHz | |
| Dell Inspiron 16 7620 2-in-1 | |
| Lenovo Yoga 7 16IAP7 | |
Webcam
Die 2-MP-Kamera ist schärfer als bei den meisten anderen Laptops, bei denen 1 MP noch der Standard ist. Ein physischer Privacy Shutter ist im Lieferumfang enthalten und es gibt einen IR-Sensor für die Unterstützung von Windows Hello.


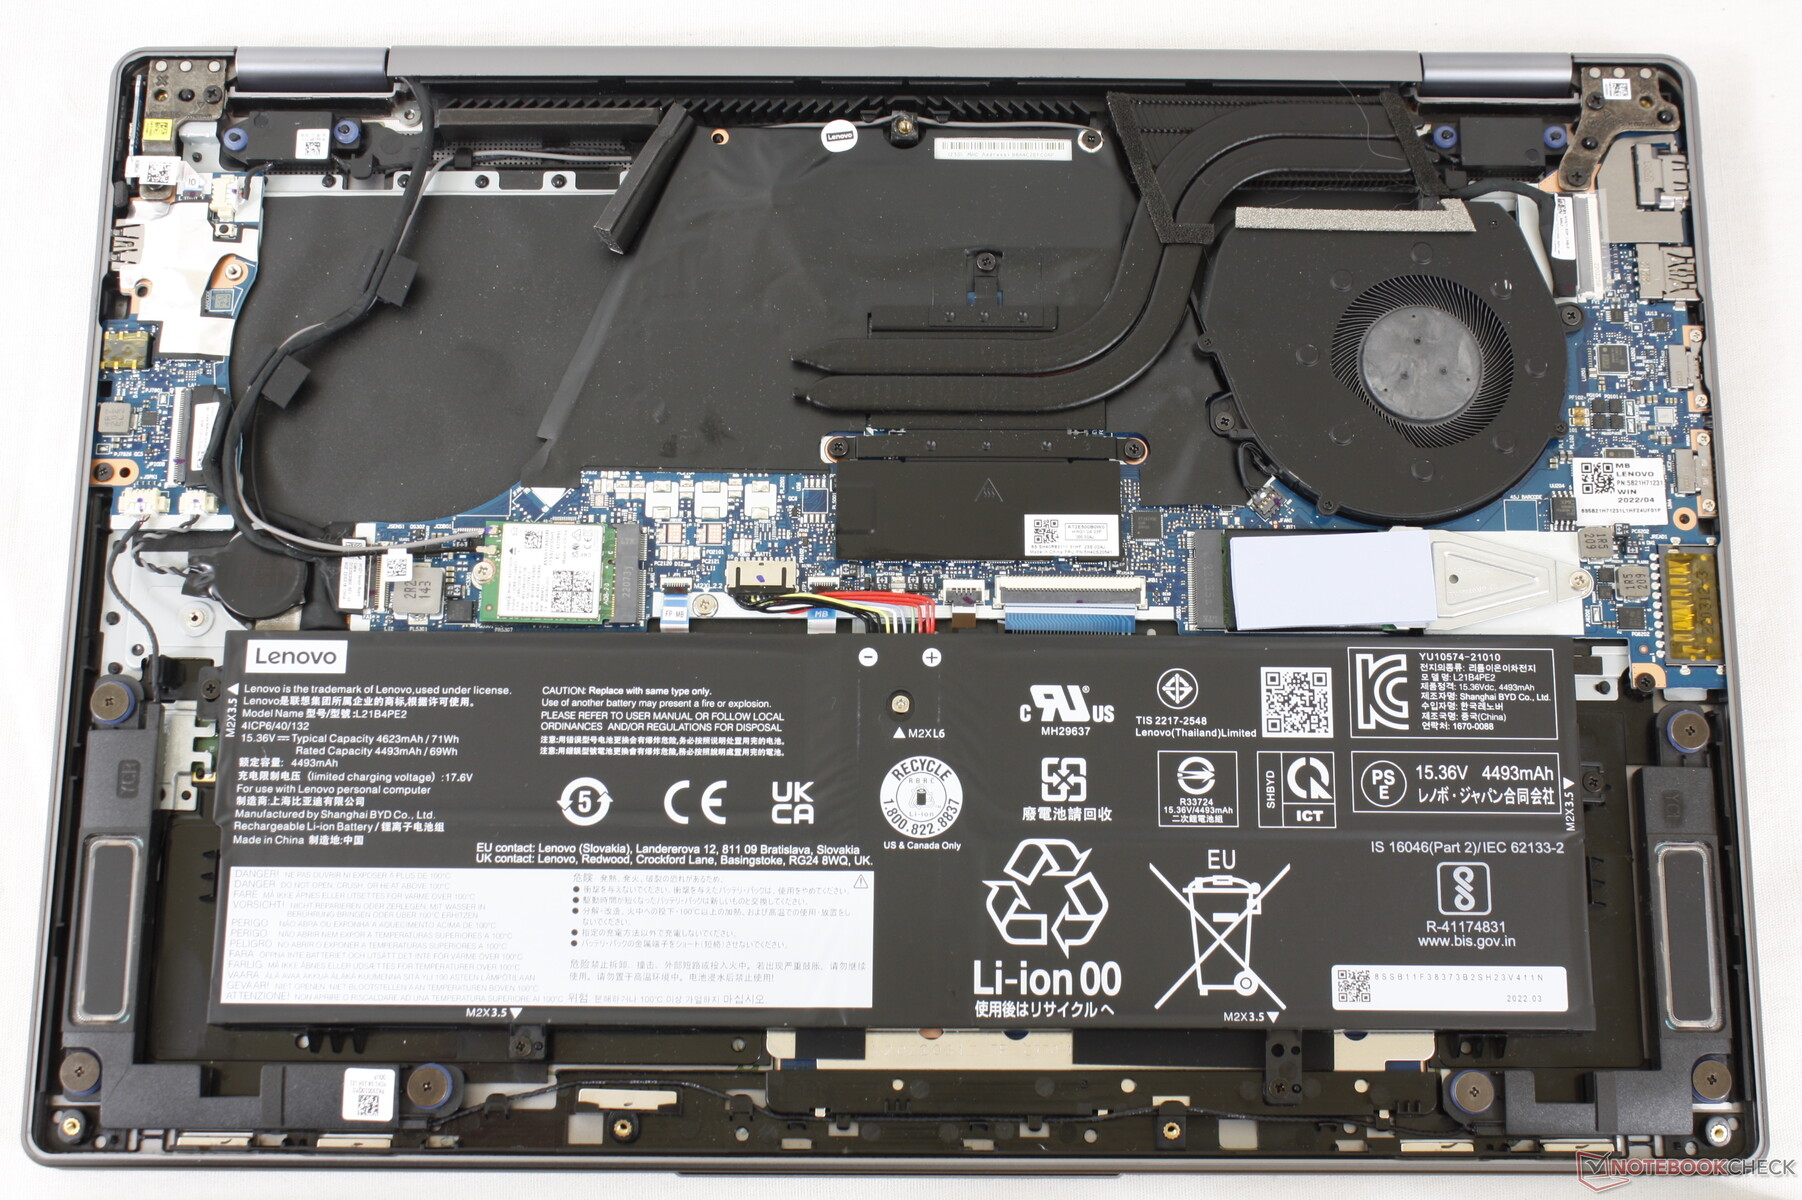
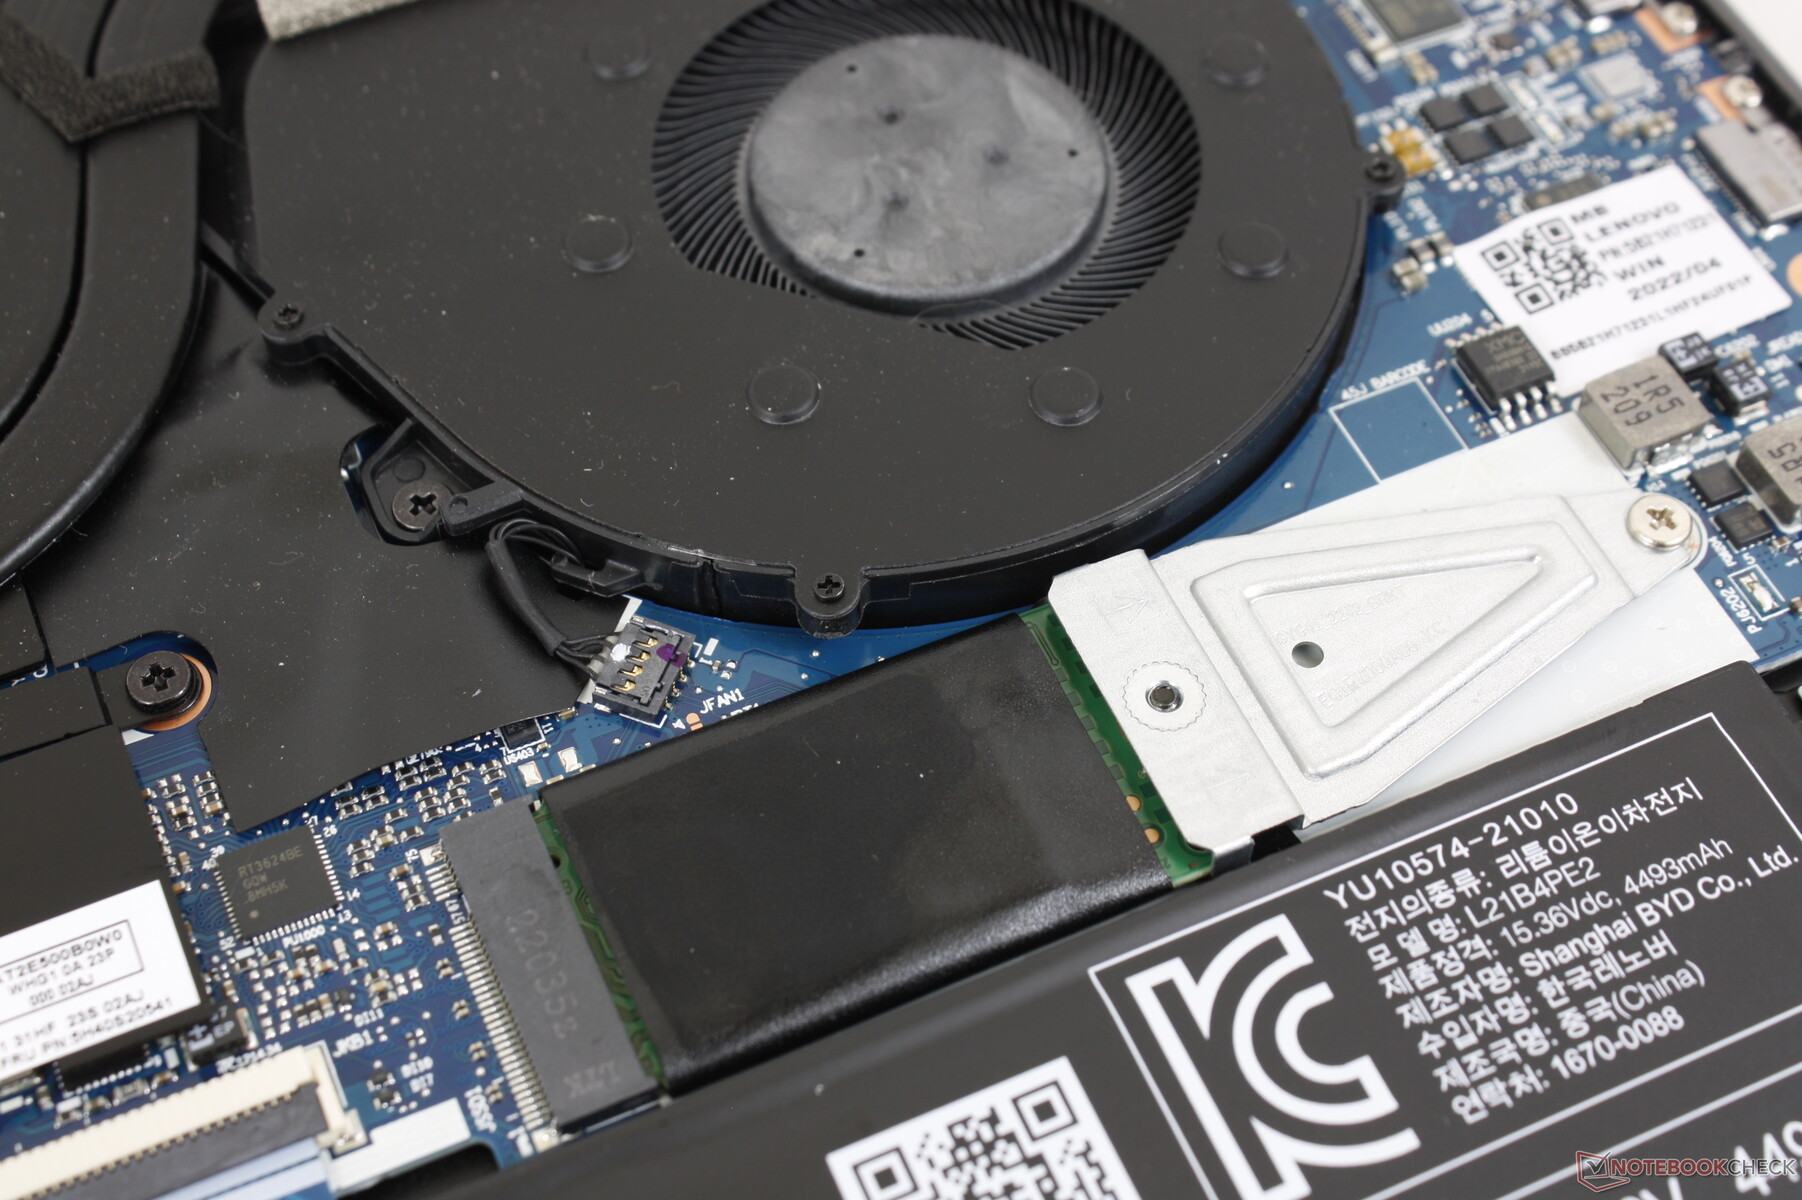
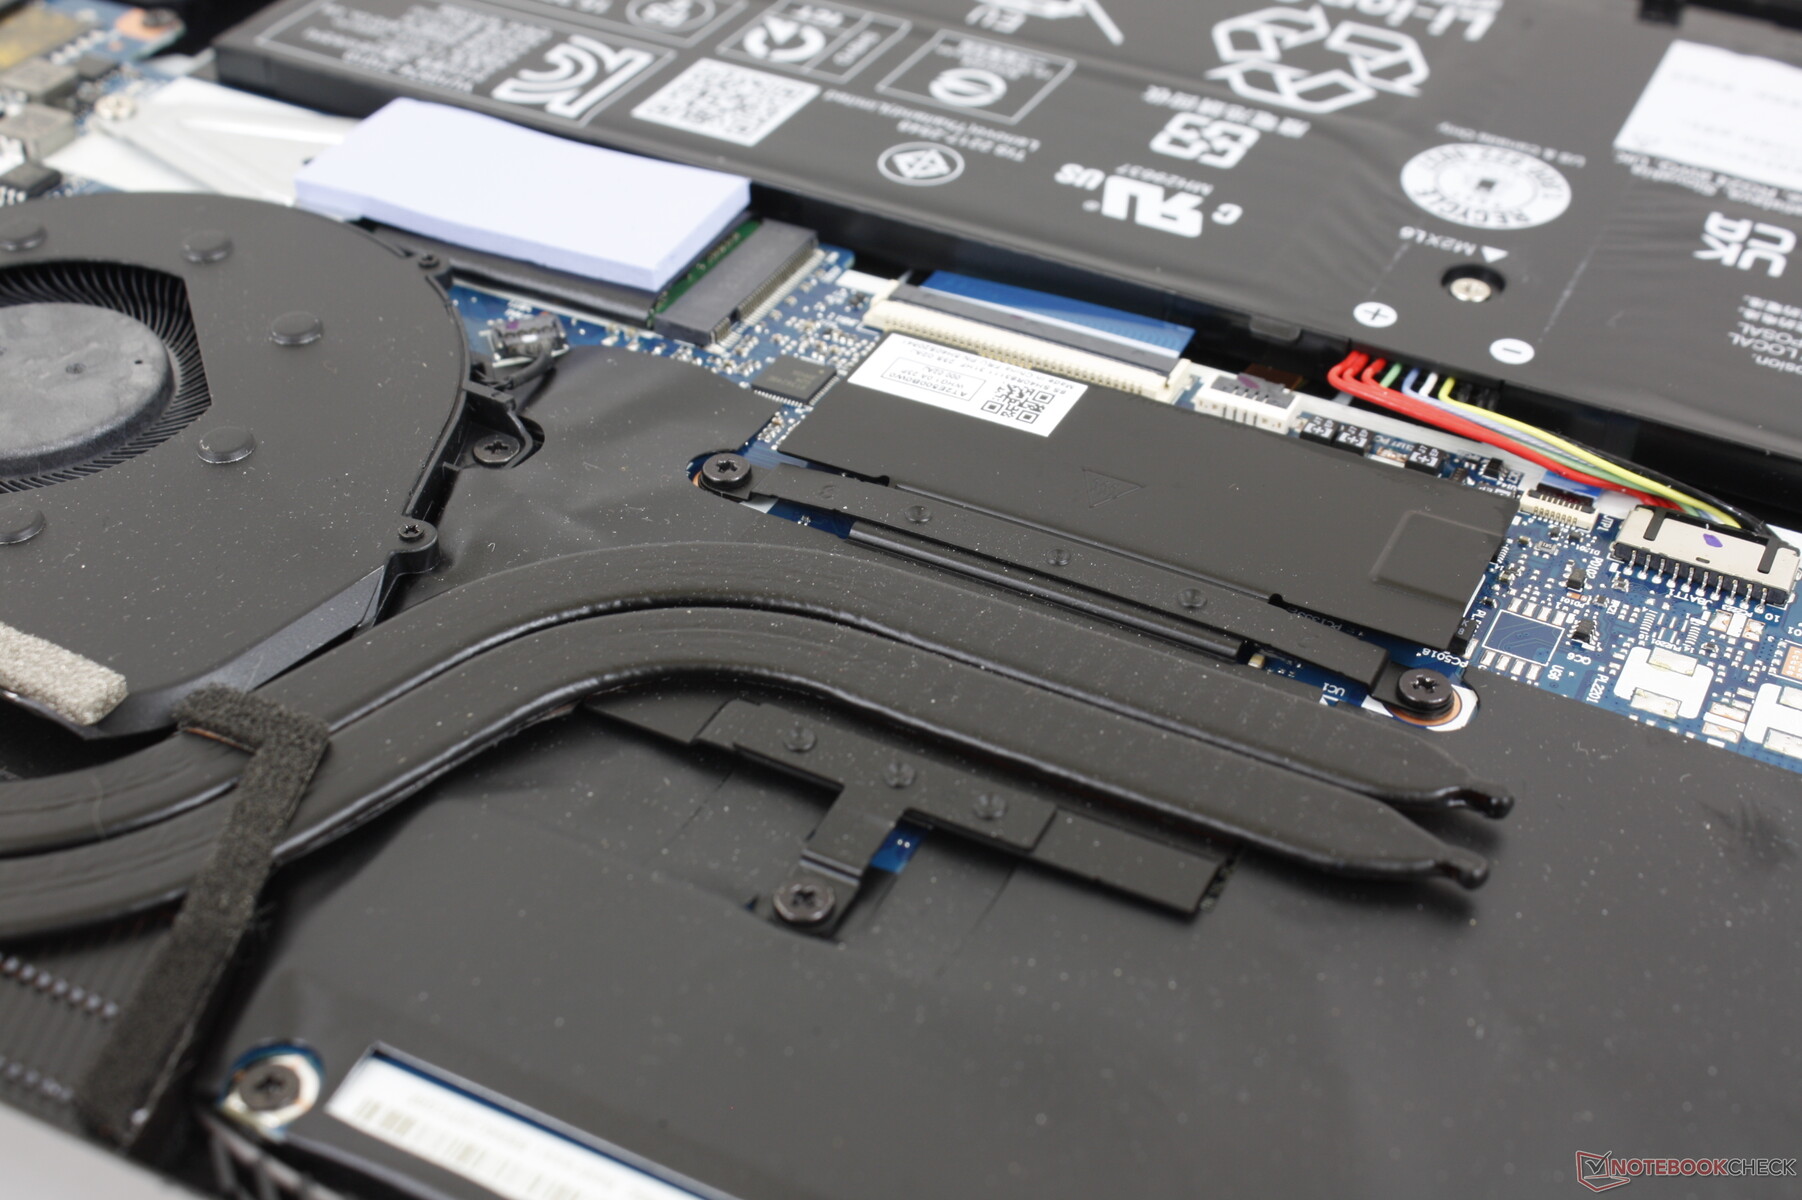
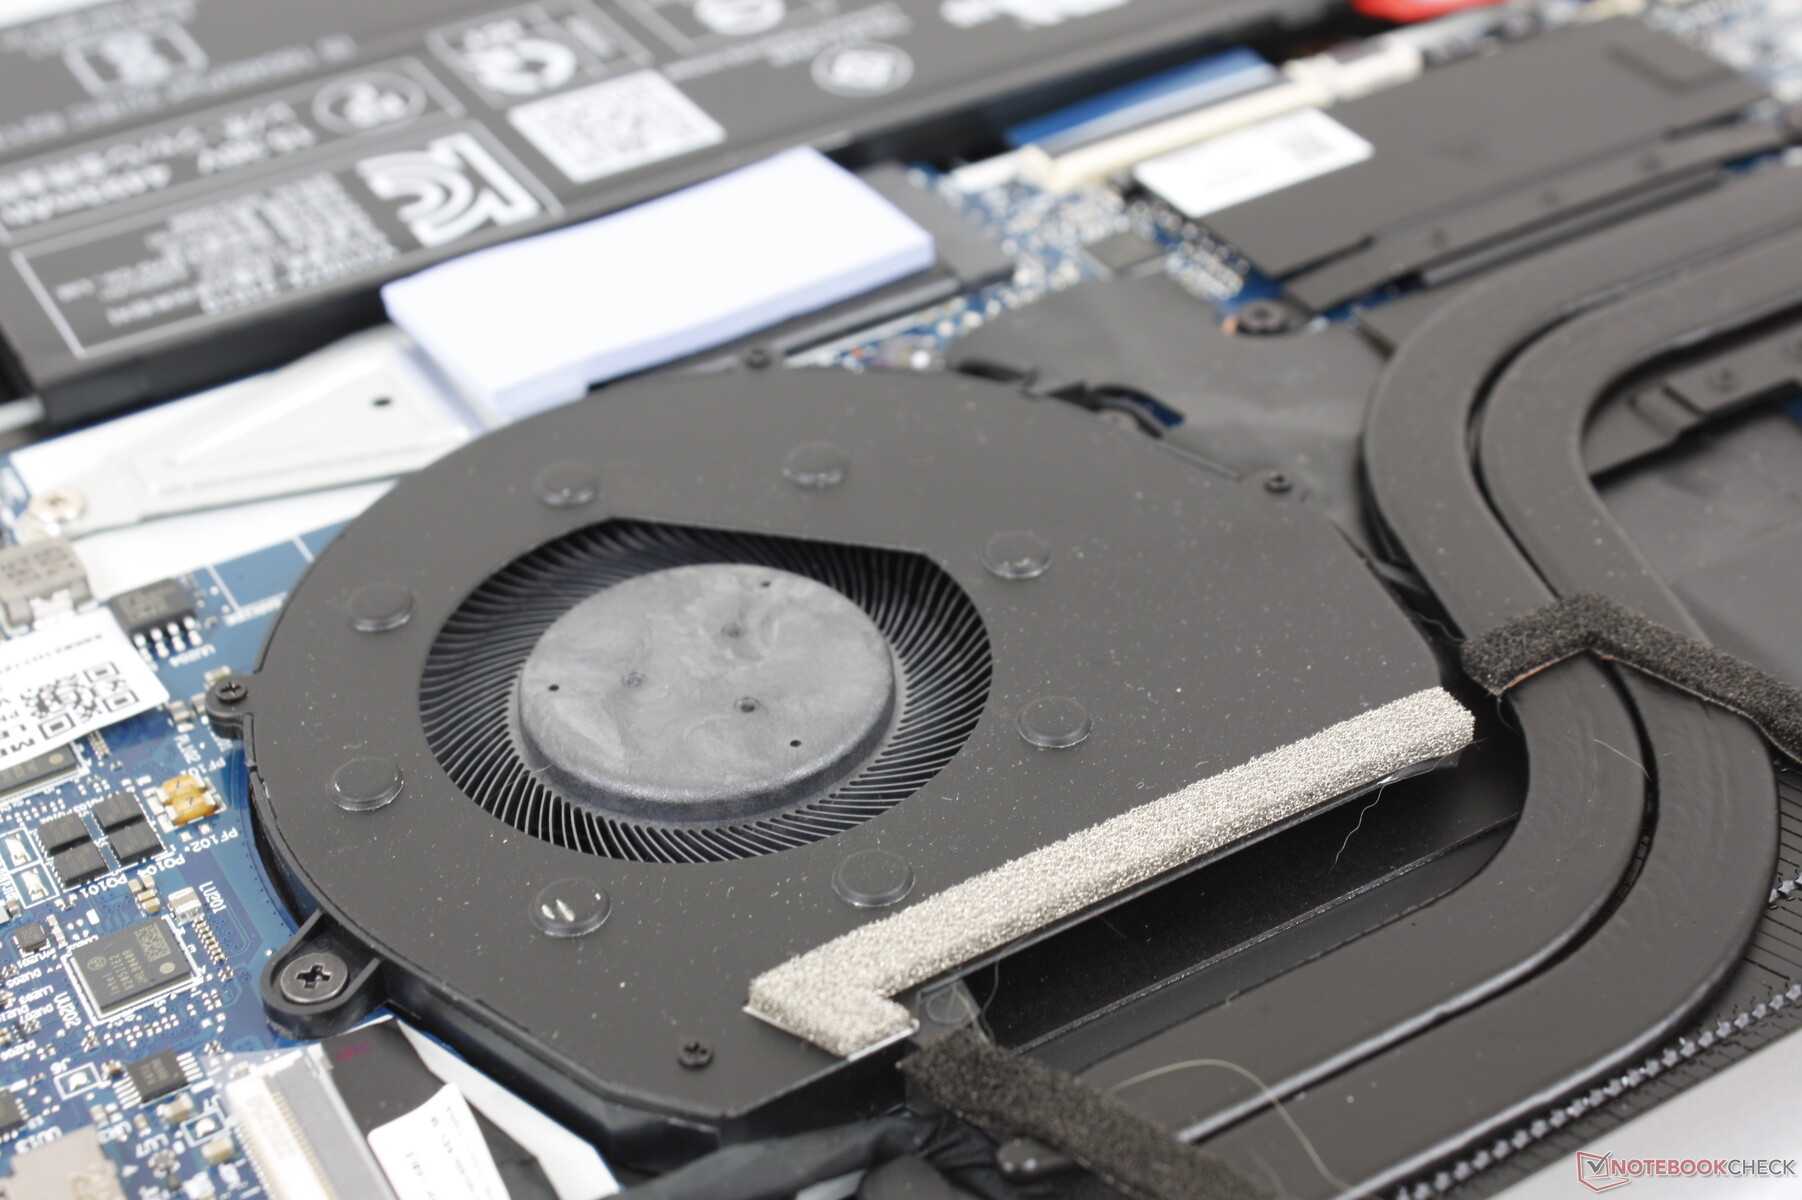
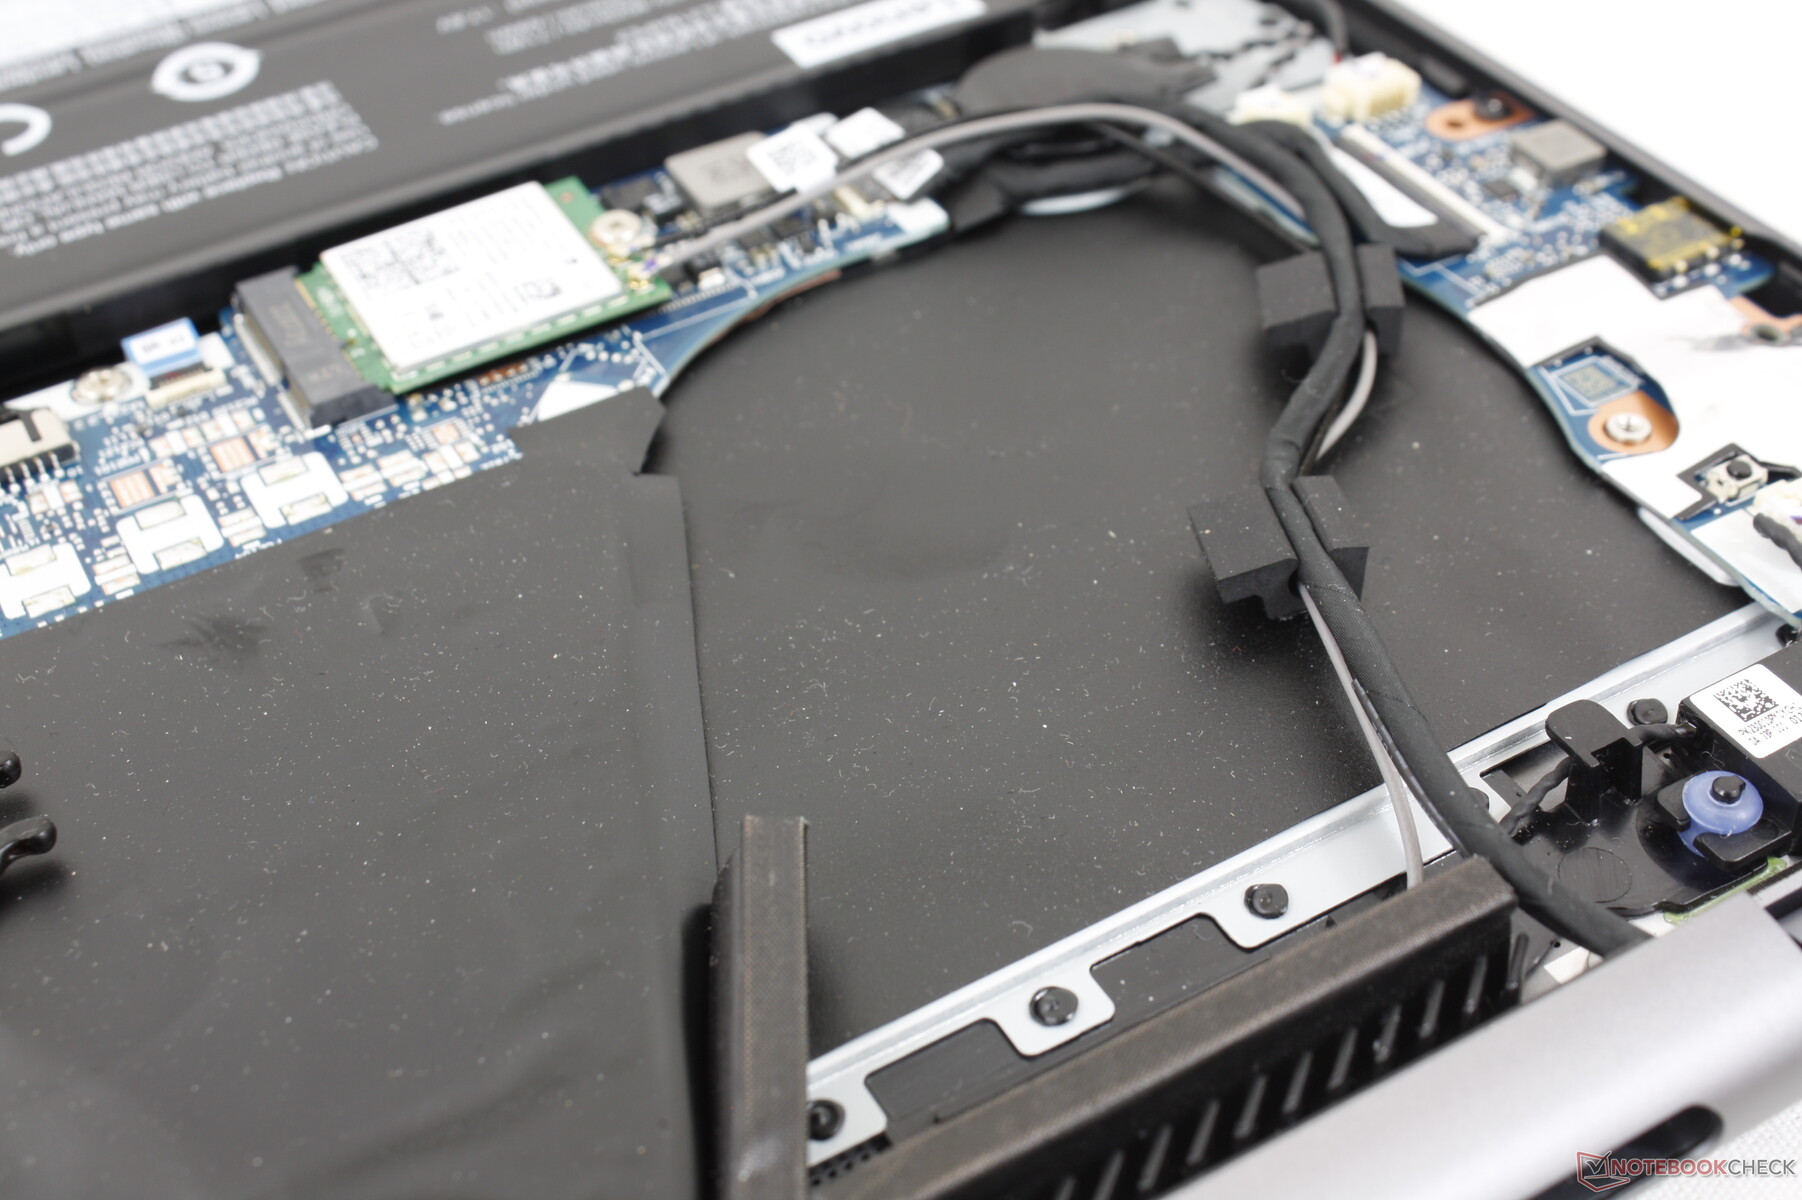
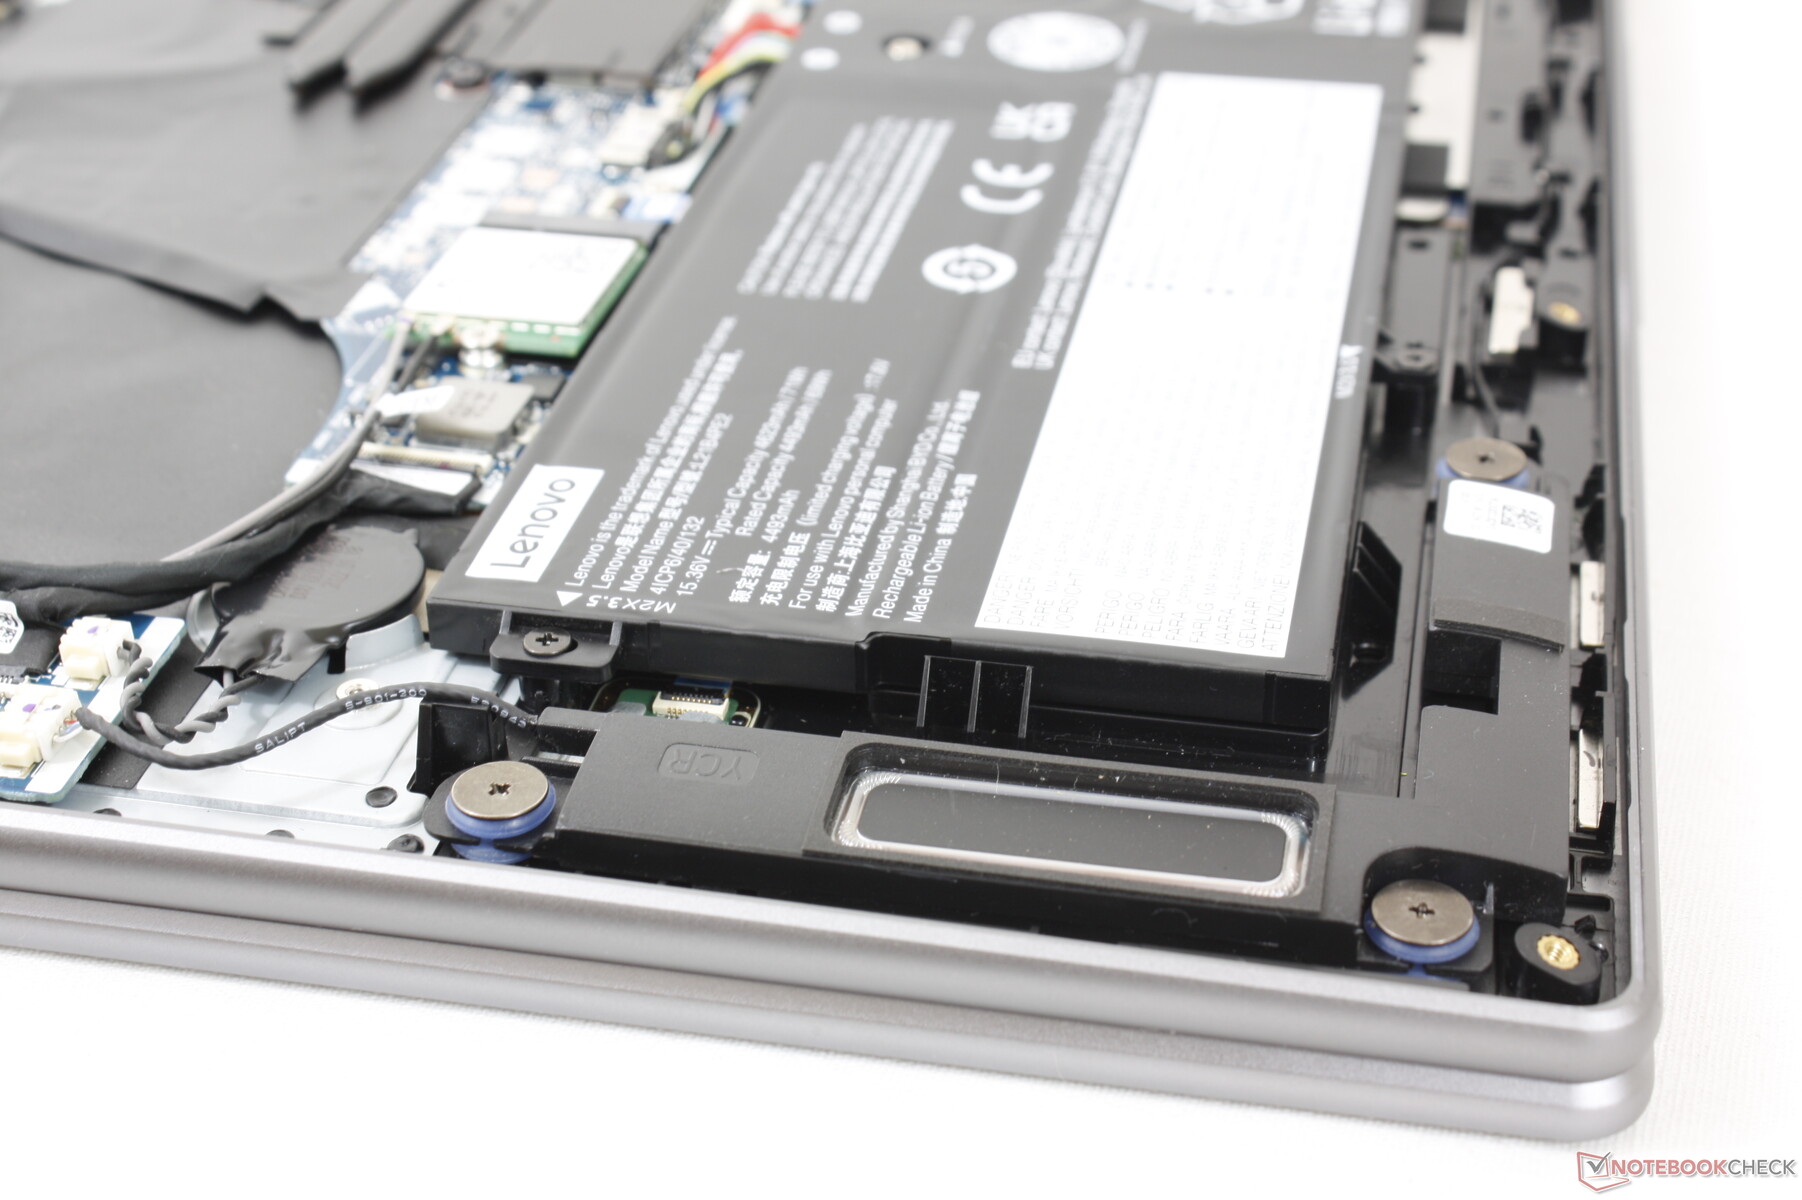
Wartung
Die Bodenplatte lässt sich nach dem Entfernen der sieben T5-Torx-Schrauben leicht lösen. Beachten Sie, dass die Kühllösung bei unserer Konfiguration kleiner ist, da die separate Intel Arc GPU fehlt. Daher sollten Benutzer, die die Konfiguration mit der Intel GPU wählen, ein noch schwereres und potenziell lauteres System als das erwarten, das bei unserem jeweiligen Gerät im Einsatz war.
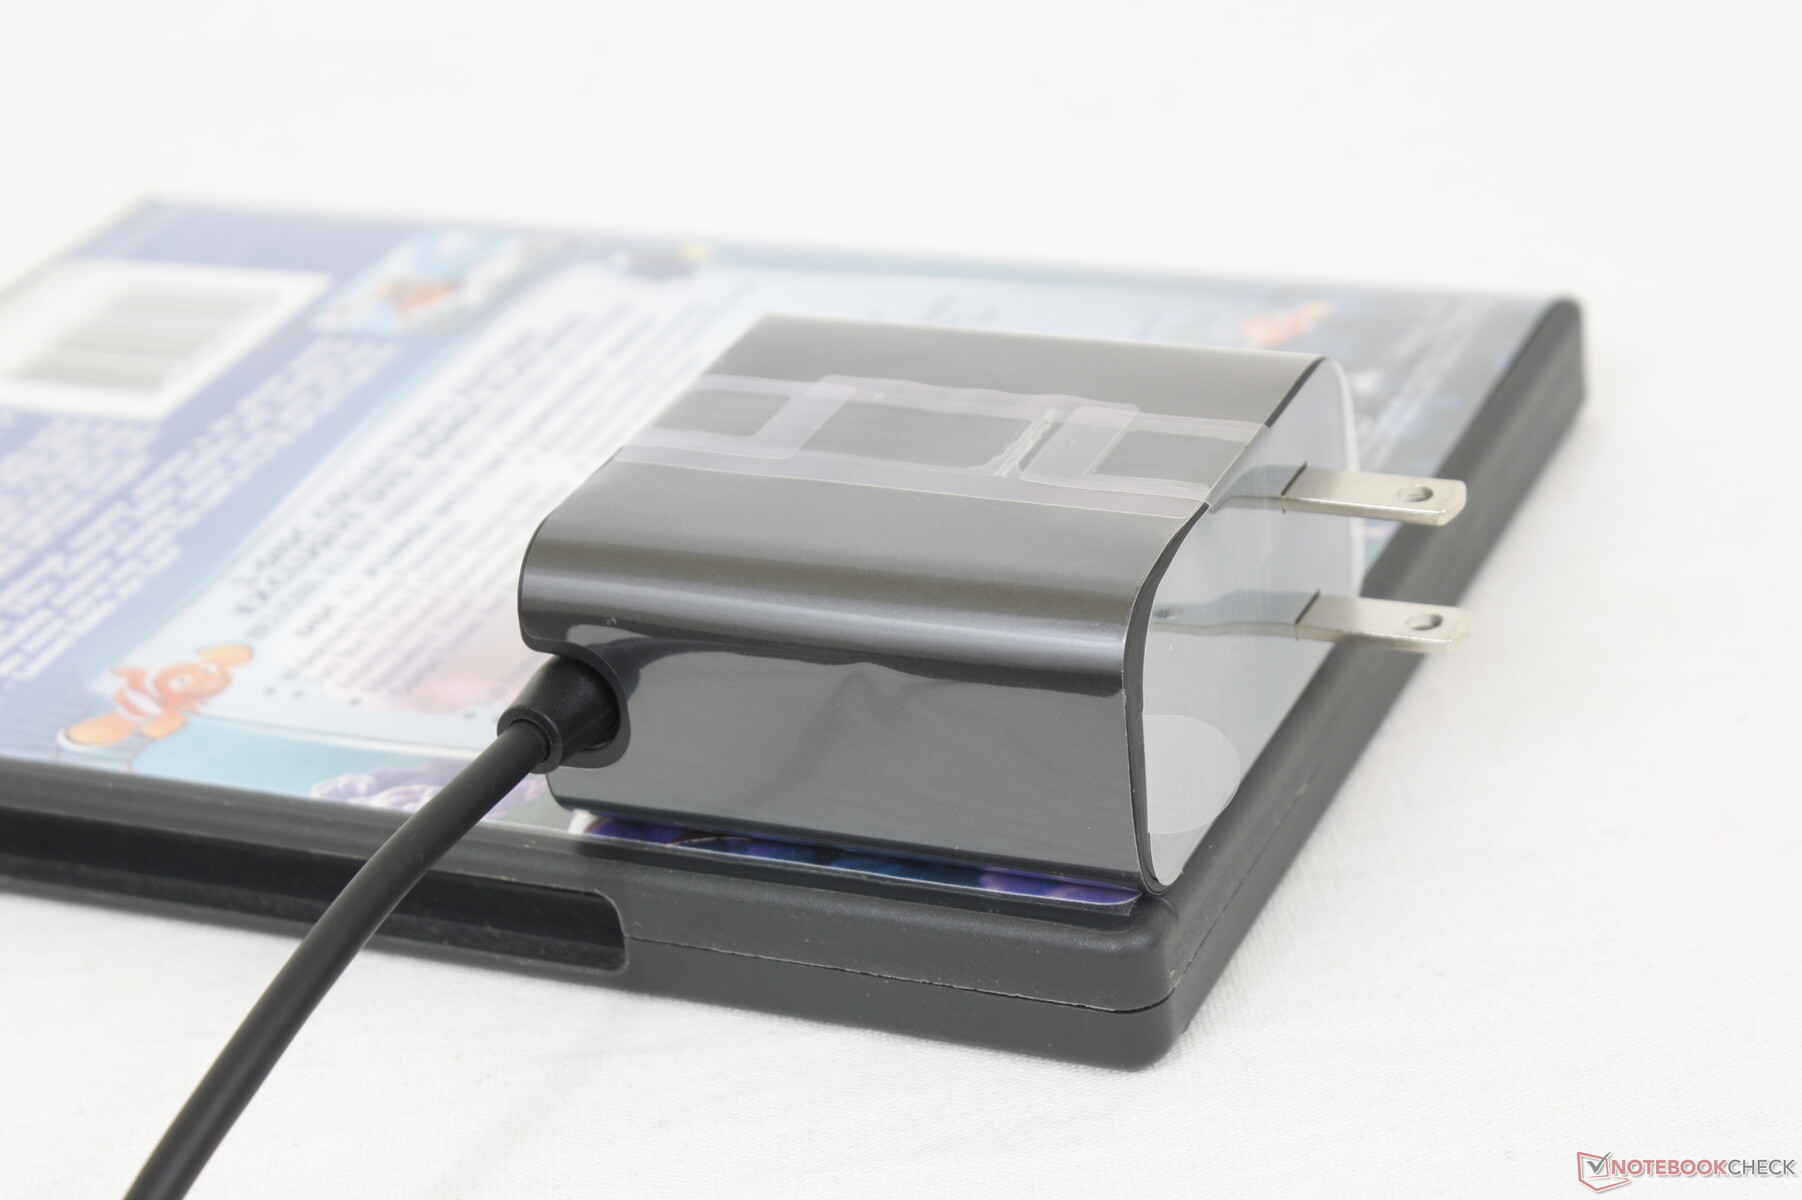
Zubehör und Garantie
Die Verkaufsbox enthält keine Extras, die über den Netzadapter und den Papierkram hinausgehen. Besonders in Anbetracht des hohen Preises des Yoga 7 16 hätten wir uns einen aktiven Stylus Pen gewünscht.
Beim Kauf in den USA gilt die standardmäßige einjährige beschränkte Herstellergarantie.
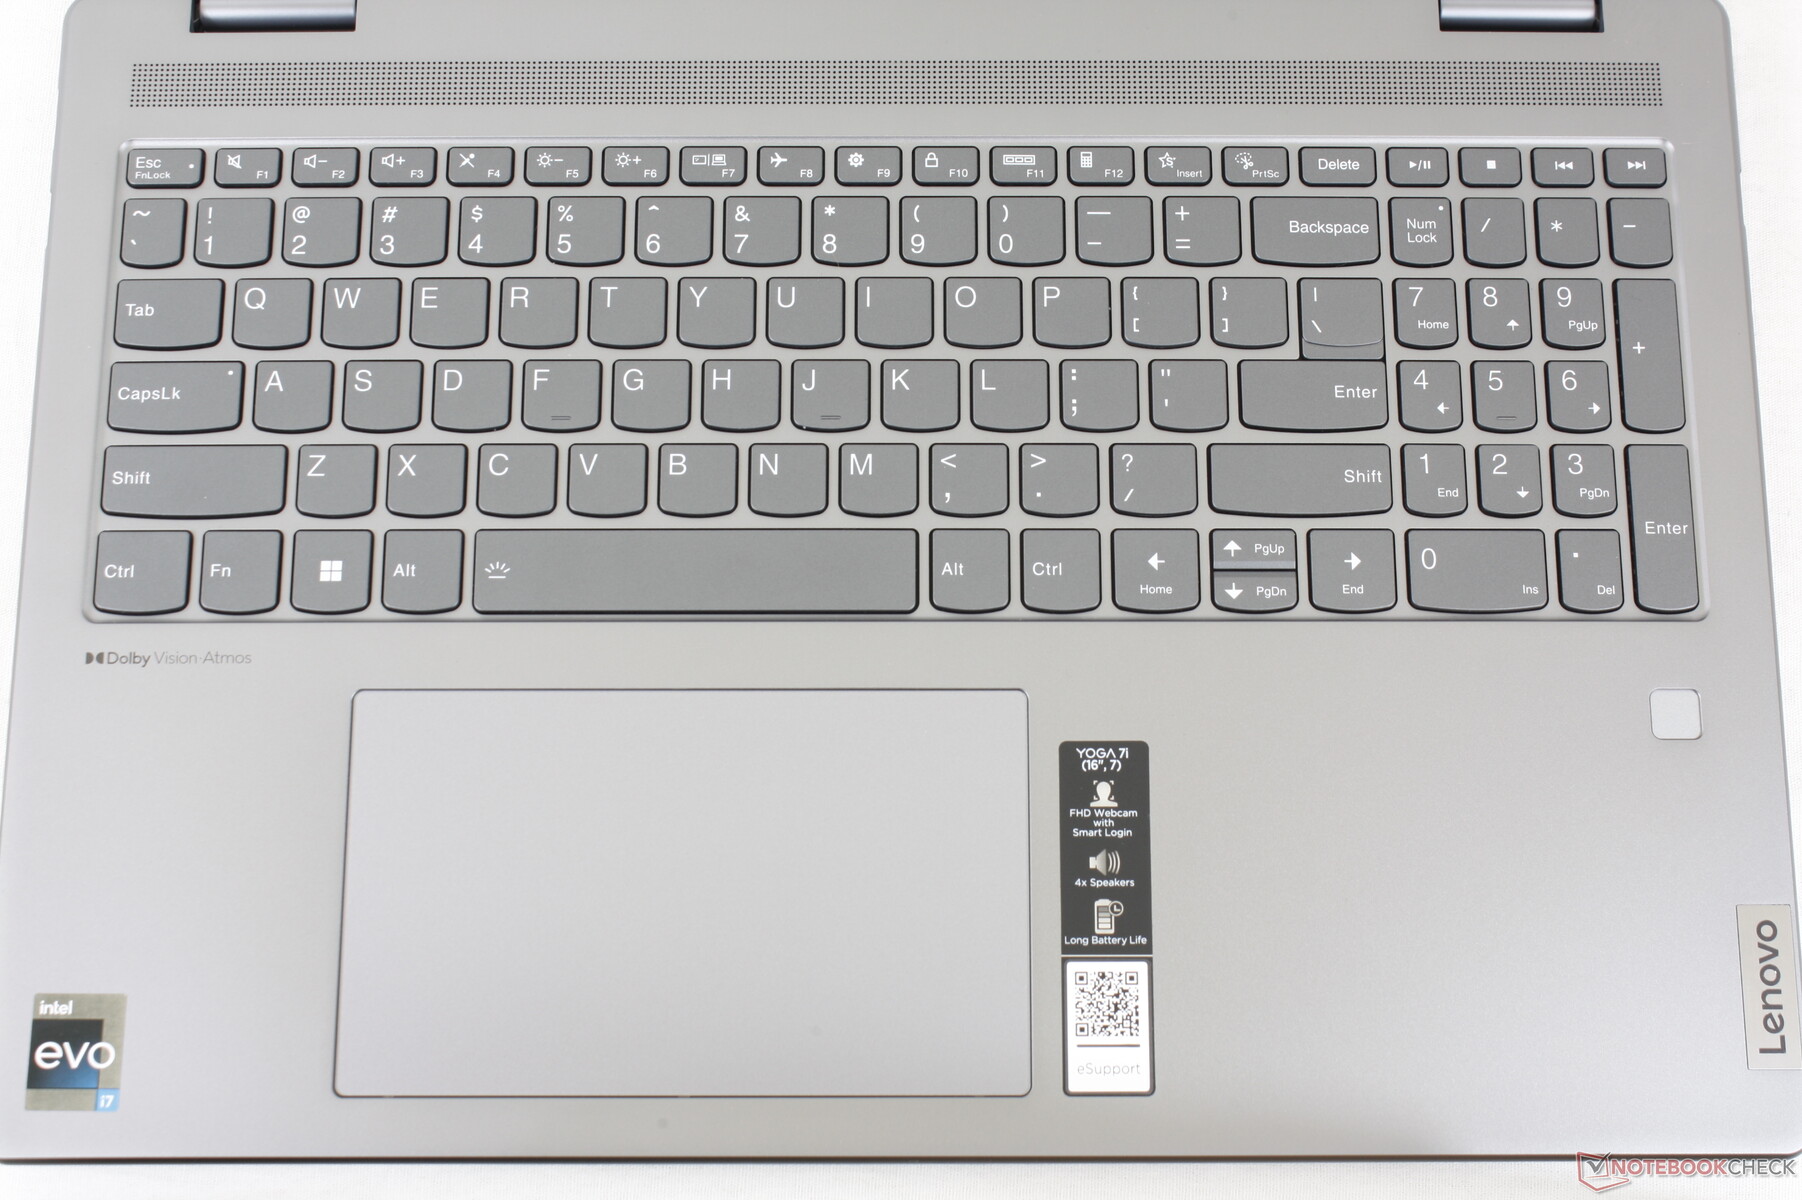
Eingabegeräte – wie ein IdeaPad
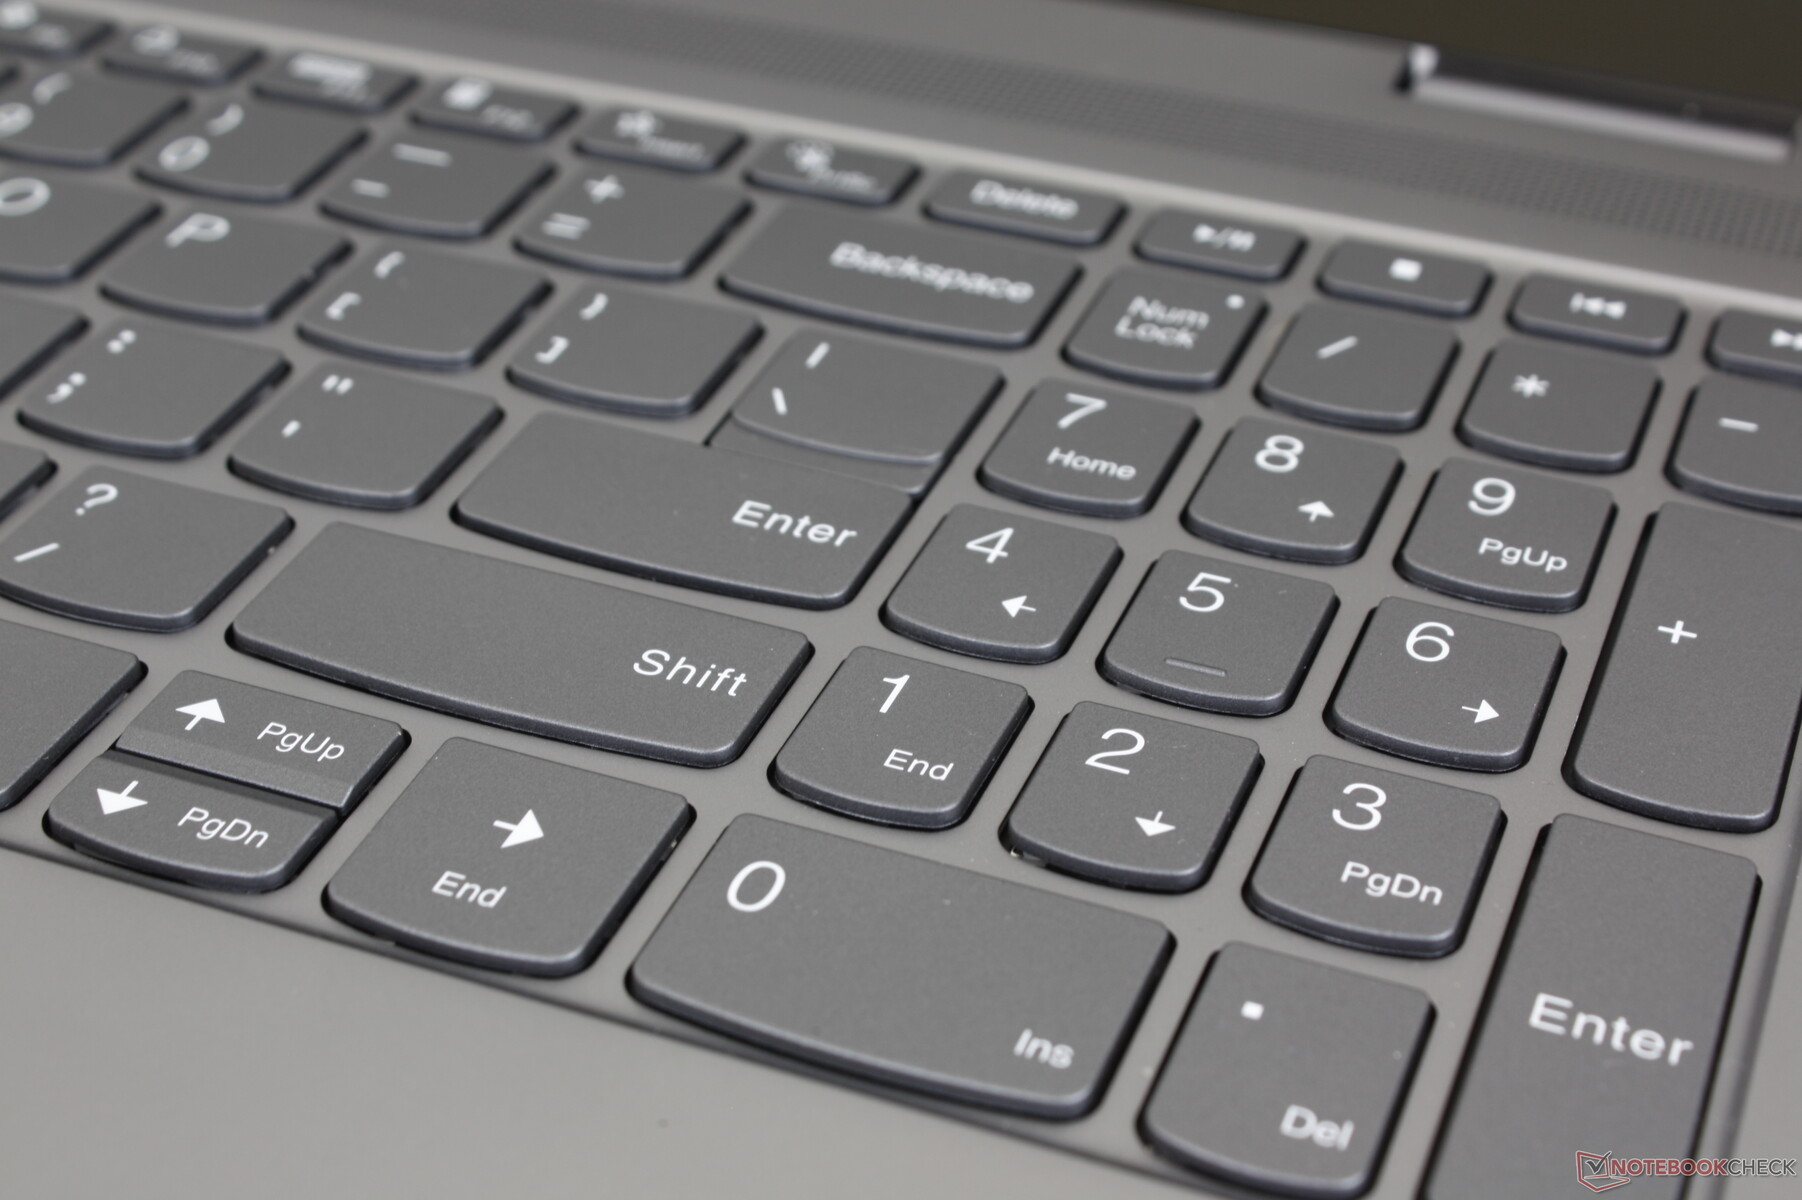
Tastatur
Die Tastatur der Yoga-Modelle ähnelt der von IdeaPad-Modellen. Somit fühlt sich das Tippen vertraut an, wenn Sie bereits Erfahrungen mit IdeaPad oder Yoga-Laptops gemacht haben. Die Tasten sind hier leicht und das Feedback ist relativ genau, aber der Federweg ist kurz und das Klappern ist außerdem mäßig laut. Die Tasten des HP Envy oder der LG Gram Serie sind im Vergleich dazu tiefer.
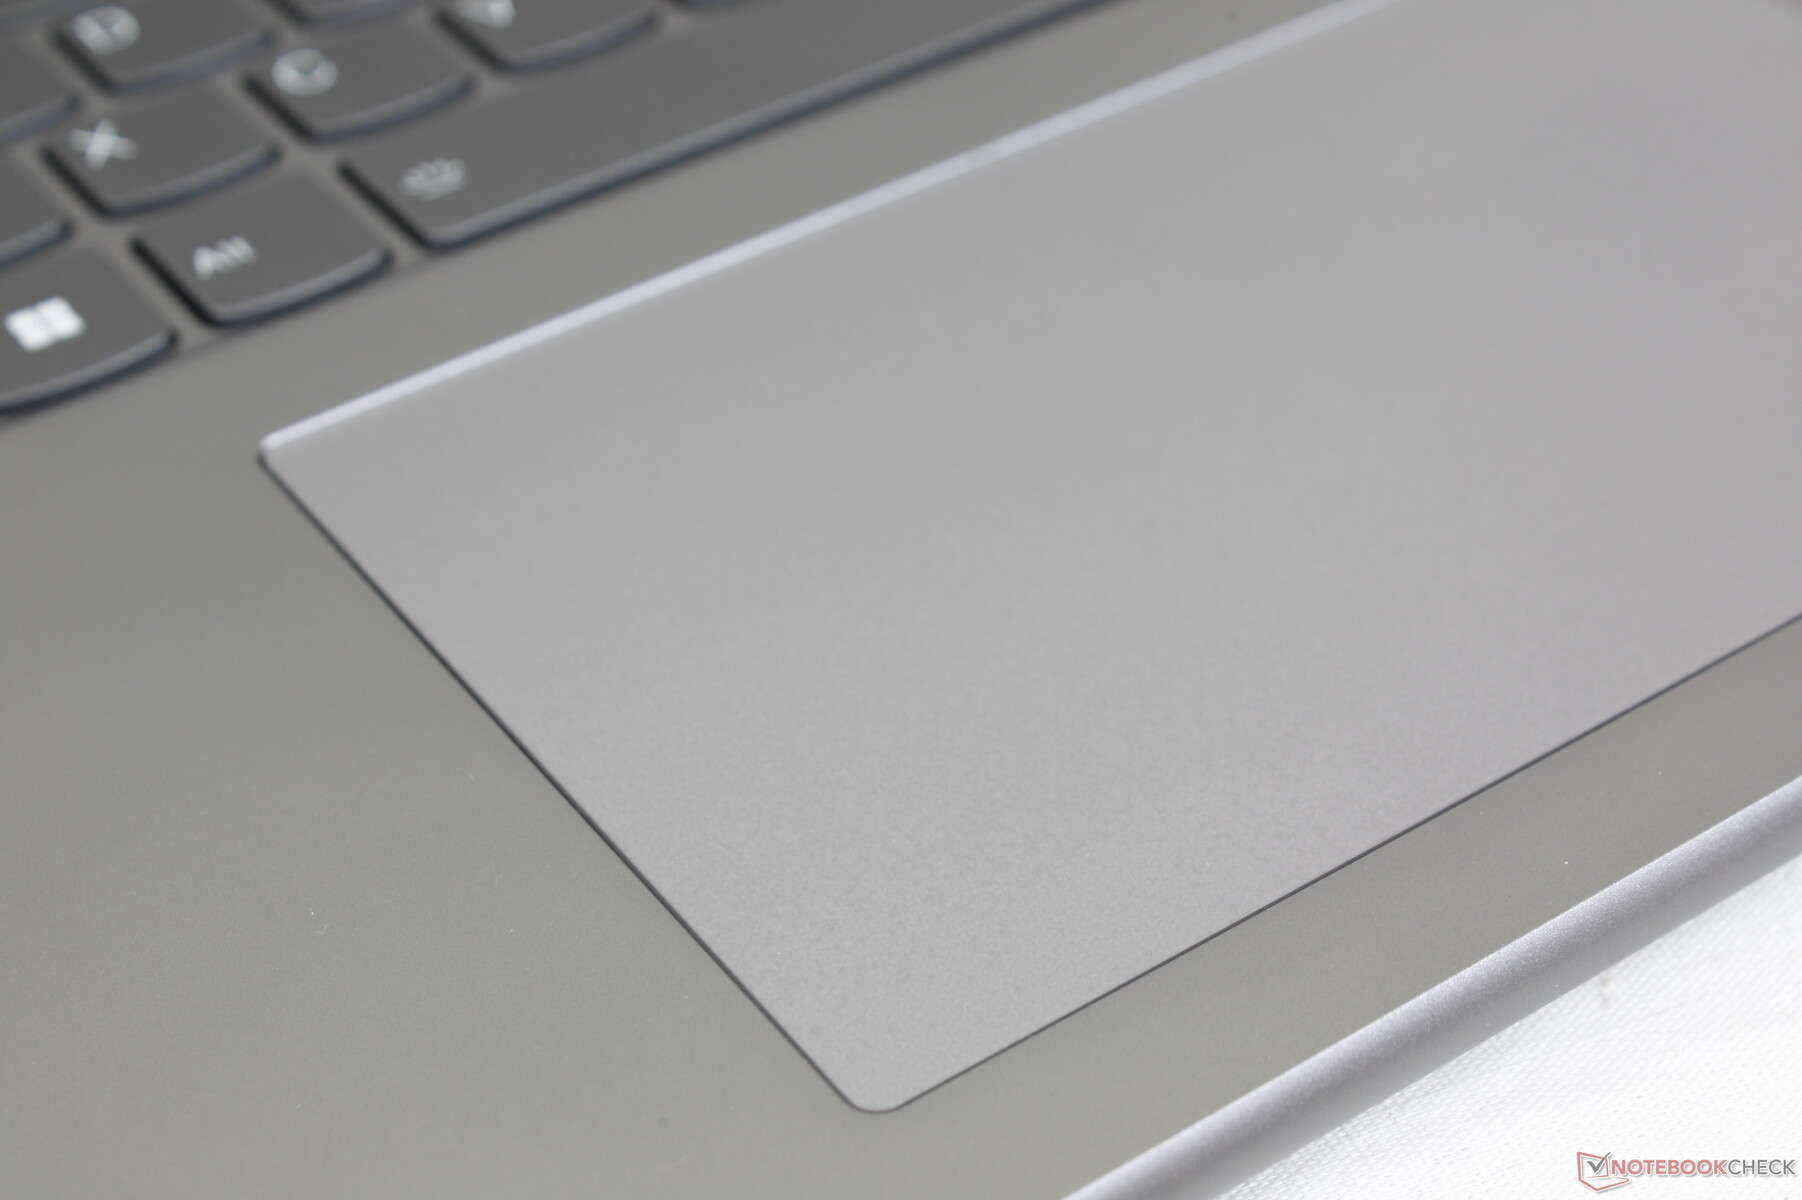
Touchpad
Mit 13,5 x 8 cm ist das Clickpad ein wenig kleiner als beim Dell Inspiron 16 7620 2-in-1 (~ 13,3 x 9 cm) oder LG Gram 16 2-in-1 (13,2 x 8,3 cm). Es ist gleichwohl groß und ermöglicht ein sehr sanftes Gleiten für komfortable Multitouch-Eingaben und Cursor-Scrollen.
Die integrierten Clickpad-Tasten haben ein anständiges Feedback, wenn sie gedrückt werden, aber der Klick ist laut, was einige Benutzer möglicherweise nicht bevorzugen.

Anzeige – keine Alternativen mit 90 Hz oder 120 Hz
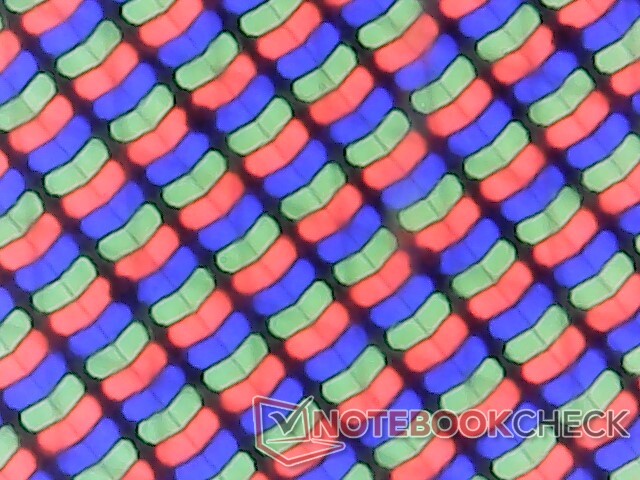
HWiNFO meldet ein ähnliches 16:10 LEN160WQXGA IPS-Panel wie beim IdeaPad 5 Pro 16IHU6. In Wirklichkeit sind die Displays jedoch sehr unterschiedlich. Zum einen ist unser Yoga-Modell auf die native 60-Hz-Bildwiederholfrequenz im Vergleich zu 120 Hz des IdeaPads beschränkt. Zweitens sind die Reaktionszeiten bei unserem Yoga viel langsamer. Die Farben und der Kontrast liegen ansonsten beim Vergleich der beiden Modellen nahe beieinander. Es ist enttäuschend zu sehen, dass das Display eines IdeaPads dem Display unseres Yoga immer noch überlegen ist, auch wenn wir dachten, dass die Yoga-Serie ein Schritt weiter sein sollte als die IdeaPad-Serie.


| |||||||||||||||||||||||||
Ausleuchtung: 84 %
Helligkeit Akku: 393.7 cd/m²
Kontrast: 1036:1 (Schwarzwert: 0.38 cd/m²)
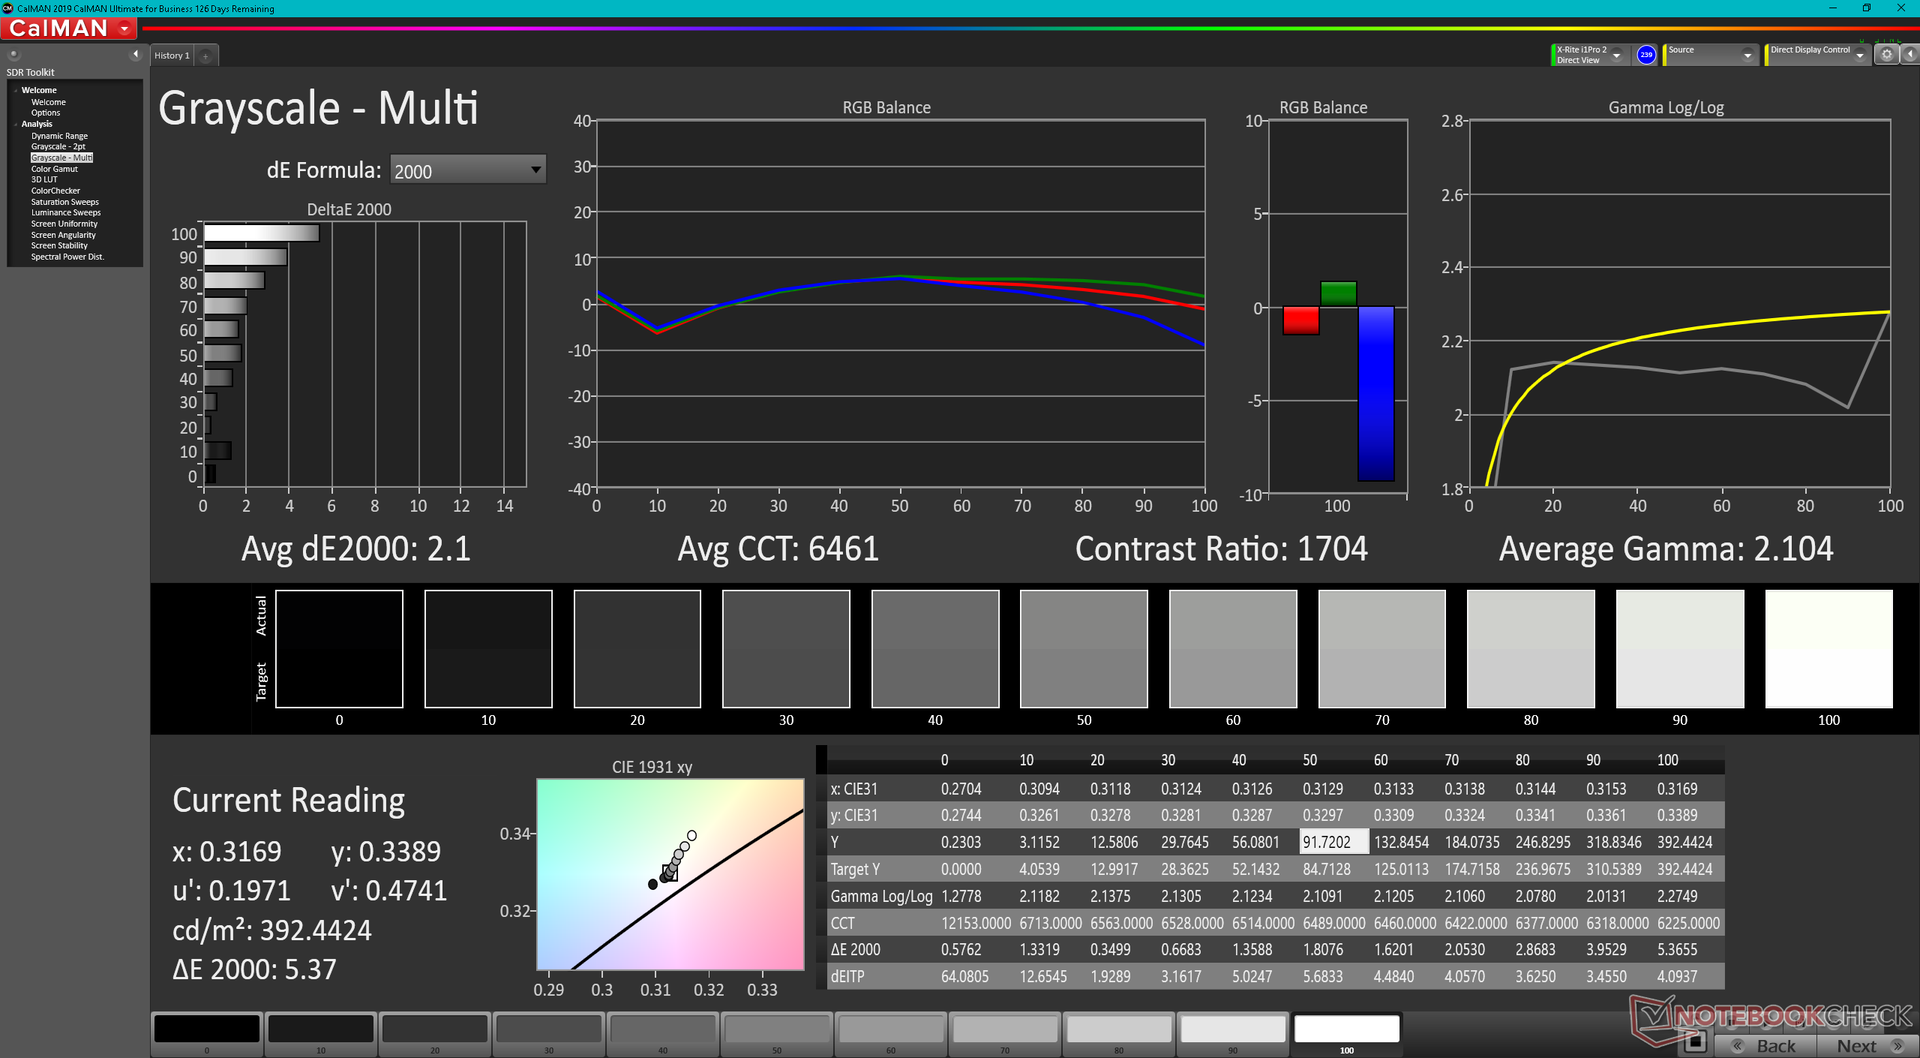
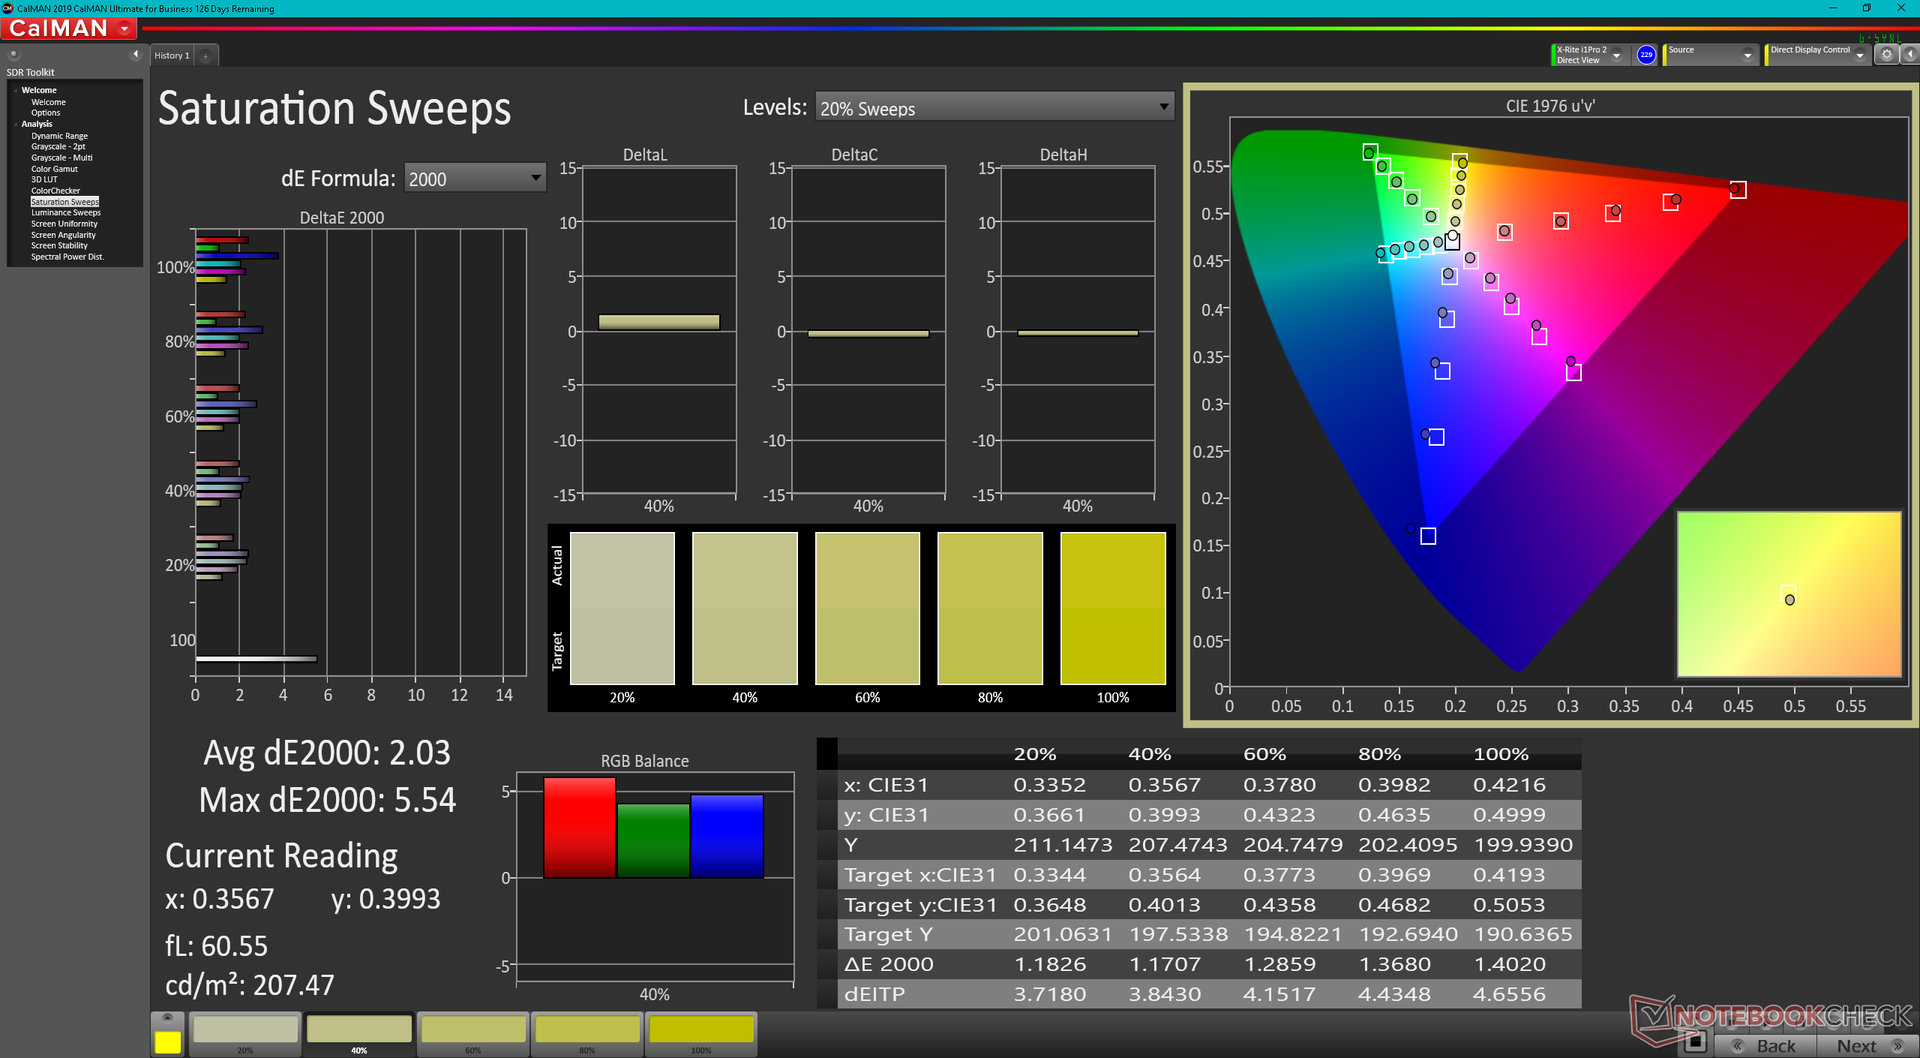
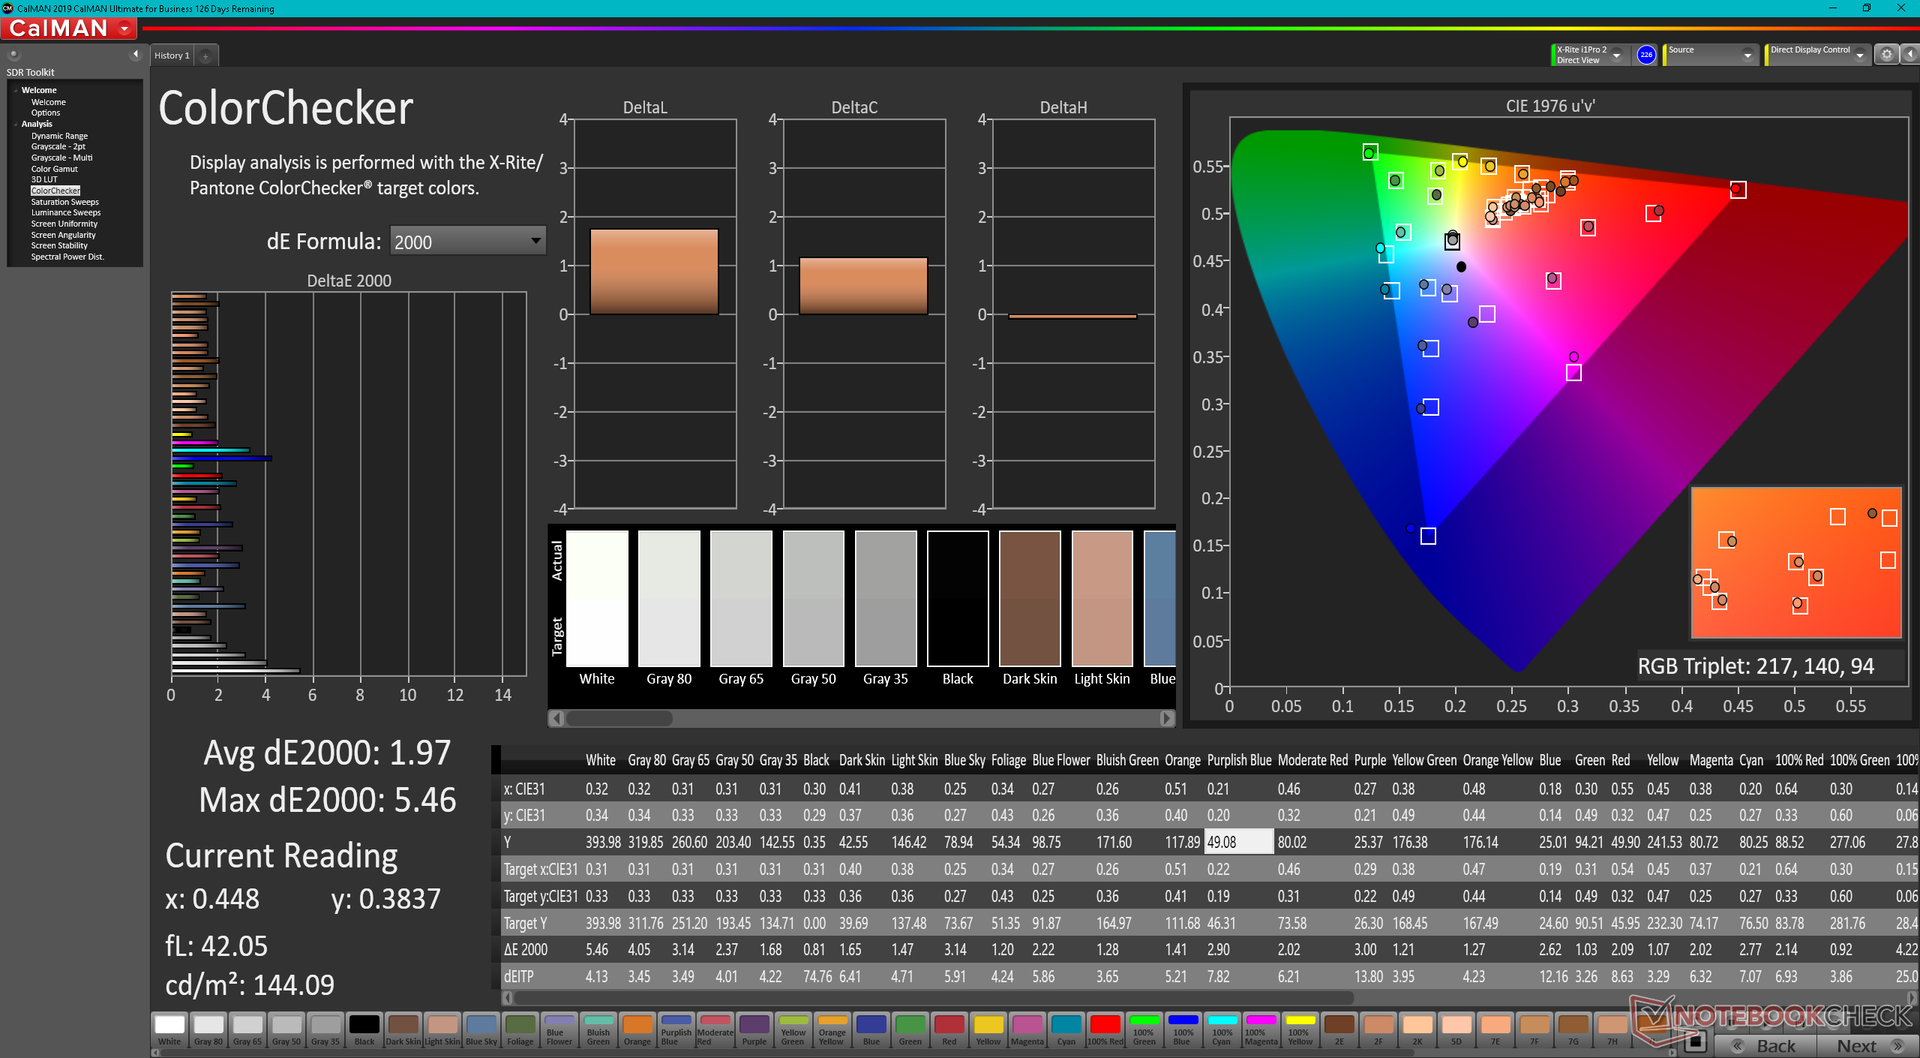
ΔE ColorChecker Calman: 1.97 | ∀{0.5-29.43 Ø4.72}
calibrated: 0.62
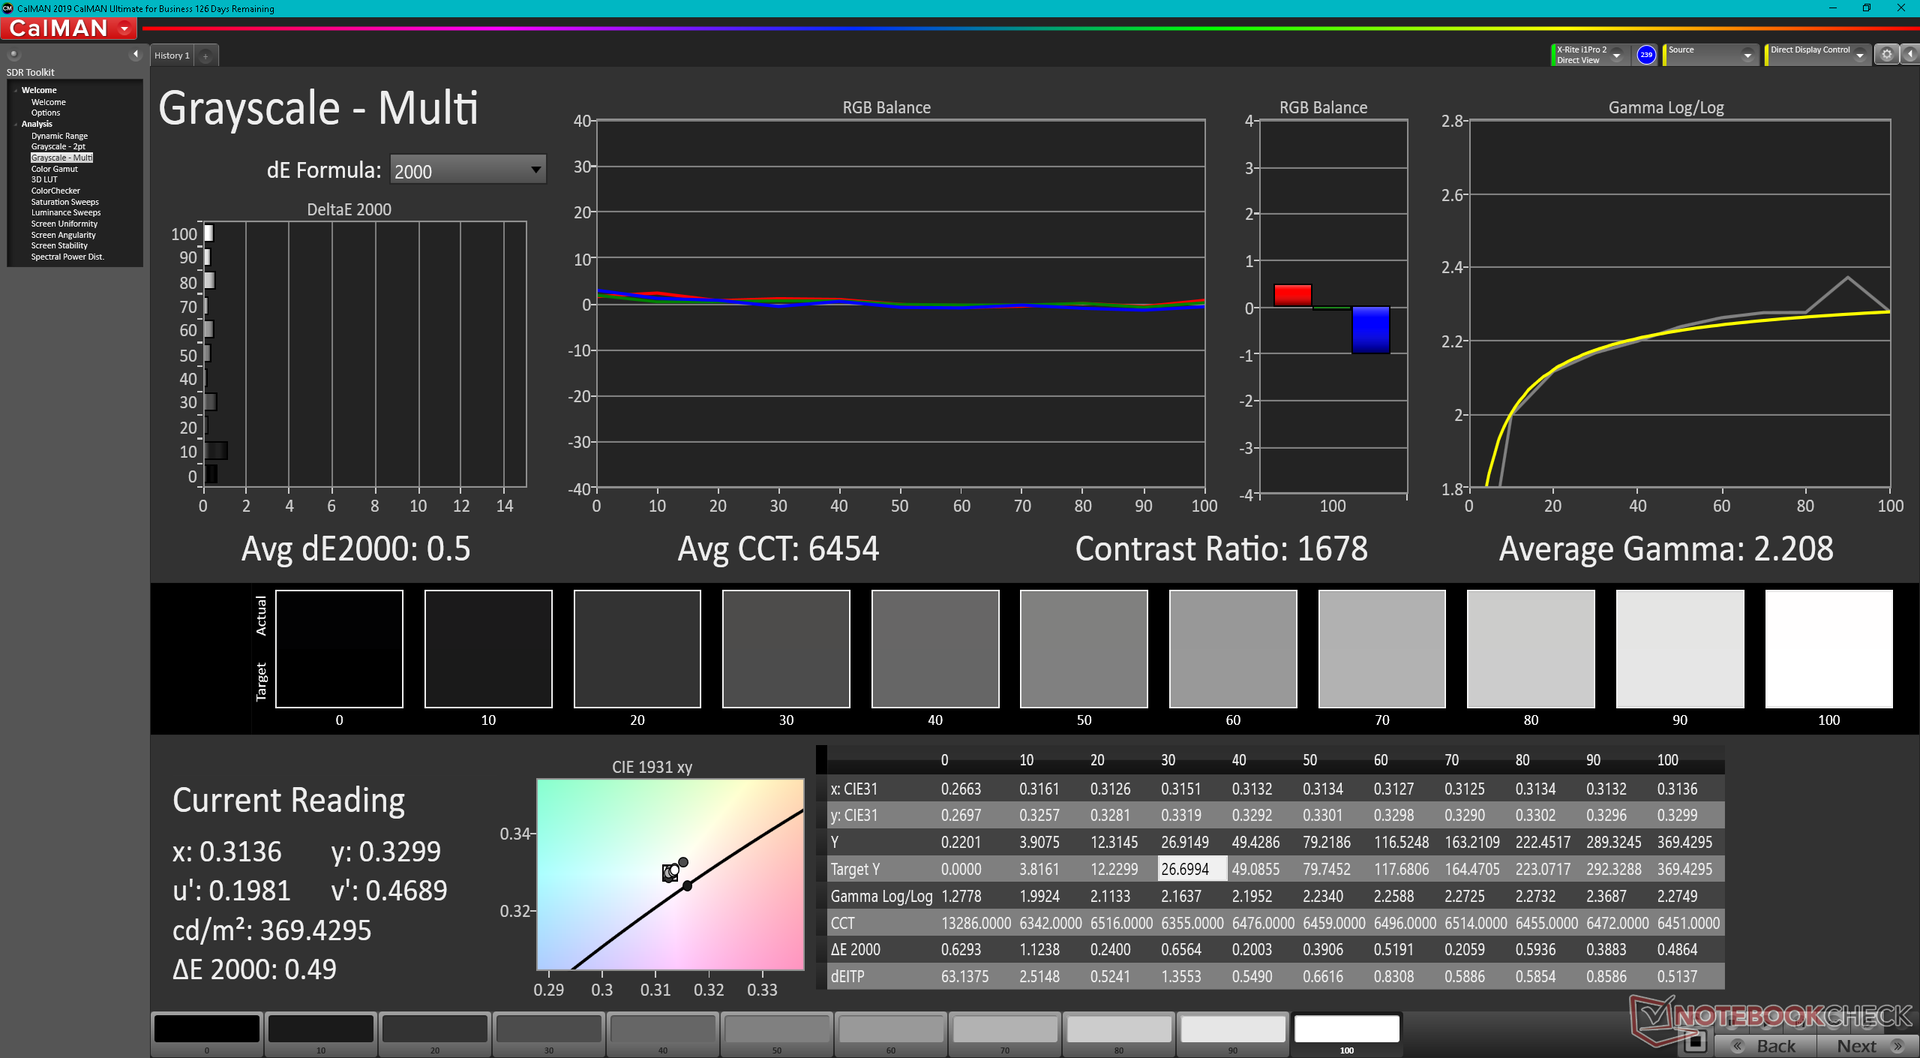
ΔE Greyscale Calman: 2.1 | ∀{0.09-98 Ø4.97}
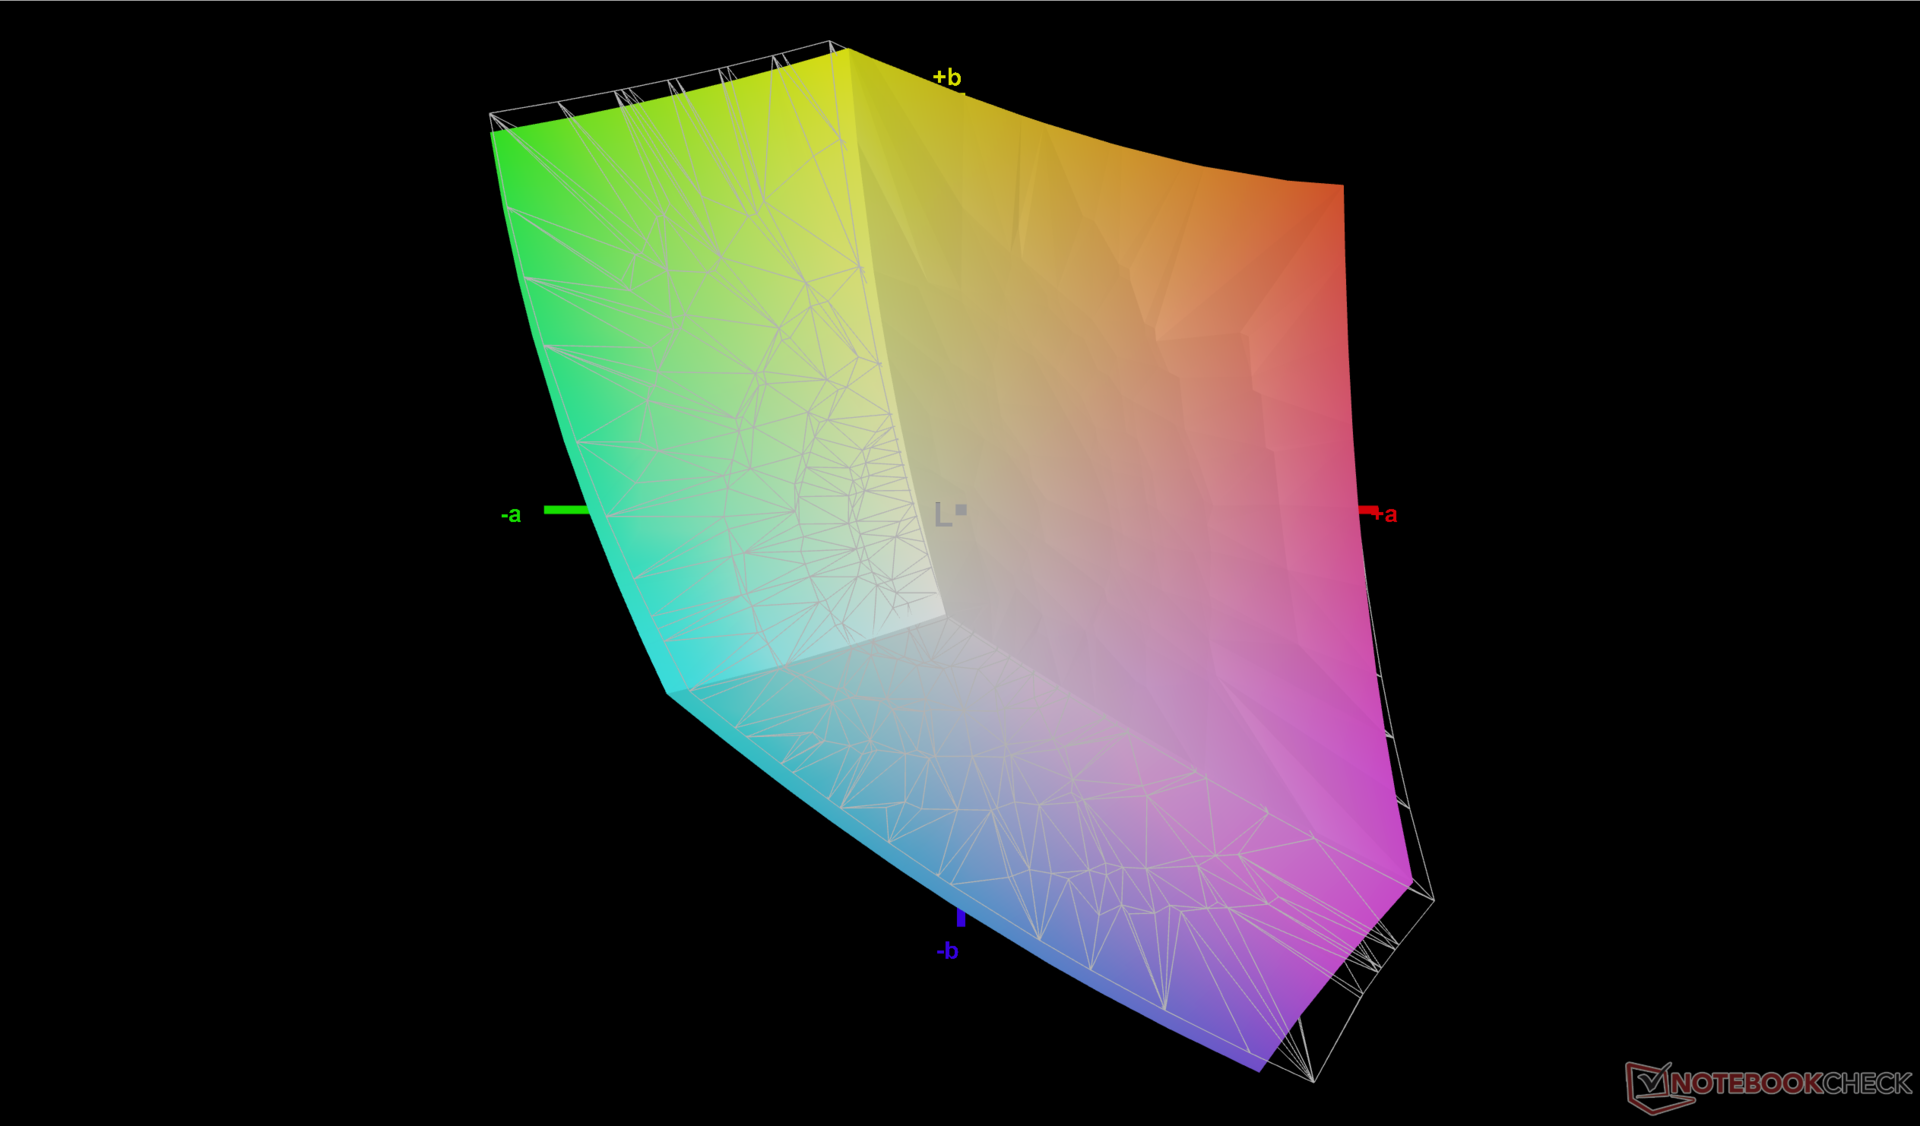
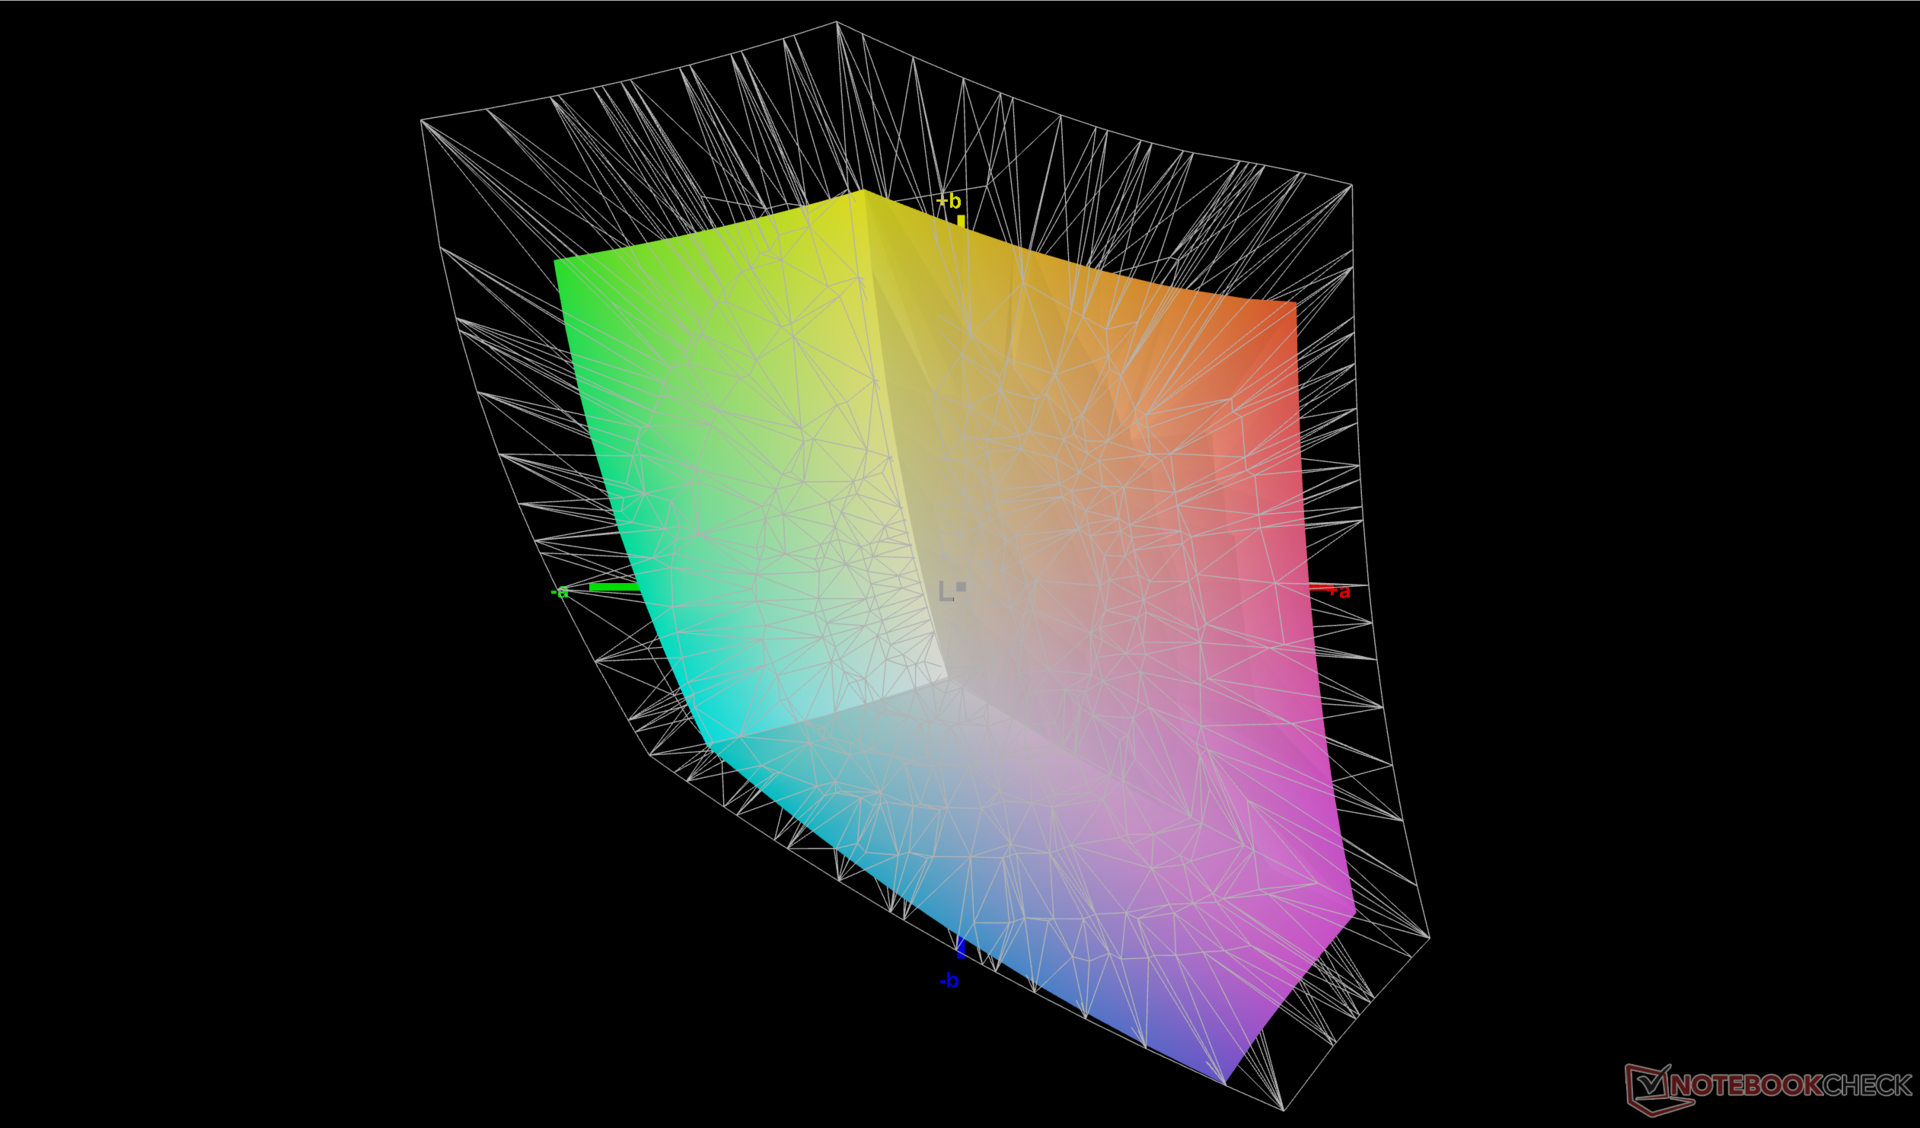
69.3% AdobeRGB 1998 (Argyll 3D)
95.7% sRGB (Argyll 3D)
67% Display P3 (Argyll 3D)
Gamma: 2.1
CCT: 6461 K
| Lenovo Yoga 7 16IAP7 Lenovo LEN160WQXGA, IPS, 2560x1600, 16" | Huawei MateBook D 16 2022 BOE NV160WUM-NH0, IPS, 1920x1200, 16" | Dell Inspiron 16 7620 2-in-1 BOE NV16N45, IPS, 1920x1200, 16" | Acer Swift X SFX16-51G-5388 Chi Mei N161HCA-EA3, , 1920x1080, 16.1" | LG Gram 16 (2021) LG Philips LP160WQ1-SPA1, IPS, 2560x1600, 16" | Lenovo IdeaPad 5 Pro 16ACH IPS LED, 2560x1600, 16" | |
|---|---|---|---|---|---|---|
| Display | -0% | 0% | -2% | 23% | 5% | |
| Display P3 Coverage (%) | 67 | 66.2 -1% | 67 0% | 65.1 -3% | 95.8 43% | 71 6% |
| sRGB Coverage (%) | 95.7 | 96.4 1% | 95.9 0% | 95.65 0% | 99.8 4% | 99 3% |
| AdobeRGB 1998 Coverage (%) | 69.3 | 68.3 -1% | 69.3 0% | 66.75 -4% | 83.8 21% | 73.3 6% |
| Response Times | 20% | 14% | 18% | -2% | 60% | |
| Response Time Grey 50% / Grey 80% * (ms) | 36 ? | 30.5 ? 15% | 32 ? 11% | 30 ? 17% | 44 ? -22% | 16.4 ? 54% |
| Response Time Black / White * (ms) | 24.8 ? | 18.7 ? 25% | 20.8 ? 16% | 20 ? 19% | 20 ? 19% | 8.8 ? 65% |
| PWM Frequency (Hz) | 24940 ? | |||||
| Bildschirm | -30% | -48% | 8% | -88% | -14% | |
| Helligkeit Bildmitte (cd/m²) | 393.7 | 319 -19% | 320.7 -19% | 276 -30% | 331 -16% | 395 0% |
| Brightness (cd/m²) | 367 | 317 -14% | 309 -16% | 264 -28% | 309 -16% | 375 2% |
| Brightness Distribution (%) | 84 | 90 7% | 90 7% | 85 1% | 88 5% | 90 7% |
| Schwarzwert * (cd/m²) | 0.38 | 0.23 39% | 0.36 5% | 0.16 58% | 0.22 42% | 0.32 16% |
| Kontrast (:1) | 1036 | 1387 34% | 891 -14% | 1725 67% | 1505 45% | 1234 19% |
| Delta E Colorchecker * | 1.97 | 3.4 -73% | 4.18 -112% | 1.8 9% | 4.64 -136% | 2.6 -32% |
| Colorchecker dE 2000 max. * | 5.46 | 8.1 -48% | 8.48 -55% | 3.77 31% | 9.82 -80% | 5.4 1% |
| Colorchecker dE 2000 calibrated * | 0.62 | 0.8 -29% | 0.77 -24% | 0.63 -2% | 3.16 -410% | 1.1 -77% |
| Delta E Graustufen * | 2.1 | 5.7 -171% | 6.3 -200% | 2.76 -31% | 6.9 -229% | 3.4 -62% |
| Gamma | 2.1 105% | 2.1 105% | 2.21 100% | 2.37 93% | 2.34 94% | 2.12 104% |
| CCT | 6461 101% | 7433 87% | 6258 104% | 6564 99% | 7904 82% | 6140 106% |
| Farbraum (Prozent von AdobeRGB 1998) (%) | 75.1 | |||||
| Color Space (Percent of sRGB) (%) | 100 | |||||
| Durchschnitt gesamt (Programm / Settings) | -3% /
-17% | -11% /
-29% | 8% /
7% | -22% /
-52% | 17% /
1% |
* ... kleinere Werte sind besser
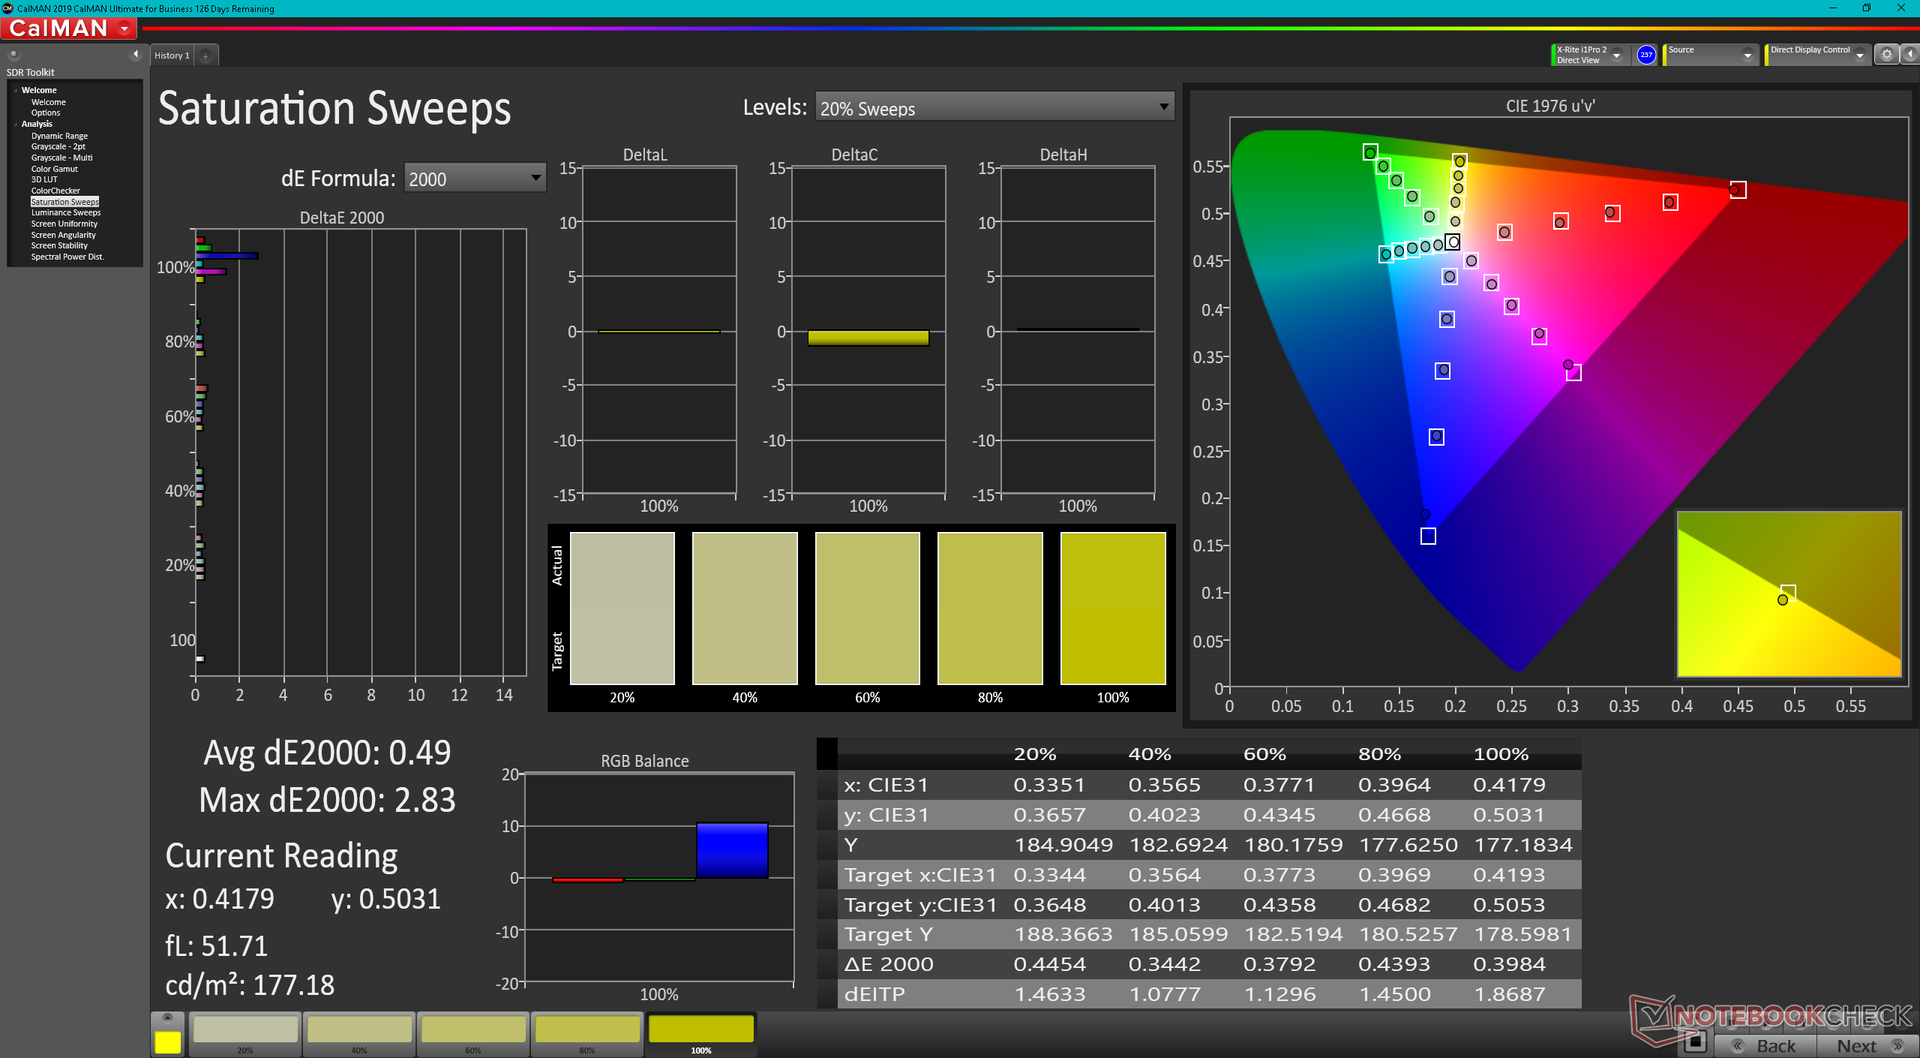
Das Panel bietet ähnlich wie die meisten anderen Convertibles oder Laptops der mittleren Preisklasse mit 16 Zoll > 95 Prozent sRGB-Abdeckung. Das LG Gram 16 ist eine der wenigen Alternativen, die eine noch breitere > 95 Prozent P3 anbietet.
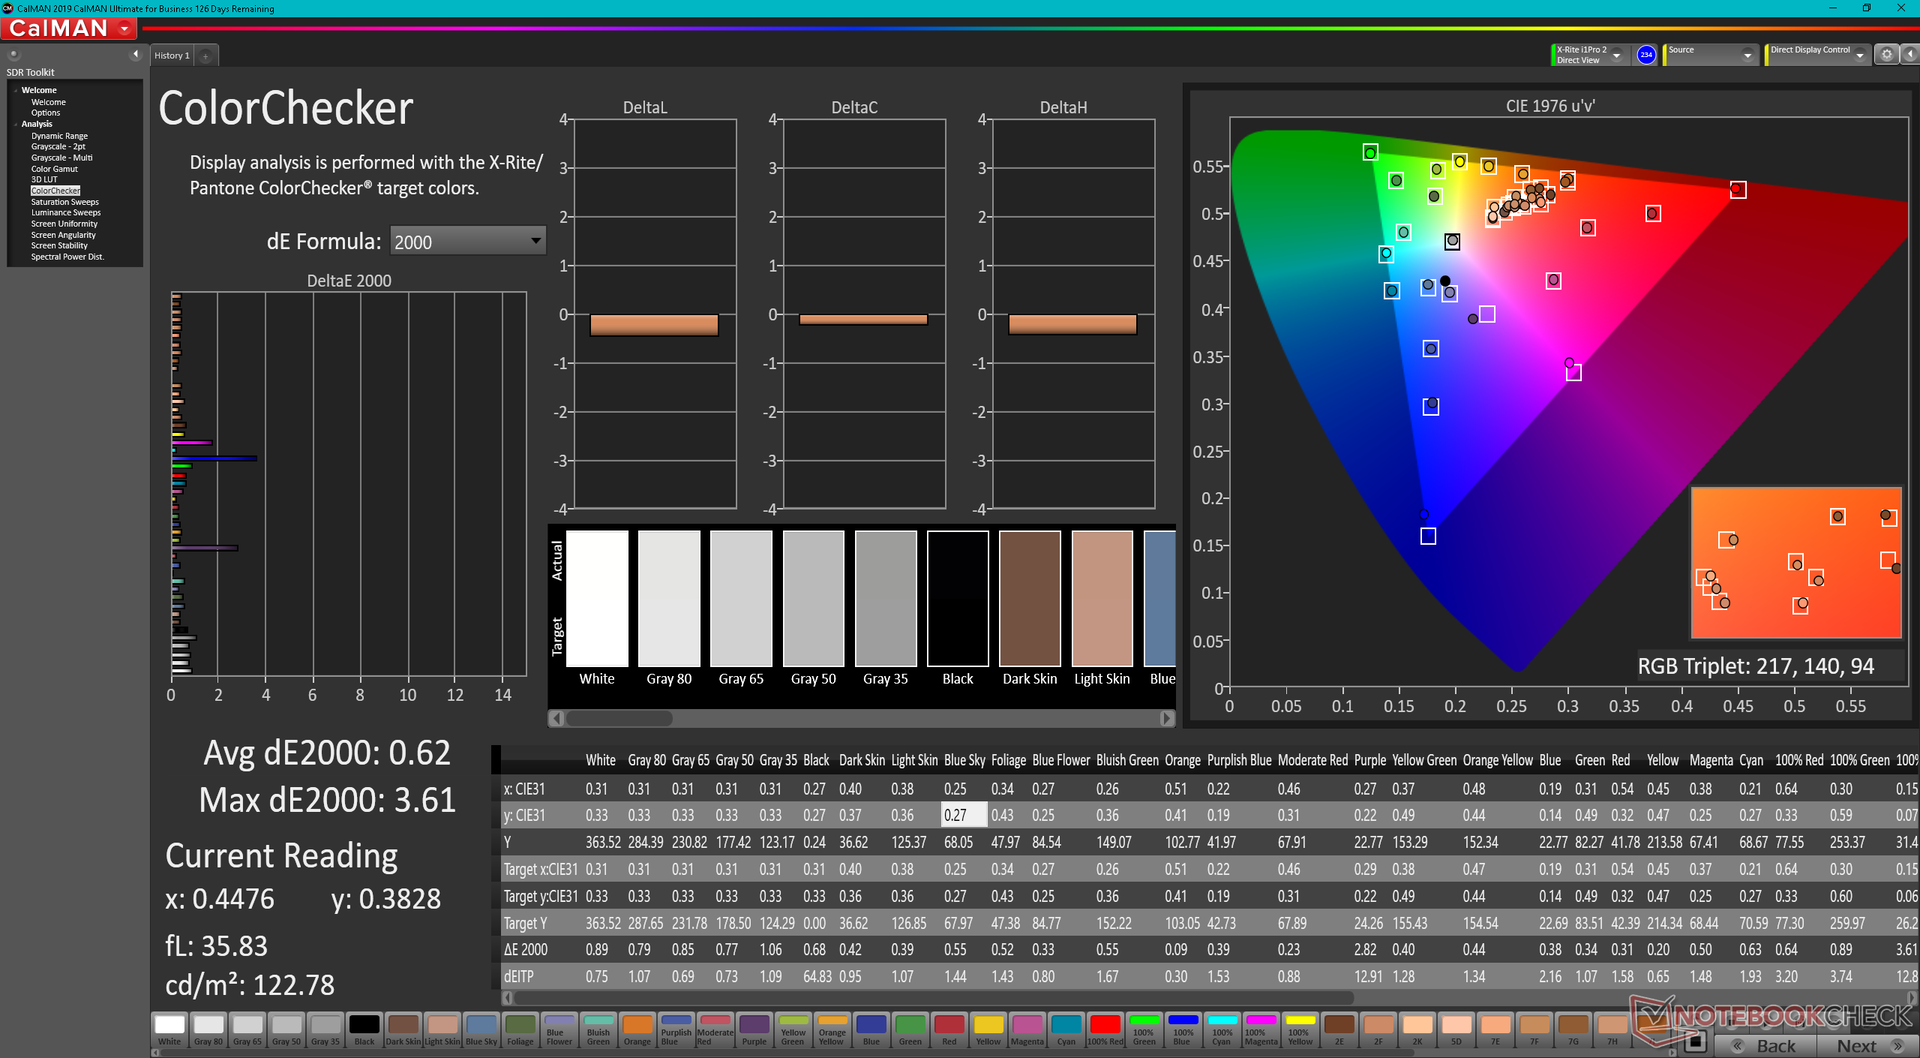
Das Display ist bereits mit durchschnittlichen Graustufen- und Farb-DeltaE-Werten von nur 2,1 bzw. 1,97 kalibriert. Wir sind in der Lage, dies mit unserer eigenen X-Rite-Kalibrierung noch weiter voranzutreiben, um die durchschnittlichen Graustufen- und Farb-DeltaE-Werte auf nur 0,5 bzw. 0,62 zu reduzieren. Trotzdem ist eine Endbenutzer-Kalibrierung nicht wirklich erforderlich, da das Display bereits im Lieferzustand sRGB-genau ist.
Reaktionszeiten (Response Times) des Displays
| ↔ Reaktionszeiten Schwarz zu Weiß | ||
|---|---|---|
| 24.8 ms ... steigend ↗ und fallend ↘ kombiniert | ↗ 12.4 ms steigend | 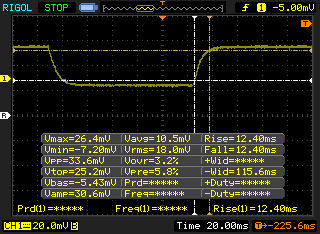 |
| ↘ 12.4 ms fallend | ||
| Die gemessenen Reaktionszeiten sind gut, für anspruchsvolle Spieler könnten der Bildschirm jedoch zu langsam sein. Im Vergleich rangierten die bei uns getesteten Geräte von 0.1 (Minimum) zu 240 (Maximum) ms. » 58 % aller Screens waren schneller als der getestete. Daher sind die gemessenen Reaktionszeiten schlechter als der Durchschnitt aller vermessenen Geräte (19.8 ms). | ||
| ↔ Reaktionszeiten 50% Grau zu 80% Grau | ||
| 36 ms ... steigend ↗ und fallend ↘ kombiniert | ↗ 18 ms steigend | 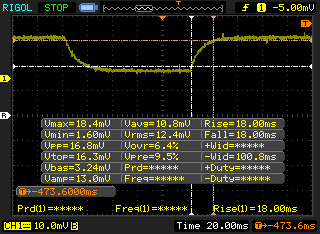 |
| ↘ 18 ms fallend | ||
| Die gemessenen Reaktionszeiten sind langsam und dadurch für viele Spieler wahrscheinlich zu langsam. Im Vergleich rangierten die bei uns getesteten Geräte von 0.165 (Minimum) zu 636 (Maximum) ms. » 51 % aller Screens waren schneller als der getestete. Daher sind die gemessenen Reaktionszeiten schlechter als der Durchschnitt aller vermessenen Geräte (31 ms). | ||
Bildschirm-Flackern / PWM (Pulse-Width Modulation)
| Flackern / PWM nicht festgestellt | 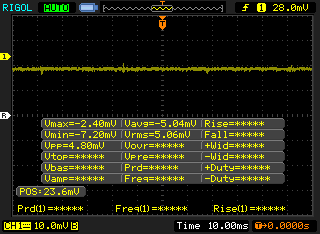 | ||
Im Vergleich: 52 % aller getesteten Geräte nutzten kein PWM um die Helligkeit zu reduzieren. Wenn PWM eingesetzt wurde, dann bei einer Frequenz von durchschnittlich 7763 (Minimum 5, Maximum 343500) Hz. | |||
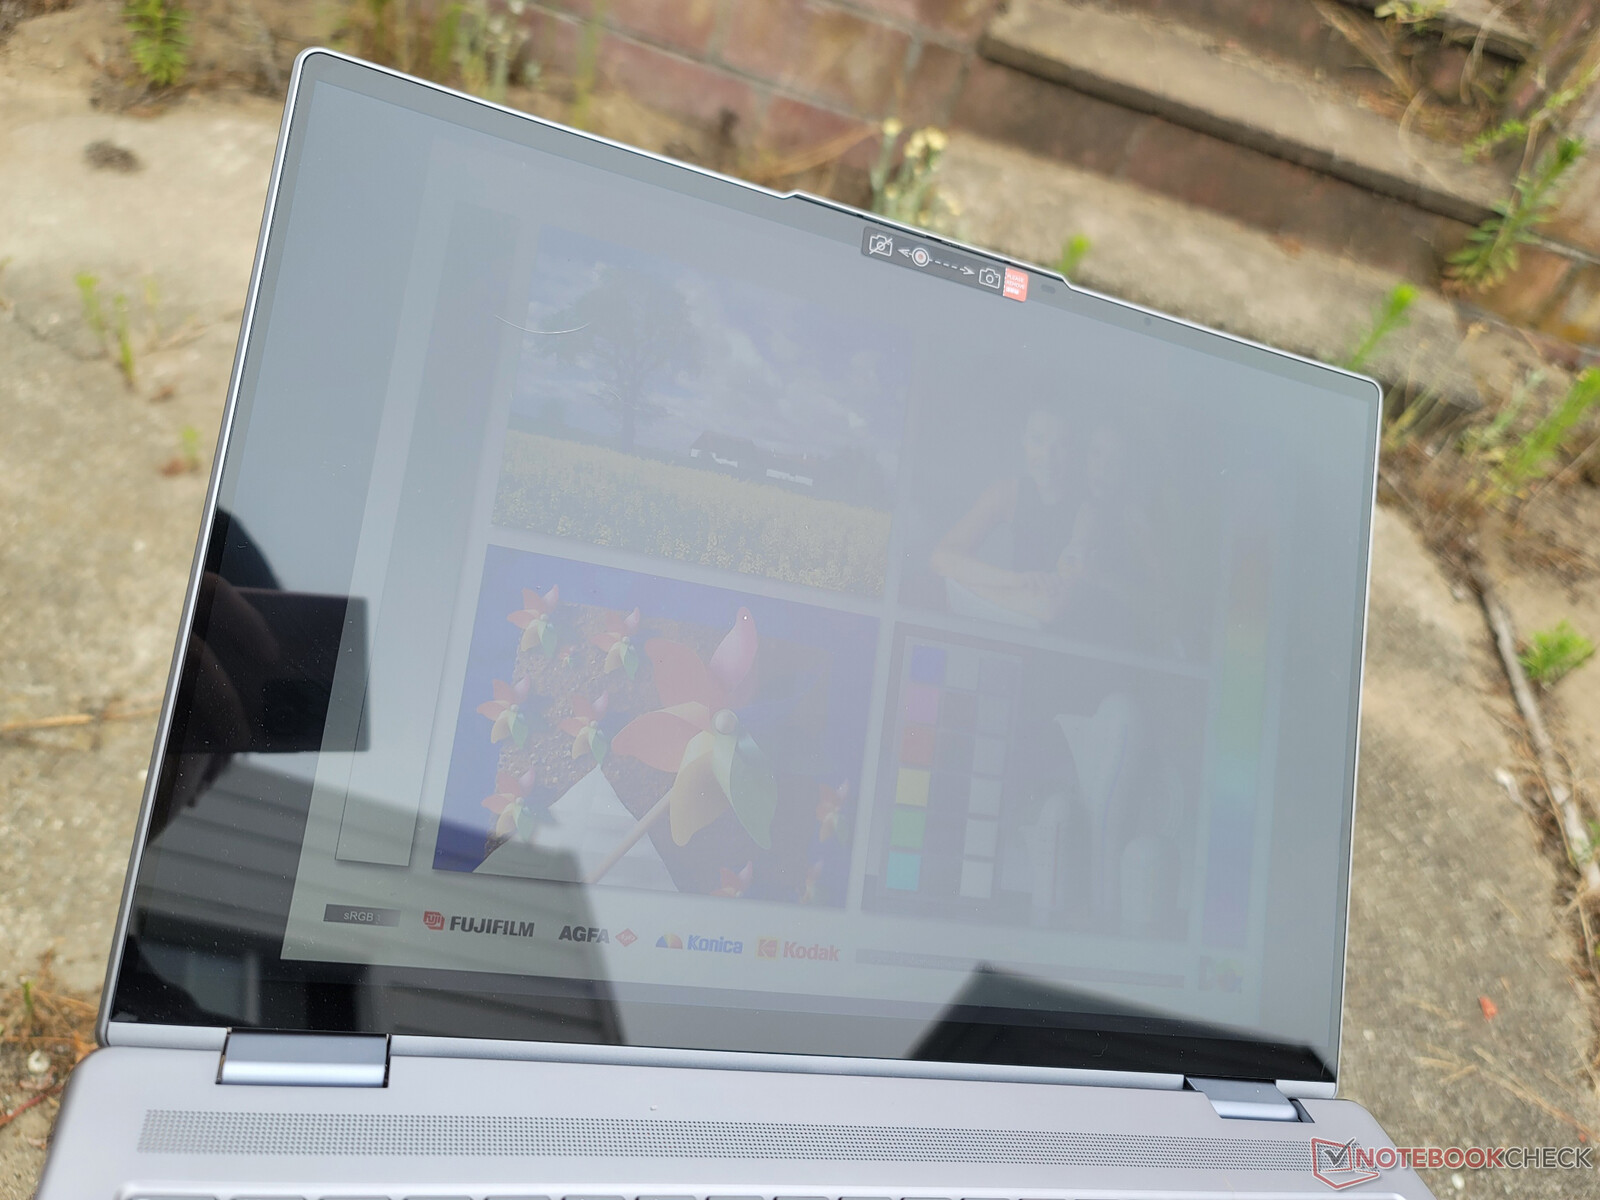
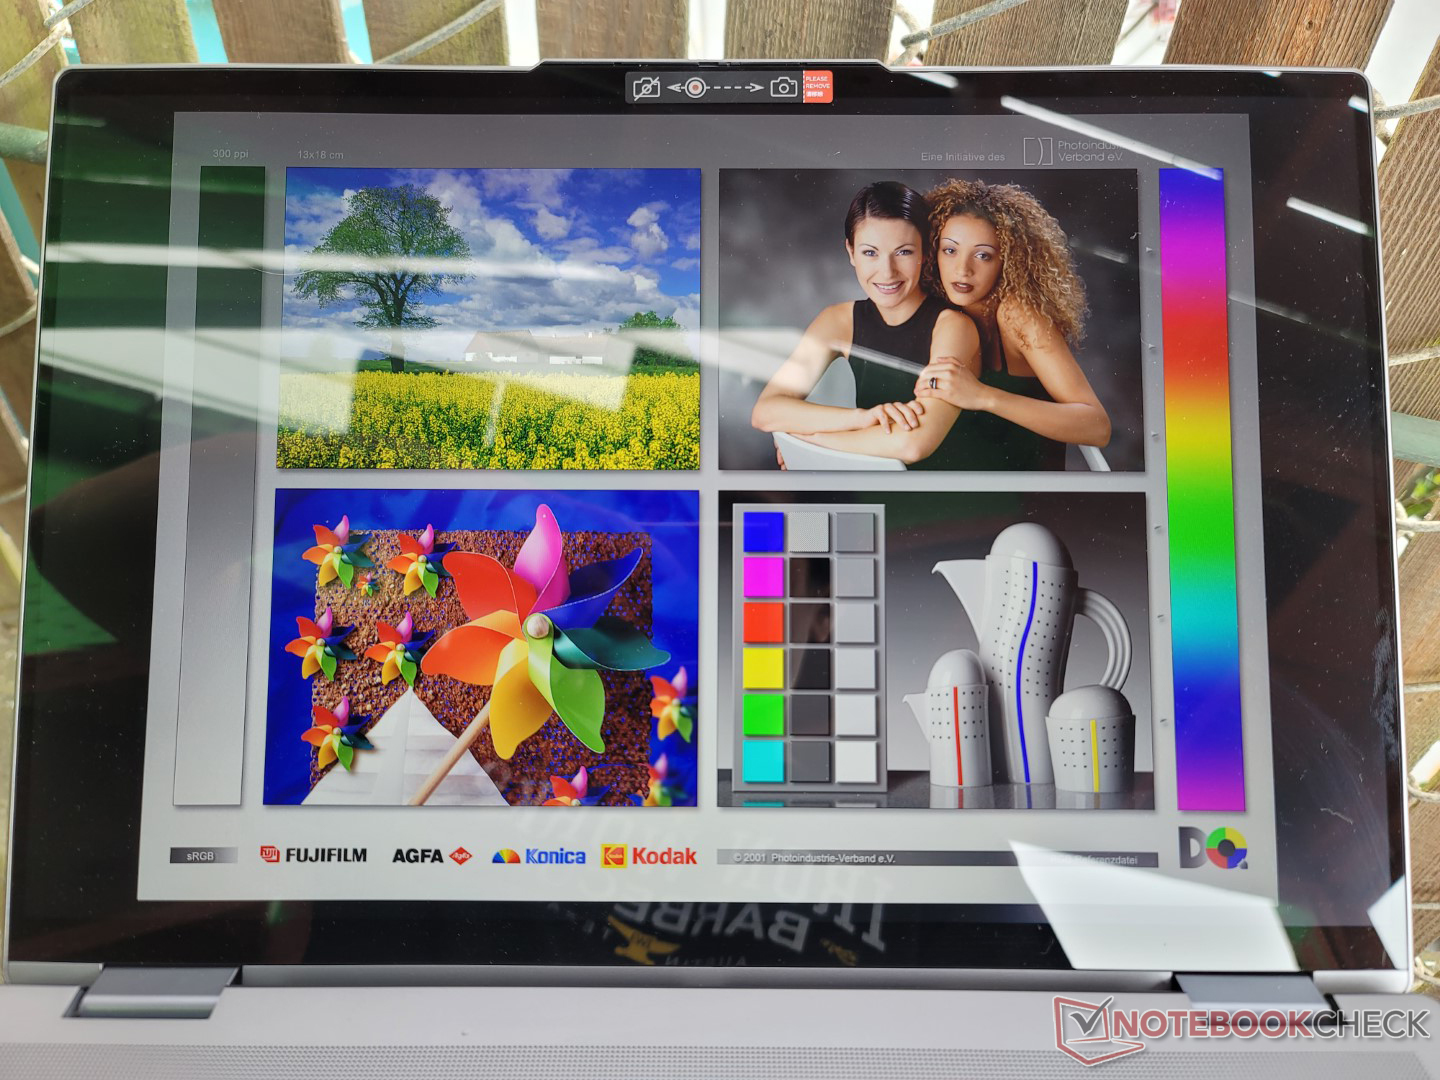
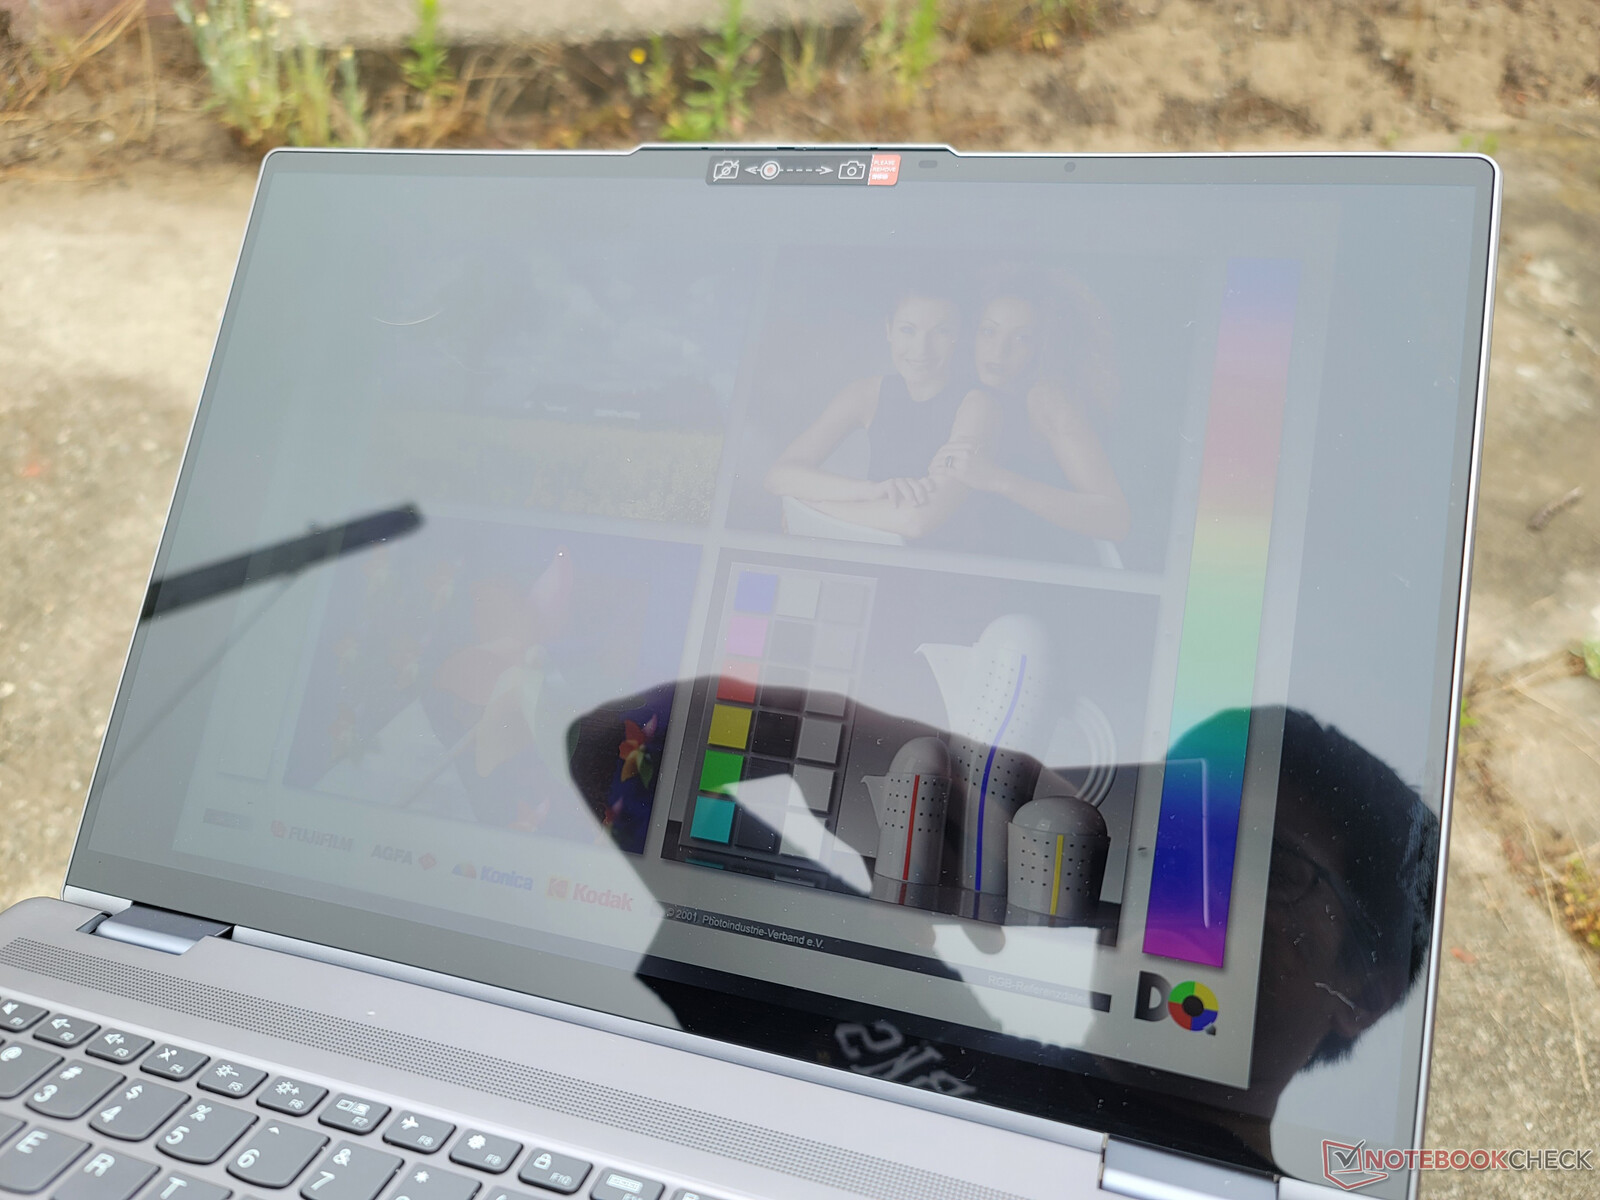
Die Sicht im Freien ist etwas besser als beim Inspiron 16 7620 2-in-1 oder LG Gram 16, da das Lenovo-Display heller ist. Die Blendung ist jedoch immer noch unvermeidlich und die zusätzliche Helligkeit reicht in den meisten Fällen nicht aus, um einen großen Unterschied zu machen. Sie werden immer noch im Schatten arbeiten müssen, um für ausreichende Lesbarkeit zu sorgen.
Leistung – Intel 12. Gen
Testbedingungen
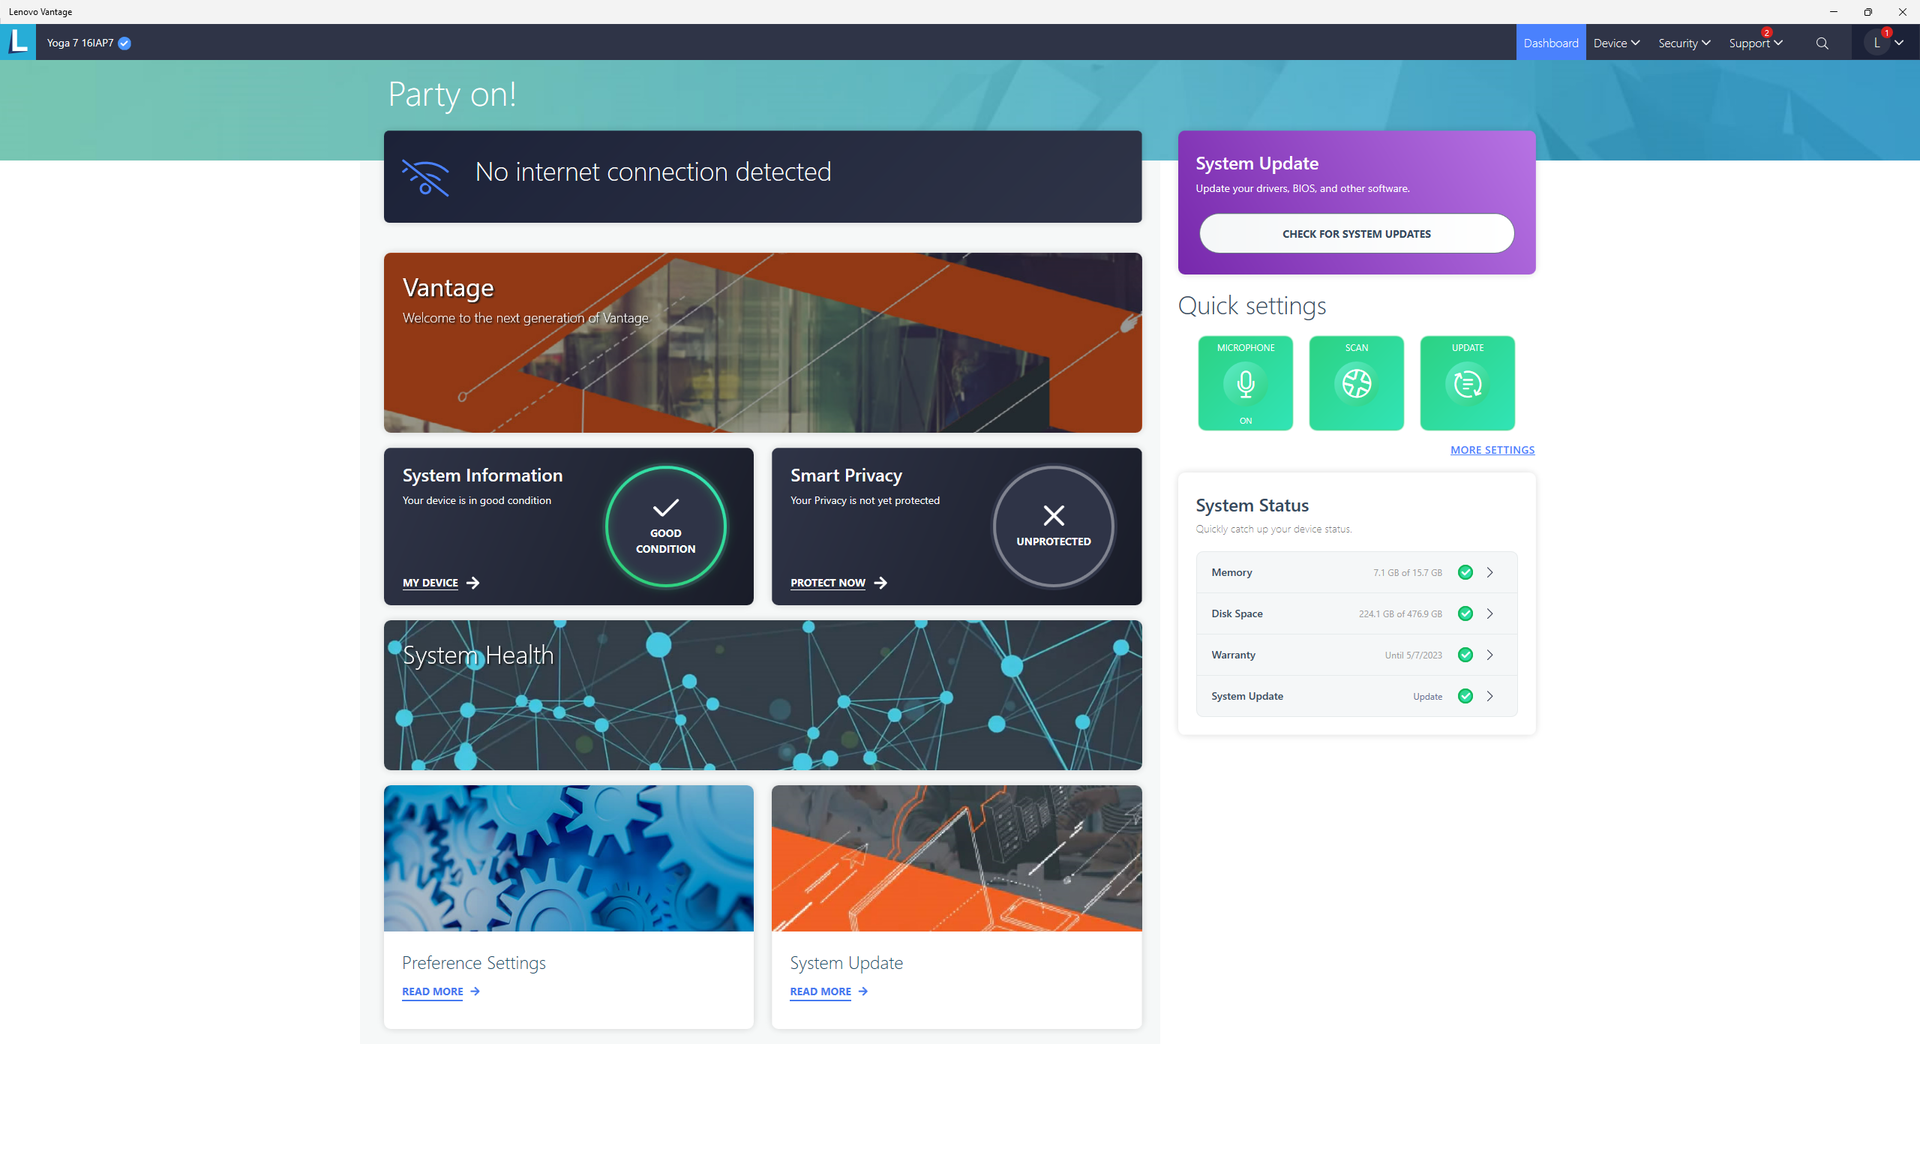
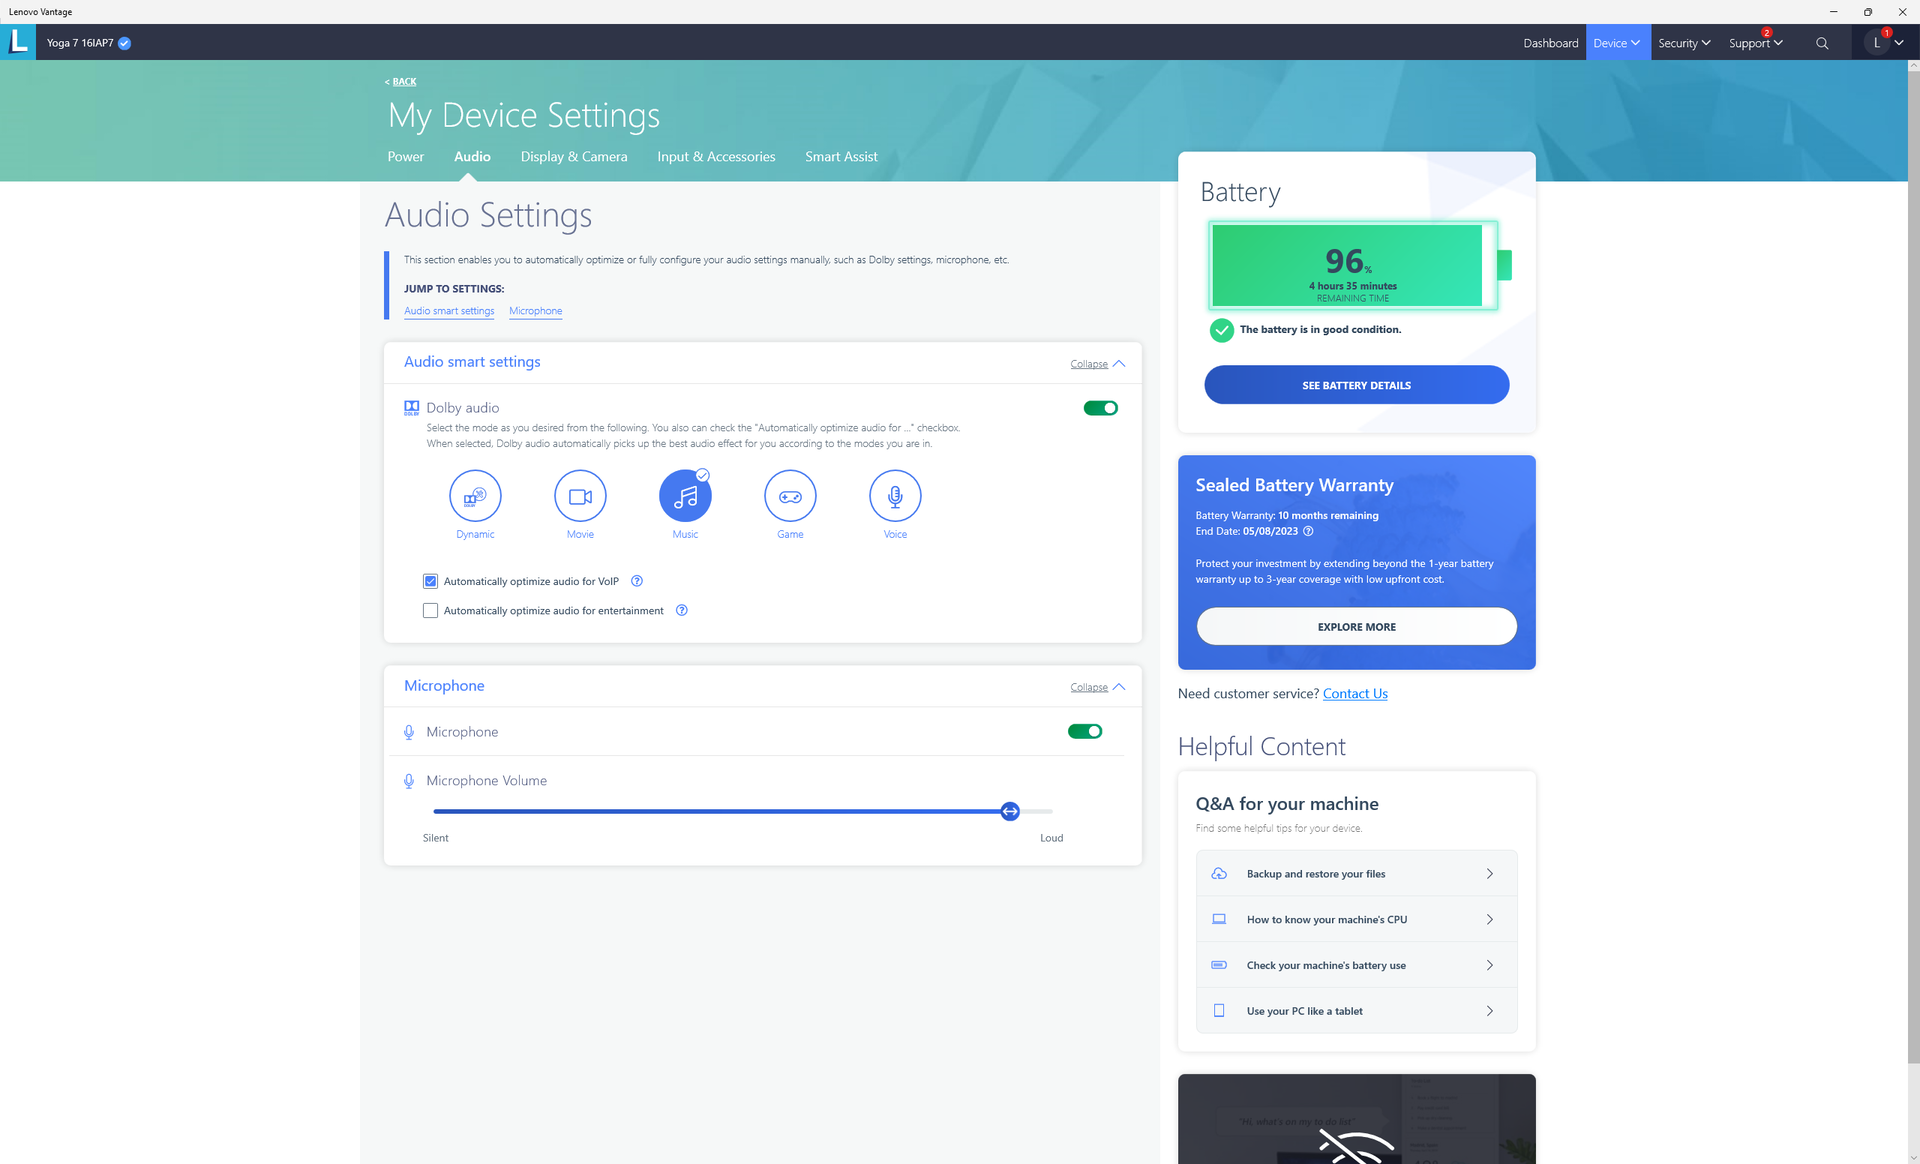
Wir hatten unser Gerät über Lenovo Vantage bzw. Windows auf den Extreme-Performance-Modus und den Performance-Modus eingestellt, bevor wir die unten aufgeführten Benchmarks ausgeführt haben. Es wird empfohlen, dass Benutzer sich mit der vorinstallierten Lenovo-Vantage-Software vertraut machen, da wichtige Einstellungen und Lenovo-spezifische Patches nur hier zu finden sind.
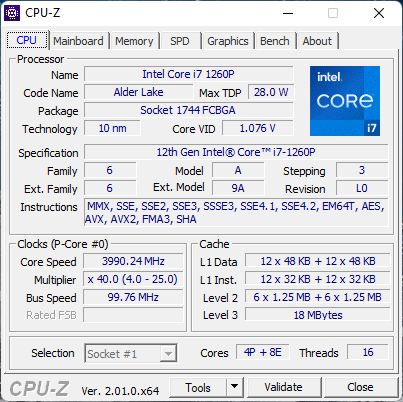
Prozessor
Die CPU-Leistung ist hervorragend, wenn man sich nur die CineBench-Ergebnisse ansieht. Unser Core i7-1260P im Lenovo ist in der Lage, den durchschnittlichen Laptop in unserer Datenbank, der mit demselben Prozessor ausgestattet ist, entsprechend um 20 bis 30 Prozent zu übertreffen. In Wirklichkeit ist das Lenovo-System jedoch nicht in der Lage, hohe Turbo-Boost-Taktraten über längere Zeiträume aufrechtzuerhalten, sodass dieser Vorteil im Laufe der Zeit schrumpft, was unser CineBench-R15-xT-Schleifendiagramm unten zeigt. Im Vergleich zum MSI Summit E14 Flip Evo mit der gleichen CPU wäre unser Lenovo-System beispielsweise zu Beginn des CineBench-Loop-Tests um rund 30 Prozent schneller, bevor es dazu kommt, dass es um rund 14 Prozent langsamer ist. Mit anderen Worten, das Lenovo-System zeichnet sich bei kurzen Ausbrüchen hoher Lasten aus, aber es fällt beim Laufen hoher Lasten für längere Zeit zurück.
Der „langsamere“ Core i5-1240P ist abhängig von den beteiligten Modellen manchmal in der Lage, schneller als unser Core i7-12700H. Tatsächlich wird die Entscheidung für die Core i7-12700H-Konfiguration anstelle des Core i7-1260P aufgrund unserer Erfahrung mit dem Huawei MateBook D 16 nur eine sehr geringe Steigerung der Prozessorleistung bringen.
Cinebench R15 Multi Loop
Cinebench R23: Multi Core | Single Core
Cinebench R15: CPU Multi 64Bit | CPU Single 64Bit
Blender: v2.79 BMW27 CPU
7-Zip 18.03: 7z b 4 | 7z b 4 -mmt1
Geekbench 5.5: Multi-Core | Single-Core
HWBOT x265 Benchmark v2.2: 4k Preset
LibreOffice : 20 Documents To PDF
R Benchmark 2.5: Overall mean
| Cinebench R20 / CPU (Multi Core) | |
| Lenovo IdeaPad 5 Pro 16ACH | |
| Huawei MateBook D 16 2022 | |
| Lenovo Yoga Slim 7i Pro 14IAP G7 | |
| Lenovo Yoga 7 16IAP7 | |
| Durchschnittliche Intel Core i7-1260P (1234 - 4748, n=25) | |
| Acer Aspire 5 A515-45-R4R1 | |
| HP Pavilion Aero 13 be0097nr | |
| Dell Inspiron 14 7420 2-in-1 | |
| Acer Swift X SFX16-51G-5388 | |
| LG Gram 14T90P | |
| LG Gram 16 (2021) | |
| Infinix INBook X2 | |
| Cinebench R20 / CPU (Single Core) | |
| Dell Inspiron 14 7420 2-in-1 | |
| Huawei MateBook D 16 2022 | |
| Lenovo Yoga 7 16IAP7 | |
| Durchschnittliche Intel Core i7-1260P (448 - 698, n=25) | |
| Lenovo Yoga Slim 7i Pro 14IAP G7 | |
| Acer Swift X SFX16-51G-5388 | |
| HP Pavilion Aero 13 be0097nr | |
| Lenovo IdeaPad 5 Pro 16ACH | |
| LG Gram 16 (2021) | |
| LG Gram 14T90P | |
| Acer Aspire 5 A515-45-R4R1 | |
| Infinix INBook X2 | |
| Cinebench R15 / CPU Single 64Bit | |
| Huawei MateBook D 16 2022 | |
| Dell Inspiron 14 7420 2-in-1 | |
| Lenovo Yoga 7 16IAP7 | |
| Lenovo Yoga Slim 7i Pro 14IAP G7 | |
| Durchschnittliche Intel Core i7-1260P (165.4 - 260, n=27) | |
| HP Pavilion Aero 13 be0097nr | |
| Lenovo IdeaPad 5 Pro 16ACH | |
| Acer Swift X SFX16-51G-5388 | |
| LG Gram 16 (2021) | |
| Acer Aspire 5 A515-45-R4R1 | |
| Infinix INBook X2 | |
| LG Gram 14T90P | |
| Geekbench 5.5 / Multi-Core | |
| Huawei MateBook D 16 2022 | |
| Lenovo Yoga 7 16IAP7 | |
| Lenovo Yoga Slim 7i Pro 14IAP G7 | |
| Durchschnittliche Intel Core i7-1260P (3866 - 10570, n=25) | |
| Lenovo IdeaPad 5 Pro 16ACH | |
| Dell Inspiron 14 7420 2-in-1 | |
| Acer Swift X SFX16-51G-5388 | |
| LG Gram 16 (2021) | |
| LG Gram 14T90P | |
| Acer Aspire 5 A515-45-R4R1 | |
| Infinix INBook X2 | |
| Geekbench 5.5 / Single-Core | |
| Huawei MateBook D 16 2022 | |
| Lenovo Yoga 7 16IAP7 | |
| Durchschnittliche Intel Core i7-1260P (1436 - 1786, n=25) | |
| Dell Inspiron 14 7420 2-in-1 | |
| Lenovo Yoga Slim 7i Pro 14IAP G7 | |
| LG Gram 16 (2021) | |
| Acer Swift X SFX16-51G-5388 | |
| Lenovo IdeaPad 5 Pro 16ACH | |
| LG Gram 14T90P | |
| Acer Aspire 5 A515-45-R4R1 | |
| Infinix INBook X2 | |
| HWBOT x265 Benchmark v2.2 / 4k Preset | |
| Lenovo IdeaPad 5 Pro 16ACH | |
| Huawei MateBook D 16 2022 | |
| Lenovo Yoga Slim 7i Pro 14IAP G7 | |
| Lenovo Yoga 7 16IAP7 | |
| Durchschnittliche Intel Core i7-1260P (3.45 - 13.6, n=26) | |
| HP Pavilion Aero 13 be0097nr | |
| Dell Inspiron 14 7420 2-in-1 | |
| Acer Aspire 5 A515-45-R4R1 | |
| Acer Swift X SFX16-51G-5388 | |
| LG Gram 14T90P | |
| LG Gram 16 (2021) | |
| Infinix INBook X2 | |
| LibreOffice / 20 Documents To PDF | |
| Infinix INBook X2 | |
| Acer Aspire 5 A515-45-R4R1 | |
| LG Gram 14T90P | |
| HP Pavilion Aero 13 be0097nr | |
| Lenovo Yoga Slim 7i Pro 14IAP G7 | |
| Acer Swift X SFX16-51G-5388 | |
| Dell Inspiron 14 7420 2-in-1 | |
| Durchschnittliche Intel Core i7-1260P (40.2 - 65.7, n=25) | |
| Lenovo Yoga 7 16IAP7 | |
| Lenovo IdeaPad 5 Pro 16ACH | |
| LG Gram 16 (2021) | |
| Huawei MateBook D 16 2022 | |
| R Benchmark 2.5 / Overall mean | |
| Infinix INBook X2 | |
| LG Gram 14T90P | |
| LG Gram 16 (2021) | |
| Acer Aspire 5 A515-45-R4R1 | |
| Acer Swift X SFX16-51G-5388 | |
| Lenovo IdeaPad 5 Pro 16ACH | |
| HP Pavilion Aero 13 be0097nr | |
| Lenovo Yoga Slim 7i Pro 14IAP G7 | |
| Durchschnittliche Intel Core i7-1260P (0.4559 - 0.727, n=25) | |
| Dell Inspiron 14 7420 2-in-1 | |
| Lenovo Yoga 7 16IAP7 | |
| Huawei MateBook D 16 2022 | |
* ... kleinere Werte sind besser
AIDA64: FP32 Ray-Trace | FPU Julia | CPU SHA3 | CPU Queen | FPU SinJulia | FPU Mandel | CPU AES | CPU ZLib | FP64 Ray-Trace | CPU PhotoWorxx
| Performance Rating | |
| Lenovo IdeaPad 5 Pro 16ACH | |
| Huawei MateBook D 16 2022 | |
| Lenovo Yoga 7 16IAP7 | |
| Durchschnittliche Intel Core i7-1260P | |
| Dell Inspiron 16 7620 2-in-1 | |
| Acer Swift X SFX16-51G-5388 | |
| LG Gram 16 (2021) | |
| AIDA64 / FP32 Ray-Trace | |
| Lenovo IdeaPad 5 Pro 16ACH | |
| Huawei MateBook D 16 2022 | |
| Lenovo Yoga 7 16IAP7 | |
| Durchschnittliche Intel Core i7-1260P (2176 - 10898, n=26) | |
| Acer Swift X SFX16-51G-5388 | |
| Dell Inspiron 16 7620 2-in-1 | |
| LG Gram 16 (2021) | |
| AIDA64 / FPU Julia | |
| Lenovo IdeaPad 5 Pro 16ACH | |
| Huawei MateBook D 16 2022 | |
| Lenovo Yoga 7 16IAP7 | |
| Durchschnittliche Intel Core i7-1260P (11015 - 56906, n=26) | |
| Acer Swift X SFX16-51G-5388 | |
| Dell Inspiron 16 7620 2-in-1 | |
| LG Gram 16 (2021) | |
| AIDA64 / CPU SHA3 | |
| Lenovo IdeaPad 5 Pro 16ACH | |
| Huawei MateBook D 16 2022 | |
| Lenovo Yoga 7 16IAP7 | |
| Acer Swift X SFX16-51G-5388 | |
| Durchschnittliche Intel Core i7-1260P (669 - 2709, n=26) | |
| Dell Inspiron 16 7620 2-in-1 | |
| LG Gram 16 (2021) | |
| AIDA64 / CPU Queen | |
| Huawei MateBook D 16 2022 | |
| Lenovo IdeaPad 5 Pro 16ACH | |
| Lenovo Yoga 7 16IAP7 | |
| Dell Inspiron 16 7620 2-in-1 | |
| Durchschnittliche Intel Core i7-1260P (42571 - 82493, n=26) | |
| LG Gram 16 (2021) | |
| Acer Swift X SFX16-51G-5388 | |
| AIDA64 / FPU SinJulia | |
| Lenovo IdeaPad 5 Pro 16ACH | |
| Huawei MateBook D 16 2022 | |
| Dell Inspiron 16 7620 2-in-1 | |
| Durchschnittliche Intel Core i7-1260P (2901 - 6975, n=26) | |
| Lenovo Yoga 7 16IAP7 | |
| Acer Swift X SFX16-51G-5388 | |
| LG Gram 16 (2021) | |
| AIDA64 / FPU Mandel | |
| Lenovo IdeaPad 5 Pro 16ACH | |
| Huawei MateBook D 16 2022 | |
| Lenovo Yoga 7 16IAP7 | |
| Acer Swift X SFX16-51G-5388 | |
| Durchschnittliche Intel Core i7-1260P (5950 - 26376, n=26) | |
| Dell Inspiron 16 7620 2-in-1 | |
| LG Gram 16 (2021) | |
| AIDA64 / CPU AES | |
| Lenovo IdeaPad 5 Pro 16ACH | |
| Huawei MateBook D 16 2022 | |
| Acer Swift X SFX16-51G-5388 | |
| LG Gram 16 (2021) | |
| Durchschnittliche Intel Core i7-1260P (16041 - 92356, n=26) | |
| Lenovo Yoga 7 16IAP7 | |
| Dell Inspiron 16 7620 2-in-1 | |
| AIDA64 / CPU ZLib | |
| Lenovo IdeaPad 5 Pro 16ACH | |
| Huawei MateBook D 16 2022 | |
| Dell Inspiron 16 7620 2-in-1 | |
| Lenovo Yoga 7 16IAP7 | |
| Durchschnittliche Intel Core i7-1260P (259 - 771, n=26) | |
| Acer Swift X SFX16-51G-5388 | |
| LG Gram 16 (2021) | |
| AIDA64 / FP64 Ray-Trace | |
| Lenovo IdeaPad 5 Pro 16ACH | |
| Huawei MateBook D 16 2022 | |
| Lenovo Yoga 7 16IAP7 | |
| Durchschnittliche Intel Core i7-1260P (1237 - 5858, n=26) | |
| Acer Swift X SFX16-51G-5388 | |
| Dell Inspiron 16 7620 2-in-1 | |
| LG Gram 16 (2021) | |
| AIDA64 / CPU PhotoWorxx | |
| LG Gram 16 (2021) | |
| Lenovo Yoga 7 16IAP7 | |
| Huawei MateBook D 16 2022 | |
| Acer Swift X SFX16-51G-5388 | |
| Durchschnittliche Intel Core i7-1260P (13261 - 43652, n=26) | |
| Dell Inspiron 16 7620 2-in-1 | |
| Lenovo IdeaPad 5 Pro 16ACH | |
Systemleistung
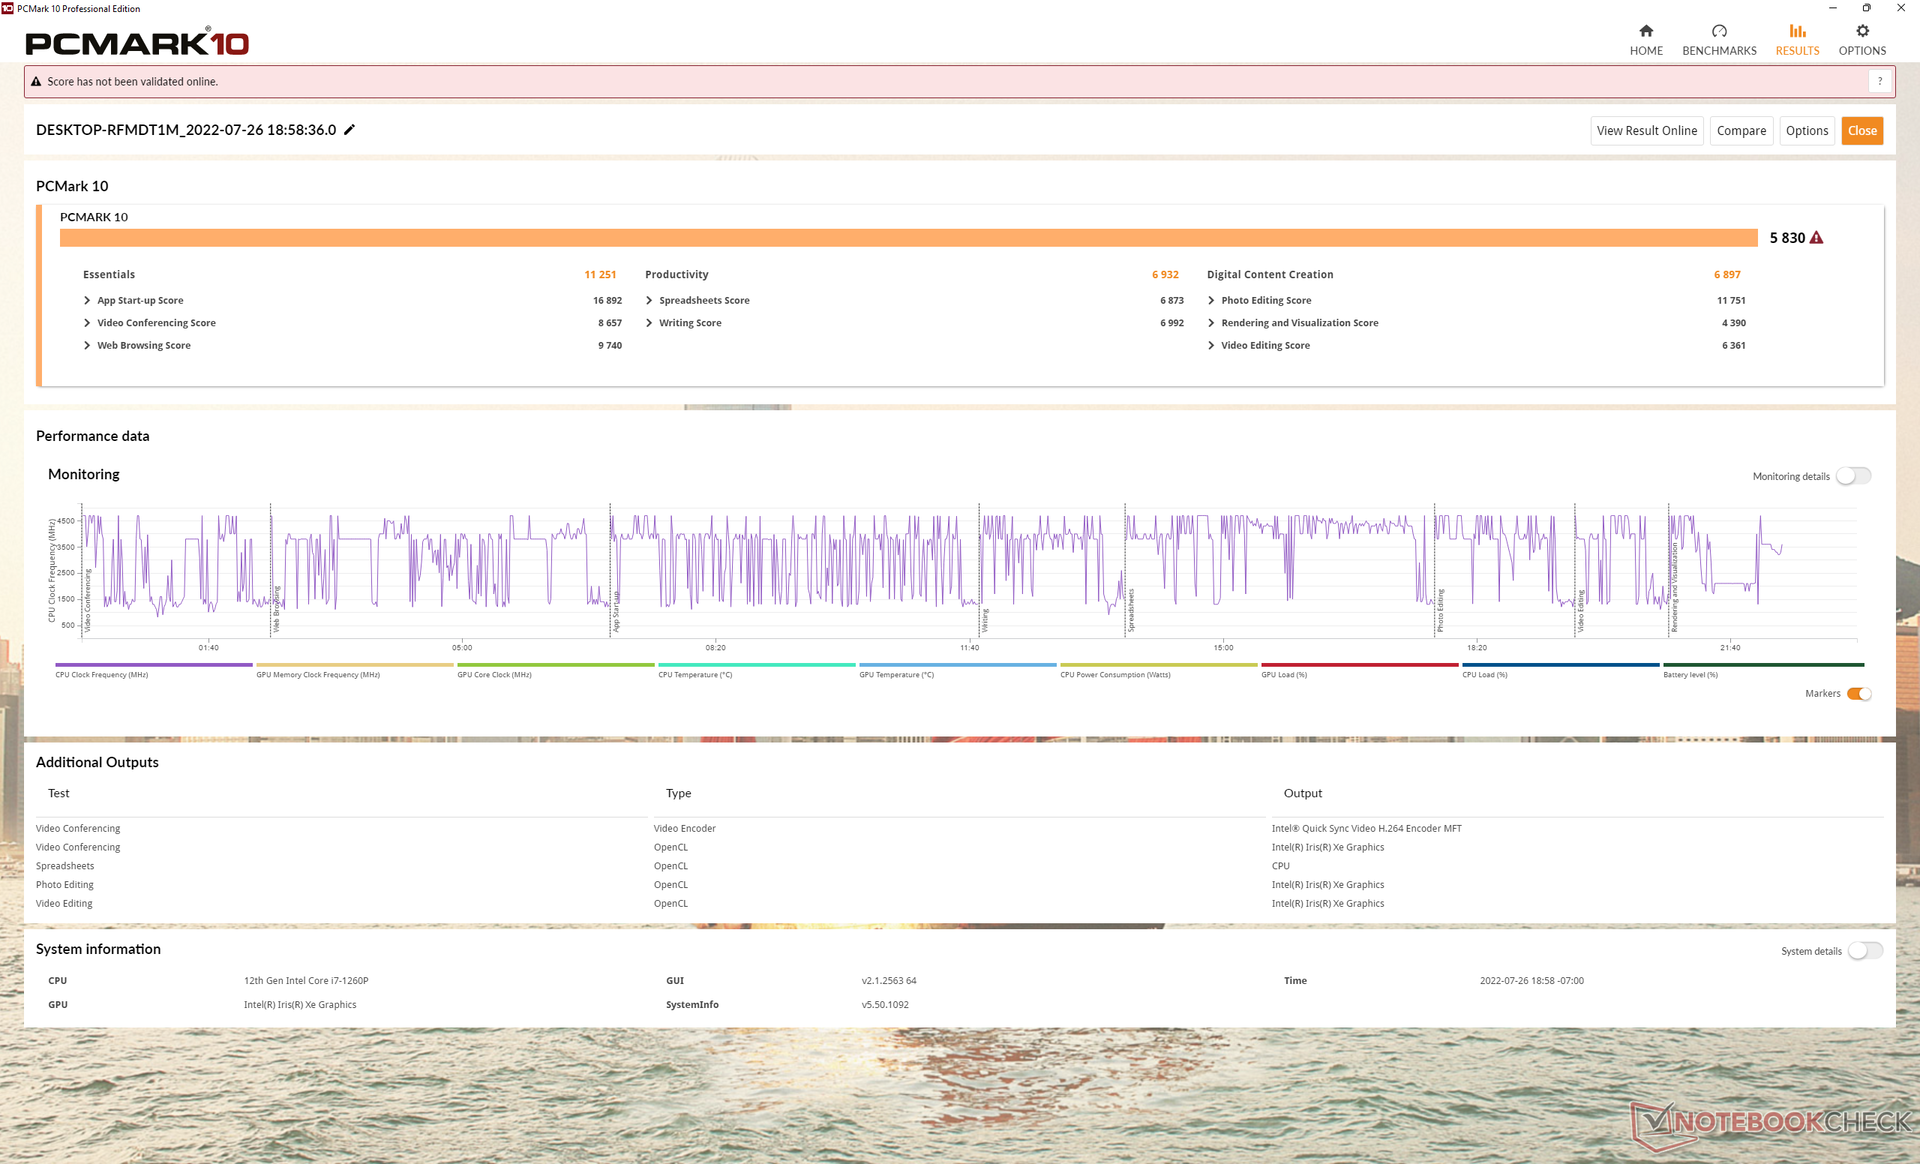
Die PCMark-10-Ergebnisse sind hervorragend und entsprechen in etwa dem, was wir mit dem Core H-powered Huawei MateBook D 16 oder dem Ryzen H-powered Lenovo IdeaPad 5 Pro 16 aufgezeichnet haben. Die Ergebnisse sind deutlich höher als beim Dell Inspiron 16 7620, obwohl beide die gleiche Core i7-1260P CPU haben – wahrscheinlich weil das Dell-Modell mit einer langsameren M.2 SSD ausgeliefert wird.
CrossMark: Overall | Productivity | Creativity | Responsiveness
| PCMark 10 / Score | |
| Huawei MateBook D 16 2022 | |
| Lenovo IdeaPad 5 Pro 16ACH | |
| Lenovo Yoga 7 16IAP7 | |
| Acer Swift X SFX16-51G-5388 | |
| Durchschnittliche Intel Core i7-1260P, Intel Iris Xe Graphics G7 96EUs (4796 - 6068, n=17) | |
| Dell Inspiron 16 7620 2-in-1 | |
| LG Gram 16 (2021) | |
| PCMark 10 / Essentials | |
| Huawei MateBook D 16 2022 | |
| Lenovo Yoga 7 16IAP7 | |
| Durchschnittliche Intel Core i7-1260P, Intel Iris Xe Graphics G7 96EUs (9260 - 11251, n=17) | |
| LG Gram 16 (2021) | |
| Lenovo IdeaPad 5 Pro 16ACH | |
| Dell Inspiron 16 7620 2-in-1 | |
| Acer Swift X SFX16-51G-5388 | |
| PCMark 10 / Productivity | |
| Acer Swift X SFX16-51G-5388 | |
| Lenovo IdeaPad 5 Pro 16ACH | |
| Huawei MateBook D 16 2022 | |
| Durchschnittliche Intel Core i7-1260P, Intel Iris Xe Graphics G7 96EUs (6167 - 8629, n=17) | |
| Lenovo Yoga 7 16IAP7 | |
| LG Gram 16 (2021) | |
| Dell Inspiron 16 7620 2-in-1 | |
| PCMark 10 / Digital Content Creation | |
| Lenovo Yoga 7 16IAP7 | |
| Huawei MateBook D 16 2022 | |
| Lenovo IdeaPad 5 Pro 16ACH | |
| Acer Swift X SFX16-51G-5388 | |
| Durchschnittliche Intel Core i7-1260P, Intel Iris Xe Graphics G7 96EUs (5231 - 6908, n=17) | |
| Dell Inspiron 16 7620 2-in-1 | |
| LG Gram 16 (2021) | |
| CrossMark / Overall | |
| Huawei MateBook D 16 2022 | |
| Lenovo Yoga 7 16IAP7 | |
| Durchschnittliche Intel Core i7-1260P, Intel Iris Xe Graphics G7 96EUs (1484 - 1811, n=16) | |
| Dell Inspiron 16 7620 2-in-1 | |
| Acer Swift X SFX16-51G-5388 | |
| CrossMark / Productivity | |
| Huawei MateBook D 16 2022 | |
| Lenovo Yoga 7 16IAP7 | |
| Durchschnittliche Intel Core i7-1260P, Intel Iris Xe Graphics G7 96EUs (1486 - 1755, n=16) | |
| Dell Inspiron 16 7620 2-in-1 | |
| Acer Swift X SFX16-51G-5388 | |
| CrossMark / Creativity | |
| Huawei MateBook D 16 2022 | |
| Lenovo Yoga 7 16IAP7 | |
| Durchschnittliche Intel Core i7-1260P, Intel Iris Xe Graphics G7 96EUs (1451 - 1872, n=16) | |
| Dell Inspiron 16 7620 2-in-1 | |
| Acer Swift X SFX16-51G-5388 | |
| CrossMark / Responsiveness | |
| Huawei MateBook D 16 2022 | |
| Durchschnittliche Intel Core i7-1260P, Intel Iris Xe Graphics G7 96EUs (1253 - 1807, n=16) | |
| Lenovo Yoga 7 16IAP7 | |
| Dell Inspiron 16 7620 2-in-1 | |
| Acer Swift X SFX16-51G-5388 | |
| PCMark 10 Score | 5830 Punkte | |
Hilfe | ||
| AIDA64 / Memory Copy | |
| Lenovo Yoga 7 16IAP7 | |
| LG Gram 16 (2021) | |
| Huawei MateBook D 16 2022 | |
| Acer Swift X SFX16-51G-5388 | |
| Durchschnittliche Intel Core i7-1260P (25125 - 71544, n=25) | |
| Lenovo IdeaPad 5 Pro 16ACH | |
| Dell Inspiron 16 7620 2-in-1 | |
| AIDA64 / Memory Read | |
| Lenovo Yoga 7 16IAP7 | |
| LG Gram 16 (2021) | |
| Huawei MateBook D 16 2022 | |
| Durchschnittliche Intel Core i7-1260P (24983 - 72065, n=25) | |
| Acer Swift X SFX16-51G-5388 | |
| Lenovo IdeaPad 5 Pro 16ACH | |
| Dell Inspiron 16 7620 2-in-1 | |
| AIDA64 / Memory Write | |
| LG Gram 16 (2021) | |
| Acer Swift X SFX16-51G-5388 | |
| Lenovo Yoga 7 16IAP7 | |
| Huawei MateBook D 16 2022 | |
| Durchschnittliche Intel Core i7-1260P (23512 - 66799, n=25) | |
| Dell Inspiron 16 7620 2-in-1 | |
| Lenovo IdeaPad 5 Pro 16ACH | |
| AIDA64 / Memory Latency | |
| Acer Swift X SFX16-51G-5388 | |
| Huawei MateBook D 16 2022 | |
| Lenovo Yoga 7 16IAP7 | |
| LG Gram 16 (2021) | |
| Lenovo IdeaPad 5 Pro 16ACH | |
| Durchschnittliche Intel Core i7-1260P (77.9 - 118.4, n=21) | |
* ... kleinere Werte sind besser
DPC-Latenz
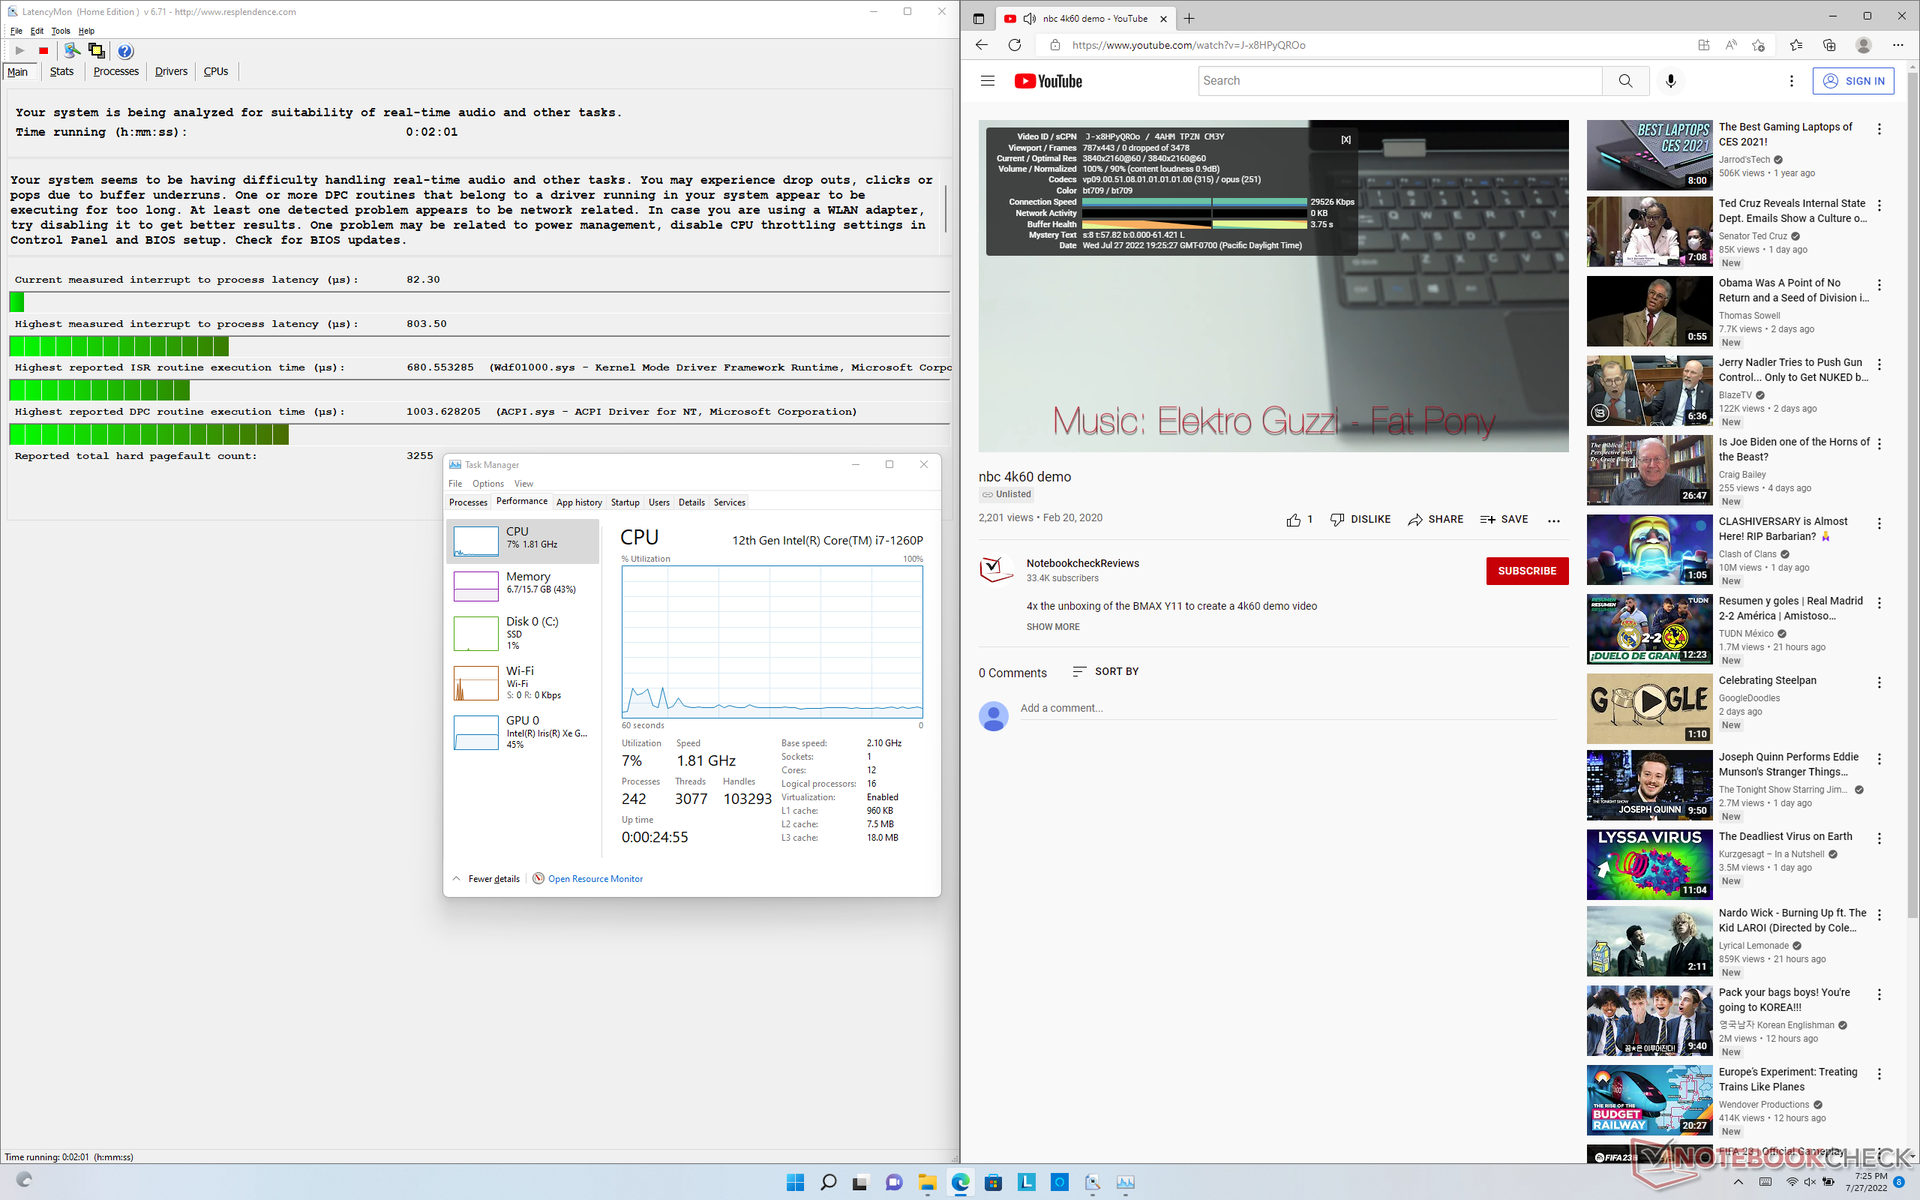
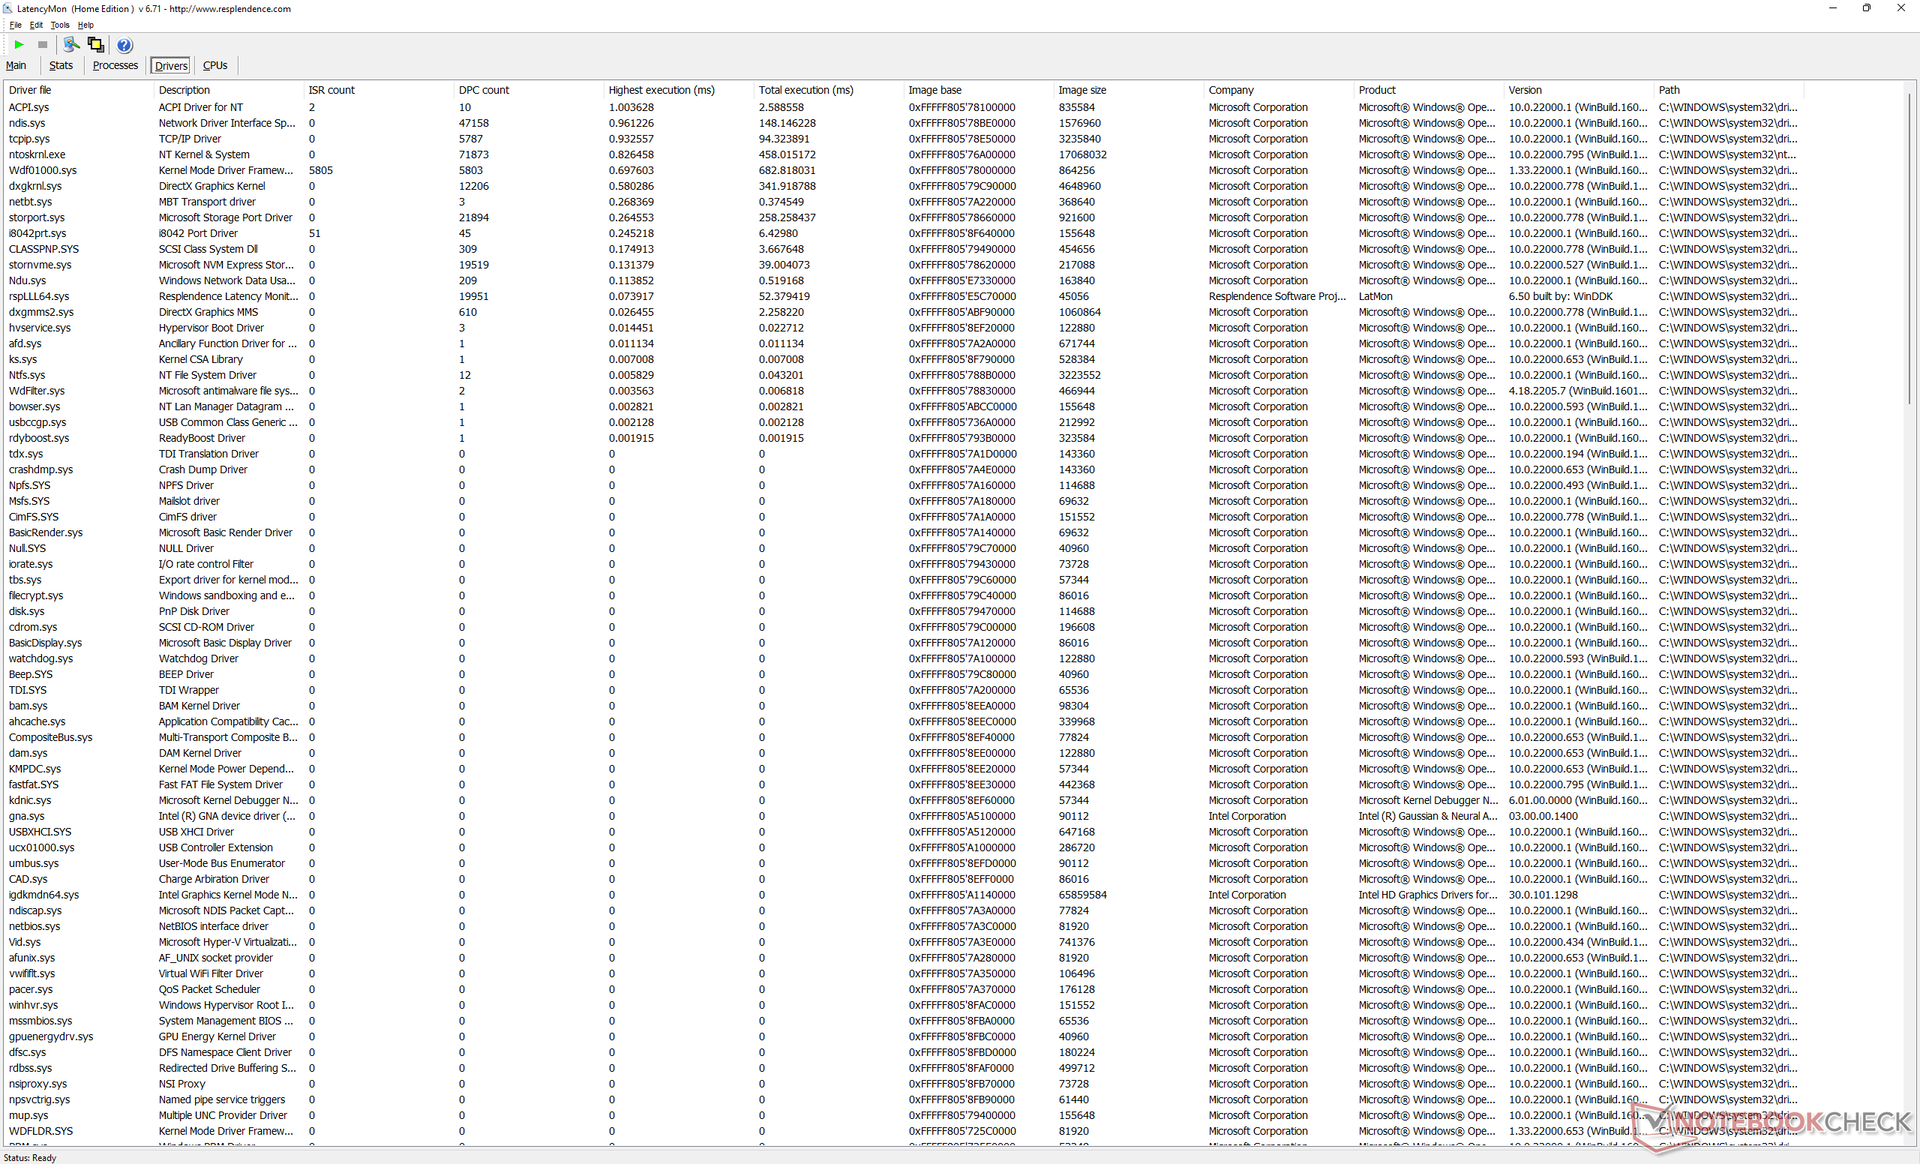
LatencyMon zeigt kleinere DPC-Probleme beim Öffnen mehrerer Browser-Tabs auf unserer Homepage. Die 4K-Videowiedergabe bei 60 FPS ist ansonsten exzellent und zeigte keine Auslassung von Frames.
| DPC Latencies / LatencyMon - interrupt to process latency (max), Web, Youtube, Prime95 | |
| Huawei MateBook D 16 2022 | |
| Lenovo Yoga 7 16IAP7 | |
| Dell Inspiron 16 7620 2-in-1 | |
| Lenovo IdeaPad 5 Pro 16ACH | |
| LG Gram 16 (2021) | |
* ... kleinere Werte sind besser
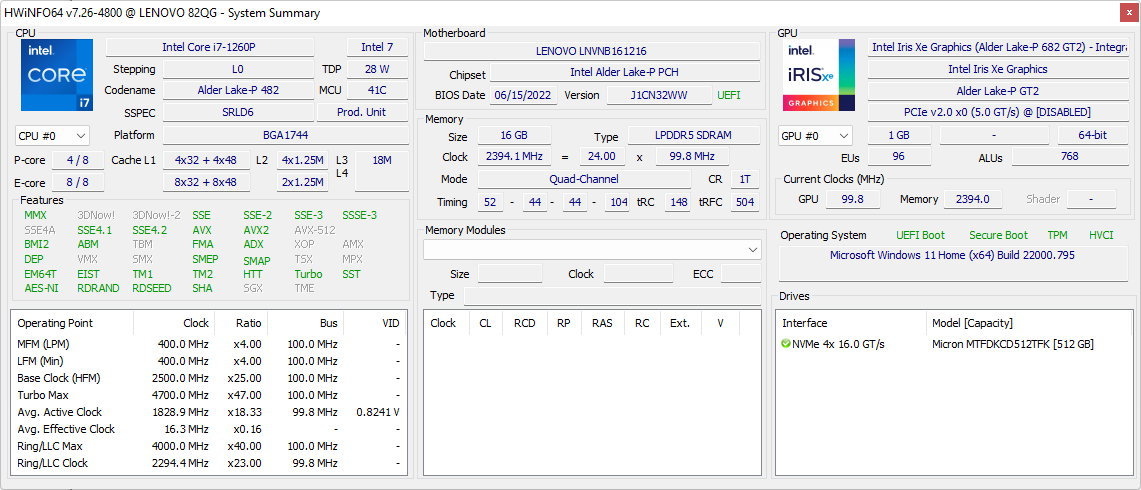
Speichergeräte – nur ein internes Laufwerk
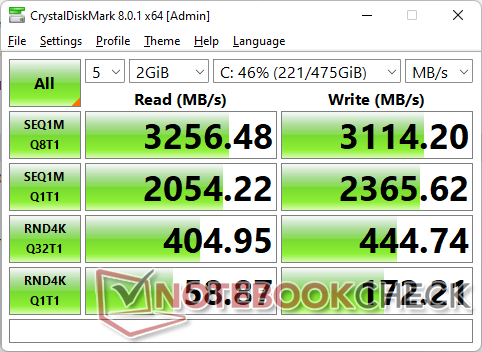
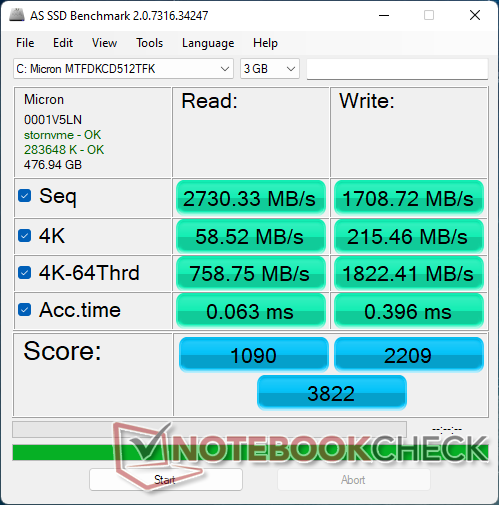
Unser Gerät wird mit einer 512 GB Micron MTFDKCD512TFK PCIe3 x4 NVMe SSD für sequentielle Lese- und Schreibgeschwindigkeiten von bis zu 3200 MB/s bzw. 3100 MB/s ausgeliefert, die dem ähneln, was die meisten High-End PCIe3-Laufwerke zu bieten haben. Allerdings sind die Lese- und Schreibgeschwindigkeiten der 4k q32 t16 im Vergleich zur Samsung PM981a viel langsamer als erwartet.
Das Laufwerk in unserem Gerät würde keine Probleme mit der Leistungsdrosselung aufweisen, wenn DiskSpd in einer Schleife läuft.

| Drive Performance Rating - Percent | |
| LG Gram 16 (2021) | |
| Huawei MateBook D 16 2022 | |
| Lenovo Yoga 7 16IAP7 | |
| Lenovo IdeaPad 5 Pro 16ACH | |
| Acer Swift X SFX16-51G-5388 | |
| Dell Inspiron 16 7620 2-in-1 | |
* ... kleinere Werte sind besser
Dauerleistung Lesen: DiskSpd Read Loop, Queue Depth 8
GPU-Leistung
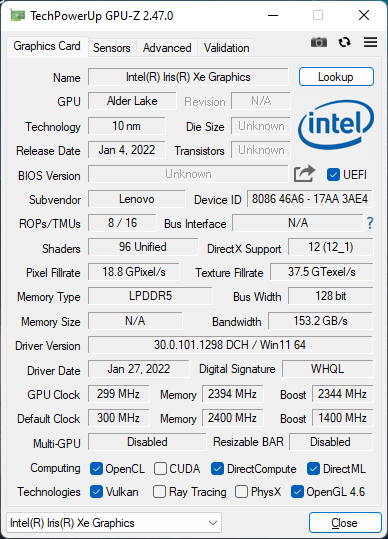
Die rohe Grafikleistung ist etwas schneller als der durchschnittliche Laptop in unserer Datenbank, der mit den gleichen integrierten Iris Xe 96 EUs ausgestattet ist. Der Aufwärtstrend ist wahrscheinlich zum Teil auf den schnelleren LPDDR5-4800 RAM zurückzuführen, während die meisten Laptops noch mit DDR4-3200 ausgestattet sind. Die Vorteile gegenüber dem Vorjahr sind ansonsten nur marginal, da sich die Kerngrafikarchitektur trotz aller CPU-Unterschiede zwischen der 11. Generation Tiger Lake und der 12. Generation Alder Lake nicht verändert hat.
Durch das Upgrade auf eine Intel Arc A370M-Konfiguration wird die GPU-Leistung basierend auf unserer Zeit mit dem Asus ZenBook Flip 15 Q539ZD um 60 bis 150 Prozent schneller als die unserer Iris Xe 96 EUs.

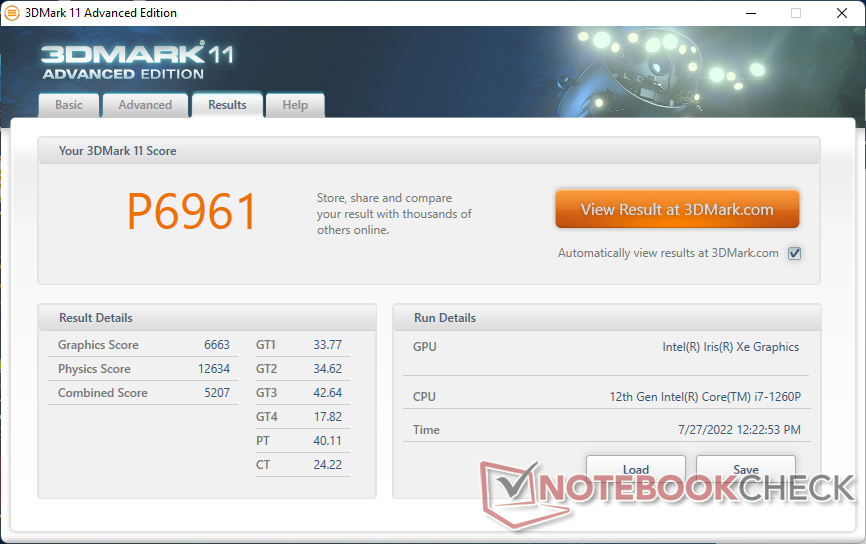
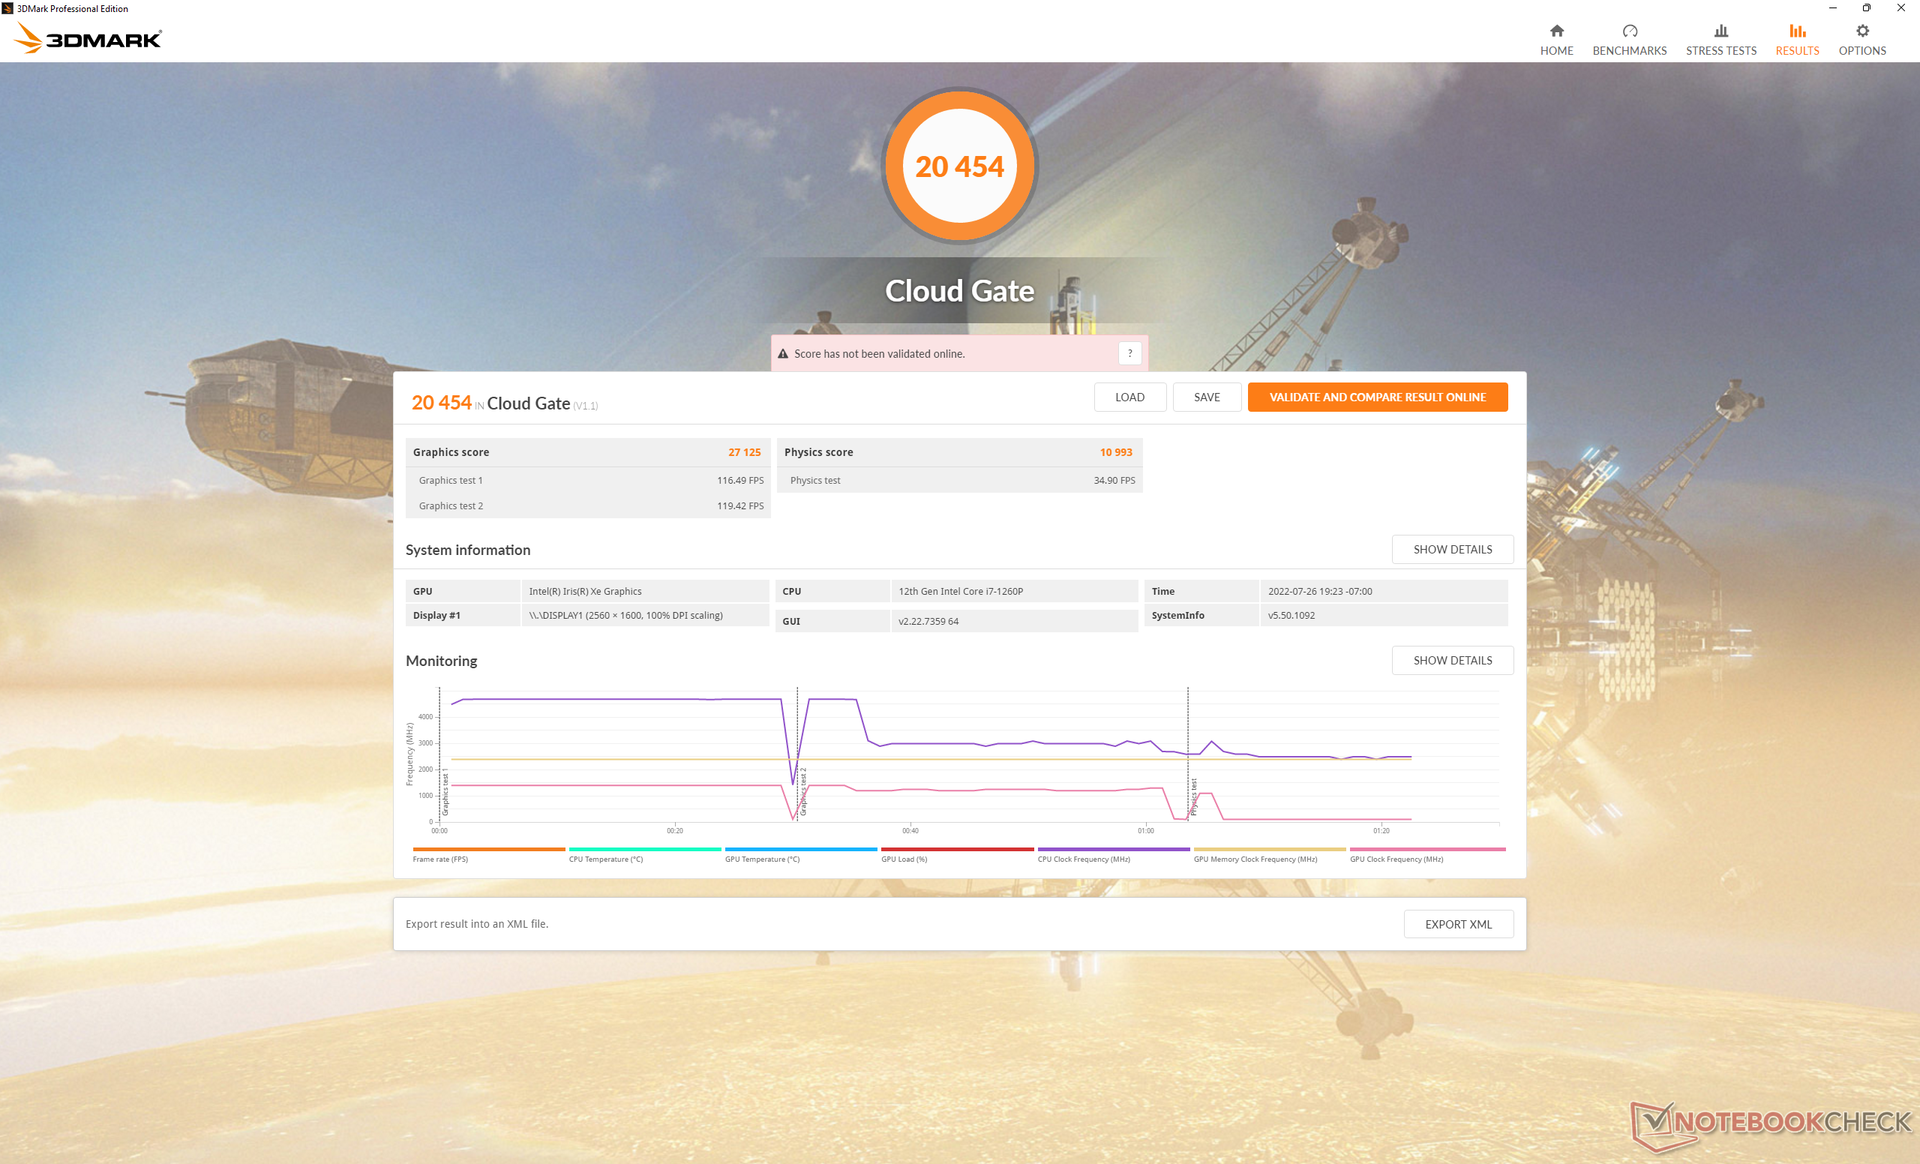
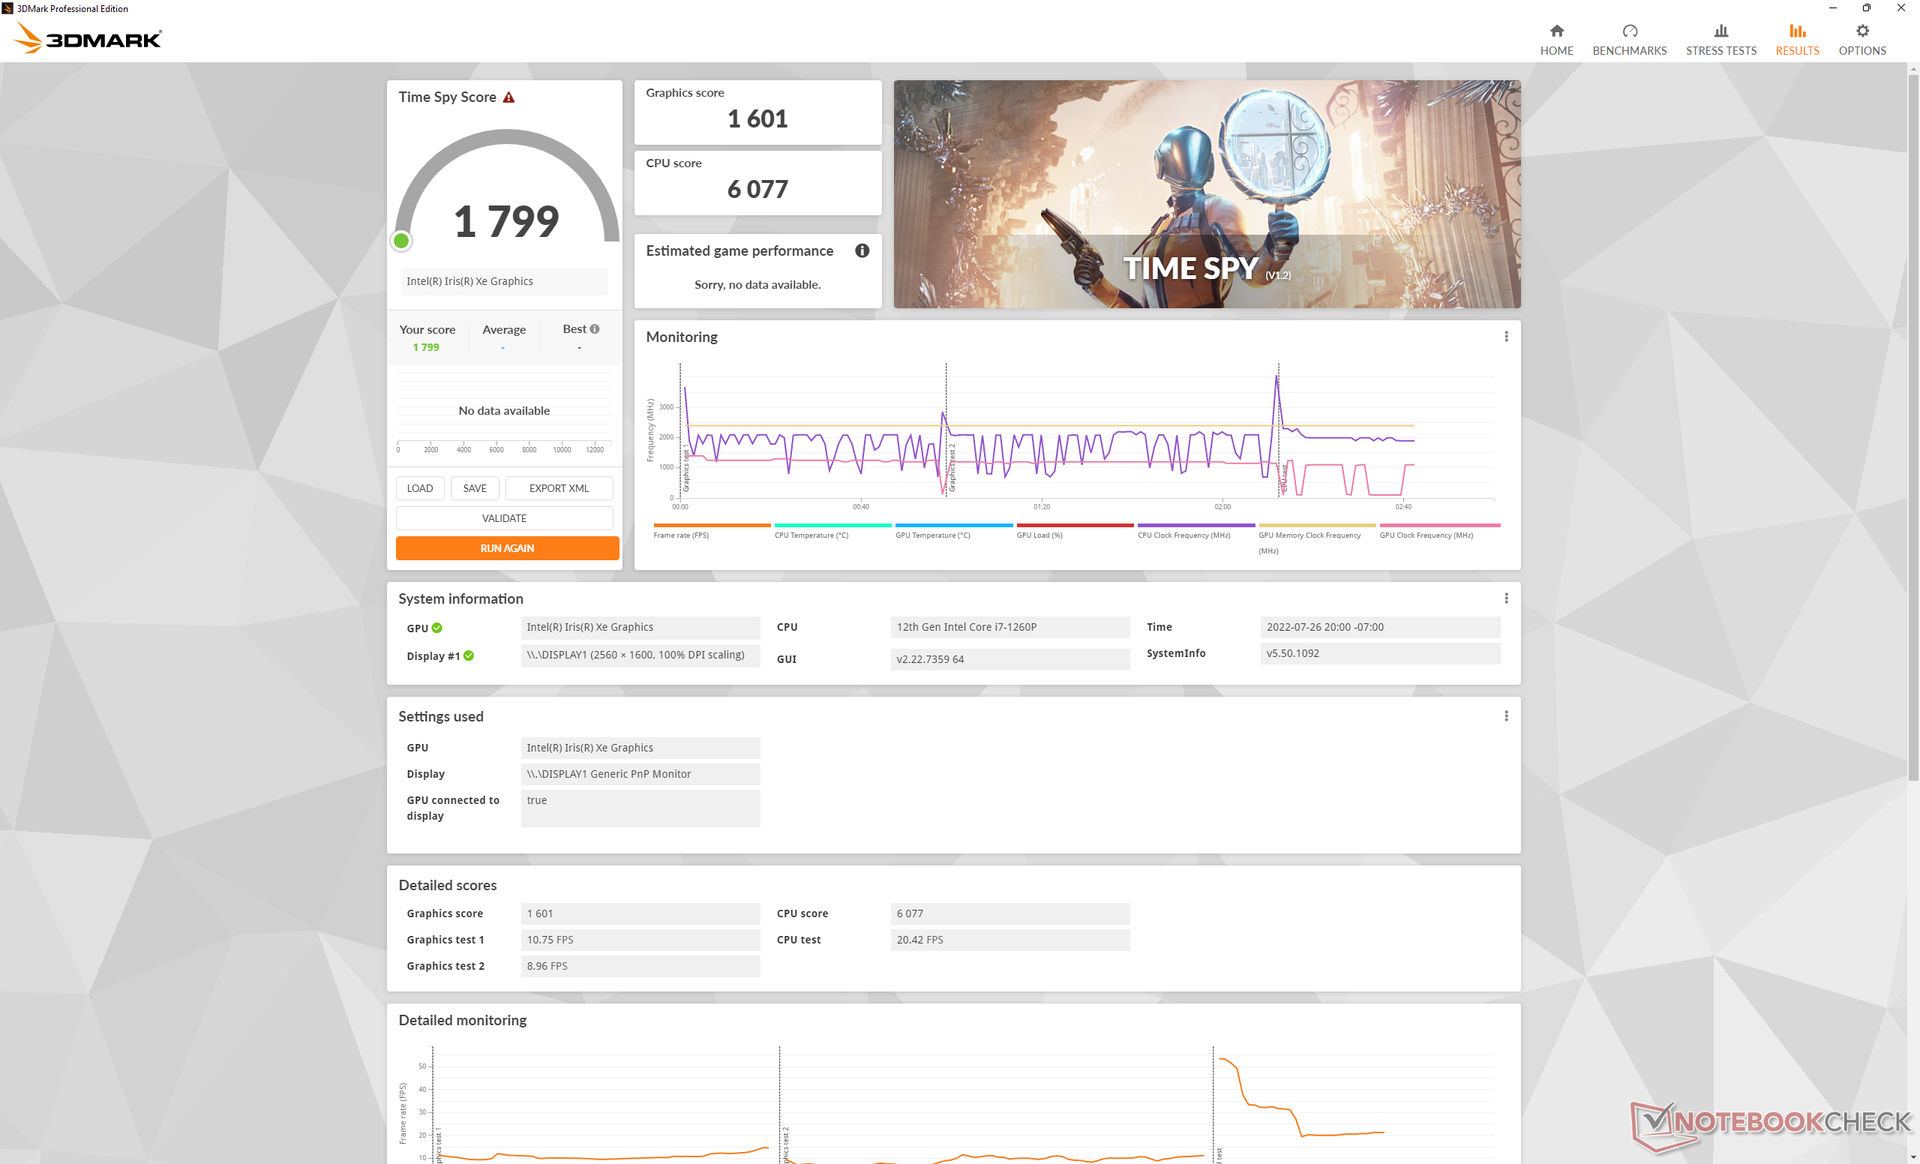
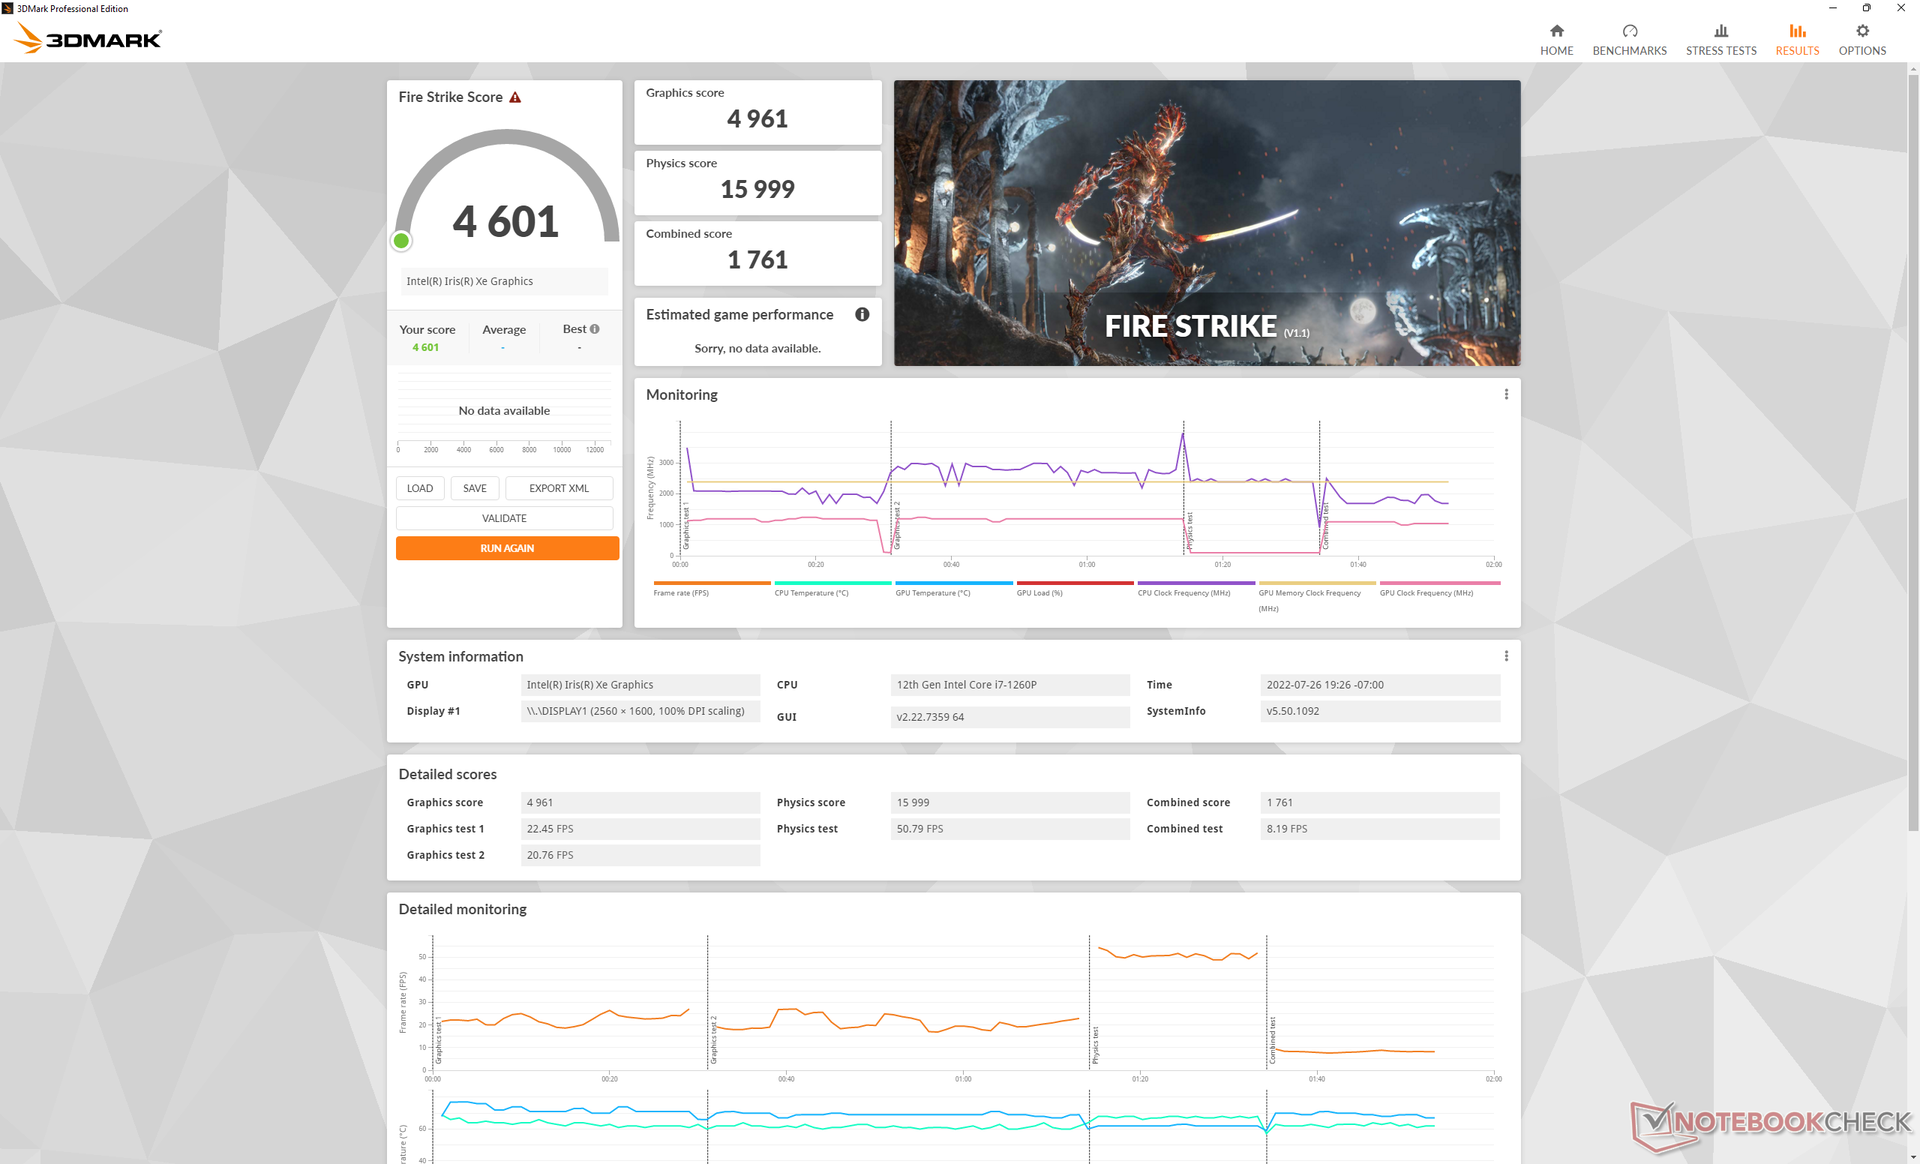
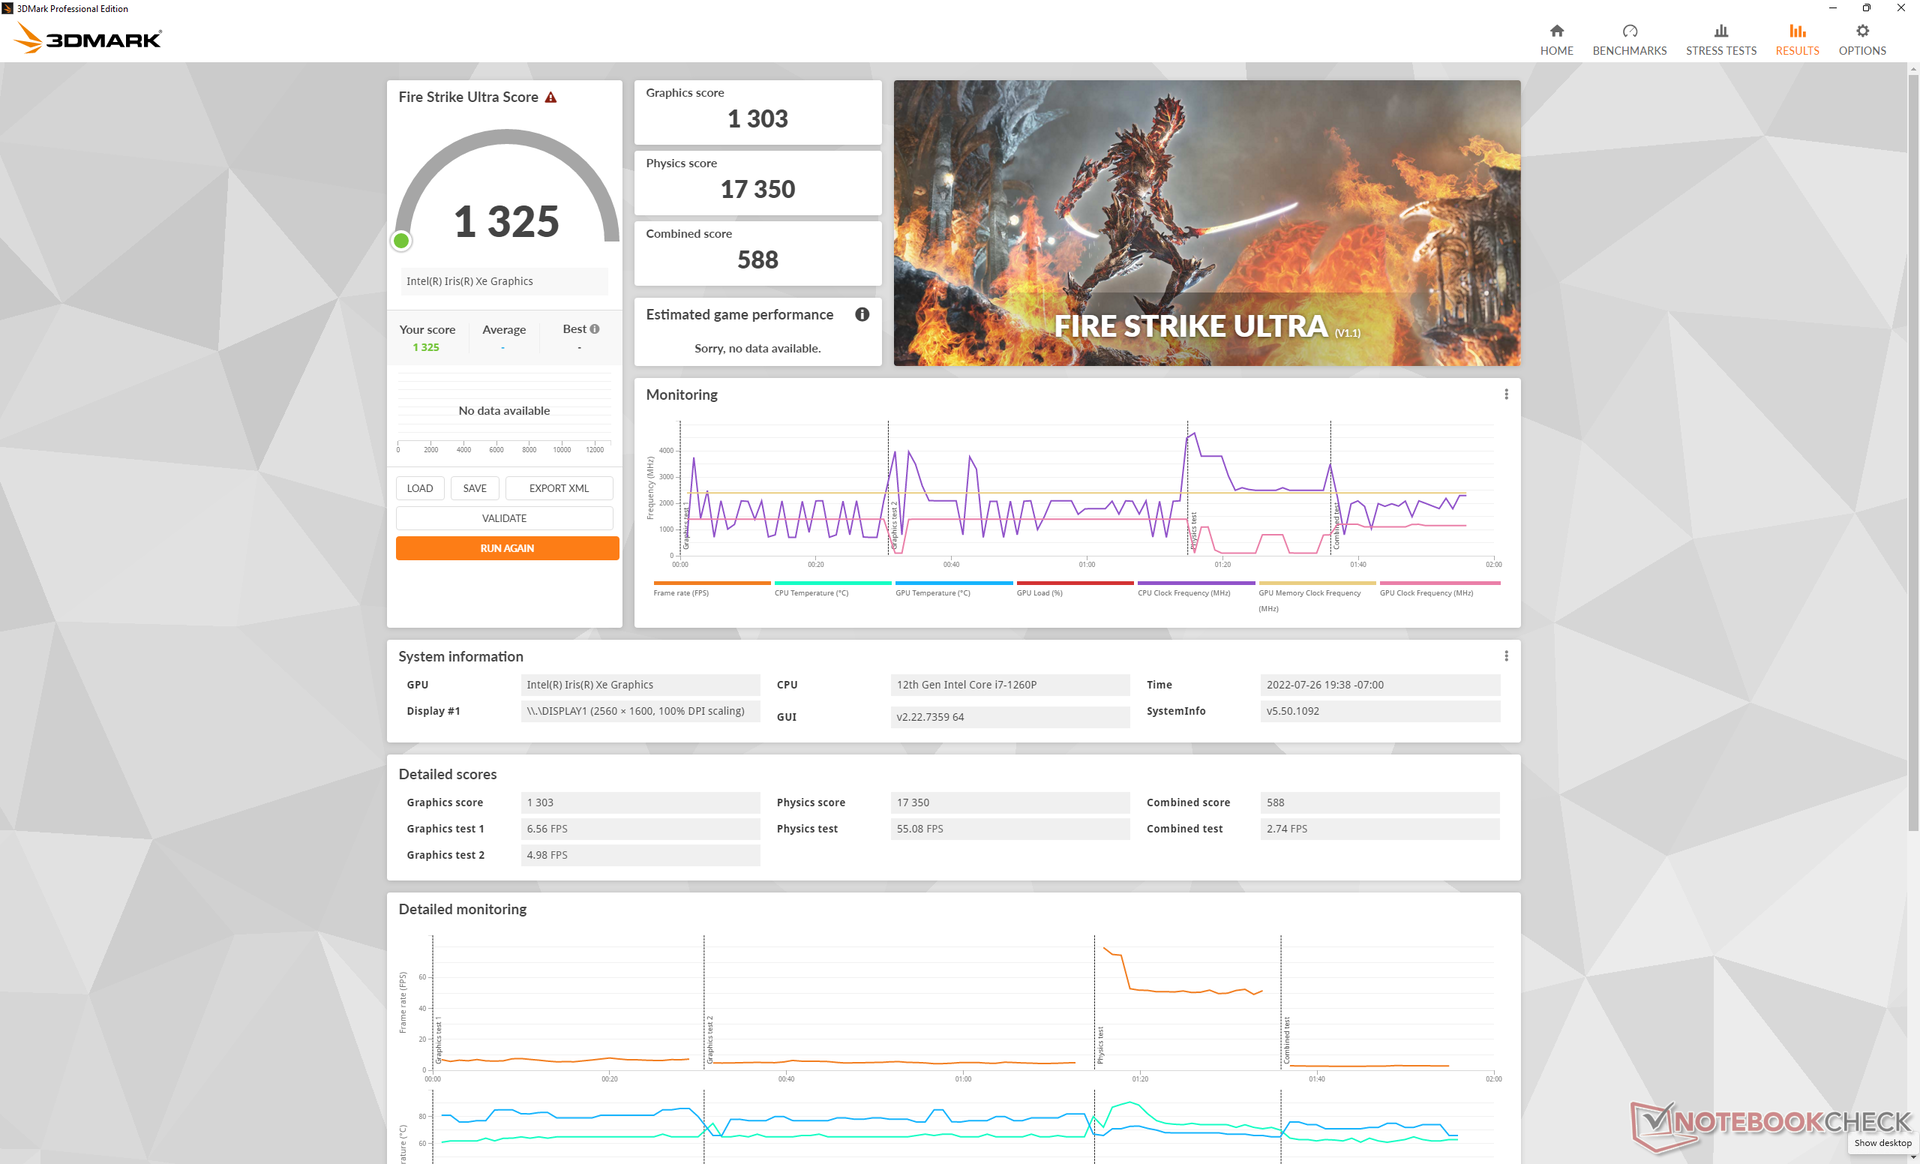
| 3DMark 11 Performance | 7279 Punkte | |
| 3DMark Cloud Gate Standard Score | 20454 Punkte | |
| 3DMark Fire Strike Score | 4601 Punkte | |
| 3DMark Time Spy Score | 1799 Punkte | |
Hilfe | ||
Witcher 3 FPS Chart
| min. | mittel | hoch | max. | |
|---|---|---|---|---|
| GTA V (2015) | 117.1 | 91 | 19.6 | 9.25 |
| The Witcher 3 (2015) | 78.3 | 51.4 | 29.1 | 13.7 |
| Dota 2 Reborn (2015) | 118.4 | 86.6 | 62.3 | 52.4 |
| Final Fantasy XV Benchmark (2018) | 40.4 | 22.6 | 16 | |
| X-Plane 11.11 (2018) | 42.6 | 30.1 | 29.1 | |
| Strange Brigade (2018) | 95.5 | 44.5 | 35.4 | 28.7 |
| Cyberpunk 2077 1.6 (2022) | 18.8 | 15.7 | 12 | 9.7 |
Emissionen
Systemrauschen
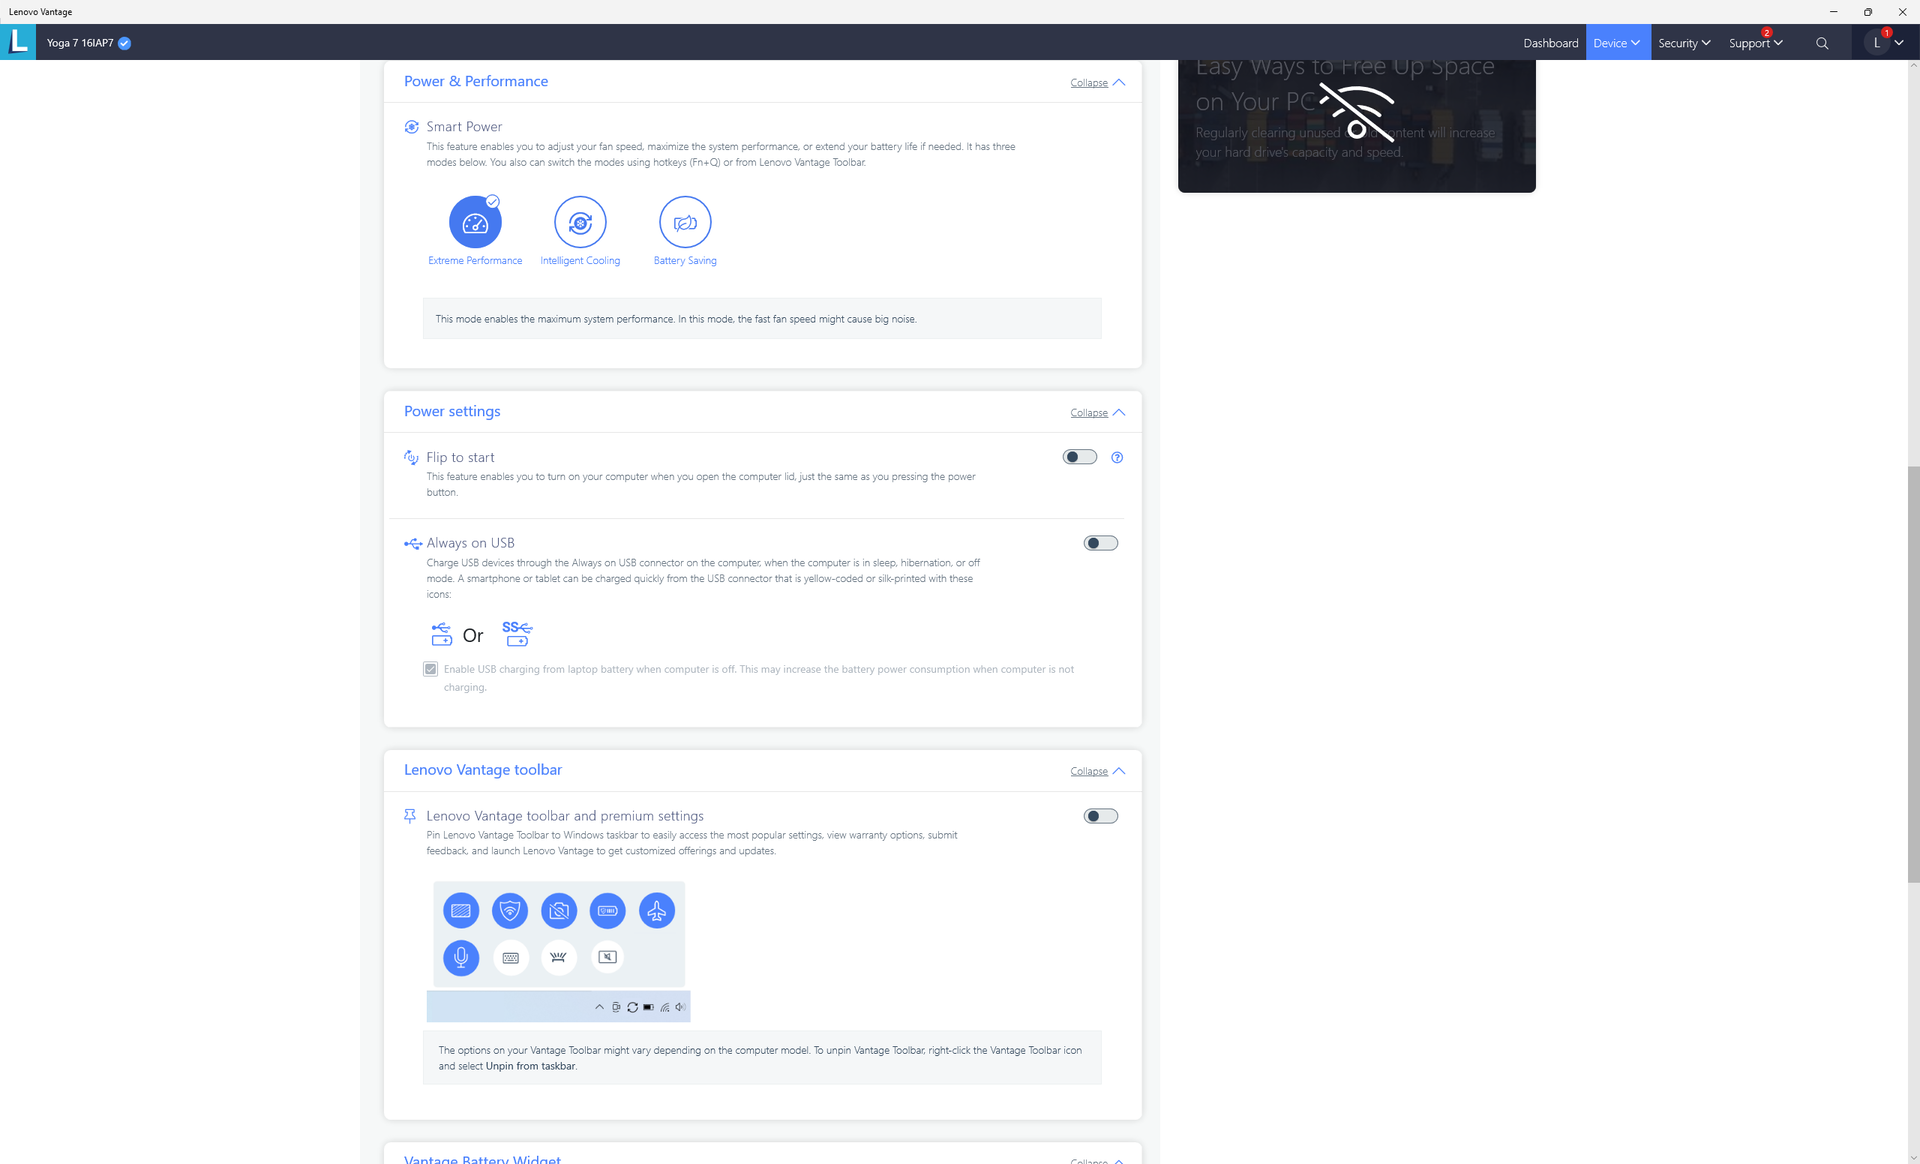
Lüftergeräusche und -verhalten hängen von den drei Lenovo-Vantage-Leistungsprofileinstellungen ab: Akkueinsparung, intelligente Kühlung und extreme Leistung. Der Batteriesparmodus wird beim Browsing oder Streaming empfohlen, da sonst der interne Lüfter recht schnell Fahrt aufnimmt, wenn schwerere Lasten auftreten. Der Betrieb von Witcher 3 im intelligenten Kühlmodus und im Extreme-Performance-Modus würde zu einem Lüftergeräuschpegel von 37,7 dB(A) bzw. 40 dB(A) führen, was etwas lauter ist als das ist, was wir beim Dell Inspiron 16 7620 2-in-1 beobachtet haben. Das System ist ansonsten bei den meisten täglichen Aufgaben mit deutlich unter 30 dB(A) einigermaßen leise.
Lautstärkediagramm
| Idle |
| 23.6 / 23.6 / 23.6 dB(A) |
| Last |
| 37.7 / 40.2 dB(A) |
 | ||
30 dB leise 40 dB(A) deutlich hörbar 50 dB(A) störend |
||
min: | ||
| Lenovo Yoga 7 16IAP7 Iris Xe G7 96EUs, i7-1260P, Micron 2450 512GB MTFDKCD512TFK | Huawei MateBook D 16 2022 Iris Xe G7 96EUs, i7-12700H, Silicon Motion PCIe-8 SSD | Dell Inspiron 16 7620 2-in-1 Iris Xe G7 96EUs, i7-1260P, Toshiba KBG40ZNS512G NVMe | Acer Swift X SFX16-51G-5388 GeForce RTX 3050 4GB Laptop GPU, i5-11320H, Samsung PM991 MZVLQ512HBLU | LG Gram 16 (2021) Iris Xe G7 96EUs, i7-1165G7, SK Hynix PC601 1TB HFS001TD9TNG | Lenovo IdeaPad 5 Pro 16ACH GeForce GTX 1650 Mobile, R7 5800H, Micron 2300 512GB MTFDHBA512TDV | |
|---|---|---|---|---|---|---|
| Geräuschentwicklung | -7% | 5% | -11% | 0% | -10% | |
| aus / Umgebung * (dB) | 23.6 | 24.2 -3% | 23.2 2% | 25.4 -8% | 26 -10% | 24.04 -2% |
| Idle min * (dB) | 23.6 | 24.2 -3% | 23.5 -0% | 25.4 -8% | 26 -10% | 24.04 -2% |
| Idle avg * (dB) | 23.6 | 25.8 -9% | 23.5 -0% | 25.4 -8% | 26 -10% | 24.04 -2% |
| Idle max * (dB) | 23.6 | 30.5 -29% | 23.5 -0% | 27.8 -18% | 26 -10% | 24.04 -2% |
| Last avg * (dB) | 37.7 | 39.8 -6% | 29.4 22% | 41 -9% | 30.8 18% | 41.3 -10% |
| Witcher 3 ultra * (dB) | 40 | 39.8 1% | 35.6 11% | 49.21 -23% | ||
| Last max * (dB) | 40.2 | 39.8 1% | 39.7 1% | 47 -17% | 31.1 23% | 52.93 -32% |
* ... kleinere Werte sind besser
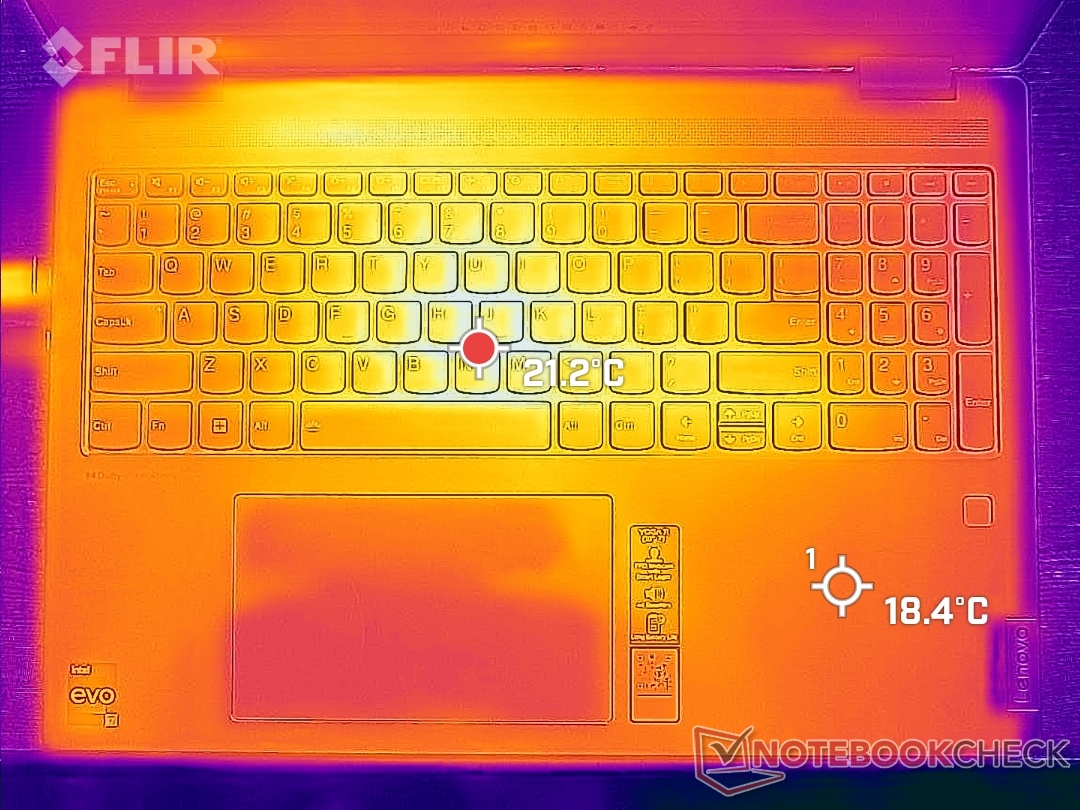
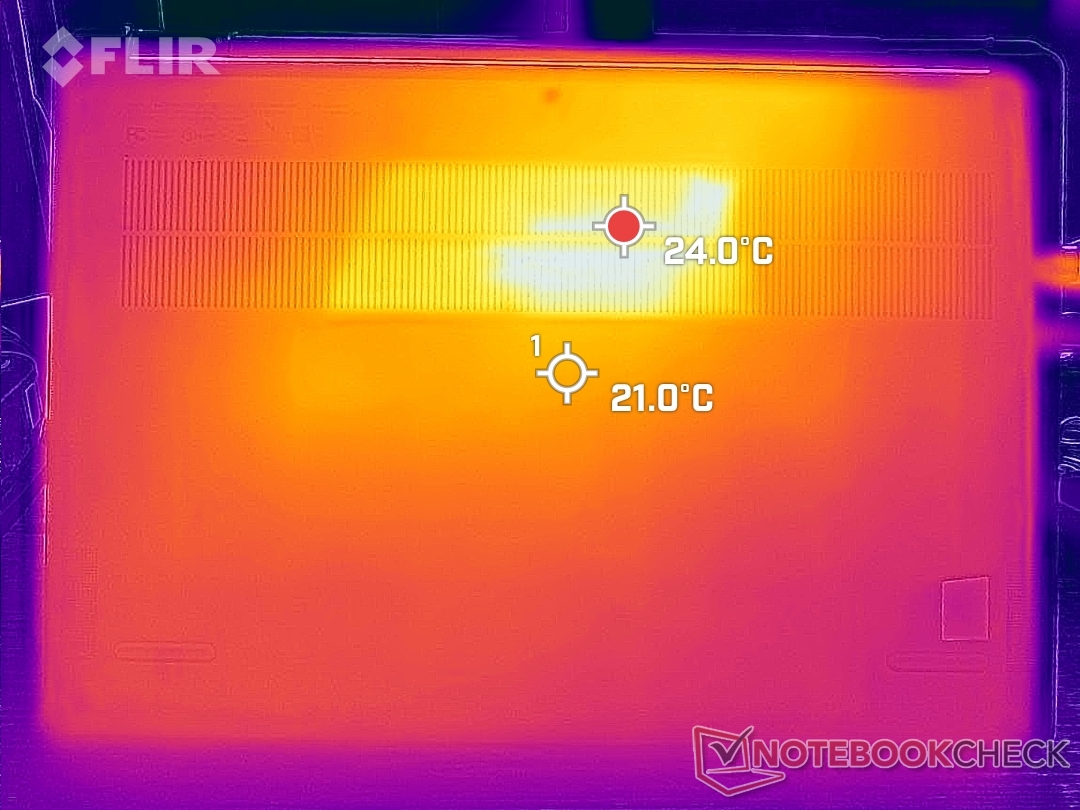
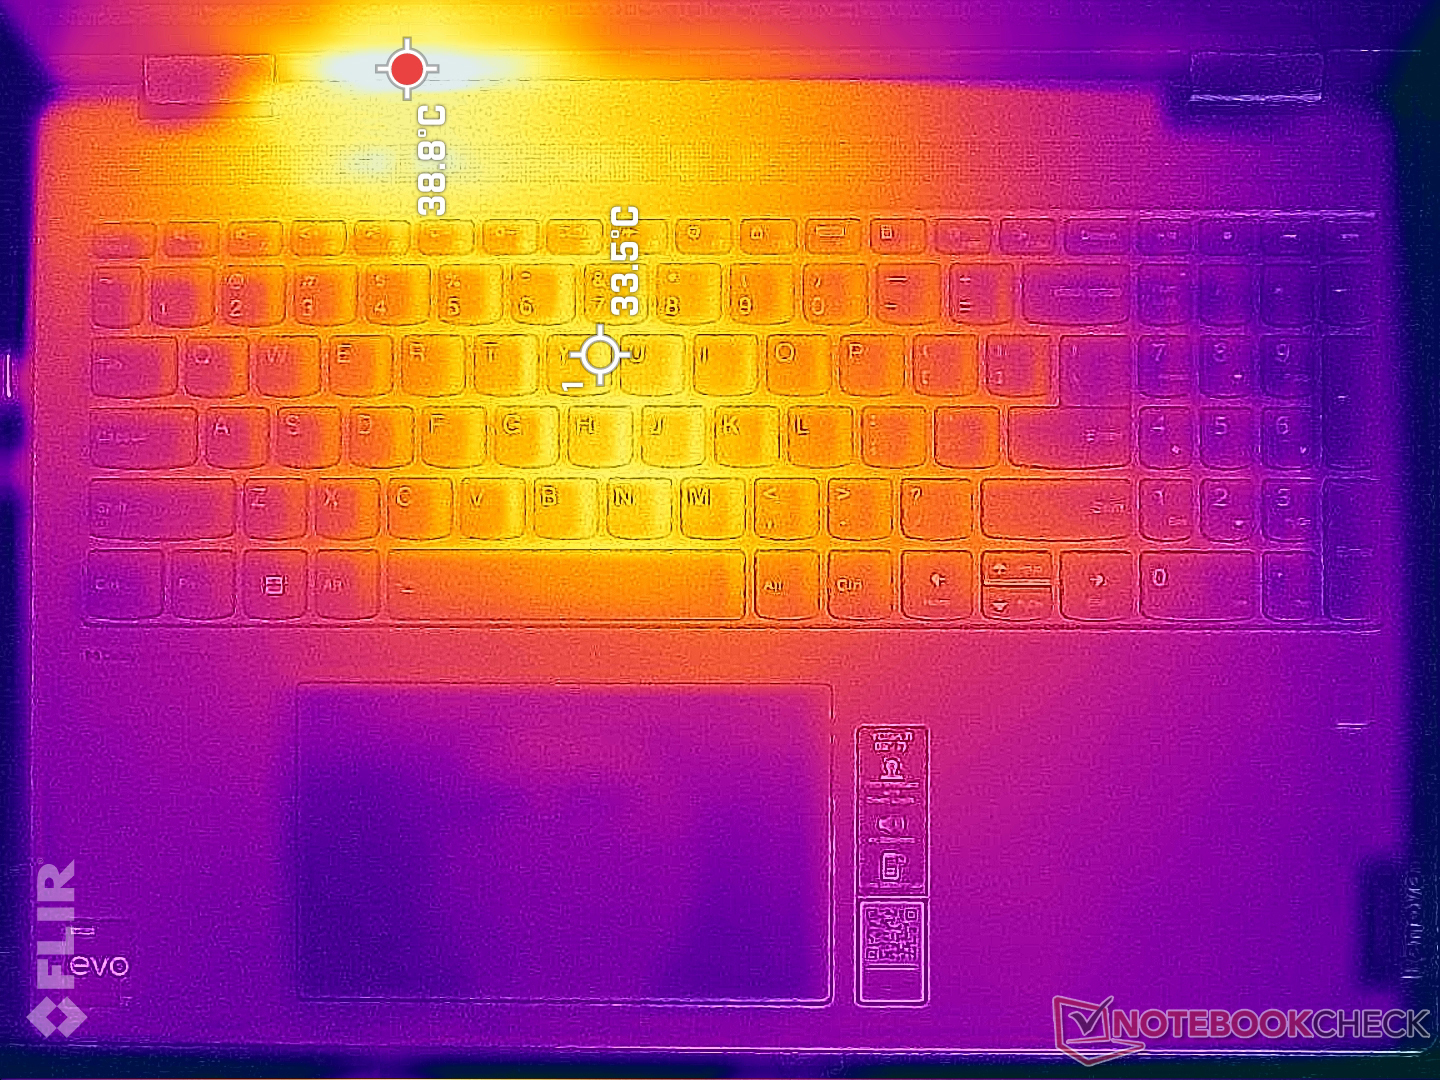
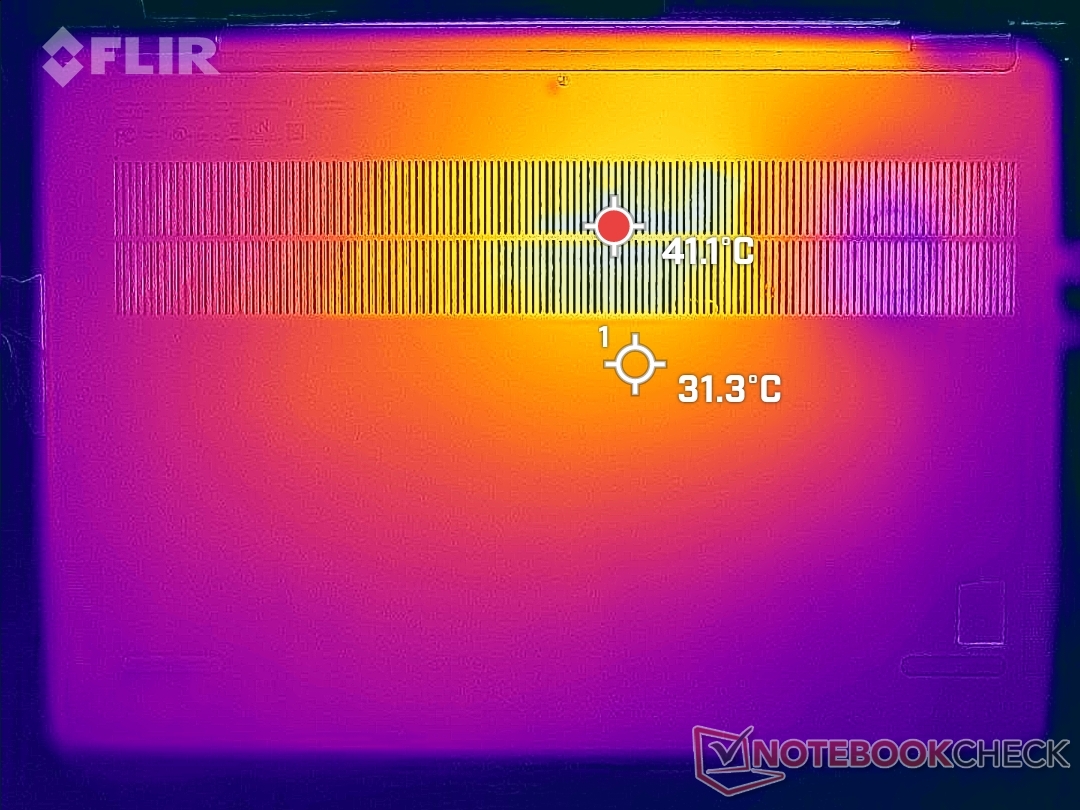
Temperatur – ziemlich kühl
Die Oberflächentemperaturen sind auch bei anspruchsvollen Lasten nicht so warm. Hotspots auf der Oberseite und Unterseite können 39 °C bzw. 35 °C erreichen, verglichen mit 41 °C bis 48 °C auf dem Huawei MateBook D 16 2022 oder 45 °C bis 47 °C auf dem LG Gram 16. Diese Hotspots liegen auf der Gehäuserückseite, wodurch die Auflagen der Handfläche kühler sind.
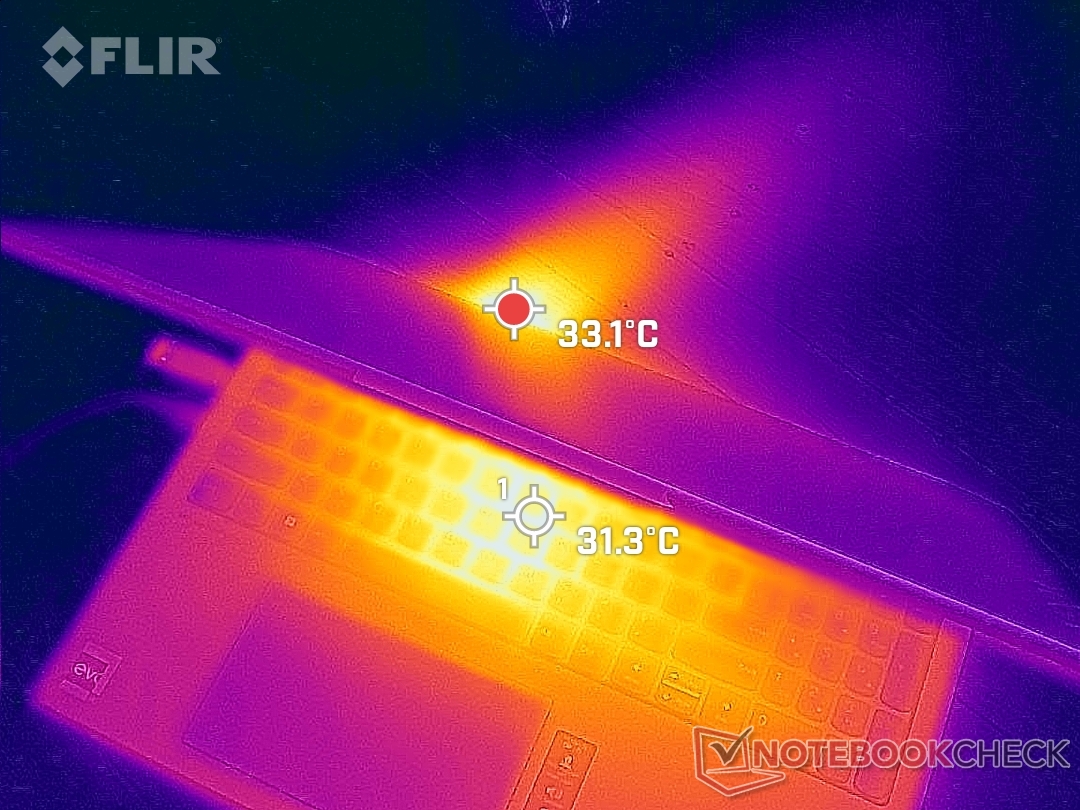
(+) Die maximale Temperatur auf der Oberseite ist 39 °C. Im Vergleich liegt der Klassendurchschnitt bei 35.4 °C (von 19.6 bis 60 °C für die Klasse Convertible).
(+) Auf der Unterseite messen wir eine maximalen Wert von 34.2 °C (im Vergleich zum Durchschnitt von 36.9 °C).
(+) Ohne Last messen wir eine durchschnittliche Temperatur von 19.3 °C auf der Oberseite. Der Klassendurchschnitt erreicht 30.3 °C.
(+) Die Handballen und der Touchpad-Bereich sind mit gemessenen 23.4 °C kühler als die typische Hauttemperatur und fühlen sich dadurch kühl an.
(+) Die durchschnittliche Handballen-Temperatur anderer getesteter Geräte war 28 °C (+4.6 °C).
| Lenovo Yoga 7 16IAP7 Intel Core i7-1260P, Intel Iris Xe Graphics G7 96EUs | Huawei MateBook D 16 2022 Intel Core i7-12700H, Intel Iris Xe Graphics G7 96EUs | Dell Inspiron 16 7620 2-in-1 Intel Core i7-1260P, Intel Iris Xe Graphics G7 96EUs | Acer Swift X SFX16-51G-5388 Intel Core i5-11320H, NVIDIA GeForce RTX 3050 4GB Laptop GPU | LG Gram 16 (2021) Intel Core i7-1165G7, Intel Iris Xe Graphics G7 96EUs | Lenovo IdeaPad 5 Pro 16ACH AMD Ryzen 7 5800H, NVIDIA GeForce GTX 1650 Mobile | |
|---|---|---|---|---|---|---|
| Hitze | -30% | -39% | -41% | -22% | -36% | |
| Last oben max * (°C) | 39 | 41.8 -7% | 42.2 -8% | 52.4 -34% | 46.9 -20% | 51.9 -33% |
| Last unten max * (°C) | 34.2 | 47.3 -38% | 47.4 -39% | 50 -46% | 45.1 -32% | 51.5 -51% |
| Idle oben max * (°C) | 21.2 | 28.3 -33% | 32.2 -52% | 30.3 -43% | 26.4 -25% | 27.2 -28% |
| Idle unten max * (°C) | 21.6 | 30.2 -40% | 33.6 -56% | 30.4 -41% | 24.1 -12% | 28.5 -32% |
* ... kleinere Werte sind besser
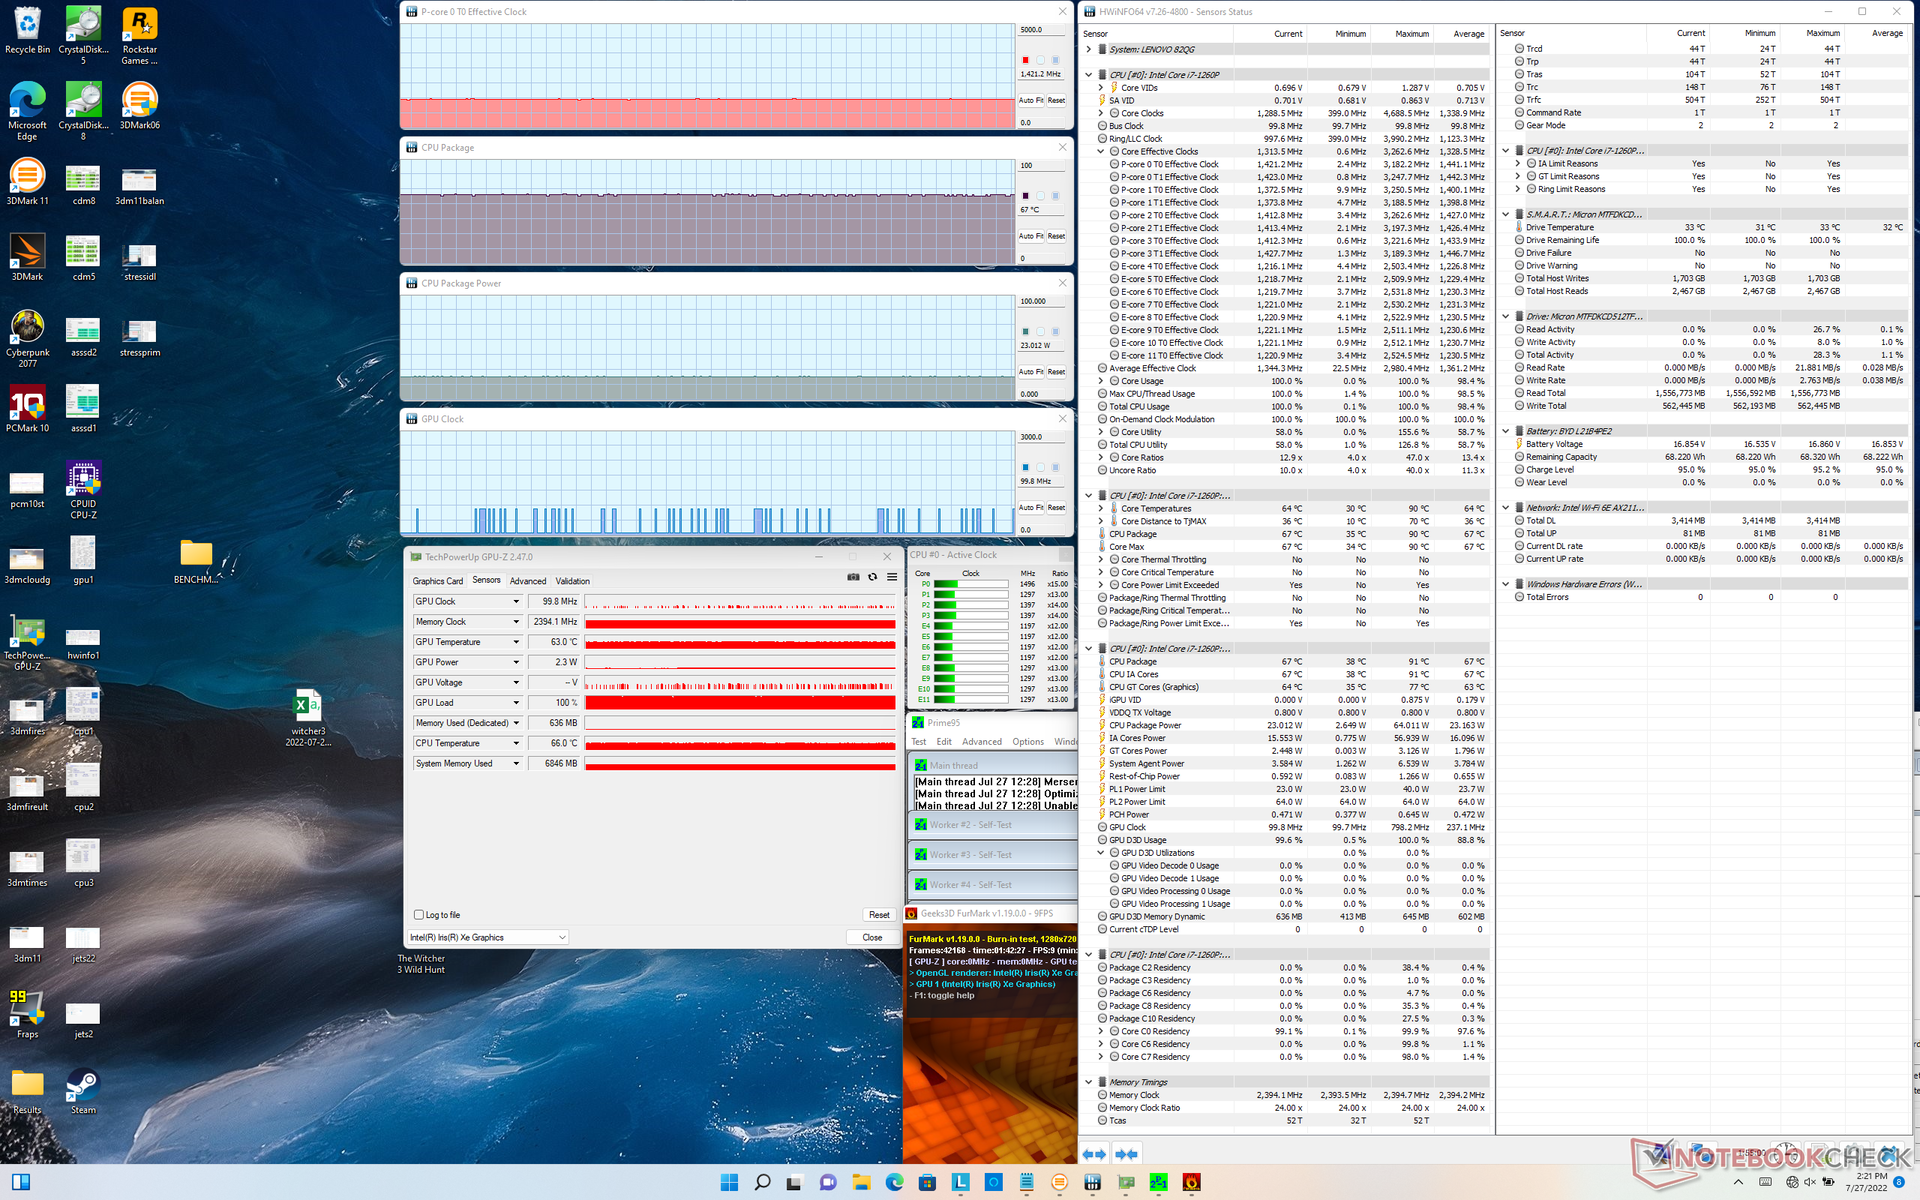
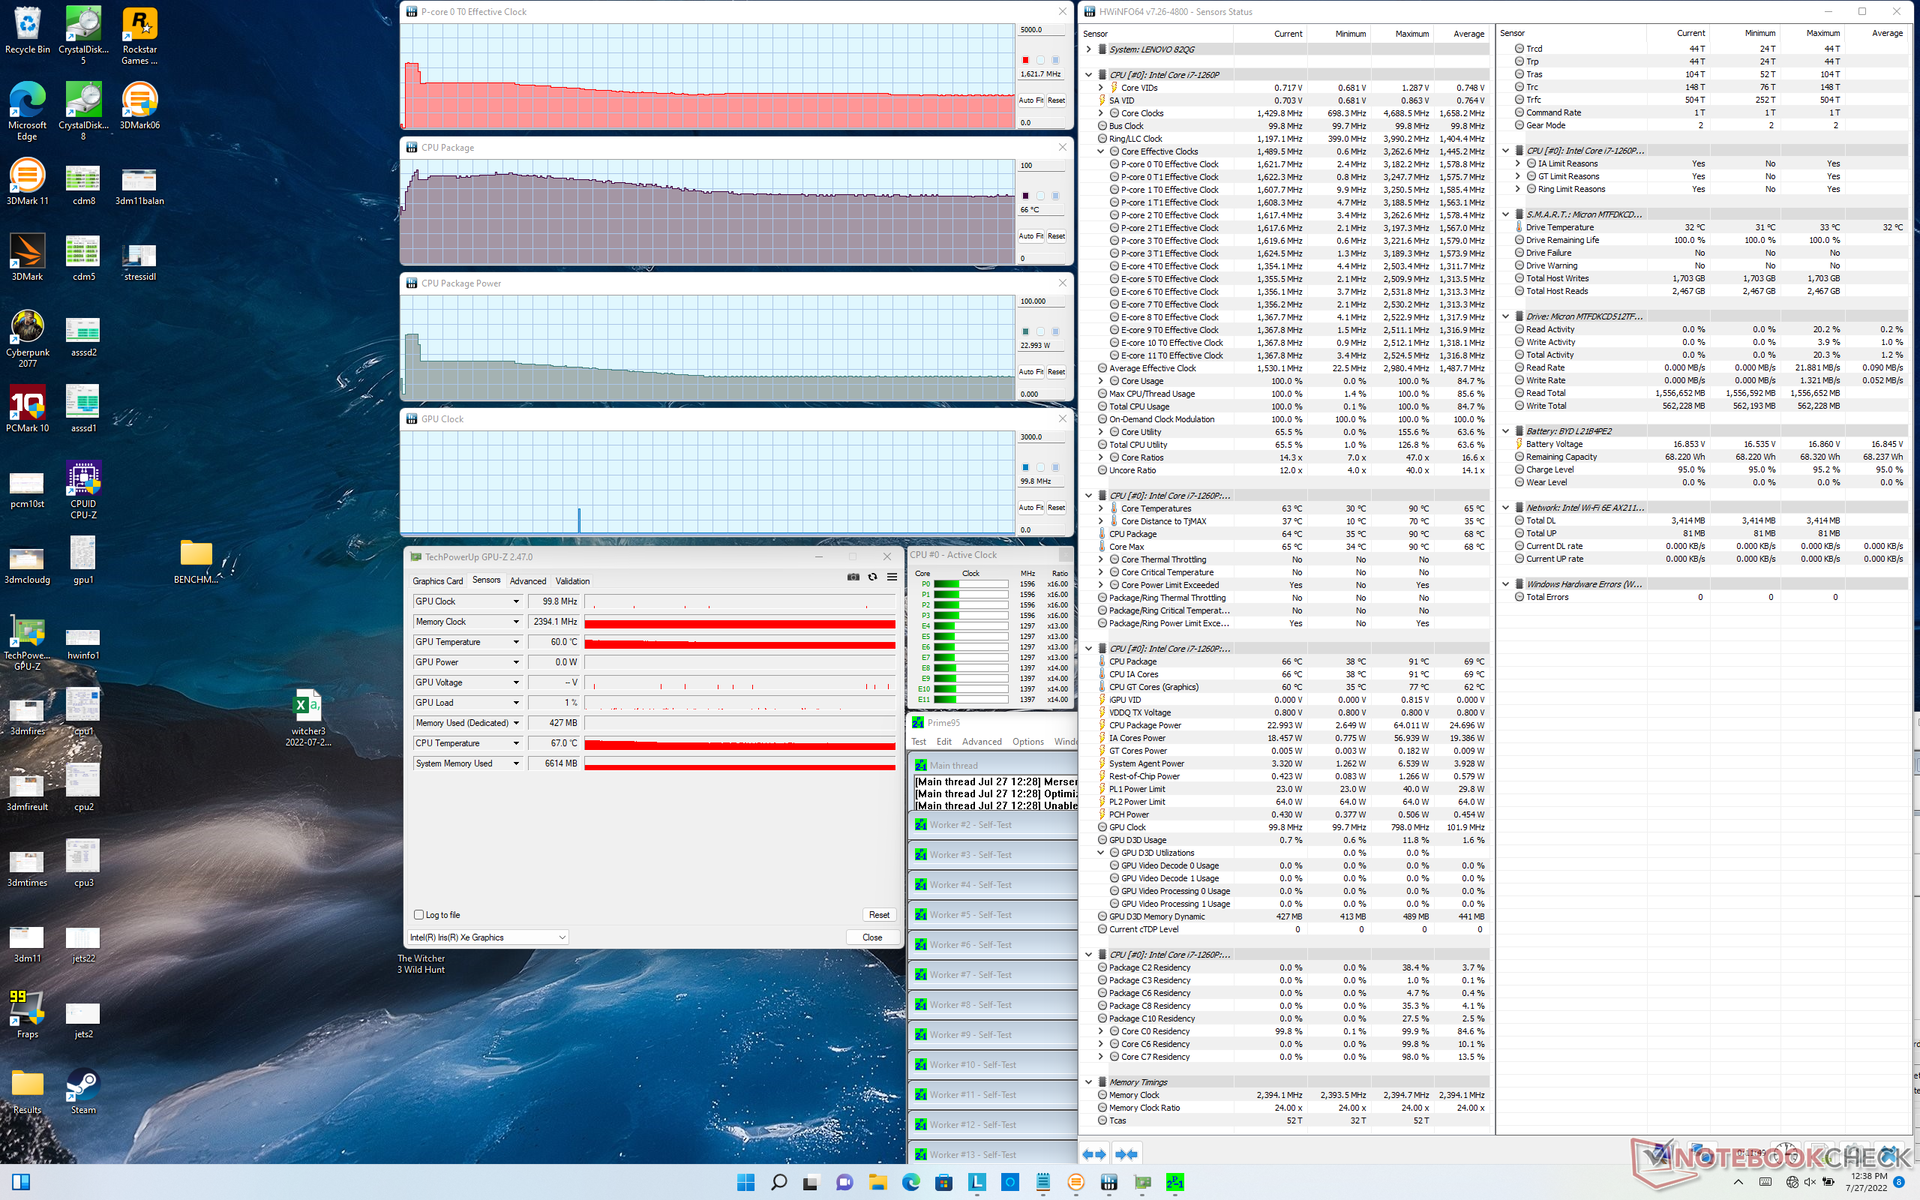
Stresstest
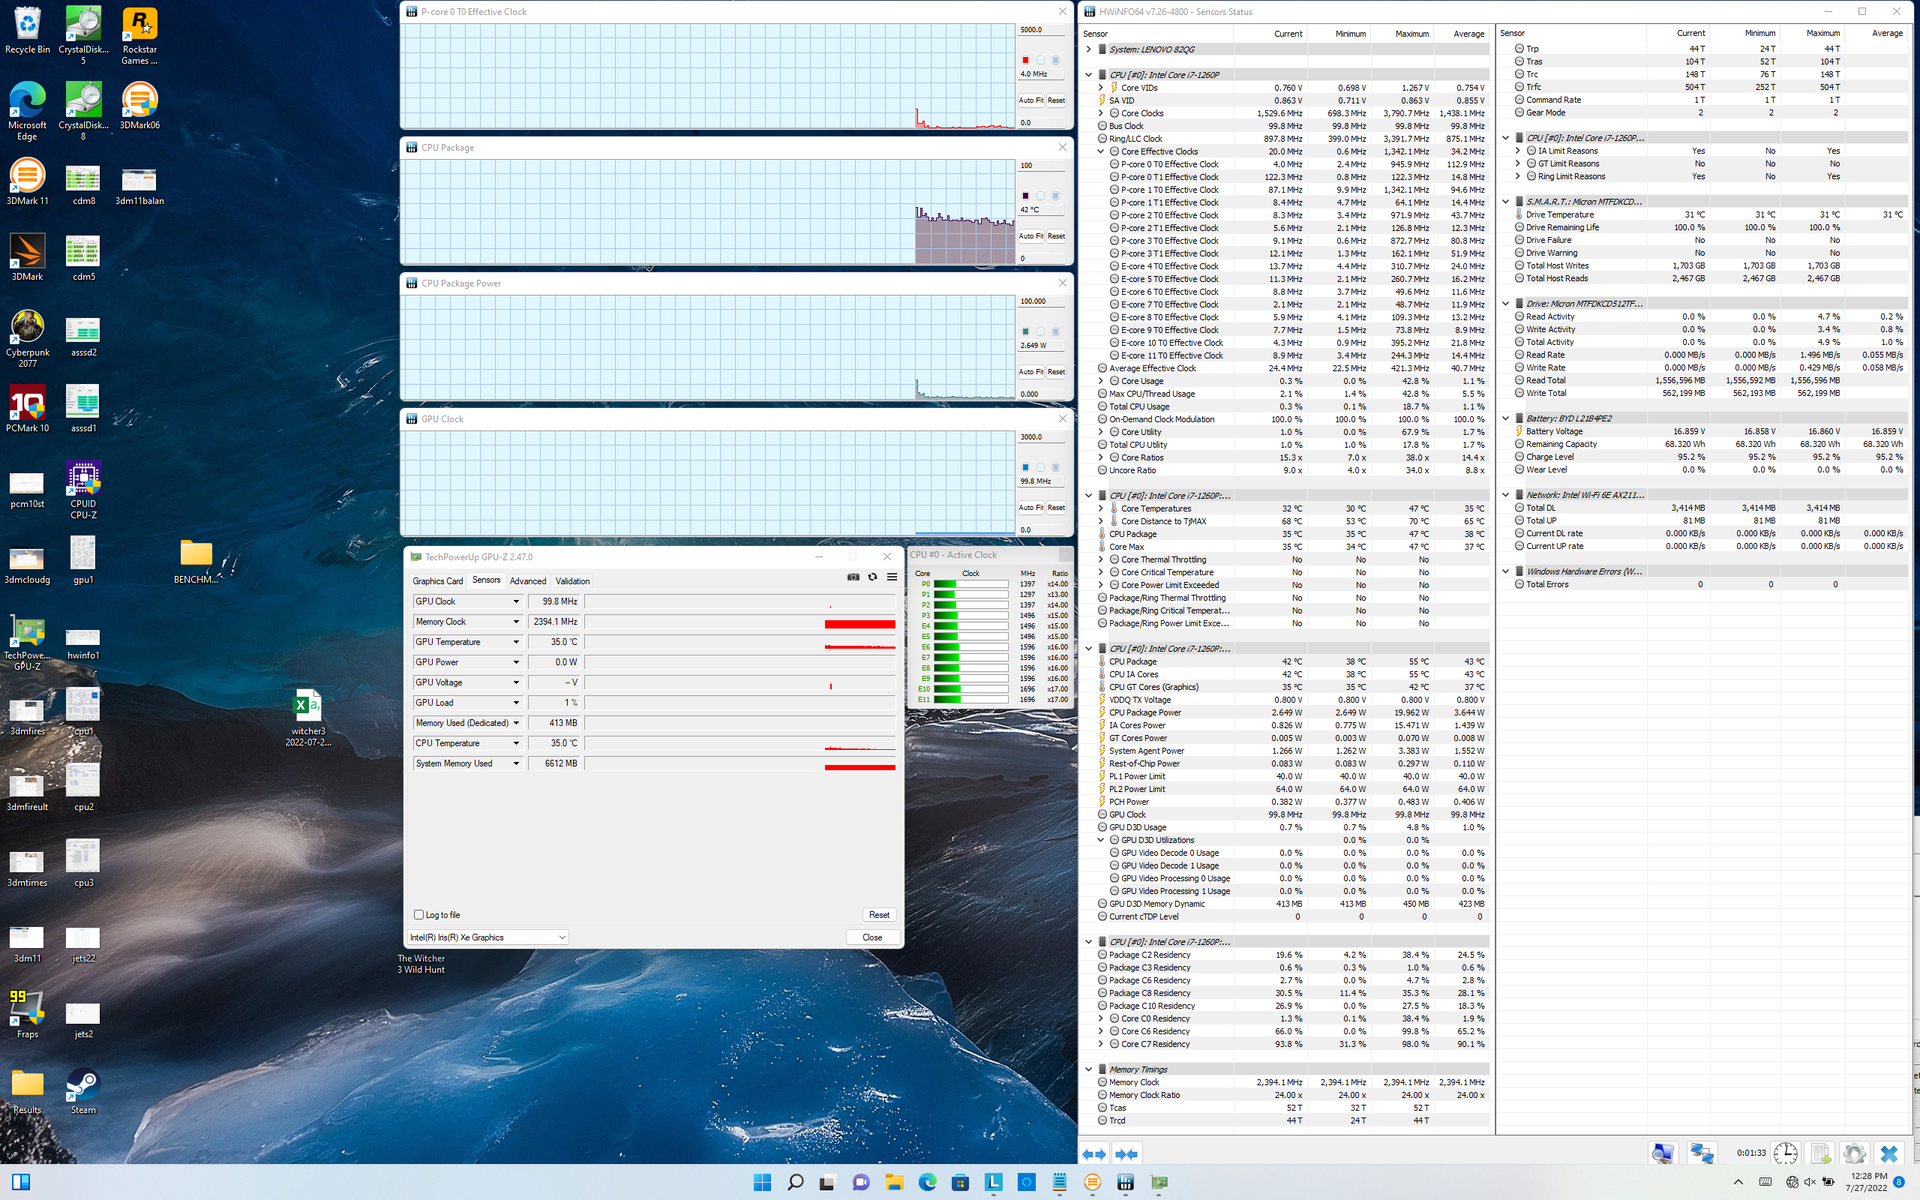
Bei Belastung unter Prime95 würden die Taktraten und die Leistungsaufnahme des CPU-Platinenpakets für nur wenige Sekunden auf 3,2 GHz bzw. 64 W ansteigen, bis die Kerntemperatur 91 °C erreicht. Danach würde die CPU auf 2,2 GHz und 38 W abfallen, bevor sie sich schließlich bei etwa 1,6 GHz, 23 W und 66 °C stabilisiert. Der stetige Leistungsabfall im Laufe der Zeit entspricht unseren oben genannten CineBench R15-xT-Loop-Testergebnissen. Der gleiche Test auf dem MSI Summit E14 Flip Evo mit der gleichen CPU zeigt etwas höhere stabile Taktraten und CPU-Leistungsaufnahme von 1,9 GHz bzw. 28 W, allerdings bei einer höheren Kerntemperatur von 82 °C.
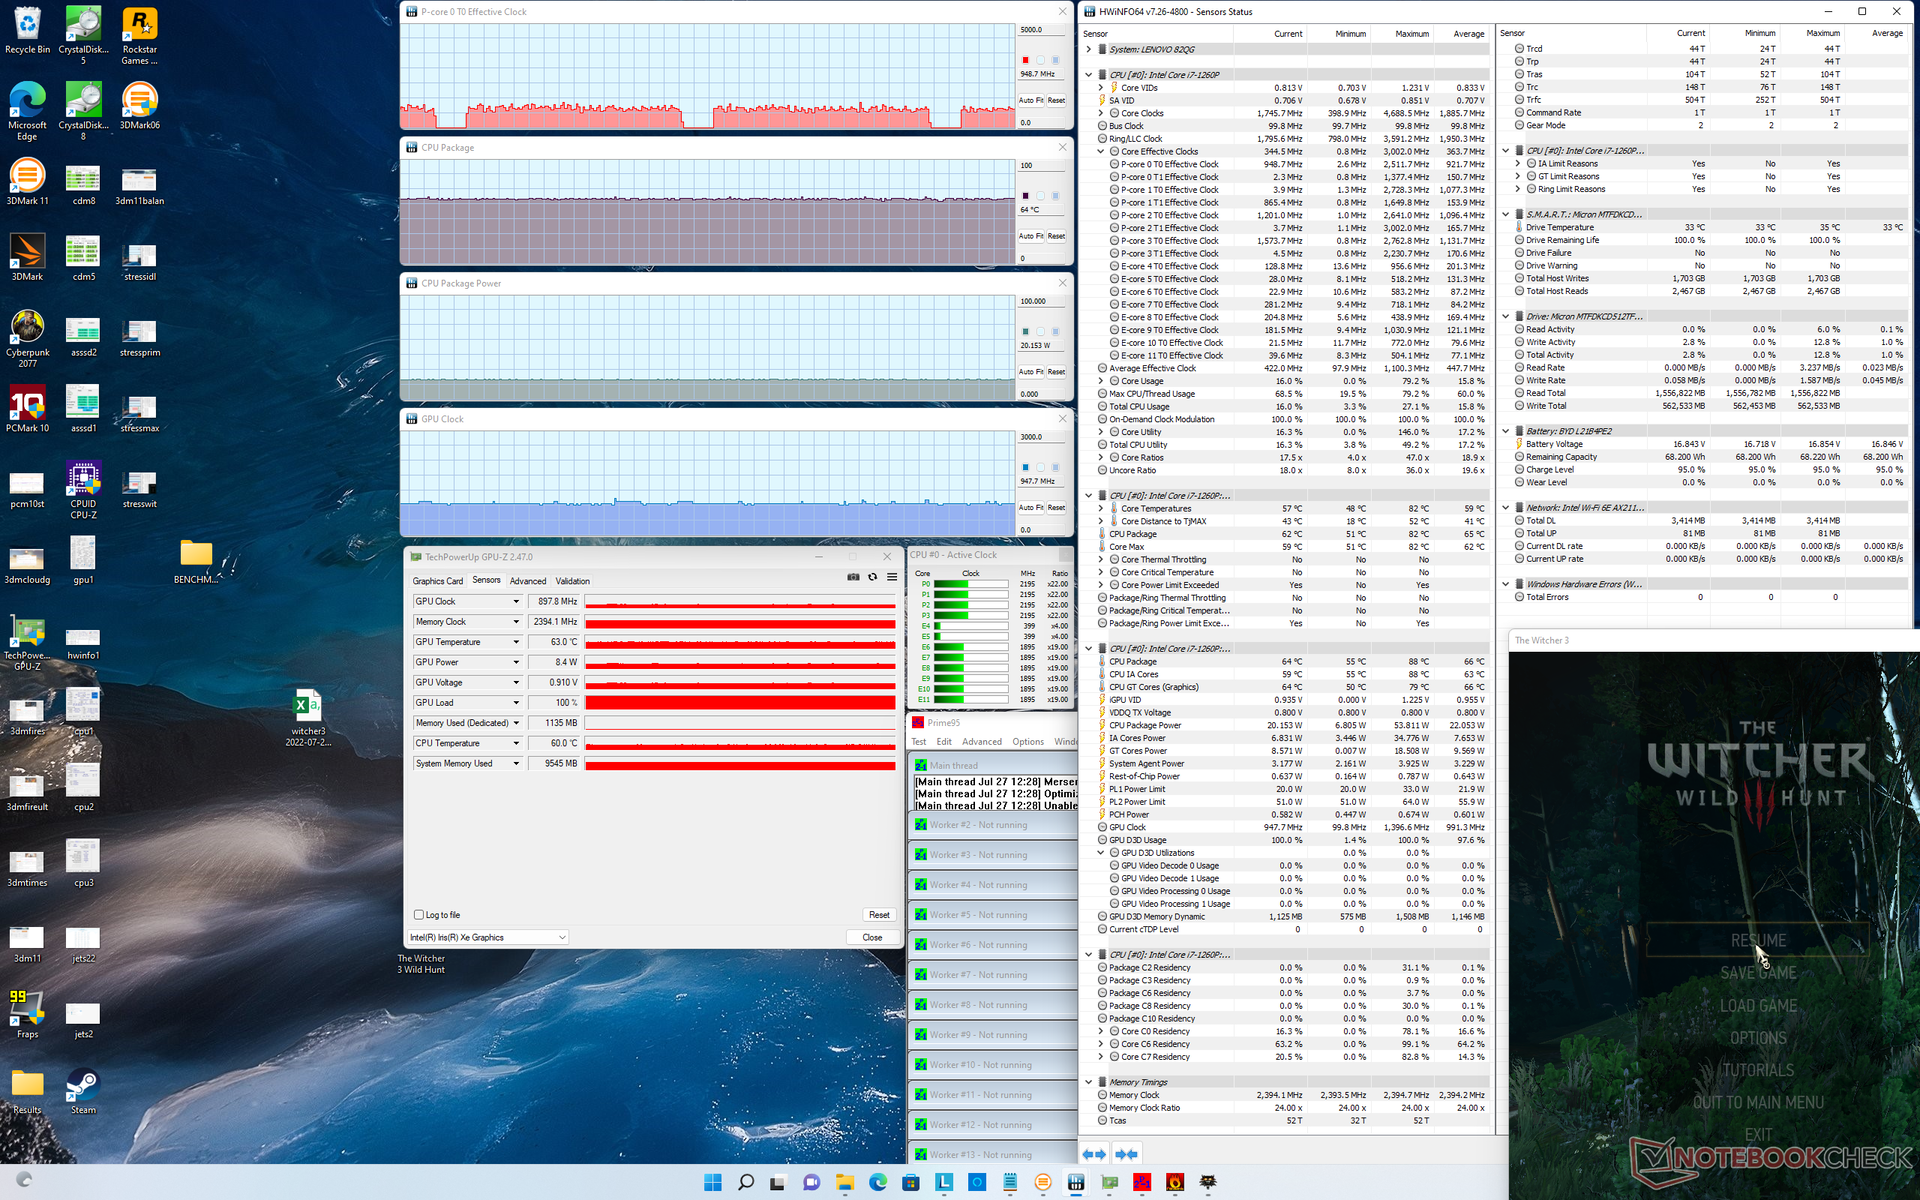
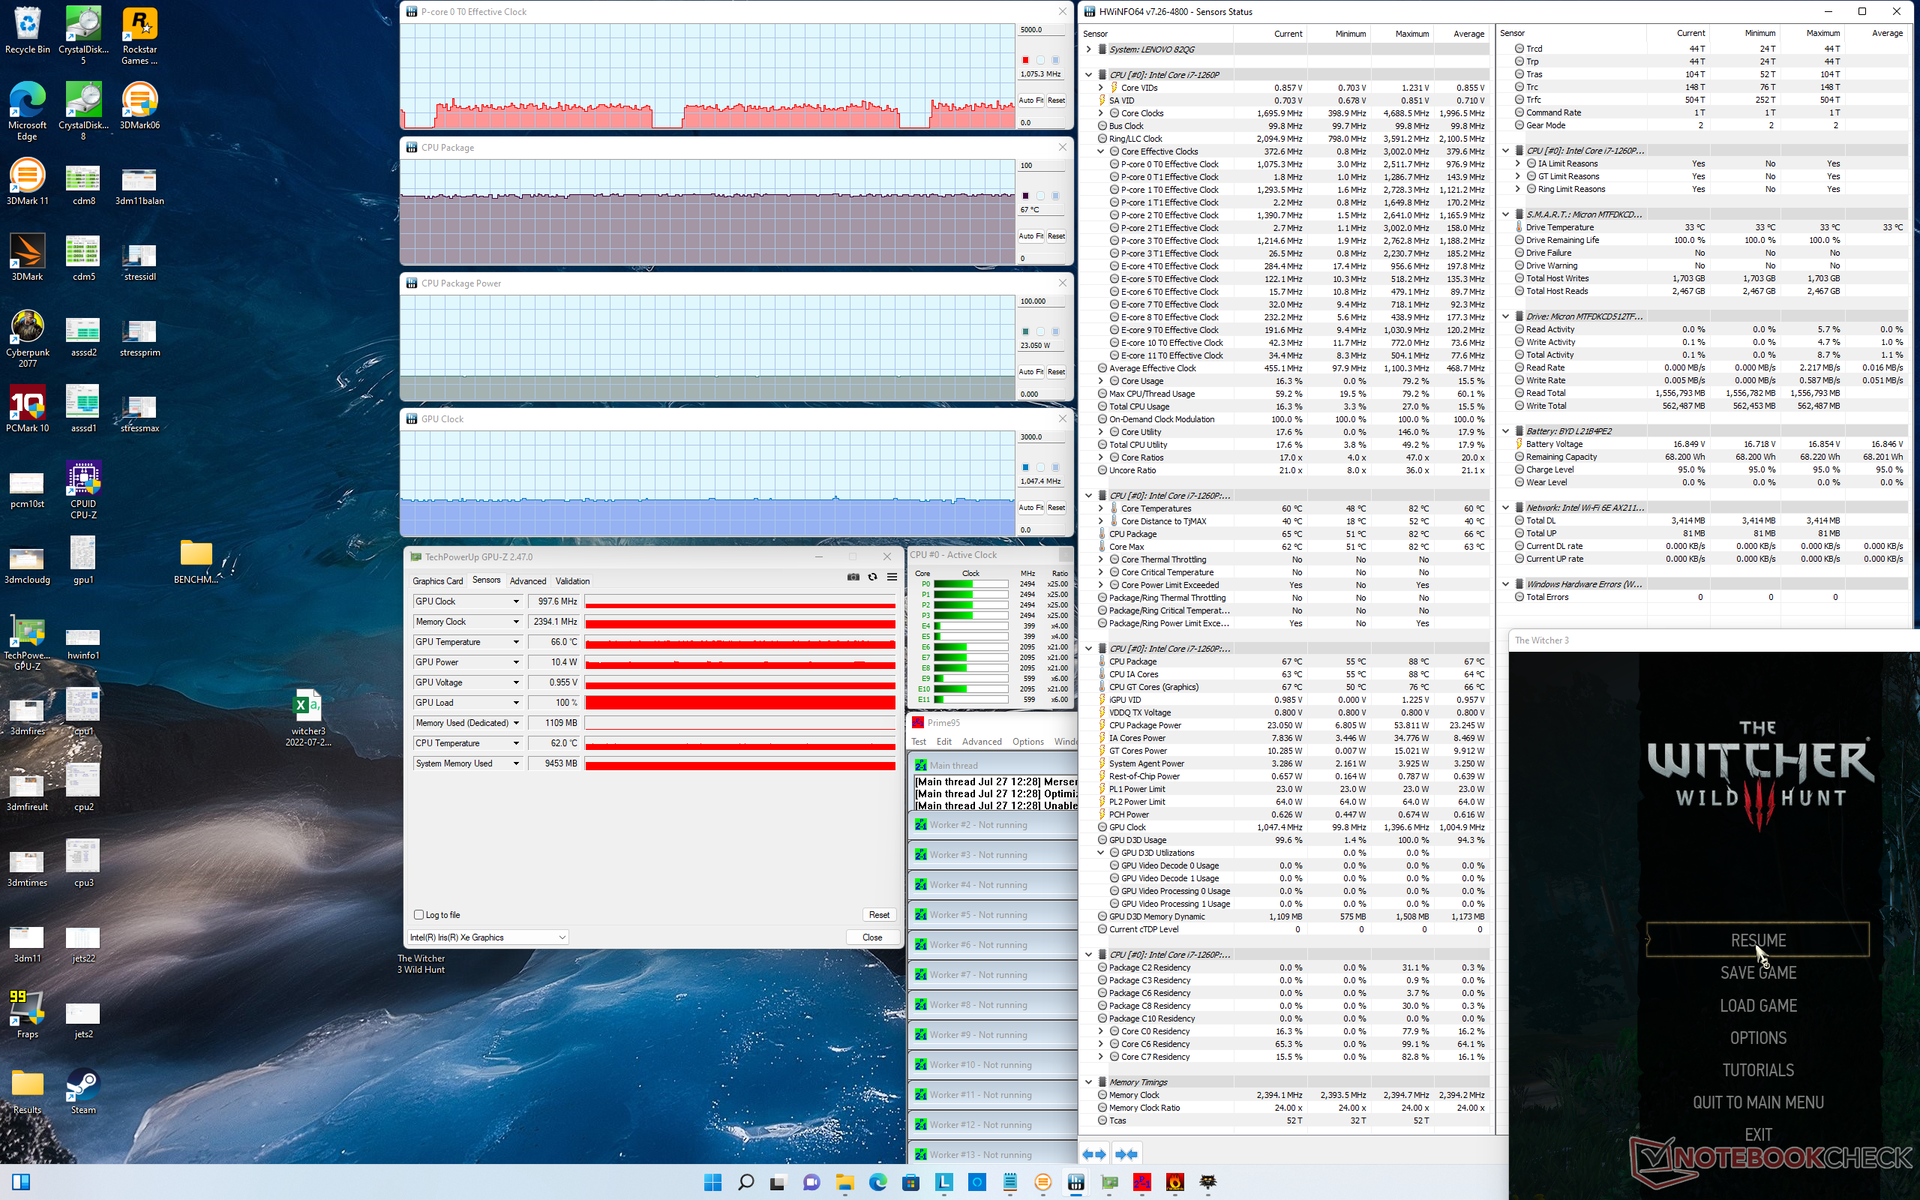
Die GPU-Taktraten und die Temperatur würden sich bei 998 MHz bzw. 67 °C stabilisieren, wenn Witcher 3 im Extreme-Performance-Modus ausgeführt wird. Die Wiederholung des gleichen Tests im intelligenten Kühlmodus würde zu etwas niedrigeren CPU- und GPU-Taktraten und einer kühleren Kerntemperatur führen, wie in der folgenden Tabelle gezeigt. Der gleiche Test auf dem Dell Inspiron 16 7620 2-in-1 würde zu höheren GPU-Taktraten und einer Temperatur von 1296 MHz bzw. 82 °C führen. Die vergleichsweise niedrigeren Kerntemperaturen des Lenovo können, wie oben erwähnt, für die kühleren Oberflächentemperaturen verantwortlich sein.
Der Betrieb mit Akku schränkt die Leistung nicht ein. Ein 3DMark-11-Test im Akkubetrieb würde im Wesentlichen die gleichen Physik- und Grafikwerte liefern wie im Netzbetrieb.
| CPU Clock (GHz) | GPU Clock (MHz) | Durchschnittliche CPU-Temperatur (°C) | |
| Systemleerlauf | -- | -- | 42 |
| Prime95 Stress | 1.6 | -- | 66 |
| Prime95 + FurMark Stress | 1.4 | 100 | 67 |
| Witcher 3 Stress (Intelligenter Kühlmodus) | 0.95 | 898 | 64 |
| Witcher 3 Stress (Extreme-Performance-Modus) | 1.1 | 998 | 67 |
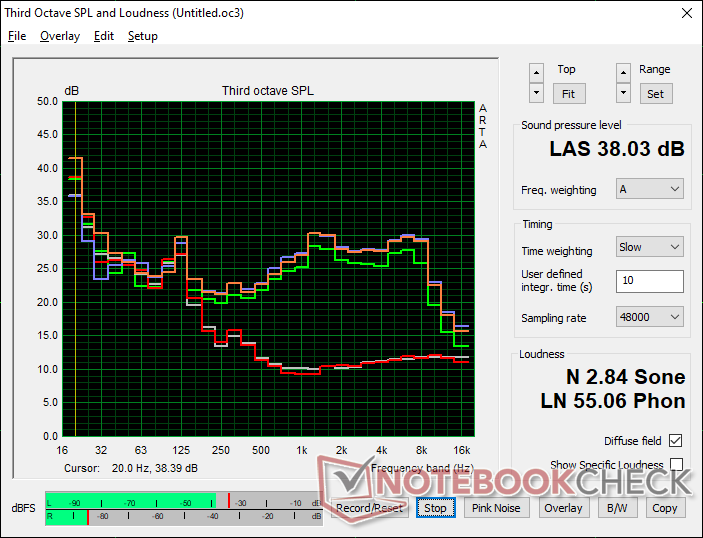
Lautsprecher

Lenovo Yoga 7 16IAP7 Audio Analyse
(+) | Die Lautsprecher können relativ laut spielen (84.7 dB)
Bass 100 - 315 Hz
(±) | abgesenkter Bass - 13.4% geringer als der Median
(±) | durchschnittlich lineare Bass-Wiedergabe (8.6% Delta zum Vorgänger)
Mitteltöne 400 - 2000 Hz
(±) | zu hohe Mitten, vom Median 5.7% abweichend
(+) | lineare Mitten (6.4% Delta zum Vorgänger)
Hochtöne 2 - 16 kHz
(+) | ausgeglichene Hochtöne, vom Median nur 3.9% abweichend
(+) | sehr lineare Hochtöne (6% Delta zum Vorgänger)
Gesamt im hörbaren Bereich 100 - 16.000 Hz
(+) | hörbarer Bereich ist sehr linear (13.2% Abstand zum Median
Im Vergleich zu allen Geräten derselben Klasse
» 17% aller getesteten Geräte dieser Klasse waren besser, 3% vergleichbar, 80% schlechter
» Das beste Gerät hat einen Delta-Wert von 6%, durchschnittlich ist 20%, das schlechteste Gerät hat 57%
Im Vergleich zu allen Geräten im Test
» 13% aller getesteten Geräte waren besser, 3% vergleichbar, 84% schlechter
» Das beste Gerät hat einen Delta-Wert von 4%, durchschnittlich ist 24%, das schlechteste Gerät hat 134%
Apple MacBook Pro 16 2021 M1 Pro Audio Analyse
(+) | Die Lautsprecher können relativ laut spielen (84.7 dB)
Bass 100 - 315 Hz
(+) | guter Bass - nur 3.8% Abweichung vom Median
(+) | lineare Bass-Wiedergabe (5.2% Delta zum Vorgänger)
Mitteltöne 400 - 2000 Hz
(+) | ausgeglichene Mitten, vom Median nur 1.3% abweichend
(+) | lineare Mitten (2.1% Delta zum Vorgänger)
Hochtöne 2 - 16 kHz
(+) | ausgeglichene Hochtöne, vom Median nur 1.9% abweichend
(+) | sehr lineare Hochtöne (2.7% Delta zum Vorgänger)
Gesamt im hörbaren Bereich 100 - 16.000 Hz
(+) | hörbarer Bereich ist sehr linear (4.6% Abstand zum Median
Im Vergleich zu allen Geräten derselben Klasse
» 0% aller getesteten Geräte dieser Klasse waren besser, 0% vergleichbar, 100% schlechter
» Das beste Gerät hat einen Delta-Wert von 5%, durchschnittlich ist 17%, das schlechteste Gerät hat 45%
Im Vergleich zu allen Geräten im Test
» 0% aller getesteten Geräte waren besser, 0% vergleichbar, 100% schlechter
» Das beste Gerät hat einen Delta-Wert von 4%, durchschnittlich ist 24%, das schlechteste Gerät hat 134%
Energiemanagement
Stromverbrauch – ein anspruchsvolles 16-Zoll-System
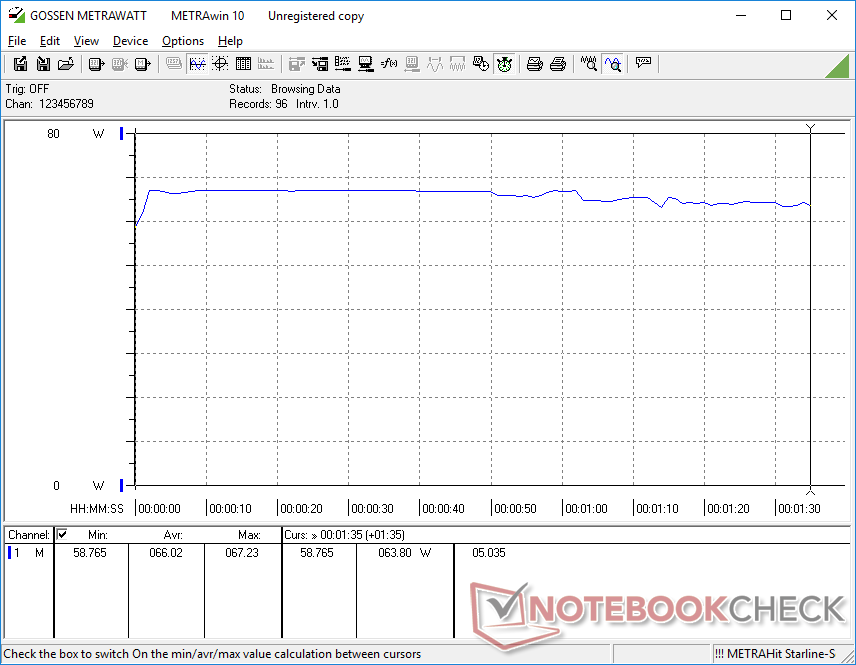
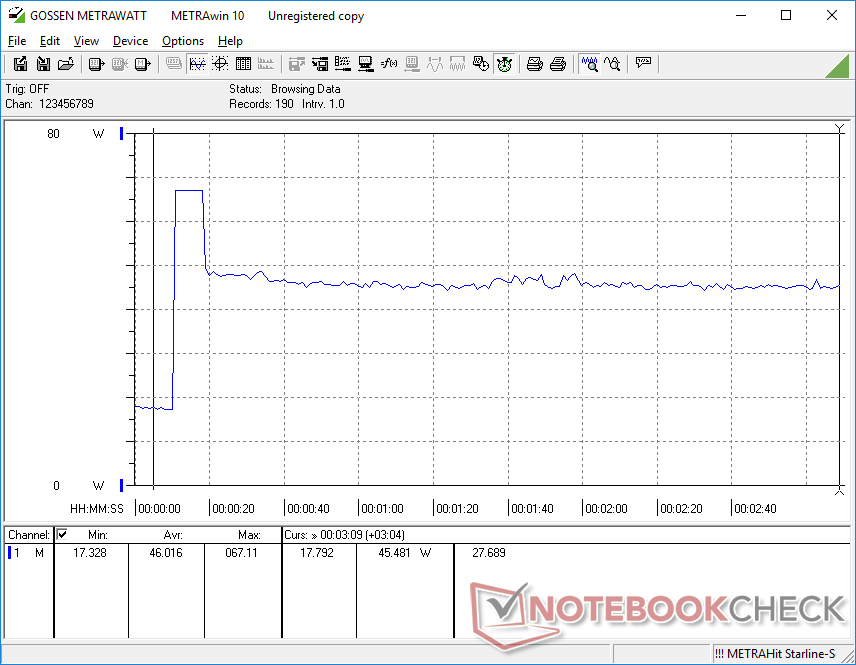
Das Lenovo erfordert etwas mehr Leistung als das Inspiron 16 7620 2-in-1. Das liegt wahrscheinlich an der höheren nativen Auflösung unseres Lenovos (1600p vs 1200p) und an der etwas schnellere Grafikleistung der integrierten Iris Xe GPU. Der Verbrauch beim Gaming ist mit etwa 60 W relativ hoch, was vergleichbar mit dem leistungsstärkeren Acer Swift Xbzw. doppelt so hoch wie beim LG Gram 16 mit dem älteren Core i7-1165G7 der 11. Generation ist.
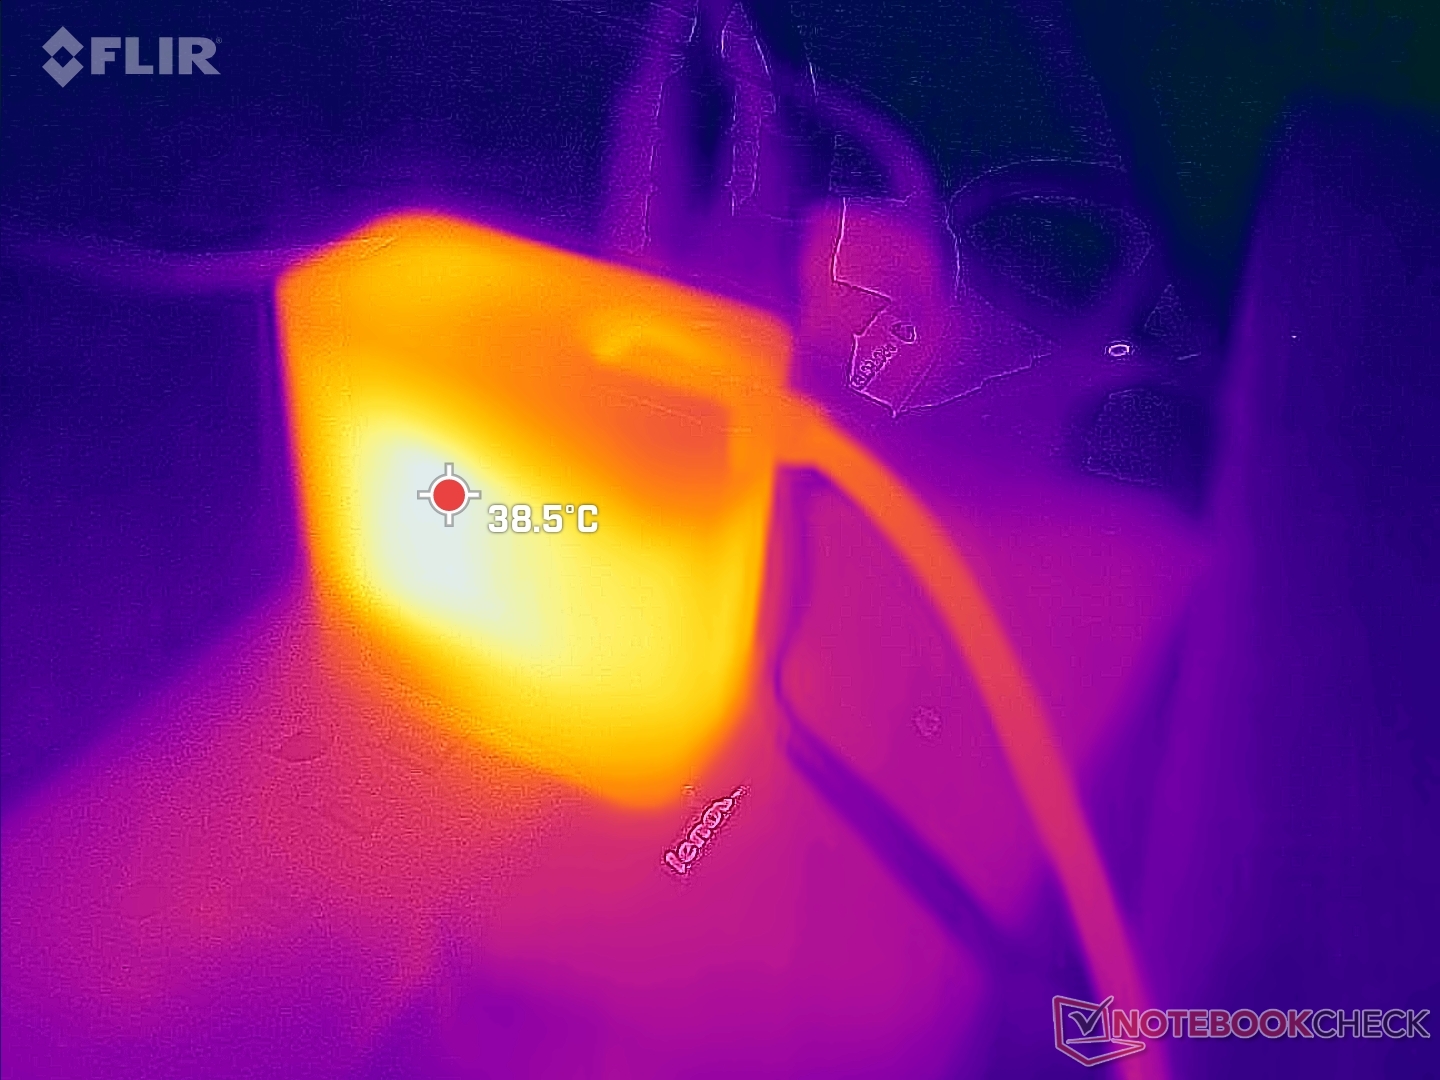
Mit dem kleinen (5,6 x 5,6 x 2,9 cm) 65-W-USB-C-Netzteil waren wir in der Lage, eine maximale Auslastung von 67 W zu messen. Diese Rate ist nur vorübergehend, bevor sie aufgrund des begrenzten Turbo-Boost-Potenzials des Systems um bis zu 25 W sinkt, wie unten gezeigt.
| Aus / Standby | |
| Idle | |
| Last |
|
Legende:
min: | |
| Lenovo Yoga 7 16IAP7 i7-1260P, Iris Xe G7 96EUs, Micron 2450 512GB MTFDKCD512TFK, IPS, 2560x1600, 16" | Huawei MateBook D 16 2022 i7-12700H, Iris Xe G7 96EUs, Silicon Motion PCIe-8 SSD, IPS, 1920x1200, 16" | Dell Inspiron 16 7620 2-in-1 i7-1260P, Iris Xe G7 96EUs, Toshiba KBG40ZNS512G NVMe, IPS, 1920x1200, 16" | Acer Swift X SFX16-51G-5388 i5-11320H, GeForce RTX 3050 4GB Laptop GPU, Samsung PM991 MZVLQ512HBLU, , 1920x1080, 16.1" | LG Gram 16 (2021) i7-1165G7, Iris Xe G7 96EUs, SK Hynix PC601 1TB HFS001TD9TNG, IPS, 2560x1600, 16" | Lenovo IdeaPad 5 Pro 16ACH R7 5800H, GeForce GTX 1650 Mobile, Micron 2300 512GB MTFDHBA512TDV, IPS LED, 2560x1600, 16" | |
|---|---|---|---|---|---|---|
| Stromverbrauch | -9% | 9% | -23% | 20% | -35% | |
| Idle min * (Watt) | 6.6 | 6.1 8% | 5.3 20% | 7 -6% | 3.8 42% | 5.7 14% |
| Idle avg * (Watt) | 8.3 | 10.6 -28% | 8.3 -0% | 10.1 -22% | 9 -8% | 9.3 -12% |
| Idle max * (Watt) | 9.8 | 11.5 -17% | 9.6 2% | 15 -53% | 11.3 -15% | 11 -12% |
| Last avg * (Watt) | 66 | 65.5 1% | 54.3 18% | 63.3 4% | 35.2 47% | 83.4 -26% |
| Witcher 3 ultra * (Watt) | 52 | 61.2 -18% | 43.9 16% | 63.3 -22% | 94.4 -82% | |
| Last max * (Watt) | 67.1 | 68.4 -2% | 70 -4% | 94 -40% | 43.5 35% | 128.7 -92% |
* ... kleinere Werte sind besser
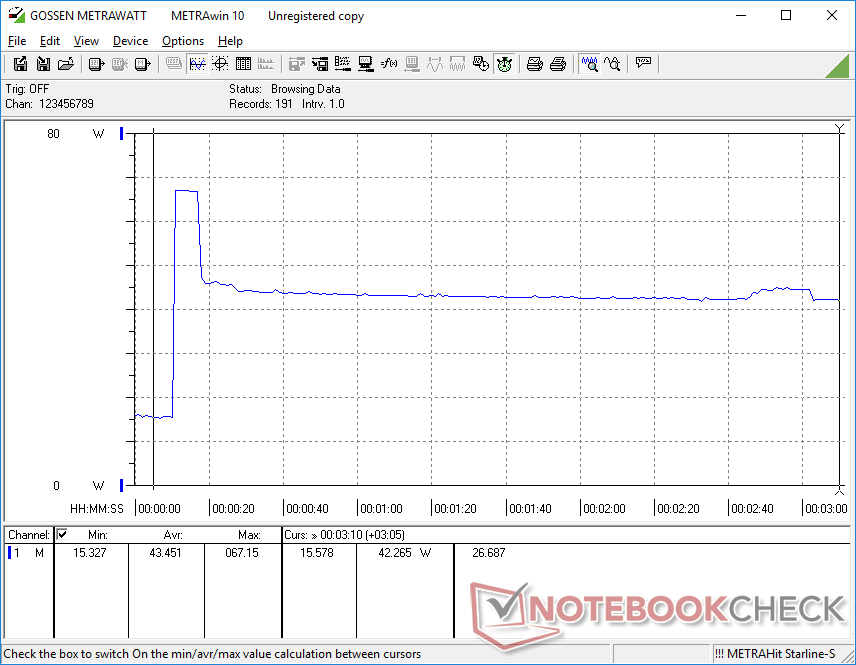
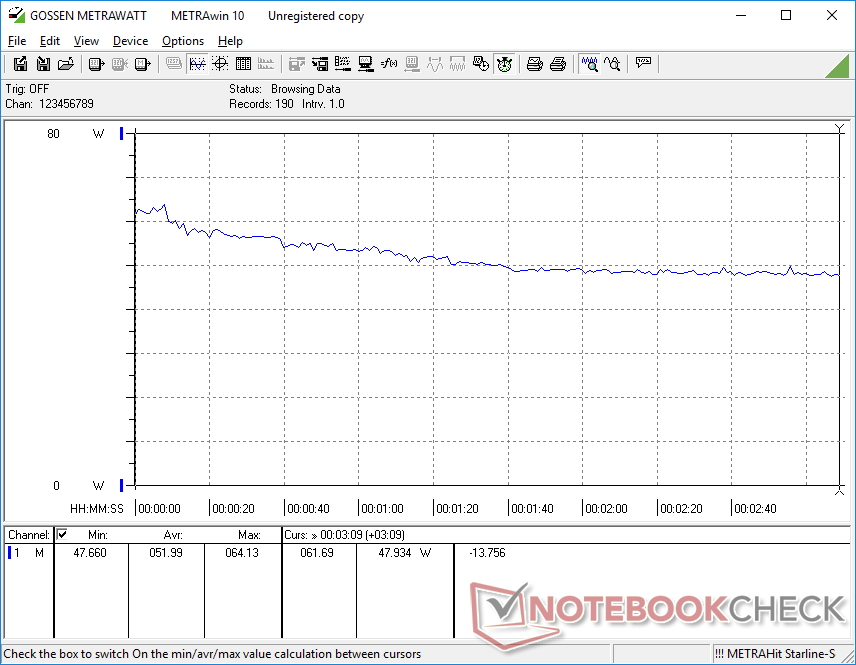
Energieverwaltung Witcher 3 / Stresstest
Stromverbrauch mit externem Monitor
Akkulaufzeit
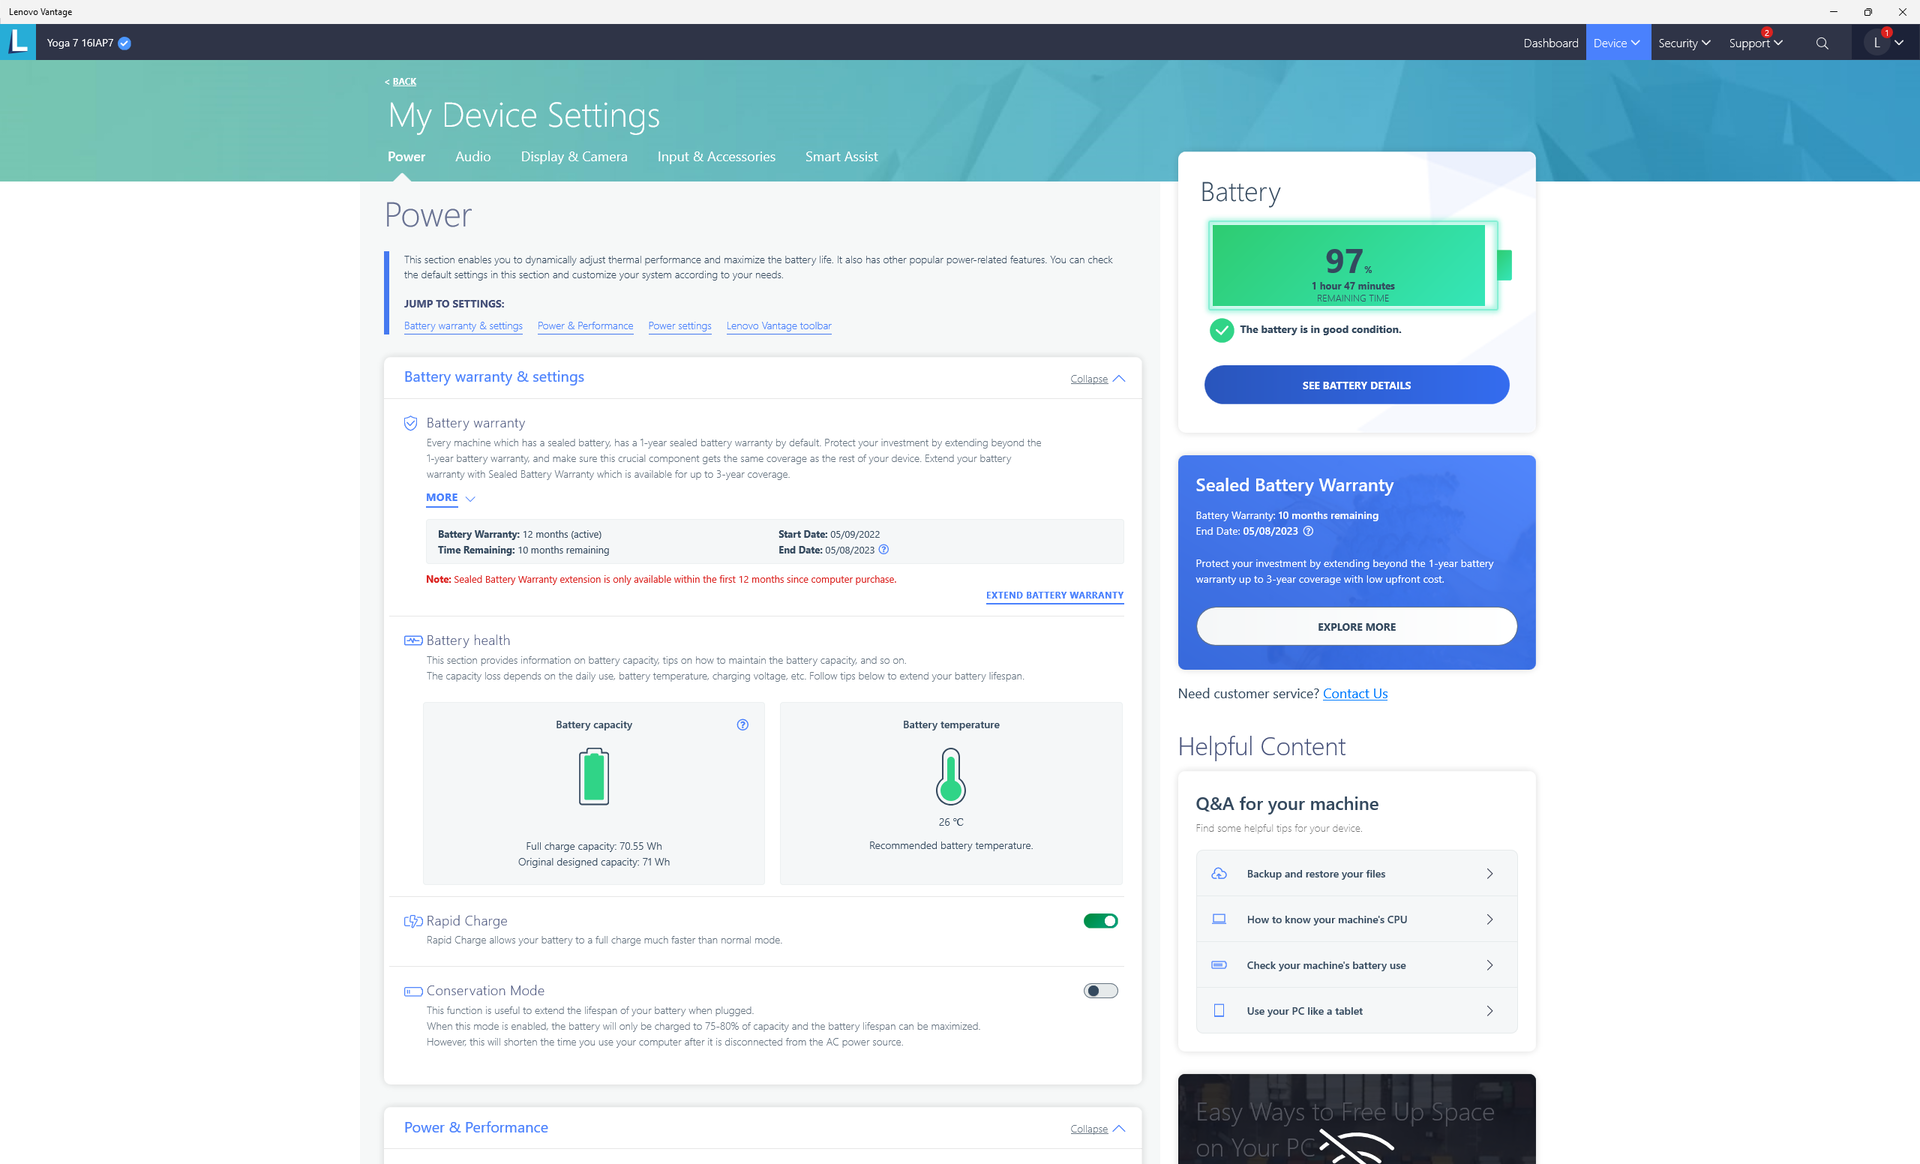
Wir waren in der Lage, knapp 8 Stunden WLAN-Nutzung unter Real-Bedingungen über den internen 71-Wh-Akku aufzuzeichnen, während der Akku des Inspiron 16 7620 oder LG Gram 16 mehrere Stunden länger hält. Es ist erwähnenswert, dass die Yoga 7 16 SKUs mit der separaten Intel Arc Option einen viel größeren 99 Wh Akku haben. 8 Stunden sollten dennoch für die meisten Benutzer ausreichend sein.
Das Laden von leerer auf volle Kapazität dauert etwa 90 Minuten.
| Lenovo Yoga 7 16IAP7 i7-1260P, Iris Xe G7 96EUs, 71 Wh | Huawei MateBook D 16 2022 i7-12700H, Iris Xe G7 96EUs, 60 Wh | Dell Inspiron 16 7620 2-in-1 i7-1260P, Iris Xe G7 96EUs, 87 Wh | Acer Swift X SFX16-51G-5388 i5-11320H, GeForce RTX 3050 4GB Laptop GPU, 58.7 Wh | LG Gram 16 (2021) i7-1165G7, Iris Xe G7 96EUs, 80 Wh | Lenovo IdeaPad 5 Pro 16ACH R7 5800H, GeForce GTX 1650 Mobile, 75 Wh | |
|---|---|---|---|---|---|---|
| Akkulaufzeit | -10% | 64% | -9% | 120% | 24% | |
| Idle (h) | 12.2 | 17 39% | 28.6 134% | |||
| WLAN (h) | 7.9 | 7.1 -10% | 14.6 85% | 8.1 3% | 15.7 99% | 12.6 59% |
| Last (h) | 1.9 | 3.2 68% | 1.5 -21% | 4.3 126% | 1.7 -11% | |
| H.264 (h) | 8.4 | 20.1 | 10.4 | |||
| Spielen (h) | 1.1 |
Pro
Contra
Urteil – Hochwertiges Convertible, wenn Ihnen das Gewicht nichts ausmacht
Die drei 16-Zoll-Convertibles zur Auswahl sind das Lenovo Yoga 7 16 Gen 7, dasDell Inspiron 16 7620 2-in-1, und das LG Gram 16 2-in-1. Das Lenovo ist einzigartig, da es separte Intel Arc A370M Grafik bietet, während das Dell separate GeForce MX550 Grafik bietet. Wenn Ihre Workloads von der zusätzlichen Grafikleistung profitieren können, dann sind Lenovo und Dell im Wesentlichen gleich auf. Die kleineren Unterschiede wie beim RAM (gelötet vs. aufrüstbar beim Dell) oder beim Touchscreen (1600p bei 400 Nits vs. 1200p bei 300 Nits oder 2400p bei 400 Nits beim Dell) beschränken sich auf die Präferenzen des Benutzers. Es ist schade, dass keines der beiden Modelle über Alternativen mit 90-Hz- oder 120-Hz-Displays verfügt, was einen Unterschied in Bezug auf Reaktionsfähigkeit und UI-Fluss ausmachen kann.
Der Lenovo Yoga 7 16 Gen 7 ist stark und verfügt über zahlreiche Funktionen, einschließlich optionaler Intel-Arc-Grafik. Sein schweres Gewicht von 2 kg macht den Tablet-Modus jedoch in den meisten Situationen umständlicher als es beim leichteren LG Gram 16 2-in-1 der Fall ist.
Wenn Sie mit integrierter Iris-Xe-Grafik leben können, dann geht ein Großteil der Attraktivität des Lenovo den Bach runter, weil das LG Gram 16 2-in-1 28 Prozent leichter ist, während es die gleiche Auflösung des Touchscreens und die gleichen 2-fach Thunderbolt-4-Ports bietet. Es hat sogar tiefere Farben, eine längere Akkulaufzeit, unterstützt zwei interne SSDs und wird mit einem kostenlosen Stylus-Pen geliefert. Das Modell von Lenovo ist sicherlich robuster gebaut, aber es lohnt sich aufgrund der Einsparungen an Gewicht und der Vorteile an anderer Stelle dem LG-Modell Beachtung zu schenken, wenn Sie über das Lenovo-Modell nachdenken.
Preis und Verfügbarkeit
Das Lenovo Yoga 7 16IAP7 wird mittlerweile bei Best Buy mit der Core i7-1260P CPU ab 1430 US$ (~1395 Eur) ausgeliefert. Alternativ können Benutzer direkt bei Lenovo kaufen, wo weitere SKUs verfügbar sind, einschließlich der Intel Arc A370M GPU für 1400 $ (~1365 Eur) .
Lenovo Yoga 7 16IAP7
- 03.08.2022 v7 (old)
Translated
Preisvergleich

