Test HP Dragonfly Folio 13.5 G3 Convertible: Das Ende von Snapdragon und Windows on ARM
Nicht zu verwechseln mit dem klassichen Laptop Dragonfly G3 bietet das Dragonfly Folio G3 als Convertible ein einzigartiges Design und spezielle Funktionsmerkmale. Obowhl es in vielerlei Hinsicht ein anderes Subnotebook ist, richtet es sich ebenfalls an Büro- und anspruchsvolle Business-Nutzer. Das Dragonfly Folio G3 ist der direkte Nachfolger des EliteBook Folio G2 aus dem letzten Jahr.
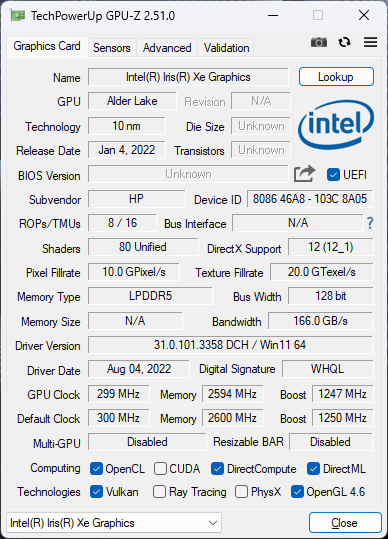
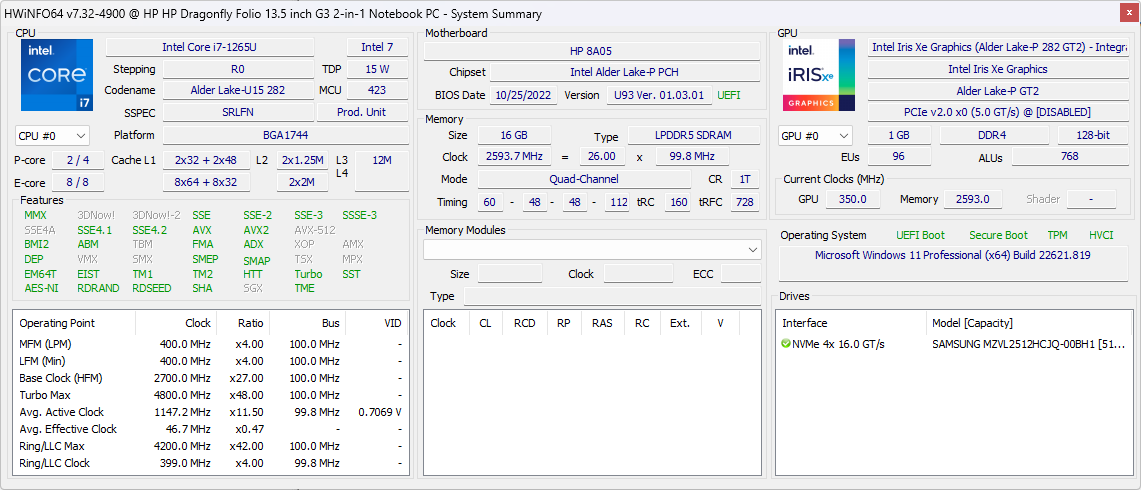
Bei unserem Testgerät handelt es sich um ein mittleres Modell mit dem Core i7-1265U aus Intels 12. Generation und einem reflektiven 400-cd/m²-Touchscreen für ca. 3.900 USD. Alternativmodelle mit WAN-Optionen, verschiedenen RAM- und SSD-Konfigurationen und dem schwächeren Core i5-1235U, i5-1245U bzw. i7-1255U gibt es ebenfalls, während die Auflösung bei allen Modellen bei 1.920 x 1.280 Pixeln und das Seitenverhältnis bei 3:2 liegt.
Zur Konkurrenz in diesem Bereich zählen andere 13-Zoll-Business-Laptops wie das MSI Summit E13 Flip, Dell Latitude 7330 2-in-1, Lenovo ThinkPad L13 Yoga Gen 2 und die Microsoft-Surface-Pro-Reihe.
Weitere HP-Tests:
Mögliche Konkurrenten im Vergleich
Bew. | Datum | Modell | Gewicht | Dicke | Größe | Auflösung | Preis ab |
|---|---|---|---|---|---|---|---|
| 90.3 % v7 (old) | 12 / 2022 | HP Elite Dragonfly Folio 13.5 G3 i7-1265U, Iris Xe G7 96EUs | 1.4 kg | 17.8 mm | 13.50" | 1920x1280 | |
| 91 % v7 (old) | 08 / 2022 | HP Elite Dragonfly G3 i7-1265U, Iris Xe G7 96EUs | 1.2 kg | 16.3 mm | 13.50" | 1920x1280 | |
| 89 % v7 (old) | 07 / 2022 | Dell Latitude 13 7330 i7-1265U, Iris Xe G7 96EUs | 1 kg | 16.96 mm | 13.30" | 1920x1080 | |
| 85.1 % v7 (old) | 07 / 2022 | Framework Laptop 13.5 12th Gen Intel i7-1260P, Iris Xe G7 96EUs | 1.3 kg | 15.85 mm | 13.50" | 2256x1504 | |
| 86.6 % v7 (old) | 12 / 2020 | Razer Book 13 FHD i7-1165G7, Iris Xe G7 96EUs | 1.4 kg | 15.15 mm | 13.40" | 1920x1200 | |
| 86.1 % v7 (old) | 01 / 2021 | Lenovo ThinkPad L13 Gen2-20VH0017GE i5-1135G7, Iris Xe G7 80EUs | 1.4 kg | 17.6 mm | 13.30" | 1920x1080 |
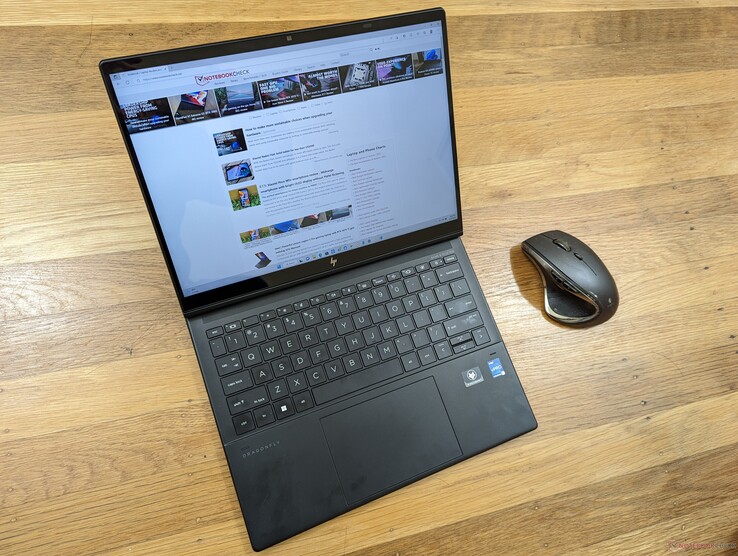
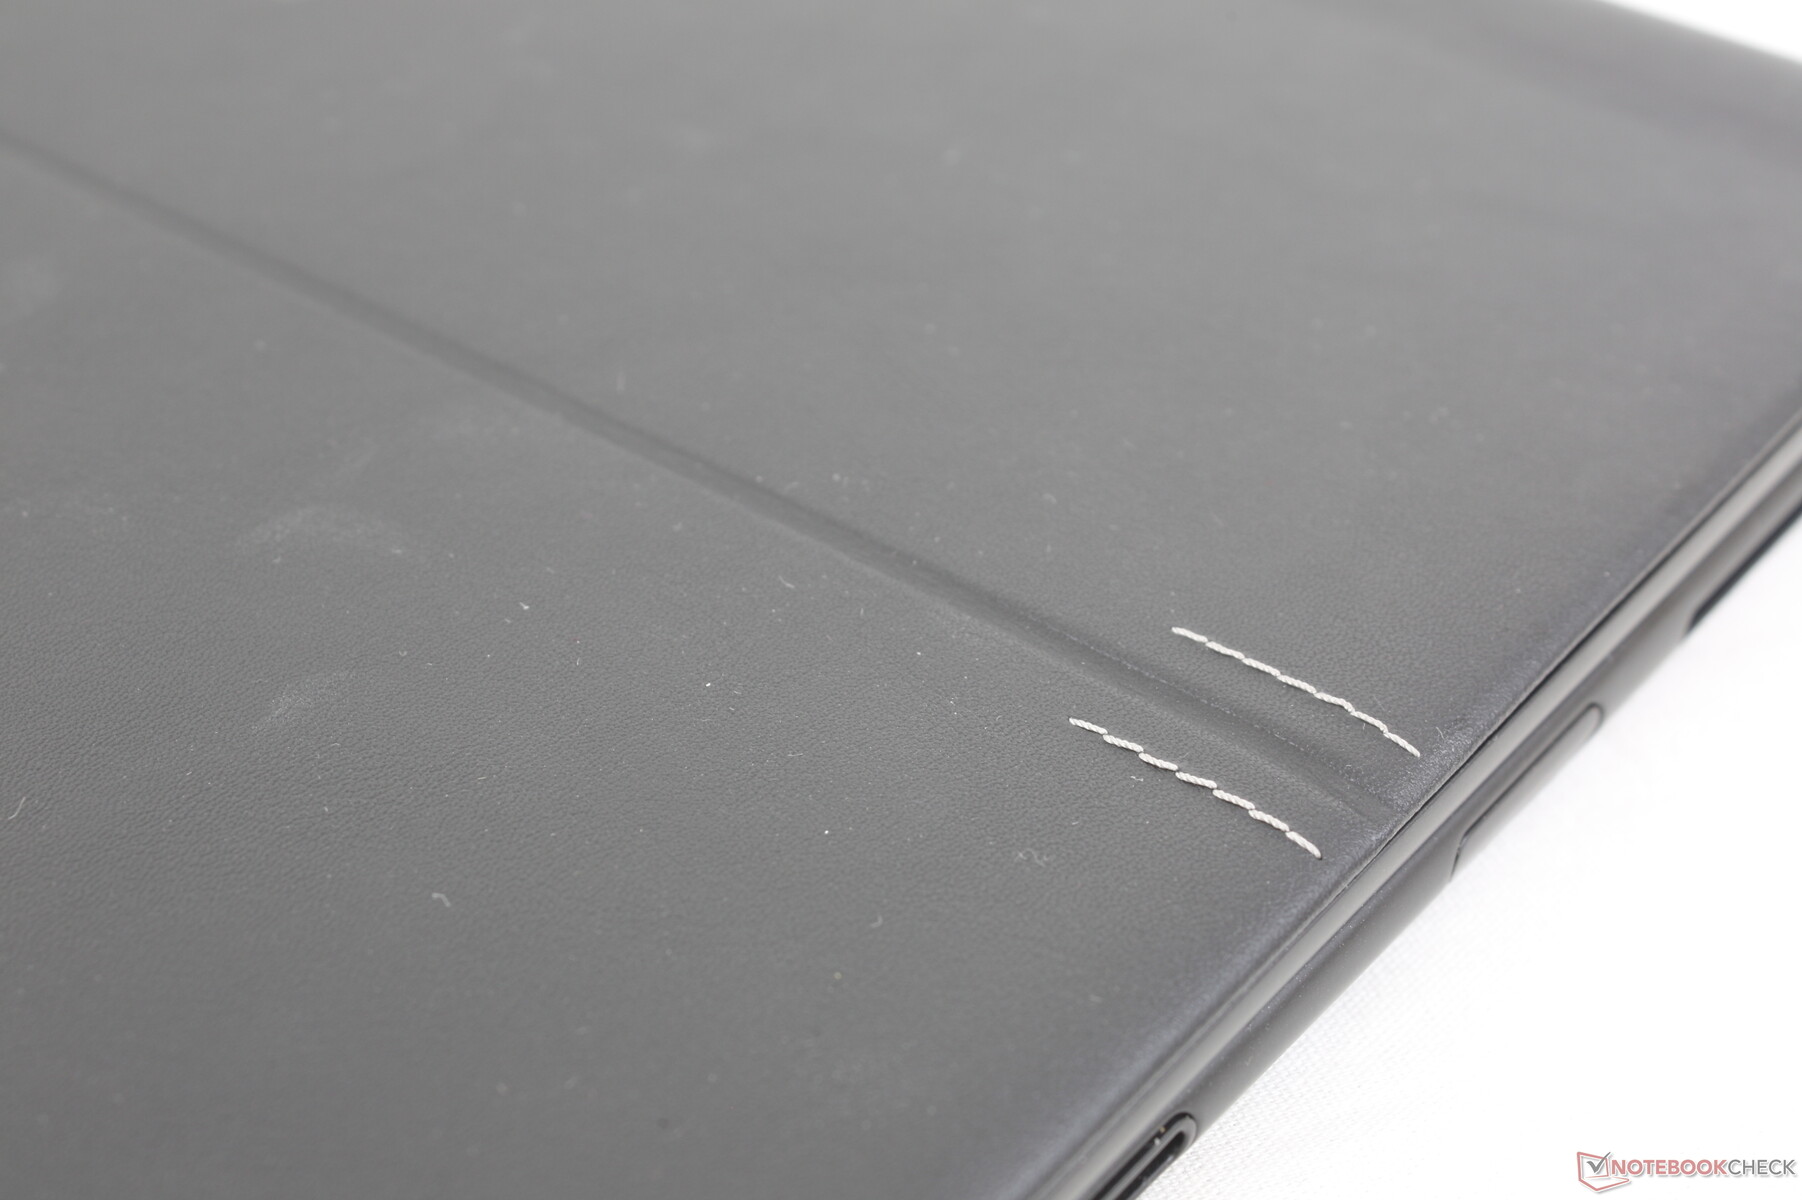
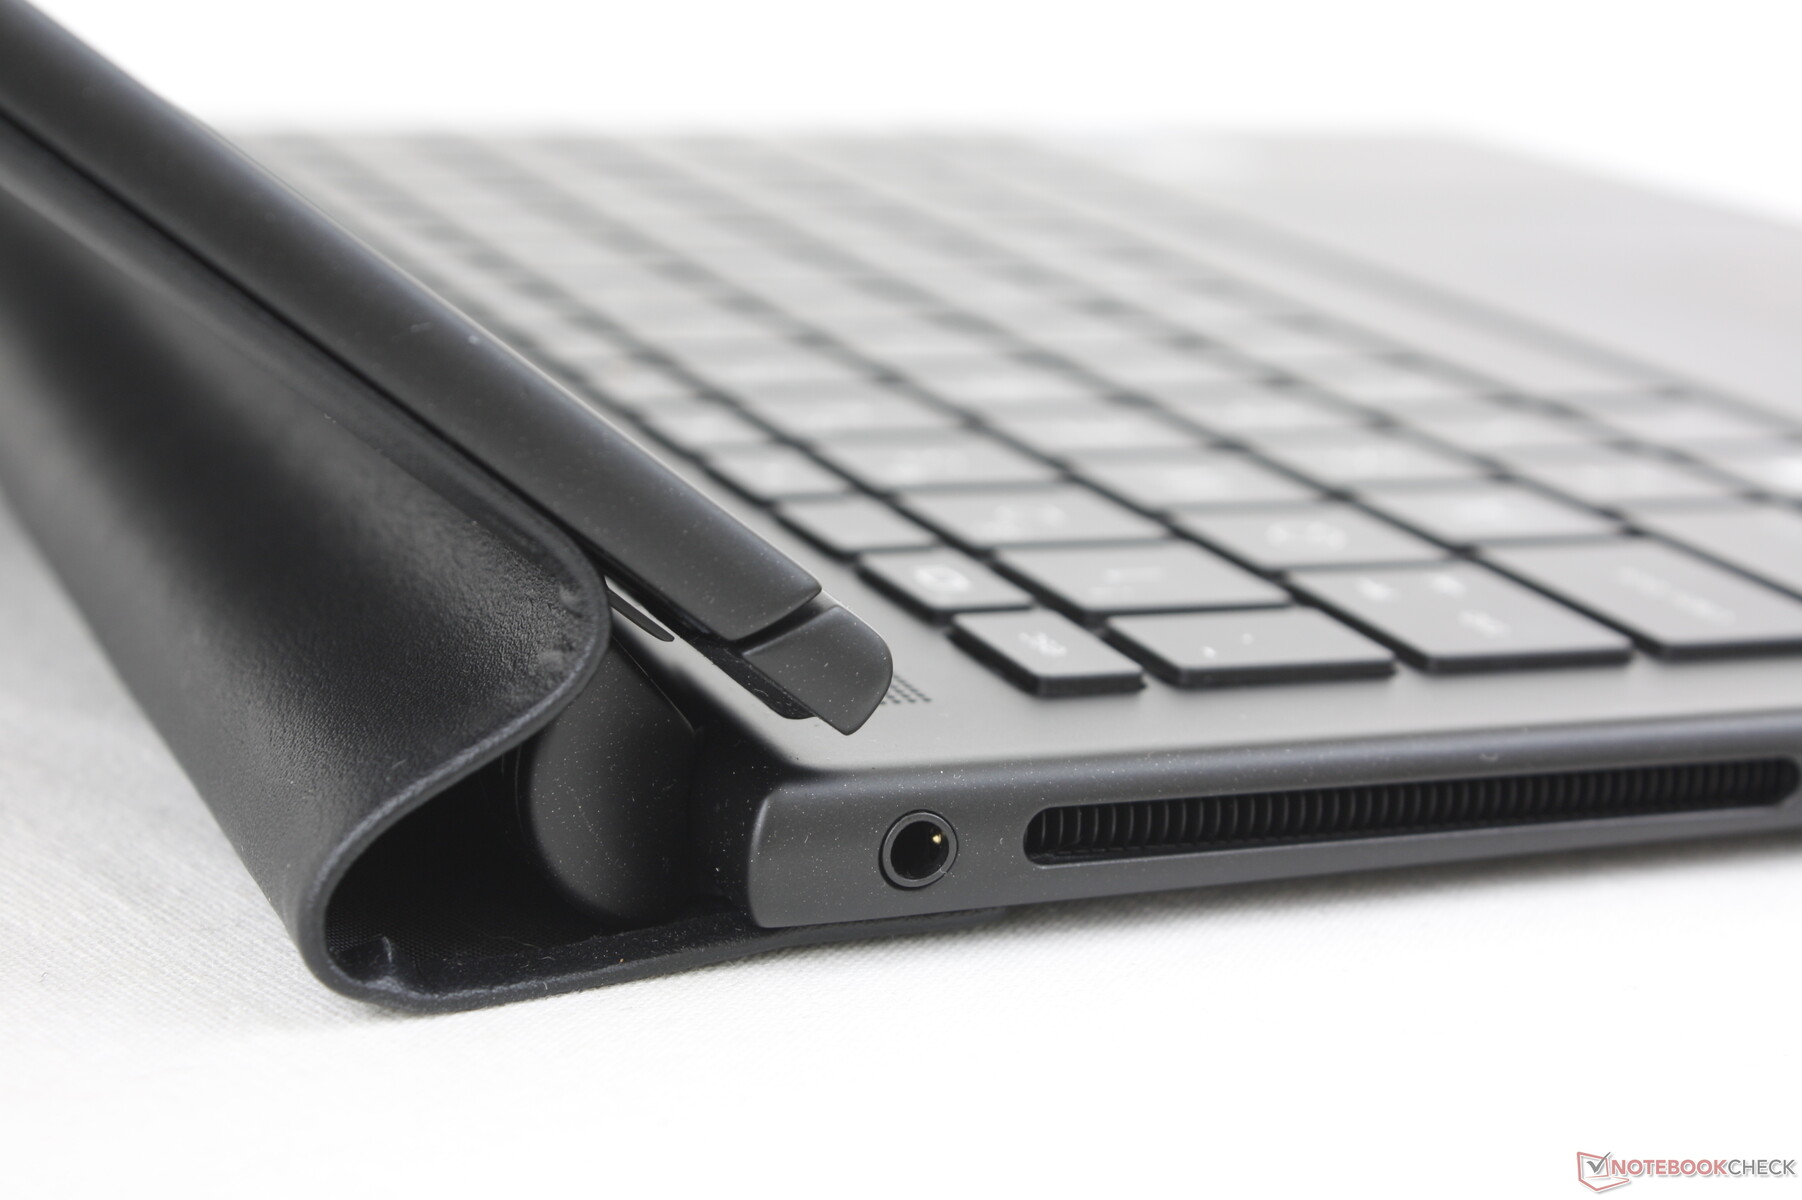
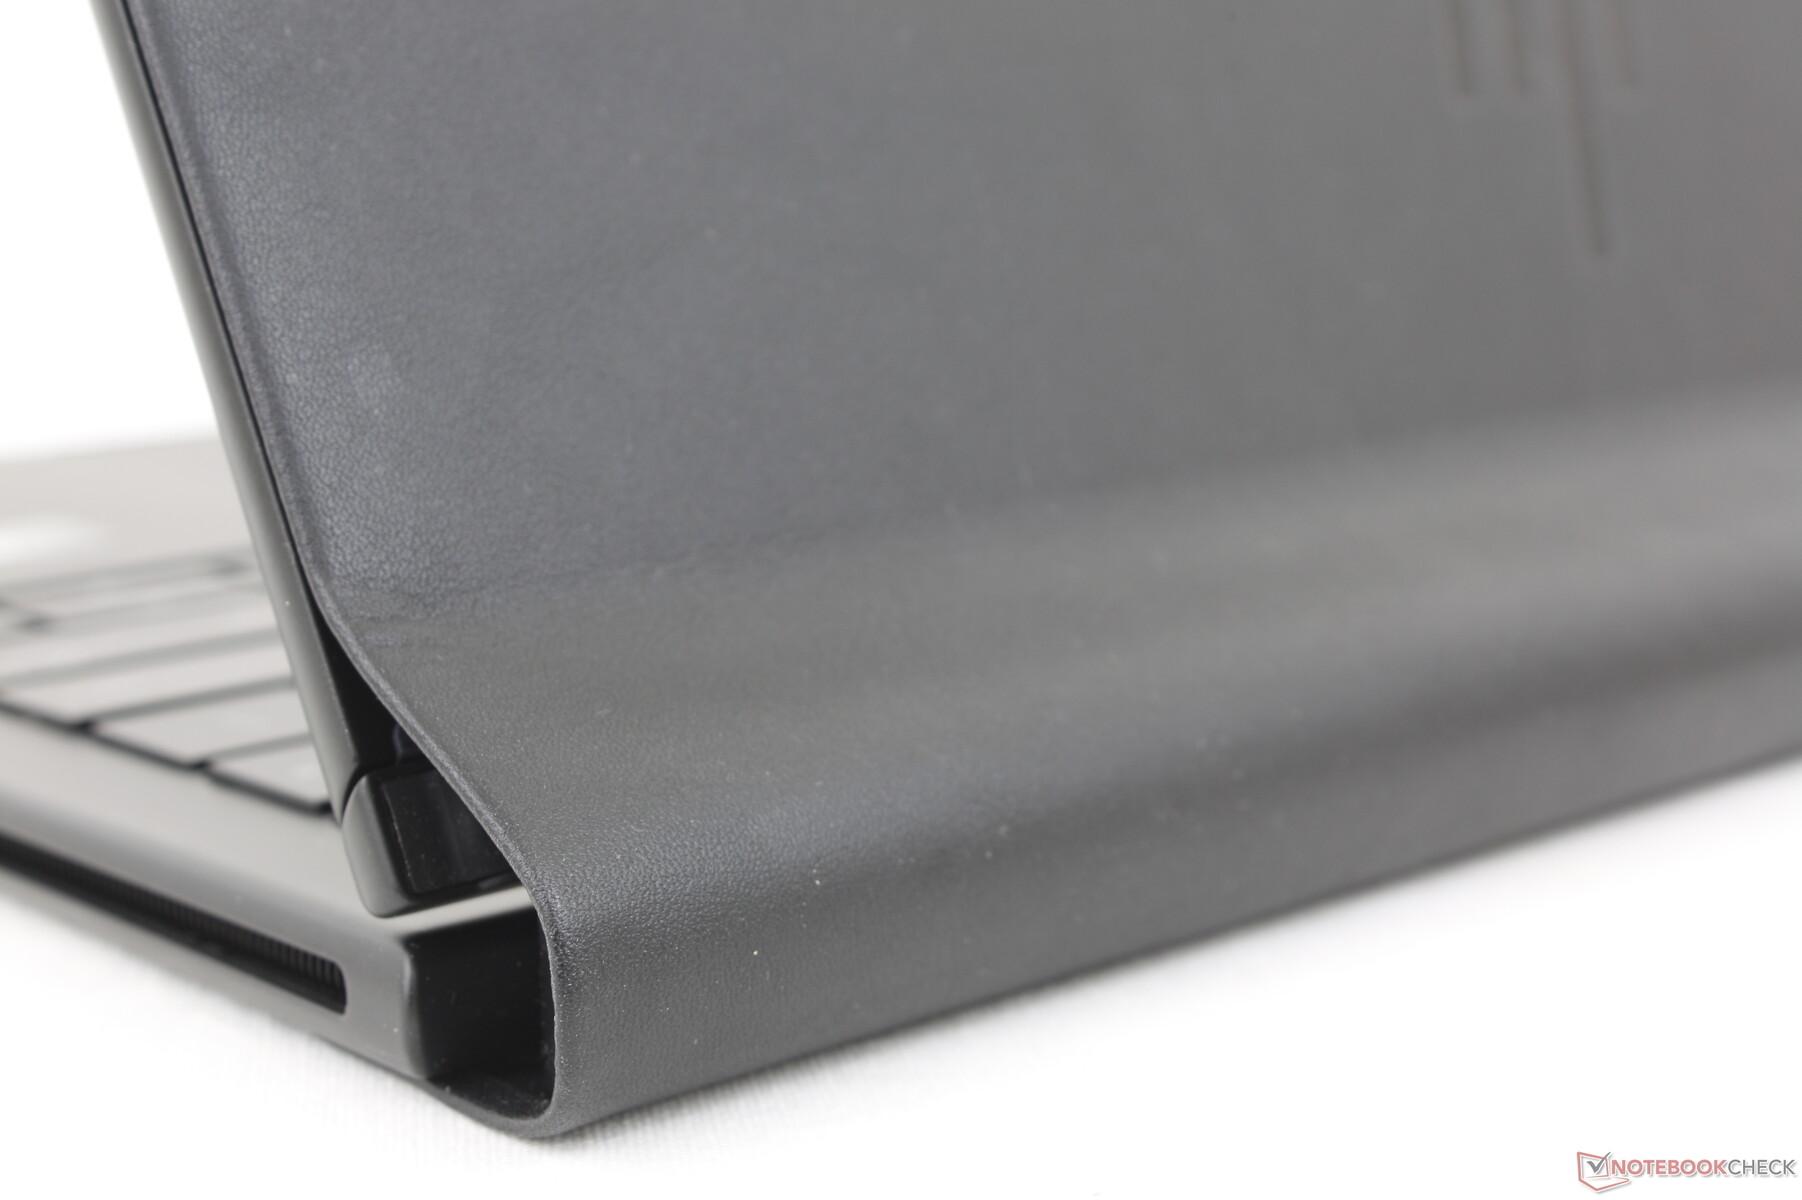
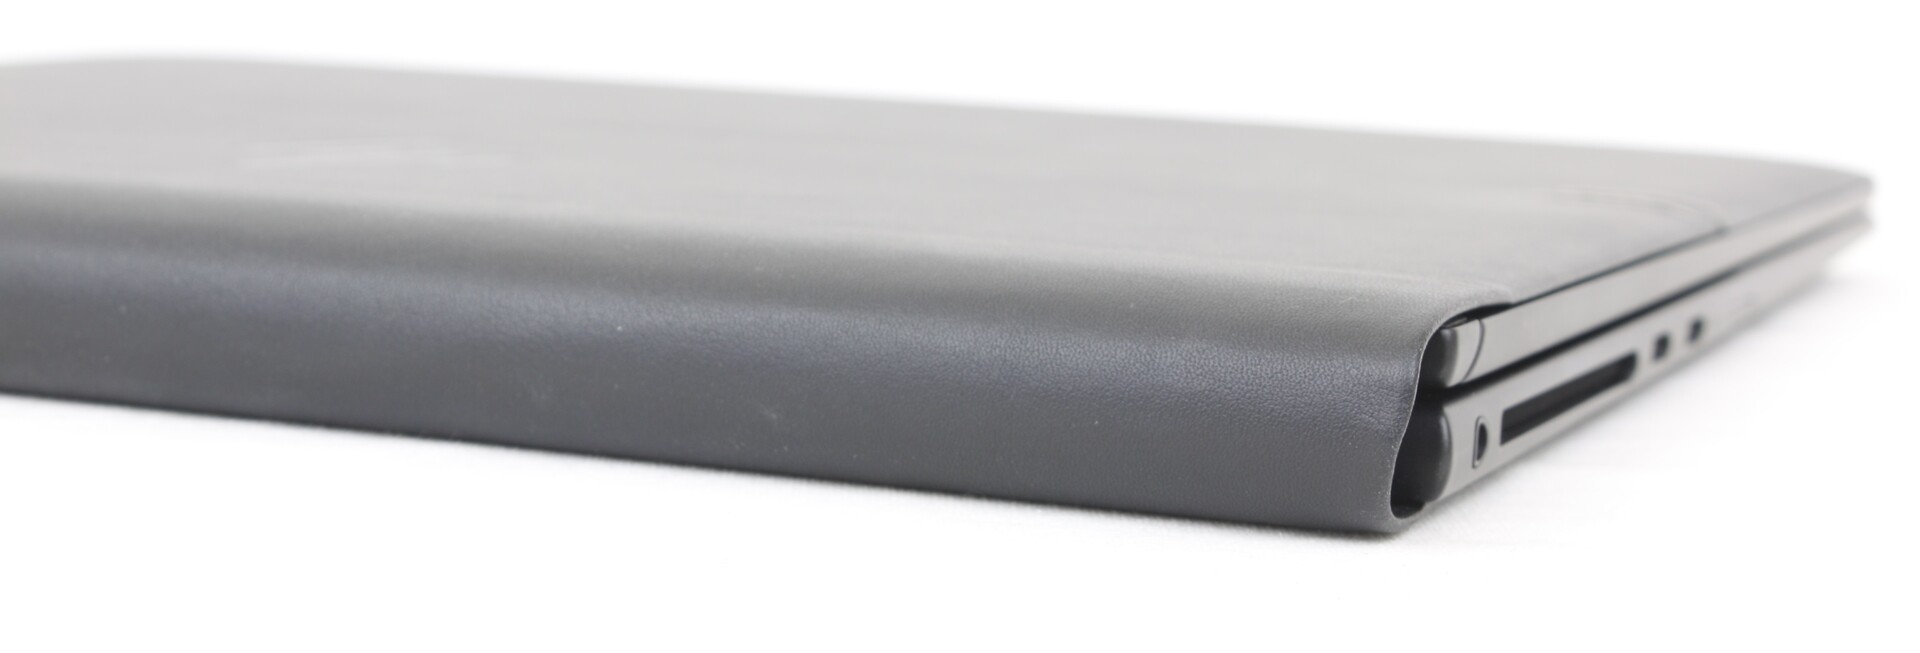
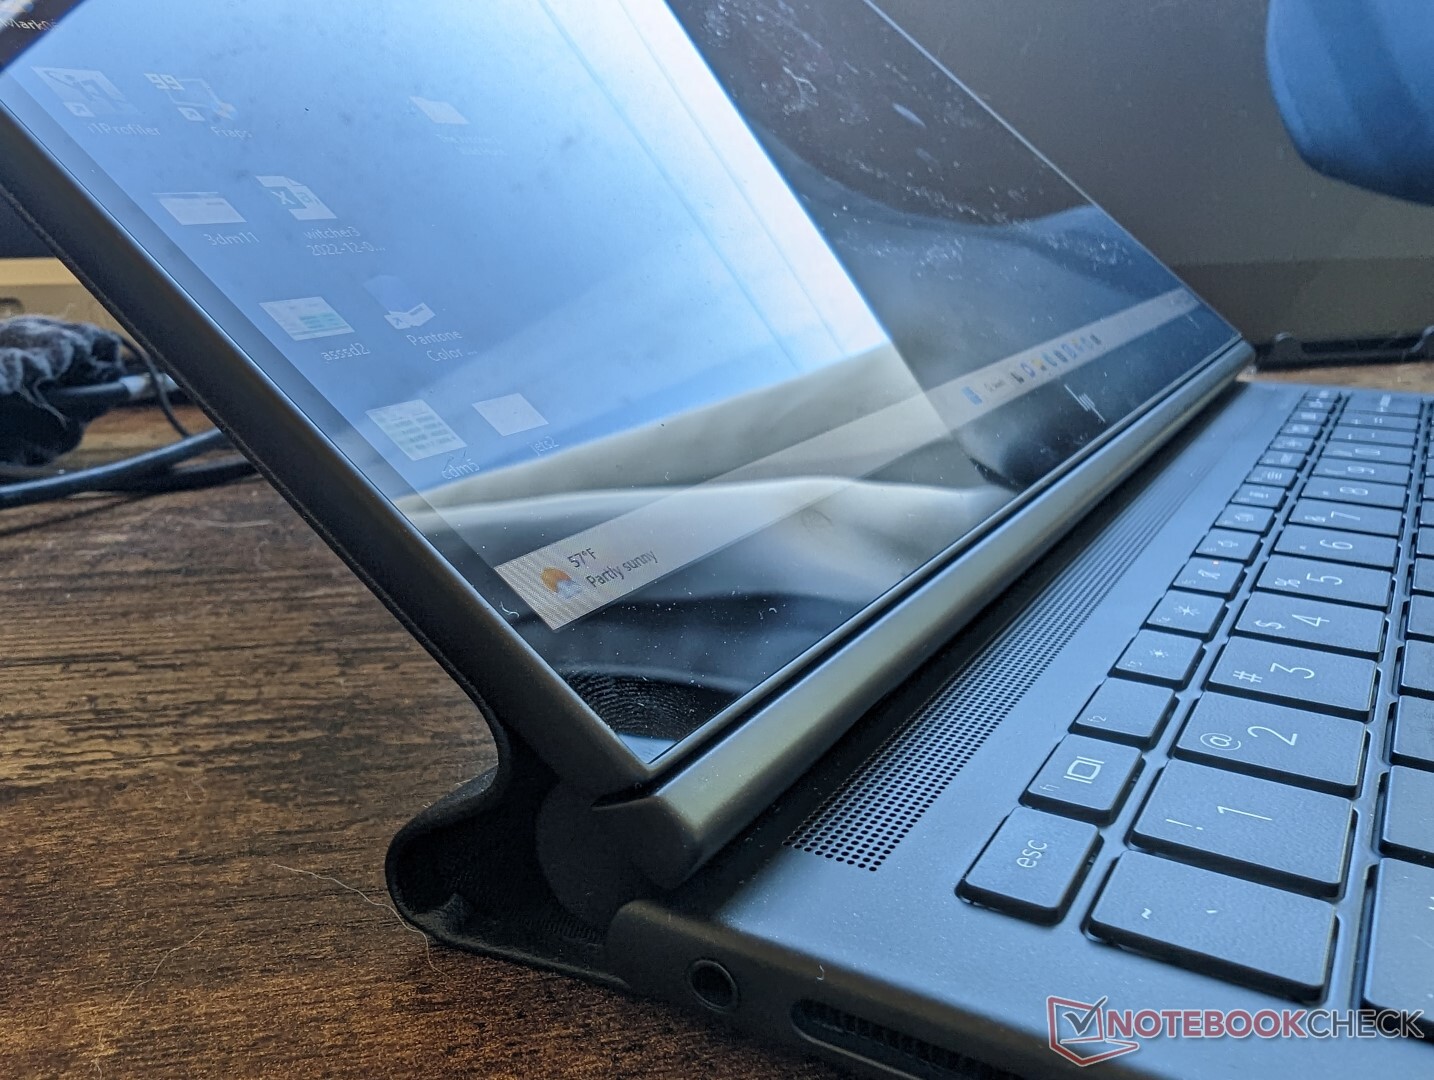
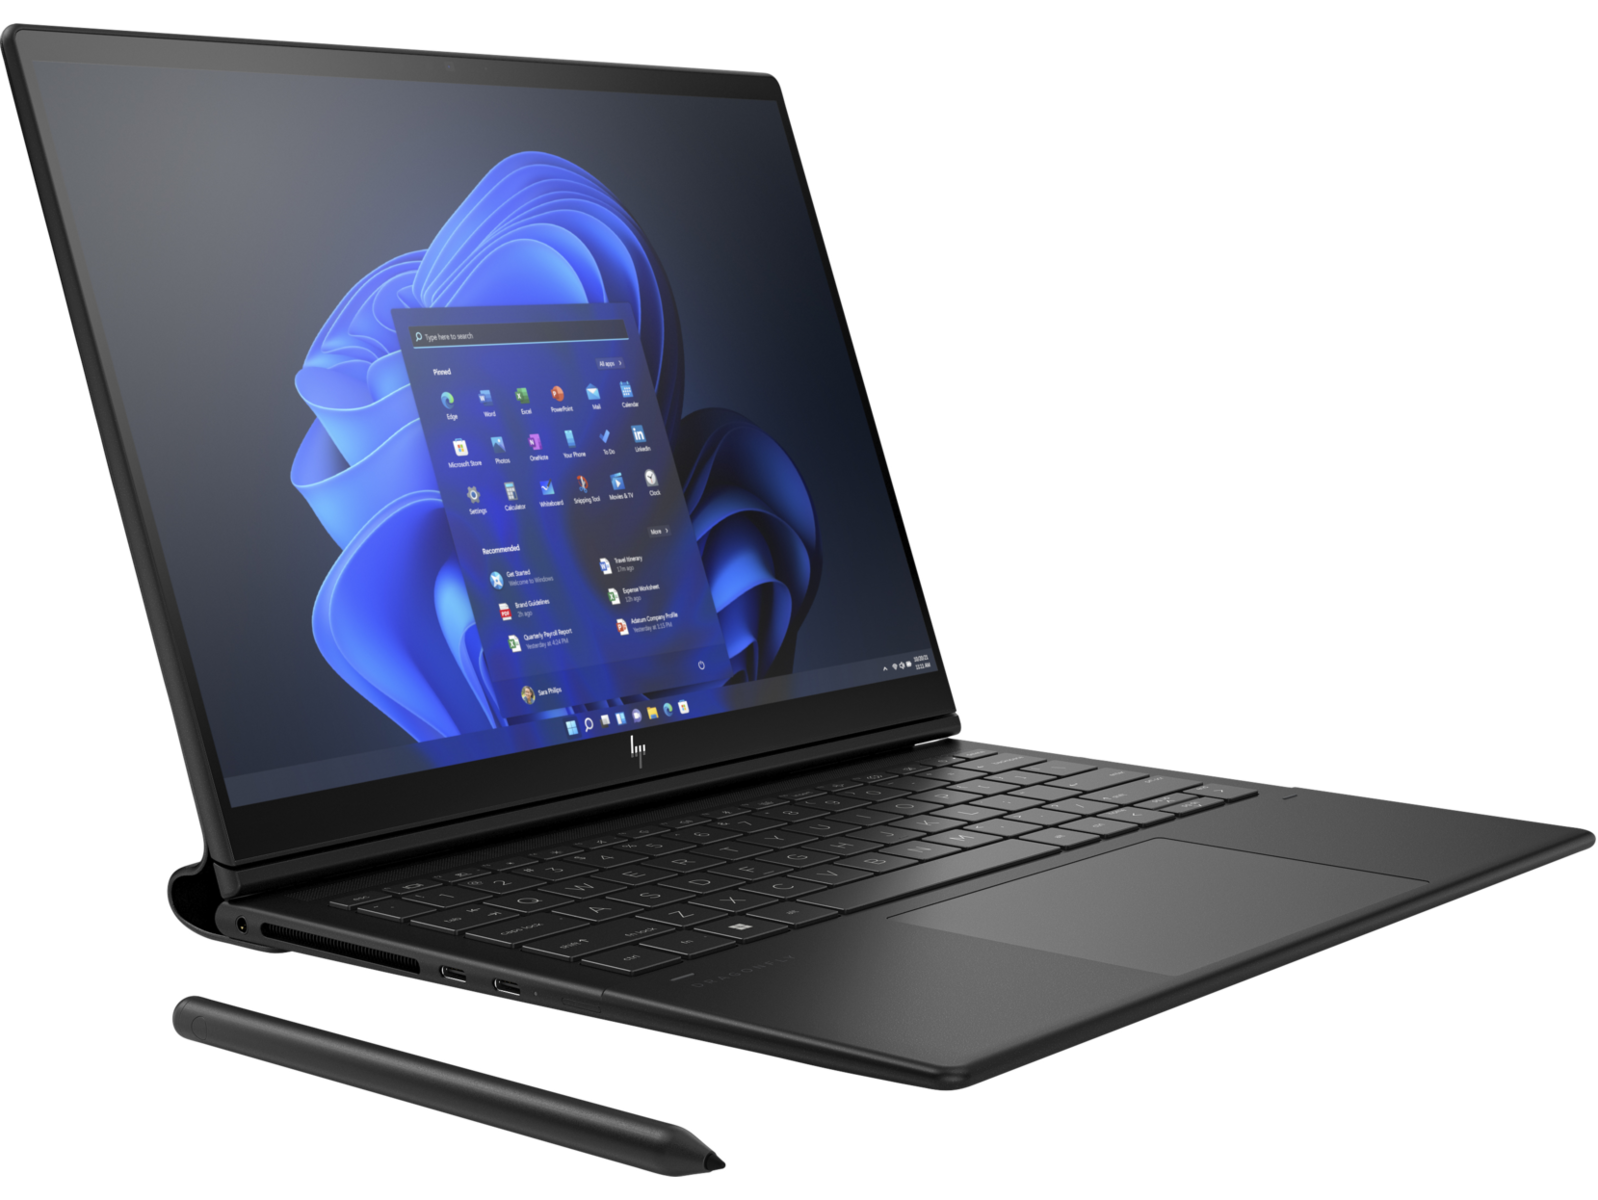
Gehäuse — Metall und Kunstleder
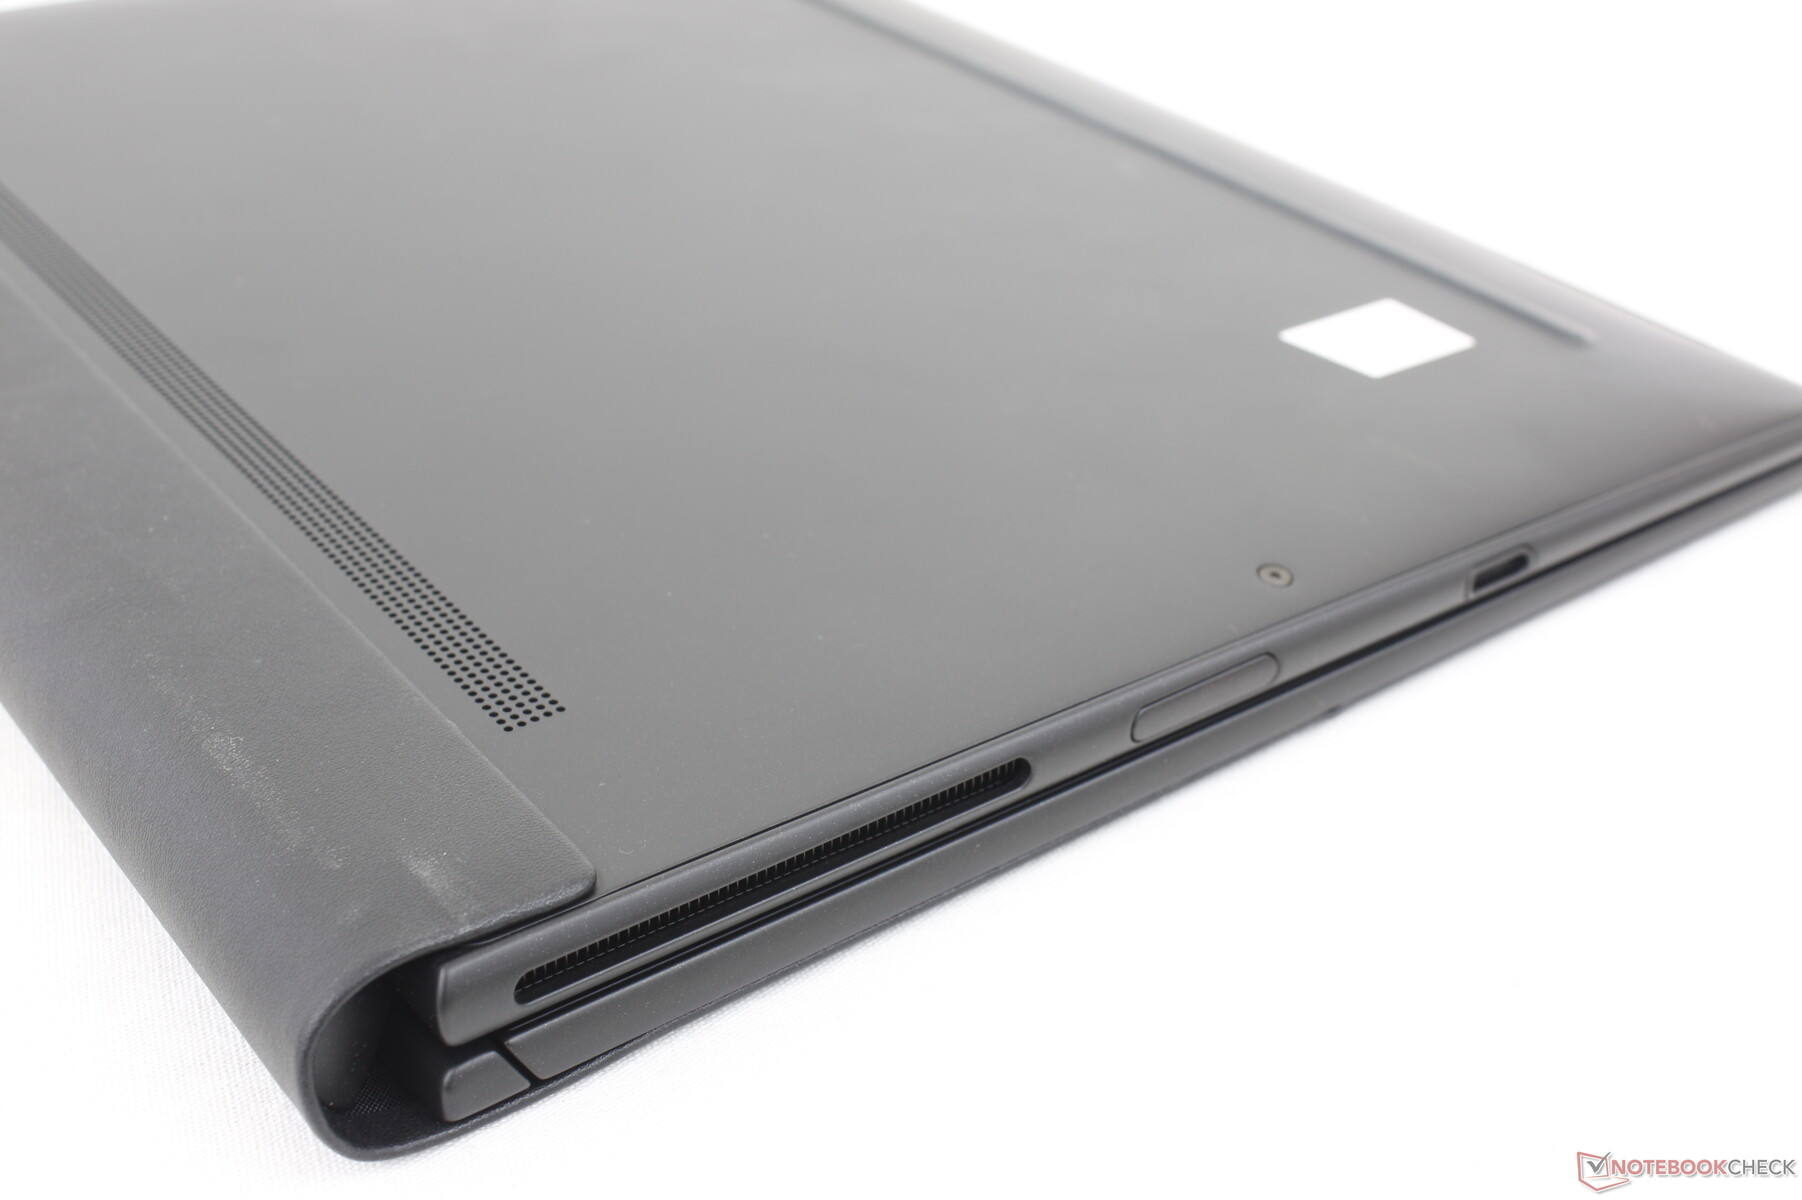
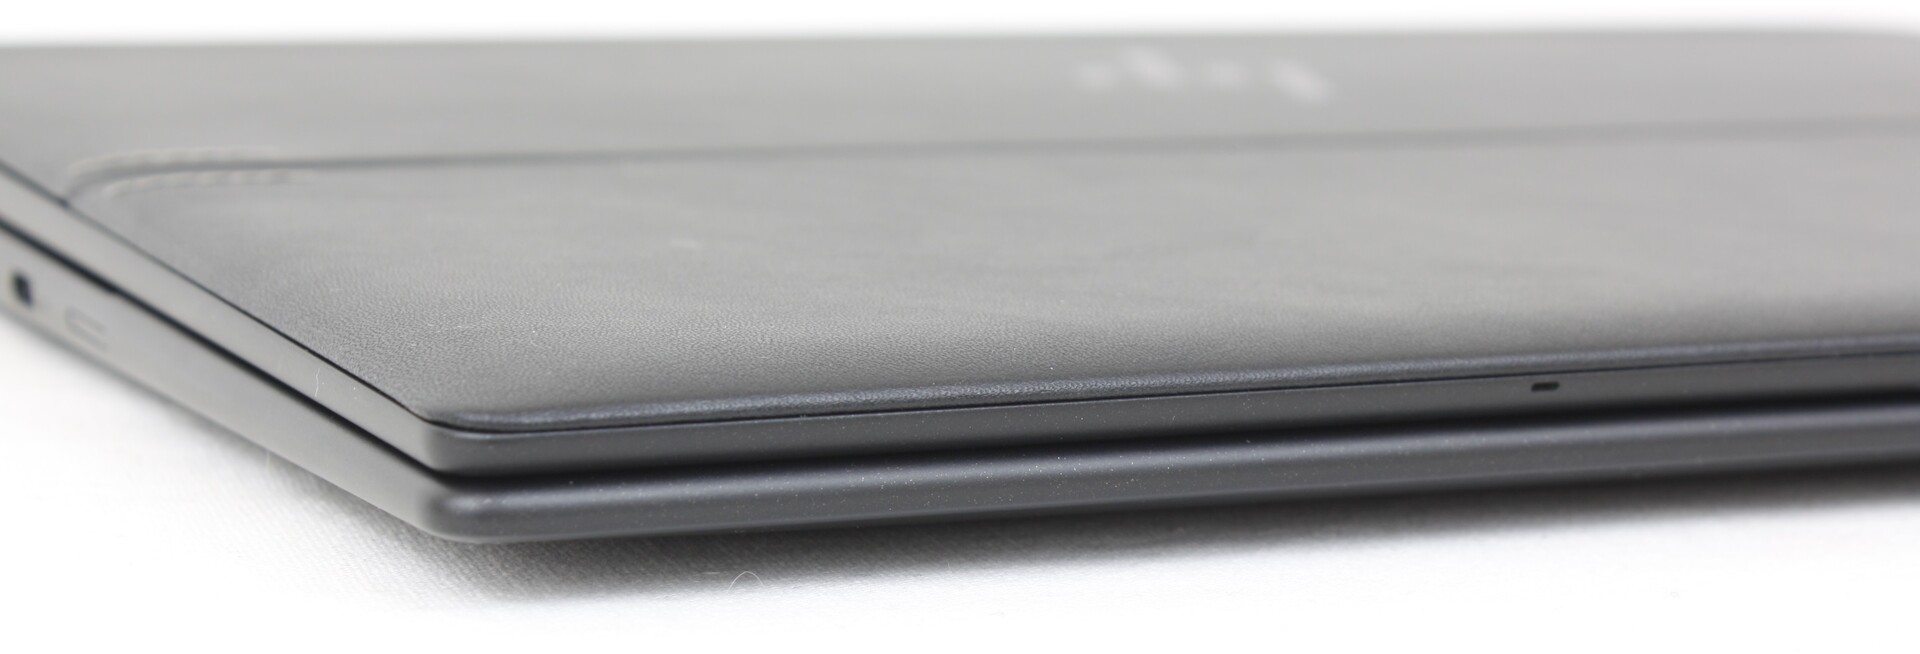
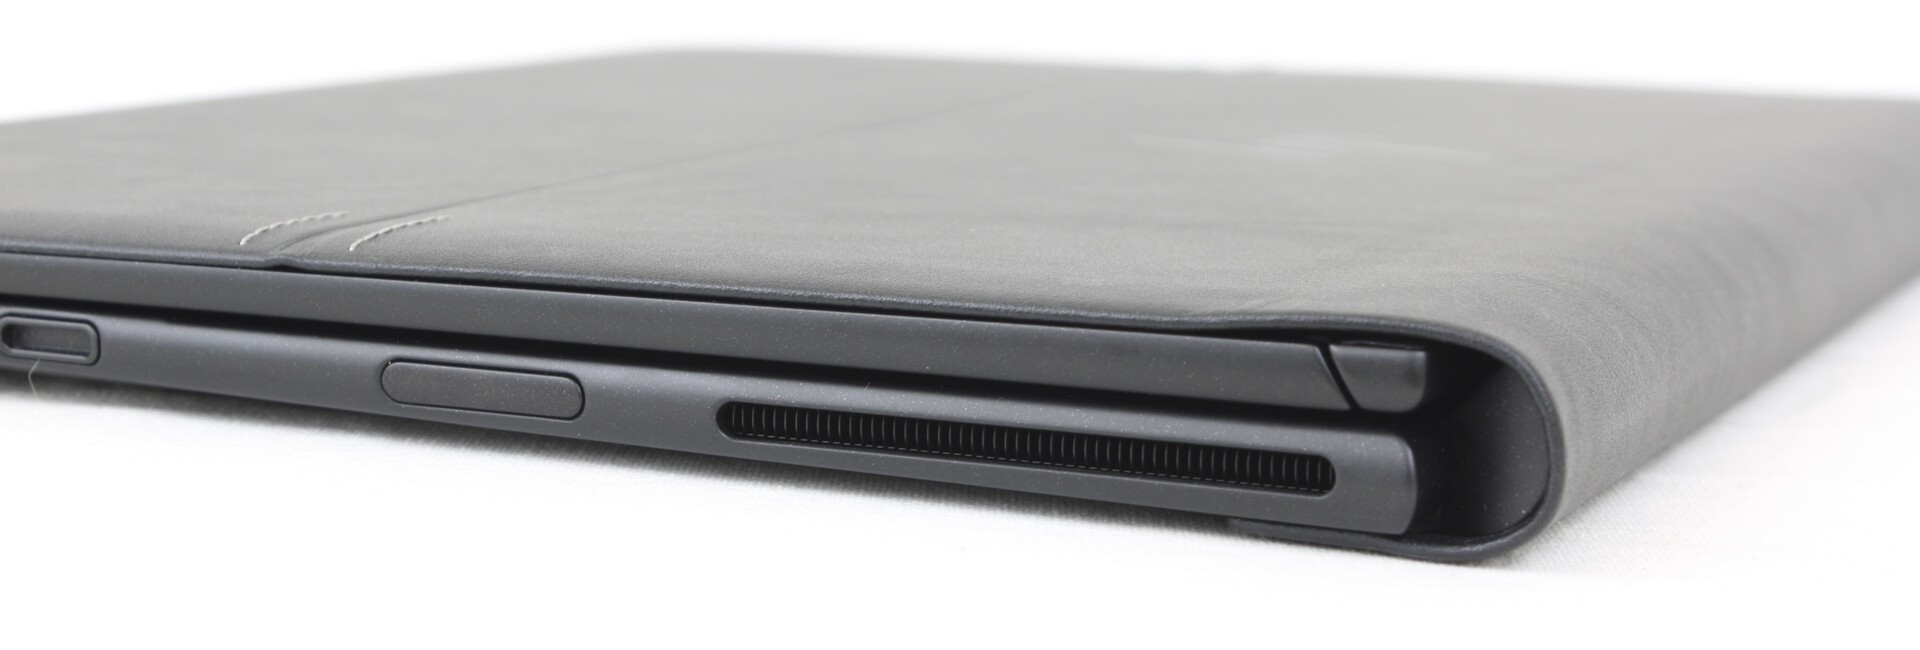
Beim Gehäuse handelt es sich um eine Evolution des ursprünglichen Dragonfly Folio G1 von 2020 und des EliteBook Folio G2 aus 2021. Das Hauptaugenmerk liegt auf dem Kunstleder, das sich vom Displaydeckel teilweise bis hin zur Basiseinheit erstreckt. Im Tablet-Modus liegt es dadurch sicherer in der Hand als ein Metall-Convertible und ist dazu auch weniger anfällig für Fingerabdrücke. Im Gegensatz zu typischen Lösungen aus Plastik oder Aluminium verleiht das Kunstleder der Konstruktion insgesamt ein gewisses Gefühl von Zeitlosigkeit.
Da HP beim 2022er-Modell auf ähnliche Materialien setzt, ist die Gehäusestabilität genauso gut wie beim Vorgänger. Das Ziel des Herstellers war es dieses Mal, die Leistung und Wartungsfreundlichkeit zu verbessern, ohne das zu opfern, was die Dragonfly-Folio-Reihe optisch einzigartig macht. Da die Basiseinheit etwas leichter nachgibt als beim Spectre 13.5 und dem Elitebook x360 1040, besteht immer noch Verbesserungspotenzial.
Um Platz für das ungewöhnliche Kunstleder-Convertible-Design und den großen 8-MP-Webcam-Sensor zu schaffen, sind der obere und untere Displayrand größer als üblich. Sogar der leistungsstärkere Framework-Laptop ist etwas dünner, kleiner und leichter als das Dragonfly Folio G3. Dadurch ist Letzteres zwar noch lange nicht schwer oder klobig, zu den dünnsten und leichtesten Laptop in seiner Größenkategorie gehört das Dragonfly Folio G3 jedoch auch nicht.
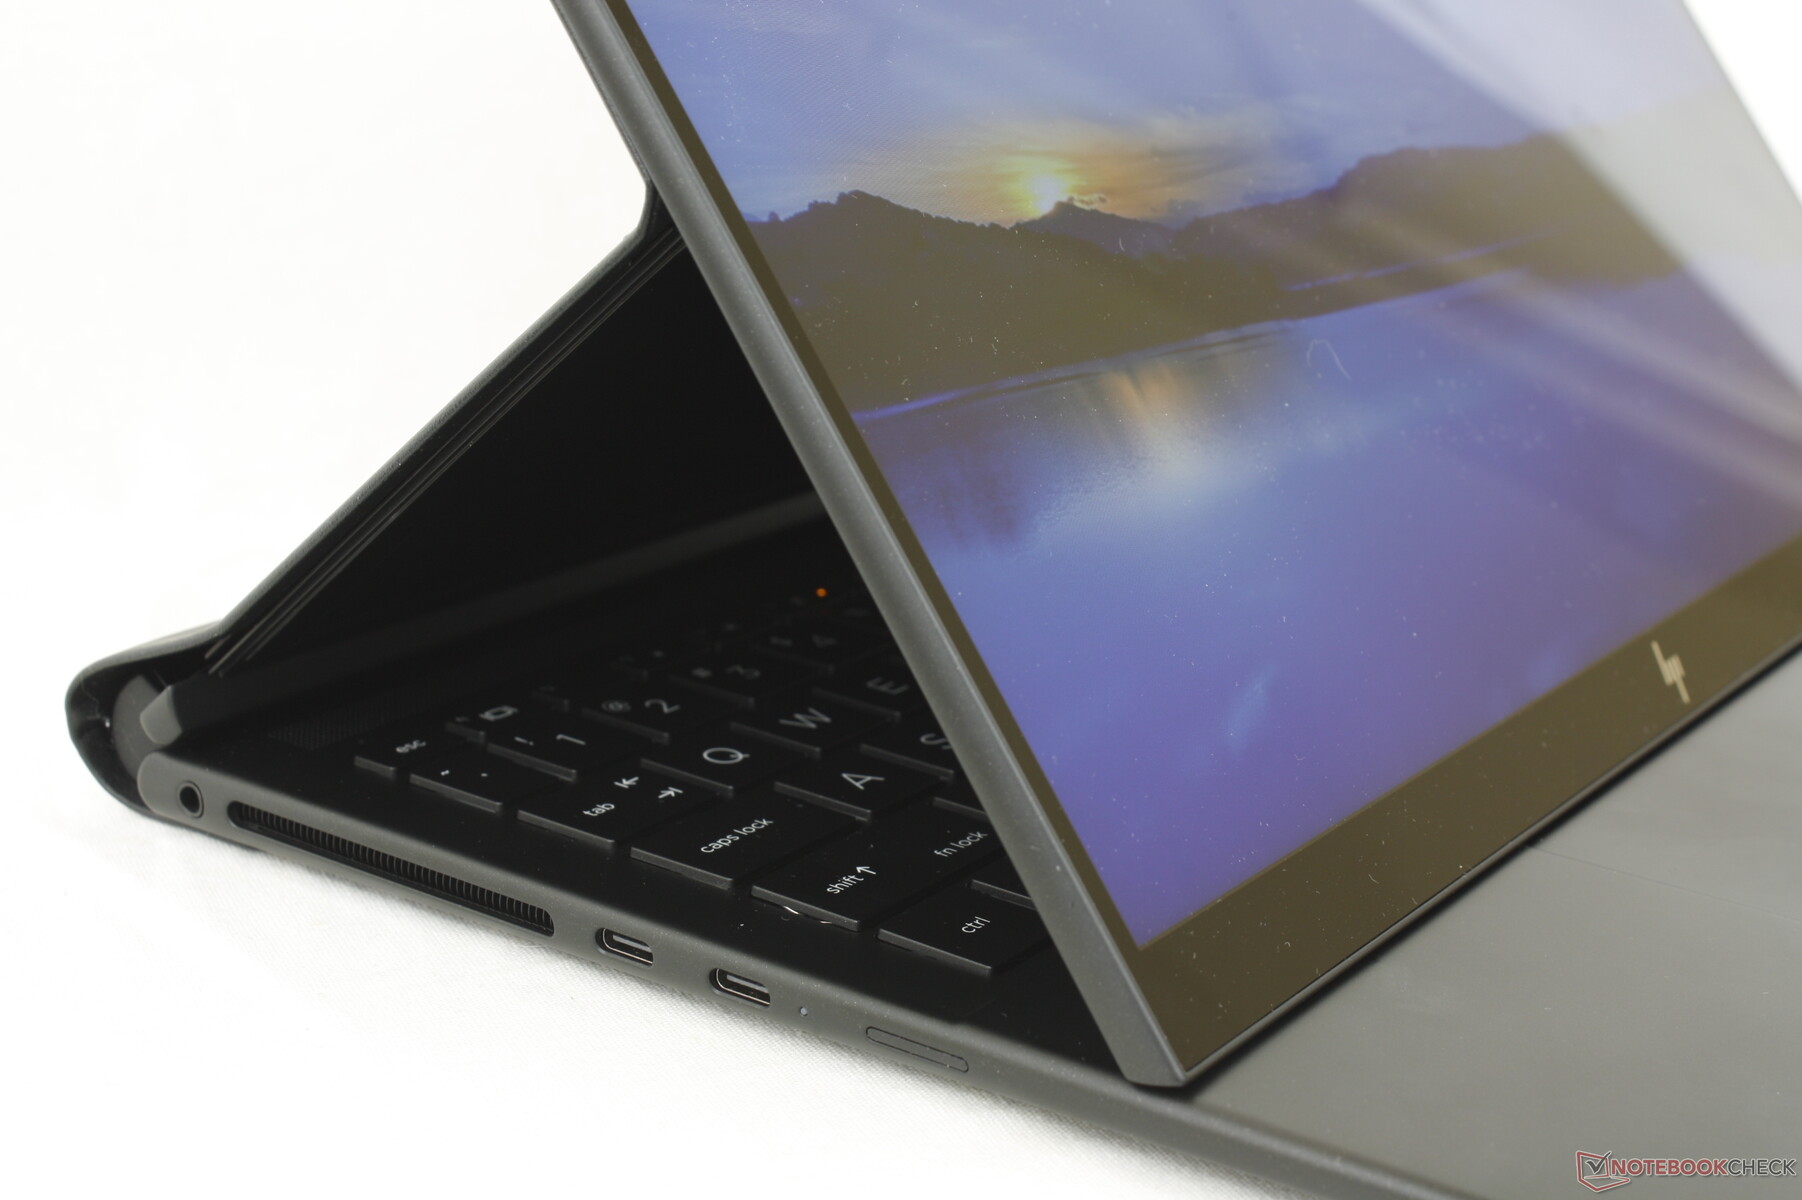
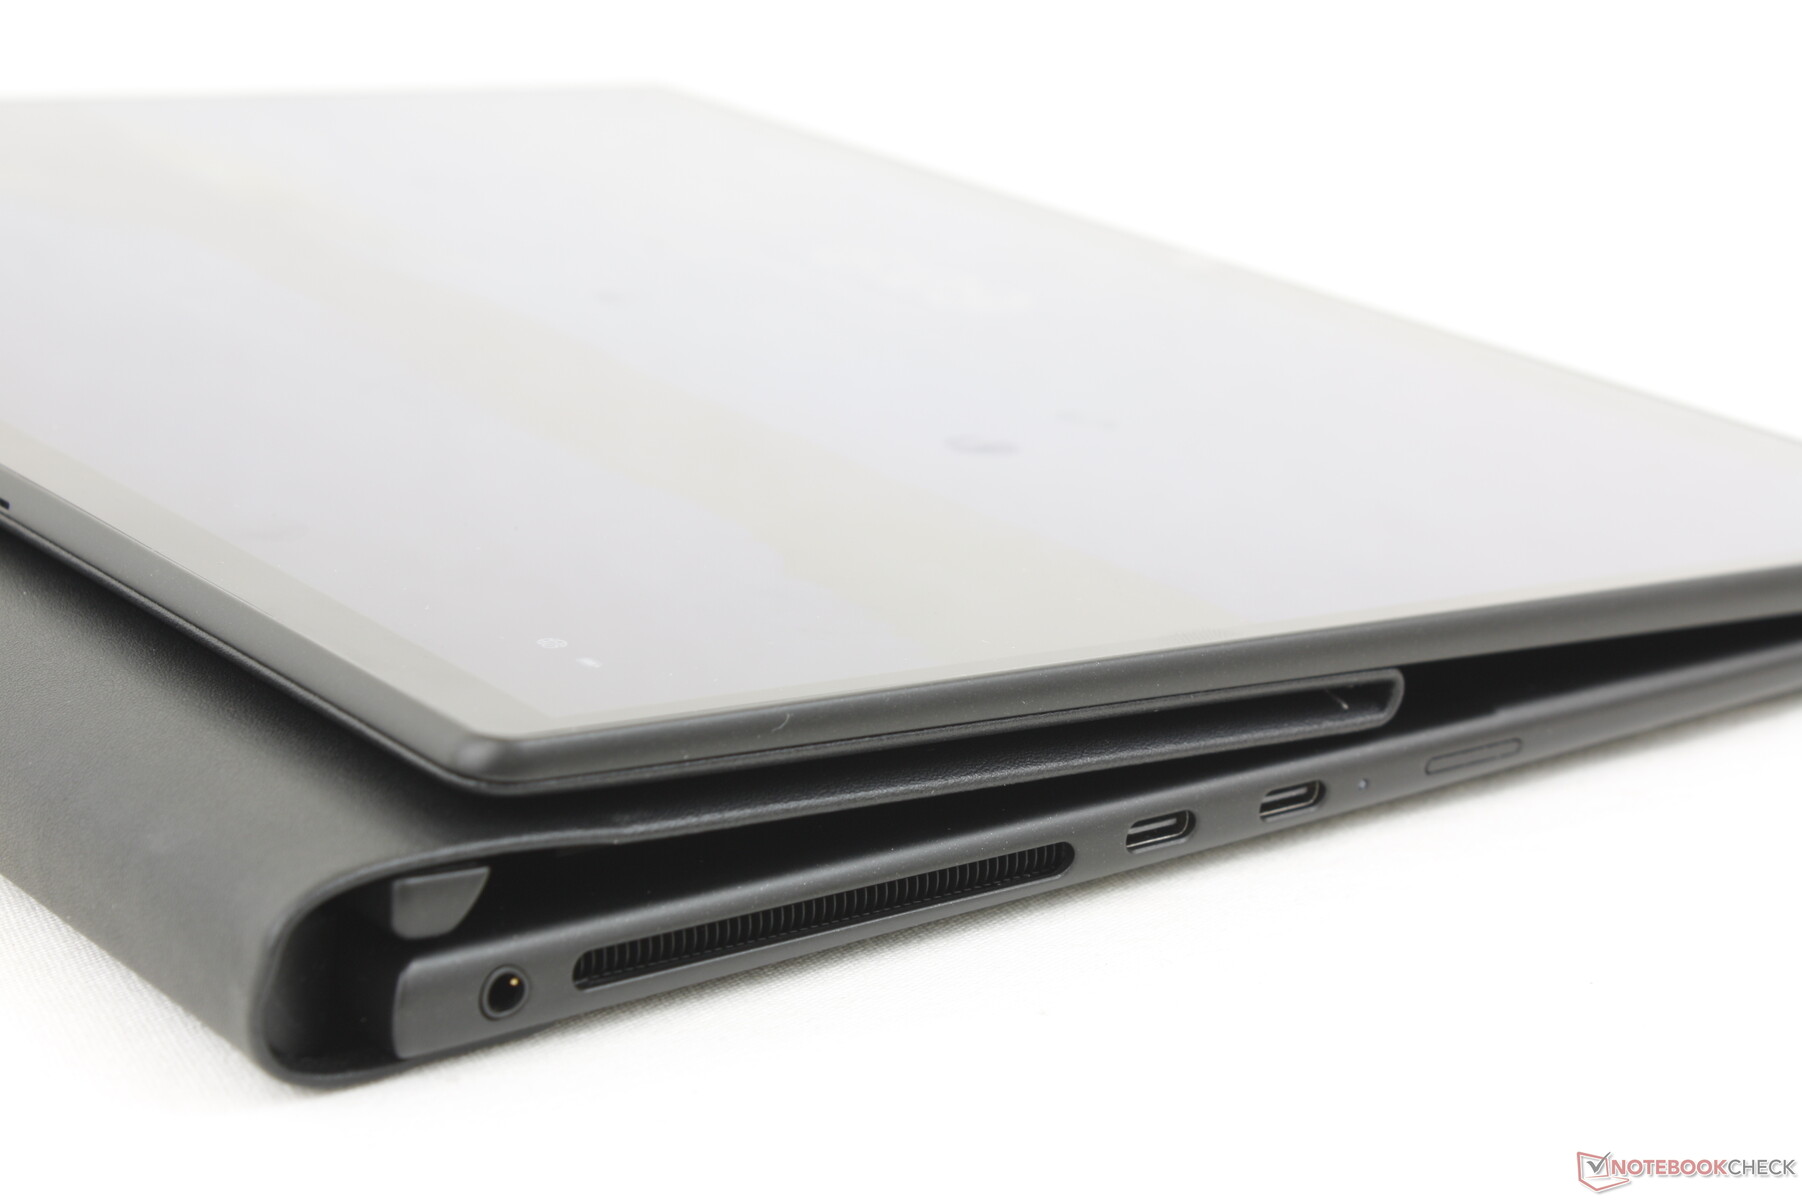
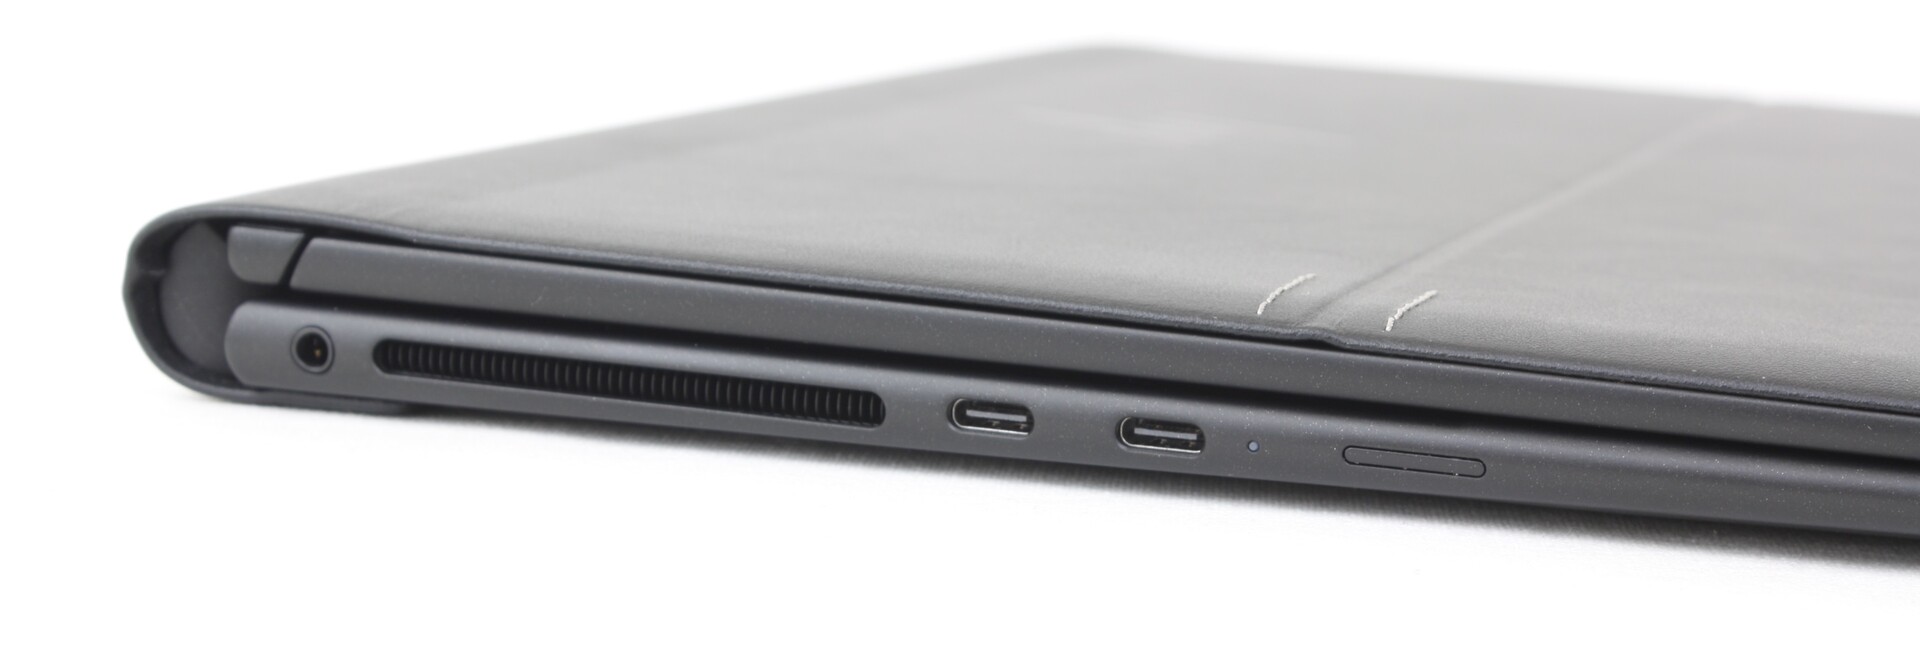
Ausstattung — Ausschließlich USB-C
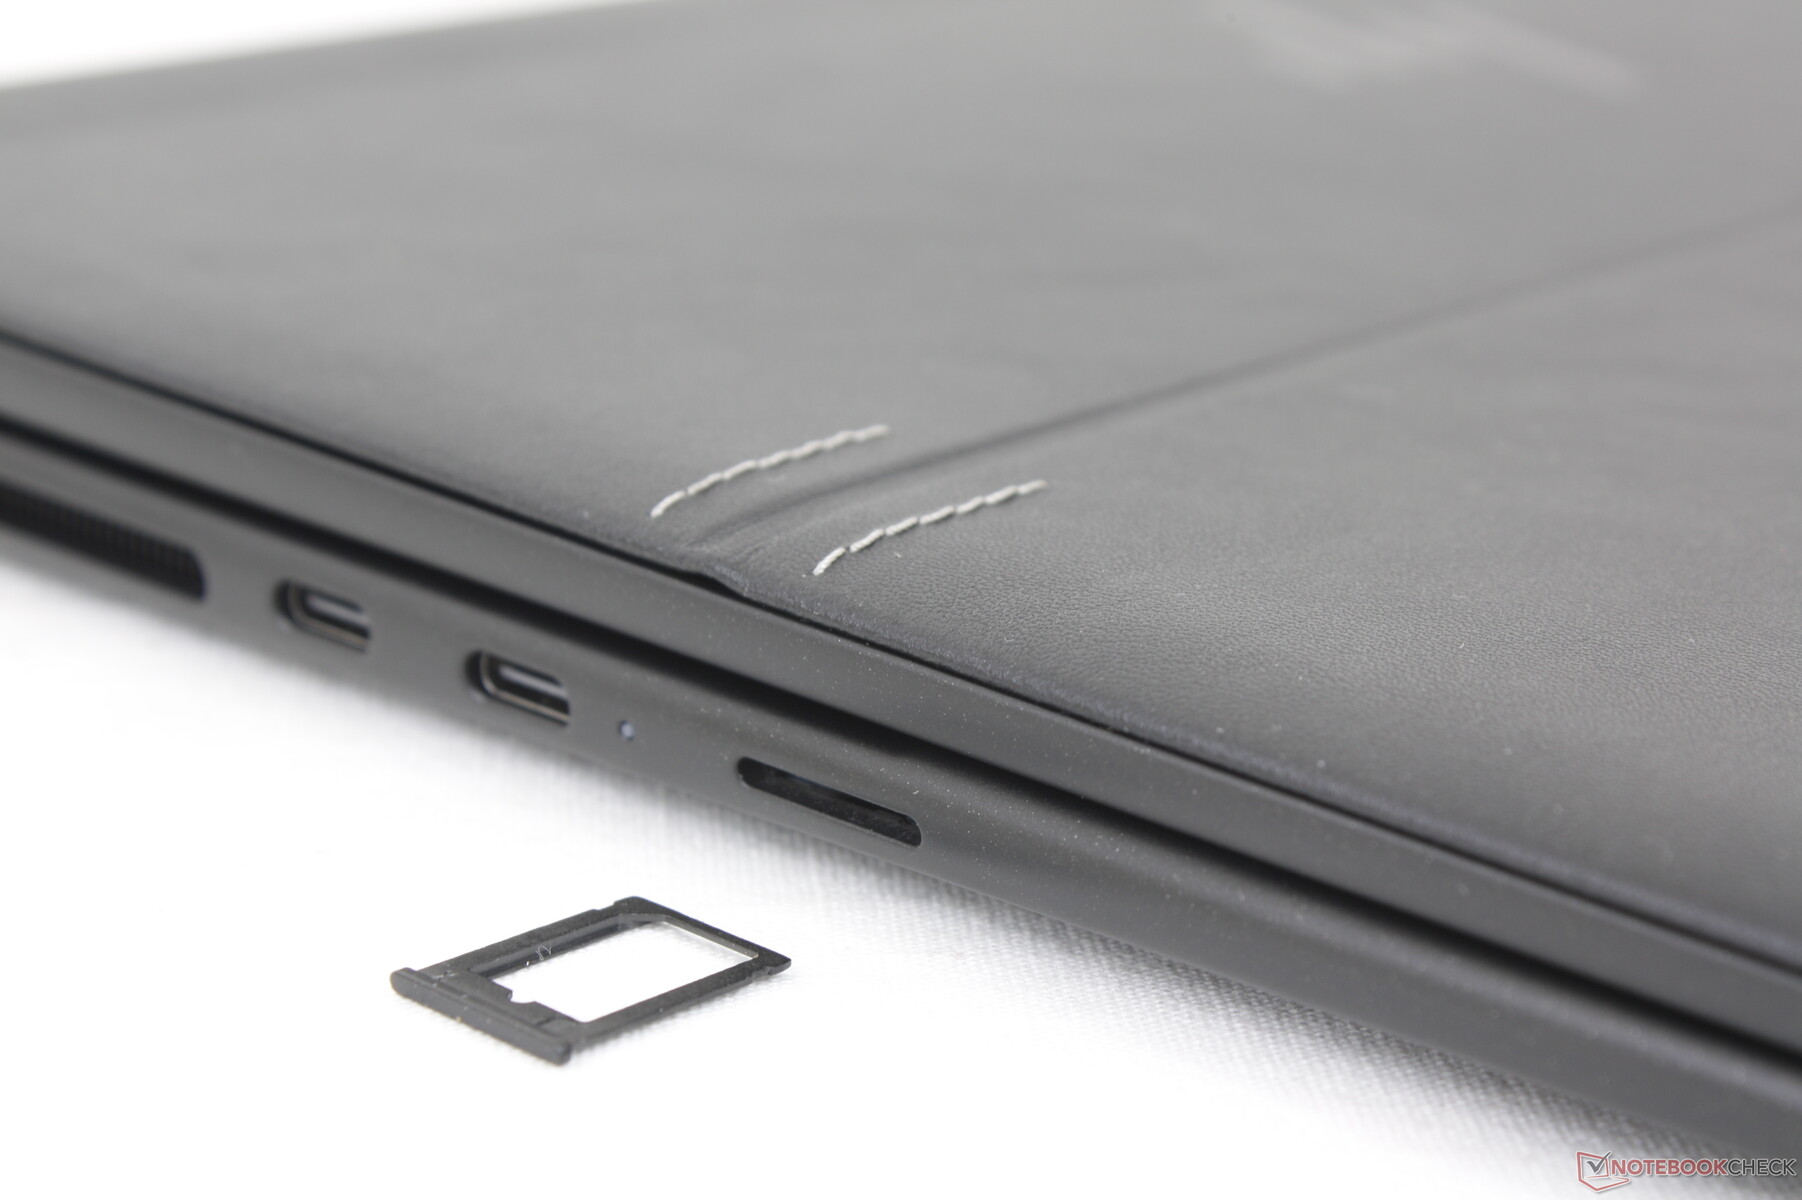
Der Laptop verfügt über nur zwei USB-C-4.0-Ports, die jeweils Thunderbolt-4-Zubehör und Monitore unterstützen. Die meisten konkurrierenden Business-Subnotebooks wie das Dragonfly G3 und das Latitude 7330 bieten eine größere Anschlussvielfalt, was die Abhängigkeit von Docking-Stationen und Dongles verringert.
Im Gegensatz zum Razer Book, bei dem sich ein USB-C-Port auf jeder Seite befindet, sind hier beide USB-C-Anschlüsse auf der linken Seite untergebracht. Die Razer-Variante hat den Vorteil, dass man den Laptop von beiden Seiten laden kann, während das Dragonfly Folio G3 nur von links geladen werden kann.
Kommunikation
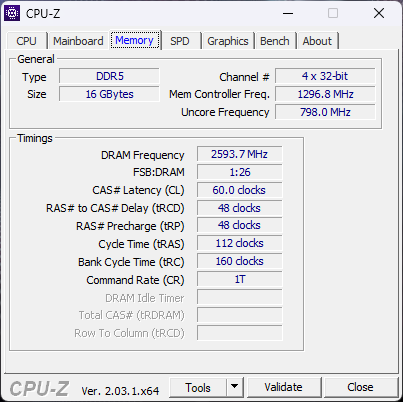
Intels AX211-Modul ist standardmäßig an Bord und bietet Bluetooth-5.3- sowie WLAN-6E-Unterstützung. In Verbindung mit unserem 6-GHz-Router sind die Transferraten schnell und stabil. Es sind keine Verbindungsprobleme aufgetreten.
5G-WAN steht optional zur Verfügung und das M.2-WAN-Modul kann leicht entfernt werden. Da eSIM nicht unterstützt wird, muss man sich gegebenenfalls um eine Nano-SIM-Karte bemühen.
| Networking | |
| iperf3 transmit AX12 | |
| Lenovo ThinkPad L13 Gen2-20VH0017GE | |
| Razer Book 13 FHD | |
| iperf3 receive AX12 | |
| Razer Book 13 FHD | |
| Lenovo ThinkPad L13 Gen2-20VH0017GE | |
| iperf3 receive AXE11000 6GHz | |
| Framework Laptop 13.5 12th Gen Intel | |
| HP Elite Dragonfly Folio 13.5 G3 | |
| HP Elite Dragonfly G3 | |
| Dell Latitude 13 7330 | |
| iperf3 receive AXE11000 | |
| HP Elite Dragonfly Folio 13.5 G3 | |
| iperf3 transmit AXE11000 | |
| HP Elite Dragonfly Folio 13.5 G3 | |
| iperf3 transmit AXE11000 6GHz | |
| Dell Latitude 13 7330 | |
| HP Elite Dragonfly Folio 13.5 G3 | |
| Framework Laptop 13.5 12th Gen Intel | |
| HP Elite Dragonfly G3 | |
Webcam — 8 MP!
Das Dragonfly Folio G3 ist einer der ersten Laptops mit einer 8-MP-Webcam, während viele Hersteller immer noch auf 2-MP- oder sogar 1-MP-Lösungen setzen. Videoaufnahmen mit bis zu 1.836p werden unterstützt. Obwohl die Webcam für Laptop-Verhältnisse die schärfsten Bilder produziert, gibt es gewisse Einschränkungen. Erstens werden 60-Fps-Videoaufnahmen von der Standardkamera-App trotz der hohen Auflösung nicht unterstützt. Zweitens sind die Farben und die allgemeine Bildqualität im Dunkeln nicht besser als bei den meisten anderen Laptops. Drittens erscheinen Bewegungen sehr verschwommen, was zumindest teilweise auf die langsamen Schwarz-zu-Weiß-Reaktionszeiten zurückzuführen ist. Somit ist die Webcam bei hellem Umgebungslicht und minimaler Bewegung zwar hervorragend, Verbesserungspotenzial besteht aber dennoch.
Ein IR-Sensor und eine digitale Kameraabdeckung sind vorhanden. Die digitale Webcamabdeckung zu aktivieren verdeckt die Linse nicht physisch.


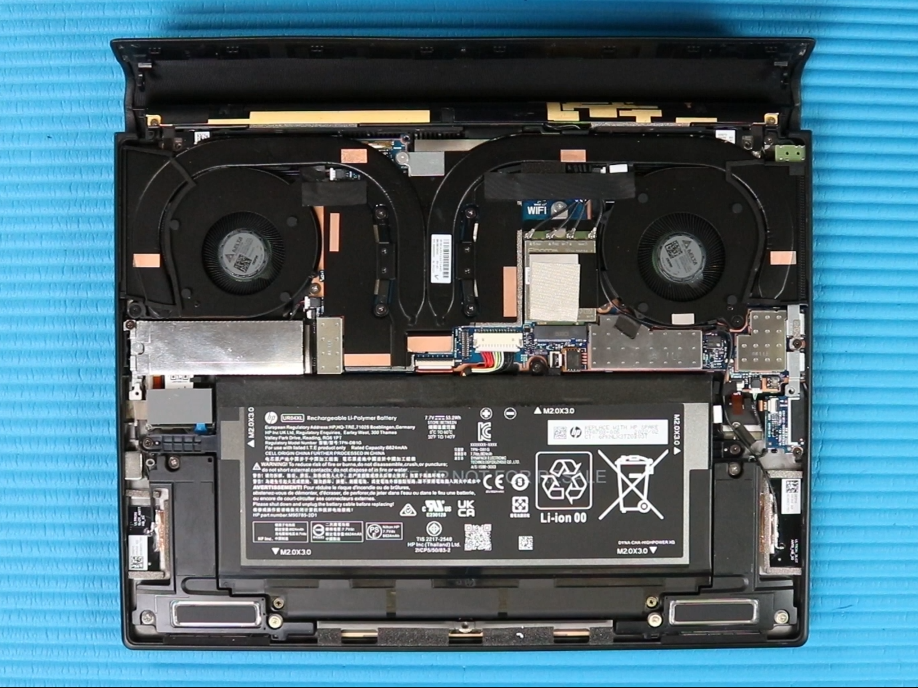
Wartung
Im Gegensatz zu den meisten anderen Laptopherstellern veröffentlicht HP offizielle Demontage-Videos von vielen Modellen einschließlich des Dragonfly Folio G3. Das entsprechende Video anzuschauen lohnt sich, wenn man den Laptop warten, einen Blick auf die internen Komponenten oder die Upgrade-Möglichkeiten werfen möchte. Im Vergleich zum 2020er- bzw. 2021er-Modell hat der Hersteller den Wartungsprozess hier deutlich vereinfacht.
Aufgrund der Kunstlederhülle erfordert das Entfernen der Bodenplatte im Vergleich zu den meisten anderen Laptops ein paar zusätzliche Schritte. Zunächst müssen zwei Abdeckungen in den hinteren Ecken entfernt werden, um die darunterliegenden Kreuzschrauben zum Vorschein zu bringen. Danach kann das Kunstleder vorsichtig von der Basiseinheit abgezogen werden, wodurch weitere Schrauben (Torx) zugänglich werden. Im Inneren hat man lediglich Zugriff auf den M.2-2280-PCIe4-x4-Slot für ein Laufwerk und den M.2-Erweiterungssteckplatz für WAN-Module. Die RAM- und WLAN-Module sind verlötet.
Garantie und Zubehör
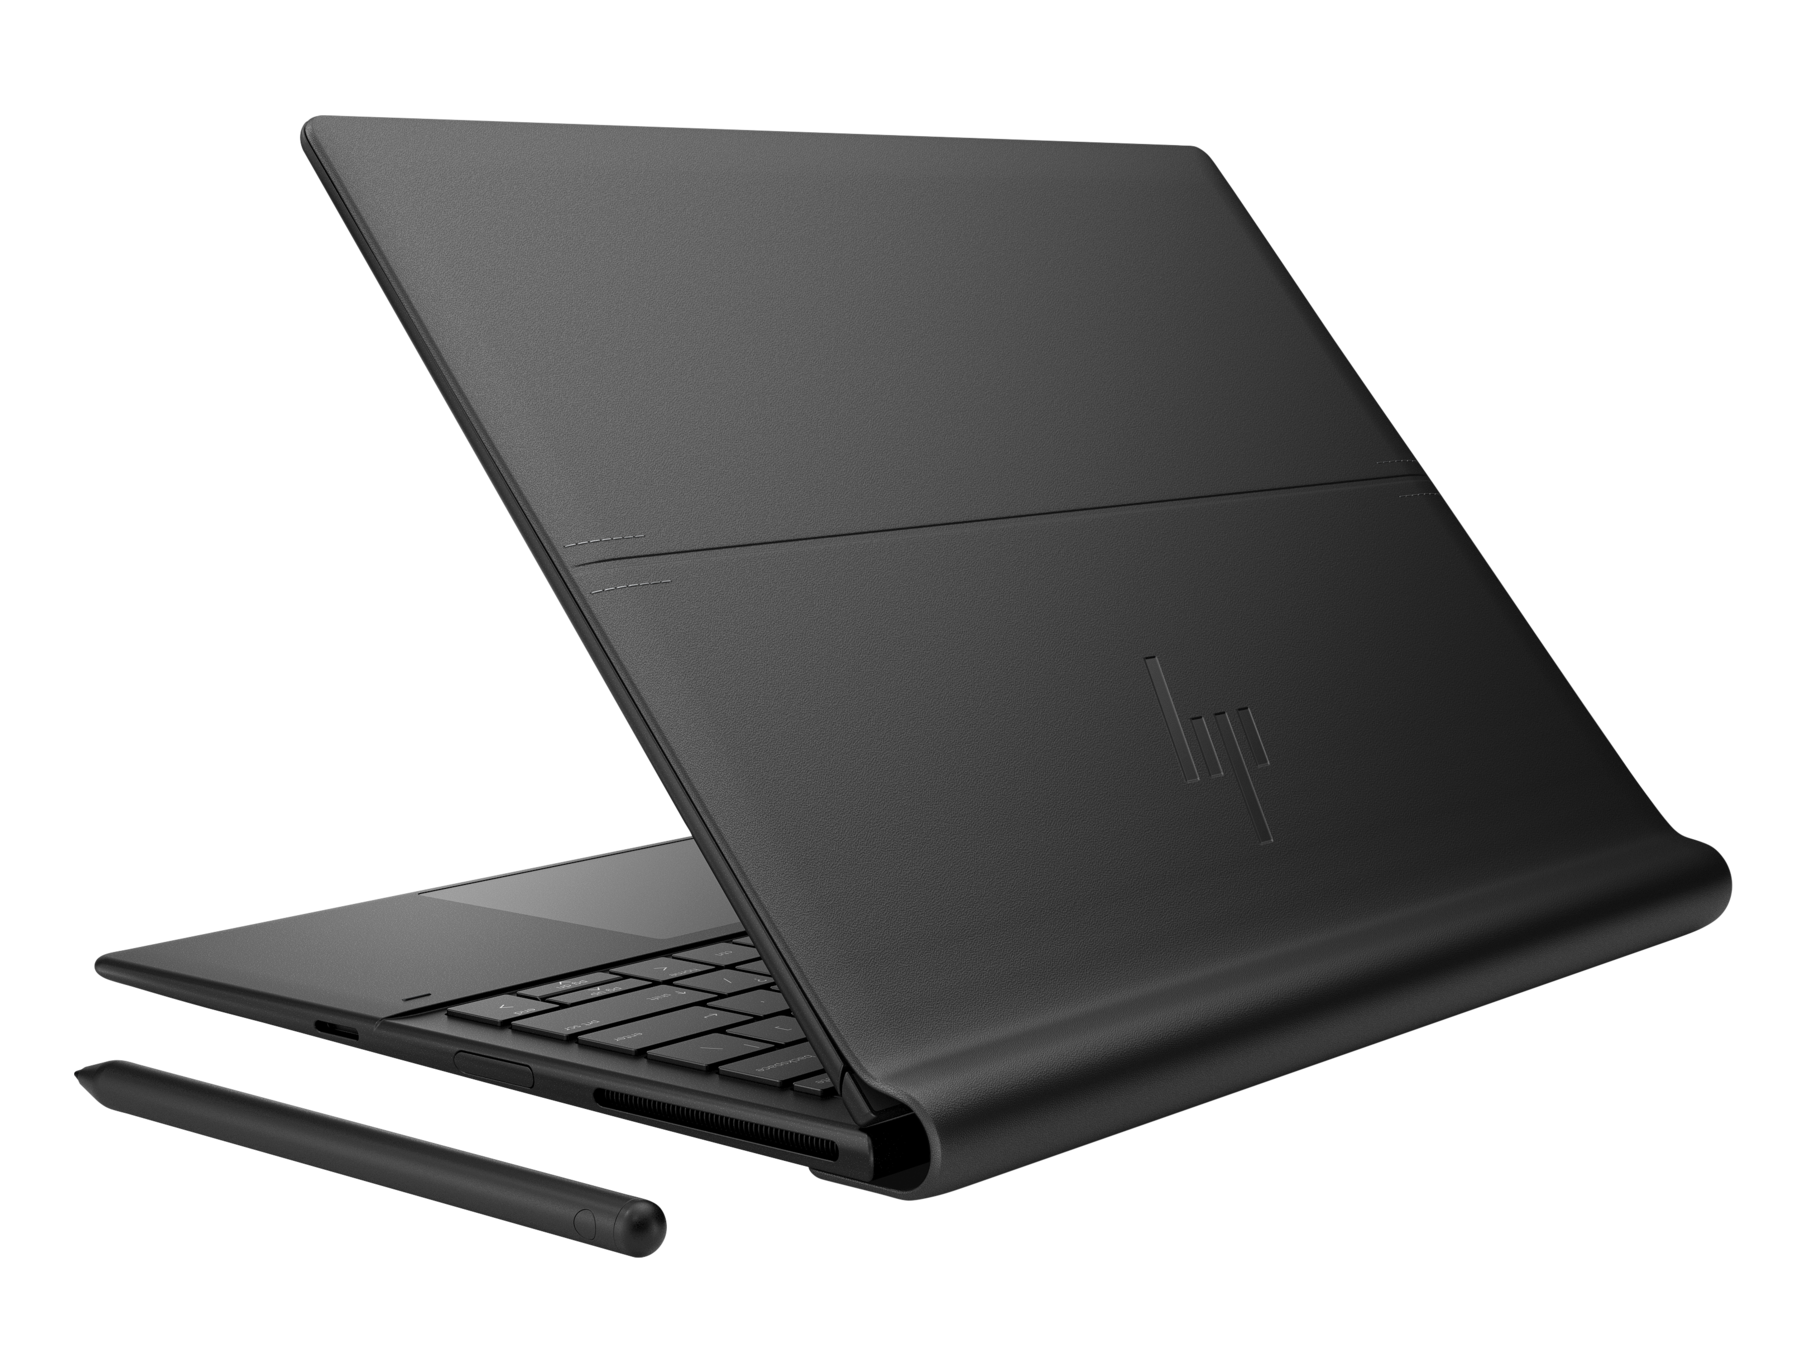
Im Lieferumfang befindet sich ein Aktivstylus, der sich magnetisch an der rechte Seite des Laptops befestigen lässt. Da digitale Stifte oft als teures Zubehör verkauft werden, ist der standardmäßig mitgelieferte Stylus ein willkommenes Extra.
Da viele High-End-EliteBook-Modelle über eine dreijährige Basisgarantie verfügen, ist die einjährigen Basisgarantie des Dragonfly Folio G3 etwas enttäuschend.
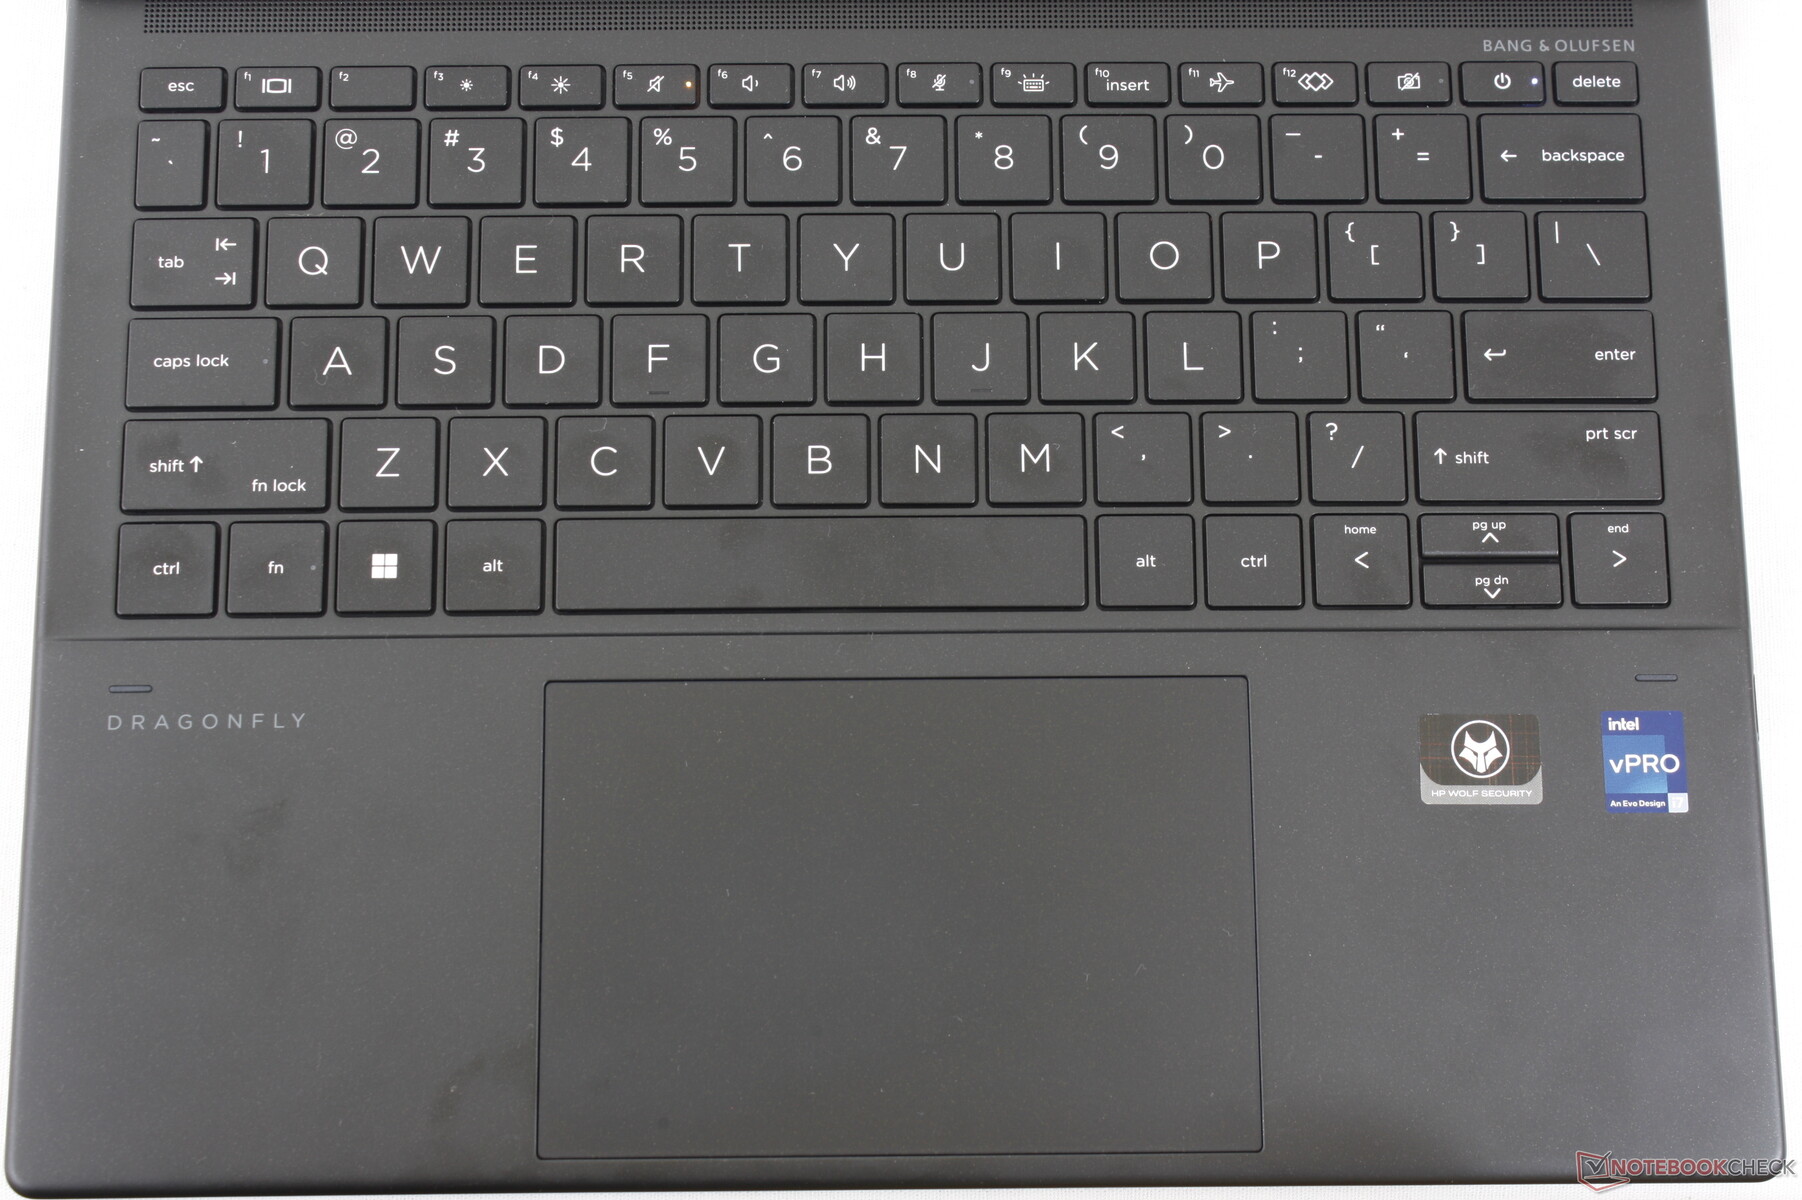
Eingabegeräte — Wie beim EliteBook
Tastatur
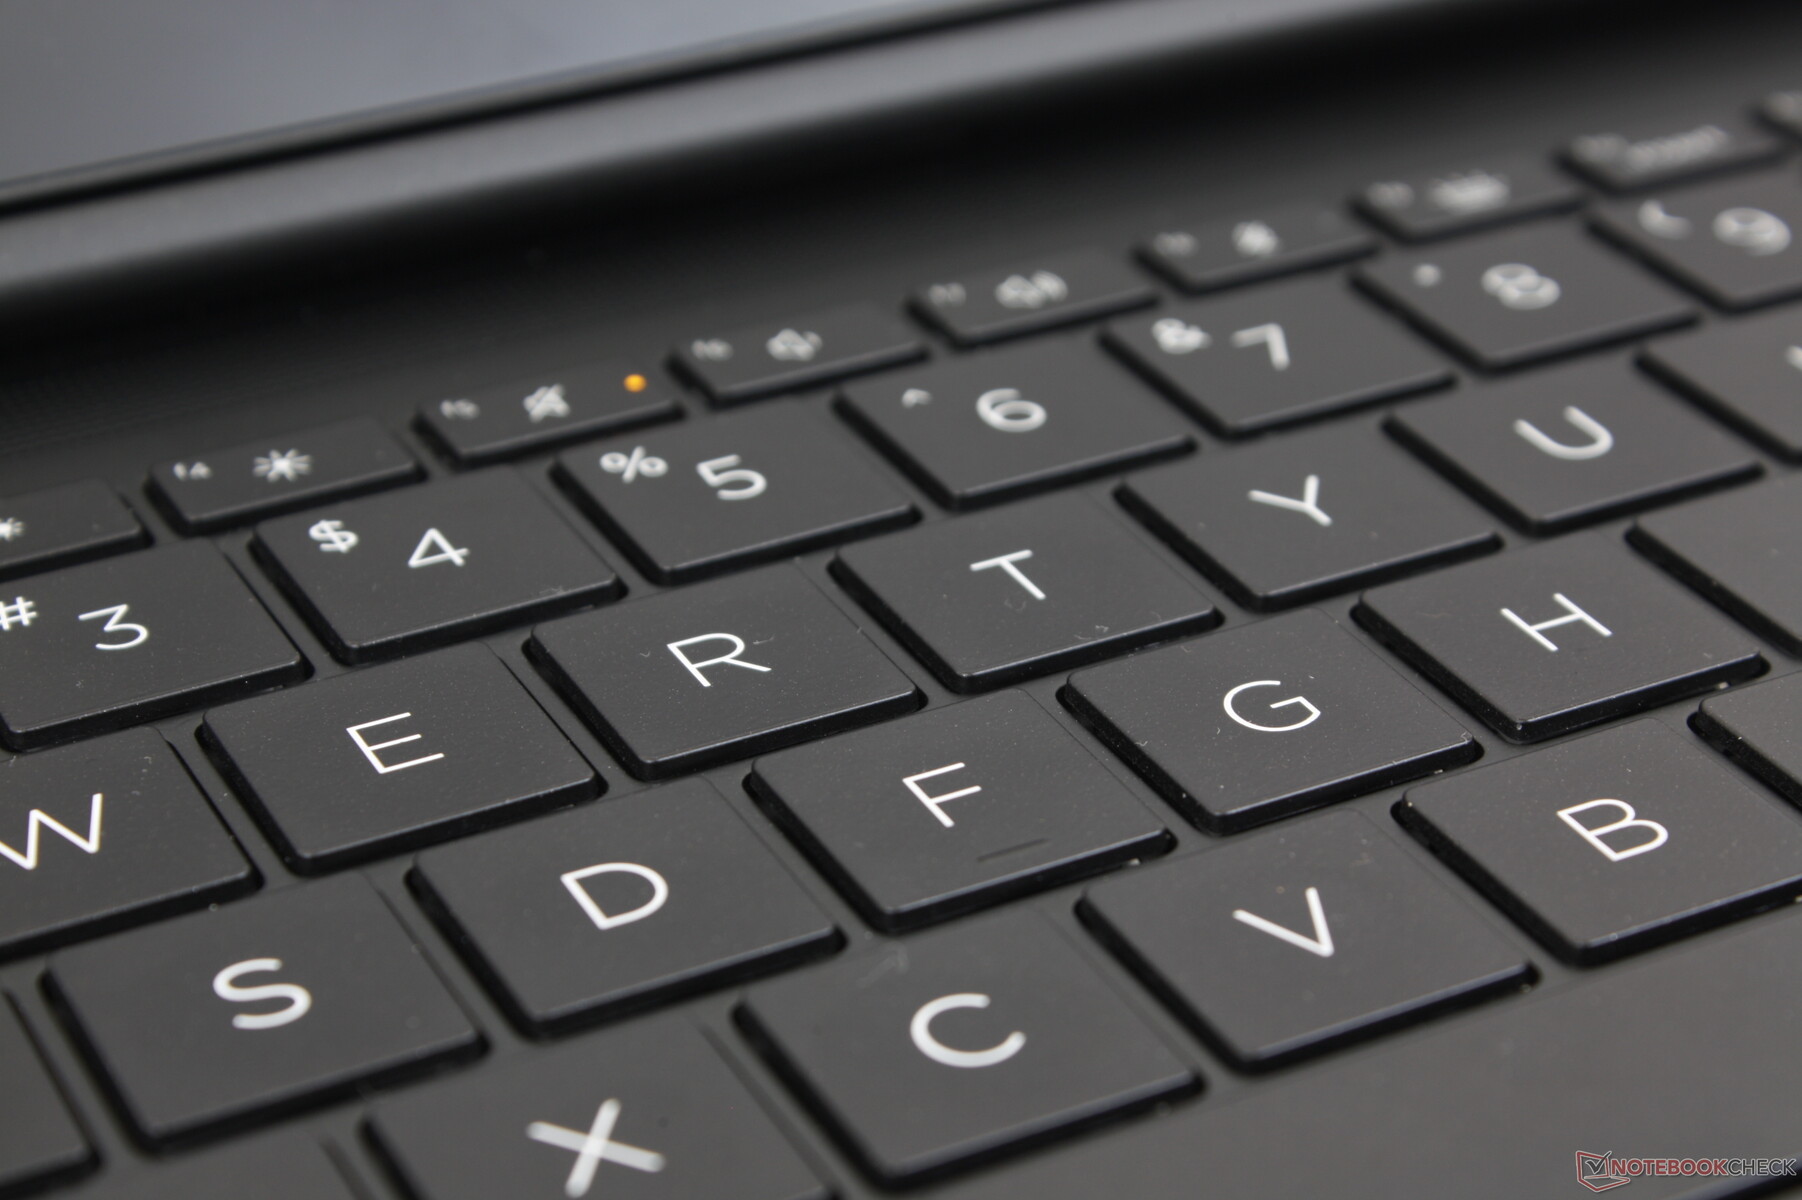
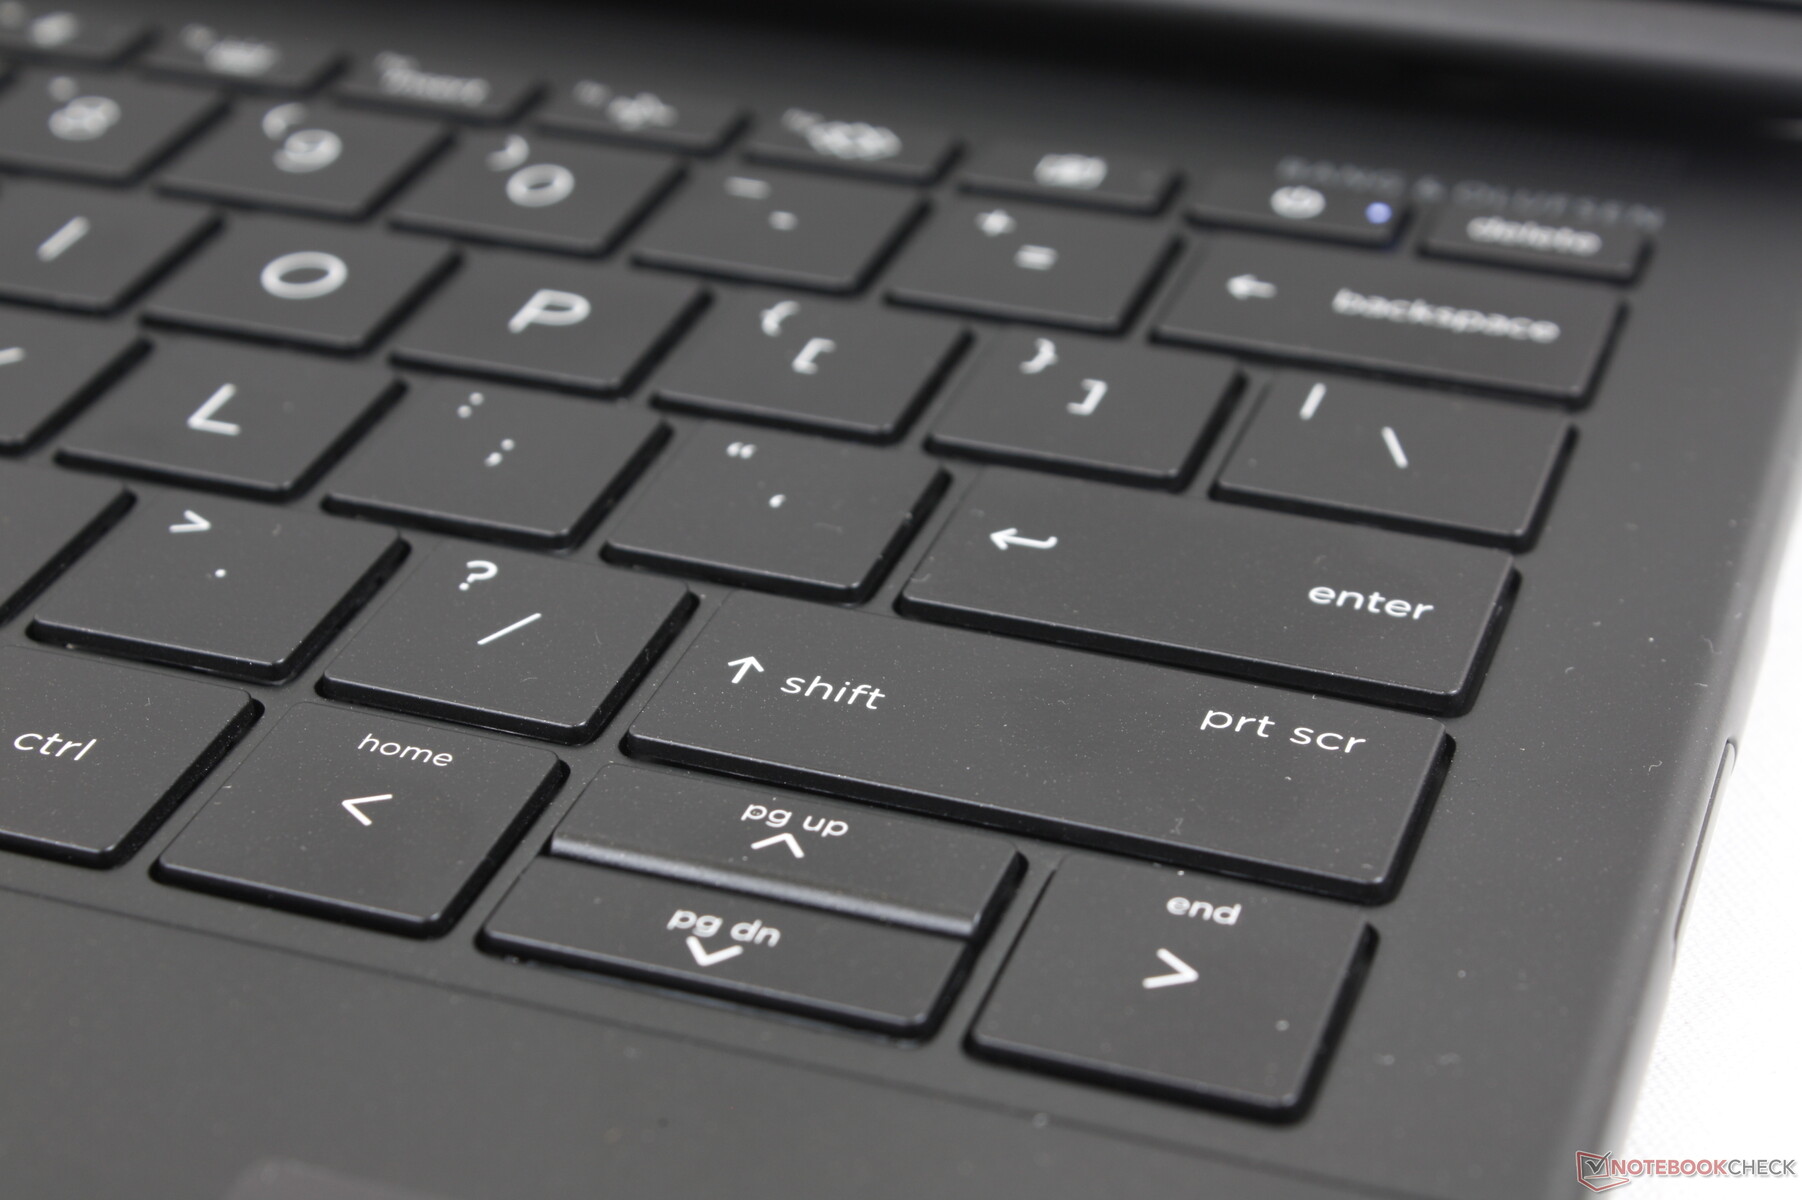
Das Tastenlayout ist mit dem des Dragonfly G3 nahezu identisch, woraus ein ähnliches Tippgefühl resultiert. HP-Spectre- und EliteBook-Tastaturen bieten tendenziell ein knackigeres Feedback, das sich weniger schwammig wirkt als bei günstigen Ultrabooks.
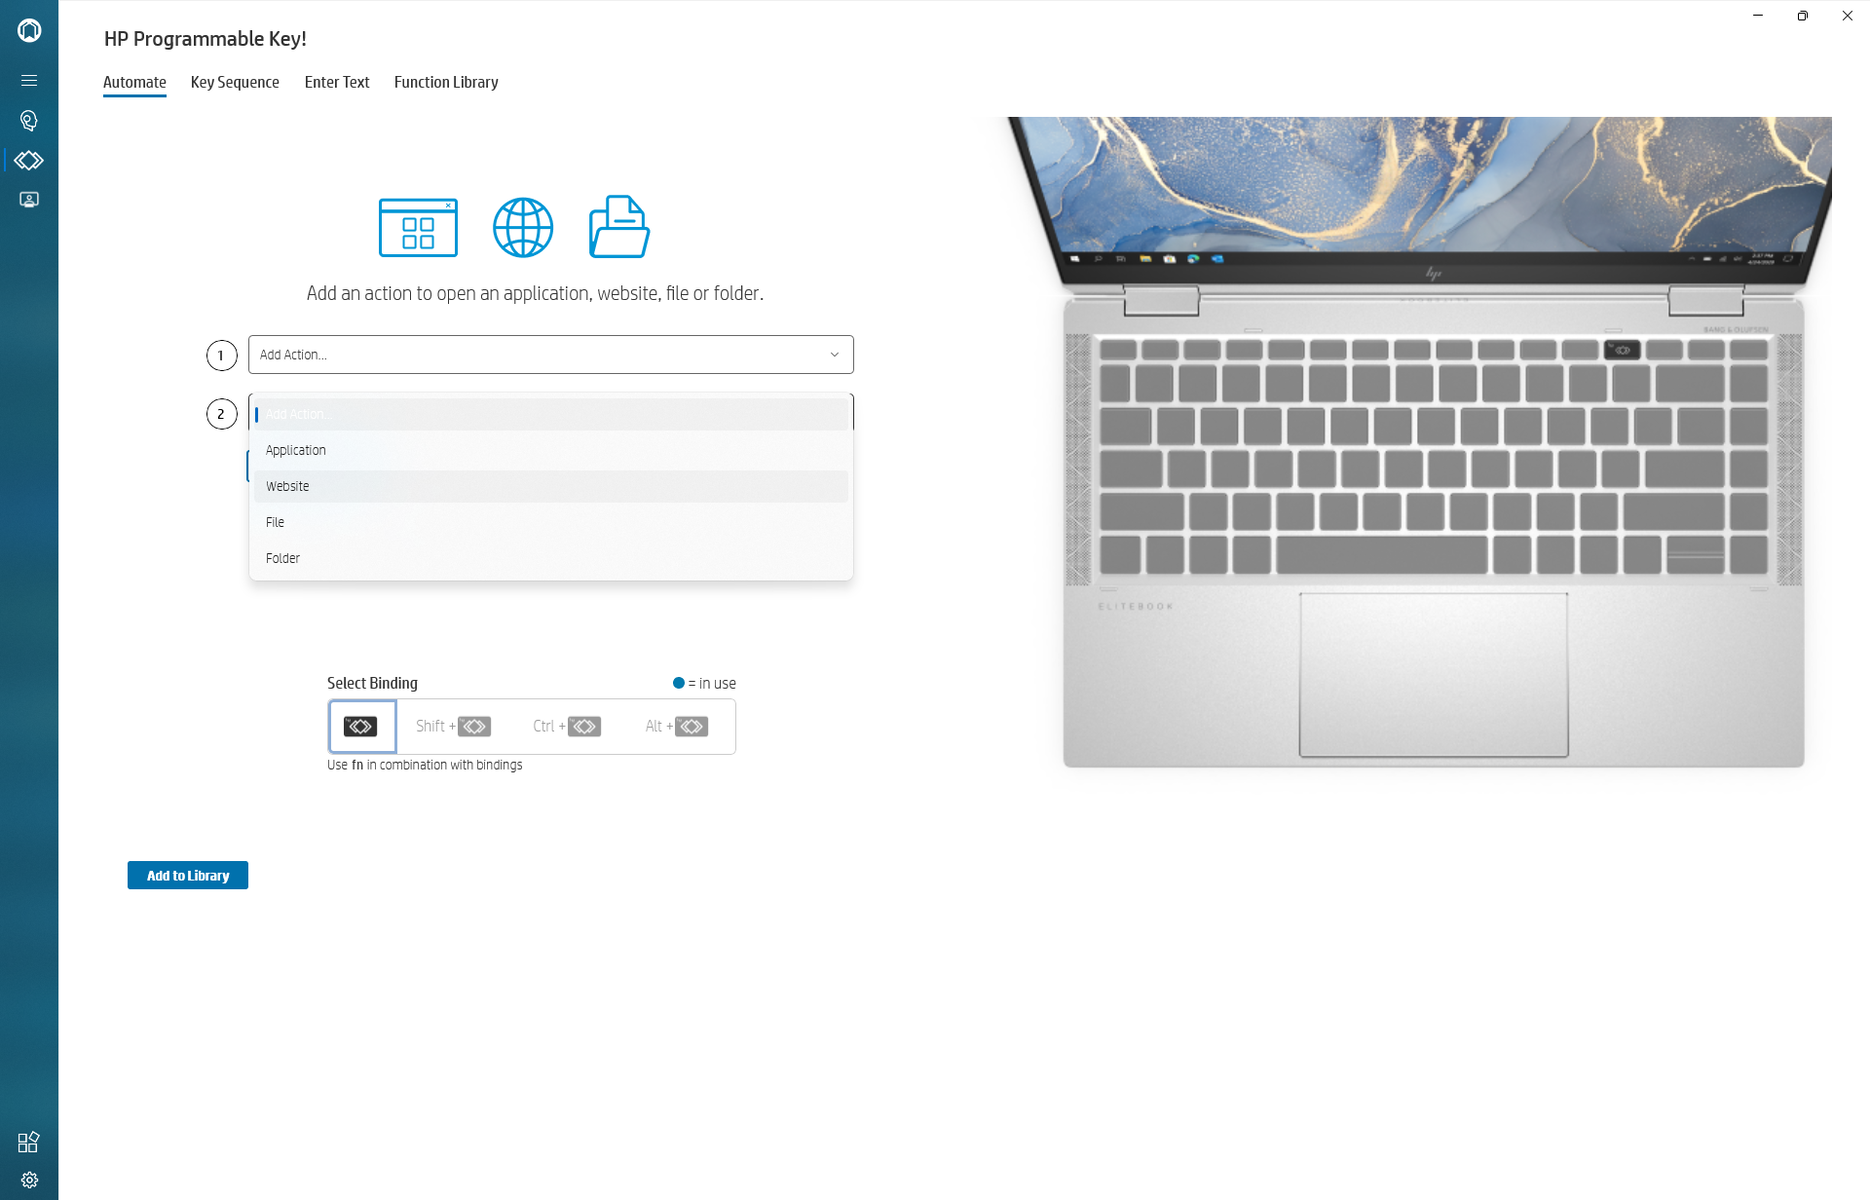
Eine einzigartige Funktion von vielen neuen HP-Laptops ist die benutzerdefinierbare "Programmierbare Taste". Über die Taste können Anwendungen gestartet oder Zeichenketten eingegeben werden. Die meisten anderen Laptops besitzen ab Werk keine derartigen Funktionen und müssen gegebenenfalls Drittanbieter-Apps dafür nutzen.
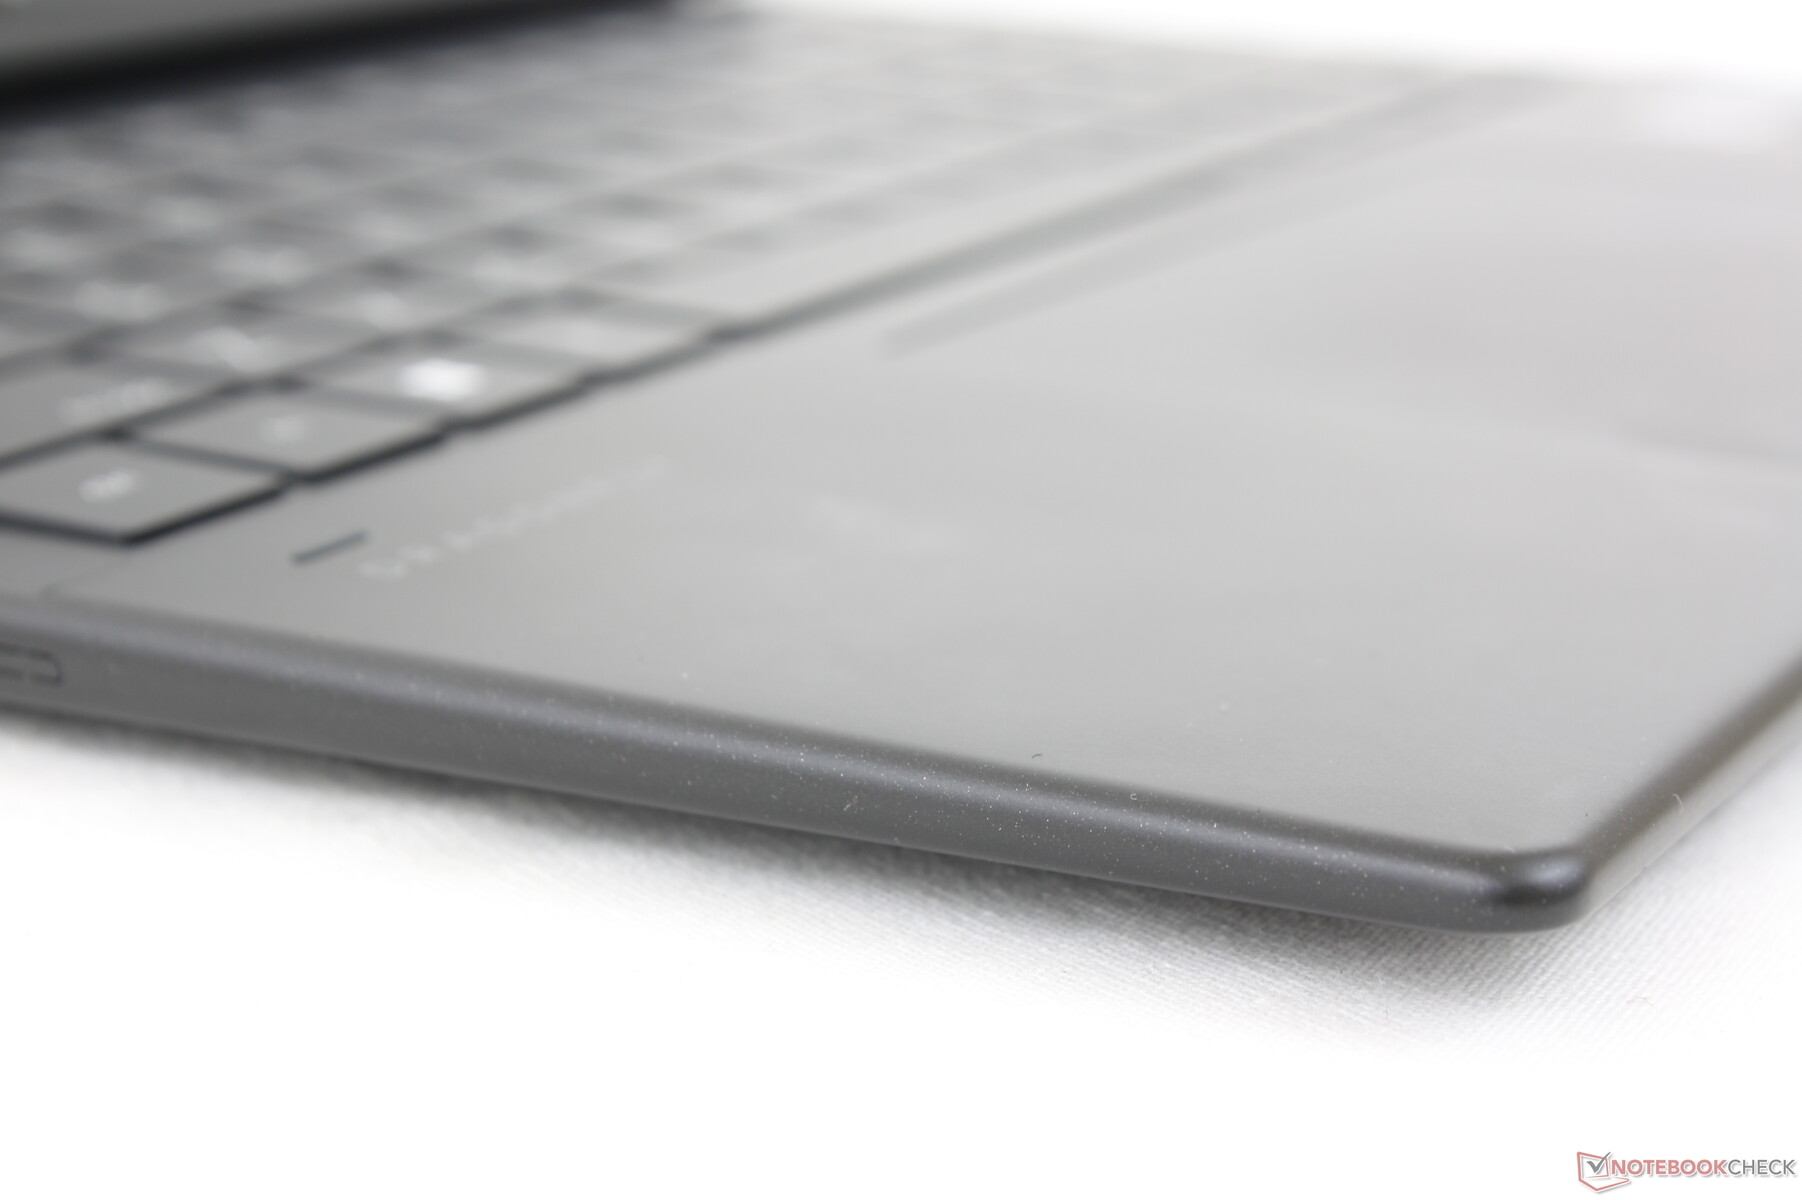
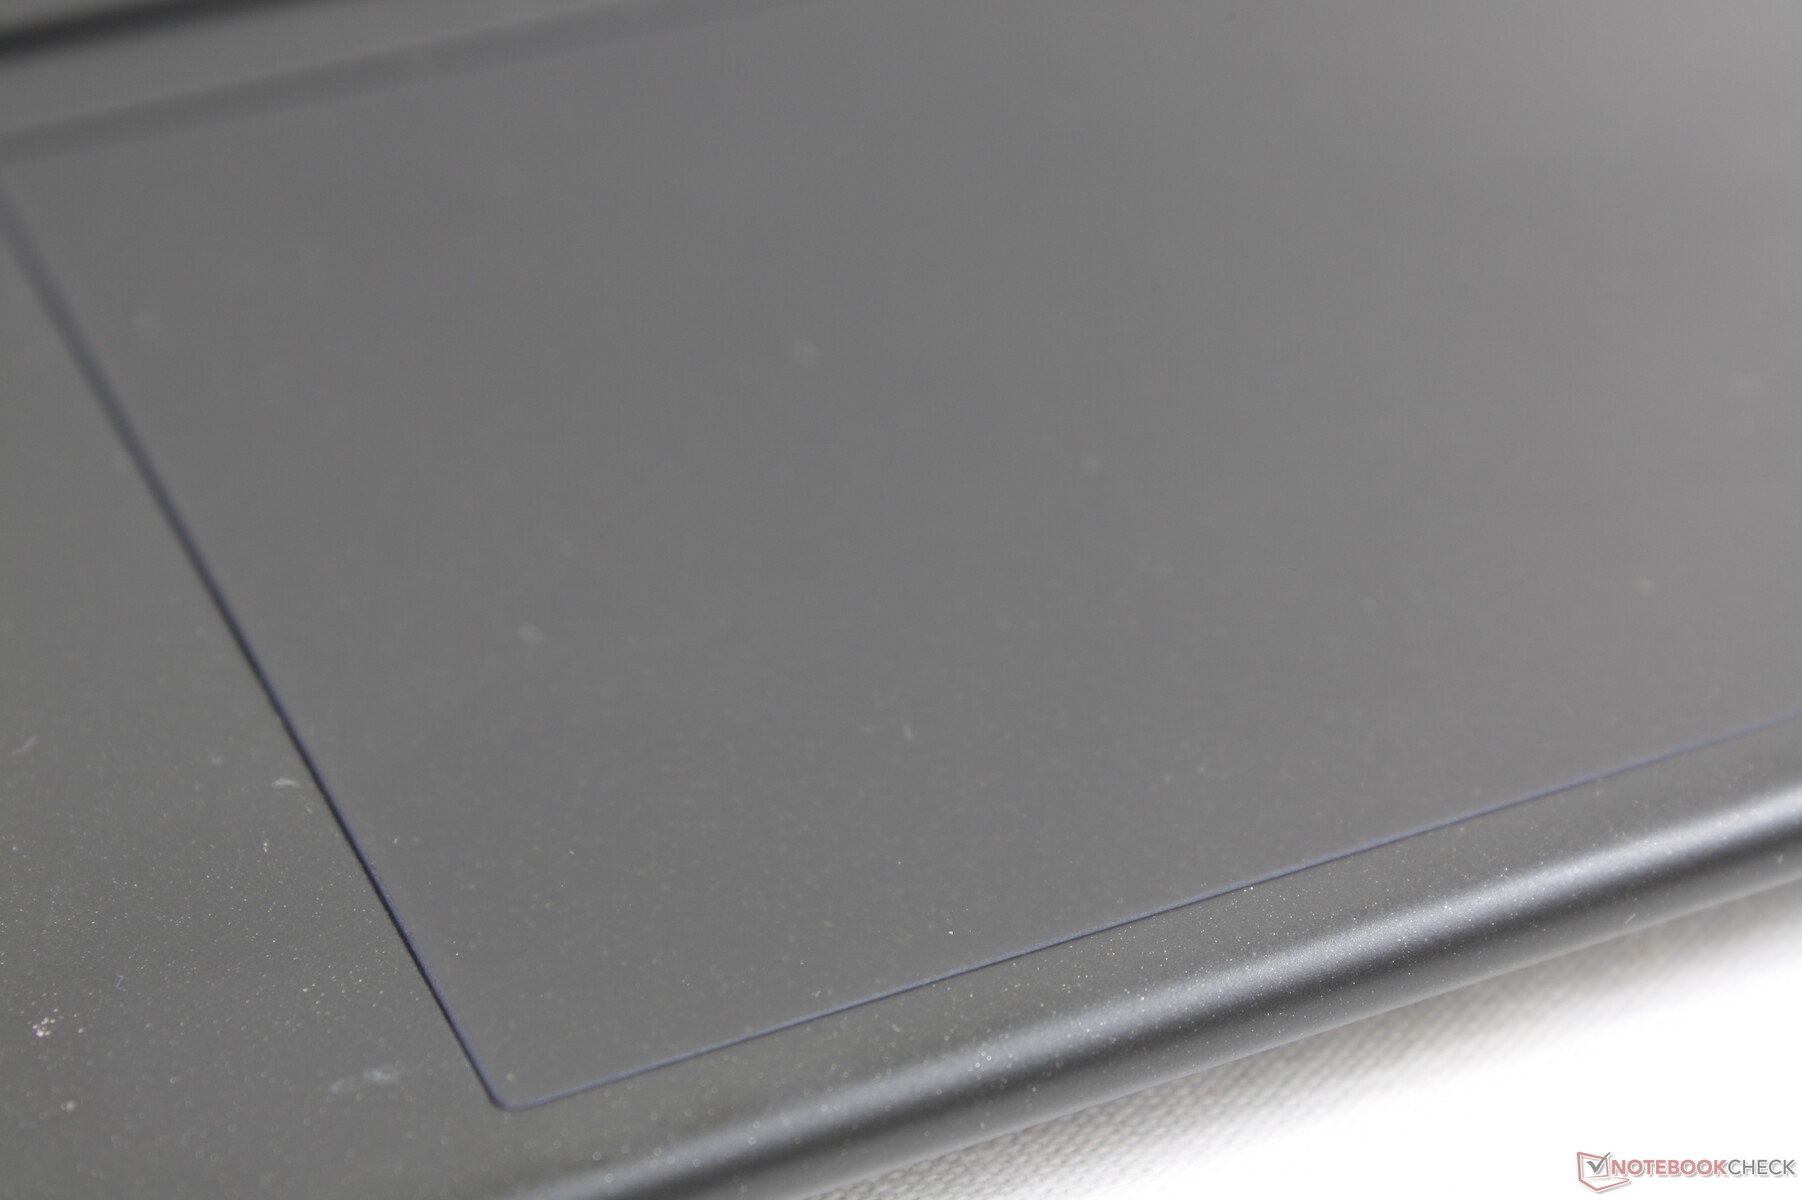
Touchpad
Das ClickPad besitzt die exakt gleiche Größe wie beim Dragonfly G3 (12 x 8 cm). Allerdings ist die NFC-Funktion im Gegensatz zum Dragonfly G3 nicht verfügbar, was für diejenigen, die auf NFC angewiesen sind, unpraktisch ist. Die Zeigersteuerung funktioniert zuverlässig und man bleibt weder bei schnellen noch bei langsamen Zeigerbewegungen auf der Oberfläche haften.
Das Tastenhub und der Tastenwiderstand des ClickPads fallen flach und gering aus, was in etwas unbefriedigenden Klicks resultiert. Obwohl dadurch auch die Tippgeräusche leise sind, wäre ein knackigeres Feedback wünschenswert.
Display — Auf 60 Hz und IPS beschränkt
Es stehen drei Touchscreen-Displays zur Auswahl:
- 1.920 x 1.280, IPS, 400 cd/m², matt, 60 Hz
- 1.920 x 1.280, IPS, 400 cd/m², reflektiv, 60 Hz
- 1.920 x 1.280, IPS, 1.000 cd/m², reflektiv, Sure View, 60 Hz
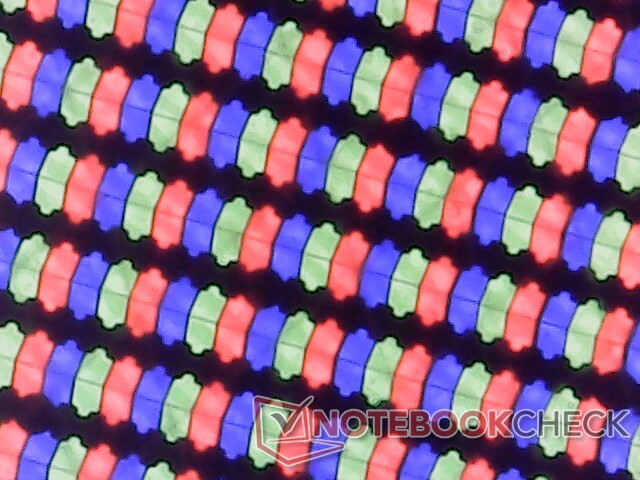
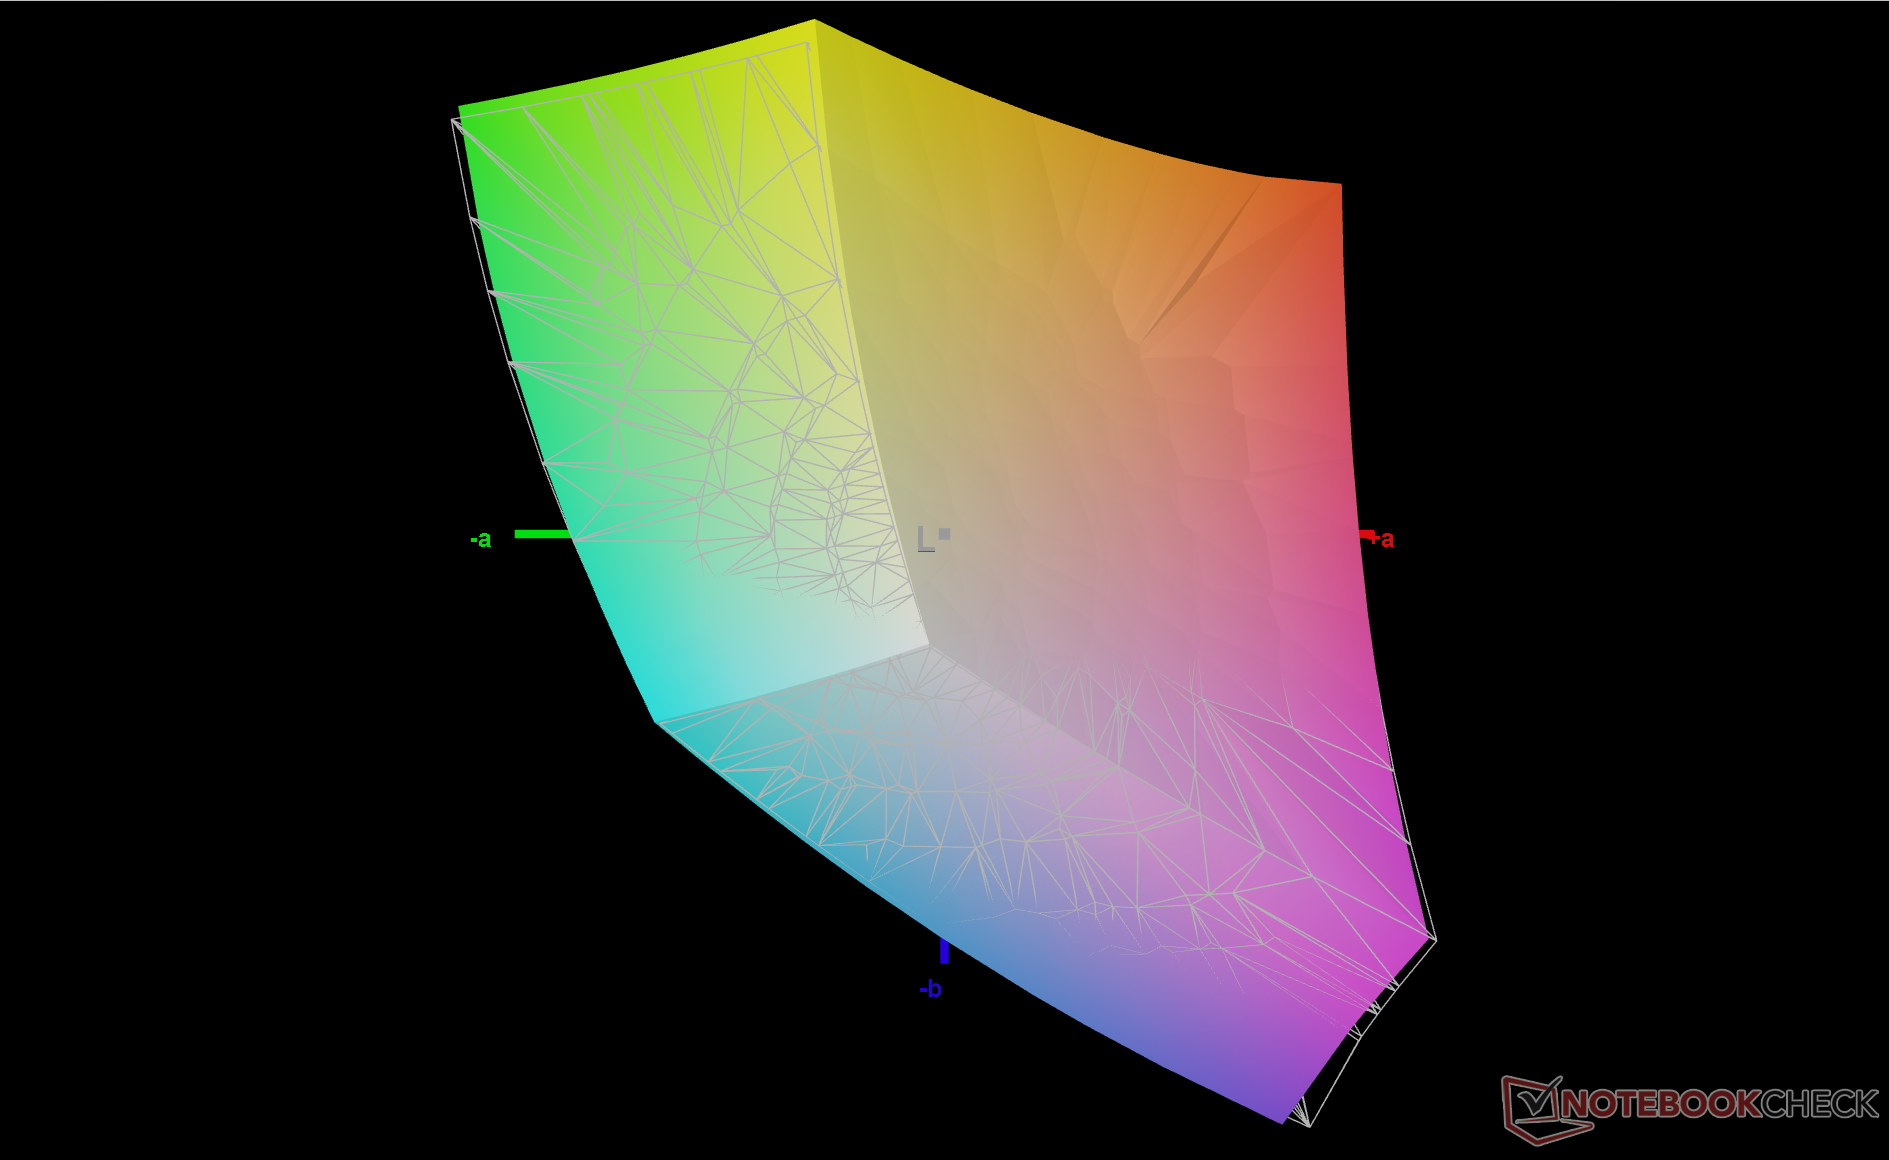
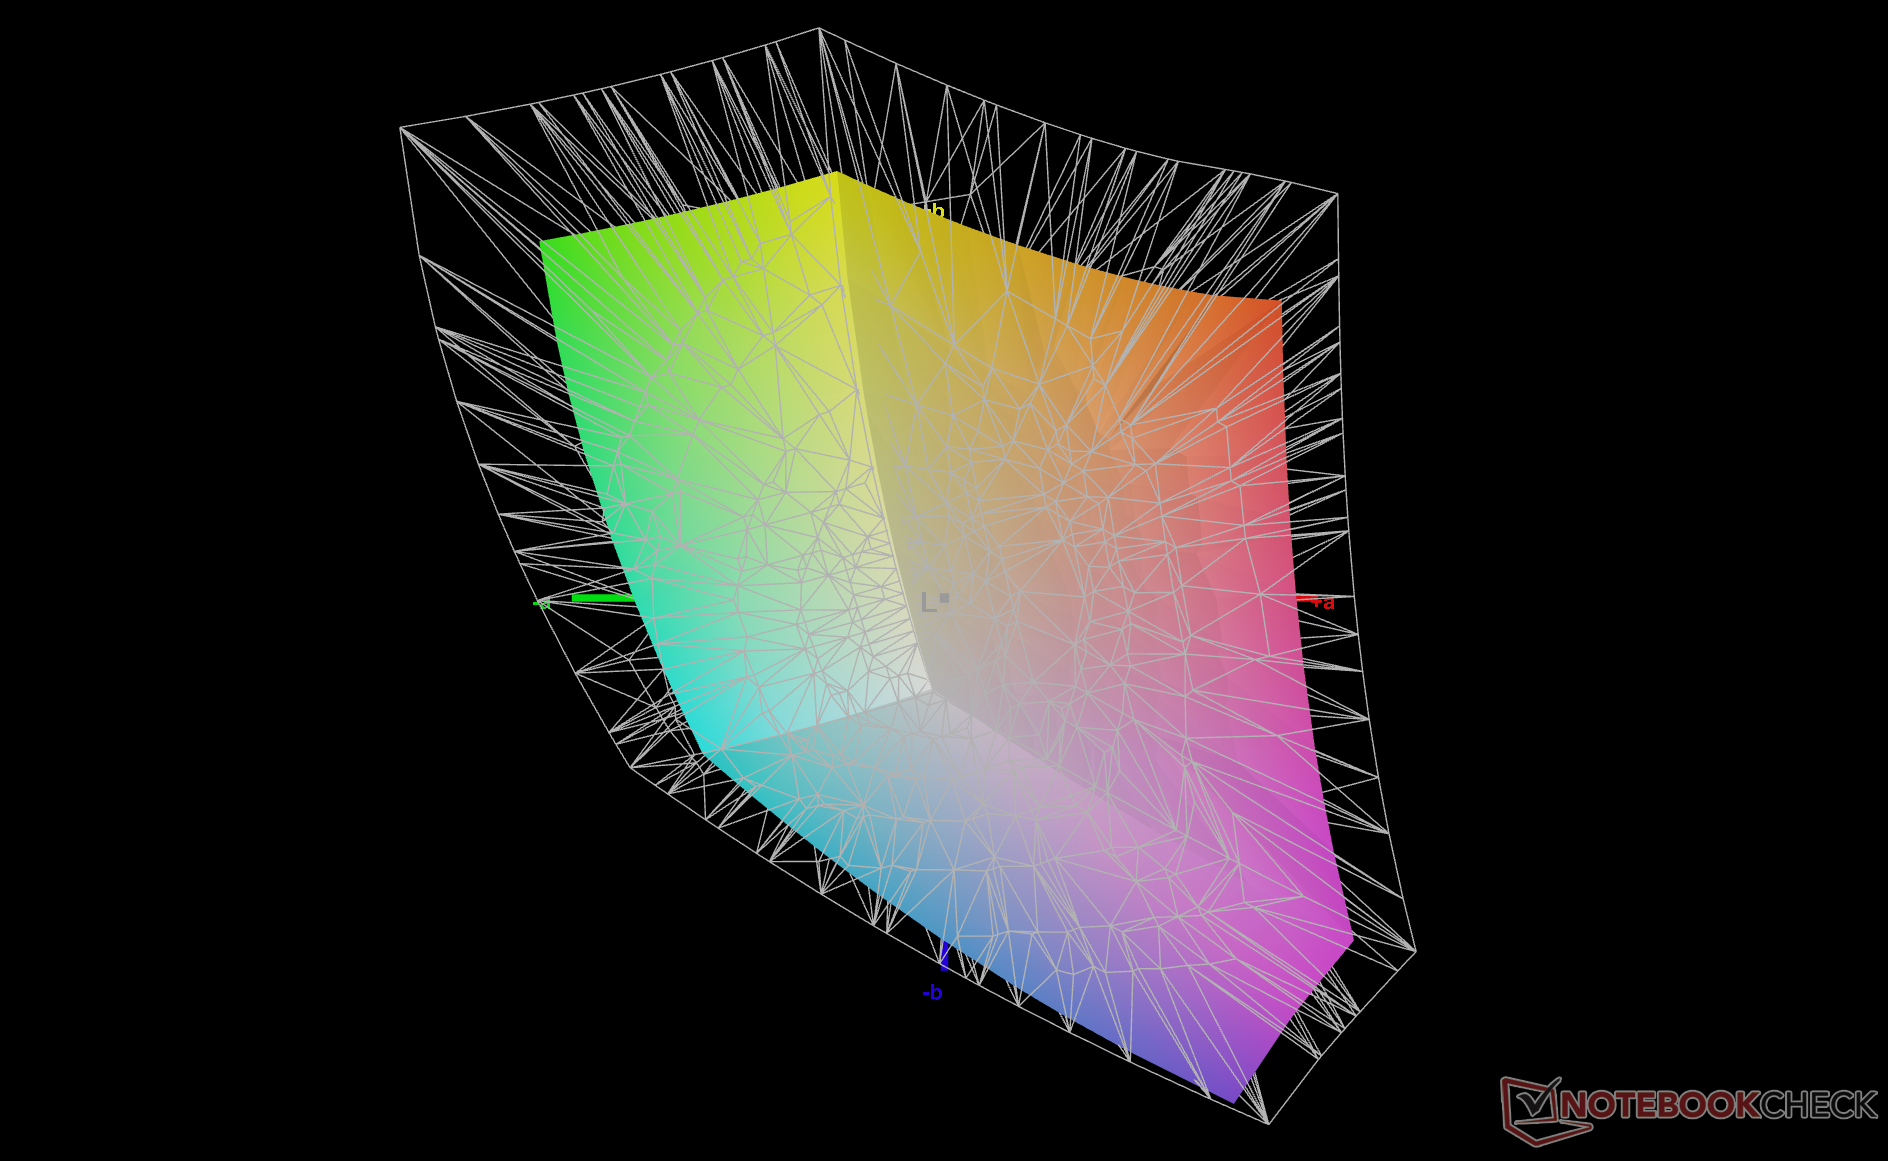
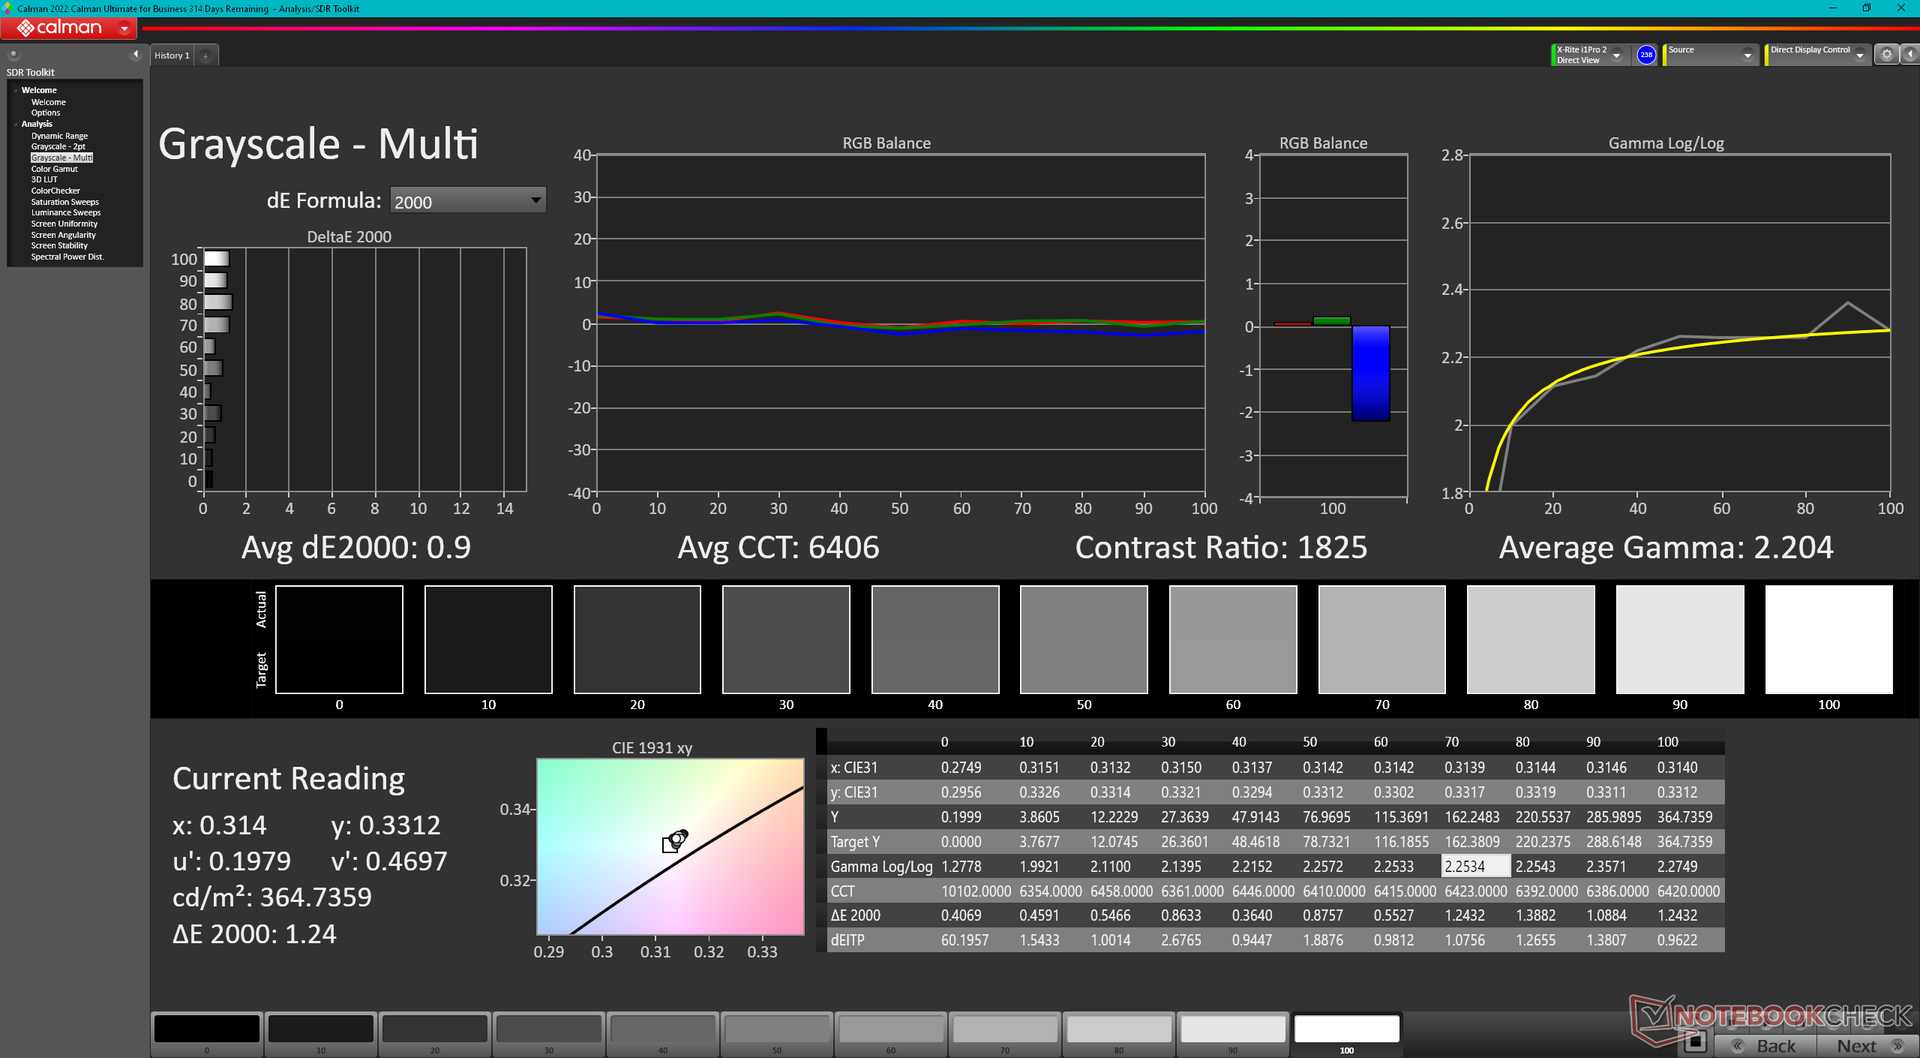
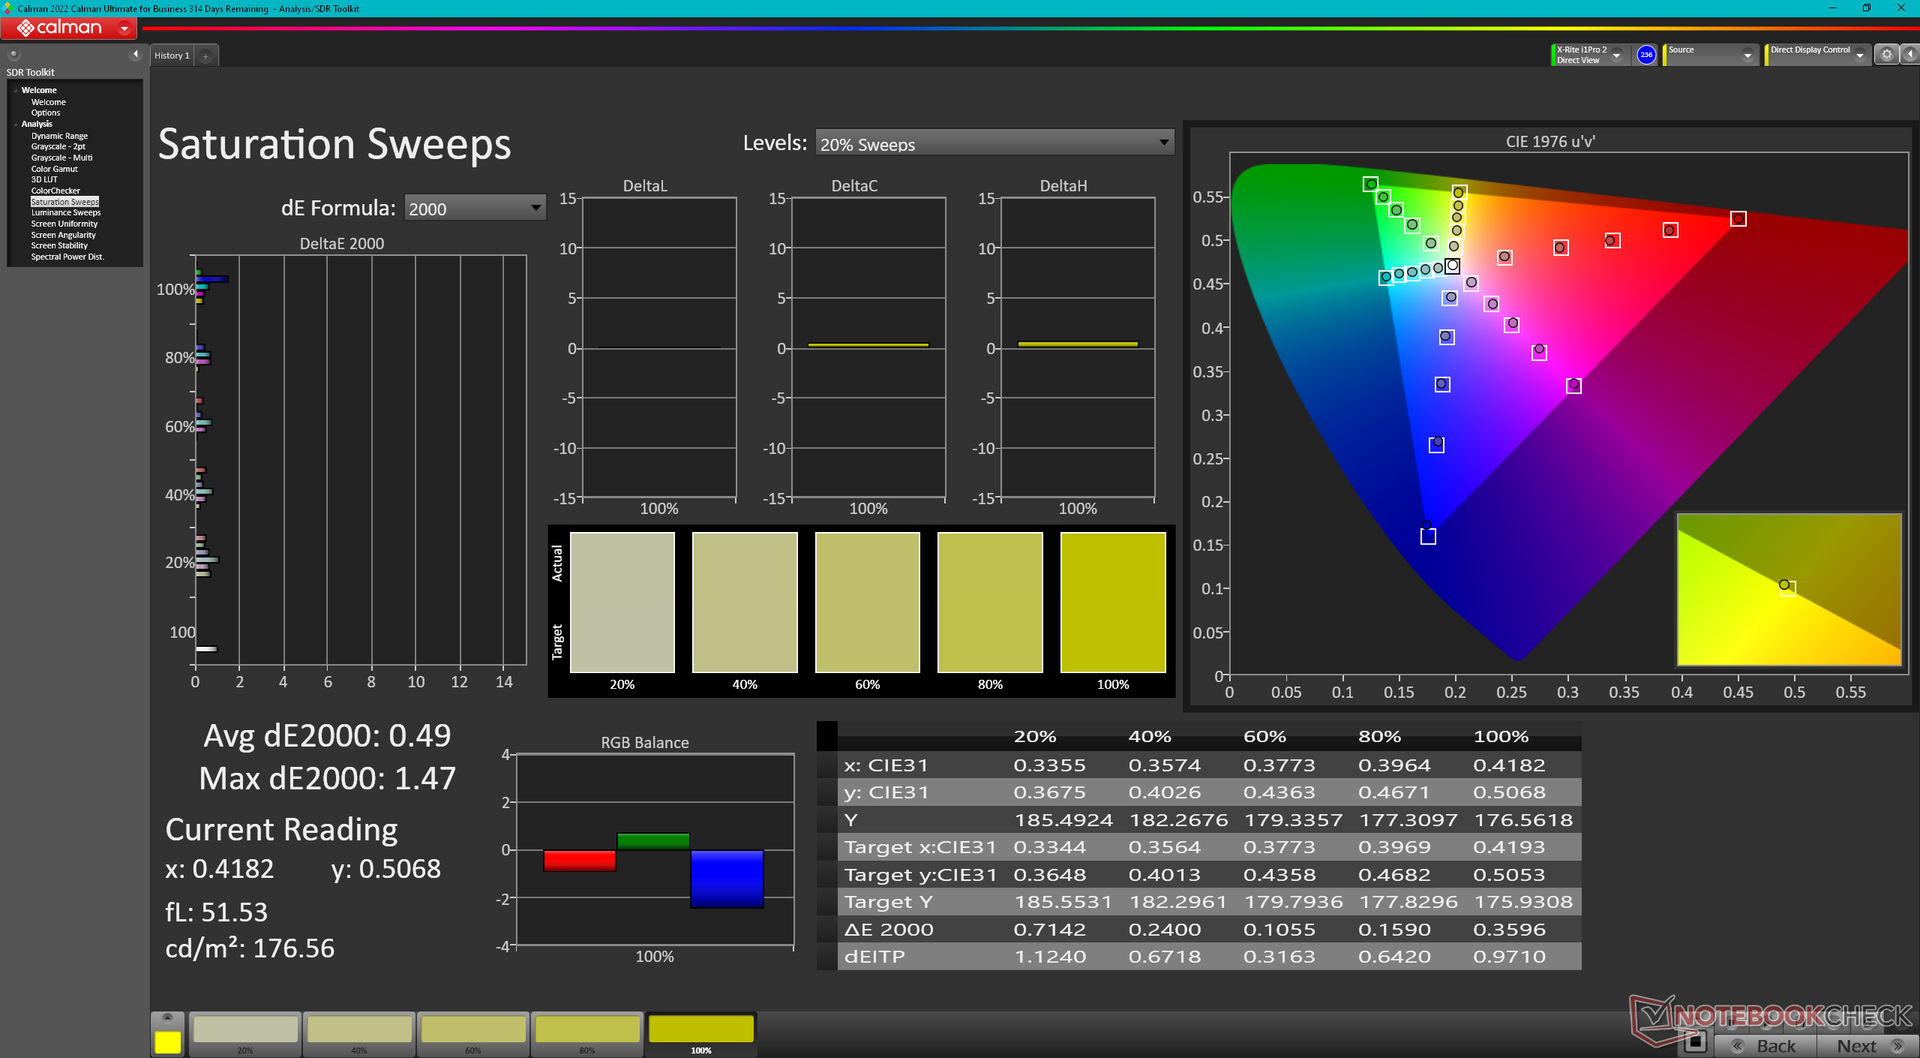
Die folgenden Messungen beziehen sich nur auf die fettgedruckte Displayoption, allerdings sind die Farbraumabdeckung und die Reaktionszeiten von allen drei Displays vermutlich ähnlich. Bei unserer Konfiguration dürfen sich Nutzer über eine sRGB-Farbraumabdeckung von 99 % und ein gutes Kontrastverhältnis von ~1.500:1 freuen. Aufgrund der langsamen Schwarz-zu-Weiß- und Grau-zu-Grau-Reaktionszeiten kommt es zu einer erkennbaren Schlierenbildung, sodass schnelle Bewegungen in Videos oder Spielen verschwommen erscheinen. Eine OLED-Option hätte hier Abhilfe schaffen können, steht allerdings nicht zur Auswahl.
Das 1.000-cd/m²-Panel ist nur mit Sure View erhältlich. Da die Technologie ein gewisses Maß an Darstellungsqualität zugunsten geschützerer Blickwinkel opfert, stehen wir ihr mit gemischten Gefühlen gegenüber.
Da unser Laptop den gleichen Chi-Mei-CMN13C0-Displaycontroller wie das Dragonfly G3 nutzt, liegt es nahe, dass HP bei beiden Modellen das gleiche Panel einsetzt.
| |||||||||||||||||||||||||
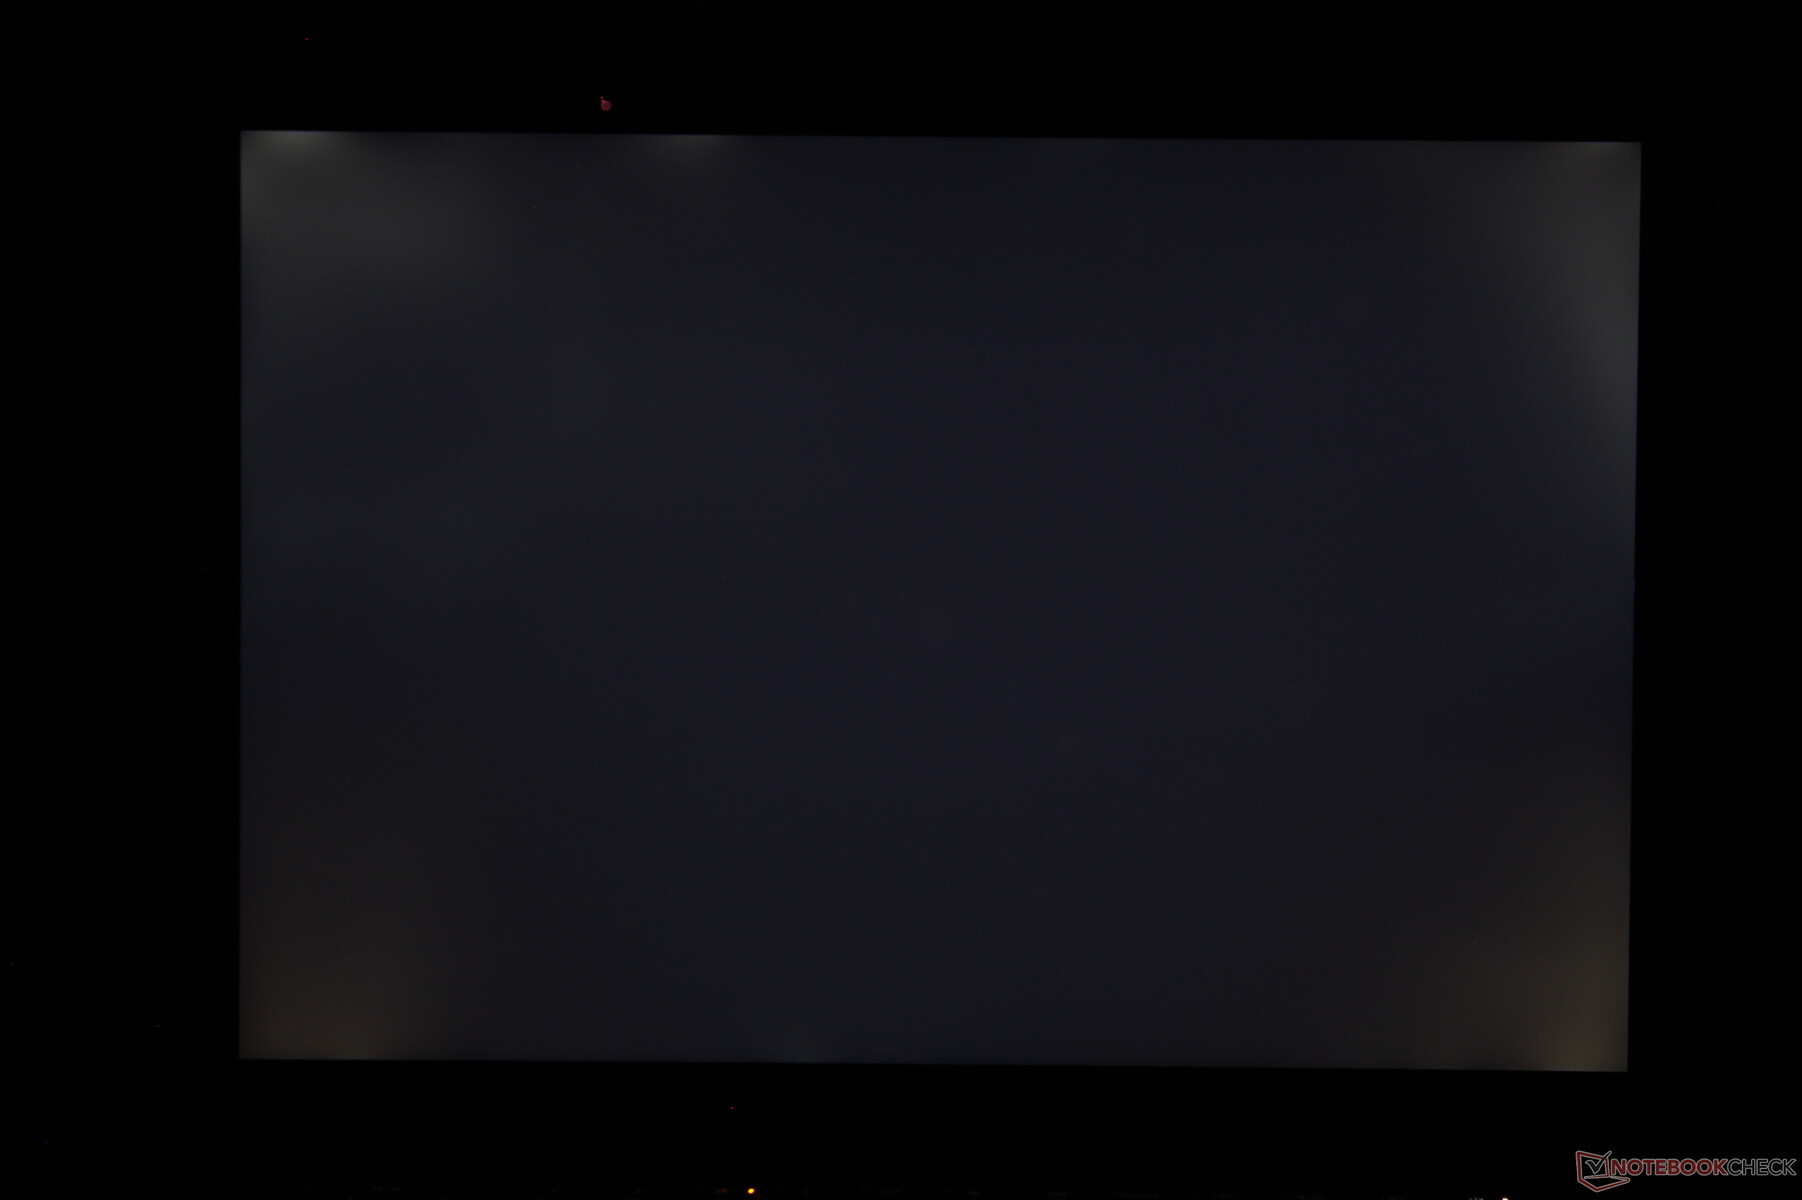
Ausleuchtung: 87 %
Helligkeit Akku: 369.5 cd/m²
Kontrast: 1540:1 (Schwarzwert: 0.24 cd/m²)
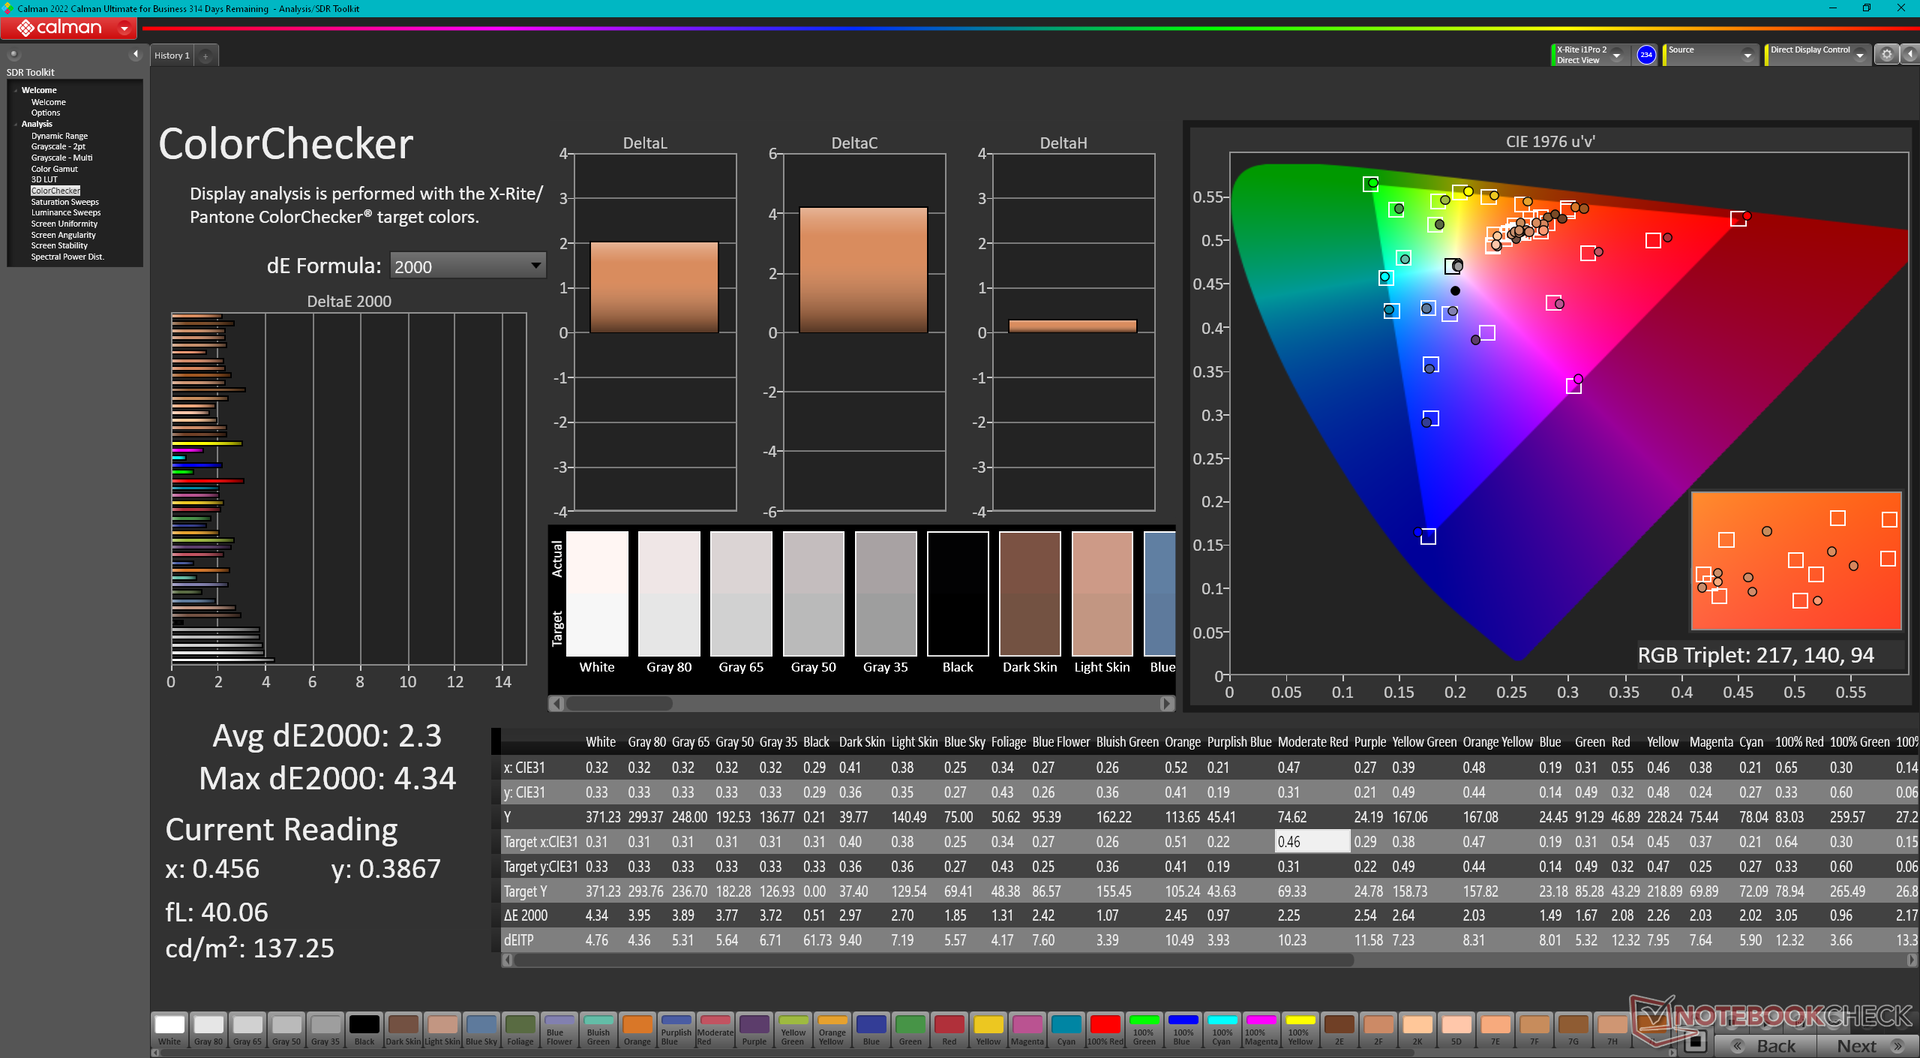
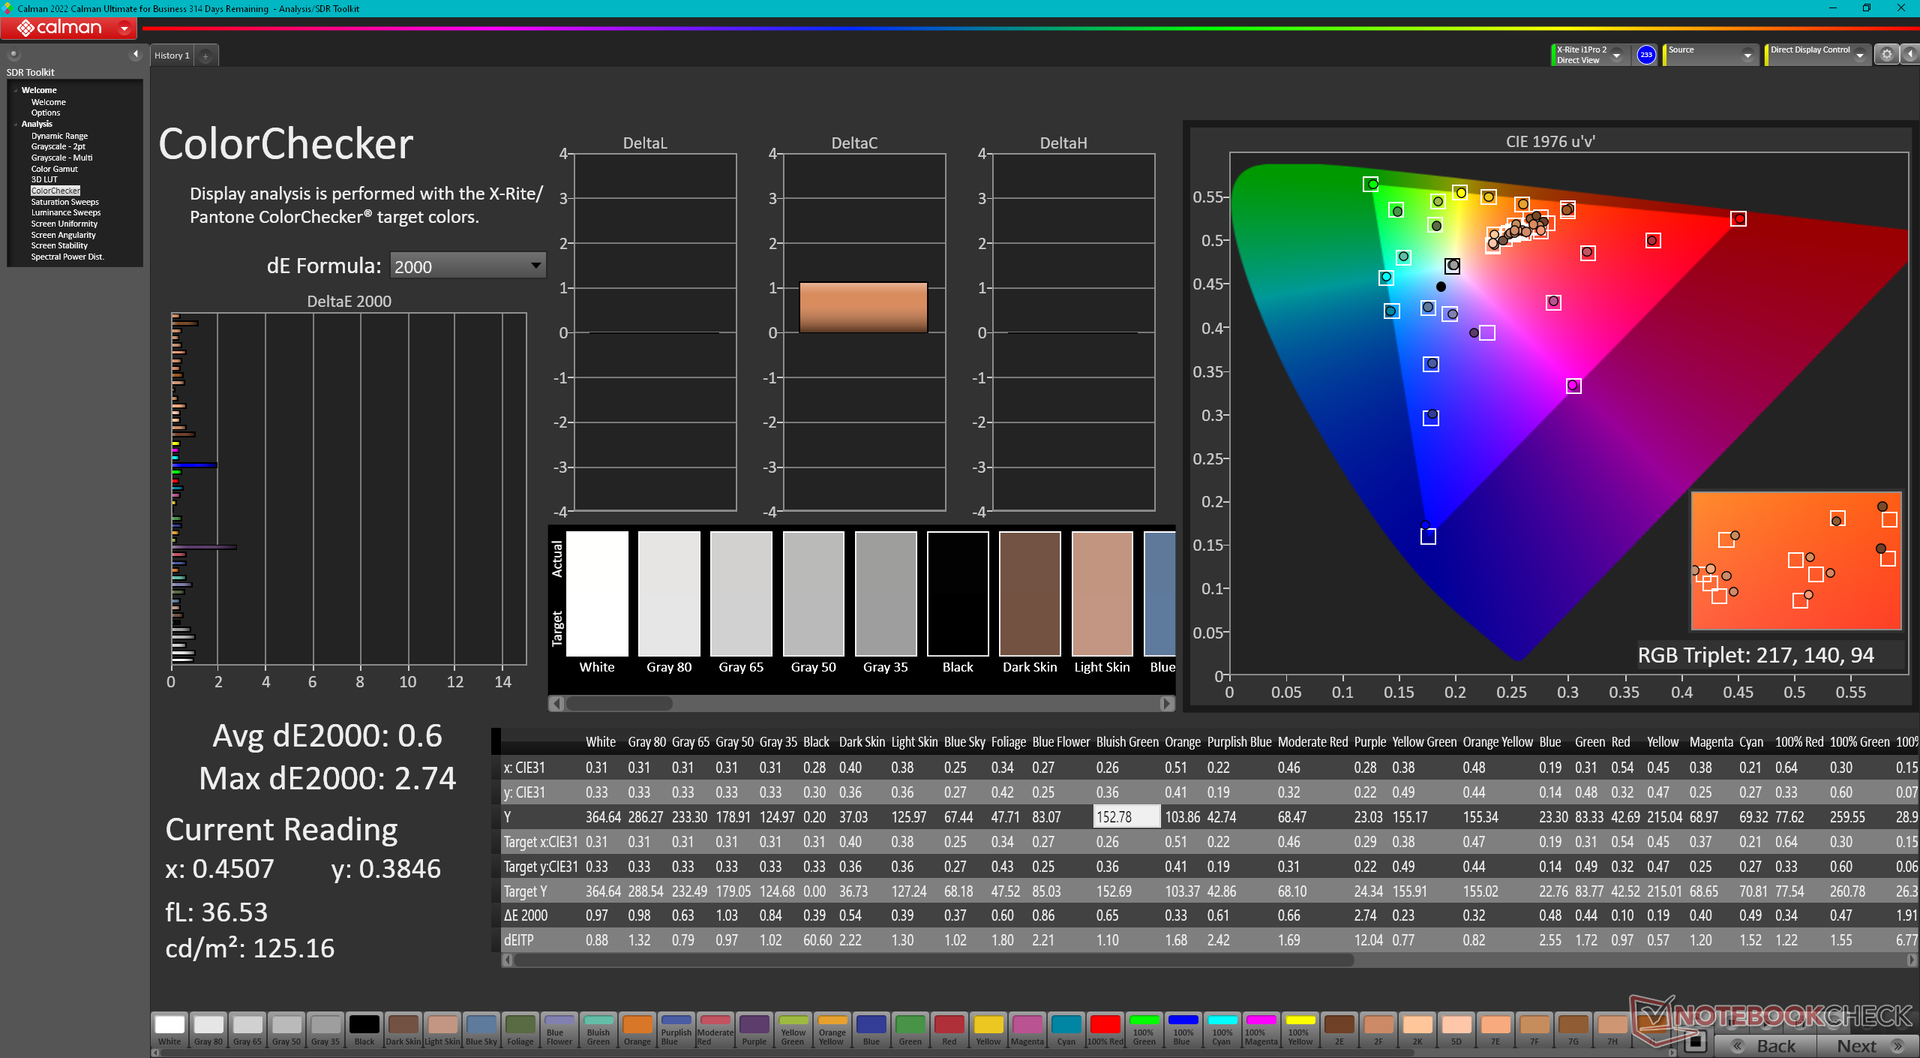
ΔE ColorChecker Calman: 2.3 | ∀{0.5-29.43 Ø4.73}
calibrated: 0.6
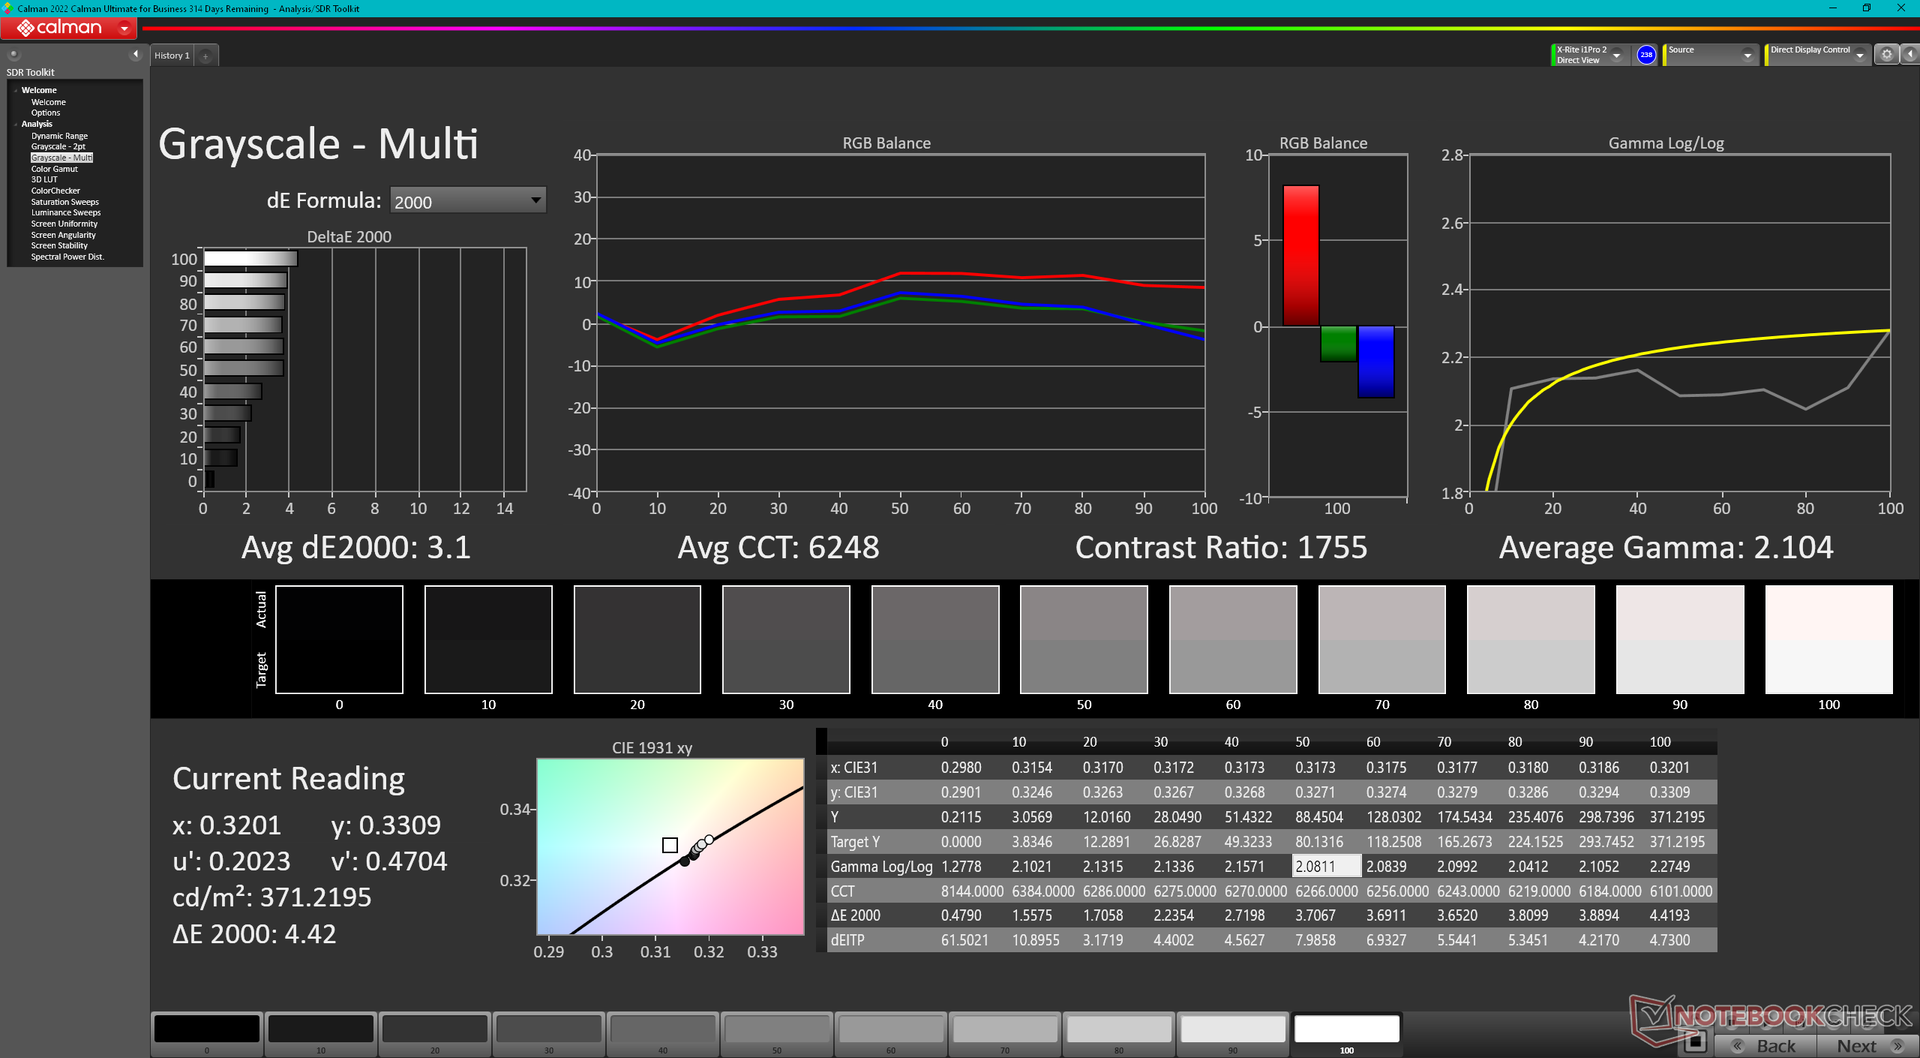
ΔE Greyscale Calman: 3.1 | ∀{0.09-98 Ø4.97}
70.2% AdobeRGB 1998 (Argyll 3D)
98.6% sRGB (Argyll 3D)
68.3% Display P3 (Argyll 3D)
Gamma: 2.1
CCT: 6248 K
| HP Elite Dragonfly Folio 13.5 G3 Chi Mei CMN13C0, IPS, 1920x1280, 13.5" | HP Elite Dragonfly G3 Chi Mei CMN13C0, IPS, 1920x1280, 13.5" | Dell Latitude 13 7330 LG Philips 133WF9, IPS, 1920x1080, 13.3" | Framework Laptop 13.5 12th Gen Intel BOE CQ NE135FBM-N41, IPS, 2256x1504, 13.5" | Razer Book 13 FHD Sharp LQ134N1JW48, IPS, 1920x1200, 13.4" | Lenovo ThinkPad L13 Gen2-20VH0017GE B133HAN06.6, IPS, 1920x1080, 13.3" | |
|---|---|---|---|---|---|---|
| Display | 0% | -4% | 1% | 2% | -38% | |
| Display P3 Coverage (%) | 68.3 | 68 0% | 66.1 -3% | 69.9 2% | 70.1 3% | 42.49 -38% |
| sRGB Coverage (%) | 98.6 | 98.3 0% | 93.5 -5% | 99.4 1% | 99.3 1% | |
| AdobeRGB 1998 Coverage (%) | 70.2 | 69.9 0% | 68.2 -3% | 71.1 1% | 71.6 2% | 43.92 -37% |
| Response Times | 23% | 31% | 43% | 14% | 26% | |
| Response Time Grey 50% / Grey 80% * (ms) | 66.8 ? | 50.8 ? 24% | 48.4 ? 28% | 34.7 ? 48% | 56.8 ? 15% | 52.4 ? 22% |
| Response Time Black / White * (ms) | 44.4 ? | 35.2 ? 21% | 29.6 ? 33% | 27.5 ? 38% | 38.8 ? 13% | 31.2 ? 30% |
| PWM Frequency (Hz) | 2475 ? | |||||
| Bildschirm | -3% | 3% | -17% | -15% | -121% | |
| Helligkeit Bildmitte (cd/m²) | 369.5 | 387.2 5% | 460.1 25% | 449.6 22% | 545.3 48% | 244 -34% |
| Brightness (cd/m²) | 350 | 360 3% | 445 27% | 431 23% | 507 45% | 237 -32% |
| Brightness Distribution (%) | 87 | 80 -8% | 89 2% | 90 3% | 88 1% | 93 7% |
| Schwarzwert * (cd/m²) | 0.24 | 0.26 -8% | 0.31 -29% | 0.31 -29% | 0.31 -29% | 0.21 12% |
| Kontrast (:1) | 1540 | 1489 -3% | 1484 -4% | 1450 -6% | 1759 14% | 1162 -25% |
| Delta E Colorchecker * | 2.3 | 2.36 -3% | 2.42 -5% | 2.76 -20% | 1.39 40% | 4.7 -104% |
| Colorchecker dE 2000 max. * | 4.34 | 4.79 -10% | 3.97 9% | 7.96 -83% | 2.61 40% | 17.7 -308% |
| Colorchecker dE 2000 calibrated * | 0.6 | 0.63 -5% | 0.77 -28% | 0.58 3% | 2.72 -353% | 4.3 -617% |
| Delta E Graustufen * | 3.1 | 3 3% | 2.3 26% | 5.2 -68% | 1.3 58% | 2.8 10% |
| Gamma | 2.1 105% | 2.17 101% | 2.23 99% | 2.23 99% | 2.2 100% | 2.24 98% |
| CCT | 6248 104% | 6137 106% | 6262 104% | 6475 100% | 6476 100% | 6259 104% |
| Farbraum (Prozent von AdobeRGB 1998) (%) | 65.9 | 40.3 | ||||
| Color Space (Percent of sRGB) (%) | 99.6 | 63 | ||||
| Durchschnitt gesamt (Programm / Settings) | 7% /
1% | 10% /
5% | 9% /
-5% | 0% /
-7% | -44% /
-86% |
* ... kleinere Werte sind besser
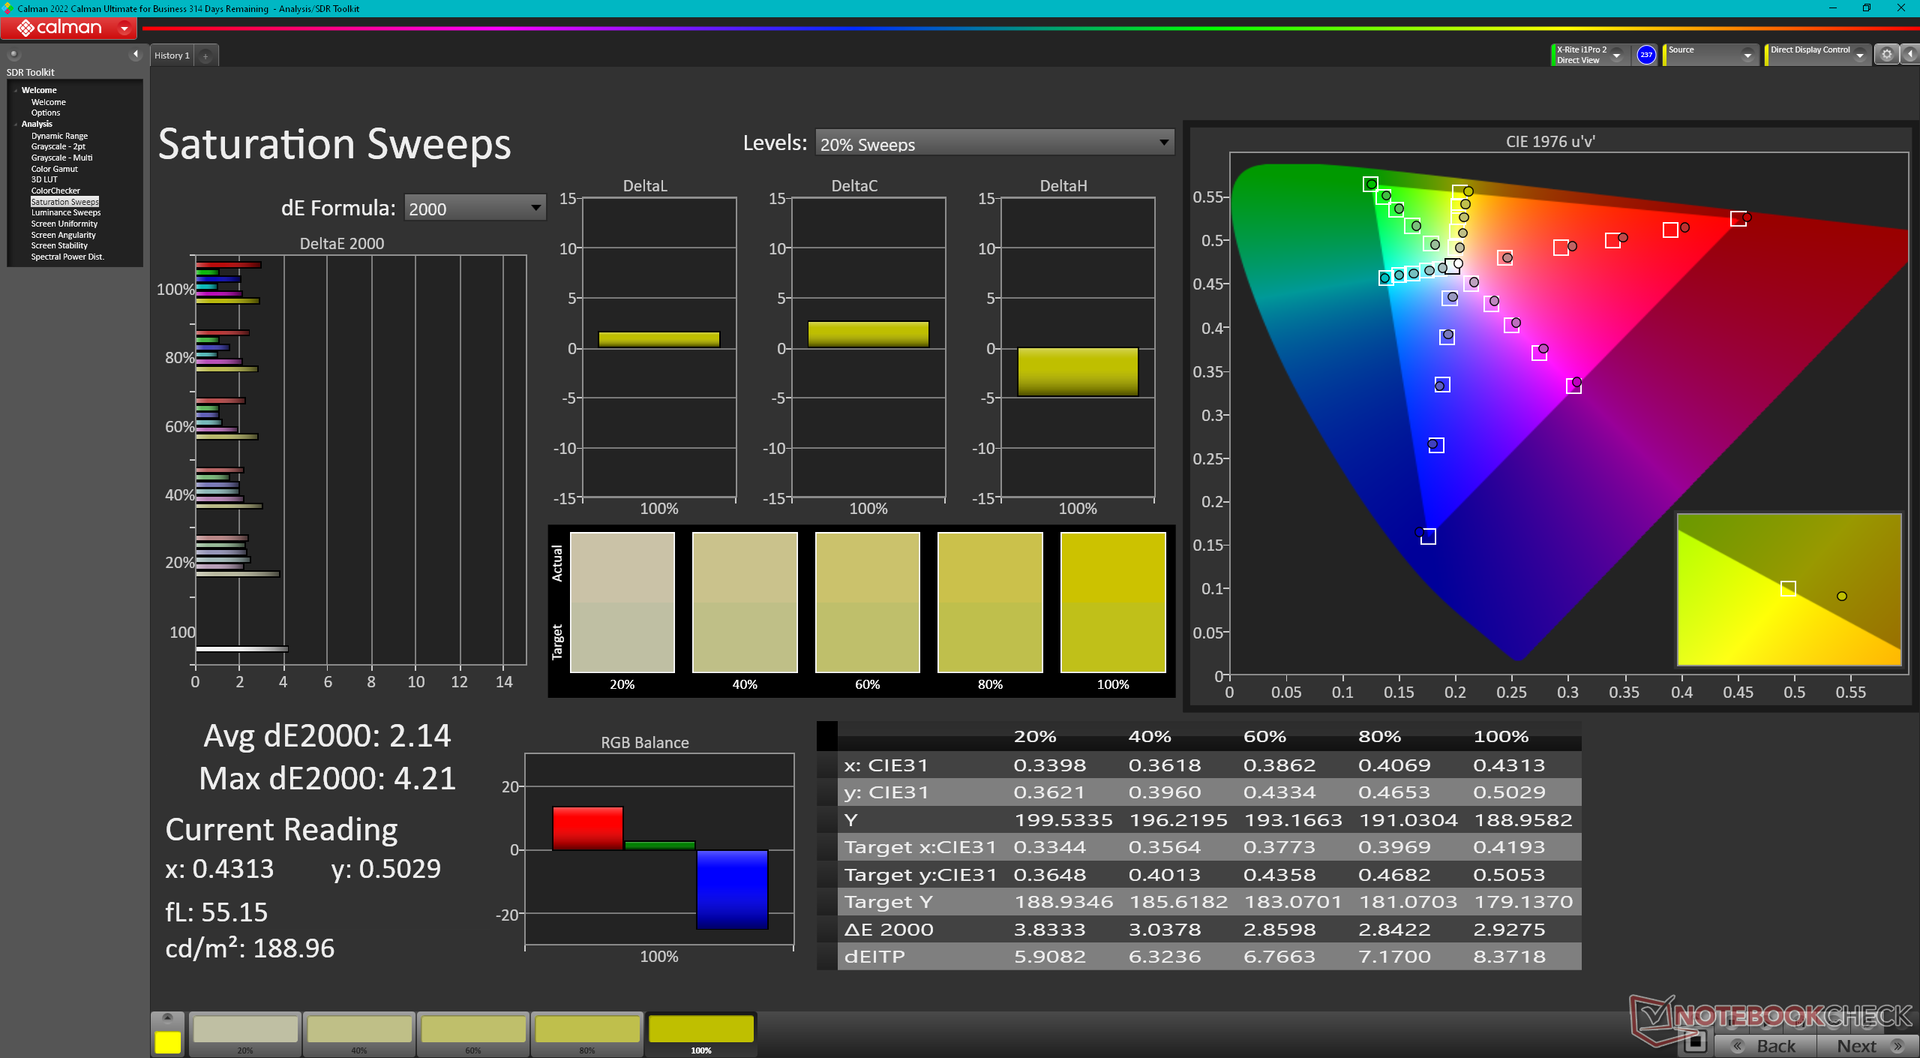
Das Panel bietet ab Werk mit Graustufen- und Farb-DeltaE-Werten von 3,1 bzw. 2,3 eine gute Darstellung. Trotzdem konnten wir die Graustufen- und Farbabweichungen durch eine Kalibrierung auf nur 0,9 bzw. 0,6 senken und somit weiter verbessern. Eine nachträgliche Kalibrierung kann sich also lohnen, ist für die meisten Nutzer jedoch nicht notwendig. Alternativ stellen wir unser kalibriertes ICM-Profil oben zum Download zur Verfügung.
Reaktionszeiten (Response Times) des Displays
| ↔ Reaktionszeiten Schwarz zu Weiß | ||
|---|---|---|
| 44.4 ms ... steigend ↗ und fallend ↘ kombiniert | ↗ 24.4 ms steigend | 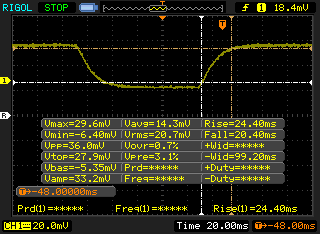 |
| ↘ 20.4 ms fallend | ||
| Die gemessenen Reaktionszeiten sind langsam und dadurch für viele Spieler wahrscheinlich zu langsam. Im Vergleich rangierten die bei uns getesteten Geräte von 0.1 (Minimum) zu 240 (Maximum) ms. » 99 % aller Screens waren schneller als der getestete. Daher sind die gemessenen Reaktionszeiten schlechter als der Durchschnitt aller vermessenen Geräte (19.9 ms). | ||
| ↔ Reaktionszeiten 50% Grau zu 80% Grau | ||
| 66.8 ms ... steigend ↗ und fallend ↘ kombiniert | ↗ 35.6 ms steigend | 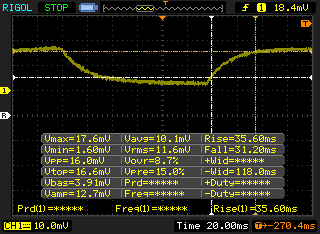 |
| ↘ 31.2 ms fallend | ||
| Die gemessenen Reaktionszeiten sind langsam und dadurch für viele Spieler wahrscheinlich zu langsam. Im Vergleich rangierten die bei uns getesteten Geräte von 0.165 (Minimum) zu 636 (Maximum) ms. » 98 % aller Screens waren schneller als der getestete. Daher sind die gemessenen Reaktionszeiten schlechter als der Durchschnitt aller vermessenen Geräte (31.1 ms). | ||
Bildschirm-Flackern / PWM (Pulse-Width Modulation)
| Flackern / PWM nicht festgestellt | 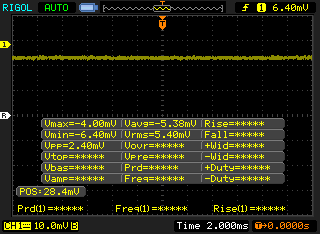 | ||
Im Vergleich: 52 % aller getesteten Geräte nutzten kein PWM um die Helligkeit zu reduzieren. Wenn PWM eingesetzt wurde, dann bei einer Frequenz von durchschnittlich 7798 (Minimum 5, Maximum 343500) Hz. | |||
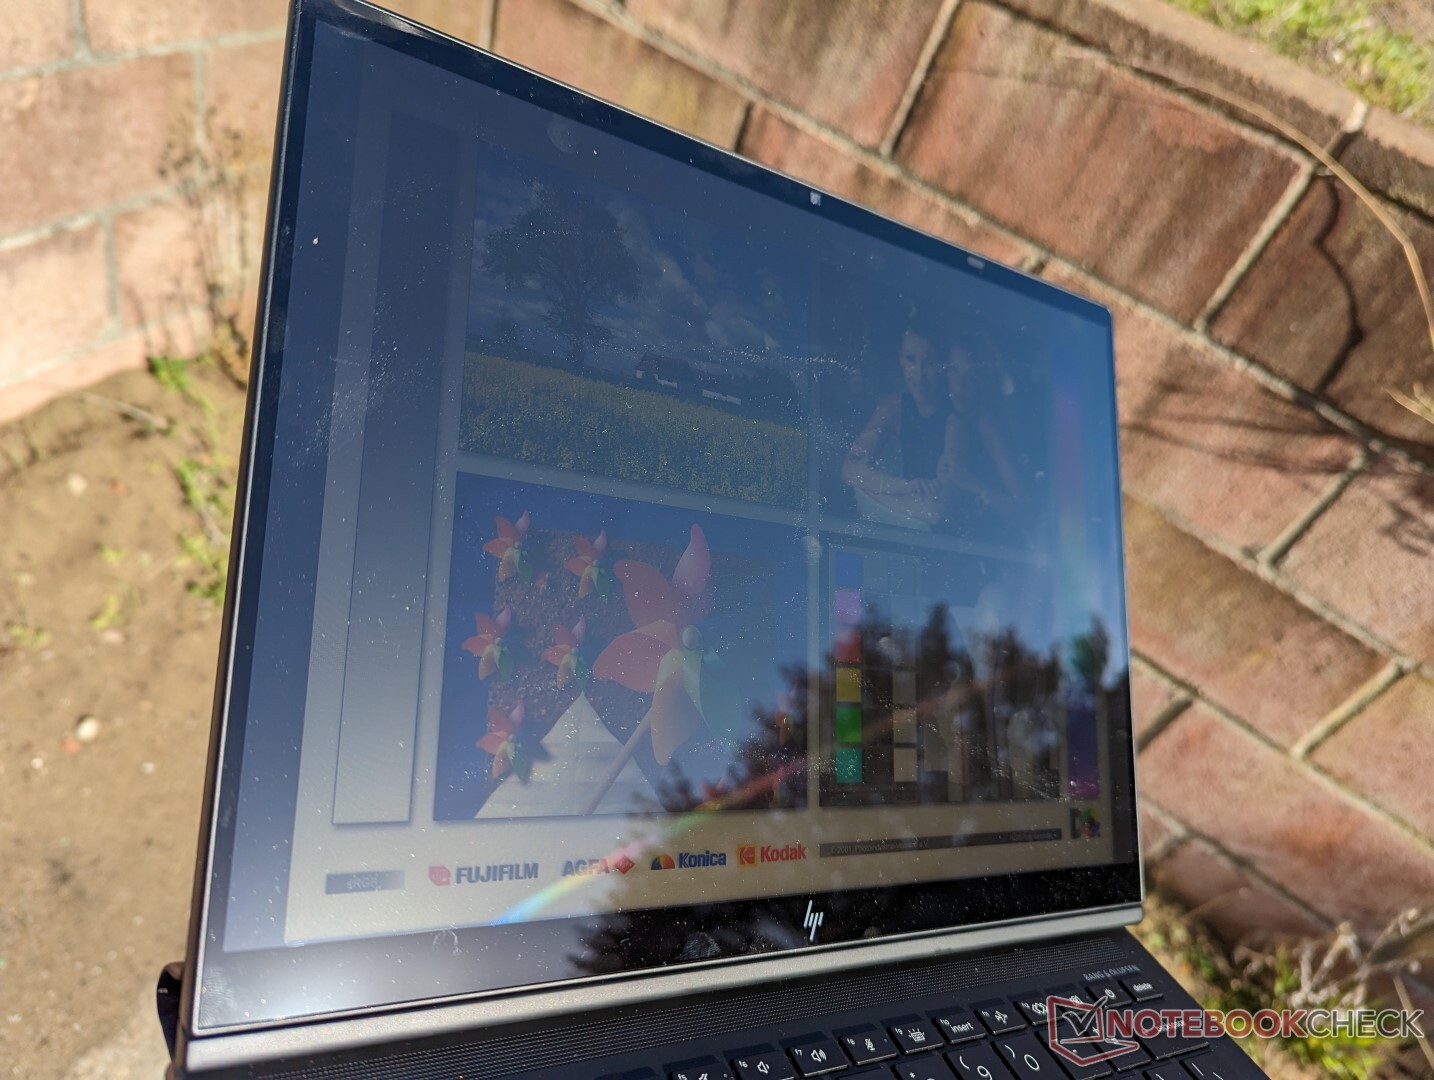
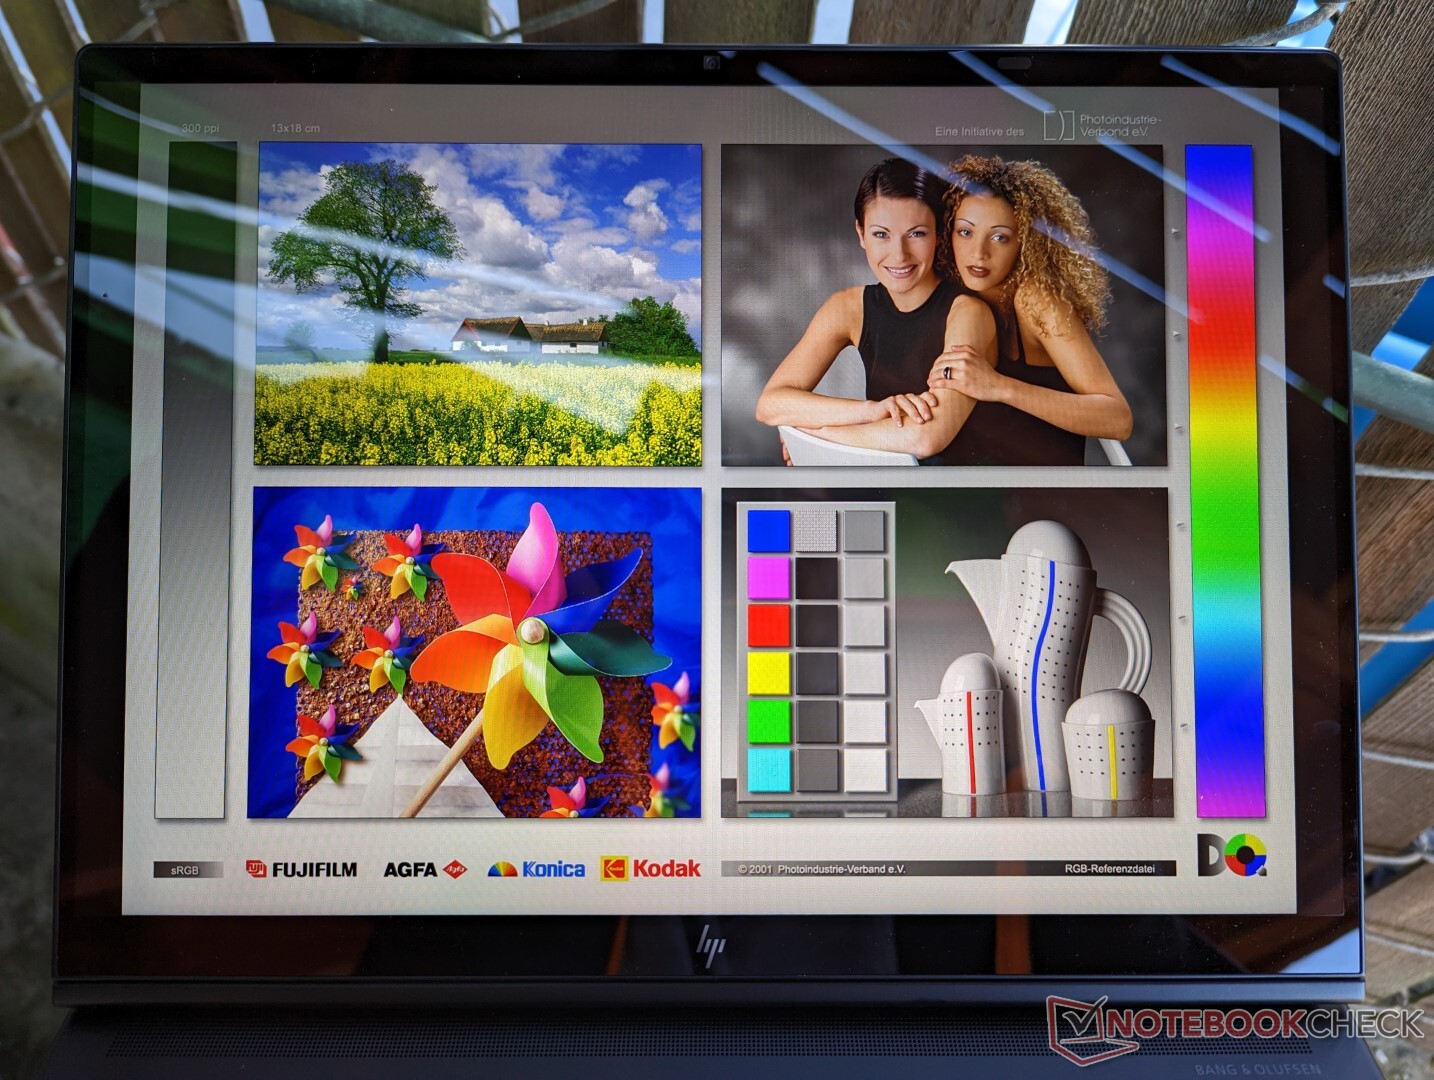
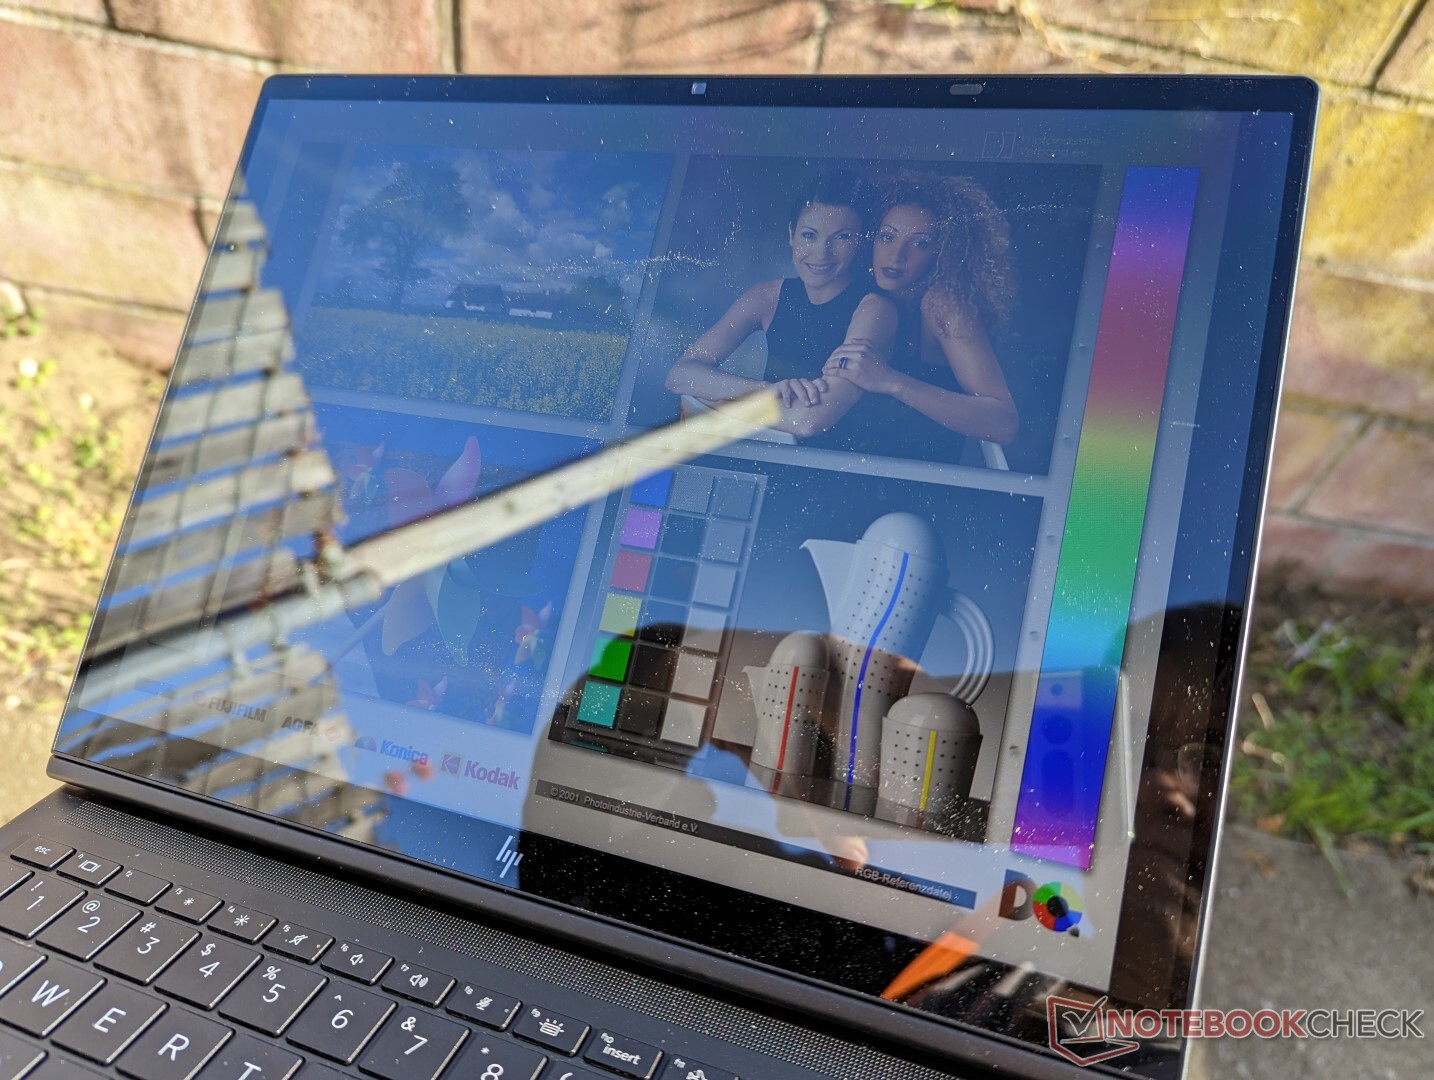
Im Freien ist die Lesbarkeit nur im Schatten wirklich gegeben, da die Farben unter helleren Bedingungen ausgewaschen wirken und Reflexionen dann in verstärktem Maße auftreten. Wie zuvor erwähnt bietet HP auch ein 1.000-cd/m²-Paneloption an, welche die Outdoor-Tauglichkeit erheblich erhöht. In dieser Hinsicht können Lenovo und Dell mit ihren ThinkPad- bzw. Latitude-Convertibles noch nicht mithalten.
Leistung — Die richtigen Core-U-Optionen

Testbedingungen
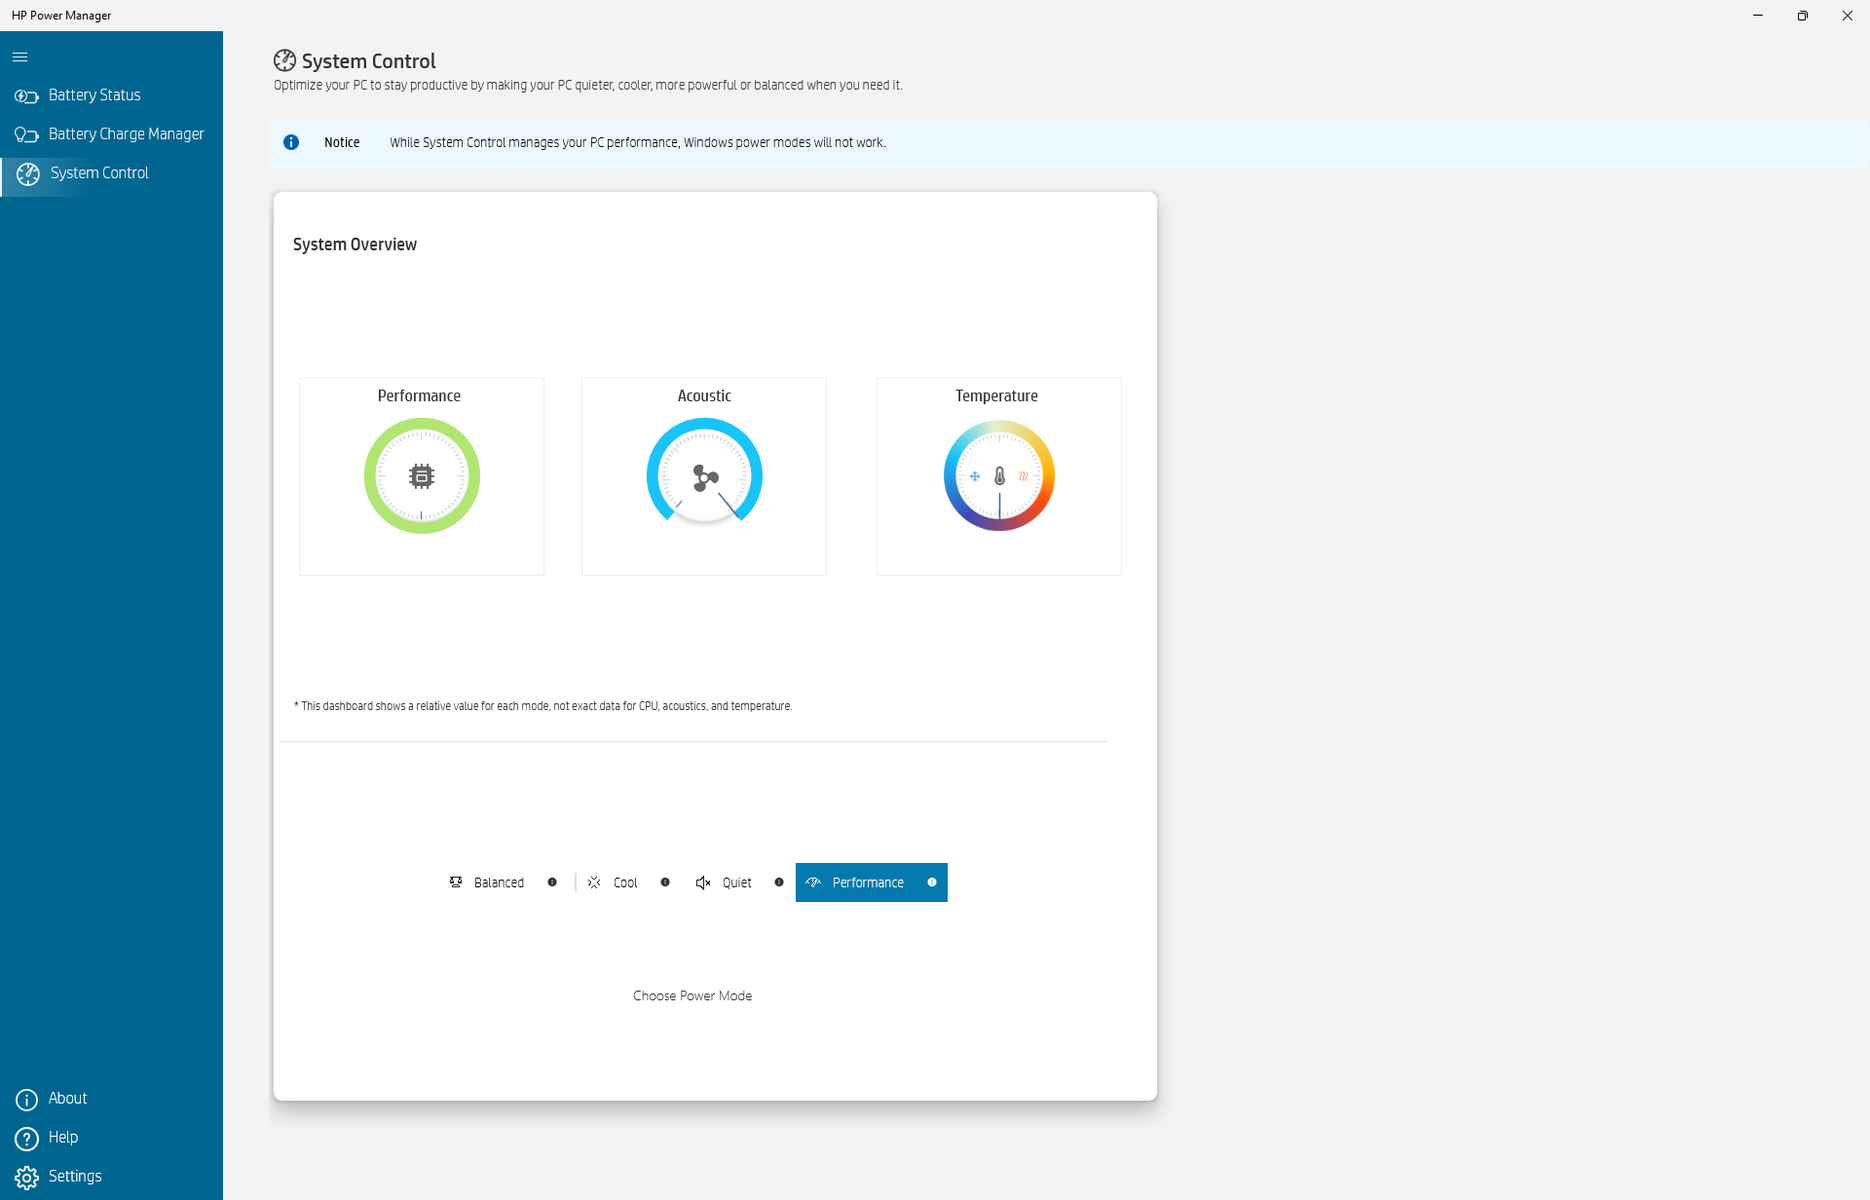
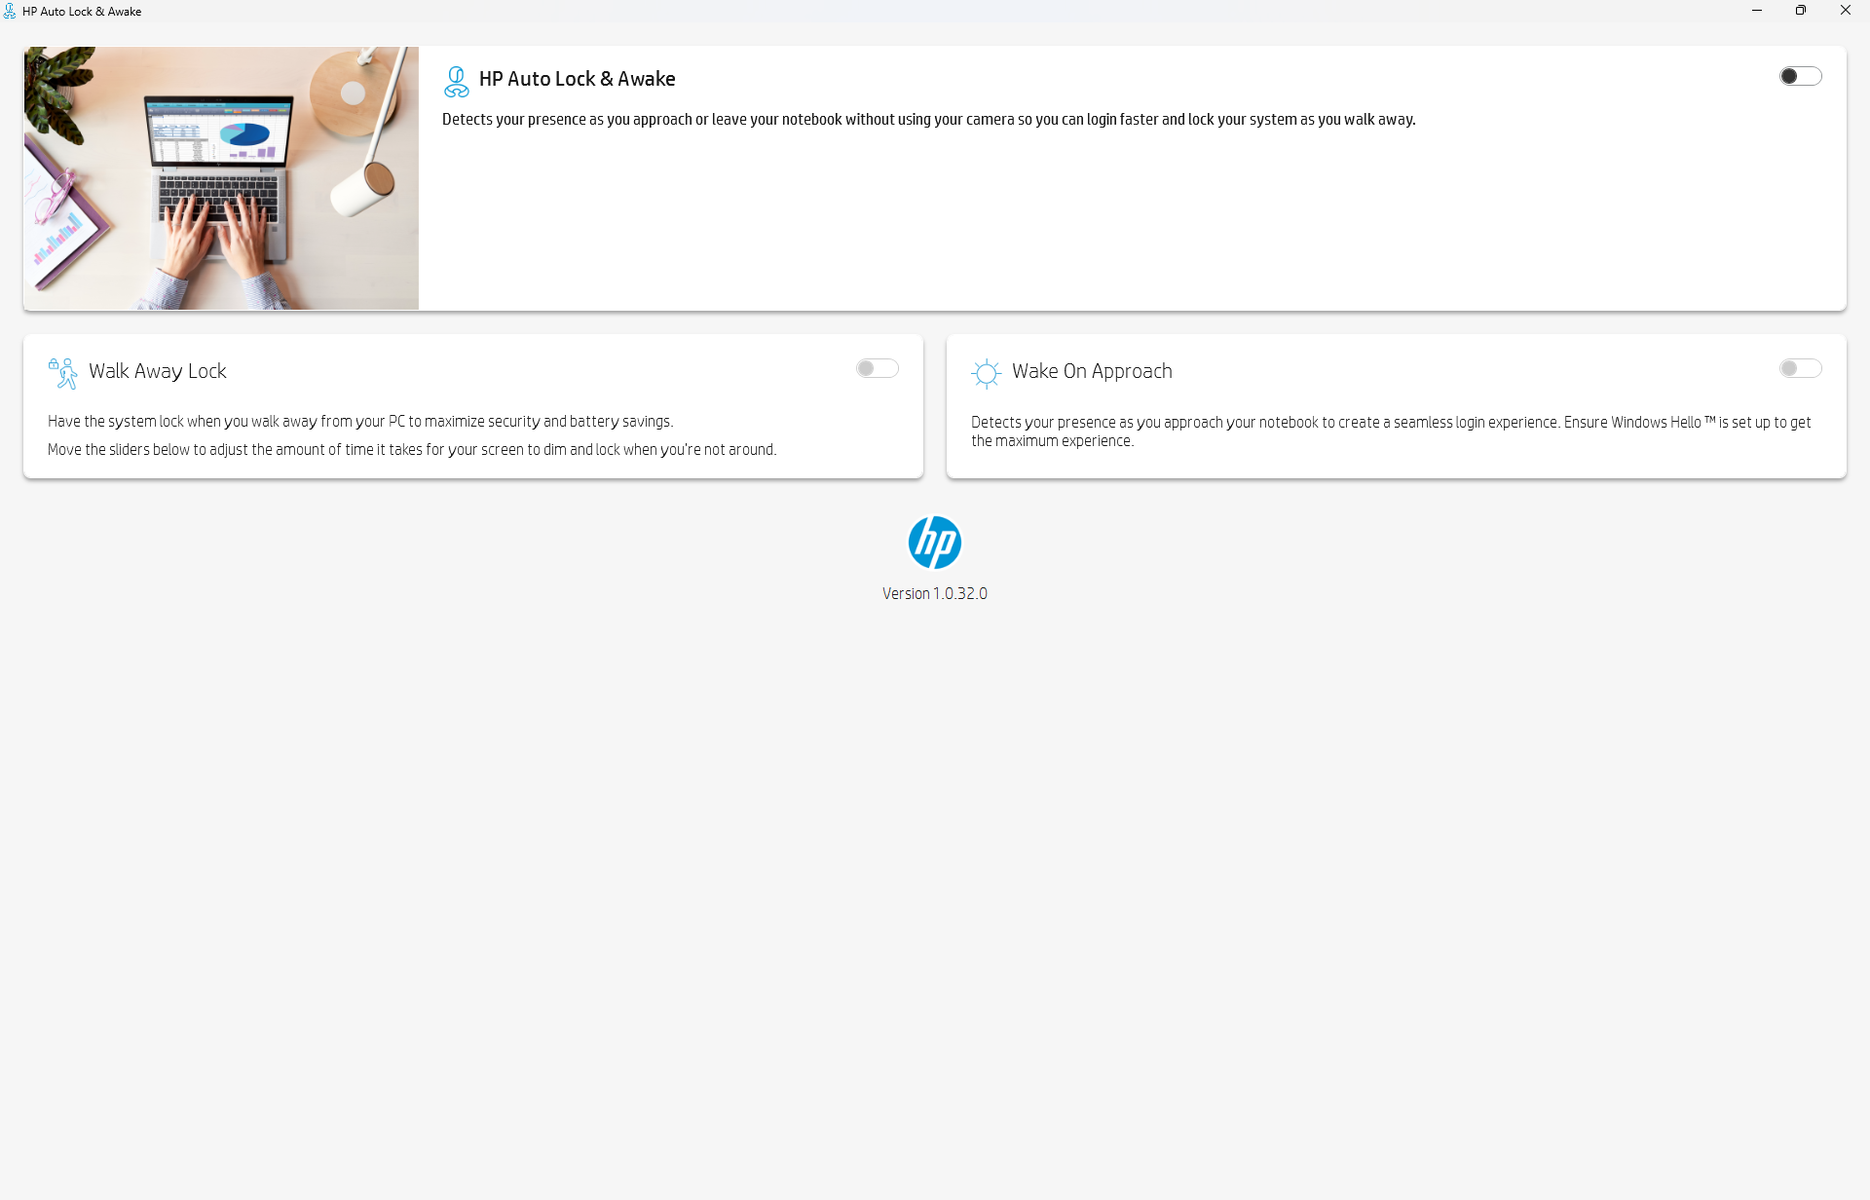
Wir haben bei unserem Testgerät in Windows und HPs Power-Manager-Software den Hochleistungsmodus ausgewählt, bevor wir die folgenden Benchmarks ausgeführt haben. Wir empfehlen Nutzern, sich mit dem HP Power Manager, der automatischen An- und Abmeldesoftware und der Anwendung für programmierbare Tasten auseinanderzusetzen. Über Power Manager hat man Zugriff auf die verschiedenen Leistungsprofile des Laptops, die automatische An- und Abmeldesoftware steuert den IR-Sensor und das automatische Dimmen, während über die Software für programmierbare Tasten die Funktion bestimmter Tasten angepasst werden kann.

Prozessor
Mit einer um 10 bis 15 % höheren Multi-Thread-Leistung als ein durchschnittlicher Laptop mit dem Core i7-1265U ist die CPU-Leistung hervorragend. Interessanterweise ist unser Testgerät auch unter der Berücksichtigung des Drosselns schneller als der Core i7-1265U im Dragonfly G3. Wer von einem älteren Prozessor wie dem Core i7-1065G7 aus der 10. Generation kommt, bekommt hier fast die doppelte Multi-Thread-Leistung.
Dass der Turbo Boost nicht dauerhaft aufrechterhalten werden kann, entspricht unseren Erwartungen für ein Ultrabook mit einem Core-U-Prozessor. Beim Ausführen von Cinebench R15 xT in einer Schleife fällt die Leistung im Laufe der Zeit um ca. 20 % ab, wie das Diagramm unten zeigt.
Dauertest: Cinebench R15 Multi
Cinebench R23: Multi Core | Single Core
Cinebench R15: CPU Multi 64Bit | CPU Single 64Bit
Blender: v2.79 BMW27 CPU
7-Zip 18.03: 7z b 4 | 7z b 4 -mmt1
Geekbench 5.5: Multi-Core | Single-Core
HWBOT x265 Benchmark v2.2: 4k Preset
LibreOffice : 20 Documents To PDF
R Benchmark 2.5: Overall mean
Cinebench R23: Multi Core | Single Core
Cinebench R15: CPU Multi 64Bit | CPU Single 64Bit
Blender: v2.79 BMW27 CPU
7-Zip 18.03: 7z b 4 | 7z b 4 -mmt1
Geekbench 5.5: Multi-Core | Single-Core
HWBOT x265 Benchmark v2.2: 4k Preset
LibreOffice : 20 Documents To PDF
R Benchmark 2.5: Overall mean
* ... kleinere Werte sind besser
AIDA64: FP32 Ray-Trace | FPU Julia | CPU SHA3 | CPU Queen | FPU SinJulia | FPU Mandel | CPU AES | CPU ZLib | FP64 Ray-Trace | CPU PhotoWorxx
| Performance Rating | |
| Framework Laptop 13.5 12th Gen Intel | |
| HP Elite Dragonfly Folio 13.5 G3 | |
| Dell Latitude 13 7330 | |
| Durchschnittliche Intel Core i7-1265U | |
| HP Elite Dragonfly G3 | |
| Lenovo ThinkPad L13 Gen2-20VH0017GE | |
| AIDA64 / FP32 Ray-Trace | |
| HP Elite Dragonfly Folio 13.5 G3 | |
| Dell Latitude 13 7330 | |
| Durchschnittliche Intel Core i7-1265U (2619 - 8178, n=10) | |
| Lenovo ThinkPad L13 Gen2-20VH0017GE | |
| Lenovo ThinkPad L13 Gen2-20VH0017GE | |
| HP Elite Dragonfly G3 | |
| Framework Laptop 13.5 12th Gen Intel | |
| AIDA64 / FPU Julia | |
| Dell Latitude 13 7330 | |
| HP Elite Dragonfly Folio 13.5 G3 | |
| Durchschnittliche Intel Core i7-1265U (12909 - 41649, n=10) | |
| HP Elite Dragonfly G3 | |
| Framework Laptop 13.5 12th Gen Intel | |
| Lenovo ThinkPad L13 Gen2-20VH0017GE | |
| Lenovo ThinkPad L13 Gen2-20VH0017GE | |
| AIDA64 / CPU SHA3 | |
| Dell Latitude 13 7330 | |
| Framework Laptop 13.5 12th Gen Intel | |
| HP Elite Dragonfly Folio 13.5 G3 | |
| Durchschnittliche Intel Core i7-1265U (824 - 2183, n=10) | |
| Lenovo ThinkPad L13 Gen2-20VH0017GE | |
| Lenovo ThinkPad L13 Gen2-20VH0017GE | |
| HP Elite Dragonfly G3 | |
| AIDA64 / CPU Queen | |
| Framework Laptop 13.5 12th Gen Intel | |
| HP Elite Dragonfly Folio 13.5 G3 | |
| Durchschnittliche Intel Core i7-1265U (63615 - 67065, n=10) | |
| Dell Latitude 13 7330 | |
| HP Elite Dragonfly G3 | |
| Lenovo ThinkPad L13 Gen2-20VH0017GE | |
| Lenovo ThinkPad L13 Gen2-20VH0017GE | |
| AIDA64 / FPU SinJulia | |
| Framework Laptop 13.5 12th Gen Intel | |
| HP Elite Dragonfly Folio 13.5 G3 | |
| Lenovo ThinkPad L13 Gen2-20VH0017GE | |
| Lenovo ThinkPad L13 Gen2-20VH0017GE | |
| Durchschnittliche Intel Core i7-1265U (3105 - 5135, n=10) | |
| Dell Latitude 13 7330 | |
| HP Elite Dragonfly G3 | |
| AIDA64 / FPU Mandel | |
| HP Elite Dragonfly Folio 13.5 G3 | |
| Dell Latitude 13 7330 | |
| Durchschnittliche Intel Core i7-1265U (6967 - 20804, n=10) | |
| Lenovo ThinkPad L13 Gen2-20VH0017GE | |
| Lenovo ThinkPad L13 Gen2-20VH0017GE | |
| HP Elite Dragonfly G3 | |
| Framework Laptop 13.5 12th Gen Intel | |
| AIDA64 / CPU AES | |
| Framework Laptop 13.5 12th Gen Intel | |
| Lenovo ThinkPad L13 Gen2-20VH0017GE | |
| Lenovo ThinkPad L13 Gen2-20VH0017GE | |
| Dell Latitude 13 7330 | |
| HP Elite Dragonfly Folio 13.5 G3 | |
| Durchschnittliche Intel Core i7-1265U (19489 - 42966, n=10) | |
| HP Elite Dragonfly G3 | |
| AIDA64 / CPU ZLib | |
| Framework Laptop 13.5 12th Gen Intel | |
| Dell Latitude 13 7330 | |
| HP Elite Dragonfly Folio 13.5 G3 | |
| Durchschnittliche Intel Core i7-1265U (314 - 632, n=10) | |
| HP Elite Dragonfly G3 | |
| Lenovo ThinkPad L13 Gen2-20VH0017GE | |
| Lenovo ThinkPad L13 Gen2-20VH0017GE | |
| AIDA64 / FP64 Ray-Trace | |
| HP Elite Dragonfly Folio 13.5 G3 | |
| Dell Latitude 13 7330 | |
| Lenovo ThinkPad L13 Gen2-20VH0017GE | |
| Lenovo ThinkPad L13 Gen2-20VH0017GE | |
| Durchschnittliche Intel Core i7-1265U (1473 - 4376, n=10) | |
| HP Elite Dragonfly G3 | |
| Framework Laptop 13.5 12th Gen Intel | |
| AIDA64 / CPU PhotoWorxx | |
| HP Elite Dragonfly Folio 13.5 G3 | |
| HP Elite Dragonfly G3 | |
| Durchschnittliche Intel Core i7-1265U (20213 - 47031, n=10) | |
| Framework Laptop 13.5 12th Gen Intel | |
| Lenovo ThinkPad L13 Gen2-20VH0017GE | |
| Lenovo ThinkPad L13 Gen2-20VH0017GE | |
| Dell Latitude 13 7330 | |
Systemleistung
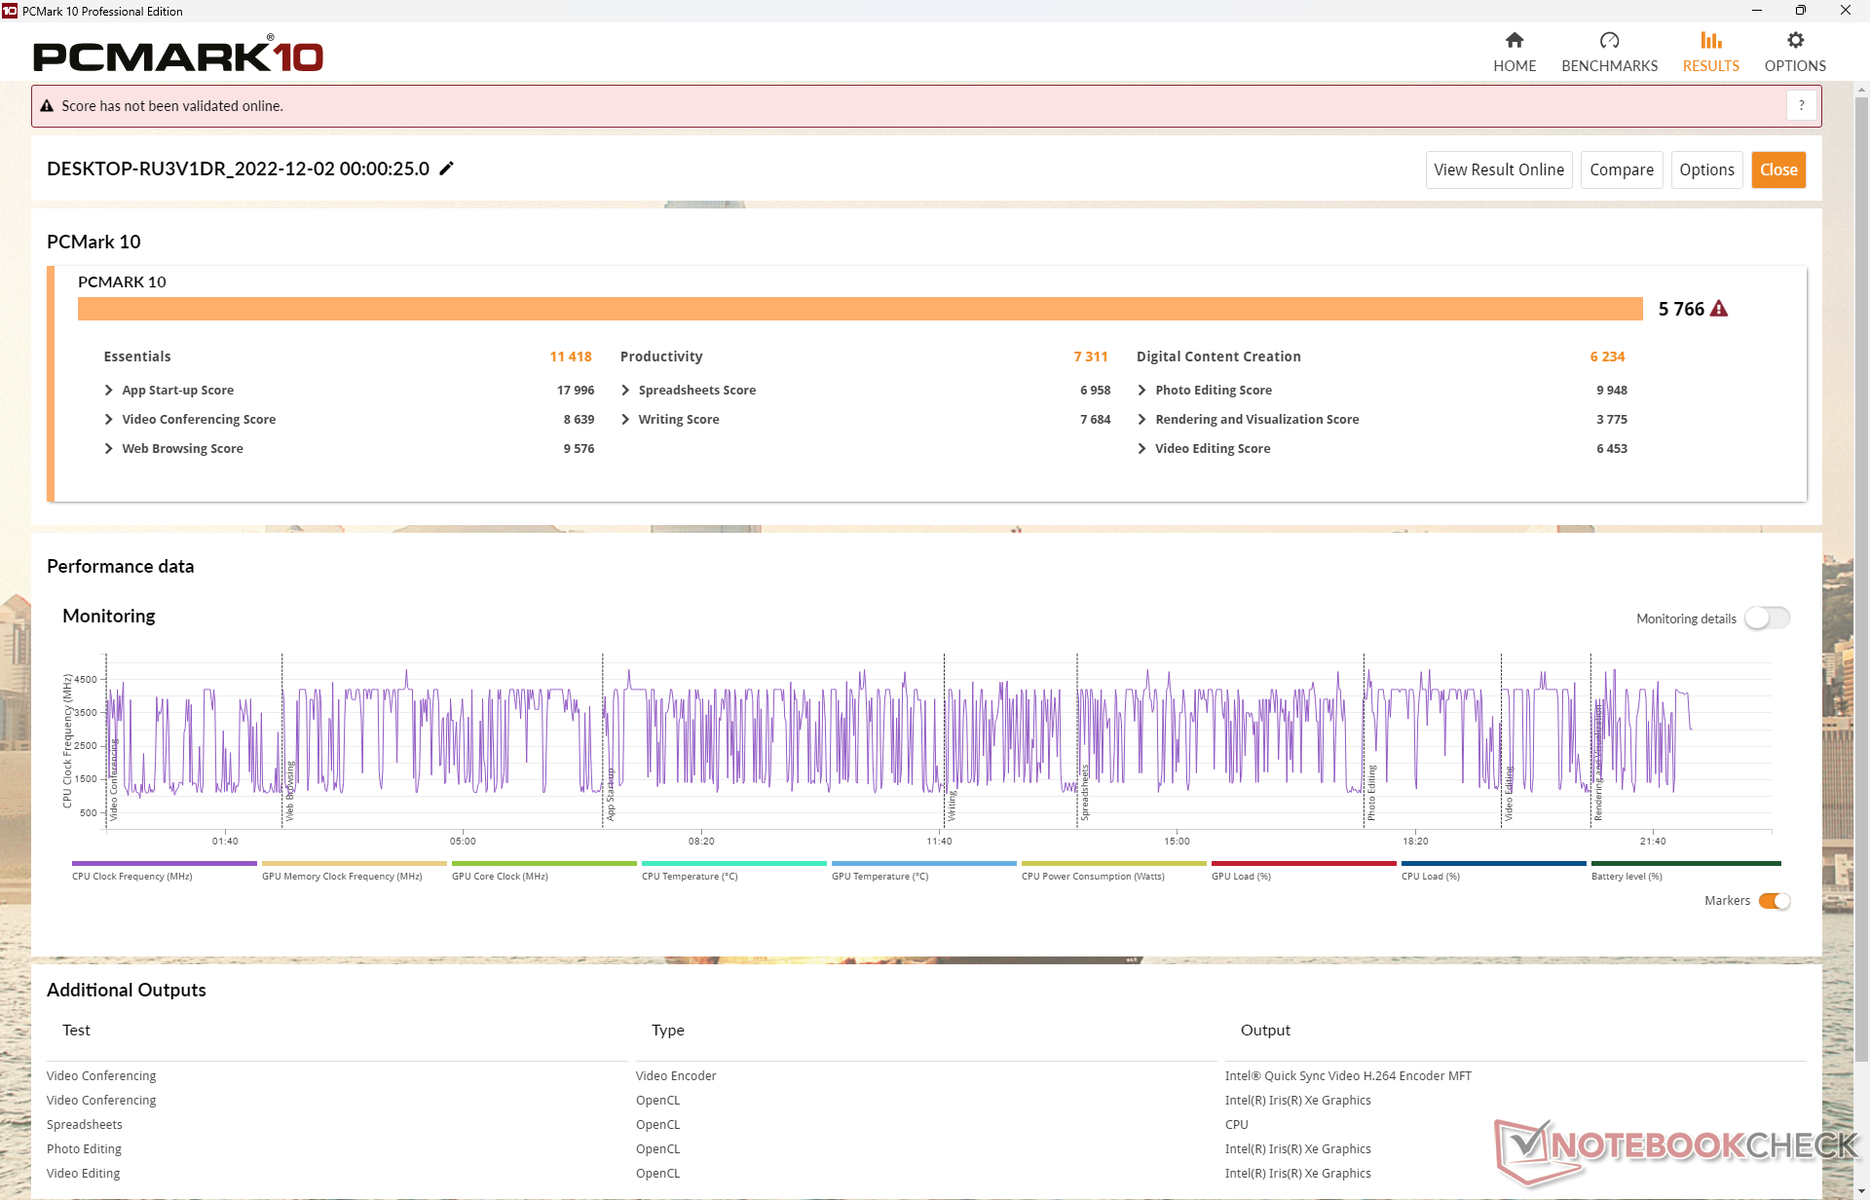
Die PCMark-10-Ergebnisse sind besser als bei den meisten anderen Convertibles bzw. Business-Subnotebooks einschließlich HPs eigenen Dragonfly G3. Wir vermuten, dass der Unterschied auf die schnelle PCIe-4-x4-Samsung-SSD zurückzuführen ist, die in den meisten Szenarien schneller als die Micron 3400 ist.
CrossMark: Overall | Productivity | Creativity | Responsiveness
| PCMark 10 / Score | |
| Durchschnitt der Klasse Convertible (3229 - 10123, n=45, der letzten 2 Jahre) | |
| Framework Laptop 13.5 12th Gen Intel | |
| HP Elite Dragonfly Folio 13.5 G3 | |
| Durchschnittliche Intel Core i7-1265U, Intel Iris Xe Graphics G7 96EUs (4753 - 5766, n=7) | |
| Dell Latitude 13 7330 | |
| Razer Book 13 FHD | |
| HP Elite Dragonfly G3 | |
| Lenovo ThinkPad L13 Gen2-20VH0017GE | |
| PCMark 10 / Essentials | |
| HP Elite Dragonfly Folio 13.5 G3 | |
| Framework Laptop 13.5 12th Gen Intel | |
| Dell Latitude 13 7330 | |
| Durchschnitt der Klasse Convertible (7233 - 12222, n=45, der letzten 2 Jahre) | |
| Durchschnittliche Intel Core i7-1265U, Intel Iris Xe Graphics G7 96EUs (9278 - 11418, n=7) | |
| Razer Book 13 FHD | |
| Lenovo ThinkPad L13 Gen2-20VH0017GE | |
| HP Elite Dragonfly G3 | |
| PCMark 10 / Productivity | |
| Durchschnitt der Klasse Convertible (5062 - 17914, n=45, der letzten 2 Jahre) | |
| HP Elite Dragonfly Folio 13.5 G3 | |
| Framework Laptop 13.5 12th Gen Intel | |
| Dell Latitude 13 7330 | |
| Razer Book 13 FHD | |
| Durchschnittliche Intel Core i7-1265U, Intel Iris Xe Graphics G7 96EUs (5828 - 7311, n=7) | |
| Lenovo ThinkPad L13 Gen2-20VH0017GE | |
| HP Elite Dragonfly G3 | |
| PCMark 10 / Digital Content Creation | |
| Durchschnitt der Klasse Convertible (2496 - 16551, n=45, der letzten 2 Jahre) | |
| Framework Laptop 13.5 12th Gen Intel | |
| HP Elite Dragonfly Folio 13.5 G3 | |
| Durchschnittliche Intel Core i7-1265U, Intel Iris Xe Graphics G7 96EUs (5127 - 6330, n=7) | |
| HP Elite Dragonfly G3 | |
| Razer Book 13 FHD | |
| Dell Latitude 13 7330 | |
| Lenovo ThinkPad L13 Gen2-20VH0017GE | |
| CrossMark / Overall | |
| Framework Laptop 13.5 12th Gen Intel | |
| HP Elite Dragonfly Folio 13.5 G3 | |
| Durchschnitt der Klasse Convertible (524 - 2274, n=49, der letzten 2 Jahre) | |
| Durchschnittliche Intel Core i7-1265U, Intel Iris Xe Graphics G7 96EUs (1301 - 1615, n=7) | |
| Dell Latitude 13 7330 | |
| HP Elite Dragonfly G3 | |
| CrossMark / Productivity | |
| Framework Laptop 13.5 12th Gen Intel | |
| HP Elite Dragonfly Folio 13.5 G3 | |
| Durchschnitt der Klasse Convertible (554 - 1942, n=49, der letzten 2 Jahre) | |
| Dell Latitude 13 7330 | |
| Durchschnittliche Intel Core i7-1265U, Intel Iris Xe Graphics G7 96EUs (1230 - 1586, n=7) | |
| HP Elite Dragonfly G3 | |
| CrossMark / Creativity | |
| Framework Laptop 13.5 12th Gen Intel | |
| Durchschnitt der Klasse Convertible (550 - 2949, n=49, der letzten 2 Jahre) | |
| HP Elite Dragonfly Folio 13.5 G3 | |
| Durchschnittliche Intel Core i7-1265U, Intel Iris Xe Graphics G7 96EUs (1413 - 1706, n=7) | |
| HP Elite Dragonfly G3 | |
| Dell Latitude 13 7330 | |
| CrossMark / Responsiveness | |
| HP Elite Dragonfly Folio 13.5 G3 | |
| Framework Laptop 13.5 12th Gen Intel | |
| Durchschnittliche Intel Core i7-1265U, Intel Iris Xe Graphics G7 96EUs (1193 - 1521, n=7) | |
| Durchschnitt der Klasse Convertible (381 - 1719, n=49, der letzten 2 Jahre) | |
| Dell Latitude 13 7330 | |
| HP Elite Dragonfly G3 | |
| PCMark 10 Score | 5766 Punkte | |
Hilfe | ||
| AIDA64 / Memory Copy | |
| HP Elite Dragonfly G3 | |
| HP Elite Dragonfly Folio 13.5 G3 | |
| Durchschnittliche Intel Core i7-1265U (40212 - 72204, n=10) | |
| Framework Laptop 13.5 12th Gen Intel | |
| Dell Latitude 13 7330 | |
| Lenovo ThinkPad L13 Gen2-20VH0017GE | |
| Lenovo ThinkPad L13 Gen2-20VH0017GE | |
| AIDA64 / Memory Read | |
| HP Elite Dragonfly Folio 13.5 G3 | |
| HP Elite Dragonfly G3 | |
| Durchschnittliche Intel Core i7-1265U (41808 - 69493, n=10) | |
| Framework Laptop 13.5 12th Gen Intel | |
| Dell Latitude 13 7330 | |
| Lenovo ThinkPad L13 Gen2-20VH0017GE | |
| Lenovo ThinkPad L13 Gen2-20VH0017GE | |
| AIDA64 / Memory Write | |
| HP Elite Dragonfly Folio 13.5 G3 | |
| Durchschnittliche Intel Core i7-1265U (41382 - 76027, n=10) | |
| HP Elite Dragonfly G3 | |
| Framework Laptop 13.5 12th Gen Intel | |
| Dell Latitude 13 7330 | |
| Lenovo ThinkPad L13 Gen2-20VH0017GE | |
| Lenovo ThinkPad L13 Gen2-20VH0017GE | |
| AIDA64 / Memory Latency | |
| HP Elite Dragonfly Folio 13.5 G3 | |
| HP Elite Dragonfly G3 | |
| Durchschnittliche Intel Core i7-1265U (74.6 - 112.4, n=10) | |
| Framework Laptop 13.5 12th Gen Intel | |
| Dell Latitude 13 7330 | |
| Lenovo ThinkPad L13 Gen2-20VH0017GE | |
| Lenovo ThinkPad L13 Gen2-20VH0017GE | |
* ... kleinere Werte sind besser
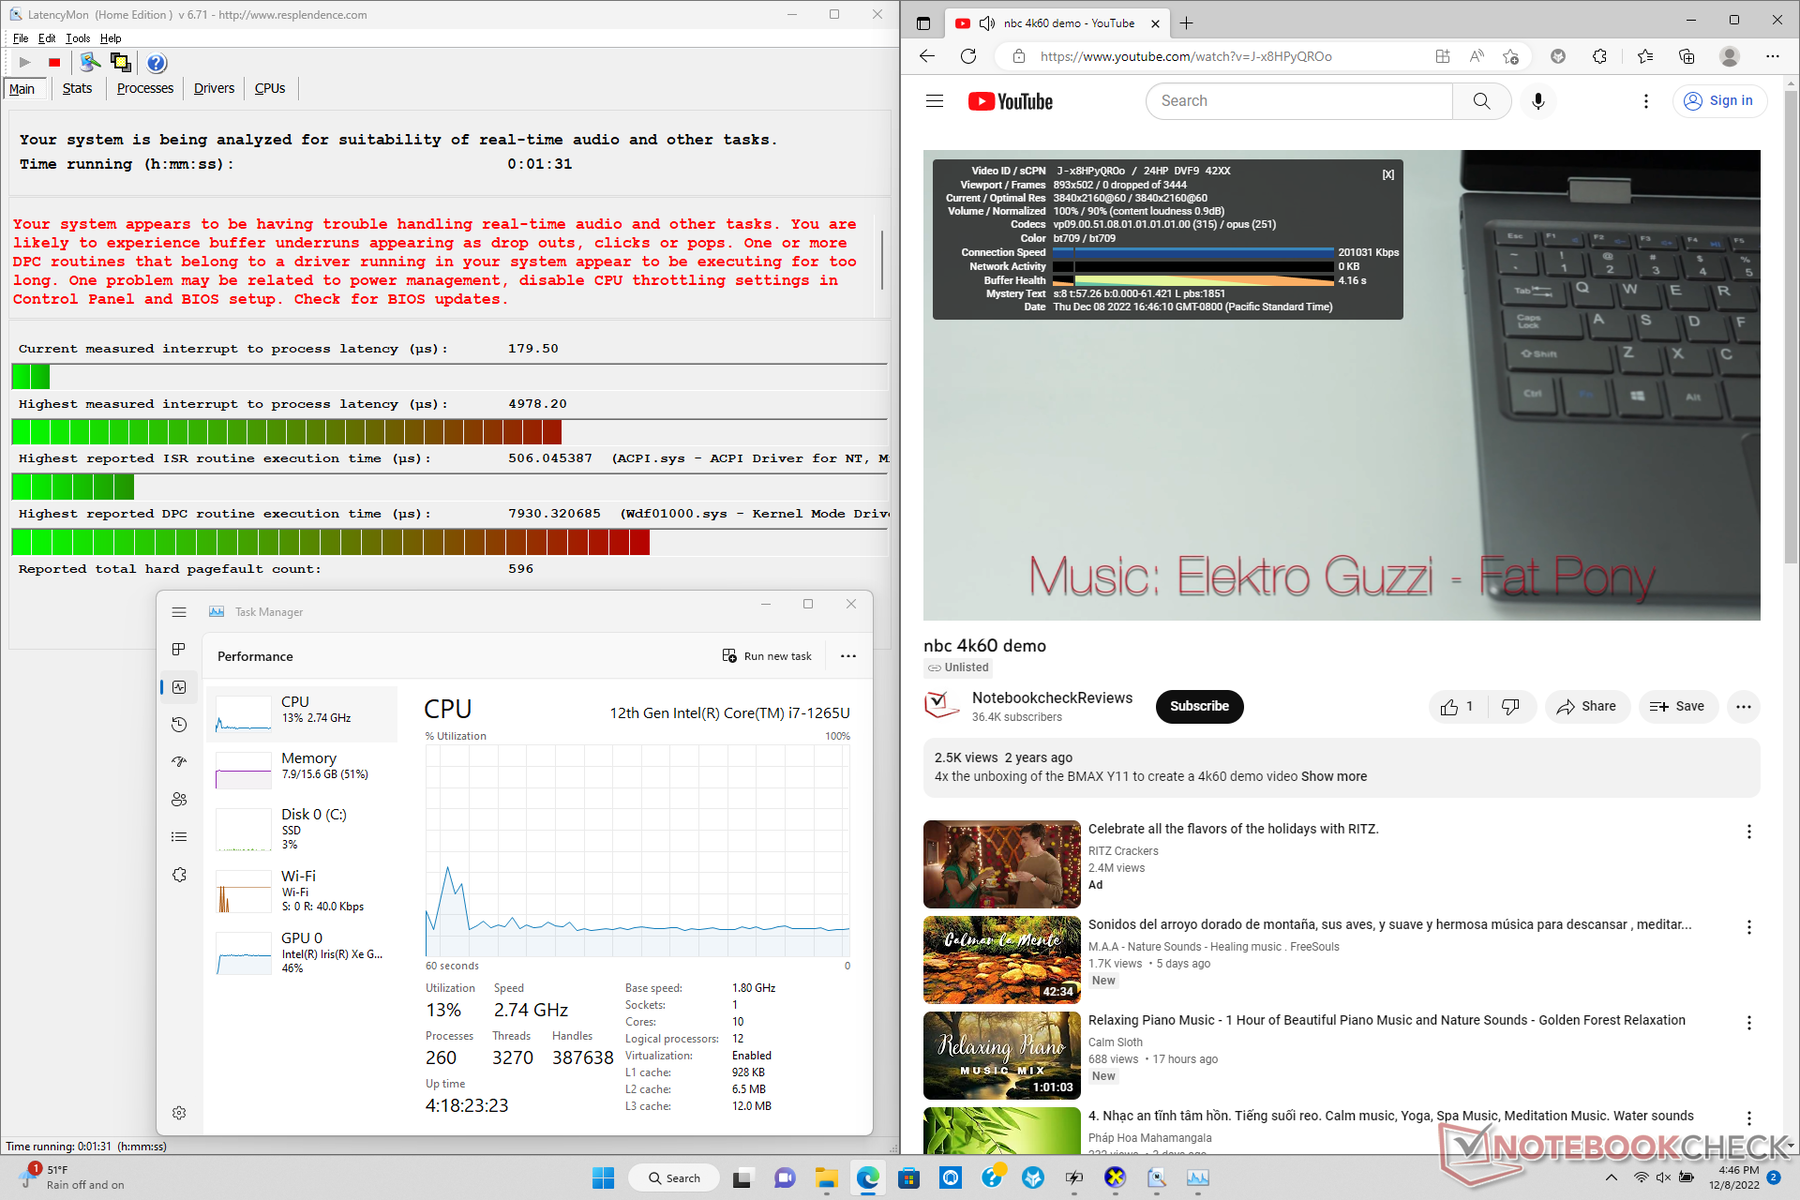
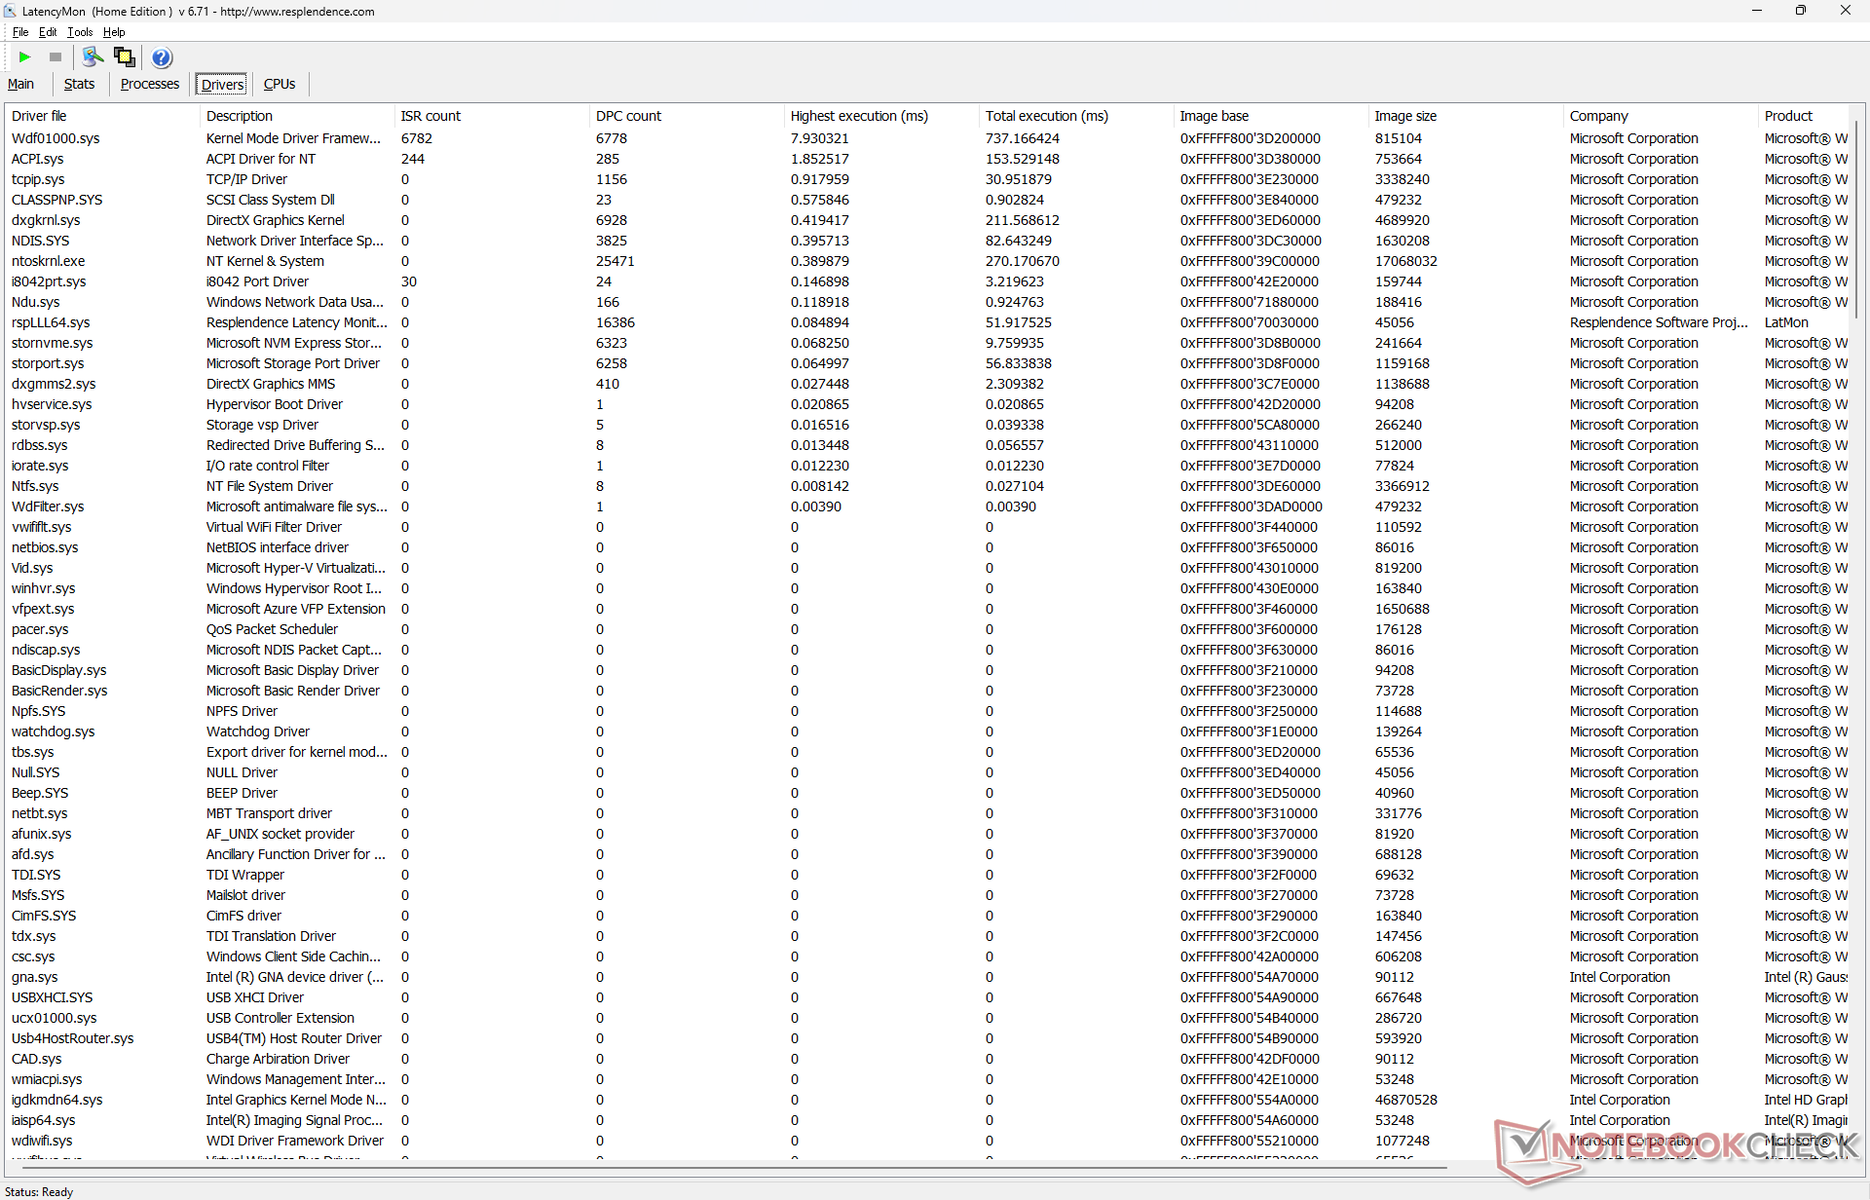
DPC-Latenzen
Beim Öffnen unserer Homepage in mehreren Browser-Tabs meldet LatencyMon sehr hohe DPC-Latenzen. Auch nach mehrmaligem Wiederholen des Tests hat sich das Ergebnis nicht verändert. Die Wiedergabe eines 4K-Videos mit 60 Fps verlief flüssig und ohne ausgelassene Frames.
| DPC Latencies / LatencyMon - interrupt to process latency (max), Web, Youtube, Prime95 | |
| HP Elite Dragonfly Folio 13.5 G3 | |
| Razer Book 13 FHD | |
| Lenovo ThinkPad L13 Gen2-20VH0017GE | |
| Framework Laptop 13.5 12th Gen Intel | |
| Dell Latitude 13 7330 | |
| HP Elite Dragonfly G3 | |
* ... kleinere Werte sind besser
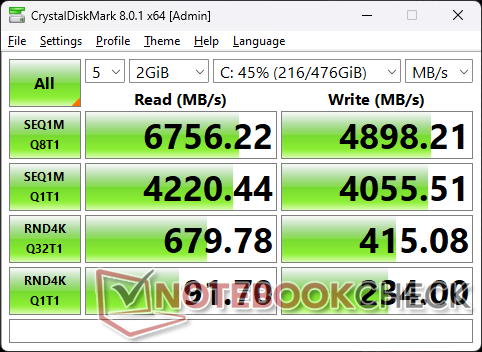
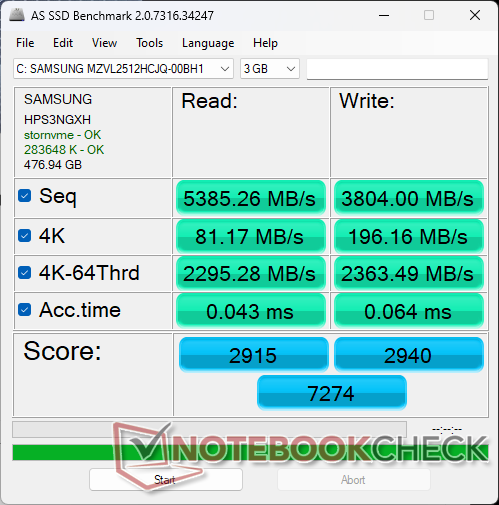
Massenspeicher — PCIe4-x4-Unterstützung
Es gibt Platz für genau eine M.2-PCIe4-x4-NVMe-SSD, ein zweites Laufwerk wird nicht unterstützt. Unser Testgerät beinhaltet eine 512 GB große Samsung PM9A1, die Lese- und Schreibraten von bis zu 6.700 MB/s bzw. 4.900 MB/s unterstützt. Leider kann das Laufwerk die hohen Transferraten nicht langfristig aufrechterhalten, wie die Ergebnisse unseres DiskSpd-Schleifentests unten zeigen. Da das Dragonfly Folio G3 über keinen SSD-Kühlkörper verfügt, muss das Laufwerk drosseln, um die Temperaturen im grünen Bereich zu halten. Da die SSD jedoch nur drosseln muss, wenn man sie einige Minuten lang stark auslastet, sollte das für die meisten Nutzer kein Problem darstellen.

| Drive Performance Rating - Percent | |
| HP Elite Dragonfly Folio 13.5 G3 -11! | |
| HP Elite Dragonfly G3 | |
| Lenovo ThinkPad L13 Gen2-20VH0017GE | |
| Framework Laptop 13.5 12th Gen Intel | |
| Razer Book 13 FHD | |
| Dell Latitude 13 7330 | |
* ... kleinere Werte sind besser
Laufwerksdrosseln: DiskSpd-Leseschleife, Warteschlangentiefe 8
Grafikkarte — Dragonfly setzt auf die Iris Xe
Die Iris Xe 96 EUs ist immer noch eine der schnellsten integrierten Intel-Grafiklösungen. Obwohl sie die Krone mittlerweile an AMD abgeben musste, ist eine hohe Grafikleistung wohl ohnehin keine Priorität für ein Business-Convertible. Schwächere Core-i5-Modelle mit der Iris Xe 80 EUs bieten ca. 20 bis 30 % weniger Grafikleistung.
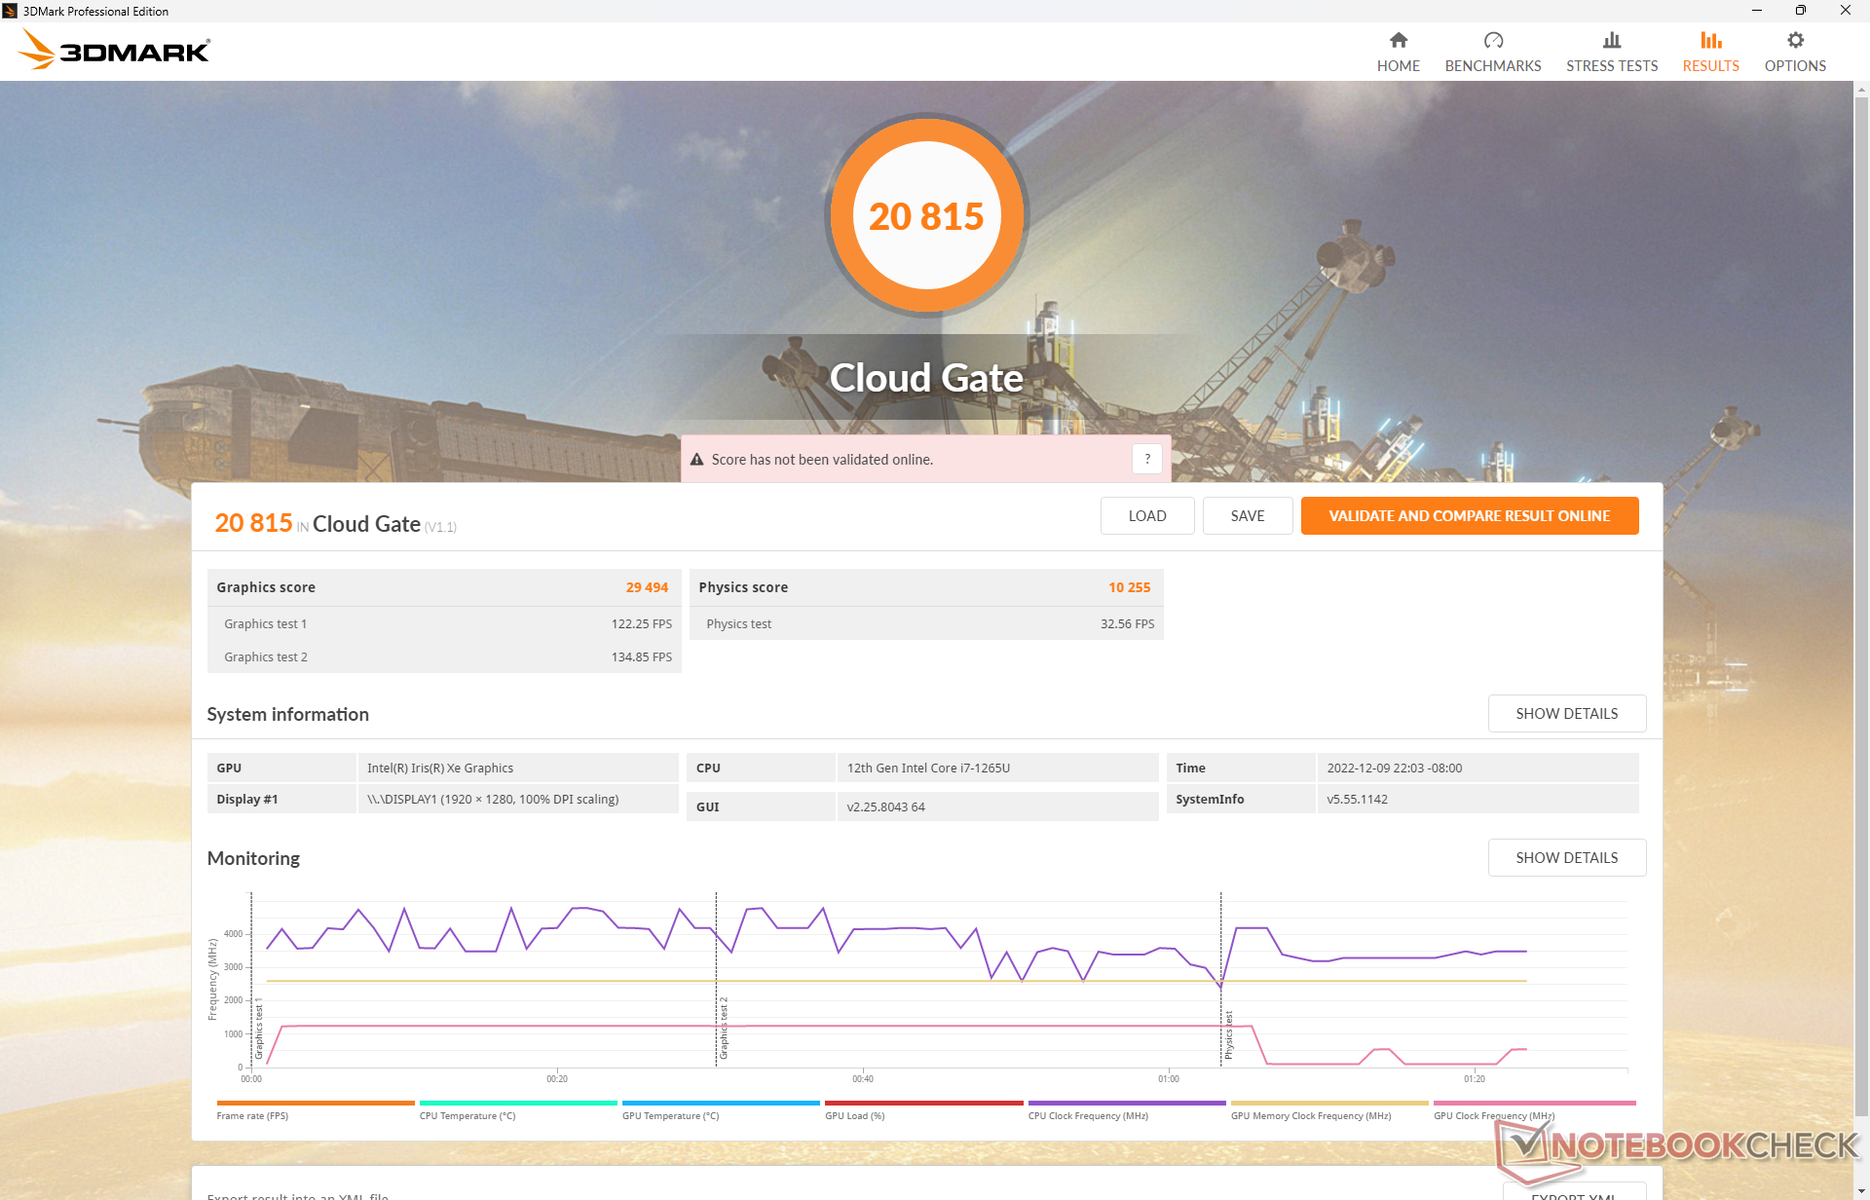
Beim Ausführen von 3Dmark 11 in den Modi "Ausbalanciert" und "Leistung" stellen wir nur vernachlässigbar kleine Unterschiede fest.
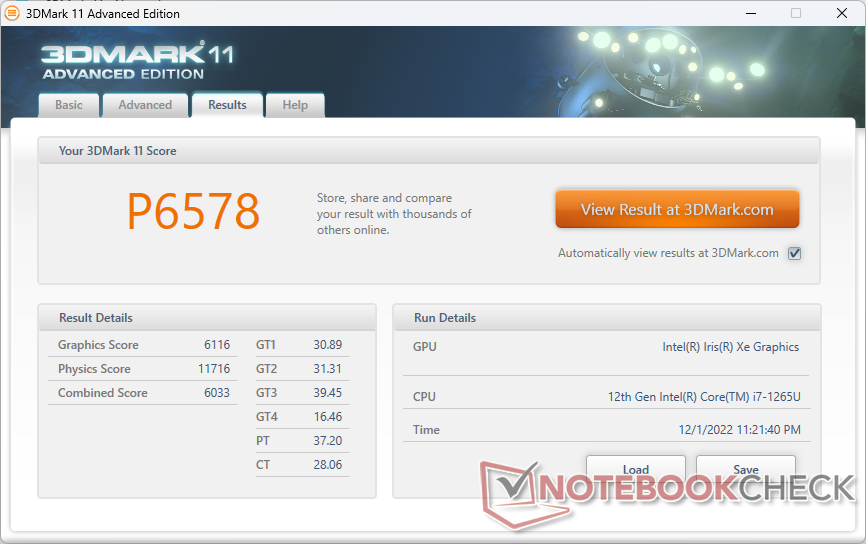
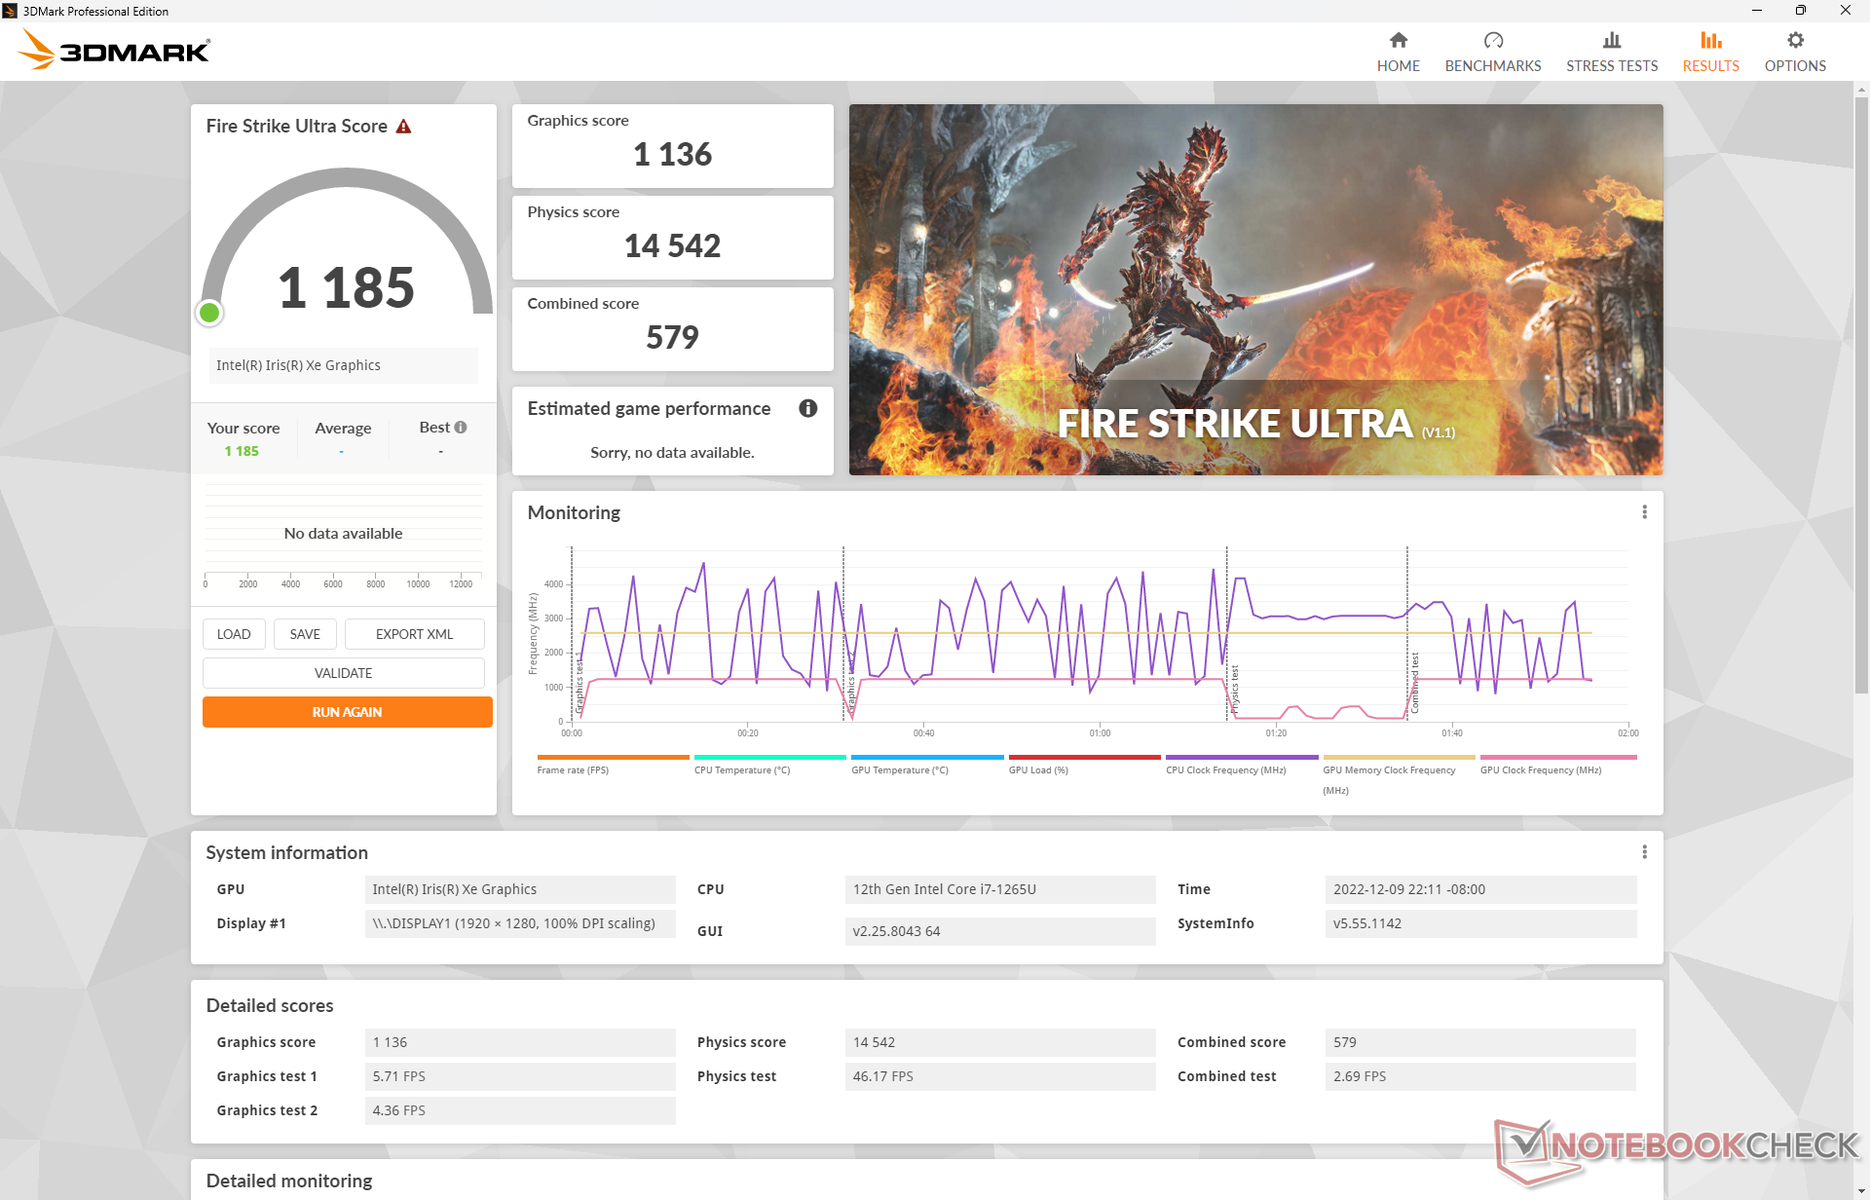
| 3DMark 11 Performance | 6578 Punkte | |
| 3DMark Cloud Gate Standard Score | 20815 Punkte | |
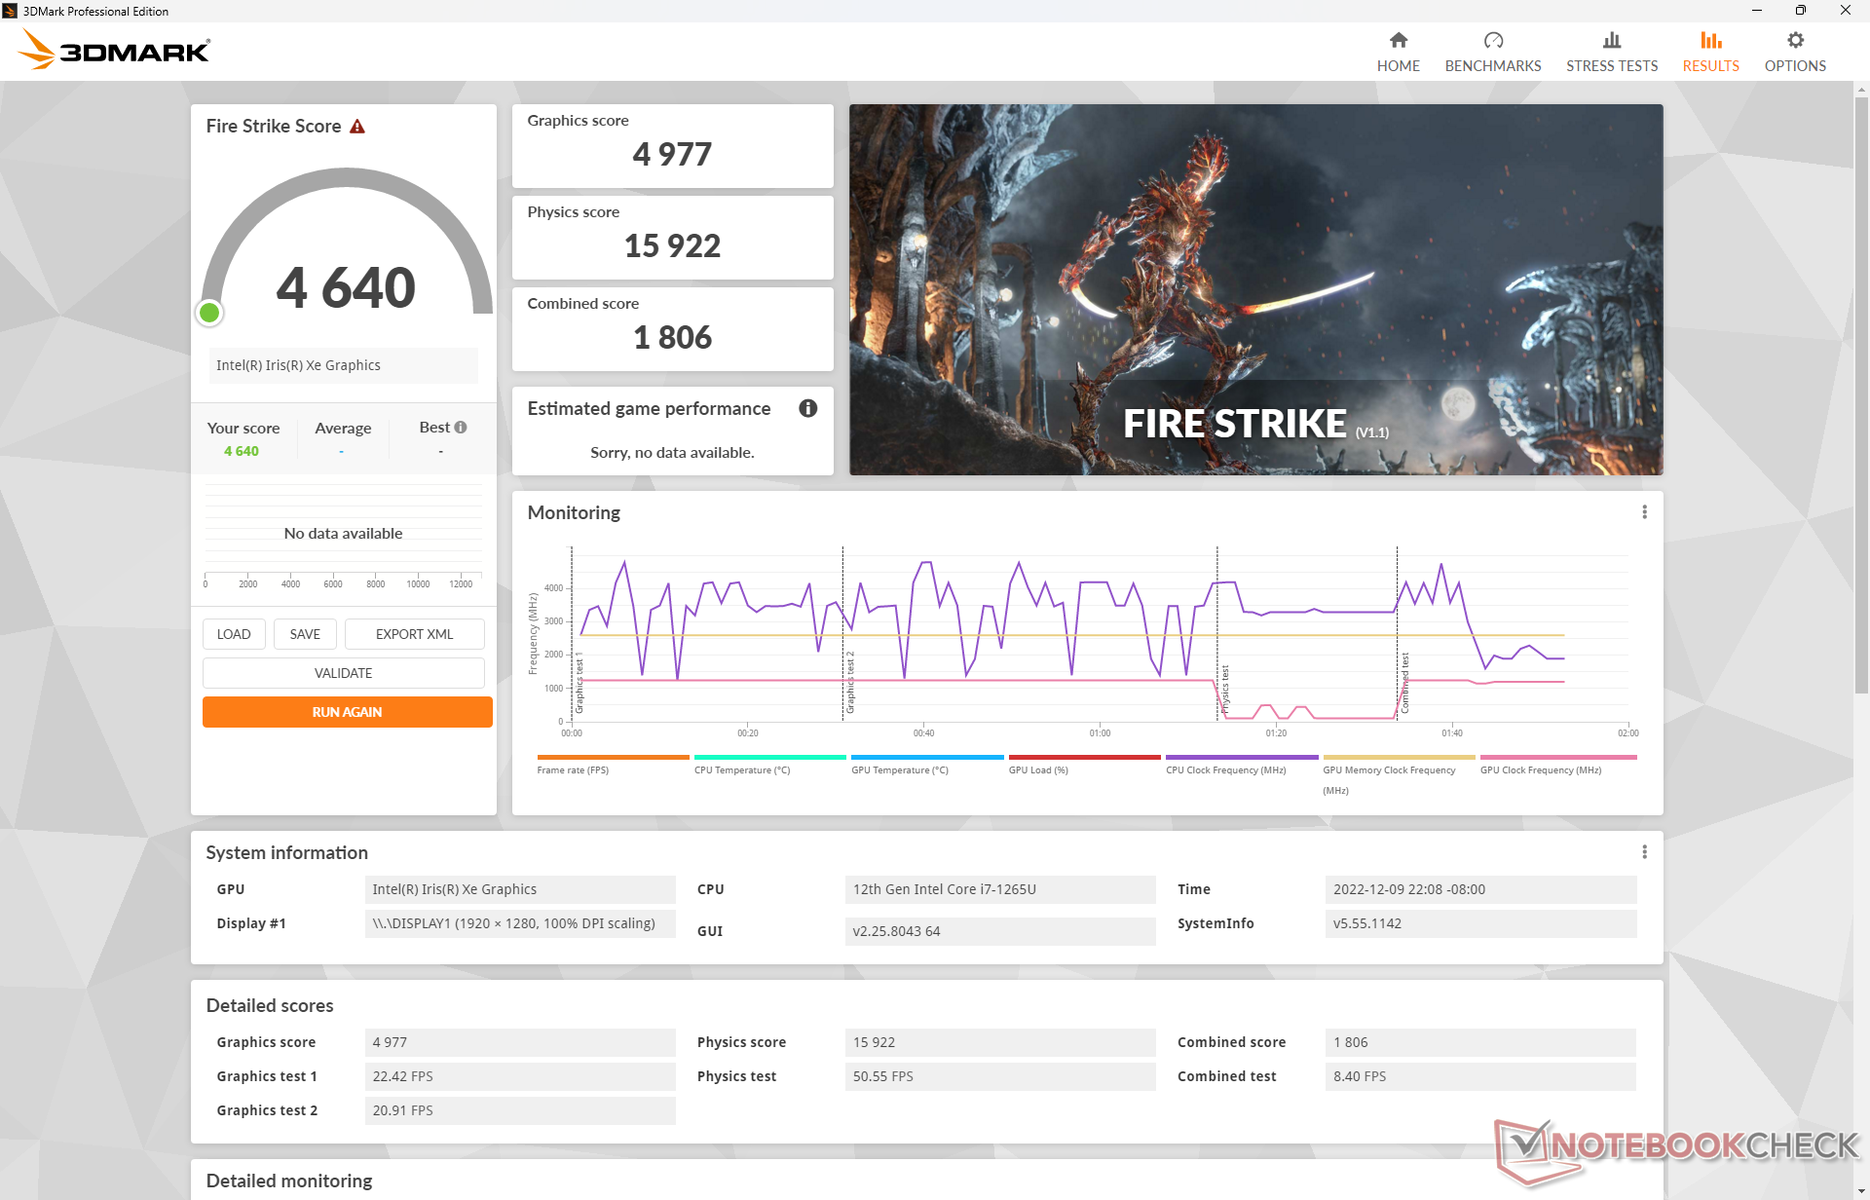
| 3DMark Fire Strike Score | 4640 Punkte | |
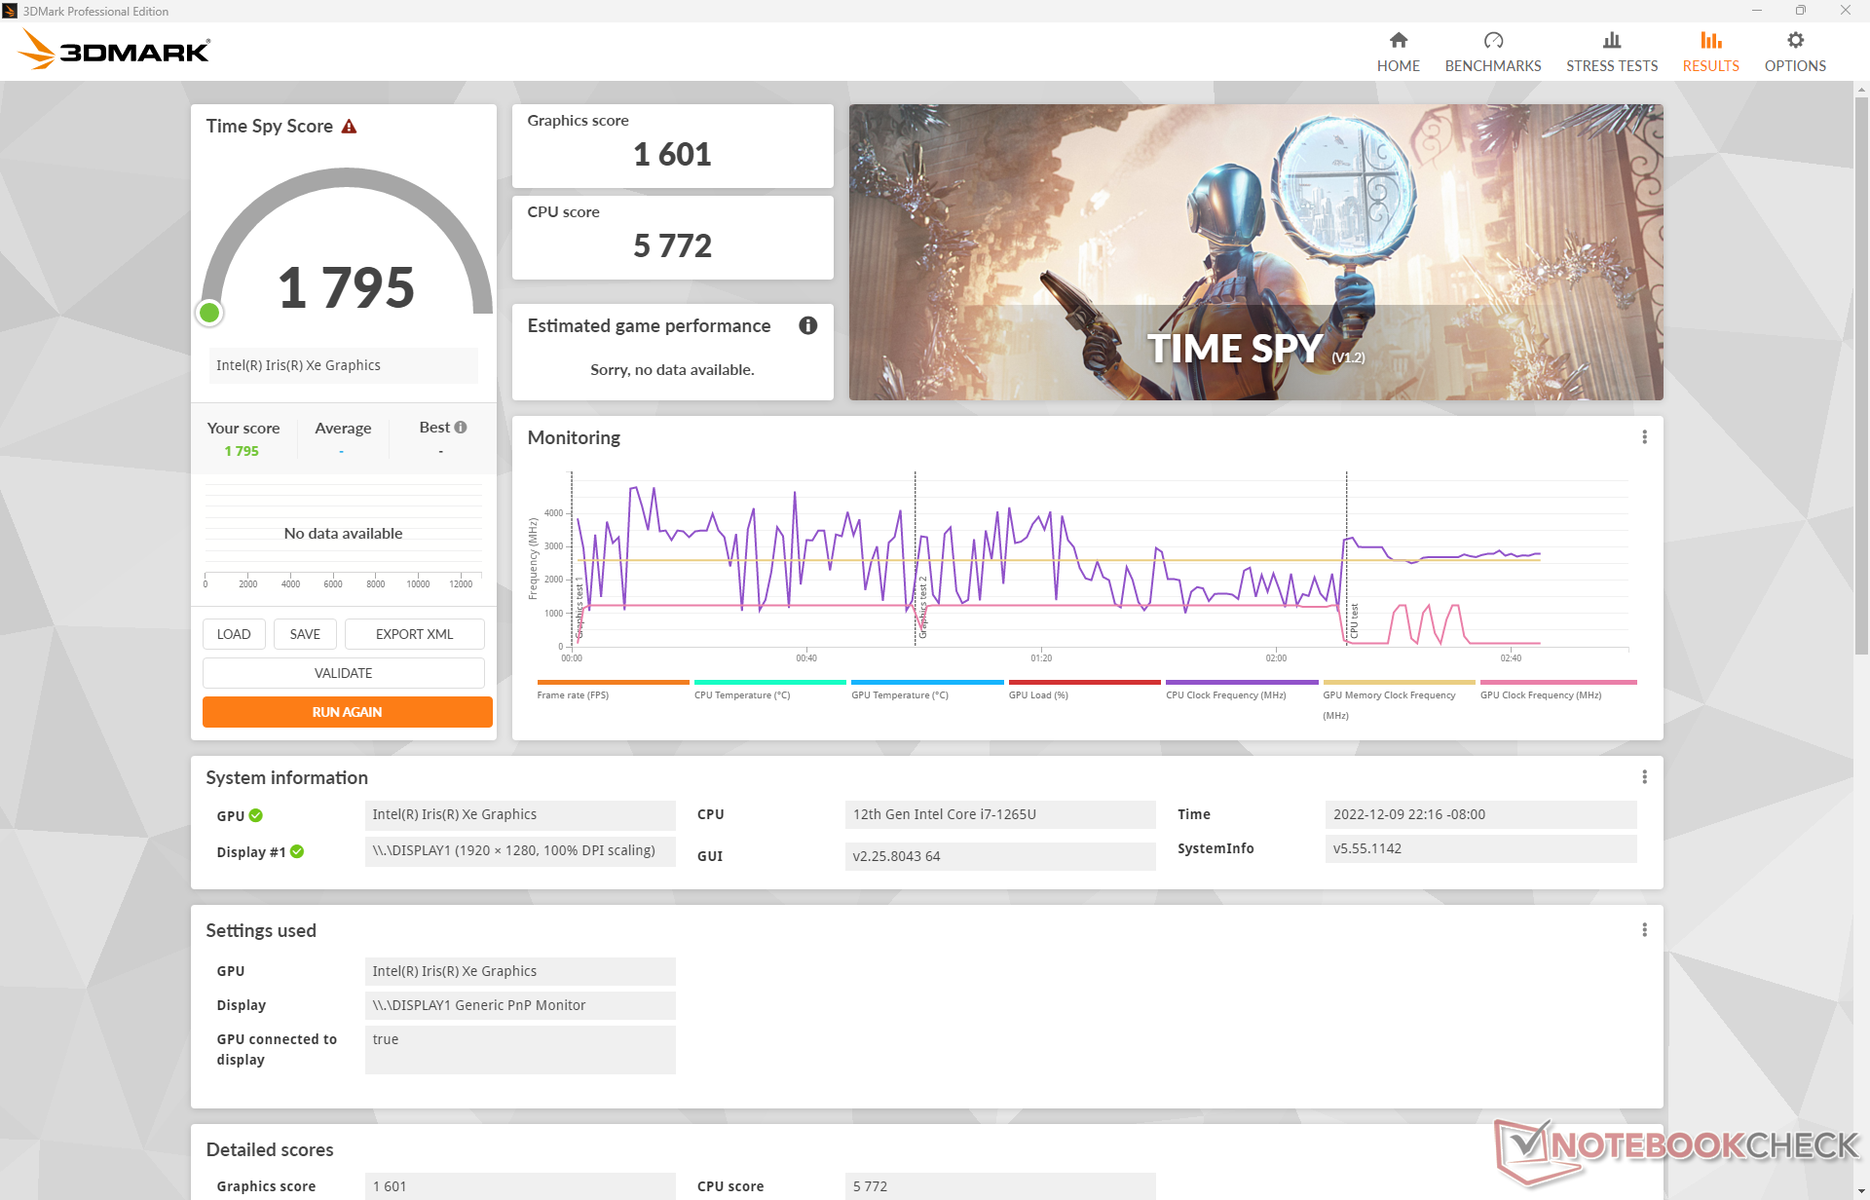
| 3DMark Time Spy Score | 1795 Punkte | |
Hilfe | ||
* ... kleinere Werte sind besser
FPS-Diagramm: Witcher 3
| min. | mittel | hoch | max. | |
|---|---|---|---|---|
| GTA V (2015) | 94.4 | 84.5 | 23.6 | 10.1 |
| The Witcher 3 (2015) | 89.7 | 52.9 | 32.6 | 14.5 |
| Dota 2 Reborn (2015) | 109 | 76.4 | 60.3 | 54.5 |
| Final Fantasy XV Benchmark (2018) | 42.2 | 23.1 | 16.5 | |
| X-Plane 11.11 (2018) | 48.4 | 39.5 | 35.1 | |
| Strange Brigade (2018) | 86.4 | 39.8 | 31.9 | 25.5 |
| Cyberpunk 2077 1.6 (2022) | 19.7 | 16.3 | 12.5 | 10.1 |
Emissionen
Geräuschemissionen — Unglaublich leise
Das Geräuschniveau zählt mit zu den leisesten, die wir bei einem Core-U-Subnotebook bisher beobachtet haben. Im Vergleich zum Dragonfly Folio G2 sind beim G3-Modell dünnere Lüfterblätter und eine neue Lüftersteuerung, welche ein Pulsieren der Lüfter verhindern soll, integriert. Das Ergebnis ist recht überraschend: Beim Ausführen von 3DMark 06 in einer Schleife messen wir ein Lüftergeräuschniveau von unter 28 dB(A), während das Latitude 7330 und das ThinkPad L13 Gen 2 hier 38 dB(A) bzw. 34 dB(A) erzeugen. Unter hoher Last wie zum Beispiel im Gaming-Betrieb messen wir bei unserem Testgerät maximal 33 dB(A).
Nutzer können zwischen vier vorinstallierten Leistungsprofilen wählen: Leise, Kühl, Ausbalanciert und Leistung. Da die Lüfter schon im Leistungsmodus sehr leise sind, gibt es eigentlich keinen Grund, die langsameren Profile zu nutzen.
Lautstärkediagramm
| Idle |
| 24.6 / 24.6 / 24.6 dB(A) |
| Last |
| 27.8 / 33.4 dB(A) |
 | ||
30 dB leise 40 dB(A) deutlich hörbar 50 dB(A) störend |
||
min: | ||
| HP Elite Dragonfly Folio 13.5 G3 Iris Xe G7 96EUs, i7-1265U, Samsung PM9A1 MZVL2512HCJQ | HP Elite Dragonfly G3 Iris Xe G7 96EUs, i7-1265U, Micron 3400 MTFDKBA512TFH 512GB | Dell Latitude 13 7330 Iris Xe G7 96EUs, i7-1265U, Toshiba KBG40ZNS512G NVMe | Framework Laptop 13.5 12th Gen Intel Iris Xe G7 96EUs, i7-1260P, WDC PC SN730 SDBPNTY-512G | Razer Book 13 FHD Iris Xe G7 96EUs, i7-1165G7, Samsung SSD PM981a MZVLB256HBHQ | Lenovo ThinkPad L13 Gen2-20VH0017GE Iris Xe G7 80EUs, i5-1135G7, Samsung SSD PM981a MZVLB512HBJQ | |
|---|---|---|---|---|---|---|
| Geräuschentwicklung | 5% | -9% | -19% | -11% | -18% | |
| aus / Umgebung * (dB) | 24.6 | 22.8 7% | 23.4 5% | 22.8 7% | 27 -10% | 29.3 -19% |
| Idle min * (dB) | 24.6 | 23.2 6% | 23.4 5% | 23 7% | 27 -10% | 29.3 -19% |
| Idle avg * (dB) | 24.6 | 23.2 6% | 23.4 5% | 23 7% | 27 -10% | 29.3 -19% |
| Idle max * (dB) | 24.6 | 23.2 6% | 23.4 5% | 23 7% | 27.1 -10% | 29.3 -19% |
| Last avg * (dB) | 27.8 | 25.1 10% | 37.8 -36% | 47.3 -70% | 29 -4% | 34.3 -23% |
| Witcher 3 ultra * (dB) | 33.4 | 32 4% | 39.2 -17% | 47.3 -42% | 33.3 -0% | |
| Last max * (dB) | 33.4 | 35.2 -5% | 43 -29% | 49.8 -49% | 44.8 -34% | 36.3 -9% |
* ... kleinere Werte sind besser
Temperaturen
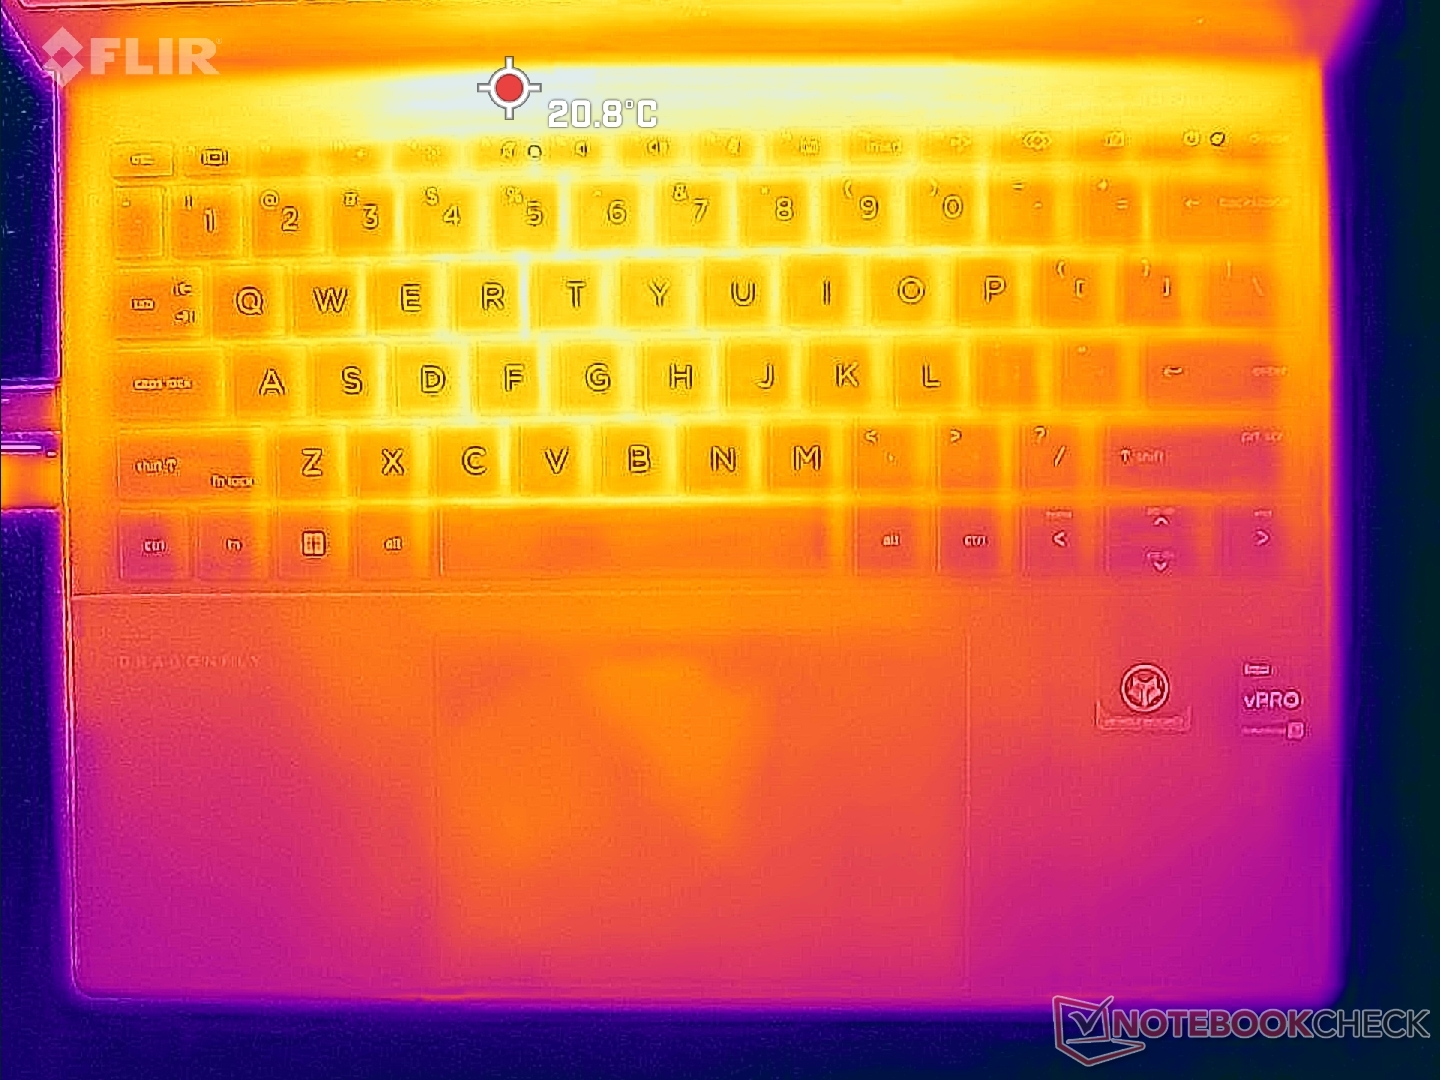
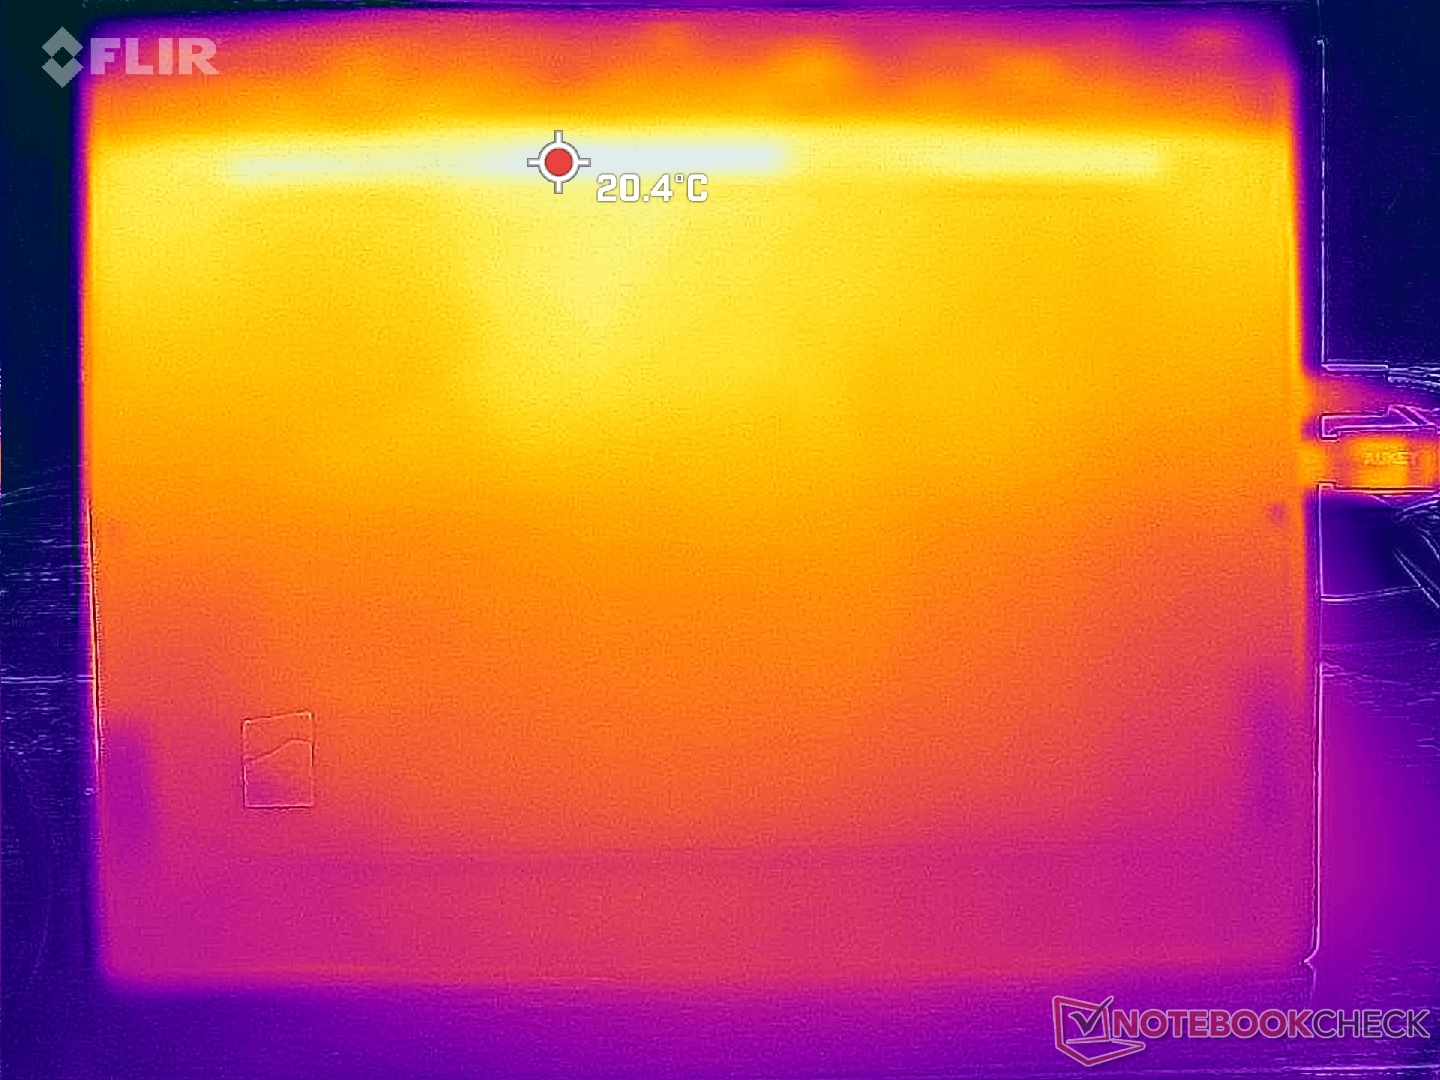
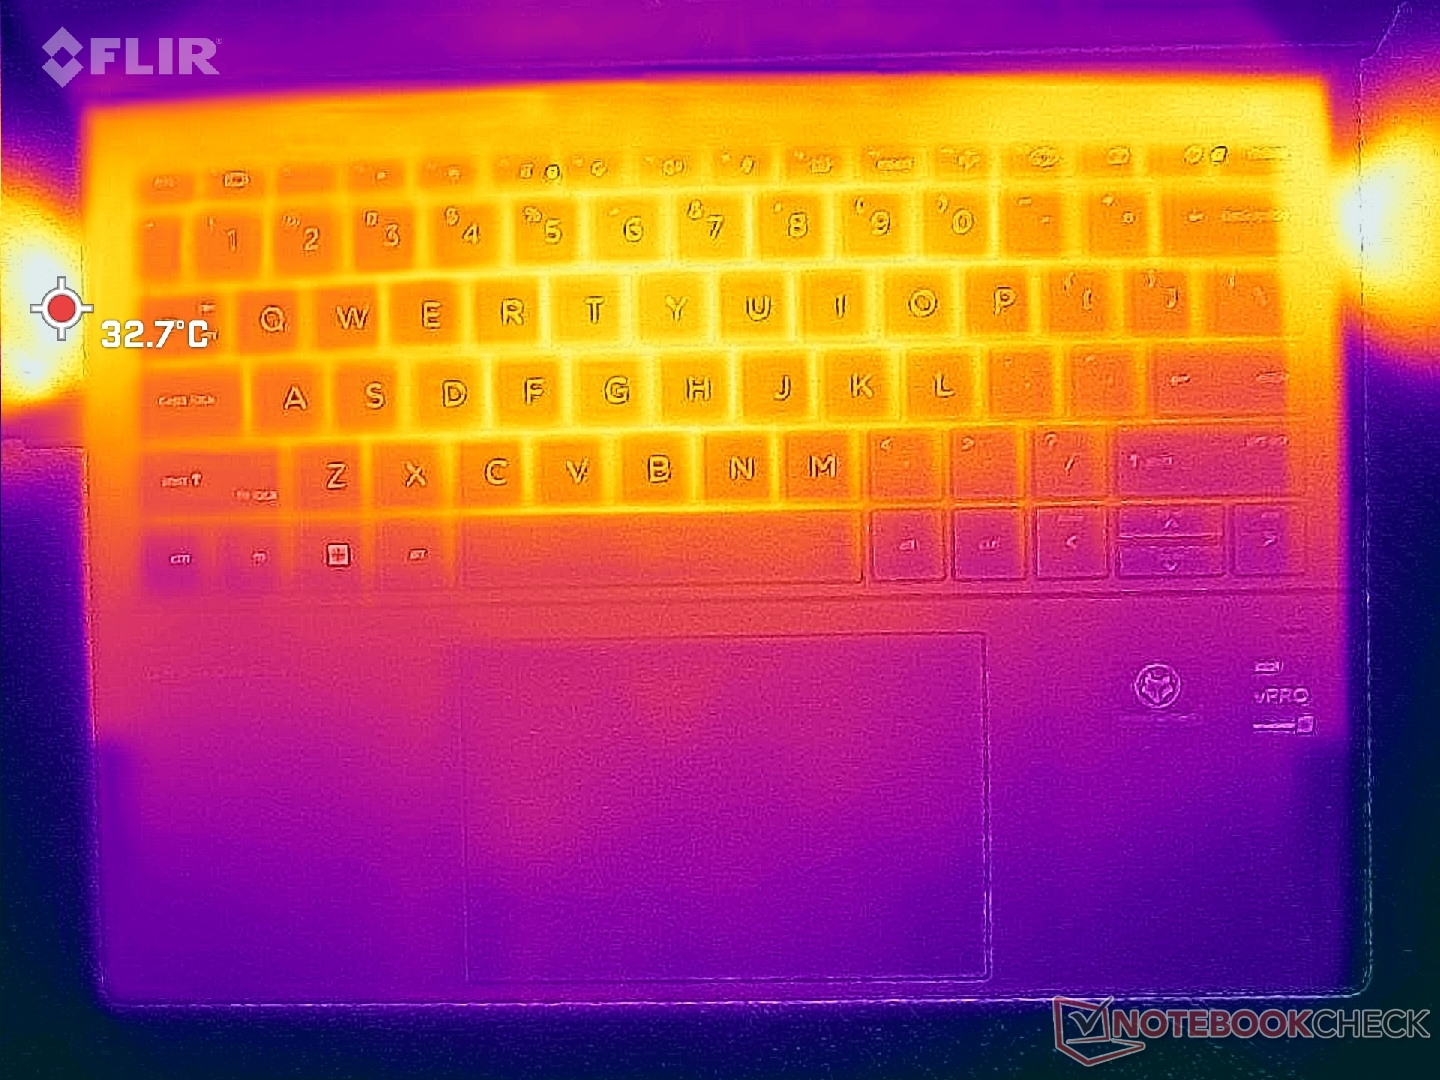
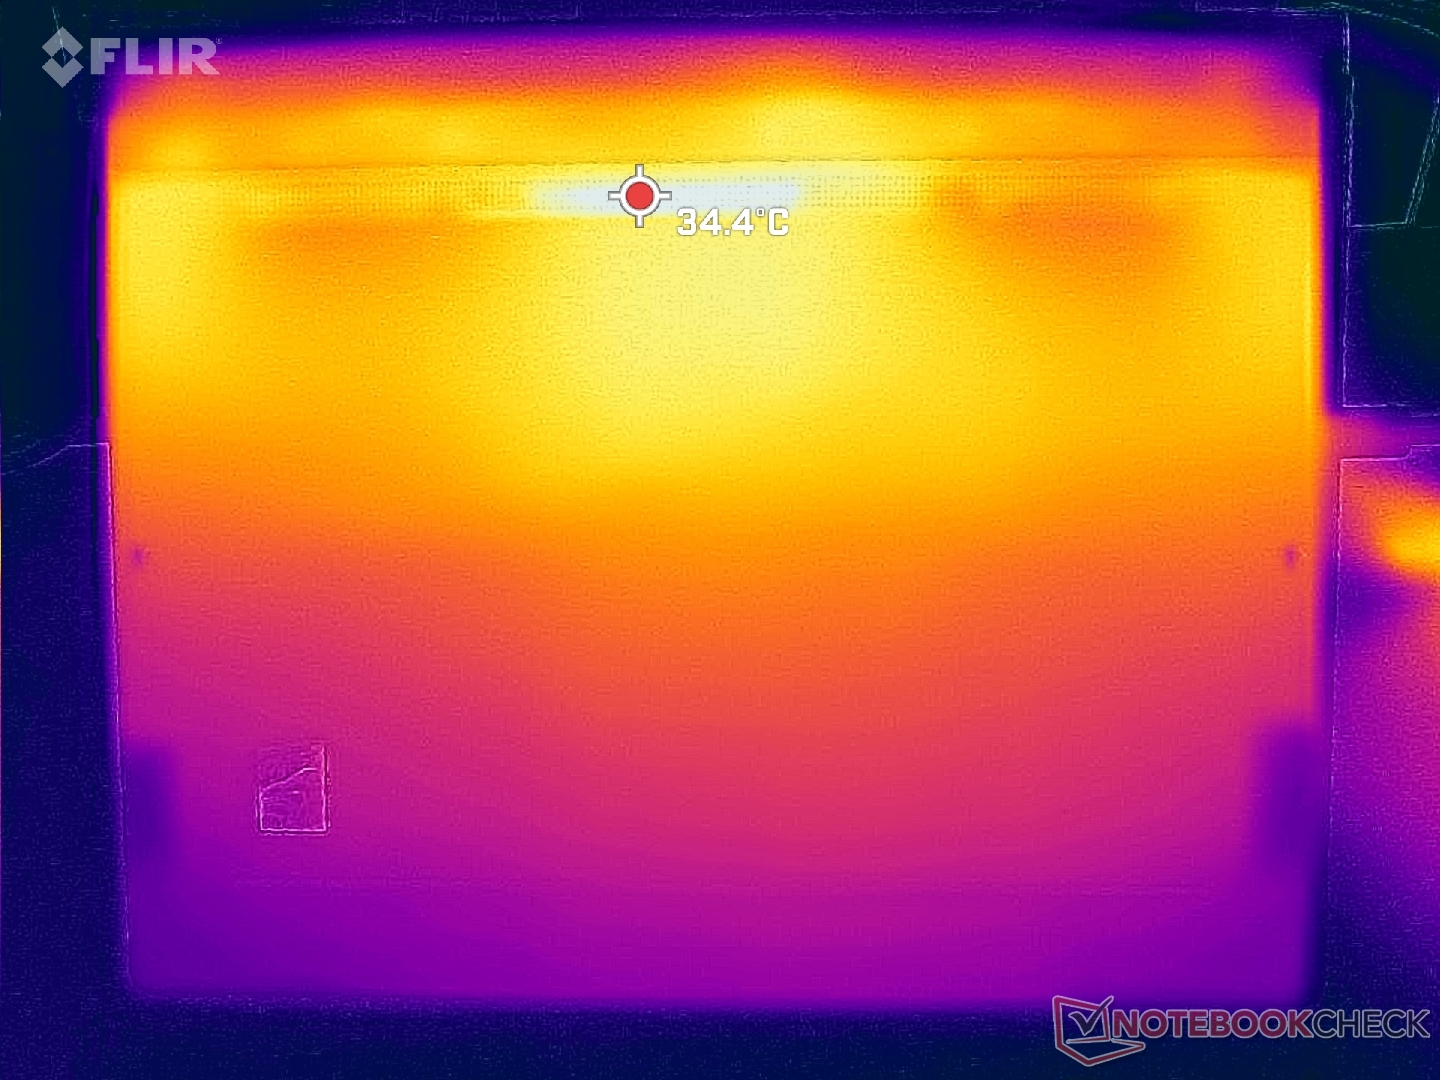
Die Oberflächentemperaturen fallen unter Last überraschend kühl aus. Im Gegensatz zu den 37 bzw. 39 °C, die das Dragonfly G3 und Dell Latitude 13 7330 erreichen, liegen die wärmsten Stellen auf der Ober- und Unterseite hier nur bei 33 °C bzw. 34 °C. Um die Kühlleistung zu verbessern, nutzt das Dragonfly Folio G3 mehr Lüfter als der Dell und längere Heatpipes als das Dragonfly G3. Die niedrigeren Oberflächentemperaturen lassen sich auch durch die niedrigeren Kerntemperaturen erklären, auf die wir im nächsten Abschnitt genauer eingehen.
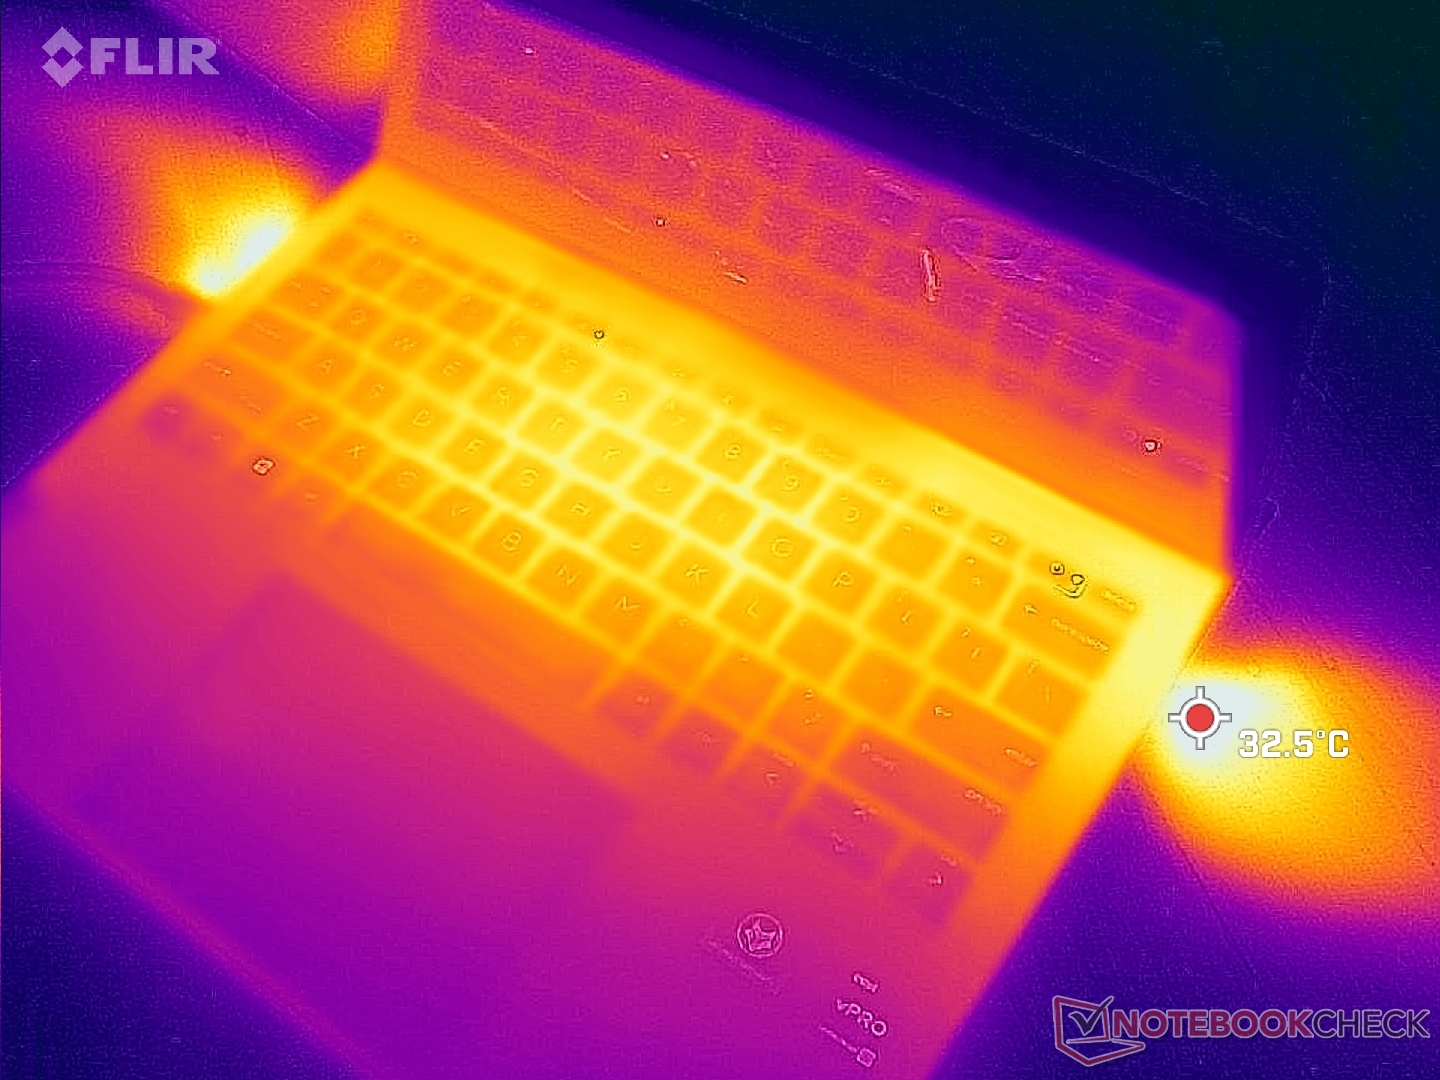
(+) Die maximale Temperatur auf der Oberseite ist 32.8 °C. Im Vergleich liegt der Klassendurchschnitt bei 35.4 °C (von 19.6 bis 60 °C für die Klasse Convertible).
(+) Auf der Unterseite messen wir eine maximalen Wert von 33.4 °C (im Vergleich zum Durchschnitt von 36.9 °C).
(+) Ohne Last messen wir eine durchschnittliche Temperatur von 22.2 °C auf der Oberseite. Der Klassendurchschnitt erreicht 30.3 °C.
(+) Die Handballen und der Touchpad-Bereich sind mit gemessenen 22.4 °C kühler als die typische Hauttemperatur und fühlen sich dadurch kühl an.
(+) Die durchschnittliche Handballen-Temperatur anderer getesteter Geräte war 28 °C (+5.6 °C).
| HP Elite Dragonfly Folio 13.5 G3 Intel Core i7-1265U, Intel Iris Xe Graphics G7 96EUs | HP Elite Dragonfly G3 Intel Core i7-1265U, Intel Iris Xe Graphics G7 96EUs | Dell Latitude 13 7330 Intel Core i7-1265U, Intel Iris Xe Graphics G7 96EUs | Framework Laptop 13.5 12th Gen Intel Intel Core i7-1260P, Intel Iris Xe Graphics G7 96EUs | Razer Book 13 FHD Intel Core i7-1165G7, Intel Iris Xe Graphics G7 96EUs | Lenovo ThinkPad L13 Gen2-20VH0017GE Intel Core i5-1135G7, Intel Iris Xe Graphics G7 80EUs | |
|---|---|---|---|---|---|---|
| Hitze | -17% | -10% | -14% | -14% | -32% | |
| Last oben max * (°C) | 32.8 | 39 -19% | 38.6 -18% | 36.8 -12% | 39.2 -20% | 43.3 -32% |
| Last unten max * (°C) | 33.4 | 42.2 -26% | 42 -26% | 42.4 -27% | 44 -32% | 58 -74% |
| Idle oben max * (°C) | 24.6 | 26.8 -9% | 23.8 3% | 24.2 2% | 23 7% | 25.6 -4% |
| Idle unten max * (°C) | 24.6 | 28.2 -15% | 24.6 -0% | 29 -18% | 26.8 -9% | 28.8 -17% |
* ... kleinere Werte sind besser
Stresstest
Beim Ausführen von Prime95 steigert die CPU ihren Takt zunächst auf 3,5 GHz und ihren Verbrauch auf 49 W und erreicht nach wenigen Sekunden eine Kerntemperatur von 69 °C. Darauf fallen die Werte auf nur 2,3 GHz bzw. 20 W, um eine kühlere Kerntemperatur von nur 60 °C zu ermöglichen. Da die meisten anderen Laptops viel höhere Kerntemperaturen zulassen, ist die Begrenzung im unteren 60-°C-Bereich überraschend. Im gleichen Test mit Prime95 erreicht der Core i7-1265U im Latitude 7330 beispielsweise 85 °C bzw. 2,5 GHz.
Beim Spielen von The Witcher 3 stabilisieren sich die GPU-Takfrequenz und -temperatur bei 1.100 MHz bzw. 58 °C, während das Latitude 7330 hier 1.247 MHz bzw. 83 °C erreicht.
Im Akkumodus ist die Leistung leicht eingeschränkt. Im Akkubetrieb liefert ein 3DMark-11-Durchlauf Physik- und Grafikpunktzahlen von 10.407 bzw. 5.888 Punkten, während im Netzbetrieb 11.716 bzw. 6116 Punkte erreicht werden.
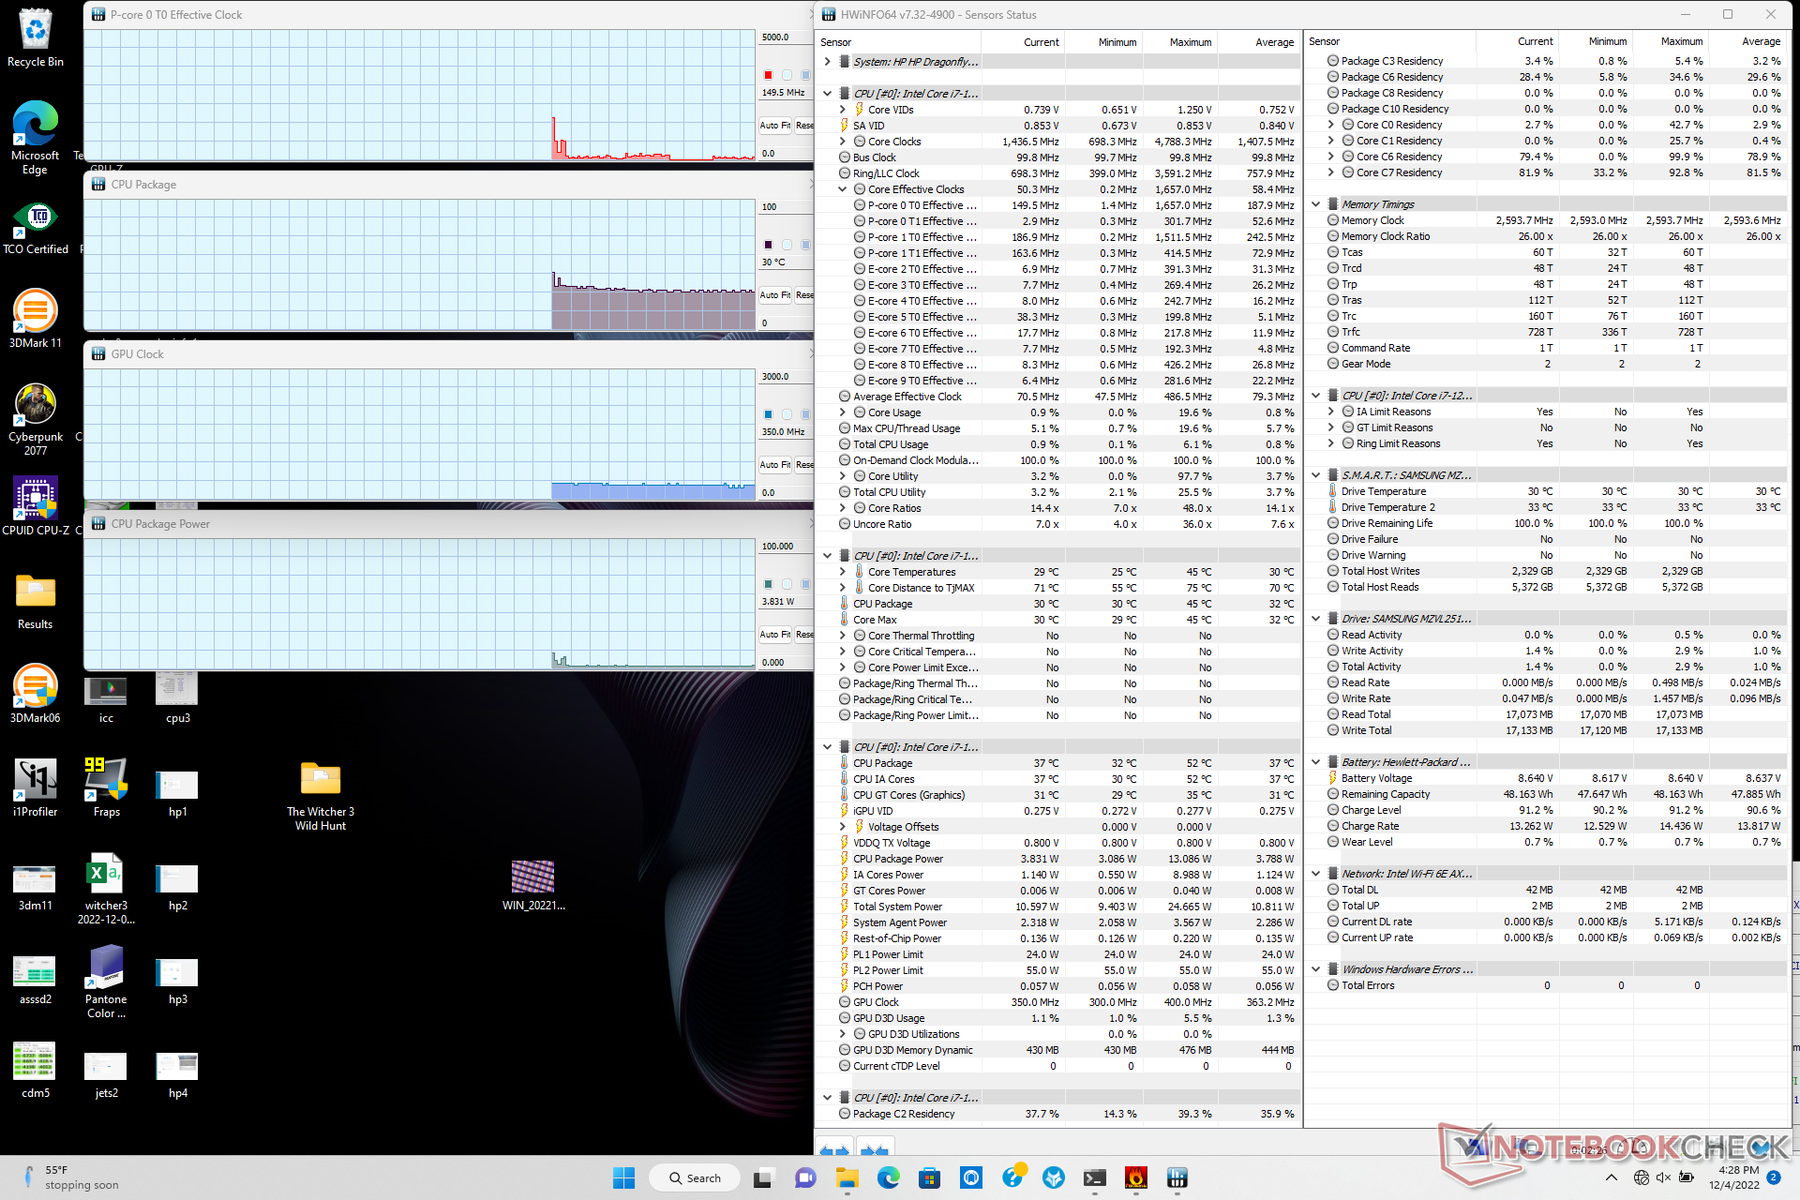
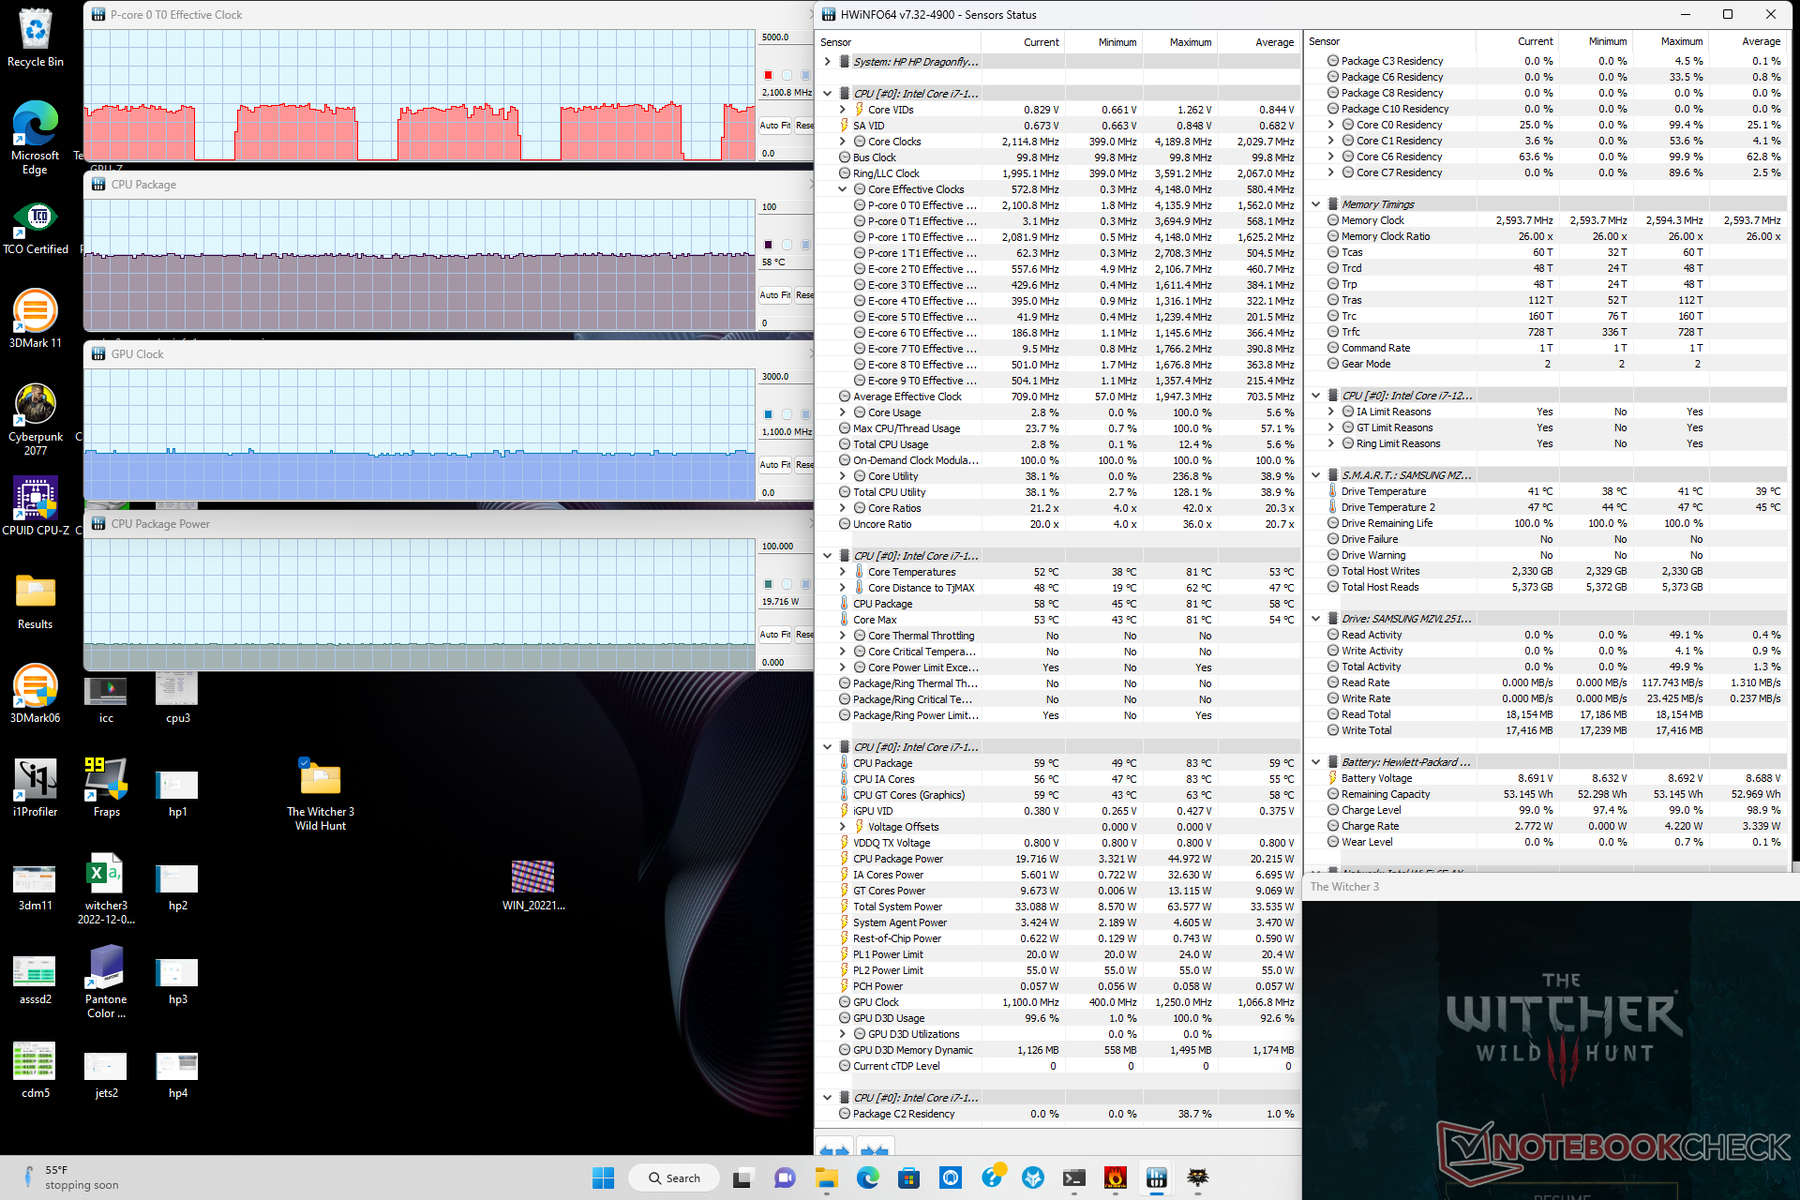
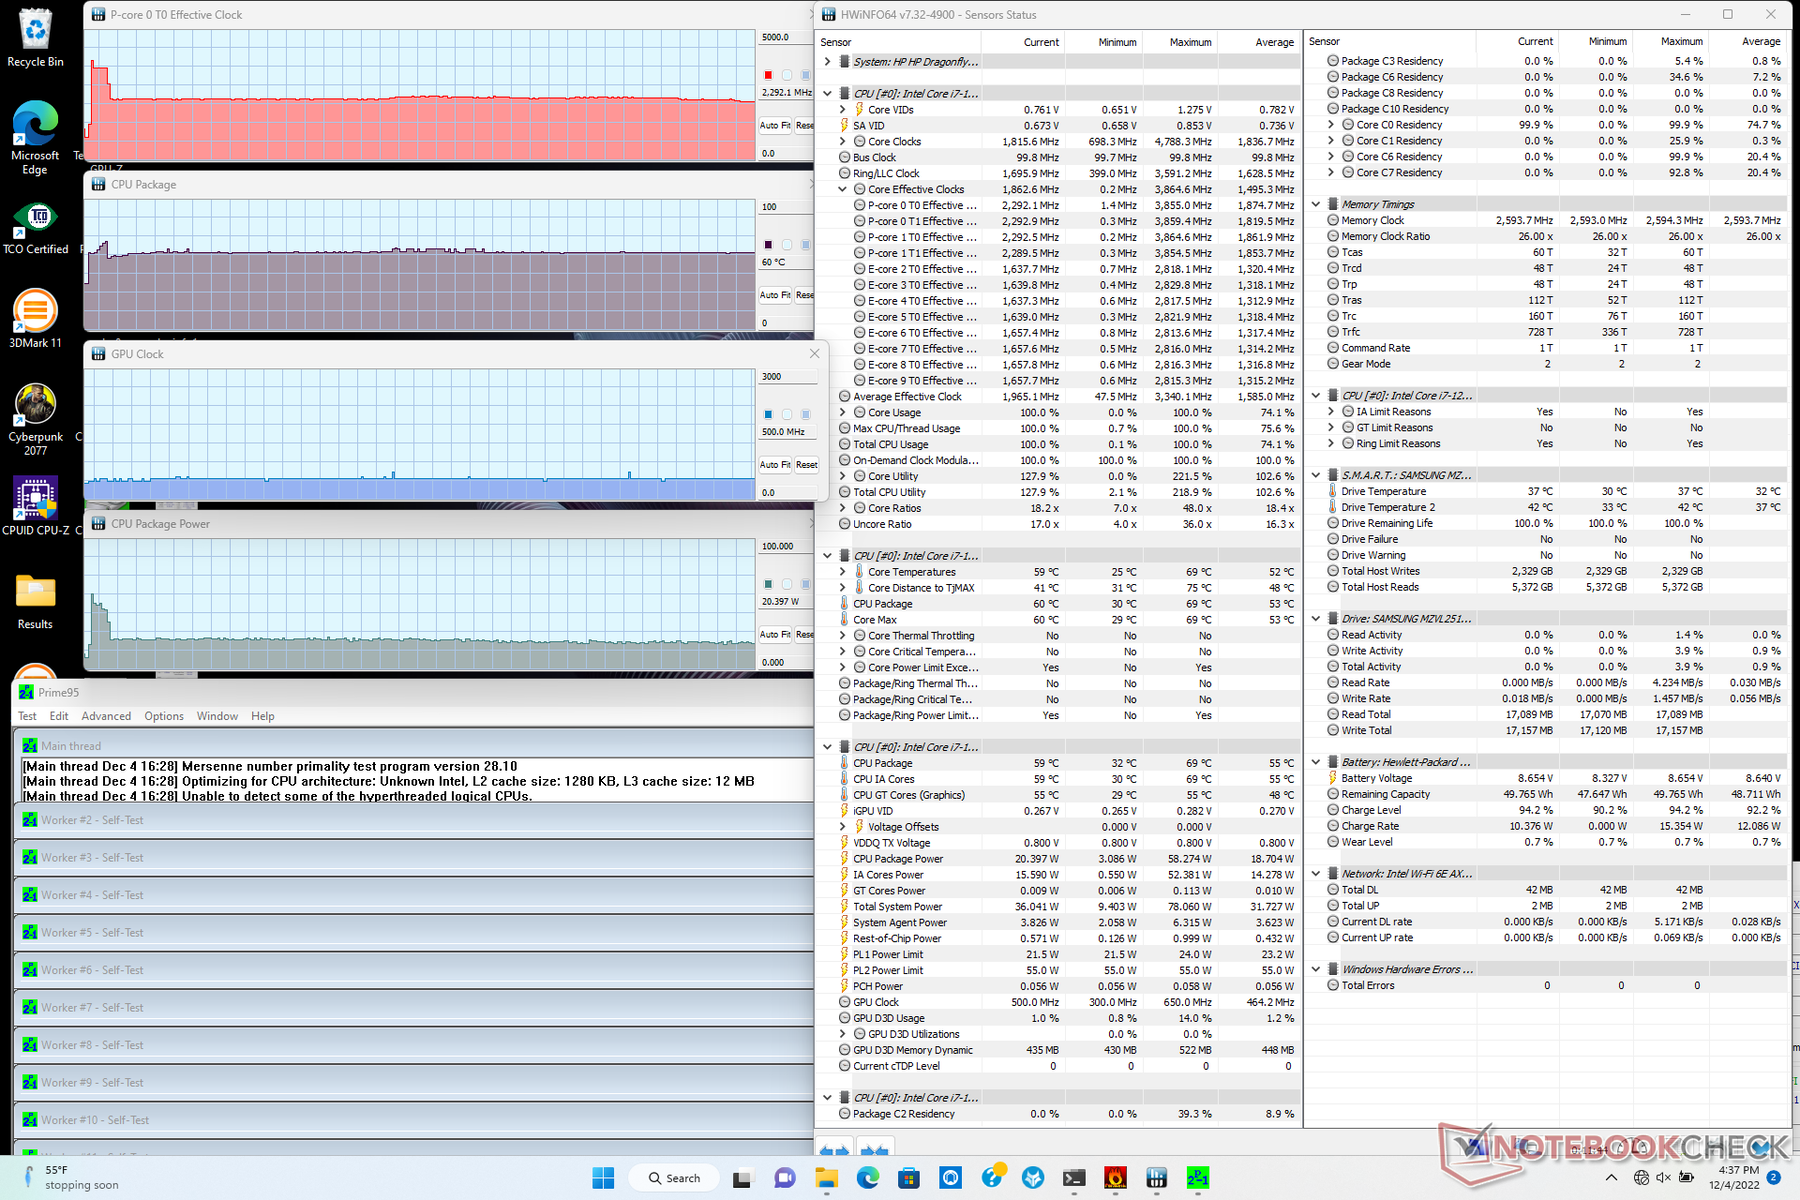
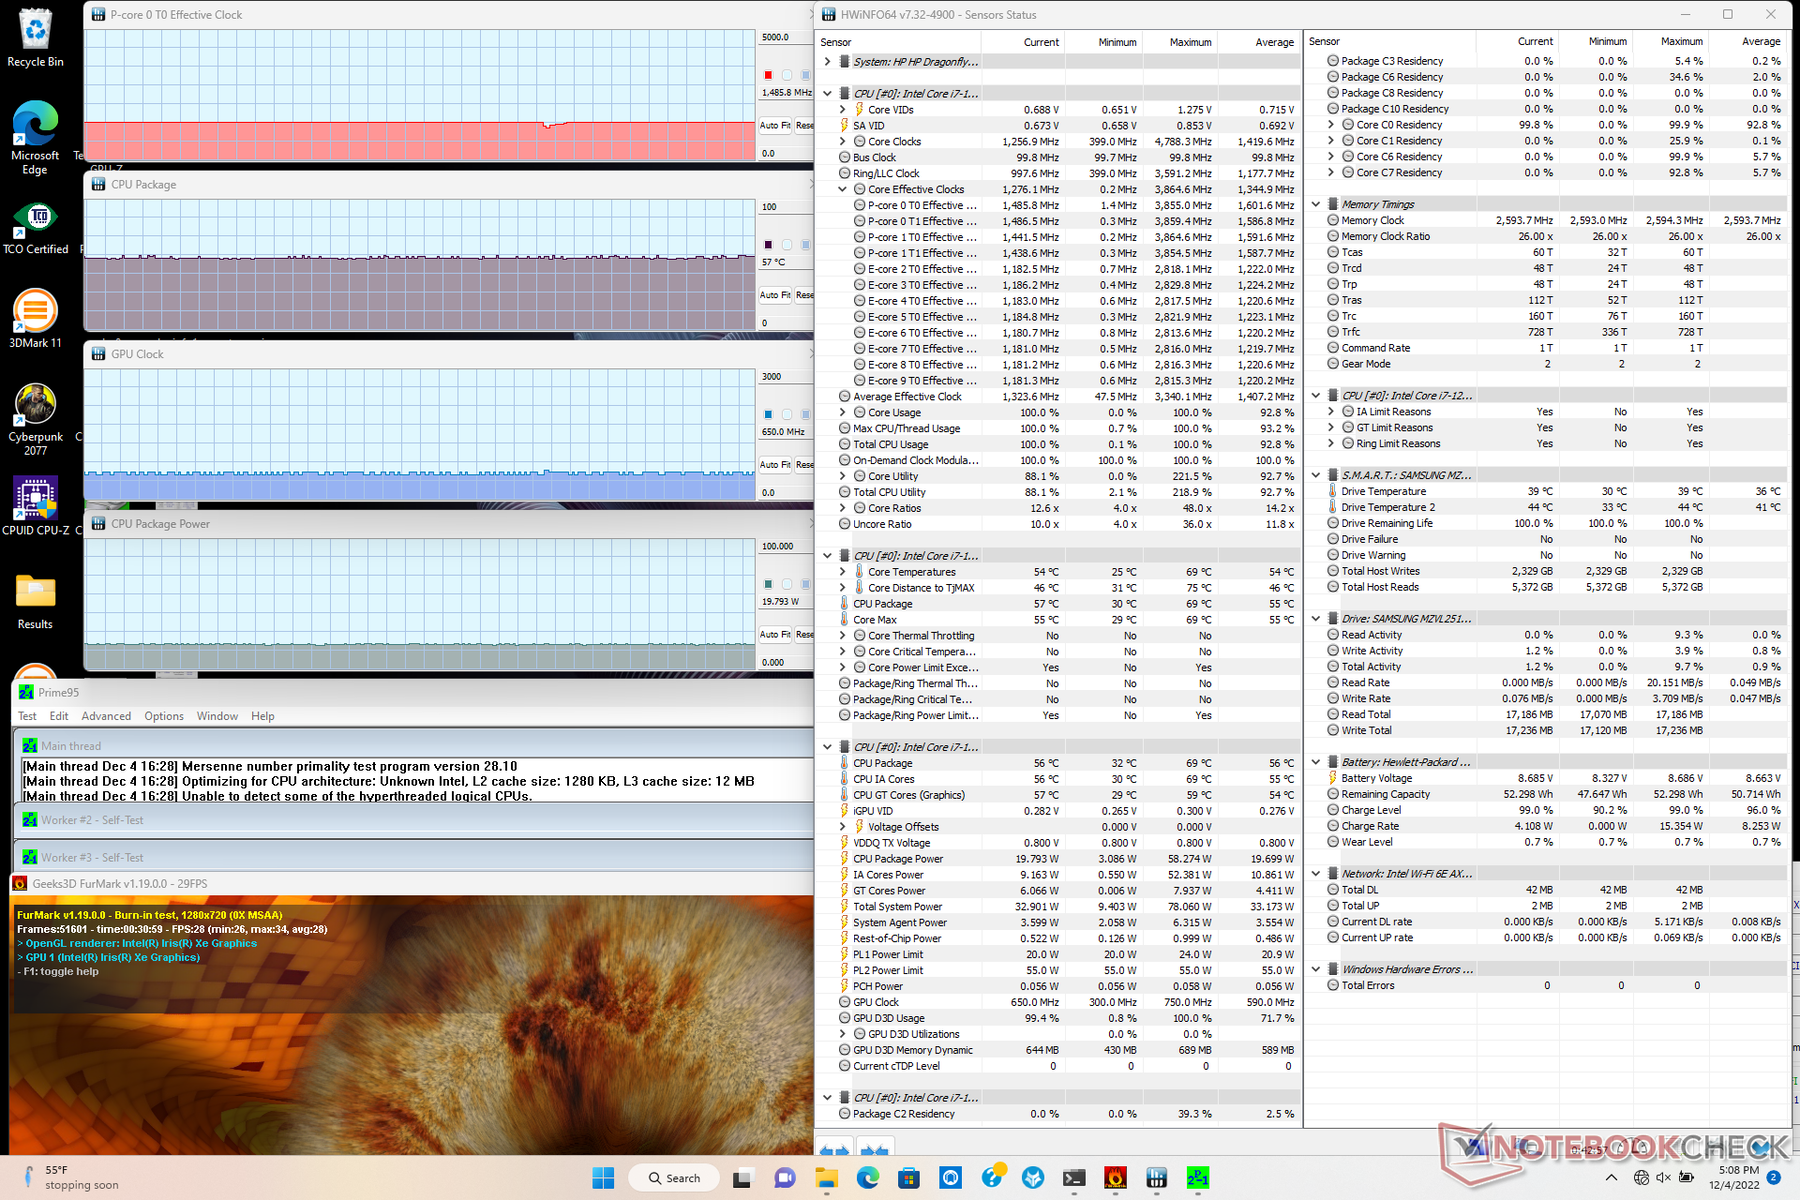
| CPU-Takt (GHz) | GPU-Takt (MHz) | Durchschnittliche CPU-Temperatur (°C) | |
| Leerlauf | -- | -- | 30 |
| Prime95-Stress | 2,3 | -- | 60 |
| Prime95-+FurMark-Stress | 1,5 | 650 | 57 |
| Witcher-3-Stress | 2,1 | 1.100 | 58 |
Lautsprecher
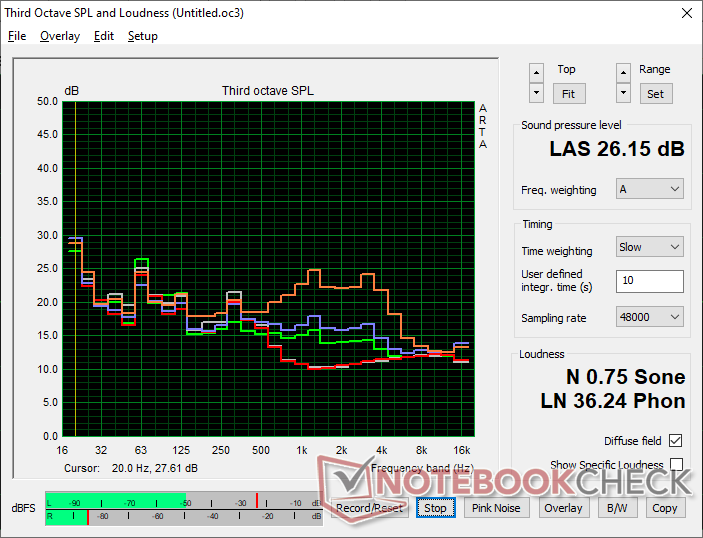
Die vier Lautsprecher sind trotz des kompakten Formats hervorragend. Unsere Mikrofon-Messungen zeigen eine sehr hohe Maximallautstärke von 89 dB(A) und eine gute Pink-Noise-Kurve, die von einer großen Frequenzabdeckung zeugt. Dadurch sind die Lautsprecher sowohl für Videokonferenzen als auch für Multimedia-Inhalte bestens geeignet.
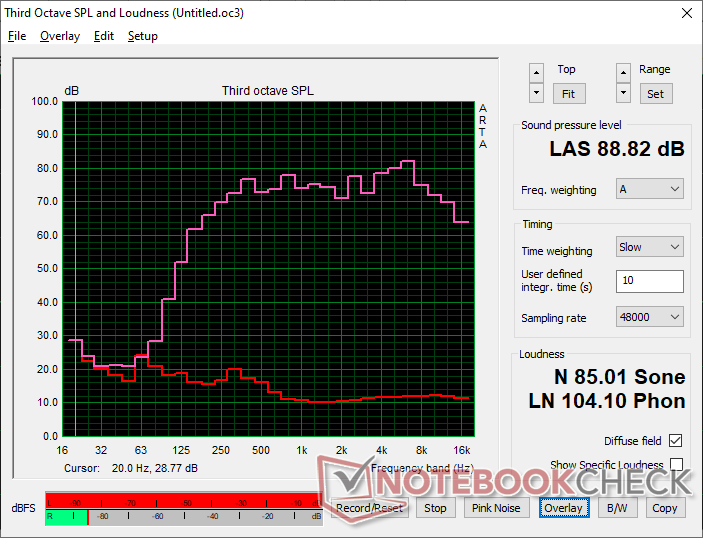
HP Elite Dragonfly Folio 13.5 G3 Audio Analyse
(+) | Die Lautsprecher können relativ laut spielen (88.8 dB)
Bass 100 - 315 Hz
(±) | abgesenkter Bass - 13.2% geringer als der Median
(±) | durchschnittlich lineare Bass-Wiedergabe (11.9% Delta zum Vorgänger)
Mitteltöne 400 - 2000 Hz
(+) | ausgeglichene Mitten, vom Median nur 1.7% abweichend
(+) | lineare Mitten (4.5% Delta zum Vorgänger)
Hochtöne 2 - 16 kHz
(+) | ausgeglichene Hochtöne, vom Median nur 4% abweichend
(±) | durchschnittlich lineare Hochtöne (7.3% Delta zum Vorgänger)
Gesamt im hörbaren Bereich 100 - 16.000 Hz
(+) | hörbarer Bereich ist sehr linear (10.4% Abstand zum Median
Im Vergleich zu allen Geräten derselben Klasse
» 6% aller getesteten Geräte dieser Klasse waren besser, 2% vergleichbar, 92% schlechter
» Das beste Gerät hat einen Delta-Wert von 6%, durchschnittlich ist 20%, das schlechteste Gerät hat 57%
Im Vergleich zu allen Geräten im Test
» 5% aller getesteten Geräte waren besser, 1% vergleichbar, 93% schlechter
» Das beste Gerät hat einen Delta-Wert von 4%, durchschnittlich ist 24%, das schlechteste Gerät hat 134%
Apple MacBook Pro 16 2021 M1 Pro Audio Analyse
(+) | Die Lautsprecher können relativ laut spielen (84.7 dB)
Bass 100 - 315 Hz
(+) | guter Bass - nur 3.8% Abweichung vom Median
(+) | lineare Bass-Wiedergabe (5.2% Delta zum Vorgänger)
Mitteltöne 400 - 2000 Hz
(+) | ausgeglichene Mitten, vom Median nur 1.3% abweichend
(+) | lineare Mitten (2.1% Delta zum Vorgänger)
Hochtöne 2 - 16 kHz
(+) | ausgeglichene Hochtöne, vom Median nur 1.9% abweichend
(+) | sehr lineare Hochtöne (2.7% Delta zum Vorgänger)
Gesamt im hörbaren Bereich 100 - 16.000 Hz
(+) | hörbarer Bereich ist sehr linear (4.6% Abstand zum Median
Im Vergleich zu allen Geräten derselben Klasse
» 0% aller getesteten Geräte dieser Klasse waren besser, 0% vergleichbar, 100% schlechter
» Das beste Gerät hat einen Delta-Wert von 5%, durchschnittlich ist 17%, das schlechteste Gerät hat 45%
Im Vergleich zu allen Geräten im Test
» 0% aller getesteten Geräte waren besser, 0% vergleichbar, 100% schlechter
» Das beste Gerät hat einen Delta-Wert von 4%, durchschnittlich ist 24%, das schlechteste Gerät hat 134%
Energieverwaltung
Energieaufnahme
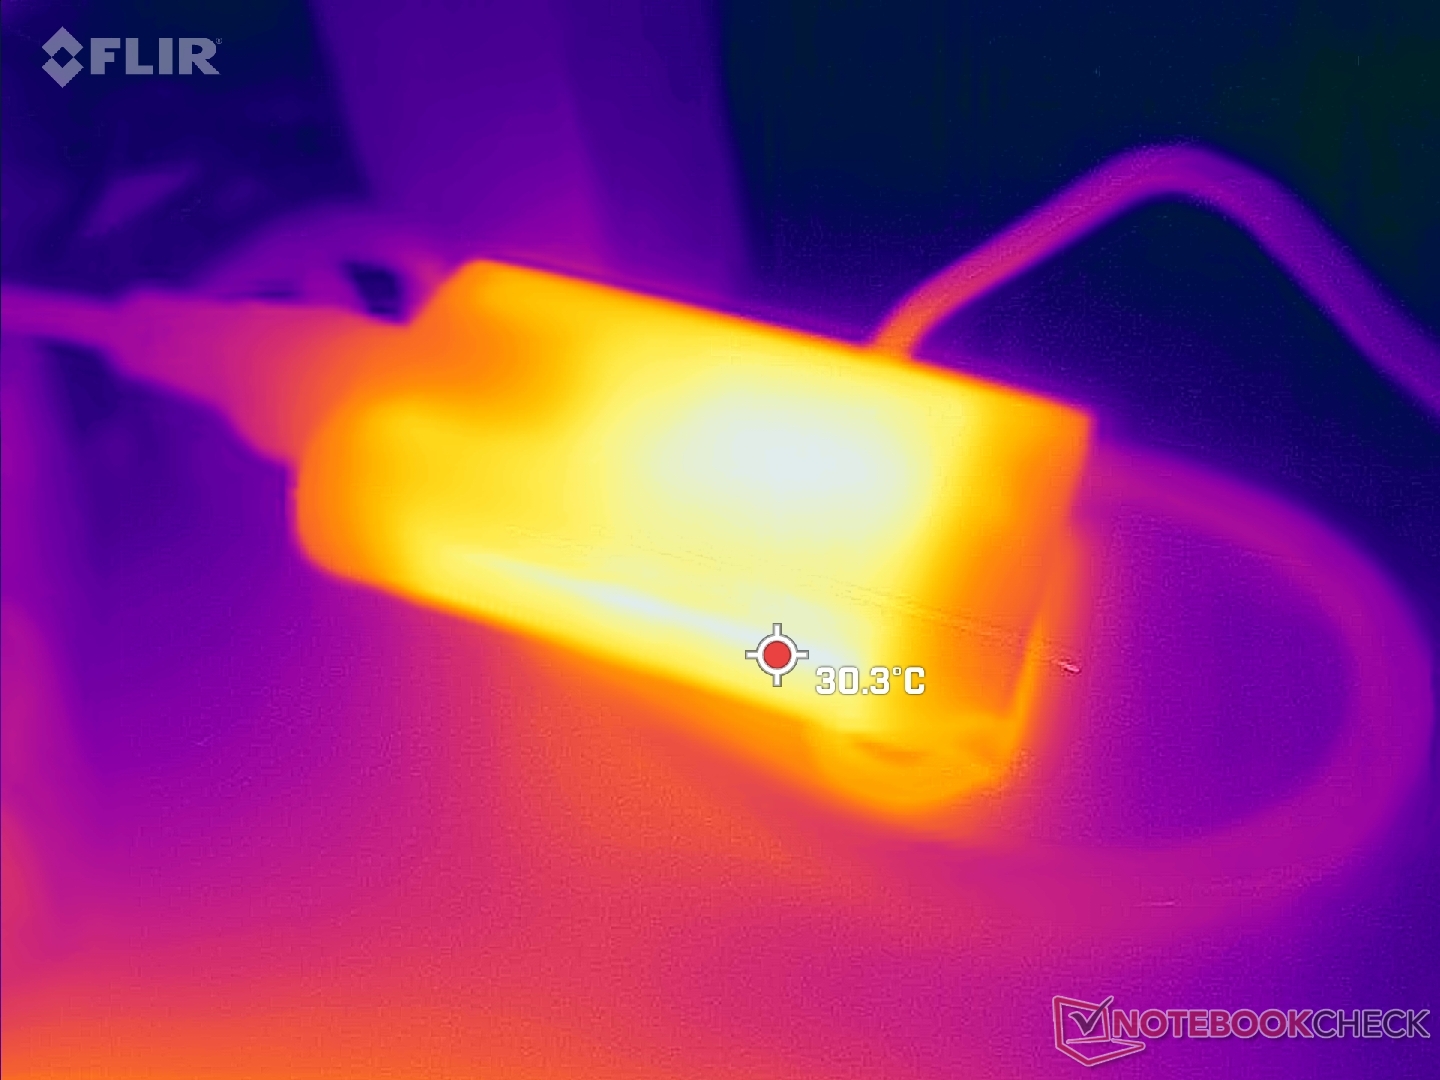
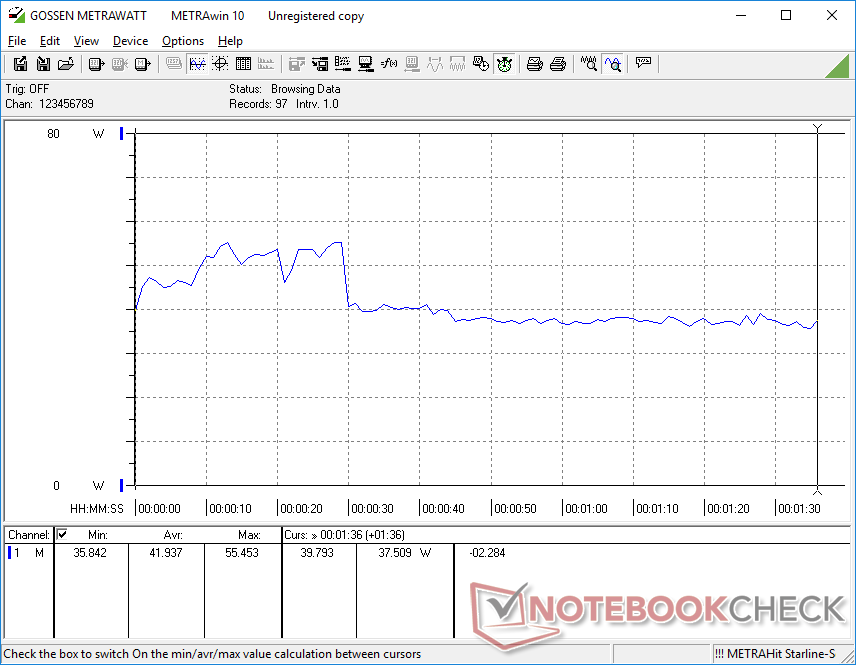
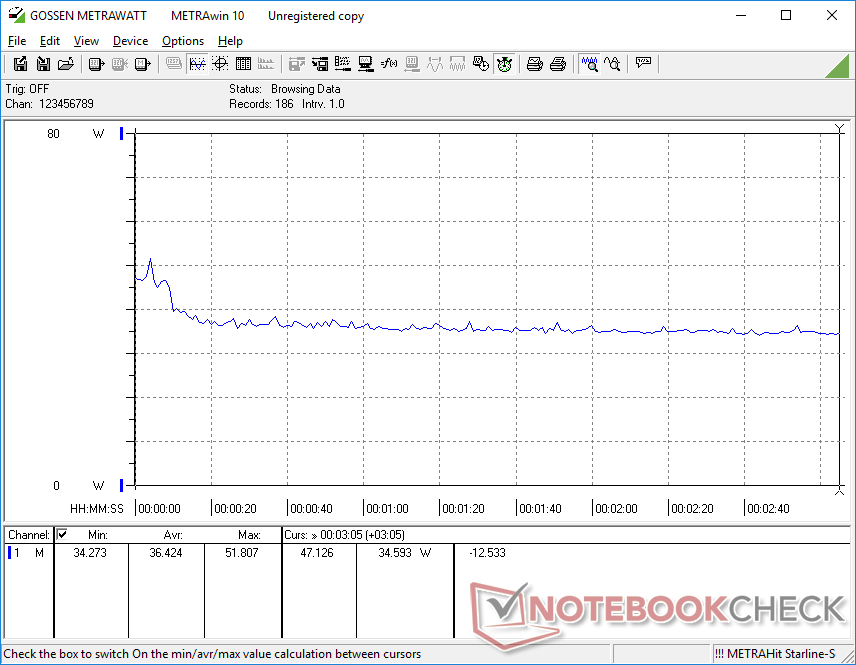
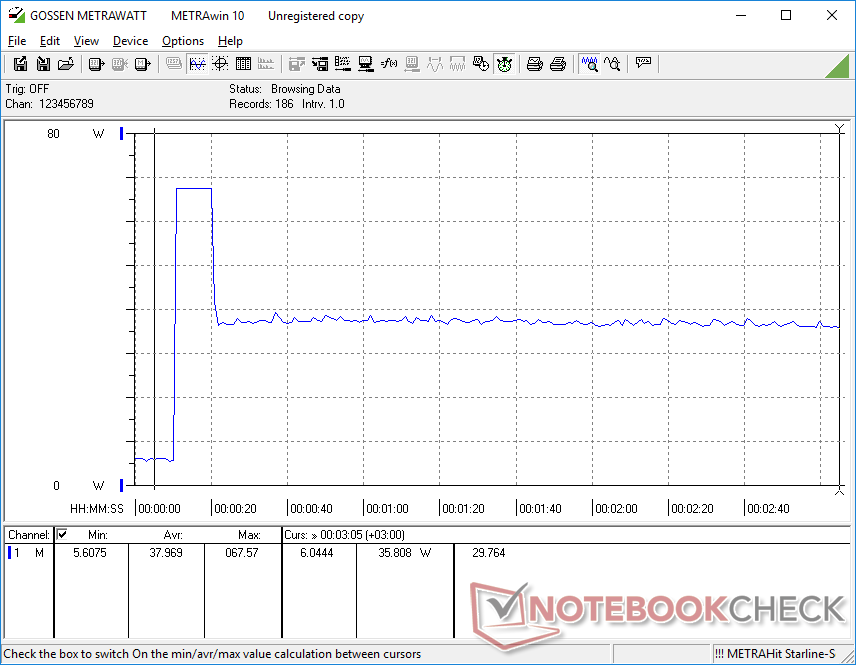
Da unser Testgerät und das Dragonfly G3 über die gleichen Panels und Prozessoren verfügen, ist der Verbrauch nahezu durchwegs identisch. Auf der maximalen Helligkeitsstufe verbraucht das 1.000-cd/m²-Modell vermutlich etwas mehr Strom.
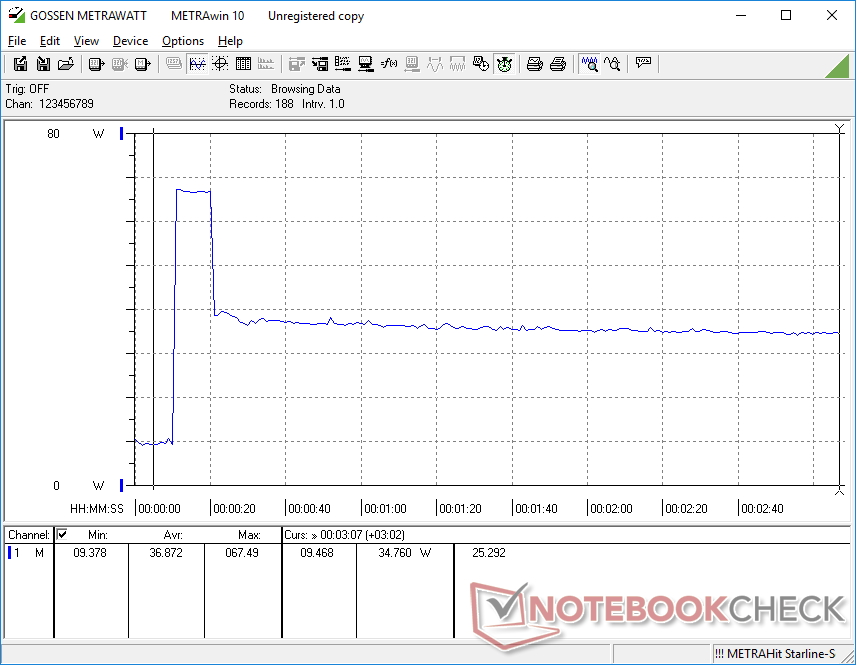
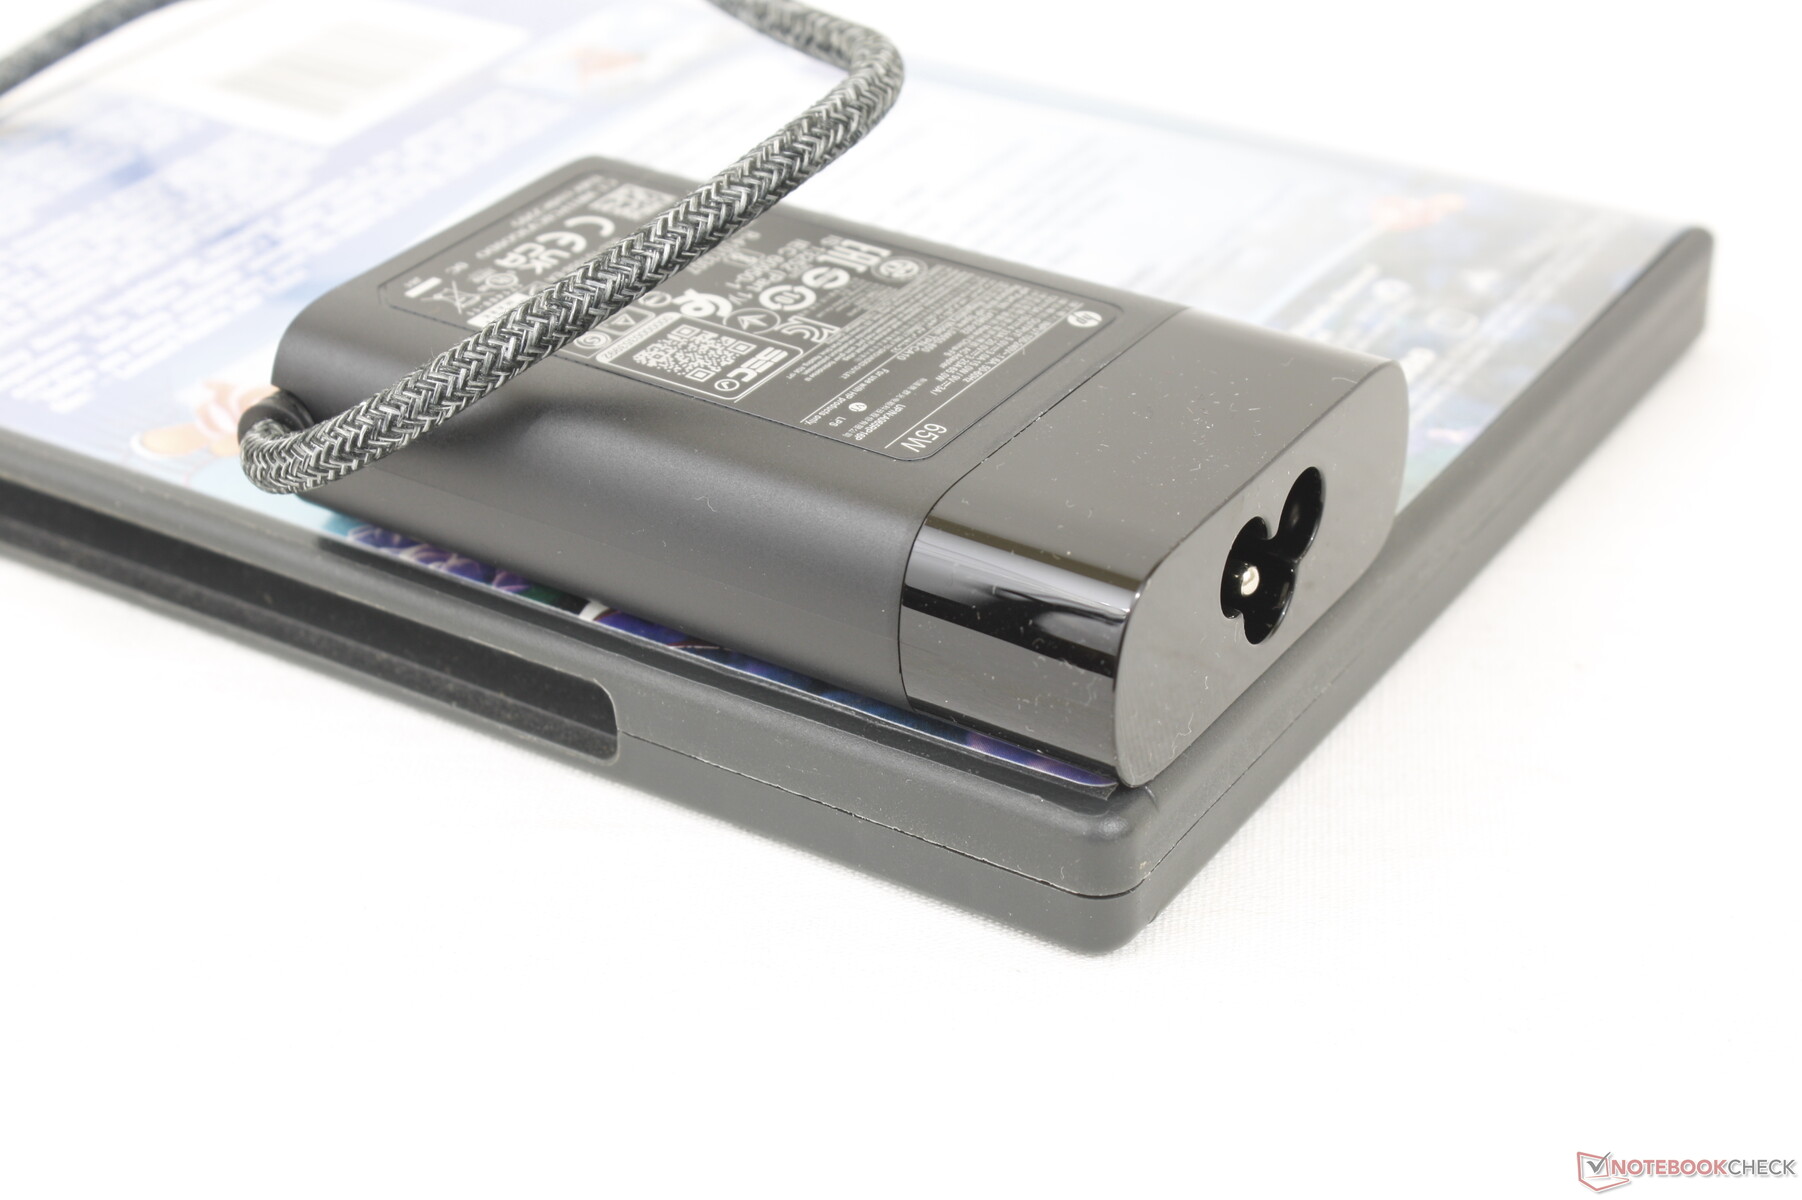
Wir konnten an dem kleinen (~8,8 x 5,4 x 2,2 cm) 65-W-USB-C-Netzteil einen maximalen Verbrauch von 67,5 W messen. Wie die Screenshots unten zeigen, wird dieses Niveau nur kurzfristig aufrechterhalten, sodass der Laptop auch unter Hochlast noch geladen werden kann. Konkurrierende Modelle wie der Framework-Laptop bieten mit dem Core i7-1260P mehr Leistung, verbrauchen jedoch auch entsprechend mehr Strom.
Es sind drei verschiedene 65-W-USB-C-Netzteile in verschiedenen Größen und mit unterschiedlichen Steckern verfügbar.
| Aus / Standby | |
| Idle | |
| Last |
|
Legende:
min: | |
| HP Elite Dragonfly Folio 13.5 G3 i7-1265U, Iris Xe G7 96EUs, Samsung PM9A1 MZVL2512HCJQ, IPS, 1920x1280, 13.5" | HP Elite Dragonfly G3 i7-1265U, Iris Xe G7 96EUs, Micron 3400 MTFDKBA512TFH 512GB, IPS, 1920x1280, 13.5" | Dell Latitude 13 7330 i7-1265U, Iris Xe G7 96EUs, Toshiba KBG40ZNS512G NVMe, IPS, 1920x1080, 13.3" | Framework Laptop 13.5 12th Gen Intel i7-1260P, Iris Xe G7 96EUs, WDC PC SN730 SDBPNTY-512G, IPS, 2256x1504, 13.5" | Razer Book 13 FHD i7-1165G7, Iris Xe G7 96EUs, Samsung SSD PM981a MZVLB256HBHQ, IPS, 1920x1200, 13.4" | Lenovo ThinkPad L13 Gen2-20VH0017GE i5-1135G7, Iris Xe G7 80EUs, Samsung SSD PM981a MZVLB512HBJQ, IPS, 1920x1080, 13.3" | |
|---|---|---|---|---|---|---|
| Stromverbrauch | 0% | 6% | -34% | 5% | -8% | |
| Idle min * (Watt) | 3.4 | 3.4 -0% | 2.8 18% | 5.3 -56% | 3.3 3% | 4.4 -29% |
| Idle avg * (Watt) | 4.9 | 5.6 -14% | 4.8 2% | 8.4 -71% | 6.4 -31% | 7.2 -47% |
| Idle max * (Watt) | 9.3 | 8.4 10% | 7.3 22% | 11.2 -20% | 7 25% | 9.8 -5% |
| Last avg * (Watt) | 41.9 | 40.8 3% | 48.1 -15% | 57.4 -37% | 37.3 11% | 31.7 24% |
| Witcher 3 ultra * (Watt) | 36.4 | 35.5 2% | 35.4 3% | 46.7 -28% | 36.4 -0% | 33.3 9% |
| Last max * (Watt) | 67.5 | 68.4 -1% | 63.6 6% | 61.2 9% | 53.7 20% | 66.6 1% |
* ... kleinere Werte sind besser
Verbrauch Witcher 3 / Stresstest
Verbrauch externer Monitor
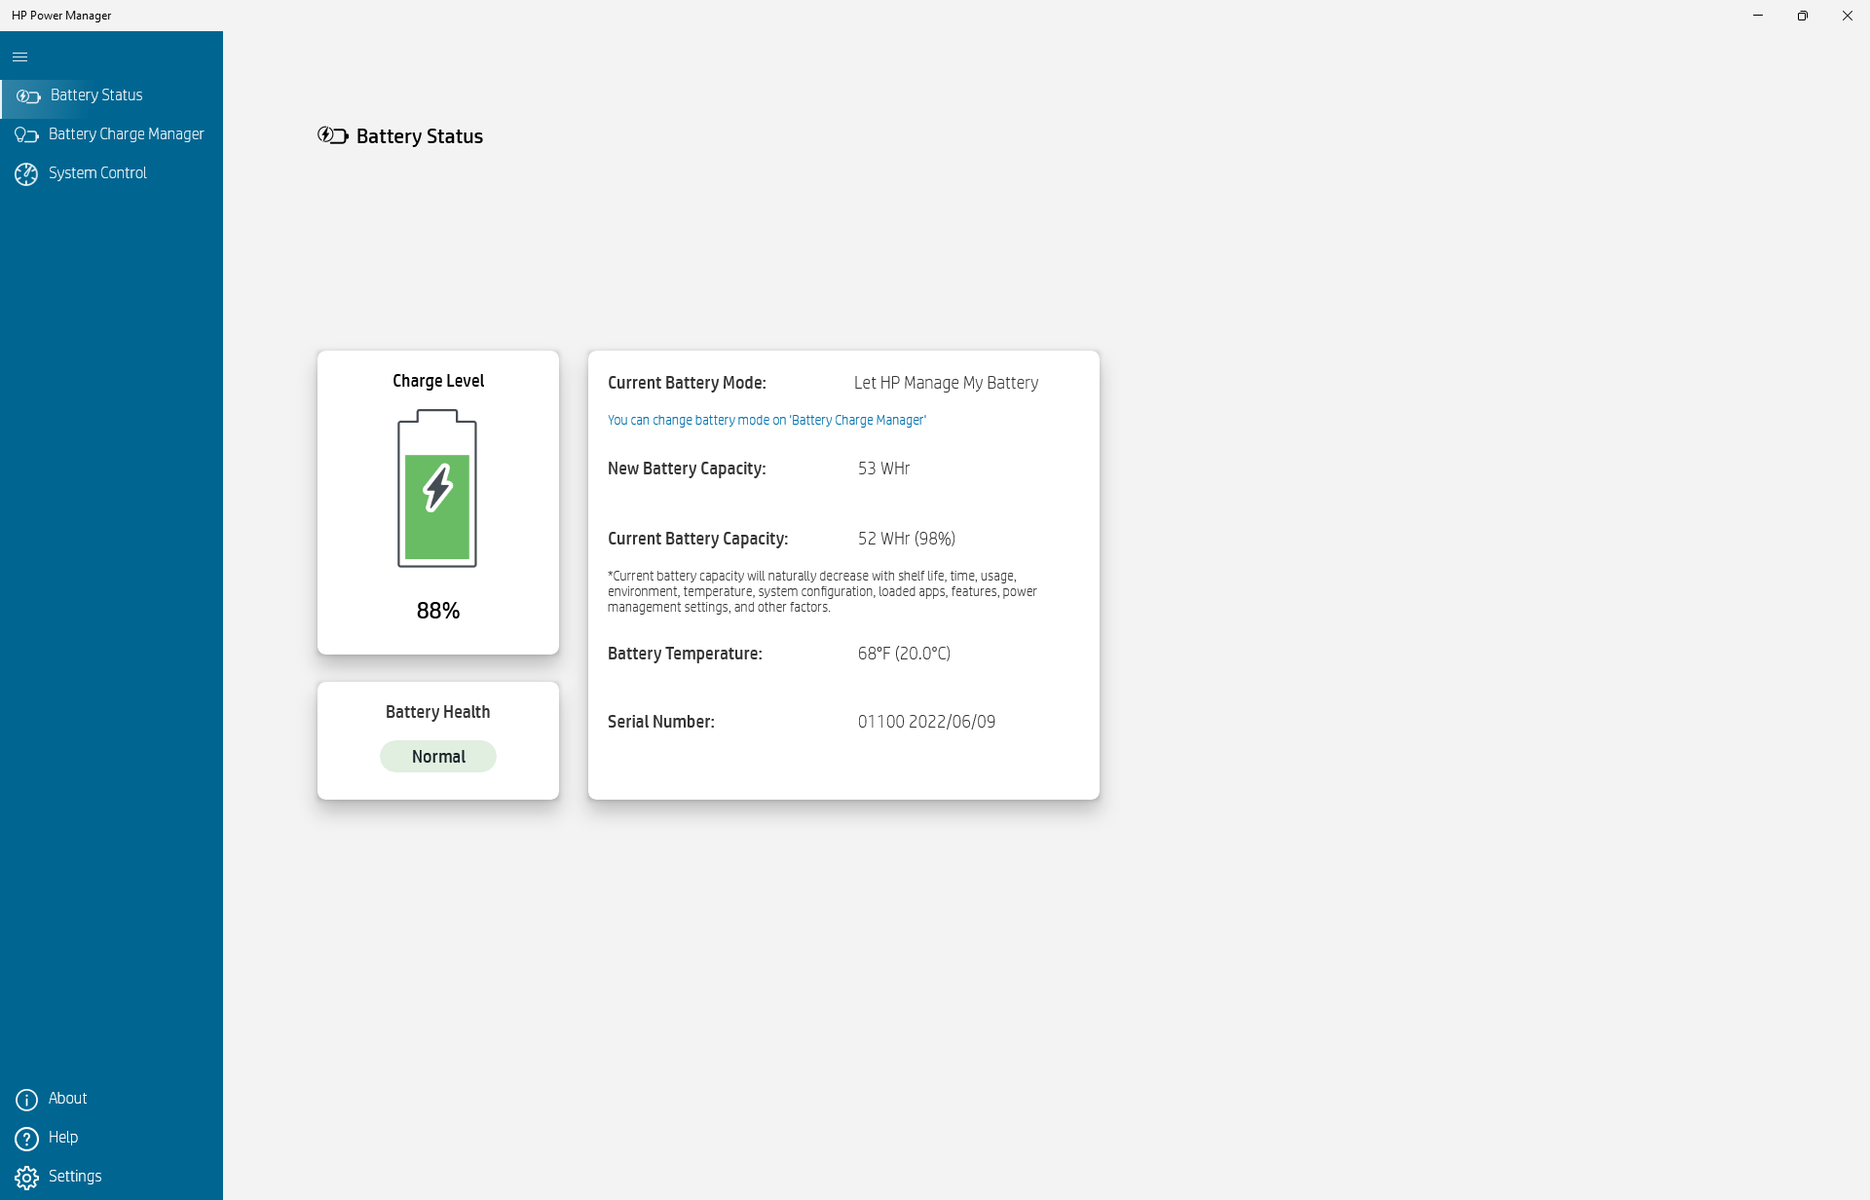
Akkulaufzeit — Kapazität von nur 53 Wh
Die Akkukapazität ist um 22 % kleiner als beim Dragonfly G3. Damit ist es vermutlich kein Zufall, dass die von uns aufgezeichnete WLAN-Laufzeit beim Dragonfly Folio G3 um mit insgesamt 9:25 Stunden um 20 % niedriger ist. Die Akkulaufzeit ist dennoch um mindestens eine Stunde länger als beim Latitude 13 7330, dem Framework-Laptop und dem ThinkPad L13.
Den leeren Akku mit dem mitgelieferten Netzteil voll zu laden dauert unter 90 Minuten.
| HP Elite Dragonfly Folio 13.5 G3 i7-1265U, Iris Xe G7 96EUs, 53 Wh | HP Elite Dragonfly G3 i7-1265U, Iris Xe G7 96EUs, 68 Wh | Dell Latitude 13 7330 i7-1265U, Iris Xe G7 96EUs, 41 Wh | Framework Laptop 13.5 12th Gen Intel i7-1260P, Iris Xe G7 96EUs, 55 Wh | Razer Book 13 FHD i7-1165G7, Iris Xe G7 96EUs, 55 Wh | Lenovo ThinkPad L13 Gen2-20VH0017GE i5-1135G7, Iris Xe G7 80EUs, 46 Wh | |
|---|---|---|---|---|---|---|
| Akkulaufzeit | 33% | -26% | -20% | 24% | -39% | |
| Idle (h) | 27.3 | 37.8 38% | 21.9 -20% | 36.8 35% | ||
| WLAN (h) | 9.4 | 11.8 26% | 8.3 -12% | 7.5 -20% | 14.8 57% | 6.1 -35% |
| Last (h) | 2.6 | 3.5 35% | 1.4 -46% | 2.1 -19% | 1.5 -42% | |
| H.264 (h) | 7.6 |
Pro
Contra
Fazit — Für Leder-Fans
Das Dragonfly Folio G3 verzichtet im Gegensatz zum Vorgänger auf das Snapdragon-SoC und setzt stattdessen auf eine klassische Intel-Core-U-CPU. Mit dieser Änderung, mit der sich das Modell von Windows on ARM verabschiedet und zu einem Benutzererlebnis zurückkehrt, das insgesamt eher dem eines traditionellen Windows-PCs entspricht, versucht HP eine größere Zielgruppe anzusprechen. Die gewonnene Wartungsfreundlichkeit des Laptops geht außerdem nicht auf Kosten des Kunstleder-Designs. Insgesamt sind die Neuerungen der Baureihe durchaus positiv.
Der vielleicht größte Konkurrent des Dragonfly Folio G3 kommt jedoch ebenfalls von HP, das mit dem EliteBook x360 schon ein tolles Convertible im Angebot hat. So ist das EliteBook x360 1040 G9 leichter, dünner und mit mehr Anschlüssen versehen und bietet mit 400-cd/m²- bzw. 1.000-cd/m²-Panels, 5G-Unterstützung und dem gleichen Core i7-1265U (bzw. Core i7-1255U bei aktuellen Modellen in Deutschland) auch ähnliche Konfigurationsmöglichkeiten. Da man vom gleichen Hersteller eine schlankere, besser ausgestattete Alternative bekommt, ist das Dragonfly Folio G3 vermutlich nur für wenige Nutzer die bessere Wahl.
Beim Dragonfly Folio G3 steht das Design an zu hoher Stelle. Das Dragonfly bietet zwar eine einzigartige Ästhetik, allerdings bekommt man bei den schlankeren EliteBooks mehr Anschlüsse und ist dadurch flexibler.
Das Hauptaugenmerk liegt beim Dragonfly Folio G3 natürlich auf dem Kunstleder-Design. Obwohl es sich hierbei um ein ansehnliches, hochklassiges Convertible handelt, muss man sich fragen, ob die zusätzliche Höhe und die im Vergleich zum EliteBook fehlenden Anschlüsse kein zu großer Kompromiss sind.
Preis und Verfügbarkeit
In HPs Online-Shop sind zwei verschiedene Modelle des Dragonfly Folio G3 mittlerweile verfügbar und kosten je nach Konfiguration rund 2.500 bzw. 2.800 Euro.
HP Elite Dragonfly Folio 13.5 G3
- 10.12.2022 v7 (old)
Allen Ngo
Preisvergleich

