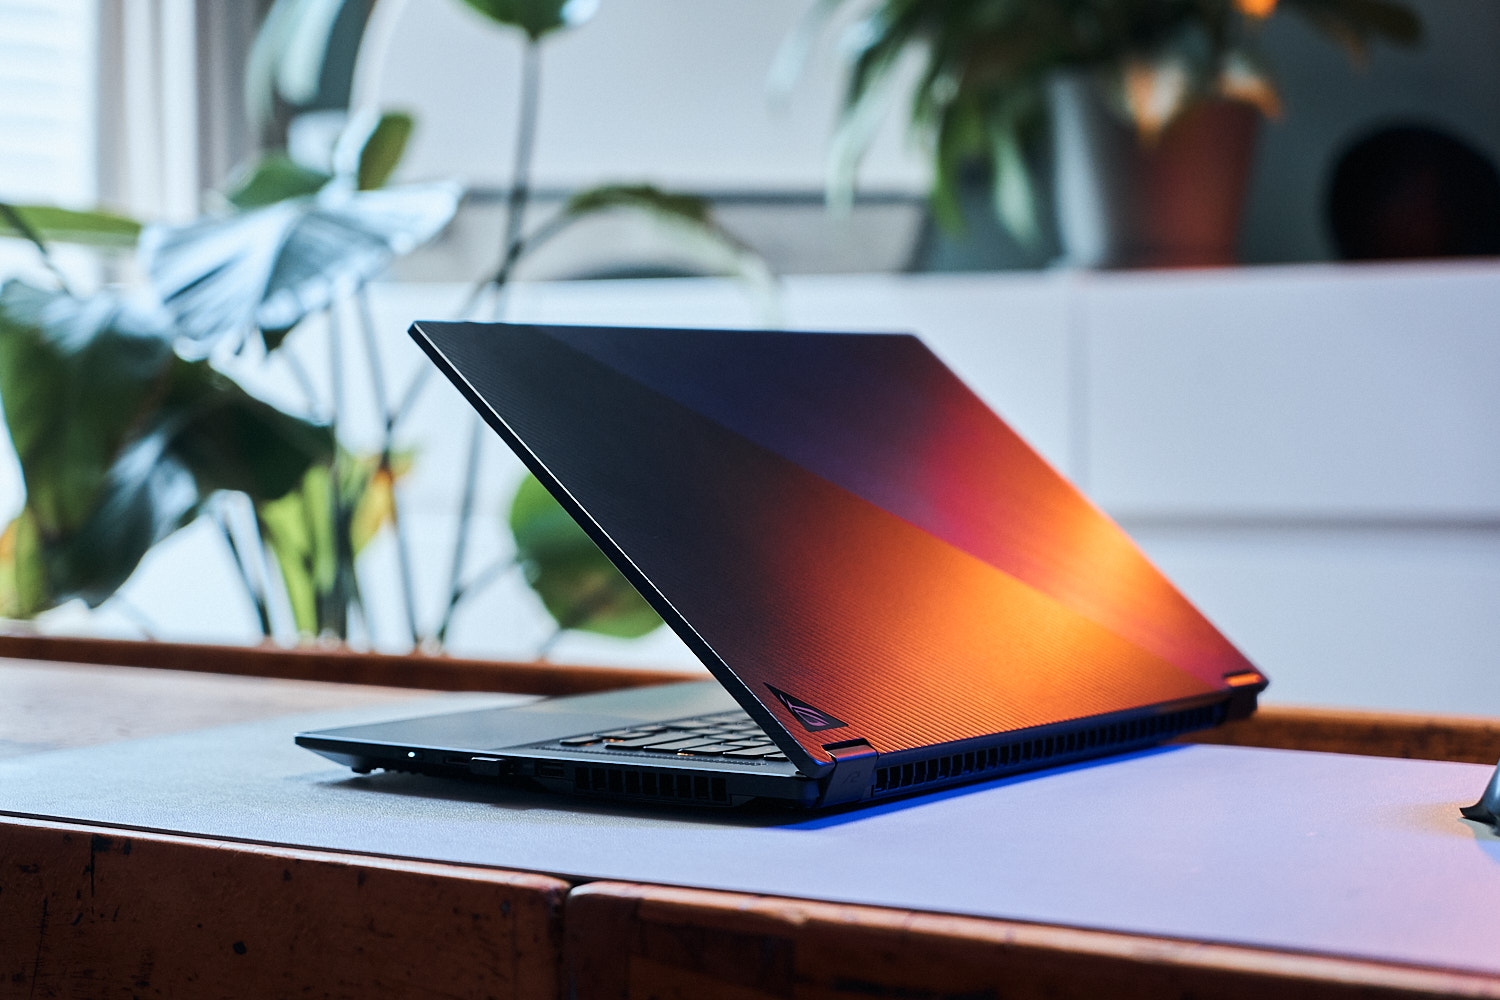
Flaches Asus ROG Flow X16 im Laptop-Test: Starkes 16-Zoll-Gaming-Workstation-Convertible mit Touch-Display
Letztes Jahr war das ROG Flow X16 unser erster Gaming-Laptop mit Mini-LED-Display. Damit war der Laptop seiner Zeit voraus und offenbar sieht Asus daher kaum einen Grund das Modell von Grund auf zu verändern. Allerdings testen wir hier die Version ohne MiniLED. Dennoch bleiben viele Merkmale wie das Gehäuse, aber auch die Anschlüsse größtenteils gleich und Asus wechselt nur die CPU/GPU-Generationen aus.
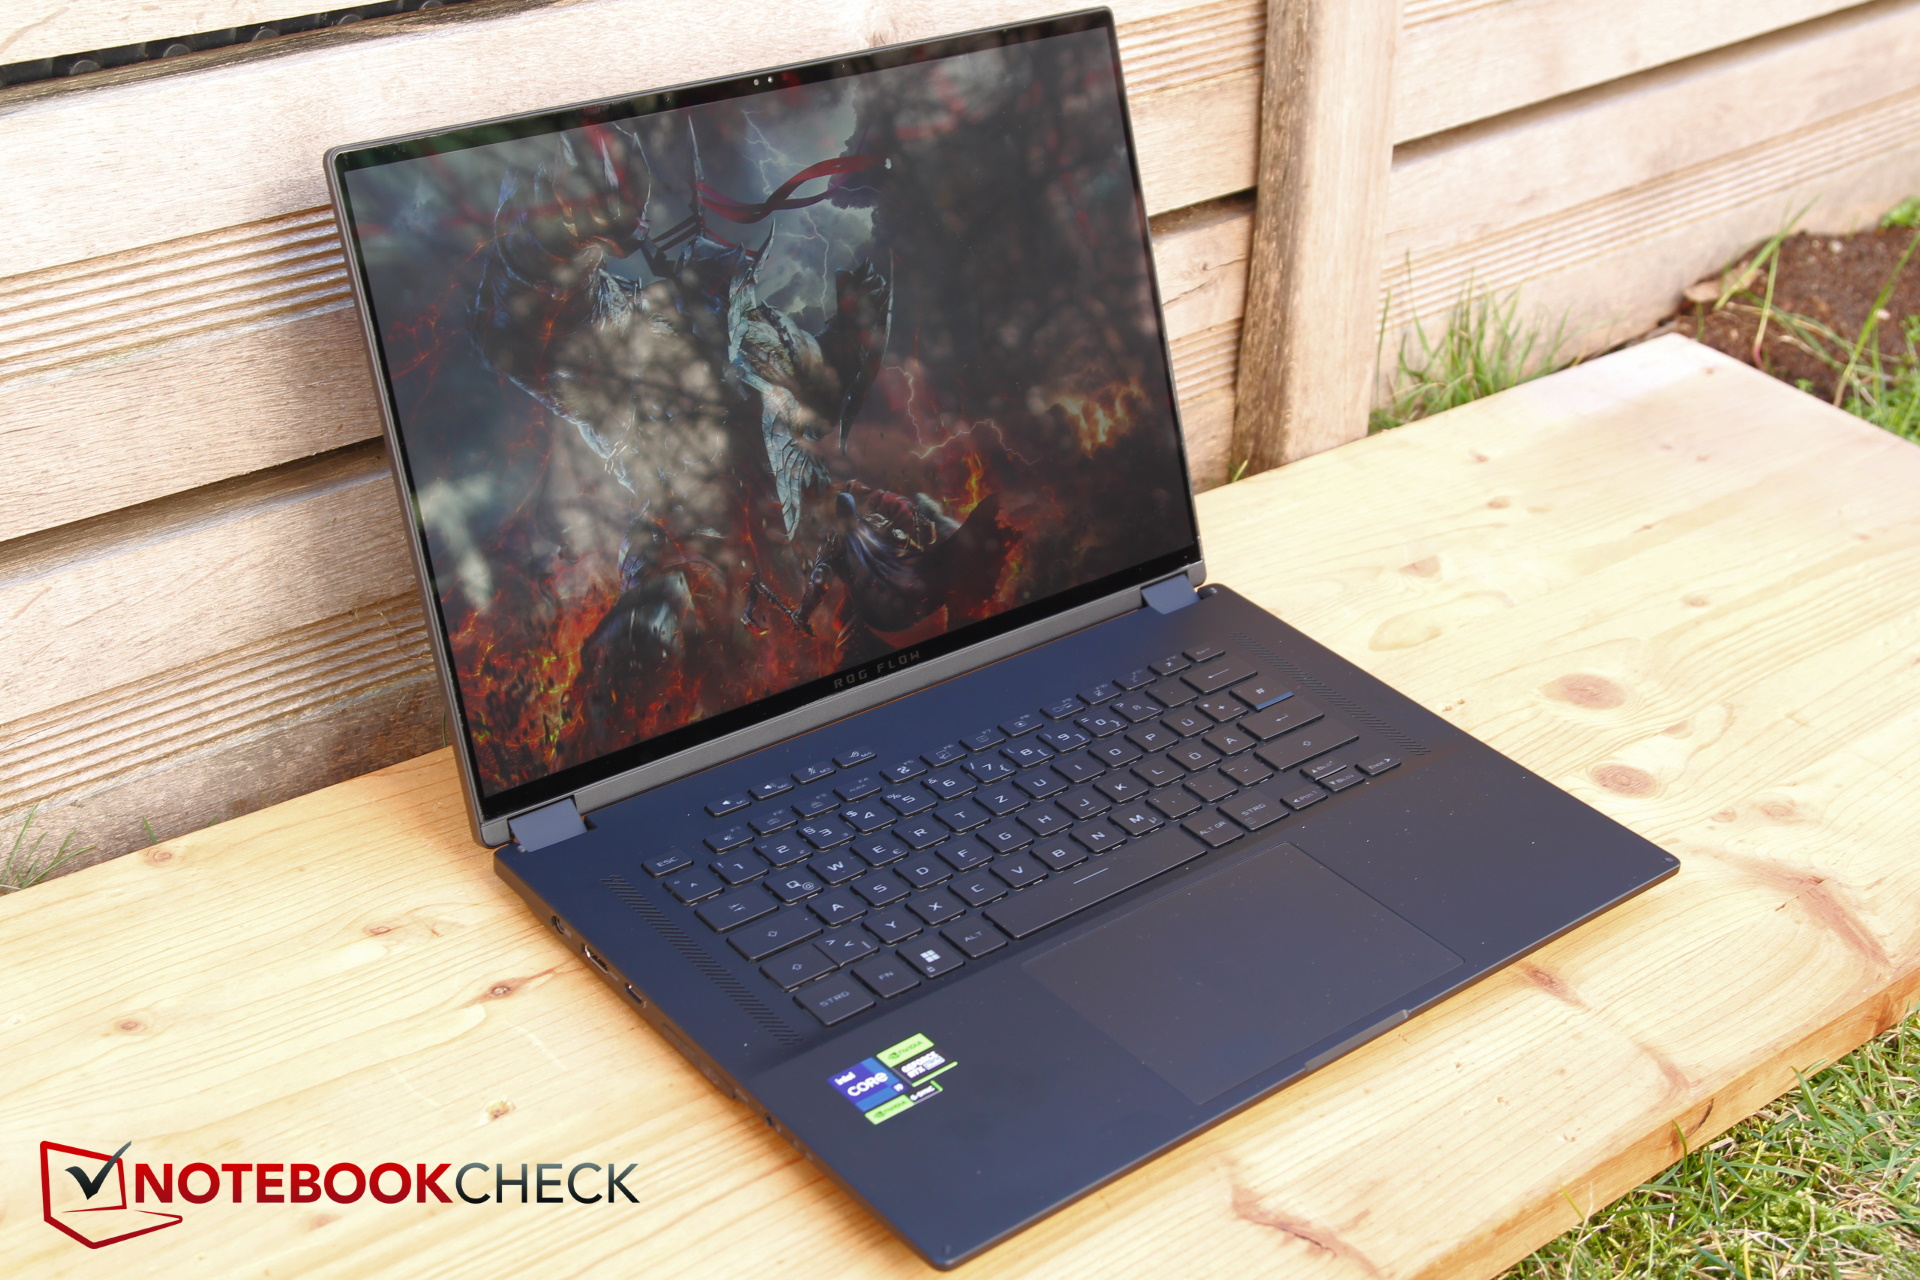
Ähnlich voraus ist Asus derzeit auch in der Realisierung neuer Konzepte, das beweisen sowohl der neue Handheld Asus ROG Ally als auch das Gaming-Tablet Asus ROG Flow Z13. Und auch das X16 ist nicht ganz gewöhnlich: Wir haben hier einen ultra-flachen Gaming-Laptop, der gleichzeitig Convertible ist. Der Bildschirm lässt sich also um 360 Grad umklappen und der Laptop dann im Tablet-Modus via Touchscreen bedienen. Direkte Konkurrenz findet man hier eher selten, weshalb wir natürlich auch mit normalen Gamern vergleichen. Wir ziehen neben dem Vorgänger auch das Samsung Galaxy Book3 Ultra 16, das Lenovo Legion Pro 5, das Lenovo Yoga Pro 7 14 G8 sowie das MSI Katana 17 B13V zum Vergleich heran.
Da diverse physische Merkmale zum Vorjahresmodell gleich bleiben, gehen wir nicht gesondert auf die Abschnitte Gehäuse, Ausstattung, Wartung und Eingabegeräte ein, sondern empfehlen unseren Test des Asus ROG Flow X16 GV601RW vom letzten Jahr für weitere Informationen hierzu.
mögliche Konkurrenten im Vergleich
Bew. | Datum | Modell | Gewicht | Dicke | Größe | Auflösung | Preis ab |
|---|---|---|---|---|---|---|---|
| 89.7 % v7 (old) | 06 / 2023 | Asus ROG Flow X16 GV601V i9-13900H, GeForce RTX 4060 Laptop GPU | 2.1 kg | 19.4 mm | 16.00" | 2560x1600 | |
| 89.5 % v7 (old) | 08 / 2022 | Asus ROG Flow X16 GV601RW-M5082W R9 6900HS, GeForce RTX 3070 Ti Laptop GPU | 2.1 kg | 19.4 mm | 16.10" | 2560x1600 | |
| 88.8 % v7 (old) | 05 / 2023 | Samsung Galaxy Book3 Ultra 16, i9-13900H RTX 4070 i9-13900H, GeForce RTX 4070 Laptop GPU | 1.8 kg | 16.8 mm | 16.00" | 2880x1800 | |
| 87.9 % v7 (old) | 05 / 2023 | Lenovo Legion Pro 5 16IRX8 i7-13700HX, GeForce RTX 4060 Laptop GPU | 2.5 kg | 26.8 mm | 16.00" | 2560x1600 | |
| 90.2 % v7 (old) | 05 / 2023 | Lenovo Yoga Pro 7 14IRH G8 i7-13700H, GeForce RTX 4050 Laptop GPU | 1.5 kg | 15.6 mm | 14.50" | 3072x1920 | |
| 82.1 % v7 (old) | 02 / 2023 | MSI Katana 17 B13VFK i7-13620H, GeForce RTX 4060 Laptop GPU | 2.8 kg | 25.2 mm | 17.30" | 1920x1080 |
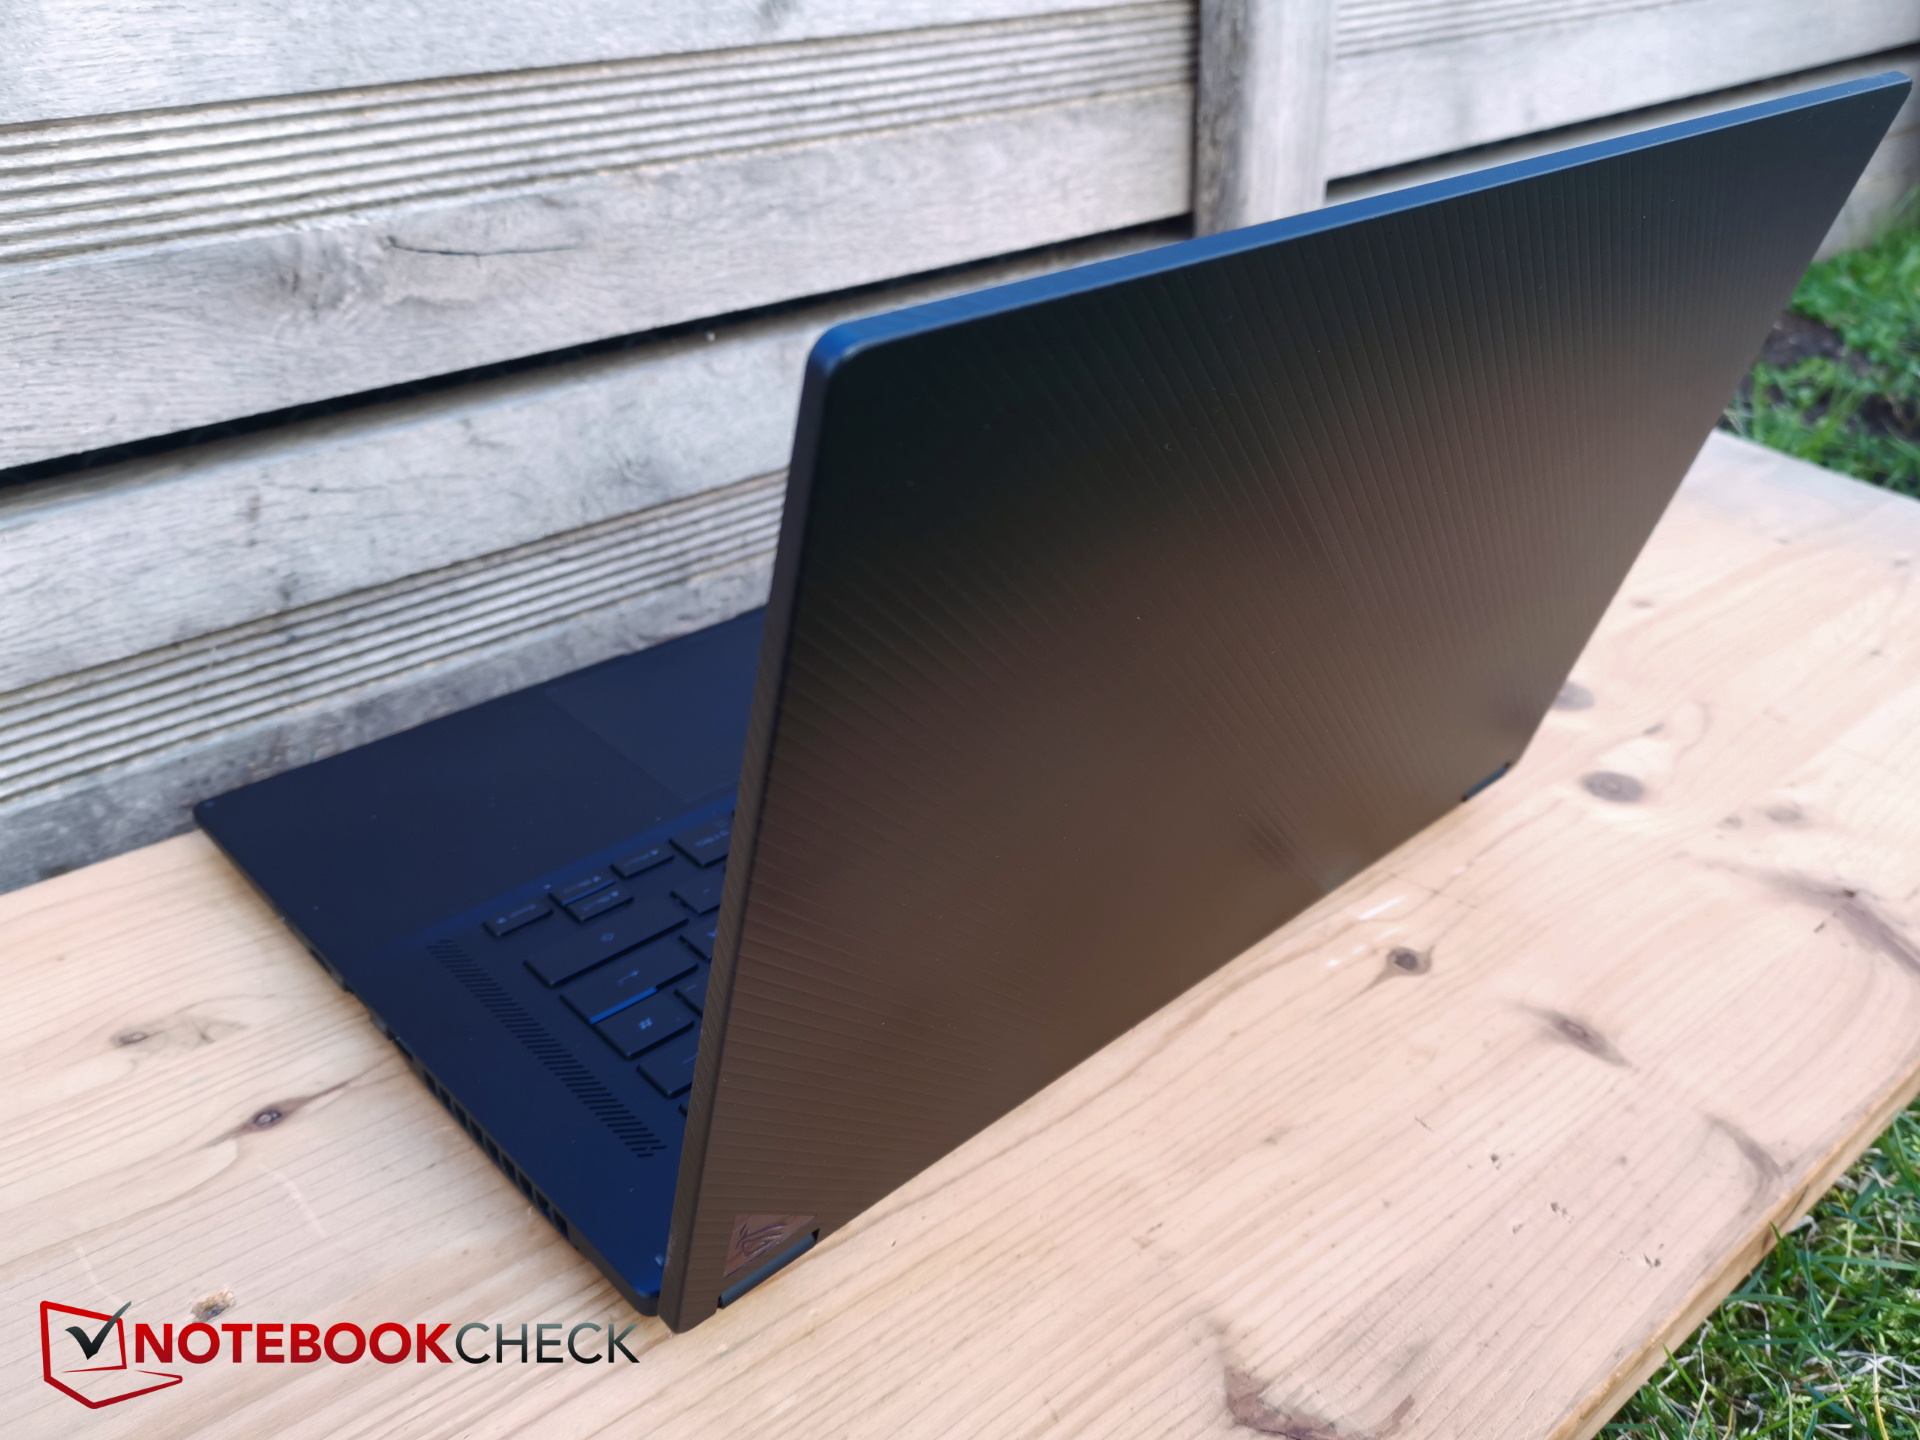
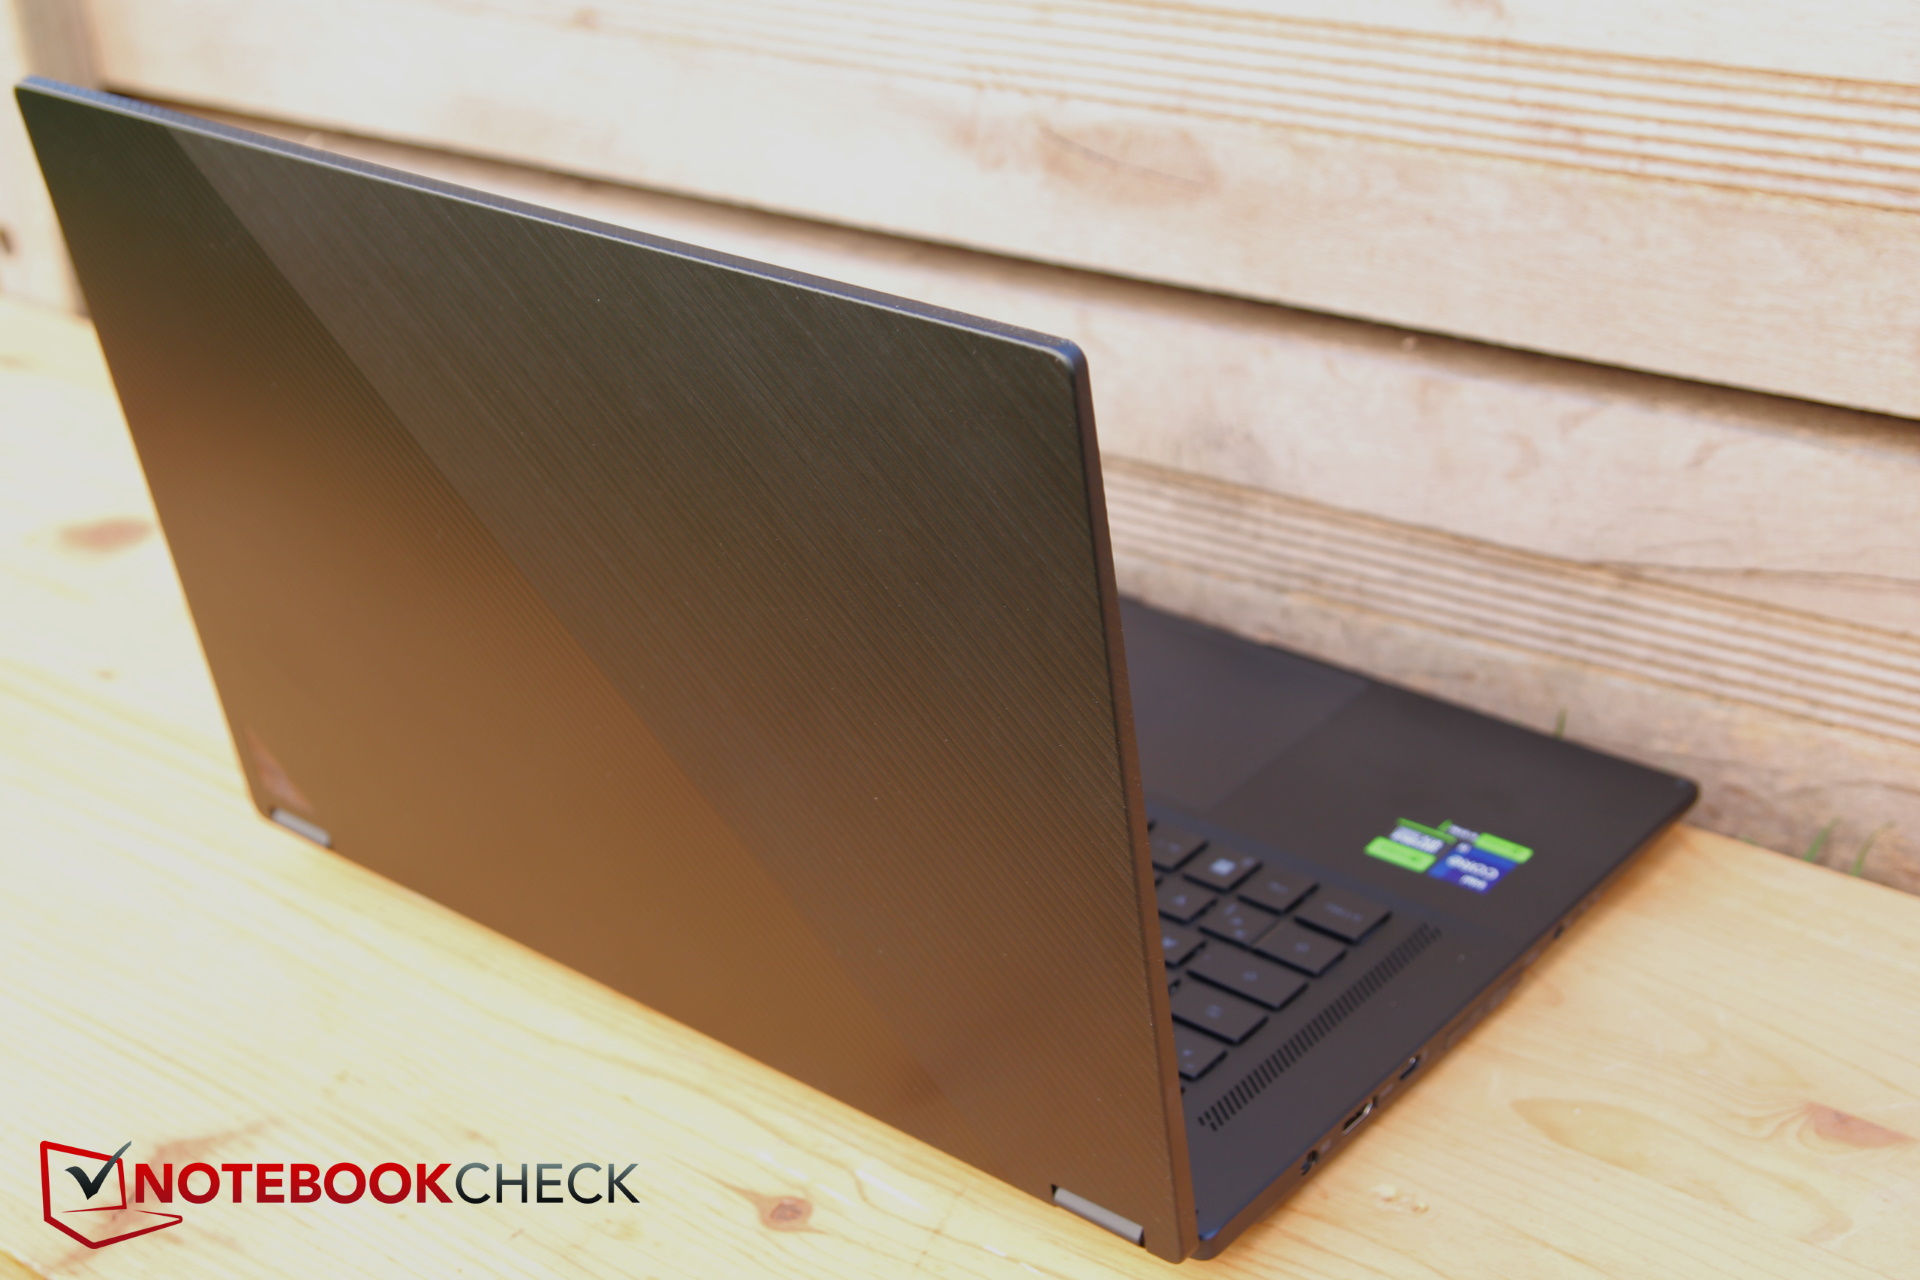
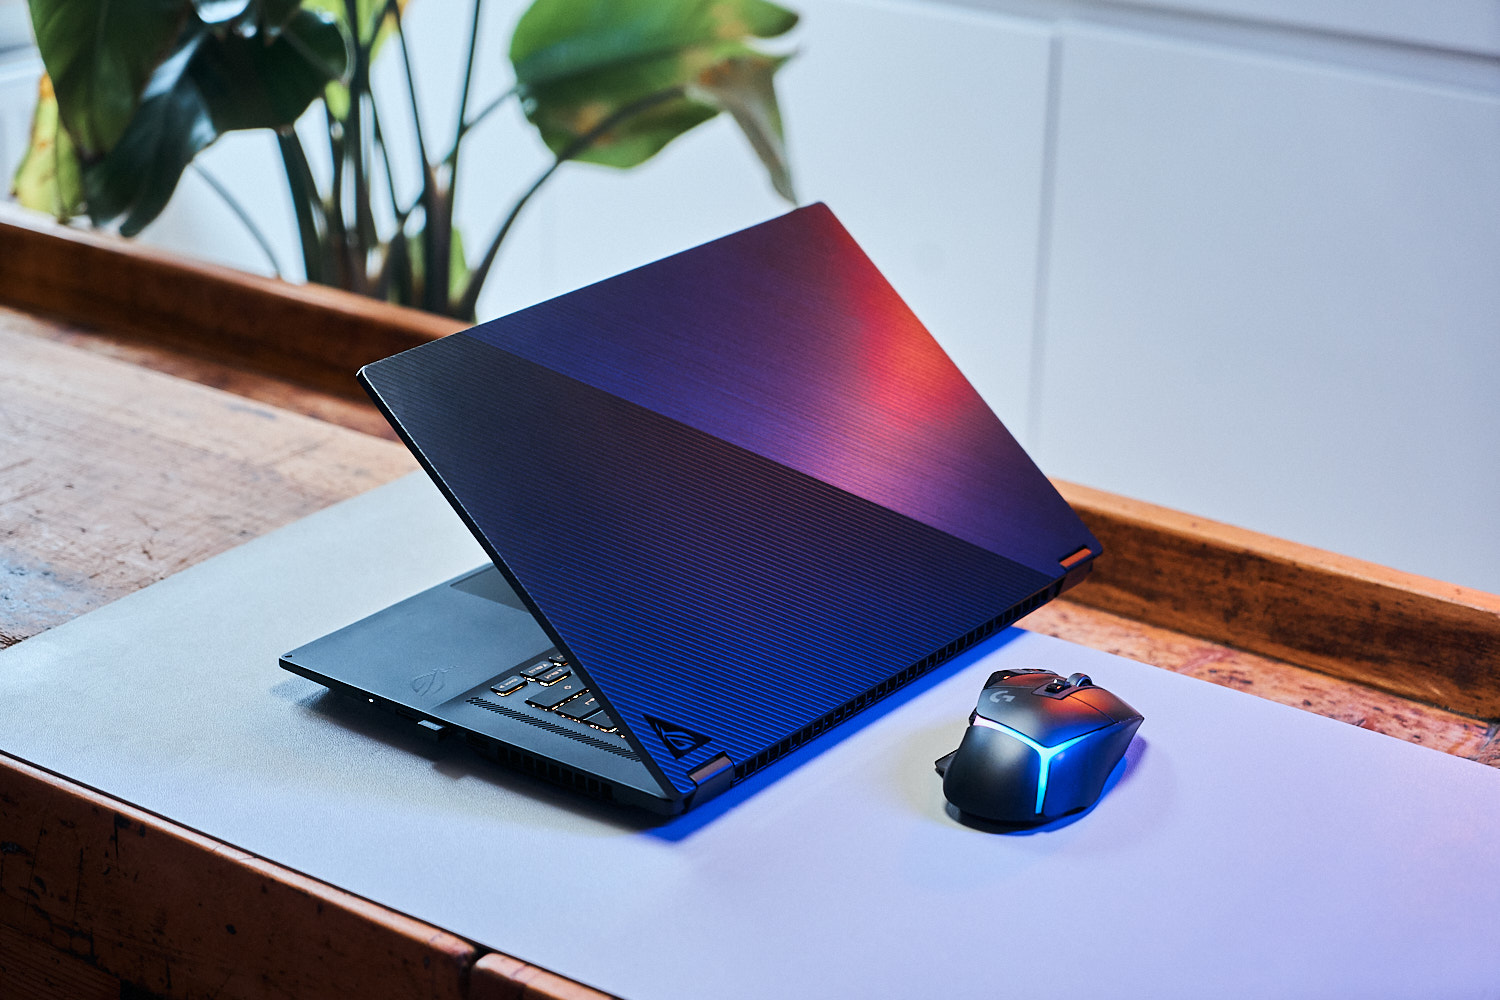
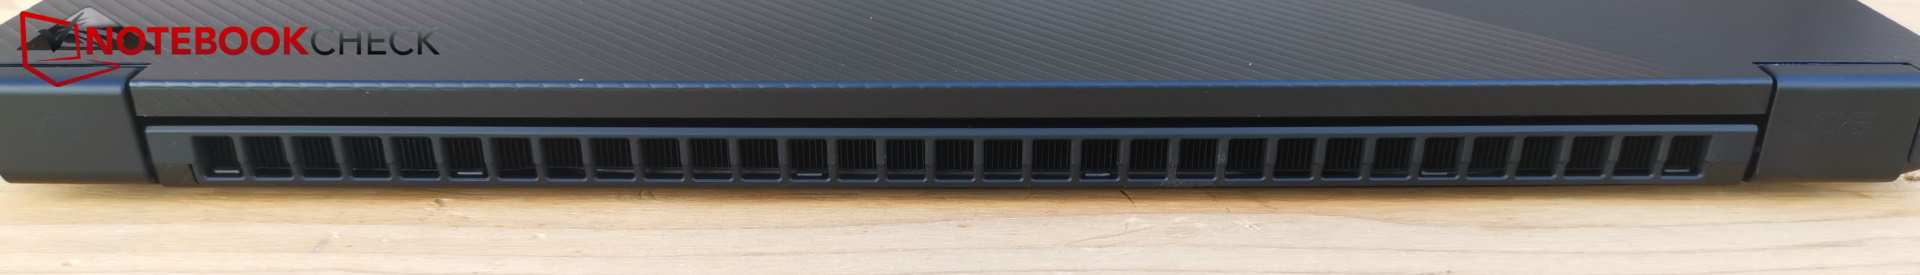
Gehäuse - So flach und gut wie im letzten Jahr
Das Logo auf dem Displaydeckel hat sich leicht verändert, ansonsten bleibt alles beim Alten.


Ausstattung - TB4 und XG Mobile Interface
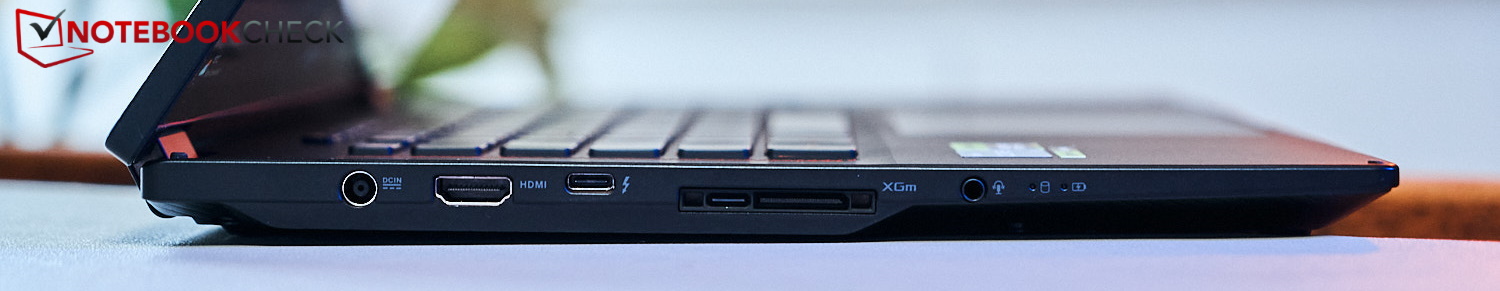
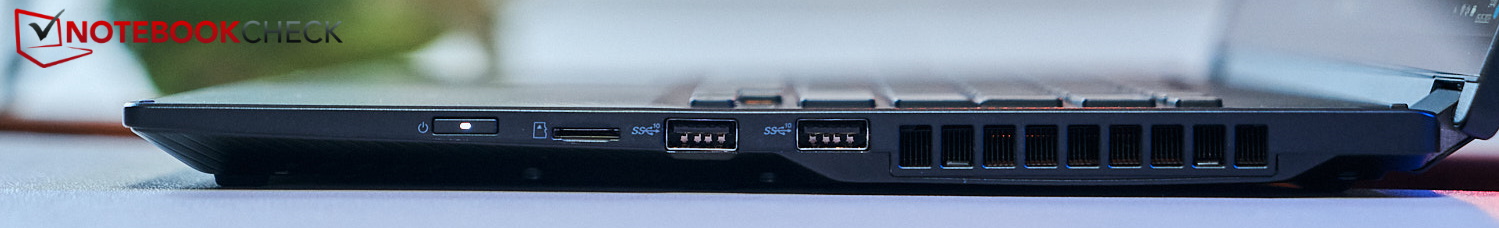
SD Card Reader
| SD Card Reader | |
| average JPG Copy Test (av. of 3 runs) | |
| Asus ROG Flow X16 GV601RW-M5082W (AV Pro SD microSD 128 GB V60) | |
| Durchschnitt der Klasse Gaming (20.9 - 210, n=54, der letzten 2 Jahre) | |
| Asus ROG Flow X16 GV601V | |
| Samsung Galaxy Book3 Ultra 16, i9-13900H RTX 4070 (AV Pro SD microSD 128 GB V60) | |
| maximum AS SSD Seq Read Test (1GB) | |
| Asus ROG Flow X16 GV601V | |
| Asus ROG Flow X16 GV601RW-M5082W (AV Pro SD microSD 128 GB V60) | |
| Durchschnitt der Klasse Gaming (25.5 - 261, n=51, der letzten 2 Jahre) | |
| Samsung Galaxy Book3 Ultra 16, i9-13900H RTX 4070 (AV Pro SD microSD 128 GB V60) | |
Kommunikation
Die Transferraten sind mit dem AX211 von Intel im 6-GHz-Netz sehr hoch und stabil (ca. 1.600 MBit/s), im 5-GHz-Netz sind geringere Transferraten von um die 1.000 MBit/s möglich.
Webcam
Hier rüstet Asus von der letztjährigen 720p-Kamera auf Full-HD um. Das Bild ist brauchbar, die Farbabweichungen sind jedoch recht hoch.


Sicherheit
TPM ist durch den Intel-Chip vorhanden, ein Fingerabdrucksensor und selbst ein Kensington-Anschluss fehlen jedoch. Die Kamera ist mit Windows Hello kompatibel.
Zubehör
Leider liegt in diesem Jahr nicht der Eingabestift bei und man erhält den Laptop theoretisch auch ohne weitere Ausstattung. Je nach Paket ist als potentielles Zubehör jedoch ein Laptop-Rucksack der Marke ROG, das Headset ROG Fusion II 300 sowie die Maus ROG Gladius III mit dabei.
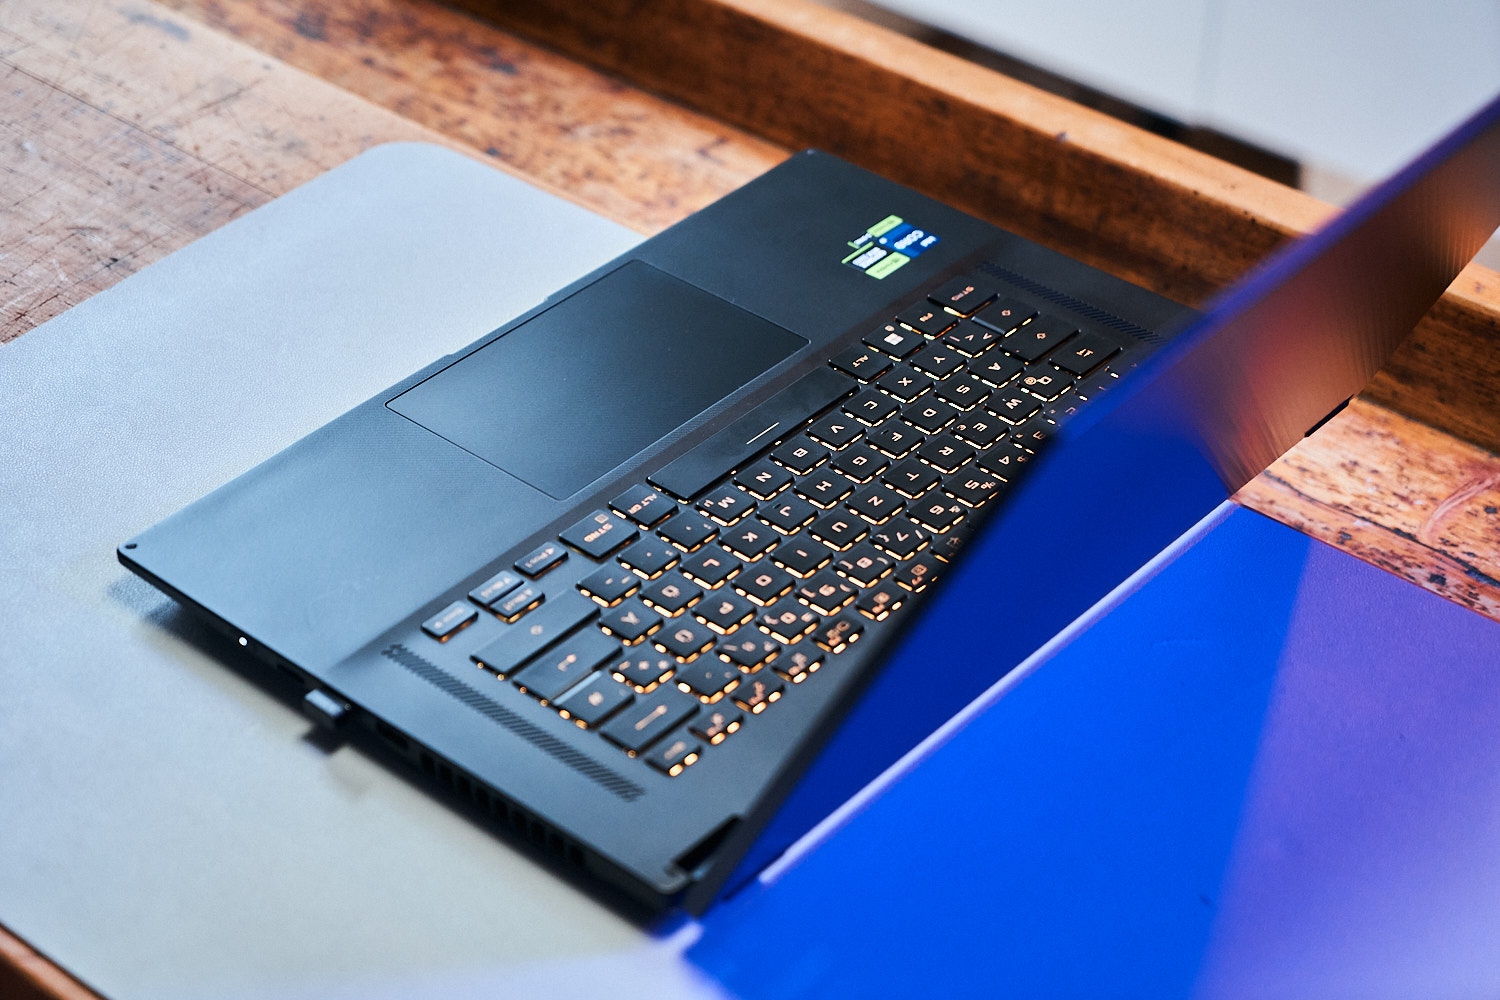
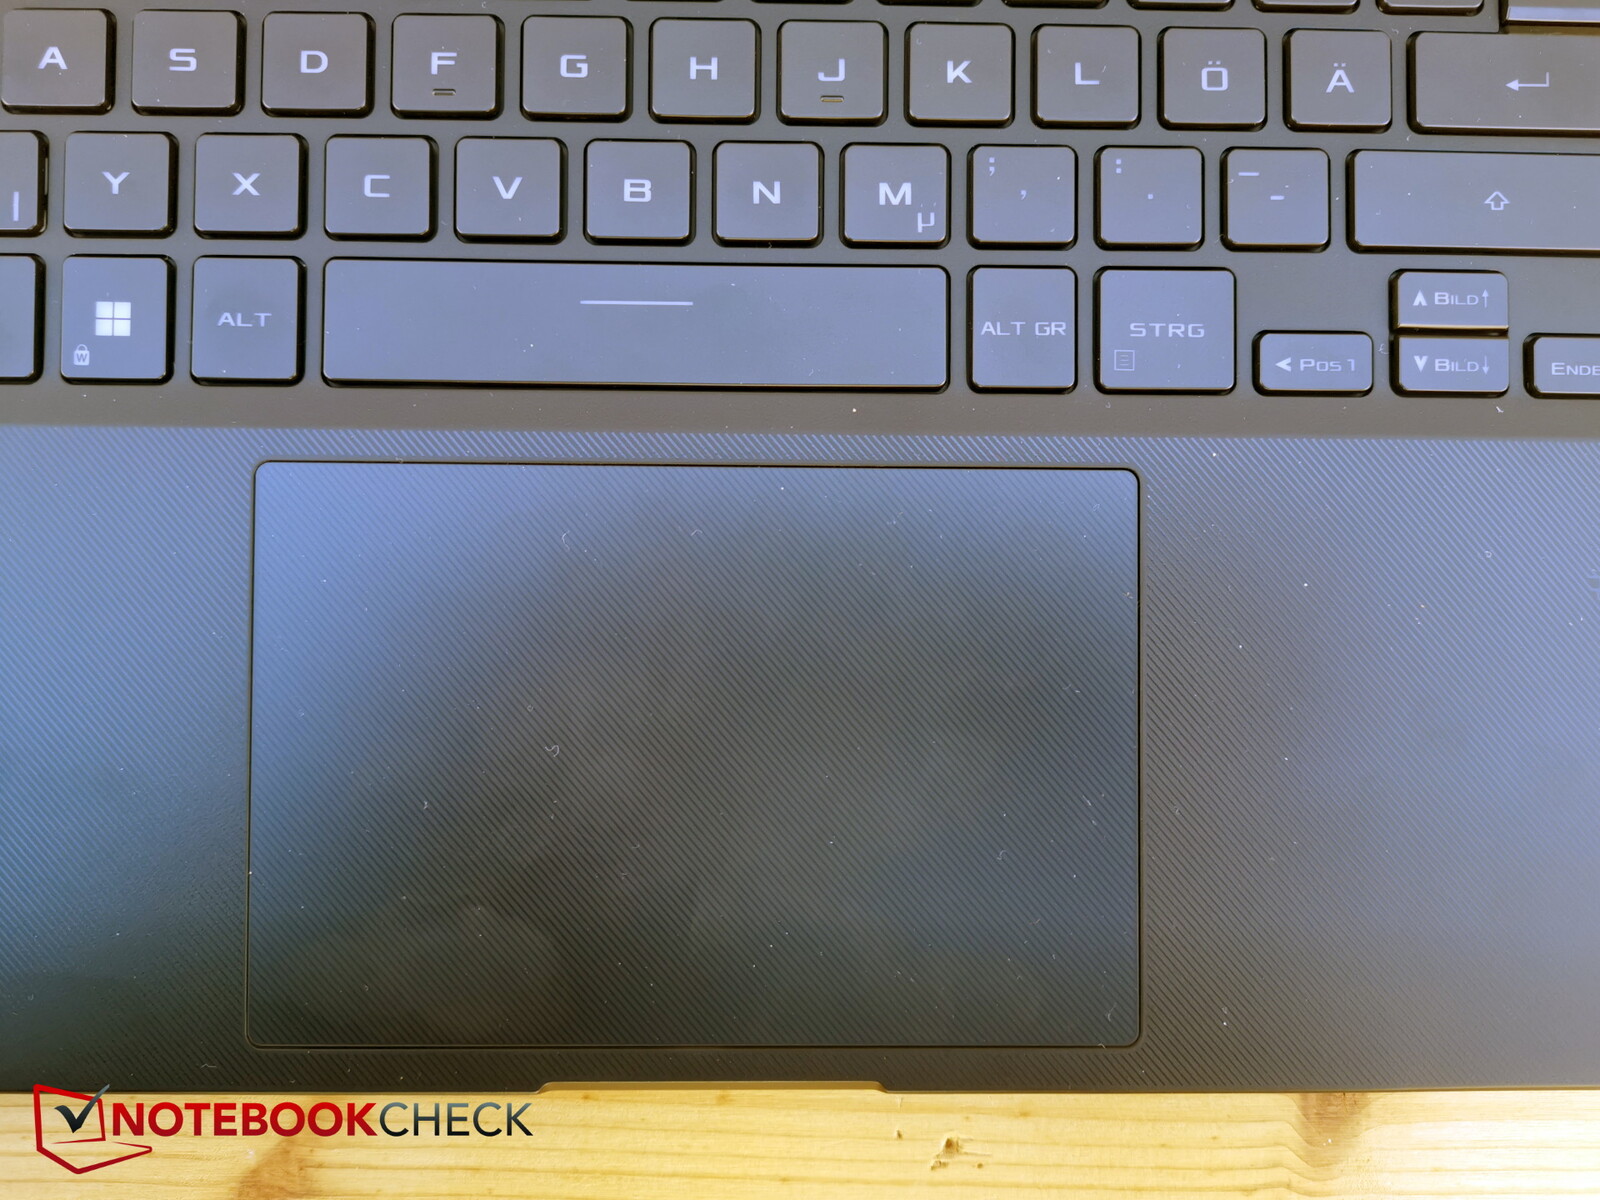
Eingabegeräte - Großes Touchpad beim X16


Display - Mit oder ohne MiniLEDs?
Im X16 sitzt das 16 Zoll große IPS-Panel Asus TMX1603 bzw. TL160ADMP03-0 mit Touch-Funktion, aber ohne MiniLEDs. Das gleiche Panel, allerdings in der Non-Touch-Variante, kommt auch im Asus ROG Strix G16 zum Einsatz. Es löst im 16:10-Format mit 2.560 x 1.600 Pixel auf und unterstützt auch Stifteingaben. Leider liegt der Stylus nicht wie im letzten Jahr bei sondern muss separat erworben werden.
Wie im letzten Jahr gibt es auch diesmal die Option auf ein Panel mit MiniLED-Hintergrundbeleuchtung, welche nochmals verbessert wurde: Die Anzahl der Dimming Zones wurden auf 1.024 verdoppelt, die Bildwiederholrate von 165 auf 240 Hz gesteigert und die Peak-Helligkeit soll nochmal leicht auf 1.100 Nits gestiegen sein (HDR). Leider gibt es das MiniLED-Panel (hier im Test) erst ab der Kombination mit RTX 4070, also nicht in unserem Testmodell.
Allerdings wird auf der Asus-Webseite der Eindruck erweckt, dass alle Modelle ein MiniLED-Display haben, auch die mit RTX 4050 und RTX 4060, also beim Kauf ganz genau hinschauen!
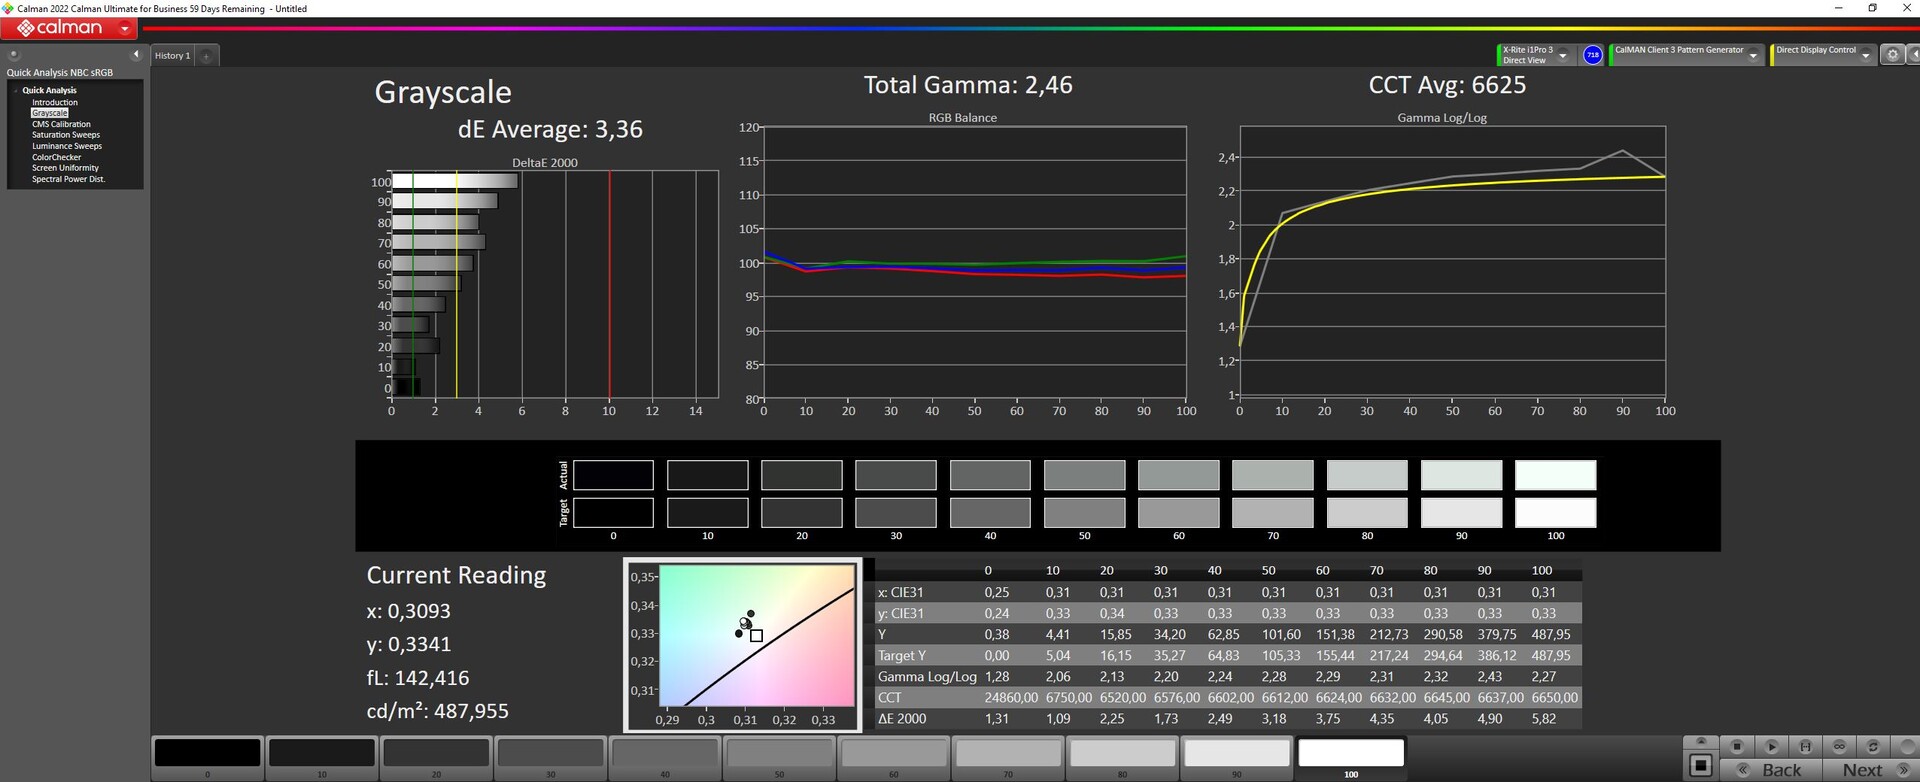
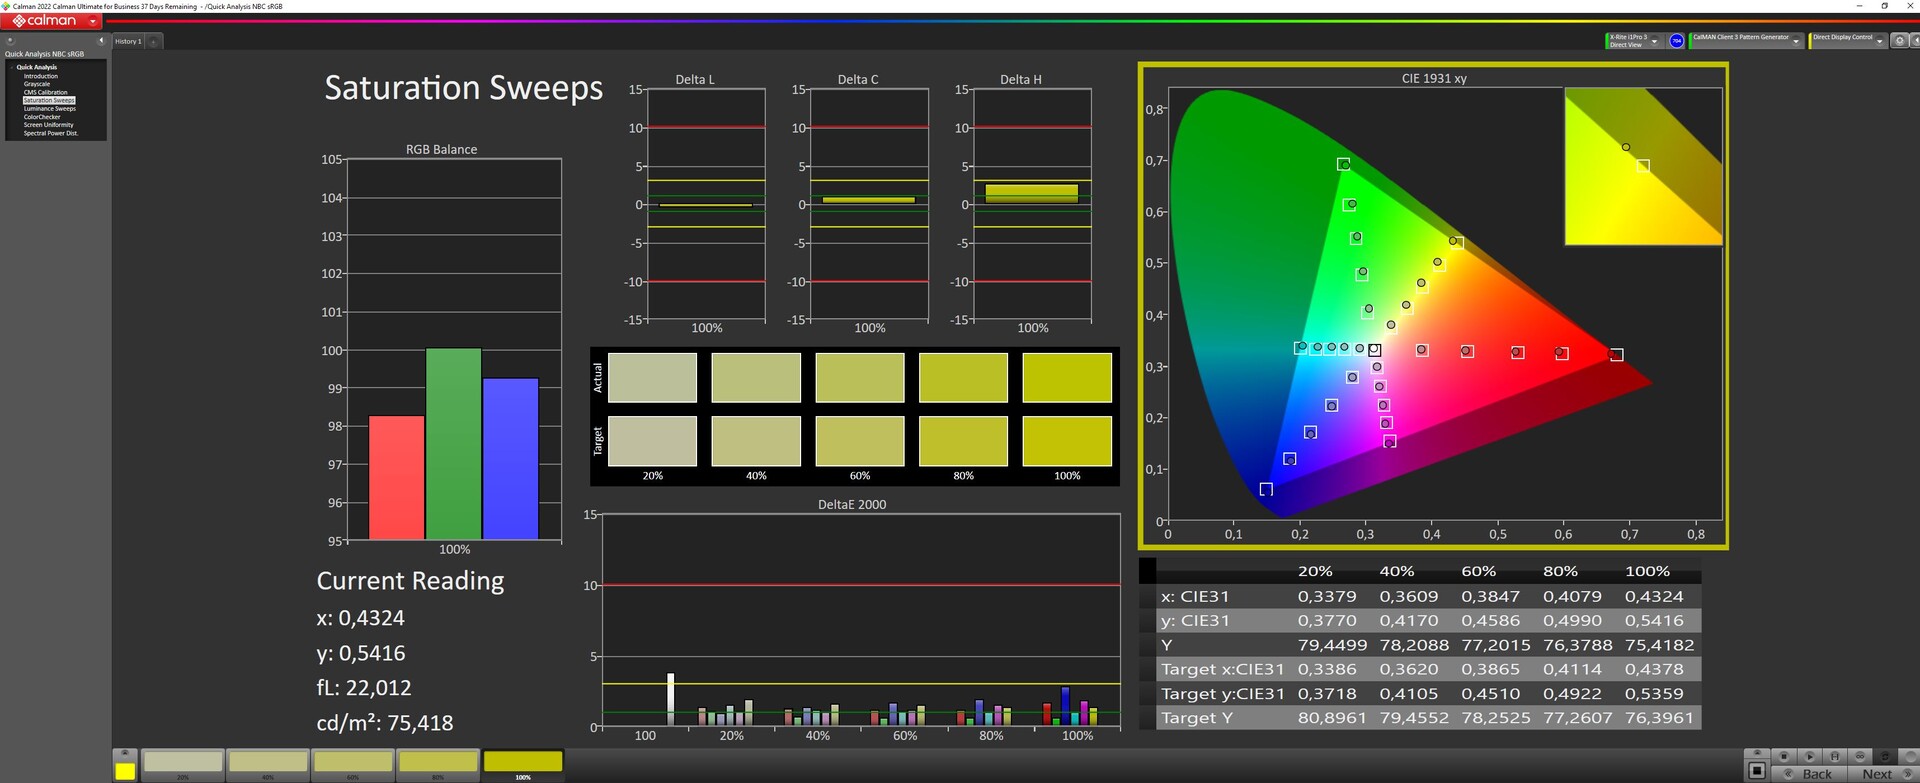
Aber auch ohne MiniLEDs messen wir bei unserem Standardmodell eine durchschnittliche Helligkeit von guten 469 Nits, die Ausleuchtung liegt bei sehr guten 91 Prozent. Der Schwarzwert beträgt akzeptable 0.39, woraus ein Kontrastverhältnis von guten 1.246:1 resultiert.
Die Reaktionszeiten sind sehr schnell, um PWM muss man sich keine Sorgen machen und Backlight Bleeding ist nur äußerst minimal, entlang der oberen Kante, vorhanden.
| |||||||||||||||||||||||||
Ausleuchtung: 91 %
Helligkeit Akku: 487 cd/m²
Kontrast: 1246:1 (Schwarzwert: 0.39 cd/m²)
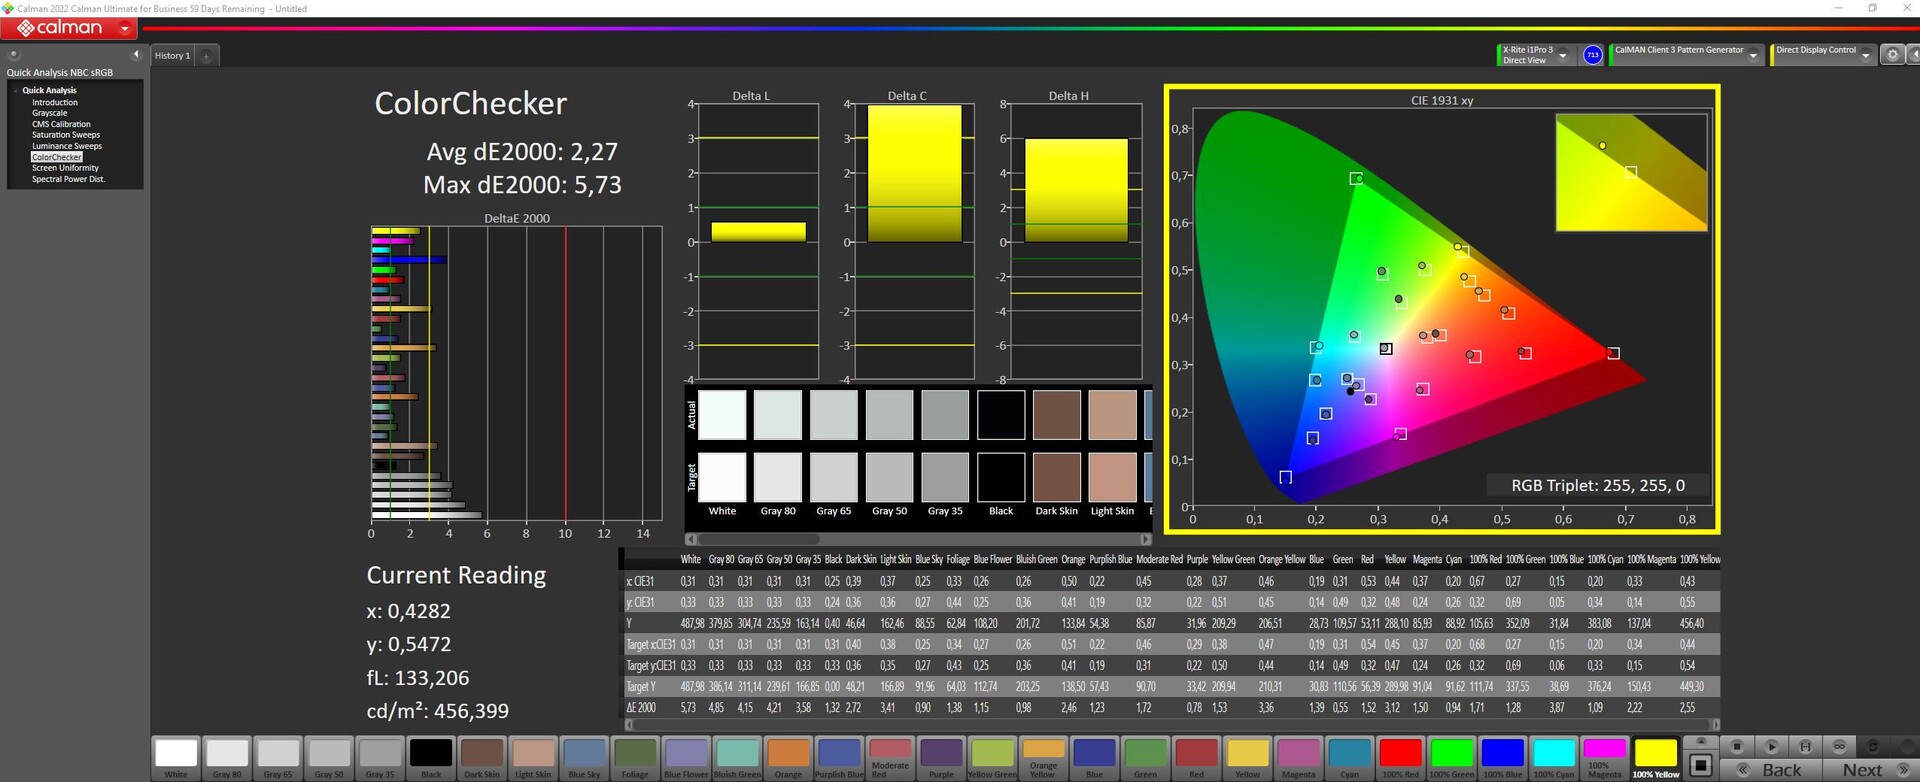
ΔE ColorChecker Calman: 2.27 | ∀{0.5-29.43 Ø4.72}
calibrated: 0.6
ΔE Greyscale Calman: 3.36 | ∀{0.09-98 Ø4.97}
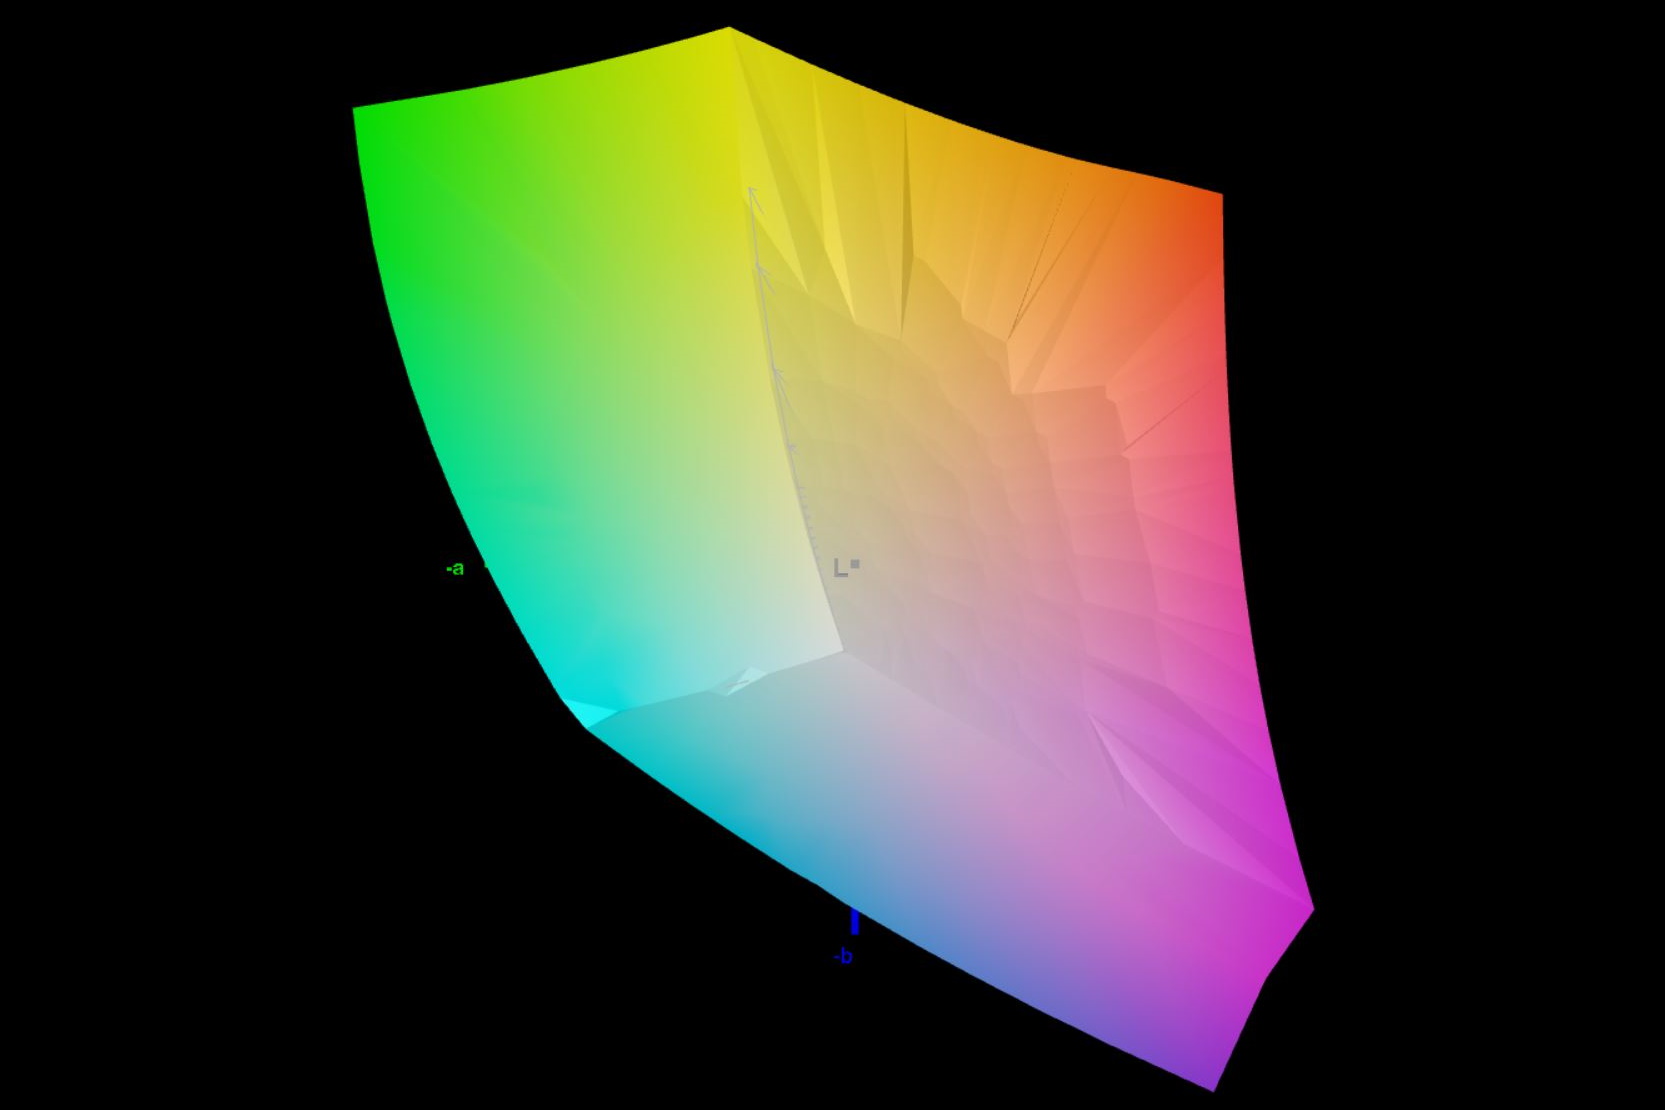
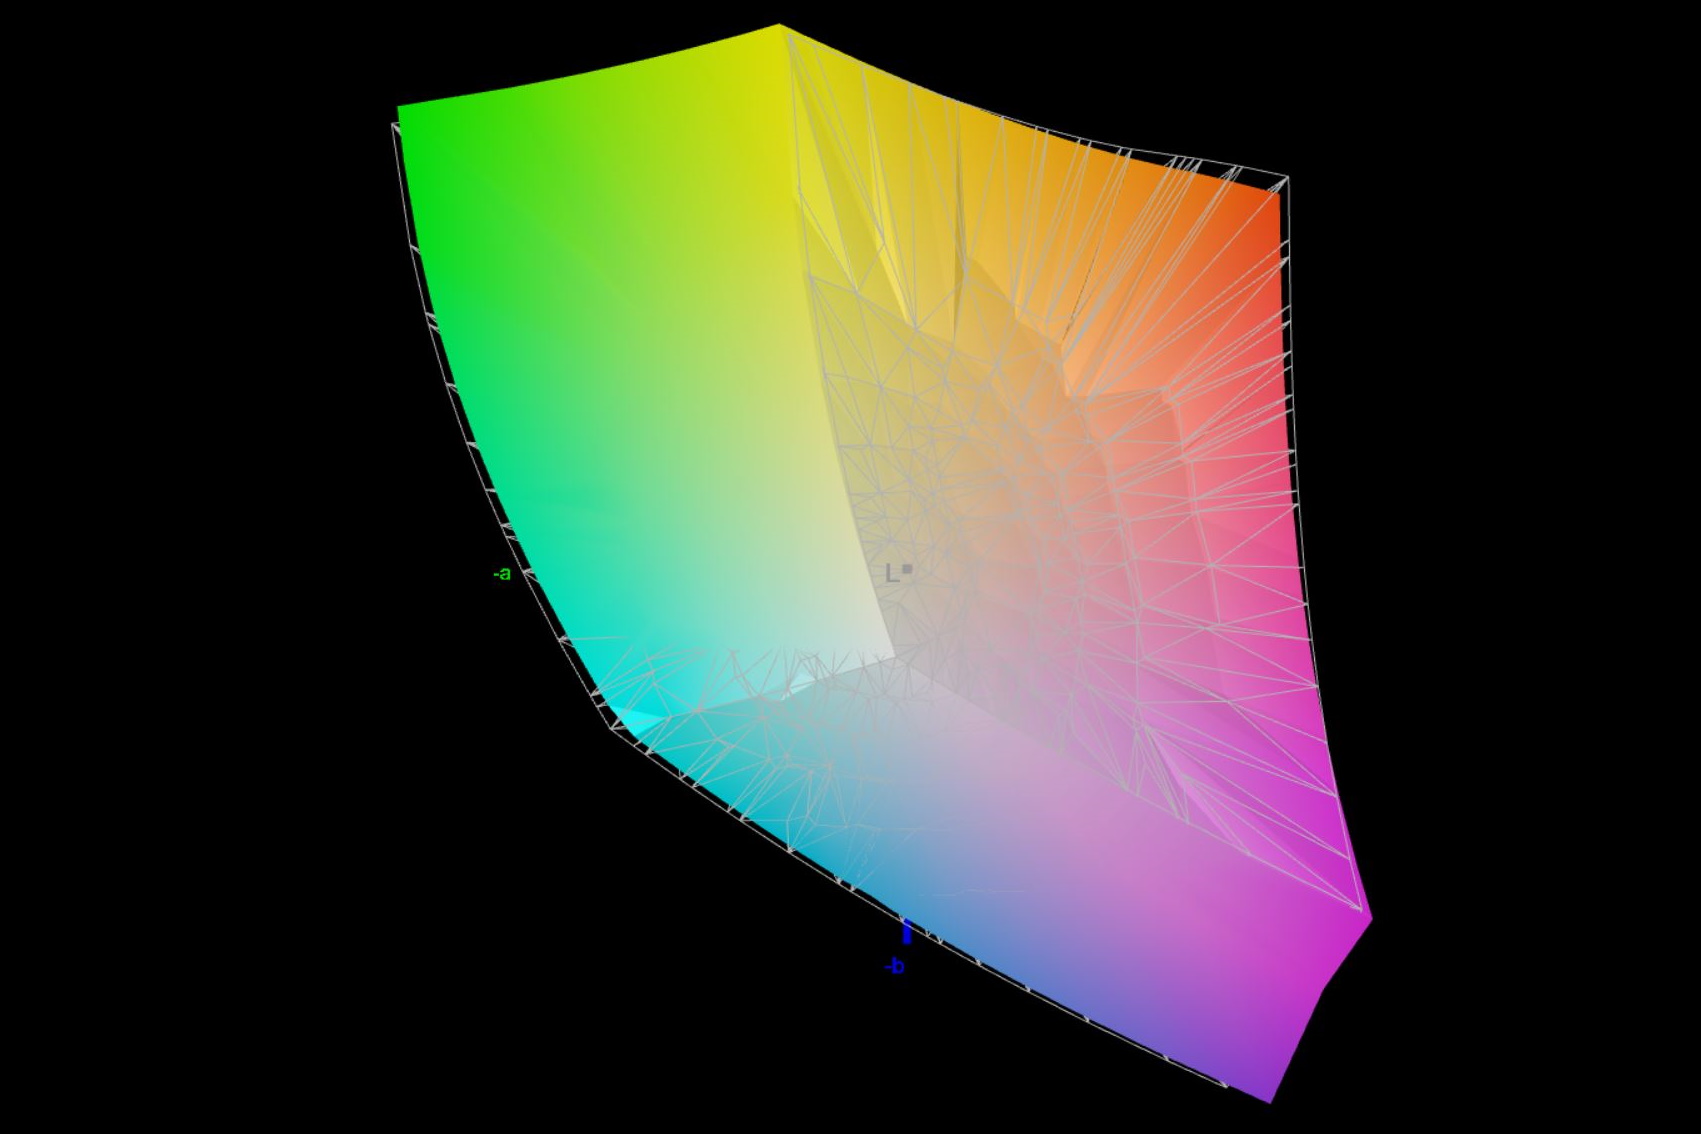
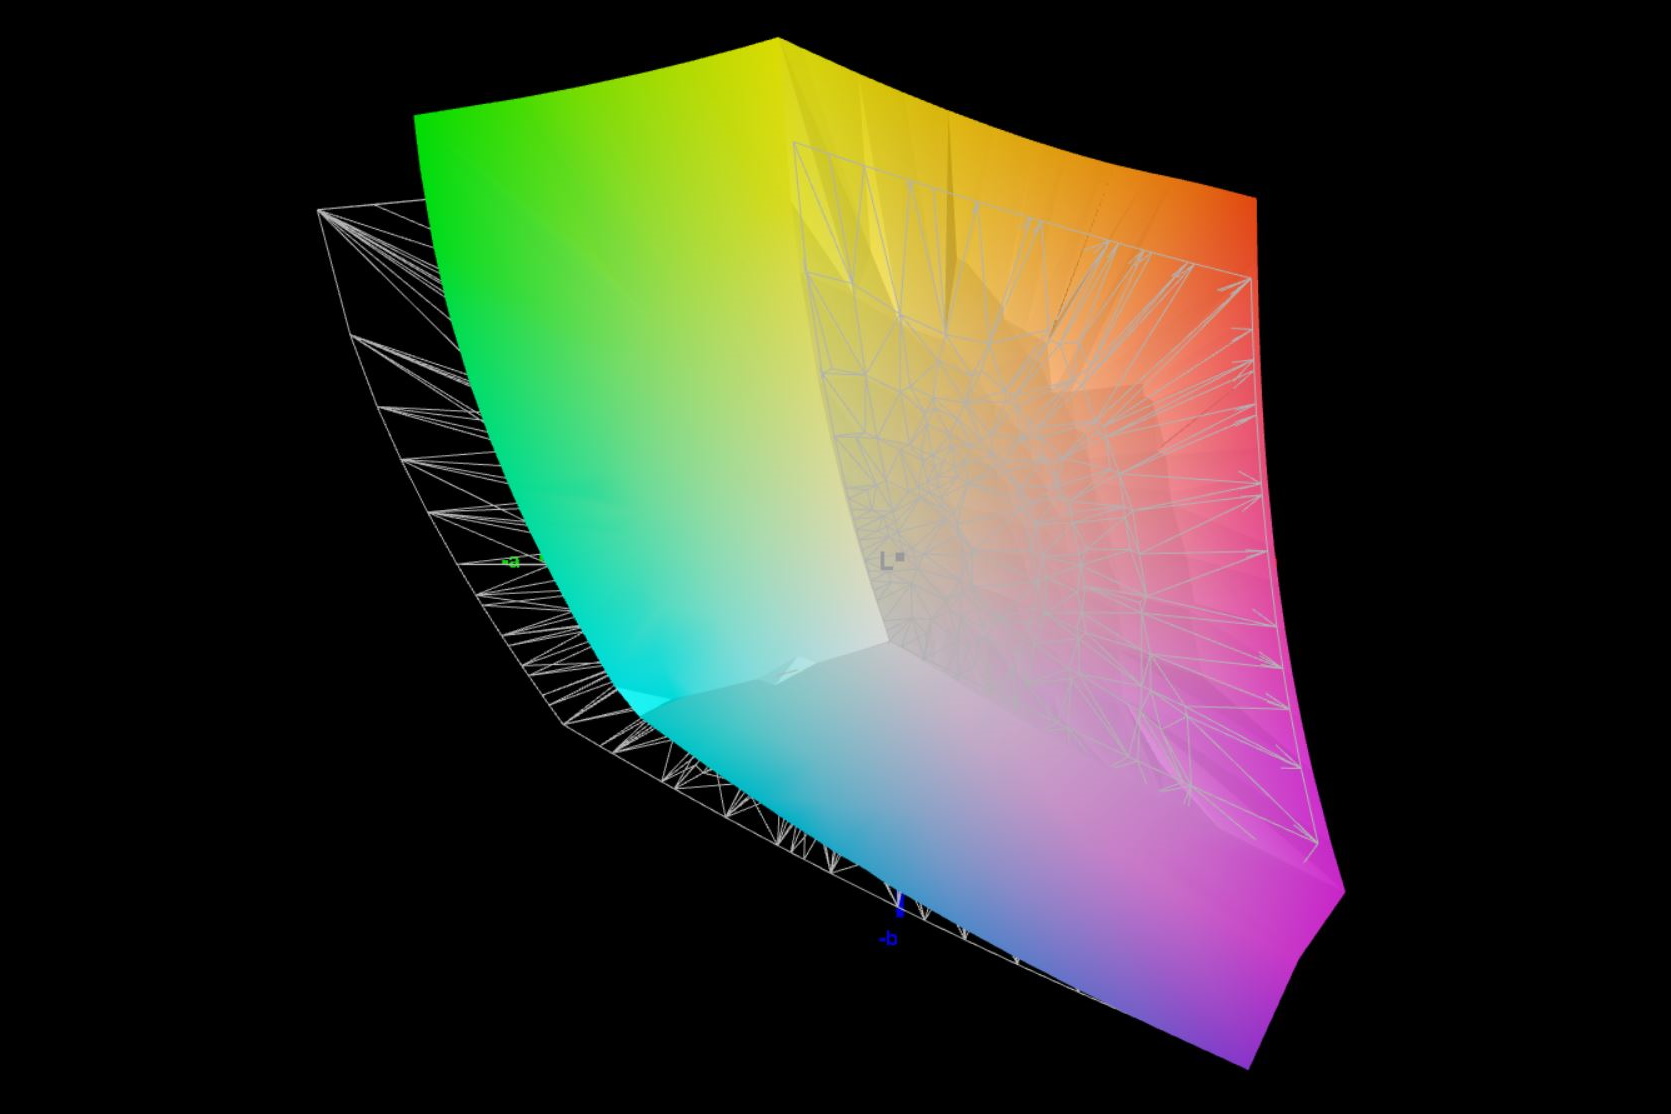
84.63% AdobeRGB 1998 (Argyll 3D)
99.92% sRGB (Argyll 3D)
96.61% Display P3 (Argyll 3D)
Gamma: 2.46
CCT: 6625 K
| Asus ROG Flow X16 GV601V TMX1603 (TL160ADMP03-0), IPS, 2560x1600, 16" | Asus ROG Flow X16 GV601RW-M5082W AUO B160QAN02.S, Mini LED, 2560x1600, 16.1" | Samsung Galaxy Book3 Ultra 16, i9-13900H RTX 4070 Samsung SDC4185 ATNA60CL03-0, OLED / AMOLED, 2880x1800, 16" | Lenovo Legion Pro 5 16IRX8 AU Optronics B160QAN03.1, IPS, 2560x1600, 16" | Lenovo Yoga Pro 7 14IRH G8 LEN145-3K, IPS, 3072x1920, 14.5" | MSI Katana 17 B13VFK B173HAN04.9, IPS LED, 1920x1080, 17.3" | |
|---|---|---|---|---|---|---|
| Display | 3% | 4% | -13% | 2% | -49% | |
| Display P3 Coverage (%) | 96.61 | 99.82 3% | 95.3 -1% | 71.2 -26% | 98.7 2% | 40.8 -58% |
| sRGB Coverage (%) | 99.92 | 99.99 0% | 99.1 -1% | 98.8 -1% | 100 0% | 61 -39% |
| AdobeRGB 1998 Coverage (%) | 84.63 | 90.21 7% | 97.4 15% | 73.3 -13% | 87.6 4% | 42.2 -50% |
| Response Times | -117% | 61% | -160% | -419% | -505% | |
| Response Time Grey 50% / Grey 80% * (ms) | 3.8 ? | 11 ? -189% | 2 ? 47% | 14.5 ? -282% | 31.5 ? -729% | 33 ? -768% |
| Response Time Black / White * (ms) | 7.6 ? | 11 ? -45% | 2 ? 74% | 10.4 ? -37% | 15.8 ? -108% | 26 ? -242% |
| PWM Frequency (Hz) | 7400 ? | 250 ? | ||||
| Bildschirm | 16% | 2% | 8% | 26% | -111% | |
| Helligkeit Bildmitte (cd/m²) | 486 | 498 2% | 403 -17% | 405.7 -17% | 441 -9% | 267 -45% |
| Brightness (cd/m²) | 469 | 502 7% | 408 -13% | 368 -22% | 453 -3% | 256 -45% |
| Brightness Distribution (%) | 91 | 94 3% | 98 8% | 87 -4% | 92 1% | 93 2% |
| Schwarzwert * (cd/m²) | 0.39 | 0.11 72% | 0.38 3% | 0.34 13% | 0.21 46% | |
| Kontrast (:1) | 1246 | 4527 263% | 1068 -14% | 1297 4% | 1271 2% | |
| Delta E Colorchecker * | 2.27 | 1.87 18% | 2.63 -16% | 1.65 27% | 0.6 74% | 4.7 -107% |
| Colorchecker dE 2000 max. * | 5.73 | 6.15 -7% | 4.07 29% | 4.2 27% | 1.3 77% | 20.4 -256% |
| Colorchecker dE 2000 calibrated * | 0.6 | 1.94 -223% | 0.53 12% | 0.6 -0% | 4.5 -650% | |
| Delta E Graustufen * | 3.36 | 3.15 6% | 2.69 20% | 1.2 64% | 0.8 76% | 1.5 55% |
| Gamma | 2.46 89% | 330.95 1% | 2.48 89% | 2.3 96% | 2.2 100% | 2.12 104% |
| CCT | 6625 98% | 7294 89% | 6907 94% | 6453 101% | 6597 99% | 6552 99% |
| Durchschnitt gesamt (Programm / Settings) | -33% /
-6% | 22% /
13% | -55% /
-20% | -130% /
-43% | -222% /
-154% |
* ... kleinere Werte sind besser
Asus wirbt mit 100 Prozent DCI P3, wir messen rund 97 Prozent. AdobeRGB wird noch zu 85 Prozent abgedeckt, sRGB vollständig.
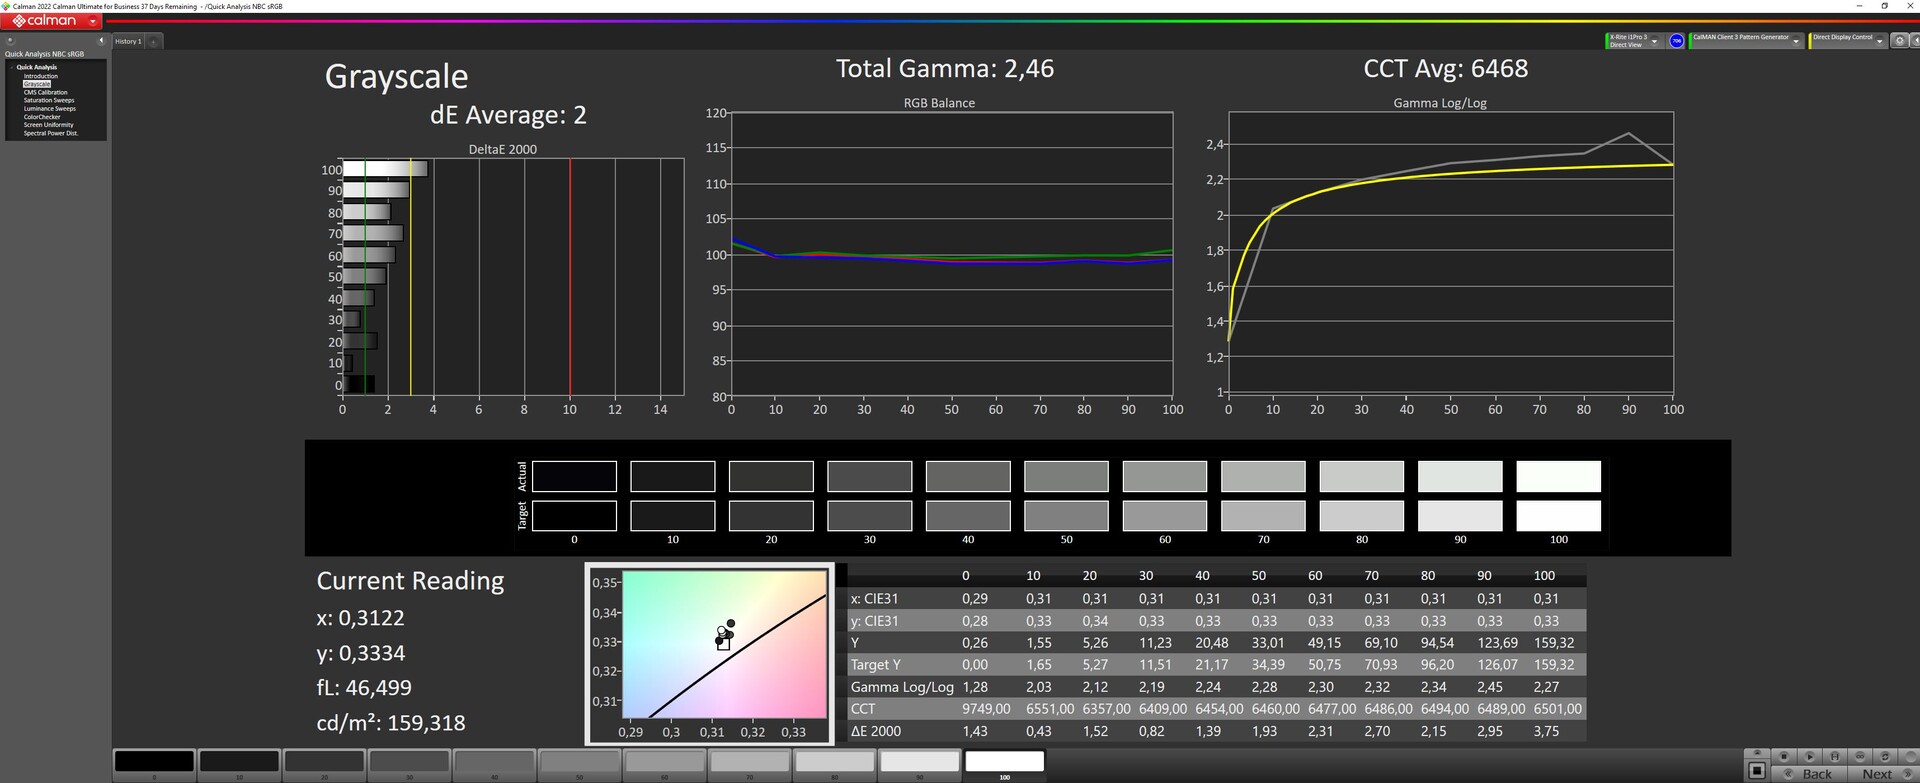
Für eine höhere Farbgenauigkeit hilft es die Helligkeit des X16 auf etwa 50 Prozent zu reduzieren. Danach verbessert sich beispielsweise das Graustufen-DeltaE von 3,36 auf nur noch 2. Auch das DeltaE des ColorCheckers sinkt damit nochmals. Eine erneute Kalibrierung mittels i1Profiler ergibt hingegen kaum Sinn.
Reaktionszeiten (Response Times) des Displays
| ↔ Reaktionszeiten Schwarz zu Weiß | ||
|---|---|---|
| 7.6 ms ... steigend ↗ und fallend ↘ kombiniert | ↗ 4 ms steigend | 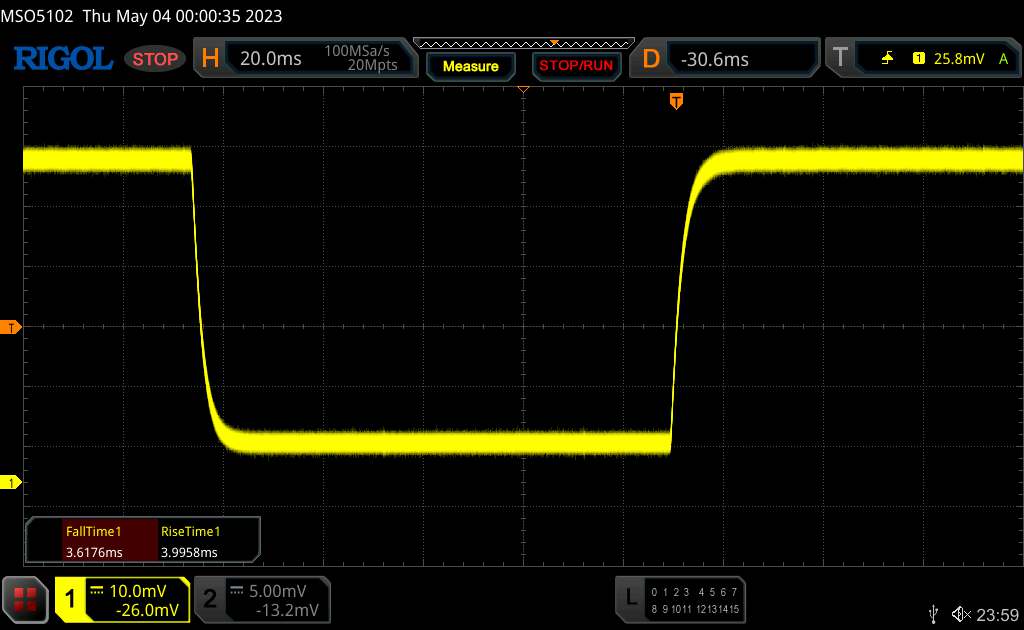 |
| ↘ 3.6 ms fallend | ||
| Die gemessenen Reaktionszeiten sind sehr kurz, wodurch sich der Bildschirm auch für schnelle 3D Spiele eignen sollte. Im Vergleich rangierten die bei uns getesteten Geräte von 0.1 (Minimum) zu 240 (Maximum) ms. » 22 % aller Screens waren schneller als der getestete. Daher sind die gemessenen Reaktionszeiten besser als der Durchschnitt aller vermessenen Geräte (19.8 ms). | ||
| ↔ Reaktionszeiten 50% Grau zu 80% Grau | ||
| 3.8 ms ... steigend ↗ und fallend ↘ kombiniert | ↗ 1.8 ms steigend | 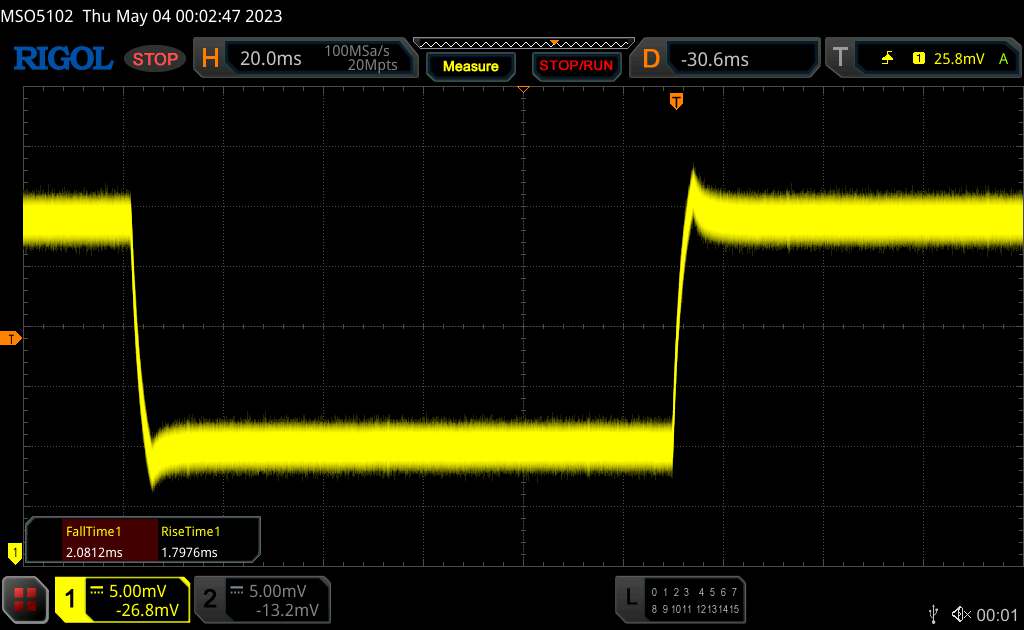 |
| ↘ 2 ms fallend | ||
| Die gemessenen Reaktionszeiten sind sehr kurz, wodurch sich der Bildschirm auch für schnelle 3D Spiele eignen sollte. Im Vergleich rangierten die bei uns getesteten Geräte von 0.165 (Minimum) zu 636 (Maximum) ms. » 15 % aller Screens waren schneller als der getestete. Daher sind die gemessenen Reaktionszeiten besser als der Durchschnitt aller vermessenen Geräte (31 ms). | ||
Bildschirm-Flackern / PWM (Pulse-Width Modulation)
| Flackern / PWM nicht festgestellt |  | ||
Im Vergleich: 52 % aller getesteten Geräte nutzten kein PWM um die Helligkeit zu reduzieren. Wenn PWM eingesetzt wurde, dann bei einer Frequenz von durchschnittlich 7763 (Minimum 5, Maximum 343500) Hz. | |||
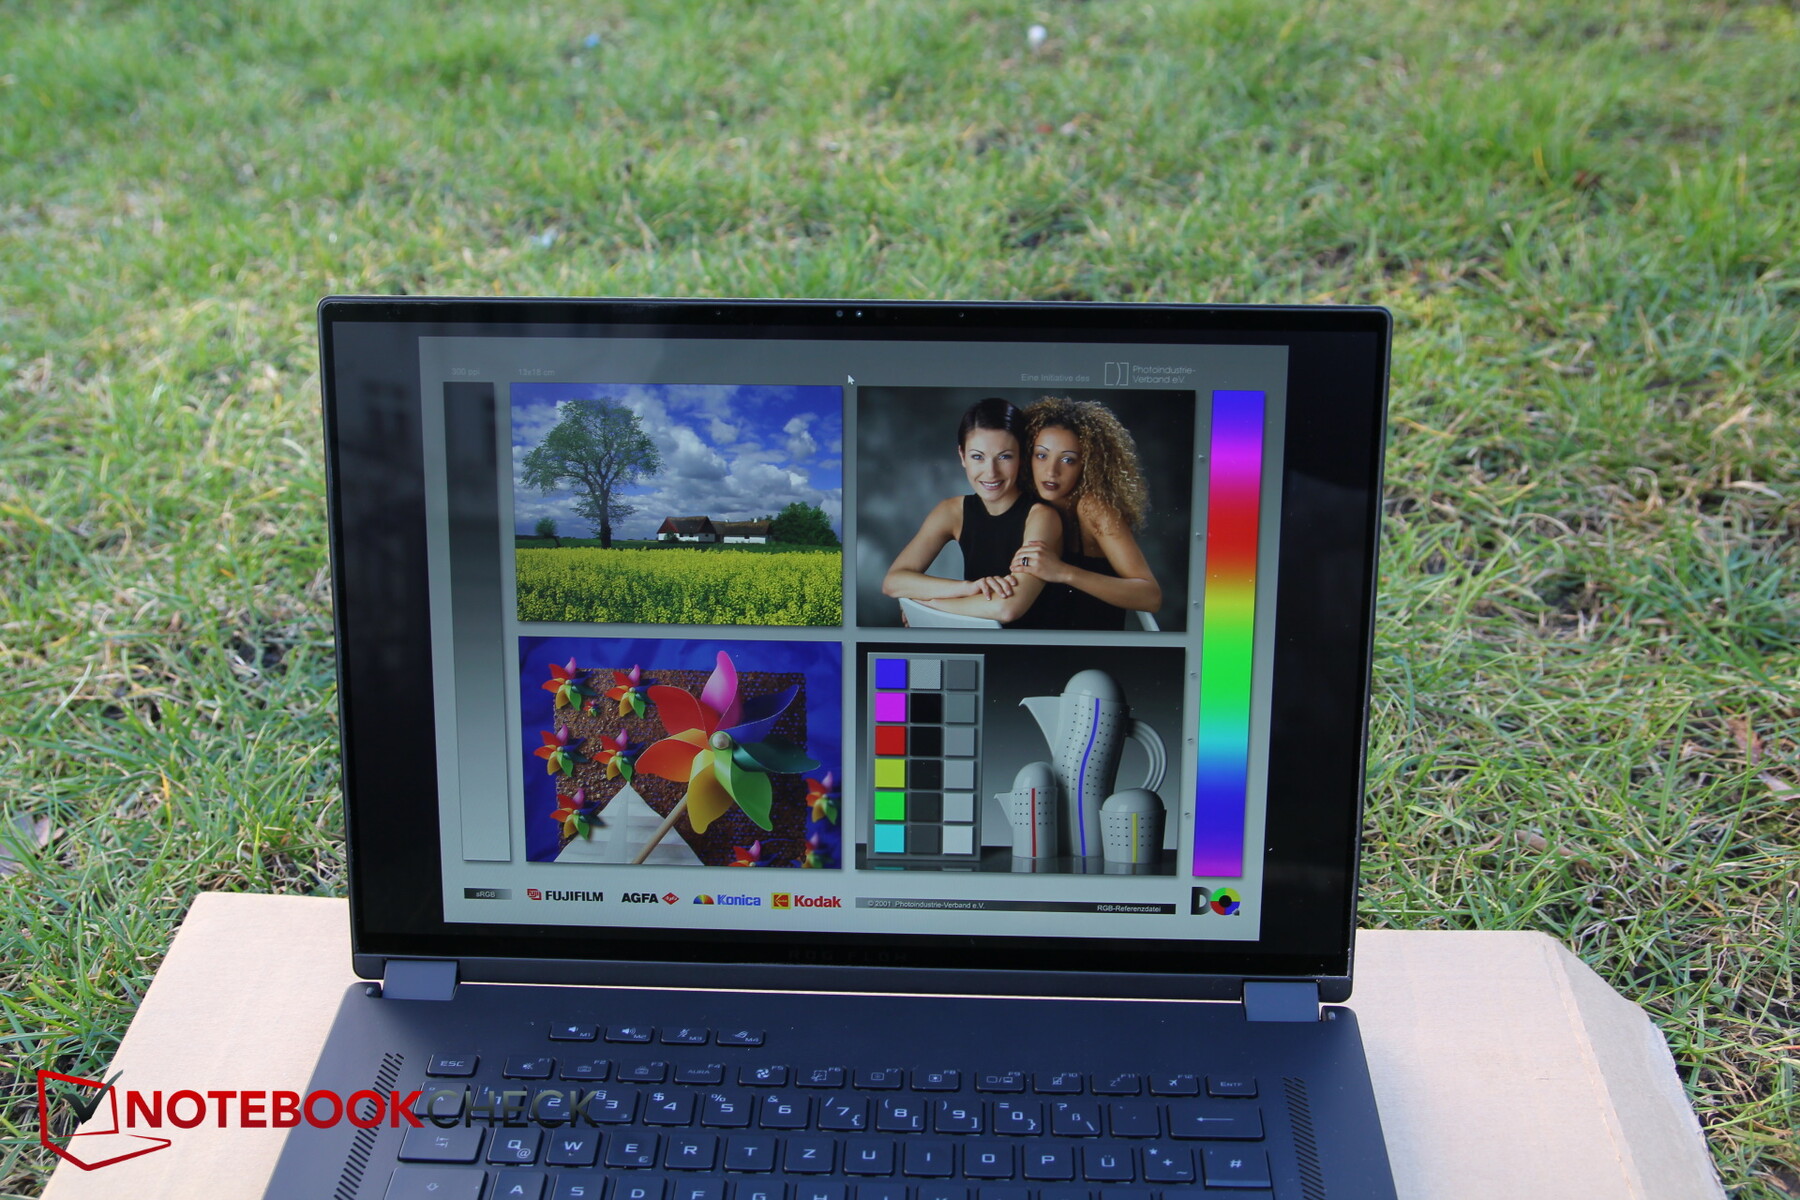
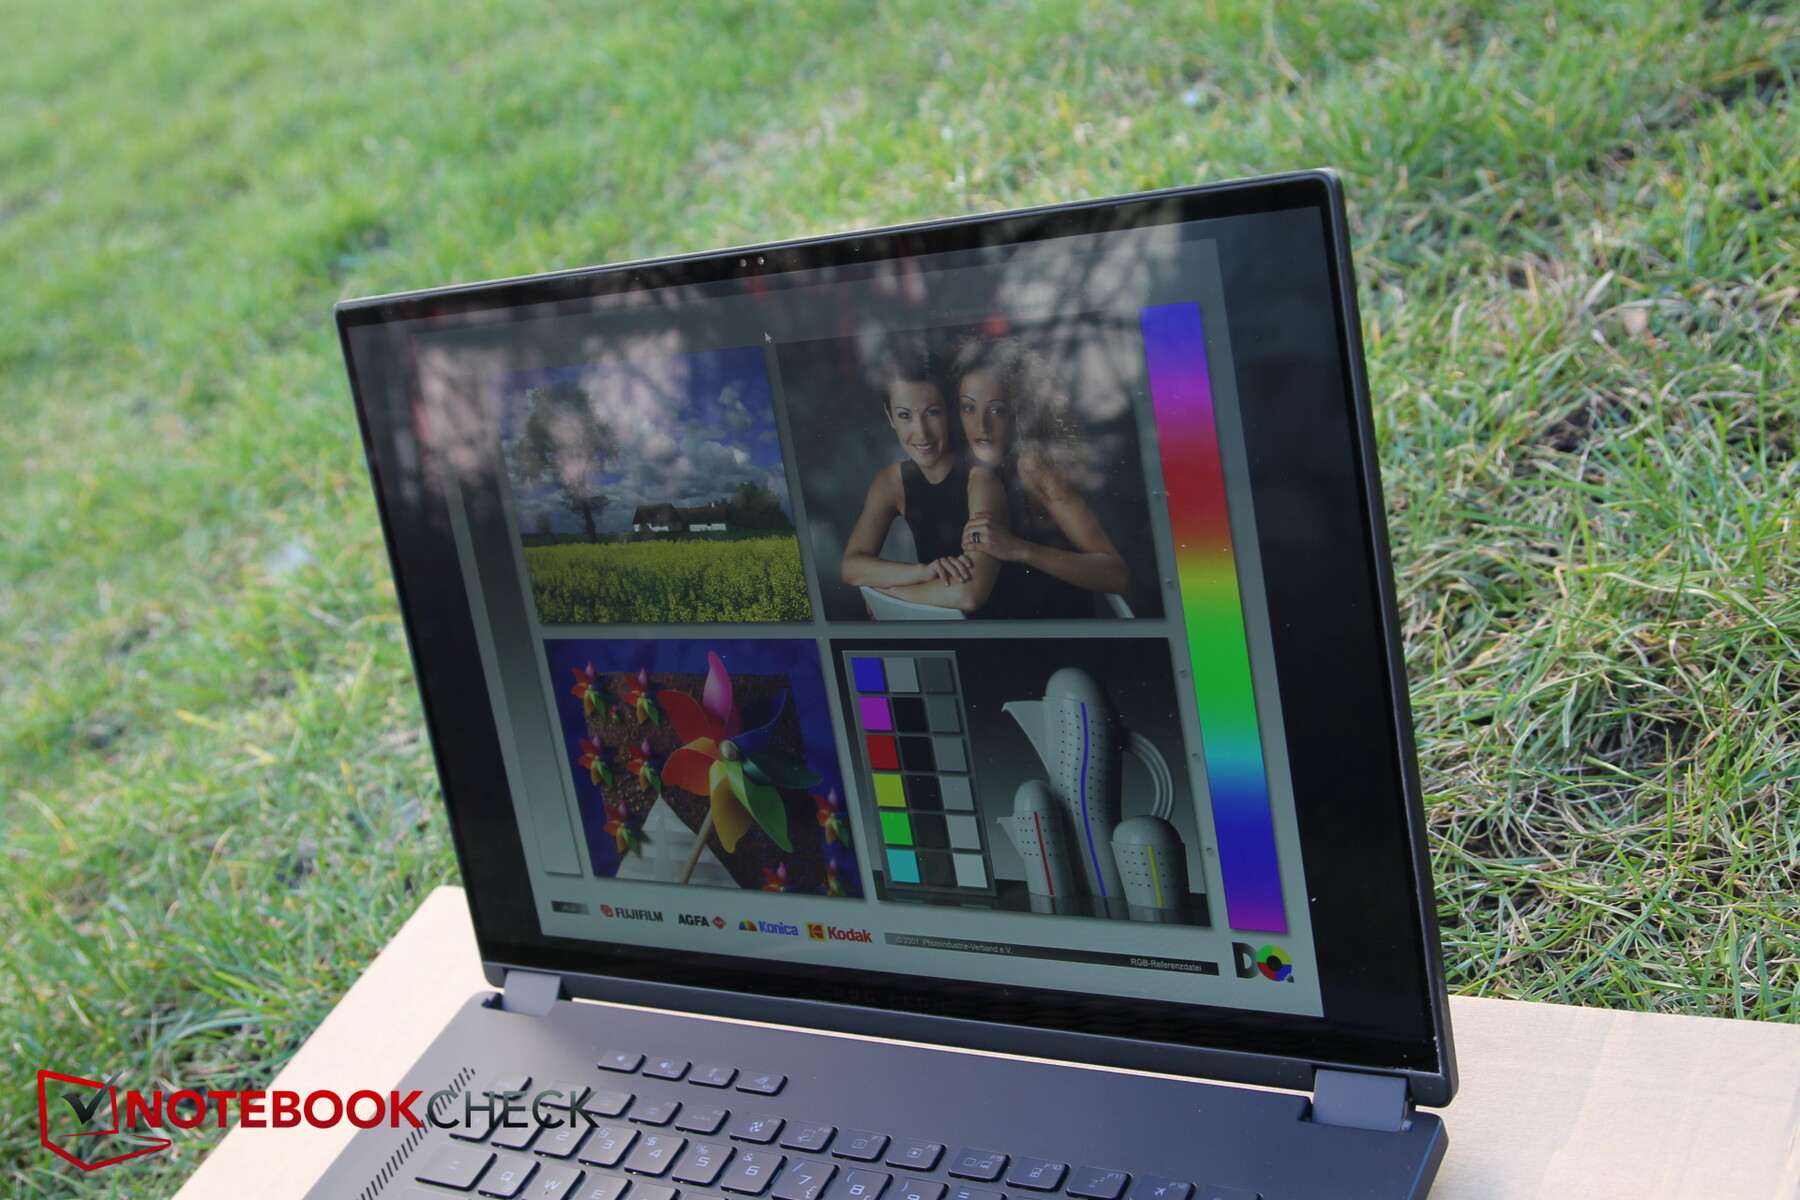
Im Freien hilft die recht hohe Helligkeit bei direkter Draufsicht und an schattigen Orten. Aus schrägen Blickwinkeln stört die spiegelnde Touch-Oberfläche.

Leistung - Starker Asus-Flachmann
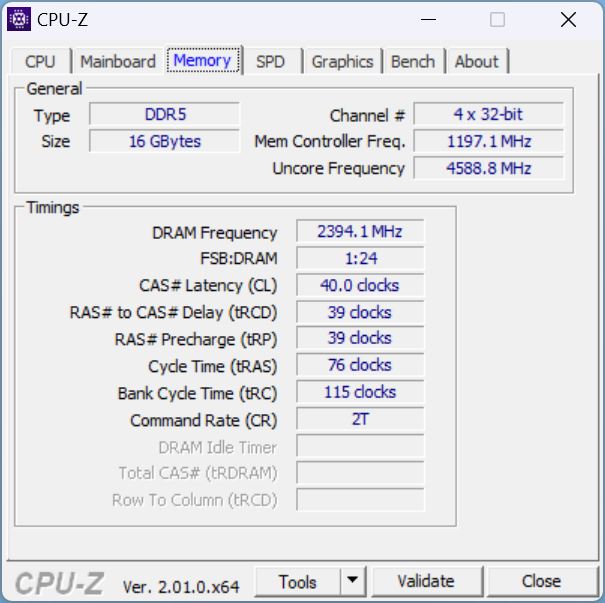
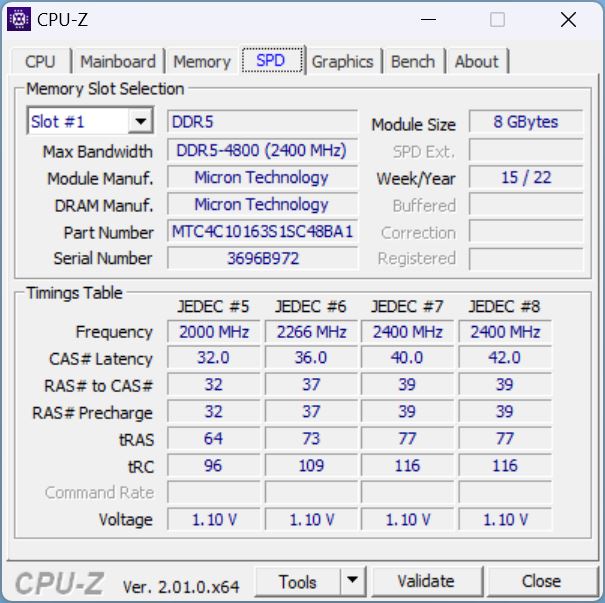
Allen Konfigurationen gemein ist der Core i9-13900H. Dieser wird wahlweise mit einer RTX 4050, RTX 4060 oder RTX 4070 kombiniert. Die SKUs mit den beiden schwächeren Grafikkarten haben laut Webseite nur 8 GB RAM verbaut, die beiden Konfigurationen mit RTX 4070 16 GB RAM. Allerdings steckt in unserer Testeinheit eine RTX 4060 und 16 GB RAM, womöglich hat Asus hier unser Testmodell aufgewertet. Bis zu 64 GB RAM kann man ansonsten einbauen.


Testbedingungen
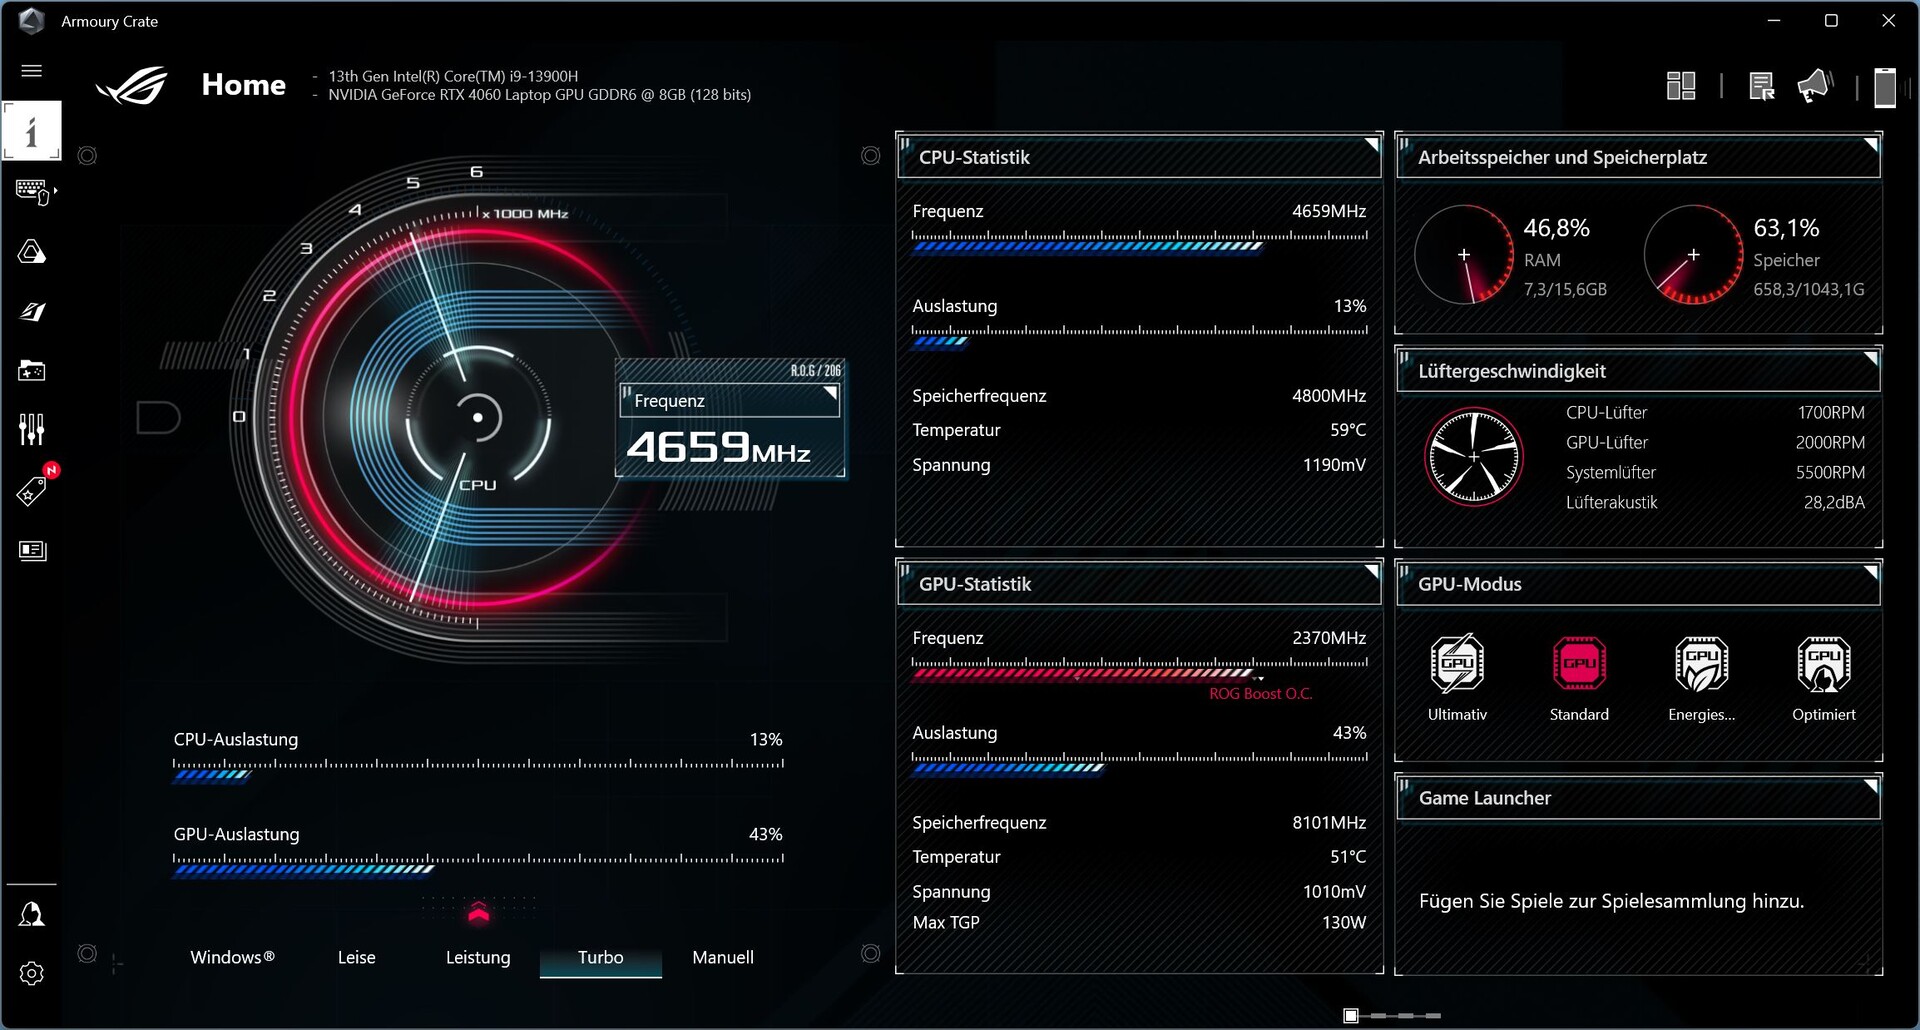
Asus-Gaming-Laptops haben immer gleich zwei Apps des Herstellers vorinstalliert, was schon fast an Bloatware erinnert. MyAsus ist für Supportfragen zuständig, während Armoury Crate das Control Center inklusive heutzutage leider üblichen Datensammelei mimt. Die App ist noch nicht ganz ausgereift, insbesondere bei der Übersetzung. Es finden sich immer wieder fehlende oder abgeschnittene Satzteile. Zudem kommt es vor, dass sich die App beim Starten ungefragt selbst aktualisiert, sodass man eine ganze Zeit lang warten muss bis man Zugriff auf die Leistungsmodi & Co erhält - ärgerlich!
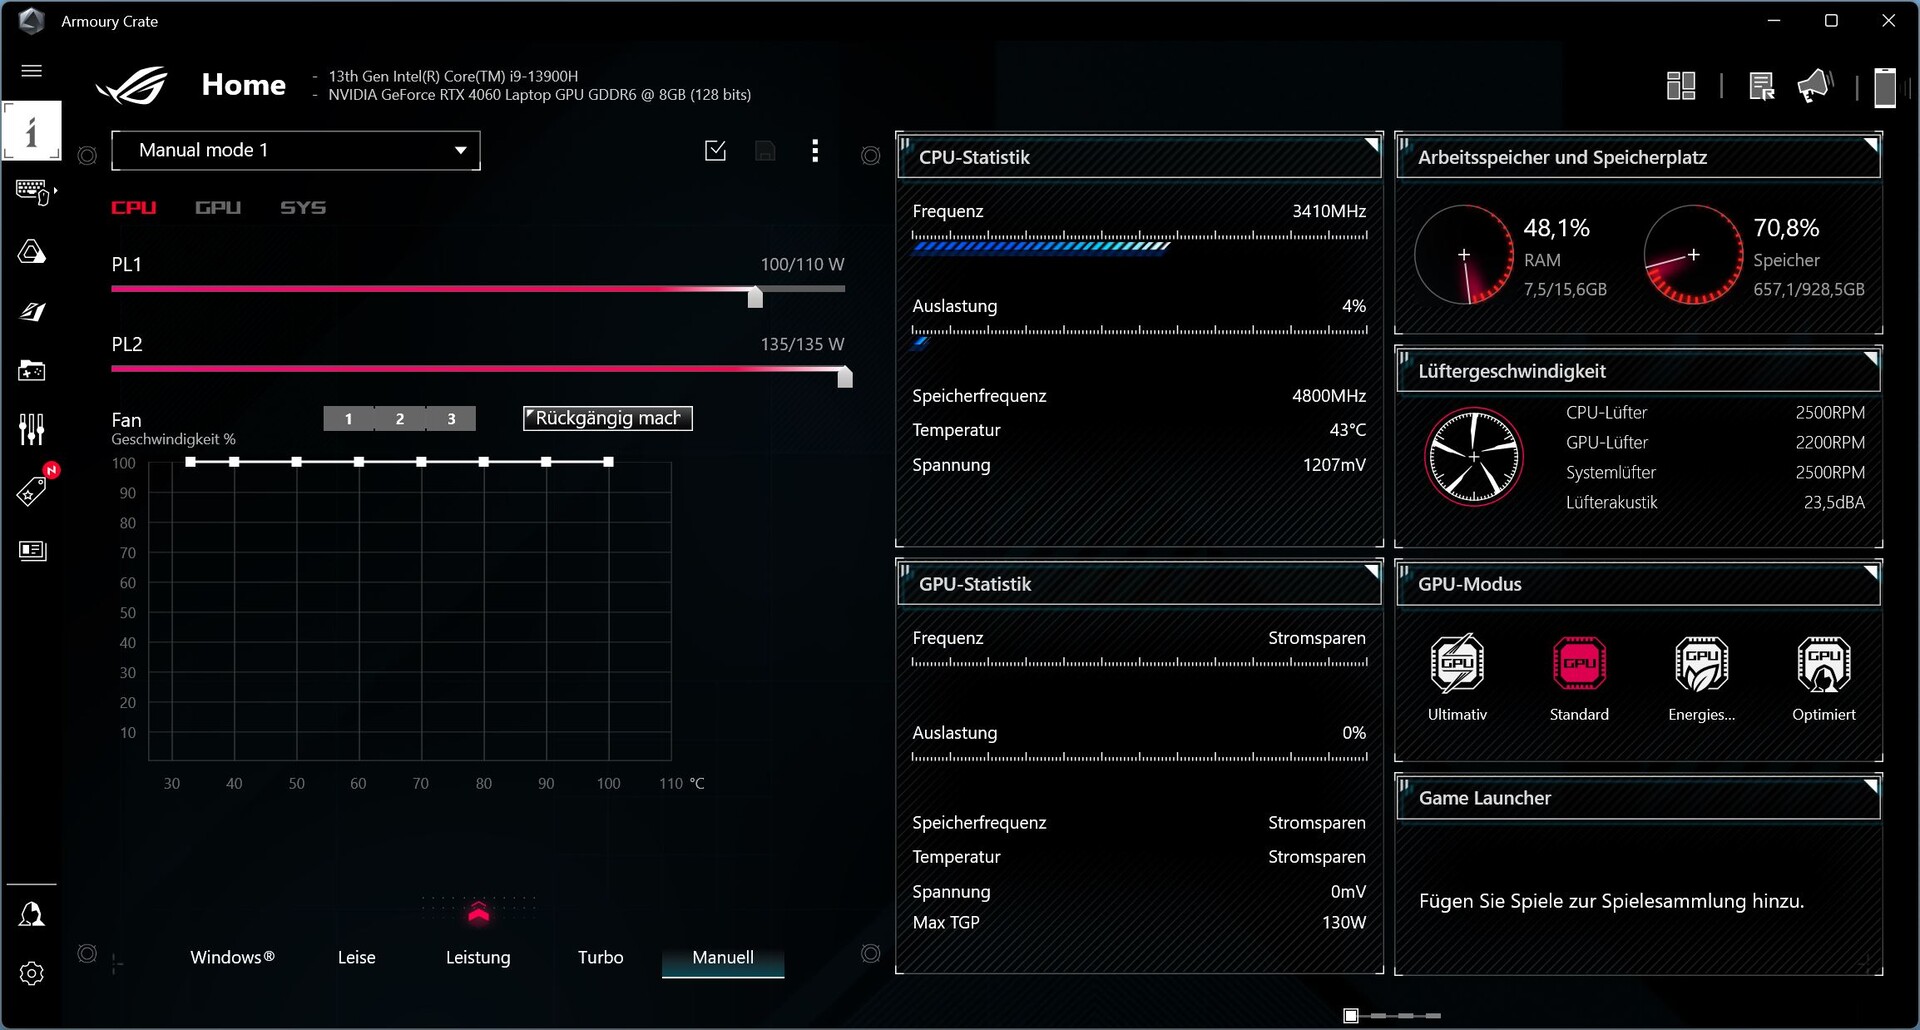
Insgesamt gibt es vier Leistungsmodi (Windows, Leise, Leistung, Turbo, Manuell). Für die besten Benchmarkergebnisse haben wir uns für Turbo entschieden, präsentieren jedoch auch Ergebnisse zu den anderen Modi. Auch den MUX-Schalter, also das Umschalten zwischen iGPU und dGPU findet man hier.
Prozessor
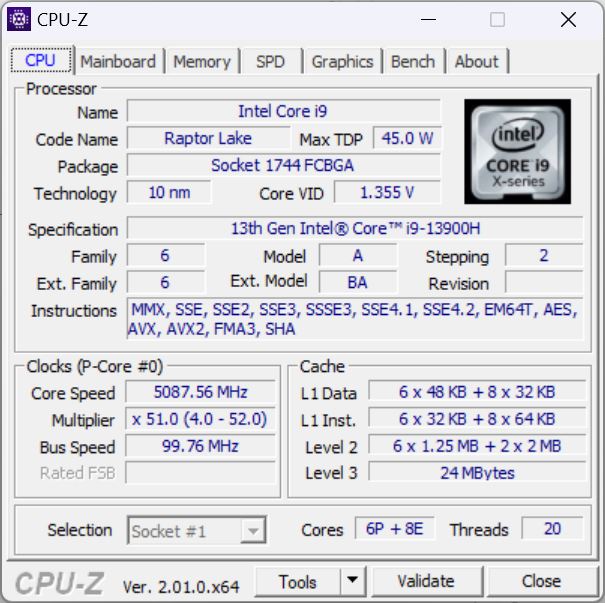
Im X16 steckt trotz des flachen Gehäuses ein Intel Core i9-13900H, eine High-End-CPU der Raptor-Lake-Serie mit 6 P- und 8 E-Kernen, welche von 1,9 (Basistakt E-Kerne) bis 5,4 GHz (Single-Core Turbo) takten können.
Da es zur Alder-Lake-Serie kaum Veränderungen in der neueren H-Serie gibt, verwundert es nicht, dass sich das X16 nicht von der Konkurrenz aus dem Vorjahr absetzen kann. Hier spielt das Lenovo Legion Pro 7 mit HX-CPU in einer anderen Liga. Beeindruckend ist jedoch, dass der Score trotz des schmalen Formfaktors ganze 10 Prozent über dem durchschnittlichen i9-13900H aus unserer Datenbank liegt.
Nach den ersten zwei bis drei Durchgängen sinkt der Wert etwas ab. Unten stehen je nach gewähltem Leistungsmodus die TDP der CPU. Wobei diese Werte eher theoretisch sind (HWinfo). So kommt die CPU praktisch auch unter Turbo im CinebenchR15 kaum über 110 W hinaus und im Modus Leise geht die TDP während eines Durchganges auch gerne auf unter 60 W zurück.
Im Akkumodus wird automatisch der Leise-Modus aktiviert. Turbo ist gesperrt, Leistung kann man theoretisch aber noch einschalten.
| Leistungsmodus/TDP der CPU | PL1 | PL2 | Score |
|---|---|---|---|
| Turbo | 110 | 135 | 3.100 |
| Leistung | 100 | 120 | 2.882 |
| Leise | 80 | 100 | 2.342 |
| Akku Leistung | 38 | 60 | 2.199 |
| Akku Leise | 30 | 30 | 1.604 |
Cinebench R15 Multi Dauertest
Cinebench R23: Multi Core | Single Core
Cinebench R20: CPU (Multi Core) | CPU (Single Core)
Cinebench R15: CPU Multi 64Bit | CPU Single 64Bit
Blender: v2.79 BMW27 CPU
7-Zip 18.03: 7z b 4 | 7z b 4 -mmt1
Geekbench 5.5: Multi-Core | Single-Core
HWBOT x265 Benchmark v2.2: 4k Preset
LibreOffice : 20 Documents To PDF
R Benchmark 2.5: Overall mean
| CPU Performance Rating | |
| Lenovo Legion Pro 7 16IRX8H | |
| Durchschnitt der Klasse Gaming | |
| Asus ROG Flow X16 GV601V | |
| Asus ROG Zephyrus M16 GU604VY-NM042X | |
| Apple MacBook Pro 16 2023 M2 Max -6! | |
| MSI Creator Z16P B12UHST | |
| Durchschnittliche Intel Core i9-13900H | |
| Lenovo Legion Slim 7-16IAH 82TF004YGE | |
| MSI Katana 17 B13VFK | |
| Razer Blade 15 OLED (Early 2022) | |
| Lenovo Legion S7 16ARHA7 | |
| Asus ROG Flow X16 GV601RW-M5082W | |
| Corsair Voyager a1600 | |
| Cinebench R23 / Multi Core | |
| Lenovo Legion Pro 7 16IRX8H | |
| Durchschnitt der Klasse Gaming (10488 - 40970, n=110, der letzten 2 Jahre) | |
| Asus ROG Zephyrus M16 GU604VY-NM042X | |
| Asus ROG Flow X16 GV601V | |
| MSI Creator Z16P B12UHST | |
| Lenovo Legion Slim 7-16IAH 82TF004YGE | |
| Durchschnittliche Intel Core i9-13900H (11997 - 20385, n=28) | |
| Razer Blade 15 OLED (Early 2022) | |
| MSI Katana 17 B13VFK | |
| Apple MacBook Pro 16 2023 M2 Max | |
| Lenovo Legion S7 16ARHA7 | |
| Asus ROG Flow X16 GV601RW-M5082W | |
| Corsair Voyager a1600 | |
| Cinebench R23 / Single Core | |
| Lenovo Legion Pro 7 16IRX8H | |
| Asus ROG Flow X16 GV601V | |
| Durchschnitt der Klasse Gaming (1166 - 2356, n=110, der letzten 2 Jahre) | |
| Asus ROG Zephyrus M16 GU604VY-NM042X | |
| MSI Creator Z16P B12UHST | |
| Durchschnittliche Intel Core i9-13900H (1297 - 2054, n=26) | |
| MSI Katana 17 B13VFK | |
| Lenovo Legion Slim 7-16IAH 82TF004YGE | |
| Razer Blade 15 OLED (Early 2022) | |
| Apple MacBook Pro 16 2023 M2 Max | |
| Lenovo Legion S7 16ARHA7 | |
| Corsair Voyager a1600 | |
| Asus ROG Flow X16 GV601RW-M5082W | |
| Cinebench R20 / CPU (Multi Core) | |
| Lenovo Legion Pro 7 16IRX8H | |
| Durchschnitt der Klasse Gaming (4029 - 16108, n=109, der letzten 2 Jahre) | |
| Asus ROG Flow X16 GV601V | |
| Asus ROG Zephyrus M16 GU604VY-NM042X | |
| MSI Creator Z16P B12UHST | |
| Lenovo Legion Slim 7-16IAH 82TF004YGE | |
| Durchschnittliche Intel Core i9-13900H (4935 - 7716, n=25) | |
| Razer Blade 15 OLED (Early 2022) | |
| MSI Katana 17 B13VFK | |
| Lenovo Legion S7 16ARHA7 | |
| Asus ROG Flow X16 GV601RW-M5082W | |
| Corsair Voyager a1600 | |
| Apple MacBook Pro 16 2023 M2 Max | |
| Cinebench R20 / CPU (Single Core) | |
| Lenovo Legion Pro 7 16IRX8H | |
| Durchschnitt der Klasse Gaming (442 - 895, n=109, der letzten 2 Jahre) | |
| Asus ROG Flow X16 GV601V | |
| Asus ROG Zephyrus M16 GU604VY-NM042X | |
| MSI Creator Z16P B12UHST | |
| Durchschnittliche Intel Core i9-13900H (428 - 792, n=25) | |
| MSI Katana 17 B13VFK | |
| Lenovo Legion Slim 7-16IAH 82TF004YGE | |
| Razer Blade 15 OLED (Early 2022) | |
| Lenovo Legion S7 16ARHA7 | |
| Asus ROG Flow X16 GV601RW-M5082W | |
| Corsair Voyager a1600 | |
| Apple MacBook Pro 16 2023 M2 Max | |
| Cinebench R15 / CPU Multi 64Bit | |
| Lenovo Legion Pro 7 16IRX8H | |
| Durchschnitt der Klasse Gaming (1578 - 6271, n=108, der letzten 2 Jahre) | |
| Asus ROG Flow X16 GV601V | |
| Asus ROG Zephyrus M16 GU604VY-NM042X | |
| MSI Creator Z16P B12UHST | |
| Lenovo Legion Slim 7-16IAH 82TF004YGE | |
| Durchschnittliche Intel Core i9-13900H (2061 - 3100, n=26) | |
| Razer Blade 15 OLED (Early 2022) | |
| Lenovo Legion S7 16ARHA7 | |
| MSI Katana 17 B13VFK | |
| Asus ROG Flow X16 GV601RW-M5082W | |
| Corsair Voyager a1600 | |
| Apple MacBook Pro 16 2023 M2 Max | |
| Cinebench R15 / CPU Single 64Bit | |
| Lenovo Legion Pro 7 16IRX8H | |
| Durchschnitt der Klasse Gaming (188.8 - 343, n=109, der letzten 2 Jahre) | |
| Asus ROG Zephyrus M16 GU604VY-NM042X | |
| Asus ROG Flow X16 GV601V | |
| MSI Creator Z16P B12UHST | |
| Durchschnittliche Intel Core i9-13900H (211 - 297, n=26) | |
| MSI Katana 17 B13VFK | |
| Lenovo Legion S7 16ARHA7 | |
| Lenovo Legion Slim 7-16IAH 82TF004YGE | |
| Razer Blade 15 OLED (Early 2022) | |
| Corsair Voyager a1600 | |
| Asus ROG Flow X16 GV601RW-M5082W | |
| Apple MacBook Pro 16 2023 M2 Max | |
| Blender / v2.79 BMW27 CPU | |
| Corsair Voyager a1600 | |
| Asus ROG Flow X16 GV601RW-M5082W | |
| Razer Blade 15 OLED (Early 2022) | |
| MSI Katana 17 B13VFK | |
| Lenovo Legion S7 16ARHA7 | |
| Durchschnittliche Intel Core i9-13900H (166 - 268, n=24) | |
| MSI Creator Z16P B12UHST | |
| Lenovo Legion Slim 7-16IAH 82TF004YGE | |
| Asus ROG Flow X16 GV601V | |
| Asus ROG Zephyrus M16 GU604VY-NM042X | |
| Durchschnitt der Klasse Gaming (80 - 330, n=107, der letzten 2 Jahre) | |
| Lenovo Legion Pro 7 16IRX8H | |
| 7-Zip 18.03 / 7z b 4 | |
| Lenovo Legion Pro 7 16IRX8H | |
| Durchschnitt der Klasse Gaming (33491 - 148086, n=108, der letzten 2 Jahre) | |
| Asus ROG Zephyrus M16 GU604VY-NM042X | |
| Asus ROG Flow X16 GV601V | |
| MSI Creator Z16P B12UHST | |
| Durchschnittliche Intel Core i9-13900H (45045 - 79032, n=25) | |
| Lenovo Legion Slim 7-16IAH 82TF004YGE | |
| Razer Blade 15 OLED (Early 2022) | |
| Lenovo Legion S7 16ARHA7 | |
| MSI Katana 17 B13VFK | |
| Corsair Voyager a1600 | |
| Asus ROG Flow X16 GV601RW-M5082W | |
| 7-Zip 18.03 / 7z b 4 -mmt1 | |
| Lenovo Legion Pro 7 16IRX8H | |
| Durchschnitt der Klasse Gaming (4199 - 7436, n=108, der letzten 2 Jahre) | |
| Asus ROG Flow X16 GV601V | |
| Asus ROG Zephyrus M16 GU604VY-NM042X | |
| MSI Creator Z16P B12UHST | |
| Lenovo Legion S7 16ARHA7 | |
| Durchschnittliche Intel Core i9-13900H (3665 - 6600, n=25) | |
| Corsair Voyager a1600 | |
| MSI Katana 17 B13VFK | |
| Asus ROG Flow X16 GV601RW-M5082W | |
| Lenovo Legion Slim 7-16IAH 82TF004YGE | |
| Razer Blade 15 OLED (Early 2022) | |
| Geekbench 5.5 / Multi-Core | |
| Lenovo Legion Pro 7 16IRX8H | |
| Durchschnitt der Klasse Gaming (6460 - 27010, n=108, der letzten 2 Jahre) | |
| Asus ROG Zephyrus M16 GU604VY-NM042X | |
| Apple MacBook Pro 16 2023 M2 Max | |
| MSI Creator Z16P B12UHST | |
| Asus ROG Flow X16 GV601V | |
| Durchschnittliche Intel Core i9-13900H (9094 - 15410, n=26) | |
| Lenovo Legion Slim 7-16IAH 82TF004YGE | |
| Razer Blade 15 OLED (Early 2022) | |
| MSI Katana 17 B13VFK | |
| Corsair Voyager a1600 | |
| Lenovo Legion S7 16ARHA7 | |
| Asus ROG Flow X16 GV601RW-M5082W | |
| Geekbench 5.5 / Single-Core | |
| Durchschnitt der Klasse Gaming (986 - 2474, n=108, der letzten 2 Jahre) | |
| Lenovo Legion Pro 7 16IRX8H | |
| Asus ROG Flow X16 GV601V | |
| Apple MacBook Pro 16 2023 M2 Max | |
| Asus ROG Zephyrus M16 GU604VY-NM042X | |
| Durchschnittliche Intel Core i9-13900H (1140 - 2043, n=26) | |
| MSI Creator Z16P B12UHST | |
| MSI Katana 17 B13VFK | |
| Lenovo Legion Slim 7-16IAH 82TF004YGE | |
| Razer Blade 15 OLED (Early 2022) | |
| Lenovo Legion S7 16ARHA7 | |
| Asus ROG Flow X16 GV601RW-M5082W | |
| Corsair Voyager a1600 | |
| HWBOT x265 Benchmark v2.2 / 4k Preset | |
| Lenovo Legion Pro 7 16IRX8H | |
| Durchschnitt der Klasse Gaming (11.5 - 44.3, n=108, der letzten 2 Jahre) | |
| Asus ROG Zephyrus M16 GU604VY-NM042X | |
| Asus ROG Flow X16 GV601V | |
| MSI Creator Z16P B12UHST | |
| Lenovo Legion Slim 7-16IAH 82TF004YGE | |
| Durchschnittliche Intel Core i9-13900H (14.1 - 22.3, n=25) | |
| Lenovo Legion S7 16ARHA7 | |
| Razer Blade 15 OLED (Early 2022) | |
| MSI Katana 17 B13VFK | |
| Corsair Voyager a1600 | |
| Asus ROG Flow X16 GV601RW-M5082W | |
| LibreOffice / 20 Documents To PDF | |
| Corsair Voyager a1600 | |
| MSI Katana 17 B13VFK | |
| Asus ROG Flow X16 GV601RW-M5082W | |
| Razer Blade 15 OLED (Early 2022) | |
| Asus ROG Zephyrus M16 GU604VY-NM042X | |
| Durchschnitt der Klasse Gaming (19 - 88.8, n=108, der letzten 2 Jahre) | |
| Lenovo Legion S7 16ARHA7 | |
| Durchschnittliche Intel Core i9-13900H (34.4 - 82.8, n=25) | |
| Lenovo Legion Pro 7 16IRX8H | |
| Lenovo Legion Slim 7-16IAH 82TF004YGE | |
| MSI Creator Z16P B12UHST | |
| Asus ROG Flow X16 GV601V | |
| R Benchmark 2.5 / Overall mean | |
| Razer Blade 15 OLED (Early 2022) | |
| Asus ROG Flow X16 GV601RW-M5082W | |
| Corsair Voyager a1600 | |
| Lenovo Legion Slim 7-16IAH 82TF004YGE | |
| Lenovo Legion S7 16ARHA7 | |
| Durchschnittliche Intel Core i9-13900H (0.4052 - 0.723, n=25) | |
| MSI Katana 17 B13VFK | |
| MSI Creator Z16P B12UHST | |
| Durchschnitt der Klasse Gaming (0.3439 - 0.759, n=109, der letzten 2 Jahre) | |
| Asus ROG Flow X16 GV601V | |
| Asus ROG Zephyrus M16 GU604VY-NM042X | |
| Lenovo Legion Pro 7 16IRX8H | |
* ... kleinere Werte sind besser
AIDA64: FP32 Ray-Trace | FPU Julia | CPU SHA3 | CPU Queen | FPU SinJulia | FPU Mandel | CPU AES | CPU ZLib | FP64 Ray-Trace | CPU PhotoWorxx
| Performance Rating | |
| Durchschnitt der Klasse Gaming | |
| Asus ROG Flow X16 GV601RW-M5082W | |
| Lenovo Legion S7 16ARHA7 | |
| Corsair Voyager a1600 | |
| Asus ROG Flow X16 GV601V | |
| Lenovo Legion Slim 7-16IAH 82TF004YGE | |
| Durchschnittliche Intel Core i9-13900H | |
| Razer Blade 15 OLED (Early 2022) | |
| MSI Creator Z16P B12UHST | |
| MSI Katana 17 B13VFK | |
| AIDA64 / FP32 Ray-Trace | |
| Durchschnitt der Klasse Gaming (10227 - 85542, n=107, der letzten 2 Jahre) | |
| Lenovo Legion Slim 7-16IAH 82TF004YGE | |
| Asus ROG Flow X16 GV601RW-M5082W | |
| Lenovo Legion S7 16ARHA7 | |
| Corsair Voyager a1600 | |
| Durchschnittliche Intel Core i9-13900H (6788 - 19557, n=25) | |
| MSI Katana 17 B13VFK | |
| Razer Blade 15 OLED (Early 2022) | |
| Asus ROG Flow X16 GV601V | |
| MSI Creator Z16P B12UHST | |
| AIDA64 / FPU Julia | |
| Durchschnitt der Klasse Gaming (51376 - 238426, n=107, der letzten 2 Jahre) | |
| Lenovo Legion S7 16ARHA7 | |
| Asus ROG Flow X16 GV601RW-M5082W | |
| Corsair Voyager a1600 | |
| Asus ROG Flow X16 GV601V | |
| Lenovo Legion Slim 7-16IAH 82TF004YGE | |
| Durchschnittliche Intel Core i9-13900H (22551 - 95579, n=25) | |
| Razer Blade 15 OLED (Early 2022) | |
| MSI Katana 17 B13VFK | |
| MSI Creator Z16P B12UHST | |
| AIDA64 / CPU SHA3 | |
| Durchschnitt der Klasse Gaming (2180 - 9817, n=107, der letzten 2 Jahre) | |
| Asus ROG Flow X16 GV601V | |
| Lenovo Legion Slim 7-16IAH 82TF004YGE | |
| Asus ROG Flow X16 GV601RW-M5082W | |
| Lenovo Legion S7 16ARHA7 | |
| Durchschnittliche Intel Core i9-13900H (2491 - 4270, n=25) | |
| Corsair Voyager a1600 | |
| Razer Blade 15 OLED (Early 2022) | |
| MSI Creator Z16P B12UHST | |
| MSI Katana 17 B13VFK | |
| AIDA64 / CPU Queen | |
| Durchschnitt der Klasse Gaming (49785 - 173351, n=94, der letzten 2 Jahre) | |
| Asus ROG Flow X16 GV601V | |
| Lenovo Legion S7 16ARHA7 | |
| MSI Creator Z16P B12UHST | |
| Razer Blade 15 OLED (Early 2022) | |
| Corsair Voyager a1600 | |
| Durchschnittliche Intel Core i9-13900H (65121 - 120936, n=25) | |
| Asus ROG Flow X16 GV601RW-M5082W | |
| Lenovo Legion Slim 7-16IAH 82TF004YGE | |
| MSI Katana 17 B13VFK | |
| AIDA64 / FPU SinJulia | |
| Durchschnitt der Klasse Gaming (4424 - 33636, n=107, der letzten 2 Jahre) | |
| Corsair Voyager a1600 | |
| Lenovo Legion S7 16ARHA7 | |
| Asus ROG Flow X16 GV601RW-M5082W | |
| Asus ROG Flow X16 GV601V | |
| MSI Creator Z16P B12UHST | |
| Lenovo Legion Slim 7-16IAH 82TF004YGE | |
| Razer Blade 15 OLED (Early 2022) | |
| Durchschnittliche Intel Core i9-13900H (6108 - 11631, n=25) | |
| MSI Katana 17 B13VFK | |
| AIDA64 / FPU Mandel | |
| Durchschnitt der Klasse Gaming (25115 - 128721, n=107, der letzten 2 Jahre) | |
| Lenovo Legion S7 16ARHA7 | |
| Asus ROG Flow X16 GV601RW-M5082W | |
| Corsair Voyager a1600 | |
| Asus ROG Flow X16 GV601V | |
| Lenovo Legion Slim 7-16IAH 82TF004YGE | |
| Durchschnittliche Intel Core i9-13900H (11283 - 48474, n=25) | |
| Razer Blade 15 OLED (Early 2022) | |
| MSI Katana 17 B13VFK | |
| MSI Creator Z16P B12UHST | |
| AIDA64 / CPU AES | |
| Asus ROG Flow X16 GV601RW-M5082W | |
| Lenovo Legion Slim 7-16IAH 82TF004YGE | |
| Lenovo Legion S7 16ARHA7 | |
| Corsair Voyager a1600 | |
| Durchschnitt der Klasse Gaming (39258 - 247074, n=107, der letzten 2 Jahre) | |
| MSI Creator Z16P B12UHST | |
| Razer Blade 15 OLED (Early 2022) | |
| Durchschnittliche Intel Core i9-13900H (3691 - 149377, n=25) | |
| Asus ROG Flow X16 GV601V | |
| MSI Katana 17 B13VFK | |
| AIDA64 / CPU ZLib | |
| Durchschnitt der Klasse Gaming (574 - 2531, n=107, der letzten 2 Jahre) | |
| Asus ROG Flow X16 GV601V | |
| MSI Creator Z16P B12UHST | |
| Razer Blade 15 OLED (Early 2022) | |
| Durchschnittliche Intel Core i9-13900H (789 - 1254, n=25) | |
| Lenovo Legion Slim 7-16IAH 82TF004YGE | |
| Asus ROG Flow X16 GV601RW-M5082W | |
| Lenovo Legion S7 16ARHA7 | |
| Corsair Voyager a1600 | |
| MSI Katana 17 B13VFK | |
| AIDA64 / FP64 Ray-Trace | |
| Durchschnitt der Klasse Gaming (5509 - 45446, n=107, der letzten 2 Jahre) | |
| Asus ROG Flow X16 GV601V | |
| Asus ROG Flow X16 GV601RW-M5082W | |
| Lenovo Legion S7 16ARHA7 | |
| Lenovo Legion Slim 7-16IAH 82TF004YGE | |
| Corsair Voyager a1600 | |
| Durchschnittliche Intel Core i9-13900H (3655 - 10716, n=25) | |
| MSI Katana 17 B13VFK | |
| Razer Blade 15 OLED (Early 2022) | |
| MSI Creator Z16P B12UHST | |
| AIDA64 / CPU PhotoWorxx | |
| Durchschnitt der Klasse Gaming (12271 - 89891, n=107, der letzten 2 Jahre) | |
| MSI Creator Z16P B12UHST | |
| Durchschnittliche Intel Core i9-13900H (10871 - 50488, n=25) | |
| Asus ROG Flow X16 GV601V | |
| Lenovo Legion Slim 7-16IAH 82TF004YGE | |
| Razer Blade 15 OLED (Early 2022) | |
| Razer Blade 15 OLED (Early 2022) | |
| MSI Katana 17 B13VFK | |
| Corsair Voyager a1600 | |
| Asus ROG Flow X16 GV601RW-M5082W | |
| Lenovo Legion S7 16ARHA7 | |
System Performance
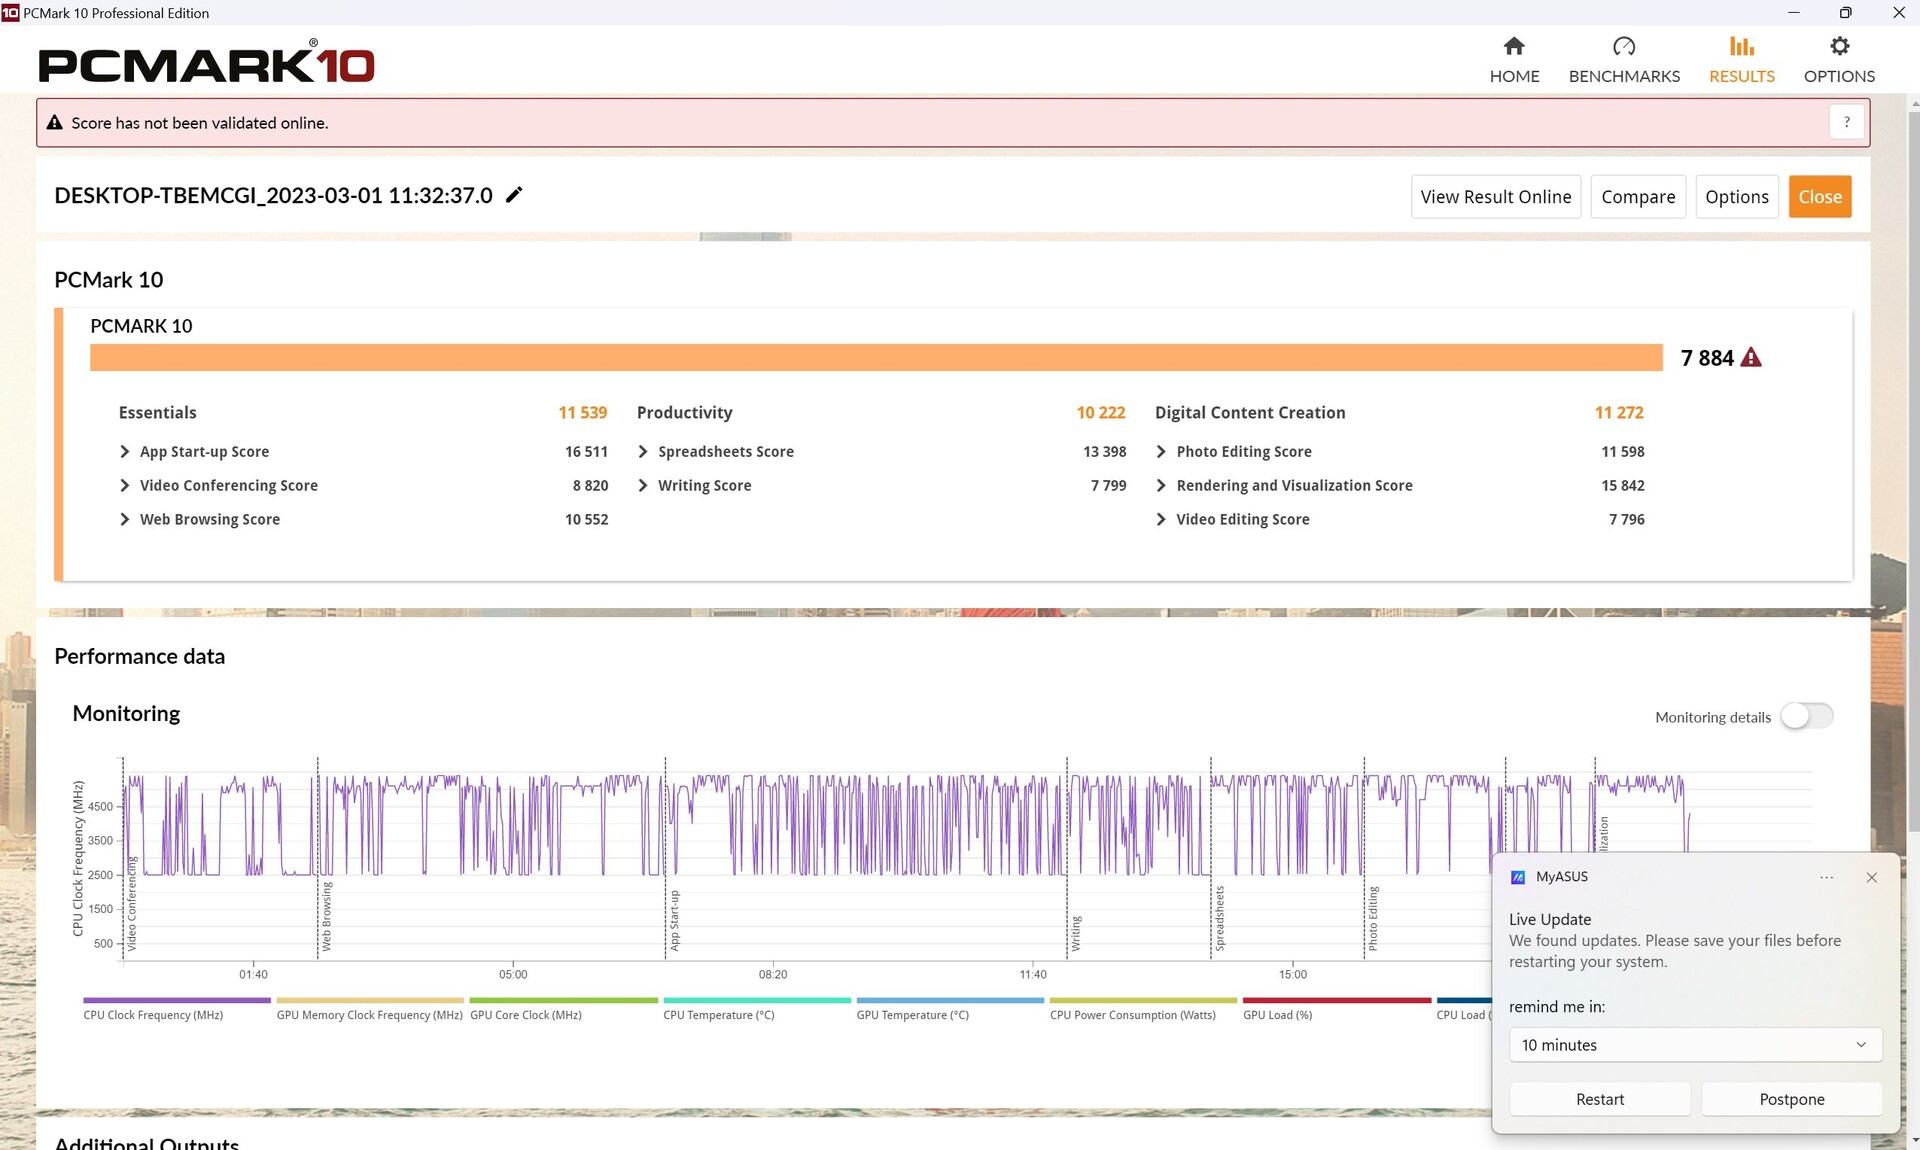
In den PCMark10-Tests agiert das X16 auf Erwartungsniveau, wenn nicht gar knapp darüber. Es gibt keine Ausreißer oder Einbrüche in einem der Untertests.
CrossMark: Overall | Productivity | Creativity | Responsiveness
| PCMark 10 / Score | |
| Durchschnitt der Klasse Gaming (5828 - 11574, n=95, der letzten 2 Jahre) | |
| Asus ROG Zephyrus M16 GU604VY-NM042X | |
| MSI Creator Z16P B12UHST | |
| Asus ROG Flow X16 GV601V | |
| Lenovo Legion Pro 7 16IRX8H | |
| Durchschnittliche Intel Core i9-13900H, NVIDIA GeForce RTX 4060 Laptop GPU (7578 - 7884, n=3) | |
| Lenovo Legion S7 16ARHA7 | |
| Lenovo Legion Slim 7-16IAH 82TF004YGE | |
| Razer Blade 15 OLED (Early 2022) | |
| Corsair Voyager a1600 | |
| MSI Katana 17 B13VFK | |
| Asus ROG Flow X16 GV601RW-M5082W | |
| PCMark 10 / Essentials | |
| Lenovo Legion Pro 7 16IRX8H | |
| Asus ROG Zephyrus M16 GU604VY-NM042X | |
| Asus ROG Flow X16 GV601V | |
| Durchschnittliche Intel Core i9-13900H, NVIDIA GeForce RTX 4060 Laptop GPU (11235 - 11539, n=3) | |
| MSI Creator Z16P B12UHST | |
| Lenovo Legion Slim 7-16IAH 82TF004YGE | |
| MSI Katana 17 B13VFK | |
| Lenovo Legion S7 16ARHA7 | |
| Durchschnitt der Klasse Gaming (8810 - 12600, n=99, der letzten 2 Jahre) | |
| Razer Blade 15 OLED (Early 2022) | |
| Corsair Voyager a1600 | |
| Asus ROG Flow X16 GV601RW-M5082W | |
| PCMark 10 / Productivity | |
| MSI Creator Z16P B12UHST | |
| Asus ROG Zephyrus M16 GU604VY-NM042X | |
| Durchschnitt der Klasse Gaming (6845 - 21327, n=97, der letzten 2 Jahre) | |
| Lenovo Legion Pro 7 16IRX8H | |
| Asus ROG Flow X16 GV601V | |
| Durchschnittliche Intel Core i9-13900H, NVIDIA GeForce RTX 4060 Laptop GPU (9888 - 10222, n=3) | |
| Razer Blade 15 OLED (Early 2022) | |
| Lenovo Legion S7 16ARHA7 | |
| Asus ROG Flow X16 GV601RW-M5082W | |
| Lenovo Legion Slim 7-16IAH 82TF004YGE | |
| MSI Katana 17 B13VFK | |
| Corsair Voyager a1600 | |
| PCMark 10 / Digital Content Creation | |
| Durchschnitt der Klasse Gaming (7602 - 19657, n=97, der letzten 2 Jahre) | |
| Asus ROG Zephyrus M16 GU604VY-NM042X | |
| MSI Creator Z16P B12UHST | |
| Lenovo Legion S7 16ARHA7 | |
| Corsair Voyager a1600 | |
| Asus ROG Flow X16 GV601V | |
| Durchschnittliche Intel Core i9-13900H, NVIDIA GeForce RTX 4060 Laptop GPU (10418 - 11272, n=3) | |
| Lenovo Legion Slim 7-16IAH 82TF004YGE | |
| Razer Blade 15 OLED (Early 2022) | |
| Lenovo Legion Pro 7 16IRX8H | |
| MSI Katana 17 B13VFK | |
| Asus ROG Flow X16 GV601RW-M5082W | |
| CrossMark / Overall | |
| Durchschnitt der Klasse Gaming (1366 - 2409, n=96, der letzten 2 Jahre) | |
| Asus ROG Zephyrus M16 GU604VY-NM042X | |
| Asus ROG Flow X16 GV601V | |
| Durchschnittliche Intel Core i9-13900H, NVIDIA GeForce RTX 4060 Laptop GPU (1874 - 1983, n=3) | |
| Apple MacBook Pro 16 2023 M2 Max | |
| Lenovo Legion Slim 7-16IAH 82TF004YGE | |
| MSI Katana 17 B13VFK | |
| Razer Blade 15 OLED (Early 2022) | |
| Lenovo Legion S7 16ARHA7 | |
| Asus ROG Flow X16 GV601RW-M5082W | |
| Corsair Voyager a1600 | |
| CrossMark / Productivity | |
| Asus ROG Flow X16 GV601V | |
| Durchschnitt der Klasse Gaming (1386 - 2254, n=96, der letzten 2 Jahre) | |
| Asus ROG Zephyrus M16 GU604VY-NM042X | |
| Durchschnittliche Intel Core i9-13900H, NVIDIA GeForce RTX 4060 Laptop GPU (1779 - 1889, n=3) | |
| Lenovo Legion Slim 7-16IAH 82TF004YGE | |
| MSI Katana 17 B13VFK | |
| Lenovo Legion S7 16ARHA7 | |
| Razer Blade 15 OLED (Early 2022) | |
| Apple MacBook Pro 16 2023 M2 Max | |
| Asus ROG Flow X16 GV601RW-M5082W | |
| Corsair Voyager a1600 | |
| CrossMark / Creativity | |
| Apple MacBook Pro 16 2023 M2 Max | |
| Asus ROG Zephyrus M16 GU604VY-NM042X | |
| Durchschnitt der Klasse Gaming (1343 - 2729, n=96, der letzten 2 Jahre) | |
| Asus ROG Flow X16 GV601V | |
| Durchschnittliche Intel Core i9-13900H, NVIDIA GeForce RTX 4060 Laptop GPU (2104 - 2195, n=3) | |
| MSI Katana 17 B13VFK | |
| Lenovo Legion Slim 7-16IAH 82TF004YGE | |
| Razer Blade 15 OLED (Early 2022) | |
| Lenovo Legion S7 16ARHA7 | |
| Asus ROG Flow X16 GV601RW-M5082W | |
| Corsair Voyager a1600 | |
| CrossMark / Responsiveness | |
| Lenovo Legion Slim 7-16IAH 82TF004YGE | |
| MSI Katana 17 B13VFK | |
| Durchschnitt der Klasse Gaming (1226 - 2334, n=96, der letzten 2 Jahre) | |
| Asus ROG Flow X16 GV601V | |
| Asus ROG Zephyrus M16 GU604VY-NM042X | |
| Durchschnittliche Intel Core i9-13900H, NVIDIA GeForce RTX 4060 Laptop GPU (1548 - 1698, n=3) | |
| Razer Blade 15 OLED (Early 2022) | |
| Lenovo Legion S7 16ARHA7 | |
| Asus ROG Flow X16 GV601RW-M5082W | |
| Apple MacBook Pro 16 2023 M2 Max | |
| Corsair Voyager a1600 | |
| PCMark 10 Score | 7884 Punkte | |
Hilfe | ||
| AIDA64 / Memory Copy | |
| Durchschnitt der Klasse Gaming (21750 - 129946, n=107, der letzten 2 Jahre) | |
| Samsung Galaxy Book3 Ultra 16, i9-13900H RTX 4070 | |
| Lenovo Yoga Pro 7 14IRH G8 | |
| Durchschnittliche Intel Core i9-13900H (37448 - 74486, n=25) | |
| Asus ROG Flow X16 GV601V | |
| Lenovo Legion Pro 5 16IRX8 | |
| MSI Katana 17 B13VFK | |
| Asus ROG Flow X16 GV601RW-M5082W | |
| AIDA64 / Memory Read | |
| Durchschnitt der Klasse Gaming (22956 - 118858, n=107, der letzten 2 Jahre) | |
| Samsung Galaxy Book3 Ultra 16, i9-13900H RTX 4070 | |
| Lenovo Yoga Pro 7 14IRH G8 | |
| Asus ROG Flow X16 GV601V | |
| Lenovo Legion Pro 5 16IRX8 | |
| Durchschnittliche Intel Core i9-13900H (41599 - 75433, n=25) | |
| MSI Katana 17 B13VFK | |
| Asus ROG Flow X16 GV601RW-M5082W | |
| AIDA64 / Memory Write | |
| Samsung Galaxy Book3 Ultra 16, i9-13900H RTX 4070 | |
| Durchschnitt der Klasse Gaming (22297 - 135096, n=107, der letzten 2 Jahre) | |
| Lenovo Yoga Pro 7 14IRH G8 | |
| Lenovo Legion Pro 5 16IRX8 | |
| Durchschnittliche Intel Core i9-13900H (36152 - 88505, n=25) | |
| Asus ROG Flow X16 GV601V | |
| Asus ROG Flow X16 GV601RW-M5082W | |
| MSI Katana 17 B13VFK | |
| AIDA64 / Memory Latency | |
| Durchschnitt der Klasse Gaming (75.3 - 259, n=107, der letzten 2 Jahre) | |
| Lenovo Yoga Pro 7 14IRH G8 | |
| Samsung Galaxy Book3 Ultra 16, i9-13900H RTX 4070 | |
| MSI Katana 17 B13VFK | |
| Asus ROG Flow X16 GV601RW-M5082W | |
| Asus ROG Flow X16 GV601V | |
| Durchschnittliche Intel Core i9-13900H (75.8 - 102.3, n=25) | |
| Lenovo Legion Pro 5 16IRX8 | |
* ... kleinere Werte sind besser
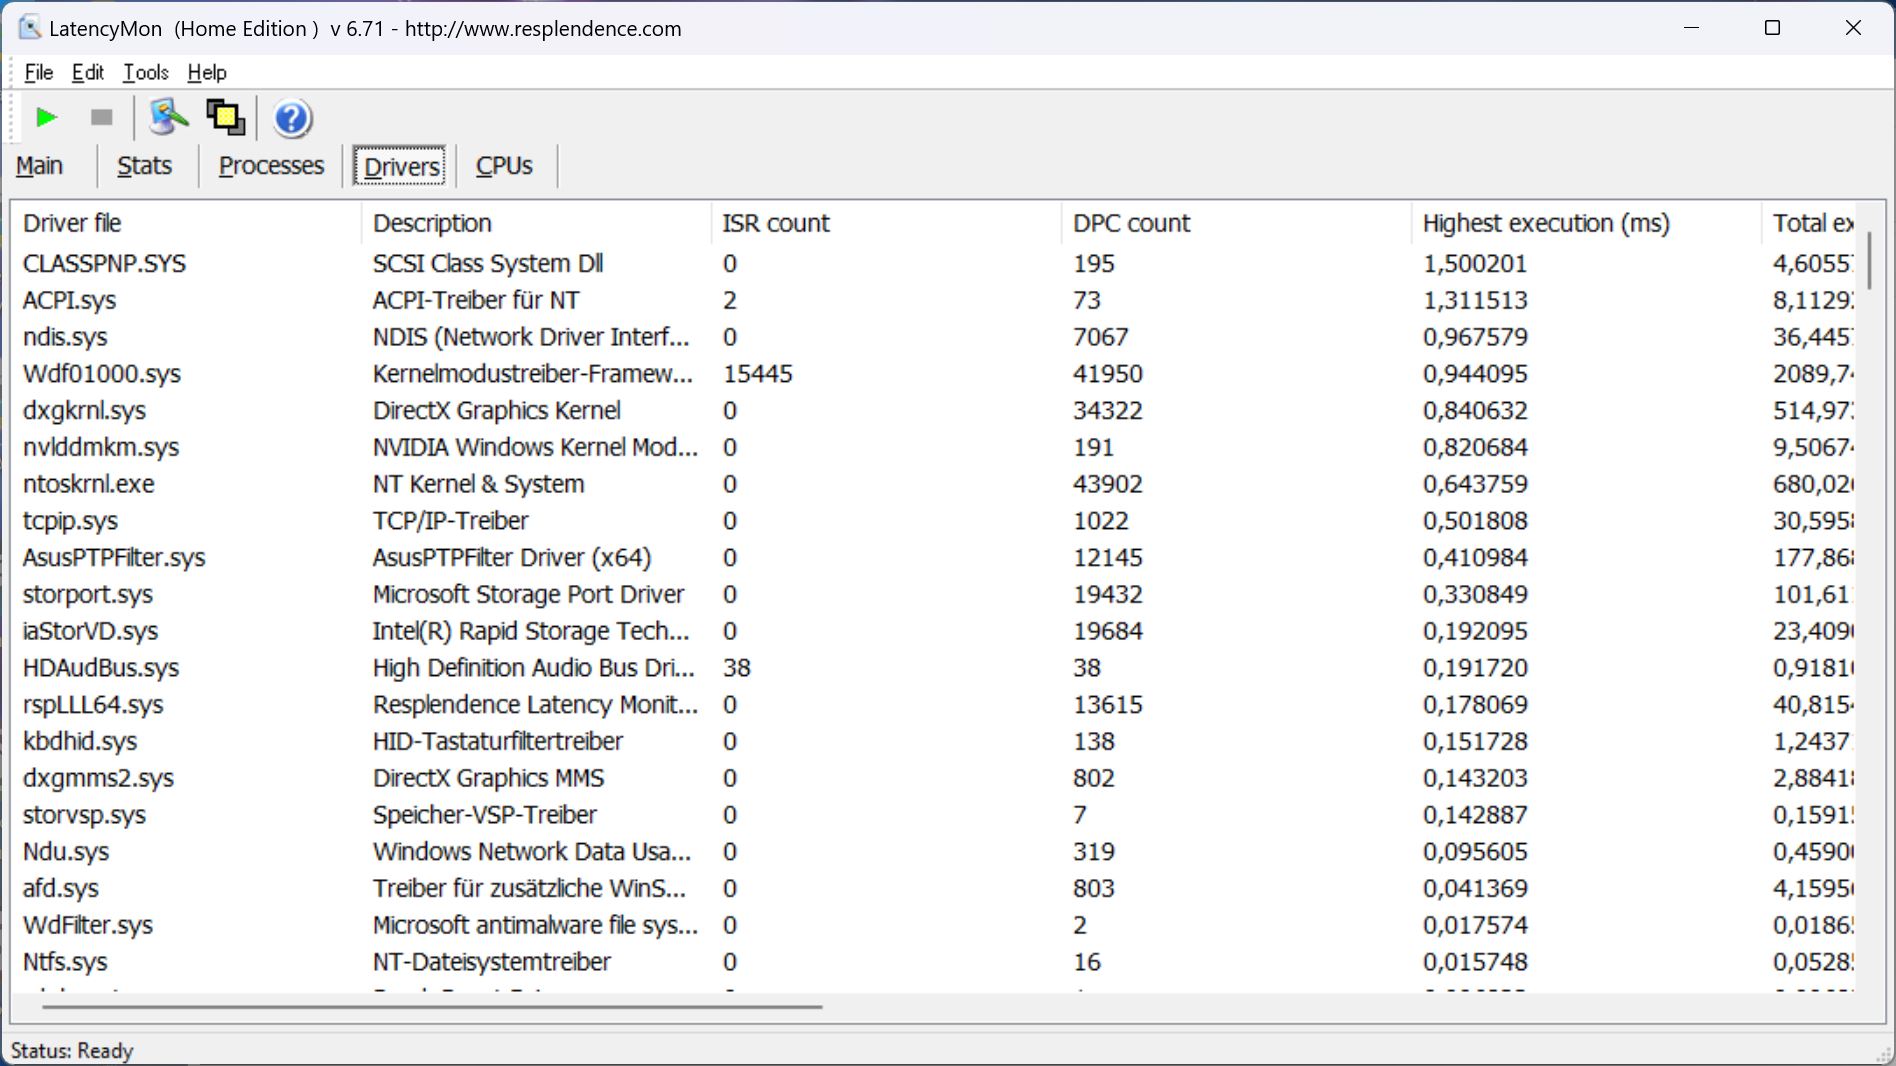
DPC-Latenzen
Beim Öffnen mehrerer Browsertabs zeigt die Software LatencyMon Latenzen an. Unser 4K/60-fps-YouTubevideo läuft dennoch flüssig und ohne ausgelassene Frames ab. Für die anvisierte Gruppe der Content Creators dürfte der Wert dennoch gerne niedriger ausfallen.


| DPC Latencies / LatencyMon - interrupt to process latency (max), Web, Youtube, Prime95 | |
| Samsung Galaxy Book3 Ultra 16, i9-13900H RTX 4070 | |
| MSI Katana 17 B13VFK | |
| Asus ROG Flow X16 GV601V | |
| Asus ROG Flow X16 GV601RW-M5082W | |
| Lenovo Yoga Pro 7 14IRH G8 | |
| Lenovo Legion Pro 5 16IRX8 | |
* ... kleinere Werte sind besser
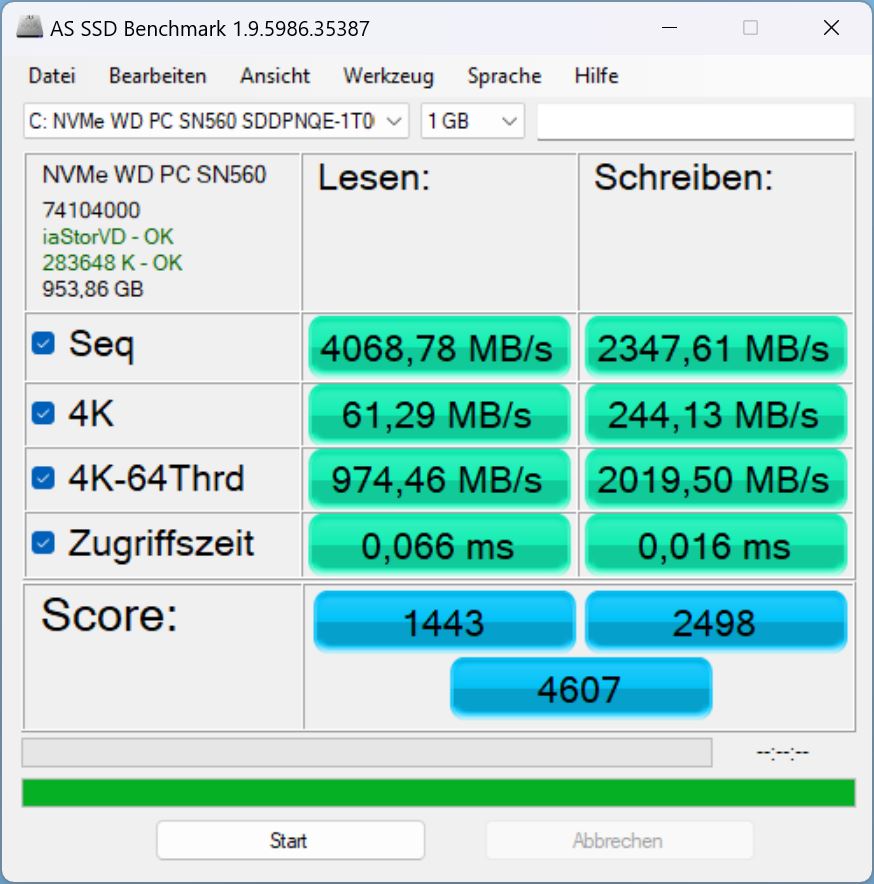
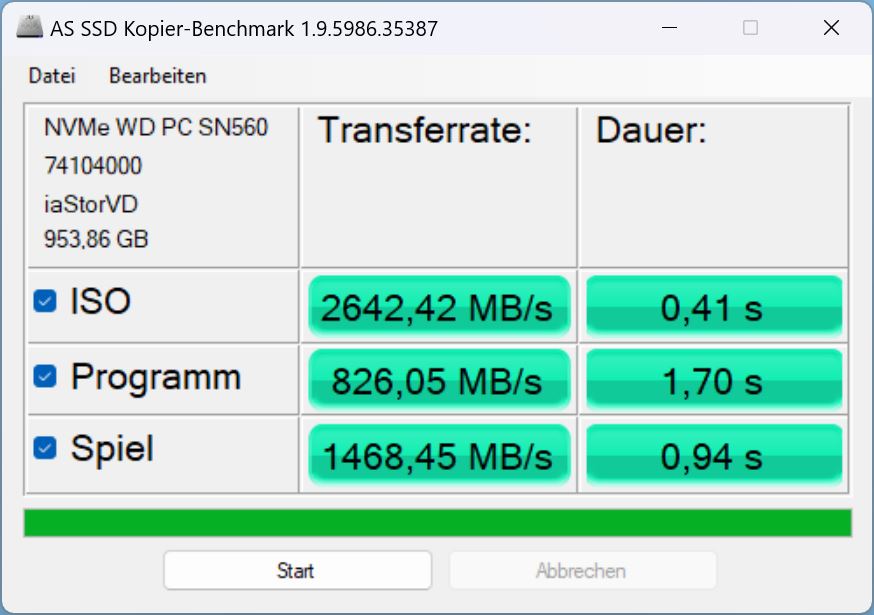
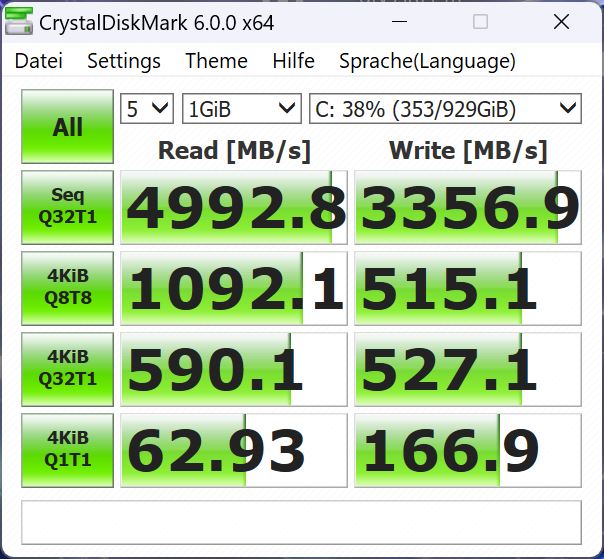
Massenspeicher
Asus verbaut eine 1TB große PCIe-4.0-x4-NVMe-SSD von Western Digital. In unserer SSD-Bestenliste findet sie sich eher auf den hinteren Rängen wieder. Die Micron-SSD im Vorgänger war deutlich schneller und zwar im Schnitt 42 Prozent!
Für den Heimanwender ist die SSD natürlich dennoch schnell genug, aber gerade für professionelle Anwender, auf die das X16 ja auch abzielt, ist dieser Leistungsrückgang etwas bedauerlich.

* ... kleinere Werte sind besser
Dauerleistung Lesen: DiskSpd Read Loop, Queue Depth 8
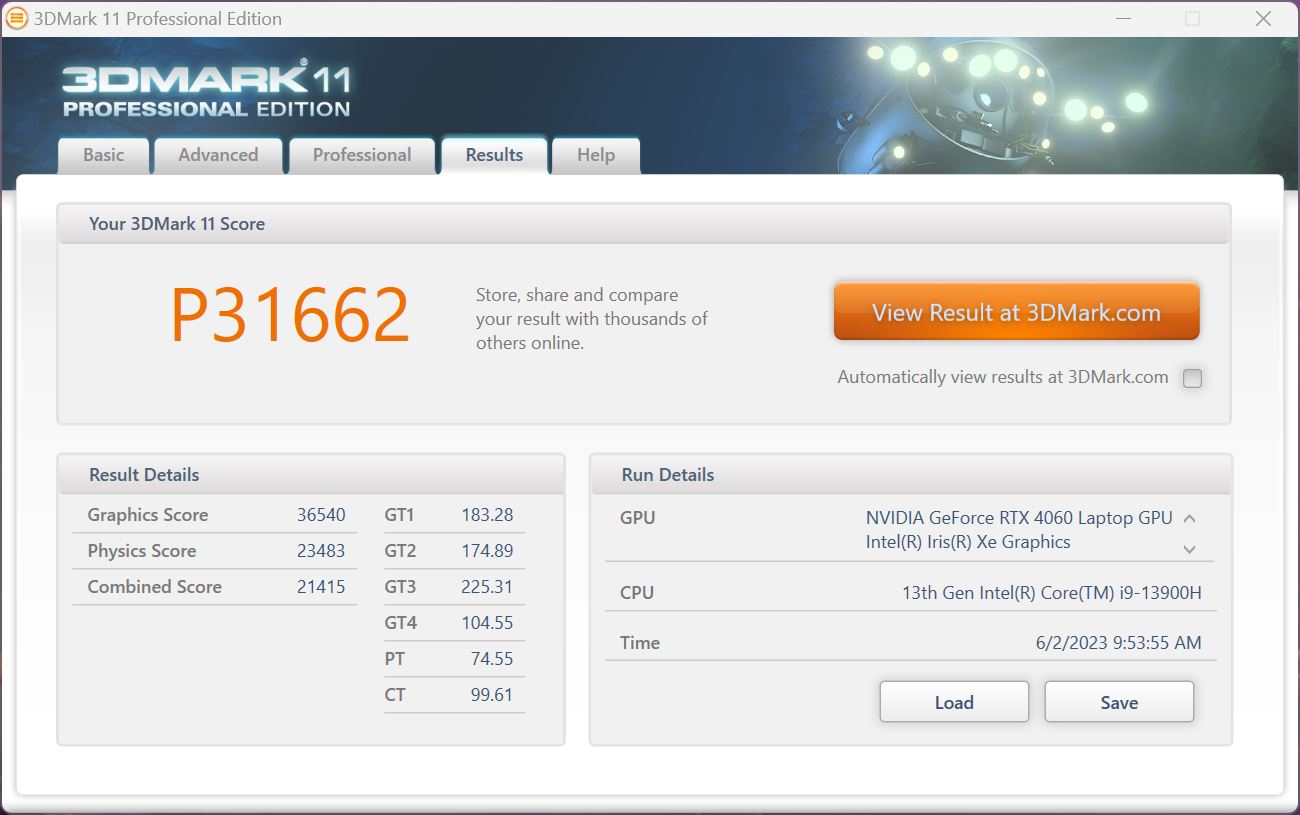
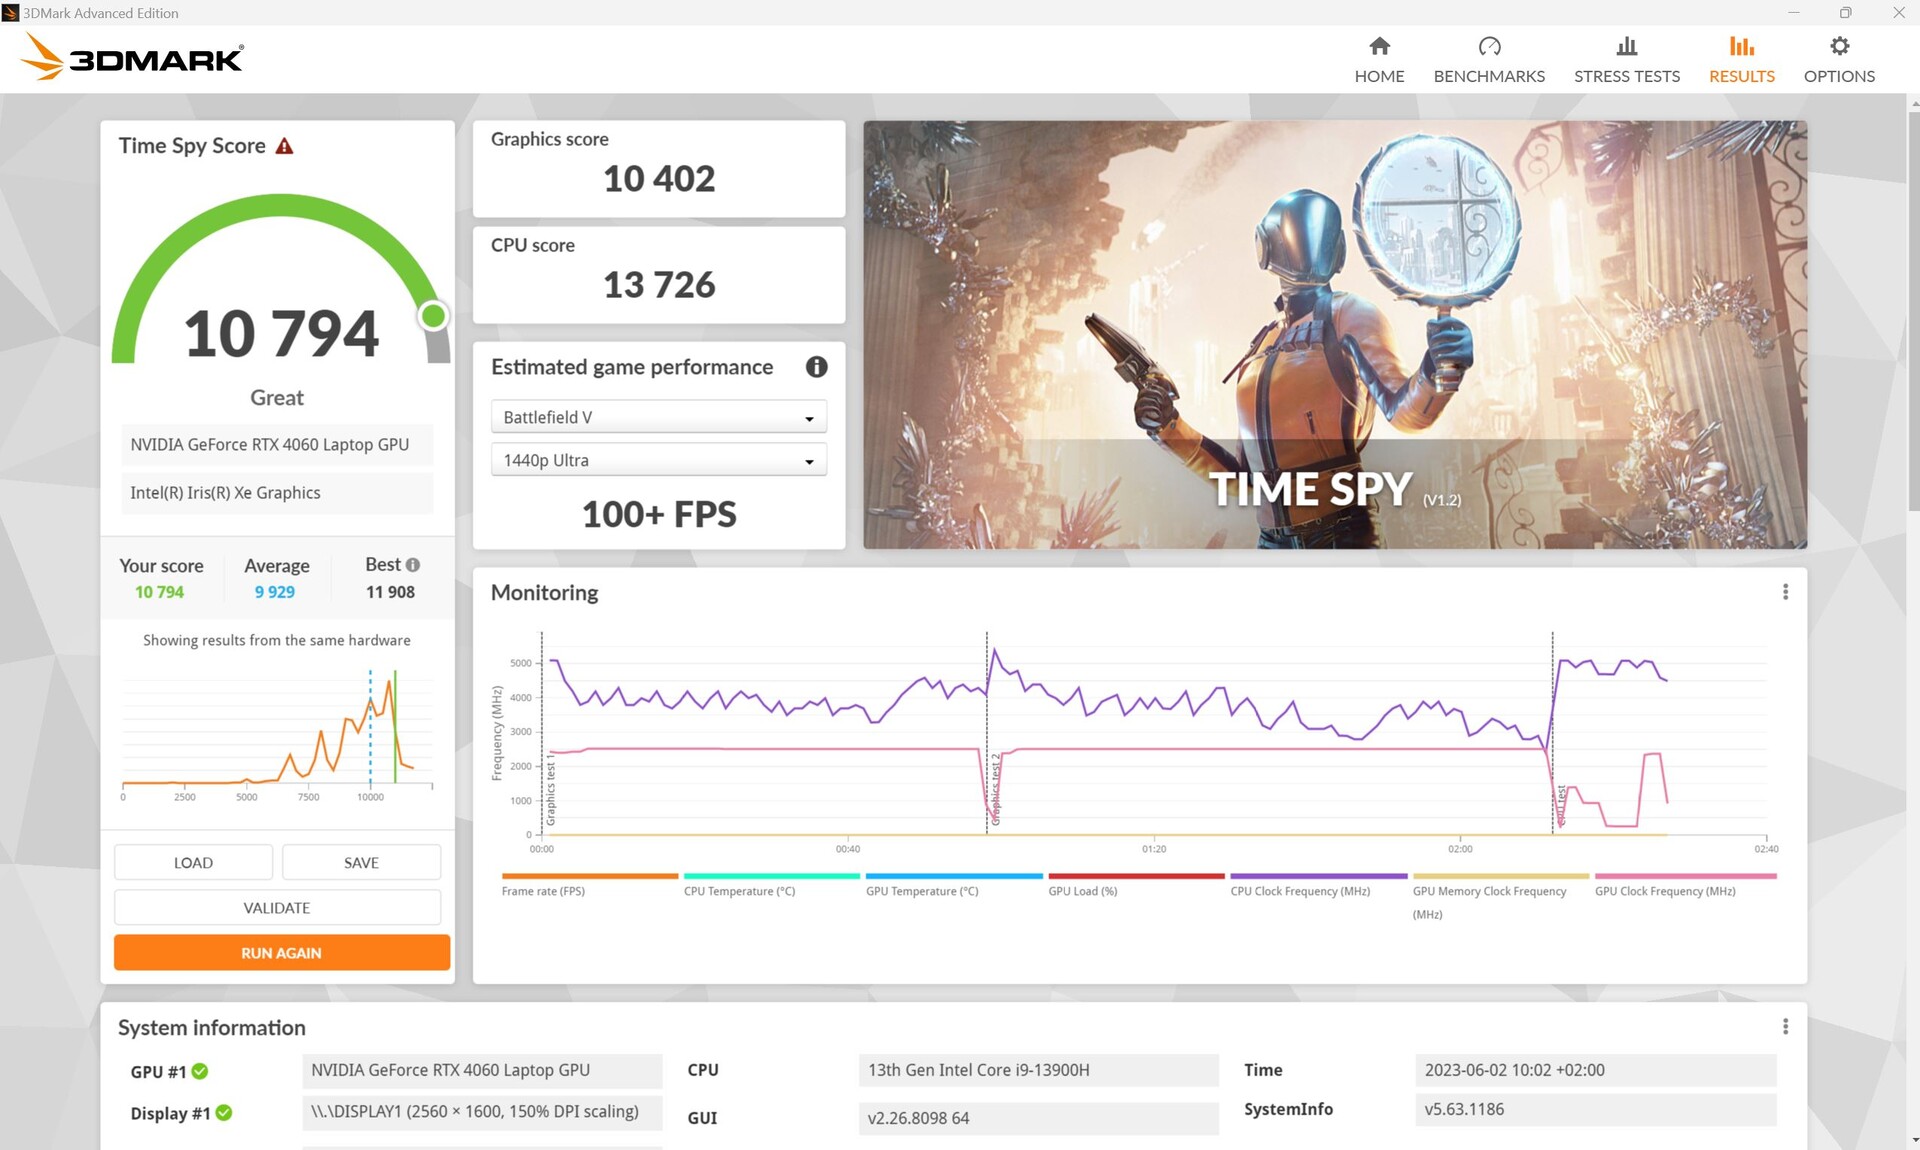
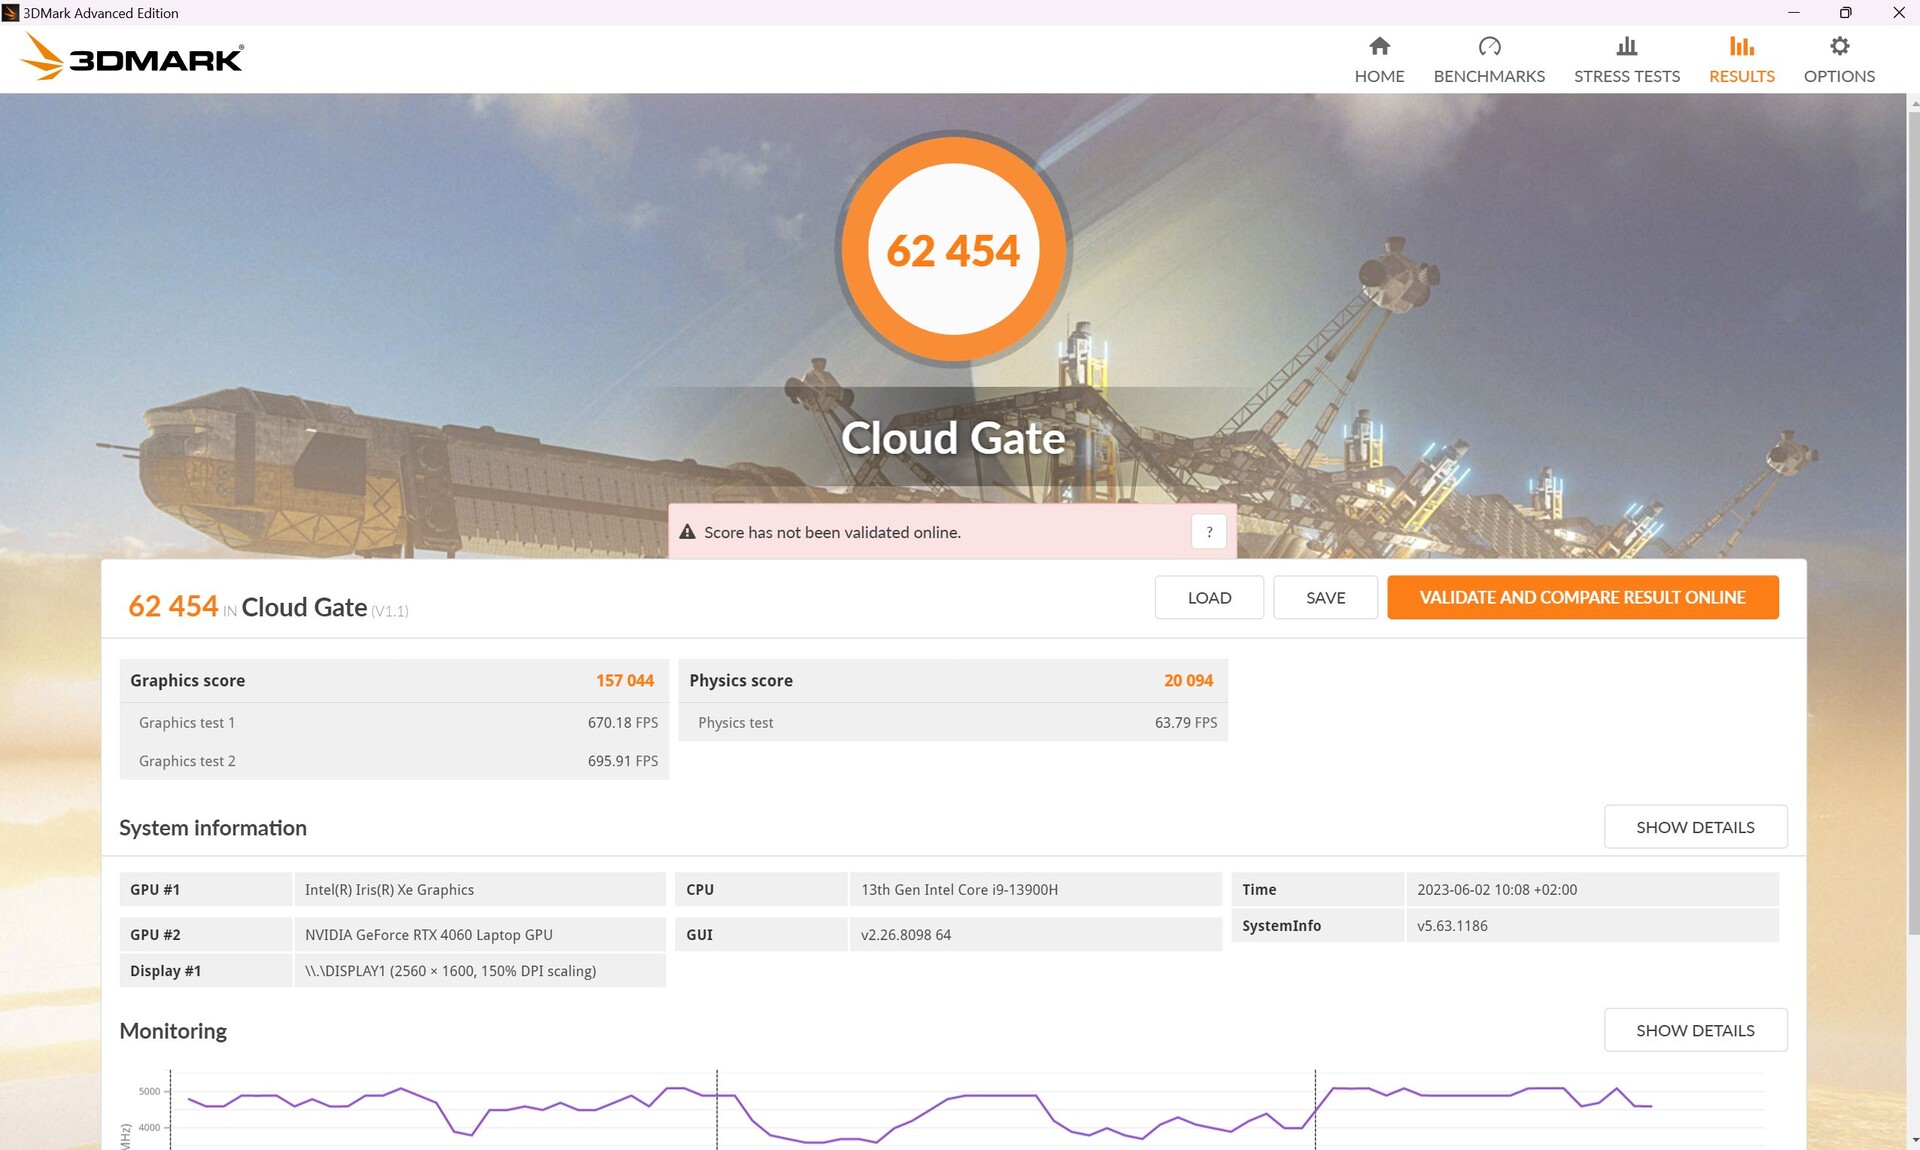
Grafikkarte
In unserem Testmodell steckt eine Nvidia Geforce RTX 4060. Zur Auswahl stehen aber auch eine RTX 4050 oder eine RTX 4070. Hier darf sie sich maximal 120 W inklusive 20 W Dynamic Boost genehmigen.
In den 3DMark-Benchmarks kann sie etwa 10 Prozent (Turbo) besser als der durchschnittliche Laptop mit RTX 4060 aus unserer Datenbank abschneiden.
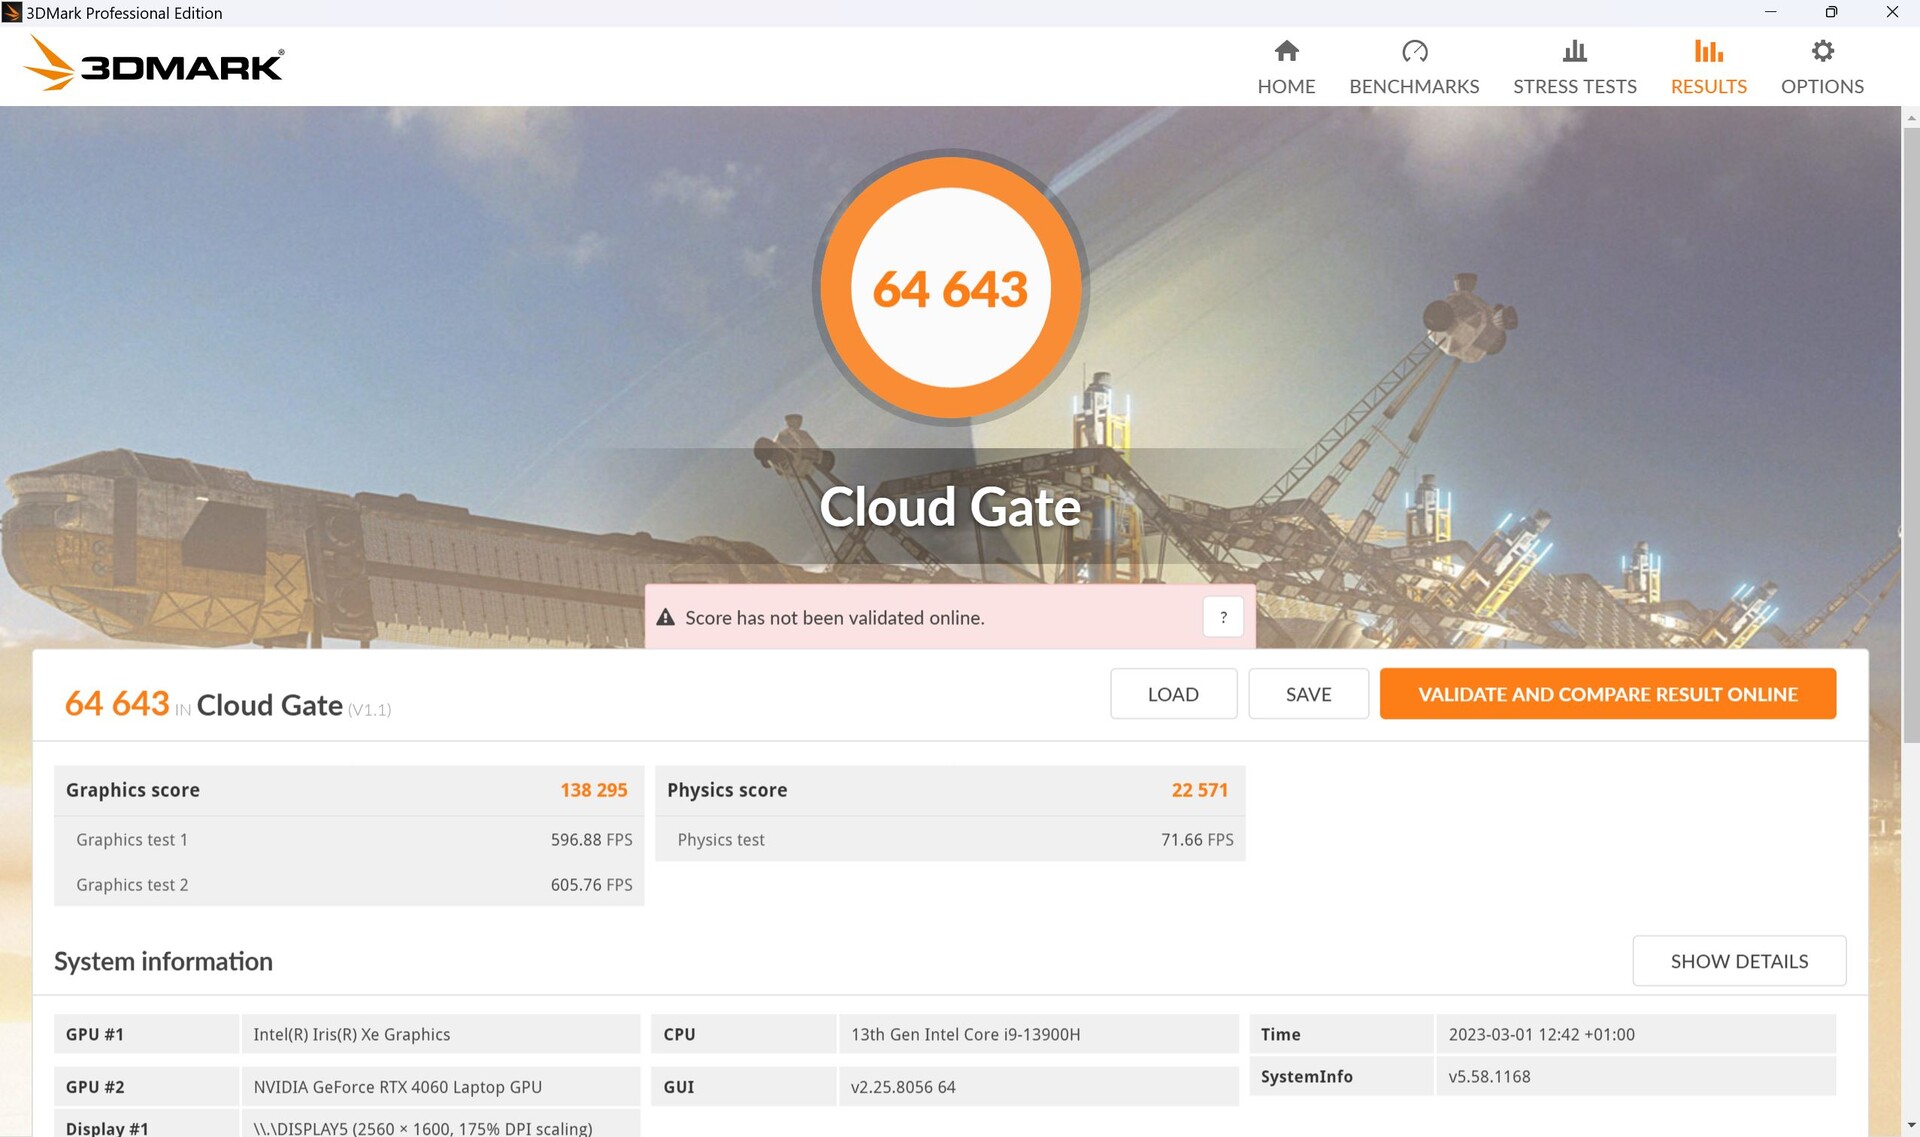
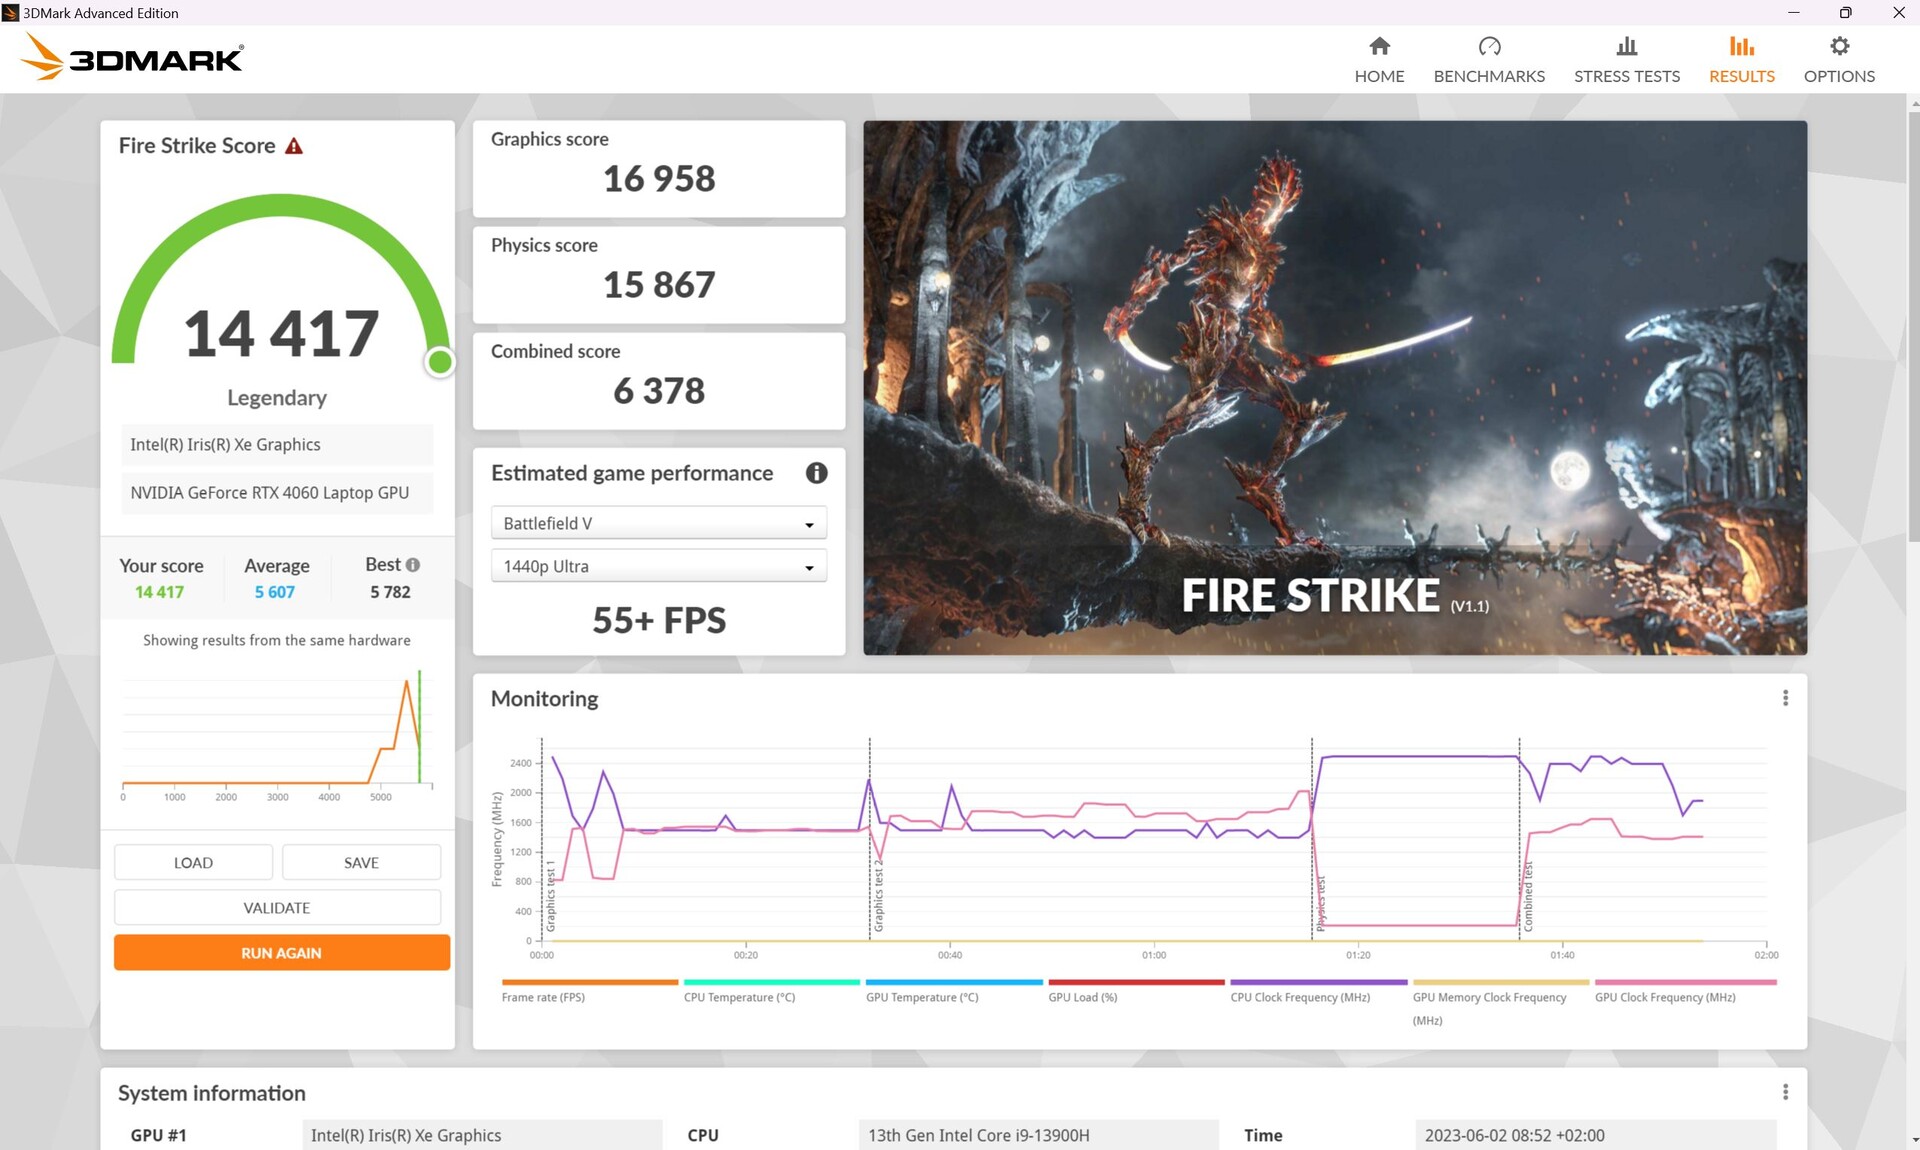
Wenn wir die Ergebnisse zwischen den Modi Turbo und Leistung vergleichen, so fällt auf, dass vor allem die Grafikleistung steigt, die CPU- und Physikleistung jedoch eher sinkt (s. Cloud Gate o. Fire Strike).

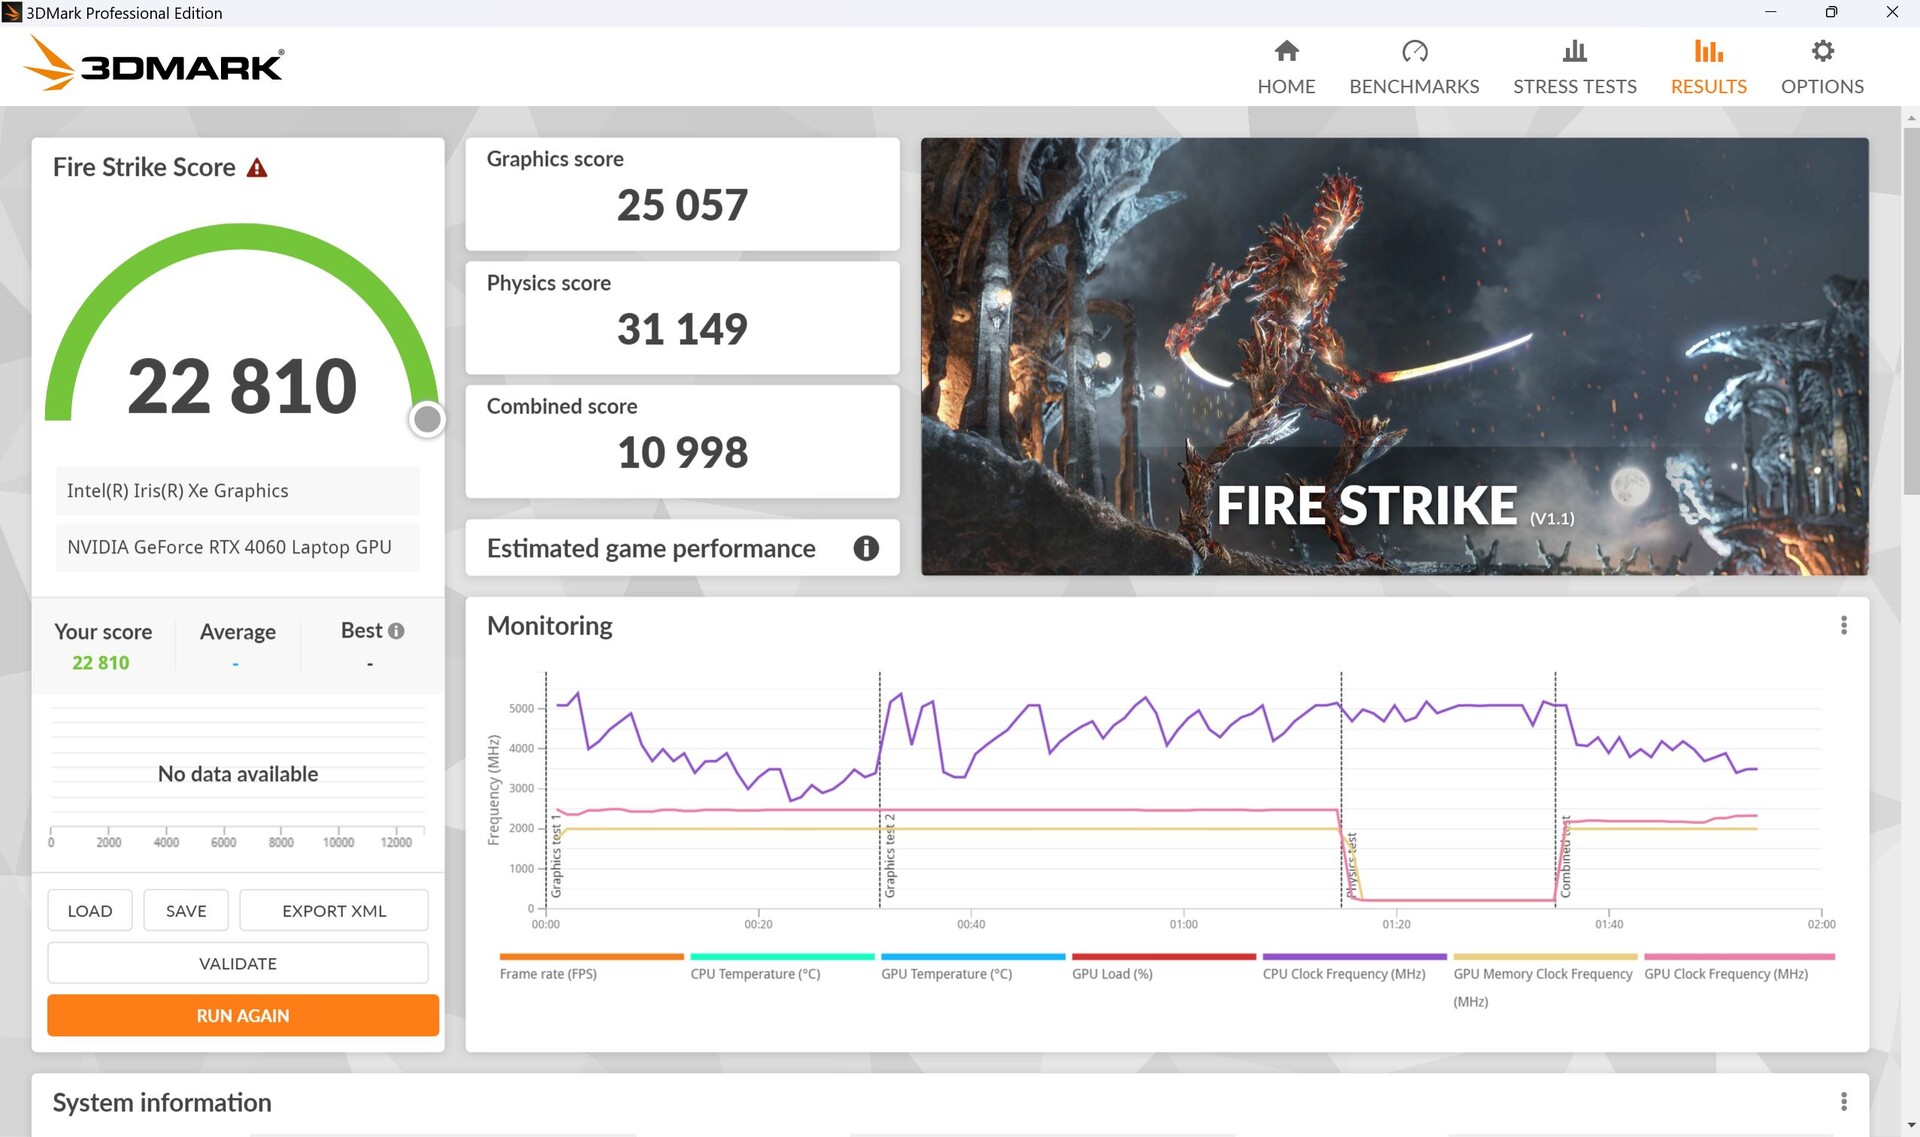
Abseits der Steckdose verringert sich die Grafikleistung. Im Modus Leistung geht der Grafikscore in Fire Strike um ca. 17 Prozent zurück, im Modus Leise um ganze 42 Prozent.

| 3DMark 11 Performance | 31662 Punkte | |
| 3DMark Cloud Gate Standard Score | 62454 Punkte | |
| 3DMark Fire Strike Score | 24131 Punkte | |
| 3DMark Time Spy Score | 10794 Punkte | |
Hilfe | ||
* ... kleinere Werte sind besser
| Premiere Pro PugetBench - Overall Score 0.9 | |
| MSI Stealth 17 Studio A13VH-014 | |
| Asus ROG Flow X16 GV601V | |
| Asus Zephyrus Duo 16 GX650PY-NM006W | |
| MSI Titan GT77 HX 13VI | |
| Apple MacBook Pro 14 2023 M2 Pro | |
| Asus ROG Zephyrus G14 GA402XY | |
Gaming Performance
In Full-HD ist quasi jedes getestete Spiel in maximalen Details flüssig spielbar. Selbst für QHD gibt es noch genügend Ressourcen, alleine in sehr anspruchsvollen Titeln wie The Last of Us kann es hier knapp werden.
Im Vergleich liegt unser Flow X16 auf einem Niveau mit dem Katana 17, dessen RTX 4060 aber nur eine TGP von maximal 105 W hat. Andererseits trennen es auch nur 5 Prozent zum Legion 5, dessen RTX 4060 eine TGP von 140 W hat. Hier zeigt sich wiederum, dass die GPU aktuell kaum von höheren TGPs profitiert, wie auch unser Kollege in seiner Analyse der neuen Nvidia Geforce RTX 4000-Karten darlegt. Den Vorgänger mit RTX 3070 Ti kann es um ganze 21 Prozent schlagen.
| The Witcher 3 - 1920x1080 Ultra Graphics & Postprocessing (HBAO+) | |
| Durchschnitt der Klasse Gaming (95 - 240, n=7, der letzten 2 Jahre) | |
| Lenovo Legion Pro 5 16IRX8 | |
| Asus ROG Flow X16 GV601V | |
| MSI Katana 17 B13VFK | |
| Asus ROG Flow X16 GV601RW-M5082W | |
| Samsung Galaxy Book3 Ultra 16, i9-13900H RTX 4070 | |
| Lenovo Yoga Pro 7 14IRH G8 | |
| Strange Brigade - 1920x1080 ultra AA:ultra AF:16 | |
| Durchschnitt der Klasse Gaming (76.3 - 456, n=88, der letzten 2 Jahre) | |
| Asus ROG Flow X16 GV601V | |
| MSI Katana 17 B13VFK | |
| Asus ROG Flow X16 GV601RW-M5082W | |
| Samsung Galaxy Book3 Ultra 16, i9-13900H RTX 4070 | |
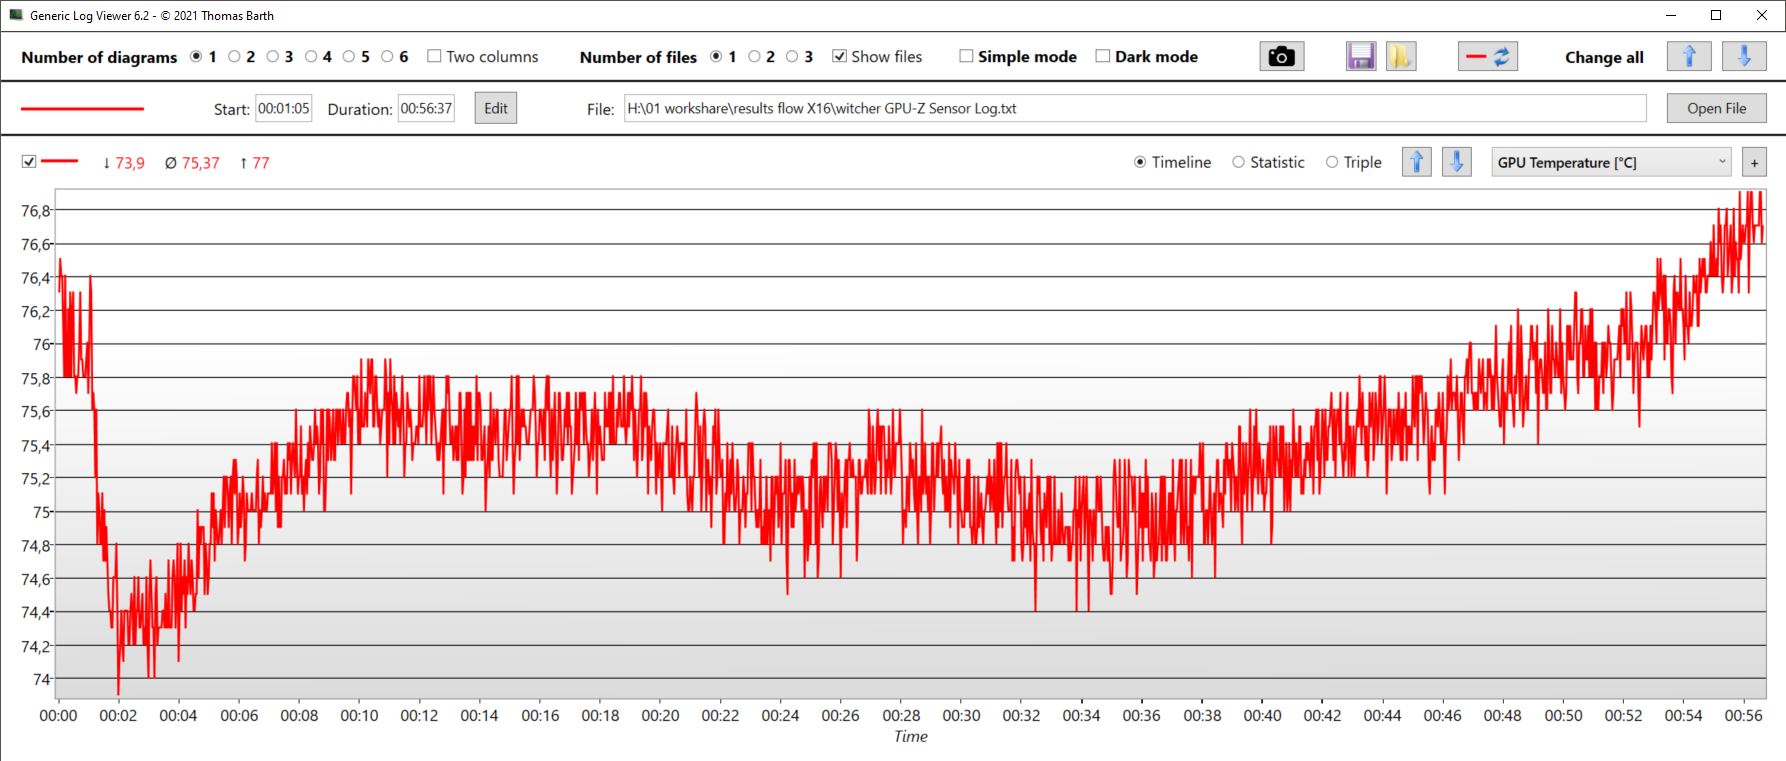
Die Witcher-3-Framerate weist den üblichen Tag/Nachtverlauf auf, ist ansonsten aber sehr stabil. Laut GPU-Z-Log liegt die Kerntaktrate nahezu konstant bei 2.460 MHz, auch der Speichertakt ist konstant (2 GHz).
Die GPU-Temperatur schwankt etwas mehr, liegt im Schnitt bei 75 °C, steigt zum Ende der Stunde hin aber kontinuierlich nach oben hin an, bei einem längeren Betrieb könnte daher doch noch der Takt gedrosselt werden.
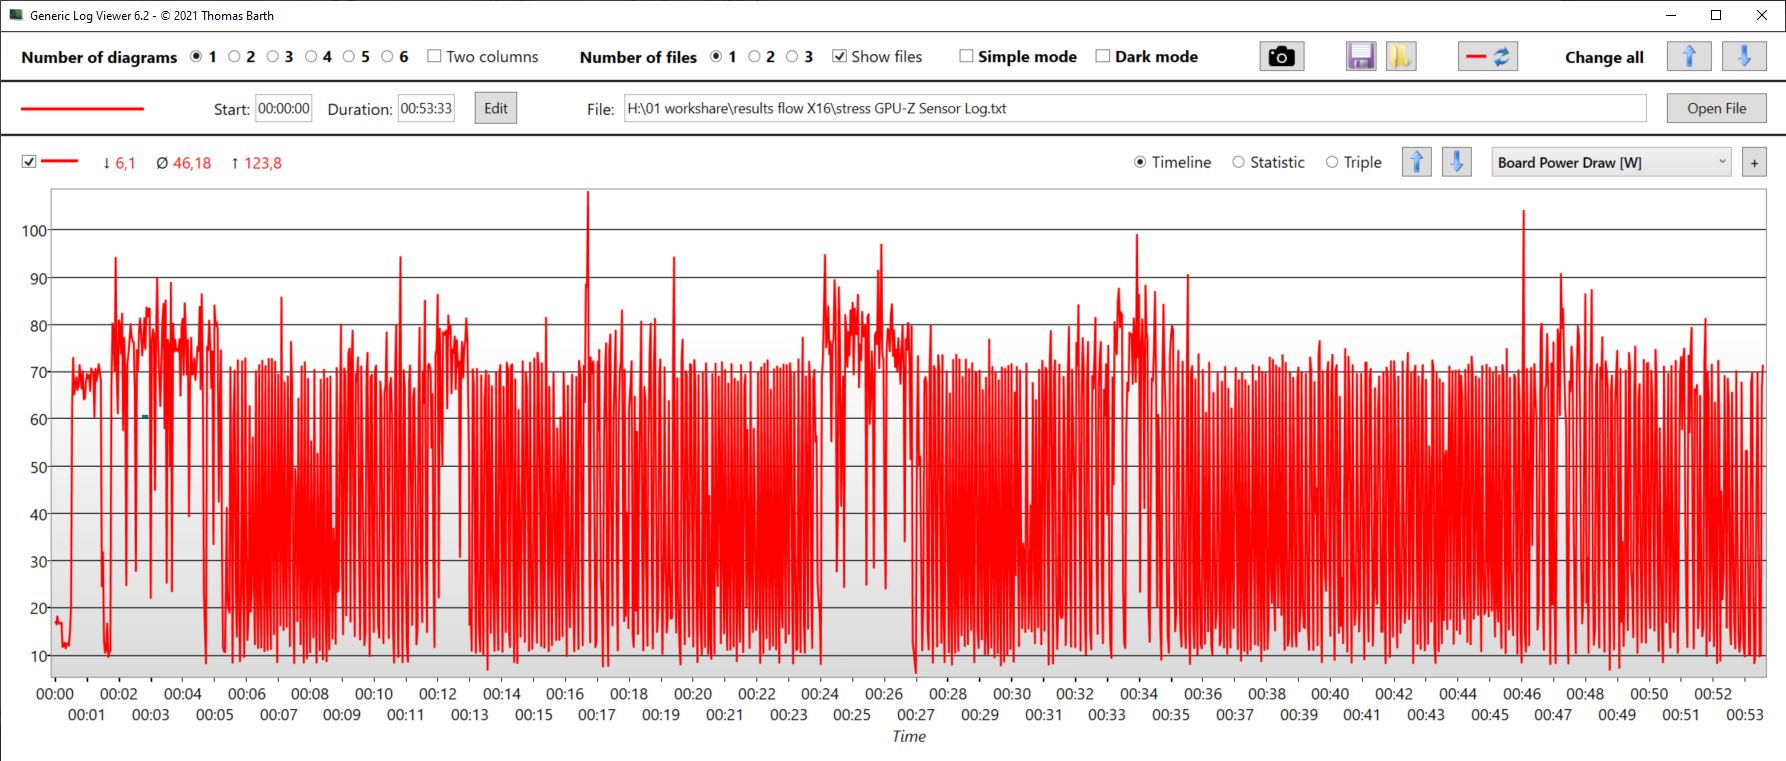
Die Karte zieht dabei im Schnitt nur 92,5 W, extremst kurzzeitige Spitzen von 110 W sind erkennbar, die möglichen 120 W werden jedoch niemals erreicht.
Das Galaxy Book3 hat auch mit RTX 4070 keine Chance gegen unser X16, welches leistungstechnisch sogar an das Legion 5 heran reicht.
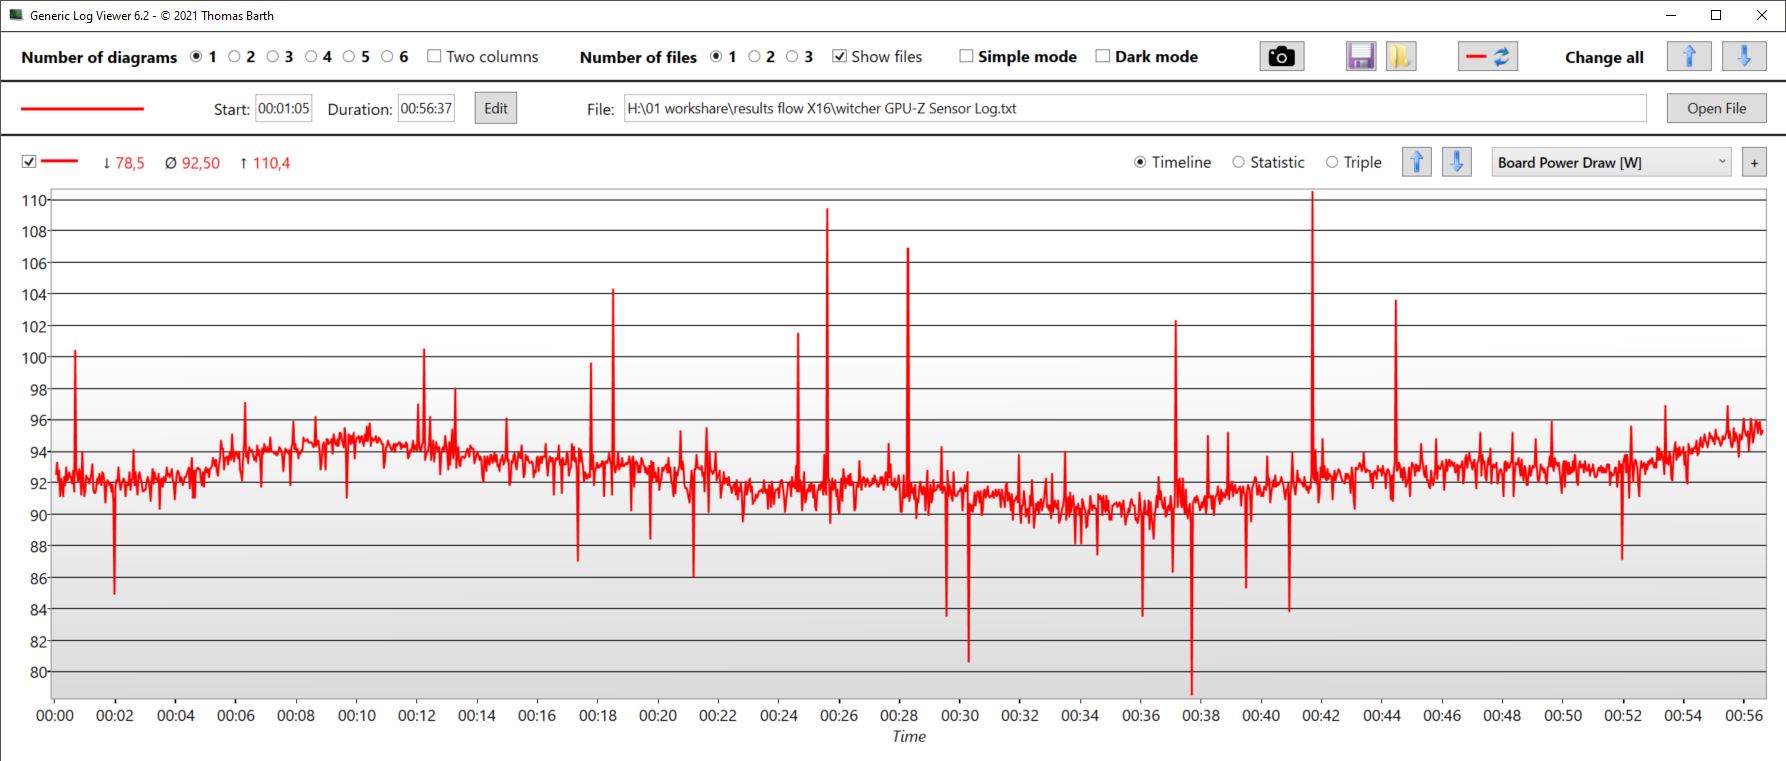
Witcher 3 FPS-Diagramm
| min. | mittel | hoch | max. | QHD | 4K | |
|---|---|---|---|---|---|---|
| GTA V (2015) | 184.4 | 179.8 | 173.9 | 110.3 | 79.4 | |
| The Witcher 3 (2015) | 214.8 | 106.5 | ||||
| Dota 2 Reborn (2015) | 188.3 | 166 | 162.8 | 149.2 | 115.5 | |
| Final Fantasy XV Benchmark (2018) | 100.8 | |||||
| X-Plane 11.11 (2018) | 174 | 145.4 | 116.4 | 105.6 | ||
| Far Cry 5 (2018) | 140 | 130 | 99 | |||
| Strange Brigade (2018) | 419 | 266 | 225 | 192.5 | 129.2 | |
| Shadow of the Tomb Raider (2018) | 150 | 137 | 93 | |||
| Assassin´s Creed Valhalla (2020) | 114 | 98 | 71 | |||
| Far Cry 6 (2021) | 120 | 108 | 79 | |||
| Cyberpunk 2077 1.6 (2022) | 84.25 | 76.64 | 48.71 | |||
| F1 22 (2022) | 257 | 218 | 183.9 | 64.8 | 42.3 | |
| Call of Duty Modern Warfare 2 2022 (2022) | 91 | 86 | 61 | |||
| Hogwarts Legacy (2023) | 106.9 | 91.9 | 42.8 | |||
| The Last of Us (2023) | 71.2 | 53.1 | 32.7 |
Emissionen - Flow X16 kann auch leise
Geräuschemissionen
Im Idle bleiben die Lüfter meistens still. Unter Last hängt die Lautstärke ganz klar vom gewählten Leistungsmodus ab. Beispielsweise touren die Lüfter beim Gaming im Modus Turbo auf über 50 dB hoch, während sie im Modus Leistung bei deutlich erträglicheren 44 dB laufen. Alleine dieser doch recht große Unterschied sollte den geringen Leistungsverlust im Modus Leistung verschmerzbar machen. Im Modus Leise sinkt die Lautstärke dann gar auf nur noch rund 37 dB.
Im Modus Turbo laufen die Lüfter nach anspruchsvollen Lasten wie Gaming noch lange nach, wenn auch nicht mehr mit voller Geschwindigkeit. Dennoch bleibt das X16 auch im Idle dann noch minutenlang laut, wenn zuvor gespielt wurde.
Gerade für Content Creators empfiehlt sich daher eher der Modus Leistung (oder gar Leise), da dieser bei verschmerzbar geringem Leistungsverlust doch deutlich ruhiger zu Werke geht.
Im Idle stören immer wieder Windows- oder auch Asus-Hintergrundprozesse leise Lüfter. Gerade im Turbomodus laufen dann schnell die Lüfter an.
| Modus/Witcher 3 Ultra | FPS | Lautstärke in dB | Durchschnittsverbrauch in W |
|---|---|---|---|
| Turbo | 102 | 50.92 | 142 |
| Leistung | 92 | 44 | |
| Leise | 80 | 37.53 | 106 |
Lautstärkediagramm
| Idle |
| 24 / 24 / 24 dB(A) |
| Last |
| 36.71 / 50.92 dB(A) |
 | ||
30 dB leise 40 dB(A) deutlich hörbar 50 dB(A) störend |
||
min: | ||
| Asus ROG Flow X16 GV601V GeForce RTX 4060 Laptop GPU, i9-13900H, WD PC SN560 SDDPNQE-1T00 | Asus ROG Flow X16 GV601RW-M5082W GeForce RTX 3070 Ti Laptop GPU, R9 6900HS, Micron 3400 1TB MTFDKBA1T0TFH | Samsung Galaxy Book3 Ultra 16, i9-13900H RTX 4070 GeForce RTX 4070 Laptop GPU, i9-13900H, Samsung PM9A1 MZVL21T0HCLR | Lenovo Legion Pro 5 16IRX8 GeForce RTX 4060 Laptop GPU, i7-13700HX, SK hynix PC801 HFS512GEJ9X115N | Lenovo Yoga Pro 7 14IRH G8 GeForce RTX 4050 Laptop GPU, i7-13700H, Samsung PM9A1 MZVL21T0HCLR | MSI Katana 17 B13VFK GeForce RTX 4060 Laptop GPU, i7-13620H, Micron 2400 MTFDKBA1T0QFM | |
|---|---|---|---|---|---|---|
| Geräuschentwicklung | -13% | -9% | 1% | -6% | -19% | |
| aus / Umgebung * (dB) | 24 | 25.5 -6% | 25.2 -5% | 23 4% | 22.9 5% | 24.5 -2% |
| Idle min * (dB) | 24 | 25.5 -6% | 25.2 -5% | 23.1 4% | 22.9 5% | 24.5 -2% |
| Idle avg * (dB) | 24 | 25.5 -6% | 25.2 -5% | 23.1 4% | 22.9 5% | 24.5 -2% |
| Idle max * (dB) | 24 | 27.4 -14% | 31.3 -30% | 26.6 -11% | 36.8 -53% | 40 -67% |
| Last avg * (dB) | 36.71 | 49.9 -36% | 38.8 -6% | 34.7 5% | 43.7 -19% | 48.3 -32% |
| Witcher 3 ultra * (dB) | 50.92 | 47.6 7% | 46.2 9% | 56 -10% | ||
| Last max * (dB) | 50.92 | 55 -8% | 51.2 -1% | 54.8 -8% | 46.2 9% | 59.1 -16% |
* ... kleinere Werte sind besser
Temperatur
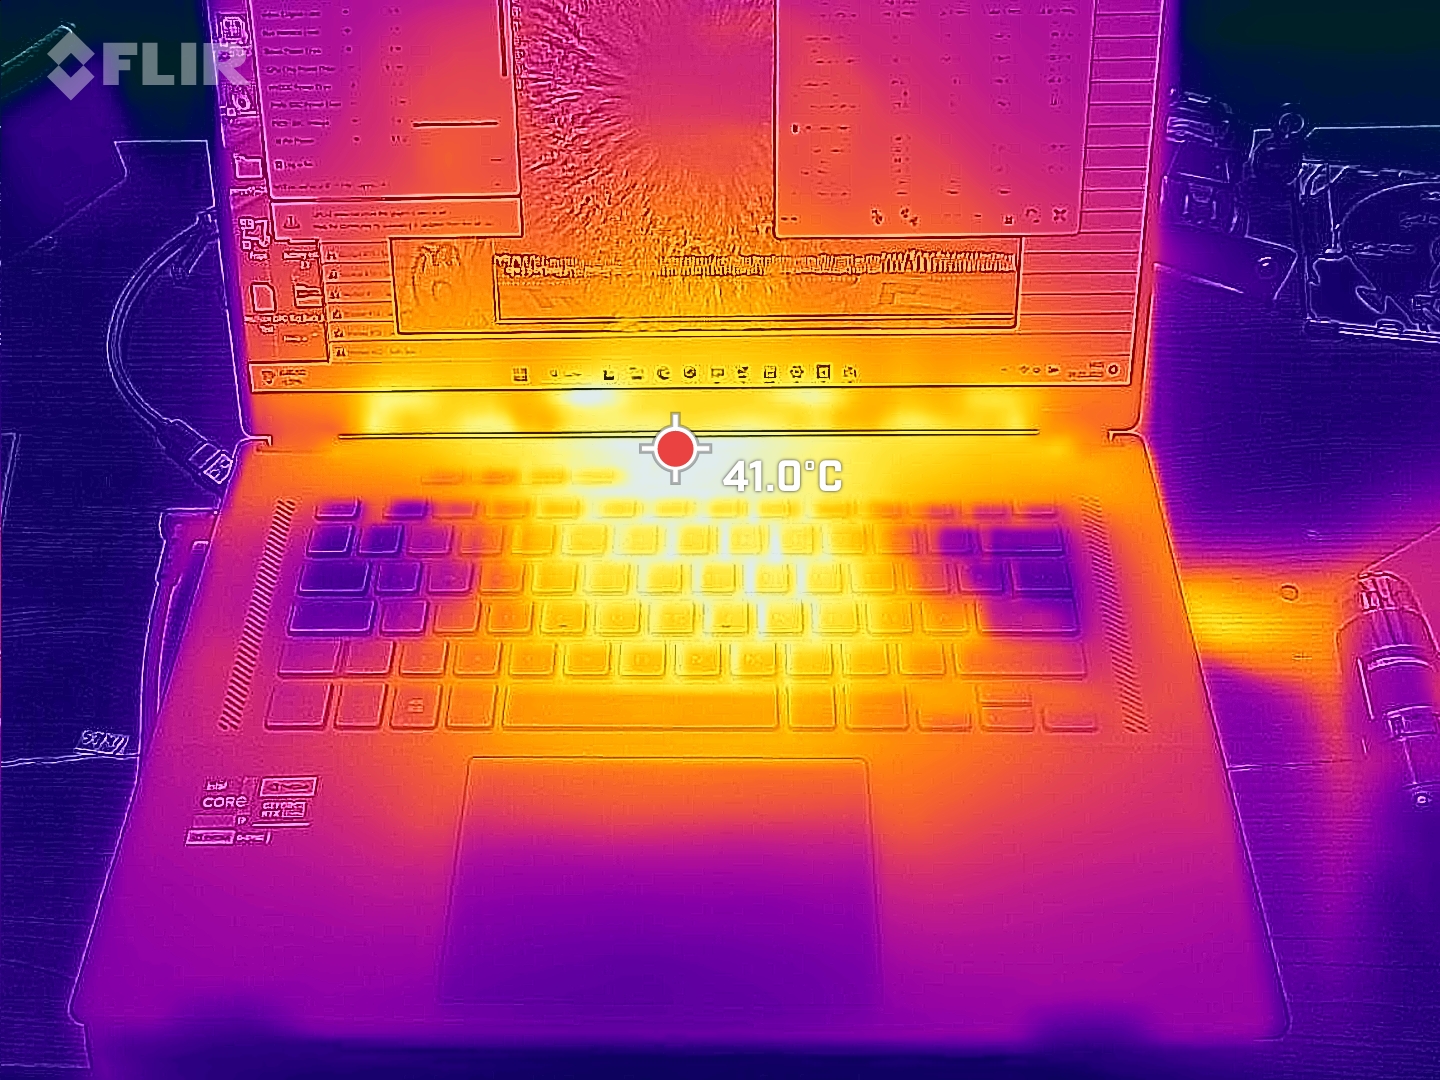
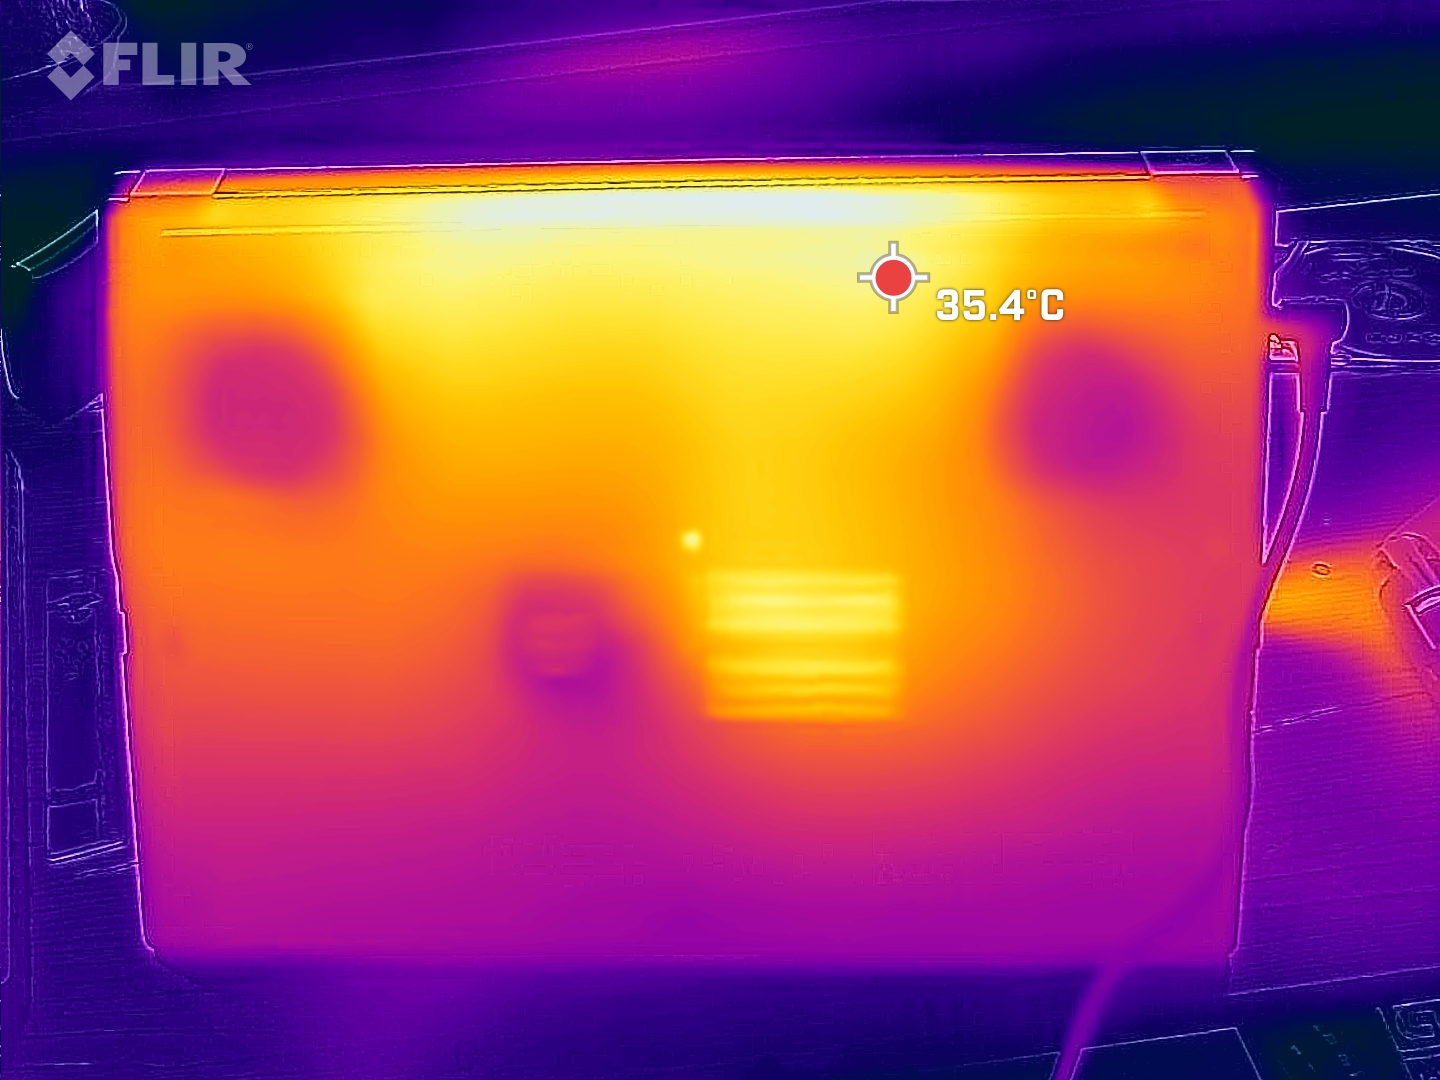
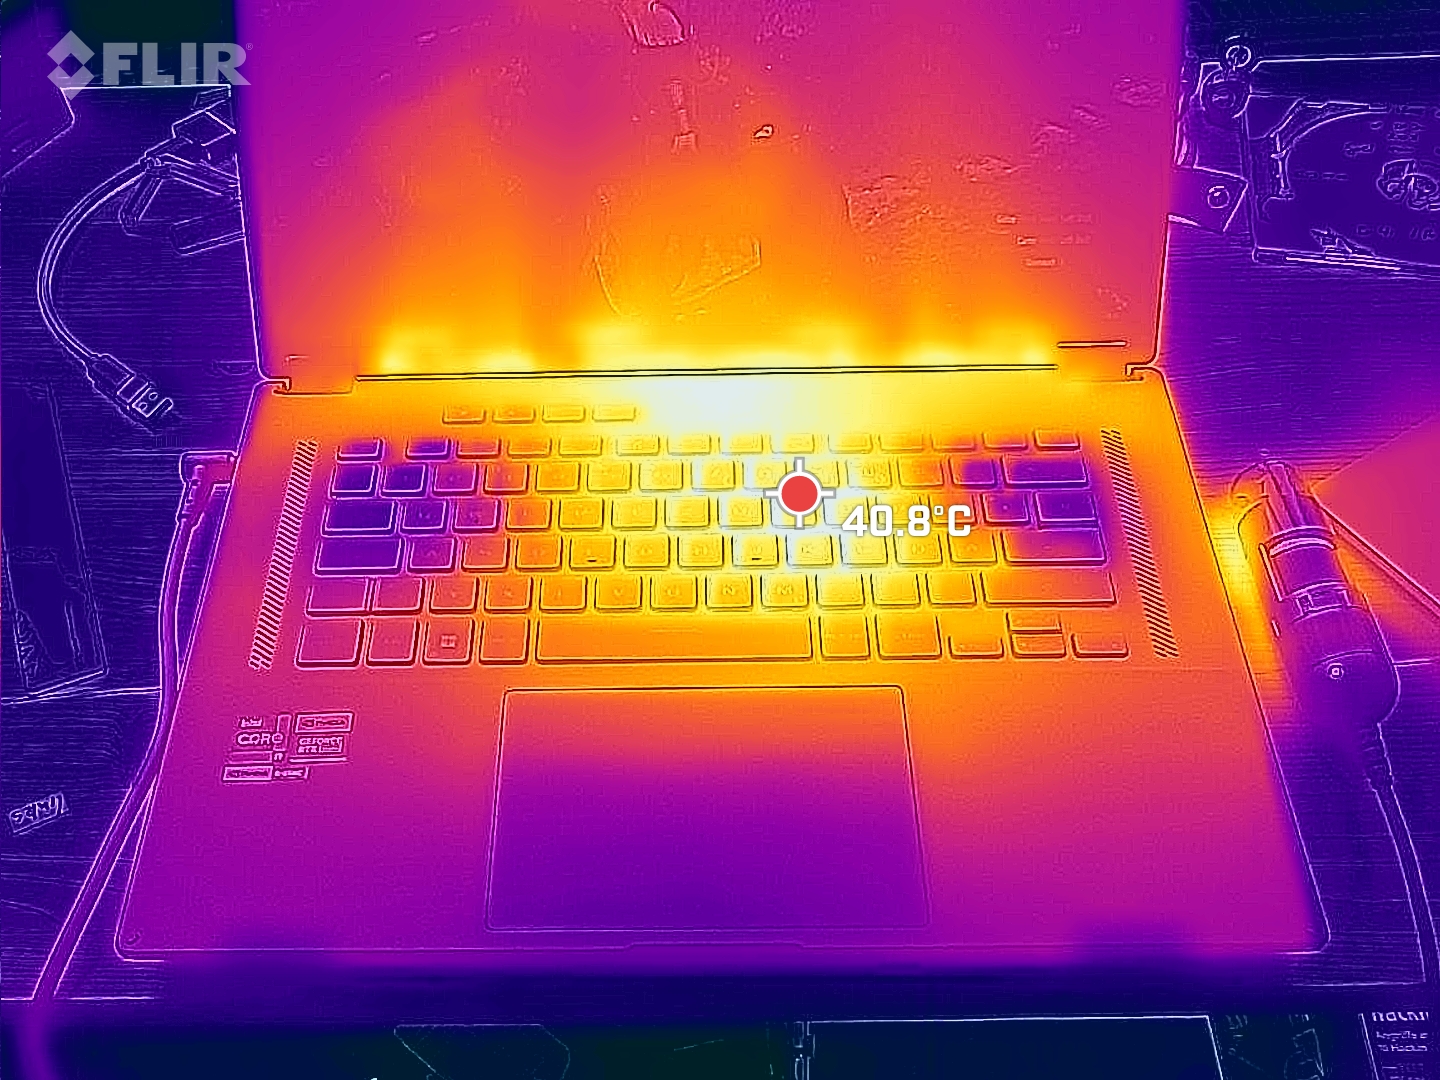
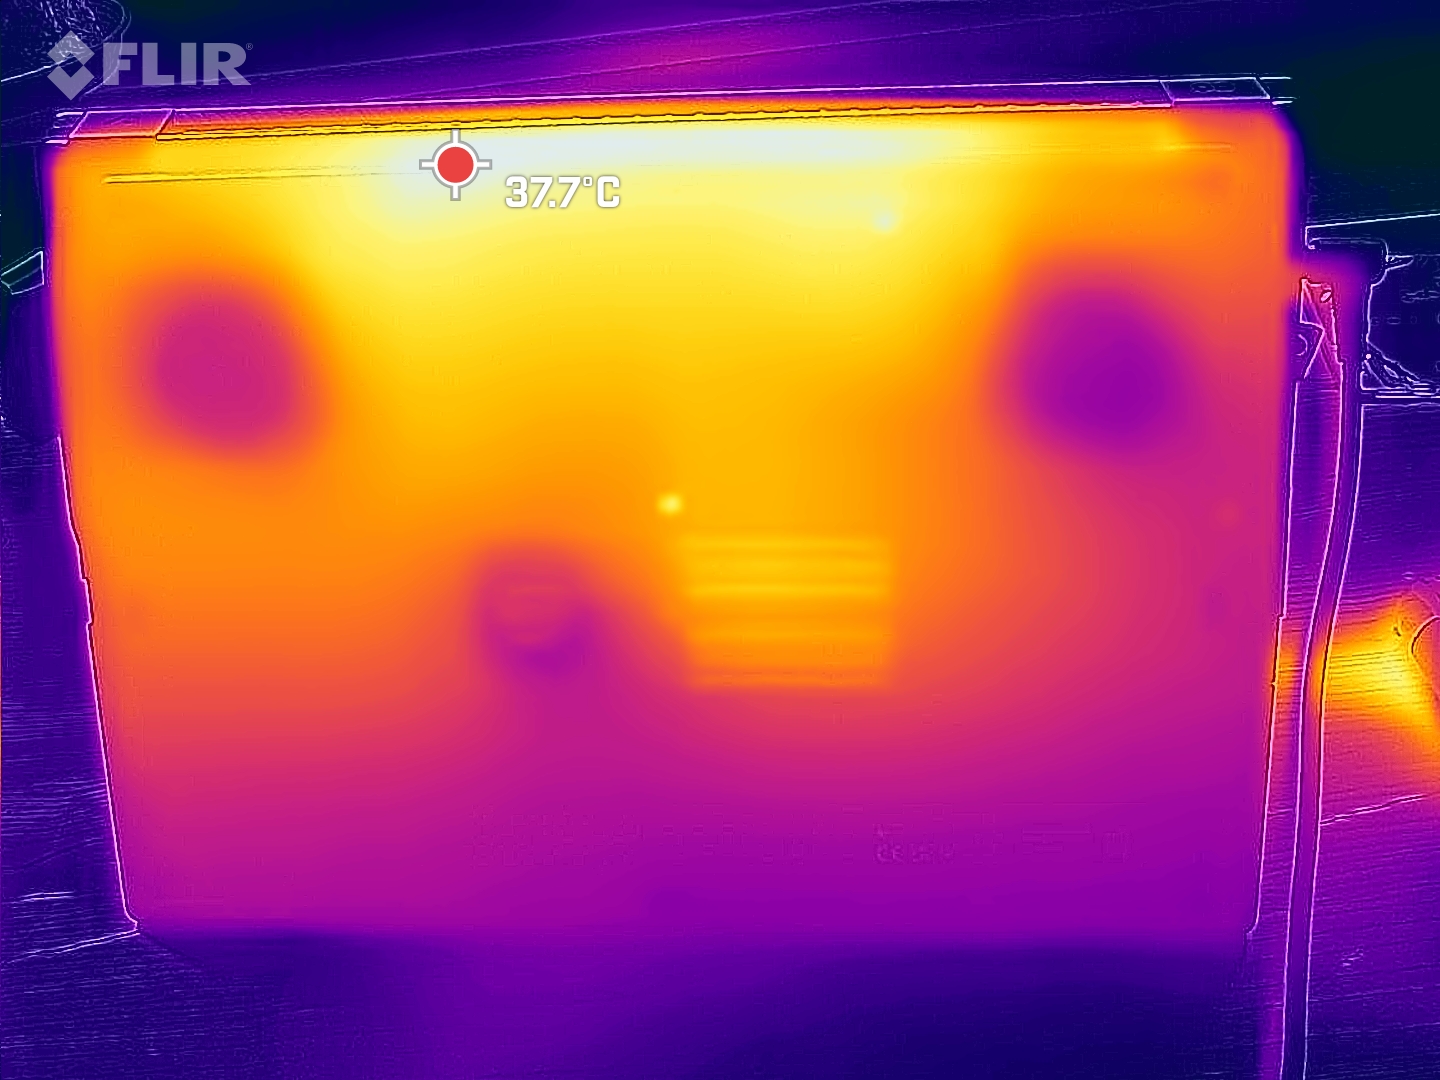
Beim Gaming gibt es Hot Spots von um die 50 °C, die vor allem an der Oberseite zentral und nach hinten liegen, Handballenauflagen und WASD-Tasten bleiben aber vergleichsweise kühl. An der Unterseite wird es weniger warm.
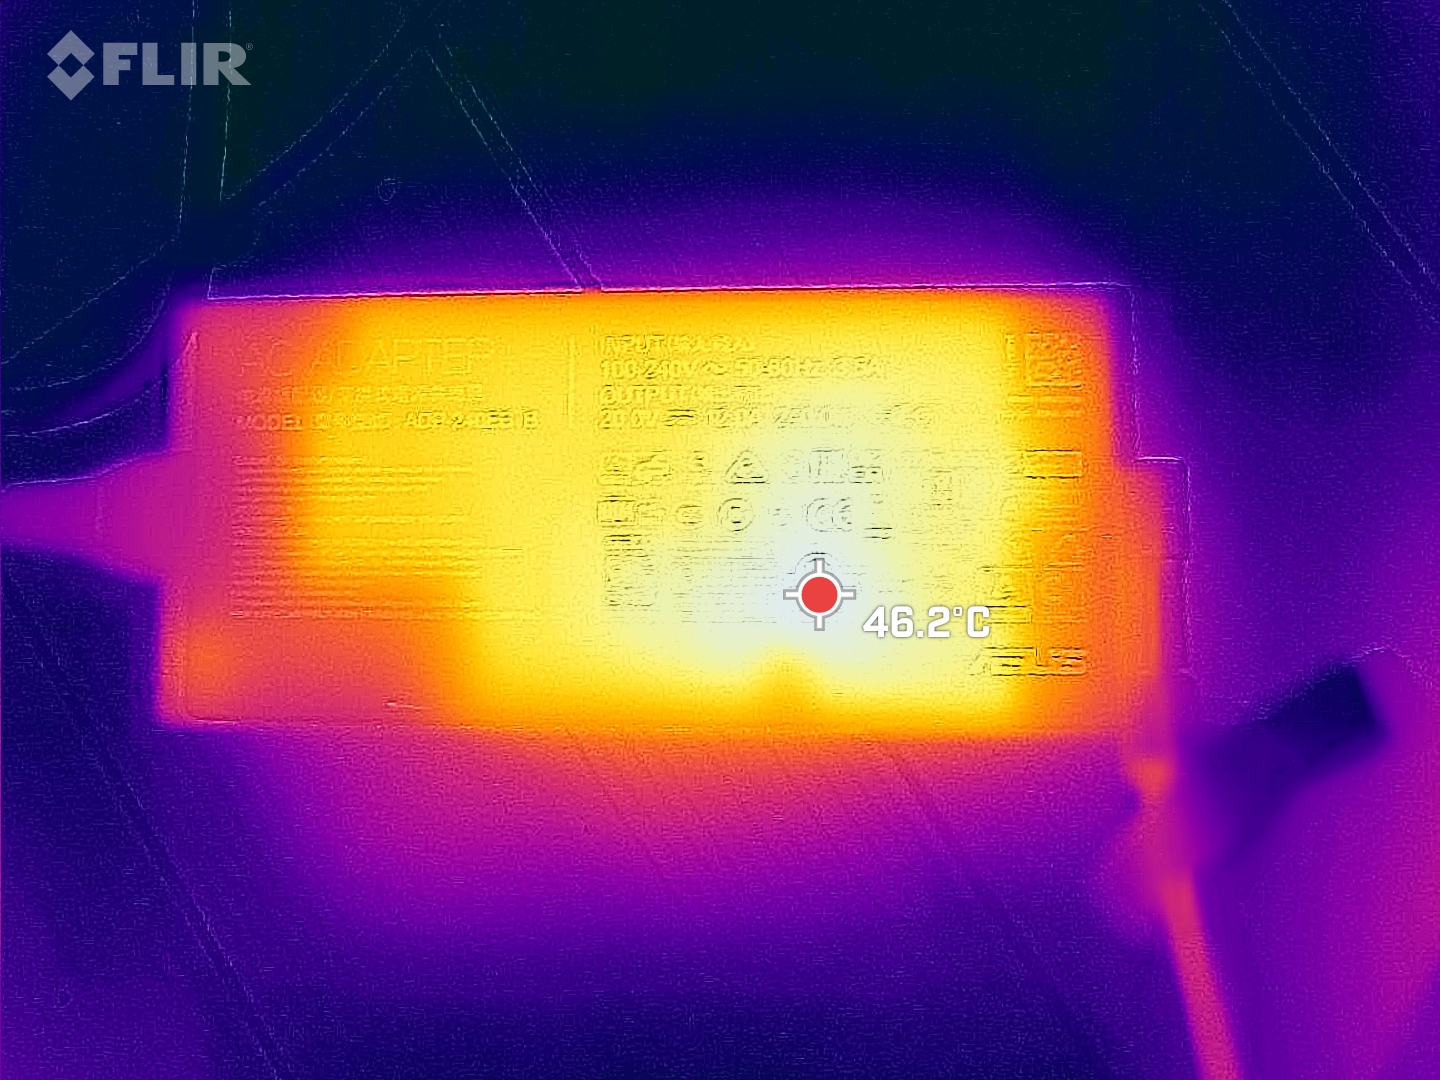
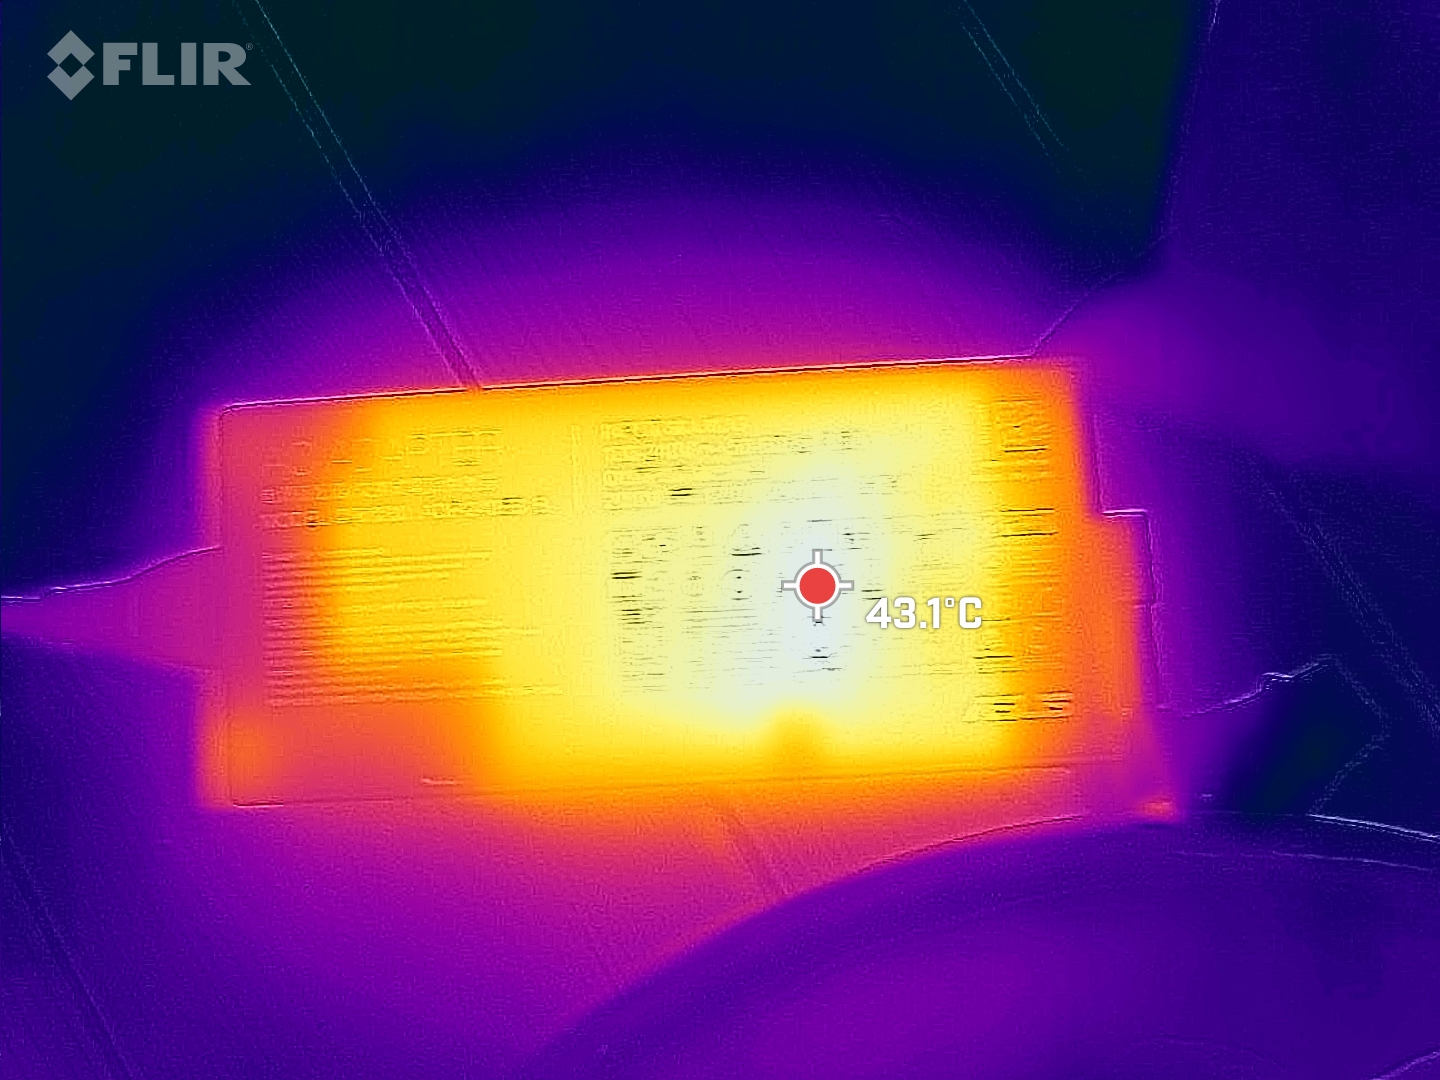
Allerdings kann das Netzteil schon im Idle recht heiß werden. Nur wegen ein paar Hintergrundprozessen erhitzte sich das flache Netzteil bereits im Idle auf 45 °C!
(-) Die maximale Temperatur auf der Oberseite ist 46 °C. Im Vergleich liegt der Klassendurchschnitt bei 40.4 °C (von 21.2 bis 68.8 °C für die Klasse Gaming).
(±) Auf der Unterseite messen wir eine maximalen Wert von 41 °C (im Vergleich zum Durchschnitt von 43.2 °C).
(+) Ohne Last messen wir eine durchschnittliche Temperatur von 31.9 °C auf der Oberseite. Der Klassendurchschnitt erreicht 33.9 °C.
(±) Beim längeren Spielen von The Witcher 3 erhitzt sich das Gerät durchschnittlich auf 37.4 °C. Der Durchschnitt der Klasse ist derzeit 33.9 °C.
(+) Die Handballen und der Touchpad-Bereich sind mit gemessenen 31 °C kühler als die typische Hauttemperatur und fühlen sich dadurch kühl an.
(-) Die durchschnittliche Handballen-Temperatur anderer getesteter Geräte war 28.8 °C (-2.2 °C).
| Asus ROG Flow X16 GV601V Intel Core i9-13900H, NVIDIA GeForce RTX 4060 Laptop GPU | Asus ROG Flow X16 GV601RW-M5082W AMD Ryzen 9 6900HS, NVIDIA GeForce RTX 3070 Ti Laptop GPU | Samsung Galaxy Book3 Ultra 16, i9-13900H RTX 4070 Intel Core i9-13900H, NVIDIA GeForce RTX 4070 Laptop GPU | Lenovo Legion Pro 5 16IRX8 Intel Core i7-13700HX, NVIDIA GeForce RTX 4060 Laptop GPU | Lenovo Yoga Pro 7 14IRH G8 Intel Core i7-13700H, NVIDIA GeForce RTX 4050 Laptop GPU | MSI Katana 17 B13VFK Intel Core i7-13620H, NVIDIA GeForce RTX 4060 Laptop GPU | |
|---|---|---|---|---|---|---|
| Hitze | -13% | -4% | 0% | 4% | 2% | |
| Last oben max * (°C) | 46 | 55.1 -20% | 45.9 -0% | 42.8 7% | 41.6 10% | 41.6 10% |
| Last unten max * (°C) | 41 | 50.3 -23% | 50.9 -24% | 50 -22% | 55.7 -36% | 43.1 -5% |
| Idle oben max * (°C) | 36 | 35.5 1% | 31.6 12% | 29.6 18% | 25.9 28% | 32 11% |
| Idle unten max * (°C) | 33 | 36.1 -9% | 34.2 -4% | 34 -3% | 28 15% | 35.8 -8% |
* ... kleinere Werte sind besser
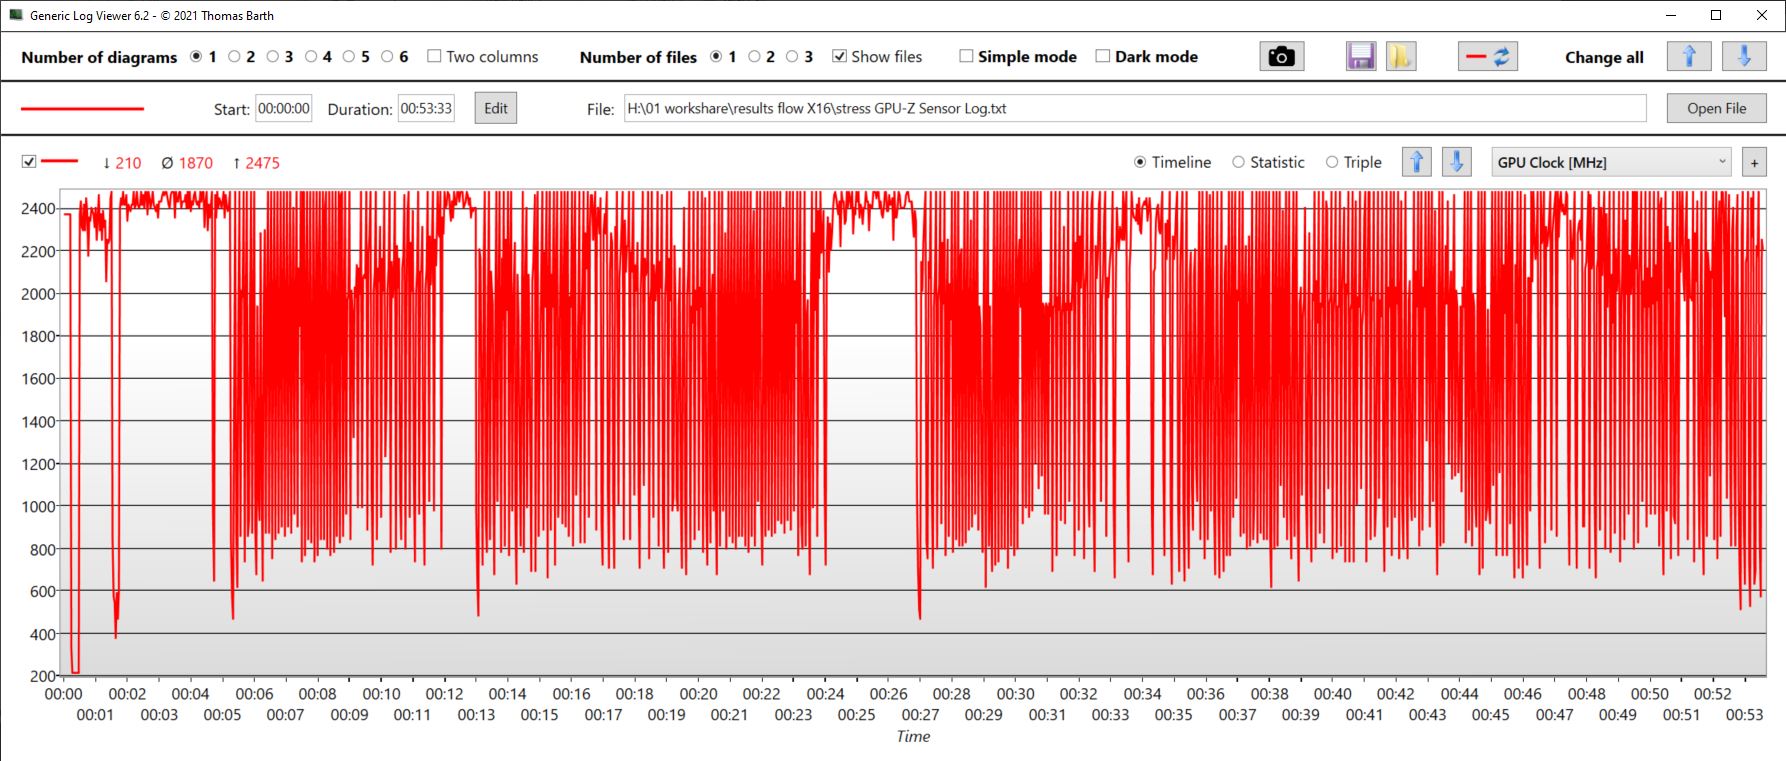
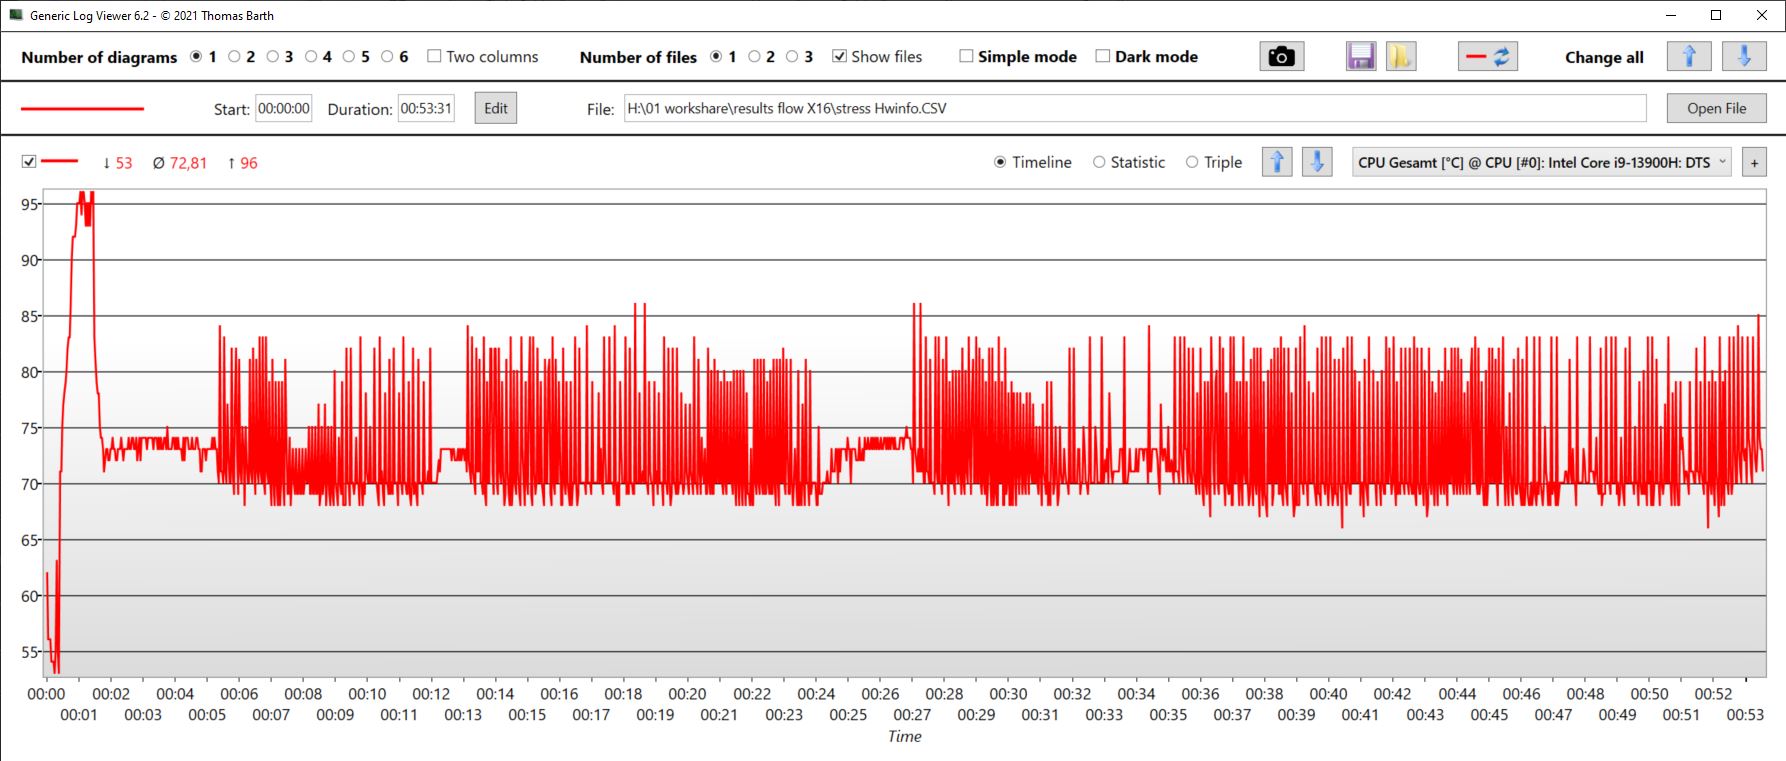
Stresstest
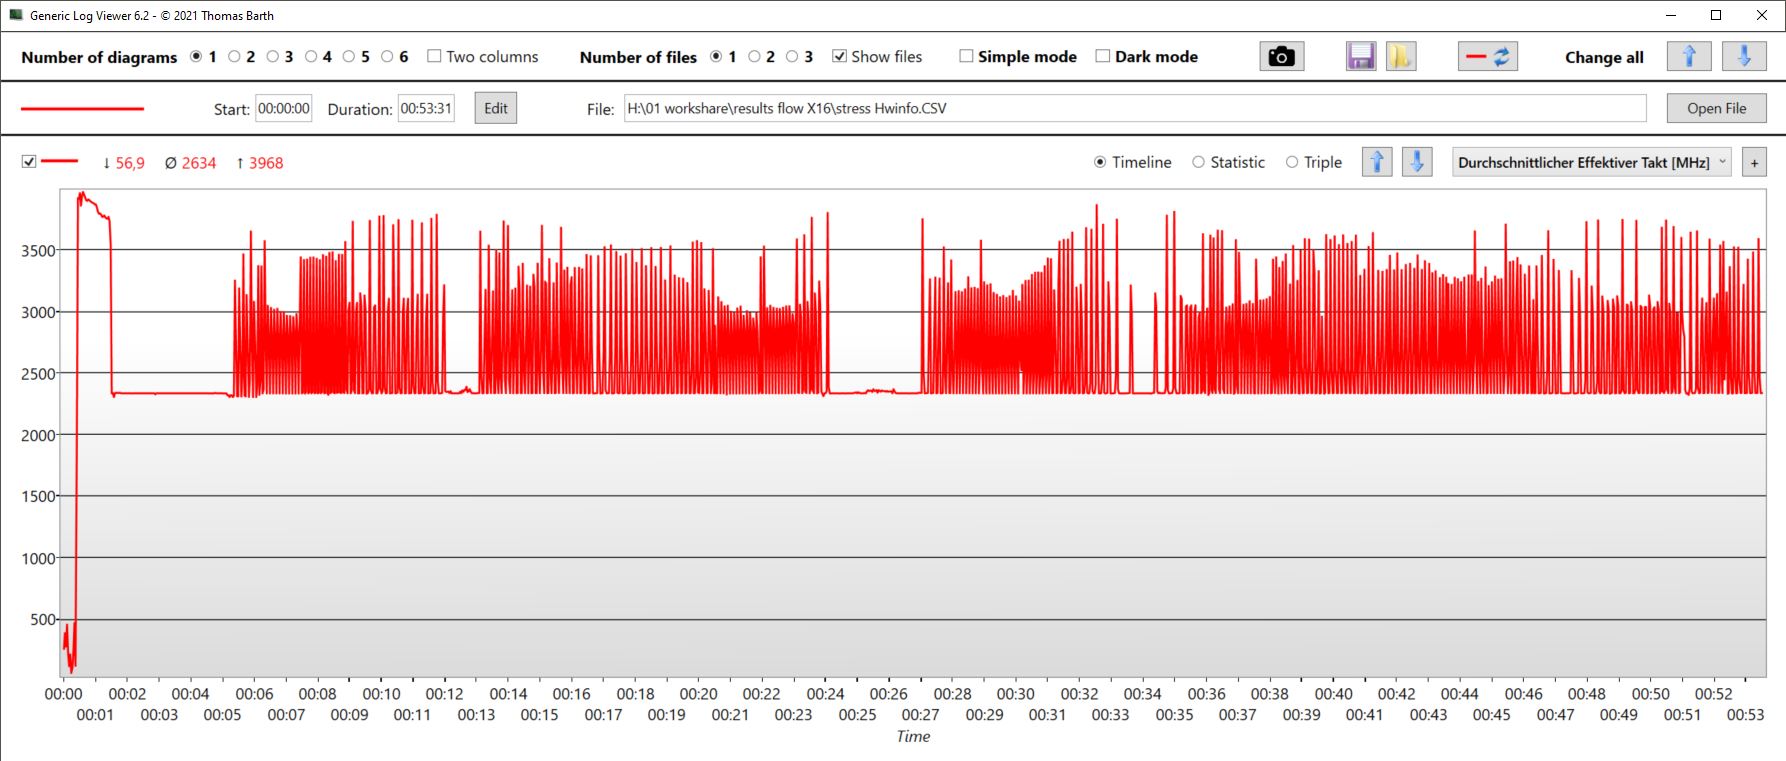
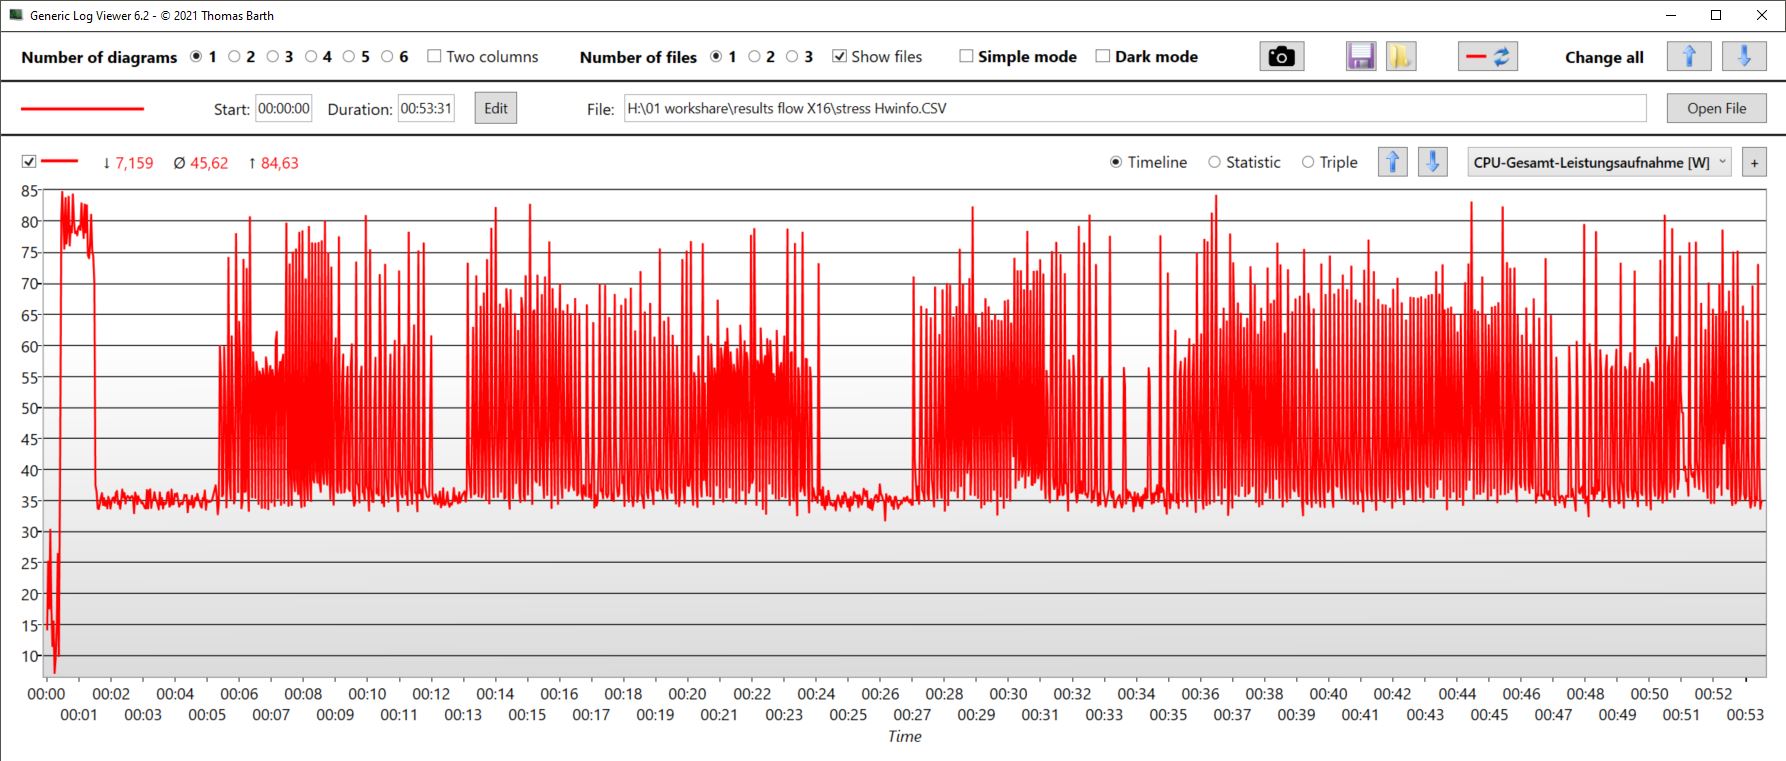
Zu Beginn boosten die Kerne im Verbund auf annähernd 4 GHz hoch, die CPU genehmigt sich an die 85 W. In etwa einer Minute erreichen die Kerntemperaturen jedoch 96 °C, woraufhin die Leistung deutlich gedrosselt wird. Die Kerntaktraten werden für mehrere Minuten auf 2,4 GHz gesenkt, die TDP beträgt nur noch 35 W. Dadurch sinkt auch die Temperatur wieder ab. Nach einigen Minuten wird der Takt wieder angehoben, er fluktuiert jetzt stärker, liegt im Mittel bei etwa 2,6 GHz. Immer wieder aber gibt es dieses Phänomen, dass die TDP minutenlang auf 35 W abgesenkt wird, dazwischen darf sie dann wieder fluktuieren. Da die Temperatur ähnlich schnell absinkt, ist sie nicht der alleinige Grund für dieses Verhalten.
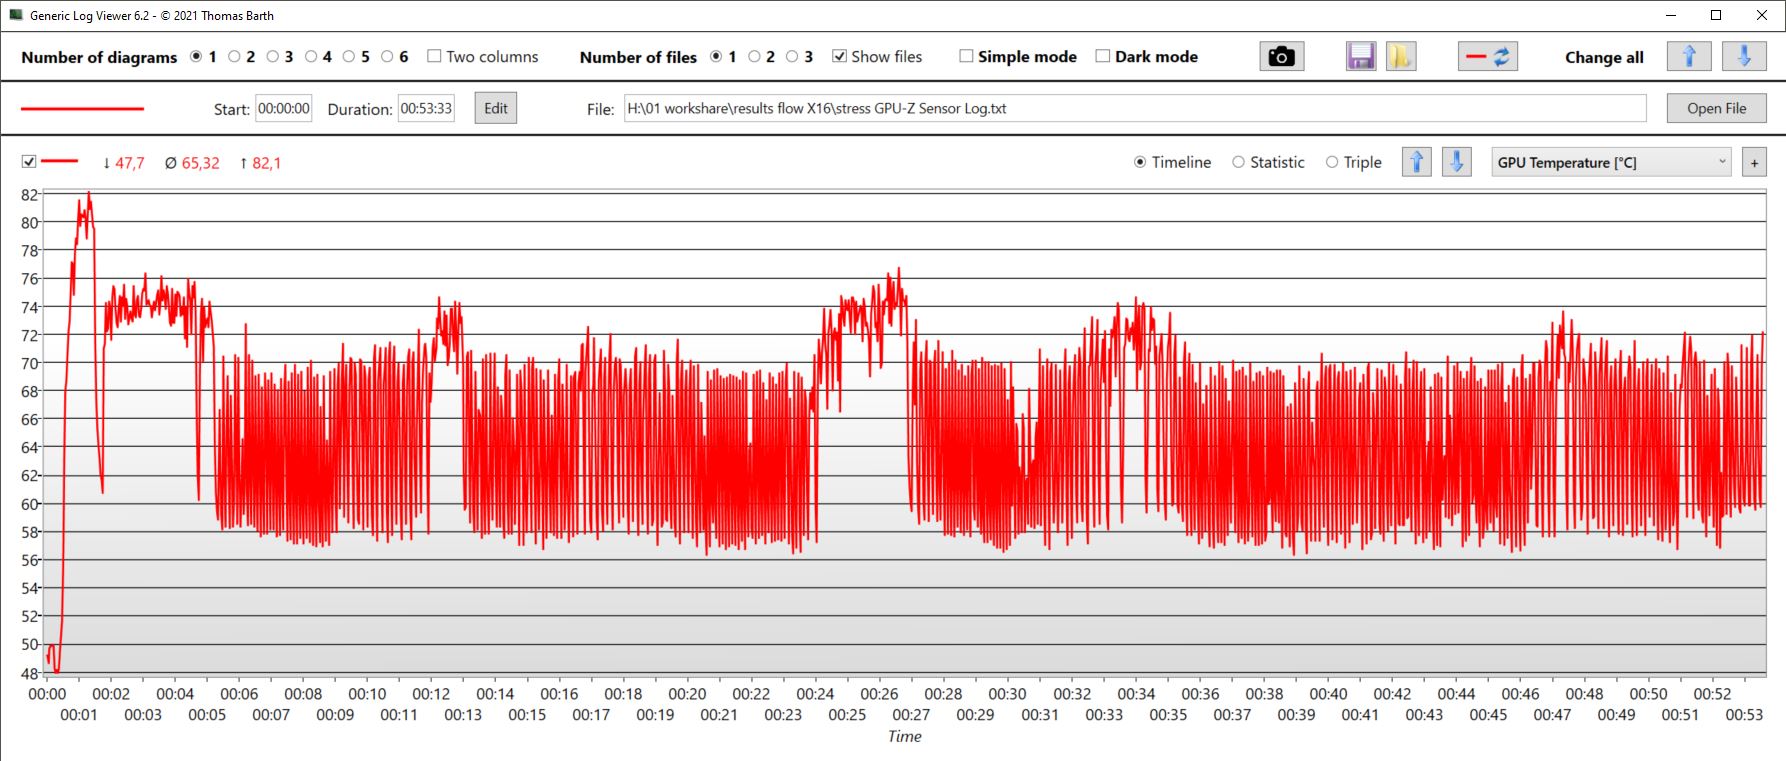
Ähnlich, jedoch in abgeschwächter Form, zeigt sich auch bei der GPU. Die relativ konstanten Phasen sind hier jedoch deutlich kürzer, insgesamt schwanken die Werte viel stärker. So sackt die Taktrate wiederholt oszillierend von 2,4 GHz auf nur noch 500 MHz und weniger ab, auch der Speichertakt weist ähnlich starke Fluktuationen auf. Die Temperatur liegt im Mittel bei 65 °C und steigt maximal auf 82 °C. Die Leistungsaufnahme liegt bei durchschnittlich 46 W, steigt aber sprunghaft auch immer wieder auf 90 W oder über 100 W.
| CPU Clock (GHz) | GPU Clock (MHz) | Average CPU Temperature (°C) | Average GPU Temperature (°C) | |
| Prime95 + FurMark Stress | 2,6 | 1.870 | 73 | 65 |
| Witcher 3 Stress | 505 | 2.460 | 67,6 | 75 |
Lautsprecher
Die Lautsprecher bieten ausgeglichene Mitten und Höhen, der Bass ist natürlich abgesenkt, wenn auch weniger als bei manch anderem Modell. Allerdings könnten die Boxen insgesamt etwas lauter aufspielen.
Für den Anschluss analoger Endgeräte bietet sich die 3,5 mm Headset-Klinke an.
Asus ROG Flow X16 GV601V Audio Analyse
(±) | Mittelmäßig laut spielende Lautsprecher (77.38 dB)
Bass 100 - 315 Hz
(±) | abgesenkter Bass - 9.6% geringer als der Median
(±) | durchschnittlich lineare Bass-Wiedergabe (9.2% Delta zum Vorgänger)
Mitteltöne 400 - 2000 Hz
(+) | ausgeglichene Mitten, vom Median nur 4.7% abweichend
(±) | Linearität der Mitten ist durchschnittlich (7.5% Delta zum Vorgänger)
Hochtöne 2 - 16 kHz
(+) | ausgeglichene Hochtöne, vom Median nur 2.2% abweichend
(+) | sehr lineare Hochtöne (6.1% Delta zum Vorgänger)
Gesamt im hörbaren Bereich 100 - 16.000 Hz
(+) | hörbarer Bereich ist sehr linear (12% Abstand zum Median
Im Vergleich zu allen Geräten derselben Klasse
» 12% aller getesteten Geräte dieser Klasse waren besser, 4% vergleichbar, 84% schlechter
» Das beste Gerät hat einen Delta-Wert von 6%, durchschnittlich ist 18%, das schlechteste Gerät hat 132%
Im Vergleich zu allen Geräten im Test
» 9% aller getesteten Geräte waren besser, 2% vergleichbar, 88% schlechter
» Das beste Gerät hat einen Delta-Wert von 4%, durchschnittlich ist 23%, das schlechteste Gerät hat 134%
Lenovo Legion Pro 5 16IRX8 Audio Analyse
(±) | Mittelmäßig laut spielende Lautsprecher (72.7 dB)
Bass 100 - 315 Hz
(-) | kaum Bass - 23.7% niedriger als der Median
(±) | durchschnittlich lineare Bass-Wiedergabe (10.7% Delta zum Vorgänger)
Mitteltöne 400 - 2000 Hz
(+) | ausgeglichene Mitten, vom Median nur 3.8% abweichend
(±) | Linearität der Mitten ist durchschnittlich (7.1% Delta zum Vorgänger)
Hochtöne 2 - 16 kHz
(+) | ausgeglichene Hochtöne, vom Median nur 3.7% abweichend
(+) | sehr lineare Hochtöne (6.7% Delta zum Vorgänger)
Gesamt im hörbaren Bereich 100 - 16.000 Hz
(±) | hörbarer Bereich ist durchschnittlich linear (21.9% Abstand zum Median)
Im Vergleich zu allen Geräten derselben Klasse
» 79% aller getesteten Geräte dieser Klasse waren besser, 6% vergleichbar, 16% schlechter
» Das beste Gerät hat einen Delta-Wert von 6%, durchschnittlich ist 18%, das schlechteste Gerät hat 132%
Im Vergleich zu allen Geräten im Test
» 63% aller getesteten Geräte waren besser, 7% vergleichbar, 30% schlechter
» Das beste Gerät hat einen Delta-Wert von 4%, durchschnittlich ist 23%, das schlechteste Gerät hat 134%
Energieverwaltung - Gut, aber nicht überragend
Energieaufnahme
So sparsam wie das Galaxy Book3 ist unser X16 auch im Idle nicht, auch wegen des hellen Touch-Displays. Dennoch liegen Welten zum Idle-Verbrauch eines Legion 5. Schaut man sich das 17-Zoll-Katana an, so sieht man aber, dass das Flow X16 durchaus noch etwas sparsamer im Idle hätte sein können.
Beim Gaming ist der Verbrauch mit dem des Katana 17 vergleichbar, bei etwas höherer Leistung. Gleichzeitig zieht das Legion 5 wieder deutlich mehr aus der Steckdose. Letzteres gilt auch für den Vorgänger, hier ist das neue Asus spürbar effizienter geworden.
| Aus / Standby | |
| Idle | |
| Last |
|
Legende:
min: | |
| Asus ROG Flow X16 GV601V i9-13900H, GeForce RTX 4060 Laptop GPU, WD PC SN560 SDDPNQE-1T00, IPS, 2560x1600, 16" | Asus ROG Flow X16 GV601RW-M5082W R9 6900HS, GeForce RTX 3070 Ti Laptop GPU, Micron 3400 1TB MTFDKBA1T0TFH, Mini LED, 2560x1600, 16.1" | Samsung Galaxy Book3 Ultra 16, i9-13900H RTX 4070 i9-13900H, GeForce RTX 4070 Laptop GPU, Samsung PM9A1 MZVL21T0HCLR, OLED / AMOLED, 2880x1800, 16" | Lenovo Legion Pro 5 16IRX8 i7-13700HX, GeForce RTX 4060 Laptop GPU, SK hynix PC801 HFS512GEJ9X115N, IPS, 2560x1600, 16" | Lenovo Yoga Pro 7 14IRH G8 i7-13700H, GeForce RTX 4050 Laptop GPU, Samsung PM9A1 MZVL21T0HCLR, IPS, 3072x1920, 14.5" | MSI Katana 17 B13VFK i7-13620H, GeForce RTX 4060 Laptop GPU, Micron 2400 MTFDKBA1T0QFM, IPS LED, 1920x1080, 17.3" | Durchschnittliche NVIDIA GeForce RTX 4060 Laptop GPU | Durchschnitt der Klasse Gaming | |
|---|---|---|---|---|---|---|---|---|
| Stromverbrauch | -48% | 41% | -63% | 23% | 0% | -5% | -24% | |
| Idle min * (Watt) | 9.6 | 12.2 -27% | 4.3 55% | 24.5 -155% | 7.6 21% | 12.2 -27% | 11.5 ? -20% | 13 ? -35% |
| Idle avg * (Watt) | 16 | 25.5 -59% | 4.6 71% | 29.2 -83% | 13.3 17% | 14.9 7% | 16 ? -0% | 18.7 ? -17% |
| Idle max * (Watt) | 16.9 | 29.8 -76% | 11.4 33% | 34.3 -103% | 13.7 19% | 15.8 7% | 20.3 ? -20% | 24.3 ? -44% |
| Last avg * (Watt) | 104 | 183 -76% | 97 7% | 98.7 5% | 88.2 15% | 85.22 18% | 92.9 ? 11% | 108.2 ? -4% |
| Witcher 3 ultra * (Watt) | 142 | 183.6 -29% | 100.9 29% | 178.6 -26% | 94.2 34% | 151.1 -6% | ||
| Last max * (Watt) | 214 | 253 -18% | 107 50% | 249.6 -17% | 143 33% | 212.8 1% | 210 ? 2% | 254 ? -19% |
* ... kleinere Werte sind besser
Energieaufnahme Witcher 3 / Stresstest
Energieaufnahme mit externem Monitor
Akkulaufzeit
Die Akkugröße von 90 Wh übernimmt unser Testmodell vom Vorgänger. Damit ist der Akku des flachen X16 größer als die der normalgroßen Gaming-Mittelklasse wie dem Legion 5.
Lange Laufzeiten sind somit erwartbar. Umso überraschender ist, dass Konkurrenten mit kleinerem Akku, wie das Galaxy Book3 (76 Wh) oder auch das Yoga Pro 7 (73 Wh) im WLAN-Test mindestens genauso lange, wenn nicht länger durchhalten. Hier sollte das X16 noch im Idle-Verbrauch optimiert werden.
Dennoch sind die Laufzeiten insgesamt in Ordnung, nur in Hinsicht auf den größeren Akku hätte man sich zumindest bei anspruchslose Lasten wie Browsen einen deutlichen Vorsprung vor der Konkurrenz erhofft. Zudem sollte man beim Surfen im Akkumodus unbedingt darauf achten, dass der Modus Lautlos eingeschaltet ist und nicht Leistung.
| Asus ROG Flow X16 GV601V i9-13900H, GeForce RTX 4060 Laptop GPU, 90 Wh | Asus ROG Flow X16 GV601RW-M5082W R9 6900HS, GeForce RTX 3070 Ti Laptop GPU, 90 Wh | Samsung Galaxy Book3 Ultra 16, i9-13900H RTX 4070 i9-13900H, GeForce RTX 4070 Laptop GPU, 76 Wh | Lenovo Legion Pro 5 16IRX8 i7-13700HX, GeForce RTX 4060 Laptop GPU, 80 Wh | Lenovo Yoga Pro 7 14IRH G8 i7-13700H, GeForce RTX 4050 Laptop GPU, 73 Wh | MSI Katana 17 B13VFK i7-13620H, GeForce RTX 4060 Laptop GPU, 53.5 Wh | Durchschnitt der Klasse Gaming | |
|---|---|---|---|---|---|---|---|
| Akkulaufzeit | -34% | -13% | -55% | 6% | -48% | -3% | |
| H.264 (h) | 8.9 | 9 1% | 12.4 39% | 8.9 ? 0% | |||
| WLAN (h) | 7.9 | 5.7 -28% | 8 1% | 3.4 -57% | 9.9 25% | 2.9 -63% | 7 ? -11% |
| Last (h) | 1.5 | 0.9 -40% | 0.9 -40% | 0.7 -53% | 0.8 -47% | 1 -33% | 1.51 ? 1% |
| Witcher 3 ultra (h) | 0.9 | ||||||
| Idle (h) | 6.7 | 8.71 ? |
Pro
Contra
Fazit - Tolles, sehr vielseitiges Gerät

Das Asus ROG Flow X16 ist vor allem eines - vielseitig! Es ist ein flaches, mobiles Arbeitsgerät, es ist Convertible, Tablet, leistungsstarke Workstation und auch noch Gaming-PC. Das noch Überraschendere dabei: Es macht alle diese Dinge wirklich gut und leistet sich kaum grobe Schnitzer, ist alles andere als ein fauler Kompromiss.
Denn trotz der kompakten Abmaße und der Convertible-Funktion ist die Hardware quasi nicht gedrosselt und liegt leistungstechnisch, zumindest im Turbomodus, sogar über dem Durchschnitt. Dann wird es allerdings etwas laut - aber eben auch nicht lauter als die reine Gaming-Konkurrenz. Allerdings laufen die Lüfter auch nach dem Beenden großer Last dann noch sehr lange nach.
Wir ändern die Produktkategorie in "Gaming", da hier die Wertung um 2,4 Prozentpunkte höher ist als in der Kategorie "Convertible".
Das Asus ROG Flow X16 ist ein extrem vielseitiges und leistungsstarkes Gaming-Workstation-Convertible mit einem guten Touch-Display.
Derart vielseitige Alternativen sind bislang rar gesät. Asus selbst scheint da aktuell schon recht experimentierfreudig zu sein, Interessierte könnten sich auch das eingangs erwähnte Asus ROG Flow Z13, ein Gaming-Tablet, mal näher anschauen. Ähnlich gut, aber trotz stärkerer GPU eher langsamer, ist das Samsung Galaxy Book3 Ultra 16 (89%). Auch das etwas schwächer ausgestattete Lenovo Yoga Pro 7 14 G8 ist einen Blick wert (90%).
Preis und Verfügbarkeit
Aktuell bekommt man unsere Konfiguration des Flow X16 mit RTX 4060 ab ca. 2.500 Euro (Caseking). Die Preise variieren allerdings stark, bei Amazon zahlt man zum Zeitpunkt der Testveröffentlichung rund 3.000 Euro.
Asus ROG Flow X16 GV601V
- 08.06.2023 v7 (old)
Christian Hintze
Transparenz
Die Auswahl der zu testenden Geräte erfolgt innerhalb der Redaktion. Das vorliegende Testmuster wurde dem Autor vom Hersteller oder einem Shop zu Testzwecken leihweise zur Verfügung gestellt. Eine Einflussnahme des Leihstellers auf den Testbericht gab es nicht, der Hersteller erhielt keine Version des Reviews vor der Veröffentlichung. Es bestand keine Verpflichtung zur Publikation. Als eigenständiges, unabhängiges Unternehmen unterliegt Notebookcheck keiner Diktion von Herstellern, Shops und Verlagen.
So testet Notebookcheck
Pro Jahr werden von Notebookcheck hunderte Laptops und Smartphones unabhängig in von uns standardisierten technischen Verfahren getestet, um eine Vergleichbarkeit aller Testergebnisse zu gewährleisten. Seit rund 20 Jahren entwickeln wir diese Testmethoden kontinuierlich weiter und setzen damit Branchenstandards. In unseren Testlaboren kommt ausschließlich hochwertiges Messequipment in die Hände erfahrener Techniker und Redakteure. Die Tests unterliegen einer mehrstufigen Kontrolle. Unsere komplexe Gesamtbewertung basiert auf hunderten fundierten Messergebnissen und Benchmarks, womit Ihnen Objektivität garantiert ist. Weitere Informationen zu unseren Testmethoden gibt es hier.
Preisvergleich
