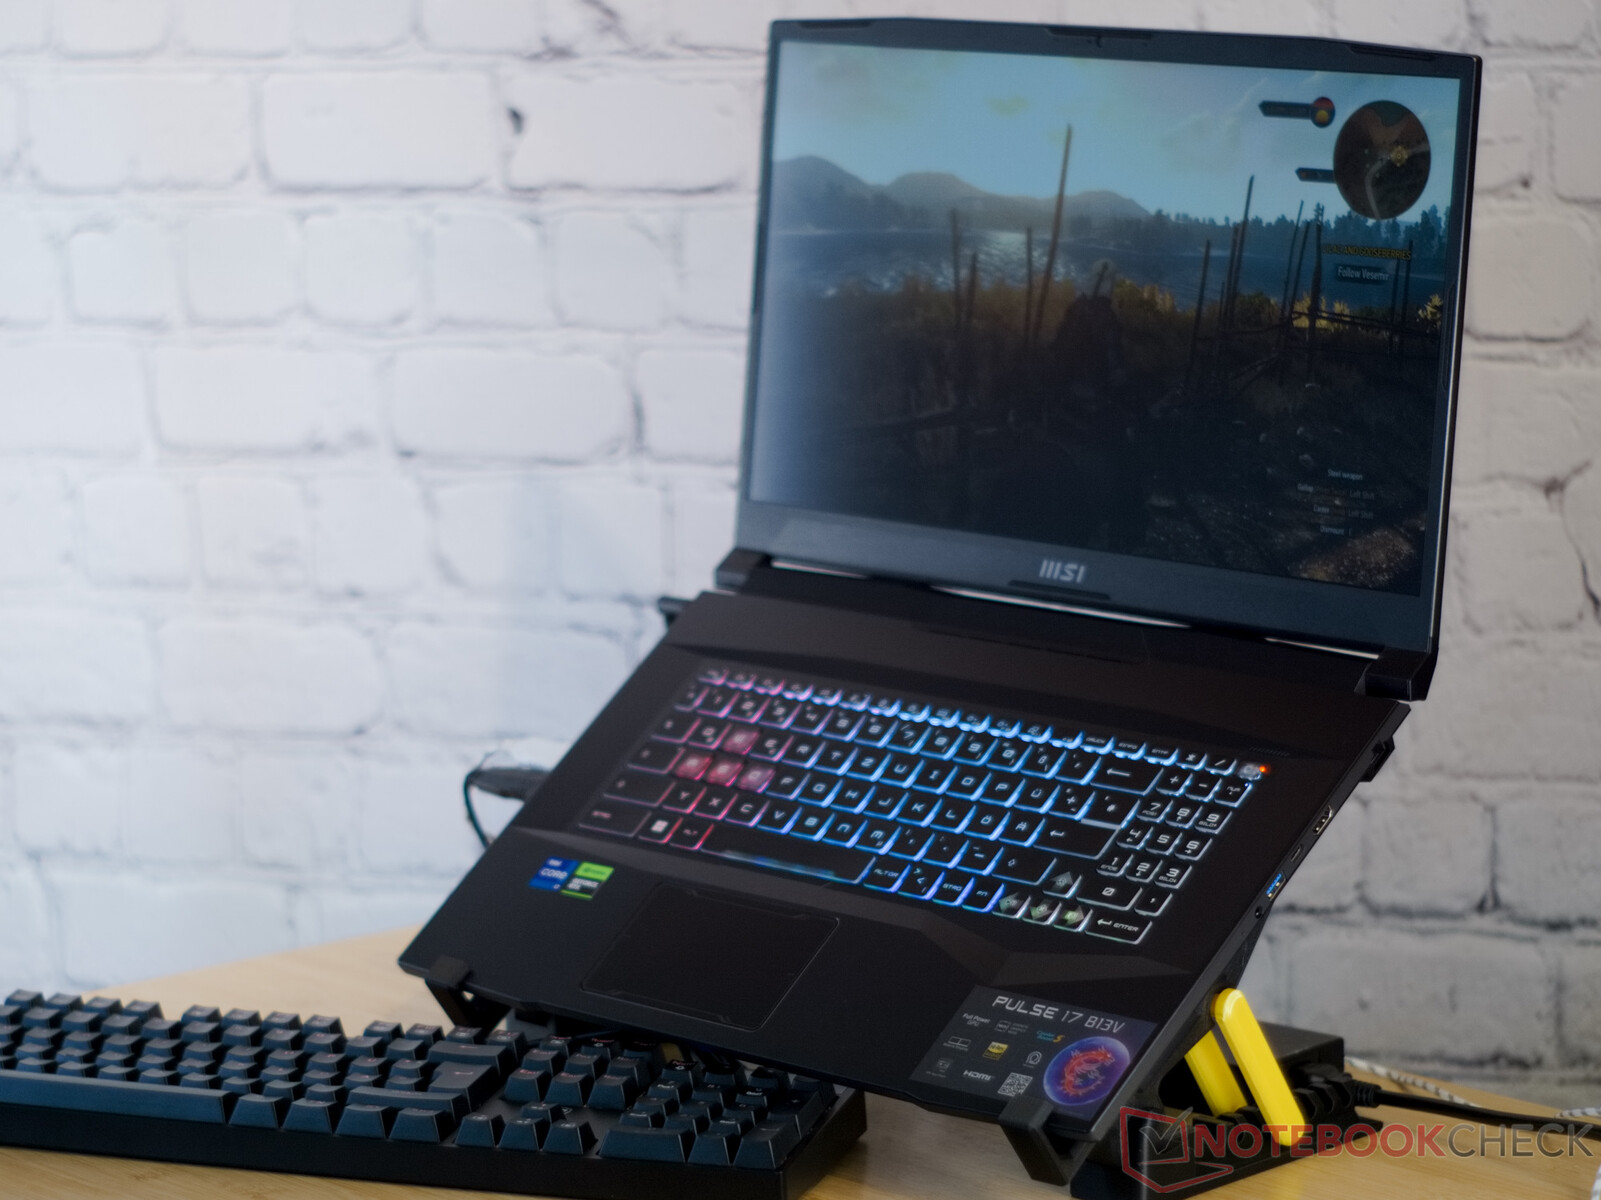
MSI Pulse 17 B13V Gaming-Laptop im Test: Auf leisen Schwingen
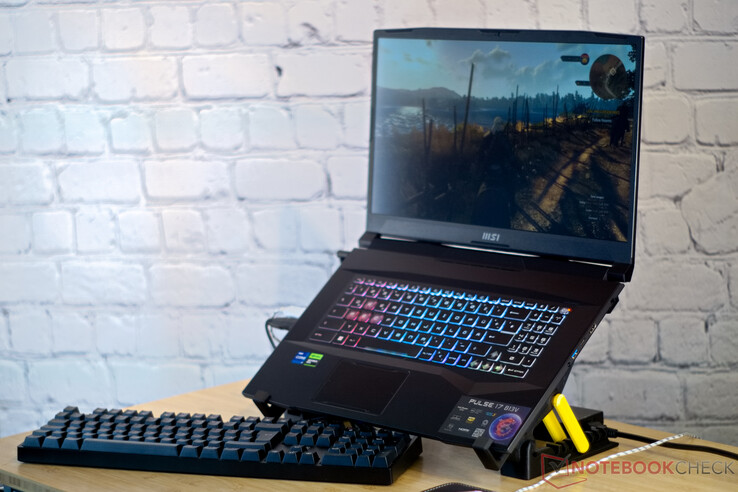
Der rote Drachen bringt mit dem MSI Pulse 17 einen Gaming-Laptop, der vom Äußeren ein wenig an Science-Fiction erinnert. Dafür sorgen ein Bildschirmdeckel aus eloxiertem Aluminium, viele Ecken und Kanten und sogar die Wabenmuster auf der Unterseite des 17-Zoll-Notebooks. Im Inneren des Laptops arbeiten aber Komponenten aus dem Hier und Jetzt, sodass unser Testgerät mit einem Intel Core i7-13700H und der Nvidia GeForce RTX 4070 bestückt ist. Beim Vorgänger, den wir Anfang des Jahres getestet haben, waren wir von der Leistung des Notebooks überzeugt. Trotzdem fehlte uns beim Pulse GL76 G-Sync-, MUX-, Advanced-Optimus- und Thunderbolt-Unterstützung. Auch an der Lautstärke der Lüfter des Gaming-Laptops gab es noch einiges auszusetzen.
MSI hat den Laptop nun aber deutlich überarbeitet, und neben dem Design, den Chip-Generationen und dem kryptischen Namen an allen Ecken und Enden Verbesserungen eingebracht. Damit steigt das performante Gerät deutlich in unserem Rating. Zum Vergleich stehen das Asus ROG Strix G17 G713PI, das MSI Katana 17 B13VFK oder das Schenker XMG Focus 17 (E23) bereit.
Mögliche Konkurrenten im Vergleich
Bew. | Datum | Modell | Gewicht | Dicke | Größe | Auflösung | Preis ab |
|---|---|---|---|---|---|---|---|
| 86.3 % v7 (old) | 07 / 2023 | MSI Pulse 17 B13VGK i7-13700H, GeForce RTX 4070 Laptop GPU | 2.7 kg | 27.2 mm | 17.30" | 1920x1080 | |
| 83.2 % v7 (old) | 01 / 2023 | MSI Pulse GL76 12UGK i7-12700H, GeForce RTX 3070 Laptop GPU | 2.6 kg | 24.2 mm | 17.30" | 1920x1080 | |
| 82.1 % v7 (old) | 02 / 2023 | MSI Katana 17 B13VFK i7-13620H, GeForce RTX 4060 Laptop GPU | 2.8 kg | 25.2 mm | 17.30" | 1920x1080 | |
| 87.2 % v7 (old) | 06 / 2023 | Acer Nitro 17 AN17-51-71ER i7-13700H, GeForce RTX 4060 Laptop GPU | 3 kg | 30.3 mm | 17.30" | 2560x1440 | |
| 85.9 % v7 (old) | 06 / 2023 | Schenker XMG Focus 17 (E23) i9-13900HX, GeForce RTX 4070 Laptop GPU | 2.9 kg | 29.3 mm | 17.30" | 2560x1440 | |
| 88.4 % v7 (old) | 04 / 2023 | Asus ROG Strix G17 G713PI R9 7945HX, GeForce RTX 4070 Laptop GPU | 2.8 kg | 30.7 mm | 17.30" | 2560x1440 |
Gehäuse - Bildschirmdeckel aus Aluminium in Sci-Fi-Optik
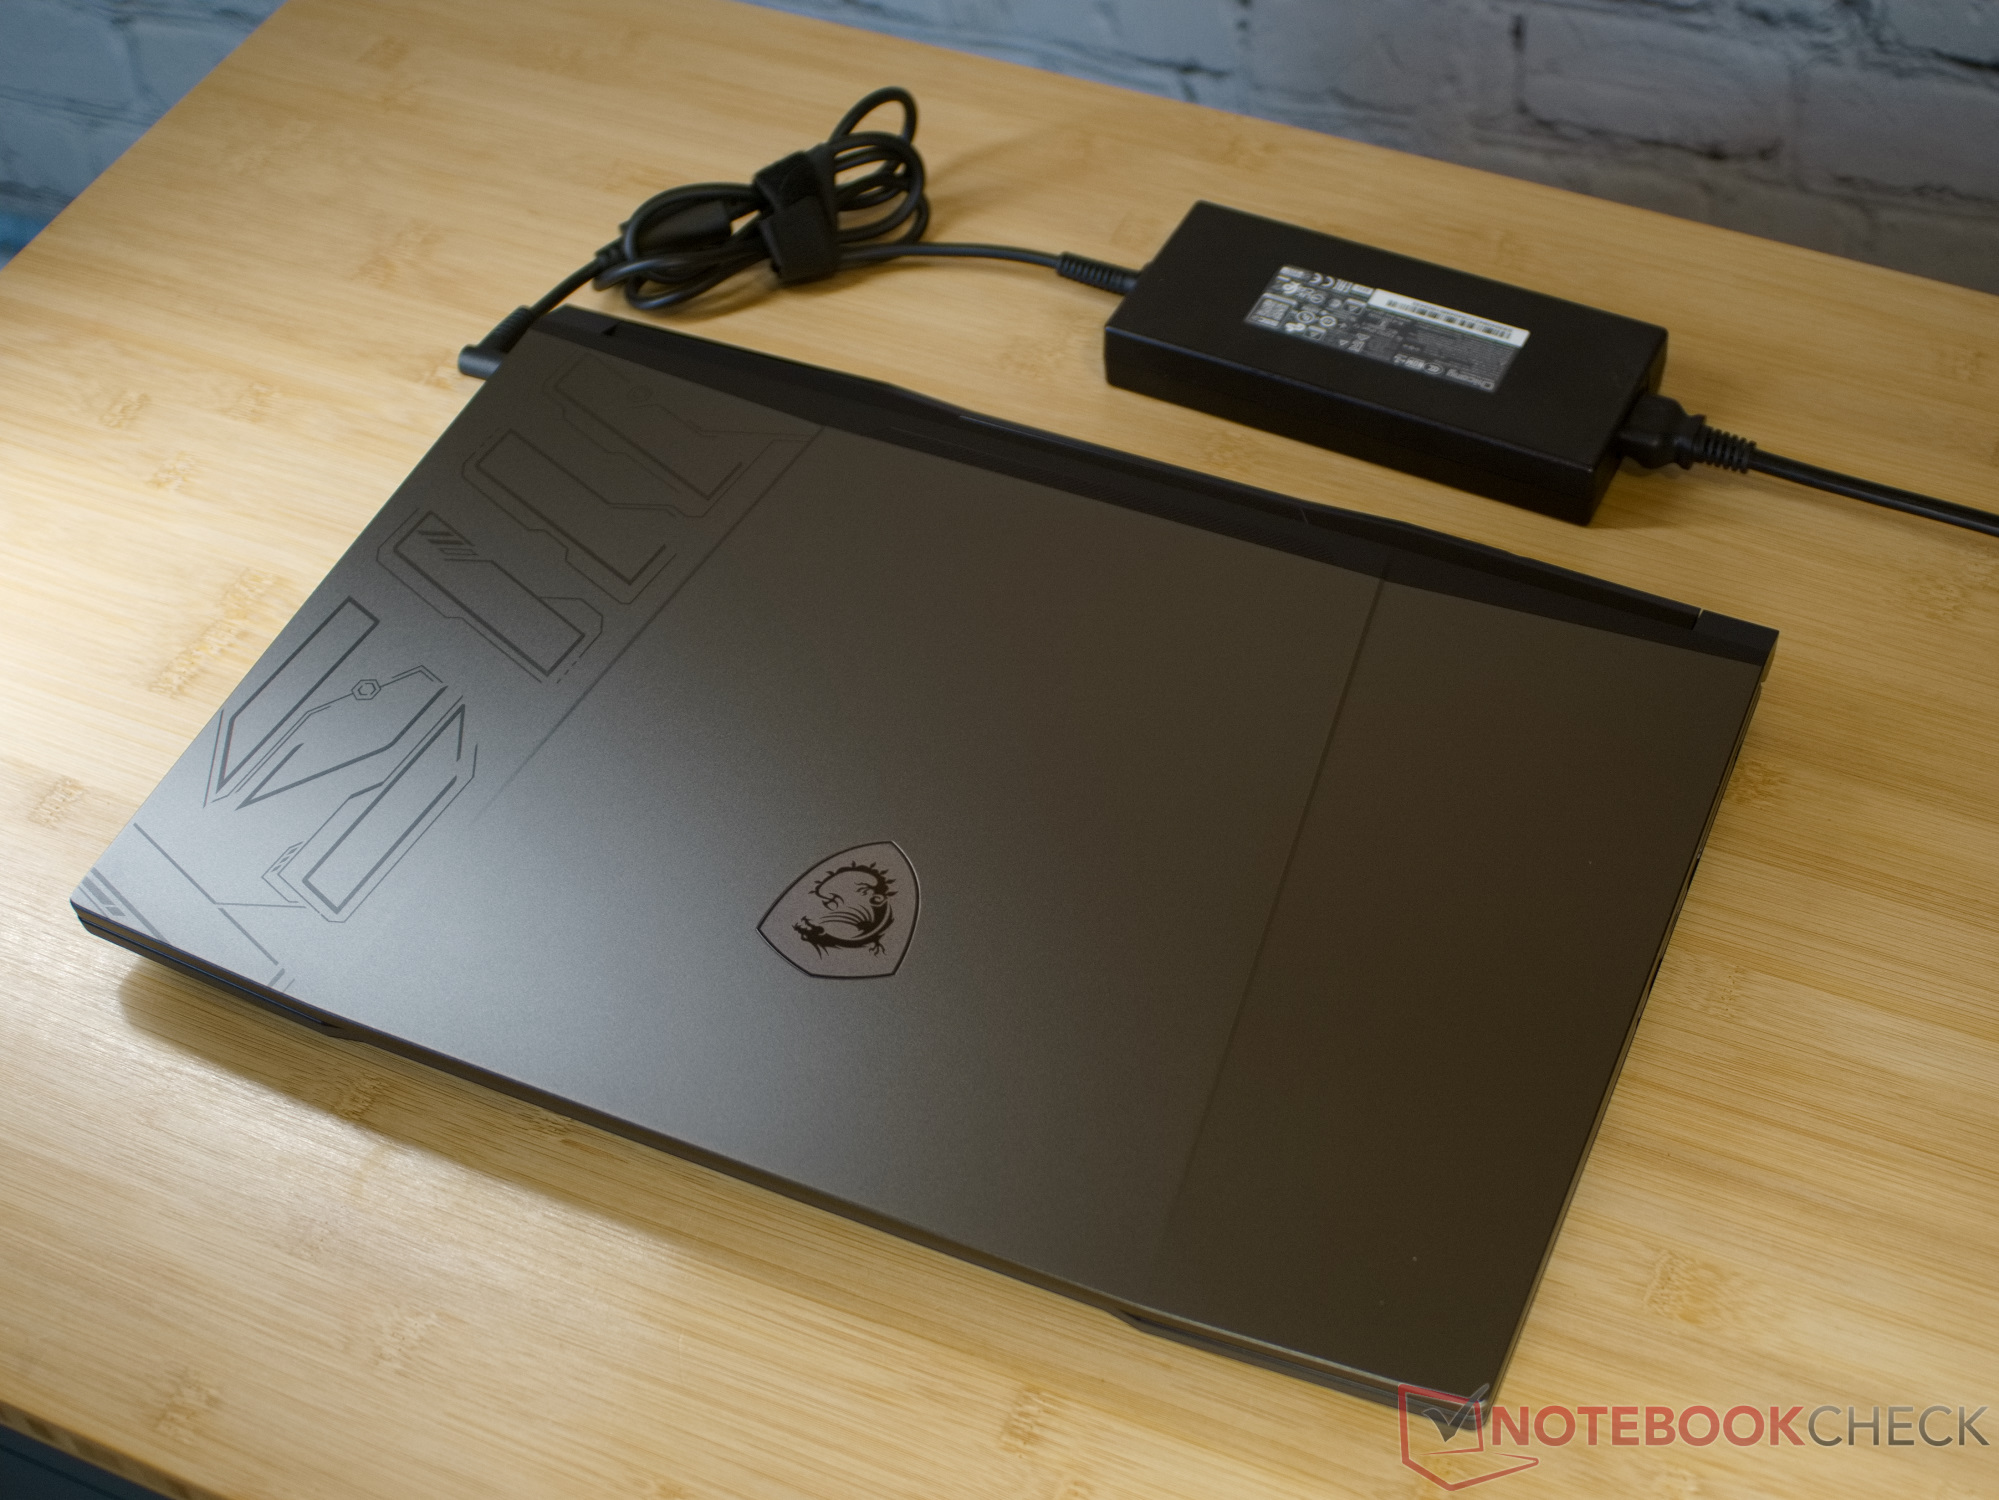
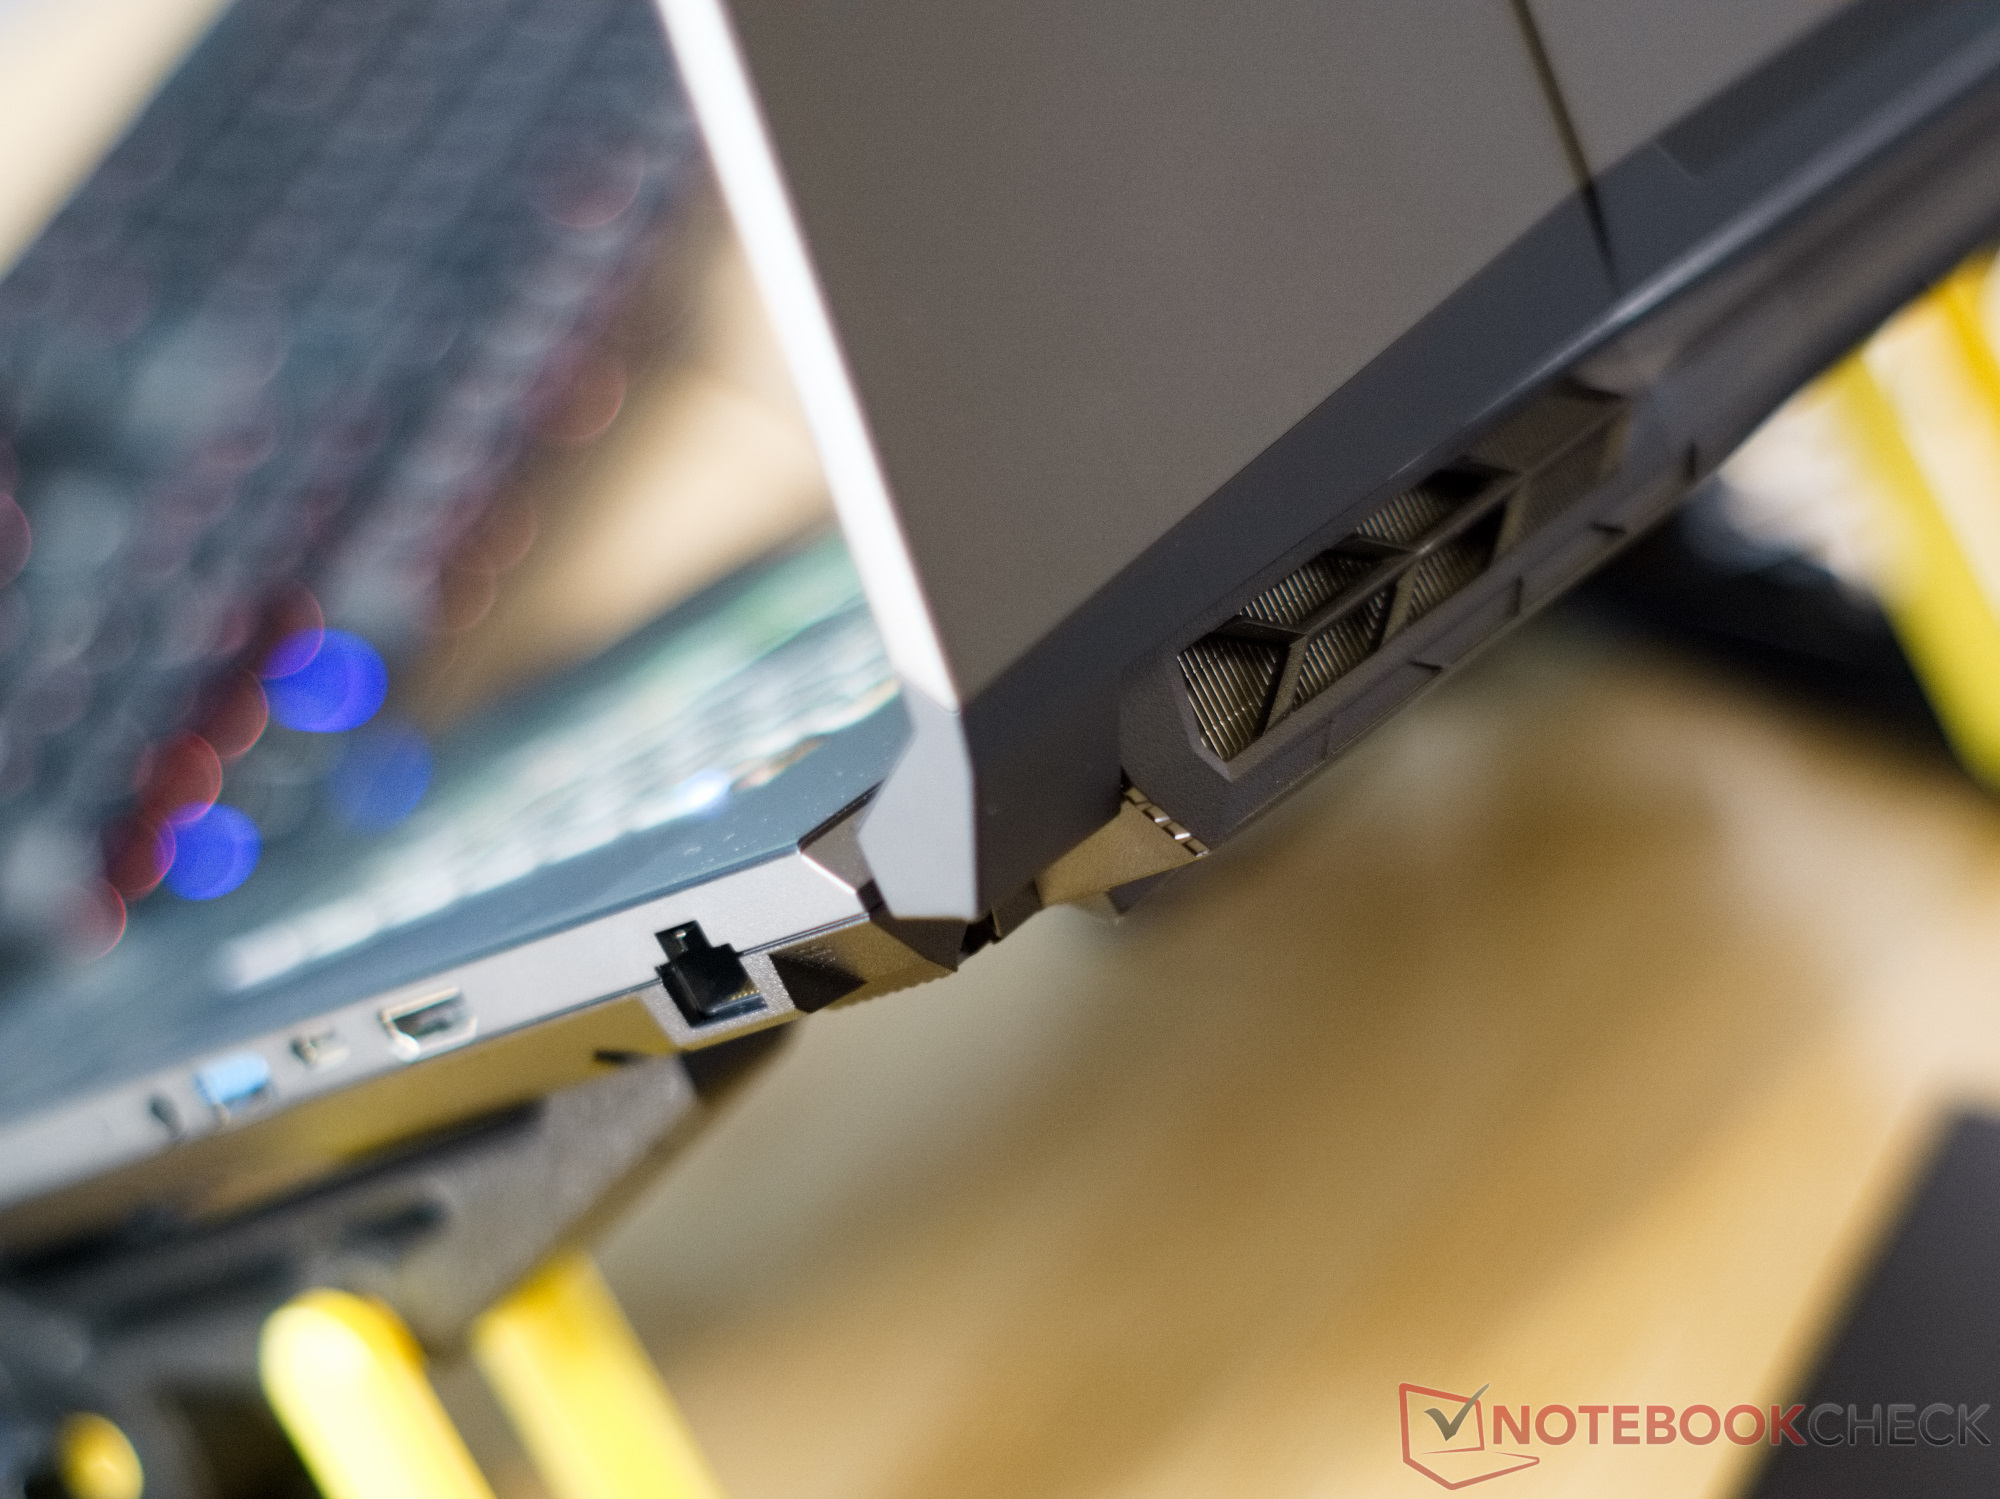
So ziemlich alle aktuellen Gaming-Laptops von MSI sind nach ähnlichen Designgrundlagen gestaltet. MSI übernimmt ein ums andere Mal die aggressive Linienführung auf dem Displaydeckel, sowie die eckigen Scharniere und das Wabenmuster auf dem Gehäuseboden. Beim Pulse 17 sind am Deckel aus Aluminium schmückende Kanten angebracht, die dem Laptop ein wenig zusätzliches Sci-Fi-Feeling verpassen. Unter dem Deckel geht es futuristisch weiter. Auch hier bringt MSI viele Designelemente an.
Dabei ist das Gehäuse des MSI Pulse 17 recht stabil, wobei die Größe des Laptops dann doch dafür sorgt, dass stellenweise leichtes Verwinden oder Eindrücken der Kunststoffbauteile möglich ist. Aber insgesamt stellt sich das Pulse 17 als solides Gerät dar. Das große Display lässt sich hier um 180° aufklappen und hält seine Position halbwegs stabil. Die Scharniere sind schon beinahe zu leichtgängig, womit leichte Vibrationen oder leichtes Anstoßen dafür sorgen können, dass sich der Bildschirm etwas bewegt.
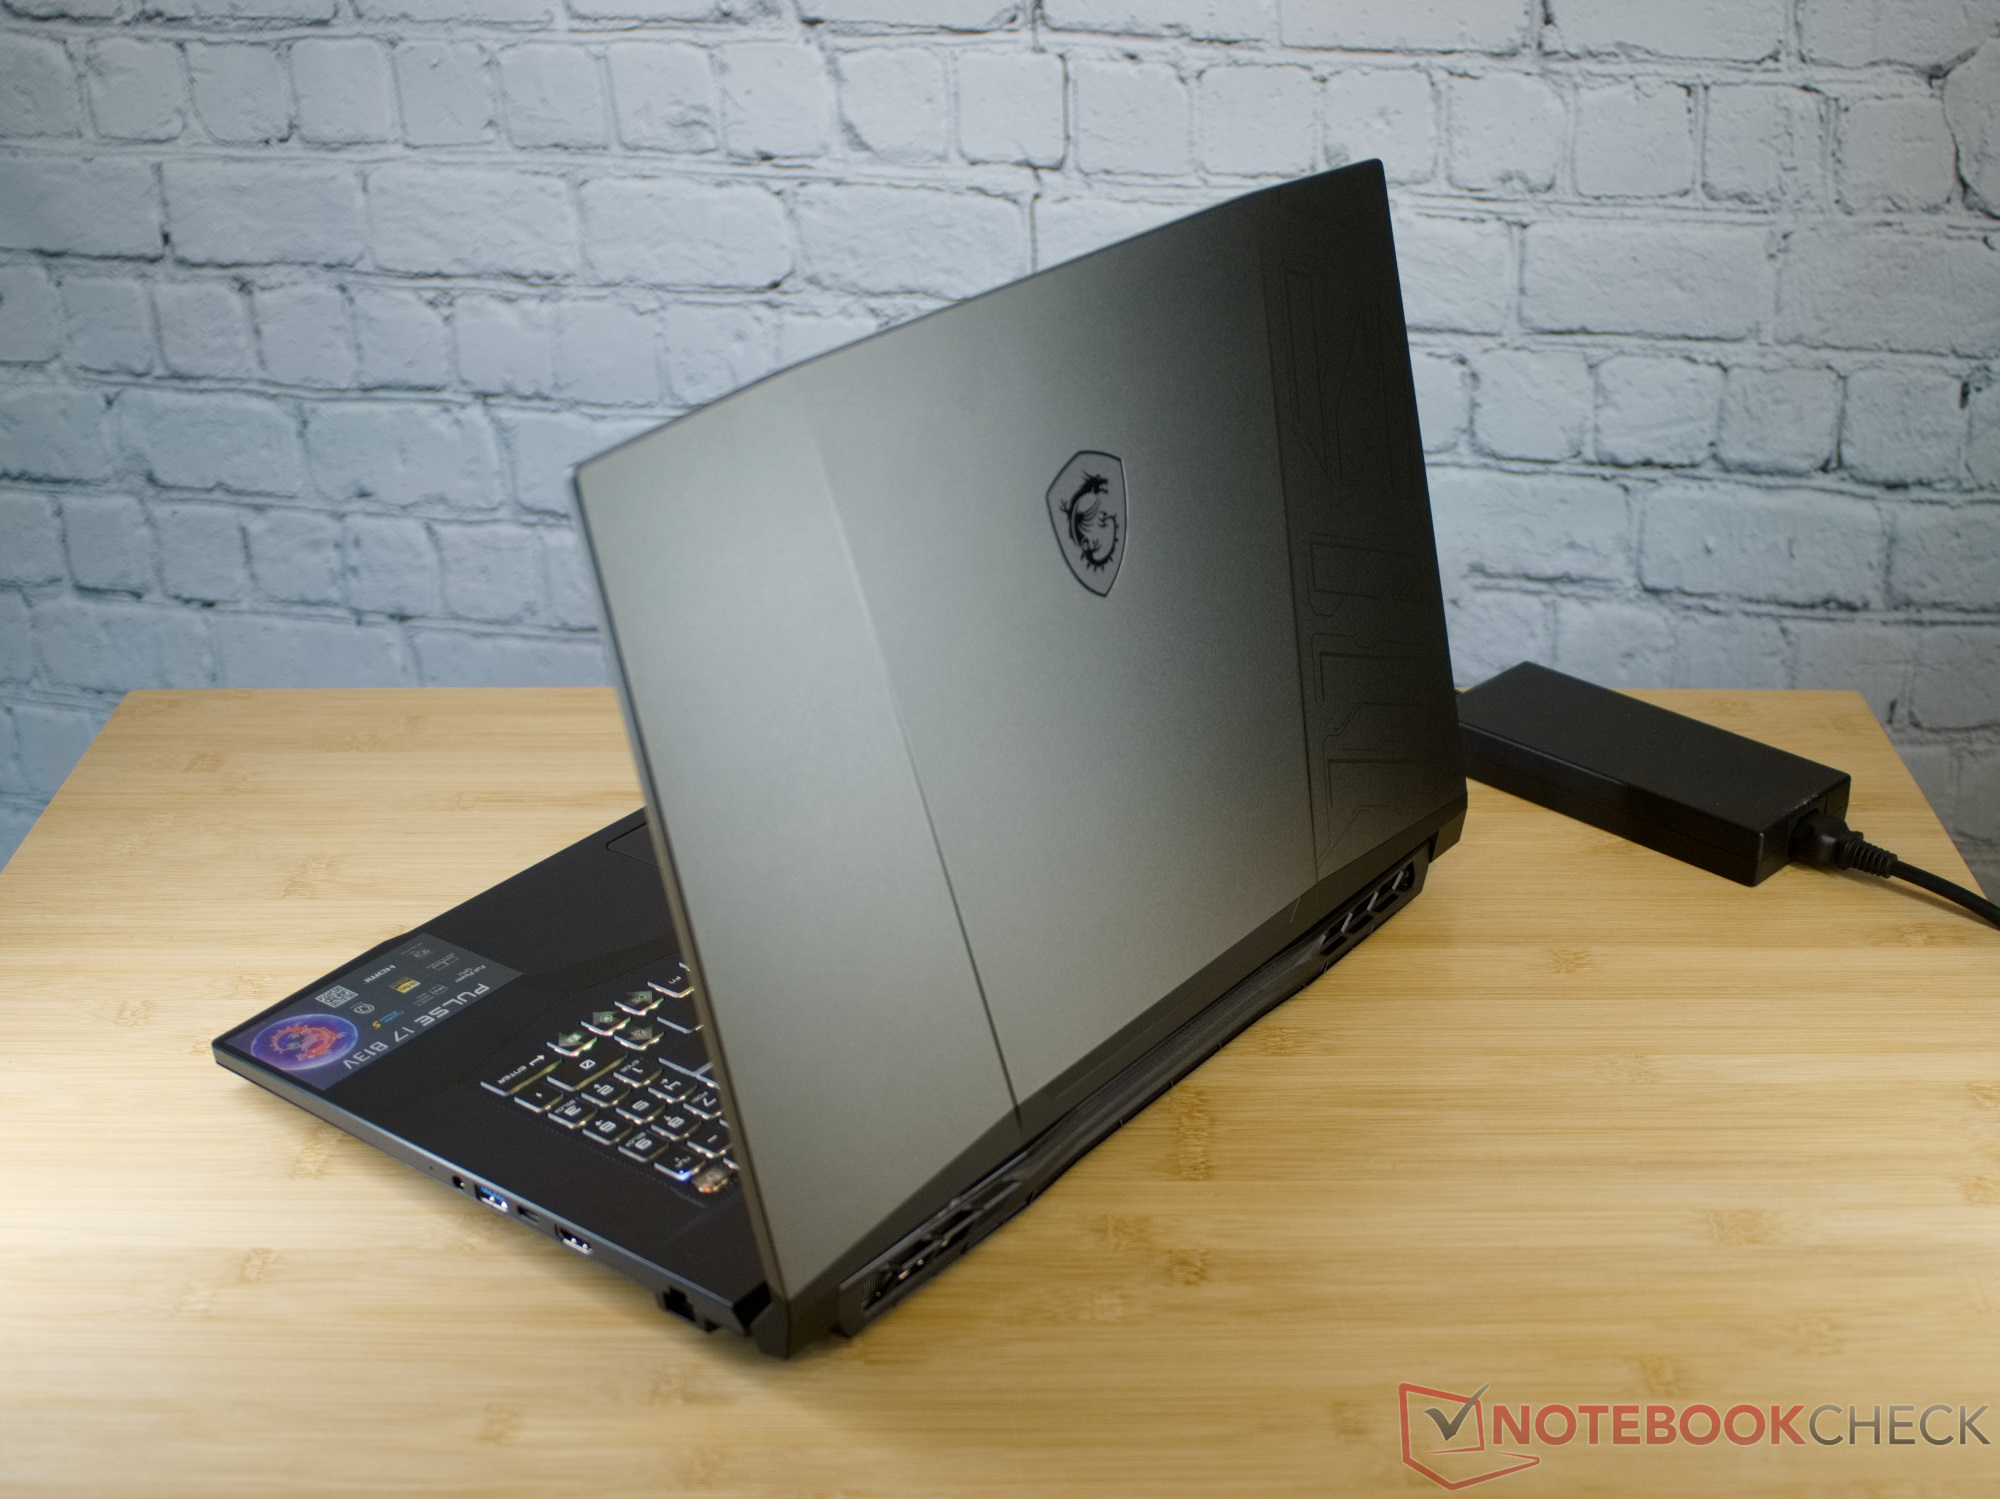
2,7 kg wiegt das MSI Pulse 17. Damit ist es unter seinen gleich großen Konkurrenten das Leichtgewicht. Nur das Vorgängermodell wiegt noch weniger. Abgesehen davon unterscheiden sich die aktuellen Gaming-Laptops im Vergleich recht wenig darin, wie sie den Rucksack ausfüllen und belasten.
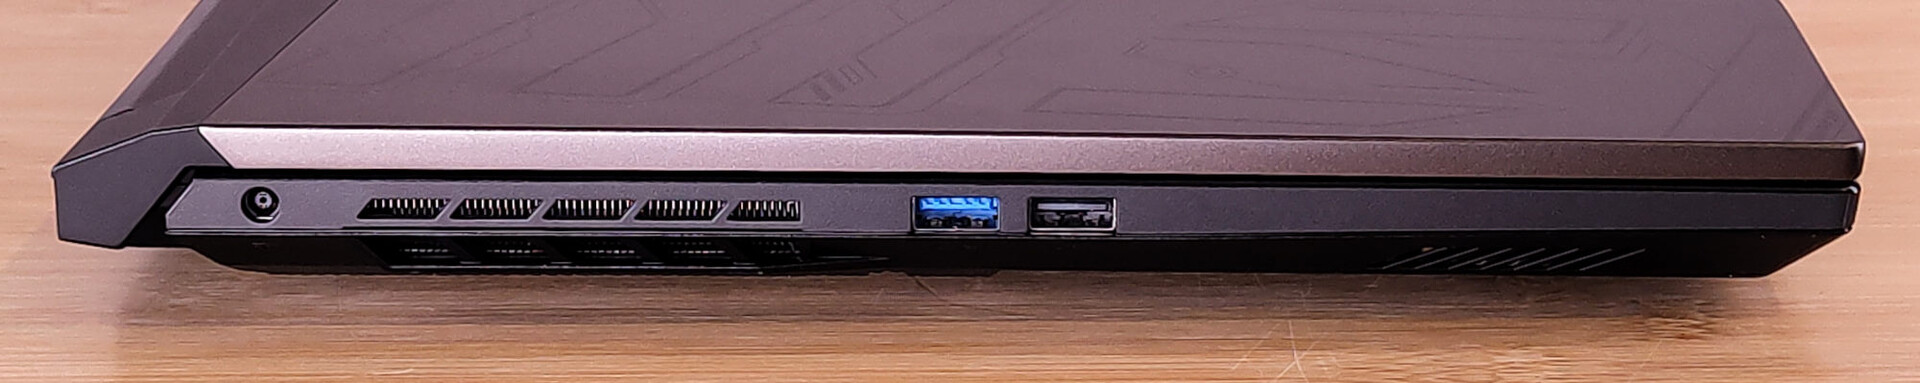
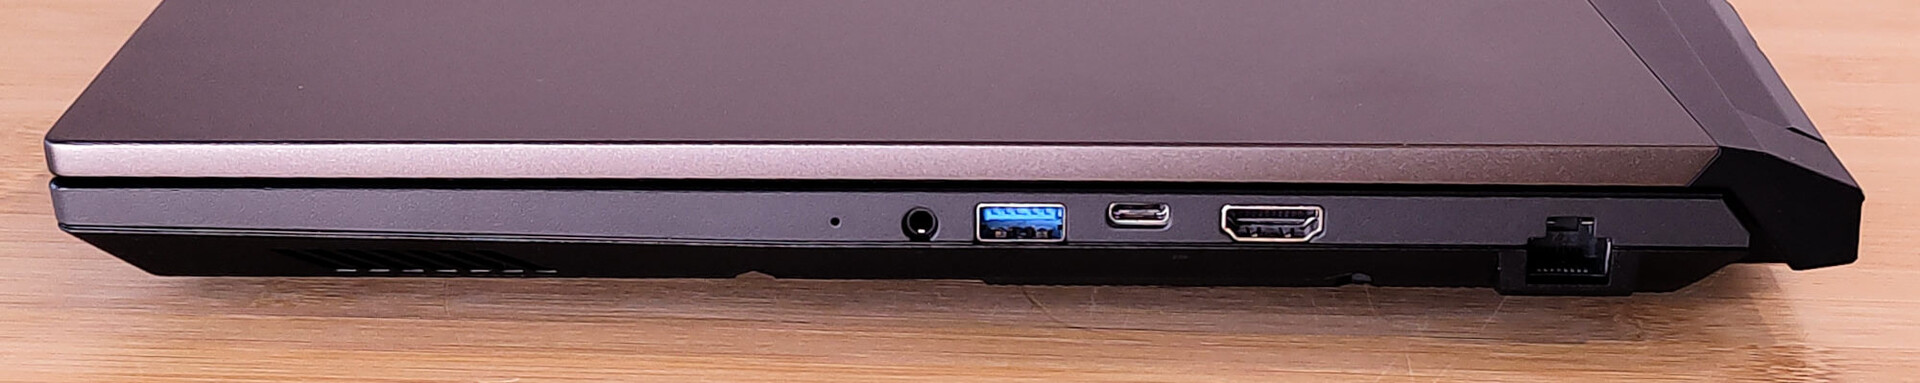
Ausstattung - Kein Thunderbolt und nur USB 3.2 Gen 1
Clevererweise hat das Pulse auf beiden Seiten je zwei USB-Anschlüsse. Damit können Kabel sowohl für Links- als auch für Rechtshänder aus dem Weg geräumt werden. Auf der rechten Seite des Laptops befindet sich ein USB-C-Anschluss. Dieser unterstützt jedoch nur die Datenübertragung und DisplayPort.
Kommunikation
Mit Gigabit-LAN und WiFi 6 vom Intel AX201 ist das Pulse 17 netzwerktechnisch nicht gerade auf dem Stand der Technik unterwegs. Aber unser Testgerät beweist: Auch im 5-GHz-Netzwerk sind hohe und stabile Übertragungsgeschwindigkeiten möglich.
Webcam
Auch bei der Webcam gibt sich das MSI Pulse 17 alles andere als modern. Diese kommt mit HD-Auflösung und liefert eher unscharfe Bilder mit starker chromatischer Aberration an den Kontrastkanten.


Zubehör
Außer den typischen Papieren, einem Sticker mit dem roten Drachen und dem zum Laptop gehörendem Netzteil finden wir kein weiteres Zubehör im Karton.
Wartung
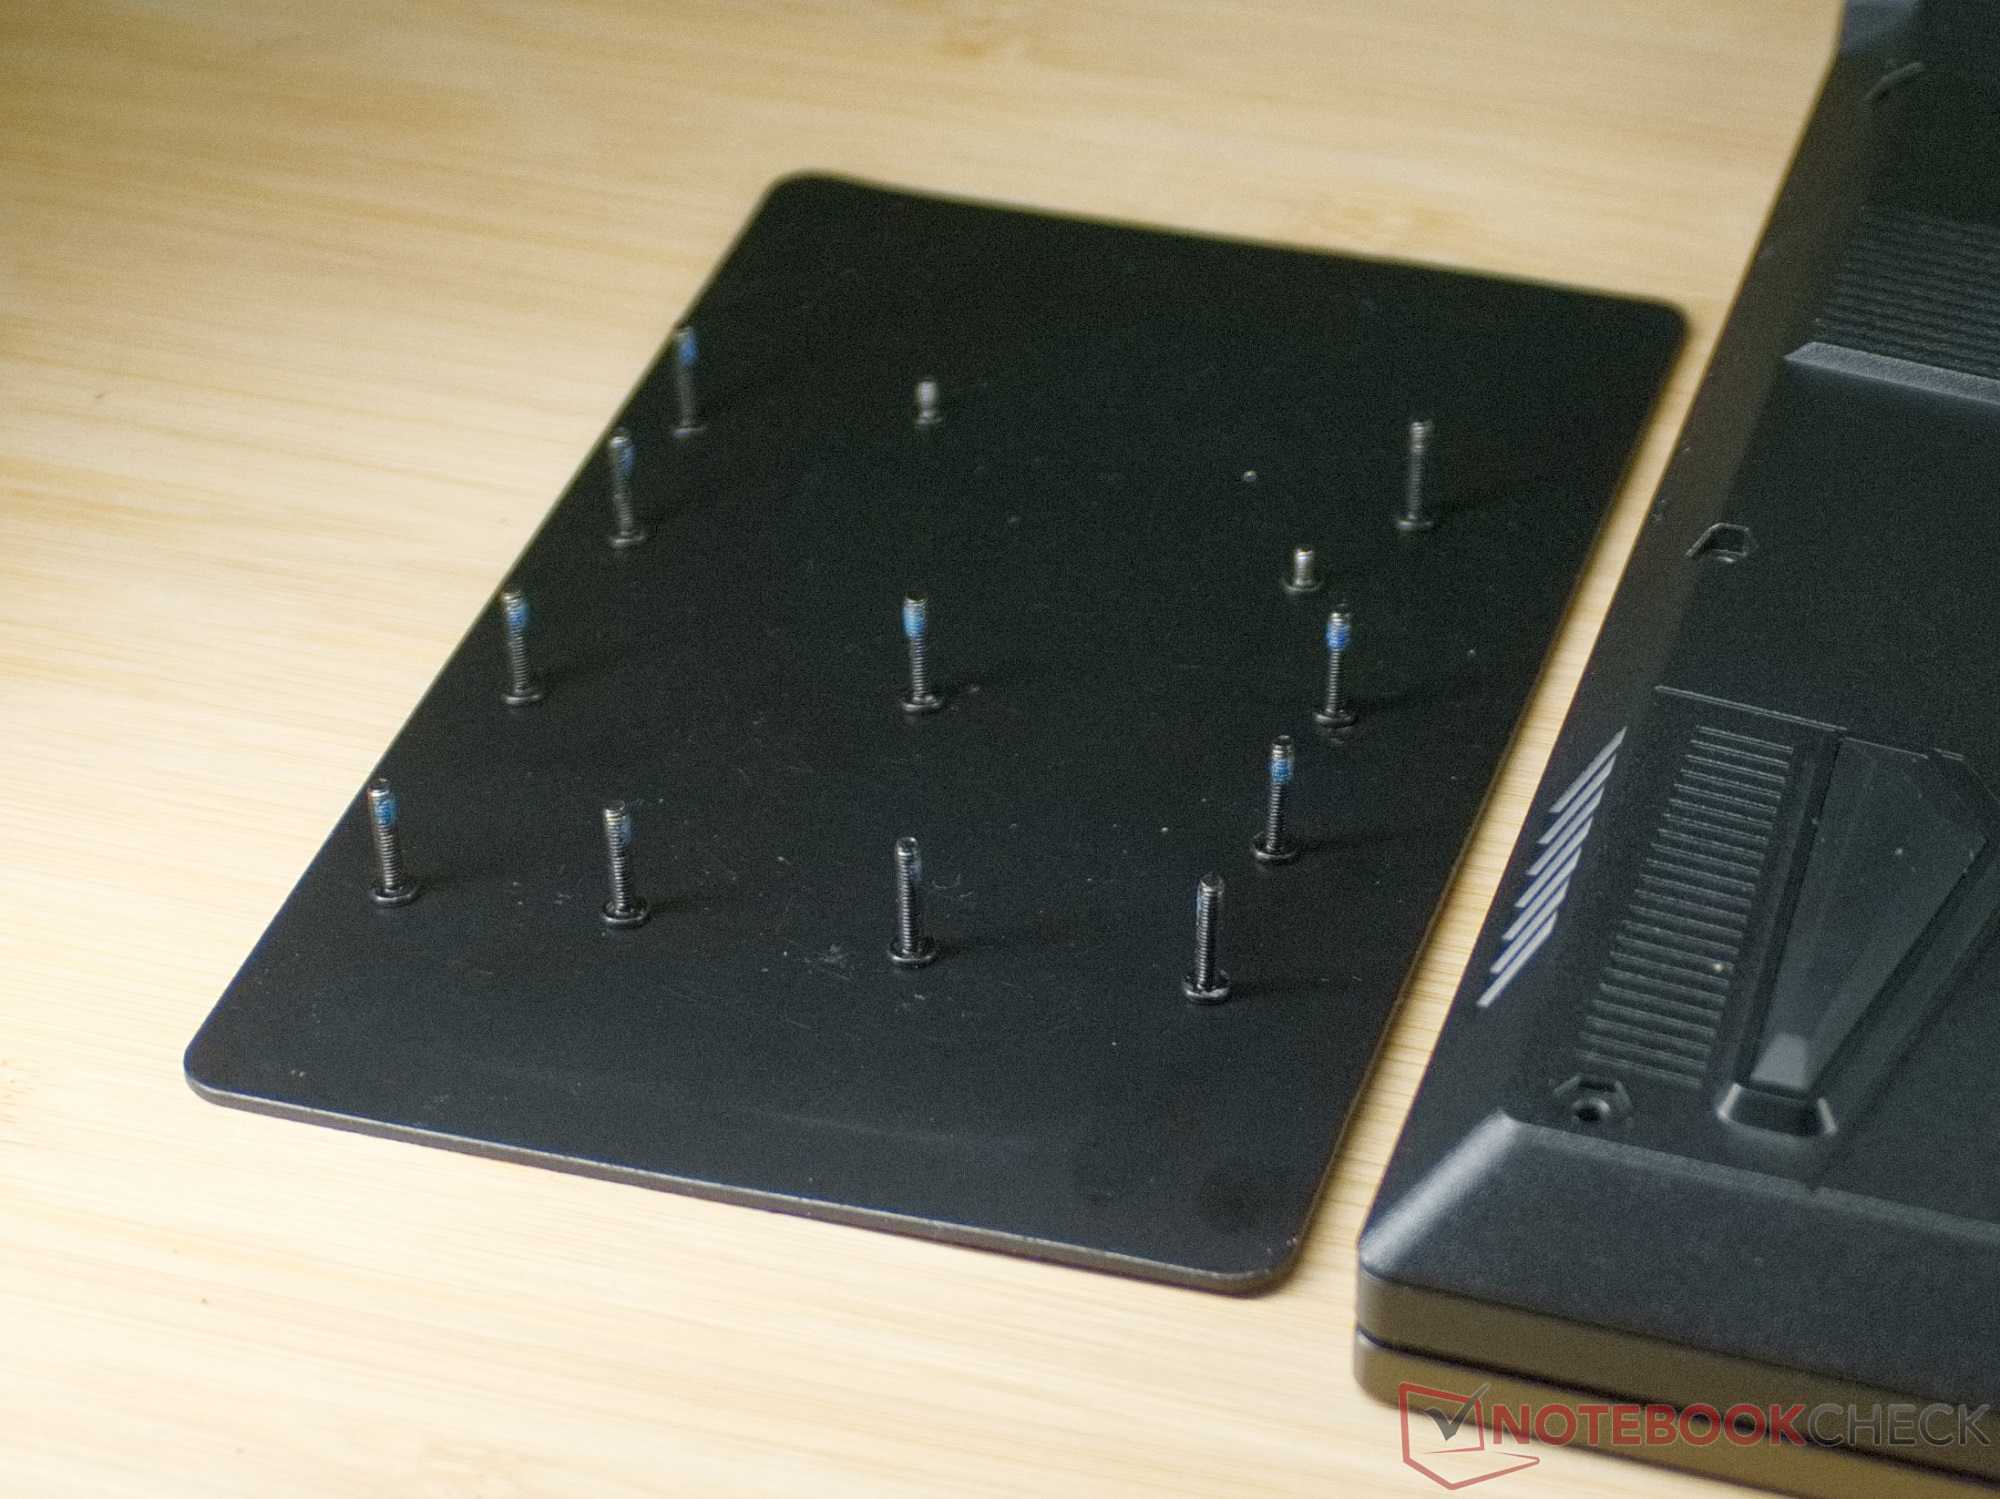
Eine der 13 PH0-Schrauben, welche die Basis sichern, wurde bei unserem Testgerät von einem Siegelsticker geschützt. MSI betont zwar immer wieder, dass dieser nicht garantierelevant ist, aber bestimmte Händler könnten im Garantiefall protestieren, wenn das Siegel gebrochen wurde.
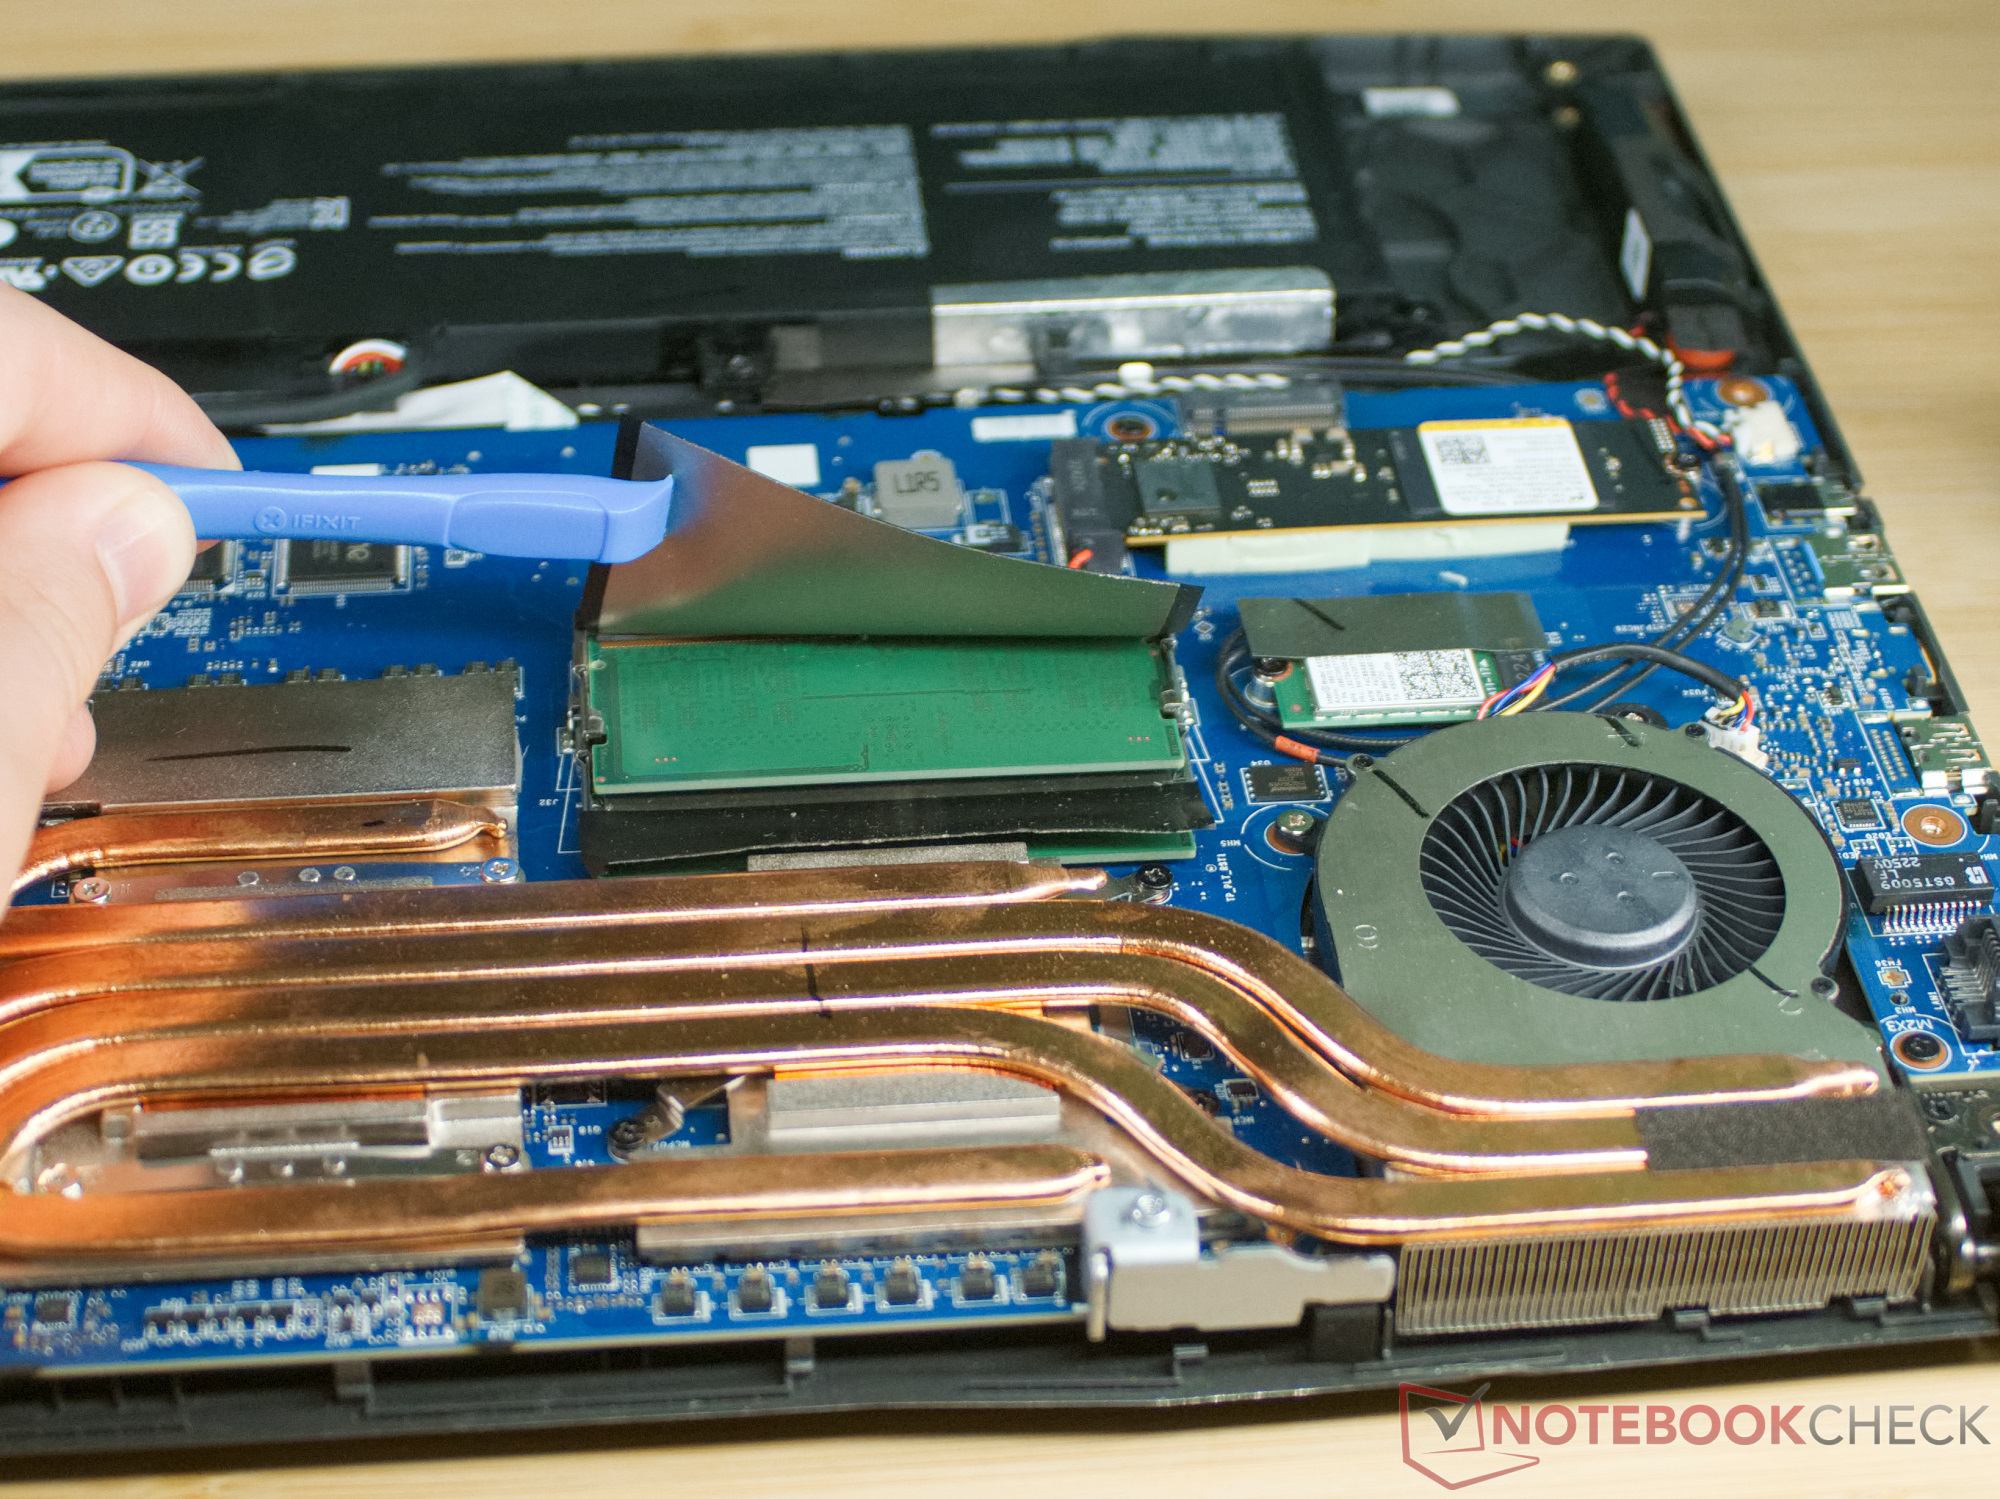
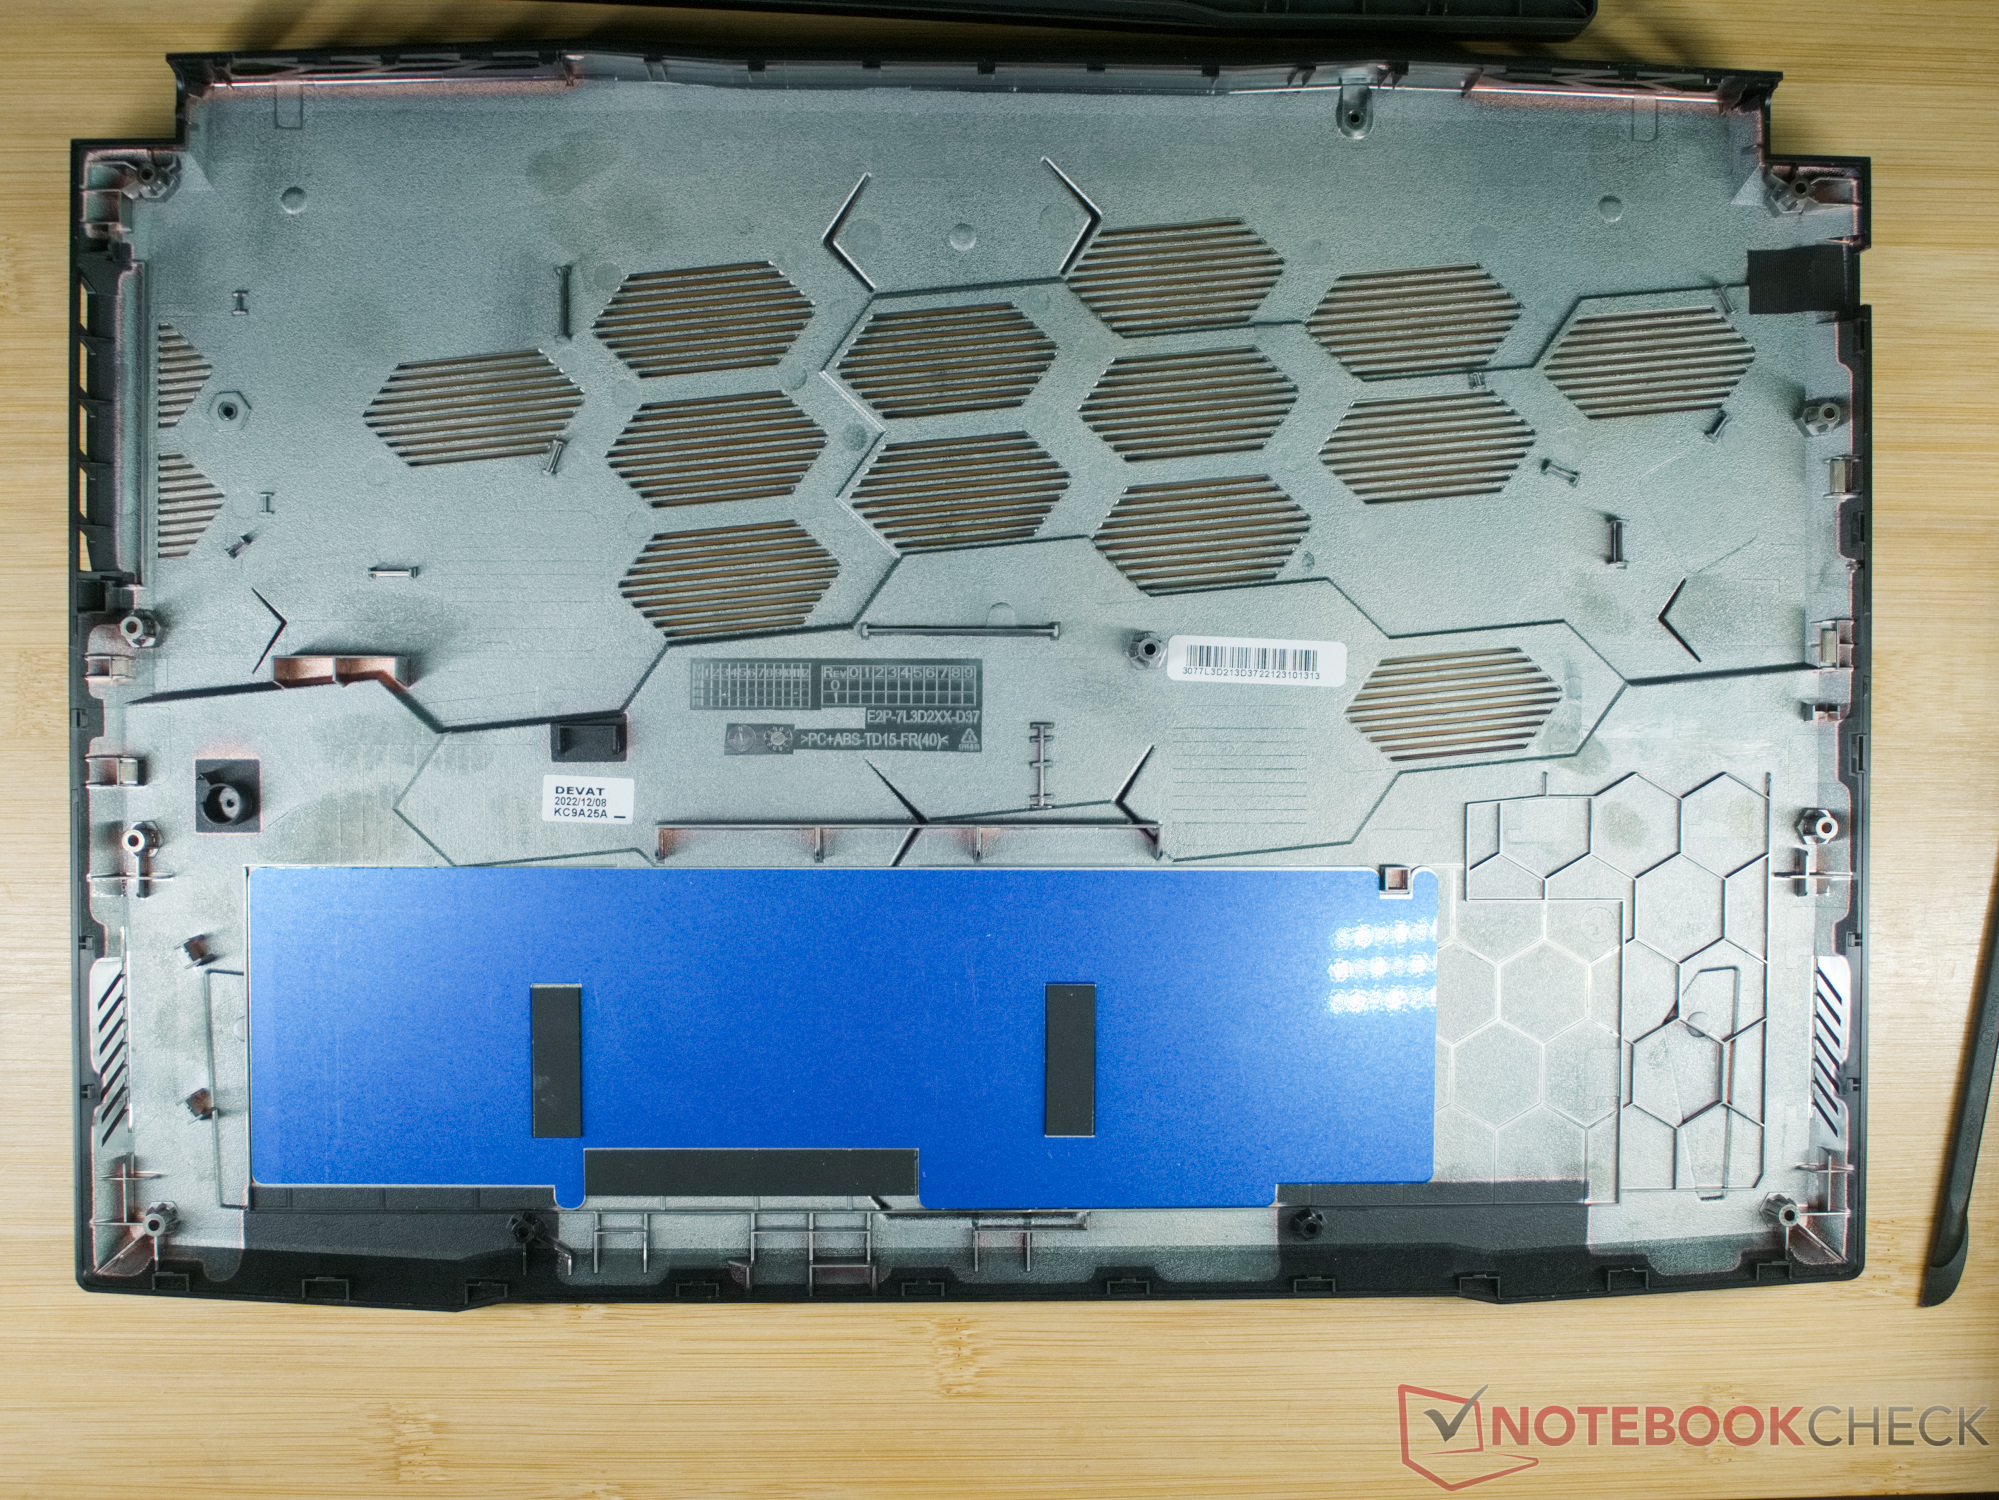
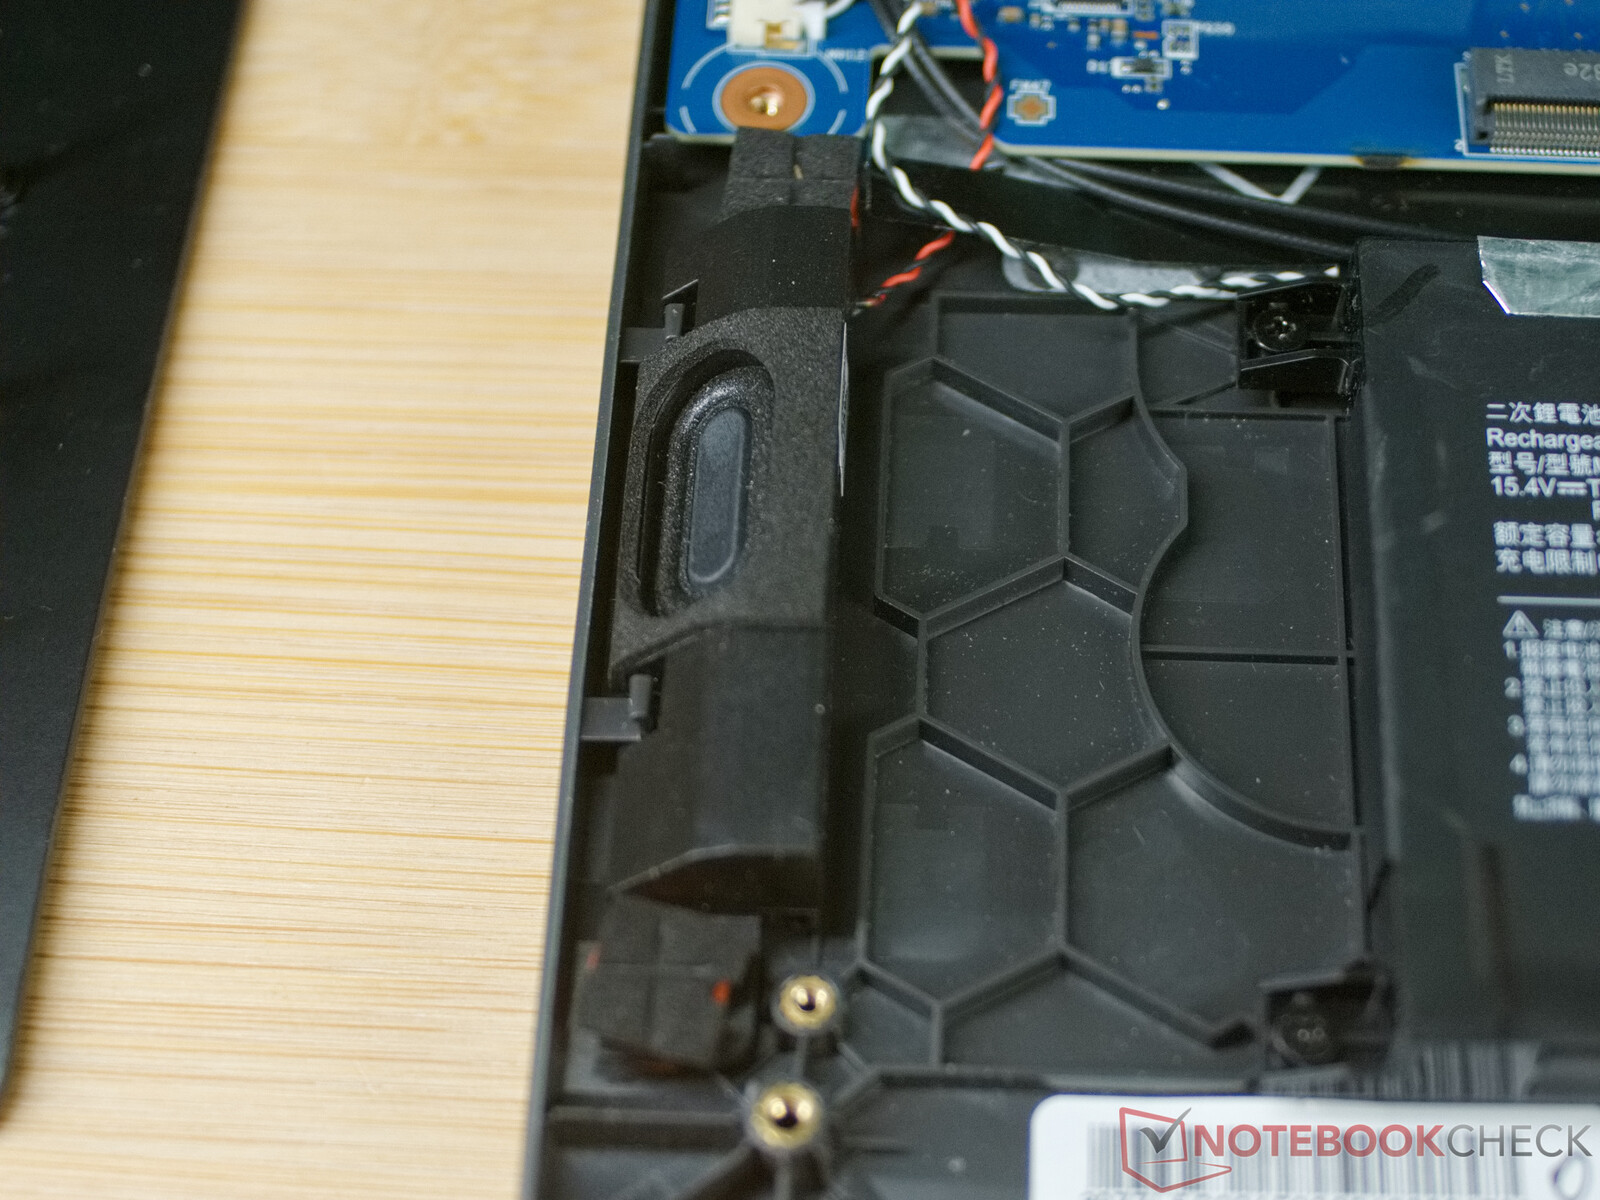
Beim Herausdrehen der 13 Schrauben sollte man auch auf deren Position achten, denn zwei Schrauben sind deutlich kürzer. Die Basisabdeckung wird rings herum von einigen Clips gesichert. Mit einem Plastiköffnungswerkzeug lassen die sich aber einfach aushebeln. Anschließend kann die Abdeckung hochgenommen werden.
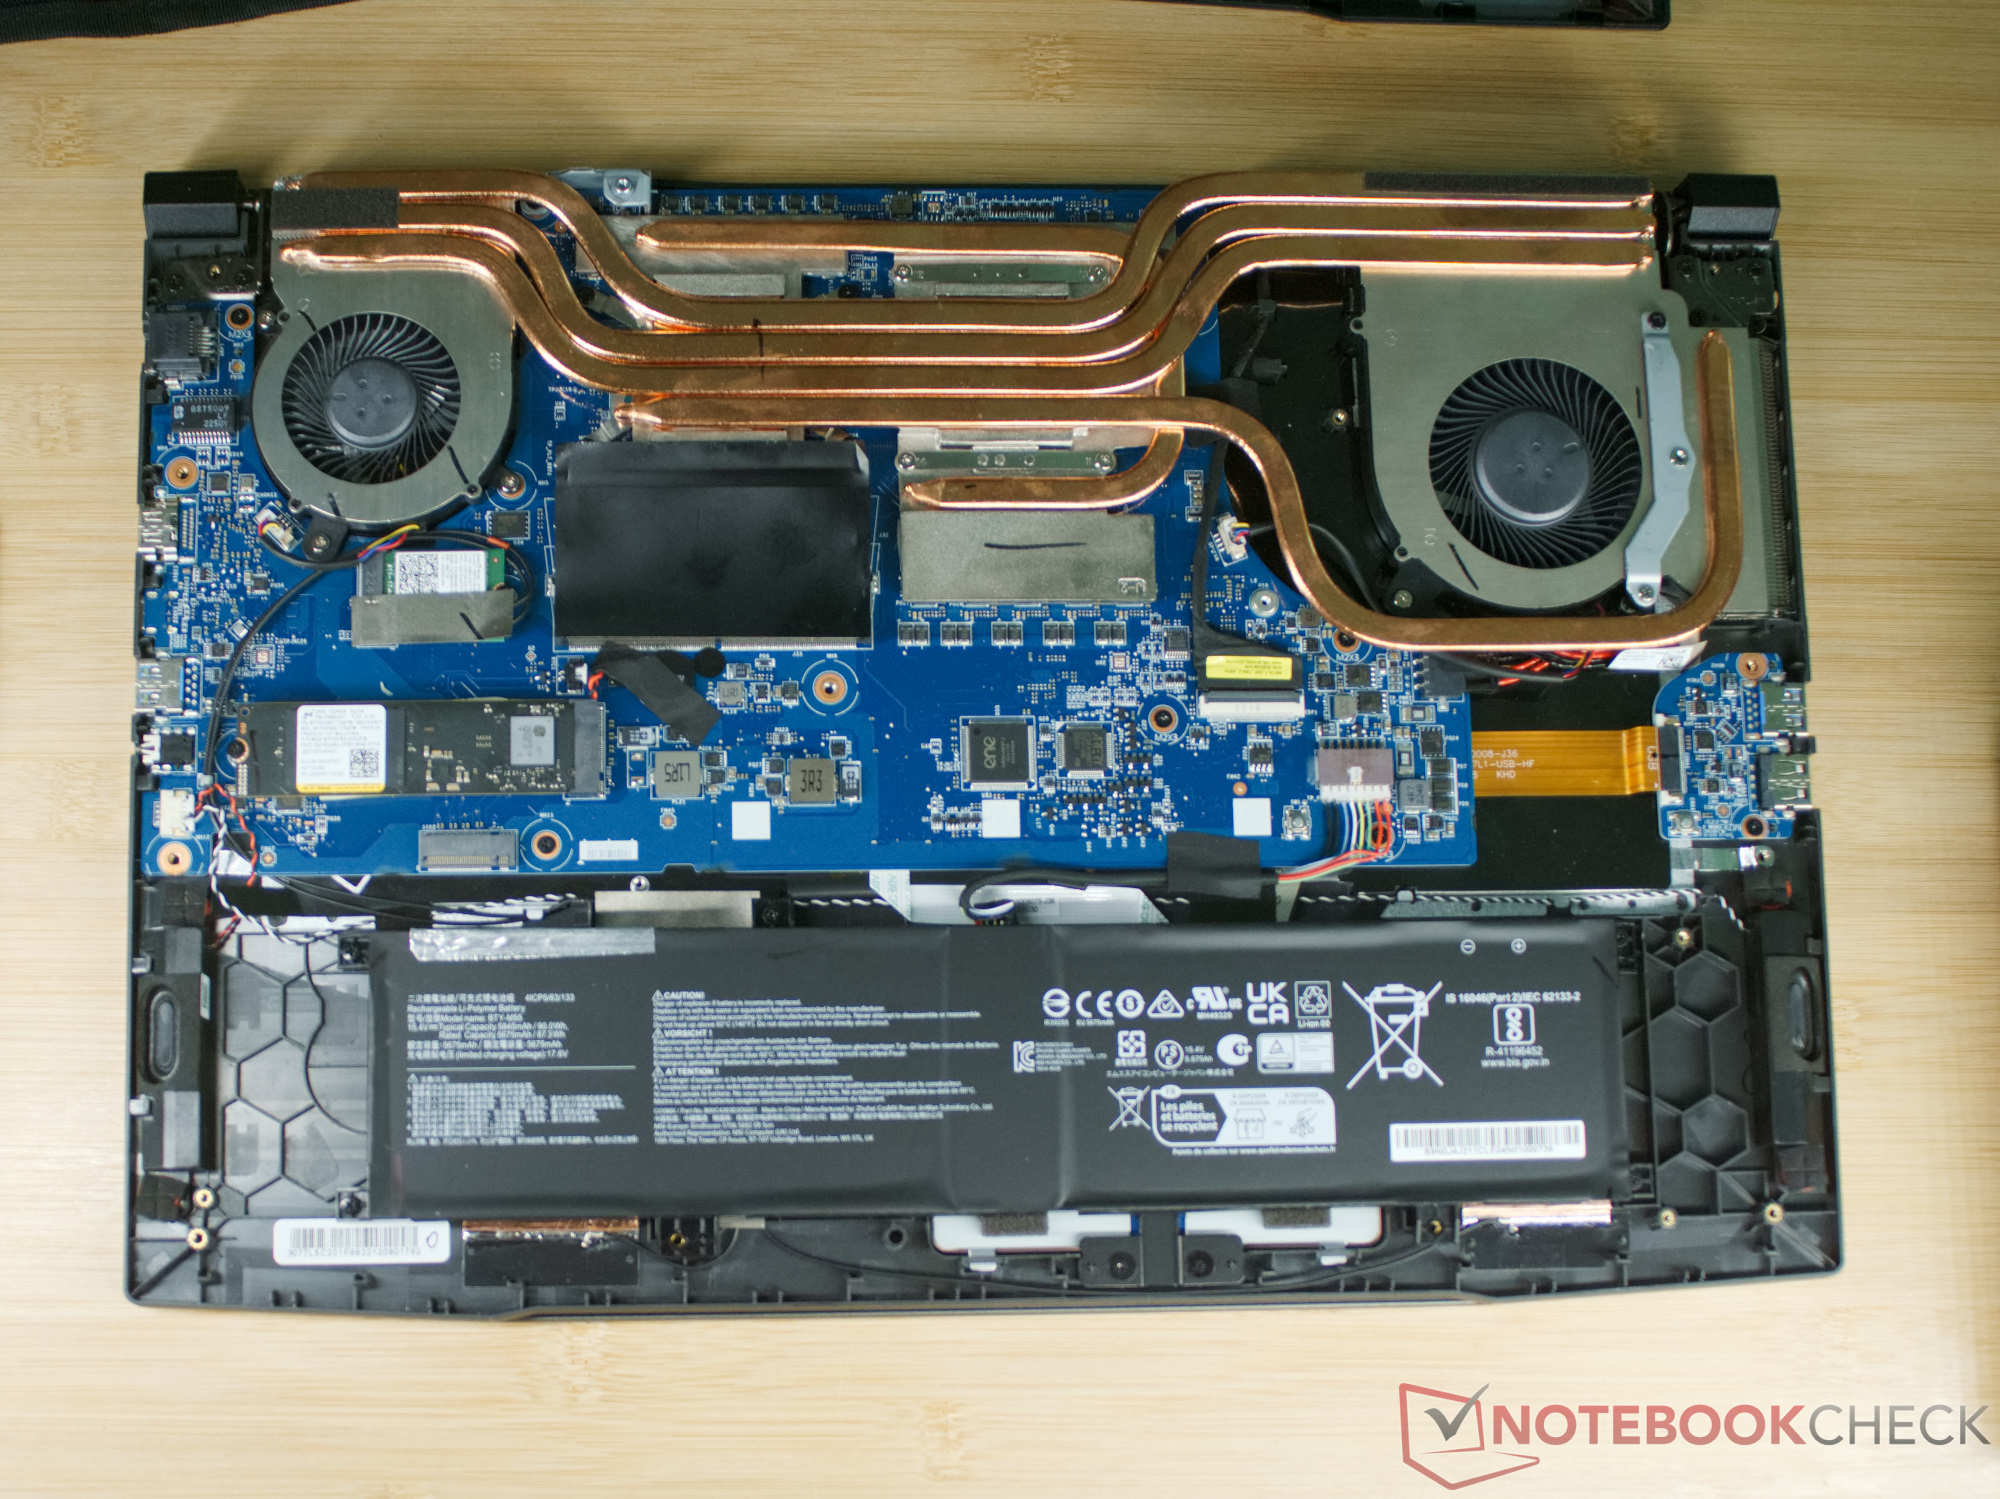
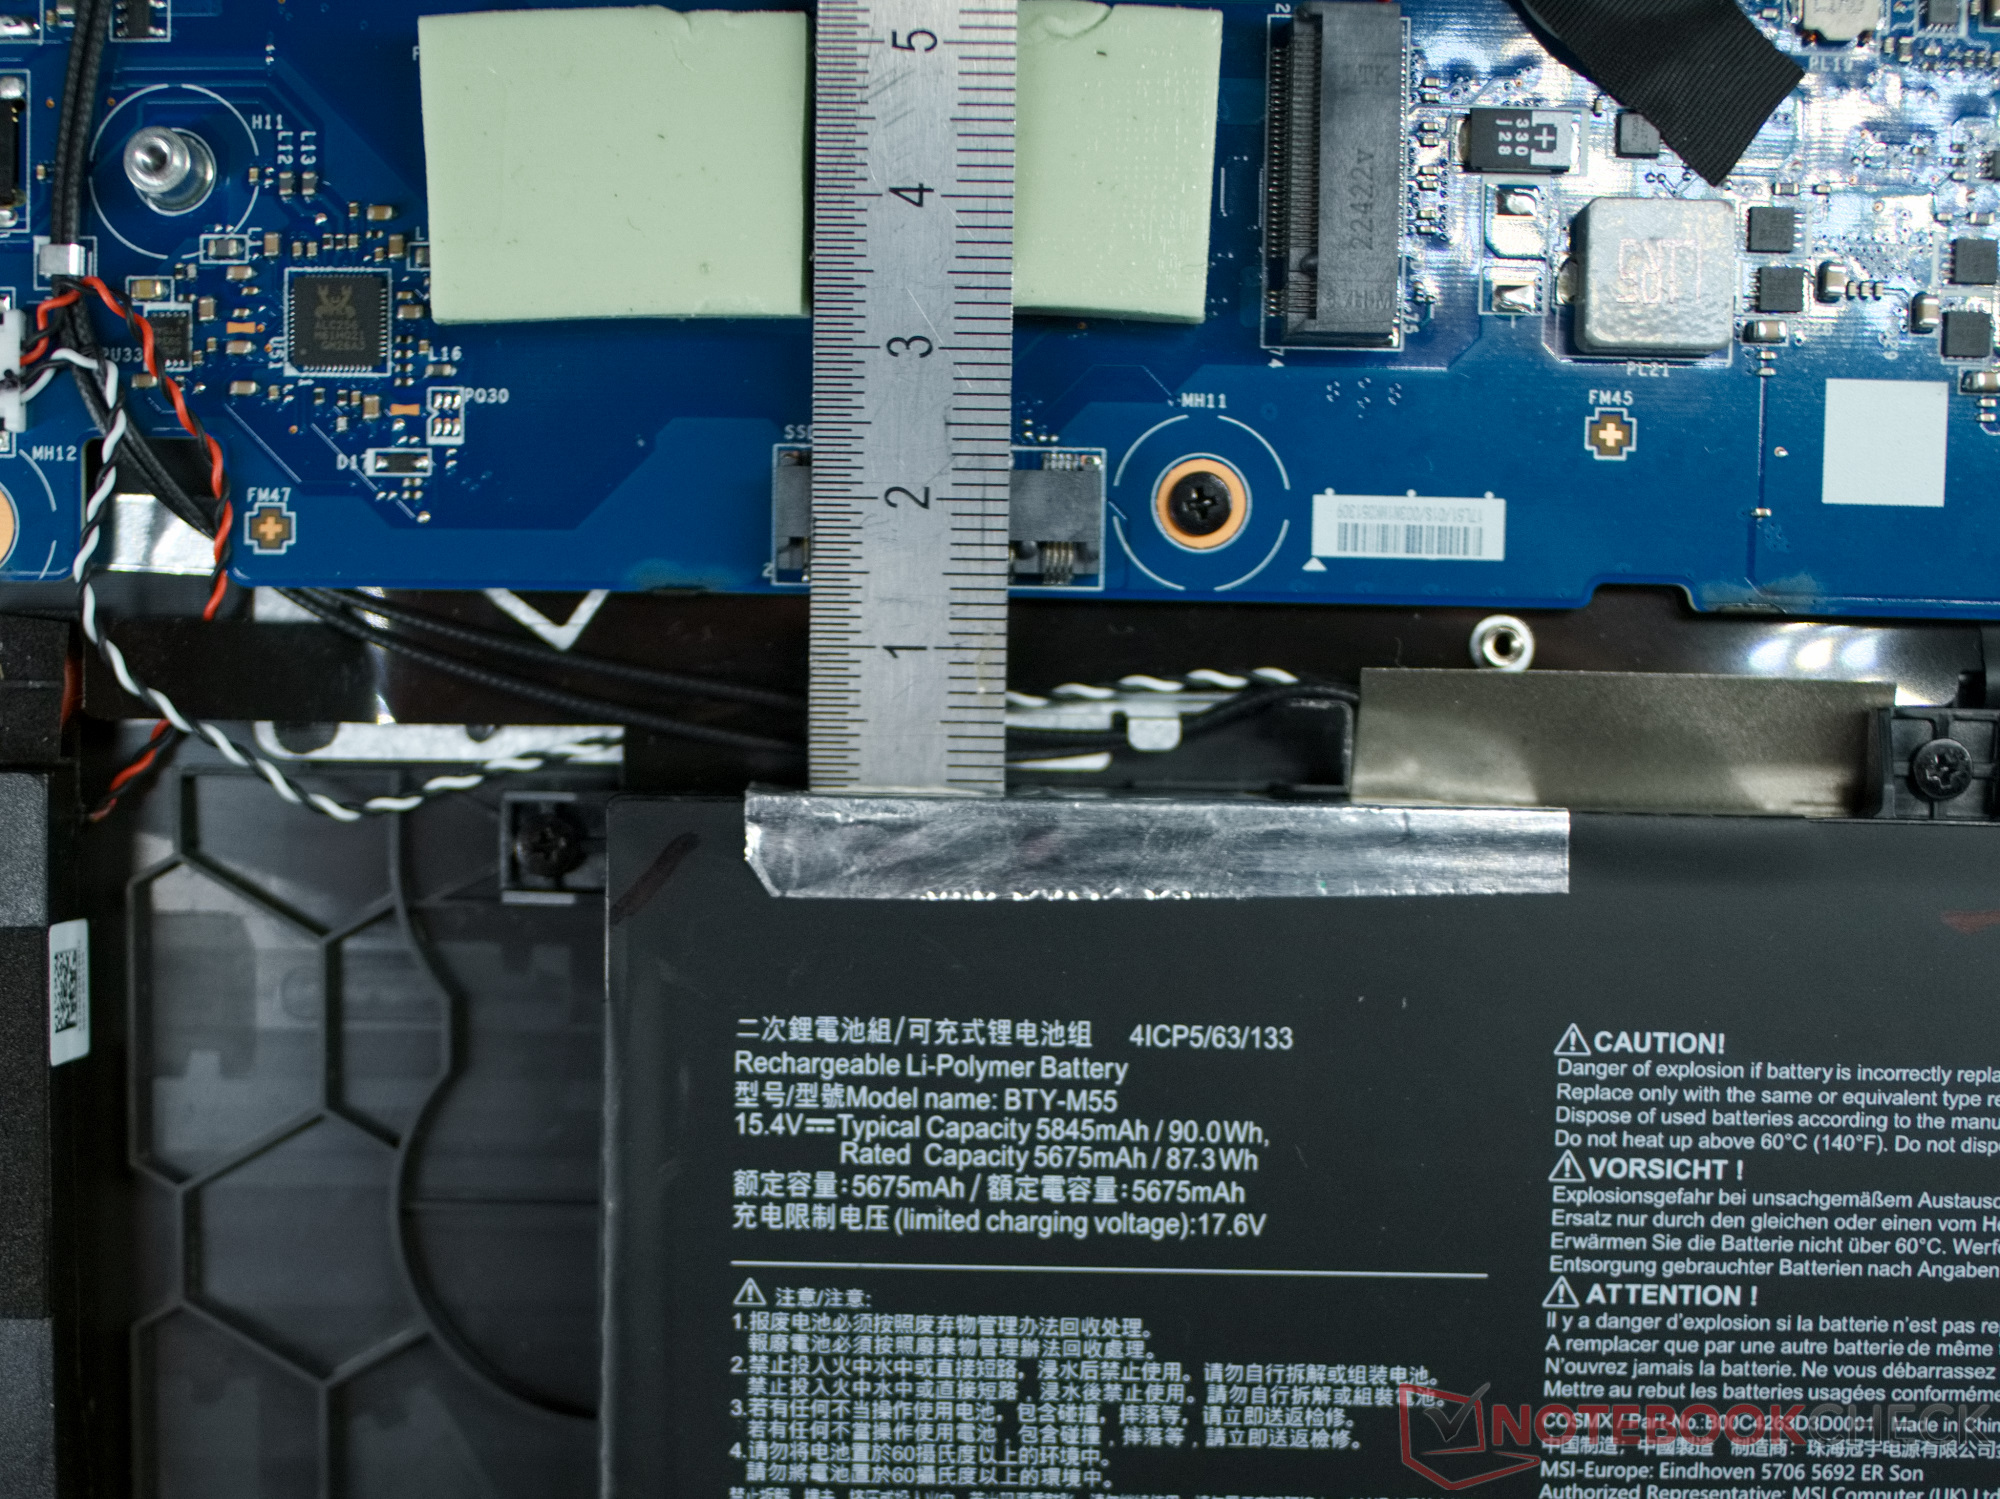
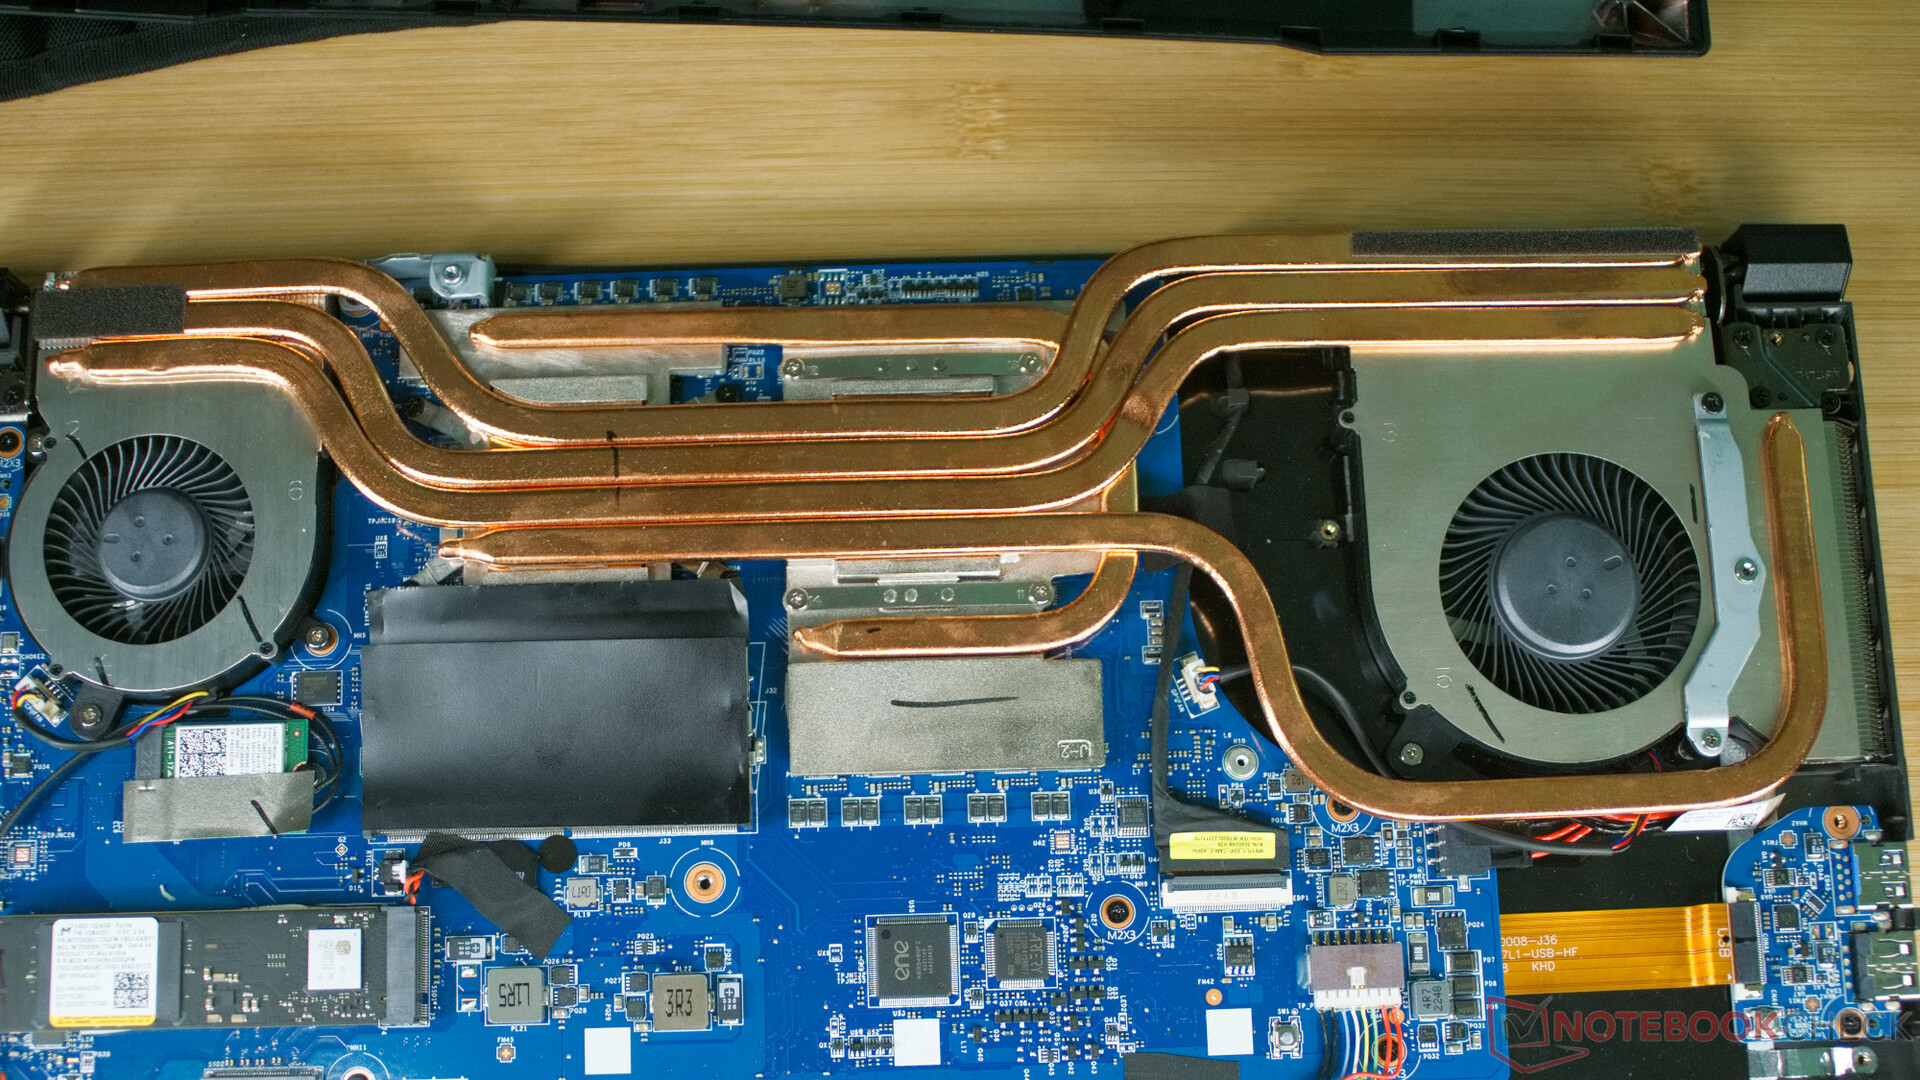
Im Inneren des Laptops finden wir einen recht modularen Aufbau vor, sodass RAM, NVMe SSD und das WLAN/Modul schnell getauscht werden könnten. Akku, Lautsprecher und die Platine mit den beiden USB-Anschlüssen ließen sich ebenfalls leicht tauschen. Wer regelmäßig zwischen Lüftern und Kühlkörpern den Staub entfernen will, muss hier jedoch das komplette Kühlsystem entfernen.
Im Laptop gibt es auch einen zweiten M.2-PCIe-Slot. Jedoch wird der vom Akku blockiert. Eine zweite SSD lässt sich so wohl nur mit einer Lösung, die auf Adapter und Kabel zurückgreift, bewerkstelligen.
Garantie
MSI gewährt Käufern in Europa 24 Monate Garantie.
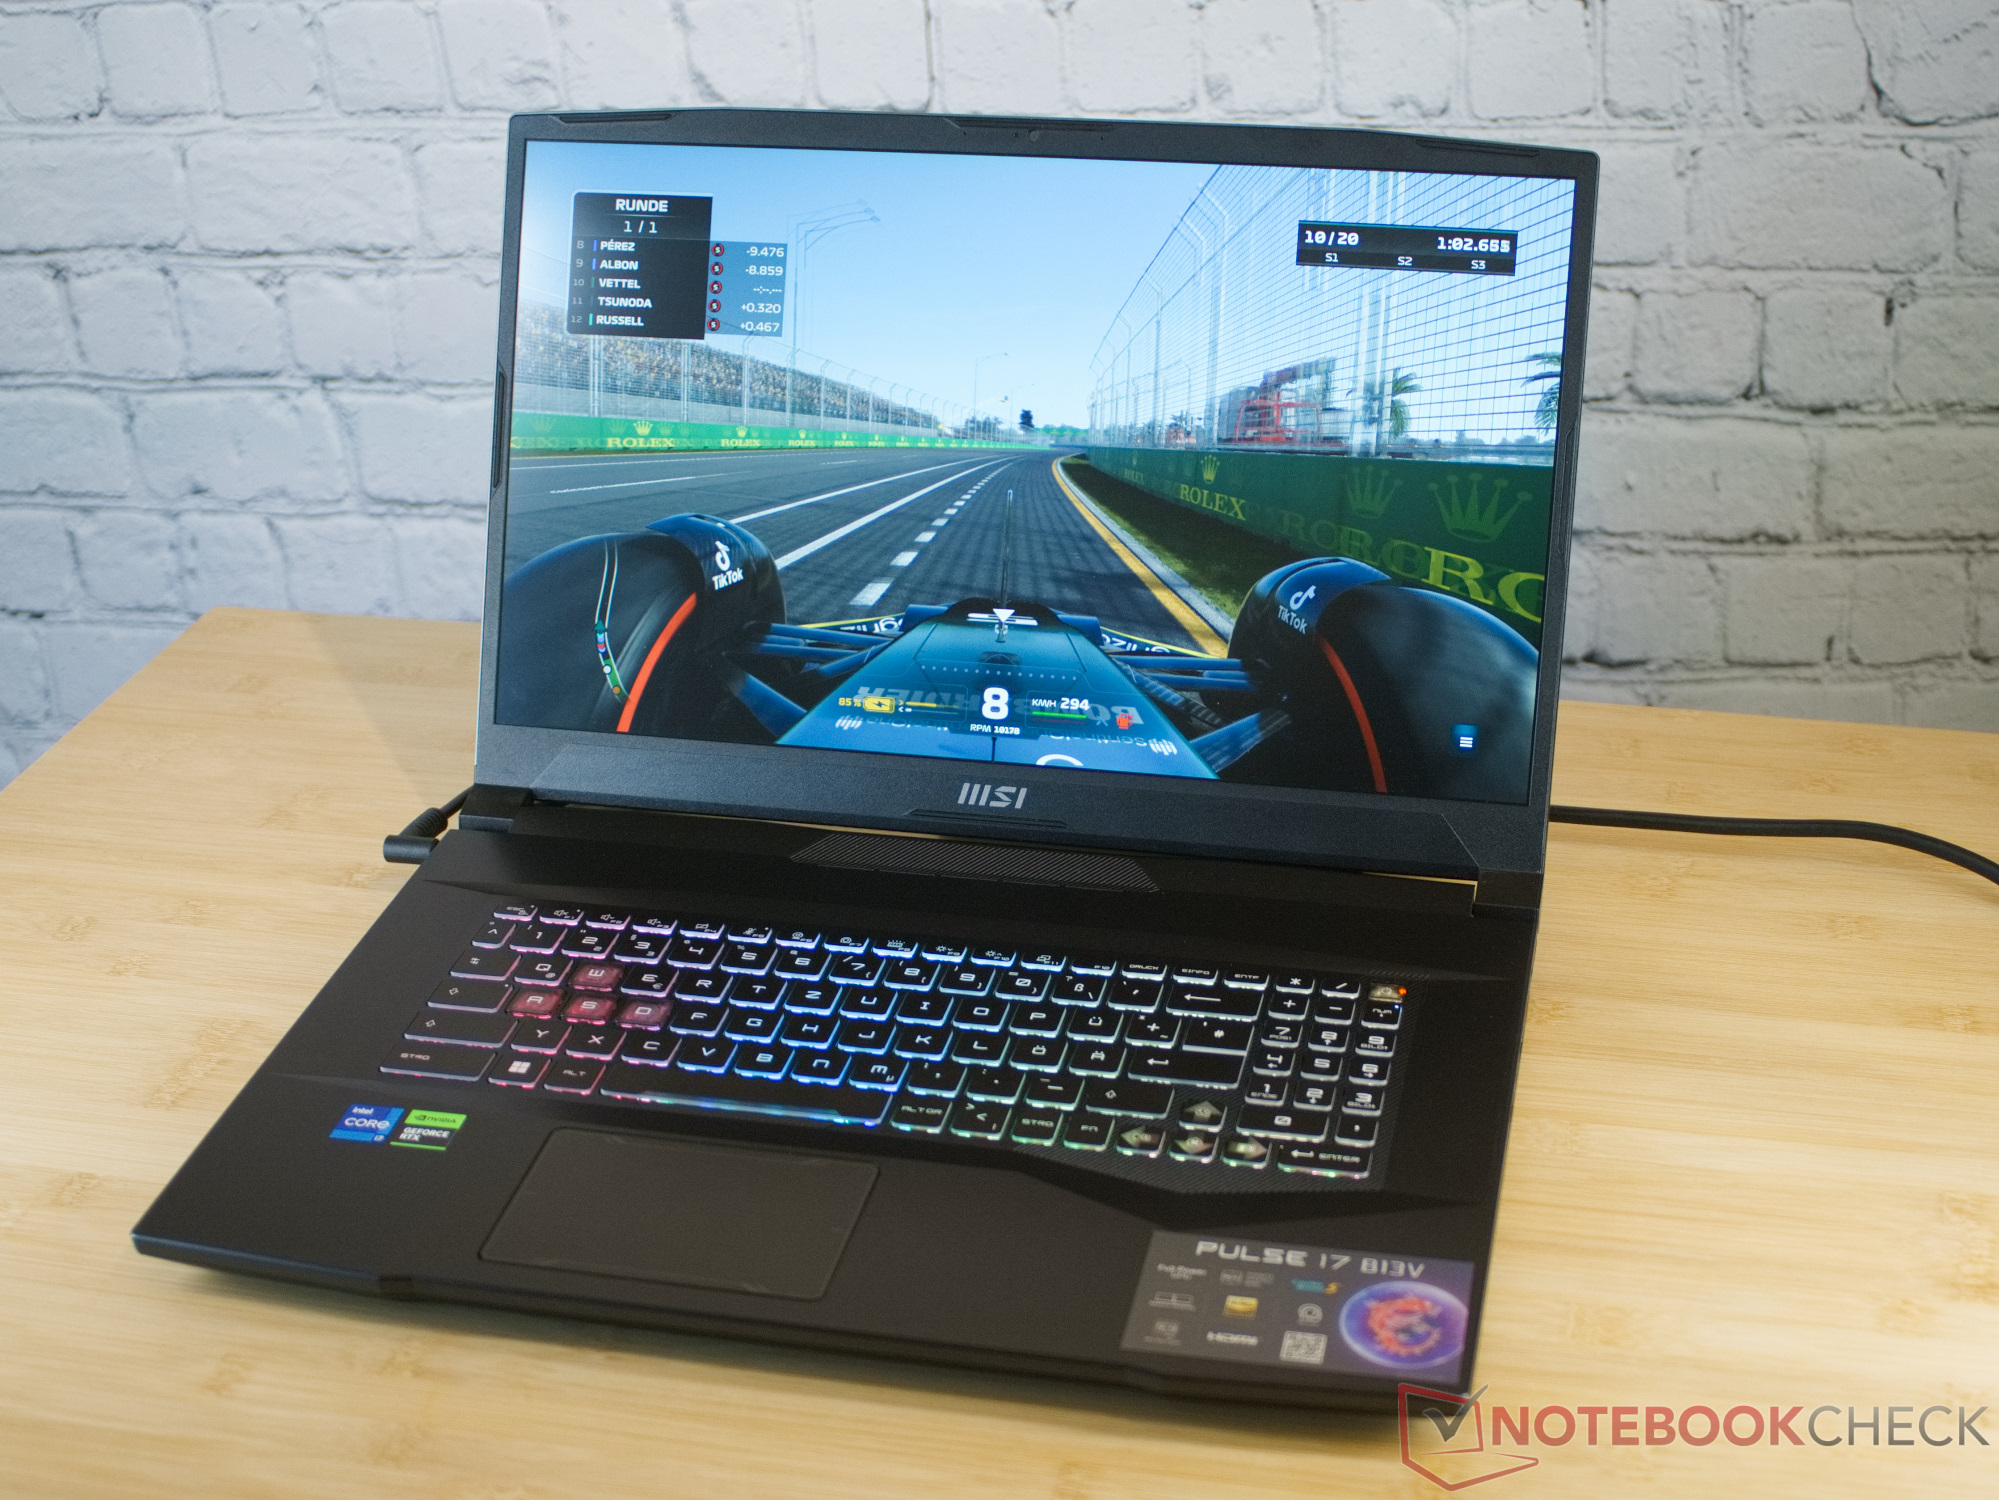
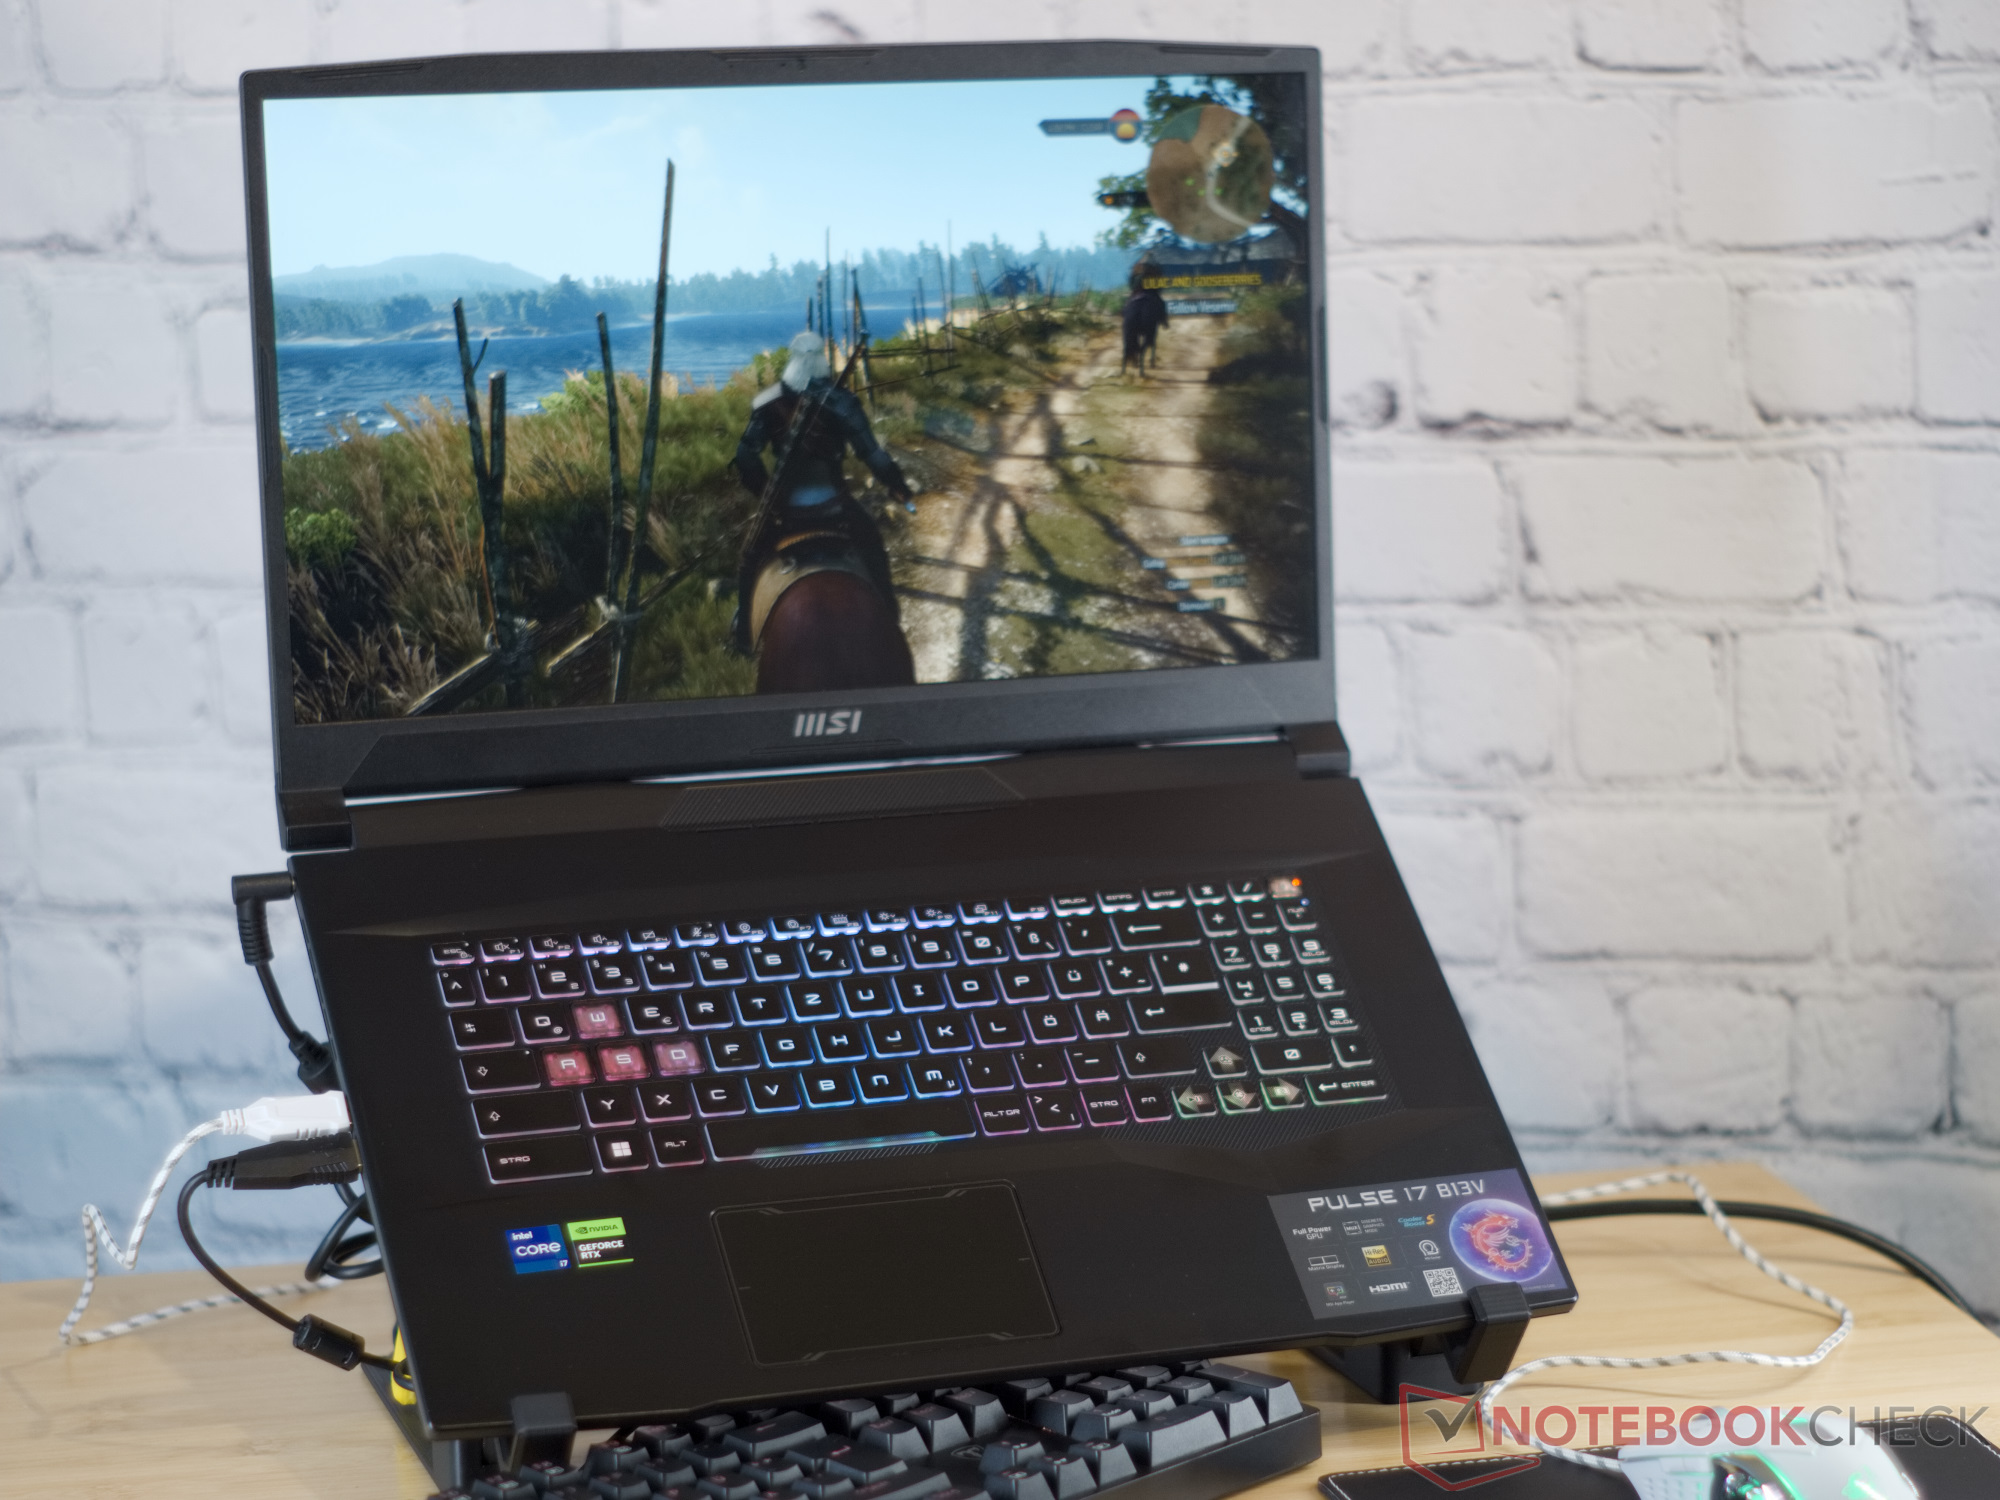
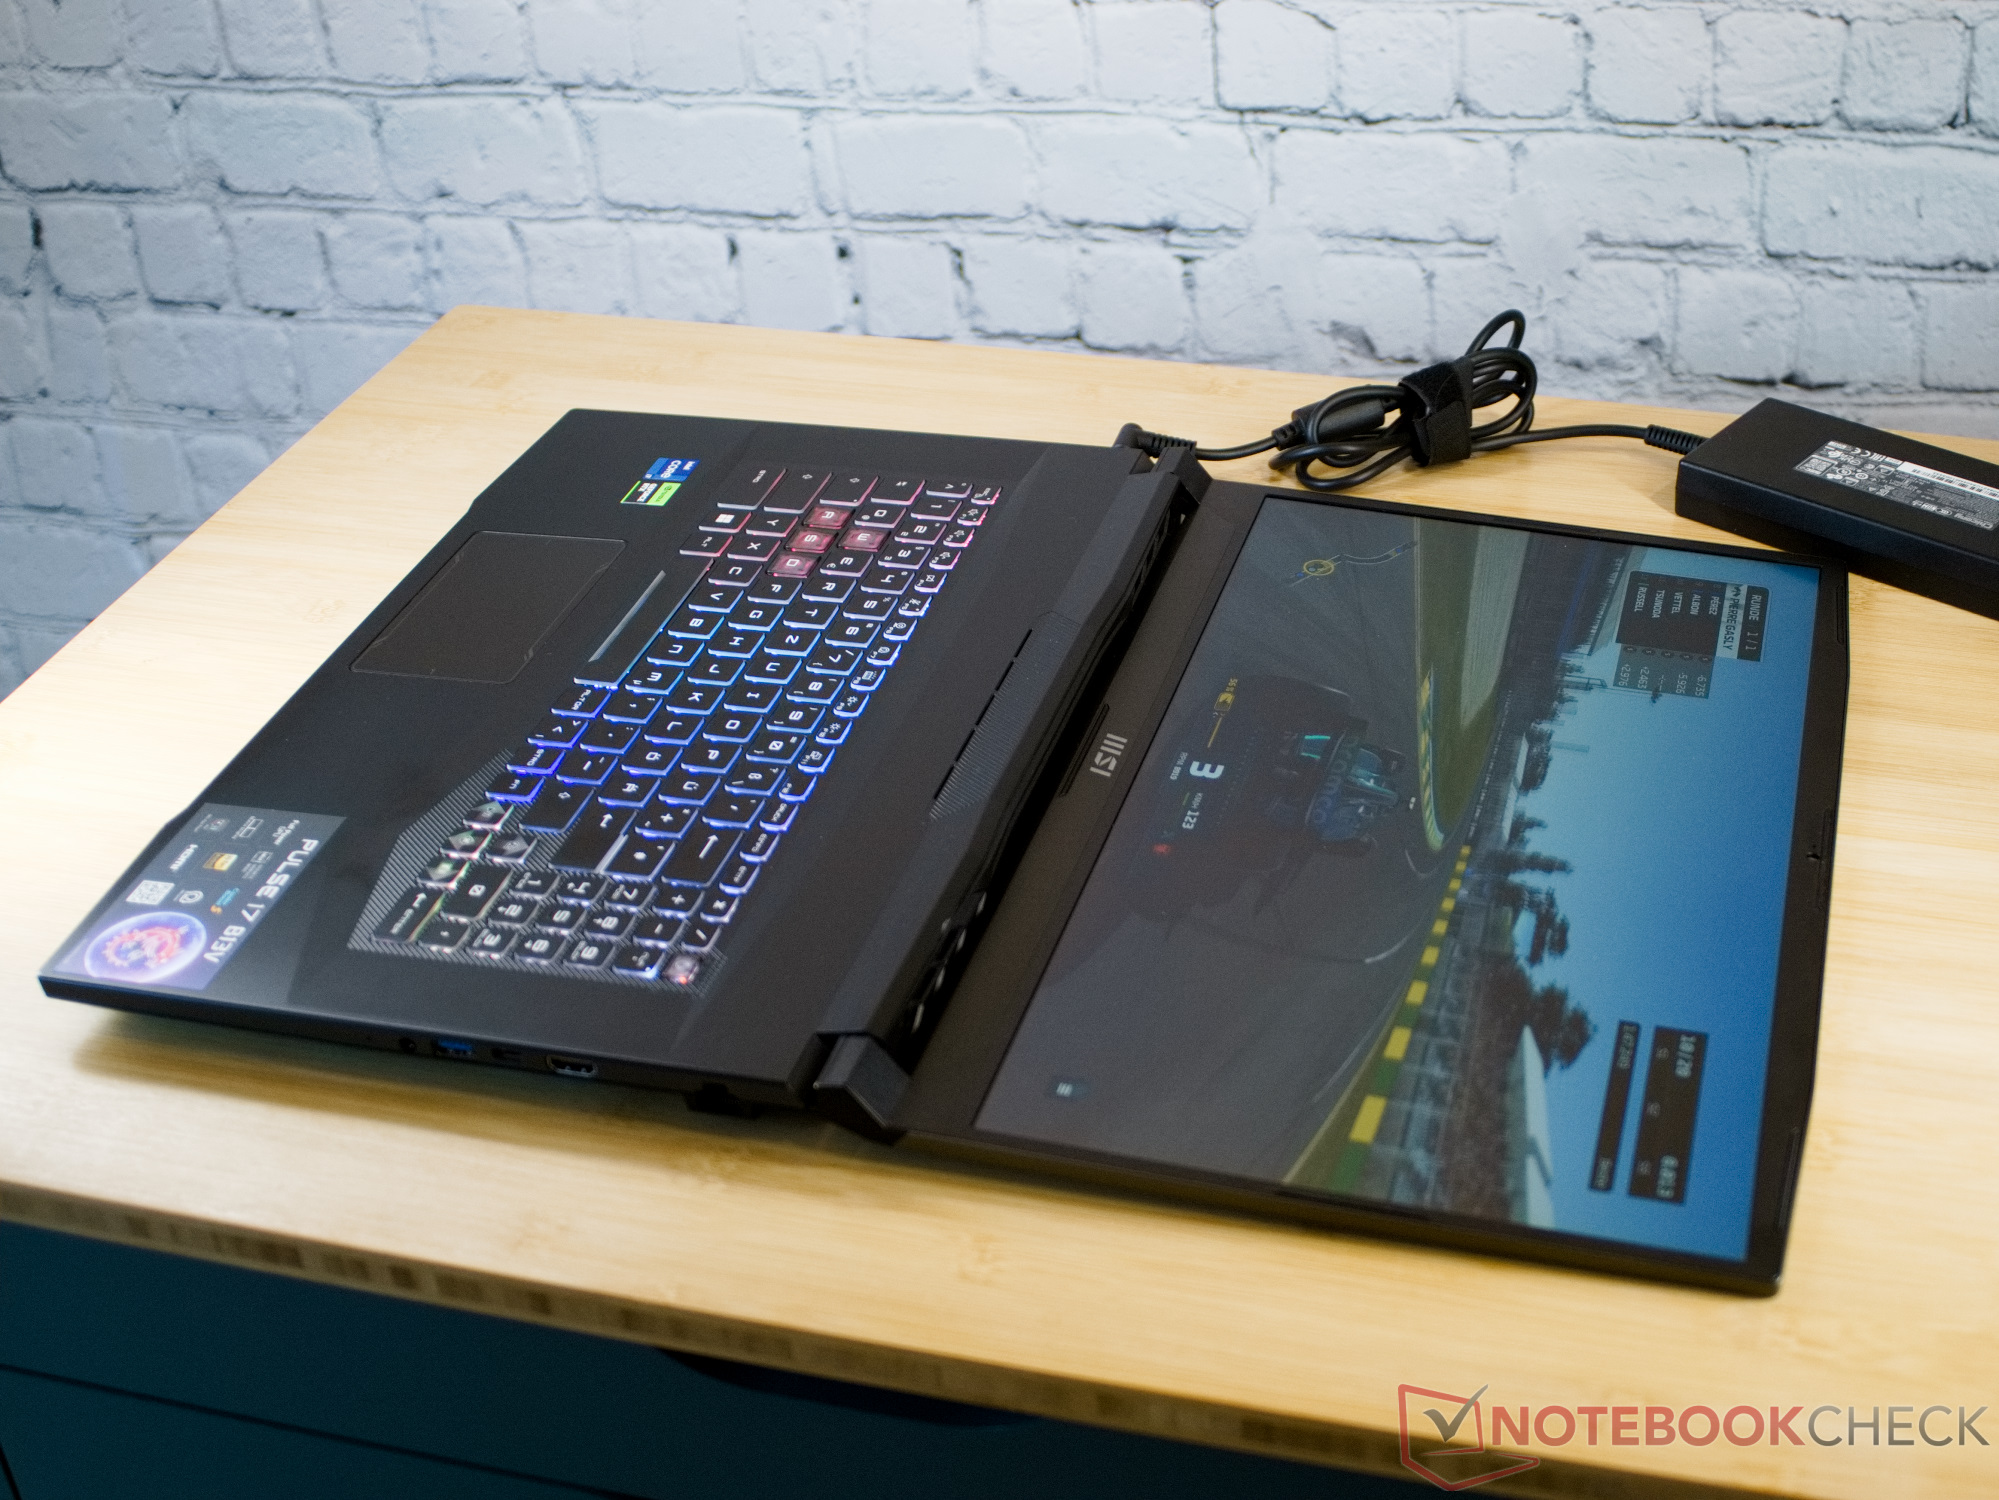
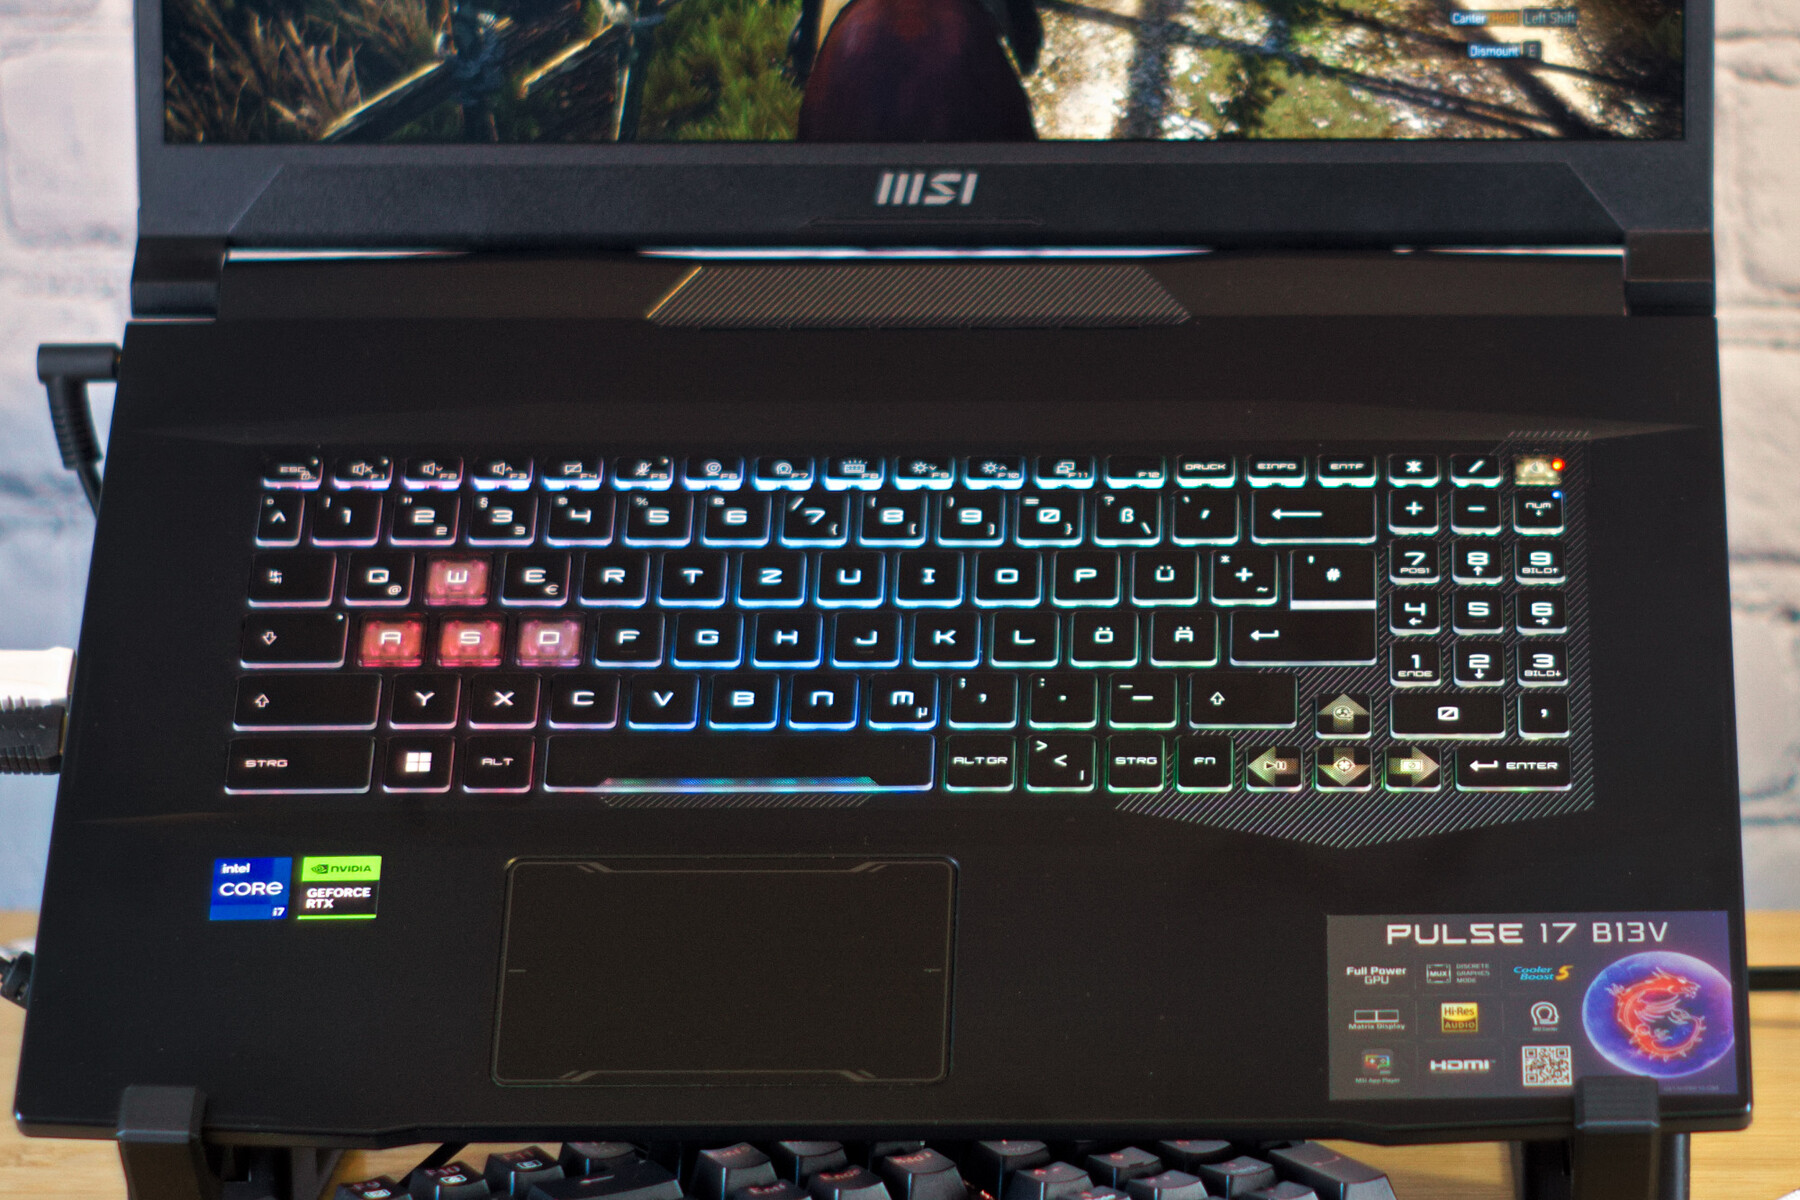
Eingabegeräte - Vier Zonen RGB und kleines Touchpad beim MSI Pulse
Tastatur
Über das MSI Control Center kann die RGB-Hintergrundbeleuchtete Tastatur des MSI Pluse 17 gesteuert werden. Der Hersteller erlaubt jedoch auch die Verwendung von Drittanbietersoftware, um die Farben und Effekte in den vier Beleuchtungsbereichen der Tastatur zu steuern. Haptisch bietet die Tastatur ein gutes Feedback und einen Tastenhub von etwa 1,2 mm. Die transparenten W-, A-, S-, D-Tasten werden hier besonders betont.
Touchpad
Das Touchpad am Pulse 17 ist relativ klein, aber so gerät es beim Zocken auch nicht in den Weg der Handballen. Prinzipiell funktioniert es dank einer gleitfähigen Oberfläche, knackigen Tasten und hoher Präzision gut.
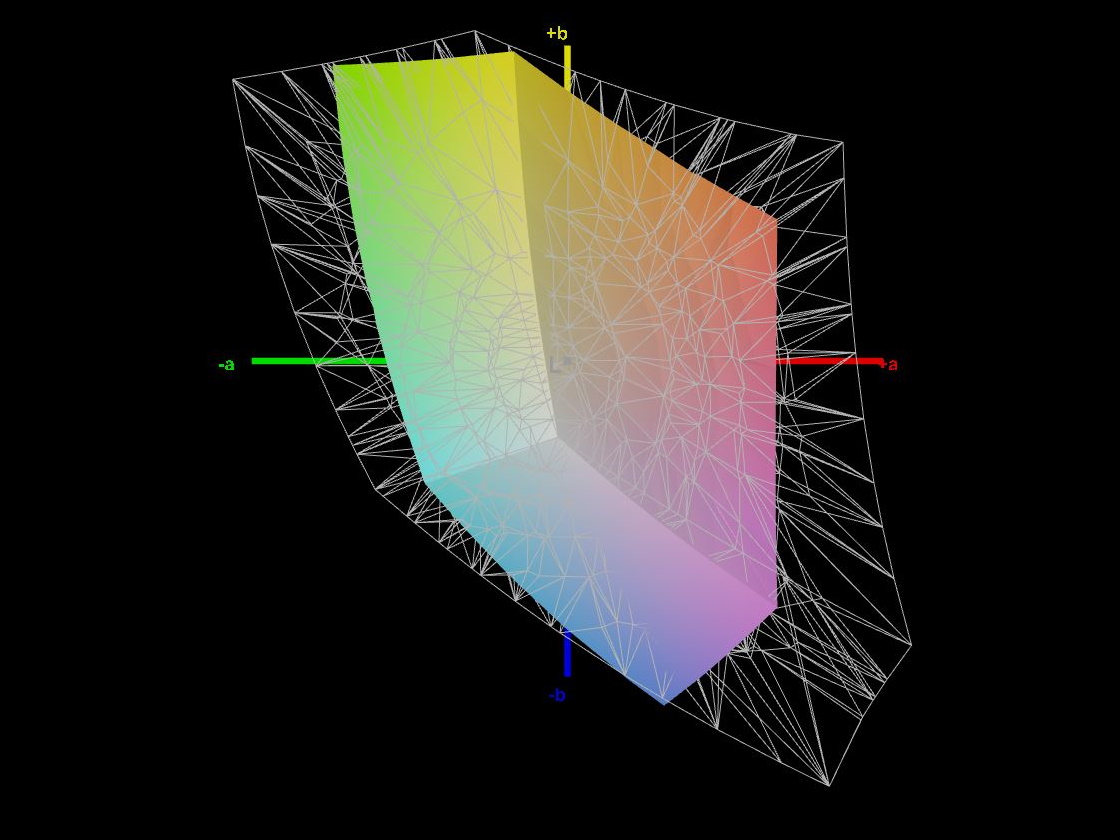
Display - Unter 60 % sRGB-Wiedergabe
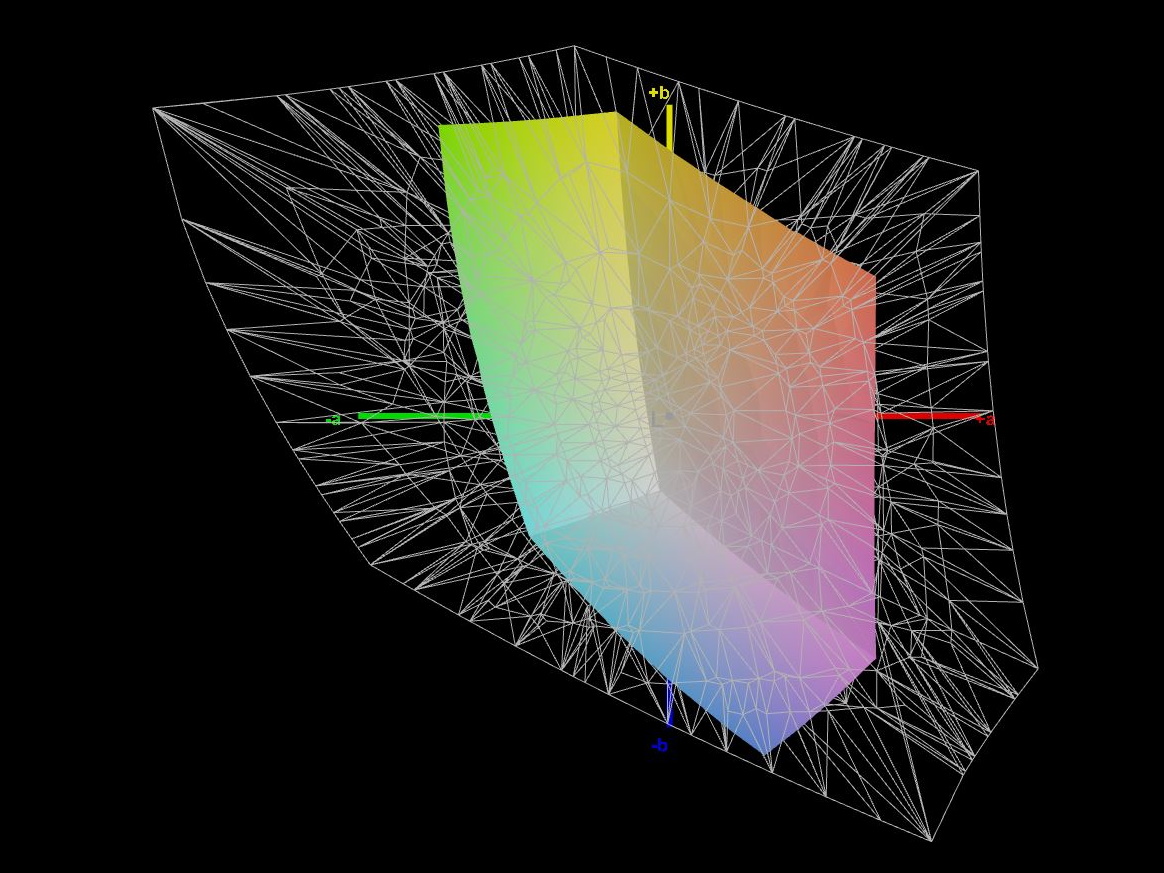
Bei einem Gaming-Laptop sollte der Bildschirm reaktionsschnell sein, den sRGB-Farbraum vollständig abdecken und kontrastreich sein. Nur ein hohes Kontrastverhältnis können wir dem MSI Pulse zugutehalten. Mit einer durchschnittlichen Helligkeit von 250 cd/m² ist das matte Display nicht besonders hell, aber der geringe Schwarzwert sorgt für das hohe Kontrastverhältnis. Die Ausleuchtung ist hier nicht allzu gleichmäßig, aber immerhin lassen sich keine wahrnehmbaren Lichthöfe feststellen.
So hat sich der Bildschirm des Pulse 17 im Vergleich zum Pulse GL76 deutlich verschlechtert. Die Reaktionszeiten haben sich im Vergleich nahezu verdoppelt bis versechsfacht, während sich die Anzahl der darstellbaren Farben nahezu halbiert hat. MSI hat beim Bildschirm ein deutliches Downgrade vorgenommen.
| |||||||||||||||||||||||||
Ausleuchtung: 91 %
Helligkeit Akku: 253 cd/m²
Kontrast: 1814:1 (Schwarzwert: 0.14 cd/m²)
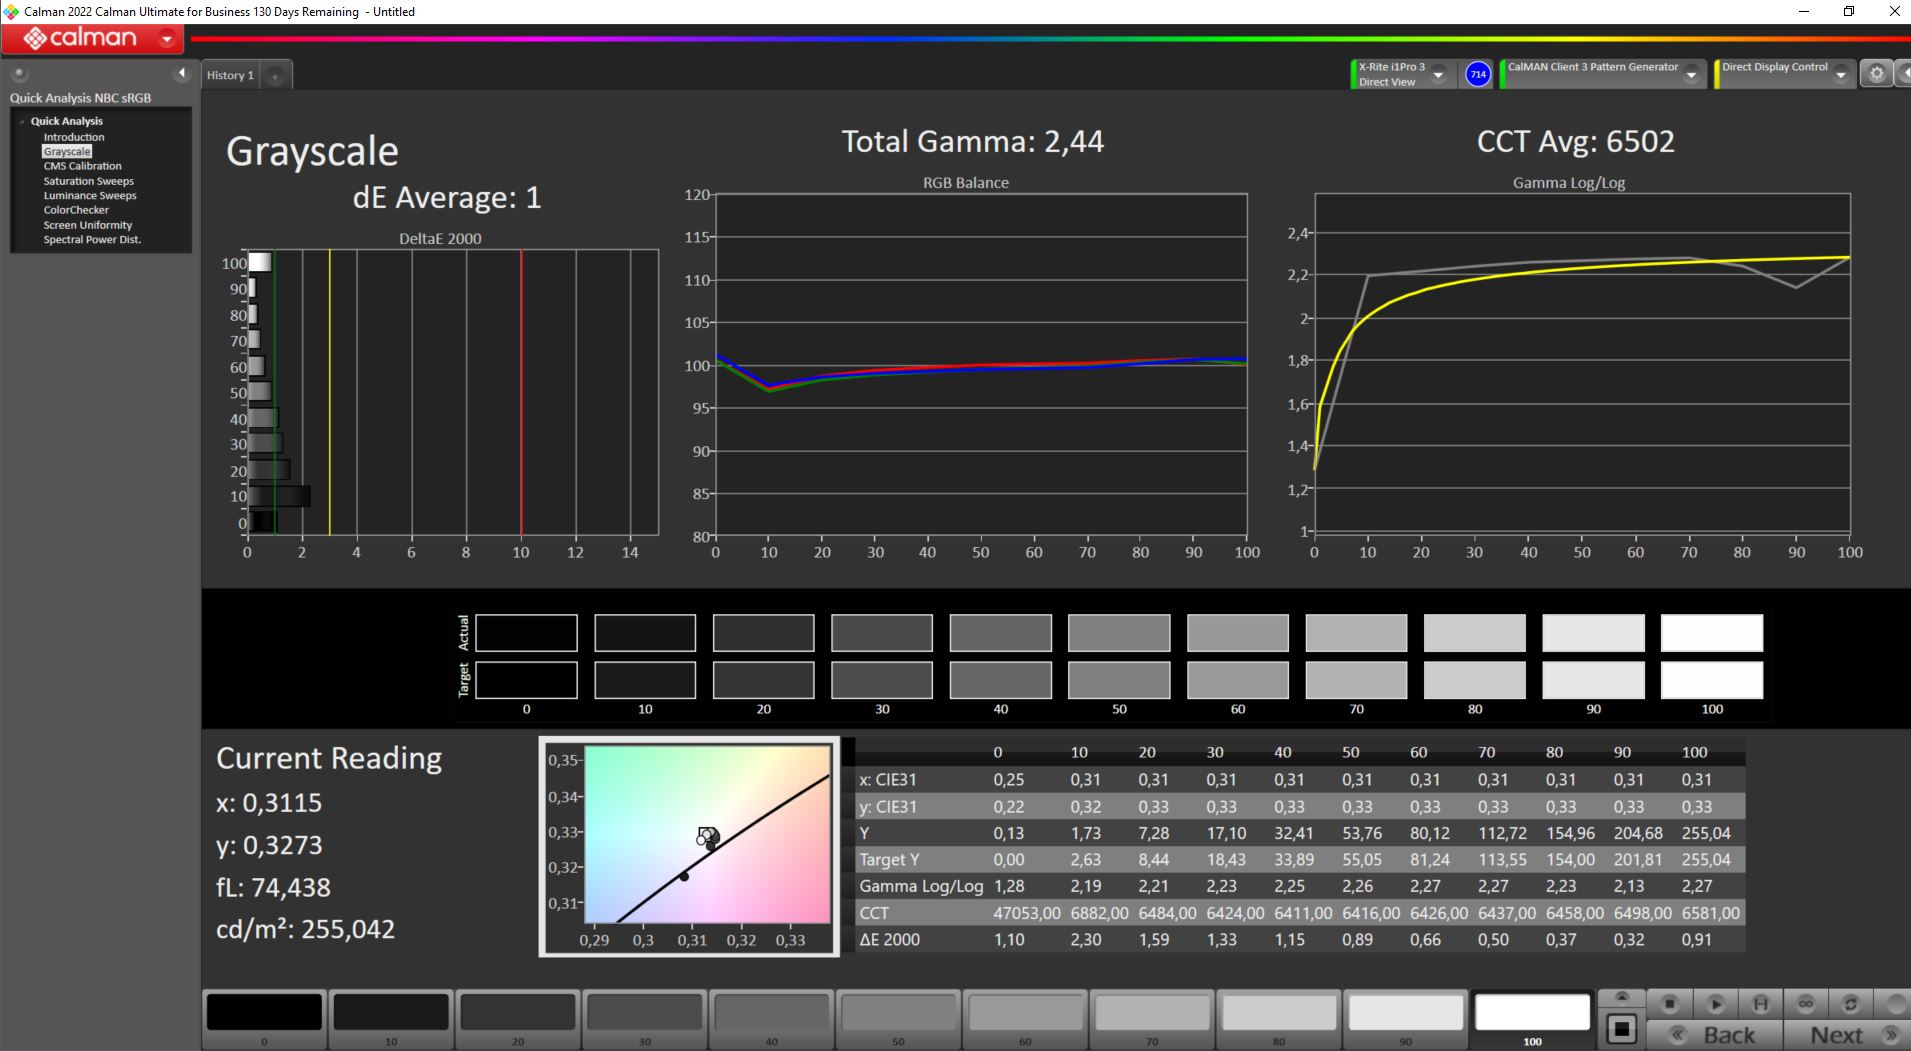
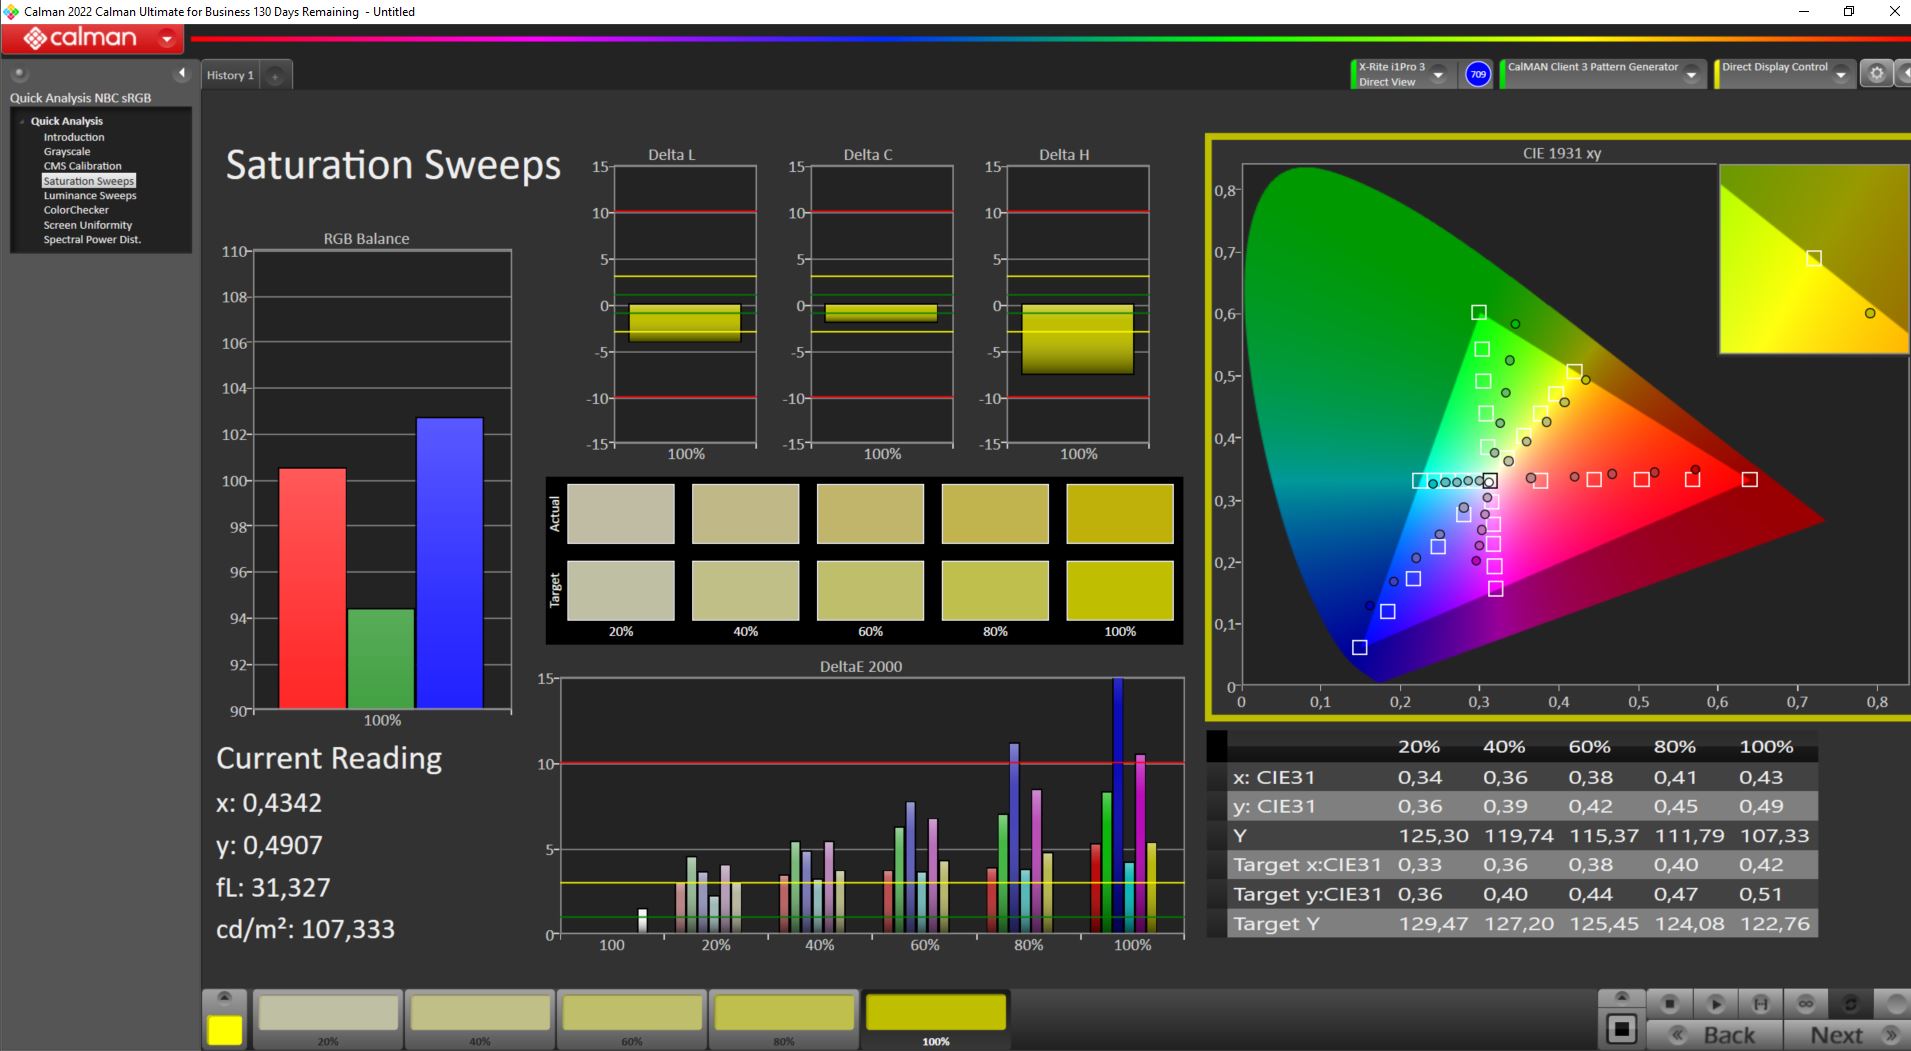
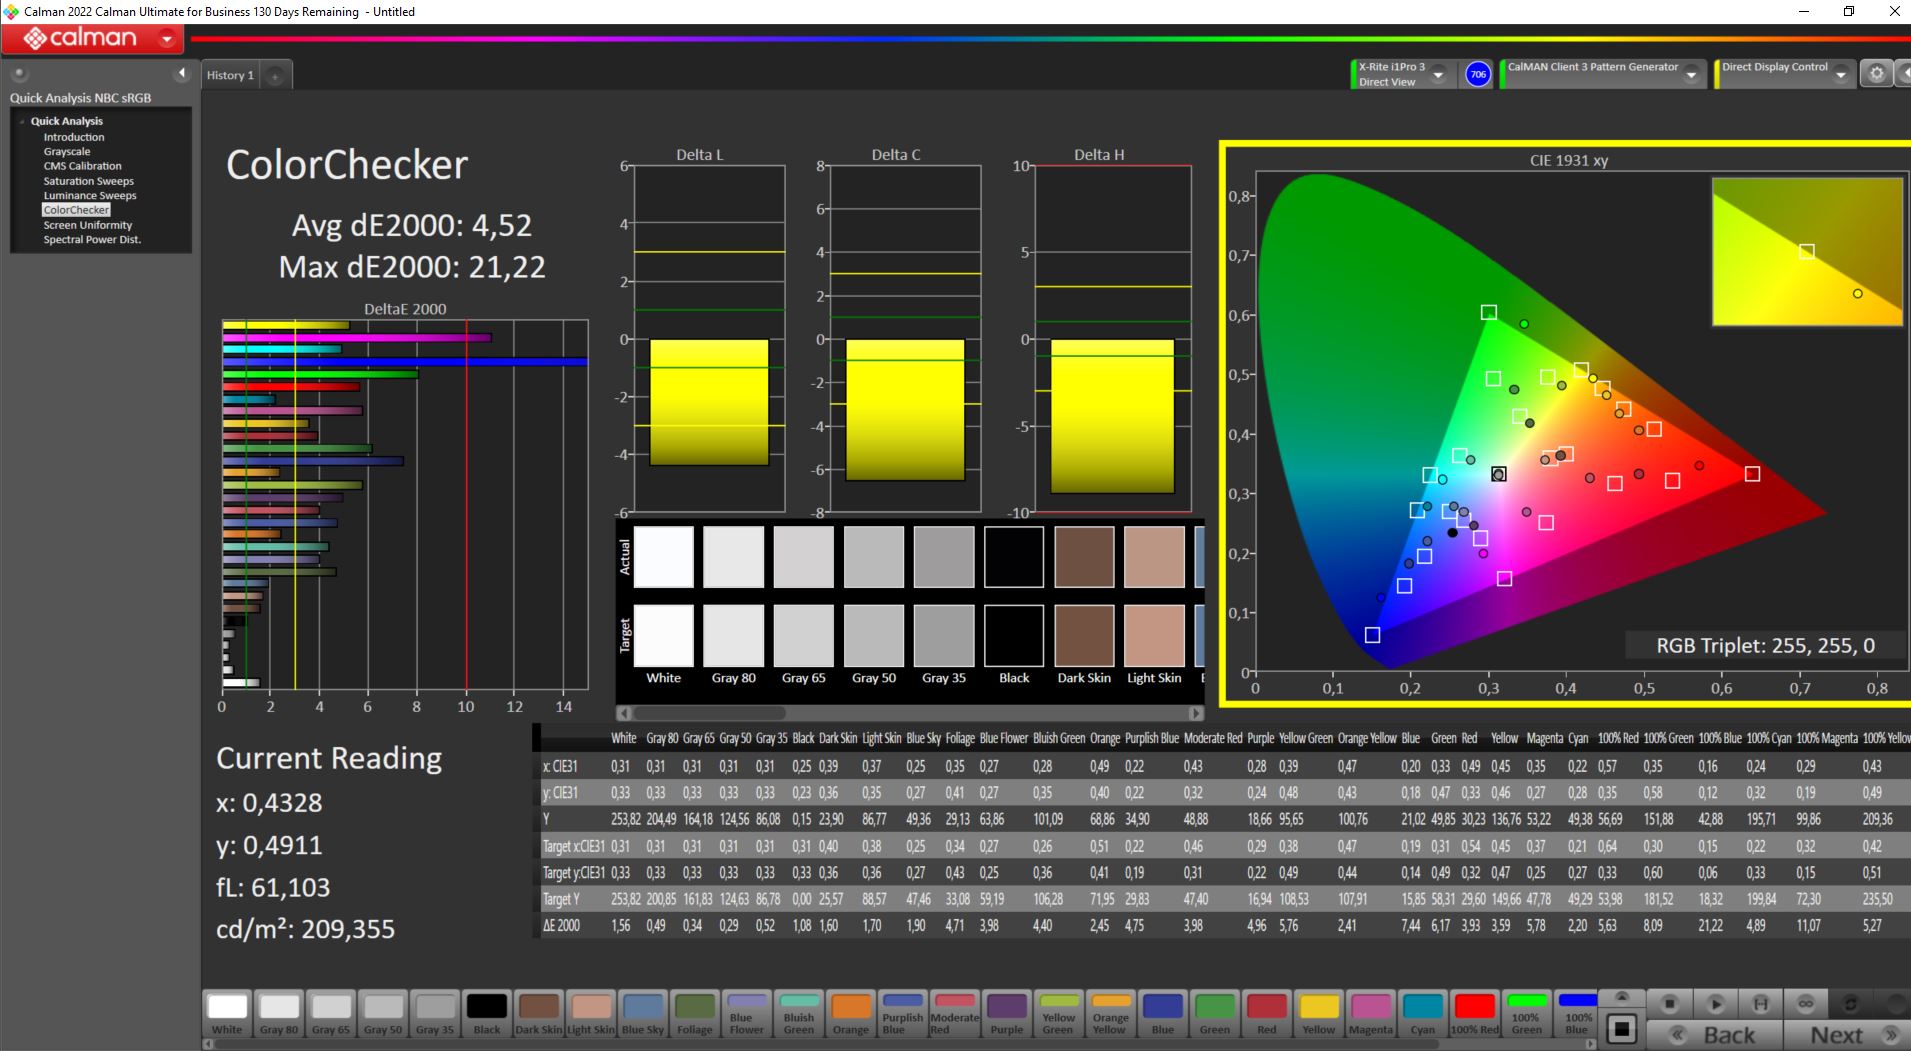
ΔE ColorChecker Calman: 4.52 | ∀{0.5-29.43 Ø4.72}
calibrated: 4.52
ΔE Greyscale Calman: 1 | ∀{0.09-98 Ø4.97}
39.7% AdobeRGB 1998 (Argyll 3D)
57.5% sRGB (Argyll 3D)
38.4% Display P3 (Argyll 3D)
Gamma: 2.44
CCT: 6502 K
| MSI Pulse 17 B13VGK AU Optronics B173HAN04.9, IPS, 1920x1080, 17.3" | MSI Pulse GL76 12UGK Sharp LQ173M1JW08, IPS, 1920x1080, 17.3" | MSI Katana 17 B13VFK B173HAN04.9, IPS LED, 1920x1080, 17.3" | Acer Nitro 17 AN17-51-71ER BOE0B7C NE173QHM-NY6, , 2560x1440, 17.3" | Schenker XMG Focus 17 (E23) BOE09F9 NE173QHM-NZ1, IPS, 2560x1440, 17.3" | Asus ROG Strix G17 G713PI BOE0B69, IPS, 2560x1440, 17.3" | |
|---|---|---|---|---|---|---|
| Display | 82% | 6% | 115% | 113% | 115% | |
| Display P3 Coverage (%) | 38.4 | 71.9 87% | 40.8 6% | 98.3 156% | 96.6 152% | 98.3 156% |
| sRGB Coverage (%) | 57.5 | 99.9 74% | 61 6% | 100 74% | 99.9 74% | 100 74% |
| AdobeRGB 1998 Coverage (%) | 39.7 | 73.7 86% | 42.2 6% | 85.7 116% | 84.5 113% | 85.9 116% |
| Response Times | 69% | -8% | 60% | 51% | 74% | |
| Response Time Grey 50% / Grey 80% * (ms) | 31.2 ? | 4.6 ? 85% | 33 ? -6% | 14.8 ? 53% | 16.4 ? 47% | 5.3 ? 83% |
| Response Time Black / White * (ms) | 23.6 ? | 11.2 ? 53% | 26 ? -10% | 8 ? 66% | 10.8 ? 54% | 8.6 ? 64% |
| PWM Frequency (Hz) | ||||||
| Bildschirm | -55% | -13% | -50% | -10% | 2% | |
| Helligkeit Bildmitte (cd/m²) | 254 | 337.7 33% | 267 5% | 361 42% | 349 37% | 327 29% |
| Brightness (cd/m²) | 250 | 331 32% | 256 2% | 326 30% | 318 27% | 320 28% |
| Brightness Distribution (%) | 91 | 82 -10% | 93 2% | 87 -4% | 82 -10% | 89 -2% |
| Schwarzwert * (cd/m²) | 0.14 | 0.31 -121% | 0.21 -50% | 0.6 -329% | 0.56 -300% | 0.38 -171% |
| Kontrast (:1) | 1814 | 1089 -40% | 1271 -30% | 602 -67% | 623 -66% | 861 -53% |
| Delta E Colorchecker * | 4.52 | 4.12 9% | 4.7 -4% | 3.83 15% | 1.08 76% | 1.01 78% |
| Colorchecker dE 2000 max. * | 21.22 | 8.89 58% | 20.4 4% | 5.71 73% | 3.05 86% | 4.01 81% |
| Colorchecker dE 2000 calibrated * | 4.52 | 0.98 78% | 4.5 -0% | 3.48 23% | 1.08 76% | 0.41 91% |
| Delta E Graustufen * | 1 | 6.3 -530% | 1.5 -50% | 3.29 -229% | 1.14 -14% | 1.6 -60% |
| Gamma | 2.44 90% | 2.48 89% | 2.12 104% | 2.29 96% | 2.41 91% | 2.168 101% |
| CCT | 6502 100% | 6542 99% | 6552 99% | 6679 97% | 6687 97% | 6659 98% |
| Durchschnitt gesamt (Programm / Settings) | 32% /
-8% | -5% /
-9% | 42% /
1% | 51% /
25% | 64% /
37% |
* ... kleinere Werte sind besser
Bei unter 40 % liegt die Wiedergabe von AdobeRGB und dem DisplayP3-Farbraum, selbst sRGB kann das Pulse 17 nicht einmal zu 60 % wiedergeben.
Der Calman zeigt immerhin ein gutes Ergebnis bei der Darstellung von Graustufen. Die Prüfung der genauen Farbdarstellung per Calman ColorChecker zeigt jedoch die Grenzen des Displays deutlich auf. Mit nur 60 % sRGB-Darstellung verfehlt der Bildschirm deutlich einen Großteil der Farben und landet hier bei Rot, Grün und Blau entsprechend weit neben der Farbskala. So ergibt sich eine maximale Farbabweichung von ΔΕ 21,22. Ein sehr hoher Wert, den keines unserer Vergleichsgeräte knackt. Bei den durchschnittlichen Farbabweichungen stellt sich der Bildschirm jedoch etwas besser dar. Kalibrieren verändert aber nichts an dem Ergebnis, sodass selbst das MSI Katana mit unserem ICC-Profil weniger Farbabweichungen vorweisen kann.
Reaktionszeiten (Response Times) des Displays
| ↔ Reaktionszeiten Schwarz zu Weiß | ||
|---|---|---|
| 23.6 ms ... steigend ↗ und fallend ↘ kombiniert | ↗ 12.2 ms steigend | 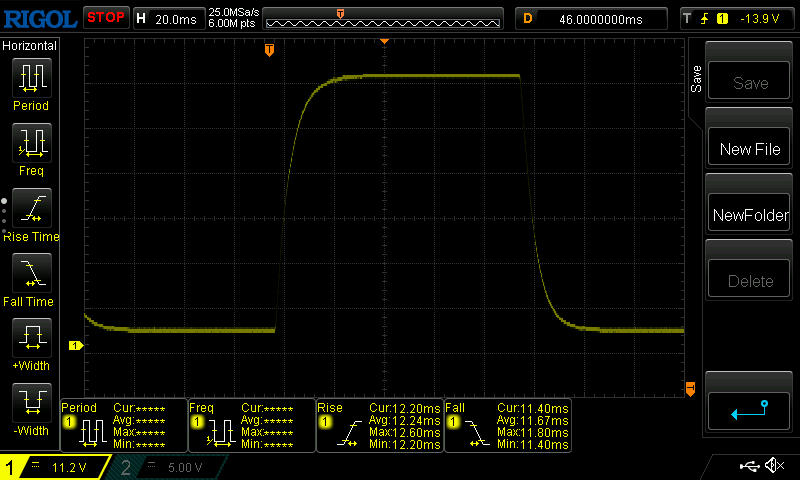 |
| ↘ 11.4 ms fallend | ||
| Die gemessenen Reaktionszeiten sind gut, für anspruchsvolle Spieler könnten der Bildschirm jedoch zu langsam sein. Im Vergleich rangierten die bei uns getesteten Geräte von 0.1 (Minimum) zu 240 (Maximum) ms. » 54 % aller Screens waren schneller als der getestete. Daher sind die gemessenen Reaktionszeiten schlechter als der Durchschnitt aller vermessenen Geräte (19.8 ms). | ||
| ↔ Reaktionszeiten 50% Grau zu 80% Grau | ||
| 31.2 ms ... steigend ↗ und fallend ↘ kombiniert | ↗ 14.2 ms steigend | 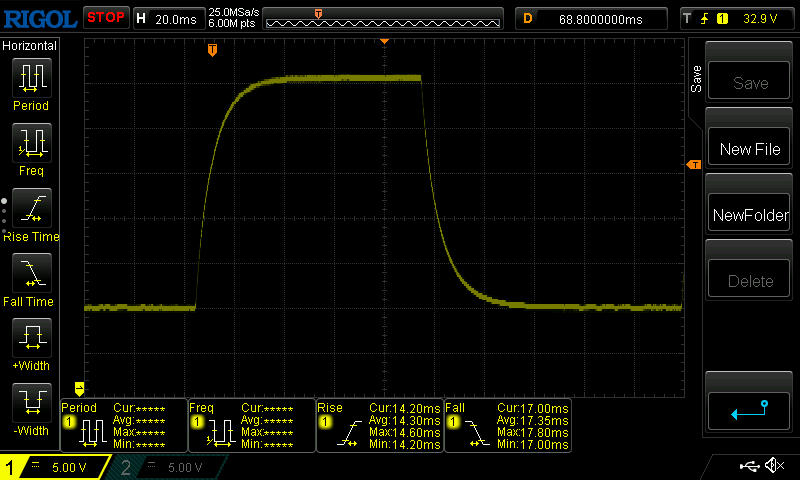 |
| ↘ 17 ms fallend | ||
| Die gemessenen Reaktionszeiten sind langsam und dadurch für viele Spieler wahrscheinlich zu langsam. Im Vergleich rangierten die bei uns getesteten Geräte von 0.165 (Minimum) zu 636 (Maximum) ms. » 42 % aller Screens waren schneller als der getestete. Daher sind die gemessenen Reaktionszeiten durchschnittlich (31 ms). | ||
Bildschirm-Flackern / PWM (Pulse-Width Modulation)
| Flackern / PWM nicht festgestellt | 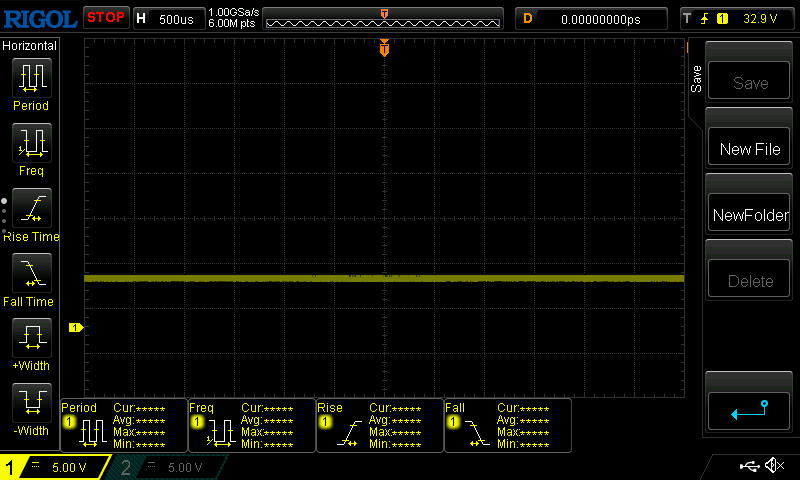 | ||
Im Vergleich: 52 % aller getesteten Geräte nutzten kein PWM um die Helligkeit zu reduzieren. Wenn PWM eingesetzt wurde, dann bei einer Frequenz von durchschnittlich 7763 (Minimum 5, Maximum 343500) Hz. | |||
Das IPS-Panel des Pulse 17 ist einigermaßen blickwinkelstabil, was die Farbdarstellung angeht, verliert jedoch mit steigendem Blickwinkel deutlich an Helligkeit. Im Außeneinsatz kann der Laptop nur bedingt überzeugen, da der Bildschirm nicht hell genug ist, um im Sonnenlicht zu bestehen. Auch unter Studiobeleuchtung wird schnell klar, dass der Bildschirm eher dunkel ist, und die matte Oberfläche doch relativ viel Licht spiegelt.


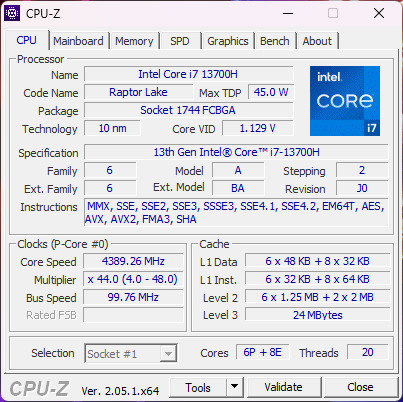
Leistung - Sehr starker Intel Core i7-13700H
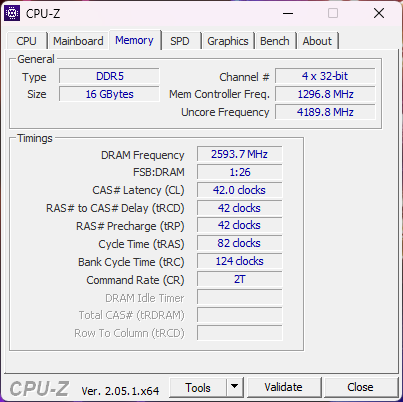
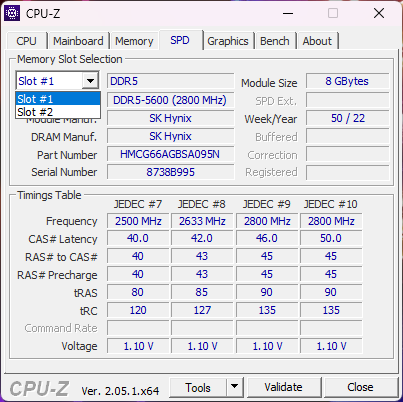
Das MSI Pulse 17 B13V gibt es in zwei Ausstattungsvarianten, die sich lediglich bei der GPU unterscheiden. In unserem Testgerät arbeitet die Nvidia GeForce RTX 4070, die andere Konfiguration kommt mit einer RTX 4060. Als Prozessor kommt der Intel Core i7-13700H zum Einsatz. Dieser wird begleitet von 16 GB DDR5-5200 RAM und einer SSD mit einem Fassungsvermögen von einem TB. Mit der starken Hardware-Konfiguration eignet sich unser Testgerät so zum Gaming bei Auflösungen über FullHD.

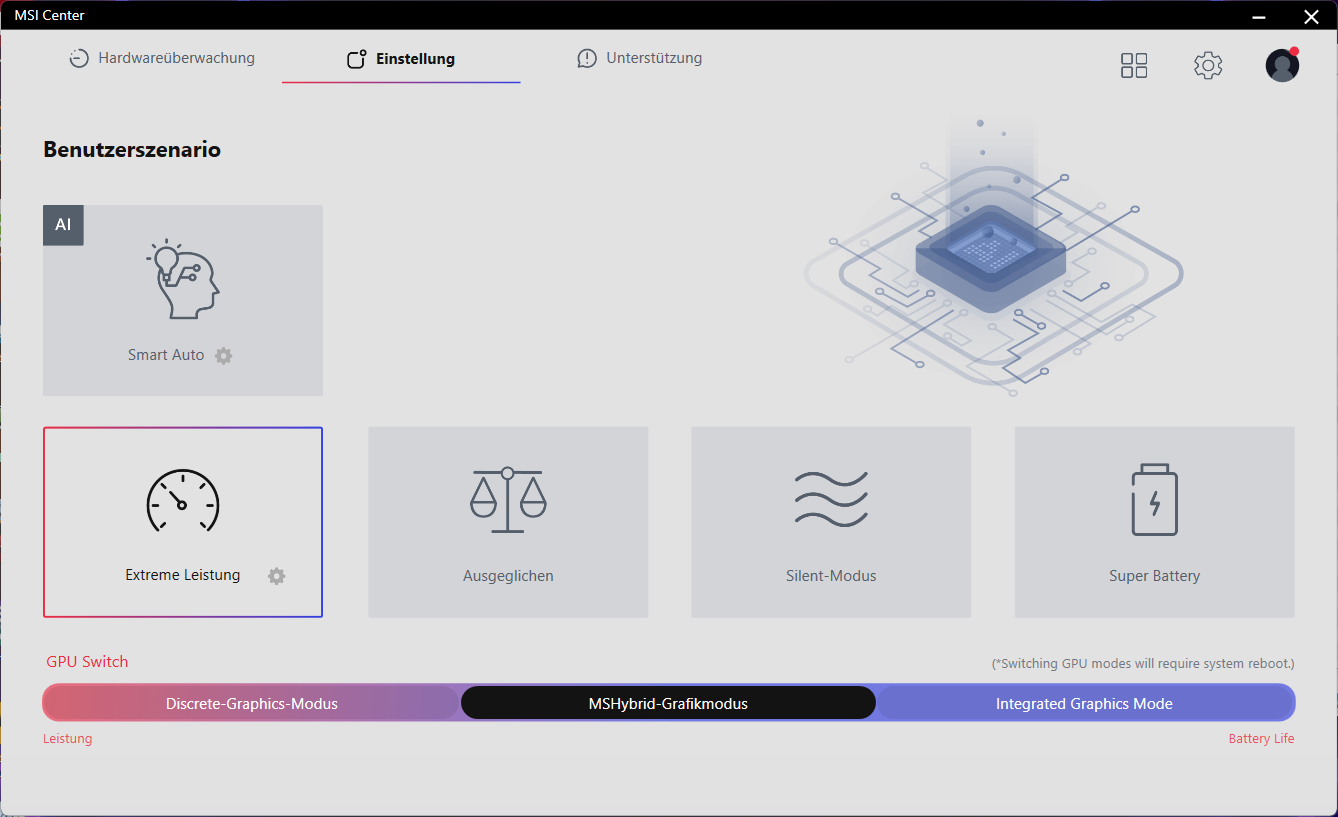
Leistungssteuerung und Testbedingungen
MSI liefert drei Leistungspläne und einen Akkusparplan mit dem Pulse 17. Zusätzlich könnte man auch auf MSIs KI-Plan umschalten. Arbeitet die CPU alleine, darf sie im Extremleistungsmodus mit einem PL1 von 90 Watt arbeiten. Die Boostleistung (PL2) liegt bei starken 140 Watt. Im ausgeglichenen Modus liegen PL1 und PL2 bei 70 respektive 120 Watt. Der ruhige Betriebsmodus, bei dem die Lüfter unhörbar sind, arbeitet mit 30 Watt ohne Boost.
Interessanter ist jedoch bei einem Gaming-Laptop die Leistung beim Spielen. Diese unterscheidet sich in allen drei Leistungsplänen während der ersten 10 Minuten in unserem Test kaum. Lediglich die Temperaturen liegen bei unterschiedlichen Werten. Der Leistungsmodus und der ausgeglichene Modus sorgen für konstante CPU und GPU Temperaturen. Im ruhigen Betriebsmodus steigen die Temperaturen so weit, dass hier nach etwa 10 Minuten abgeregelt wird und die Leistungen deutlich einbrechen.
Damit haben wir uns entschieden, alle generischen Benchmarks im Leistungsmodus auszuführen. Die Spiele-Benchmarks wurden hingegen im ausgeglichenen Modus durchgeführt. In allen getesteten Spielen haben wir zudem einen Benchmark auf höchsten Qualitätseinstellungen im Leistungsmodus durchgeführt. Die dabei erzielten FPS unterschieden sich durchgehen um weniger als einen Prozentpunkt. Der Leistungsmodus erzielt damit beim Gaming wohl kaum einen FPS-Vorteil.
Prozessor
Mit sechs P- und acht E-Kernen kommt der Intel Core i7-13700H im Pulse 17 auf 20 Threads. Der Prozessor wird hier mit vergleichsweise viel Energie versorgt, und kann sich so knapp an die Spitze der Vergleichsgeräte mit dem Core i7 setzen. Das XMG Focus 17 mit Core i9 und das Asus ROG Strix G17 mit Ryzen 9 übertreffen die i7-Prozessoren jedoch deutlich.
Cinebench R15 Multi Dauertest
Cinebench R23: Multi Core | Single Core
Cinebench R20: CPU (Multi Core) | CPU (Single Core)
Cinebench R15: CPU Multi 64Bit | CPU Single 64Bit
Blender: v2.79 BMW27 CPU
7-Zip 18.03: 7z b 4 | 7z b 4 -mmt1
Geekbench 5.5: Multi-Core | Single-Core
HWBOT x265 Benchmark v2.2: 4k Preset
LibreOffice : 20 Documents To PDF
R Benchmark 2.5: Overall mean
| CPU Performance Rating | |
| Asus ROG Strix G17 G713PI | |
| Schenker XMG Focus 17 (E23) | |
| Durchschnitt der Klasse Gaming | |
| MSI Pulse 17 B13VGK | |
| MSI Pulse GL76 12UGK | |
| Durchschnittliche Intel Core i7-13700H | |
| MSI Katana 17 B13VFK | |
| Acer Nitro 17 AN17-51-71ER | |
| Cinebench R23 / Multi Core | |
| Asus ROG Strix G17 G713PI | |
| Schenker XMG Focus 17 (E23) | |
| Durchschnitt der Klasse Gaming (10488 - 40970, n=110, der letzten 2 Jahre) | |
| Acer Nitro 17 AN17-51-71ER | |
| MSI Pulse 17 B13VGK | |
| MSI Pulse GL76 12UGK | |
| MSI Katana 17 B13VFK | |
| Durchschnittliche Intel Core i7-13700H (5890 - 20034, n=29) | |
| Cinebench R23 / Single Core | |
| Schenker XMG Focus 17 (E23) | |
| Durchschnitt der Klasse Gaming (1166 - 2356, n=110, der letzten 2 Jahre) | |
| Asus ROG Strix G17 G713PI | |
| MSI Katana 17 B13VFK | |
| Durchschnittliche Intel Core i7-13700H (1323 - 1914, n=29) | |
| MSI Pulse GL76 12UGK | |
| MSI Pulse 17 B13VGK | |
| Acer Nitro 17 AN17-51-71ER | |
| Cinebench R20 / CPU (Multi Core) | |
| Schenker XMG Focus 17 (E23) | |
| Asus ROG Strix G17 G713PI | |
| Durchschnitt der Klasse Gaming (4029 - 16108, n=109, der letzten 2 Jahre) | |
| MSI Pulse 17 B13VGK | |
| Acer Nitro 17 AN17-51-71ER | |
| MSI Pulse GL76 12UGK | |
| MSI Katana 17 B13VFK | |
| Durchschnittliche Intel Core i7-13700H (2322 - 7674, n=29) | |
| Cinebench R20 / CPU (Single Core) | |
| Durchschnitt der Klasse Gaming (442 - 895, n=109, der letzten 2 Jahre) | |
| Schenker XMG Focus 17 (E23) | |
| Asus ROG Strix G17 G713PI | |
| Durchschnittliche Intel Core i7-13700H (508 - 741, n=29) | |
| MSI Katana 17 B13VFK | |
| MSI Pulse GL76 12UGK | |
| MSI Pulse 17 B13VGK | |
| Acer Nitro 17 AN17-51-71ER | |
| Cinebench R15 / CPU Multi 64Bit | |
| Asus ROG Strix G17 G713PI | |
| Schenker XMG Focus 17 (E23) | |
| Durchschnitt der Klasse Gaming (1578 - 6271, n=108, der letzten 2 Jahre) | |
| Acer Nitro 17 AN17-51-71ER | |
| MSI Pulse 17 B13VGK | |
| MSI Pulse GL76 12UGK | |
| Durchschnittliche Intel Core i7-13700H (905 - 2982, n=29) | |
| MSI Katana 17 B13VFK | |
| Cinebench R15 / CPU Single 64Bit | |
| Durchschnitt der Klasse Gaming (188.8 - 343, n=109, der letzten 2 Jahre) | |
| Asus ROG Strix G17 G713PI | |
| Schenker XMG Focus 17 (E23) | |
| Durchschnittliche Intel Core i7-13700H (213 - 278, n=29) | |
| MSI Katana 17 B13VFK | |
| MSI Pulse GL76 12UGK | |
| MSI Pulse 17 B13VGK | |
| Acer Nitro 17 AN17-51-71ER | |
| Blender / v2.79 BMW27 CPU | |
| Durchschnittliche Intel Core i7-13700H (169 - 555, n=29) | |
| MSI Katana 17 B13VFK | |
| MSI Pulse GL76 12UGK | |
| Acer Nitro 17 AN17-51-71ER | |
| MSI Pulse 17 B13VGK | |
| Durchschnitt der Klasse Gaming (80 - 330, n=107, der letzten 2 Jahre) | |
| Schenker XMG Focus 17 (E23) | |
| Asus ROG Strix G17 G713PI | |
| 7-Zip 18.03 / 7z b 4 | |
| Asus ROG Strix G17 G713PI | |
| Schenker XMG Focus 17 (E23) | |
| Durchschnitt der Klasse Gaming (33491 - 148086, n=108, der letzten 2 Jahre) | |
| MSI Pulse 17 B13VGK | |
| Acer Nitro 17 AN17-51-71ER | |
| MSI Pulse GL76 12UGK | |
| MSI Katana 17 B13VFK | |
| Durchschnittliche Intel Core i7-13700H (27322 - 76344, n=29) | |
| 7-Zip 18.03 / 7z b 4 -mmt1 | |
| Asus ROG Strix G17 G713PI | |
| Schenker XMG Focus 17 (E23) | |
| Durchschnitt der Klasse Gaming (4199 - 7436, n=108, der letzten 2 Jahre) | |
| Durchschnittliche Intel Core i7-13700H (4825 - 6238, n=29) | |
| MSI Katana 17 B13VFK | |
| MSI Pulse GL76 12UGK | |
| MSI Pulse 17 B13VGK | |
| Acer Nitro 17 AN17-51-71ER | |
| Geekbench 5.5 / Multi-Core | |
| Asus ROG Strix G17 G713PI | |
| Schenker XMG Focus 17 (E23) | |
| Durchschnitt der Klasse Gaming (6460 - 27010, n=108, der letzten 2 Jahre) | |
| MSI Pulse 17 B13VGK | |
| Acer Nitro 17 AN17-51-71ER | |
| MSI Pulse GL76 12UGK | |
| Durchschnittliche Intel Core i7-13700H (6165 - 14215, n=29) | |
| MSI Katana 17 B13VFK | |
| Geekbench 5.5 / Single-Core | |
| Asus ROG Strix G17 G713PI | |
| Durchschnitt der Klasse Gaming (986 - 2474, n=108, der letzten 2 Jahre) | |
| Schenker XMG Focus 17 (E23) | |
| Durchschnittliche Intel Core i7-13700H (1362 - 1919, n=29) | |
| MSI Katana 17 B13VFK | |
| MSI Pulse 17 B13VGK | |
| MSI Pulse GL76 12UGK | |
| Acer Nitro 17 AN17-51-71ER | |
| HWBOT x265 Benchmark v2.2 / 4k Preset | |
| Asus ROG Strix G17 G713PI | |
| Durchschnitt der Klasse Gaming (11.5 - 44.3, n=108, der letzten 2 Jahre) | |
| Schenker XMG Focus 17 (E23) | |
| MSI Pulse 17 B13VGK | |
| Acer Nitro 17 AN17-51-71ER | |
| MSI Pulse GL76 12UGK | |
| MSI Katana 17 B13VFK | |
| Durchschnittliche Intel Core i7-13700H (6.72 - 21.2, n=29) | |
| LibreOffice / 20 Documents To PDF | |
| MSI Pulse 17 B13VGK | |
| MSI Katana 17 B13VFK | |
| Acer Nitro 17 AN17-51-71ER | |
| Schenker XMG Focus 17 (E23) | |
| Durchschnitt der Klasse Gaming (19 - 88.8, n=108, der letzten 2 Jahre) | |
| Durchschnittliche Intel Core i7-13700H (31.3 - 62.4, n=29) | |
| MSI Pulse GL76 12UGK | |
| Asus ROG Strix G17 G713PI | |
| R Benchmark 2.5 / Overall mean | |
| Acer Nitro 17 AN17-51-71ER | |
| MSI Pulse 17 B13VGK | |
| MSI Pulse GL76 12UGK | |
| Durchschnittliche Intel Core i7-13700H (0.4308 - 0.607, n=29) | |
| MSI Katana 17 B13VFK | |
| Durchschnitt der Klasse Gaming (0.3439 - 0.759, n=109, der letzten 2 Jahre) | |
| Schenker XMG Focus 17 (E23) | |
| Asus ROG Strix G17 G713PI | |
* ... kleinere Werte sind besser
AIDA64: FP32 Ray-Trace | FPU Julia | CPU SHA3 | CPU Queen | FPU SinJulia | FPU Mandel | CPU AES | CPU ZLib | FP64 Ray-Trace | CPU PhotoWorxx
| Performance Rating | |
| Asus ROG Strix G17 G713PI | |
| Durchschnitt der Klasse Gaming | |
| Schenker XMG Focus 17 (E23) | |
| Acer Nitro 17 AN17-51-71ER | |
| MSI Pulse 17 B13VGK | |
| MSI Pulse GL76 12UGK | |
| Durchschnittliche Intel Core i7-13700H | |
| MSI Katana 17 B13VFK | |
| AIDA64 / FP32 Ray-Trace | |
| Asus ROG Strix G17 G713PI | |
| Durchschnitt der Klasse Gaming (10227 - 85542, n=107, der letzten 2 Jahre) | |
| Schenker XMG Focus 17 (E23) | |
| MSI Pulse 17 B13VGK | |
| Acer Nitro 17 AN17-51-71ER | |
| MSI Pulse GL76 12UGK | |
| Durchschnittliche Intel Core i7-13700H (4986 - 18908, n=29) | |
| MSI Katana 17 B13VFK | |
| AIDA64 / FPU Julia | |
| Asus ROG Strix G17 G713PI | |
| Durchschnitt der Klasse Gaming (51376 - 238426, n=107, der letzten 2 Jahre) | |
| Schenker XMG Focus 17 (E23) | |
| MSI Pulse 17 B13VGK | |
| Acer Nitro 17 AN17-51-71ER | |
| MSI Pulse GL76 12UGK | |
| Durchschnittliche Intel Core i7-13700H (25360 - 92359, n=29) | |
| MSI Katana 17 B13VFK | |
| AIDA64 / CPU SHA3 | |
| Asus ROG Strix G17 G713PI | |
| Durchschnitt der Klasse Gaming (2180 - 9817, n=107, der letzten 2 Jahre) | |
| Schenker XMG Focus 17 (E23) | |
| Acer Nitro 17 AN17-51-71ER | |
| MSI Pulse 17 B13VGK | |
| MSI Pulse GL76 12UGK | |
| Durchschnittliche Intel Core i7-13700H (1339 - 4224, n=29) | |
| MSI Katana 17 B13VFK | |
| AIDA64 / CPU Queen | |
| Asus ROG Strix G17 G713PI | |
| Schenker XMG Focus 17 (E23) | |
| Durchschnitt der Klasse Gaming (49785 - 173351, n=94, der letzten 2 Jahre) | |
| MSI Pulse GL76 12UGK | |
| Acer Nitro 17 AN17-51-71ER | |
| MSI Pulse 17 B13VGK | |
| Durchschnittliche Intel Core i7-13700H (59324 - 107159, n=29) | |
| MSI Katana 17 B13VFK | |
| AIDA64 / FPU SinJulia | |
| Asus ROG Strix G17 G713PI | |
| Durchschnitt der Klasse Gaming (4424 - 33636, n=107, der letzten 2 Jahre) | |
| Schenker XMG Focus 17 (E23) | |
| MSI Pulse 17 B13VGK | |
| Acer Nitro 17 AN17-51-71ER | |
| MSI Pulse GL76 12UGK | |
| Durchschnittliche Intel Core i7-13700H (4800 - 11050, n=29) | |
| MSI Katana 17 B13VFK | |
| AIDA64 / FPU Mandel | |
| Asus ROG Strix G17 G713PI | |
| Durchschnitt der Klasse Gaming (25115 - 128721, n=107, der letzten 2 Jahre) | |
| Schenker XMG Focus 17 (E23) | |
| MSI Pulse 17 B13VGK | |
| Acer Nitro 17 AN17-51-71ER | |
| MSI Pulse GL76 12UGK | |
| Durchschnittliche Intel Core i7-13700H (12321 - 45118, n=29) | |
| MSI Katana 17 B13VFK | |
| AIDA64 / CPU AES | |
| Asus ROG Strix G17 G713PI | |
| Acer Nitro 17 AN17-51-71ER | |
| MSI Pulse GL76 12UGK | |
| Durchschnitt der Klasse Gaming (39258 - 247074, n=107, der letzten 2 Jahre) | |
| Schenker XMG Focus 17 (E23) | |
| MSI Pulse 17 B13VGK | |
| Durchschnittliche Intel Core i7-13700H (28769 - 151254, n=29) | |
| MSI Katana 17 B13VFK | |
| AIDA64 / CPU ZLib | |
| Asus ROG Strix G17 G713PI | |
| Schenker XMG Focus 17 (E23) | |
| Durchschnitt der Klasse Gaming (574 - 2531, n=107, der letzten 2 Jahre) | |
| Acer Nitro 17 AN17-51-71ER | |
| MSI Pulse 17 B13VGK | |
| MSI Pulse GL76 12UGK | |
| Durchschnittliche Intel Core i7-13700H (389 - 1215, n=29) | |
| MSI Katana 17 B13VFK | |
| AIDA64 / FP64 Ray-Trace | |
| Asus ROG Strix G17 G713PI | |
| Durchschnitt der Klasse Gaming (5509 - 45446, n=107, der letzten 2 Jahre) | |
| Schenker XMG Focus 17 (E23) | |
| MSI Pulse 17 B13VGK | |
| Acer Nitro 17 AN17-51-71ER | |
| MSI Pulse GL76 12UGK | |
| Durchschnittliche Intel Core i7-13700H (2540 - 10135, n=29) | |
| MSI Katana 17 B13VFK | |
| AIDA64 / CPU PhotoWorxx | |
| Schenker XMG Focus 17 (E23) | |
| Durchschnitt der Klasse Gaming (12271 - 89891, n=107, der letzten 2 Jahre) | |
| Durchschnittliche Intel Core i7-13700H (12872 - 52727, n=29) | |
| MSI Pulse 17 B13VGK | |
| Acer Nitro 17 AN17-51-71ER | |
| MSI Katana 17 B13VFK | |
| Asus ROG Strix G17 G713PI | |
| MSI Pulse GL76 12UGK | |
System Performance
Den Benchmark der Systemleistung mit PCMark 10 haben wir zweimal ausgeführt, denn im ersten Versuch lag das MSI Pulse weit ab von den starken Ergebnissen, die der Prozessor zuvor in seinen Benchmarks gezeigt hat. Mit 6844 Punkten hätte es so den letzten Platz unter unseren Vergleichsgeräten eingenommen. Einige Updates über Windows Update später ergibt sich ein völlig anderes Bild.
Der Gaming-Laptop setzt sich knapp an die Spitze der Vergleichsgeräte. Im Teilbereich Essentials zeigt sich hier der einzige deutliche Aussetzer. Als Schuldige vermuten wir die vergleichsweise langsame SSD im Testgerät, da der Teilbereich Essentials besonders die Zugriffszeiten auf Dateien und Programme berücksichtigt.
Das CPU-lastige CrossMark zeichnet ein ähnliches Bild, wobei sich hier die Vergleichsgeräte mit Core i9 und Ryzen 9 klar absetzen können.
CrossMark: Overall | Productivity | Creativity | Responsiveness
| PCMark 10 / Score | |
| Durchschnitt der Klasse Gaming (5828 - 11574, n=95, der letzten 2 Jahre) | |
| MSI Pulse 17 B13VGK | |
| MSI Pulse GL76 12UGK | |
| Asus ROG Strix G17 G713PI | |
| Durchschnittliche Intel Core i7-13700H, NVIDIA GeForce RTX 4070 Laptop GPU (7158 - 7956, n=8) | |
| MSI Katana 17 B13VFK | |
| Acer Nitro 17 AN17-51-71ER | |
| Schenker XMG Focus 17 (E23) | |
| PCMark 10 / Essentials | |
| Asus ROG Strix G17 G713PI | |
| MSI Pulse GL76 12UGK | |
| MSI Katana 17 B13VFK | |
| Durchschnittliche Intel Core i7-13700H, NVIDIA GeForce RTX 4070 Laptop GPU (10252 - 11449, n=8) | |
| Durchschnitt der Klasse Gaming (8810 - 12600, n=99, der letzten 2 Jahre) | |
| MSI Pulse 17 B13VGK | |
| Acer Nitro 17 AN17-51-71ER | |
| Schenker XMG Focus 17 (E23) | |
| PCMark 10 / Productivity | |
| Asus ROG Strix G17 G713PI | |
| Durchschnitt der Klasse Gaming (6845 - 21327, n=97, der letzten 2 Jahre) | |
| MSI Pulse 17 B13VGK | |
| MSI Pulse GL76 12UGK | |
| Schenker XMG Focus 17 (E23) | |
| Durchschnittliche Intel Core i7-13700H, NVIDIA GeForce RTX 4070 Laptop GPU (8501 - 10769, n=8) | |
| MSI Katana 17 B13VFK | |
| Acer Nitro 17 AN17-51-71ER | |
| PCMark 10 / Digital Content Creation | |
| Durchschnitt der Klasse Gaming (7602 - 19657, n=97, der letzten 2 Jahre) | |
| Acer Nitro 17 AN17-51-71ER | |
| MSI Pulse 17 B13VGK | |
| MSI Pulse GL76 12UGK | |
| Durchschnittliche Intel Core i7-13700H, NVIDIA GeForce RTX 4070 Laptop GPU (10358 - 12908, n=8) | |
| MSI Katana 17 B13VFK | |
| Schenker XMG Focus 17 (E23) | |
| Asus ROG Strix G17 G713PI | |
| CrossMark / Overall | |
| Asus ROG Strix G17 G713PI | |
| Schenker XMG Focus 17 (E23) | |
| Durchschnitt der Klasse Gaming (1366 - 2409, n=96, der letzten 2 Jahre) | |
| MSI Pulse 17 B13VGK | |
| Durchschnittliche Intel Core i7-13700H, NVIDIA GeForce RTX 4070 Laptop GPU (1768 - 2073, n=6) | |
| MSI Katana 17 B13VFK | |
| MSI Pulse GL76 12UGK | |
| Acer Nitro 17 AN17-51-71ER | |
| CrossMark / Productivity | |
| Asus ROG Strix G17 G713PI | |
| Schenker XMG Focus 17 (E23) | |
| Durchschnitt der Klasse Gaming (1386 - 2254, n=96, der letzten 2 Jahre) | |
| MSI Pulse 17 B13VGK | |
| Durchschnittliche Intel Core i7-13700H, NVIDIA GeForce RTX 4070 Laptop GPU (1645 - 2006, n=6) | |
| MSI Pulse GL76 12UGK | |
| MSI Katana 17 B13VFK | |
| Acer Nitro 17 AN17-51-71ER | |
| CrossMark / Creativity | |
| Asus ROG Strix G17 G713PI | |
| Schenker XMG Focus 17 (E23) | |
| Durchschnitt der Klasse Gaming (1343 - 2729, n=96, der letzten 2 Jahre) | |
| MSI Pulse 17 B13VGK | |
| Durchschnittliche Intel Core i7-13700H, NVIDIA GeForce RTX 4070 Laptop GPU (1936 - 2137, n=6) | |
| MSI Katana 17 B13VFK | |
| MSI Pulse GL76 12UGK | |
| Acer Nitro 17 AN17-51-71ER | |
| CrossMark / Responsiveness | |
| MSI Pulse GL76 12UGK | |
| MSI Pulse 17 B13VGK | |
| Schenker XMG Focus 17 (E23) | |
| Durchschnittliche Intel Core i7-13700H, NVIDIA GeForce RTX 4070 Laptop GPU (1451 - 2202, n=6) | |
| MSI Katana 17 B13VFK | |
| Durchschnitt der Klasse Gaming (1226 - 2334, n=96, der letzten 2 Jahre) | |
| Asus ROG Strix G17 G713PI | |
| Acer Nitro 17 AN17-51-71ER | |
| PCMark 10 Score | 7796 Punkte | |
Hilfe | ||
| AIDA64 / Memory Copy | |
| Schenker XMG Focus 17 (E23) | |
| Durchschnitt der Klasse Gaming (21750 - 129946, n=107, der letzten 2 Jahre) | |
| Durchschnittliche Intel Core i7-13700H (24334 - 78081, n=29) | |
| MSI Pulse 17 B13VGK | |
| Acer Nitro 17 AN17-51-71ER | |
| MSI Katana 17 B13VFK | |
| Asus ROG Strix G17 G713PI | |
| MSI Pulse GL76 12UGK | |
| AIDA64 / Memory Read | |
| Schenker XMG Focus 17 (E23) | |
| Durchschnitt der Klasse Gaming (22956 - 118858, n=107, der letzten 2 Jahre) | |
| MSI Pulse 17 B13VGK | |
| Acer Nitro 17 AN17-51-71ER | |
| Durchschnittliche Intel Core i7-13700H (23681 - 79656, n=29) | |
| MSI Katana 17 B13VFK | |
| Asus ROG Strix G17 G713PI | |
| MSI Pulse GL76 12UGK | |
| AIDA64 / Memory Write | |
| Durchschnitt der Klasse Gaming (22297 - 135096, n=107, der letzten 2 Jahre) | |
| Schenker XMG Focus 17 (E23) | |
| Durchschnittliche Intel Core i7-13700H (22986 - 99898, n=29) | |
| Acer Nitro 17 AN17-51-71ER | |
| MSI Pulse 17 B13VGK | |
| Asus ROG Strix G17 G713PI | |
| MSI Katana 17 B13VFK | |
| MSI Pulse GL76 12UGK | |
| AIDA64 / Memory Latency | |
| Acer Nitro 17 AN17-51-71ER | |
| Durchschnitt der Klasse Gaming (75.3 - 259, n=107, der letzten 2 Jahre) | |
| MSI Katana 17 B13VFK | |
| MSI Pulse 17 B13VGK | |
| Durchschnittliche Intel Core i7-13700H (82.4 - 136.8, n=29) | |
| MSI Pulse GL76 12UGK | |
| Schenker XMG Focus 17 (E23) | |
| Asus ROG Strix G17 G713PI | |
* ... kleinere Werte sind besser
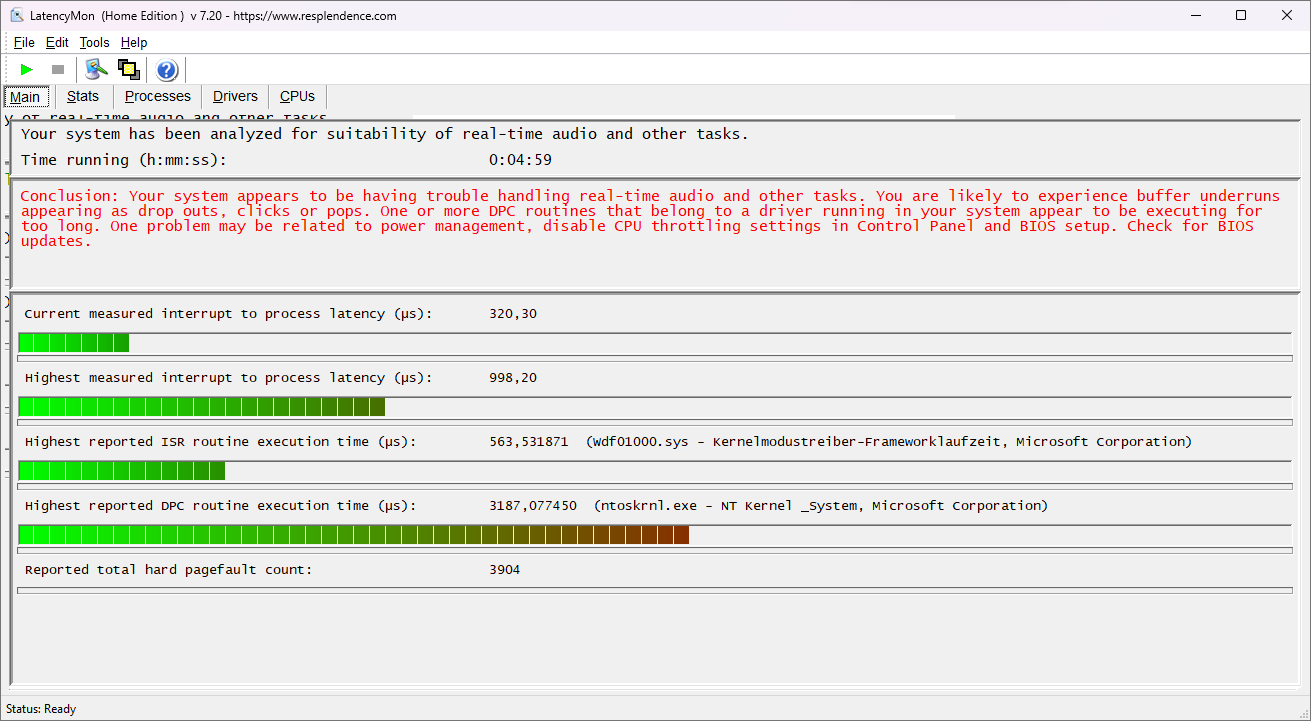
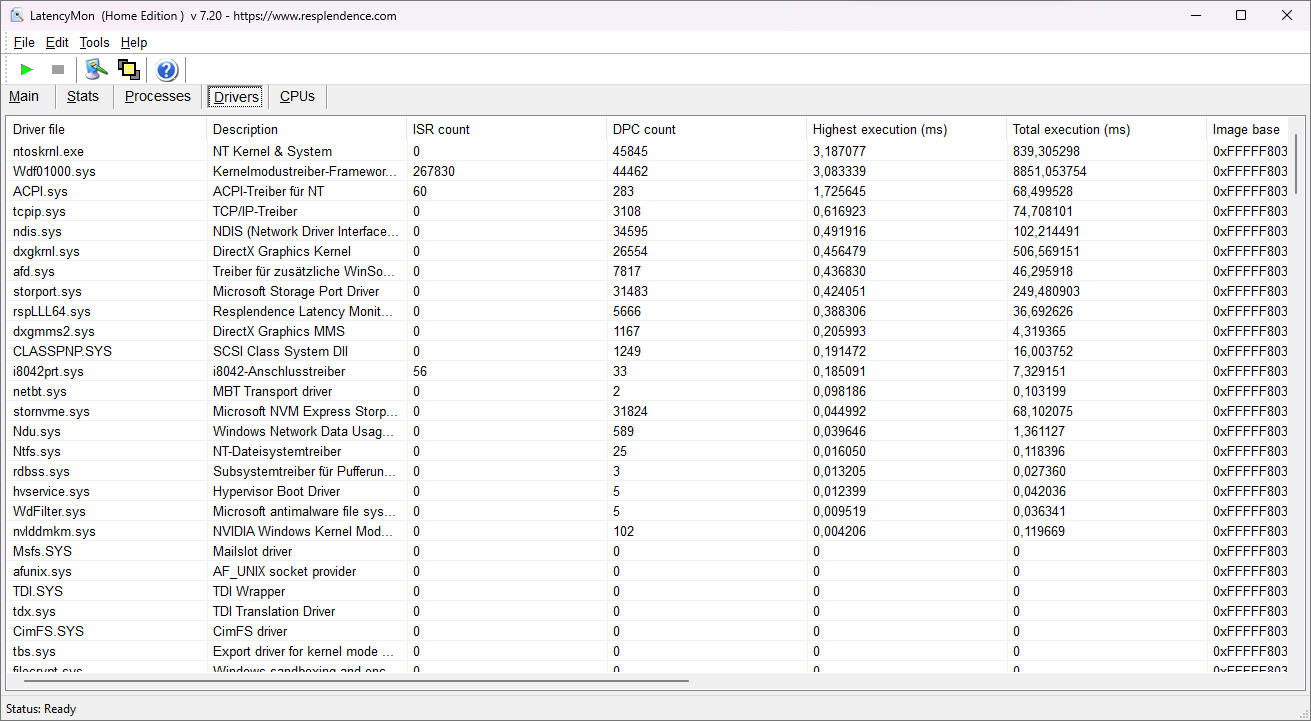
DPC-Latenzen
Bei den DPC-Latenzen ermittelt LatencyMon, dass der Gaming-Laptop mit den zum Testzeitpunkt verfügbaren Updates nicht für die Echtzeitbearbeitung von Audio geeignet sei. Das Problem liegt hier augenscheinlich beim Windows Kernel.
| DPC Latencies / LatencyMon - interrupt to process latency (max), Web, Youtube, Prime95 | |
| MSI Katana 17 B13VFK | |
| Asus ROG Strix G17 G713PI | |
| Acer Nitro 17 AN17-51-71ER | |
| MSI Pulse 17 B13VGK | |
| Schenker XMG Focus 17 (E23) | |
| MSI Pulse GL76 12UGK | |
* ... kleinere Werte sind besser
Massenspeicher
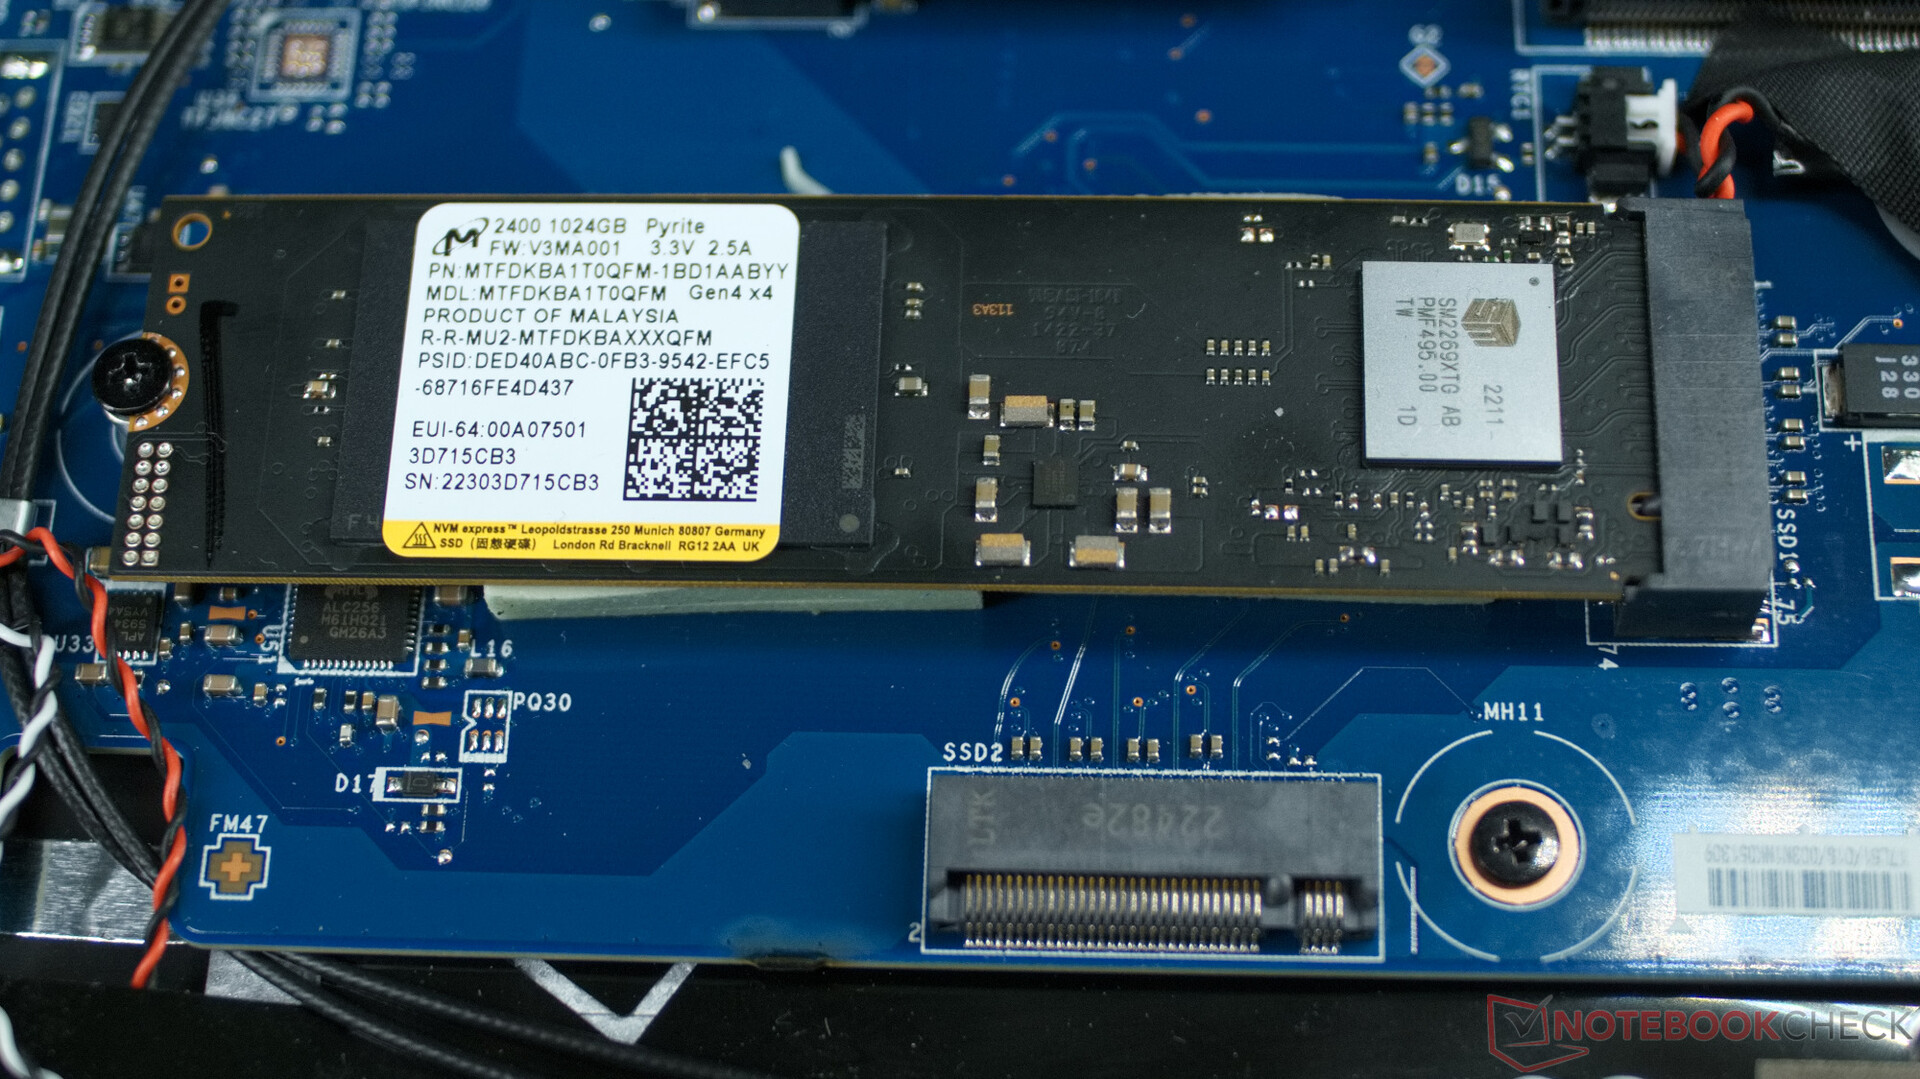
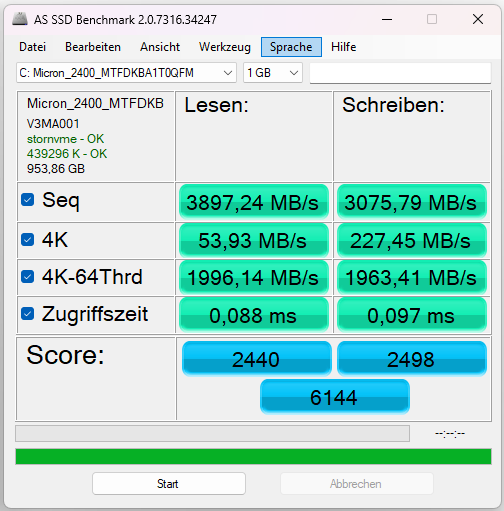
Die Micron 2400 NVMe-SSD im Testgerät fasst ein Terabyte. Sie bietet unter den Gaming-Laptops eine durchschnittliche Geschwindigkeit und kann im MSI Pulse 17 ihre Geschwindigkeit auch über lange Strecken problemlos halten.

* ... kleinere Werte sind besser
Dauerleistung Lesen: DiskSpd Read Loop, Queue Depth 8
Grafikkarte
Die Nvidia RTX 4070 im MSI Pulse 17 kann dauerhaft mit starken 100 Watt bis 140 Watt arbeiten, ohne dass die Temperaturen des Chips hier zu hoch würden. Damit liefert der Grafikchip in den Benchmarks mit 3DMark eine vergleichsweise hohe Leistung. So dürften FullHD-Gaming und leichtes Raytracing für die Grafikkarte kein Problem darstellen. Auch praktische Anwendungen, etwa das Rendering von 3D-Grafiken in Programmen wie Blender meistert der Chip zügig.
| 3DMark 11 Performance | 34584 Punkte | |
| 3DMark Cloud Gate Standard Score | 70329 Punkte | |
| 3DMark Fire Strike Score | 27138 Punkte | |
| 3DMark Time Spy Score | 12235 Punkte | |
Hilfe | ||
| Geekbench 6.7 - GPU OpenCL | |
| Durchschnitt der Klasse Gaming (67235 - 253130, n=106, der letzten 2 Jahre) | |
| MSI Pulse 17 B13VGK | |
| Durchschnittliche NVIDIA GeForce RTX 4070 Laptop GPU (85488 - 129836, n=45) | |
* ... kleinere Werte sind besser
Gaming Performance
Einen kleinen Vorteil gegenüber dem MSI Pulse 17 haben hier das Schenker XMG Focus 17 und das Asus ROG Strix G17. Beide Laptops verfügen schlicht und einfach über einen stärkeren Prozessor, was sich in den FPS der CPU-lastigen Spielen wie Dota 2 Reborn deutlich widerspiegelt. Aber, das Pulse 17 zeigt, dass hier FullHD-Gaming und mehr bei hohen Qualitätseinstellungen und sogar Raytracing möglich ist, ohne dass weniger als 60 Bilder pro Sekunde angezeigt werden. Trotzdem bleibt der Laptop wesentlich leiser als andere. Man kann hier ohne Leistungsverlust im ausgeglichenen Modus bei nur 42 dB(A) (im Abstand von 15 cm gemessen) spielen.
| Performance Rating - Percent | |
| Durchschnitt der Klasse Gaming | |
| Asus ROG Strix G17 G713PI | |
| Schenker XMG Focus 17 (E23) | |
| MSI Katana 17 B13VFK | |
| MSI Pulse 17 B13VGK | |
| Acer Nitro 17 AN17-51-71ER | |
| MSI Pulse GL76 12UGK | |
| The Witcher 3 - 1920x1080 Ultra Graphics & Postprocessing (HBAO+) | |
| Durchschnitt der Klasse Gaming (95 - 240, n=7, der letzten 2 Jahre) | |
| Asus ROG Strix G17 G713PI | |
| Schenker XMG Focus 17 (E23) | |
| MSI Pulse 17 B13VGK | |
| Acer Nitro 17 AN17-51-71ER | |
| MSI Katana 17 B13VFK | |
| MSI Pulse GL76 12UGK | |
| Final Fantasy XV Benchmark - 1920x1080 High Quality | |
| Durchschnitt der Klasse Gaming (41 - 215, n=98, der letzten 2 Jahre) | |
| Schenker XMG Focus 17 (E23) | |
| Asus ROG Strix G17 G713PI | |
| MSI Pulse 17 B13VGK | |
| Acer Nitro 17 AN17-51-71ER | |
| MSI Katana 17 B13VFK | |
| MSI Pulse GL76 12UGK | |
| Strange Brigade - 1920x1080 ultra AA:ultra AF:16 | |
| Durchschnitt der Klasse Gaming (76.3 - 456, n=88, der letzten 2 Jahre) | |
| Schenker XMG Focus 17 (E23) | |
| Asus ROG Strix G17 G713PI | |
| MSI Pulse 17 B13VGK | |
| Acer Nitro 17 AN17-51-71ER | |
| MSI Katana 17 B13VFK | |
| MSI Pulse GL76 12UGK | |
| Dota 2 Reborn - 1920x1080 ultra (3/3) best looking | |
| Schenker XMG Focus 17 (E23) | |
| Asus ROG Strix G17 G713PI | |
| MSI Katana 17 B13VFK | |
| Durchschnitt der Klasse Gaming (84.8 - 248, n=110, der letzten 2 Jahre) | |
| MSI Pulse 17 B13VGK | |
| Acer Nitro 17 AN17-51-71ER | |
| MSI Pulse GL76 12UGK | |
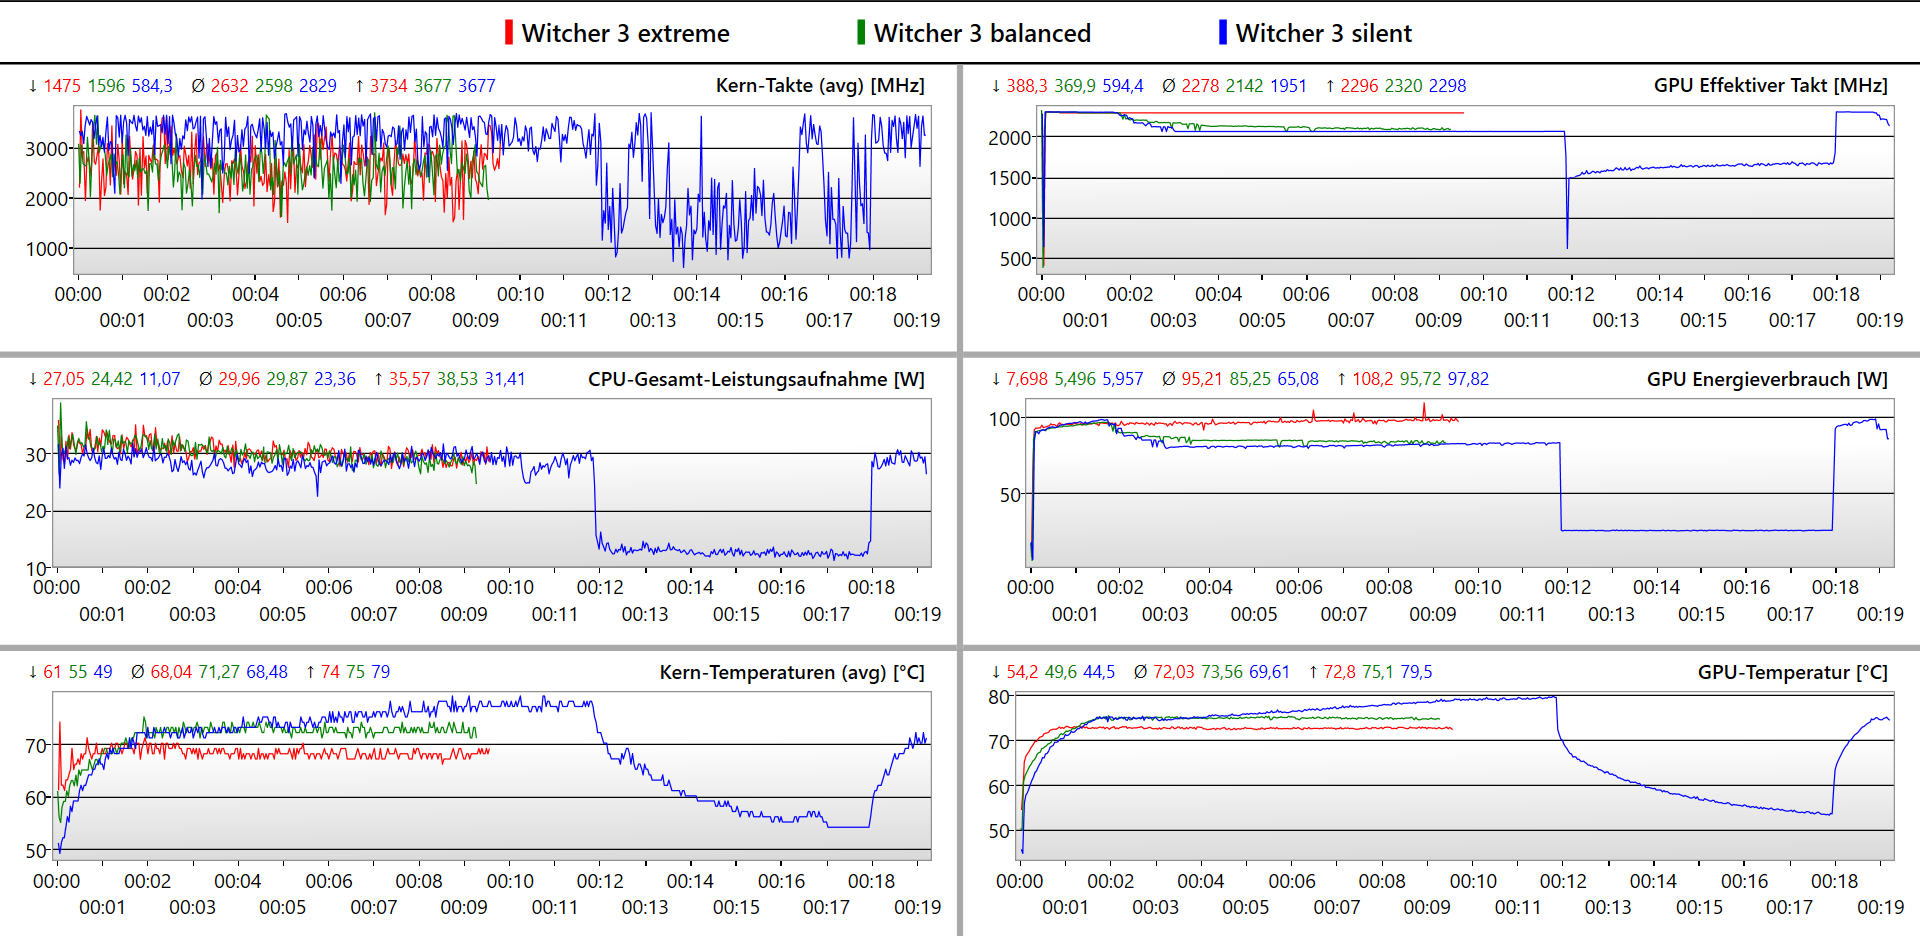
Im einstündigen Test mit Witcher 3 zeigt sich der typische FPS-Verlauf im Tag- und Nachtrhythmus des Spiels. Wesentliche Ausreißer sind hier nicht zu erkennen.
Witcher 3 FPS-Diagramm
| min. | mittel | hoch | max. | QHD | 4K | |
|---|---|---|---|---|---|---|
| GTA V (2015) | 184.8 | 182.2 | 176.9 | 116.4 | ||
| The Witcher 3 (2015) | 106.9 | |||||
| Dota 2 Reborn (2015) | 174 | 158 | 146.3 | 138.5 | 132.4 | |
| Final Fantasy XV Benchmark (2018) | 150.5 | 111.9 | 86.2 | 47.5 | ||
| X-Plane 11.11 (2018) | 147.6 | 130.8 | 102 | 102.2 | ||
| Far Cry 5 (2018) | 163 | 154 | 145 | |||
| Strange Brigade (2018) | 468 | 295 | 233 | 202 | ||
| F1 22 (2022) | 239 | 228 | 186.7 | 71 | ||
| F1 23 (2023) | 248 | 251 | 199.2 | 100 |
Emissionen - Lüfter auf leisen Schwingen
Geräuschemissionen
Das MSI Pulse 17 ist für einen Gaming-Laptop extrem leise. Schon im Leistungsmodus messen wir maximal eine Lautstärke von 46,5 dB(A) unter Last. Im ausgeglichenen Modus sind es nochmals bis zu 4 dB(A) weniger. Dabei werden die Lüfter bei Last auch erst verspätet hörbar. So wurden sie in unserer Messung bei durchschnittlicher Last mit PCMark 06 erst kurz vor Ende des Benchmarks aktiv.
Lautstärkediagramm
| Idle |
| 24 / 24 / 24 dB(A) |
| Last |
| 32.49 / 46.51 dB(A) |
 | ||
30 dB leise 40 dB(A) deutlich hörbar 50 dB(A) störend |
||
min: | ||
| MSI Pulse 17 B13VGK GeForce RTX 4070 Laptop GPU, i7-13700H, Micron 2400 MTFDKBA1T0QFM | MSI Pulse GL76 12UGK GeForce RTX 3070 Laptop GPU, i7-12700H, Micron 3400 1TB MTFDKBA1T0TFH | MSI Katana 17 B13VFK GeForce RTX 4060 Laptop GPU, i7-13620H, Micron 2400 MTFDKBA1T0QFM | Acer Nitro 17 AN17-51-71ER GeForce RTX 4060 Laptop GPU, i7-13700H, Samsung PM9A1 MZVL21T0HCLR | Schenker XMG Focus 17 (E23) GeForce RTX 4070 Laptop GPU, i9-13900HX, Crucial P5 Plus 1TB CT1000P5PSSD8 | Asus ROG Strix G17 G713PI GeForce RTX 4070 Laptop GPU, R9 7945HX, WD PC SN560 SDDPNQE-1T00 | |
|---|---|---|---|---|---|---|
| Geräuschentwicklung | -13% | -24% | -11% | -19% | -14% | |
| aus / Umgebung * (dB) | 24 | 24.1 -0% | 24.5 -2% | 24 -0% | 24 -0% | 25 -4% |
| Idle min * (dB) | 24 | 26.9 -12% | 24.5 -2% | 24 -0% | 24 -0% | 26 -8% |
| Idle avg * (dB) | 24 | 26.9 -12% | 24.5 -2% | 24 -0% | 24 -0% | 29 -21% |
| Idle max * (dB) | 24 | 27 -13% | 40 -67% | 32.32 -35% | 26.47 -10% | 30 -25% |
| Last avg * (dB) | 32.49 | 43.8 -35% | 48.3 -49% | 35.18 -8% | 55.72 -71% | 46 -42% |
| Witcher 3 ultra * (dB) | 46.51 | 44.7 4% | 56 -20% | 54.78 -18% | 57.94 -25% | 46 1% |
| Last max * (dB) | 46.51 | 58.3 -25% | 59.1 -27% | 54.78 -18% | 57.94 -25% | 47 -1% |
* ... kleinere Werte sind besser
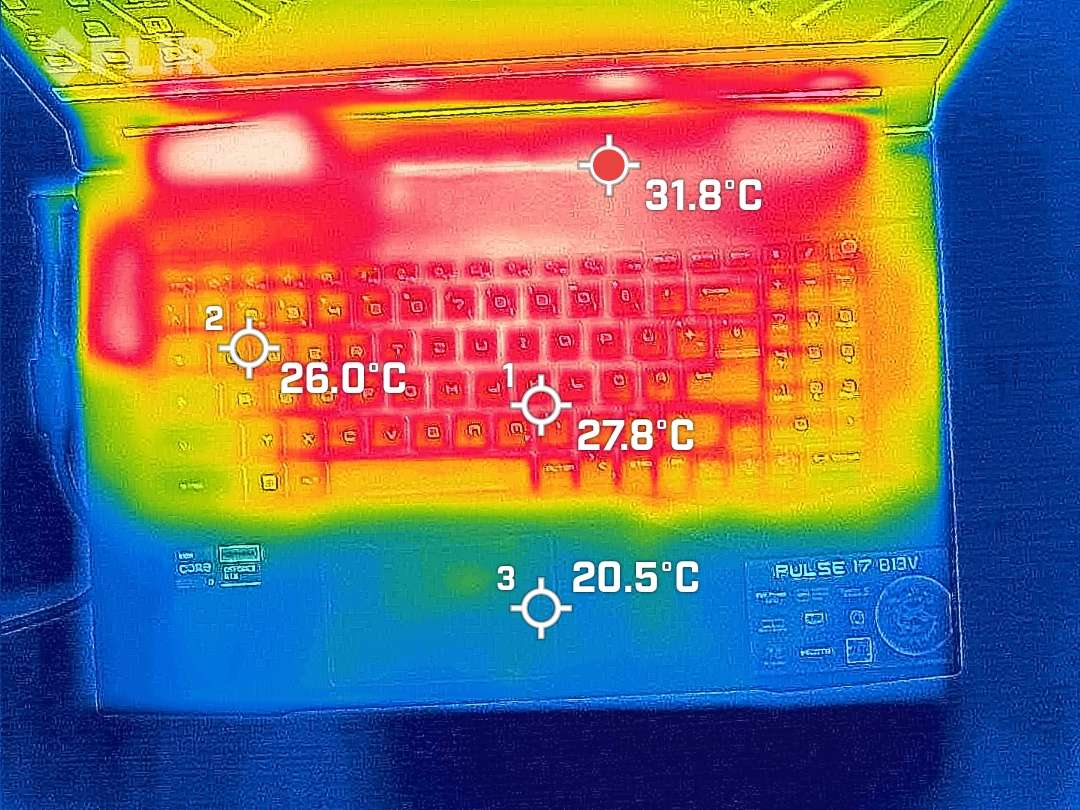
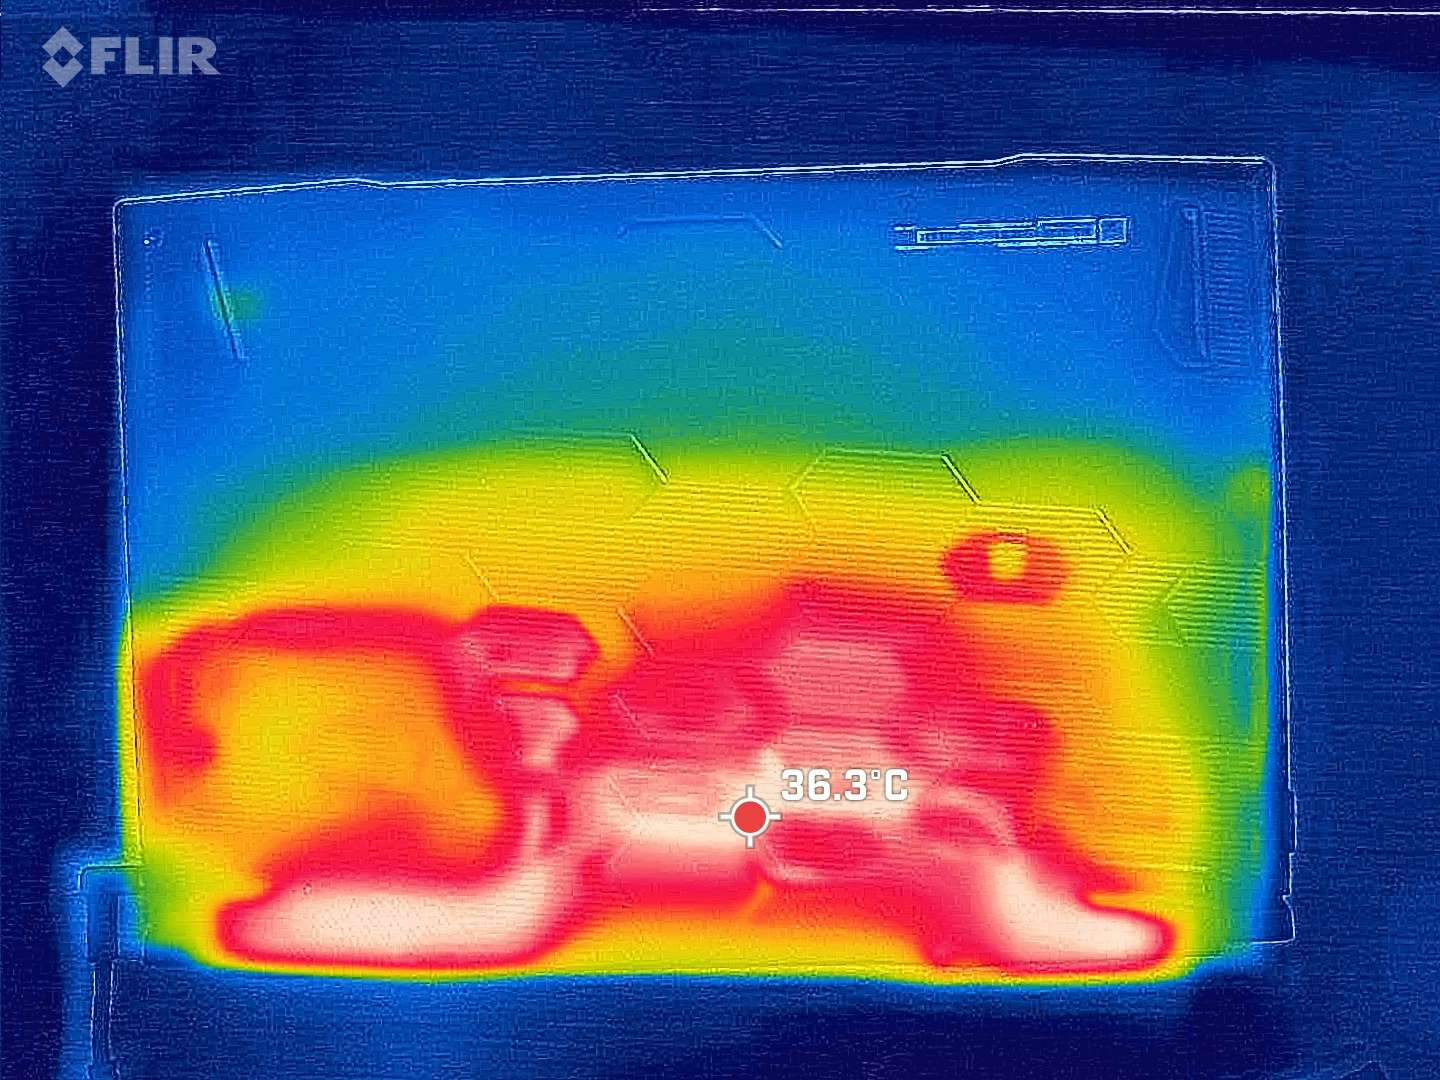
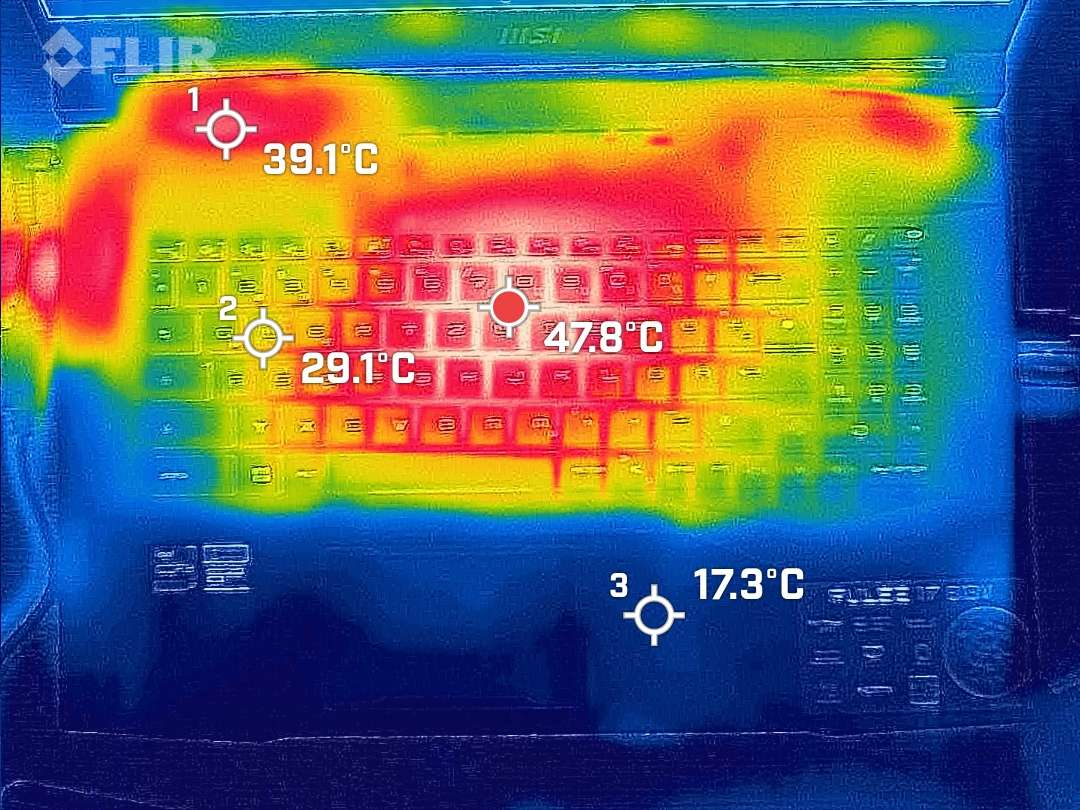
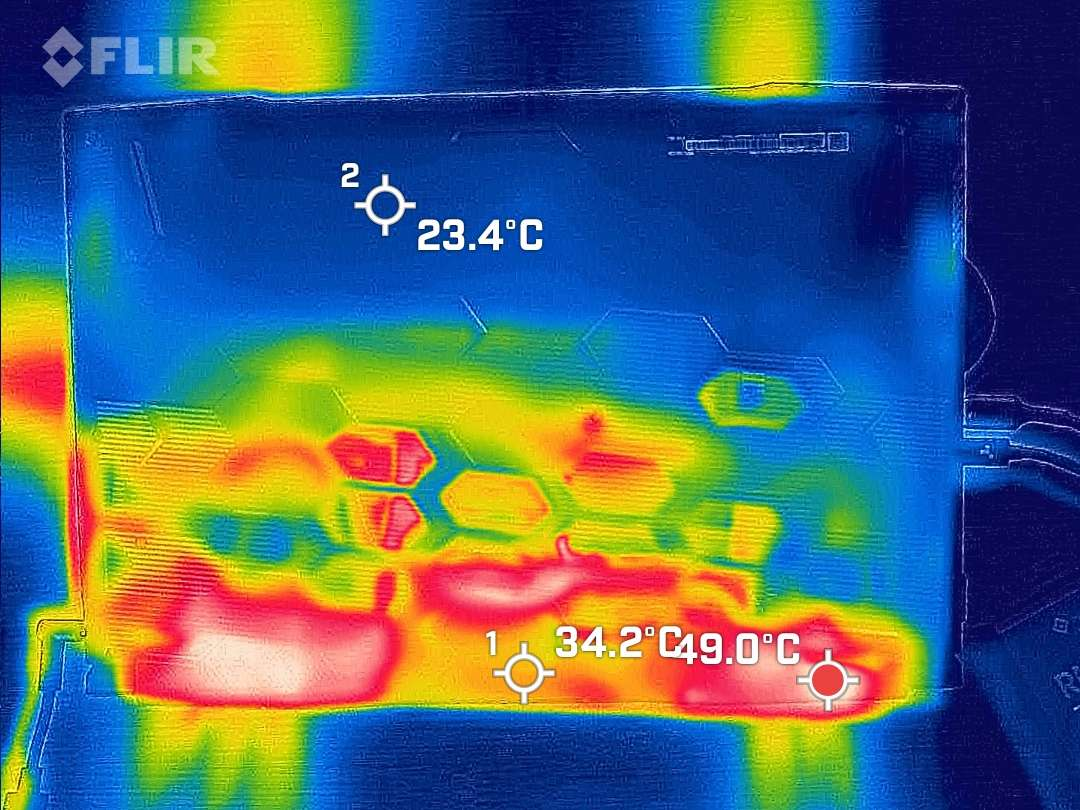
Temperatur
Die Oberflächentemperaturen der Handballenauflagen bleiben beim Testgerät durchgehend kühl, und nur knapp über Raumtemperatur. Maximal erreicht das Gerät 48 °C, dies aber auch recht großflächig am hinteren Rand über und unter den Kühlkörpern sowie in der Mitte der Tastatur. Die Tastatur bleibt jedoch in den zum Gaming wichtigen Bereichen auf erträglichen Temperaturen, ebenso wie die Unterseite des performanten Gaming-Laptops.
(-) Die maximale Temperatur auf der Oberseite ist 48 °C. Im Vergleich liegt der Klassendurchschnitt bei 40.4 °C (von 21.2 bis 68.8 °C für die Klasse Gaming).
(-) Auf der Unterseite messen wir eine maximalen Wert von 50 °C (im Vergleich zum Durchschnitt von 43.2 °C).
(+) Ohne Last messen wir eine durchschnittliche Temperatur von 27.8 °C auf der Oberseite. Der Klassendurchschnitt erreicht 33.9 °C.
(±) Beim längeren Spielen von The Witcher 3 erhitzt sich das Gerät durchschnittlich auf 37 °C. Der Durchschnitt der Klasse ist derzeit 33.9 °C.
(+) Die Handballen und der Touchpad-Bereich sind mit gemessenen 24 °C kühler als die typische Hauttemperatur und fühlen sich dadurch kühl an.
(+) Die durchschnittliche Handballen-Temperatur anderer getesteter Geräte war 28.8 °C (+4.8 °C).
| MSI Pulse 17 B13VGK Intel Core i7-13700H, NVIDIA GeForce RTX 4070 Laptop GPU | |
|---|---|
| Hitze | |
| Last oben max * (°C) | 48 |
| Last unten max * (°C) | 50 |
| Idle oben max * (°C) | 30 |
| Idle unten max * (°C) | 33 |
* ... kleinere Werte sind besser
Stresstest
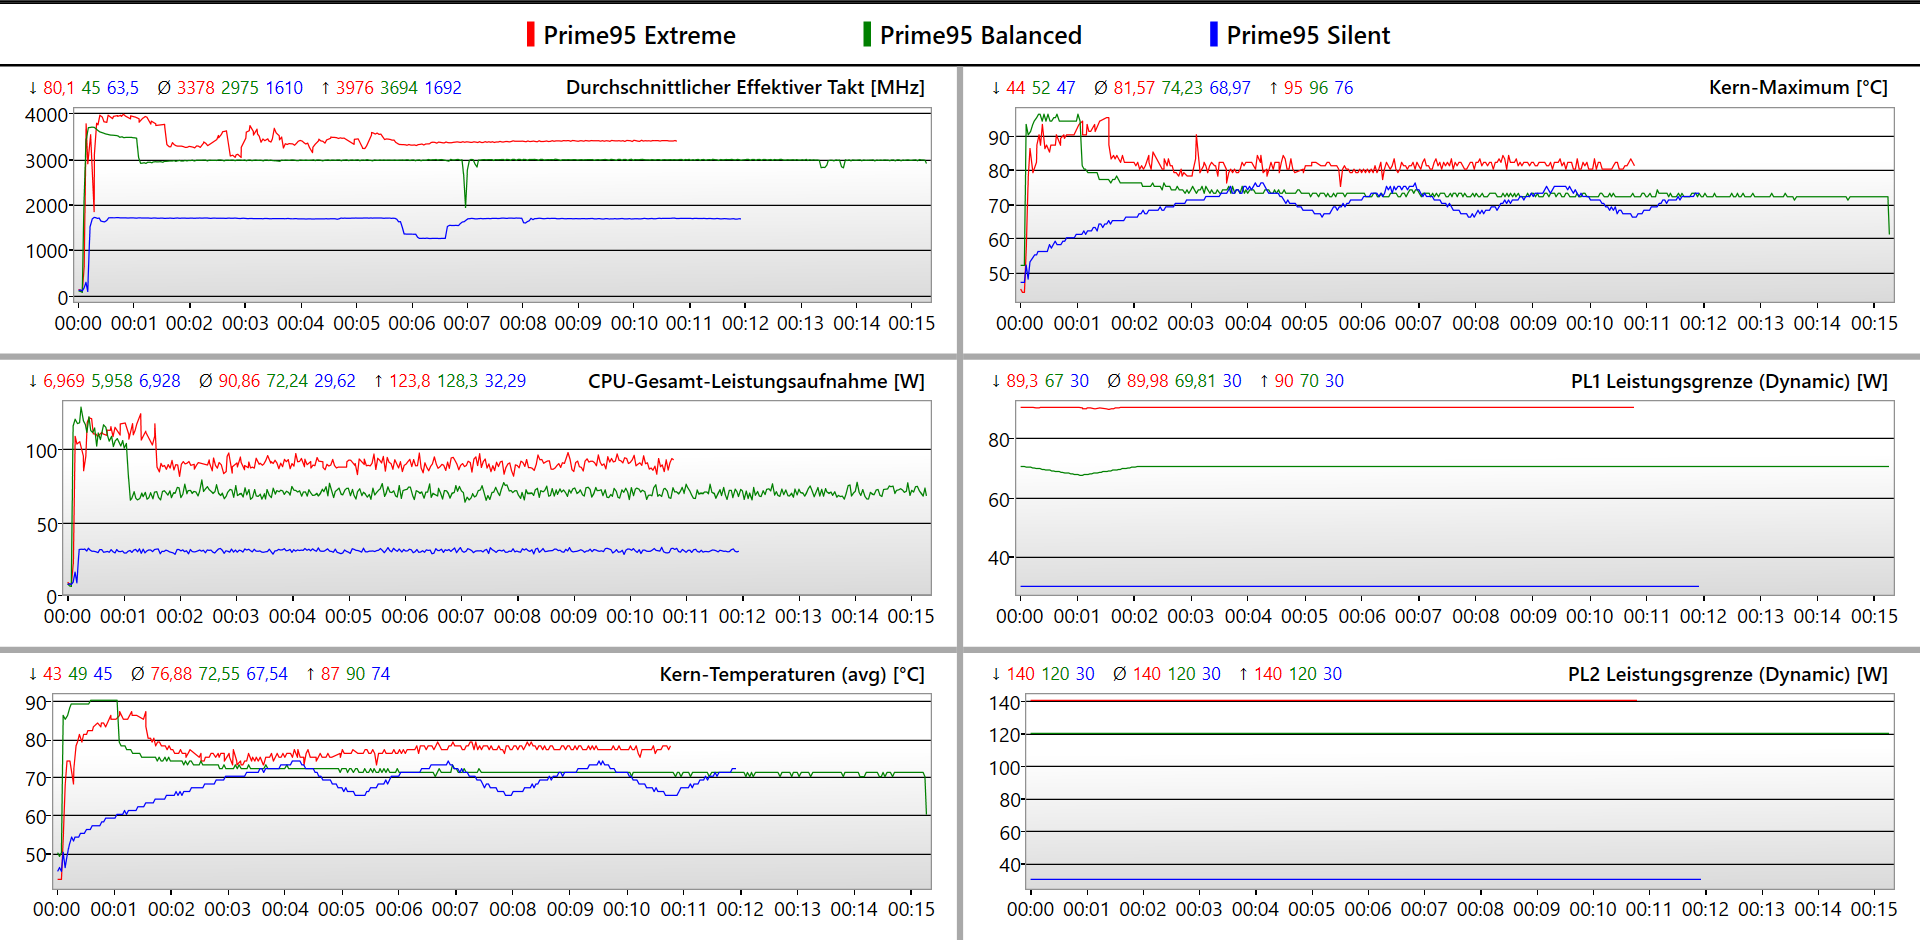
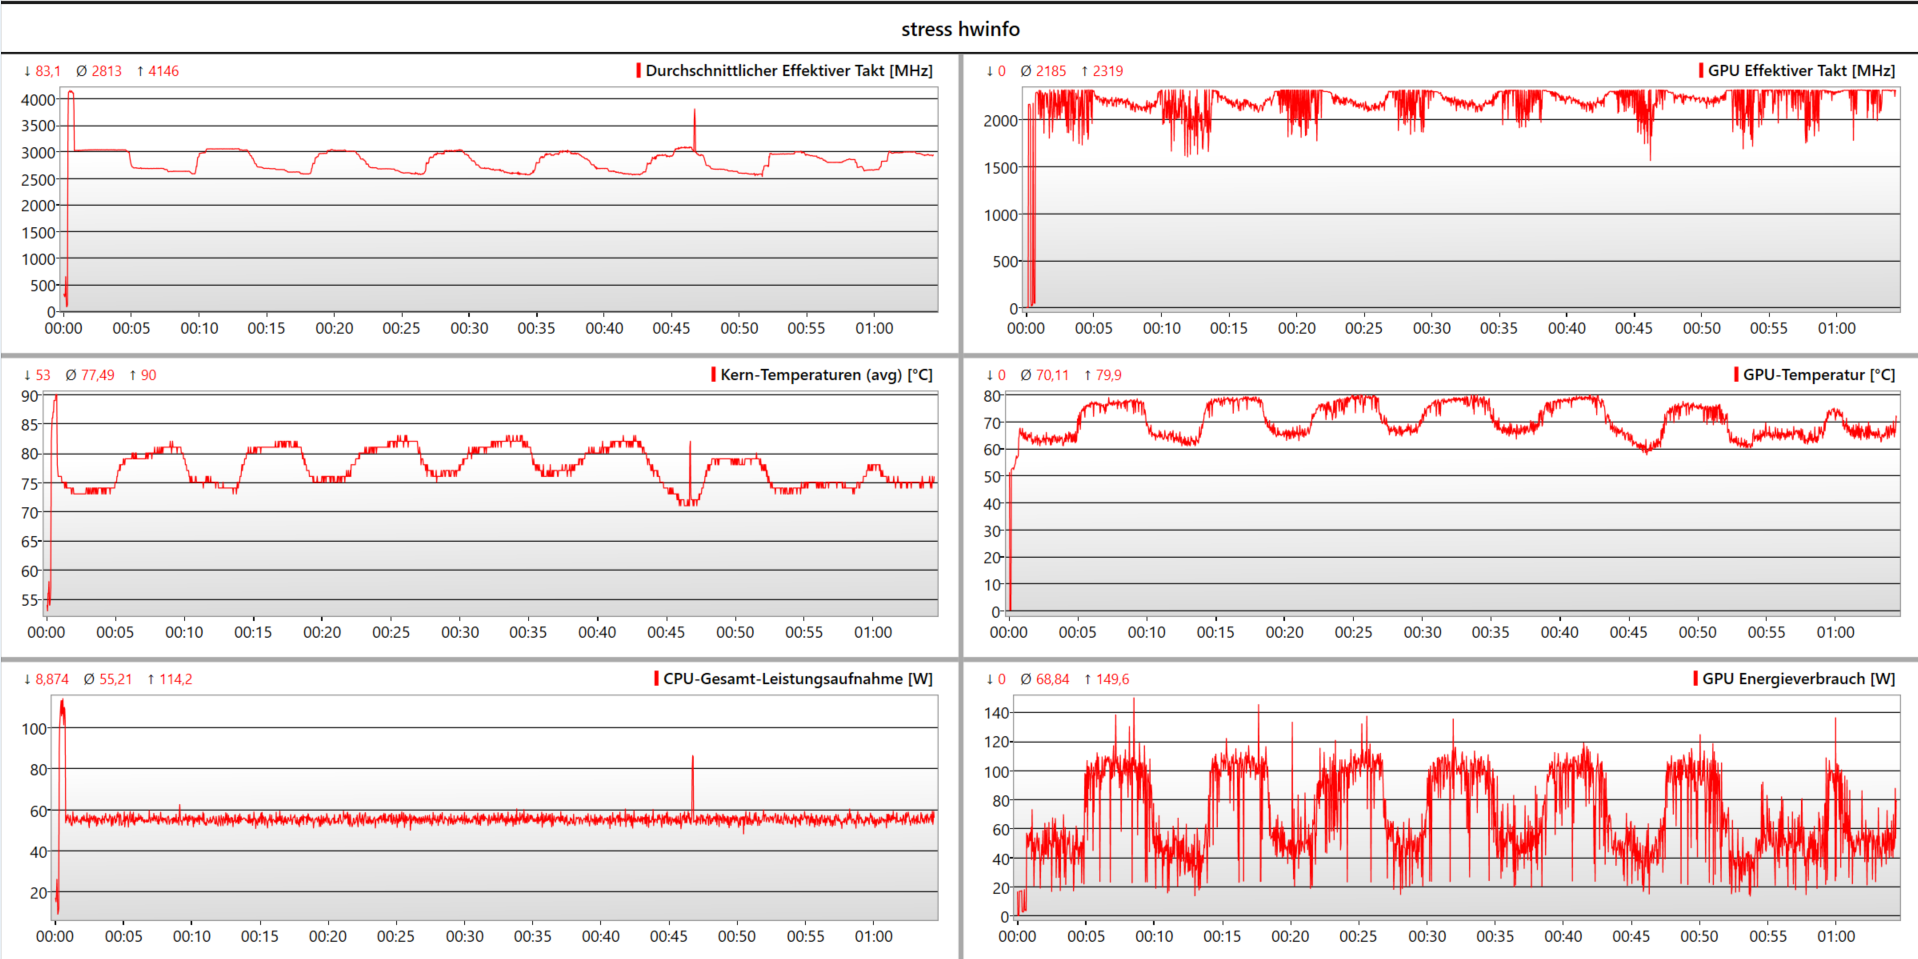
Den Stresstest führten wir am fast neuen MSI Pulse 17 aus. Die Zieltemperatur der GPU liegt hier augenscheinlich bei etwa 80 °C. Sobald dieser Wert erreicht ist, regelt die Leistungssteuerung ab, bis sich die GPU etwas abgekühlt hat. Dadurch entstehen die Wellen in unserem Log des Stresstests mit Prime95 und Furmark. Der Core i7 wird nach seiner kurzen Boost-Phase durchgehend mit rund 55 Watt betrieben. Die RTX 4070 muss immer wieder von 110 Watt auf 50 Watt herunterregeln. Im späteren Verlauf unseres Tests des MSI Pulse 17 hat sich die Leistungssteuerung des Notebooks wesentlich stabilisiert, sodass wir hier von einem Lerneffekt ausgehen.
Lautsprecher
Deutlich überbetonte Mitten sorgen dafür, dass das MSI Pulse 17 etwas blechern klingt. Dabei sind die kleinen Lautsprecher aber mit bis zu 85 dB(A) relativ laut und übertönen locker die leisen Lüfter in diesem Gaming-Notebook. Wem die Lautsprecher nicht zusagen, kann per Bluetooth oder 3,5 mm Klinke externe Geräte anschließen.
MSI Pulse 17 B13VGK Audio Analyse
(+) | Die Lautsprecher können relativ laut spielen (85.01 dB)
Bass 100 - 315 Hz
(±) | abgesenkter Bass - 13.2% geringer als der Median
(±) | durchschnittlich lineare Bass-Wiedergabe (12.3% Delta zum Vorgänger)
Mitteltöne 400 - 2000 Hz
(±) | zu hohe Mitten, vom Median 9.4% abweichend
(+) | lineare Mitten (5.7% Delta zum Vorgänger)
Hochtöne 2 - 16 kHz
(+) | ausgeglichene Hochtöne, vom Median nur 2.9% abweichend
(+) | sehr lineare Hochtöne (6.7% Delta zum Vorgänger)
Gesamt im hörbaren Bereich 100 - 16.000 Hz
(±) | hörbarer Bereich ist durchschnittlich linear (15.8% Abstand zum Median)
Im Vergleich zu allen Geräten derselben Klasse
» 37% aller getesteten Geräte dieser Klasse waren besser, 7% vergleichbar, 56% schlechter
» Das beste Gerät hat einen Delta-Wert von 6%, durchschnittlich ist 18%, das schlechteste Gerät hat 132%
Im Vergleich zu allen Geräten im Test
» 24% aller getesteten Geräte waren besser, 5% vergleichbar, 71% schlechter
» Das beste Gerät hat einen Delta-Wert von 4%, durchschnittlich ist 24%, das schlechteste Gerät hat 134%
Apple MacBook Pro 16 2021 M1 Pro Audio Analyse
(+) | Die Lautsprecher können relativ laut spielen (84.7 dB)
Bass 100 - 315 Hz
(+) | guter Bass - nur 3.8% Abweichung vom Median
(+) | lineare Bass-Wiedergabe (5.2% Delta zum Vorgänger)
Mitteltöne 400 - 2000 Hz
(+) | ausgeglichene Mitten, vom Median nur 1.3% abweichend
(+) | lineare Mitten (2.1% Delta zum Vorgänger)
Hochtöne 2 - 16 kHz
(+) | ausgeglichene Hochtöne, vom Median nur 1.9% abweichend
(+) | sehr lineare Hochtöne (2.7% Delta zum Vorgänger)
Gesamt im hörbaren Bereich 100 - 16.000 Hz
(+) | hörbarer Bereich ist sehr linear (4.6% Abstand zum Median
Im Vergleich zu allen Geräten derselben Klasse
» 0% aller getesteten Geräte dieser Klasse waren besser, 0% vergleichbar, 100% schlechter
» Das beste Gerät hat einen Delta-Wert von 5%, durchschnittlich ist 17%, das schlechteste Gerät hat 45%
Im Vergleich zu allen Geräten im Test
» 0% aller getesteten Geräte waren besser, 0% vergleichbar, 100% schlechter
» Das beste Gerät hat einen Delta-Wert von 4%, durchschnittlich ist 24%, das schlechteste Gerät hat 134%
Energieverwaltung - 90 Wh Akku sorgt für lange Laufzeiten
Energieaufnahme
Recht klassentypisch stellt sich die maximale Energieaufnahme des Pulse 17 unter Last dar. Aber sowohl im Leerlauf, als auch unter moderaten Lasten gibt sich das Testgerät ungewohnt energiesparsam für einen Gaming-Laptop.
| Aus / Standby | |
| Idle | |
| Last |
|
Legende:
min: | |
| MSI Pulse 17 B13VGK i7-13700H, GeForce RTX 4070 Laptop GPU, Micron 2400 MTFDKBA1T0QFM, IPS, 1920x1080, 17.3" | MSI Pulse GL76 12UGK i7-12700H, GeForce RTX 3070 Laptop GPU, Micron 3400 1TB MTFDKBA1T0TFH, IPS, 1920x1080, 17.3" | MSI Katana 17 B13VFK i7-13620H, GeForce RTX 4060 Laptop GPU, Micron 2400 MTFDKBA1T0QFM, IPS LED, 1920x1080, 17.3" | Acer Nitro 17 AN17-51-71ER i7-13700H, GeForce RTX 4060 Laptop GPU, Samsung PM9A1 MZVL21T0HCLR, , 2560x1440, 17.3" | Schenker XMG Focus 17 (E23) i9-13900HX, GeForce RTX 4070 Laptop GPU, Crucial P5 Plus 1TB CT1000P5PSSD8, IPS, 2560x1440, 17.3" | Asus ROG Strix G17 G713PI R9 7945HX, GeForce RTX 4070 Laptop GPU, WD PC SN560 SDDPNQE-1T00, IPS, 2560x1440, 17.3" | Durchschnittliche NVIDIA GeForce RTX 4070 Laptop GPU | Durchschnitt der Klasse Gaming | |
|---|---|---|---|---|---|---|---|---|
| Stromverbrauch | -45% | -26% | -18% | -97% | -75% | -58% | -64% | |
| Idle min * (Watt) | 9 | 12.4 -38% | 12.2 -36% | 8.3 8% | 17 -89% | 15 -67% | 13.2 ? -47% | 13.1 ? -46% |
| Idle avg * (Watt) | 10.2 | 13.1 -28% | 14.9 -46% | 13.5 -32% | 18 -76% | 20 -96% | 18.2 ? -78% | 18.8 ? -84% |
| Idle max * (Watt) | 10.8 | 25.3 -134% | 15.8 -46% | 14.8 -37% | 25.8 -139% | 29 -169% | 24.6 ? -128% | 24.4 ? -126% |
| Last avg * (Watt) | 72 | 105.4 -46% | 85.22 -18% | 77 -7% | 178 -147% | 121 -68% | 97 ? -35% | 108.6 ? -51% |
| Witcher 3 ultra * (Watt) | 130 | 150 -15% | 151.1 -16% | 154 -18% | 265 -104% | 179.8 -38% | ||
| Last max * (Watt) | 221 | 240.5 -9% | 212.8 4% | 263 -19% | 275 -24% | 246 -11% | 221 ? -0% | 255 ? -15% |
* ... kleinere Werte sind besser
Energieaufnahme Witcher 3 / Stresstest
Energieaufnahme mit externem Monitor
Akkulaufzeit
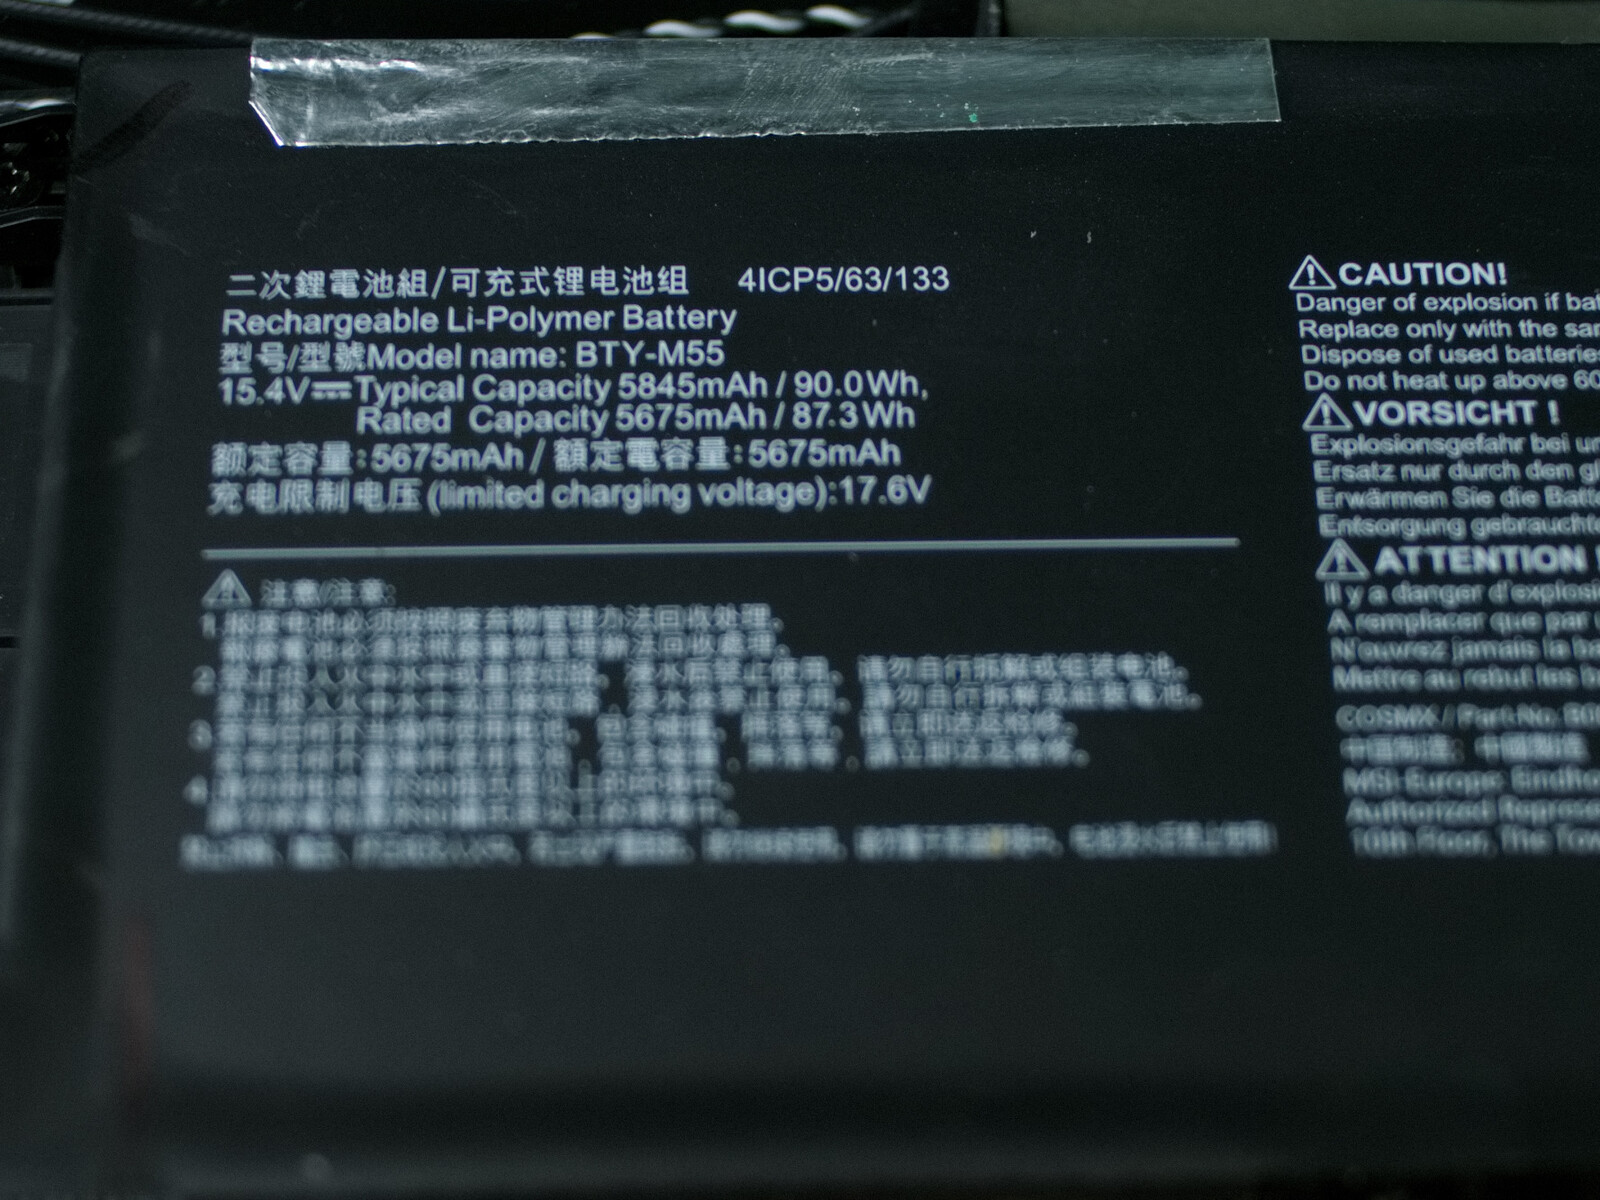
Entsprechend den Messwerten bei der Energieaufnahme verwundert es so auch nicht, dass der Gaming-Laptop mit seinem 90 Wh Akku über sehr lange Strecken im WiFi-Websurfingtest auskommt. Fast neun Stunden erreicht der Laptop hier. Selbst unter Last hält der Akku gute zwei Stunden.
| MSI Pulse 17 B13VGK i7-13700H, GeForce RTX 4070 Laptop GPU, 90 Wh | MSI Pulse GL76 12UGK i7-12700H, GeForce RTX 3070 Laptop GPU, 90 Wh | MSI Katana 17 B13VFK i7-13620H, GeForce RTX 4060 Laptop GPU, 53.5 Wh | Acer Nitro 17 AN17-51-71ER i7-13700H, GeForce RTX 4060 Laptop GPU, 90 Wh | Schenker XMG Focus 17 (E23) i9-13900HX, GeForce RTX 4070 Laptop GPU, 73 Wh | Asus ROG Strix G17 G713PI R9 7945HX, GeForce RTX 4070 Laptop GPU, 90 Wh | Durchschnitt der Klasse Gaming | |
|---|---|---|---|---|---|---|---|
| Akkulaufzeit | -20% | -62% | -9% | -57% | -54% | -27% | |
| WLAN (h) | 9 | 5.9 -34% | 2.9 -68% | 8.2 -9% | 3.9 -57% | 4.3 -52% | 7 ? -22% |
| Last (h) | 2.2 | 2.1 -5% | 1 -55% | 1 -55% | 1.51 ? -31% | ||
| Idle (h) | 7.3 | 8.71 ? | |||||
| H.264 (h) | 6.9 | 3.1 | 2.8 | 8.9 ? | |||
| Witcher 3 ultra (h) | 2.5 | 1 | 1.1 |
Pro
Contra
Fazit - Eher Steam Punk als Sci-Fi
Auf der Habenseite beim MSI Pulse 17 stehen mehrere starke Fakten, die für den Laptop sprechen. Ganz voran eine optimale Leistung vom Core i7 und der Nvidia GeForce RTX 4070. Dafür braucht das Pulse nicht einmal pulsierende Lüfter, denn der Laptop ist gerade für seine Leistungsklasse ausgesprochen leise. Auch eine ordentliche Tastatur und eine gute Positionierung der externen Anschlüsse können wir dem Gaming-Notebook zugutehalten. Für einen Gaming-Laptop sind auch die Akkulaufzeiten überragend.
Das Pulse 17 ist ein Gaming-Laptop, der mit brachialer Leistung bei geringer Lautstärke dienen kann. In vielen Aspekten ist das Gerät jedoch nicht ganz im Jahr 2023 angekommen.
Unerfreulicherweise hat der Laptop auch herbe Nachteile. Abgesehen vom MSI Katana 17 hat kein anderer Gaming-Laptop im Vergleich einen so schlechten Bildschirm. Auch die Ausstattung mit langsamen USB 2.0 und USB 3.2 Gen 1 Anschlüssen sowie 1 GBit/s LAN und das Fehlen von 6 GHz Wi-Fi stellen den Gamer nicht gerade als hochklassiges Gerät dar. Richtig ärgerlich ist dabei der blockierte M.2-NVMe-Port. Denn diesem Ärger hätte der Hersteller auf zwei Arten entgehen können. Zum einen haben Mainboard und Gehäuse hier genügen Platz, um das Bauteil etwas nach links zu verschieben und dem Akku auszuweichen. Zum anderen hätte man die unnütz verschwendeten PCIe-Lanes auch in einen Thunderbolt-Port investieren können.
Im Vergleich zum Vorgänger bietet das aktuelle Modell zwar nun G-Sync-, MUX-, Advanced-Optimus-Unterstützung, aber Thunderbolt fehlt noch immer. Der Bildschirm des Vorgängers war zudem, laut unseren Messergebnissen, wesentlich besser.
Mit Straßenpreisen, die zum Testzeitpunkt bei 2.150 Euro beginnen, erscheinen sehr viele (teils deutlich günstigere) Laptops als Alternative zum Testgerät. Der Preis, den man beim Hersteller für das Asus ROG Stix G17 zahlt, liegt mit dem MSI Gerät bei vielen Verkäufern gleichauf. Beim Laptop von Asus muss man zwar mit starken Abstichen bei der Akkulaufzeit rechnen, sonst sind sich das Pulse 17 und das ROG Strix G17 jedoch in allen Bereichen der Leistung recht ähnlich. Aber der Bildschirm und die Anschlussausstattung beim ROG Strix sind wesentlich besser.
Preis und Verfügbarkeit
Das günstigste Angebot für das MSI Pulse 17 B13VGK-068 finden wir zum Zeitpunkt der Veröffentlichung unseres Testberichts auf Amazon. 2.150 Euro verlangt man dort. Cyberport bietet das MSI Pulse 17 für rund 2.500 Euro an.
MSI Pulse 17 B13VGK
- 16.07.2023 v7 (old)
Marc Herter
Transparenz
Die Auswahl der zu testenden Geräte erfolgt innerhalb der Redaktion. Das vorliegende Testmuster wurde dem Autor vom Hersteller oder einem Shop zu Testzwecken leihweise zur Verfügung gestellt. Eine Einflussnahme des Leihstellers auf den Testbericht gab es nicht, der Hersteller erhielt keine Version des Reviews vor der Veröffentlichung. Es bestand keine Verpflichtung zur Publikation. Als eigenständiges, unabhängiges Unternehmen unterliegt Notebookcheck keiner Diktion von Herstellern, Shops und Verlagen.
So testet Notebookcheck
Pro Jahr werden von Notebookcheck hunderte Laptops und Smartphones unabhängig in von uns standardisierten technischen Verfahren getestet, um eine Vergleichbarkeit aller Testergebnisse zu gewährleisten. Seit rund 20 Jahren entwickeln wir diese Testmethoden kontinuierlich weiter und setzen damit Branchenstandards. In unseren Testlaboren kommt ausschließlich hochwertiges Messequipment in die Hände erfahrener Techniker und Redakteure. Die Tests unterliegen einer mehrstufigen Kontrolle. Unsere komplexe Gesamtbewertung basiert auf hunderten fundierten Messergebnissen und Benchmarks, womit Ihnen Objektivität garantiert ist. Weitere Informationen zu unseren Testmethoden gibt es hier.
Preisvergleich
