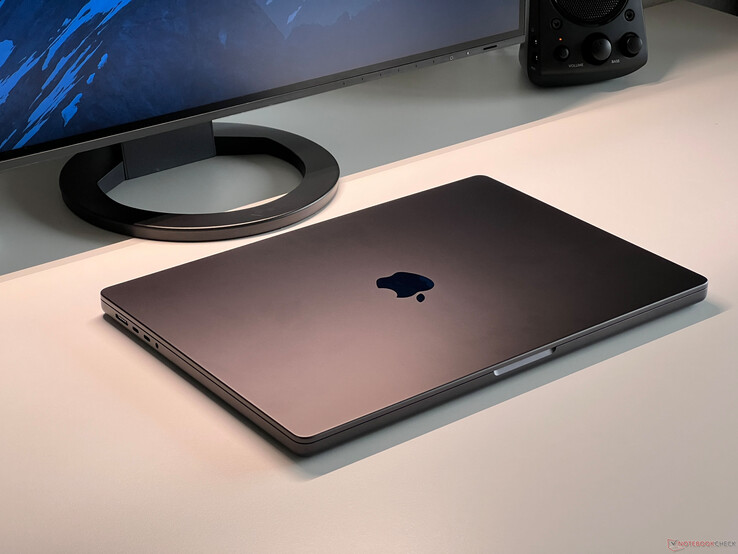
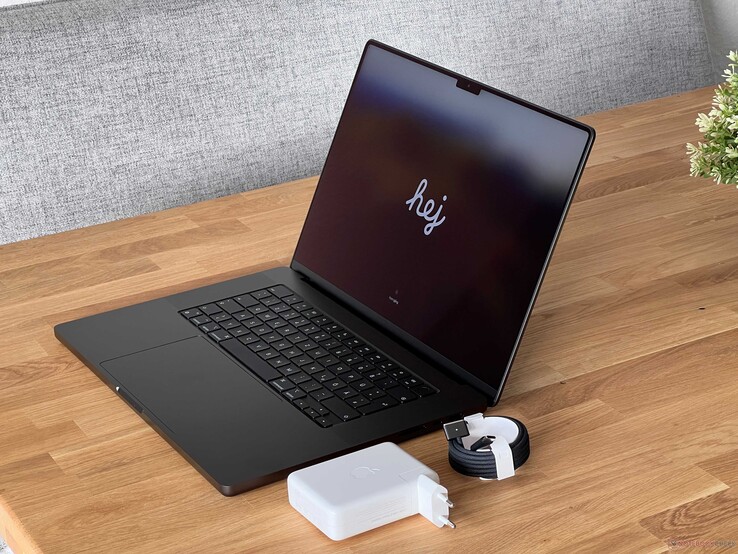
Apple MacBook Pro 16 2023 M3 Pro im Test - Effizienz vor Leistung
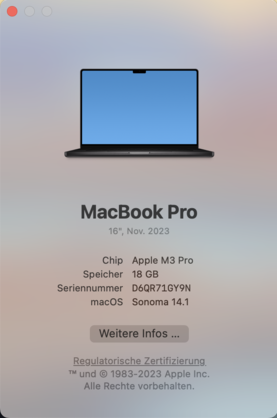
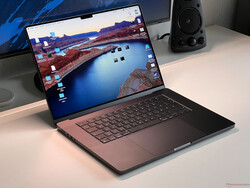
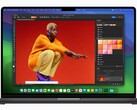
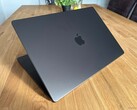
Das neue MacBook Pro 16 2023 in der High-End-Variante mit dem M3 Max hatten wir bereits im Test, doch das Basismodell mit dem M3-Pro-SoC für eine UVP von 2.999 Euro ist für die meisten Nutzer vermutlich deutlich interessanter. Mehr Leistung schadet zwar nie, doch nicht jeder Anwender benötigt die enorme Leistung (sowohl CPU als auch GPU) des neuen M3 Max. Im Gegensatz zum kleineren MacBook Pro 14 wird das MBP 16 ausschließlich mit der schnellsten Variante des M3 Pro ausgeliefert. Leider bleibt man beim Basismodell trotz des hohen Preises weiterhin bei einer mageren 512-GB-SSD.
| MBP 16 M3 Pro | MBP 16 M3 Max | MBP 16 M3 Max | |
|---|---|---|---|
| CPU | Apple M3 Pro 12 CPU-Kerne (6P & 6E) |
Apple M3 Max 14 CPU-Kerne (10P & 4E) |
Apple M3 Max 16 CPU-Kerne (12P & 4E) |
| GPU | 18 GPU-Kerne | 30 GPU-Kerne | 40 GPU-Kerne |
| RAM | 18 GB (36 GB) | 36 GB (96 GB) | 48 GB (64/128 GB) |
| SSD | 512 GB (1/2/4 TB) | 1 TB (2/4/8 TB) | 1 TB (2/4/8 TB) |
| Speicherbandbreite | 150 GB/s | 300 GB/s | 400 GB/s |
| Anschlüsse | 3x USB-C 4.0 mit Thunderbolt 4 HDMI, SD-Leser |
3x USB-C 4.0 mit Thunderbolt 4 HDMI, SD-Leser |
3x USB-C 4.0 mit Thunderbolt 4 HDMI, SD-Leser |
| Preis | ab 2.999 Euro | ab 4.249 Euro | ab 4.849 Euro |
Zu den Vergleichsgeräten gehören natürlich die Vorgänger-Modelle des MacBook Pro 16 mit M1- bzw. M2-Chips, aber auch hochwertige Windows-Multimedia-Laptops wie beispielsweise das Dell XPS 15, das Lenovo Yoga Pro 9i 16, das Asus Vivobook Pro 16, das Schenker Vision 16 oder auch das Samsung Galaxy Book3 Ultra 16.
Das sich viele Eigenschaften vom M3-Pro-Modell nicht vom bereits getesteten MBP 16 M3 Max unterscheiden, werden wir uns in diesem Test auf die Leistung und die Emissionen konzentrieren. Für alle Informationen zum Gehäuse, der Ausstattung, den Eingabegeräten, dem Display sowie den Lautsprechern steht unser ausführlicher Test der M3-Max-Variante zur Verfügung:
Mögliche Konkurrenten im Vergleich
Bew. | Datum | Modell | Gewicht | Dicke | Größe | Auflösung | Preis ab |
|---|---|---|---|---|---|---|---|
| 93.7 % v7 (old) | 11 / 2023 | Apple MacBook Pro 16 2023 M3 Pro Apple M3 Pro 12-Core, M3 Pro 18-Core GPU | 2.1 kg | 16.9 mm | 16.20" | 3456x2234 | |
| 87.6 % v7 (old) | 11 / 2023 | Asus VivoBook Pro 16 K6602VU i9-13900H, GeForce RTX 4050 Laptop GPU | 1.9 kg | 19 mm | 16.00" | 3200x2000 | |
| 88 % v7 (old) | 08 / 2023 | Lenovo Slim Pro 9i 16IRP8 i9-13905H, GeForce RTX 4050 Laptop GPU | 2.2 kg | 18.2 mm | 16.00" | 3200x2000 | |
| 88.6 % v7 (old) | 07 / 2023 | Schenker VISION 16 Pro (M23) i7-13700H, GeForce RTX 4070 Laptop GPU | 1.6 kg | 17.1 mm | 16.00" | 2560x1600 | |
| 89.4 % v7 (old) | 04 / 2023 | Samsung Galaxy Book3 Ultra 16 i7-13700H, GeForce RTX 4050 Laptop GPU | 1.8 kg | 16.5 mm | 16.00" | 2880x1800 | |
| 90.3 % v7 (old) | 04 / 2023 | Dell XPS 15 9530 RTX 4070 i7-13700H, GeForce RTX 4070 Laptop GPU | 1.9 kg | 18 mm | 15.60" | 3456x2160 |
Unterschiede zum MacBook Pro 16 mit M3 Max
Beim Gehäuse und den Anschlüssen gibt es keine Unterschiede zwischen den Konfigurationen mit dem M3 Pro und dem M3 Max, das wir bereits ausführlich getestet haben. Der interne Aufbau ist ebenfalls absolut identisch, lediglich bei den Videoanschlüssen gibt es Unterschiede. Während das MBP 16 mit dem M3 Max maximal vier externe Displays gleichzeitig ansteuern kann sind es mi dem M3 Pro maximal zwei externe Bildschirme (maximale Auflösungen sind aber identisch zum M3 Max).
Leistung - Apple M3 Pro mit 18 GB RAM
Prozessor - 6-Performance-Kerne
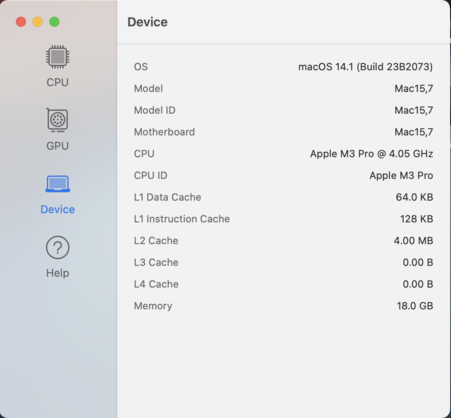
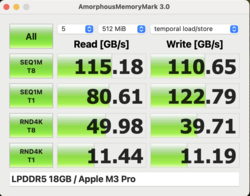
Den neuen M3-Pro-SoC gibt es in zwei Varianten, wobei das große MacBook Pro 16 ausschließlich mit der schnelleren Variante ausgeliefert wird. Wie schon beim Vorgänger bietet dieser insgesamt 12 CPU-Kerne, allerdings wurde die Kernkonfiguration verändert. Denn während es beim M2 Pro noch 8 Performance-Kerne und 4 Efficiency-Kerne waren, sind es nun jeweils 6 Performance-Kerne sowie 6 Efficiency-Kerne. Im Vergleich zu den alten M2-Chips (Pro/Max) kommen in den CPU-Cluster beim M3 Pro/Max nun jeweils sechs anstelle von vier Kernen zum Einsatz. Die Kerne selbst haben die gleichen Specs wie bei den anderen M3-CPUs, denn die Performance-Kerne können bis zu 4,056 GHz und die Efficiency-Kerne bis zu 2,748 GHz erreichen, was in der Praxis auch der Fall ist. Zudem wurde die Geschwindigkeit vom Speicherinterface von 256 Bit auf 192 Bit reduziert, weshalb die maximale Speicherbandbreite jetzt nur noch bei 150 GB/s anstatt 200 GB/s liegt.
Natürlich ist zunächst einmal der Vergleich gegenüber dem alten M2 Pro interessant, der in unseren Test einen maximalen Stromverbrauch von ~34 Watt aufgewiesen hat. Die Multi-Core-Leistung in den nativen Tests ist nur um wenige Prozentpunkte höher (2 bis maximal 6 %) und damit praktisch identisch, aber gleichzeitig konnte Apple den Stromverbrauch reduzieren und liegt jetzt bei nur noch knapp 26-27 Watt. Im Vergleich mit den aktuellen Intel-Prozessoren bewegt sich der M3 Pro in den Multi-Core-Tests damit auf dem Niveau des Core i7-13700H im Samsung Galaxy Book 3 Ultra oder dem Dell XPS 15 9530, die dafür aber jeweils deutlich mehr Strom benötigen.
Cinebench 2024: CPU Multi Core | CPU Single Core
Geekbench 5.5: Multi-Core | Single-Core
Geekbench 6.5: Multi-Core | Single-Core
Blender: v3.3 Classroom CPU
| Cinebench R23 / Multi Core | |
| Apple MacBook Pro 16 2023 M3 Max | |
| Lenovo Slim Pro 9i 16IRP8 | |
| Durchschnitt der Klasse Multimedia (4861 - 33362, n=78, der letzten 2 Jahre) | |
| Dell XPS 15 9530 RTX 4070 | |
| Samsung Galaxy Book3 Ultra 16 | |
| Apple MacBook Pro 16 2023 M3 Pro | |
| Durchschnittliche Apple M3 Pro 12-Core (n=1) | |
| Asus VivoBook Pro 16 K6602VU | |
| Apple MacBook Pro 14 2023 M2 Pro | |
| Apple MacBook Pro 14 2023 M2 Pro | |
| Schenker VISION 16 Pro (M23) | |
| Apple MacBook Pro 16 2021 M1 Pro | |
| Cinebench R23 / Single Core | |
| Lenovo Slim Pro 9i 16IRP8 | |
| Apple MacBook Pro 16 2023 M3 Pro | |
| Durchschnittliche Apple M3 Pro 12-Core (n=1) | |
| Apple MacBook Pro 16 2023 M3 Max | |
| Schenker VISION 16 Pro (M23) | |
| Durchschnitt der Klasse Multimedia (1128 - 2459, n=70, der letzten 2 Jahre) | |
| Dell XPS 15 9530 RTX 4070 | |
| Asus VivoBook Pro 16 K6602VU | |
| Samsung Galaxy Book3 Ultra 16 | |
| Apple MacBook Pro 14 2023 M2 Pro | |
| Apple MacBook Pro 14 2023 M2 Pro | |
| Apple MacBook Pro 16 2021 M1 Pro | |
| Cinebench 2024 / CPU Multi Core | |
| Apple MacBook Pro 16 2023 M3 Max | |
| Apple MacBook Pro 16 2023 M3 Pro | |
| Durchschnittliche Apple M3 Pro 12-Core (n=1) | |
| Apple MacBook Pro 14 2023 M2 Pro | |
| Durchschnitt der Klasse Multimedia (327 - 2069, n=70, der letzten 2 Jahre) | |
| Apple MacBook Pro 16 2021 M1 Pro | |
| Cinebench 2024 / CPU Single Core | |
| Apple MacBook Pro 16 2023 M3 Pro | |
| Durchschnittliche Apple M3 Pro 12-Core (n=1) | |
| Apple MacBook Pro 16 2023 M3 Max | |
| Apple MacBook Pro 14 2023 M2 Pro | |
| Durchschnitt der Klasse Multimedia (72.5 - 200, n=50, der letzten 2 Jahre) | |
| Apple MacBook Pro 16 2021 M1 Pro | |
| Geekbench 5.5 / Multi-Core | |
| Apple MacBook Pro 16 2023 M3 Max | |
| Apple MacBook Pro 16 2023 M3 Pro | |
| Durchschnittliche Apple M3 Pro 12-Core (n=1) | |
| Apple MacBook Pro 14 2023 M2 Pro | |
| Lenovo Slim Pro 9i 16IRP8 | |
| Apple MacBook Pro 14 2023 M2 Pro | |
| Dell XPS 15 9530 RTX 4070 | |
| Apple MacBook Pro 16 2021 M1 Pro | |
| Durchschnitt der Klasse Multimedia (4652 - 20422, n=61, der letzten 2 Jahre) | |
| Schenker VISION 16 Pro (M23) | |
| Samsung Galaxy Book3 Ultra 16 | |
| Asus VivoBook Pro 16 K6602VU | |
| Geekbench 5.5 / Single-Core | |
| Apple MacBook Pro 16 2023 M3 Max | |
| Apple MacBook Pro 16 2023 M3 Pro | |
| Durchschnittliche Apple M3 Pro 12-Core (n=1) | |
| Lenovo Slim Pro 9i 16IRP8 | |
| Apple MacBook Pro 14 2023 M2 Pro | |
| Apple MacBook Pro 14 2023 M2 Pro | |
| Dell XPS 15 9530 RTX 4070 | |
| Schenker VISION 16 Pro (M23) | |
| Durchschnitt der Klasse Multimedia (805 - 2974, n=61, der letzten 2 Jahre) | |
| Apple MacBook Pro 16 2021 M1 Pro | |
| Asus VivoBook Pro 16 K6602VU | |
| Samsung Galaxy Book3 Ultra 16 | |
| Geekbench 6.5 / Multi-Core | |
| Apple MacBook Pro 16 2023 M3 Max | |
| Apple MacBook Pro 16 2023 M3 Pro | |
| Durchschnittliche Apple M3 Pro 12-Core (n=1) | |
| Apple MacBook Pro 14 2023 M2 Pro | |
| Durchschnitt der Klasse Multimedia (4983 - 25760, n=75, der letzten 2 Jahre) | |
| Apple MacBook Pro 16 2021 M1 Pro | |
| Asus VivoBook Pro 16 K6602VU | |
| Geekbench 6.5 / Single-Core | |
| Apple MacBook Pro 16 2023 M3 Pro | |
| Durchschnittliche Apple M3 Pro 12-Core (n=1) | |
| Apple MacBook Pro 16 2023 M3 Max | |
| Durchschnitt der Klasse Multimedia (1534 - 4326, n=71, der letzten 2 Jahre) | |
| Apple MacBook Pro 14 2023 M2 Pro | |
| Asus VivoBook Pro 16 K6602VU | |
| Apple MacBook Pro 16 2021 M1 Pro | |
| Blender / v3.3 Classroom CPU | |
| Durchschnitt der Klasse Multimedia (160 - 1042, n=63, der letzten 2 Jahre) | |
| Schenker VISION 16 Pro (M23) | |
| Samsung Galaxy Book3 Ultra 16 | |
| Dell XPS 15 9530 RTX 4070 | |
| Asus VivoBook Pro 16 K6602VU | |
| Apple MacBook Pro 14 2023 M2 Pro | |
| Apple MacBook Pro 16 2023 M3 Pro | |
| Durchschnittliche Apple M3 Pro 12-Core (n=1) | |
| Lenovo Slim Pro 9i 16IRP8 | |
| Apple MacBook Pro 16 2023 M3 Max | |
* ... kleinere Werte sind besser
In den Single-Core-Tests kann der neue M3 Pro (genauso wie der normale M3 & M3 Max) aber voll überzeugen und wir sehen einen Leistungsvorteil von 20 % gegenüber der alten M2-Generation, trotz vergleichbarem CPU-Verbrauch (~5,6 Watt). Damit muss sich Apple in dieser Vergleichsgruppe nur noch dem Core i9-13905H ganz klapp geschlagen geben, der bei Single-Core-Last aber wiederum deutlich mehr Strom verbraucht. Eine genauere Analyse der Effizienz bieten wir in unserer Analyse zum M3 Pro/M3 Max, die in Kürze veröffentlicht wird.
Wie üblich bleibt die CPU-Leistung abseits der Steckdose vollkommen konstant. Unsere übliche Cinebench R15 Multi-Schleife haben wir ebenfalls durchgeführt, hierbei muss man aber beachten, dass die Leistung aufgrund der Emulation etwas reduziert ist. Auch hier gibt es einen leichten Vorsprung gegenüber dem alten M2 Pro, die Schleife zeigt aber sehr gut, dass die CPU-Leistung auch bei dauerhafter Belastung vollkommen stabil bleibt. Weitere CPU-Benchmarks stehen hier zur Verfügung.
Cinebench R15 Multi Dauertest
System Performance
Jedes Macbook Pro mit einem Apple-M-SoC (egal ob M1, M2 oder M3) bietet einen extrem hohen subjektiven Leistungseindruck und die gestiegene Single-Core-Leistung des neuen M3 Pro unterstützt das noch weiter. Alle Anwendungen werden sehr schnell gestartet (auch komplexe Apps) und native Apps laufen extrem gut. Im plattformübergreifenden CrossMark-Test muss sich das MBP 16 M3 Pro zudem nur dem schnelleren MBP 16 M3 Max geschlagen geben, die Windows-Konkurrenz kann aber überholt werden. Grundsätzlich eignet sich auch das kleinste MacBook Pro 16 hervorragend für die Bearbeitung von Videos und Fotos.
Programme für Intel-Macs können dank Rosetta 2 emuliert werden, was auch gut funktioniert. Das kostet aber etwas Leistung, was man vor allem bei komplexen Anwendungen bemerkt. Wir haben dennoch die beiden PugetBench-Tests für Adobe Photoshop sowie Premiere Pro durchgeführt und die Ergebnisse sind dennoch sehr respektabel.
Blackmagic RAW Speed Test: 12:1 8K Metal | 12:1 8K CPU
Photoshop PugetBench: Overall Score | GPU Score | General Score | Filter Score
Premiere Pro PugetBench: Overall Score 0.98 | LongGOP 0.98 | Intraframe 0.98 | RAW 0.98 | GPU Effects 0.98
Jetstream 2: 2.0 Total Score
Speedometer 2.0: Result 2.0
WebXPRT 3: Overall
| CrossMark / Overall | |
| Apple MacBook Pro 16 2023 M3 Max | |
| Asus Zenbook Pro 16X UX7602BZ-MY005W | |
| Apple MacBook Pro 16 2023 M3 Pro | |
| Durchschnittliche Apple M3 Pro 12-Core, Apple M3 Pro 18-Core GPU (n=1) | |
| Schenker VISION 16 Pro (M23) | |
| Dell XPS 15 9530 RTX 4070 | |
| Asus ROG Zephyrus G14 GA402XY | |
| Apple MacBook Pro 14 2023 M2 Pro | |
| Lenovo Slim Pro 9i 16IRP8 | |
| Durchschnitt der Klasse Multimedia (866 - 2426, n=62, der letzten 2 Jahre) | |
| Asus VivoBook Pro 16 K6602VU | |
| Samsung Galaxy Book3 Ultra 16 | |
| Apple MacBook Pro 16 2021 M1 Pro | |
| CrossMark / Productivity | |
| Asus Zenbook Pro 16X UX7602BZ-MY005W | |
| Apple MacBook Pro 16 2023 M3 Max | |
| Schenker VISION 16 Pro (M23) | |
| Apple MacBook Pro 16 2023 M3 Pro | |
| Durchschnittliche Apple M3 Pro 12-Core, Apple M3 Pro 18-Core GPU (n=1) | |
| Asus ROG Zephyrus G14 GA402XY | |
| Dell XPS 15 9530 RTX 4070 | |
| Durchschnitt der Klasse Multimedia (913 - 2344, n=62, der letzten 2 Jahre) | |
| Asus VivoBook Pro 16 K6602VU | |
| Lenovo Slim Pro 9i 16IRP8 | |
| Apple MacBook Pro 14 2023 M2 Pro | |
| Samsung Galaxy Book3 Ultra 16 | |
| Apple MacBook Pro 16 2021 M1 Pro | |
| CrossMark / Creativity | |
| Apple MacBook Pro 16 2023 M3 Max | |
| Apple MacBook Pro 16 2023 M3 Pro | |
| Durchschnittliche Apple M3 Pro 12-Core, Apple M3 Pro 18-Core GPU (n=1) | |
| Apple MacBook Pro 14 2023 M2 Pro | |
| Asus Zenbook Pro 16X UX7602BZ-MY005W | |
| Dell XPS 15 9530 RTX 4070 | |
| Asus ROG Zephyrus G14 GA402XY | |
| Lenovo Slim Pro 9i 16IRP8 | |
| Apple MacBook Pro 16 2021 M1 Pro | |
| Schenker VISION 16 Pro (M23) | |
| Durchschnitt der Klasse Multimedia (907 - 2820, n=62, der letzten 2 Jahre) | |
| Asus VivoBook Pro 16 K6602VU | |
| Samsung Galaxy Book3 Ultra 16 | |
| CrossMark / Responsiveness | |
| Schenker VISION 16 Pro (M23) | |
| Dell XPS 15 9530 RTX 4070 | |
| Asus Zenbook Pro 16X UX7602BZ-MY005W | |
| Asus VivoBook Pro 16 K6602VU | |
| Samsung Galaxy Book3 Ultra 16 | |
| Apple MacBook Pro 16 2023 M3 Max | |
| Apple MacBook Pro 16 2023 M3 Pro | |
| Durchschnittliche Apple M3 Pro 12-Core, Apple M3 Pro 18-Core GPU (n=1) | |
| Durchschnitt der Klasse Multimedia (605 - 2024, n=62, der letzten 2 Jahre) | |
| Asus ROG Zephyrus G14 GA402XY | |
| Lenovo Slim Pro 9i 16IRP8 | |
| Apple MacBook Pro 14 2023 M2 Pro | |
| Apple MacBook Pro 16 2021 M1 Pro | |
| Blackmagic RAW Speed Test / 12:1 8K Metal | |
| Apple MacBook Pro 16 2023 M3 Max | |
| Durchschnitt der Klasse Multimedia (78 - 379, n=5, der letzten 2 Jahre) | |
| Apple MacBook Pro 14 2023 M2 Pro | |
| Apple MacBook Pro 16 2021 M1 Pro | |
| Apple MacBook Pro 16 2023 M3 Pro | |
| Durchschnittliche Apple M3 Pro 12-Core, Apple M3 Pro 18-Core GPU (n=1) | |
| Blackmagic RAW Speed Test / 12:1 8K CPU | |
| Apple MacBook Pro 16 2023 M3 Max | |
| Durchschnitt der Klasse Multimedia (44 - 91, n=5, der letzten 2 Jahre) | |
| Apple MacBook Pro 14 2023 M2 Pro | |
| Apple MacBook Pro 16 2023 M3 Pro | |
| Durchschnittliche Apple M3 Pro 12-Core, Apple M3 Pro 18-Core GPU (n=1) | |
| Apple MacBook Pro 16 2021 M1 Pro | |
| Photoshop PugetBench / Overall Score | |
| Apple MacBook Pro 16 2023 M3 Max | |
| Asus ROG Zephyrus G14 GA402XY | |
| Asus Zenbook Pro 16X UX7602BZ-MY005W | |
| Apple MacBook Pro 16 2023 M3 Pro | |
| Durchschnittliche Apple M3 Pro 12-Core, Apple M3 Pro 18-Core GPU (n=1) | |
| Apple MacBook Pro 14 2023 M2 Pro | |
| Apple MacBook Pro 16 2021 M1 Pro | |
| Photoshop PugetBench / GPU Score | |
| Apple MacBook Pro 16 2023 M3 Max | |
| Apple MacBook Pro 16 2023 M3 Pro | |
| Durchschnittliche Apple M3 Pro 12-Core, Apple M3 Pro 18-Core GPU (n=1) | |
| Asus ROG Zephyrus G14 GA402XY | |
| Apple MacBook Pro 14 2023 M2 Pro | |
| Asus Zenbook Pro 16X UX7602BZ-MY005W | |
| Apple MacBook Pro 16 2021 M1 Pro | |
| Photoshop PugetBench / General Score | |
| Apple MacBook Pro 16 2023 M3 Max | |
| Asus ROG Zephyrus G14 GA402XY | |
| Asus Zenbook Pro 16X UX7602BZ-MY005W | |
| Apple MacBook Pro 16 2023 M3 Pro | |
| Durchschnittliche Apple M3 Pro 12-Core, Apple M3 Pro 18-Core GPU (n=1) | |
| Apple MacBook Pro 14 2023 M2 Pro | |
| Apple MacBook Pro 16 2021 M1 Pro | |
| Photoshop PugetBench / Filter Score | |
| Apple MacBook Pro 16 2023 M3 Max | |
| Apple MacBook Pro 16 2023 M3 Pro | |
| Durchschnittliche Apple M3 Pro 12-Core, Apple M3 Pro 18-Core GPU (n=1) | |
| Asus ROG Zephyrus G14 GA402XY | |
| Apple MacBook Pro 14 2023 M2 Pro | |
| Asus Zenbook Pro 16X UX7602BZ-MY005W | |
| Apple MacBook Pro 16 2021 M1 Pro | |
| Premiere Pro PugetBench / Overall Score 0.98 | |
| Asus Zenbook Pro 16X UX7602BZ-MY005W | |
| Apple MacBook Pro 16 2023 M3 Max | |
| Asus ROG Zephyrus G14 GA402XY | |
| Apple MacBook Pro 16 2023 M3 Pro | |
| Durchschnittliche Apple M3 Pro 12-Core, Apple M3 Pro 18-Core GPU (n=1) | |
| Apple MacBook Pro 16 2021 M1 Pro | |
| Premiere Pro PugetBench / LongGOP 0.98 | |
| Asus Zenbook Pro 16X UX7602BZ-MY005W | |
| Apple MacBook Pro 16 2023 M3 Max | |
| Asus ROG Zephyrus G14 GA402XY | |
| Apple MacBook Pro 16 2023 M3 Pro | |
| Durchschnittliche Apple M3 Pro 12-Core, Apple M3 Pro 18-Core GPU (n=1) | |
| Apple MacBook Pro 16 2021 M1 Pro | |
| Premiere Pro PugetBench / Intraframe 0.98 | |
| Apple MacBook Pro 16 2023 M3 Max | |
| Asus Zenbook Pro 16X UX7602BZ-MY005W | |
| Apple MacBook Pro 16 2023 M3 Pro | |
| Durchschnittliche Apple M3 Pro 12-Core, Apple M3 Pro 18-Core GPU (n=1) | |
| Apple MacBook Pro 16 2021 M1 Pro | |
| Asus ROG Zephyrus G14 GA402XY | |
| Premiere Pro PugetBench / RAW 0.98 | |
| Asus Zenbook Pro 16X UX7602BZ-MY005W | |
| Apple MacBook Pro 16 2023 M3 Max | |
| Asus ROG Zephyrus G14 GA402XY | |
| Apple MacBook Pro 16 2023 M3 Pro | |
| Durchschnittliche Apple M3 Pro 12-Core, Apple M3 Pro 18-Core GPU (n=1) | |
| Apple MacBook Pro 16 2021 M1 Pro | |
| Premiere Pro PugetBench / GPU Effects 0.98 | |
| Asus Zenbook Pro 16X UX7602BZ-MY005W | |
| Asus ROG Zephyrus G14 GA402XY | |
| Apple MacBook Pro 16 2023 M3 Max | |
| Apple MacBook Pro 16 2021 M1 Pro | |
| Apple MacBook Pro 16 2023 M3 Pro | |
| Durchschnittliche Apple M3 Pro 12-Core, Apple M3 Pro 18-Core GPU (n=1) | |
| Jetstream 2 / 2.0 Total Score | |
| Durchschnitt der Klasse Multimedia (261 - 476, n=36, der letzten 2 Jahre) | |
| Lenovo Slim Pro 9i 16IRP8 | |
| Apple MacBook Pro 16 2023 M3 Max | |
| Apple MacBook Pro 16 2023 M3 Pro | |
| Durchschnittliche Apple M3 Pro 12-Core, Apple M3 Pro 18-Core GPU (n=1) | |
| Schenker VISION 16 Pro (M23) | |
| Dell XPS 15 9530 RTX 4070 | |
| Samsung Galaxy Book3 Ultra 16 | |
| Apple MacBook Pro 14 2023 M2 Pro | |
| Apple MacBook Pro 16 2021 M1 Pro | |
| Speedometer 2.0 / Result 2.0 | |
| Apple MacBook Pro 16 2023 M3 Max | |
| Apple MacBook Pro 16 2023 M3 Pro | |
| Durchschnittliche Apple M3 Pro 12-Core, Apple M3 Pro 18-Core GPU (n=1) | |
| Durchschnitt der Klasse Multimedia (337 - 946, n=35, der letzten 2 Jahre) | |
| Apple MacBook Pro 14 2023 M2 Pro | |
| Schenker VISION 16 Pro (M23) | |
| Samsung Galaxy Book3 Ultra 16 | |
| Apple MacBook Pro 16 2021 M1 Pro | |
| WebXPRT 3 / Overall | |
| Apple MacBook Pro 16 2023 M3 Pro | |
| Durchschnittliche Apple M3 Pro 12-Core, Apple M3 Pro 18-Core GPU (n=1) | |
| Apple MacBook Pro 16 2023 M3 Max | |
| Apple MacBook Pro 14 2023 M2 Pro | |
| Apple MacBook Pro 16 2021 M1 Pro | |
| Lenovo Slim Pro 9i 16IRP8 | |
| Durchschnitt der Klasse Multimedia (136.4 - 545, n=65, der letzten 2 Jahre) | |
| Dell XPS 15 9530 RTX 4070 | |
| Asus ROG Zephyrus G14 GA402XY | |
| Schenker VISION 16 Pro (M23) | |
| Samsung Galaxy Book3 Ultra 16 | |
Massenspeicher
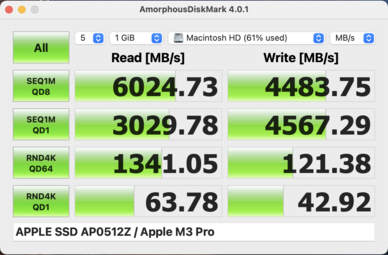
Die Basisvariante des MacBook Pro 16 wird weiterhin mit einer 512-GB-SSD ausgeliefert (AP0512Z). Beim alten MacBook Pro 14 mit dem M2 Pro wurden weniger NAND-Chips verbaut als zuvor, was sich negativ auf die Transferraten auswirkte. Umso erstaunter waren wir nun, dass nun wieder vier NAND-Chips verbaut sind, was übrigens auch für das neue MacBook Pro 14 M3 Pro mit der 512-GB-SSD gilt. Die Transferraten sind nun wieder angestiegen und maximal sehen wir knapp 6 GB/s beim Lesen und ~4,5 GB/s beim Schreiben. Von den 512 GB stehen dem Nutzer nach der ersten Inbetriebnahme 466 GB zur freien Verfügung. Weitere SSD-Benchmarks sind in unserer Techniksektion gelistet.
Grafikkarte
Wie schon beim Prozessor hat sich auch die Kernzahl der Grafikkarten verändert. Während das Topmodell des M2 Pro noch 19 GPU-Kerne geboten hat, sind es nun 18 GPU-Kerne beim M3 Pro. Den Takt können wir nicht auslesen, wir gehen aber auch hier von einer Steigerung aus. In den meisten Benchmarks sehen wir einen geringfügigen Leistungsanstieg gegenüber dem M2 Pro mit 19 GPU-Kernen (die Ausnahme ist Geekbench 6.2), allerdings ist auch der Stromverbrauch mit 28 zu 25 Watt etwas angestiegen. Im Gegensatz zum Prozessor ist die Grafikkarte also nicht effizienter geworden und bei der Leistung herrscht Stillstand, was schon etwas ernüchternd ist.
Im WildLife-Extreme-Unlimited-Test ordnet sich die M3-Pro-GPU vor der RTX 4050 Laptop (65 Watt), aber knapp hinter der RTX 4060 Laptop (80 Watt) ein. In den OpenCL-Tests liegt die M3-Pro-GPU allerdings deutlich hinter ihre dedizierten GeForce-Konkurrenten zurück.
Die Grafikleistung bleibt jederzeit stabil, sowohl bei dauerhafter Belastung als auch im Akkubetrieb, was bei den meisten GeForce-GPUs nicht der Fall ist. Weitere GPU-Benchmarks sind hier gelistet.
* ... kleinere Werte sind besser
Gaming Performance
In den anderen Testberichten haben wir schon erwähnt, dass es verschiedene Möglichkeiten gibt, auf dem MacBook zu spielen. Neben emulierten Titeln oder zusätzliche Software wie CrossOver ist mittlerweile einiges möglich (beispielsweise GTA V, Cyberpunk 2077), aber hier kann nicht immer das volle Potenzial der Hardware genutzt werden und natürlich fehlen hier Optimierungen.
Am besten laufen natürlich native Spiele, wozu mittlerweile auch einige AAA-Titel wie Baldur's Gate 3 oder No Man's Sky gehören. Diese laufen auch sehr gut auf dem MacBook Pro und in der Regel sind hier die höchsten Settings möglich, doch im Vergleich zu Windows-Rechnern ist die Gaming-Performance schon noch deutlich unterhalb der GeForce RTX 4050 Laptop. Wer ab und an auf dem MacBook spielen möchte und mit der begrenzten Auswahl zurechtkommt wird nicht enttäuscht werden, doch man muss sich im Klaren sein, dass es sich hier nicht um einen Gamer handelt. Im nachfolgenden Video haben wir einige native Games in den jeweils höchsten Settings in der 1080p-Auflösung getestet.
| min. | mittel | hoch | max. | QHD | |
|---|---|---|---|---|---|
| GTA V (2015) | 90 | 79 | 52 | 49 | |
| The Witcher 3 (2015) | 43 | ||||
| Shadow of the Tomb Raider (2018) | 71 | 65 | 57 | 37 | |
| Total War: Three Kingdoms (2019) | 87 | 56 | 41 | 25 | |
| Star Wars Jedi Survivor (2023) | 30 | 26 | 17 | ||
| Baldur's Gate 3 (2023) | 53 | 43 | |||
| Cyberpunk 2077 (2023) | 53 | 42.6 | 35 | 30.8 | |
| Total War Pharaoh (2023) | 212 | 140 | 77 | 58 | 42 |
Emissionen - Fast immer unhörbar
Geräuschemissionen
Die beiden Lüfter des MacBook Pro 16 sind bei leichter/mittlerer Belastung in der Regel komplett unhörbar. Selbst die erste Lüfterstufe bei 1.400 U/Min fällt mit 25,1 dB(A) nur auf, wenn man das Ohr direkt an das Gerät hält. Dank dem effizienten M3-Pro-Chip ist auch Gaming auf diesem Niveau möglich und das Maximum was wir bei nativen Games ermitteln konnten waren rund 1.900 U/Min, was nur rund 26,2 dB(A) entspricht. Der 3DMark WildLife Extreme Stresstest führte nach 20 Minuten Dauerlast ebenfalls nur zu ~1.900 U/Min und bei Cinebench R23 Multi waren es nach 30 Minuten maximal 2.400 U/Min bei 31,1 dB(A).
Lediglich im Stresstest mit kombinierter CPU-/GPU-Belastung erreichen die Lüfter zu in den ersten Minuten des Tests bis zu 4.400 U/Min, was zu lauten 50,4 dB(A) führt. Das liegt an dem Lüfterverhalten, denn der Chip darf erst sehr warm werden (über 100 °C), was die Lüfter dann wieder einfangen müssen. Im weiteren Verlauf des Stresstests pendelt sich die Lüftergeschwindigkeit dann wieder bei 3.600-3.800 U/Min ein. Damit ist das MBP 16 M3 Pro tatsächlich sogar etwas lauter als das MBP 16 mit dem M3 Max (im Modus Automatisch), was wir aber gleich in der Sektion Stresstest erklären werden.
In Stresstest bei voller Belastung liegt das MacBook damit fast auf dem Niveau der Konkurrenten, lediglich das Samsung Galaxy Book3 Ultra ist bleibt leiser, was aber an der deutlichen reduzierten Leistung bei kombinierter Last liegt (CPU: 17 Watt/GPU: 12 Watt). In allen anderen Last-Szenarien ist das MBP 16 es aber deutlich leiser. Im Gegensatz zu den M3-Max-Modellen konnten wir beim MacBook mit dem M3 Pro kein Spulenfiepen oder sonstige elektronischen Geräusche erkennen.
Lautstärkediagramm
| Idle |
| 24.4 / 24.4 / 24.4 dB(A) |
| Last |
| 26.9 / 50.4 dB(A) |
 | ||
30 dB leise 40 dB(A) deutlich hörbar 50 dB(A) störend |
||
min: | ||
| Apple MacBook Pro 16 2023 M3 Pro M3 Pro 18-Core GPU, Apple M3 Pro 12-Core, Apple SSD AP0512Z | Asus VivoBook Pro 16 K6602VU GeForce RTX 4050 Laptop GPU, i9-13900H, Micron 2400 MTFDKBA1T0QFM | Lenovo Slim Pro 9i 16IRP8 GeForce RTX 4050 Laptop GPU, i9-13905H, Samsung PM9A1 MZVL21T0HCLR | Schenker VISION 16 Pro (M23) GeForce RTX 4070 Laptop GPU, i7-13700H, Samsung 990 Pro 1 TB | Samsung Galaxy Book3 Ultra 16 GeForce RTX 4050 Laptop GPU, i7-13700H, Samsung PM9A1 MZVL2512HCJQ | Dell XPS 15 9530 RTX 4070 GeForce RTX 4070 Laptop GPU, i7-13700H, SK hynix PC801 HFS001TEJ9X101N | |
|---|---|---|---|---|---|---|
| Geräuschentwicklung | -27% | -16% | -34% | -17% | -5% | |
| aus / Umgebung * (dB) | 24.4 | 20.96 14% | 22.7 7% | 25.9 -6% | 25 -2% | 23.1 5% |
| Idle min * (dB) | 24.4 | 25.28 -4% | 22.7 7% | 25.9 -6% | 26 -7% | 23.1 5% |
| Idle avg * (dB) | 24.4 | 25.28 -4% | 22.7 7% | 25.9 -6% | 27 -11% | 23.1 5% |
| Idle max * (dB) | 24.4 | 25.28 -4% | 27.5 -13% | 32 -31% | 28 -15% | 24.2 1% |
| Last avg * (dB) | 26.9 | 51.88 -93% | 28.9 -7% | 47.2 -75% | 40 -49% | 27.1 -1% |
| Witcher 3 ultra * (dB) | 25.1 | 49 -95% | 52.6 -110% | 53.1 -112% | 39 -55% | 40.1 -60% |
| Last max * (dB) | 50.4 | 51.8 -3% | 52.5 -4% | 53.1 -5% | 41 19% | 44.6 12% |
* ... kleinere Werte sind besser
Temperatur
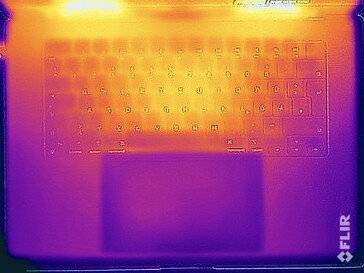
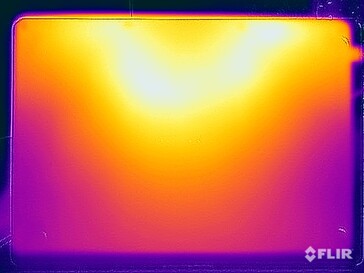
Temperaturprobleme sind dem MacBook Pro 16 mit dem M3 Pro ein Fremdwort. Bei wenig anspruchsvollen Aufgaben wärmt sich das Gehäuse überhaupt nicht auf. Im Stresstest bleiben die Oberflächentemperaturen aufgrund der hohen Lüfteraktivität bei gerade einmal 37-38 °C an den wärmsten Stellen. Das Worst-Case-Szenario ist beim Spielen, wenn die Lüfter in der Regel mit 1.400-1.900 U/Min, doch auch hier sind maximal 42 °C vollkommen unbedenklich. Das 140-Watt-Steckernetzteil wird maximal 45 °C warm.
(+) Die maximale Temperatur auf der Oberseite ist 38.1 °C. Im Vergleich liegt der Klassendurchschnitt bei 36.9 °C (von 21.1 bis 71 °C für die Klasse Multimedia).
(+) Auf der Unterseite messen wir eine maximalen Wert von 37 °C (im Vergleich zum Durchschnitt von 39.2 °C).
(+) Ohne Last messen wir eine durchschnittliche Temperatur von 24 °C auf der Oberseite. Der Klassendurchschnitt erreicht 31.3 °C.
(±) Beim längeren Spielen von The Witcher 3 erhitzt sich das Gerät durchschnittlich auf 37.6 °C. Der Durchschnitt der Klasse ist derzeit 31.3 °C.
(+) Die Handballen und der Touchpad-Bereich erreichen maximal 33.8 °C und damit die typische Hauttemperatur und fühlen sich daher nicht heiß an.
(-) Die durchschnittliche Handballen-Temperatur anderer getesteter Geräte war 28.7 °C (-5.1 °C).
| Apple MacBook Pro 16 2023 M3 Pro Apple M3 Pro 12-Core, Apple M3 Pro 18-Core GPU | Asus VivoBook Pro 16 K6602VU Intel Core i9-13900H, NVIDIA GeForce RTX 4050 Laptop GPU | Lenovo Slim Pro 9i 16IRP8 Intel Core i9-13905H, NVIDIA GeForce RTX 4050 Laptop GPU | Schenker VISION 16 Pro (M23) Intel Core i7-13700H, NVIDIA GeForce RTX 4070 Laptop GPU | Samsung Galaxy Book3 Ultra 16 Intel Core i7-13700H, NVIDIA GeForce RTX 4050 Laptop GPU | Dell XPS 15 9530 RTX 4070 Intel Core i7-13700H, NVIDIA GeForce RTX 4070 Laptop GPU | |
|---|---|---|---|---|---|---|
| Hitze | -42% | -18% | -22% | -7% | -28% | |
| Last oben max * (°C) | 38.1 | 42.6 -12% | 37.8 1% | 46.7 -23% | 41 -8% | 45.6 -20% |
| Last unten max * (°C) | 37 | 48.4 -31% | 44.8 -21% | 54.1 -46% | 44 -19% | 42 -14% |
| Idle oben max * (°C) | 24.2 | 39.4 -63% | 30.6 -26% | 26.5 -10% | 23 5% | 34.4 -42% |
| Idle unten max * (°C) | 24.6 | 39.8 -62% | 31 -26% | 26.8 -9% | 26 -6% | 33.2 -35% |
* ... kleinere Werte sind besser
Stresstest
Der Stresstest mit kombinierter CPU/GPU-Last ist überaus interessant, denn hier erkennen wir einen deutlichen Unterschied zum Modell mit dem M3 Max. Der M3 Pro kann auch im Stresstest die volle Leistung des Prozessors sowie der Grafikkarte ausnutzen, und zwar die gesamte Zeit. Insgesamt liegt der Verbrauch also bei rund 55 Watt. Das ist spannend, denn beim M3 Max wurde die GPU ganz klar bevorzugt und insgesamt konnten nur dauerhaft nur etwa 48 Watt gekühlt werden. Wir vermuten, dass die schnellere GPU des M3 Max einfach mehr Hitze produziert, was die Kühlung stärker fordert.
Energieverwaltung - Enorme Ausdauer
Energieaufnahme
In den Verbrauchsmessungen gibt es keine Überraschungen und bei minimaler Helligkeit ist das Gerät sehr effizient. Selbst der maximale Idle-Verbrauch von knapp 17 Watt geht angesichts der hohen Auflösung und der gesteigerten SDR-Helligkeit von mehr als 600 cd/m² vollkommen in Ordnung. Unter Last (Stresstest) ermitteln wir maximal knapp 103 Watt, weshalb das 140-Watt-Netzteil vollkommen ausreichend dimensioniert ist und auch unter Last noch genügend Reserven hat, um den Akku aufzuladen.
| Aus / Standby | |
| Idle | |
| Last |
|
Legende:
min: | |
| Apple MacBook Pro 16 2023 M3 Pro Apple M3 Pro 12-Core, M3 Pro 18-Core GPU, Apple SSD AP0512Z, Mini-LED, 3456x2234, 16.2" | Asus VivoBook Pro 16 K6602VU i9-13900H, GeForce RTX 4050 Laptop GPU, Micron 2400 MTFDKBA1T0QFM, OLED, 3200x2000, 16" | Lenovo Slim Pro 9i 16IRP8 i9-13905H, GeForce RTX 4050 Laptop GPU, Samsung PM9A1 MZVL21T0HCLR, Mini-LED, 3200x2000, 16" | Schenker VISION 16 Pro (M23) i7-13700H, GeForce RTX 4070 Laptop GPU, Samsung 990 Pro 1 TB, IPS, 2560x1600, 16" | Samsung Galaxy Book3 Ultra 16 i7-13700H, GeForce RTX 4050 Laptop GPU, Samsung PM9A1 MZVL2512HCJQ, AMOLED, 2880x1800, 16" | Dell XPS 15 9530 RTX 4070 i7-13700H, GeForce RTX 4070 Laptop GPU, SK hynix PC801 HFS001TEJ9X101N, OLED, 3456x2160, 15.6" | Durchschnittliche Apple M3 Pro 18-Core GPU | Durchschnitt der Klasse Multimedia | |
|---|---|---|---|---|---|---|---|---|
| Stromverbrauch | -101% | -121% | -54% | 13% | -91% | 0% | -0% | |
| Idle min * (Watt) | 4.5 | 21.06 -368% | 16 -256% | 8.6 -91% | 3 33% | 20 -344% | 4.5 ? -0% | 6.09 ? -35% |
| Idle avg * (Watt) | 16.5 | 24.27 -47% | 30 -82% | 12 27% | 5 70% | 20.7 -25% | 16.5 ? -0% | 10.6 ? 36% |
| Idle max * (Watt) | 16.7 | 25.12 -50% | 30.4 -82% | 12.4 26% | 11 34% | 22.4 -34% | 16.7 ? -0% | 12.6 ? 25% |
| Last avg * (Watt) | 60.4 | 52.4 13% | 78.9 -31% | 80 -32% | 72 -19% | 77.1 -28% | 60.4 ? -0% | 69.2 ? -15% |
| Witcher 3 ultra * (Watt) | 52.1 | 110.2 -112% | 155.3 -198% | 147.7 -183% | 69.7 -34% | 95.4 -83% | ||
| Last max * (Watt) | 102.9 | 146 -42% | 180.4 -75% | 173.1 -68% | 108 -5% | 133.4 -30% | 102.9 ? -0% | 115.8 ? -13% |
* ... kleinere Werte sind besser
Energieaufnahme Witcher 3 / Stresstest
Energieaufnahme mit externem Monitor
Akkulaufzeit
mit 99,6 Wattstunden verbaut Apple weiterhin einen sehr großen Akku und die gesteigerte Effizienz verhilft dem großen MacBook Pro 16 zu extrem langen Laufzeiten. Bei maximaler Belastung (CPU- & GPU-Last, maximale Helligkeit) kann man den Akku im Extremfall in gerade einmal 83 Minuten leeren, dafür steht aber auch die volle Leistung zur Verfügung (bis der Akku eine Restkapazität von 3 % erreicht).
Wenn wir die Helligkeit aber auf 150 cd/m² einstellen erreicht das MBP 16 mit dem M3 Pro enorme Laufzeiten von mehr als 24 Stunden in unserem Videotest und 20 Stunden in unserem WLAN-Test. An diese Ergebnisse kommt die Konkurrenz nicht einmal annähernd heran und das MBP 16 mit dem M3 Pro ist auch noch einmal ausdauernder als die M3-Max-Konfiguration. Wenn wir den WLAN-Test mit der maximalen SDR-Helligkeit durchführen, reduziert sich die Laufzeit auf rund 7,5 Stunden, was bei einem großen 16,2-Zoll-Display mit hoher Auflösung und 600 cd/m² Helligkeit ein gutes Ergebnis darstellt.
Ein vollständiger Ladevorgang dauert bei eingeschaltetem Gerät knapp 1,5 Stunden; 80 % der Kapazität stehen schon nach 50 Minuten wieder zur Verfügung.
| Apple MacBook Pro 16 2023 M3 Pro Apple M3 Pro 12-Core, M3 Pro 18-Core GPU, 99.6 Wh | Asus VivoBook Pro 16 K6602VU i9-13900H, GeForce RTX 4050 Laptop GPU, 96 Wh | Lenovo Slim Pro 9i 16IRP8 i9-13905H, GeForce RTX 4050 Laptop GPU, 75 Wh | Schenker VISION 16 Pro (M23) i7-13700H, GeForce RTX 4070 Laptop GPU, 80 Wh | Samsung Galaxy Book3 Ultra 16 i7-13700H, GeForce RTX 4050 Laptop GPU, 76 Wh | Dell XPS 15 9530 RTX 4070 i7-13700H, GeForce RTX 4070 Laptop GPU, 86 Wh | Apple MacBook Pro 16 2023 M3 Max Apple M3 Max 16-Core, M3 Max 40-Core GPU, 99.6 Wh | Durchschnitt der Klasse Multimedia | |
|---|---|---|---|---|---|---|---|---|
| Akkulaufzeit | -55% | -67% | -45% | -23% | -27% | -16% | -20% | |
| H.264 (h) | 24.7 | 9.8 -60% | 7.8 -68% | 13.4 -46% | 20.4 -17% | 16 ? -35% | ||
| WLAN (h) | 20.1 | 10.1 -50% | 6.6 -67% | 7.8 -61% | 9.6 -52% | 8 -60% | 16.7 -17% | 11.3 ? -44% |
| Last (h) | 1.4 | 1.3 -7% | 1.8 29% | 1.5 7% | 1.2 -14% | 1.667 ? 19% |
Pro
Contra
Fazit MacBook Pro 16 ist ein hervorragendes, aber teures Multimedia-Notebook
Mit dem neuen M3-Pro-SoC schlägt Apple einen anderen Weg ein als mit den M3-Max-Chips, denn sowohl die Multi-Core-Leistung als auch die GPU-Performance sind im Vergleich zum M2 Pro praktisch unverändert geblieben. Stattdessen ist die Single-Core-Leistung deutlich angestiegen und insgesamt ist der M3 Pro effizienter geworden. Das führt in der Praxis auch zu noch besseren Akkulaufzeiten und in unseren Tests mit 150 cd/m² sind mehr als 20 Stunden im WLAN-Test möglich (sogar 24 Stunden bei der Videowiedergabe), was bei einem großen 16-Zoll-Laptop mit einem hochauflösenden Mini-LED-Panel eine extrem gute Leistung ist. Die Windows-Konkurrenten scheitern oftmals an der 10-Stunden-Marke. Ansonsten hat Apple die maximale SDR-Helligkeit von 500 auf 600 cd/m² angehoben und das Panel bietet weiterhin eine sehr gute Bildqualität. Die Reaktionszeiten sind zwar sehr langsam, in der Praxis merkt man davon aber nicht viel und es gibt kaum sichtbares Ghosting, wobei auch die hohe Frequenz von 120 Hz hilft.
Dank dem effizienteren M3 Pro und der deutlich gestiegenen Single-Core-Leistung ist das MacBook Pro 16 noch einmal besser geworden und es ist weiterhin das Multimedia-Notebook mit dem besten Gesamtpaket am Markt.
Einen etwas faden Beigeschmack hat der neue M3 Pro dennoch, denn die neue Kernkonfiguration (mehr Effizienz-Kerne, weniger Performance-Kerne) vermittelt den Eindruck, dass man die Leistung absichtlich begrenzt, aufgrund der neuen Cluster-Konfiguration gibt es hier aber auch nicht viele Alternativen. Gleichzeitig muss man aber auch attestieren, das die Leistung sowohl im Akkubetrieb als auch bei gleichzeitiger Belastung von CPU/GPU vollkommen stabil bleibt. Das ist weder bei den neuen M3-Max-Modellen noch der Windows-Konkurrenz der Fall. Ein weiterer Kritikpunkt ist, dass ein 3.000-Euro-Laptop weiterhin nur mit einer mickrigen 512-GB-SSD ausgeliefert wird.
Ein Upgrade von einem MacBook Pro 16 mit dem M2 Pro oder selbst mit dem M1 Pro macht eigentlich keinen Sinn macht. Vielmehr ist das neue MBP 16 M3 Pro eine ideale Wahl, wenn man noch ein MacBook Pro 16 mit Intel-Prozessor nutzt oder aber zum ersten Mal ein MacBook Pro kauft.
Im Vergleich zur Windows-Konkurrenz in dieser Preisklasse muss man ganz klar sagen, dass diese oftmals mehr Leistung bieten, insbesondere bei den Grafikkarten und wenn man mit seinem Laptop auch spielen möchte. Native Games wie Baldur's Gate 3, Lies of P oder No Man's Sky laufen flüssig auf dem MacBook, doch die Leistung ist geringer als bei der Windows-Konkurrenz und da hilft auch die bessere Effizienz nicht viel. Dennoch ist es schwierig, ein besseres Gesamtpaket im Multimedia-Bereich zu bekommen, denn die Kombination aus hochwertiger Verarbeitung, tollem Mini-LED-Display, geringen Emissionen (im Alltag wird man die Lüfter so gut wie nie hören), exzellenten Lautsprechern und immensen Akkulaufzeiten findet man nicht. In irgendeiner Form muss man Kompromisse machen, was bei Windows-Laptops in der Regel bei den Lüftern und der Akkulaufzeit der Fall ist. Dieses Gesamtpaket lässt sich Apple aber auch teuer bezahlen und die enormen Upgrade-Preise in Verbindung mit den nicht vorhandenen Wartungsmöglichkeiten sind ganz klar ein großer Nachteil.
Preis und Verfügbarkeit
Das Basismodell des MacBook Pro 16 mit dem M3 Pro ist für 2.999 Euro bei Online-Shops wie Cyberport (Space Schwarz, Silber) oder Amazon (Space Schwarz, Silber) sofort verfügbar.
Apple MacBook Pro 16 2023 M3 Pro
- 24.11.2023 v7 (old)
Andreas Osthoff
Transparenz
Die Auswahl der zu testenden Geräte erfolgt innerhalb der Redaktion. Das vorliegende Testmuster wurde dem Autor vom Hersteller oder einem Shop zu Testzwecken leihweise zur Verfügung gestellt. Eine Einflussnahme des Leihstellers auf den Testbericht gab es nicht, der Hersteller erhielt keine Version des Reviews vor der Veröffentlichung. Es bestand keine Verpflichtung zur Publikation. Als eigenständiges, unabhängiges Unternehmen unterliegt Notebookcheck keiner Diktion von Herstellern, Shops und Verlagen.
So testet Notebookcheck
Pro Jahr werden von Notebookcheck hunderte Laptops und Smartphones unabhängig in von uns standardisierten technischen Verfahren getestet, um eine Vergleichbarkeit aller Testergebnisse zu gewährleisten. Seit rund 20 Jahren entwickeln wir diese Testmethoden kontinuierlich weiter und setzen damit Branchenstandards. In unseren Testlaboren kommt ausschließlich hochwertiges Messequipment in die Hände erfahrener Techniker und Redakteure. Die Tests unterliegen einer mehrstufigen Kontrolle. Unsere komplexe Gesamtbewertung basiert auf hunderten fundierten Messergebnissen und Benchmarks, womit Ihnen Objektivität garantiert ist. Weitere Informationen zu unseren Testmethoden gibt es hier.


