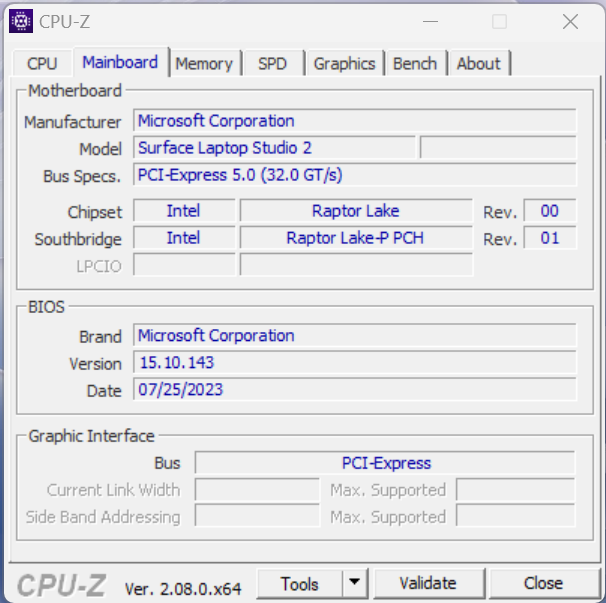
Microsoft Surface Laptop Studio 2 im Test - Multimedia-Convertible mit deutlich mehr Leistung

Anfang 2022 hat Microsoft den Surface Laptop Studio als Nachfolger für das Surface Book vorgestellt. Mit seinem speziellen Klappdisplay lässt sich der Multimedia-Laptop sowohl als reguläres Notebook oder als Tablet verwenden, zudem gibt es eine Art Präsentationsmodus. Das große Problem der ersten Generation war allerdings der recht lahme Quad-Core-Prozessor von Intel. Mit der zweiten Generation hat Microsoft nun aber aufgerüstet und verwendet einen Raptor Lake Core i7-13700H sowie aktuelle GPUs von Nvidia mit der Option auf die professionelle RTX 2000 ADA. Zudem verbaut Microsoft nun einen separaten AI-Chip, der die neuen Windows-Funktionen wie den Copilot beschleunigen soll.
Preislich beginnt der neue Surface Laptop Studio 2 mit dem Core i7-13700H, 16 GB RAM sowie einer 512 GB großen SSD bei 2.239 Euro, wobei hier keine dedizierte Nvidia-GPU verbaut ist. Unser Testgerät ist die Variante mit der GeForce RTX 4060, die automatisch mit einer 1-TB-SSD sowie 64 GB RAM ausgeliefert wird, wofür der Hersteller allerdings auch satte 3.799 Euro verlangt. Die aktuell verfügbaren Konfigurationen bringen einige unverständliche Einschränkungen mit sich, denn RAM und SSD-Kapazität können nicht verändert werden. Nachfolgend eine Übersicht der Modelle:
| Prozessor | Core i7-13700H | Core i7-13700H | Core i7-13700H | Core i7-13700H | Core i7-13700H |
|---|---|---|---|---|---|
| Grafikkarte | Iris Xe Graphics G7 | Nvidia GeForce RTX 4050 Laptop | Nvidia GeForce RTX 4050 Laptop | Nvidia GeForce RTX 4060 Laptop | Nvidia RTX 2000 Ada |
| Display | 14,4 Zoll PixelSense-Flow 120 Hz | 14,4 Zoll PixelSense-Flow 120 Hz | 14,4 Zoll PixelSense-Flow 120 Hz | 14,4 Zoll PixelSense-Flow 120 Hz | 14,4 Zoll PixelSense-Flow 120 Hz |
| RAM | 16 GB | 16 GB | 32 GB | 64 GB | 32 GB |
| SSD | 512 GB | 512 GB | 1 TB | 1 TB | 1 TB |
| Preis | 2.239 Euro | 2.719 Euro | 3.199 Euro | 3.799 Euro | 4.159 Euro |
Laut Microsoft richtet sich das Gerät vor allem an die Gruppe der Content Creators, was jedoch bei vielen aktuellen Modellen der Fall ist und gerade im 14-Zoll-Bereich verschwimmen hier auch schnell die Grenzen zwischen klassischen Multimedia-Laptops aber auch Gaming-Laptops, bei denen es oftmals mehr Leistung in Verbindung mit sehr guten Displays (OLED, Mini-LED) gibt.
Mögliche Konkurrenten im Vergleich
Bew. | Datum | Modell | Gewicht | Dicke | Größe | Auflösung | Preis ab |
|---|---|---|---|---|---|---|---|
| 85.5 % v7 (old) | 10 / 2023 | Microsoft Surface Laptop Studio 2 RTX 4060 i7-13700H, GeForce RTX 4060 Laptop GPU | 2 kg | 22 mm | 14.40" | 2400x1600 | |
| 93.9 % v7 (old) | 03 / 2023 | Apple MacBook Pro 14 2023 M2 Pro M2 Pro, M2 Pro 19-Core GPU | 1.6 kg | 15.5 mm | 14.20" | 3024x1964 | |
| 89.8 % v7 (old) | 07 / 2023 | Lenovo Yoga Pro 9-14IRP G8 i7-13705H, GeForce RTX 4050 Laptop GPU | 1.7 kg | 17.6 mm | 14.50" | 3072x1920 | |
| 89.3 % v7 (old) | 06 / 2023 | Asus Zenbook Pro 14 OLED UX6404VI i9-13900H, GeForce RTX 4070 Laptop GPU | 1.7 kg | 17.9 mm | 14.50" | 2880x1800 | |
| 87 % v7 (old) | 06 / 2023 | Asus ZenBook Pro 14 Duo UX8402VV-P1021W i9-13900H, GeForce RTX 4060 Laptop GPU | 1.8 kg | 21 mm | 14.50" | 2880x1800 | |
| 90 % v7 (old) | 04 / 2023 | Asus ROG Zephyrus G14 GA402XY R9 7940HS, GeForce RTX 4090 Laptop GPU | 1.7 kg | 20.5 mm | 14.00" | 2560x1600 | |
| 87.7 % v7 (old) | 09 / 2023 | Lenovo Legion Slim 5 14APH8 R7 7840HS, GeForce RTX 4060 Laptop GPU | 1.7 kg | 20.79 mm | 14.50" | 2880x1600 |
Gehäuse - Alu-Hülle und Klappdisplay
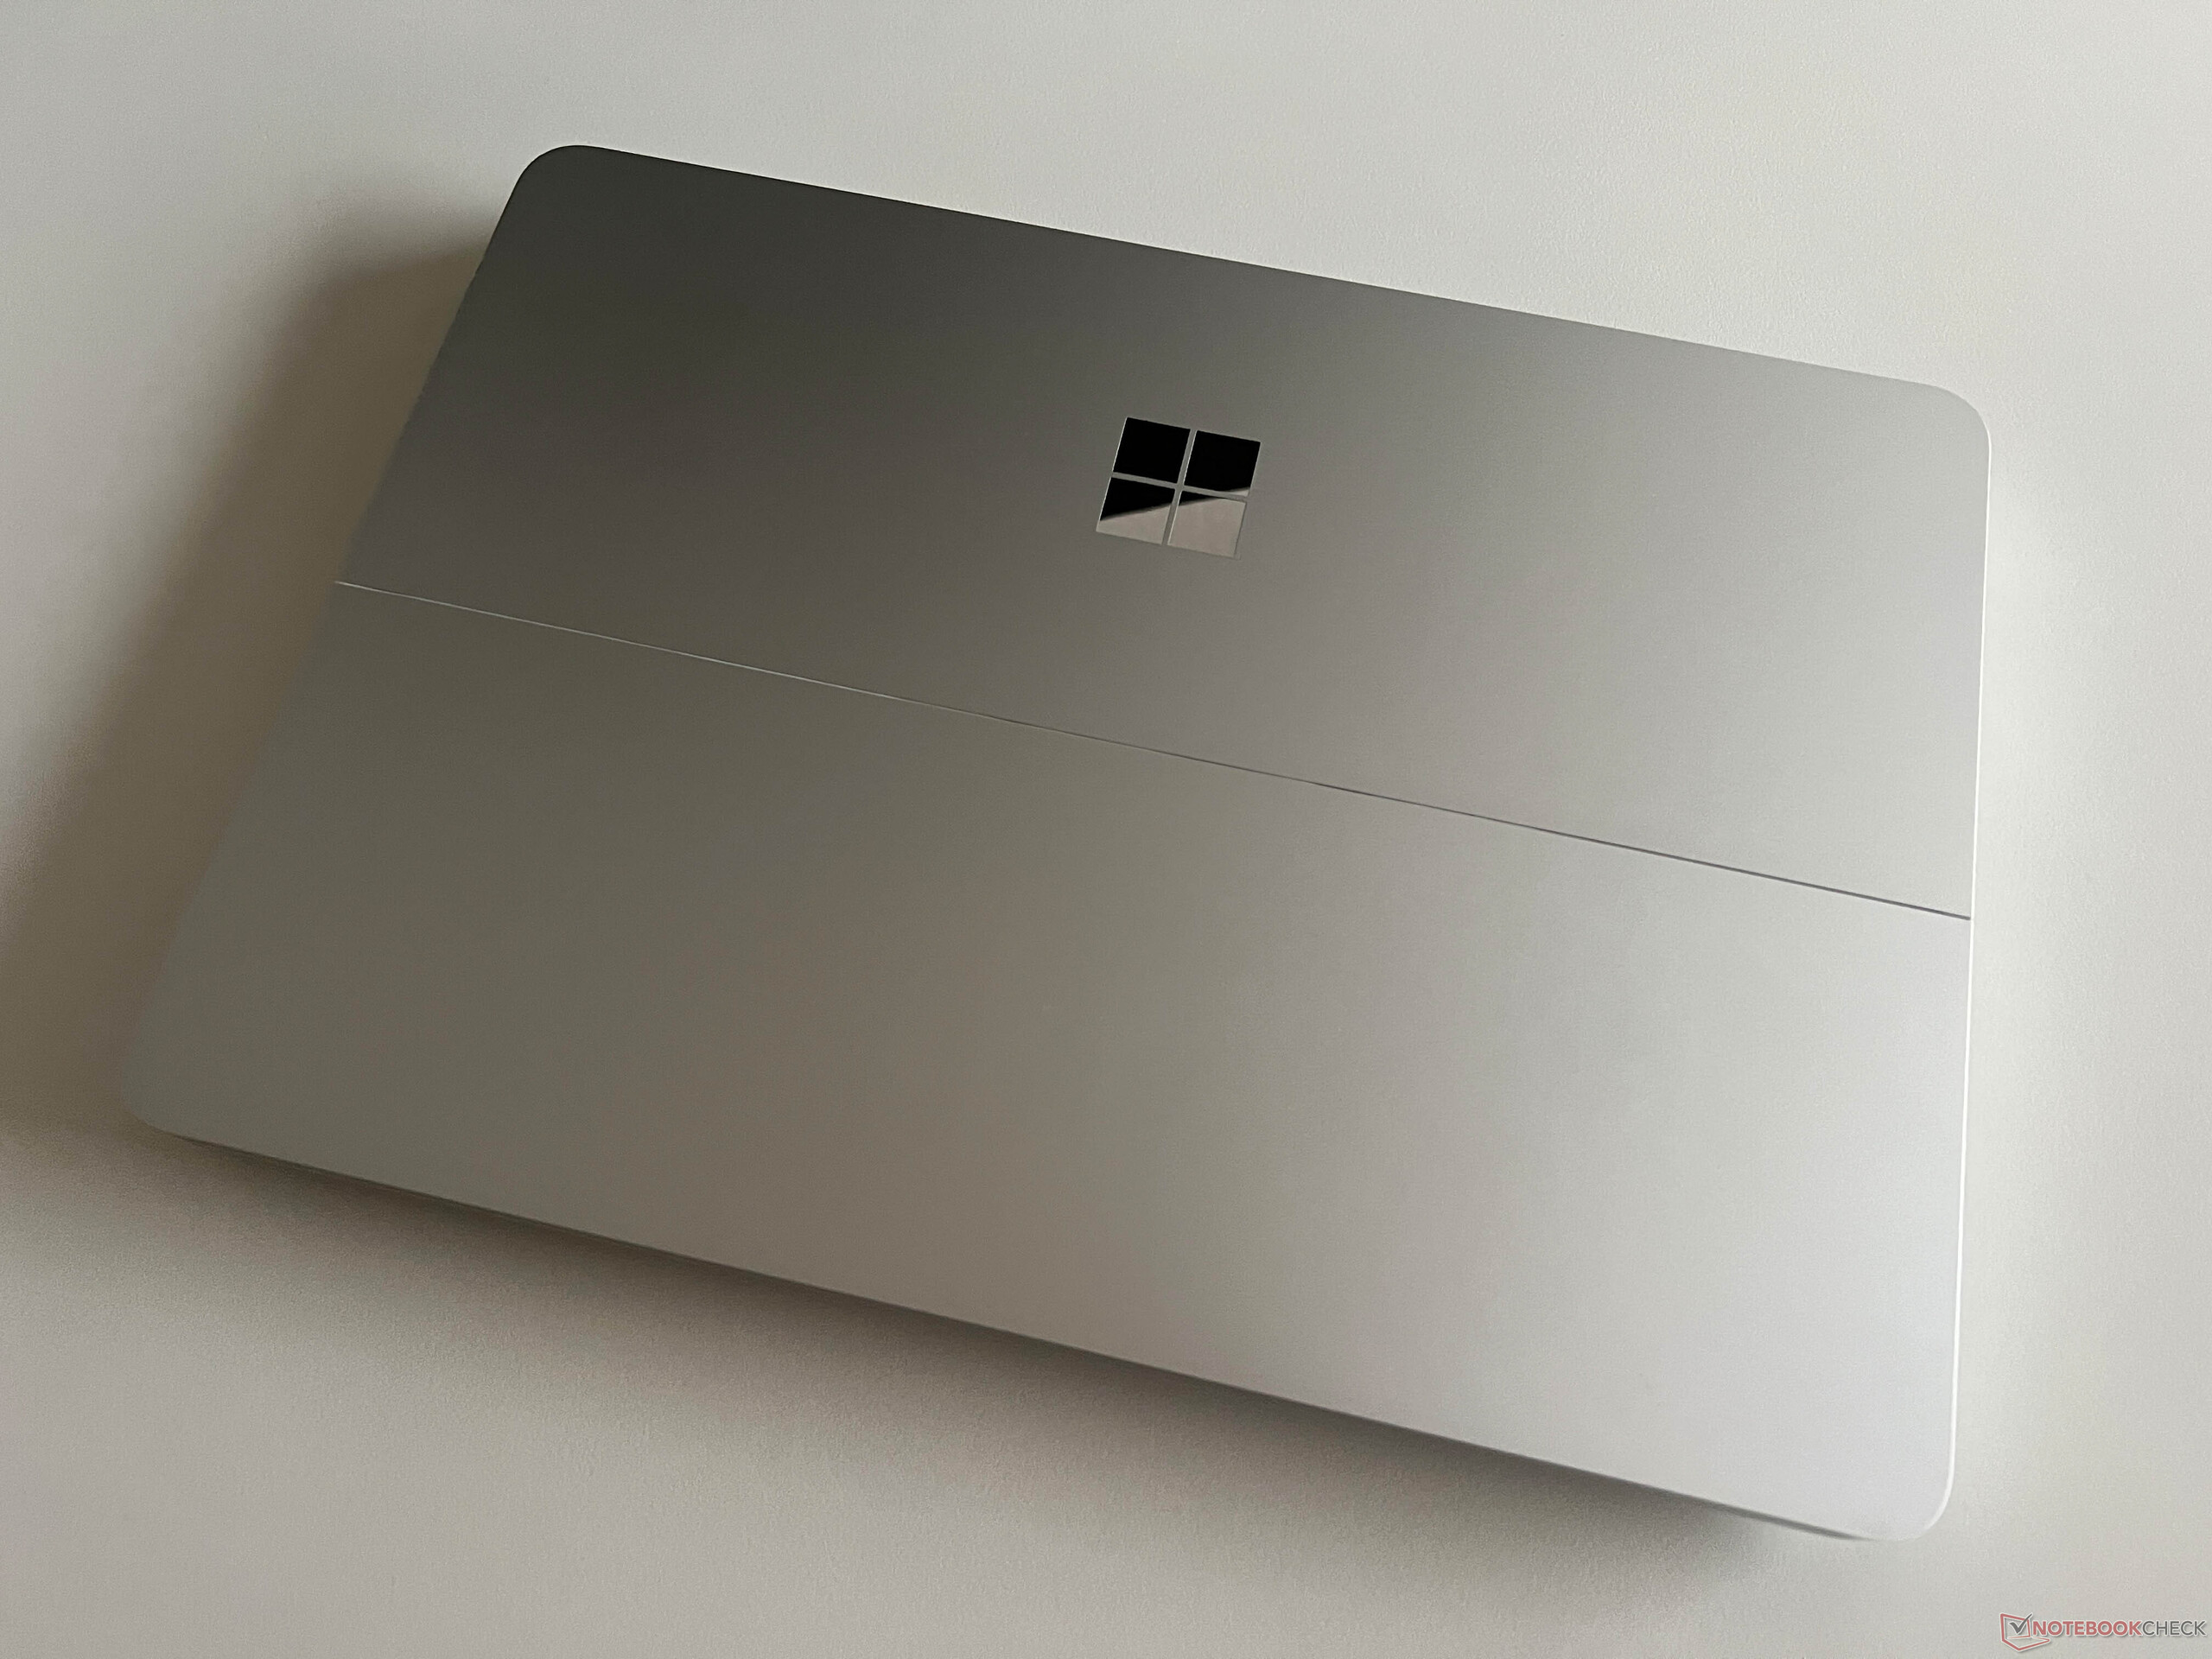
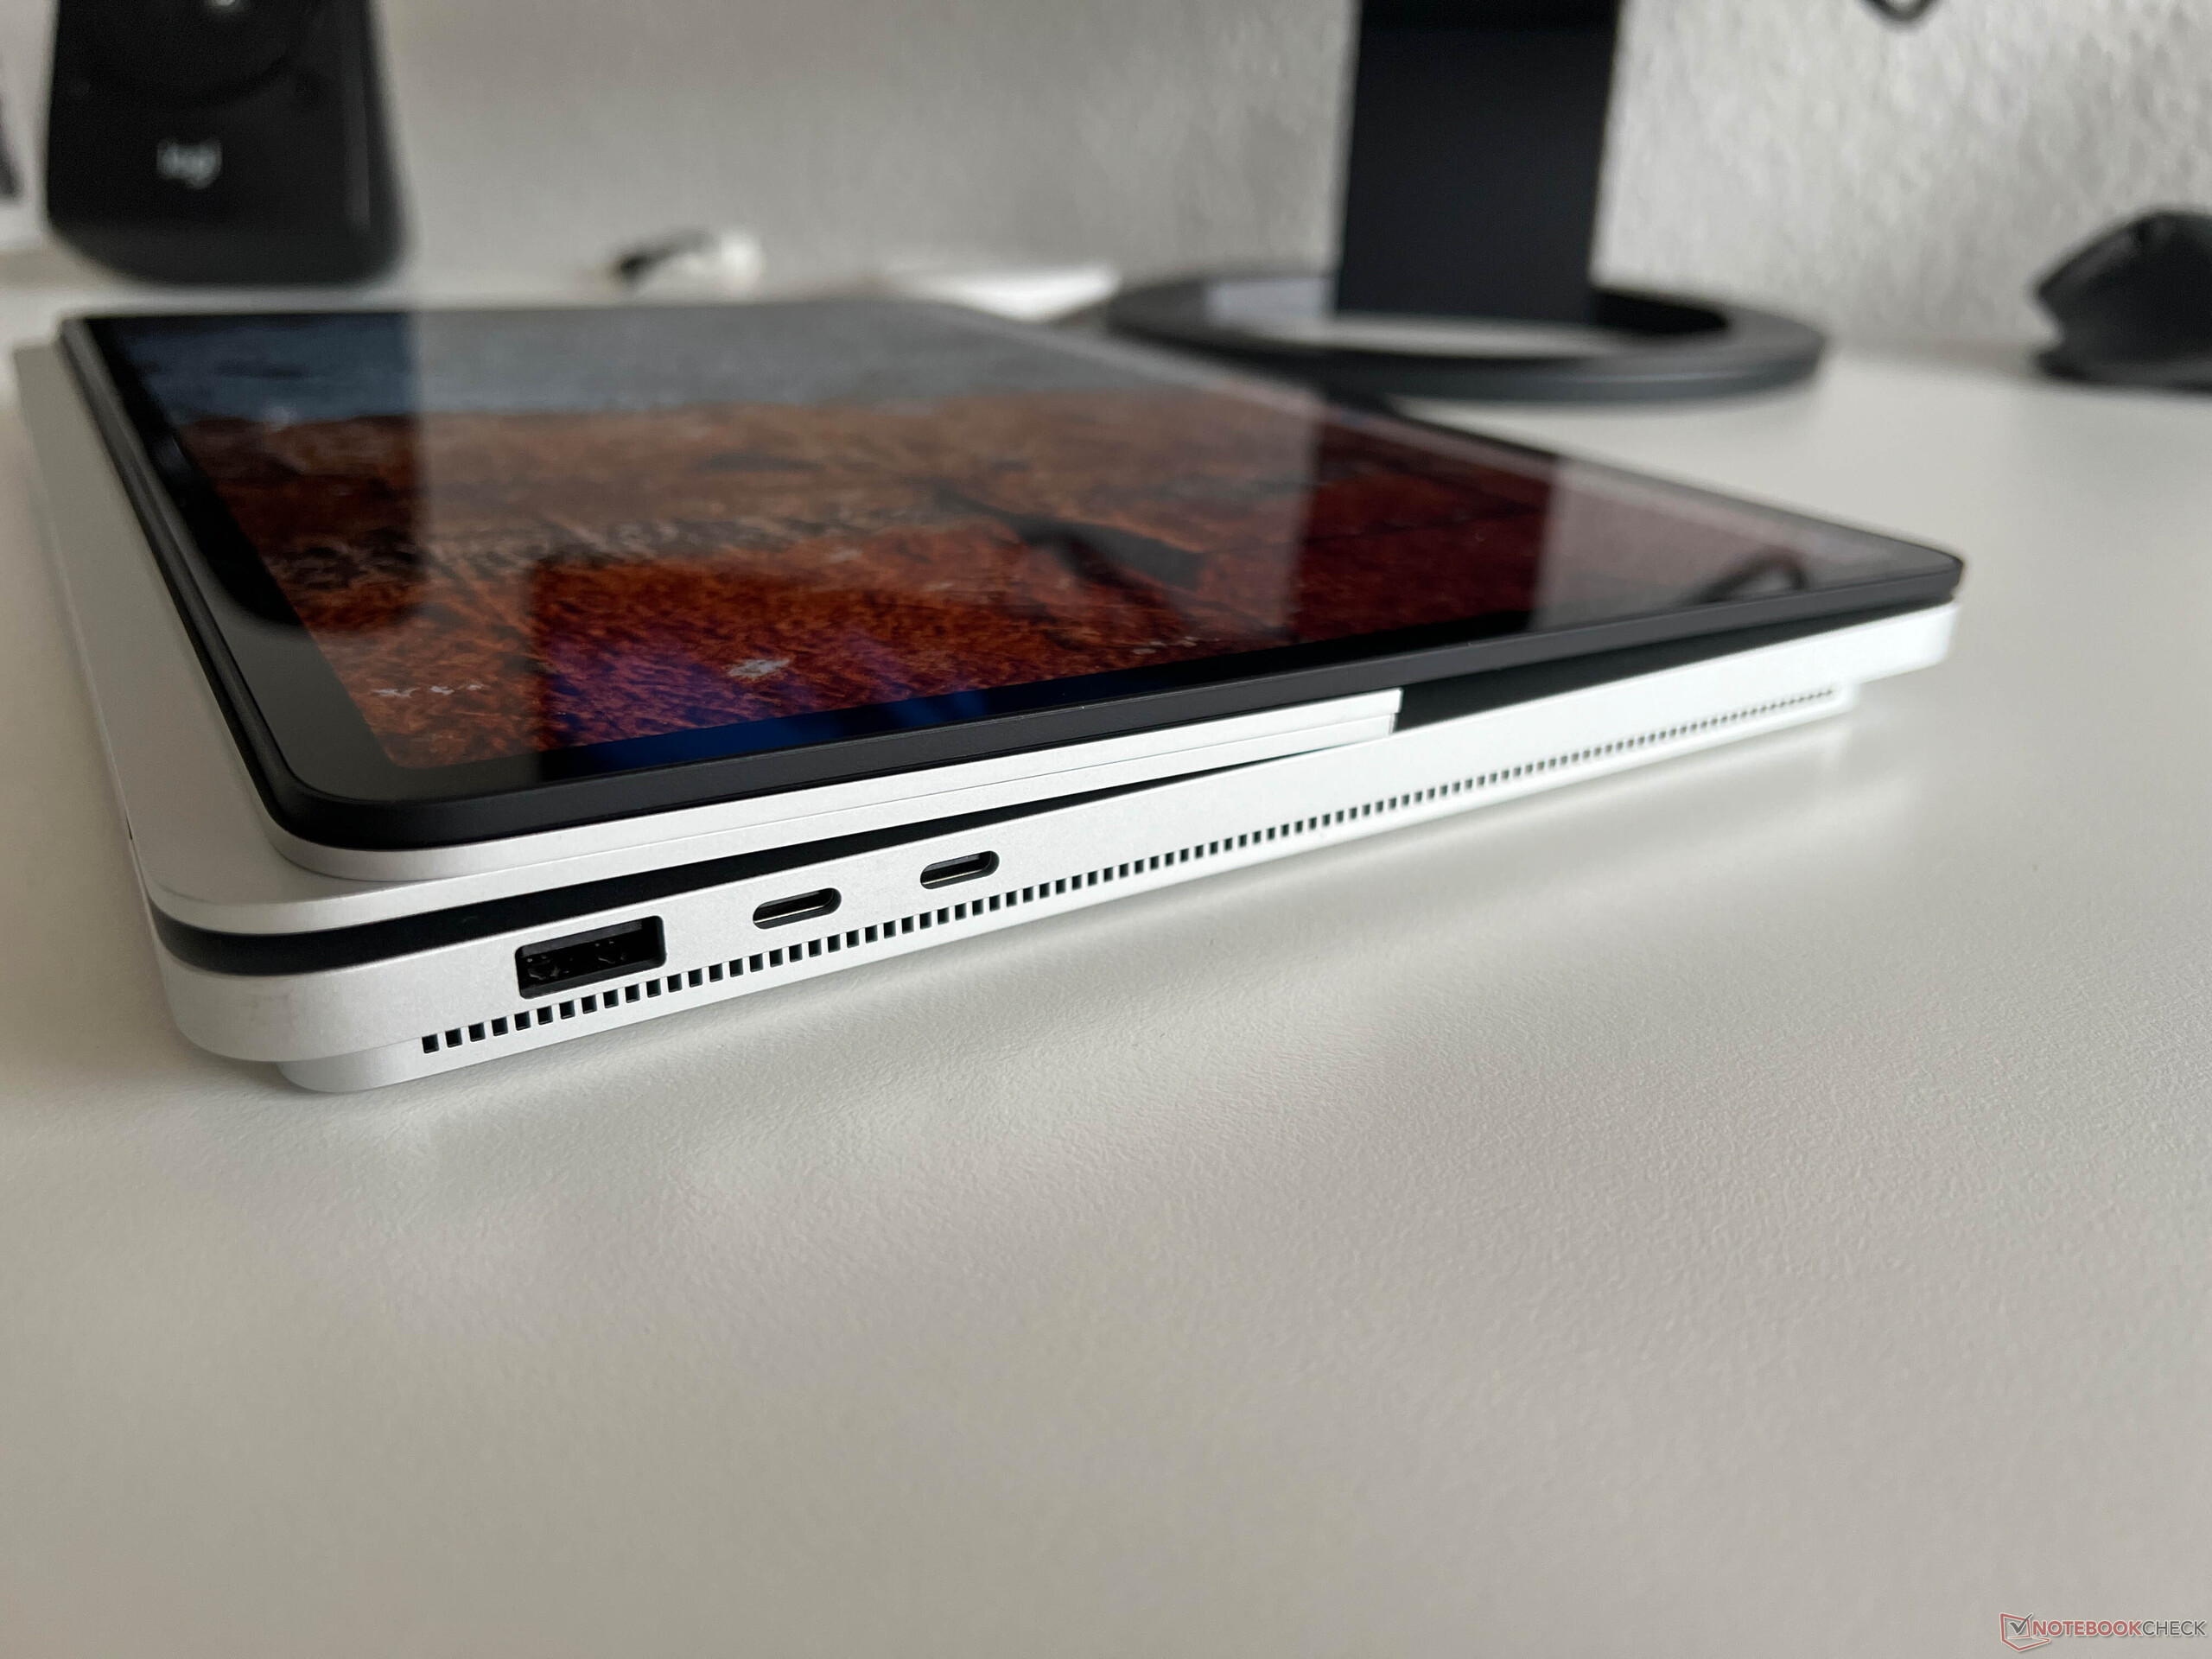
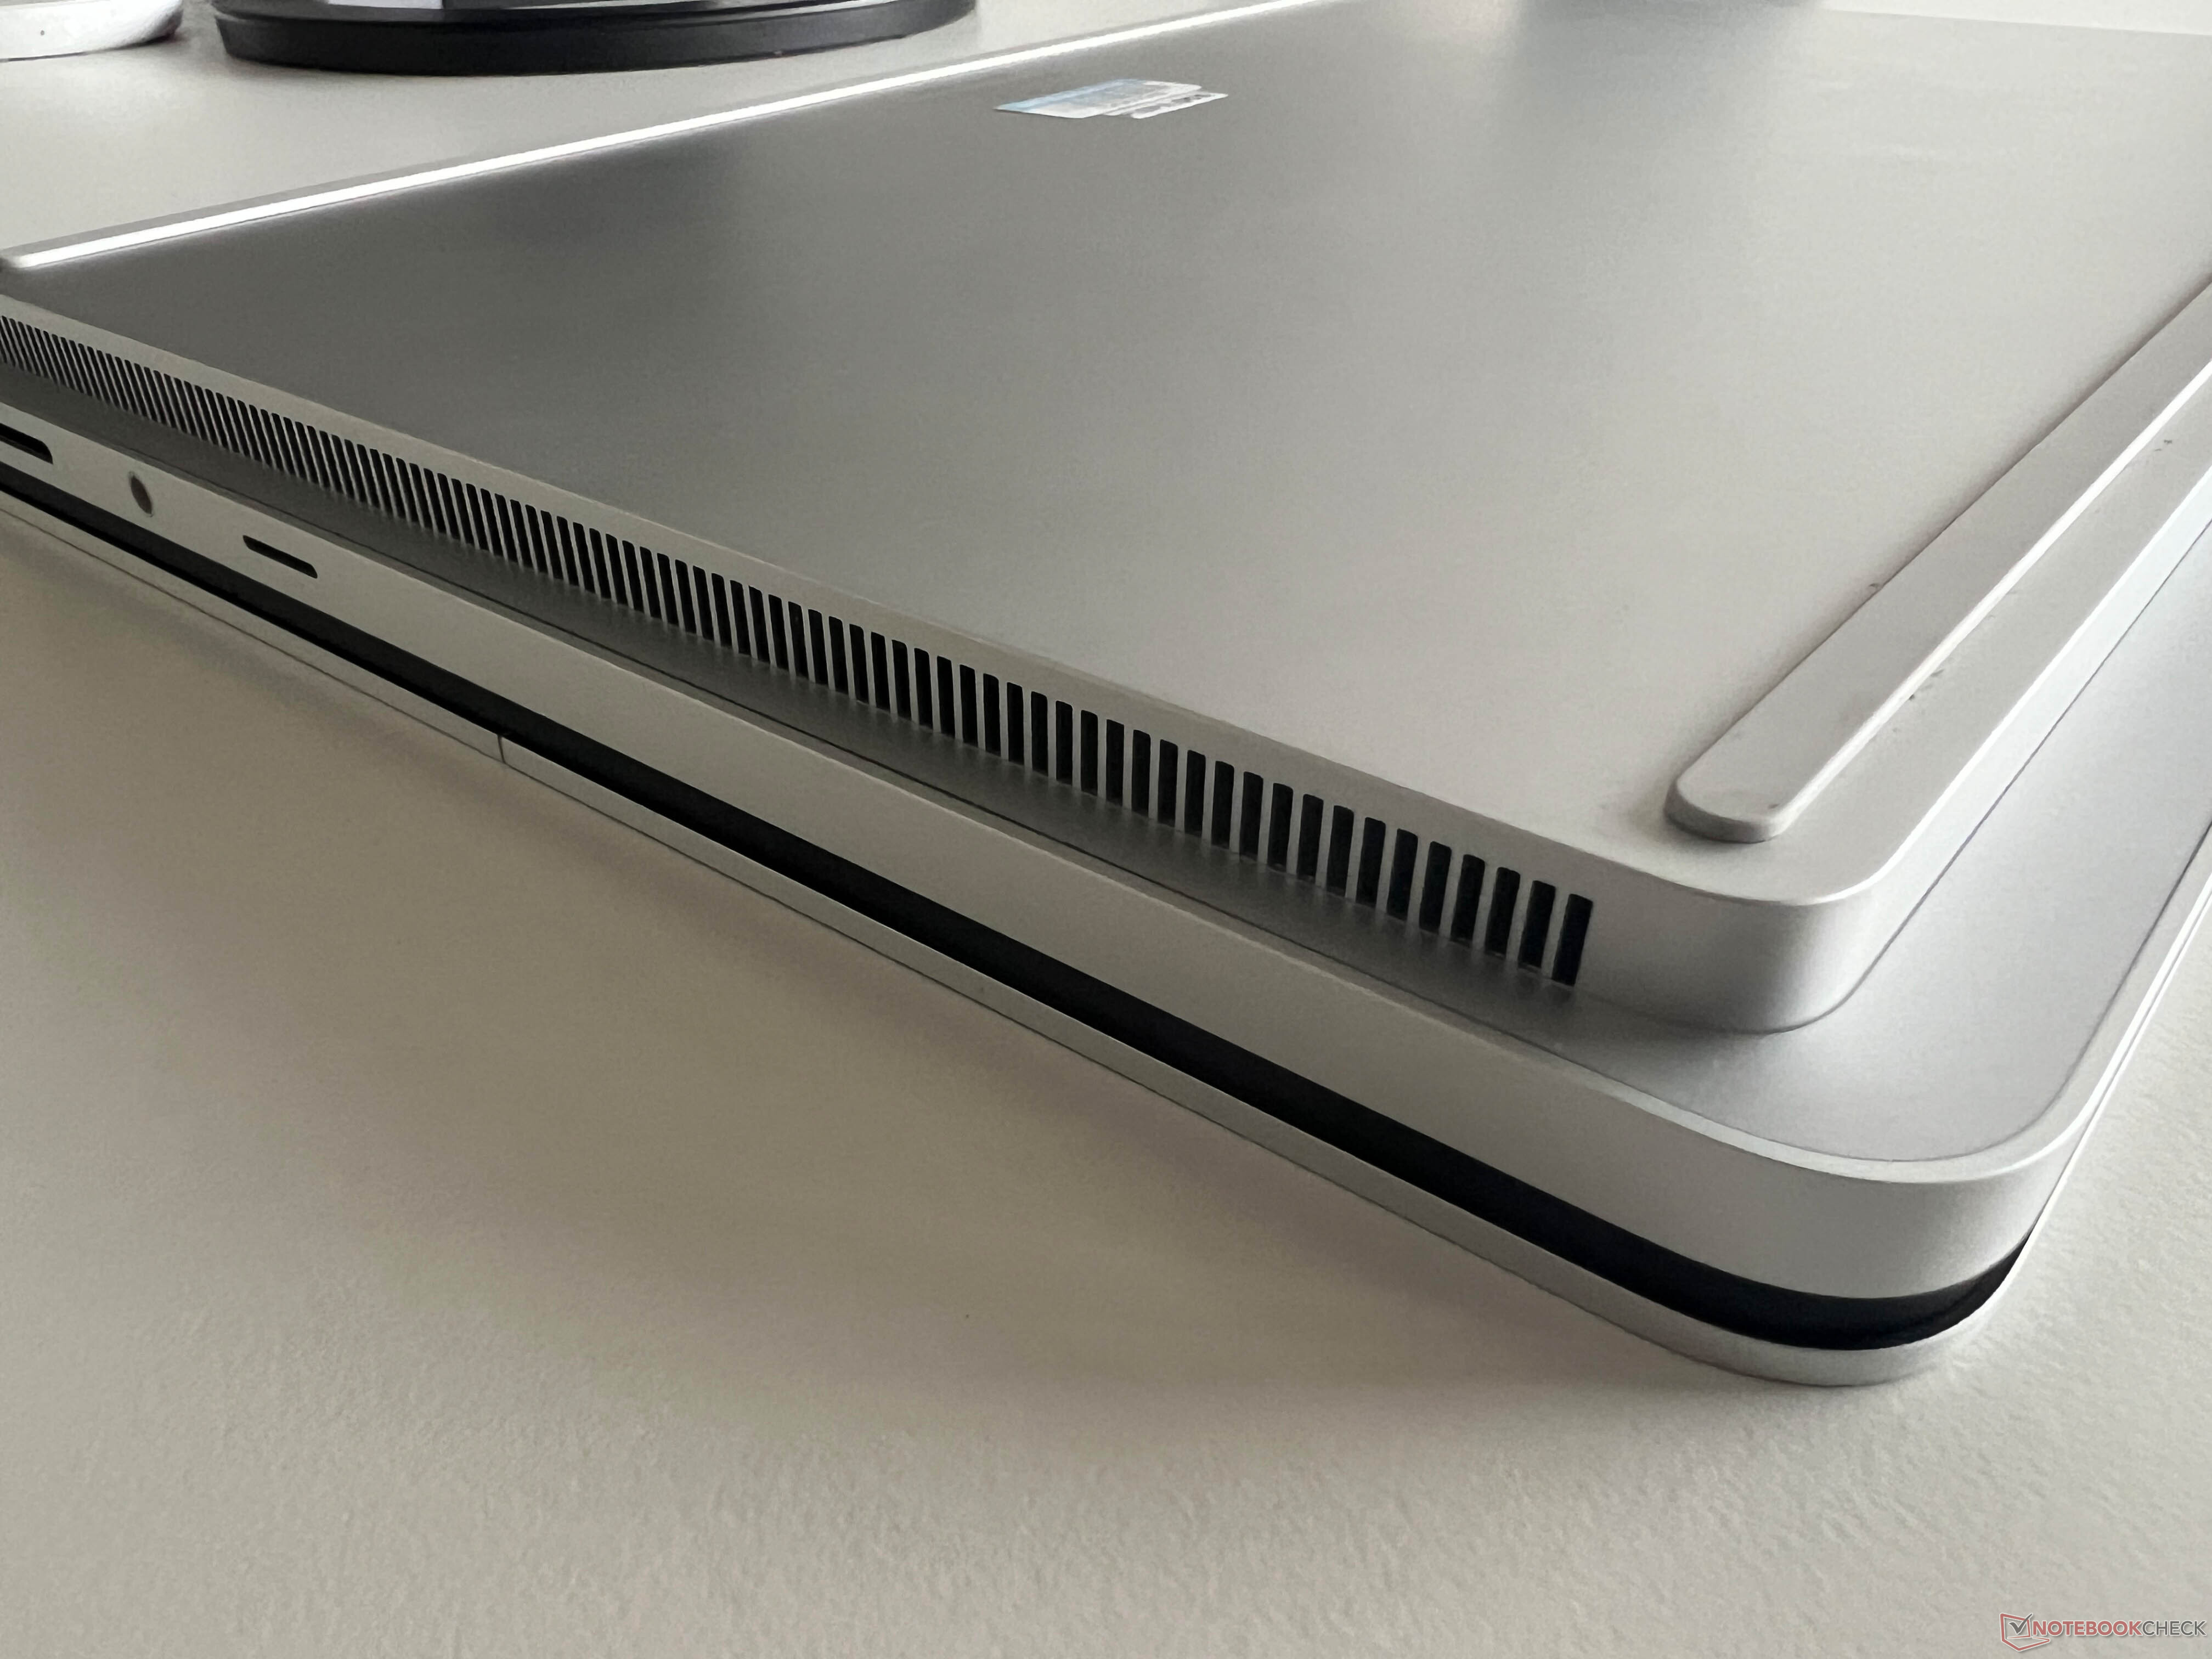
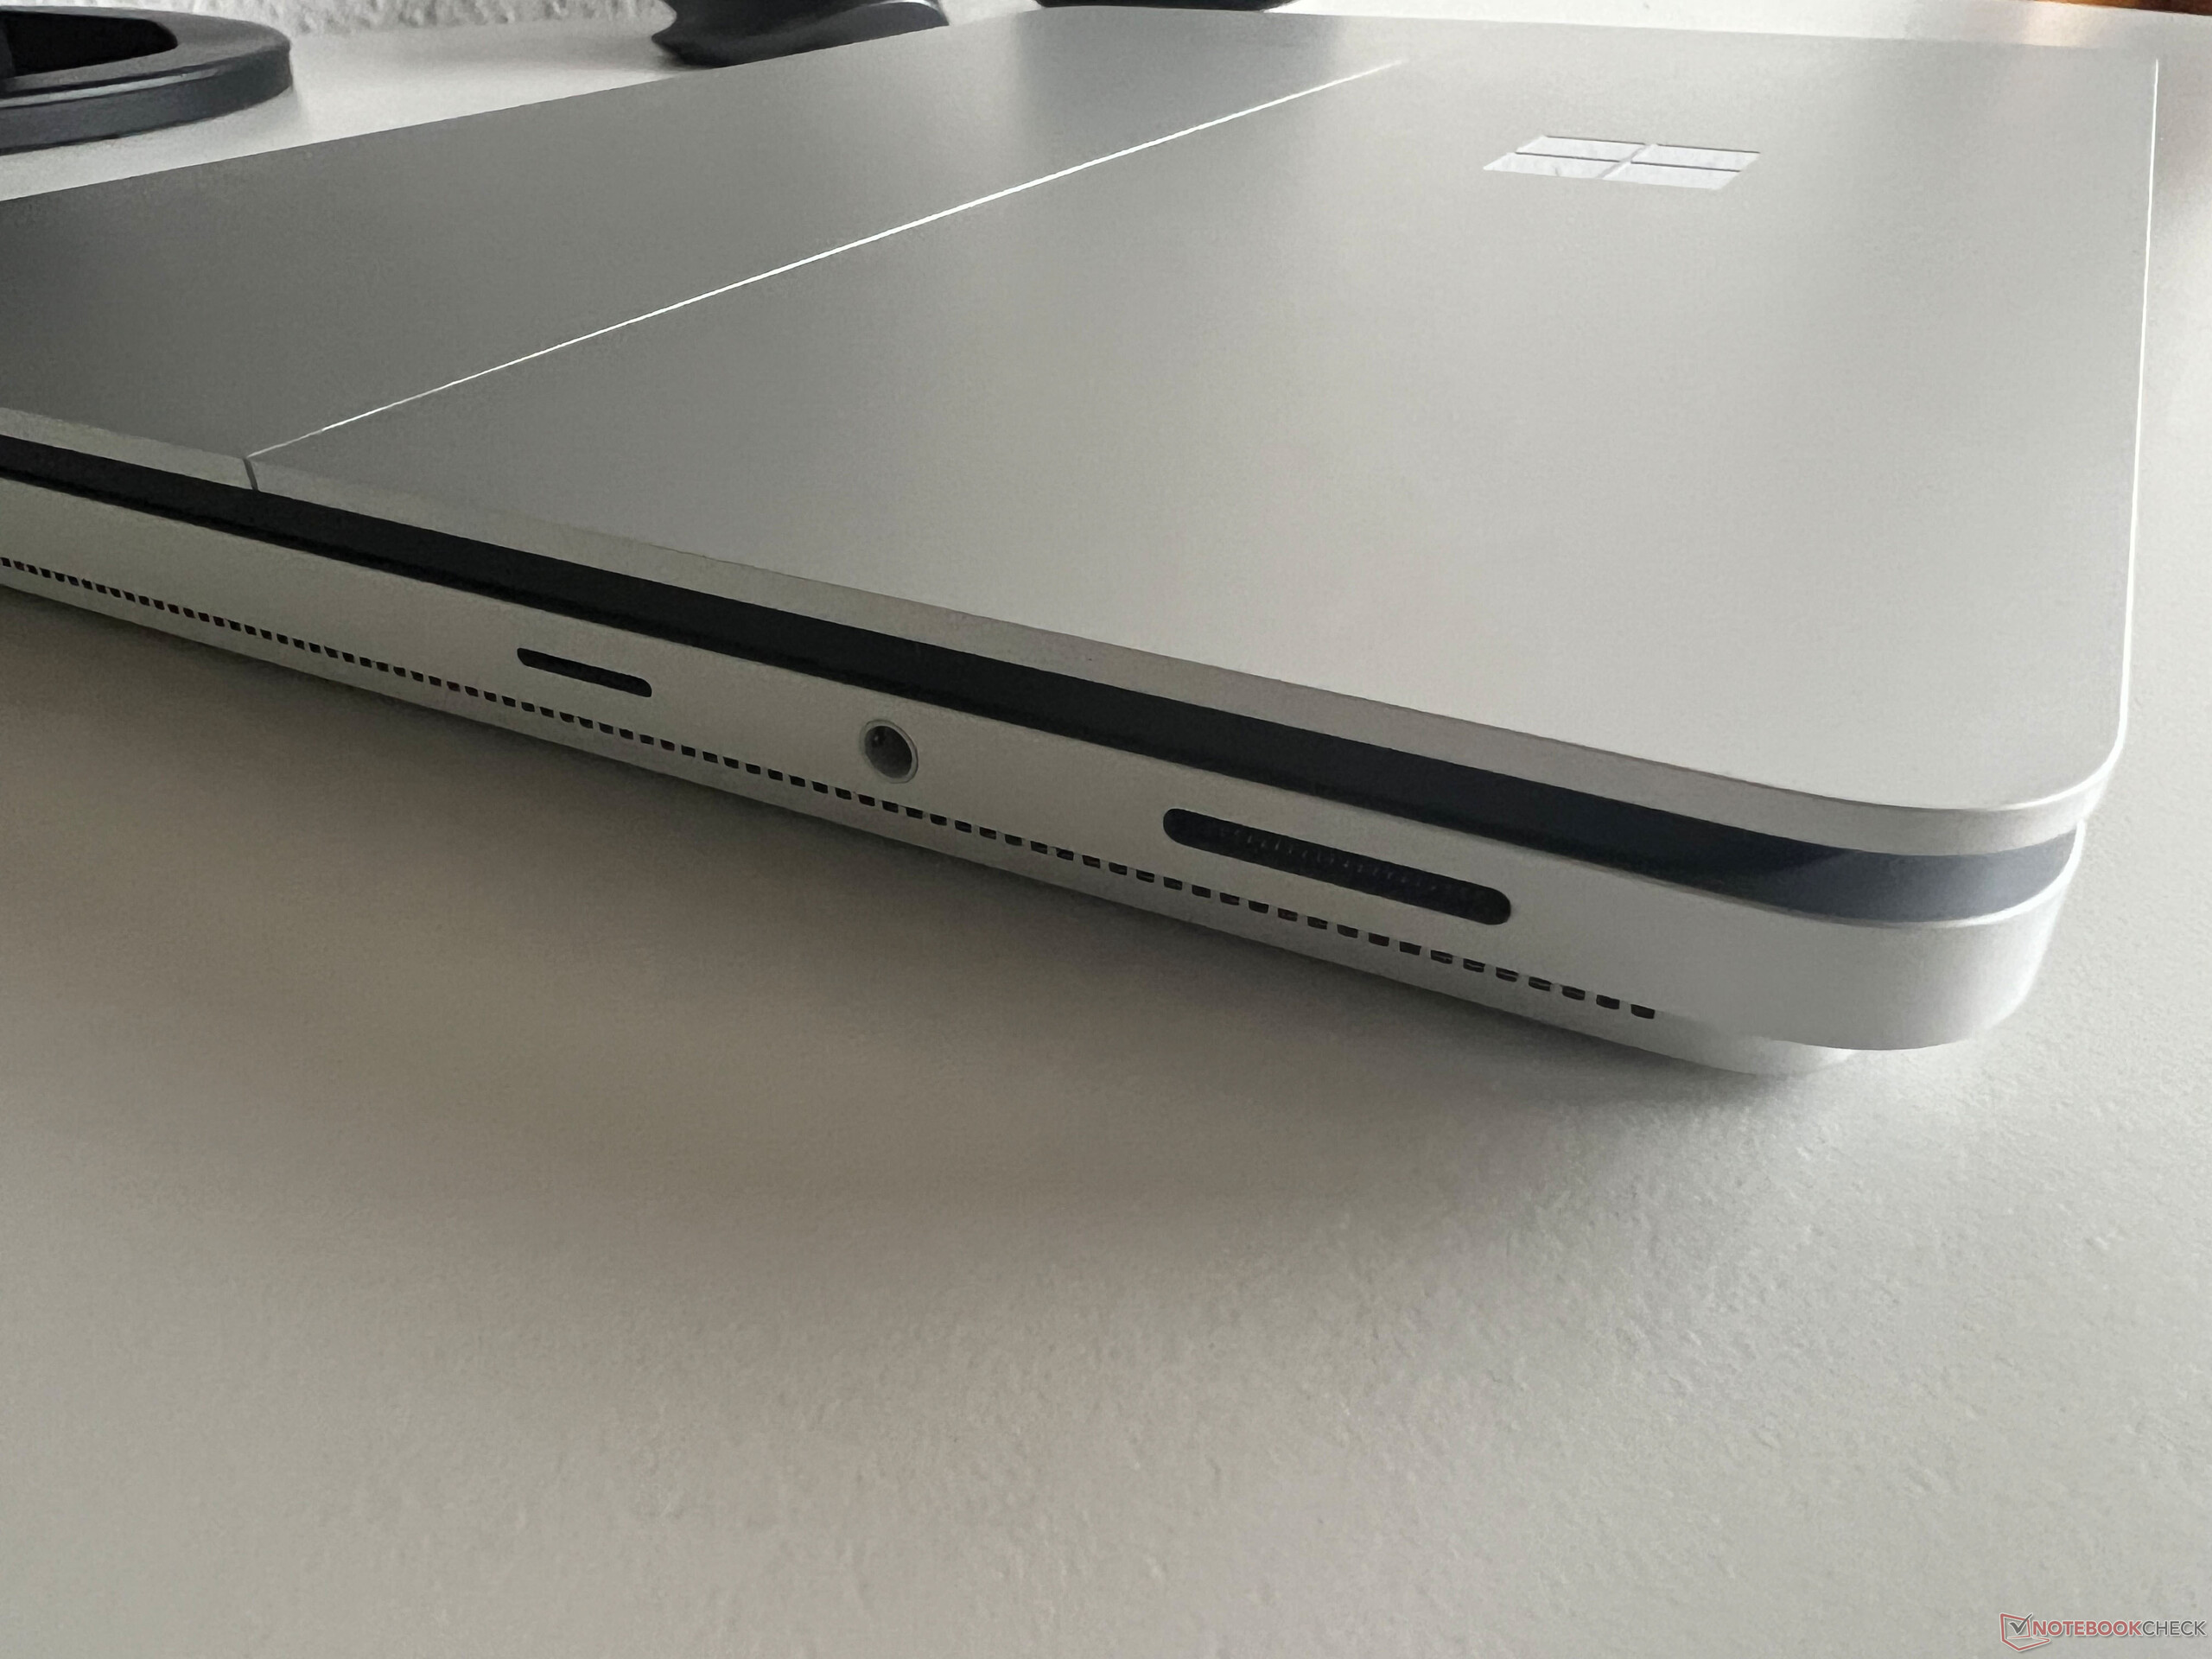
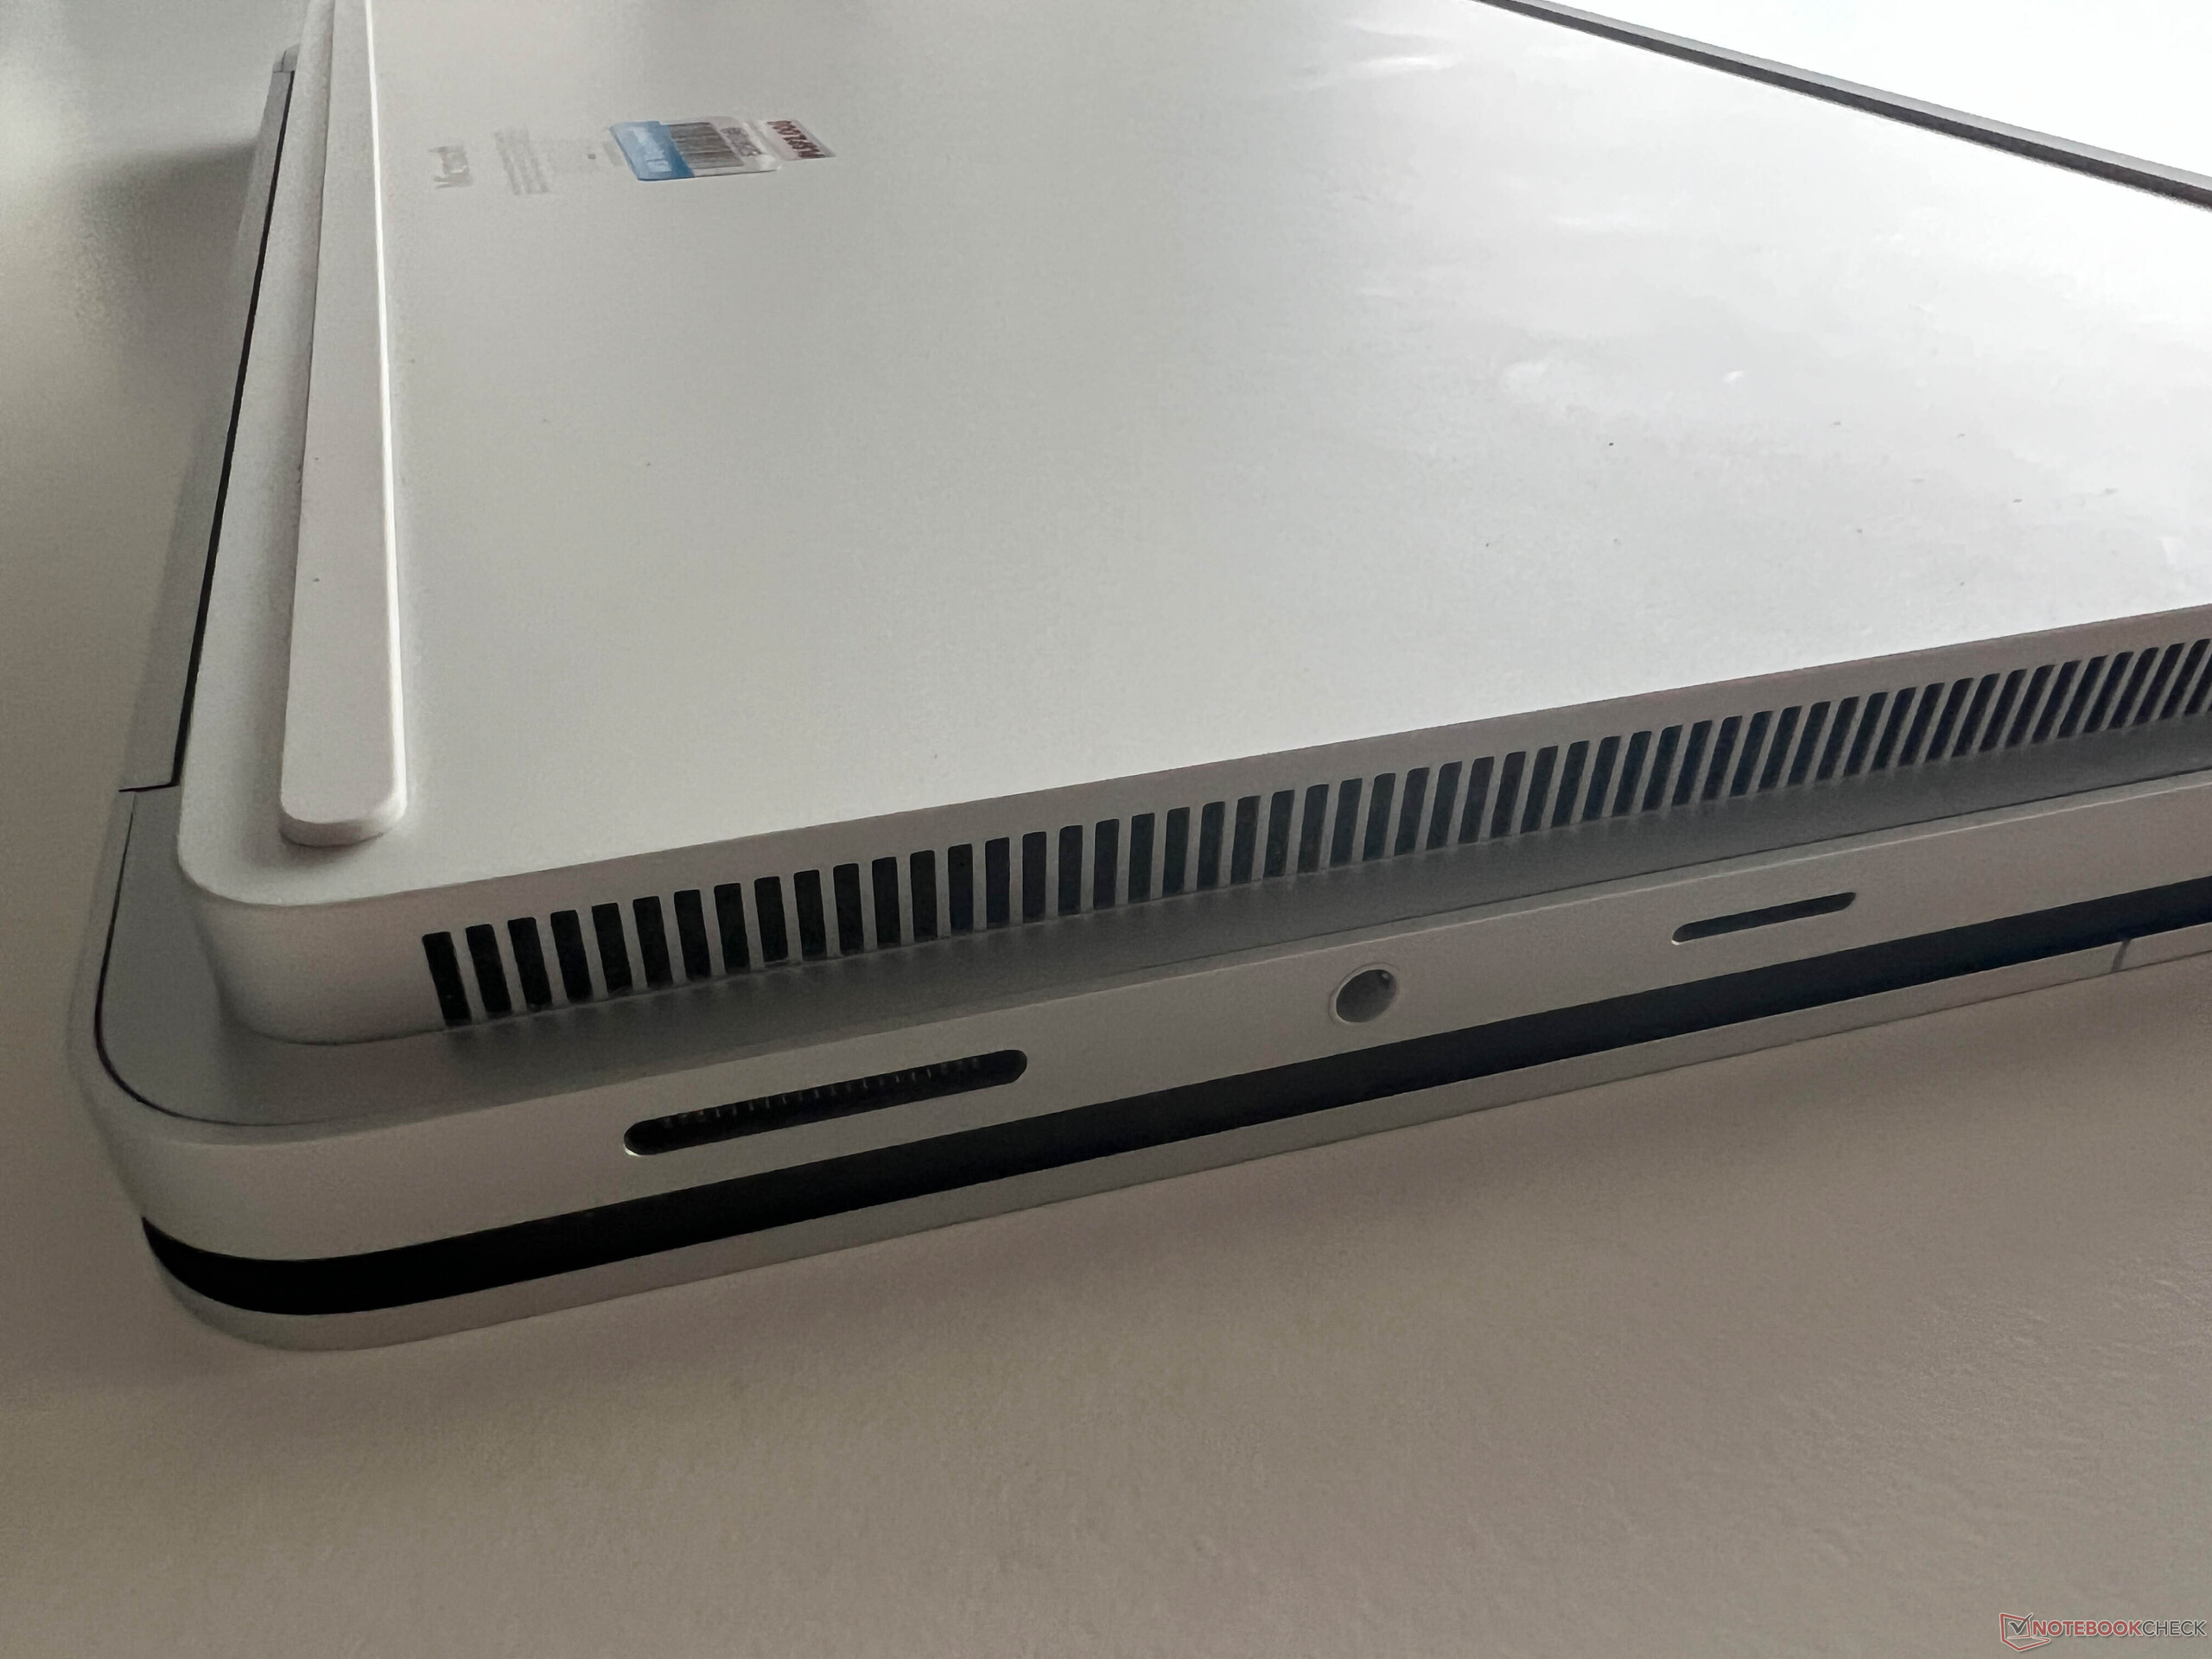
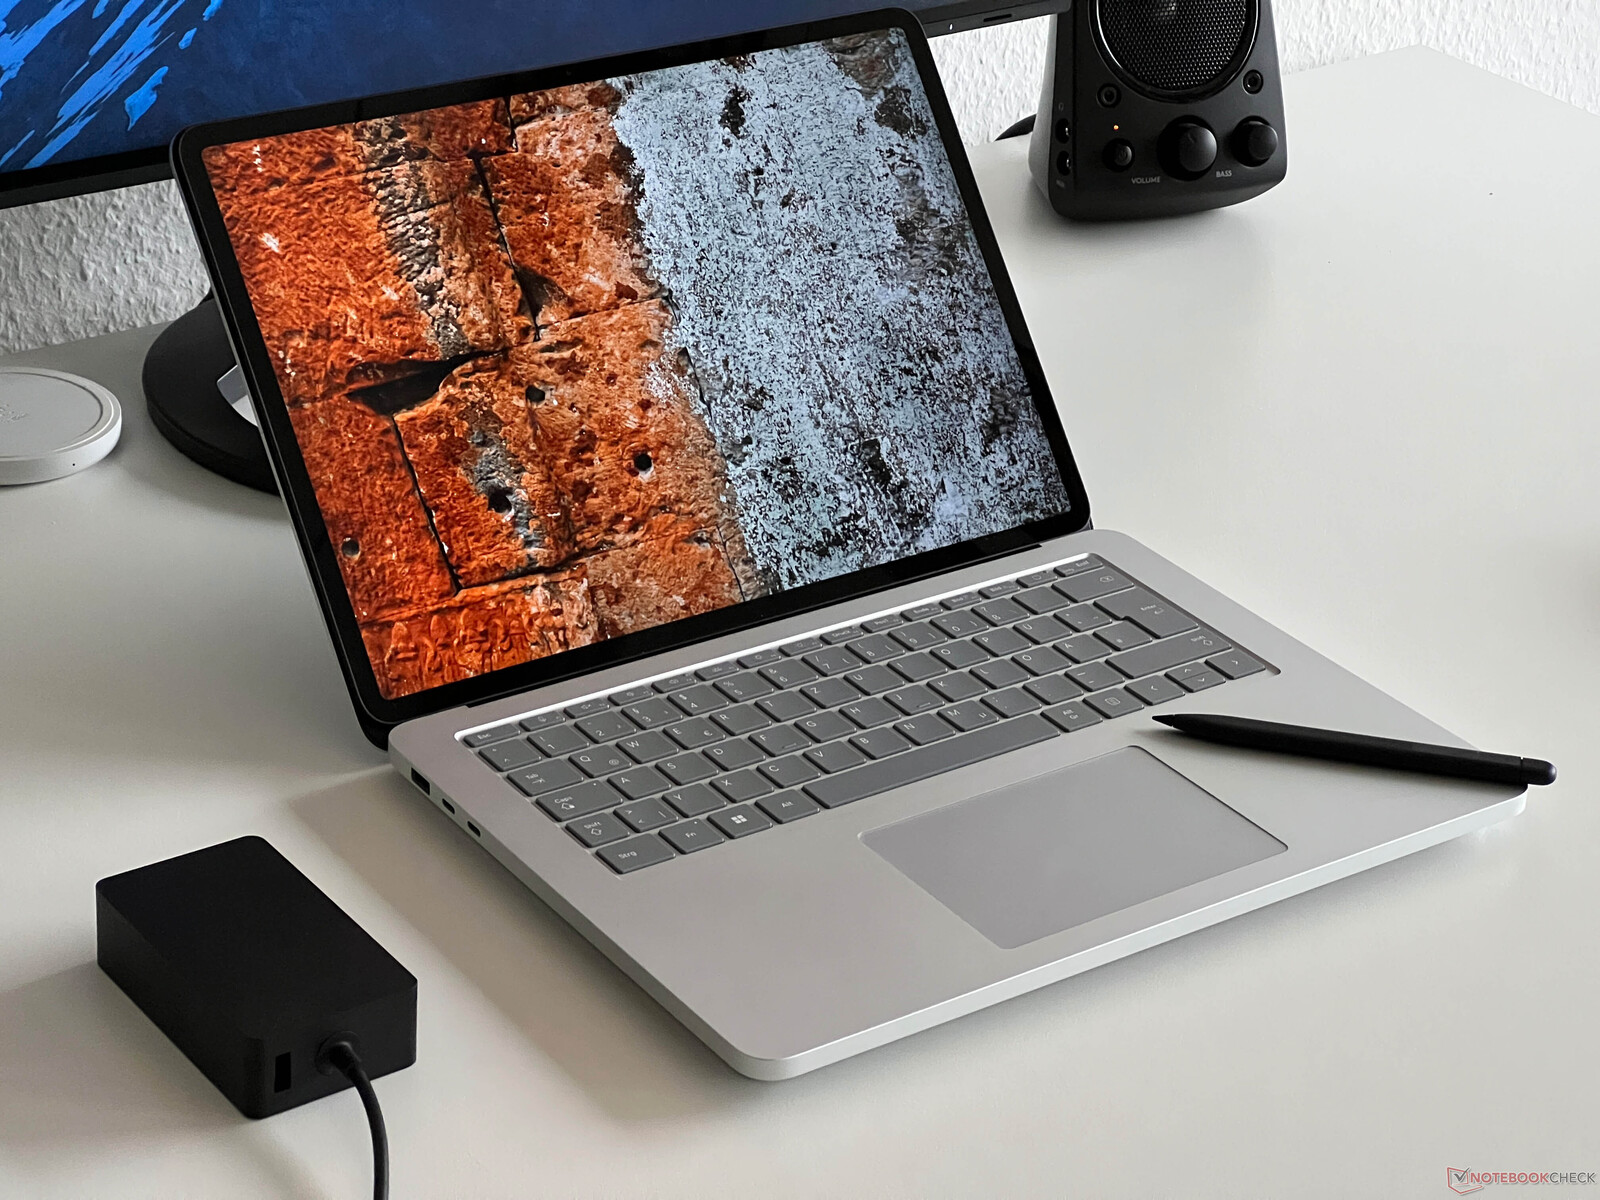
Am Gehäusedesign hat sich im Vergleich zur ersten Generation des Surface Laptop Studio nichts verändert. Die Baseunit besteht aus zwei Ebenen, wobei der obere Teil mit der Tastatur an allen Seite breiter ist. Damit entsteht der Eindruck eines kompakteren Gerätes, obwohl die Baseunit selbst schon 15 Millimeter dick ist. Als Material kommt hier eloxiertes Aluminium zum Einsatz und sowohl die Stabilität als auch die Verarbeitung sind hervorragend. Die Bildschirmränder sind mit rund 1 cm aber nach wie vor sehr breit, was etwas altmodisch wirkt.
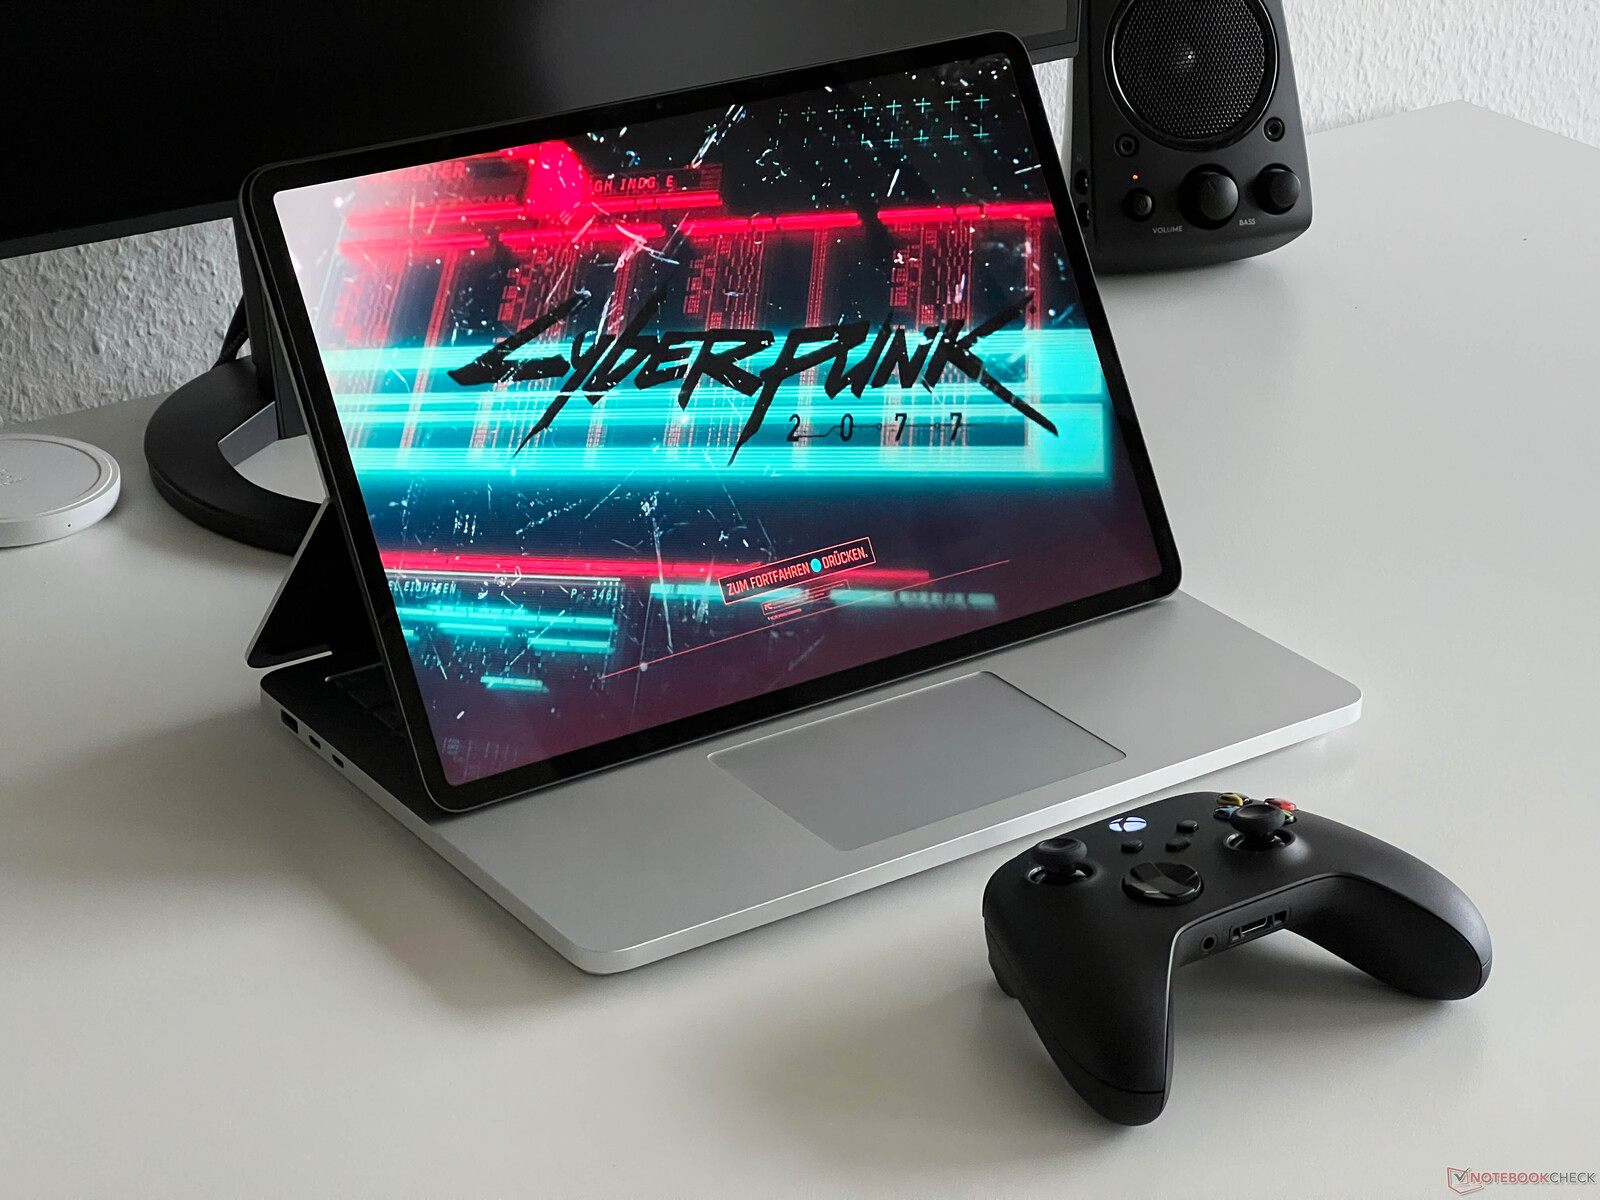
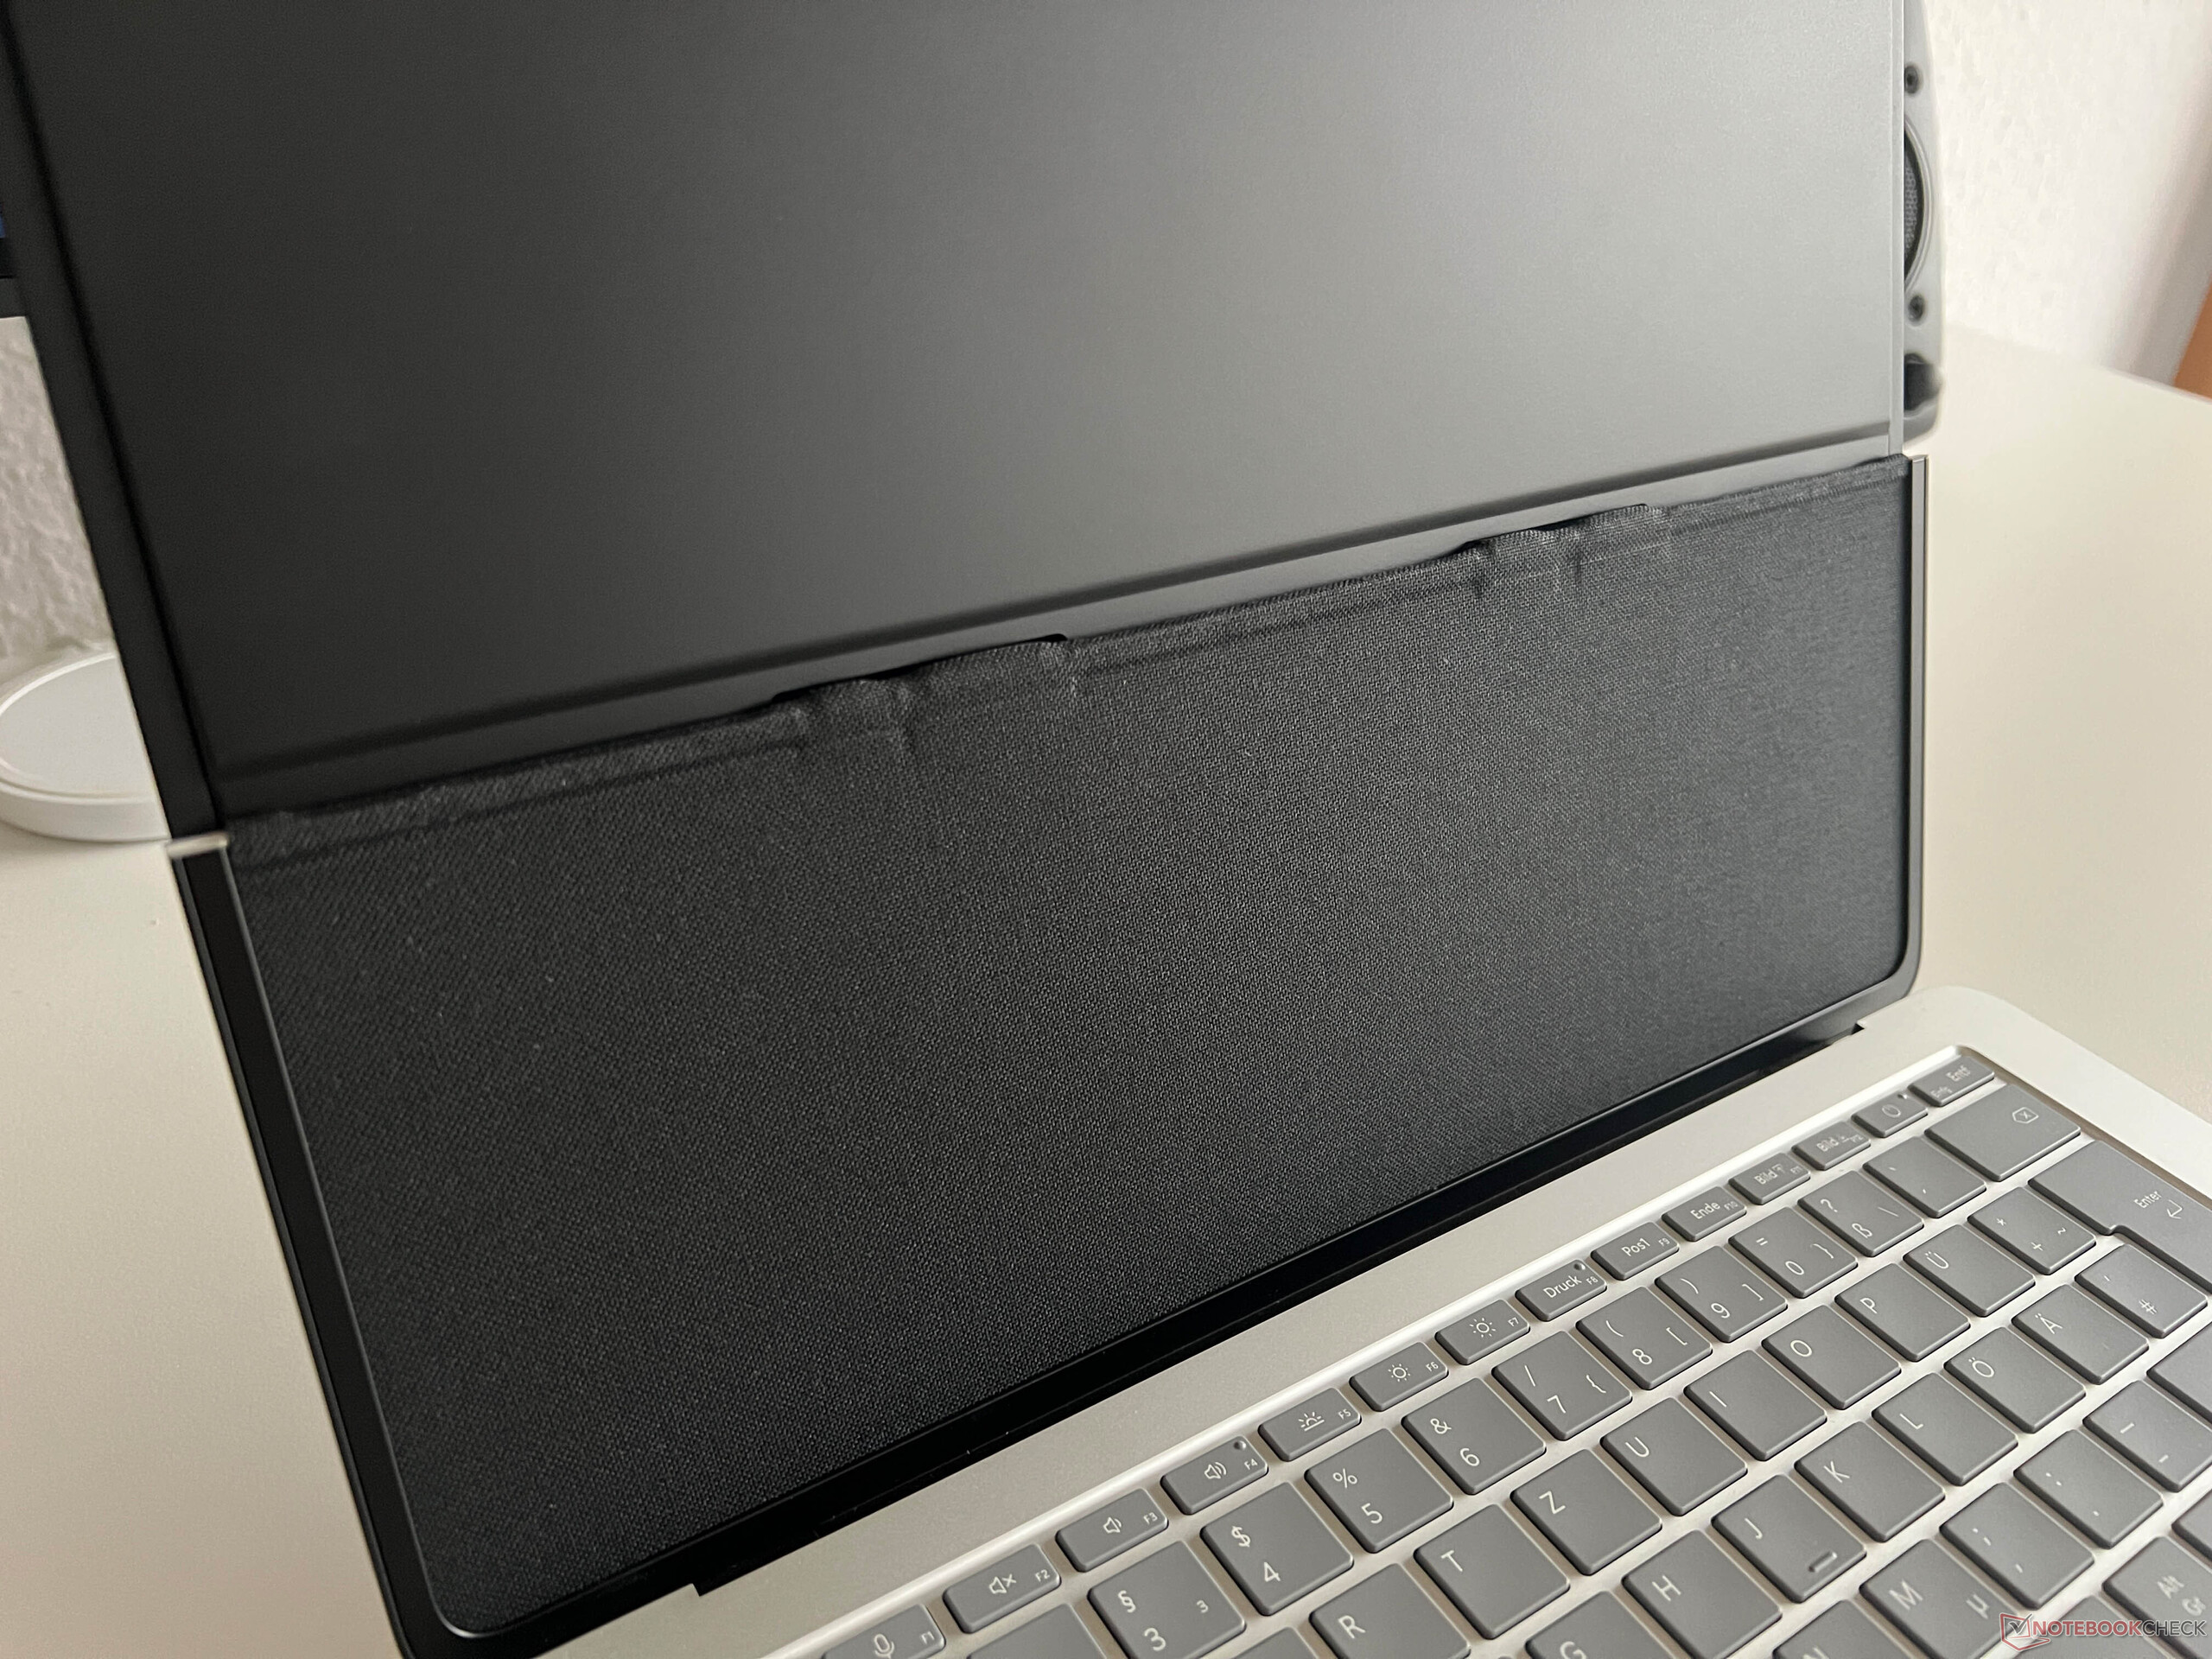
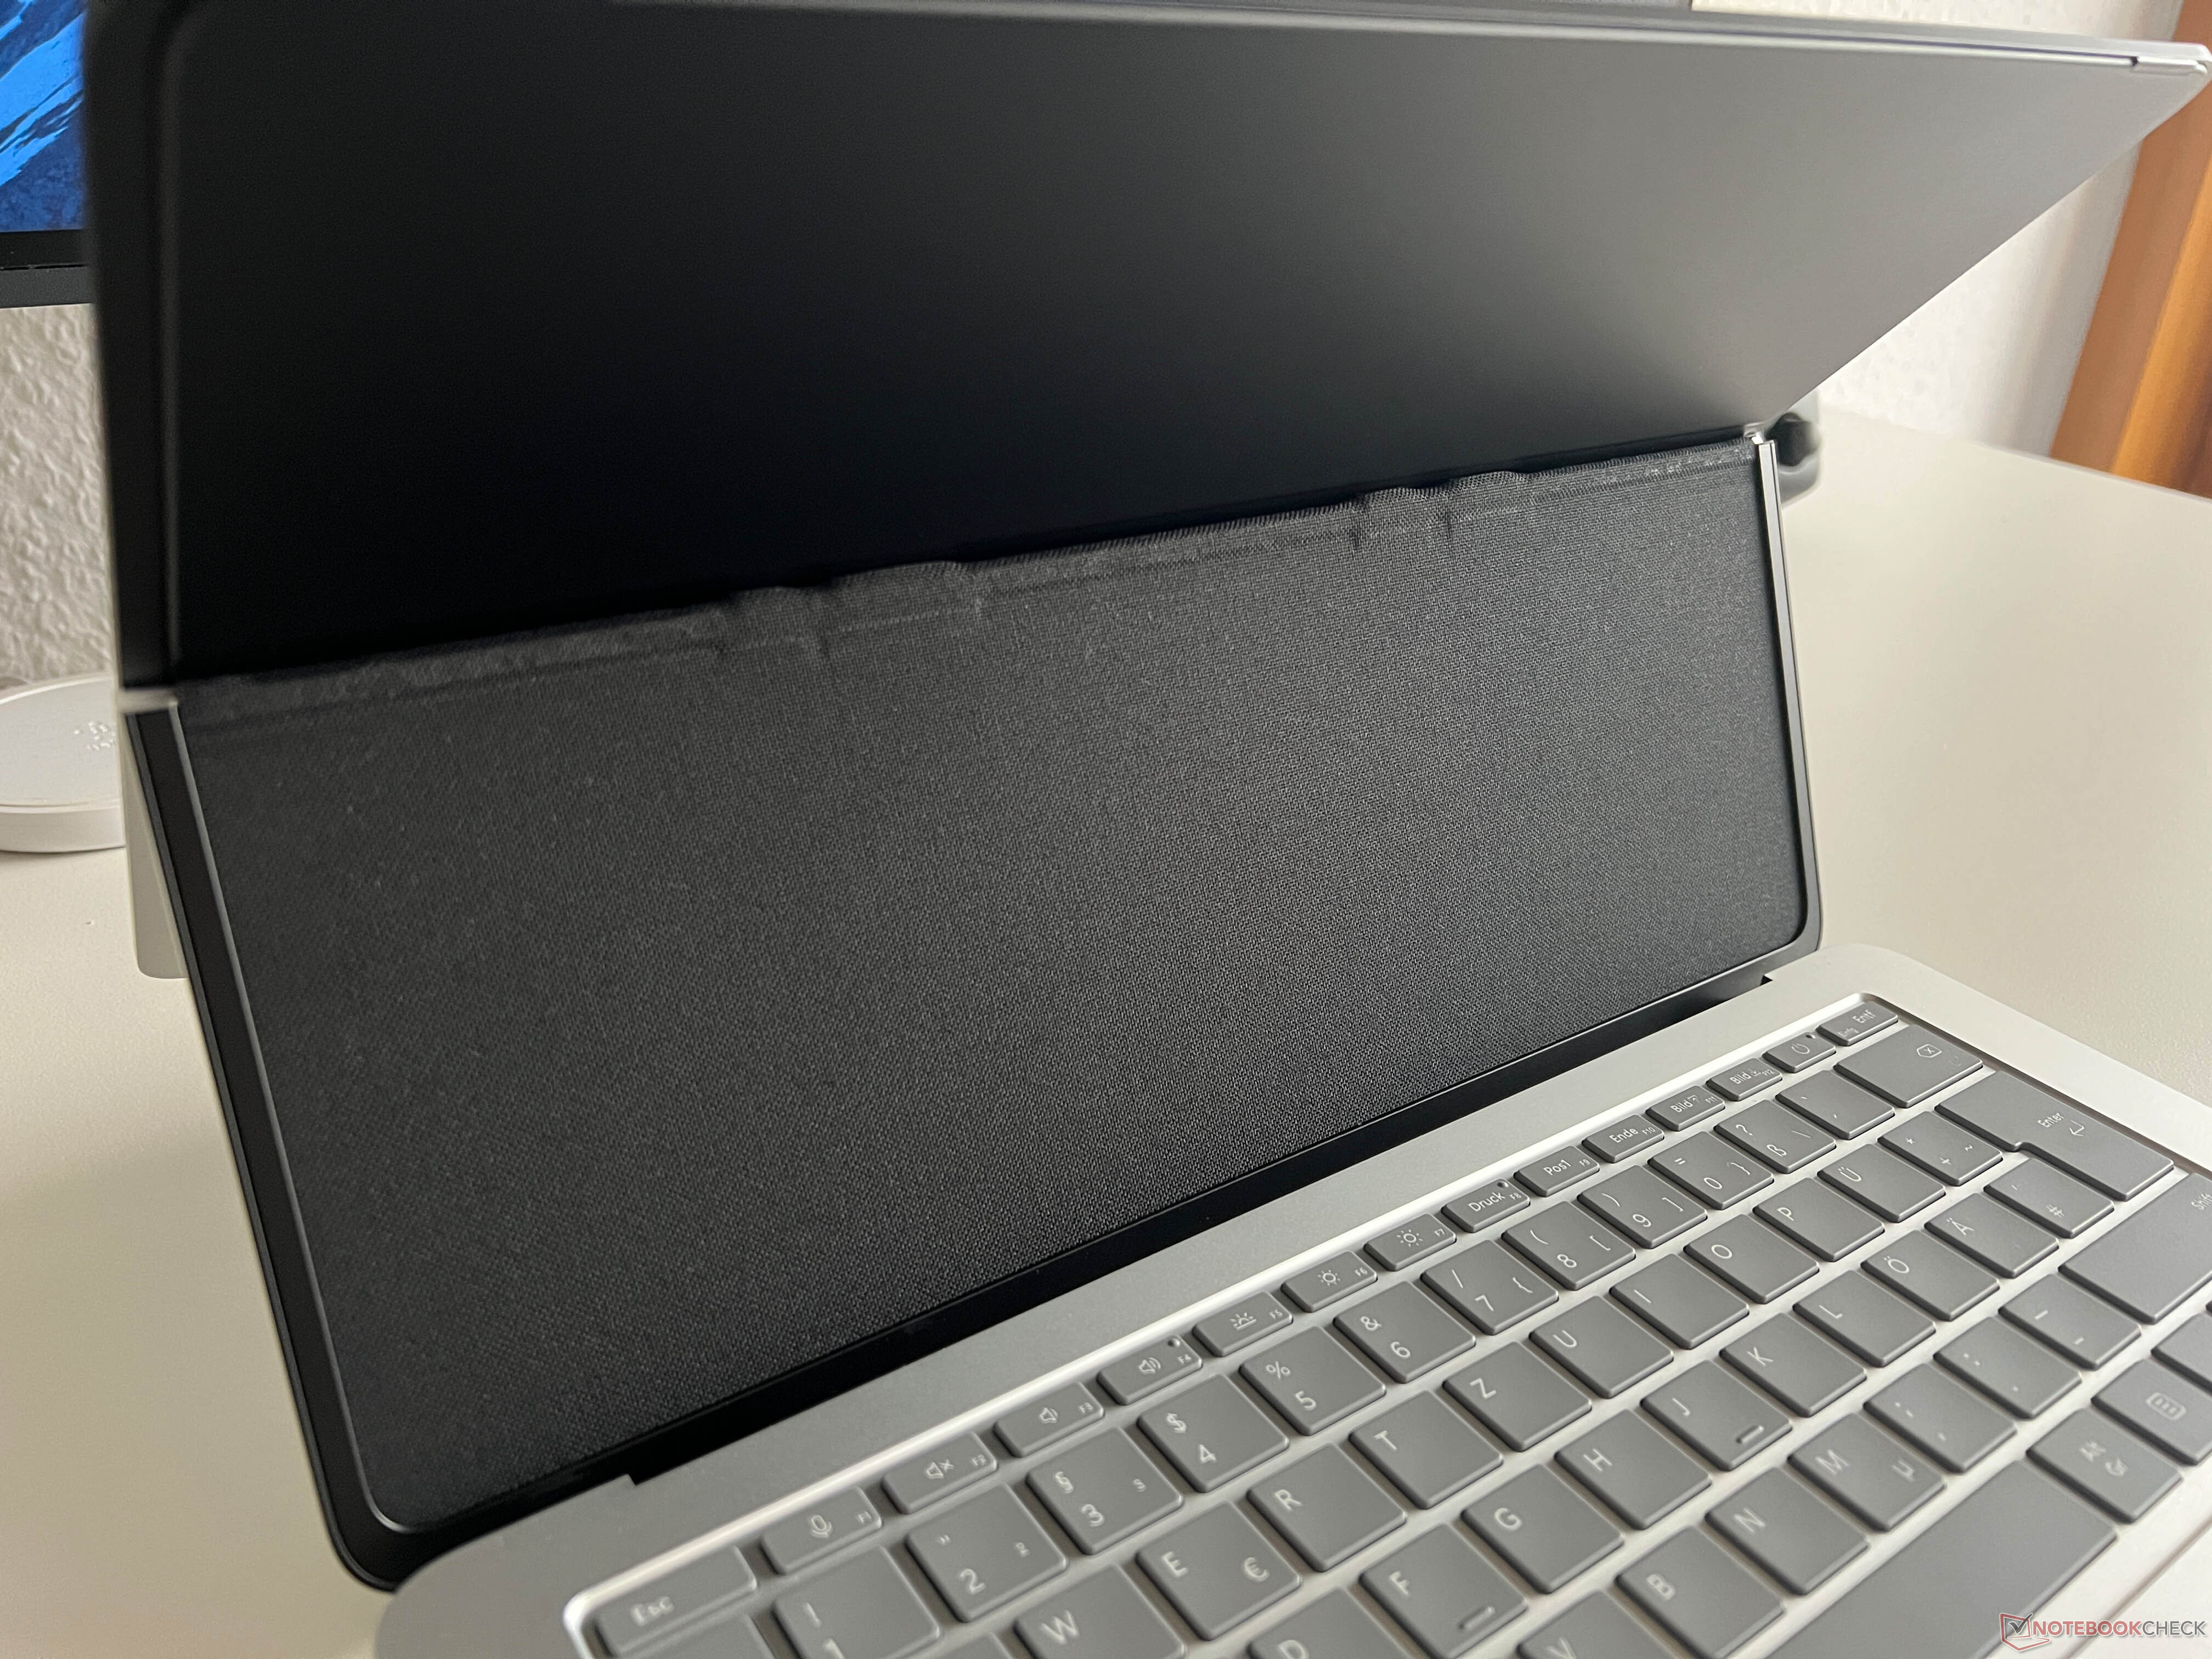
Highlight des Gerätes ist natürlich das klappbare Display, bei dem sich ein zweites Scharnier in der Mitte des Bildschirms befindet. Neben der Nutzung als normaler Laptop kann man das Display auf die Baseunit "legen" und bekommt dann eine minimal angewinkelte Arbeitsfläche, was beispielsweise bei Touch-Eingaben nützlich sein kann. Als Tablet selbst lässt sich das Gerät ebenfalls nutzen, allerdings stören hier das hohe Gewicht und auch die scharfen Kanten der Baseunit. Ein weiterer Modus ist mit vorgelagertem Display, bei dem die Tastatur verdeckt wird. Das Touchpad ist weiterhin zugänglich und natürlich kann man auch den Touchscreen weiterhin nutzen. Dieser Modus eignet sich am besten für die Wiedergabe von Filmen oder aber zum Spielen mit einem Gamepad.
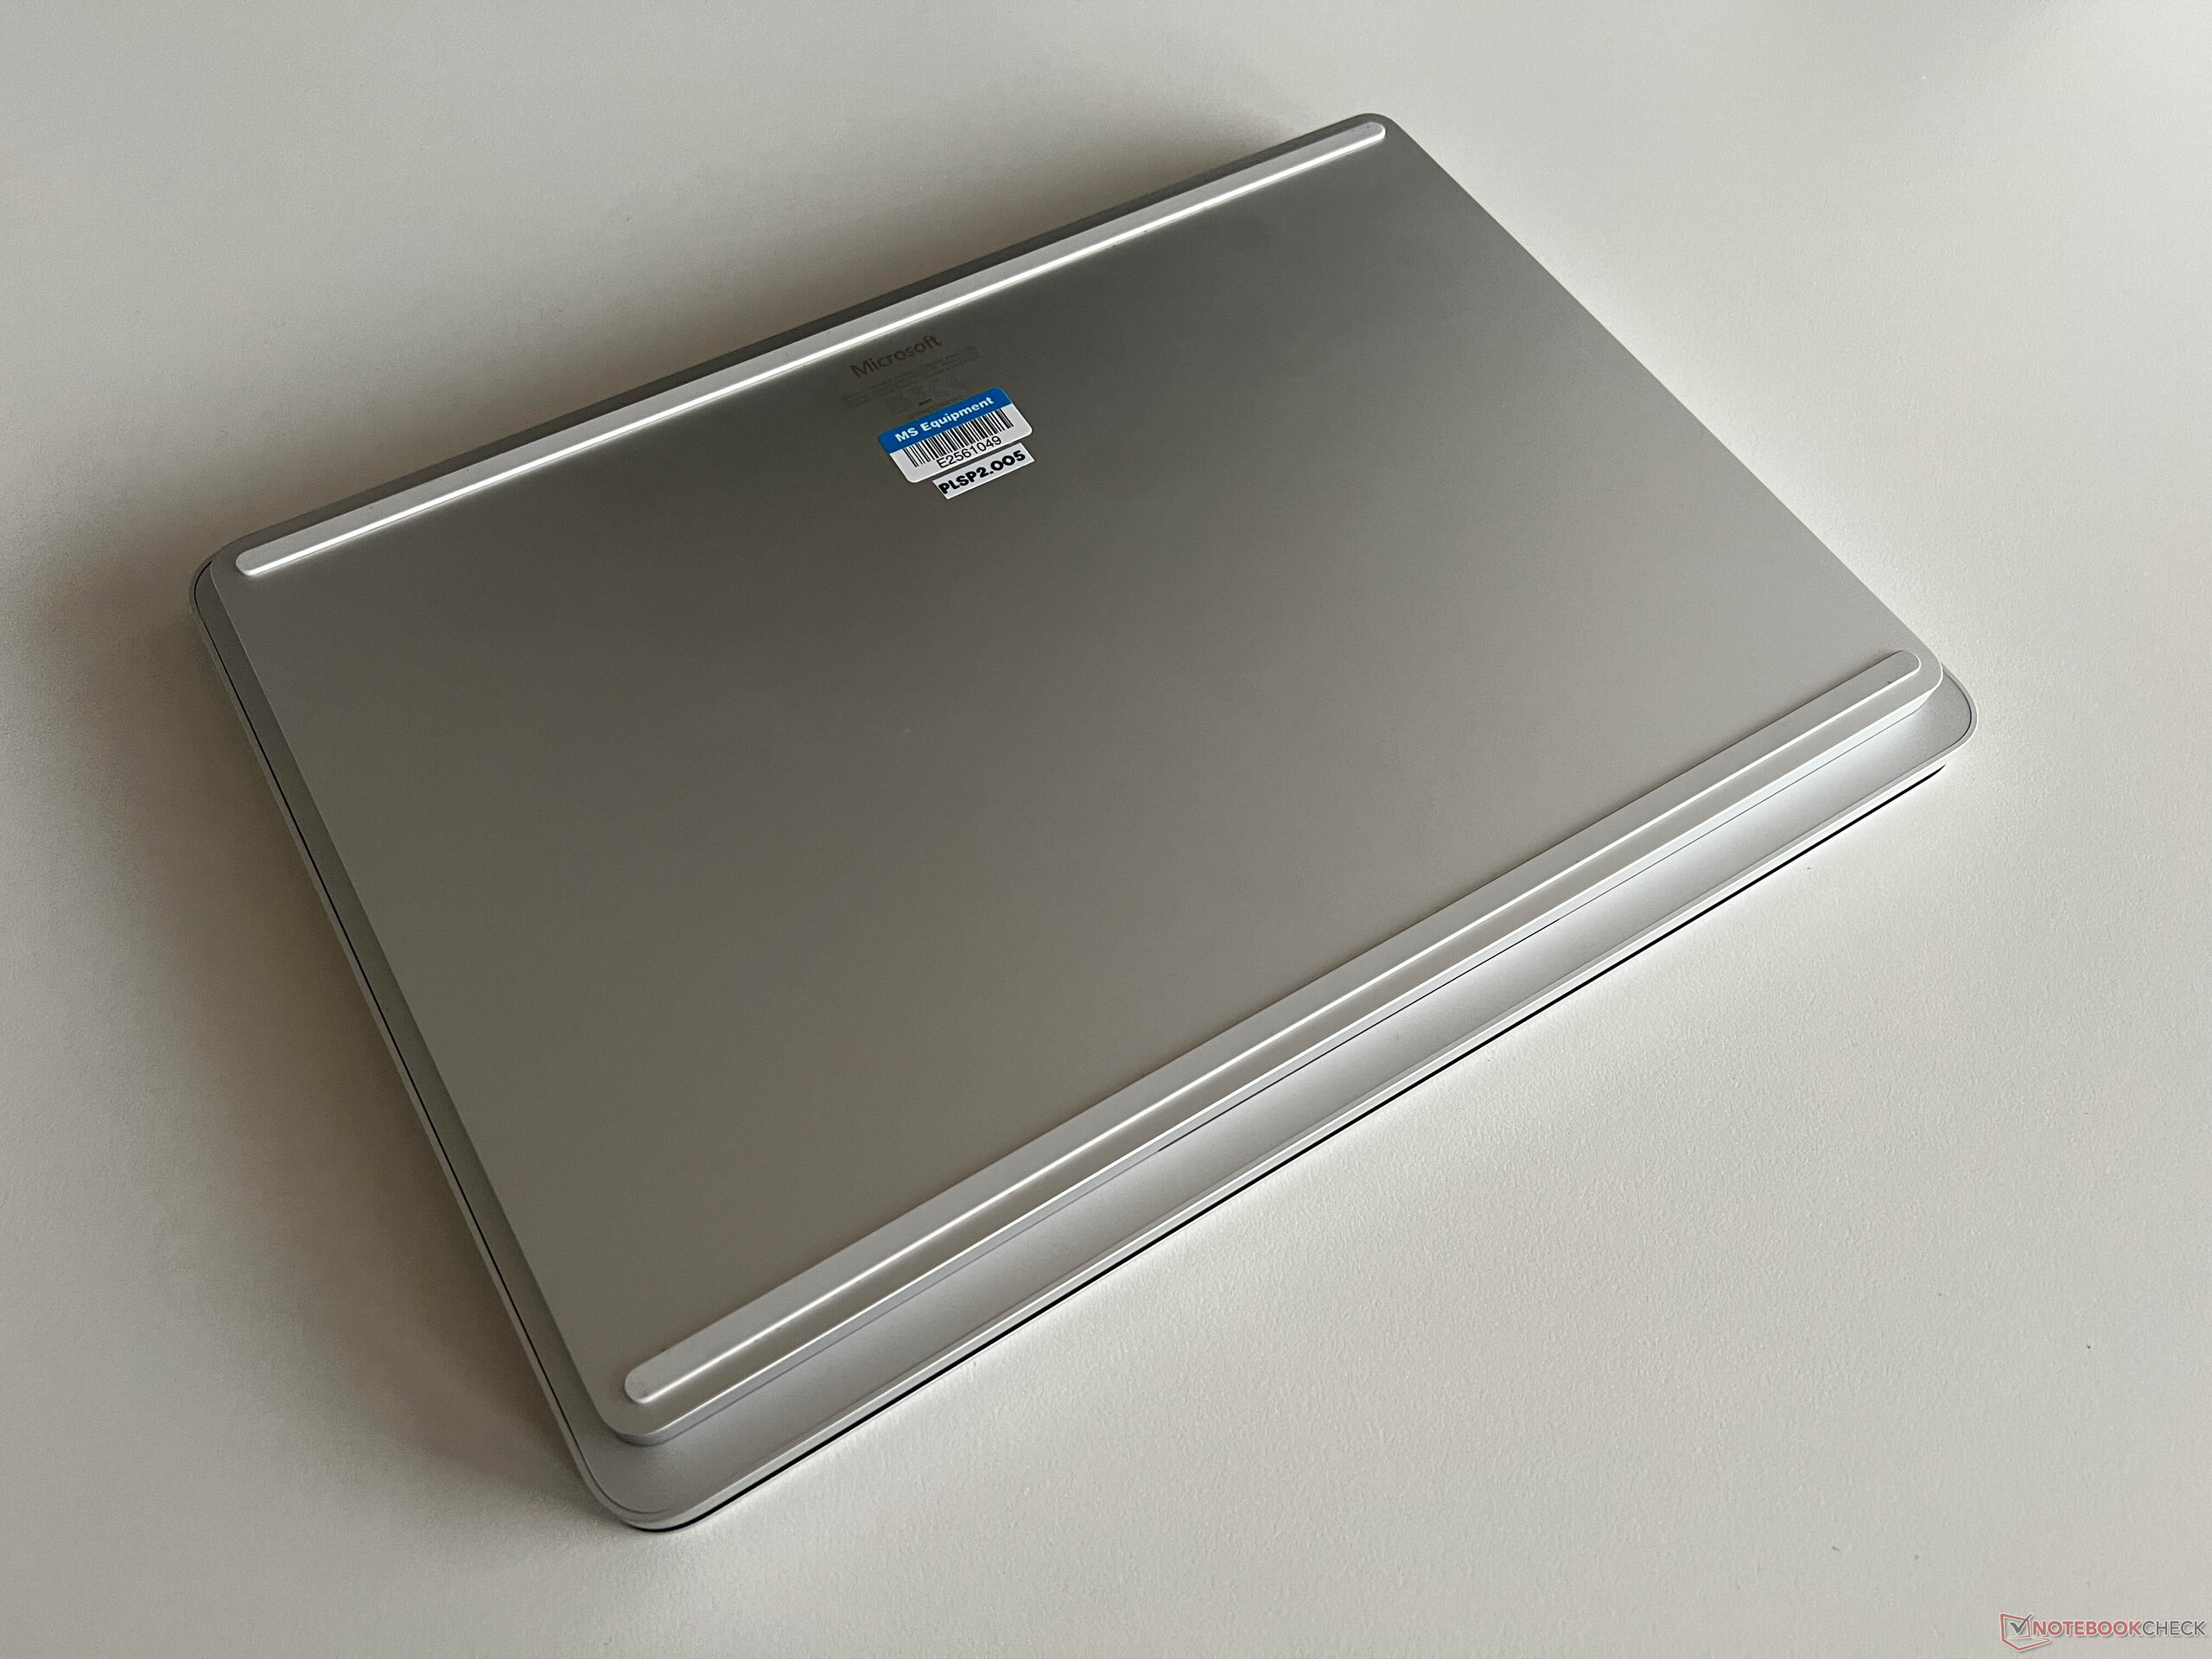
Der große Nachteil am Gehäuse ist weiterhin, dass es für den Endnutzer keinerlei Wartungsmöglichkeiten gibt. Das Gehäuse bietet keinerlei sichtbare Schrauben (befinden sich unter den geklebten Standfüßen) und daher besteht noch nicht einmal die Möglichkeit, die Lüfter zu reinigen oder die M2.-2280-SSD zu tauschen. Der Arbeitsspeicher sowie die anderen Komponenten sind verlötet.


Der Surface Laptop Studio 2 gehört innerhalb unserer Vergleichsgruppe zu den größten Geräten, wobei die Unterschiede bei der Stellfläche nicht riesig sind. Allerdings ist das Testgerät auch das dickste Gerät und das merkt man schon. Mit einem Gewicht von genau 2 kg ist es zudem deutlich schwerer als die Konkurrenz. Das neue 127-Watt-Netzteil mit dem Surface-Connect-Anschluss bringt noch einmal rund 450 Gramm auf die Waage.
Ausstattung - Microsoft spendiert neue Anschlüsse
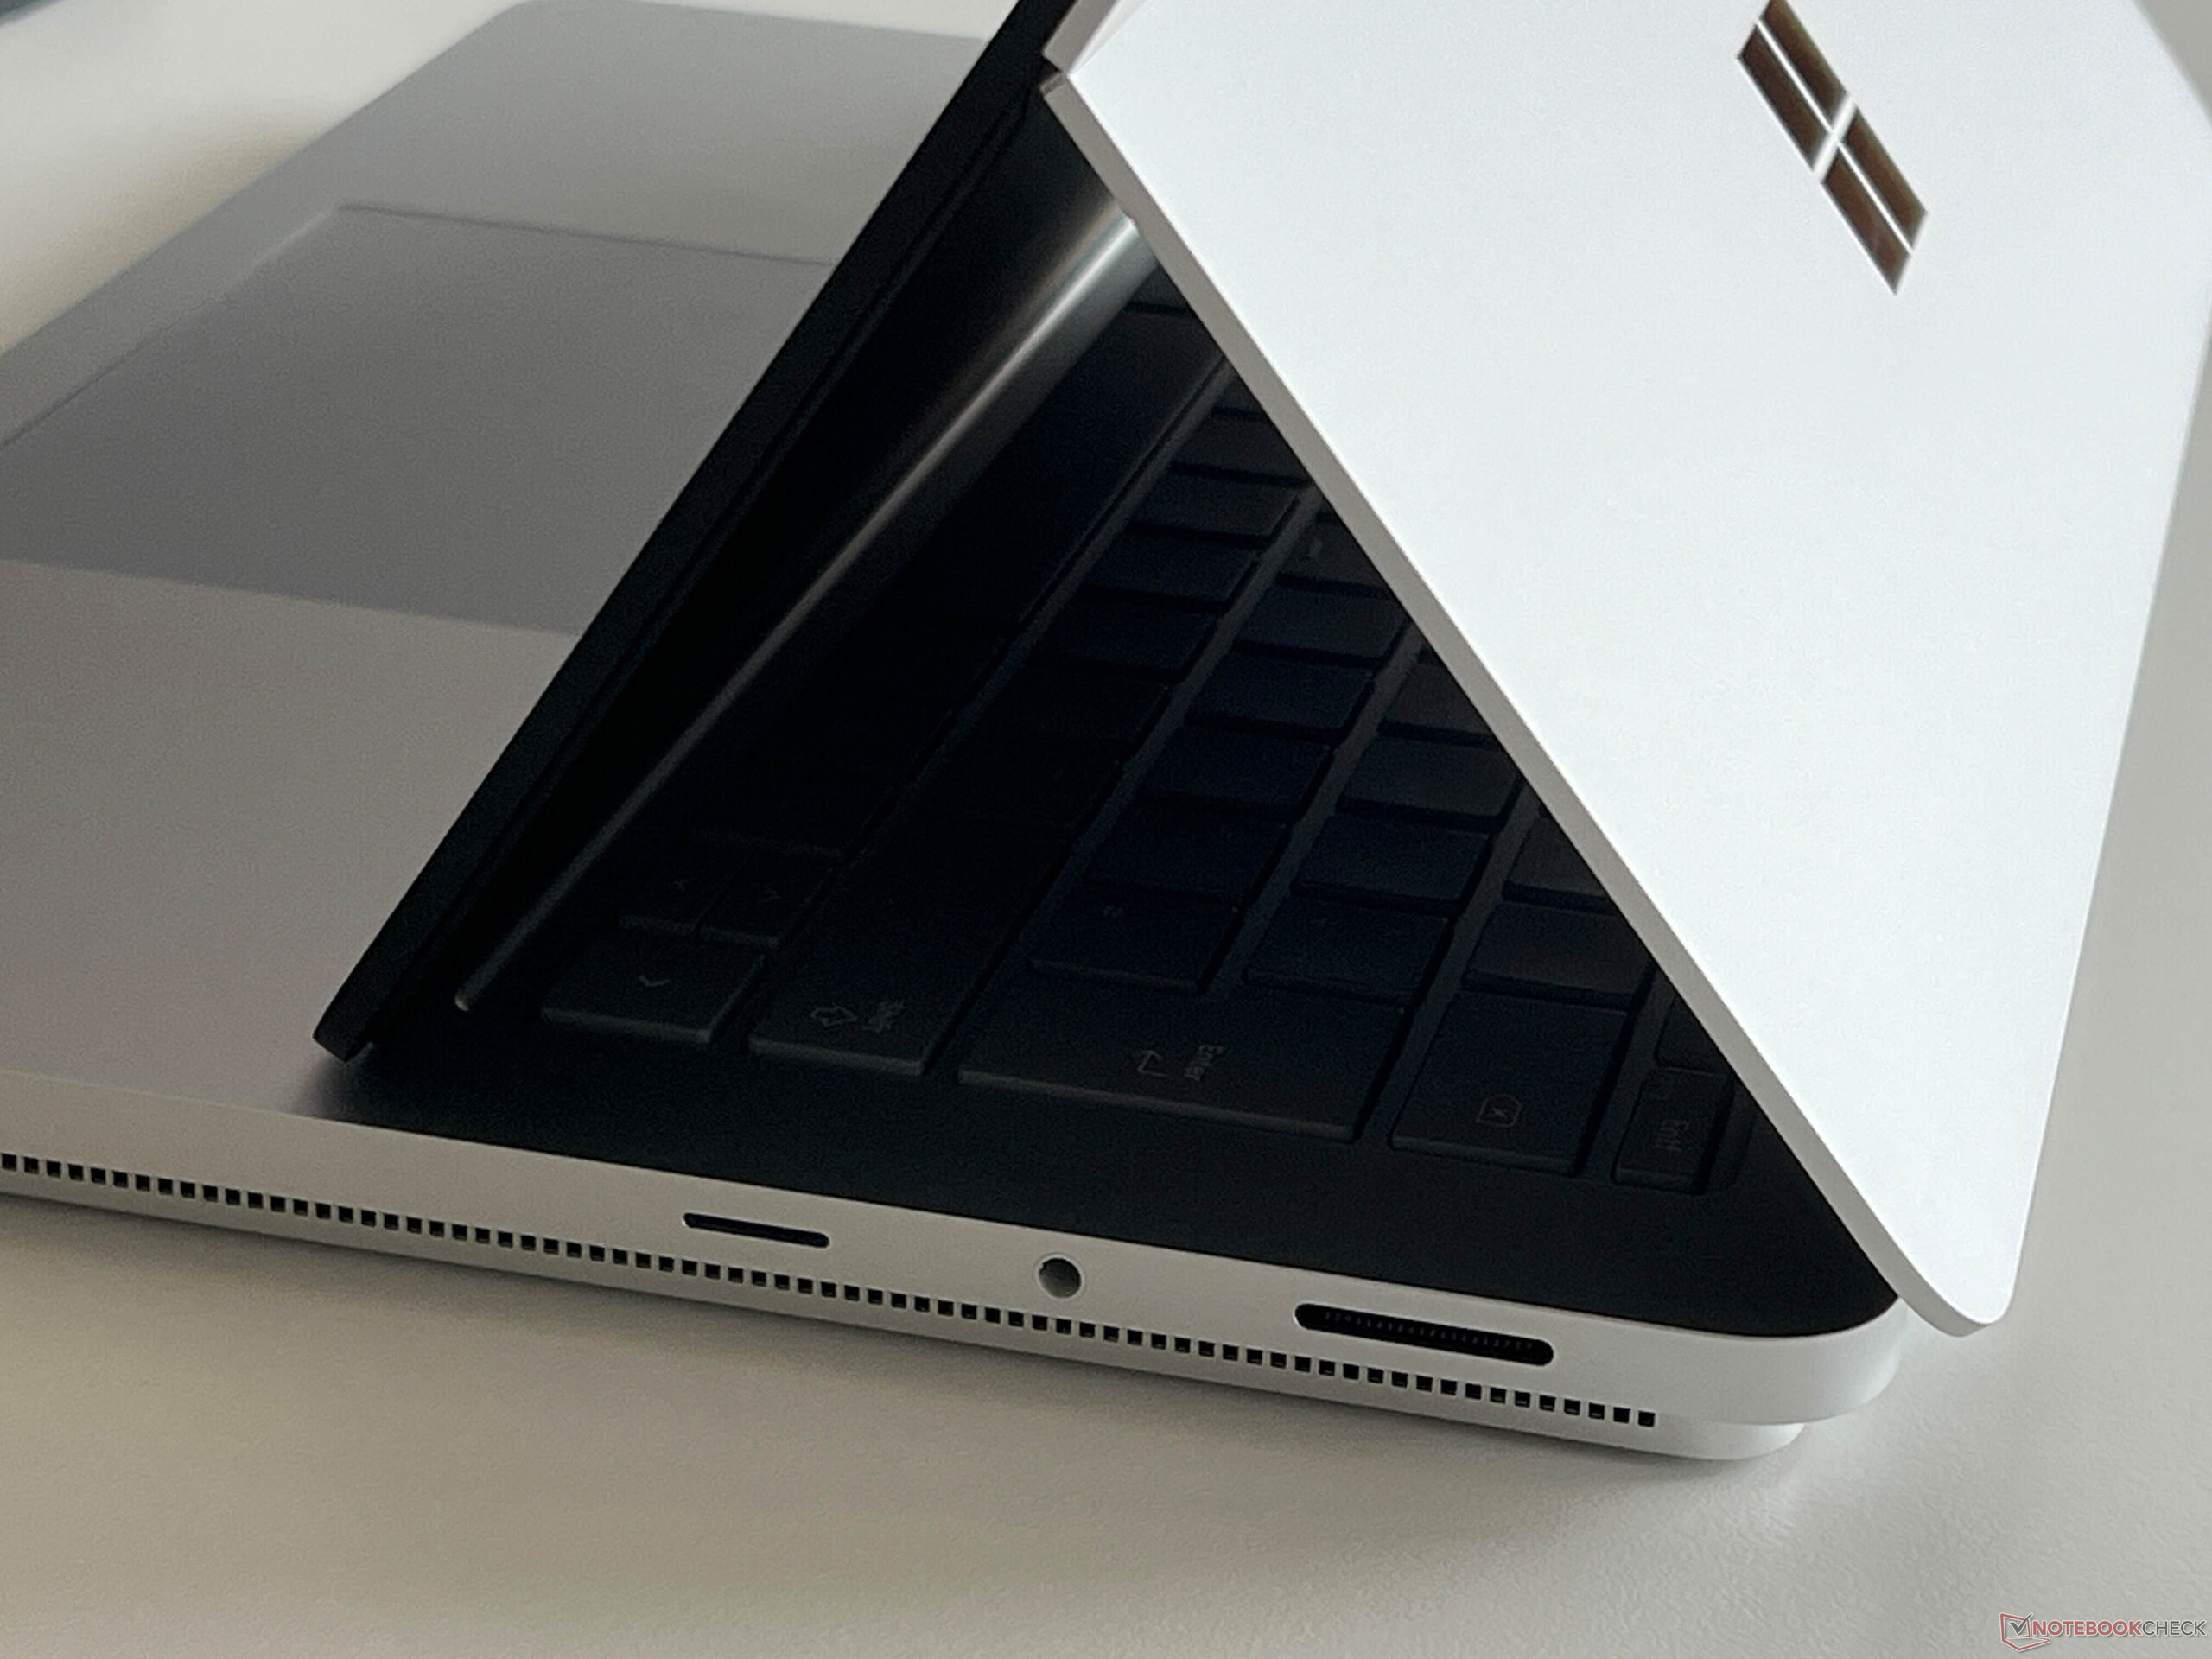
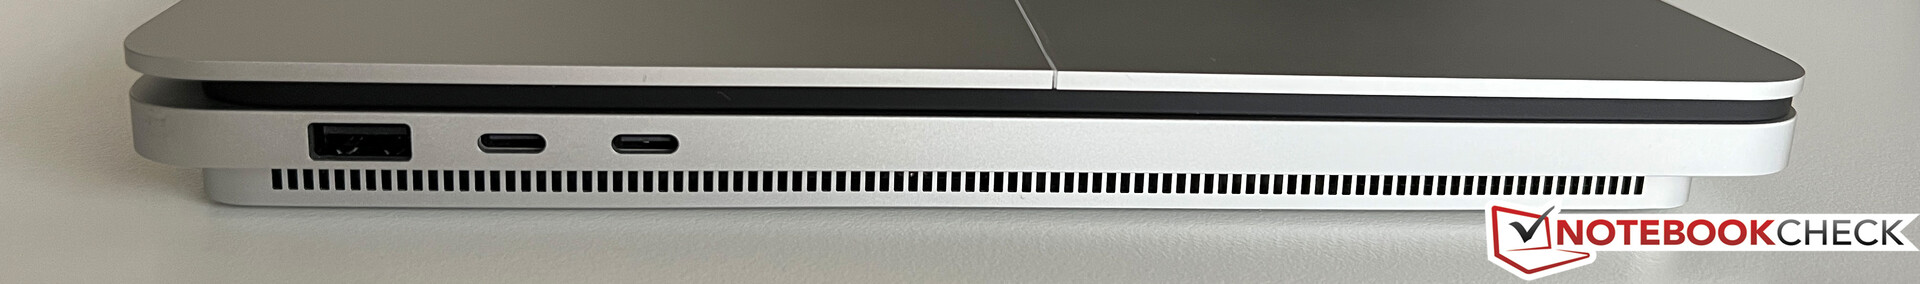
Die Anschlussausstattung war einer der Kritikpunkte bei der ersten Generation des Surface Laptop Studio und Microsoft hat sich der Kritik angenommen. Neben den bisher bekannten USB-C-Anschlüssen samt Thunderbolt 4 sowie dem Surface-Connect-Anschluss finden wir am Gerät nun noch eine reguläre USB-A-Buchse sowie einen microSD-Kartenleser. Der Surface-Connect-Anschluss ist in unseren Augen weiterhin etwas sperrig, aber zumindest bleibt Microsoft hier konsequent und bietet auch weiterhin Zubehör dafür an.

SD Card Reader
Auf der rechten Seite befindet sich der neue microSD-Kartenleser, der einen Federmechanismus verwendet. Eingesetzte Karten stehen nur minimal ab und theoretisch kann man die Karte auch für den dauerhaften Betrieb im Gerät lassen. In Verbindung mit unserer Referenzkarte (Angelbird AV Pro V60) sind die Transferraten mit mehr als 190 MB/s sehr gut.
Kommunikation
Microsoft verbaut ein aktuelles Wi-Fi-6E-Modul von Intel (AX210), welches auch die modernen 6-GHz-Netzwerke sowie Bluetooth 5.3 unterstützt. Die Transferraten sind in Ordnung, gerade beim Senden von Daten könnte die Leistung aber noch besser sein. Im Alltag ergeben sich dadurch aber keine Einschränkungen.
| Networking | |
| Microsoft Surface Laptop Studio 2 RTX 4060 | |
| iperf3 transmit AXE11000 | |
| iperf3 receive AXE11000 | |
| Apple MacBook Pro 14 2023 M2 Pro | |
| iperf3 transmit AXE11000 6GHz | |
| iperf3 receive AXE11000 6GHz | |
| Lenovo Yoga Pro 9-14IRP G8 | |
| iperf3 transmit AXE11000 | |
| iperf3 receive AXE11000 | |
| Asus Zenbook Pro 14 OLED UX6404VI | |
| iperf3 transmit AXE11000 | |
| iperf3 receive AXE11000 | |
| Asus ZenBook Pro 14 Duo UX8402VV-P1021W | |
| iperf3 transmit AXE11000 | |
| iperf3 receive AXE11000 | |
| iperf3 transmit AXE11000 6GHz | |
| iperf3 receive AXE11000 6GHz | |
| Asus ROG Zephyrus G14 GA402XY | |
| iperf3 transmit AXE11000 | |
| iperf3 receive AXE11000 | |
| Lenovo Legion Slim 5 14APH8 | |
| iperf3 transmit AXE11000 | |
| iperf3 receive AXE11000 | |
| iperf3 transmit AXE11000 6GHz | |
| iperf3 receive AXE11000 6GHz | |
| Microsoft Surface Laptop Studio i7 RTX 3050 Ti | |
| iperf3 transmit AX12 | |
| iperf3 receive AX12 | |
Webcam
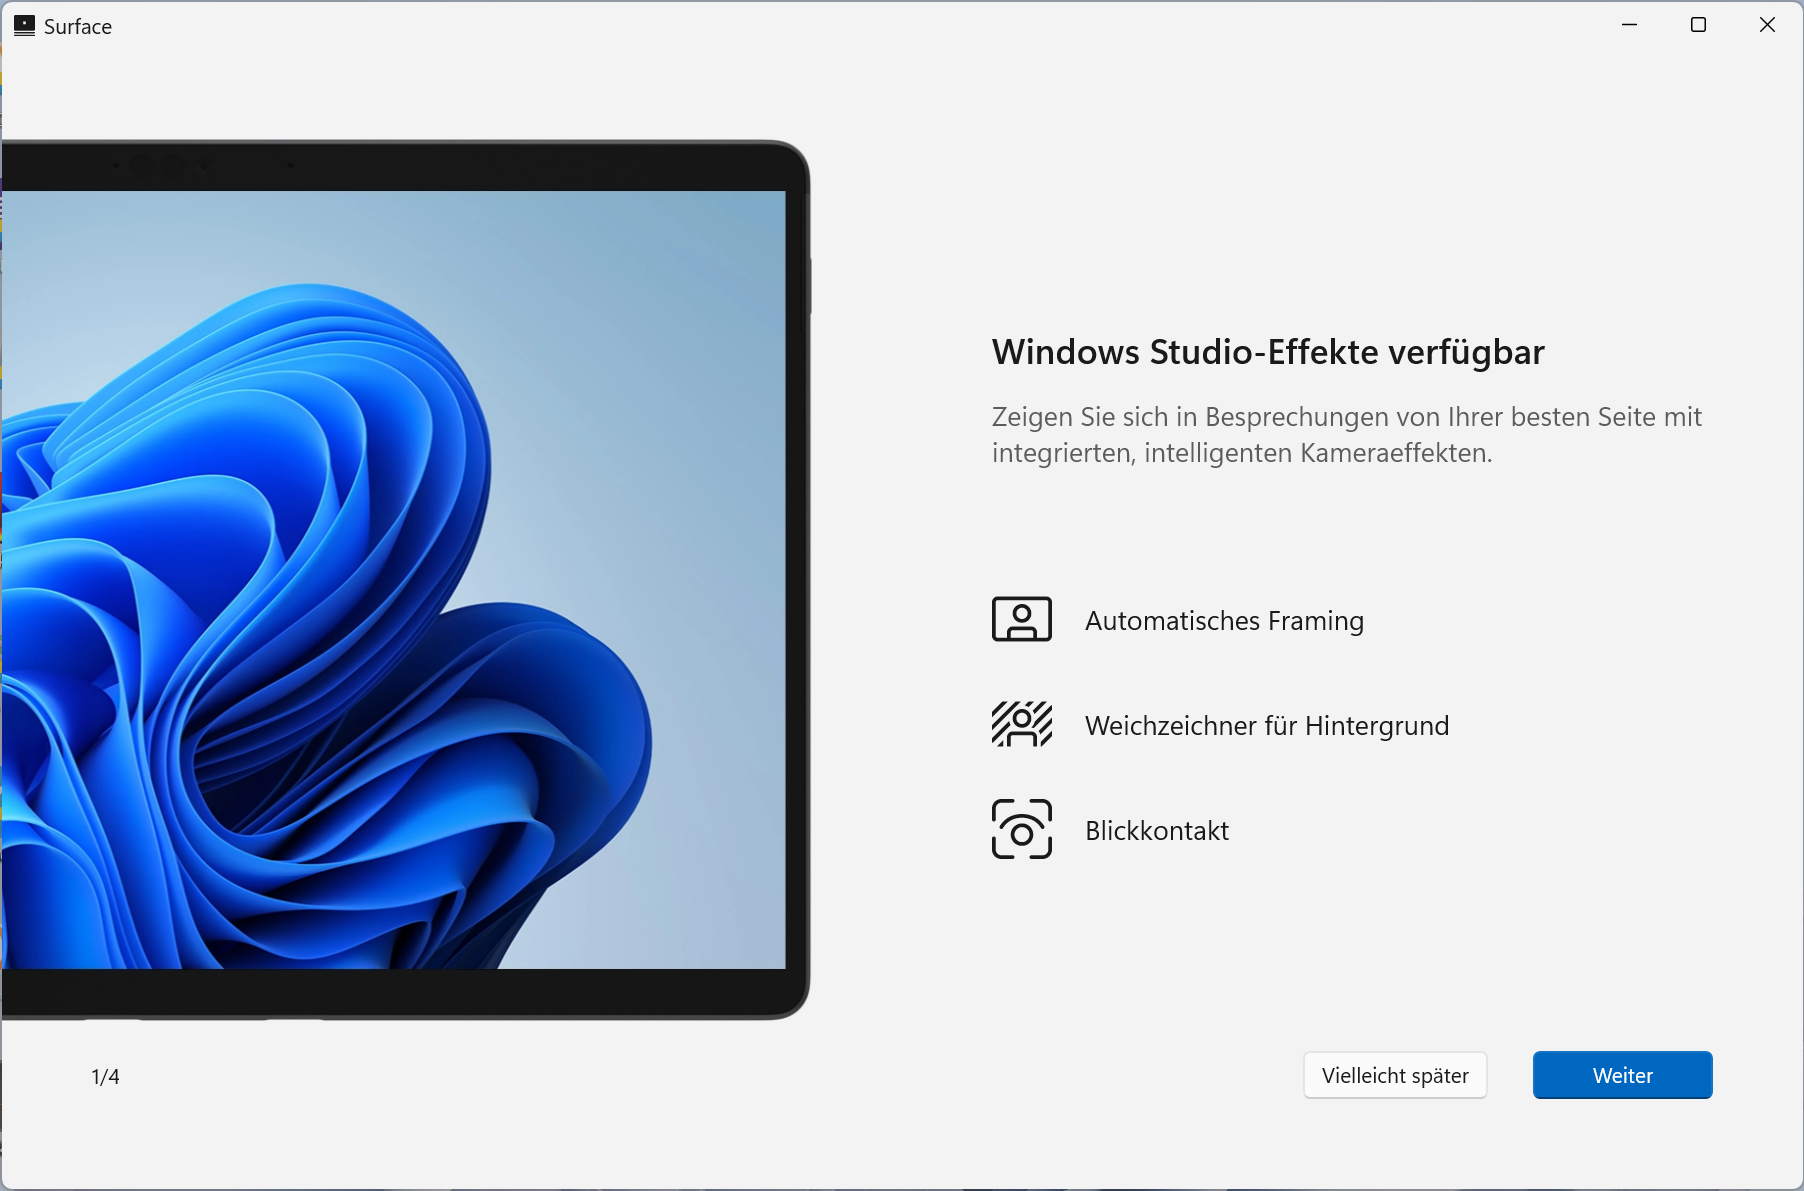
Die Qualität der 1080p-Webcam ist bei guten Lichtverhältnissen in Ordnung, in den Surface-Pro-Modellen sind allerdings deutlich bessere Kameras verbaut. Zudem kommt nun eine Weitwinkellinse zum Einsatz, was zu deutlich sichtbaren Verzerrungen führt, wenn man sehr nah an die Kamera herangeht (siehe auch Testchart-Aufnahme unten). Die Kamera unterstützt Studio-Funktionen wie einen Weichzeichner, einen Folgemodus oder Blickkontakt, was in der Praxis auch gut funktioniert. Zusätzlich steht noch eine IR-Kamera für die Gesichtserkennung via Windows Hello zur Verfügung.


Eingabegeräte - Surface Pen mit haptischem Feedback
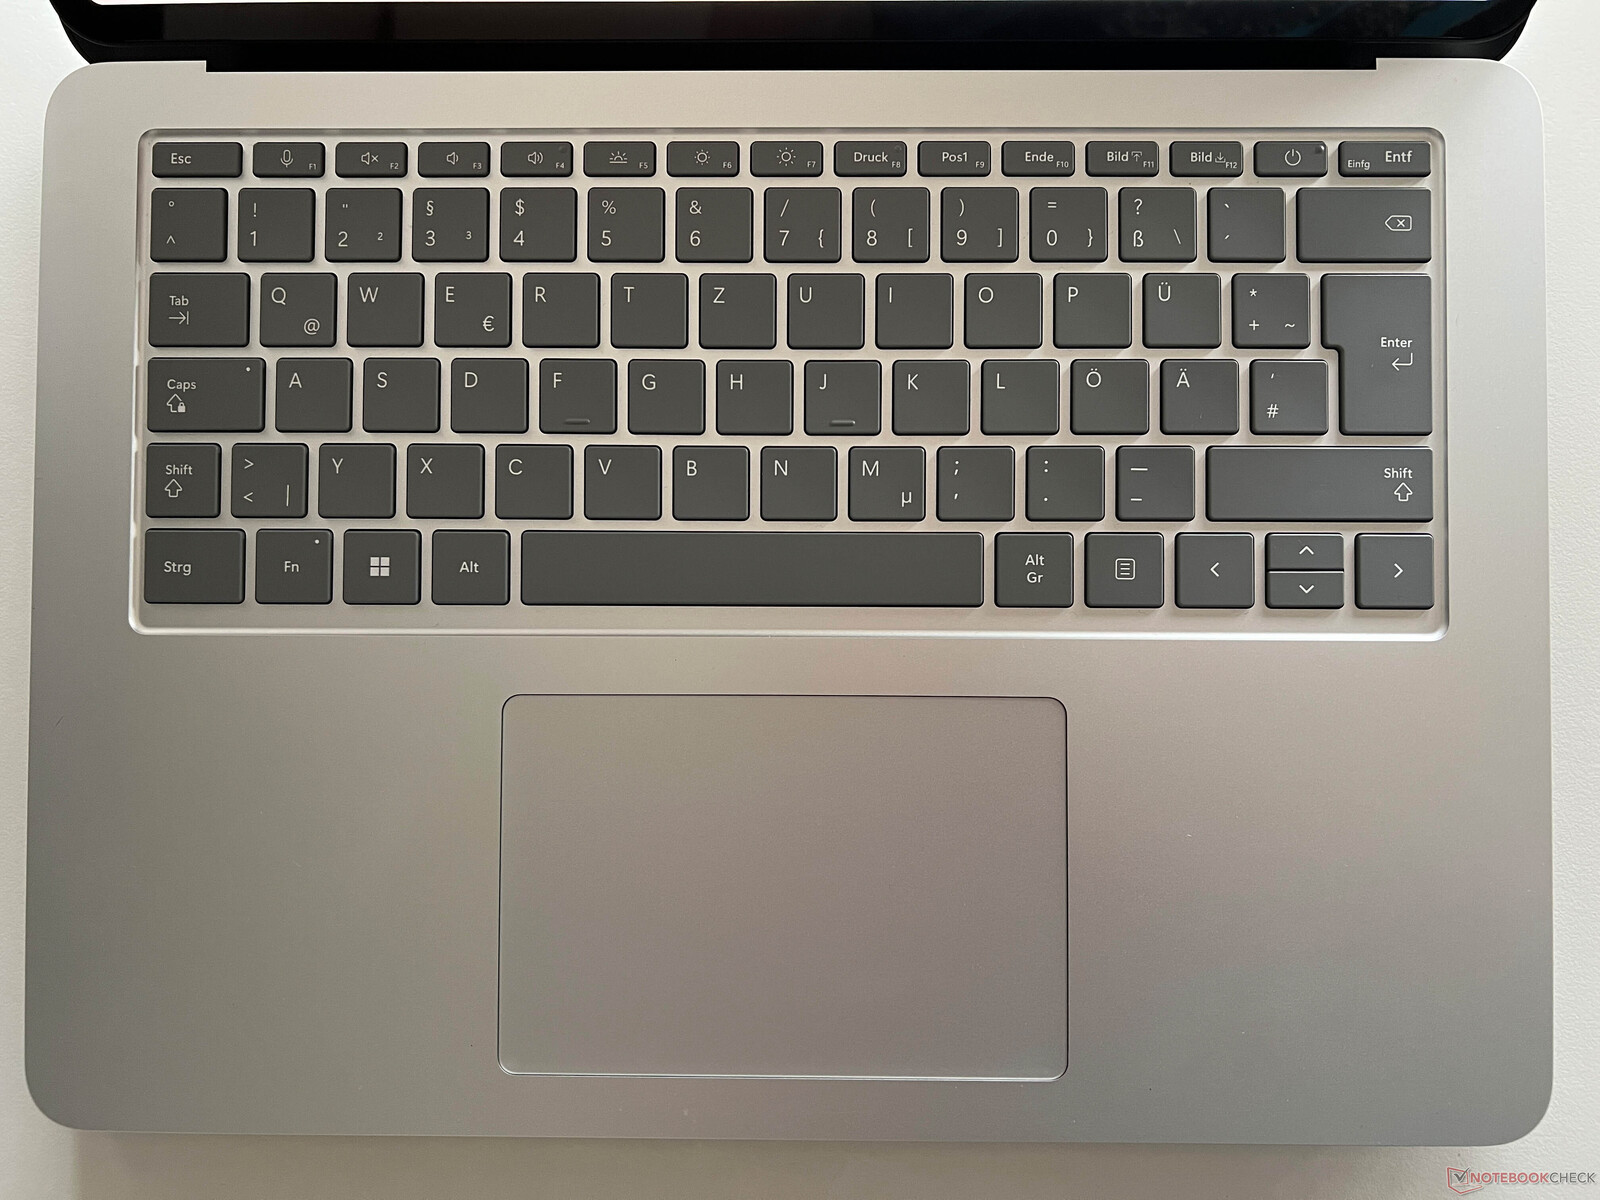
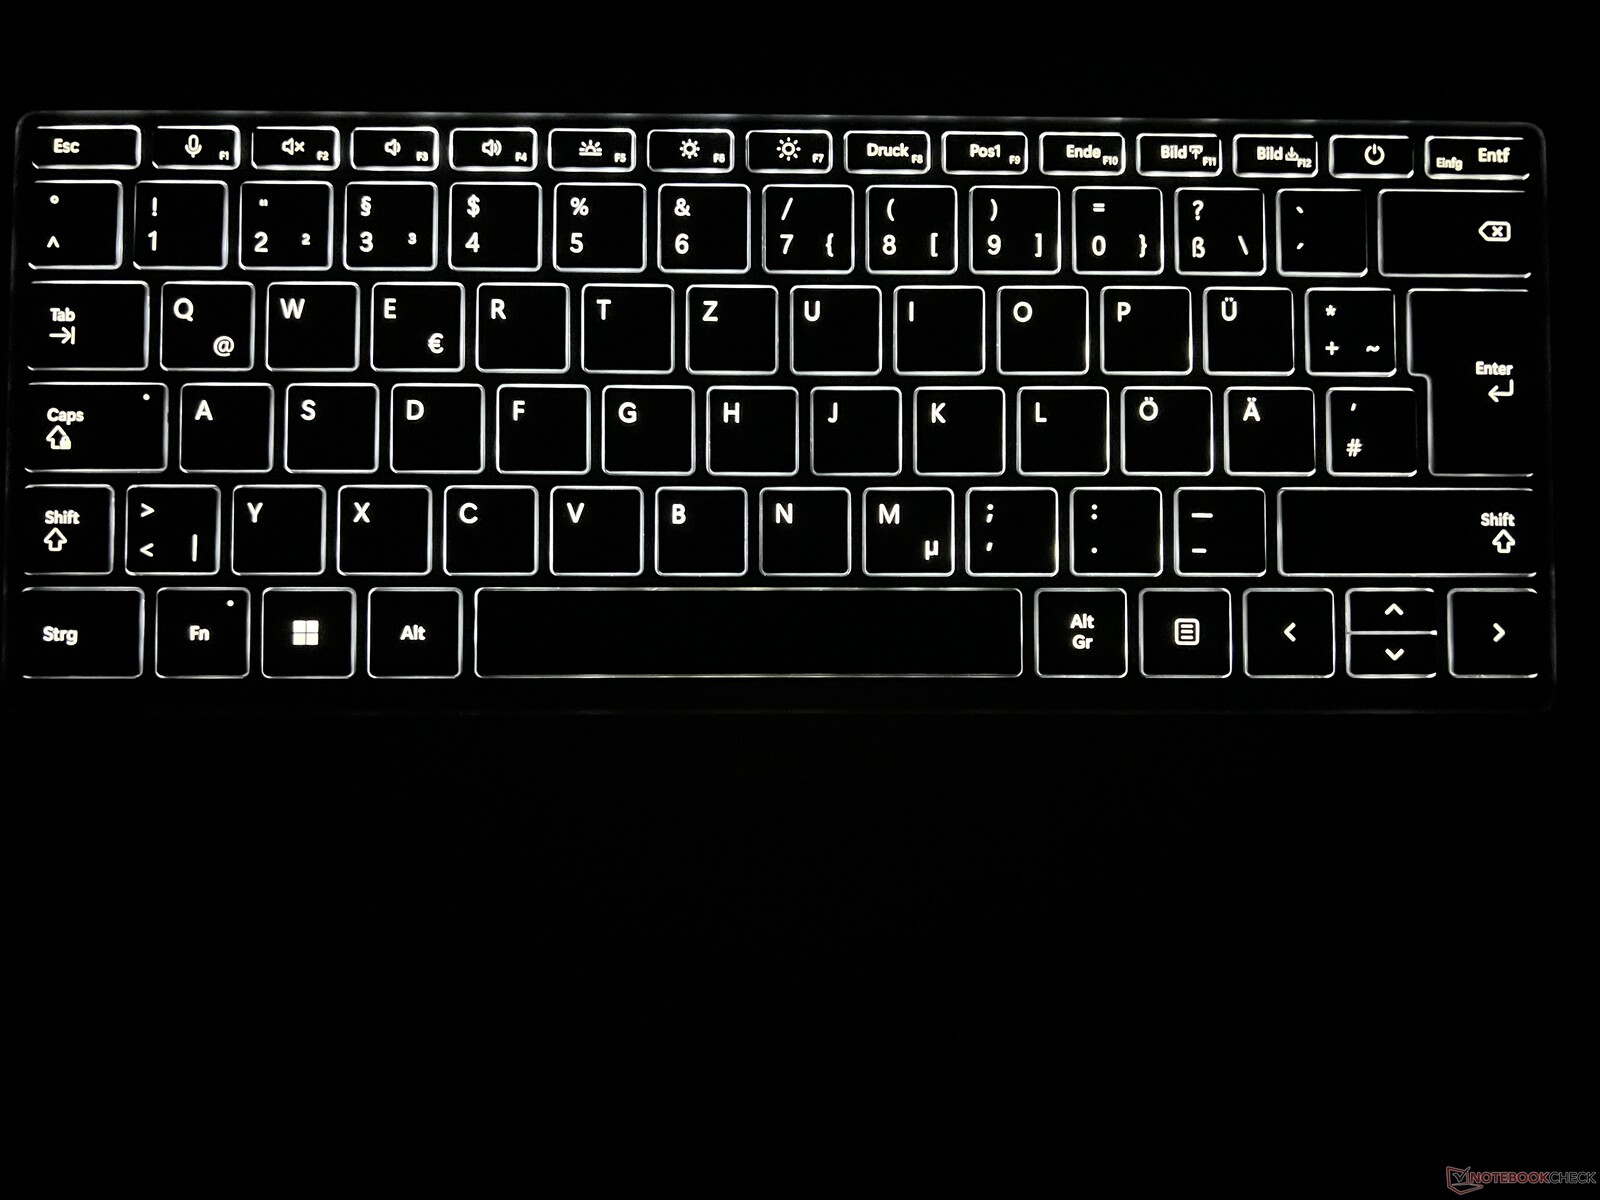
Die Tastatur wurde unverändert übernommen. Die dunkelgrauen Tasten sind gut sichtbar und in dunklen Umgebungen hilft die dreistufige Hintergrundbeleuchtung, die allerdings nicht via Sensor aktiviert werden kann. Die Tastatur selbst bietet weiterhin ein komfortables Tippgefühl mit einem ausreichend langem Hubweg, auch lange Texte sind also kein Problem.
Wie bei den Apple MacBooks bietet der Surface Laptop Studio 2 ein sogenanntes Precision Haptic Touchpad, es gibt also keine beweglichen Tasten. Stattdessen wird das Feedback beim Drücken durch Vibrationsmotoren erzeugt. Der Vorteil dadurch ist ein gleichmäßiges Klicken, egal wo man auf dem Pad drückt. Die haptische Rückmeldung kann aber auch deaktiviert werden. In der Praxis funktionierte das Pad einwandfrei und die seltenen Sensitivitätsprobleme, die wir beim Test der ersten Generation hatten, waren hier nicht mehr vorhanden.
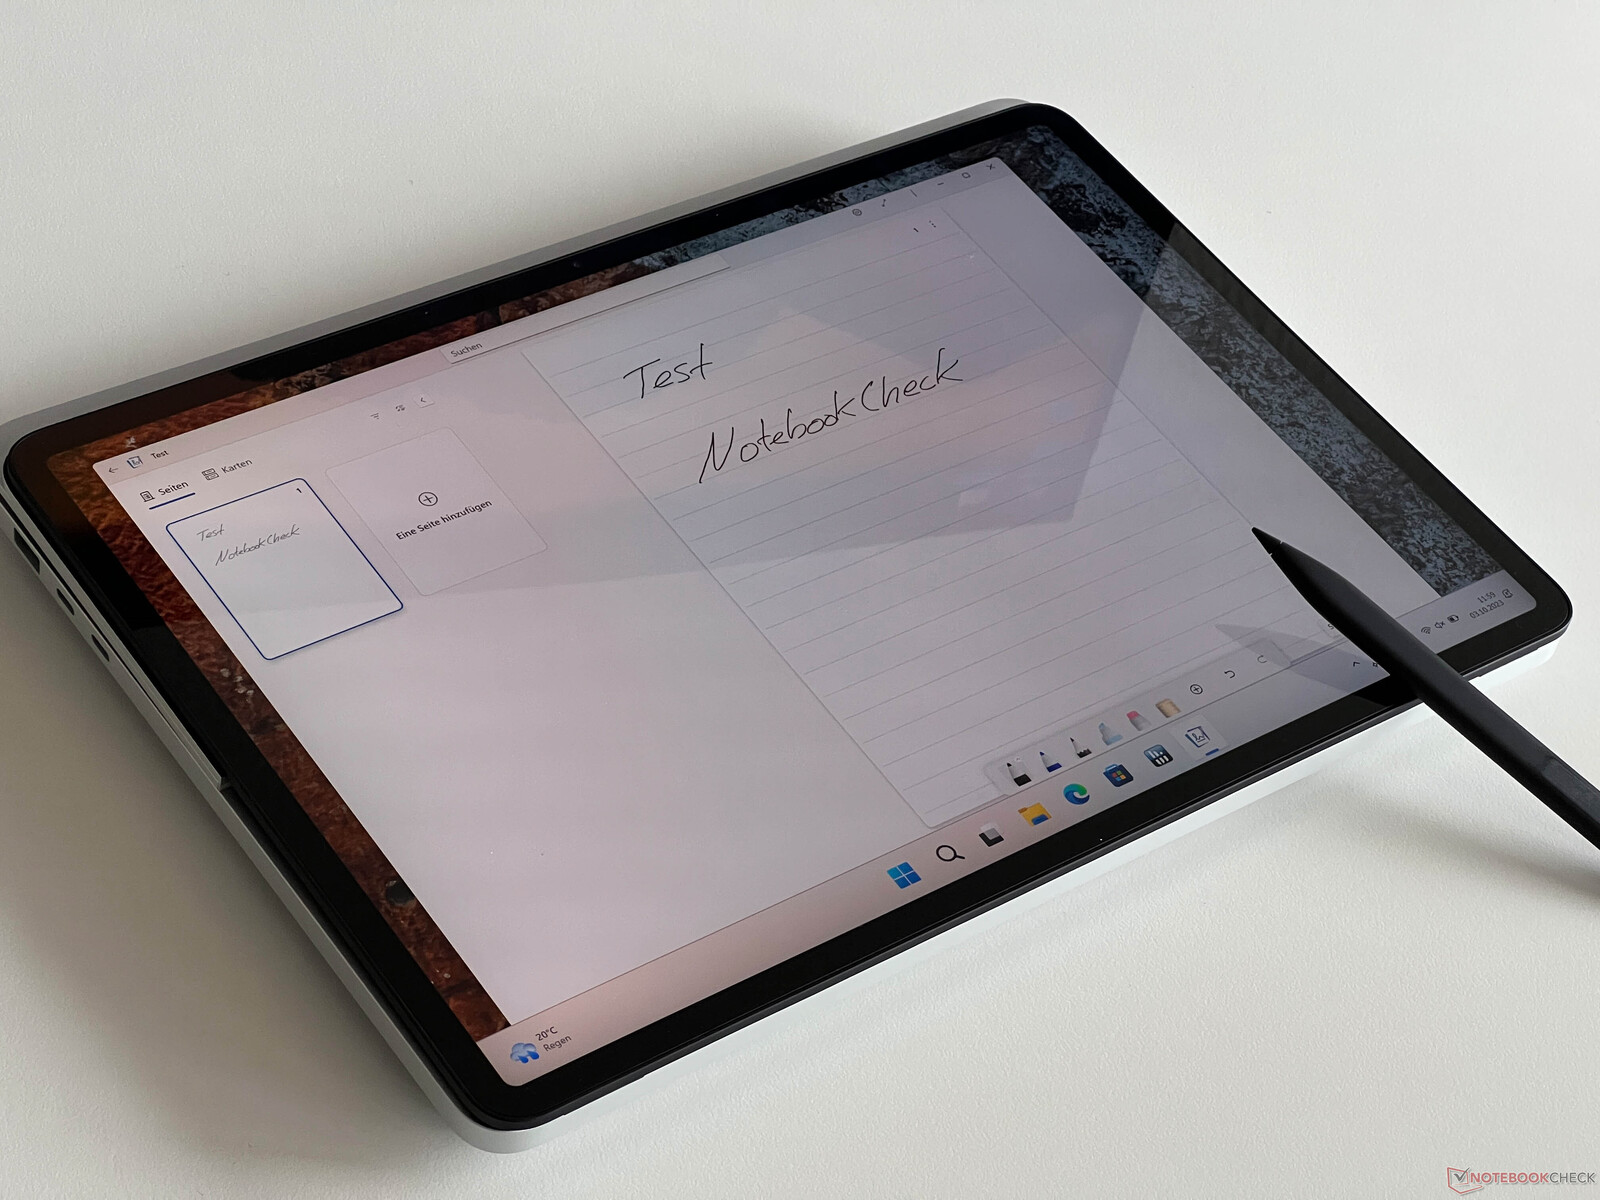
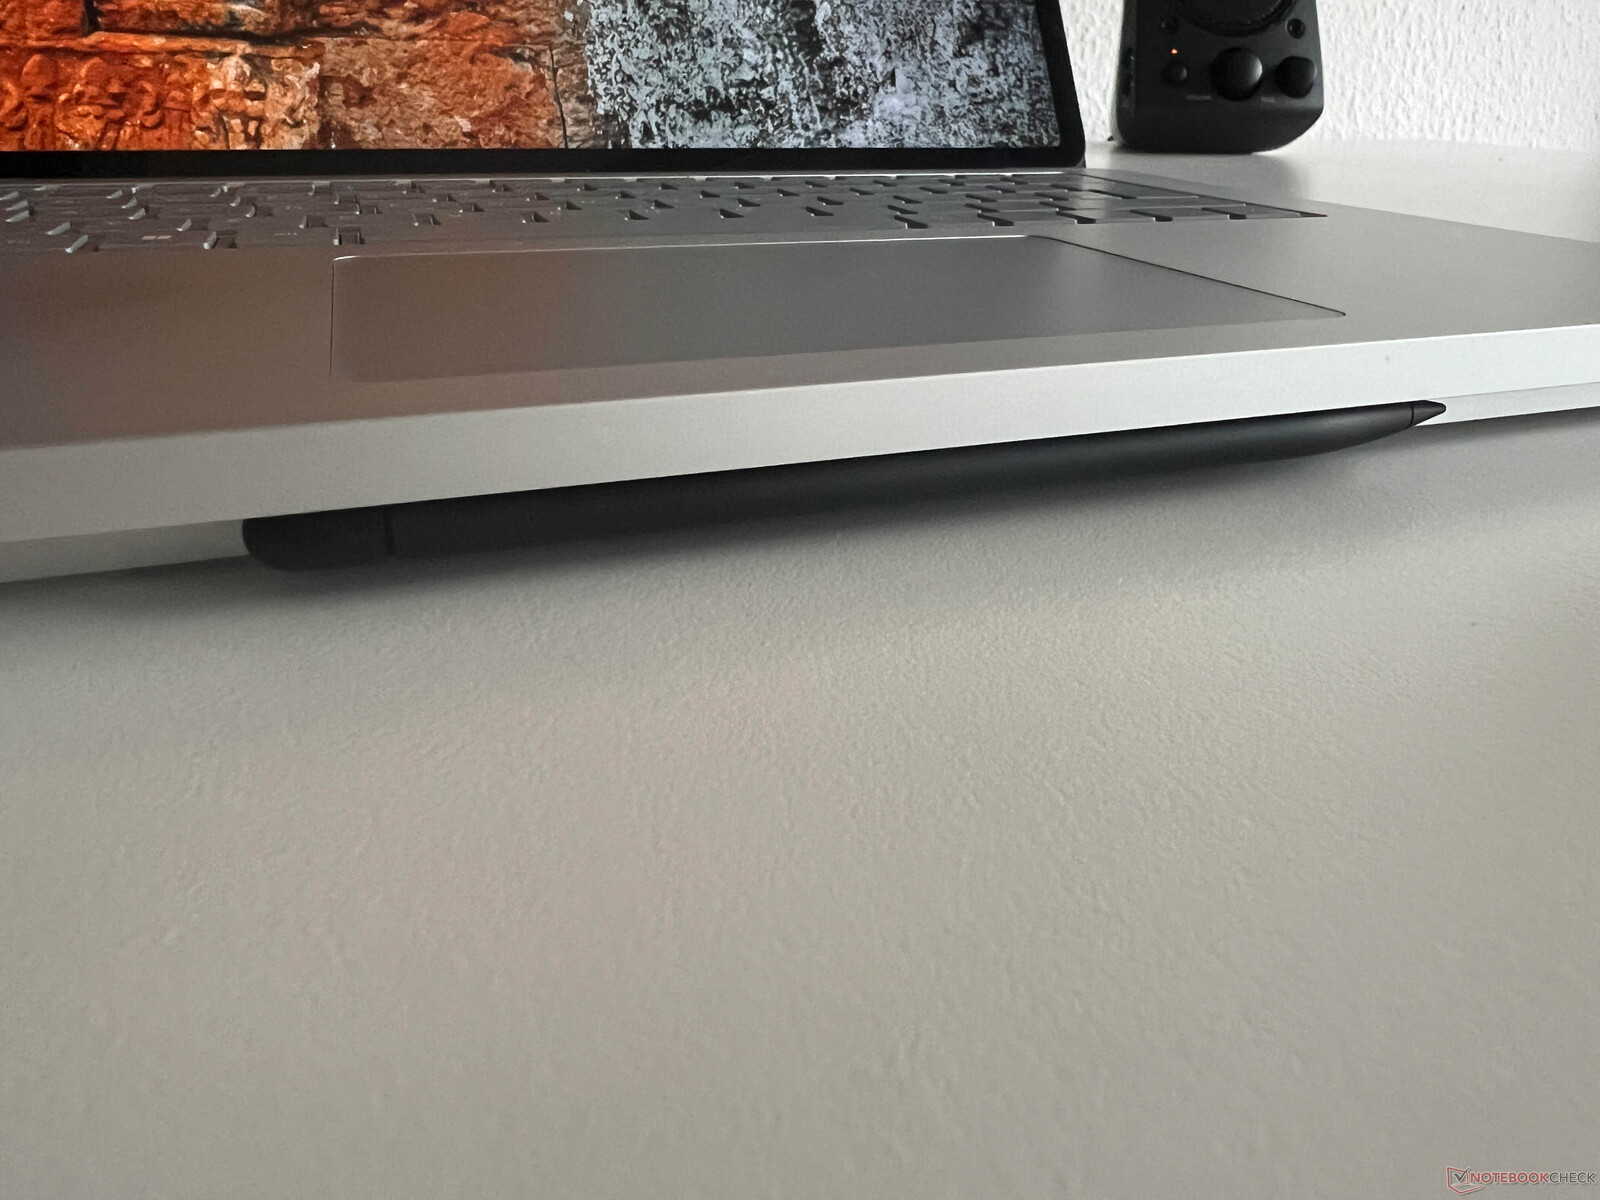
Dieses Mal haben wir noch ein Exemplar des Slim Pen 2 (muss separat erworben werden, ~100 Euro), der sich magnetisch am Gehäuse des Surface Laptop Studio befestigen lässt. Die Besonderheit hierbei ist, dass der Stift haptisches Feedback unterstützt, allerdings nur mit kompatiblen Apps (z. B. Whiteboard oder Journal). Je fester man den Stift auf den Touchscreen drückt, desto stärker wird die Vibration und damit der gefühlte Widerstand. Wenn man den Stift allerdings nur leicht aufsetzt kommt es zu keiner haptischen Rückmeldung. Insgesamt ist die Stifteingabe gelungen und wir hatten keine Probleme mit Fehleingaben, auch bei umfangreicheren Notizen. Der kapazitive Touchscreen funktioniert ebenfalls problemlos.
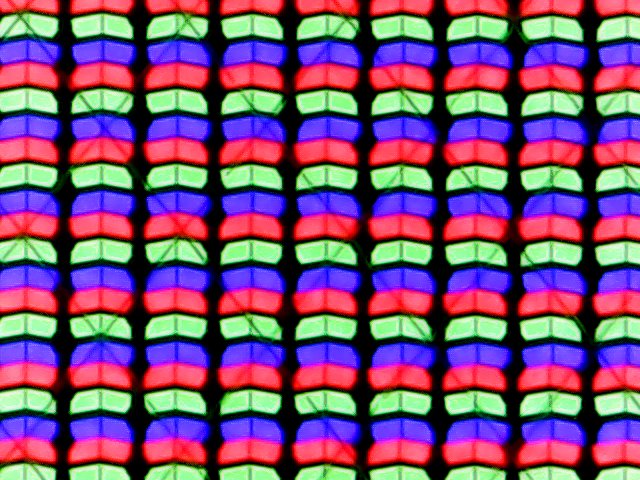
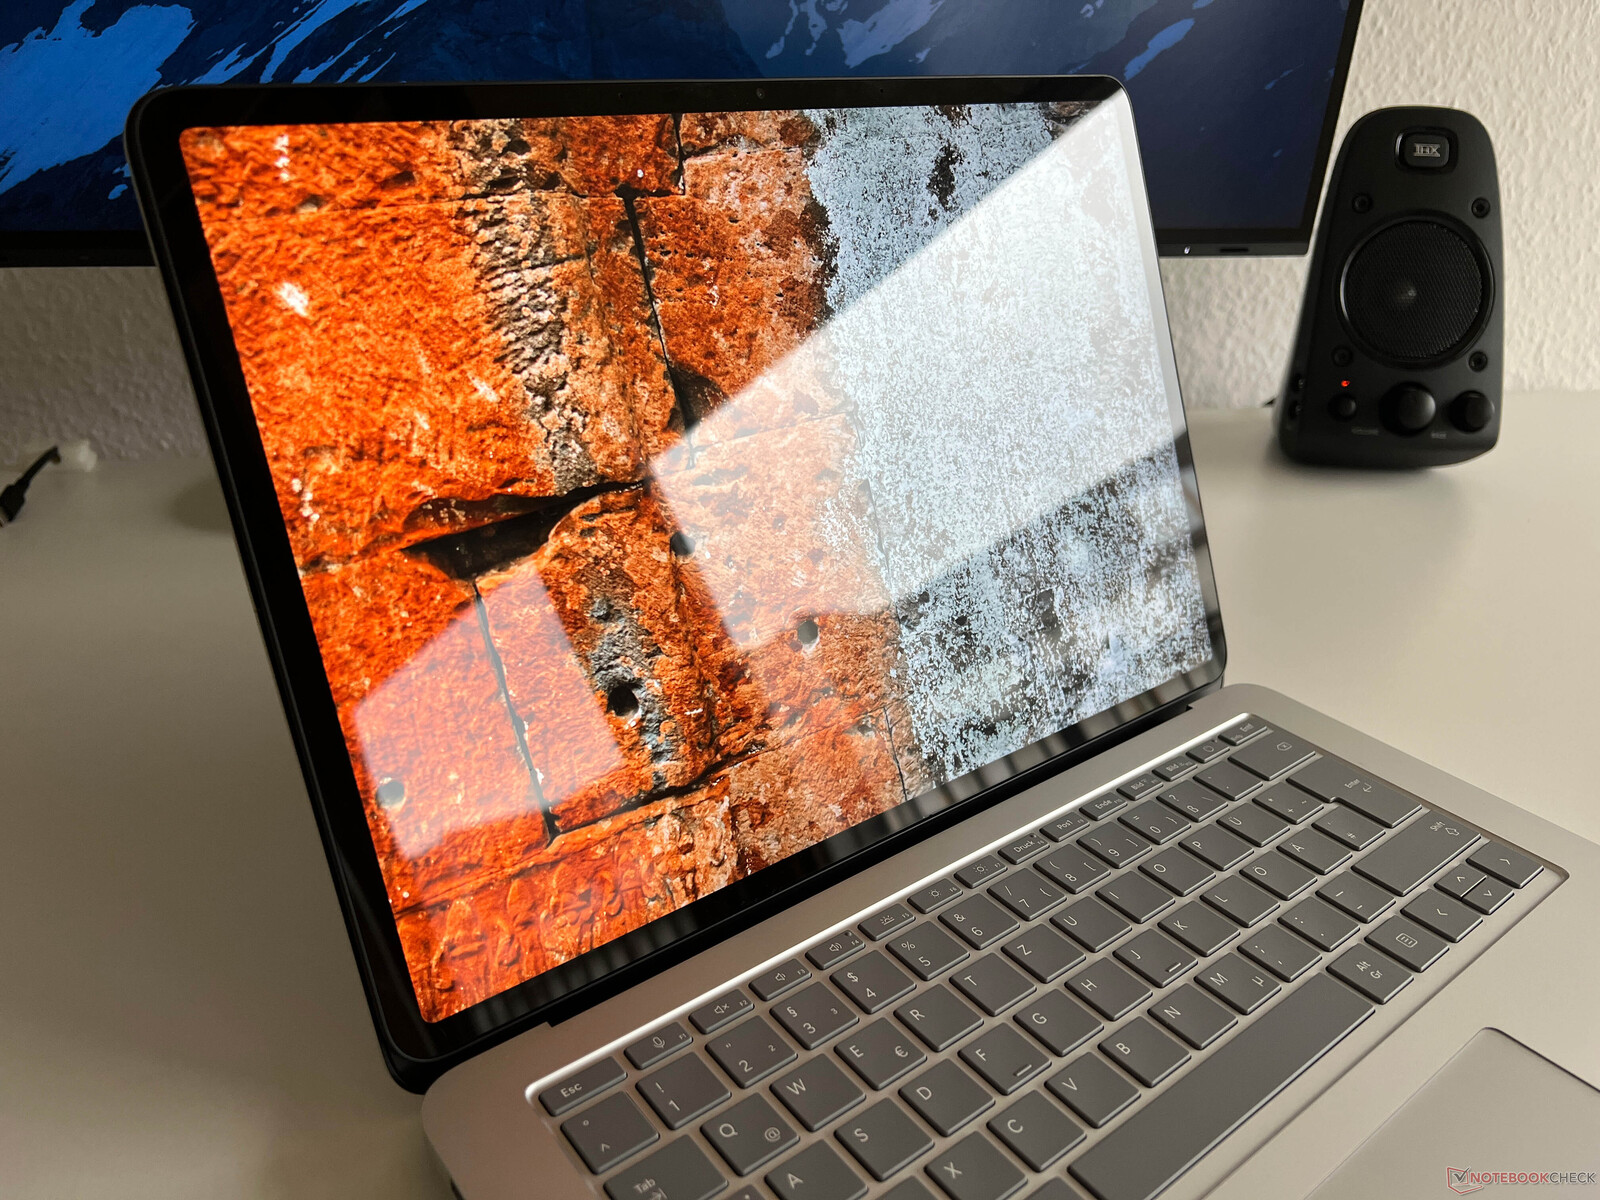
Display - 120 Hz und HDR, aber nur sRGB
Am 14,4 Zoll großen Display hat sich nichts verändert. Er bietet nach wie vor die Auflösung von 2.400 x 1.600 Pixeln im Format 3:2 und eine stark spiegelnde Oberfläche, die auch in Innenräumen problematisch werden kann. Die subjektive Bildqualität ist hervorragend, denn alle Inhalte sind extrem scharf und Farben wirken kräftig. Dank der erhöhten Frequenz von 120 Hz wirken Bewegungen sehr flüssig und es gibt auch keine großen Probleme mit Nachzieheffekten (Ghosting), auch wenn die Reaktionszeiten nicht besonders schnell sind.
Microsoft gibt für den SDR-Modus eine maximale Helligkeit von 500 cd/m², was wir mit unserer Messung auch bestätigen können (maximal 529 cd/m², durchschnittlich 503 cd/m²). Der Schwarzwert ist mit 0,26 cd/m² recht gering, was zu einem hervorragenden maximalen Kontrastverhältnis von knapp 2000:1 führt.
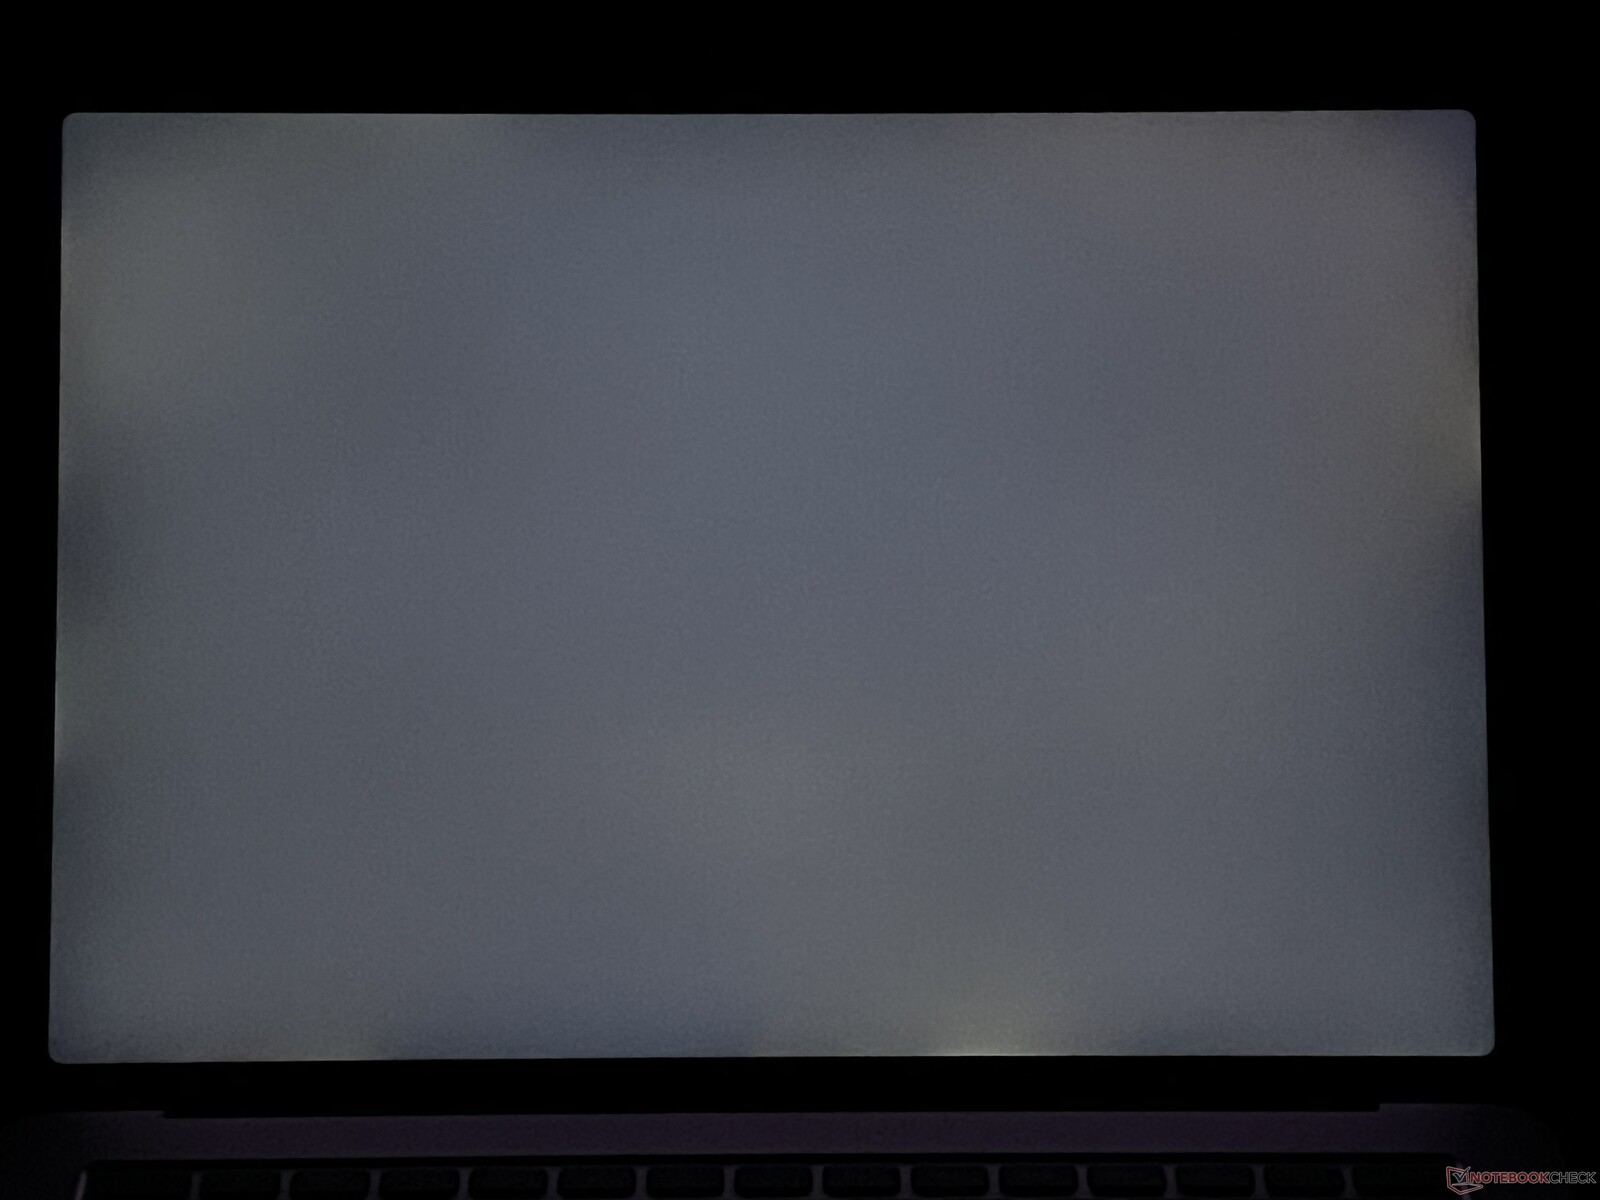
Im HDR-Modus gibt Microsoft eine maximale Helligkeit von 650 cd/m². Dieses Verhalten kennt man von OLED-Panels oder Mini-LED-Bildschirmen, ist für IPS-Panels aber eher ungewöhnlich. Wir haben maximal 647 cd/m² gemessen und können die Angabe daher bestätigen. Hier hat lediglich der Mini-LED-Bildschirm des Apple MacBook Pro 14 einen deutlichen Vorteil (bis zu 1.600 cd/m²). Die HDR-Umsetzung von Windows ist nach wie vor problematisch, denn der HDR-Modus muss manuell aktiviert werden (was kurzzeitig zu einem schwarzen Bildschirm führt) und auch die Farbverwaltung funktioniert nicht mehr korrekt. Das kann Apple mit macOS einfach deutlich besser.
| |||||||||||||||||||||||||
Ausleuchtung: 89 %
Helligkeit Akku: 501 cd/m²
Kontrast: 1965:1 (Schwarzwert: 0.26 cd/m²)
ΔE ColorChecker Calman: 0.5 | ∀{0.5-29.43 Ø4.71}
ΔE Greyscale Calman: 0.8 | ∀{0.09-98 Ø4.96}
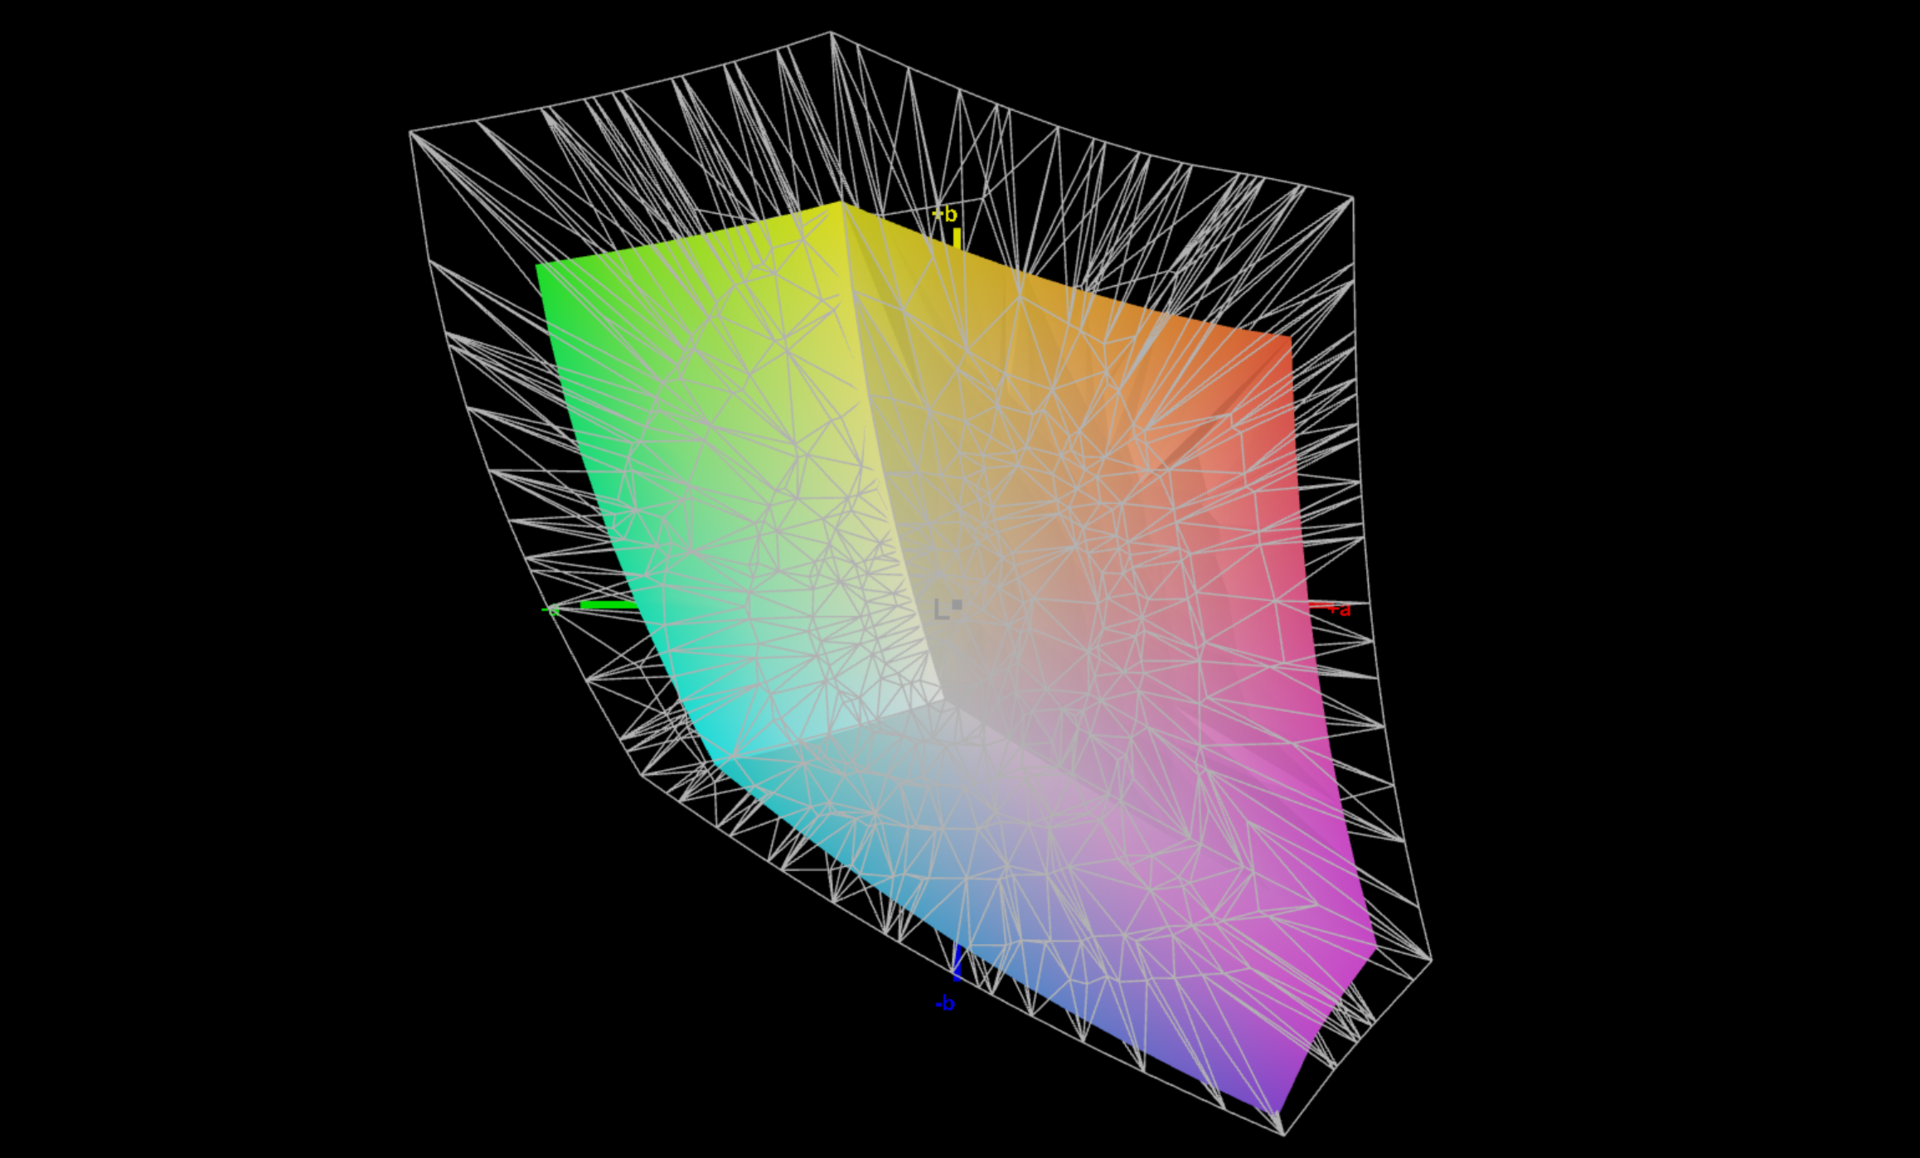
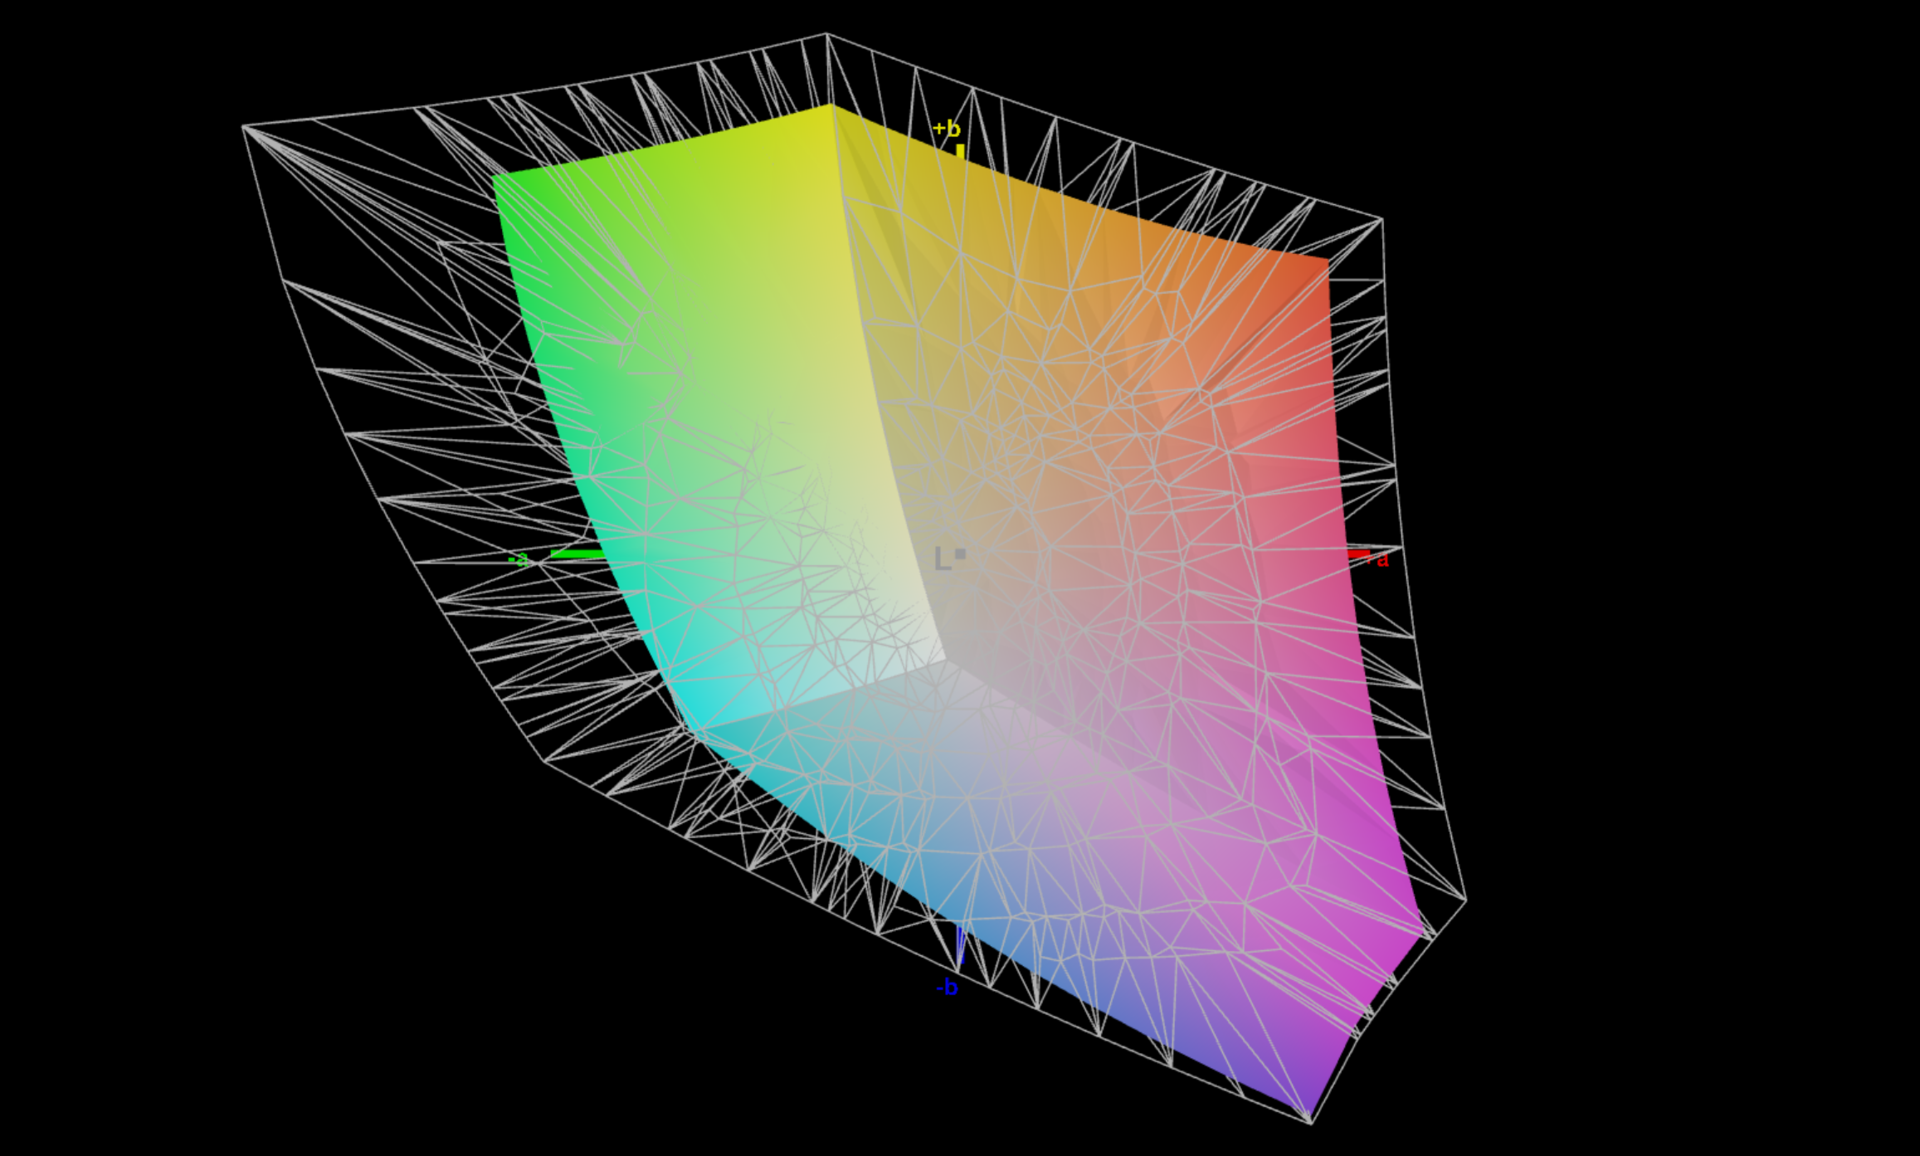
68.9% AdobeRGB 1998 (Argyll 3D)
99% sRGB (Argyll 3D)
66.7% Display P3 (Argyll 3D)
Gamma: 2.19
CCT: 6650 K
| Microsoft Surface Laptop Studio 2 RTX 4060 LQ144P1JX01, IPS, 2400x1600, 14.4" | Apple MacBook Pro 14 2023 M2 Pro Mini-LED, 3024x1964, 14.2" | Lenovo Yoga Pro 9-14IRP G8 CSOT T3 MNE507HZ2-1, Mini-LED, 3072x1920, 14.5" | Asus Zenbook Pro 14 OLED UX6404VI SDC4190, OLED, 2880x1800, 14.5" | Asus ZenBook Pro 14 Duo UX8402VV-P1021W ATNA45AF04-0 , OLED, 2880x1800, 14.5" | Asus ROG Zephyrus G14 GA402XY B140QAN06.S, Mini-LED, 2560x1600, 14" | Lenovo Legion Slim 5 14APH8 Samsung SDC ATNA45AF02-2, OLED, 2880x1600, 14.5" | Microsoft Surface Laptop Studio i7 RTX 3050 Ti LQ144P1JX01, IPS, 2400x1600, 14.4" | |
|---|---|---|---|---|---|---|---|---|
| Display | 49% | 27% | 31% | 30% | 29% | 30% | 12% | |
| Display P3 Coverage (%) | 66.7 | 99.2 49% | 92 38% | 99.6 49% | 99.91 50% | 99.6 49% | 99.9 50% | 80.6 21% |
| sRGB Coverage (%) | 99 | 99.7 1% | 100 1% | 100 1% | 100 1% | 100 1% | 99.9 1% | |
| AdobeRGB 1998 Coverage (%) | 68.9 | 96.9 41% | 97.5 42% | 95.35 38% | 93.4 36% | 96.5 40% | 78.5 14% | |
| Response Times | 39% | 76% | 98% | 96% | 75% | 98% | 28% | |
| Response Time Grey 50% / Grey 80% * (ms) | 77.6 ? | 35.2 ? 55% | 12.7 ? 84% | 0.67 ? 99% | 2 ? 97% | 17.2 ? 78% | 0.79 ? 99% | 58.4 ? 25% |
| Response Time Black / White * (ms) | 34.3 ? | 26.4 ? 23% | 11.4 ? 67% | 0.9 ? 97% | 2 ? 94% | 9.9 ? 71% | 1.01 ? 97% | 24 ? 30% |
| PWM Frequency (Hz) | 17600 ? | 14880 ? | 6000 ? | 240 | 240 | 5430 | 240.5 ? | 5000 ? |
| Bildschirm | 110% | -169% | -28% | 1014% | -60% | -228% | -57% | |
| Helligkeit Bildmitte (cd/m²) | 511 | 500 -2% | 670 31% | 356 -30% | 340 -33% | 535 5% | 377.5 -26% | 497 -3% |
| Brightness (cd/m²) | 503 | 489 -3% | 680 35% | 358 -29% | 340 -32% | 563 12% | 381 -24% | 491 -2% |
| Brightness Distribution (%) | 89 | 94 6% | 89 0% | 99 11% | 99 11% | 91 2% | 97 9% | 92 3% |
| Schwarzwert * (cd/m²) | 0.26 | 0.02 92% | 0.19 27% | 0.002 99% | 0.29 -12% | |||
| Kontrast (:1) | 1965 | 25000 1172% | 3526 79% | 170000 8551% | 1714 -13% | |||
| Delta E Colorchecker * | 0.5 | 1.2 -140% | 4 -700% | 0.8 -60% | 1.76 -252% | 1 -100% | 4.19 -738% | 1.2 -140% |
| Colorchecker dE 2000 max. * | 1.1 | 2.6 -136% | 4.5 -309% | 1.6 -45% | 3.2 -191% | 2.8 -155% | 7.02 -538% | 2.8 -155% |
| Delta E Graustufen * | 0.8 | 1.7 -113% | 4.9 -513% | 0.9 -13% | 1.16 -45% | 1.8 -125% | 1.2 -50% | 1.9 -137% |
| Gamma | 2.19 100% | 2.24 98% | 2.22 99% | 2.19 100% | 2.43 91% | 2.24 98% | 2.22 99% | 2.14 103% |
| CCT | 6650 98% | 6791 96% | 5735 113% | 6590 99% | 6418 101% | 6337 103% | 6296 103% | 6821 95% |
| Colorchecker dE 2000 calibrated * | 1.3 | 1.62 | 0.81 | 0.8 | ||||
| Durchschnitt gesamt (Programm / Settings) | 66% /
91% | -22% /
-86% | 34% /
11% | 380% /
645% | 15% /
-11% | -33% /
-98% | -6% /
-28% |
* ... kleinere Werte sind besser
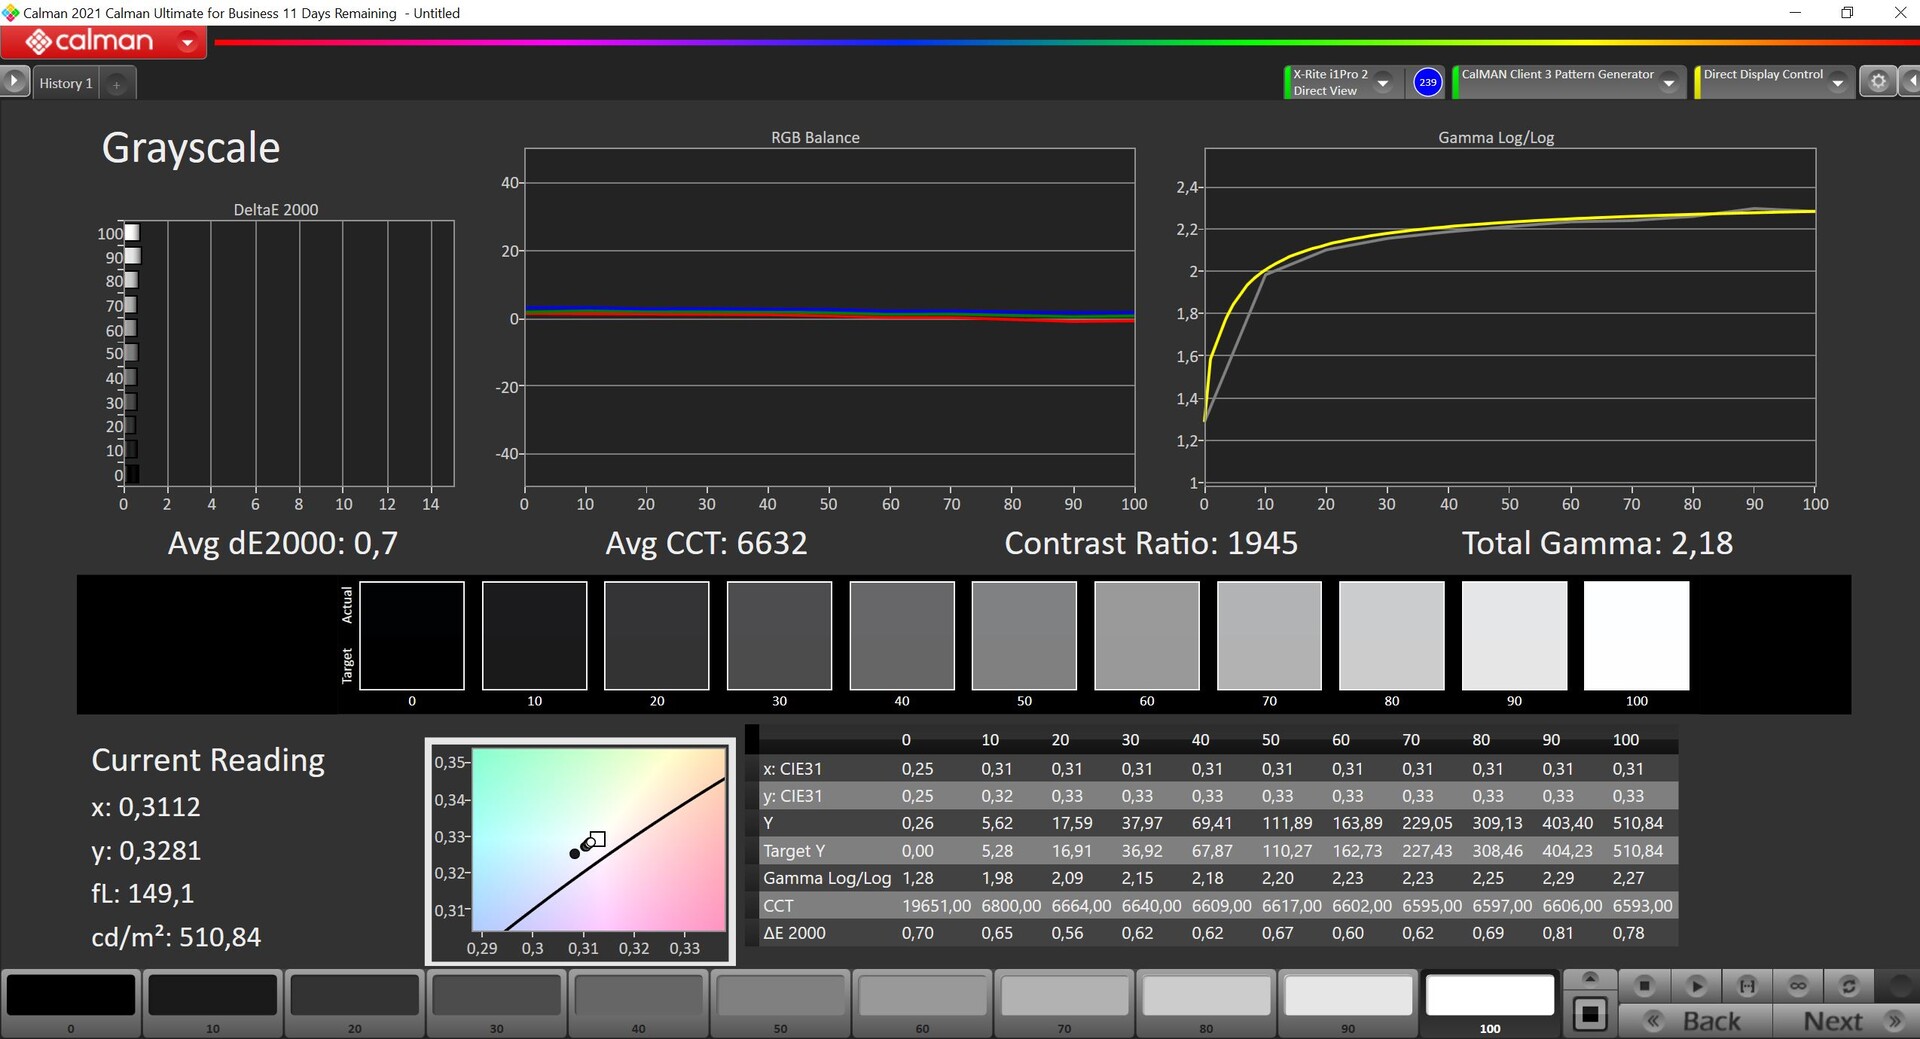
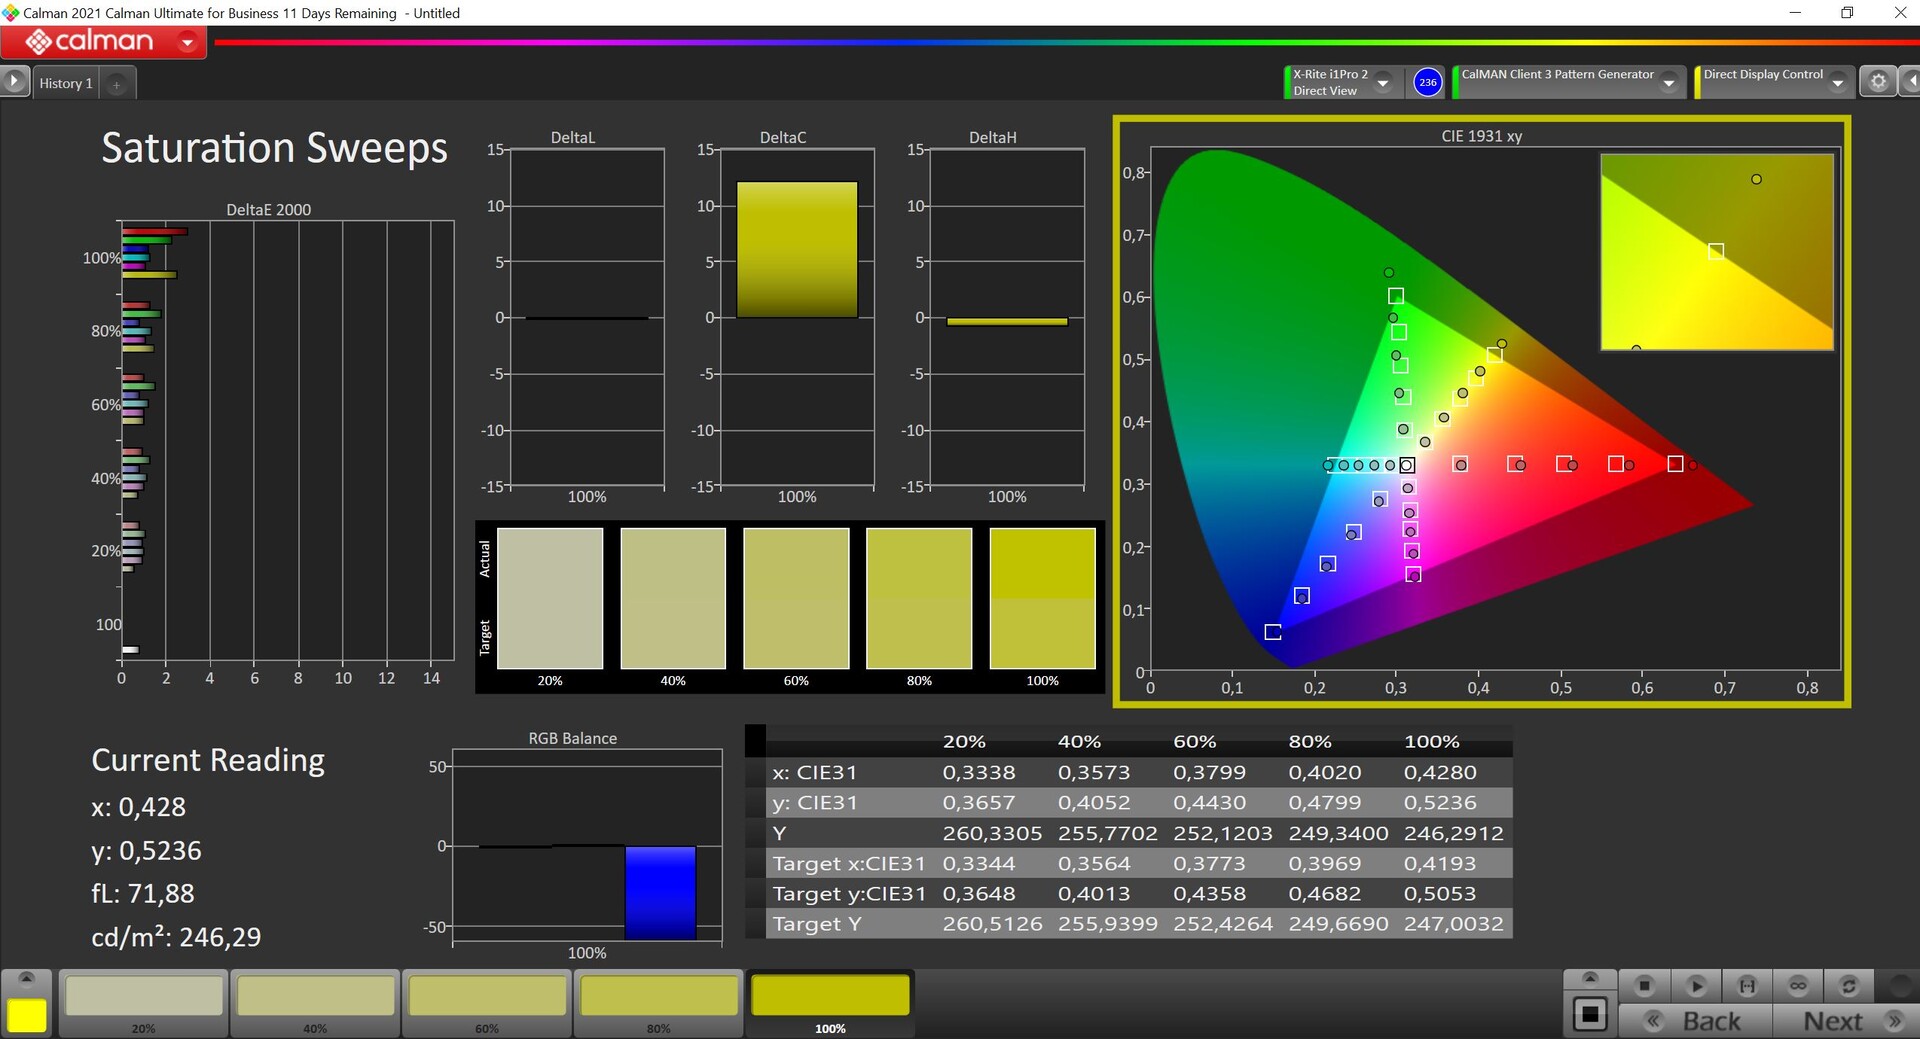


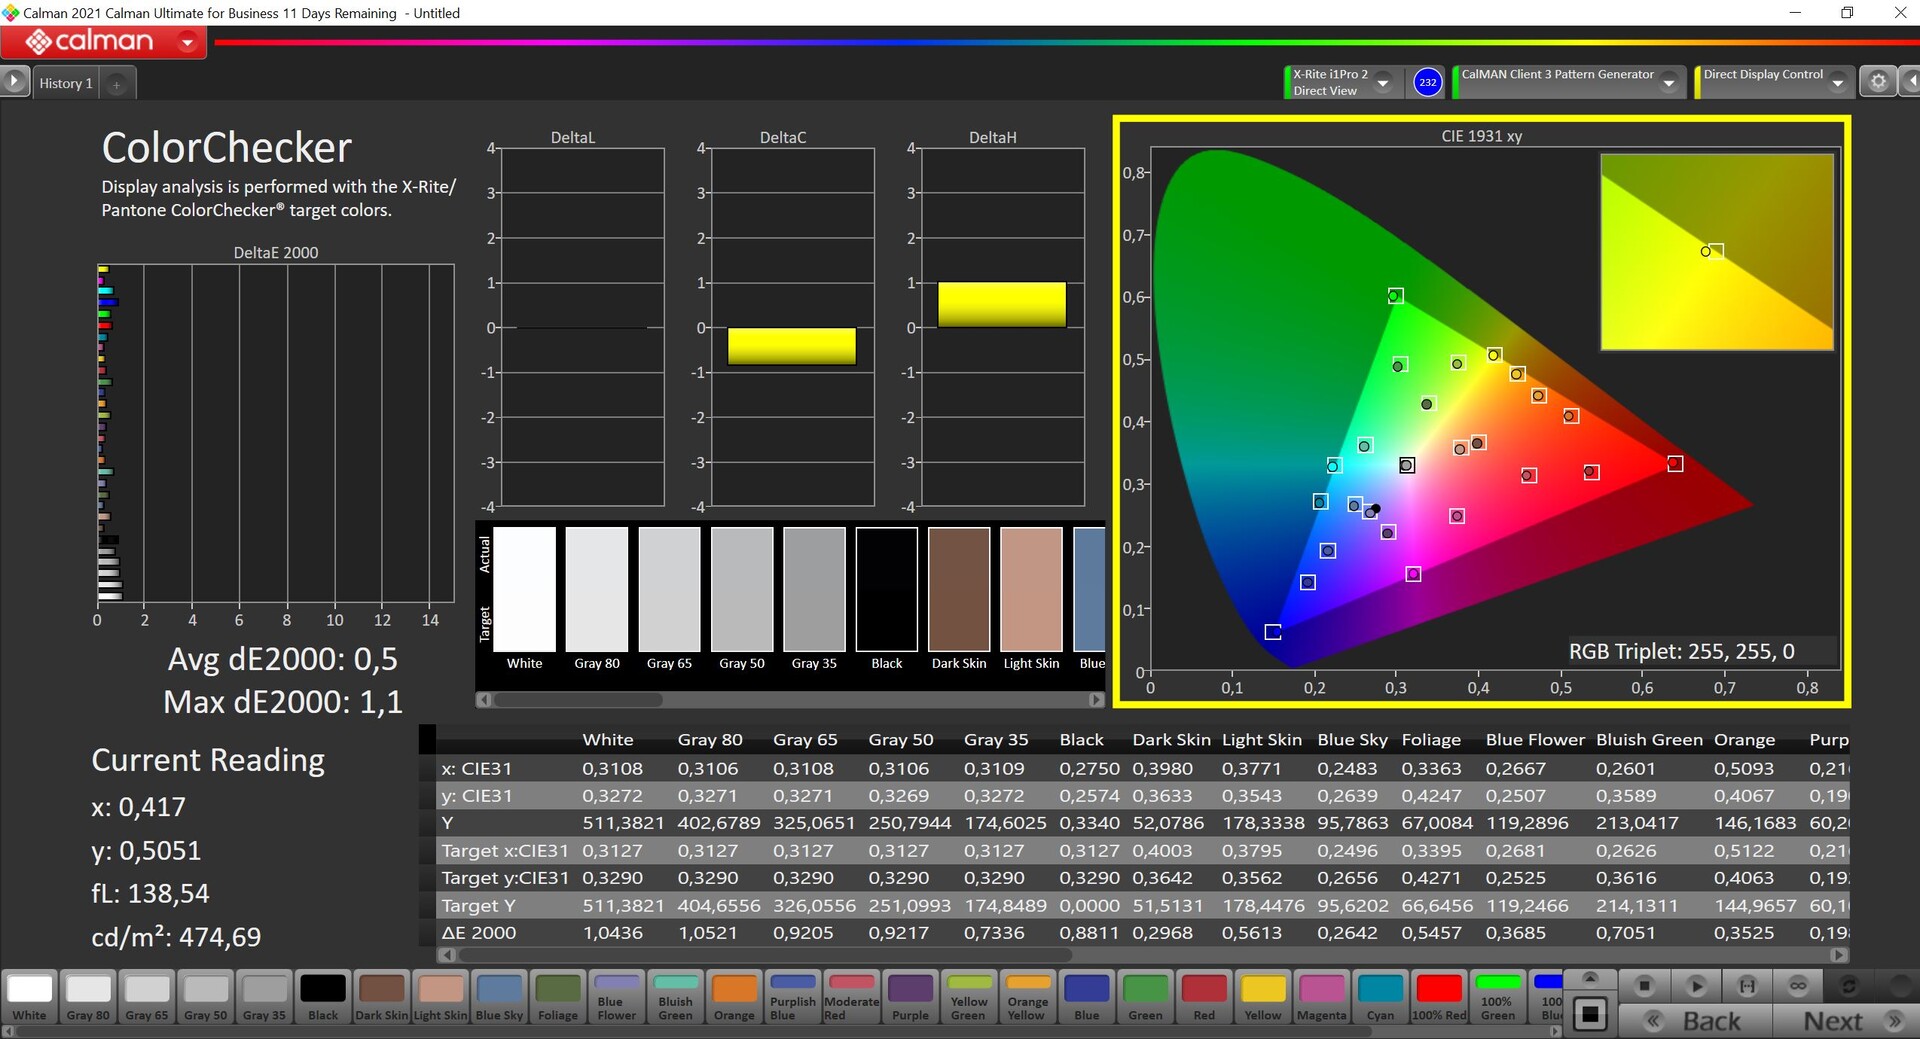
Microsoft liefert den Surface Laptop Studio 2 mit zwei Farbprofilen für den SDR-Modus aus: Vivid und sRGB. Standardmäßig ist das Profil Vivid aktiv, bei dem die Farben allerdings etwas übersättigt sind, grundsätzlich ist aber auch dieses Profil sehr akkurat. Wir haben beide Profile mit der professionellen CalMAN-Software vermessen und das sRGB-Profil ist extrem gut kalibriert, da es hier keine Farbabweichungen gibt. Wer also Bilder oder Videos bearbeiten möchte sollte auf jeden Fall das sRGB-Profil verwenden. Das bringt uns aber auch zu einem großen Nachteil, denn der Bildschirm deckt lediglich den kleinen sRGB-Farbraum ab, was angesichts des hohen Preises auf jeden Fall ein Nachteil ist. Wir konnten die Darstellung mit unserer eigenen Kalibrierung übrigens nicht noch weiter verbessern, weshalb wir auch kein entsprechendes Profil zum Download anbieten.

Reaktionszeiten (Response Times) des Displays
| ↔ Reaktionszeiten Schwarz zu Weiß | ||
|---|---|---|
| 34.3 ms ... steigend ↗ und fallend ↘ kombiniert | ↗ 7.7 ms steigend | 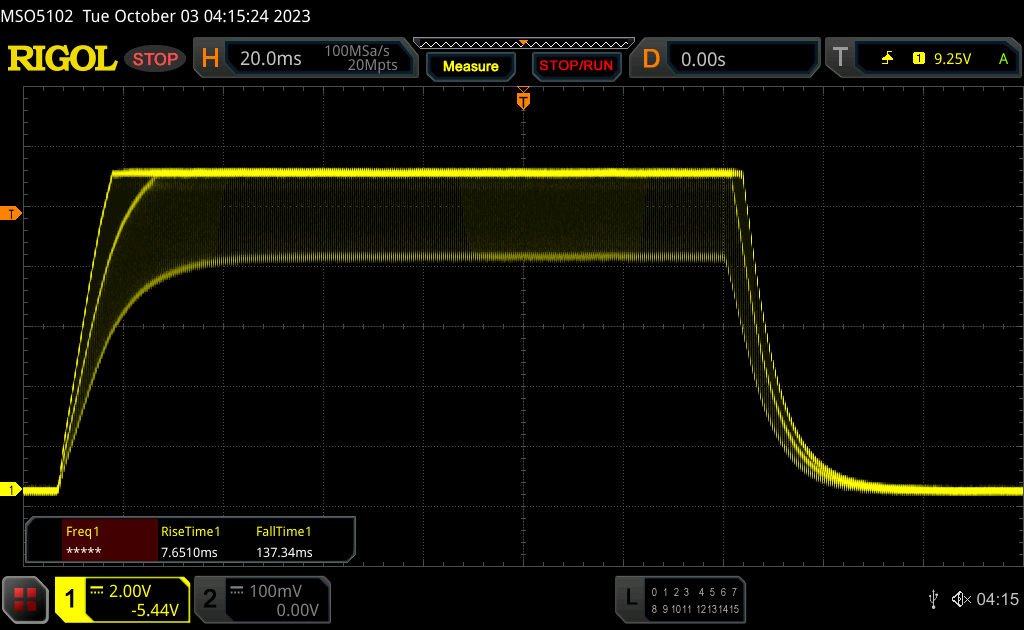 |
| ↘ 26.6 ms fallend | ||
| Die gemessenen Reaktionszeiten sind langsam und dadurch für viele Spieler wahrscheinlich zu langsam. Im Vergleich rangierten die bei uns getesteten Geräte von 0.1 (Minimum) zu 240 (Maximum) ms. » 92 % aller Screens waren schneller als der getestete. Daher sind die gemessenen Reaktionszeiten schlechter als der Durchschnitt aller vermessenen Geräte (19.8 ms). | ||
| ↔ Reaktionszeiten 50% Grau zu 80% Grau | ||
| 77.6 ms ... steigend ↗ und fallend ↘ kombiniert | ↗ 35.4 ms steigend | 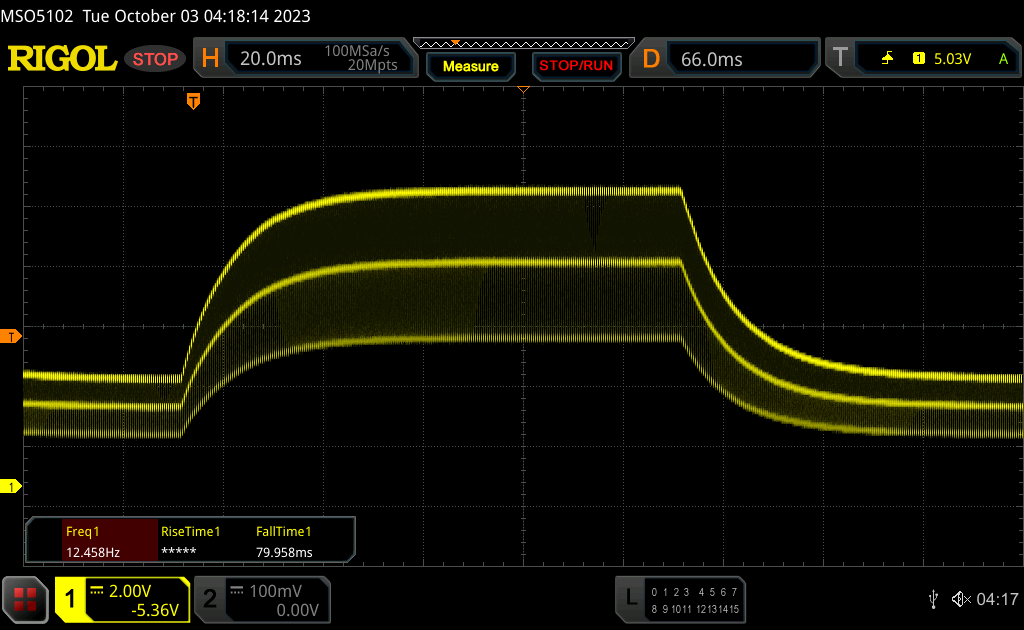 |
| ↘ 42.2 ms fallend | ||
| Die gemessenen Reaktionszeiten sind langsam und dadurch für viele Spieler wahrscheinlich zu langsam. Im Vergleich rangierten die bei uns getesteten Geräte von 0.165 (Minimum) zu 636 (Maximum) ms. » 99 % aller Screens waren schneller als der getestete. Daher sind die gemessenen Reaktionszeiten schlechter als der Durchschnitt aller vermessenen Geräte (30.9 ms). | ||
Bildschirm-Flackern / PWM (Pulse-Width Modulation)
| Flackern / PWM festgestellt | 17600 Hz | ≤ 100 % Helligkeit | 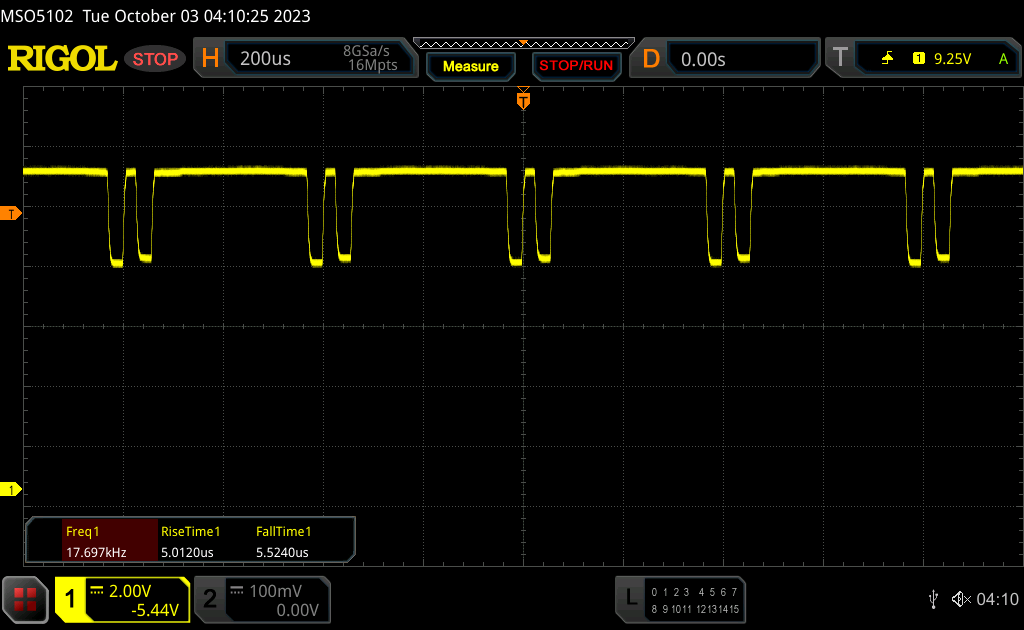 |
Das Display flackert mit 17600 Hz (im schlimmsten Fall, eventuell durch Pulsweitenmodulation PWM) bei einer eingestellten Helligkeit von 100 % und darunter. Darüber sollte es zu keinem Flackern kommen. Die Frequenz von 17600 Hz ist sehr hoch und sollte daher auch bei empfindlichen Personen zu keinen Problemen führen. Im Vergleich: 52 % aller getesteten Geräte nutzten kein PWM um die Helligkeit zu reduzieren. Wenn PWM eingesetzt wurde, dann bei einer Frequenz von durchschnittlich 7744 (Minimum 5, Maximum 343500) Hz. | |||
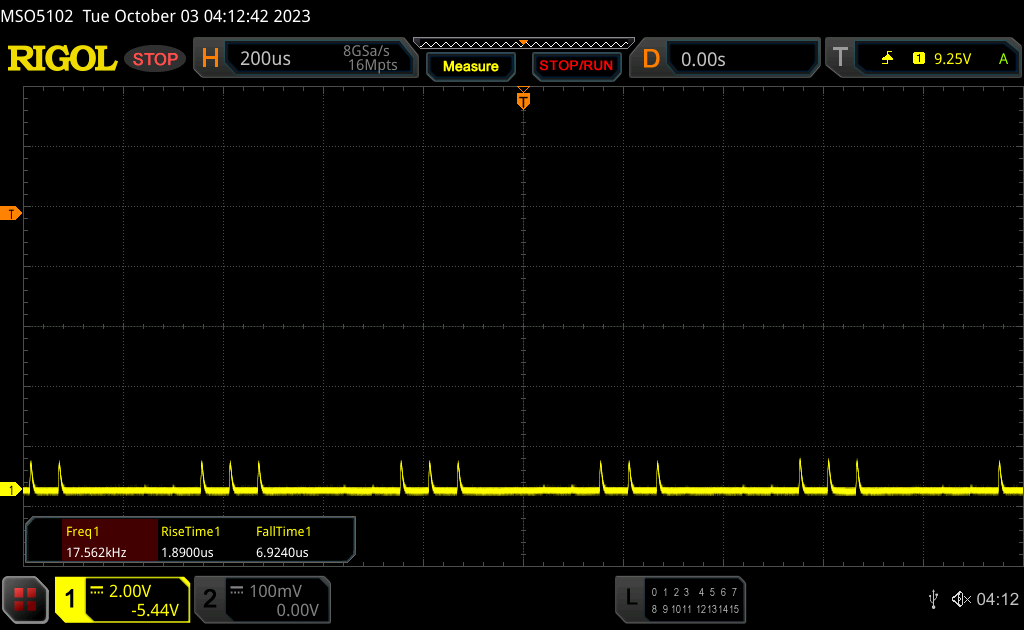

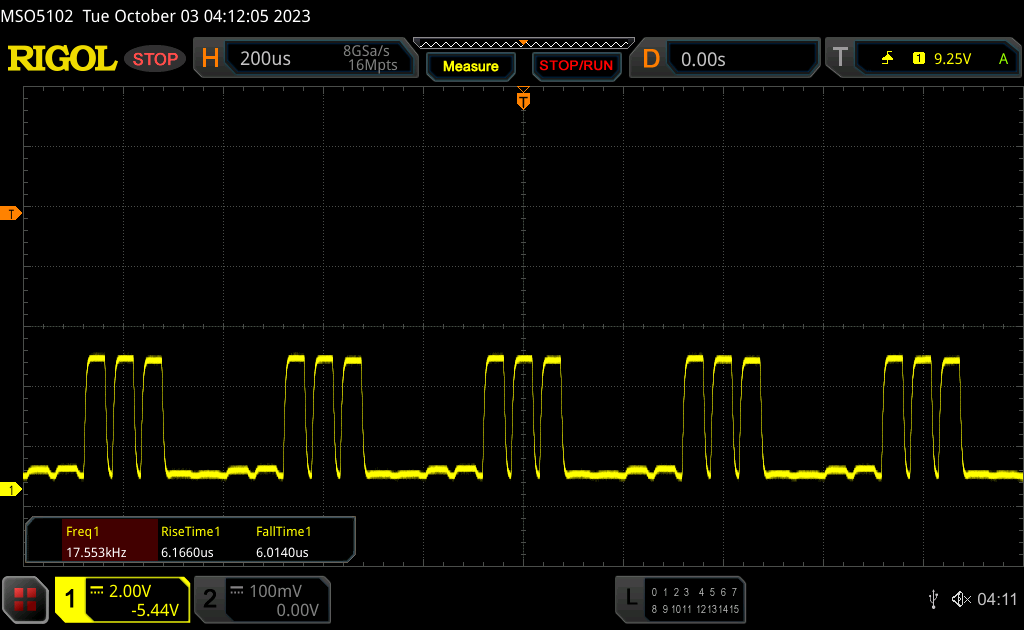
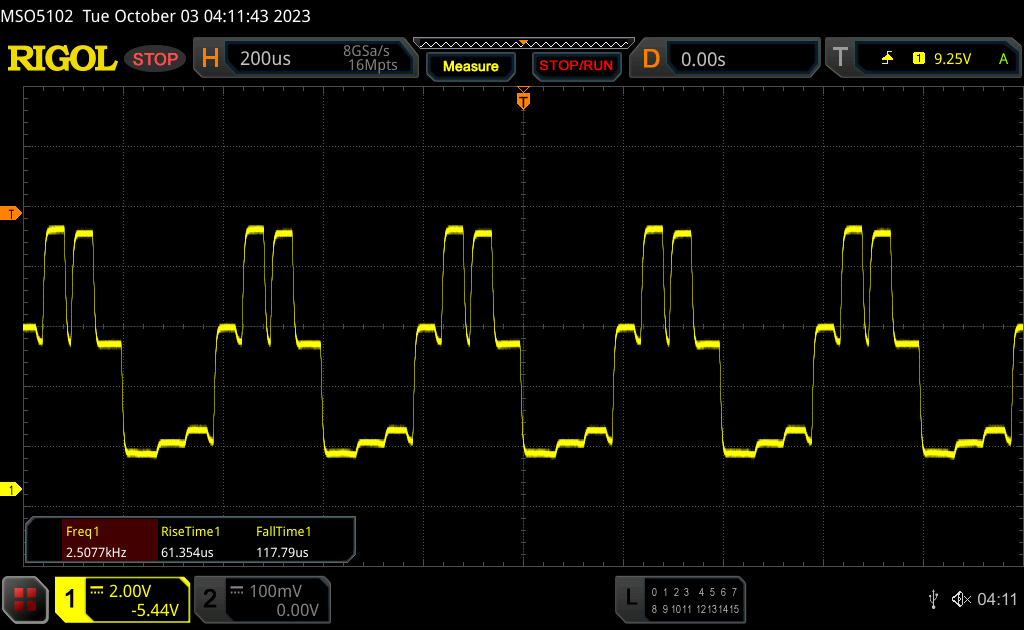
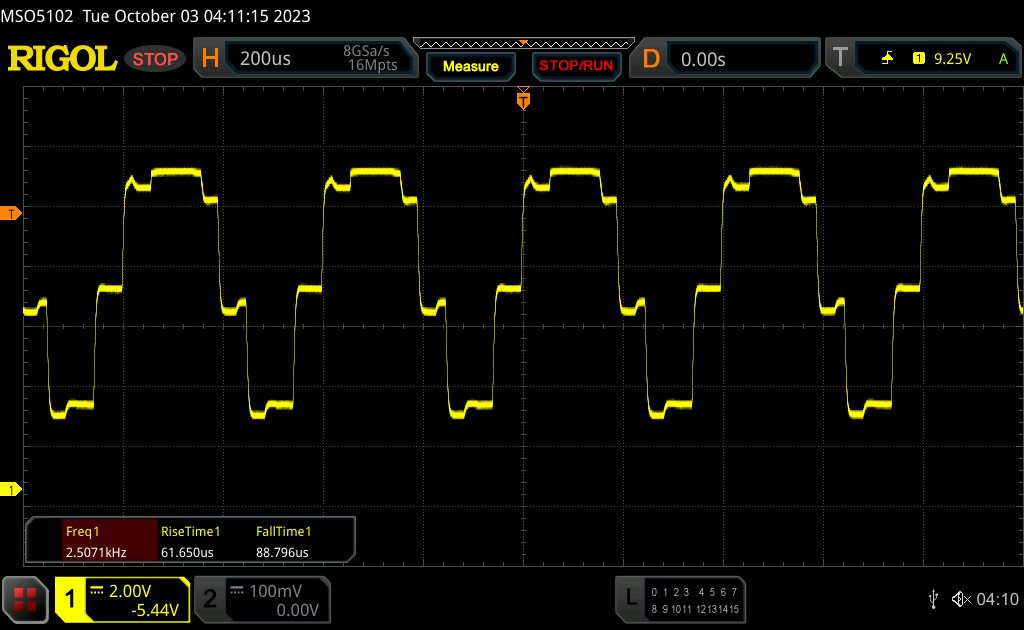
Das PWM-Verhalten hat sich im Vergleich zum letztjährigen testgerät etwas verändert, denn nun können wir auch bei voller Helligkeit ein Flackern messen, dafür ist die Frequenz mit 17 kHz aber auch höher und sollte zu keinen Problemen führen.
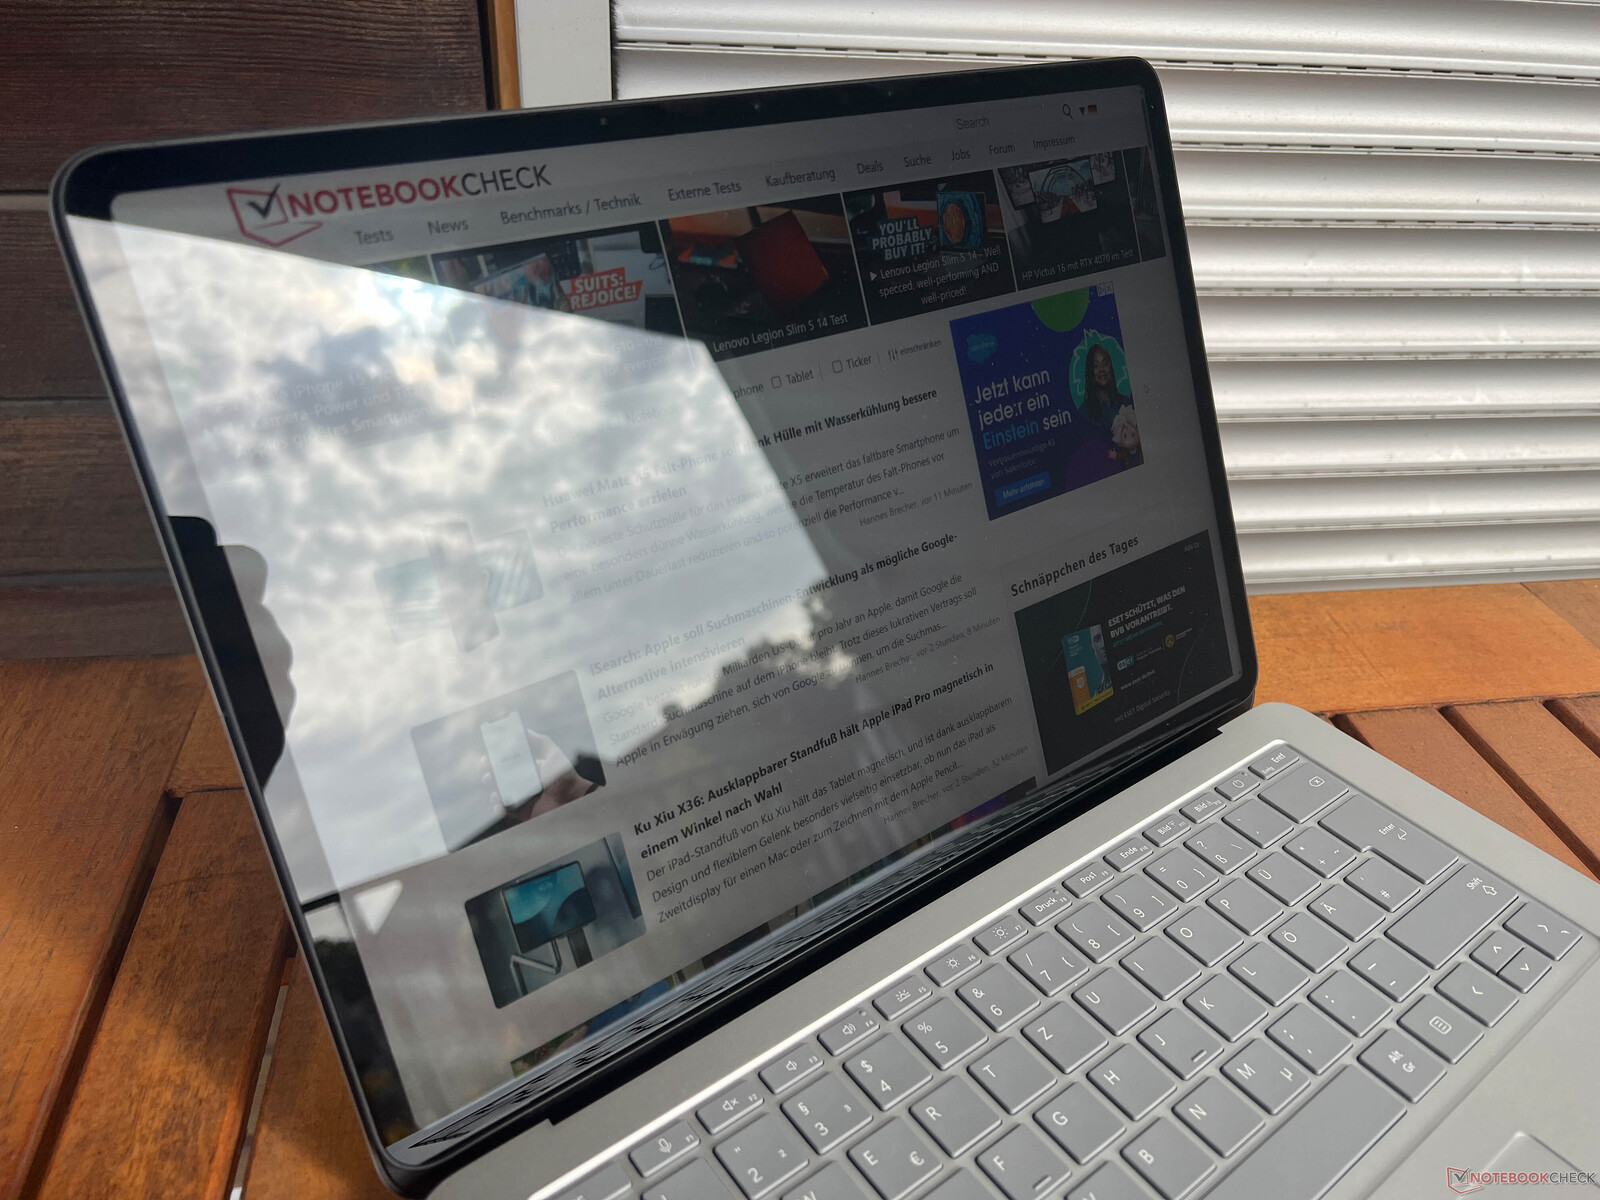
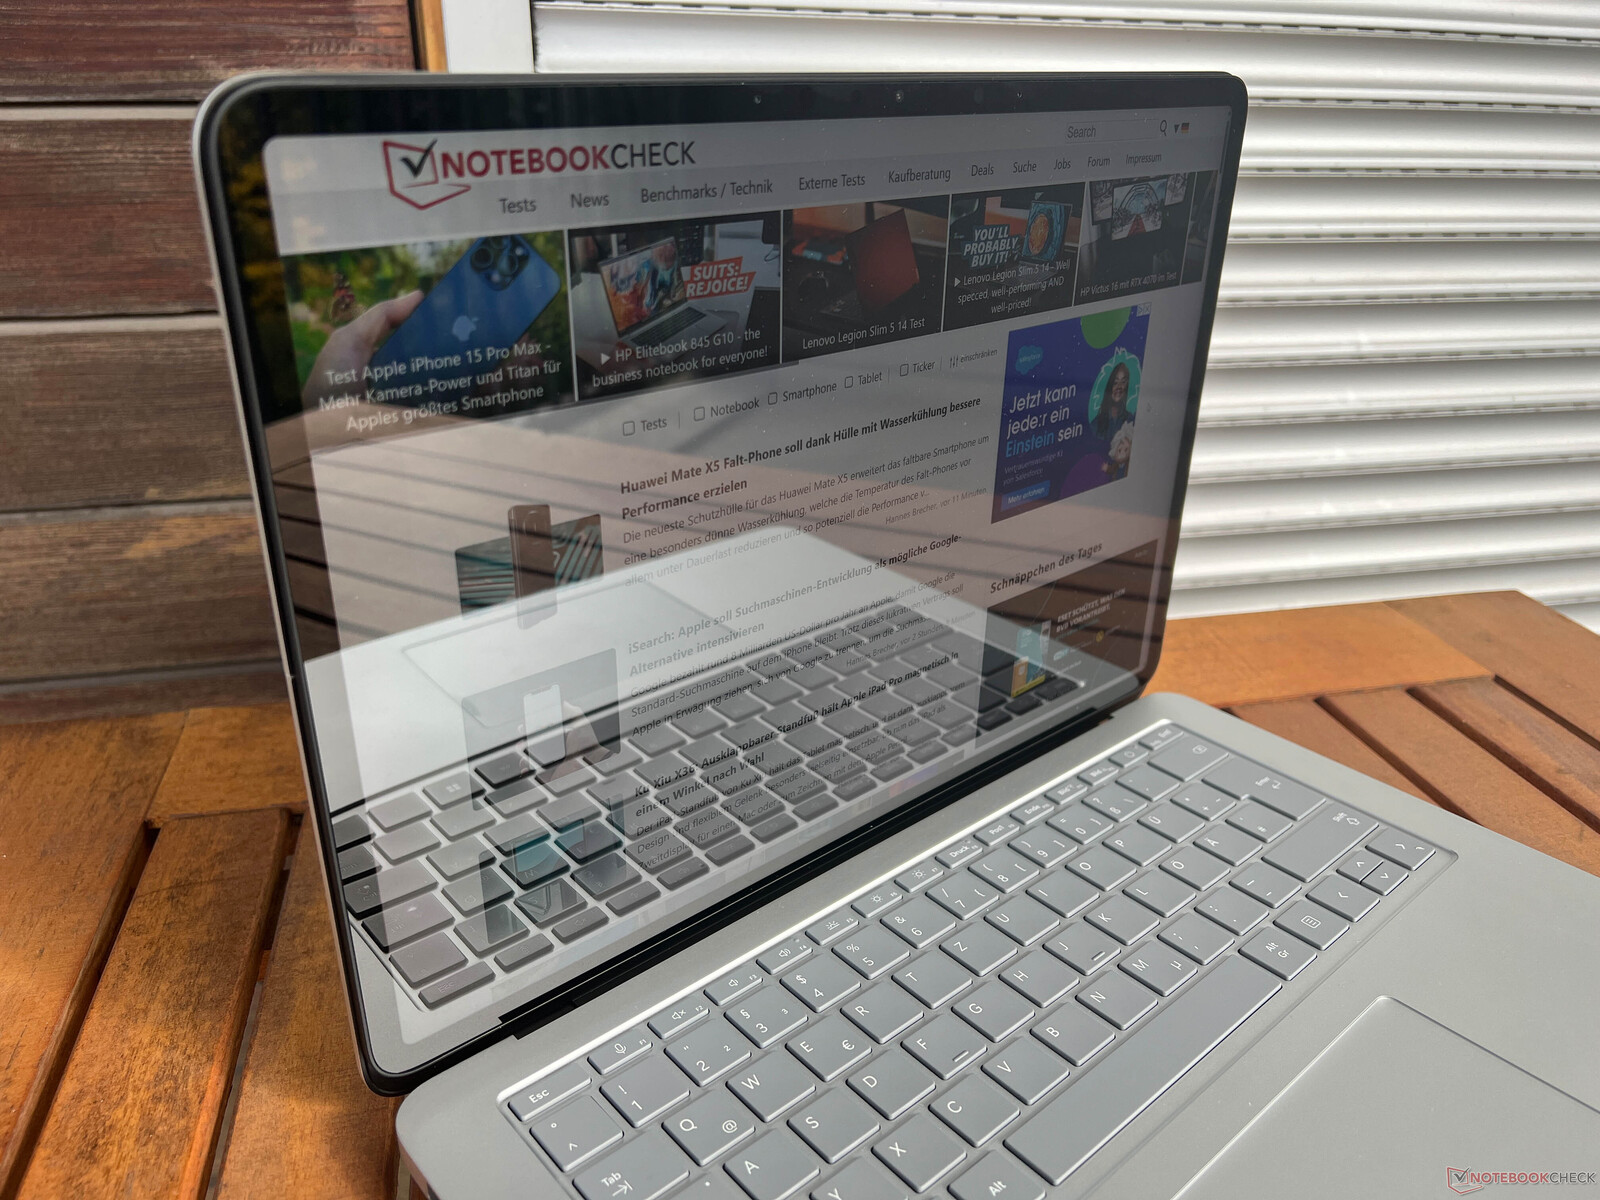
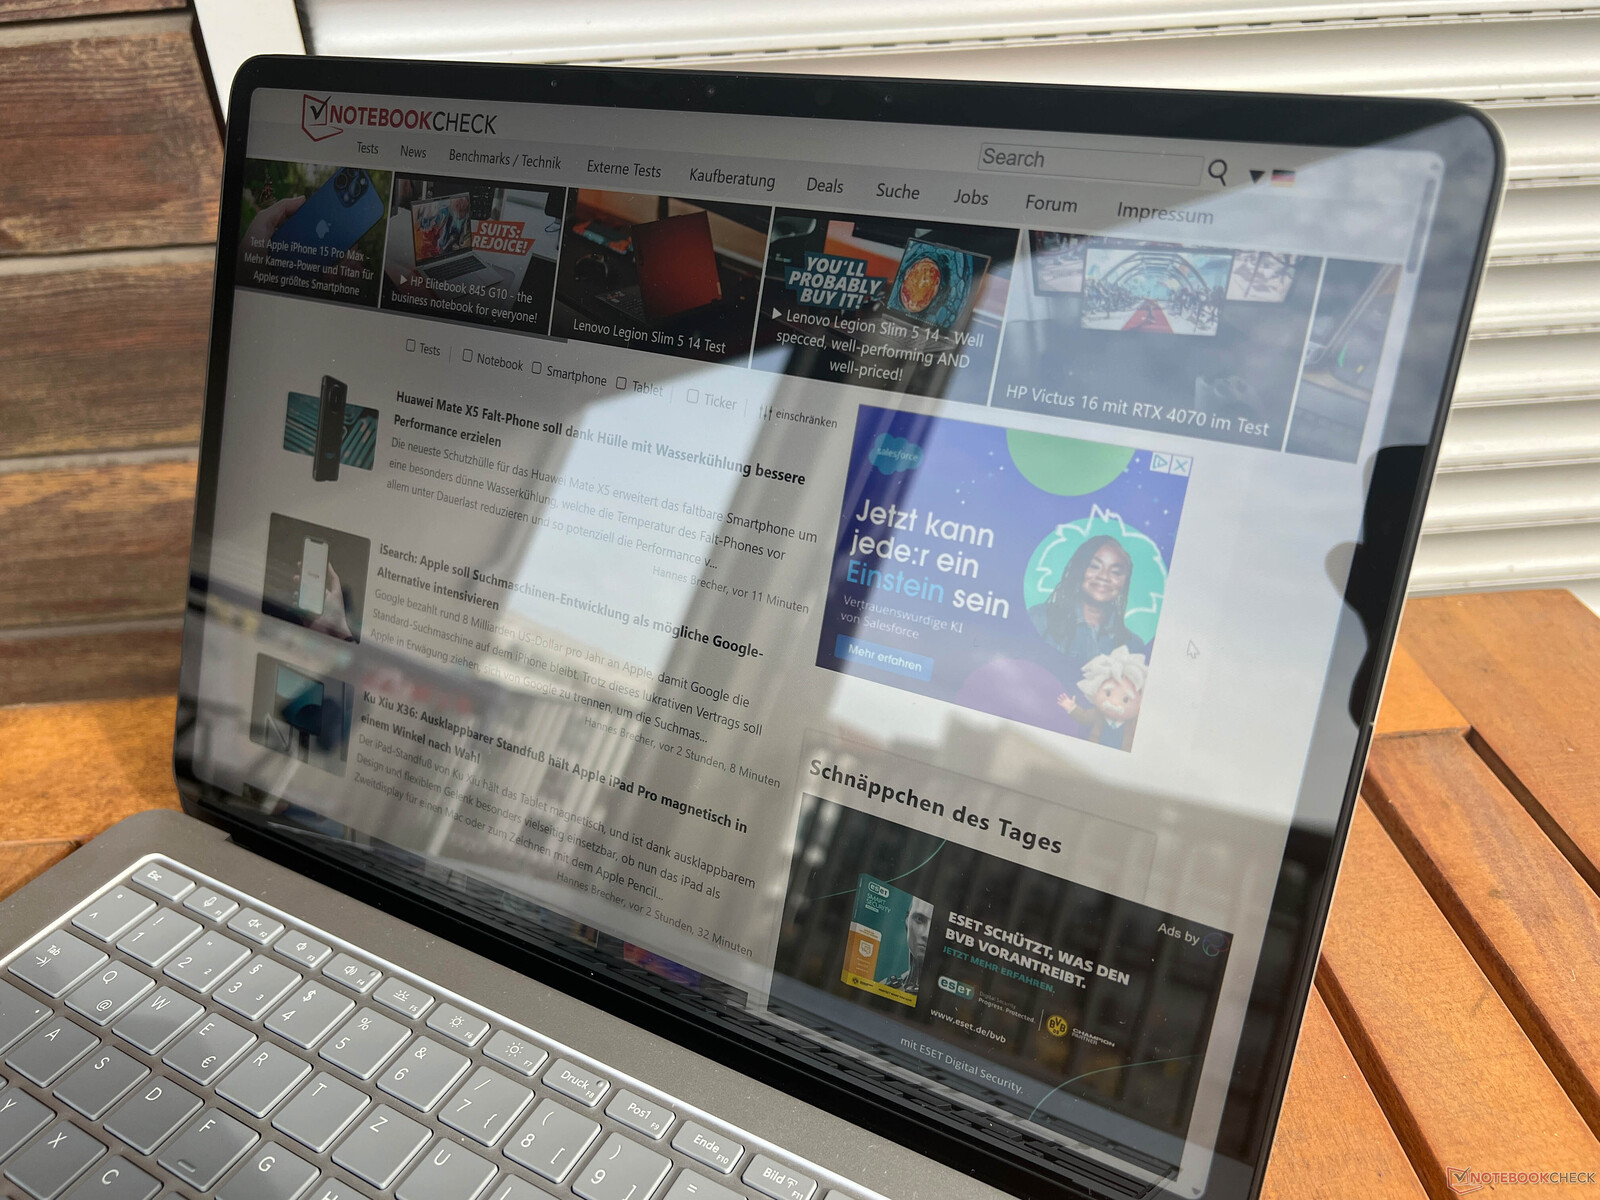
Die Helligkeit ist zwar gut, man muss im Freien aber versuchen, Reflexionen auf dem stark spiegelnden Touchscreen zu vermeiden. Die Blickwinkelstabilität des IPS-Bildschirms ist sehr gut.

Leistung - Raptor Lake und ADA-Lovelace

Testbedingungen
Wie bei den Microsoft-Geräten üblich stehen lediglich die Energieprofile von Windows zur Verfügung, die im Vergleich zu Windows-Geräten aber umbenannt wurden. Als Nutzer hat man die Wahl zwischen den Profilen Empfohlen, Bessere Leistung sowie Beste Leistung. Die jeweiligen TDP/TGP-Werte haben wir in der nachfolgenden Tabelle aufgeführt. Für unsere Benchmarks und Messungen kam standardmäßig das Profil Beste Leistung zum Einsatz, bei einfachen Aufgaben kann man aber auch bedenkenlos das Profil Empfohlen verwenden.
| CPU-Last | GPU-Last | Stresstest | |
|---|---|---|---|
| Empfohlen | 35 Watt | 60 Watt | CPU: 16 Watt GPU: 32 Watt |
| Bessere Leistung | 45 -> 35 Watt | 70 Watt | CPU: 18 Watt GPU: 37 Watt |
| Beste Leistung | 82 -> 50 Watt | 80 Watt | CPU: 23 Watt GPU: 57 Watt |
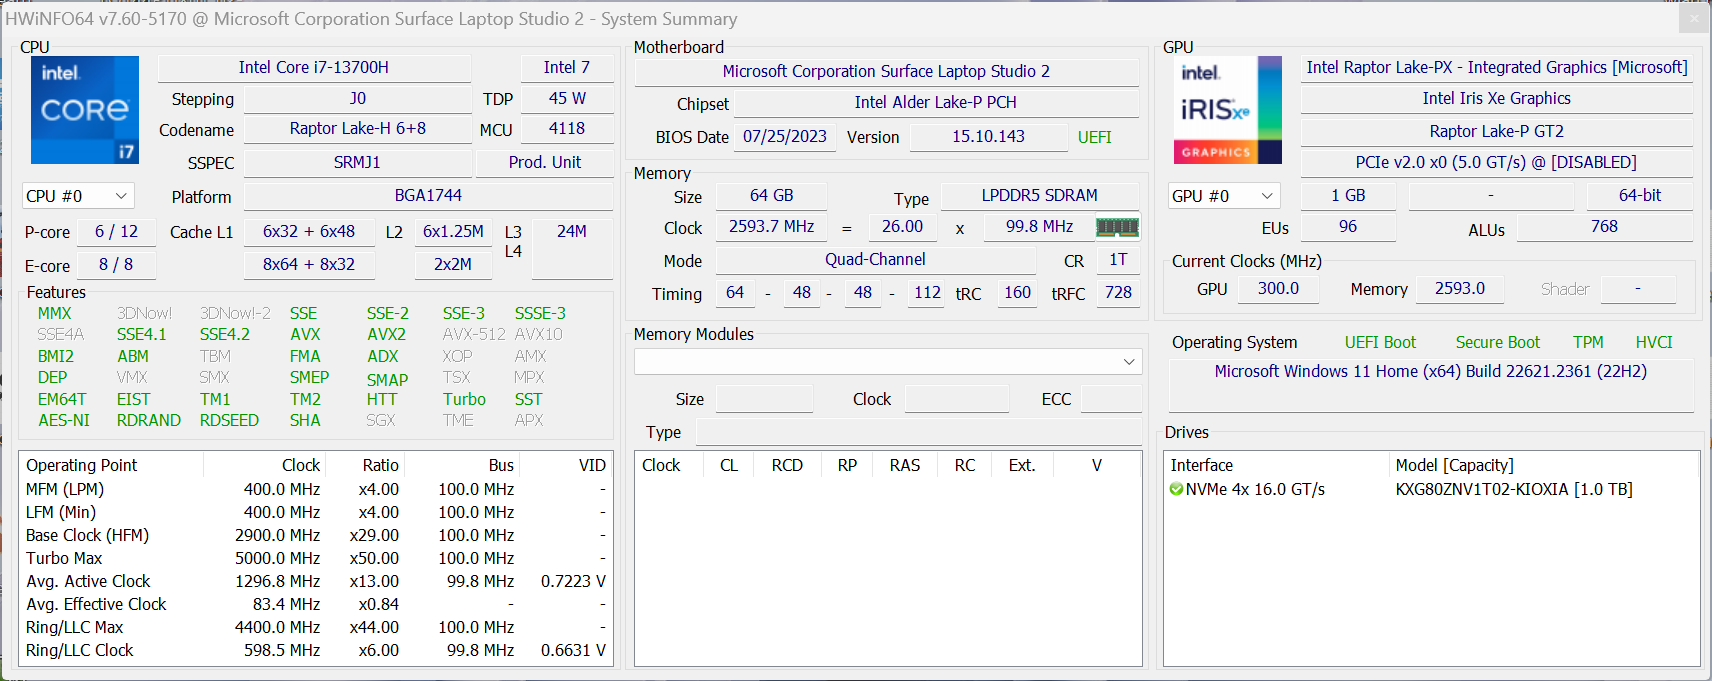
Prozessor - Core i7-13700H
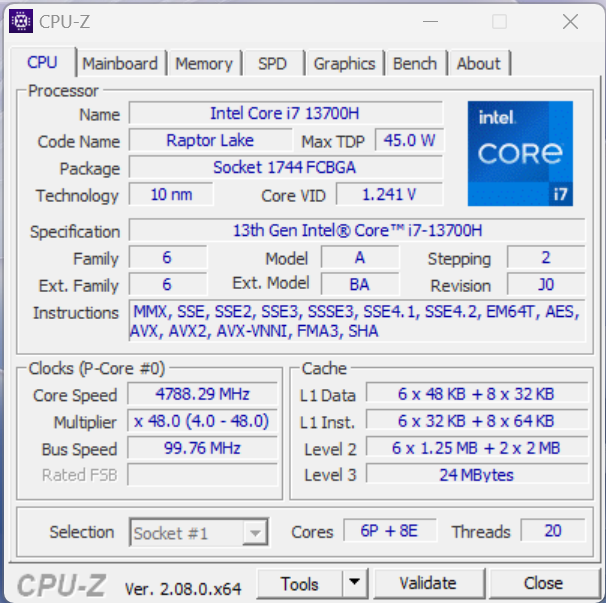
Microsoft hat den Tiger-Lake-Prozessor Core i7-11370H (vier Kerne) jetzt gegen den aktuellen Raptor-Lake-Chip Core i7-13700H ausgetauscht, der auf eine Hybrid-Architektur mit sechs Performance- und acht Efficiency-Kernen setzt, insgesamt können daher bis zu 20 Threads gleichzeitig bearbeitet werden. Maximal darf der 45-Watt-Prozessor im Surface Laptop Studio 2 bis zu 82 Watt verbrauchen, was dann aber auch schnell auf 52 Watt herabfällt.
Cinebench R15 Multi Dauertest
Der Vorteil gegenüber dem alten Surface Laptop Studio ist enorm (+150 % in Multi-Core-Tests) und auch die Single-Core-Performance ist sehr gut, allerdings fällt die Leistung auch schnell wieder ab und in unserer Cinebench-R15-Schleife liegt das testgerät dann nur noch auf dem Niveau des Apple M2 Pro (wo Cinebench R15 allerdings emuliert wird, was etwas Leistung kostet). Die Konkurrenten mit AMD-Prozessoren bietet hier eine bessere und vor allem deutlich stabilere Leistung.
Im Akkubetrieb fällt die Leistung noch weiter ab, denn hier wird der Stromverbrauch auf 55/40 Watt reduziert. In den Single-Core-Tests hat das keine Auswirkungen, in den Multi-Tests fällt die Leistung aber um etwa 18 % ab. Weitere CPU-Benchmarks stehen in unserer Techniksektion zur Verfügung.
Cinebench R20: CPU (Multi Core) | CPU (Single Core)
Cinebench R15: CPU Multi 64Bit | CPU Single 64Bit
Blender: v2.79 BMW27 CPU
7-Zip 18.03: 7z b 4 | 7z b 4 -mmt1
Geekbench 5.5: Multi-Core | Single-Core
HWBOT x265 Benchmark v2.2: 4k Preset
LibreOffice : 20 Documents To PDF
R Benchmark 2.5: Overall mean
| Cinebench R23 / Multi Core | |
| Asus Zenbook Pro 14 OLED UX6404VI | |
| Asus ROG Zephyrus G14 GA402XY | |
| Lenovo Yoga Pro 9-14IRP G8 | |
| Asus ZenBook Pro 14 Duo UX8402VV-P1021W | |
| Lenovo Legion Slim 5 14APH8 | |
| Durchschnitt der Klasse Multimedia (4861 - 33362, n=65, der letzten 2 Jahre) | |
| Microsoft Surface Laptop Studio 2 RTX 4060 | |
| Durchschnittliche Intel Core i7-13700H (5890 - 20034, n=29) | |
| Apple MacBook Pro 14 2023 M2 Pro | |
| Microsoft Surface Laptop Studio i7 RTX 3050 Ti | |
| Cinebench R23 / Single Core | |
| Asus Zenbook Pro 14 OLED UX6404VI | |
| Asus ZenBook Pro 14 Duo UX8402VV-P1021W | |
| Durchschnitt der Klasse Multimedia (1128 - 2459, n=64, der letzten 2 Jahre) | |
| Microsoft Surface Laptop Studio 2 RTX 4060 | |
| Lenovo Yoga Pro 9-14IRP G8 | |
| Durchschnittliche Intel Core i7-13700H (1323 - 1914, n=29) | |
| Lenovo Legion Slim 5 14APH8 | |
| Asus ROG Zephyrus G14 GA402XY | |
| Apple MacBook Pro 14 2023 M2 Pro | |
| Microsoft Surface Laptop Studio i7 RTX 3050 Ti | |
| Cinebench R20 / CPU (Multi Core) | |
| Asus Zenbook Pro 14 OLED UX6404VI | |
| Asus ROG Zephyrus G14 GA402XY | |
| Lenovo Yoga Pro 9-14IRP G8 | |
| Asus ZenBook Pro 14 Duo UX8402VV-P1021W | |
| Lenovo Legion Slim 5 14APH8 | |
| Durchschnitt der Klasse Multimedia (1887 - 12912, n=56, der letzten 2 Jahre) | |
| Microsoft Surface Laptop Studio 2 RTX 4060 | |
| Durchschnittliche Intel Core i7-13700H (2322 - 7674, n=29) | |
| Apple MacBook Pro 14 2023 M2 Pro | |
| Microsoft Surface Laptop Studio i7 RTX 3050 Ti | |
| Cinebench R20 / CPU (Single Core) | |
| Asus Zenbook Pro 14 OLED UX6404VI | |
| Asus ZenBook Pro 14 Duo UX8402VV-P1021W | |
| Microsoft Surface Laptop Studio 2 RTX 4060 | |
| Durchschnitt der Klasse Multimedia (425 - 853, n=56, der letzten 2 Jahre) | |
| Lenovo Yoga Pro 9-14IRP G8 | |
| Asus ROG Zephyrus G14 GA402XY | |
| Durchschnittliche Intel Core i7-13700H (508 - 741, n=29) | |
| Lenovo Legion Slim 5 14APH8 | |
| Microsoft Surface Laptop Studio i7 RTX 3050 Ti | |
| Apple MacBook Pro 14 2023 M2 Pro | |
| Cinebench R15 / CPU Multi 64Bit | |
| Asus Zenbook Pro 14 OLED UX6404VI | |
| Asus ROG Zephyrus G14 GA402XY | |
| Lenovo Yoga Pro 9-14IRP G8 | |
| Lenovo Legion Slim 5 14APH8 | |
| Asus ZenBook Pro 14 Duo UX8402VV-P1021W | |
| Microsoft Surface Laptop Studio 2 RTX 4060 | |
| Durchschnitt der Klasse Multimedia (856 - 5224, n=60, der letzten 2 Jahre) | |
| Durchschnittliche Intel Core i7-13700H (905 - 2982, n=29) | |
| Apple MacBook Pro 14 2023 M2 Pro | |
| Microsoft Surface Laptop Studio i7 RTX 3050 Ti | |
| Cinebench R15 / CPU Single 64Bit | |
| Asus Zenbook Pro 14 OLED UX6404VI | |
| Asus ZenBook Pro 14 Duo UX8402VV-P1021W | |
| Asus ROG Zephyrus G14 GA402XY | |
| Durchschnitt der Klasse Multimedia (184.8 - 326, n=58, der letzten 2 Jahre) | |
| Lenovo Legion Slim 5 14APH8 | |
| Microsoft Surface Laptop Studio 2 RTX 4060 | |
| Lenovo Yoga Pro 9-14IRP G8 | |
| Durchschnittliche Intel Core i7-13700H (213 - 278, n=29) | |
| Apple MacBook Pro 14 2023 M2 Pro | |
| Microsoft Surface Laptop Studio i7 RTX 3050 Ti | |
| Blender / v2.79 BMW27 CPU | |
| Microsoft Surface Laptop Studio i7 RTX 3050 Ti | |
| Durchschnitt der Klasse Multimedia (100 - 557, n=57, der letzten 2 Jahre) | |
| Microsoft Surface Laptop Studio 2 RTX 4060 | |
| Durchschnittliche Intel Core i7-13700H (169 - 555, n=29) | |
| Lenovo Yoga Pro 9-14IRP G8 | |
| Lenovo Legion Slim 5 14APH8 | |
| Asus ZenBook Pro 14 Duo UX8402VV-P1021W | |
| Asus ROG Zephyrus G14 GA402XY | |
| Asus Zenbook Pro 14 OLED UX6404VI | |
| 7-Zip 18.03 / 7z b 4 | |
| Asus Zenbook Pro 14 OLED UX6404VI | |
| Asus ROG Zephyrus G14 GA402XY | |
| Lenovo Yoga Pro 9-14IRP G8 | |
| Asus ZenBook Pro 14 Duo UX8402VV-P1021W | |
| Lenovo Legion Slim 5 14APH8 | |
| Microsoft Surface Laptop Studio 2 RTX 4060 | |
| Durchschnittliche Intel Core i7-13700H (27322 - 76344, n=29) | |
| Durchschnitt der Klasse Multimedia (26062 - 130368, n=54, der letzten 2 Jahre) | |
| Microsoft Surface Laptop Studio i7 RTX 3050 Ti | |
| 7-Zip 18.03 / 7z b 4 -mmt1 | |
| Asus ROG Zephyrus G14 GA402XY | |
| Asus Zenbook Pro 14 OLED UX6404VI | |
| Asus ZenBook Pro 14 Duo UX8402VV-P1021W | |
| Microsoft Surface Laptop Studio 2 RTX 4060 | |
| Lenovo Legion Slim 5 14APH8 | |
| Lenovo Yoga Pro 9-14IRP G8 | |
| Durchschnitt der Klasse Multimedia (3666 - 7545, n=55, der letzten 2 Jahre) | |
| Durchschnittliche Intel Core i7-13700H (4825 - 6238, n=29) | |
| Microsoft Surface Laptop Studio i7 RTX 3050 Ti | |
| Geekbench 5.5 / Multi-Core | |
| Apple MacBook Pro 14 2023 M2 Pro | |
| Asus Zenbook Pro 14 OLED UX6404VI | |
| Lenovo Yoga Pro 9-14IRP G8 | |
| Durchschnitt der Klasse Multimedia (4652 - 20422, n=55, der letzten 2 Jahre) | |
| Microsoft Surface Laptop Studio 2 RTX 4060 | |
| Asus ZenBook Pro 14 Duo UX8402VV-P1021W | |
| Asus ROG Zephyrus G14 GA402XY | |
| Durchschnittliche Intel Core i7-13700H (6165 - 14215, n=29) | |
| Lenovo Legion Slim 5 14APH8 | |
| Microsoft Surface Laptop Studio i7 RTX 3050 Ti | |
| Geekbench 5.5 / Single-Core | |
| Asus ROG Zephyrus G14 GA402XY | |
| Asus Zenbook Pro 14 OLED UX6404VI | |
| Durchschnitt der Klasse Multimedia (805 - 2974, n=55, der letzten 2 Jahre) | |
| Apple MacBook Pro 14 2023 M2 Pro | |
| Lenovo Legion Slim 5 14APH8 | |
| Asus ZenBook Pro 14 Duo UX8402VV-P1021W | |
| Lenovo Yoga Pro 9-14IRP G8 | |
| Microsoft Surface Laptop Studio 2 RTX 4060 | |
| Durchschnittliche Intel Core i7-13700H (1362 - 1919, n=29) | |
| Microsoft Surface Laptop Studio i7 RTX 3050 Ti | |
| HWBOT x265 Benchmark v2.2 / 4k Preset | |
| Asus ROG Zephyrus G14 GA402XY | |
| Lenovo Legion Slim 5 14APH8 | |
| Asus Zenbook Pro 14 OLED UX6404VI | |
| Lenovo Yoga Pro 9-14IRP G8 | |
| Durchschnitt der Klasse Multimedia (5.26 - 36.1, n=55, der letzten 2 Jahre) | |
| Asus ZenBook Pro 14 Duo UX8402VV-P1021W | |
| Microsoft Surface Laptop Studio 2 RTX 4060 | |
| Durchschnittliche Intel Core i7-13700H (6.72 - 21.2, n=29) | |
| Microsoft Surface Laptop Studio i7 RTX 3050 Ti | |
| LibreOffice / 20 Documents To PDF | |
| Microsoft Surface Laptop Studio i7 RTX 3050 Ti | |
| Durchschnitt der Klasse Multimedia (23.9 - 146.7, n=56, der letzten 2 Jahre) | |
| Durchschnittliche Intel Core i7-13700H (31.3 - 62.4, n=29) | |
| Lenovo Yoga Pro 9-14IRP G8 | |
| Microsoft Surface Laptop Studio 2 RTX 4060 | |
| Asus Zenbook Pro 14 OLED UX6404VI | |
| Lenovo Legion Slim 5 14APH8 | |
| Asus ZenBook Pro 14 Duo UX8402VV-P1021W | |
| Asus ROG Zephyrus G14 GA402XY | |
| R Benchmark 2.5 / Overall mean | |
| Microsoft Surface Laptop Studio i7 RTX 3050 Ti | |
| Durchschnittliche Intel Core i7-13700H (0.4308 - 0.607, n=29) | |
| Durchschnitt der Klasse Multimedia (0.3604 - 0.947, n=55, der letzten 2 Jahre) | |
| Lenovo Legion Slim 5 14APH8 | |
| Microsoft Surface Laptop Studio 2 RTX 4060 | |
| Asus ZenBook Pro 14 Duo UX8402VV-P1021W | |
| Lenovo Yoga Pro 9-14IRP G8 | |
| Asus ROG Zephyrus G14 GA402XY | |
| Asus Zenbook Pro 14 OLED UX6404VI | |
* ... kleinere Werte sind besser
AIDA64: FP32 Ray-Trace | FPU Julia | CPU SHA3 | CPU Queen | FPU SinJulia | FPU Mandel | CPU AES | CPU ZLib | FP64 Ray-Trace | CPU PhotoWorxx
| Performance Rating | |
| Lenovo Legion Slim 5 14APH8 | |
| Asus Zenbook Pro 14 OLED UX6404VI | |
| Lenovo Yoga Pro 9-14IRP G8 | |
| Durchschnitt der Klasse Multimedia | |
| Asus ZenBook Pro 14 Duo UX8402VV-P1021W | |
| Durchschnittliche Intel Core i7-13700H | |
| Microsoft Surface Laptop Studio 2 RTX 4060 | |
| Microsoft Surface Laptop Studio i7 RTX 3050 Ti | |
| AIDA64 / FP32 Ray-Trace | |
| Lenovo Legion Slim 5 14APH8 | |
| Durchschnitt der Klasse Multimedia (2214 - 50388, n=53, der letzten 2 Jahre) | |
| Lenovo Yoga Pro 9-14IRP G8 | |
| Asus Zenbook Pro 14 OLED UX6404VI | |
| Asus ZenBook Pro 14 Duo UX8402VV-P1021W | |
| Durchschnittliche Intel Core i7-13700H (4986 - 18908, n=29) | |
| Microsoft Surface Laptop Studio 2 RTX 4060 | |
| Microsoft Surface Laptop Studio i7 RTX 3050 Ti | |
| AIDA64 / FPU Julia | |
| Lenovo Legion Slim 5 14APH8 | |
| Asus Zenbook Pro 14 OLED UX6404VI | |
| Durchschnitt der Klasse Multimedia (12867 - 201874, n=53, der letzten 2 Jahre) | |
| Lenovo Yoga Pro 9-14IRP G8 | |
| Asus ZenBook Pro 14 Duo UX8402VV-P1021W | |
| Microsoft Surface Laptop Studio 2 RTX 4060 | |
| Durchschnittliche Intel Core i7-13700H (25360 - 92359, n=29) | |
| Microsoft Surface Laptop Studio i7 RTX 3050 Ti | |
| AIDA64 / CPU SHA3 | |
| Lenovo Legion Slim 5 14APH8 | |
| Asus Zenbook Pro 14 OLED UX6404VI | |
| Durchschnitt der Klasse Multimedia (626 - 8623, n=53, der letzten 2 Jahre) | |
| Lenovo Yoga Pro 9-14IRP G8 | |
| Microsoft Surface Laptop Studio 2 RTX 4060 | |
| Durchschnittliche Intel Core i7-13700H (1339 - 4224, n=29) | |
| Asus ZenBook Pro 14 Duo UX8402VV-P1021W | |
| Microsoft Surface Laptop Studio i7 RTX 3050 Ti | |
| AIDA64 / CPU Queen | |
| Lenovo Legion Slim 5 14APH8 | |
| Asus Zenbook Pro 14 OLED UX6404VI | |
| Asus ZenBook Pro 14 Duo UX8402VV-P1021W | |
| Lenovo Yoga Pro 9-14IRP G8 | |
| Microsoft Surface Laptop Studio 2 RTX 4060 | |
| Durchschnittliche Intel Core i7-13700H (59324 - 107159, n=29) | |
| Durchschnitt der Klasse Multimedia (13483 - 181505, n=40, der letzten 2 Jahre) | |
| Microsoft Surface Laptop Studio i7 RTX 3050 Ti | |
| AIDA64 / FPU SinJulia | |
| Lenovo Legion Slim 5 14APH8 | |
| Lenovo Yoga Pro 9-14IRP G8 | |
| Asus Zenbook Pro 14 OLED UX6404VI | |
| Asus ZenBook Pro 14 Duo UX8402VV-P1021W | |
| Durchschnittliche Intel Core i7-13700H (4800 - 11050, n=29) | |
| Durchschnitt der Klasse Multimedia (886 - 28794, n=53, der letzten 2 Jahre) | |
| Microsoft Surface Laptop Studio 2 RTX 4060 | |
| Microsoft Surface Laptop Studio i7 RTX 3050 Ti | |
| AIDA64 / FPU Mandel | |
| Lenovo Legion Slim 5 14APH8 | |
| Durchschnitt der Klasse Multimedia (6395 - 105740, n=53, der letzten 2 Jahre) | |
| Lenovo Yoga Pro 9-14IRP G8 | |
| Asus Zenbook Pro 14 OLED UX6404VI | |
| Asus ZenBook Pro 14 Duo UX8402VV-P1021W | |
| Durchschnittliche Intel Core i7-13700H (12321 - 45118, n=29) | |
| Microsoft Surface Laptop Studio 2 RTX 4060 | |
| Microsoft Surface Laptop Studio i7 RTX 3050 Ti | |
| AIDA64 / CPU AES | |
| Asus Zenbook Pro 14 OLED UX6404VI | |
| Lenovo Yoga Pro 9-14IRP G8 | |
| Durchschnittliche Intel Core i7-13700H (28769 - 151254, n=29) | |
| Lenovo Legion Slim 5 14APH8 | |
| Microsoft Surface Laptop Studio 2 RTX 4060 | |
| Durchschnitt der Klasse Multimedia (8171 - 126790, n=53, der letzten 2 Jahre) | |
| Asus ZenBook Pro 14 Duo UX8402VV-P1021W | |
| Microsoft Surface Laptop Studio i7 RTX 3050 Ti | |
| AIDA64 / CPU ZLib | |
| Asus Zenbook Pro 14 OLED UX6404VI | |
| Lenovo Yoga Pro 9-14IRP G8 | |
| Lenovo Legion Slim 5 14APH8 | |
| Durchschnitt der Klasse Multimedia (143.8 - 2022, n=53, der letzten 2 Jahre) | |
| Microsoft Surface Laptop Studio 2 RTX 4060 | |
| Durchschnittliche Intel Core i7-13700H (389 - 1215, n=29) | |
| Asus ZenBook Pro 14 Duo UX8402VV-P1021W | |
| Microsoft Surface Laptop Studio i7 RTX 3050 Ti | |
| AIDA64 / FP64 Ray-Trace | |
| Lenovo Legion Slim 5 14APH8 | |
| Durchschnitt der Klasse Multimedia (1014 - 26875, n=53, der letzten 2 Jahre) | |
| Lenovo Yoga Pro 9-14IRP G8 | |
| Asus Zenbook Pro 14 OLED UX6404VI | |
| Asus ZenBook Pro 14 Duo UX8402VV-P1021W | |
| Durchschnittliche Intel Core i7-13700H (2540 - 10135, n=29) | |
| Microsoft Surface Laptop Studio 2 RTX 4060 | |
| Microsoft Surface Laptop Studio i7 RTX 3050 Ti | |
| AIDA64 / CPU PhotoWorxx | |
| Lenovo Yoga Pro 9-14IRP G8 | |
| Durchschnitt der Klasse Multimedia (8187 - 88154, n=53, der letzten 2 Jahre) | |
| Microsoft Surface Laptop Studio 2 RTX 4060 | |
| Asus Zenbook Pro 14 OLED UX6404VI | |
| Asus ZenBook Pro 14 Duo UX8402VV-P1021W | |
| Durchschnittliche Intel Core i7-13700H (12872 - 52727, n=29) | |
| Microsoft Surface Laptop Studio i7 RTX 3050 Ti | |
| Lenovo Legion Slim 5 14APH8 | |
System Performance
Der Surface Laptop Studio 2 ist im Alltag ein sehr reaktionsschneller Rechner, was angesichts der leistungsstarken Komponenten aber auch keine Überraschung darstellt. In den synthetischen Benchmarks schneidet das System ebenfalls ordentlich ab und wir konnten während des Tests keinerlei Probleme erkennen.
CrossMark: Overall | Productivity | Creativity | Responsiveness
| PCMark 10 / Score | |
| Asus ROG Zephyrus G14 GA402XY | |
| Lenovo Legion Slim 5 14APH8 | |
| Durchschnitt der Klasse Multimedia (4325 - 10386, n=51, der letzten 2 Jahre) | |
| Asus ZenBook Pro 14 Duo UX8402VV-P1021W | |
| Asus Zenbook Pro 14 OLED UX6404VI | |
| Durchschnittliche Intel Core i7-13700H, NVIDIA GeForce RTX 4060 Laptop GPU (7157 - 7661, n=5) | |
| Lenovo Yoga Pro 9-14IRP G8 | |
| Microsoft Surface Laptop Studio 2 RTX 4060 | |
| Microsoft Surface Laptop Studio i7 RTX 3050 Ti | |
| PCMark 10 / Essentials | |
| Asus ZenBook Pro 14 Duo UX8402VV-P1021W | |
| Lenovo Yoga Pro 9-14IRP G8 | |
| Lenovo Legion Slim 5 14APH8 | |
| Asus Zenbook Pro 14 OLED UX6404VI | |
| Durchschnittliche Intel Core i7-13700H, NVIDIA GeForce RTX 4060 Laptop GPU (10179 - 11200, n=5) | |
| Microsoft Surface Laptop Studio 2 RTX 4060 | |
| Asus ROG Zephyrus G14 GA402XY | |
| Durchschnitt der Klasse Multimedia (8025 - 11664, n=50, der letzten 2 Jahre) | |
| Microsoft Surface Laptop Studio i7 RTX 3050 Ti | |
| PCMark 10 / Productivity | |
| Durchschnitt der Klasse Multimedia (7323 - 18233, n=50, der letzten 2 Jahre) | |
| Asus ROG Zephyrus G14 GA402XY | |
| Asus ZenBook Pro 14 Duo UX8402VV-P1021W | |
| Lenovo Legion Slim 5 14APH8 | |
| Asus Zenbook Pro 14 OLED UX6404VI | |
| Durchschnittliche Intel Core i7-13700H, NVIDIA GeForce RTX 4060 Laptop GPU (8238 - 10249, n=5) | |
| Microsoft Surface Laptop Studio 2 RTX 4060 | |
| Lenovo Yoga Pro 9-14IRP G8 | |
| Microsoft Surface Laptop Studio i7 RTX 3050 Ti | |
| PCMark 10 / Digital Content Creation | |
| Asus ROG Zephyrus G14 GA402XY | |
| Lenovo Legion Slim 5 14APH8 | |
| Durchschnittliche Intel Core i7-13700H, NVIDIA GeForce RTX 4060 Laptop GPU (10308 - 11862, n=5) | |
| Asus Zenbook Pro 14 OLED UX6404VI | |
| Lenovo Yoga Pro 9-14IRP G8 | |
| Microsoft Surface Laptop Studio 2 RTX 4060 | |
| Asus ZenBook Pro 14 Duo UX8402VV-P1021W | |
| Durchschnitt der Klasse Multimedia (3651 - 16240, n=50, der letzten 2 Jahre) | |
| Microsoft Surface Laptop Studio i7 RTX 3050 Ti | |
| CrossMark / Overall | |
| Asus Zenbook Pro 14 OLED UX6404VI | |
| Durchschnitt der Klasse Multimedia (866 - 2728, n=59, der letzten 2 Jahre) | |
| Asus ZenBook Pro 14 Duo UX8402VV-P1021W | |
| Lenovo Yoga Pro 9-14IRP G8 | |
| Lenovo Legion Slim 5 14APH8 | |
| Asus ROG Zephyrus G14 GA402XY | |
| Apple MacBook Pro 14 2023 M2 Pro | |
| Microsoft Surface Laptop Studio 2 RTX 4060 | |
| Durchschnittliche Intel Core i7-13700H, NVIDIA GeForce RTX 4060 Laptop GPU (1629 - 1849, n=5) | |
| Microsoft Surface Laptop Studio i7 RTX 3050 Ti | |
| CrossMark / Productivity | |
| Lenovo Legion Slim 5 14APH8 | |
| Asus Zenbook Pro 14 OLED UX6404VI | |
| Asus ZenBook Pro 14 Duo UX8402VV-P1021W | |
| Durchschnitt der Klasse Multimedia (931 - 2489, n=59, der letzten 2 Jahre) | |
| Asus ROG Zephyrus G14 GA402XY | |
| Lenovo Yoga Pro 9-14IRP G8 | |
| Durchschnittliche Intel Core i7-13700H, NVIDIA GeForce RTX 4060 Laptop GPU (1561 - 1743, n=5) | |
| Microsoft Surface Laptop Studio 2 RTX 4060 | |
| Apple MacBook Pro 14 2023 M2 Pro | |
| Microsoft Surface Laptop Studio i7 RTX 3050 Ti | |
| CrossMark / Creativity | |
| Apple MacBook Pro 14 2023 M2 Pro | |
| Asus Zenbook Pro 14 OLED UX6404VI | |
| Durchschnitt der Klasse Multimedia (907 - 3465, n=59, der letzten 2 Jahre) | |
| Lenovo Yoga Pro 9-14IRP G8 | |
| Asus ZenBook Pro 14 Duo UX8402VV-P1021W | |
| Asus ROG Zephyrus G14 GA402XY | |
| Microsoft Surface Laptop Studio 2 RTX 4060 | |
| Lenovo Legion Slim 5 14APH8 | |
| Durchschnittliche Intel Core i7-13700H, NVIDIA GeForce RTX 4060 Laptop GPU (1691 - 2064, n=5) | |
| Microsoft Surface Laptop Studio i7 RTX 3050 Ti | |
| CrossMark / Responsiveness | |
| Lenovo Legion Slim 5 14APH8 | |
| Asus Zenbook Pro 14 OLED UX6404VI | |
| Asus ZenBook Pro 14 Duo UX8402VV-P1021W | |
| Lenovo Yoga Pro 9-14IRP G8 | |
| Durchschnitt der Klasse Multimedia (605 - 2024, n=59, der letzten 2 Jahre) | |
| Durchschnittliche Intel Core i7-13700H, NVIDIA GeForce RTX 4060 Laptop GPU (1381 - 1656, n=5) | |
| Asus ROG Zephyrus G14 GA402XY | |
| Microsoft Surface Laptop Studio 2 RTX 4060 | |
| Apple MacBook Pro 14 2023 M2 Pro | |
| Microsoft Surface Laptop Studio i7 RTX 3050 Ti | |
| PCMark 10 Score | 7351 Punkte | |
Hilfe | ||
| AIDA64 / Memory Copy | |
| Durchschnitt der Klasse Multimedia (11299 - 132135, n=53, der letzten 2 Jahre) | |
| Lenovo Yoga Pro 9-14IRP G8 | |
| Lenovo Legion Slim 5 14APH8 | |
| Microsoft Surface Laptop Studio 2 RTX 4060 | |
| Asus Zenbook Pro 14 OLED UX6404VI | |
| Durchschnittliche Intel Core i7-13700H (24334 - 78081, n=29) | |
| Asus ZenBook Pro 14 Duo UX8402VV-P1021W | |
| Microsoft Surface Laptop Studio i7 RTX 3050 Ti | |
| AIDA64 / Memory Read | |
| Durchschnitt der Klasse Multimedia (11624 - 174586, n=53, der letzten 2 Jahre) | |
| Lenovo Yoga Pro 9-14IRP G8 | |
| Asus Zenbook Pro 14 OLED UX6404VI | |
| Durchschnittliche Intel Core i7-13700H (23681 - 79656, n=29) | |
| Microsoft Surface Laptop Studio 2 RTX 4060 | |
| Asus ZenBook Pro 14 Duo UX8402VV-P1021W | |
| Microsoft Surface Laptop Studio i7 RTX 3050 Ti | |
| Lenovo Legion Slim 5 14APH8 | |
| AIDA64 / Memory Write | |
| Lenovo Legion Slim 5 14APH8 | |
| Lenovo Yoga Pro 9-14IRP G8 | |
| Durchschnitt der Klasse Multimedia (11755 - 134998, n=53, der letzten 2 Jahre) | |
| Microsoft Surface Laptop Studio 2 RTX 4060 | |
| Asus ZenBook Pro 14 Duo UX8402VV-P1021W | |
| Durchschnittliche Intel Core i7-13700H (22986 - 99898, n=29) | |
| Asus Zenbook Pro 14 OLED UX6404VI | |
| Microsoft Surface Laptop Studio i7 RTX 3050 Ti | |
| AIDA64 / Memory Latency | |
| Durchschnitt der Klasse Multimedia (7 - 535, n=52, der letzten 2 Jahre) | |
| Lenovo Legion Slim 5 14APH8 | |
| Microsoft Surface Laptop Studio i7 RTX 3050 Ti | |
| Durchschnittliche Intel Core i7-13700H (82.4 - 136.8, n=29) | |
| Lenovo Yoga Pro 9-14IRP G8 | |
| Asus ZenBook Pro 14 Duo UX8402VV-P1021W | |
| Microsoft Surface Laptop Studio 2 RTX 4060 | |
| Asus Zenbook Pro 14 OLED UX6404VI | |
* ... kleinere Werte sind besser
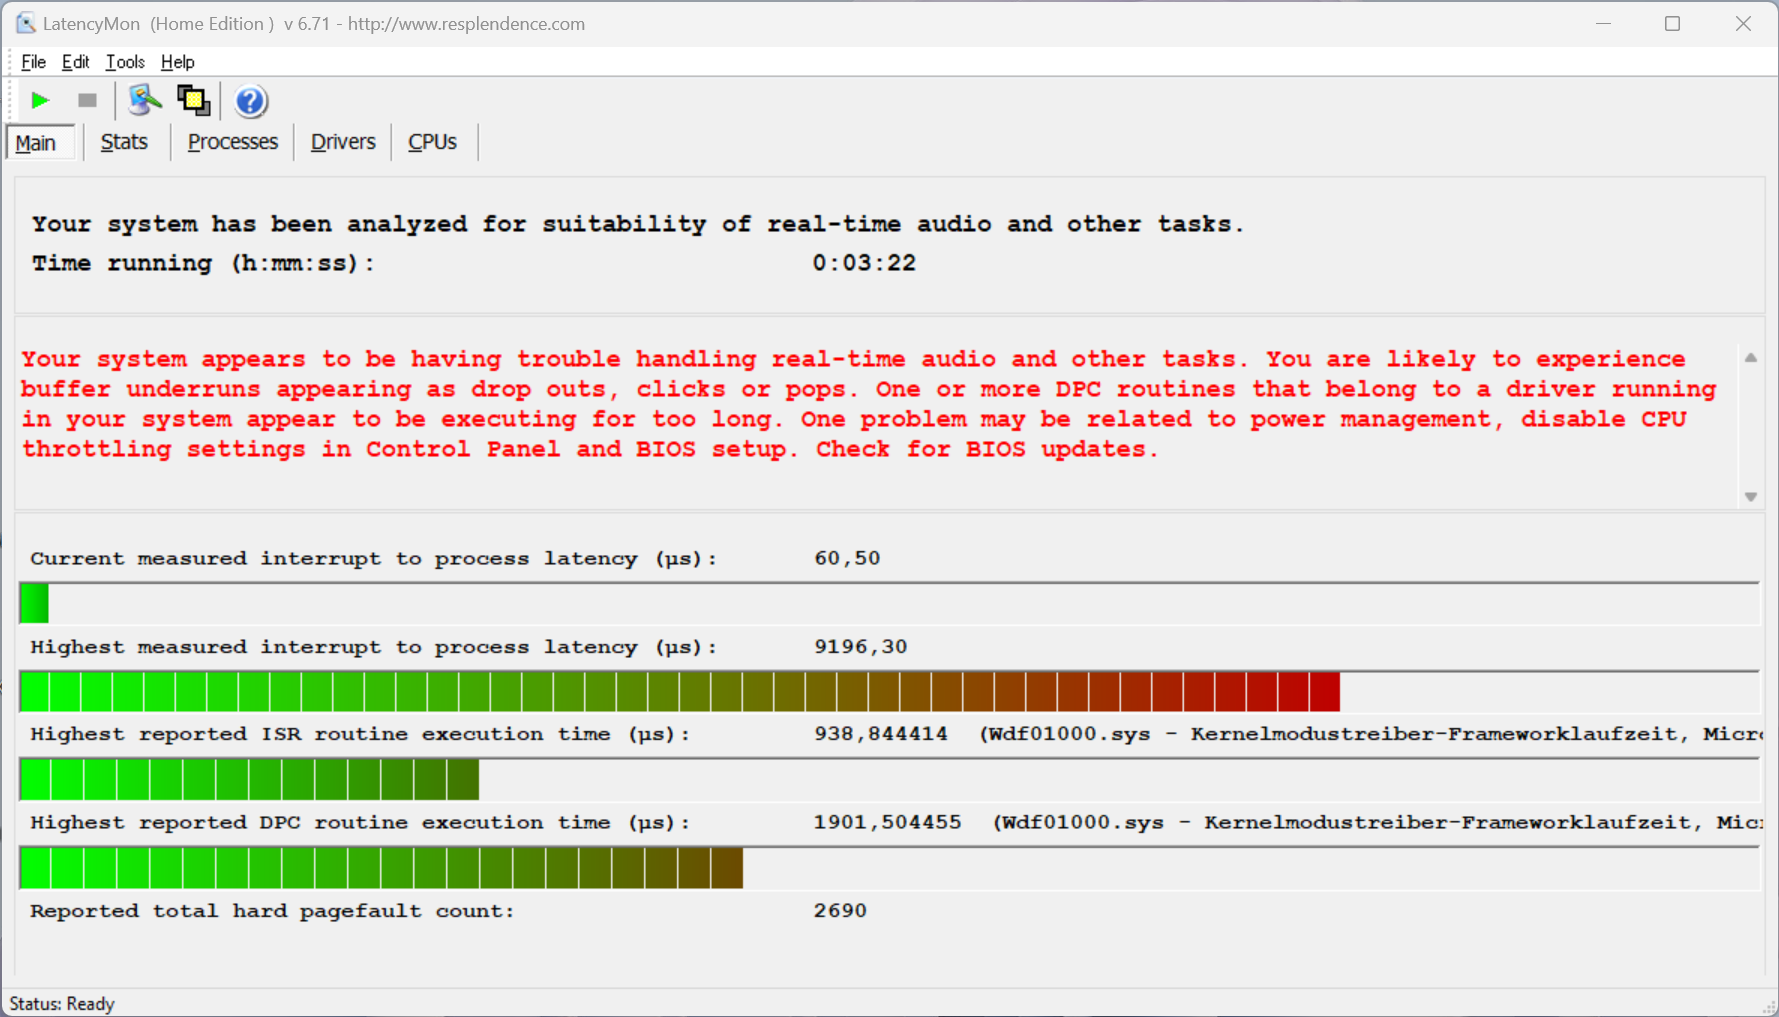
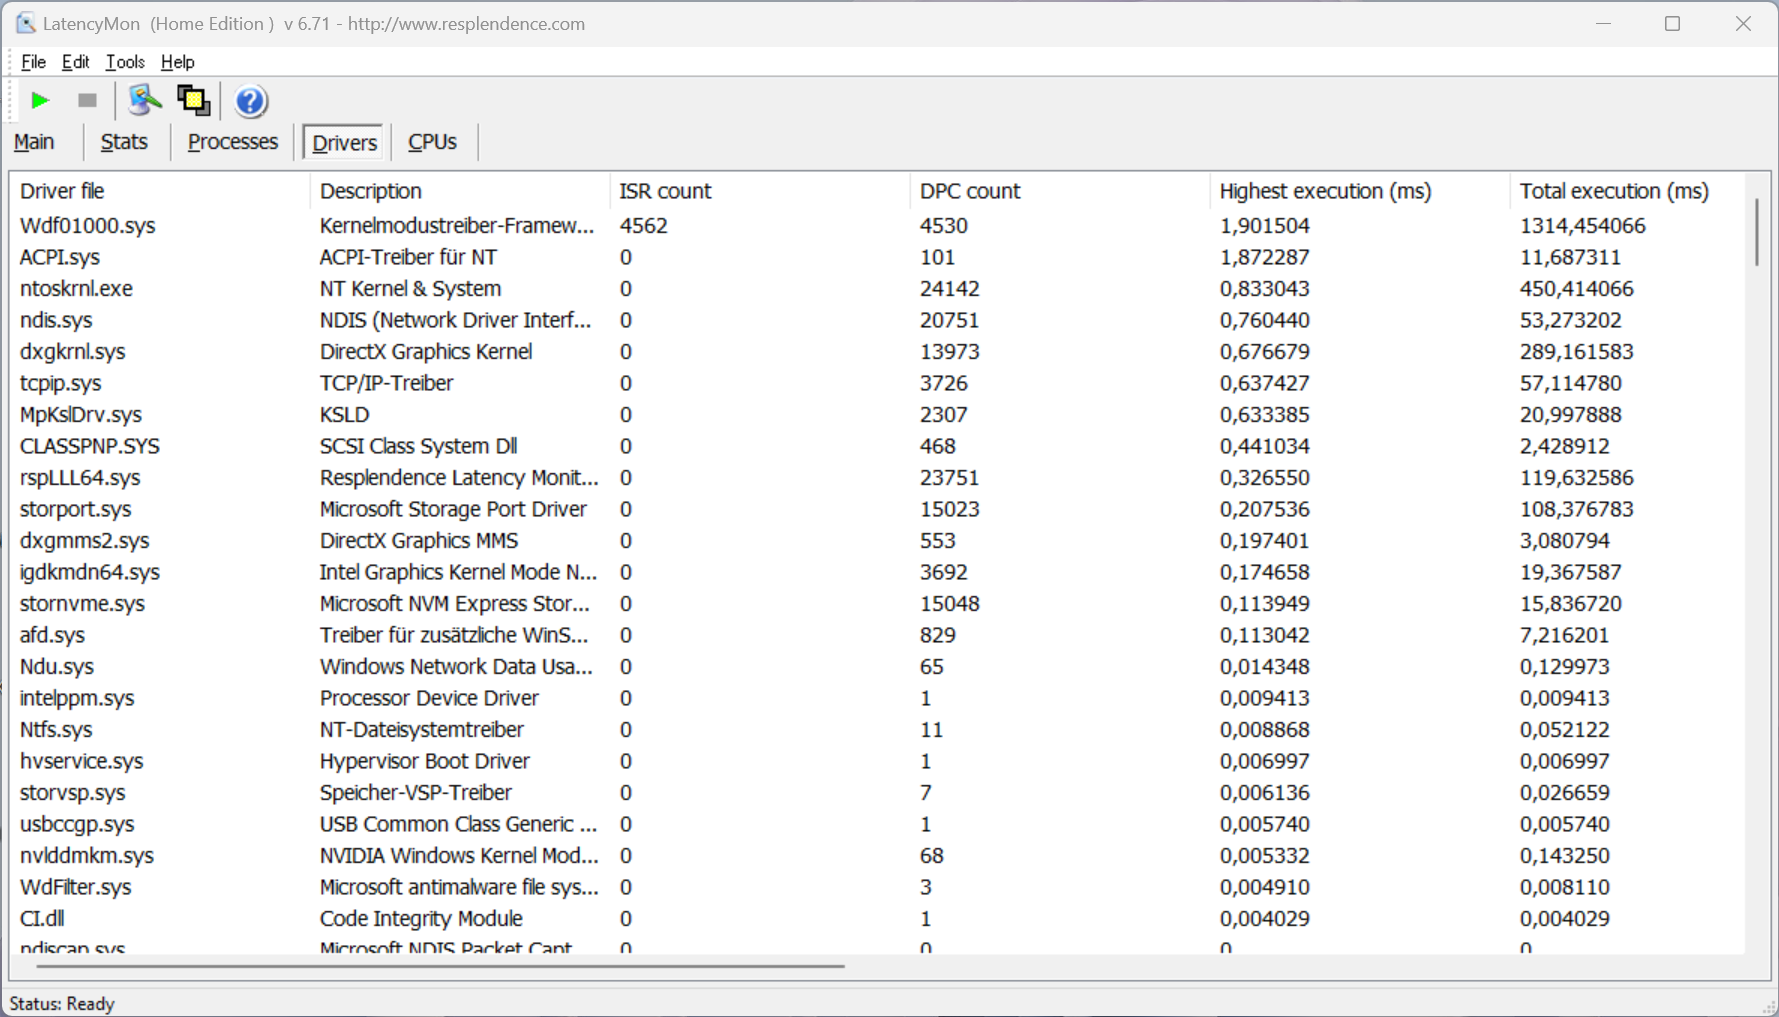
DPC-Latenzen
In unserem standardisierten Latency-Test (Surfen im Internet, 4K-YouTube-Wiedergabe, CPU-Last) zeigt das testgerät mit der aktuellen BIOS-Version massive Einschränkungen für die Nutzung von Echtzeit-Audioanwendungen.
| DPC Latencies / LatencyMon - interrupt to process latency (max), Web, Youtube, Prime95 | |
| Microsoft Surface Laptop Studio 2 RTX 4060 | |
| Lenovo Legion Slim 5 14APH8 | |
| Asus Zenbook Pro 14 OLED UX6404VI | |
| Asus ZenBook Pro 14 Duo UX8402VV-P1021W | |
| Lenovo Yoga Pro 9-14IRP G8 | |
| Asus ROG Zephyrus G14 GA402XY | |
| Microsoft Surface Laptop Studio i7 RTX 3050 Ti | |
* ... kleinere Werte sind besser
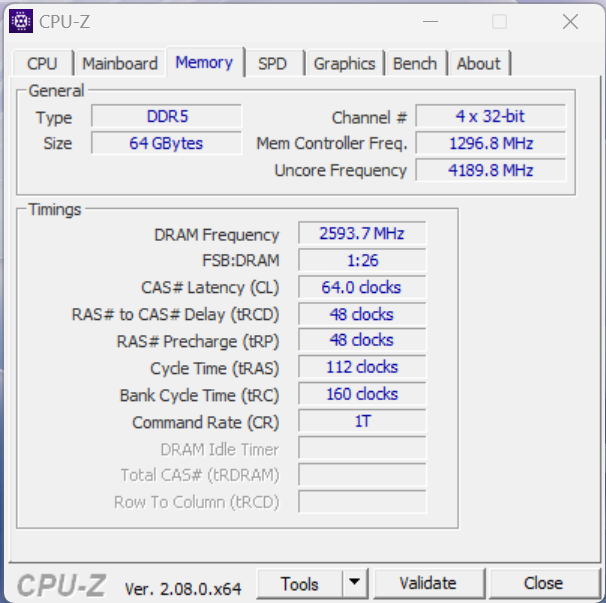
Massenspeicher
Microsoft verwendet beim Surface Laptop Studio 2 eine PCIe-4.0-SSD im M.2-2280-Format. Bei unserem Testgerät kommt die 1-TB-Variante der Kioxia XG8 zum Einsatz, die insgesamt einen sehr guten Eindruck hinterlässt und Transferraten von bis zu 7 GB/s erreicht. Zudem bleibt die Leistung auch bei längerer Belastung vollkommen stabil. Nach der ersten Inbetriebnahme stehen dem Nutzer 863 GB zur freien Verfügung. Weitere SSD-Benchmarks sind hier gelistet.

* ... kleinere Werte sind besser
Dauerleistung Lesen: DiskSpd Read Loop, Queue Depth 8
Grafikkarte - GeForce RTX 4060 Laptop
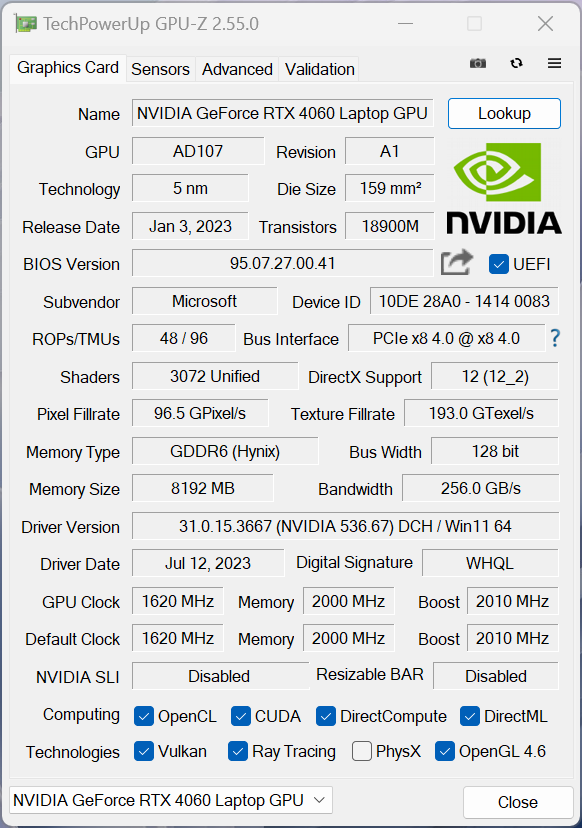
Im Alltag kümmert sich die integrierte Xe Graphics G7 des Prozessors um die Grafikberechnungen, bei anspruchsvolleren Dingen wie Spielen wird dann automatisch die Nvidia GeForce RTX 4060 Laptop aktiviert. Als Grafikumschaltung dient die ganz normale Optimus-Technologie, was bei einem Multimedia-Laptop auch vollkommen in Ordnung ist. Es handelt sich um die 80-Watt-Variante (inkl. 20 Watt Dynamic Boost vom Prozessor) der RTX 4060 Laptop und die Leistung ist deutlich besser als bei der alten GeForce RTX 3050 Ti der ersten Studio-Generation. Zudem ist die RTX 4060 Laptop im WildLife-Extreme-Unlimited-Test auch 18 % schneller als die M2-Pro-GPU des MacBook Pro 14.
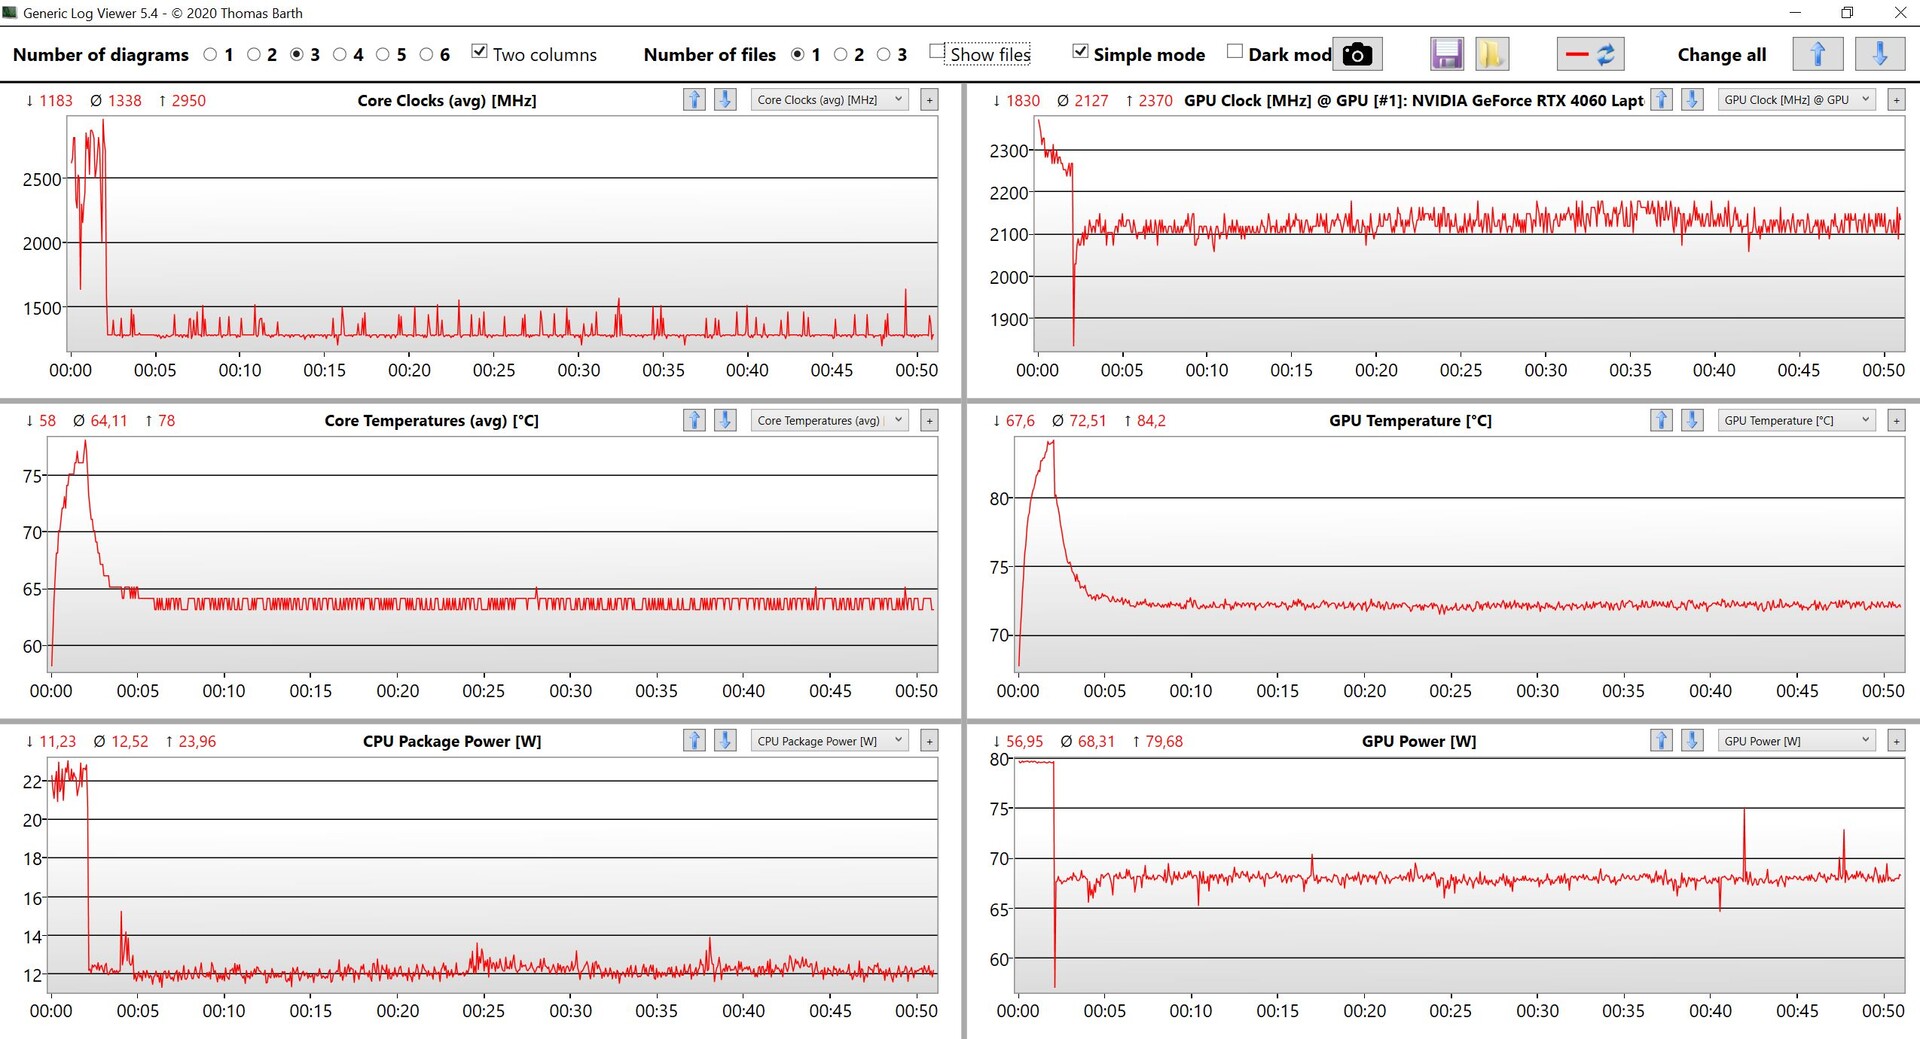
Allerdings muss man sich auch im Klaren darüber sein, dass es sich hier nicht um die schnellste RTX 4060 handelt und das Legion Slim 5 14 ist im Time-Spy-Test beispielsweise rund 12 % schneller. Zudem bleibt die Grafikleistung nicht konstant und fällt nach einigen Minuten von 80 auf nur noch etwa 68 Watt ab. Der entsprechende Time-Spy-Stresstest wurde daher mit 72,9 % auch ganz klar nicht bestanden. Im Akkubetrieb darf die GPU maximale 40 Watt verbrauchen, was allerdings nur zu einer Leistungsreduzierung von ~20 % führt. Weitere GPU-Benchmarks stehen in unserer Techniksektion zur Verfügung.
| 3DMark 11 Performance | 25182 Punkte | |
| 3DMark Fire Strike Score | 17076 Punkte | |
| 3DMark Time Spy Score | 9541 Punkte | |
Hilfe | ||
| Blender / v3.3 Classroom OPTIX/RTX | |
| Durchschnitt der Klasse Multimedia (12 - 105, n=21, der letzten 2 Jahre) | |
| Lenovo Yoga Pro 9-14IRP G8 | |
| Asus ZenBook Pro 14 Duo UX8402VV-P1021W | |
| Microsoft Surface Laptop Studio 2 RTX 4060 | |
| Asus Zenbook Pro 14 OLED UX6404VI | |
| Durchschnittliche NVIDIA GeForce RTX 4060 Laptop GPU (19 - 28, n=53) | |
| Lenovo Legion Slim 5 14APH8 | |
| Asus ROG Zephyrus G14 GA402XY | |
| Blender / v3.3 Classroom CUDA | |
| Durchschnitt der Klasse Multimedia (20 - 186, n=21, der letzten 2 Jahre) | |
| Asus ZenBook Pro 14 Duo UX8402VV-P1021W | |
| Lenovo Yoga Pro 9-14IRP G8 | |
| Durchschnittliche NVIDIA GeForce RTX 4060 Laptop GPU (39 - 53, n=53) | |
| Microsoft Surface Laptop Studio 2 RTX 4060 | |
| Lenovo Legion Slim 5 14APH8 | |
| Asus Zenbook Pro 14 OLED UX6404VI | |
| Asus ROG Zephyrus G14 GA402XY | |
| Blender / v3.3 Classroom METAL | |
| Apple MacBook Pro 14 2023 M2 Pro | |
| Durchschnitt der Klasse Multimedia (17.8 - 68, n=5, der letzten 2 Jahre) | |
| Blender / v3.3 Classroom CPU | |
| Durchschnitt der Klasse Multimedia (134.5 - 1042, n=61, der letzten 2 Jahre) | |
| Microsoft Surface Laptop Studio 2 RTX 4060 | |
| Lenovo Yoga Pro 9-14IRP G8 | |
| Apple MacBook Pro 14 2023 M2 Pro | |
| Asus ZenBook Pro 14 Duo UX8402VV-P1021W | |
| Durchschnittliche NVIDIA GeForce RTX 4060 Laptop GPU (189 - 452, n=53) | |
| Asus Zenbook Pro 14 OLED UX6404VI | |
| Lenovo Legion Slim 5 14APH8 | |
| Asus ROG Zephyrus G14 GA402XY | |
* ... kleinere Werte sind besser
Gaming Performance
Bei der Gaming-Performance gibt es ebenfalls einen deutlichen Vorsprung gegenüber der alten RTX 3050 Ti (bei unseren Standard-Games rund 50 % schneller), aber die anderen Konkurrent bieten in der Regel mehr Leistung. In unserer Witcher-3-Schleife zeigt sich auch hier wieder, dass die GPU-Leistung nicht stabil bleibt und die 80 Watt TGP nicht gehalten werden können. Nach wenigen Minuten sinkt der Wert unterhalb von 70 Watt, was man auch deutlich in der Auswertung sehen kann. Insgesamt lassen sich aber dennoch alle modernen Spiele flüssig mit höchsten Details in der Full-HD-Auflösung spielen. Weitere Gaming-Benchmarks stehen hier zur Verfügung.
Witcher 3 FPS-Diagramm
| min. | mittel | hoch | max. | |
|---|---|---|---|---|
| GTA V (2015) | 180 | 172.2 | 160.4 | 94.6 |
| The Witcher 3 (2015) | 181 | 81.4 | ||
| Dota 2 Reborn (2015) | 168.7 | 153.7 | 145.4 | 135 |
| Final Fantasy XV Benchmark (2018) | 109.9 | 84.2 | ||
| X-Plane 11.11 (2018) | 138.9 | 107 | 86.9 | |
| Far Cry 5 (2018) | 137 | 113 | 104 | 99 |
| Strange Brigade (2018) | 372 | 195.4 | 199.4 | 169.3 |
| Shadow of the Tomb Raider (2018) | 122 | 109 | ||
| F1 2021 (2021) | 298 | 249 | 208 | 113.2 |
| Cyberpunk 2077 1.6 (2022) | 95 | 82 | 72 | 68 |
| F1 22 (2022) | 198.3 | 199.2 | 148.7 | 56.7 |
| Call of Duty Modern Warfare 2 2022 (2022) | 88 | 80 | ||
| F1 23 (2023) | 177.9 | 180.7 | 143.7 | 43.8 |
| Cyberpunk 2077 (2023) | 67.11 | 60.59 |
Emissionen - Deutlich lautere Lüfter
Geräuschemissionen
Im Alltag bleibt der Surface Laptop Studio wie im letzten Jahr auch schon meistens lautlos, zumindest was die Lüfter angeht. Bei unseren Testgerät kommt es nämlich auch im Leerlauf fast konstant zu leichten elektronischen Geräuschen (Spratzeln). Sobald man den Prozessor und vor allem die Grafikkarte fordert wird es aber schnell laut und insgesamt sind die Lüfter auch noch einmal deutlich lauter geworden als beim alten Modell. Sowohl beim Spielen als auch im Stresstest zeigt unser Messgerät knapp 52 dB(A) an, was angesichts der durchschnittlichen Leistung kein besonders gutes Ergebnis darstellt. In den beiden schwächeren Profilen sind es maximal 41,4 dB(A) bzw. 42,8 dB(A). Bei einigen Spielen ist uns zudem noch deutlich hörbares Spulenfiepen aufgefallen.
Lautstärkediagramm
| Idle |
| 23.9 / 24.4 / 26.9 dB(A) |
| Last |
| 48.5 / 51.8 dB(A) |
 | ||
30 dB leise 40 dB(A) deutlich hörbar 50 dB(A) störend |
||
min: | ||
| Microsoft Surface Laptop Studio 2 RTX 4060 GeForce RTX 4060 Laptop GPU, i7-13700H, Kioxia XG8 KXG80ZNV1T02 | Apple MacBook Pro 14 2023 M2 Pro M2 Pro 19-Core GPU, M2 Pro, Apple SSD AP2048Z | Lenovo Yoga Pro 9-14IRP G8 GeForce RTX 4050 Laptop GPU, i7-13705H, Samsung PM9A1 MZVL21T0HCLR | Asus Zenbook Pro 14 OLED UX6404VI GeForce RTX 4070 Laptop GPU, i9-13900H, Micron 3400 2TB MTFDKBA2T0TFH | Asus ZenBook Pro 14 Duo UX8402VV-P1021W GeForce RTX 4060 Laptop GPU, i9-13900H, Samsung PM9A1 MZVL22T0HBLB | Asus ROG Zephyrus G14 GA402XY GeForce RTX 4090 Laptop GPU, R9 7940HS, Samsung PM9A1 MZVL21T0HCLR | Lenovo Legion Slim 5 14APH8 GeForce RTX 4060 Laptop GPU, R7 7840HS, SK Hynix HFS001TEJ9X115N | Microsoft Surface Laptop Studio i7 RTX 3050 Ti GeForce RTX 3050 Ti Laptop GPU, i7-11370H, SK Hynix PC711 1TB HFS001TDE9X084N | |
|---|---|---|---|---|---|---|---|---|
| Geräuschentwicklung | 13% | -1% | 8% | -13% | -3% | -1% | 8% | |
| aus / Umgebung * (dB) | 23.9 | 23.9 -0% | 24.8 -4% | 23.3 3% | 25.2 -5% | 23.3 3% | 22.8 5% | 24.7 -3% |
| Idle min * (dB) | 23.9 | 23.9 -0% | 24.8 -4% | 23.3 3% | 25.2 -5% | 23.6 1% | 22.8 5% | 24.7 -3% |
| Idle avg * (dB) | 24.4 | 23.9 2% | 24.8 -2% | 23.3 5% | 25.2 -3% | 23.6 3% | 27.3 -12% | 24.7 -1% |
| Idle max * (dB) | 26.9 | 23.9 11% | 24.8 8% | 23.3 13% | 32.5 -21% | 33 -23% | 30.7 -14% | 24.7 8% |
| Last avg * (dB) | 48.5 | 26 46% | 47.4 2% | 39.3 19% | 59.7 -23% | 49.5 -2% | 41.6 14% | 33.2 32% |
| Witcher 3 ultra * (dB) | 51.8 | 52.9 -2% | 48.8 6% | 52.2 -1% | 52.8 -2% | 44.5 14% | ||
| Last max * (dB) | 51.8 | 43.2 17% | 52.9 -2% | 48.8 6% | 60.9 -18% | 52.2 -1% | 52.6 -2% | 46.7 10% |
* ... kleinere Werte sind besser
Temperatur
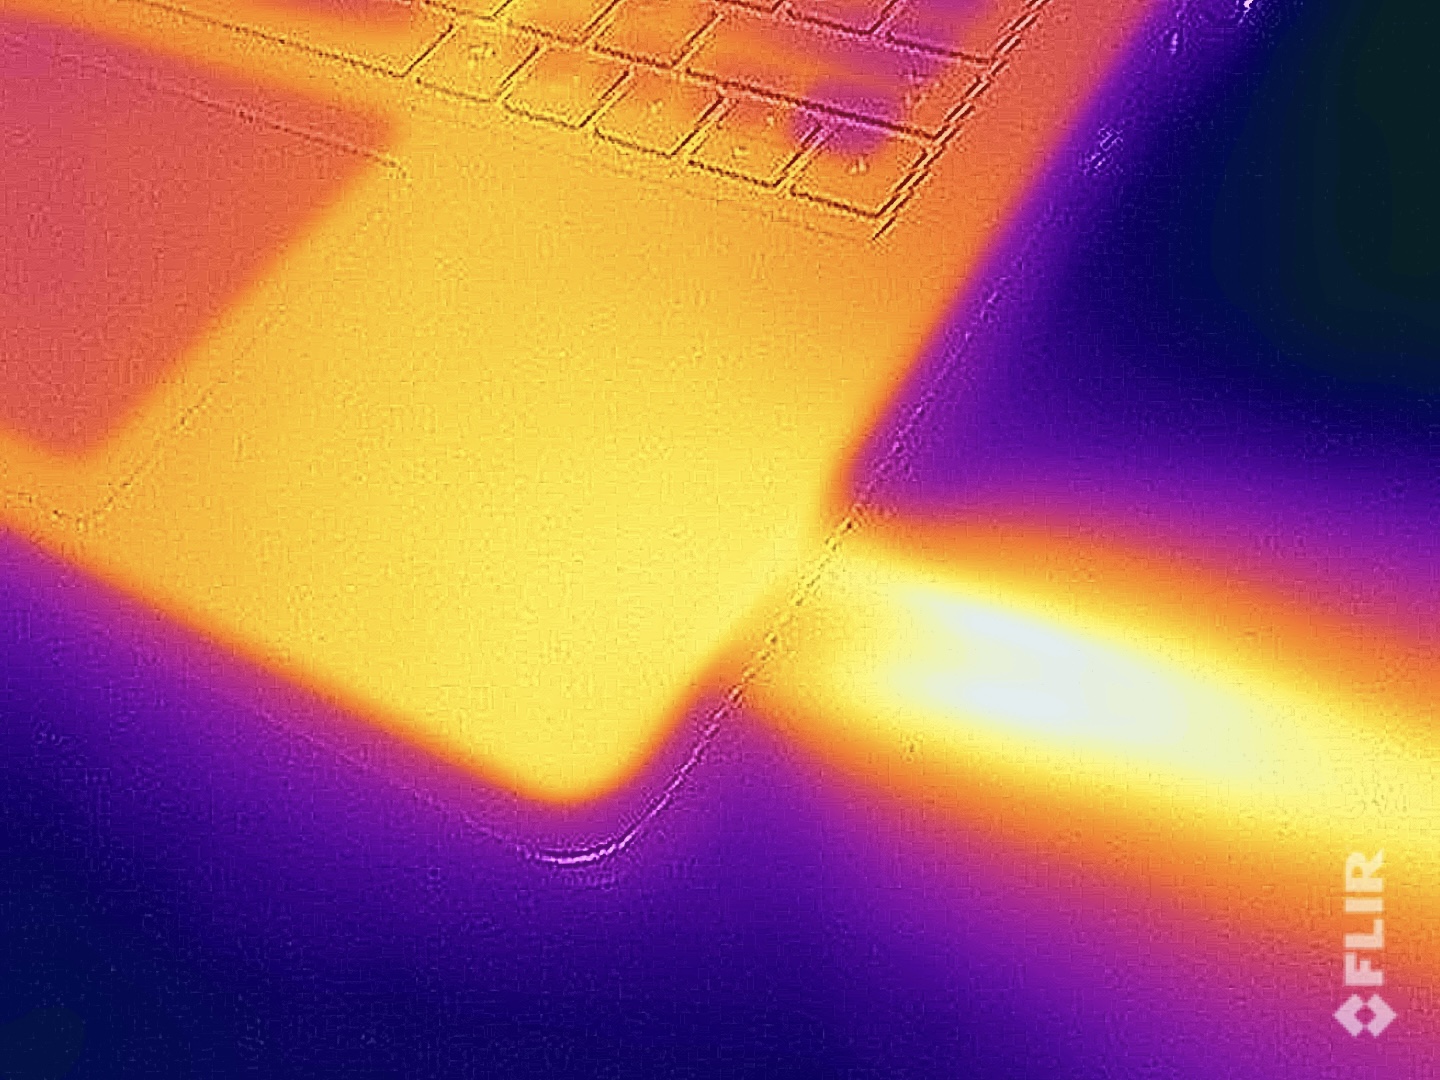
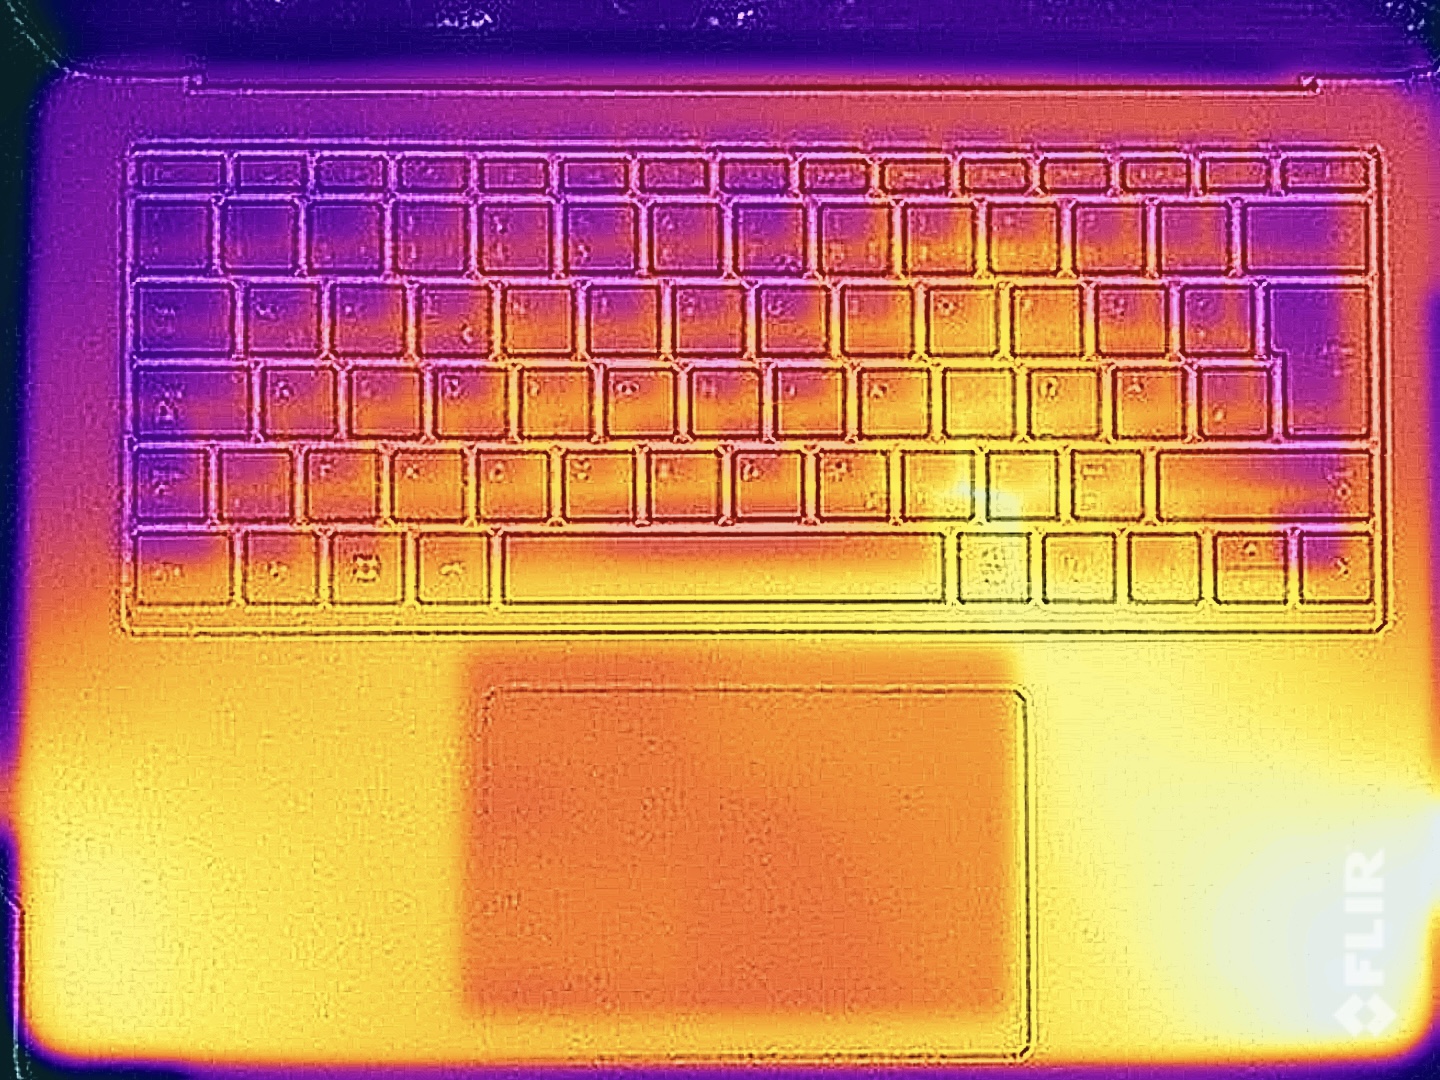
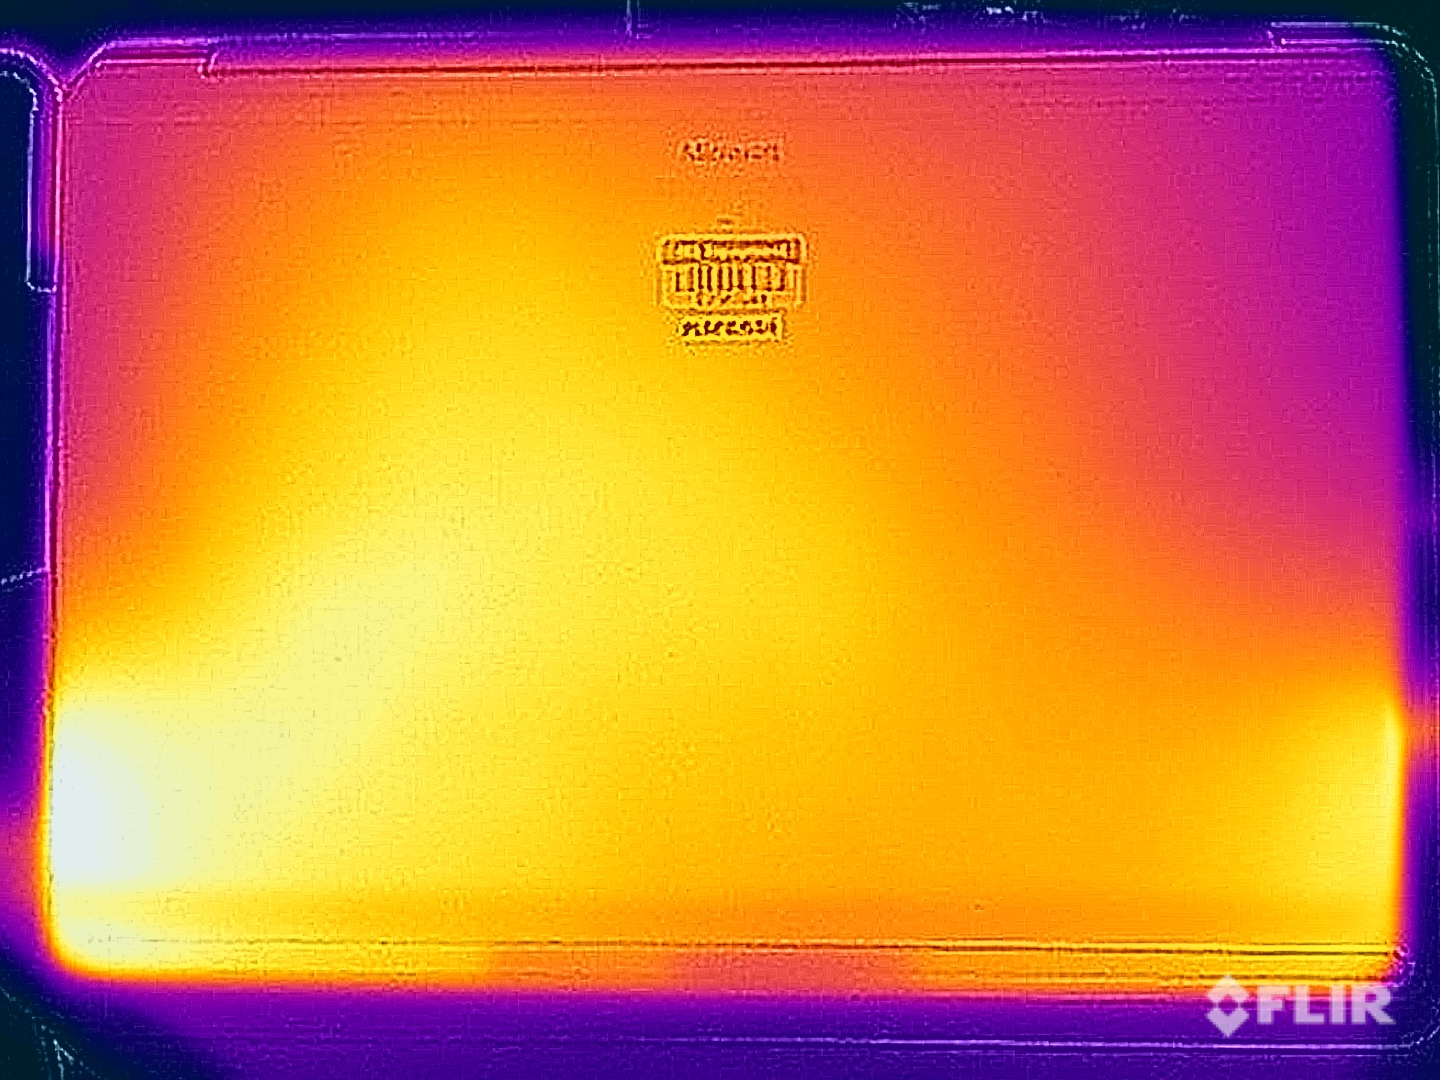
Bei den Oberflächentemperaturen zeigt sich das Problem der Kühlung. Im Alltag ist zwar alles im grünen Bereich, doch aufgrund der Positionierung der Lüfter im vorderen Bereich der Baseunit werden die Handballenauflagen sehr schnell sehr warm. Grundsätzlich kennen wir das schon vom alten Modell, doch beim Surface Laptop Studio 2 sind die Temperaturne gestiegen. Wir messen jetzt nämlich rund 40 °C im vorderen Bereich, was in Verbindung mit der Metalloberfläche schnell unangenehm wird. Da hilft es auch nichts, dass das restliche Gehäuse etwas kühler bleibt. Ein weiteres Problem ist die Positionierung der Lüfterauslässe an den beiden vorderen Kanten, was vor allem bei der Nutzung einer Maus stört.
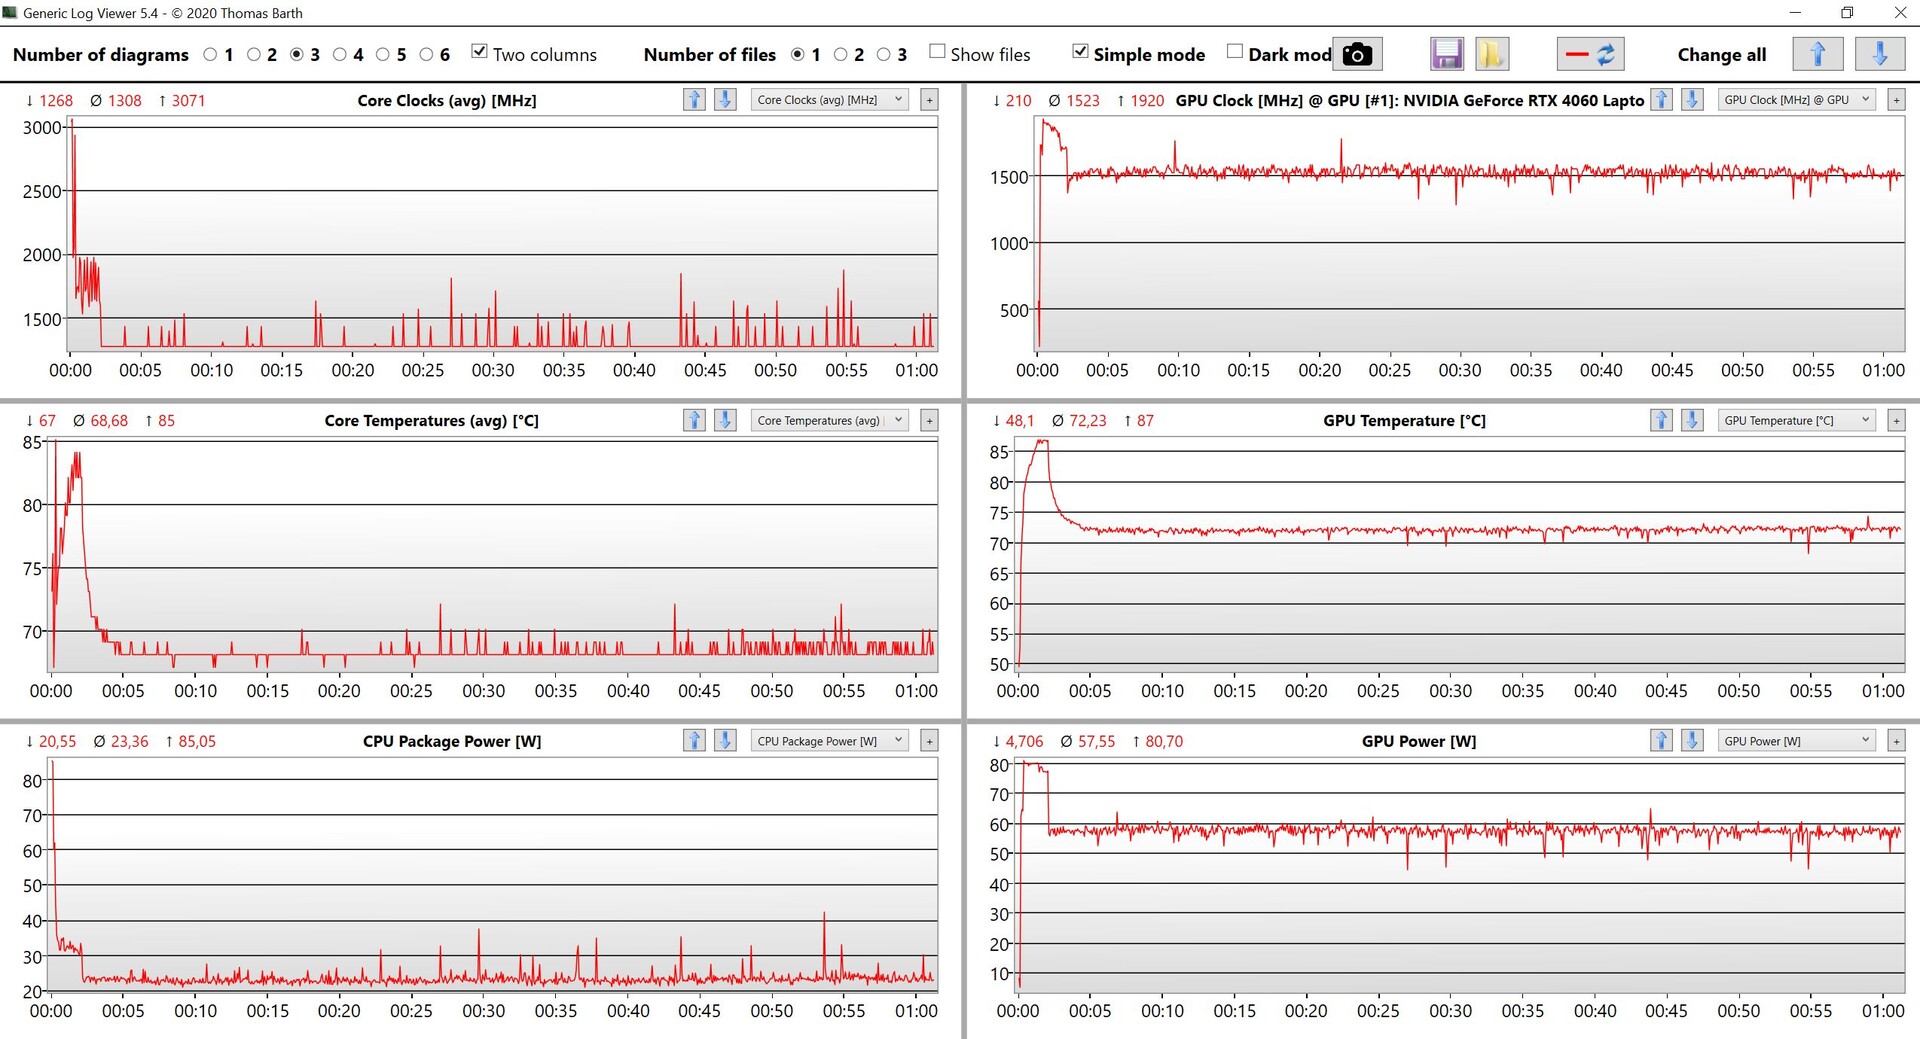
Im Stresstest mit kombinierter CPU-/GPU-Belastung bricht vor allem die CPU-Leistung sehr schnell ein und pendelt sich nach wenigen Minuten bei gerade einmal 23 Watt ein. Die GPU wird vom System klar bevorzugt und darf etwa 58 Watt verbrauchen.
(±) Die maximale Temperatur auf der Oberseite ist 40.4 °C. Im Vergleich liegt der Klassendurchschnitt bei 36.8 °C (von 21 bis 71 °C für die Klasse Multimedia).
(±) Auf der Unterseite messen wir eine maximalen Wert von 42.2 °C (im Vergleich zum Durchschnitt von 39.1 °C).
(+) Ohne Last messen wir eine durchschnittliche Temperatur von 26.4 °C auf der Oberseite. Der Klassendurchschnitt erreicht 31.3 °C.
(±) Beim längeren Spielen von The Witcher 3 erhitzt sich das Gerät durchschnittlich auf 37 °C. Der Durchschnitt der Klasse ist derzeit 31.3 °C.
(-) Die Handballen und der Touchpad-Bereich können sehr heiß werden mit maximal 40.4 °C.
(-) Die durchschnittliche Handballen-Temperatur anderer getesteter Geräte war 28.7 °C (-11.7 °C).
| Microsoft Surface Laptop Studio 2 RTX 4060 Intel Core i7-13700H, NVIDIA GeForce RTX 4060 Laptop GPU | Apple MacBook Pro 14 2023 M2 Pro Apple M2 Pro, Apple M2 Pro 19-Core GPU | Lenovo Yoga Pro 9-14IRP G8 Intel Core i7-13705H, NVIDIA GeForce RTX 4050 Laptop GPU | Asus Zenbook Pro 14 OLED UX6404VI Intel Core i9-13900H, NVIDIA GeForce RTX 4070 Laptop GPU | Asus ZenBook Pro 14 Duo UX8402VV-P1021W Intel Core i9-13900H, NVIDIA GeForce RTX 4060 Laptop GPU | Asus ROG Zephyrus G14 GA402XY AMD Ryzen 9 7940HS, NVIDIA GeForce RTX 4090 Laptop GPU | Lenovo Legion Slim 5 14APH8 AMD Ryzen 7 7840HS, NVIDIA GeForce RTX 4060 Laptop GPU | Microsoft Surface Laptop Studio i7 RTX 3050 Ti Intel Core i7-11370H, NVIDIA GeForce RTX 3050 Ti Laptop GPU | |
|---|---|---|---|---|---|---|---|---|
| Hitze | 7% | -12% | -9% | -11% | -7% | -8% | 7% | |
| Last oben max * (°C) | 40.4 | 46.9 -16% | 41 -1% | 40.6 -0% | 37.1 8% | 47 -16% | 40.4 -0% | 42.3 -5% |
| Last unten max * (°C) | 42.2 | 41.7 1% | 56.7 -34% | 49.5 -17% | 49.4 -17% | 46.5 -10% | 49.4 -17% | 38.2 9% |
| Idle oben max * (°C) | 26.6 | 21.4 20% | 27.4 -3% | 28.2 -6% | 30 -13% | 25.9 3% | 28.2 -6% | 23.4 12% |
| Idle unten max * (°C) | 27 | 21.4 21% | 29.1 -8% | 30.6 -13% | 32.4 -20% | 28 -4% | 29.8 -10% | 23.5 13% |
* ... kleinere Werte sind besser
Lautsprecher
Laut unserer Audioanalyse hat sich die Qualität der Lautsprecher etwas verschlechtert. Die maximale Lautstärke ist minimal geringer und vor allem beim Bass schneidet das neue Modell etwas schwächer ab. Die Konkurrenz in der Form des Lenovo Yoga Pro 9i 14 und Apple MacBook Pro 14 haben hier insgesamt einen leichten Vorteil. Ohne direkte Vergleichsmöglichkeit wird man im Alltag aber kaum von dem Soundsystem enttäuscht sein.
Microsoft Surface Laptop Studio 2 RTX 4060 Audio Analyse
(±) | Mittelmäßig laut spielende Lautsprecher (81.8 dB)
Bass 100 - 315 Hz
(±) | abgesenkter Bass - 12% geringer als der Median
(±) | durchschnittlich lineare Bass-Wiedergabe (10% Delta zum Vorgänger)
Mitteltöne 400 - 2000 Hz
(±) | zu hohe Mitten, vom Median 6.1% abweichend
(+) | lineare Mitten (2.3% Delta zum Vorgänger)
Hochtöne 2 - 16 kHz
(+) | ausgeglichene Hochtöne, vom Median nur 2.3% abweichend
(+) | sehr lineare Hochtöne (4.1% Delta zum Vorgänger)
Gesamt im hörbaren Bereich 100 - 16.000 Hz
(+) | hörbarer Bereich ist sehr linear (13.9% Abstand zum Median
Im Vergleich zu allen Geräten derselben Klasse
» 31% aller getesteten Geräte dieser Klasse waren besser, 4% vergleichbar, 65% schlechter
» Das beste Gerät hat einen Delta-Wert von 5%, durchschnittlich ist 17%, das schlechteste Gerät hat 45%
Im Vergleich zu allen Geräten im Test
» 16% aller getesteten Geräte waren besser, 4% vergleichbar, 80% schlechter
» Das beste Gerät hat einen Delta-Wert von 4%, durchschnittlich ist 23%, das schlechteste Gerät hat 134%
Apple MacBook Pro 14 2023 M2 Pro Audio Analyse
(+) | Die Lautsprecher können relativ laut spielen (84.3 dB)
Bass 100 - 315 Hz
(+) | guter Bass - nur 3.8% Abweichung vom Median
(+) | lineare Bass-Wiedergabe (6.9% Delta zum Vorgänger)
Mitteltöne 400 - 2000 Hz
(+) | ausgeglichene Mitten, vom Median nur 2.1% abweichend
(+) | lineare Mitten (2.2% Delta zum Vorgänger)
Hochtöne 2 - 16 kHz
(+) | ausgeglichene Hochtöne, vom Median nur 2.7% abweichend
(+) | sehr lineare Hochtöne (4.8% Delta zum Vorgänger)
Gesamt im hörbaren Bereich 100 - 16.000 Hz
(+) | hörbarer Bereich ist sehr linear (6% Abstand zum Median
Im Vergleich zu allen Geräten derselben Klasse
» 3% aller getesteten Geräte dieser Klasse waren besser, 0% vergleichbar, 97% schlechter
» Das beste Gerät hat einen Delta-Wert von 5%, durchschnittlich ist 17%, das schlechteste Gerät hat 45%
Im Vergleich zu allen Geräten im Test
» 0% aller getesteten Geräte waren besser, 0% vergleichbar, 100% schlechter
» Das beste Gerät hat einen Delta-Wert von 4%, durchschnittlich ist 23%, das schlechteste Gerät hat 134%
Lenovo Yoga Pro 9-14IRP G8 Audio Analyse
(±) | Mittelmäßig laut spielende Lautsprecher (81.8 dB)
Bass 100 - 315 Hz
(±) | abgesenkter Bass - 5.9% geringer als der Median
(±) | durchschnittlich lineare Bass-Wiedergabe (7.8% Delta zum Vorgänger)
Mitteltöne 400 - 2000 Hz
(+) | ausgeglichene Mitten, vom Median nur 2.3% abweichend
(+) | lineare Mitten (3.2% Delta zum Vorgänger)
Hochtöne 2 - 16 kHz
(+) | ausgeglichene Hochtöne, vom Median nur 2.5% abweichend
(+) | sehr lineare Hochtöne (3.4% Delta zum Vorgänger)
Gesamt im hörbaren Bereich 100 - 16.000 Hz
(+) | hörbarer Bereich ist sehr linear (7.3% Abstand zum Median
Im Vergleich zu allen Geräten derselben Klasse
» 6% aller getesteten Geräte dieser Klasse waren besser, 1% vergleichbar, 94% schlechter
» Das beste Gerät hat einen Delta-Wert von 5%, durchschnittlich ist 17%, das schlechteste Gerät hat 45%
Im Vergleich zu allen Geräten im Test
» 1% aller getesteten Geräte waren besser, 0% vergleichbar, 99% schlechter
» Das beste Gerät hat einen Delta-Wert von 4%, durchschnittlich ist 23%, das schlechteste Gerät hat 134%
Energieverwaltung - Ordentliche Ausdauer mit kleinem Akku
Energieaufnahme
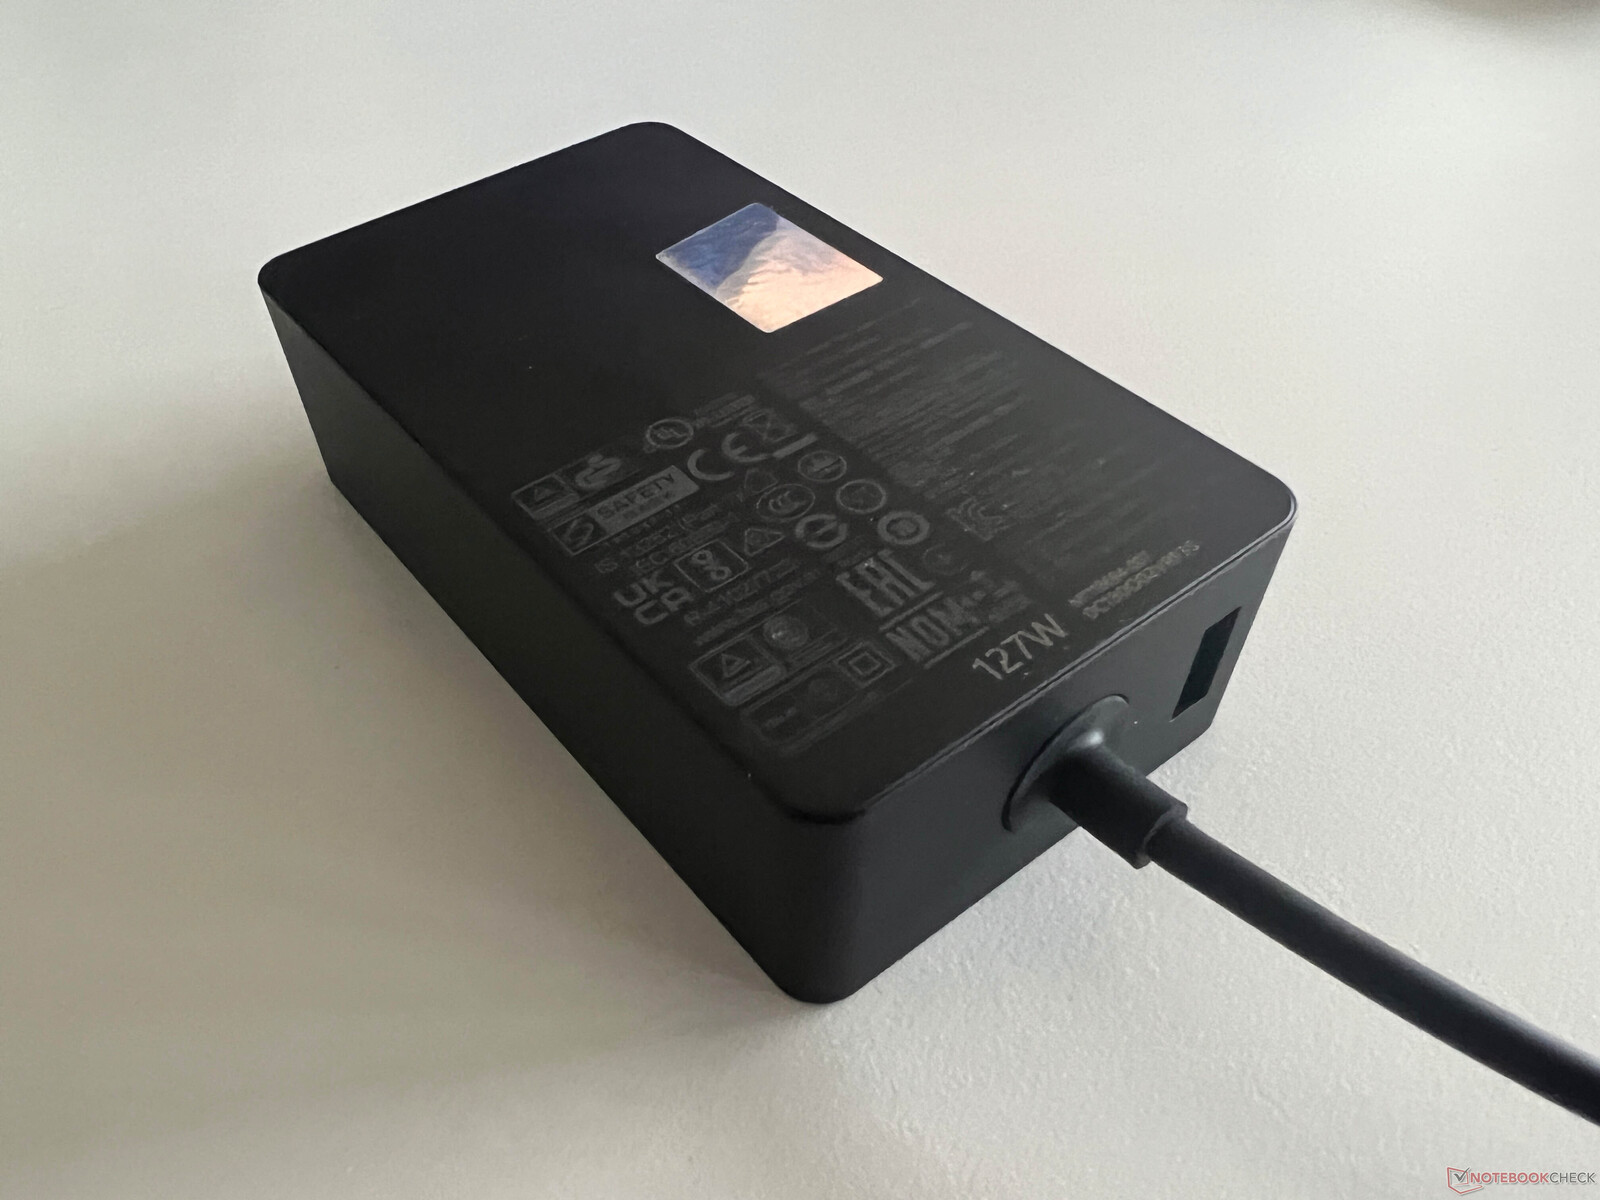
Unsere Verbrauchsmessungen zeigen keine Überraschungen und die Idle-Werte liegen auf dem Niveau des Vorgängers. Unter Last machen sich dann aber die stärkeren Komponenten bemerkbar der maximale Verbrauch liegt kurzzeitig bei 128 Watt, pendelt sich dann aber schnell bei etwa 110 Watt ein. Das mitgelieferte 127-Watt-Netzteil ist damit ausreichend dimensioniert und bietet noch einen zusätzlichen USB-A-Ausgang, um weitere Peripheriegeräte wie Smartphones zu Laden.
| Aus / Standby | |
| Idle | |
| Last |
|
Legende:
min: | |
| Microsoft Surface Laptop Studio 2 RTX 4060 i7-13700H, GeForce RTX 4060 Laptop GPU, Kioxia XG8 KXG80ZNV1T02, IPS, 2400x1600, 14.4" | Apple MacBook Pro 14 2023 M2 Pro M2 Pro, M2 Pro 19-Core GPU, Apple SSD AP2048Z, Mini-LED, 3024x1964, 14.2" | Lenovo Yoga Pro 9-14IRP G8 i7-13705H, GeForce RTX 4050 Laptop GPU, Samsung PM9A1 MZVL21T0HCLR, Mini-LED, 3072x1920, 14.5" | Asus Zenbook Pro 14 OLED UX6404VI i9-13900H, GeForce RTX 4070 Laptop GPU, Micron 3400 2TB MTFDKBA2T0TFH, OLED, 2880x1800, 14.5" | Asus ZenBook Pro 14 Duo UX8402VV-P1021W i9-13900H, GeForce RTX 4060 Laptop GPU, Samsung PM9A1 MZVL22T0HBLB, OLED, 2880x1800, 14.5" | Asus ROG Zephyrus G14 GA402XY R9 7940HS, GeForce RTX 4090 Laptop GPU, Samsung PM9A1 MZVL21T0HCLR, Mini-LED, 2560x1600, 14" | Lenovo Legion Slim 5 14APH8 R7 7840HS, GeForce RTX 4060 Laptop GPU, SK Hynix HFS001TEJ9X115N, OLED, 2880x1600, 14.5" | Microsoft Surface Laptop Studio i7 RTX 3050 Ti i7-11370H, GeForce RTX 3050 Ti Laptop GPU, SK Hynix PC711 1TB HFS001TDE9X084N, IPS, 2400x1600, 14.4" | Durchschnittliche NVIDIA GeForce RTX 4060 Laptop GPU | Durchschnitt der Klasse Multimedia | |
|---|---|---|---|---|---|---|---|---|---|---|
| Stromverbrauch | 0% | -104% | -61% | -60% | -89% | -62% | 9% | -133% | -34% | |
| Idle min * (Watt) | 3 | 2.4 20% | 10.9 -263% | 7.5 -150% | 8.5 -183% | 9.4 -213% | 7.3 -143% | 2.6 13% | 11.5 ? -283% | 5.62 ? -87% |
| Idle avg * (Watt) | 7.1 | 11.3 -59% | 17.7 -149% | 11.1 -56% | 8.8 -24% | 14.2 -100% | 9.6 -35% | 7.1 -0% | 16 ? -125% | 10.2 ? -44% |
| Idle max * (Watt) | 7.6 | 11.5 -51% | 19.3 -154% | 11.6 -53% | 16.5 -117% | 14.5 -91% | 17.3 -128% | 7.9 -4% | 20.3 ? -167% | 12.5 ? -64% |
| Last avg * (Watt) | 73.1 | 59.6 18% | 93.3 -28% | 91.9 -26% | 102 -40% | 79 -8% | 76.6 -5% | 76.8 -5% | 92.9 ? -27% | 65 ? 11% |
| Witcher 3 ultra * (Watt) | 113.9 | 55.9 51% | 129.5 -14% | 132.2 -16% | 101.2 11% | 172 -51% | 152 -33% | 83 27% | ||
| Last max * (Watt) | 128.5 | 100 22% | 150.2 -17% | 208 -62% | 140 -9% | 220.8 -72% | 160.9 -25% | 97.3 24% | 210 ? -63% | 111.9 ? 13% |
* ... kleinere Werte sind besser
Energieaufnahme Witcher 3 / Stresstest
Energieaufnahme mit externem Monitor
Akkulaufzeit

Microsoft verwendet den gleichen 58-Wh-Akku wie beim letztjährigen Modell und damit handelt es sich um den kleinsten Akku innerhalb unserer Vergleichsgruppe. Wenn man das MacBook Pro 14 ausklammert sind die Ergebnisse aber dennoch konkurrenzfähig. Im Video-Test mit 150 cd/m² (entspricht beim Testgerät 62 % der maximalen Helligkeit) ermitteln wir sehr gute 11:15 Stunden und im WLAN-Test gute 8:18 Stunden. Mit der maximalen SDR-Helligkeit sind es im WLAN-Test dann noch knapp 6 Stunden (jeweils mit 120 Hz). Ein vollständiger Ladevorgang benötigt bei eingeschaltetem Gerät 126 Minuten, wobei 80 % der Kapazität schon nach 65 Minuten wieder zur Verfügung stehen.
Update 06.10.2023: Wir haben jetzt noch weitere Akkutests durchgeführt. Bei einer reduzierten Frequenz von 60 Hz konnten wir Verbesserungen erkennen, denn sowohl im WLAN-Test bei voller Bildschirmhelligkeit (6:51h) als auch mit 150 cd/m² (9:35h) hält der Akku jetzt rund eine Stunde länger durch. Bei unserem Videotest mit 150 cd/m² ist es immerhin eine halbe Stunde mehr (11:45h). Im HDR-Modus läuft ein YouTube-HDR-Video mit voller Bildschirmhelligkeit für etwas mehr als 3,5 Stunden (3:38h).
| Microsoft Surface Laptop Studio 2 RTX 4060 i7-13700H, GeForce RTX 4060 Laptop GPU, 58 Wh | Apple MacBook Pro 14 2023 M2 Pro M2 Pro, M2 Pro 19-Core GPU, 70 Wh | Lenovo Yoga Pro 9-14IRP G8 i7-13705H, GeForce RTX 4050 Laptop GPU, 75 Wh | Asus Zenbook Pro 14 OLED UX6404VI i9-13900H, GeForce RTX 4070 Laptop GPU, 76 Wh | Asus ZenBook Pro 14 Duo UX8402VV-P1021W i9-13900H, GeForce RTX 4060 Laptop GPU, 76 Wh | Asus ROG Zephyrus G14 GA402XY R9 7940HS, GeForce RTX 4090 Laptop GPU, 76 Wh | Lenovo Legion Slim 5 14APH8 R7 7840HS, GeForce RTX 4060 Laptop GPU, 73.6 Wh | Microsoft Surface Laptop Studio i7 RTX 3050 Ti i7-11370H, GeForce RTX 3050 Ti Laptop GPU, 58 Wh | Durchschnitt der Klasse Multimedia | |
|---|---|---|---|---|---|---|---|---|---|
| Akkulaufzeit | 18% | -23% | -29% | 34% | -34% | -26% | -17% | 24% | |
| H.264 (h) | 11.3 | 15.3 35% | 9.1 -19% | 8.5 -25% | 7.2 -36% | 12.3 9% | 16.8 ? 49% | ||
| WLAN (h) | 8.3 | 13.5 63% | 8 -4% | 7.6 -8% | 9 8% | 7.5 -10% | 7.5 -10% | 8 -4% | 12.3 ? 48% |
| Last (h) | 2.2 | 1.2 -45% | 1.2 -45% | 1 -55% | 3.5 59% | 1 -55% | 1.3 -41% | 1 -55% | 1.645 ? -25% |
Pro
Contra
Fazit - Surface Laptop Studio 2 mit Licht und Schatten
Microsoft hat mit dem neuen Surface Laptop Studio 2 zwei große Kritikpunkte des Vorgängers behoben, denn neben mehr Anschlüssen (USB-A und ein schneller Kartenleser) gibt es jetzt auch einen aktuellen Prozessor. Die Grafikkarte wurde ebenfalls auf den aktuellen Stand gebracht und die Leistung geht für einen Multimedia-Laptop in Ordnung. Aufgrund der gestiegenen Leistung kommt das Konzept mit der Kühlung im vorderen Bereich der Baseunit aber an ihre Grenzen. Die Handballenauflagen werden unter Last schnell unangenehm warm und die warme Luft wird an der Vorderseite abgeführt, was die Nutzung einer Maus erschwert. Zudem kommt es fast konstant zu leisen elektronischen Geräuschen, was nervig ist.
Die Konstruktion mit den beiden Ebenen der Baseunit hat zudem den Nachteil, dass sie vergleichsweise dick und unhandlich ist, zudem ist der Betrieb als Tablet nicht besonders komfortabel. An der Gehäusequalität an sich gibt es aber keine Kritik und auch der Klappmechanismus vom Display hinterlässt einen guten Eindruck. Das Display selbst ist sehr gut und bietet akkurate Farben, spiegelt aber auch sehr stark und deckt lediglich den kleinen sRGB-Farbraum ab, was angesichts des Preises schon überrascht.
Microsoft spendiert dem neuen Surface Laptop Studio 2 mehr Anschlüsse und mehr Leistung, doch die Kühlung kommt dadurch an ihre Grenzen. Die nicht vorhandene Wartungsmöglichkeiten sind ein großer Nachteil und die Preise sind extrem hoch.
Der Surface Laptop Studio 2 bietet nach wie vor ein spannendes Konzept, aber das Preis-Leistungsverhältnis ist nicht gut. Zudem verstehen wir nicht, warum Microsoft beim Kauf nur so wenige Modelle bietet und den Nutzern 64 GB RAM aufzwingt, wenn man die schnellere RTX 4060 Laptop möchte. Aufgrund der nicht vorhandene Wartungsmöglichkeiten (man kann das Gehäuse nicht einmal öffnen) gibt es hier auch keine Aufrüstmöglichkeiten.
Bei der aktuellen Konkurrenz wird es der Surface Laptop Studio 2 nicht leicht haben. Das Apple MacBook Pro 14 hat zwar keinen Touchscreen und kein USB-A, aber dafür bleibt das System leiser, der Akku hält länger und das Display ist vor allem im HDR-Betrieb deutlich überlegen. Zudem kann man hier wenigstens die Lüfter reinigen. Im Windows-Lager ist das Zenbook Pro Duo mit dem zweiten Touchscreen eine interessante Alternative, wenn man viel mit Touch arbeitet. Ansonsten ist das Lenovo Yoga Pro 9i 14 eine bessere Alternative und wer kein problem mit einem Gamer hat, bekommt beim Lenovo Legion Slim 5 14 mehr Leistung und ein OLED-Panel für nicht einmal die Hälfte des Preises.
Preis und Verfügbarkeit
Der Microsoft Surface Laptop Studio 2 ist ab sofort ab 2.239 Euro erhältlich (beispielsweise Amazon oder Notebooksbilliger). Unsere Testkonfiguration mit der RTX 4060 Laptop wird für 3.799 Euro angeboten (beispielsweise Amazon & Cyberport).
Microsoft Surface Laptop Studio 2 RTX 4060
- 03.10.2023 v7 (old)
Andreas Osthoff
Transparenz
Die Auswahl der zu testenden Geräte erfolgt innerhalb der Redaktion. Das vorliegende Testmuster wurde dem Autor vom Hersteller oder einem Shop zu Testzwecken leihweise zur Verfügung gestellt. Eine Einflussnahme des Leihstellers auf den Testbericht gab es nicht, der Hersteller erhielt keine Version des Reviews vor der Veröffentlichung. Es bestand keine Verpflichtung zur Publikation. Als eigenständiges, unabhängiges Unternehmen unterliegt Notebookcheck keiner Diktion von Herstellern, Shops und Verlagen.
So testet Notebookcheck
Pro Jahr werden von Notebookcheck hunderte Laptops und Smartphones unabhängig in von uns standardisierten technischen Verfahren getestet, um eine Vergleichbarkeit aller Testergebnisse zu gewährleisten. Seit rund 20 Jahren entwickeln wir diese Testmethoden kontinuierlich weiter und setzen damit Branchenstandards. In unseren Testlaboren kommt ausschließlich hochwertiges Messequipment in die Hände erfahrener Techniker und Redakteure. Die Tests unterliegen einer mehrstufigen Kontrolle. Unsere komplexe Gesamtbewertung basiert auf hunderten fundierten Messergebnissen und Benchmarks, womit Ihnen Objektivität garantiert ist. Weitere Informationen zu unseren Testmethoden gibt es hier.
Preisvergleich
