Lenovo Legion Slim 5 14APH8 Laptop im Test: OLED-Perfektion in 120 Hz und 2,8K
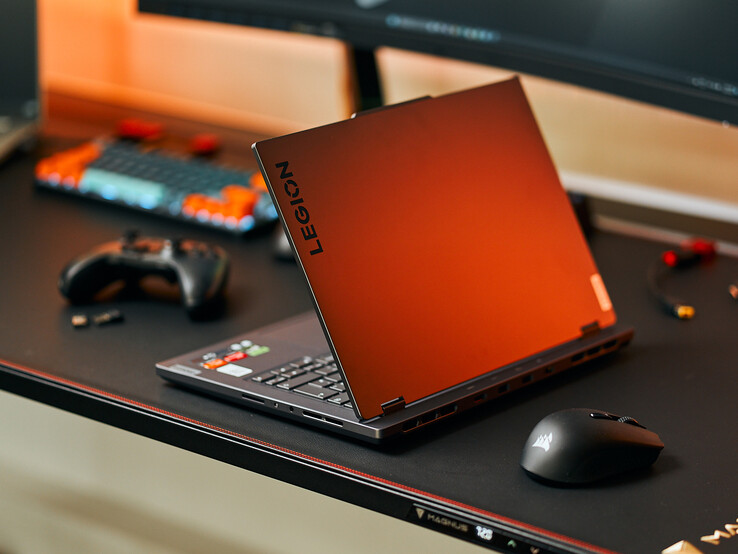
Das Legion Slim 5 14 ist der erste und kleinste 14-Zoll-Legion-Laptop dieser Serie. Es hebt sich durch sein 120-Hz-OLED-Display und die etwas größere Bildschirmgröße von 14,5 Zoll im Vergleich zu den 14,0-Zoll-IPS-Panelen von Alternativen wie Razer, Acer oder Azus ab.
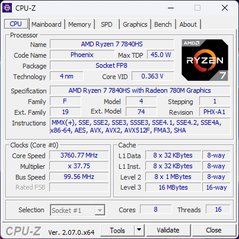
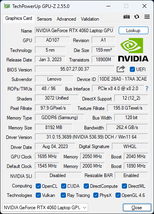
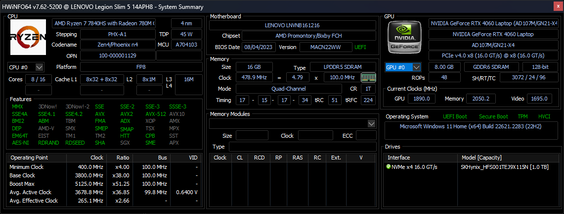
Unser Testmodel ist eine Mittelklasse-Konfiguration mit Zen-4-Ryzen-7-7840HS-CPU und 105-W-GeForce-RTX-4060-GPU. Erhältlich ist das Gerät im Handel für rund 1700 Euro. Weitere Konfigurationen sind mit der schnelleren Ryzen 9 7940HS oder der langsameren RTX 4050 ausgestattet. Das 14,5-Zoll-2,8K-120-Hz-OLED-Display (ohne Touchfunktion) bleibt unverändert. Zum Zeitpunkt der Abfassung dieses Testberichts gab es keine Informationen über mögliche Konfigurationen mit Intel-CPU.
Das Lenovo-Modell steht im direkten Wettstreit mit weiteren 14-Zoll-Gaming-Laptops wie Acer Predator Triton 14, Razer Blade 14, Asus ROG Zephyrus G14, oder Alienware x14.
Weitere Lenovo-Testberichte:
Potenzielle Mitstreiter im Vergleich
Bew. | Datum | Modell | Gewicht | Dicke | Größe | Auflösung | Preis ab |
|---|---|---|---|---|---|---|---|
| 87.7 % v7 (old) | 09 / 2023 | Lenovo Legion Slim 5 14APH8 R7 7840HS, GeForce RTX 4060 Laptop GPU | 1.7 kg | 20.79 mm | 14.50" | 2880x1600 | |
| 87.3 % v7 (old) | 07 / 2023 | Acer Predator Triton 14 PT14-51 i7-13700H, GeForce RTX 4050 Laptop GPU | 1.7 kg | 19.81 mm | 14.00" | 2560x1600 | |
| 88.7 % v7 (old) | 06 / 2023 | Razer Blade 14 RTX 4070 R9 7940HS, GeForce RTX 4070 Laptop GPU | 1.8 kg | 17.99 mm | 14.00" | 2560x1600 | |
| 90 % v7 (old) | 04 / 2023 | Asus ROG Zephyrus G14 GA402XY R9 7940HS, GeForce RTX 4090 Laptop GPU | 1.7 kg | 20.5 mm | 14.00" | 2560x1600 | |
| 86.7 % v7 (old) | 03 / 2022 | Alienware x14 i7 RTX 3060 i7-12700H, GeForce RTX 3060 Laptop GPU | 1.8 kg | 14.5 mm | 14.00" | 1920x1080 | |
| 85.7 % v7 (old) | 07 / 2023 | Lenovo LOQ 15APH8 R7 7840HS, GeForce RTX 4050 Laptop GPU | 2.5 kg | 25.2 mm | 15.60" | 1920x1080 |
Gehäuse — Sieht aus wie ein ThinkBook, spielt sich wie ein Legion
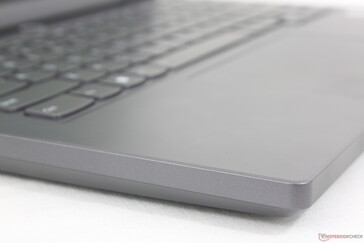
Lenovo setzt wie bei vielen seiner Legion- und ThinkBook-Modelle glatte Metalloberflächen im monotonen Grau ein. Gamern, denen das eher exzentrische Aussehen von Alienware und Asus ROG weniger gefällt, freuen sich vermutlich über das schlankere, RGB-lose Design des Legion Slim 5 14. Insbesondere im Klassenzimmer oder anderen Situationen außerhalb der Gaming-Welt könnte diese Designentscheidung daher von Vorteil sein.
Die Gehäusequalität ist von oben bis unten sehr gut und vermittelt einen stabilen ersten Eindruck. Die Oberflächen sind nicht so steif wie beim Blade 14 oder Alienware x14; das wird bei Druck auf die Keyboardmitte oder auf die Handballenablage bzw. beim Verziehen des Bildschirms deutlich. Dennoch ist die Durchbiegung minimal.
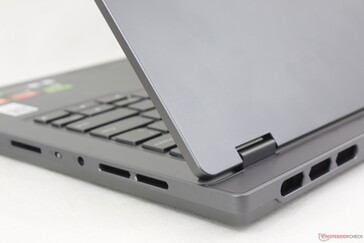
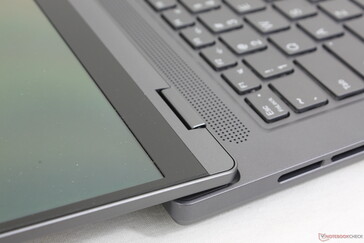
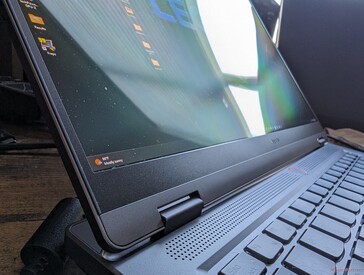
Erwähnenswert sind an dieser Stelle auch die Scharniere, die es ermöglichen, den Laptop auf 180° aufzuklappen. Das ist bei anderen 14-Zoll-Laptops selten der Fall. Auch die Steifigkeit der Scharniere ist zufriedenstellend, könnte bei größerem Öffnungswinkel allerdings etwas besser sein, um einen möglichst langlebigen Eindruck zu verleihen.
Das größere 14,5-Zoll-Display und die verlängerte Rückseite des Legion-Designs verleihen unserem Legion Slim 5 14 eine größere Stellfläche im Vergleich zu Mitstreitern wie Blade 14, Zephyrus G14 bzw. Predator Triton 14. Das Gewicht ist allerdings ähnlich, was bedeutet, dass das Legion Slim 5 15 wohl eine geringere Dichte hat.
Connectivity — Wo ist der USB-4-Anschluss?
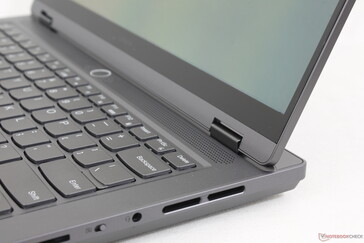
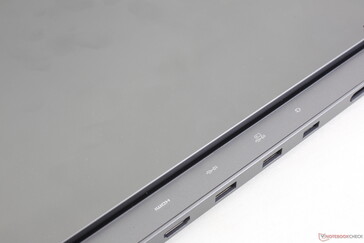
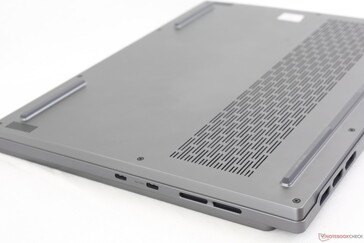
Die Anschlussoptionen ähneln insbesondere denen des Blade 14, wenngleich sich die Positionierung deutlich unterscheidet. Letzere gefällt uns beim Legion Slim 5 weniger, da die Anschlüsse ungleich verteilt sind und sich großteils auf der Rückseite befinden. Das gilt etwa auch für die USB-A-Ports.
Leider fehlen dem Gerät USB-4 und Thunderbolt-Anschlüsse. Auch ein Kensington Lock ist nicht vorhanden.
SD-Katenleser
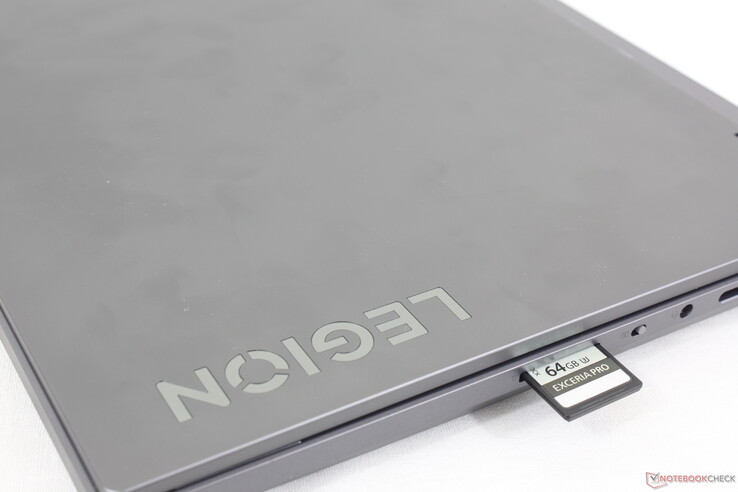
Der integrierte SD-Kartenleser ist deutlich schneller als derjenige im Predator Triton 14, kann aber nicht mit denjenigen im Zephyrus G14 oder Alienware x14 mithalten. Das Verschieben von 1 GB Fotos von unserer UHS-II-Testkarte auf den Desktop dauert 12 Sekunden. Beim Alienware x14 wird diese Aufgabe doppelt so schnell erledigt.
| SD Card Reader | |
| average JPG Copy Test (av. of 3 runs) | |
| Alienware x14 i7 RTX 3060 (Angelbird AV Pro V60) | |
| Asus ROG Zephyrus G14 GA402XY (Angelibrid AV Pro V60) | |
| Lenovo Legion Slim 5 14APH8 (Toshiba Exceria Pro SDXC 64 GB UHS-II) | |
| Acer Predator Triton 14 PT14-51 (AV PRO microSD 128 GB V60) | |
| maximum AS SSD Seq Read Test (1GB) | |
| Asus ROG Zephyrus G14 GA402XY (Angelibrid AV Pro V60) | |
| Alienware x14 i7 RTX 3060 (Angelbird AV Pro V60) | |
| Lenovo Legion Slim 5 14APH8 (Toshiba Exceria Pro SDXC 64 GB UHS-II) | |
| Acer Predator Triton 14 PT14-51 (AV PRO microSD 128 GB V60) | |
Kommunikation
Anstatt des herkömmlichen Intel AX211 ist unser Testgerät mit einem MediaTek MT7922 ausgestattet und unterstützt somit Wi-Fi 6E und Bluetooth 5.2. Die Leistung war während unseres Testdurchlaufs gleichmäßig und es kam zu keinerlei Verbindungsproblemen mit unserem 6-GHz-AXE11000-Netzwerk.
| Networking | |
| iperf3 transmit AX12 | |
| Alienware x14 i7 RTX 3060 | |
| iperf3 receive AX12 | |
| Alienware x14 i7 RTX 3060 | |
| iperf3 transmit AXE11000 | |
| Asus ROG Zephyrus G14 GA402XY | |
| Acer Predator Triton 14 PT14-51 | |
| Lenovo Legion Slim 5 14APH8 | |
| Razer Blade 14 RTX 4070 | |
| Lenovo LOQ 15APH8 | |
| iperf3 receive AXE11000 | |
| Acer Predator Triton 14 PT14-51 | |
| Asus ROG Zephyrus G14 GA402XY | |
| Razer Blade 14 RTX 4070 | |
| Lenovo Legion Slim 5 14APH8 | |
| Lenovo LOQ 15APH8 | |
| iperf3 transmit AXE11000 6GHz | |
| Lenovo Legion Slim 5 14APH8 | |
| Razer Blade 14 RTX 4070 | |
| iperf3 receive AXE11000 6GHz | |
| Razer Blade 14 RTX 4070 | |
| Lenovo Legion Slim 5 14APH8 | |
Webcam
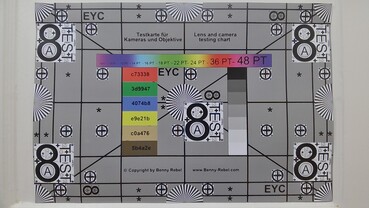
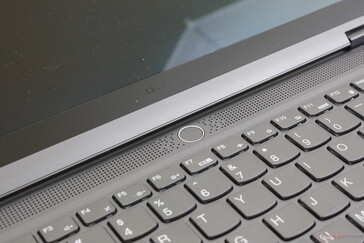
Die 2-MP-Webcam ist bei Gaming-Laptops Standard. Unterstützt werden sowohl IR als auch eine Taste, um die Kamera zu deaktivieren.
Wartung
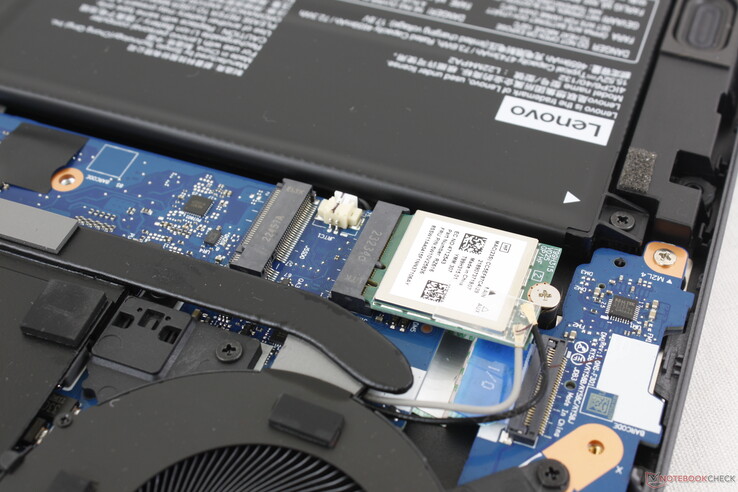
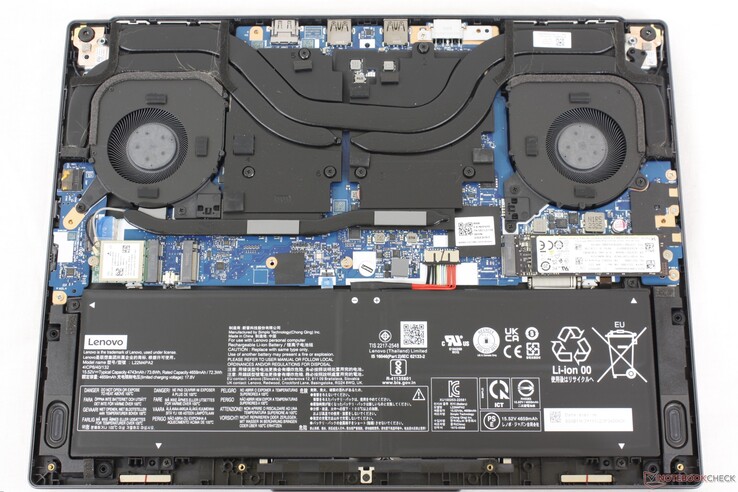
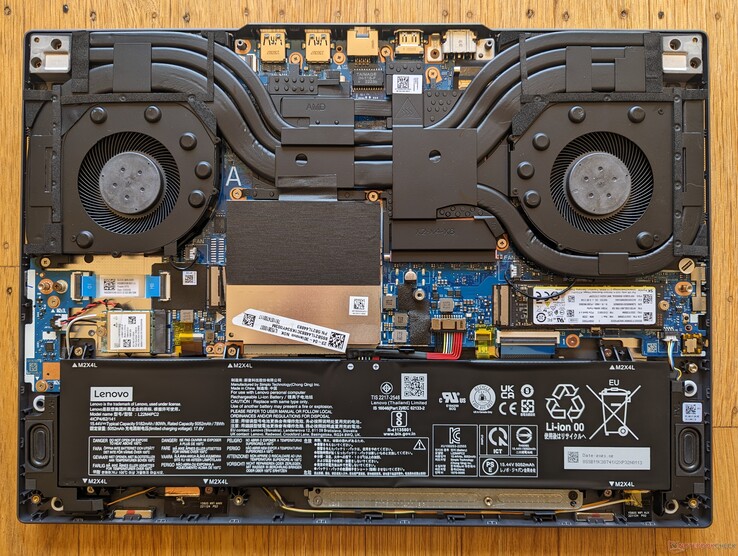
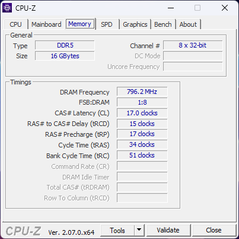
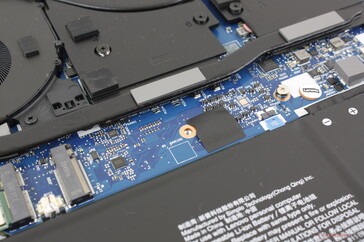
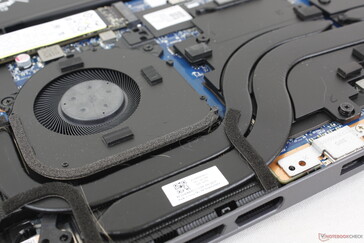
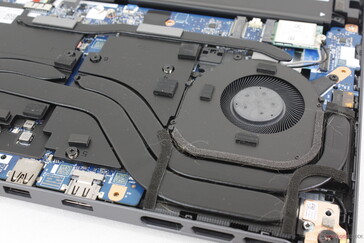
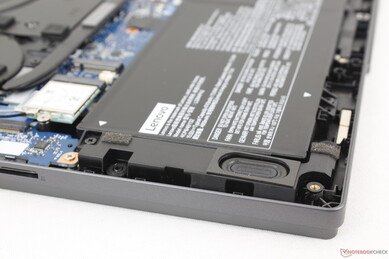
Die Unterseite wird mit 10 Kreuzschrauben festgehalten und lässt sich leicht abnehmen. Das RAM-Modul ist angelötet. Nur die beiden M.2-2280-SSD-Slots und das WLAN-Modul lassen sich austauschen. Im Vergleich dazu lässt sich der Arbeitsspeicher beim 2023er Blade 14 und beim Zephyrus G14 einfach ersetzen.
Zubehör und Garantie
Der Laptop wird mit einem Netzgerät und etwas Papierkram ausgeliefert. Zusätzliches Zubehör ist nicht vorhanden. Das Gerät ist mit einem dreimonatigen Premium-Care-Abo ausgestattet.
Eingabegeräte — Kein RGB-Backlight
Tastatur
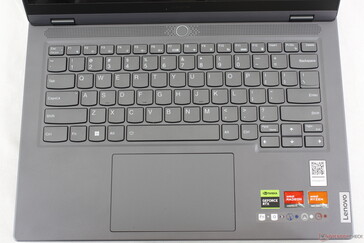
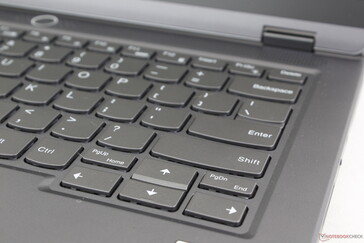
Die Tastatur hat das gleiche Look-and-Feel wie die QWERTZ-Tasten des größeren Legion Slim 5 16 – nur die Pfeiltasten sind aus Platzgründen kleiner und der Ziffernblock fehlt. Das Tippgefühl ist knackig, das Feedback der einzelnen Tasten ist besser als bei den weicheren Tasten des Blade 14. Leider wurden die schmalen Bild-Rauf- und Bild-Runter-Tasten zwischen die Pfeiltasten gequetscht. Deren Bedienung ist dementsprechend unangenehm.
Lenovo hat sein Legion Slim 5 14 nur mit einer einheitlichen weißen Tastaturhintergrundbeleuchtung ausgestattet. Die Mitstreiter von Razer, Asus und Alienware beeindrucken hingegen alle mit Multi-Zone-RGB-Backlighting.
Touchpad
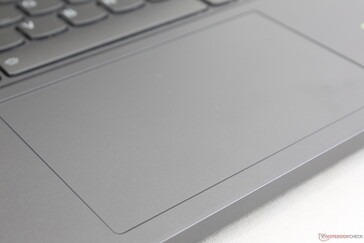
Das Clickpad (12 x 7,5 cm) ist größer als das des Alienware x14 (10,8 x 5,5 cm) aber kleiner als das des Blade 14 (15 x 8,5 cm). Insgesamt hat es eine glatte Oberfläche und lässt sich verlässlich und relativ lautlos bedienen. Das Feedback der Tastaturbetätigung könnte etwas deutlicher sein.
Display — Ein wichtiges Feature fehlt
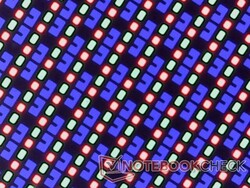
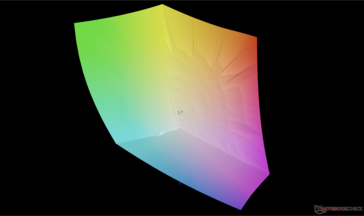
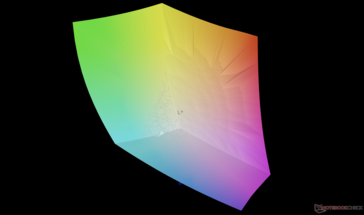
Das OLED-Panel ist das Highlight des Legion Slim 5 14, da ein solches Display aktuell auf keinem anderen 14-Zoll-Gaming-Laptop erhältlich ist. Es hat eine native Bildwiederholrate von 120 Hz, eine brillante Auflösung von 2,8K und deckt den gesamten DCI-P3-Farbraum ab. Somit eignet sich das Gerät sowohl fürs Gamen als auch für das Contentdesign. Die meisten anderen OLED-Panele, etwa im billigeren Asus VivoBook, sind auf 60 oder 90 Hz begrenzt. Das vorliegende Panel wird sogar mit Pantone-Zertifizierung ausgeliefert, die wir uns von einem fürs Gamen entwickelten Legion-Laptop nicht erwartet hätten.
Der größte Nachteil des Displays ist die fehlende Unterstützung für G-Sync. Das ist bei einem teuren Gaming-Laptop wie diesem eine Enttäuschung.
| |||||||||||||||||||||||||
Ausleuchtung: 97 %
Helligkeit Akku: 377.5 cd/m²
Kontrast: ∞:1 (Schwarzwert: 0 cd/m²)
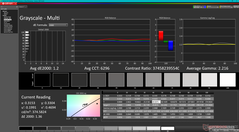
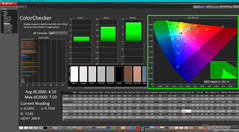
ΔE ColorChecker Calman: 4.19 | ∀{0.5-29.43 Ø4.76}
calibrated: 0.81
ΔE Greyscale Calman: 1.2 | ∀{0.09-98 Ø5}
96.5% AdobeRGB 1998 (Argyll 3D)
100% sRGB (Argyll 3D)
99.9% Display P3 (Argyll 3D)
Gamma: 2.22
CCT: 6296 K
| Lenovo Legion Slim 5 14APH8 Samsung SDC ATNA45AF02-2, OLED, 2880x1600, 14.5" | Acer Predator Triton 14 PT14-51 BOE NE140QDM-NY1, IPS, 2560x1600, 14" | Razer Blade 14 RTX 4070 AU Optronics B140QAN06.U, IPS, 2560x1600, 14" | Asus ROG Zephyrus G14 GA402XY B140QAN06.S, Mini-LED, 2560x1600, 14" | Alienware x14 i7 RTX 3060 SHP154D, IPS, 1920x1080, 14" | Lenovo LOQ 15APH8 BOE NJ NE156FHM-NX3, IPS, 1920x1080, 15.6" | |
|---|---|---|---|---|---|---|
| Display | -5% | -5% | -1% | -3% | -52% | |
| Display P3 Coverage (%) | 99.9 | 96.9 -3% | 97.3 -3% | 99.6 0% | 99.6 0% | 40.2 -60% |
| sRGB Coverage (%) | 100 | 99.9 0% | 99.8 0% | 100 0% | 100 0% | 60.2 -40% |
| AdobeRGB 1998 Coverage (%) | 96.5 | 85.5 -11% | 85.3 -12% | 93.4 -3% | 87.6 -9% | 41.5 -57% |
| Response Times | -1143% | -1049% | -1479% | -884% | -3816% | |
| Response Time Grey 50% / Grey 80% * (ms) | 0.79 ? | 15.1 ? -1811% | 11.9 ? -1406% | 17.2 ? -2077% | 9.6 ? -1115% | 42.7 ? -5305% |
| Response Time Black / White * (ms) | 1.01 ? | 5.8 ? -474% | 8 ? -692% | 9.9 ? -880% | 7.6 ? -652% | 24.5 ? -2326% |
| PWM Frequency (Hz) | 240.5 ? | 5430 | ||||
| Bildschirm | -33% | -52% | 28% | -38% | -62% | |
| Helligkeit Bildmitte (cd/m²) | 377.5 | 547 45% | 559.3 48% | 535 42% | 434 15% | 346.2 -8% |
| Brightness (cd/m²) | 381 | 516 35% | 560 47% | 563 48% | 411 8% | 329 -14% |
| Brightness Distribution (%) | 97 | 88 -9% | 88 -9% | 91 -6% | 89 -8% | 81 -16% |
| Schwarzwert * (cd/m²) | 0.56 | 0.44 | 0.25 | 0.31 | ||
| Delta E Colorchecker * | 4.19 | 3.28 22% | 4.44 -6% | 1 76% | 3 28% | 4.19 -0% |
| Colorchecker dE 2000 max. * | 7.02 | 8.57 -22% | 9.3 -32% | 2.8 60% | 7.1 -1% | 19.19 -173% |
| Colorchecker dE 2000 calibrated * | 0.81 | 1.09 -35% | 0.39 52% | 0.7 14% | 1.66 -105% | |
| Delta E Graustufen * | 1.2 | 4.4 -267% | 6.8 -467% | 1.8 -50% | 5.1 -325% | 2.6 -117% |
| Gamma | 2.22 99% | 2.168 101% | 2.3 96% | 2.24 98% | 2.19 100% | 2.19 100% |
| CCT | 6296 103% | 7767 84% | 6242 104% | 6337 103% | 6204 105% | 6749 96% |
| Kontrast (:1) | 977 | 1271 | 1736 | 1117 | ||
| Durchschnitt gesamt (Programm / Settings) | -394% /
-211% | -369% /
-207% | -484% /
-254% | -308% /
-170% | -1310% /
-685% |
* ... kleinere Werte sind besser
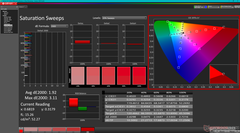
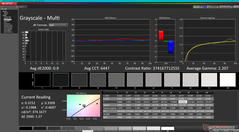
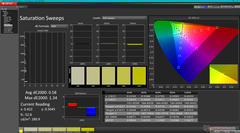
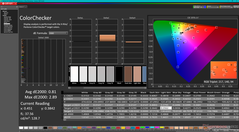
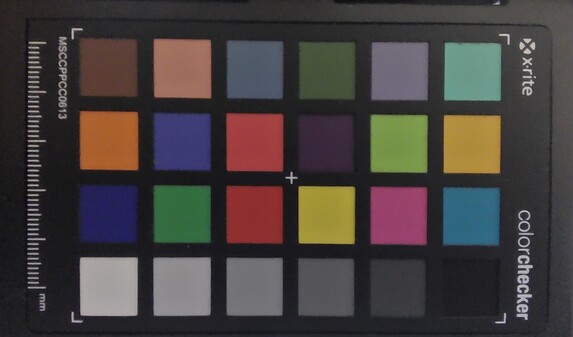
Das Display ist bereits im Lieferzustand gut auf den DCI-P3-Standard kalibriert. Eine weitere Kalibrierung durch den User wird für die meisten Bedürfnisse nicht notwendig sein. Die Farbtemperatur ist mit 6400K etwas zu warm, allerdings ist das nur eine Kleinigkeit. Unser ICM-Profil steht oben kostenlos zum Download zur Verfügung.
Reaktionszeiten (Response Times) des Displays
| ↔ Reaktionszeiten Schwarz zu Weiß | ||
|---|---|---|
| 1.01 ms ... steigend ↗ und fallend ↘ kombiniert | ↗ 0.64 ms steigend | |
| ↘ 0.37 ms fallend | ||
| Die gemessenen Reaktionszeiten sind sehr kurz, wodurch sich der Bildschirm auch für schnelle 3D Spiele eignen sollte. Im Vergleich rangierten die bei uns getesteten Geräte von 0.1 (Minimum) zu 240 (Maximum) ms. » 4 % aller Screens waren schneller als der getestete. Daher sind die gemessenen Reaktionszeiten besser als der Durchschnitt aller vermessenen Geräte (20.1 ms). | ||
| ↔ Reaktionszeiten 50% Grau zu 80% Grau | ||
| 0.79 ms ... steigend ↗ und fallend ↘ kombiniert | ↗ 0.46 ms steigend | |
| ↘ 0.33 ms fallend | ||
| Die gemessenen Reaktionszeiten sind sehr kurz, wodurch sich der Bildschirm auch für schnelle 3D Spiele eignen sollte. Im Vergleich rangierten die bei uns getesteten Geräte von 0.165 (Minimum) zu 636 (Maximum) ms. » 2 % aller Screens waren schneller als der getestete. Daher sind die gemessenen Reaktionszeiten besser als der Durchschnitt aller vermessenen Geräte (31.4 ms). | ||
Bildschirm-Flackern / PWM (Pulse-Width Modulation)
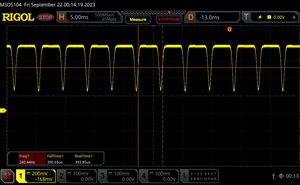
| Flackern / PWM festgestellt | 240.5 Hz | ≤ 100 % Helligkeit | |
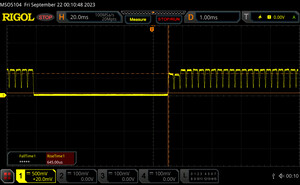
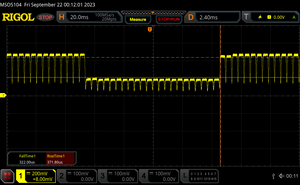
Das Display flackert mit 240.5 Hz (im schlimmsten Fall, eventuell durch Pulsweitenmodulation PWM) bei einer eingestellten Helligkeit von 100 % und darunter. Darüber sollte es zu keinem Flackern kommen. Die Frequenz von 240.5 Hz ist relativ gering und daher sollte es bei sensiblen Personen zu Problemen wie Flackern oder Augenbeschwerden führen. Im Vergleich: 53 % aller getesteten Geräte nutzten kein PWM um die Helligkeit zu reduzieren. Wenn PWM eingesetzt wurde, dann bei einer Frequenz von durchschnittlich 8013 (Minimum 5, Maximum 343500) Hz. | |||
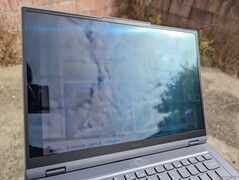
Die reelle maximale Helligkeit liegt bei rund 386 cd/m². Lenovo verspricht eine Helligkeit von 400 cd/m² bei SDR-Inhalten. Ist HDR aktiv, steigt die maximale Helligkeit auf 515 cd/m², was Lenovos Behauptung von HDR500-Kompatibilität entspricht. Die matten IPS-Panels des Blade 14 bzw. Zephyrus G14 sind mit rund 550 cd/m² bei SDR-Inhalten deutlich heller und eignen sich daher im Vergleich zu unserem stark glänzenden Lenovo-Modell besser für die Verwendung im Freien.
Leistung — Zen 4 und Nvidia RTX harmonieren gut
Testkonditionen
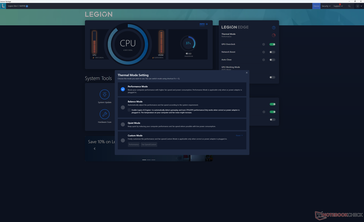
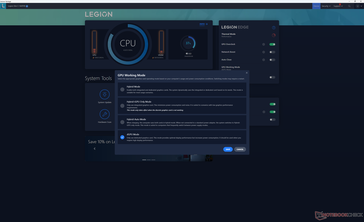
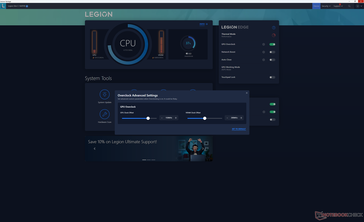
Vor den unten beschriebenen Benchmarkdurchläufen haben wir im Programm Lenovo Vantage den Leistungsmodus sowie den dGPU-Modus mit GPU-Übertaktung eingestellt. Wir würden es Nutzer empfehlen, sich mit Vantage vertraut zu machen. Es dient als Steuerzentrale für die Anpassung von Leistungsprofilen und dGPU/iGPU-Einstellungen.
Prozessor
Der Ryzen 7 7840HS liefert eine gute Leistung und hat kein nennenswertes Throttling. Die Multi-Thread-Ergebnisse liegen nur 10 Prozent hinter jenen des weit verbreiteten Core i7-13700H der 13. Generation. Ein Aufstieg auf die Konfiguration mit Ryzen 9 7940HS erhöht die Leistung vermutlich um 10 Prozent und könnte so die Lücke schließen. Wer auf der Suche nach einer Prozessorleistung, die der des Intel Core i7 entspricht, greift daher am besten zur Ryzen-9-Konfiguration.
Noch stärkere Ryzen-HX-CPUs wie der Ryzen 9 7945HX sind nur mit größeren Bildschirmen erhältlich.
Cinebench R15 Multi Loop
Cinebench R23: Multi Core | Single Core
Cinebench R20: CPU (Multi Core) | CPU (Single Core)
Cinebench R15: CPU Multi 64Bit | CPU Single 64Bit
Blender: v2.79 BMW27 CPU
7-Zip 18.03: 7z b 4 | 7z b 4 -mmt1
Geekbench 5.5: Multi-Core | Single-Core
HWBOT x265 Benchmark v2.2: 4k Preset
LibreOffice : 20 Documents To PDF
R Benchmark 2.5: Overall mean
| LibreOffice / 20 Documents To PDF | |
| Asus ROG Strix G15 G513RW | |
| Asus Zephyrus G14 GA401QEC | |
| Schenker XMG Pro 15 (E23) | |
| Asus TUF A15 FA507 | |
| Durchschnittliche AMD Ryzen 7 7840HS (38.3 - 68.3, n=20) | |
| Asus ROG Zephyrus G14 GA402RK | |
| Acer Predator Triton 14 PT14-51 | |
| Dell G15 5530 | |
| Lenovo Legion Slim 5 14APH8 | |
| Acer Predator Triton 300 SE | |
| Alienware x14 i7 RTX 3060 | |
| Asus ROG Zephyrus G14 GA402XY | |
Cinebench R23: Multi Core | Single Core
Cinebench R20: CPU (Multi Core) | CPU (Single Core)
Cinebench R15: CPU Multi 64Bit | CPU Single 64Bit
Blender: v2.79 BMW27 CPU
7-Zip 18.03: 7z b 4 | 7z b 4 -mmt1
Geekbench 5.5: Multi-Core | Single-Core
HWBOT x265 Benchmark v2.2: 4k Preset
LibreOffice : 20 Documents To PDF
R Benchmark 2.5: Overall mean
* ... kleinere Werte sind besser
AIDA64: FP32 Ray-Trace | FPU Julia | CPU SHA3 | CPU Queen | FPU SinJulia | FPU Mandel | CPU AES | CPU ZLib | FP64 Ray-Trace | CPU PhotoWorxx
| Performance Rating | |
| Razer Blade 14 RTX 4070 | |
| Lenovo Legion Slim 5 14APH8 | |
| Durchschnittliche AMD Ryzen 7 7840HS | |
| Lenovo LOQ 15APH8 | |
| Acer Predator Triton 14 PT14-51 | |
| Alienware x14 i7 RTX 3060 | |
| AIDA64 / FP32 Ray-Trace | |
| Razer Blade 14 RTX 4070 | |
| Lenovo Legion Slim 5 14APH8 | |
| Lenovo LOQ 15APH8 | |
| Durchschnittliche AMD Ryzen 7 7840HS (22845 - 28921, n=21) | |
| Acer Predator Triton 14 PT14-51 | |
| Alienware x14 i7 RTX 3060 | |
| AIDA64 / FPU Julia | |
| Lenovo LOQ 15APH8 | |
| Razer Blade 14 RTX 4070 | |
| Lenovo Legion Slim 5 14APH8 | |
| Durchschnittliche AMD Ryzen 7 7840HS (97164 - 123167, n=21) | |
| Acer Predator Triton 14 PT14-51 | |
| Alienware x14 i7 RTX 3060 | |
| AIDA64 / CPU SHA3 | |
| Razer Blade 14 RTX 4070 | |
| Lenovo Legion Slim 5 14APH8 | |
| Lenovo LOQ 15APH8 | |
| Durchschnittliche AMD Ryzen 7 7840HS (4293 - 5155, n=21) | |
| Acer Predator Triton 14 PT14-51 | |
| Alienware x14 i7 RTX 3060 | |
| AIDA64 / CPU Queen | |
| Razer Blade 14 RTX 4070 | |
| Lenovo Legion Slim 5 14APH8 | |
| Lenovo LOQ 15APH8 | |
| Durchschnittliche AMD Ryzen 7 7840HS (102271 - 125820, n=21) | |
| Alienware x14 i7 RTX 3060 | |
| Acer Predator Triton 14 PT14-51 | |
| AIDA64 / FPU SinJulia | |
| Razer Blade 14 RTX 4070 | |
| Lenovo Legion Slim 5 14APH8 | |
| Lenovo LOQ 15APH8 | |
| Durchschnittliche AMD Ryzen 7 7840HS (13767 - 15525, n=21) | |
| Acer Predator Triton 14 PT14-51 | |
| Alienware x14 i7 RTX 3060 | |
| AIDA64 / FPU Mandel | |
| Razer Blade 14 RTX 4070 | |
| Lenovo LOQ 15APH8 | |
| Lenovo Legion Slim 5 14APH8 | |
| Durchschnittliche AMD Ryzen 7 7840HS (52084 - 65812, n=21) | |
| Acer Predator Triton 14 PT14-51 | |
| Alienware x14 i7 RTX 3060 | |
| AIDA64 / CPU AES | |
| Acer Predator Triton 14 PT14-51 | |
| Durchschnittliche AMD Ryzen 7 7840HS (67389 - 177158, n=21) | |
| Alienware x14 i7 RTX 3060 | |
| Razer Blade 14 RTX 4070 | |
| Lenovo Legion Slim 5 14APH8 | |
| Lenovo LOQ 15APH8 | |
| AIDA64 / CPU ZLib | |
| Acer Predator Triton 14 PT14-51 | |
| Razer Blade 14 RTX 4070 | |
| Lenovo LOQ 15APH8 | |
| Lenovo Legion Slim 5 14APH8 | |
| Durchschnittliche AMD Ryzen 7 7840HS (944 - 1123, n=21) | |
| Alienware x14 i7 RTX 3060 | |
| AIDA64 / FP64 Ray-Trace | |
| Razer Blade 14 RTX 4070 | |
| Lenovo LOQ 15APH8 | |
| Lenovo Legion Slim 5 14APH8 | |
| Durchschnittliche AMD Ryzen 7 7840HS (12248 - 15599, n=21) | |
| Acer Predator Triton 14 PT14-51 | |
| Alienware x14 i7 RTX 3060 | |
| AIDA64 / CPU PhotoWorxx | |
| Acer Predator Triton 14 PT14-51 | |
| Alienware x14 i7 RTX 3060 | |
| Durchschnittliche AMD Ryzen 7 7840HS (17615 - 41516, n=21) | |
| Lenovo Legion Slim 5 14APH8 | |
| Razer Blade 14 RTX 4070 | |
| Lenovo LOQ 15APH8 | |
Systemleistung
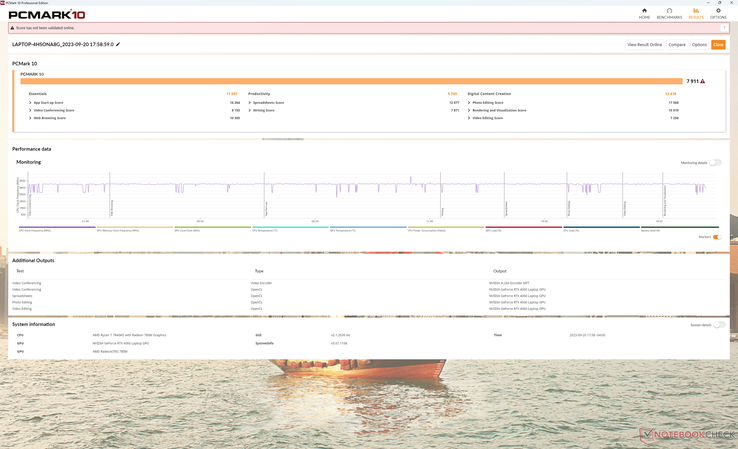
Die PCMark-Ergebnisse sind mit jenen der konkurrierenden 14-Zoll-Gaming-Latpos kompatibel und unterscheiden sich nur um Prozentpunkte im einstelligen Bereich. Während der Testphase kam es hier zu keinerlei nennenswerten Problemen. Bei dem kürzlich getesteten Legion Slim 5 16 bzw. dem Alienware m16 R1 war das anders.
CrossMark: Overall | Productivity | Creativity | Responsiveness
| PCMark 10 / Score | |
| Asus ROG Zephyrus G14 GA402XY | |
| Razer Blade 14 RTX 4070 | |
| Lenovo Legion Slim 5 14APH8 | |
| Durchschnittliche AMD Ryzen 7 7840HS, NVIDIA GeForce RTX 4060 Laptop GPU (7502 - 7946, n=4) | |
| Lenovo LOQ 15APH8 | |
| Acer Predator Triton 14 PT14-51 | |
| Alienware x14 i7 RTX 3060 | |
| PCMark 10 / Essentials | |
| Lenovo Legion Slim 5 14APH8 | |
| Razer Blade 14 RTX 4070 | |
| Durchschnittliche AMD Ryzen 7 7840HS, NVIDIA GeForce RTX 4060 Laptop GPU (10441 - 11169, n=4) | |
| Asus ROG Zephyrus G14 GA402XY | |
| Lenovo LOQ 15APH8 | |
| Acer Predator Triton 14 PT14-51 | |
| Alienware x14 i7 RTX 3060 | |
| PCMark 10 / Productivity | |
| Razer Blade 14 RTX 4070 | |
| Asus ROG Zephyrus G14 GA402XY | |
| Lenovo LOQ 15APH8 | |
| Durchschnittliche AMD Ryzen 7 7840HS, NVIDIA GeForce RTX 4060 Laptop GPU (9575 - 10273, n=4) | |
| Acer Predator Triton 14 PT14-51 | |
| Lenovo Legion Slim 5 14APH8 | |
| Alienware x14 i7 RTX 3060 | |
| PCMark 10 / Digital Content Creation | |
| Asus ROG Zephyrus G14 GA402XY | |
| Razer Blade 14 RTX 4070 | |
| Lenovo Legion Slim 5 14APH8 | |
| Durchschnittliche AMD Ryzen 7 7840HS, NVIDIA GeForce RTX 4060 Laptop GPU (11464 - 12418, n=4) | |
| Lenovo LOQ 15APH8 | |
| Acer Predator Triton 14 PT14-51 | |
| Alienware x14 i7 RTX 3060 | |
| CrossMark / Overall | |
| Alienware x14 i7 RTX 3060 | |
| Lenovo Legion Slim 5 14APH8 | |
| Acer Predator Triton 14 PT14-51 | |
| Asus ROG Zephyrus G14 GA402XY | |
| Durchschnittliche AMD Ryzen 7 7840HS, NVIDIA GeForce RTX 4060 Laptop GPU (1800 - 1866, n=3) | |
| Razer Blade 14 RTX 4070 | |
| Lenovo LOQ 15APH8 | |
| CrossMark / Productivity | |
| Lenovo Legion Slim 5 14APH8 | |
| Alienware x14 i7 RTX 3060 | |
| Durchschnittliche AMD Ryzen 7 7840HS, NVIDIA GeForce RTX 4060 Laptop GPU (1743 - 1821, n=3) | |
| Razer Blade 14 RTX 4070 | |
| Asus ROG Zephyrus G14 GA402XY | |
| Acer Predator Triton 14 PT14-51 | |
| Lenovo LOQ 15APH8 | |
| CrossMark / Creativity | |
| Asus ROG Zephyrus G14 GA402XY | |
| Alienware x14 i7 RTX 3060 | |
| Acer Predator Triton 14 PT14-51 | |
| Razer Blade 14 RTX 4070 | |
| Lenovo Legion Slim 5 14APH8 | |
| Durchschnittliche AMD Ryzen 7 7840HS, NVIDIA GeForce RTX 4060 Laptop GPU (1908 - 1966, n=3) | |
| Lenovo LOQ 15APH8 | |
| CrossMark / Responsiveness | |
| Alienware x14 i7 RTX 3060 | |
| Lenovo Legion Slim 5 14APH8 | |
| Acer Predator Triton 14 PT14-51 | |
| Durchschnittliche AMD Ryzen 7 7840HS, NVIDIA GeForce RTX 4060 Laptop GPU (1522 - 1776, n=3) | |
| Razer Blade 14 RTX 4070 | |
| Asus ROG Zephyrus G14 GA402XY | |
| Lenovo LOQ 15APH8 | |
| PCMark 10 Score | 7911 Punkte | |
Hilfe | ||
| AIDA64 / Memory Copy | |
| Alienware x14 i7 RTX 3060 | |
| Acer Predator Triton 14 PT14-51 | |
| Lenovo Legion Slim 5 14APH8 | |
| Durchschnittliche AMD Ryzen 7 7840HS (30937 - 72158, n=21) | |
| Razer Blade 14 RTX 4070 | |
| Lenovo LOQ 15APH8 | |
| AIDA64 / Memory Read | |
| Alienware x14 i7 RTX 3060 | |
| Acer Predator Triton 14 PT14-51 | |
| Razer Blade 14 RTX 4070 | |
| Durchschnittliche AMD Ryzen 7 7840HS (30497 - 62147, n=21) | |
| Lenovo Legion Slim 5 14APH8 | |
| Lenovo LOQ 15APH8 | |
| AIDA64 / Memory Write | |
| Lenovo Legion Slim 5 14APH8 | |
| Acer Predator Triton 14 PT14-51 | |
| Durchschnittliche AMD Ryzen 7 7840HS (34590 - 93323, n=21) | |
| Razer Blade 14 RTX 4070 | |
| Alienware x14 i7 RTX 3060 | |
| Lenovo LOQ 15APH8 | |
| AIDA64 / Memory Latency | |
| Lenovo Legion Slim 5 14APH8 | |
| Alienware x14 i7 RTX 3060 | |
| Acer Predator Triton 14 PT14-51 | |
| Lenovo LOQ 15APH8 | |
| Durchschnittliche AMD Ryzen 7 7840HS (85.1 - 112, n=21) | |
| Razer Blade 14 RTX 4070 | |
* ... kleinere Werte sind besser
DPC-Latenzen
| DPC Latencies / LatencyMon - interrupt to process latency (max), Web, Youtube, Prime95 | |
| Lenovo Legion Slim 5 14APH8 | |
| Acer Predator Triton 14 PT14-51 | |
| Lenovo LOQ 15APH8 | |
| Alienware x14 i7 RTX 3060 | |
| Asus ROG Zephyrus G14 GA402XY | |
| Razer Blade 14 RTX 4070 | |
* ... kleinere Werte sind besser
Massenspeicher
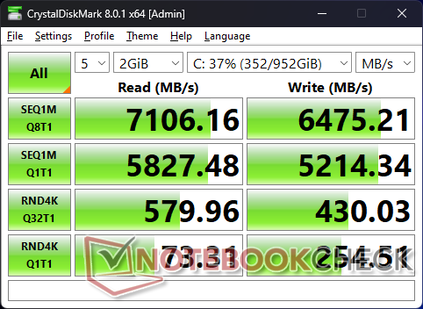
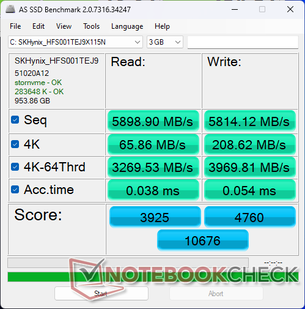
Unser Gerät ist mit einer 1-TB-SK-Hynix-HFS001TEJ9X115N-SSD ausgestattet. Dabei handelt es sich um eine High-End-PCIe4-x4-SSD. Der Massenspeicher hat keine Probleme, die sehr schnelle Übertragungsrate von fast 7100 MB/s auch unter Last aufrecht zu halten. Das beweist, dass trotz des kleinen Formfaktors bei diesem Legion Slim keine Probleme mit Throttling auftreten.
| Drive Performance Rating - Percent | |
| Lenovo Legion Slim 5 14APH8 | |
| Razer Blade 14 RTX 4070 | |
| Alienware x14 i7 RTX 3060 | |
| Asus ROG Zephyrus G14 GA402XY | |
| Acer Predator Triton 14 PT14-51 | |
| Lenovo LOQ 15APH8 | |
* ... kleinere Werte sind besser
Dauerleistung Lesen: DiskSpd Read Loop, Queue Depth 8
GPU Performance — 105 W GeForce RTX 4060
Die Grafikleistung ist ausgezeichnet und die Ergebnisse entsprechen jenen der anderen mit der gleichen RTX-4060-GPU ausgestatteten Geräte. Auch hier deutet nichts auf Throttling. Die RTX 4070 im Blade 14 ist um 15 Prozent schneller. Diese Option ist im aktuellen Legion Slim 5 14 nicht verfügbar.
Eine Abstufung auf die RTX-4050-Konfiguration reduziert die Leistung um rund 20-25 Prozent. Diese Einschätzung basiert auf unserer Erfahrung mit dem Acer Predator Triton 14. Das Umschalten des Modus von Leistung auf Ausgeglichen hat auch Auswirkungen auf die der Grafikleistung, die sich um bis zu 15 Prozent abschwächt (siehe Fire-Strike-Ergebnisse unten). Allerdings läuft der Laptop im ausgeglichenen Modus etwas leiser und kompensiert dadurch den Leistungsverlust.
| Energieprofil | Graphics Score | Physics Score | Combined Score |
| Leistungsmodus | 28207 | 29118 | 13123 |
| Ausgeglichener Modus (Turbo aus) | 24505 (-13 %) | 28015 (-4 %) | 11701 (-11 %) |
| Akumodus | 22396 (-21 %) | 26867 (-8 %) | 10136 (-23 %) |
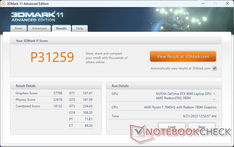
| 3DMark 11 Performance | 31259 Punkte | |
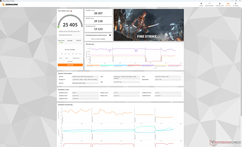
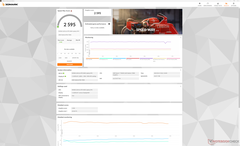
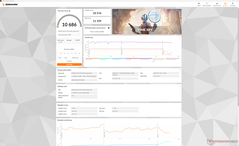
| 3DMark Fire Strike Score | 24304 Punkte | |
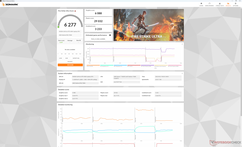
| 3DMark Time Spy Score | 10514 Punkte | |
Hilfe | ||
* ... kleinere Werte sind besser
Gamingleistung
Alle getesteten Spiele laufen auf dem Legion Slim 5 14 selbst bei nativer 2,8K-Auflösung gut. Allerdings empfehlen wir Nutzern, die Einstellungen beim Spielen von anspruchsvollen Titeln wie Star Wars Jedi Survivor oder Returnal auf Medium zu reduzieren, damit die Frameraten bei oder über 60 FPS bleiben – vor allem, da das Display kein G-Sync hat.
| Far Cry 6 | |
| 1920x1080 High Graphics Quality AA:T | |
| Durchschnittliche NVIDIA GeForce RTX 4060 Laptop GPU (101 - 120, n=2) | |
| Asus ROG Zephyrus G14 GA402RK | |
| Asus ROG Zephyrus G14 GA402XY | |
| Inno3D GeForce RTX 3060 Twin X2 | |
| Lenovo Legion Slim 5 14APH8 | |
| 1920x1080 Ultra Graphics Quality + HD Textures AA:T | |
| Razer Blade 14 RTX 4070 | |
| Durchschnittliche NVIDIA GeForce RTX 4060 Laptop GPU (76 - 117, n=5) | |
| Asus ROG Zephyrus G14 GA402RK | |
| Asus ROG Zephyrus G14 GA402XY | |
| Lenovo Legion Slim 5 14APH8 | |
| Inno3D GeForce RTX 3060 Twin X2 | |
| 2560x1440 Ultra Graphics Quality + HD Textures AA:T | |
| Asus ROG Zephyrus G14 GA402XY | |
| Razer Blade 14 RTX 4070 | |
| Lenovo Legion Slim 5 14APH8 | |
| Asus ROG Zephyrus G14 GA402RK | |
| Inno3D GeForce RTX 3060 Twin X2 | |
| Durchschnittliche NVIDIA GeForce RTX 4060 Laptop GPU (32.6 - 83, n=5) | |
| Call of Duty Modern Warfare 2 2022 | |
| 1920x1080 Ultra Quality Preset AA:T2X Filmic SM | |
| Asus ROG Zephyrus G14 GA402XY | |
| Lenovo Legion Slim 5 14APH8 | |
| Durchschnittliche NVIDIA GeForce RTX 4060 Laptop GPU (70 - 104, n=4) | |
| 1920x1080 Extreme Quality Preset AA:T2X Filmic SM | |
| Asus ROG Zephyrus G14 GA402XY | |
| Razer Blade 14 RTX 4070 | |
| Lenovo Legion Slim 5 14APH8 | |
| Durchschnittliche NVIDIA GeForce RTX 4060 Laptop GPU (68 - 94, n=9) | |
| 2560x1440 Extreme Quality Preset AA:T2X Filmic SM | |
| Asus ROG Zephyrus G14 GA402XY | |
| Razer Blade 14 RTX 4070 | |
| Lenovo Legion Slim 5 14APH8 | |
| Durchschnittliche NVIDIA GeForce RTX 4060 Laptop GPU (49 - 66, n=7) | |
Witcher 3 FPS-Tabelle
| min. | mittel | hoch | max. | QHD | |
|---|---|---|---|---|---|
| GTA V (2015) | 178.9 | 171.6 | 162.3 | 102.1 | 86.6 |
| The Witcher 3 (2015) | 355 | 313.5 | 209.8 | 101.4 | |
| Dota 2 Reborn (2015) | 146 | 141.9 | 137.2 | 131.8 | |
| Final Fantasy XV Benchmark (2018) | 199.9 | 145.9 | 104.3 | 76.3 | |
| X-Plane 11.11 (2018) | 124.4 | 107.8 | 84.9 | ||
| Strange Brigade (2018) | 353 | 282 | 230 | 197.9 | 131.7 |
| Shadow of the Tomb Raider (2018) | 144 | 132 | 93 | ||
| Assassin´s Creed Valhalla (2020) | 117 | 99 | 72 | ||
| Far Cry 6 (2021) | 101 | 94 | 79 | ||
| Cyberpunk 2077 1.6 (2022) | 83.68 | 78.08 | 48.54 | ||
| Tiny Tina's Wonderlands (2022) | 114.65 | 88.15 | 59.69 | ||
| F1 22 (2022) | 218 | 217 | 193.1 | 65.8 | 42.4 |
| Call of Duty Modern Warfare 2 2022 (2022) | 104 | 94 | 65 | ||
| Returnal (2023) | 73 | 67 | 45 | ||
| Star Wars Jedi Survivor (2023) | 67.6 | 65 | 39.9 |
Emissionen — Kleiner lauter Gamer
Geräuschemissionen
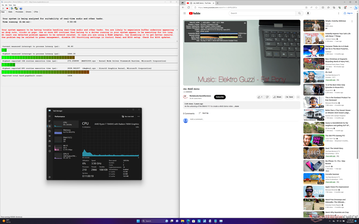
Die internen Lüfter neigen dazu, im ausgeglichenen Modus zu pulsieren. Das Lüftergeräusch schwankt beim Surfen im Internet oder Streamen von Videos zwischen 23 und 31 dB(A). Wir empfehlen daher, das Gerät in Fällen, in denen das Lüftergeräusch stört, im Modus Leise zu verwenden.
Wird anstatt im Leistungsmodus im ausgeglichenen Modus gespielt, reduziert sich das Lüftergeräusch leicht von 52,8 dB(A) auf 49,3 dB(A). In beiden Fällen zeigt sich das Legion Slim 5 14 als ein sehr lautes Gaming-Gerät und ähnelt darin seinen Mitstreitern Blade 14, Zephyrus G14 und Alienware x14.
Lautstärkediagramm
| Idle |
| 22.8 / 27.3 / 30.7 dB(A) |
| Last |
| 41.6 / 52.6 dB(A) |
 | ||
30 dB leise 40 dB(A) deutlich hörbar 50 dB(A) störend |
||
min: | ||
| Lenovo Legion Slim 5 14APH8 GeForce RTX 4060 Laptop GPU, R7 7840HS, SK Hynix HFS001TEJ9X115N | Acer Predator Triton 14 PT14-51 GeForce RTX 4050 Laptop GPU, i7-13700H, Micron 3400 MTFDKBA512TFH 512GB | Razer Blade 14 RTX 4070 GeForce RTX 4070 Laptop GPU, R9 7940HS, Samsung PM9A1 MZVL21T0HCLR | Asus ROG Zephyrus G14 GA402XY GeForce RTX 4090 Laptop GPU, R9 7940HS, Samsung PM9A1 MZVL21T0HCLR | Alienware x14 i7 RTX 3060 GeForce RTX 3060 Laptop GPU, i7-12700H, WDC PC SN810 1TB | Lenovo LOQ 15APH8 GeForce RTX 4050 Laptop GPU, R7 7840HS, Micron 2450 512GB MTFDKCD512TFK | |
|---|---|---|---|---|---|---|
| Geräuschentwicklung | -0% | 7% | -2% | 0% | 6% | |
| aus / Umgebung * (dB) | 22.8 | 25 -10% | 22.7 -0% | 23.3 -2% | 24.7 -8% | 23.1 -1% |
| Idle min * (dB) | 22.8 | 27 -18% | 23.4 -3% | 23.6 -4% | 24.7 -8% | 23.1 -1% |
| Idle avg * (dB) | 27.3 | 29 -6% | 23.4 14% | 23.6 14% | 24.7 10% | 23.1 15% |
| Idle max * (dB) | 30.7 | 31 -1% | 23.4 24% | 33 -7% | 30.9 -1% | 25.2 18% |
| Last avg * (dB) | 41.6 | 42 -1% | 33 21% | 49.5 -19% | 40 4% | 44.3 -6% |
| Witcher 3 ultra * (dB) | 52.8 | 43 19% | 51.8 2% | 52.2 1% | 51.5 2% | 45.8 13% |
| Last max * (dB) | 52.6 | 45 14% | 55.6 -6% | 52.2 1% | 51.5 2% | 52 1% |
* ... kleinere Werte sind besser
Temperatur
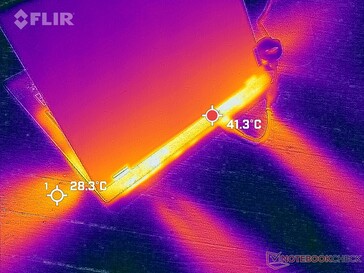
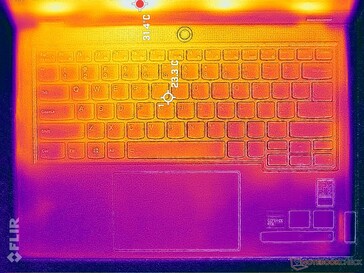
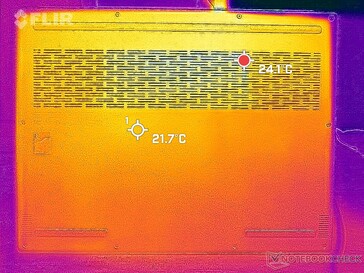
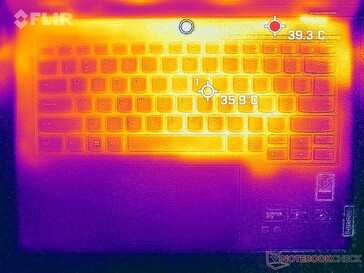
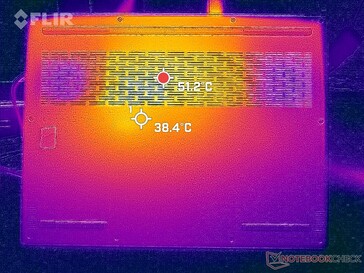
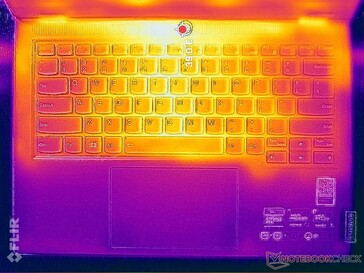
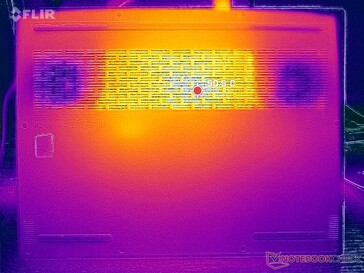
Die Oberflächentemperaturen sind in der Mitte der Tastatur und Rückseite am wärmsten und erreichen dort bei anspruchsvoller Belastung, etwa beim Gaming, bis zu 36 bzw. 52 °C. Das Gerät wird durchschnittlich etwas wärmer als das Blade 14, obwohl das Design von Lenovo mehr Lüftungsgitter beinhaltet. Die Handballenablage und das Clickpad bleiben kühler und fühlen sich angenehmer an.
(±) Die maximale Temperatur auf der Oberseite ist 40.4 °C. Im Vergleich liegt der Klassendurchschnitt bei 40.4 °C (von 21.2 bis 68.8 °C für die Klasse Gaming).
(-) Auf der Unterseite messen wir eine maximalen Wert von 49.4 °C (im Vergleich zum Durchschnitt von 43.3 °C).
(+) Ohne Last messen wir eine durchschnittliche Temperatur von 26.7 °C auf der Oberseite. Der Klassendurchschnitt erreicht 33.9 °C.
(±) Beim längeren Spielen von The Witcher 3 erhitzt sich das Gerät durchschnittlich auf 34.8 °C. Der Durchschnitt der Klasse ist derzeit 33.9 °C.
(+) Die Handballen und der Touchpad-Bereich sind mit gemessenen 29.2 °C kühler als die typische Hauttemperatur und fühlen sich dadurch kühl an.
(±) Die durchschnittliche Handballen-Temperatur anderer getesteter Geräte war 28.8 °C (-0.4 °C).
| Lenovo Legion Slim 5 14APH8 AMD Ryzen 7 7840HS, NVIDIA GeForce RTX 4060 Laptop GPU | Acer Predator Triton 14 PT14-51 Intel Core i7-13700H, NVIDIA GeForce RTX 4050 Laptop GPU | Razer Blade 14 RTX 4070 AMD Ryzen 9 7940HS, NVIDIA GeForce RTX 4070 Laptop GPU | Asus ROG Zephyrus G14 GA402XY AMD Ryzen 9 7940HS, NVIDIA GeForce RTX 4090 Laptop GPU | Alienware x14 i7 RTX 3060 Intel Core i7-12700H, NVIDIA GeForce RTX 3060 Laptop GPU | Lenovo LOQ 15APH8 AMD Ryzen 7 7840HS, NVIDIA GeForce RTX 4050 Laptop GPU | |
|---|---|---|---|---|---|---|
| Hitze | -15% | -1% | 1% | -1% | -3% | |
| Last oben max * (°C) | 40.4 | 54 -34% | 37.4 7% | 47 -16% | 51.3 -27% | 44.4 -10% |
| Last unten max * (°C) | 49.4 | 56 -13% | 35.2 29% | 46.5 6% | 44.4 10% | 52 -5% |
| Idle oben max * (°C) | 28.2 | 31 -10% | 33.2 -18% | 25.9 8% | 27.2 4% | 28 1% |
| Idle unten max * (°C) | 29.8 | 31 -4% | 36.2 -21% | 28 6% | 26.6 11% | 29.6 1% |
* ... kleinere Werte sind besser
Stresstest
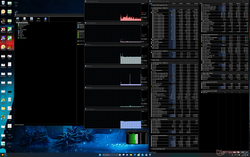
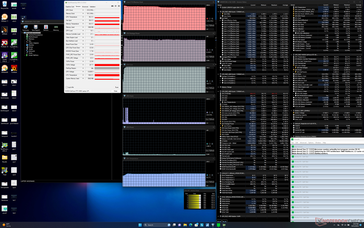
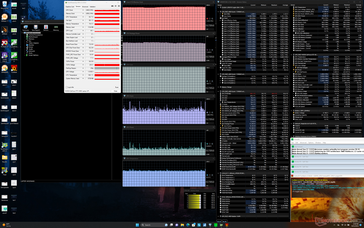
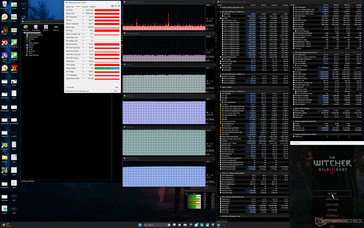
Die CPU-Taktrate steigt beim Start von Prime95 auf 3,8 GHz und 92 W, fällt dann aber wenige Sekunden später auf 4,6 GHz bzw. 84 W zurück und bleibt auf dieser Höhe stabil. Die Kerntemperatur wird mit 100 °C sehr warm, was andeutet, dass der AMD-Prozessor das Kühlvermögen des Legion Slim 5 14 an seine Grenzen bringt. Im Blade 14, das mit einer ähnlichen CPU der Zen-4-Klasse ausgestattet ist, führt dieser Test zu einer kühleren Kerntemperatur von 90 °C.
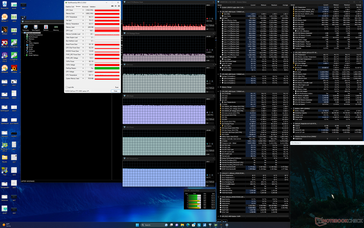
Die Nvidia-GPU stabilisiert sich unter Witcher 3 im Leistungsmodus bei 2625 MHz, 78 °C und 99 W – im ausgeglichenen Modus liegen die Werte jeweils bei 2160 MHz, 69 °C bzw. 69 W. Die eingeschränkte Leistung führt, wie oben erwähnt, auch zu niedrigeren Geräuschemissionen.
| CPU-Taktrate (GHz) | GPU-Taktrate (MHz) | Durchschn. CPU-Temperatur (°C) | Durchschn. GPU-Temperatur (°C) | |
| Leerlauf | ||||
| Prime95-Last | 4,4 | -- | 100 | 50 |
| Prime95+FurMark-Last | 4,5 | ~2460 | 100 | 68 |
| Witcher-3-Last (Ausgeglichen) | ~0,8 | 2160 | 69 | 69 |
| Witcher-3-Last (Leistungsmodus) | ~0,8 | 2625 | 70 | 78 |
Lautsprecher
Lenovo Legion Slim 5 14APH8 Audio Analyse
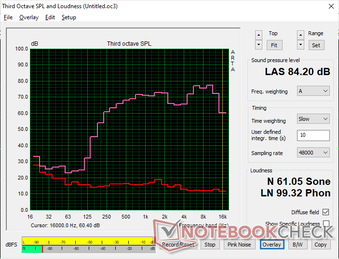
(+) | Die Lautsprecher können relativ laut spielen (84.2 dB)
Bass 100 - 315 Hz
(-) | kaum Bass - 21.4% niedriger als der Median
(±) | durchschnittlich lineare Bass-Wiedergabe (12.4% Delta zum Vorgänger)
Mitteltöne 400 - 2000 Hz
(+) | ausgeglichene Mitten, vom Median nur 2.7% abweichend
(+) | lineare Mitten (2.9% Delta zum Vorgänger)
Hochtöne 2 - 16 kHz
(±) | zu hohe Hochtöne, vom Median nur 5.3% abweichend
(+) | sehr lineare Hochtöne (6.1% Delta zum Vorgänger)
Gesamt im hörbaren Bereich 100 - 16.000 Hz
(±) | hörbarer Bereich ist durchschnittlich linear (16.9% Abstand zum Median)
Im Vergleich zu allen Geräten derselben Klasse
» 44% aller getesteten Geräte dieser Klasse waren besser, 11% vergleichbar, 45% schlechter
» Das beste Gerät hat einen Delta-Wert von 6%, durchschnittlich ist 18%, das schlechteste Gerät hat 132%
Im Vergleich zu allen Geräten im Test
» 29% aller getesteten Geräte waren besser, 8% vergleichbar, 63% schlechter
» Das beste Gerät hat einen Delta-Wert von 4%, durchschnittlich ist 24%, das schlechteste Gerät hat 134%
Apple MacBook Pro 16 2021 M1 Pro Audio Analyse
(+) | Die Lautsprecher können relativ laut spielen (84.7 dB)
Bass 100 - 315 Hz
(+) | guter Bass - nur 3.8% Abweichung vom Median
(+) | lineare Bass-Wiedergabe (5.2% Delta zum Vorgänger)
Mitteltöne 400 - 2000 Hz
(+) | ausgeglichene Mitten, vom Median nur 1.3% abweichend
(+) | lineare Mitten (2.1% Delta zum Vorgänger)
Hochtöne 2 - 16 kHz
(+) | ausgeglichene Hochtöne, vom Median nur 1.9% abweichend
(+) | sehr lineare Hochtöne (2.7% Delta zum Vorgänger)
Gesamt im hörbaren Bereich 100 - 16.000 Hz
(+) | hörbarer Bereich ist sehr linear (4.6% Abstand zum Median
Im Vergleich zu allen Geräten derselben Klasse
» 0% aller getesteten Geräte dieser Klasse waren besser, 0% vergleichbar, 100% schlechter
» Das beste Gerät hat einen Delta-Wert von 5%, durchschnittlich ist 17%, das schlechteste Gerät hat 45%
Im Vergleich zu allen Geräten im Test
» 0% aller getesteten Geräte waren besser, 0% vergleichbar, 100% schlechter
» Das beste Gerät hat einen Delta-Wert von 4%, durchschnittlich ist 24%, das schlechteste Gerät hat 134%
Energieverwaltung — Gute Leistung pro Watt
Energieaufnahme
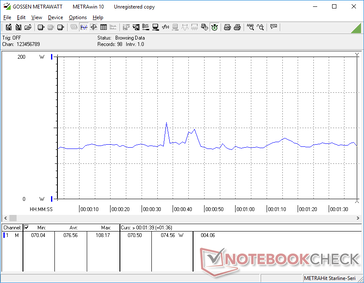
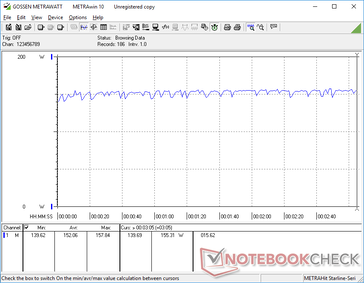
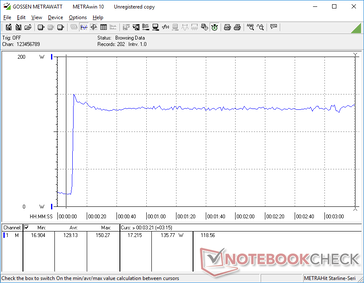
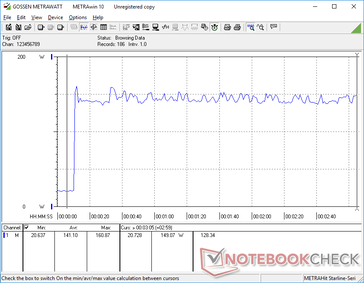
Unser Legion Slim 5 14 konsumiert etwas weniger Strom als unser Blade 14, das mit der schnelleren Ryzen-9-CPU und einer RTX-4070-GPU ausgestattet ist. Das Verhältnis von Leistung zu Watt ist weiterhin ausgezeichnet – besonders im Vergleich zu auf Intel basierten Gaming-Laptops mit der gleichen RTX-4060-GPU, wie dem Legion Pro 5 16, das nur gering besserer Leistung deutlich mehr Energie aufnimmt.
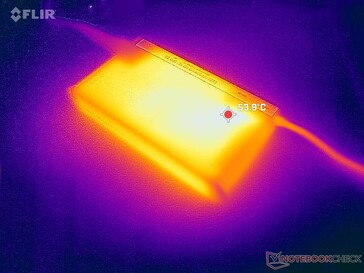
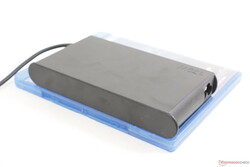
Die maximale Energieaufnahme aus dem mittelgroßen 170-W-Netzadapter (17 x 7,6 x 2,1 cm) lag bei 161 W. Die Mitstreiter Blade 14 und Zephyrus G14 werden mit stärkeren Netzadapter mit 230 bzw. 240 W versandt. Das Lenovo-Modell lädt langsamer, wenn es gleichzeitig stark belastet wird.
| Aus / Standby | |
| Idle | |
| Last |
|
Legende:
min: | |
| Lenovo Legion Slim 5 14APH8 R7 7840HS, GeForce RTX 4060 Laptop GPU, SK Hynix HFS001TEJ9X115N, OLED, 2880x1600, 14.5" | Acer Predator Triton 14 PT14-51 i7-13700H, GeForce RTX 4050 Laptop GPU, Micron 3400 MTFDKBA512TFH 512GB, IPS, 2560x1600, 14" | Razer Blade 14 RTX 4070 R9 7940HS, GeForce RTX 4070 Laptop GPU, Samsung PM9A1 MZVL21T0HCLR, IPS, 2560x1600, 14" | Asus ROG Zephyrus G14 GA402XY R9 7940HS, GeForce RTX 4090 Laptop GPU, Samsung PM9A1 MZVL21T0HCLR, Mini-LED, 2560x1600, 14" | Alienware x14 i7 RTX 3060 i7-12700H, GeForce RTX 3060 Laptop GPU, WDC PC SN810 1TB, IPS, 1920x1080, 14" | Lenovo LOQ 15APH8 R7 7840HS, GeForce RTX 4050 Laptop GPU, Micron 2450 512GB MTFDKCD512TFK, IPS, 1920x1080, 15.6" | |
|---|---|---|---|---|---|---|
| Stromverbrauch | -31% | -71% | -19% | 1% | -35% | |
| Idle min * (Watt) | 7.3 | 12 -64% | 19.5 -167% | 9.4 -29% | 7.9 -8% | 15 -105% |
| Idle avg * (Watt) | 9.6 | 14 -46% | 24.7 -157% | 14.2 -48% | 11.1 -16% | 17.7 -84% |
| Idle max * (Watt) | 17.3 | 26 -50% | 27 -56% | 14.5 16% | 11.8 32% | 21.5 -24% |
| Last avg * (Watt) | 76.6 | 88 -15% | 83.2 -9% | 79 -3% | 107.4 -40% | 73.5 4% |
| Witcher 3 ultra * (Watt) | 152 | 114.9 24% | 165.8 -9% | 172 -13% | 111 27% | 138.6 9% |
| Last max * (Watt) | 160.9 | 213 -32% | 204.5 -27% | 220.8 -37% | 140.4 13% | 176.5 -10% |
* ... kleinere Werte sind besser
Energieaufnahme Witcher 3 / Stresstest
Energieaufnahme externer Monitor
Akkulaufzeit
Die Akkukapazität ist für einen 14-Zoll-Laptop mit 75 Wh groß. Die Laufzeit ist dementsprechend lang und hält bei realistischer Browser-Aktivität im ausgeglichenen Modus fast 7,5 Stunden durch, ähnlich wie der Zephyrus G14.
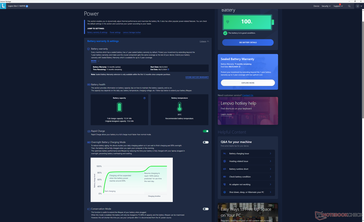
Das vollständige Aufladen des leeren Akkus läuft mit nur 45 Minuten sehr schnell, wenn Lenovo Rapid Charge aktiviert ist. Die meisten anderen Laptops benötigen dafür mindestens doppelt so lang. Das System kann auch über USB-C aufgeladen werden, wobei Lenovo empfiehlt, dafür ein optional erhältliches 140-W-USB-C-Netzgerät von Lenovo zu verwenden, da die meisten anderen Netzgeräte nicht kompatibel sind.
| Lenovo Legion Slim 5 14APH8 R7 7840HS, GeForce RTX 4060 Laptop GPU, 73.6 Wh | Acer Predator Triton 14 PT14-51 i7-13700H, GeForce RTX 4050 Laptop GPU, 76.3 Wh | Razer Blade 14 RTX 4070 R9 7940HS, GeForce RTX 4070 Laptop GPU, 68 Wh | Asus ROG Zephyrus G14 GA402XY R9 7940HS, GeForce RTX 4090 Laptop GPU, 76 Wh | Alienware x14 i7 RTX 3060 i7-12700H, GeForce RTX 3060 Laptop GPU, 80 Wh | Lenovo LOQ 15APH8 R7 7840HS, GeForce RTX 4050 Laptop GPU, 60 Wh | |
|---|---|---|---|---|---|---|
| Akkulaufzeit | 4% | -19% | -12% | -10% | -8% | |
| Idle (h) | 10.5 | 11.2 7% | 8.6 -18% | 9.8 -7% | ||
| WLAN (h) | 7.5 | 5 -33% | 6.2 -17% | 7.5 0% | 8.9 19% | 7.4 -1% |
| Last (h) | 1.3 | 1.8 38% | 1 -23% | 1 -23% | 0.8 -38% | 1.1 -15% |
| H.264 (h) | 9 | 7.2 | 9.4 | |||
| Witcher 3 ultra (h) | 0.8 |
Pro
Contra
Fazit — Nicht nur für Gaming gut
Einige Aspekte heben das Legion Slim 5 14 von seinen Mitstreitern ab. Erstens: Sein an ein ThinkBook angelehntes Aussehen ohne RGB-Beleuchtung verleiht dem Gerät eine professionellere Ausstrahlung als das aggressive Design des Acer Predator Triton oder Zephyrus G14. Wer es bevorzugt, sowohl fürs Gamen als auch für Geschäftsmeetings nur einen Laptop zu verwenden, ist hier daher gut bedient. Zweitens: Sein 120-Hz-OLED-Panel ist den IPS-Displays anderer 14-Zoll-Gaming-Laptops in Sachen Schwarzwert, Reaktionszeit und Bildqualität weit überlegen.
Lenovos erster 14-Zoll-Legion-Gaming-Laptop legt mit seinem OLED-Panel mit 2,8K und 120 Hz einen guten Start hin. Dass G-Sync und eine RGB-Tastaturhintergrundbeleuchtung fehlen, ist angesichts der Preisklasse von über 1000 Euro allerdings seltsam.
Einiger Nachteile sollten sich potenzielle Käufer jedoch bewusst sein. Am auffälligsten ist dabei die fehlende G-Sync-Unterstützung für das OLED-Display, die dazu führt, dass Nutzer entweder v-sync aktivieren oder auf stabile 120 FPS mit reduzierten Einstellungen abzielen müssen, um Tearing zu vermeiden. Der nächste Nachteil ist die fehlende RGB-Tastaturhintergrundbeleuchtung und die Tatsache, dass es keine GPU-Optionen gibt, die über die RTX 4060 hinausgehen. Die RTX 4060 ist zwar sehr gut, allerdings entgehen Lenovo somit Gaming-Liebhaber, die sich eine RTX 4070 oder noch schnellere Varianten wünschen. Das Asus Zephyrus G14 und das Razer Blade 14 sind beide kleiner und bieten sowohl ein erweiterbares RAM-Modul und schnellere GPU-Optionen.
Das laute Lüftergeräusch und die hohen Kerntemperaturen sind weitere nennenswerte Nachteile – allerdings sind diese Mängel bei allen 14-Zoll-Gaming-Laptops vorhanden.
Das Legion Slim 5 14 eignet sich am besten als leistungsstarker Reisebegleiter fürs Gamen, die grafische Datenverarbeitung und Textverarbeitung. Als reiner Gamer wird er allerdings von den Alternativen von Razer, Asus oder Alienware mit ihren besseren GPUs und zusätzlichen Features, die Gamer ansprechen, geschlagen.
Preis und Verfügbarkeit
Lenovo Legion Slim 5 14APH8
- 25.09.2023 v7 (old)
Allen Ngo
Transparenz
Die Auswahl der zu testenden Geräte erfolgt innerhalb der Redaktion. Das vorliegende Testmuster wurde dem Autor vom Hersteller oder einem Shop zu Testzwecken leihweise zur Verfügung gestellt. Eine Einflussnahme des Leihstellers auf den Testbericht gab es nicht, der Hersteller erhielt keine Version des Reviews vor der Veröffentlichung. Es bestand keine Verpflichtung zur Publikation. Als eigenständiges, unabhängiges Unternehmen unterliegt Notebookcheck keiner Diktion von Herstellern, Shops und Verlagen.
So testet Notebookcheck
Pro Jahr werden von Notebookcheck hunderte Laptops und Smartphones unabhängig in von uns standardisierten technischen Verfahren getestet, um eine Vergleichbarkeit aller Testergebnisse zu gewährleisten. Seit rund 20 Jahren entwickeln wir diese Testmethoden kontinuierlich weiter und setzen damit Branchenstandards. In unseren Testlaboren kommt ausschließlich hochwertiges Messequipment in die Hände erfahrener Techniker und Redakteure. Die Tests unterliegen einer mehrstufigen Kontrolle. Unsere komplexe Gesamtbewertung basiert auf hunderten fundierten Messergebnissen und Benchmarks, womit Ihnen Objektivität garantiert ist. Weitere Informationen zu unseren Testmethoden gibt es hier.


