Schenker XMG Pro 15 E23 (PD50SND-G) Gaming-Laptop im Test: Ein Hoch auf die Work-Play-Balance
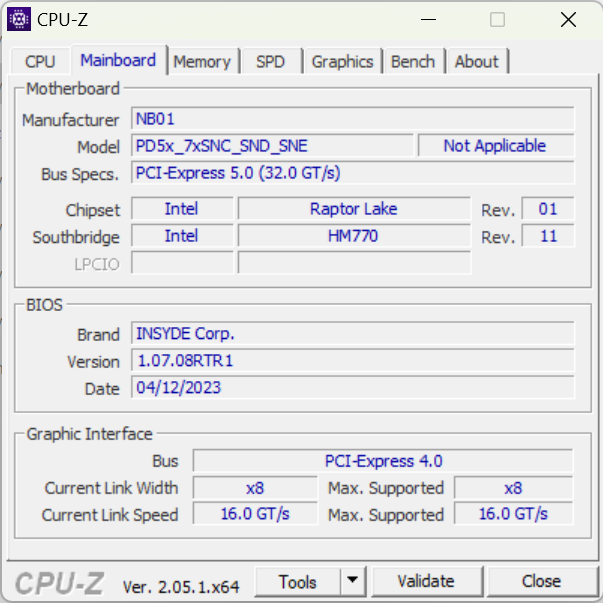
Die Laptops von Schenker werden regelmäßig auf den neuesten Stand gebracht. So haben wir im letzten Jahr gleich zwei Vorgänger des XMG Pro 15 getestet. Einen mit Tiger-Lake-CPU, einen mit Alder-Lake, beide mit einer RTX 3080. Unser Testgerät ist mit der neuesten Raptor-Lake-Genaraton beim Prozessor ausgestattet und setzt auf die Nvidia GeForce RTX 4060. Aber nicht nur im Inneren des Laptops gab es Anpassungen, auch das Design wurde leicht überarbeitet. Der Laptop basiert nun auf dem Clevo PD50SND-G Barebone.
Interessant wird hier der Vergleich mit dem Vorgänger, denn obwohl die Grafikkarte inzwischen aus der neusten Ada-Lovelace-Generation von Nvidia stammt, wurde deren Klasse von der 80 auf die 60 gesetzt. Eine andere Konfigurationsmöglichkeit sieht die RTX 4070 vor. Beide Grafikkarten werden mit 140 bis 150 Watt betrieben. So könnte das Pro 15 E23 eine stattliche Leistung ablegen und im Vergleich zu Gaming Laptops wie dem Dell G15 5530 oder dem Aorus 15X ASF Bestand haben. Etwas außerhalb der Klasse liegt das Asus ZenBook Pro 14 Duo. Der Multimedia-Laptop kann jedoch auch mit hohen FPS in vielen aktuellen Titeln aufwarten.
Mögliche Konkurrenten im Vergleich
Bew. | Datum | Modell | Gewicht | Dicke | Größe | Auflösung | Preis ab |
|---|---|---|---|---|---|---|---|
| 86.2 % v7 (old) | 07 / 2023 | Schenker XMG Pro 15 (E23) i9-13900HX, GeForce RTX 4060 Laptop GPU | 2.4 kg | 24.9 mm | 15.60" | 2560x1440 | |
| 86.9 % v7 (old) | 07 / 2022 | Schenker XMG Pro 15 (i7-12700H, RTX 3080 Ti) i7-12700H, GeForce RTX 3080 Ti Laptop GPU | 2.4 kg | 25 mm | 15.60" | 2560x1440 | |
| 84.2 % v7 (old) | 06 / 2023 | Dell G15 5530 i7-13650HX, GeForce RTX 4060 Laptop GPU | 3 kg | 26.95 mm | 15.60" | 1920x1080 | |
| 86.3 % v7 (old) | 06 / 2023 | Asus TUF A15 FA507 R7 7735HS, GeForce RTX 4050 Laptop GPU | 2.2 kg | 24.9 mm | 15.60" | 1920x1080 | |
| 86.2 % v7 (old) | 04 / 2023 | Aorus 15X ASF i7-13700HX, GeForce RTX 4070 Laptop GPU | 2.3 kg | 19.7 mm | 15.60" | 2560x1440 | |
| 87 % v7 (old) | 06 / 2023 | Asus ZenBook Pro 14 Duo UX8402VV-P1021W i9-13900H, GeForce RTX 4060 Laptop GPU | 1.8 kg | 21 mm | 14.50" | 2880x1800 | |
| 82.4 % v7 (old) | 04 / 2023 | MSI Cyborg 15 A12VF i7-12650H, GeForce RTX 4060 Laptop GPU | 2 kg | 22.9 mm | 15.60" | 1920x1080 | |
| 88.4 % v7 (old) | 06 / 2023 | Alienware x16 R1 i9-13900HK, GeForce RTX 4080 Laptop GPU | 2.6 kg | 18.57 mm | 16.00" | 2560x1600 |
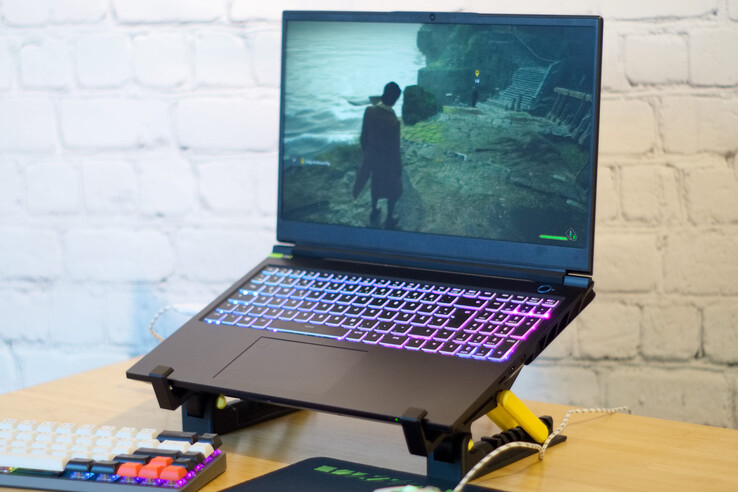
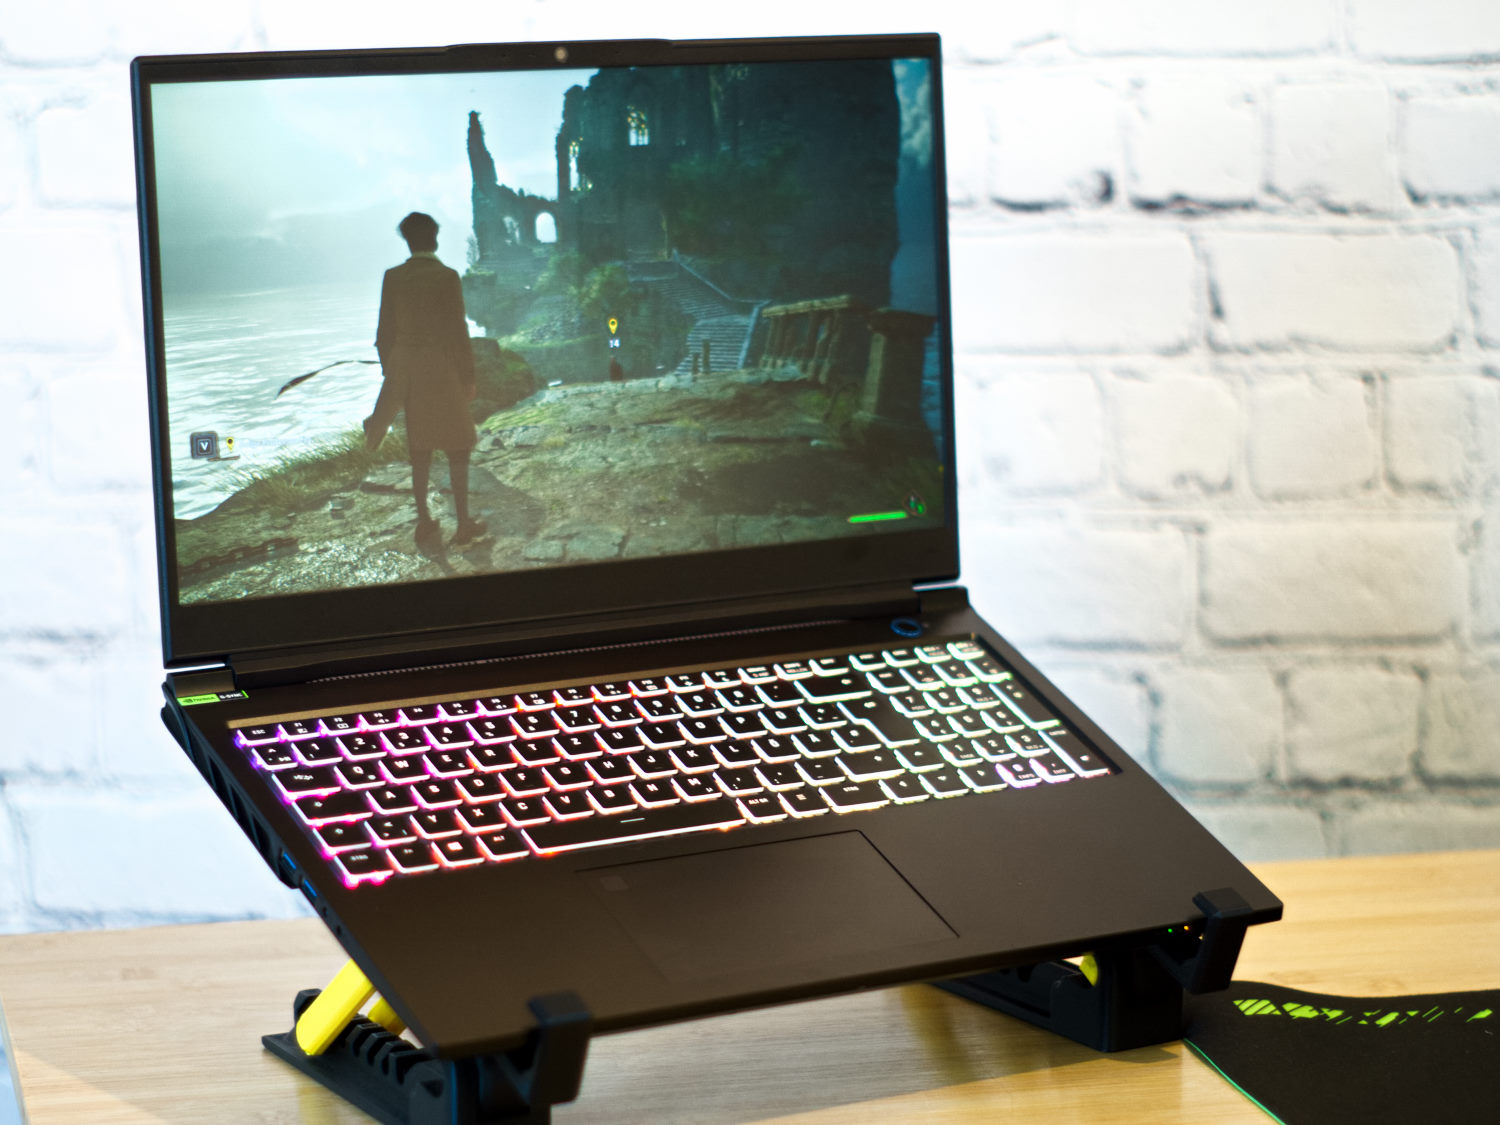
Gehäuse & Ausstattung - Hoher Metallgehalt
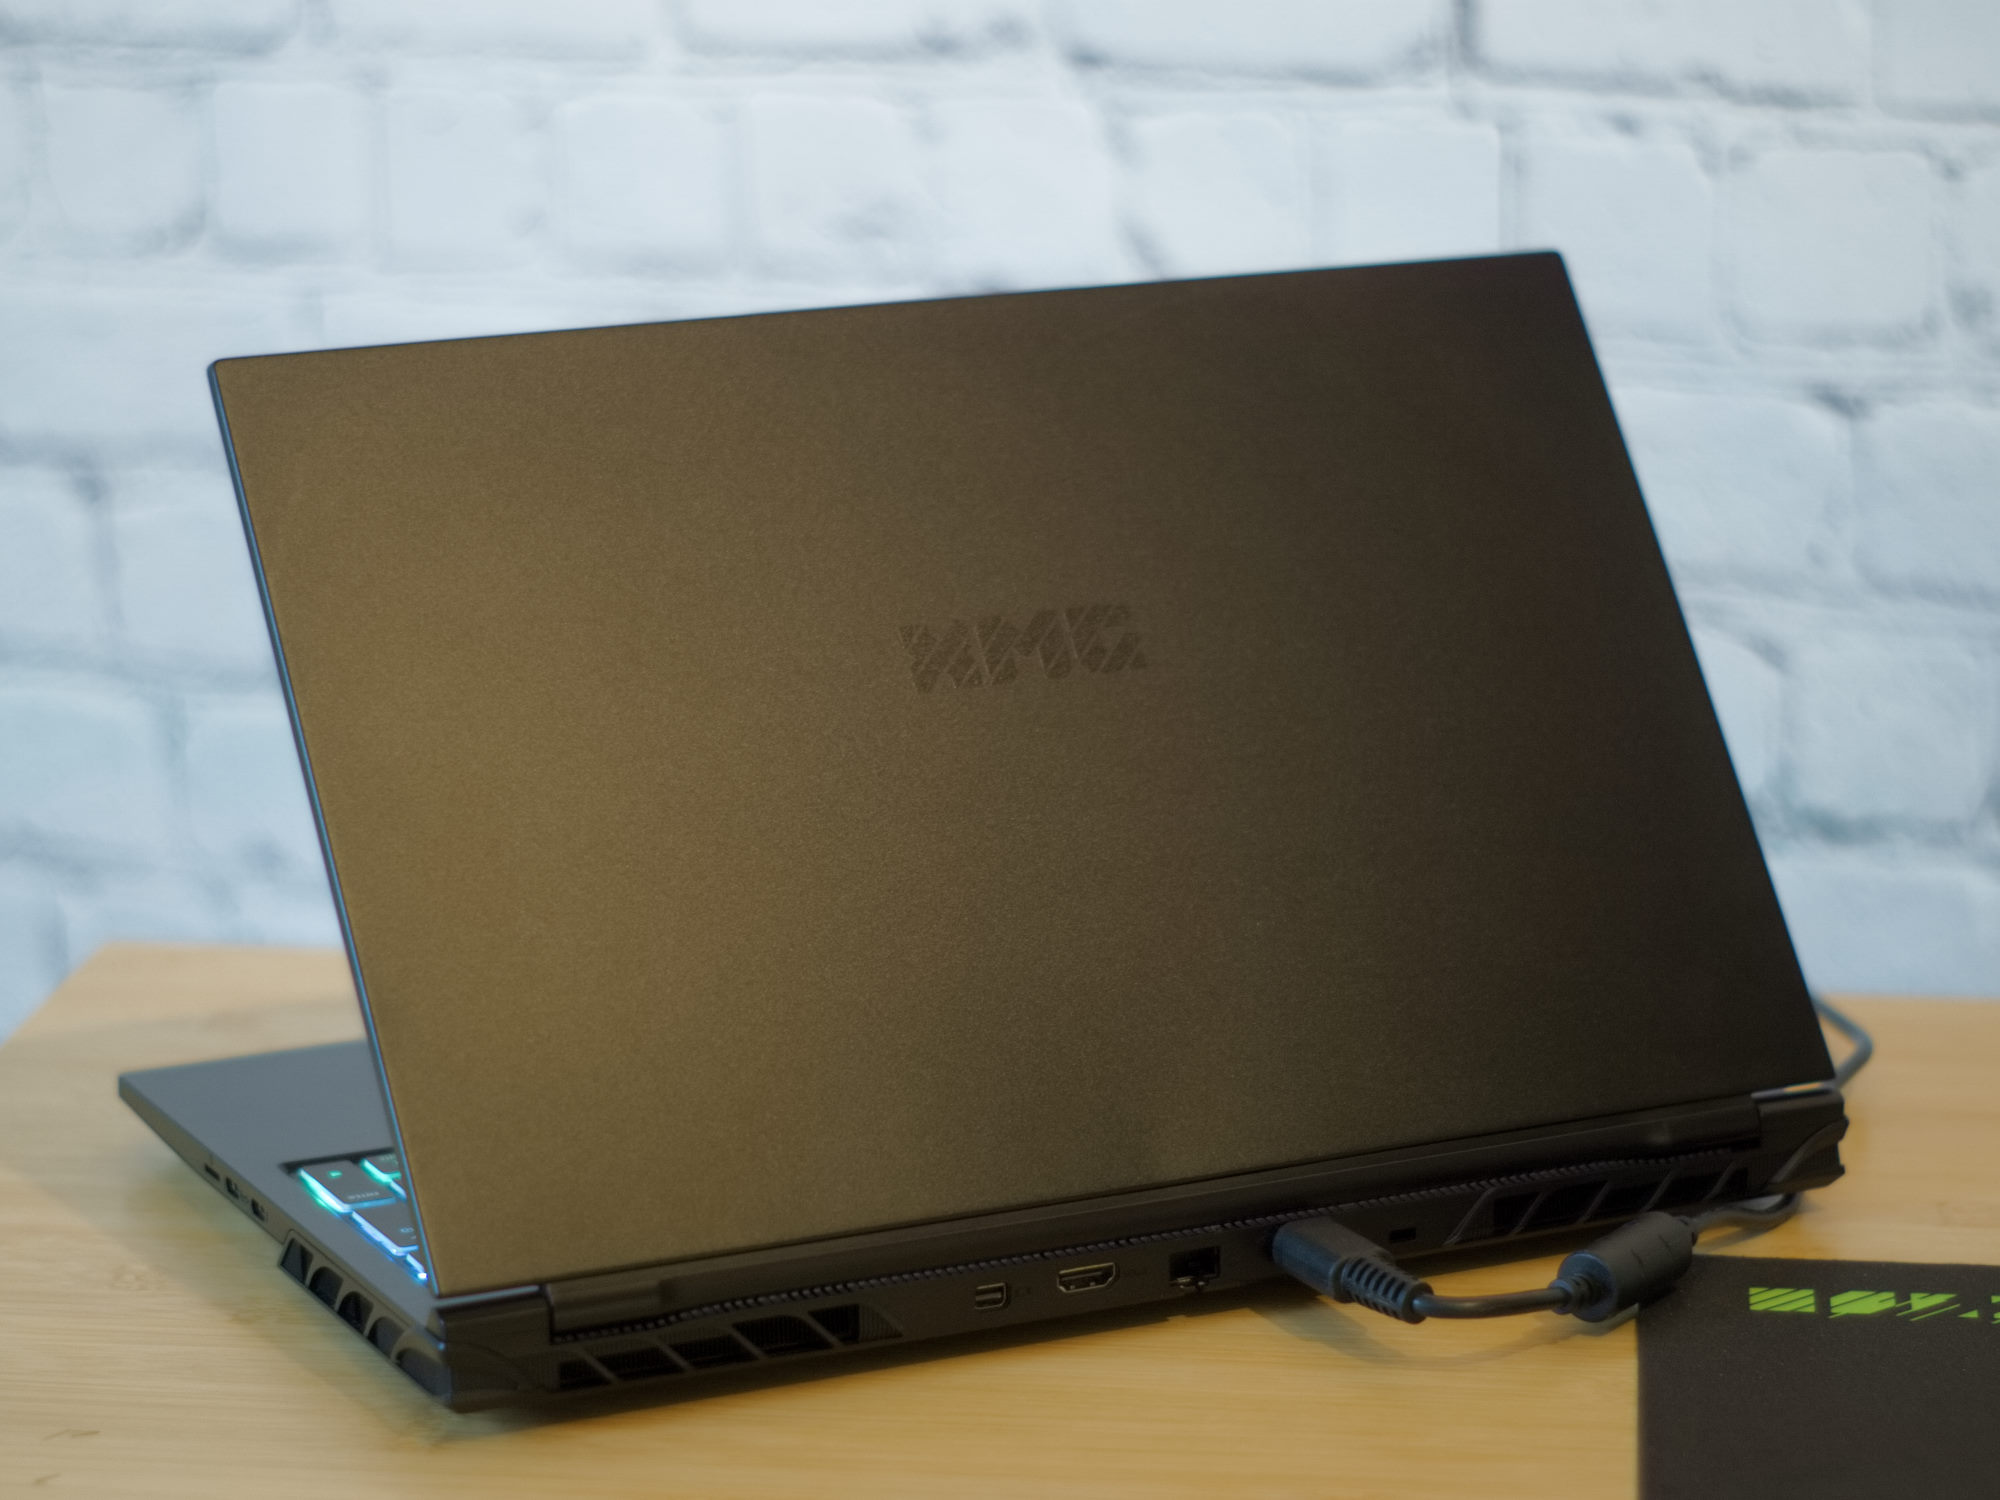
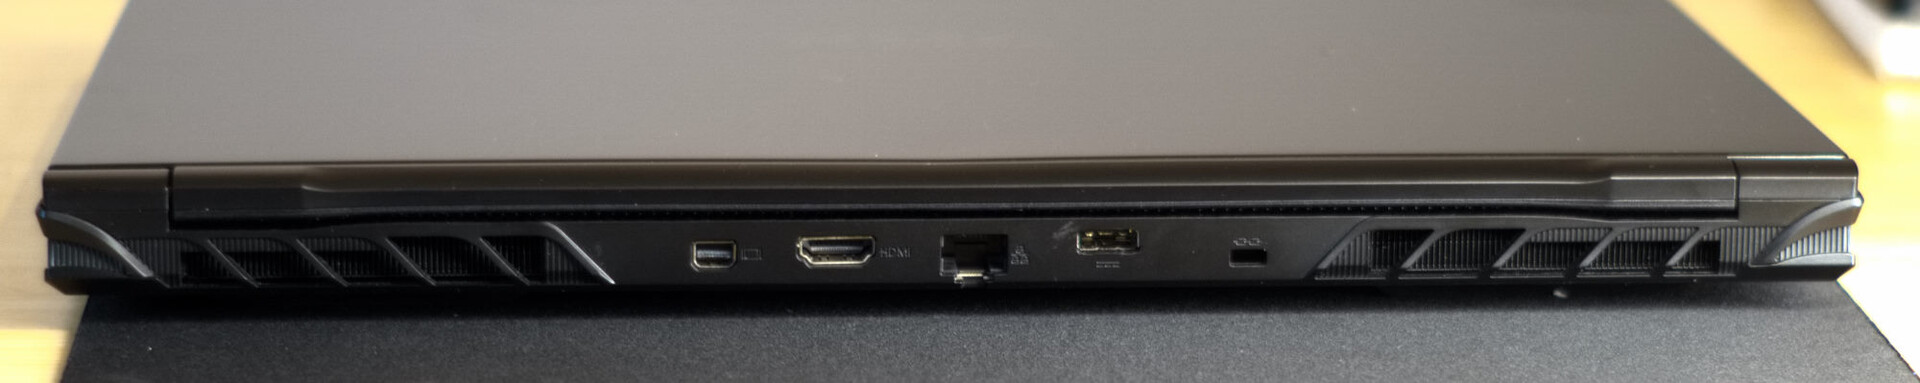
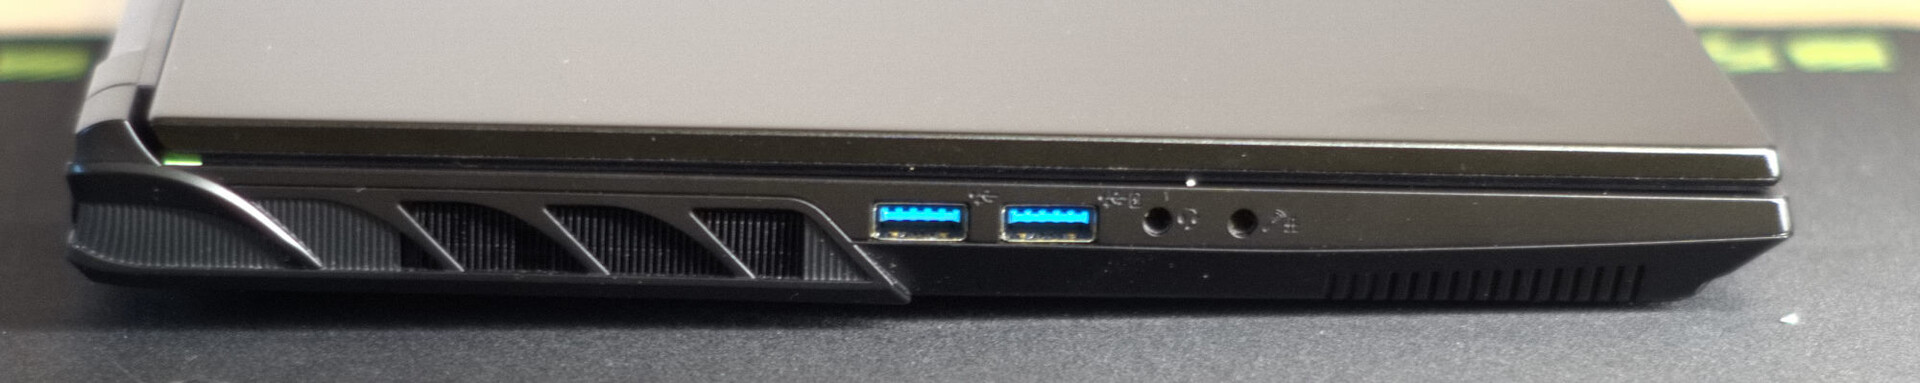
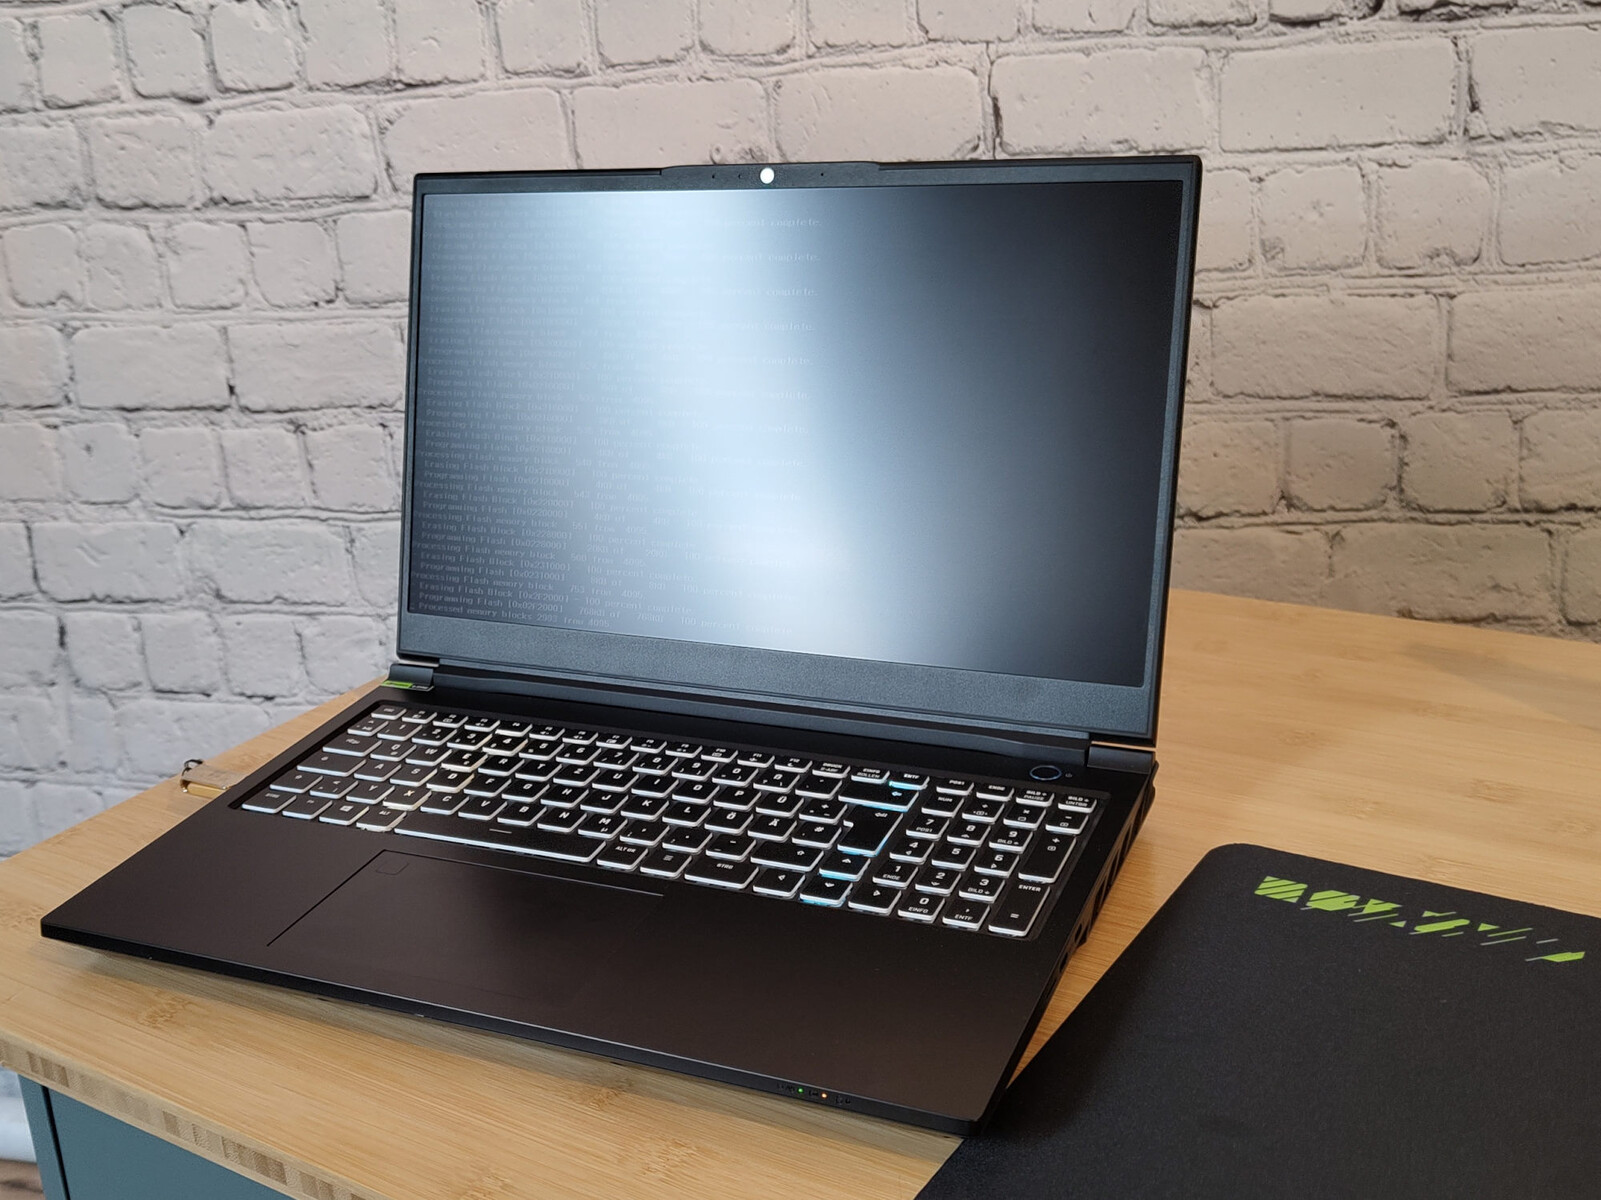
Im Vergleich zum Vorgänger wurden am Pro 15 E23 ein paar kleine Änderungen im Detail vorgenommen. Davon betroffen sind im Wesentlichen die Luftauslässe an den Seiten des Laptops und der Positionstausch vom RJ45-Slot und einer USB-C-Buchse. Damit befinden sich nun alle USB-Buchsen an den Seiten des Gerätes.
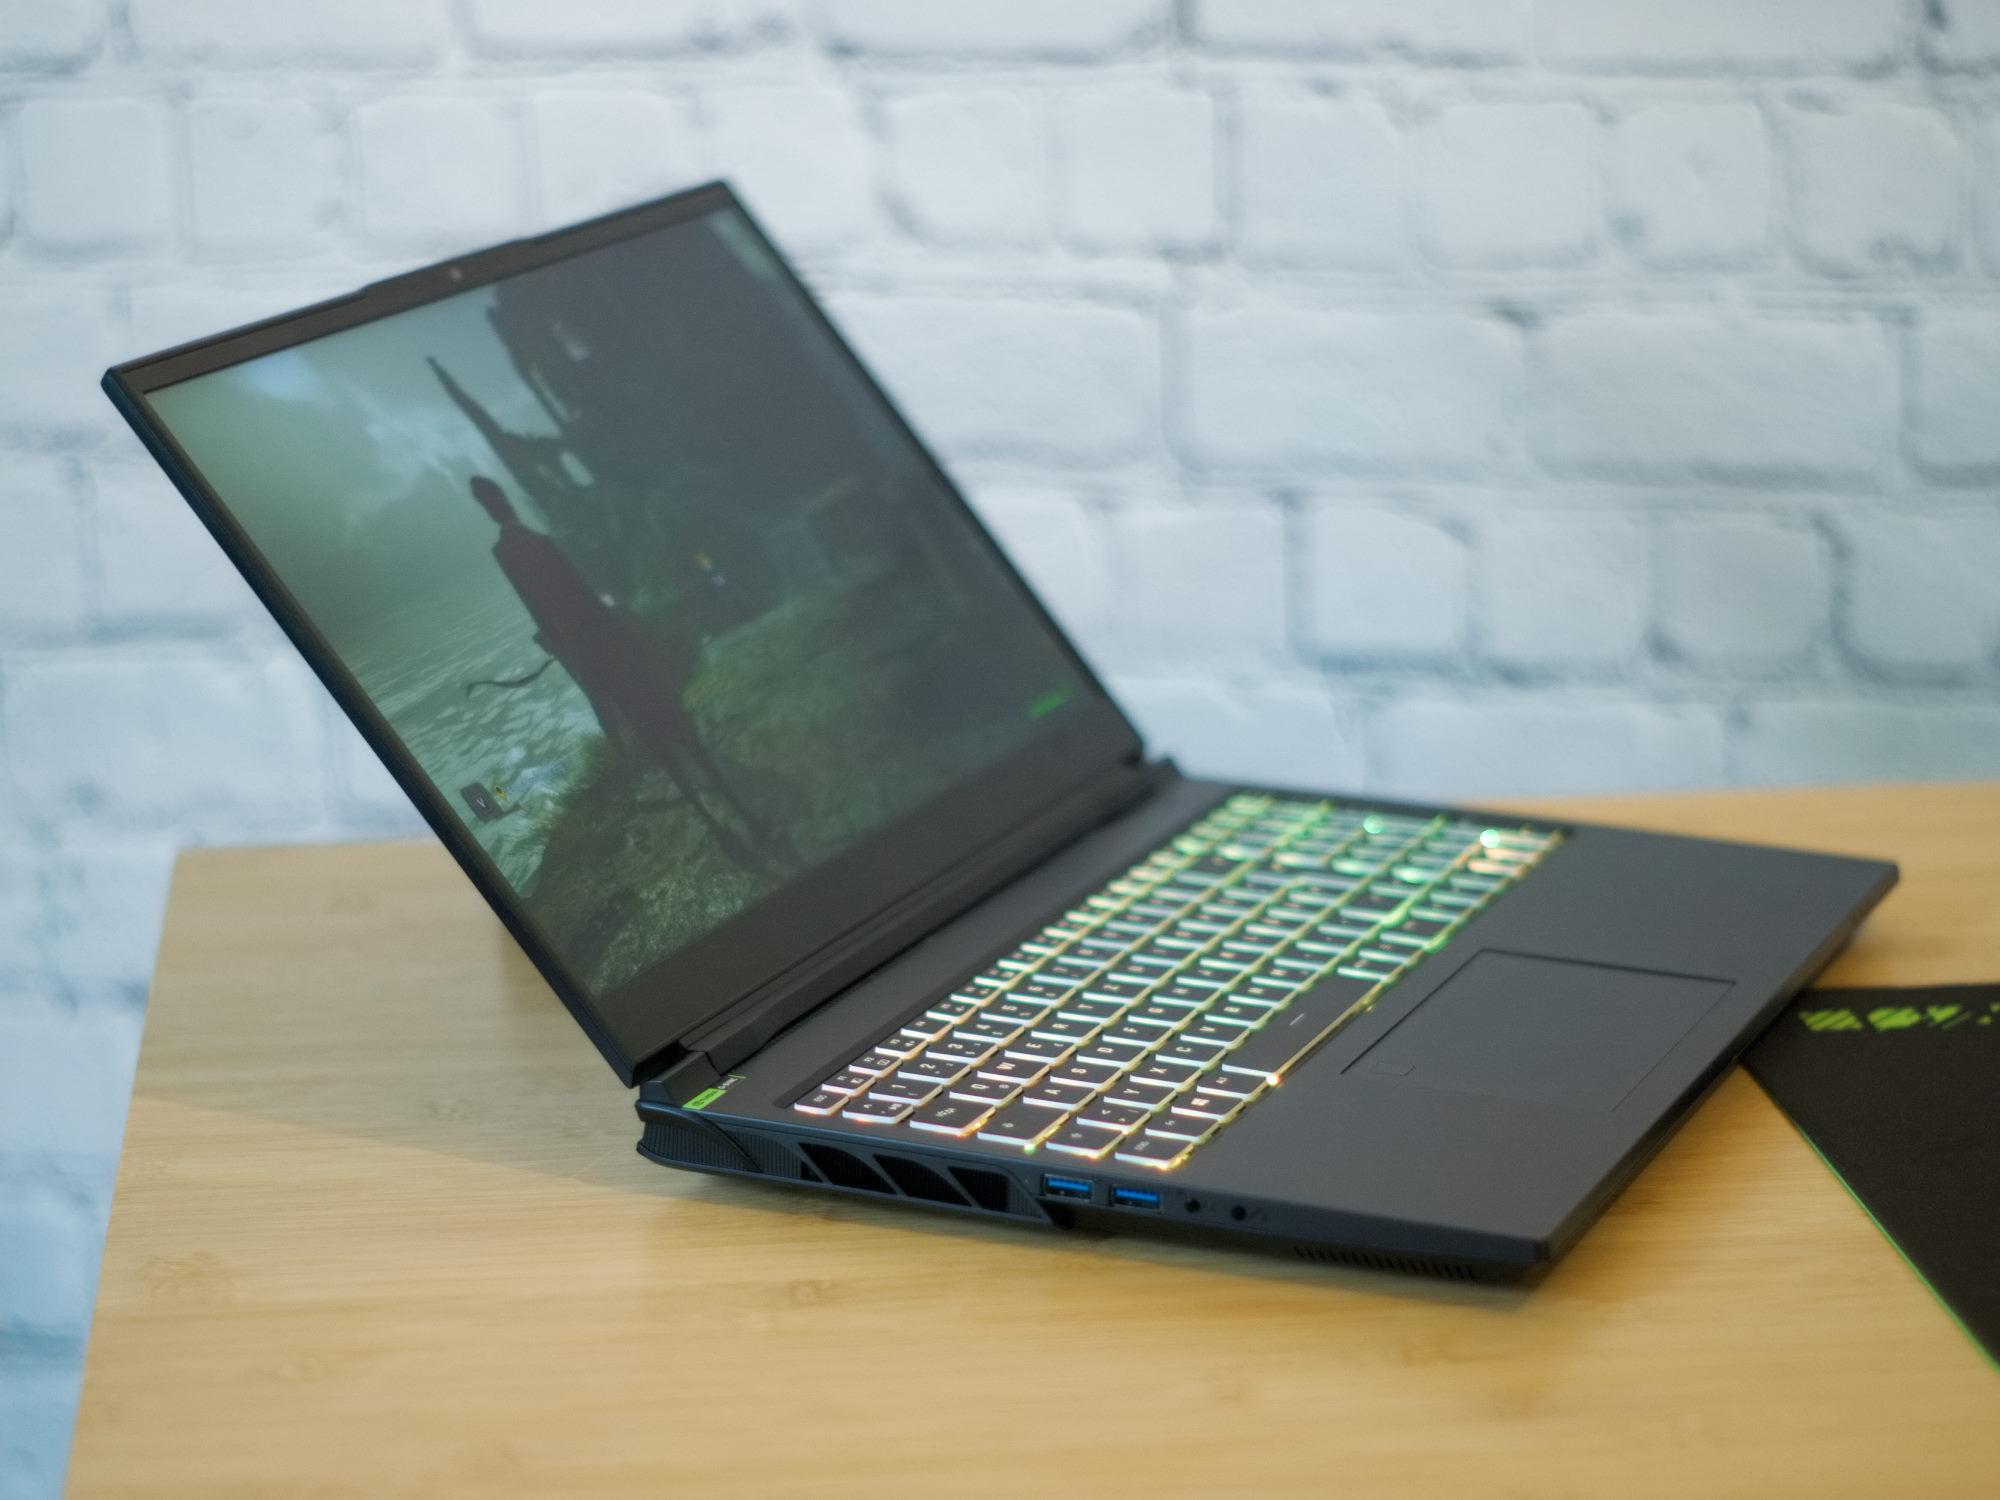
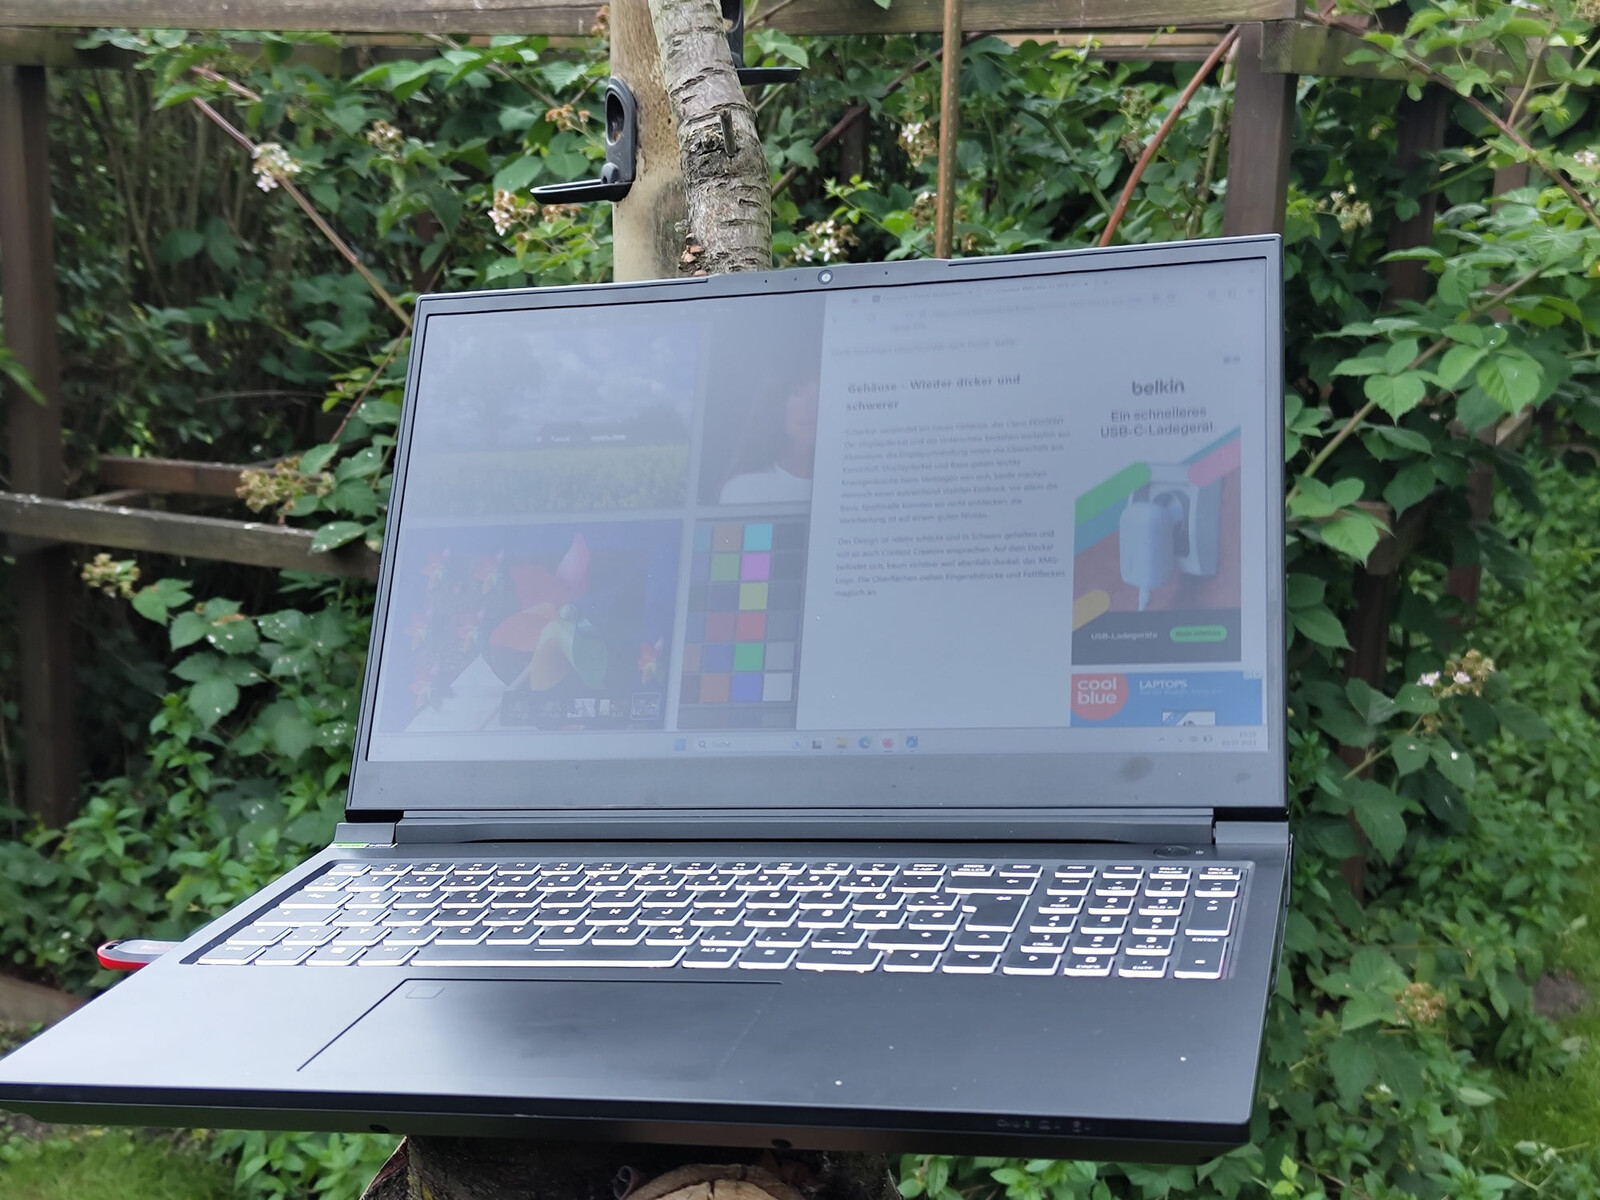
Das Design bleibt weiterhin schlicht, schwarz und mit kaum sichtbarem Branding. So sind auch Größe und Gewicht zum Vorgänger beinahe identisch. Bildschirmdeckel und Unterschale bestehen am Gaming-Laptop weiterhin aus Aluminium, die Oberschale aus Kunststoff. Um das Display herum liegt ein Kunststoffrand, der an den Seiten nur 5 mm schmal ist, oben mit einem und unten mit zwei Zentimetern dann aber doch recht breit wirkt. Wenn man es darauf anlegt, kann man Basis und Bildschirm beim Verwinden ein leichtes Knarzen entlocken. Hier muss man sich jedoch schon ziemlich anstrengen, denn alle Bauteile am Laptop sind passgenau verarbeitet und stabil. So geben Tastatur und Bildschirmdeckel nur beim kraftvollen Drücken nach und die Scharniere halten den Monitor sicher in jeder erdenklichen Position zwischen 0° und 135°.
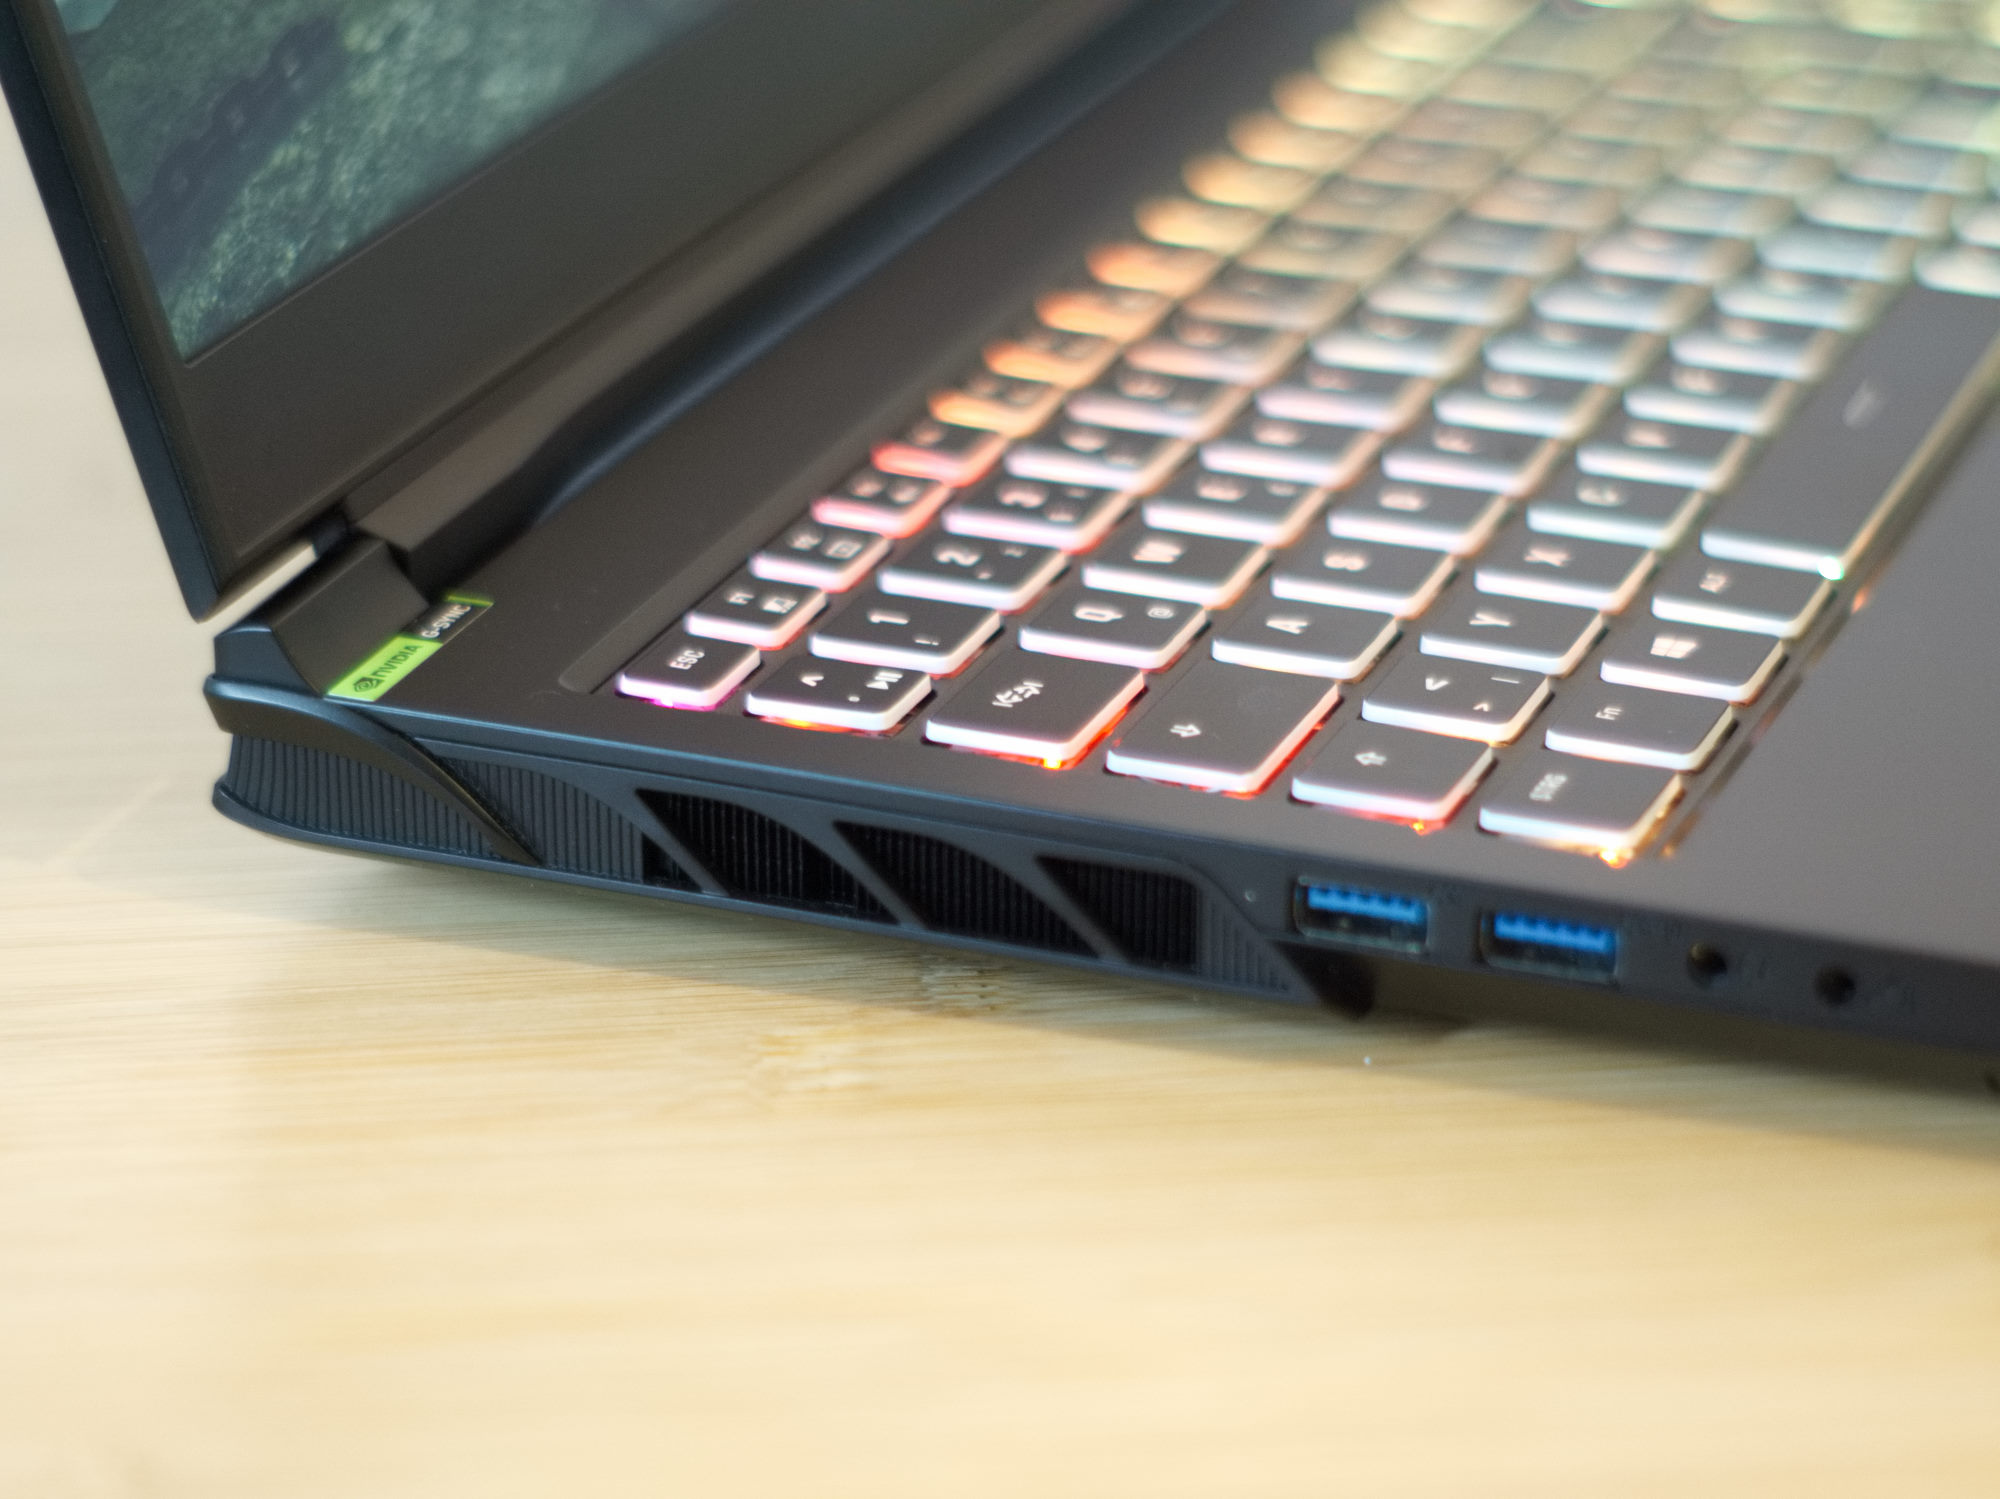

SD-Kartenleser, WiFi und Webcam
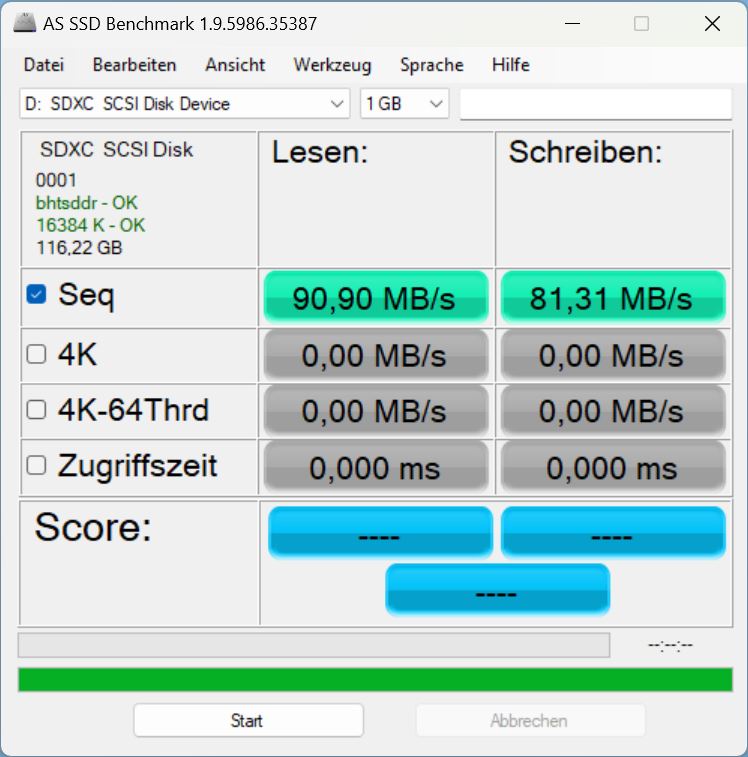
Das Pro 15 verfügt, im Gegensatz zu vielen anderen Gaming-Notebooks, zumindest noch über einen microSD-Kartenleser. Im Zusammenspiel mit unserer AV Pro microSD (V60) ergeben sich hier gute Übertragungsraten im Bereich von 80 bis 90 MB/s.
Das Intel Wi-Fi 6E AX211 im Laptop zeigt vorwiegend im 6 GHz Netzwerk hervorragende Datenraten, während im 5 GHz Netzwerk eher unterdurchschnittliche Werte bei den Übertragungsgeschwindigkeiten erreicht werden.
Für Streamer dürfte die Qualität der verbauten Full-HD-Webcam vorwiegend bei schwacher Beleuchtung ungenügend sein. Gelegentliche Videotelefonate lassen sich jedoch damit bewerkstelligen.
| SD Card Reader | |
| average JPG Copy Test (av. of 3 runs) | |
| Durchschnitt der Klasse Gaming (20.9 - 210, n=54, der letzten 2 Jahre) | |
| Schenker XMG Pro 15 (E23) | |
| Schenker XMG Pro 15 (i7-12700H, RTX 3080 Ti) | |
| Asus ZenBook Pro 14 Duo UX8402VV-P1021W (AV Pro SD microSD 128 GB V60) | |
| Alienware x16 R1 (AV PRO microSD 128 GB V60) | |
| maximum AS SSD Seq Read Test (1GB) | |
| Alienware x16 R1 (AV PRO microSD 128 GB V60) | |
| Durchschnitt der Klasse Gaming (25.5 - 261, n=51, der letzten 2 Jahre) | |
| Schenker XMG Pro 15 (i7-12700H, RTX 3080 Ti) | |
| Schenker XMG Pro 15 (E23) | |
| Asus ZenBook Pro 14 Duo UX8402VV-P1021W (AV Pro SD microSD 128 GB V60) | |

 GeForce RTX 4060 Laptop GPU, i9-13900HX, Crucial P5 Plus 1TB CT1000P5PSSD8")
 GeForce RTX 4060 Laptop GPU, i9-13900HX, Crucial P5 Plus 1TB CT1000P5PSSD8")
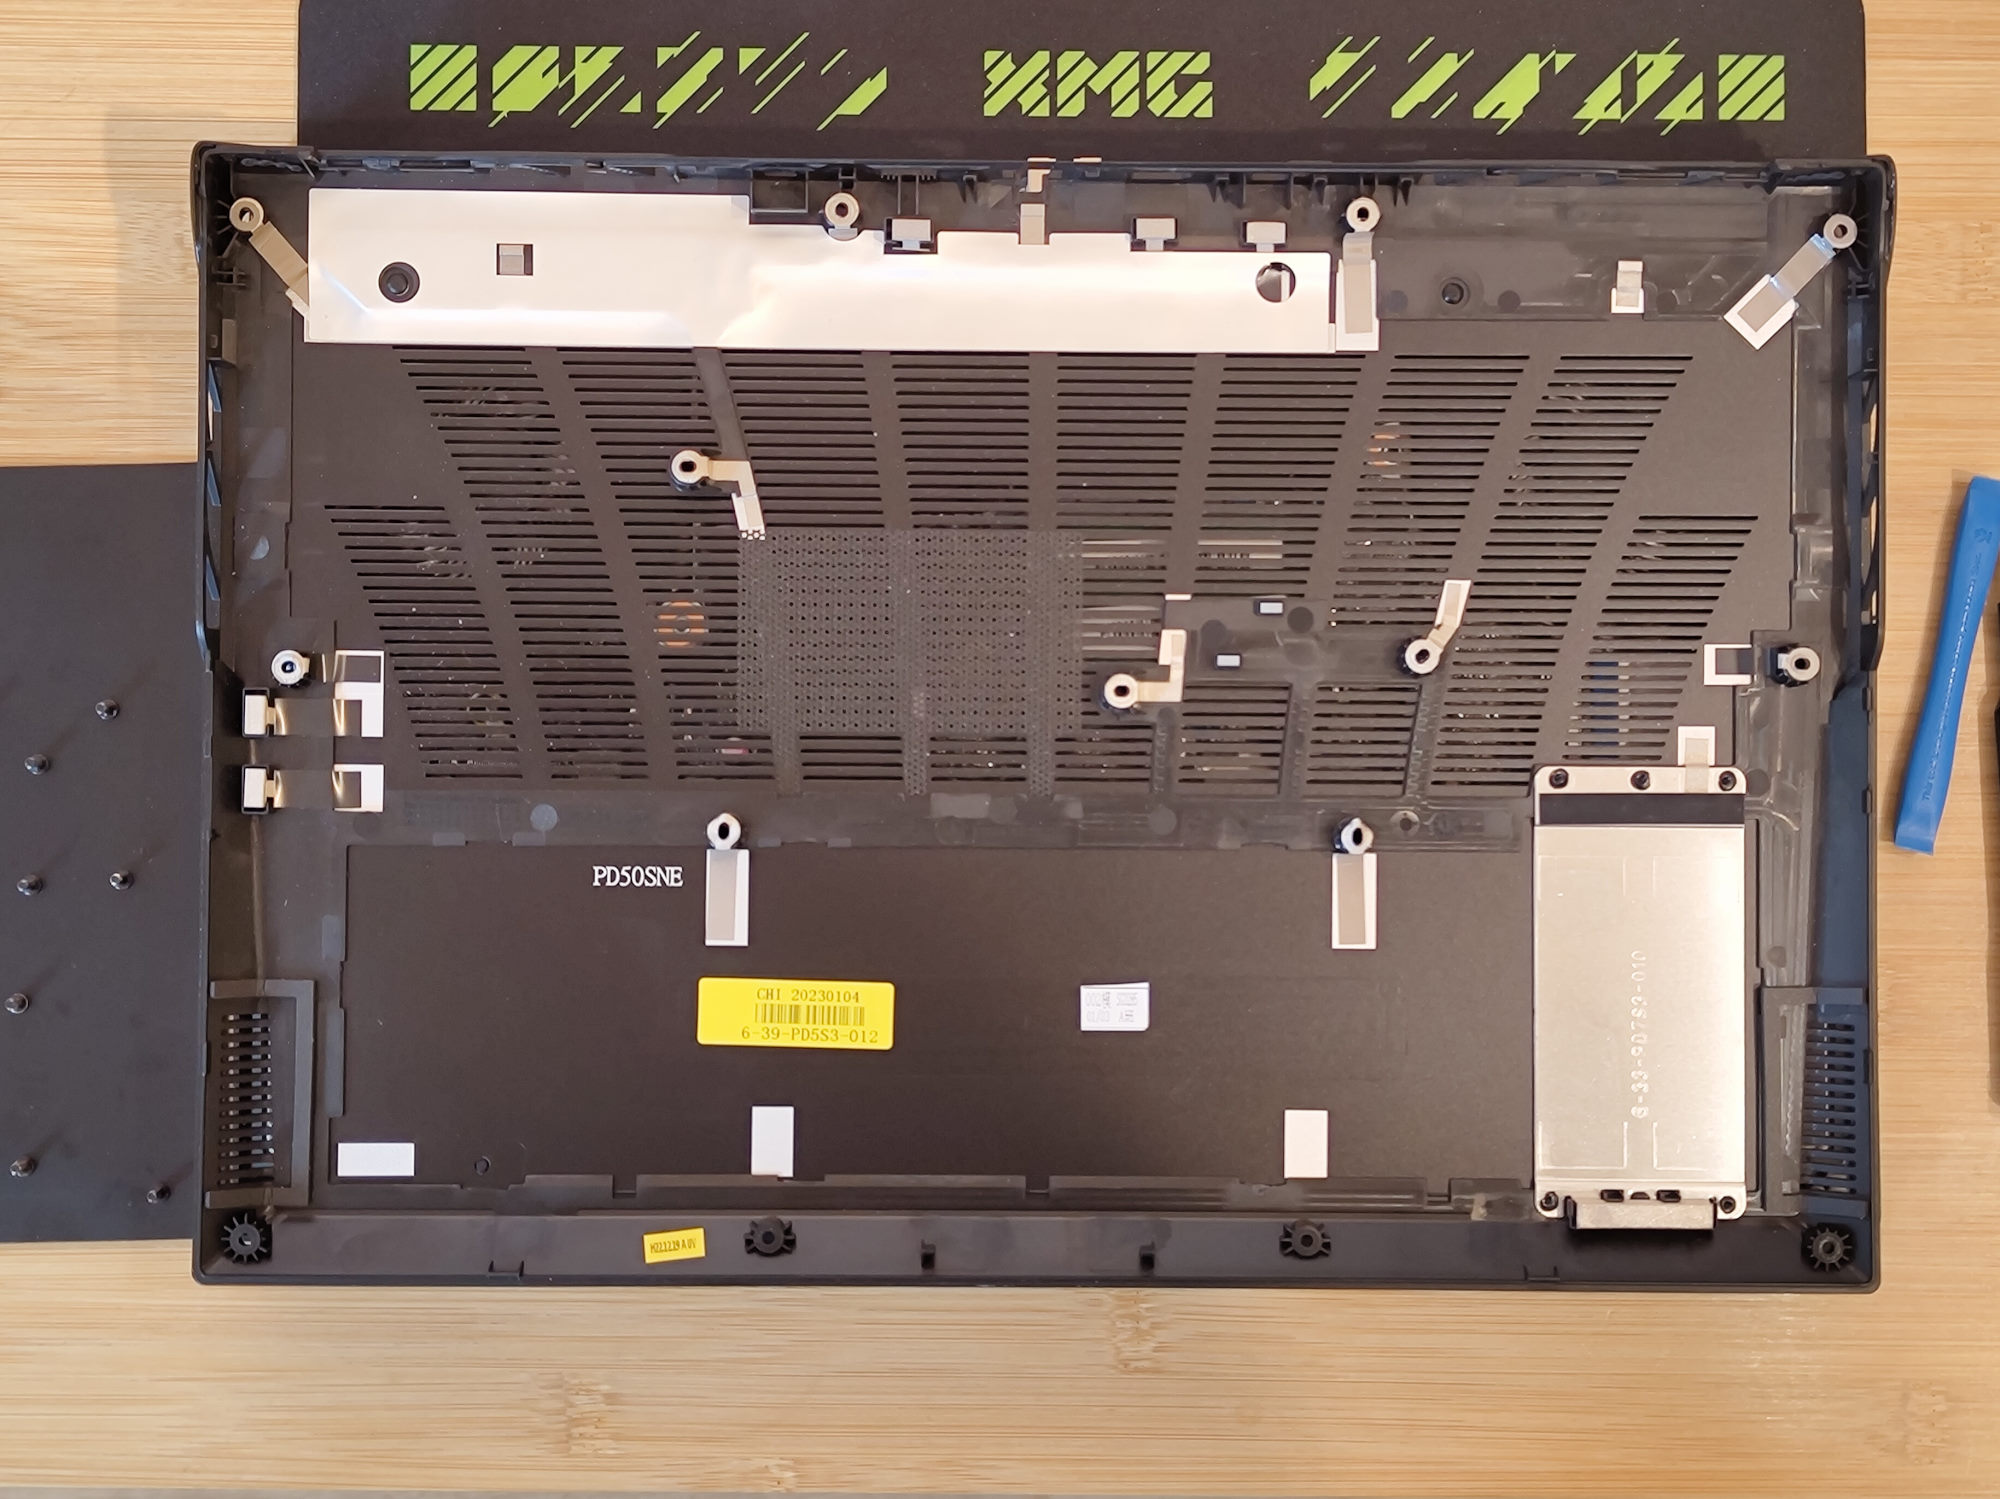
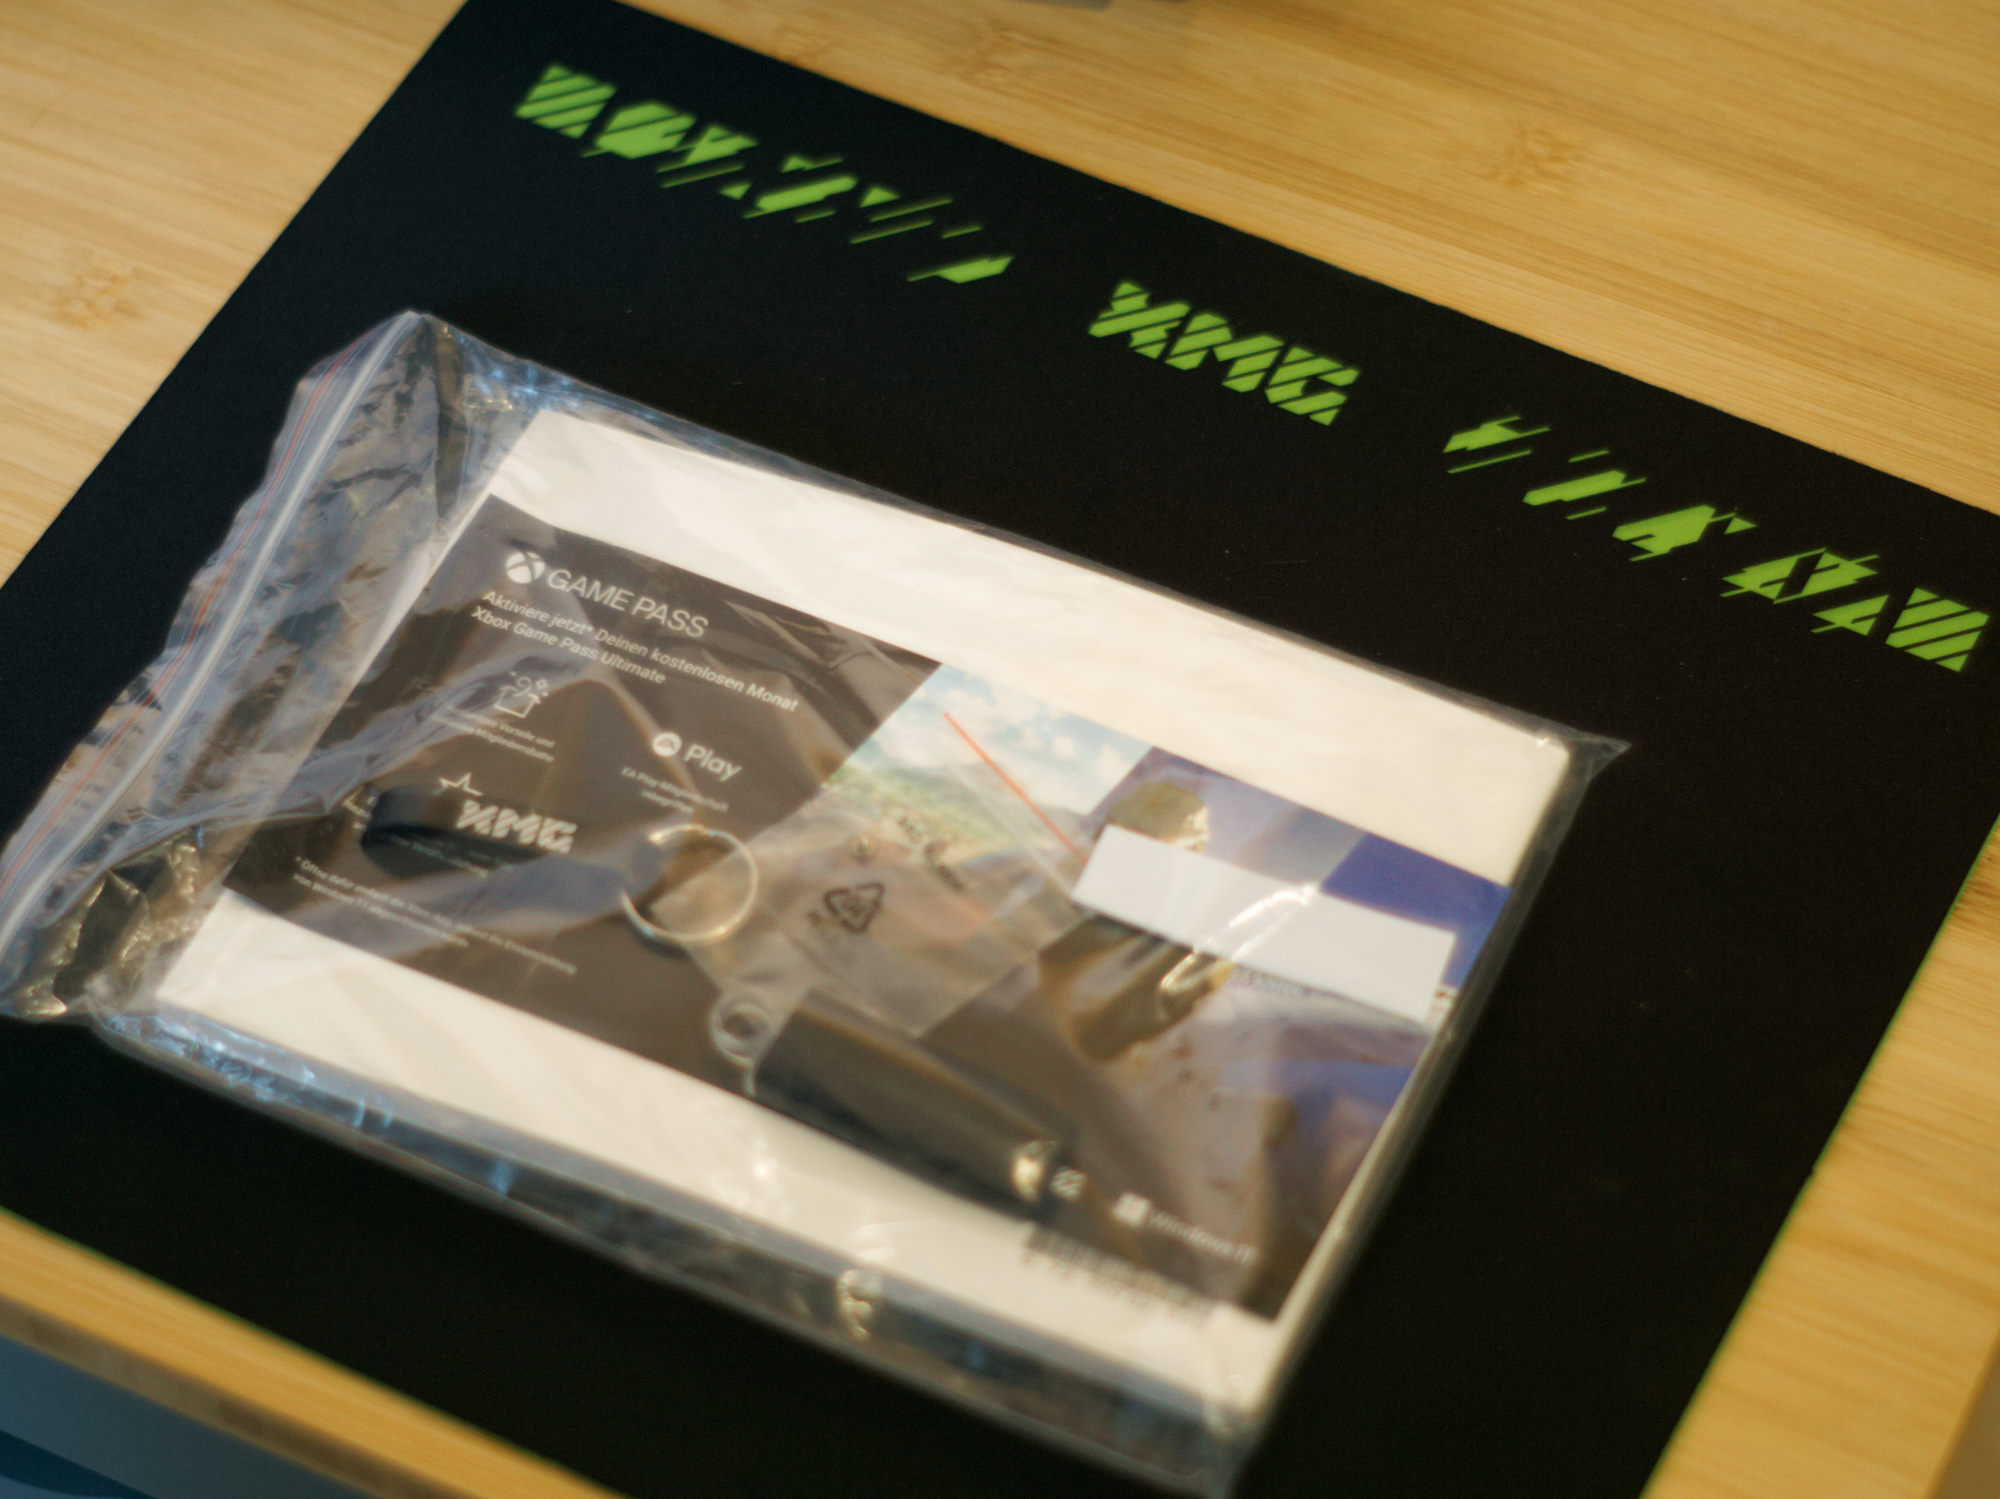
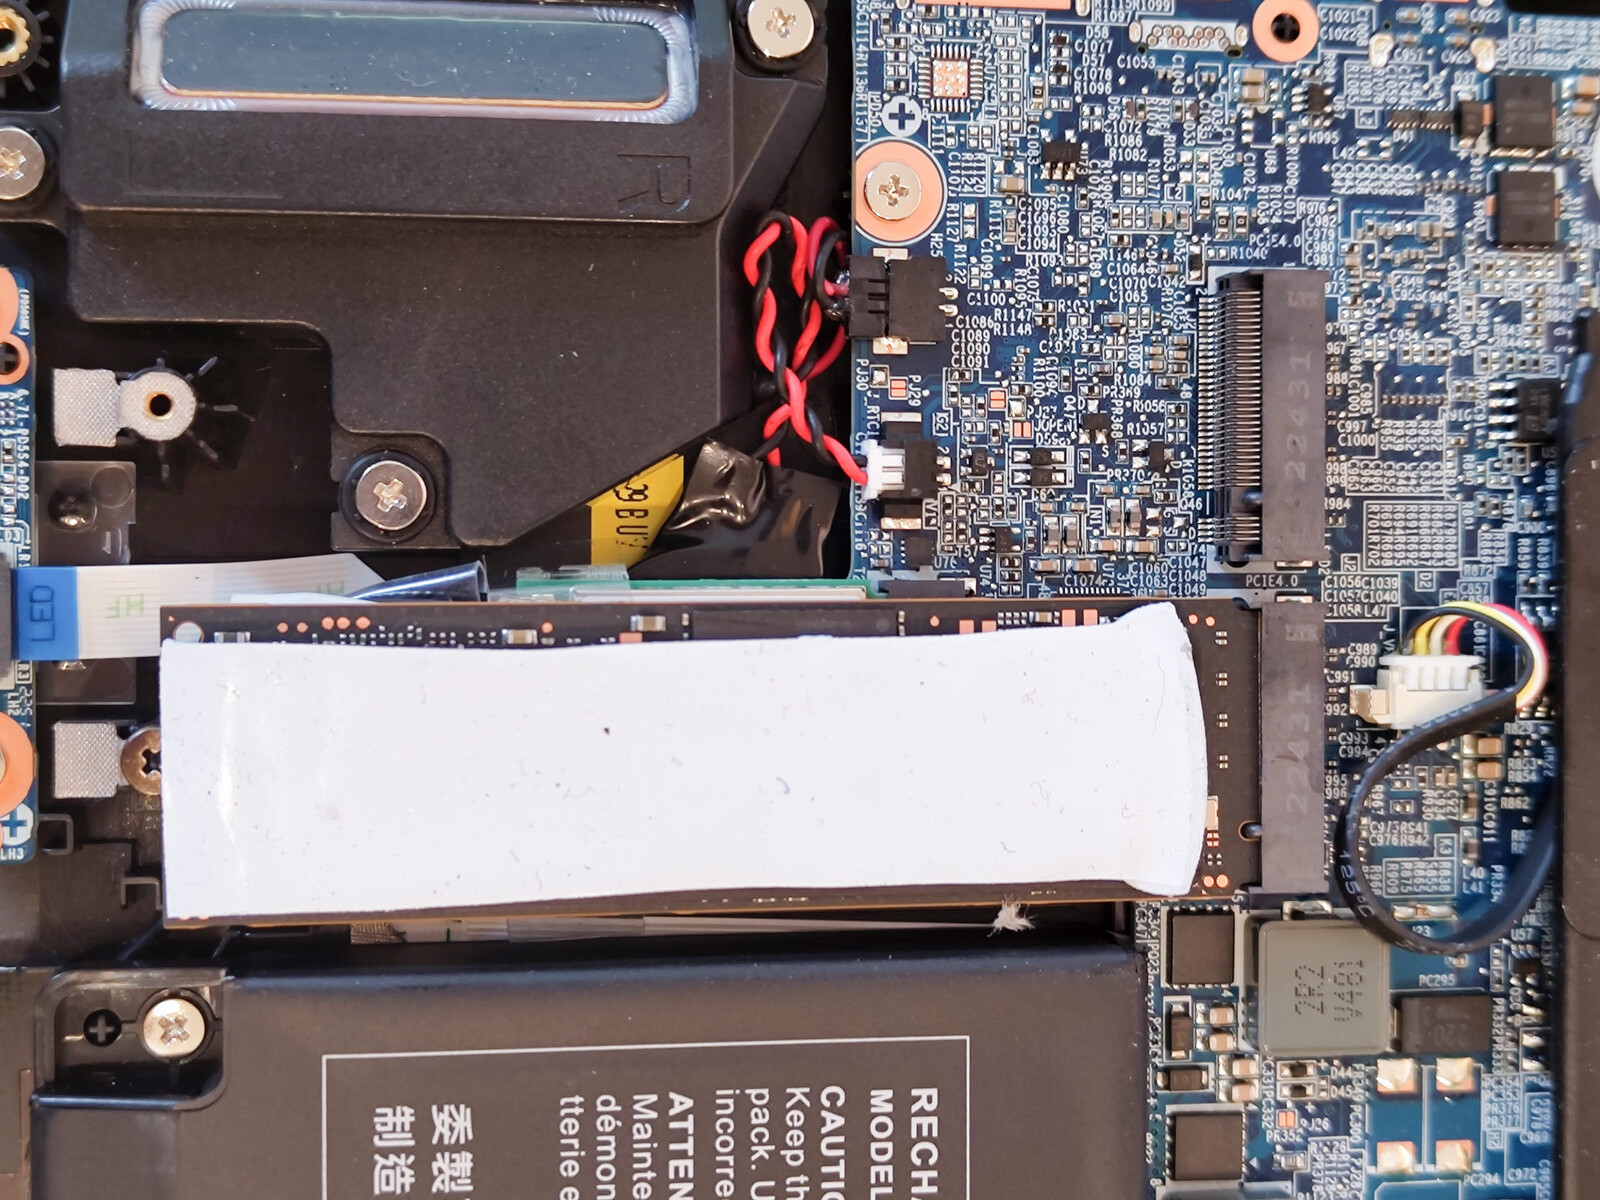
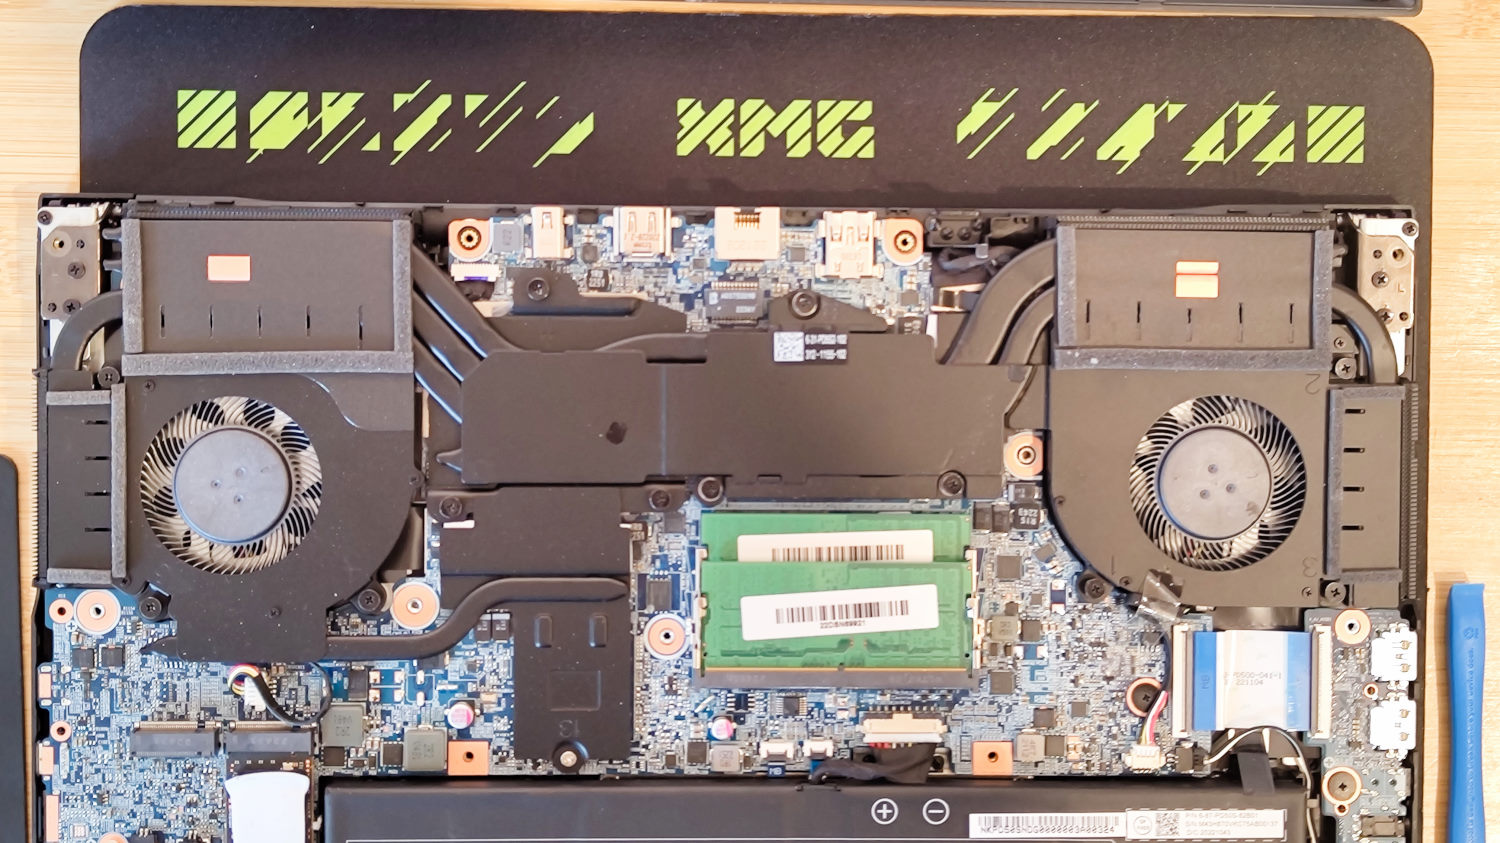
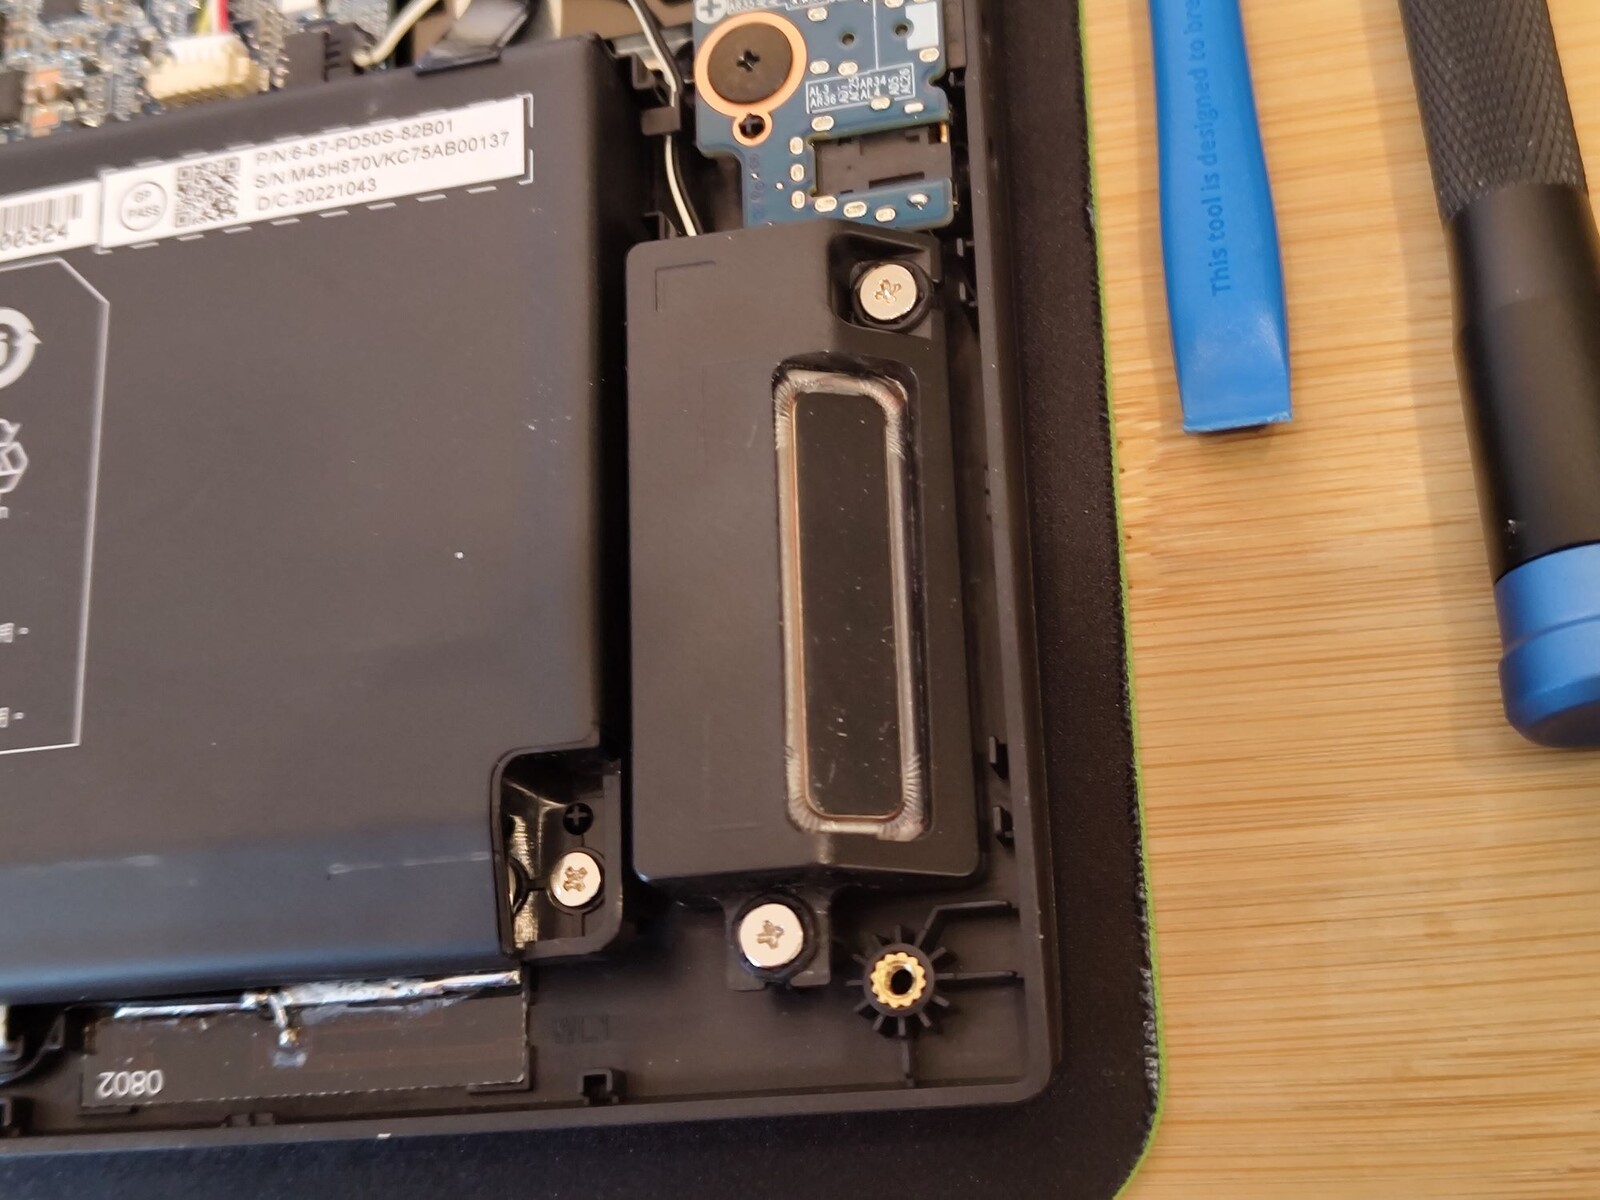
Zubehör und Wartung
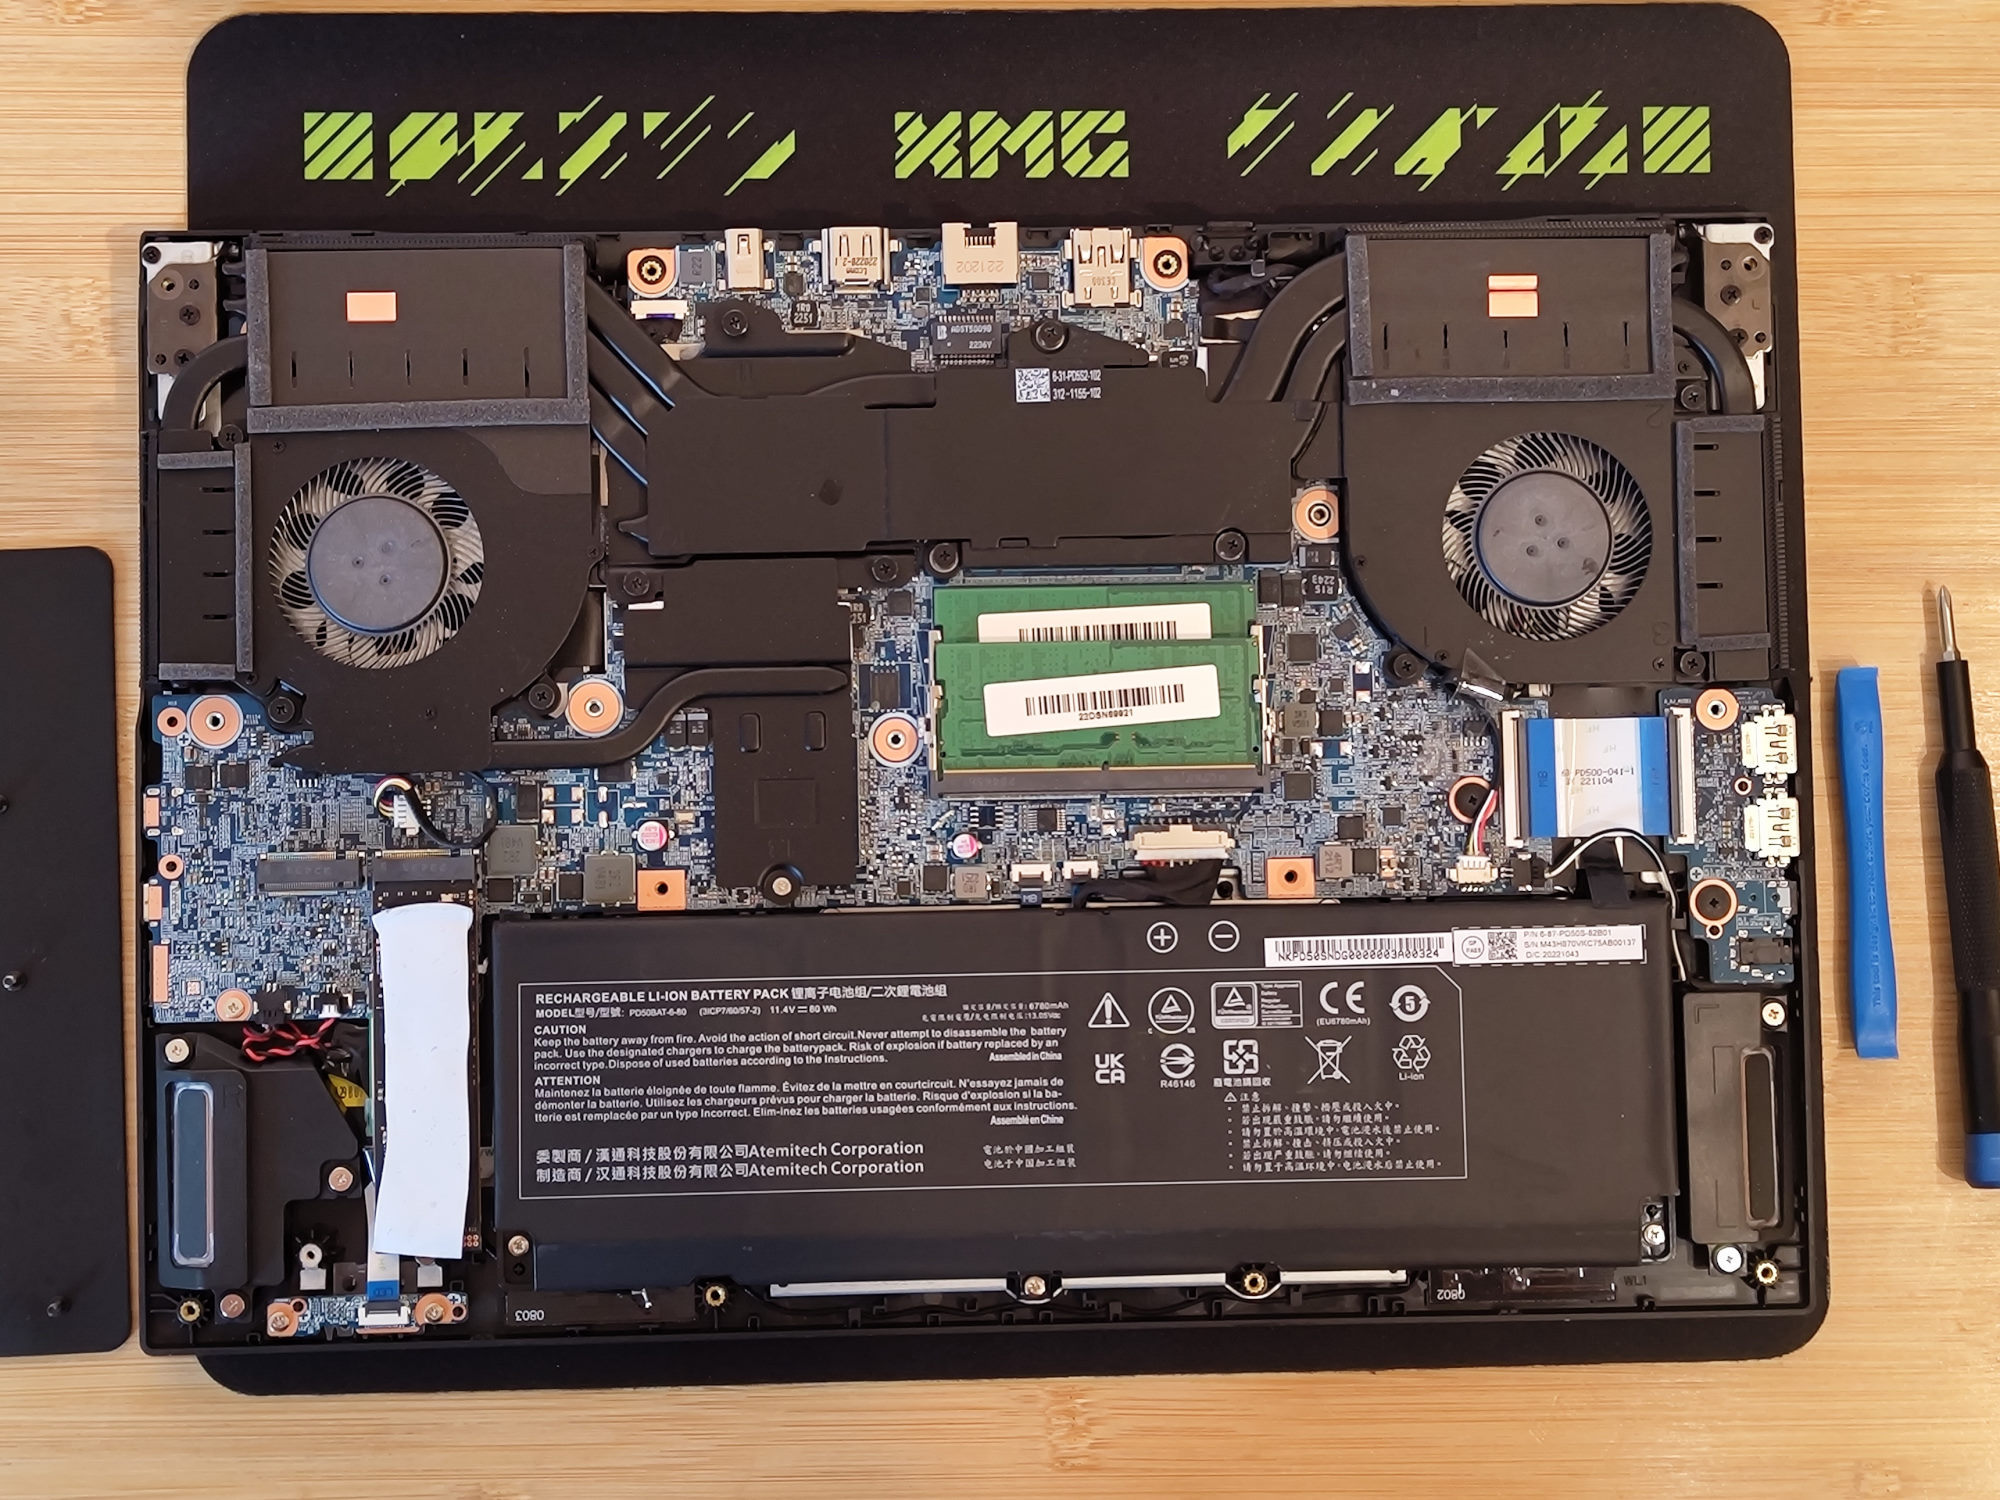
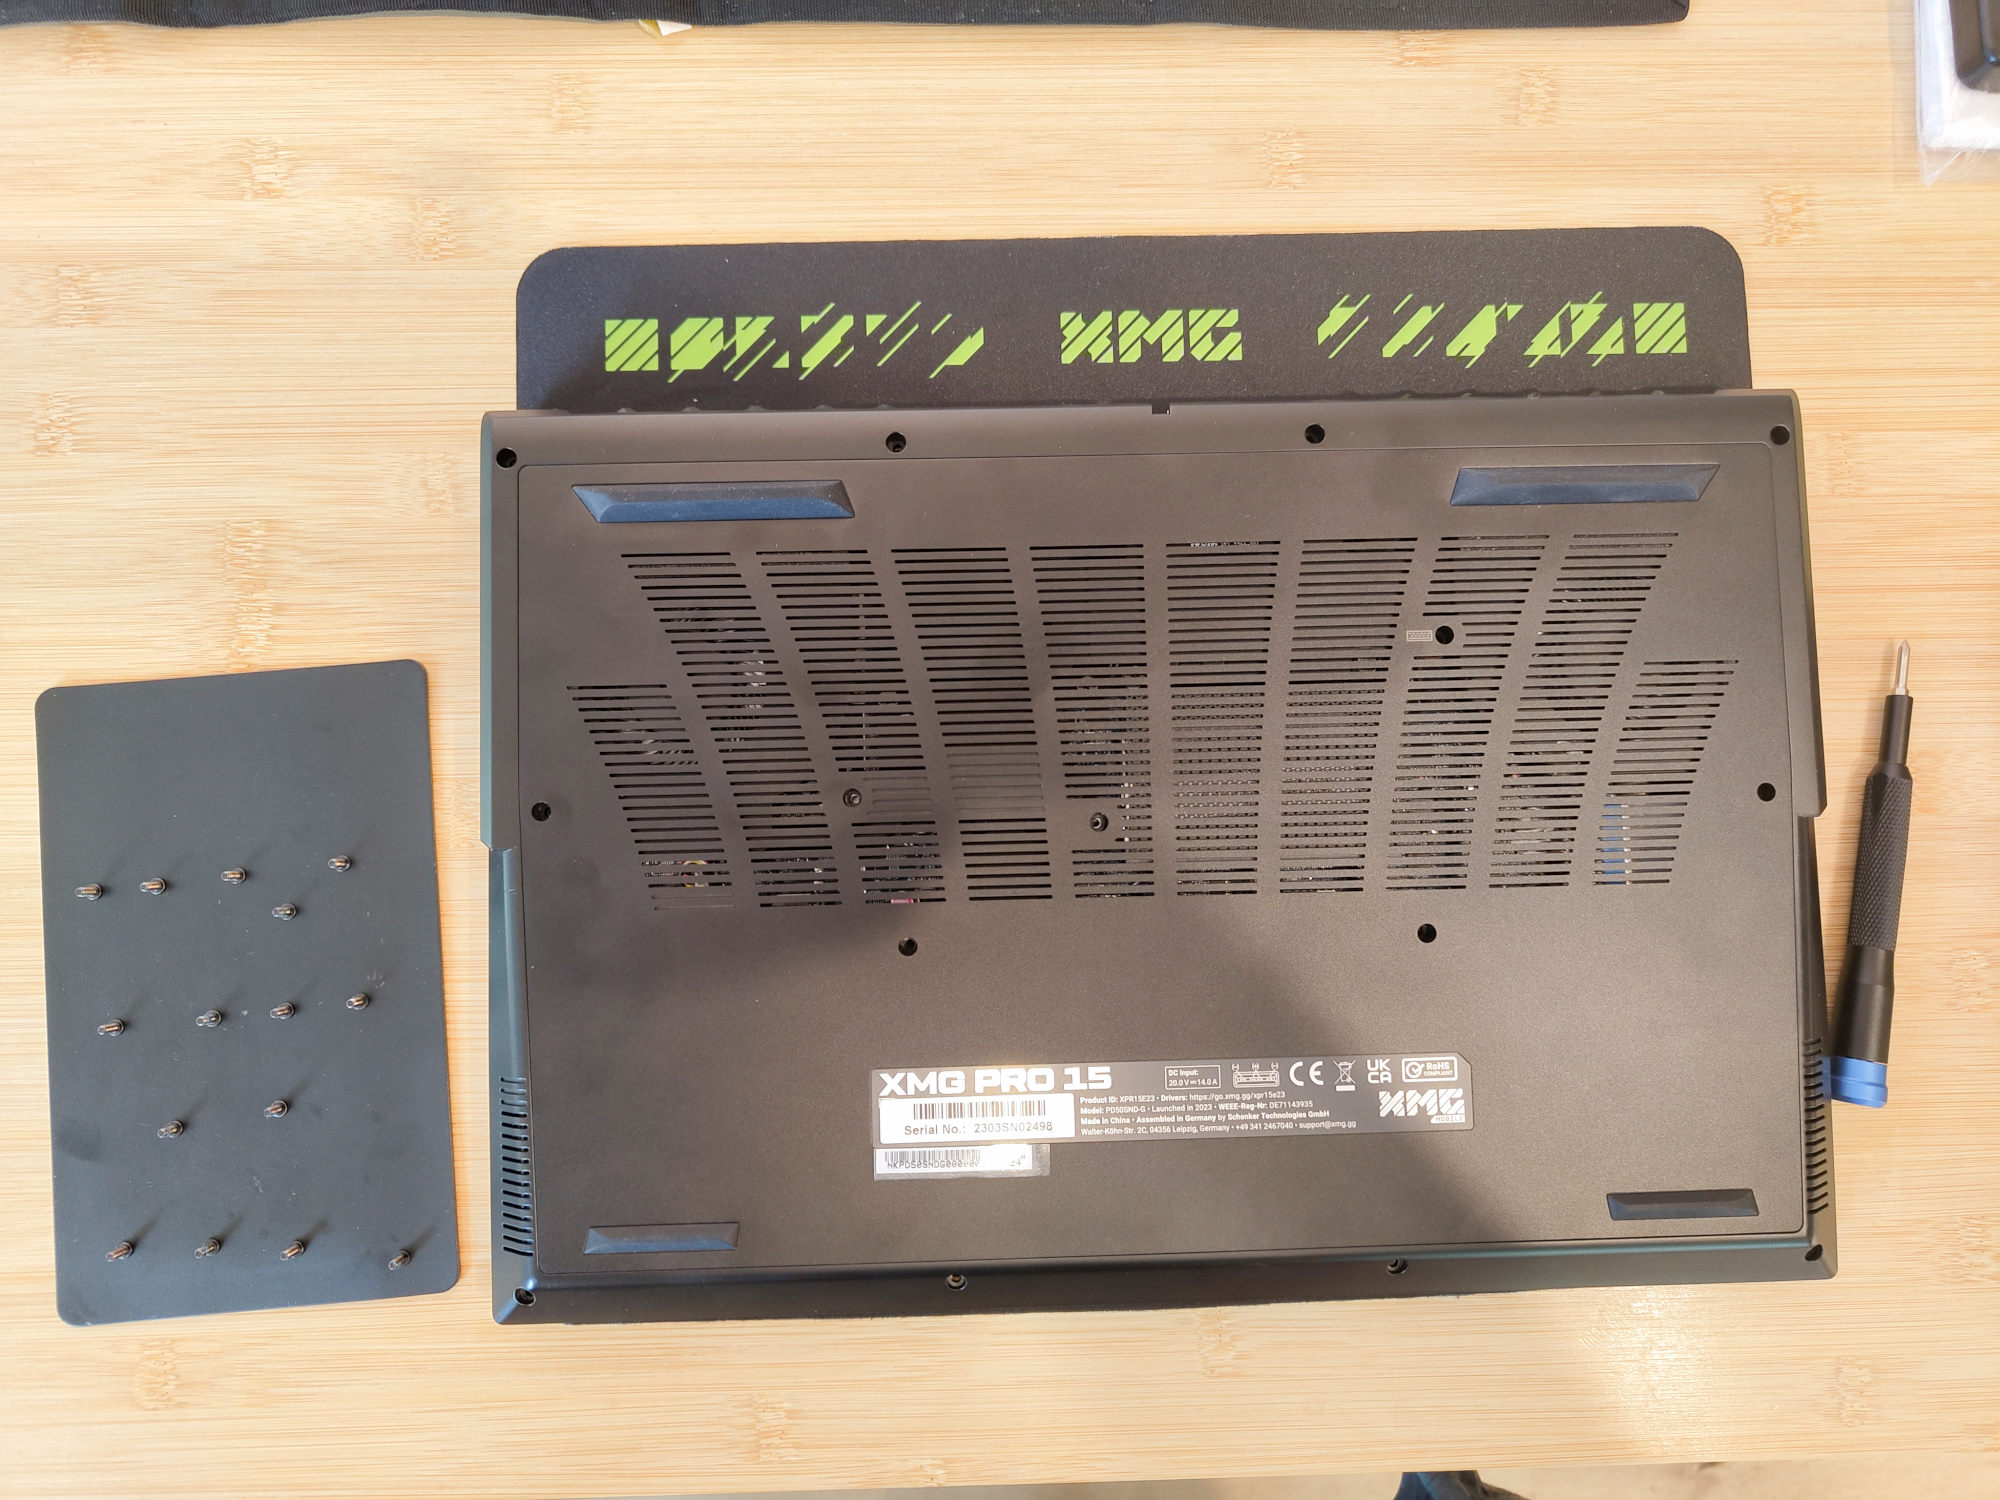
Gleich 15 Schrauben sichern die Basisabdeckung. Nachdem diese herausgedreht sind, lässt sich die Abdeckung von der Front her leicht mit einem Plastiköffnungswerkzeug aushebeln. Darunter finden wir tauschbaren RAM und einen freien M.2-Slot für eine weitere SSD. Das passende Wärmeleit-Pad ist im Lieferumfang des Laptops ebenso enthalten wie ein CD mit Treibern, ein USB-Stick mit gleichem Inhalt, ein großes Maus-Pad und ein Flaschenöffner.
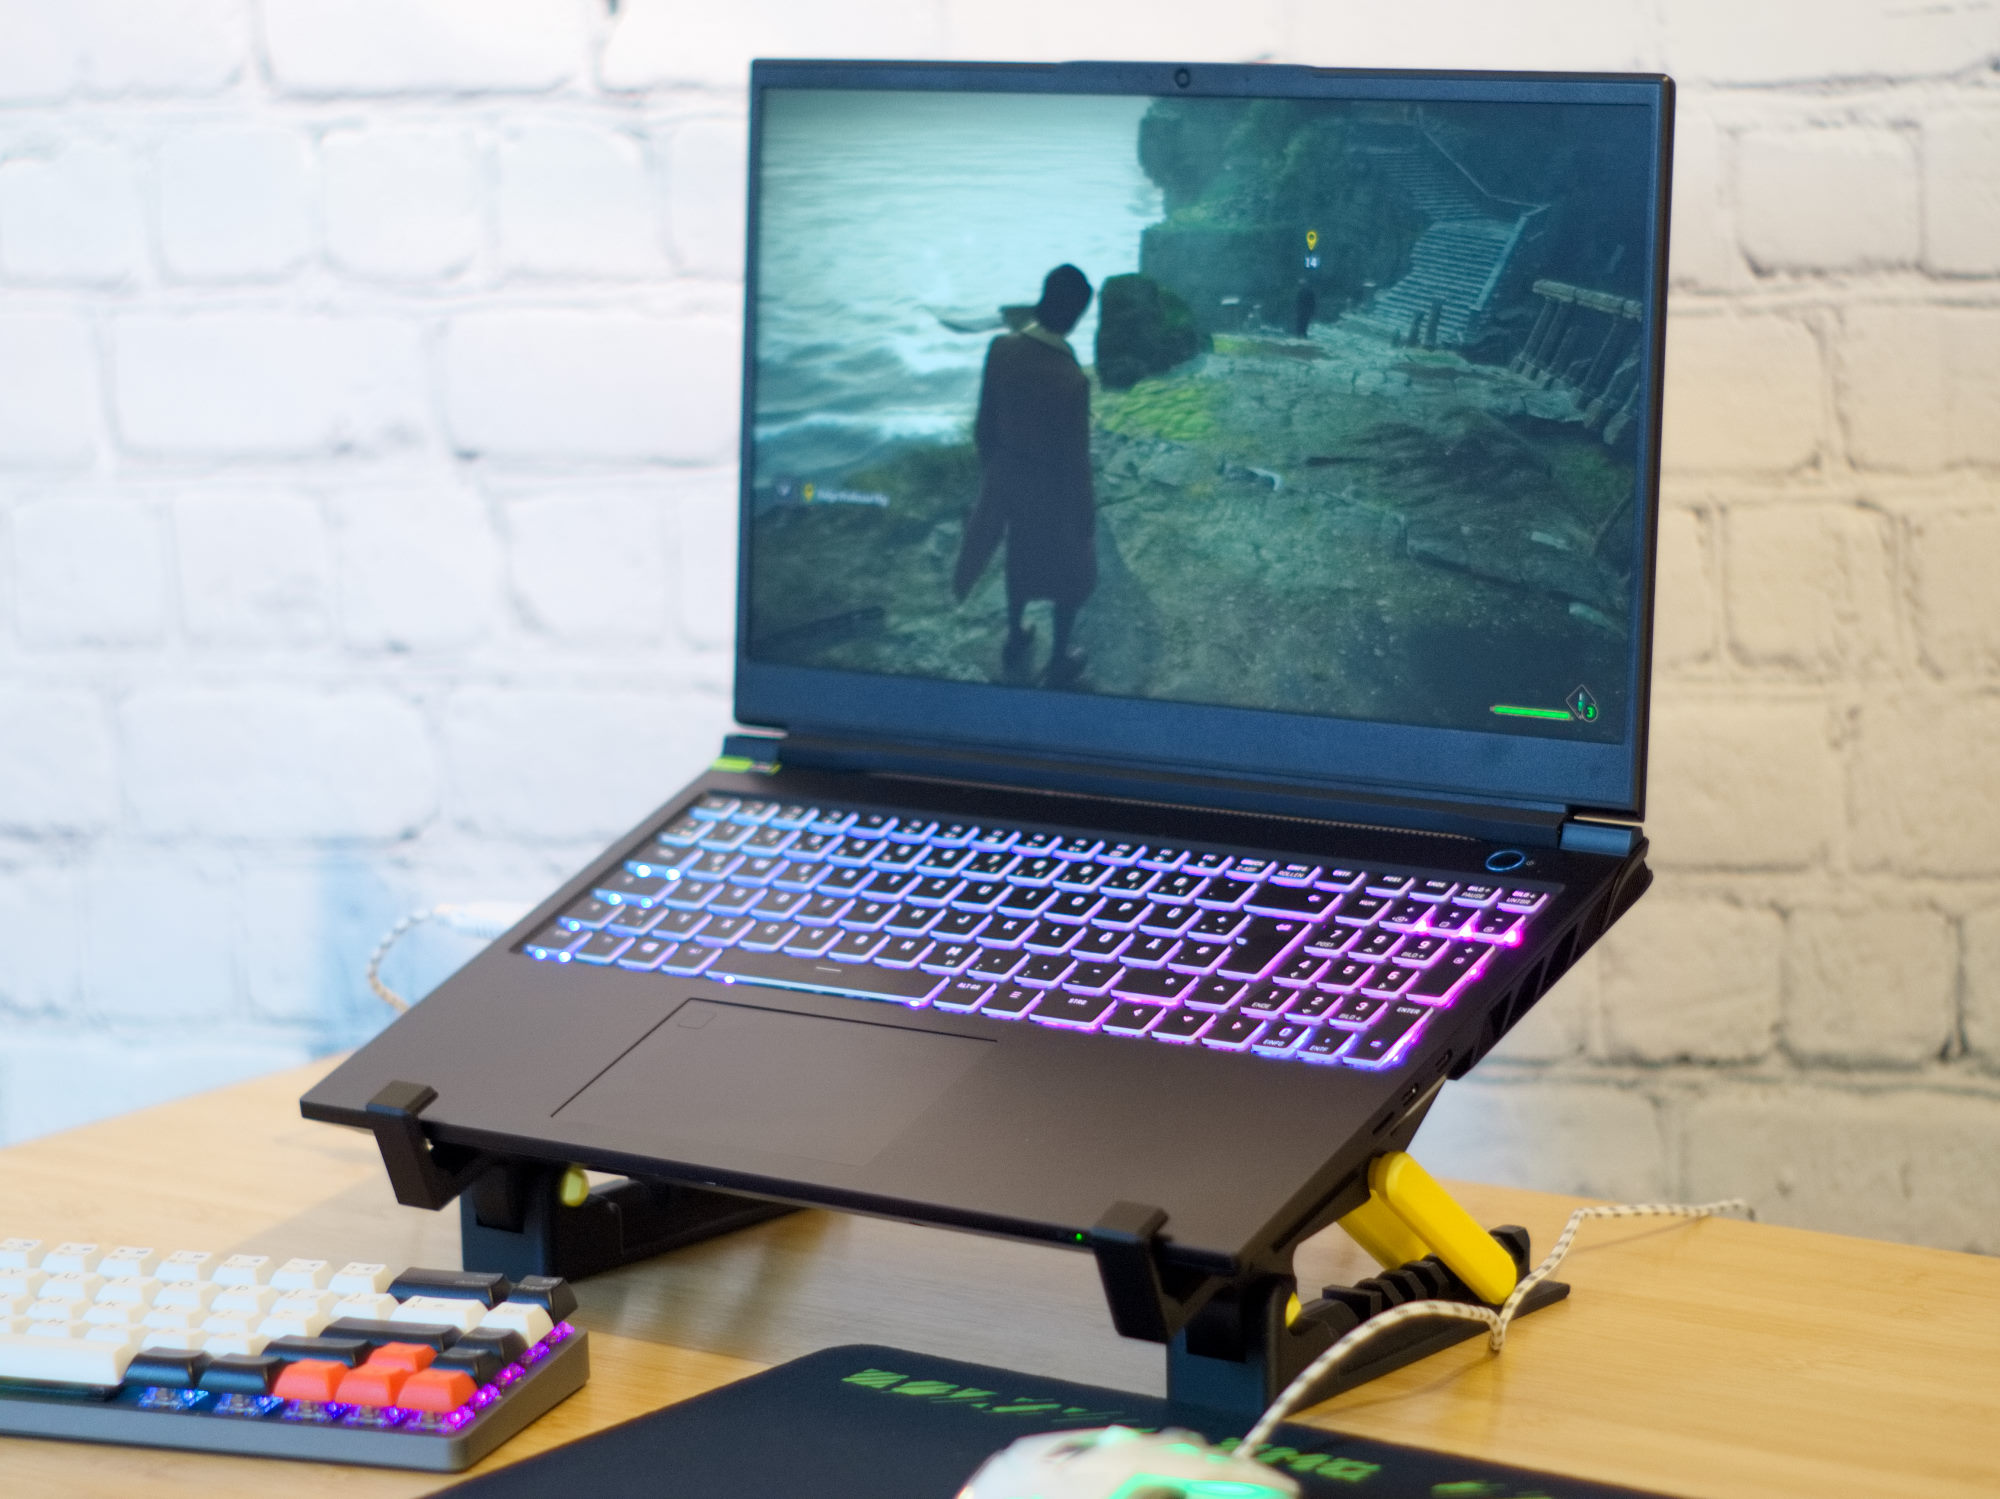
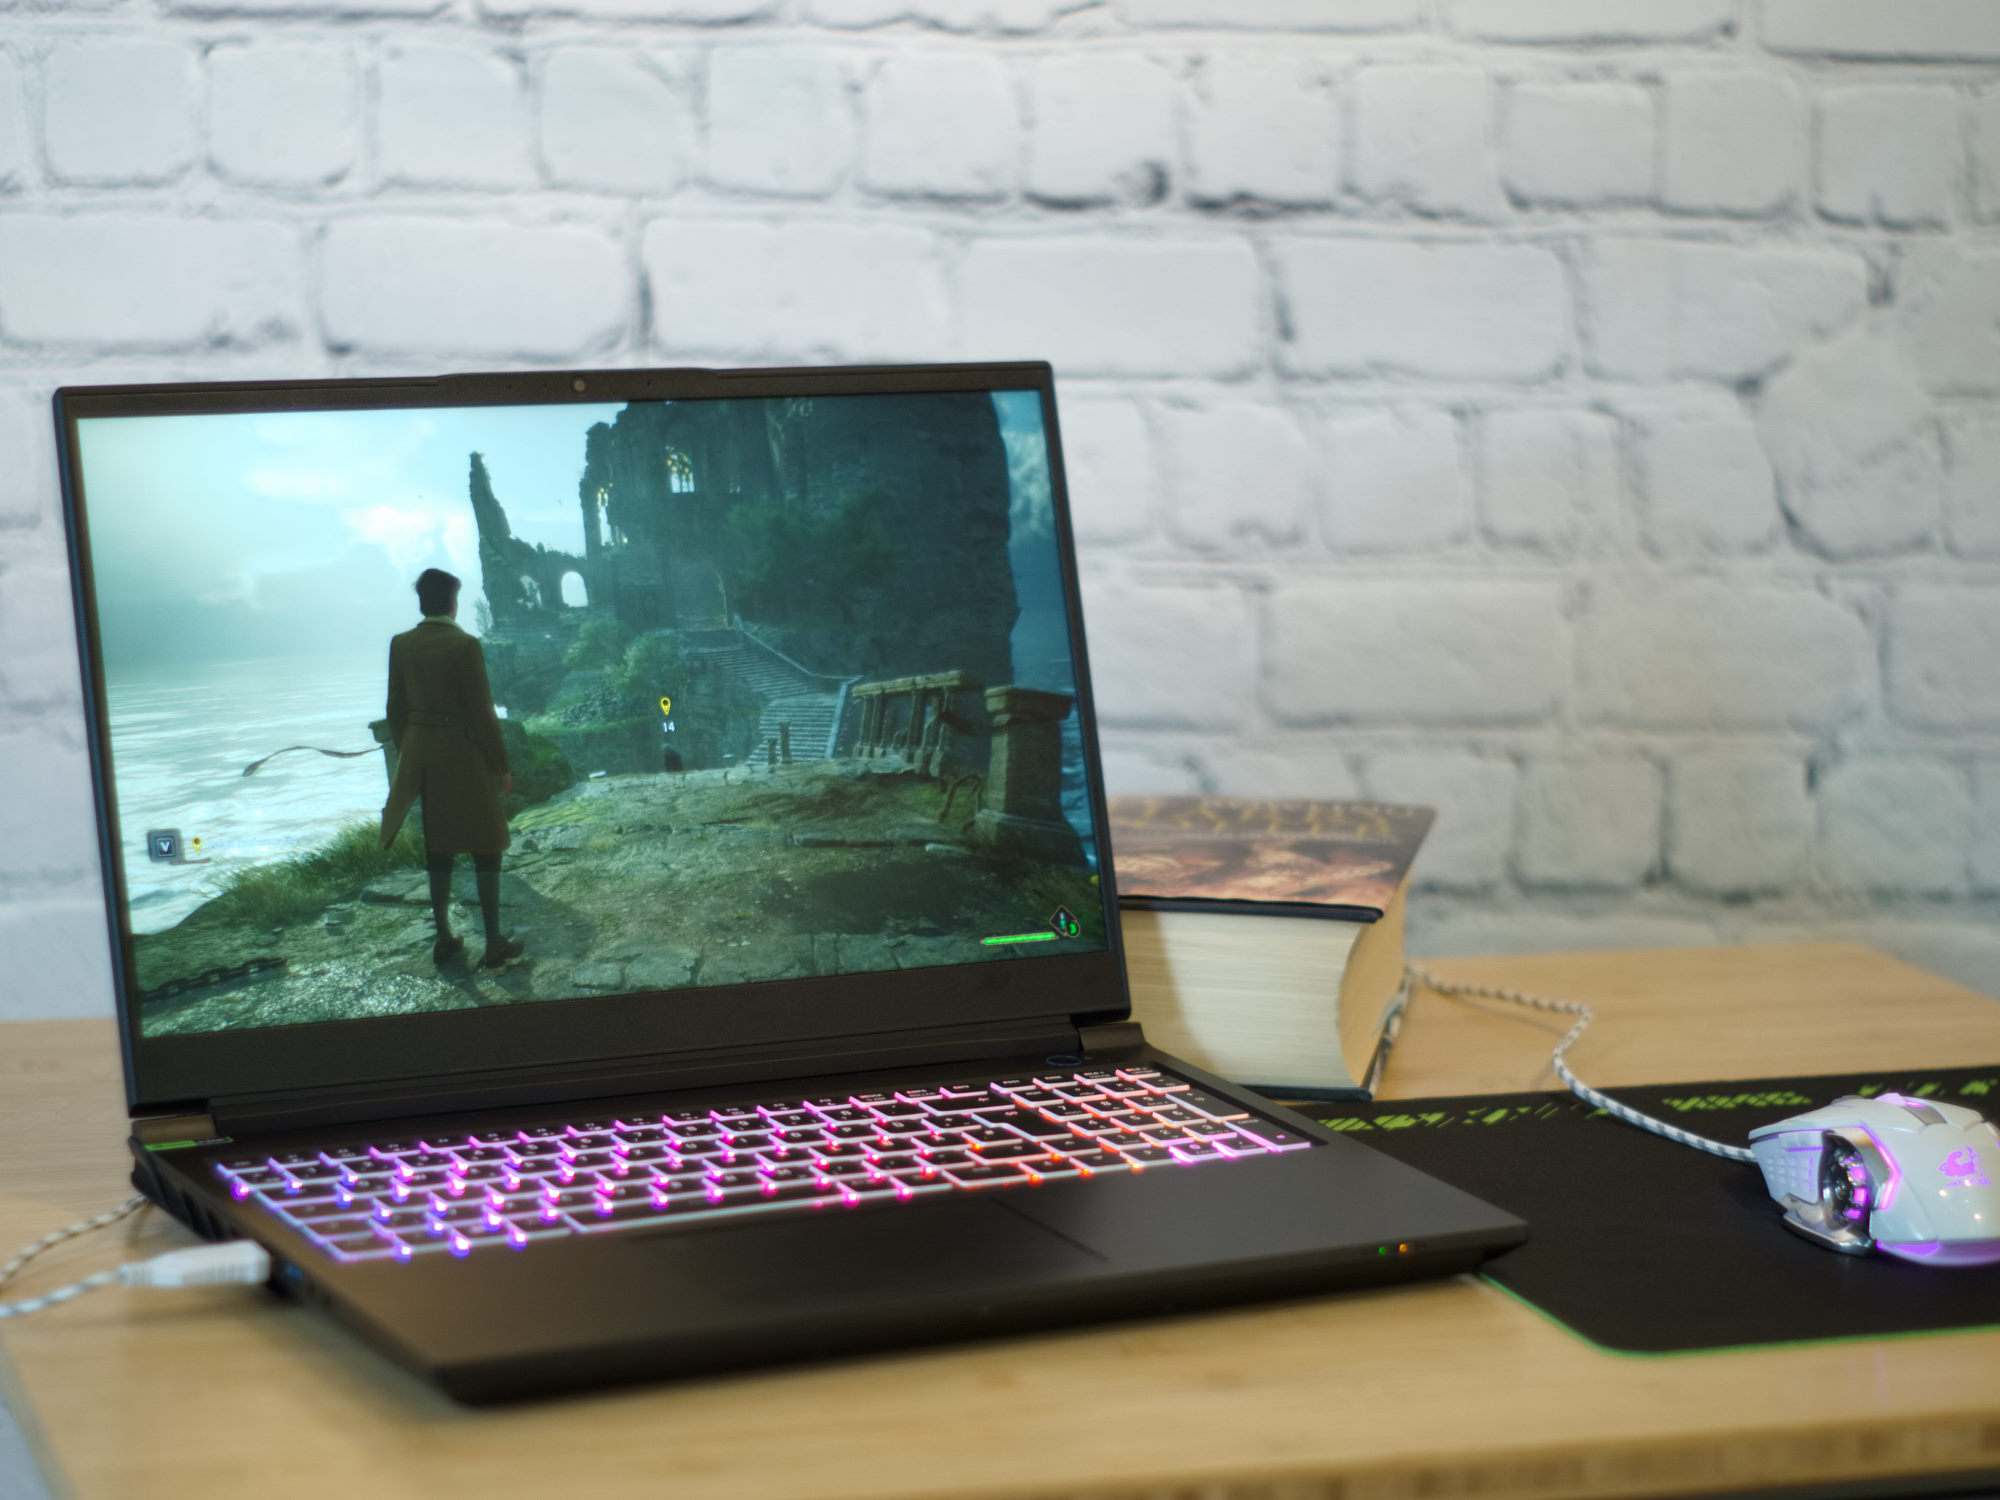
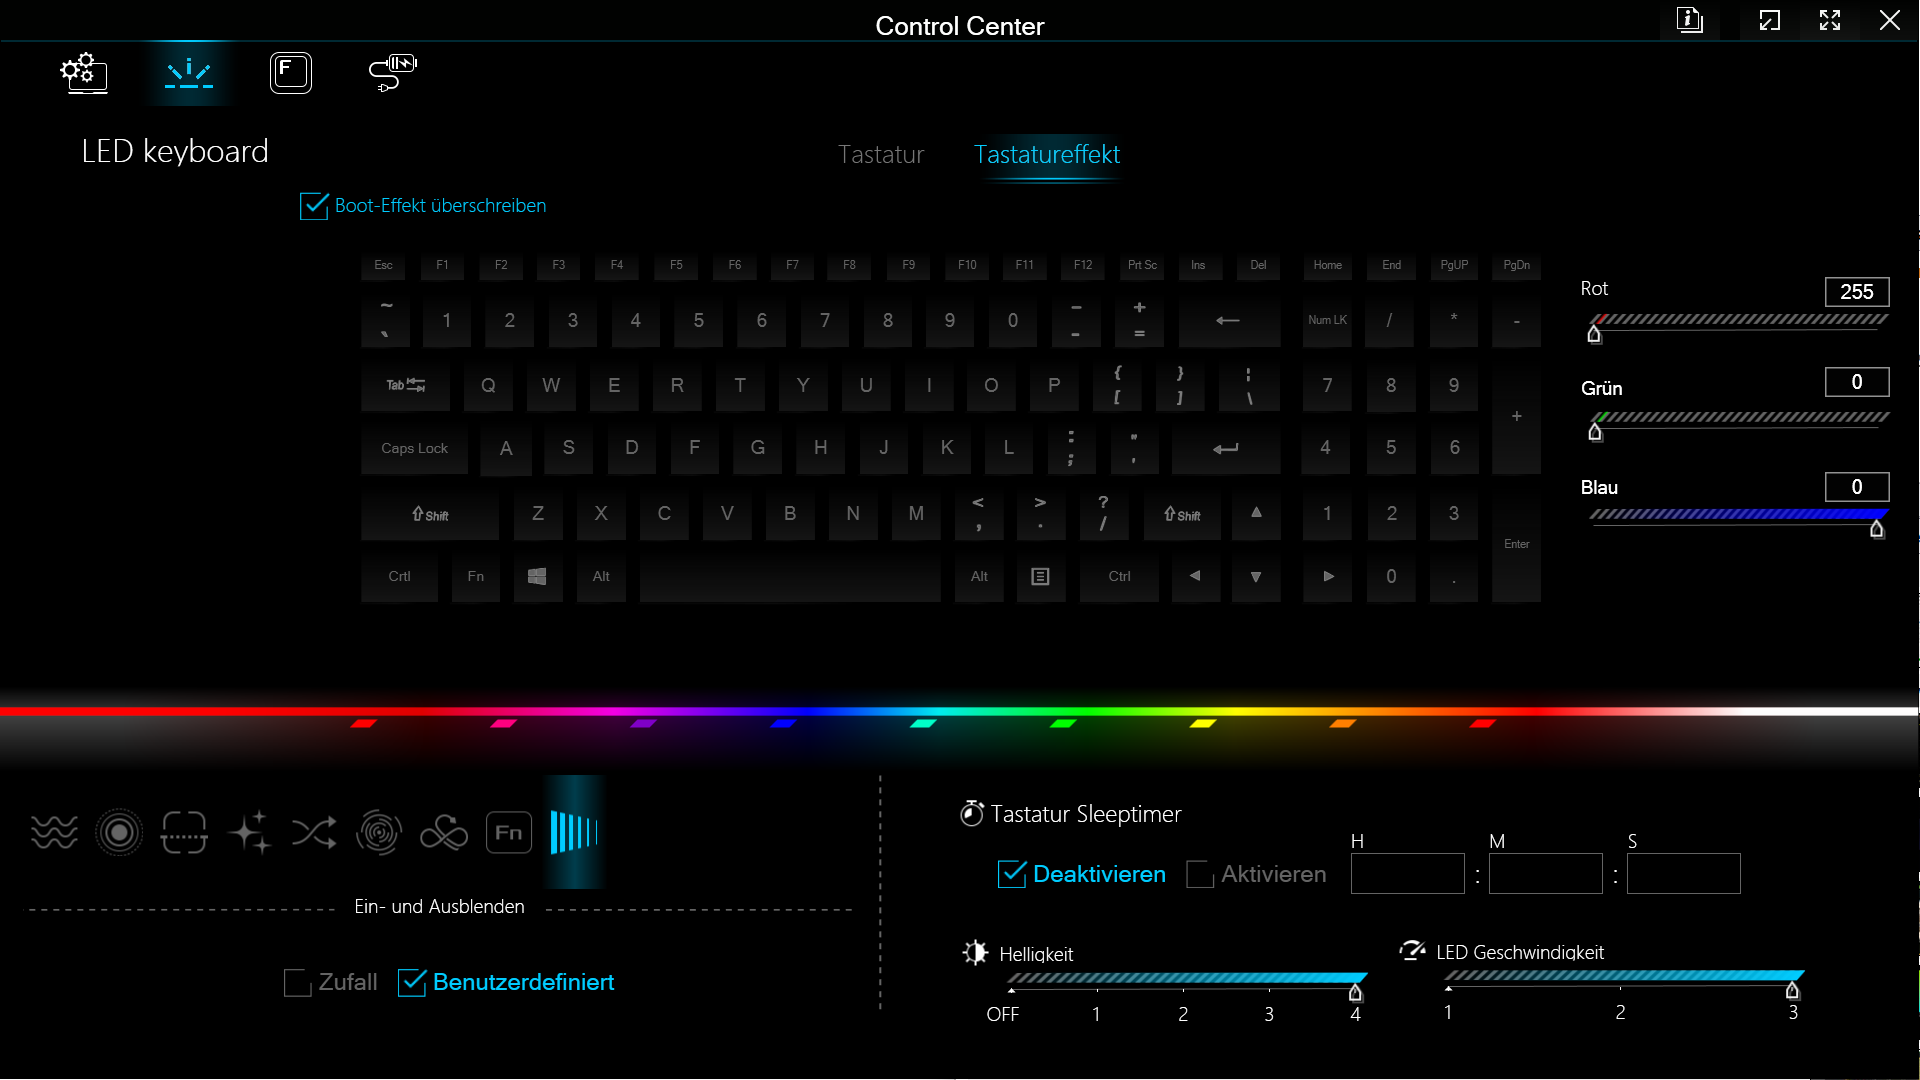
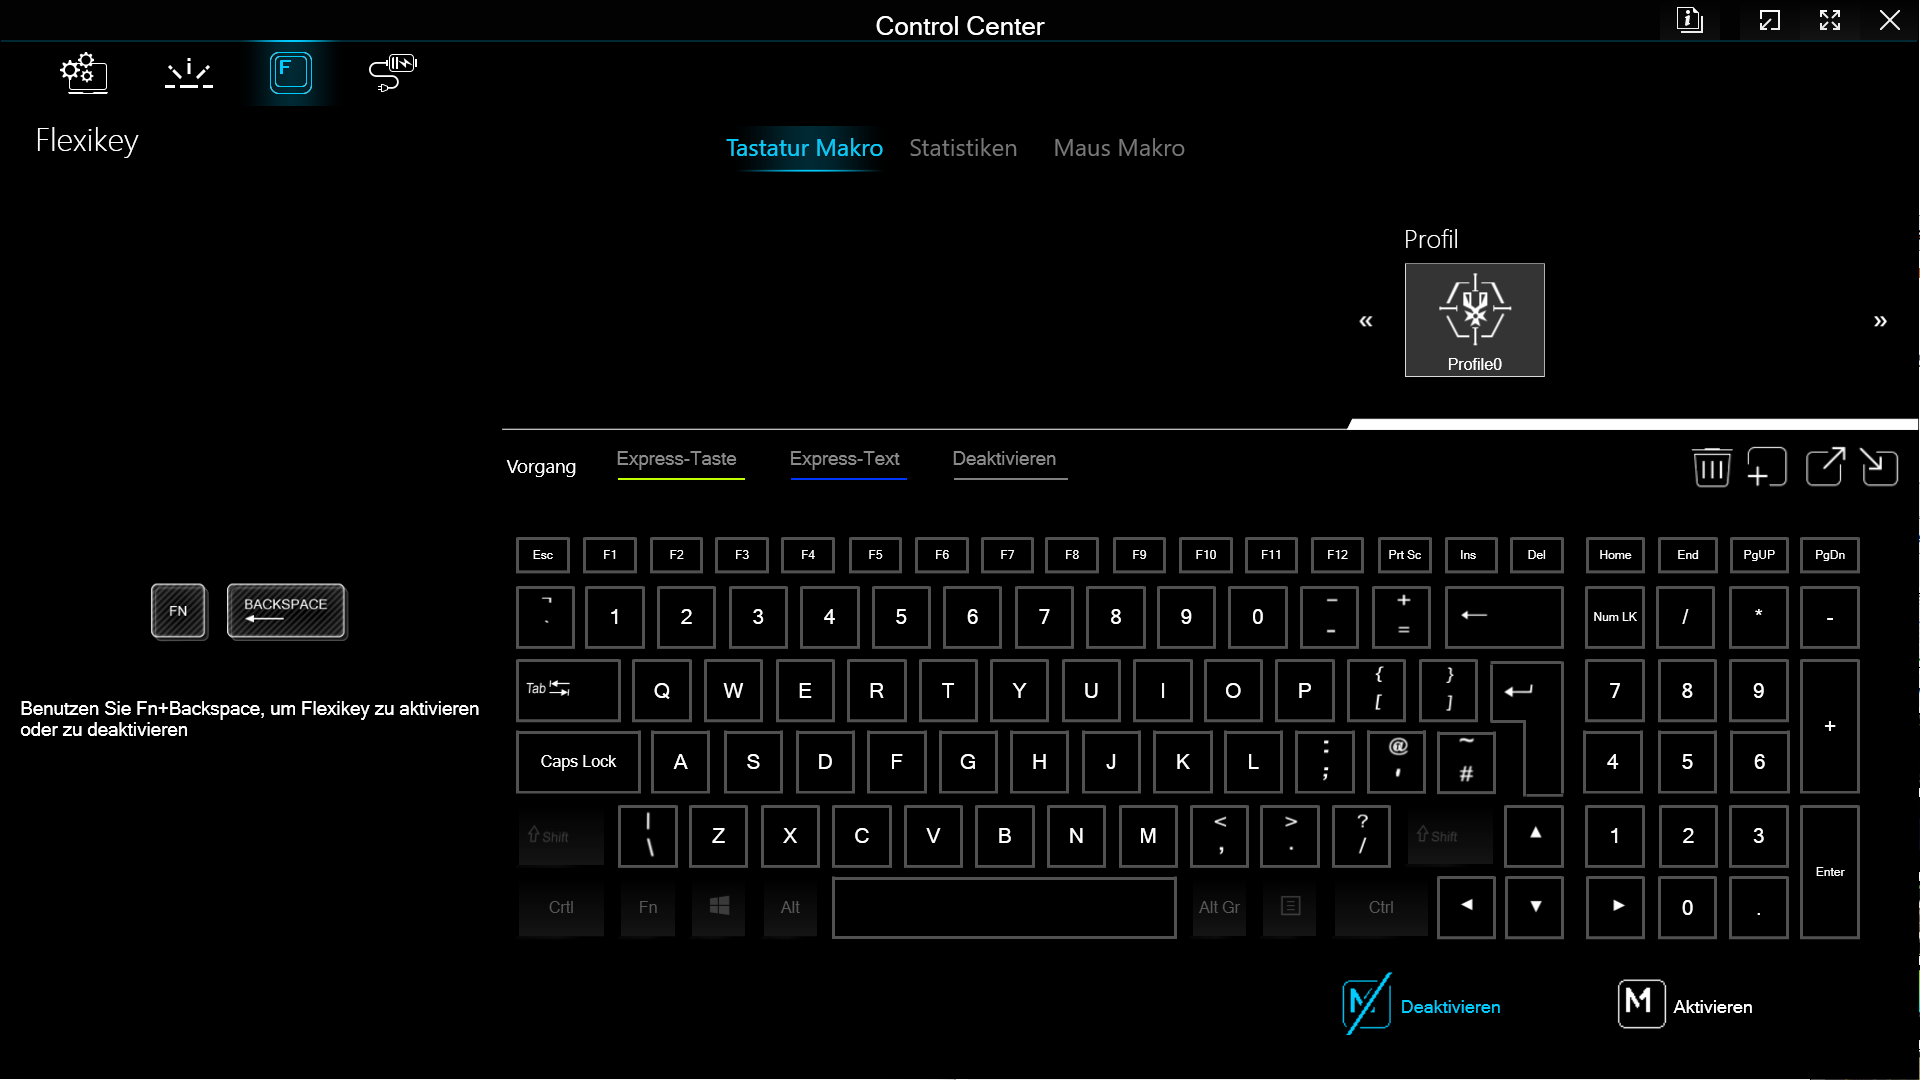
Eingabegeräte - Full-RGB-Tastatur
Ein 12 × 7 cm großes Clickpad mit Fingerabdruckscanner und eine vollständige Tastatur mit NumPad bilden die Eingabegeräte am XMG Pro 15. Beide haben eine angenehme Haptik und merkliche Druckpunkte. Bei der Tastatur liegt der Tastenhub um 1,5 mm. Hier können alle Tasten einzeln RGB-beleuchtet werden.

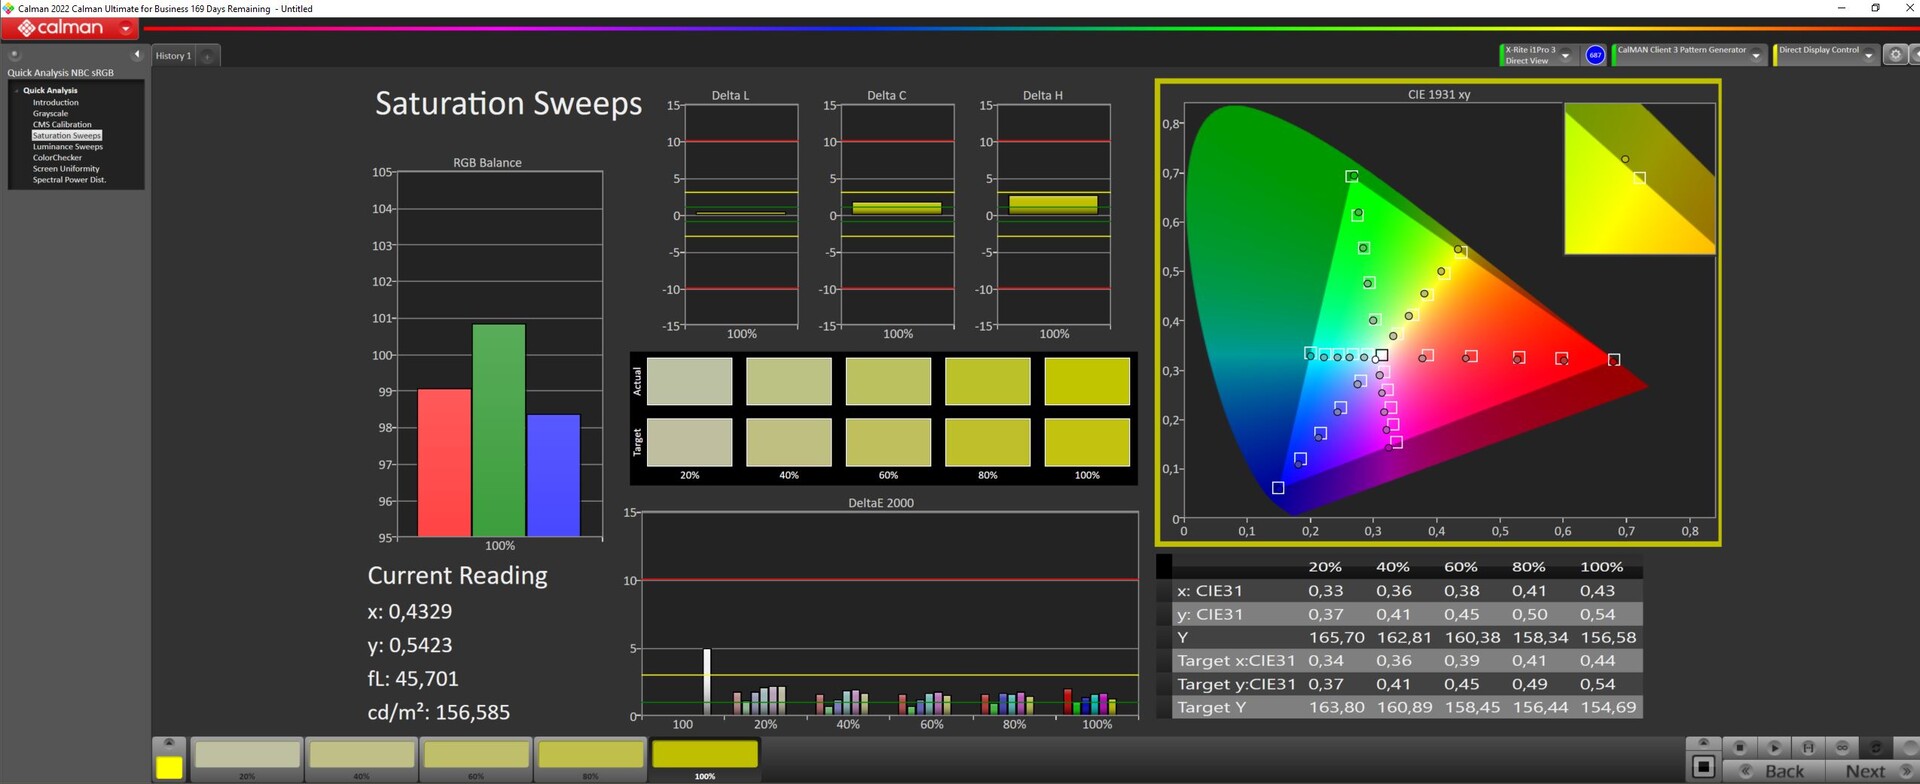
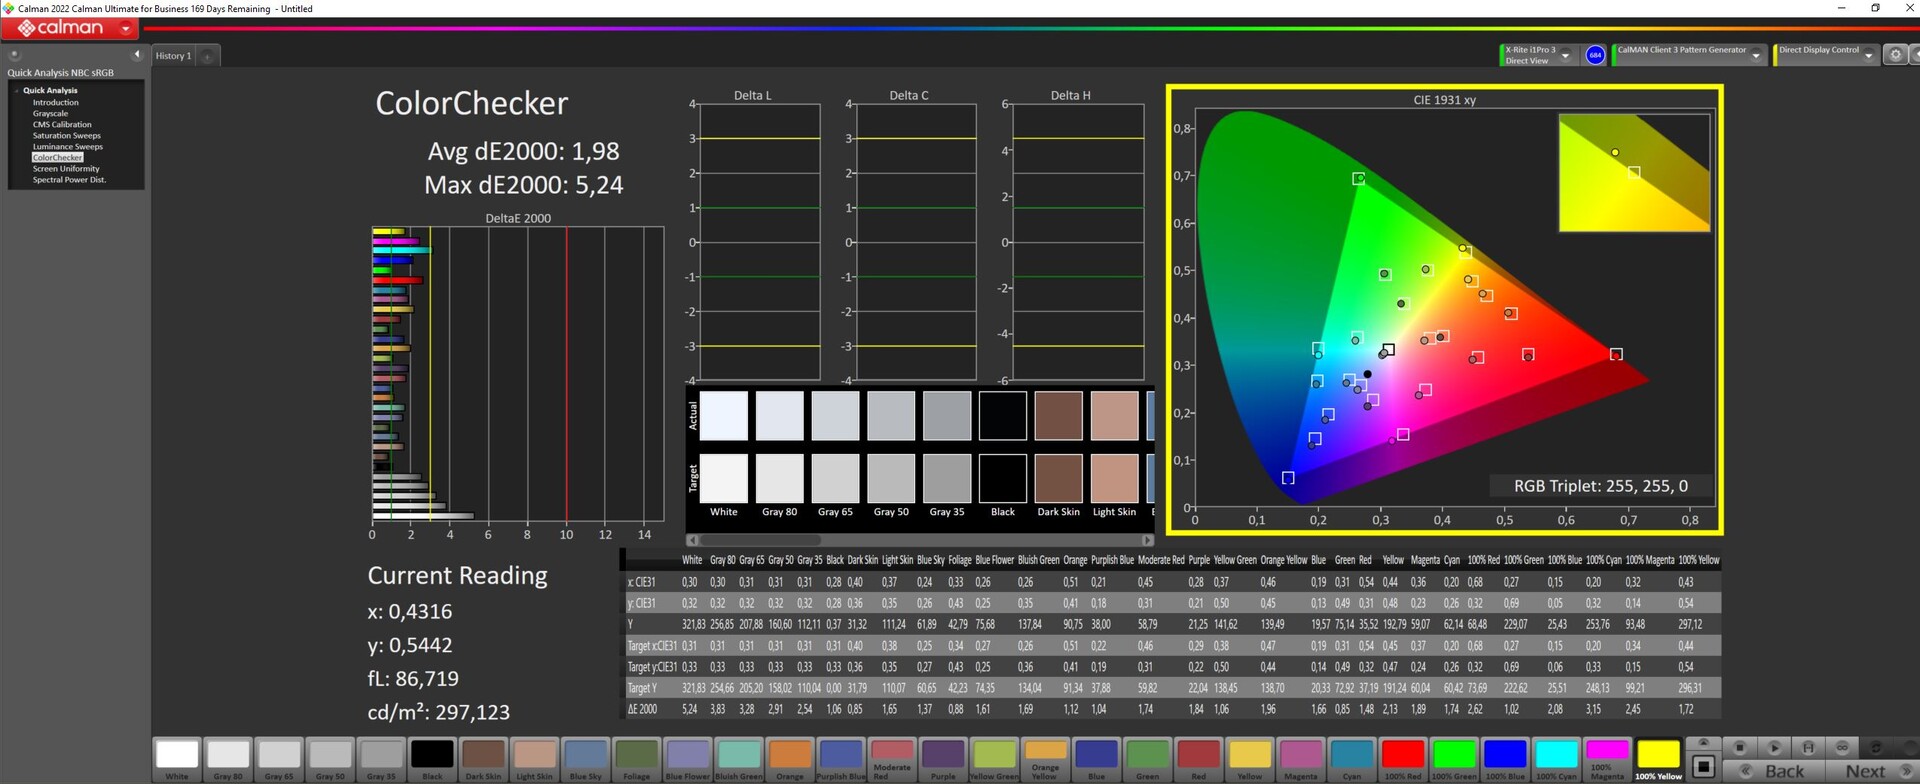
Display - QHD mit 240 Hz und DisplayP3
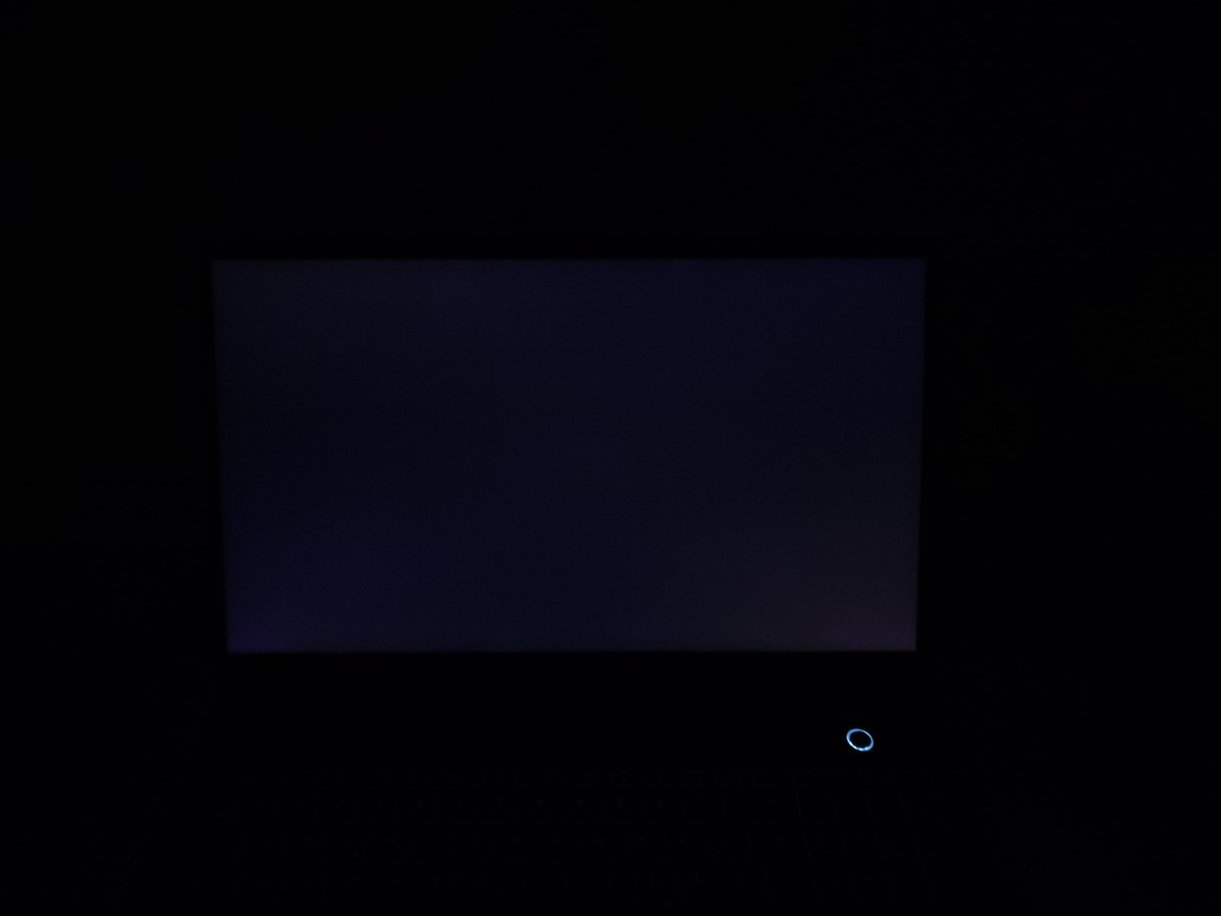
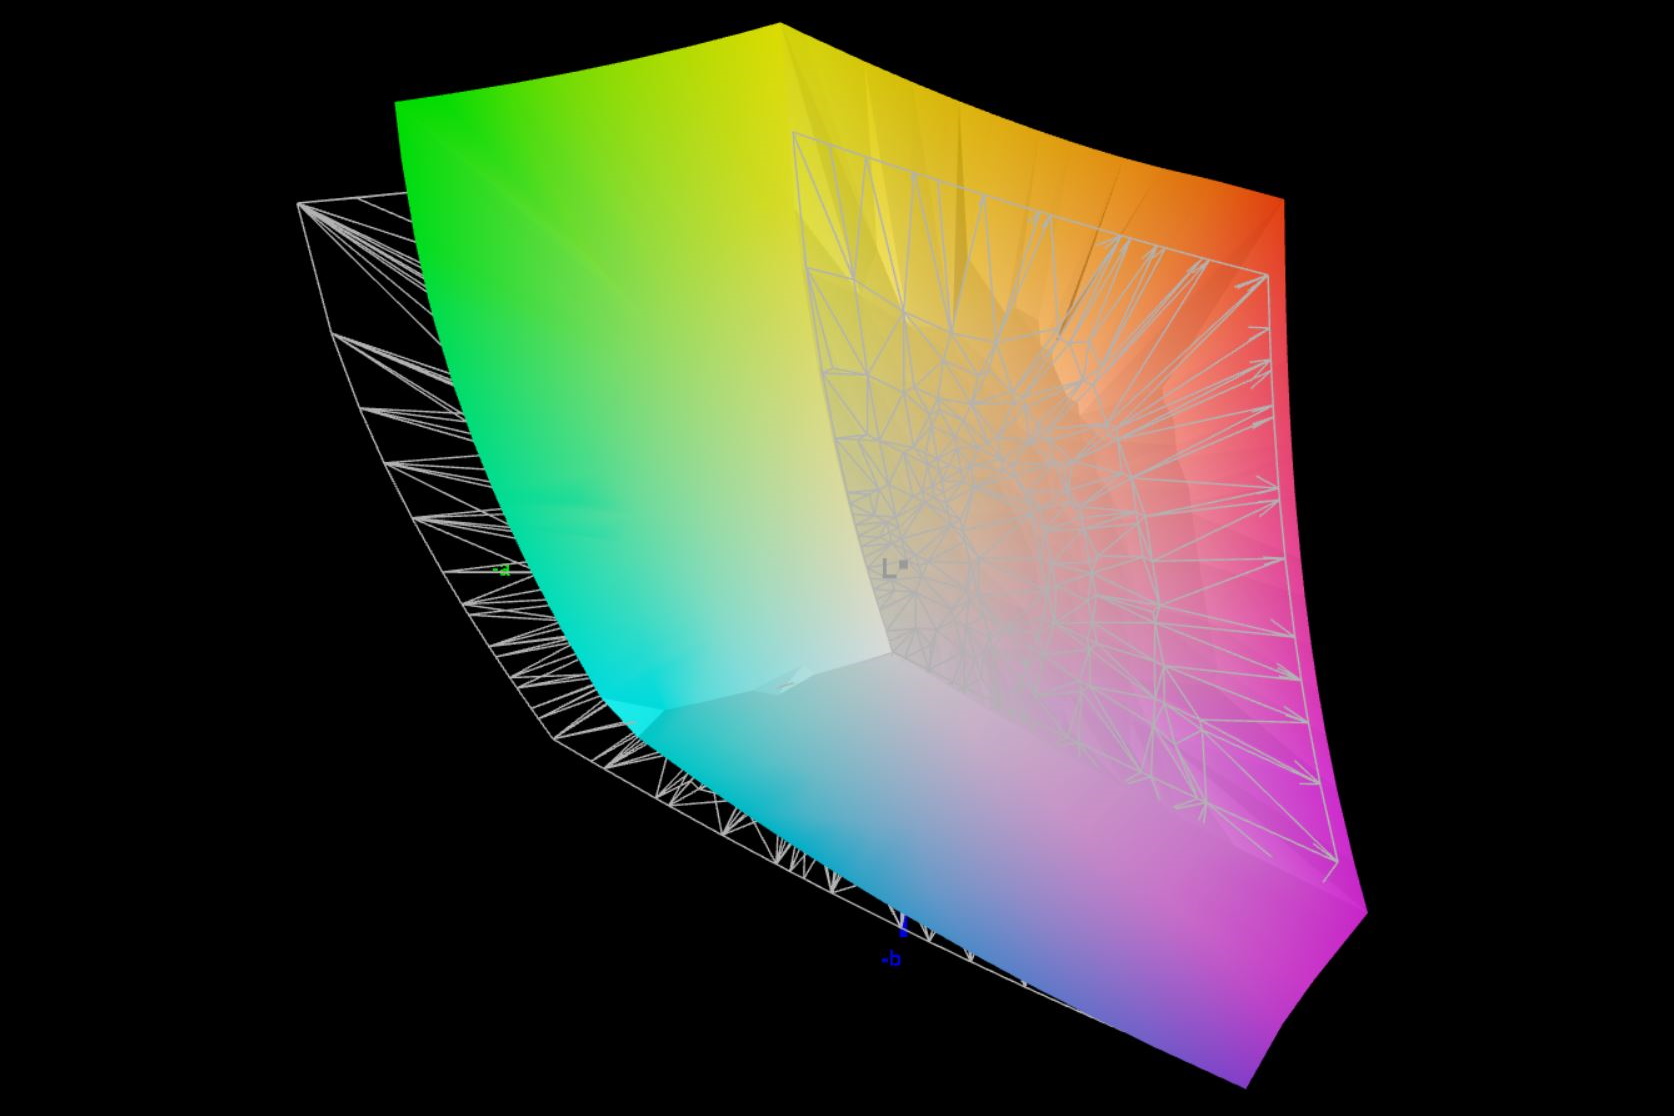
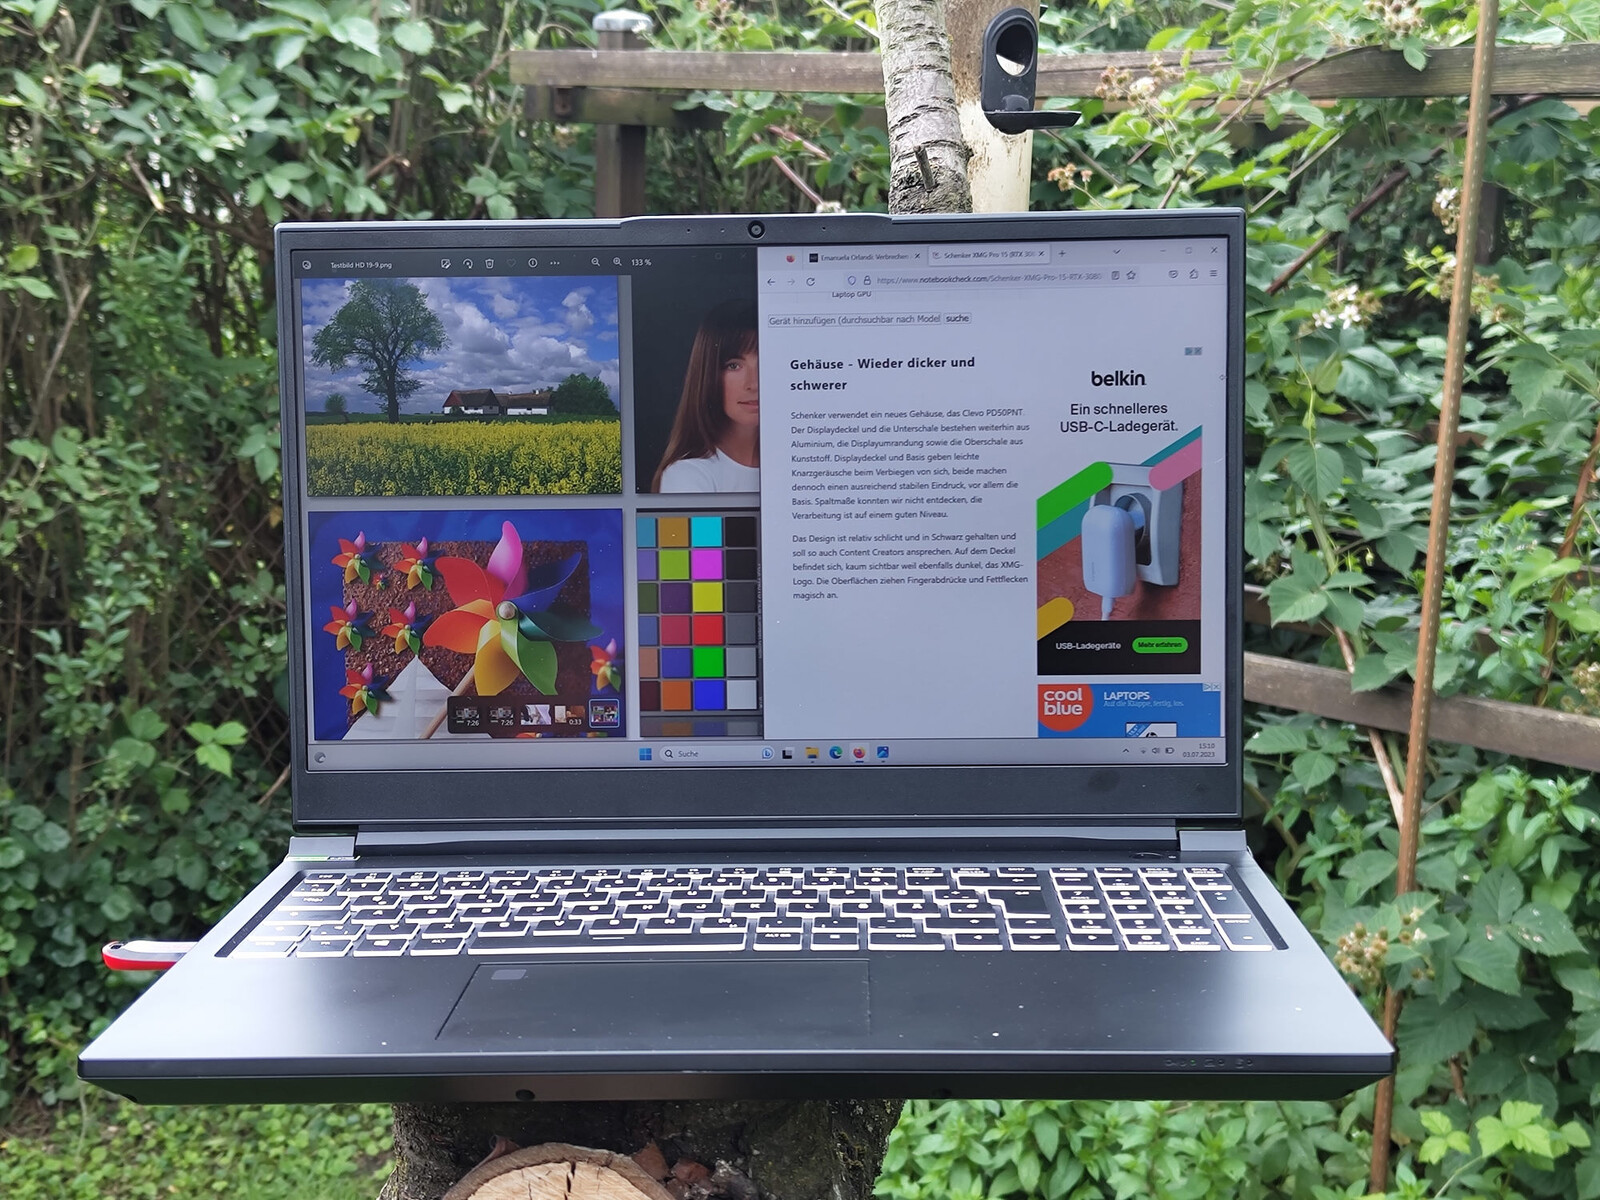
Wenn auch nicht OLED, so besitzt das XMG Pro 15 doch ein gutes IPS-Display mit G-Sync. Auf 2.560 × 1.440 Pixeln werden hier bei 240 Hz der sRGB- und der DisplayP3-Farbraum nahezu vollständig abgebildet. Etwas auffällig ist, dass der etwa 300 cd/m² helle Bildschirm bei voller Helligkeit in der Mitte merklich stärker als an den Rändern ausgeleuchtet ist. Im Gegensatz zum Vorgänger äußert sich dies jedoch nicht in deutlich sichtbaren Lichthöfen.
Im Vergleich zum Vorgängermodell hat sich die Reaktionszeit des Bildschirms kaum verändert. Die Bildrate wurde von 165 Hz auf 240 Hz aufgerüstet. Ein Flackern des Bildschirms konnten wir nicht feststellen.
| |||||||||||||||||||||||||
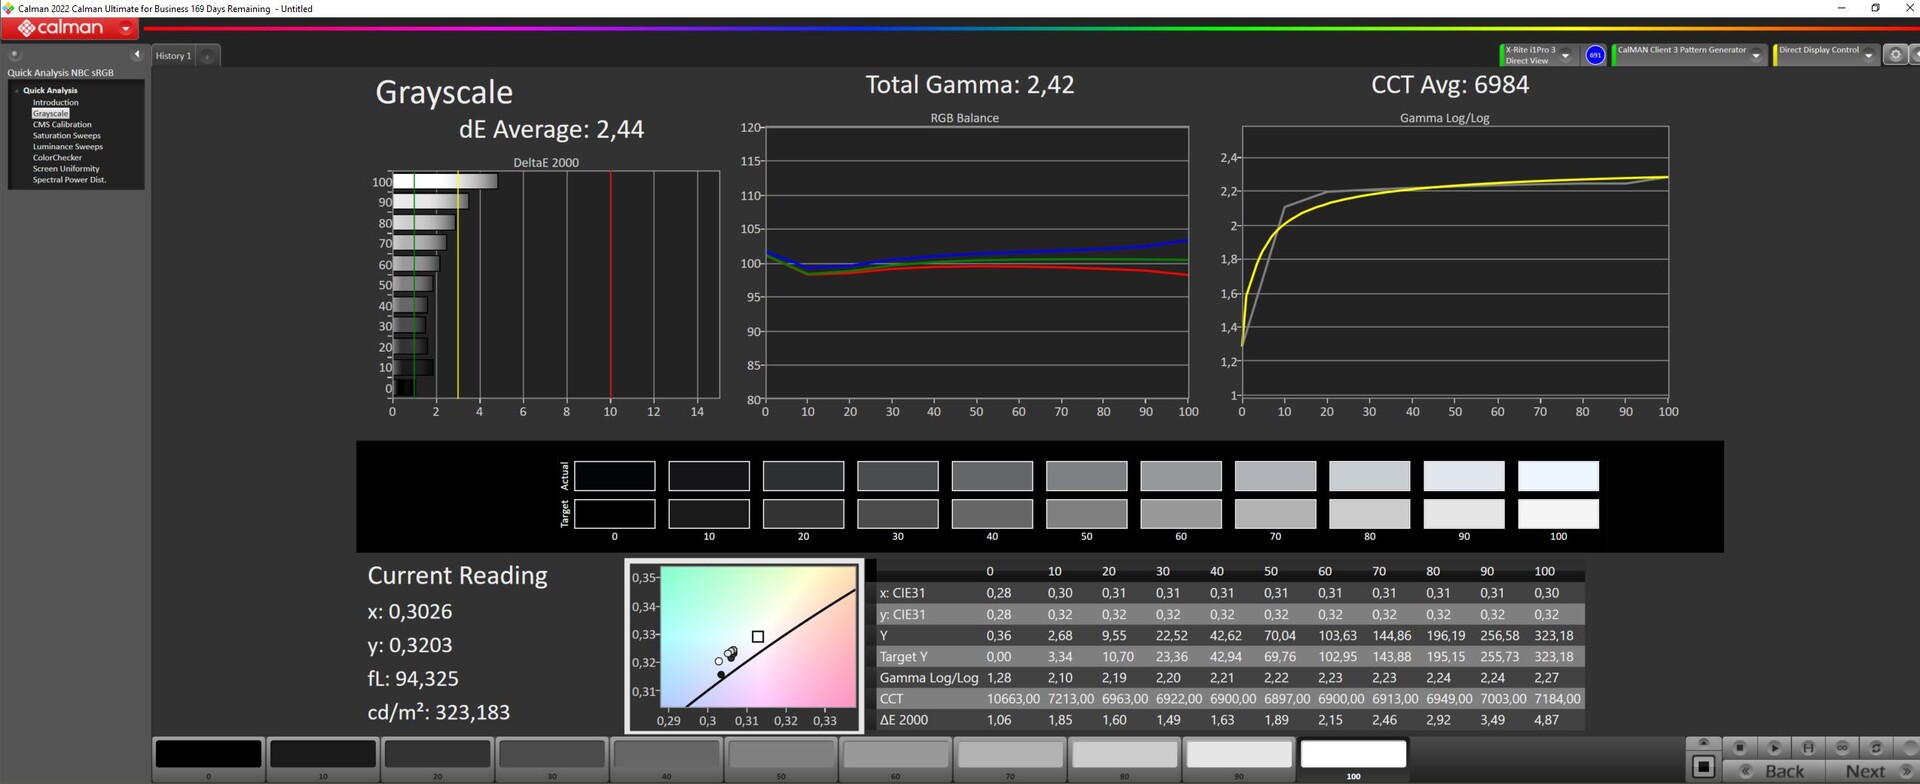
Ausleuchtung: 85 %
Kontrast: 894:1 (Schwarzwert: 0.36 cd/m²)
ΔE ColorChecker Calman: 1.98 | ∀{0.5-29.43 Ø4.72}
calibrated: 1.98
ΔE Greyscale Calman: 2.44 | ∀{0.09-98 Ø4.97}
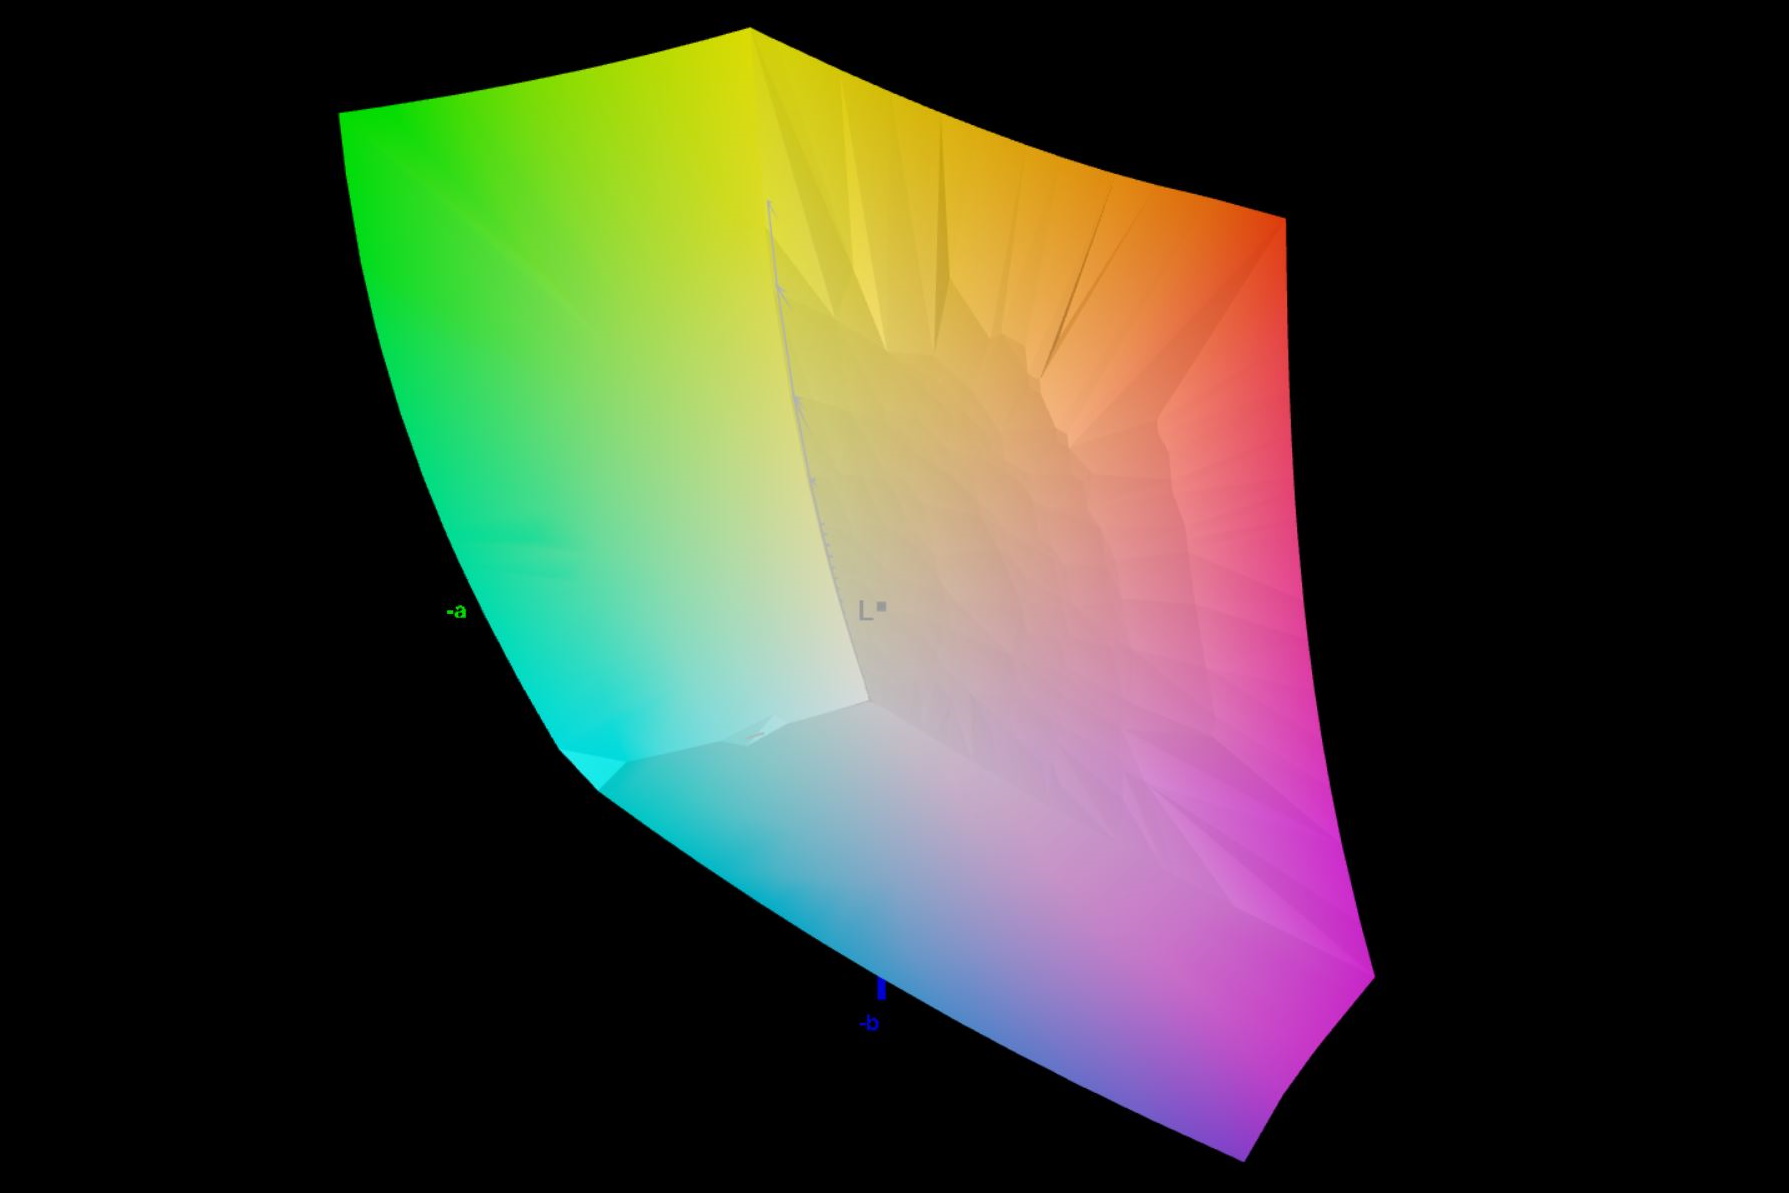
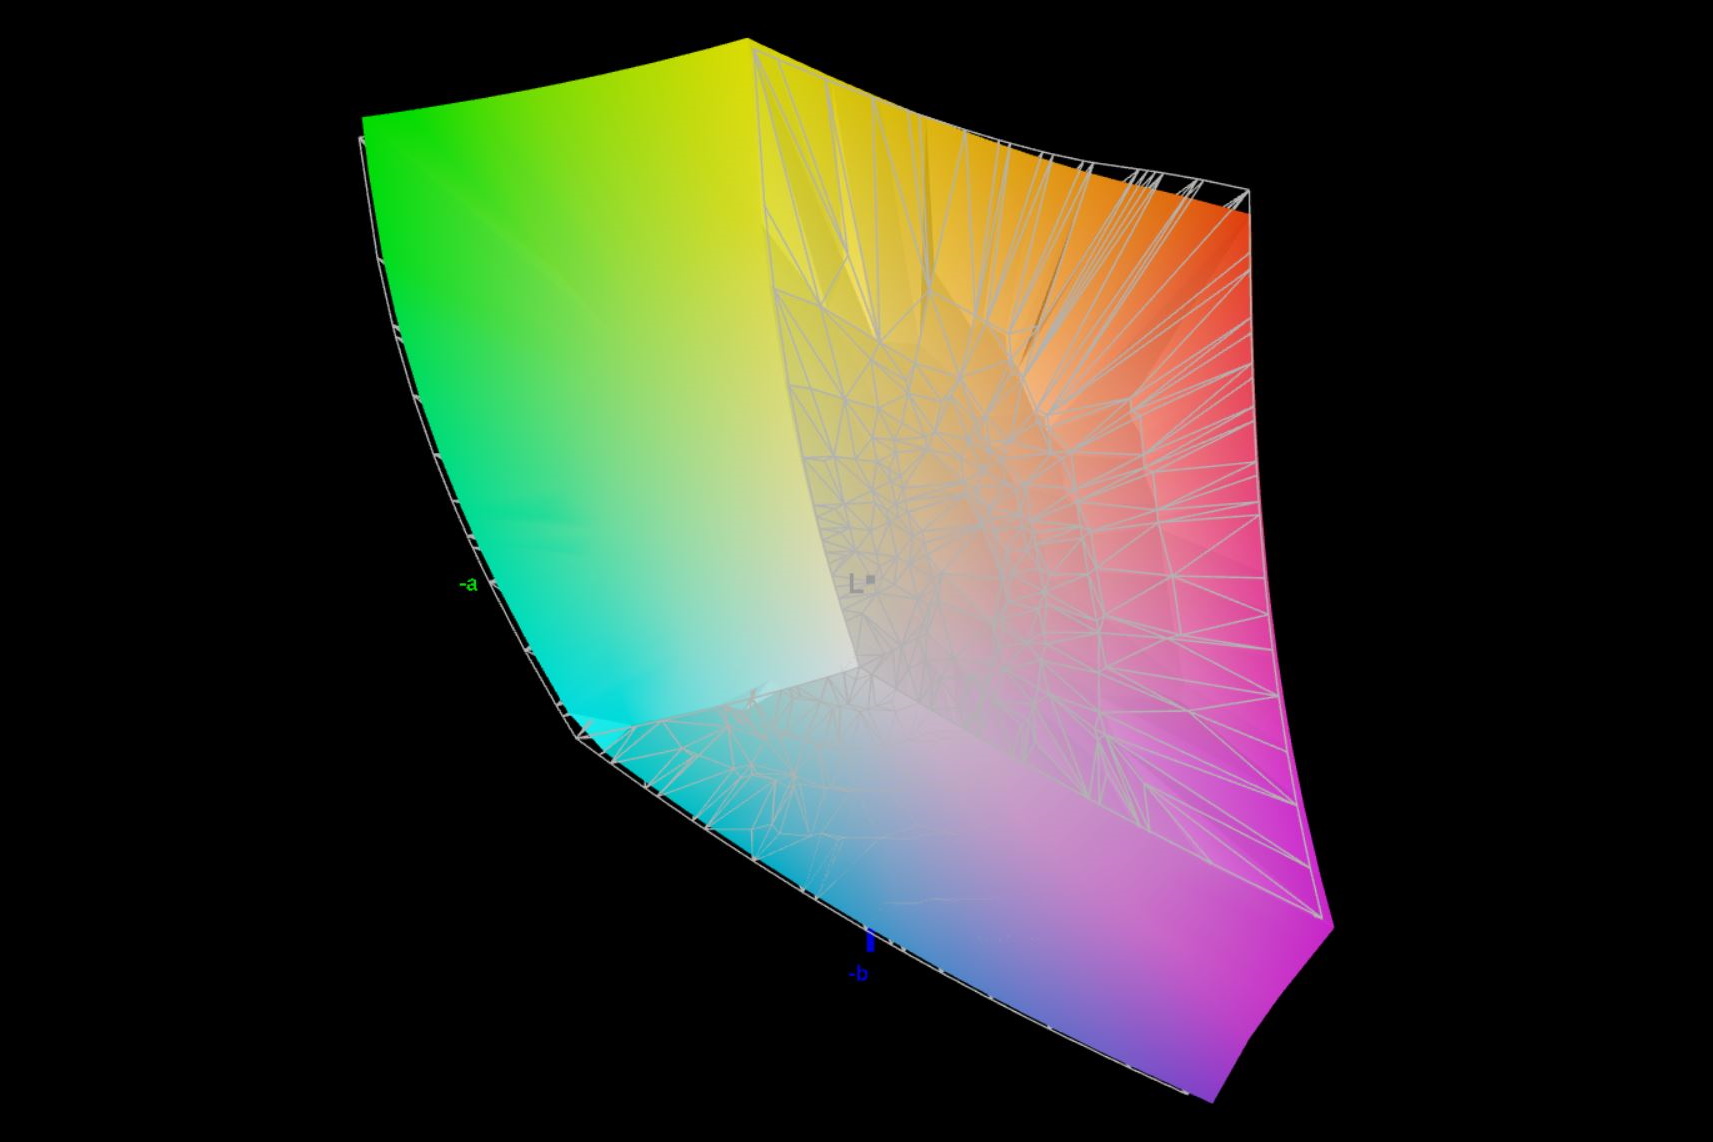
85.4% AdobeRGB 1998 (Argyll 3D)
99.9% sRGB (Argyll 3D)
97.8% Display P3 (Argyll 3D)
Gamma: 2.42
CCT: 6984 K
| Schenker XMG Pro 15 (E23) BOE0AD1, IPS, 2560x1440, 15.6" | Schenker XMG Pro 15 (i7-12700H, RTX 3080 Ti) BOE09C2 (BOE CQ NE156QHM-NY1), IPS, 2560x1440, 15.6" | Dell G15 5530 AUO B156HAN, IPS, 1920x1080, 15.6" | Aorus 15X ASF BOE CQ NE156QHM-NZ1, IPS, 2560x1440, 15.6" | MSI Cyborg 15 A12VF AU Optronics B156HAN15.1, IPS, 1920x1080, 15.6" | Alienware x16 R1 BOE NE16NZ4, IPS, 2560x1600, 16" | |
|---|---|---|---|---|---|---|
| Display | 0% | -13% | -16% | -48% | 2% | |
| Display P3 Coverage (%) | 97.8 | 97.5 0% | 73.1 -25% | 69.3 -29% | 42.3 -57% | 99.2 1% |
| sRGB Coverage (%) | 99.9 | 99.9 0% | 98.4 -2% | 98.2 -2% | 62.6 -37% | 100 0% |
| AdobeRGB 1998 Coverage (%) | 85.4 | 85.2 0% | 74.4 -13% | 70.5 -17% | 43.7 -49% | 88.6 4% |
| Response Times | 7% | 60% | 7% | -52% | 29% | |
| Response Time Grey 50% / Grey 80% * (ms) | 14 ? | 13.2 ? 6% | 3.39 ? 76% | 12.4 ? 11% | 22 ? -57% | 5.1 ? 64% |
| Response Time Black / White * (ms) | 9.6 ? | 8.8 ? 8% | 5.35 ? 44% | 9.4 ? 2% | 14 ? -46% | 10.3 ? -7% |
| PWM Frequency (Hz) | 21620 ? | |||||
| Bildschirm | -33% | -25% | 24% | -22% | 14% | |
| Helligkeit Bildmitte (cd/m²) | 322 | 317 -2% | 320 -1% | 316 -2% | 247 -23% | 302.2 -6% |
| Brightness (cd/m²) | 301 | 294 -2% | 316 5% | 301 0% | 234 -22% | 285 -5% |
| Brightness Distribution (%) | 85 | 83 -2% | 94 11% | 90 6% | 89 5% | 89 5% |
| Schwarzwert * (cd/m²) | 0.36 | 0.32 11% | 0.21 42% | 0.28 22% | 0.25 31% | 0.26 28% |
| Kontrast (:1) | 894 | 991 11% | 1524 70% | 1129 26% | 988 11% | 1162 30% |
| Delta E Colorchecker * | 1.98 | 4.22 -113% | 4.55 -130% | 1.54 22% | 3.78 -91% | 1.63 18% |
| Colorchecker dE 2000 max. * | 5.24 | 5.97 -14% | 9.83 -88% | 2.46 53% | 6.42 -23% | 4.13 21% |
| Colorchecker dE 2000 calibrated * | 1.98 | 4.09 -107% | 1.51 24% | 1.21 39% | 3.94 -99% | 1.17 41% |
| Delta E Graustufen * | 2.44 | 4.41 -81% | 6.2 -154% | 1.3 47% | 2.16 11% | 2.5 -2% |
| Gamma | 2.42 91% | 2.29 96% | 2.07 106% | 2.307 95% | 2.33 94% | 2.23 99% |
| CCT | 6984 93% | 6733 97% | 6479 100% | 6456 101% | 6906 94% | 6590 99% |
| Durchschnitt gesamt (Programm / Settings) | -9% /
-20% | 7% /
-10% | 5% /
13% | -41% /
-32% | 15% /
14% |
* ... kleinere Werte sind besser
Von Haus aus sind die Farbabweichungen für einen Gaming-Laptop mehr als angemessen klein. Sowohl bei den Farben im Calman ColorChecker als auch den Graustufen liegt das XMG Pro 15 mit ΔΕ 1,98 respektive ΔΕ 2,44 deutlich im Zielbereich bei ΔΕ < 3. Das von uns erstellte ICC-Profil (Download in der Infobox) dürfte hier das überbetonte Blau etwas reduzieren, womit sowohl die Graustufen, als auch die Farbdarstellung nochmals deutlich verbessert würden. Zusammen mit dem beinahe vollständig abgedeckten DisplayP3-Farbraum ergibt sich hier ein Bildschirm, der auch für die professionelle Videobearbeitung geeignet scheint.
Reaktionszeiten (Response Times) des Displays
| ↔ Reaktionszeiten Schwarz zu Weiß | ||
|---|---|---|
| 9.6 ms ... steigend ↗ und fallend ↘ kombiniert | ↗ 4.2 ms steigend | 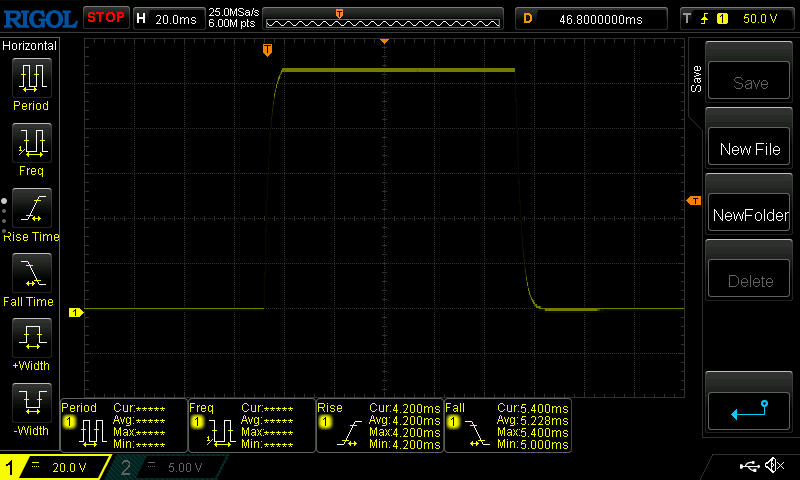 |
| ↘ 5.4 ms fallend | ||
| Die gemessenen Reaktionszeiten sind kurz wodurch sich der Bildschirm auch für Spiele gut eignen sollte. Im Vergleich rangierten die bei uns getesteten Geräte von 0.1 (Minimum) zu 240 (Maximum) ms. » 26 % aller Screens waren schneller als der getestete. Daher sind die gemessenen Reaktionszeiten besser als der Durchschnitt aller vermessenen Geräte (19.8 ms). | ||
| ↔ Reaktionszeiten 50% Grau zu 80% Grau | ||
| 14 ms ... steigend ↗ und fallend ↘ kombiniert | ↗ 6.6 ms steigend | 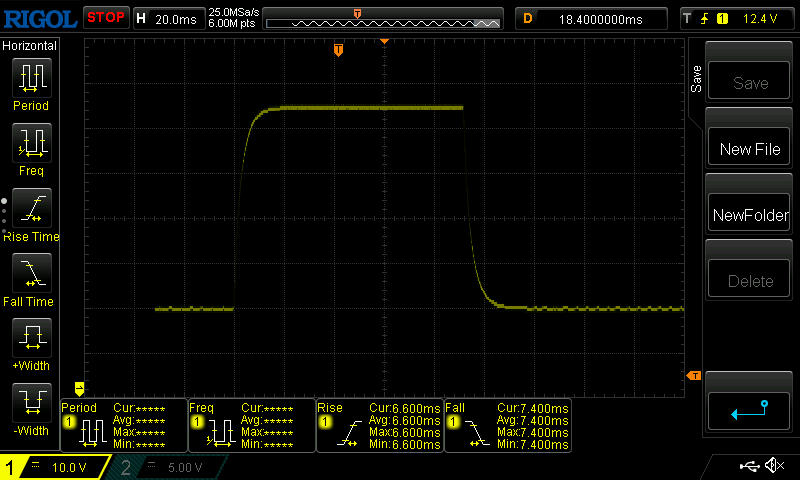 |
| ↘ 7.4 ms fallend | ||
| Die gemessenen Reaktionszeiten sind gut, für anspruchsvolle Spieler könnten der Bildschirm jedoch zu langsam sein. Im Vergleich rangierten die bei uns getesteten Geräte von 0.165 (Minimum) zu 636 (Maximum) ms. » 28 % aller Screens waren schneller als der getestete. Daher sind die gemessenen Reaktionszeiten besser als der Durchschnitt aller vermessenen Geräte (31 ms). | ||
Bildschirm-Flackern / PWM (Pulse-Width Modulation)
| Flackern / PWM nicht festgestellt | 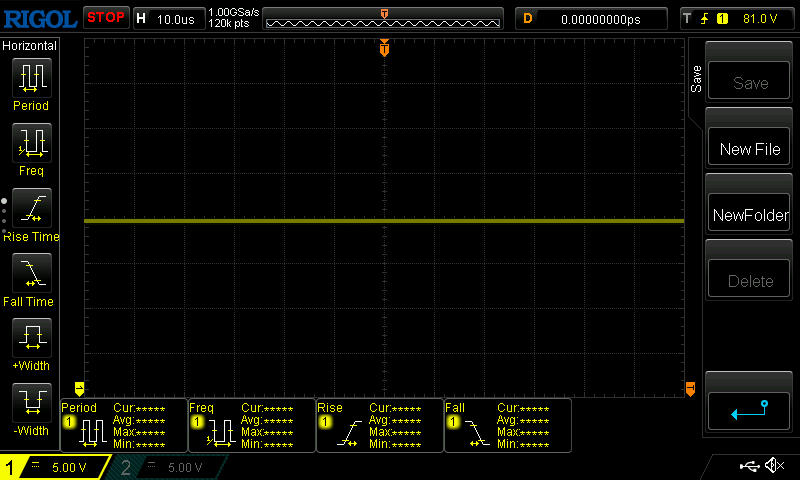 | ||
Im Vergleich: 52 % aller getesteten Geräte nutzten kein PWM um die Helligkeit zu reduzieren. Wenn PWM eingesetzt wurde, dann bei einer Frequenz von durchschnittlich 7763 (Minimum 5, Maximum 343500) Hz. | |||
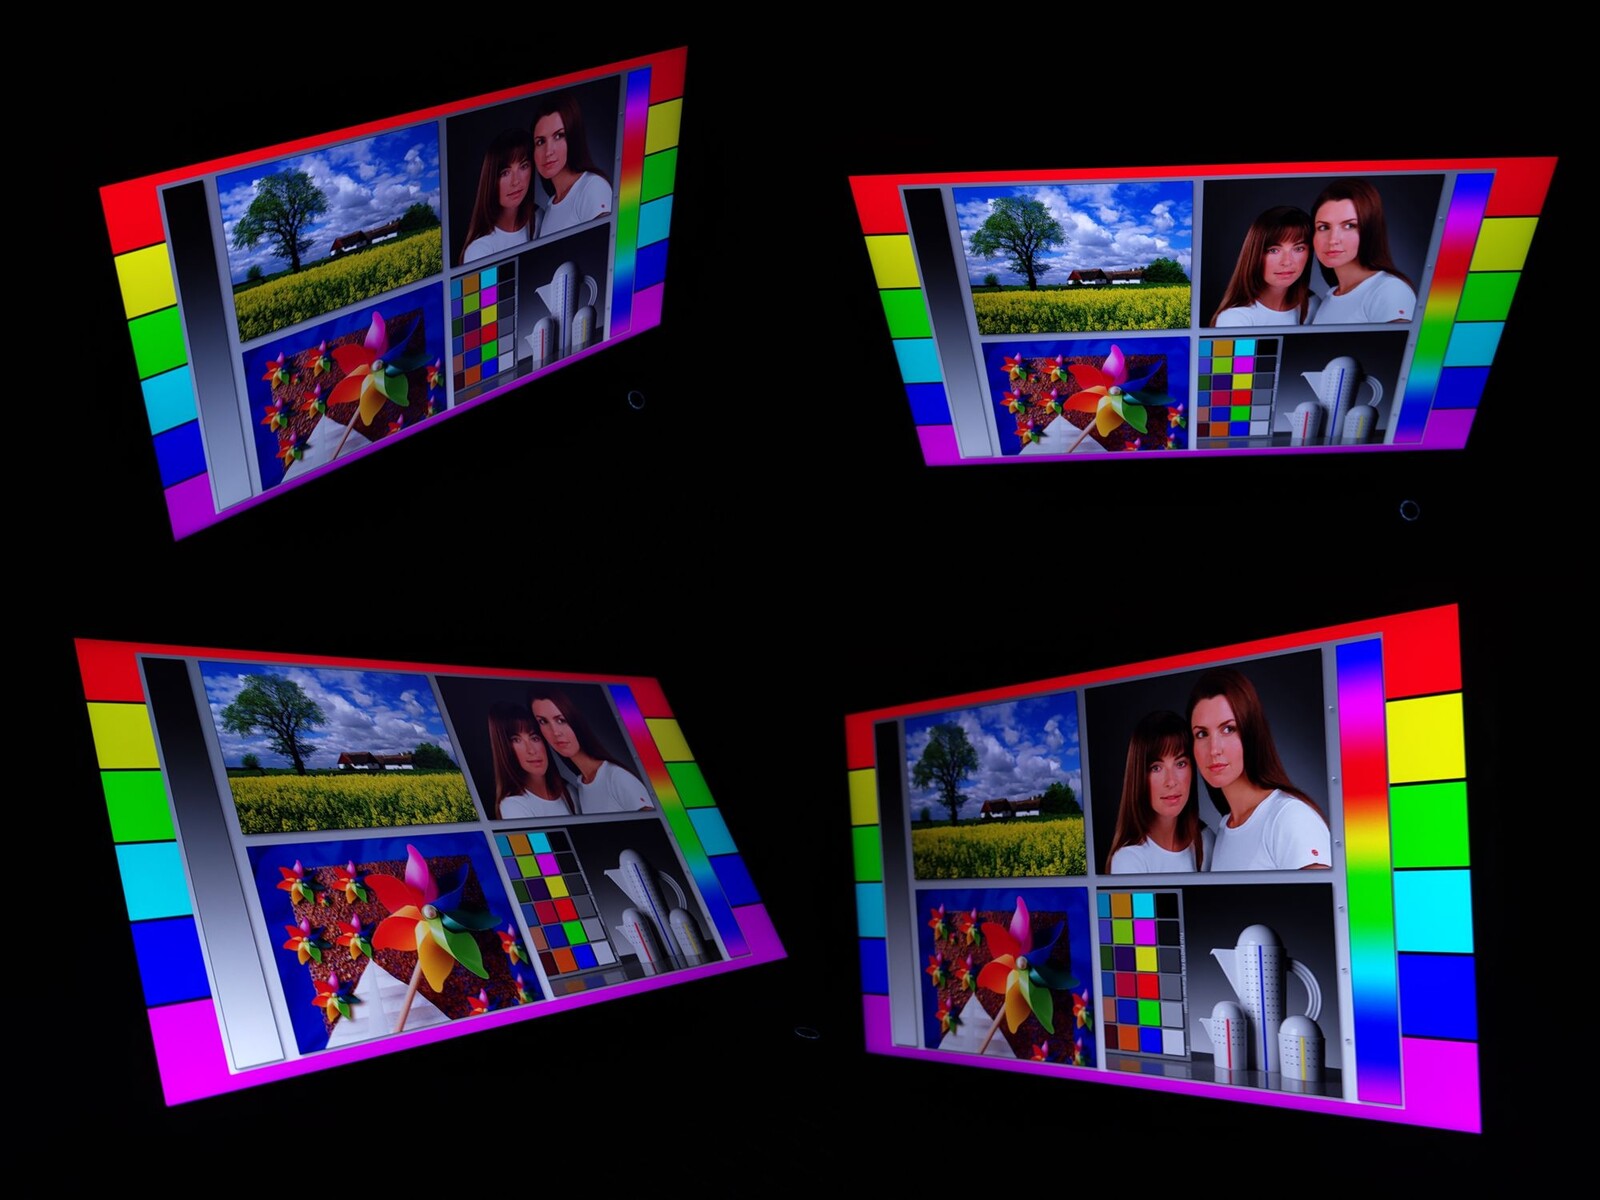
Dank mattem und einigermaßen hellem Display kann man den 15-Zoll-Laptop auch im Freien nutzen. Je nach Aufstellort muss man sich hier einen passenden Blickwinkel wählen, um einen möglichst geringen Anteil an Reflexionen zu sehen. Zum Glück gibt sich das IPS-Panel sehr blickwinkelstabil.
Leistung - Intel Core i9 und Nvidia GeForce RTX 4060 mit Ausdauer
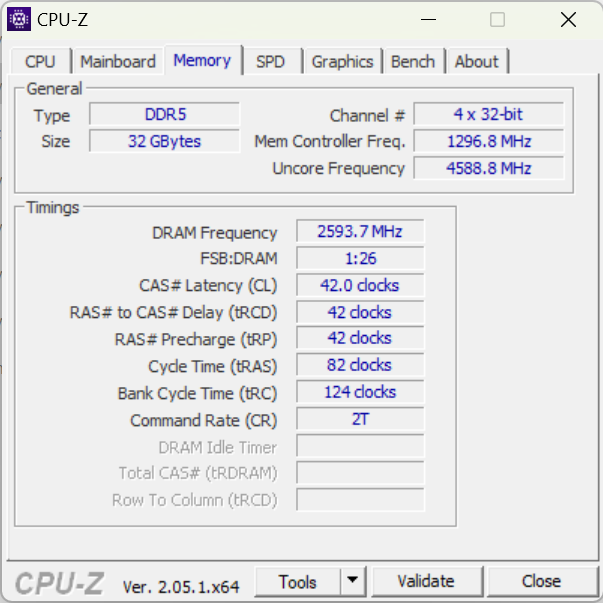
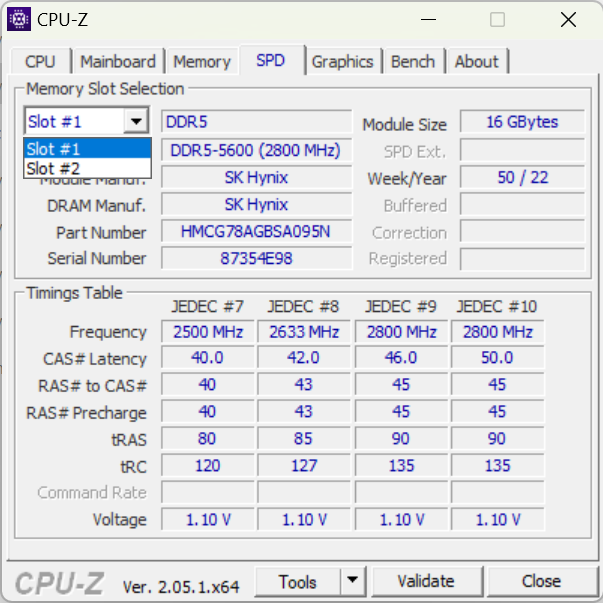
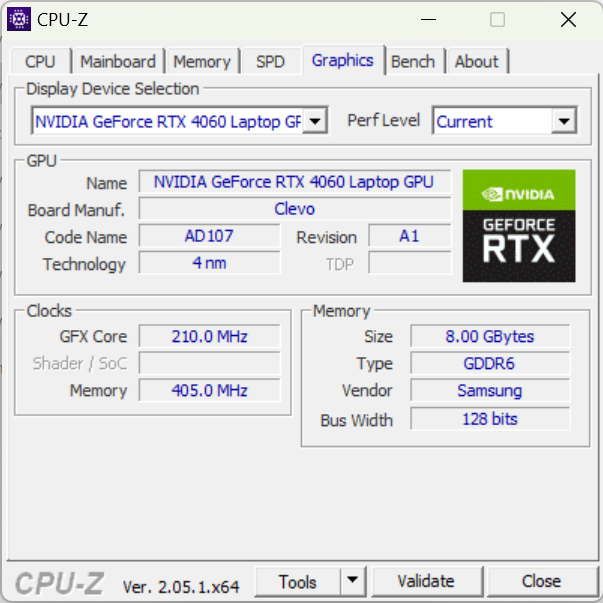
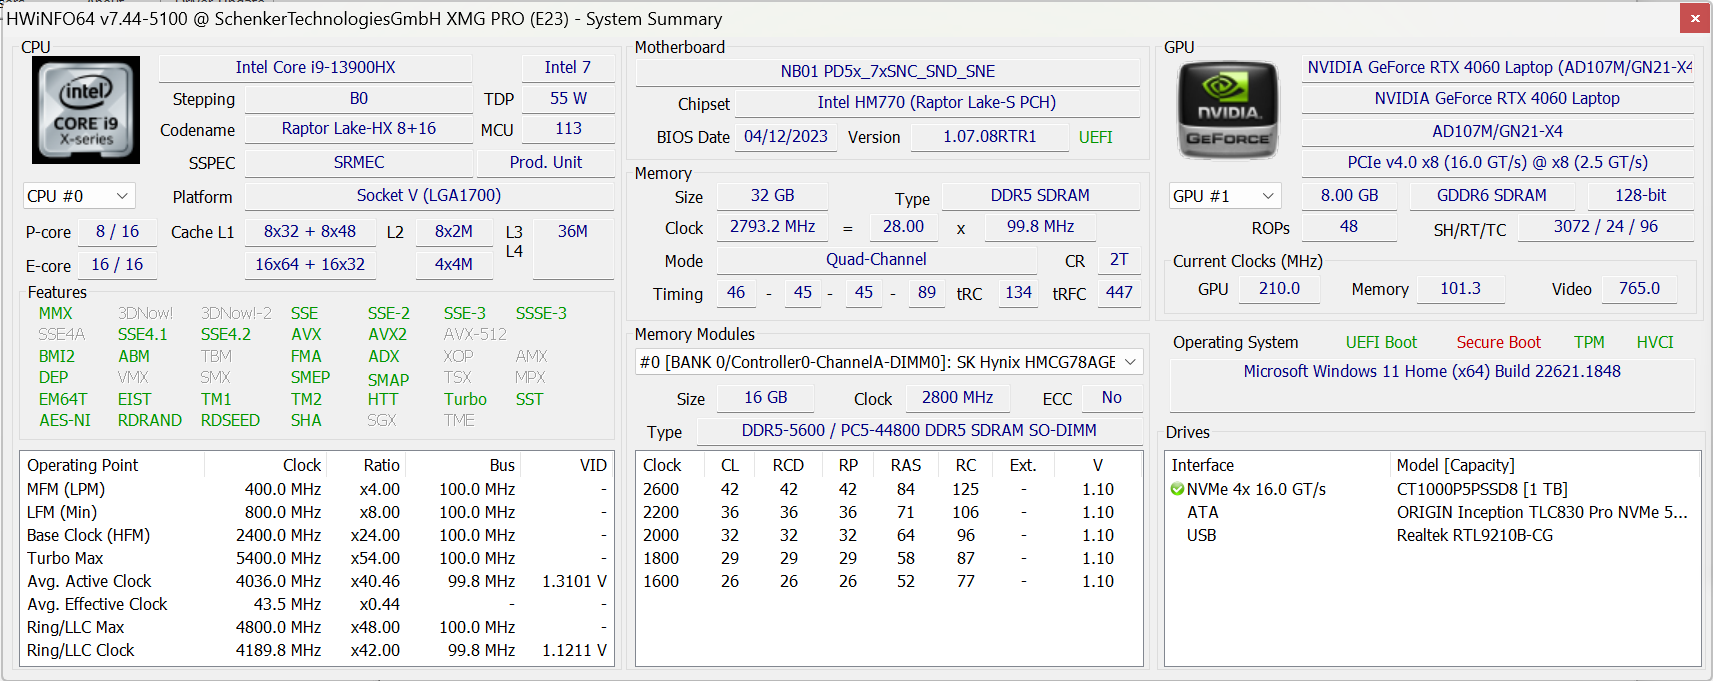
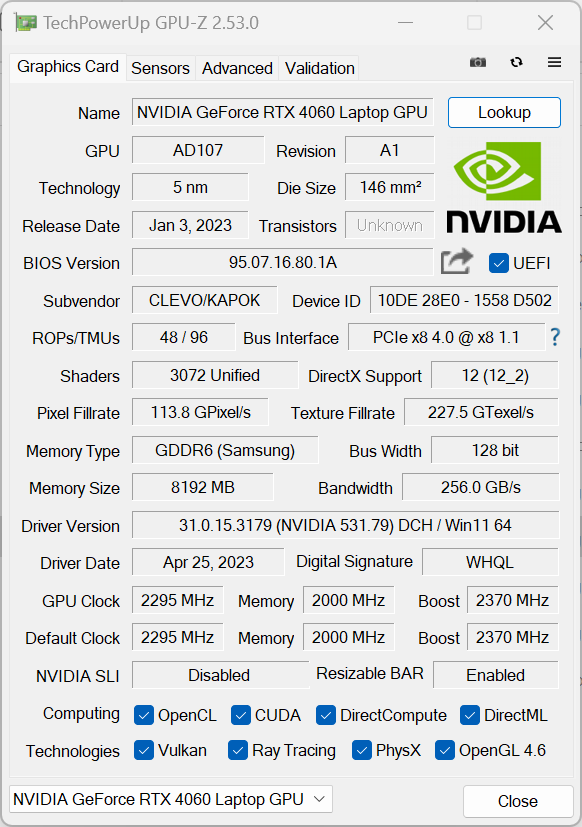
Ein leistungsstarker Intel Core i9-13900HX und die Nvidia GeForce RTX 4060 sorgen im Testgerät für ausreichend Rechenleistung zum Spielen und für die meisten kreativen Aufgaben. Das Notebook kann mit 8 bis 64 GB DDR5-Arbeitsspeicher konfiguriert werden. Unser Testgerät ist mit 32 GB bestückt. Typisch für Schenker kann man hier im Bestellvorgang bei Bestware sehr viele verschiedene Optionen auswählen. Neben der RTX 4060 ist so ebenfalls eine RTX 4070 konfigurierbar. Auch bei den SSDs und WiFi-Optionen gibt es eine breite Auswahl.
Testbedingungen
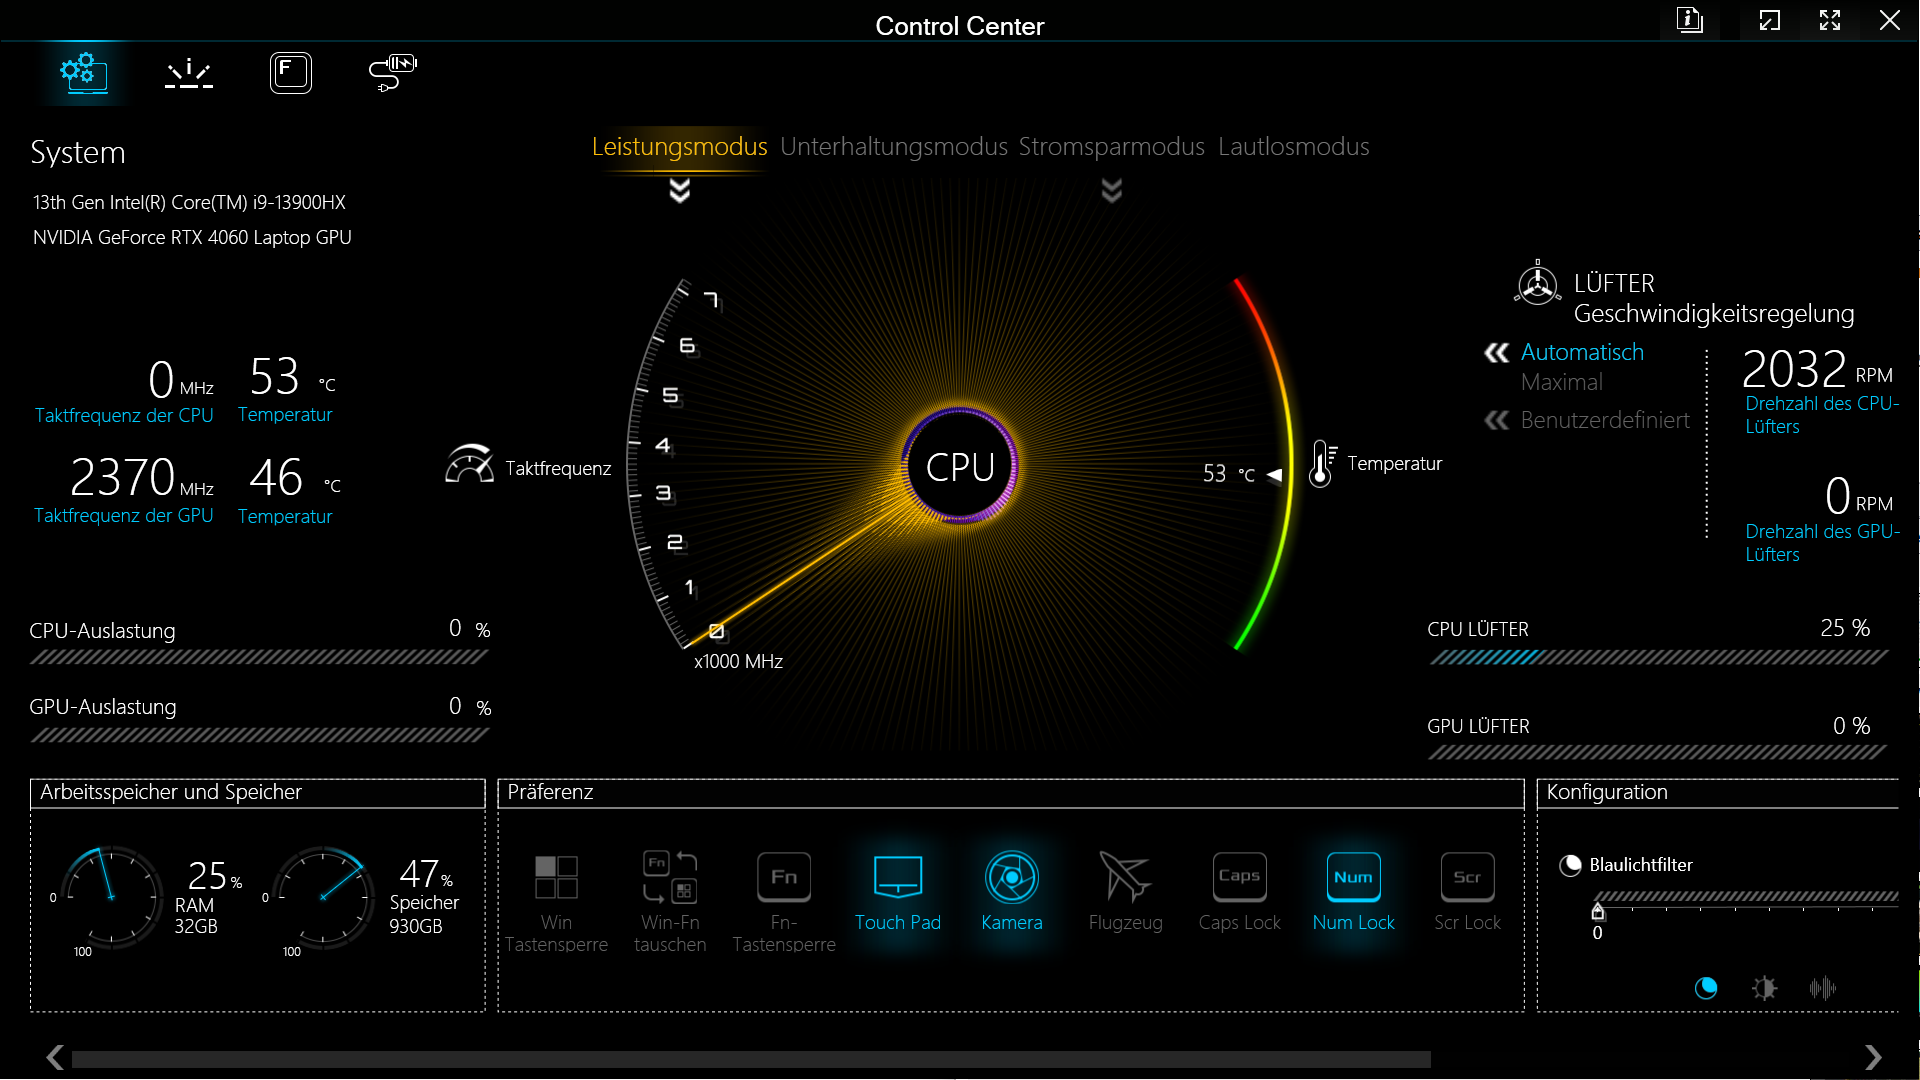
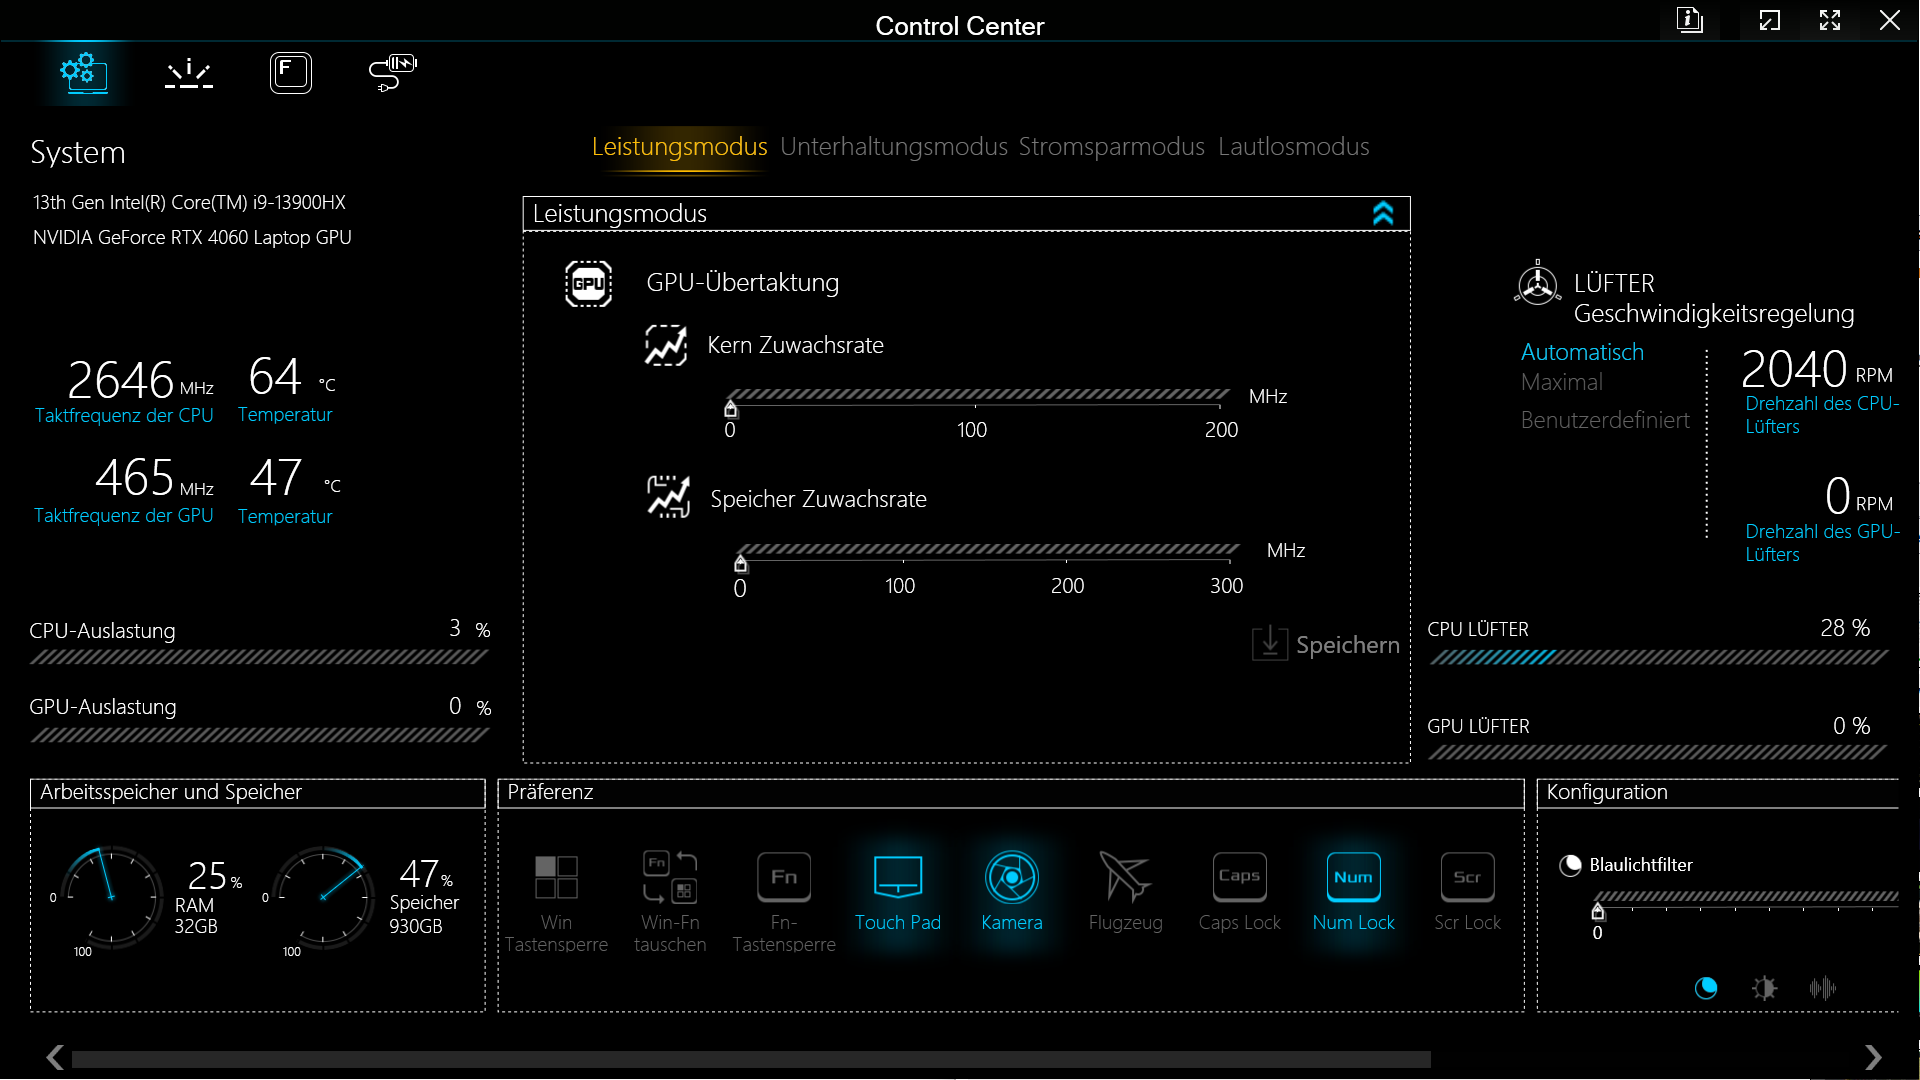
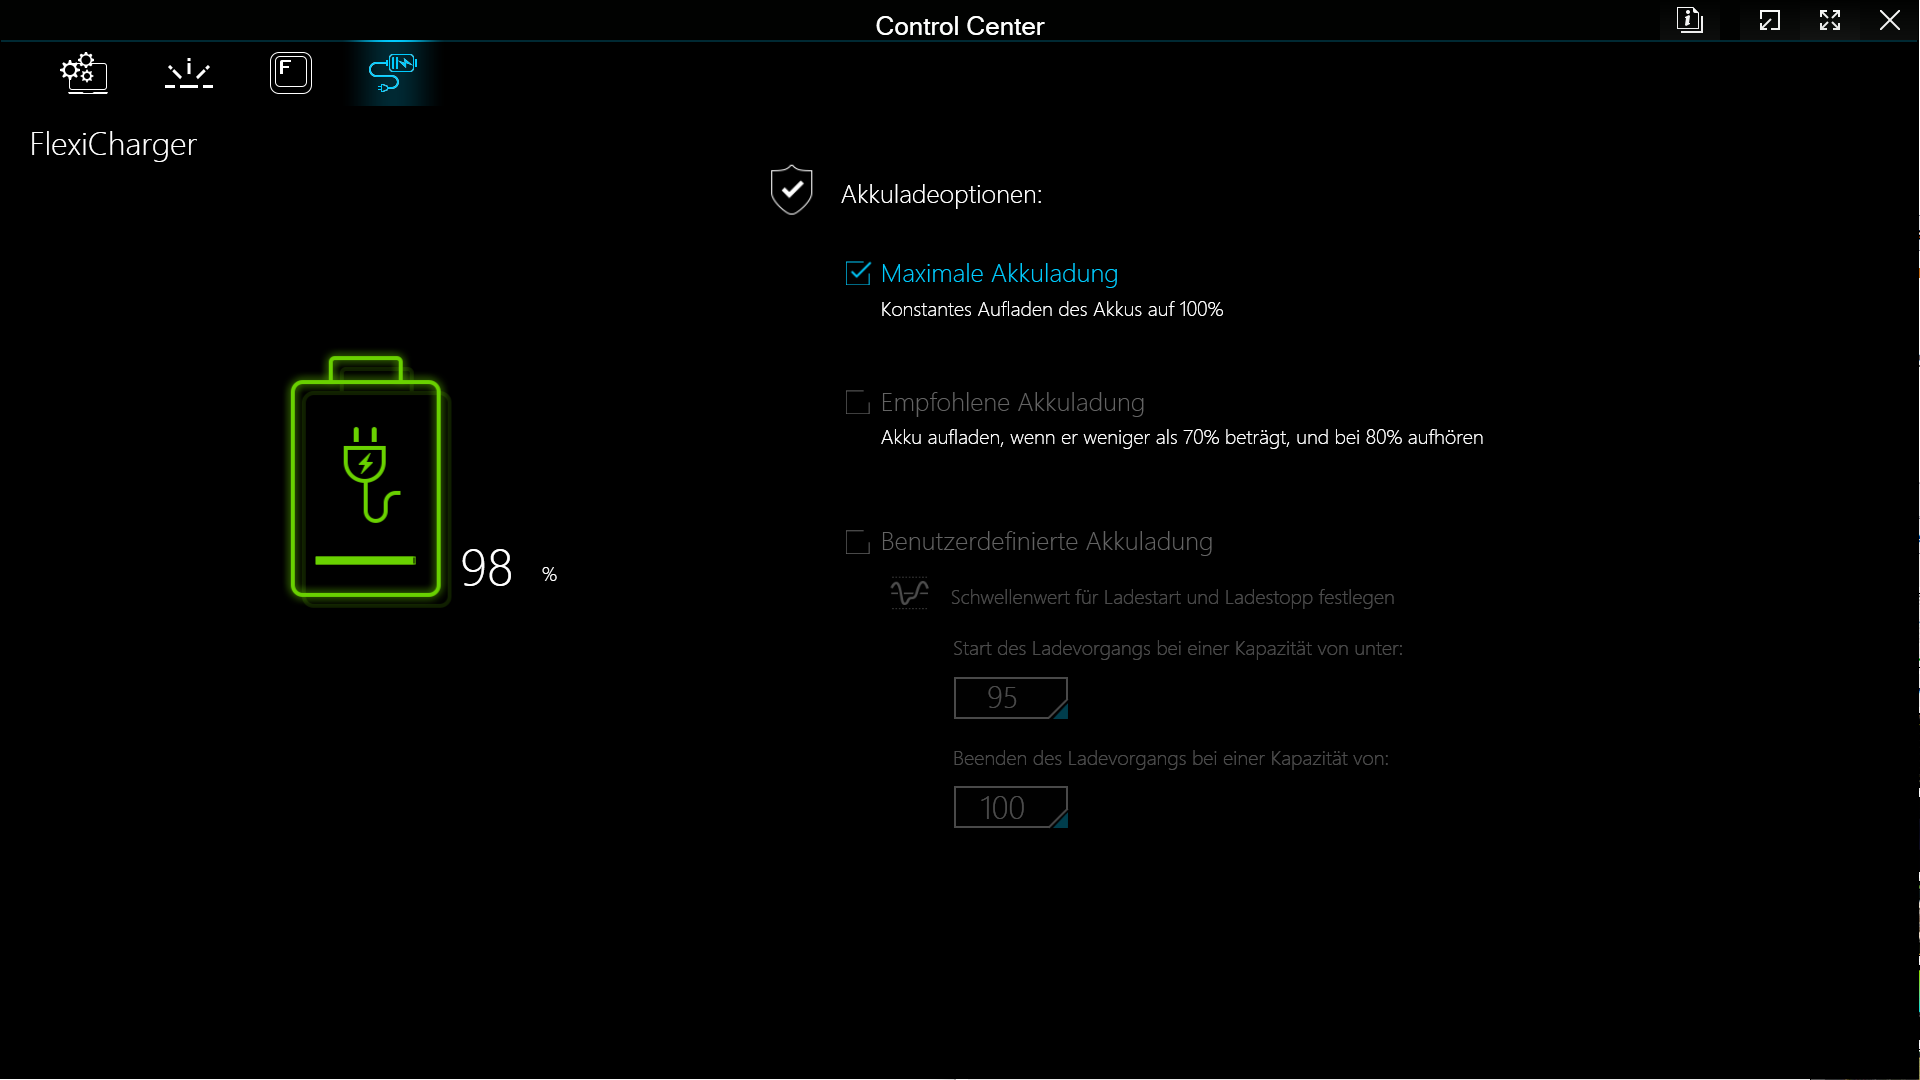
Leistungsmodus, Unterhaltungsmodus, Stromsparmodus und Lautlosmodus sind die verschiedenen Leistungsstufen, die über das Control Center ausgewählt werden können. Im Leistungsmodus gibt es zudem Optionen zum sanften Übertakten der GPU und des Grafikspeichers. Der Intel Core i9 wird dabei mit maximal 135 Watt versorgt, die GeForce RTX 4060 mit 140 Watt, wenn 25 Watt vom Prozessor zur Grafikkarte verschoben werden. In den einzelnen Energiesparplänen gelten folgende Zielwerte:
| Modus: | Leistungsmodus | Unterhaltungsmodus | Stromsparmodus | Ruhemodus |
|---|---|---|---|---|
| CPU PL1 | 135 W | 65 W | 55 W | 45 W |
| CPU PL2 | 162 W | 115 W | 115 W | 115W |
| Zieltemperatur CPU | 93 °C | 87 °C | 85 °C | 85 °C |
| GPU TGP + Dynamic Boost | 115 W + 25 W | 115 W + 0 W | 115 W + 0 W | 115 W + 0 W |
| Zieltemperatur GPU | 87 °C | 87 °C | 87 °C | 87 °C |
Sowohl im Unterhaltungsmodus als auch im Leistungsmodus zeigt sich anhand der von uns erstellten Logs, dass der Gaming-Laptop hier bis zu 90 Sekunden seine hohe Boostleistung halten kann. Schenker schlägt vor, die alltäglichen Aufgaben im Unterhaltungsmodus auszuführen. Wir haben uns dennoch entschieden, alle Benchmarks im Leistungsmodus auszuführen.
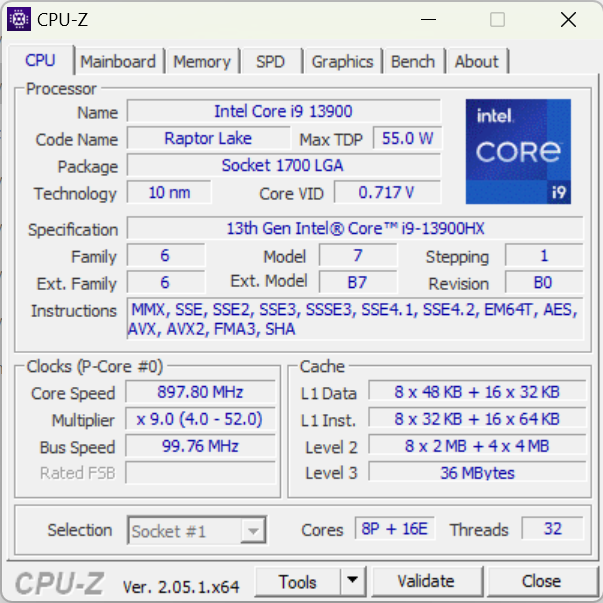
Prozessor
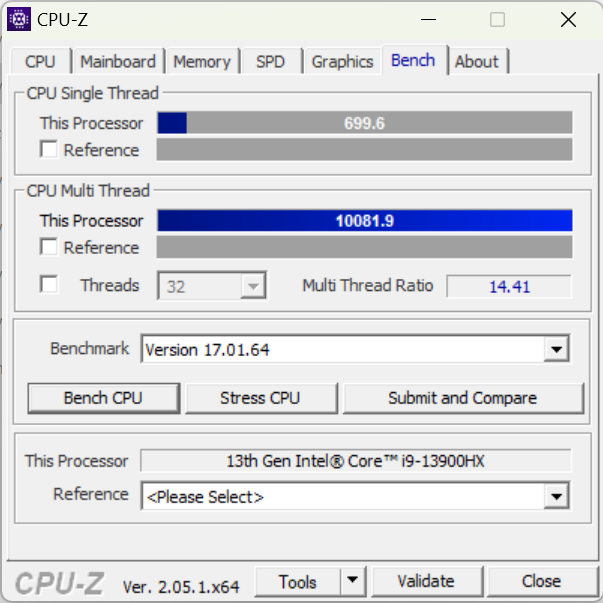
Der Intel Core i9-13900HX stellt sich als stärkster Laptop-Prozessor der aktuellen Raptor-Lake-Generation dar. 32 Threads verteilt auf 8 P-Kerne und 16 E-Kerne kann diese CPU gleichzeitig abarbeiten. Dank seiner hohen Werte bei PL1 und PL2 kann der i9 hier so richtig zeigen, welches Potenzial in ihm steckt. So übertrifft das XMG Pro 15 sämtliche anderen Geräte in den Prozessor Benchmarks.
Cinebench R15 Multi Dauertest
Cinebench R23: Multi Core | Single Core
Cinebench R20: CPU (Multi Core) | CPU (Single Core)
Cinebench R15: CPU Multi 64Bit | CPU Single 64Bit
Blender: v2.79 BMW27 CPU
7-Zip 18.03: 7z b 4 | 7z b 4 -mmt1
Geekbench 5.5: Multi-Core | Single-Core
HWBOT x265 Benchmark v2.2: 4k Preset
LibreOffice : 20 Documents To PDF
R Benchmark 2.5: Overall mean
| CPU Performance Rating | |
| Durchschnittliche Intel Core i9-13900HX | |
| Durchschnitt der Klasse Gaming | |
| Schenker XMG Pro 15 (E23) | |
| Alienware x16 R1 -1! | |
| Aorus 15X ASF | |
| Dell G15 5530 | |
| Asus ZenBook Pro 14 Duo UX8402VV-P1021W | |
| Schenker XMG Pro 15 (i7-12700H, RTX 3080 Ti) | |
| MSI Cyborg 15 A12VF | |
| Asus TUF A15 FA507 | |
| Cinebench R23 / Multi Core | |
| Durchschnittliche Intel Core i9-13900HX (24270 - 32623, n=23) | |
| Durchschnitt der Klasse Gaming (10488 - 40970, n=110, der letzten 2 Jahre) | |
| Schenker XMG Pro 15 (E23) | |
| Dell G15 5530 | |
| Aorus 15X ASF | |
| Alienware x16 R1 | |
| Asus ZenBook Pro 14 Duo UX8402VV-P1021W | |
| Schenker XMG Pro 15 (i7-12700H, RTX 3080 Ti) | |
| MSI Cyborg 15 A12VF | |
| Asus TUF A15 FA507 | |
| Cinebench R23 / Single Core | |
| Durchschnittliche Intel Core i9-13900HX (1867 - 2105, n=20) | |
| Durchschnitt der Klasse Gaming (1166 - 2356, n=110, der letzten 2 Jahre) | |
| Asus ZenBook Pro 14 Duo UX8402VV-P1021W | |
| Alienware x16 R1 | |
| Aorus 15X ASF | |
| Schenker XMG Pro 15 (E23) | |
| Dell G15 5530 | |
| Schenker XMG Pro 15 (i7-12700H, RTX 3080 Ti) | |
| MSI Cyborg 15 A12VF | |
| Asus TUF A15 FA507 | |
| Cinebench R20 / CPU (Multi Core) | |
| Durchschnittliche Intel Core i9-13900HX (9152 - 12541, n=21) | |
| Durchschnitt der Klasse Gaming (4029 - 16108, n=109, der letzten 2 Jahre) | |
| Schenker XMG Pro 15 (E23) | |
| Dell G15 5530 | |
| Aorus 15X ASF | |
| Alienware x16 R1 | |
| Asus ZenBook Pro 14 Duo UX8402VV-P1021W | |
| Schenker XMG Pro 15 (i7-12700H, RTX 3080 Ti) | |
| MSI Cyborg 15 A12VF | |
| Asus TUF A15 FA507 | |
| Cinebench R20 / CPU (Single Core) | |
| Durchschnittliche Intel Core i9-13900HX (722 - 810, n=21) | |
| Durchschnitt der Klasse Gaming (442 - 895, n=109, der letzten 2 Jahre) | |
| Asus ZenBook Pro 14 Duo UX8402VV-P1021W | |
| Alienware x16 R1 | |
| Aorus 15X ASF | |
| Schenker XMG Pro 15 (E23) | |
| Dell G15 5530 | |
| Schenker XMG Pro 15 (i7-12700H, RTX 3080 Ti) | |
| MSI Cyborg 15 A12VF | |
| Asus TUF A15 FA507 | |
| Cinebench R15 / CPU Multi 64Bit | |
| Durchschnittliche Intel Core i9-13900HX (3913 - 4970, n=22) | |
| Durchschnitt der Klasse Gaming (1578 - 6271, n=108, der letzten 2 Jahre) | |
| Schenker XMG Pro 15 (E23) | |
| Aorus 15X ASF | |
| Dell G15 5530 | |
| Alienware x16 R1 | |
| Asus ZenBook Pro 14 Duo UX8402VV-P1021W | |
| Schenker XMG Pro 15 (i7-12700H, RTX 3080 Ti) | |
| Asus TUF A15 FA507 | |
| MSI Cyborg 15 A12VF | |
| Cinebench R15 / CPU Single 64Bit | |
| Durchschnitt der Klasse Gaming (188.8 - 343, n=109, der letzten 2 Jahre) | |
| Durchschnittliche Intel Core i9-13900HX (247 - 304, n=22) | |
| Asus ZenBook Pro 14 Duo UX8402VV-P1021W | |
| Alienware x16 R1 | |
| Aorus 15X ASF | |
| Dell G15 5530 | |
| Schenker XMG Pro 15 (i7-12700H, RTX 3080 Ti) | |
| Asus TUF A15 FA507 | |
| Schenker XMG Pro 15 (E23) | |
| MSI Cyborg 15 A12VF | |
| Blender / v2.79 BMW27 CPU | |
| MSI Cyborg 15 A12VF | |
| Asus TUF A15 FA507 | |
| Schenker XMG Pro 15 (i7-12700H, RTX 3080 Ti) | |
| Asus ZenBook Pro 14 Duo UX8402VV-P1021W | |
| Aorus 15X ASF | |
| Dell G15 5530 | |
| Durchschnitt der Klasse Gaming (80 - 330, n=107, der letzten 2 Jahre) | |
| Schenker XMG Pro 15 (E23) | |
| Durchschnittliche Intel Core i9-13900HX (101 - 153, n=22) | |
| 7-Zip 18.03 / 7z b 4 | |
| Durchschnittliche Intel Core i9-13900HX (90675 - 127283, n=21) | |
| Schenker XMG Pro 15 (E23) | |
| Durchschnitt der Klasse Gaming (33491 - 148086, n=108, der letzten 2 Jahre) | |
| Dell G15 5530 | |
| Alienware x16 R1 | |
| Aorus 15X ASF | |
| Asus ZenBook Pro 14 Duo UX8402VV-P1021W | |
| Schenker XMG Pro 15 (i7-12700H, RTX 3080 Ti) | |
| Asus TUF A15 FA507 | |
| MSI Cyborg 15 A12VF | |
| 7-Zip 18.03 / 7z b 4 -mmt1 | |
| Durchschnittliche Intel Core i9-13900HX (6340 - 7177, n=21) | |
| Aorus 15X ASF | |
| Durchschnitt der Klasse Gaming (4199 - 7436, n=108, der letzten 2 Jahre) | |
| Schenker XMG Pro 15 (E23) | |
| Asus ZenBook Pro 14 Duo UX8402VV-P1021W | |
| Alienware x16 R1 | |
| Dell G15 5530 | |
| Asus TUF A15 FA507 | |
| Schenker XMG Pro 15 (i7-12700H, RTX 3080 Ti) | |
| MSI Cyborg 15 A12VF | |
| Geekbench 5.5 / Multi-Core | |
| Durchschnittliche Intel Core i9-13900HX (17614 - 21075, n=22) | |
| Schenker XMG Pro 15 (E23) | |
| Durchschnitt der Klasse Gaming (6460 - 27010, n=108, der letzten 2 Jahre) | |
| Aorus 15X ASF | |
| Alienware x16 R1 | |
| Dell G15 5530 | |
| Asus ZenBook Pro 14 Duo UX8402VV-P1021W | |
| Schenker XMG Pro 15 (i7-12700H, RTX 3080 Ti) | |
| MSI Cyborg 15 A12VF | |
| Asus TUF A15 FA507 | |
| Geekbench 5.5 / Single-Core | |
| Durchschnitt der Klasse Gaming (986 - 2474, n=108, der letzten 2 Jahre) | |
| Durchschnittliche Intel Core i9-13900HX (1345 - 2093, n=22) | |
| Alienware x16 R1 | |
| Asus ZenBook Pro 14 Duo UX8402VV-P1021W | |
| Aorus 15X ASF | |
| Dell G15 5530 | |
| Schenker XMG Pro 15 (E23) | |
| MSI Cyborg 15 A12VF | |
| Schenker XMG Pro 15 (i7-12700H, RTX 3080 Ti) | |
| Asus TUF A15 FA507 | |
| HWBOT x265 Benchmark v2.2 / 4k Preset | |
| Durchschnittliche Intel Core i9-13900HX (23.5 - 34.4, n=22) | |
| Durchschnitt der Klasse Gaming (11.5 - 44.3, n=108, der letzten 2 Jahre) | |
| Schenker XMG Pro 15 (E23) | |
| Dell G15 5530 | |
| Alienware x16 R1 | |
| Aorus 15X ASF | |
| Schenker XMG Pro 15 (i7-12700H, RTX 3080 Ti) | |
| Asus ZenBook Pro 14 Duo UX8402VV-P1021W | |
| Asus TUF A15 FA507 | |
| MSI Cyborg 15 A12VF | |
| MSI Cyborg 15 A12VF | |
| LibreOffice / 20 Documents To PDF | |
| Schenker XMG Pro 15 (E23) | |
| Asus TUF A15 FA507 | |
| Durchschnitt der Klasse Gaming (19 - 88.8, n=108, der letzten 2 Jahre) | |
| Schenker XMG Pro 15 (i7-12700H, RTX 3080 Ti) | |
| Dell G15 5530 | |
| Alienware x16 R1 | |
| Aorus 15X ASF | |
| Durchschnittliche Intel Core i9-13900HX (32.8 - 51.1, n=21) | |
| Asus ZenBook Pro 14 Duo UX8402VV-P1021W | |
| MSI Cyborg 15 A12VF | |
| R Benchmark 2.5 / Overall mean | |
| Asus TUF A15 FA507 | |
| MSI Cyborg 15 A12VF | |
| Schenker XMG Pro 15 (E23) | |
| Schenker XMG Pro 15 (i7-12700H, RTX 3080 Ti) | |
| Aorus 15X ASF | |
| Asus ZenBook Pro 14 Duo UX8402VV-P1021W | |
| Durchschnitt der Klasse Gaming (0.3439 - 0.759, n=109, der letzten 2 Jahre) | |
| Alienware x16 R1 | |
| Dell G15 5530 | |
| Durchschnittliche Intel Core i9-13900HX (0.375 - 0.4564, n=22) | |
* ... kleinere Werte sind besser
AIDA64: FP32 Ray-Trace | FPU Julia | CPU SHA3 | CPU Queen | FPU SinJulia | FPU Mandel | CPU AES | CPU ZLib | FP64 Ray-Trace | CPU PhotoWorxx
| Performance Rating | |
| Durchschnitt der Klasse Gaming | |
| Durchschnittliche Intel Core i9-13900HX | |
| Schenker XMG Pro 15 (E23) | |
| Alienware x16 R1 | |
| Aorus 15X ASF | |
| Dell G15 5530 | |
| Asus TUF A15 FA507 | |
| Asus ZenBook Pro 14 Duo UX8402VV-P1021W | |
| MSI Cyborg 15 A12VF | |
| Schenker XMG Pro 15 (i7-12700H, RTX 3080 Ti) | |
| AIDA64 / FP32 Ray-Trace | |
| Durchschnitt der Klasse Gaming (10227 - 85542, n=107, der letzten 2 Jahre) | |
| Durchschnittliche Intel Core i9-13900HX (17589 - 27615, n=22) | |
| Alienware x16 R1 | |
| Dell G15 5530 | |
| Schenker XMG Pro 15 (E23) | |
| Aorus 15X ASF | |
| Asus TUF A15 FA507 | |
| Asus ZenBook Pro 14 Duo UX8402VV-P1021W | |
| MSI Cyborg 15 A12VF | |
| Schenker XMG Pro 15 (i7-12700H, RTX 3080 Ti) | |
| AIDA64 / FPU Julia | |
| Durchschnitt der Klasse Gaming (51376 - 238426, n=107, der letzten 2 Jahre) | |
| Durchschnittliche Intel Core i9-13900HX (88686 - 137015, n=22) | |
| Asus TUF A15 FA507 | |
| Schenker XMG Pro 15 (E23) | |
| Alienware x16 R1 | |
| Dell G15 5530 | |
| Aorus 15X ASF | |
| Asus ZenBook Pro 14 Duo UX8402VV-P1021W | |
| MSI Cyborg 15 A12VF | |
| Schenker XMG Pro 15 (i7-12700H, RTX 3080 Ti) | |
| AIDA64 / CPU SHA3 | |
| Durchschnitt der Klasse Gaming (2180 - 9817, n=107, der letzten 2 Jahre) | |
| Durchschnittliche Intel Core i9-13900HX (4362 - 7029, n=22) | |
| Schenker XMG Pro 15 (E23) | |
| Dell G15 5530 | |
| Alienware x16 R1 | |
| Aorus 15X ASF | |
| Asus TUF A15 FA507 | |
| Asus ZenBook Pro 14 Duo UX8402VV-P1021W | |
| MSI Cyborg 15 A12VF | |
| Schenker XMG Pro 15 (i7-12700H, RTX 3080 Ti) | |
| AIDA64 / CPU Queen | |
| Durchschnittliche Intel Core i9-13900HX (125644 - 141385, n=22) | |
| Schenker XMG Pro 15 (E23) | |
| Alienware x16 R1 | |
| Durchschnitt der Klasse Gaming (49785 - 173351, n=94, der letzten 2 Jahre) | |
| Aorus 15X ASF | |
| Asus ZenBook Pro 14 Duo UX8402VV-P1021W | |
| Dell G15 5530 | |
| Asus TUF A15 FA507 | |
| Schenker XMG Pro 15 (i7-12700H, RTX 3080 Ti) | |
| MSI Cyborg 15 A12VF | |
| AIDA64 / FPU SinJulia | |
| Durchschnittliche Intel Core i9-13900HX (12334 - 17179, n=22) | |
| Durchschnitt der Klasse Gaming (4424 - 33636, n=107, der letzten 2 Jahre) | |
| Asus TUF A15 FA507 | |
| Schenker XMG Pro 15 (E23) | |
| Aorus 15X ASF | |
| Alienware x16 R1 | |
| Dell G15 5530 | |
| Schenker XMG Pro 15 (i7-12700H, RTX 3080 Ti) | |
| Asus ZenBook Pro 14 Duo UX8402VV-P1021W | |
| MSI Cyborg 15 A12VF | |
| AIDA64 / FPU Mandel | |
| Durchschnitt der Klasse Gaming (25115 - 128721, n=107, der letzten 2 Jahre) | |
| Durchschnittliche Intel Core i9-13900HX (43850 - 69202, n=22) | |
| Asus TUF A15 FA507 | |
| Alienware x16 R1 | |
| Schenker XMG Pro 15 (E23) | |
| Dell G15 5530 | |
| Aorus 15X ASF | |
| Asus ZenBook Pro 14 Duo UX8402VV-P1021W | |
| MSI Cyborg 15 A12VF | |
| Schenker XMG Pro 15 (i7-12700H, RTX 3080 Ti) | |
| AIDA64 / CPU AES | |
| Aorus 15X ASF | |
| Durchschnittliche Intel Core i9-13900HX (89413 - 237881, n=22) | |
| Durchschnitt der Klasse Gaming (39258 - 247074, n=107, der letzten 2 Jahre) | |
| Schenker XMG Pro 15 (E23) | |
| Dell G15 5530 | |
| Alienware x16 R1 | |
| Asus TUF A15 FA507 | |
| MSI Cyborg 15 A12VF | |
| Asus ZenBook Pro 14 Duo UX8402VV-P1021W | |
| Schenker XMG Pro 15 (i7-12700H, RTX 3080 Ti) | |
| AIDA64 / CPU ZLib | |
| Durchschnittliche Intel Core i9-13900HX (1284 - 1958, n=22) | |
| Durchschnitt der Klasse Gaming (574 - 2531, n=107, der letzten 2 Jahre) | |
| Schenker XMG Pro 15 (E23) | |
| Dell G15 5530 | |
| Alienware x16 R1 | |
| Aorus 15X ASF | |
| Schenker XMG Pro 15 (i7-12700H, RTX 3080 Ti) | |
| MSI Cyborg 15 A12VF | |
| Asus ZenBook Pro 14 Duo UX8402VV-P1021W | |
| Asus TUF A15 FA507 | |
| AIDA64 / FP64 Ray-Trace | |
| Durchschnitt der Klasse Gaming (5509 - 45446, n=107, der letzten 2 Jahre) | |
| Durchschnittliche Intel Core i9-13900HX (9481 - 15279, n=22) | |
| Alienware x16 R1 | |
| Dell G15 5530 | |
| Schenker XMG Pro 15 (E23) | |
| Aorus 15X ASF | |
| Asus TUF A15 FA507 | |
| Asus ZenBook Pro 14 Duo UX8402VV-P1021W | |
| MSI Cyborg 15 A12VF | |
| Schenker XMG Pro 15 (i7-12700H, RTX 3080 Ti) | |
| AIDA64 / CPU PhotoWorxx | |
| Schenker XMG Pro 15 (E23) | |
| Alienware x16 R1 | |
| Durchschnittliche Intel Core i9-13900HX (42994 - 51994, n=22) | |
| Durchschnitt der Klasse Gaming (12271 - 89891, n=107, der letzten 2 Jahre) | |
| Asus ZenBook Pro 14 Duo UX8402VV-P1021W | |
| Dell G15 5530 | |
| MSI Cyborg 15 A12VF | |
| Aorus 15X ASF | |
| Schenker XMG Pro 15 (i7-12700H, RTX 3080 Ti) | |
| Asus TUF A15 FA507 | |
System Performance
Auch bei der Systemleistung zeigt sich das Testgerät stark und übertrifft trotz ähnlicher Werte bei TDP und TGP sogar das Aorus 15X ASF. Im PCMark 10 liegt das XMG Pro 15 nur wenige Punkte hinter dem schlanken Asus ZenBook Pro 14 Duo, welches so zeigt, dass es nicht immer ein schweres Gaming-Notebook sein muss, um einen performanten Rechner zu erhalten.
CrossMark: Overall | Productivity | Creativity | Responsiveness
| PCMark 10 / Score | |
| Durchschnitt der Klasse Gaming (5828 - 11574, n=95, der letzten 2 Jahre) | |
| Alienware x16 R1 | |
| Asus ZenBook Pro 14 Duo UX8402VV-P1021W | |
| Schenker XMG Pro 15 (E23) | |
| Durchschnittliche Intel Core i9-13900HX, NVIDIA GeForce RTX 4060 Laptop GPU (n=1) | |
| Asus TUF A15 FA507 | |
| Aorus 15X ASF | |
| MSI Cyborg 15 A12VF | |
| Dell G15 5530 | |
| Schenker XMG Pro 15 (i7-12700H, RTX 3080 Ti) | |
| PCMark 10 / Essentials | |
| Schenker XMG Pro 15 (E23) | |
| Durchschnittliche Intel Core i9-13900HX, NVIDIA GeForce RTX 4060 Laptop GPU (n=1) | |
| Asus ZenBook Pro 14 Duo UX8402VV-P1021W | |
| Alienware x16 R1 | |
| Dell G15 5530 | |
| Schenker XMG Pro 15 (i7-12700H, RTX 3080 Ti) | |
| Aorus 15X ASF | |
| MSI Cyborg 15 A12VF | |
| Durchschnitt der Klasse Gaming (8810 - 12600, n=99, der letzten 2 Jahre) | |
| Asus TUF A15 FA507 | |
| PCMark 10 / Productivity | |
| Durchschnitt der Klasse Gaming (6845 - 21327, n=97, der letzten 2 Jahre) | |
| Schenker XMG Pro 15 (E23) | |
| Durchschnittliche Intel Core i9-13900HX, NVIDIA GeForce RTX 4060 Laptop GPU (n=1) | |
| Dell G15 5530 | |
| MSI Cyborg 15 A12VF | |
| Alienware x16 R1 | |
| Asus ZenBook Pro 14 Duo UX8402VV-P1021W | |
| Aorus 15X ASF | |
| Asus TUF A15 FA507 | |
| Schenker XMG Pro 15 (i7-12700H, RTX 3080 Ti) | |
| PCMark 10 / Digital Content Creation | |
| Alienware x16 R1 | |
| Durchschnitt der Klasse Gaming (7602 - 19657, n=97, der letzten 2 Jahre) | |
| Asus ZenBook Pro 14 Duo UX8402VV-P1021W | |
| Asus TUF A15 FA507 | |
| Aorus 15X ASF | |
| Schenker XMG Pro 15 (E23) | |
| Durchschnittliche Intel Core i9-13900HX, NVIDIA GeForce RTX 4060 Laptop GPU (n=1) | |
| MSI Cyborg 15 A12VF | |
| Schenker XMG Pro 15 (i7-12700H, RTX 3080 Ti) | |
| Dell G15 5530 | |
| CrossMark / Overall | |
| Aorus 15X ASF | |
| Durchschnitt der Klasse Gaming (1366 - 2409, n=96, der letzten 2 Jahre) | |
| Schenker XMG Pro 15 (E23) | |
| Durchschnittliche Intel Core i9-13900HX, NVIDIA GeForce RTX 4060 Laptop GPU (n=1) | |
| Alienware x16 R1 | |
| Asus ZenBook Pro 14 Duo UX8402VV-P1021W | |
| Dell G15 5530 | |
| MSI Cyborg 15 A12VF | |
| Asus TUF A15 FA507 | |
| CrossMark / Productivity | |
| Aorus 15X ASF | |
| Durchschnitt der Klasse Gaming (1386 - 2254, n=96, der letzten 2 Jahre) | |
| Alienware x16 R1 | |
| Schenker XMG Pro 15 (E23) | |
| Durchschnittliche Intel Core i9-13900HX, NVIDIA GeForce RTX 4060 Laptop GPU (n=1) | |
| Asus ZenBook Pro 14 Duo UX8402VV-P1021W | |
| Dell G15 5530 | |
| MSI Cyborg 15 A12VF | |
| Asus TUF A15 FA507 | |
| CrossMark / Creativity | |
| Durchschnitt der Klasse Gaming (1343 - 2729, n=96, der letzten 2 Jahre) | |
| Schenker XMG Pro 15 (E23) | |
| Durchschnittliche Intel Core i9-13900HX, NVIDIA GeForce RTX 4060 Laptop GPU (n=1) | |
| Aorus 15X ASF | |
| Asus ZenBook Pro 14 Duo UX8402VV-P1021W | |
| Dell G15 5530 | |
| Alienware x16 R1 | |
| MSI Cyborg 15 A12VF | |
| Asus TUF A15 FA507 | |
| CrossMark / Responsiveness | |
| Aorus 15X ASF | |
| Alienware x16 R1 | |
| Schenker XMG Pro 15 (E23) | |
| Durchschnittliche Intel Core i9-13900HX, NVIDIA GeForce RTX 4060 Laptop GPU (n=1) | |
| Durchschnitt der Klasse Gaming (1226 - 2334, n=96, der letzten 2 Jahre) | |
| MSI Cyborg 15 A12VF | |
| Asus ZenBook Pro 14 Duo UX8402VV-P1021W | |
| Dell G15 5530 | |
| Asus TUF A15 FA507 | |
| PCMark 10 Score | 7521 Punkte | |
Hilfe | ||
| AIDA64 / Memory Copy | |
| Schenker XMG Pro 15 (E23) | |
| Durchschnittliche Intel Core i9-13900HX (67716 - 79193, n=22) | |
| Alienware x16 R1 | |
| Durchschnitt der Klasse Gaming (21750 - 129946, n=107, der letzten 2 Jahre) | |
| Asus ZenBook Pro 14 Duo UX8402VV-P1021W | |
| Dell G15 5530 | |
| Aorus 15X ASF | |
| MSI Cyborg 15 A12VF | |
| Asus TUF A15 FA507 | |
| Schenker XMG Pro 15 (i7-12700H, RTX 3080 Ti) | |
| AIDA64 / Memory Read | |
| Schenker XMG Pro 15 (E23) | |
| Durchschnittliche Intel Core i9-13900HX (73998 - 88462, n=22) | |
| Durchschnitt der Klasse Gaming (22956 - 118858, n=107, der letzten 2 Jahre) | |
| Dell G15 5530 | |
| Alienware x16 R1 | |
| Aorus 15X ASF | |
| MSI Cyborg 15 A12VF | |
| Asus ZenBook Pro 14 Duo UX8402VV-P1021W | |
| Asus TUF A15 FA507 | |
| Schenker XMG Pro 15 (i7-12700H, RTX 3080 Ti) | |
| AIDA64 / Memory Write | |
| Alienware x16 R1 | |
| Durchschnitt der Klasse Gaming (22297 - 135096, n=107, der letzten 2 Jahre) | |
| Schenker XMG Pro 15 (E23) | |
| Durchschnittliche Intel Core i9-13900HX (65472 - 77045, n=22) | |
| Asus ZenBook Pro 14 Duo UX8402VV-P1021W | |
| Dell G15 5530 | |
| MSI Cyborg 15 A12VF | |
| Aorus 15X ASF | |
| Asus TUF A15 FA507 | |
| Schenker XMG Pro 15 (i7-12700H, RTX 3080 Ti) | |
| AIDA64 / Memory Latency | |
| Durchschnitt der Klasse Gaming (75.3 - 259, n=107, der letzten 2 Jahre) | |
| Alienware x16 R1 | |
| Asus ZenBook Pro 14 Duo UX8402VV-P1021W | |
| MSI Cyborg 15 A12VF | |
| Dell G15 5530 | |
| Aorus 15X ASF | |
| Durchschnittliche Intel Core i9-13900HX (75.3 - 91.1, n=22) | |
| Schenker XMG Pro 15 (E23) | |
| Asus TUF A15 FA507 | |
* ... kleinere Werte sind besser
DPC-Latenzen
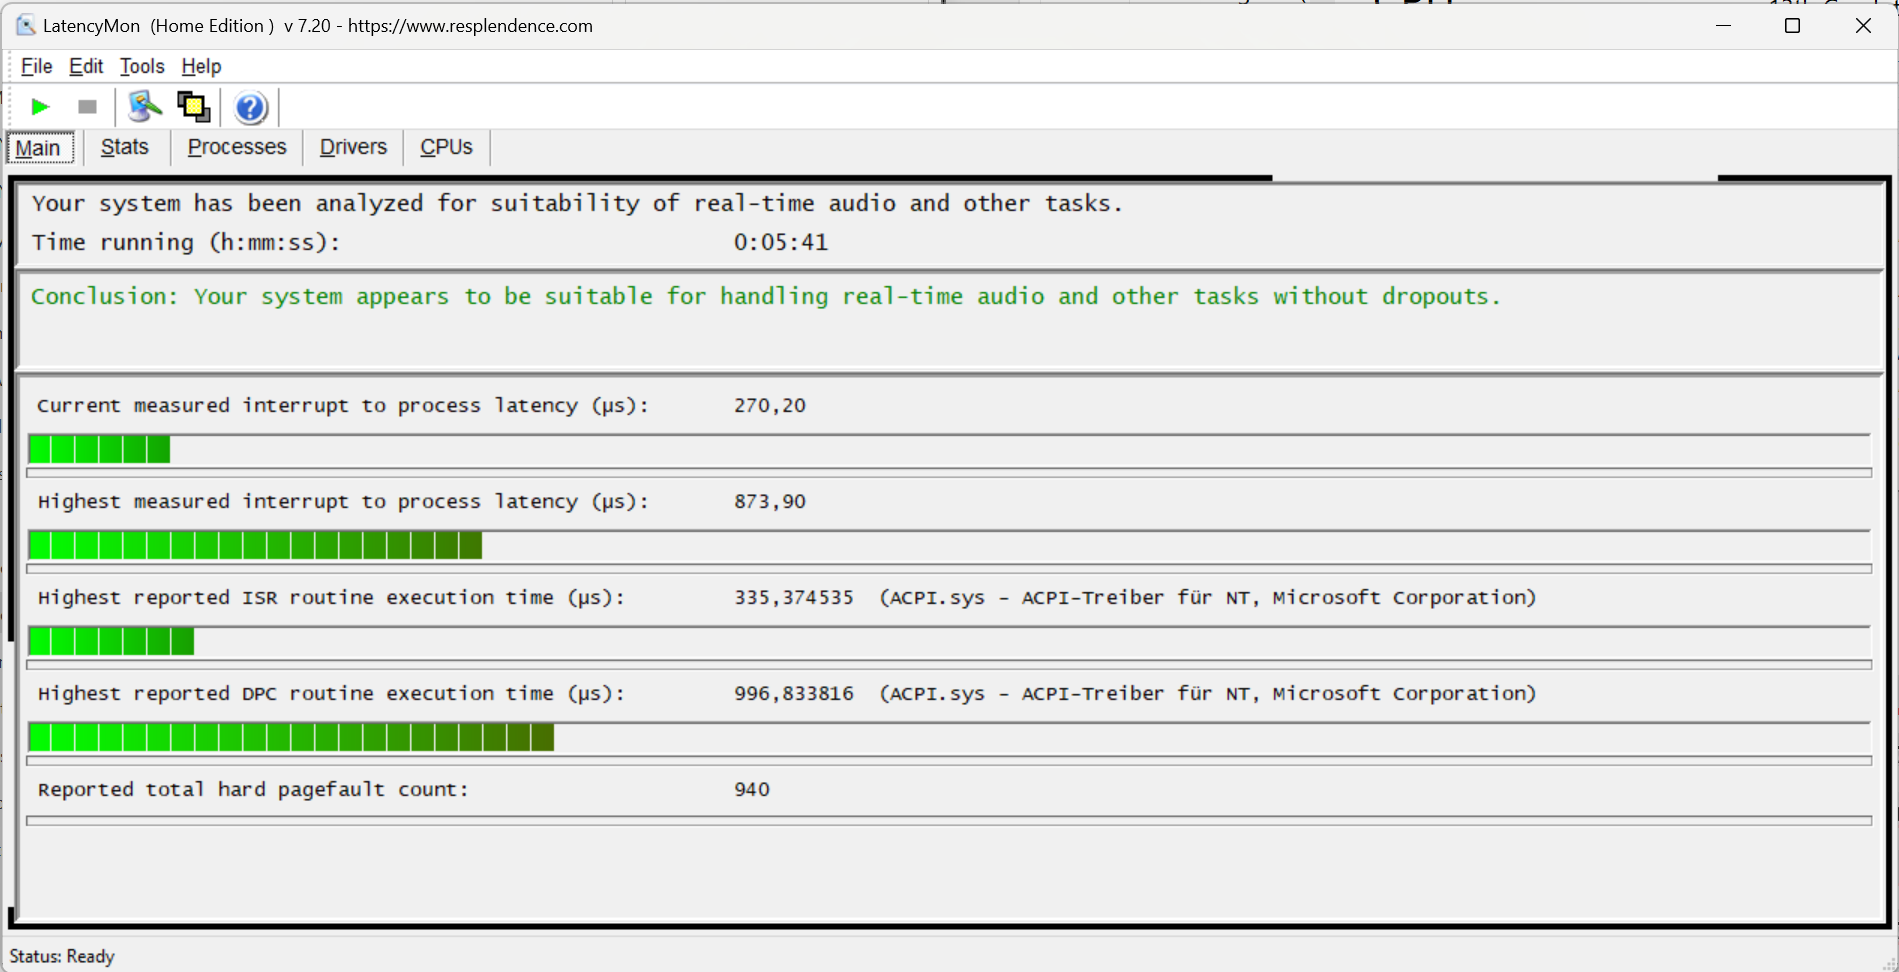
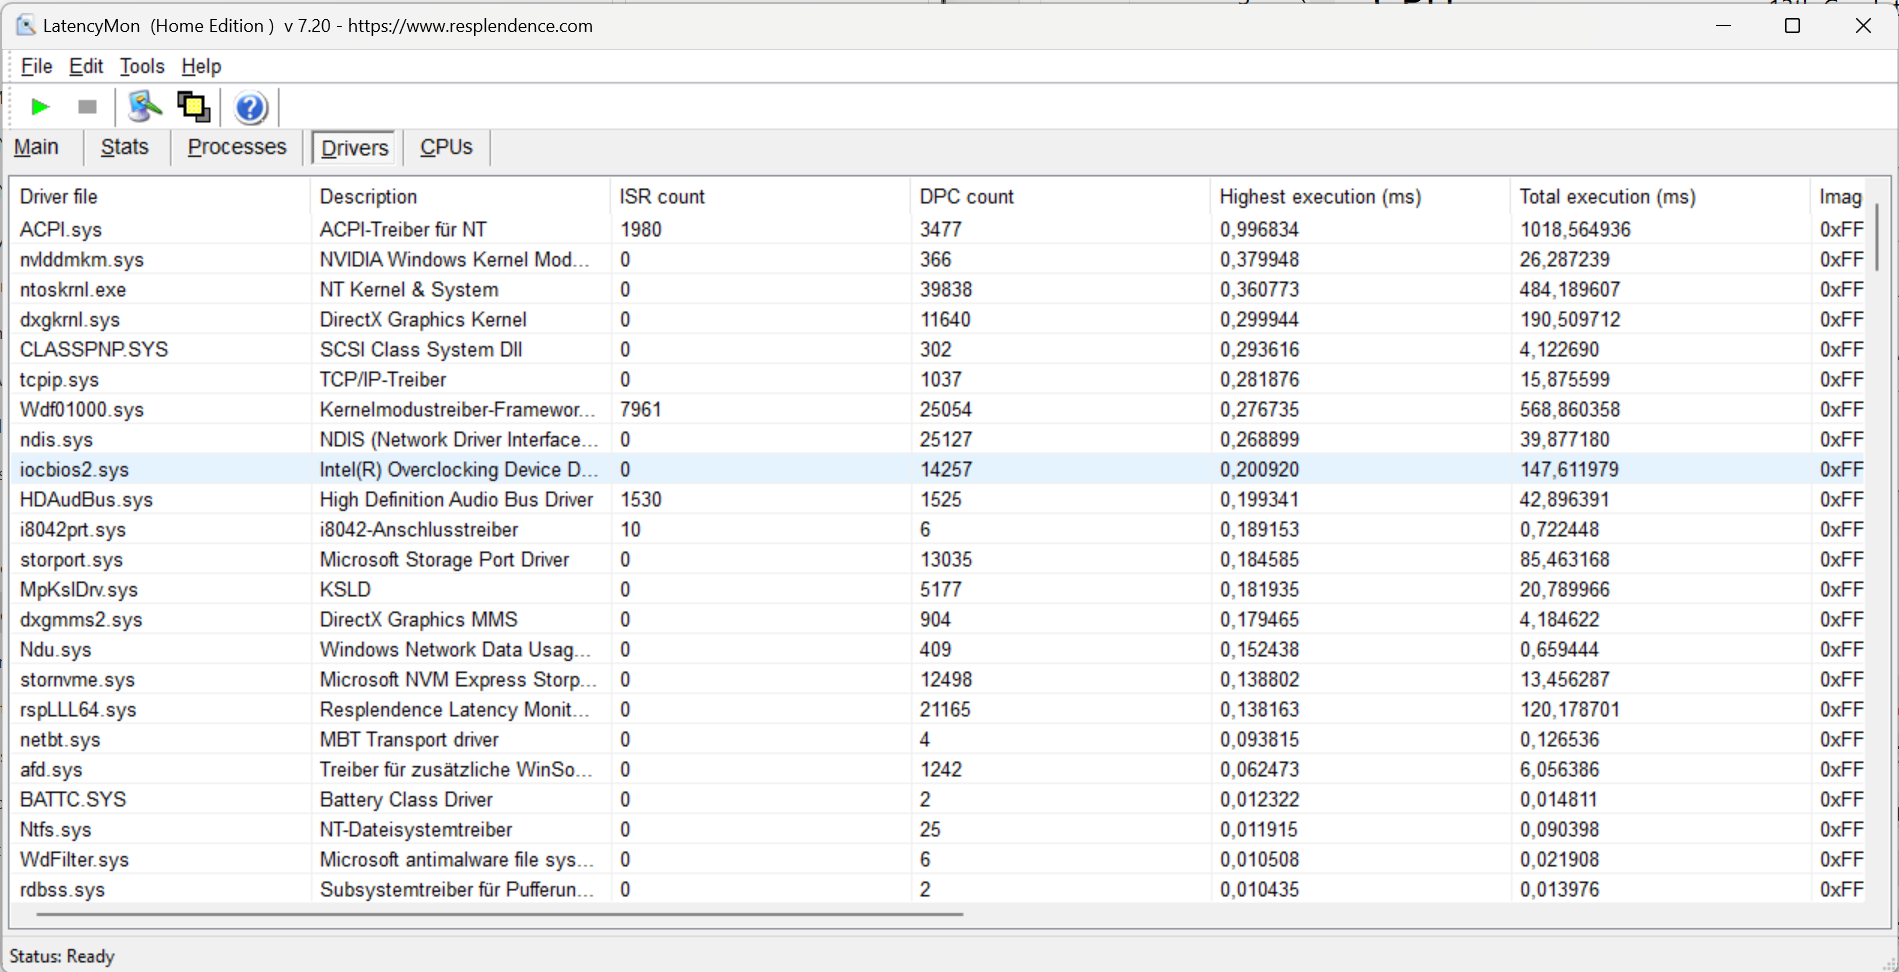
Hier merkt man, dass die Probleme im Zusammenspiel der Nvidia-Treiber mit anderen Treibern mittlerweile überwunden sind. Die DPC-Latenzen liegen bei diesem Laptop mit zum Testzeitpunkt aktuellen Treibern und Firmware in einem niedrigen Bereich.
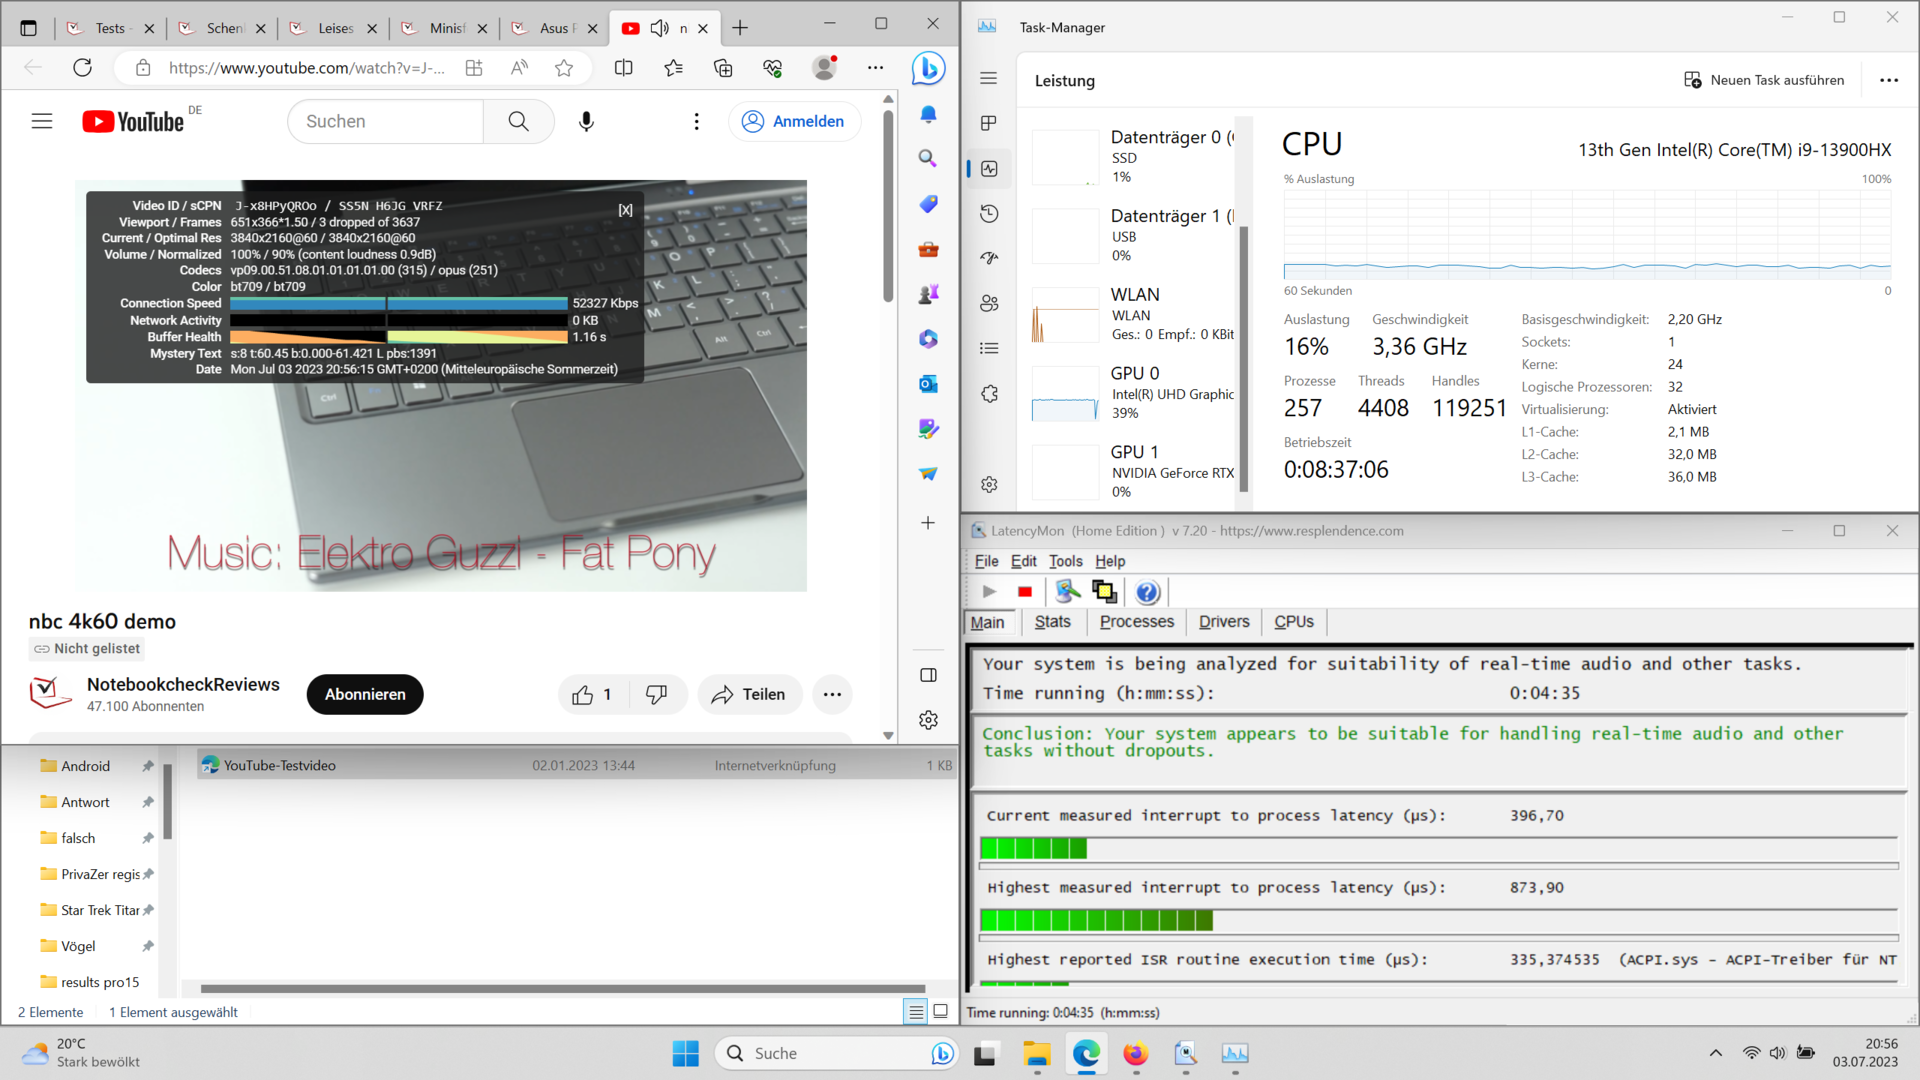
| DPC Latencies / LatencyMon - interrupt to process latency (max), Web, Youtube, Prime95 | |
| Dell G15 5530 | |
| Aorus 15X ASF | |
| Schenker XMG Pro 15 (i7-12700H, RTX 3080 Ti) | |
| Alienware x16 R1 | |
| MSI Cyborg 15 A12VF | |
| Asus ZenBook Pro 14 Duo UX8402VV-P1021W | |
| Schenker XMG Pro 15 (E23) | |
* ... kleinere Werte sind besser
Massenspeicher
Unter den verschiedenen NVMe-SSDs, die Schenker für das XMG Pro 15 anbietet, ist die Crucial P5 Plus eventuell nicht die allerschnellste Option. Sie liefert im Test allerdings gute Werte und hält diese auch über lange Zeiträume. Im DiskSpd-Loop beobachten wir nur geringfügiges Throttling nach etlichen Durchläufen.

* ... kleinere Werte sind besser
Dauerleistung Lesen: DiskSpd Read Loop, Queue Depth 8
Grafikkarte
Damit kommen wir zur Kernfrage des Testberichts. Kann die Nvidia GeForce RTX 4060 im Testgerät mit der RTX 3080 Ti des Vorgängers mithalten? Die ehrliche Antwort auf diese Frage ist ein klares Jein. Je nach Benchmark muss man hier mit 10 % bis 20 % weniger Leistung rechnen. Beim Gaming selbst ist der Leistungsunterschied vom aktuellen XMG Pro 15 zum Vorgänger dann eher abhängig vom Spiel. Während etwa The Witcher 3 von der höheren Taktrate der 4060 profitiert und mehr FPS erreicht, fällt das Pro 15 E23 in GTA V etwas hinter seinen Vorgänger zurück. Allerdings kann das XMG Pro 15 auch mit einer RTX 4070 konfiguriert werden. Hier zeigt das Aorus 15X ASF, dass der Leistungsunterschied zwischen RTX 3080 Ti und RTX 4070 in allen Fällen sehr gering ist. Da Aorus und XMG Pro 15 mit nahezu identischen TDP und TGP Werten arbeiten, gibt dies auch einen Hinweis auf die mögliche Performance des XMG Pro 15 mit RTX 4070.
| 3DMark 11 Performance | 29518 Punkte | |
| 3DMark Ice Storm Standard Score | 146918 Punkte | |
| 3DMark Cloud Gate Standard Score | 54429 Punkte | |
| 3DMark Fire Strike Score | 23131 Punkte | |
| 3DMark Time Spy Score | 10776 Punkte | |
Hilfe | ||
* ... kleinere Werte sind besser
| The Witcher 3 - 1920x1080 Ultra Graphics & Postprocessing (HBAO+) | |
| Durchschnitt der Klasse Gaming (95 - 240, n=7, der letzten 2 Jahre) | |
| Alienware x16 R1 | |
| Schenker XMG Pro 15 (E23) | |
| Asus ZenBook Pro 14 Duo UX8402VV-P1021W | |
| Schenker XMG Pro 15 (i7-12700H, RTX 3080 Ti) | |
| Aorus 15X ASF | |
| Dell G15 5530 | |
| Asus TUF A15 FA507 | |
| MSI Cyborg 15 A12VF | |
| Hogwarts Legacy | |
| 2560x1440 Ultra Preset AA:High T | |
| Durchschnitt der Klasse Gaming (n=1der letzten 2 Jahre) | |
| Schenker XMG Pro 15 (E23) | |
| Durchschnittliche NVIDIA GeForce RTX 4060 Laptop GPU (42.8 - 45, n=4) | |
| 1920x1080 Ultra Preset AA:High T | |
| Durchschnitt der Klasse Gaming (n=1der letzten 2 Jahre) | |
| Durchschnittliche NVIDIA GeForce RTX 4060 Laptop GPU (61.9 - 91.9, n=6) | |
| Schenker XMG Pro 15 (E23) | |
| MSI Cyborg 15 A12VF | |
| Asus TUF A15 FA507 | |
| 1920x1080 High Preset AA:High T | |
| Asus TUF A15 FA507 | |
| Durchschnittliche NVIDIA GeForce RTX 4060 Laptop GPU (70.8 - 107.7, n=6) | |
| MSI Cyborg 15 A12VF | |
| Schenker XMG Pro 15 (E23) | |
| min. | mittel | hoch | max. | QHD | 4K | |
|---|---|---|---|---|---|---|
| GTA V (2015) | 184.5 | 178.9 | 170.6 | 107.2 | 87 | |
| The Witcher 3 (2015) | 112 | 159.7 | ||||
| Dota 2 Reborn (2015) | 210 | 182.9 | 176.1 | 154.3 | 126.4 | |
| X-Plane 11.11 (2018) | 154.9 | 135.9 | 111 | 102 | ||
| Strange Brigade (2018) | 377 | 267 | 213 | 183.3 | 127.5 | |
| Shadow of the Tomb Raider (2018) | 142 | 94 | ||||
| Cyberpunk 2077 1.6 (2022) | 80.6 | 48.56 | ||||
| Tiny Tina's Wonderlands (2022) | 89.29 | 60.01 | ||||
| F1 22 (2022) | 245 | 235 | 179.8 | 66.4 | 43 | |
| Call of Duty Modern Warfare 2 2022 (2022) | 91 | 66 | ||||
| Hogwarts Legacy (2023) | 90.4 | 70.8 | 64 | 44.4 |
Emissionen & Energie - Leise Lautsprecher und laute Lüfter
Geräuschemissionen
Das XMG Pro 15 erweist sich im Test leider als sehr laut. Im Abstand von 15 Zentimetern messen wir im aktivierten Performance-Modus und unter Volllast mit Prime95 und Furmark satte 53 dB(A). Die Lüfter können aber auch anders. Die Erfahrung zeigt, dass der Unterhaltungsmodus auch für viele Spiele ausreichend Leistung zur Verfügung stellt. Damit wird das Notebook deutlich geräuschreduziert. Im Normalbetrieb ohne 3D-Anwendungen kann man hier sogar einen sehr leisen bis lautlosen Einsatz erwarten. Zumindest seinem Vorgänger hat der Laptop damit ein wenig voraus.
Lautstärkediagramm
| Idle |
| 24 / 24 / 24 dB(A) |
| Last |
| 53.65 / 53.65 dB(A) |
 | ||
30 dB leise 40 dB(A) deutlich hörbar 50 dB(A) störend |
||
min: | ||
| Schenker XMG Pro 15 (E23) GeForce RTX 4060 Laptop GPU, i9-13900HX, Crucial P5 Plus 1TB CT1000P5PSSD8 | Schenker XMG Pro 15 (i7-12700H, RTX 3080 Ti) GeForce RTX 3080 Ti Laptop GPU, i7-12700H, Samsung SSD 980 Pro 1TB MZ-V8P1T0BW | Dell G15 5530 GeForce RTX 4060 Laptop GPU, i7-13650HX, SSTC CL4-3D512-Q11 | Asus TUF A15 FA507 GeForce RTX 4050 Laptop GPU, R7 7735HS, Micron 2400 MTFDKBA512QFM | Aorus 15X ASF GeForce RTX 4070 Laptop GPU, i7-13700HX, Gigabyte AG470S1TB-SI B10 | Asus ZenBook Pro 14 Duo UX8402VV-P1021W GeForce RTX 4060 Laptop GPU, i9-13900H, Samsung PM9A1 MZVL22T0HBLB | MSI Cyborg 15 A12VF GeForce RTX 4060 Laptop GPU, i7-12650H, Samsung PM9B1 1024GB MZVL41T0HBLB | Alienware x16 R1 GeForce RTX 4080 Laptop GPU, i9-13900HK, SK hynix PC801 HFS001TEJ9X101N | |
|---|---|---|---|---|---|---|---|---|
| Geräuschentwicklung | -11% | 7% | 14% | -13% | -13% | -25% | 4% | |
| aus / Umgebung * (dB) | 24 | 23 4% | 20.41 15% | 23.3 3% | 25 -4% | 25.2 -5% | 27 -13% | 22.7 5% |
| Idle min * (dB) | 24 | 23 4% | 26.85 -12% | 23.3 3% | 28 -17% | 25.2 -5% | 27 -13% | 23.1 4% |
| Idle avg * (dB) | 24 | 31.22 -30% | 26.85 -12% | 23.3 3% | 29 -21% | 25.2 -5% | 37.5 -56% | 25.8 -8% |
| Idle max * (dB) | 24 | 33.09 -38% | 26.85 -12% | 23.3 3% | 36 -50% | 32.5 -35% | 38 -58% | 25.8 -8% |
| Last avg * (dB) | 53.65 | 56.35 -5% | 27.65 48% | 29.6 45% | 50 7% | 59.7 -11% | 56.3 -5% | 39.3 27% |
| Witcher 3 ultra * (dB) | 53.53 | 56.89 -6% | 47.9 11% | 43 20% | 54 -1% | 49.9 7% | ||
| Last max * (dB) | 53.65 | 56.89 -6% | 47.86 11% | 43 20% | 58 -8% | 60.9 -14% | 56.3 -5% | 54.8 -2% |
* ... kleinere Werte sind besser
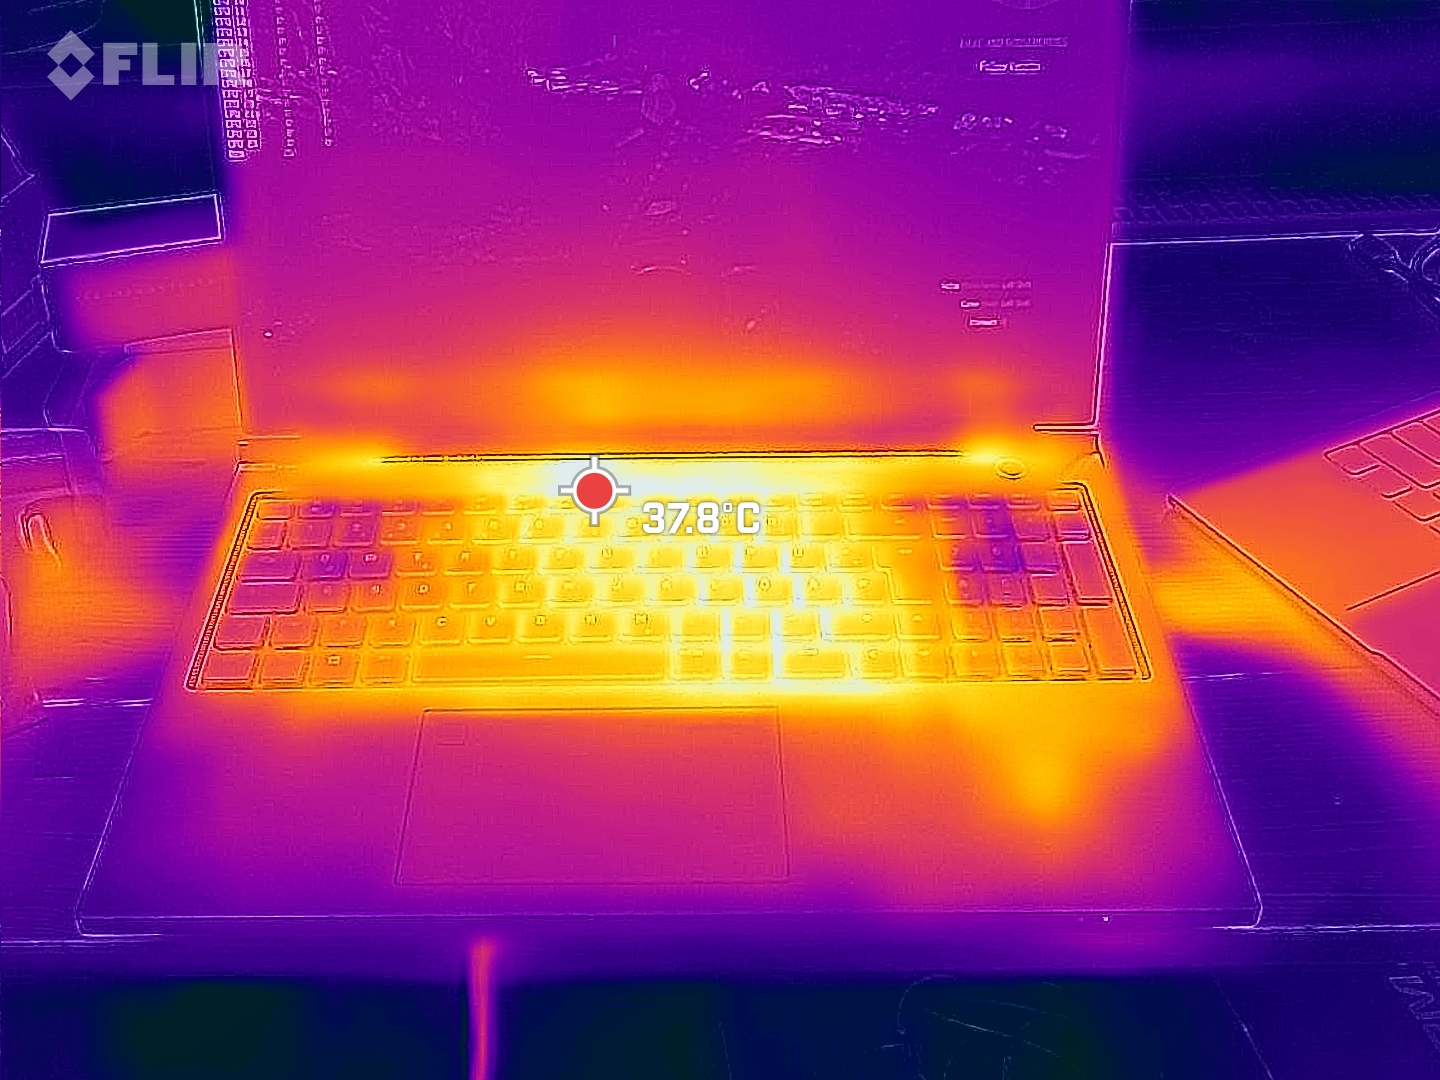
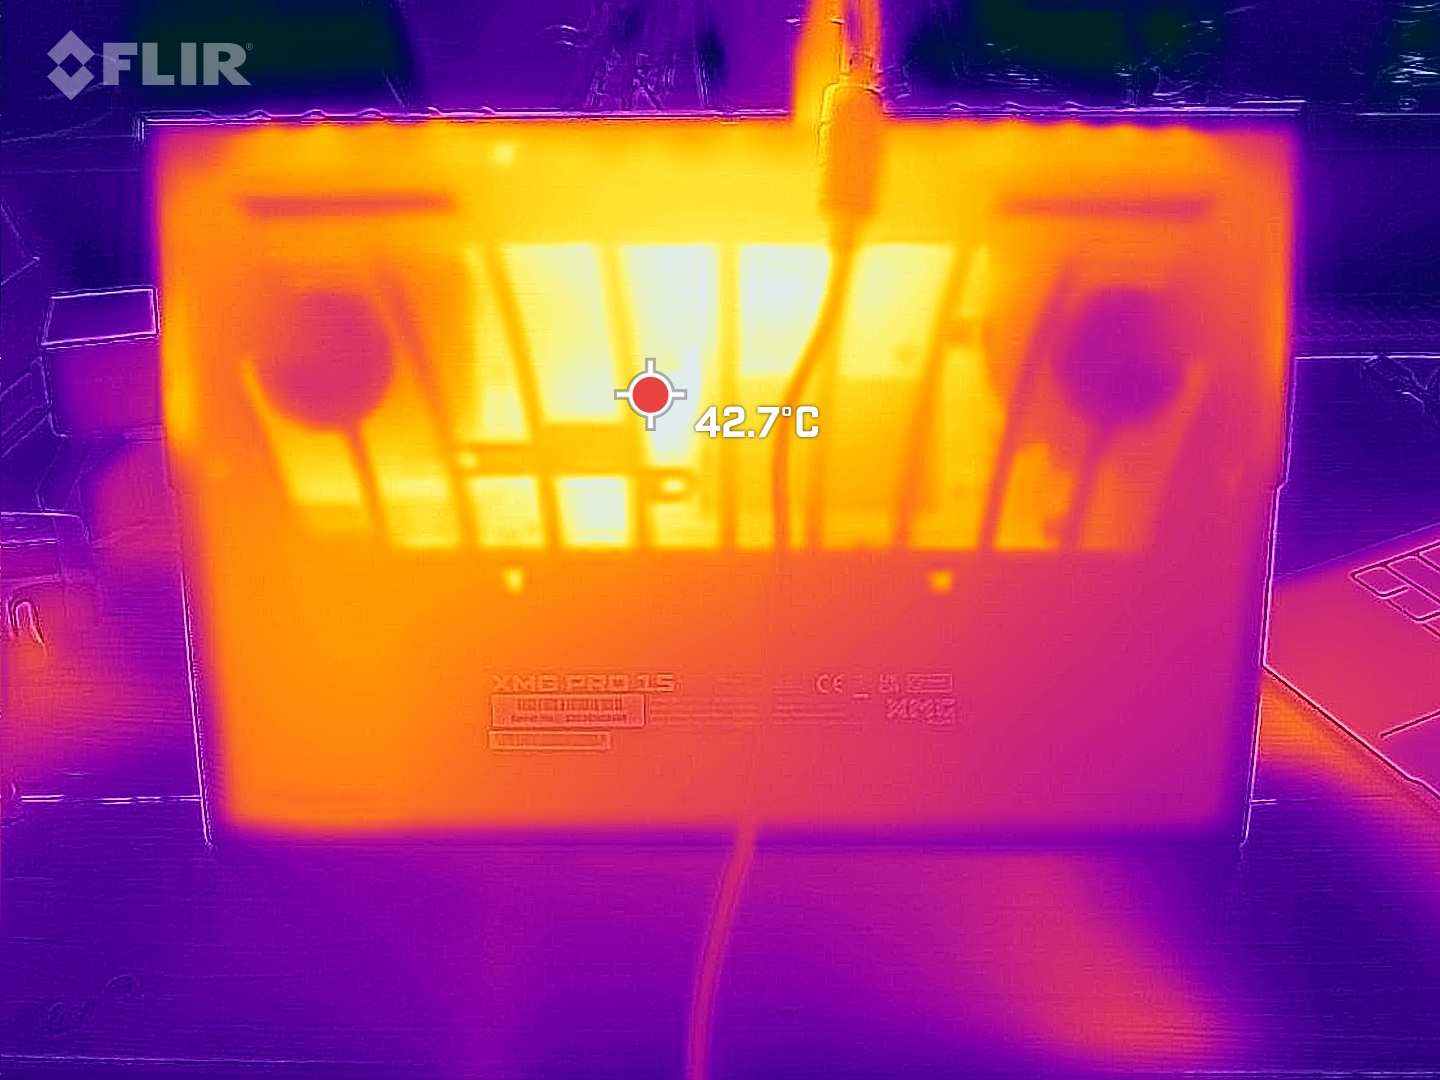
Temperatur
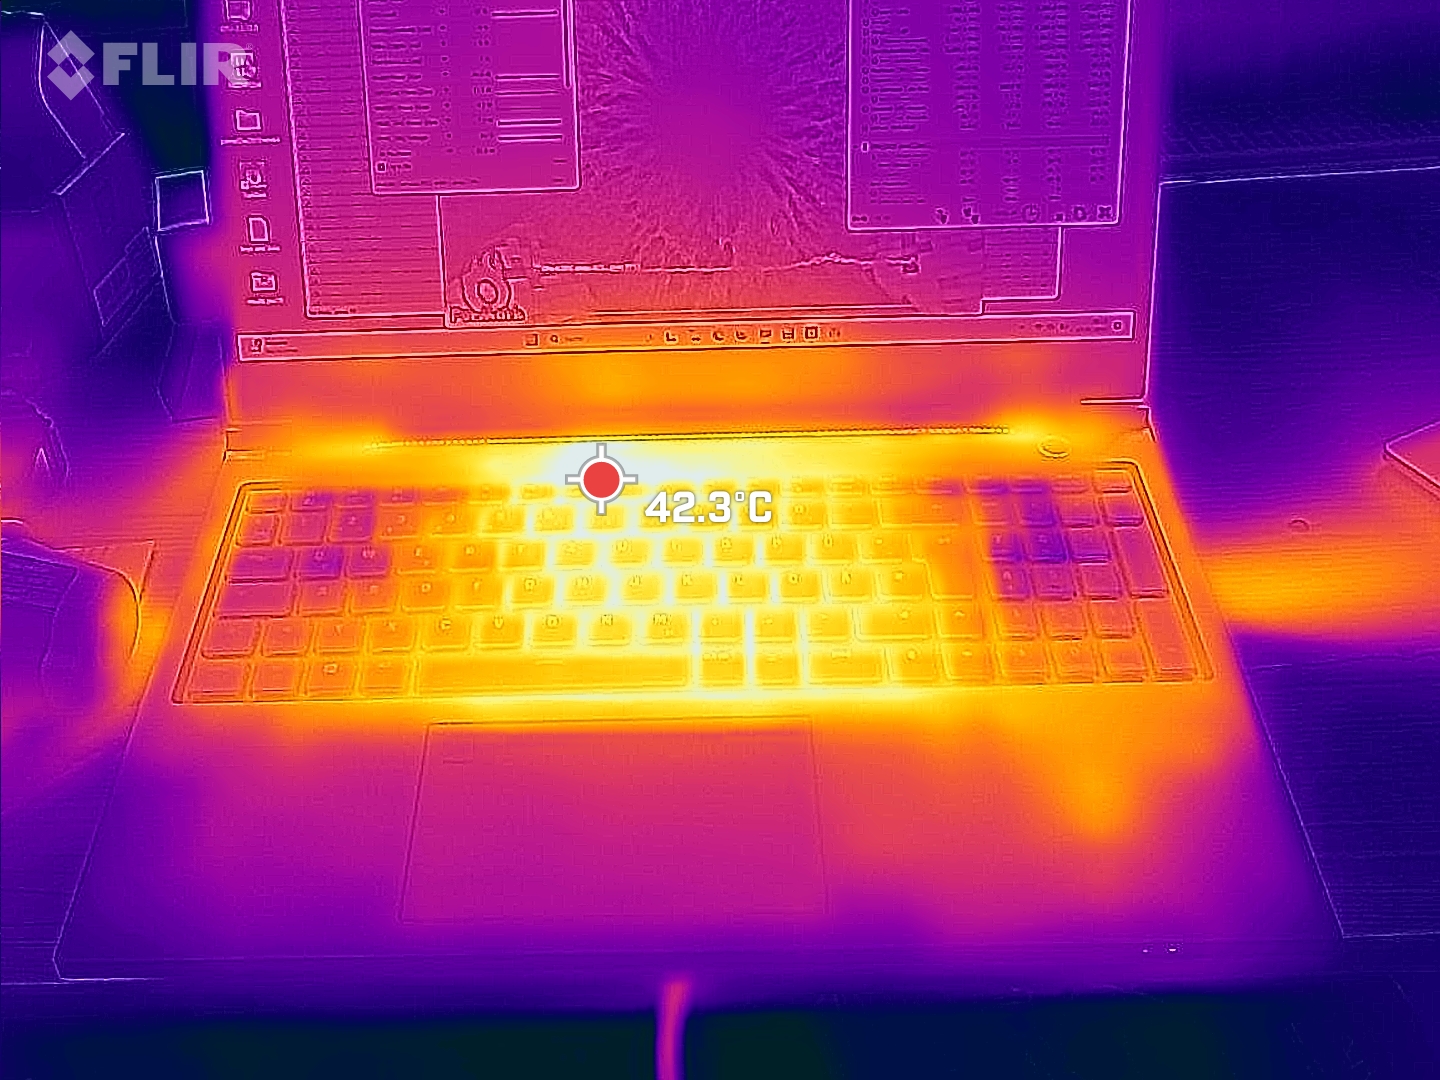
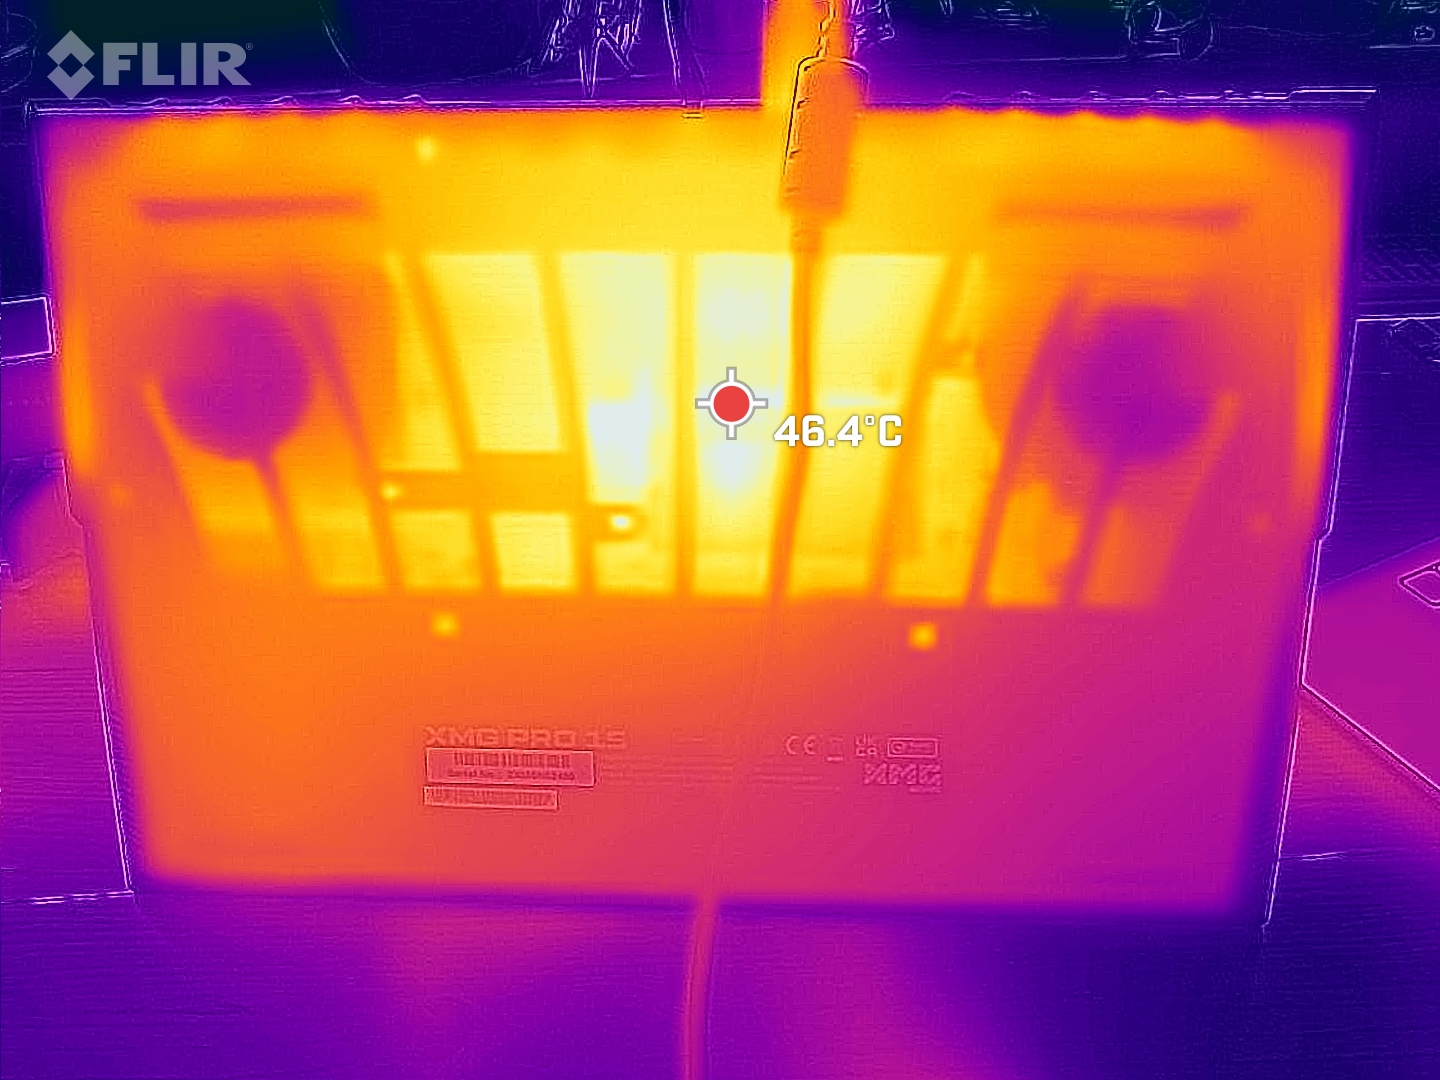
Mit Oberflächentemperaturen von bis zu 50 °C im Stresstest ist das XMG Pro 15 deutlich wärmer als viele Vergleichsgeräte. Allerdings handelt es sich zum einen um relativ kleine Hotspots, zum anderen besteht die Base-Oberfläche aus Kunststoff. Dadurch fallen die hohen Temperaturen bei Berührung deutlich weniger auf. Als kühl kann man die Tastatur beim Spielen zwar nicht bezeichnen, unangenehm warm fühlt sie sich aber auch nicht an. Die Leistung des Notebooks wird hier auch auf Dauer nicht gedrosselt.
(-) Die maximale Temperatur auf der Oberseite ist 50 °C. Im Vergleich liegt der Klassendurchschnitt bei 40.4 °C (von 21.2 bis 68.8 °C für die Klasse Gaming).
(-) Auf der Unterseite messen wir eine maximalen Wert von 50 °C (im Vergleich zum Durchschnitt von 43.2 °C).
(+) Ohne Last messen wir eine durchschnittliche Temperatur von 28.7 °C auf der Oberseite. Der Klassendurchschnitt erreicht 33.9 °C.
(±) Beim längeren Spielen von The Witcher 3 erhitzt sich das Gerät durchschnittlich auf 35.6 °C. Der Durchschnitt der Klasse ist derzeit 33.9 °C.
(+) Die Handballen und der Touchpad-Bereich erreichen maximal 34 °C und damit die typische Hauttemperatur und fühlen sich daher nicht heiß an.
(-) Die durchschnittliche Handballen-Temperatur anderer getesteter Geräte war 28.8 °C (-5.2 °C).
| Schenker XMG Pro 15 (E23) Intel Core i9-13900HX, NVIDIA GeForce RTX 4060 Laptop GPU | Schenker XMG Pro 15 (i7-12700H, RTX 3080 Ti) Intel Core i7-12700H, NVIDIA GeForce RTX 3080 Ti Laptop GPU | Dell G15 5530 Intel Core i7-13650HX, NVIDIA GeForce RTX 4060 Laptop GPU | Asus TUF A15 FA507 AMD Ryzen 7 7735HS, NVIDIA GeForce RTX 4050 Laptop GPU | Aorus 15X ASF Intel Core i7-13700HX, NVIDIA GeForce RTX 4070 Laptop GPU | Asus ZenBook Pro 14 Duo UX8402VV-P1021W Intel Core i9-13900H, NVIDIA GeForce RTX 4060 Laptop GPU | MSI Cyborg 15 A12VF Intel Core i7-12650H, NVIDIA GeForce RTX 4060 Laptop GPU | Alienware x16 R1 Intel Core i9-13900HK, NVIDIA GeForce RTX 4080 Laptop GPU | |
|---|---|---|---|---|---|---|---|---|
| Hitze | -5% | -9% | 11% | 13% | 9% | 15% | -4% | |
| Last oben max * (°C) | 50 | 57 -14% | 54 -8% | 48.9 2% | 42 16% | 37.1 26% | 47.5 5% | 47.2 6% |
| Last unten max * (°C) | 50 | 52 -4% | 62.2 -24% | 44.6 11% | 51 -2% | 49.4 1% | 35.5 29% | 47.8 4% |
| Idle oben max * (°C) | 33 | 32 3% | 33.4 -1% | 27.1 18% | 27 18% | 30 9% | 27.7 16% | 36.8 -12% |
| Idle unten max * (°C) | 32 | 34 -6% | 33.4 -4% | 27.5 14% | 26 19% | 32.4 -1% | 29.5 8% | 35.8 -12% |
* ... kleinere Werte sind besser
Lautsprecher
Die durchschnittliche wahrgenommene Lautstärke der beiden Lautsprecher des XMG Pro 15 liegt bei nur 72,5 dB(A). Viele Frequenzbereiche liegen dabei deutlich unter der Lautstärke der Lüfter unter Last. Ein Headset oder externe Lautsprecher sind daher beim Spielen wohl Pflicht. Diese können per 3,5 mm Klinke, Bluetooth oder per optischem S/PDIF in der 3,5 mm Buchse angeschlossen werden. Auf diese Weise können auch Surround-Sound-Anlagen direkt an den Computer angeschlossen werden.
Schenker XMG Pro 15 (E23) Audio Analyse
(±) | Mittelmäßig laut spielende Lautsprecher (72.52 dB)
Bass 100 - 315 Hz
(±) | abgesenkter Bass - 12.9% geringer als der Median
(±) | durchschnittlich lineare Bass-Wiedergabe (7.2% Delta zum Vorgänger)
Mitteltöne 400 - 2000 Hz
(±) | zu hohe Mitten, vom Median 6.2% abweichend
(±) | Linearität der Mitten ist durchschnittlich (7.8% Delta zum Vorgänger)
Hochtöne 2 - 16 kHz
(+) | ausgeglichene Hochtöne, vom Median nur 2.5% abweichend
(+) | sehr lineare Hochtöne (4.6% Delta zum Vorgänger)
Gesamt im hörbaren Bereich 100 - 16.000 Hz
(±) | hörbarer Bereich ist durchschnittlich linear (18% Abstand zum Median)
Im Vergleich zu allen Geräten derselben Klasse
» 55% aller getesteten Geräte dieser Klasse waren besser, 9% vergleichbar, 36% schlechter
» Das beste Gerät hat einen Delta-Wert von 6%, durchschnittlich ist 18%, das schlechteste Gerät hat 132%
Im Vergleich zu allen Geräten im Test
» 38% aller getesteten Geräte waren besser, 8% vergleichbar, 54% schlechter
» Das beste Gerät hat einen Delta-Wert von 4%, durchschnittlich ist 23%, das schlechteste Gerät hat 134%
Asus ZenBook Pro 14 Duo UX8402VV-P1021W Audio Analyse
(+) | Die Lautsprecher können relativ laut spielen (83.7 dB)
Bass 100 - 315 Hz
(-) | kaum Bass - 19.9% niedriger als der Median
(±) | durchschnittlich lineare Bass-Wiedergabe (11.9% Delta zum Vorgänger)
Mitteltöne 400 - 2000 Hz
(+) | ausgeglichene Mitten, vom Median nur 1.2% abweichend
(+) | lineare Mitten (4.7% Delta zum Vorgänger)
Hochtöne 2 - 16 kHz
(±) | zu hohe Hochtöne, vom Median nur 5.5% abweichend
(+) | sehr lineare Hochtöne (5.9% Delta zum Vorgänger)
Gesamt im hörbaren Bereich 100 - 16.000 Hz
(±) | hörbarer Bereich ist durchschnittlich linear (16.1% Abstand zum Median)
Im Vergleich zu allen Geräten derselben Klasse
» 41% aller getesteten Geräte dieser Klasse waren besser, 6% vergleichbar, 53% schlechter
» Das beste Gerät hat einen Delta-Wert von 5%, durchschnittlich ist 17%, das schlechteste Gerät hat 45%
Im Vergleich zu allen Geräten im Test
» 26% aller getesteten Geräte waren besser, 5% vergleichbar, 69% schlechter
» Das beste Gerät hat einen Delta-Wert von 4%, durchschnittlich ist 23%, das schlechteste Gerät hat 134%
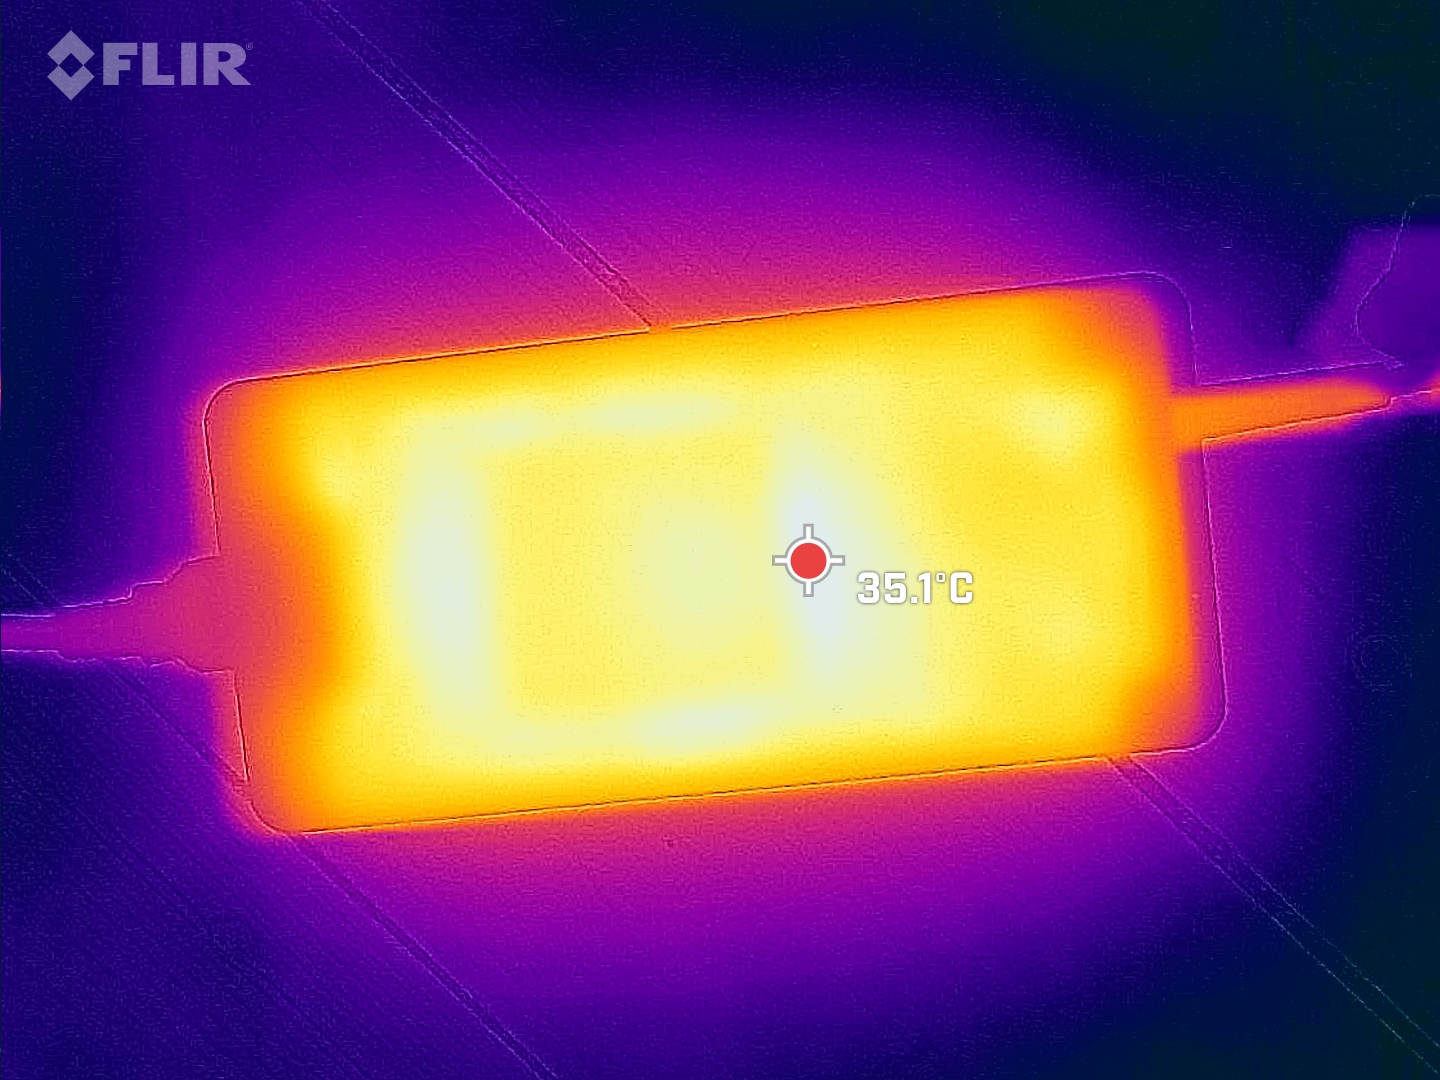
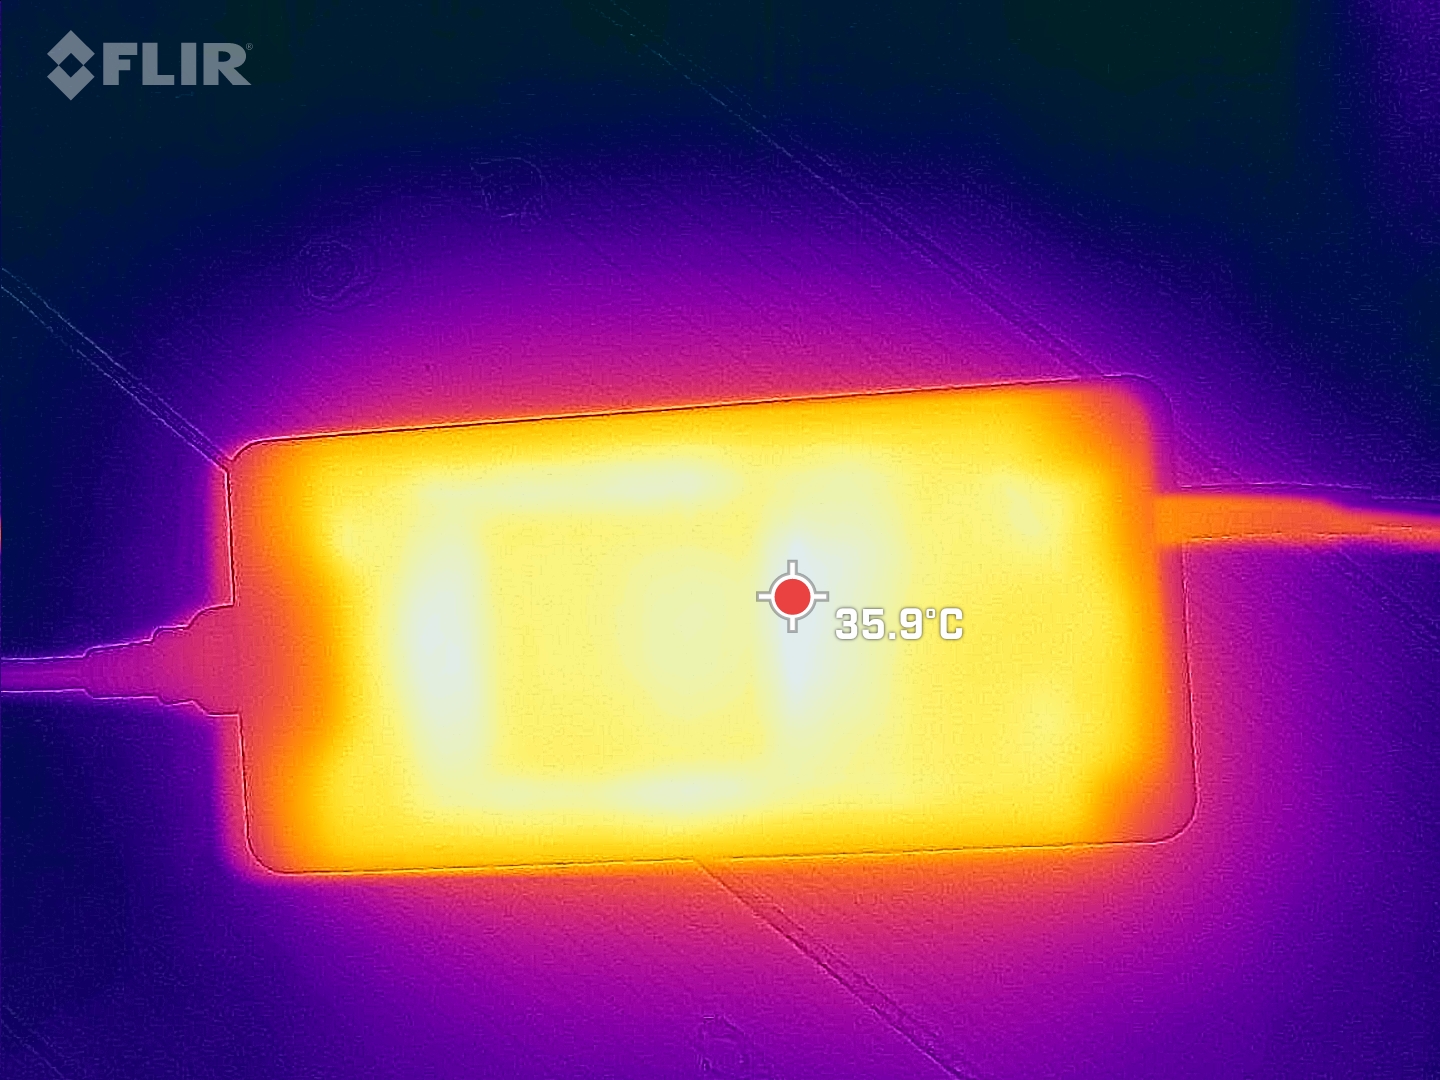
Energieaufnahme
Seiner Kategorie entsprechend ist das Schenker XMG Pro 15 kein Energiesparwunder. Ein großes Netzteil, das bis zu 280 Watt liefern kann, ist im Lieferumfang enthalten. Damit hat es im Betrieb mit dem Gaming-Notebook noch leichte Reserven. Dieser benötigt im Stresstest mit Prime95 und Furmark maximal 269 Watt, im Durchschnitt eher 215 Watt.
| Aus / Standby | |
| Idle | |
| Last |
|
Legende:
min: | |
Energieaufnahme Witcher 3 / Stresstest
Energieaufnahme mit externem Monitor
Akkulaufzeit
Mehr als sechs Stunden hält das XMG Pro 15 E23 in unserem WiFi-Websurfing-Test nicht aus. Mit einem 80 Wh fassendem Akku dürfte man auch mehr erwarten. Allerdings hat das Testgerät hier noch ein kleines Problem, was den Schlafmodus der dGPU angeht. Dieser wird nicht immer zuverlässig eingeschaltet, Schenker ist sich des Problems bewusst und arbeitet daran.
| Schenker XMG Pro 15 (E23) i9-13900HX, GeForce RTX 4060 Laptop GPU, 80 Wh | Schenker XMG Pro 15 (i7-12700H, RTX 3080 Ti) i7-12700H, GeForce RTX 3080 Ti Laptop GPU, 80 Wh | Dell G15 5530 i7-13650HX, GeForce RTX 4060 Laptop GPU, 86 Wh | Asus TUF A15 FA507 R7 7735HS, GeForce RTX 4050 Laptop GPU, 90 Wh | Aorus 15X ASF i7-13700HX, GeForce RTX 4070 Laptop GPU, 99 Wh | Asus ZenBook Pro 14 Duo UX8402VV-P1021W i9-13900H, GeForce RTX 4060 Laptop GPU, 76 Wh | MSI Cyborg 15 A12VF i7-12650H, GeForce RTX 4060 Laptop GPU, 53.5 Wh | Alienware x16 R1 i9-13900HK, GeForce RTX 4080 Laptop GPU, 90 Wh | Durchschnitt der Klasse Gaming | |
|---|---|---|---|---|---|---|---|---|---|
| Akkulaufzeit | -2% | -22% | 29% | 25% | 71% | 27% | -60% | 2% | |
| WLAN (h) | 5.7 | 5.8 2% | 6.5 14% | 11.7 105% | 8.2 44% | 9 58% | 7.5 32% | 2.5 -56% | 7.06 ? 24% |
| Last (h) | 1.9 | 1.8 -5% | 0.8 -58% | 1 -47% | 2 5% | 3.5 84% | 2.3 21% | 0.7 -63% | 1.51 ? -21% |
| H.264 (h) | 5.3 | 6.8 | 12.5 | 7.9 | 8 | 8.9 ? | |||
| Witcher 3 ultra (h) | 0.8 | ||||||||
| Idle (h) | 11.3 | 13.6 | 7.3 | 8.71 ? |
Pro
Contra
Fazit - Perfekt für die Work-Play-Balance

Als Gaming-Workstation wird das XMG Pro 15 E23 beworben. So deckt es im Test alle Anforderungen an einen guten Mittelklasse-Gamer ab, aber auch viele Punkte, die ein ordentliches Notebook für die Arbeit an Videos und Filmen ausmachen. Das schlichte Design spiegelt hier keineswegs die stürmische Leistung des 15.6-Zollers wider. Schenker hat hier ein solides Barbone, das von Haus aus mit guten Eingabegeräten und einer starken Anschlussauswahl kommt, mit hochwertigen Komponenten verfeinert.
Einige Nachteile des Vorgängers wurden deutlich reduziert oder ganz beseitigt. So läuft die SSD nun auch bei hohen Geschwindigkeiten stabil, der Bildschirm ist nun besser ausgeleuchtet und auch die Lautstärke wurde etwas angepasst. Leise ist das Gaming-Notebook damit zwar immer noch nicht, aber es zeigt, dass es sich zu benehmen weiß, wenn es darauf ankommt.
Beim XMG Pro 15 E23 wurden einige Kanten abgerundet, jetzt sind es nur noch Feinheiten, die am guten Gaming-Laptop stören könnten.
Deutliche Negativpunkte fallen uns kaum auf. Etwas ungünstig ist etwa das Fehlen eines USB-Anschlusses an der Rückseite, somit lässt sich hier nur kabellos ein sauberes Set-up mit Maus und Tastatur umsetzen. Wer die Leistungsfähigkeit des Laptops nicht permanent auf das äußerste auslasten möchte, dürfte auch mit dem ruhigeren Unterhaltungsmodus seine Freude haben. Hier laufen die meisten Spiele ebenso gut. Einzig die für 240 Hz etwas langsamen Reaktionszeiten stören uns am QHD-Display. Der Unterschied zu Konkurrenten wie Aorus 15X ASF oder MSI Cyborg 15 liegt mittlerweile eher im Detail. Wer einen optisch aufregenden Gaming-Laptop sucht, sollte wohl lieber zum Alienware x16 R1 oder zum Asus ROG Strix G16 greifen, wird dafür aber nicht mit wesentlich mehr Leistung belohnt.
Preis und Verfügbarkeit
Bei Bestware lässt sich das XMG Pro 15 konfigurieren. Ohne Windows, SSD und mit minimalem RAM startet es bei 1.893 Euro. Unsere Testausstattung liegt ohne Windows 11 bei 2.150 Euro. Für ein aktiviertes Windows 11 Home verlangt Bestware rund 100 Euro zusätzlich. Merklich folgt Schenker hier nicht der Aufwärtsspirale der Preise. Das Pro 15 E22 kostete im letzten Jahr mit RTX 3070 Ti, 32 GB RAM und 1 TB SSD schon 2.510 Euro. Für das E23 mit RTX 4070, 32 GB RAM und 1 TB SSD verlangt Bestware rund 2.400 Euro.
Schenker XMG Pro 15 (E23)
- 04.07.2023 v7 (old)
Marc Herter
Transparenz
Die Auswahl der zu testenden Geräte erfolgt innerhalb der Redaktion. Das vorliegende Testmuster wurde dem Autor vom Hersteller oder einem Shop zu Testzwecken leihweise zur Verfügung gestellt. Eine Einflussnahme des Leihstellers auf den Testbericht gab es nicht, der Hersteller erhielt keine Version des Reviews vor der Veröffentlichung. Es bestand keine Verpflichtung zur Publikation. Als eigenständiges, unabhängiges Unternehmen unterliegt Notebookcheck keiner Diktion von Herstellern, Shops und Verlagen.
So testet Notebookcheck
Pro Jahr werden von Notebookcheck hunderte Laptops und Smartphones unabhängig in von uns standardisierten technischen Verfahren getestet, um eine Vergleichbarkeit aller Testergebnisse zu gewährleisten. Seit rund 20 Jahren entwickeln wir diese Testmethoden kontinuierlich weiter und setzen damit Branchenstandards. In unseren Testlaboren kommt ausschließlich hochwertiges Messequipment in die Hände erfahrener Techniker und Redakteure. Die Tests unterliegen einer mehrstufigen Kontrolle. Unsere komplexe Gesamtbewertung basiert auf hunderten fundierten Messergebnissen und Benchmarks, womit Ihnen Objektivität garantiert ist. Weitere Informationen zu unseren Testmethoden gibt es hier.
Preisvergleich
