Lenovo ThinkBook Plus Gen 4 3-in-1-Laptop im Test: Elektronisches Papier und organische LEDs für ein perfektes Bild

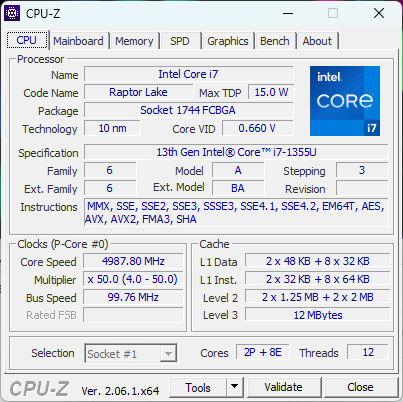
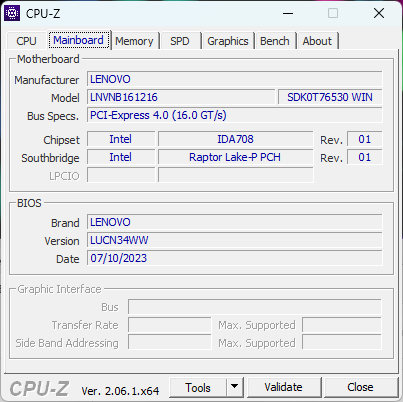
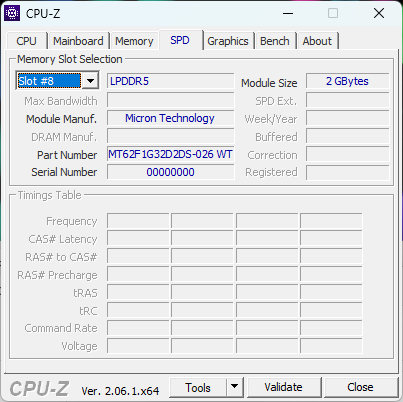
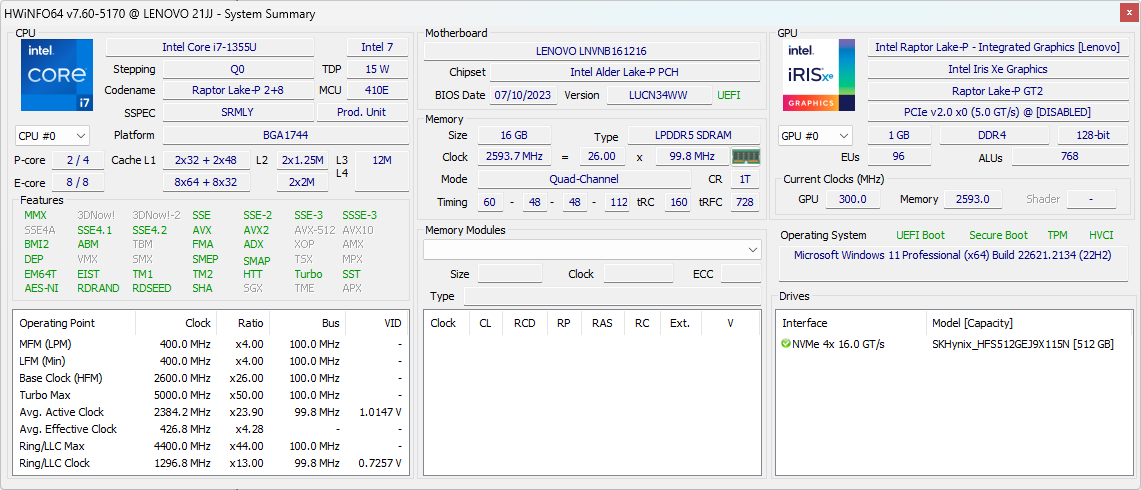
Nachdem es bereits auf der CES 2023 vorgestellt wurde, ist das ThinkBook Plus Gen 4 nun endlich verfügbar. Dabei ersetzt es das ThinkBook Plus Gen 3 nicht, denn Design und Größe unterscheiden sich in der vierten Generation deutlich vom Vorgänger. Immerhin bleiben die Materialauswahl und die Zielgruppe der semiprofessionellen Anwender gleich. Bei unserem Testgerät handelt es sich um eine hochklassige Ausstattungsvariante, Intel Core i7-1355U, integriertem E-Ink-Display und 16 GB verlötetem RAM. Eine andere Ausstattungsvariante mit Core i5-1335U ist ebenfalls verfügbar. Bei Lenovo kosten beide Varianten im Moment rund 1.800 Euro.
Zu den Konkurrenten zählen wohl Geräte wie das Dell Latitude 9330, MSI Summit E14 Flip, Asus ZenBook Flip 14, oder das HP Spectre x360. Aber keines der Konkurrenzgeräte kommt mit einem E-Ink-Display.
Mögliche Konkurrenten im Vergleich
Bew. | Datum | Modell | Gewicht | Dicke | Größe | Auflösung | Preis ab |
|---|---|---|---|---|---|---|---|
| 87.4 % v7 (old) | 09 / 2023 | Lenovo ThinkBook Plus Gen4 IRU i7-1355U, Iris Xe G7 96EUs | 1.4 kg | 17.7 mm | 13.30" | 2880x1800 | |
| 89.5 % v7 (old) | 08 / 2023 | Lenovo ThinkPad X1 Nano Gen 3 i7-1360P, Iris Xe G7 96EUs | 989 g | 14.8 mm | 13.00" | 2160x1350 | |
| 91.9 % v7 (old) | 07 / 2023 | HP Dragonfly G4 i7-1365U, Iris Xe G7 96EUs | 1.1 kg | 16.3 mm | 13.50" | 1920x1280 | |
| 85.4 % v7 (old) | 04 / 2023 | Asus ZenBook S13 OLED UX5304 i7-1355U, Iris Xe G7 96EUs | 1 kg | 11.8 mm | 13.30" | 2880x1800 | |
| 89 % v7 (old) | 11 / 2022 | Dell Latitude 9330 i7-1260U, Iris Xe G7 96EUs | 1.2 kg | 14.1 mm | 13.30" | 2560x1600 | |
| 86.9 % v7 (old) | 04 / 2021 | MSI Summit E13 Flip Evo A11MT i7-1185G7, Iris Xe G7 96EUs | 1.4 kg | 14.9 mm | 13.40" | 1920x1200 |
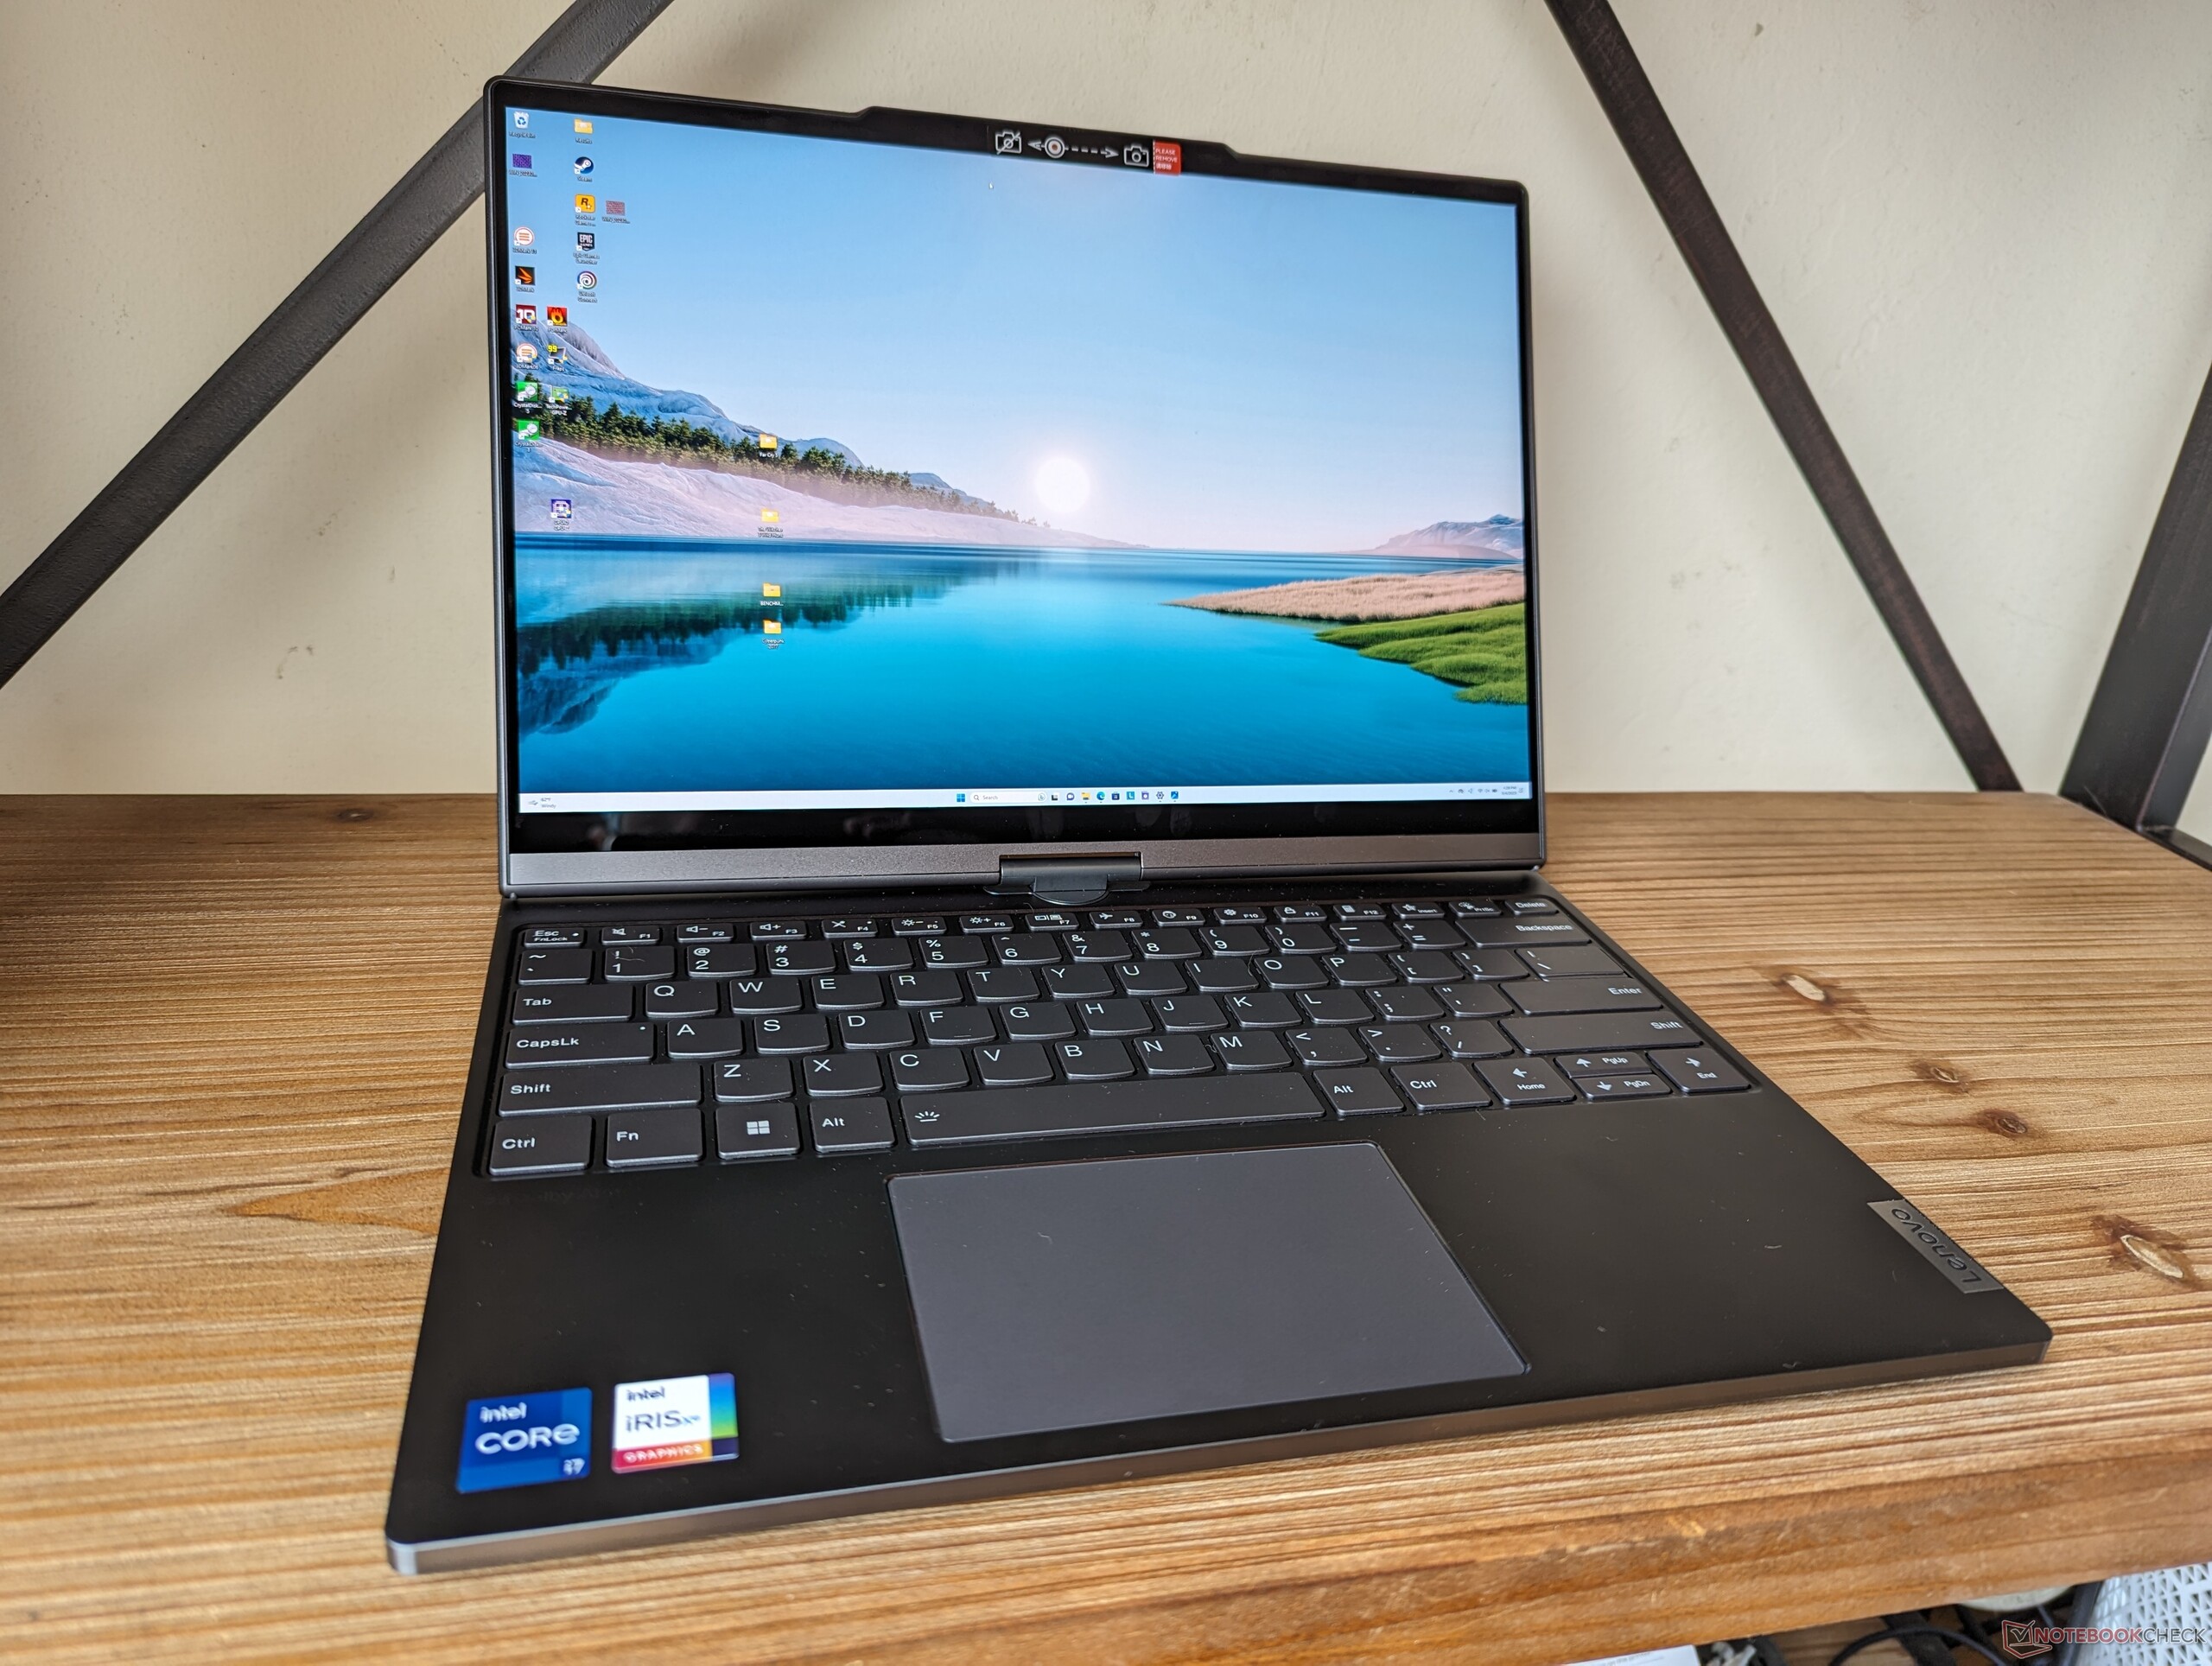
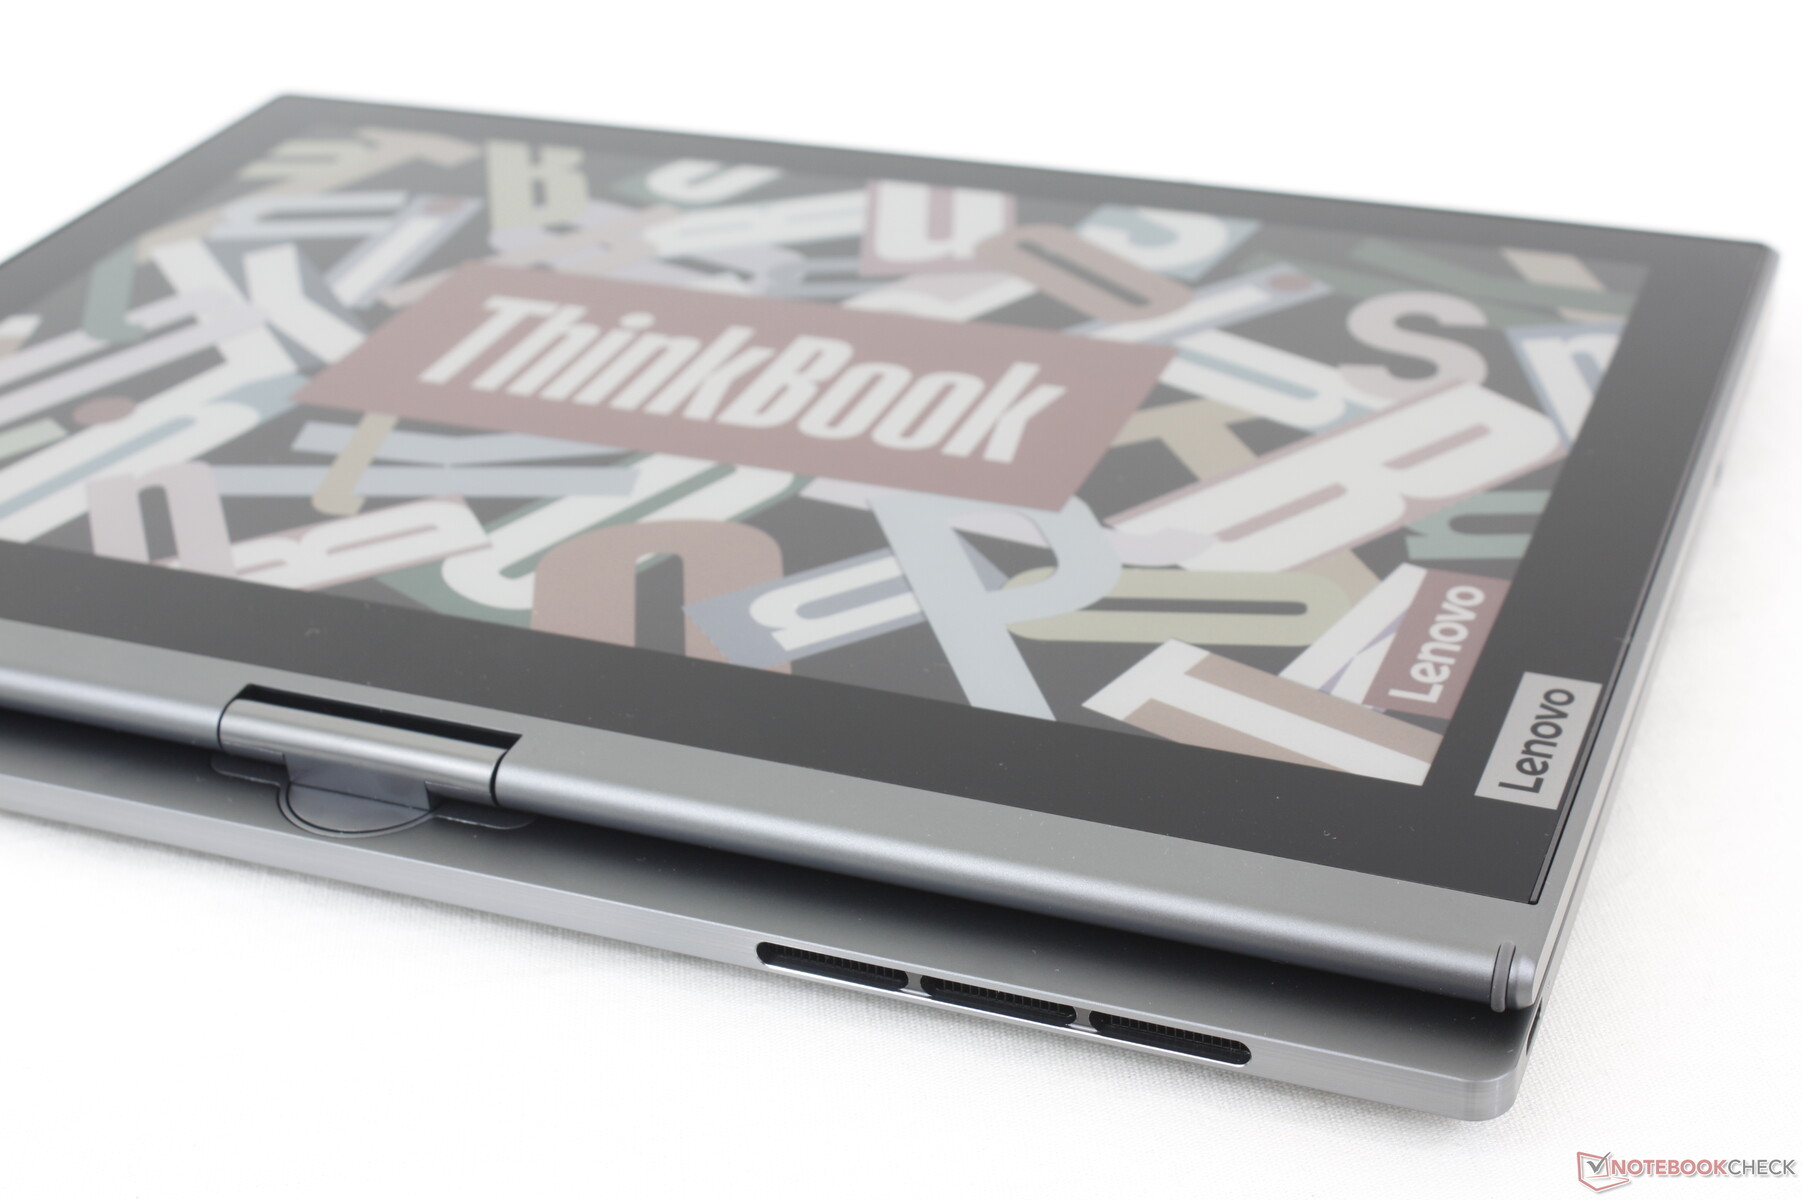
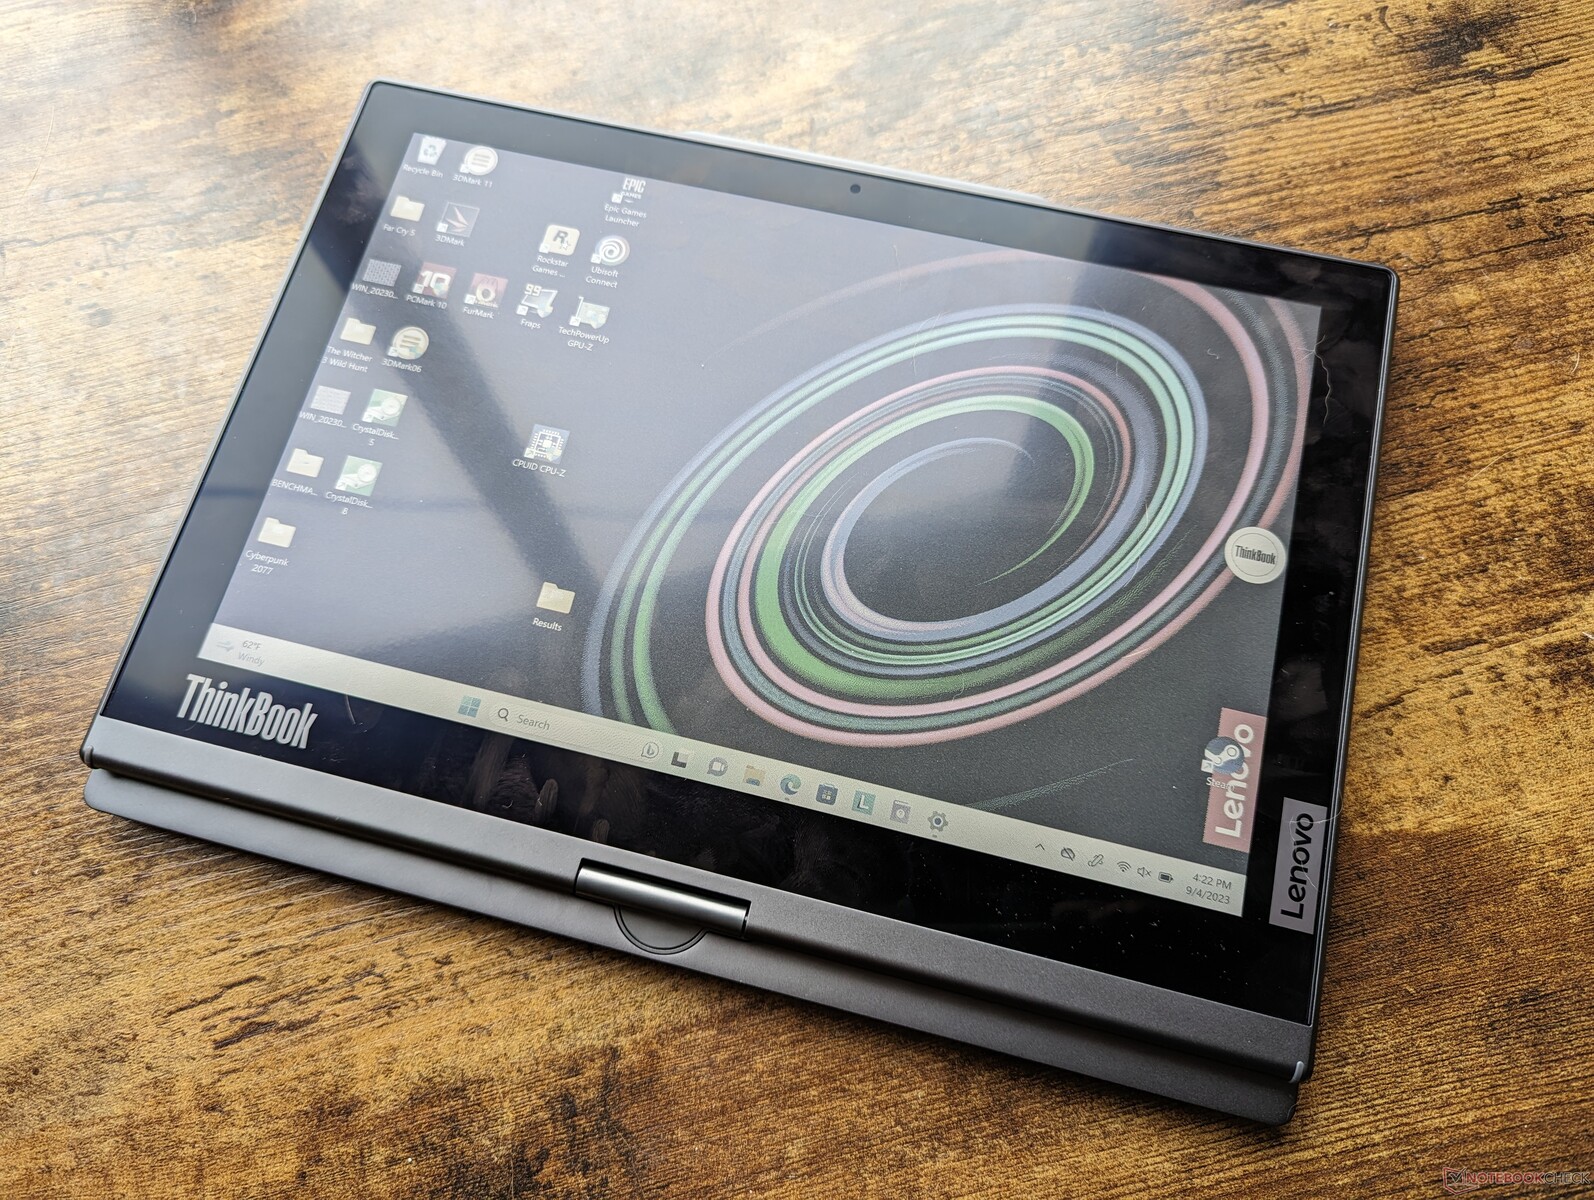
Gehäuse — Im Geiste ein ThinkPad Twist
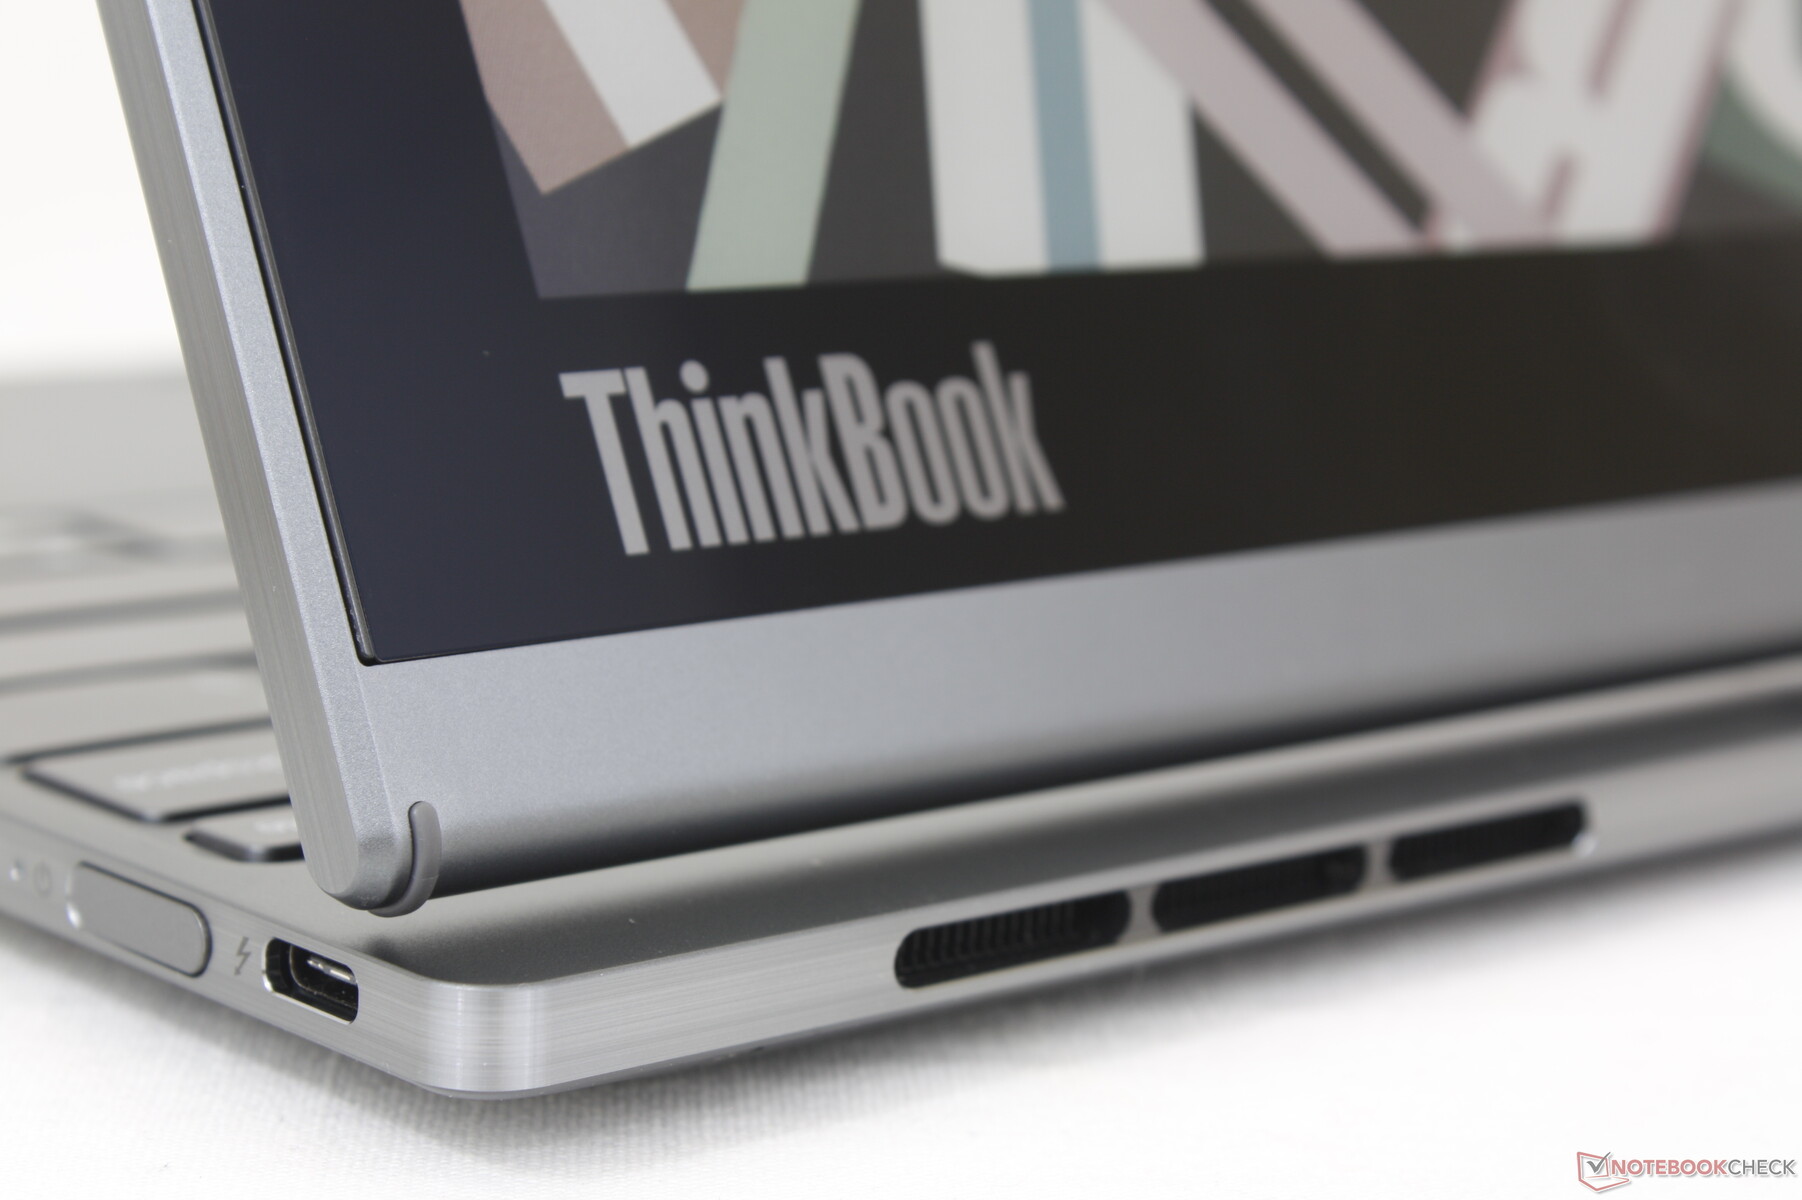
Im Gegensatz zu anderen ThinkBooks wie dem ThinkBook 15 G3 besteht das ThinkBook Plus Gen 4 mehr aus Metall als aus Kunststoff. Die Basis ist etwa deutlich verwindungssteifer und knarrt nicht so stark wie beim HP Spectre x360. Auch der Deckel ist recht stabil, da er zwei Glasscheiben zur Verstärkung der OLED- und E-Ink-Displays besitzt, im Gegensatz zu nur einer Scheibe bei den meisten anderen Notebooks.
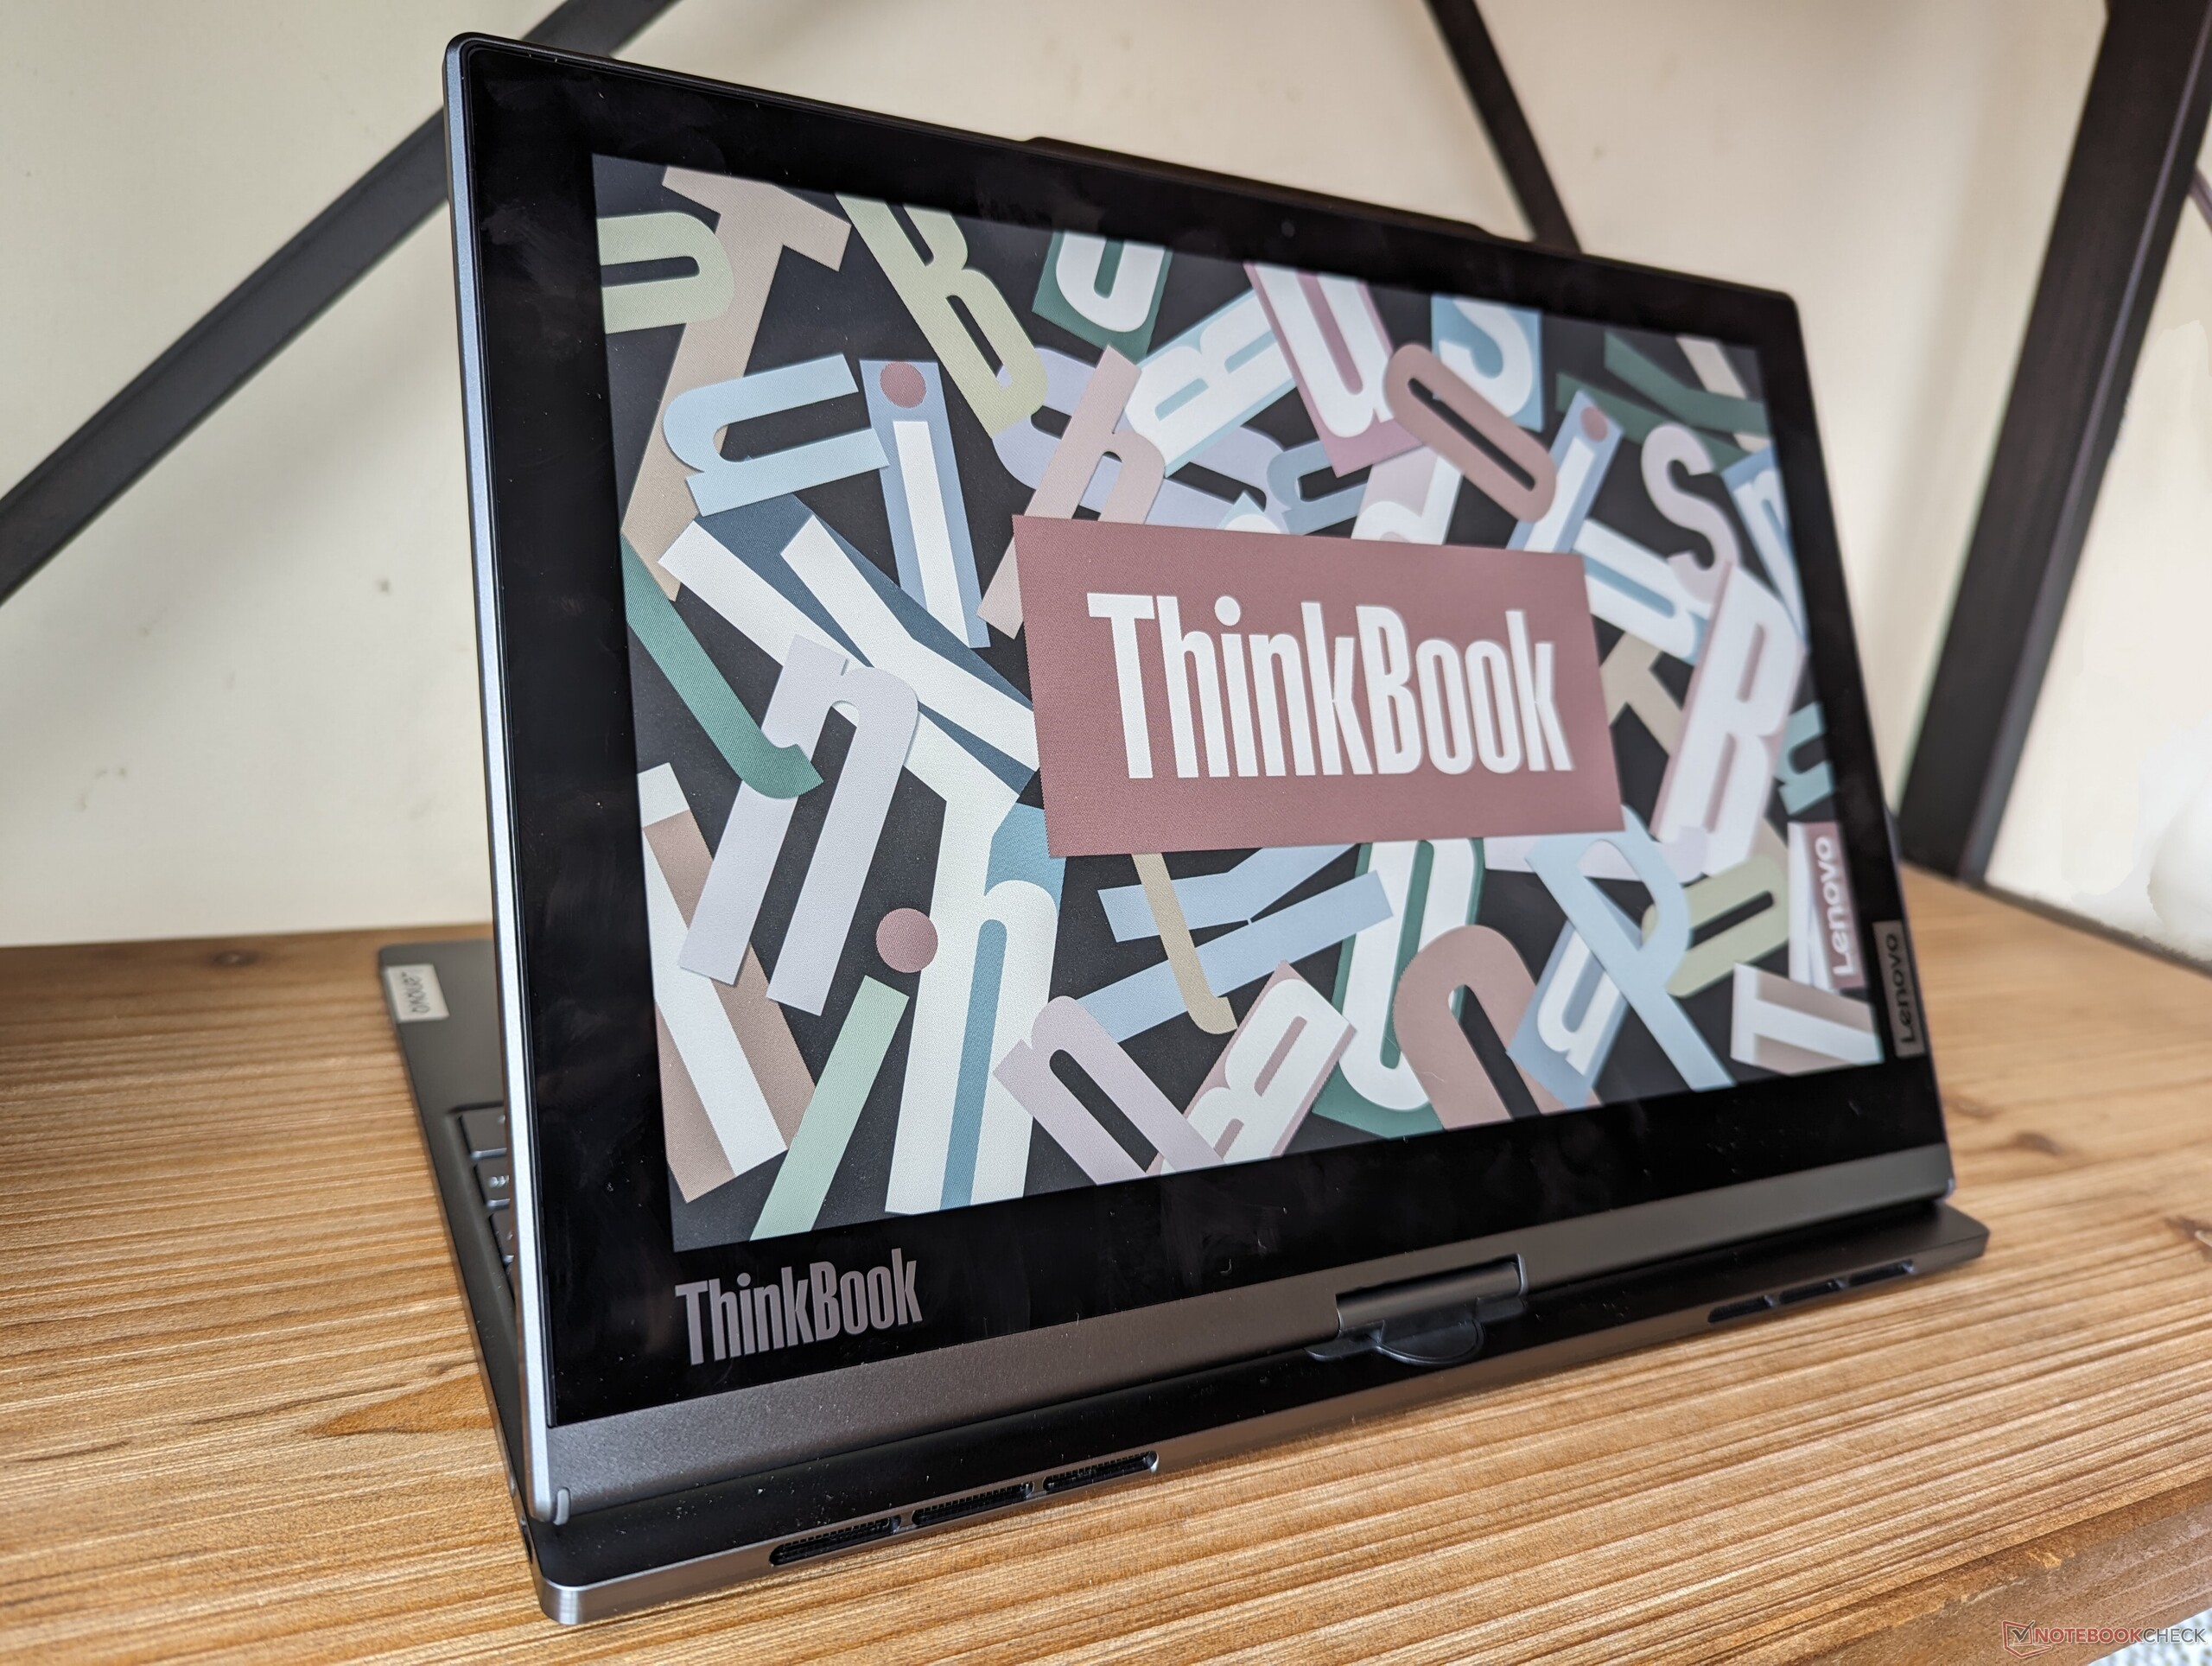
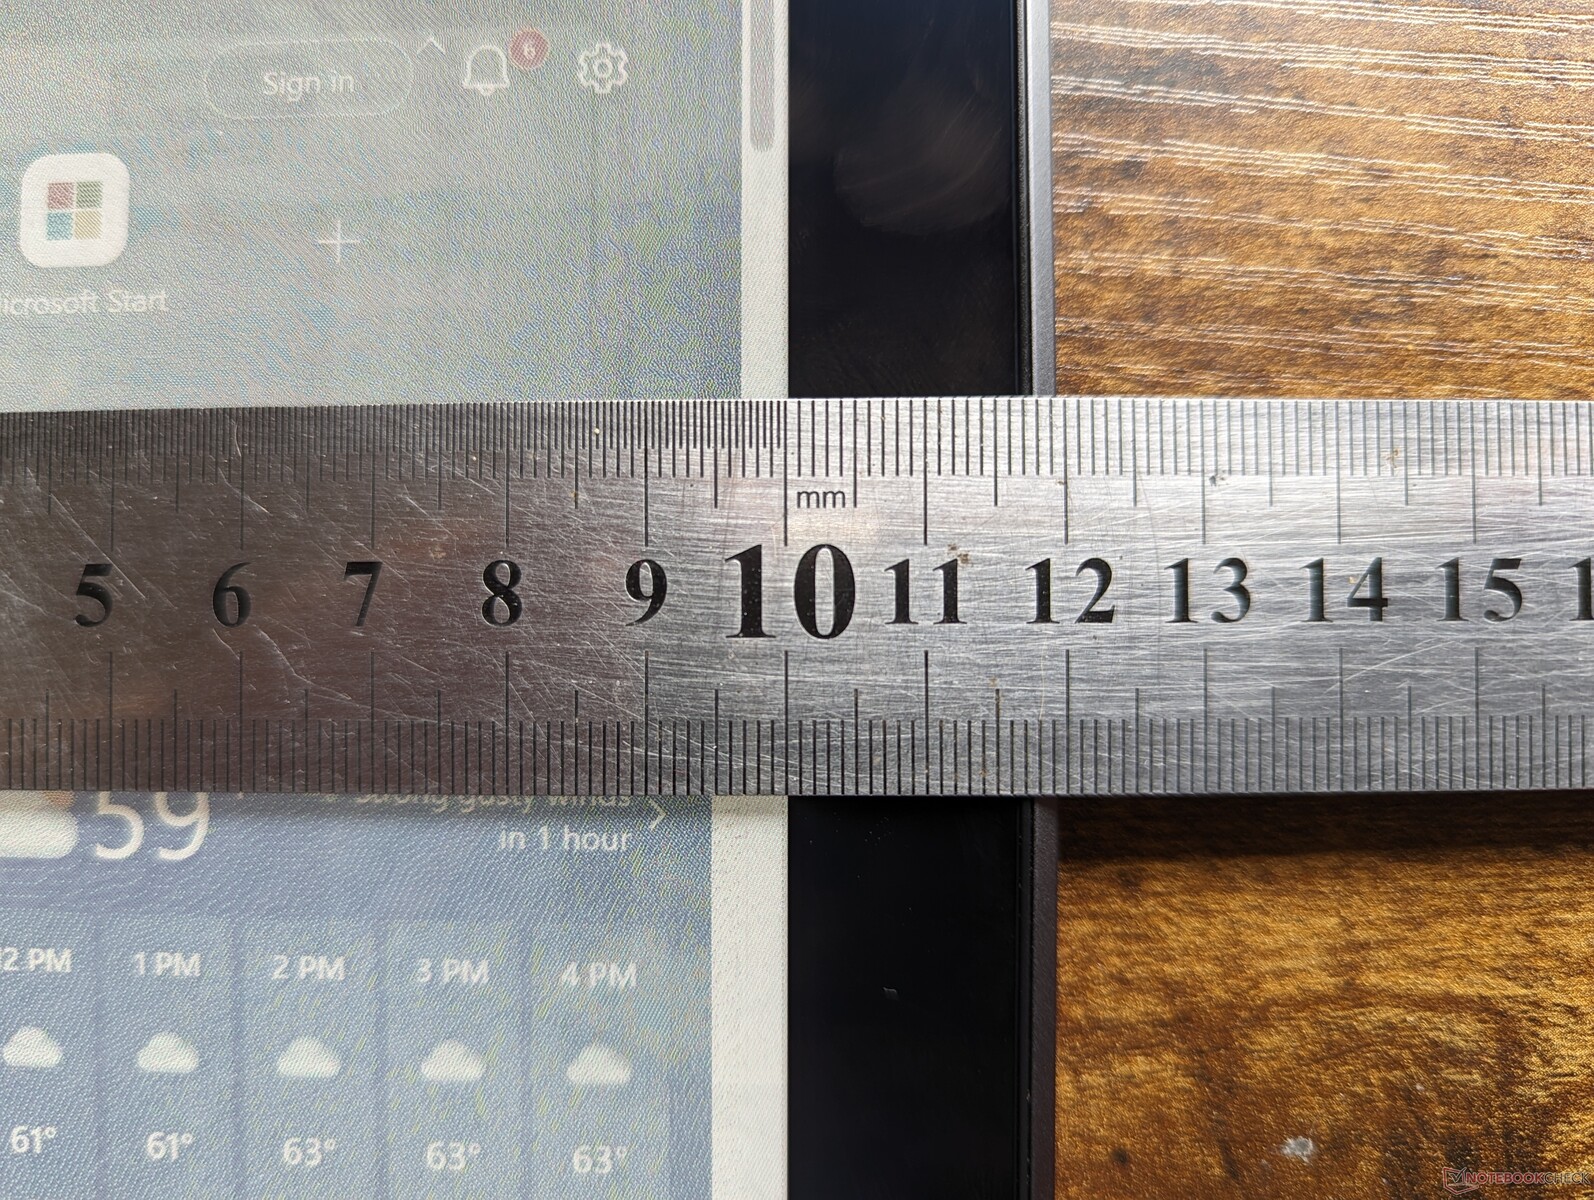
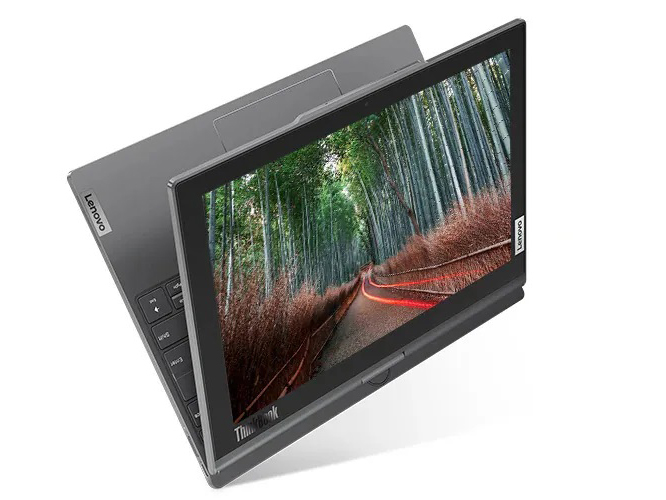
Neben dem 12 Zoll großen E-Ink-Touchscreen auf dem Außendeckel unterscheidet sich das Lenovo-Modell auch durch seinen Drehmechanismus von den meisten anderen Convertibles auf dem Markt. Das kleine Scharnier lässt sich um 180 Grad im Uhrzeigersinn in den Tablet-Modus und um 180 Grad gegen den Uhrzeigersinn in den Laptop-Modus drehen, funktioniert also ganz anders als die üblichen 360-Grad-Scharniere, die man bei typischen Convertibles findet. Mechanisch funktioniert das gut, allerdings neigt der Deckel im Vergleich zu herkömmlichen größeren Scharnieren eher zum Wippen. Es bleibt zu hoffen, dass das einzigartige Drehscharnier im täglichen Gebrauch mehrere Jahre hält.
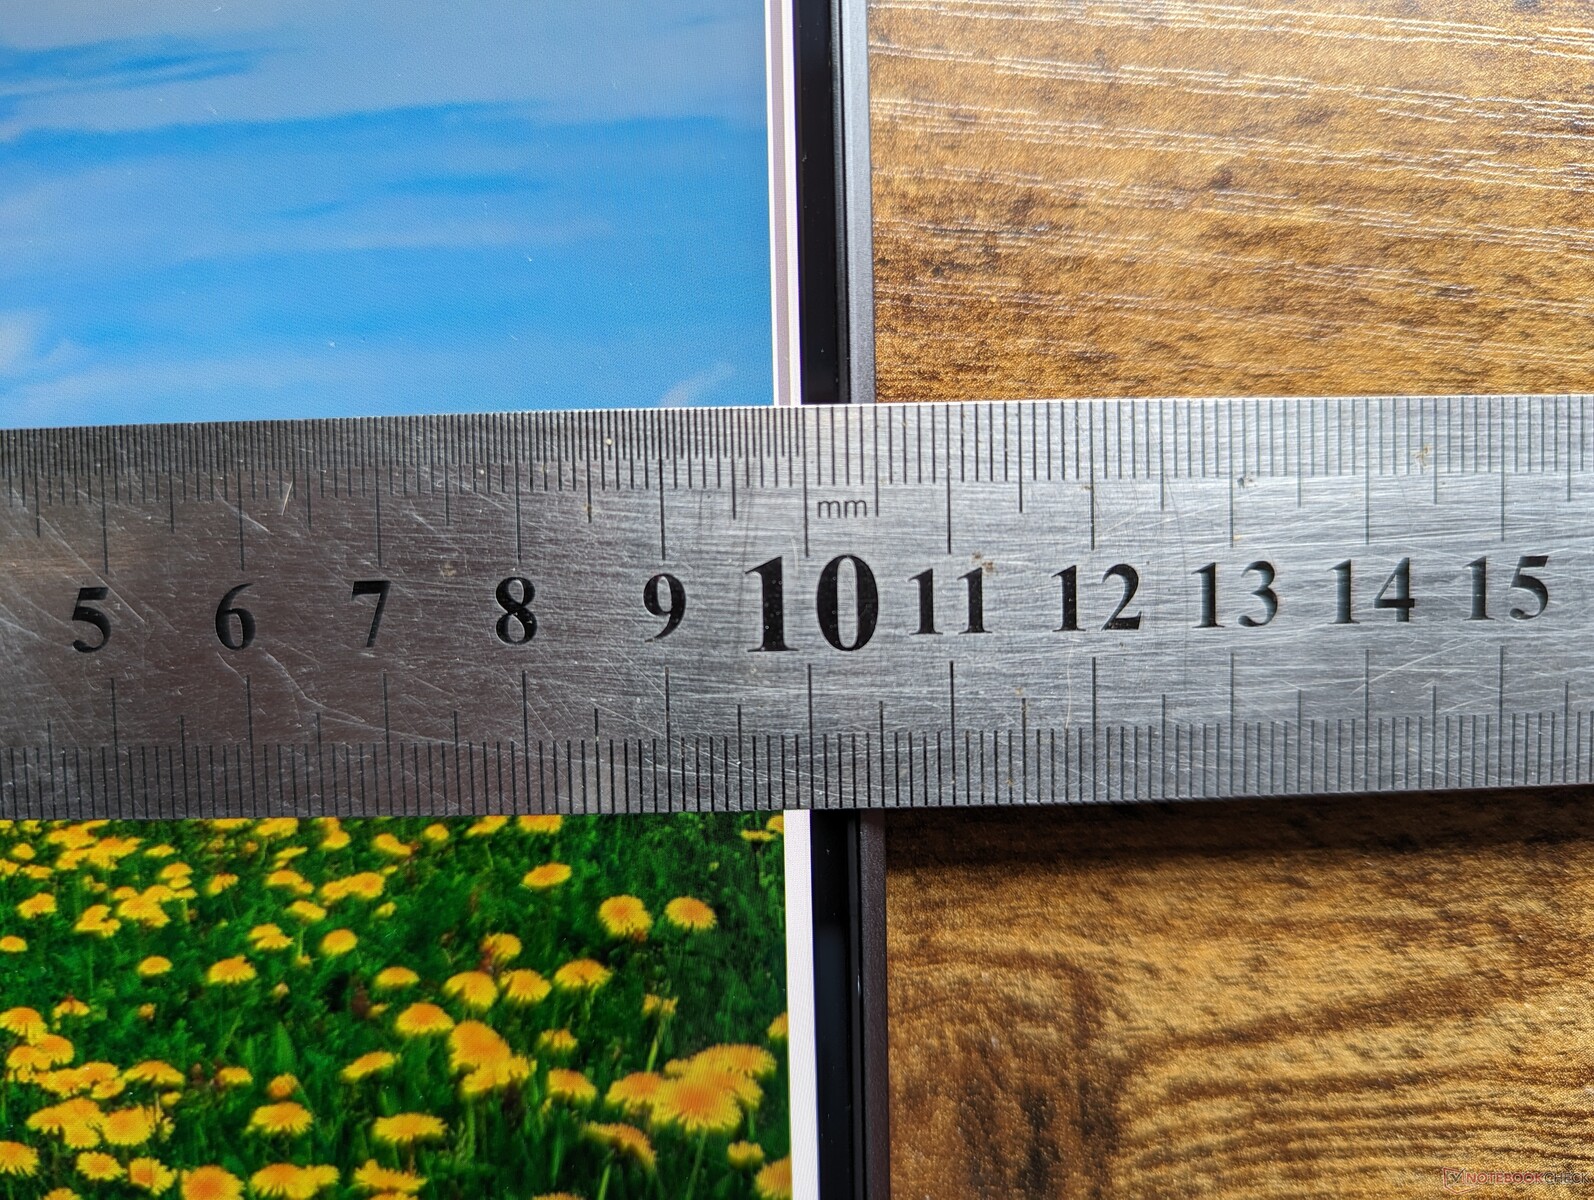
Durch den Drehmechanismus und das zweite Display ist das Gerät etwas dicker und schwerer als herkömmliche 13-Zoll-Subnotebooks. Das Dragonfly G4 beispielsweise ist in allen drei Dimensionen fast gleich groß, aber mit 300 Gramm deutlich leichter und damit besser für unterwegs geeignet. Man muss also die einzigartigen Funktionen des ThinkBook Plus Gen 4 sehr schätzen, um das Mehrgewicht zu rechtfertigen. Zu bedenken ist aber auch, dass selbst kleinere E-Book-Reader wie das PocketBook Touch HD 3 mit 6-Zoll-Display 155 Gramm auf die Waage bringen. Hier spart man sich das zweite Gerät


Aussstattung
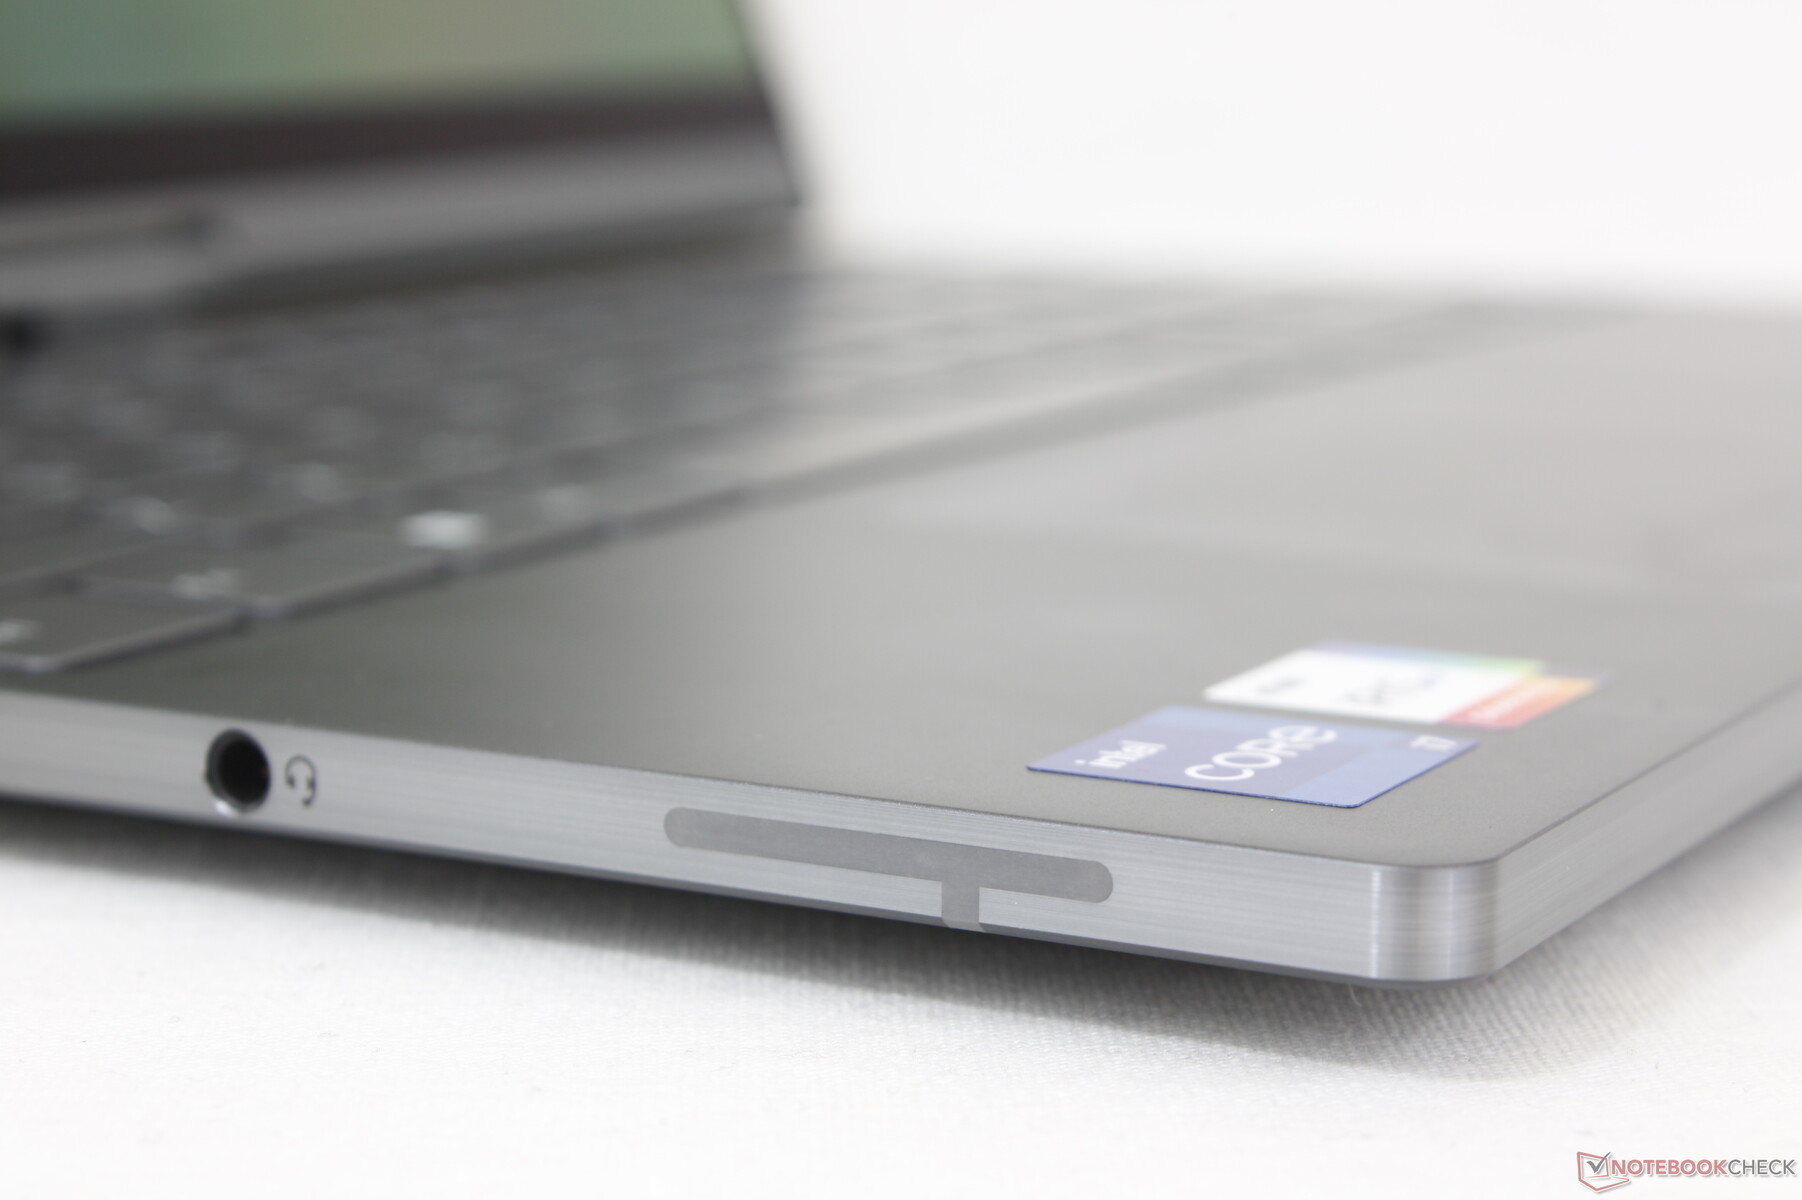
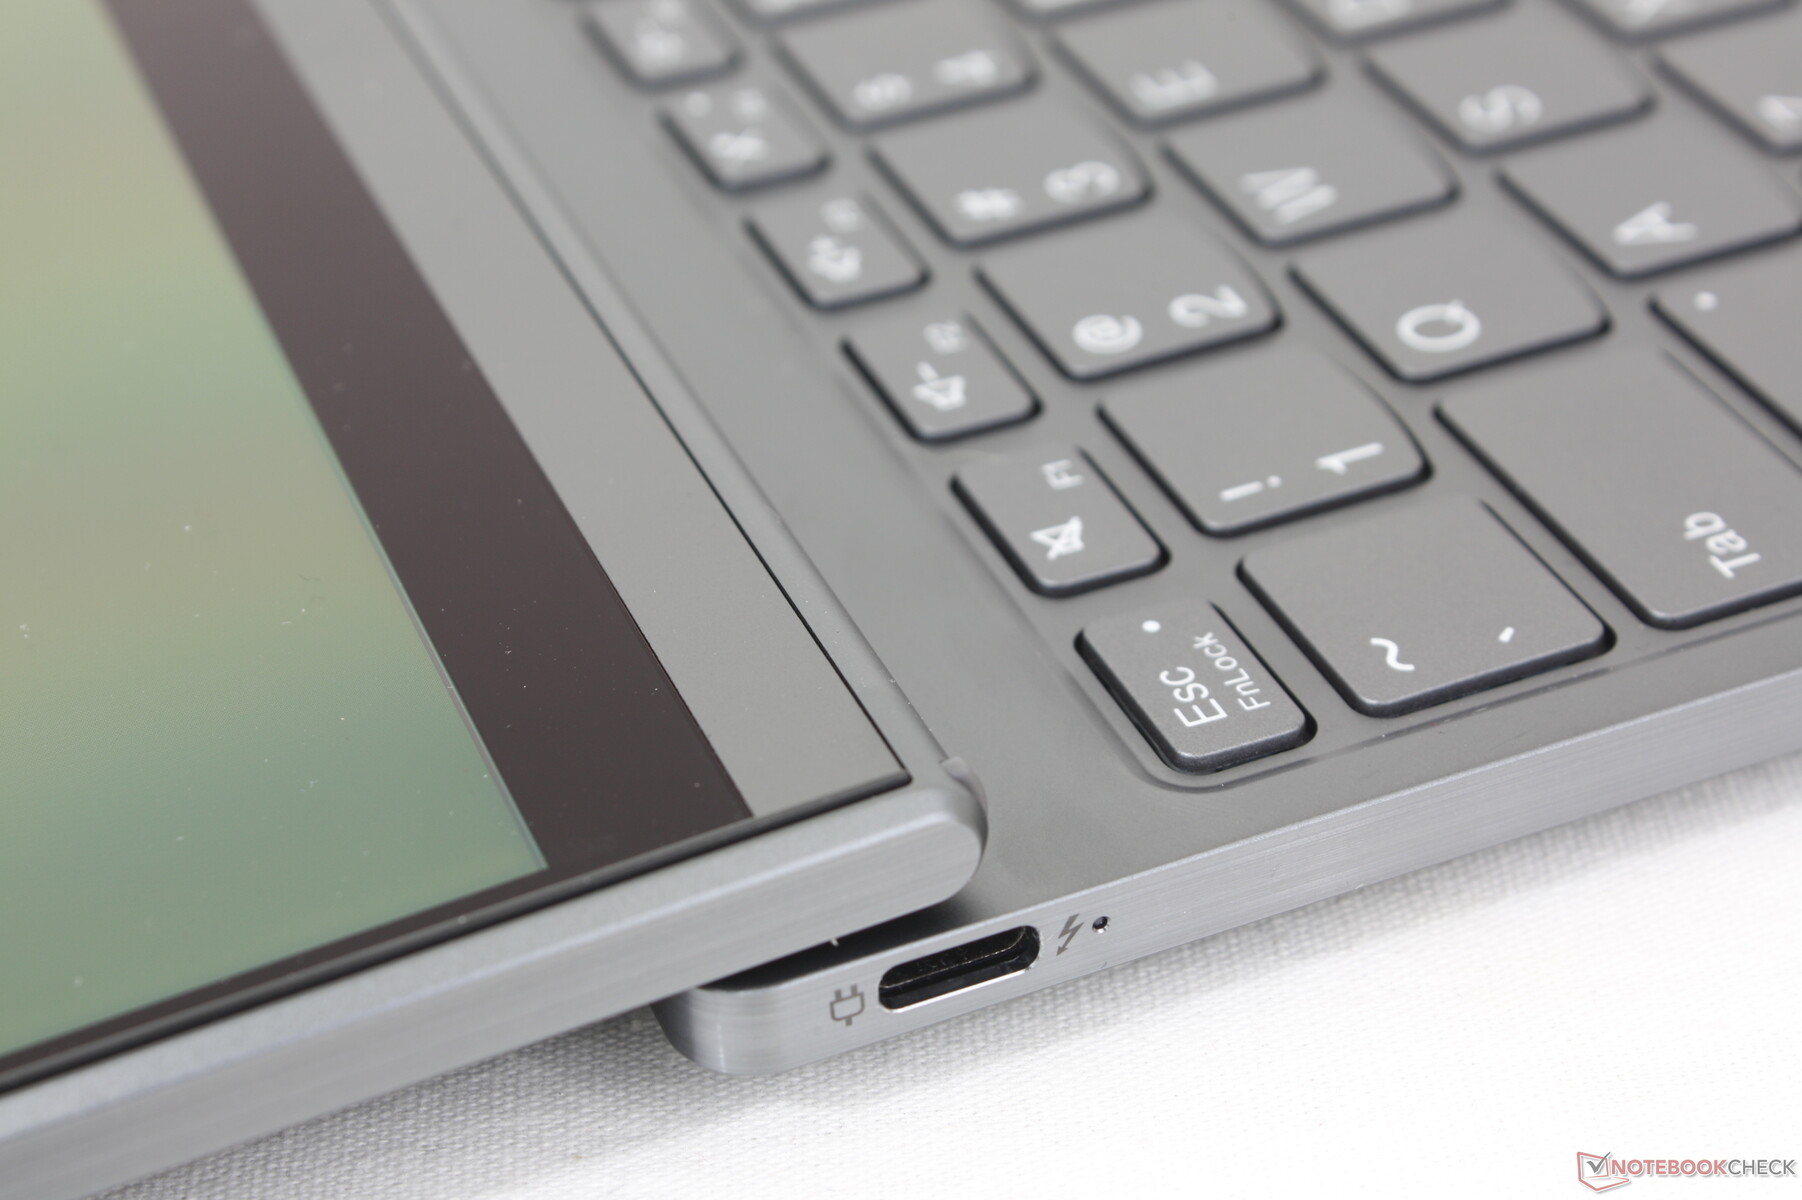
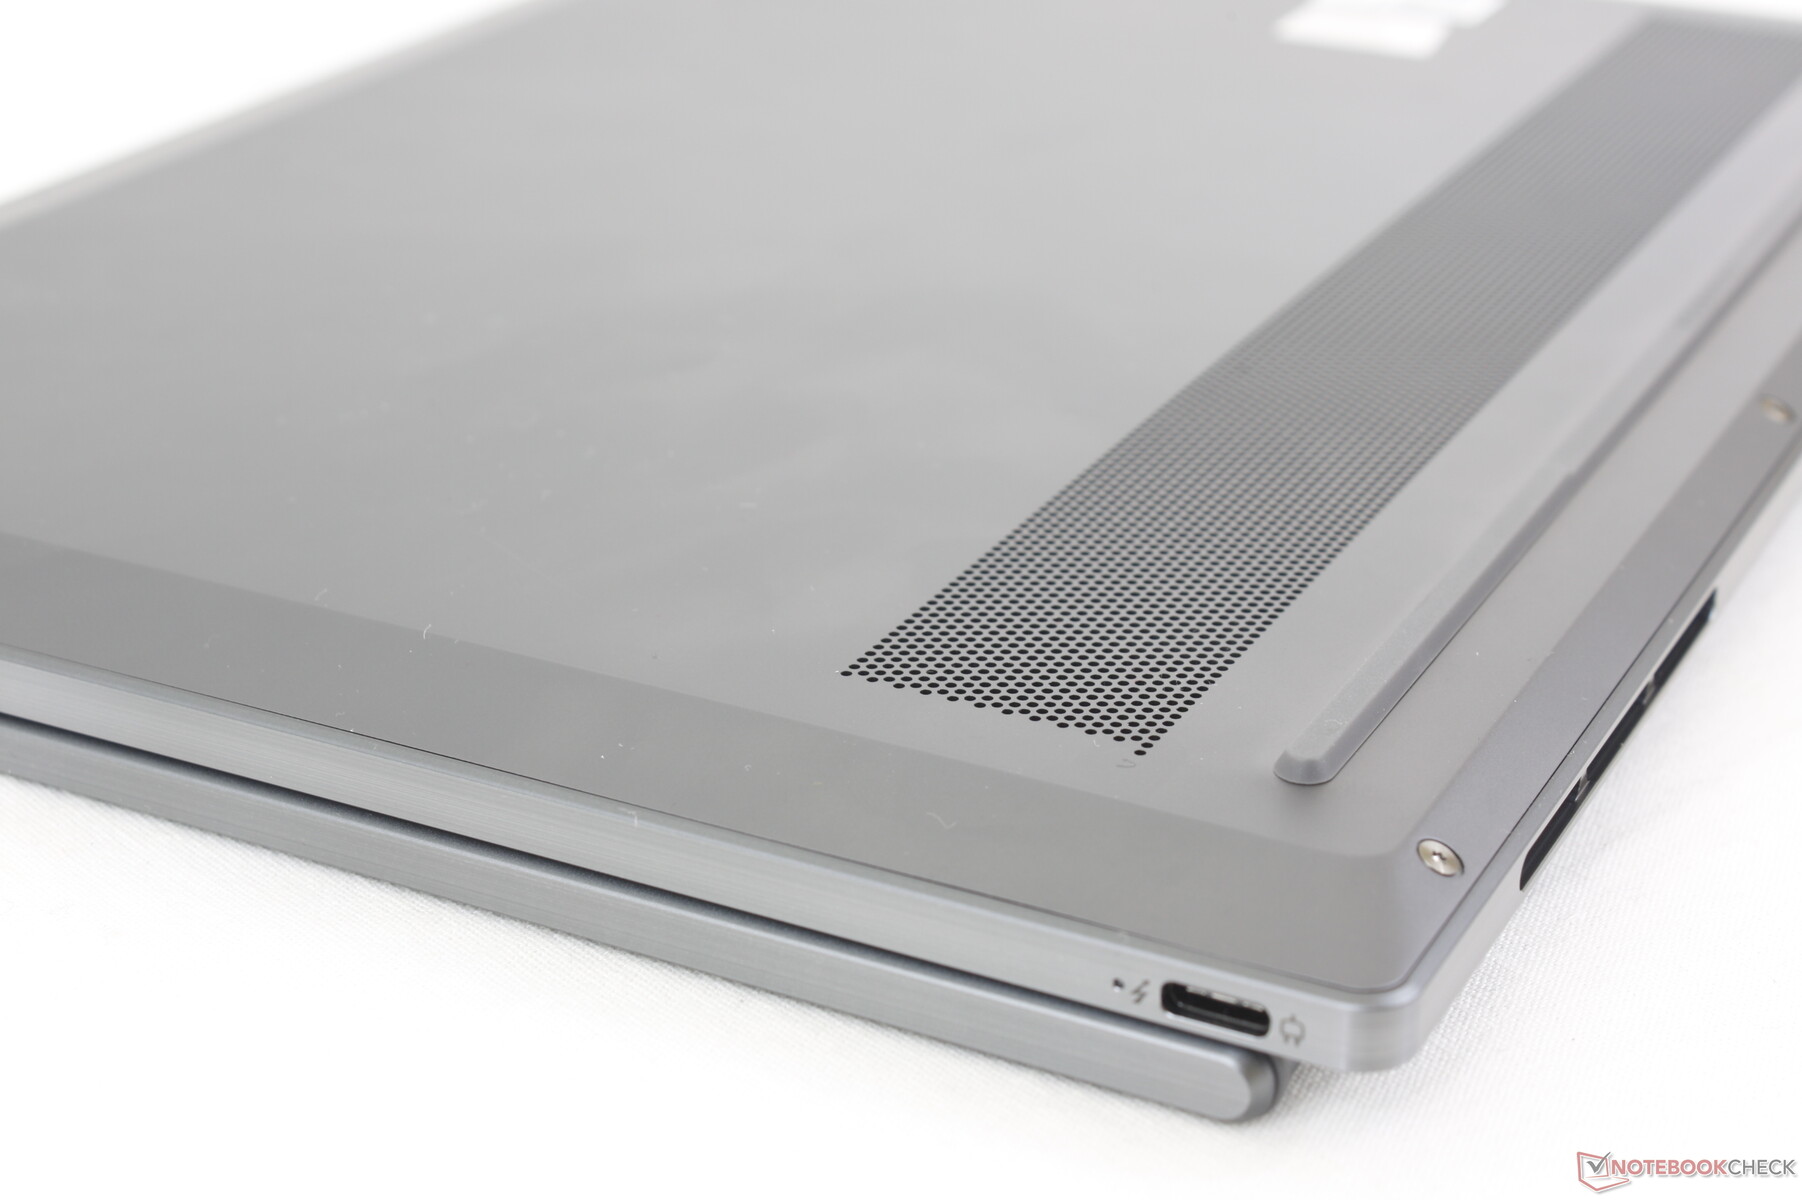
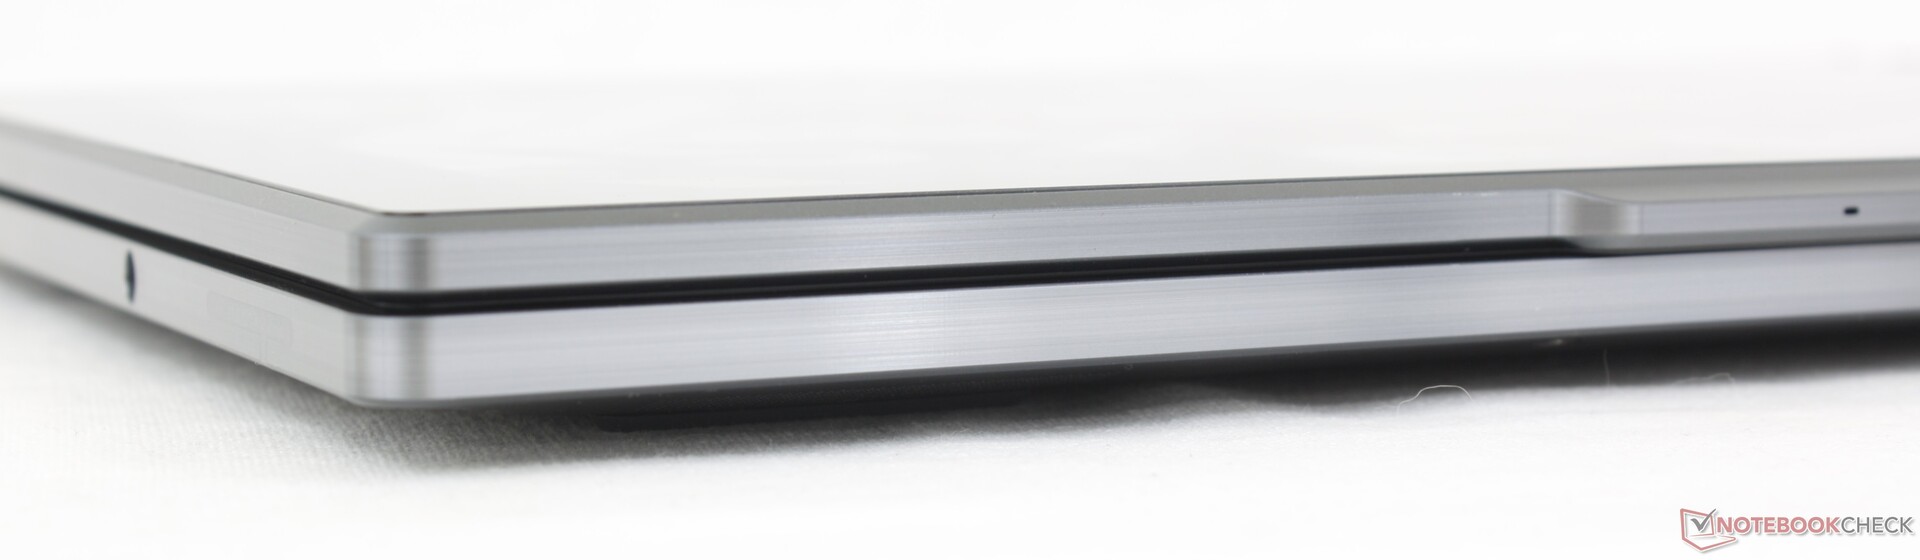
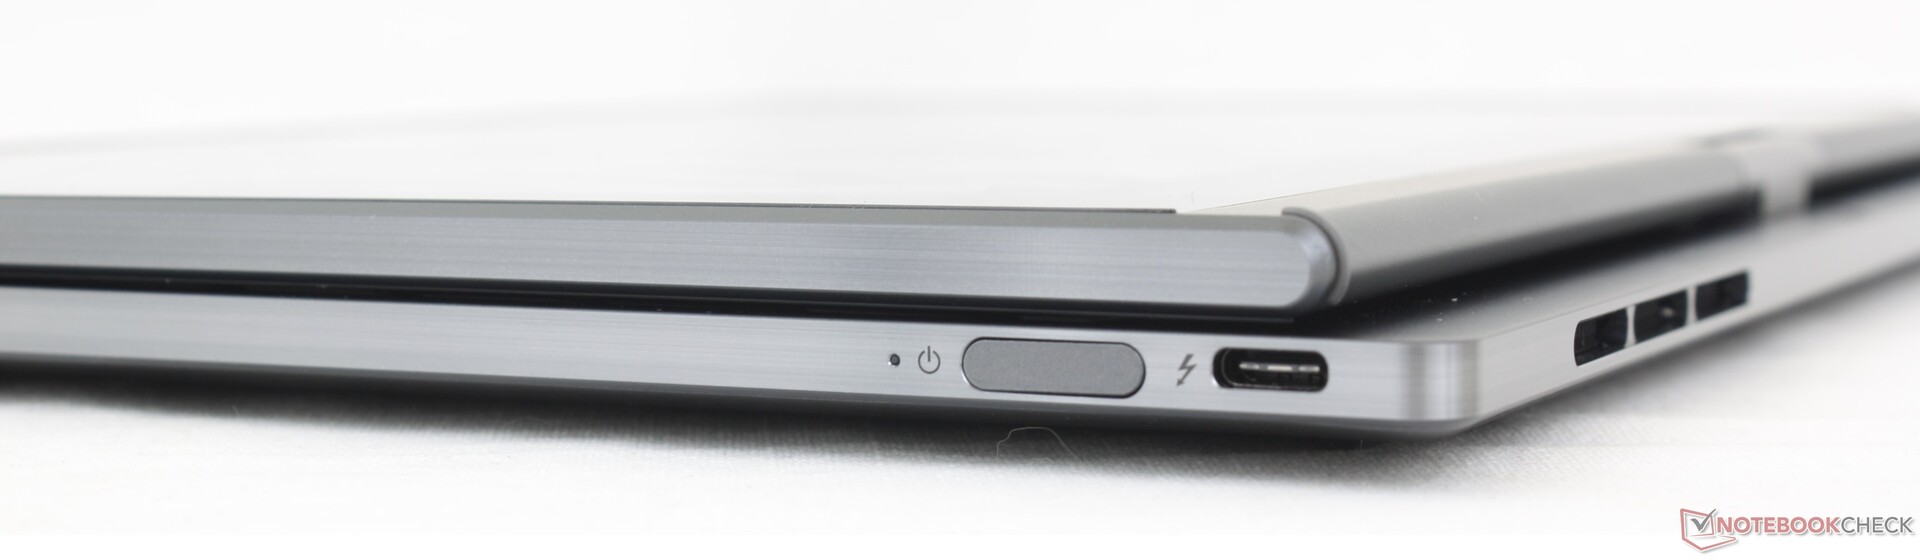
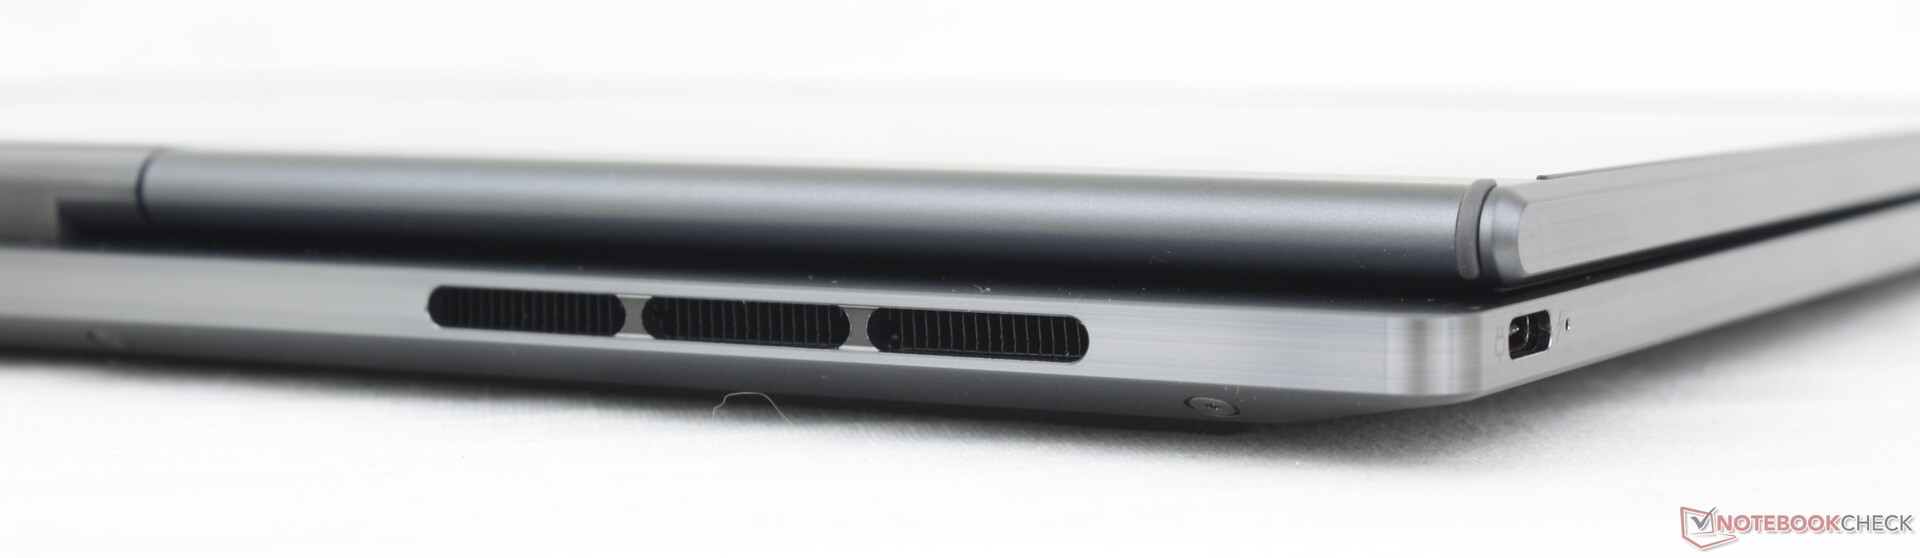
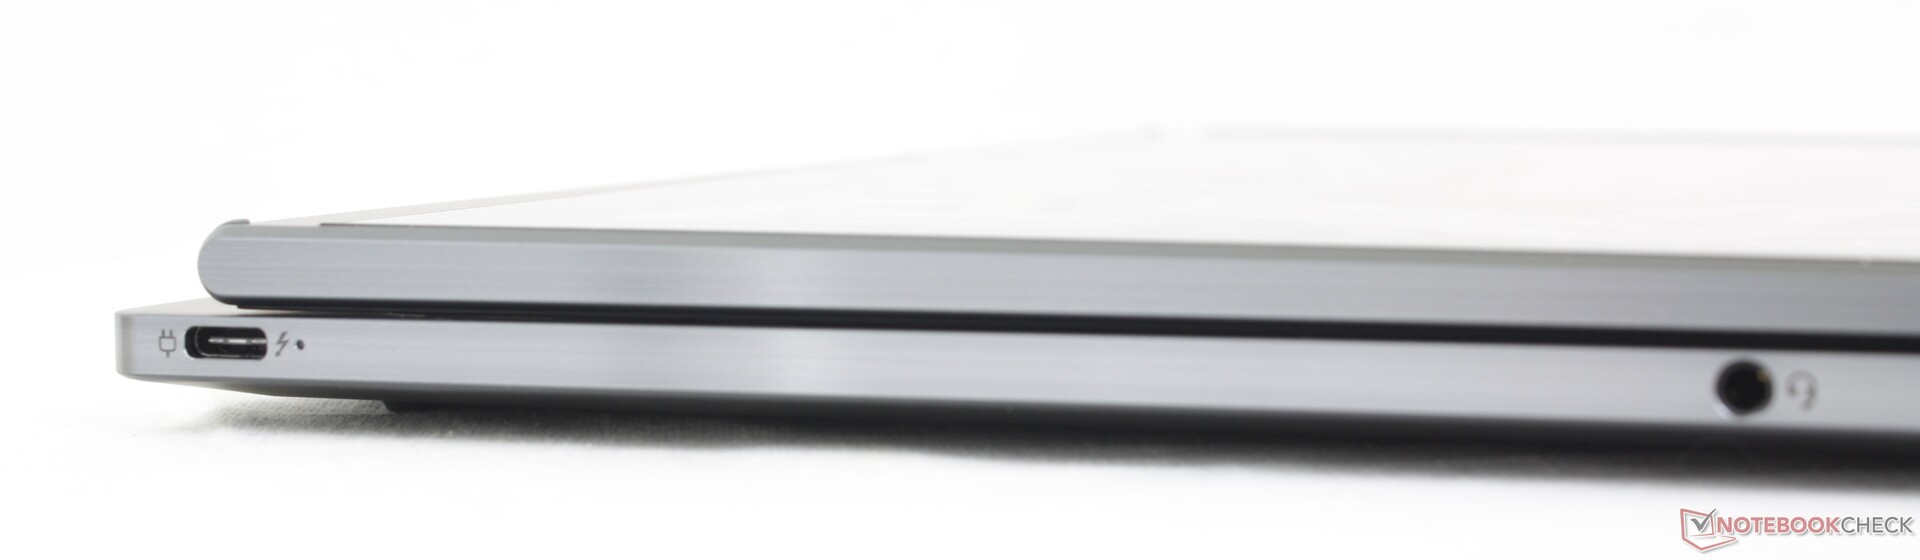
Das Gerät bietet lediglich zwei Thunderbolt-4-Anschlüsse und eine 3,5-mm-Audiobuchse. Dies ist insofern bemerkenswert, als dass einige Subnotebooks wie das ZenBook 13 überhaupt keine Kopfhörerbuchse mehr aufweisen. Für den Anschluss von USB-A- oder HDMI-Geräten sollten Adapter und Docking-Stationen bereitgehalten werden.
Gut finden wir, dass es an beiden Seiten des Notebooks je einen USB-C-Anschluss gibt, sodass man das Notebook von beiden Seiten aus aufladen kann. Dies steht im Gegensatz zum Spectre x360 13.5, das nur über die rechte Seite aufgeladen werden kann.
Kommunikation
Ein Intel AX211 gehört zur Ausstattung und unterstützt Wi-Fi 6E sowie Bluetooth 5.2. Die Übertragungsraten sind zuverlässig und in Verbindung mit unserem Asus AXE11000 6GHz Testrouter mehr oder weniger konstant.
Da es sich nicht um ein ThinkPad handelt, werden 4G-LTE oder 5G leider nicht unterstützt.
| Networking | |
| iperf3 transmit AX12 | |
| MSI Summit E13 Flip Evo A11MT | |
| iperf3 receive AX12 | |
| MSI Summit E13 Flip Evo A11MT | |
| iperf3 transmit AXE11000 | |
| Asus ZenBook S13 OLED UX5304 | |
| Lenovo ThinkBook Plus Gen4 IRU | |
| Lenovo ThinkPad X1 Nano Gen 3 | |
| HP Dragonfly G4 | |
| Dell Latitude 9330 | |
| iperf3 receive AXE11000 | |
| Asus ZenBook S13 OLED UX5304 | |
| Lenovo ThinkPad X1 Nano Gen 3 | |
| Lenovo ThinkBook Plus Gen4 IRU | |
| HP Dragonfly G4 | |
| Dell Latitude 9330 | |
| iperf3 transmit AXE11000 6GHz | |
| Lenovo ThinkBook Plus Gen4 IRU | |
| Lenovo ThinkPad X1 Nano Gen 3 | |
| HP Dragonfly G4 | |
| Dell Latitude 9330 | |
| iperf3 receive AXE11000 6GHz | |
| Lenovo ThinkBook Plus Gen4 IRU | |
| Lenovo ThinkPad X1 Nano Gen 3 | |
| HP Dragonfly G4 | |
| Dell Latitude 9330 | |
Webcam
Eine FullHD-Webcam mit Schiebeverschluss und IR ist bereits serienmäßig vorhanden. Konkurrenten wie HP haben bereits damit begonnen, Laptops mit 5-MP- und sogar 8-MP-Sensoren für schärfere Bilder bereitzustellen.


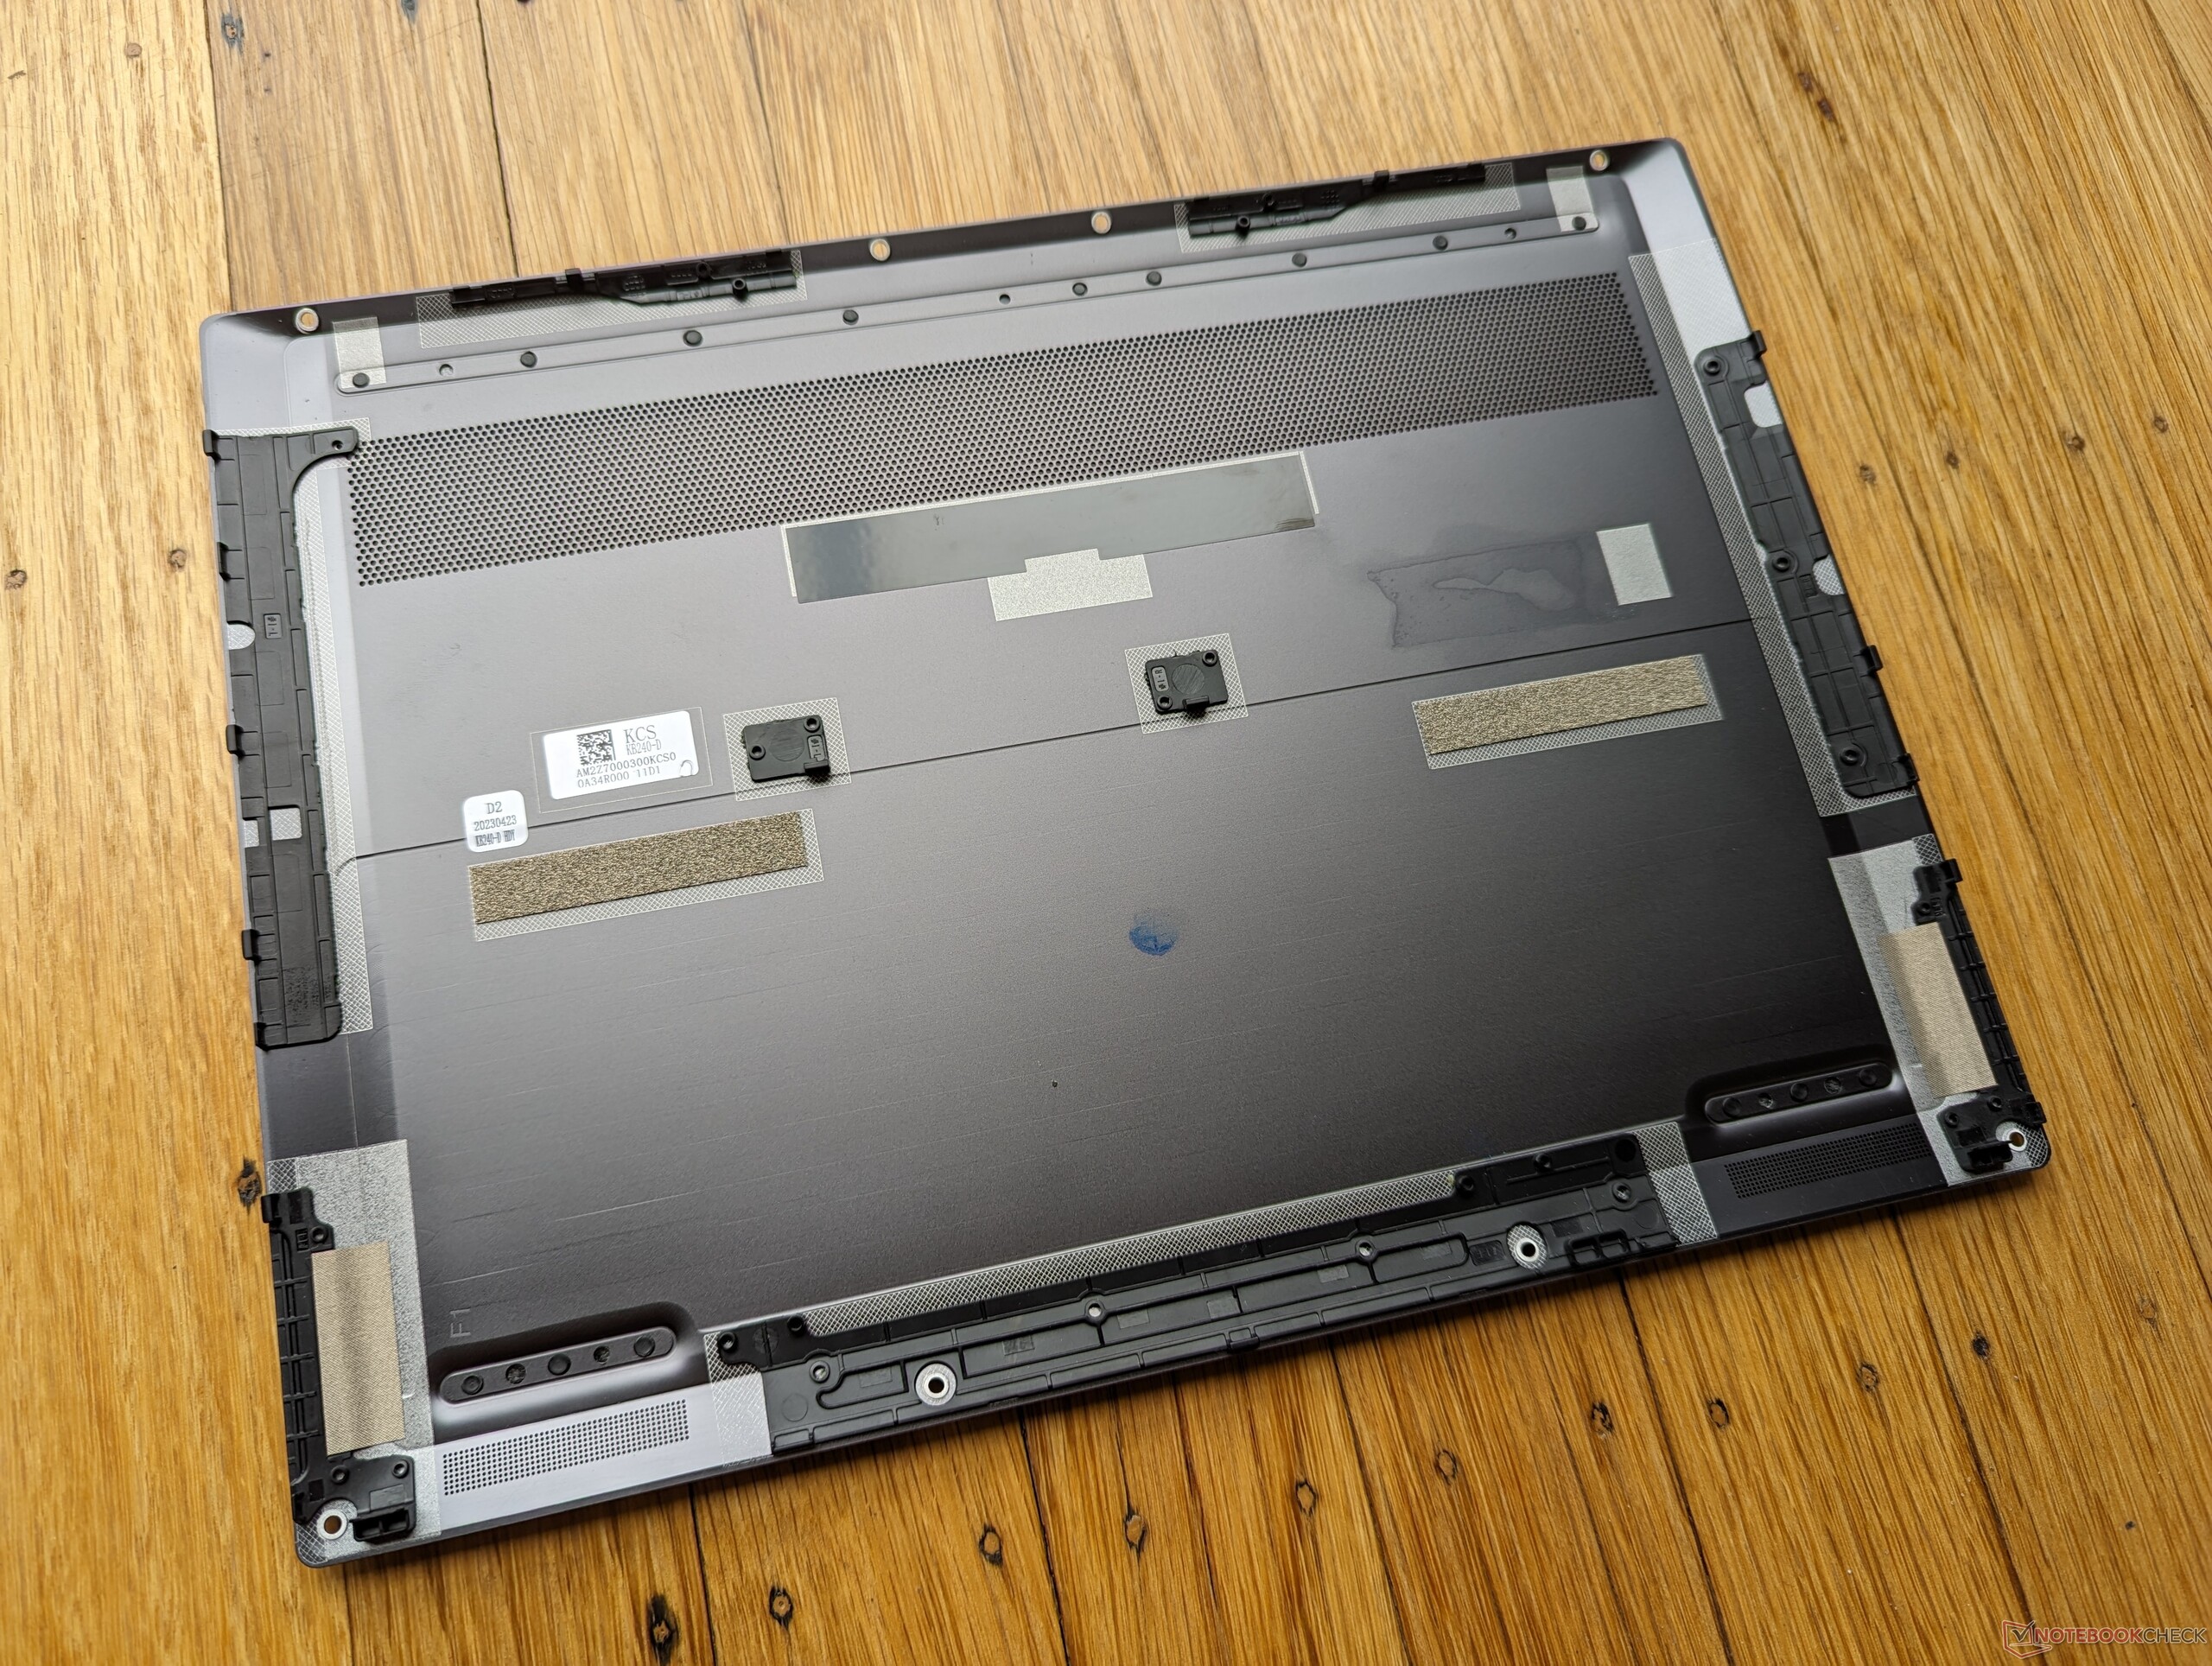
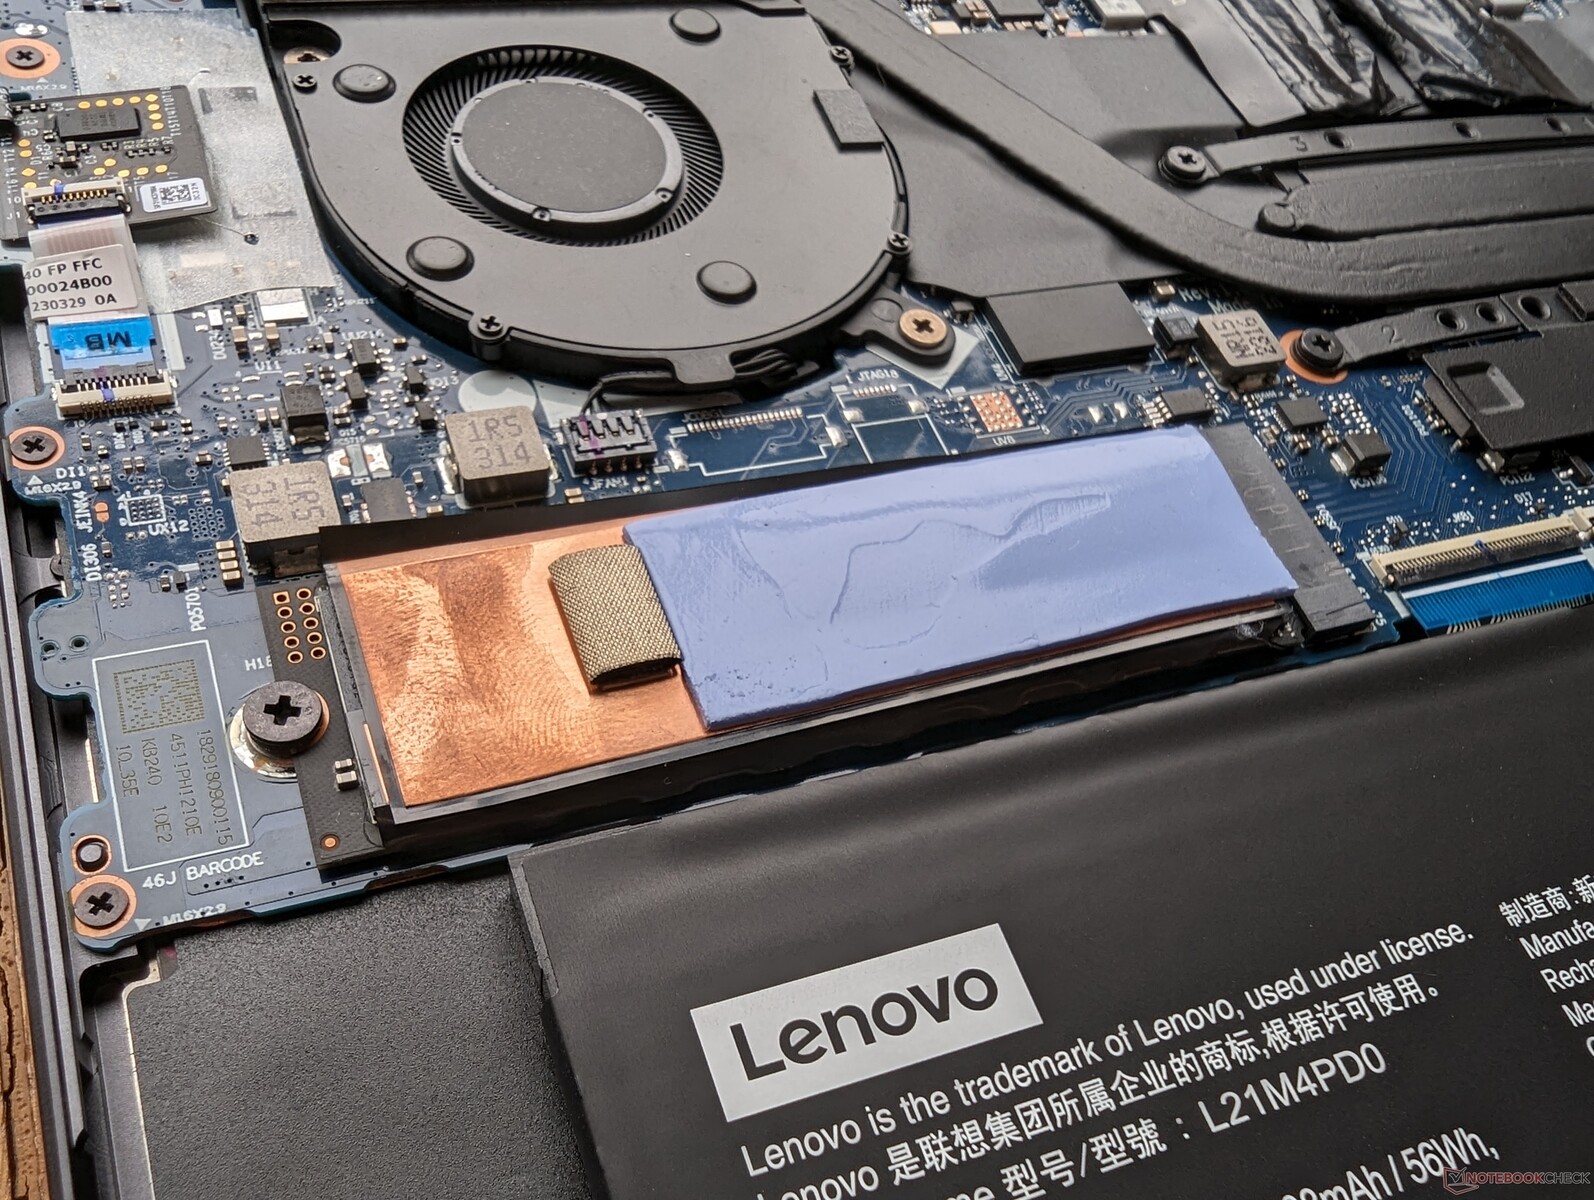
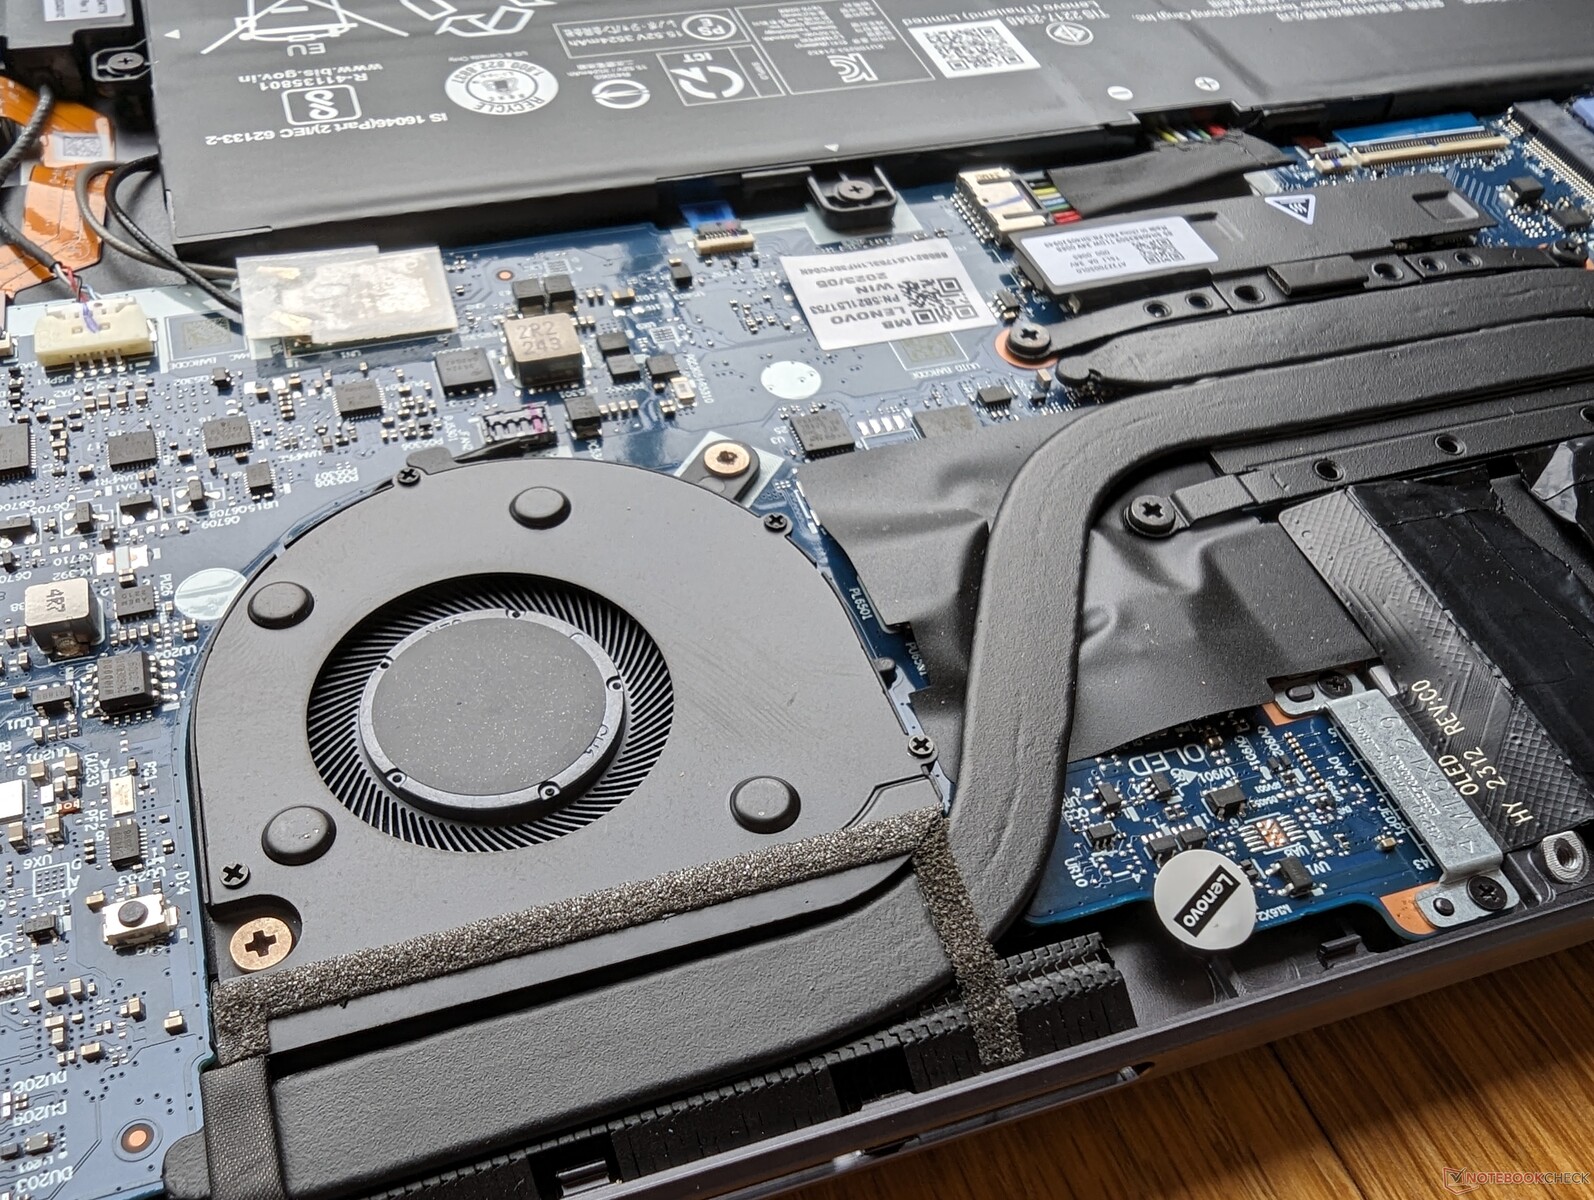
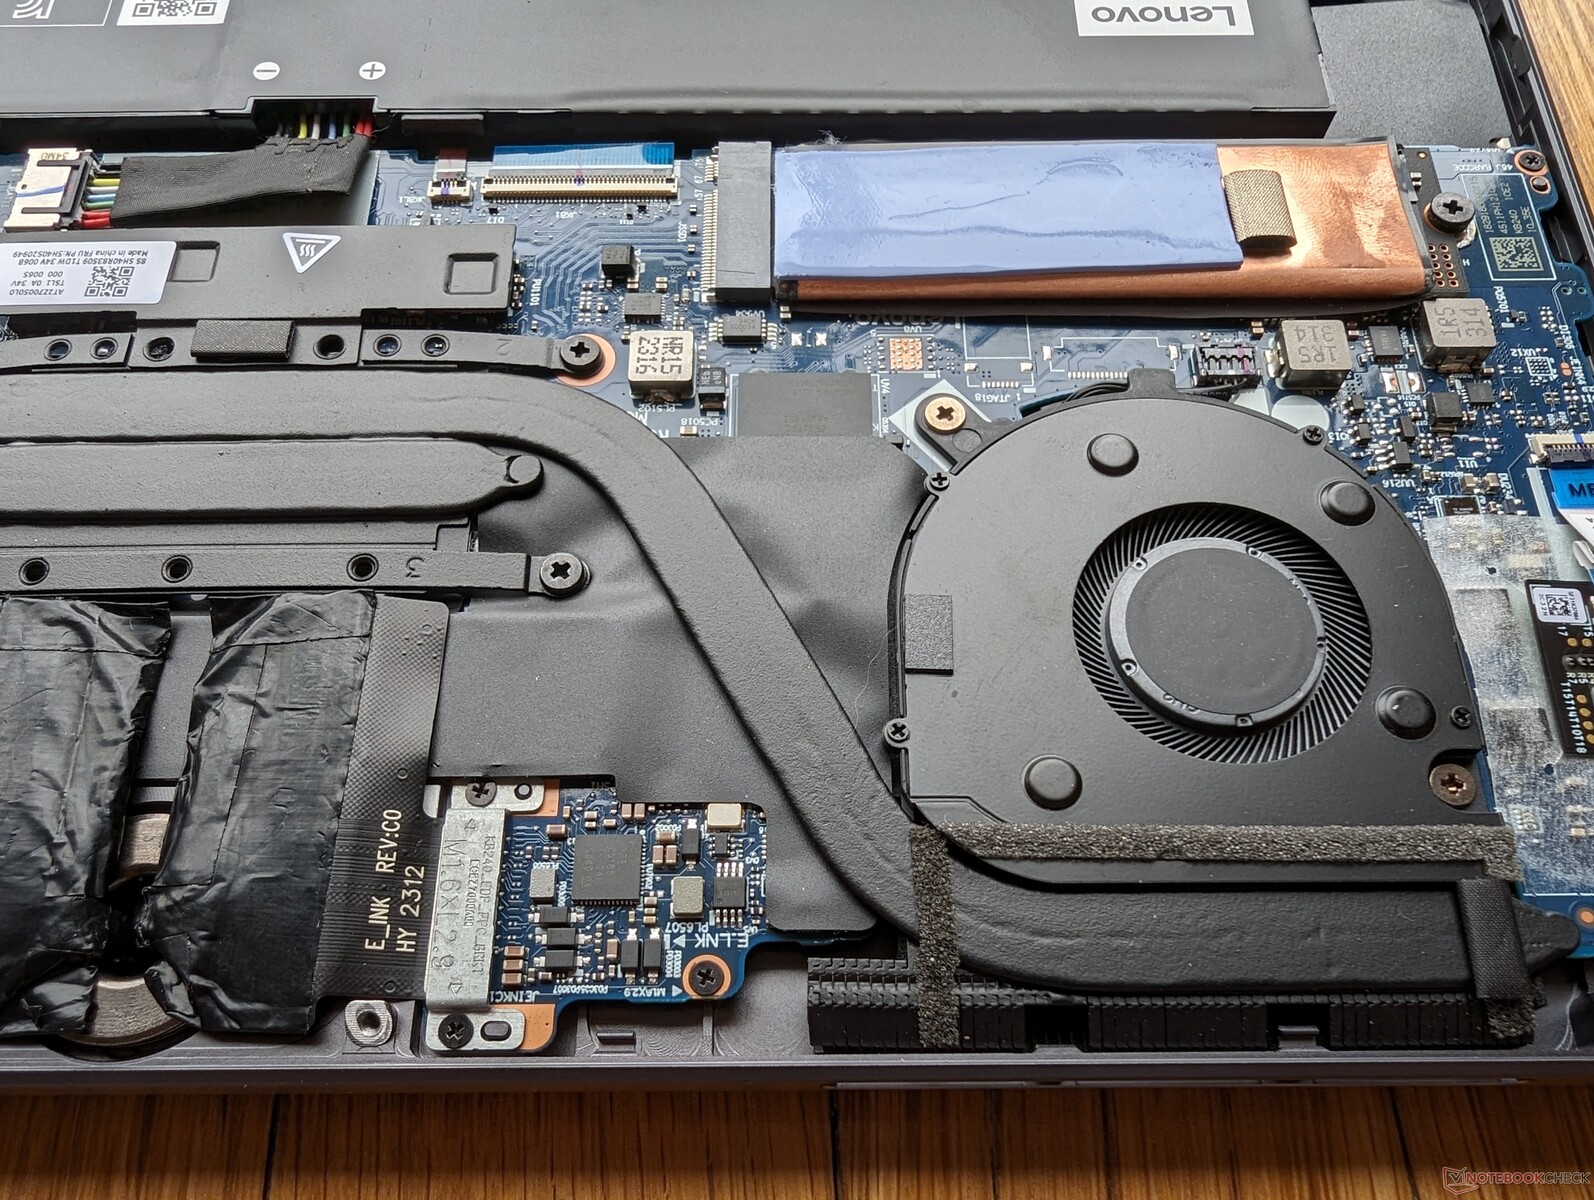
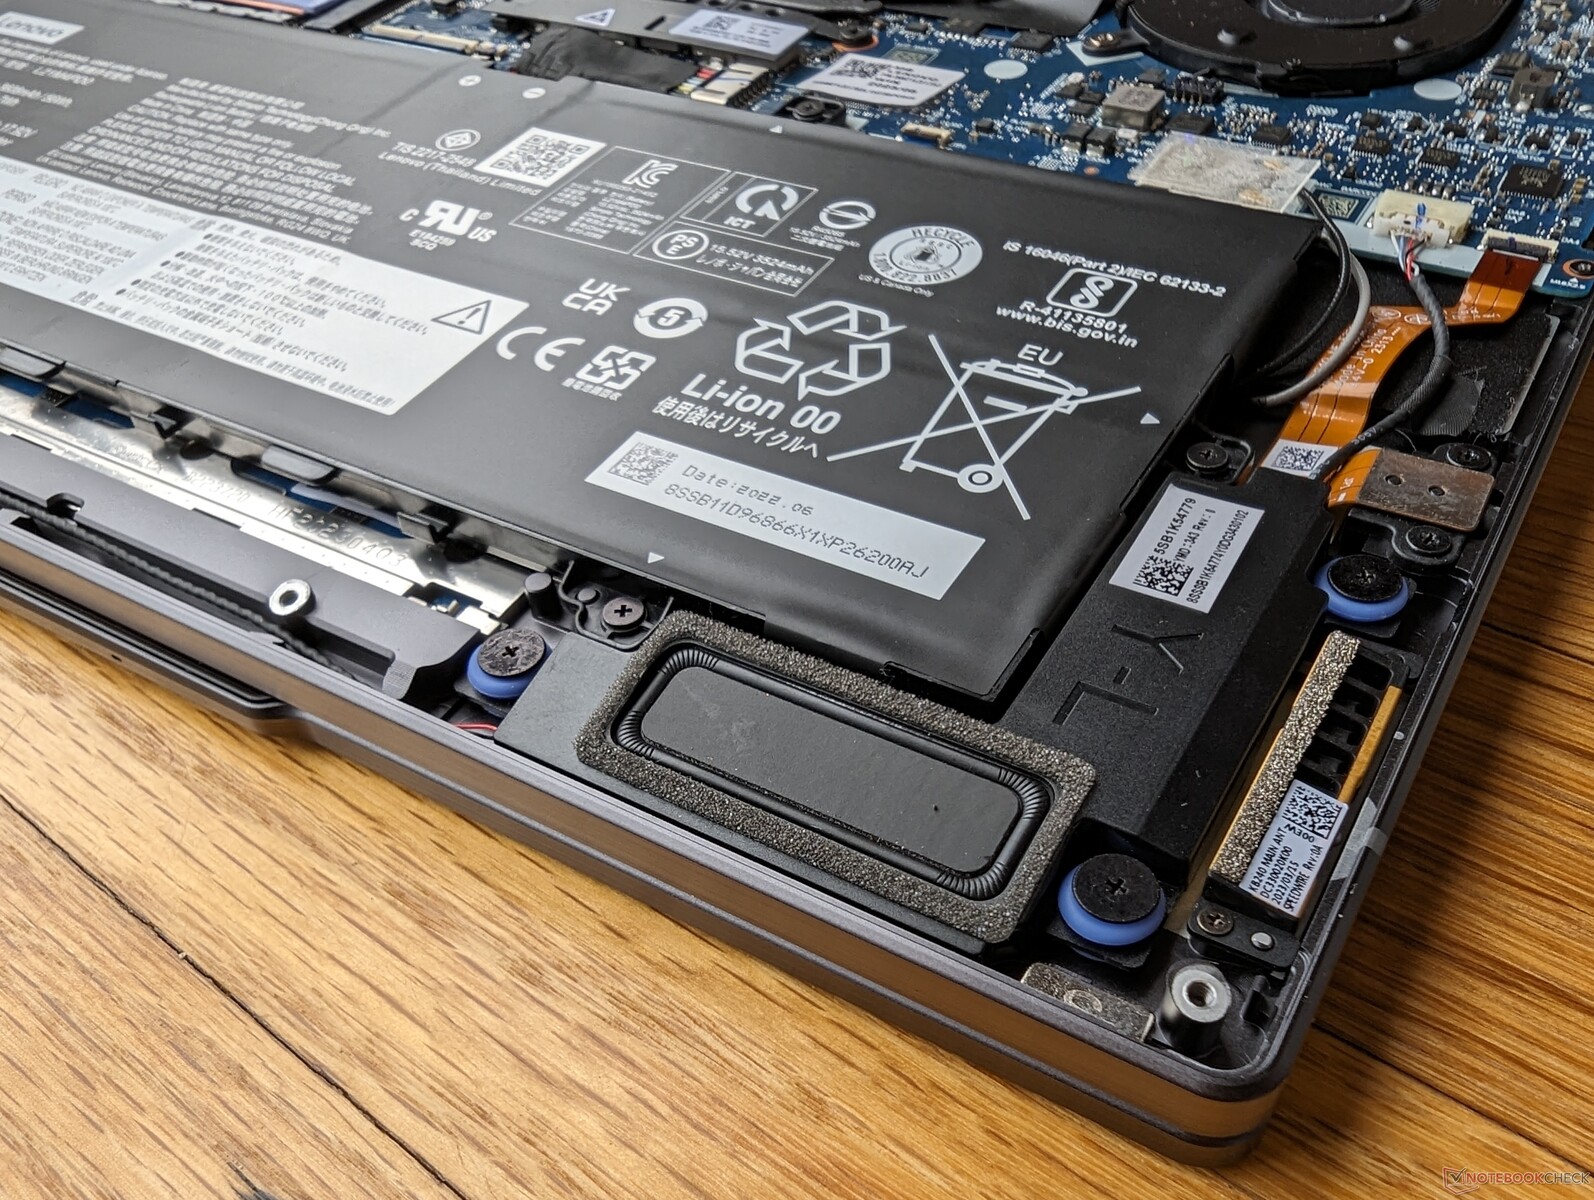
Wartung
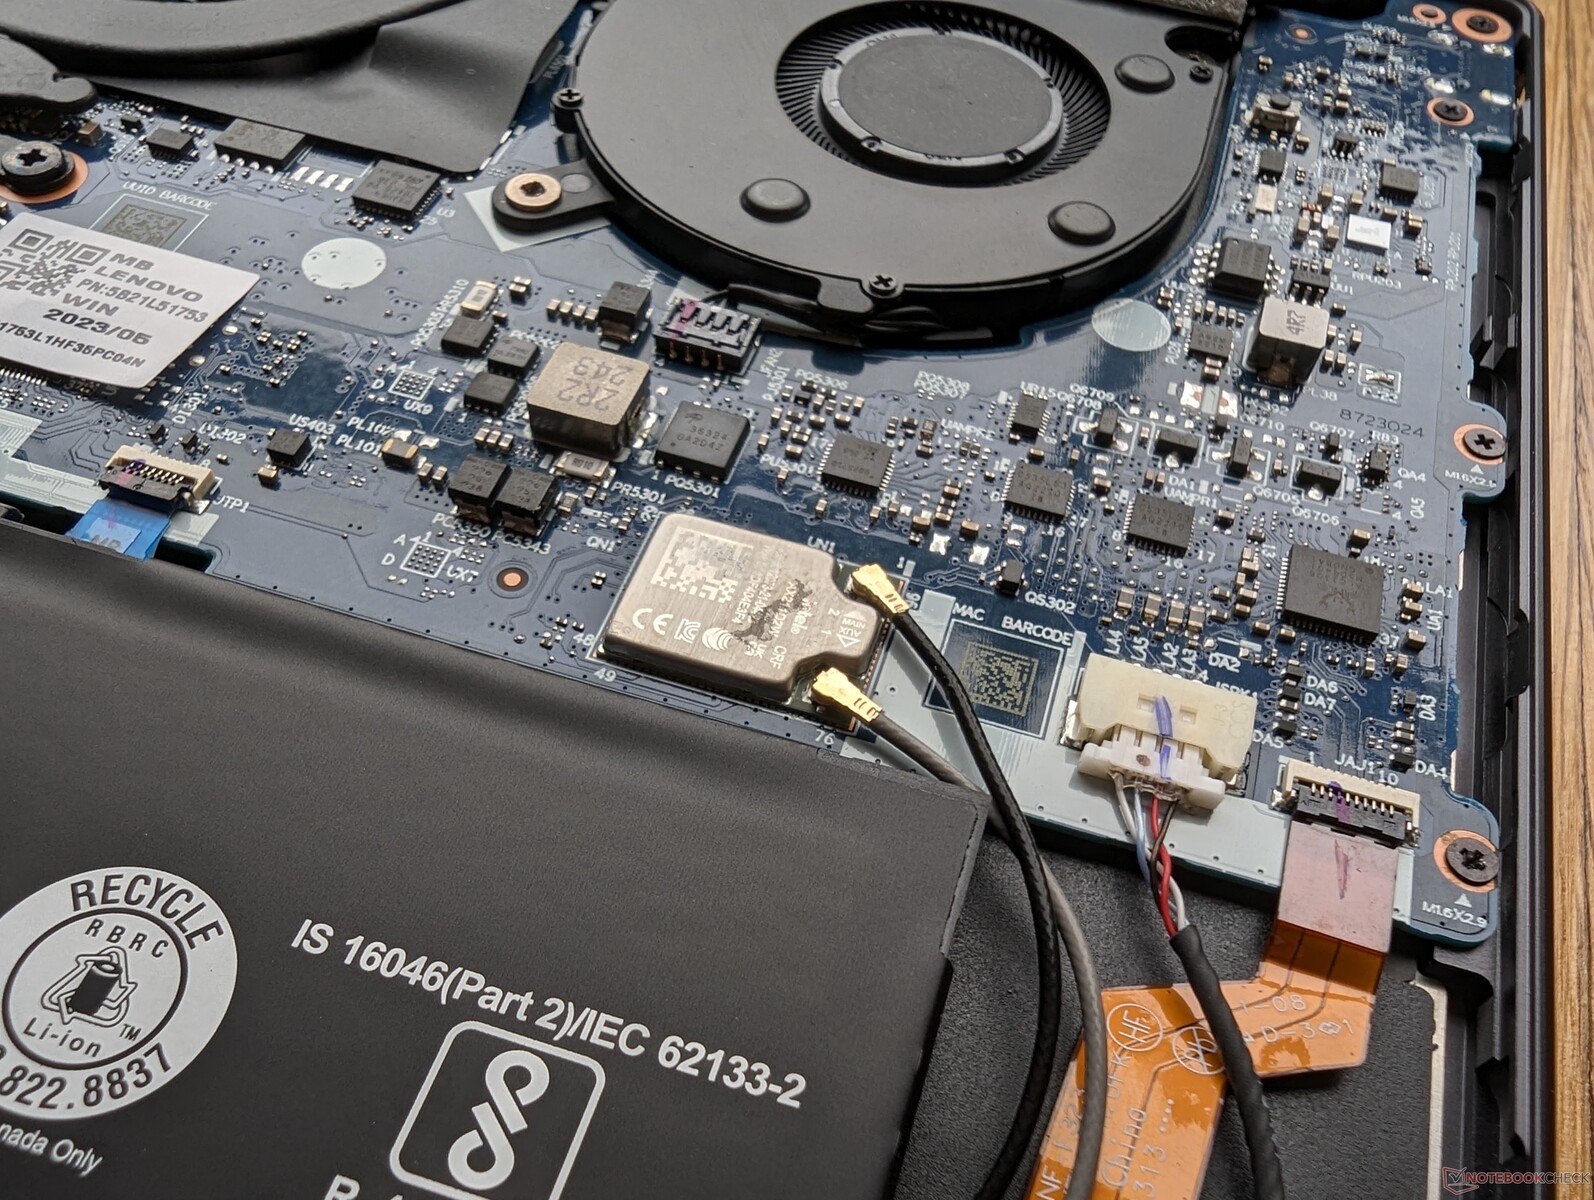
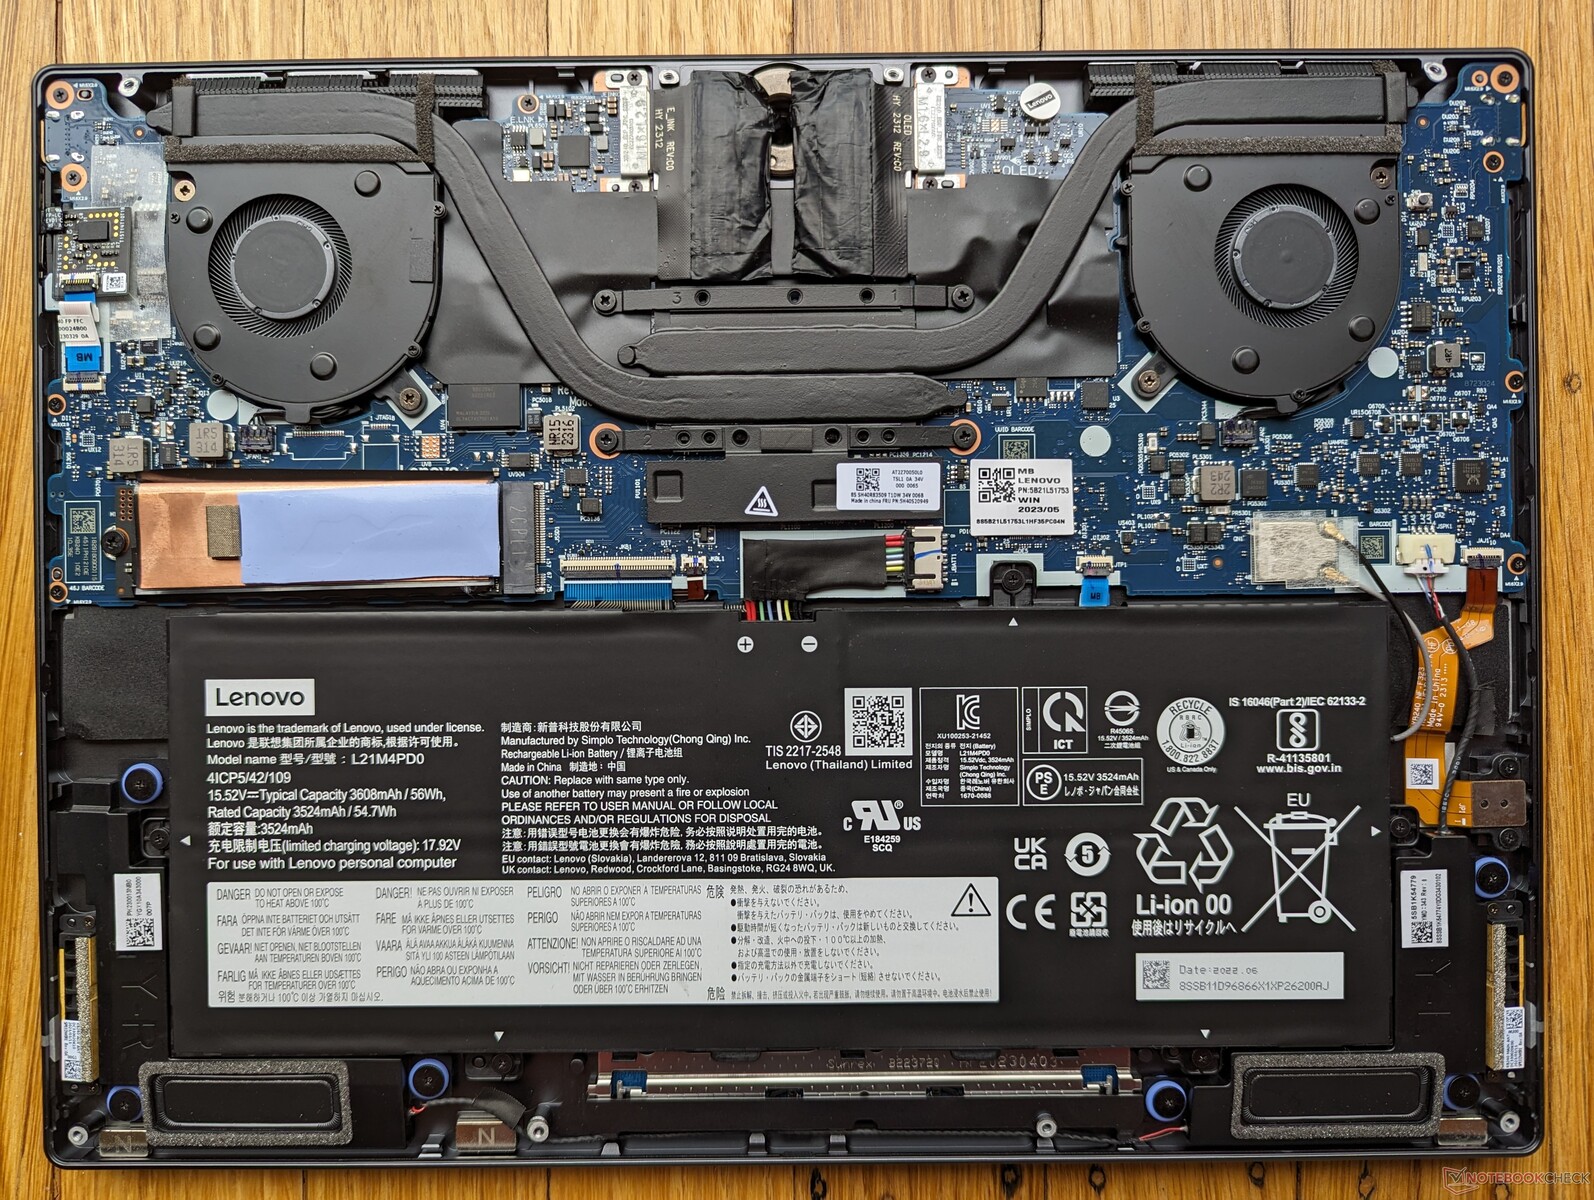
Acht TX5-Schrauben sichern die Basis, welche sich leicht öffnen lässt. Im inneren des Laptops finden wir nur wenige Upgrademöglichkeiten vor. Lediglich die SSD könnte ausgetauscht werden. Alle anderen Bauteile sind proprietär oder schlicht verlötet.
Zubehöhr und Garantie
Im Zubehör unseres US-Testgeräts für 3.000 US-Dollar finden wir den Lenovo Digital Pen 2 mitsamt einer AAAA-Batterie. Dieser lässt sich leider nicht magnetisch am Laptop befestigen. In Europa stehen verschiedene Garantieoptionen zur Verfügung, die bei 2 Jahren Pick-and-Return-Garantie beginnen.
Eingabegeräte - Könnte besser sein
Tastatur
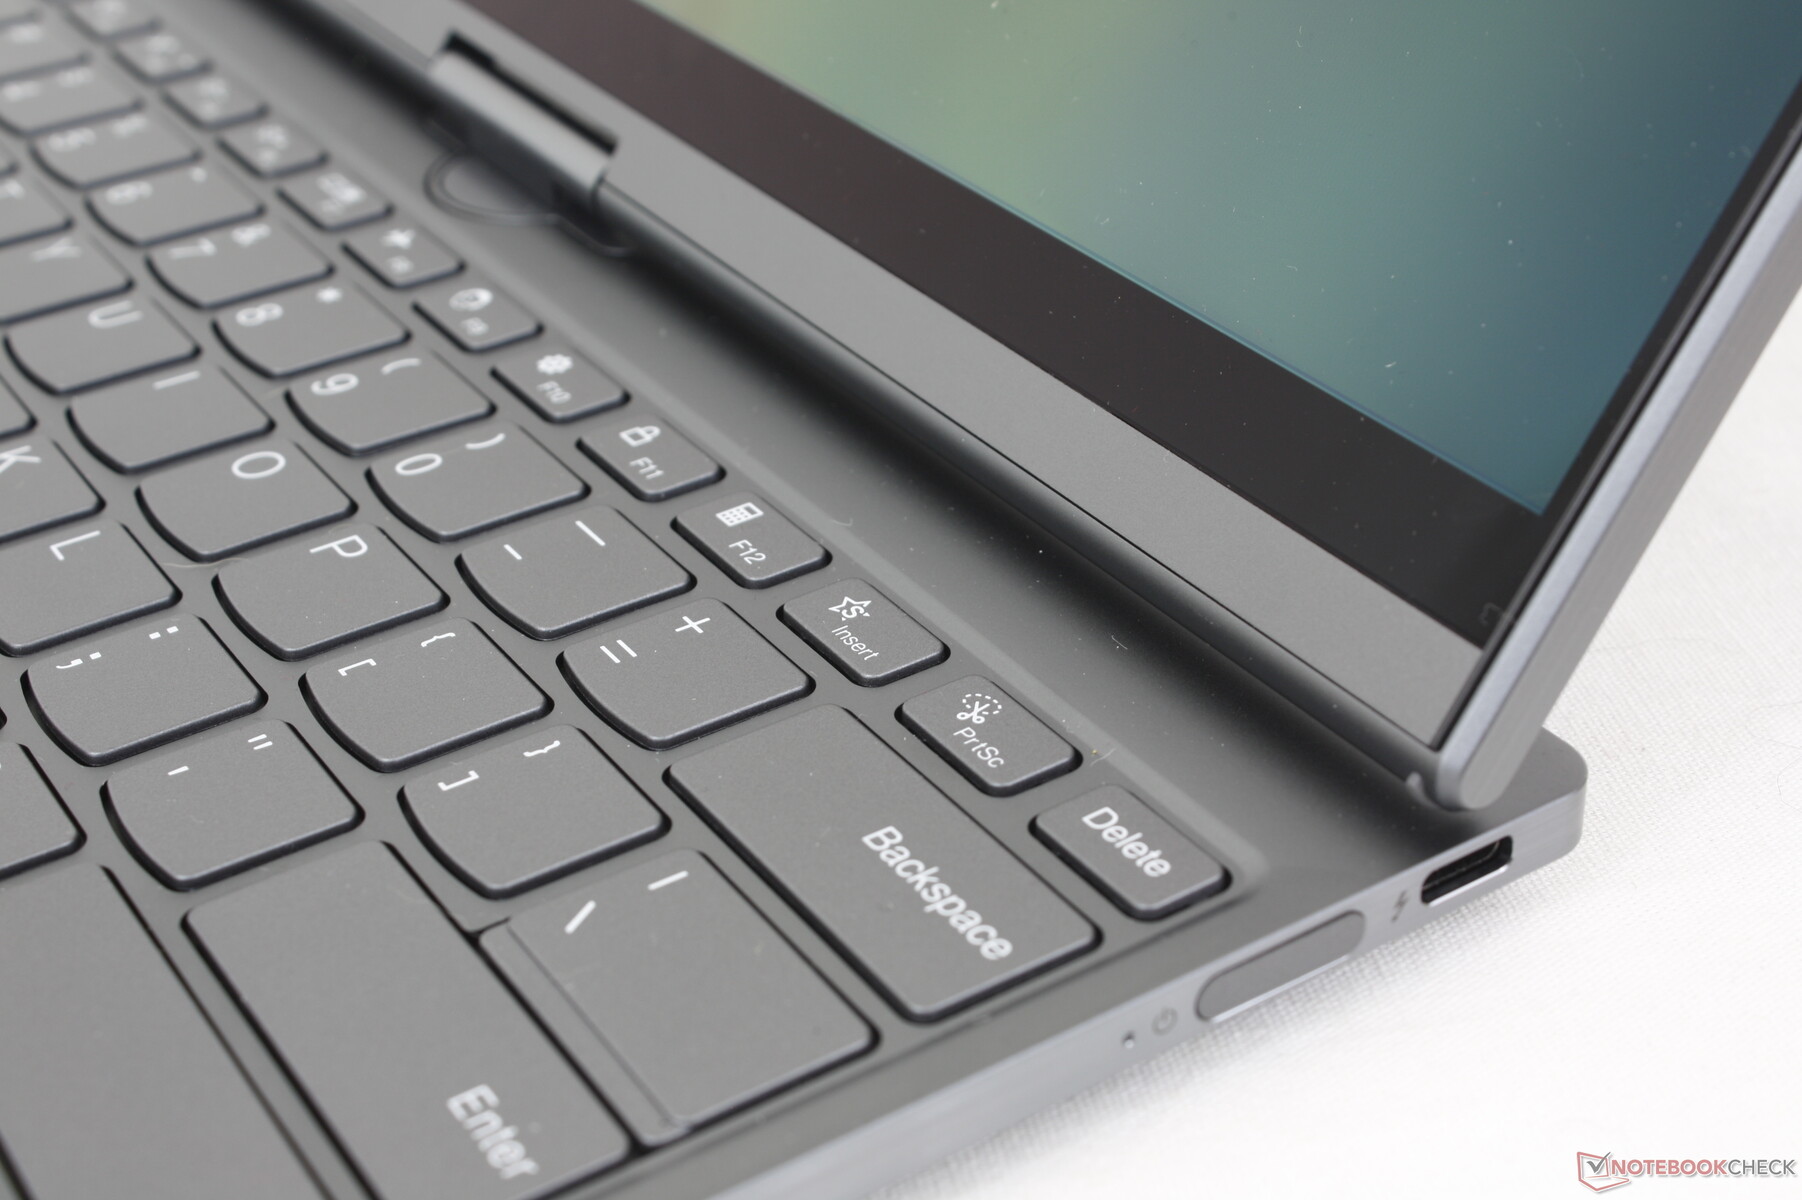
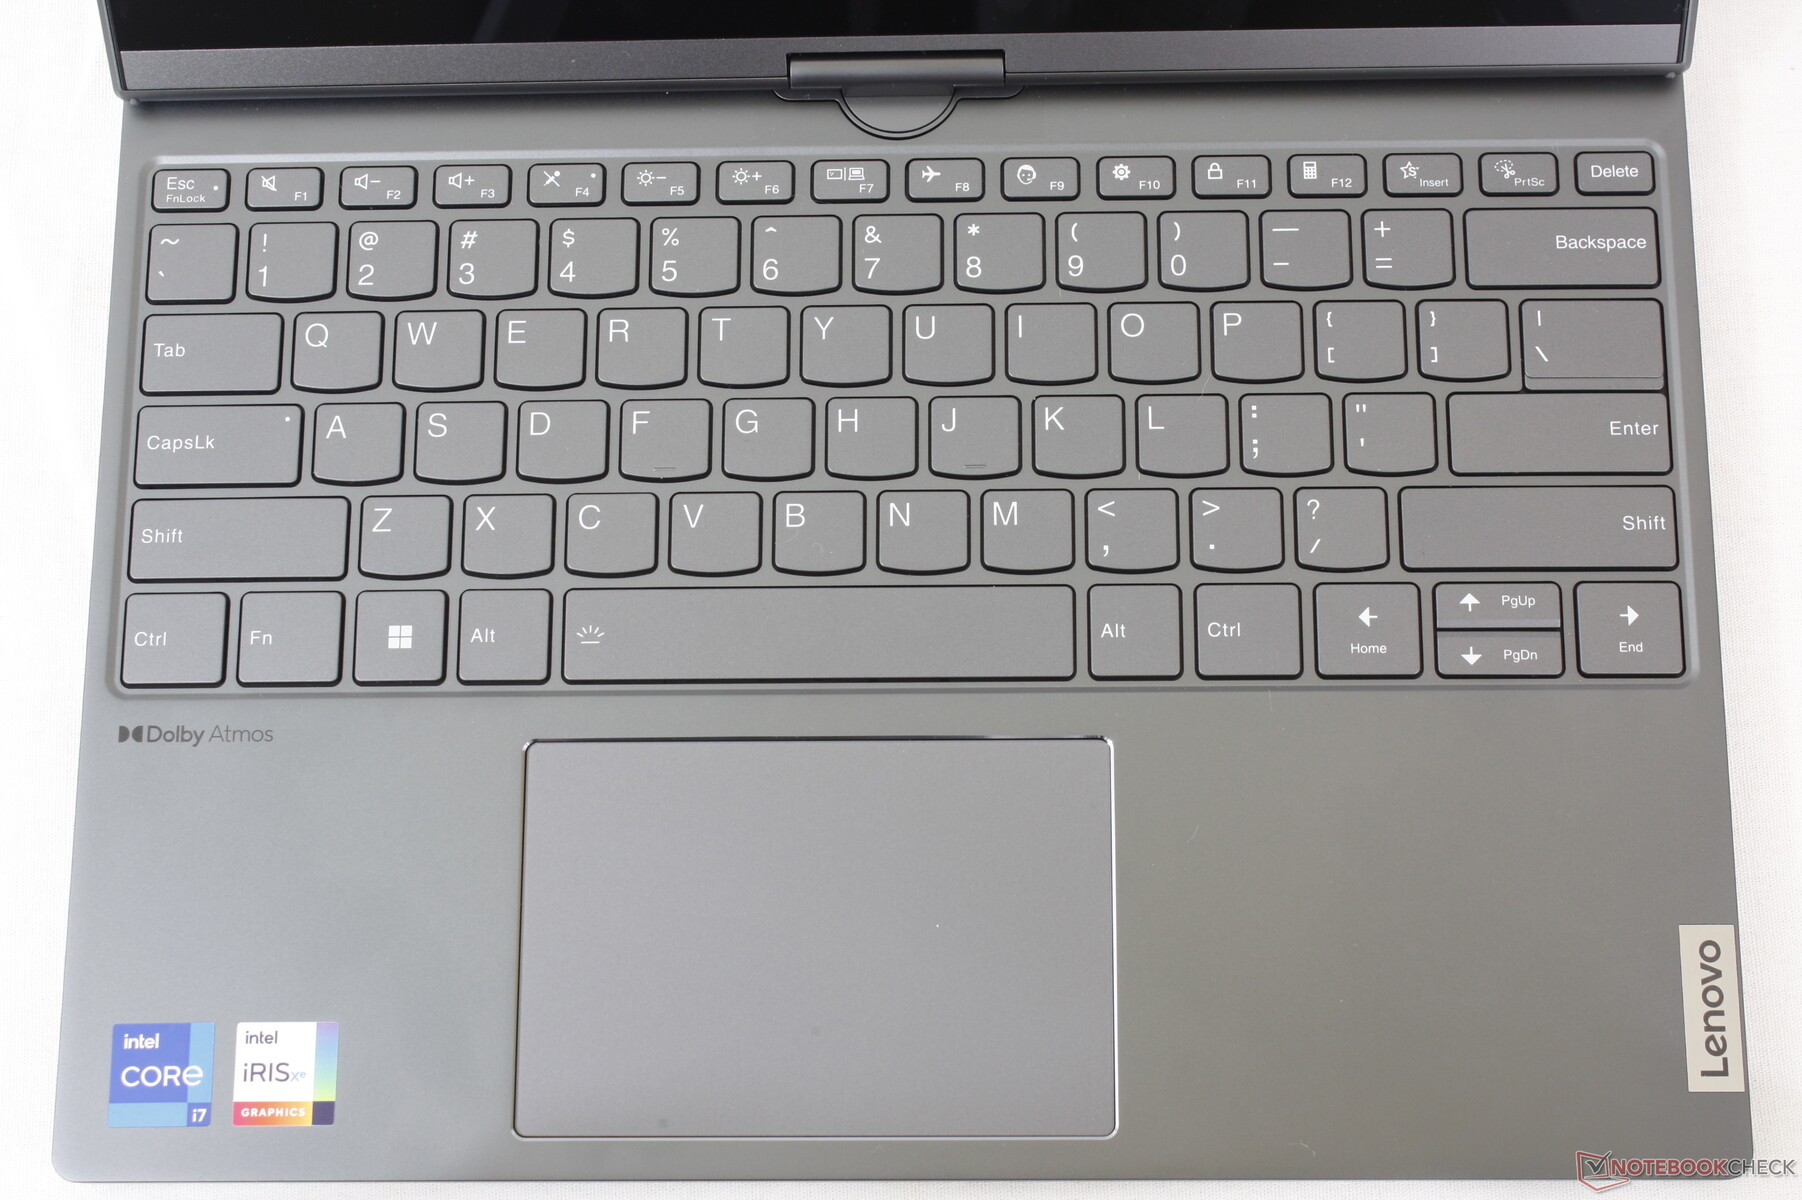
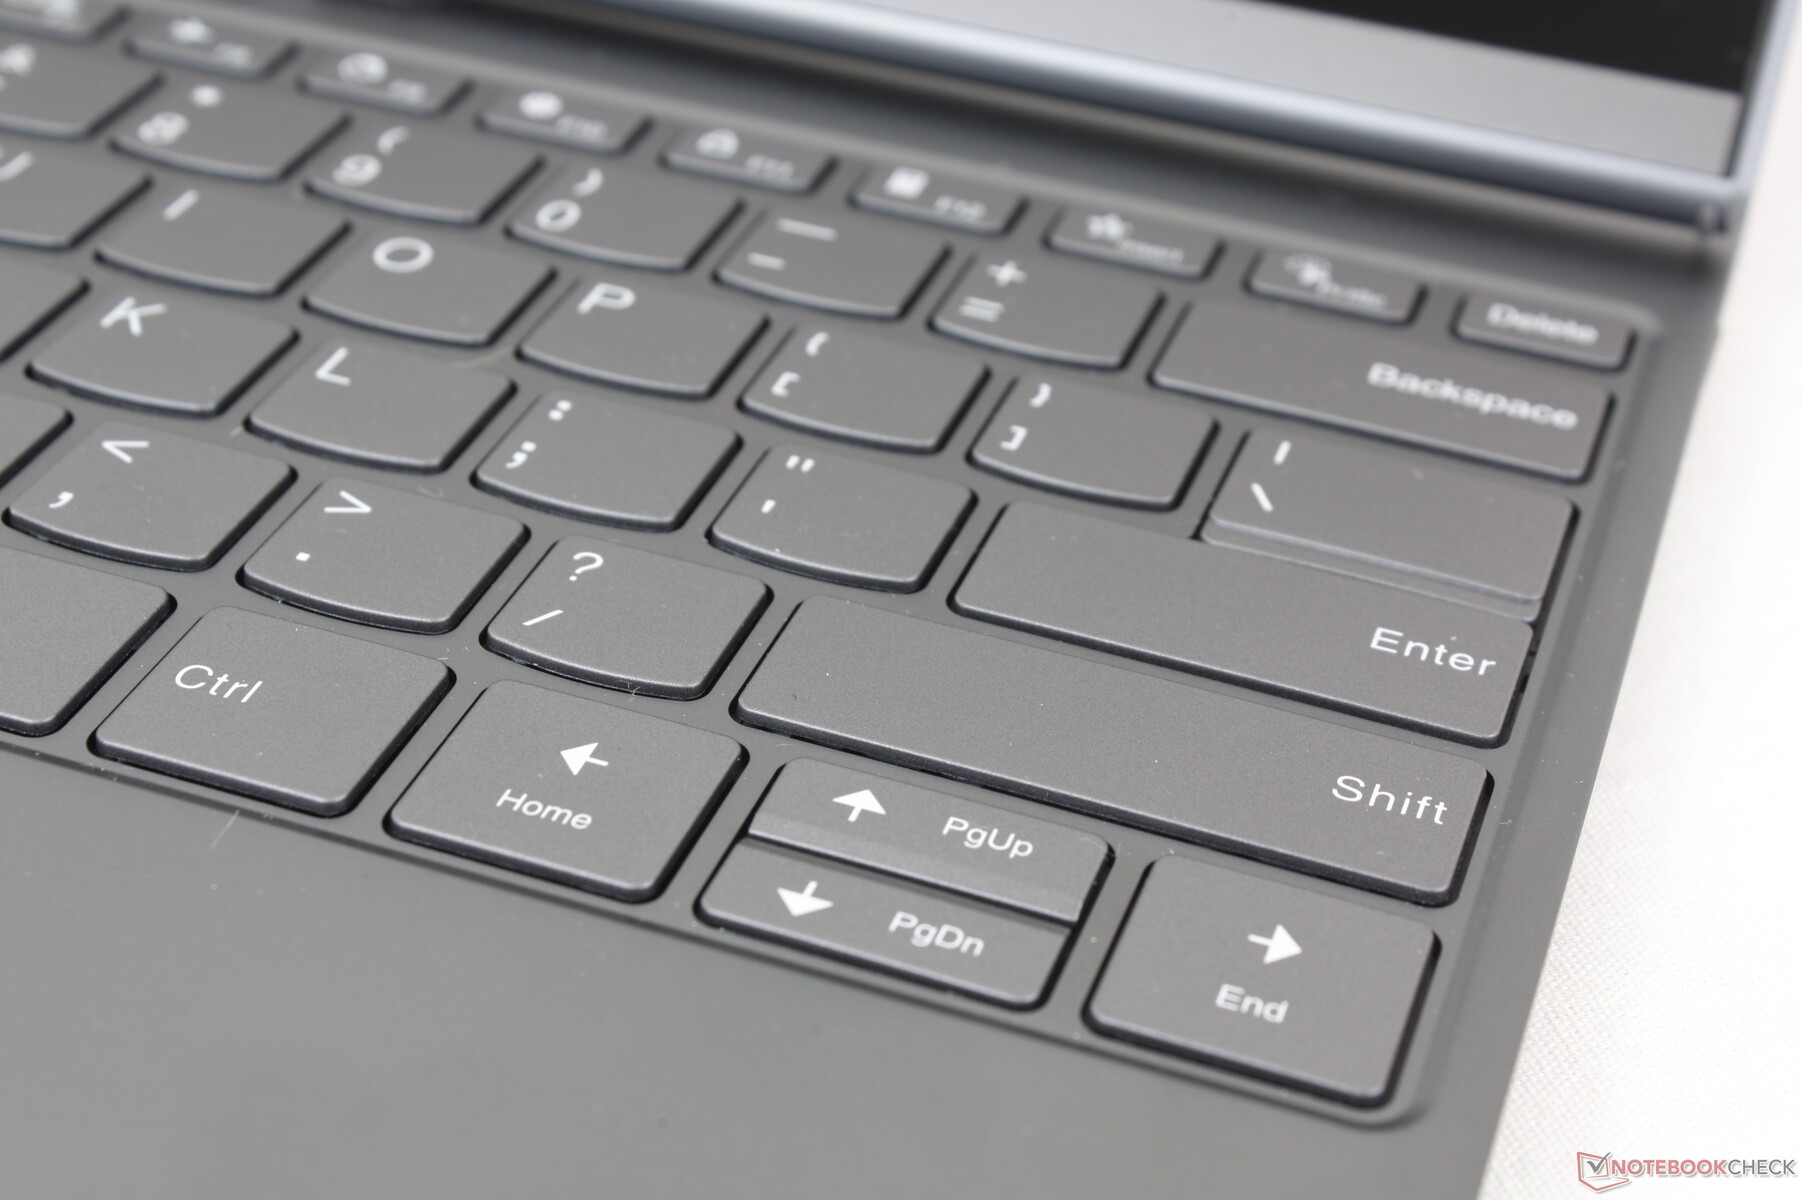
Die Tastatur ist an diesem ThinkBook eine zwiespältige Angelegenheit, da sie sich fast so anfühlt, als ob man sich erst nach den Displays Gedanken um die Tasten gemacht hätte. Genauer gesagt sind die Tasten schwammiger als wir es selbst im Vergleich zu IdeaPad-Modellen gewohnt sind. Besonders frustrierend ist die Leertaste, deren rechte Hälfte sich beim Drücken schwammiger anfühlt als die linke. Die Enter- und Backspace-Tasten sindzudem kleiner als wir es uns wünschen würden. Lenovo ist normalerweise sehr gut, wenn es um ThinkPad-Tastaturen geht, daher ist es etwas enttäuschend, dass hier beim ThinkBook Plus Gen 4 eher eine schlechte Tastatur verbaut ist.
Touchpad
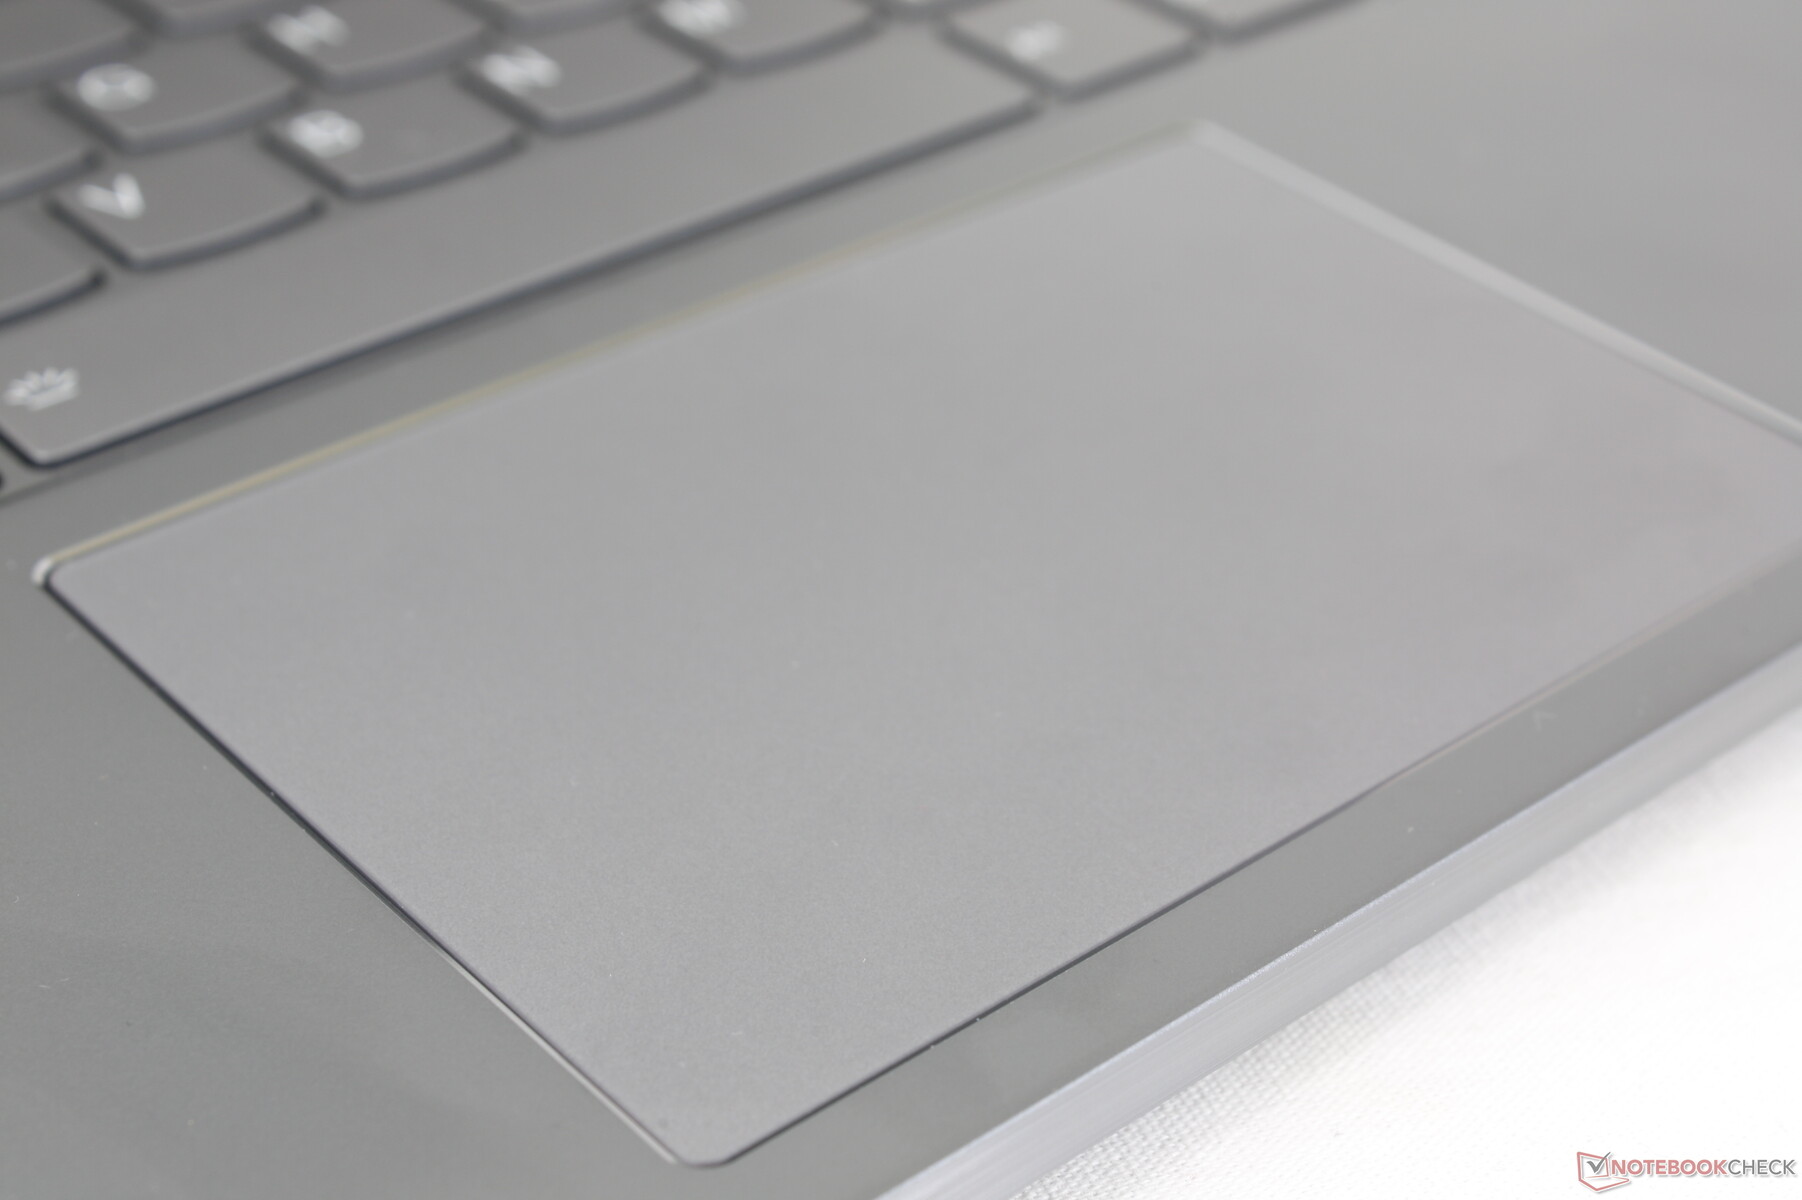
Das 10,5 x 7 cm große Clickpad bietet ein sattes haptisches und akustisches Feedback. Eine angenehme Oberfläche rundet das gesamtbild ab.

Displays — Die Hauptatraktion
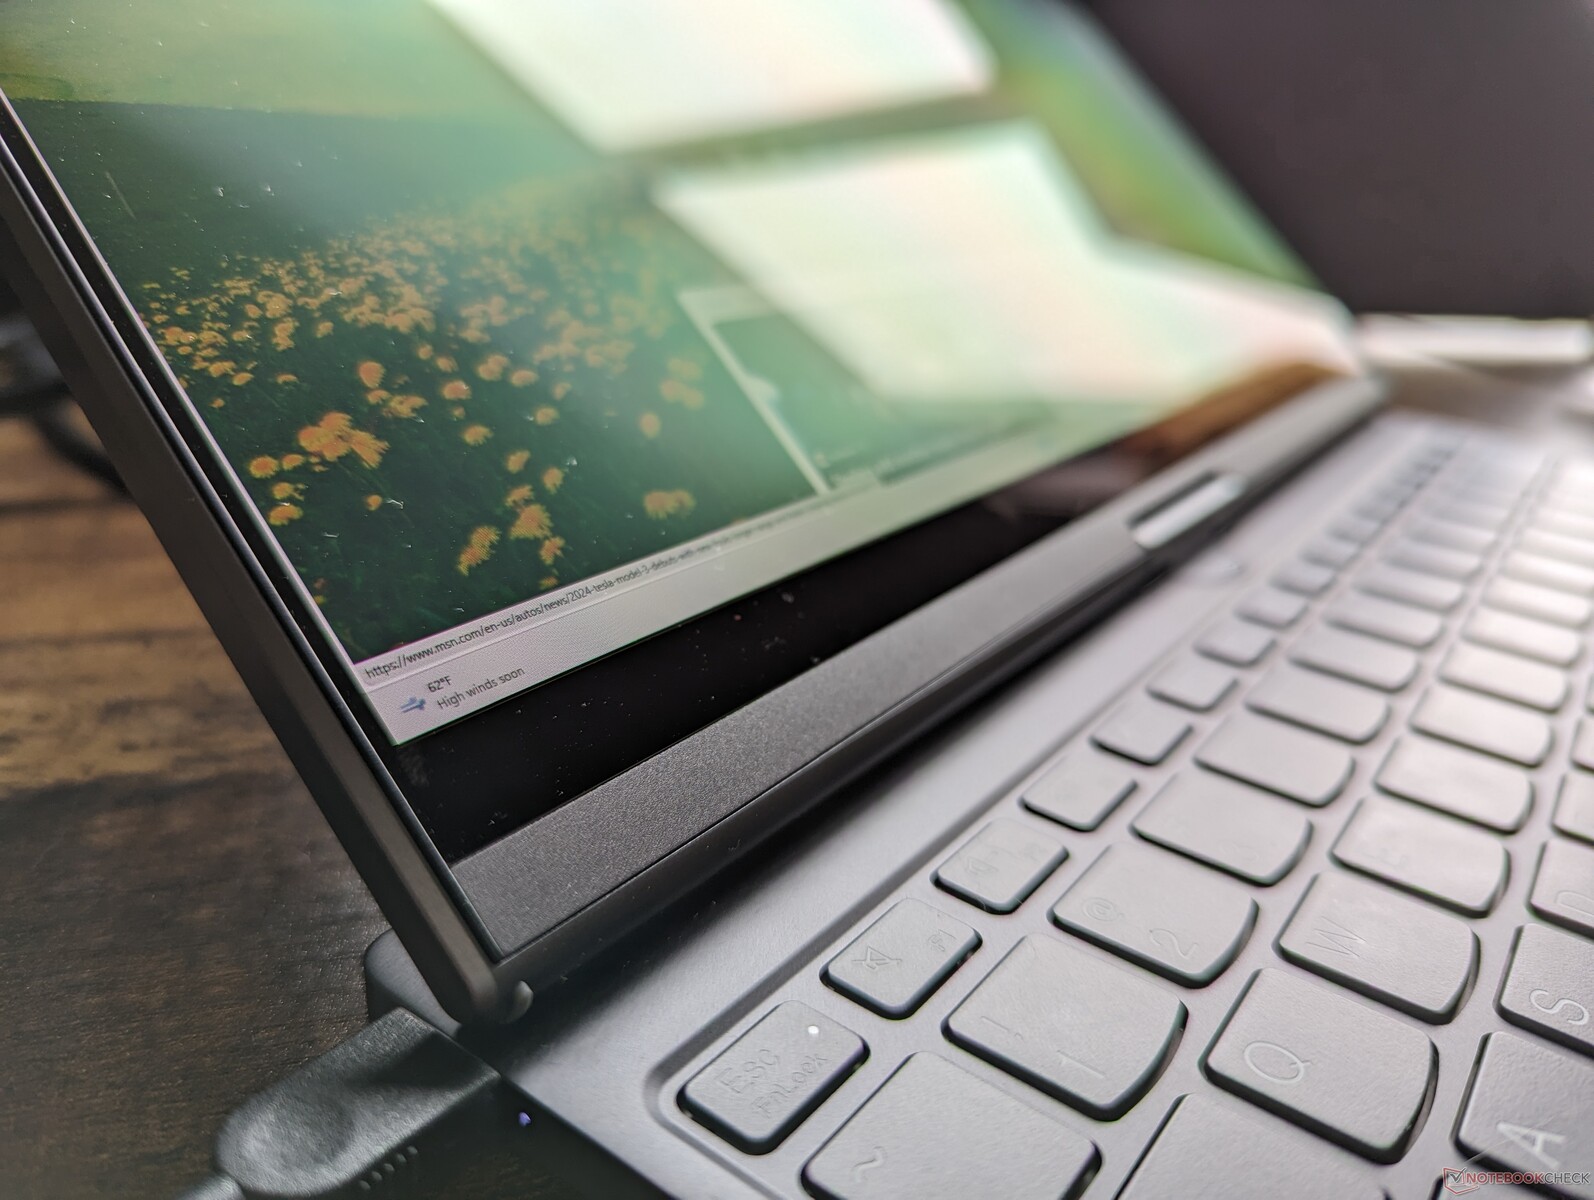
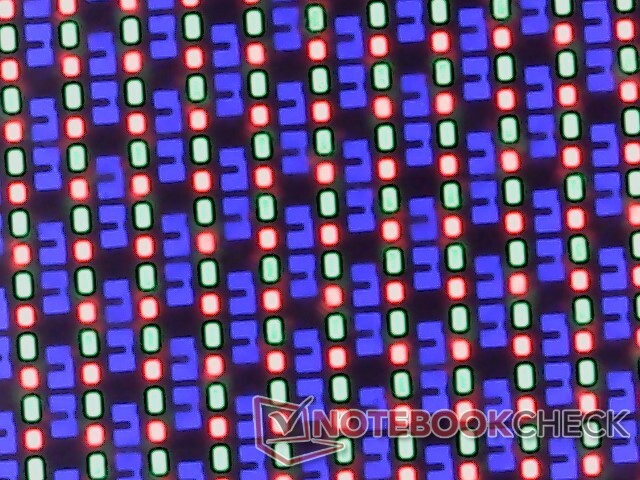
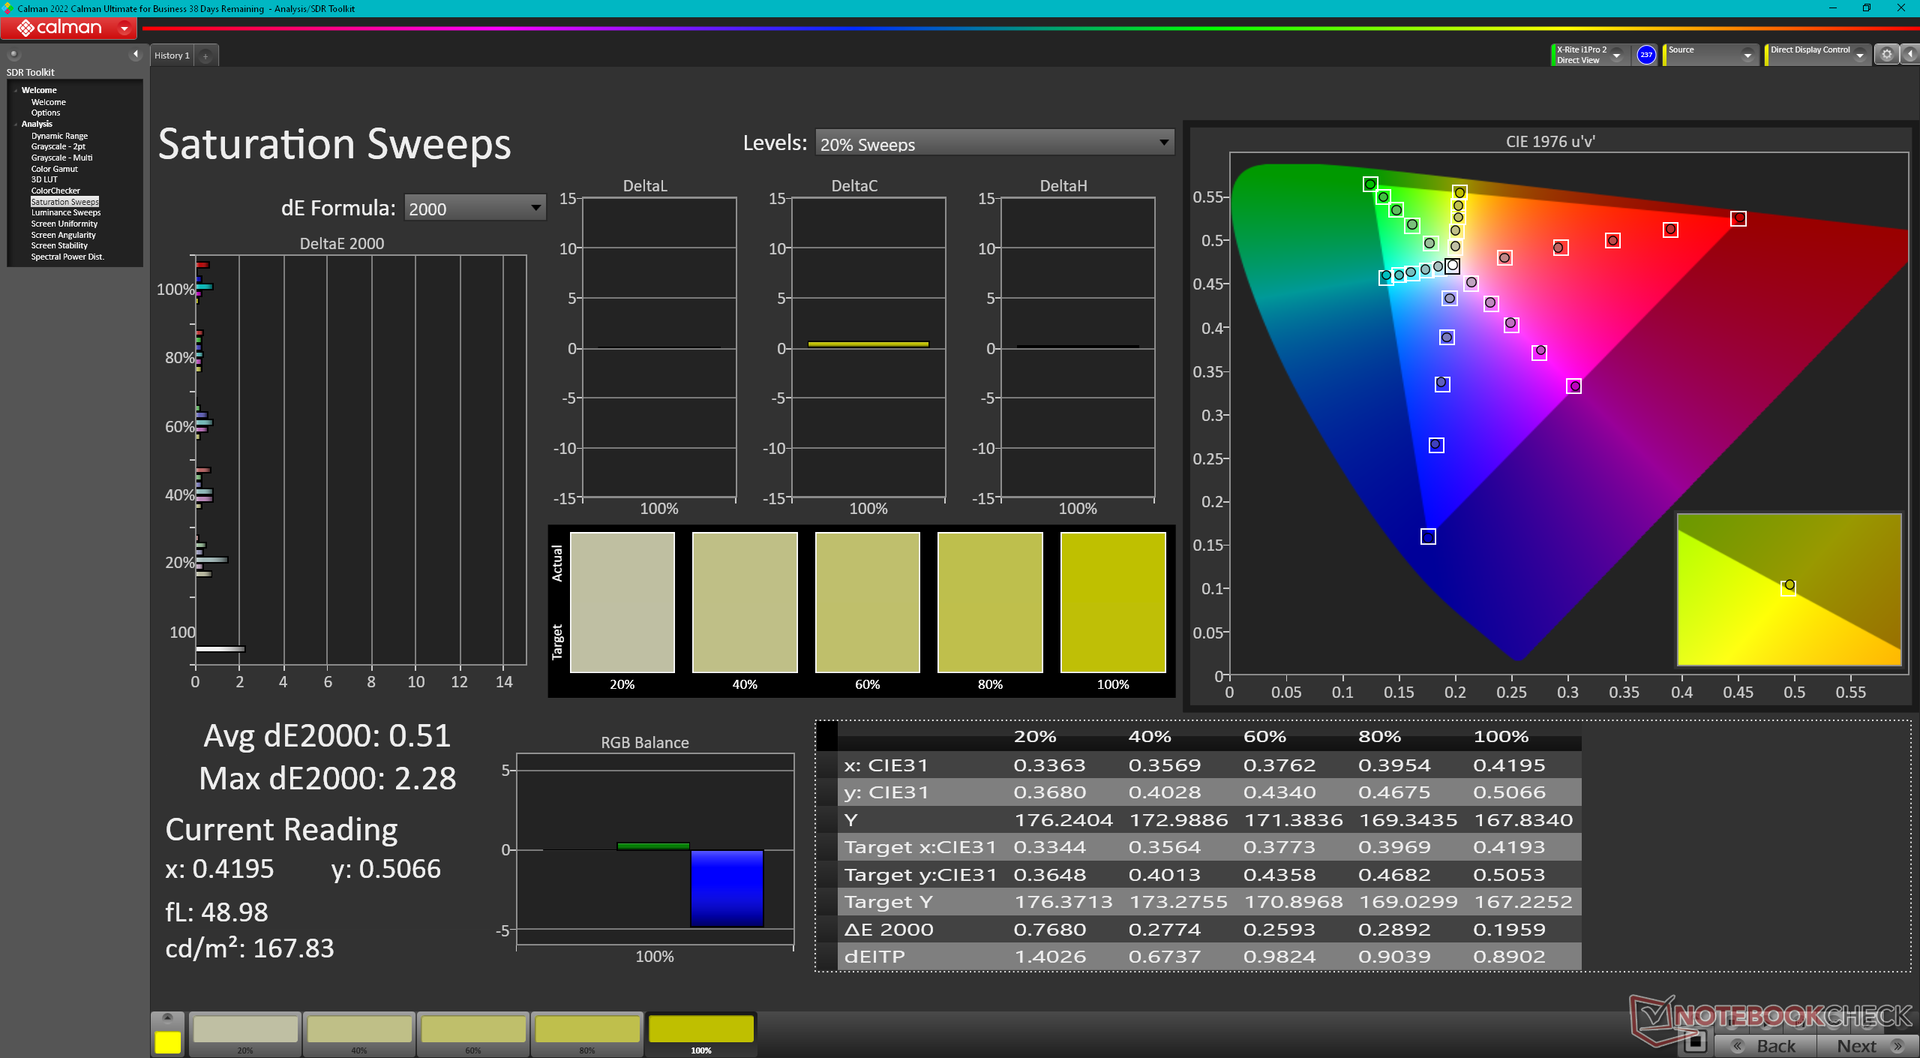
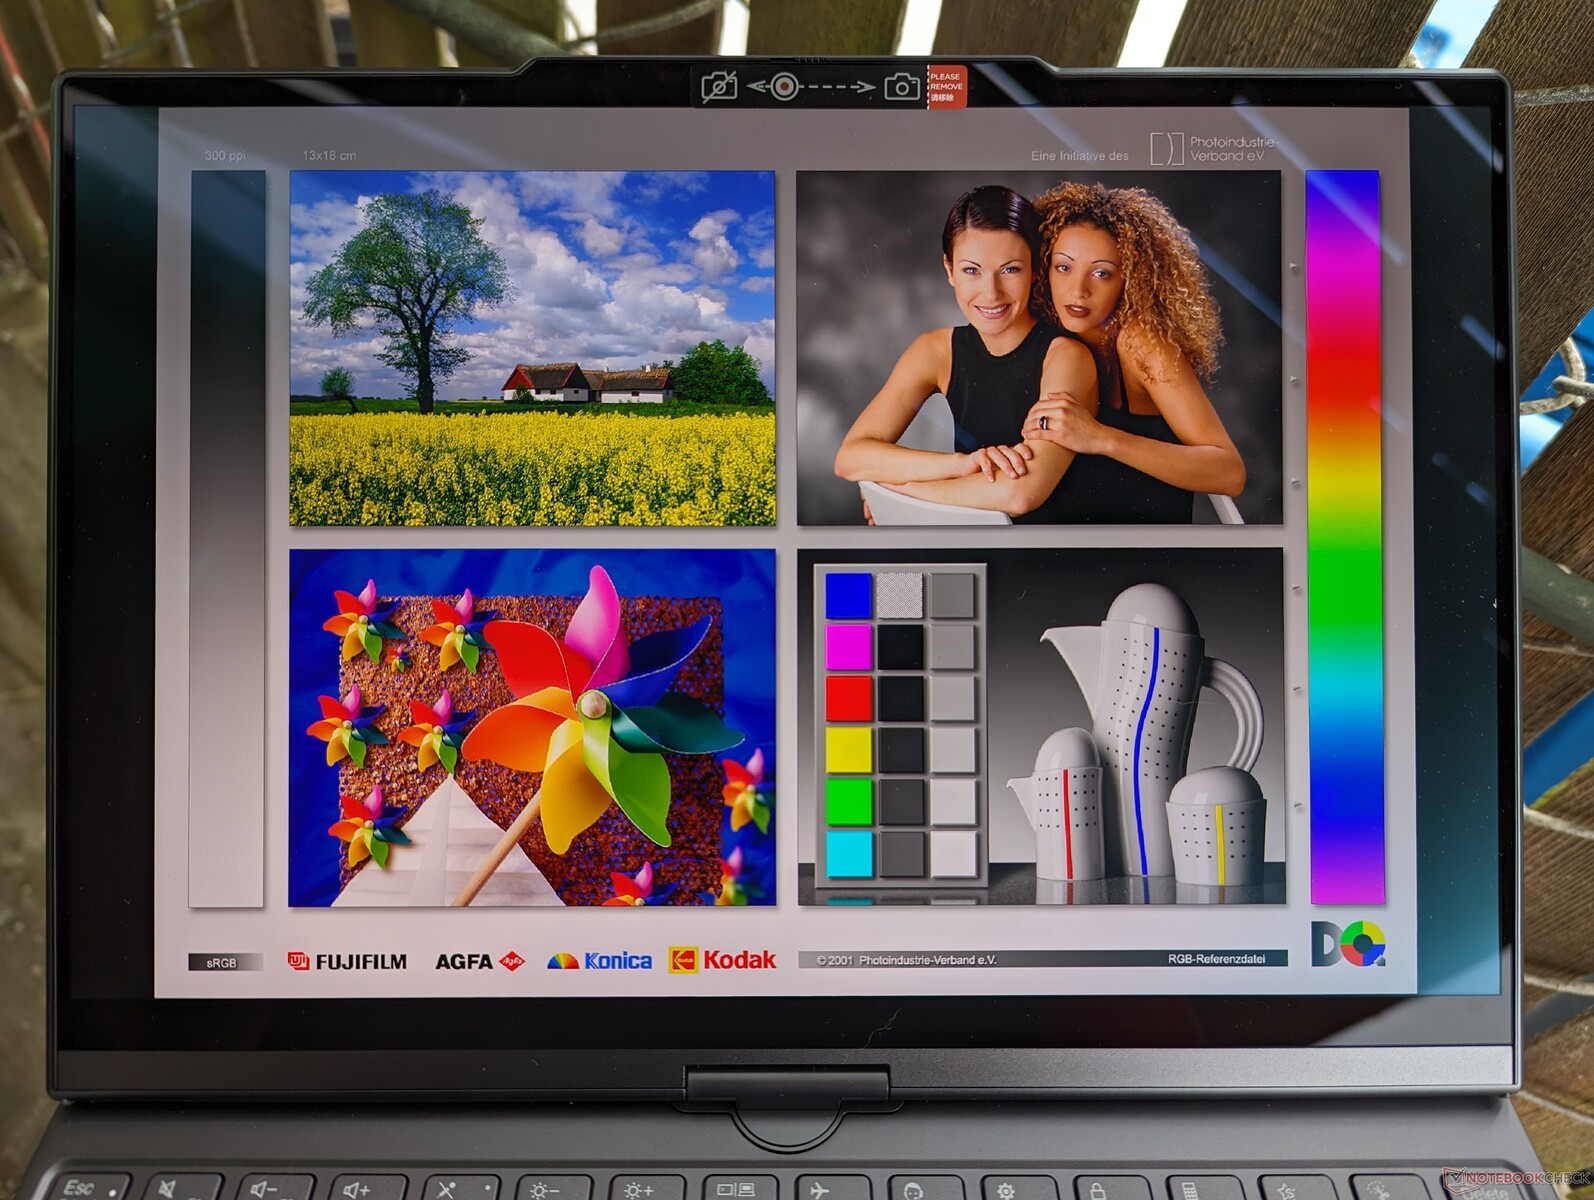
Als Primärbildschirm am ThinkBook Plus Gen 4 darf man wohl den OLED-Bildschirm mit 2880 x 1800 Pixeln ansehen. Dieser bietet mit einer Ausnahme genau das, was man von einem guten OLED-Display erwarten darf. Schnelle Reaktionszeiten, tiefes Schwarz und eine gute Farbdarstellung im DisplayP3-Farbraum stehen hier auf der Habenseite. Aber den Bildschirm hat eine Aktualisierungsrate von nur 60 Hz, womit Scrollen nicht ganz so flüssig läuft wie bei anderen Laptops mit 90 oder 120 Hz. Damit fühlen sich Convertibles wie das Asus ZenBook einfach noch flüssiger an.
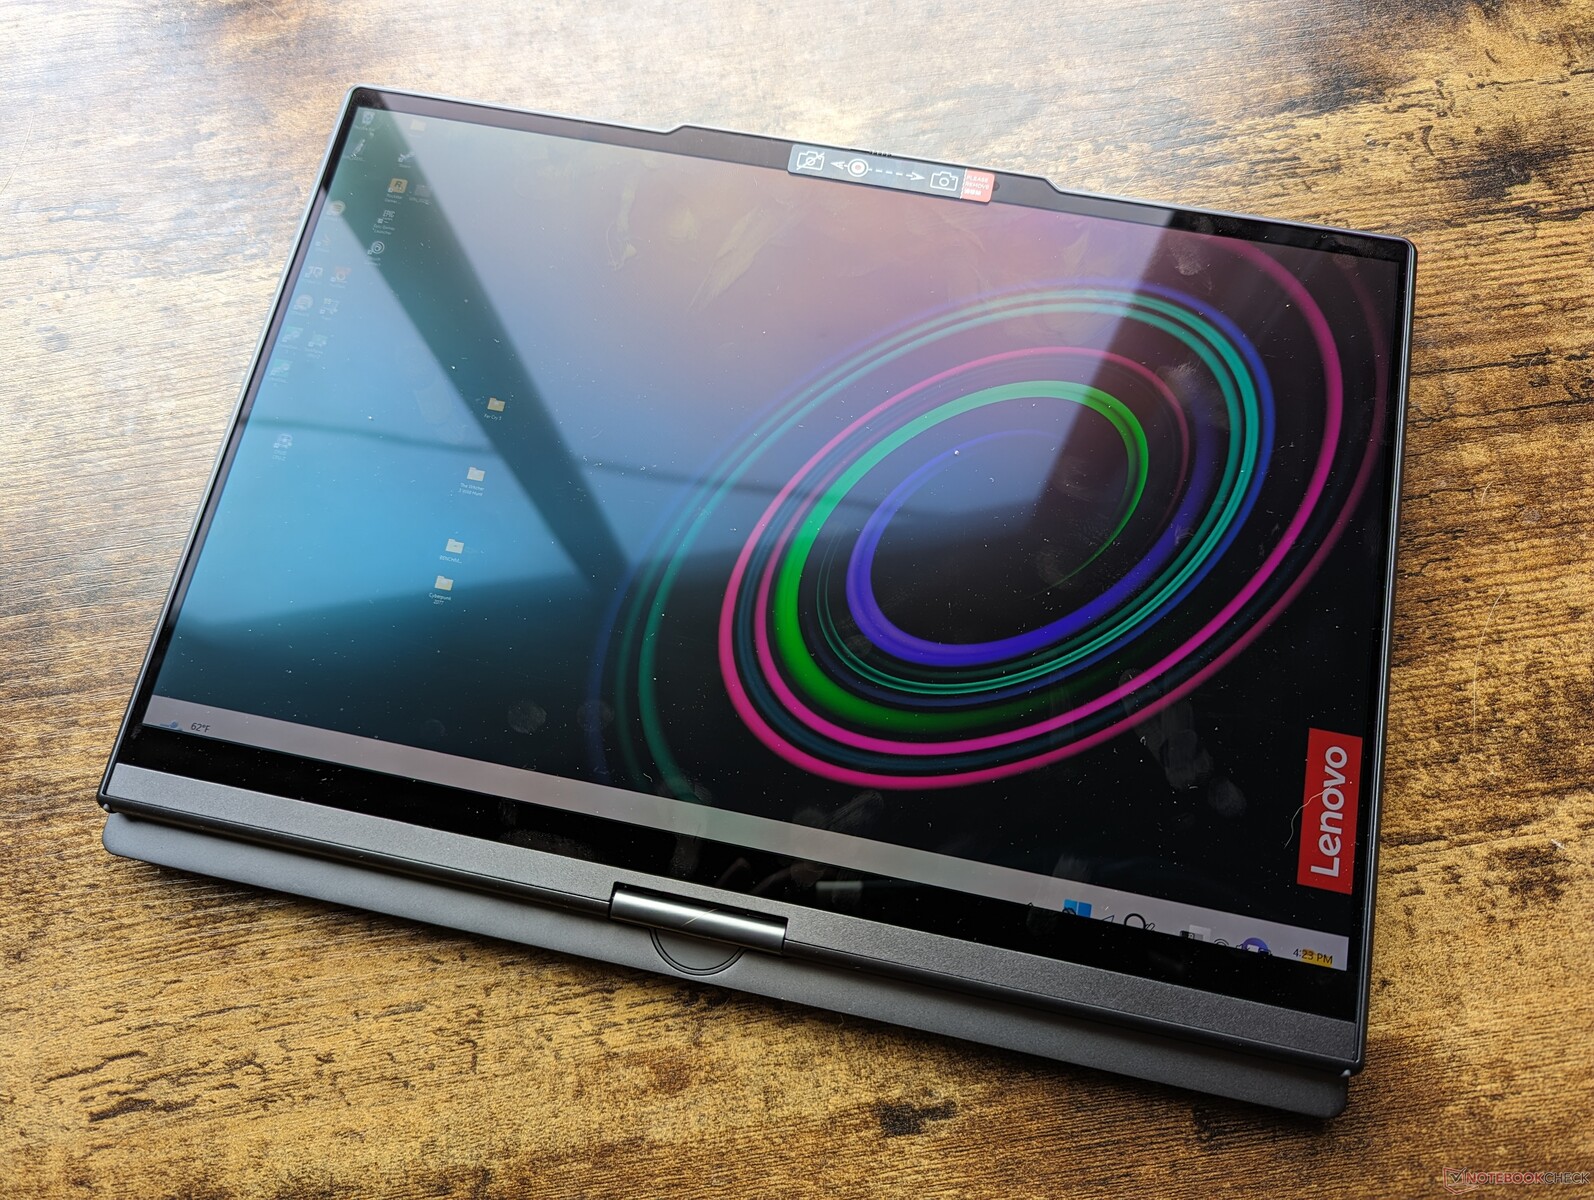
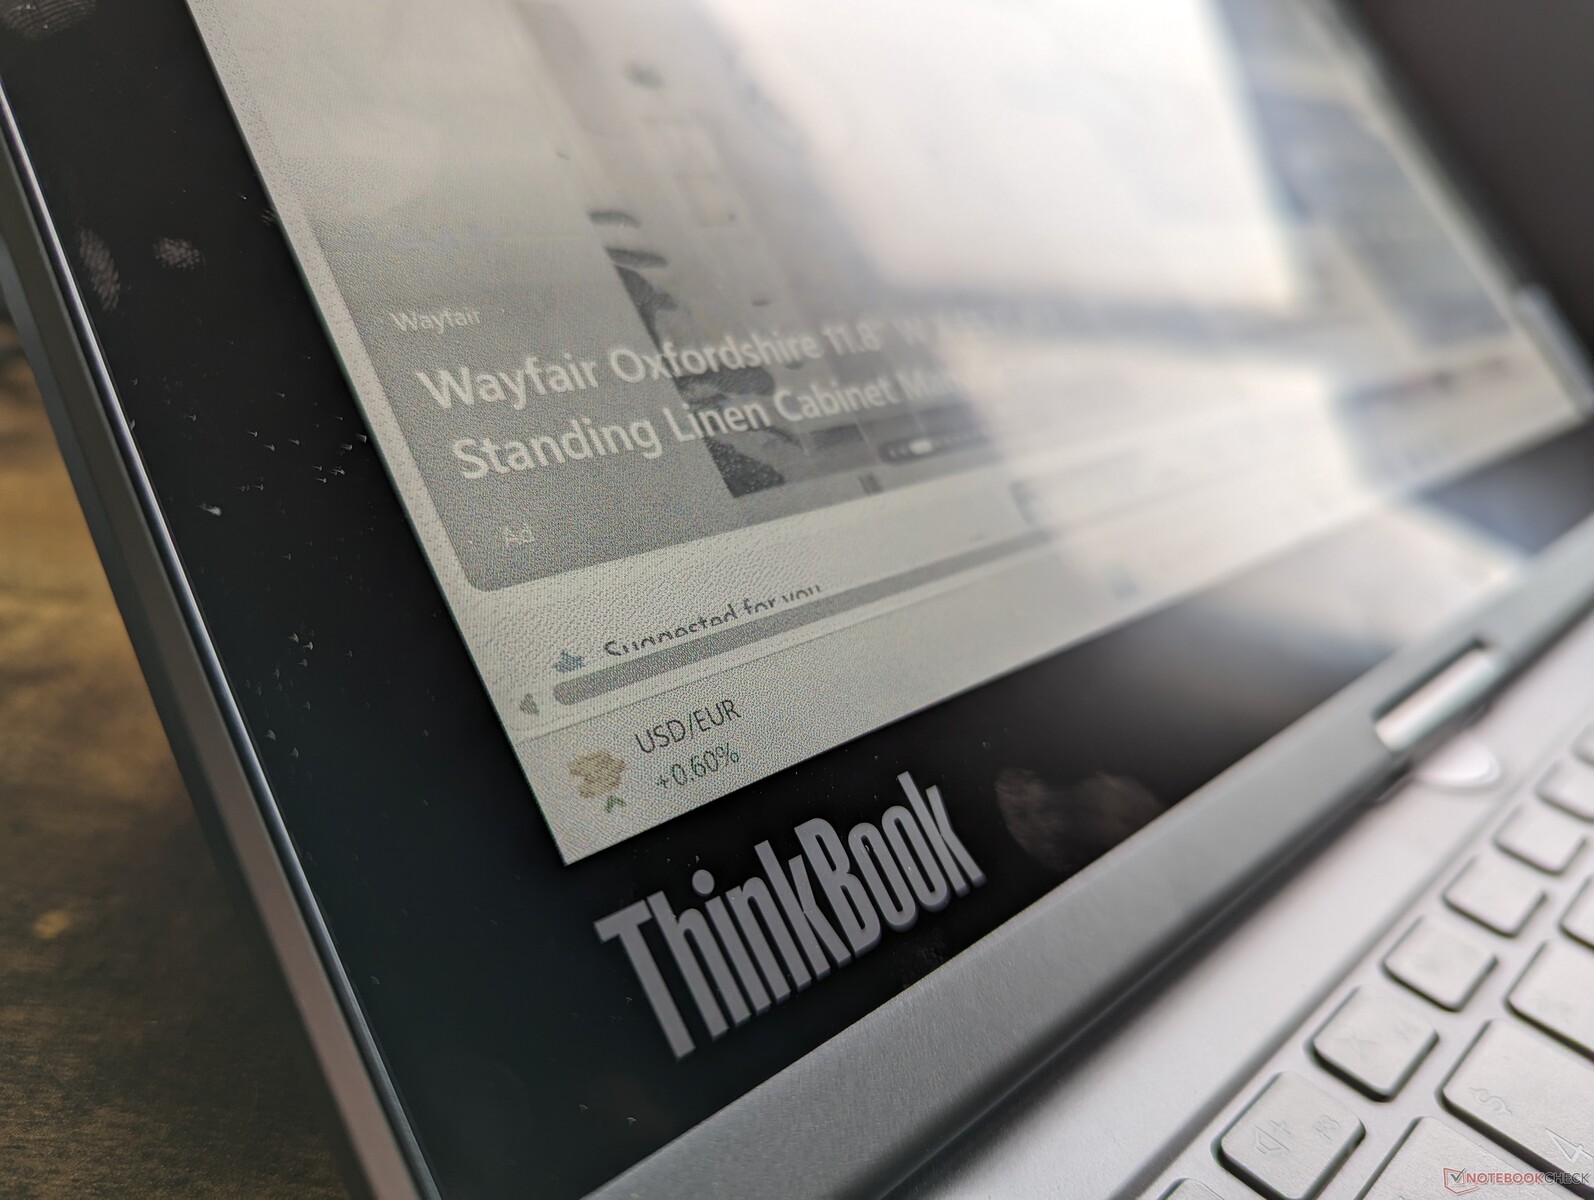
Das Farbige E-Ink-Display am ThinkBook lößt mit 2560 x 1600 Pixeln auf. Damit ergibt sich zwar ein scharfes Bild, aber trotzdem finden wir hier auch einen Nachteil, denn dessen native Auflösung kleiner als die des OLED-Hauptdisplays, was zu Problemen führt, wenn Windows zwischen den beiden Bildschirmen umschaltet. Der gesamte Inhalt wird bei jedem Bildschirmwechsel in der Größe verändert und neu positioniert, was dann manuell korrigiert werden muss. Ein Auflösungsverhältnis von 1:1 zwischen den beiden Bildschirmen hätte dieses lästige Problem beheben können.
Ein weiteres Problem ist, dass sich der E Ink-Touchscreen selbst unter Berücksichtigung der langsamen Reaktionszeiten recht schwerfällig anfühlt. Das liegt vor allem daran, dass sich Windows für eReader-Zwecke nicht optimieren lässt. Das automatische Drehen des Bildschirms funktioniert im eReader-Modus beispielsweise nicht zuverlässig, und die Bildschirme brauchen mehrere Sekunden, um beim Umschalten zwischen den Bildschirmen zu laden. Die Übergangsphase ist daher nicht so reibungslos und nahtlos wie das einfache Umschalten zwischen Laptop- und Tablet-Modus bei herkömmlichen Convertible-Modellen mit nur einem Bildschirm.

| |||||||||||||||||||||||||
Ausleuchtung: 98 %
Helligkeit Akku: 367.5 cd/m²
Kontrast: ∞:1 (Schwarzwert: 0 cd/m²)
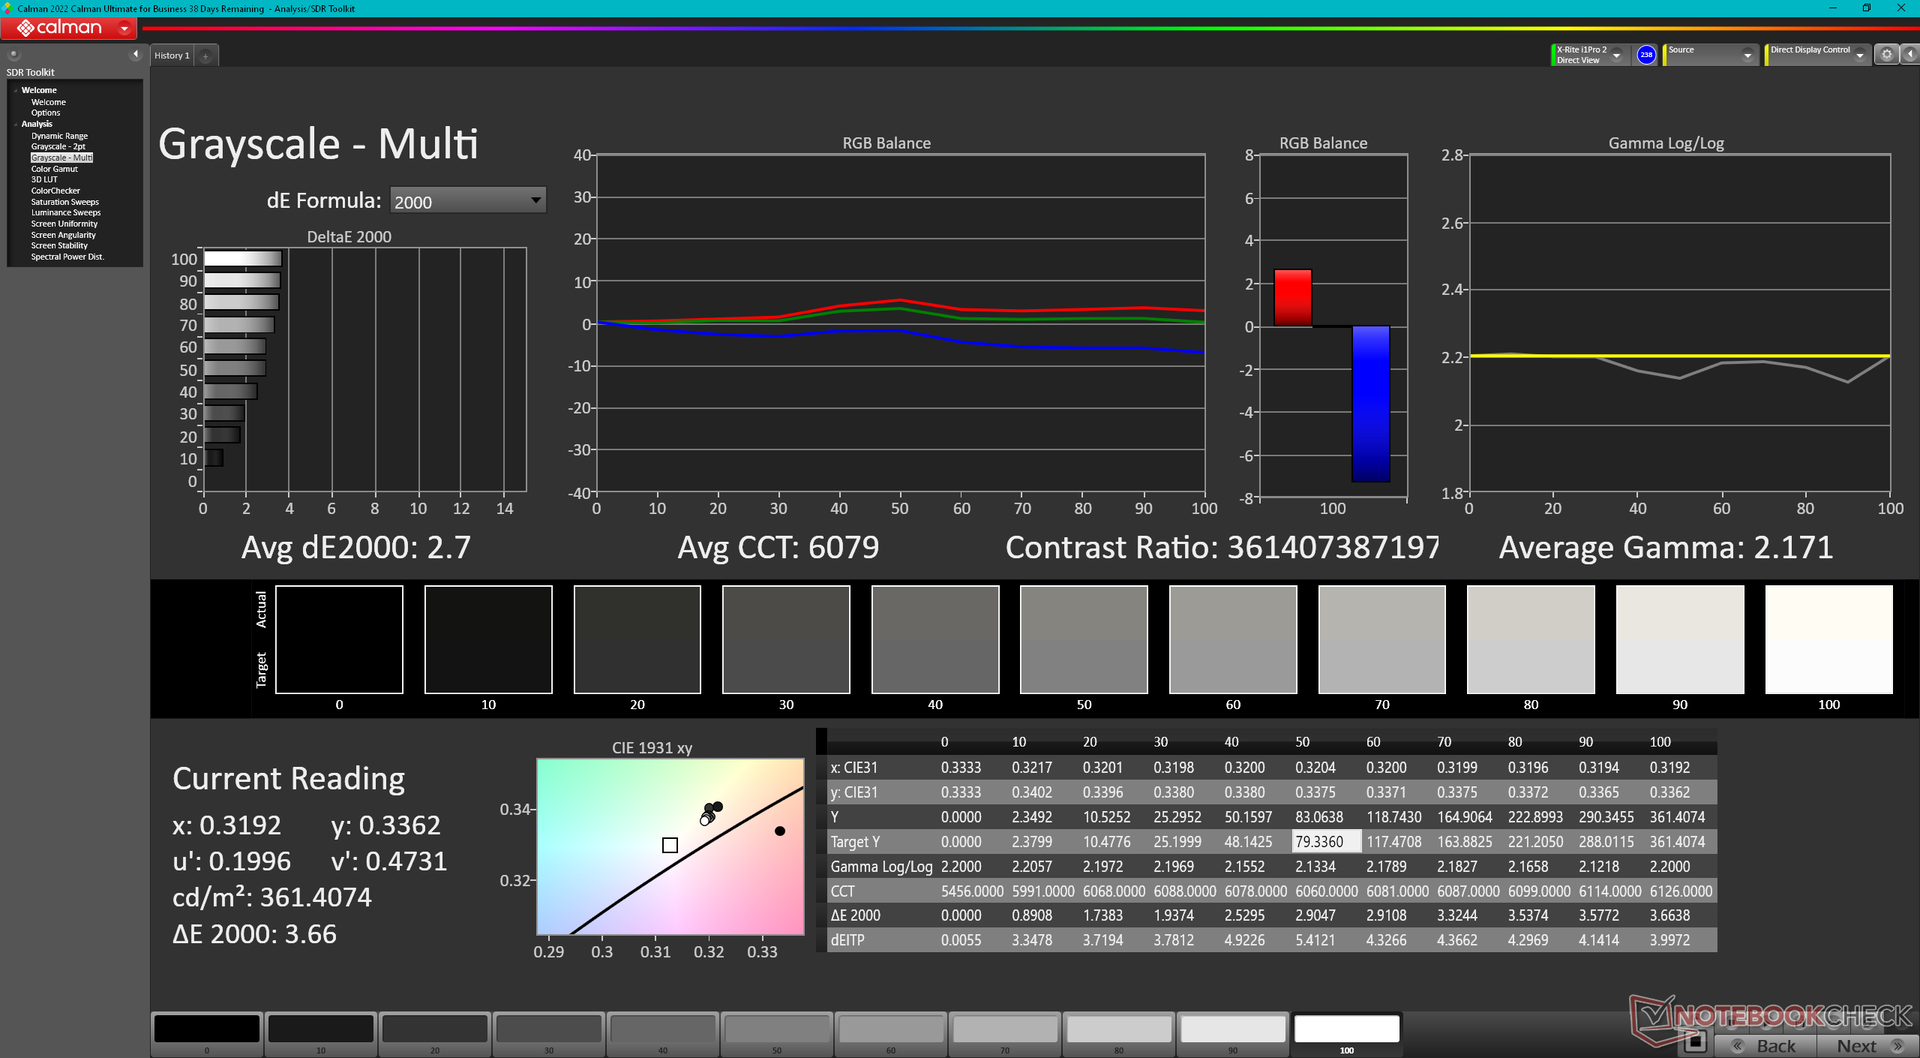
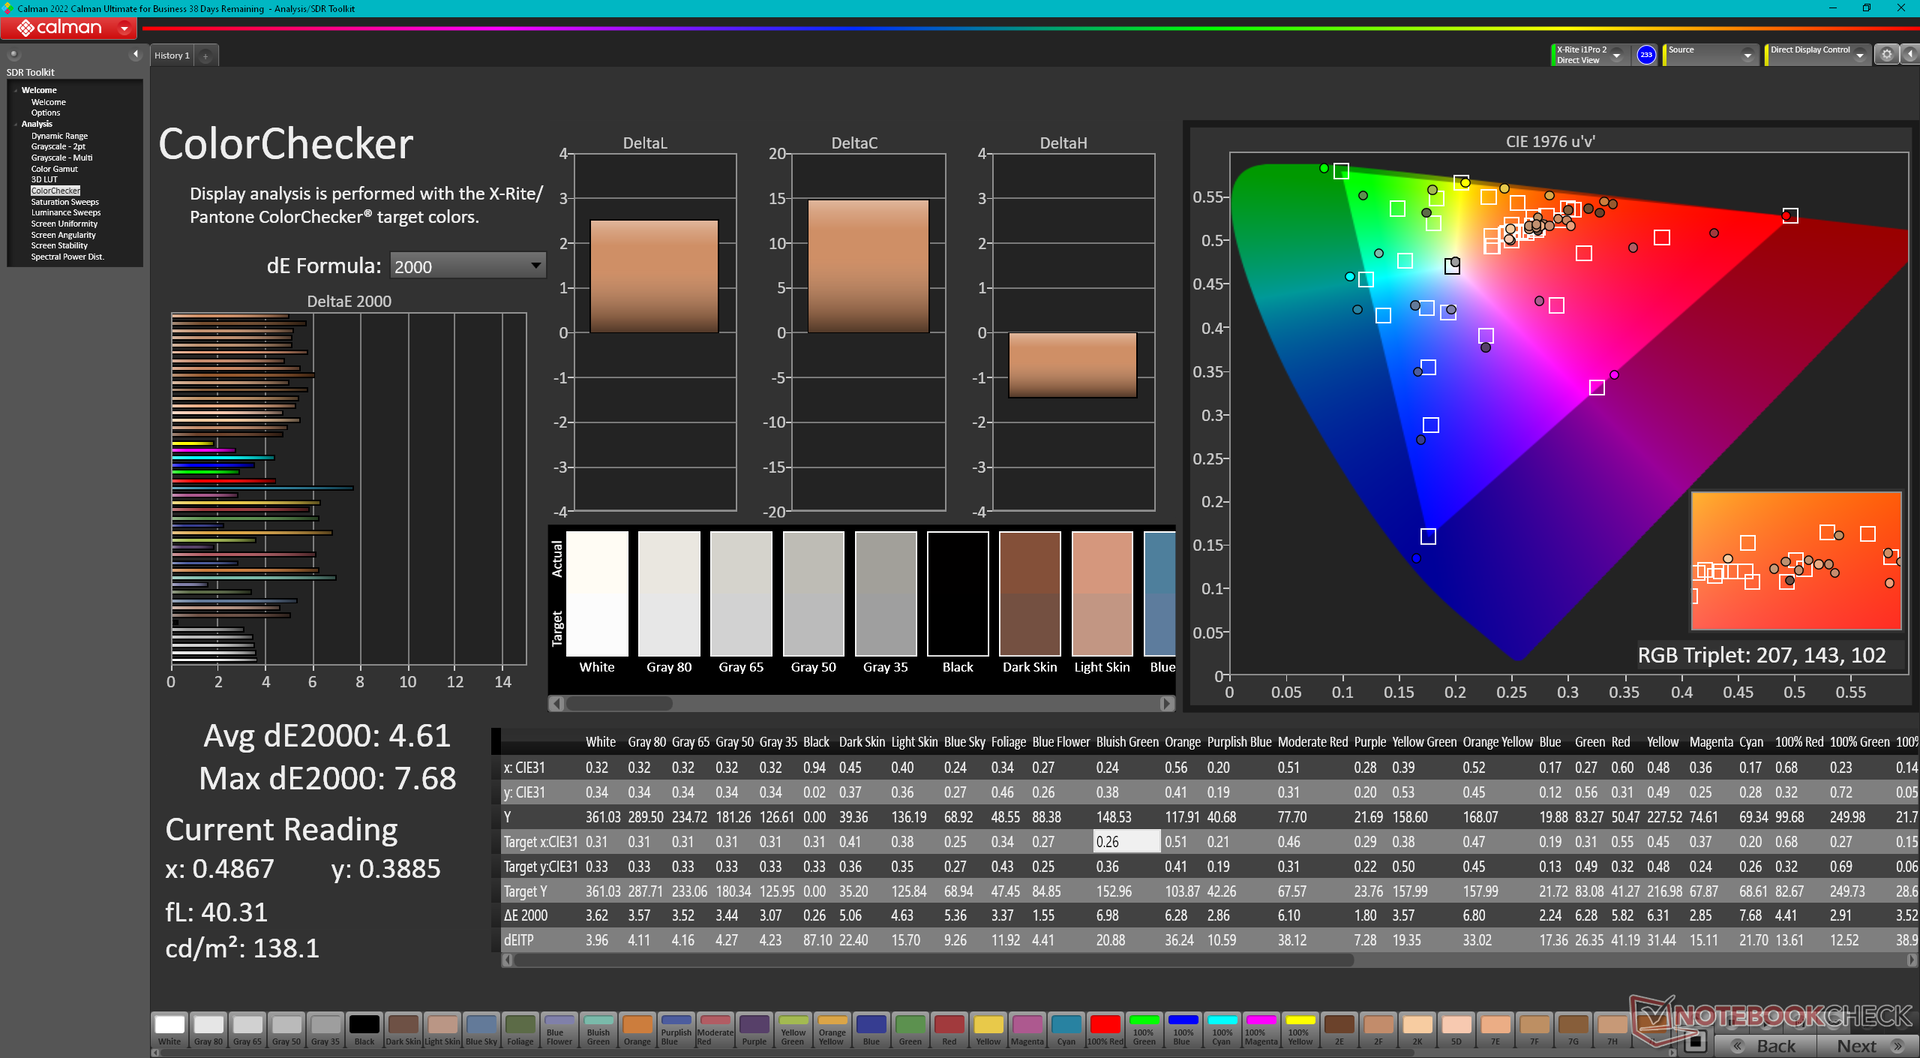
ΔE ColorChecker Calman: 4.61 | ∀{0.5-29.43 Ø4.72}
calibrated: 0.66
ΔE Greyscale Calman: 2.7 | ∀{0.09-98 Ø4.97}
97.1% AdobeRGB 1998 (Argyll 3D)
100% sRGB (Argyll 3D)
99.6% Display P3 (Argyll 3D)
Gamma: 2.17
CCT: 6079 K
| Lenovo ThinkBook Plus Gen4 IRU SDC ATNA33AA06-0, OLED, 2880x1800, 13.3" | Lenovo ThinkPad X1 Nano Gen 3 MND007ZA1-3, IPS, 2160x1350, 13" | HP Dragonfly G4 Chi Mei CMN13C0, IPS, 1920x1280, 13.5" | Asus ZenBook S13 OLED UX5304 SDC417B, OLED, 2880x1800, 13.3" | Dell Latitude 9330 AU Optronics B133QAA, IPS, 2560x1600, 13.3" | MSI Summit E13 Flip Evo A11MT Sharp LQ134N1JW53, IPS, 1920x1200, 13.4" | |
|---|---|---|---|---|---|---|
| Display | -20% | -20% | 0% | -14% | -19% | |
| Display P3 Coverage (%) | 99.6 | 68.5 -31% | 68.4 -31% | 99.7 0% | 77.8 -22% | 69.8 -30% |
| sRGB Coverage (%) | 100 | 99.5 0% | 98.3 -2% | 100 0% | 99.9 0% | 98.8 -1% |
| AdobeRGB 1998 Coverage (%) | 97.1 | 69.7 -28% | 70.4 -27% | 96.9 0% | 77.5 -20% | 70.6 -27% |
| Response Times | -1565% | -1929% | 10% | -2879% | -2632% | |
| Response Time Grey 50% / Grey 80% * (ms) | 1.9 ? | 39.9 ? -2000% | 48.8 ? -2468% | 2 ? -5% | 67.6 ? -3458% | 64 ? -3268% |
| Response Time Black / White * (ms) | 2.1 ? | 25.8 ? -1129% | 31.3 ? -1390% | 1.6 ? 24% | 50.4 ? -2300% | 44 ? -1995% |
| PWM Frequency (Hz) | 60 ? | 240 ? | ||||
| Bildschirm | 30% | 20% | 34% | 16% | 16% | |
| Helligkeit Bildmitte (cd/m²) | 367.5 | 461.2 25% | 408.8 11% | 361 -2% | 542.3 48% | 551.3 50% |
| Brightness (cd/m²) | 370 | 428 16% | 399 8% | 365 -1% | 516 39% | 517 40% |
| Brightness Distribution (%) | 98 | 86 -12% | 90 -8% | 98 0% | 85 -13% | 91 -7% |
| Schwarzwert * (cd/m²) | 0.29 | 0.32 | 0.38 | 0.37 | ||
| Delta E Colorchecker * | 4.61 | 1.79 61% | 2.02 56% | 1.2 74% | 3.18 31% | 1.45 69% |
| Colorchecker dE 2000 max. * | 7.68 | 3.3 57% | 3.84 50% | 1.9 75% | 6.05 21% | 2.86 63% |
| Colorchecker dE 2000 calibrated * | 0.66 | 0.47 29% | 0.61 8% | 0.67 -2% | 1.7 -158% | |
| Delta E Graustufen * | 2.7 | 1.8 33% | 2.3 15% | 1.2 56% | 3.1 -15% | 1.3 52% |
| Gamma | 2.17 101% | 2.24 98% | 2.2 100% | 2.27 97% | 2.08 106% | 2.14 103% |
| CCT | 6079 107% | 6588 99% | 6203 105% | 6486 100% | 6140 106% | 6580 99% |
| Kontrast (:1) | 1590 | 1278 | 1427 | 1490 | ||
| Farbraum (Prozent von AdobeRGB 1998) (%) | 65 | |||||
| Color Space (Percent of sRGB) (%) | 99 | |||||
| Durchschnitt gesamt (Programm / Settings) | -518% /
-248% | -643% /
-315% | 15% /
20% | -959% /
-474% | -878% /
-434% |
* ... kleinere Werte sind besser
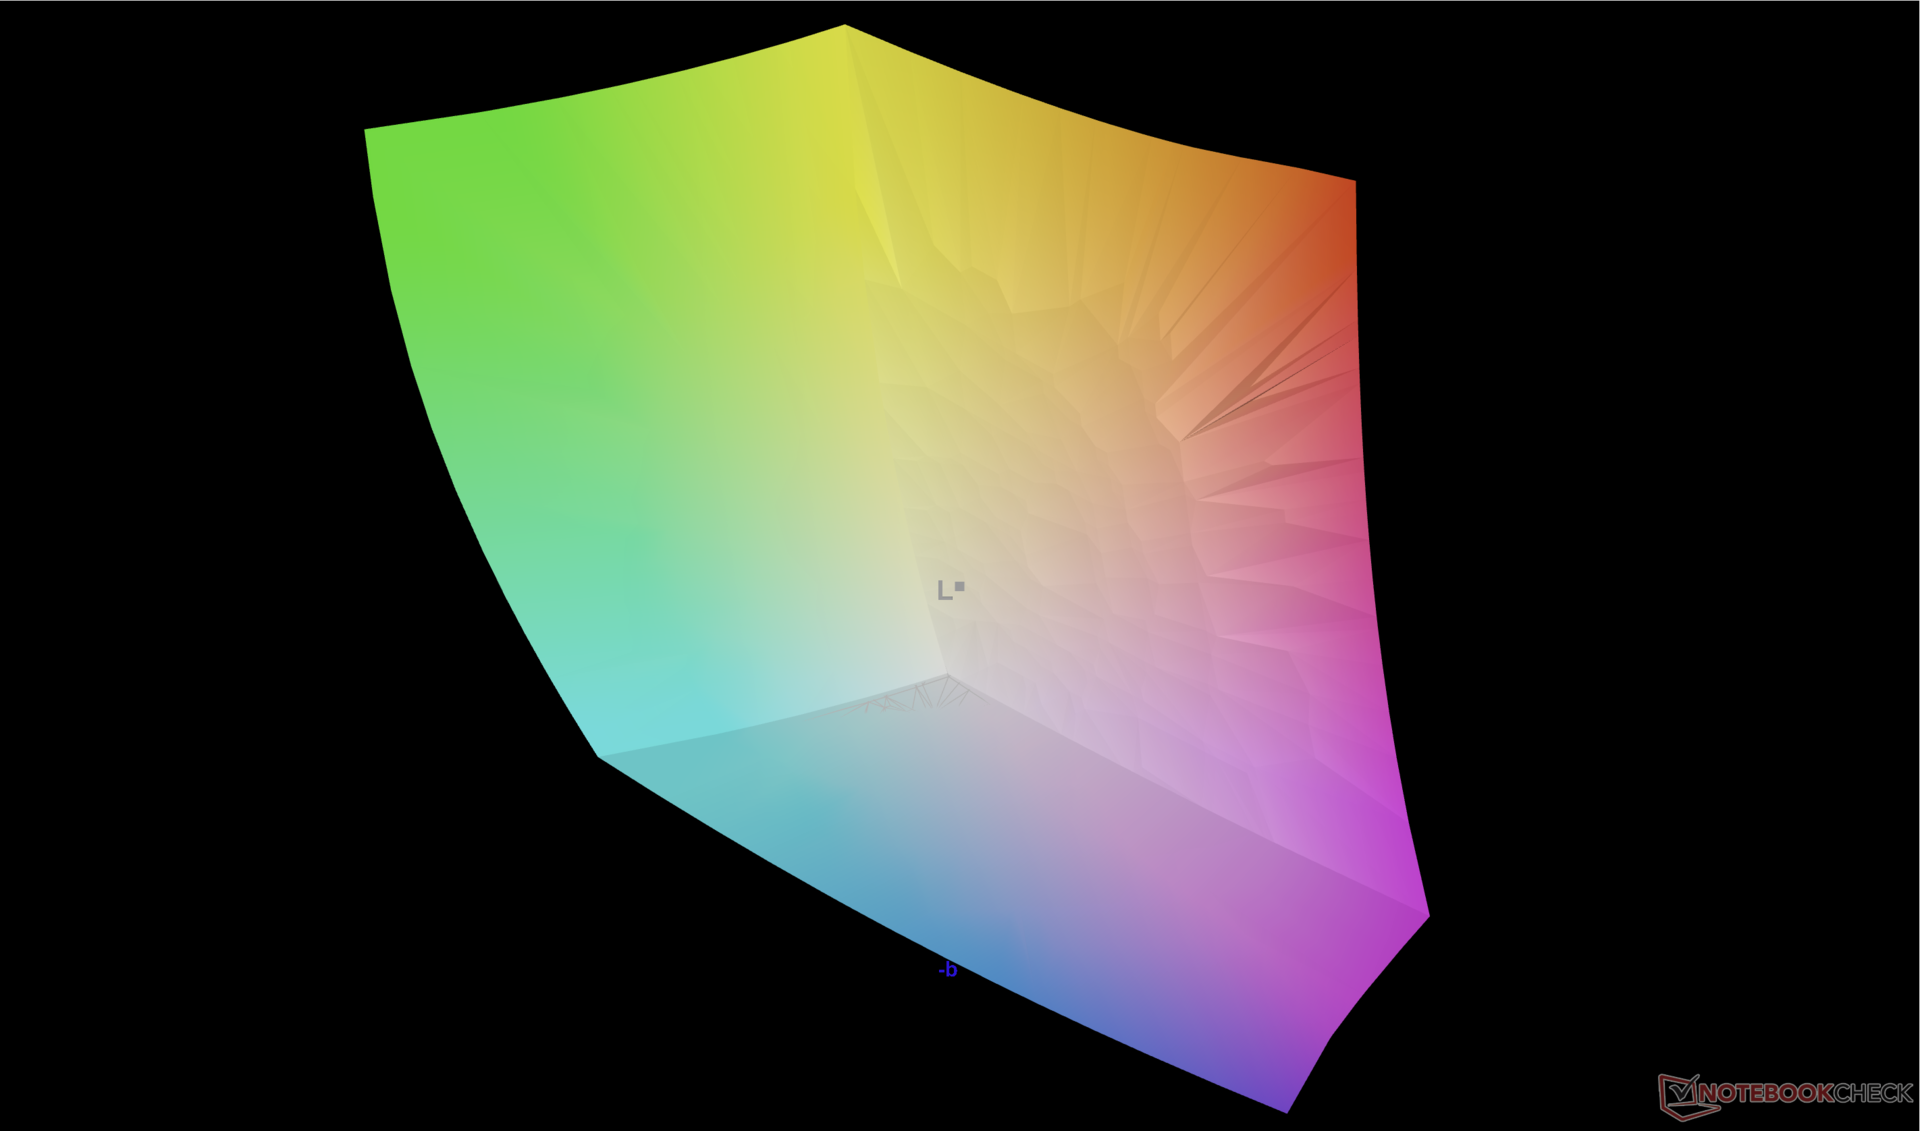
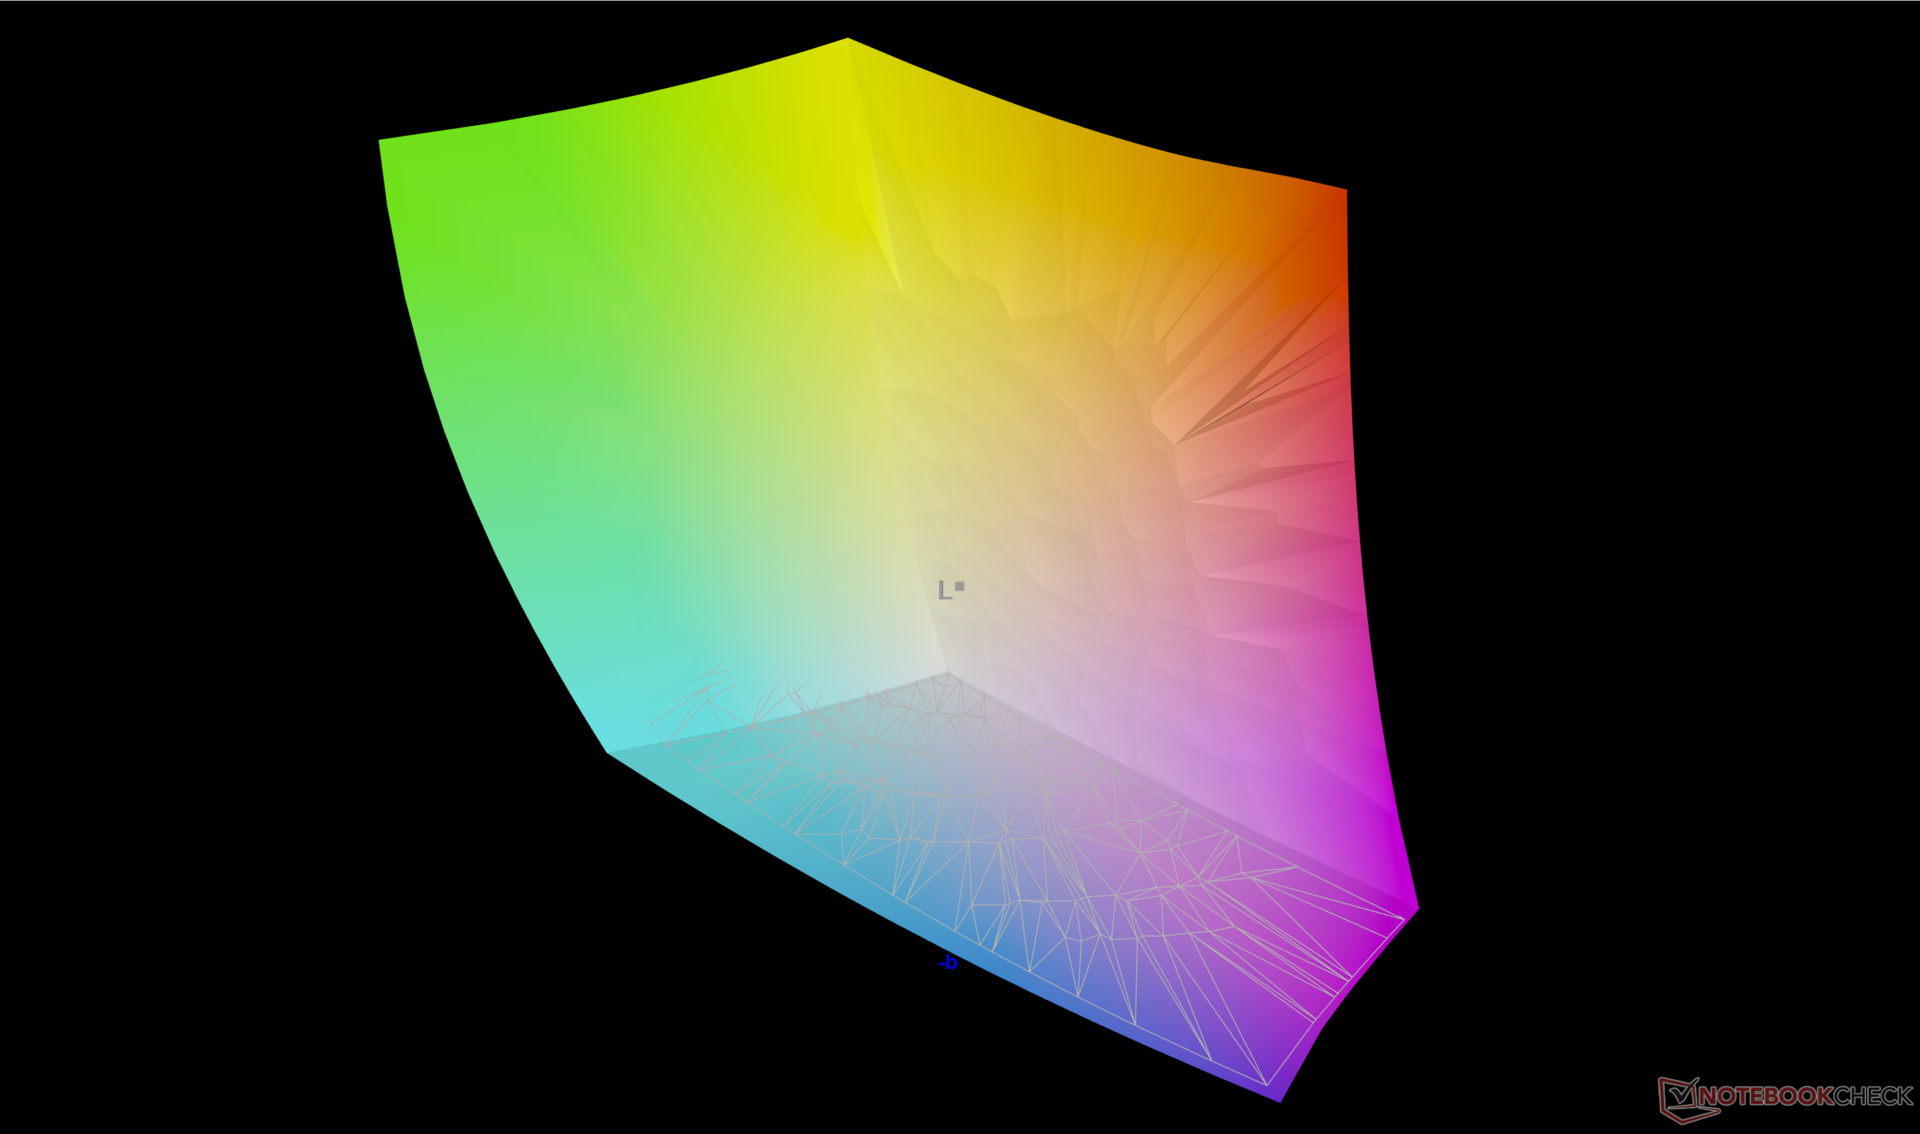
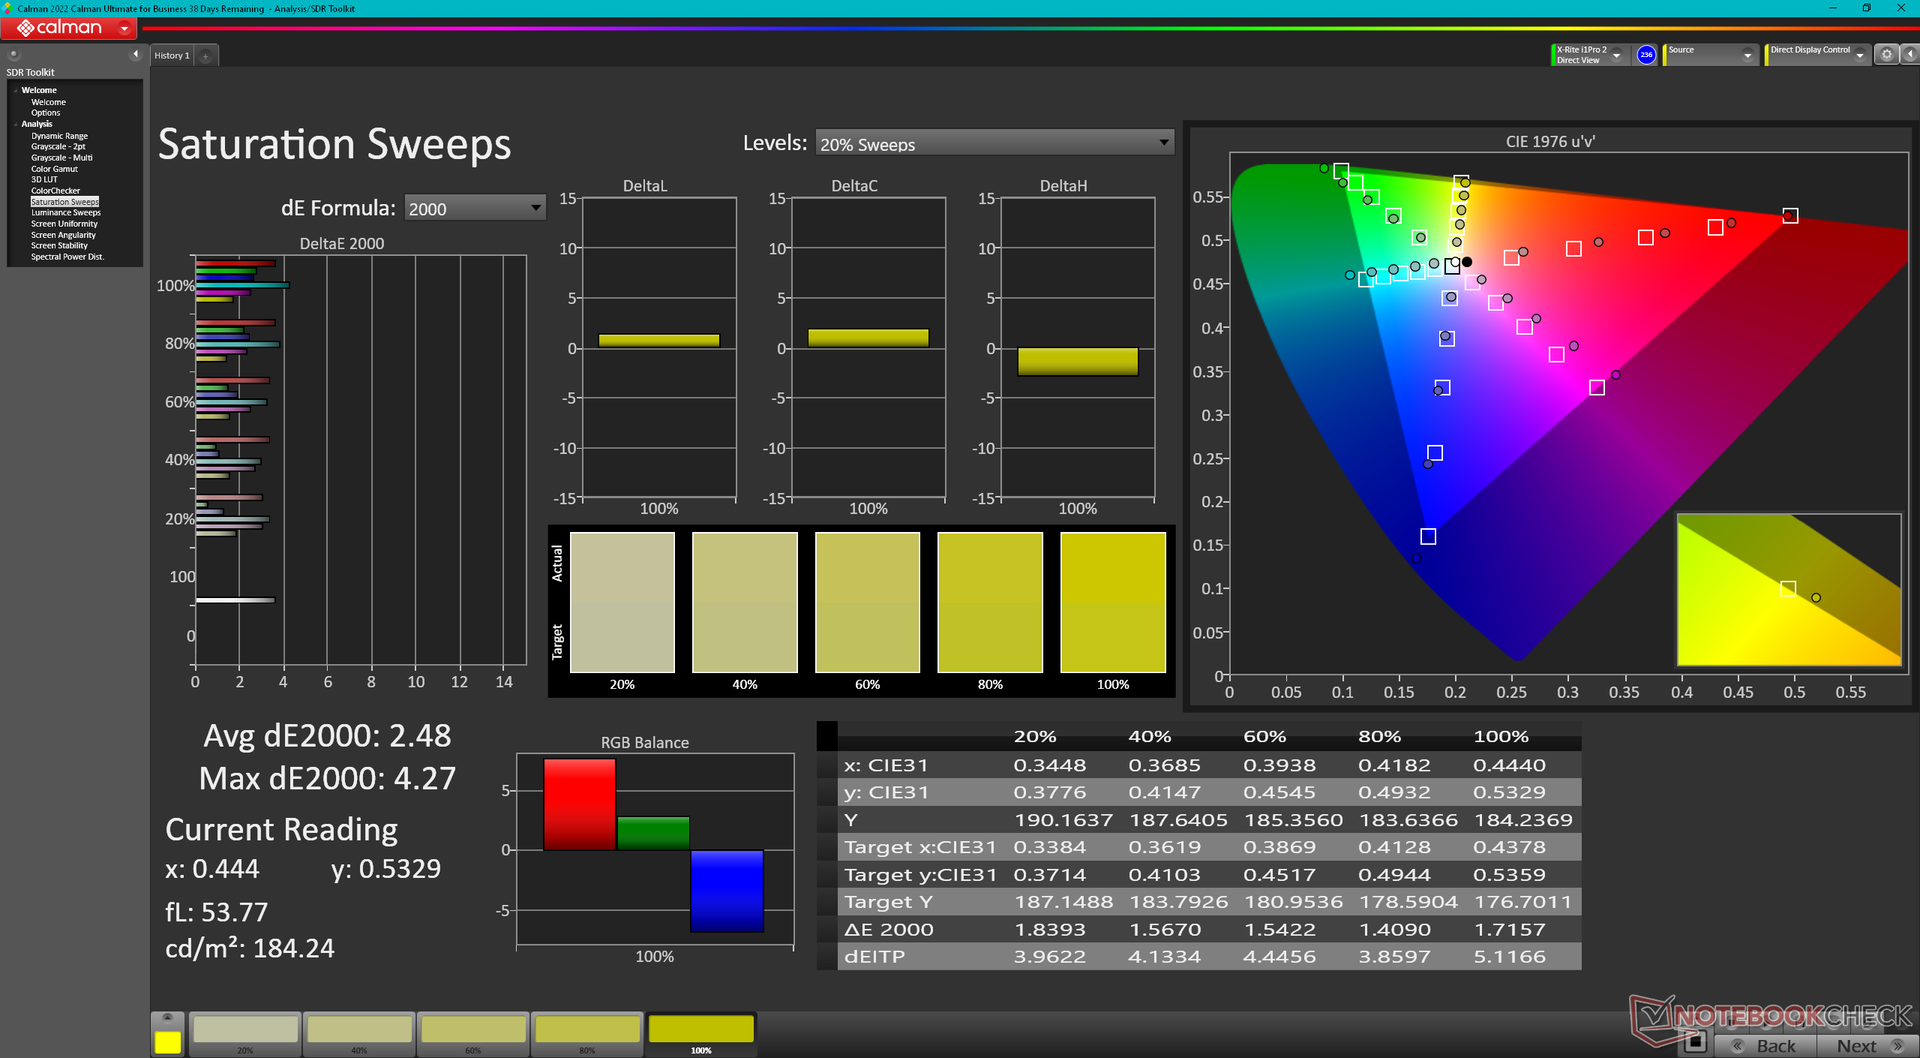
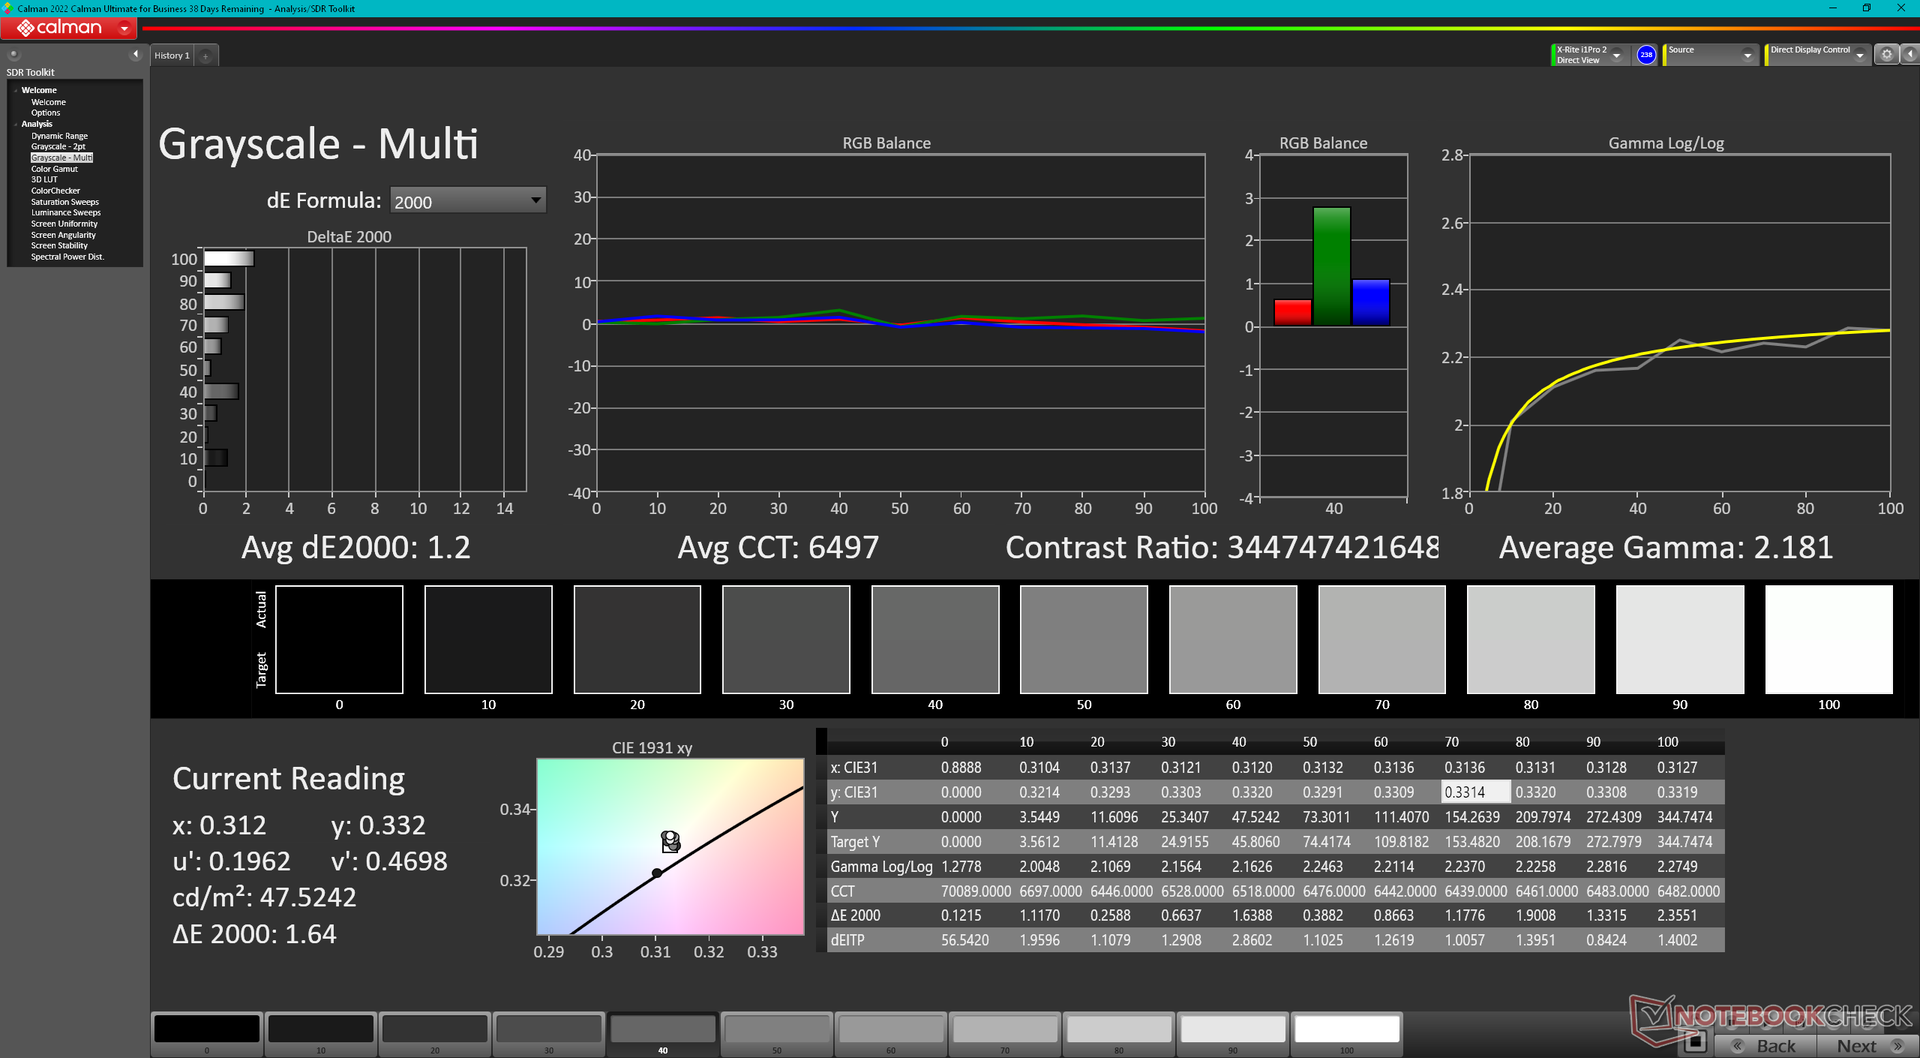
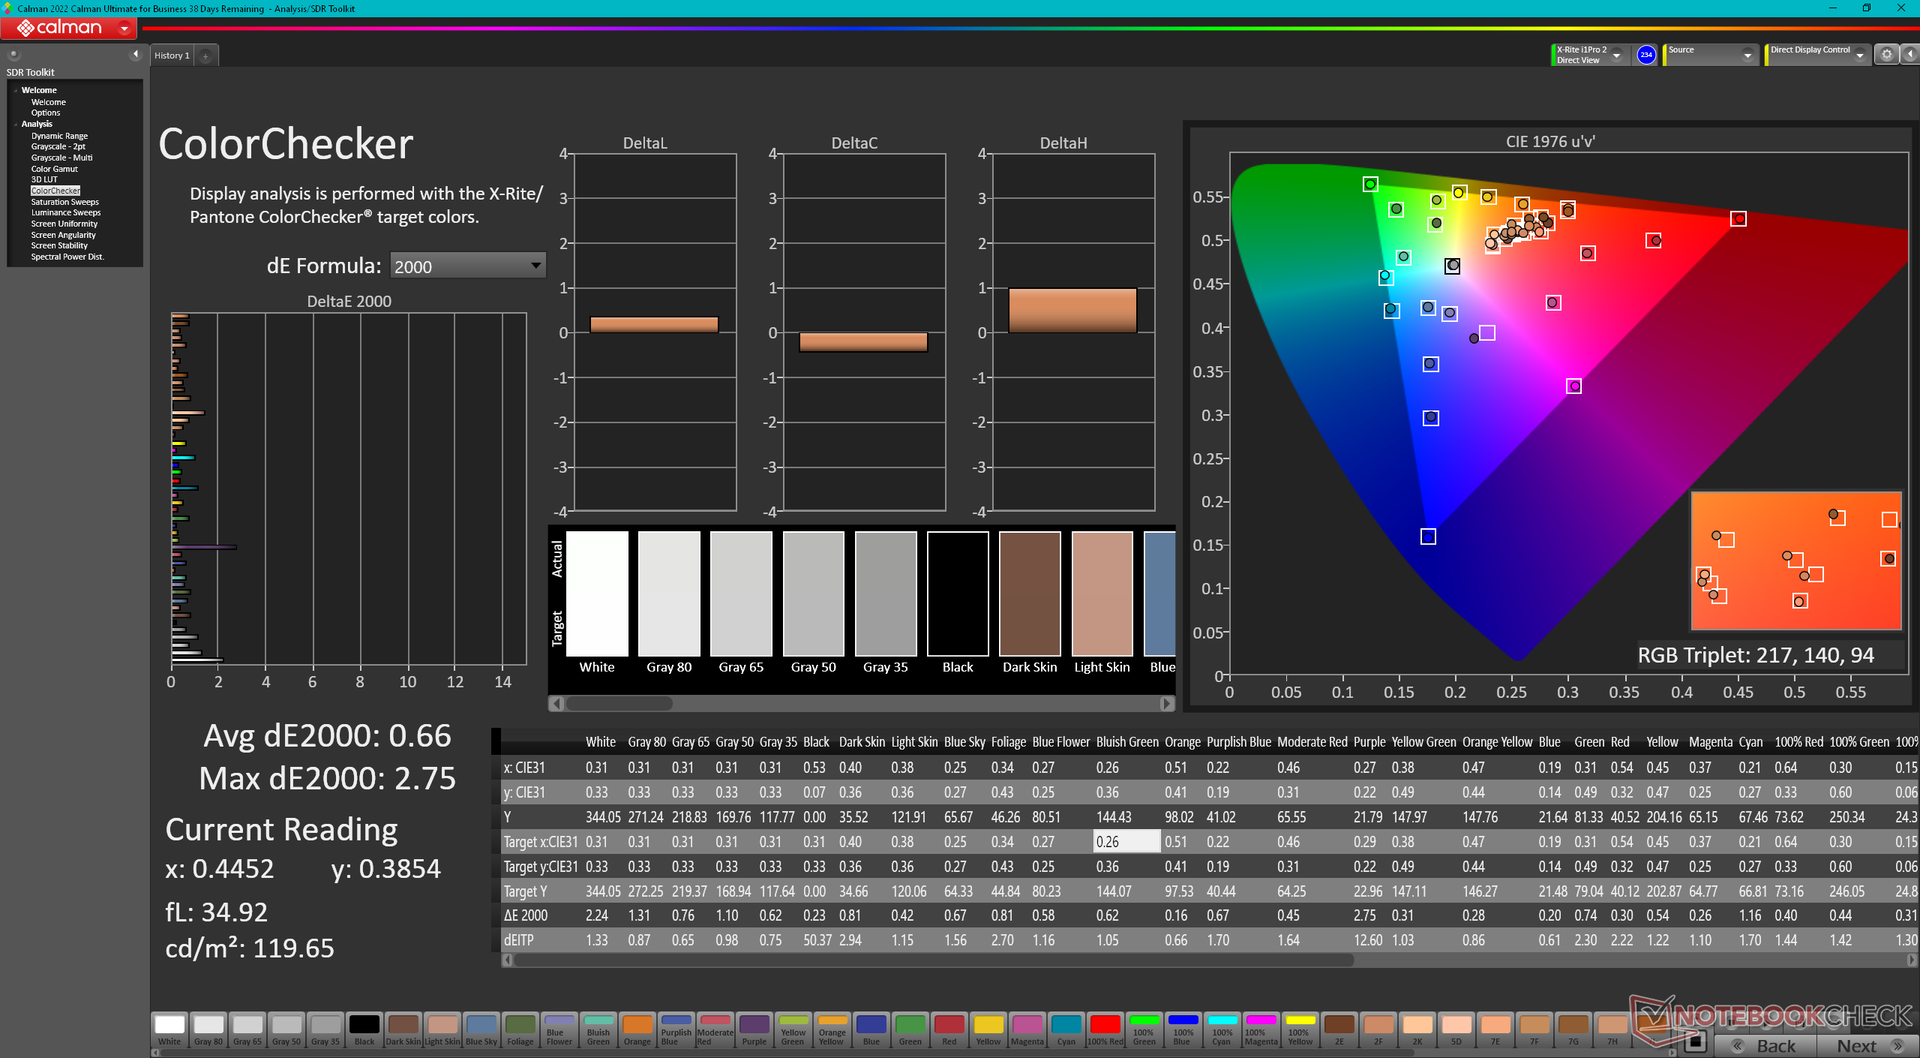
Das OLED-Display ist mit durchschnittlichen Graustufen- und Farb-DeltaE-Werten von 2,7 bzw. 4,61 anständig auf den P3-Standard kalibriert. Videoexperten profitieren am meisten von den tieferen Farben von OLED, wo P3-Farben üblich sind. Unser kalibriertes ICM-Profil steht oben zum Download bereit.
Reaktionszeiten (Response Times) des Displays
| ↔ Reaktionszeiten Schwarz zu Weiß | ||
|---|---|---|
| 2.1 ms ... steigend ↗ und fallend ↘ kombiniert | ↗ 0.9 ms steigend | 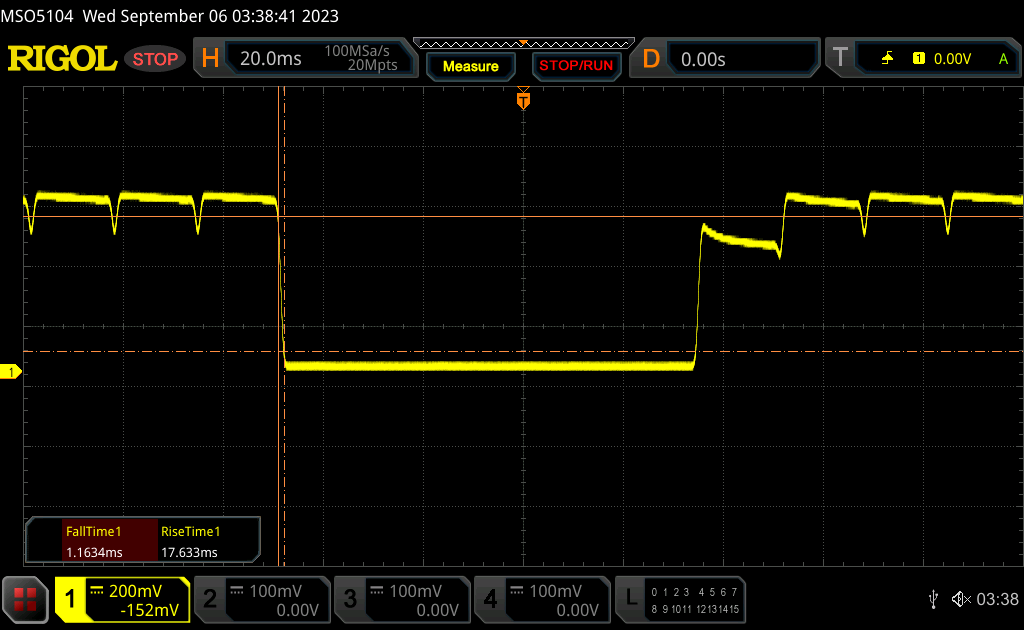 |
| ↘ 1.2 ms fallend | ||
| Die gemessenen Reaktionszeiten sind sehr kurz, wodurch sich der Bildschirm auch für schnelle 3D Spiele eignen sollte. Im Vergleich rangierten die bei uns getesteten Geräte von 0.1 (Minimum) zu 240 (Maximum) ms. » 12 % aller Screens waren schneller als der getestete. Daher sind die gemessenen Reaktionszeiten besser als der Durchschnitt aller vermessenen Geräte (19.8 ms). | ||
| ↔ Reaktionszeiten 50% Grau zu 80% Grau | ||
| 1.9 ms ... steigend ↗ und fallend ↘ kombiniert | ↗ 1 ms steigend | 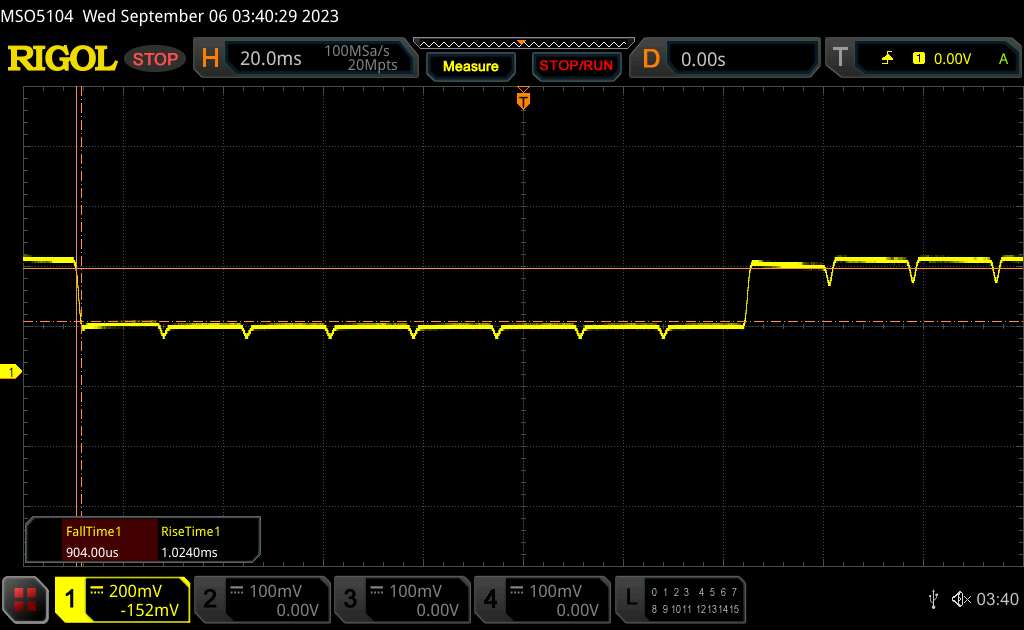 |
| ↘ 0.9 ms fallend | ||
| Die gemessenen Reaktionszeiten sind sehr kurz, wodurch sich der Bildschirm auch für schnelle 3D Spiele eignen sollte. Im Vergleich rangierten die bei uns getesteten Geräte von 0.165 (Minimum) zu 636 (Maximum) ms. » 9 % aller Screens waren schneller als der getestete. Daher sind die gemessenen Reaktionszeiten besser als der Durchschnitt aller vermessenen Geräte (31 ms). | ||
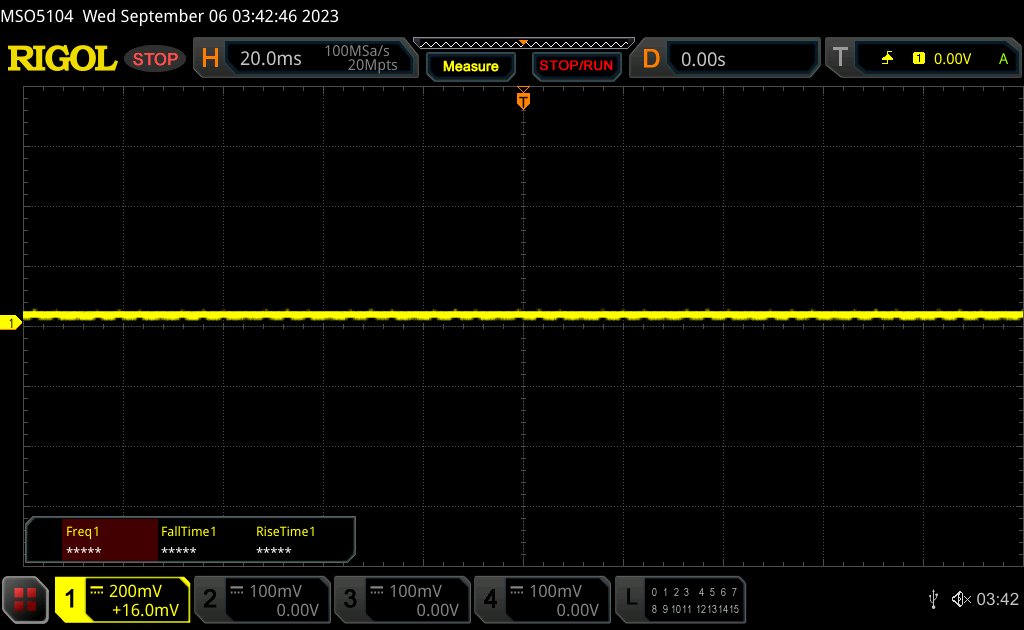
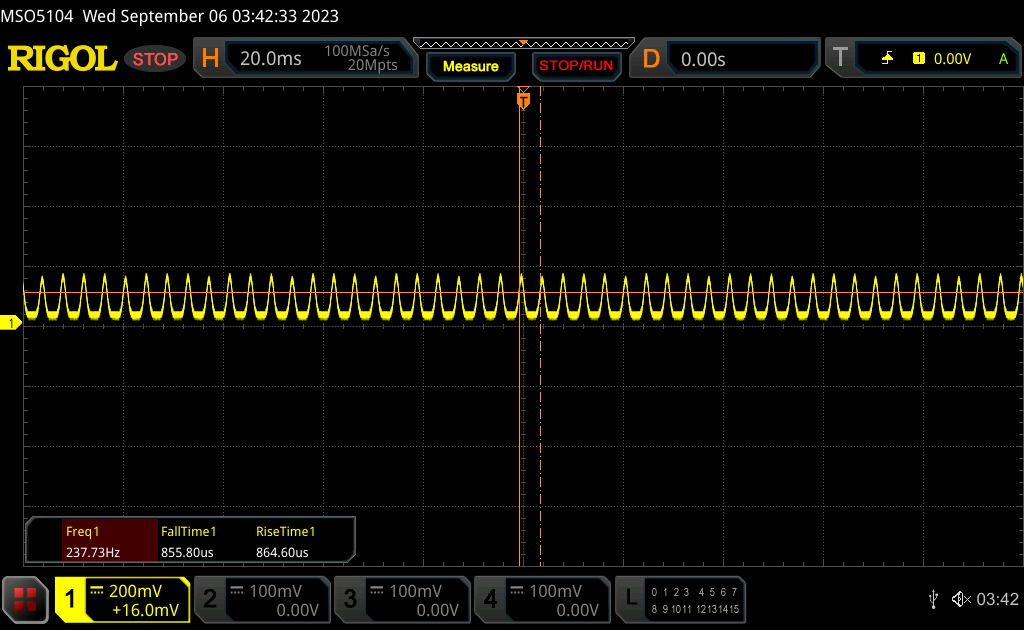
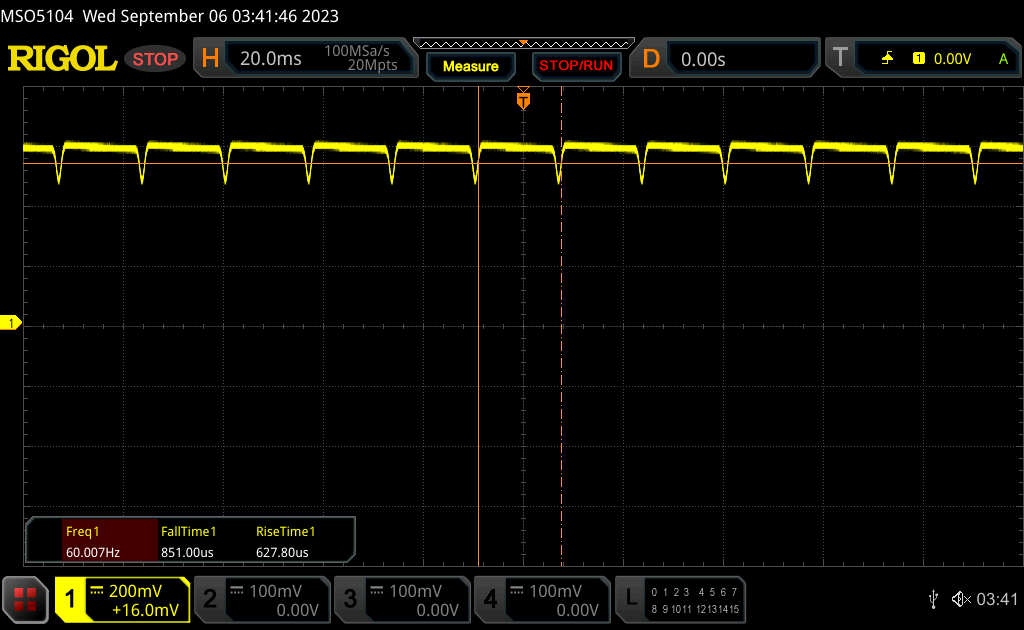
Bildschirm-Flackern / PWM (Pulse-Width Modulation)
| Flackern / PWM festgestellt | 60 Hz | ≤ 100 % Helligkeit | 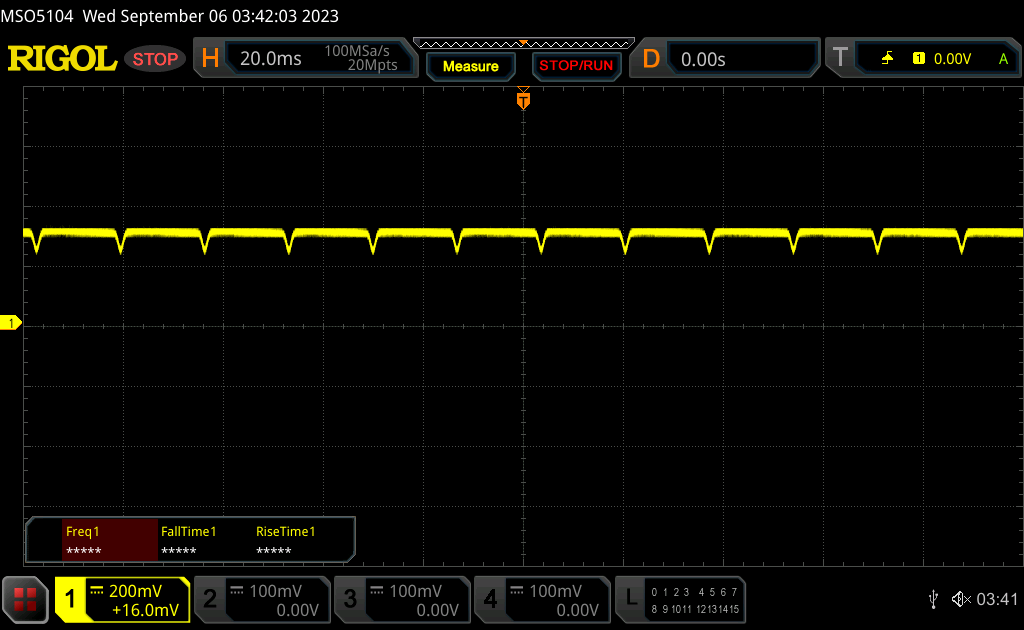 |
Das Display flackert mit 60 Hz (im schlimmsten Fall, eventuell durch Pulsweitenmodulation PWM) bei einer eingestellten Helligkeit von 100 % und darunter. Darüber sollte es zu keinem Flackern kommen. Die Frequenz von 60 Hz ist sehr gering und daher kann es bei allen Usern zu sichtbaren Flackern, brennenden Augen oder Kopfweh kommen. Im Vergleich: 52 % aller getesteten Geräte nutzten kein PWM um die Helligkeit zu reduzieren. Wenn PWM eingesetzt wurde, dann bei einer Frequenz von durchschnittlich 7763 (Minimum 5, Maximum 343500) Hz. | |||
Auf dem Display ist das OLED-typische Flackern zu erkennen, wenn der Bildschirminhalt zeilenweise aktualisiert wird. Unterhalb einer Helligkeit von 57% kommt noch ein PWM-Verhalten hinzu. So liegt das Flimmern hier bei ca. 240 Hz, bei höheren Helligkeiten bei 60 Hz.

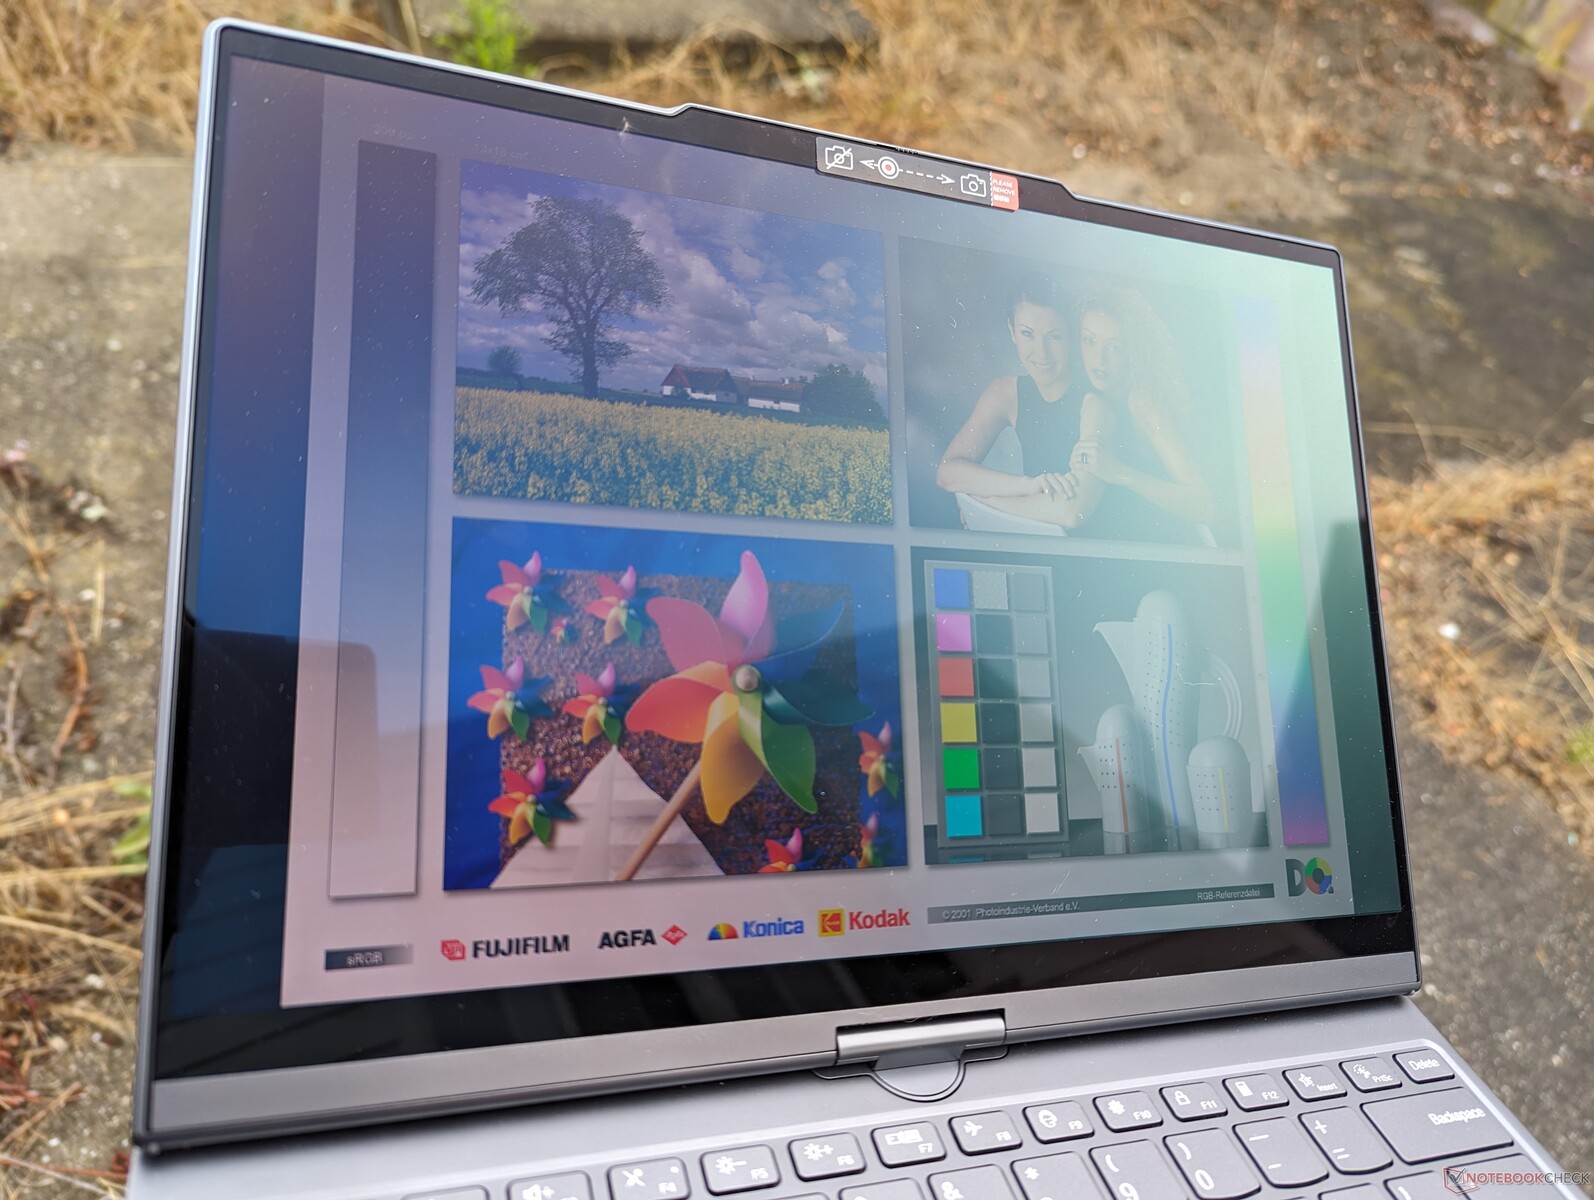
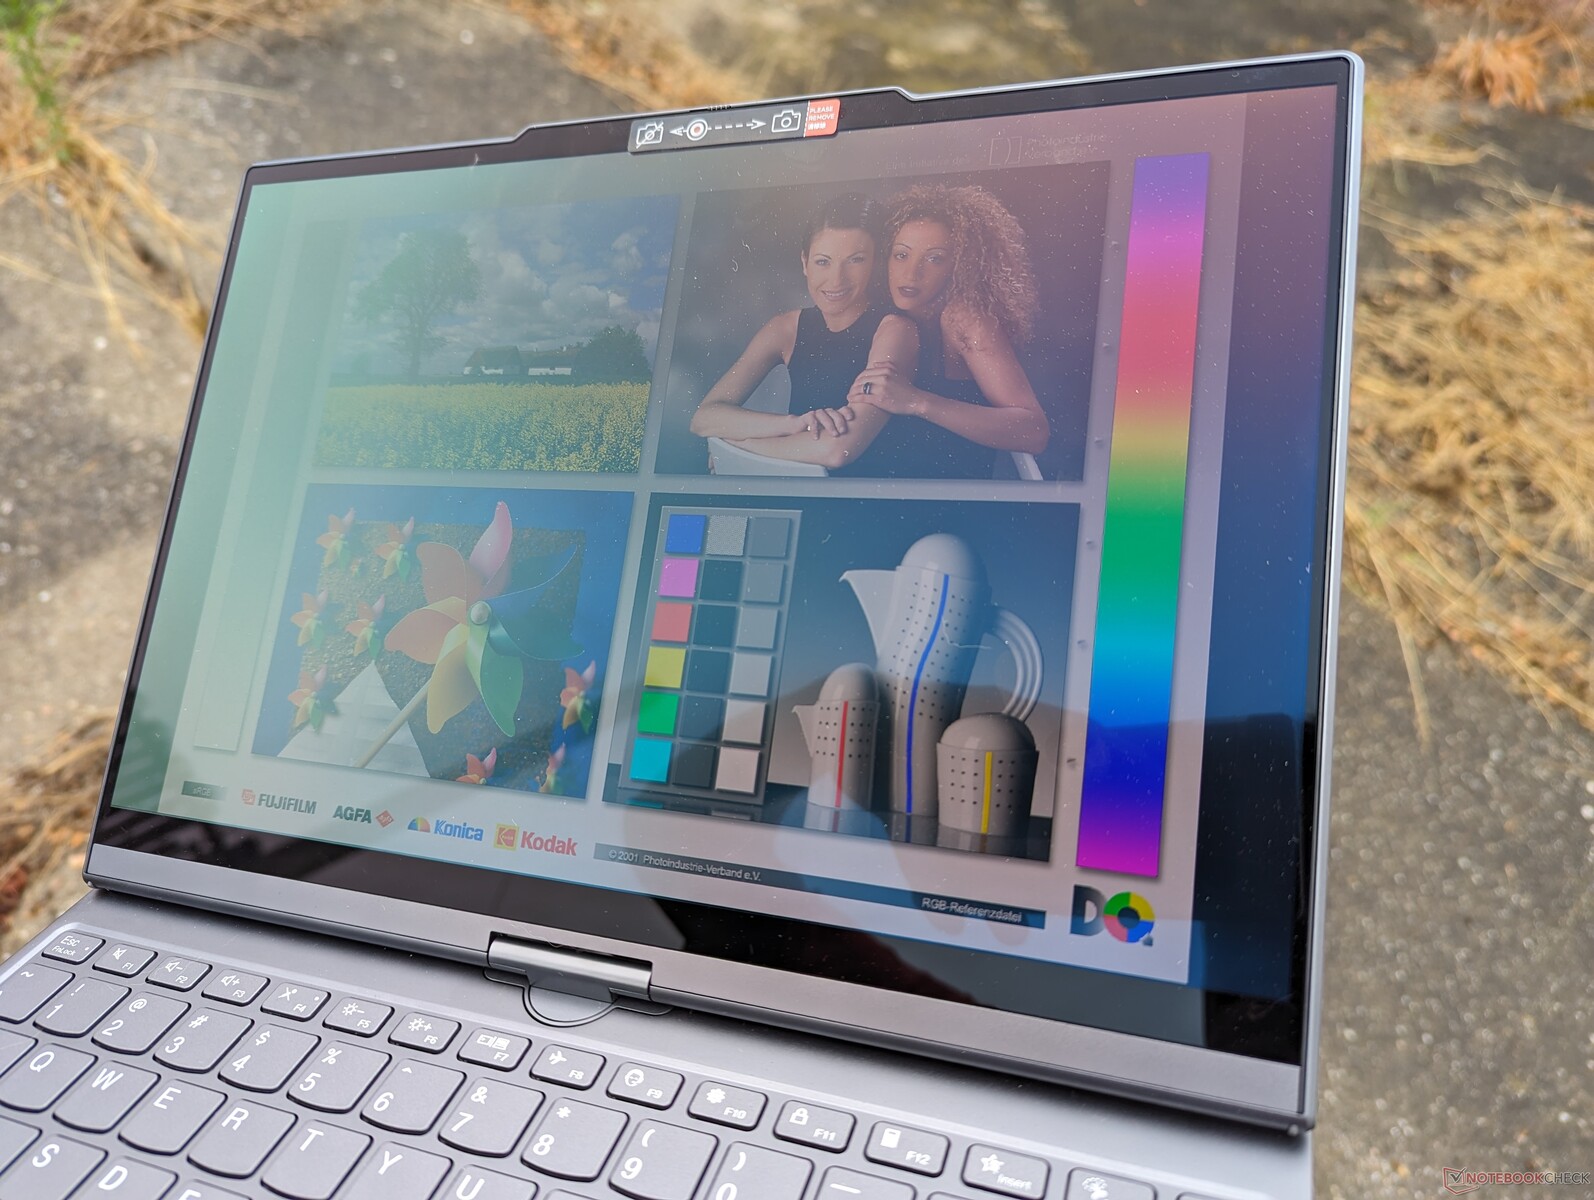
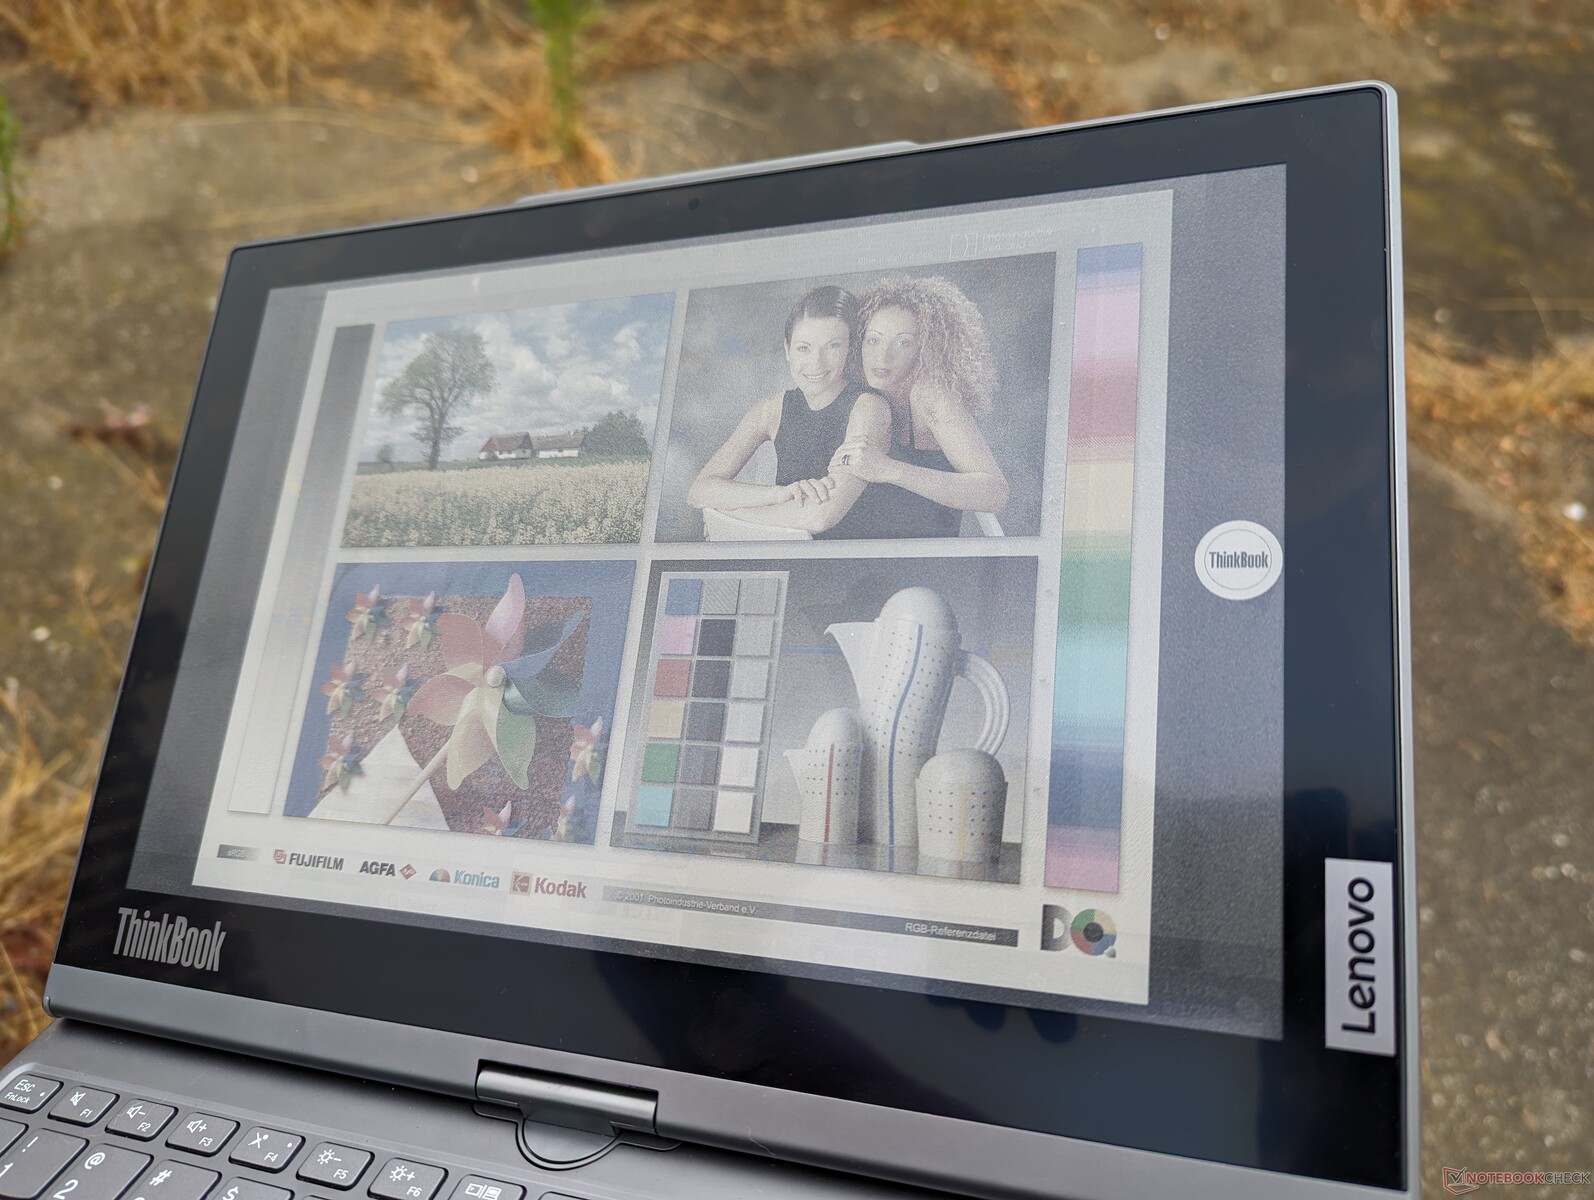
Die Sichtbarkeit im Freien ist gut, aber für ein OLED-Panel nicht überragend. Mit maximal 350 cd/m² ist das Display schwächer als einige Alternativen mit IPS-Panels wie das MSI Summit E13 oder das Dell Latitude 9330, die jeweils 550 cd/m² erreichen. Reflexionen sind daher kaum zu vermeiden, es sei denn, man arbeitet im Schatten.
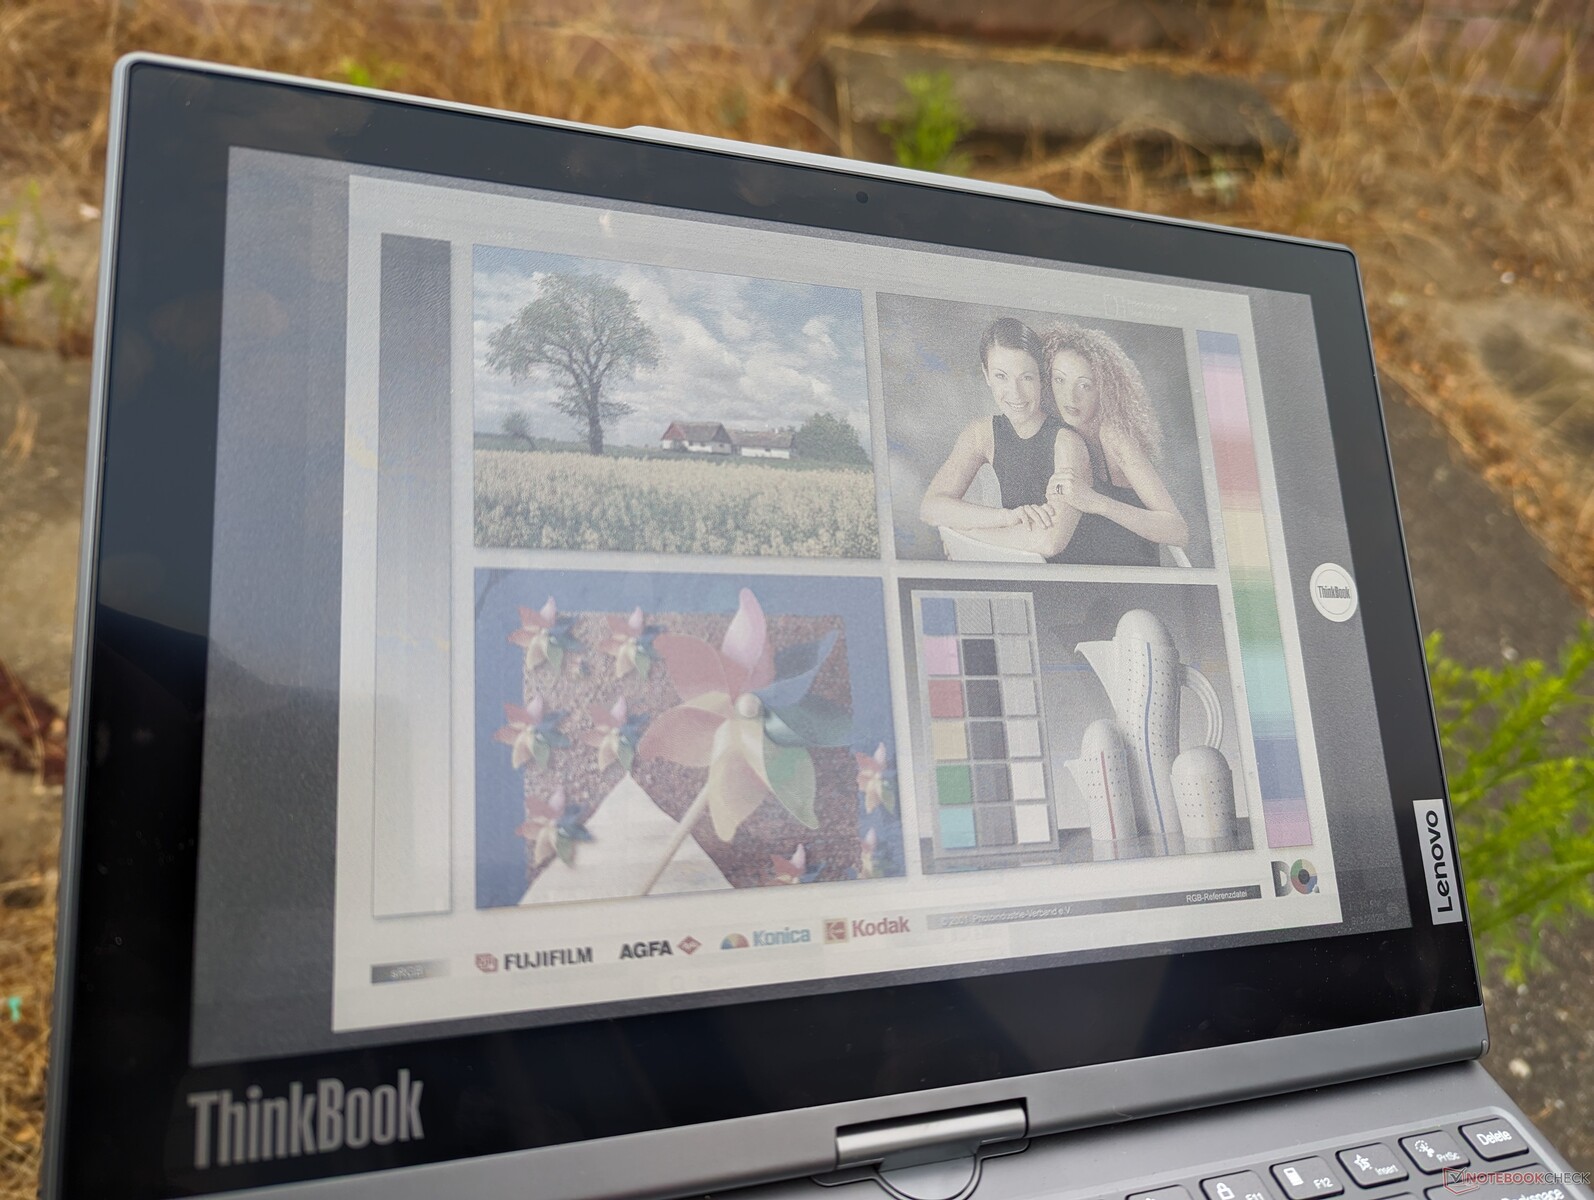
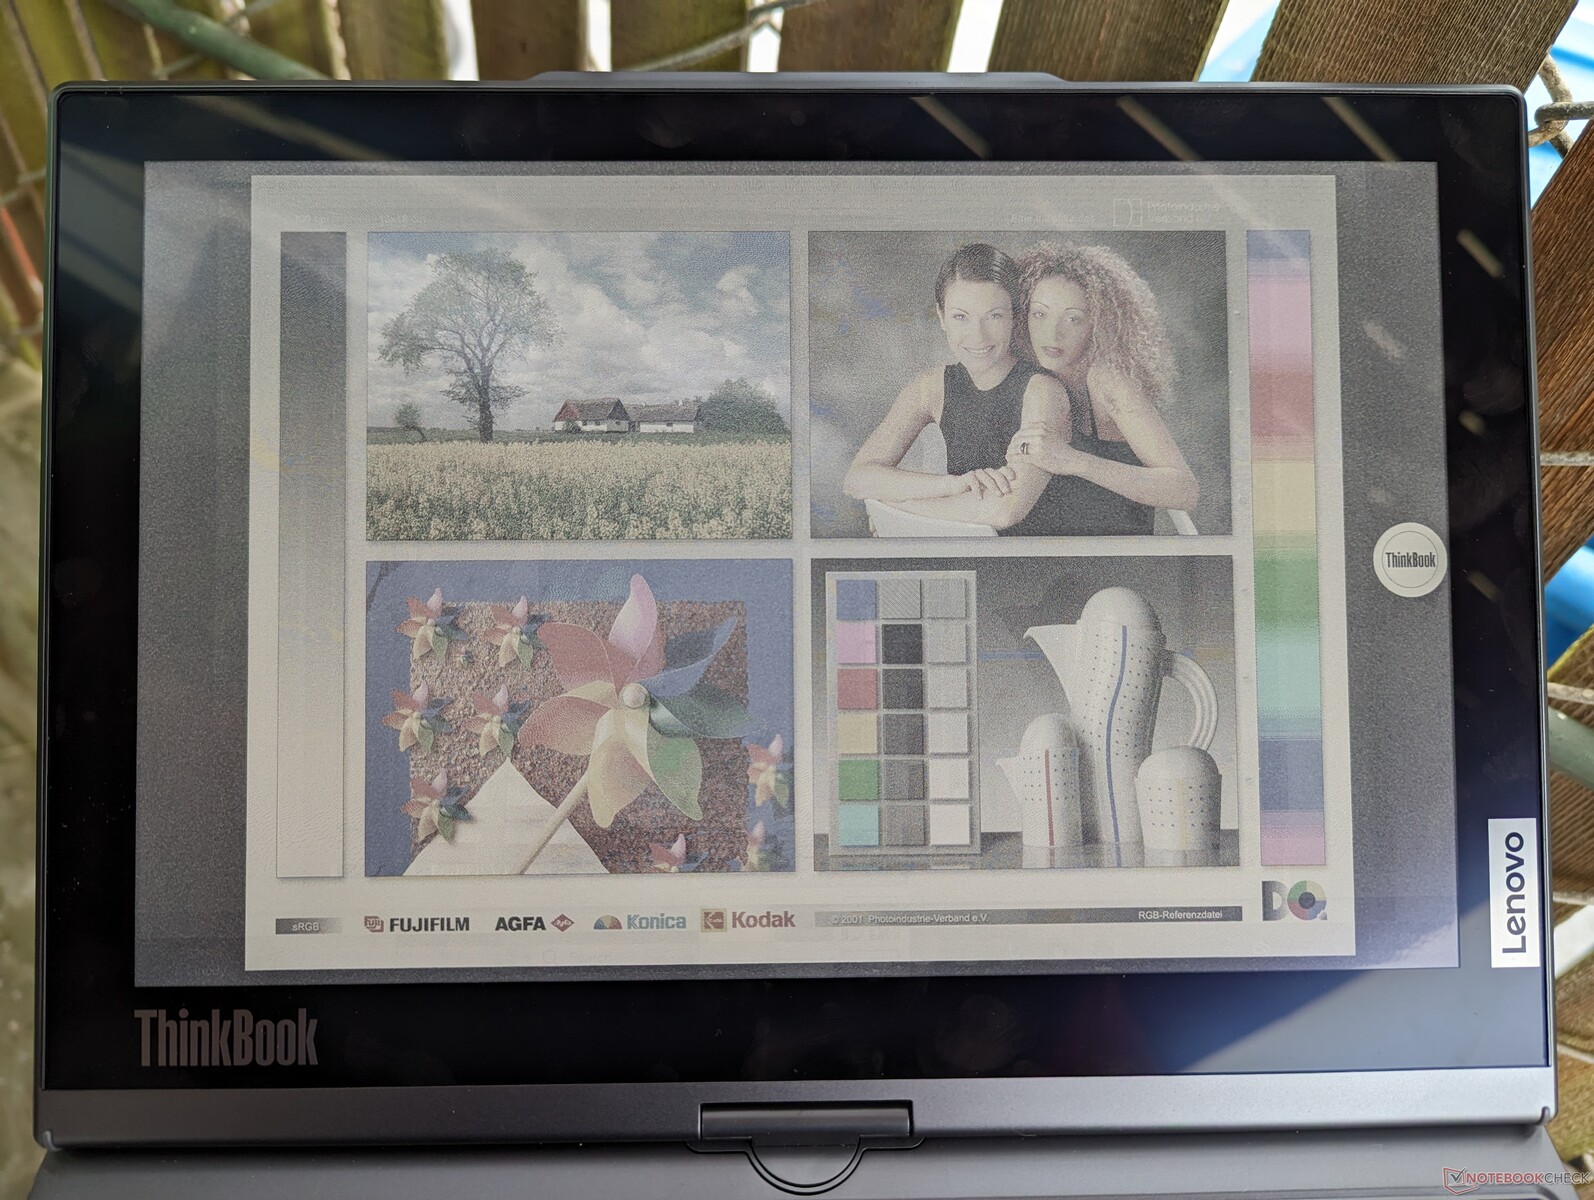
Andererseits ist das E-Ink-Display auch bei direkter Sonneneinstrahlung gut ablesbar. Da das Deckglas nicht vollständig entspiegelt ist, kommt es zwar immer noch zu Reflexionen, diese sind aber gering und können leicht ignoriert werden.
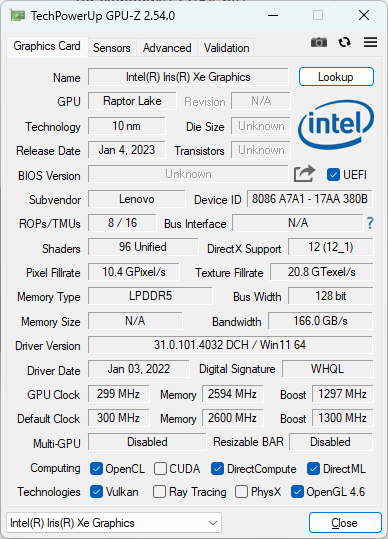
Leistung - Intel-Prozessor der 13. Generation (Raptor Lake-U)
Testbedingungen
Vor der Durchführung der folgenden Benchmarks haben wir das Gerät über Windows und die Software Lenovo Vantage in den Leistungsmodus versetzt. Wir empfehlen, sich mit Vantage vertraut zu machen, da es die Drehscheibe für Lenovo-spezifische Einstellungen und Software-Updates ist.
Prozessor
Die CPU-Leistung ist nur etwa 5 % langsamer als die eines durchschnittlichen Notebooks in unserer Datenbank, das mit der gleichen Core i7-1355U CPU ausgestattet ist. Das leichte Leistungsdefizit kann auf den begrenzten Turbo Boost im Lenovo-Convertible zurückgeführt werden, da die Leistung nach dem ersten Durchlauf unseres Cinebench R15 Multi Dauertest um bis zu 18 % abfällt.
Ein Downgrade auf die Core i5-1335U-Konfiguration beeinträchtigt die CPU-Leistung nur um 10 bis 15 Prozent. Falls die Grafikleistung des Core i7-1355U nicht benötigt wird, kann es sich lohnen, stattdessen den günstigeren Core i5-1335U in Erwägung zu ziehen, da dieser für gängige Nutzungsszenarien wie Webbrowsing, moderates Multitasking oder Videostreaming nicht merklich langsamer ist, aber etwas energiesparender Arbeiten kann.
Cinebench R15 Multi Dauertest
Cinebench R23: Multi Core | Single Core
Cinebench R20: CPU (Multi Core) | CPU (Single Core)
Cinebench R15: CPU Multi 64Bit | CPU Single 64Bit
Blender: v2.79 BMW27 CPU
7-Zip 18.03: 7z b 4 | 7z b 4 -mmt1
Geekbench 5.5: Multi-Core | Single-Core
HWBOT x265 Benchmark v2.2: 4k Preset
LibreOffice : 20 Documents To PDF
R Benchmark 2.5: Overall mean
* ... kleinere Werte sind besser
AIDA64: FP32 Ray-Trace | FPU Julia | CPU SHA3 | CPU Queen | FPU SinJulia | FPU Mandel | CPU AES | CPU ZLib | FP64 Ray-Trace | CPU PhotoWorxx
| Performance Rating | |
| Lenovo ThinkPad X1 Nano Gen 3 | |
| Lenovo ThinkBook Plus Gen4 IRU | |
| Durchschnittliche Intel Core i7-1355U | |
| MSI Summit E13 Flip Evo A11MT | |
| HP Dragonfly G4 | |
| Dell Latitude 9330 | |
| Asus ZenBook S13 OLED UX5304 | |
| AIDA64 / FP32 Ray-Trace | |
| Lenovo ThinkPad X1 Nano Gen 3 | |
| Lenovo ThinkBook Plus Gen4 IRU | |
| Durchschnittliche Intel Core i7-1355U (5673 - 8424, n=18) | |
| MSI Summit E13 Flip Evo A11MT | |
| HP Dragonfly G4 | |
| Dell Latitude 9330 | |
| Asus ZenBook S13 OLED UX5304 | |
| AIDA64 / FPU Julia | |
| Lenovo ThinkPad X1 Nano Gen 3 | |
| Lenovo ThinkBook Plus Gen4 IRU | |
| Durchschnittliche Intel Core i7-1355U (29580 - 42706, n=18) | |
| Dell Latitude 9330 | |
| HP Dragonfly G4 | |
| Asus ZenBook S13 OLED UX5304 | |
| MSI Summit E13 Flip Evo A11MT | |
| AIDA64 / CPU SHA3 | |
| MSI Summit E13 Flip Evo A11MT | |
| Durchschnittliche Intel Core i7-1355U (1529 - 2200, n=18) | |
| Lenovo ThinkBook Plus Gen4 IRU | |
| Lenovo ThinkPad X1 Nano Gen 3 | |
| Dell Latitude 9330 | |
| HP Dragonfly G4 | |
| Asus ZenBook S13 OLED UX5304 | |
| AIDA64 / CPU Queen | |
| Lenovo ThinkPad X1 Nano Gen 3 | |
| HP Dragonfly G4 | |
| Asus ZenBook S13 OLED UX5304 | |
| Lenovo ThinkBook Plus Gen4 IRU | |
| Durchschnittliche Intel Core i7-1355U (21547 - 66907, n=18) | |
| MSI Summit E13 Flip Evo A11MT | |
| Dell Latitude 9330 | |
| AIDA64 / FPU SinJulia | |
| Lenovo ThinkPad X1 Nano Gen 3 | |
| MSI Summit E13 Flip Evo A11MT | |
| Lenovo ThinkBook Plus Gen4 IRU | |
| Durchschnittliche Intel Core i7-1355U (4045 - 5426, n=18) | |
| HP Dragonfly G4 | |
| Asus ZenBook S13 OLED UX5304 | |
| Dell Latitude 9330 | |
| AIDA64 / FPU Mandel | |
| Lenovo ThinkPad X1 Nano Gen 3 | |
| Durchschnittliche Intel Core i7-1355U (14596 - 21627, n=18) | |
| Lenovo ThinkBook Plus Gen4 IRU | |
| MSI Summit E13 Flip Evo A11MT | |
| Dell Latitude 9330 | |
| HP Dragonfly G4 | |
| Asus ZenBook S13 OLED UX5304 | |
| AIDA64 / CPU AES | |
| MSI Summit E13 Flip Evo A11MT | |
| Durchschnittliche Intel Core i7-1355U (31432 - 75408, n=18) | |
| Lenovo ThinkPad X1 Nano Gen 3 | |
| Lenovo ThinkBook Plus Gen4 IRU | |
| HP Dragonfly G4 | |
| Dell Latitude 9330 | |
| Asus ZenBook S13 OLED UX5304 | |
| AIDA64 / CPU ZLib | |
| Durchschnittliche Intel Core i7-1355U (454 - 684, n=18) | |
| Lenovo ThinkPad X1 Nano Gen 3 | |
| Lenovo ThinkBook Plus Gen4 IRU | |
| HP Dragonfly G4 | |
| Dell Latitude 9330 | |
| Asus ZenBook S13 OLED UX5304 | |
| MSI Summit E13 Flip Evo A11MT | |
| AIDA64 / FP64 Ray-Trace | |
| Lenovo ThinkPad X1 Nano Gen 3 | |
| Lenovo ThinkBook Plus Gen4 IRU | |
| MSI Summit E13 Flip Evo A11MT | |
| Durchschnittliche Intel Core i7-1355U (2991 - 4453, n=18) | |
| Dell Latitude 9330 | |
| HP Dragonfly G4 | |
| Asus ZenBook S13 OLED UX5304 | |
| AIDA64 / CPU PhotoWorxx | |
| Lenovo ThinkPad X1 Nano Gen 3 | |
| Lenovo ThinkBook Plus Gen4 IRU | |
| MSI Summit E13 Flip Evo A11MT | |
| Asus ZenBook S13 OLED UX5304 | |
| HP Dragonfly G4 | |
| Dell Latitude 9330 | |
| Durchschnittliche Intel Core i7-1355U (21800 - 46154, n=18) | |
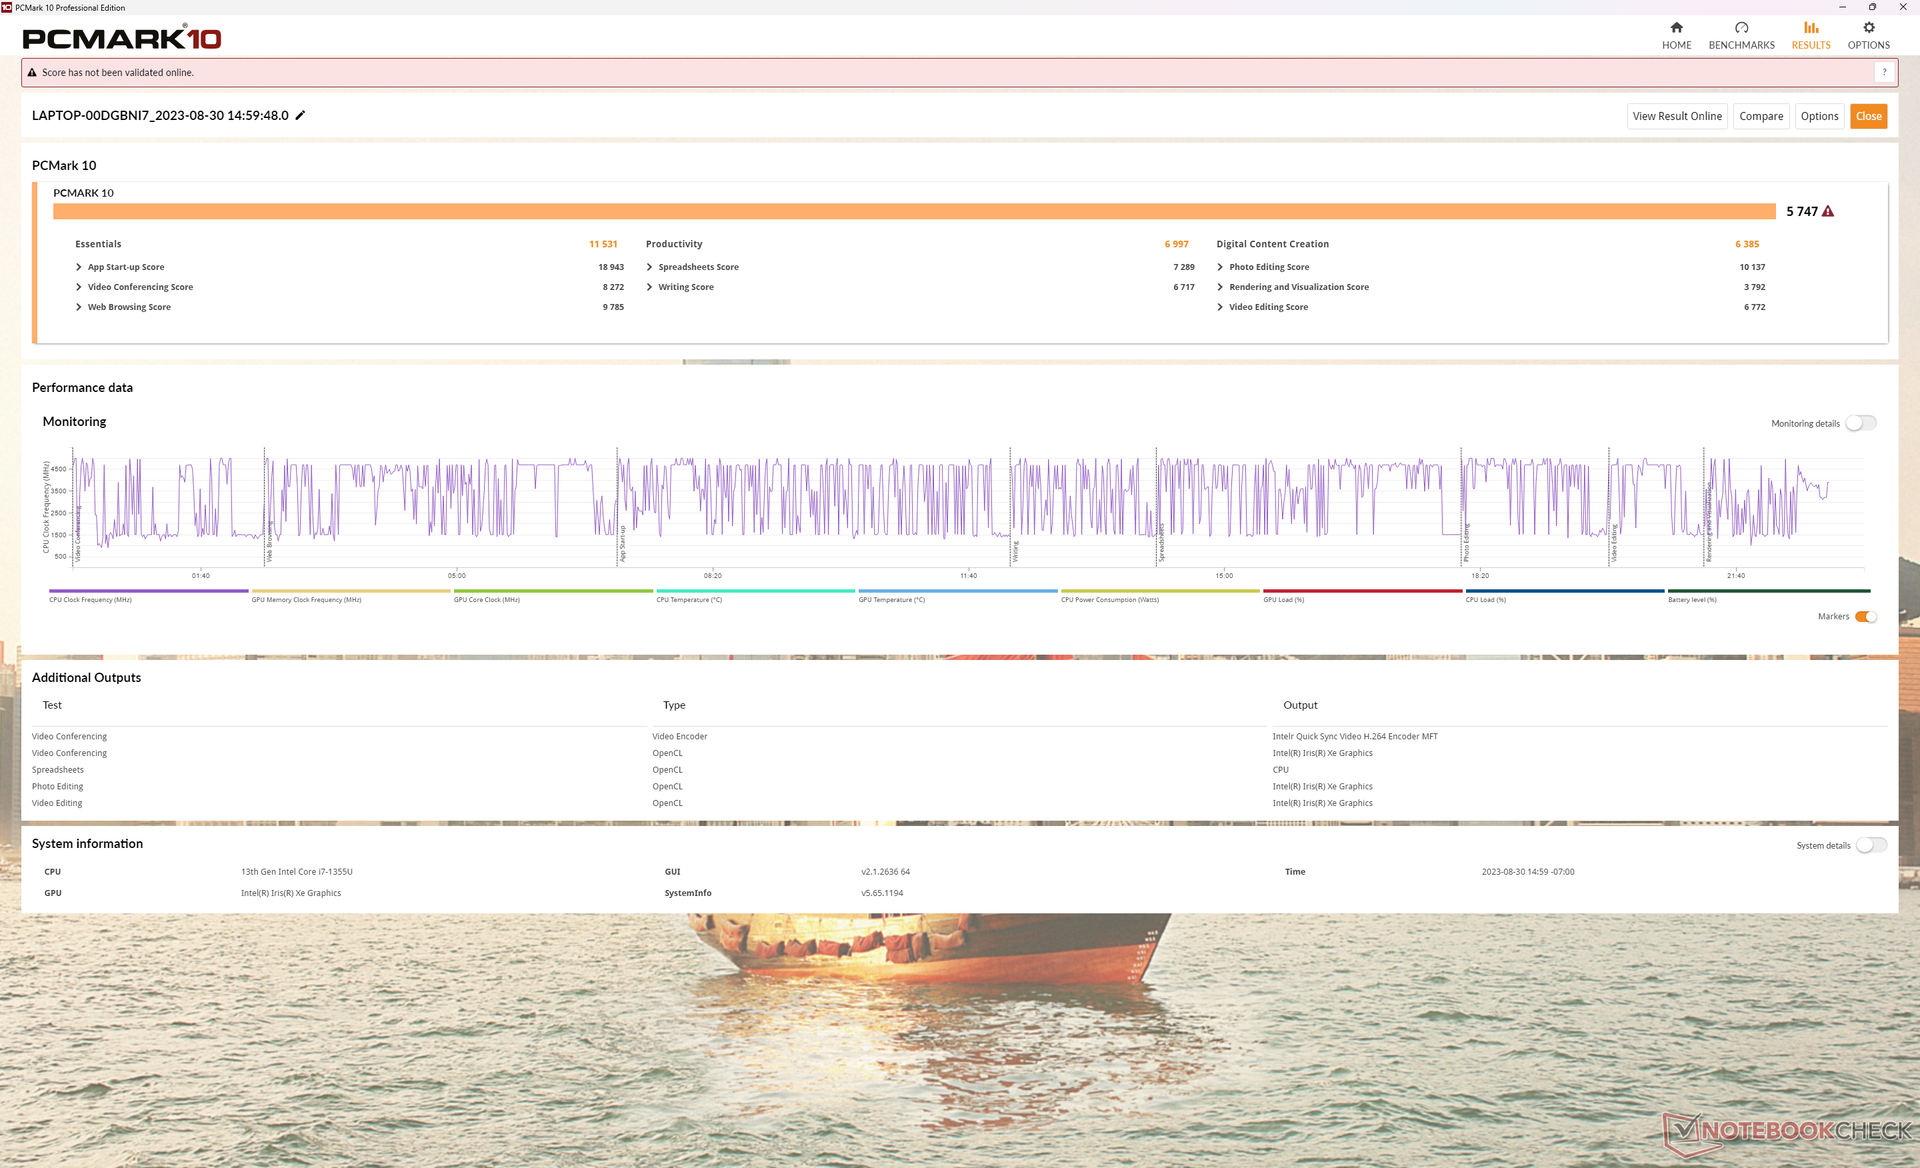
System Performance
Die PCMark-Ergebnisse liegen leicht über denen der meisten anderen Laptops mit ähnlichen CPUs der Intel Core-U-Serie. Subnotebooks mit AMD-Zen-3+- oder Zen-4-CPUs wie das Lenovo Yoga 7-14 oder das HP EliteBook 845 G10 erzielen aufgrund ihrer viel schnelleren integrierten GPUs im Vergleich zu unserer alternden Iris Xe tendenziell höhere Werte.
CrossMark: Overall | Productivity | Creativity | Responsiveness
| PCMark 10 / Score | |
| Lenovo ThinkPad X1 Nano Gen 3 | |
| Lenovo ThinkBook Plus Gen4 IRU | |
| Durchschnittliche Intel Core i7-1355U, Intel Iris Xe Graphics G7 96EUs (5455 - 5933, n=15) | |
| HP Dragonfly G4 | |
| Asus ZenBook S13 OLED UX5304 | |
| Dell Latitude 9330 | |
| MSI Summit E13 Flip Evo A11MT | |
| PCMark 10 / Essentials | |
| Lenovo ThinkBook Plus Gen4 IRU | |
| Durchschnittliche Intel Core i7-1355U, Intel Iris Xe Graphics G7 96EUs (10203 - 11822, n=15) | |
| HP Dragonfly G4 | |
| Lenovo ThinkPad X1 Nano Gen 3 | |
| Asus ZenBook S13 OLED UX5304 | |
| Dell Latitude 9330 | |
| MSI Summit E13 Flip Evo A11MT | |
| PCMark 10 / Productivity | |
| Lenovo ThinkPad X1 Nano Gen 3 | |
| Durchschnittliche Intel Core i7-1355U, Intel Iris Xe Graphics G7 96EUs (6763 - 7536, n=15) | |
| HP Dragonfly G4 | |
| Asus ZenBook S13 OLED UX5304 | |
| Dell Latitude 9330 | |
| Lenovo ThinkBook Plus Gen4 IRU | |
| MSI Summit E13 Flip Evo A11MT | |
| PCMark 10 / Digital Content Creation | |
| Lenovo ThinkPad X1 Nano Gen 3 | |
| HP Dragonfly G4 | |
| Lenovo ThinkBook Plus Gen4 IRU | |
| Durchschnittliche Intel Core i7-1355U, Intel Iris Xe Graphics G7 96EUs (5723 - 6712, n=15) | |
| Asus ZenBook S13 OLED UX5304 | |
| Dell Latitude 9330 | |
| MSI Summit E13 Flip Evo A11MT | |
| CrossMark / Overall | |
| Lenovo ThinkPad X1 Nano Gen 3 | |
| HP Dragonfly G4 | |
| Lenovo ThinkBook Plus Gen4 IRU | |
| Asus ZenBook S13 OLED UX5304 | |
| Durchschnittliche Intel Core i7-1355U, Intel Iris Xe Graphics G7 96EUs (1478 - 1643, n=15) | |
| CrossMark / Productivity | |
| Lenovo ThinkPad X1 Nano Gen 3 | |
| HP Dragonfly G4 | |
| Lenovo ThinkBook Plus Gen4 IRU | |
| Asus ZenBook S13 OLED UX5304 | |
| Durchschnittliche Intel Core i7-1355U, Intel Iris Xe Graphics G7 96EUs (1444 - 1665, n=15) | |
| CrossMark / Creativity | |
| Lenovo ThinkPad X1 Nano Gen 3 | |
| HP Dragonfly G4 | |
| Lenovo ThinkBook Plus Gen4 IRU | |
| Asus ZenBook S13 OLED UX5304 | |
| Durchschnittliche Intel Core i7-1355U, Intel Iris Xe Graphics G7 96EUs (1563 - 1732, n=15) | |
| CrossMark / Responsiveness | |
| Lenovo ThinkPad X1 Nano Gen 3 | |
| Lenovo ThinkBook Plus Gen4 IRU | |
| Asus ZenBook S13 OLED UX5304 | |
| HP Dragonfly G4 | |
| Durchschnittliche Intel Core i7-1355U, Intel Iris Xe Graphics G7 96EUs (1217 - 1681, n=15) | |
| PCMark 10 Score | 5747 Punkte | |
Hilfe | ||
| AIDA64 / Memory Copy | |
| Lenovo ThinkPad X1 Nano Gen 3 | |
| Dell Latitude 9330 | |
| Lenovo ThinkBook Plus Gen4 IRU | |
| Asus ZenBook S13 OLED UX5304 | |
| HP Dragonfly G4 | |
| Durchschnittliche Intel Core i7-1355U (35017 - 71600, n=18) | |
| MSI Summit E13 Flip Evo A11MT | |
| AIDA64 / Memory Read | |
| Lenovo ThinkPad X1 Nano Gen 3 | |
| Dell Latitude 9330 | |
| MSI Summit E13 Flip Evo A11MT | |
| Lenovo ThinkBook Plus Gen4 IRU | |
| Durchschnittliche Intel Core i7-1355U (38551 - 73377, n=18) | |
| Asus ZenBook S13 OLED UX5304 | |
| HP Dragonfly G4 | |
| AIDA64 / Memory Write | |
| Lenovo ThinkPad X1 Nano Gen 3 | |
| Lenovo ThinkBook Plus Gen4 IRU | |
| Asus ZenBook S13 OLED UX5304 | |
| HP Dragonfly G4 | |
| Durchschnittliche Intel Core i7-1355U (35910 - 93342, n=18) | |
| Dell Latitude 9330 | |
| MSI Summit E13 Flip Evo A11MT | |
| AIDA64 / Memory Latency | |
| Durchschnittliche Intel Core i7-1355U (72.2 - 346, n=18) | |
| Dell Latitude 9330 | |
| Lenovo ThinkBook Plus Gen4 IRU | |
| MSI Summit E13 Flip Evo A11MT | |
| Lenovo ThinkPad X1 Nano Gen 3 | |
| HP Dragonfly G4 | |
| Asus ZenBook S13 OLED UX5304 | |
* ... kleinere Werte sind besser
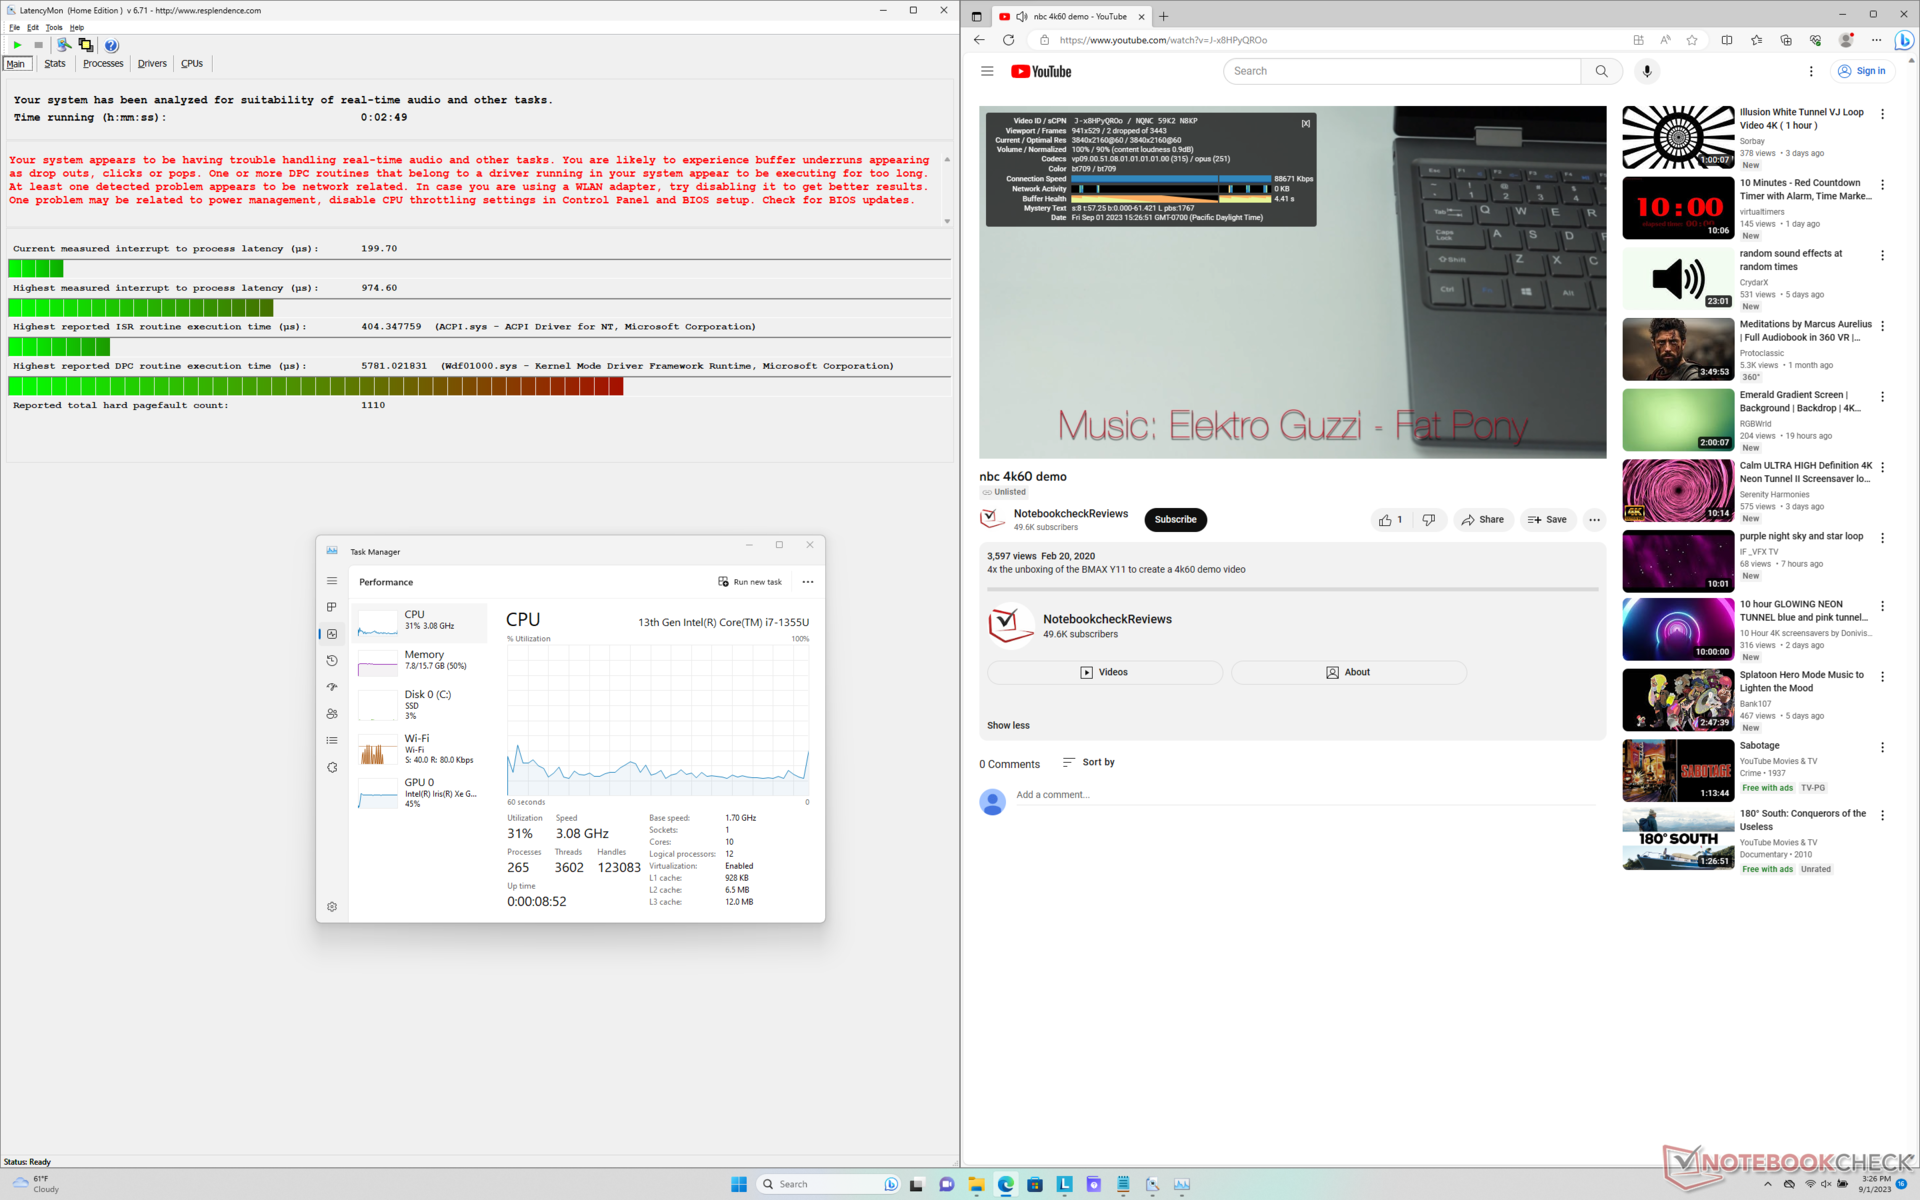
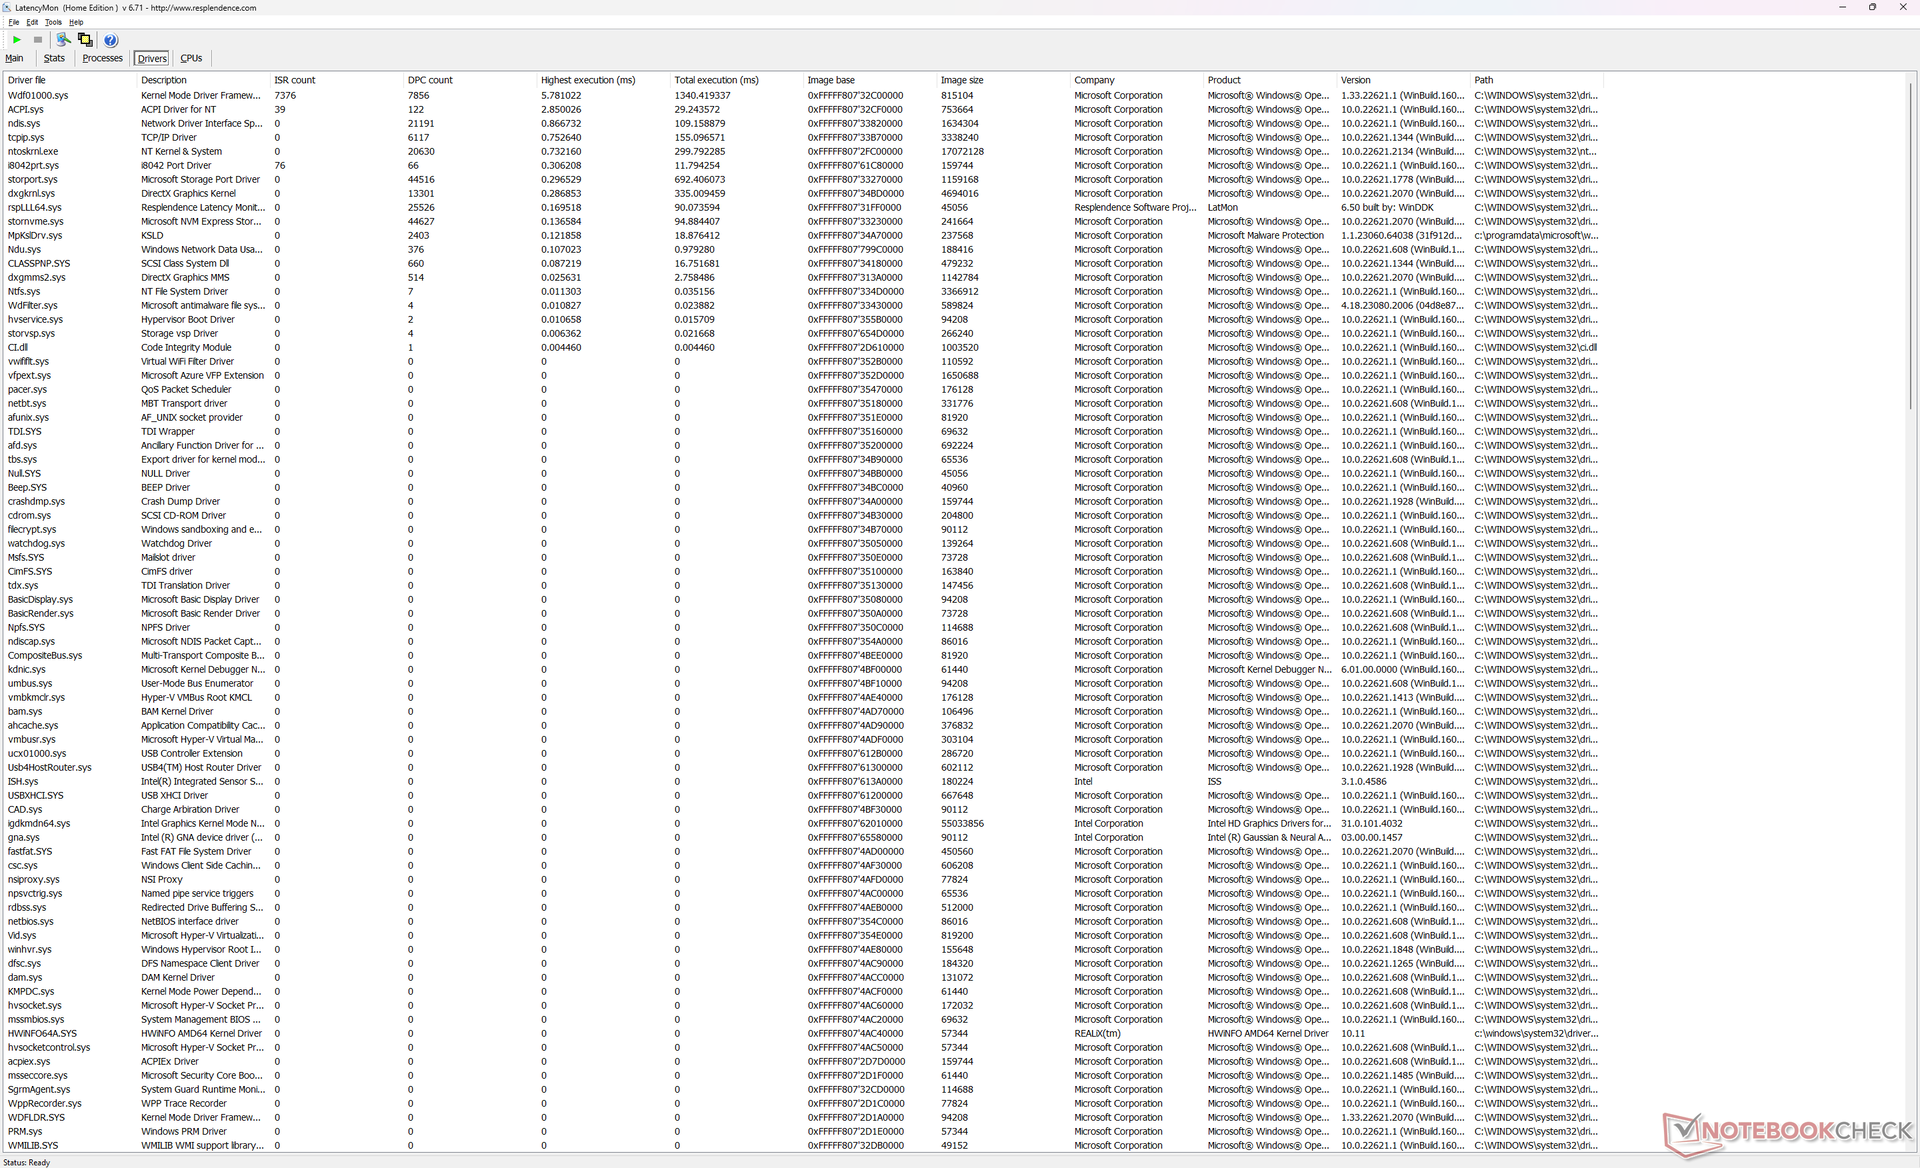
DPC Latenzen
LatencyMon zeigt leichte bis mittelschwere DPC-Probleme beim Öffnen mehrerer Browser-Tabs unserer Homepage. Die 4K-Videowiedergabe bei 60 FPS ist mit nur 2 Aussetzern während eines 60-Sekunden-Fensters nahezu perfekt.
| DPC Latencies / LatencyMon - interrupt to process latency (max), Web, Youtube, Prime95 | |
| Dell Latitude 9330 | |
| MSI Summit E13 Flip Evo A11MT | |
| Lenovo ThinkPad X1 Nano Gen 3 | |
| Asus ZenBook S13 OLED UX5304 | |
| HP Dragonfly G4 | |
| Lenovo ThinkBook Plus Gen4 IRU | |
* ... kleinere Werte sind besser
Massenspeicher — Nur eine SSD
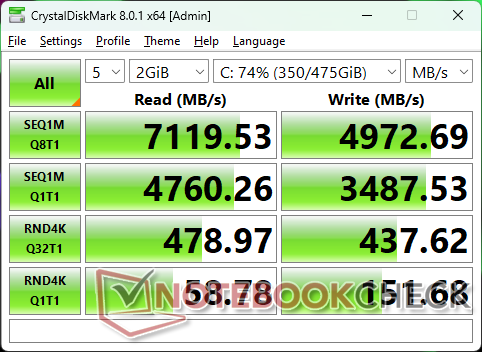
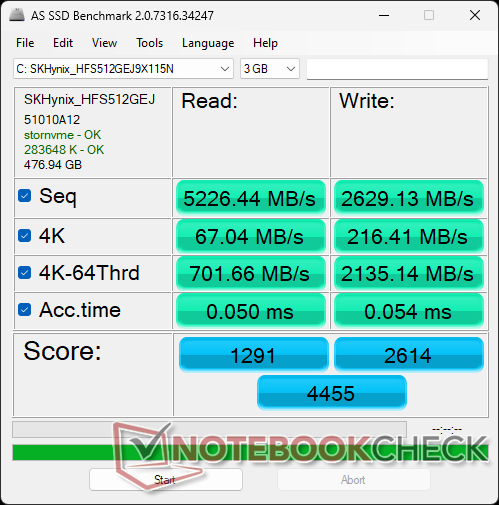
Unser Testgerät ist mit einer High-End SK hynix PC801 PCIe4 x4 NVMe SSD ausgestattet, die direkt mit der beliebten Samsung PM9A1 konkurriert. Die Leistung ist hervorragend und die maximalen Leseraten liegen trotz des kleinen und dünnen Formfaktors des ThinkBook Plus Gen 4 bei hohen 6200 MB/s.
Die Leseraten sind hier auch langfristig stabil. Dies deutet auf eine gute Wärmeableitung dank des verbauten Wärmeleitpads hin.

| Drive Performance Rating - Percent | |
| Asus ZenBook S13 OLED UX5304 | |
| MSI Summit E13 Flip Evo A11MT | |
| Lenovo ThinkBook Plus Gen4 IRU | |
| HP Dragonfly G4 | |
| Dell Latitude 9330 | |
| Lenovo ThinkPad X1 Nano Gen 3 | |
* ... kleinere Werte sind besser
Dauerleistung Lesen: DiskSpd Read Loop, Queue Depth 8
GPU-Leistung - Vertraute Xe Grafik
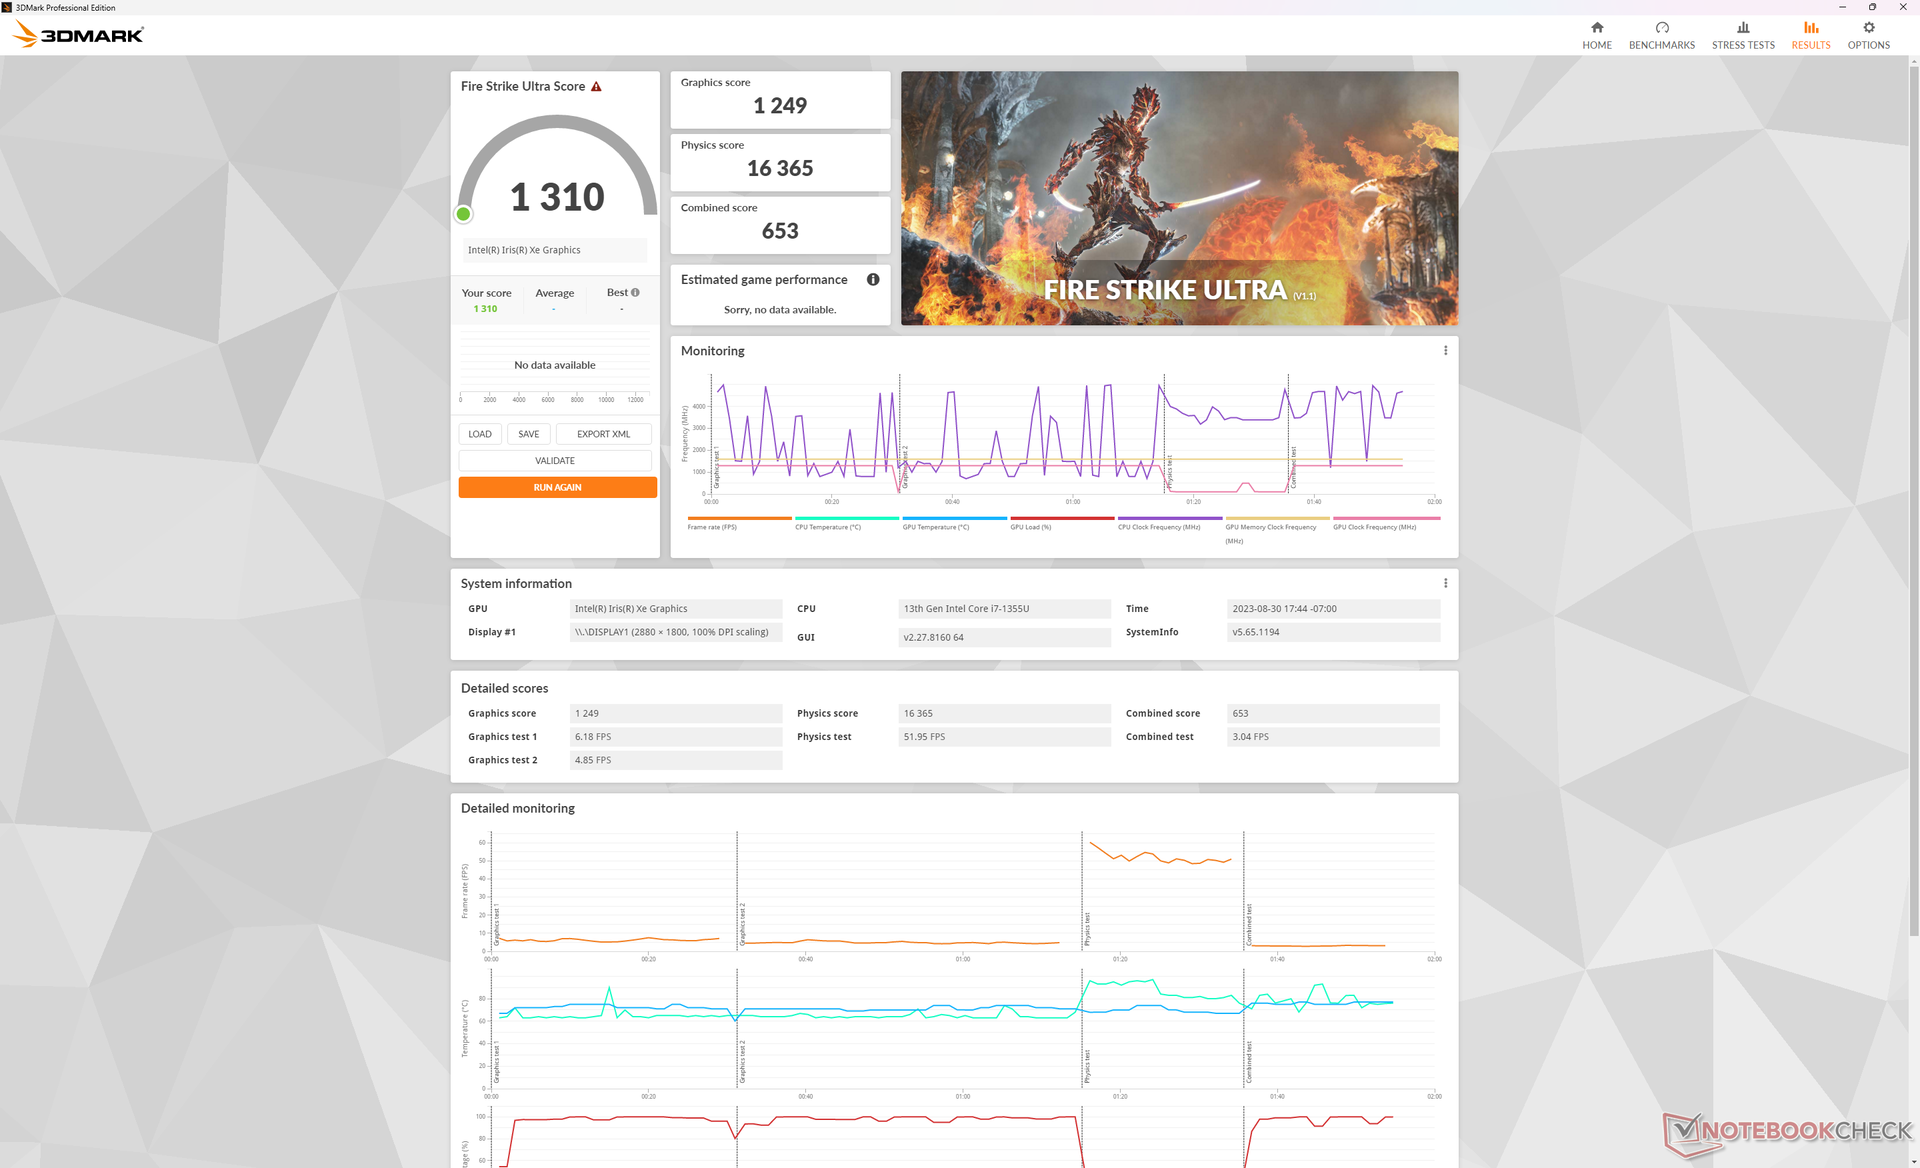
Die Leistung der integrierten Iris Xe 96 EUs entspricht dem, was wir im Vergleich zu anderen Laptops mit derselben GPU erwarten, wenn sie nicht sogar um einige Prozentpunkte schneller ist. Ein Downgrade auf den Core i5 mit Iris Xe 80 EUs dürfte die Grafikleistung um etwa 30 bis 35 Prozent verringern, wenn man auf unseren Erfahrungen mit dem Lenovo ThinkPad X13 Yoga G4 zurückgreift. Aktuelle AMD-Alternativen wie die Radeon 680M oder 780M sind viel schneller als jede Intel iGPU-Lösung zum Zeitpunkt der Erstellung dieses Artikels.
Externe GPUs werden für eine höhere Leistung unterstützt. Technisch gesehen kann man auch 3D-Spiele auf dem E-Ink-Display ausführen, was zwar nett anzusehen, aber ansonsten unpraktisch ist.
Die Ergebnisse des 3DMark 11 sind im Akkubetrieb, im Modus "Ausbalanciert" und im Modus "Leistung" relativ ähnlich, wie die Tabelle unten zeigt. Dies deutet darauf hin, dass die Gesamtleistung eher durch den begrenzten Turbo-Boost des Systems als durch die aktuelle Profileinstellung beeinflusst wird.
| Energieprofil | Graphics Score | Physics Score | Combined Score |
| Akkubetrieb | 6468 | 13039 | 6591 |
| Ausgeglichen | 6509 | 11451 (-12%) | 5636 |
| Leistungsmodus | 6456 | 13055 | 6586 |
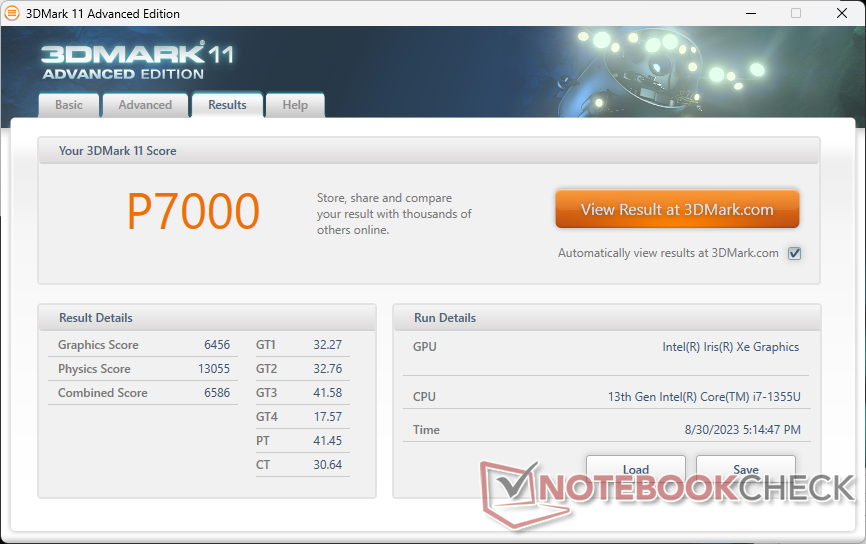
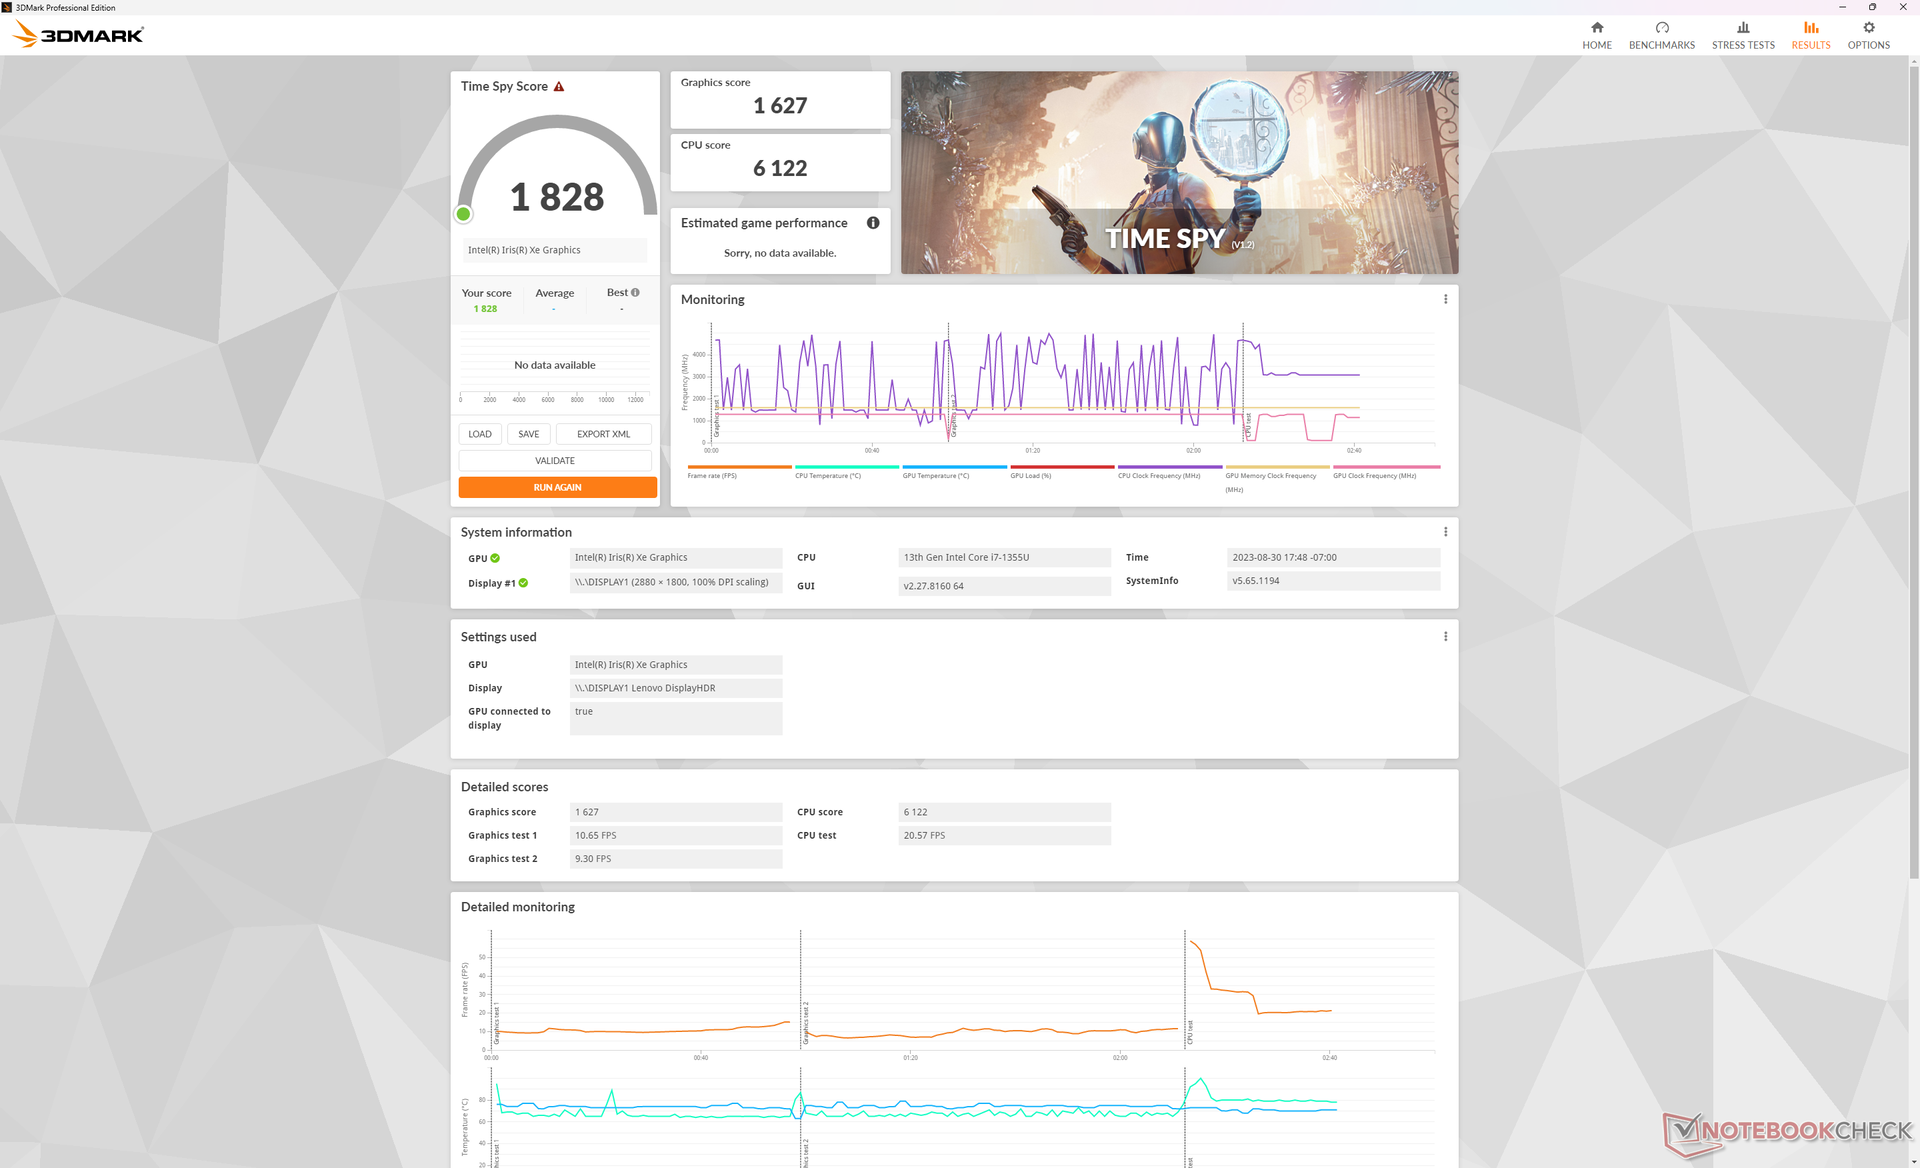
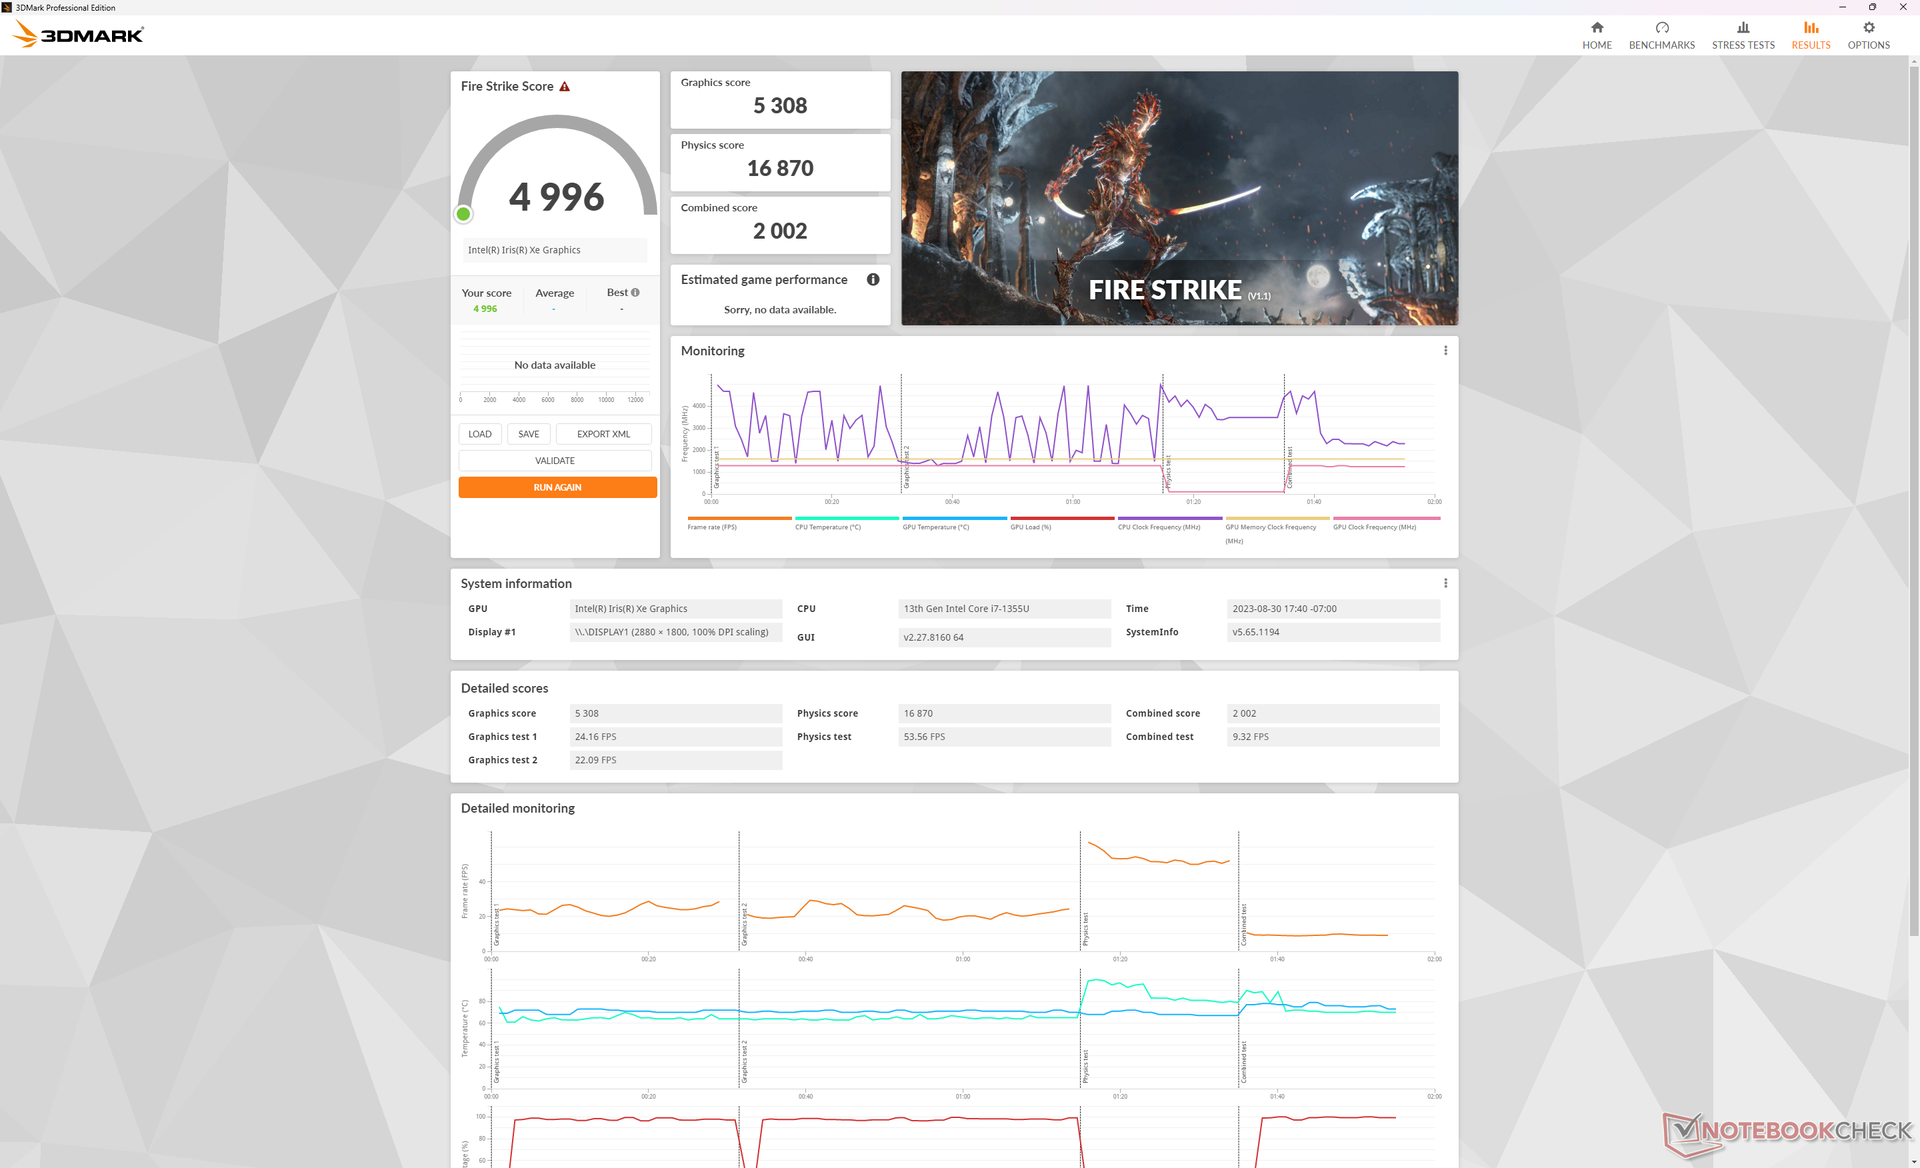
| 3DMark 11 Performance | 7000 Punkte | |
| 3DMark Fire Strike Score | 4996 Punkte | |
| 3DMark Time Spy Score | 1828 Punkte | |
Hilfe | ||
| Blender | |
| v3.3 Classroom HIP/AMD | |
| Lenovo Yoga 6 13 83B2001SGE | |
| v3.3 Classroom OPTIX/RTX | |
| Lenovo Yoga Pro 7 14IRH G8 | |
| v3.3 Classroom CUDA | |
| Lenovo Yoga Pro 7 14IRH G8 | |
| v3.3 Classroom CPU | |
| Asus ZenBook S13 OLED UX5304 | |
| Dell Latitude 9330 | |
| HP Dragonfly G4 | |
| Lenovo ThinkPad X1 Nano Gen 3 | |
| Lenovo ThinkBook Plus Gen4 IRU | |
| Durchschnittliche Intel Iris Xe Graphics G7 96EUs (336 - 1259, n=109) | |
| Lenovo Yoga 6 13 83B2001SGE | |
| Framework Laptop 13.5 13th Gen Intel | |
| Lenovo Yoga Pro 7 14IRH G8 | |
* ... kleinere Werte sind besser
Witcher 3 FPS Chart
| min. | mittel | hoch | max. | |
|---|---|---|---|---|
| GTA V (2015) | 102.8 | 91.3 | 26.2 | 11.1 |
| The Witcher 3 (2015) | 89.8 | 59.1 | 32.5 | 15.4 |
| Dota 2 Reborn (2015) | 114.8 | 84.3 | 68.7 | 60.5 |
| Final Fantasy XV Benchmark (2018) | 46.4 | 25.6 | 17.9 | |
| X-Plane 11.11 (2018) | 38.8 | 34.4 | 34.3 | |
| Far Cry 5 (2018) | 50 | 31 | 29 | 27 |
| Strange Brigade (2018) | 94.4 | 41.1 | 32.5 | 26.1 |
| Cyberpunk 2077 1.6 (2022) | 18 | 14.3 | 12.1 | 11.4 |
| Tiny Tina's Wonderlands (2022) | 30.8 | 23.5 | 15.4 | 12 |
| F1 22 (2022) | 48.5 | 44.7 | 32 | 23.8 |
Emissionen - Nur laut unter Last
Lüfter
Das Lüftergeräusch ist bei normaler Belastung wie Webbrowsing, Lesen oder Videostreaming kaum wahrnehmbar und liegt bei 27 dB(A) vor einem leisen Hintergrund von 24,3 dB(A). Höhere Belastungen wie 3DMark 06 oder erhöhen das Lüftergeräusch auf merkliche 38 dB(A), ähnlich dem, was wir beim Latitude 9330 beobachtet haben.
Bei Spielen oder anderen intensiven Belastungen über einen längeren Zeitraum konnten wir ein maximales Lüftergeräusch von knapp unter 42 dB(A) aufzeichnen. Der niedrige 40-dB(A)-Bereich ist typisch für die meisten Convertibles und Laptops, die von CPUs der U-Serie angetrieben werden.
Lautstärkediagramm
| Idle |
| 24.3 / 24.3 / 24.3 dB(A) |
| Last |
| 38.2 / 41.8 dB(A) |
 | ||
30 dB leise 40 dB(A) deutlich hörbar 50 dB(A) störend |
||
min: | ||
| Lenovo ThinkBook Plus Gen4 IRU Iris Xe G7 96EUs, i7-1355U, SK hynix PC801 HFS512GEJ9X115N | Lenovo ThinkPad X1 Nano Gen 3 Iris Xe G7 96EUs, i7-1360P, Lenovo UMIS AM6A0 RPJTJ512MKP1QDQ | HP Dragonfly G4 Iris Xe G7 96EUs, i7-1365U, Micron 3400 MTFDKBA512TFH 512GB | Asus ZenBook S13 OLED UX5304 Iris Xe G7 96EUs, i7-1355U, Samsung PM9A1 MZVL21T0HCLR | Dell Latitude 9330 Iris Xe G7 96EUs, i7-1260U | MSI Summit E13 Flip Evo A11MT Iris Xe G7 96EUs, i7-1185G7, Phison 1TB SM2801T24GKBB4S-E162 | |
|---|---|---|---|---|---|---|
| Geräuschentwicklung | 8% | 10% | 4% | 4% | -4% | |
| aus / Umgebung * (dB) | 24.3 | 22.9 6% | 23.3 4% | 23.3 4% | 23 5% | 24.5 -1% |
| Idle min * (dB) | 24.3 | 23 5% | 23.5 3% | 23.3 4% | 23 5% | 24.7 -2% |
| Idle avg * (dB) | 24.3 | 23 5% | 23.5 3% | 23.3 4% | 23.1 5% | 24.7 -2% |
| Idle max * (dB) | 24.3 | 23 5% | 26.8 -10% | 23.3 4% | 23.1 5% | 26.4 -9% |
| Last avg * (dB) | 38.2 | 32.8 14% | 27.2 29% | 37.7 1% | 37.1 3% | 37.8 1% |
| Witcher 3 ultra * (dB) | 41.9 | 36.9 12% | 32.7 22% | 40.1 4% | 40.6 3% | 41.4 1% |
| Last max * (dB) | 41.8 | 36.9 12% | 35 16% | 40.1 4% | 40.5 3% | 48.8 -17% |
* ... kleinere Werte sind besser
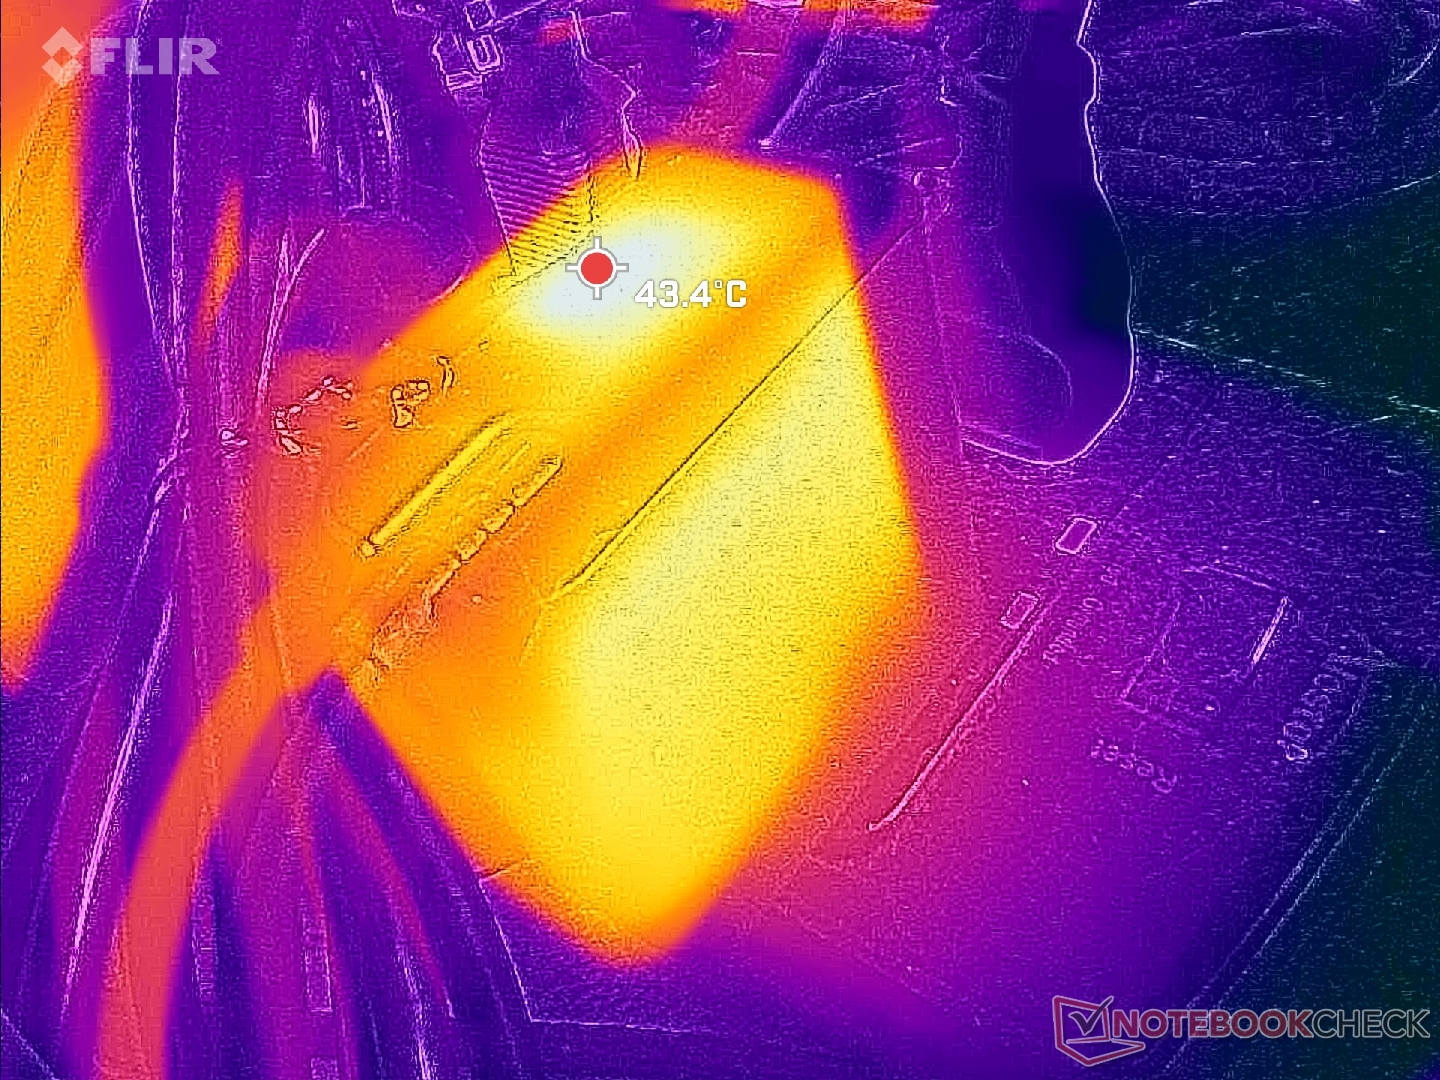
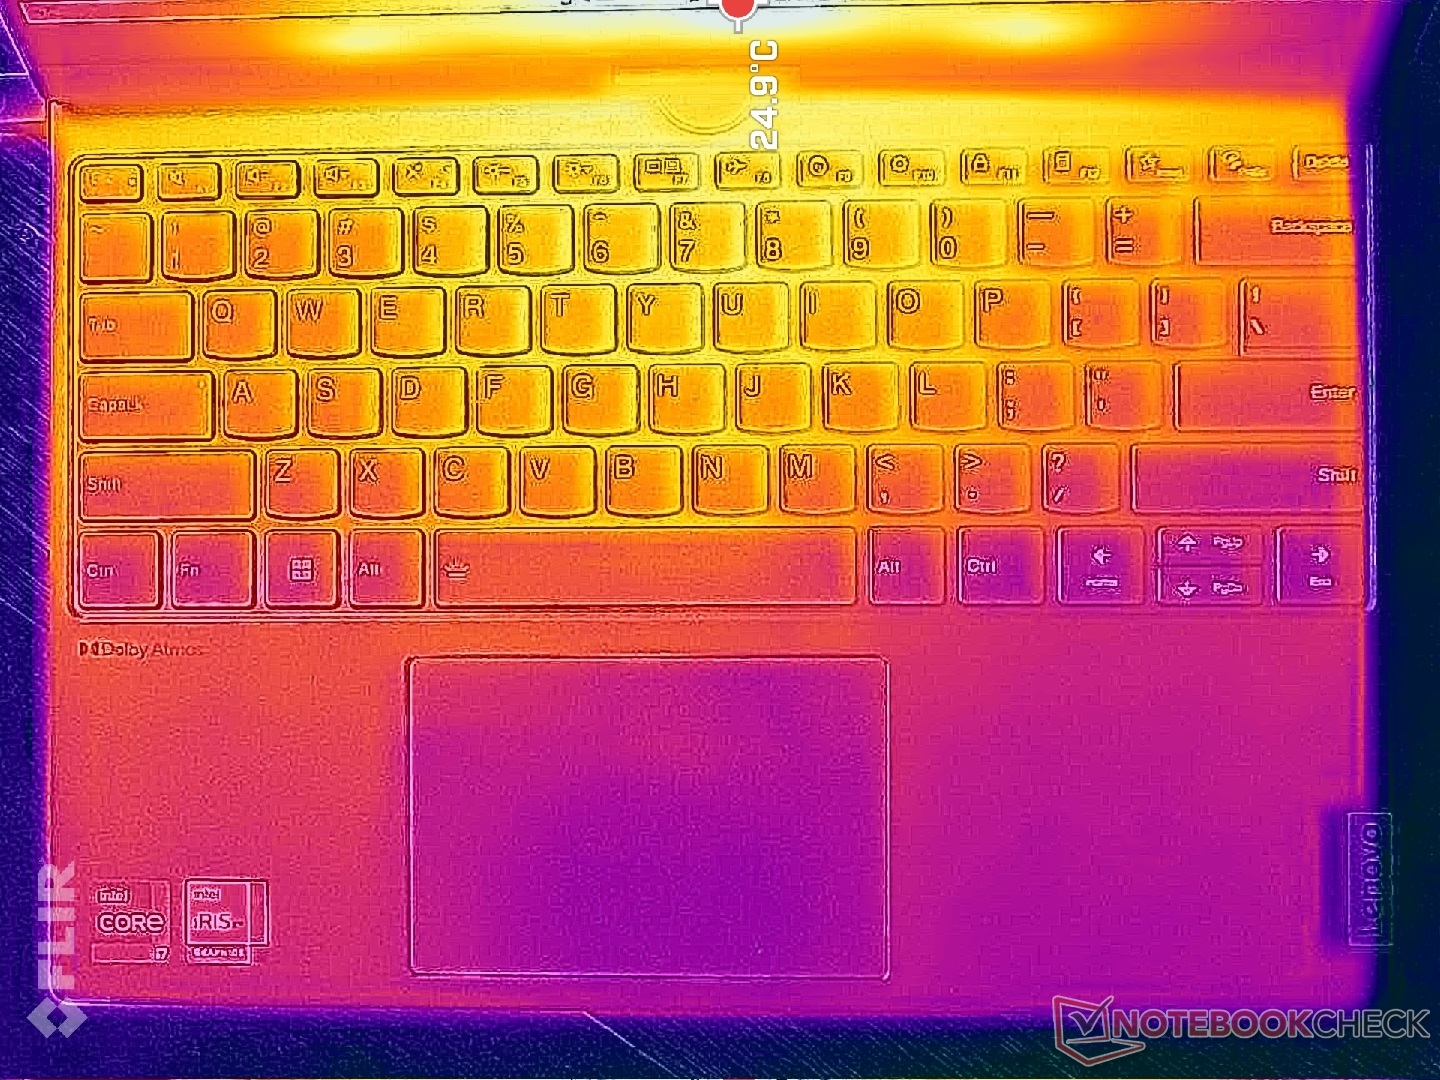
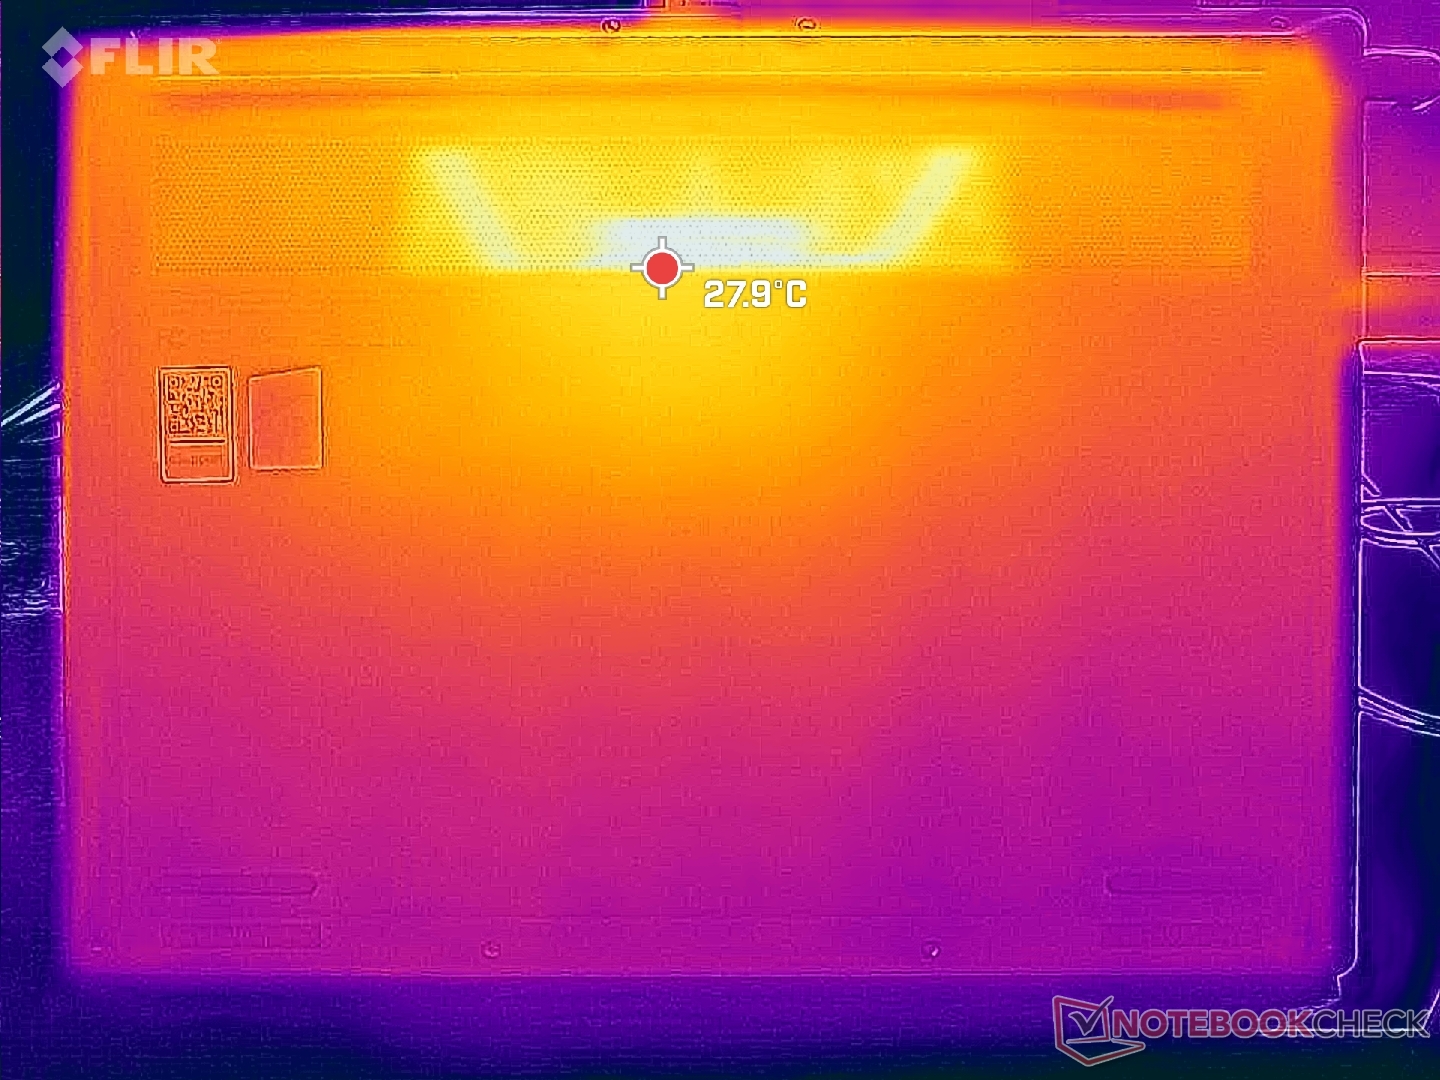
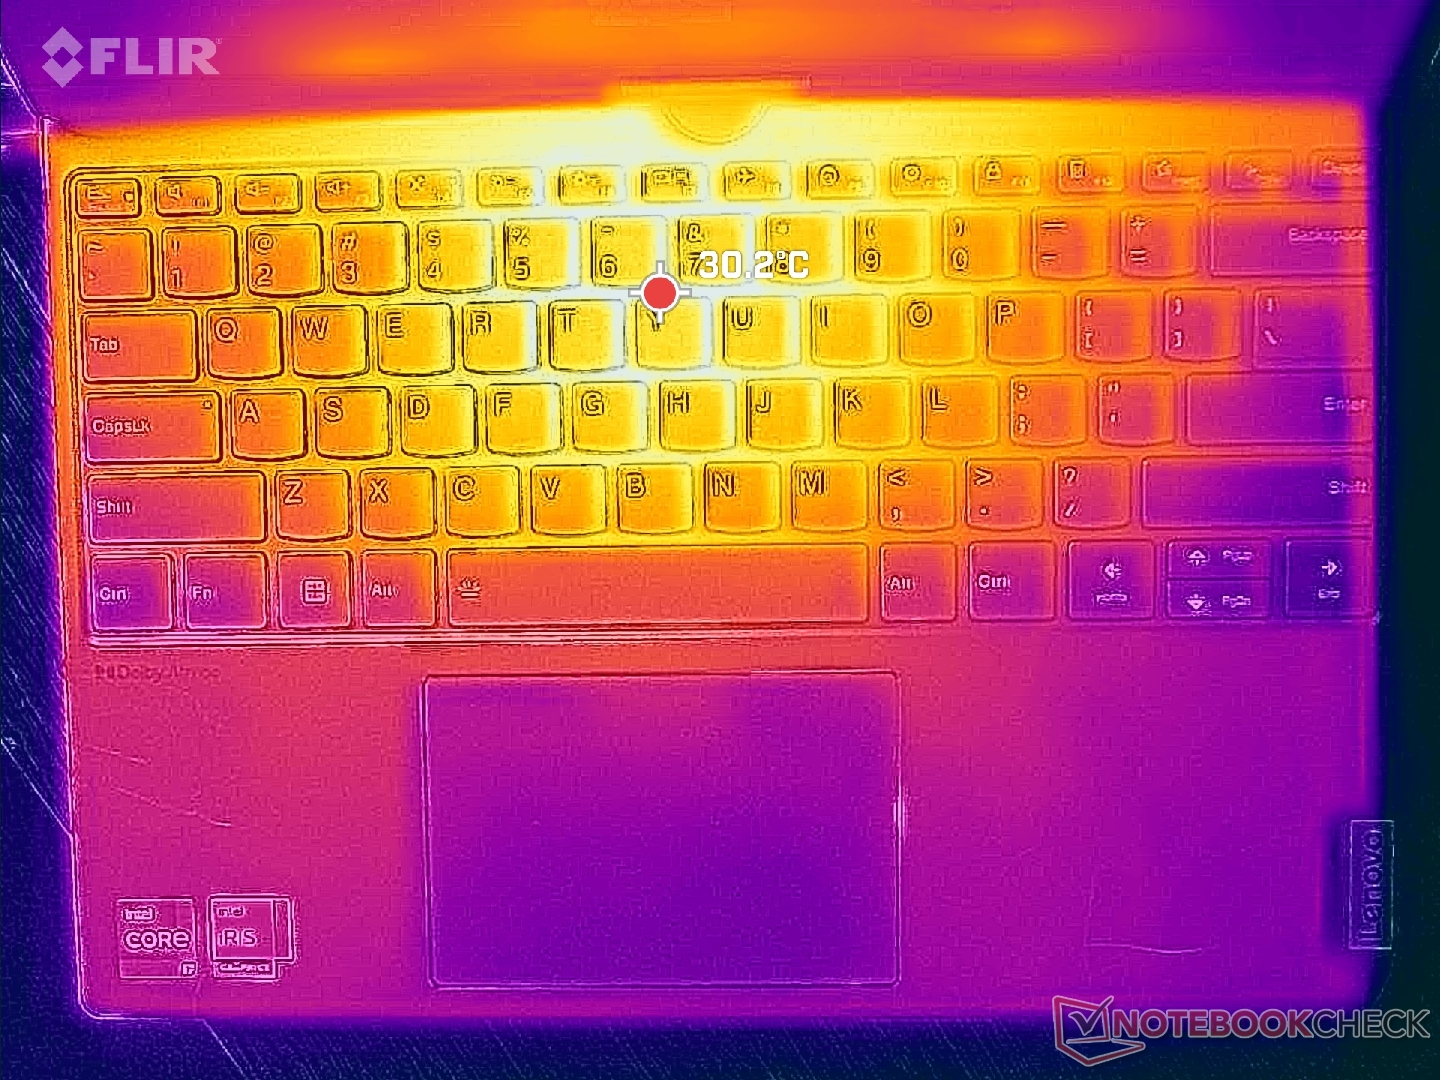
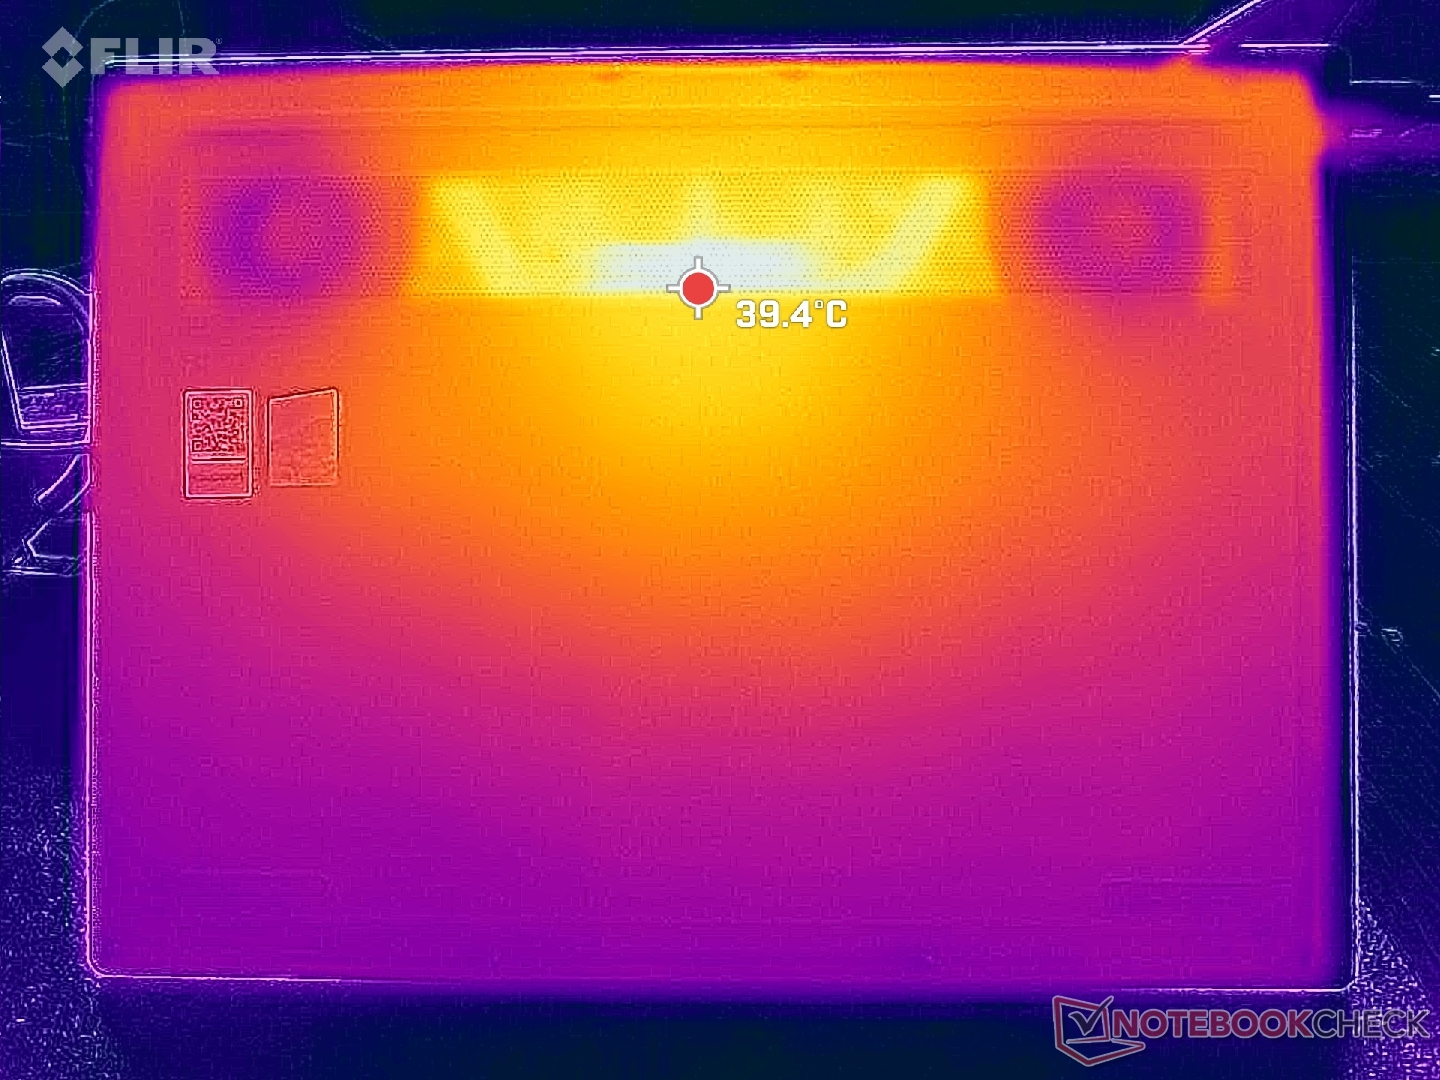
Temperaturen
Die Oberflächentemperaturen sind auf der Tastaturseite kühler als erwartet, während es auf der Unterseite des ThinkBooks deutlich wärmer werden kann. Heiße Stellen auf der Tastatur erreichen nur ca. 30°C im Vergleich zu 39°C auf der Unterseite. Die Wärme ist spürbar, aber nie störend im Notebook- oder Tablet-Betrieb.
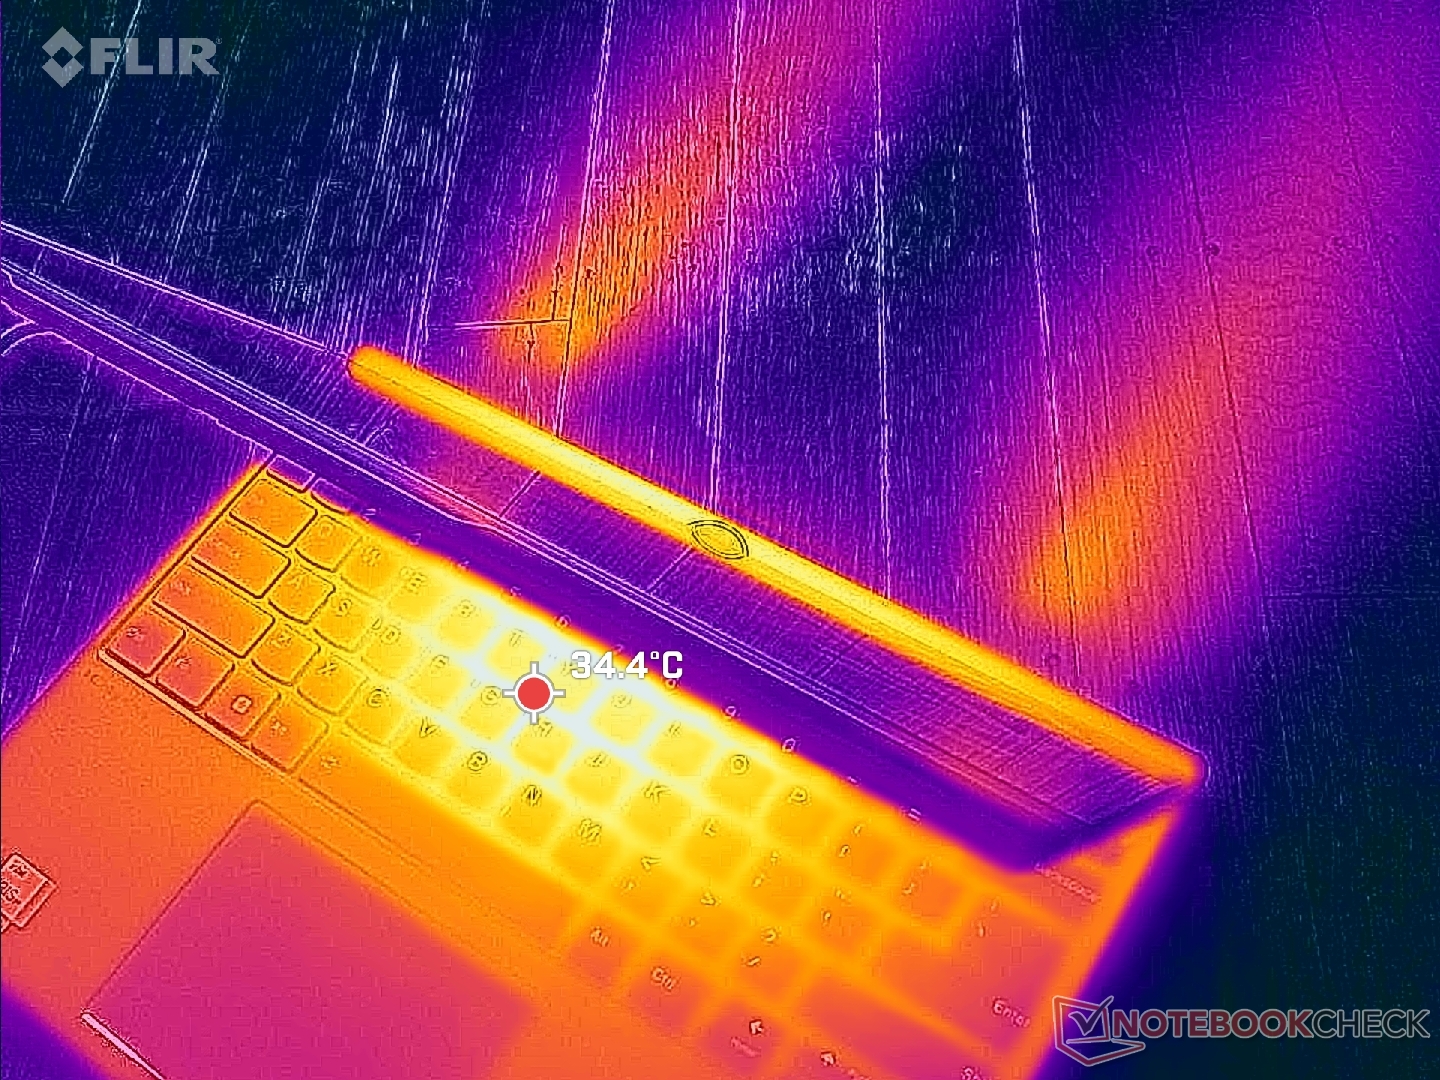
(+) Die maximale Temperatur auf der Oberseite ist 34.2 °C. Im Vergleich liegt der Klassendurchschnitt bei 35.4 °C (von 19.6 bis 60 °C für die Klasse Convertible).
(+) Auf der Unterseite messen wir eine maximalen Wert von 35.8 °C (im Vergleich zum Durchschnitt von 36.9 °C).
(+) Ohne Last messen wir eine durchschnittliche Temperatur von 26.7 °C auf der Oberseite. Der Klassendurchschnitt erreicht 30.3 °C.
(+) Die Handballen und der Touchpad-Bereich sind mit gemessenen 26.6 °C kühler als die typische Hauttemperatur und fühlen sich dadurch kühl an.
(±) Die durchschnittliche Handballen-Temperatur anderer getesteter Geräte war 28 °C (+1.4 °C).
| Lenovo ThinkBook Plus Gen4 IRU Intel Core i7-1355U, Intel Iris Xe Graphics G7 96EUs | Lenovo ThinkPad X1 Nano Gen 3 Intel Core i7-1360P, Intel Iris Xe Graphics G7 96EUs | HP Dragonfly G4 Intel Core i7-1365U, Intel Iris Xe Graphics G7 96EUs | Asus ZenBook S13 OLED UX5304 Intel Core i7-1355U, Intel Iris Xe Graphics G7 96EUs | Dell Latitude 9330 Intel Core i7-1260U, Intel Iris Xe Graphics G7 96EUs | MSI Summit E13 Flip Evo A11MT Intel Core i7-1185G7, Intel Iris Xe Graphics G7 96EUs | |
|---|---|---|---|---|---|---|
| Hitze | -6% | -5% | -10% | -9% | -33% | |
| Last oben max * (°C) | 34.2 | 44 -29% | 38.6 -13% | 43.1 -26% | 40.6 -19% | 52 -52% |
| Last unten max * (°C) | 35.8 | 43.2 -21% | 40.4 -13% | 45 -26% | 50.2 -40% | 57.4 -60% |
| Idle oben max * (°C) | 28.6 | 25.6 10% | 28.2 1% | 27.3 5% | 25 13% | 30.4 -6% |
| Idle unten max * (°C) | 30.4 | 25.6 16% | 29 5% | 27.8 9% | 27.6 9% | 34.2 -13% |
* ... kleinere Werte sind besser
Stresstest
Bei der Ausführung von Prime95 stiegen die CPU-Taktraten und die Leistungsaufnahme auf 3,3 GHz bzw. 54 W, und das bei einer hohen Kerntemperatur von 97 C. Dies hielt nur 10 bis 15 Sekunden an, bevor die Taktraten und die Leistungsaufnahme auf 2,4 GHz und 26 W sanken. Dabei wurde kühlere Kerntemperatur von 75 C aufrechterhalten.
Die GPU-Taktraten und die Temperatur bei der Ausführung von Witcher 3 stabilisieren sich bei 1297 MHz bzw. 71 °C, verglichen mit 69 °C auf dem Intel-betriebenen Dragonfly G4.
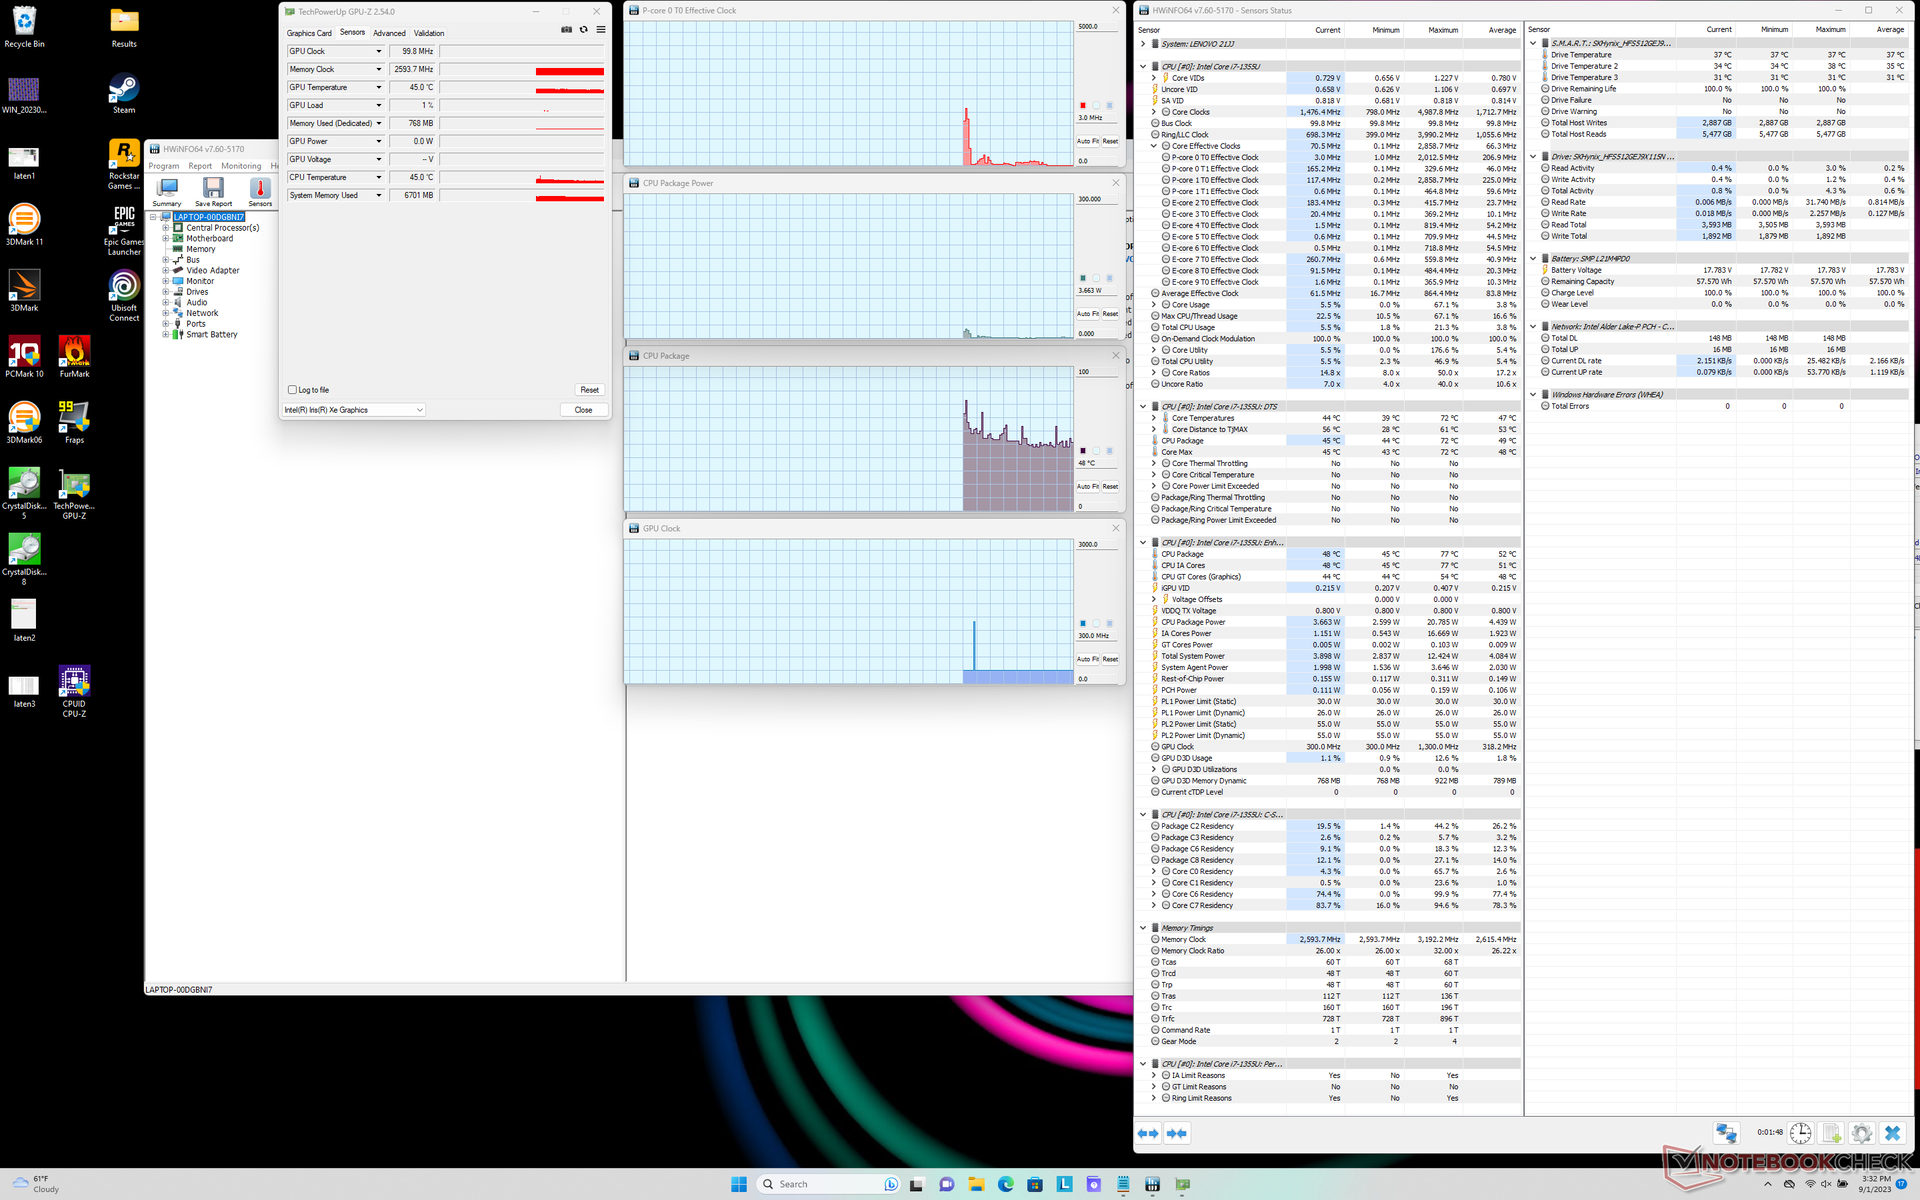
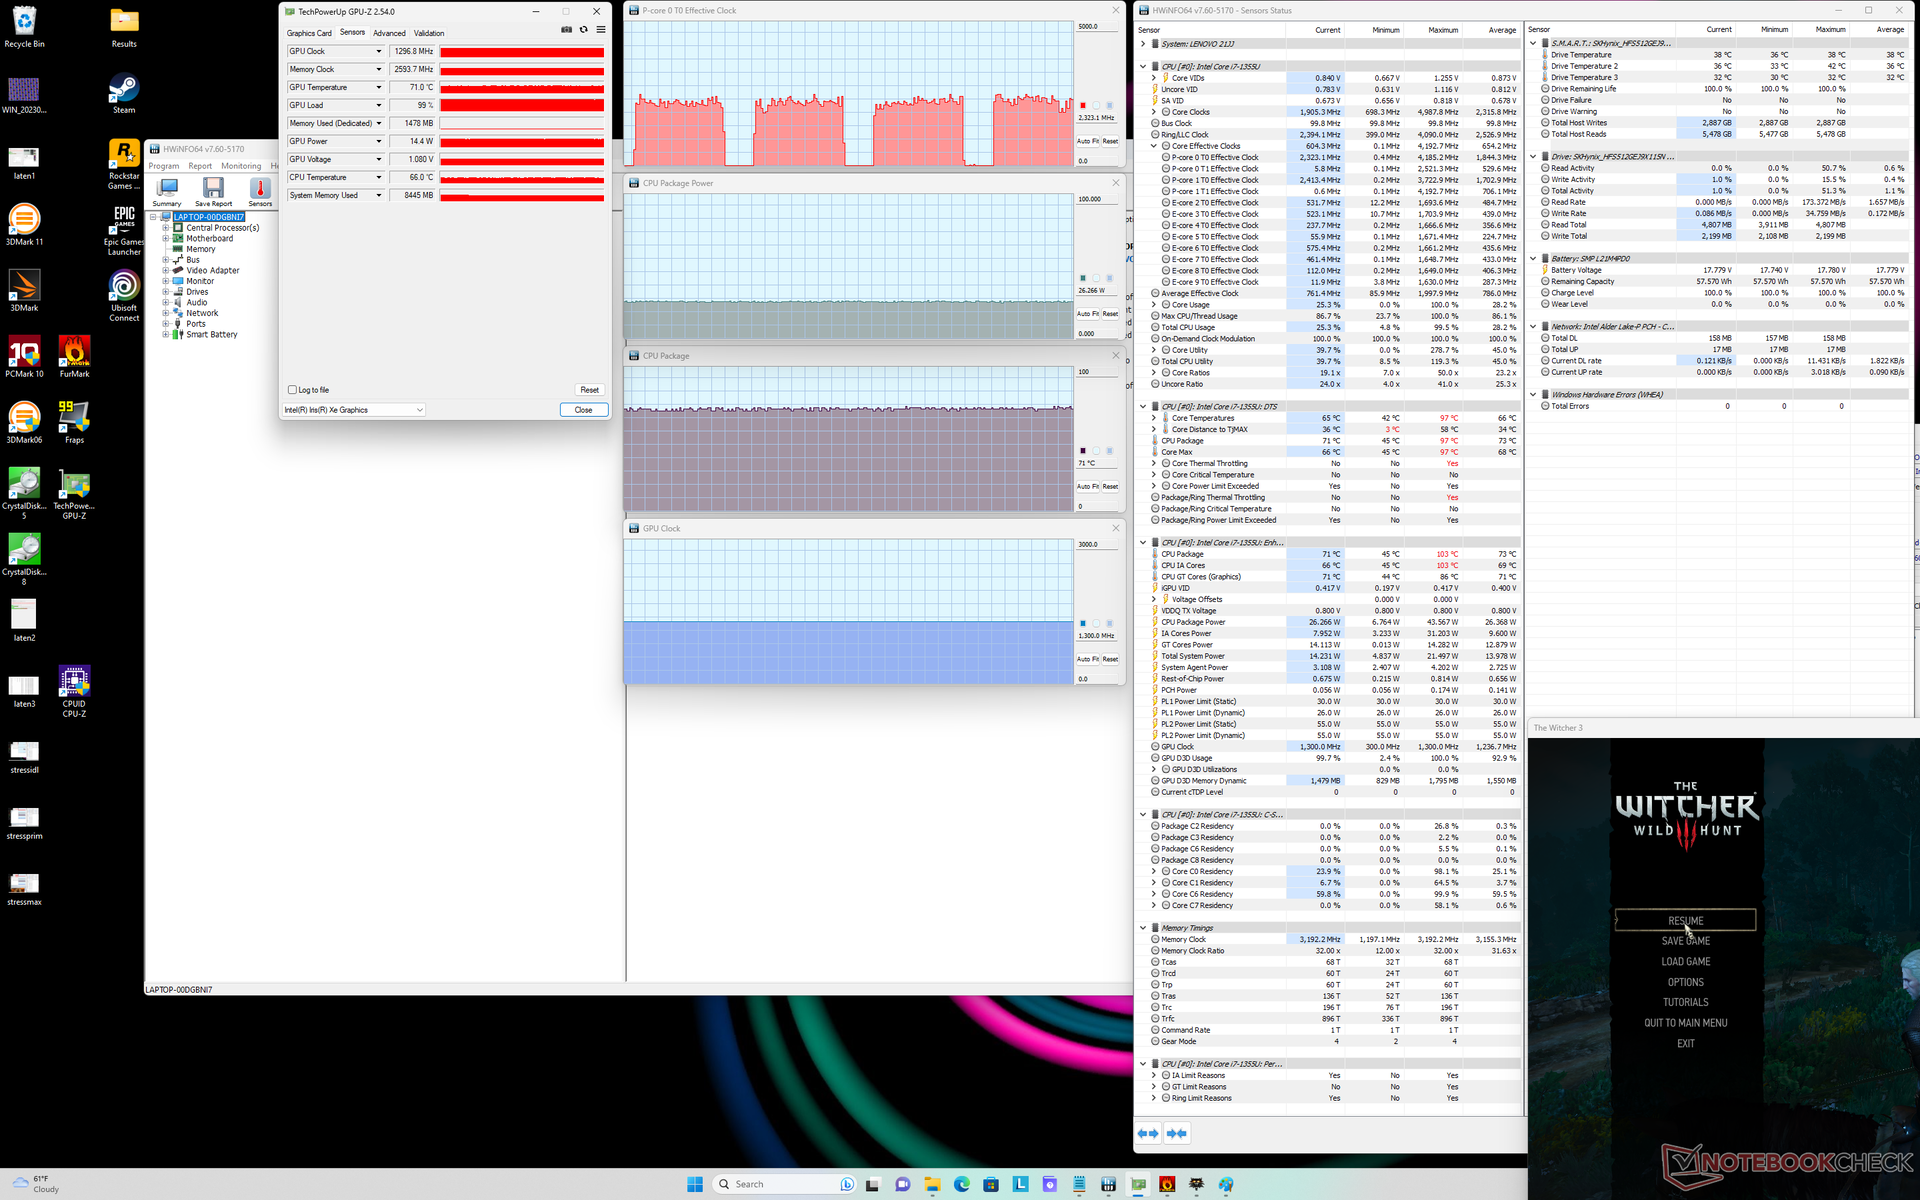
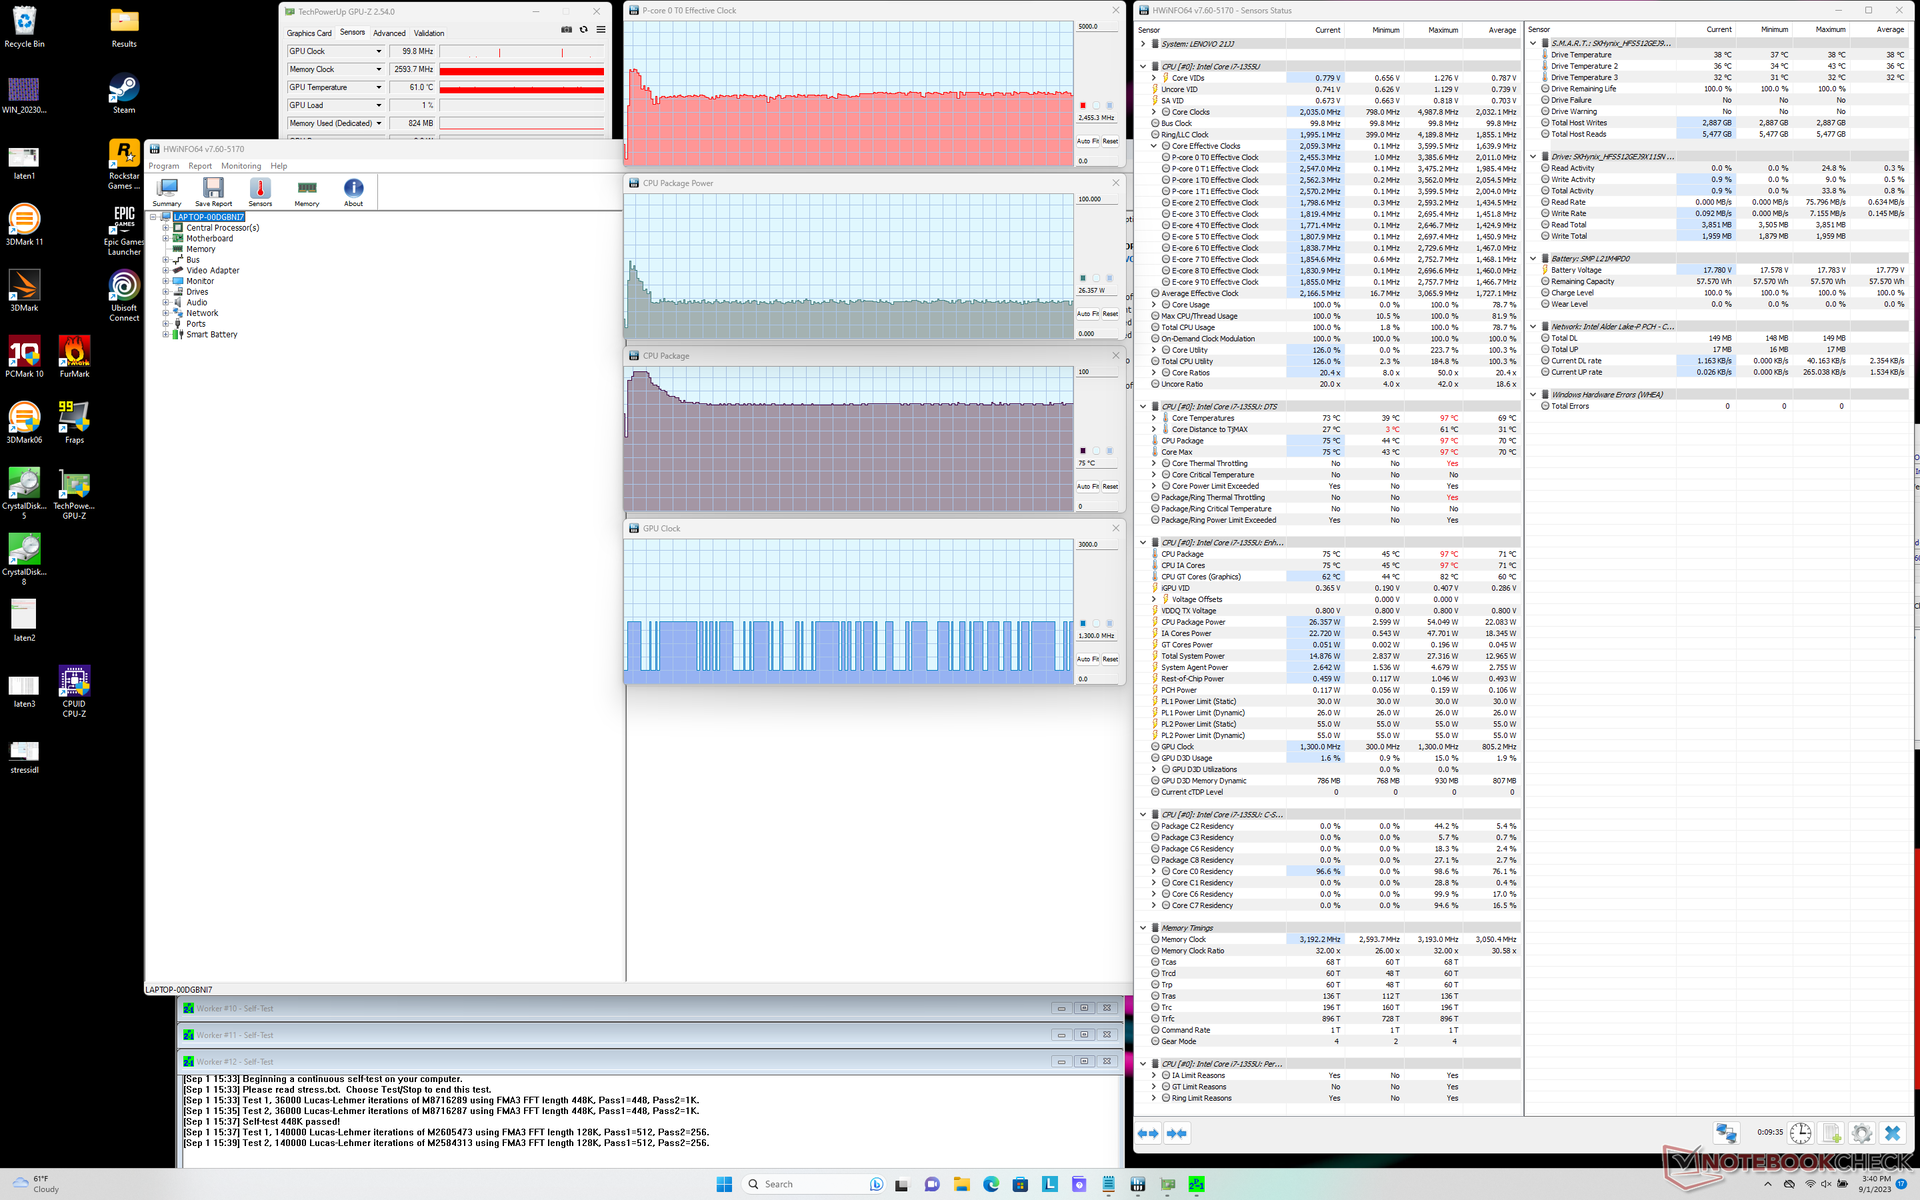
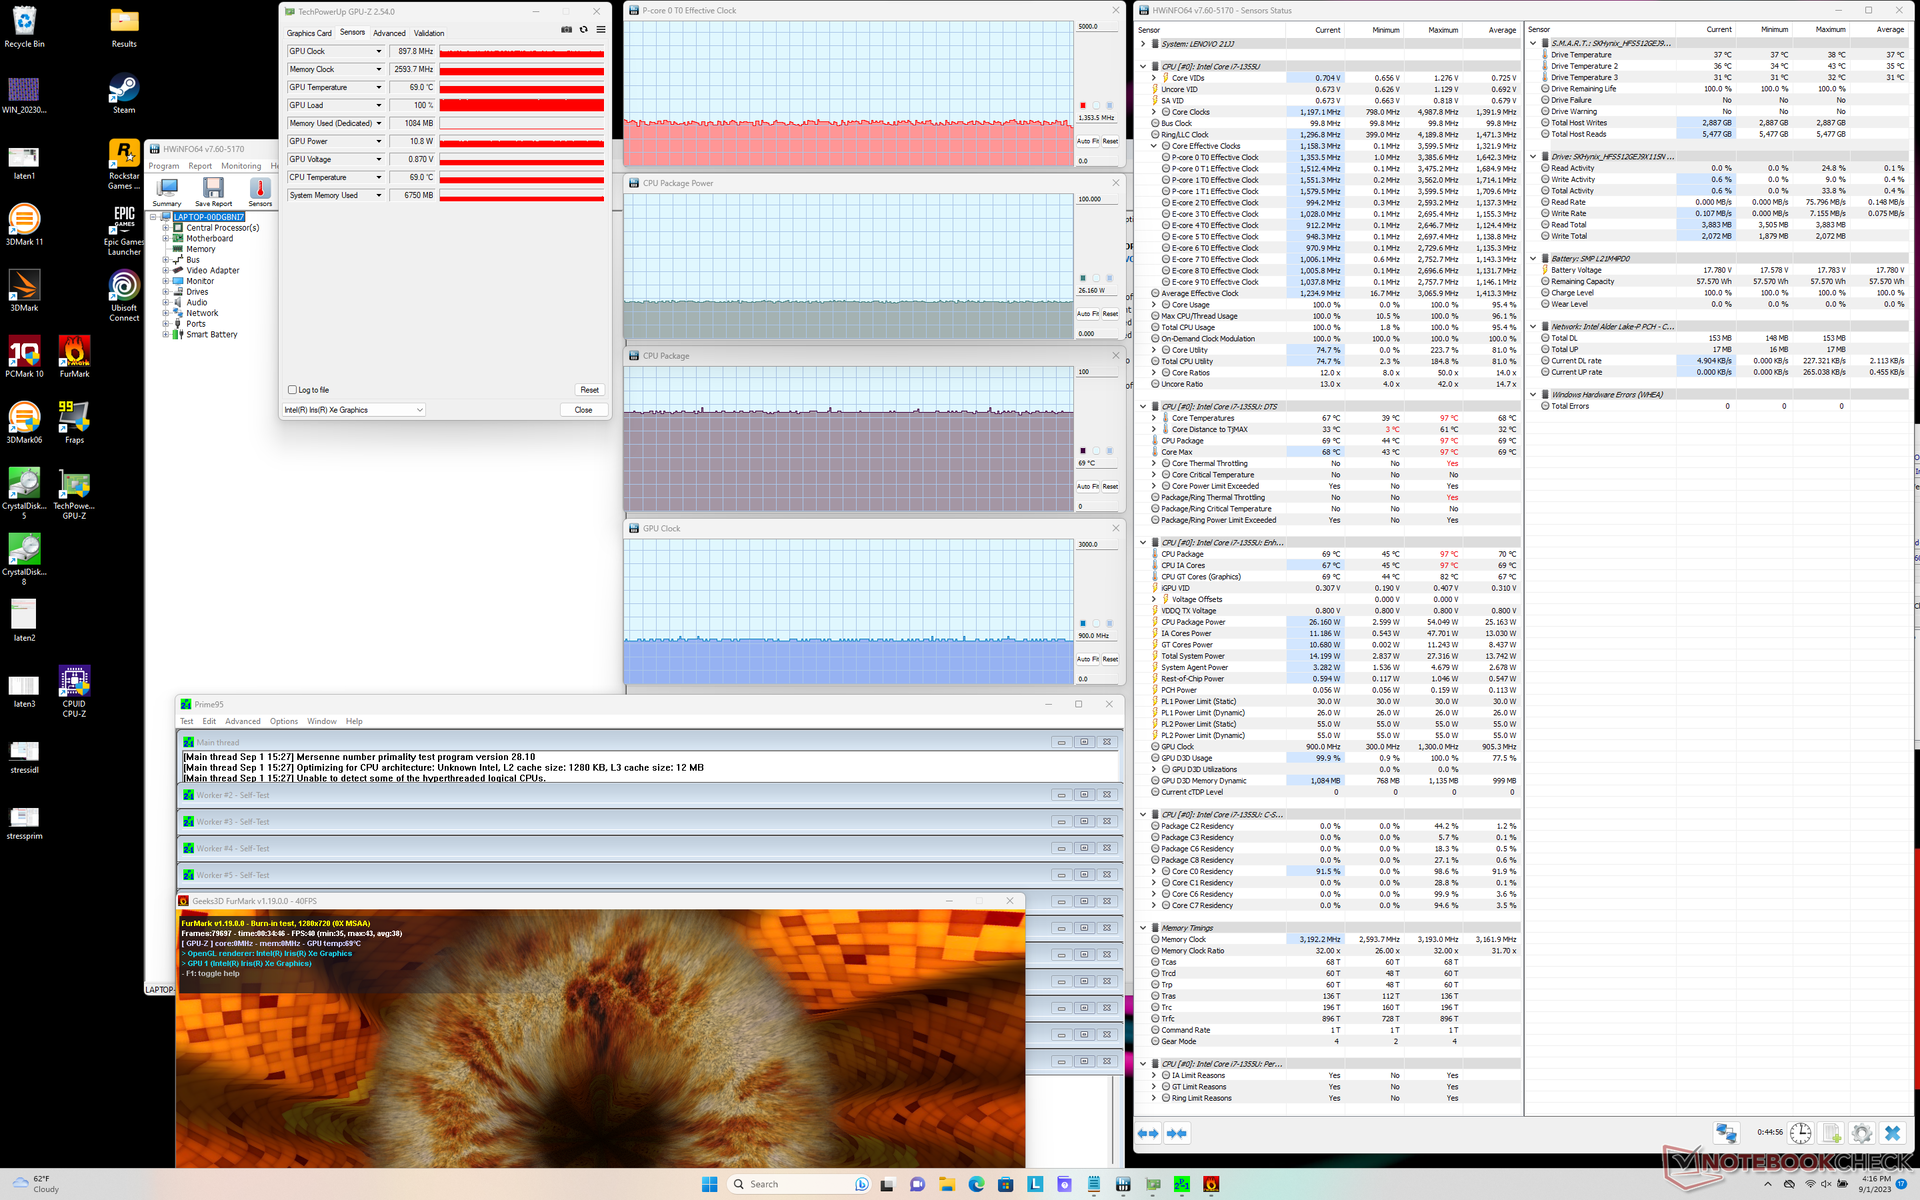
| CPU Takt (GHz) | GPU Takt (MHz) | Durchschnittliche CPU Temperatur (°C) | |
| Leerlauf | -- | -- | 48 |
| Prime95 Belastung | 2.4 | -- | 75 |
| Prime95 + FurMark Stresstest | 1.3 | 898 | 69 |
| Witcher 3 Langzeittest | 2.2 | 1297 | 71 |
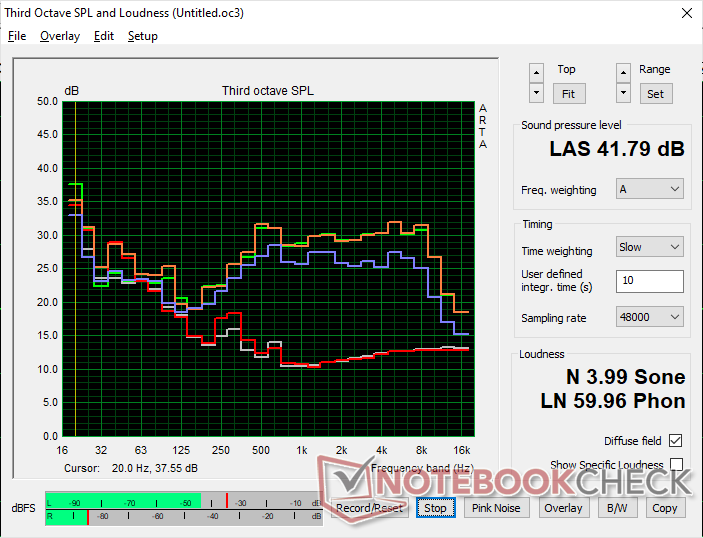
Lautsprecher

Lenovo ThinkBook Plus Gen4 IRU Audio Analyse
(+) | Die Lautsprecher können relativ laut spielen (84.5 dB)
Bass 100 - 315 Hz
(±) | abgesenkter Bass - 7.5% geringer als der Median
(±) | durchschnittlich lineare Bass-Wiedergabe (8.5% Delta zum Vorgänger)
Mitteltöne 400 - 2000 Hz
(+) | ausgeglichene Mitten, vom Median nur 4.8% abweichend
(+) | lineare Mitten (3.6% Delta zum Vorgänger)
Hochtöne 2 - 16 kHz
(+) | ausgeglichene Hochtöne, vom Median nur 0.8% abweichend
(+) | sehr lineare Hochtöne (2.3% Delta zum Vorgänger)
Gesamt im hörbaren Bereich 100 - 16.000 Hz
(+) | hörbarer Bereich ist sehr linear (8% Abstand zum Median
Im Vergleich zu allen Geräten derselben Klasse
» 2% aller getesteten Geräte dieser Klasse waren besser, 1% vergleichbar, 97% schlechter
» Das beste Gerät hat einen Delta-Wert von 6%, durchschnittlich ist 20%, das schlechteste Gerät hat 57%
Im Vergleich zu allen Geräten im Test
» 2% aller getesteten Geräte waren besser, 1% vergleichbar, 98% schlechter
» Das beste Gerät hat einen Delta-Wert von 4%, durchschnittlich ist 24%, das schlechteste Gerät hat 134%
Apple MacBook Pro 16 2021 M1 Pro Audio Analyse
(+) | Die Lautsprecher können relativ laut spielen (84.7 dB)
Bass 100 - 315 Hz
(+) | guter Bass - nur 3.8% Abweichung vom Median
(+) | lineare Bass-Wiedergabe (5.2% Delta zum Vorgänger)
Mitteltöne 400 - 2000 Hz
(+) | ausgeglichene Mitten, vom Median nur 1.3% abweichend
(+) | lineare Mitten (2.1% Delta zum Vorgänger)
Hochtöne 2 - 16 kHz
(+) | ausgeglichene Hochtöne, vom Median nur 1.9% abweichend
(+) | sehr lineare Hochtöne (2.7% Delta zum Vorgänger)
Gesamt im hörbaren Bereich 100 - 16.000 Hz
(+) | hörbarer Bereich ist sehr linear (4.6% Abstand zum Median
Im Vergleich zu allen Geräten derselben Klasse
» 0% aller getesteten Geräte dieser Klasse waren besser, 0% vergleichbar, 100% schlechter
» Das beste Gerät hat einen Delta-Wert von 5%, durchschnittlich ist 17%, das schlechteste Gerät hat 45%
Im Vergleich zu allen Geräten im Test
» 0% aller getesteten Geräte waren besser, 0% vergleichbar, 100% schlechter
» Das beste Gerät hat einen Delta-Wert von 4%, durchschnittlich ist 24%, das schlechteste Gerät hat 134%
Energieverwaltung
Stromverbrauch - nicht schlecht für OLED
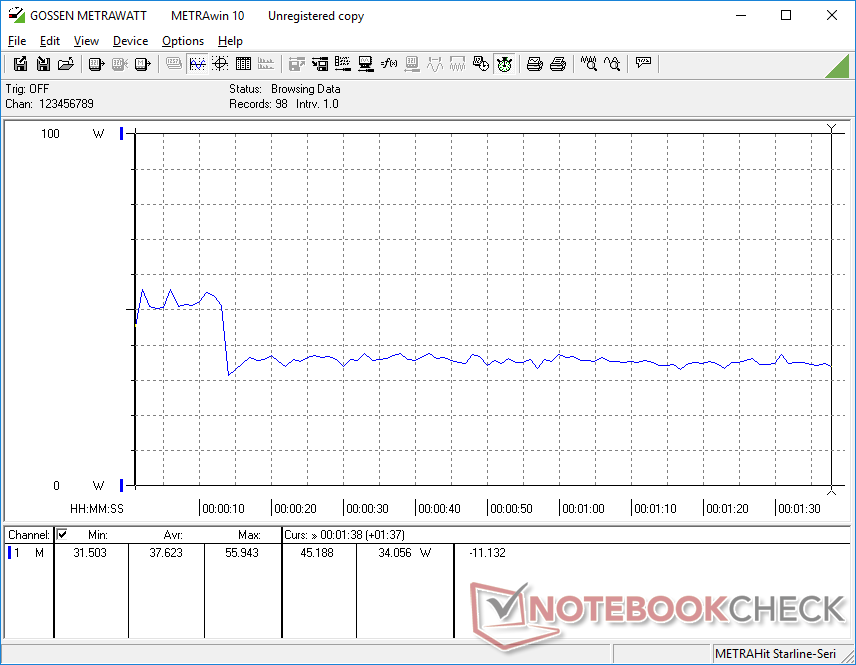
Der Stromverbrauch liegt im Leerlauf bei ca. 7 bis 8 Watt, kann aber aufgrund des OLED-Touchscreens auf bis zu 13 Watt ansteigen, wenn überwiegend weiße Inhalte dargestellt werden, was bei den meisten Webseiten der Fall ist. Im Vergleich dazu verbrauchen andere Subnotebooks mit herkömmlichen IPS-Panels wie das ThinkPad X1 Nano Gen 3 oder das Dragonfly G4 selbst bei maximaler Helligkeit nur etwa halb so viel Strom.
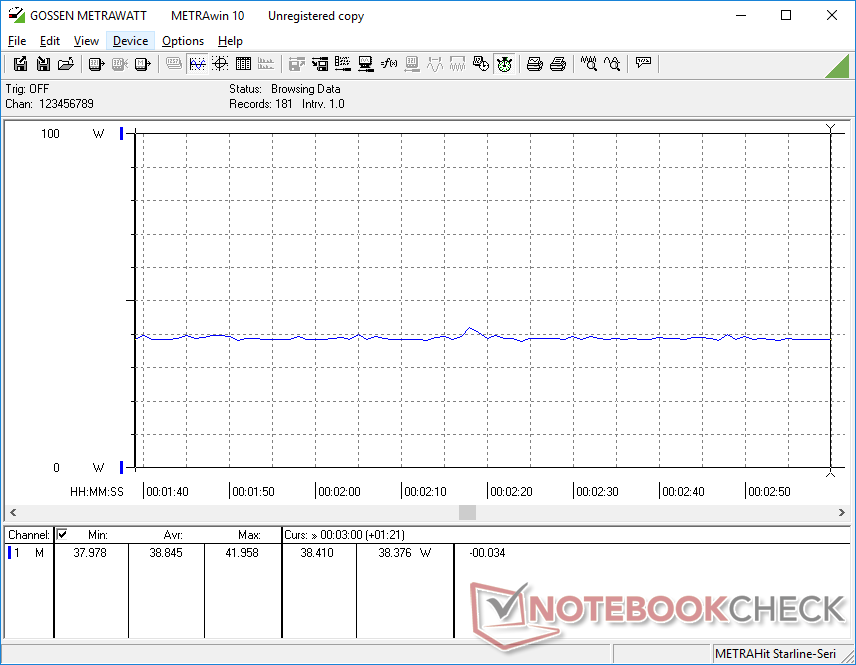
Bei höherer Last nähert sich der Verbrauch dem an, was wir von einem Notebook der Core U Serie gewohnt sind. Tatsächlich ist der gesamte Verbrauchsbereich sehr ähnlich zu dem, was wir beim ZenBook S 13 OLED oder beim Dragonfly G4 gemessen haben.
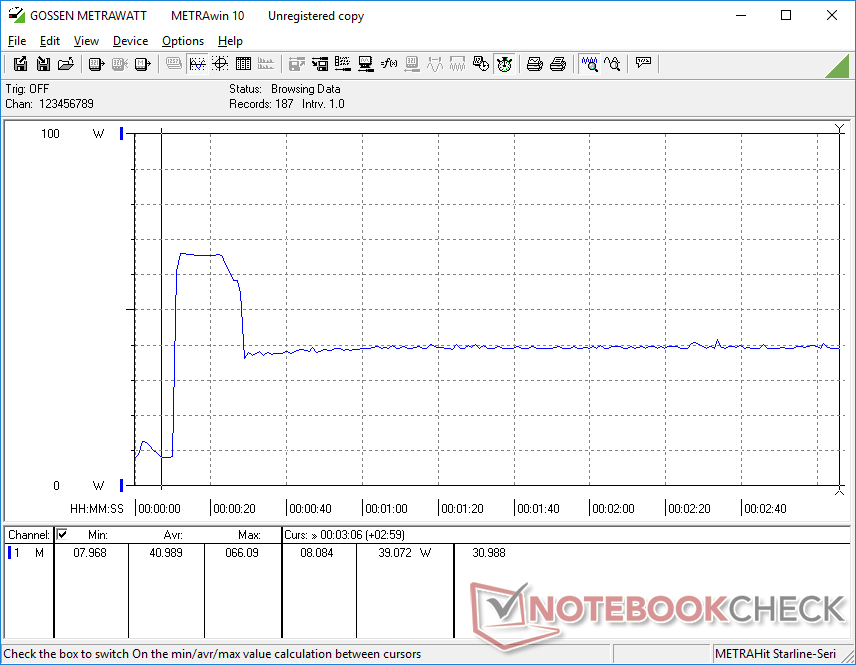
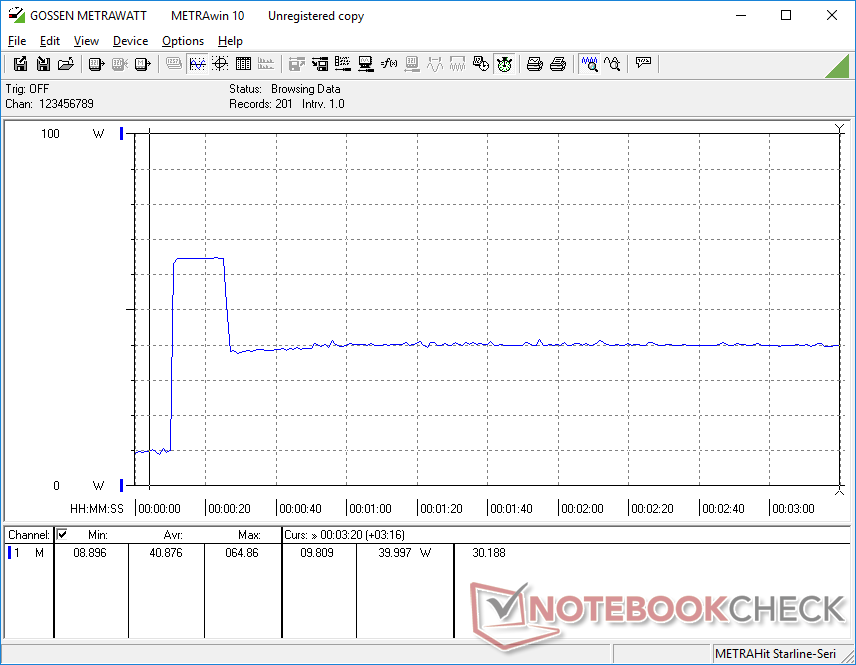
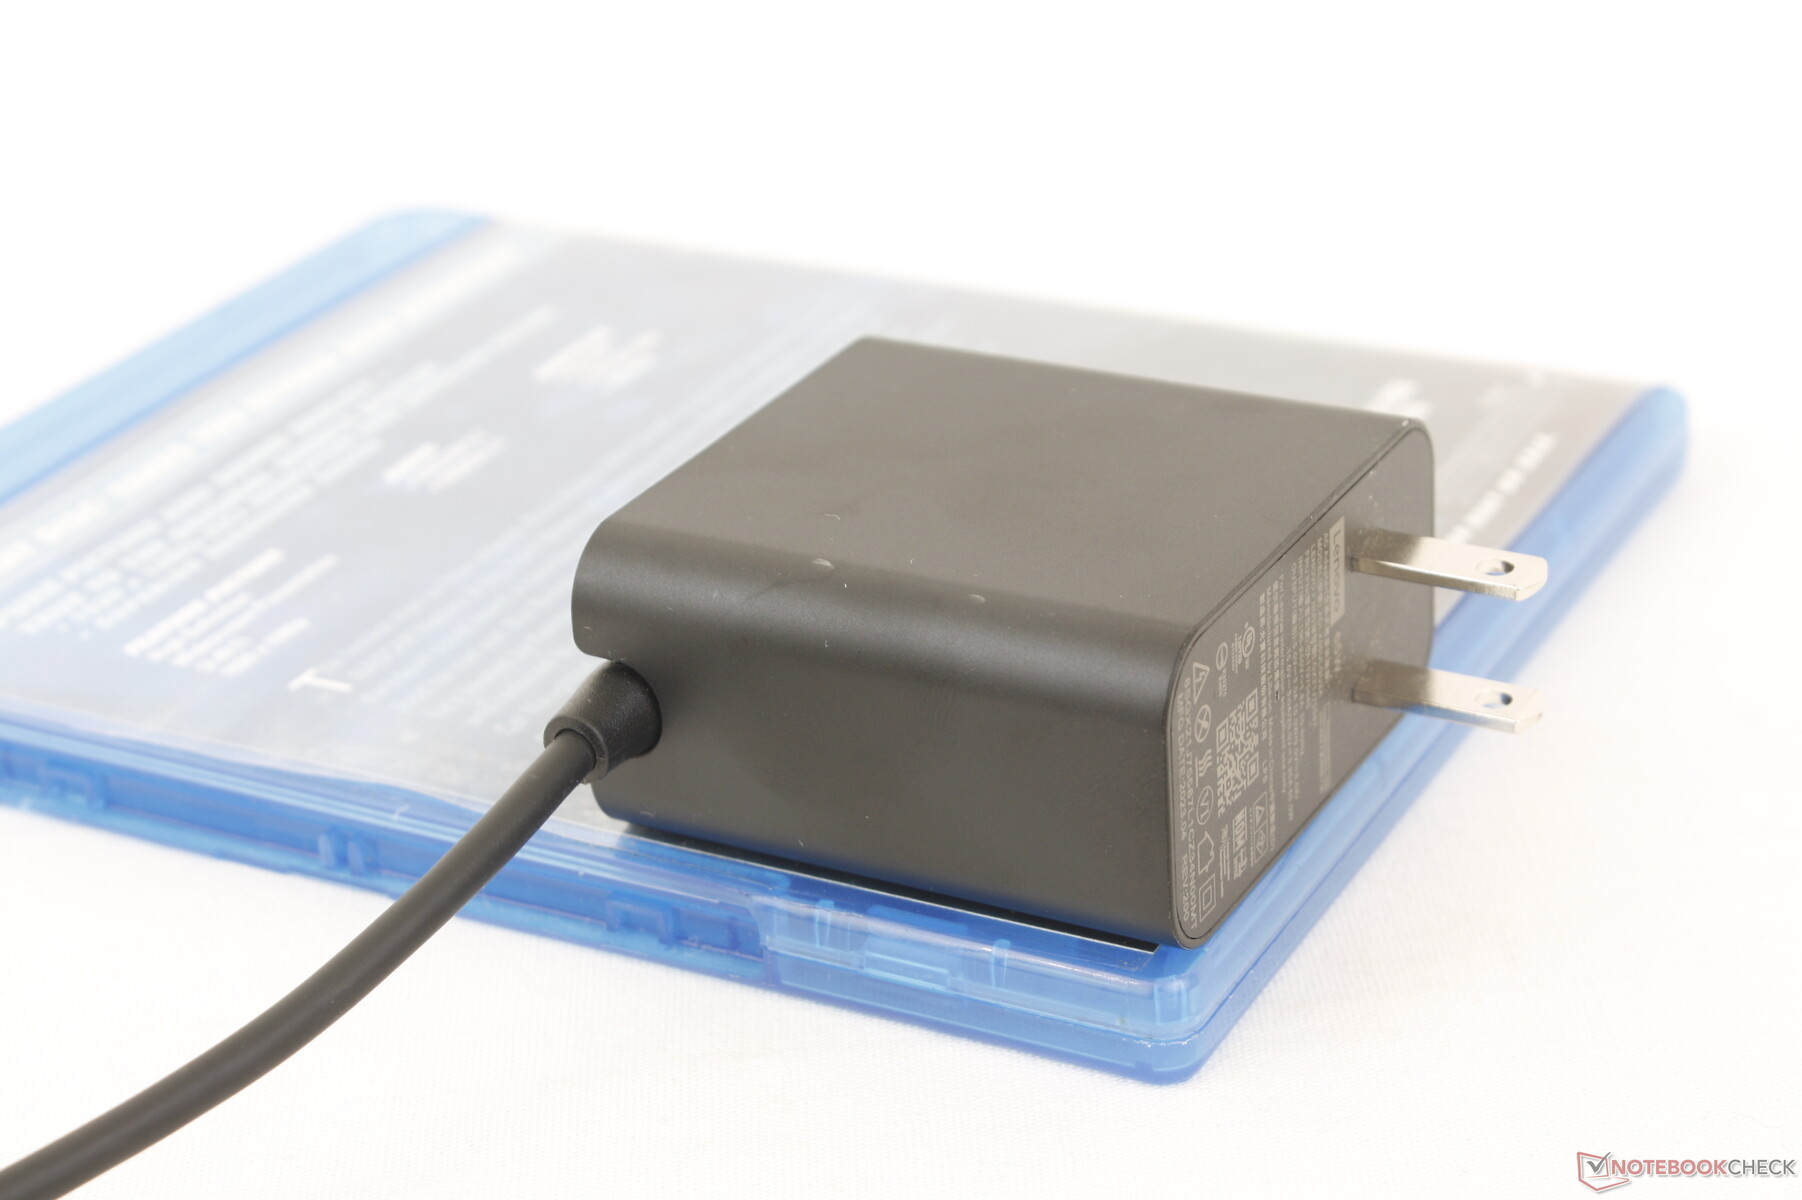
Mit dem kleinen (5,5 × 5,5 × 2,8 cm) 65W USB-C Adapter können wir einen maximalen Verbrauch von 66W bei 100 % CPU-Last messen. Dieser Wert gilt aufgrund der thermischen Einschränkungen des Modells nur für 10 bis 15 Sekunden, wie die Screenshots unten zeigen.
| Aus / Standby | |
| Idle | |
| Last |
|
Legende:
min: | |
| Lenovo ThinkBook Plus Gen4 IRU i7-1355U, Iris Xe G7 96EUs, SK hynix PC801 HFS512GEJ9X115N, OLED, 2880x1800, 13.3" | Lenovo ThinkPad X1 Nano Gen 3 i7-1360P, Iris Xe G7 96EUs, Lenovo UMIS AM6A0 RPJTJ512MKP1QDQ, IPS, 2160x1350, 13" | HP Dragonfly G4 i7-1365U, Iris Xe G7 96EUs, Micron 3400 MTFDKBA512TFH 512GB, IPS, 1920x1280, 13.5" | Asus ZenBook S13 OLED UX5304 i7-1355U, Iris Xe G7 96EUs, Samsung PM9A1 MZVL21T0HCLR, OLED, 2880x1800, 13.3" | Dell Latitude 9330 i7-1260U, Iris Xe G7 96EUs, , IPS, 2560x1600, 13.3" | MSI Summit E13 Flip Evo A11MT i7-1185G7, Iris Xe G7 96EUs, Phison 1TB SM2801T24GKBB4S-E162, IPS, 1920x1200, 13.4" | |
|---|---|---|---|---|---|---|
| Stromverbrauch | 21% | 15% | 14% | 19% | 0% | |
| Idle min * (Watt) | 7.2 | 3.3 54% | 4.1 43% | 5.8 19% | 4.7 35% | 4.8 33% |
| Idle avg * (Watt) | 7.9 | 6.5 18% | 7.5 5% | 8.5 -8% | 8.2 -4% | 8.4 -6% |
| Idle max * (Watt) | 12.7 | 7.1 44% | 8.2 35% | 8.8 31% | 8.4 34% | 8.6 32% |
| Last avg * (Watt) | 37.6 | 40.7 -8% | 35.5 6% | 35.1 7% | 36.8 2% | 47.1 -25% |
| Witcher 3 ultra * (Watt) | 39.1 | 37 5% | 37.5 4% | 27.6 29% | 30.4 22% | 51.6 -32% |
| Last max * (Watt) | 65 | 58.6 10% | 66.5 -2% | 59.5 8% | 49.9 23% | 65.9 -1% |
* ... kleinere Werte sind besser
Leistungsaufnahme Witcher 3 und Stresstest
Leistungsaufnahme: Externer Monitor
Akkulaufzeit
Die Akkukapazität ist etwas höher als beim ThinkPad X1 Nano Gen 3, um die höheren Anforderungen des OLED-Touchscreens zu kompensieren. Die WLAN-Laufzeit ist daher mit etwa 8 Stunden zwischen den beiden Modellen fast gleich lang. Konkurrierende Systeme wie das Latitude 9330 oder HP Dragonfly G4 können immerhin ein bis zwei Stunden länger durchhalten.
Die Akkulaufzeit beim Lesen im E-Ink-Modus ist mit etwa 12 Stunden länger.
Das Aufladen von leerer auf volle Kapazität dauert etwa 80 Minuten, selbst wenn Lenovo Rapid Charge aktiviert ist.
| Lenovo ThinkBook Plus Gen4 IRU i7-1355U, Iris Xe G7 96EUs, 56 Wh | Lenovo ThinkPad X1 Nano Gen 3 i7-1360P, Iris Xe G7 96EUs, 49.5 Wh | HP Dragonfly G4 i7-1365U, Iris Xe G7 96EUs, 68 Wh | Asus ZenBook S13 OLED UX5304 i7-1355U, Iris Xe G7 96EUs, 63 Wh | Dell Latitude 9330 i7-1260U, Iris Xe G7 96EUs, 50 Wh | MSI Summit E13 Flip Evo A11MT i7-1185G7, Iris Xe G7 96EUs, 70 Wh | |
|---|---|---|---|---|---|---|
| Akkulaufzeit | -2% | 140% | 63% | 31% | 38% | |
| Idle (h) | 15.5 | 42.5 174% | 15.4 -1% | 21.1 36% | ||
| WLAN (h) | 8 | 7.8 -2% | 15.9 99% | 11.3 41% | 9.4 18% | 11.2 40% |
| Last (h) | 1.3 | 3.2 146% | 2.4 85% | 2.3 77% | 1.8 38% | |
| H.264 (h) | 13.8 |
Pro
Contra
Fazit: Ausgezeichnete 3-in-1-Lösung für ein sehr spezielles Zielpublikum
Wer Laptop und E-Reader immer dabei haben möchte, ist mit dem ThinkBook Plus Gen 4 gut beraten. Das E-Ink-Display funktioniert unter Windows 11 recht gut und wirkt sich nicht negativ auf die Qualität des restlichen Gehäuses aus. Tatsächlich sind Deckel und Boden durch das zusätzliche Metall und Glas stabiler als erwartet.
Raum für Verbesserungen ist definitiv vorhanden. Der langsame Bildwechsel und die ständige Größenanpassung der Fenster beim Wechsel zwischen den beiden Bildschirmen wirken in der Praxis schwerfällig, obwohl die Bildschirme selbst von hoher Qualität sind. Die automatische Drehung ist unzuverlässig. Die Ausrichtung ist oft falsch, was wahrscheinlich auf den einzigartigen Drehmechanismus des Modells zurückzuführen ist.
Der vielleicht größte Nachteil ist, dass das ThinkBook Plus Gen 4 deutlich schwerer ist als ein herkömmlicher eReader, was die Handhabung im eReader-Modus erschweren kann. Wer gerne im Bett oder im Bus liest, muss sich mit dem Gewicht arrangieren.
Das ThinkBook Plus Gen 4 eignet sich gut als Standard-Convertible, aber seine eReader-Funktionalität wird durch eine schwerfällige Software und ein relativ hohes Gewicht im Vergleich zu Standalone-eReadern beeinträchtigt.
Wer keinen Wert auf ein E-Ink-Display legt, findet Alternativen wie das Dell XPS 13 2-in-1 oder das LG Gram 14 2-in-1. Diese sind deutlich leichter und bieten eine längere Akkulaufzeit oder mehr integrierte Anschlüsse. Es lässt sich nicht leugnen, dass das Design des ThinkBook Plus Gen 4 durch das E Ink-Display deutlich schwerer und dicker wird, auch wenn es ohne E Ink-Display konfiguriert wude.
Preise und Verfügbarkeit
Lenovo ThinkBook Plus Gen4 IRU
- 06.09.2023 v7 (old)
Allen Ngo
Transparenz
Die Auswahl der zu testenden Geräte erfolgt innerhalb der Redaktion. Das vorliegende Testmuster wurde dem Autor vom Hersteller oder einem Shop zu Testzwecken leihweise zur Verfügung gestellt. Eine Einflussnahme des Leihstellers auf den Testbericht gab es nicht, der Hersteller erhielt keine Version des Reviews vor der Veröffentlichung. Es bestand keine Verpflichtung zur Publikation. Als eigenständiges, unabhängiges Unternehmen unterliegt Notebookcheck keiner Diktion von Herstellern, Shops und Verlagen.
So testet Notebookcheck
Pro Jahr werden von Notebookcheck hunderte Laptops und Smartphones unabhängig in von uns standardisierten technischen Verfahren getestet, um eine Vergleichbarkeit aller Testergebnisse zu gewährleisten. Seit rund 20 Jahren entwickeln wir diese Testmethoden kontinuierlich weiter und setzen damit Branchenstandards. In unseren Testlaboren kommt ausschließlich hochwertiges Messequipment in die Hände erfahrener Techniker und Redakteure. Die Tests unterliegen einer mehrstufigen Kontrolle. Unsere komplexe Gesamtbewertung basiert auf hunderten fundierten Messergebnissen und Benchmarks, womit Ihnen Objektivität garantiert ist. Weitere Informationen zu unseren Testmethoden gibt es hier.
Preisvergleich

