Lenovo ThinkBook Plus Gen 3 im Laptop-Test: 21:10 ultrabreiter Produktivitätsbooster
Das Lenovo ThinkBook Plus Gen 3 tritt die direkte Nachfolge des ThinkBook Plus Gen 2 aus dem letzten Jahr an. Am Namen alleine lässt sich das nicht erkennen, aber das Gen 3 unterscheidet sich signifikant vom Vorgänger, die Änderungen sind größer als zwischen vielen anderen Modellen. Während das Gen 2 ein 16:10-13,3-Zoll-Convertible mit sekundärem 12-Zoll-E-Ink-Touchscreen war, ist das Gen 3 ein Laptop mit 21:10-17,3-Zoll-Display und einem sekundären 8-Zoll-IPS-Touchscreen. Die beiden Modelle sind in der Tat derart unterschiedlich, dass man die Namensgebung in Zweifel ziehen kann, immerhin dienen sie komplett anderen Anwendungsgebieten.
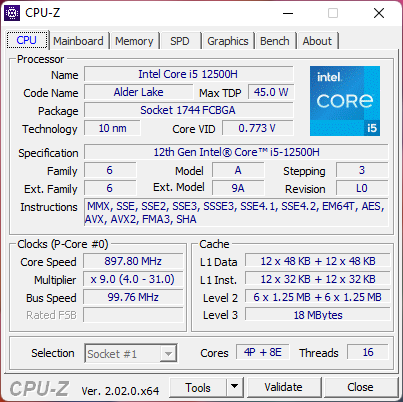
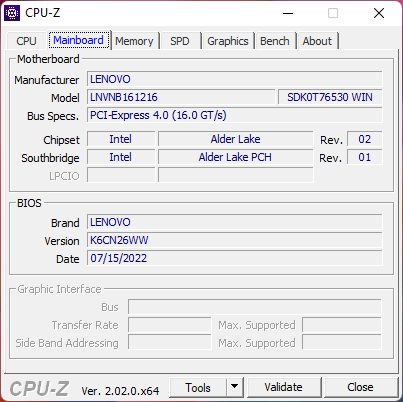
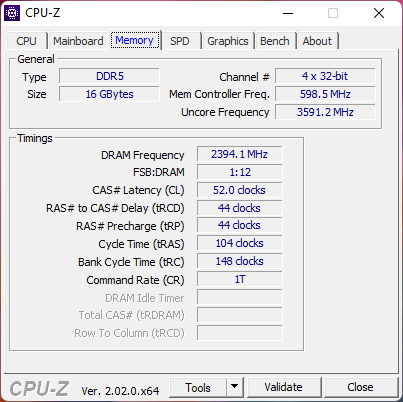
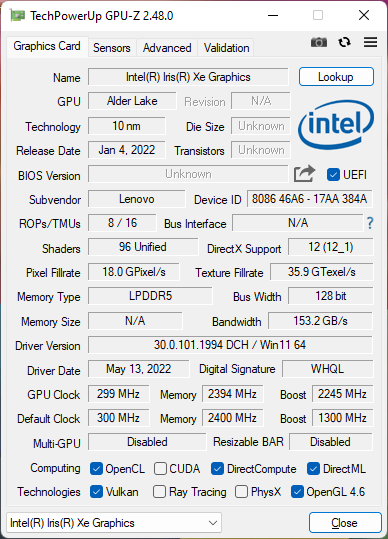
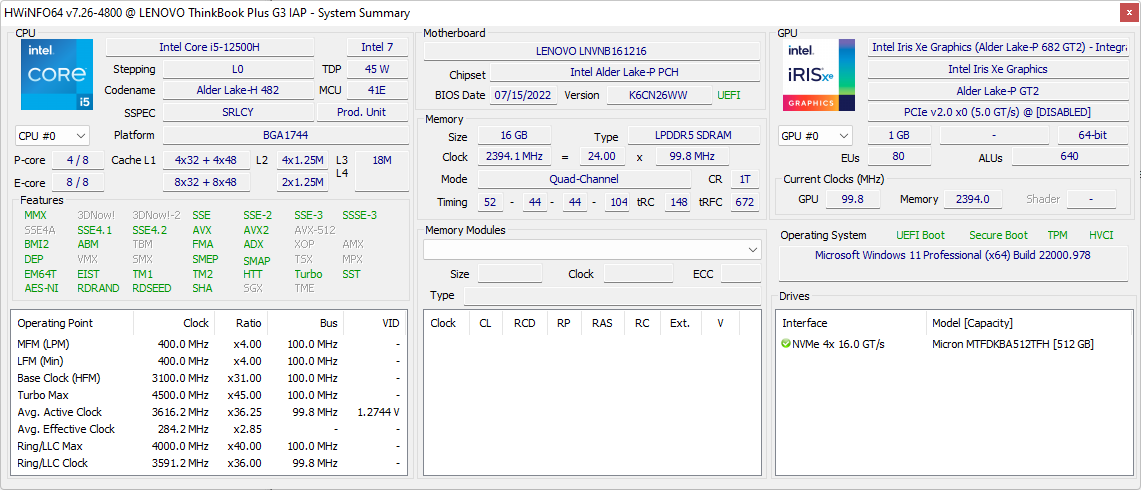
Unsere Testkonfiguration verfügt über einen Core i7-12700H, 16 GB verlötetem RAM und einer 512 GB großen PCIe4-SSD. Das Paket kostet etwa $1600 USD (~1.626 Euro). Es gibt auch eine Konfiguration mit Core i5-12500H, aber alle Varianten haben exakt den gleichen primären, matten IPS-Touchscreen mit 3.072 x 1.440 Pixeln sowie den sekundären 8-Zoll-IPS-Touchscreen mit 800 x 1.280 sowie die integrierte Iris-Xe-Grafik.
Alternativen zum ThinkBook Plus Gen 3 beinhalten das 15 Zoll große Asus ZenBook Pro Duo sowie einige 17-Zoll-Laptops, welche für Content Creators oder Office-Nutzer konzipiert wurden, darunter das LG Gram 17 oder das Dell XPS 17.
Weitere Lenovo-Tests:
Potentielle Konkurrenten im Vergleich
Bew. | Datum | Modell | Gewicht | Dicke | Größe | Auflösung | Preis ab |
|---|---|---|---|---|---|---|---|
| 85.6 % v7 (old) | 09 / 2022 | Lenovo ThinkBook Plus Gen3 i7-12700H, Iris Xe G7 96EUs | 2 kg | 17.9 mm | 17.30" | 3072x1440 | |
| 86.1 % v7 (old) | 10 / 2021 | Lenovo ThinkBook Plus Gen2 Core i5 i5-1130G7, Iris Xe G7 80EUs | 1.2 kg | 13.9 mm | 13.30" | 2560x1600 | |
| 86.4 % v7 (old) | 05 / 2020 | Asus ProArt StudioBook Pro 17 W700G3T i7-9750H, Quadro RTX 3000 Max-Q | 2.5 kg | 18.4 mm | 17.00" | 1920x1200 | |
| 87.3 % v7 (old) | 08 / 2022 | LG Gram 17 (2022) i5-1240P, Iris Xe G7 80EUs | 1.4 kg | 17.7 mm | 17.00" | 2560x1600 | |
| 89.3 % v7 (old) | 06 / 2022 | Dell XPS 17 9720 i7-12700H, GeForce RTX 3050 4GB Laptop GPU | 2.5 kg | 19.5 mm | 17.00" | 3840x2400 | |
| 88 % v7 (old) | 05 / 2021 | Gigabyte Aero 17 HDR YD i9-11980HK, GeForce RTX 3080 Laptop GPU | 2.8 kg | 22 mm | 17.30" | 3840x2160 |
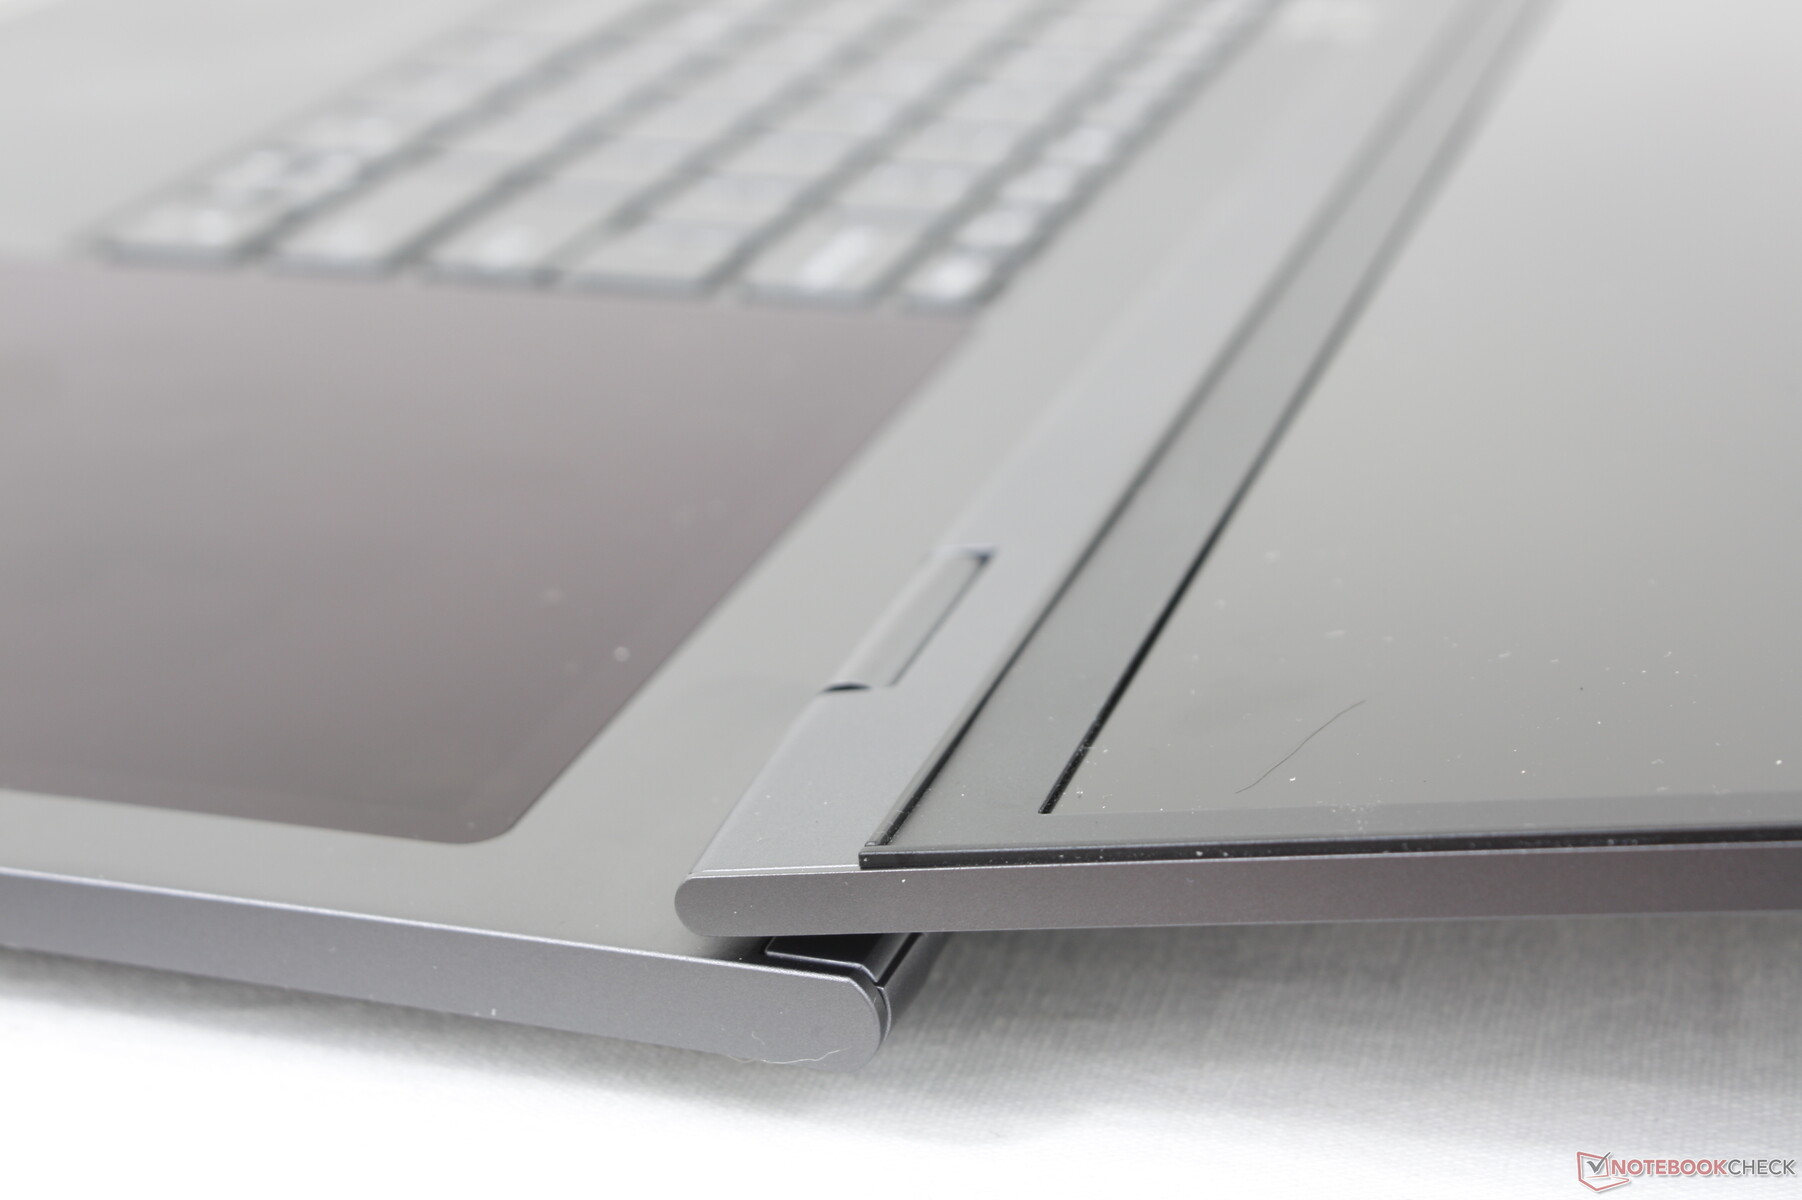
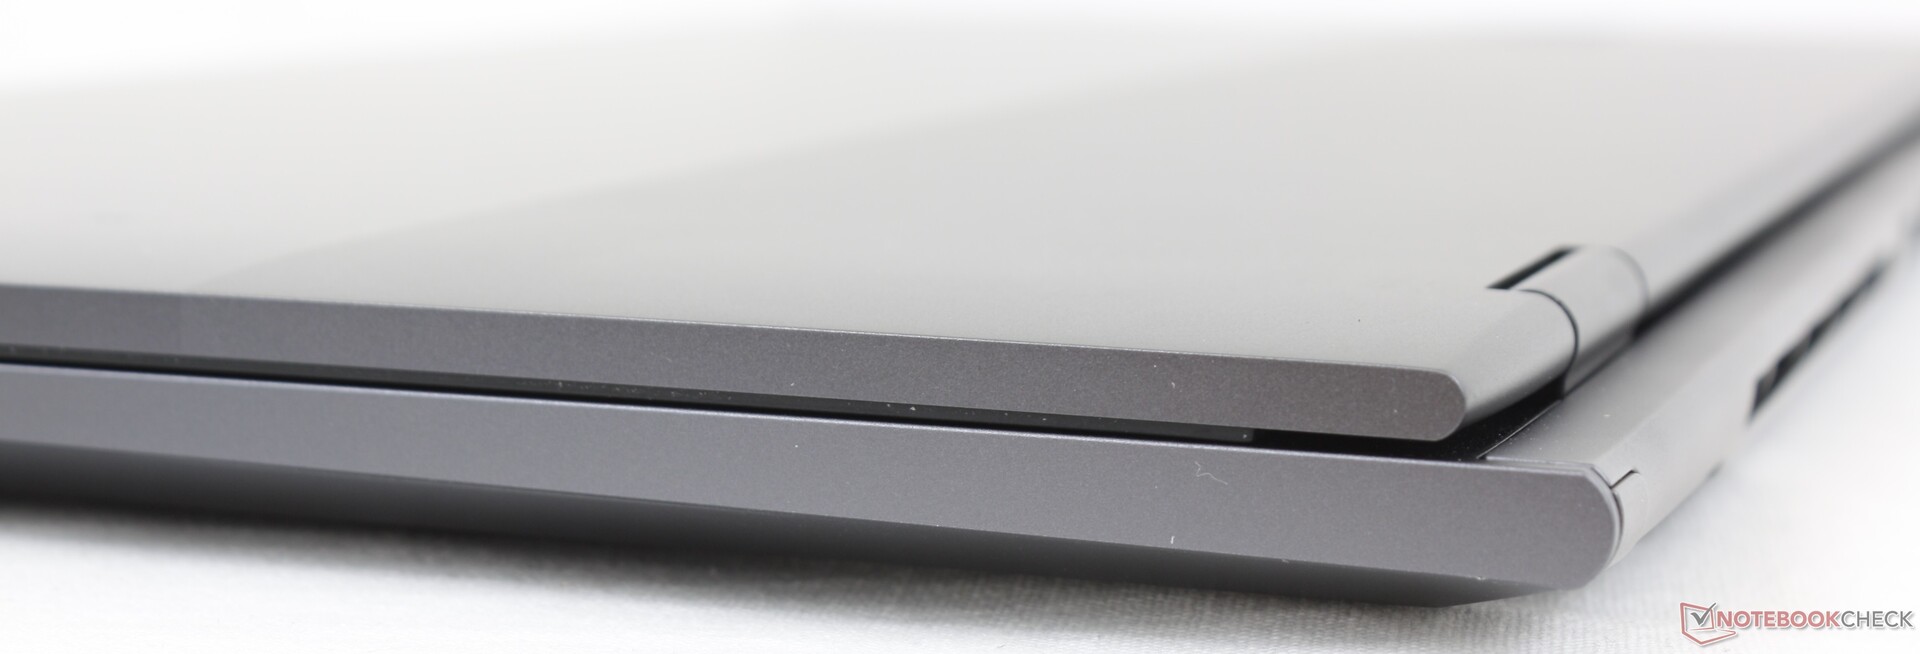
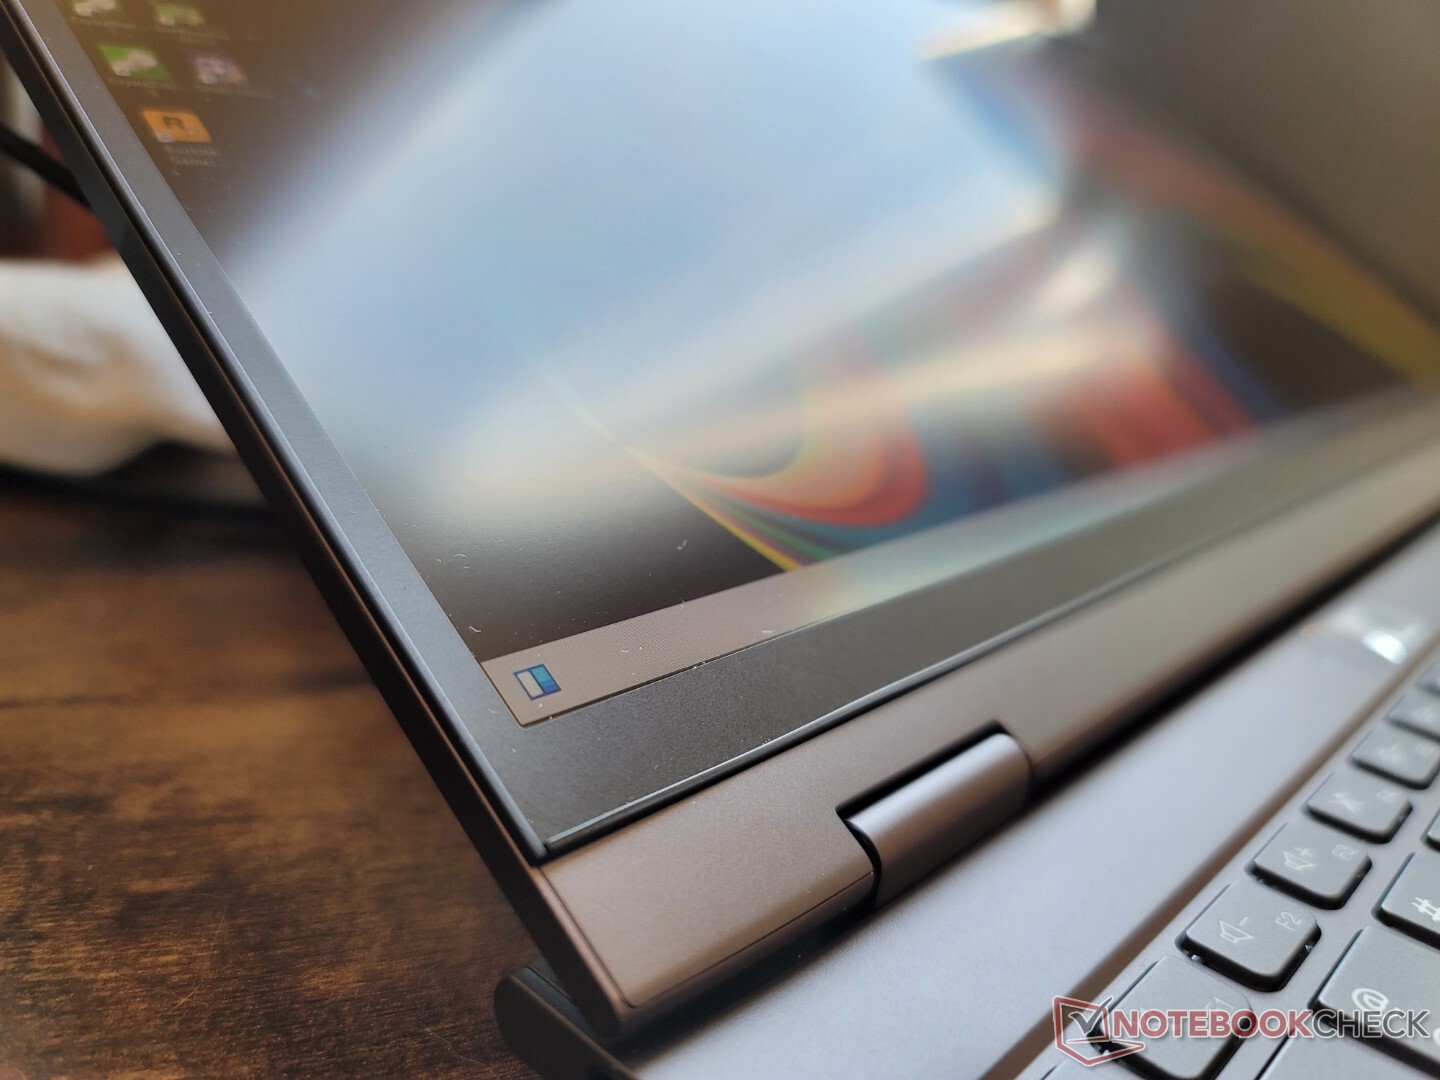
Gehäuse — Lang und dünn
In unserem Modell kommen die gleichen Aluminiummaterialien zum Einsatz wie in anderen ThinkBook-Modellen wie das kürzlich erschienene ThinkBook 16 G4 Plus. Wer also schon einmal ein ThinkBook in der Hand gehalten hat, wird sich bei den glatten und dunkelgrauen Oberflächen des ThinkBook Plus Gen 3 gleich heimisch fühlen. Das Design zielt auf Nutzer von Office sowie SMB-Umgebungen und setzt sich zwischen das Consumer-zentrierte Yoga und die eher traditionellere ThinkPad-Serie.
Die Verarbeitungsqualität liegt etwas unterhalb eines Yoga- oder ThinkPad-X-Modells. Displaydeckel und Basis reagieren etwas schneller mit Knarzgeräuschen auf Verwindungsversuche, vermutlich durch den größeren 17-Zoll-Formfaktor und das dünne Skelett. Alternativen wie das kleinere ZenBook Duo oder das schwerere XPS 17 wirken nochmals etwas stabiler, insbesondere in Sachen Scharniere.
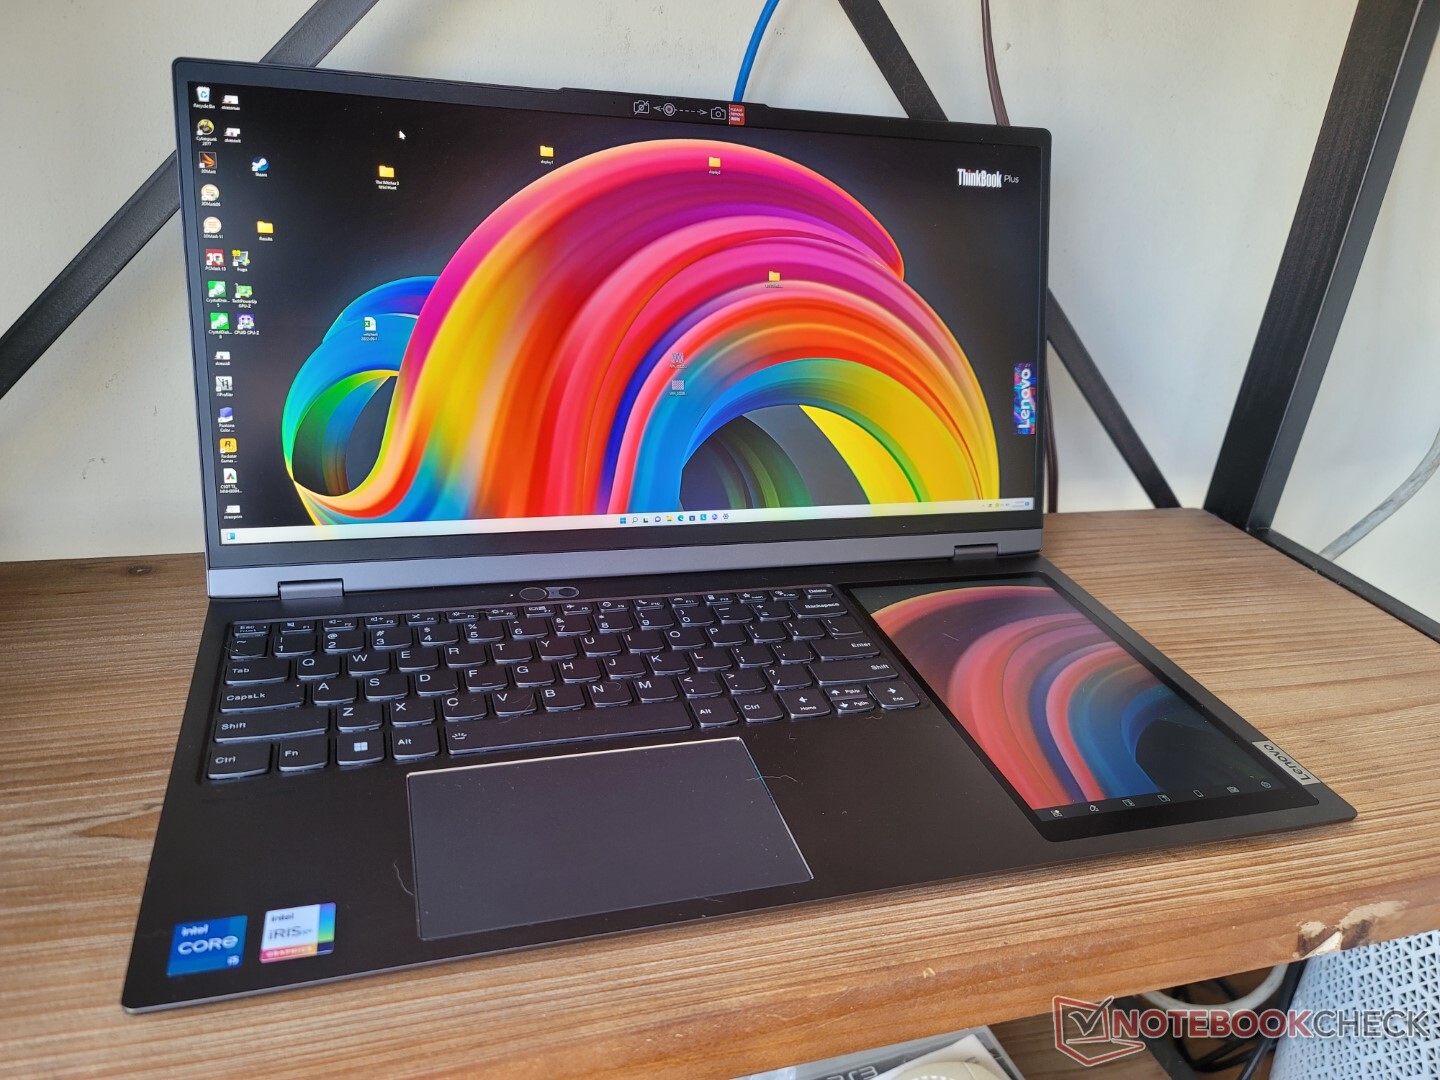
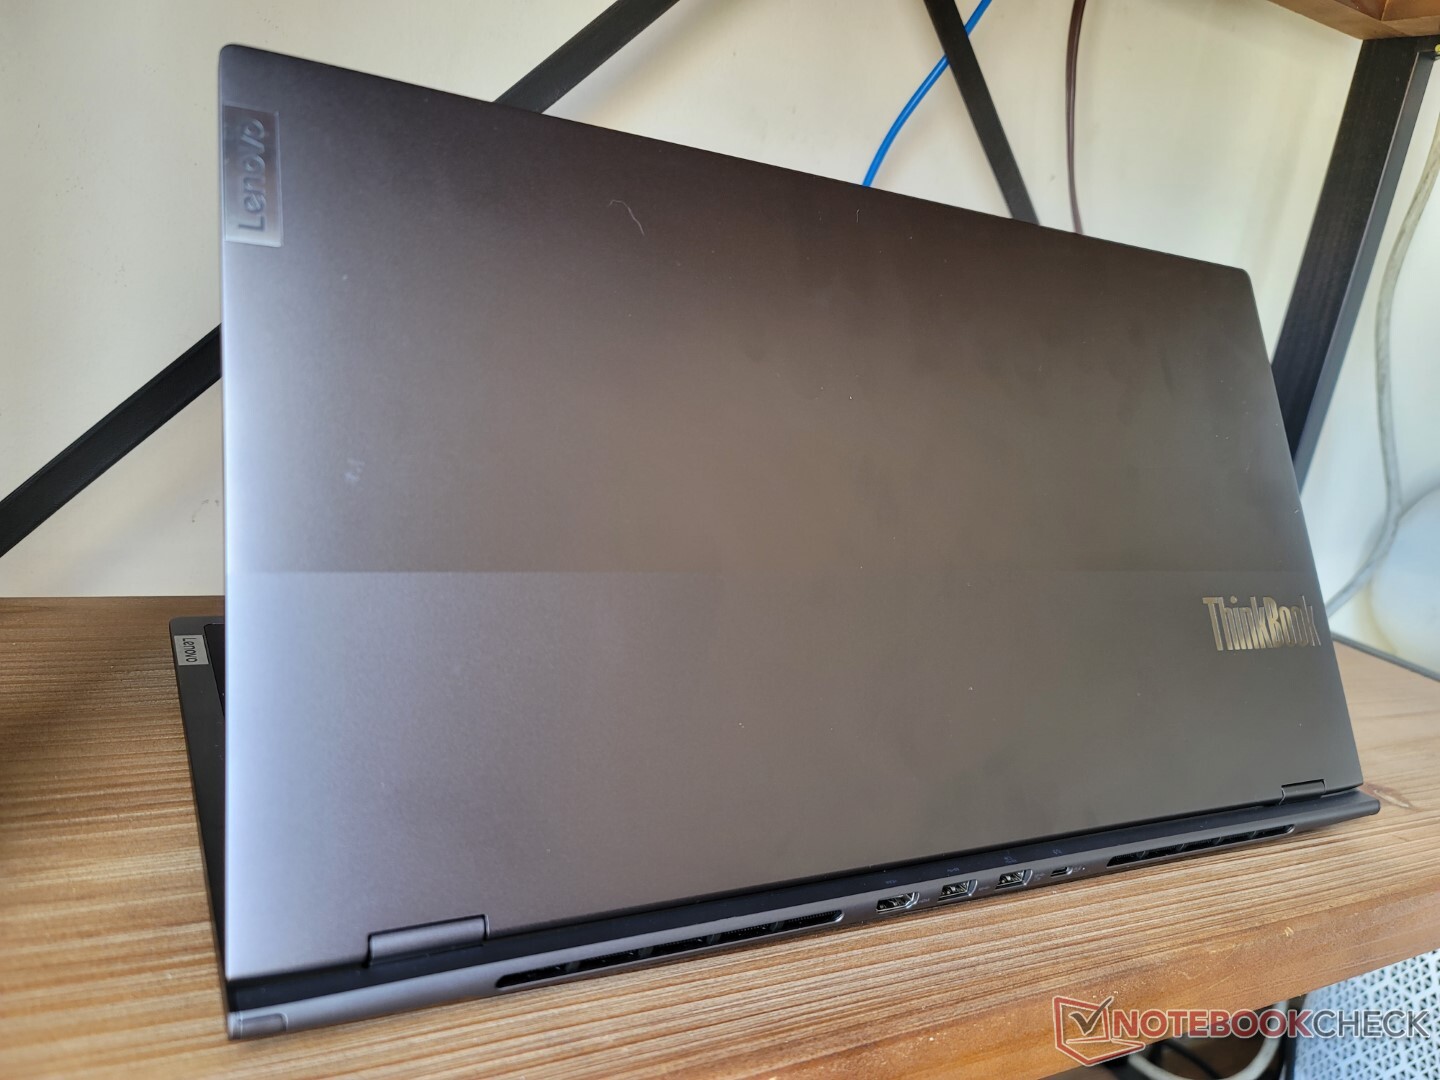
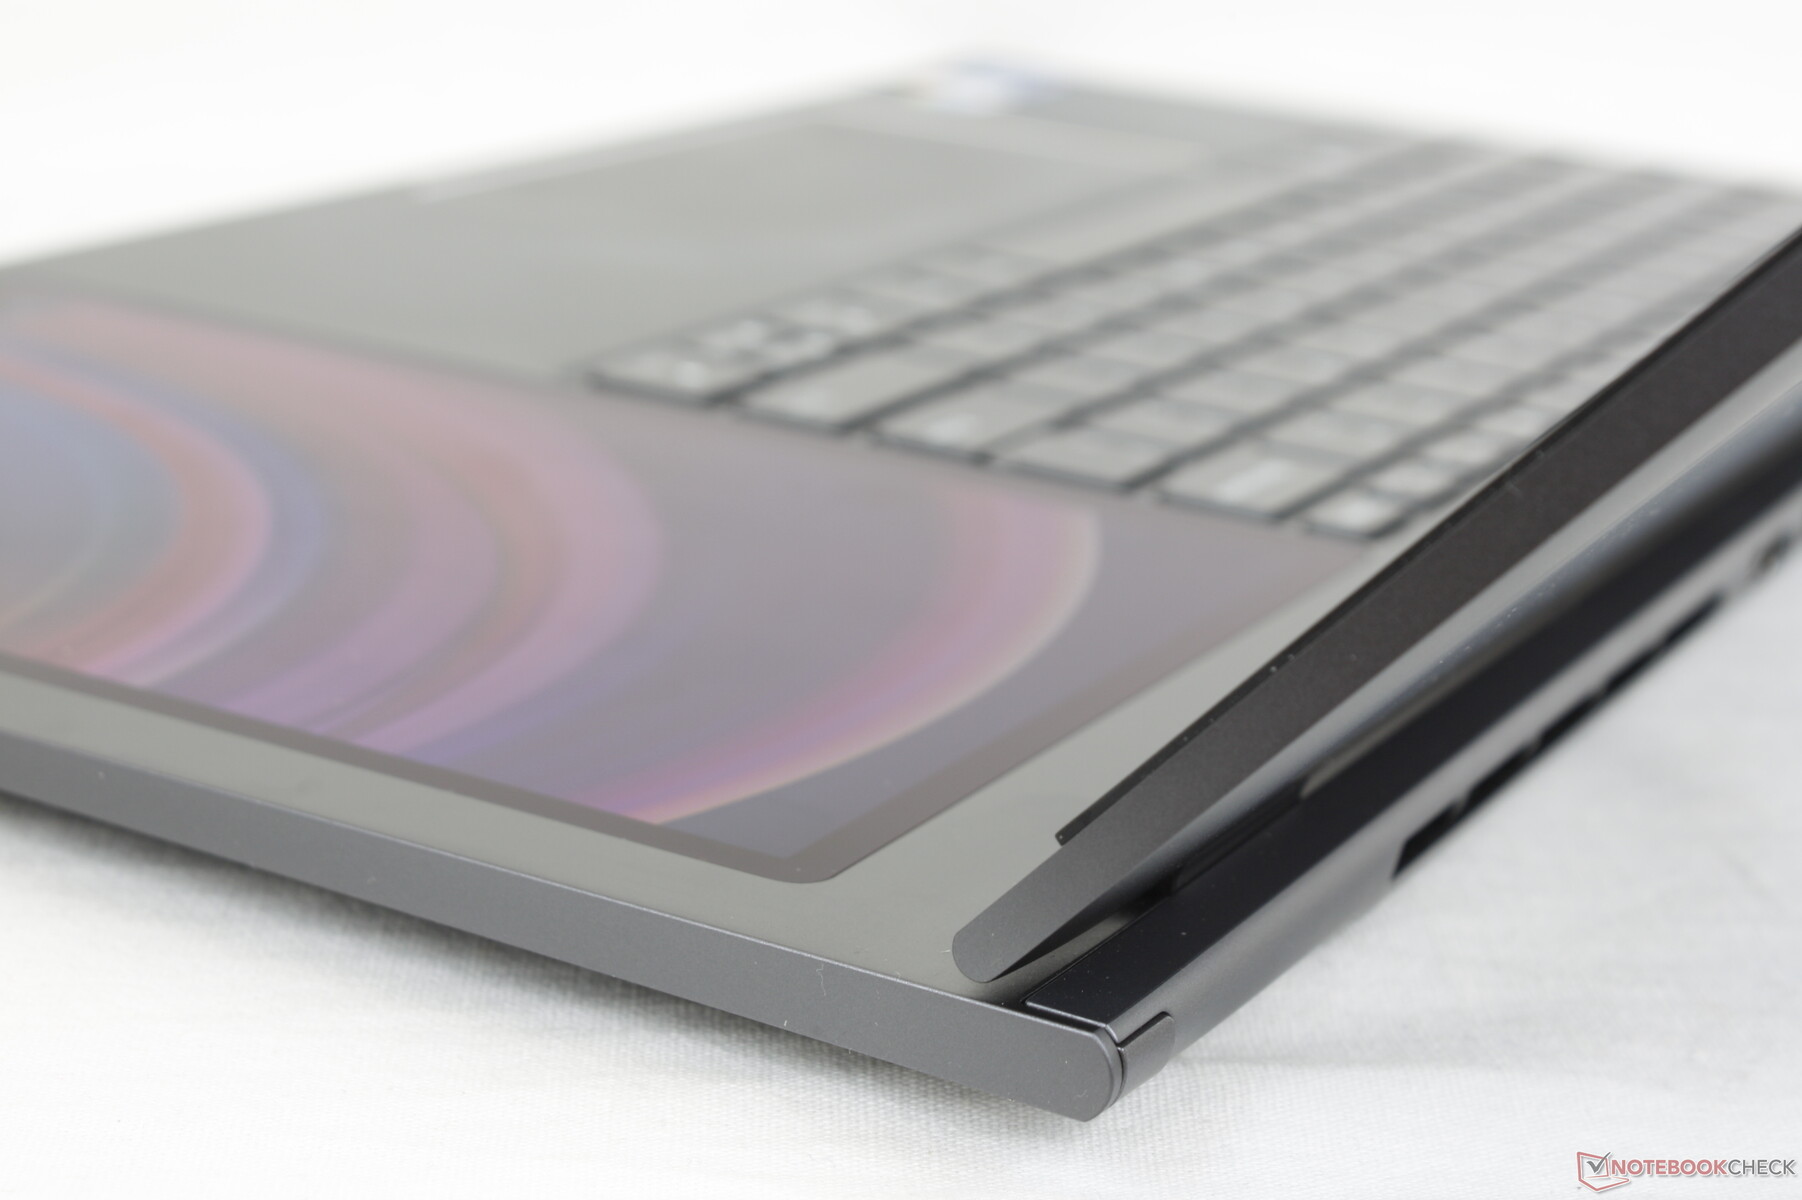
Das verlängerte Seitenverhältnis resultiert in einem Gehäuse, welches sich sowohl breiter als auch kürzer als andere 17-Zoll-Laptops präsentiert. In Anbetracht der Größenkategorie ist es aber noch immer dünn und leicht. Beispielsweise ist das XPS 17 einen halben Kilogramm schwerer.

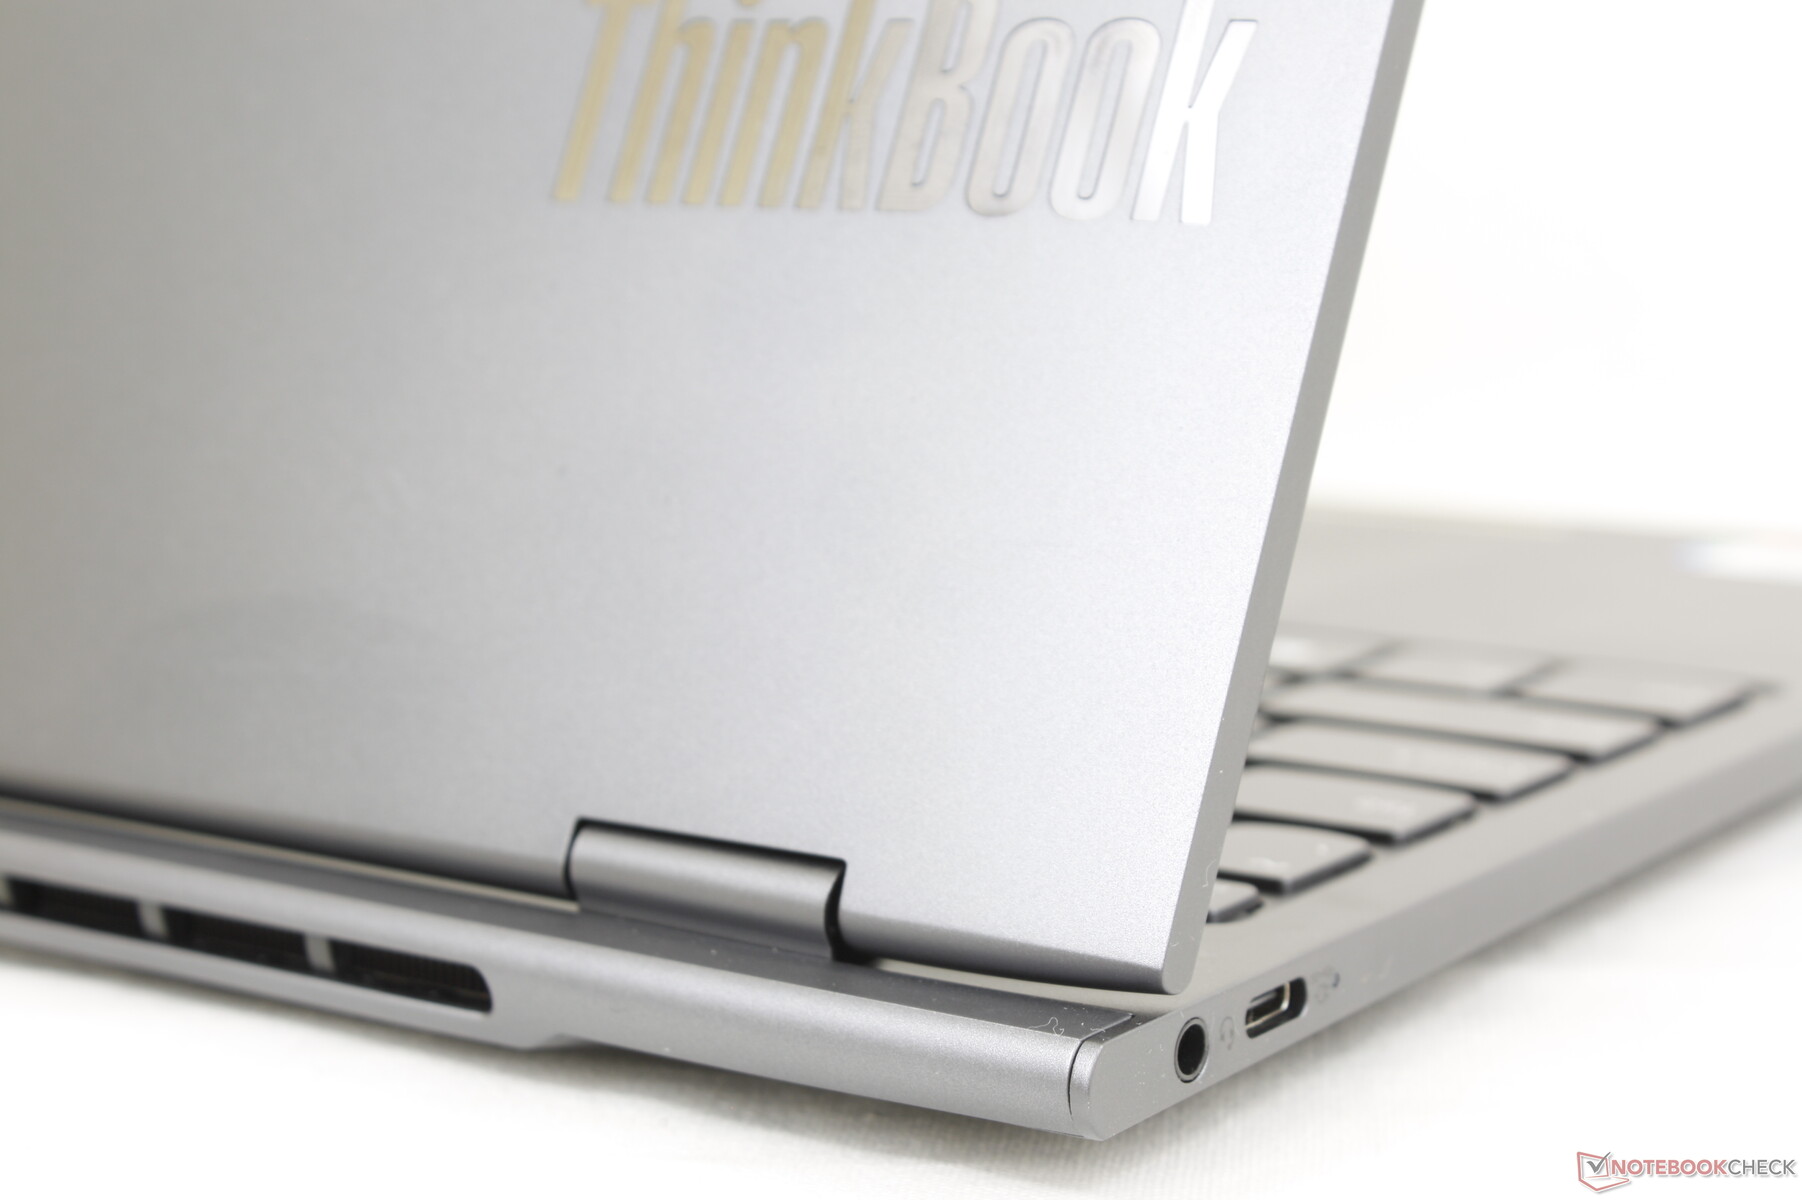
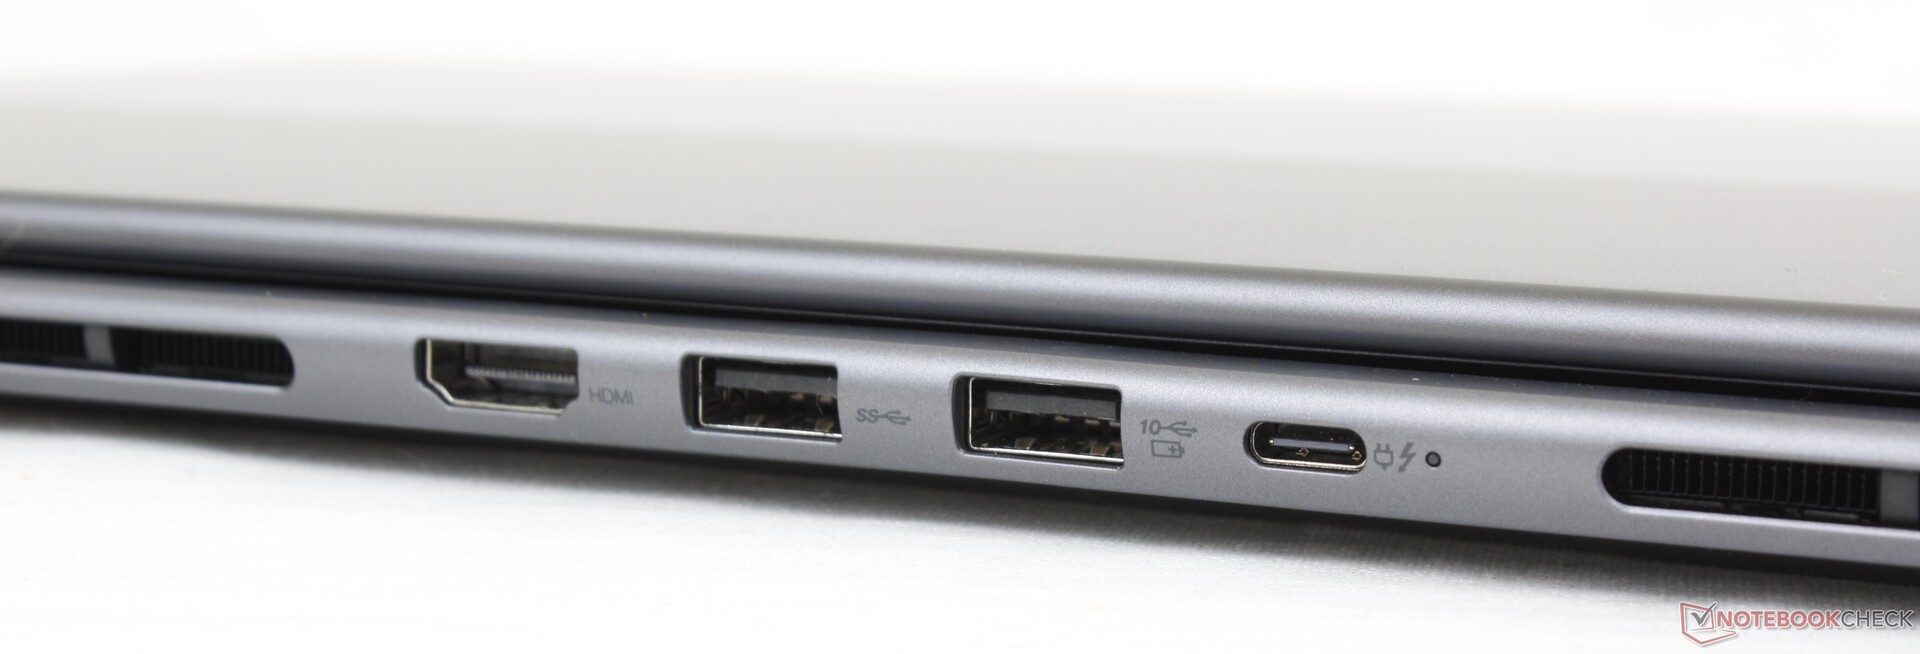
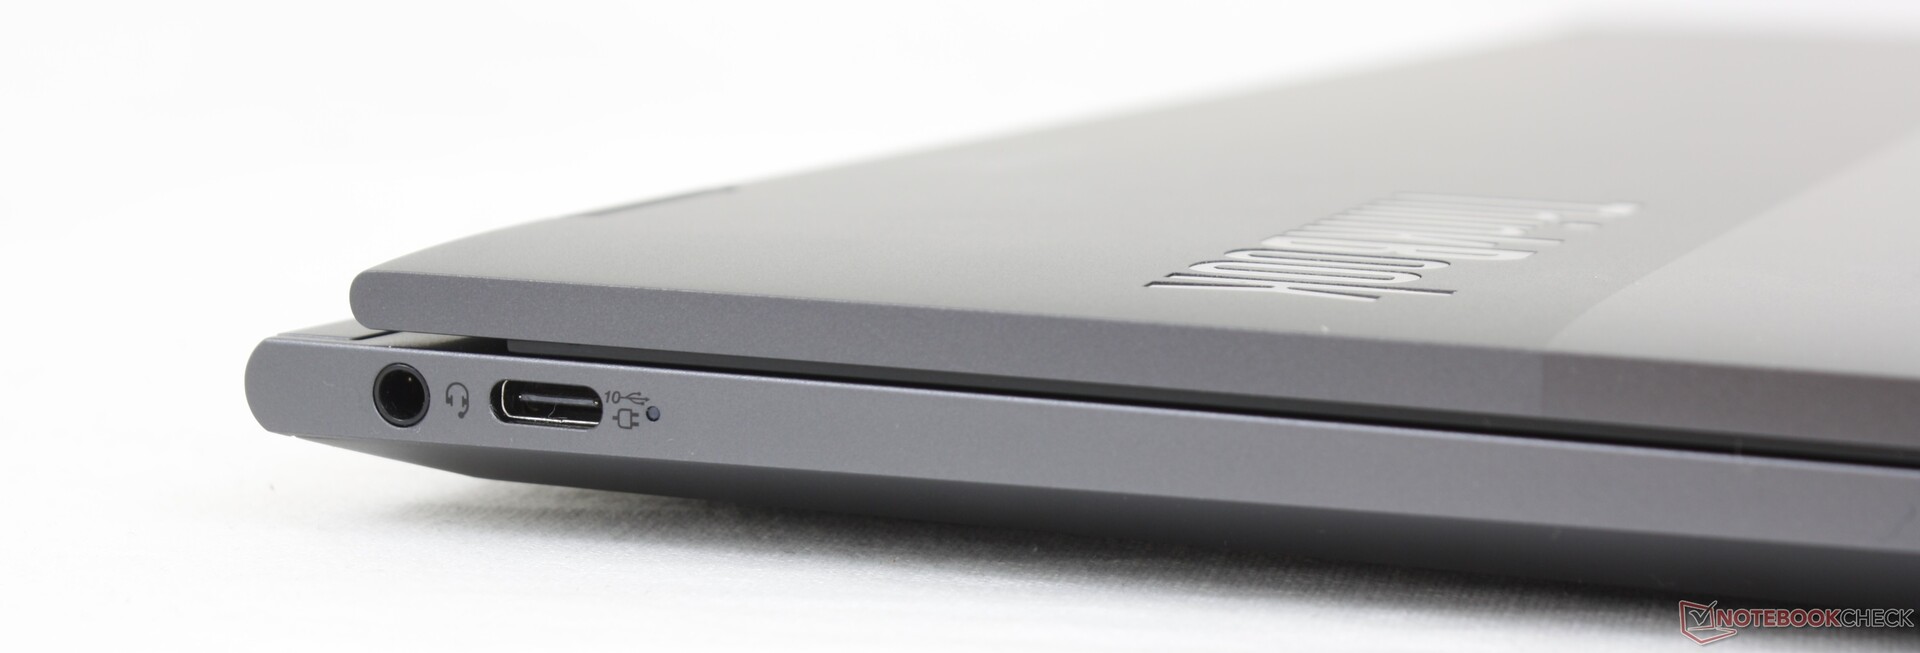
Anschlüsse — Thunderbolt 4
Es wäre schon ein Vergehen das Gen 3 mit weniger Anschlüssen auszustatten als den deutlich kleineren Vorgänger. Genau wie der Vorgänger sind zwei USB-C-Ports verbaut, zusätzlich kommen neu noch ein USB-A-Port sowie HDMI an der Rückseite dazu. Übrigens unterstützt nur einer der beiden USB-C-Slots Thunderbolt, aber immerhin können beide auch zum Aufladen des Gerätes also als DisplayPort verwendet werden.
Einen SD-Kartenleser gibt es nicht, was angesichts des großen Formfaktors und dem Fokus auf Office- und Editing-Nutzung schon etwas enttäuscht.
Kommunikation
Standardmäßig wird das Modul Intel AX211 mit Wi-Fi 6E und Bluetooth 5.2 verbaut. In Verbindung mit unserem 6-GHz-Netzwerk haben wir eine stabile Transferraten ohne Abbrüche gemessen.
| Networking | |
| iperf3 transmit AX12 | |
| Gigabyte Aero 17 HDR YD | |
| Asus ProArt StudioBook Pro 17 W700G3T | |
| Lenovo ThinkBook Plus Gen2 Core i5 | |
| iperf3 receive AX12 | |
| Asus ProArt StudioBook Pro 17 W700G3T | |
| Lenovo ThinkBook Plus Gen2 Core i5 | |
| Gigabyte Aero 17 HDR YD | |
| iperf3 receive AXE11000 6GHz | |
| Lenovo ThinkBook Plus Gen3 | |
| iperf3 receive AXE11000 | |
| LG Gram 17 (2022) | |
| Dell XPS 17 9720 | |
| iperf3 transmit AXE11000 6GHz | |
| Lenovo ThinkBook Plus Gen3 | |
| iperf3 transmit AXE11000 | |
| Dell XPS 17 9720 | |
| LG Gram 17 (2022) | |
Webcam
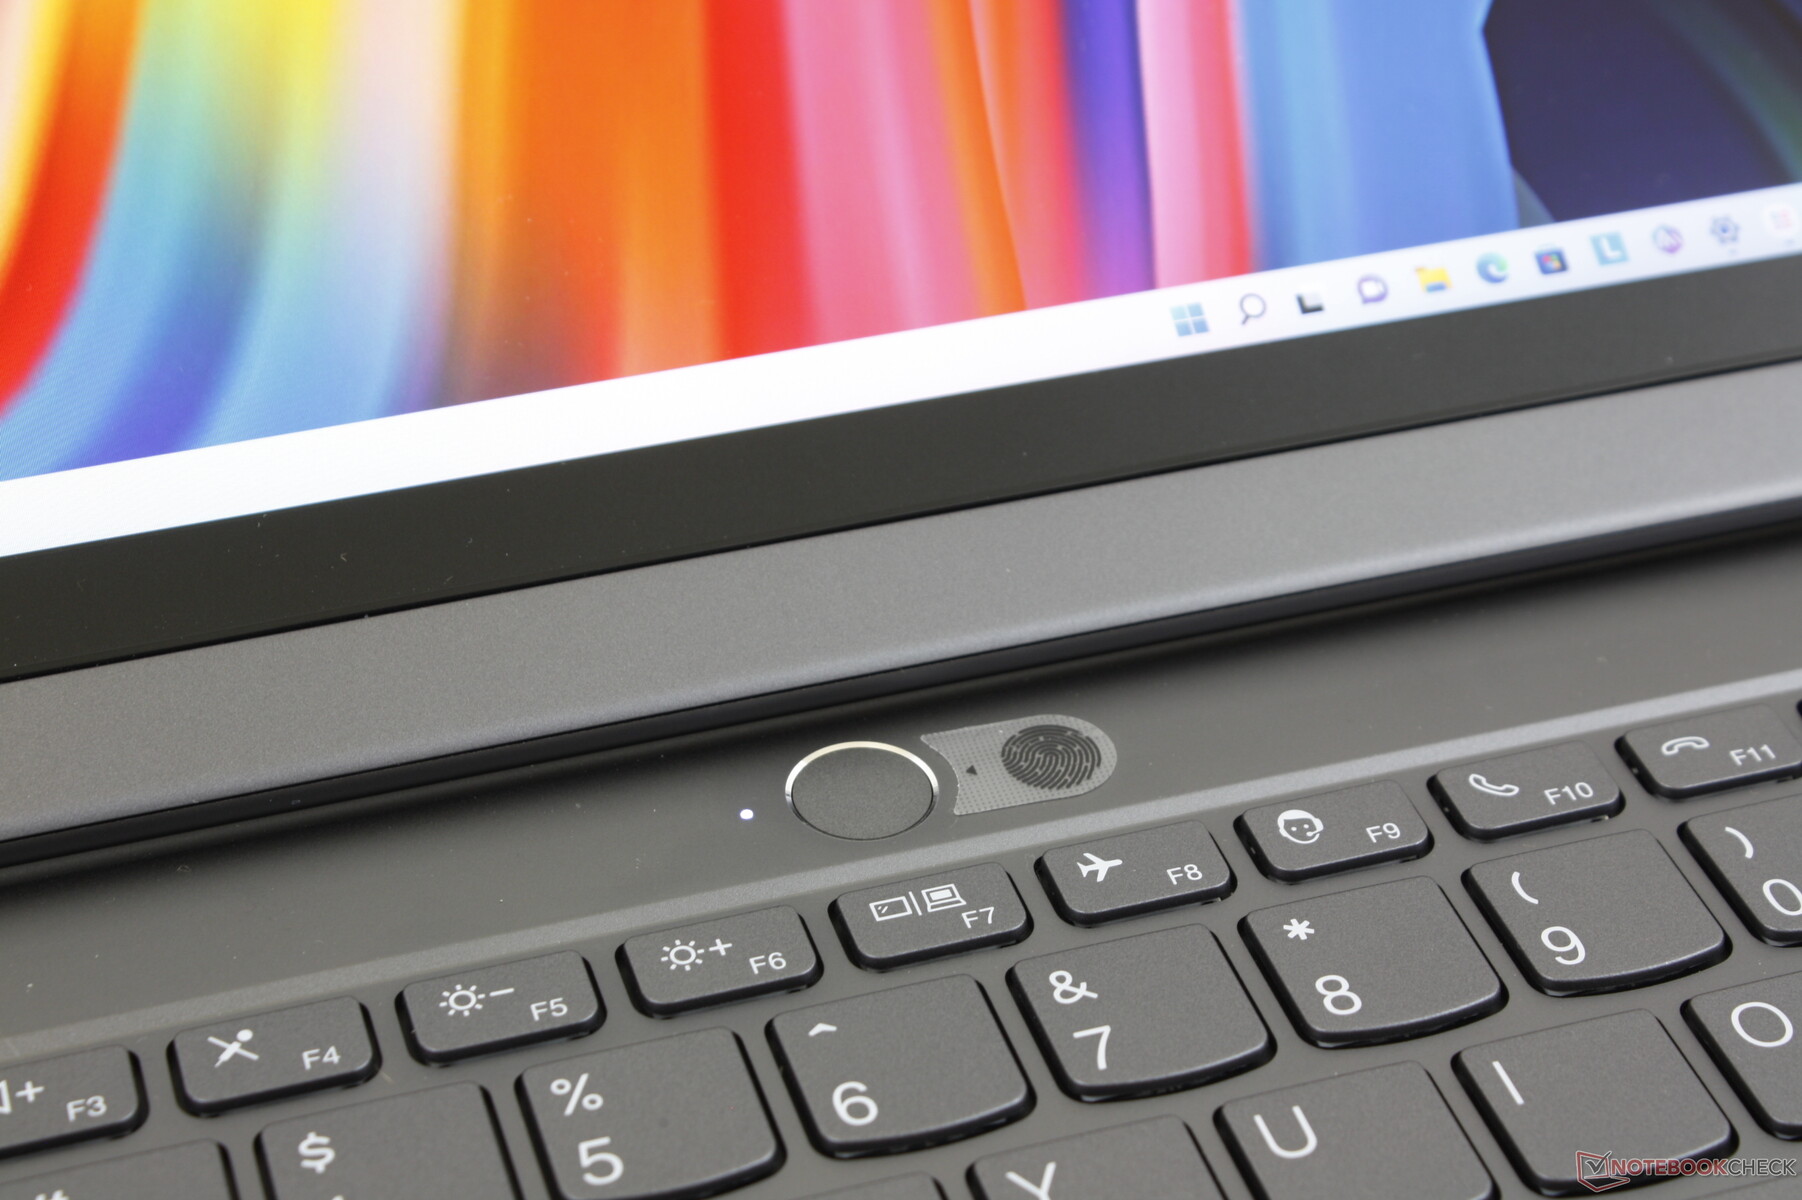
Die 2-MP-Kamera erweist sich als schärfer als die Modelle in der XPS-Serie, aber nicht so gut wie die 5-MP-Kameras auf vielen neueren HP Modellen. Sowohl ein IR-Sensor für Hello als auch ein Shutter für mehr Privatsphäre sind mit an Bord.


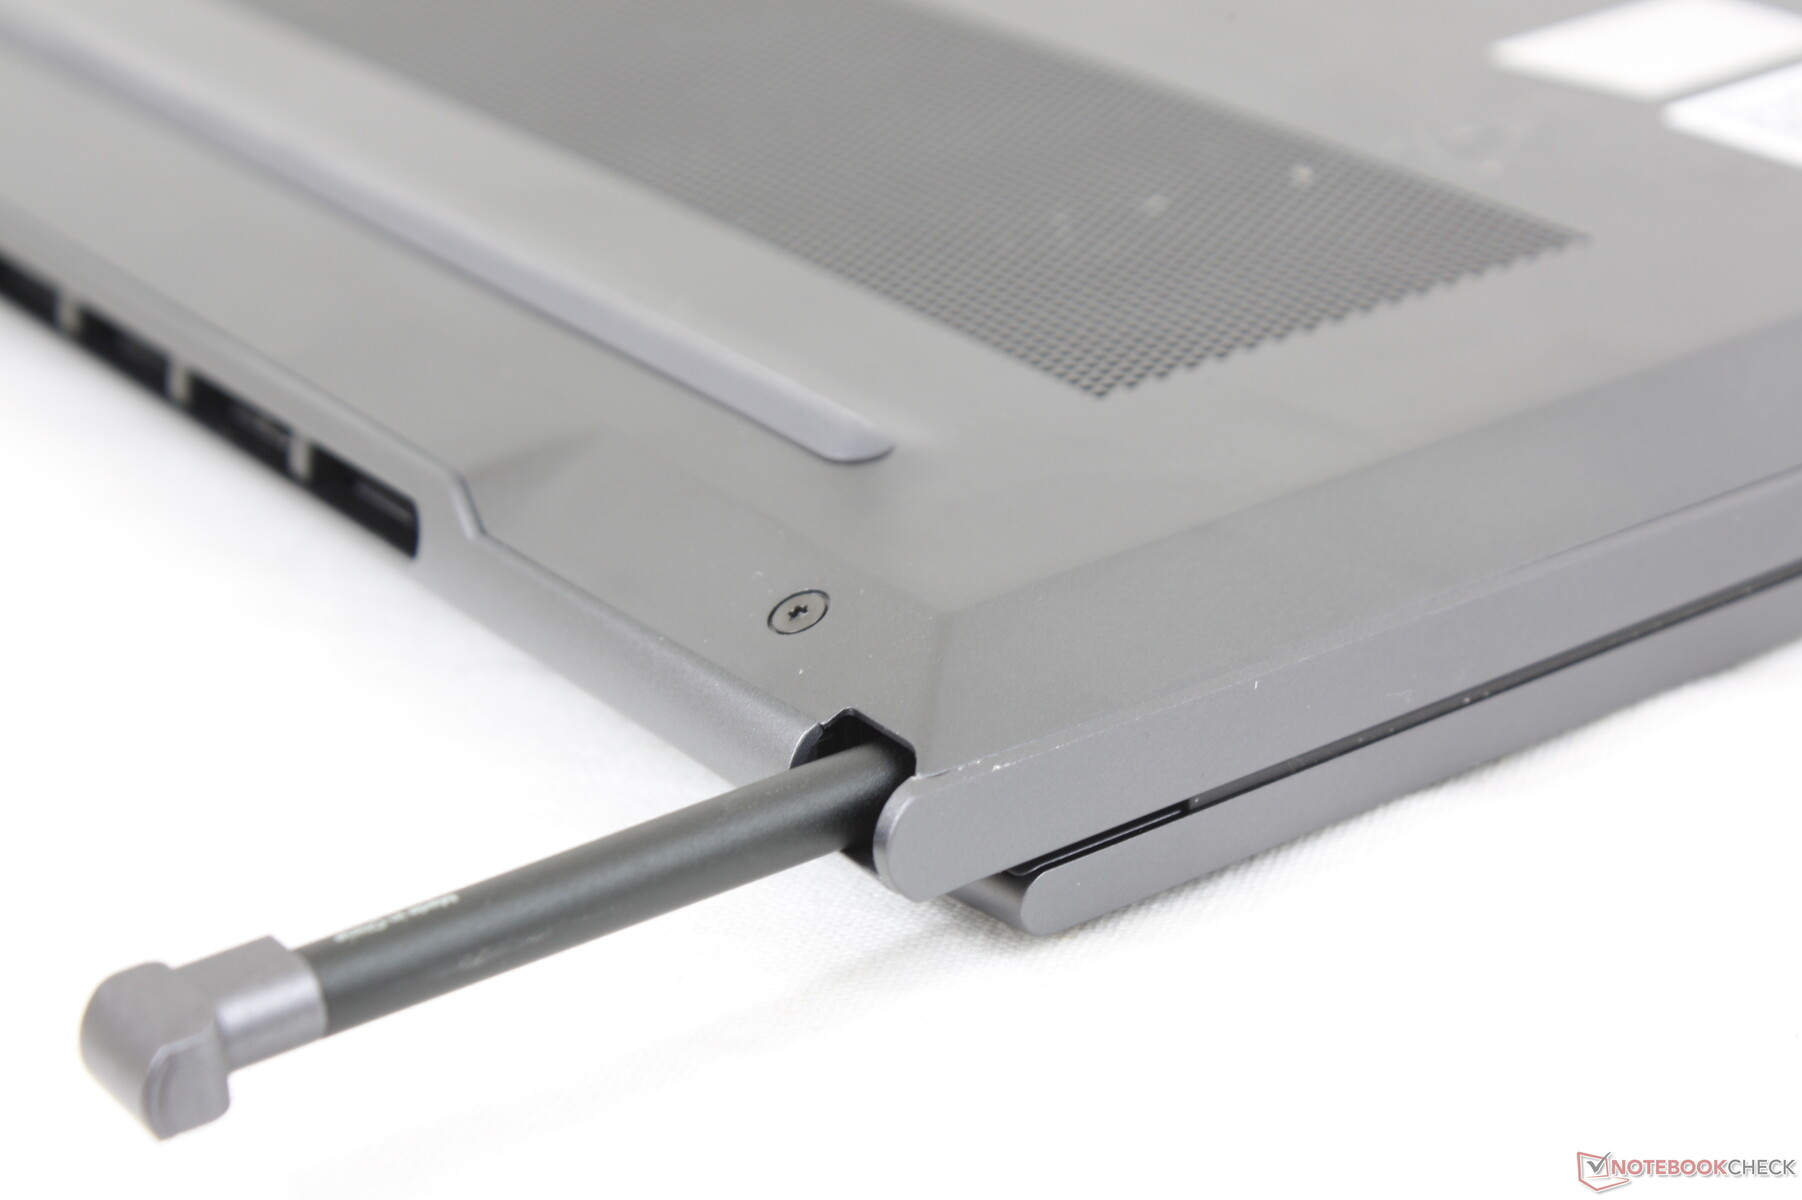
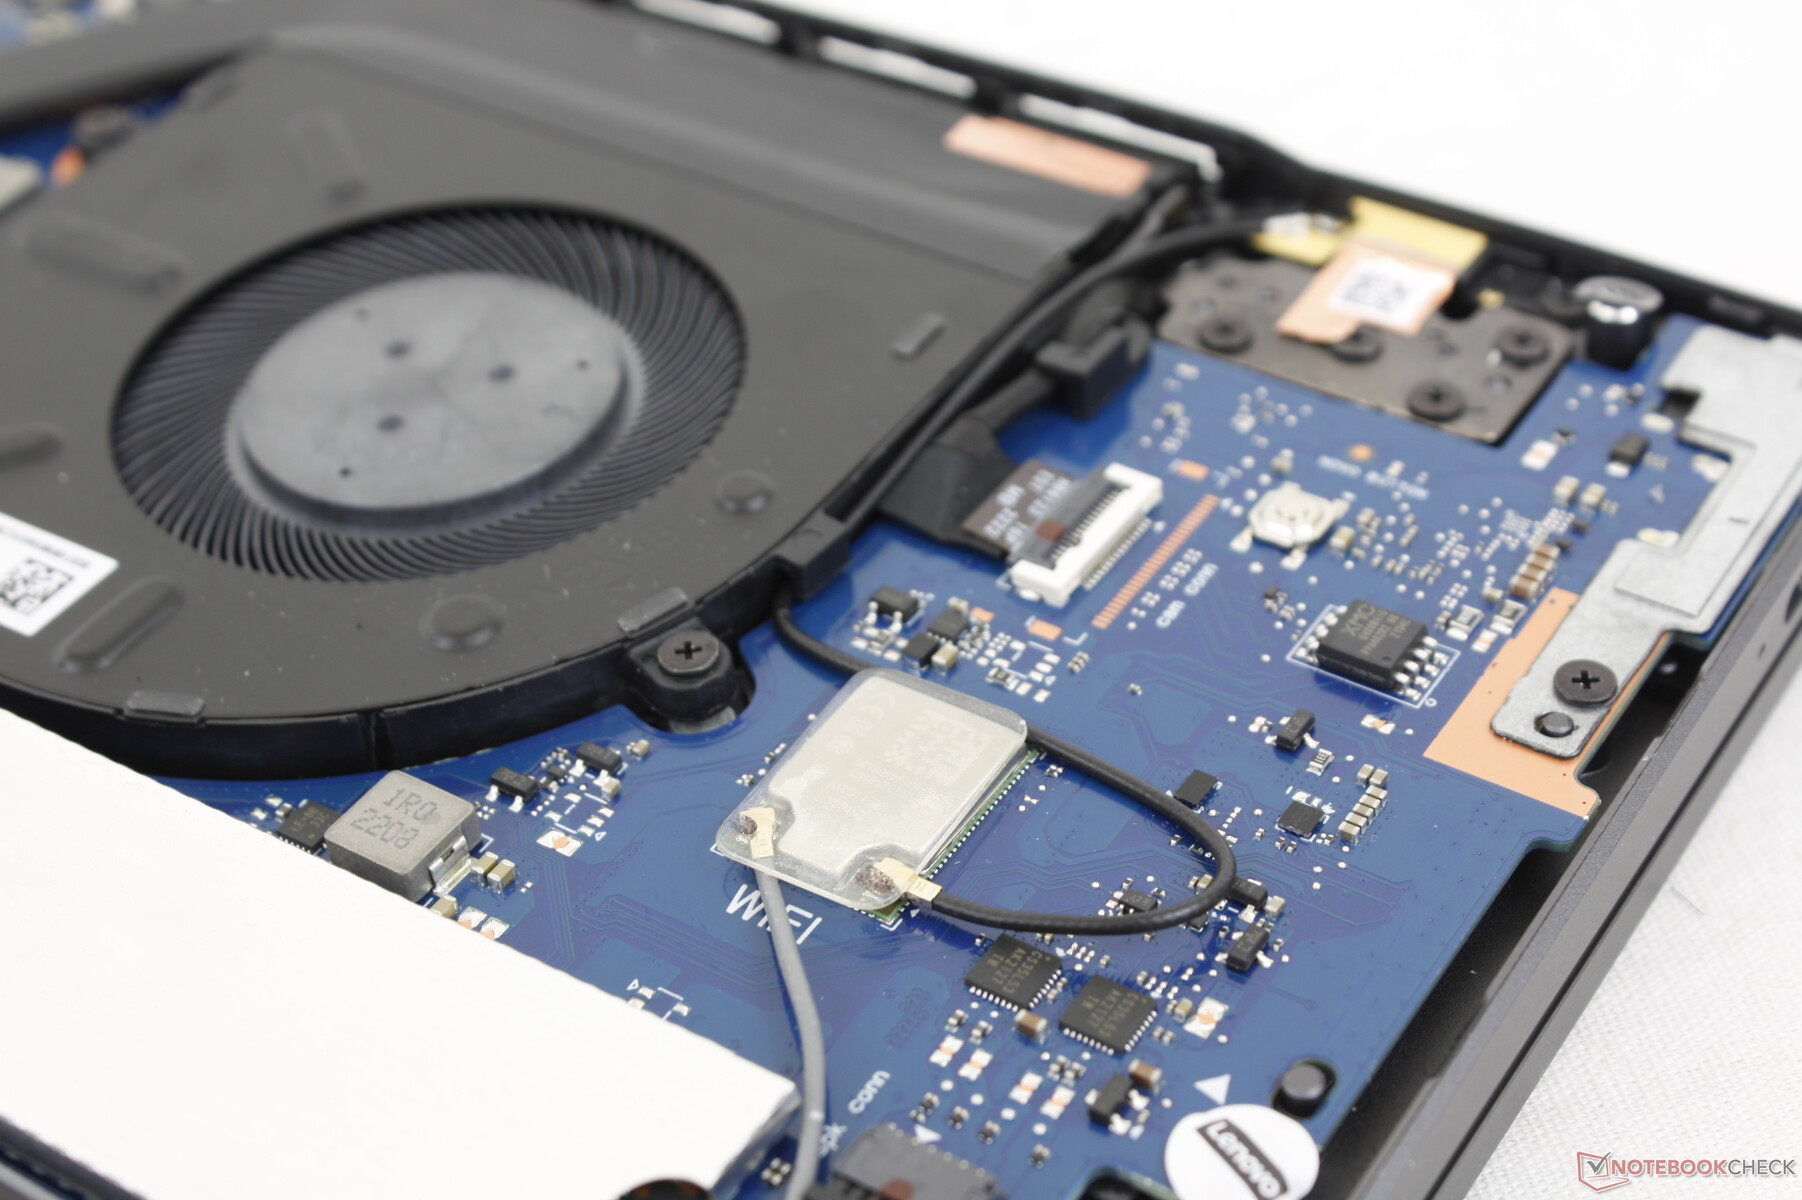
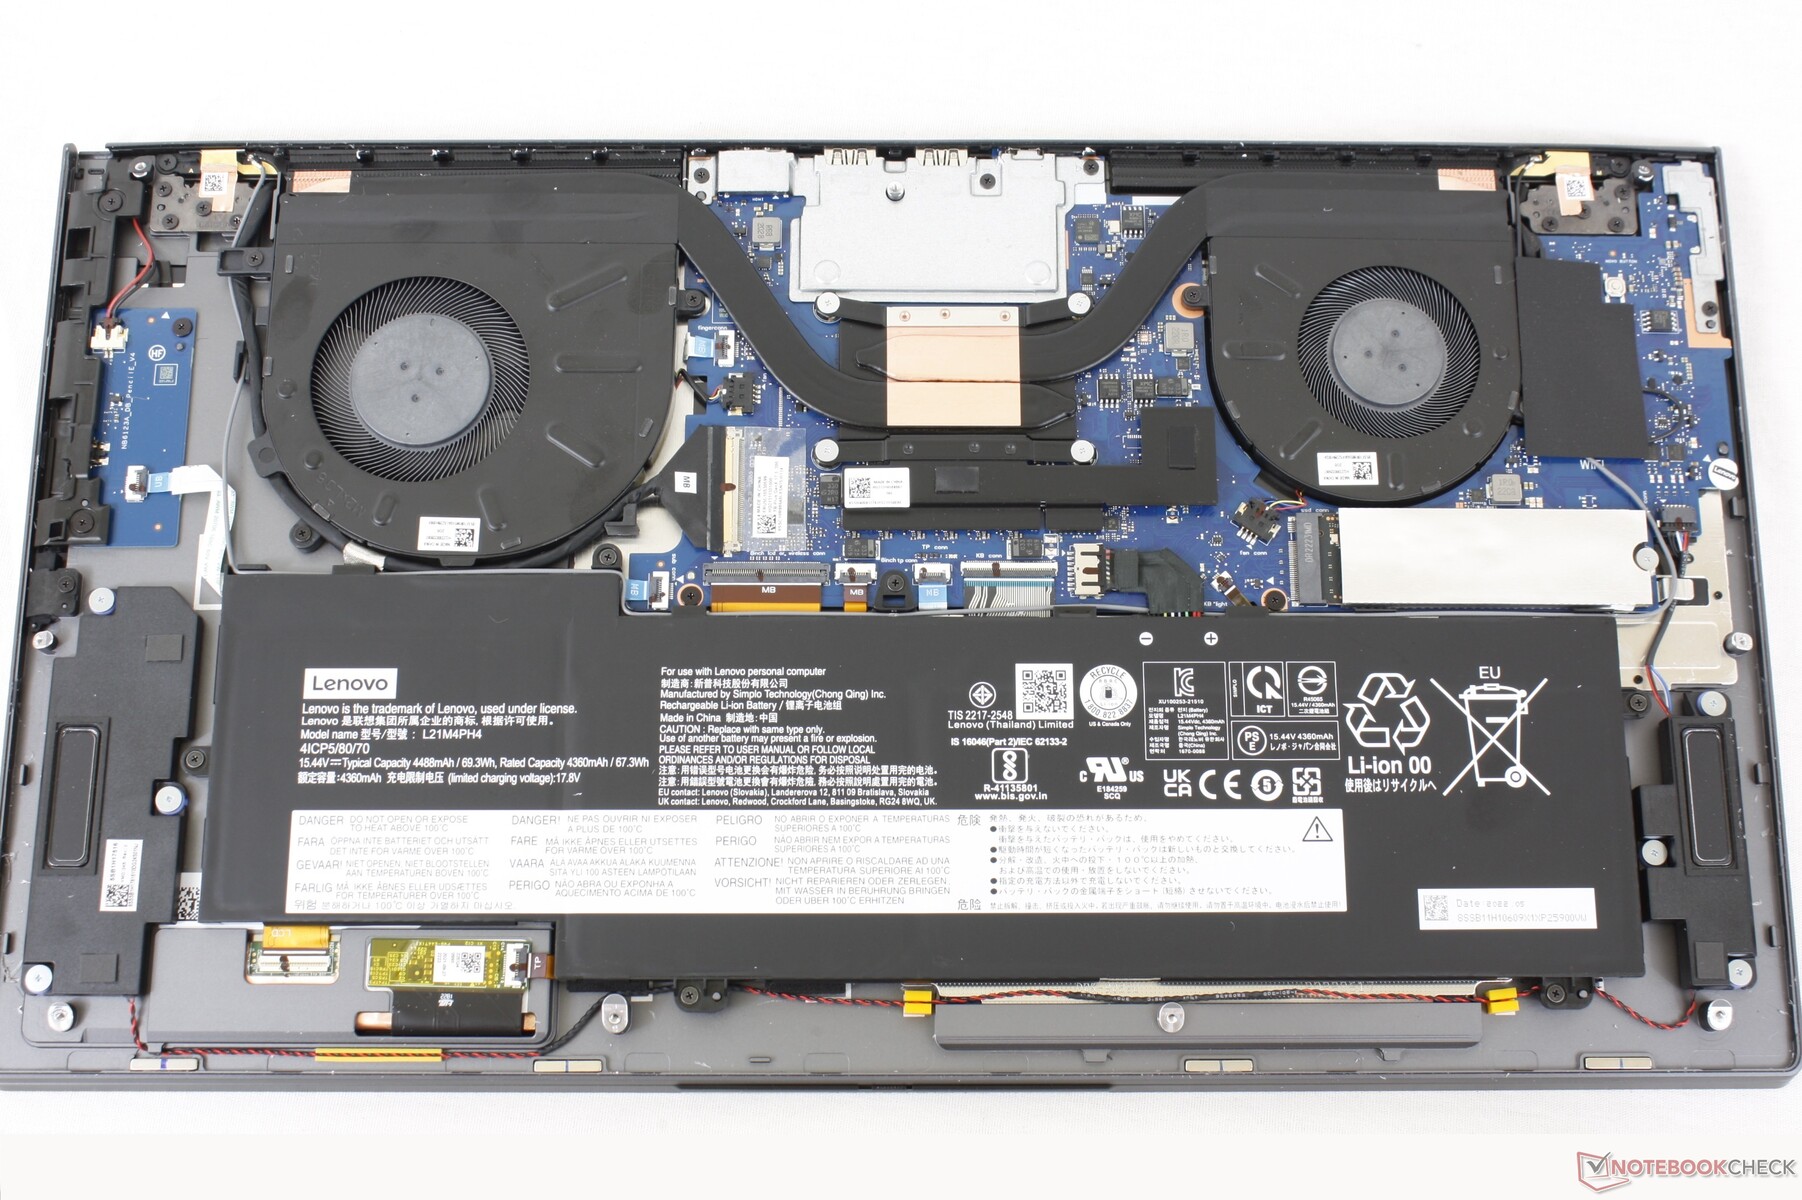
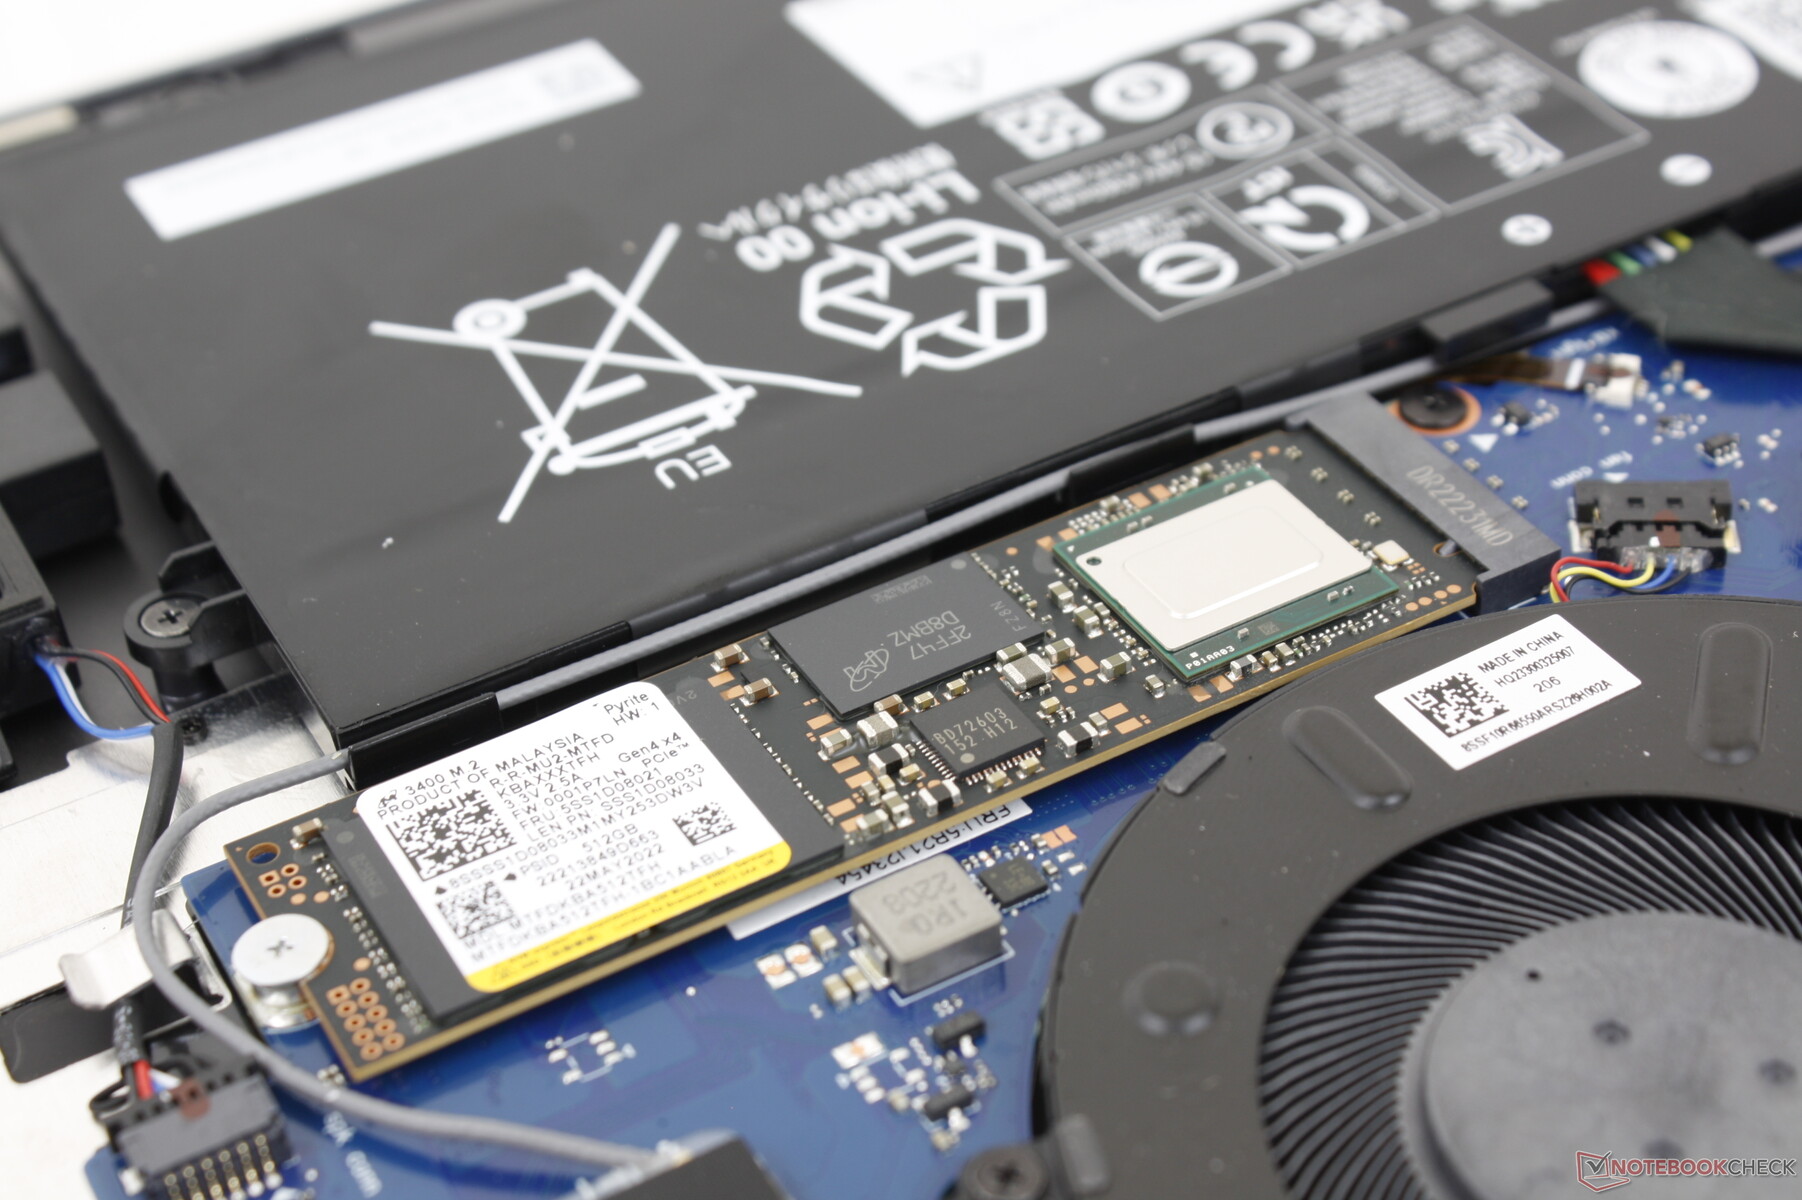
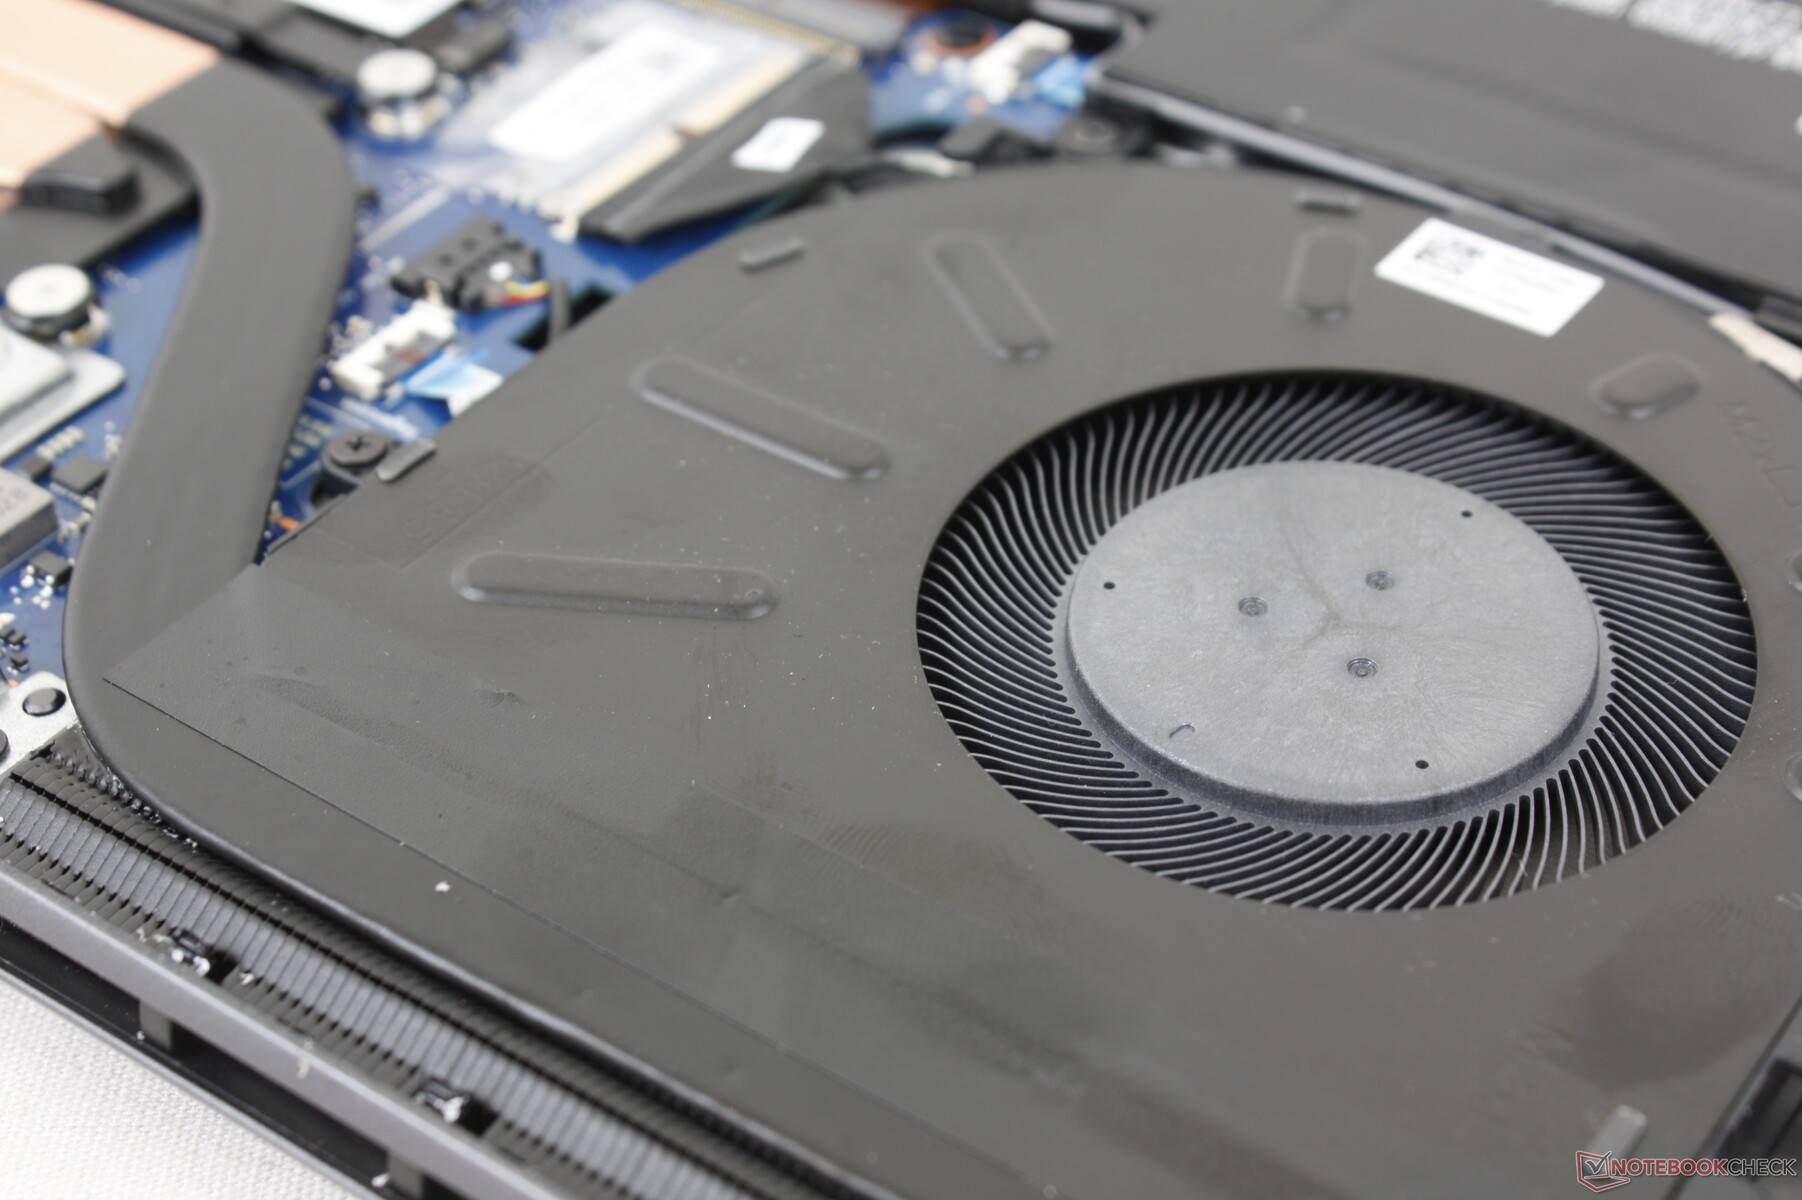
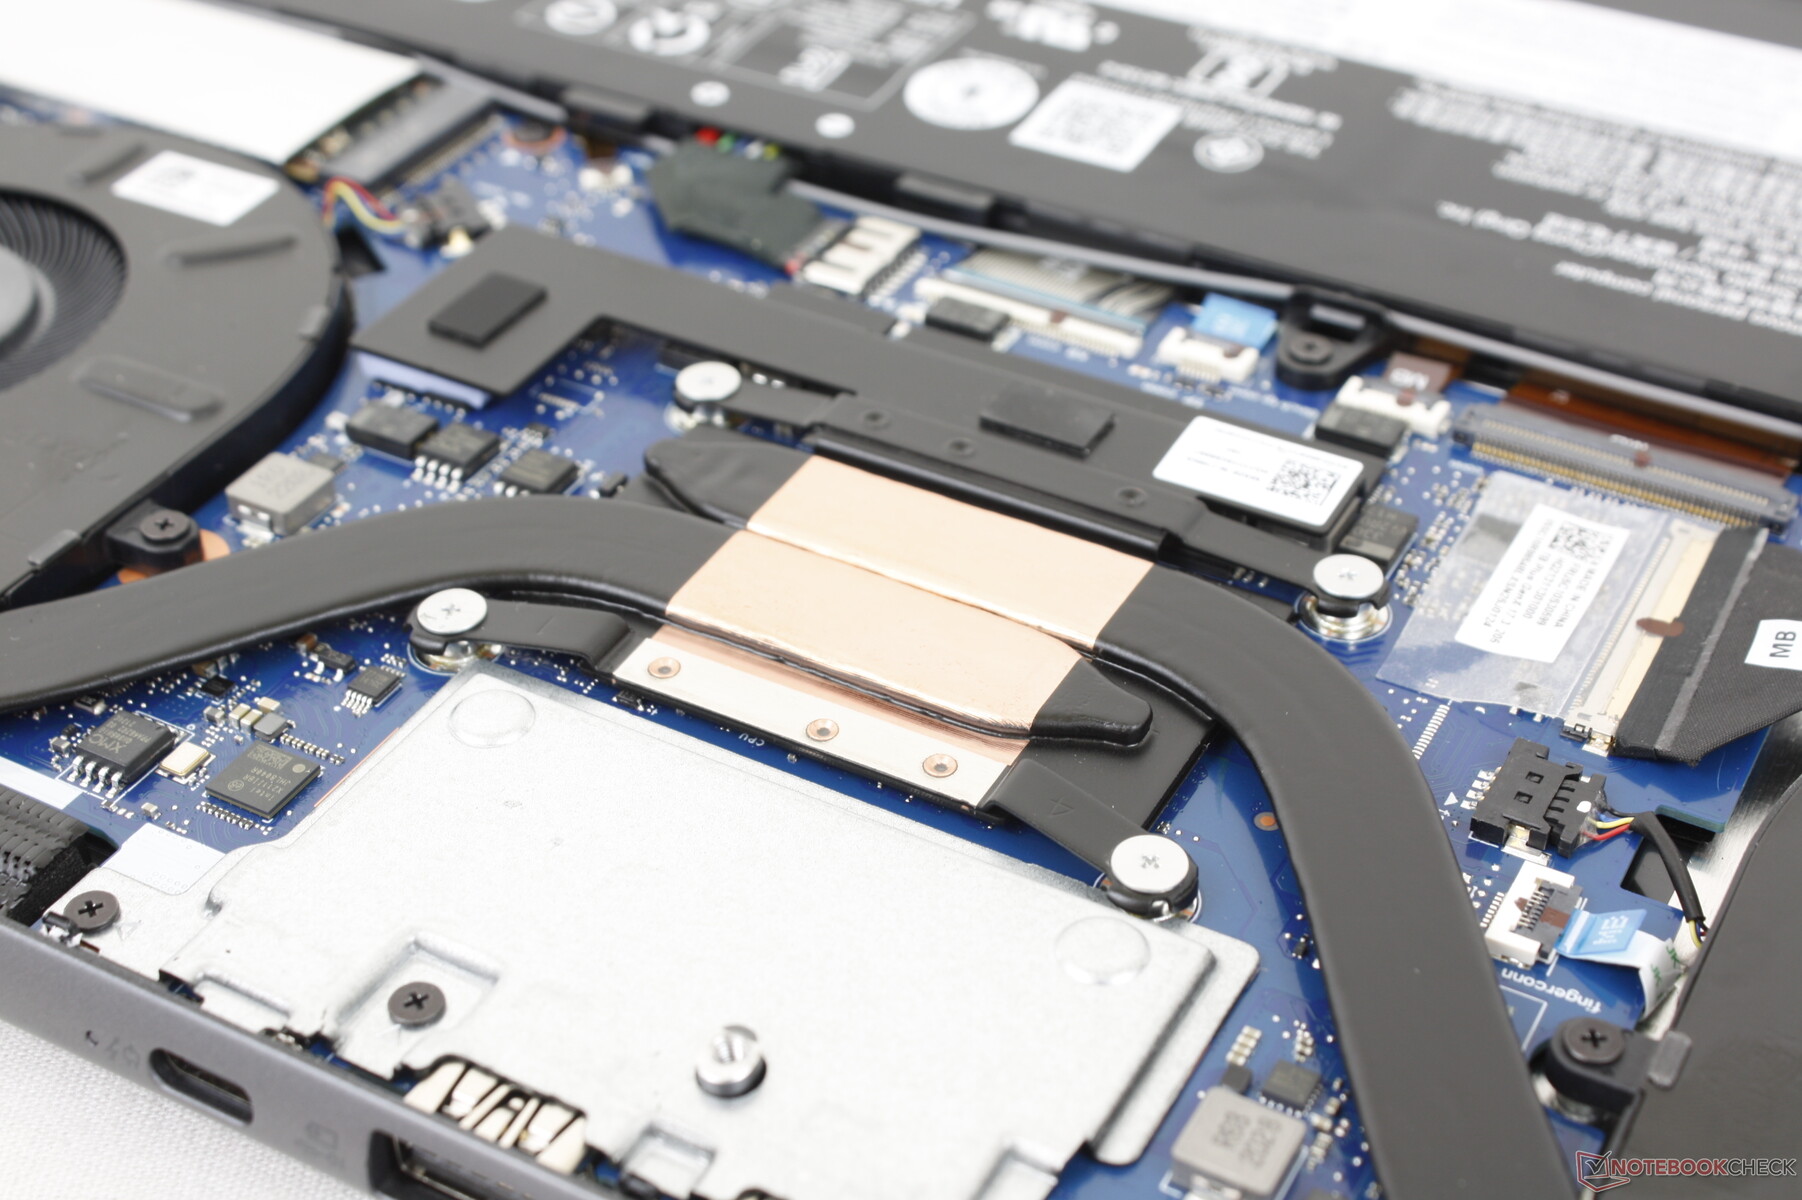
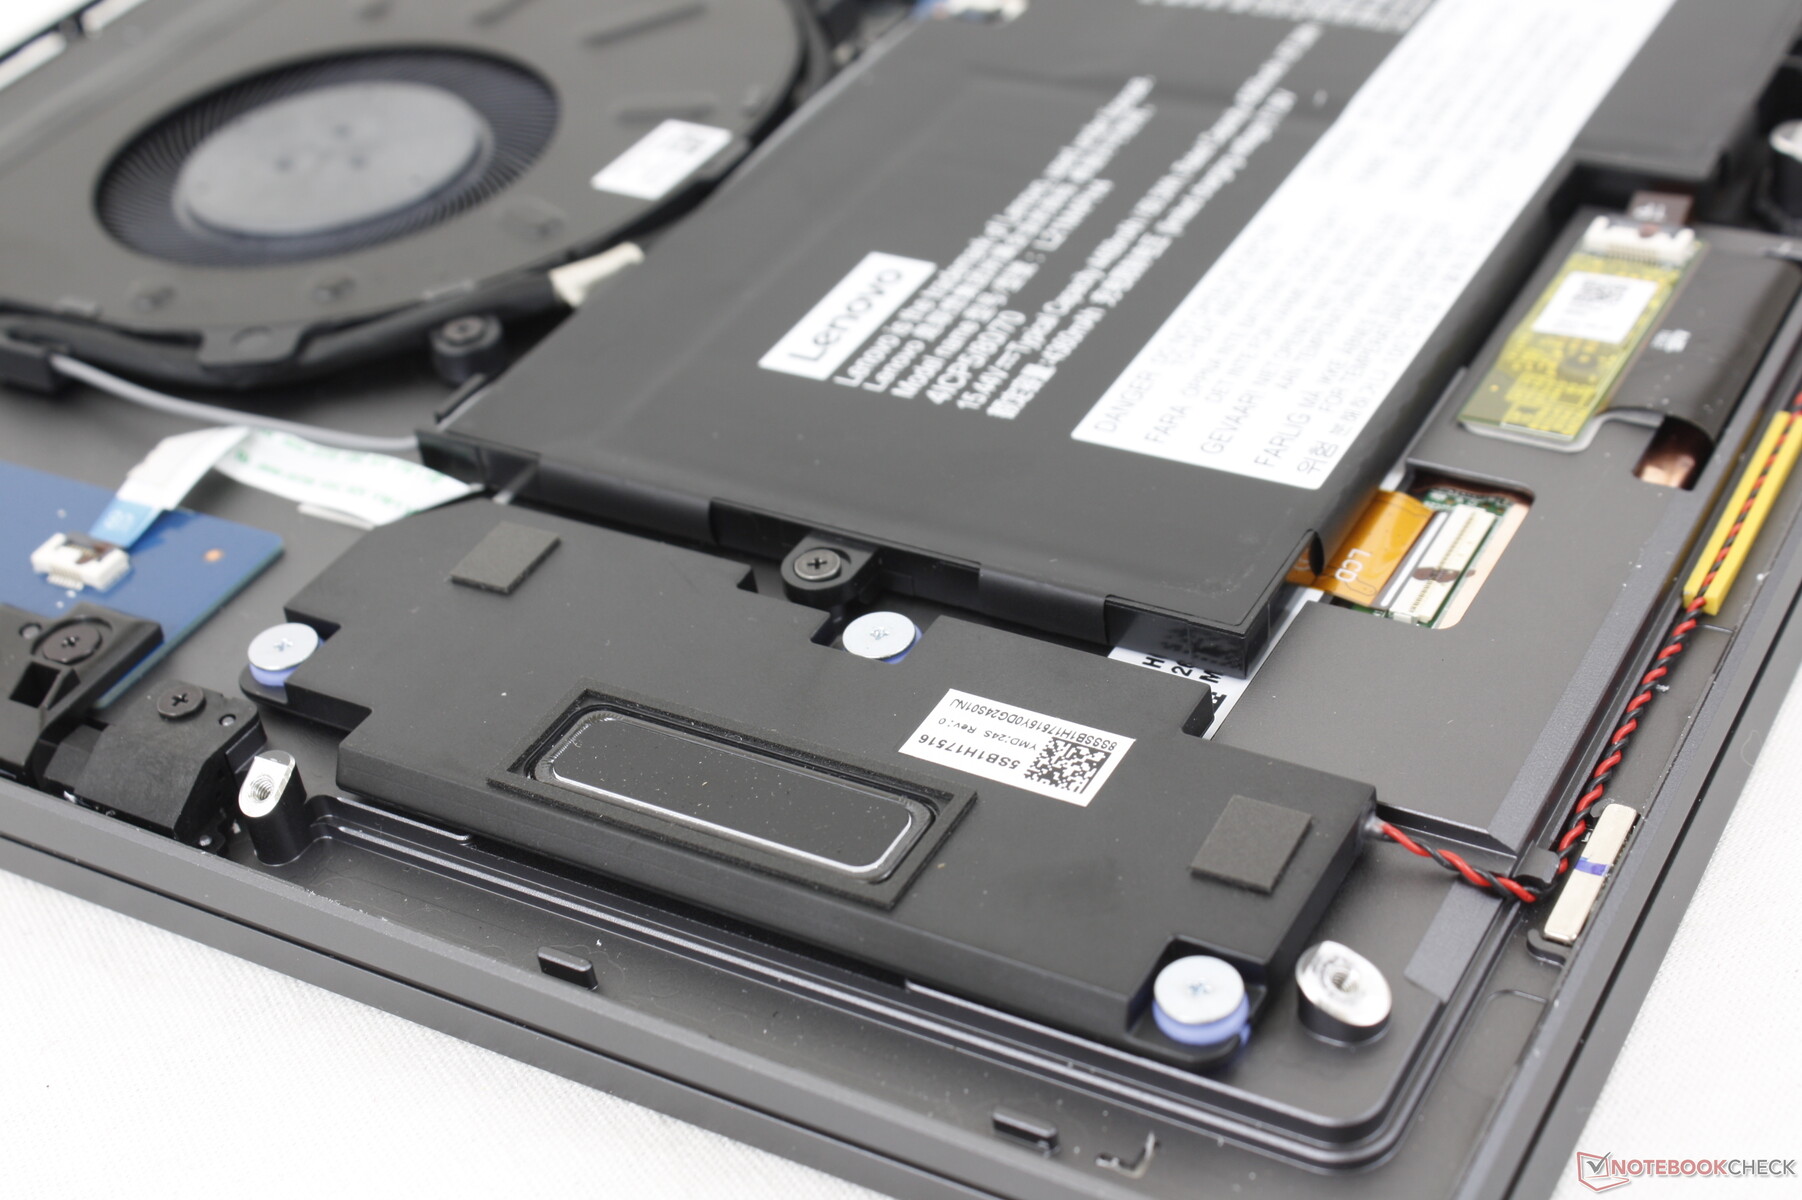
Wartung
Die Unterseite wird von neun T5-Torx-Schrauben gesichert. Wir empfehlen zunächst den Stift herauszunehmen und beim Aufhebeln am nun leeren Schacht an der Hinterseite anzusetzen, was deutlich leichter geht.
Viel zu tauschen gibt es allerdings nicht, sowohl WLAN-Modul als auch RAM sind aufgelötet.
Zubehör und Garantie
Genau wie im letzten Jahr liegt auch beim Gen 3 ein Active Stylus bei. In Deutschland beträgt die Garantiezeit nur 1 Jahr. Unternehmen und Privatpersonen können gegen Aufpreis jedoch zusätzliche Garantieservices und -zeiten in Anspruch nehmen.
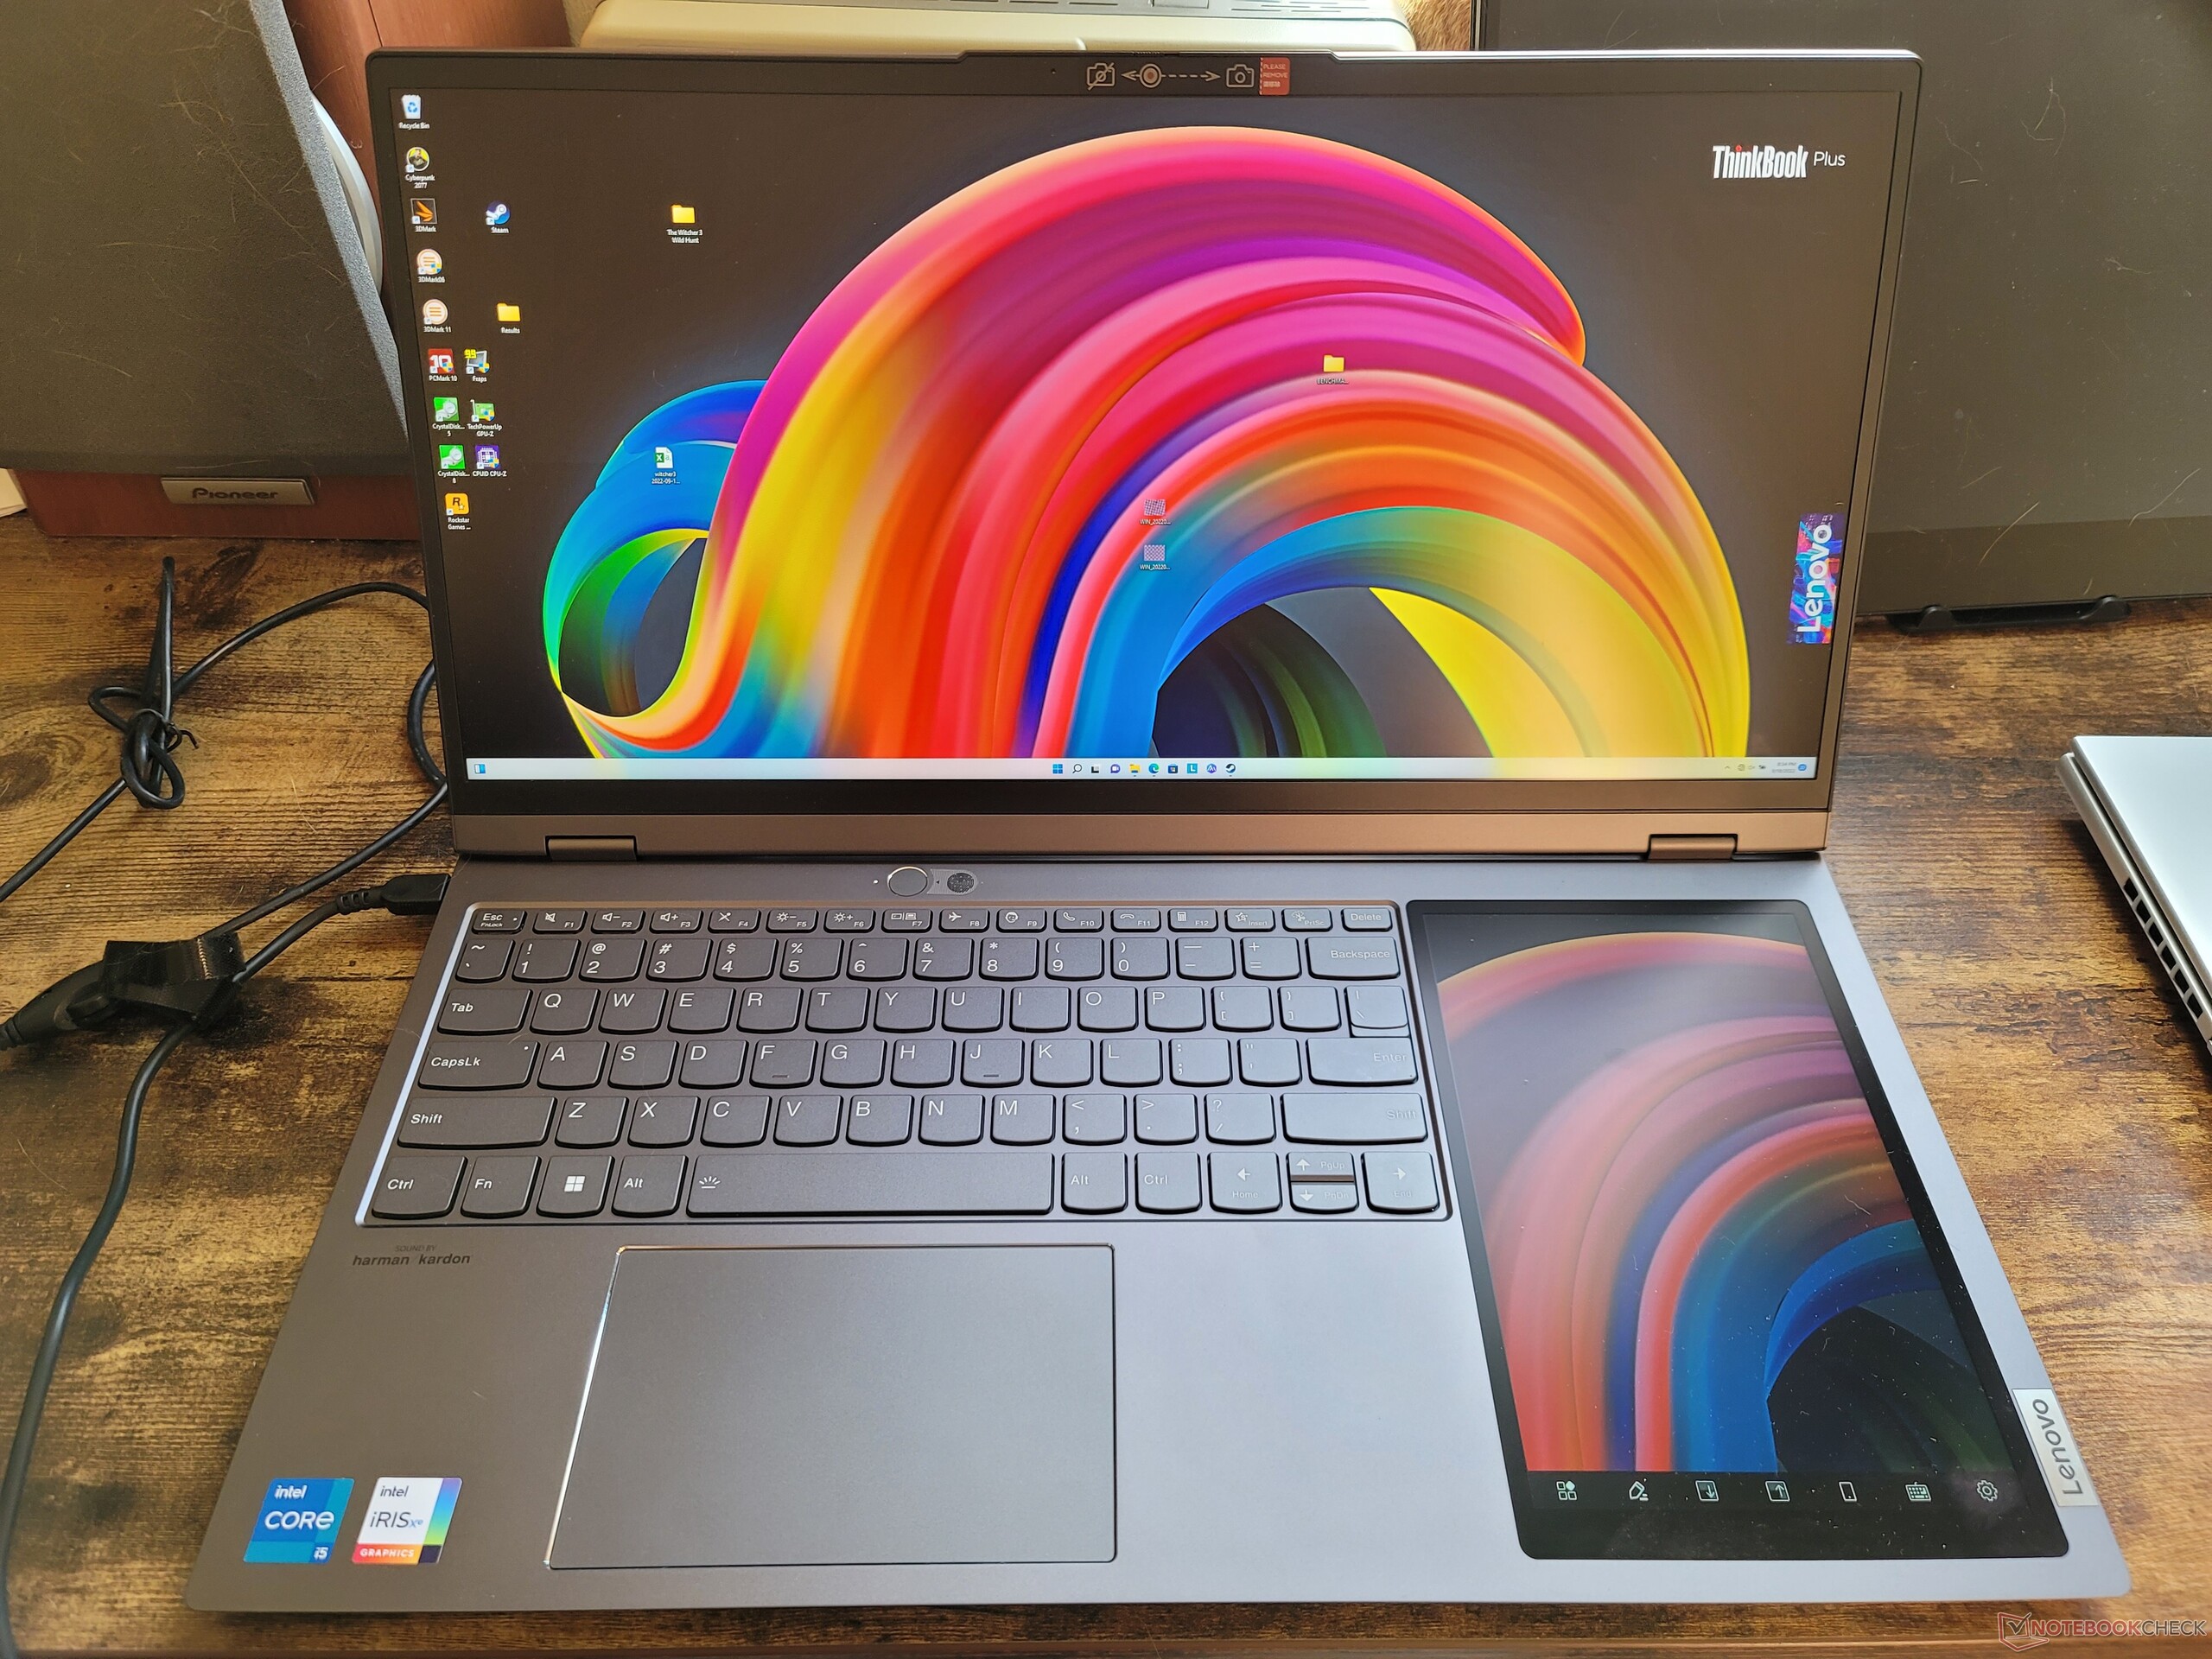
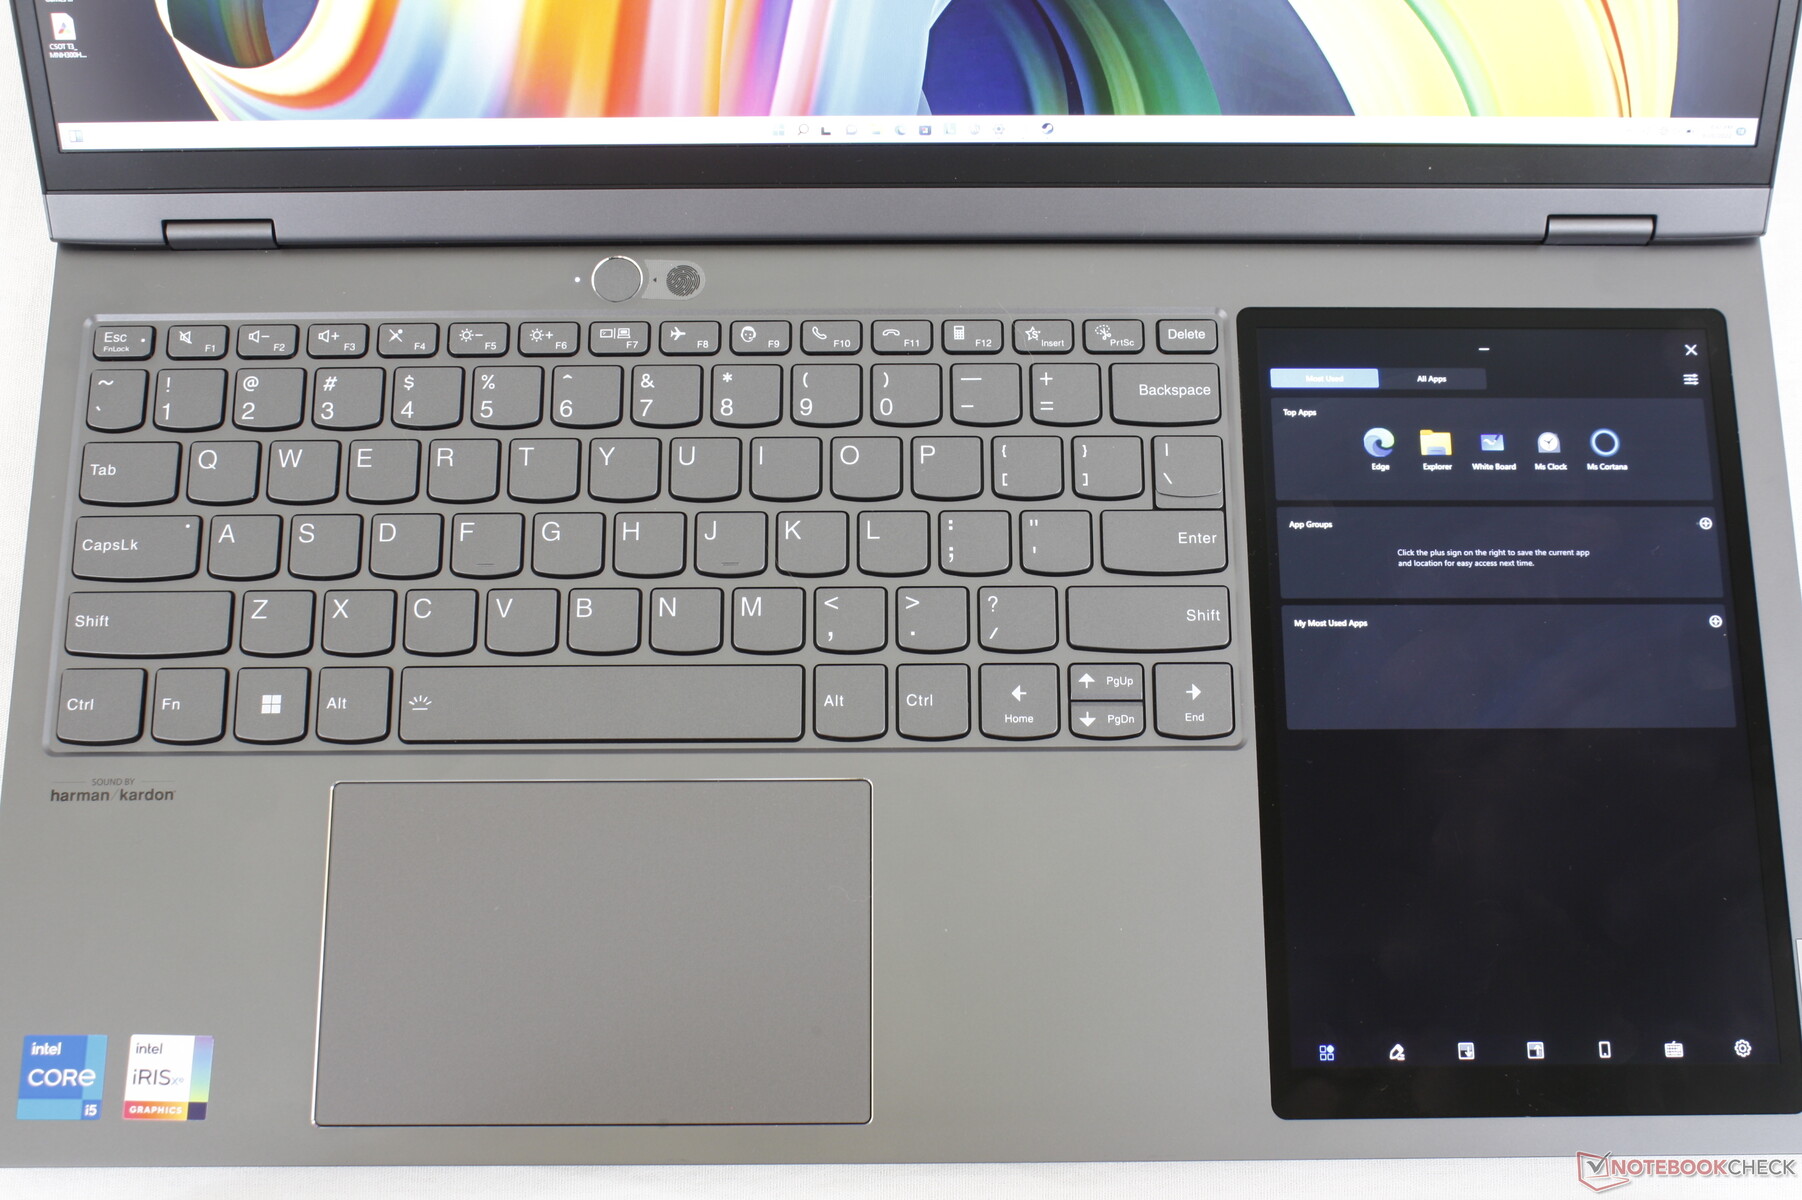
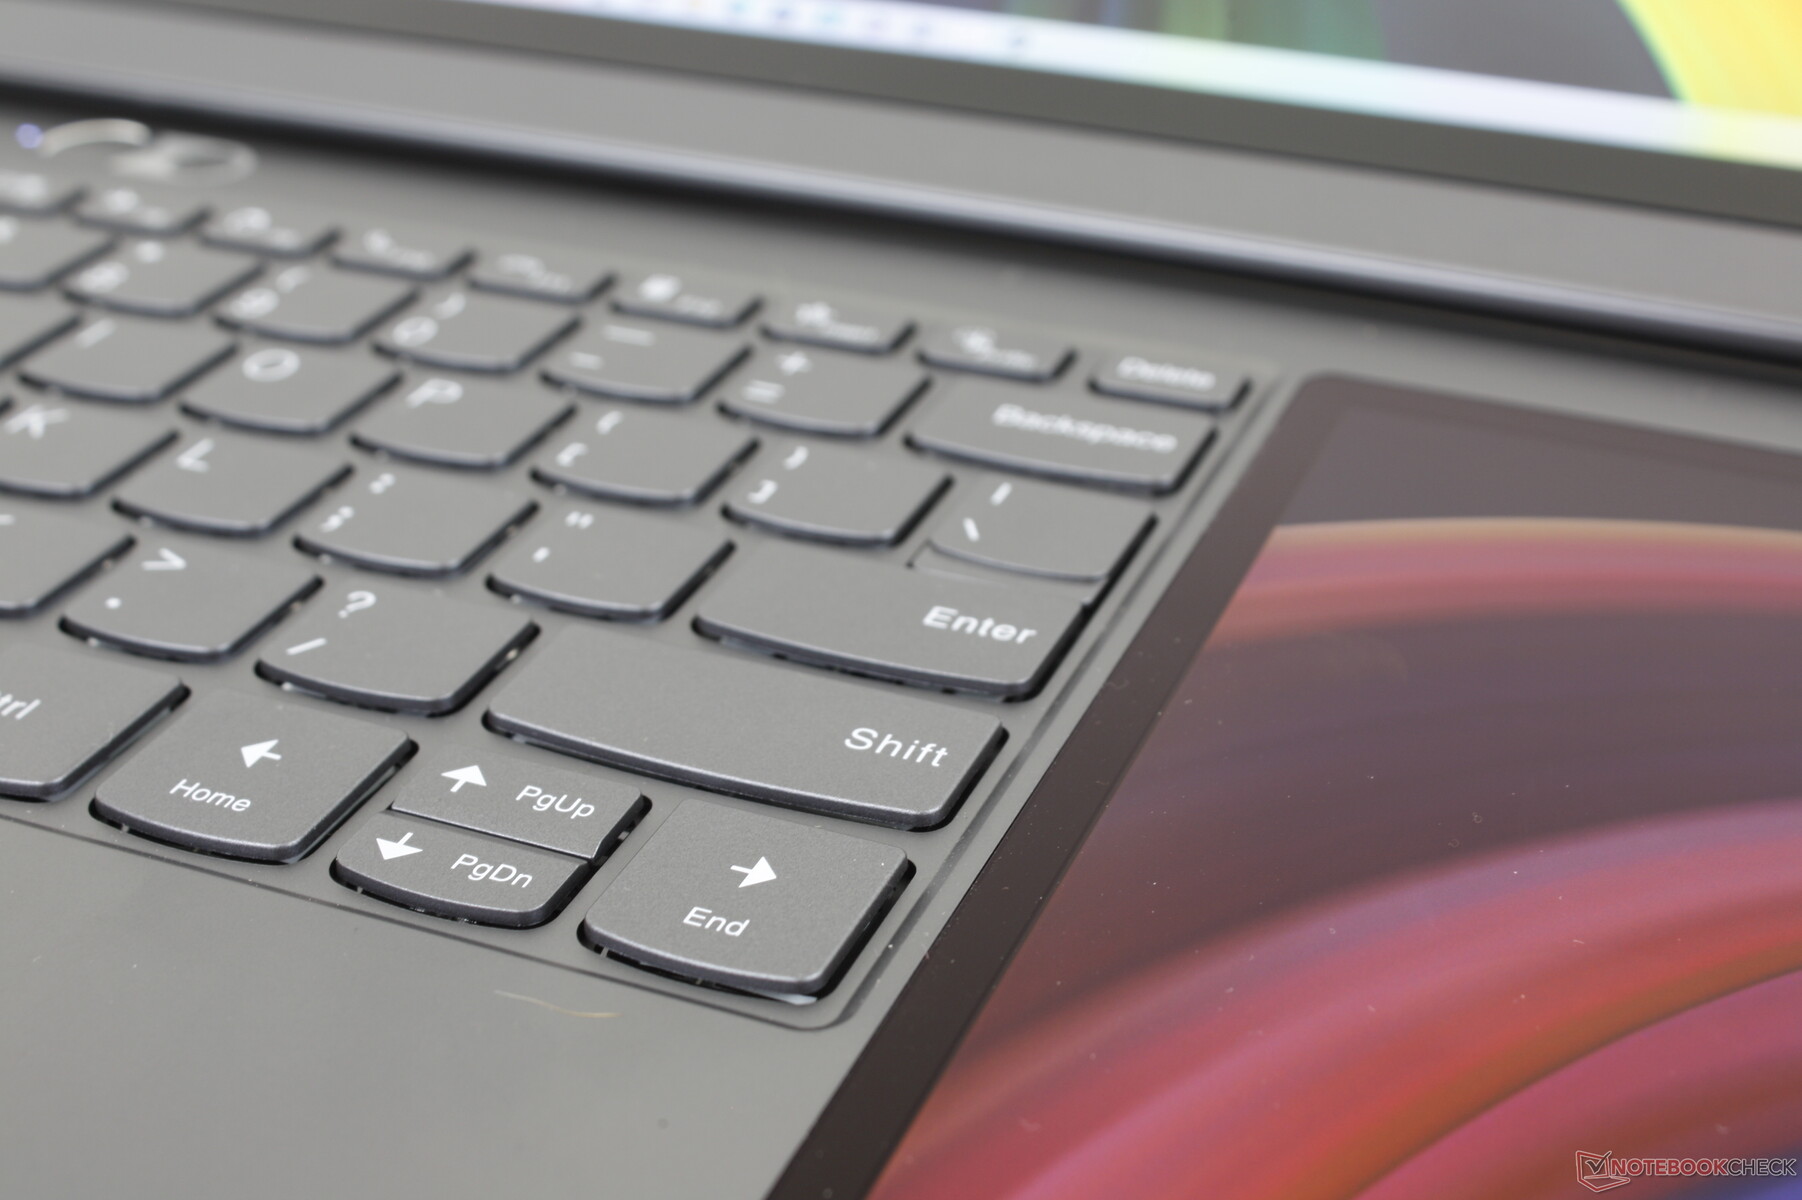
Eingabegeräte — Großzügiges Tastendeck
Tastatur
Die Schreiberfahrung bleibt quasi identisch zu der anderer ThinkBook-Laptops, beispielsweise dem ThinkBook 14 G4, trotz des sekundären Touchscreens. Die breitere Basis erlaubt nun relativ geräumige Komponenten wie Touchpad, Tastatur und Touchscreen.
Das Tastenfeedback ist recht schwach und seicht, ähnlich wie bei den Tastaturen vieler Yoga-, IdeaPad- oder Mittelklasse-Ultrabook-Modelle. ThinkPad-Tastaturen sind hingegen generell fester und haben im Vergleich einen längeren Hub.
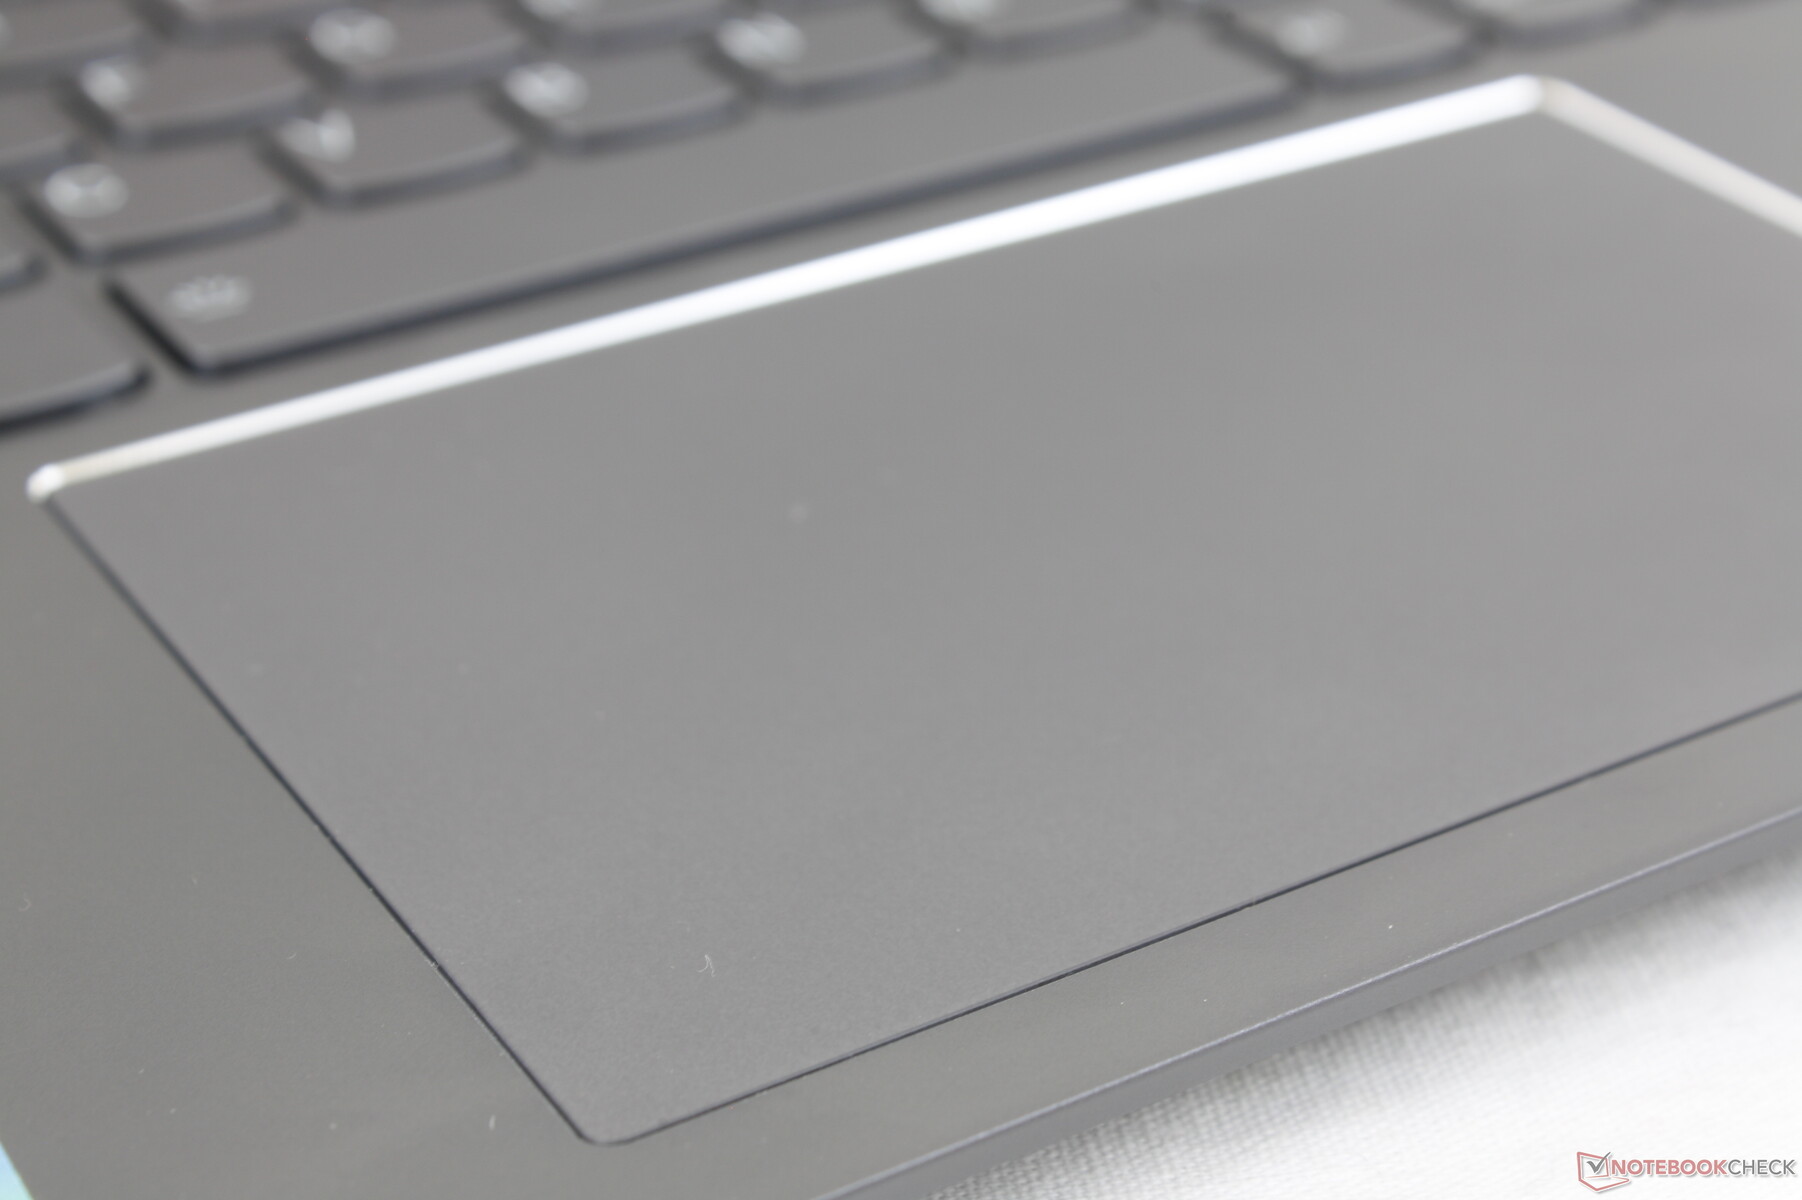
Touchpad
Anders als beim kleinen Touchpad eines ZenBook Duo UX481 ist das hier verbaute Modell angenehm geräumig (12 x 7.5 cm vs. 5.5 x 7 cm). Gleitbewegungen gelingen flüssig und die Reaktionen wirken auch durch die Bildwiederholrate von 120 Hz etwas schneller. Klicks fühlen sich fest und laut an, was in einem ordentlichen Feedback resultiert.

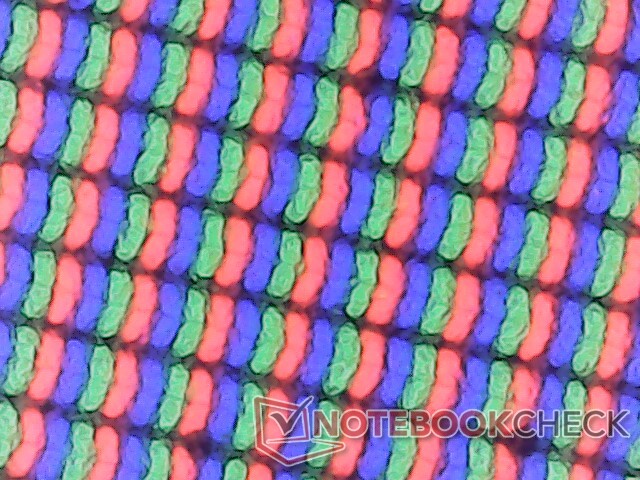
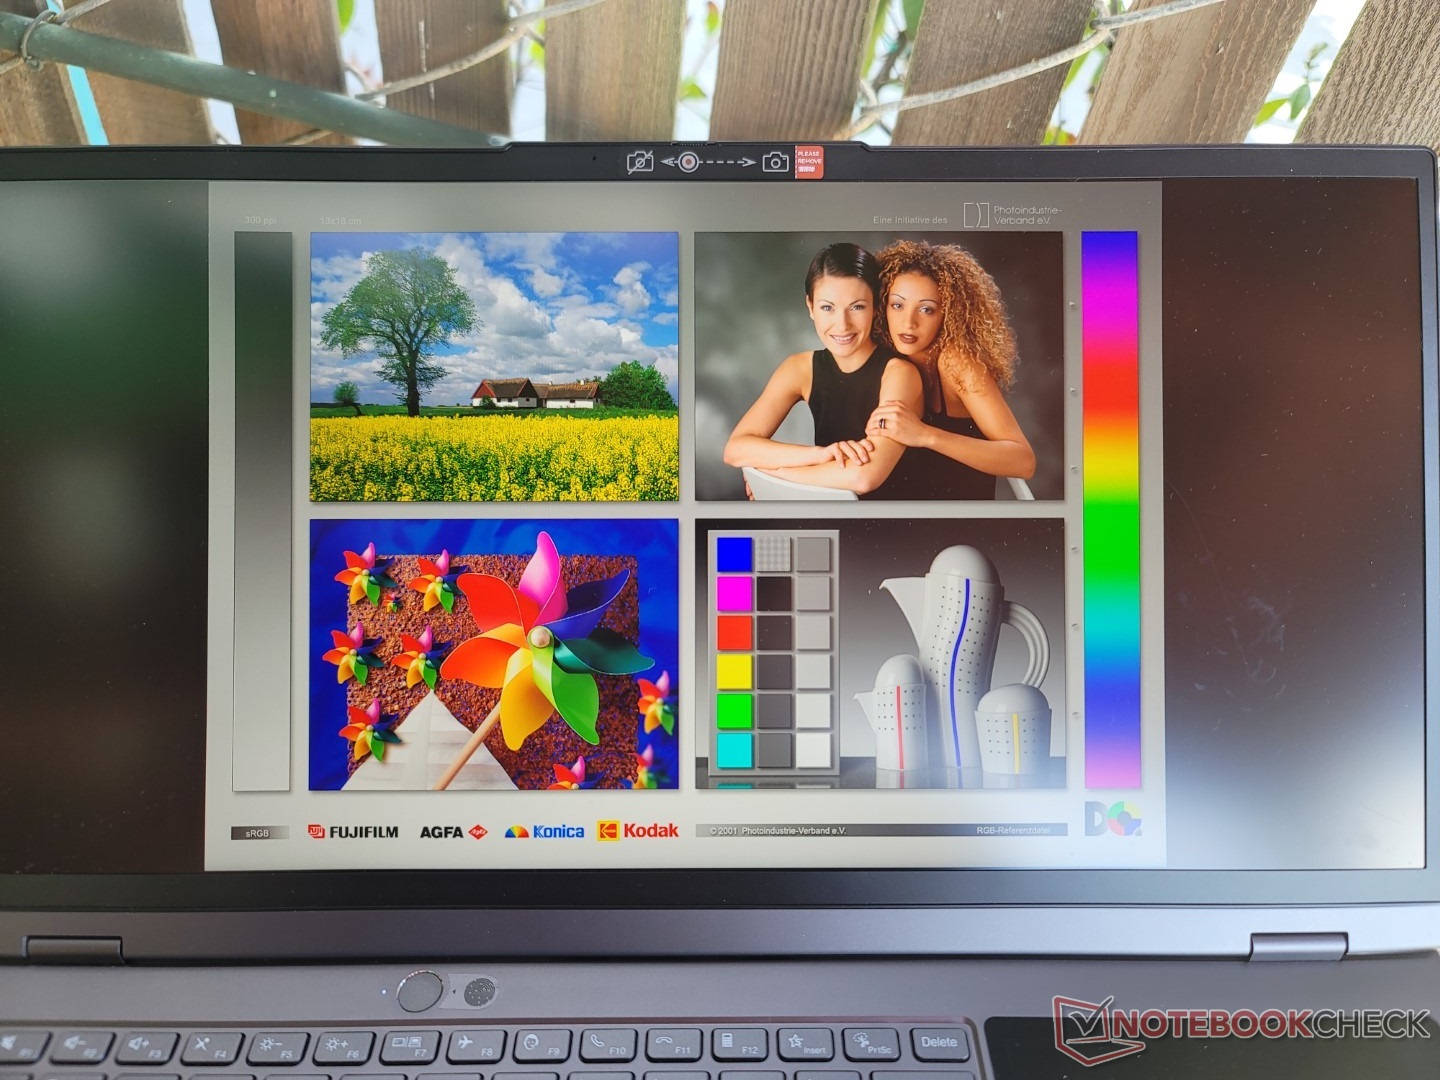
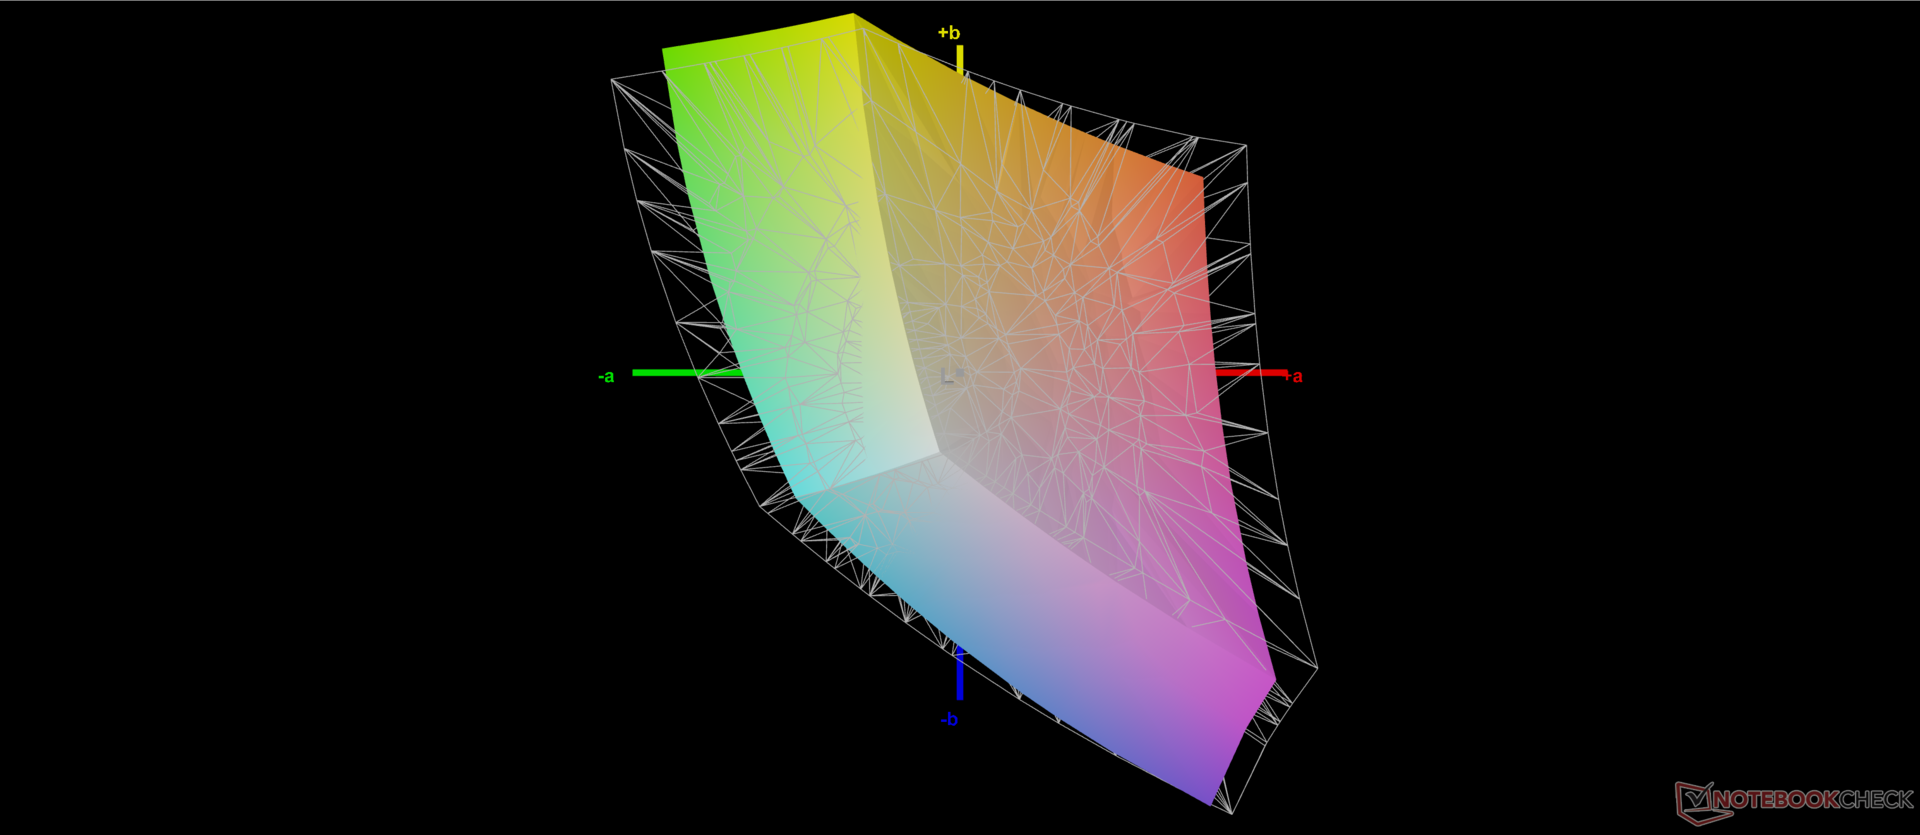
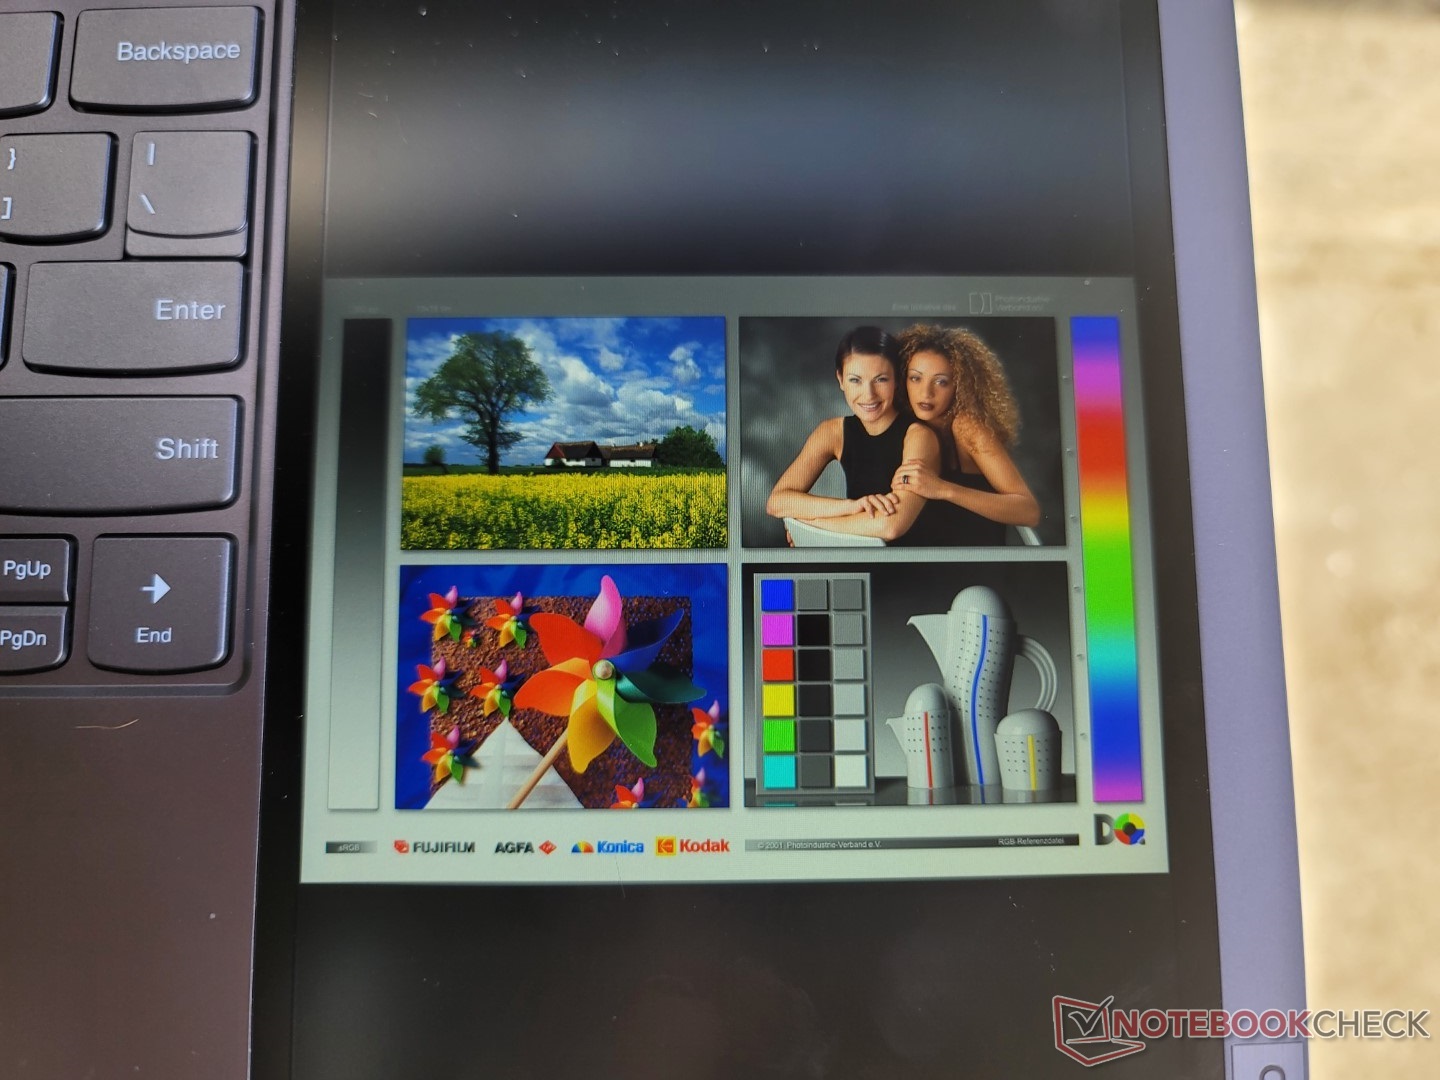
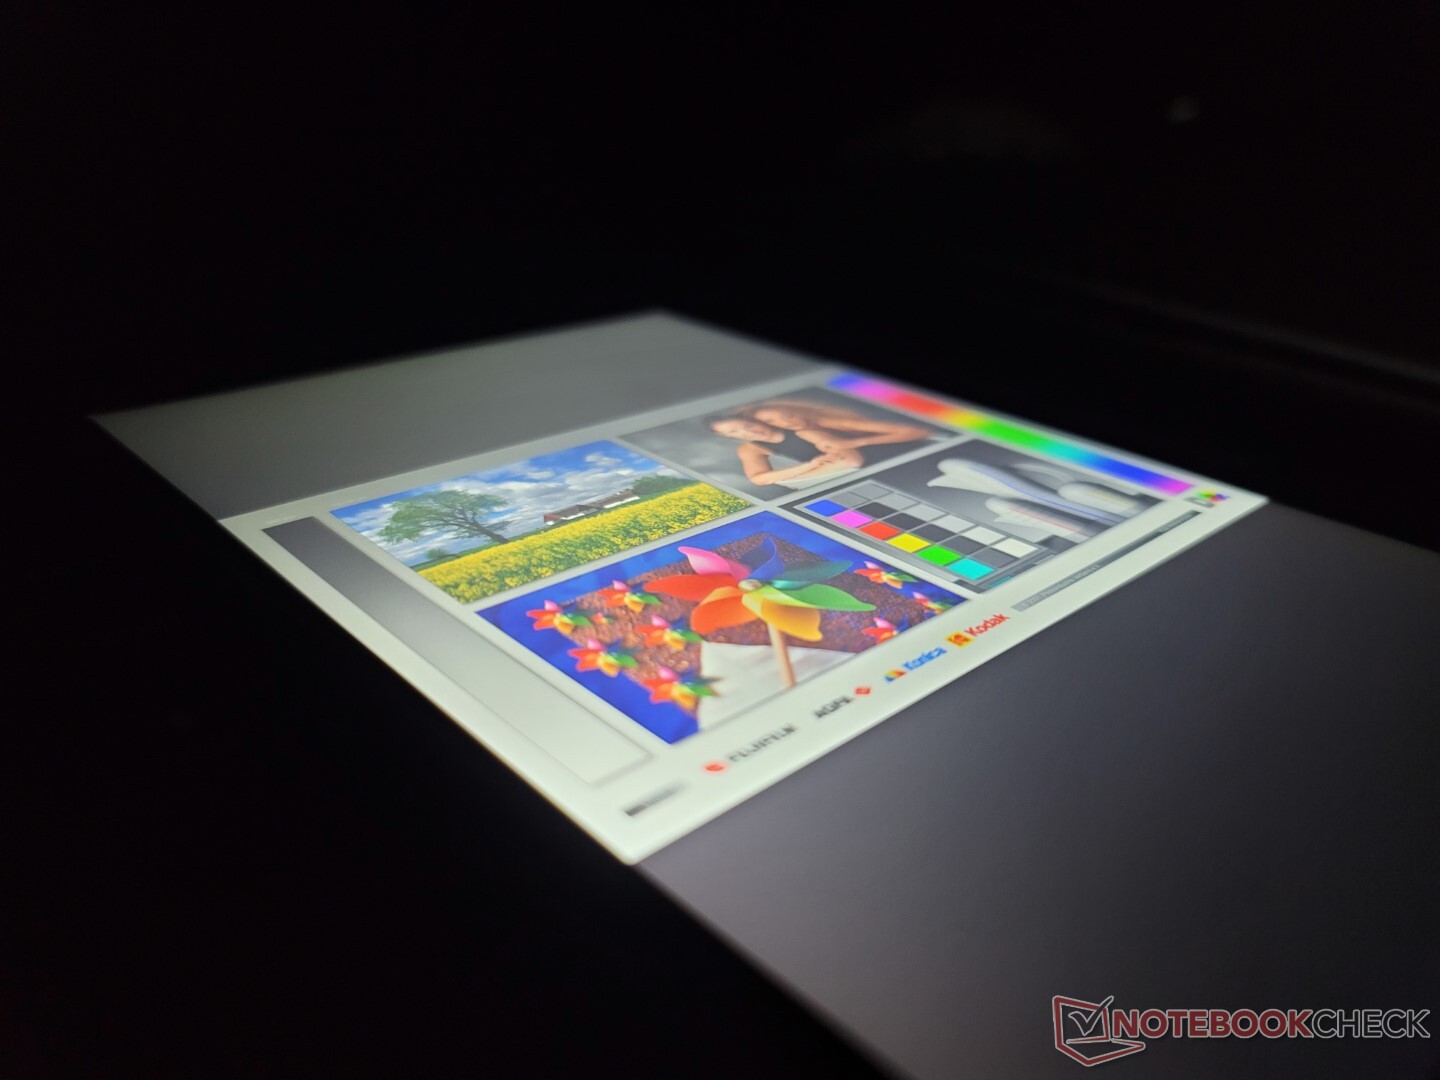
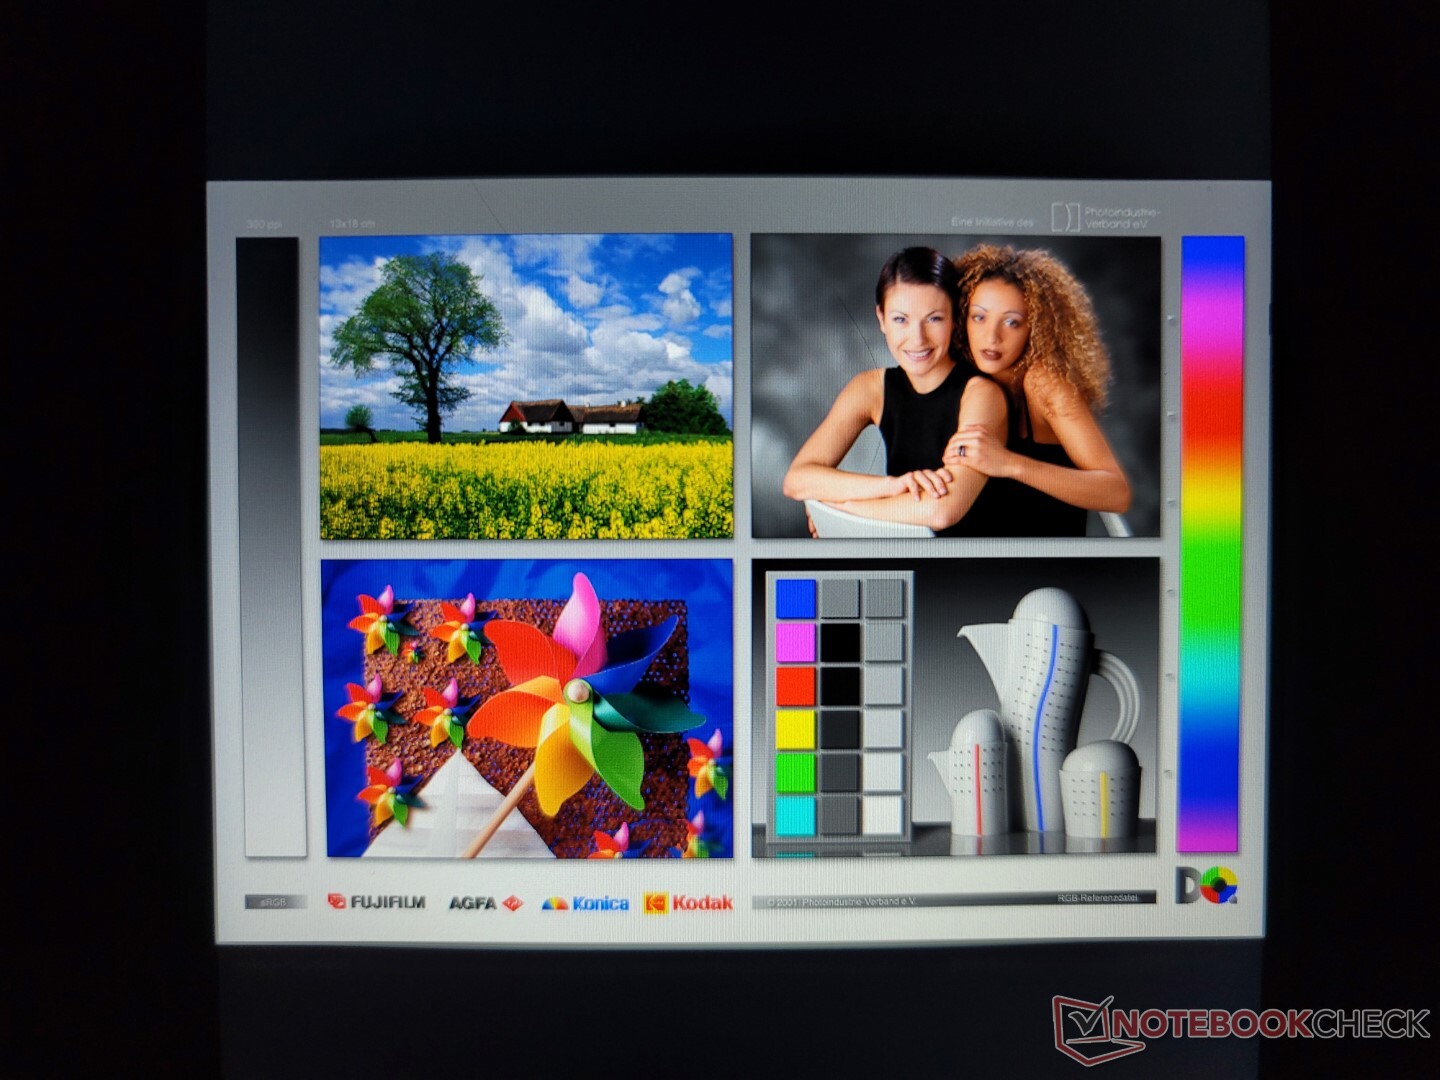
Primäres Display — P3, 120 Hz und IPS 21:10
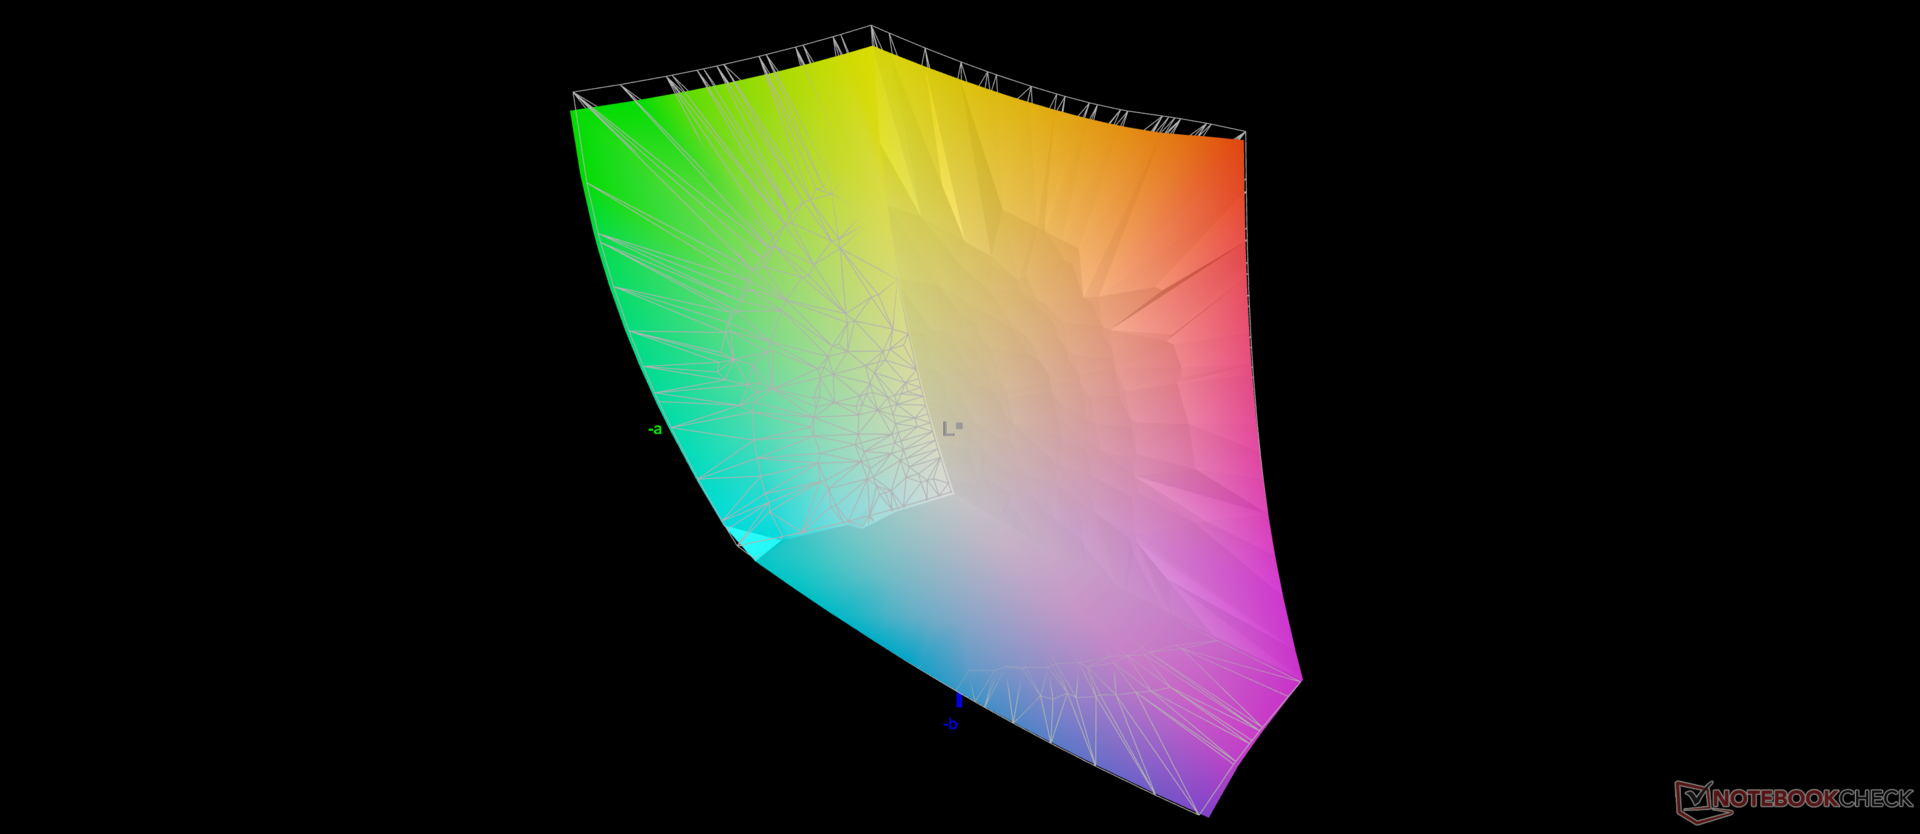
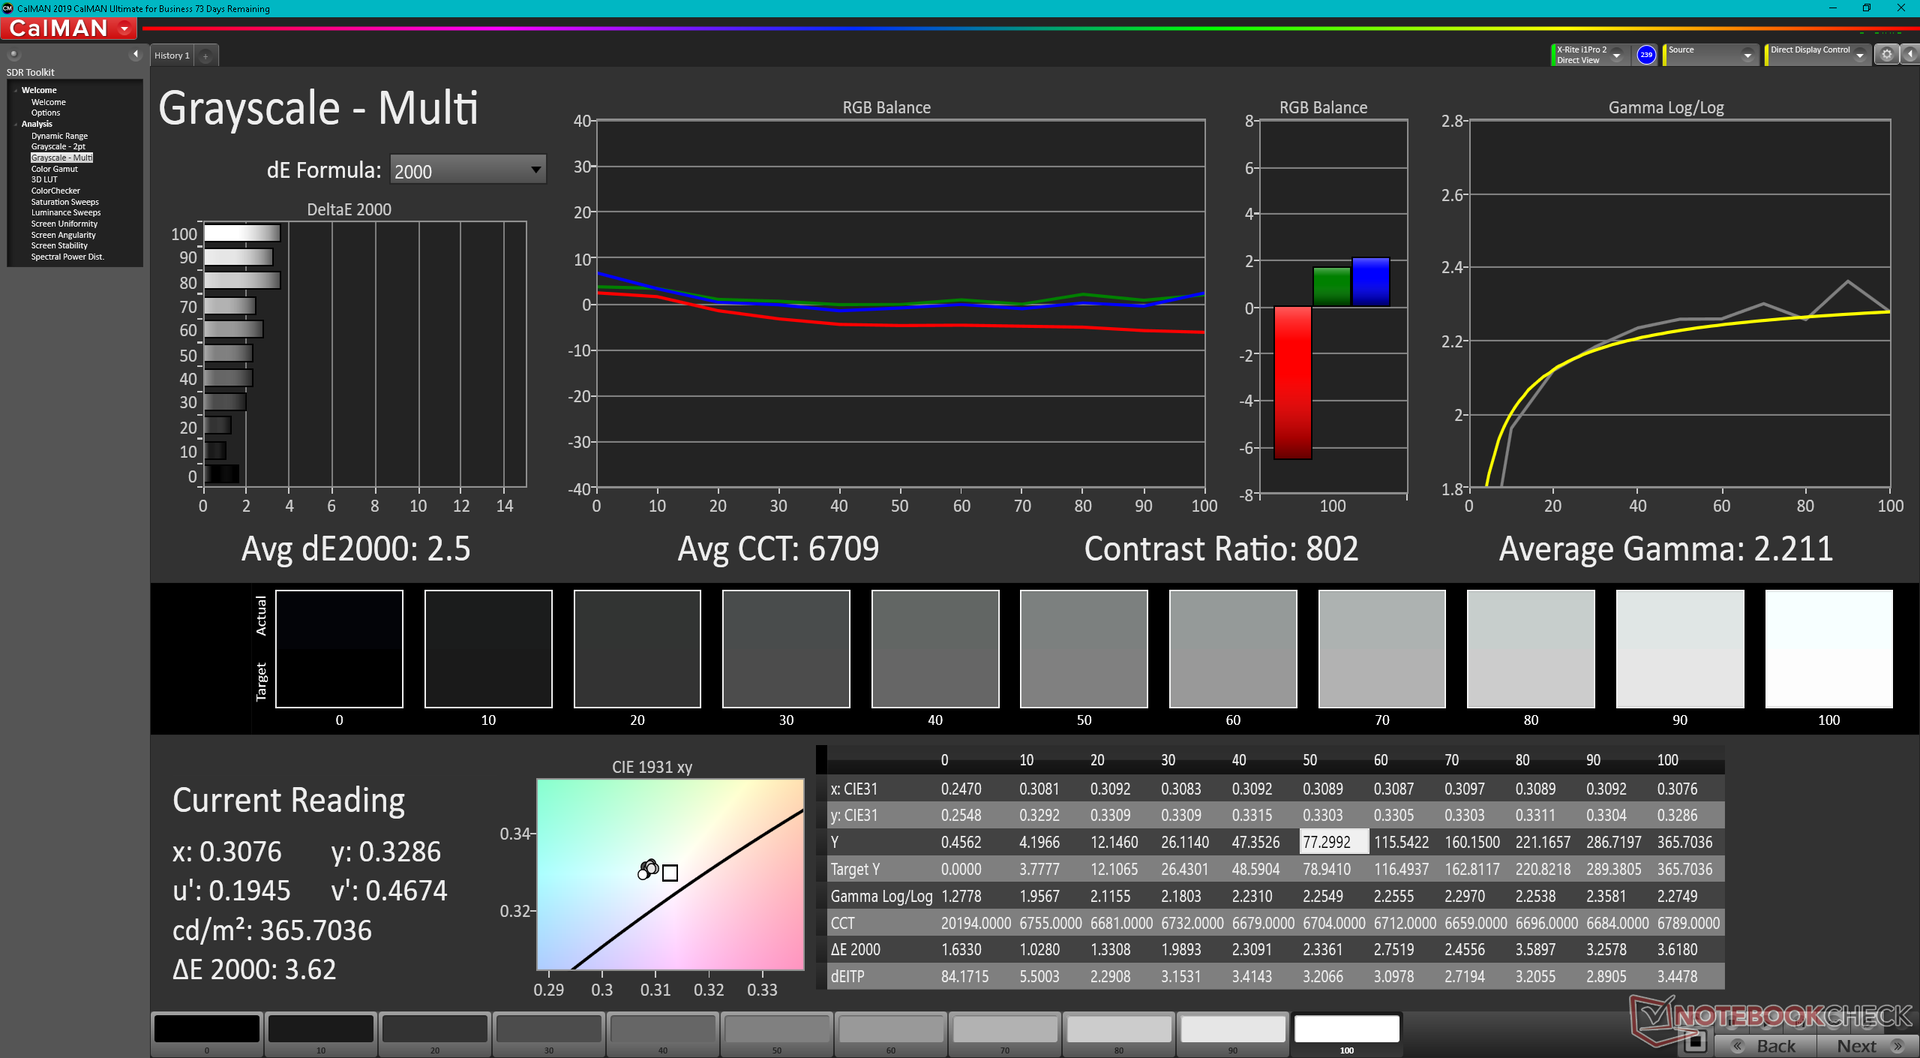
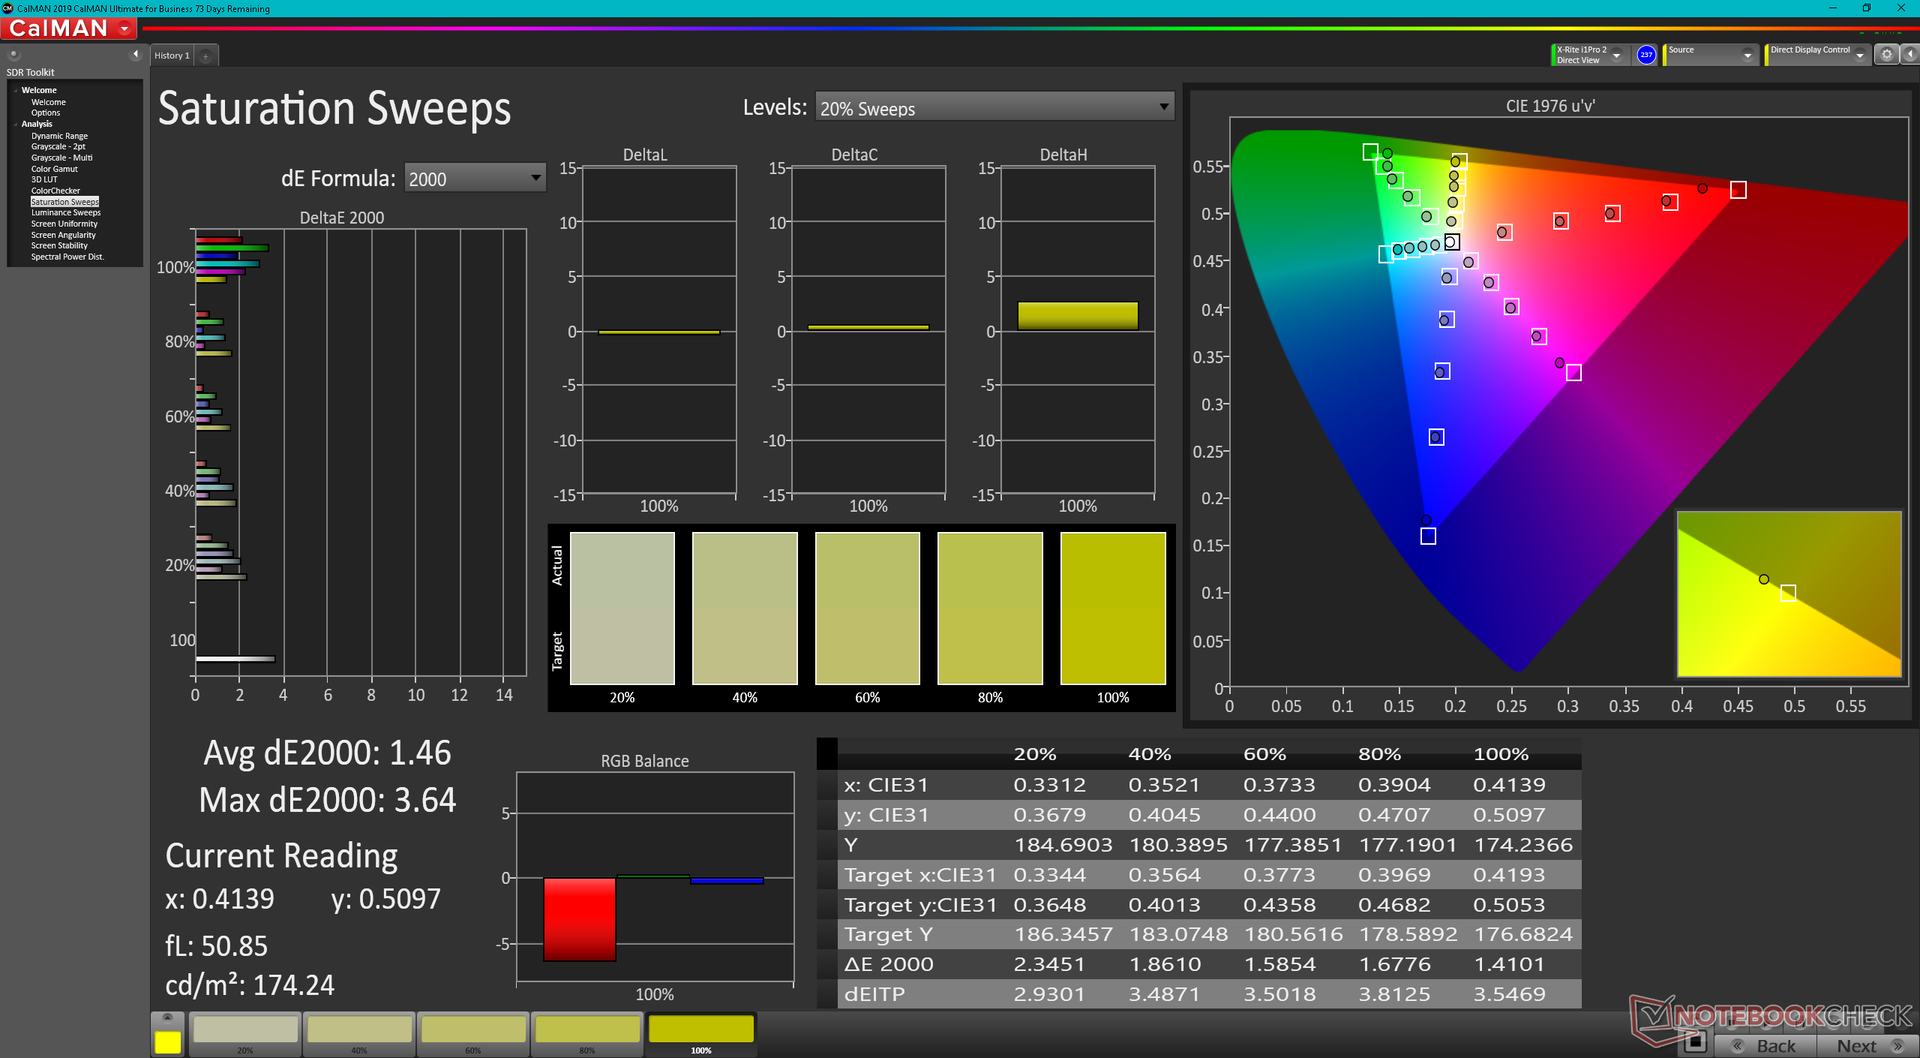
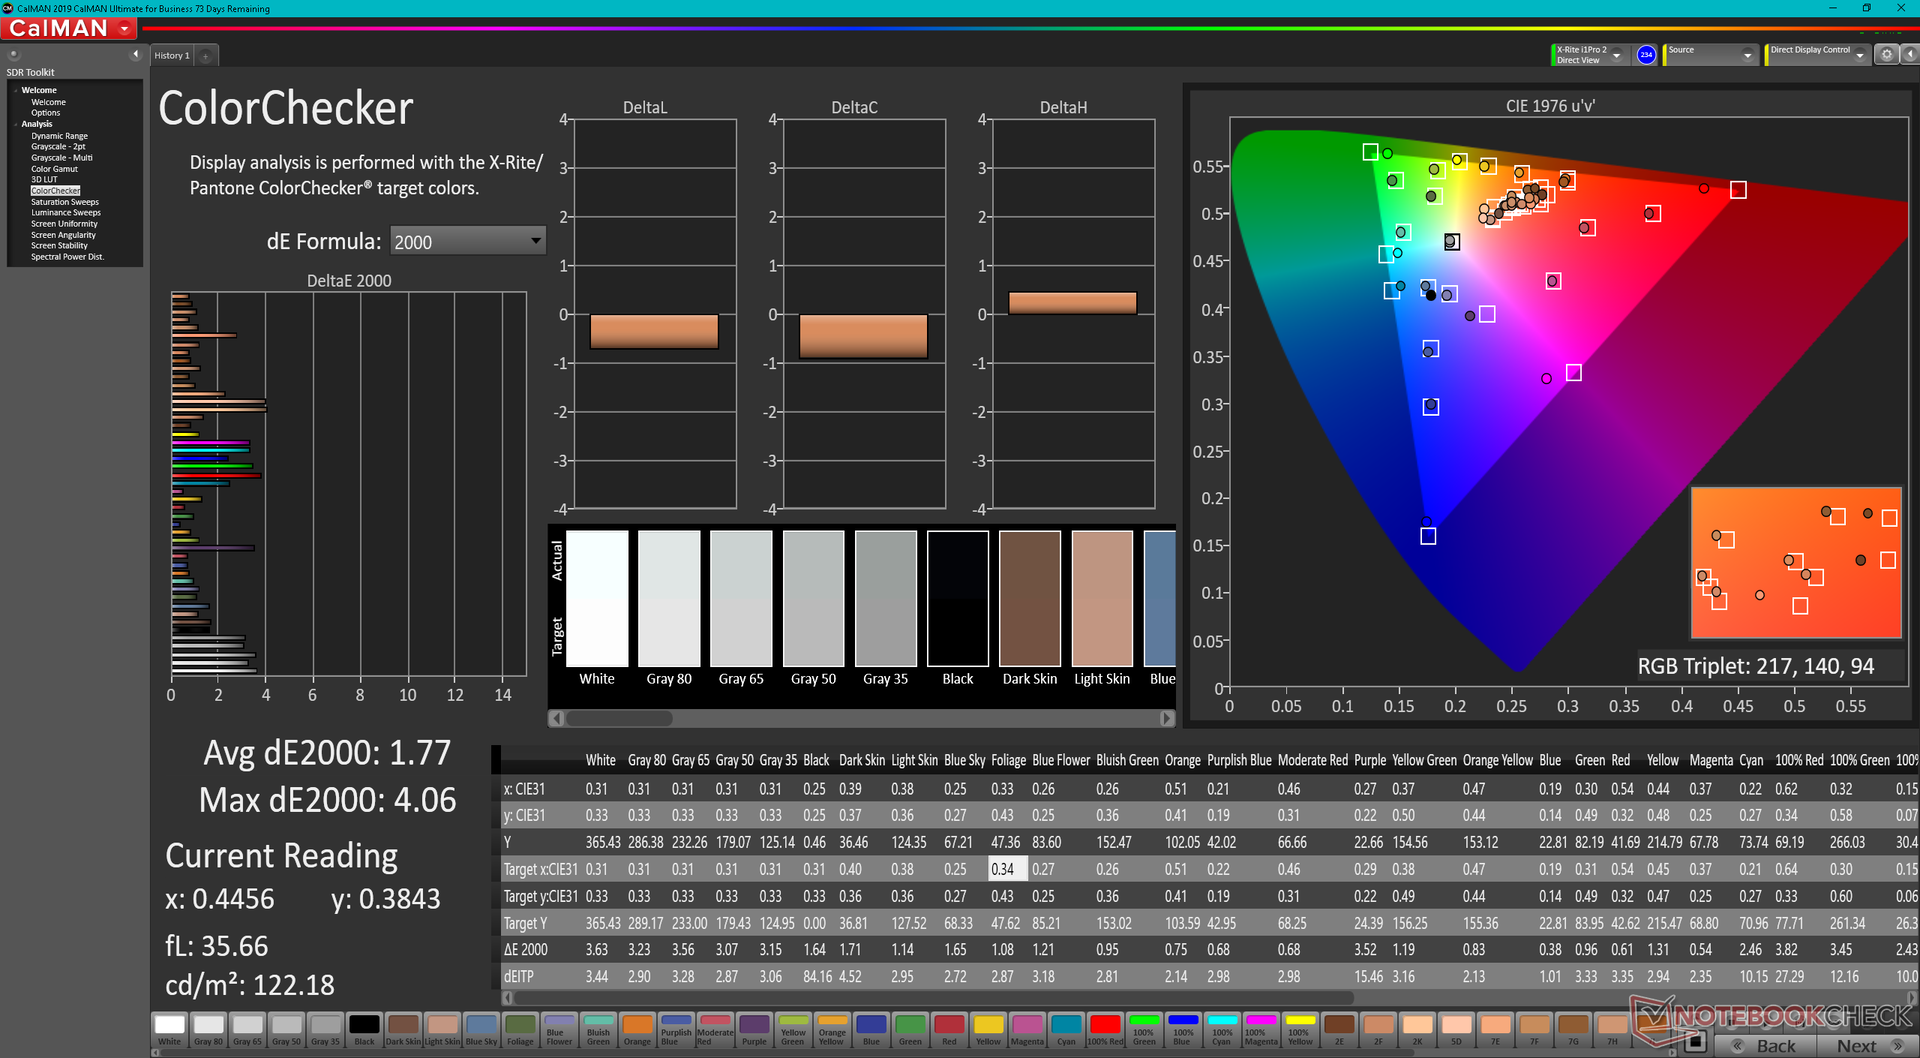
Das Hauptdisplay hat zwar ein ungewöhnliches Seitenverhältnis, ist ansonsten aber ähnliche Werte wie andere High-End-IPS-Panels. Ein Kontrast von etwa 1000:1, ordentliche Reaktionszeiten, 120 Hz und mehr als 95 Prozent P3-Abdeckung lassen das Display für diverse Aufgaben wie Grafikanwendungen, Editing und alles andere sehr gut geeignet erscheinen. Besonders die Farben und Reaktionszeiten haben es positiv vom Panel im ThinkBook Plus Gen 2 ab, die Helligkeit bleibt etwa auf einem Niveau.

| |||||||||||||||||||||||||
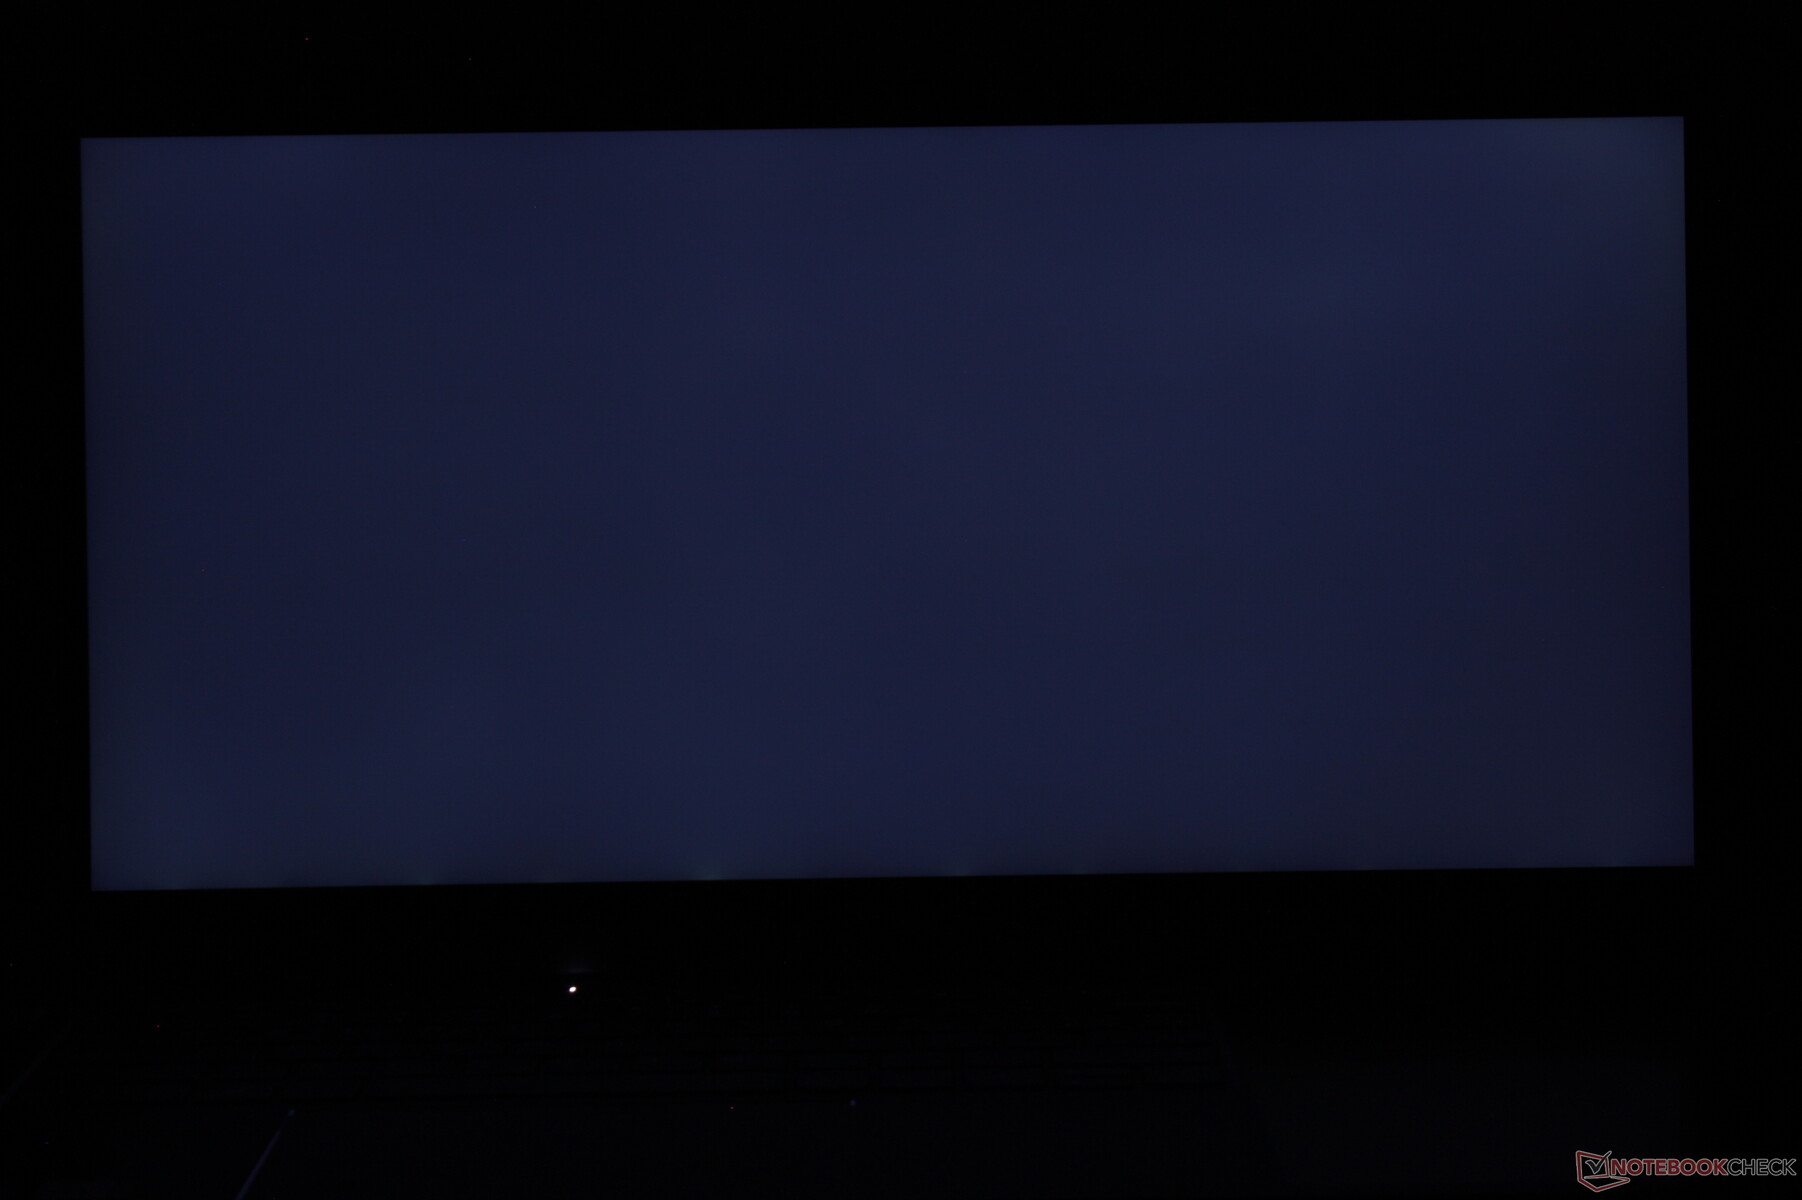
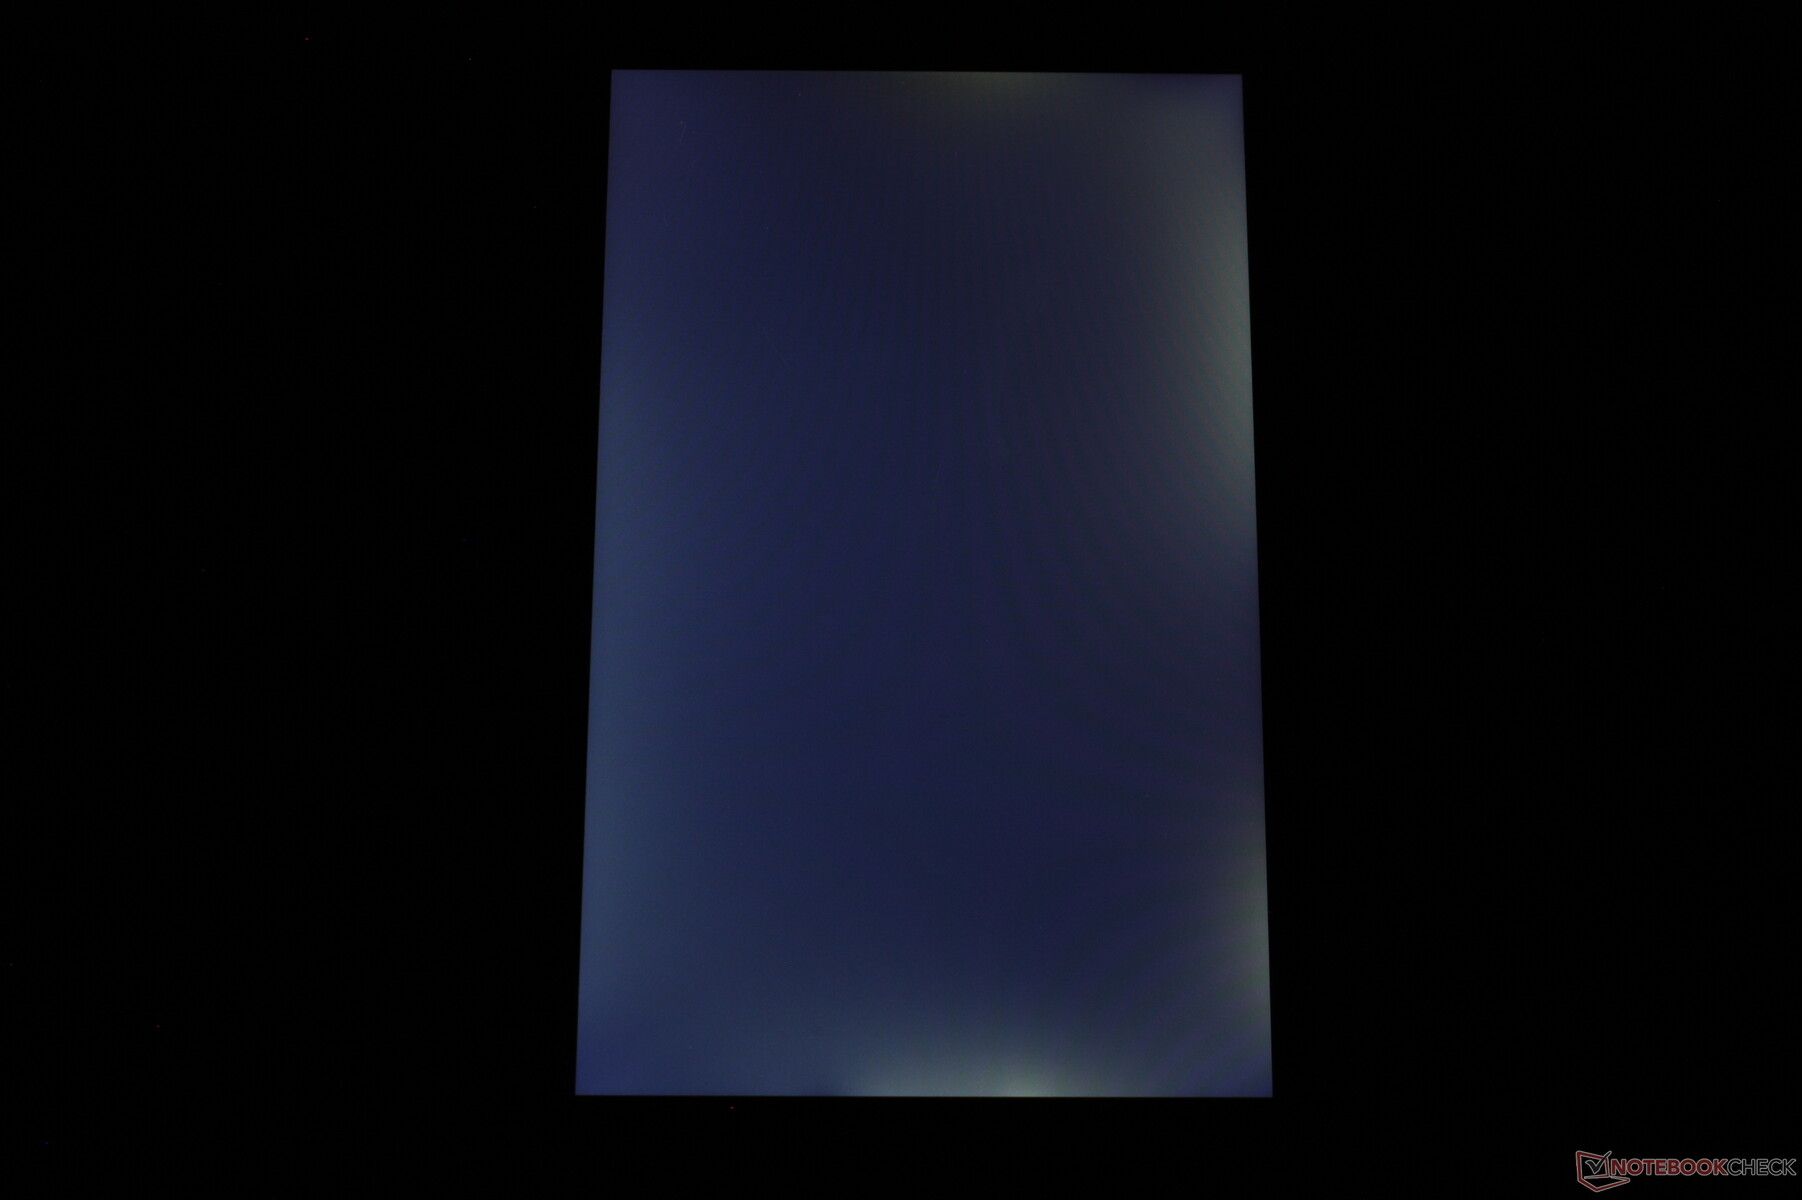
Ausleuchtung: 84 %
Helligkeit Akku: 405 cd/m²
Kontrast: 1191:1 (Schwarzwert: 0.34 cd/m²)
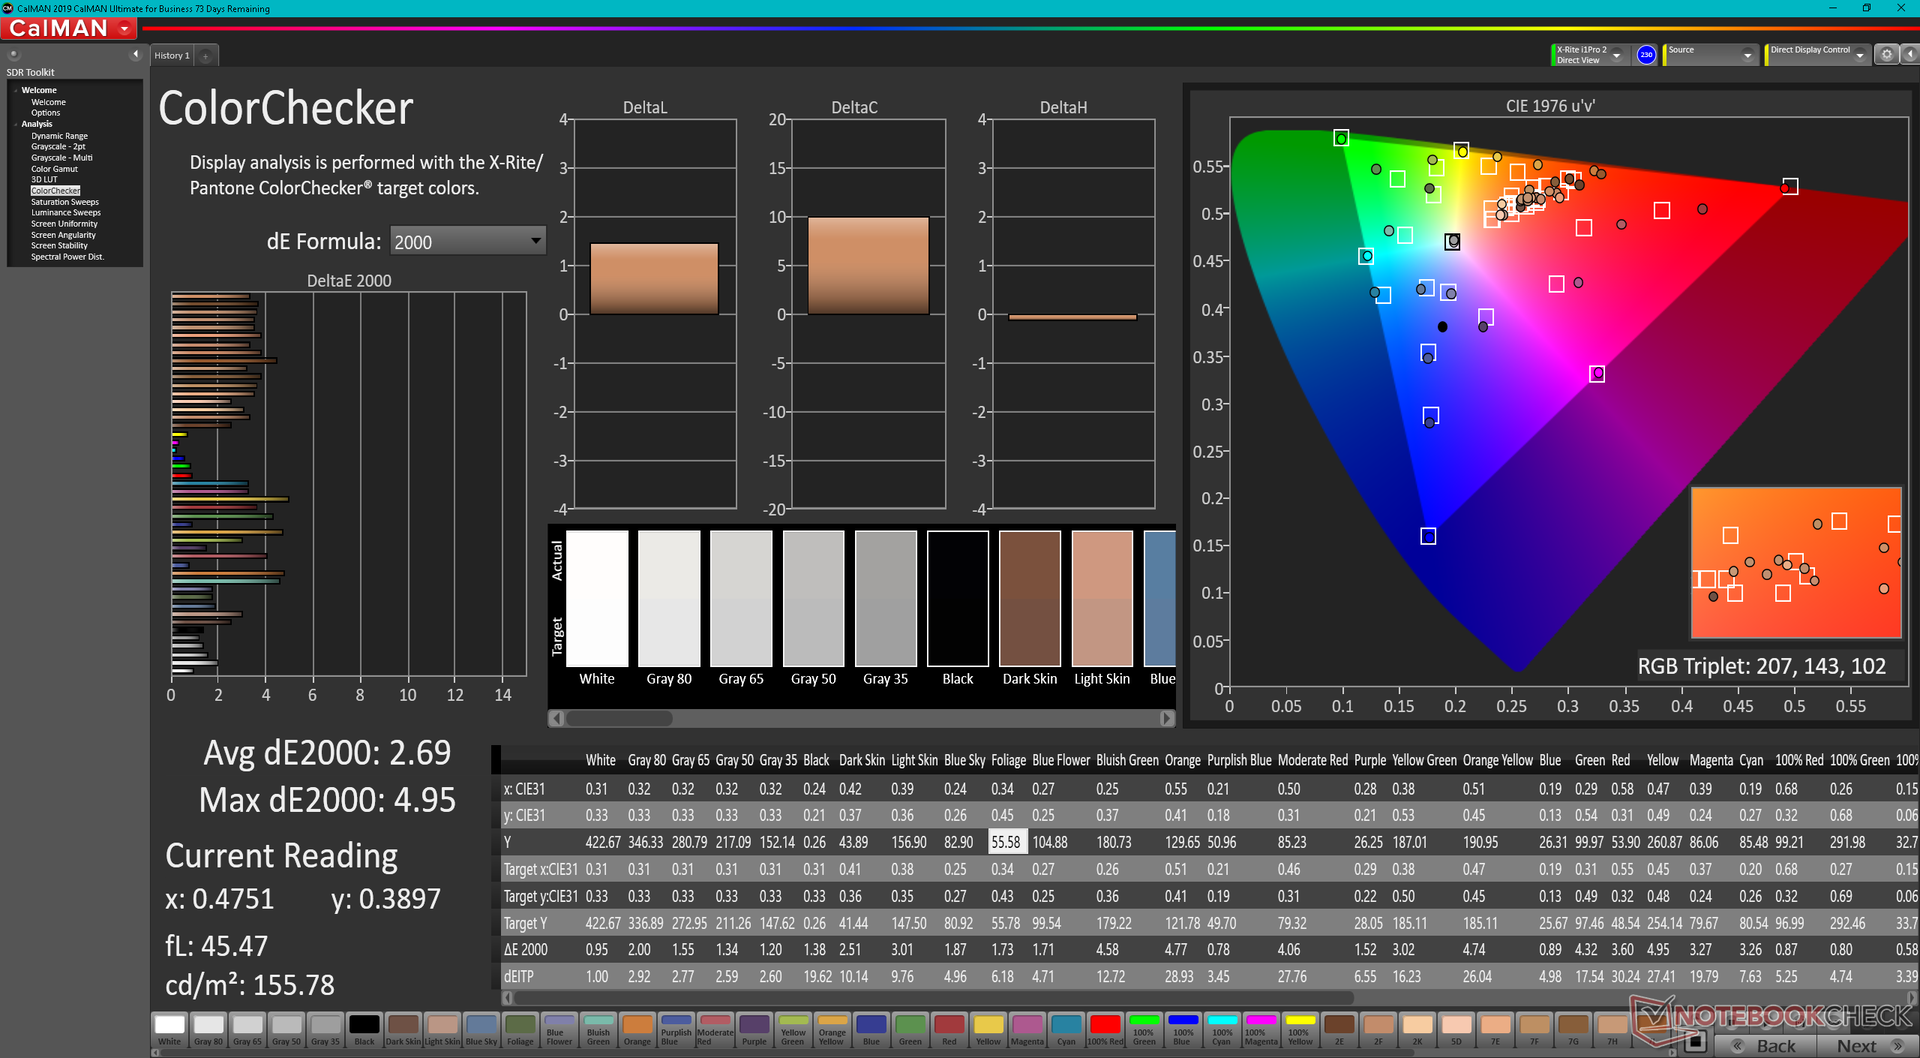
ΔE ColorChecker Calman: 2.69 | ∀{0.5-29.43 Ø4.72}
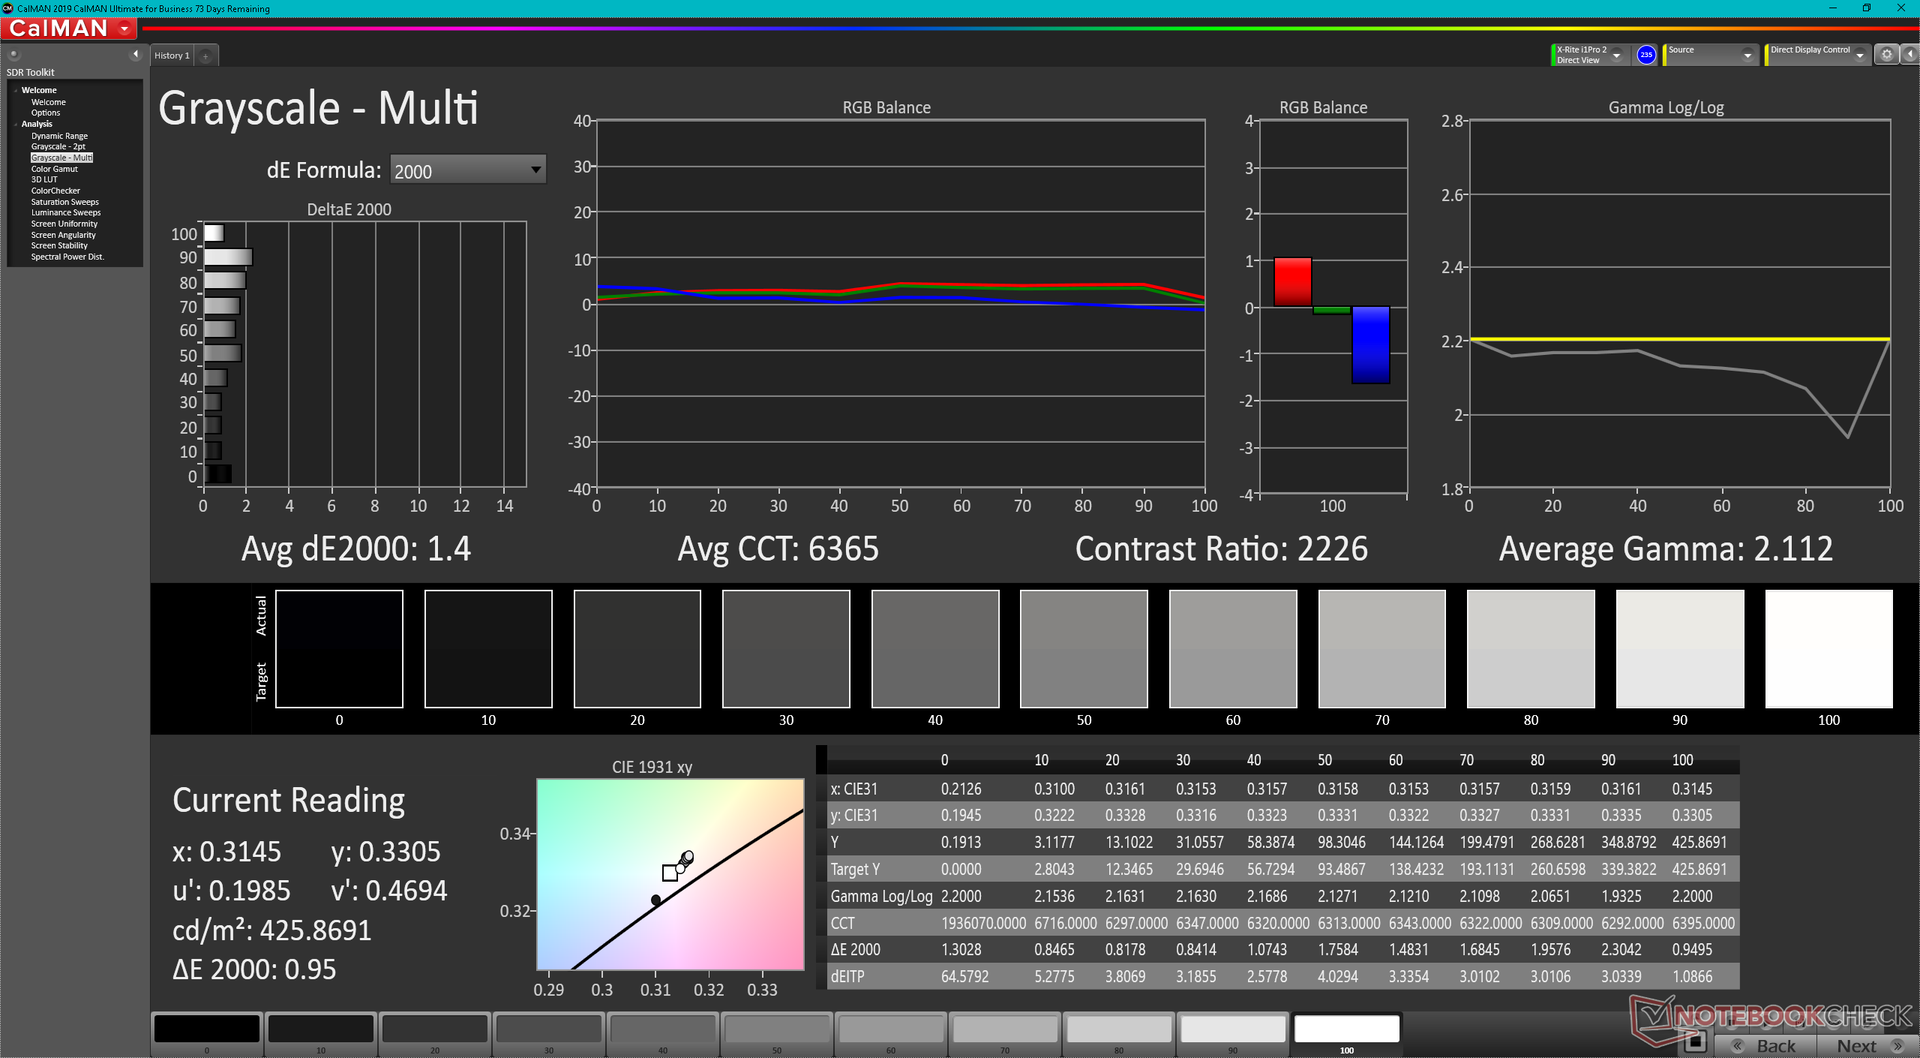
ΔE Greyscale Calman: 1.4 | ∀{0.09-98 Ø4.97}
87.8% AdobeRGB 1998 (Argyll 3D)
100% sRGB (Argyll 3D)
96.8% Display P3 (Argyll 3D)
Gamma: 2.1
CCT: 6365 K
| Lenovo ThinkBook Plus Gen3 MNH300HB1-1 CSOT T3, IPS, 3072x1440, 17.3" | Lenovo ThinkBook Plus Gen2 Core i5 CSOT T3 MND307DA1-5 (LCD), IPS, E-Ink, 2560x1600, 13.3" | Asus ProArt StudioBook Pro 17 W700G3T 170PUW1-A00, IPS, 1920x1200, 17" | LG Gram 17 (2022) LG Philips LP170WQ1-SPF2, IPS, 2560x1600, 17" | Dell XPS 17 9720 Sharp LQ170R1, IPS, 3840x2400, 17" | Gigabyte Aero 17 HDR YD AU Optronics AUO329B, IPS, 3840x2160, 17.3" | |
|---|---|---|---|---|---|---|
| Display | -16% | -2% | -0% | 4% | 1% | |
| Display P3 Coverage (%) | 96.8 | 70.1 -28% | 96.2 -1% | 98.1 1% | 94.8 -2% | 86.9 -10% |
| sRGB Coverage (%) | 100 | 98 -2% | 99.8 0% | 99.9 0% | 100 0% | 100 0% |
| AdobeRGB 1998 Coverage (%) | 87.8 | 72.2 -18% | 84.7 -4% | 85.9 -2% | 100 14% | 99.6 13% |
| Response Times | -44% | -45% | -28% | -64% | -56% | |
| Response Time Grey 50% / Grey 80% * (ms) | 28 ? | 42.8 ? -53% | 41.2 ? -47% | 46 ? -64% | 53.2 ? -90% | 52 ? -86% |
| Response Time Black / White * (ms) | 20.8 ? | 28 ? -35% | 29.6 ? -42% | 19 ? 9% | 28.4 ? -37% | 26 ? -25% |
| PWM Frequency (Hz) | 17990 ? | |||||
| Bildschirm | -17% | 9% | -28% | -18% | 20% | |
| Helligkeit Bildmitte (cd/m²) | 405 | 404 0% | 323 -20% | 400 -1% | 438 8% | 488 20% |
| Brightness (cd/m²) | 389 | 388 0% | 308 -21% | 353 -9% | 411 6% | 467 20% |
| Brightness Distribution (%) | 84 | 94 12% | 88 5% | 81 -4% | 86 2% | 86 2% |
| Schwarzwert * (cd/m²) | 0.34 | 0.24 29% | 0.36 -6% | 0.3 12% | 0.27 21% | 0.33 3% |
| Kontrast (:1) | 1191 | 1683 41% | 897 -25% | 1333 12% | 1622 36% | 1479 24% |
| Delta E Colorchecker * | 2.69 | 3.1 -15% | 1.1 59% | 3.15 -17% | 2.5 7% | 1.23 54% |
| Colorchecker dE 2000 max. * | 4.95 | 6.9 -39% | 3.3 33% | 6.54 -32% | 6.3 -27% | 2.94 41% |
| Delta E Graustufen * | 1.4 | 3.7 -164% | 0.8 43% | 4 -186% | 4.2 -200% | 1.5 -7% |
| Gamma | 2.1 105% | 2.26 97% | 2.23 99% | 2.14 103% | 2.22 99% | 2.169 101% |
| CCT | 6365 102% | 5936 110% | 6479 100% | 7278 89% | 7034 92% | 6614 98% |
| Colorchecker dE 2000 calibrated * | 1.3 | 0.8 | 1.44 | 0.8 | 0.77 | |
| Farbraum (Prozent von AdobeRGB 1998) (%) | 75.7 | 99 | ||||
| Color Space (Percent of sRGB) (%) | 99.8 | 99 | ||||
| Durchschnitt gesamt (Programm / Settings) | -26% /
-21% | -13% /
-2% | -19% /
-22% | -26% /
-20% | -12% /
4% |
* ... kleinere Werte sind besser
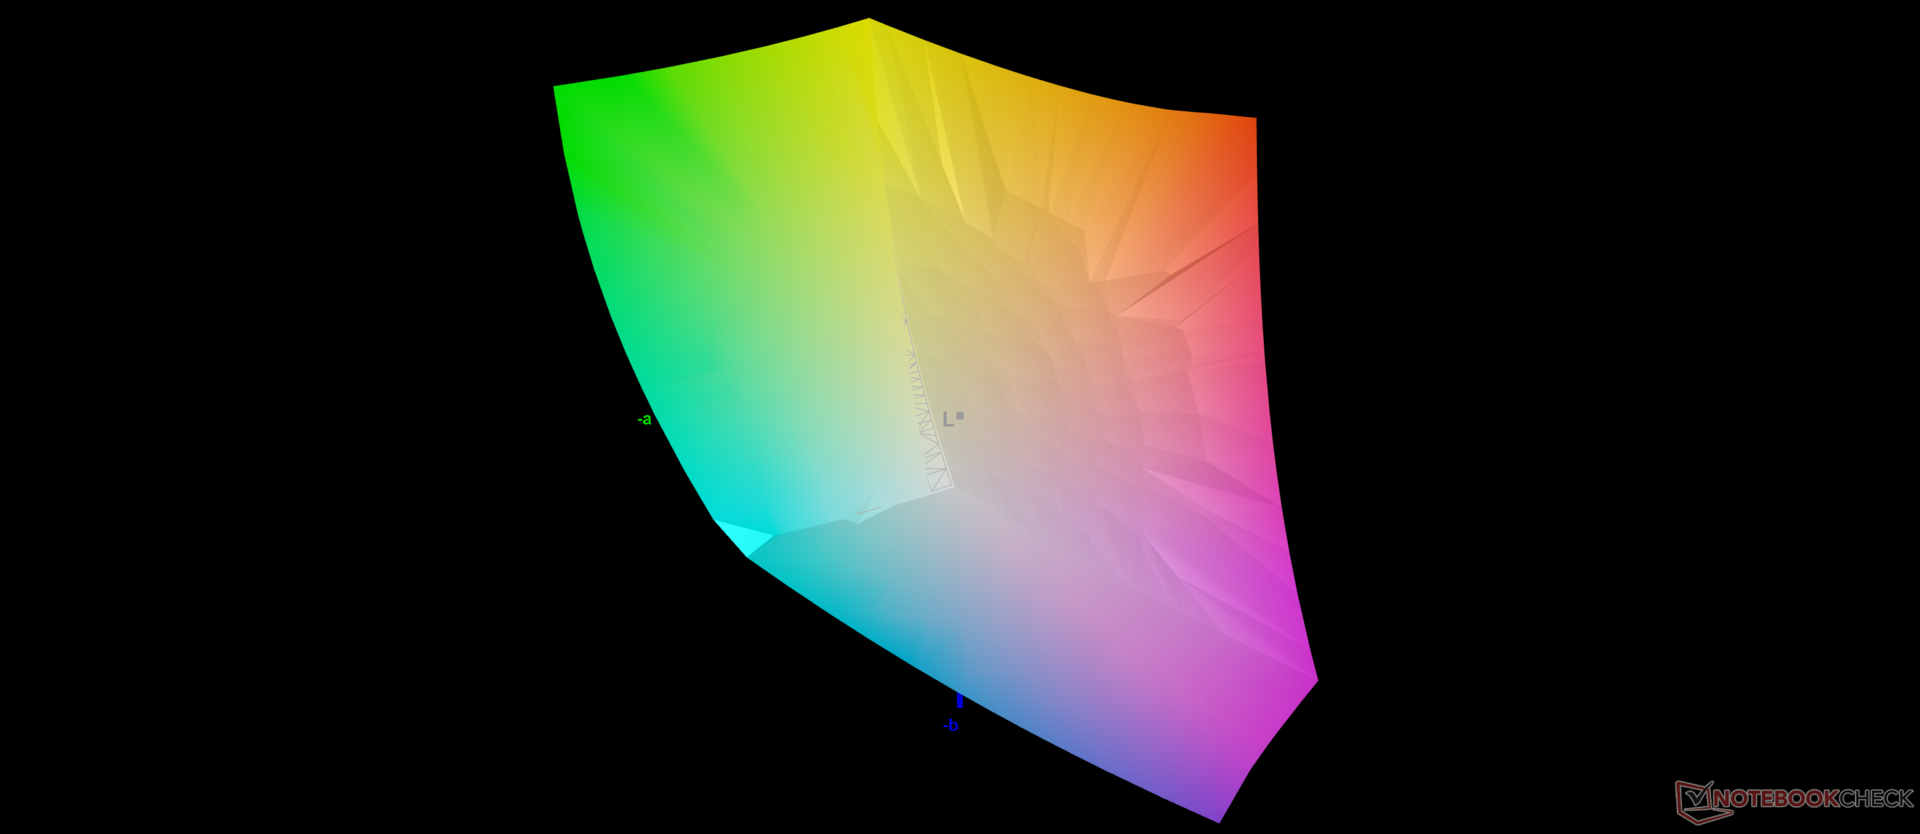
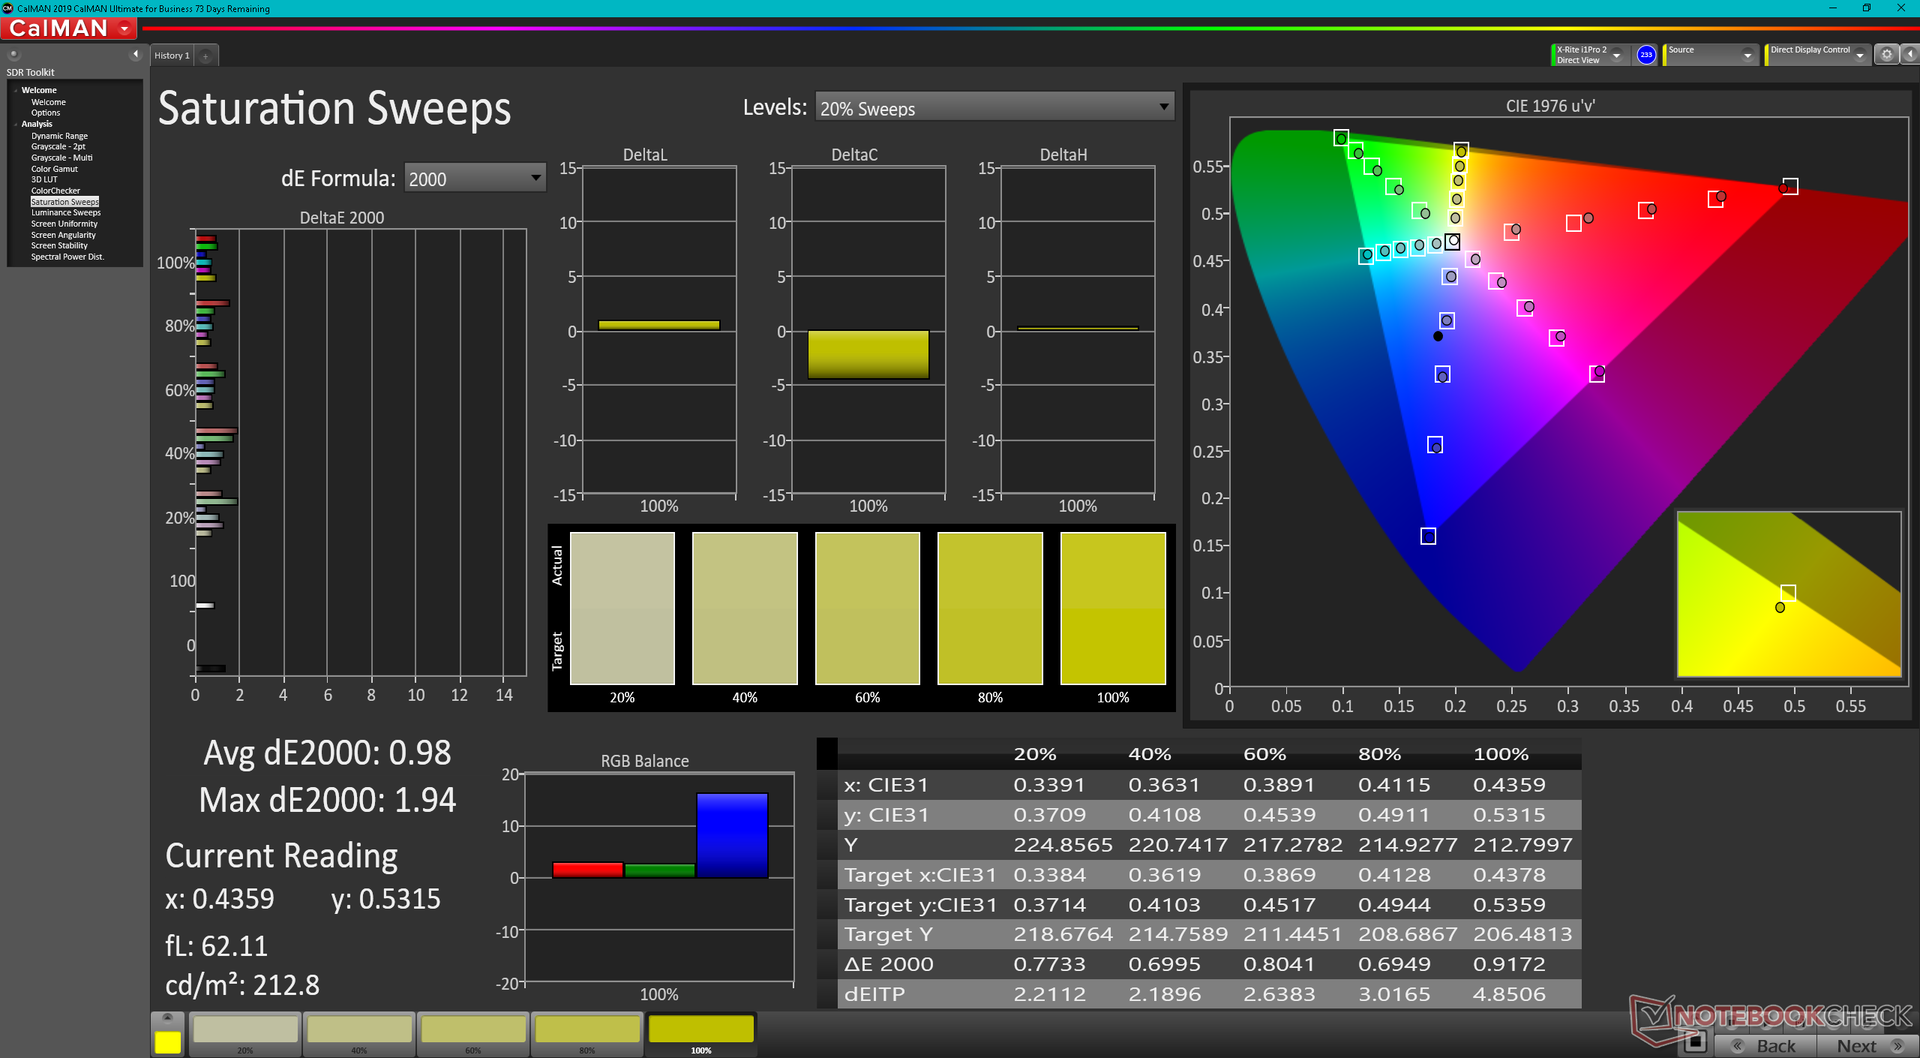
Ab Werk ist das Display bereits gut gegen den P3-Standard kalibriert. Die durchschnittlichen Graustufen- und Farb-DeltaE-Werte betragen nur 1,4 und 2,69. Eine erneute Nutzerkalibrierung ist somit nicht nötig.
Reaktionszeiten (Response Times) des Displays
| ↔ Reaktionszeiten Schwarz zu Weiß | ||
|---|---|---|
| 20.8 ms ... steigend ↗ und fallend ↘ kombiniert | ↗ 10.8 ms steigend | 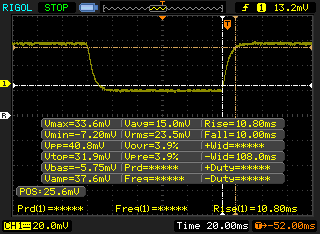 |
| ↘ 10 ms fallend | ||
| Die gemessenen Reaktionszeiten sind gut, für anspruchsvolle Spieler könnten der Bildschirm jedoch zu langsam sein. Im Vergleich rangierten die bei uns getesteten Geräte von 0.1 (Minimum) zu 240 (Maximum) ms. » 46 % aller Screens waren schneller als der getestete. Daher sind die gemessenen Reaktionszeiten durchschnittlich (19.8 ms). | ||
| ↔ Reaktionszeiten 50% Grau zu 80% Grau | ||
| 28 ms ... steigend ↗ und fallend ↘ kombiniert | ↗ 13.2 ms steigend | 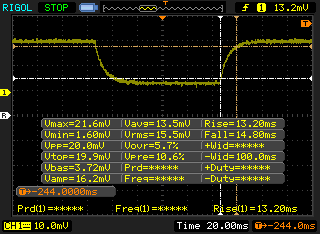 |
| ↘ 14.8 ms fallend | ||
| Die gemessenen Reaktionszeiten sind mittelmäßig und dadurch für Spieler eventuell zu langsam. Im Vergleich rangierten die bei uns getesteten Geräte von 0.165 (Minimum) zu 636 (Maximum) ms. » 38 % aller Screens waren schneller als der getestete. Daher sind die gemessenen Reaktionszeiten durchschnittlich (31 ms). | ||
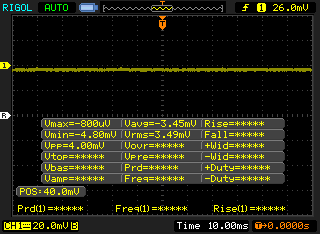
Bildschirm-Flackern / PWM (Pulse-Width Modulation)
| Flackern / PWM nicht festgestellt | 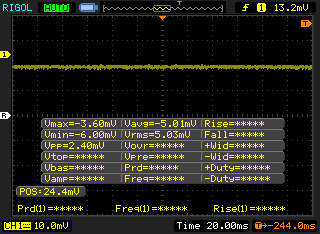 | ||
Im Vergleich: 52 % aller getesteten Geräte nutzten kein PWM um die Helligkeit zu reduzieren. Wenn PWM eingesetzt wurde, dann bei einer Frequenz von durchschnittlich 7769 (Minimum 5, Maximum 343500) Hz. | |||
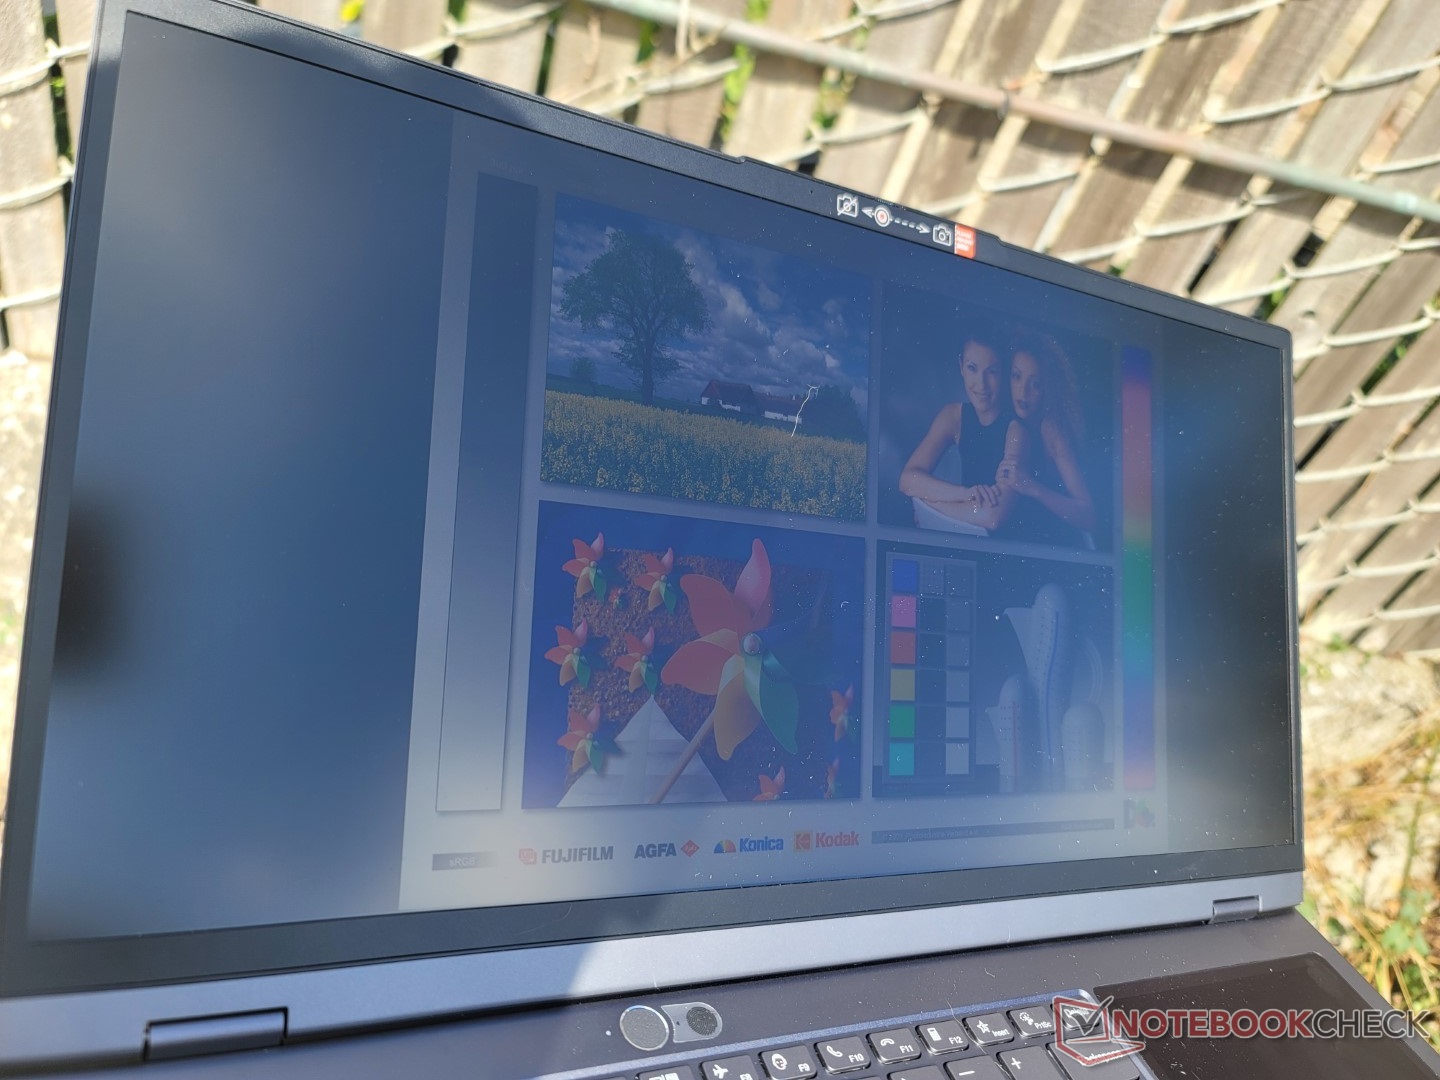
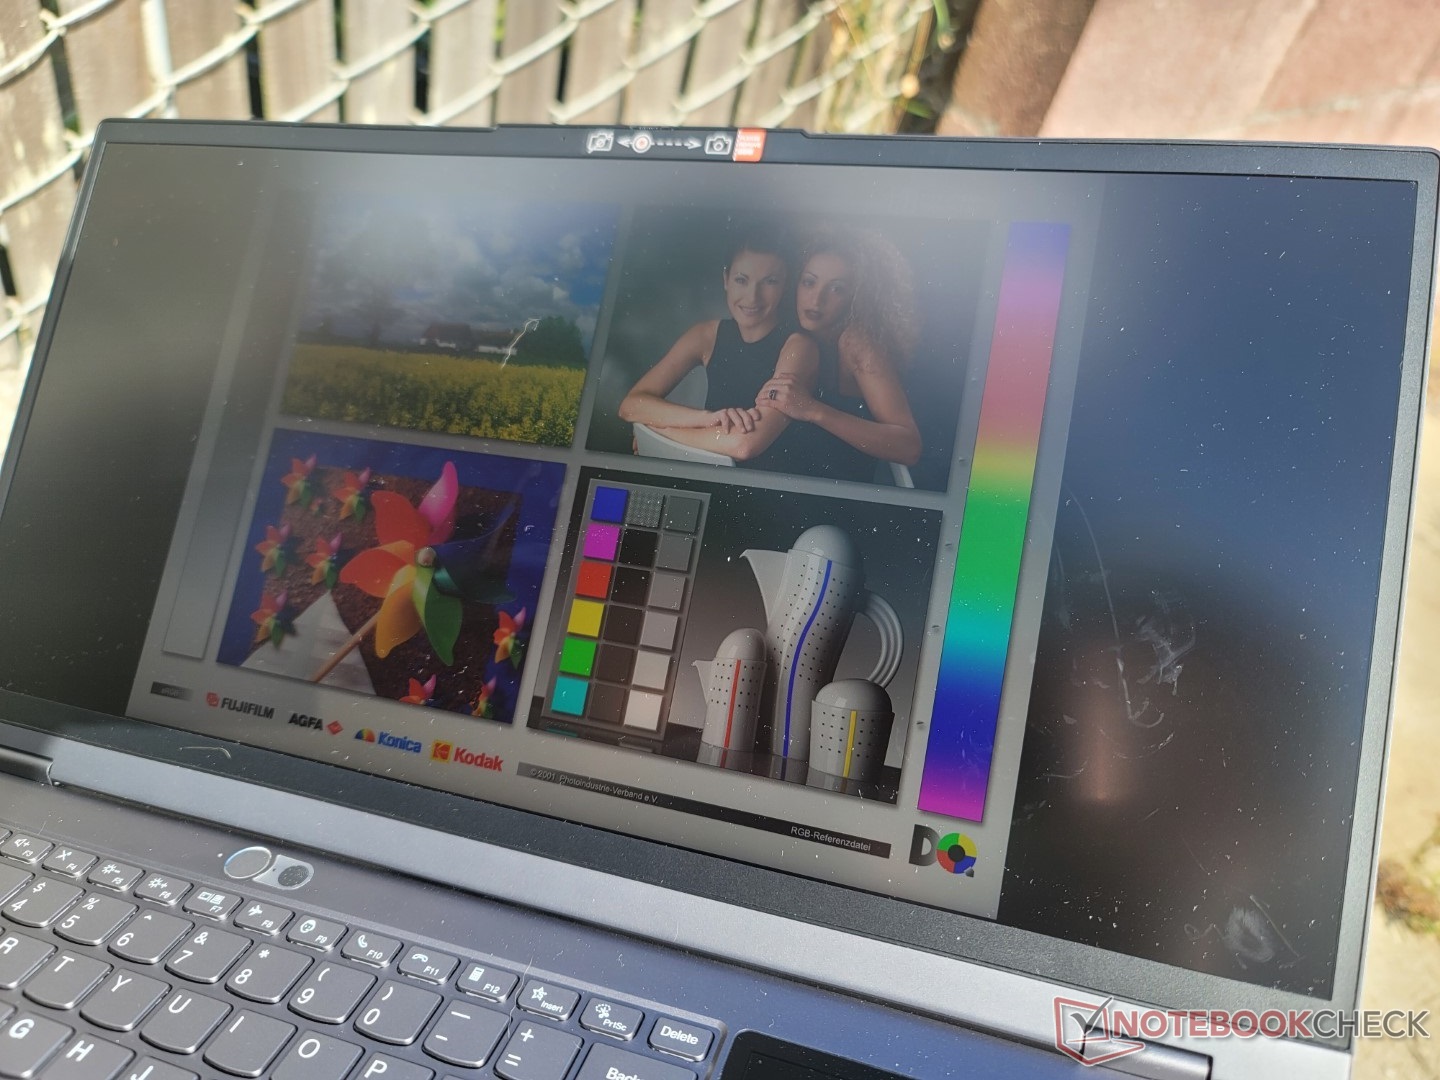
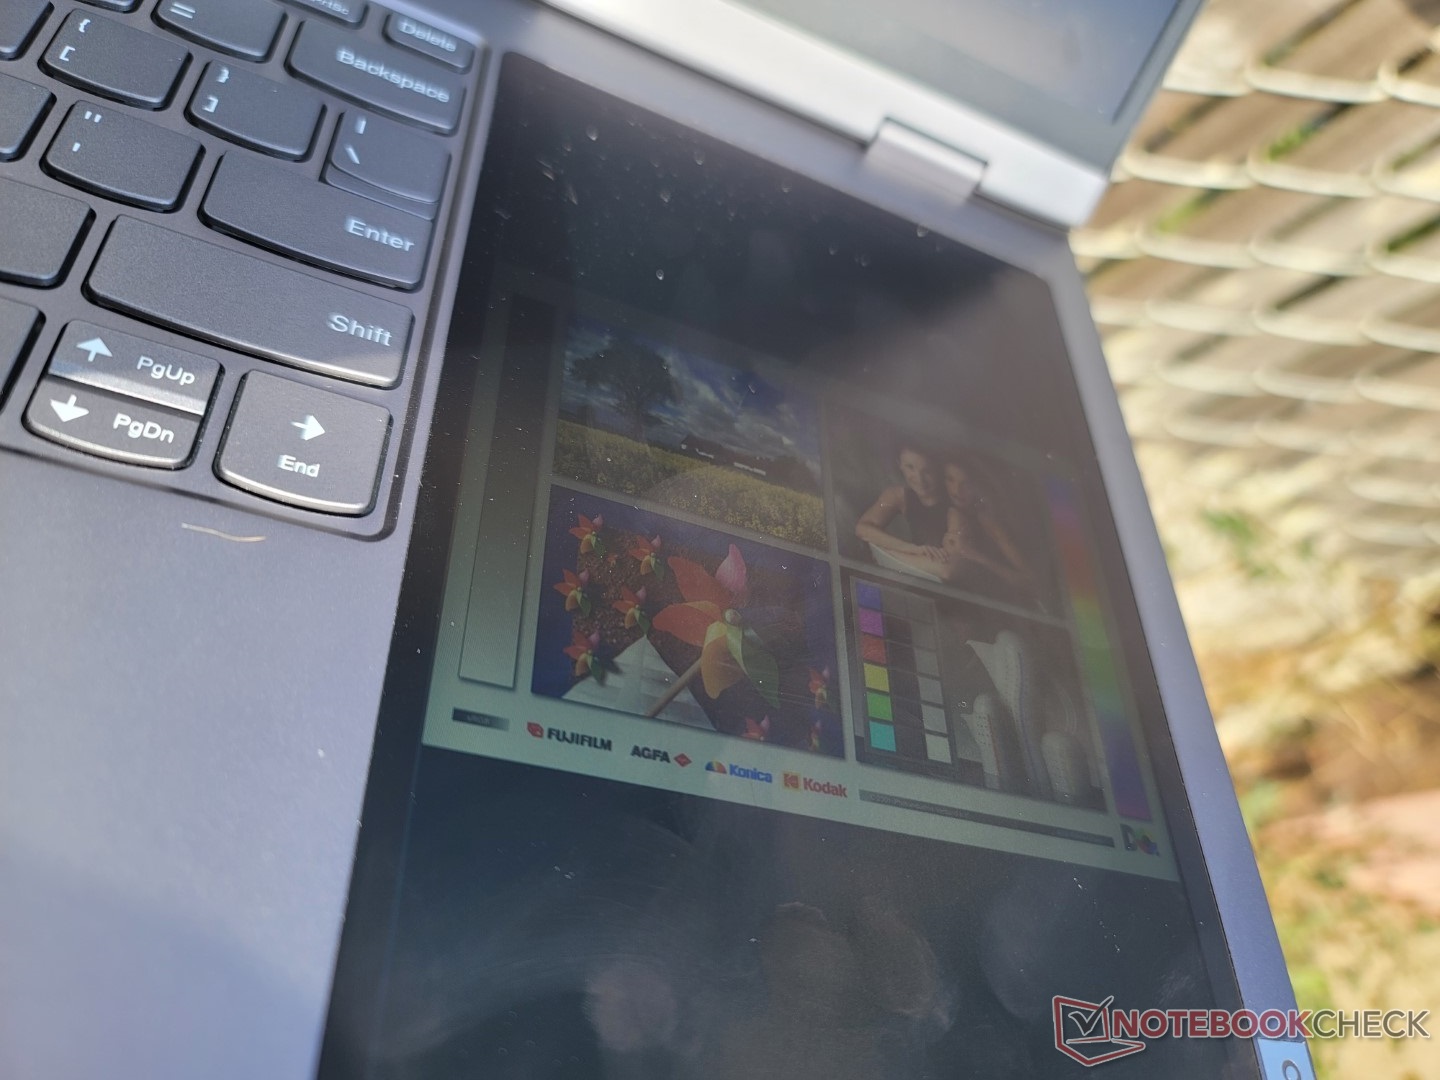
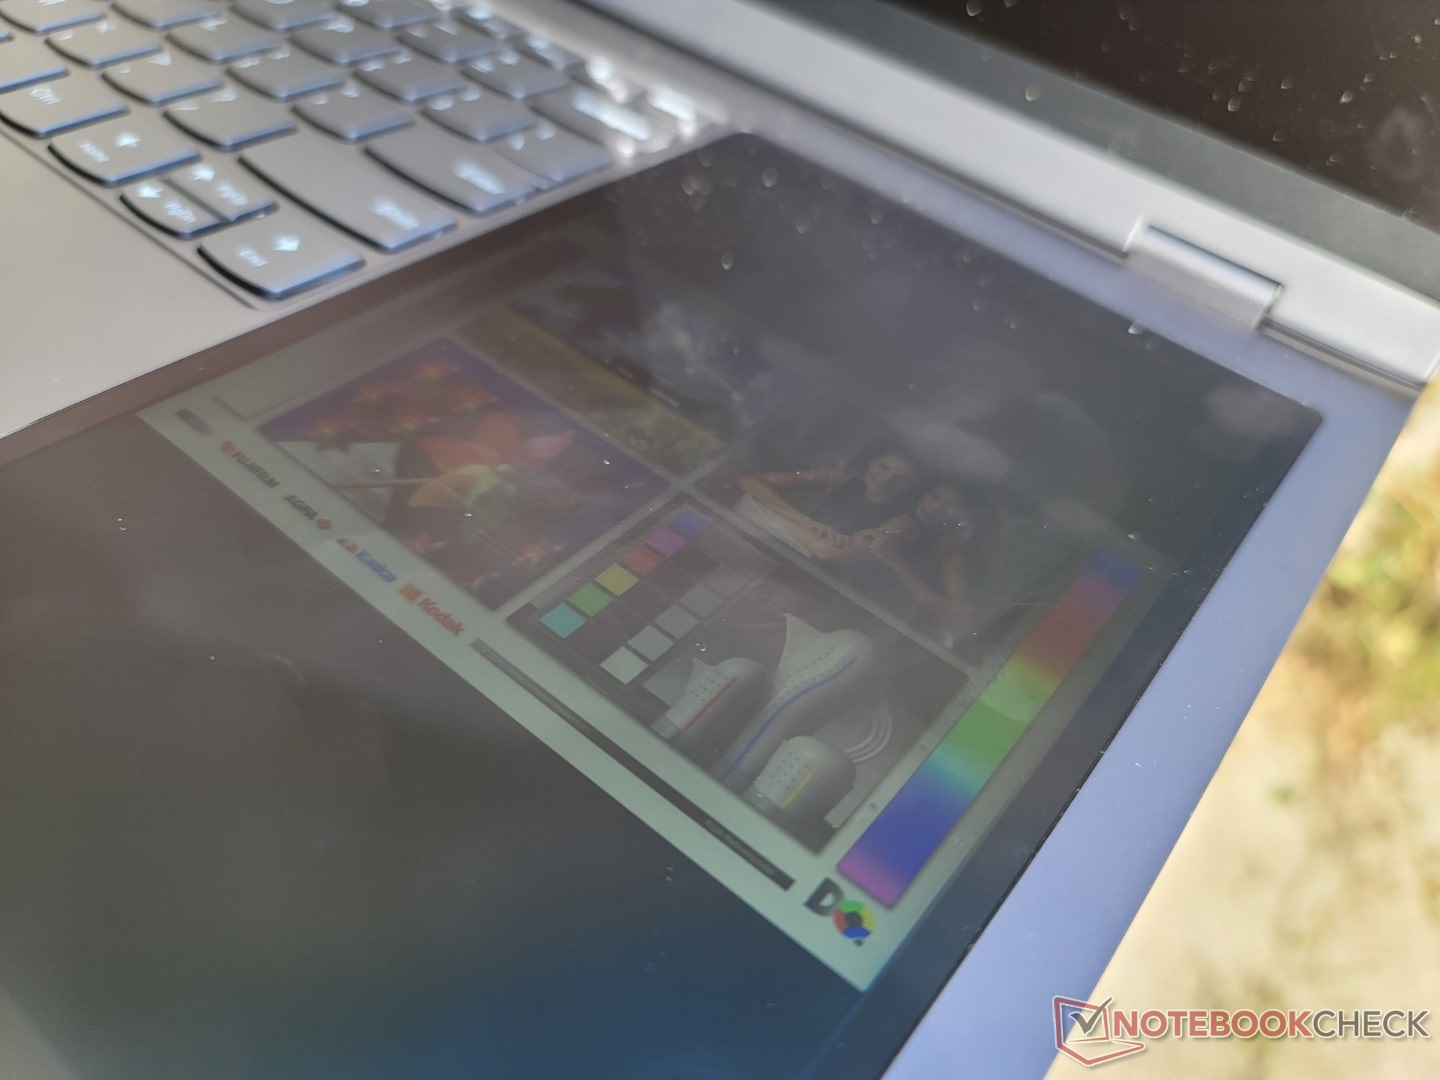
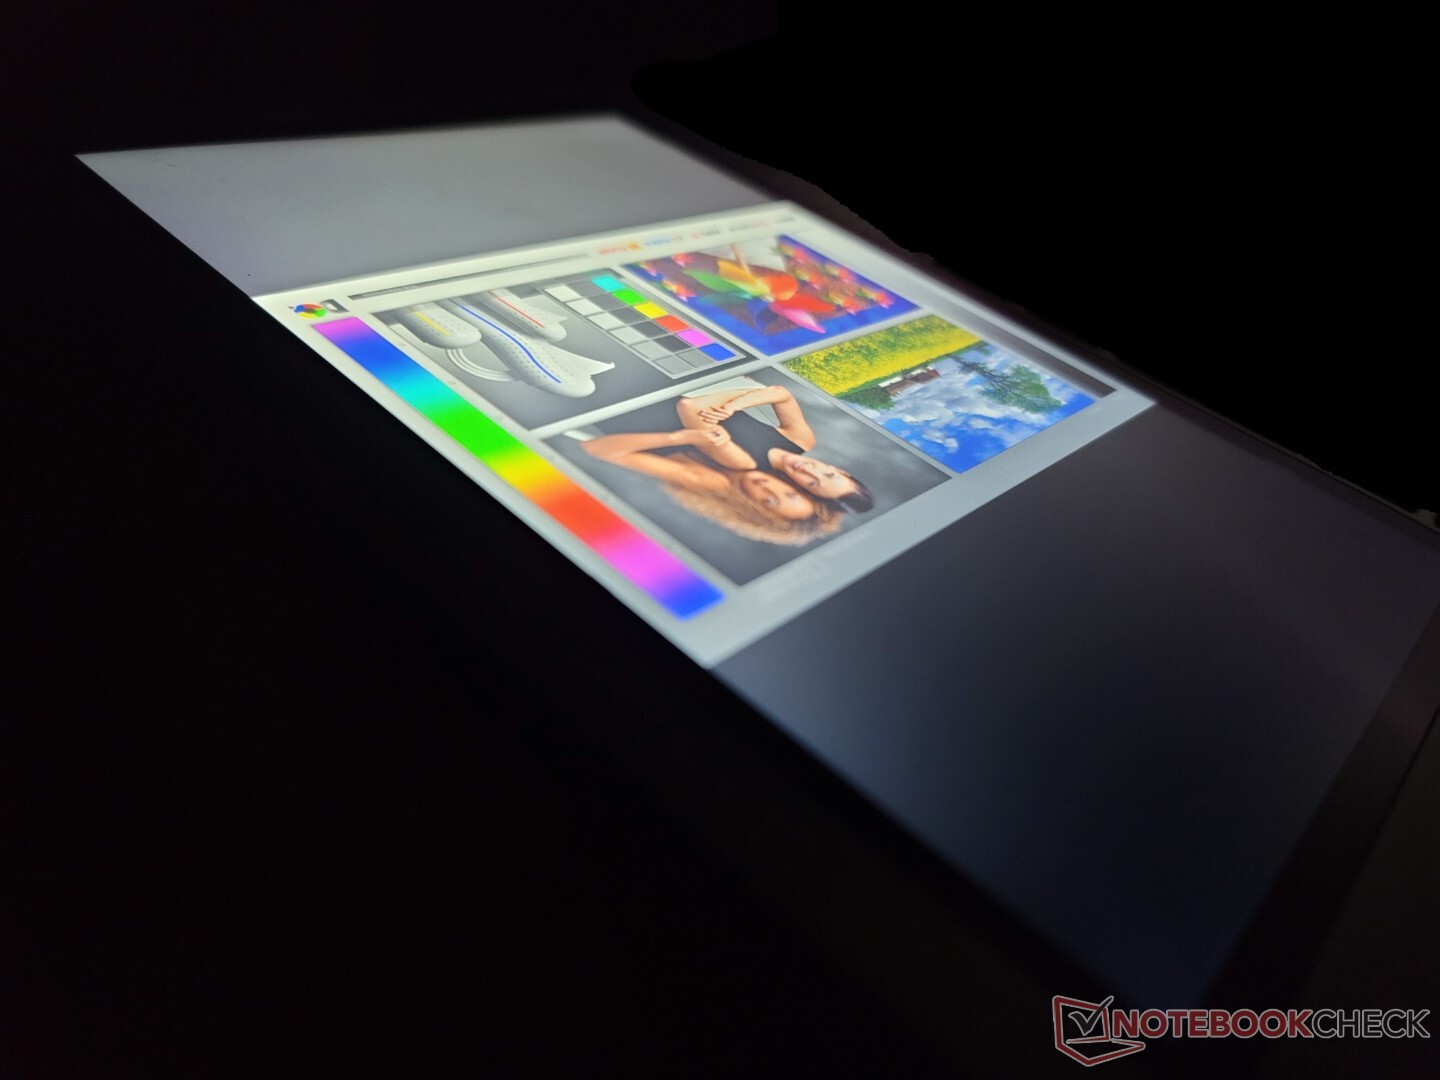
Im Freien entspricht die Sichtbarkeit in etwa der auf dem LG Gram 17 oder XPS 17, immerhin haben alle ähnliche Helligkeitswerte. Auf dem Lenovo fallen allerdings mehr Spiegelungen an den Seiten auf, was am breiteren Seitenverhältnis liegt. Ein Arbeiten im Schatten ist daher vorzuziehen.
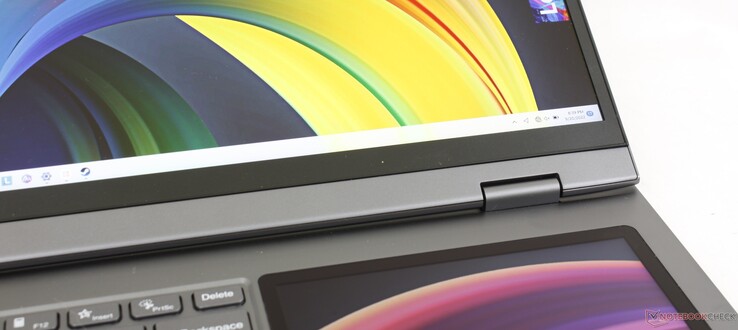
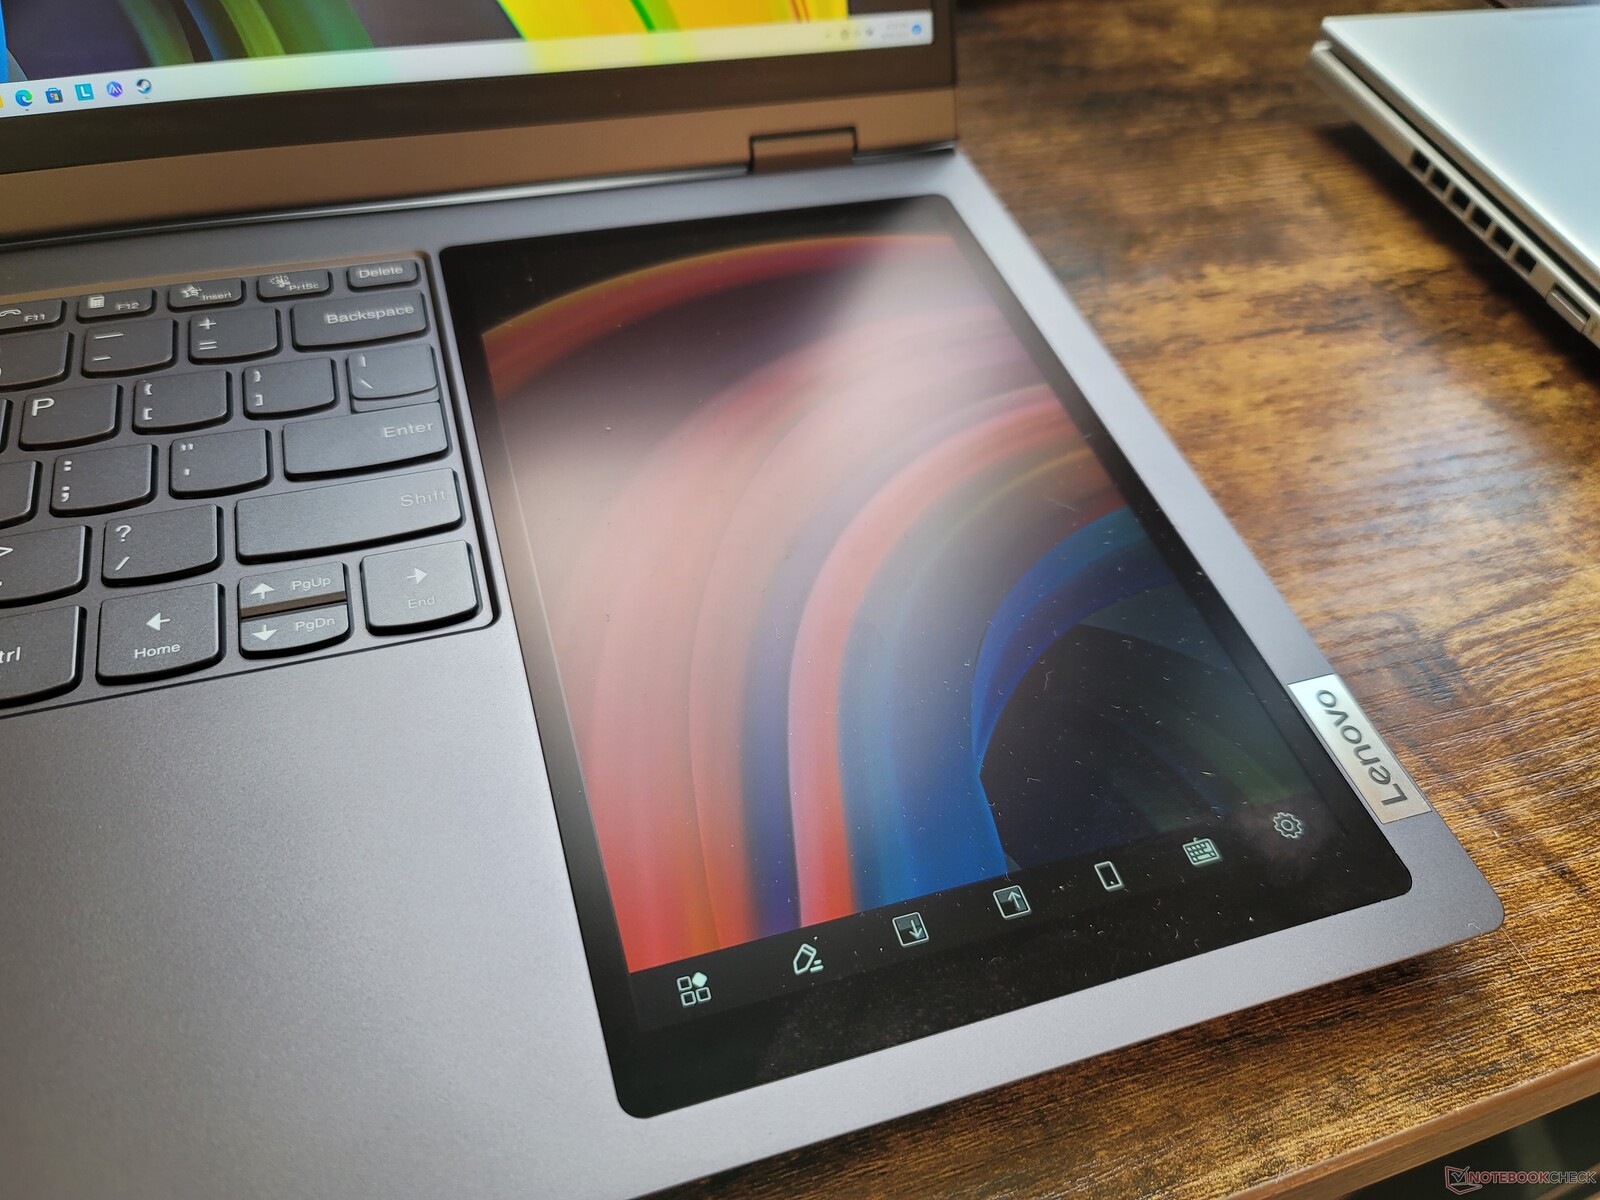
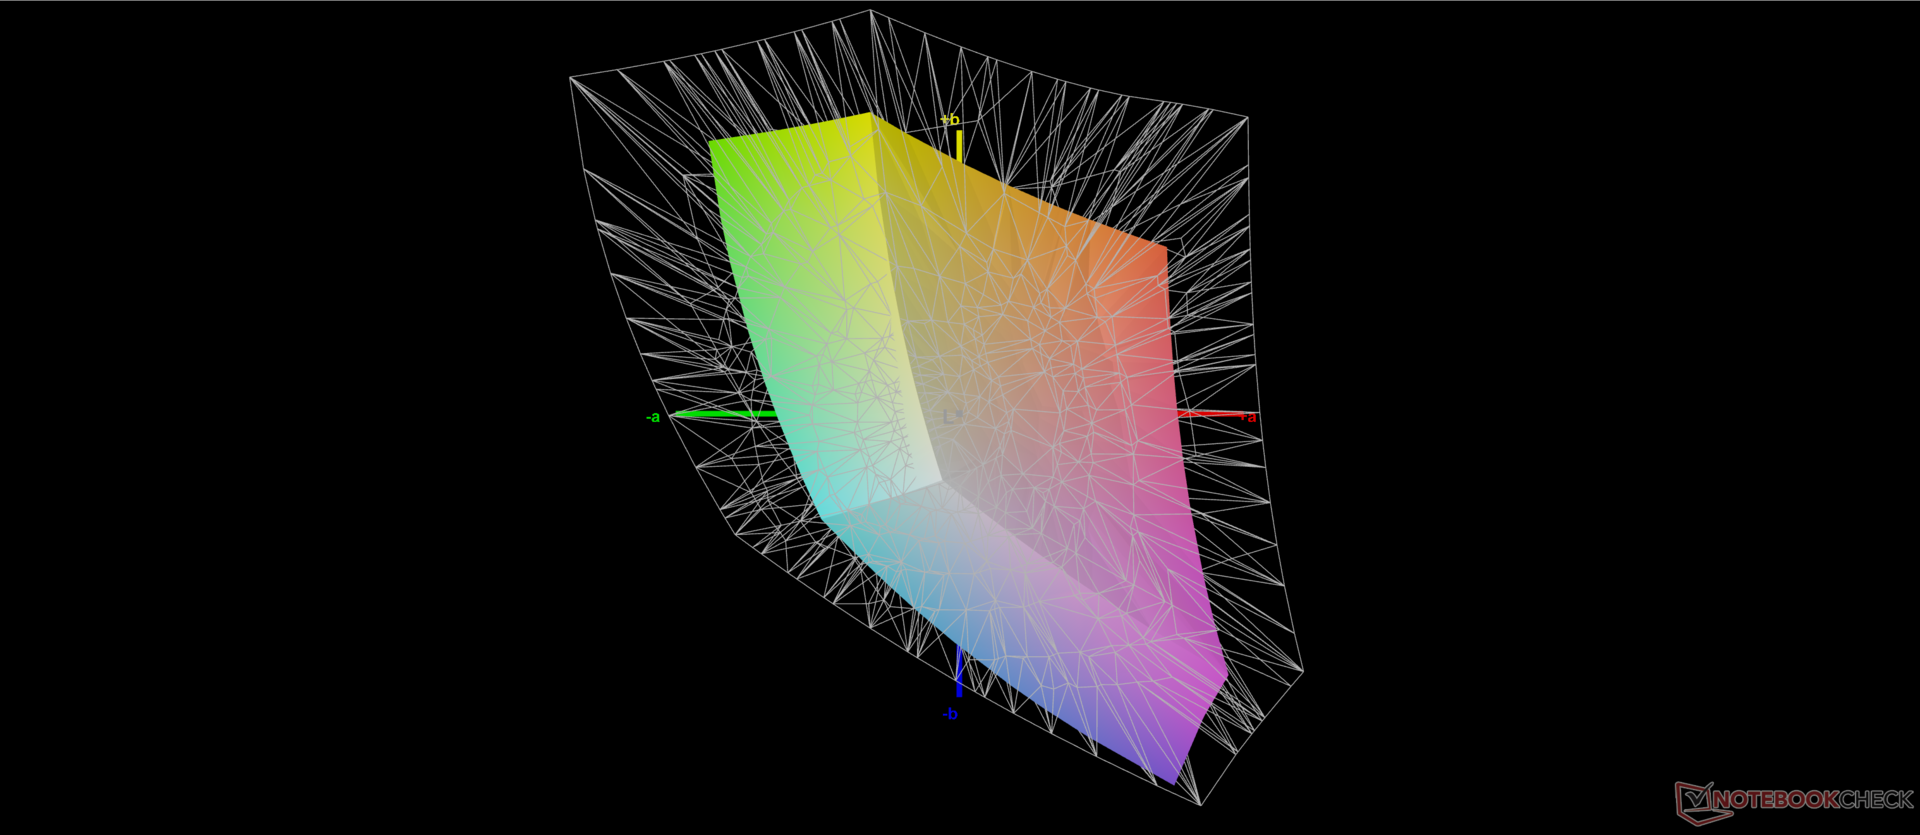
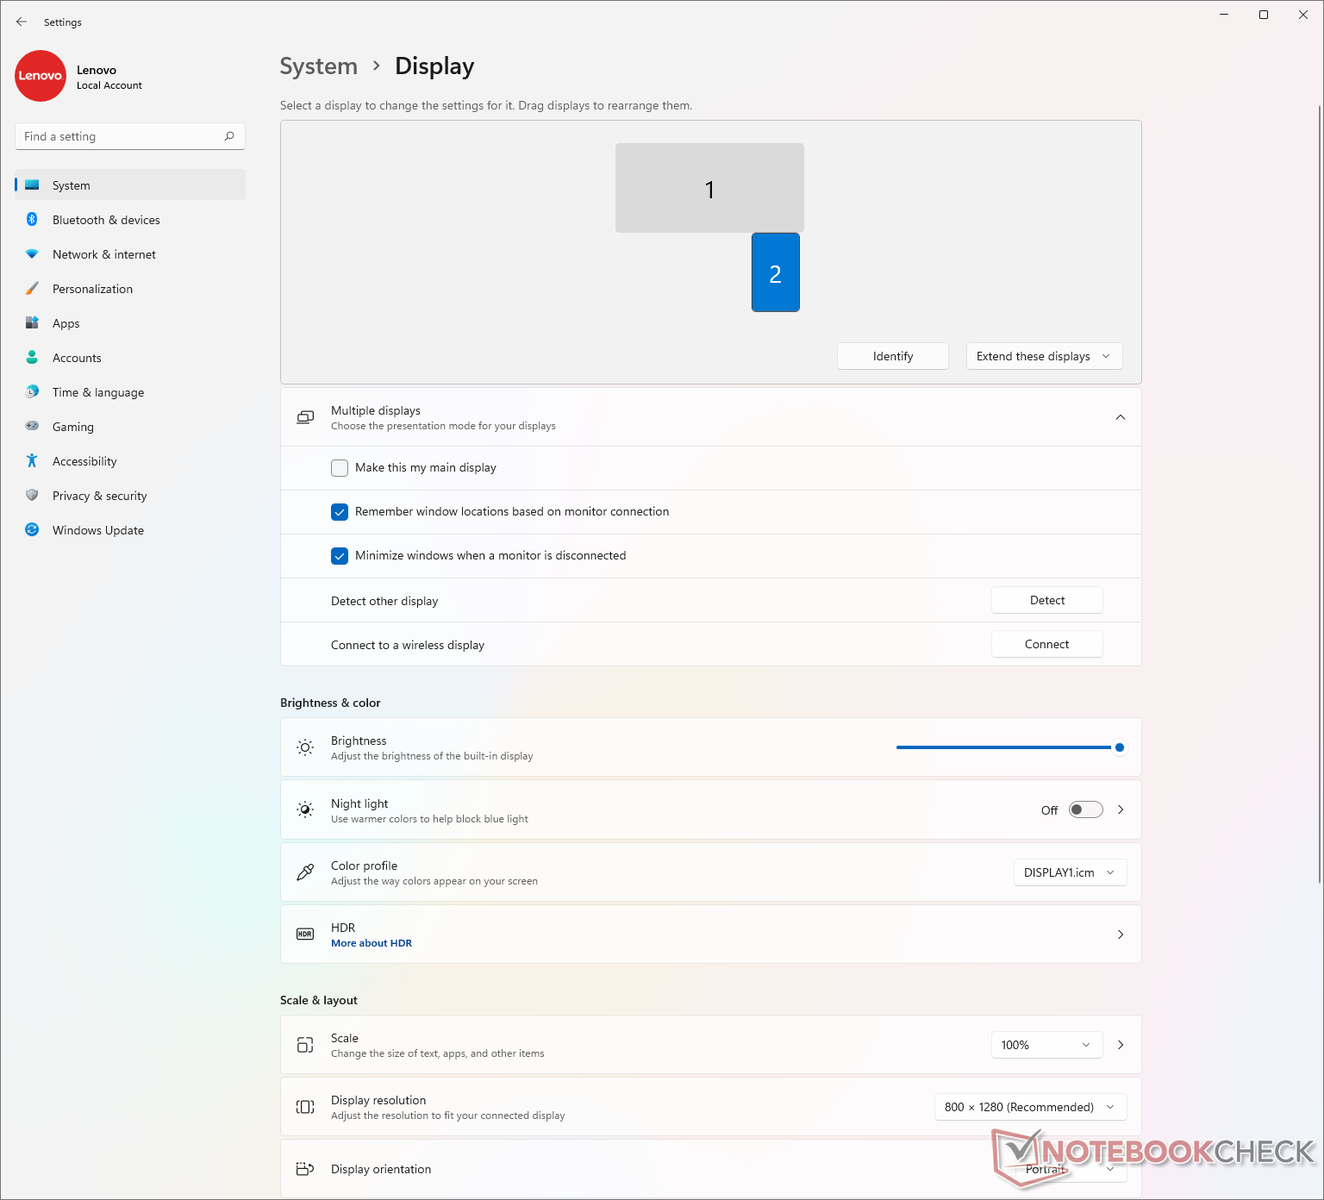
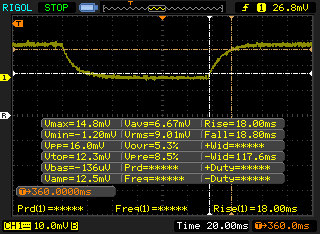
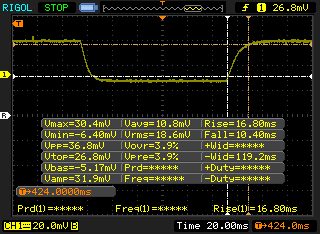
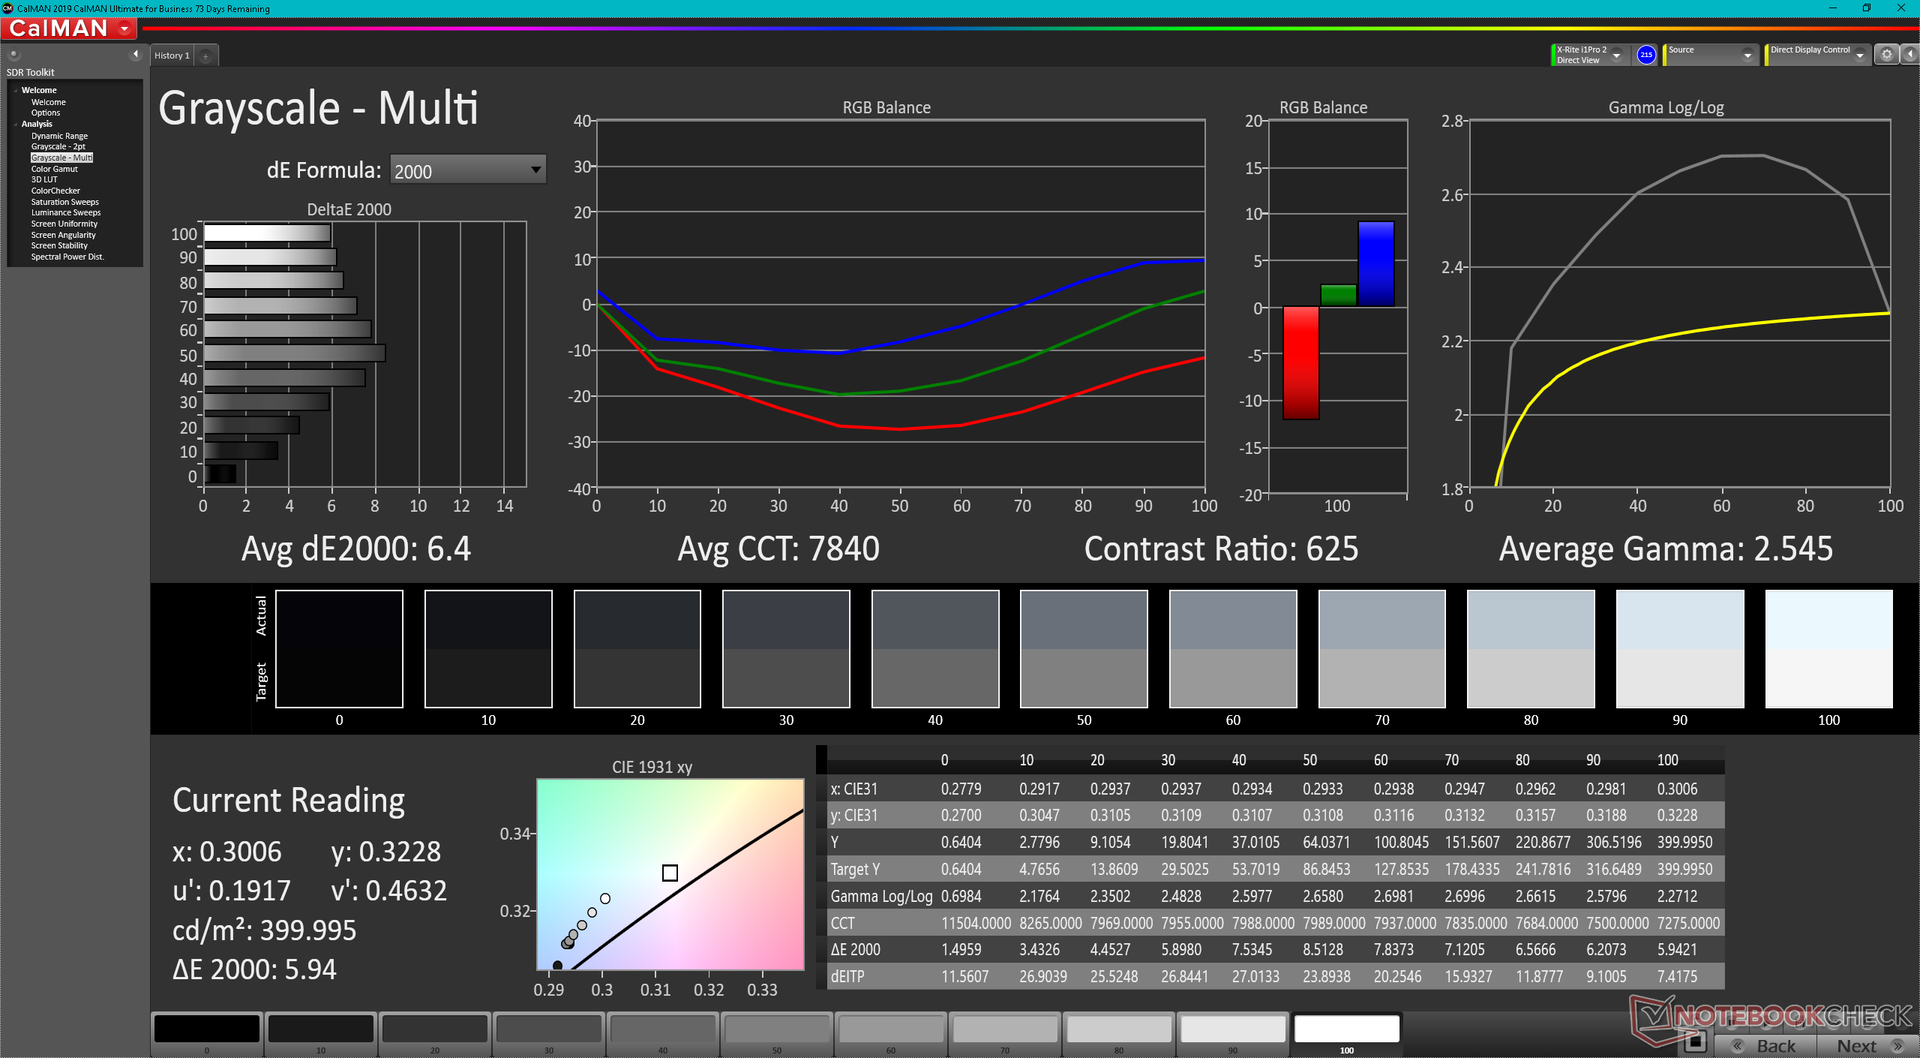
Sekundäres Display — So viel Extra-Bildschirmfläche
Der sekundäre Bildschirm funktioniert flüssig und eignet sich perfekt, um verschiedene Fenster vom und auf das Hauptdisplay zu verschieben. Hier erweist sich das Seitenverhältnis von 10:16 als besonders nützlich, da es sich für eine Vielzahl von Anwendungen gut eignet, gerade im Vergleich zu dem engeren Zweitdisplay auf dem konkurrierenden Asus ZenBook Duo.
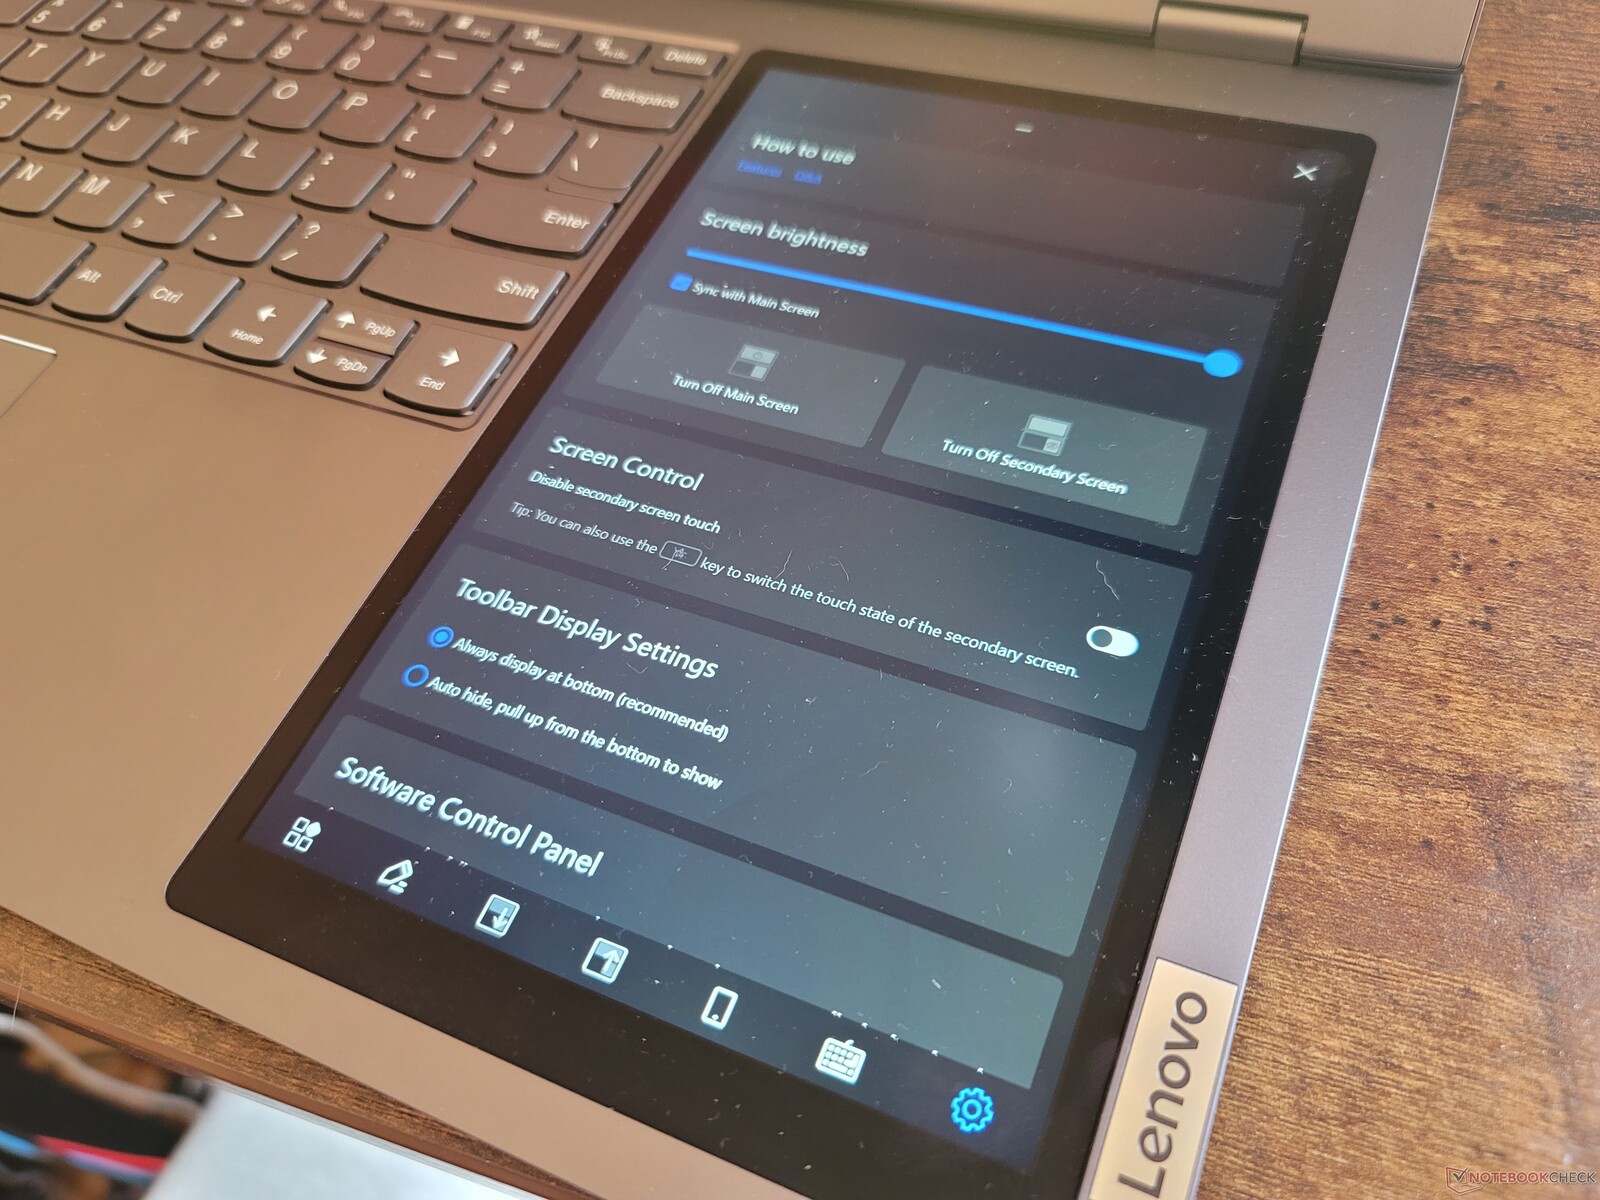
Zudem bietet der Bildschirm einige Hilfsfunktionen, die im Asus-Modell fehlen: Beispielsweise gibt es die Möglichkeit den Helligkeitswert mit dem Hauptdisplay zu synchronisieren oder einen spezifischen Bereich des Hauptdisplays von 800 x 1.280 Pixeln zu spiegeln.

| 8-Zoll sekundärer IPS-Touchscreen | Auflösung 800 x 1.280 |
|---|---|
| Bildwiederholrate | 60 Hz |
| Maximale Helligkeit | 393,6 Nits |
| Reaktionszeiten Schwarz-zu-Weiß | 16,8 ms rise, 10,4 ms fall |
| Reaktionszeiten Grau-zu-Grau | 18,0 ms rise, 18,8 ms fall |
| Kontrast | 579:1 |
| sRGB-Abdeckung | 80,6 percent |
| Gamma | 2,55 |
| CCT | 7840 |
| Graustufen Avg DeltaE2000 | 6,4 |
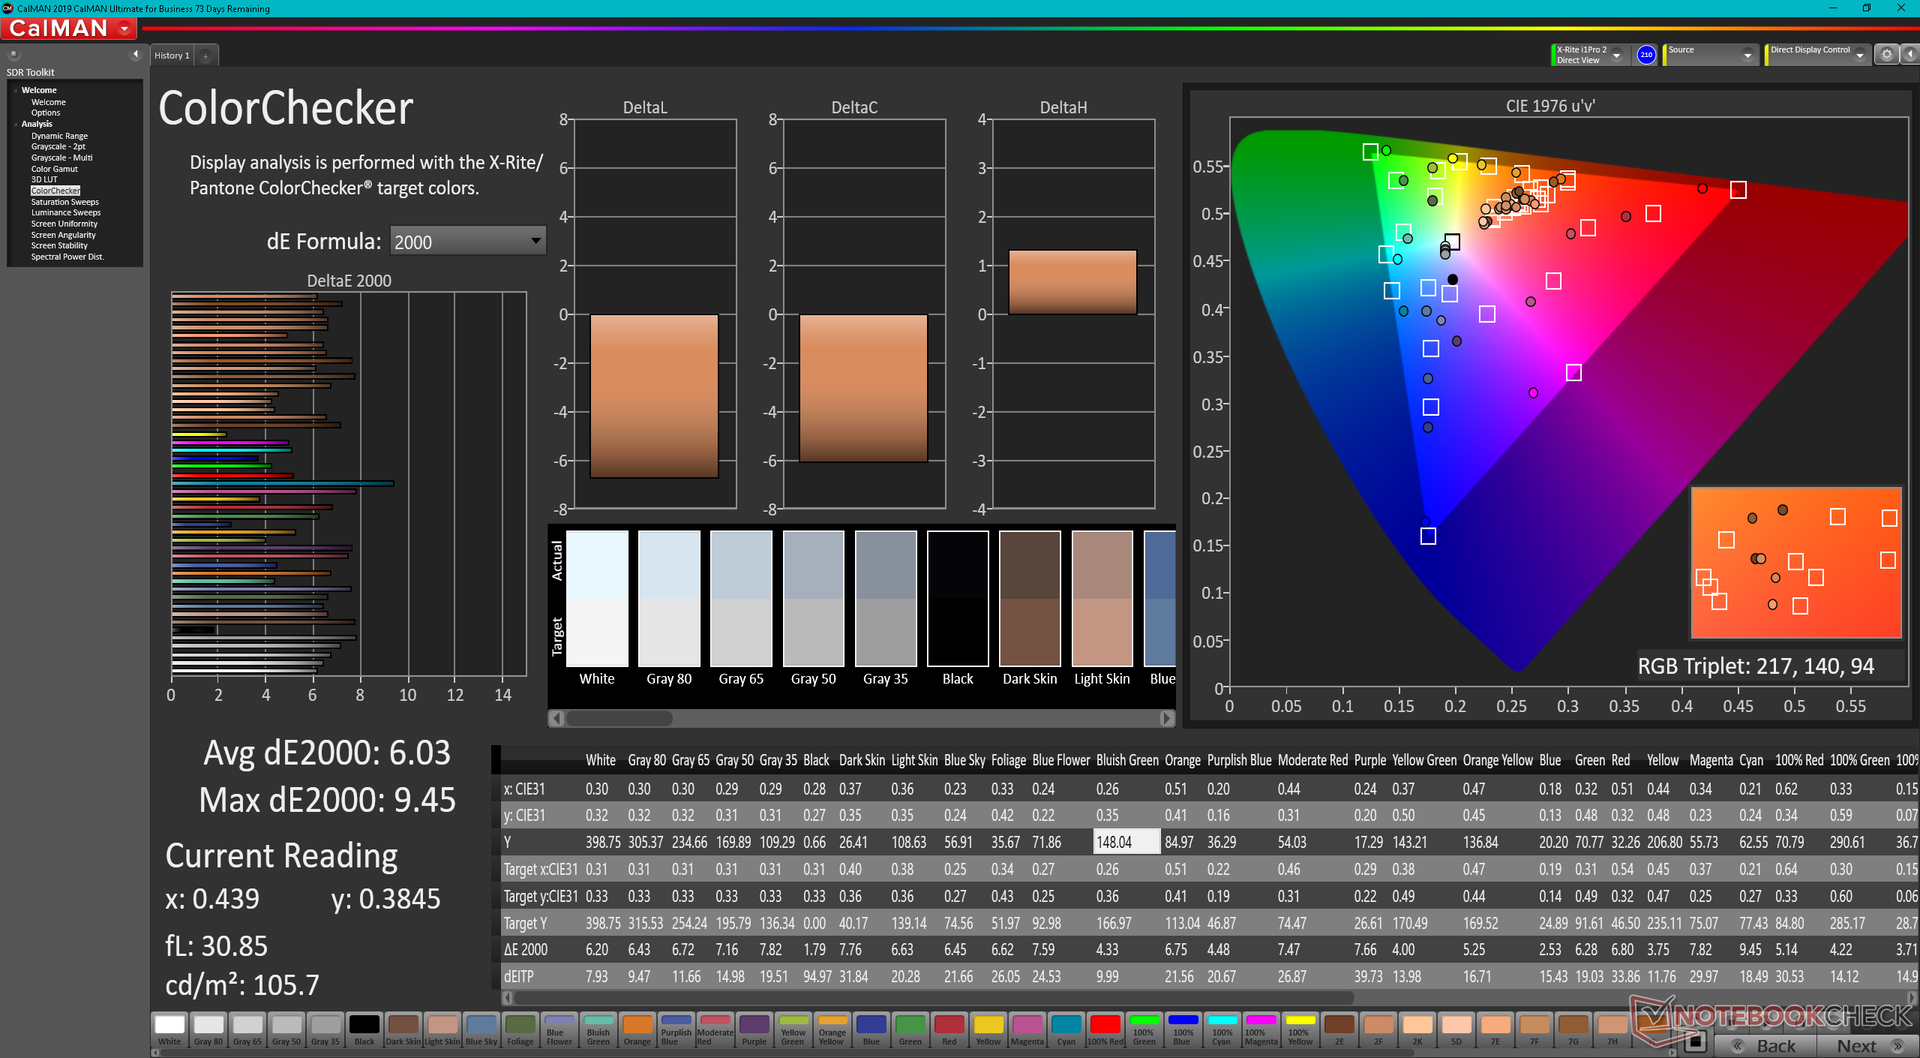
| Colorchecker dE 2000 | 6,03 |
| Colorchecker dE 2000 Max | 9,45 |
Leider zeichnet das Zweitdisplay die gleichen Nachteile wie bei einigen frühen ZenBook-Duo-Modellen aus. Seine Farben, die Bildwiederholrate, die Körnung und die Blickwinkel sind allesamt deutlich schwächer als beim Hauptdisplay. Die Bildqualität erinnert eher an die eines billigen 8-Zoll-Android-Tablets anstelle eines iPad oder Samsung Galaxy Tab S. Wer also auf eine 1:1-Reproduktion der Bildqualität zwischen primären und sekundären Bildschirm angewiesen ist, sollte lieber auf zwei gleiche, externe Displays setzen.
Wir sind außerdem auf diverse Bugs beim Zweitdisplay gestoßen: Manchmal wollte sich beispielsweise die Helligkeit einfach nicht mit der des Hauptbildschirms synchronisieren. Zweitens kam es vor, dass das Hauptdisplay nach dem Aufwachen vom Sleep Modus abgeschaltet wurde und sich nur das Zweitdisplay einschaltete, obwohl beide Displays vor dem Sleep Modus aktiv waren. Drittens reagierte der sekundäre Touchscreen auch dann noch auf Eingaben, wenn er via Windows eigentlich deaktiviert war, was mehrere ungewollte Eingaben am Hauptbildschirm zur Folge hatte. Nutzer sollten daran denken manuell die "S Star"-Taste (oder die Einfügen-Taste) zu drücken, um die Touchfunktion zu (de)aktivieren). Zu guter Letzt werden viele Eingaben vom Zweitdisplay nicht registriert, was teilweise zu Frust bei der Nutzung führt. Viele Funktionen sind vielversprechend, brauchen aber offenbar noch etwas Entwicklungszeit.

Leistung — Intel Alder Lake-H Gen 12
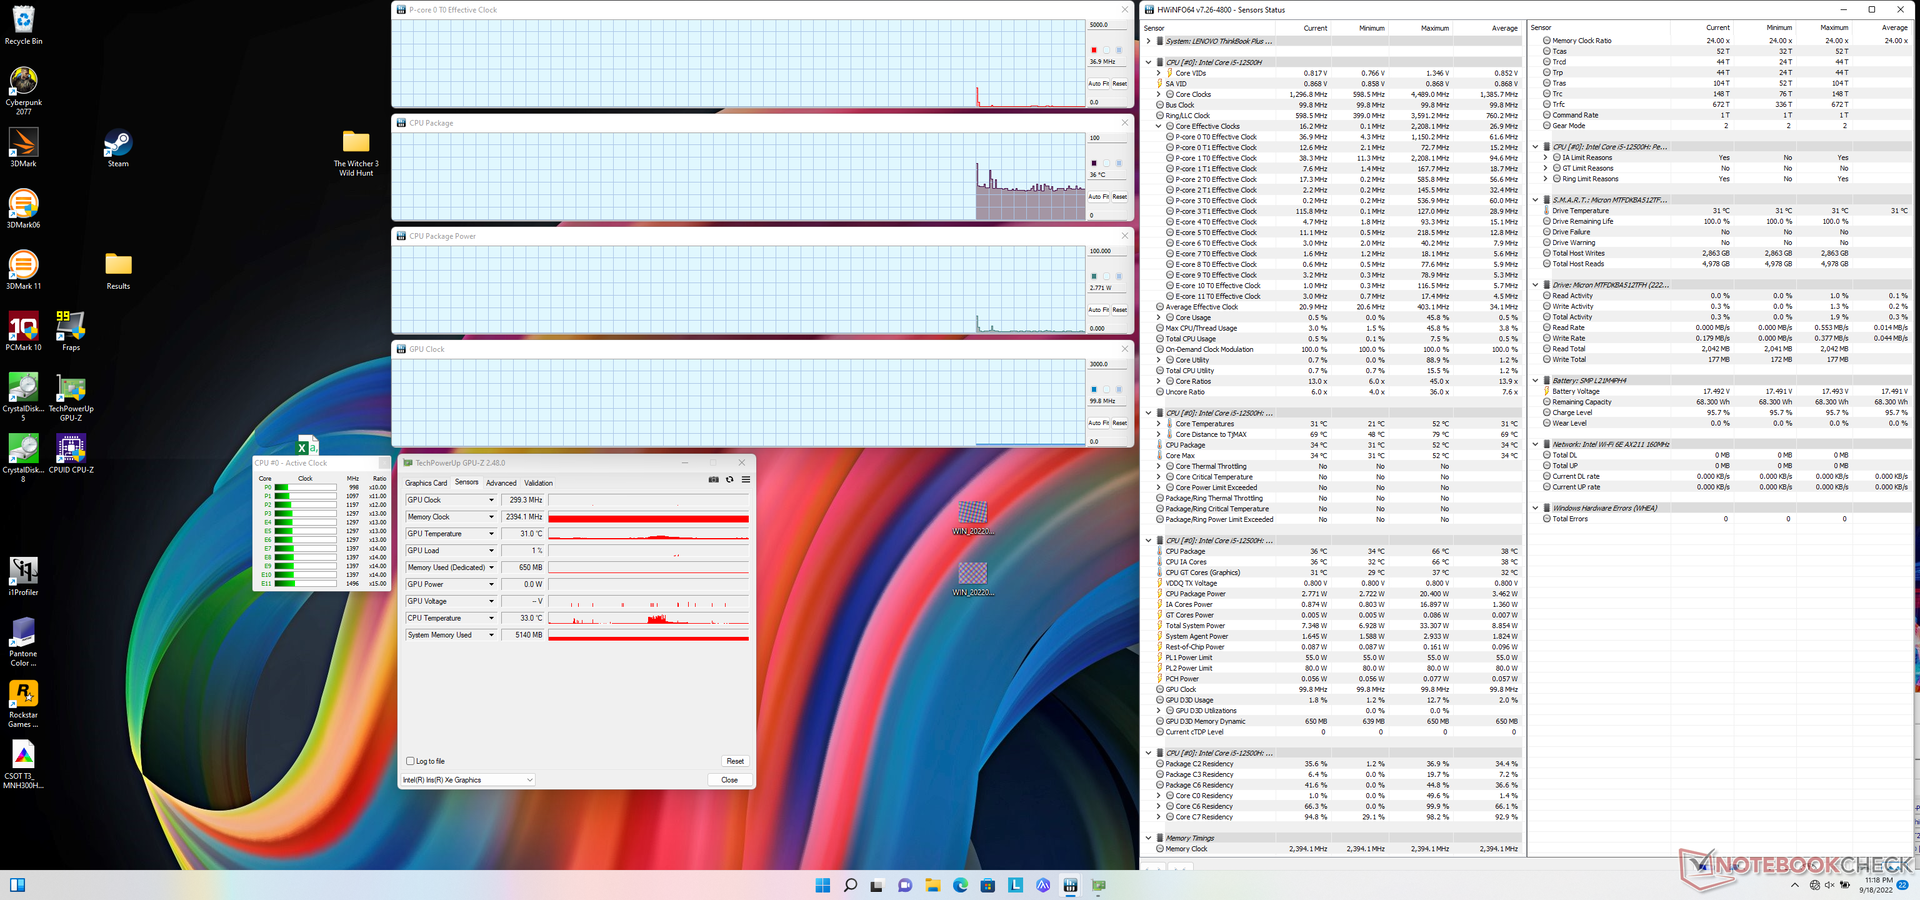
Testbedingungen
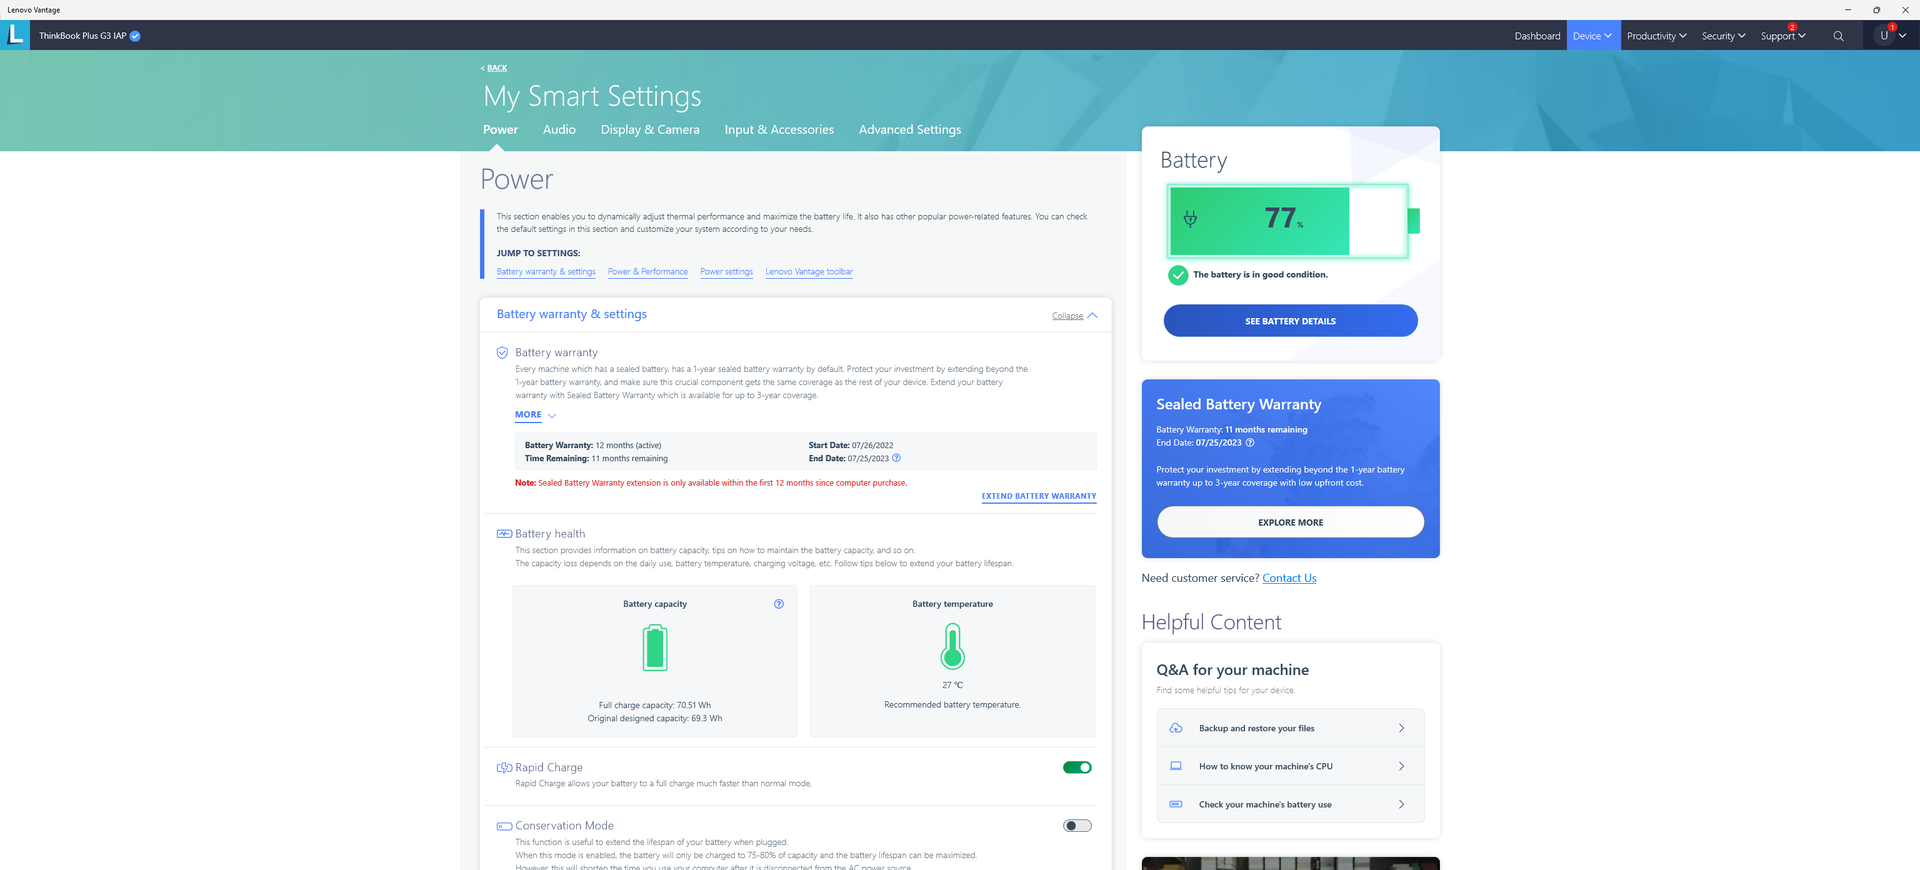
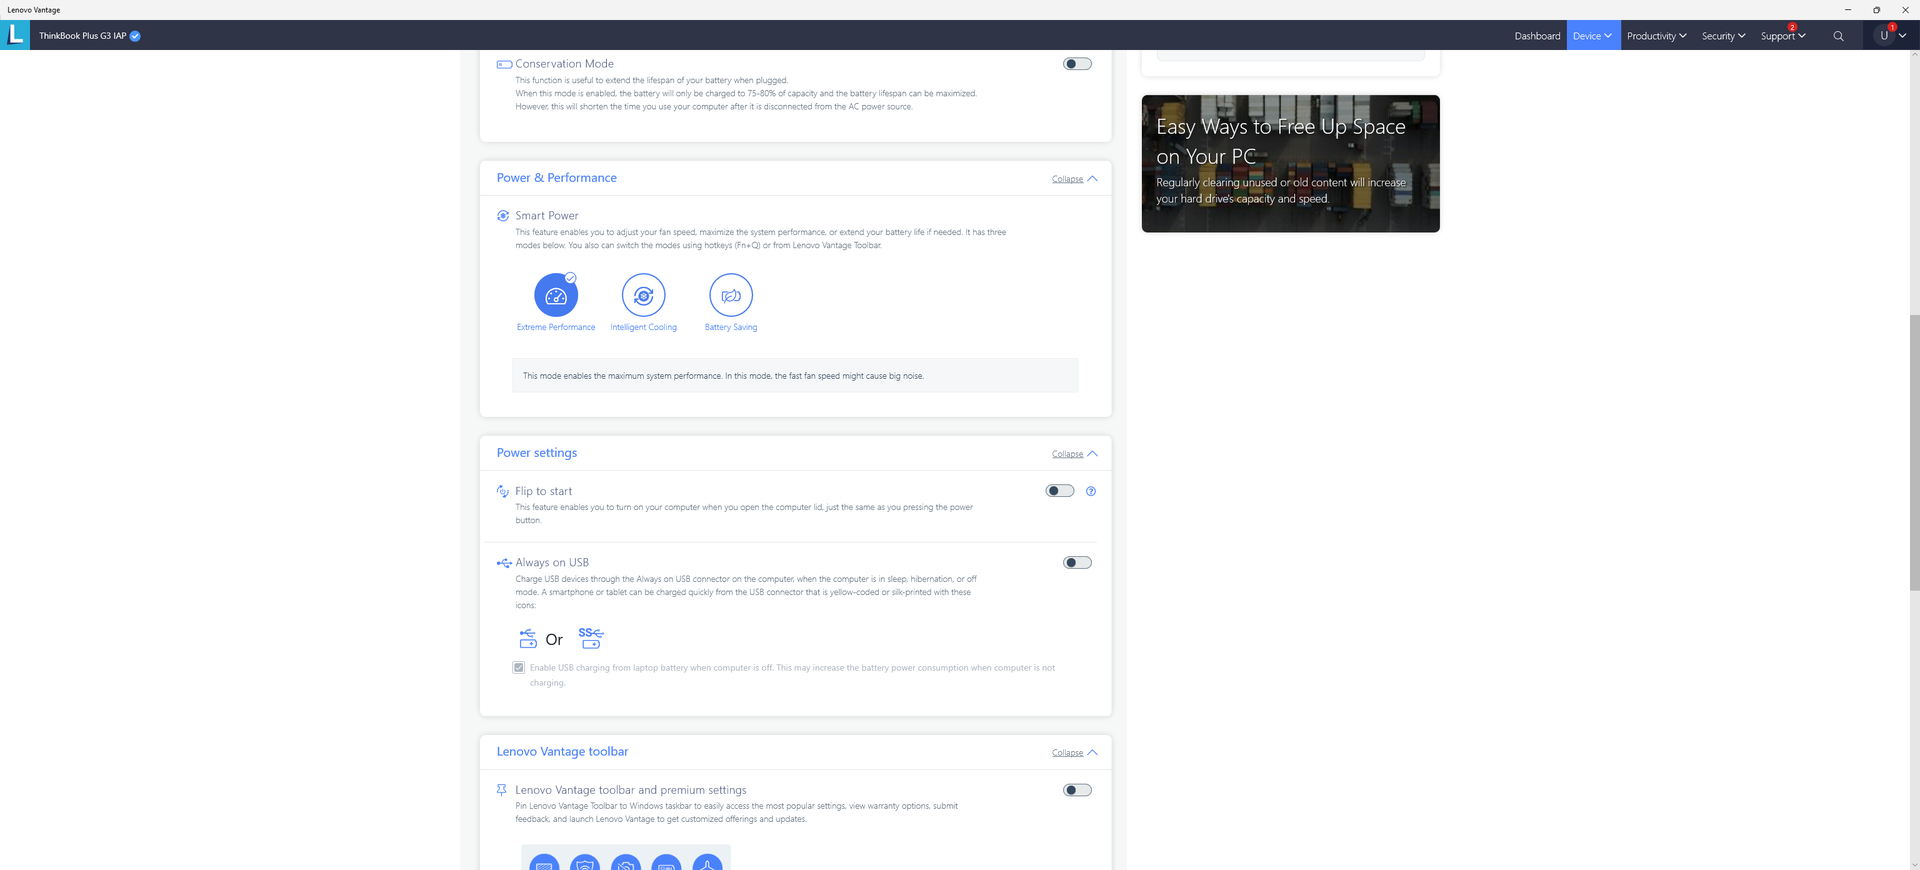
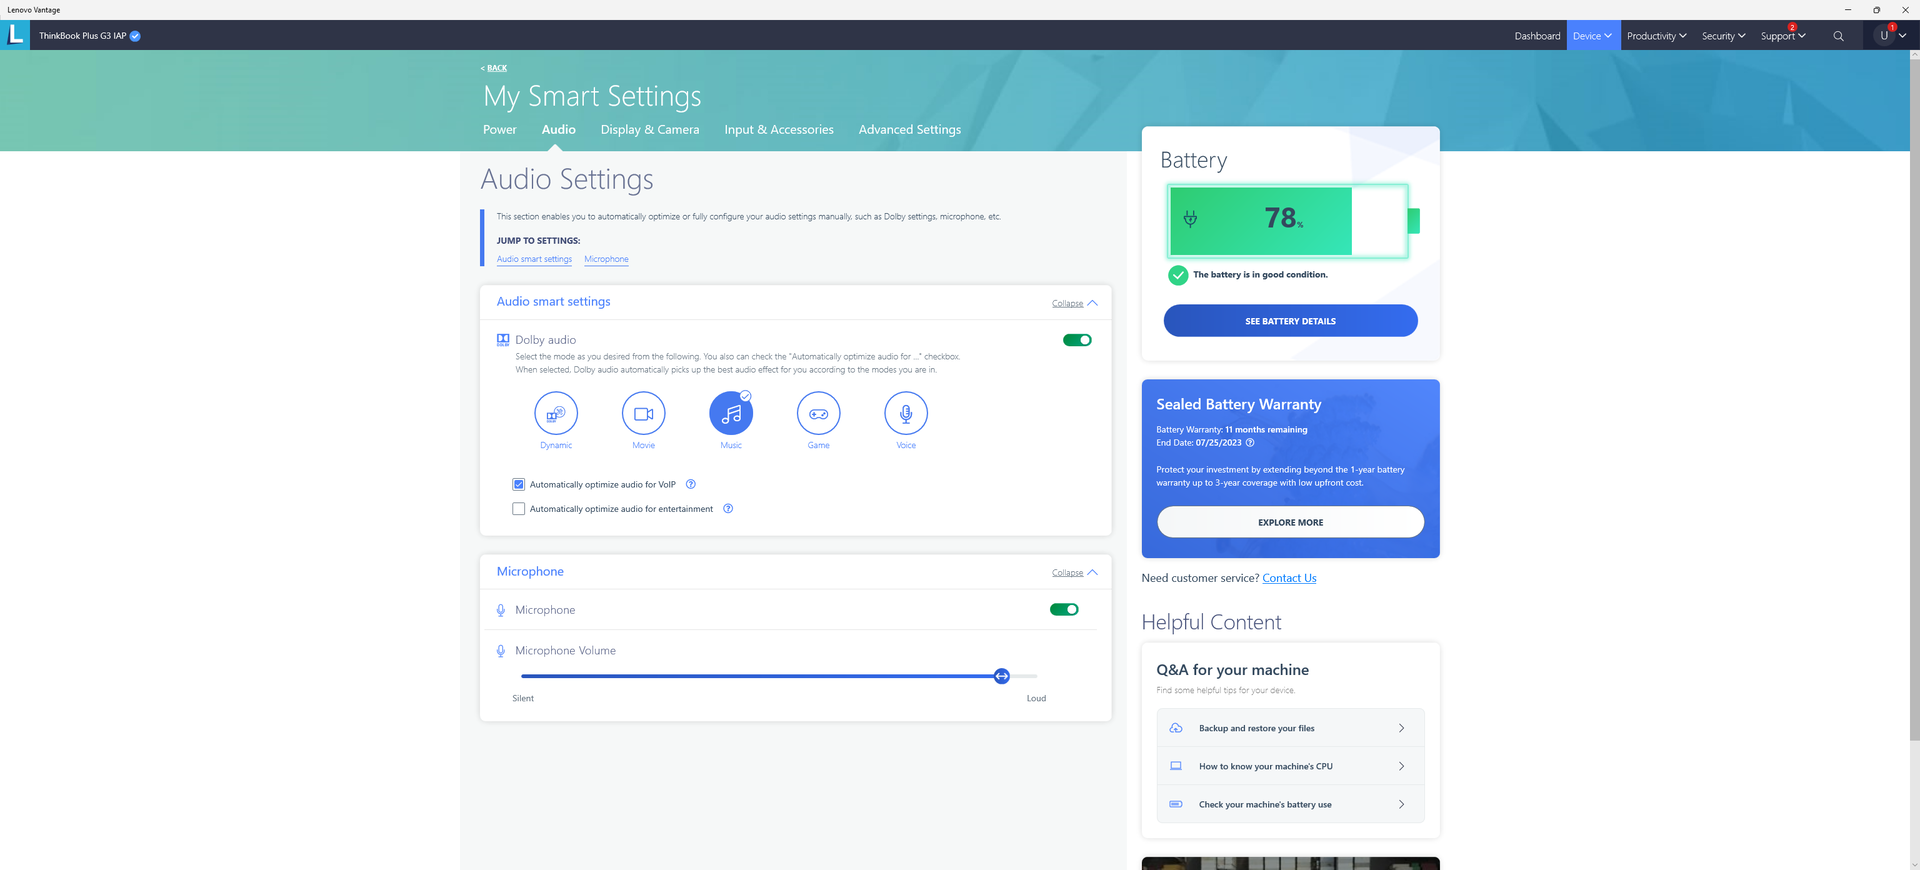
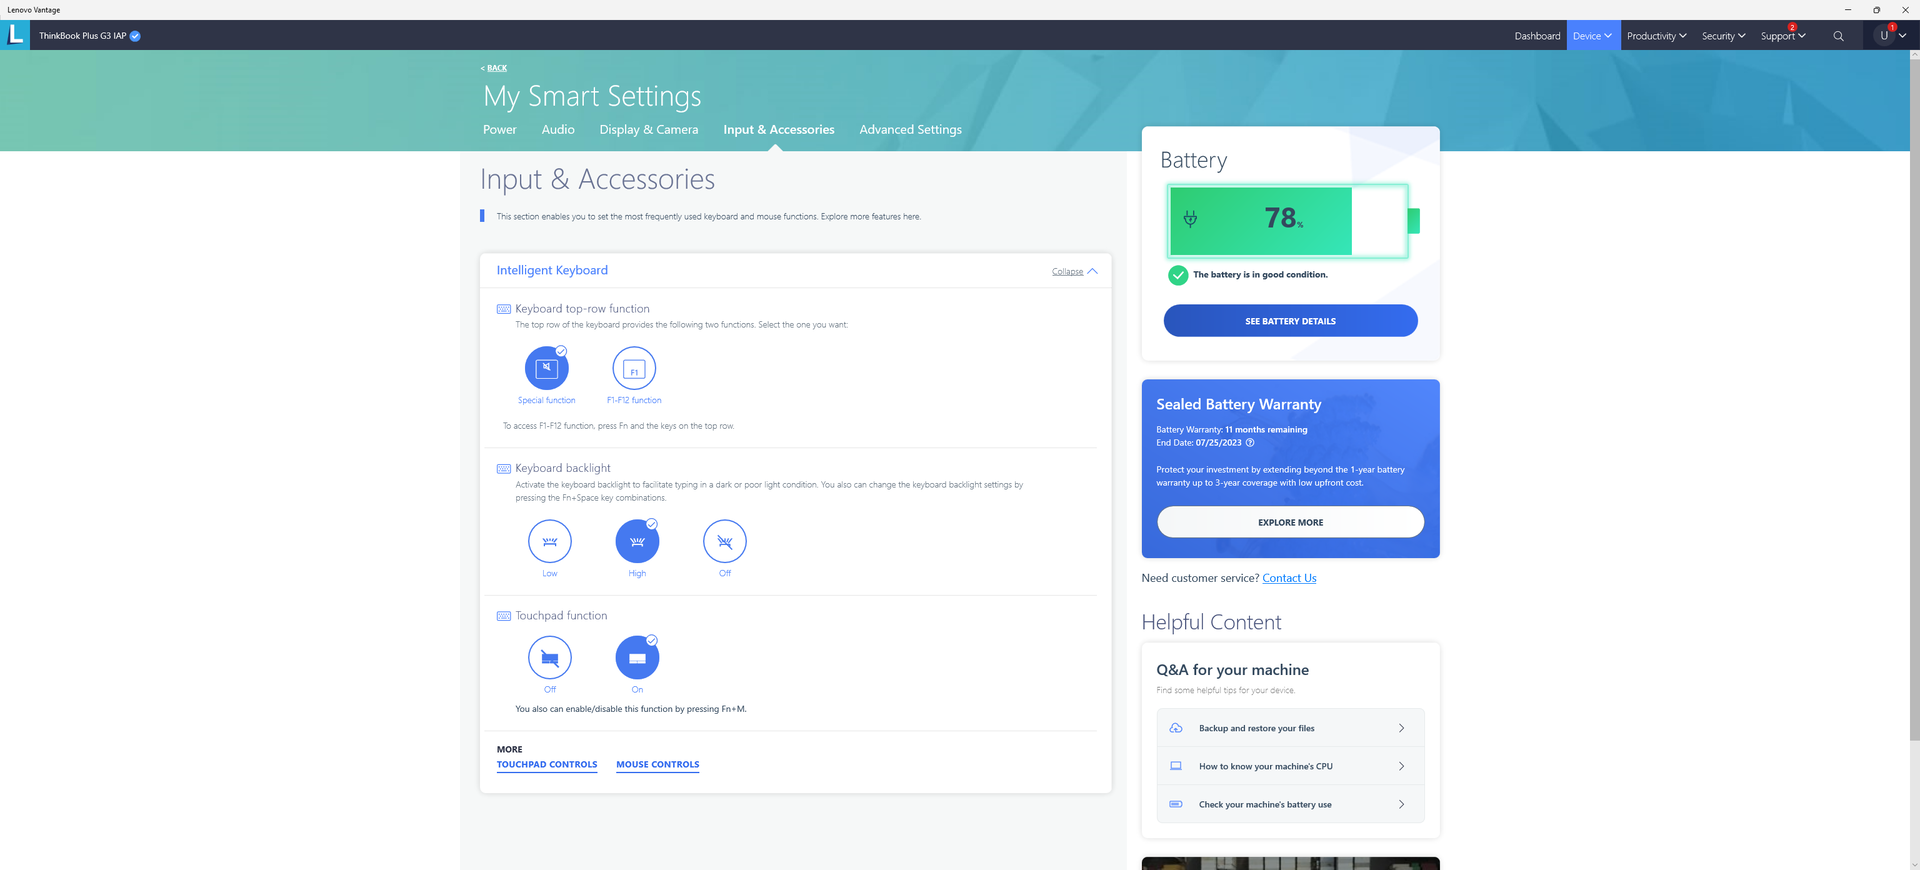
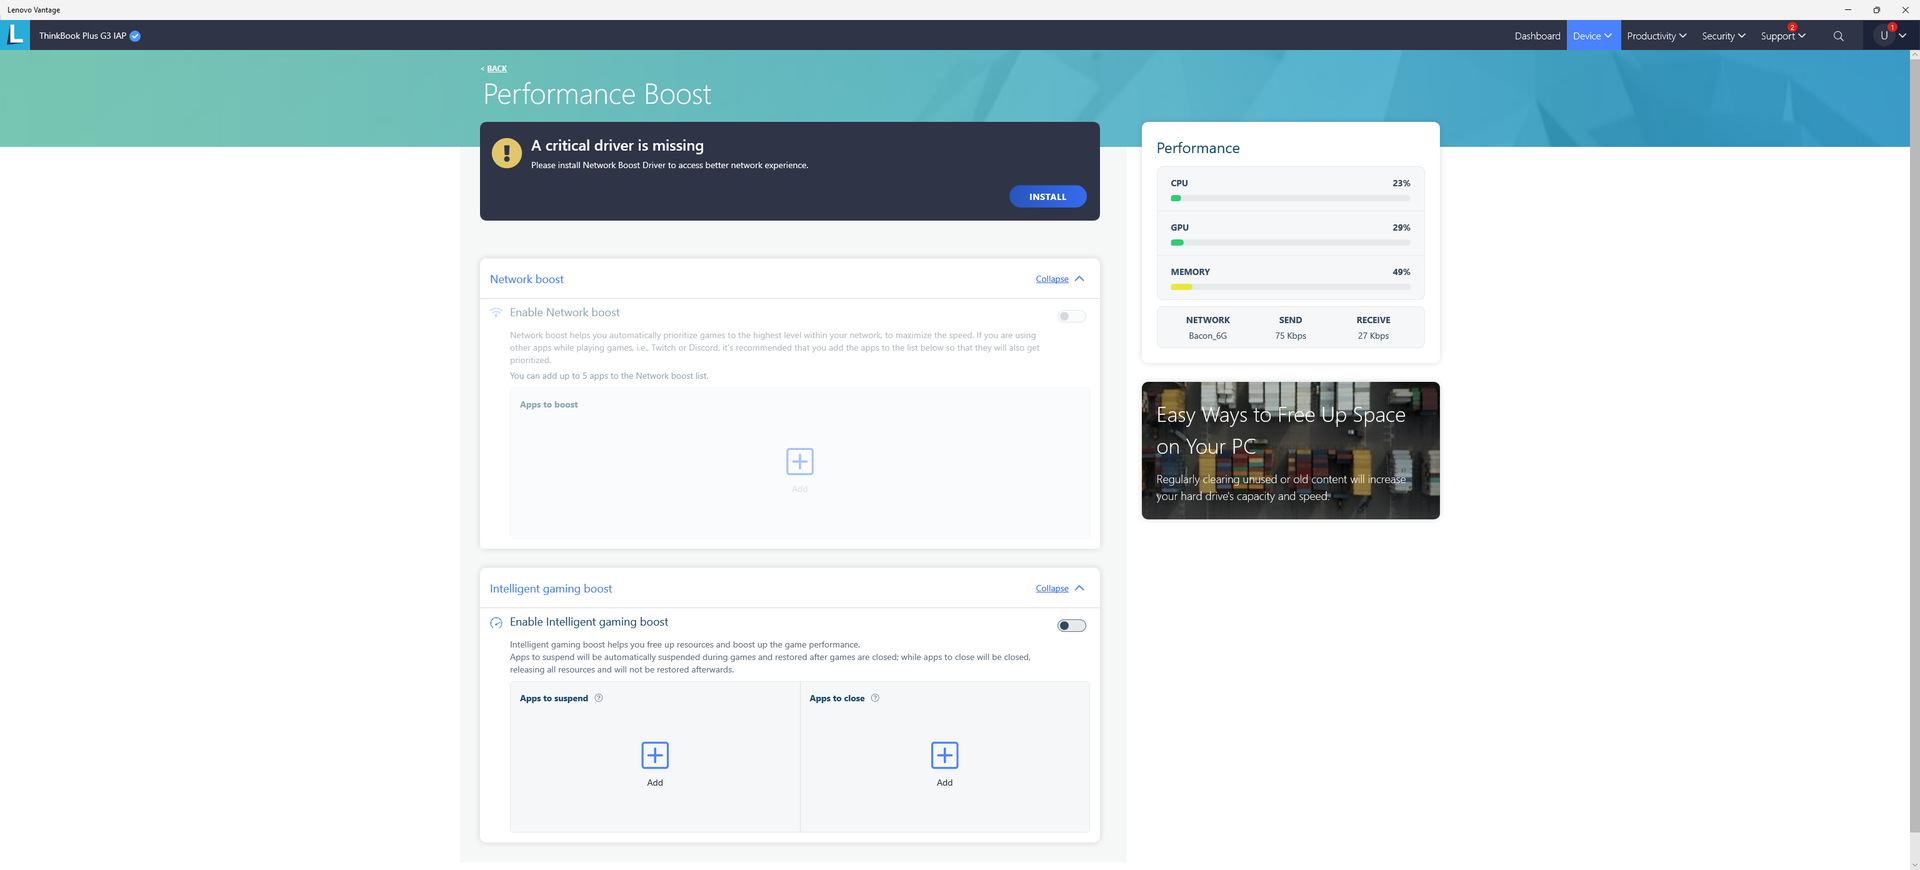
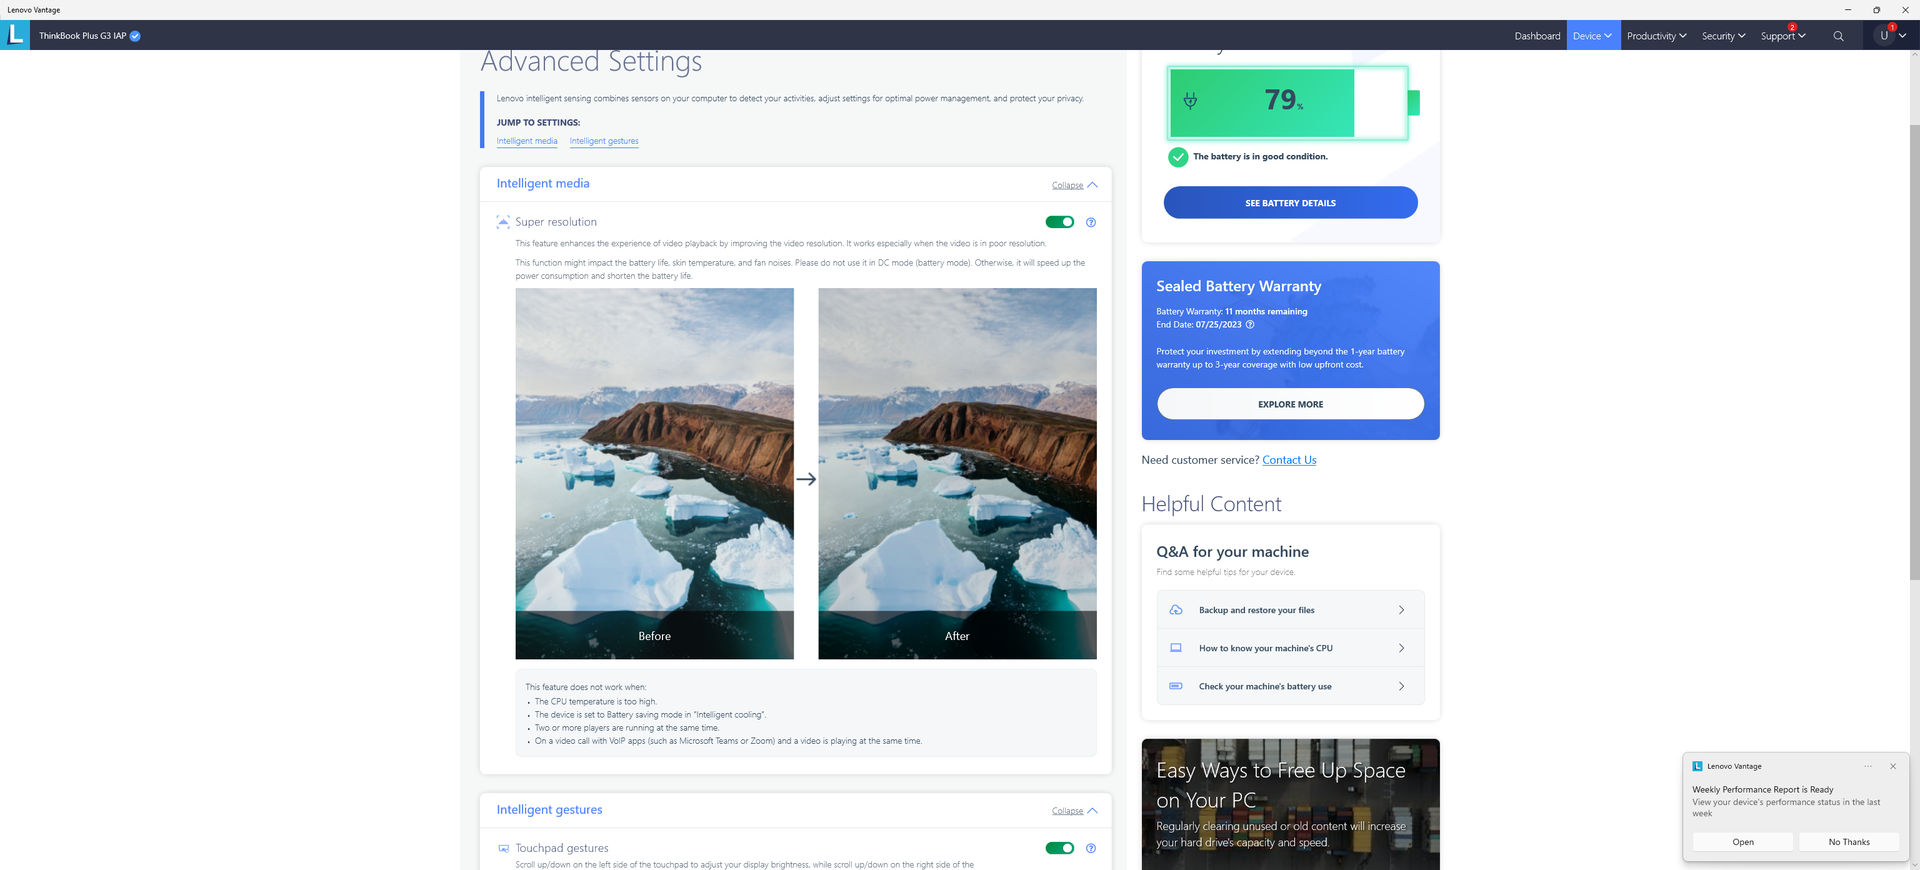
Vor den Benchmarks haben wir unser Testmodell in den Extreme-Performance-Modus via Lenovo Vantage sowie Performance-Modus in Windows versetzt. Nutzer sollten sich mit der vorinstallierten Vantage Software auseinandersetzen, es fungiert als Control Center für Updates, Leistungseinstellungen und generelle Funktionen des Laptops. Der Screenshot weiter unten zeigt einige der Funktionen der Software.
Prozessor
Die CPU-Leistung erweist sich als 20 bis 25 Prozent langsamer als die eines durchschnittlichen Core i7-12700H in unserer Datenbank. Der Rückstand ist groß genug, dass selbst Laptops mit dem langsameren Core i5-12500H, wie zum Beispiel das Honor MagicBook 15, mit unserem Lenovo mithalten oder ihn gar übertrumpfen können. Immerhin ist die Leistung noch besser als bei den sparsameren Core i7-1260P oder Core i7-1165G7. Der Vorteil verdeutlicht sich vor allem gegenüber dem Core i5-1130G7, welcher im letztjährigen ThinkBook Plus Gen 2 steckte.
Cinebench R15 Multi Loop
Cinebench R23: Multi Core | Single Core
Cinebench R15: CPU Multi 64Bit | CPU Single 64Bit
Blender: v2.79 BMW27 CPU
7-Zip 18.03: 7z b 4 | 7z b 4 -mmt1
Geekbench 5.5: Multi-Core | Single-Core
HWBOT x265 Benchmark v2.2: 4k Preset
LibreOffice : 20 Documents To PDF
R Benchmark 2.5: Overall mean
| HWBOT x265 Benchmark v2.2 / 4k Preset | |
| Schenker XMG Neo 17 M22 | |
| Durchschnittliche Intel Core i7-12700H (4.67 - 21.8, n=64) | |
| Gigabyte Aero 17 HDR YD | |
| Acer Nitro 5 AN517-41-R9S5 | |
| Gigabyte A7 X1 | |
| Dell XPS 17 9720 | |
| Honor MagicBook 14 2022 | |
| Lenovo ThinkBook Plus Gen3 | |
| Lenovo Legion 5 17ACH6H-82JY0003GE | |
| Samsung Galaxy Book2 15 | |
| Asus ProArt StudioBook Pro 17 W700G3T | |
| LG Gram 17 (2022) | |
| Acer Aspire 5 A517-52G-79Z5 | |
Cinebench R23: Multi Core | Single Core
Cinebench R15: CPU Multi 64Bit | CPU Single 64Bit
Blender: v2.79 BMW27 CPU
7-Zip 18.03: 7z b 4 | 7z b 4 -mmt1
Geekbench 5.5: Multi-Core | Single-Core
HWBOT x265 Benchmark v2.2: 4k Preset
LibreOffice : 20 Documents To PDF
R Benchmark 2.5: Overall mean
* ... kleinere Werte sind besser
AIDA64: FP32 Ray-Trace | FPU Julia | CPU SHA3 | CPU Queen | FPU SinJulia | FPU Mandel | CPU AES | CPU ZLib | FP64 Ray-Trace | CPU PhotoWorxx
| Performance Rating | |
| Durchschnittliche Intel Core i7-12700H | |
| Lenovo ThinkBook Plus Gen3 | |
| Dell XPS 17 9720 | |
| Asus ProArt StudioBook Pro 17 W700G3T | |
| LG Gram 17 (2022) | |
| Lenovo ThinkBook Plus Gen2 Core i5 | |
| Gigabyte Aero 17 HDR YD -9! | |
| AIDA64 / FP32 Ray-Trace | |
| Lenovo ThinkBook Plus Gen3 | |
| Durchschnittliche Intel Core i7-12700H (2585 - 17957, n=64) | |
| Asus ProArt StudioBook Pro 17 W700G3T | |
| Dell XPS 17 9720 | |
| LG Gram 17 (2022) | |
| Lenovo ThinkBook Plus Gen2 Core i5 | |
| AIDA64 / FPU Julia | |
| Lenovo ThinkBook Plus Gen3 | |
| Durchschnittliche Intel Core i7-12700H (12439 - 90760, n=64) | |
| Asus ProArt StudioBook Pro 17 W700G3T | |
| Dell XPS 17 9720 | |
| LG Gram 17 (2022) | |
| Lenovo ThinkBook Plus Gen2 Core i5 | |
| AIDA64 / CPU SHA3 | |
| Durchschnittliche Intel Core i7-12700H (833 - 4242, n=64) | |
| Lenovo ThinkBook Plus Gen3 | |
| Dell XPS 17 9720 | |
| Asus ProArt StudioBook Pro 17 W700G3T | |
| Lenovo ThinkBook Plus Gen2 Core i5 | |
| LG Gram 17 (2022) | |
| AIDA64 / CPU Queen | |
| Dell XPS 17 9720 | |
| Durchschnittliche Intel Core i7-12700H (57923 - 103202, n=63) | |
| Lenovo ThinkBook Plus Gen3 | |
| Asus ProArt StudioBook Pro 17 W700G3T | |
| LG Gram 17 (2022) | |
| Lenovo ThinkBook Plus Gen2 Core i5 | |
| AIDA64 / FPU SinJulia | |
| Durchschnittliche Intel Core i7-12700H (3249 - 9939, n=64) | |
| Dell XPS 17 9720 | |
| Lenovo ThinkBook Plus Gen3 | |
| Asus ProArt StudioBook Pro 17 W700G3T | |
| LG Gram 17 (2022) | |
| Lenovo ThinkBook Plus Gen2 Core i5 | |
| AIDA64 / FPU Mandel | |
| Lenovo ThinkBook Plus Gen3 | |
| Durchschnittliche Intel Core i7-12700H (7135 - 44760, n=64) | |
| Asus ProArt StudioBook Pro 17 W700G3T | |
| Dell XPS 17 9720 | |
| LG Gram 17 (2022) | |
| Lenovo ThinkBook Plus Gen2 Core i5 | |
| AIDA64 / CPU AES | |
| Durchschnittliche Intel Core i7-12700H (31839 - 144360, n=64) | |
| Dell XPS 17 9720 | |
| Lenovo ThinkBook Plus Gen3 | |
| Lenovo ThinkBook Plus Gen2 Core i5 | |
| LG Gram 17 (2022) | |
| Asus ProArt StudioBook Pro 17 W700G3T | |
| AIDA64 / CPU ZLib | |
| Durchschnittliche Intel Core i7-12700H (305 - 1171, n=64) | |
| Dell XPS 17 9720 | |
| Lenovo ThinkBook Plus Gen3 | |
| Asus ProArt StudioBook Pro 17 W700G3T | |
| LG Gram 17 (2022) | |
| Lenovo ThinkBook Plus Gen2 Core i5 | |
| Gigabyte Aero 17 HDR YD | |
| AIDA64 / FP64 Ray-Trace | |
| Lenovo ThinkBook Plus Gen3 | |
| Durchschnittliche Intel Core i7-12700H (1437 - 9692, n=64) | |
| Asus ProArt StudioBook Pro 17 W700G3T | |
| Dell XPS 17 9720 | |
| LG Gram 17 (2022) | |
| Lenovo ThinkBook Plus Gen2 Core i5 | |
| AIDA64 / CPU PhotoWorxx | |
| Dell XPS 17 9720 | |
| Lenovo ThinkBook Plus Gen3 | |
| Lenovo ThinkBook Plus Gen2 Core i5 | |
| LG Gram 17 (2022) | |
| Durchschnittliche Intel Core i7-12700H (12863 - 52207, n=64) | |
| Asus ProArt StudioBook Pro 17 W700G3T | |
Systemleistung
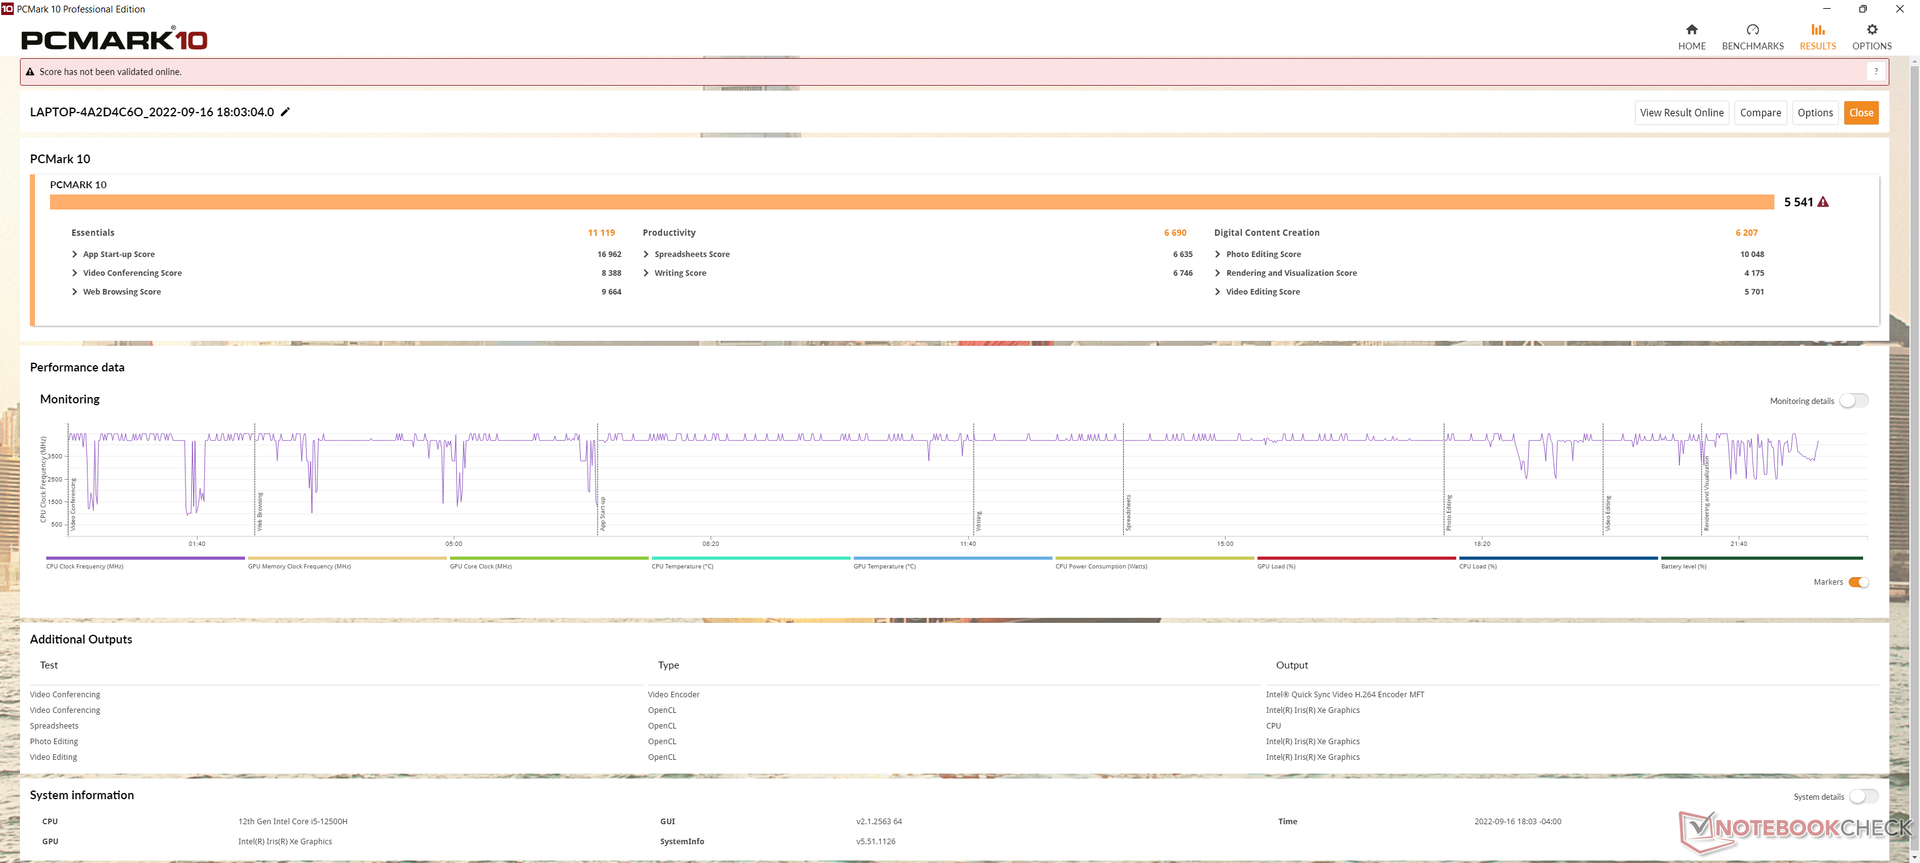
Die Ergebnisse im PCMark 10 sind höher als bei vielen Laptops mit Core-U- oder älterer Core-H-CPU, aber niedriger als bei Modellen mit dedizierter GPU wie dem XPS 17 9720.
CrossMark: Overall | Productivity | Creativity | Responsiveness
| PCMark 10 / Score | |
| Gigabyte Aero 17 HDR YD | |
| Dell XPS 17 9720 | |
| Durchschnittliche Intel Core i7-12700H, Intel Iris Xe Graphics G7 96EUs (5541 - 6281, n=8) | |
| Lenovo ThinkBook Plus Gen3 | |
| LG Gram 17 (2022) | |
| Asus ProArt StudioBook Pro 17 W700G3T | |
| Lenovo ThinkBook Plus Gen2 Core i5 | |
| PCMark 10 / Essentials | |
| Lenovo ThinkBook Plus Gen3 | |
| Durchschnittliche Intel Core i7-12700H, Intel Iris Xe Graphics G7 96EUs (9991 - 11699, n=8) | |
| Dell XPS 17 9720 | |
| Lenovo ThinkBook Plus Gen2 Core i5 | |
| Gigabyte Aero 17 HDR YD | |
| LG Gram 17 (2022) | |
| Asus ProArt StudioBook Pro 17 W700G3T | |
| PCMark 10 / Productivity | |
| Dell XPS 17 9720 | |
| Gigabyte Aero 17 HDR YD | |
| Asus ProArt StudioBook Pro 17 W700G3T | |
| Durchschnittliche Intel Core i7-12700H, Intel Iris Xe Graphics G7 96EUs (6690 - 8038, n=8) | |
| Lenovo ThinkBook Plus Gen3 | |
| LG Gram 17 (2022) | |
| Lenovo ThinkBook Plus Gen2 Core i5 | |
| PCMark 10 / Digital Content Creation | |
| Gigabyte Aero 17 HDR YD | |
| Dell XPS 17 9720 | |
| Durchschnittliche Intel Core i7-12700H, Intel Iris Xe Graphics G7 96EUs (6207 - 7401, n=8) | |
| Lenovo ThinkBook Plus Gen3 | |
| LG Gram 17 (2022) | |
| Asus ProArt StudioBook Pro 17 W700G3T | |
| Lenovo ThinkBook Plus Gen2 Core i5 | |
| CrossMark / Overall | |
| Dell XPS 17 9720 | |
| Durchschnittliche Intel Core i7-12700H, Intel Iris Xe Graphics G7 96EUs (1492 - 1907, n=8) | |
| Lenovo ThinkBook Plus Gen3 | |
| LG Gram 17 (2022) | |
| CrossMark / Productivity | |
| Dell XPS 17 9720 | |
| Durchschnittliche Intel Core i7-12700H, Intel Iris Xe Graphics G7 96EUs (1499 - 1832, n=8) | |
| Lenovo ThinkBook Plus Gen3 | |
| LG Gram 17 (2022) | |
| CrossMark / Creativity | |
| Dell XPS 17 9720 | |
| Lenovo ThinkBook Plus Gen3 | |
| Durchschnittliche Intel Core i7-12700H, Intel Iris Xe Graphics G7 96EUs (1507 - 2016, n=8) | |
| LG Gram 17 (2022) | |
| CrossMark / Responsiveness | |
| Dell XPS 17 9720 | |
| Durchschnittliche Intel Core i7-12700H, Intel Iris Xe Graphics G7 96EUs (1384 - 1831, n=8) | |
| LG Gram 17 (2022) | |
| Lenovo ThinkBook Plus Gen3 | |
| PCMark 10 Score | 5541 Punkte | |
Hilfe | ||
| AIDA64 / Memory Copy | |
| Dell XPS 17 9720 | |
| Lenovo ThinkBook Plus Gen3 | |
| LG Gram 17 (2022) | |
| Lenovo ThinkBook Plus Gen2 Core i5 | |
| Durchschnittliche Intel Core i7-12700H (25615 - 80511, n=64) | |
| Asus ProArt StudioBook Pro 17 W700G3T | |
| AIDA64 / Memory Read | |
| Lenovo ThinkBook Plus Gen3 | |
| Dell XPS 17 9720 | |
| LG Gram 17 (2022) | |
| Lenovo ThinkBook Plus Gen2 Core i5 | |
| Durchschnittliche Intel Core i7-12700H (25586 - 79442, n=64) | |
| Asus ProArt StudioBook Pro 17 W700G3T | |
| AIDA64 / Memory Write | |
| Dell XPS 17 9720 | |
| Lenovo ThinkBook Plus Gen2 Core i5 | |
| LG Gram 17 (2022) | |
| Lenovo ThinkBook Plus Gen3 | |
| Durchschnittliche Intel Core i7-12700H (23679 - 88660, n=64) | |
| Asus ProArt StudioBook Pro 17 W700G3T | |
| AIDA64 / Memory Latency | |
| Lenovo ThinkBook Plus Gen3 | |
| LG Gram 17 (2022) | |
| Lenovo ThinkBook Plus Gen2 Core i5 | |
| Dell XPS 17 9720 | |
| Durchschnittliche Intel Core i7-12700H (76.2 - 133.9, n=62) | |
| Asus ProArt StudioBook Pro 17 W700G3T | |
| Gigabyte Aero 17 HDR YD | |
* ... kleinere Werte sind besser
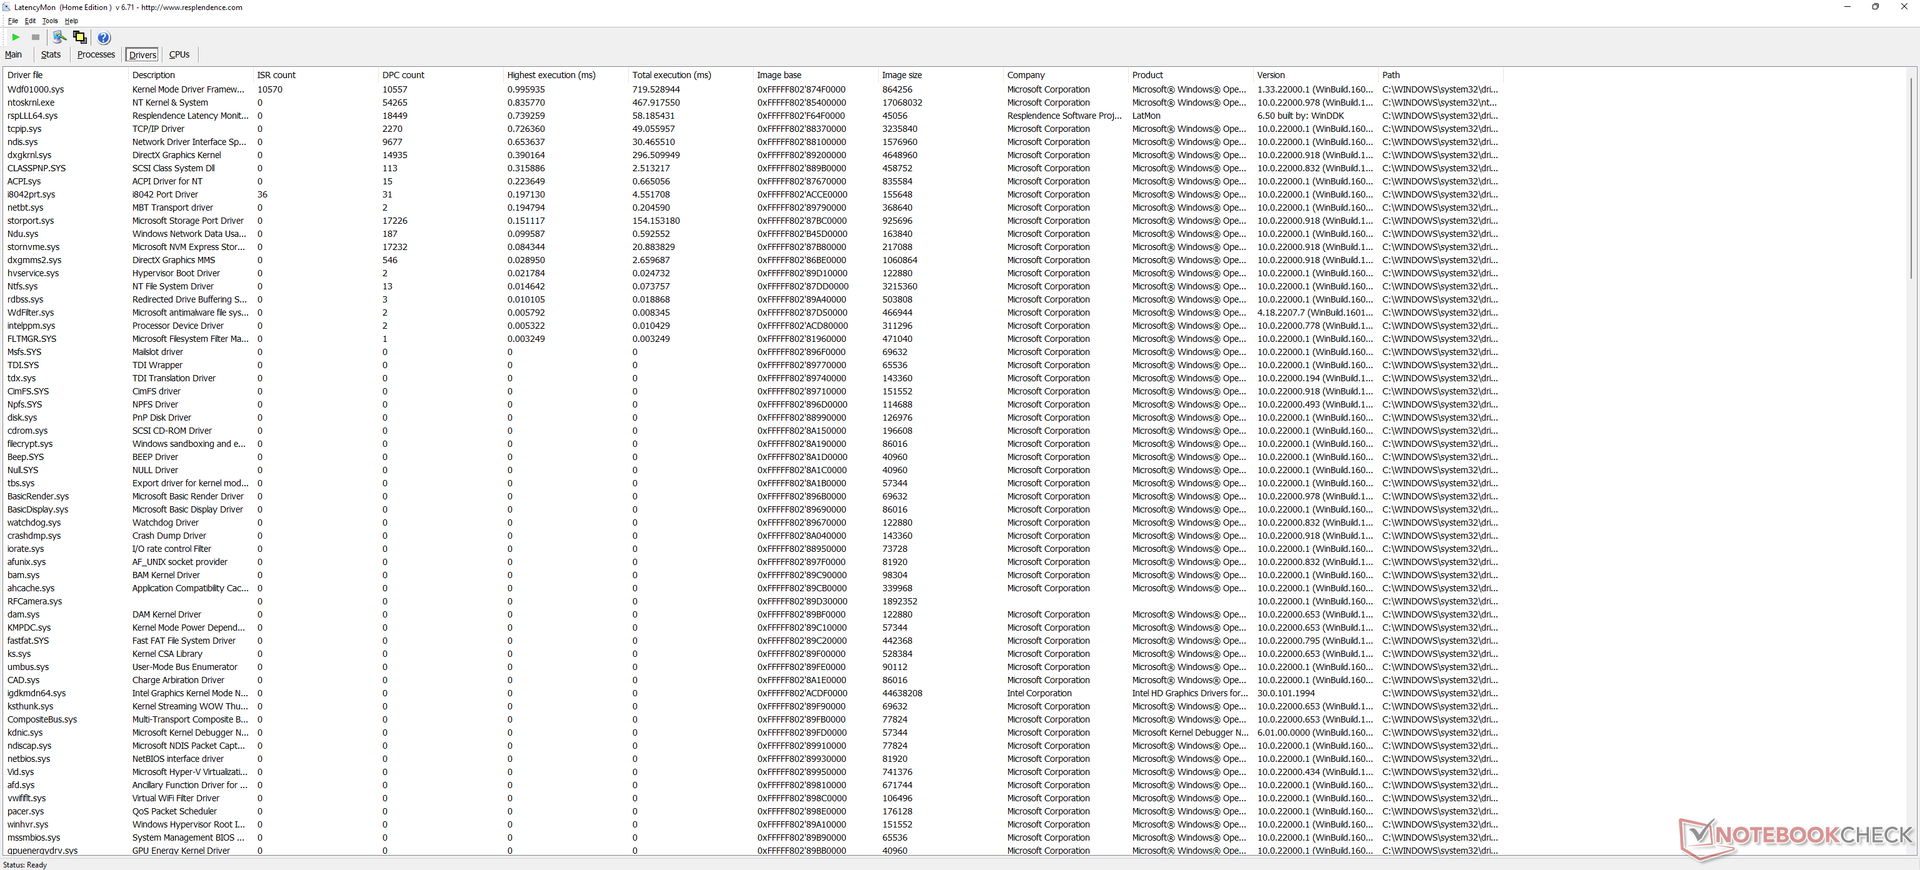
DPC Latency
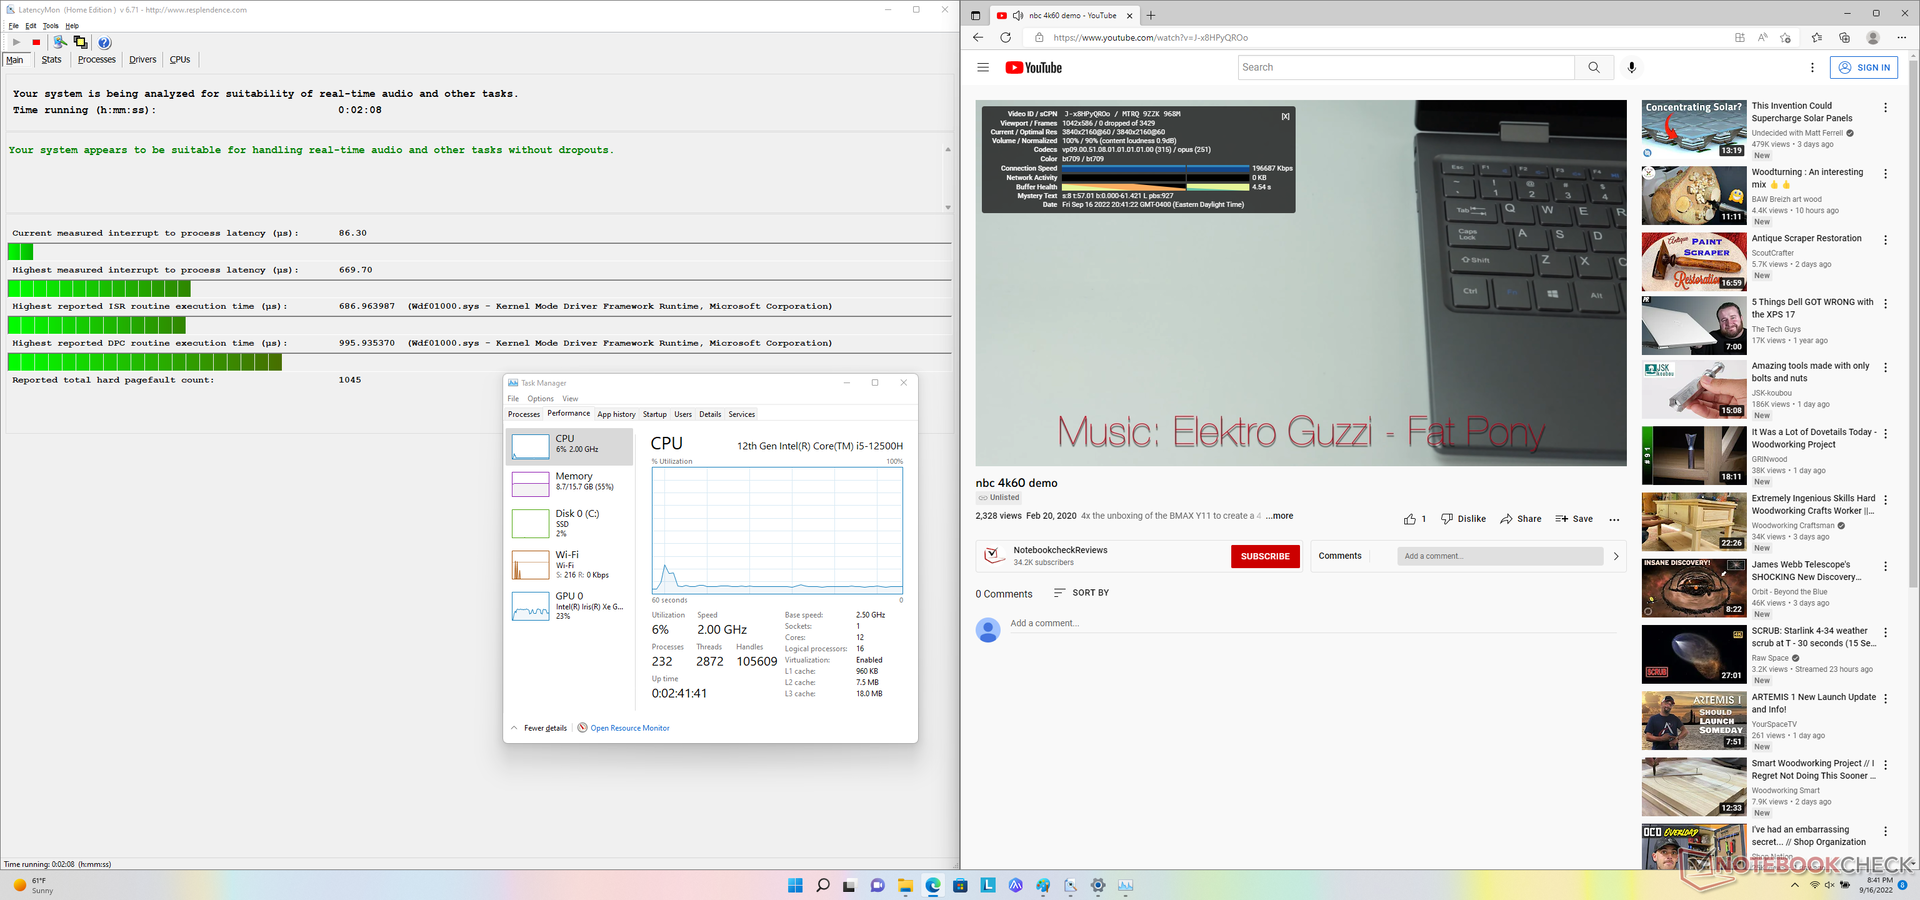
LatencyMon erkennt keine größeren DPC-Probleme beim Öffnen mehrerer Browsertabs auf unserer Homepage oder beim Prime95-Durchgang für 30 Sekunden. Auch unser 4K/60-fps-YouTubevideo wird perfekt und ohne Dropped Frames abgespielt.
| DPC Latencies / LatencyMon - interrupt to process latency (max), Web, Youtube, Prime95 | |
| Gigabyte Aero 17 HDR YD | |
| Lenovo ThinkBook Plus Gen2 Core i5 | |
| Dell XPS 17 9720 | |
| Lenovo ThinkBook Plus Gen3 | |
| LG Gram 17 (2022) | |
* ... kleinere Werte sind besser
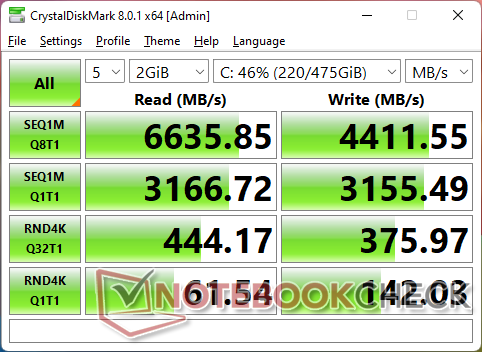
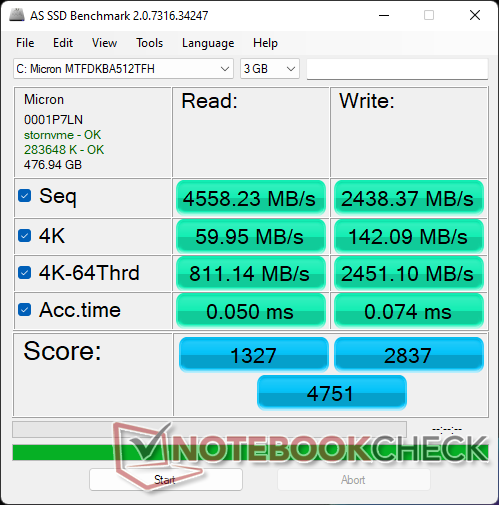
Massenspeicher
Unsere Testeinheit wird mit der gleichen Micron 3400 MTFDKBA512TFH mit 512 GB Notebook SSD und Festplatten Benchmarksausgeliefert wie im Dell XPS 17 9720. Diese ist zwar nicht ganz so schnell wie eine Samsung PM9A1, zeigt aber auch keine Drosselung im Dauertest, sondern offenbart eine konstante Leistung, selbst unter Stressbedingungen.

| Drive Performance Rating - Percent | |
| Gigabyte Aero 17 HDR YD | |
| LG Gram 17 (2022) | |
| Lenovo ThinkBook Plus Gen2 Core i5 | |
| Dell XPS 17 9720 | |
| Lenovo ThinkBook Plus Gen3 | |
| Asus ProArt StudioBook Pro 17 W700G3T | |
* ... kleinere Werte sind besser
Disk Throttling: DiskSpd Read Loop, Queue Depth 8
Grafikleistung — Nur mit integrierter Iris Xe
Die reine Grafikleistung liegt nur wenige Prozentpunkte unterhalb unseres Durchschnittsmodells mit der gleichen Iris Xe 96 EUs. Es ist wirklich zu schade, dass es keine Optionen auf eine dedizierte GeForce GTX/RTX oder wenigstens MX gibt, welche die Grafikleistung signifikant angehoben hätte. Das integrierte Intel-Modell ist gerade für einen 17-Zöller eine recht langsame Option.
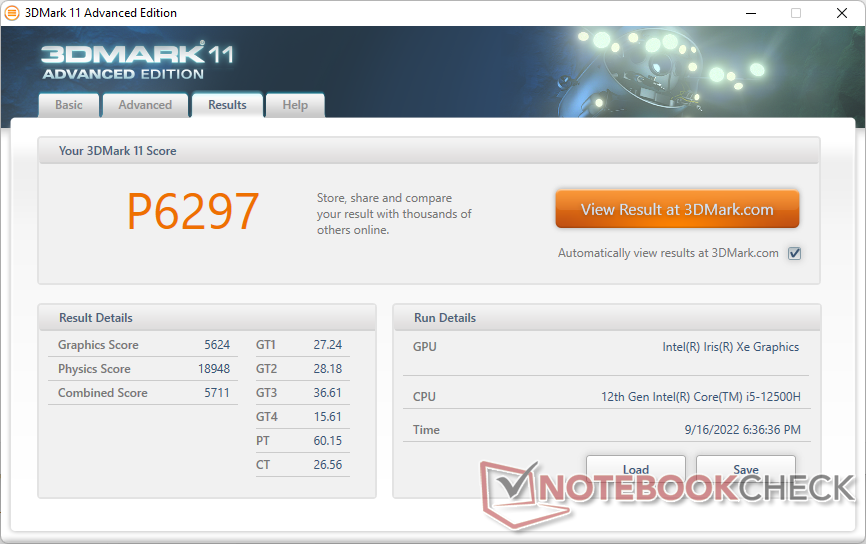
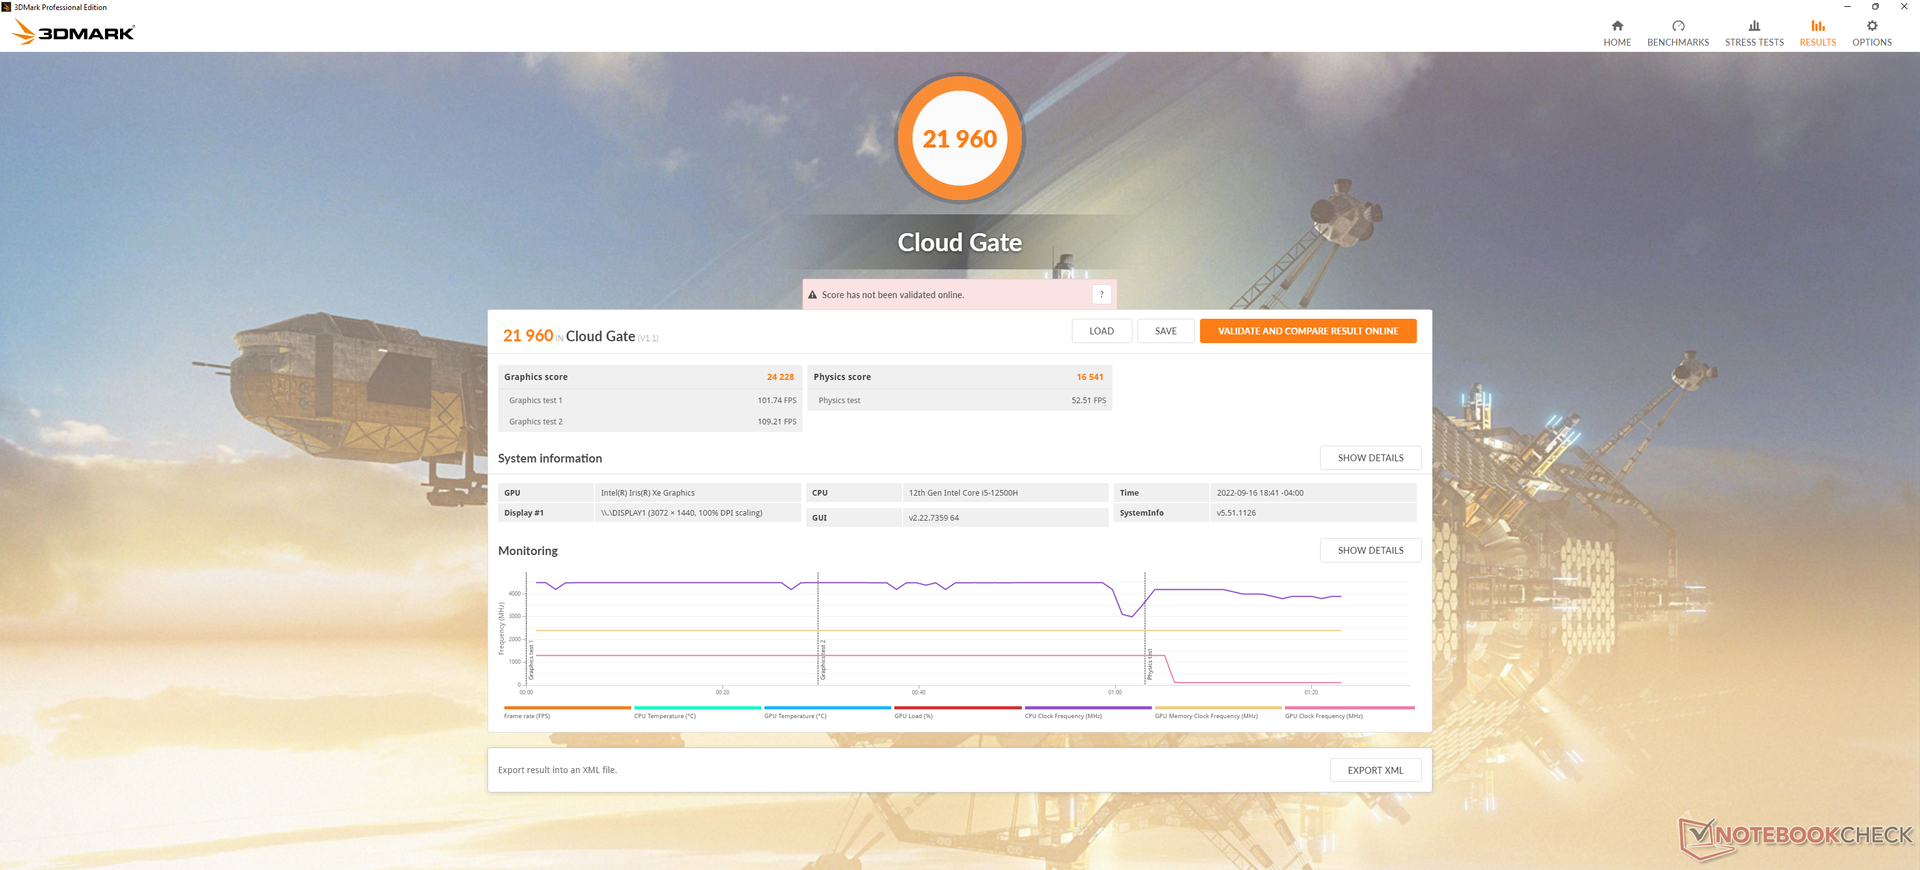
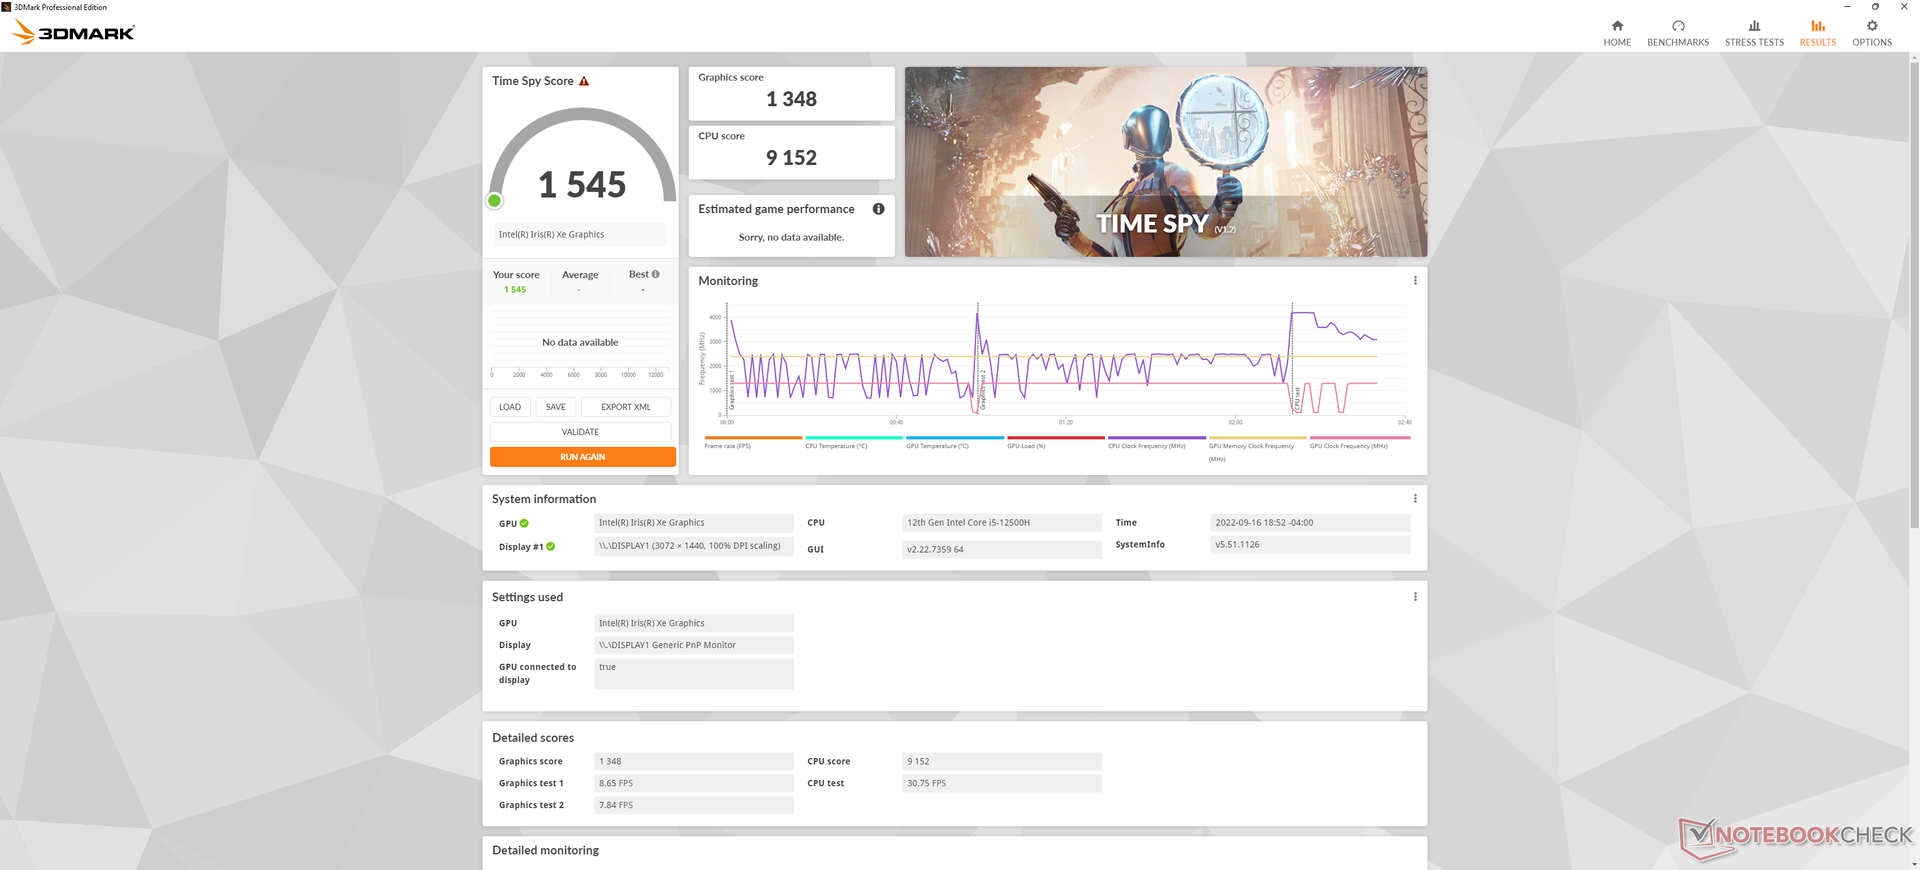
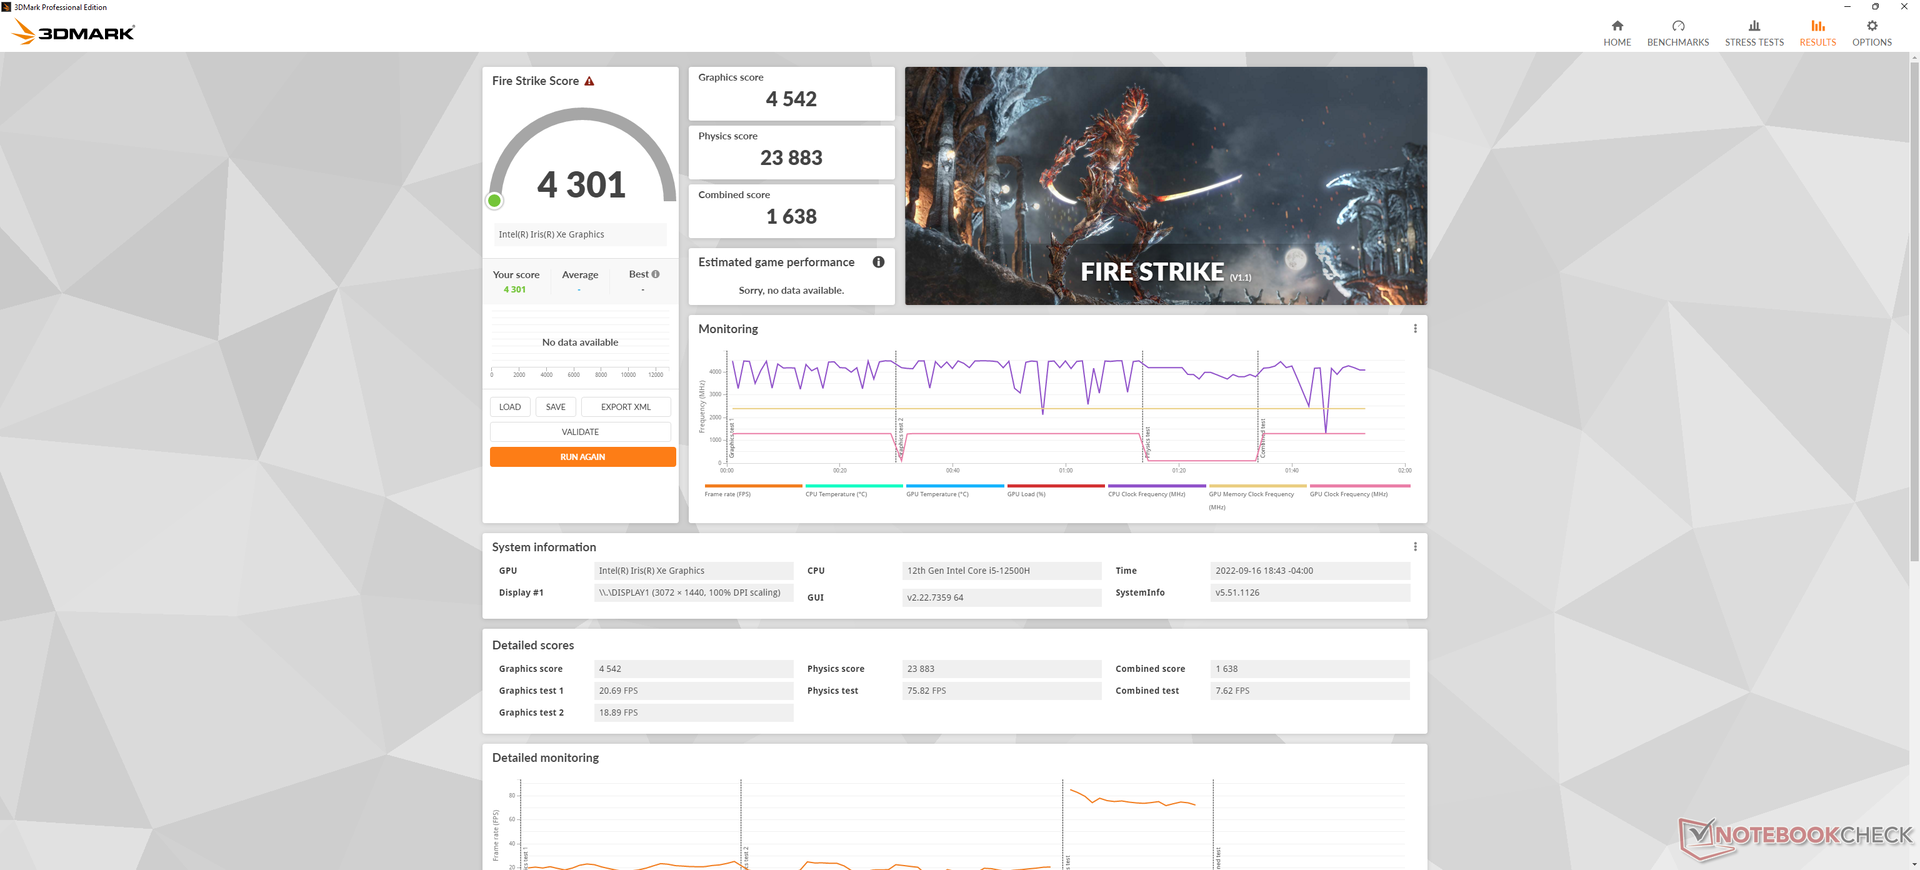
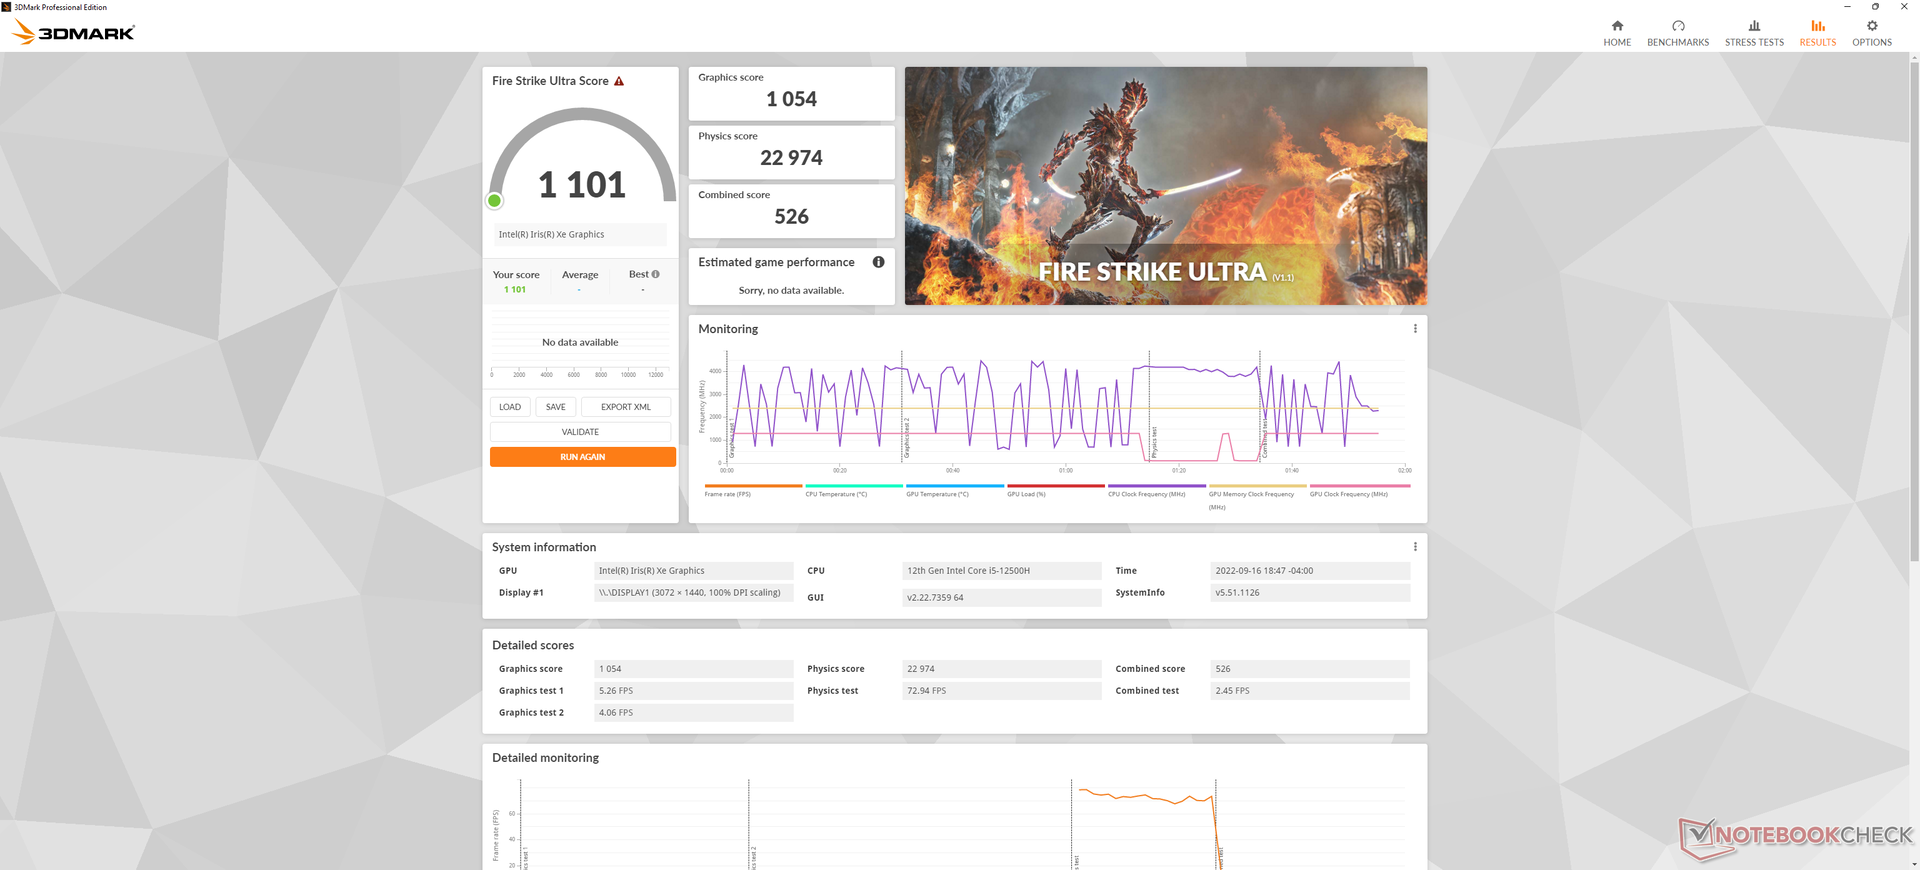
| 3DMark 11 Performance | 6297 Punkte | |
| 3DMark Cloud Gate Standard Score | 21960 Punkte | |
| 3DMark Fire Strike Score | 4301 Punkte | |
| 3DMark Time Spy Score | 1545 Punkte | |
Hilfe | ||
Witcher 3 FPS Chart
| min. | mittel | hoch | max. | |
|---|---|---|---|---|
| GTA V (2015) | 100.1 | 60.9 | 20 | 8.96 |
| The Witcher 3 (2015) | 87.1 | 51.2 | 30.4 | 13.4 |
| Dota 2 Reborn (2015) | 126 | 94.1 | 48.6 | 44.9 |
| Final Fantasy XV Benchmark (2018) | 39 | 21.3 | 16.8 | |
| X-Plane 11.11 (2018) | 43.5 | 34 | 30.4 | |
| Strange Brigade (2018) | 74.6 | 32 | 25.5 | 20.2 |
| Cyberpunk 2077 1.6 (2022) | 16 | 13.4 | 10.6 | 8.6 |
Emissionen
Systemlautstärke — Laut unter Last
Im Leerlauf säuseln die Lüfter zwischen 26 und 28 dB(A), je nach gewähltem Leistungsprofil (Hintergrund: 22.7 dB(A)). Das bedeutet leider auch, dass die Lüfter niemals wirklich still stehen, was sicher auch eine Konsequenz aus der Wahl einer Core-H-CPU anstelle einer langsameren, aber effizienteren Core-U-Option darstellt. Die Lüfter neigen dazu selbst beim Surfen oder der Word-Nutzung immer wieder mal auf 35 dB(A) hochzufahren, sofern der Extreme Performance Modus anliegt. Wir empfehlen daher für weniger anspruchsvolle Aufgaben die Modi Balanced oder "Intelligent Cooling".
Anspruchsvollere Lasten wie Gaming trotzen den Lüftern eine Lautstärke zwischen 39 und 43 dB(A) ab, was deutlich lauter ist als beim kleineren ThinkBook Plus Gen 2.
Lautstärkediagramm
| Idle |
| 26.3 / 26.3 / 27.9 dB(A) |
| Last |
| 42.2 / 46.5 dB(A) |
 | ||
30 dB leise 40 dB(A) deutlich hörbar 50 dB(A) störend |
||
min: | ||
| Lenovo ThinkBook Plus Gen3 Iris Xe G7 96EUs, i7-12700H, Micron 3400 MTFDKBA512TFH 512GB | Lenovo ThinkBook Plus Gen2 Core i5 Iris Xe G7 80EUs, i5-1130G7, Samsung PM9A1 MZVL2512HCJQ | Asus ProArt StudioBook Pro 17 W700G3T Quadro RTX 3000 Max-Q, i7-9750H, Samsung SSD PM981 MZVLB1T0HALR | LG Gram 17 (2022) Iris Xe G7 80EUs, i5-1240P, Samsung PM9A1 MZVL2512HCJQ | Dell XPS 17 9720 GeForce RTX 3050 4GB Laptop GPU, i7-12700H, Micron 3400 MTFDKBA512TFH 512GB | Gigabyte Aero 17 HDR YD GeForce RTX 3080 Laptop GPU, i9-11980HK, Samsung PM9A1 MZVL2512HCJQ | |
|---|---|---|---|---|---|---|
| Geräuschentwicklung | 6% | 2% | 6% | -1% | -21% | |
| aus / Umgebung * (dB) | 22.7 | 25.4 -12% | 29.4 -30% | 25.1 -11% | 24 -6% | 25 -10% |
| Idle min * (dB) | 26.3 | 25.4 3% | 29.4 -12% | 25.12 4% | 24 9% | 30 -14% |
| Idle avg * (dB) | 26.3 | 27.4 -4% | 29.9 -14% | 25.15 4% | 24 9% | 32 -22% |
| Idle max * (dB) | 27.9 | 32.2 -15% | 29.9 -7% | 26 7% | 24 14% | 41 -47% |
| Last avg * (dB) | 42.2 | 32.2 24% | 31.6 25% | 36.9 13% | 43.9 -4% | 43 -2% |
| Witcher 3 ultra * (dB) | 39.8 | 32.2 19% | 31.6 21% | 48.4 -22% | 51 -28% | |
| Last max * (dB) | 46.5 | 34.5 26% | 31.6 32% | 37.2 20% | 48.4 -4% | 59 -27% |
* ... kleinere Werte sind besser
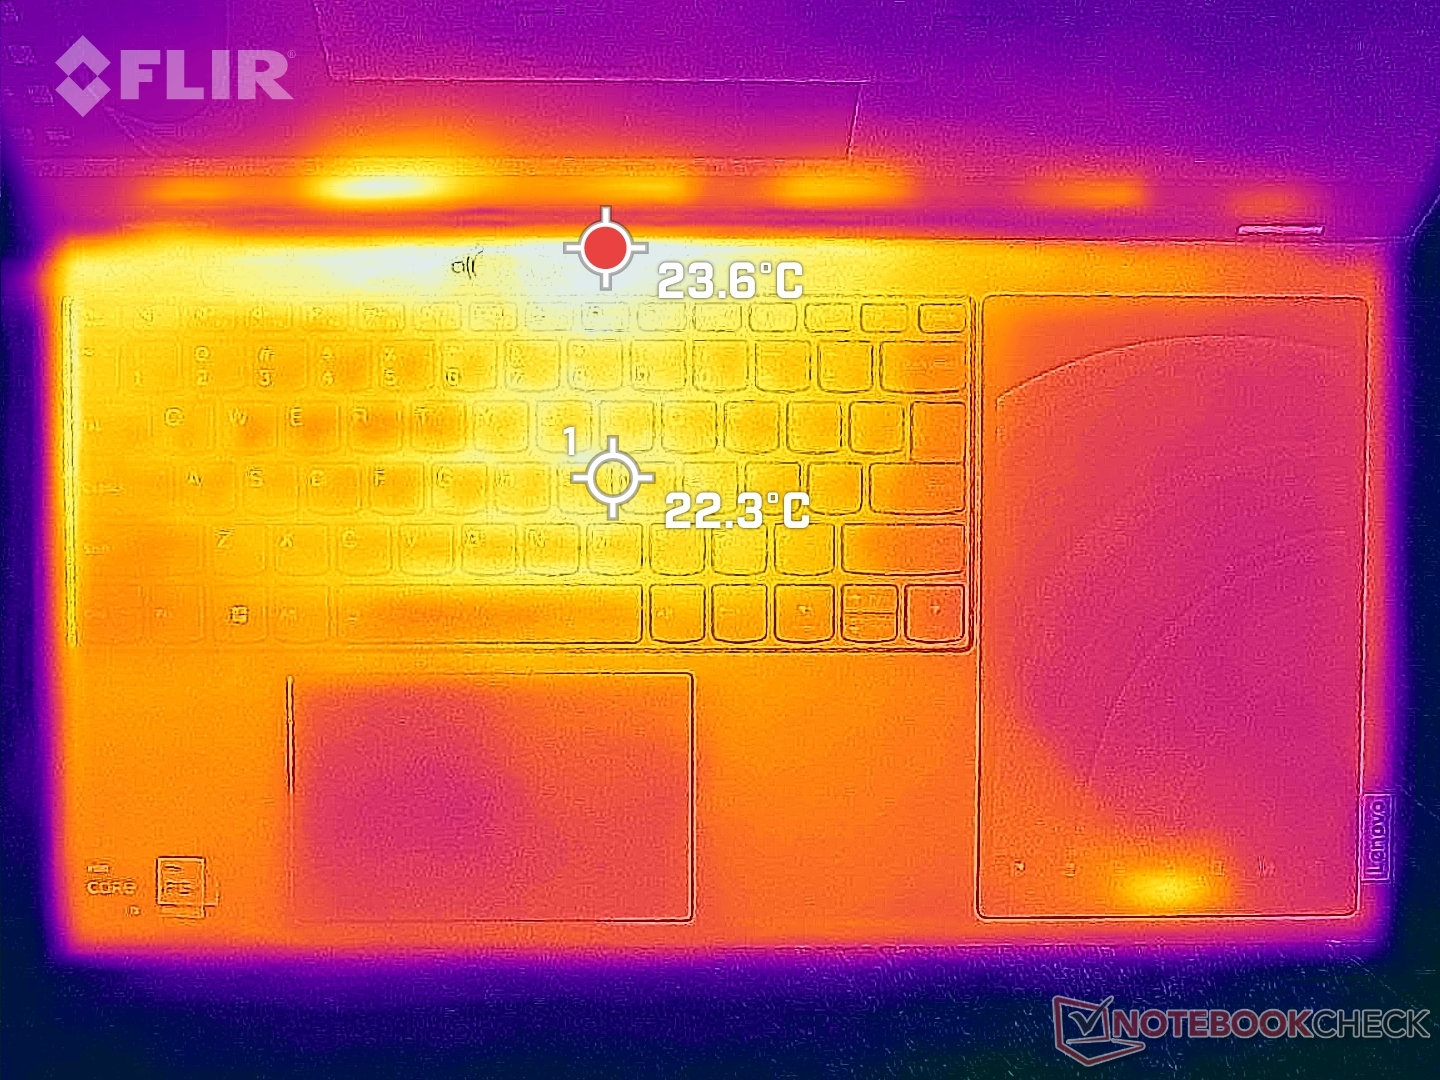
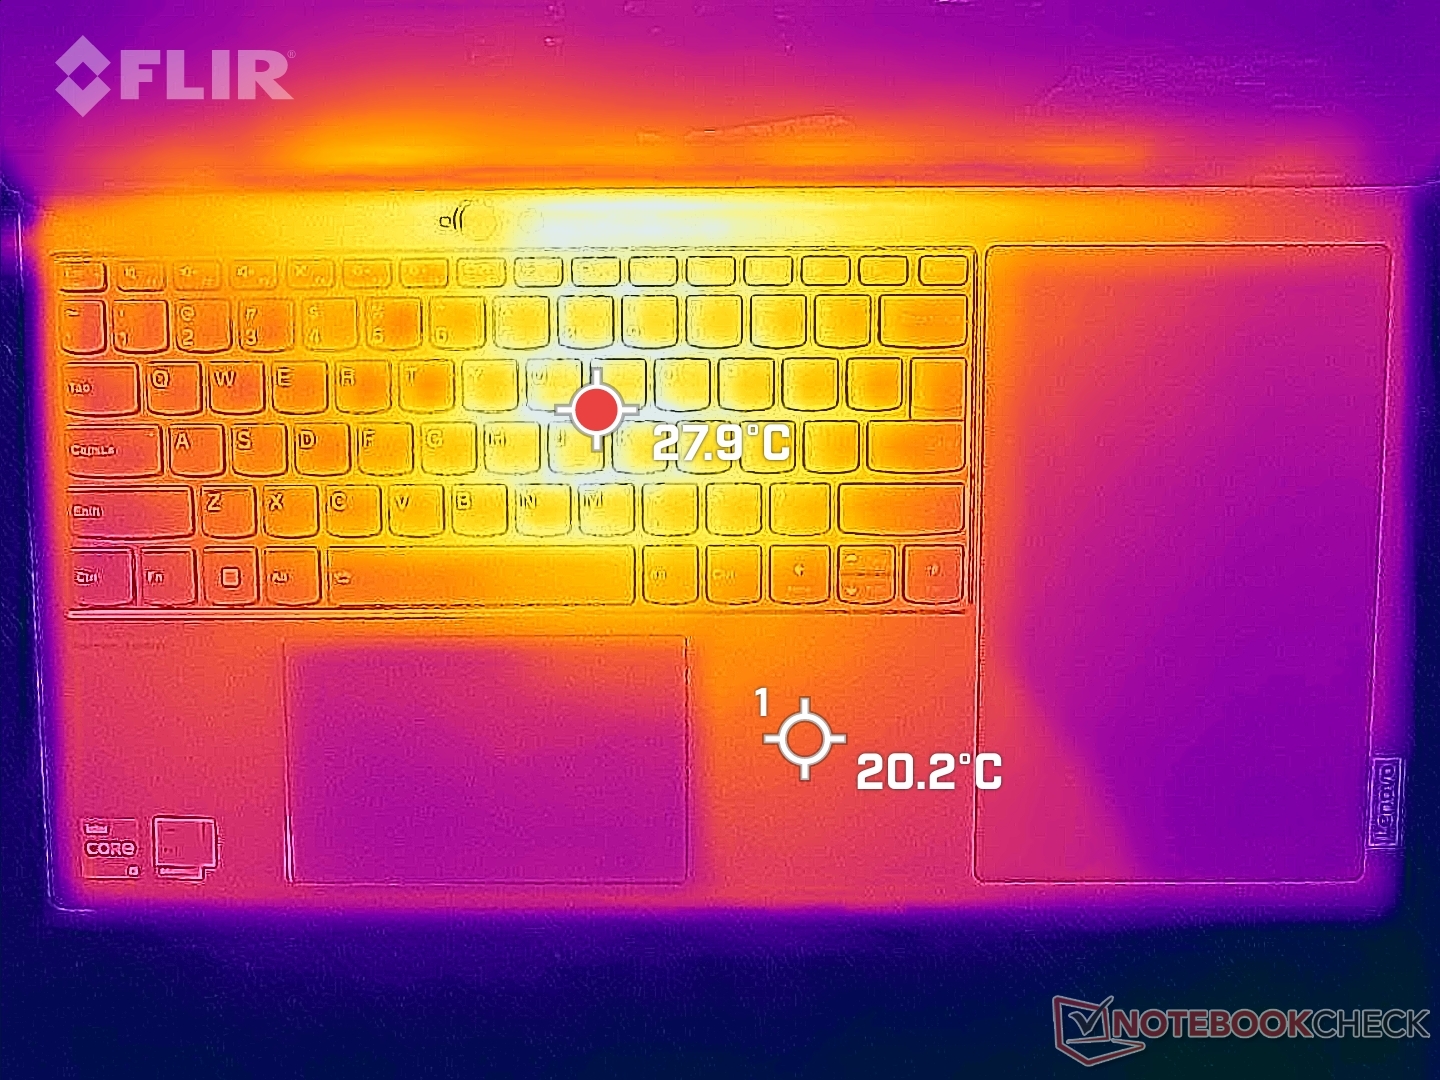
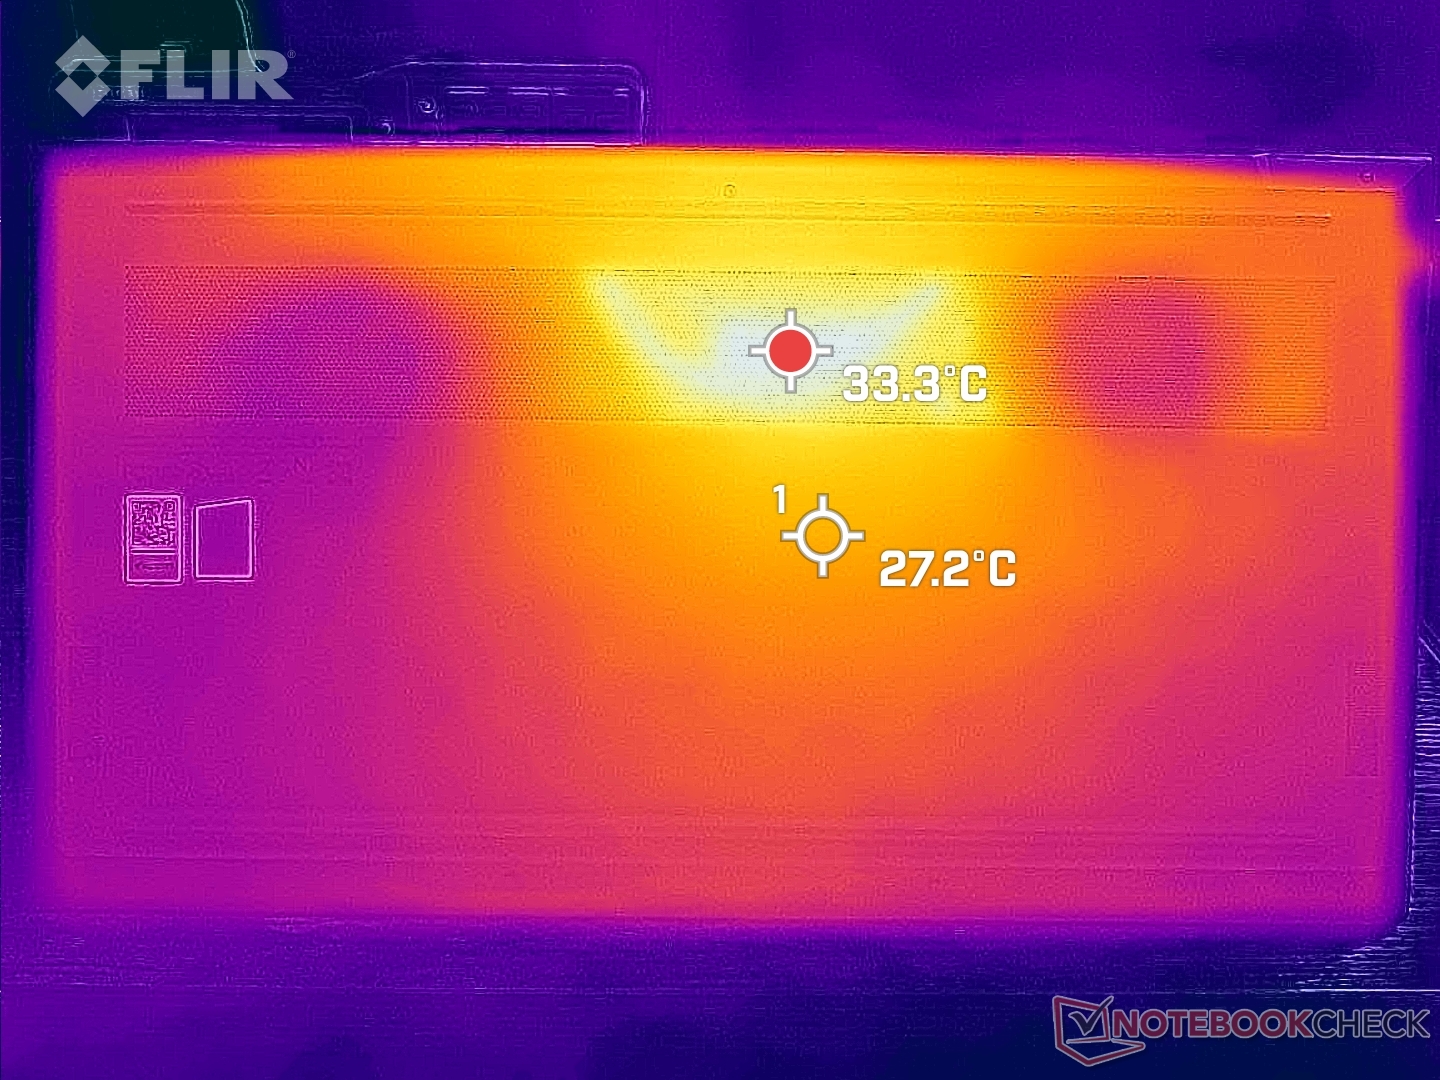
Temperatur — Ziemlich Cool
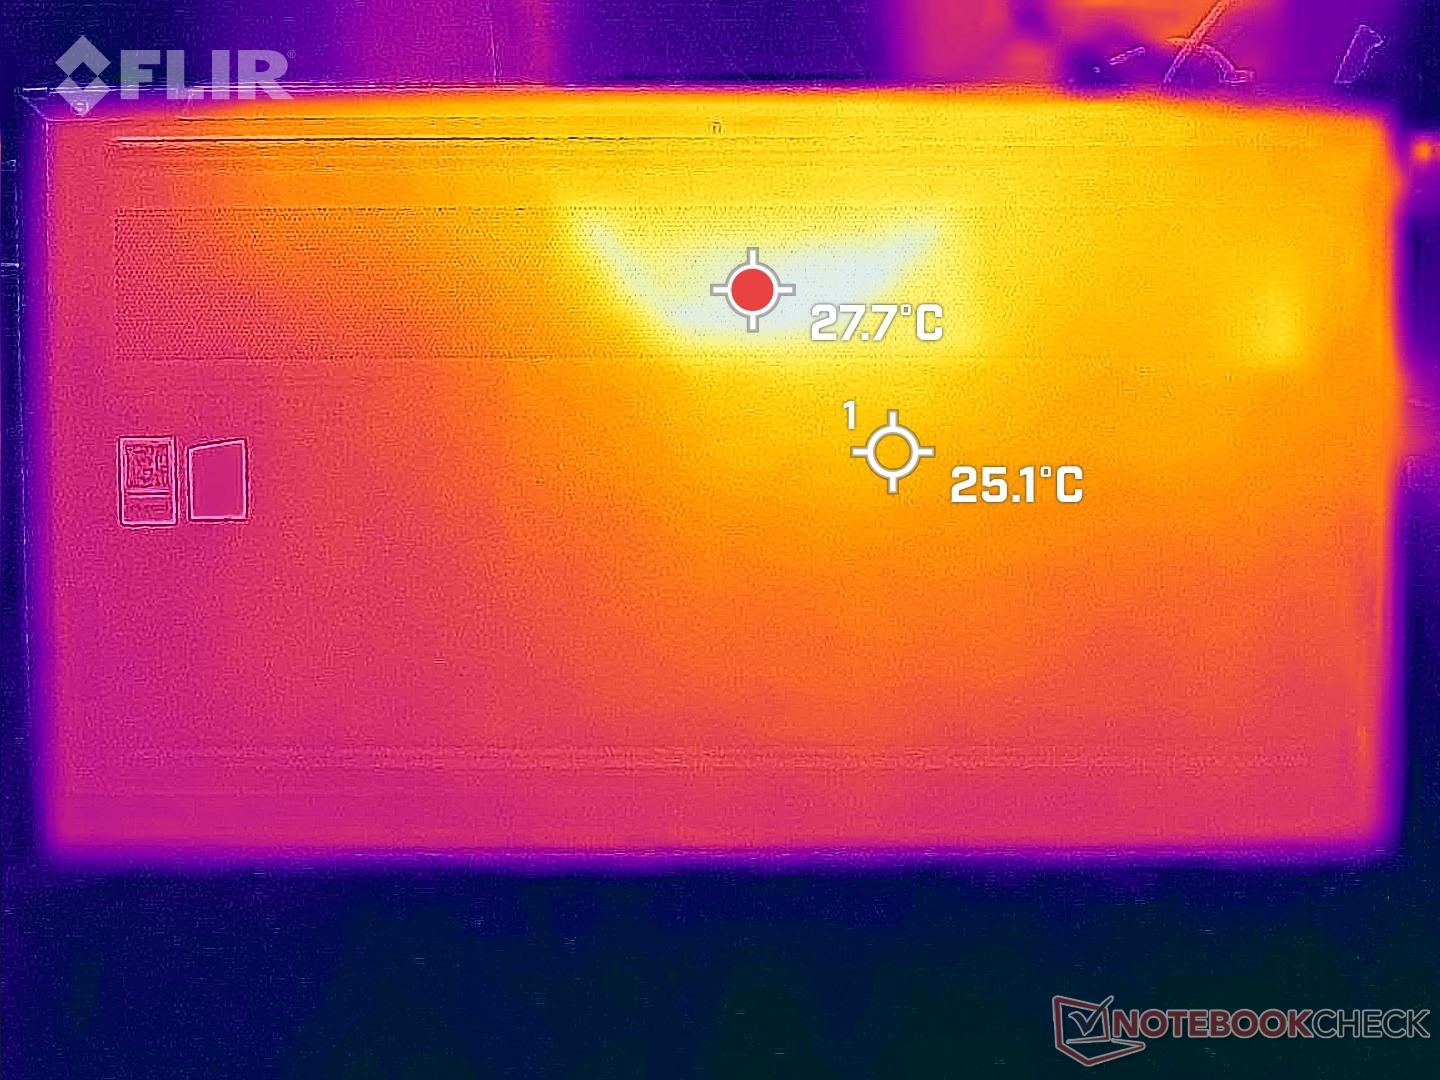
Die Oberflächentemperaturen erweisen sich als kühler als erwartet, selbst unter starken Lasten. Die Hot Spots werden sowohl oben als auch unten nicht wärmer als 33 °C. Das LG Gram 17 wird unter gleichen Bedingungen 50 °C heiß. Offenbar hat die durch das 21:10-Seitenverhältnis große Oberfläche einen positiven Effekt auf die generelle Temperaturentwicklung.
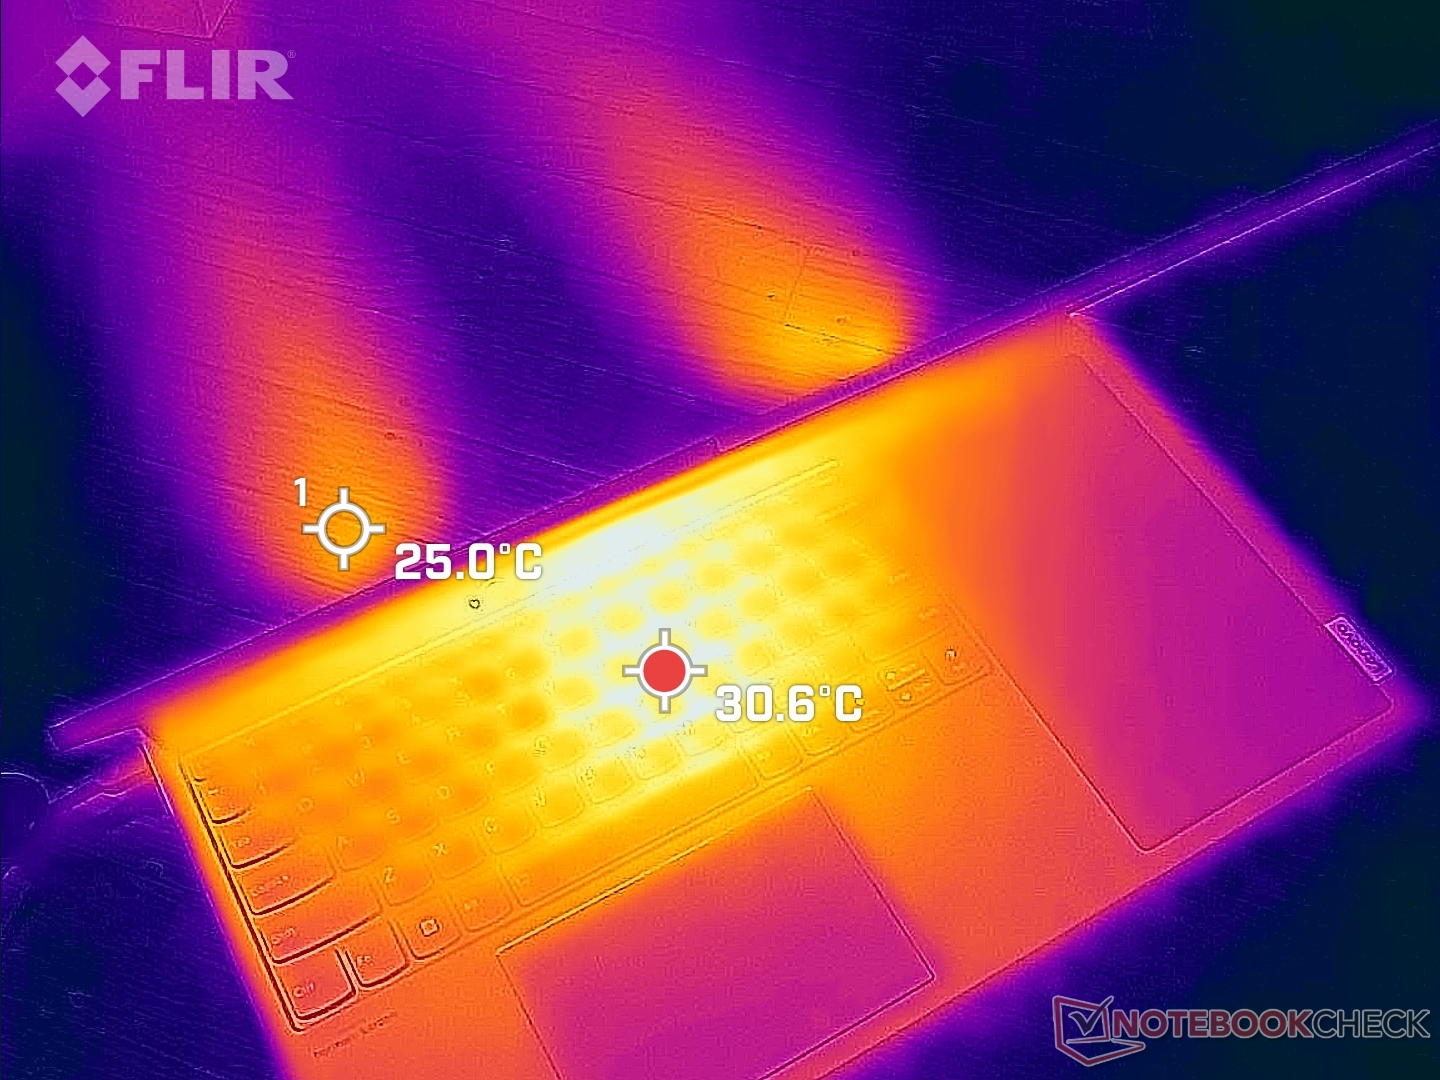
(+) Die maximale Temperatur auf der Oberseite ist 33.2 °C. Im Vergleich liegt der Klassendurchschnitt bei 34.3 °C (von 21.2 bis 62.5 °C für die Klasse Office).
(+) Auf der Unterseite messen wir eine maximalen Wert von 32.8 °C (im Vergleich zum Durchschnitt von 36.8 °C).
(+) Ohne Last messen wir eine durchschnittliche Temperatur von 27.2 °C auf der Oberseite. Der Klassendurchschnitt erreicht 29.5 °C.
(+) Die Handballen und der Touchpad-Bereich sind mit gemessenen 26.4 °C kühler als die typische Hauttemperatur und fühlen sich dadurch kühl an.
(±) Die durchschnittliche Handballen-Temperatur anderer getesteter Geräte war 27.5 °C (+1.1 °C).
| Lenovo ThinkBook Plus Gen3 Intel Core i7-12700H, Intel Iris Xe Graphics G7 96EUs | Lenovo ThinkBook Plus Gen2 Core i5 Intel Core i5-1130G7, Intel Iris Xe Graphics G7 80EUs | Asus ProArt StudioBook Pro 17 W700G3T Intel Core i7-9750H, NVIDIA Quadro RTX 3000 Max-Q | LG Gram 17 (2022) Intel Core i5-1240P, Intel Iris Xe Graphics G7 80EUs | Dell XPS 17 9720 Intel Core i7-12700H, NVIDIA GeForce RTX 3050 4GB Laptop GPU | Gigabyte Aero 17 HDR YD Intel Core i9-11980HK, NVIDIA GeForce RTX 3080 Laptop GPU | |
|---|---|---|---|---|---|---|
| Hitze | -17% | -12% | -30% | -13% | -32% | |
| Last oben max * (°C) | 33.2 | 42 -27% | 45.4 -37% | 50 -51% | 49.5 -49% | 44 -33% |
| Last unten max * (°C) | 32.8 | 44.5 -36% | 53.7 -64% | 50 -52% | 38.4 -17% | 56 -71% |
| Idle oben max * (°C) | 29.8 | 29.8 -0% | 22.2 26% | 31.5 -6% | 28 6% | 32 -7% |
| Idle unten max * (°C) | 30.4 | 31.9 -5% | 21.8 28% | 33.5 -10% | 27.8 9% | 35 -15% |
* ... kleinere Werte sind besser
Stresstest
Stressen wir die CPU mit Prime95 so maximieren sich die Taktraten und die Leistungsaufnahme für wenige Sekunden auf 3,6 GHz und 80 W, dabei wird eine Temperatur von 98 °C erreicht. Danach fallen die Taktraten und die Leistungsaufnahme parallel auf 3 GHz und 60 W und stabilisieren sich letztlich bei 2,8 GHz und 52 W, sodass eine Temperatur von knapp unter 90 °C gehalten werden kann. Der gleiche Test resultiert auf einem XPS 17 mit dem gleichen Core i7-12700H in ähnlichen Taktraten, aber einer kühleren Kerntemperatur von nur 75 °C.
Beim Gaming von Witcher 3 stabilisieren sich die GPU-Taktraten und Temperaturen auf 1.297 MHz und 85 °C, was für dünne Multimedialaptops mit Core-H-CPU ein gewohntes Bild ist, beispielsweise auch beim Dell Inspiron 16 Plus 7620.
Im Akkumodus reduziert sich die Leistung. Ein erneuter 3DMark-11-Durchgang bringt nur noch Physics- und Graphics-Scores von 16.704 und 5.421 Punkte hervor anstelle der 18.948 und 6.524 am Stromnetz.
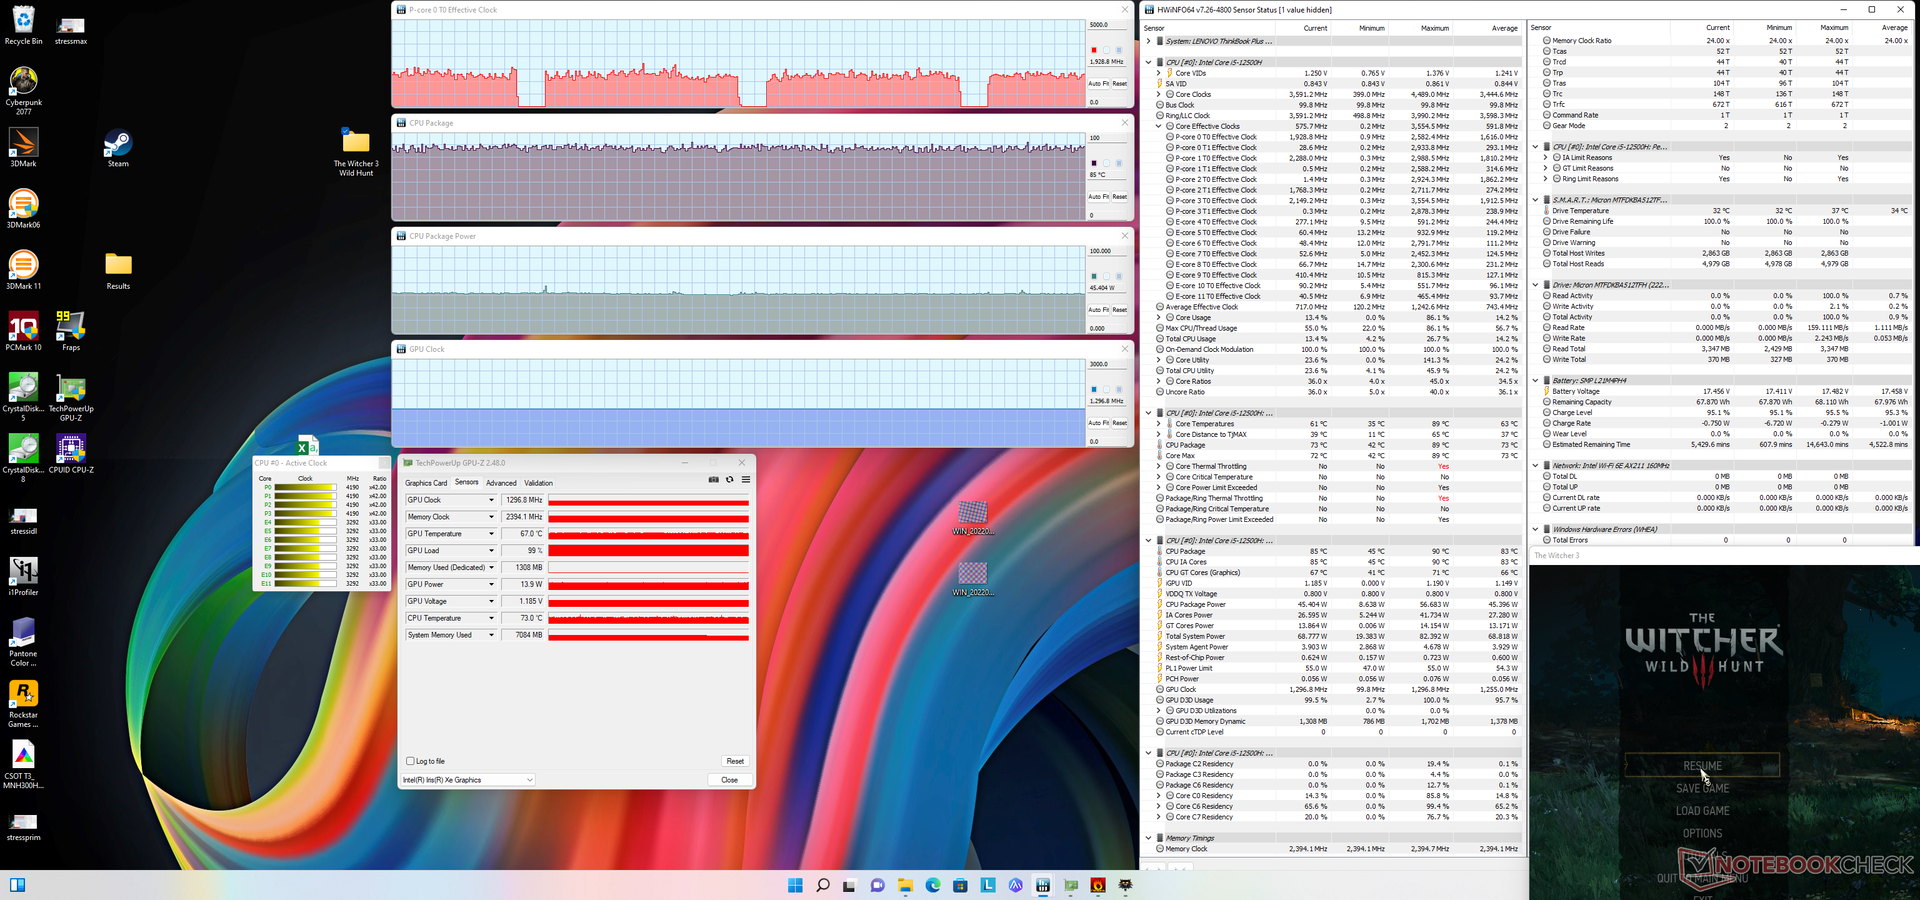
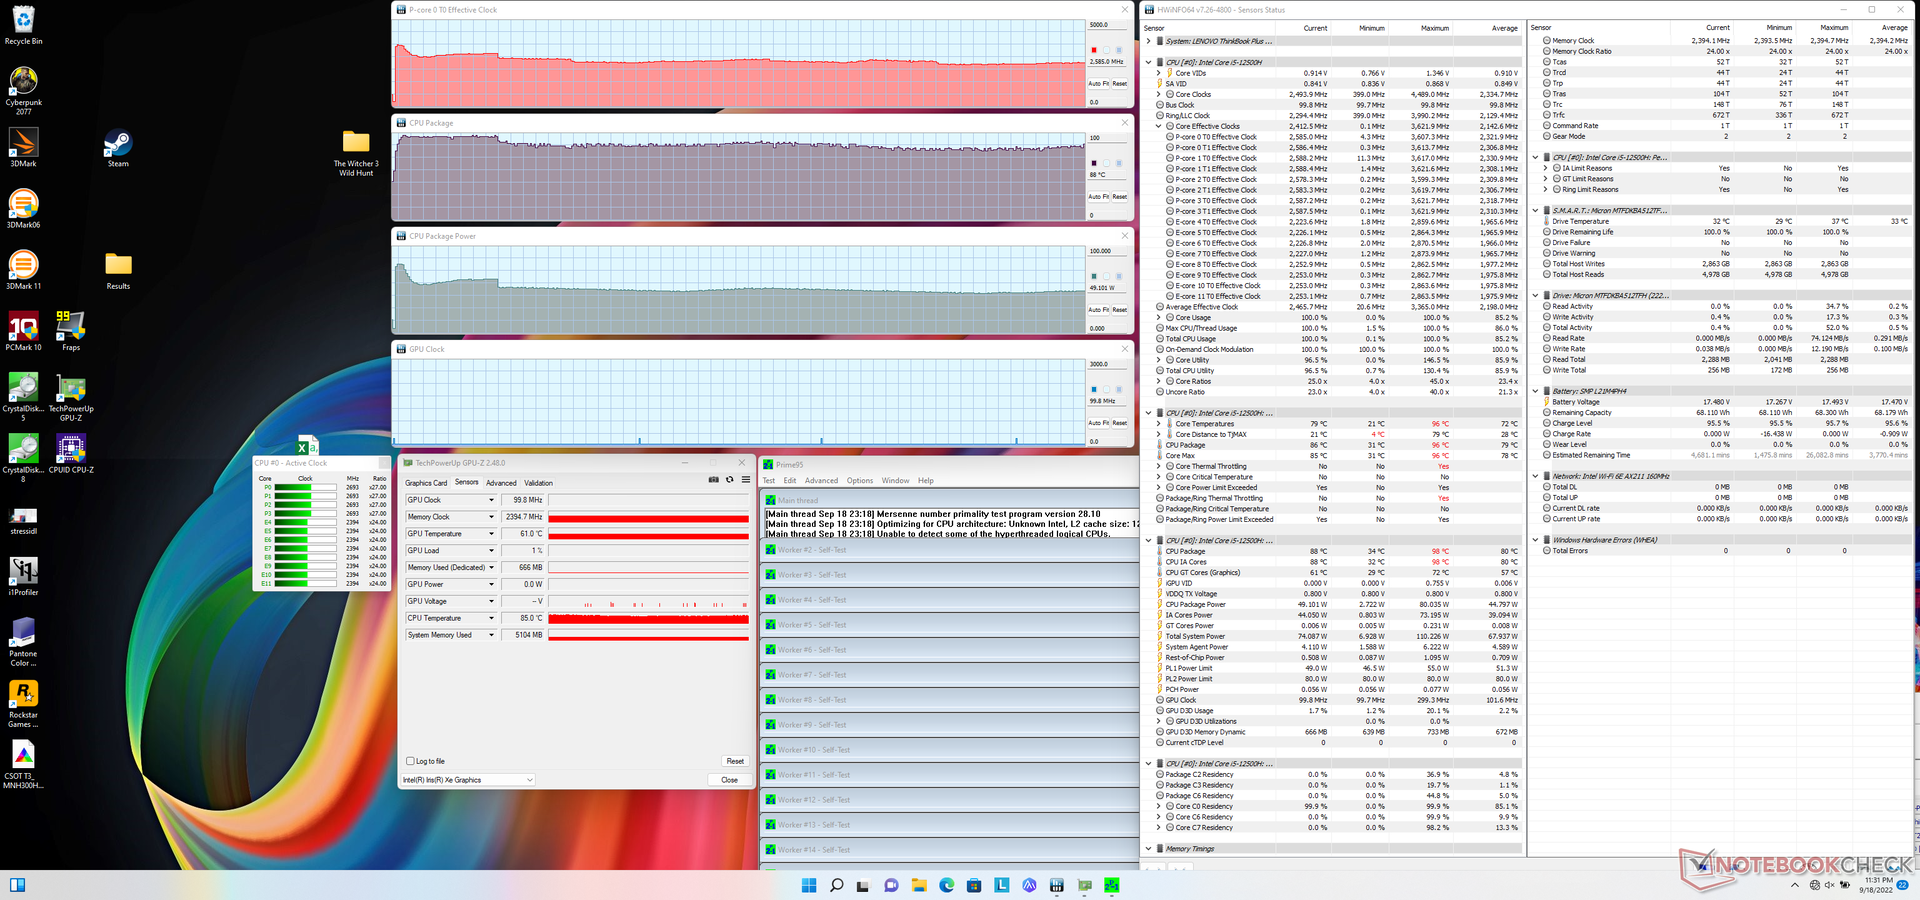
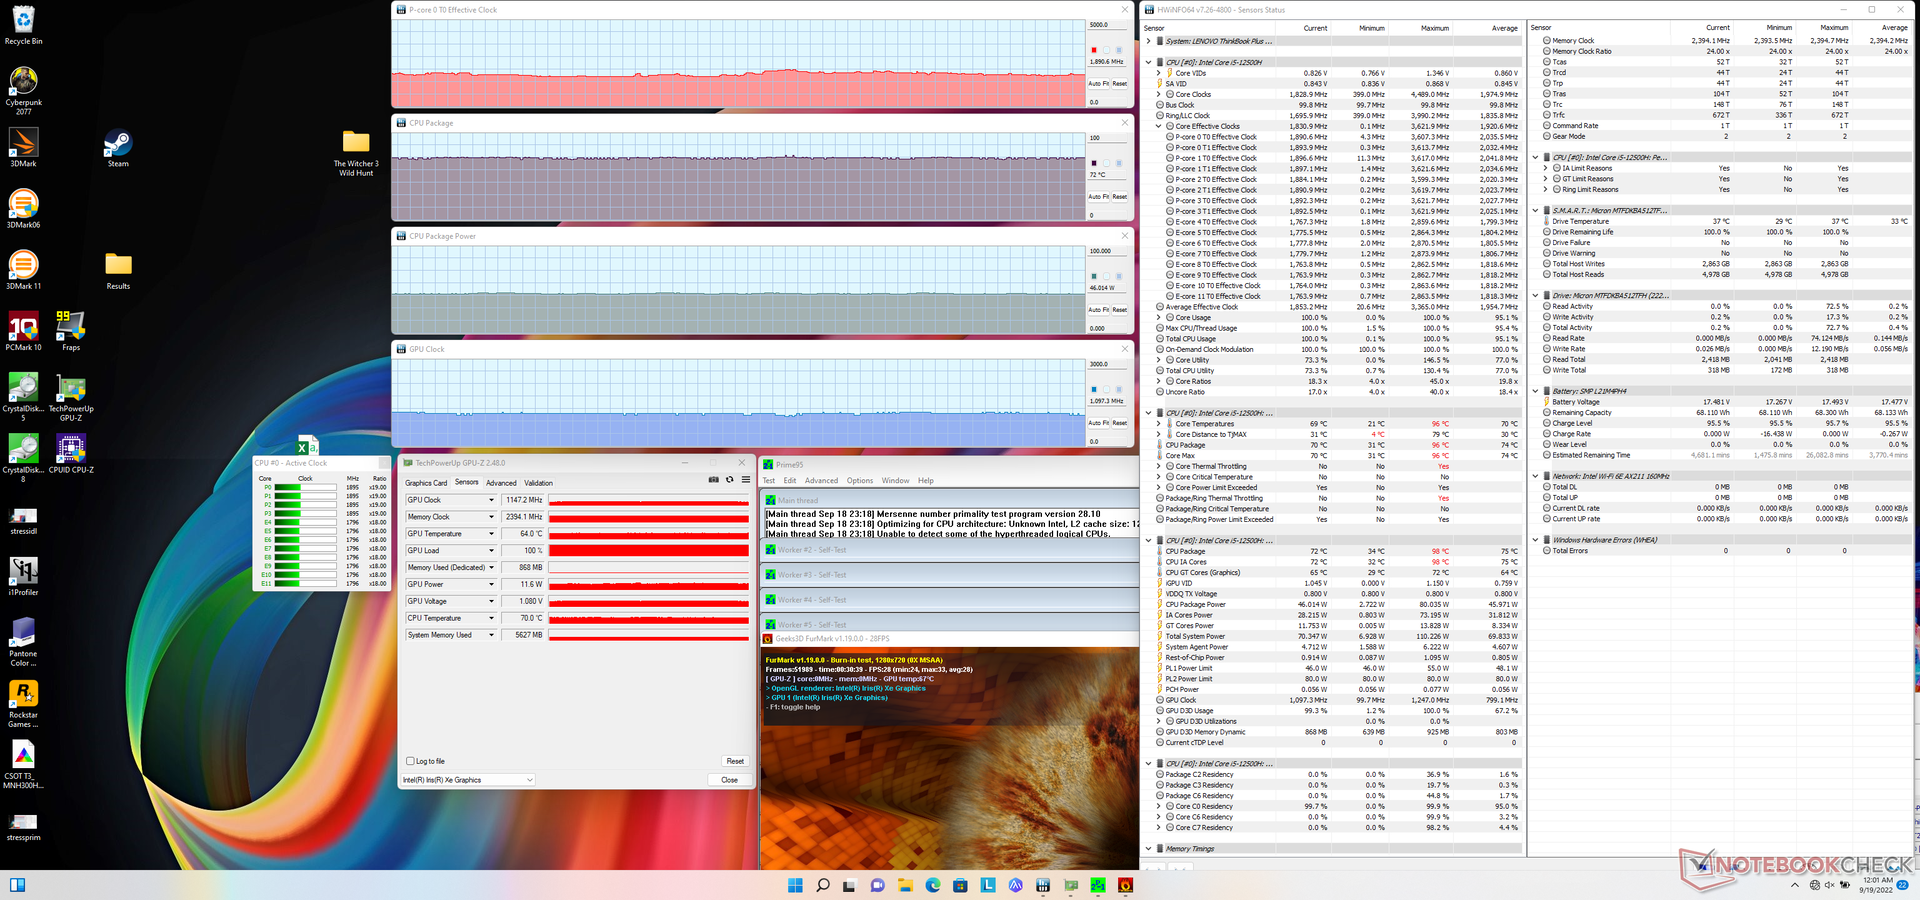
| CPU Clock (GHz) | GPU Clock (MHz) | Average CPU Temperature (°C) | |
| System Idle | -- | -- | 36 |
| Prime95 Stress | 2.6 | -- | 88 |
| Prime95 + FurMark Stress | 1.9 | 1147 | 72 |
| Witcher 3 Stress | ~1.9 | 1297 | 85 |
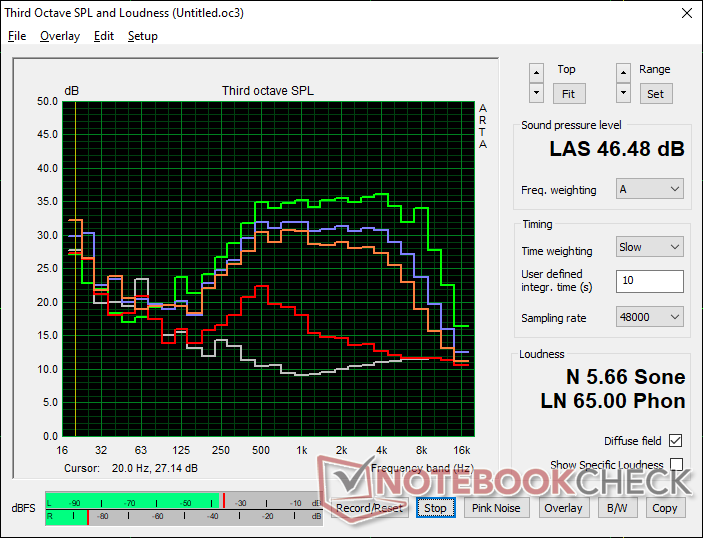
Lautsprecher
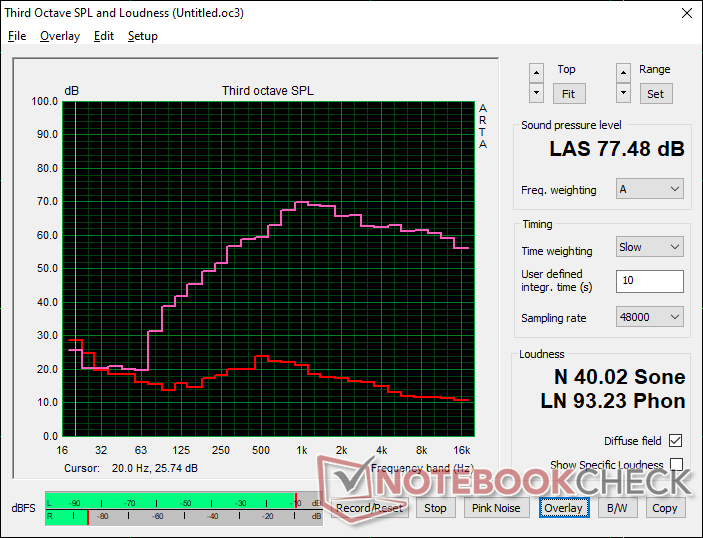
Lenovo ThinkBook Plus Gen3 Audio Analyse
(±) | Mittelmäßig laut spielende Lautsprecher (77.5 dB)
Bass 100 - 315 Hz
(±) | abgesenkter Bass - 14% geringer als der Median
(±) | durchschnittlich lineare Bass-Wiedergabe (9.4% Delta zum Vorgänger)
Mitteltöne 400 - 2000 Hz
(±) | zu hohe Mitten, vom Median 5% abweichend
(+) | lineare Mitten (5% Delta zum Vorgänger)
Hochtöne 2 - 16 kHz
(+) | ausgeglichene Hochtöne, vom Median nur 1.4% abweichend
(+) | sehr lineare Hochtöne (2.5% Delta zum Vorgänger)
Gesamt im hörbaren Bereich 100 - 16.000 Hz
(±) | hörbarer Bereich ist durchschnittlich linear (16% Abstand zum Median)
Im Vergleich zu allen Geräten derselben Klasse
» 18% aller getesteten Geräte dieser Klasse waren besser, 6% vergleichbar, 76% schlechter
» Das beste Gerät hat einen Delta-Wert von 7%, durchschnittlich ist 21%, das schlechteste Gerät hat 53%
Im Vergleich zu allen Geräten im Test
» 25% aller getesteten Geräte waren besser, 5% vergleichbar, 70% schlechter
» Das beste Gerät hat einen Delta-Wert von 4%, durchschnittlich ist 24%, das schlechteste Gerät hat 134%
Apple MacBook Pro 16 2021 M1 Pro Audio Analyse
(+) | Die Lautsprecher können relativ laut spielen (84.7 dB)
Bass 100 - 315 Hz
(+) | guter Bass - nur 3.8% Abweichung vom Median
(+) | lineare Bass-Wiedergabe (5.2% Delta zum Vorgänger)
Mitteltöne 400 - 2000 Hz
(+) | ausgeglichene Mitten, vom Median nur 1.3% abweichend
(+) | lineare Mitten (2.1% Delta zum Vorgänger)
Hochtöne 2 - 16 kHz
(+) | ausgeglichene Hochtöne, vom Median nur 1.9% abweichend
(+) | sehr lineare Hochtöne (2.7% Delta zum Vorgänger)
Gesamt im hörbaren Bereich 100 - 16.000 Hz
(+) | hörbarer Bereich ist sehr linear (4.6% Abstand zum Median
Im Vergleich zu allen Geräten derselben Klasse
» 0% aller getesteten Geräte dieser Klasse waren besser, 0% vergleichbar, 100% schlechter
» Das beste Gerät hat einen Delta-Wert von 5%, durchschnittlich ist 17%, das schlechteste Gerät hat 45%
Im Vergleich zu allen Geräten im Test
» 0% aller getesteten Geräte waren besser, 0% vergleichbar, 100% schlechter
» Das beste Gerät hat einen Delta-Wert von 4%, durchschnittlich ist 24%, das schlechteste Gerät hat 134%
Energiemanagement
Energieverbrauch
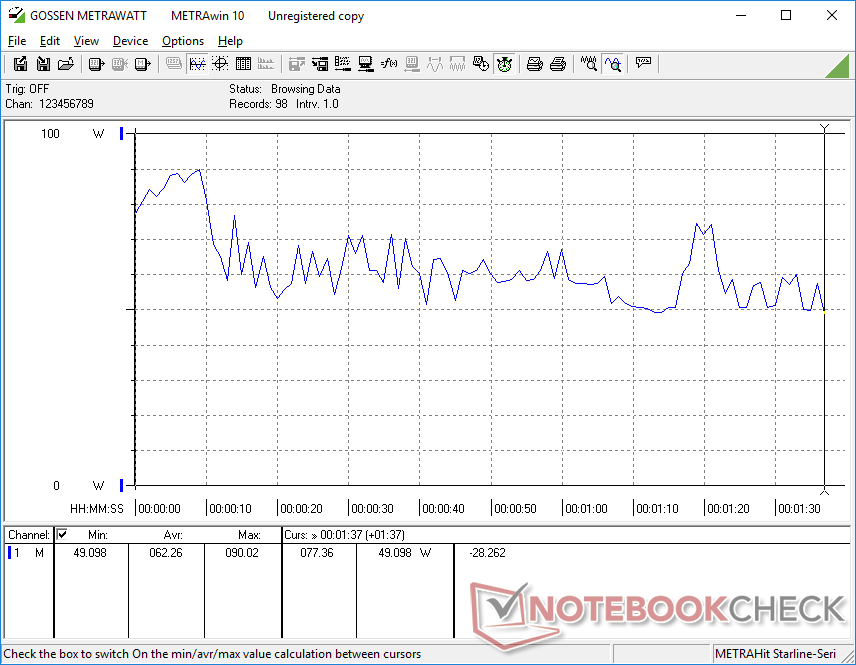
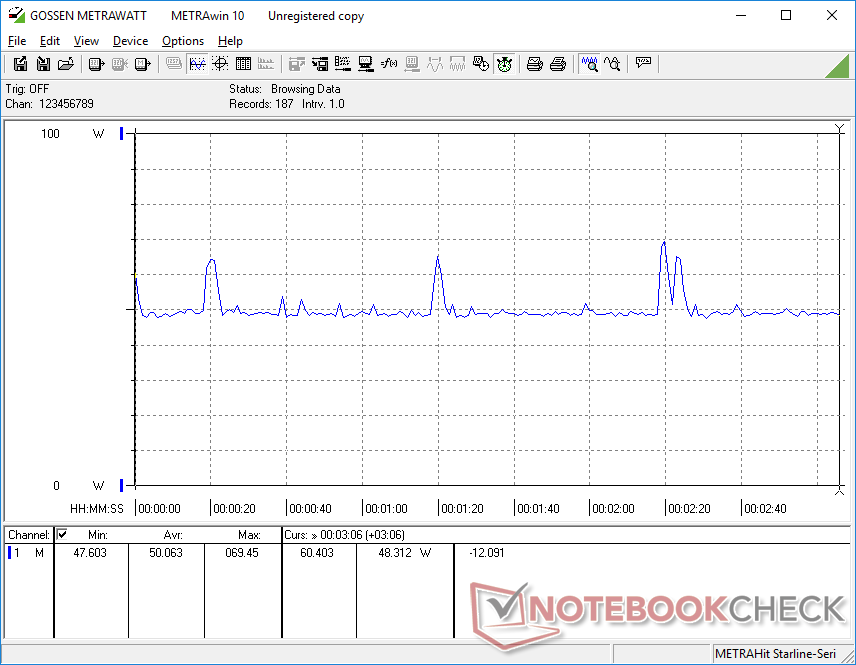
Im Modus Power Saver im Leerlauf zieht das Netzteil nur 7 W aus der Dose, bei minimaler Helligkeit und deaktiviertem Zweitdisplay. Wird Letzteres bei maximaler Helligkeit aktiviert, so werden etwa 2,8 W mehr verbraucht. Sind beide Bildschirme maximal hell und der Laptop im Modus Extreme Performance, so werden knapp unter 17 W verbraucht, was in etwa so viel ist, wie sonst eher schnellere 17-Zoll-Laptops mit dedizierter GPU benötigen.
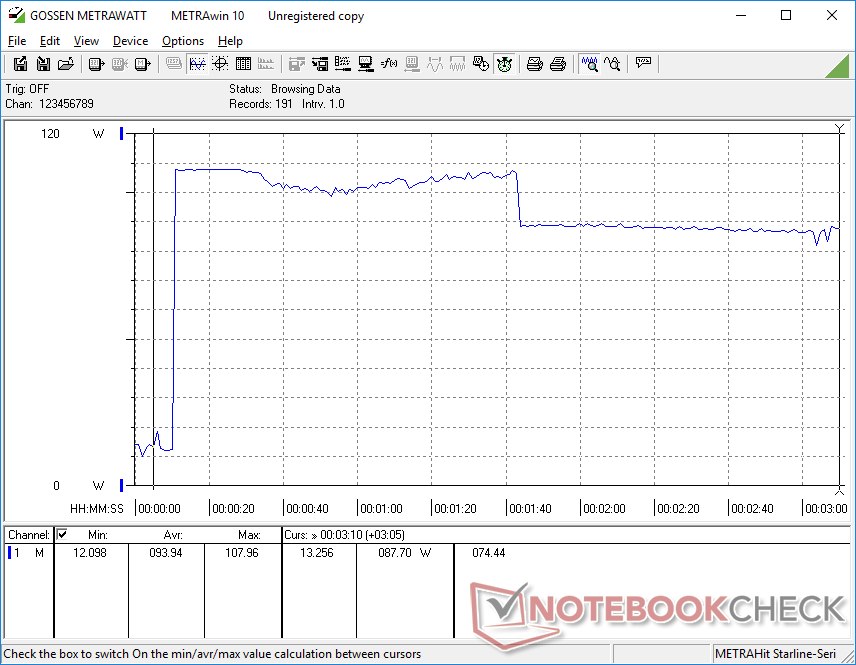
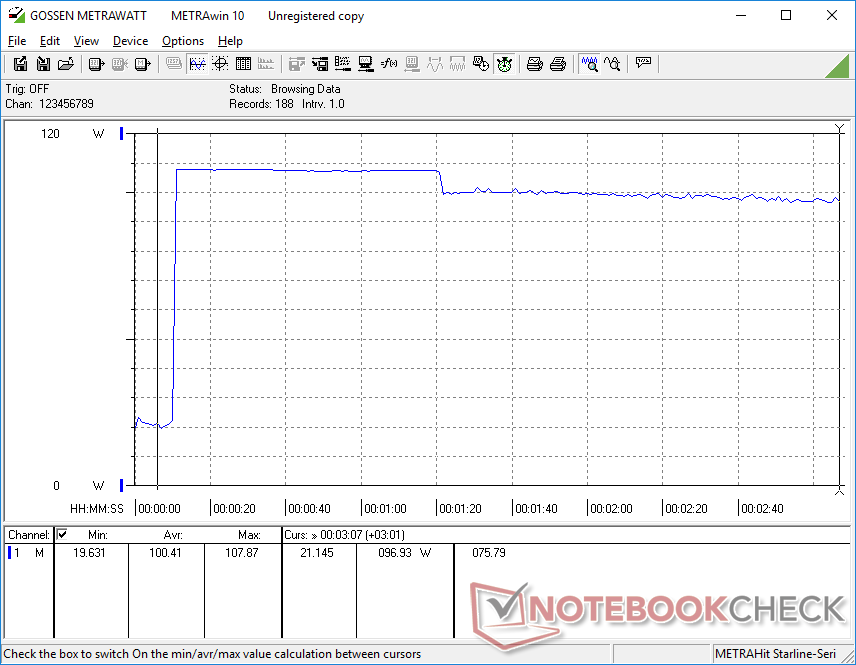
Anspruchsvollere Lasten wie Gaming verlangt zwischen 50 und 65 W, verglichen mit den ~40 W auf den meisten Laptops mit Core-U- oder Core-P-CPUs und der gleichen integrierten Iris Xe 96 EUs wie dem LG Gram 17.
Der allgemeine Verbrauch ist in den meisten Fällen etwa doppelt so hoch wie bei der letzten Generation ThinkBook Plus Gen 2. Das liegt an der gestiegenen Leistung, aber auch am größeren Bildschirm und dem Zweitdisplay.
| Aus / Standby | |
| Idle | |
| Last |
|
Legende:
min: | |
| Lenovo ThinkBook Plus Gen3 i7-12700H, Iris Xe G7 96EUs, Micron 3400 MTFDKBA512TFH 512GB, IPS, 3072x1440, 17.3" | Lenovo ThinkBook Plus Gen2 Core i5 i5-1130G7, Iris Xe G7 80EUs, Samsung PM9A1 MZVL2512HCJQ, IPS, E-Ink, 2560x1600, 13.3" | Asus ProArt StudioBook Pro 17 W700G3T i7-9750H, Quadro RTX 3000 Max-Q, Samsung SSD PM981 MZVLB1T0HALR, IPS, 1920x1200, 17" | LG Gram 17 (2022) i5-1240P, Iris Xe G7 80EUs, Samsung PM9A1 MZVL2512HCJQ, IPS, 2560x1600, 17" | Dell XPS 17 9720 i7-12700H, GeForce RTX 3050 4GB Laptop GPU, Micron 3400 MTFDKBA512TFH 512GB, IPS, 3840x2400, 17" | Gigabyte Aero 17 HDR YD i9-11980HK, GeForce RTX 3080 Laptop GPU, Samsung PM9A1 MZVL2512HCJQ, IPS, 3840x2160, 17.3" | |
|---|---|---|---|---|---|---|
| Stromverbrauch | 46% | -48% | 33% | -40% | -150% | |
| Idle min * (Watt) | 7.4 | 5 32% | 11.3 -53% | 4 46% | 7.8 -5% | 25 -238% |
| Idle avg * (Watt) | 16.4 | 7.9 52% | 16 2% | 12.2 26% | 15.1 8% | 28 -71% |
| Idle max * (Watt) | 16.8 | 8.3 51% | 16.8 -0% | 13.2 21% | 17 -1% | 40 -138% |
| Last avg * (Watt) | 62.3 | 30.9 50% | 93.6 -50% | 34 45% | 114 -83% | 114 -83% |
| Witcher 3 ultra * (Watt) | 50 | 25.2 50% | 106 -112% | 39.4 21% | 115.2 -130% | 176 -252% |
| Last max * (Watt) | 107.9 | 66.8 38% | 186.6 -73% | 65.9 39% | 135.6 -26% | 236 -119% |
* ... kleinere Werte sind besser
Power Consumption Witcher 3 / Stresstest
Energieverbrauch mit externem Monitor
Akkulaufzeit — Nicht allzu lang
Die Laufzeiten sind für einen 17-Zöller bestenfalls durchschnittlich. Die Akkukapazität ist geringer als beim LG Gram 17 oder Dell XPS 17 und resultiert in WLAN-Laufzeiten, die mehrere Stunden unter denen der soeben erwähnten Konkurrenz liegen. Wir messen knapp unter 5,5 Stunden praxisnaher WLAN-Nutzung bei aktiviertem Zweitdisplay, die beiden Konkurrenten von Asus und Dell kommen hier auf über 9 Stunden.
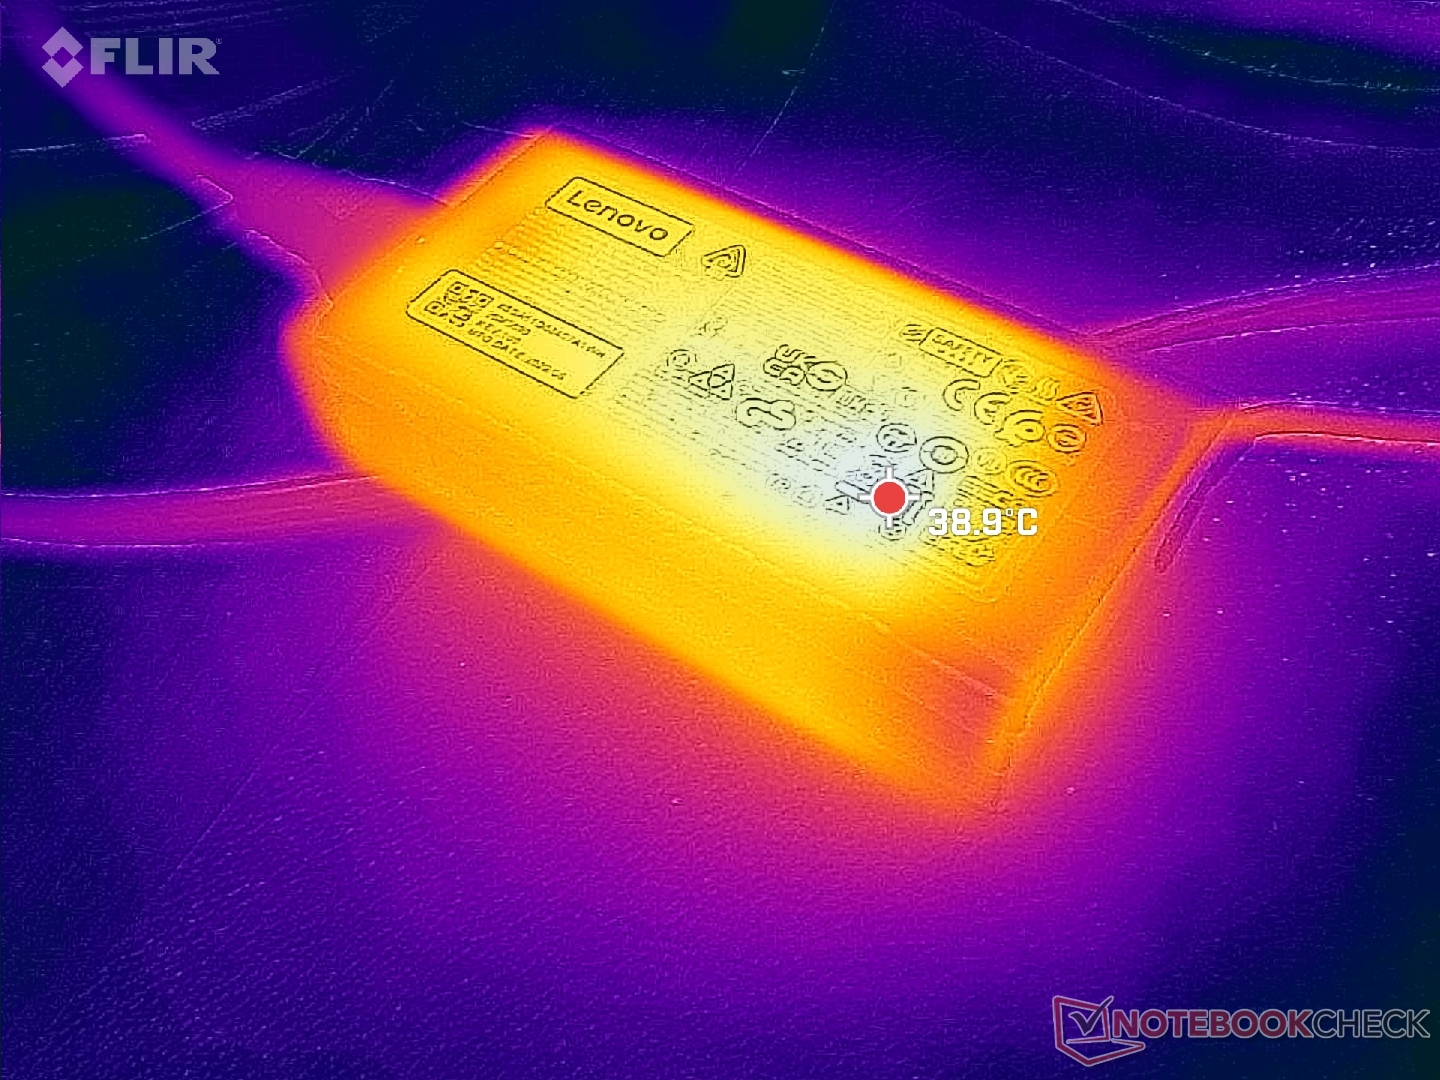
Eine komplette Aufladung dauert zwischen einer und 1,5 Stunden, sofern Rapid Charge aktiviert wurde.
| Lenovo ThinkBook Plus Gen3 i7-12700H, Iris Xe G7 96EUs, 70 Wh | Lenovo ThinkBook Plus Gen2 Core i5 i5-1130G7, Iris Xe G7 80EUs, 53 Wh | Asus ProArt StudioBook Pro 17 W700G3T i7-9750H, Quadro RTX 3000 Max-Q, 57 Wh | LG Gram 17 (2022) i5-1240P, Iris Xe G7 80EUs, 80 Wh | Dell XPS 17 9720 i7-12700H, GeForce RTX 3050 4GB Laptop GPU, 97 Wh | Gigabyte Aero 17 HDR YD i9-11980HK, GeForce RTX 3080 Laptop GPU, 99 Wh | |
|---|---|---|---|---|---|---|
| Akkulaufzeit | 43% | 41% | 186% | 47% | 13% | |
| Idle (h) | 8.1 | 28.2 248% | ||||
| WLAN (h) | 5.3 | 7.6 43% | 5.9 11% | 11.2 111% | 9.2 74% | 5.6 6% |
| Last (h) | 1 | 1.7 70% | 3 200% | 1.2 20% | 1.2 20% | |
| H.264 (h) | 6.9 | 14.1 | 11.2 | |||
| Witcher 3 ultra (h) | 1.7 |
Pro
Contra
Fazit — Ideal für enge Arbeitsplätze
Das ThinkBook Plus Gen 3 ist in seiner Größenkategorie einzigartig und das nicht nur wegen seines 8-Zoll-Zweitdisplays oder dem 21:10-Formfaktor. Es ist auch eines der wenigen 17-Zoll-Modelle mit Core-H-Prozessor der 12. Generation und absolut keiner Option für eine dedizierte Grafikkarte. Dieser Ansatz erlaubt erst die Verwendung eines so dünnen und leichten Gehäuses, mal abgesehen vom Einsatz eines Zweitdisplays und dem langen Formfaktor.
Ein wesentlicher Nachteil des Modells ist, dass er für einige Nutzer zu schwach sein könnte. Schon die CPU-Leistung ist geringer als auf vielen anderen 17-Zoll-Laptops mit dem gleichen Core i7-12700H und das Fehlen einer dGPU könnte viele Poweruser abschrecken. Letzteres ist ein echter Jammer, da das primäre Display die richtige Farbdarstellung und Funktionen zur Grafikbearbeitung mitbringt, während sich das Zweitdisplay für schweres Multitasking als wirklich nützlich erweisen könnte. Sofern man keine GPU-lastigen Anwendungen bedienen muss, sollte dieser Nachteil aber nicht so schwer wiegen.
Das ThinkBook Plus Gen 3 optimiert die Produktivität durch mehr Displaygröße als die meisten anderen Laptops auf dem Markt. Dafür verzichtet man allerdings auf etwas Grafikleistung.
Das sekundäre Display zeigt seinen Wert vor allem bei Fenstern vom File Explorer, Testeditoren, Eingabeaufforderung und anderen Anwendungen, bei denen eine akkurate Farbwiedergabe eine untergeordnete Rolle spielt. Seine Touchscreen-Funktionalität ist allerdings nicht so zuverlässig wie bei einem Smartphone oder Tablet, weshalb wir seine Nutzung via Maus am leichtesten finden.
Wer auf dem eigenen Schreibtisch Platz für einen externen Monitor wie dem Lepow C2 hat, dürfte die Anschaffung eines ThinkBook Plus Gen 3 weniger in den Fingern jucken. Vor allem mobile Nutzer und solche mit wenig Platz auf dem Schreibtisch für externe Monitore werden den Lenovo gegenüber anderen 17-Zoll-Laptops überraschend geräumig finden.
Preise und Verfügbarkeit
Bislang ist der Laptop in Deutschland noch nicht flächendeckend verfügbar. Auf der Lenovo-Homepage steht, dass der Laptop "Vorübergehend nicht verfügbar" ist, gleichzeitig steht hier "In Kürze".
Lenovo ThinkBook Plus Gen3
- 21.09.2022 v7 (old)
Allen Ngo
Preisvergleich

