Asus Vivobook 15 K513 OLED im Laptop-Test: Die Alternative zum Lenovo IdeaPad
Wer sich von der High-End-Serie Asus ZenBook etwas nach unten orientiert, gelangt unweigerlich bei der Budget-freundlicheren Serie Asus VivoBook an. Die Modellserie hat mittlerweile verwirrend viele Modelle hervorgebracht, sowohl mit AMD- als auch Intel-CPU, kombiniert mit sowohl integrierter als auch dedizierter Grafik und sogar mit OLED-Optionen. Das macht es nicht gerade leicht den Überblick zu behalten und das aktuelle VivoBook 15 K513 macht die Sache auch nicht gerade einfacher.
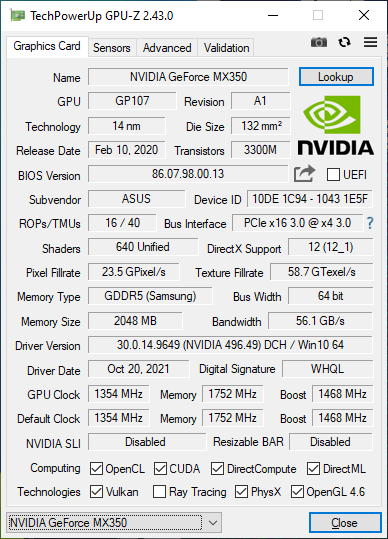
Mal abgesehen vom Namen unterscheidet sich das VivoBook 15 K513 mit seiner eher ungewöhnlichen Kombination aus Intel Gen11 Core i7-1165G7 und GeForce MX350 von den meisten anderen Budget- oder Mittelklasse-Multimedialaptops. Außerdem ist es einer der wenigen aktuellen 15,6-Zoll-Laptops mit einem Non-Touch 1080p-OLED-Display, sonst sieht man zur Zeit vor allem 4K-OLED-Panels. Wir schauen heute ganz genau auf die Leistung, das Display und die Ausstattung des VivoBook 15 K513 und wollen herausfinden, was es von all den anderen Modellen der VivoBook-15-Serie unterscheidet.
Konkurrenz findet sich in anderen Mittelklasse-Multimedia-Laptops wie dem Lenovo IdeaPad 5 15, dem Dell Inspiron 15, dem HP Pavilion 15 oder dem MSI Summit B15/E15. Unsere spezifische Testkonfiguration kann online für etwa $900 bis $1000 USD (~ 786 bis 874 Euro) erworben werden.
Weitere Asus-VivoBook-Tests:
Potentielle Konkurrenten im Vergleich
Bew. | Datum | Modell | Gewicht | Dicke | Größe | Auflösung | Preis ab |
|---|---|---|---|---|---|---|---|
| 80.6 % v7 (old) | 11 / 2021 | Asus Vivobook 15 K513EQ i7-1165G7, GeForce MX350 | 1.6 kg | 17.9 mm | 15.60" | 1920x1080 | |
| 85.9 % v7 (old) | 10 / 2021 | Asus VivoBook 15 Pro M3500QC-L1062 R5 5600H, GeForce RTX 3050 4GB Laptop GPU | 1.7 kg | 19.9 mm | 15.60" | 1920x1080 | |
| 83.4 % v7 (old) | 12 / 2020 | Asus VivoBook S15 S533EQ-BQ002T i7-1165G7, GeForce MX350 | 1.8 kg | 16.1 mm | 15.60" | 1920x1080 | |
| 83.5 % v7 (old) | 08 / 2021 | Lenovo IdeaPad 5 15ALC05 R5 5500U, Vega 7 | 1.7 kg | 19.1 mm | 15.60" | 1920x1080 | |
| 80.5 % v7 (old) | 10 / 2021 | Dell Inspiron 15 3501 i7-1165G7, Iris Xe G7 96EUs | 2 kg | 19.9 mm | 15.60" | 1920x1080 | |
| 81.2 % v7 (old) | 06 / 2021 | HP Pavilion 15-eg i7-1165G7, GeForce MX450 | 1.7 kg | 17.9 mm | 15.60" | 1920x1080 |
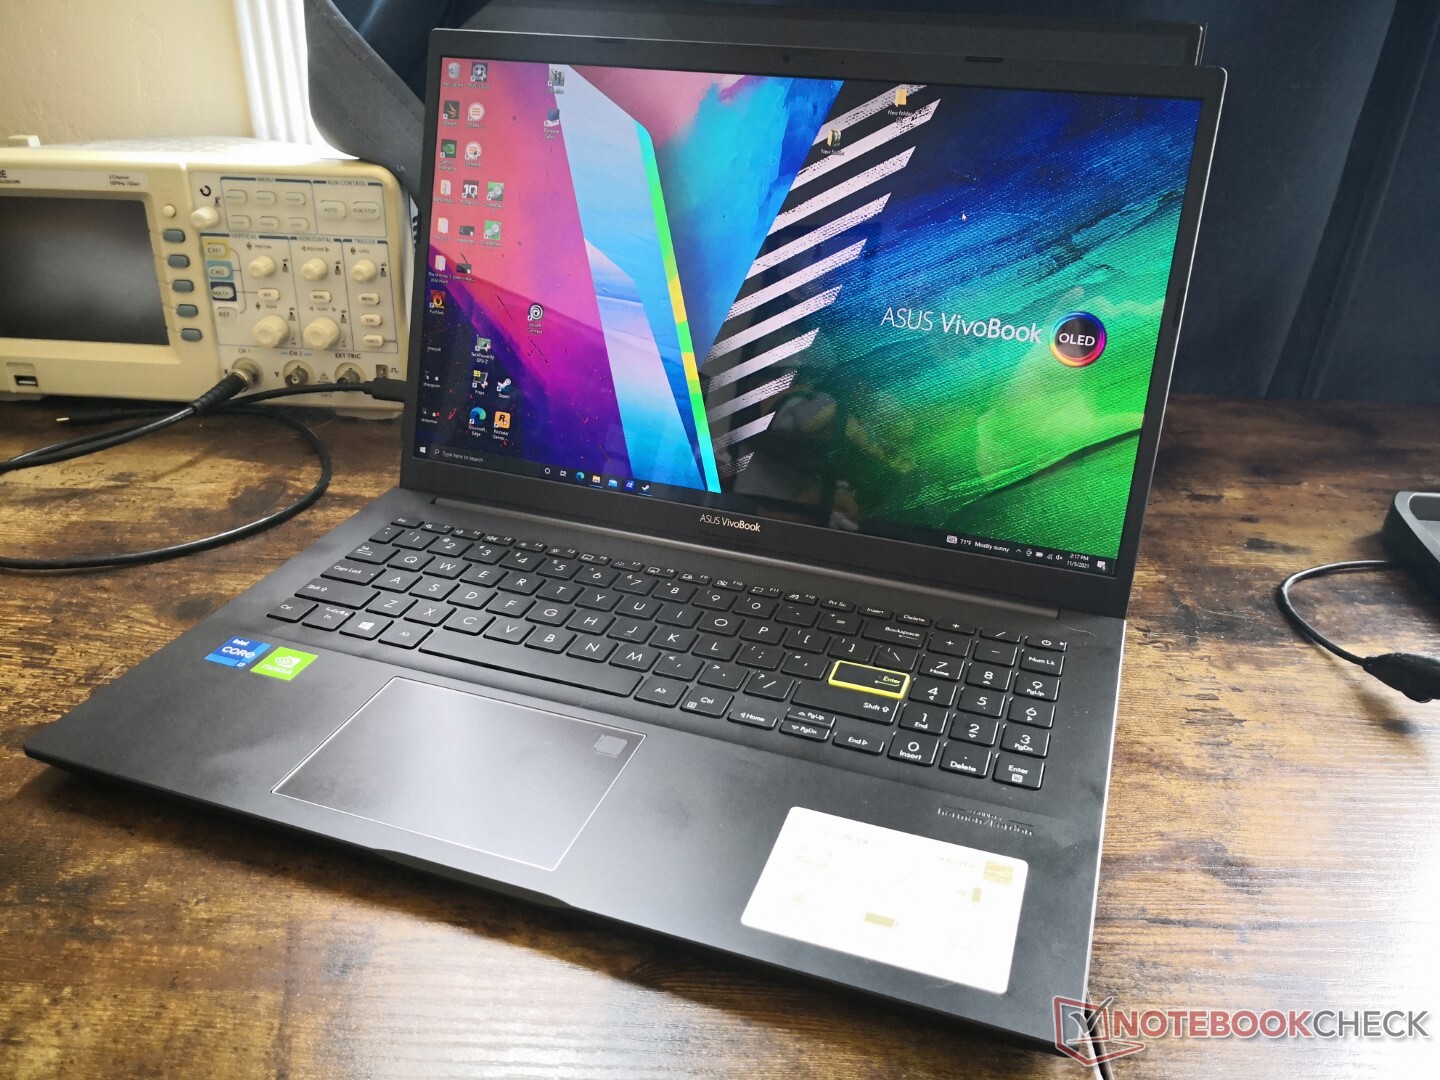
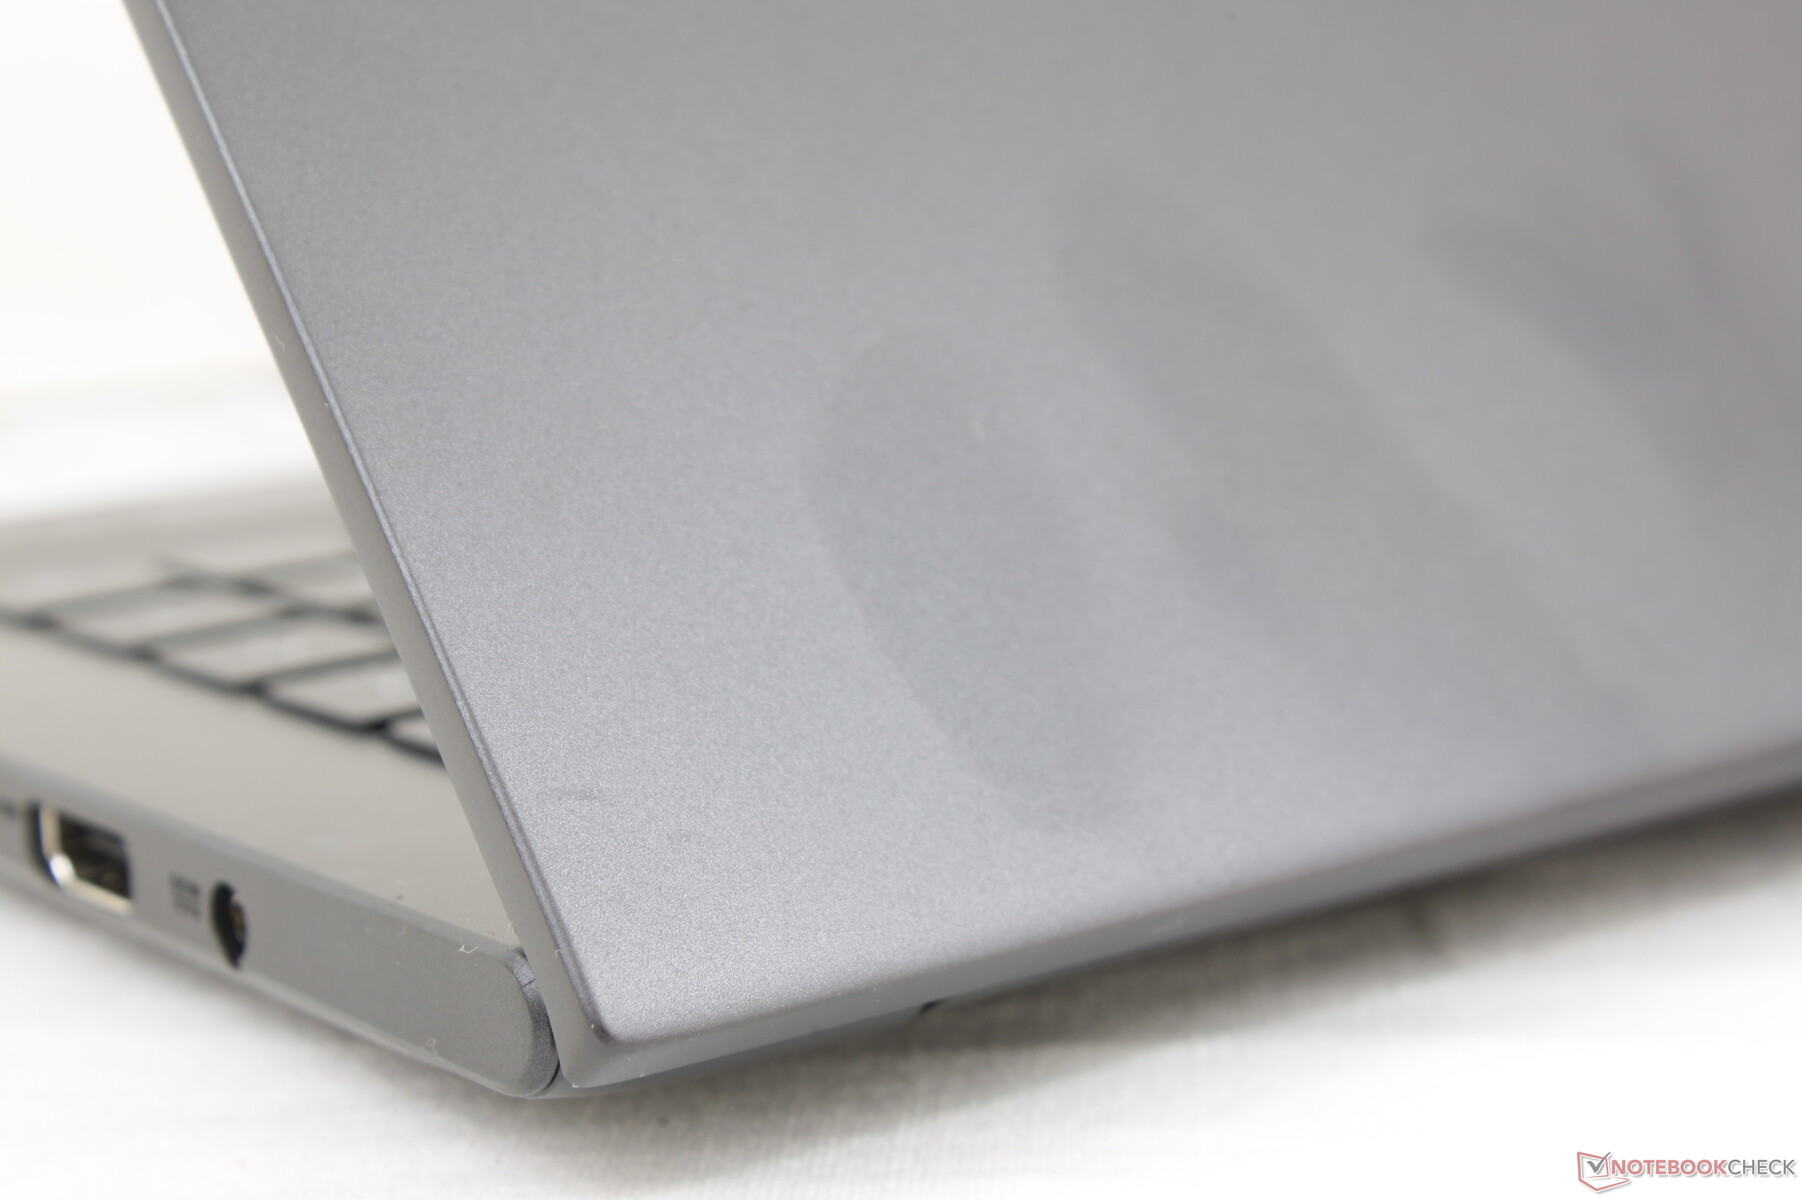
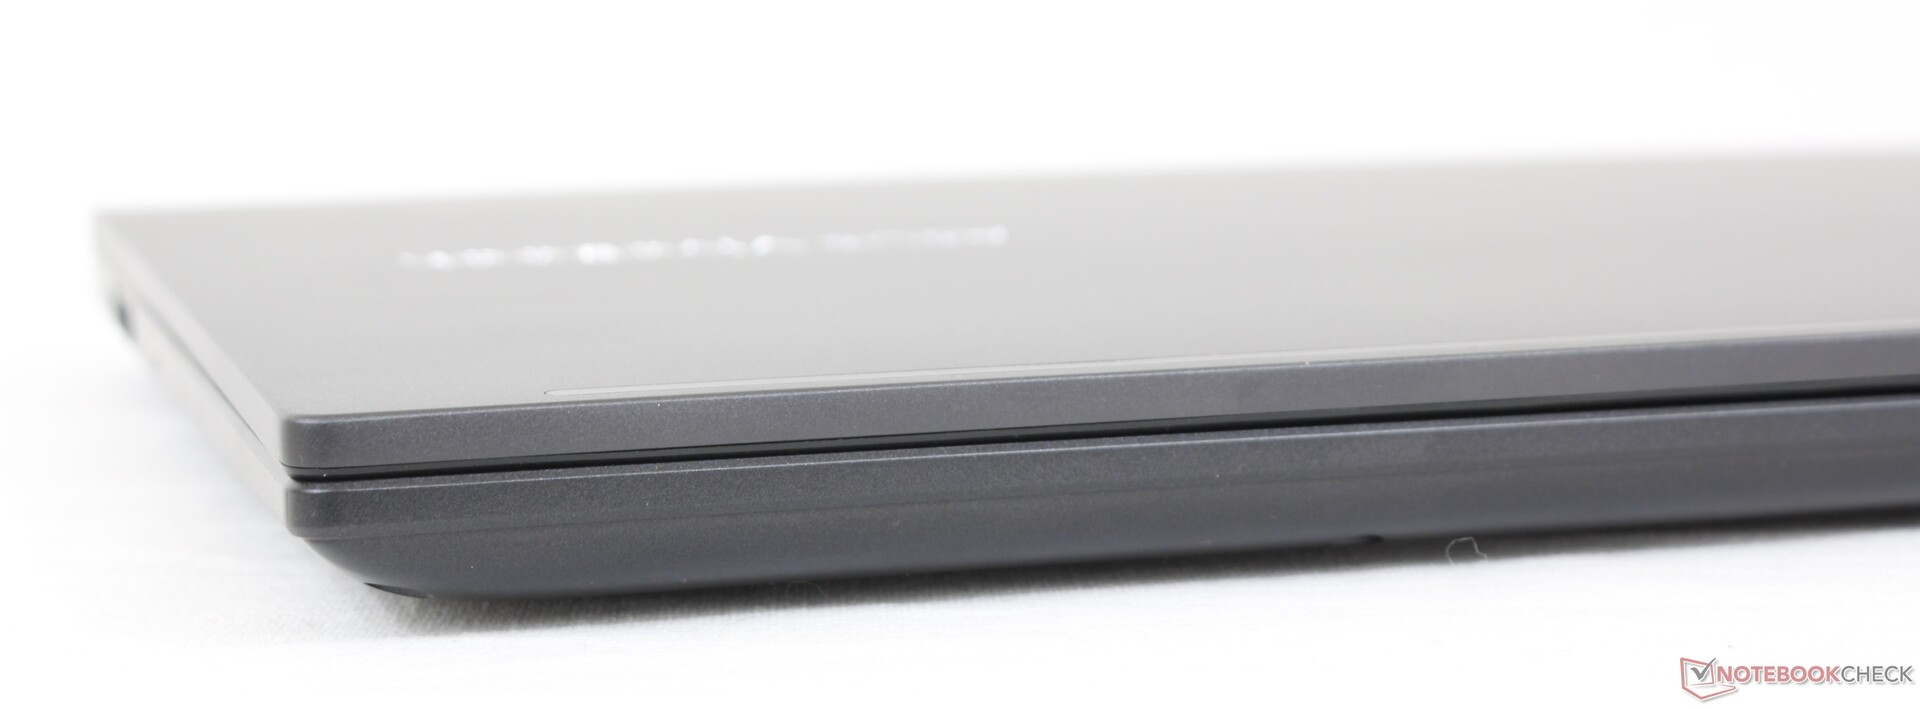
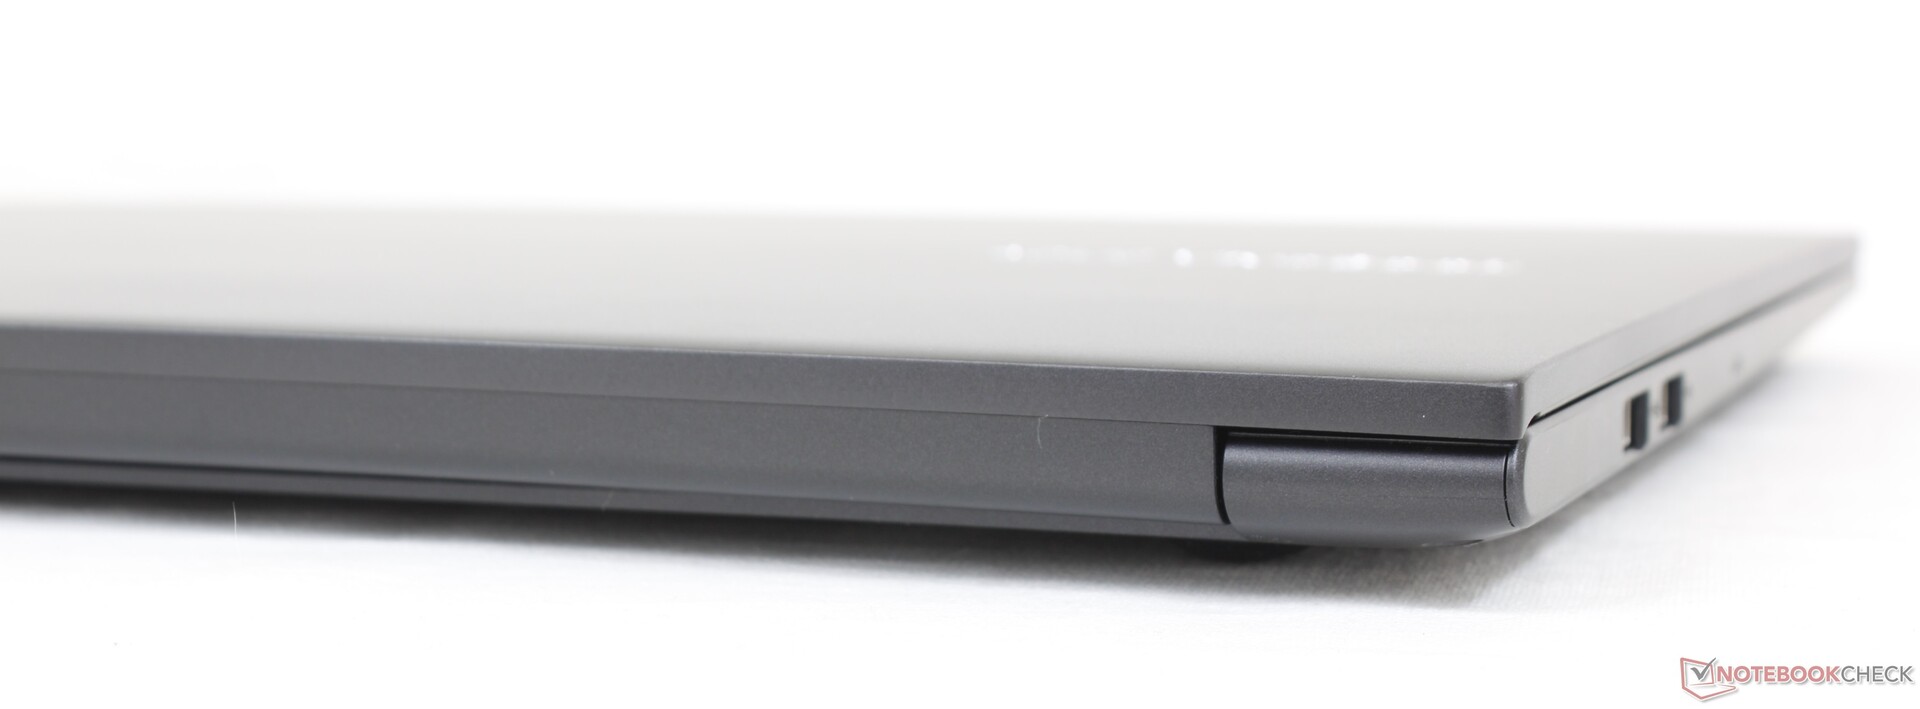
Gehäuse — Hoffentlich mögen Sie Plastik
Es gibt leichte Unterschiede zwischen den verschiedenen Modellen des VivoBook 15. In unserem Fall gleicht das VivoBook 15 K513 am ehesten dem VivoBook 15 F512, zumindest was die Anschlussverteilung und das Mainboard-Layout angeht. Vor allem die Kunststoffbasis ist nicht annähernd so stabil und hochwertig wie das Gehäuse eines typischen ZenBook 15, HP Spectre oder Dell XPS 15, was bei dem Preis aber auch niemanden überraschen sollte. Die Gehäusestabilität ist eher vergleichbar mit der eines Lenovo IdeaPad 5 15 oder Dell Inspiron 3501 und gleichzeitig etwas schwächer als die des aktuellen HP Pavilion 15. Beispielsweise biegt sich die Tastaturmitte stärker durch als uns lieb ist.
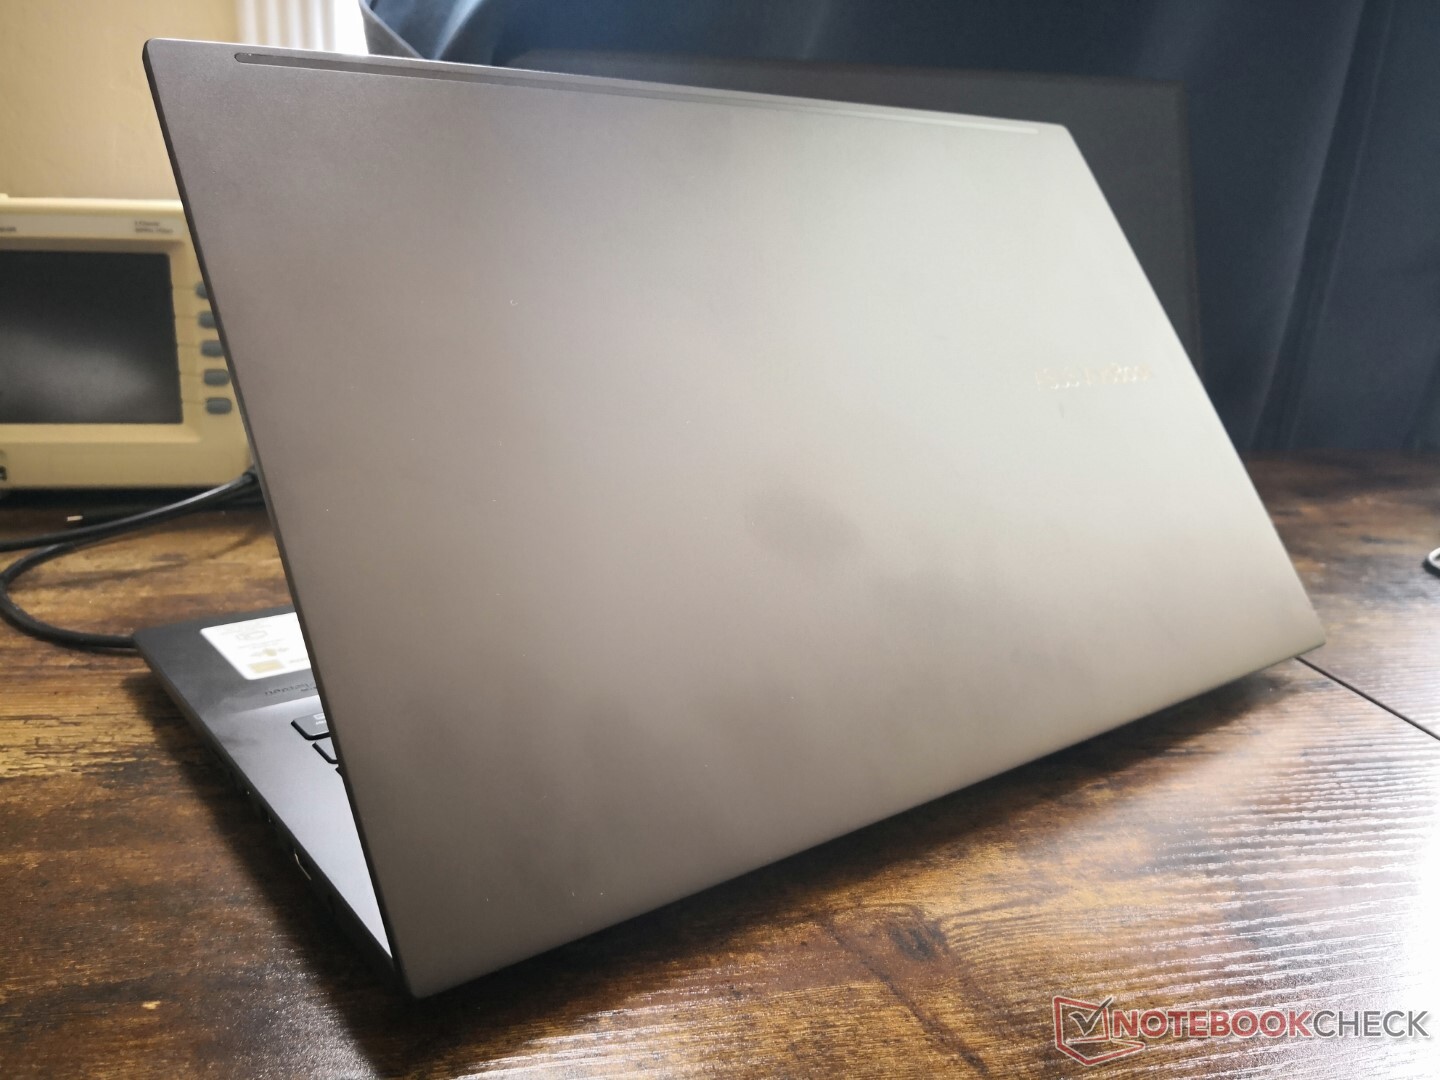
Vom Gewicht her ist das System etwa 100 - 200 g leichter als viele Konkurrenten und das trotz dedizierter GPU und OLED-Panel. Die allgemeinen Ausmaße entsprechen am ehesten dem aktuellen HP Pavilion 15, es ist gleichzeitig dünner als das VivoBook 15 Pro und dicker als das VivoBook S15.
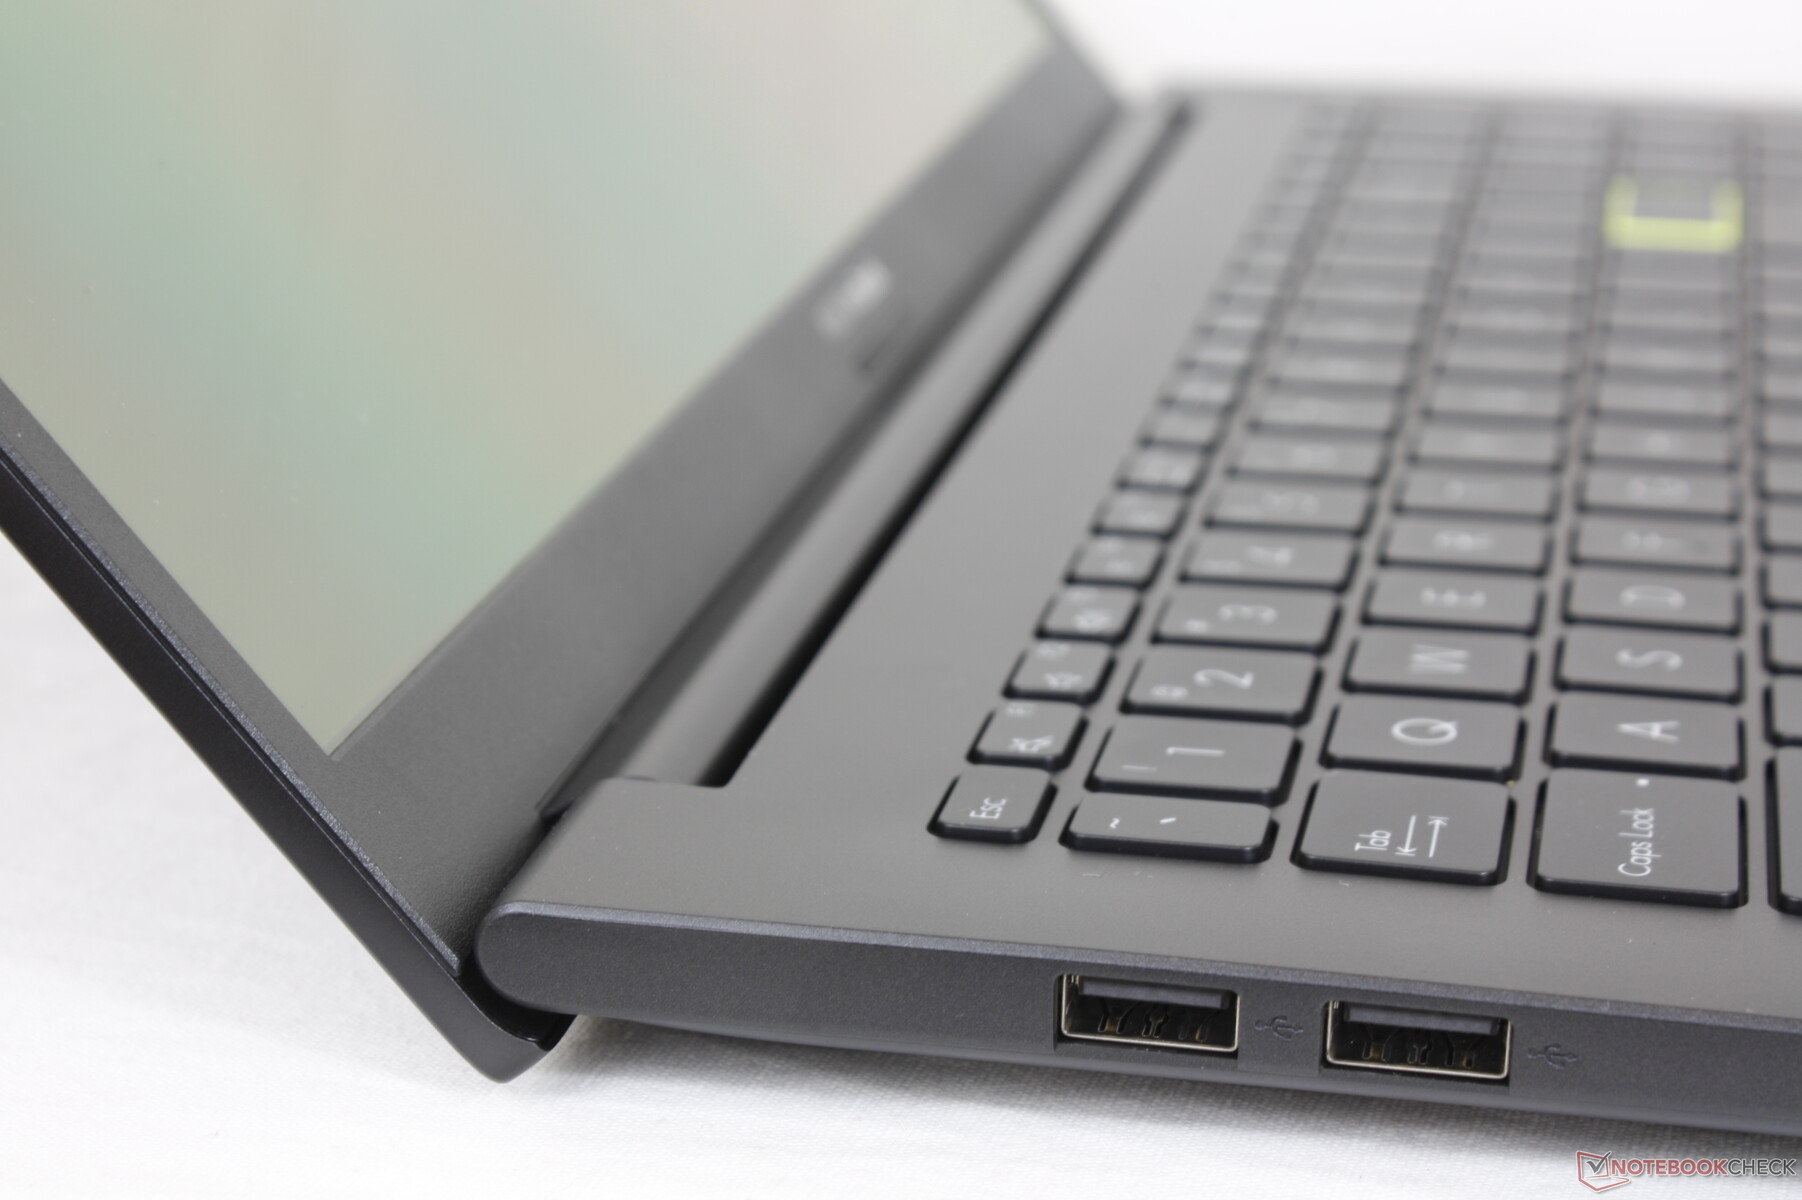
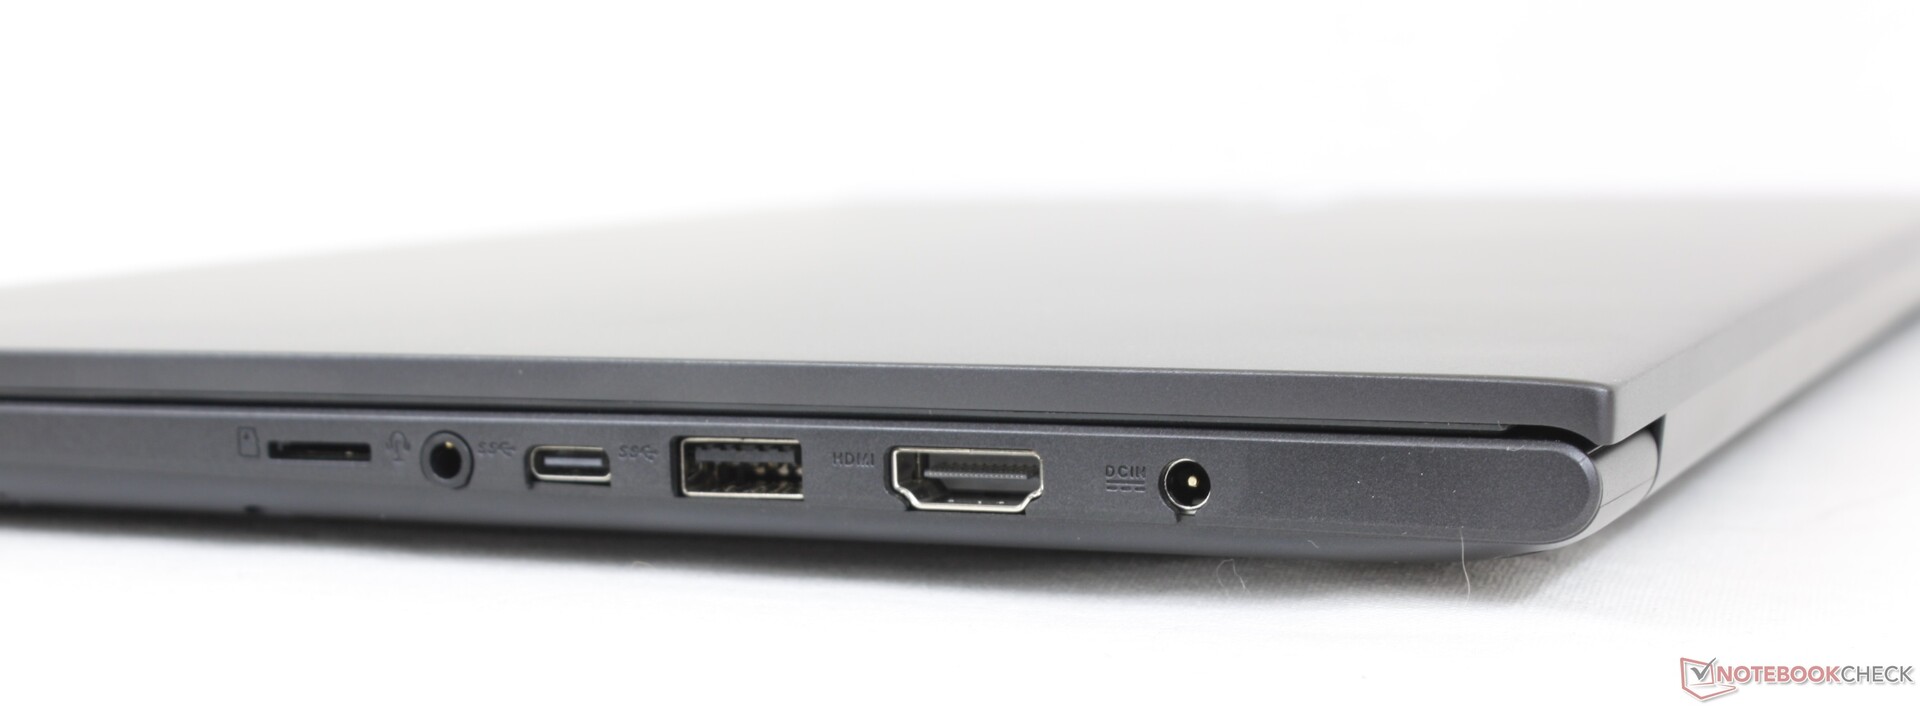
Anschlüsse — Kein Thunderbolt oder USB-C-Ladefunktion
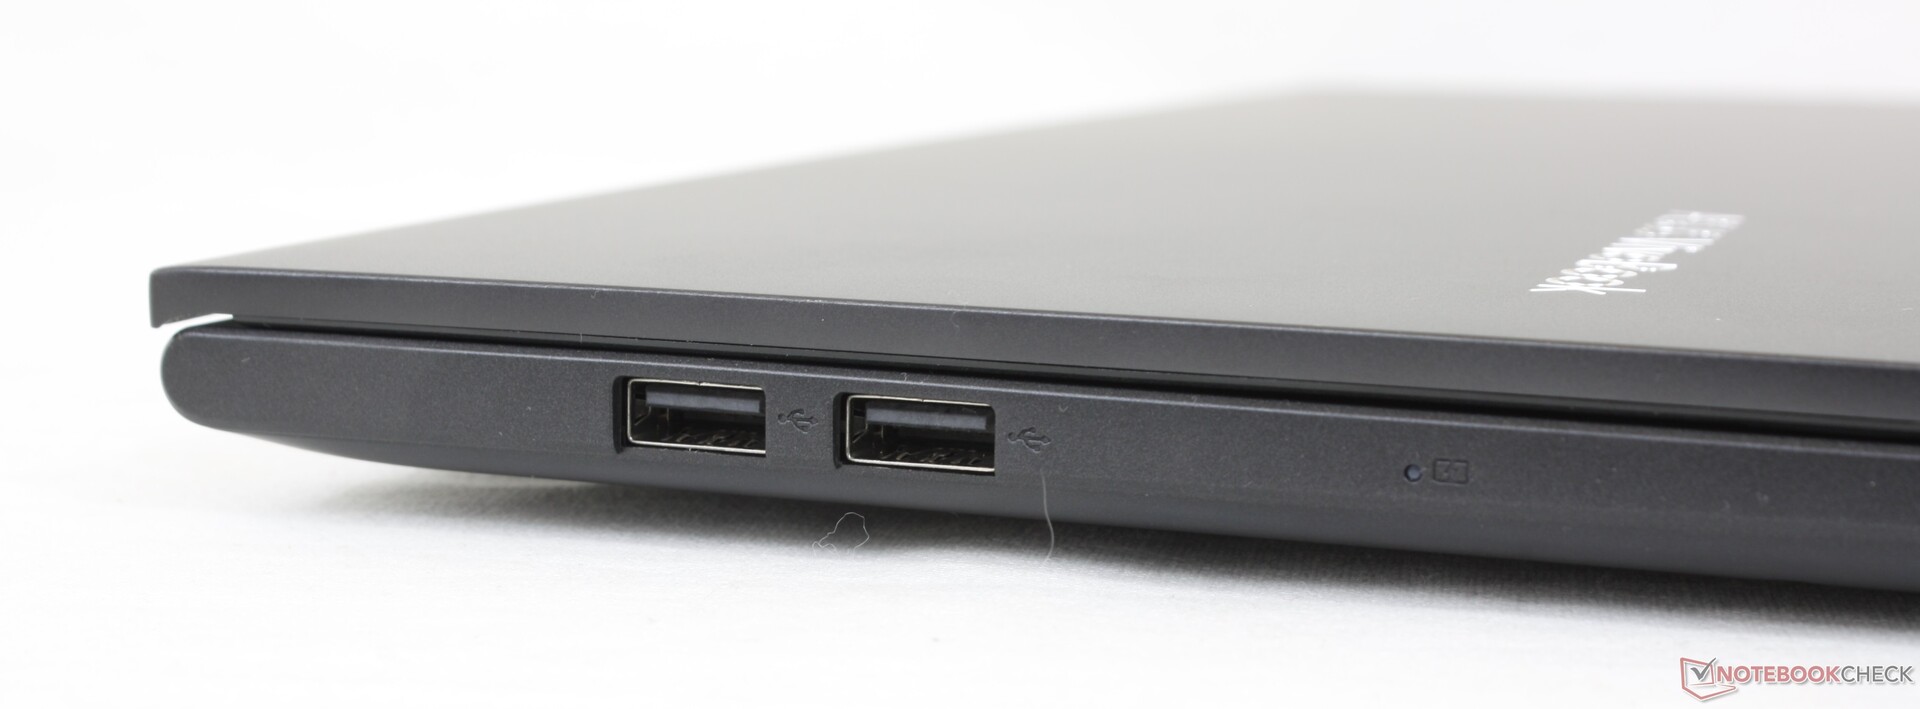
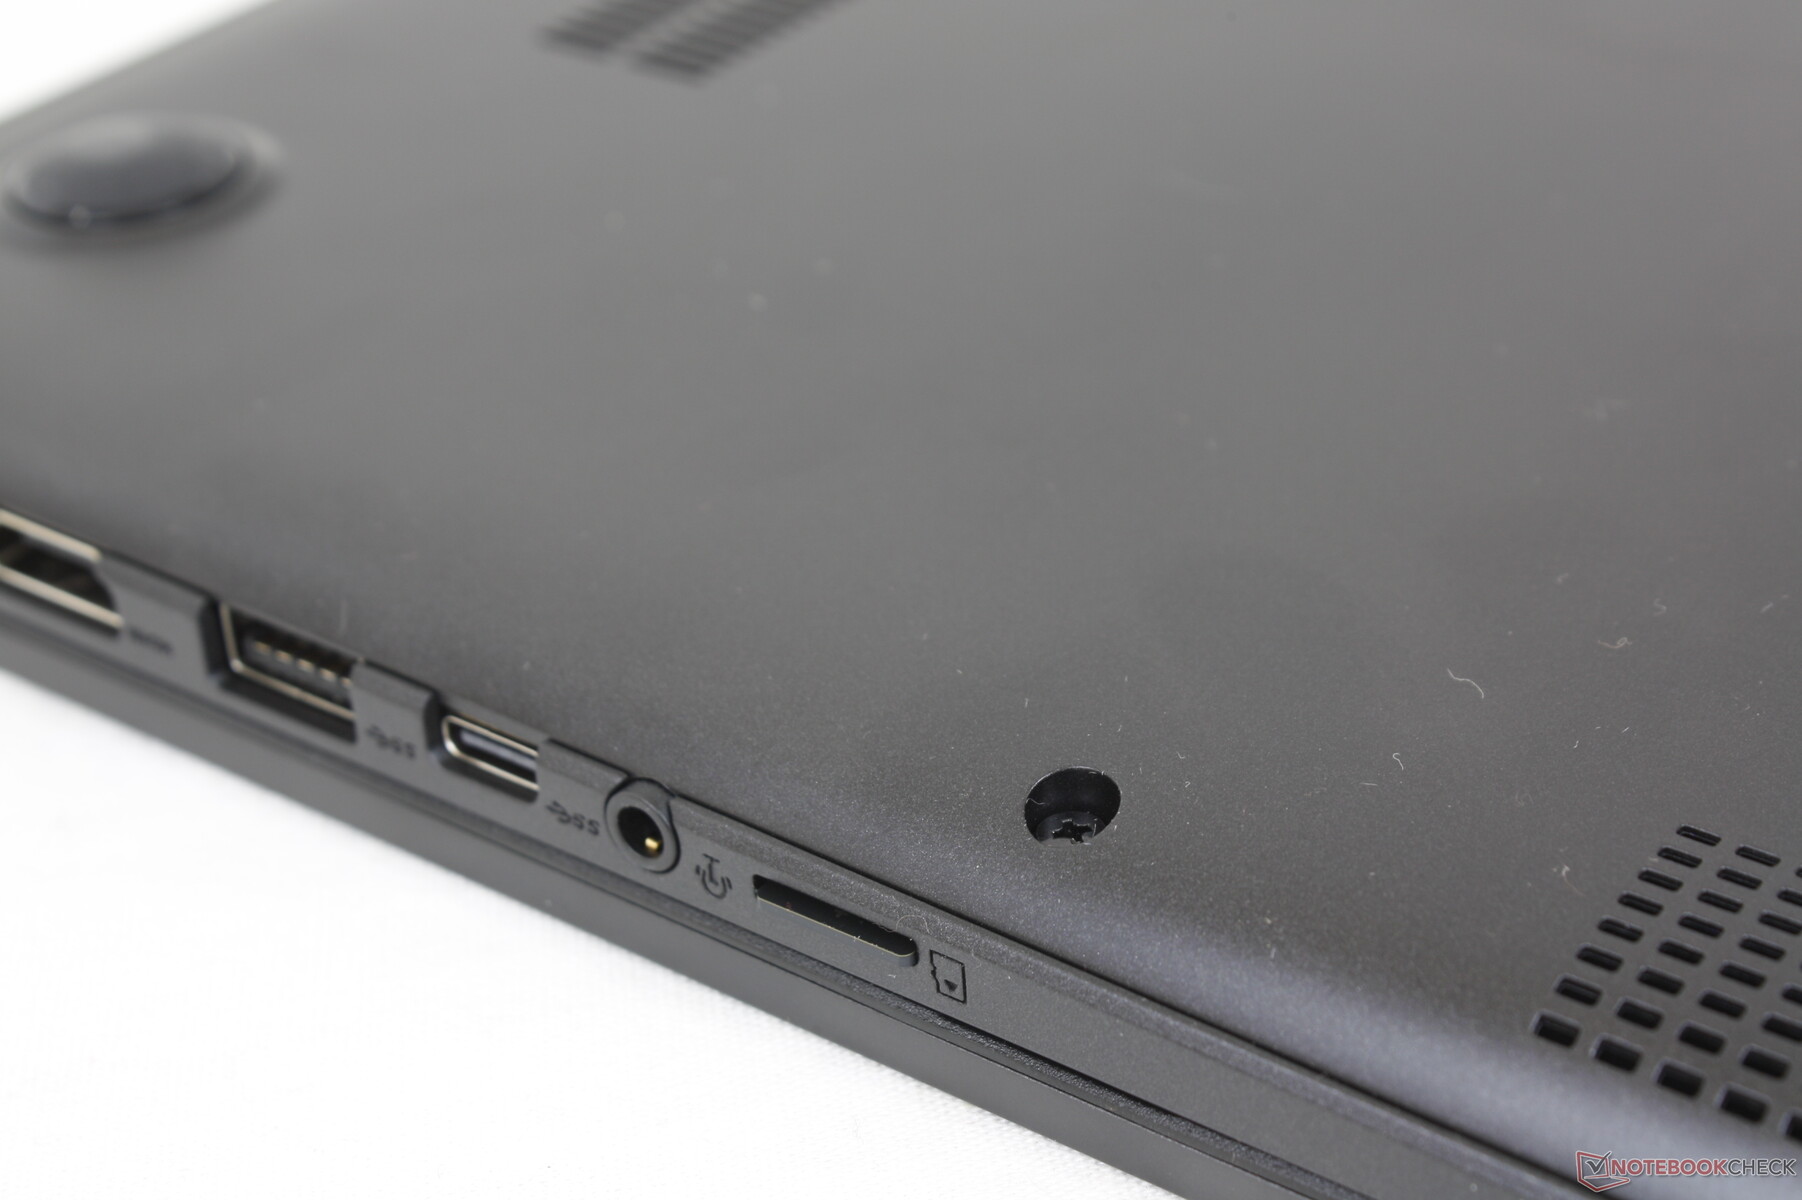
Die Anschlussvielfalt ist auf einem guten Niveau, allerdings gibt es ein paar Einschränkungen zu verdauen. Zunächst unterstützt der USB-C-Port weder DisplayPort noch Power Delivery, man kann den Laptop über diesen Port also weder aufladen noch externe Monitore anschließen, das machen die meisten anderen Notebooks besser. Und zweitens liegt der HDMI-Port nur in der Version 1.4 vor, was bedeutet, dass 4K-Monitore mit 60 FPS nicht unterstützt werden. Unser Testmodell verwendet darüber hinaus teils sogar noch USB-A-2.0- anstelle von USB-A-3.0-Anschlüssen.
SD Card Reader
Der MicroSD-Kartenleser mit Einrastfunktion bleibt der Preisklasse getreu langsam. Das Verschieben von 1 GB an Bildern von unserer UHS-II-Testkarte auf den Desktop dauert etwa 30 Sekunden, das ZenBook 15 benötigt hierfür nur etwa 14 Sekunden.
| SD Card Reader | |
| average JPG Copy Test (av. of 3 runs) | |
| HP Pavilion 15-eg (AV PRO microSD 128 GB V60) | |
| Asus VivoBook 15 Pro M3500QC-L1062 (AV Pro V60) | |
| Asus Vivobook 15 K513EQ (AV Pro V60) | |
| Lenovo IdeaPad 5 15ALC05 (Toshiba Exceria Pro SDXC 64 GB UHS-II) | |
| Asus VivoBook S15 S533EQ-BQ002T (Toshiba Exceria Pro M501 microSDXC 64GB) | |
| Dell Inspiron 15 3501 (AV Pro SD 128 GB V60) | |
| maximum AS SSD Seq Read Test (1GB) | |
| HP Pavilion 15-eg (AV PRO microSD 128 GB V60) | |
| Asus VivoBook 15 Pro M3500QC-L1062 (AV Pro V60) | |
| Asus Vivobook 15 K513EQ (AV Pro V60) | |
| Lenovo IdeaPad 5 15ALC05 (Toshiba Exceria Pro SDXC 64 GB UHS-II) | |
| Dell Inspiron 15 3501 (AV Pro SD microSD 128 GB V60) | |
| Asus VivoBook S15 S533EQ-BQ002T (Toshiba Exceria Pro M501 microSDXC 64GB) | |
Kommunikation
Unser Testmodell ist mit Wi-Fi 6 ausgestattet, während preiswertere Konfigurationen auch noch mit Wi-Fi 5 ausgeliefert werden. Wir ermitteln sehr gute Empfangswerte von durchschnittlich 1,2 Gbps an unserem Testrouter Netgear RAX200. Auf der anderen Seite enttäuscht die Sendeleistung mit rund 600 Mbps ein wenig.
Webcam
Die Kameraqualität ist seit Jahren unverändert schlecht geblieben. Windows Hello wird nicht unterstützt, vermutlich durch den fehlenden IR-Sensor, einen physischen Privacy Shutter gibt es ebenfalls nicht.


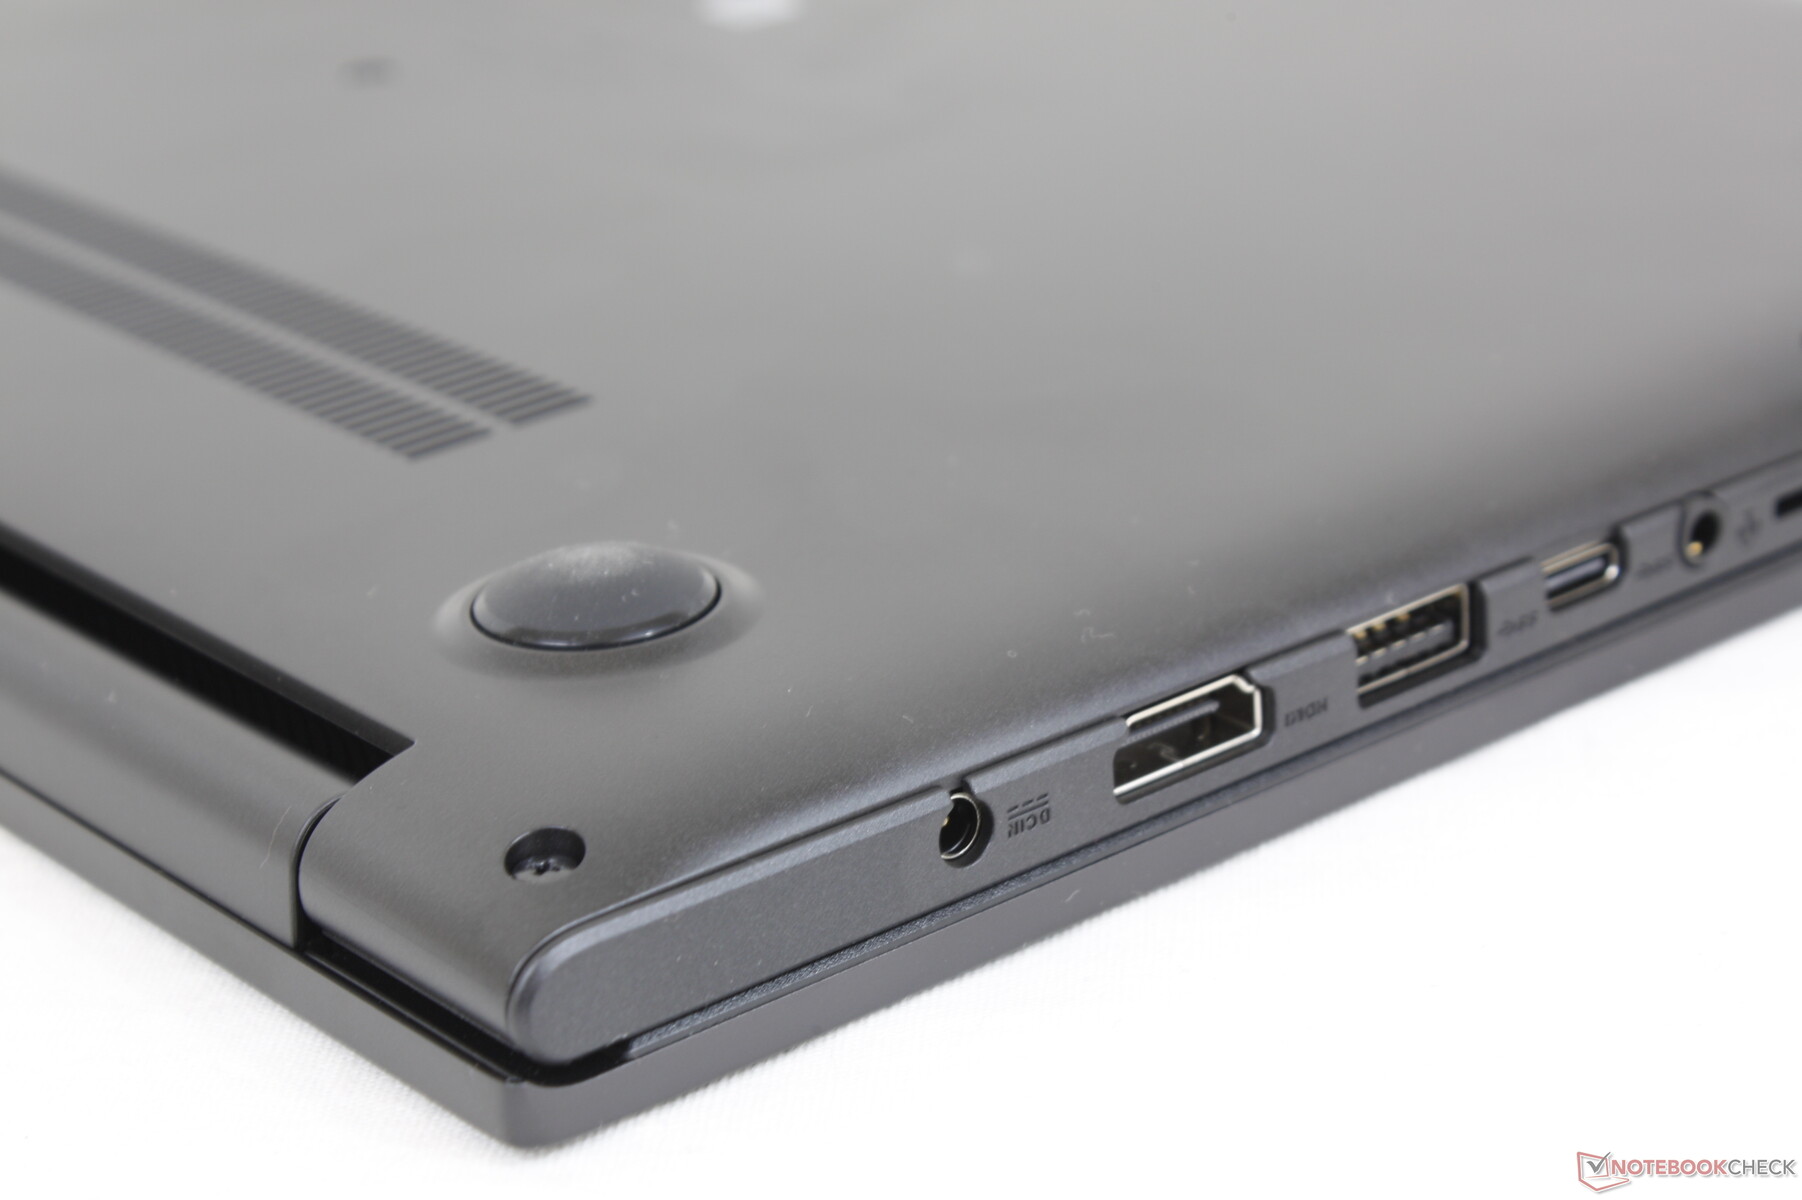
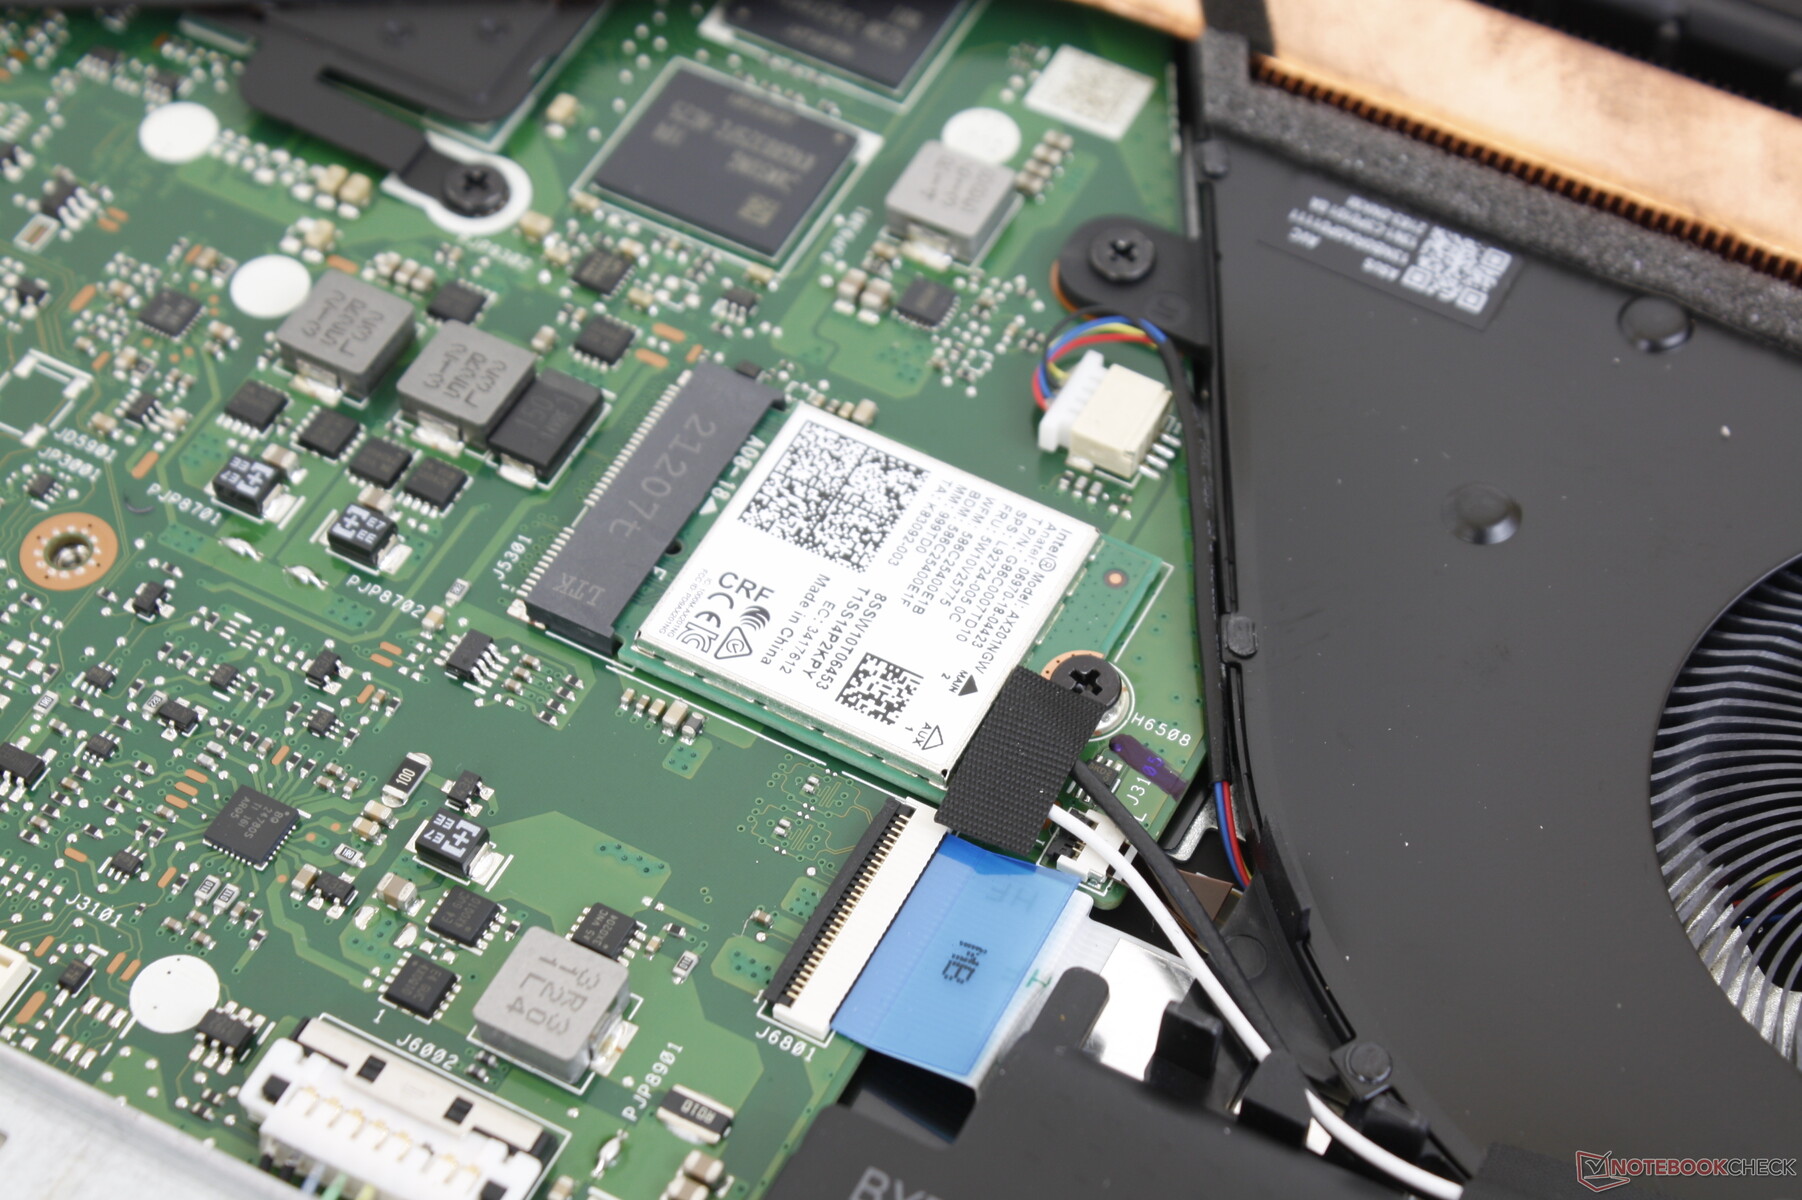
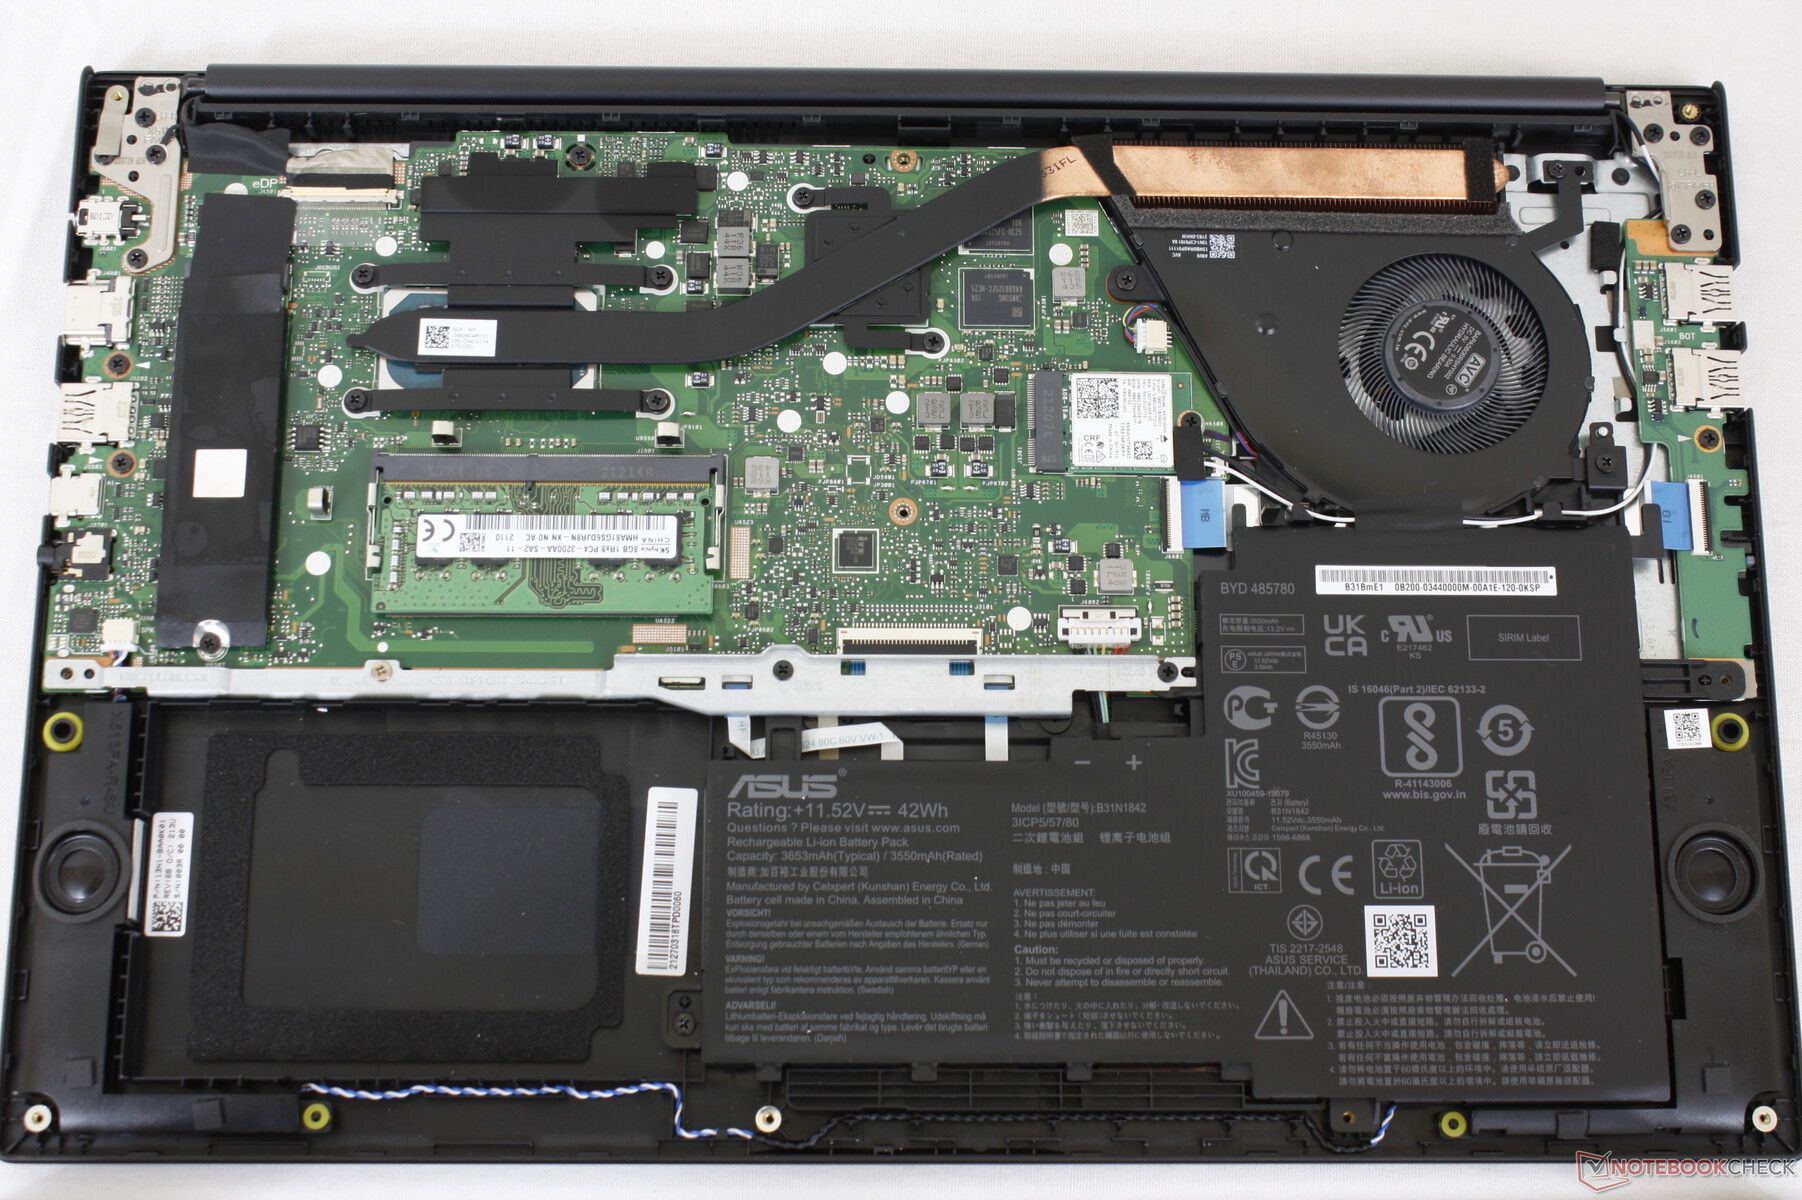
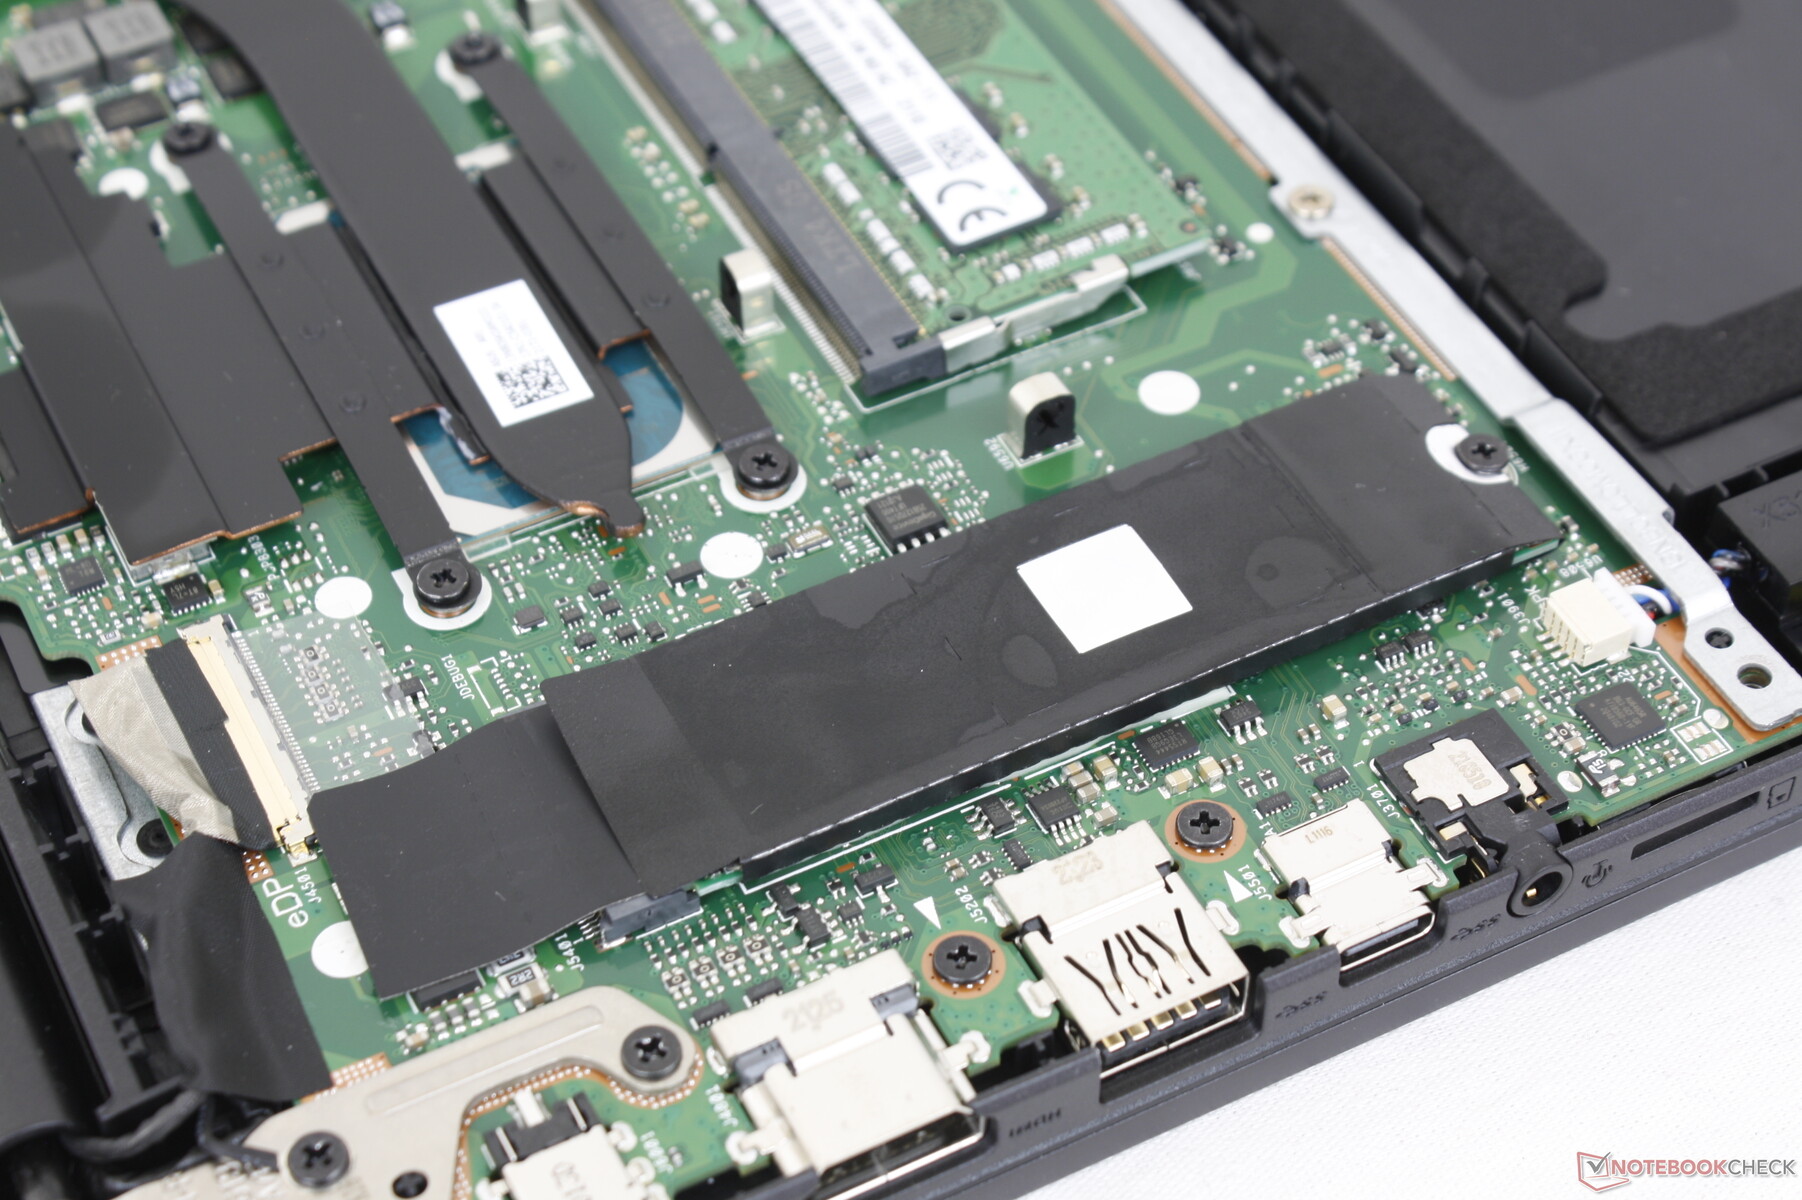
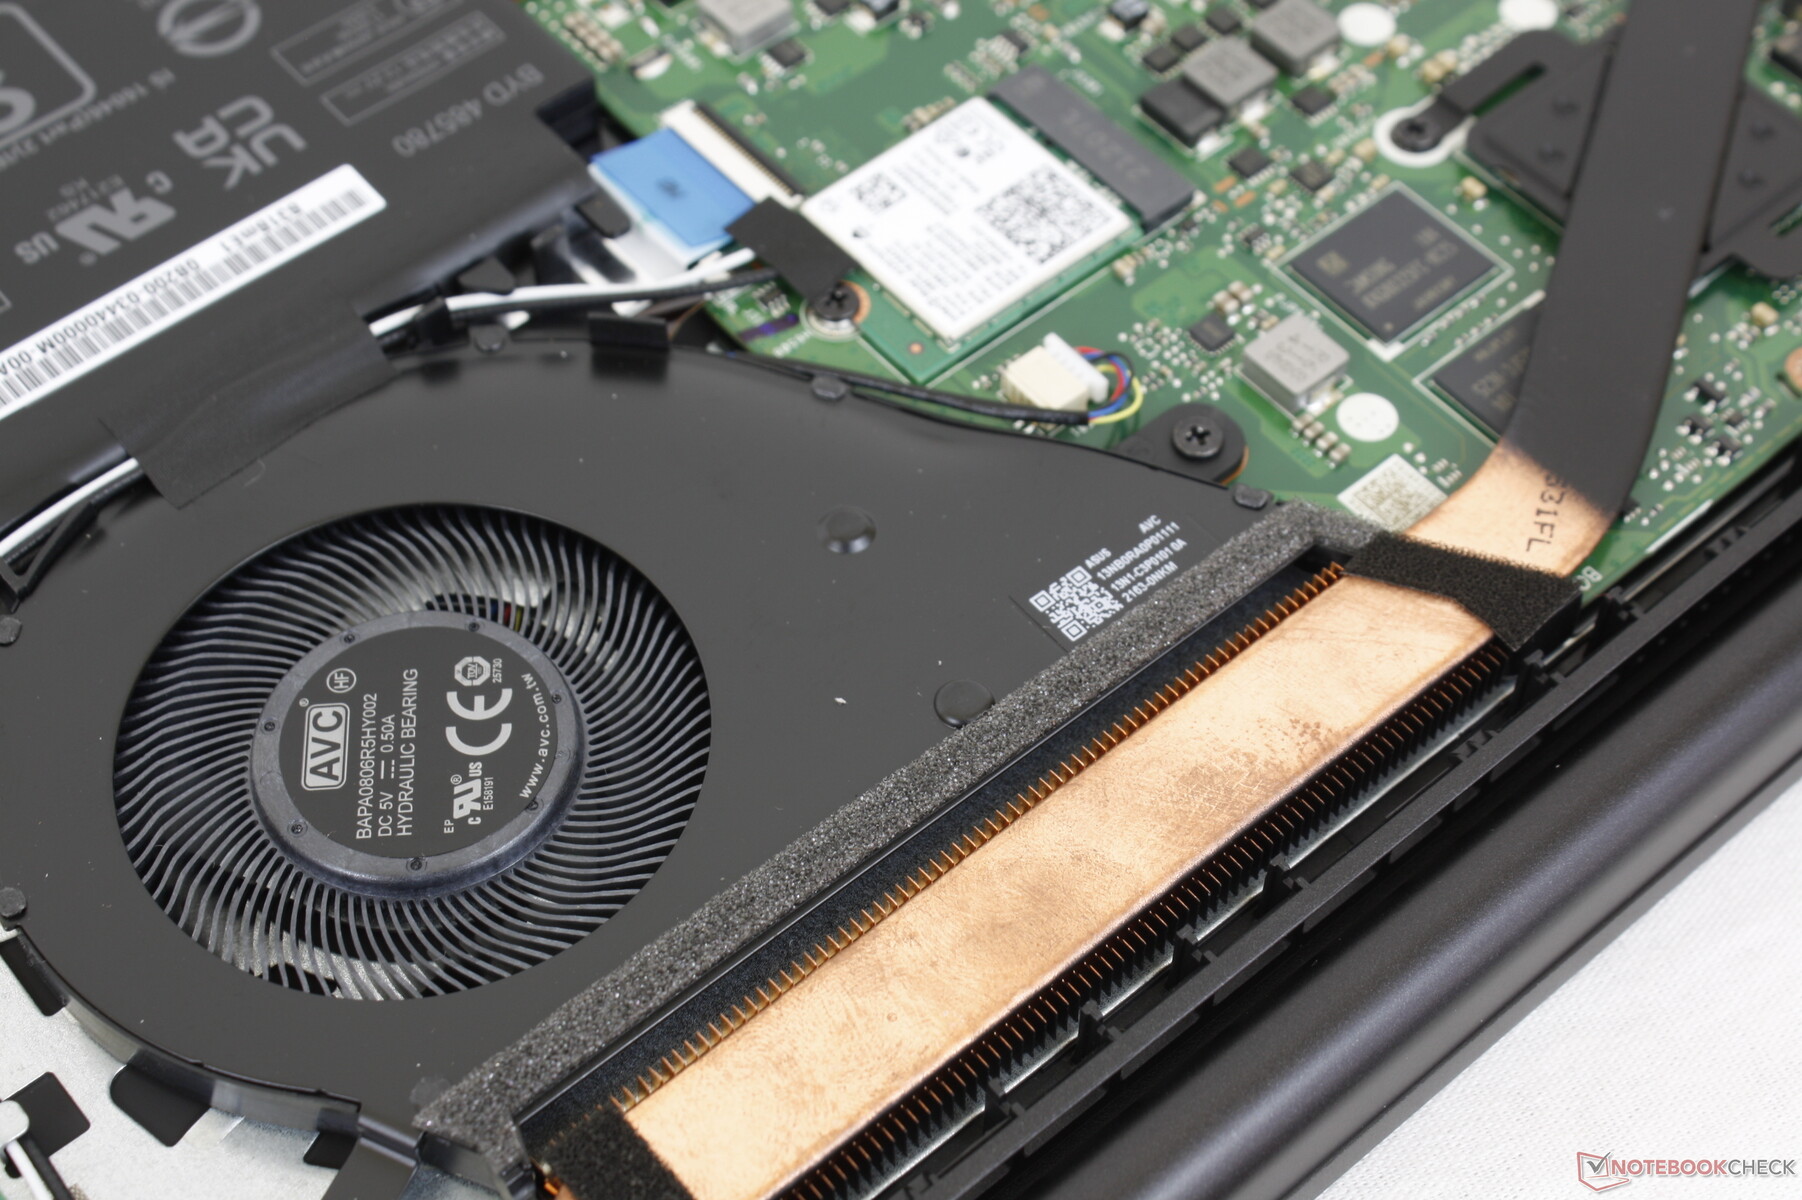
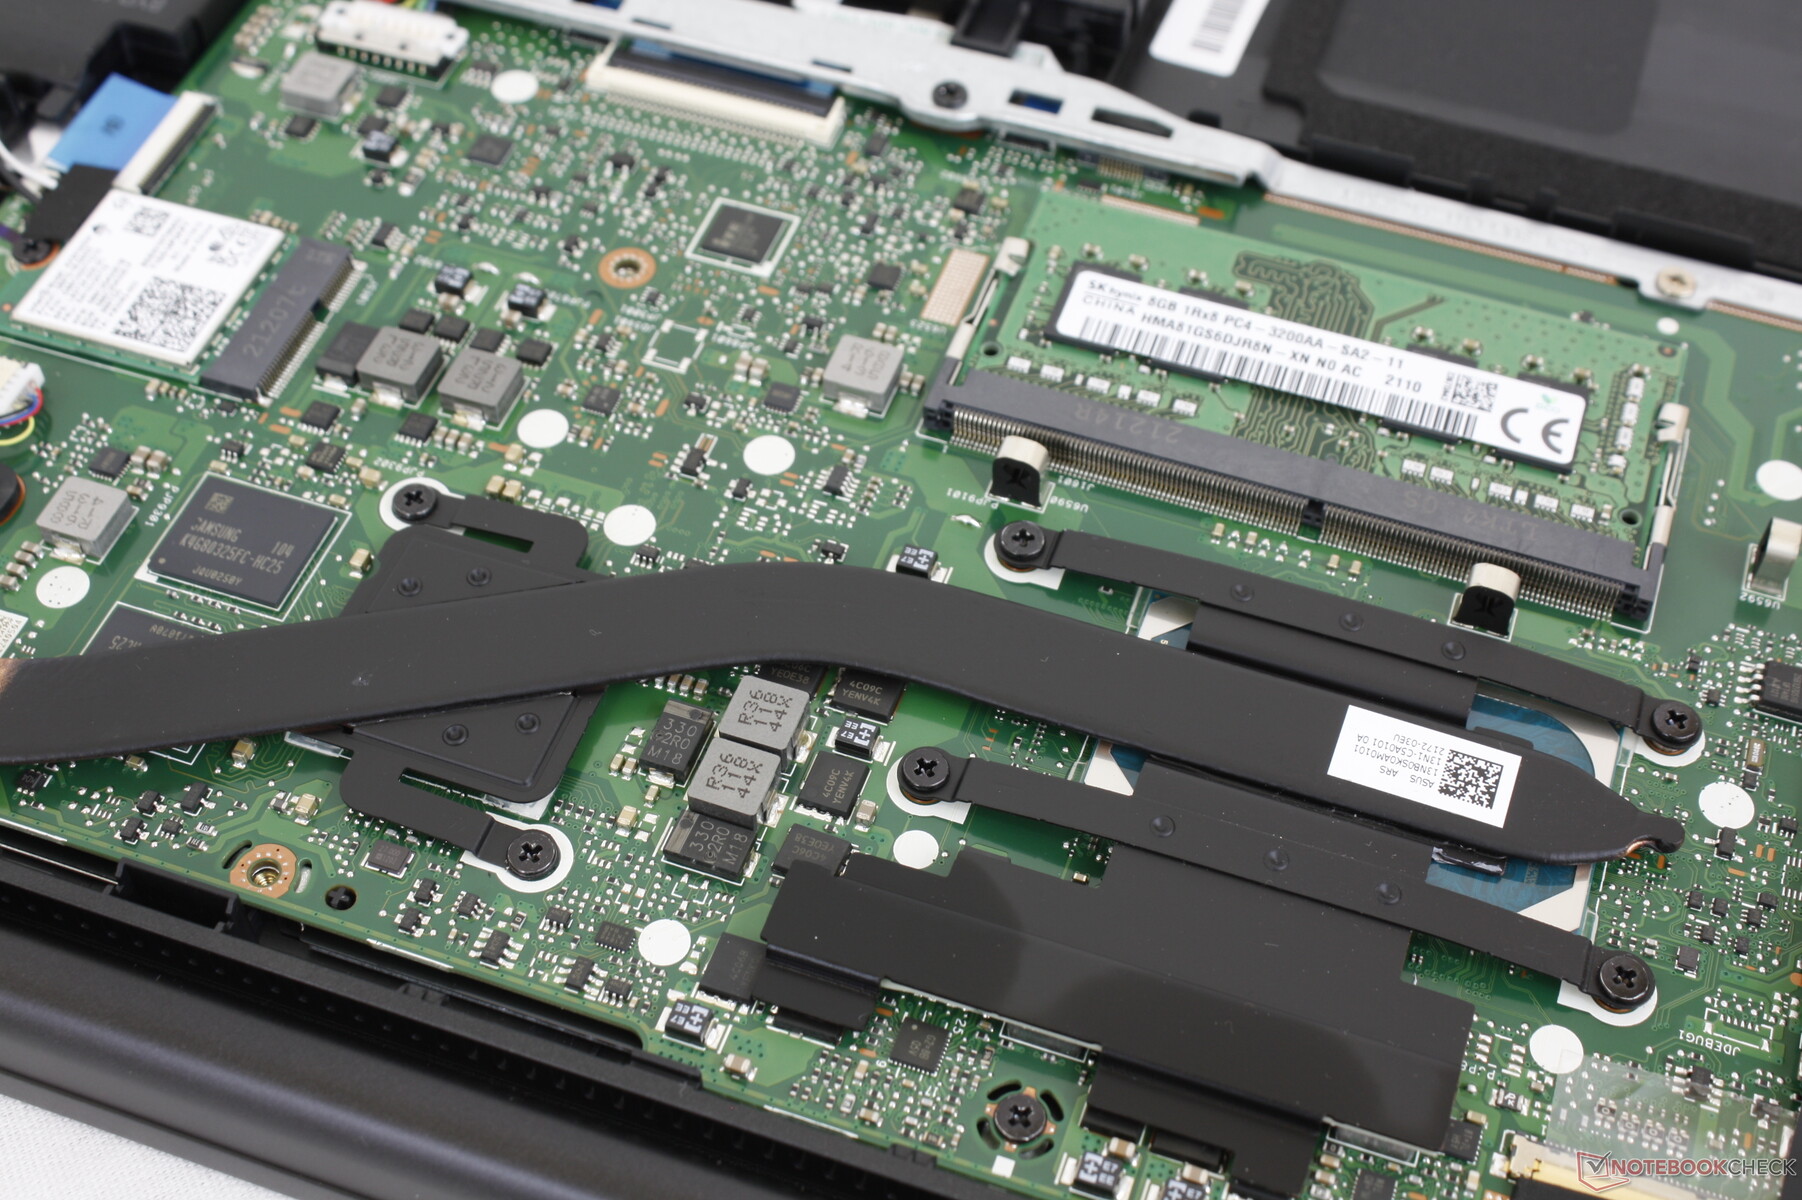
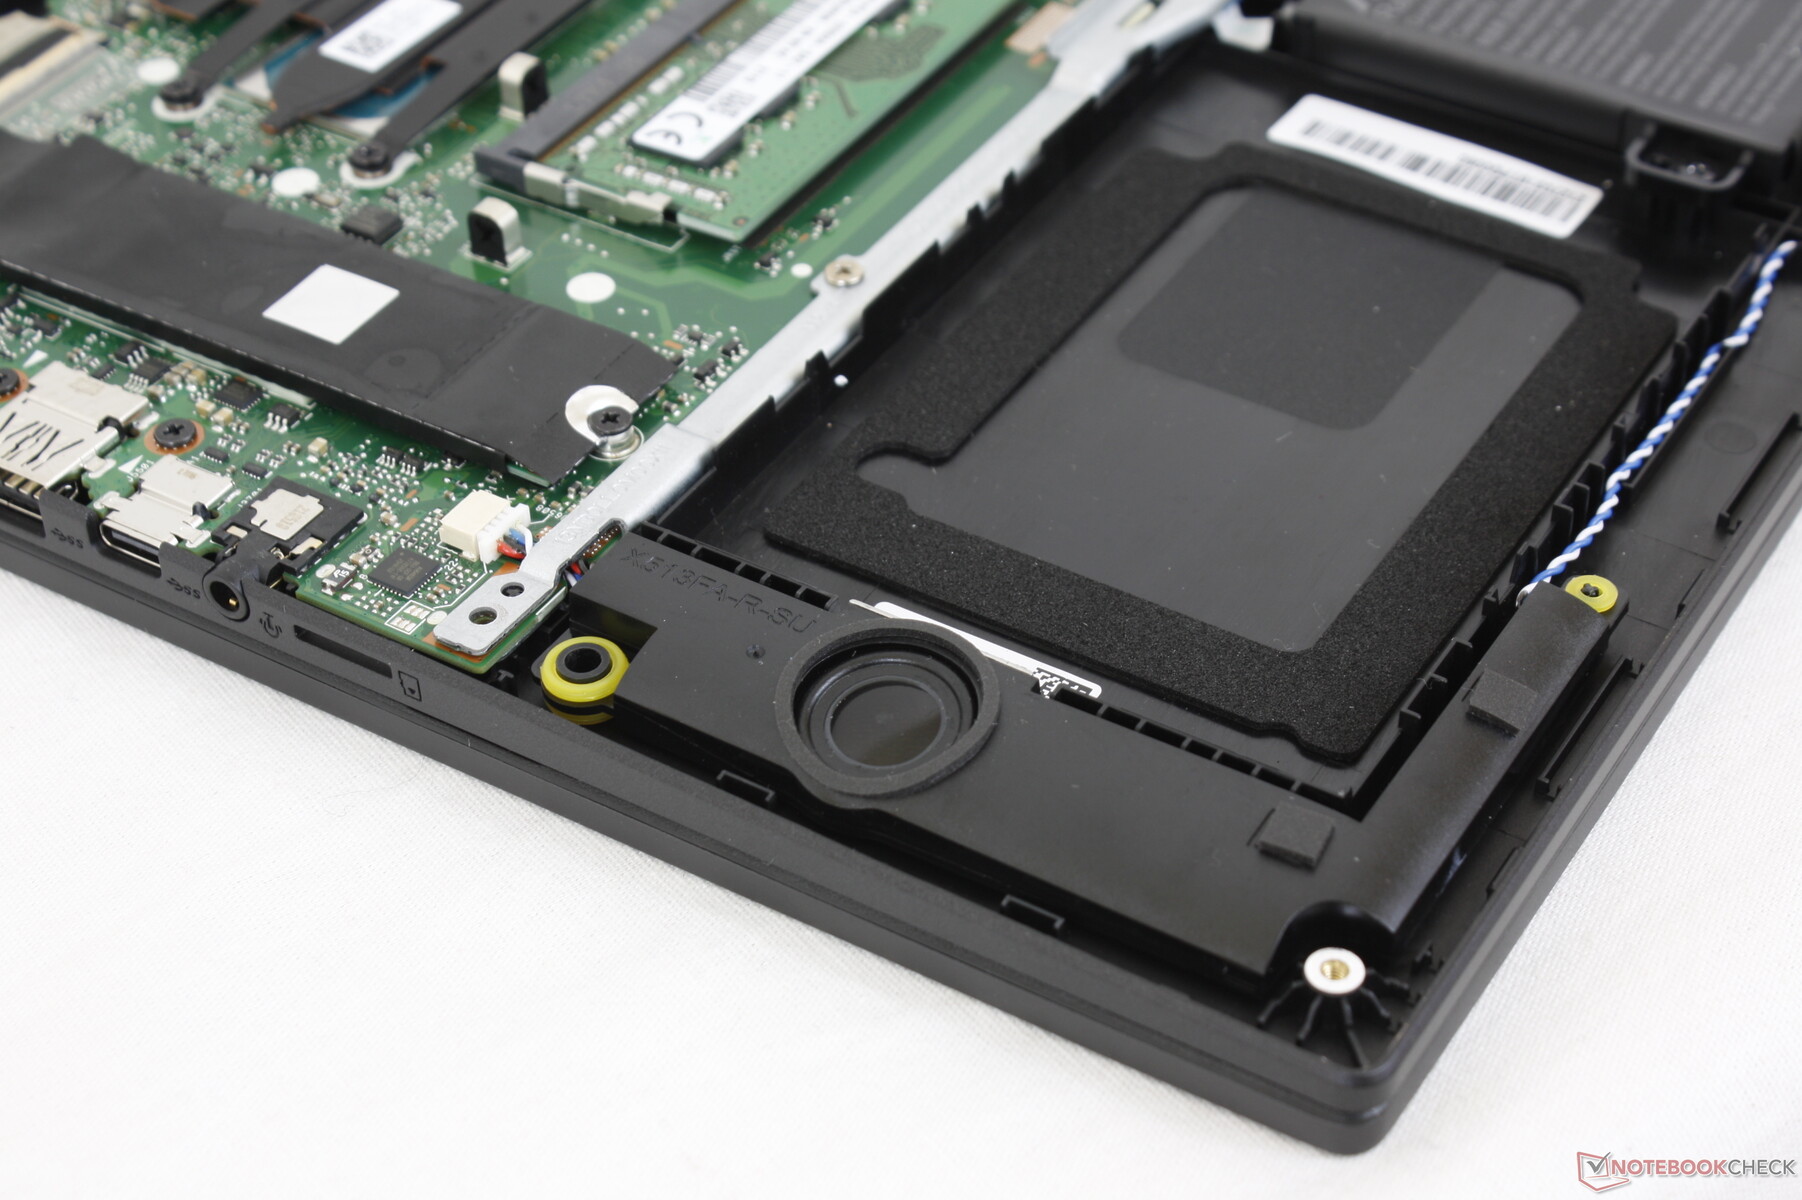
Wartung — Leicht zu öffnen
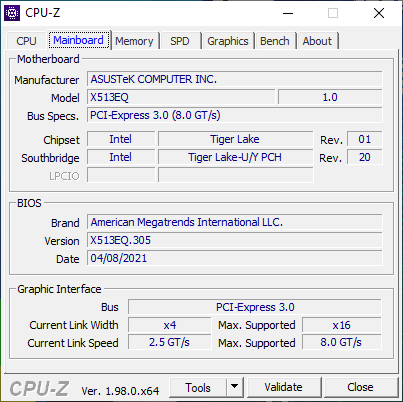
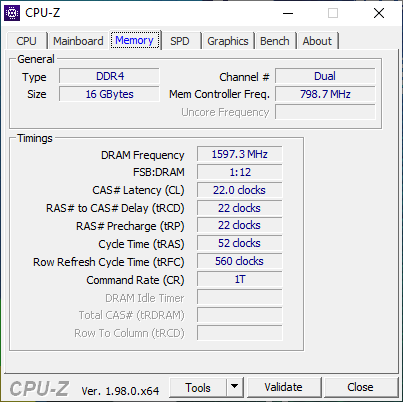
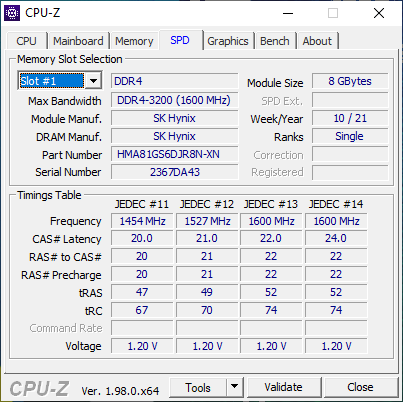
Die Unterseite lässt sich leicht mit einem Kreuzschraubendreher öffnen und enthüllt sodann den Single-SODIMM-Slot, das WLAN-Modul und den M.2-2280-PCIe3-x4-Slot. 8 GB Single-Channel-RAM sind fest verlötet und werden mit einem austauschbaren 8-GB-Modul zu insgesamt 16 GB kombiniert.
Zubehör und Garantie
Außer dem Netzteil und ein wenig Papierkram befinden sich keine Extras in der Verpackung. Der Hersteller gewährt eine limitierte 1-Jahres-Garantie.
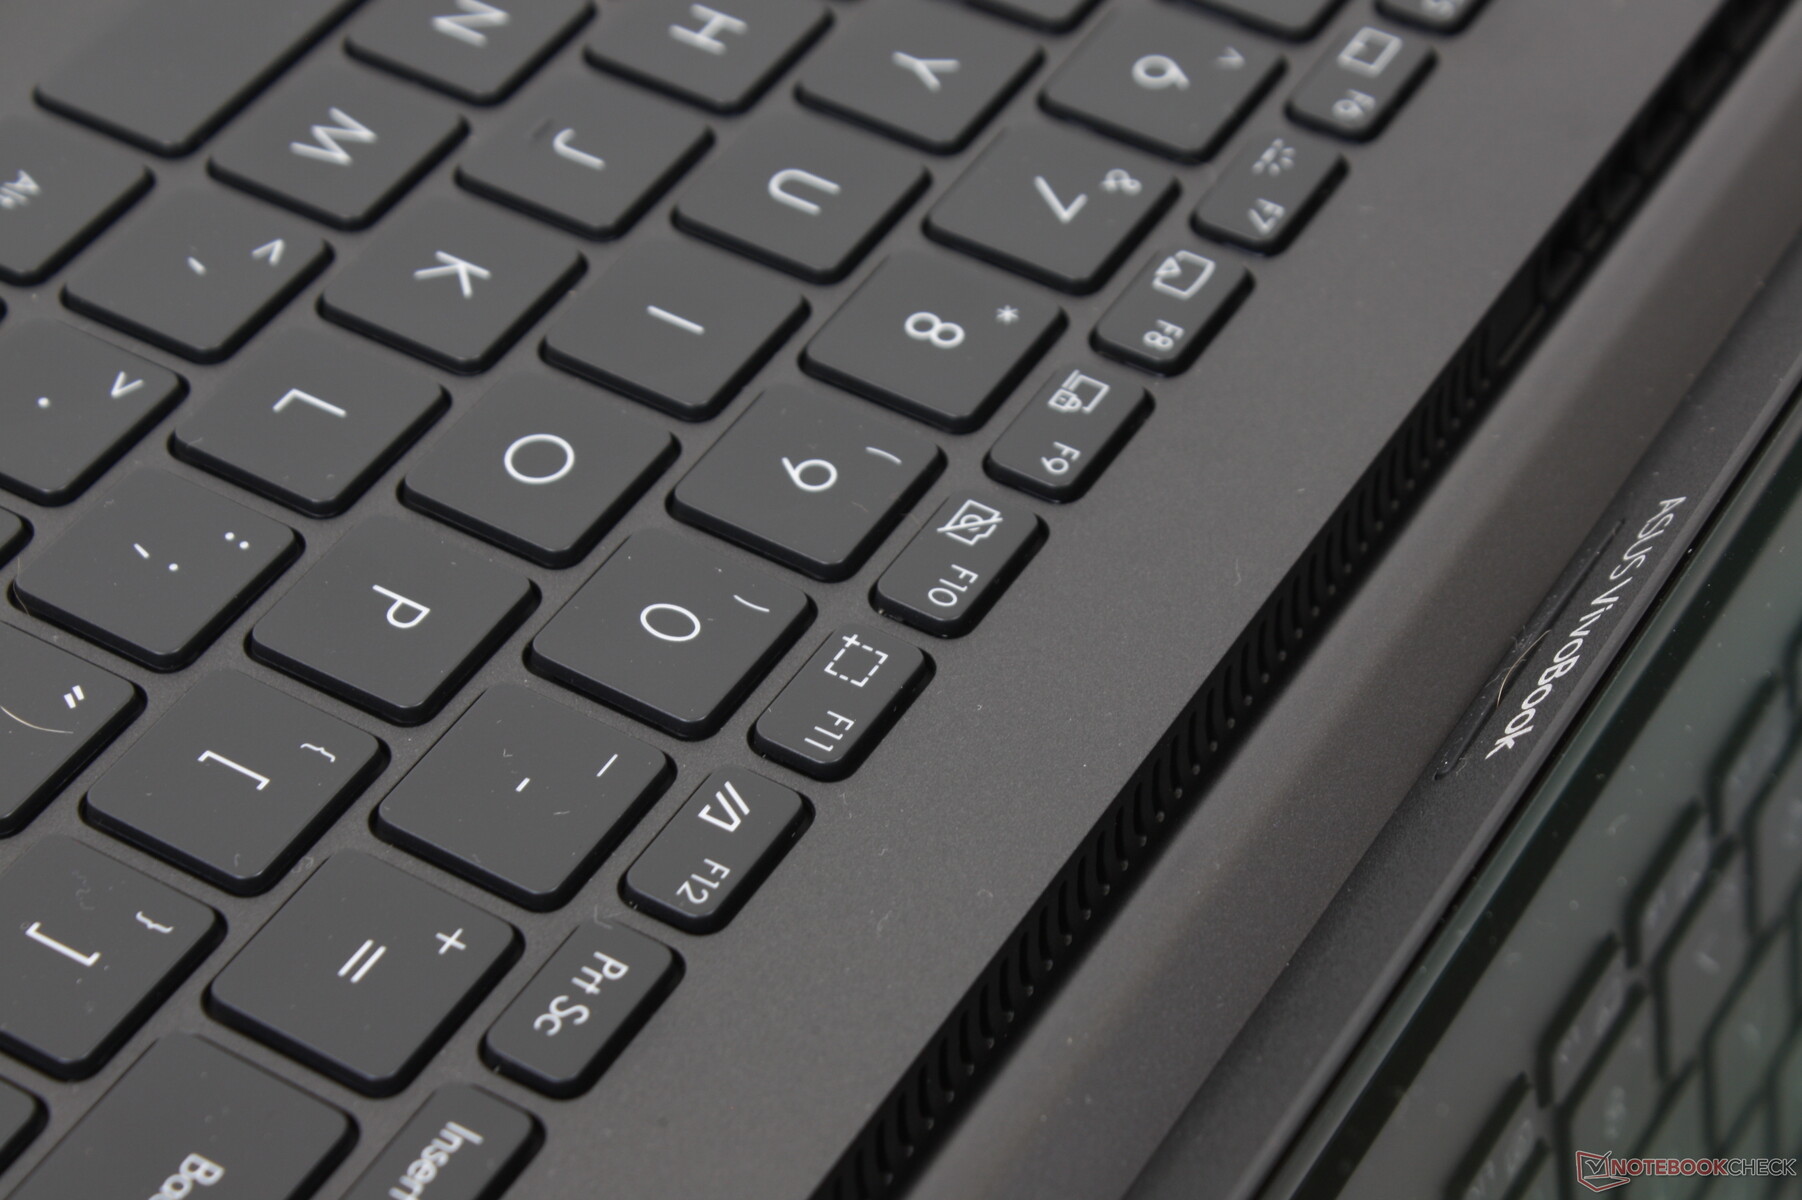
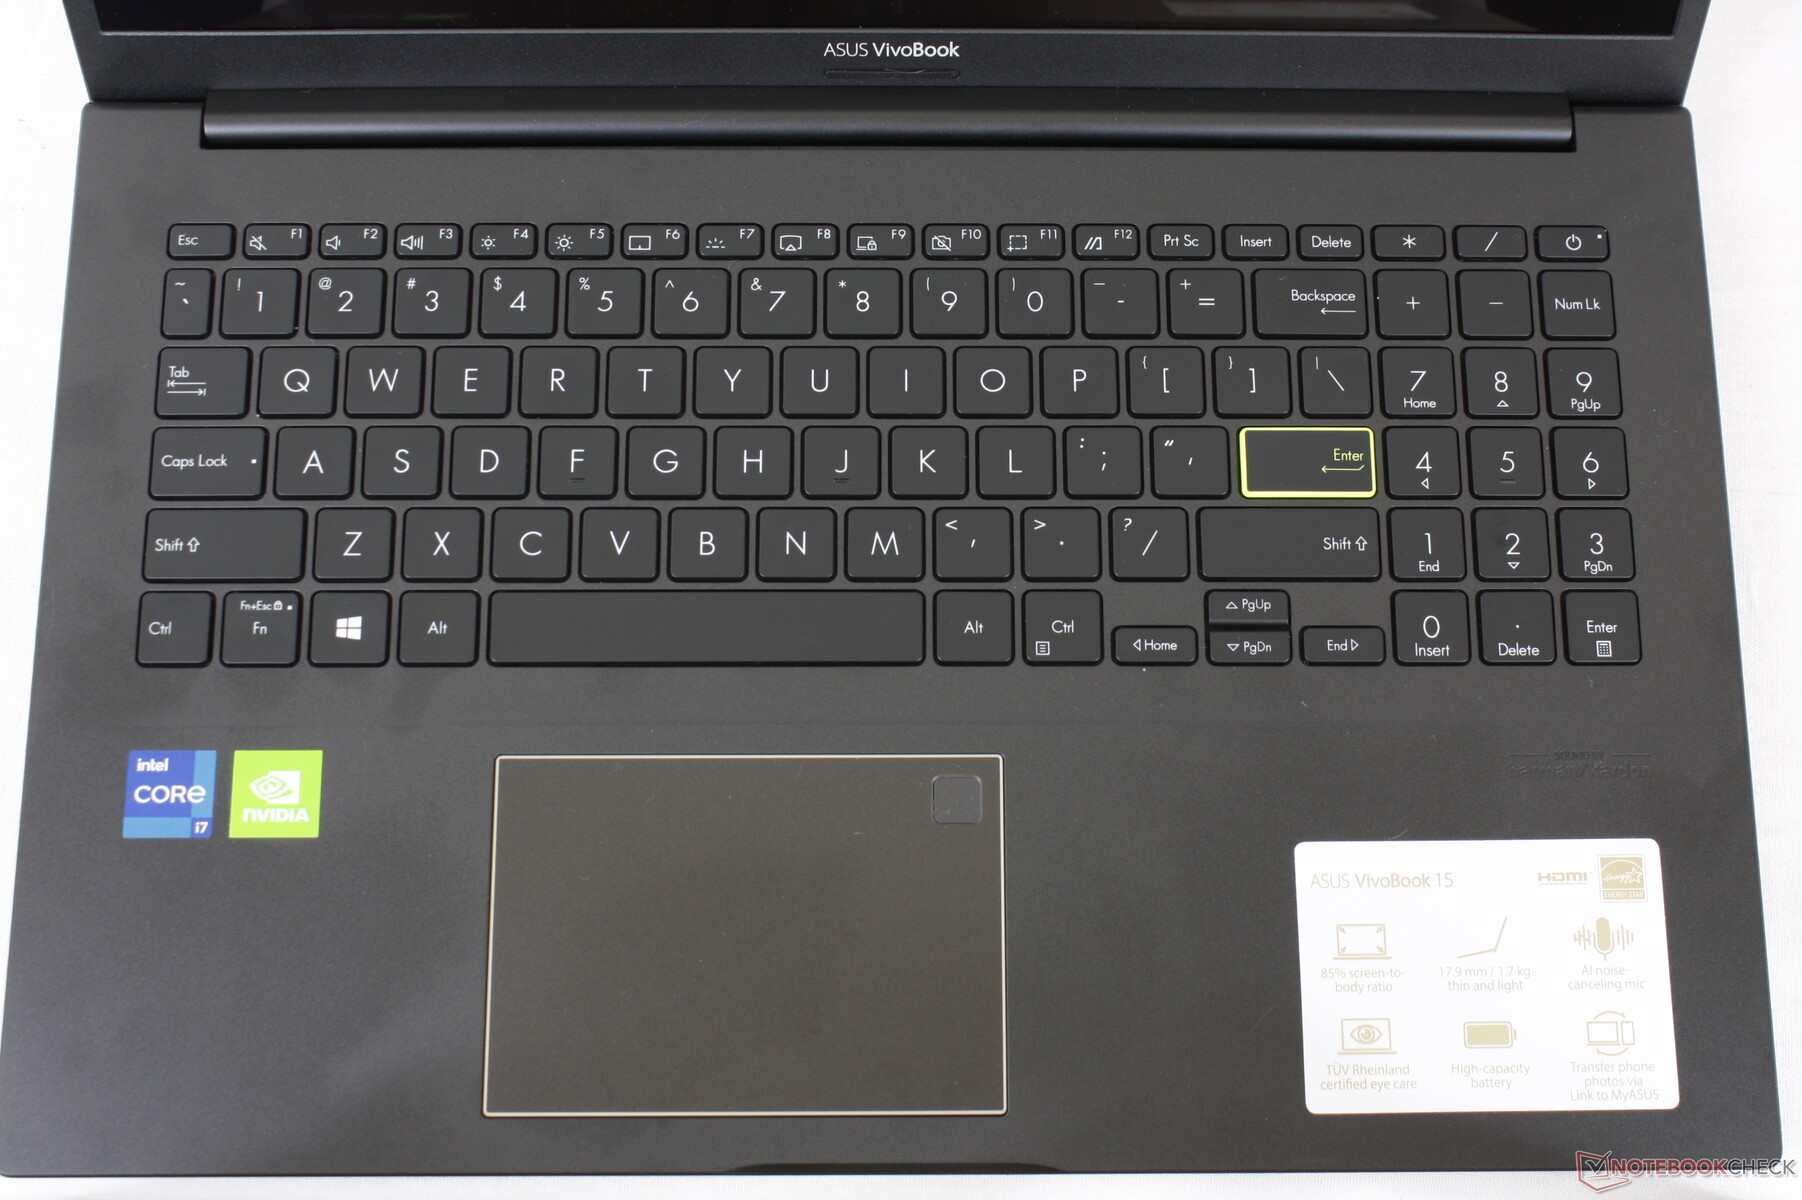
Eingabegeräte — Schwammiges Clickpad
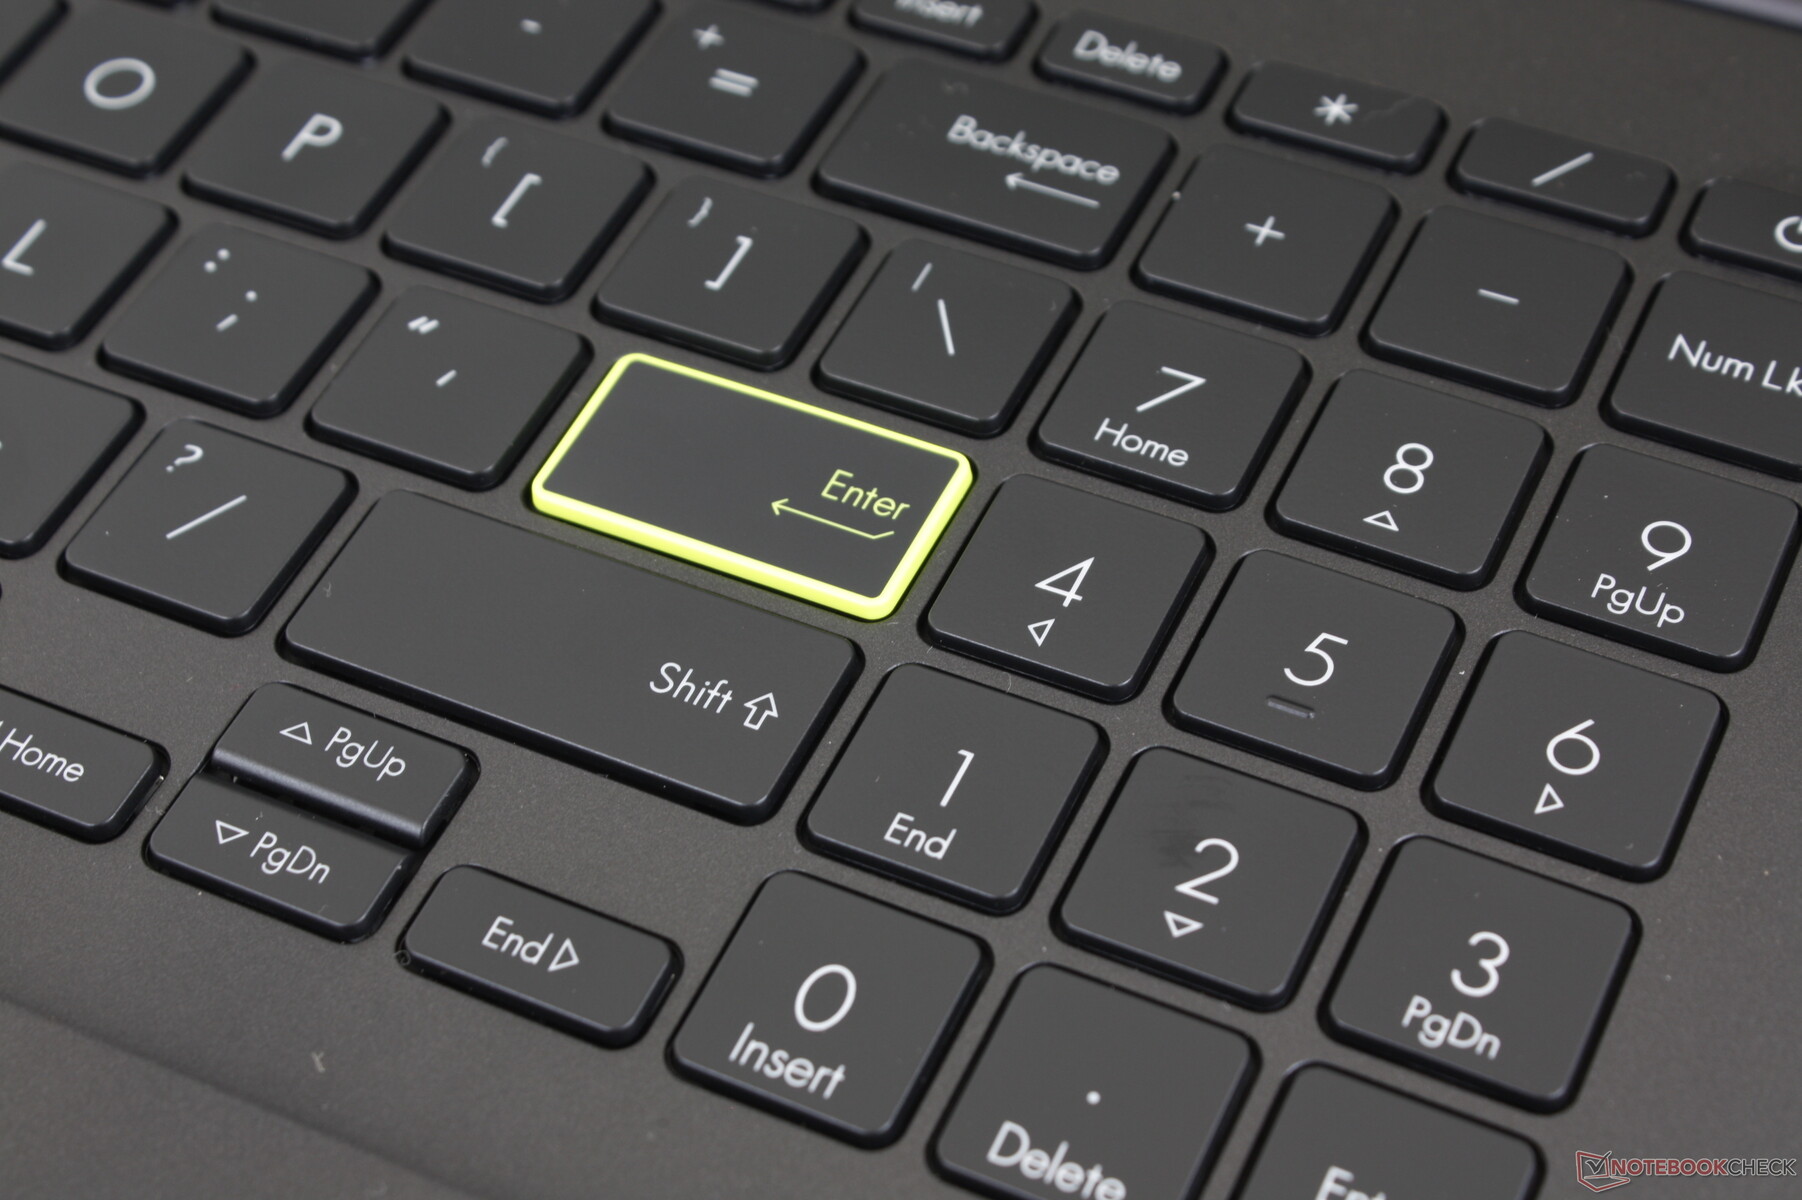
Tastatur
Wer bereits auf einem VivoBook getippt hat, wird die Tastatur des VivoBook 15 K513 gleich wiedererkennen, immerhin gibt es zwischen den Modellen nur geringfügige Variationen was das Feedback angeht. Sowohl Hub als auch das Feedback sind zu flach und weich, vor allem im Vergleich zu den festeren Tasten eines Business-orientierten Lenovo ThinkPad oder HP EliteBook. Die Tasten eines Lenovo IdeaPad 5 15 fühlen sich ähnlich wie bei unserem Asus an, allerdings ist das Schreibgeräusch im vorliegenden Modell spürbar lauter.
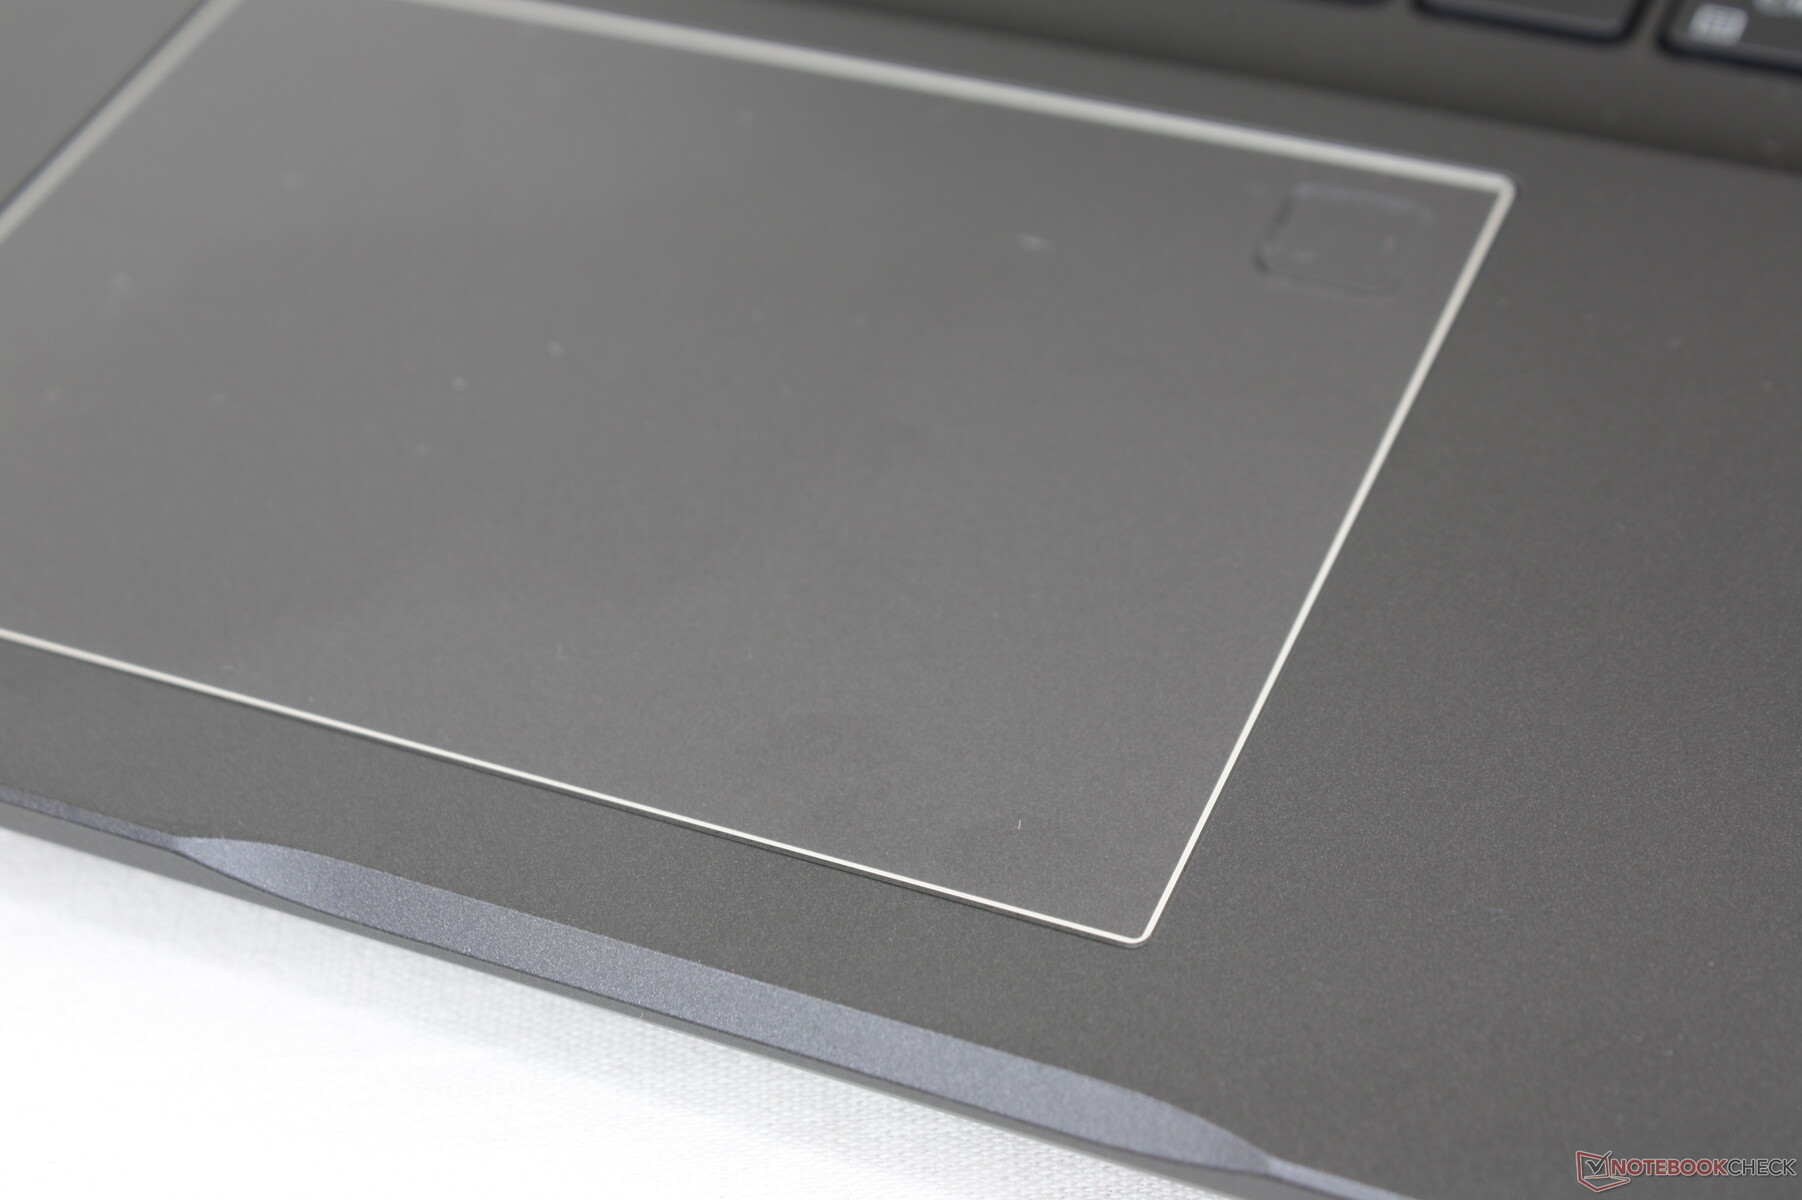
Touchpad
Das Touchpad (~10,5 x 7,3 cm) macht einen schwachen, unterdurchschnittlichen Eindruck, selbst angesichts von Budget-Standards. Während Cursorbewegungen flüssig und ohne Sprünge vonstatten gehen, sind die integrierten Maustasten deutlich zu schwammig und seicht. Folglich fühlen sich Klicks alles andere als befriedigend an, besonders merkt man dies beim Klicken und Ziehen oder anderen Multi-Touch-Aktionen.

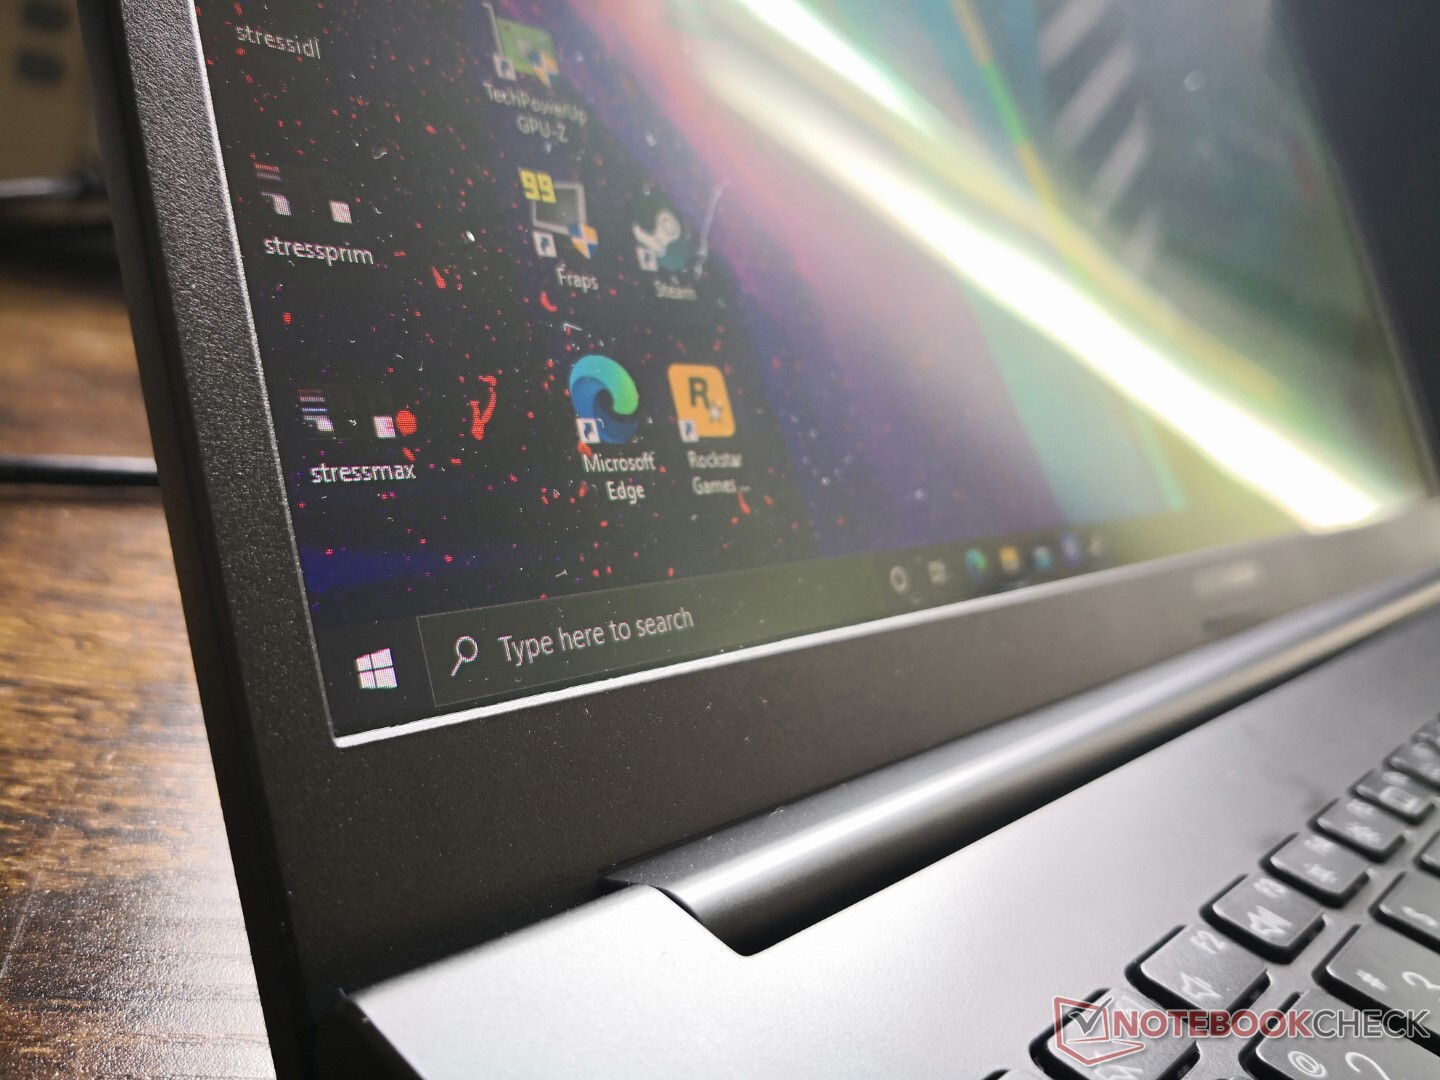
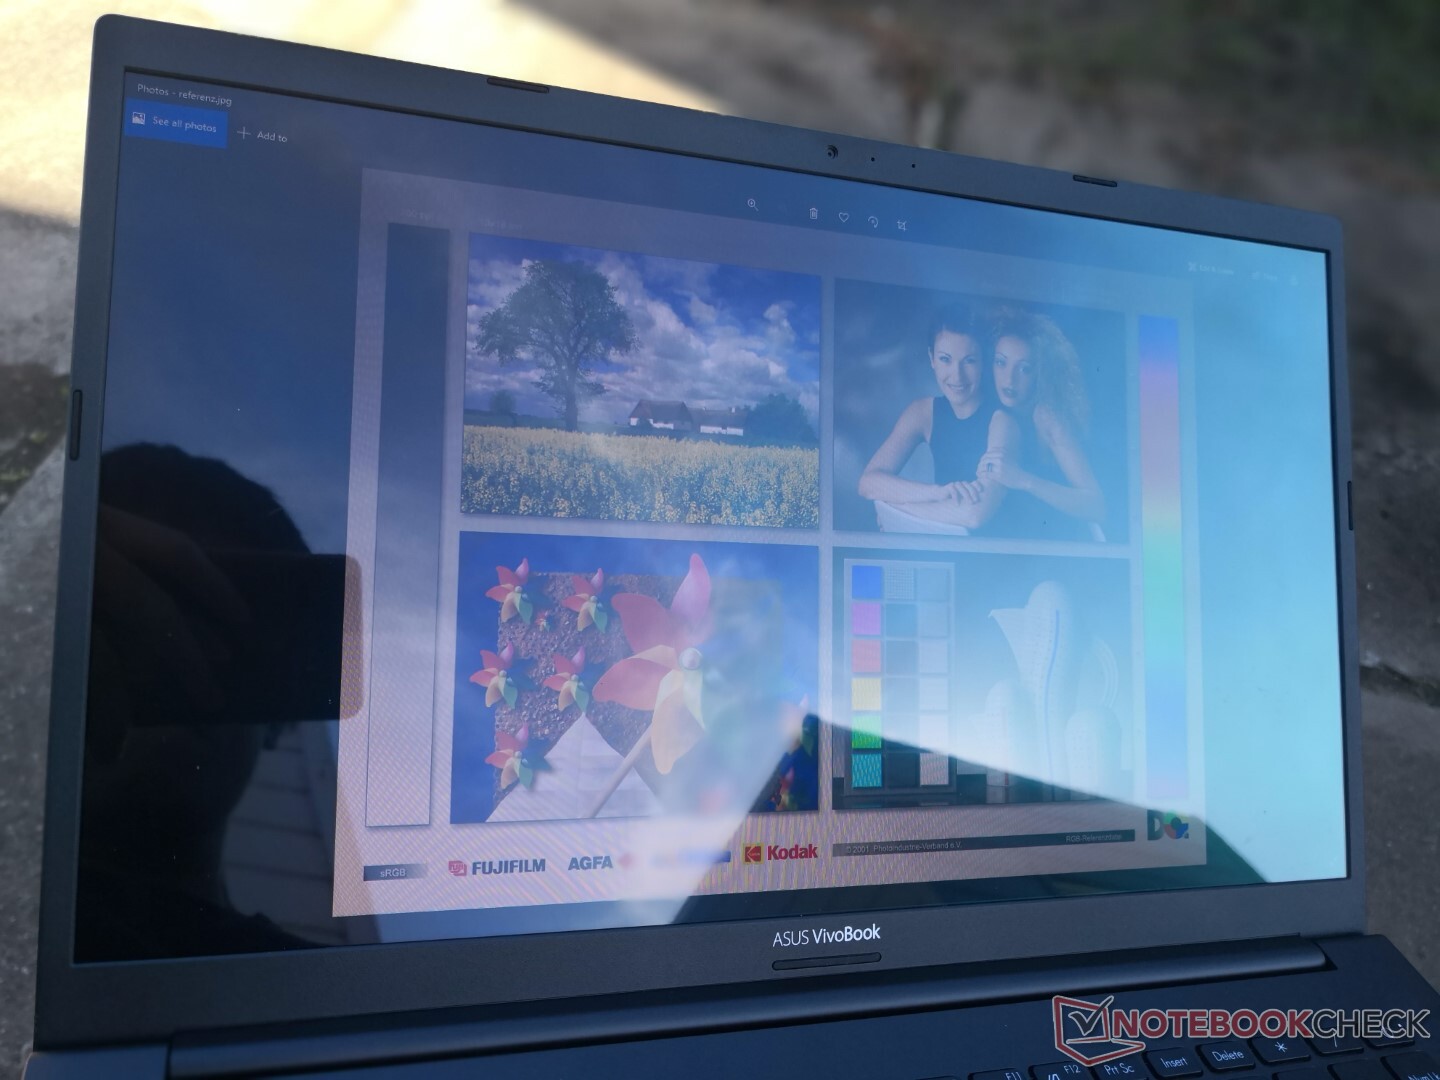
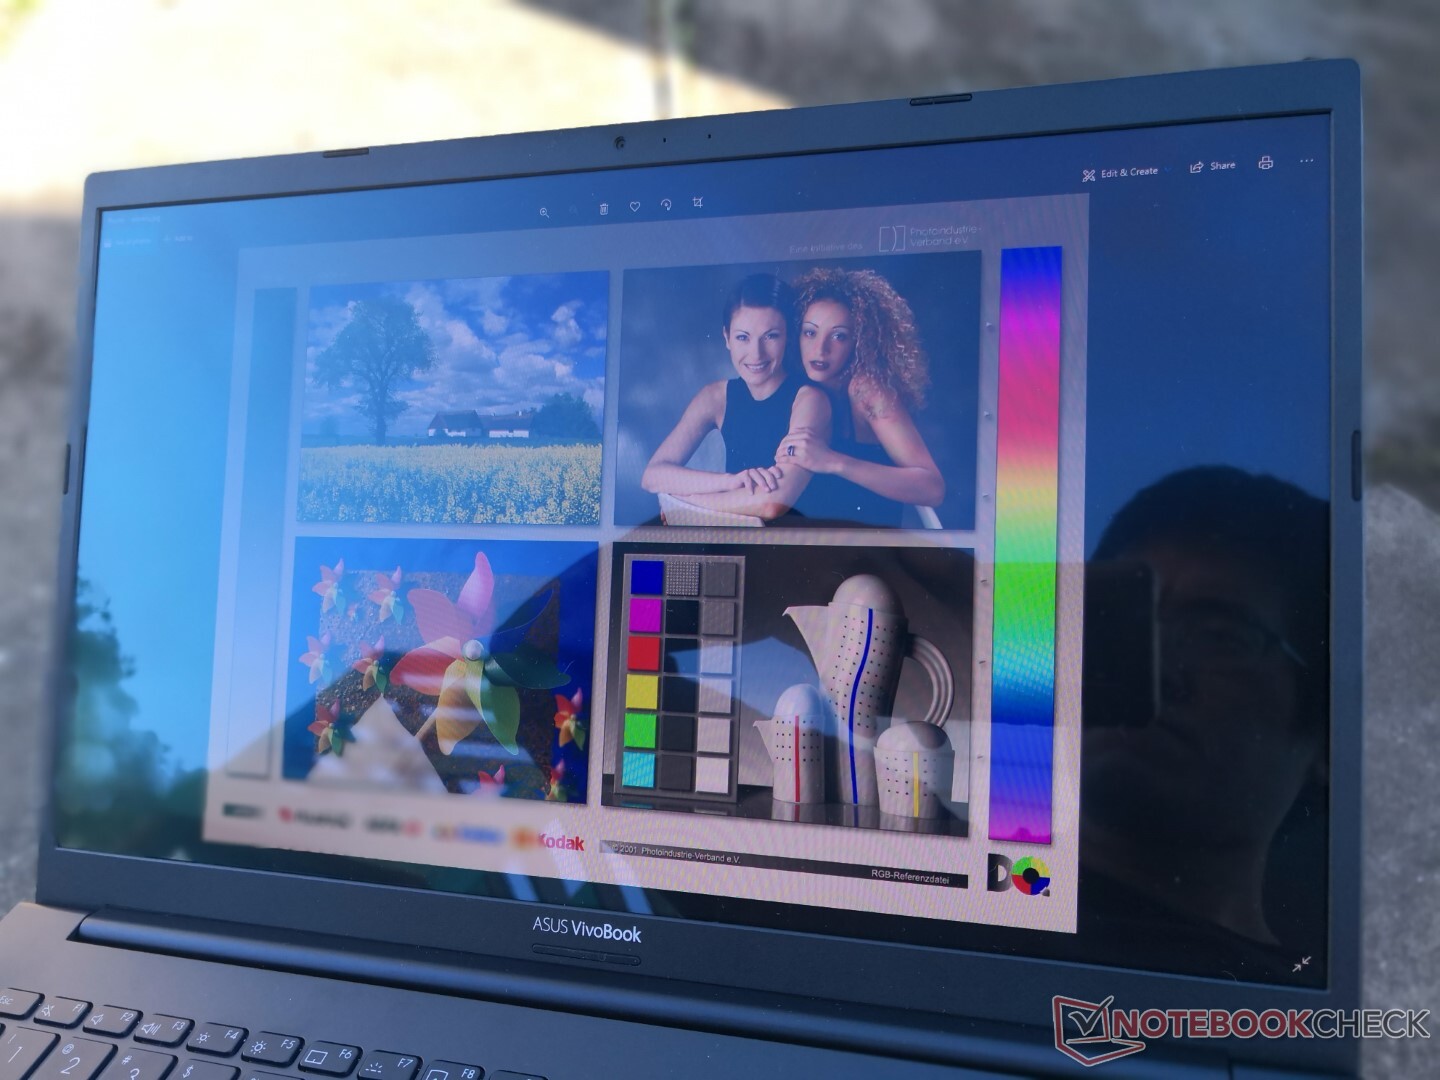
Display — Insgesamt besser als IPS
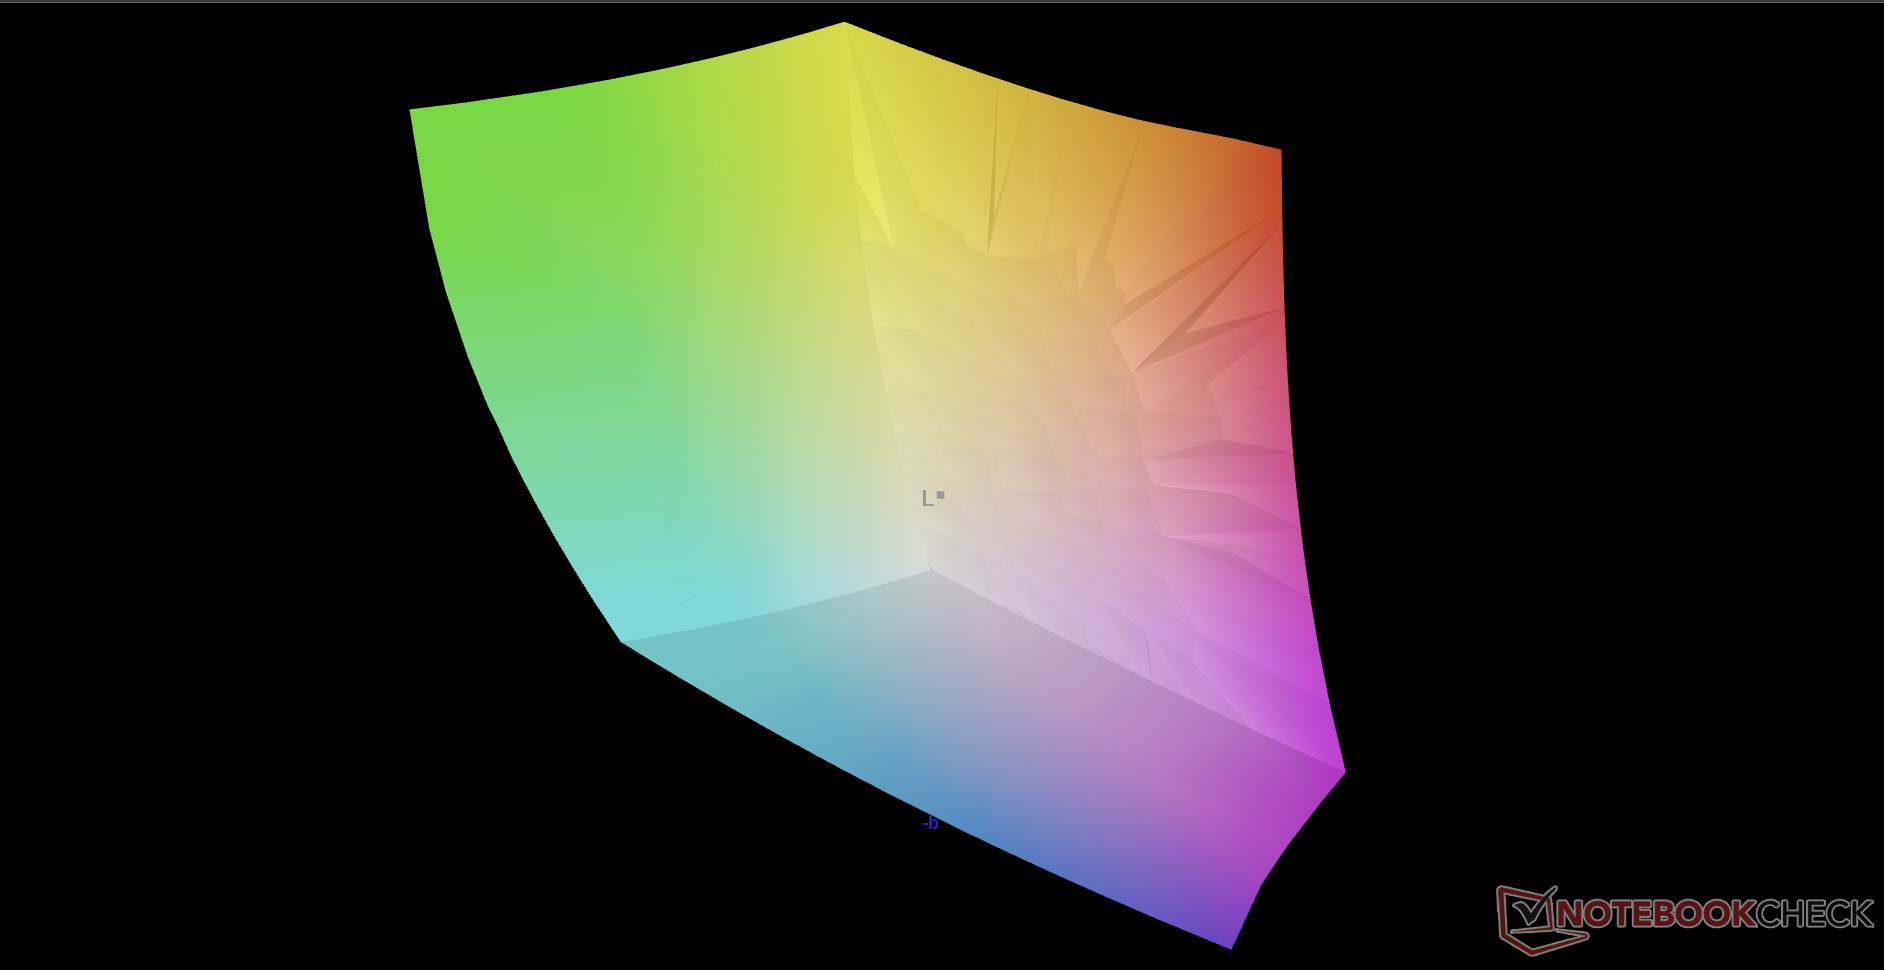
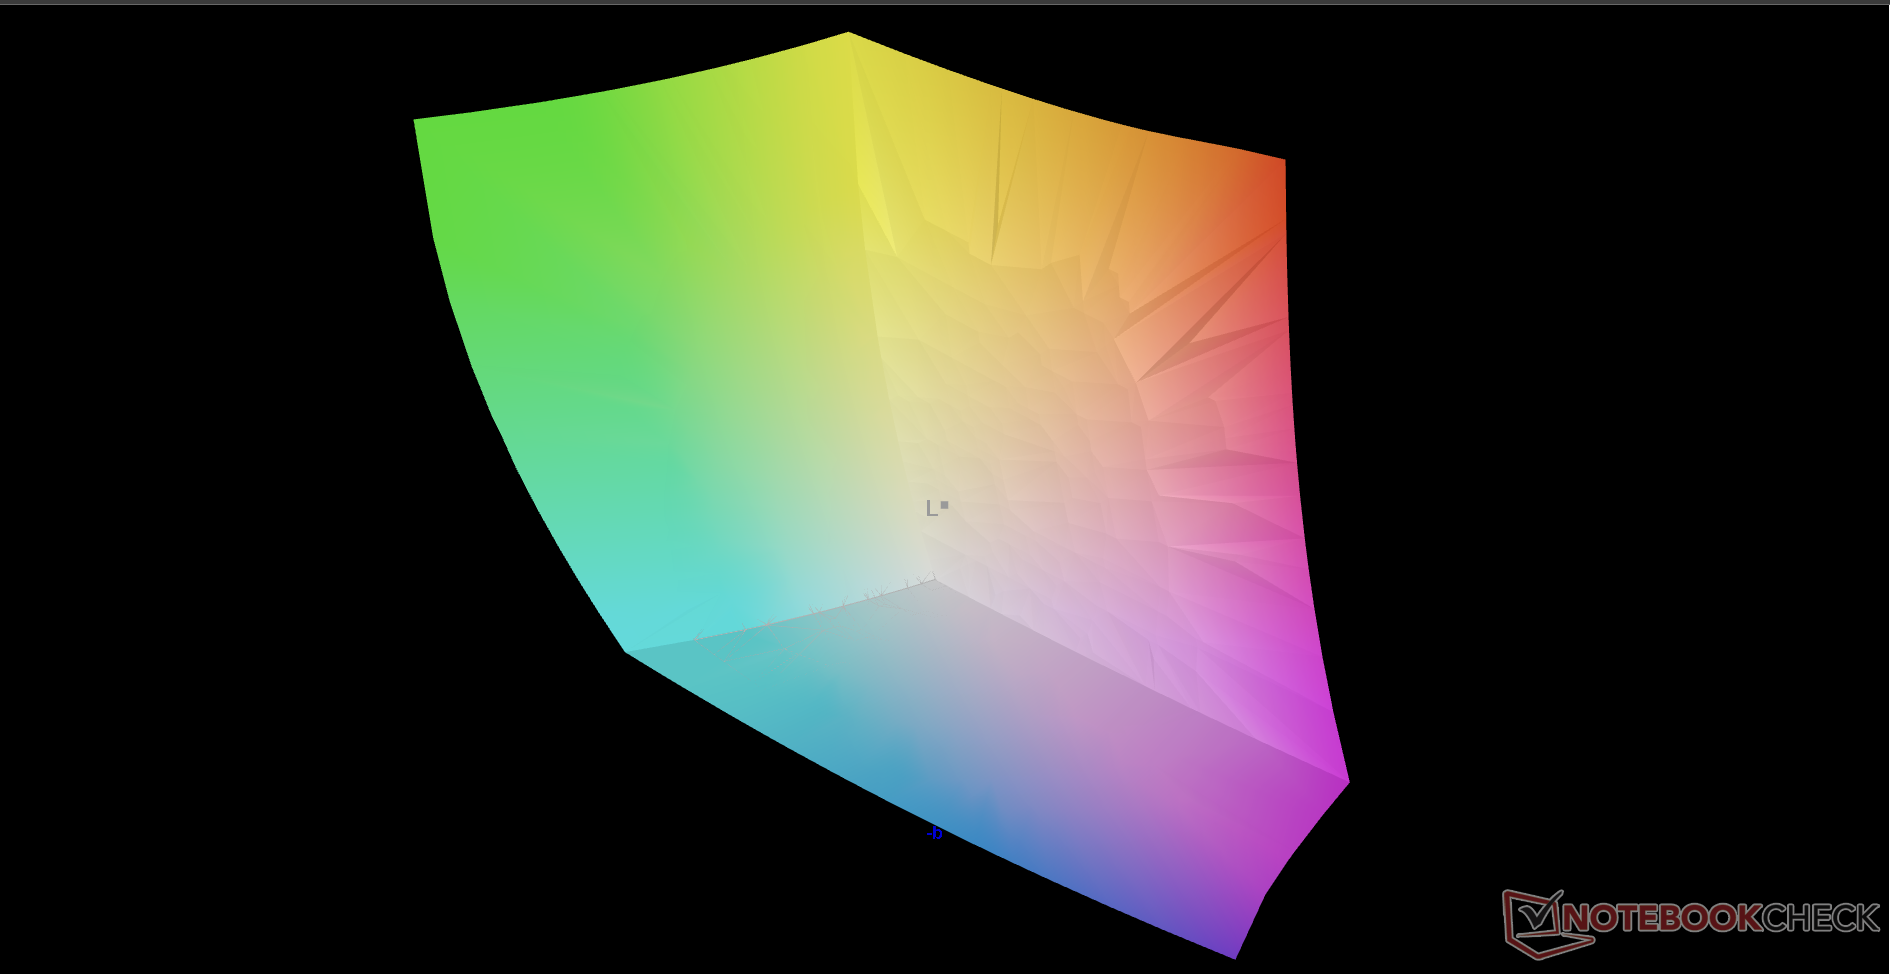
Asus verwendet das gleiche 1080p-OLED-Panel Samsung ATNA56YX03-0 für das VivoBook 15 K513 und die VivoBook-15-Pro-Serie. Das Panel macht auf sich aufmerksam, weil es den kompletten DCI-P3-Farbraum abdeckt, das können die allermeisten IPS-Panel nicht von sich behaupten, schon gar nicht im Preisbereich bis $1000 USD. Die besonders schnellen Reaktionszeiten, das recht helle Display und das extrem gute Kontrastverhältnis eignen das VivoBook besser zum grafischen Editieren als gedacht.
Beachtet werden sollte, dass anders als bei vielen anderen Laptops PWM bei allen Helligkeitsstufen präsent ist. Bei einem Helligkeitswert von 50 Prozent und darüber messen wir eine Frequenz von 59 Hz, bei dunkleren Einstellungen sind es 434 Hz.


| |||||||||||||||||||||||||
Ausleuchtung: 98 %
Helligkeit Akku: 384.5 cd/m²
Kontrast: ∞:1 (Schwarzwert: 0 cd/m²)
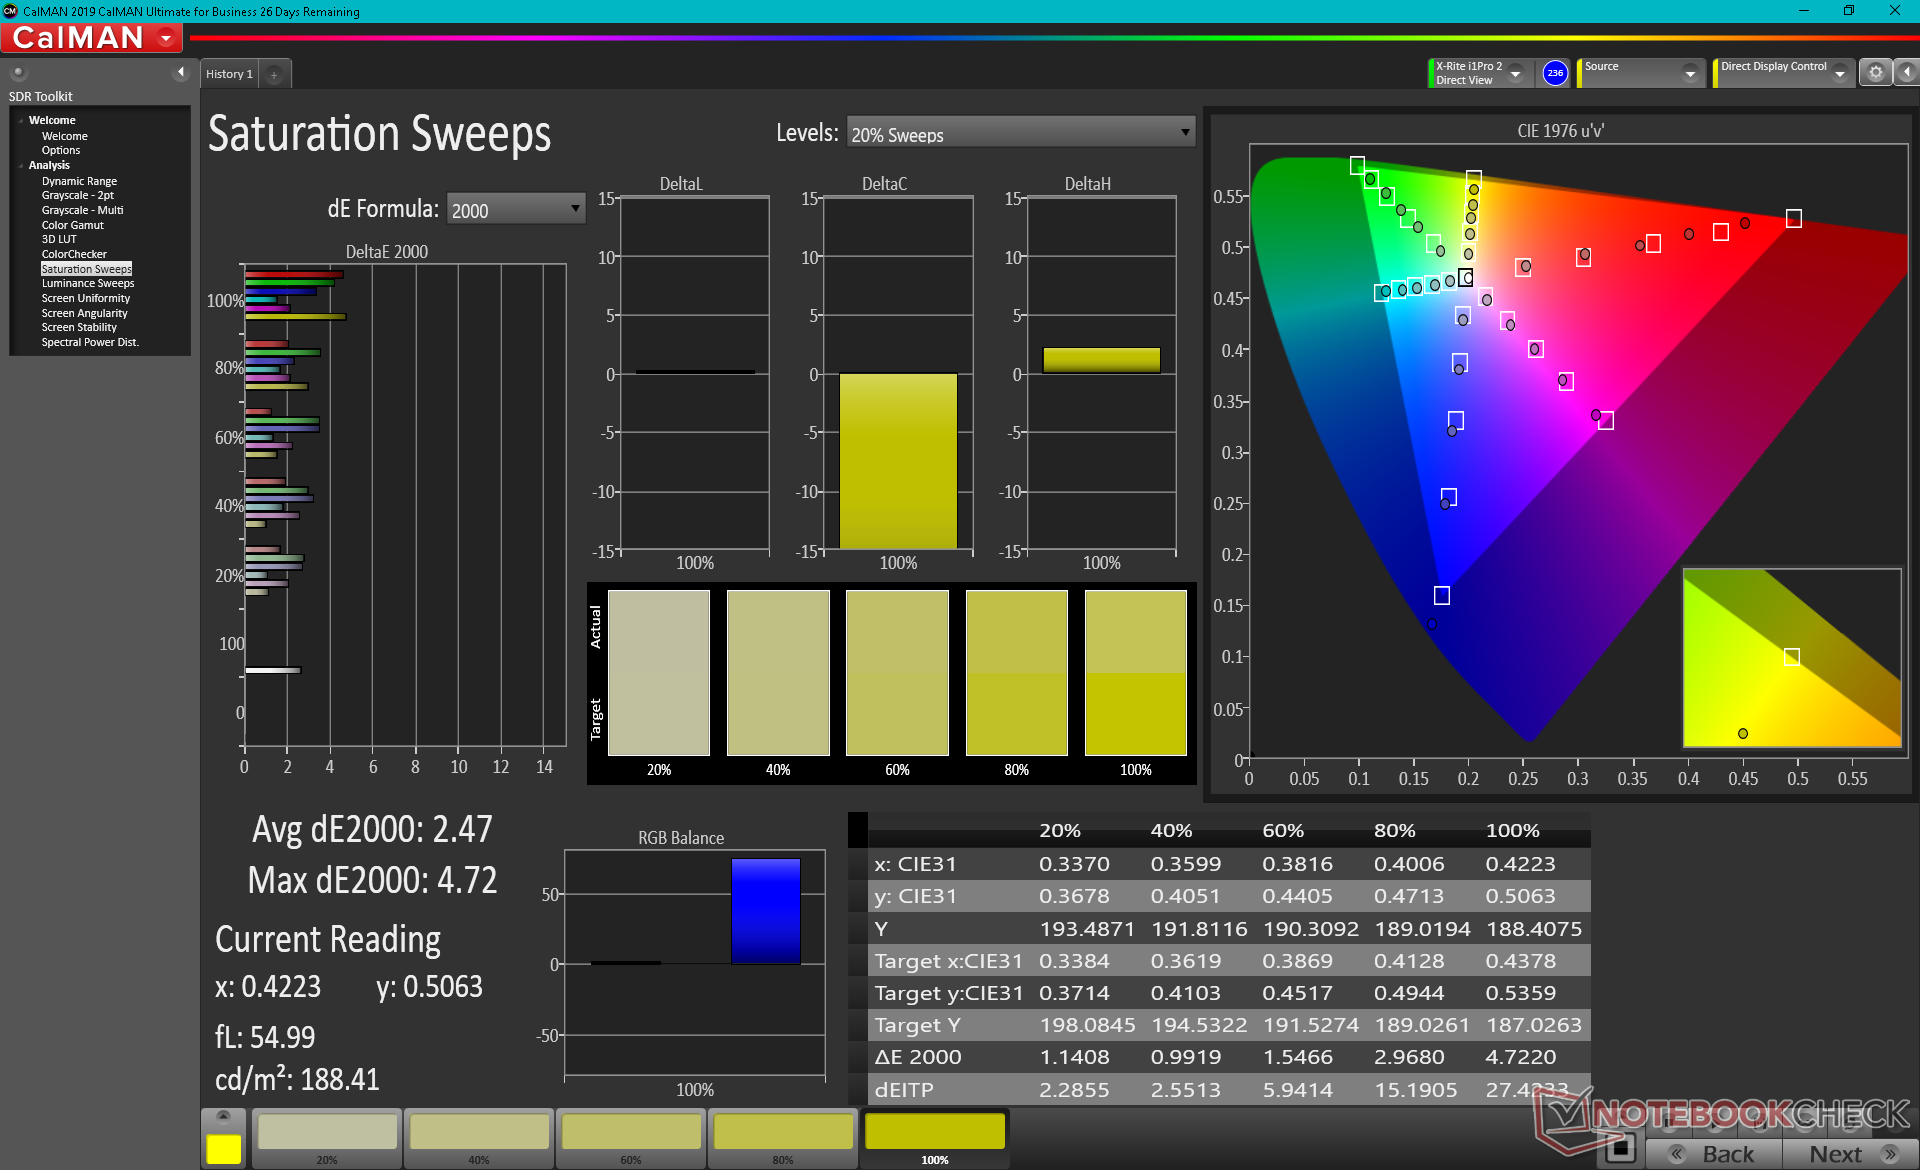
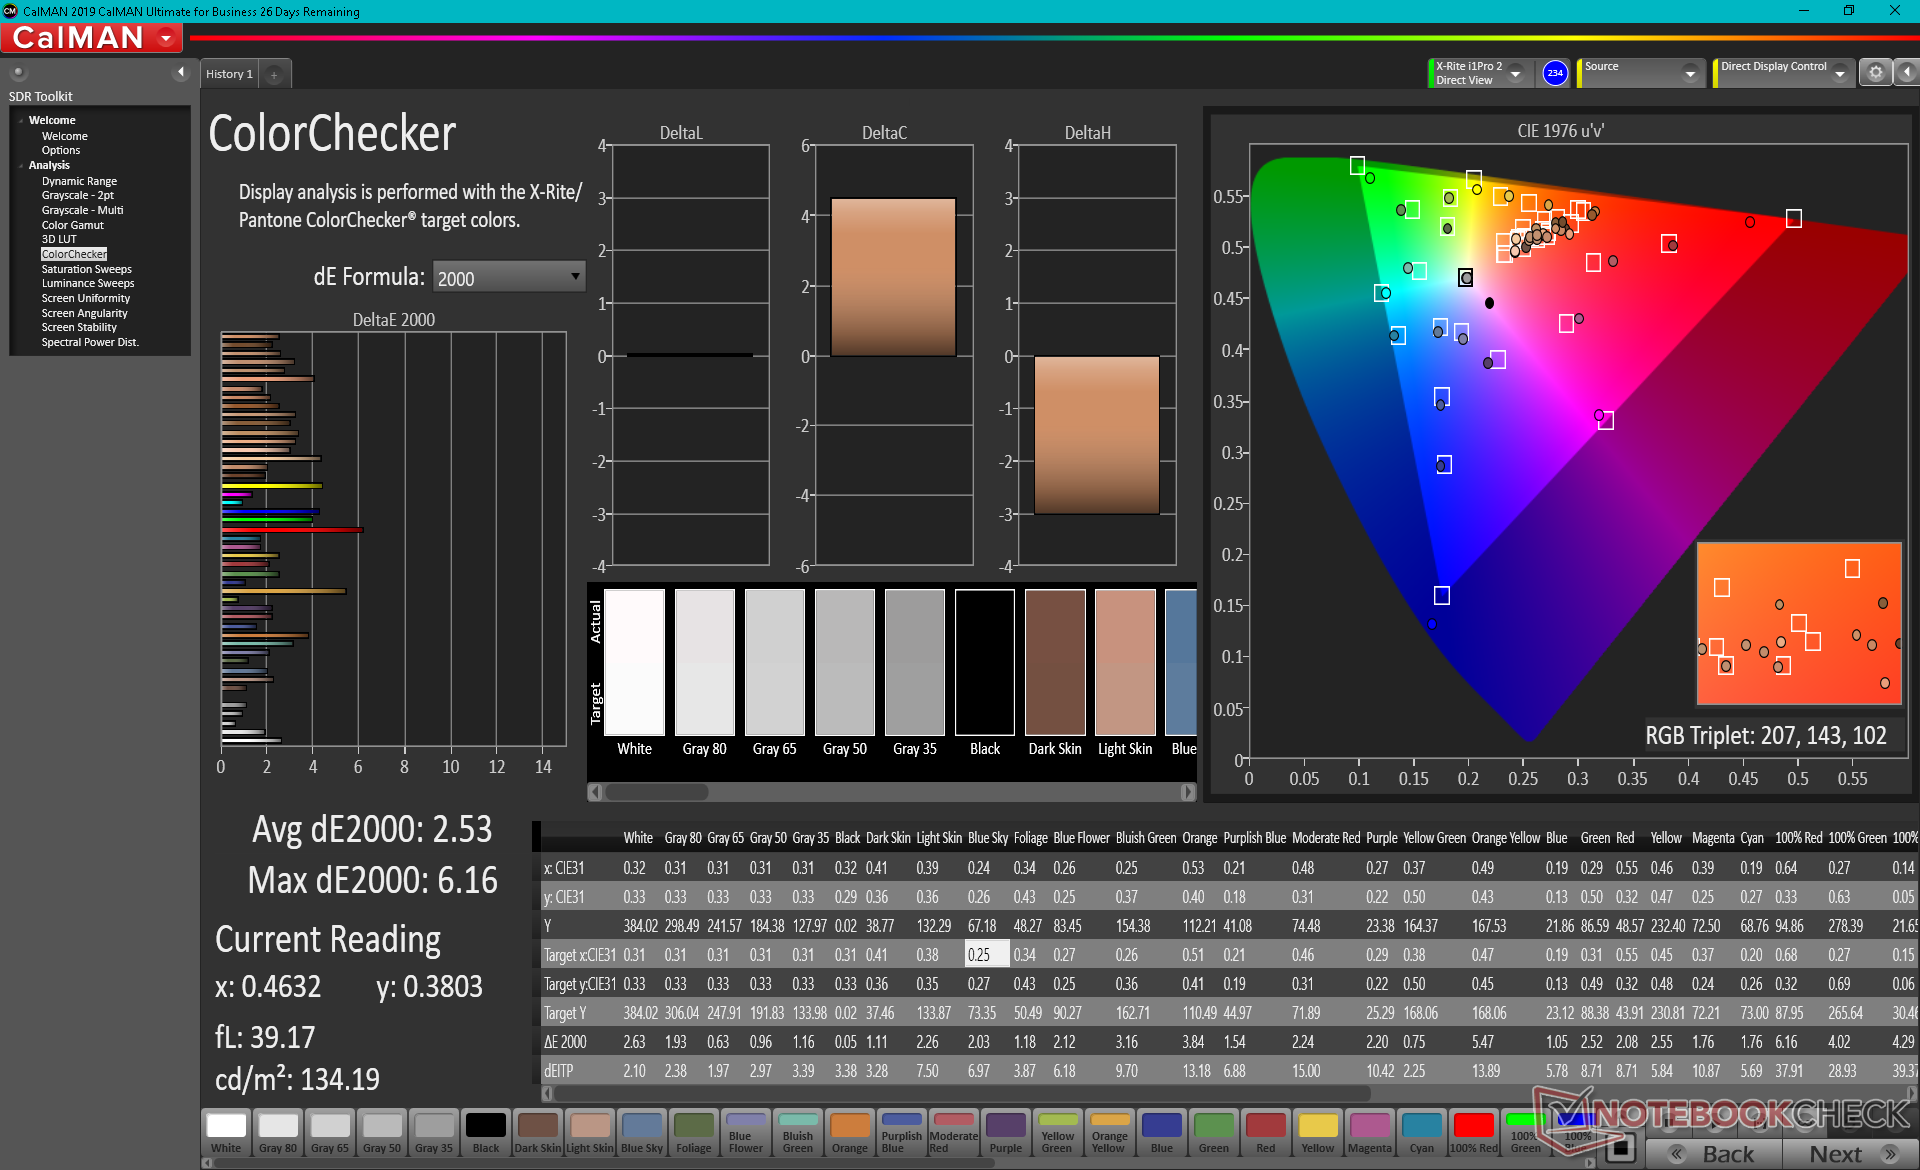
ΔE ColorChecker Calman: 2.53 | ∀{0.5-29.43 Ø4.72}
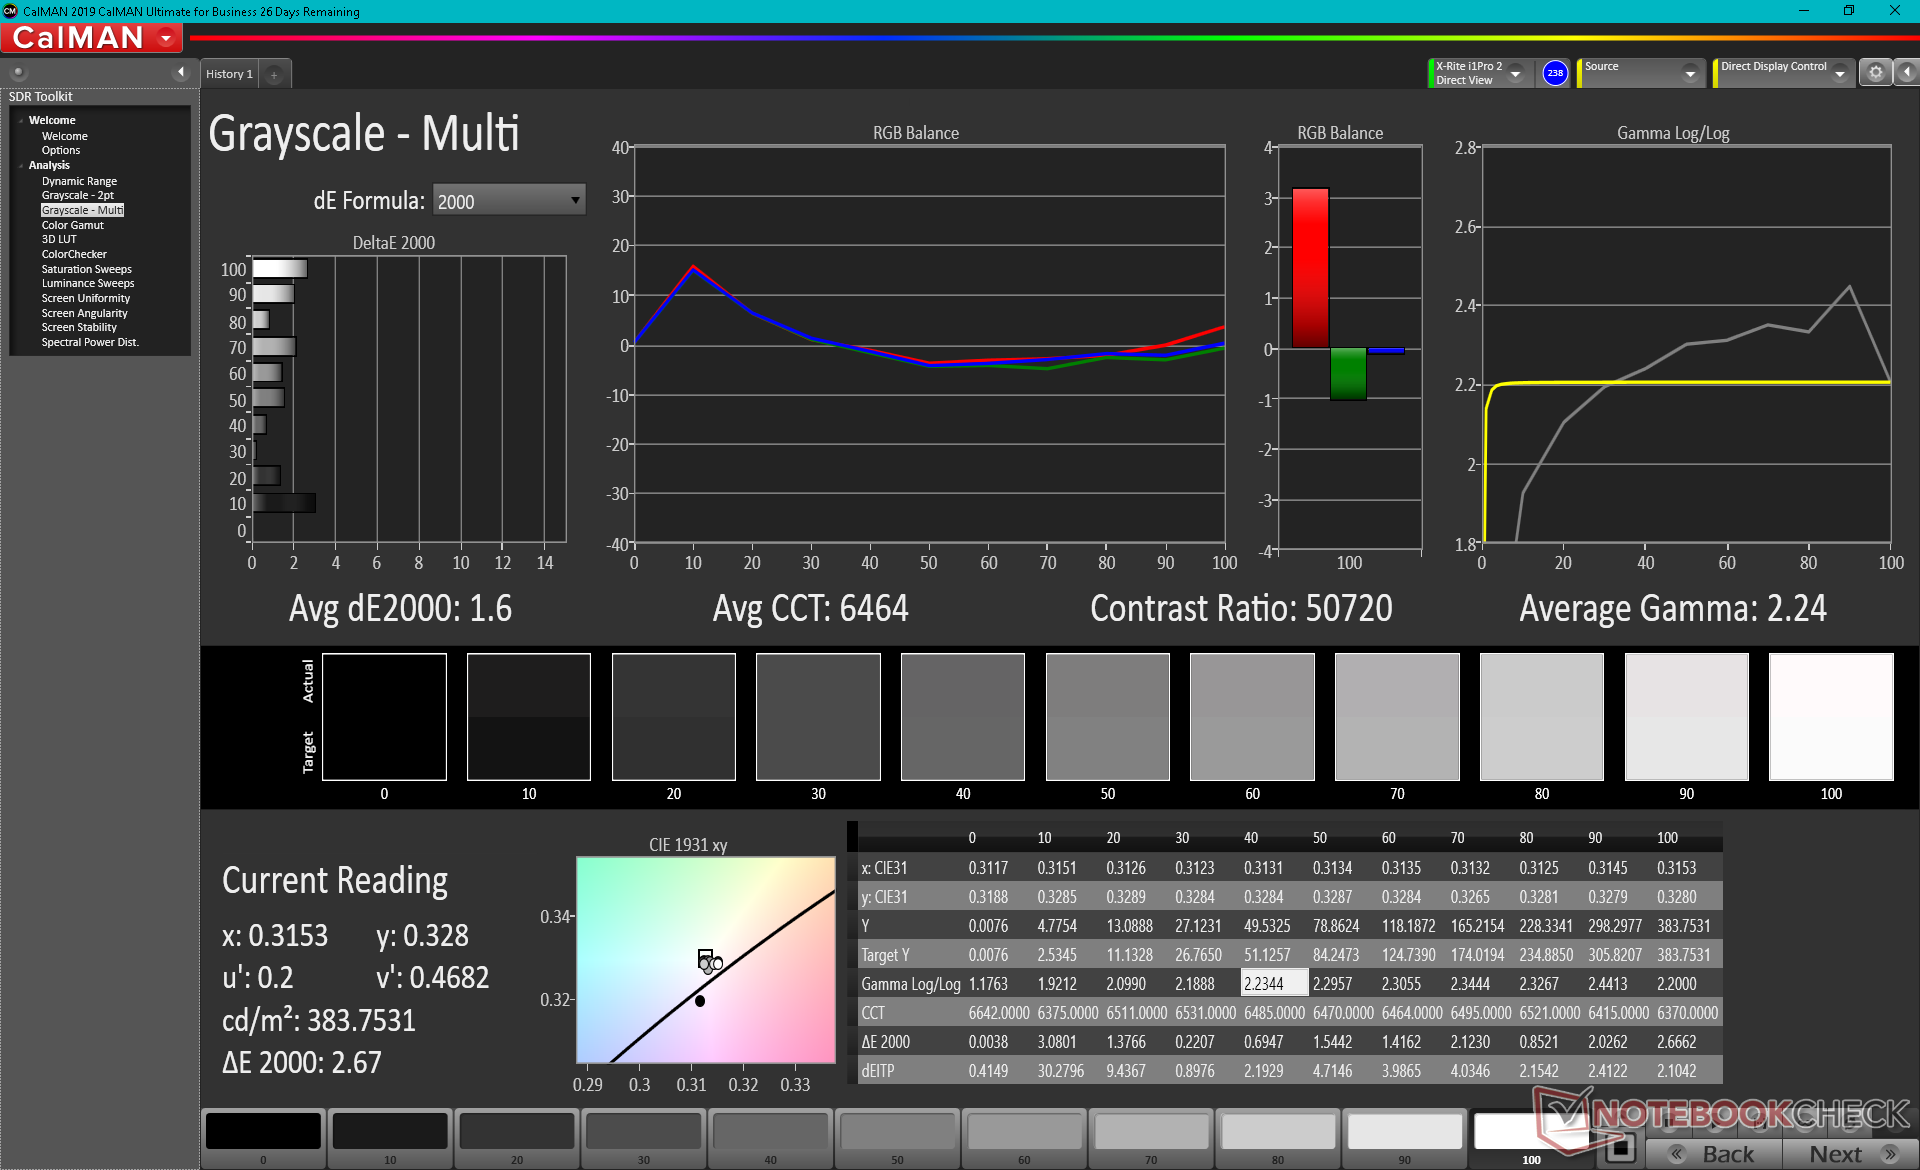
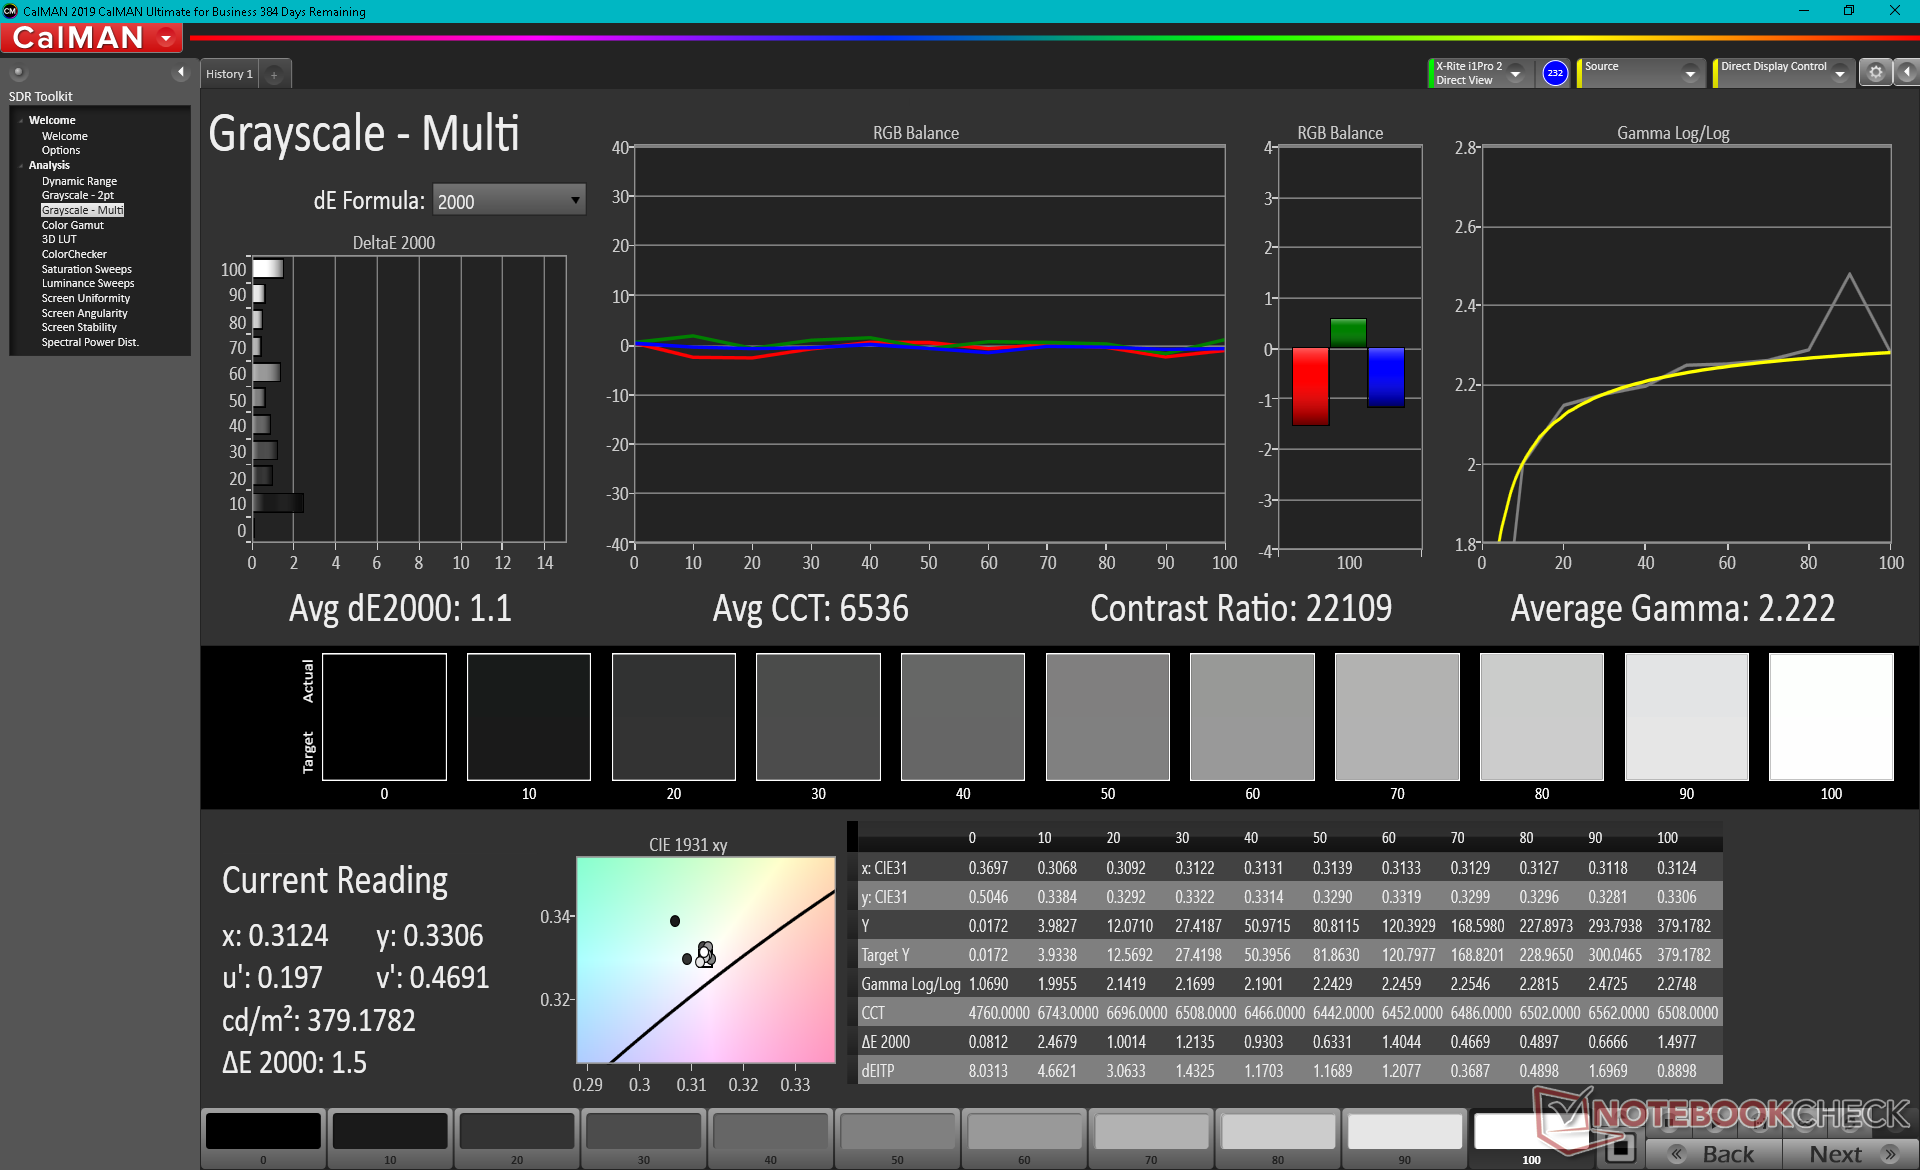
ΔE Greyscale Calman: 1.6 | ∀{0.09-98 Ø4.97}
99.9% AdobeRGB 1998 (Argyll 3D)
100% sRGB (Argyll 3D)
99.9% Display P3 (Argyll 3D)
Gamma: 2.24
CCT: 6464 K
| Asus Vivobook 15 K513EQ Samsung ATNA56YX03-0, OLED, 1920x1080, 15.6" | Asus VivoBook 15 Pro M3500QC-L1062 ATNA56YX03-0, AMOLED, 1920x1080, 15.6" | Asus VivoBook S15 S533EQ-BQ002T Panda LM156LF-5L04, IPS, 1920x1080, 15.6" | Lenovo IdeaPad 5 15ALC05 Lenovo LEN156FHD, IPS, 1920x1080, 15.6" | Dell Inspiron 15 3501 BOE NV15N3D (Dell P/N: N39X1), IPS, 1920x1080, 15.6" | HP Pavilion 15-eg Chi Mei CMN1523, IPS, 1920x1080, 15.6" | |
|---|---|---|---|---|---|---|
| Display | -1% | -54% | -52% | -54% | -50% | |
| Display P3 Coverage (%) | 99.9 | 99.9 0% | 39.01 -61% | 39.4 -61% | 42.9 -57% | |
| sRGB Coverage (%) | 100 | 99.9 0% | 58.5 -41% | 59 -41% | 58.7 -41% | 64 -36% |
| AdobeRGB 1998 Coverage (%) | 99.9 | 95.8 -4% | 40.33 -60% | 38 -62% | 40.7 -59% | 44.4 -56% |
| Response Times | -28% | -1229% | -870% | -1429% | -825% | |
| Response Time Grey 50% / Grey 80% * (ms) | 2.2 ? | 3.2 ? -45% | 38 ? -1627% | 29 ? -1218% | 43 ? -1855% | 22.8 ? -936% |
| Response Time Black / White * (ms) | 2.9 ? | 3.2 ? -10% | 27 ? -831% | 18 ? -521% | 32 ? -1003% | 23.6 ? -714% |
| PWM Frequency (Hz) | 59.5 ? | 60.2 ? | 1000 ? | 26320 ? | ||
| Bildschirm | 14% | -65% | -101% | -47% | -74% | |
| Helligkeit Bildmitte (cd/m²) | 384.5 | 396 3% | 287 -25% | 376 -2% | 271 -30% | 294.3 -23% |
| Brightness (cd/m²) | 388 | 397 2% | 261 -33% | 341 -12% | 263 -32% | 251 -35% |
| Brightness Distribution (%) | 98 | 99 1% | 84 -14% | 78 -20% | 92 -6% | 76 -22% |
| Schwarzwert * (cd/m²) | 0.51 | 0.66 | 0.15 | 0.26 | ||
| Delta E Colorchecker * | 2.53 | 2 21% | 4.72 -87% | 6.4 -153% | 4.83 -91% | 4.08 -61% |
| Colorchecker dE 2000 max. * | 6.16 | 4.8 22% | 17.94 -191% | 20.45 -232% | 7 -14% | 19.49 -216% |
| Delta E Graustufen * | 1.6 | 1 37% | 2.2 -38% | 4.59 -187% | 3.36 -110% | 3 -88% |
| Gamma | 2.24 98% | 2.17 101% | 2.51 88% | 2.26 97% | 2.56 86% | 2.21 100% |
| CCT | 6464 101% | 6608 98% | 6758 96% | 6819 95% | 6764 96% | 6616 98% |
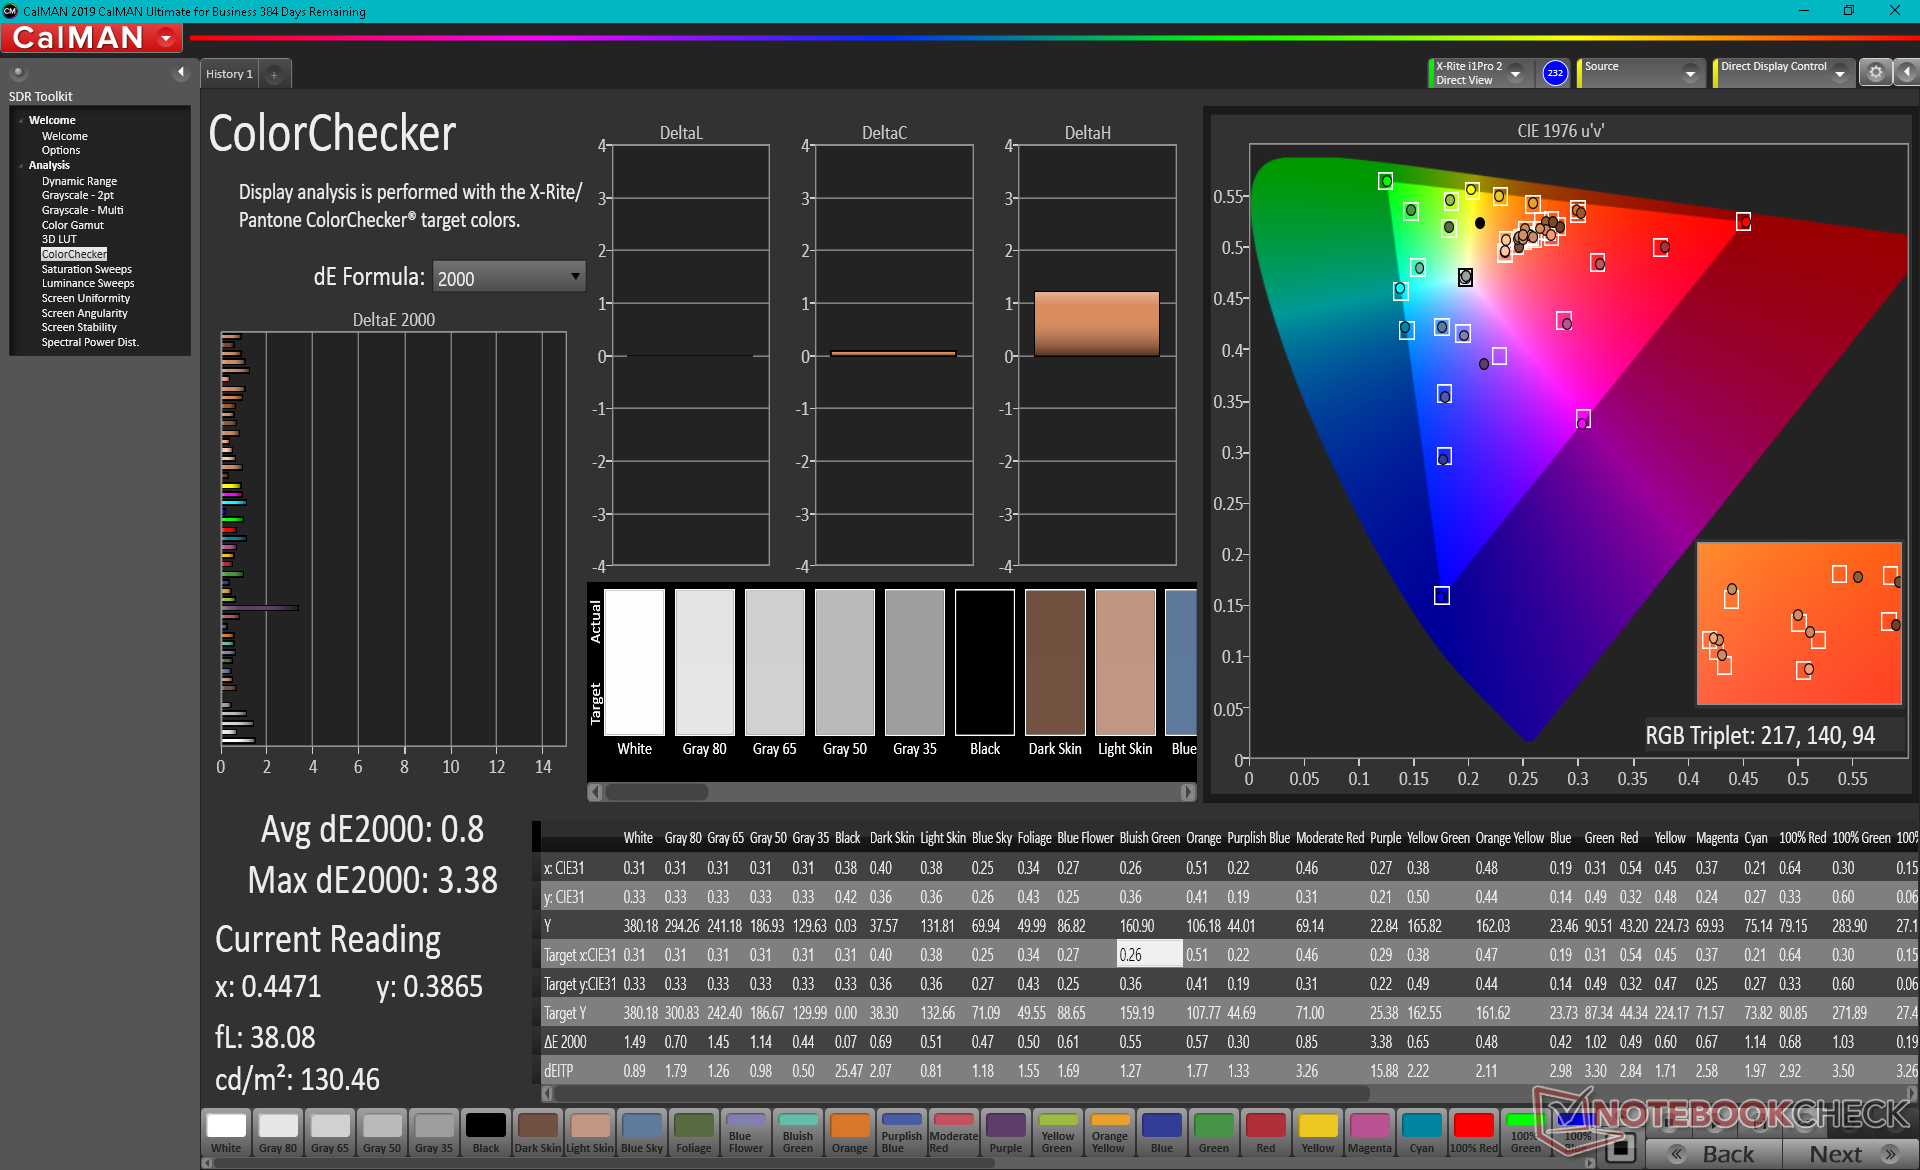
| Colorchecker dE 2000 calibrated * | 1.8 | 3.74 | 3.7 | |||
| Kontrast (:1) | 563 | 570 | 1807 | 1132 | ||
| Farbraum (Prozent von AdobeRGB 1998) (%) | 37 | 38 | ||||
| Color Space (Percent of sRGB) (%) | 58 | 59 | ||||
| Durchschnitt gesamt (Programm / Settings) | -5% /
2% | -449% /
-273% | -341% /
-245% | -510% /
-300% | -316% /
-204% |
* ... kleinere Werte sind besser
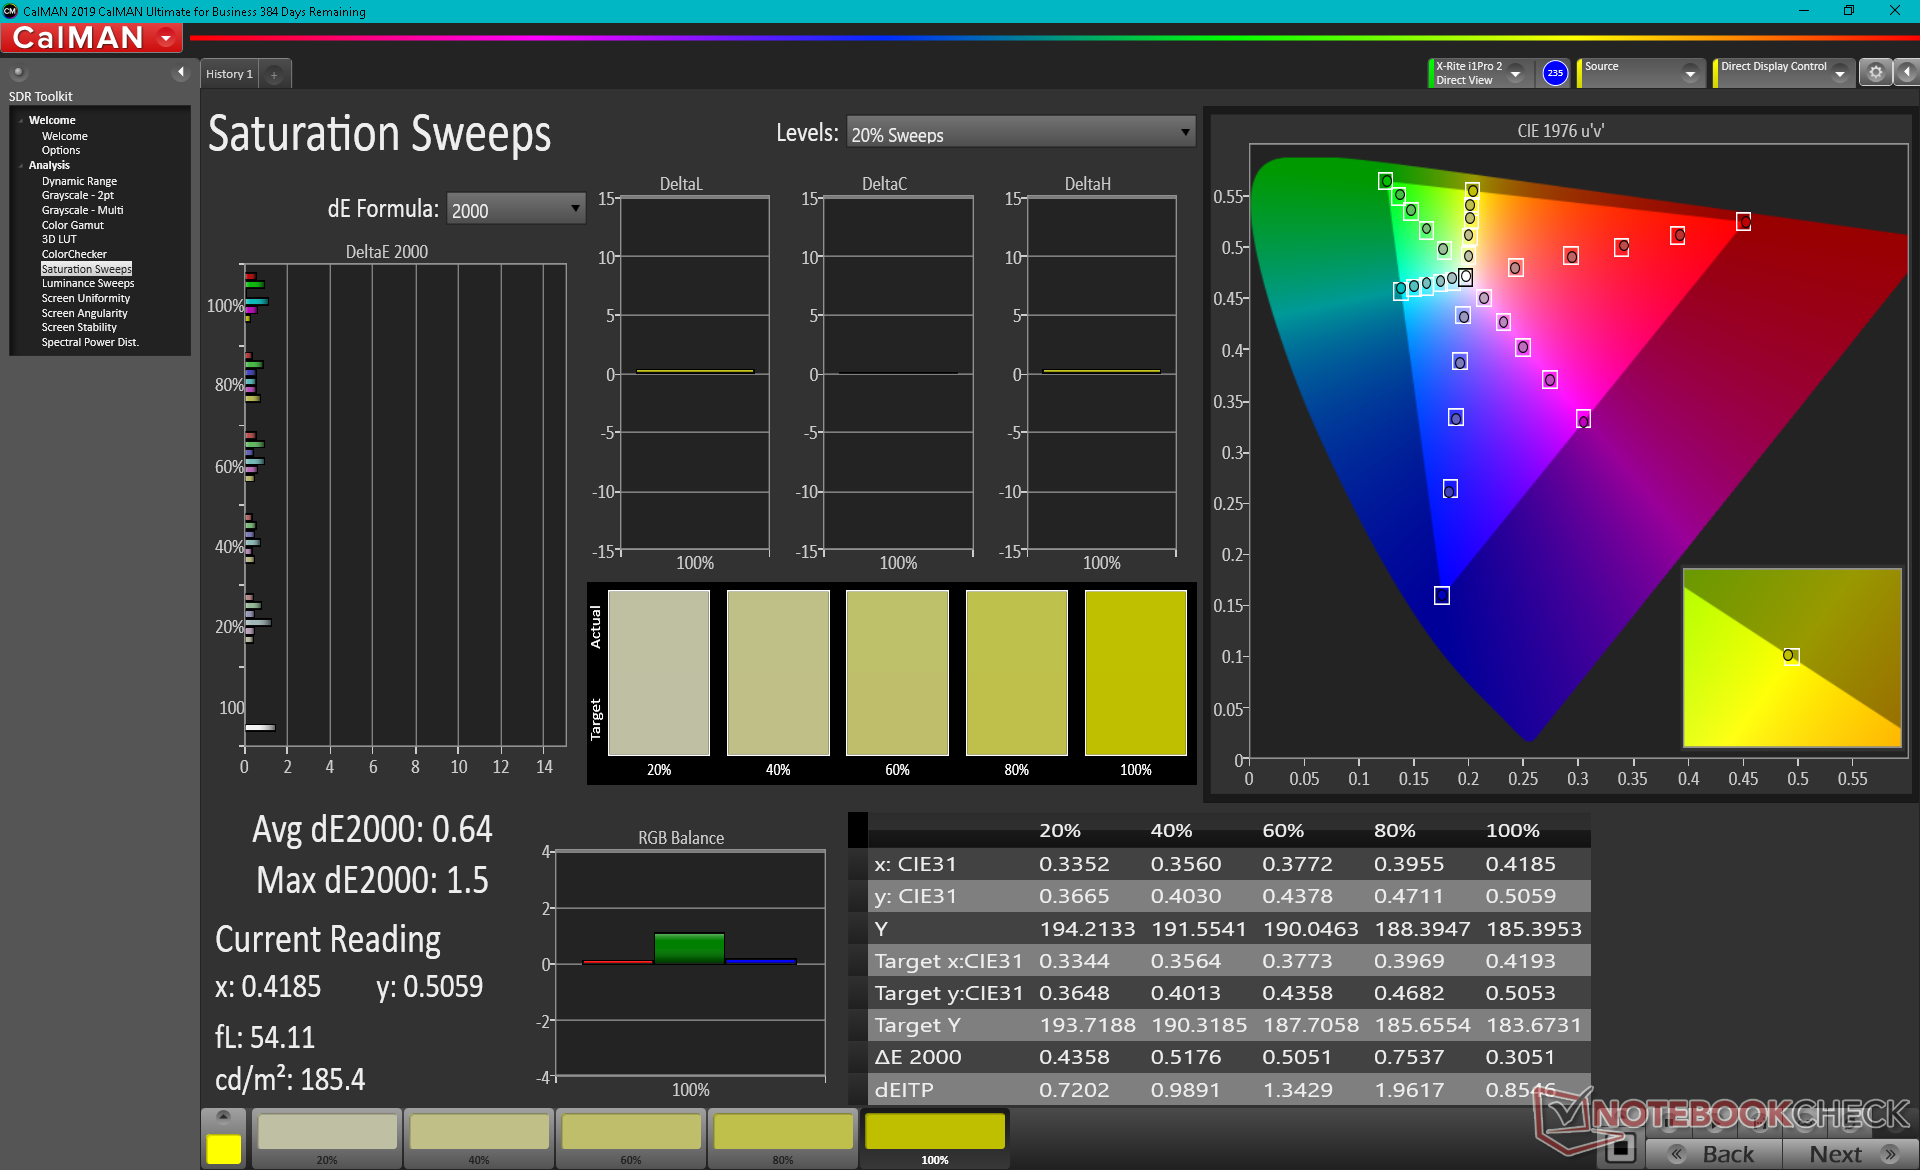
Ab Werk ist das Display ordentlich kalibriert, die durchschnittlichen Graustufen und Farbabweichungen betragen nur 1,6 und 2,53. Die Farben Rot und Gelb scheinen etwas weniger akkurat zu sein, verglichen mit anderen primären und sekundären Farben.
Reaktionszeiten (Response Times) des Displays
| ↔ Reaktionszeiten Schwarz zu Weiß | ||
|---|---|---|
| 2.9 ms ... steigend ↗ und fallend ↘ kombiniert | ↗ 1.1 ms steigend | 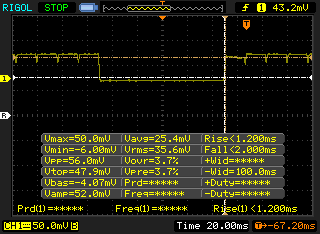 |
| ↘ 1.8 ms fallend | ||
| Die gemessenen Reaktionszeiten sind sehr kurz, wodurch sich der Bildschirm auch für schnelle 3D Spiele eignen sollte. Im Vergleich rangierten die bei uns getesteten Geräte von 0.1 (Minimum) zu 240 (Maximum) ms. » 14 % aller Screens waren schneller als der getestete. Daher sind die gemessenen Reaktionszeiten besser als der Durchschnitt aller vermessenen Geräte (19.8 ms). | ||
| ↔ Reaktionszeiten 50% Grau zu 80% Grau | ||
| 2.2 ms ... steigend ↗ und fallend ↘ kombiniert | ↗ 1.1 ms steigend | 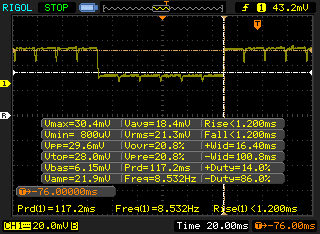 |
| ↘ 1.1 ms fallend | ||
| Die gemessenen Reaktionszeiten sind sehr kurz, wodurch sich der Bildschirm auch für schnelle 3D Spiele eignen sollte. Im Vergleich rangierten die bei uns getesteten Geräte von 0.165 (Minimum) zu 636 (Maximum) ms. » 11 % aller Screens waren schneller als der getestete. Daher sind die gemessenen Reaktionszeiten besser als der Durchschnitt aller vermessenen Geräte (31 ms). | ||
Bildschirm-Flackern / PWM (Pulse-Width Modulation)
| Flackern / PWM festgestellt | 59.5 Hz | ≤ 100 % Helligkeit | 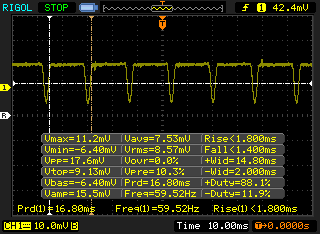 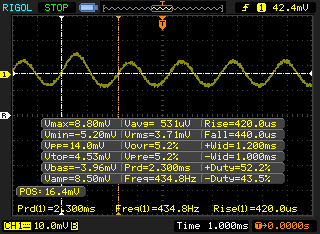 |
Das Display flackert mit 59.5 Hz (im schlimmsten Fall, eventuell durch Pulsweitenmodulation PWM) bei einer eingestellten Helligkeit von 100 % und darunter. Darüber sollte es zu keinem Flackern kommen. Die Frequenz von 59.5 Hz ist sehr gering und daher kann es bei allen Usern zu sichtbaren Flackern, brennenden Augen oder Kopfweh kommen. Im Vergleich: 52 % aller getesteten Geräte nutzten kein PWM um die Helligkeit zu reduzieren. Wenn PWM eingesetzt wurde, dann bei einer Frequenz von durchschnittlich 7763 (Minimum 5, Maximum 343500) Hz. | |||
Die Sichtbarkeit im Freien ist durchschnittlich im Schatten, durch die besseren Schwarzwerte aber unter gleichen Lichtbedingungen etwas besser als bei IPS-Panels. Die Farben verwaschen deutlich weniger schnell, dafür sind Spiegelungen stets ein Problem.


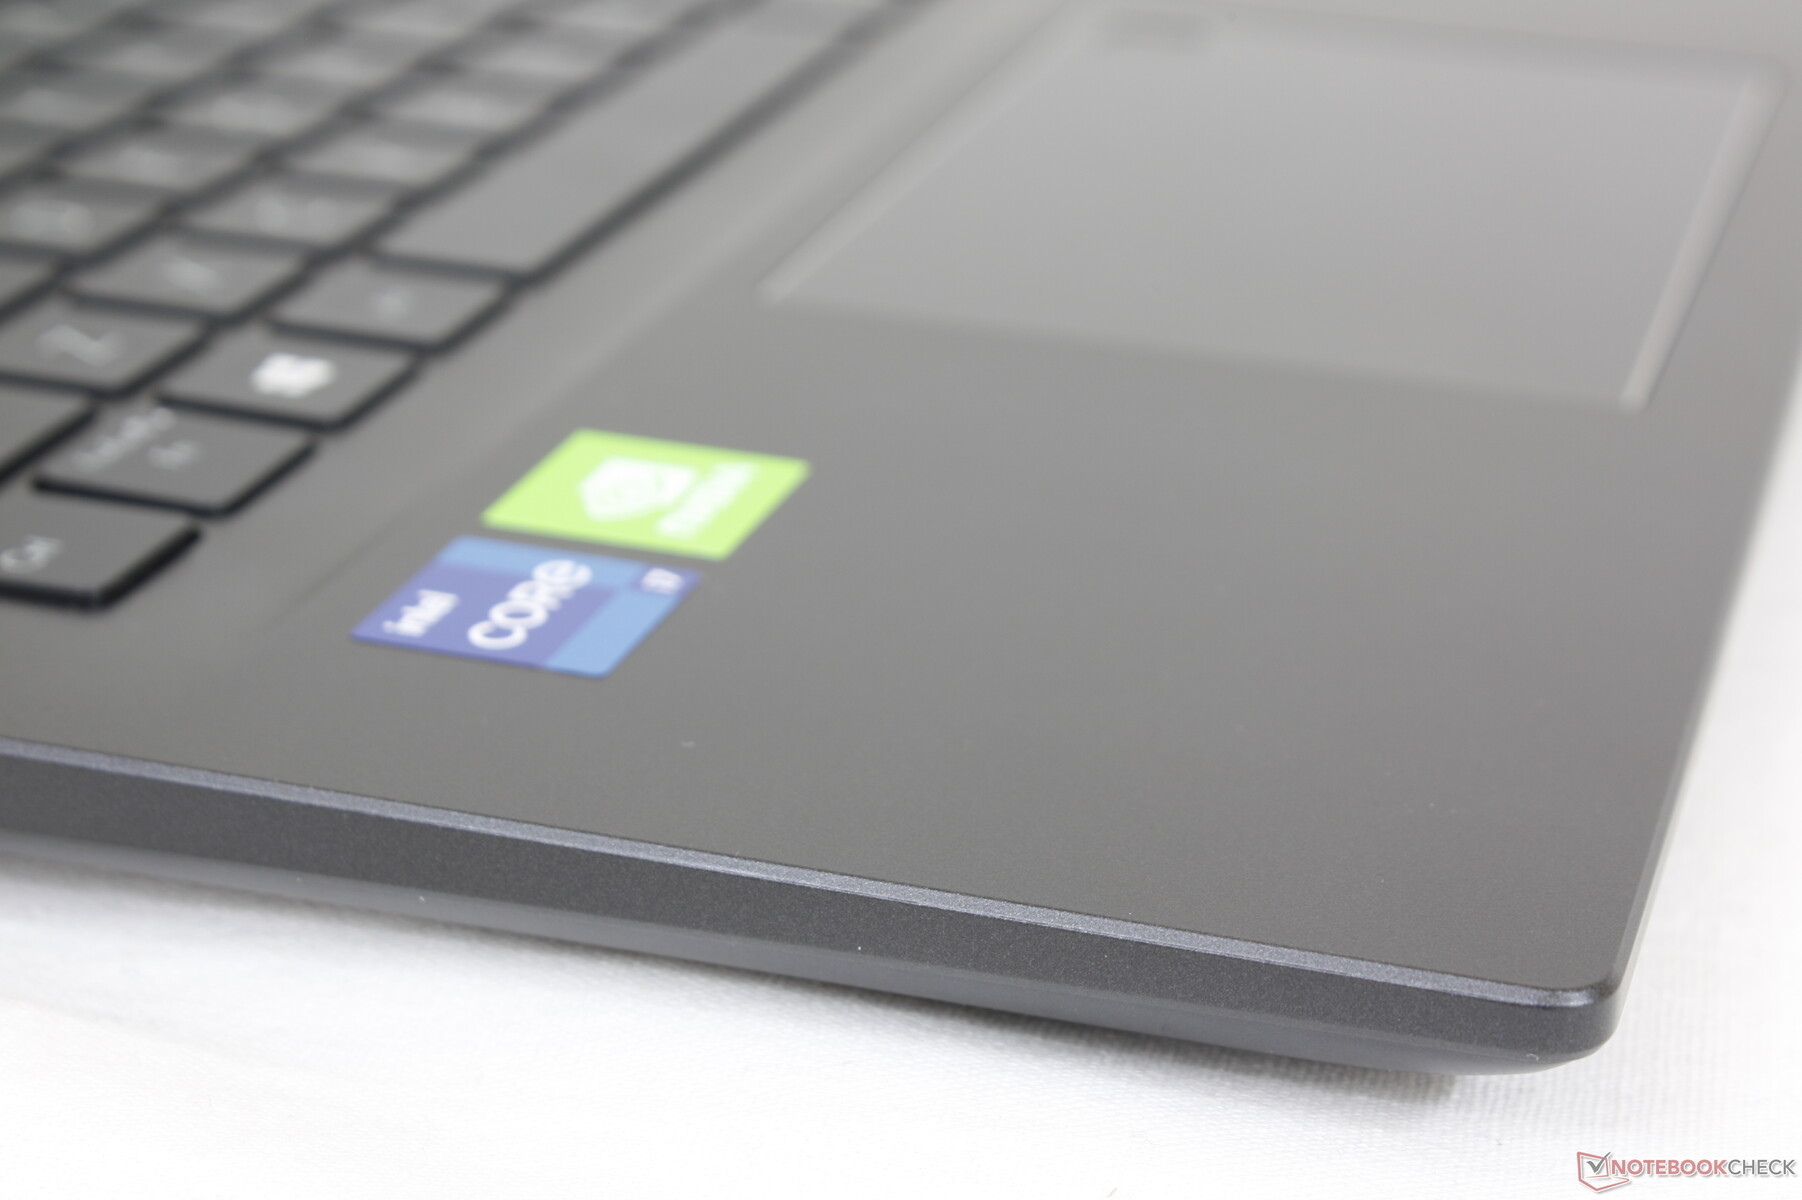
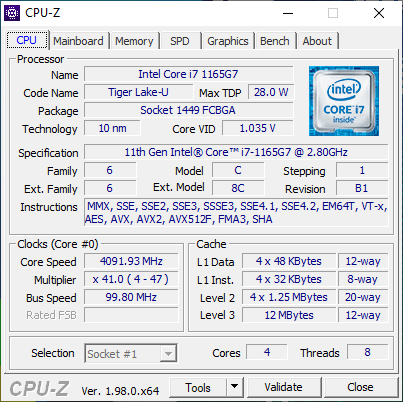
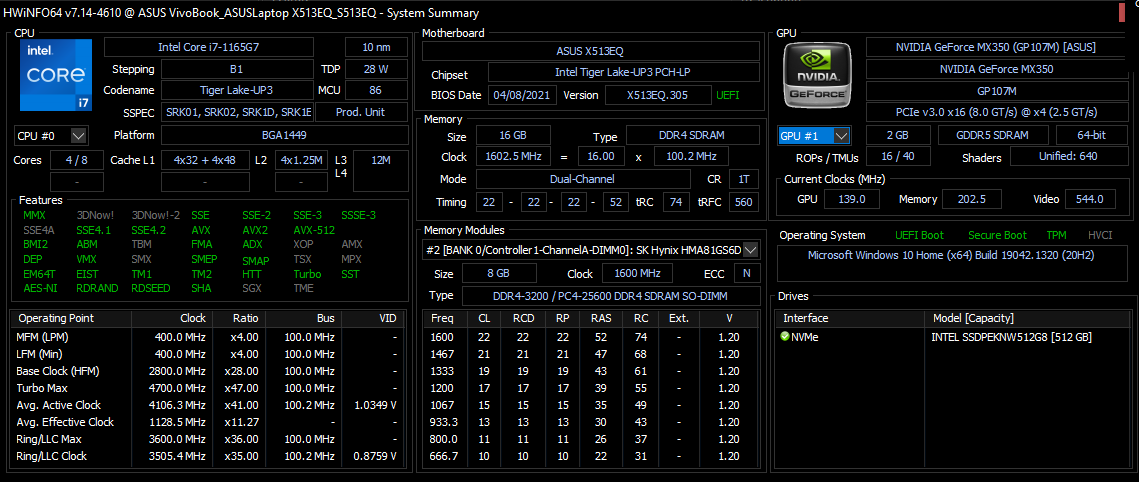
Leistung — Gen11 Tiger Lake-U
Aktuelle Konfigurationen rüsten eine CPU der U-Serie aus und reichen von dem Core i3-1115G4 bis hin zum Core i7-1165G7. Hinzu kommt optional eine GeForce MX330 oder MX350 mit Optimus 1.0. Die eben erwähnte Konfiguration mit Core i3 verfügt allerdings nur über eine integrierte UHD Graphics, welche signifikant langsamer ist als eine Iris Xe, geschweige denn eine dedizierte Nvidia-GPU. Wer lieber eine schnellere CPU der Core-H-Serie samt GeForce-RTX-GPU möchte, sollte sich das höherwertige VivoBook 15 Pro anschauen.
Testbedingung
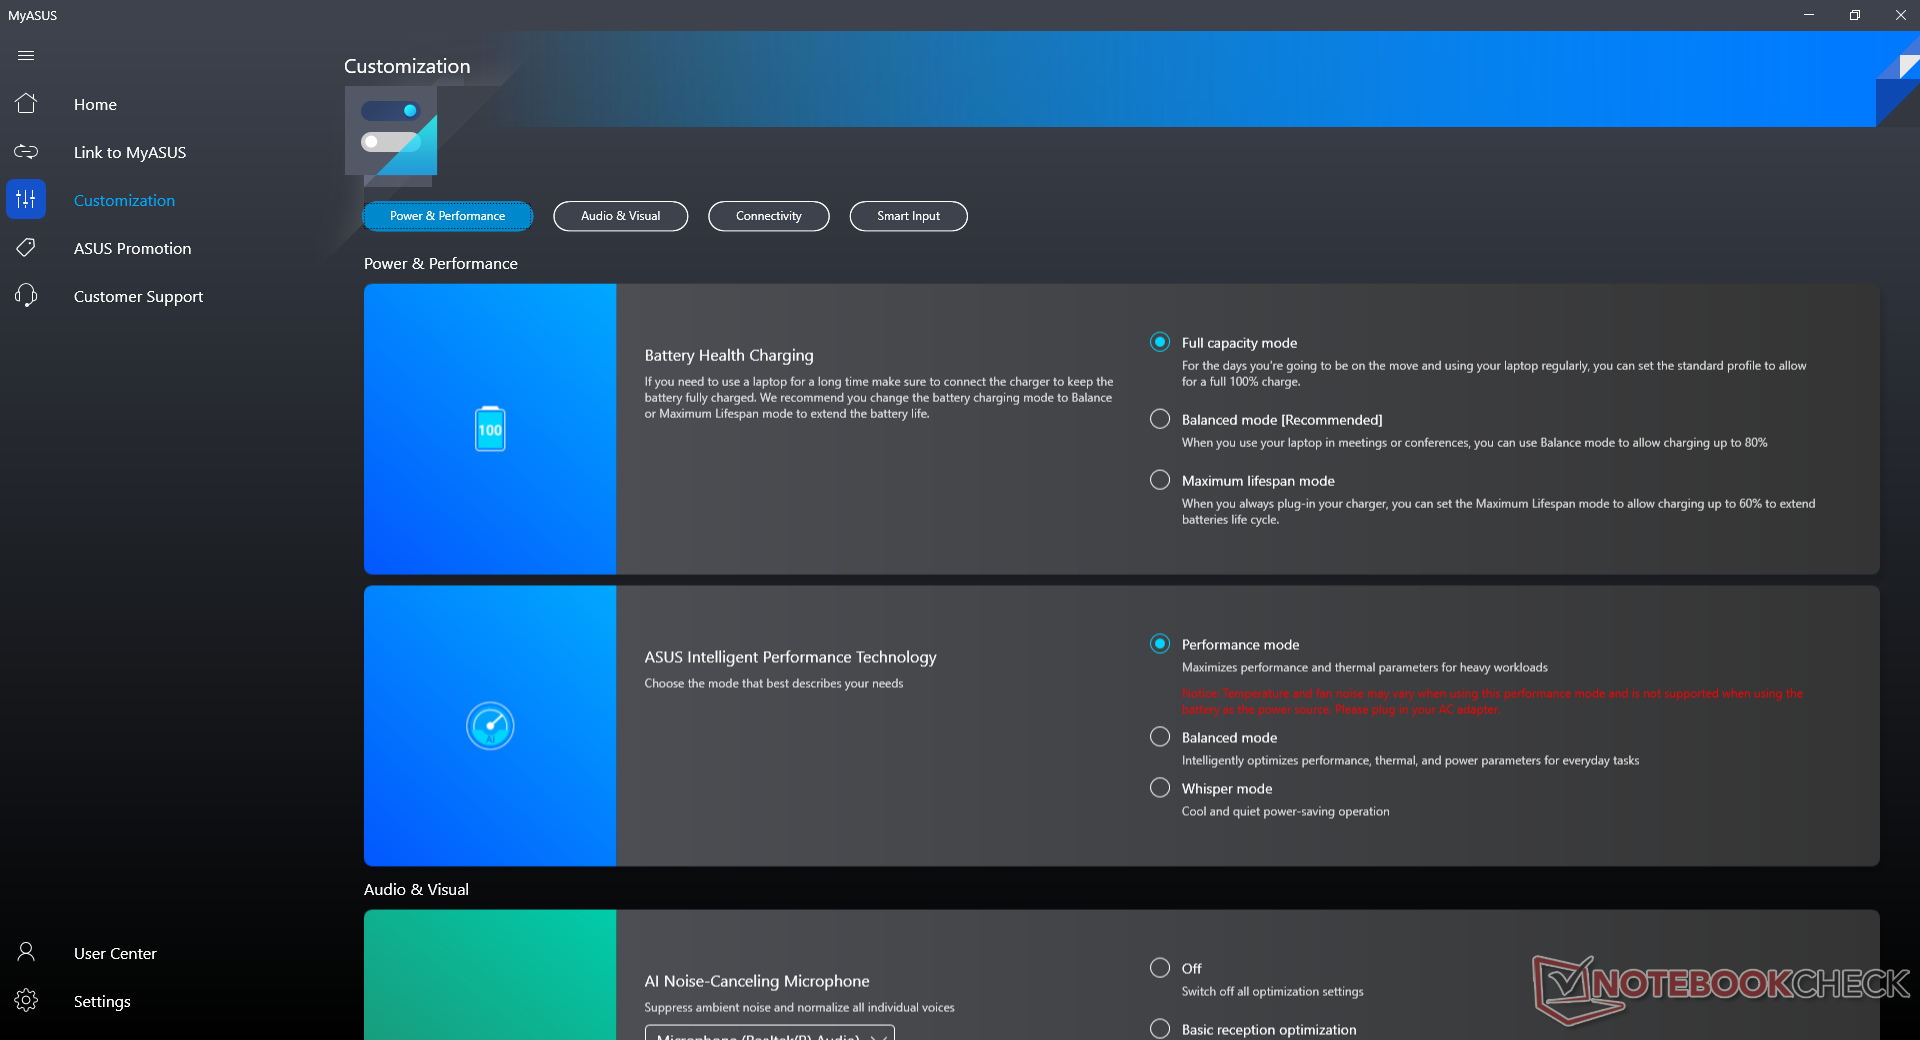
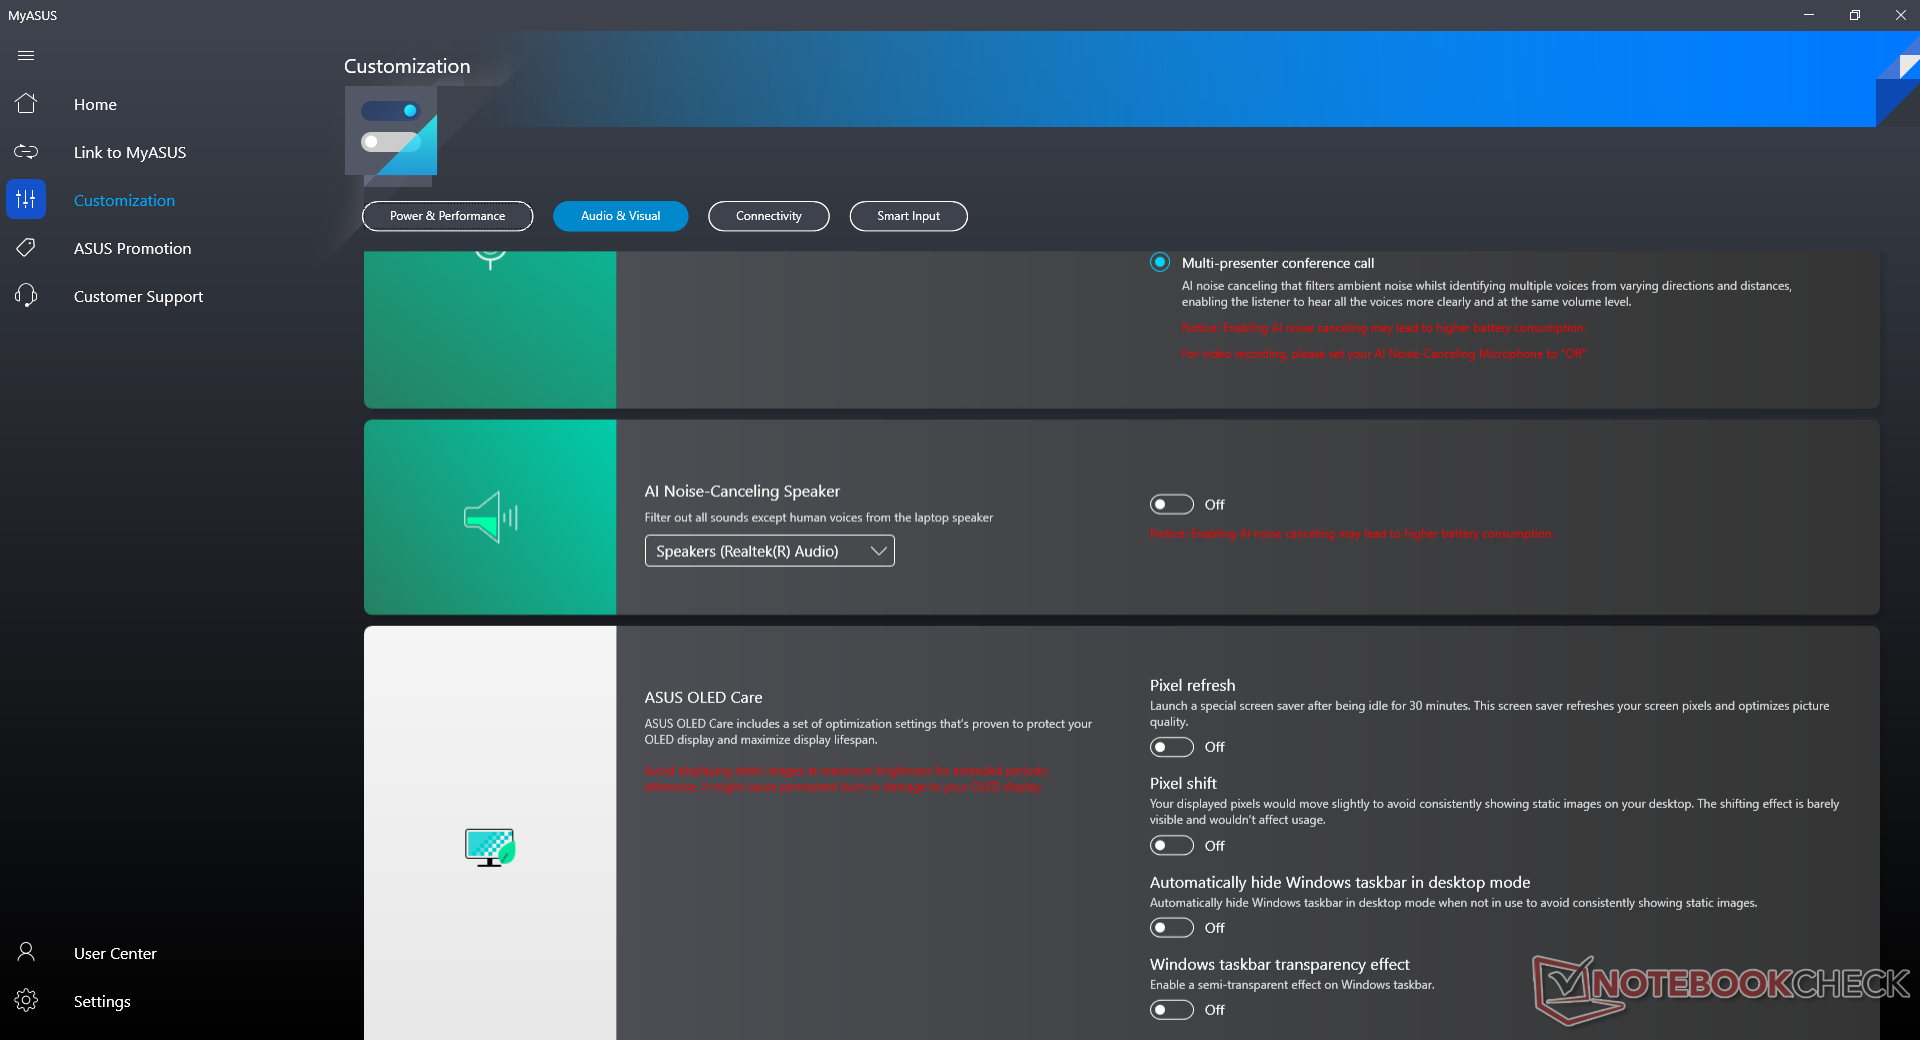
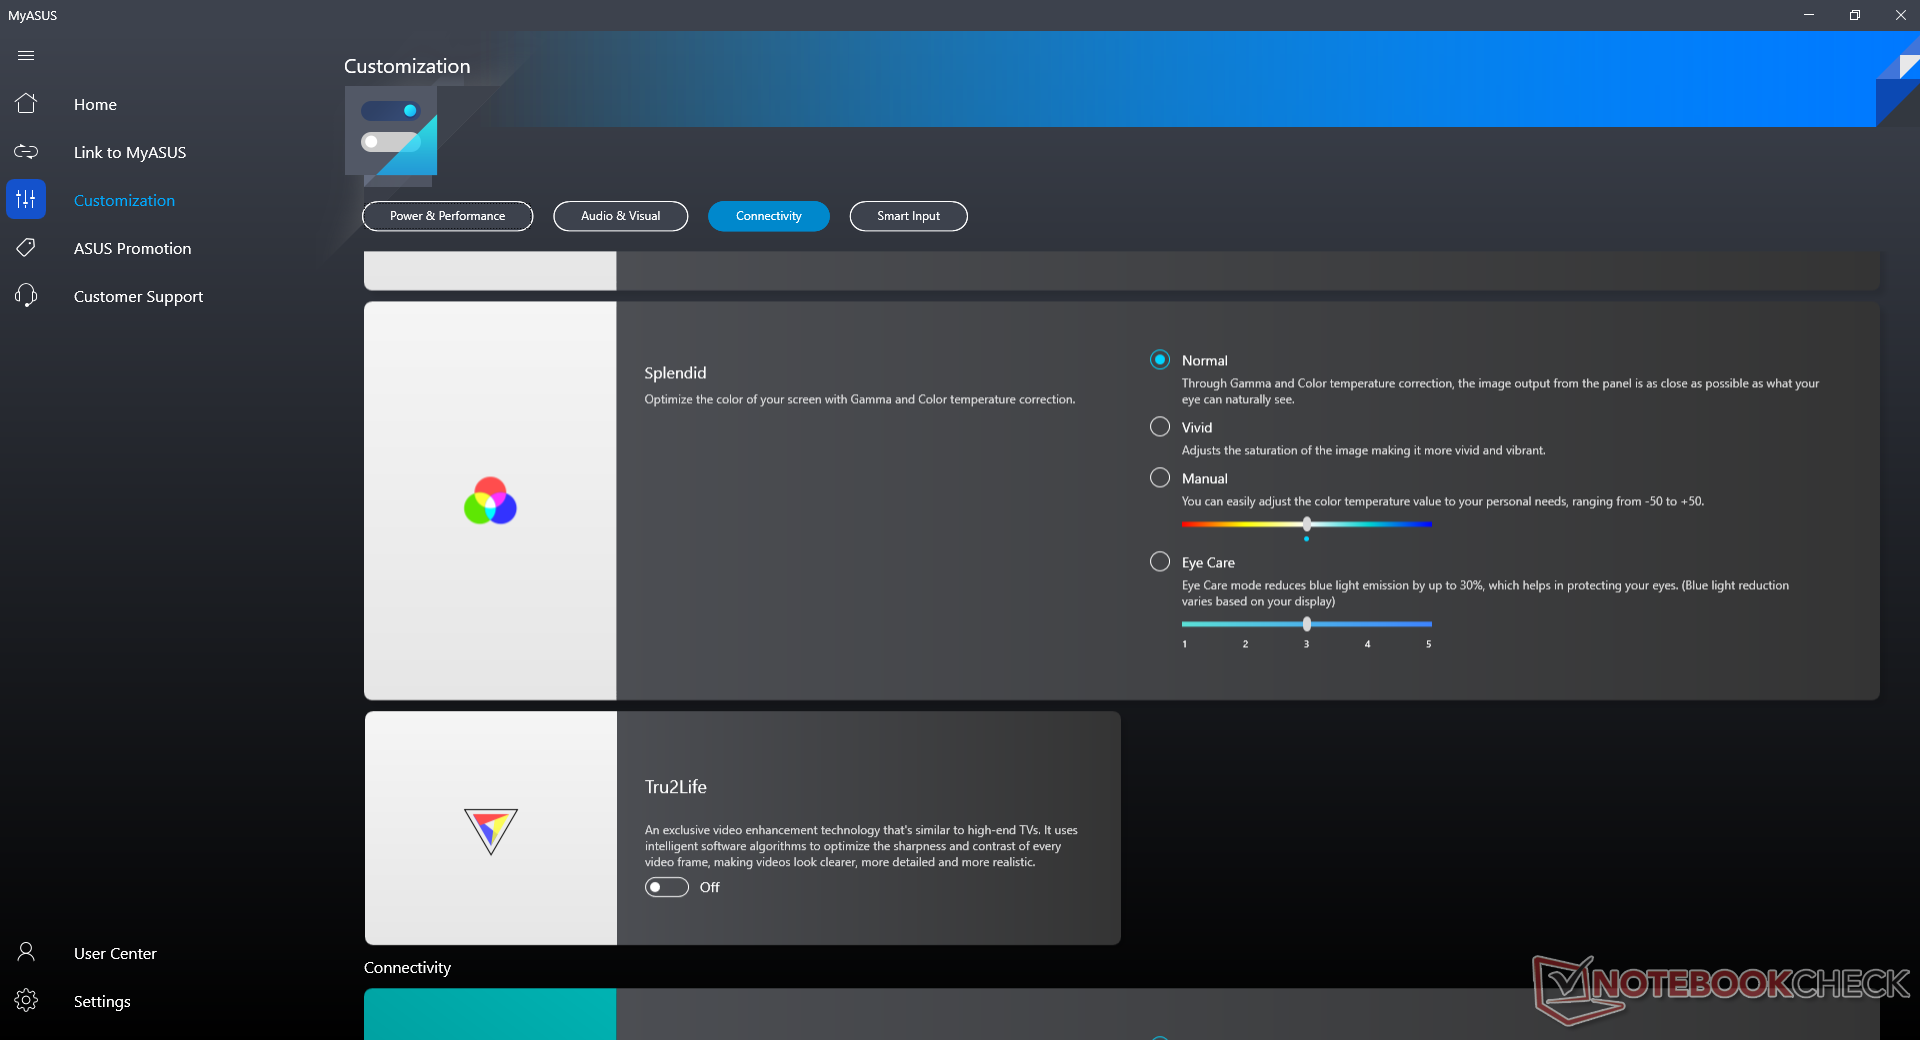
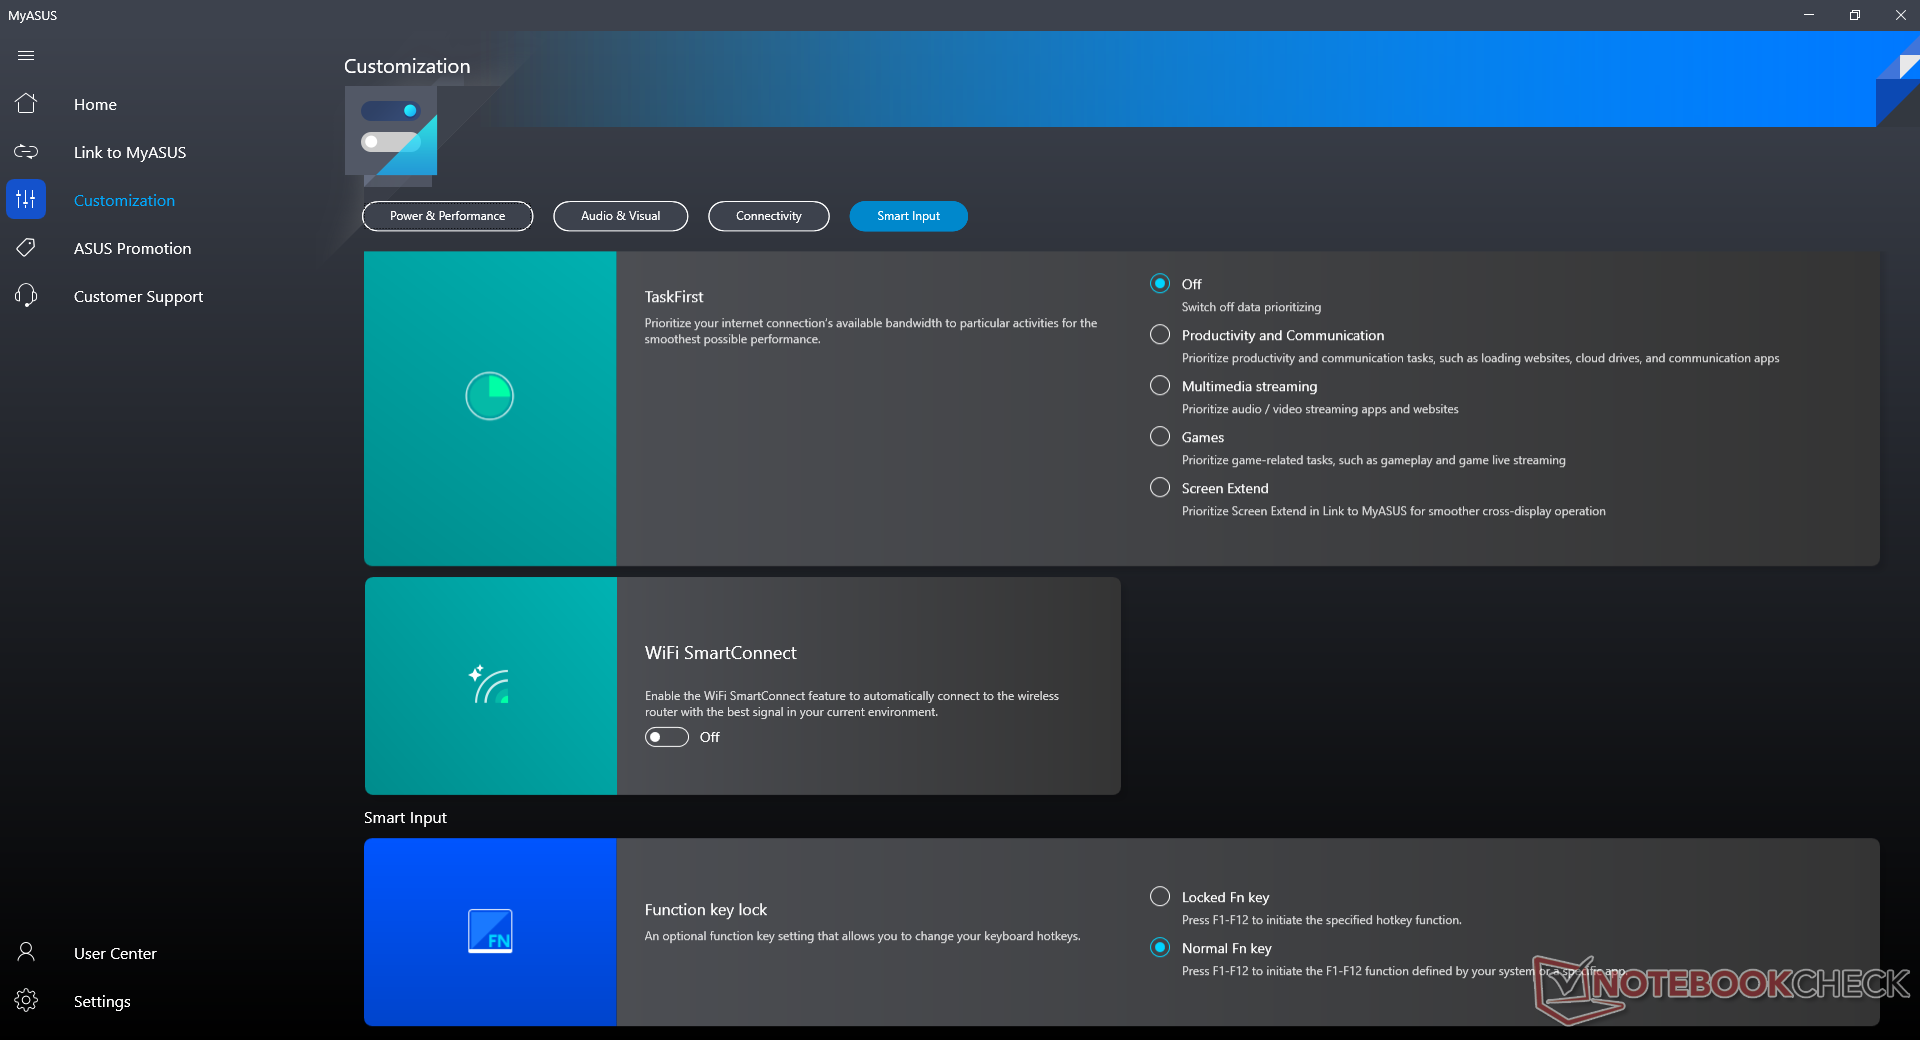
Über die MyAsus-Software haben wir den Laptop vor den Benchmarks in der Performance-Modus versetzt, um die bestmöglichen Ergebnisse erzielen zu können. Besitzer sollten sich mit der Software vertraut machen, hier sitzen Schlüsselfunktionen zum OLED-Panel, dem Mikrofon, dem Akku, Asus-Updates und weitere.
Prozessor
Die CPU-Leistung ist ausgezeichnet, immerhin performt der Core i7-1165G7 in den Multi-Thread-Tests etwa 10 Prozent besser als alle Laptops mit der gleichen CPU aus unserer Datenbank. Konfigurationen mit dem langsameren Core i5-1135G7 dürften etwa 10 bis 15 Prozent langsamer sein.
Cinebench R15 Multi Loop
Cinebench R23: Multi Core | Single Core
Cinebench R20: CPU (Multi Core) | CPU (Single Core)
Cinebench R15: CPU Multi 64Bit | CPU Single 64Bit
Blender: v2.79 BMW27 CPU
7-Zip 18.03: 7z b 4 | 7z b 4 -mmt1
Geekbench 5.5: Multi-Core | Single-Core
HWBOT x265 Benchmark v2.2: 4k Preset
LibreOffice : 20 Documents To PDF
R Benchmark 2.5: Overall mean
| CPU Performance Rating | |
| HP Pavilion Aero 13 be0097nr -2! | |
| Lenovo ThinkPad E15 G3-20YG003UGE | |
| Microsoft Surface Laptop 4 15 AMD TFF_00028 | |
| MSI Prestige 15 A10SC -10! | |
| VAIO SX14 VJS144X0111K -2! | |
| Asus Vivobook 15 K513EQ -2! | |
| Durchschnittliche Intel Core i7-1165G7 | |
| Microsoft Surface Laptop 3 15 i7-1065G7 -10! | |
| HP Pavilion x360 15-er0155ng | |
| Asus ZenBook 15 UX534FT-DB77 -10! | |
| Lenovo ThinkPad P15s Gen1-20T4000JGE -2! | |
| HP 250 G7-15S40ES -2! | |
| Dell Inspiron 15 5000 5502 -2! | |
| Cinebench R23 / Multi Core | |
| Microsoft Surface Laptop 4 15 AMD TFF_00028 | |
| Lenovo ThinkPad E15 G3-20YG003UGE | |
| HP Pavilion Aero 13 be0097nr | |
| VAIO SX14 VJS144X0111K | |
| Asus Vivobook 15 K513EQ | |
| Durchschnittliche Intel Core i7-1165G7 (2525 - 6862, n=64) | |
| HP Pavilion x360 15-er0155ng | |
| Cinebench R23 / Single Core | |
| VAIO SX14 VJS144X0111K | |
| Asus Vivobook 15 K513EQ | |
| Durchschnittliche Intel Core i7-1165G7 (1110 - 1539, n=59) | |
| HP Pavilion Aero 13 be0097nr | |
| HP Pavilion x360 15-er0155ng | |
| Microsoft Surface Laptop 4 15 AMD TFF_00028 | |
| Lenovo ThinkPad E15 G3-20YG003UGE | |
| Geekbench 5.5 / Multi-Core | |
| Microsoft Surface Laptop 4 15 AMD TFF_00028 | |
| Lenovo ThinkPad E15 G3-20YG003UGE | |
| Durchschnittliche Intel Core i7-1165G7 (3078 - 5926, n=77) | |
| HP Pavilion x360 15-er0155ng | |
| Lenovo ThinkPad P15s Gen1-20T4000JGE | |
| HP 250 G7-15S40ES | |
| Dell Inspiron 15 5000 5502 | |
| Geekbench 5.5 / Single-Core | |
| Durchschnittliche Intel Core i7-1165G7 (1302 - 1595, n=77) | |
| HP Pavilion x360 15-er0155ng | |
| Dell Inspiron 15 5000 5502 | |
| Lenovo ThinkPad P15s Gen1-20T4000JGE | |
| Lenovo ThinkPad E15 G3-20YG003UGE | |
| HP 250 G7-15S40ES | |
| Microsoft Surface Laptop 4 15 AMD TFF_00028 | |
| HWBOT x265 Benchmark v2.2 / 4k Preset | |
| HP Pavilion Aero 13 be0097nr | |
| Lenovo ThinkPad E15 G3-20YG003UGE | |
| Microsoft Surface Laptop 4 15 AMD TFF_00028 | |
| VAIO SX14 VJS144X0111K | |
| Asus Vivobook 15 K513EQ | |
| Durchschnittliche Intel Core i7-1165G7 (1.39 - 8.47, n=80) | |
| HP Pavilion x360 15-er0155ng | |
| Lenovo ThinkPad P15s Gen1-20T4000JGE | |
| HP 250 G7-15S40ES | |
| Dell Inspiron 15 5000 5502 | |
| LibreOffice / 20 Documents To PDF | |
| Microsoft Surface Laptop 4 15 AMD TFF_00028 | |
| Lenovo ThinkPad P15s Gen1-20T4000JGE | |
| Dell Inspiron 15 5000 5502 | |
| Lenovo ThinkPad E15 G3-20YG003UGE | |
| HP 250 G7-15S40ES | |
| HP Pavilion Aero 13 be0097nr | |
| VAIO SX14 VJS144X0111K | |
| Durchschnittliche Intel Core i7-1165G7 (21.5 - 88.1, n=78) | |
| HP Pavilion x360 15-er0155ng | |
| Asus Vivobook 15 K513EQ | |
| R Benchmark 2.5 / Overall mean | |
| HP 250 G7-15S40ES | |
| Dell Inspiron 15 5000 5502 | |
| Microsoft Surface Laptop 4 15 AMD TFF_00028 | |
| Lenovo ThinkPad P15s Gen1-20T4000JGE | |
| HP Pavilion x360 15-er0155ng | |
| Lenovo ThinkPad E15 G3-20YG003UGE | |
| Durchschnittliche Intel Core i7-1165G7 (0.552 - 1.002, n=80) | |
| Asus Vivobook 15 K513EQ | |
| VAIO SX14 VJS144X0111K | |
| HP Pavilion Aero 13 be0097nr | |
Cinebench R23: Multi Core | Single Core
Cinebench R20: CPU (Multi Core) | CPU (Single Core)
Cinebench R15: CPU Multi 64Bit | CPU Single 64Bit
Blender: v2.79 BMW27 CPU
7-Zip 18.03: 7z b 4 | 7z b 4 -mmt1
Geekbench 5.5: Multi-Core | Single-Core
HWBOT x265 Benchmark v2.2: 4k Preset
LibreOffice : 20 Documents To PDF
R Benchmark 2.5: Overall mean
* ... kleinere Werte sind besser
AIDA64: FP32 Ray-Trace | FPU Julia | CPU SHA3 | CPU Queen | FPU SinJulia | FPU Mandel | CPU AES | CPU ZLib | FP64 Ray-Trace | CPU PhotoWorxx
| Performance Rating | |
| Asus VivoBook 15 Pro M3500QC-L1062 | |
| Lenovo IdeaPad 5 15ALC05 | |
| Asus Vivobook 15 K513EQ | |
| HP Pavilion 15-eg | |
| Asus VivoBook S15 S533EQ-BQ002T | |
| Durchschnittliche Intel Core i7-1165G7 | |
| Dell Inspiron 15 3501 | |
| AIDA64 / FP32 Ray-Trace | |
| Asus VivoBook 15 Pro M3500QC-L1062 | |
| Lenovo IdeaPad 5 15ALC05 | |
| Asus Vivobook 15 K513EQ | |
| Asus VivoBook S15 S533EQ-BQ002T | |
| Durchschnittliche Intel Core i7-1165G7 (3933 - 8184, n=58) | |
| HP Pavilion 15-eg | |
| Dell Inspiron 15 3501 | |
| AIDA64 / FPU Julia | |
| Asus VivoBook 15 Pro M3500QC-L1062 | |
| Lenovo IdeaPad 5 15ALC05 | |
| Asus Vivobook 15 K513EQ | |
| Asus VivoBook S15 S533EQ-BQ002T | |
| Durchschnittliche Intel Core i7-1165G7 (17720 - 34369, n=58) | |
| HP Pavilion 15-eg | |
| Dell Inspiron 15 3501 | |
| AIDA64 / CPU SHA3 | |
| Asus VivoBook 15 Pro M3500QC-L1062 | |
| Asus Vivobook 15 K513EQ | |
| Asus VivoBook S15 S533EQ-BQ002T | |
| Durchschnittliche Intel Core i7-1165G7 (958 - 2338, n=58) | |
| HP Pavilion 15-eg | |
| Dell Inspiron 15 3501 | |
| Lenovo IdeaPad 5 15ALC05 | |
| AIDA64 / CPU Queen | |
| Asus VivoBook 15 Pro M3500QC-L1062 | |
| Lenovo IdeaPad 5 15ALC05 | |
| HP Pavilion 15-eg | |
| Asus VivoBook S15 S533EQ-BQ002T | |
| Asus Vivobook 15 K513EQ | |
| Dell Inspiron 15 3501 | |
| Durchschnittliche Intel Core i7-1165G7 (44161 - 50624, n=58) | |
| AIDA64 / FPU SinJulia | |
| Lenovo IdeaPad 5 15ALC05 | |
| Asus VivoBook 15 Pro M3500QC-L1062 | |
| Asus Vivobook 15 K513EQ | |
| Asus VivoBook S15 S533EQ-BQ002T | |
| Durchschnittliche Intel Core i7-1165G7 (3183 - 4796, n=58) | |
| HP Pavilion 15-eg | |
| Dell Inspiron 15 3501 | |
| AIDA64 / FPU Mandel | |
| Asus VivoBook 15 Pro M3500QC-L1062 | |
| Lenovo IdeaPad 5 15ALC05 | |
| Asus Vivobook 15 K513EQ | |
| Asus VivoBook S15 S533EQ-BQ002T | |
| Durchschnittliche Intel Core i7-1165G7 (11876 - 20468, n=58) | |
| HP Pavilion 15-eg | |
| Dell Inspiron 15 3501 | |
| AIDA64 / CPU AES | |
| Asus VivoBook 15 Pro M3500QC-L1062 | |
| Asus Vivobook 15 K513EQ | |
| Asus VivoBook S15 S533EQ-BQ002T | |
| HP Pavilion 15-eg | |
| Dell Inspiron 15 3501 | |
| Durchschnittliche Intel Core i7-1165G7 (29506 - 73387, n=58) | |
| Lenovo IdeaPad 5 15ALC05 | |
| AIDA64 / CPU ZLib | |
| Asus VivoBook 15 Pro M3500QC-L1062 | |
| Lenovo IdeaPad 5 15ALC05 | |
| Asus Vivobook 15 K513EQ | |
| Asus VivoBook S15 S533EQ-BQ002T | |
| Dell Inspiron 15 3501 | |
| HP Pavilion 15-eg | |
| Durchschnittliche Intel Core i7-1165G7 (169 - 402, n=65) | |
| AIDA64 / FP64 Ray-Trace | |
| Asus VivoBook 15 Pro M3500QC-L1062 | |
| Lenovo IdeaPad 5 15ALC05 | |
| Asus Vivobook 15 K513EQ | |
| Asus VivoBook S15 S533EQ-BQ002T | |
| Dell Inspiron 15 3501 | |
| Durchschnittliche Intel Core i7-1165G7 (2033 - 4461, n=58) | |
| HP Pavilion 15-eg | |
| AIDA64 / CPU PhotoWorxx | |
| HP Pavilion 15-eg | |
| Durchschnittliche Intel Core i7-1165G7 (12392 - 45694, n=58) | |
| Asus VivoBook S15 S533EQ-BQ002T | |
| Asus Vivobook 15 K513EQ | |
| Dell Inspiron 15 3501 | |
| Lenovo IdeaPad 5 15ALC05 | |
| Asus VivoBook 15 Pro M3500QC-L1062 | |
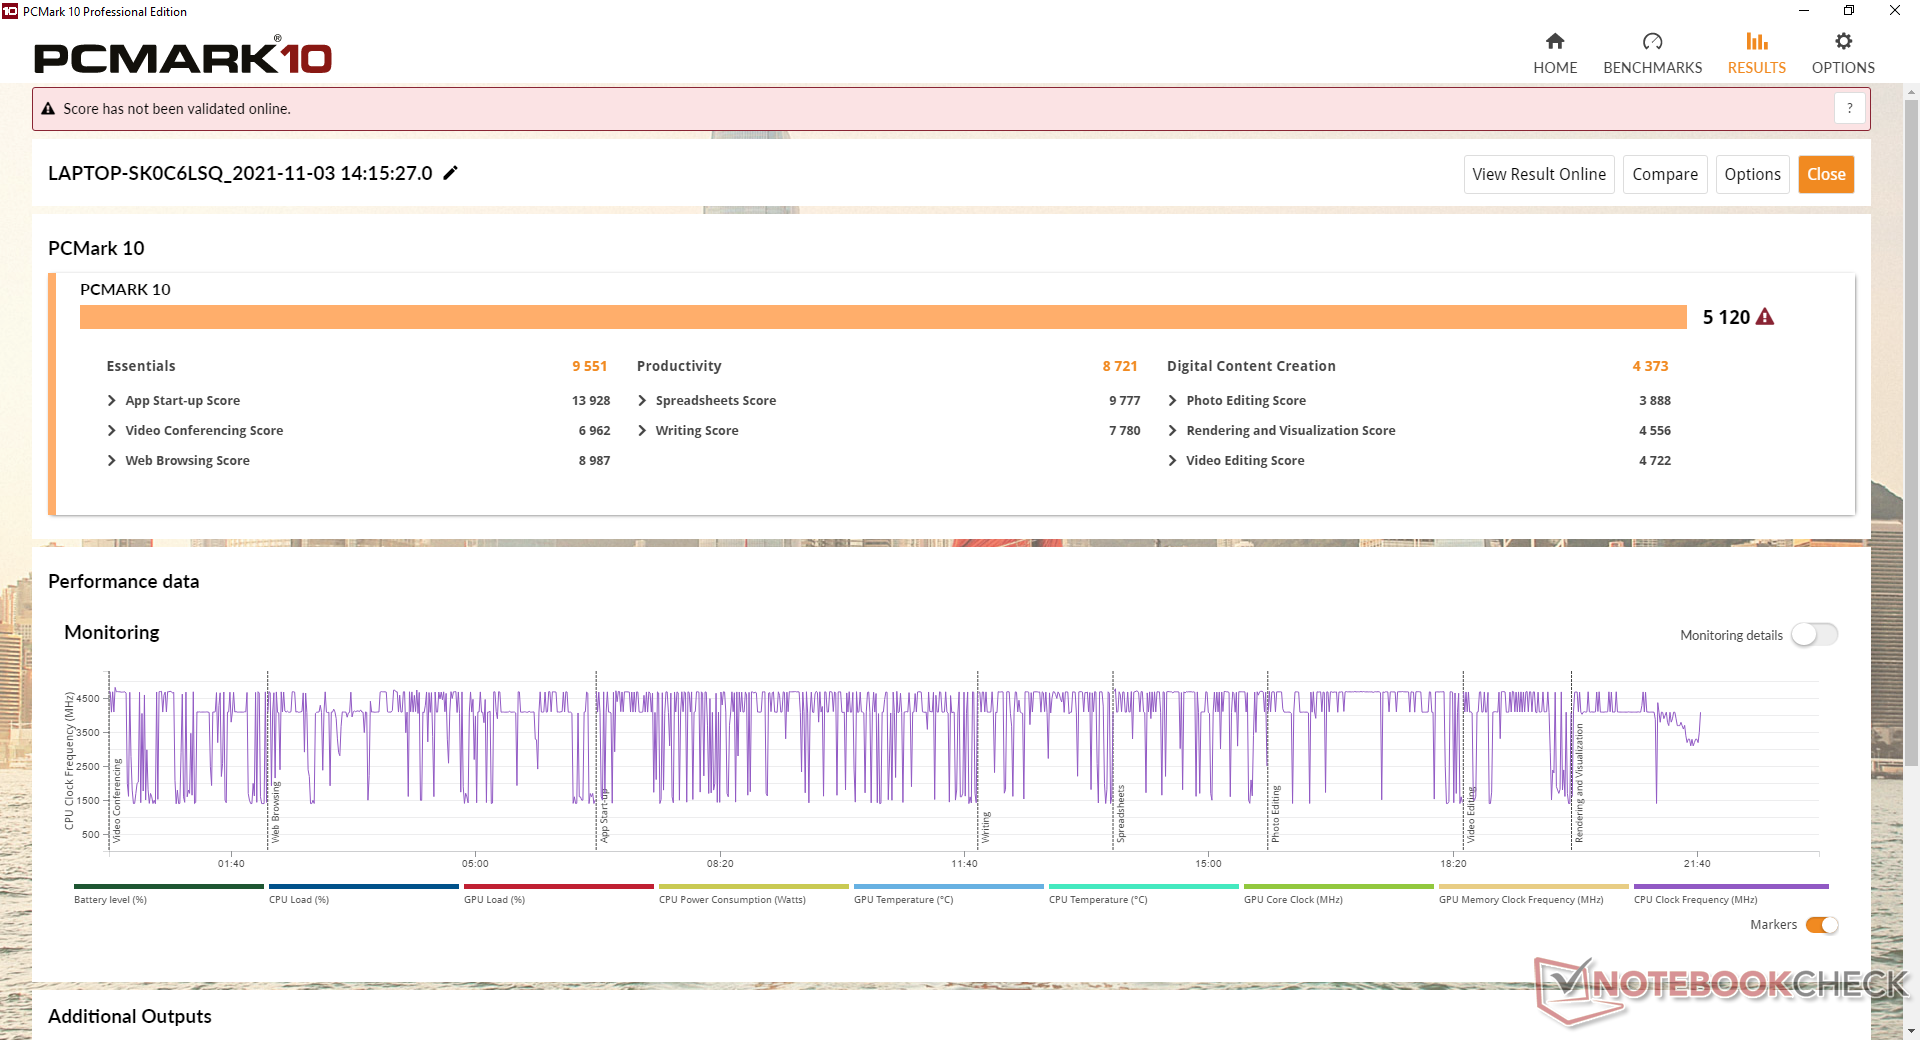
System Performance
| PCMark 10 / Score | |
| Asus VivoBook 15 Pro M3500QC-L1062 | |
| HP Pavilion 15-eg | |
| Asus VivoBook S15 S533EQ-BQ002T | |
| Lenovo IdeaPad 5 15ALC05 | |
| Asus Vivobook 15 K513EQ | |
| Durchschnittliche Intel Core i7-1165G7, NVIDIA GeForce MX350 (4855 - 5306, n=5) | |
| Dell Inspiron 15 3501 | |
| PCMark 10 / Essentials | |
| Asus VivoBook 15 Pro M3500QC-L1062 | |
| HP Pavilion 15-eg | |
| Dell Inspiron 15 3501 | |
| Asus Vivobook 15 K513EQ | |
| Lenovo IdeaPad 5 15ALC05 | |
| Asus VivoBook S15 S533EQ-BQ002T | |
| Durchschnittliche Intel Core i7-1165G7, NVIDIA GeForce MX350 (8026 - 9551, n=5) | |
| PCMark 10 / Productivity | |
| HP Pavilion 15-eg | |
| Asus Vivobook 15 K513EQ | |
| Durchschnittliche Intel Core i7-1165G7, NVIDIA GeForce MX350 (8343 - 9071, n=5) | |
| Asus VivoBook 15 Pro M3500QC-L1062 | |
| Asus VivoBook S15 S533EQ-BQ002T | |
| Lenovo IdeaPad 5 15ALC05 | |
| Dell Inspiron 15 3501 | |
| PCMark 10 / Digital Content Creation | |
| Asus VivoBook 15 Pro M3500QC-L1062 | |
| HP Pavilion 15-eg | |
| Asus VivoBook S15 S533EQ-BQ002T | |
| Lenovo IdeaPad 5 15ALC05 | |
| Dell Inspiron 15 3501 | |
| Durchschnittliche Intel Core i7-1165G7, NVIDIA GeForce MX350 (4373 - 5330, n=5) | |
| Asus Vivobook 15 K513EQ | |
| PCMark 10 Score | 5120 Punkte | |
Hilfe | ||
| AIDA64 / Memory Copy | |
| Durchschnittliche Intel Core i7-1165G7 (20032 - 65446, n=58) | |
| HP Pavilion 15-eg | |
| Asus VivoBook 15 Pro M3500QC-L1062 | |
| Asus VivoBook S15 S533EQ-BQ002T | |
| Asus Vivobook 15 K513EQ | |
| Lenovo IdeaPad 5 15ALC05 | |
| Dell Inspiron 15 3501 | |
| AIDA64 / Memory Read | |
| Durchschnittliche Intel Core i7-1165G7 (23033 - 64524, n=58) | |
| HP Pavilion 15-eg | |
| Asus VivoBook 15 Pro M3500QC-L1062 | |
| Asus Vivobook 15 K513EQ | |
| Asus VivoBook S15 S533EQ-BQ002T | |
| Lenovo IdeaPad 5 15ALC05 | |
| Dell Inspiron 15 3501 | |
| AIDA64 / Memory Write | |
| Durchschnittliche Intel Core i7-1165G7 (21736 - 66791, n=58) | |
| HP Pavilion 15-eg | |
| Asus Vivobook 15 K513EQ | |
| Asus VivoBook S15 S533EQ-BQ002T | |
| Asus VivoBook 15 Pro M3500QC-L1062 | |
| Dell Inspiron 15 3501 | |
| Lenovo IdeaPad 5 15ALC05 | |
| AIDA64 / Memory Latency | |
| Lenovo IdeaPad 5 15ALC05 | |
| Dell Inspiron 15 3501 | |
| Asus Vivobook 15 K513EQ | |
| Asus VivoBook S15 S533EQ-BQ002T | |
| Durchschnittliche Intel Core i7-1165G7 (69 - 110, n=65) | |
| Asus VivoBook 15 Pro M3500QC-L1062 | |
| HP Pavilion 15-eg | |
* ... kleinere Werte sind besser
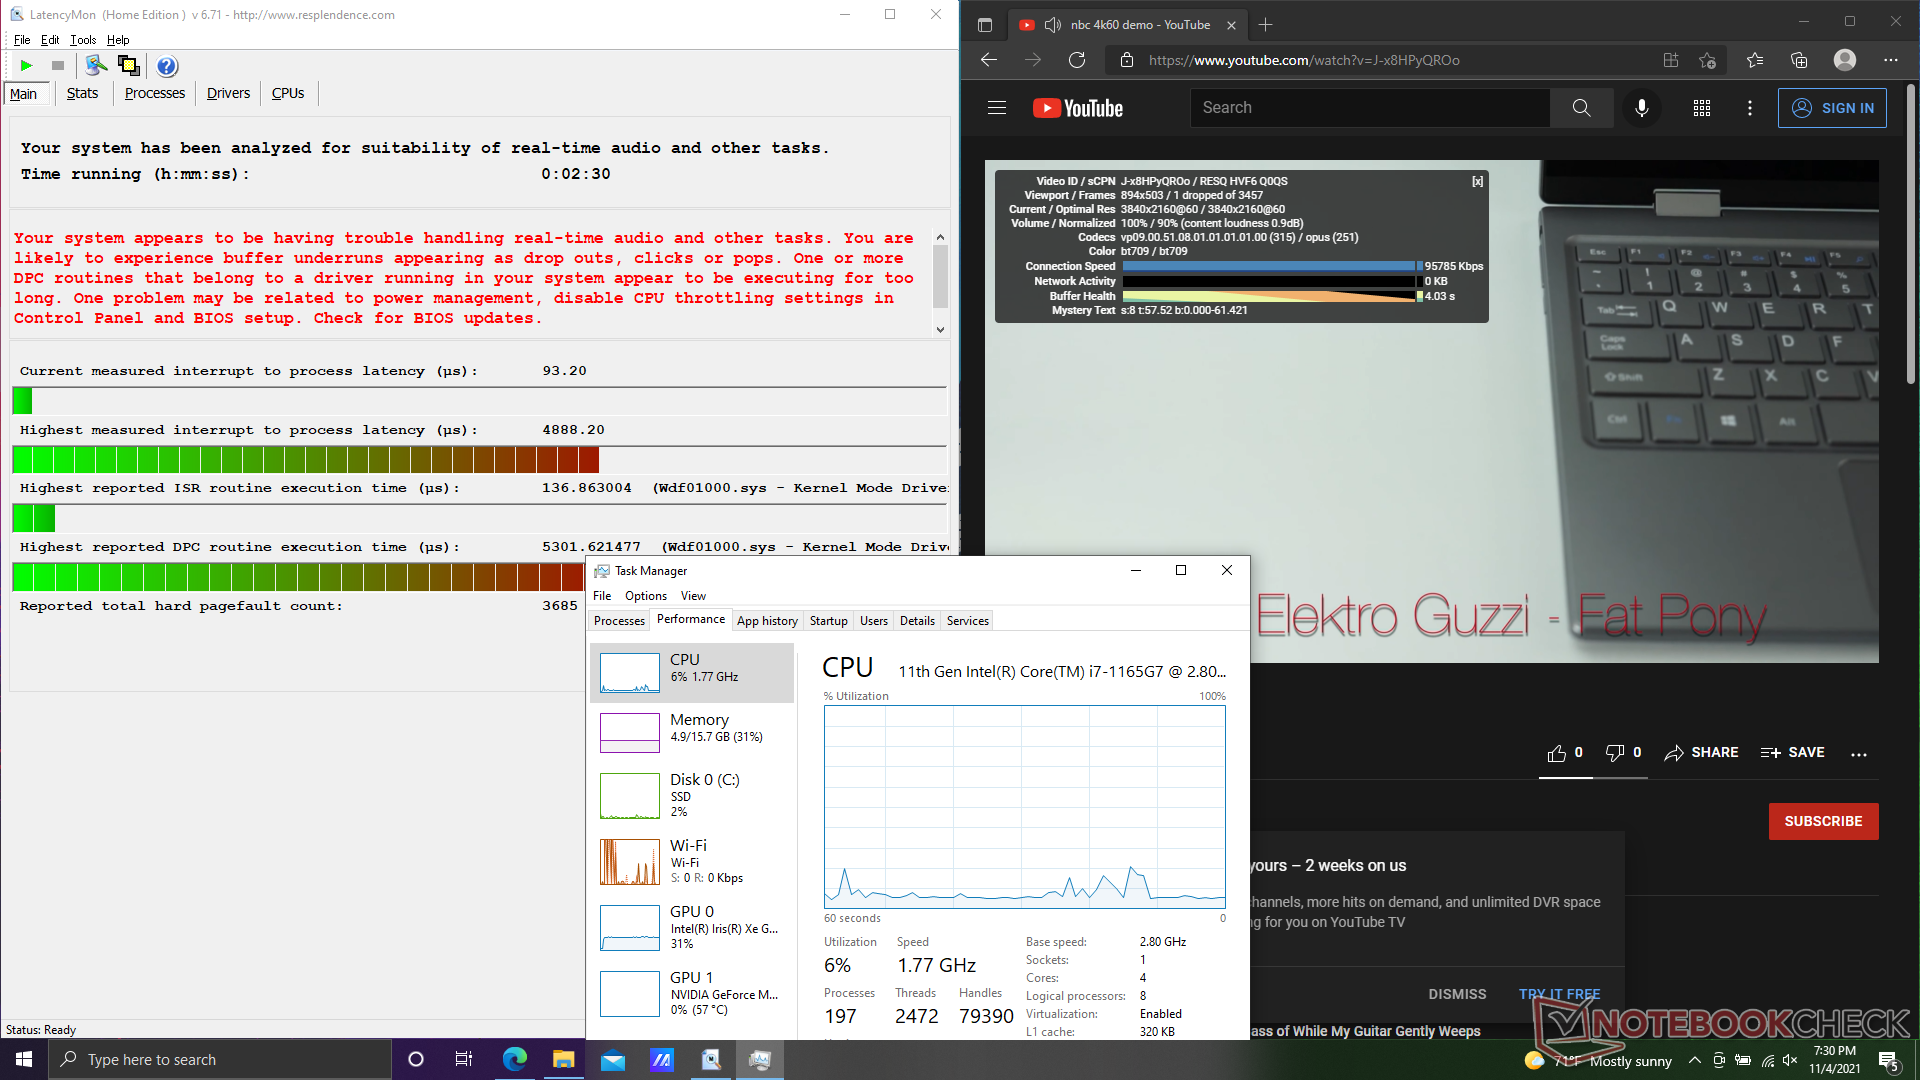
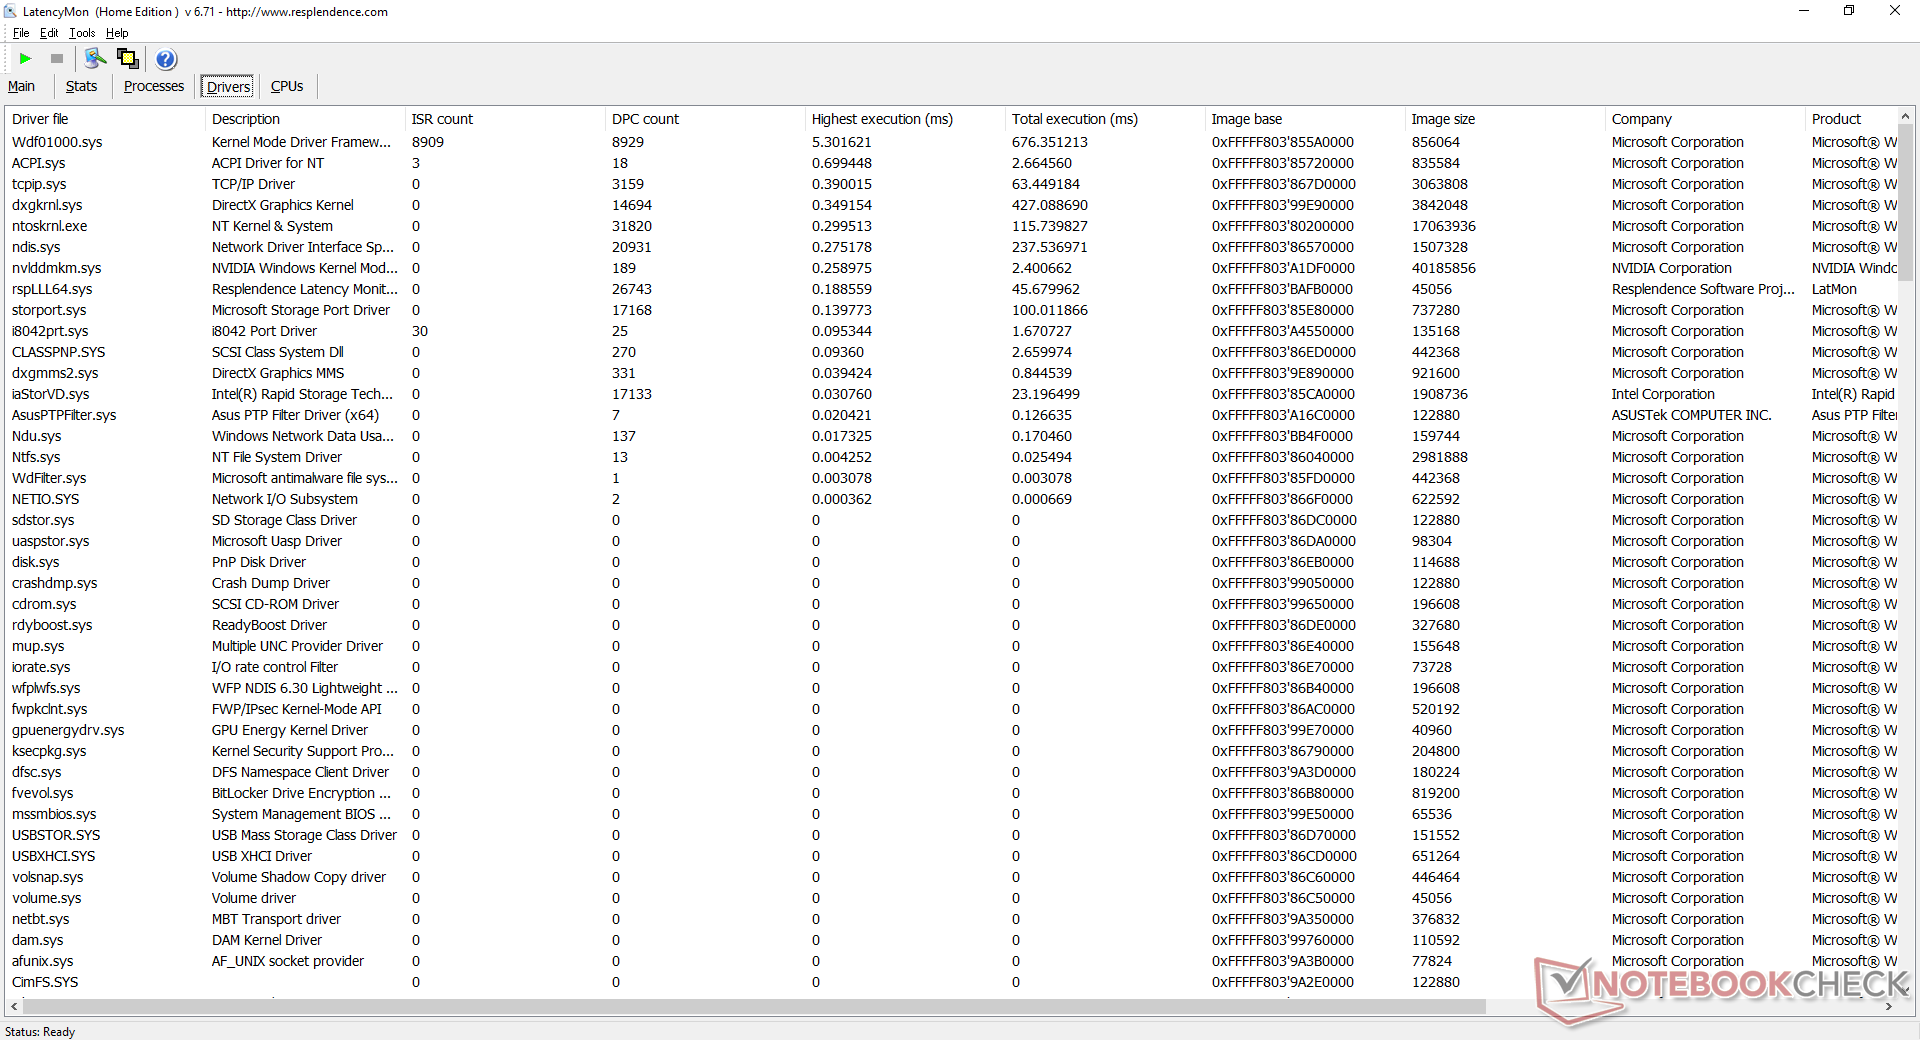
DPC Latency
LatencyMon zeigt Latenzprobleme beim Öffnen mehrerer Browsertabs an. Die Wiedergabe unseres nativen 4K-Videos bei 60 FPS läuft aber flüssig und ohne Problem ab.
| DPC Latencies / LatencyMon - interrupt to process latency (max), Web, Youtube, Prime95 | |
| Asus Vivobook 15 K513EQ | |
| HP Pavilion 15-eg | |
| Dell Inspiron 15 3501 | |
| Lenovo IdeaPad 5 15ALC05 | |
| Asus VivoBook S15 S533EQ-BQ002T | |
| Asus VivoBook 15 Pro M3500QC-L1062 | |
* ... kleinere Werte sind besser
Massenspeicher — Nur Platz für 1 Laufwerk
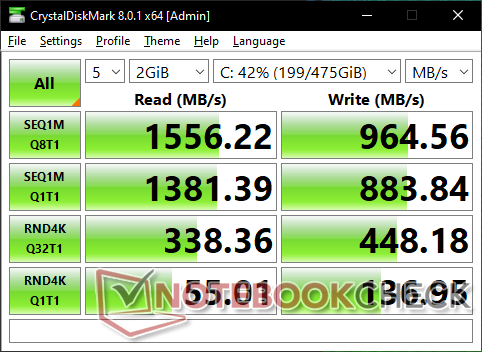
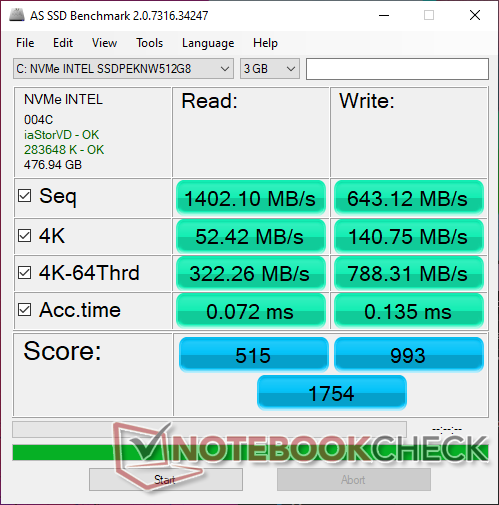
Unser Testmodell ist mit der 512 GB großen PCIe3-NVMe-SSD Intel 660p SSDPEKNW512G8 bestückt, welche theoretisch maximale Lese- und Schreibraten von nur 1.500 MB/s bzw. 1.000 MB/s bietet und damit etwa nur halb so schnell ist wie eine teurere Samsung PM981a. Für die anvisierte Zielgruppe dürfte die Performance aber dennoch ausreichen, vor allem in Kombination mit dem ULV-Prozessor und der GeForce-MX-Grafik. Ein Heat-Spreader ist dadurch aber auch unter Stress kaum nötig, da die Intel 660p nur eine Budget- bis Mittelklasse-NVMe-Lösung darstellt.

| Drive Performance Rating - Percent | |
| Asus VivoBook 15 Pro M3500QC-L1062 | |
| Dell Inspiron 15 3501 | |
| Lenovo IdeaPad 5 15ALC05 | |
| Asus VivoBook S15 S533EQ-BQ002T | |
| HP Pavilion 15-eg | |
| Asus Vivobook 15 K513EQ | |
* ... kleinere Werte sind besser
Disk Throttling: DiskSpd Read Loop, Queue Depth 8
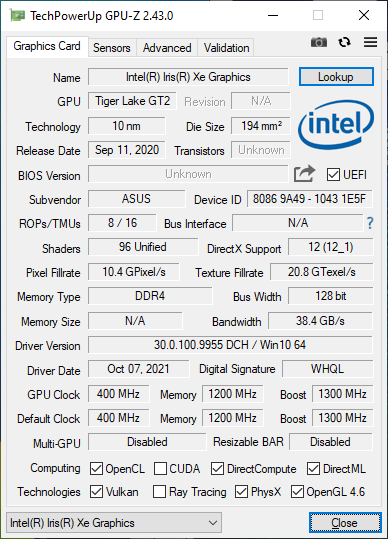
Grafikleistung — Iris Xe vs. GeForce MX350
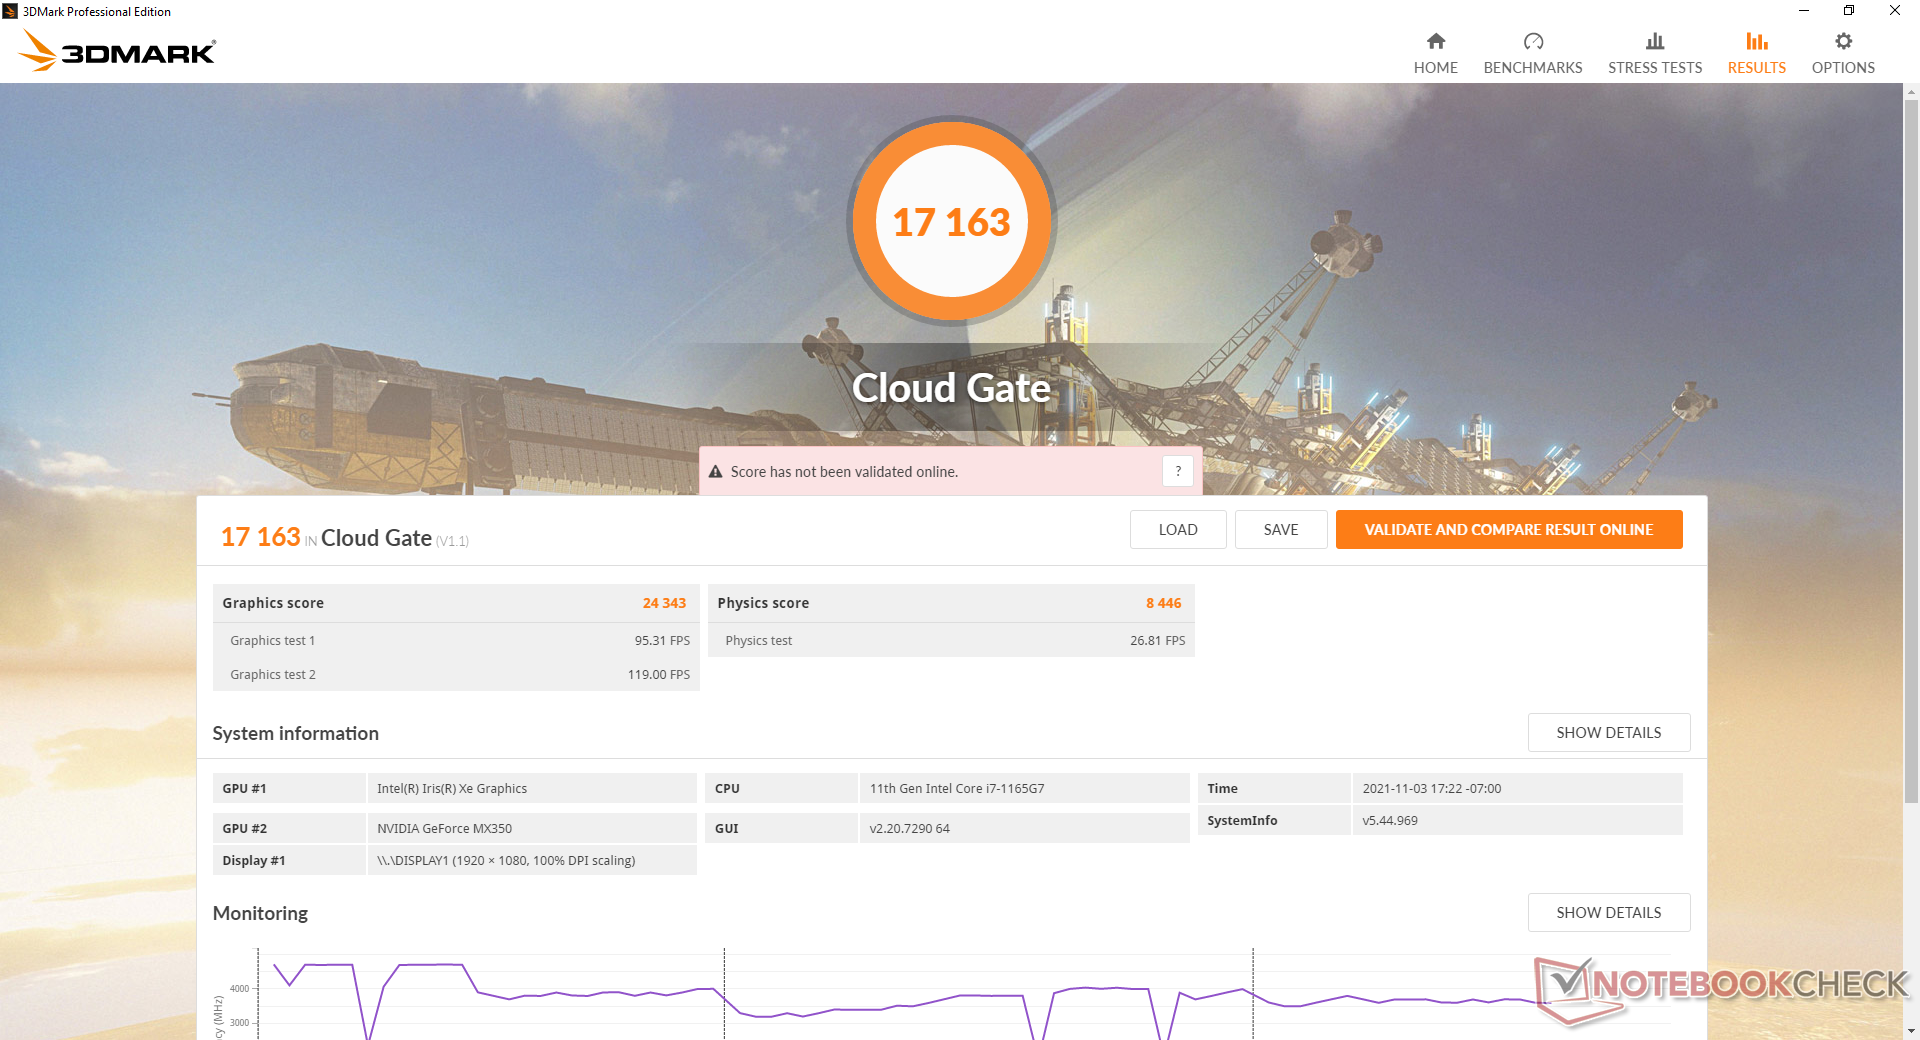
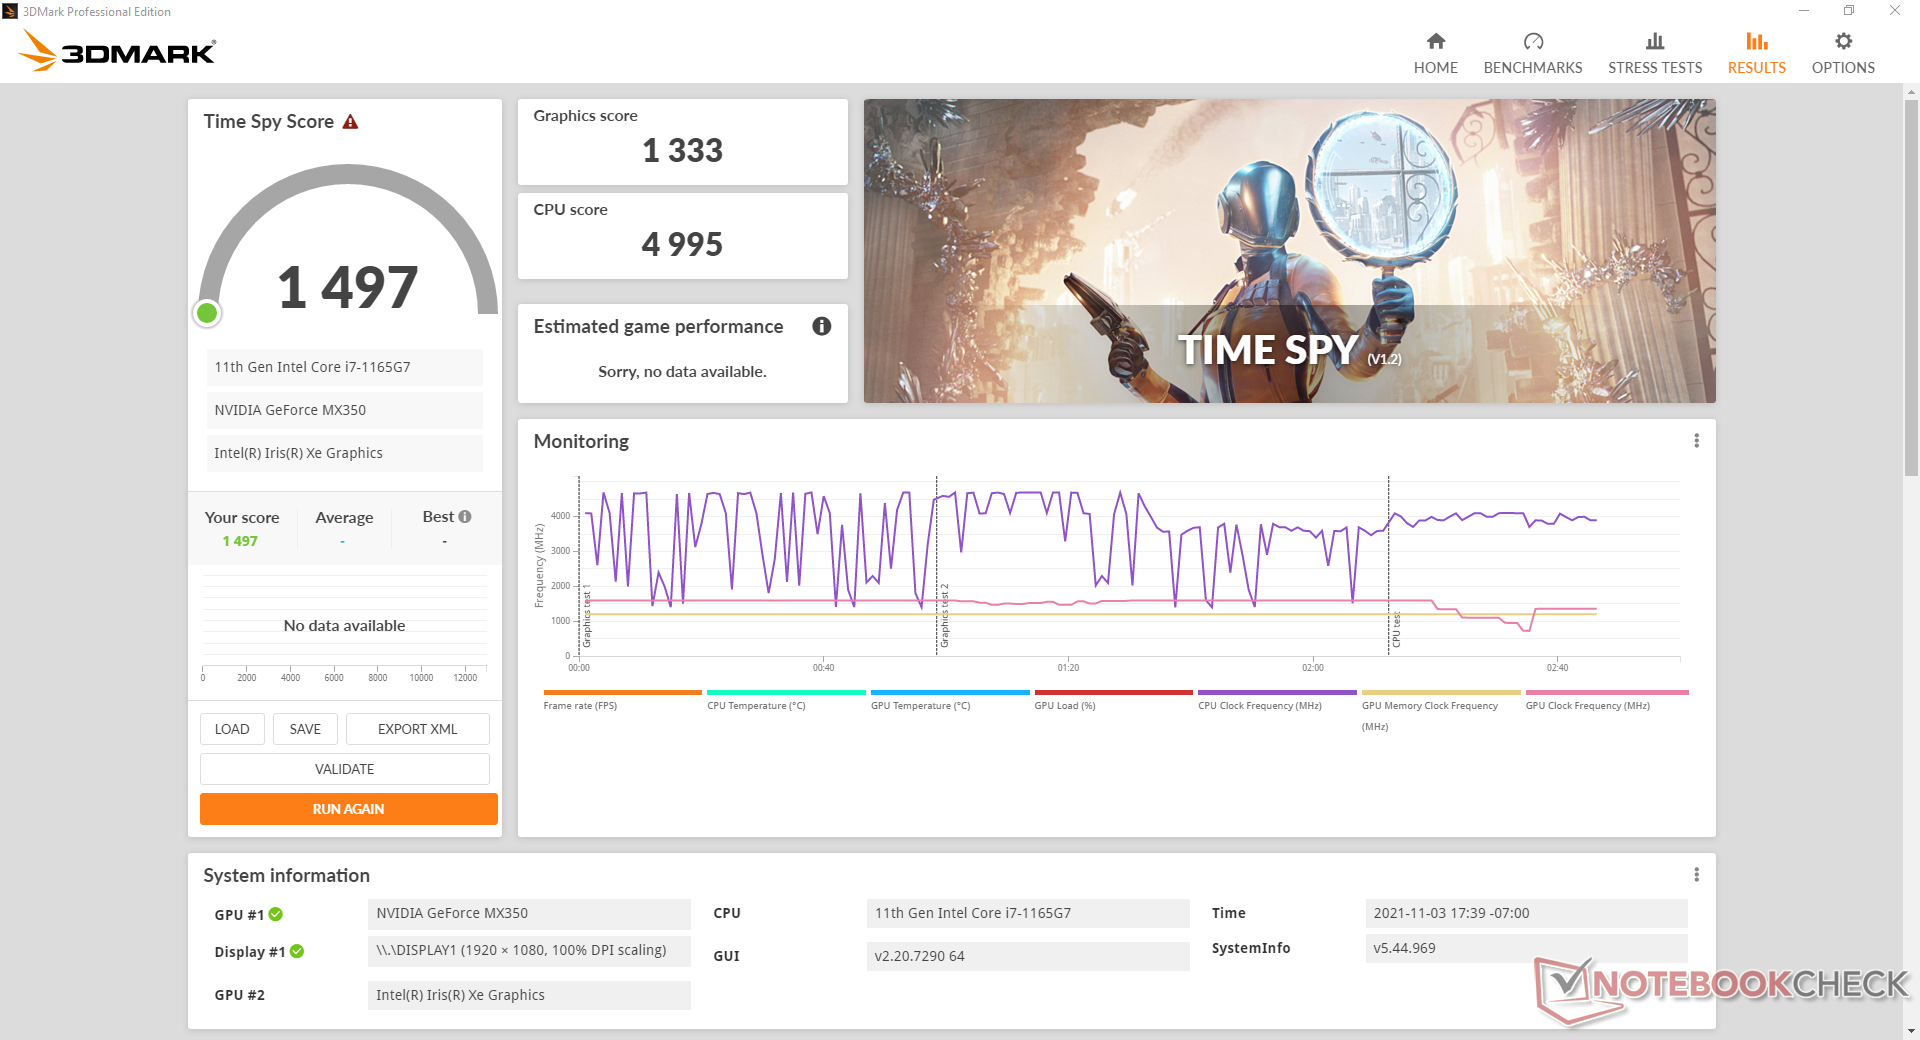
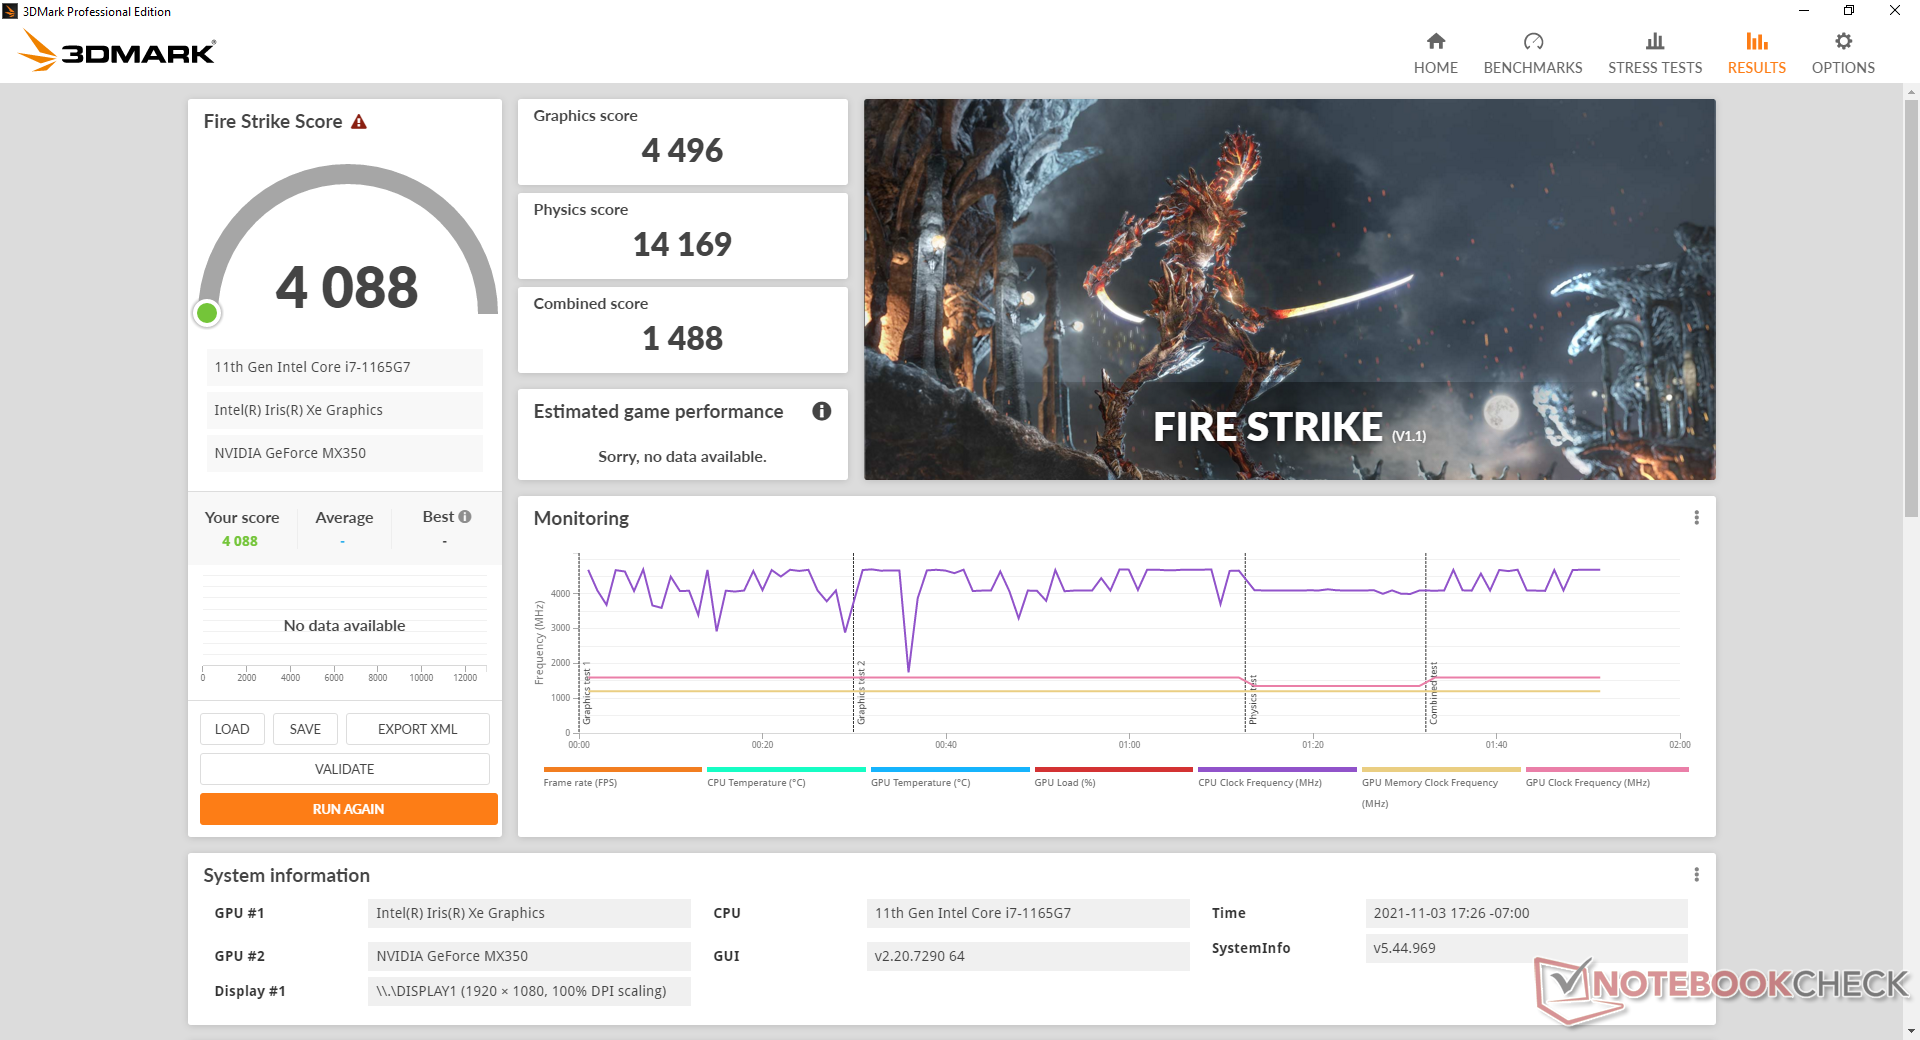
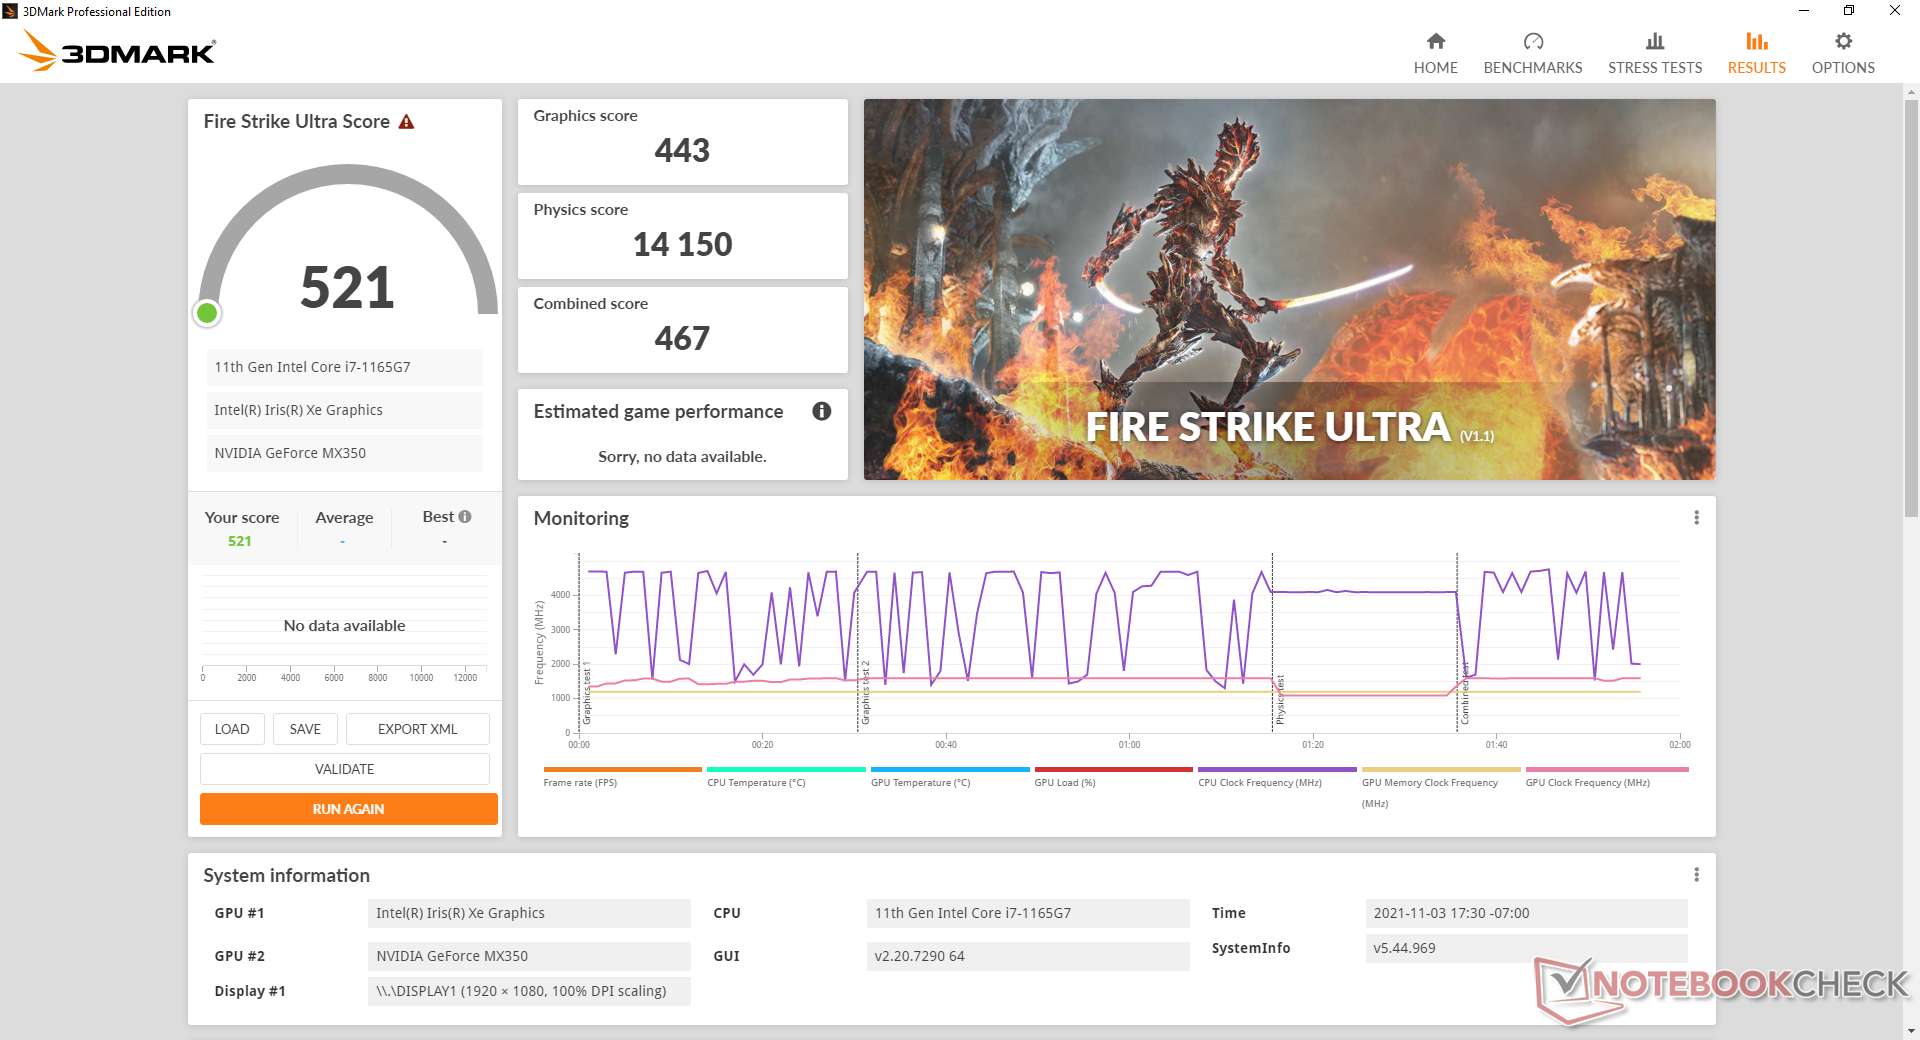
Die Grafikleistung orientiert sich an der anderer Laptops mit GeForce MX350. Intels konkurrierende, integrierte Iris Xe-Plattform wurde jedoch ständig in Sachen Treiber und Gaming-Support verbessert, sodass sie sich in den meisten Szenarien mittlerweile ein Kopf-an-Kopf-Rennen mit der Nvidia-GPU liefert. GTA V und DOTA 2 Reborn sind dabei zwei Ausnahmen, bei denen unser Vivobook mit Geforce-GPU noch immer einen signifikanten Vorsprung gegenüber der Iris Xe hält.
Ein Upgrade von einer MX330 auf eine MX350 dürfte die Leistung um etwa 15 bis 20 Prozent verbessern.
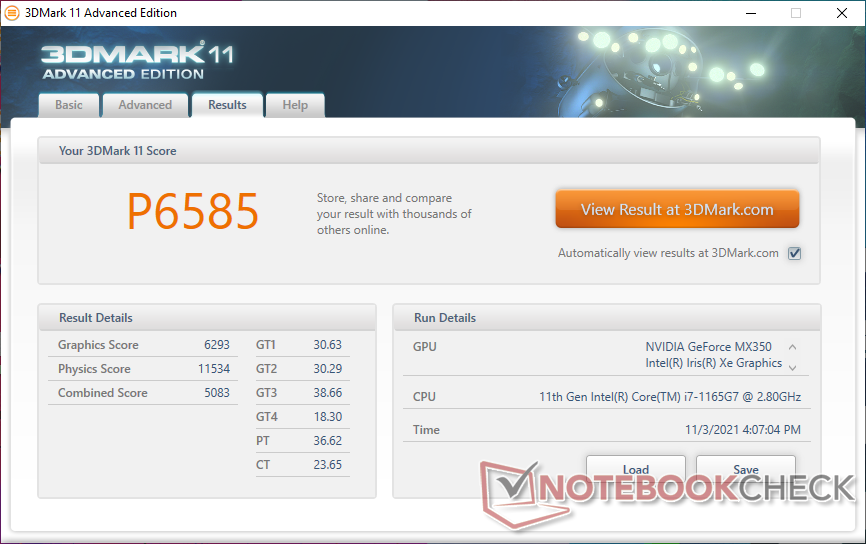
| 3DMark 11 Performance | 6585 Punkte | |
| 3DMark Cloud Gate Standard Score | 17163 Punkte | |
| 3DMark Fire Strike Score | 4088 Punkte | |
| 3DMark Time Spy Score | 1497 Punkte | |
Hilfe | ||
Witcher 3 FPS Chart
| min. | mittel | hoch | max. | |
|---|---|---|---|---|
| GTA V (2015) | 141 | 115 | 45.8 | 23.7 |
| The Witcher 3 (2015) | 86 | 48.6 | 29.9 | 16.7 |
| Dota 2 Reborn (2015) | 126 | 119 | 80.4 | 73.4 |
| Final Fantasy XV Benchmark (2018) | 48.6 | 23 | 14.5 | |
| X-Plane 11.11 (2018) | 66.7 | 62.7 | 53.9 | |
| Far Cry 5 (2018) | 59 | 26 | 23 | 22 |
| Strange Brigade (2018) | 92.7 | 32.3 | 25 | 18.8 |
Emissionen — Meistens leise
Systemlautstärke
Die internen Lüfter machen unter geringen Lasten einen hervorragenden Job wenn es darum geht stets so leise wie möglich und mit minimalem Pulsierverhalten zu agieren. Beim Browsen oder Videostreamen laufen die Lüfter bei 27 dB(A) oder niedriger (Hintergrund 23,4 dB(A)). Ein leises elektronischen Geräusch oder Spulenfiepen verhindert, dass es geräuschlos ist.
Die Lüfterlautstärke wird von drei Leistungsmodi (Whisper, Balanced und Performance) in der MyAsus-Software beeinflusst. Läuft Witcher 3 im Balanced- oder Performance-Modus rauschen die Lüfter mit konstanten 40,7 dB(A) bzw. 42,9 dB(A), was etwas lauter ist als viele Ultrabooks mit rein integrierter GPU. Extreme Lasten wie Prime95 und FurMark gleichzeitig treibt die Lautstärke gar auf maximal 47 dB(A) hoch.
Lautstärkediagramm
| Idle |
| 23.6 / 23.6 / 23.6 dB(A) |
| Last |
| 41 / 47 dB(A) |
 | ||
30 dB leise 40 dB(A) deutlich hörbar 50 dB(A) störend |
||
min: | ||
| Asus Vivobook 15 K513EQ GeForce MX350, i7-1165G7, Intel SSD 660p SSDPEKNW512G8 | Asus VivoBook 15 Pro M3500QC-L1062 GeForce RTX 3050 4GB Laptop GPU, R5 5600H, SK Hynix HFM512GD3JX013N | Asus VivoBook S15 S533EQ-BQ002T GeForce MX350, i7-1165G7, Intel SSD 660p 1TB SSDPEKNW010T8 | Lenovo IdeaPad 5 15ALC05 Vega 7, R5 5500U | Dell Inspiron 15 3501 Iris Xe G7 96EUs, i7-1165G7, Samsung PM991a MZ9LQ512HBLU-00BD1 | HP Pavilion 15-eg GeForce MX450, i7-1165G7, Samsung PM991 MZVLQ1T0HALB | |
|---|---|---|---|---|---|---|
| Geräuschentwicklung | -3% | -0% | -4% | -1% | -1% | |
| aus / Umgebung * (dB) | 23.4 | 24.8 -6% | 25 -7% | 26 -11% | 26 -11% | 25.4 -9% |
| Idle min * (dB) | 23.6 | 24.8 -5% | 25 -6% | 26 -10% | 26 -10% | 25.6 -8% |
| Idle avg * (dB) | 23.6 | 24.8 -5% | 25 -6% | 26 -10% | 26 -10% | 25.6 -8% |
| Idle max * (dB) | 23.6 | 26.4 -12% | 25 -6% | 26 -10% | 26 -10% | 25.6 -8% |
| Last avg * (dB) | 41 | 42.8 -4% | 39.5 4% | 42.6 -4% | 35.9 12% | 39.2 4% |
| Witcher 3 ultra * (dB) | 42.9 | 42.8 -0% | 39.3 8% | 39.1 9% | ||
| Last max * (dB) | 47 | 42.8 9% | 41.6 11% | 37.4 20% | 35.8 24% | 41.5 12% |
* ... kleinere Werte sind besser
Temperatur
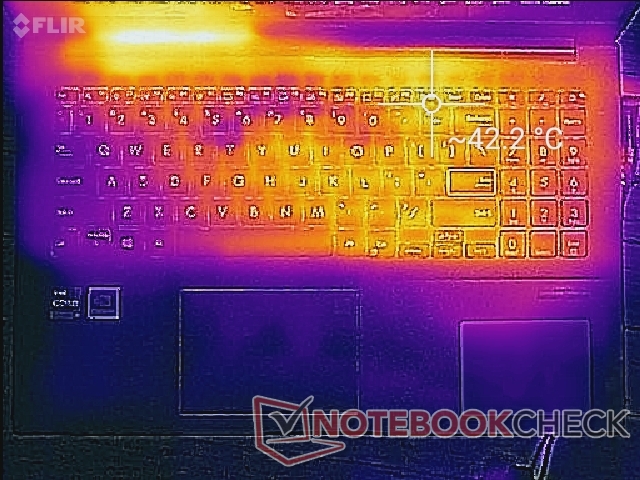
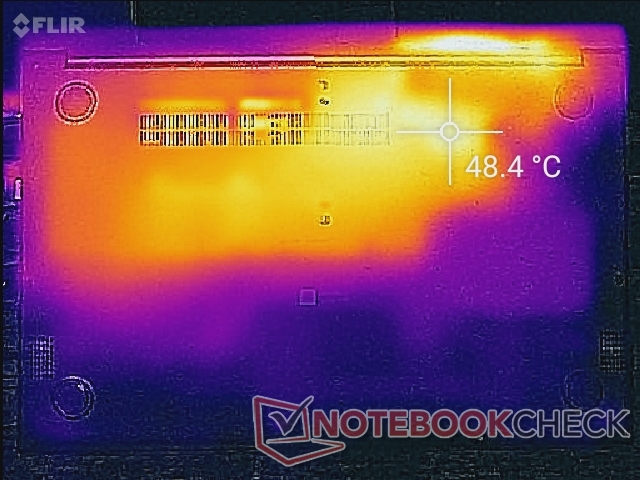
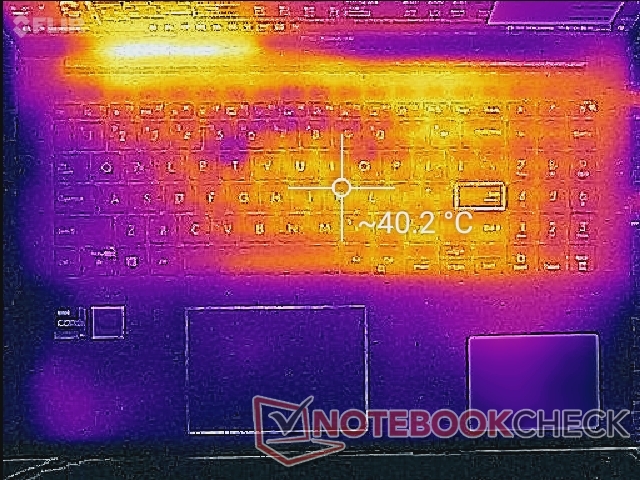
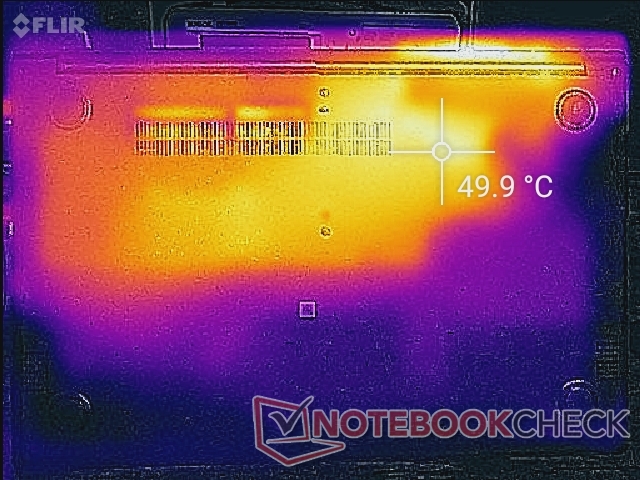
Die rechte Seite des Laptops erhitzt sich durch das Design des Kühlsystems stets stärker als die linke Seite. Die Hot Spots an der Tastatur erreichen 42 °C beim Gaming, was mit dem HP Pavilion 15 mit Iris Xe vergleichbar ist. Allerdings wird die Unterseite im hinteren Bereich mit beinahe 50 °C nochmals heißer.
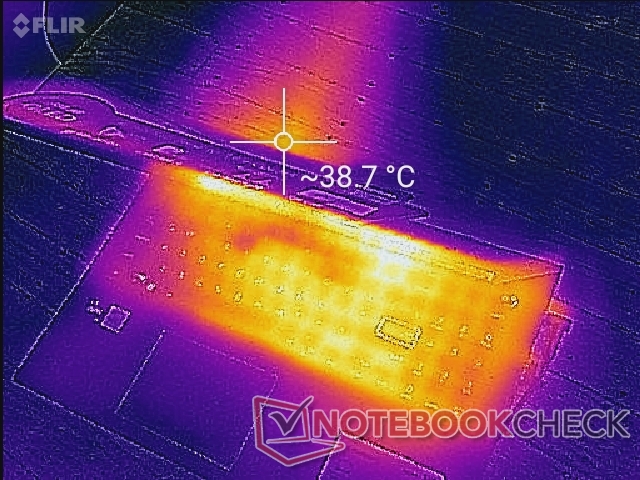

(-) Die maximale Temperatur auf der Oberseite ist 48.8 °C. Im Vergleich liegt der Klassendurchschnitt bei 36.8 °C (von 21 bis 71 °C für die Klasse Multimedia).
(±) Auf der Unterseite messen wir eine maximalen Wert von 42 °C (im Vergleich zum Durchschnitt von 39.1 °C).
(+) Ohne Last messen wir eine durchschnittliche Temperatur von 25.6 °C auf der Oberseite. Der Klassendurchschnitt erreicht 31.3 °C.
(±) Beim längeren Spielen von The Witcher 3 erhitzt sich das Gerät durchschnittlich auf 33.9 °C. Der Durchschnitt der Klasse ist derzeit 31.3 °C.
(+) Die Handballen und der Touchpad-Bereich sind mit gemessenen 28.2 °C kühler als die typische Hauttemperatur und fühlen sich dadurch kühl an.
(±) Die durchschnittliche Handballen-Temperatur anderer getesteter Geräte war 28.7 °C (+0.5 °C).


| Asus Vivobook 15 K513EQ Intel Core i7-1165G7, NVIDIA GeForce MX350 | Asus VivoBook 15 Pro M3500QC-L1062 AMD Ryzen 5 5600H, NVIDIA GeForce RTX 3050 4GB Laptop GPU | Asus VivoBook S15 S533EQ-BQ002T Intel Core i7-1165G7, NVIDIA GeForce MX350 | Lenovo IdeaPad 5 15ALC05 AMD Ryzen 5 5500U, AMD Radeon RX Vega 7 | Dell Inspiron 15 3501 Intel Core i7-1165G7, Intel Iris Xe Graphics G7 96EUs | HP Pavilion 15-eg Intel Core i7-1165G7, NVIDIA GeForce MX450 | |
|---|---|---|---|---|---|---|
| Hitze | 14% | 16% | 12% | 8% | 3% | |
| Last oben max * (°C) | 48.8 | 37.8 23% | 38.1 22% | 40.5 17% | 45.6 7% | 44 10% |
| Last unten max * (°C) | 42 | 48.4 -15% | 41.3 2% | 42 -0% | 41 2% | 53.4 -27% |
| Idle oben max * (°C) | 30 | 24 20% | 24.5 18% | 26.5 12% | 28.2 6% | 27.4 9% |
| Idle unten max * (°C) | 35 | 25.1 28% | 26.8 23% | 29 17% | 29.1 17% | 28.8 18% |
* ... kleinere Werte sind besser
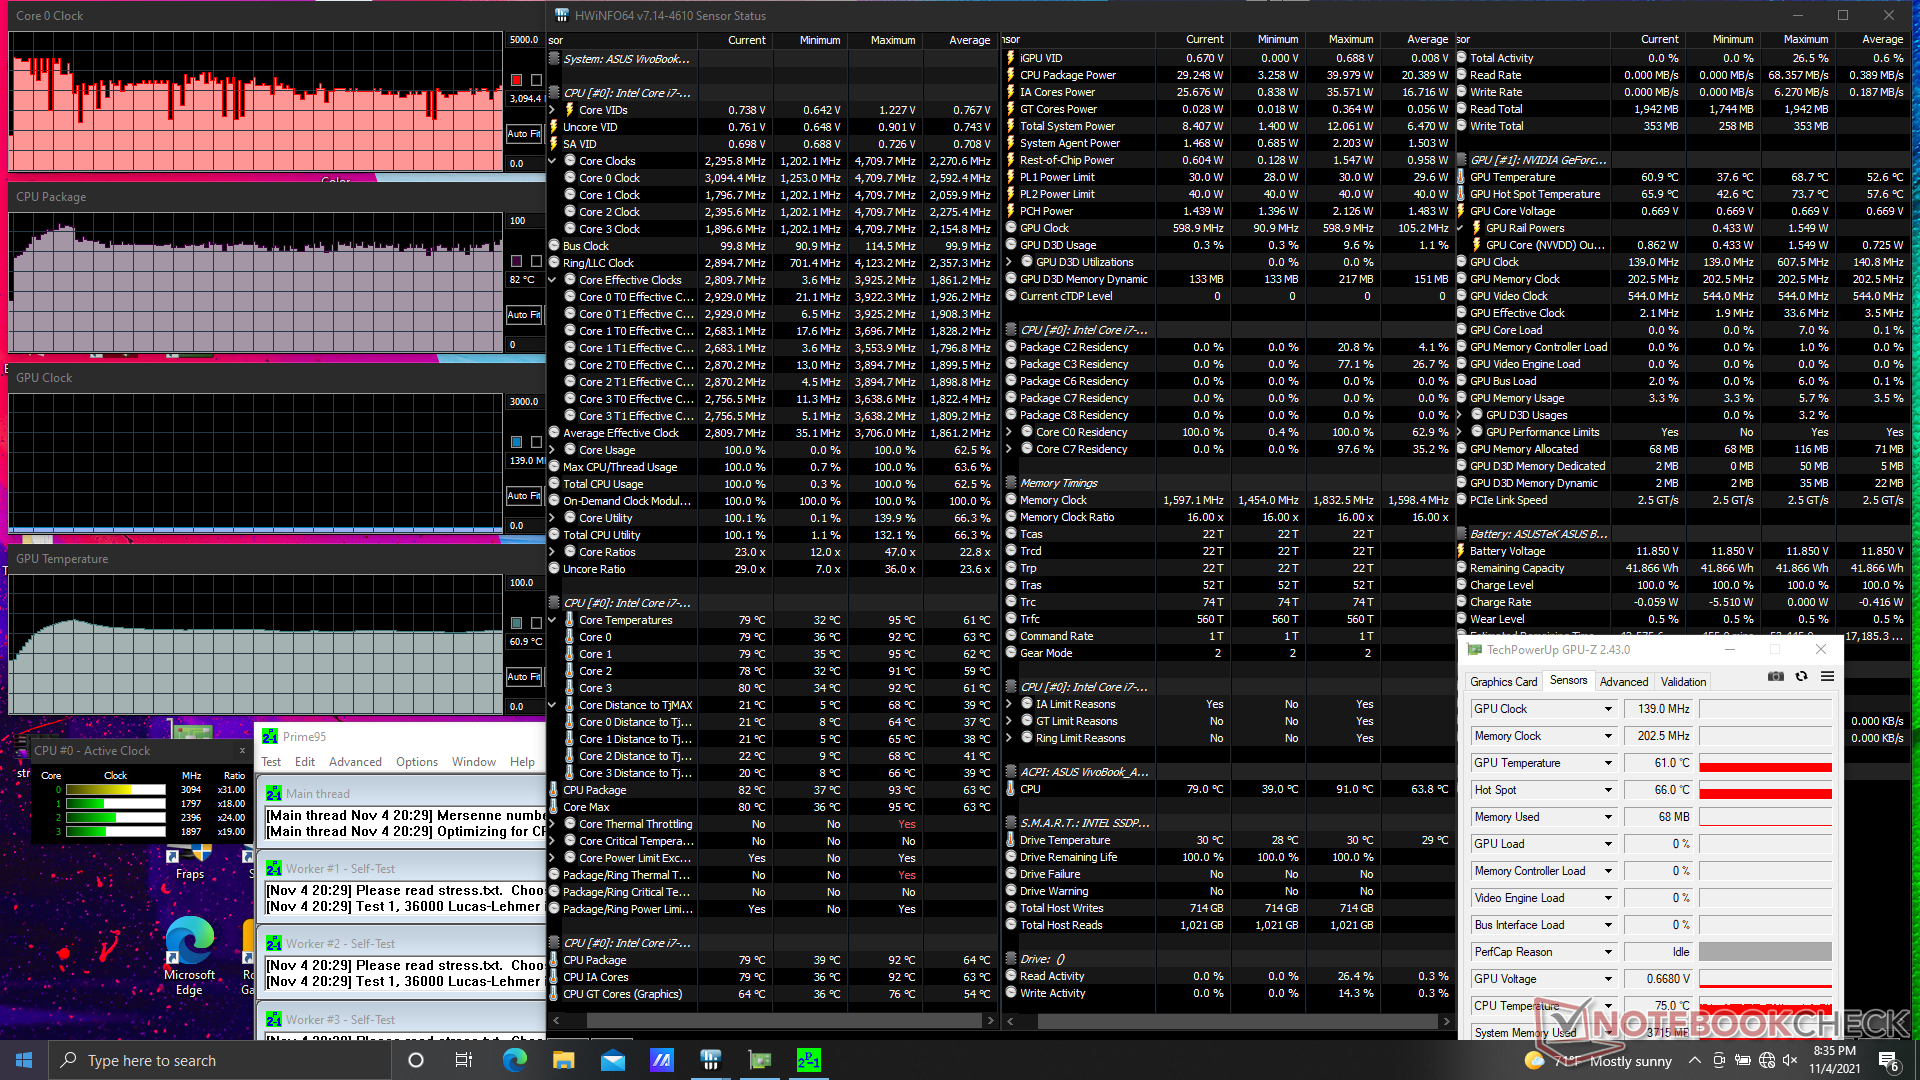
Stresstest
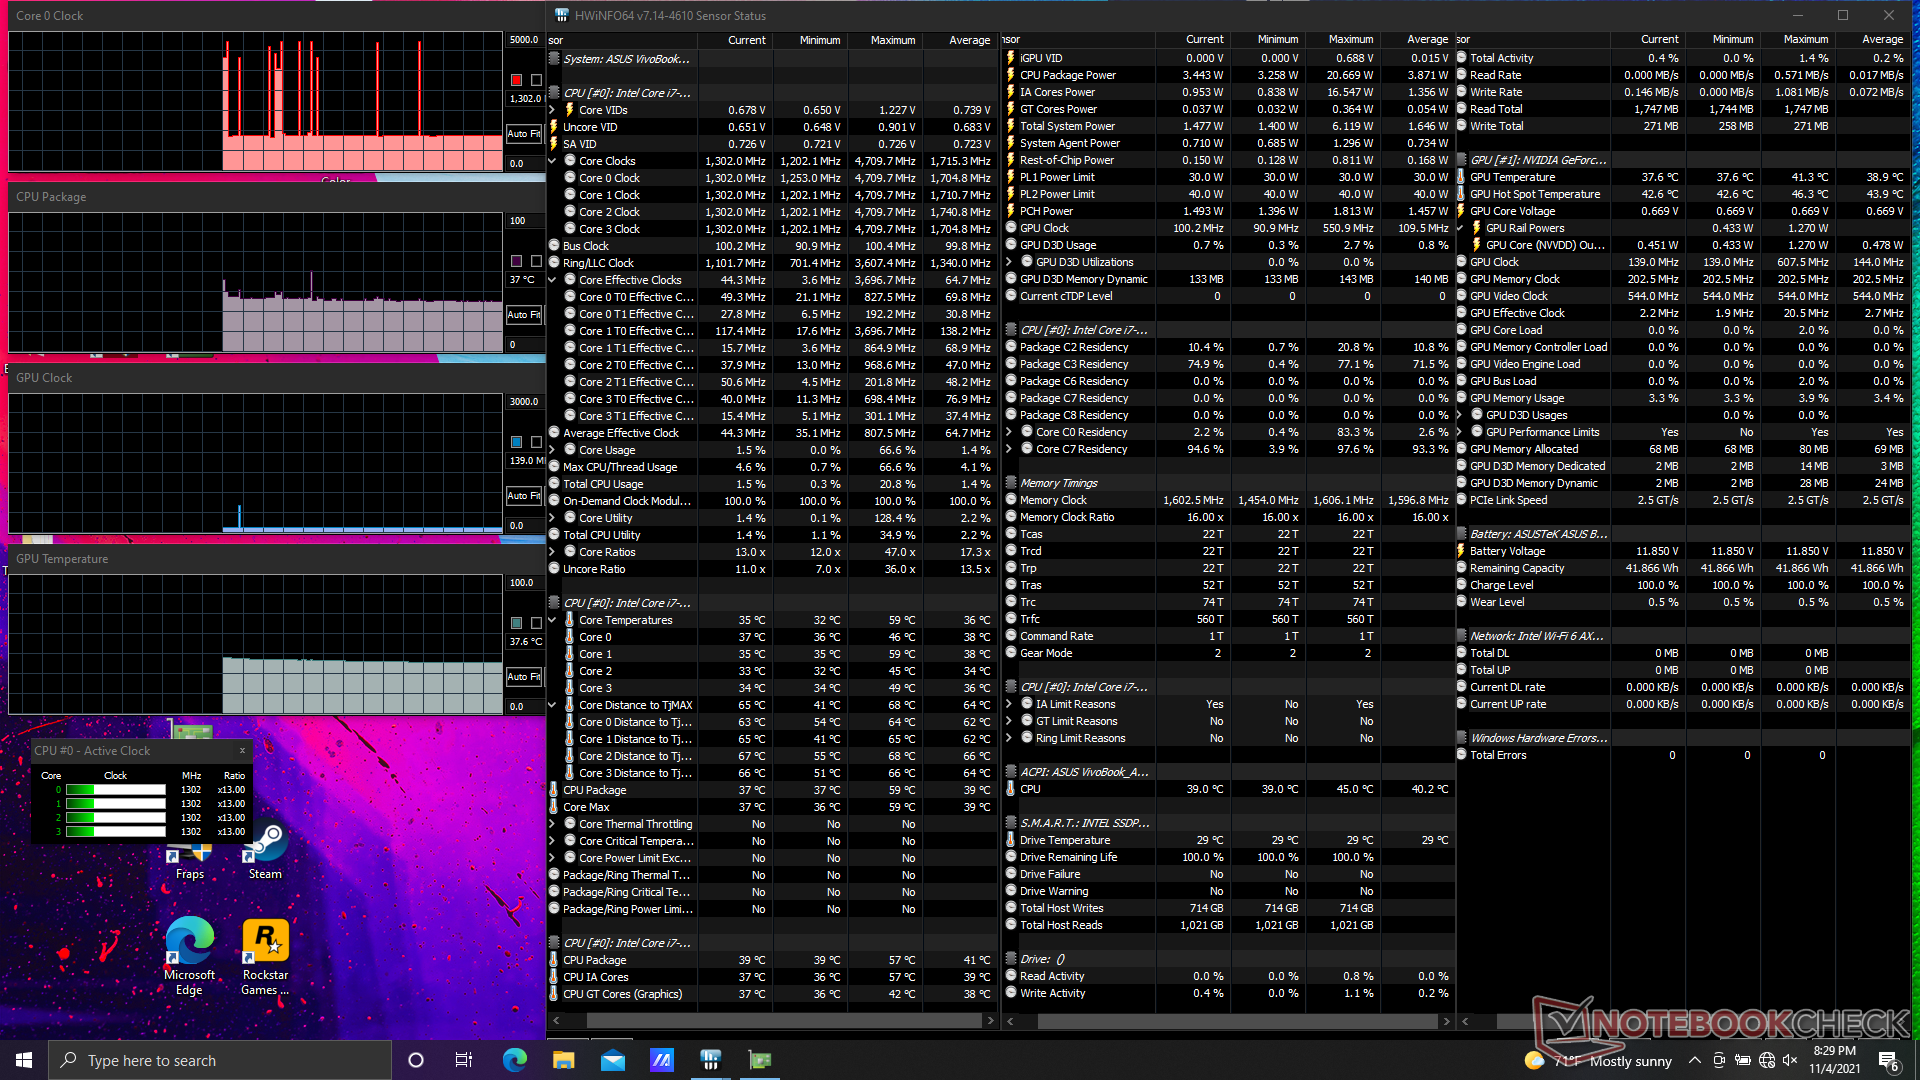
Beim Stress mit Prime95 boosten die Kerne für die ersten 30 Sekunden auf 4,1 GHz und erreichen eine Kerntemperatur von 91 °C. Danach fallen die Taktraten unter 3,1 GHz, um eine niedrigere Temperatur von um die 78 °C aufrecht zu erhalten. Der Framework Laptop mit dem gleichen Core i7-1165G7 stabilisiert sich im Vergleich dazu bei leicht höheren Temperaturen um die 82 °C.
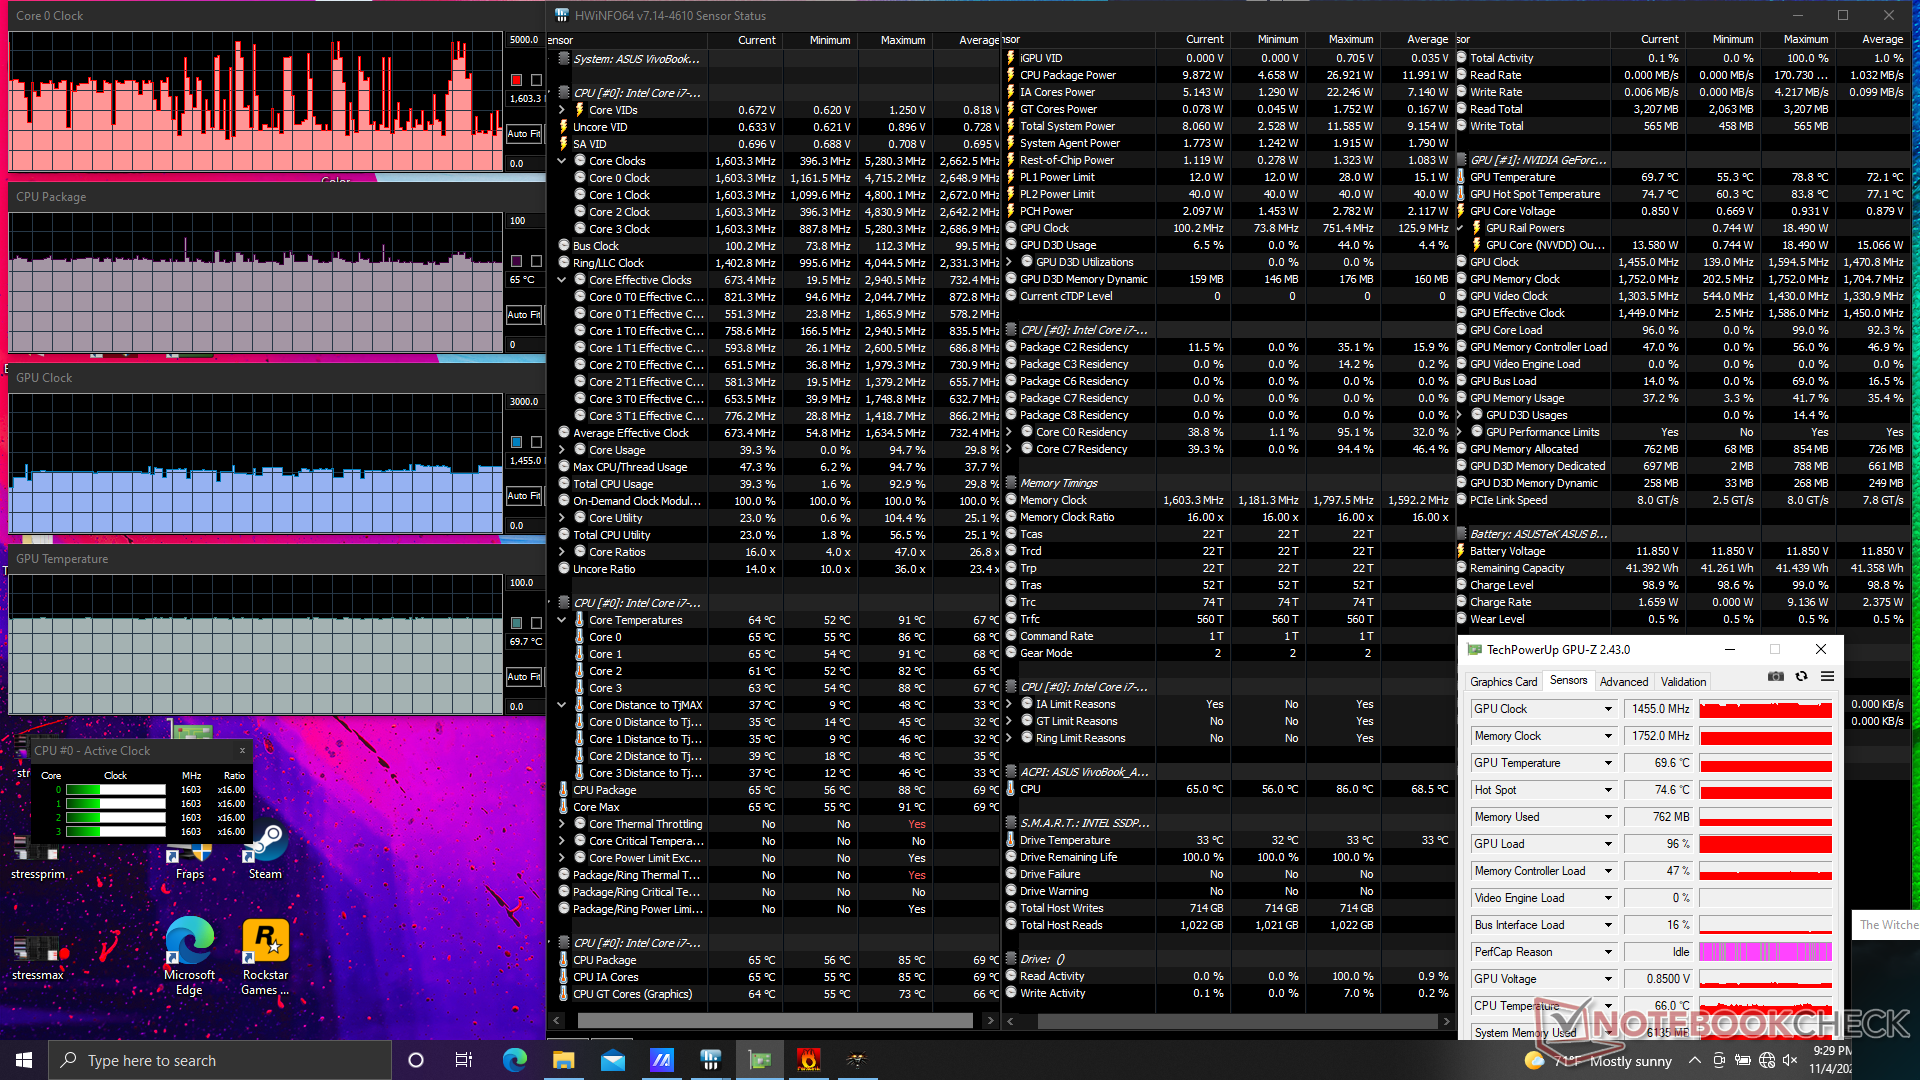
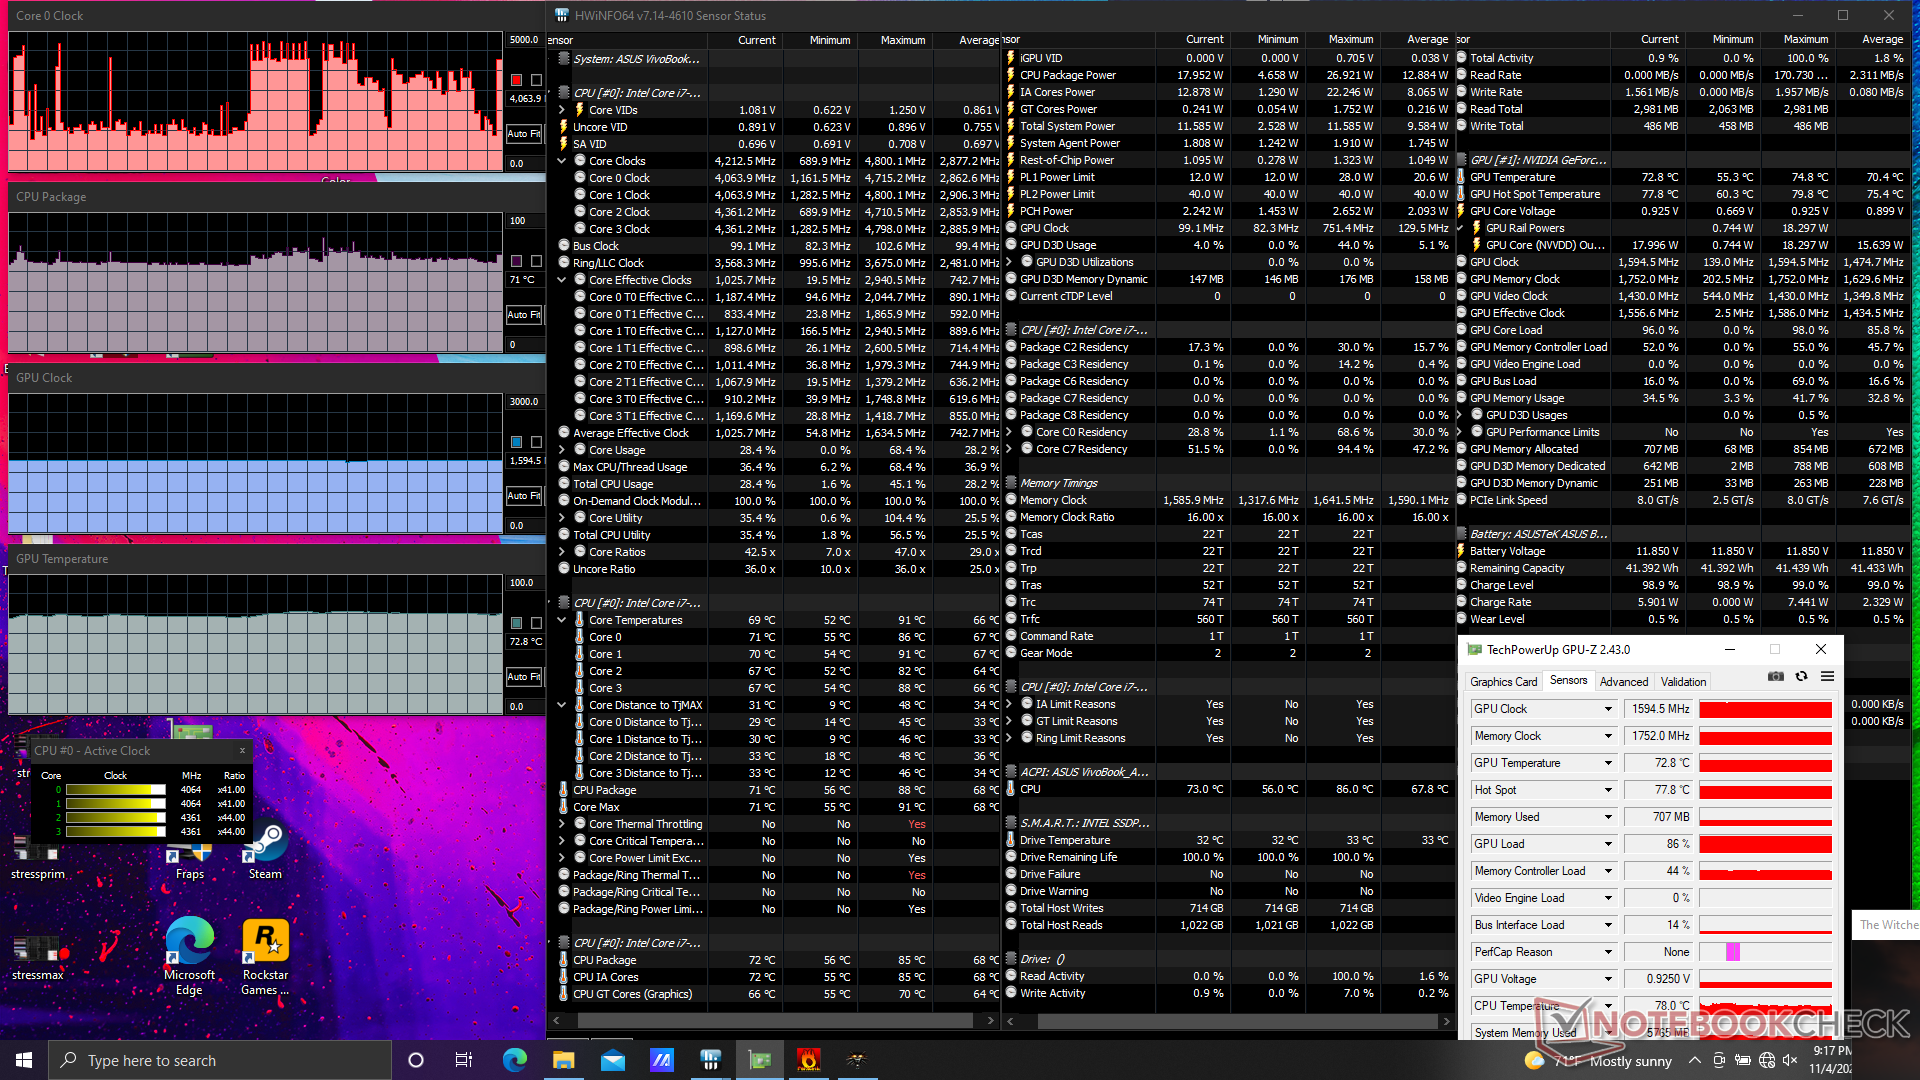
Der Performance-Modus erlaubt eine leicht höhere Grafikleistung. Der GPU-Takt schwankt im Balanced-Modus zwischen 1.100 bis 1.455 MHz bei Witcher 3, während er im Performance-Modus konstante 1.595 MHz hält. Wer also die beste Performance aus dem VivoBook herausholen möchte, muss mit den lauteren Lüftern leben, die der Performance-Modus mit sich bringt.
Abseits der Steckdose kommt unser Laptop im 3DMark 11 nur noch auf Physics- und Graphics-Scores von 8.064 und 6.075 Punkten, verglichen mit den 11.534 und 6.293 Punkten am Stromnetz.
| CPU Clock (GHz) | GPU Clock (MHz) | Average CPU Temperature (°C) | Average GPU Temperature (°C) | |
| System Idle | -- | -- | 37 | 38 |
| Prime95 Stress | 1.7 - 2.9 | ~82 | -- | 61 |
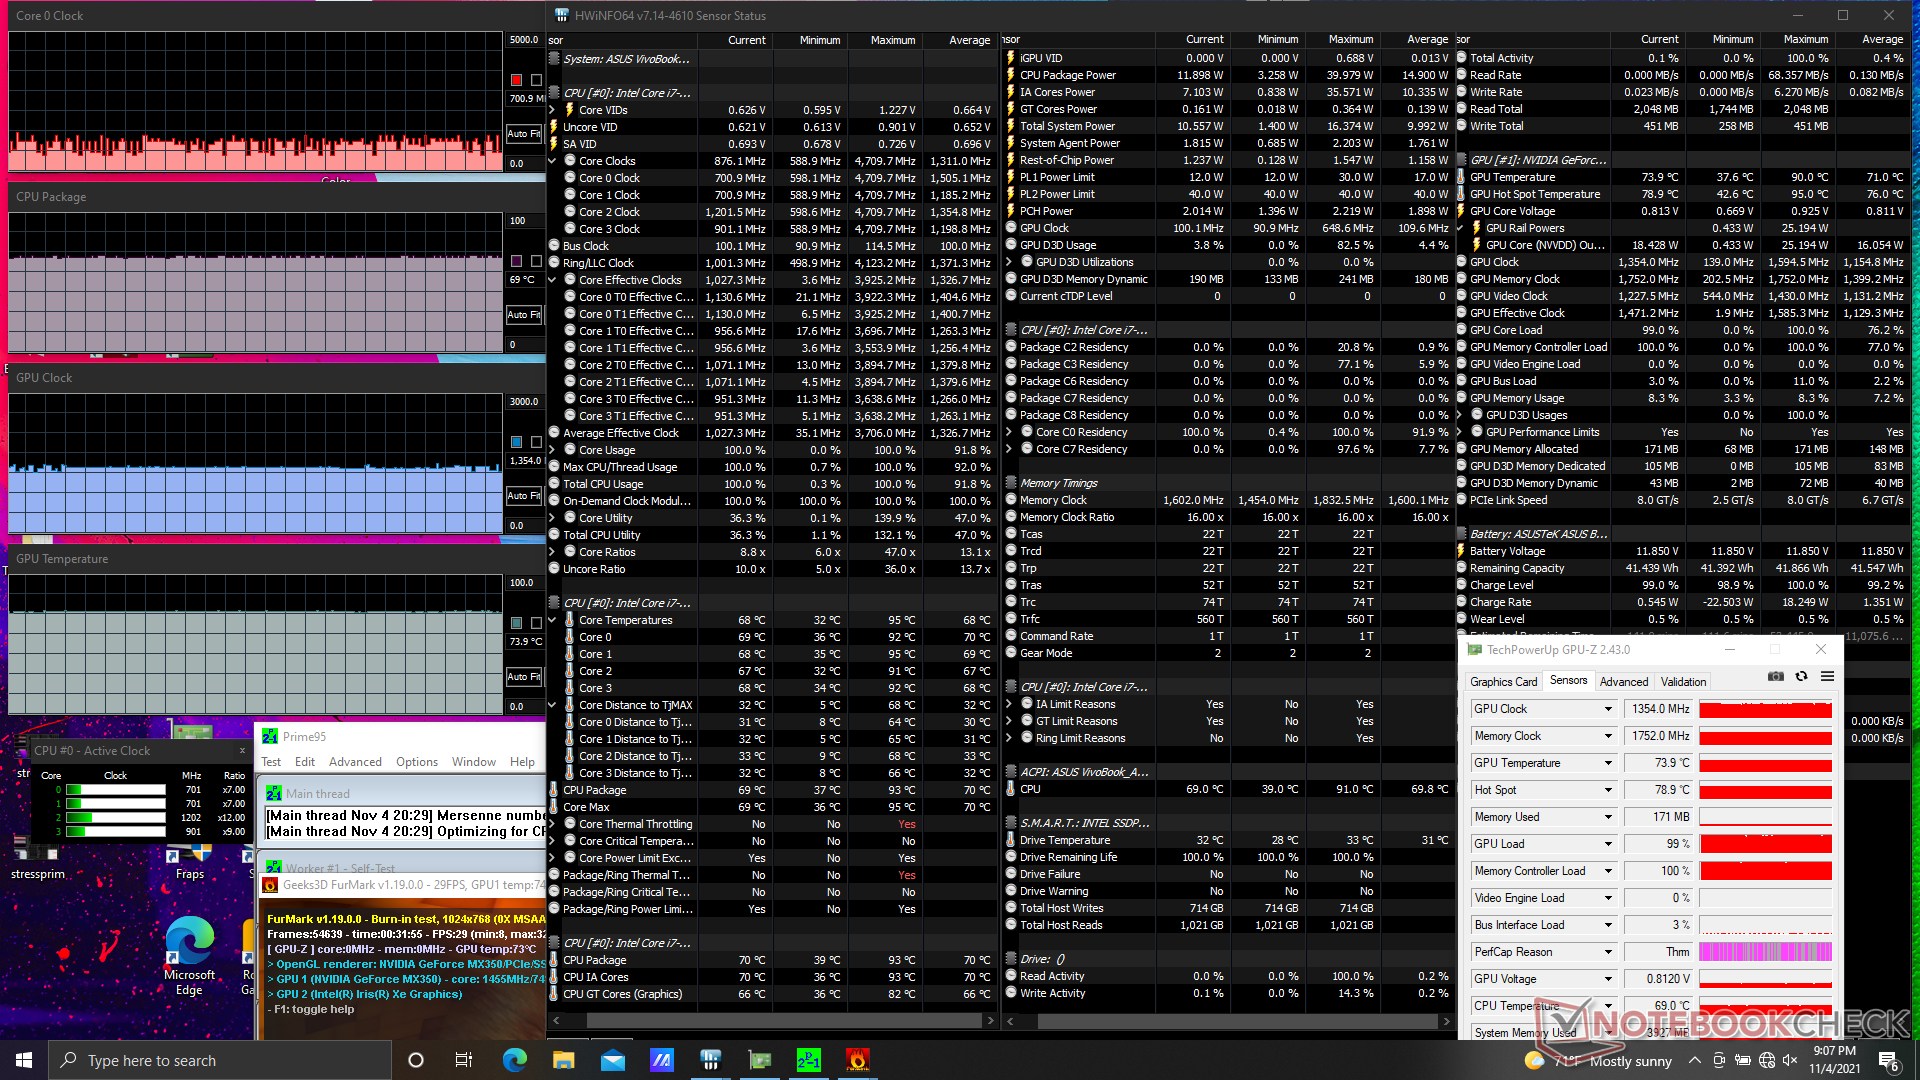
| Prime95 + FurMark Stress | 0.7 - 1.1 | 1354 | 69 | 74 |
| Witcher 3 Stress (Balanced mode) | 0.6 - 0.8 | 1100 - 1455 | 65 | 70 |
| Witcher 3 Stress (Performance mode) | 0.8 - 1.2 | 1595 | 71 | 73 |
Lautsprecher
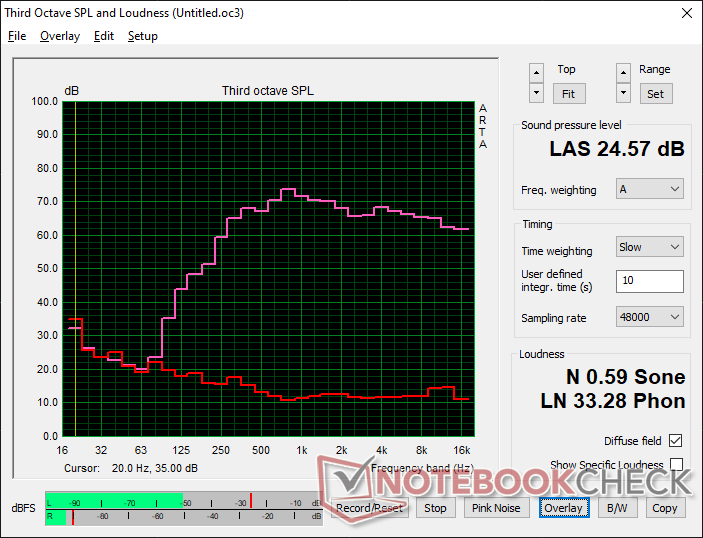
Asus Vivobook 15 K513EQ Audio Analyse
(±) | Mittelmäßig laut spielende Lautsprecher (80.8 dB)
Bass 100 - 315 Hz
(-) | kaum Bass - 15.3% niedriger als der Median
(±) | durchschnittlich lineare Bass-Wiedergabe (13% Delta zum Vorgänger)
Mitteltöne 400 - 2000 Hz
(+) | ausgeglichene Mitten, vom Median nur 4.2% abweichend
(+) | lineare Mitten (3.8% Delta zum Vorgänger)
Hochtöne 2 - 16 kHz
(+) | ausgeglichene Hochtöne, vom Median nur 0.8% abweichend
(+) | sehr lineare Hochtöne (2.3% Delta zum Vorgänger)
Gesamt im hörbaren Bereich 100 - 16.000 Hz
(+) | hörbarer Bereich ist sehr linear (12.5% Abstand zum Median
Im Vergleich zu allen Geräten derselben Klasse
» 24% aller getesteten Geräte dieser Klasse waren besser, 3% vergleichbar, 73% schlechter
» Das beste Gerät hat einen Delta-Wert von 5%, durchschnittlich ist 17%, das schlechteste Gerät hat 45%
Im Vergleich zu allen Geräten im Test
» 11% aller getesteten Geräte waren besser, 2% vergleichbar, 87% schlechter
» Das beste Gerät hat einen Delta-Wert von 4%, durchschnittlich ist 24%, das schlechteste Gerät hat 134%
Apple MacBook 12 (Early 2016) 1.1 GHz Audio Analyse
(+) | Die Lautsprecher können relativ laut spielen (83.6 dB)
Bass 100 - 315 Hz
(±) | abgesenkter Bass - 11.3% geringer als der Median
(±) | durchschnittlich lineare Bass-Wiedergabe (14.2% Delta zum Vorgänger)
Mitteltöne 400 - 2000 Hz
(+) | ausgeglichene Mitten, vom Median nur 2.4% abweichend
(+) | lineare Mitten (5.5% Delta zum Vorgänger)
Hochtöne 2 - 16 kHz
(+) | ausgeglichene Hochtöne, vom Median nur 2% abweichend
(+) | sehr lineare Hochtöne (4.5% Delta zum Vorgänger)
Gesamt im hörbaren Bereich 100 - 16.000 Hz
(+) | hörbarer Bereich ist sehr linear (10.2% Abstand zum Median
Im Vergleich zu allen Geräten derselben Klasse
» 7% aller getesteten Geräte dieser Klasse waren besser, 2% vergleichbar, 91% schlechter
» Das beste Gerät hat einen Delta-Wert von 5%, durchschnittlich ist 18%, das schlechteste Gerät hat 53%
Im Vergleich zu allen Geräten im Test
» 5% aller getesteten Geräte waren besser, 1% vergleichbar, 94% schlechter
» Das beste Gerät hat einen Delta-Wert von 4%, durchschnittlich ist 24%, das schlechteste Gerät hat 134%
Energiemanagement
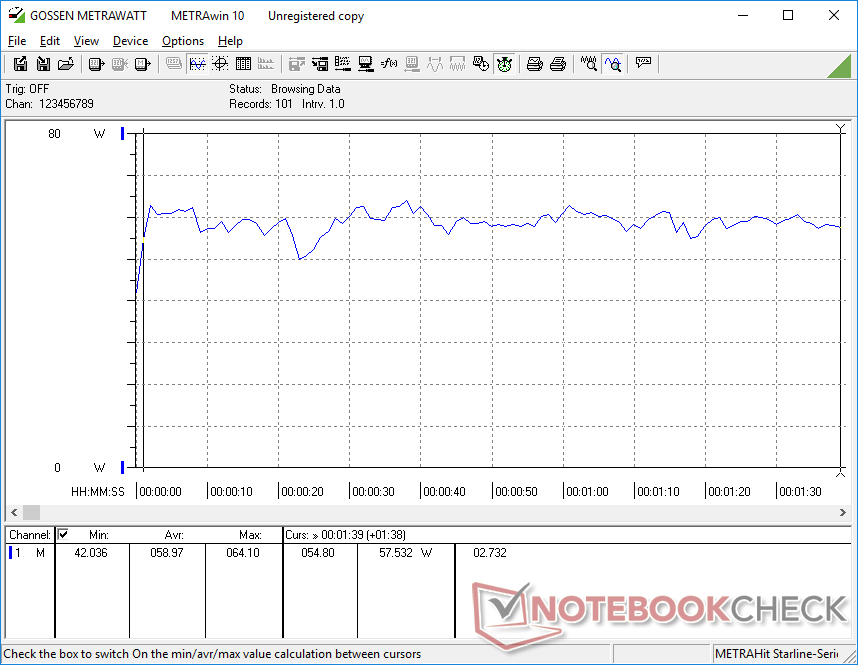
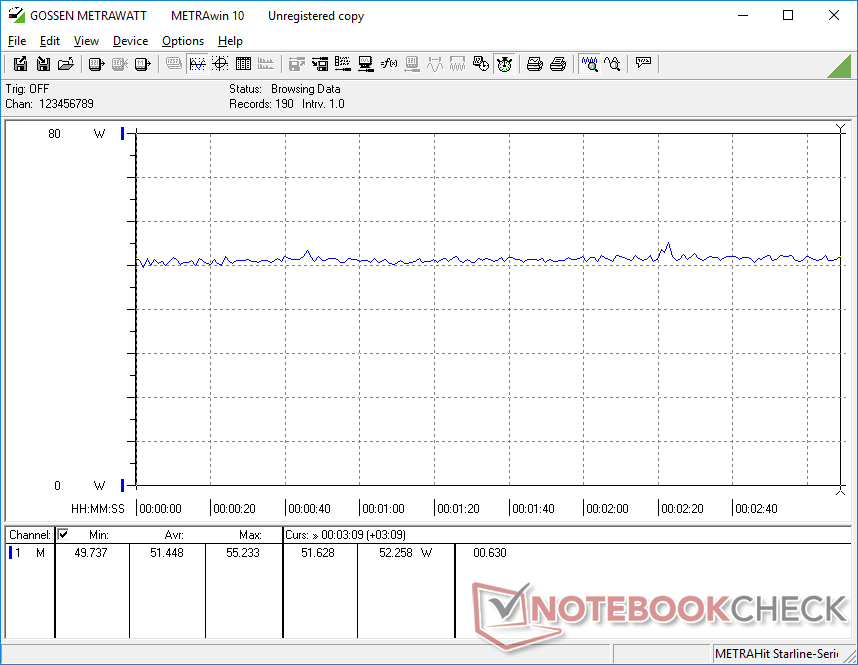
Energieverbrauch — Höherer Verbrauch durch die Nvidia-GPU
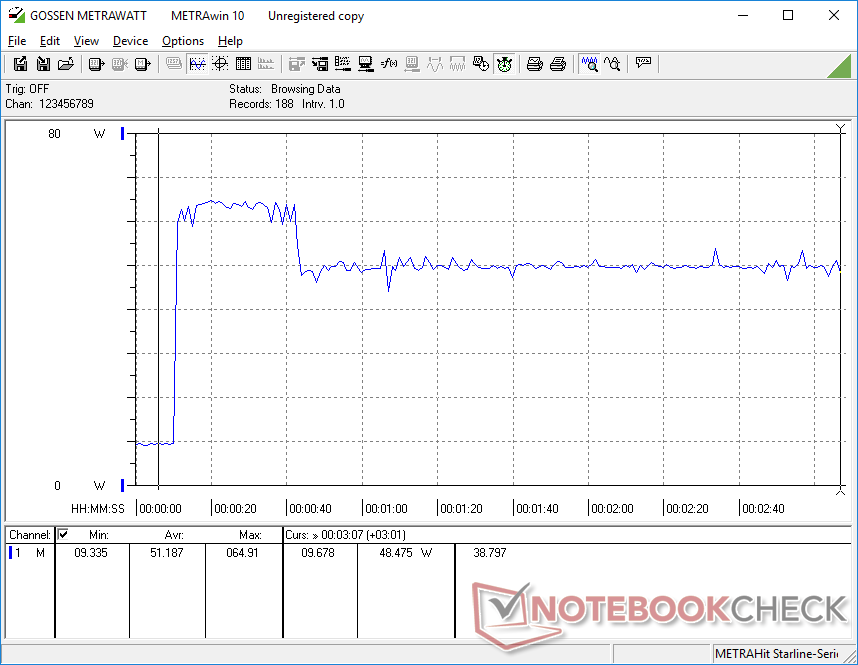
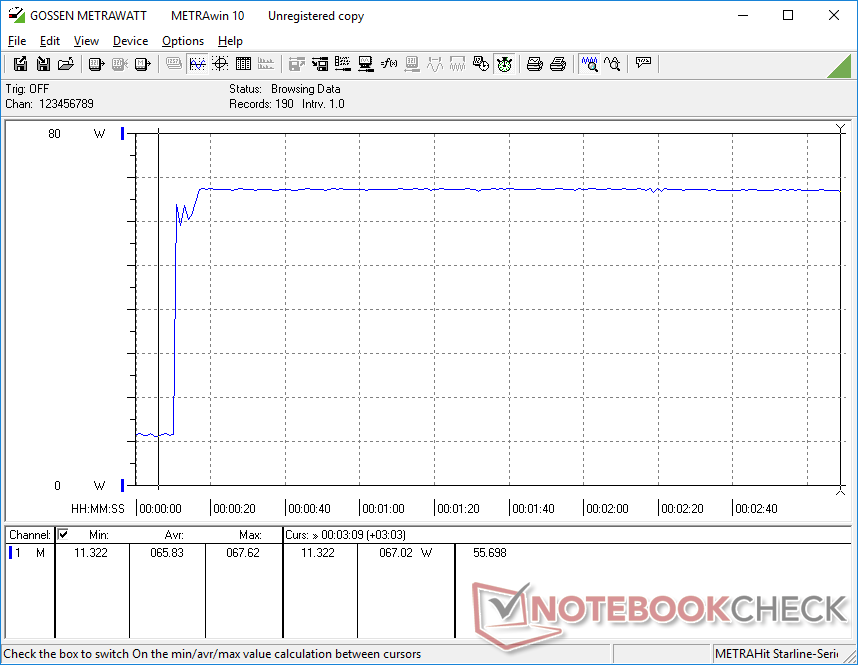
Im Leerlauf werden zwischen 3 und 9 W verbraucht, abhängig von der eingestellten Helligkeit und dem Leistungsprofil. Durch das OLED-Panel hängt der Verbrauch außerdem auch von den dargestellten Farben ab, wie wir in diesem Artikel "beleuchten".
Höhere Lasten wie Spiele verbrauchen zwischen 51 und 59 W, verglichen mit den nur 40 W des AMD-betriebenen Lenovo IdeaPad 5 15ALC05 oder Iris-Xe-betriebenen Dell Inspiron 15 3501. Die dedizierte Nvidia-GPU ist für den etwa 48 Prozent höheren Verbrauch gegenüber den meisten anderen Ultrabooks mit integrierter Grafik verantwortlich. Dafür profitieren Nutzer aber auch von der etwas stabileren und insgesamt leicht höheren Leistung der GeForce MX350.
Maximal werden 67,6 W aus dem kleinen 65-W-Netzteil (~6,4 x 6,4 x 3 cm) gezogen, was bedeutet, dass der Akku in solchen Lastszenarien bestenfalls nur sehr langsam aufgeladen wird. Ein etwas größerer Akku wäre dem System besser angemessen.
| Aus / Standby | |
| Idle | |
| Last |
|
Legende:
min: | |
| Asus Vivobook 15 K513EQ i7-1165G7, GeForce MX350, Intel SSD 660p SSDPEKNW512G8, OLED, 1920x1080, 15.6" | Asus VivoBook 15 Pro M3500QC-L1062 R5 5600H, GeForce RTX 3050 4GB Laptop GPU, SK Hynix HFM512GD3JX013N, AMOLED, 1920x1080, 15.6" | Asus VivoBook S15 S533EQ-BQ002T i7-1165G7, GeForce MX350, Intel SSD 660p 1TB SSDPEKNW010T8, IPS, 1920x1080, 15.6" | Lenovo IdeaPad 5 15ALC05 R5 5500U, Vega 7, , IPS, 1920x1080, 15.6" | Dell Inspiron 15 3501 i7-1165G7, Iris Xe G7 96EUs, Samsung PM991a MZ9LQ512HBLU-00BD1, IPS, 1920x1080, 15.6" | HP Pavilion 15-eg i7-1165G7, GeForce MX450, Samsung PM991 MZVLQ1T0HALB, IPS, 1920x1080, 15.6" | |
|---|---|---|---|---|---|---|
| Stromverbrauch | -33% | 7% | 9% | 20% | -20% | |
| Idle min * (Watt) | 3.7 | 4.7 -27% | 3 19% | 3.7 -0% | 3.6 3% | 4.9 -32% |
| Idle avg * (Watt) | 6.3 | 9.4 -49% | 6.4 -2% | 7.9 -25% | 6.4 -2% | 7.9 -25% |
| Idle max * (Watt) | 9.7 | 10 -3% | 7.9 19% | 9.3 4% | 7.9 19% | 14.2 -46% |
| Last avg * (Watt) | 59 | 74.3 -26% | 59 -0% | 41 31% | 39 34% | 64.3 -9% |
| Witcher 3 ultra * (Watt) | 51.4 | 67.7 -32% | 48 7% | 41 20% | 37.6 27% | 55.6 -8% |
| Last max * (Watt) | 67.7 | 106.9 -58% | 68 -0% | 52.2 23% | 41.8 38% | 65.4 3% |
* ... kleinere Werte sind besser
Power Consumption Witcher 3 / Stresstest
Akkulaufzeit — Kleinere Kapazität bedeutet kürzere Laufzeit
Die Akkukapazität beträgt nur 41 Wh, verglichen mit den 71 Wh des teureren ZenBook 15. Daher sind die Laufzeiten auch nur durchschnittlich. Im praxisnahen WLAN-Test hält der Laptop etwa 6 Stunden durch, das ZenBook schafft hier über 12 Stunden! Als Budget-System sind die 6 Stunden aber durchaus mit Modellen wie dem HP Pavilion 15 oder dem Dell Inspiron 15 vergleichbar.
Ein komplettes Wiederaufladen nimmt knapp unter 90 Minuten in Anspruch.
| Asus Vivobook 15 K513EQ i7-1165G7, GeForce MX350, 42 Wh | Asus VivoBook 15 Pro M3500QC-L1062 R5 5600H, GeForce RTX 3050 4GB Laptop GPU, 63 Wh | Asus VivoBook S15 S533EQ-BQ002T i7-1165G7, GeForce MX350, 50 Wh | Lenovo IdeaPad 5 15ALC05 R5 5500U, Vega 7, 70 Wh | Dell Inspiron 15 3501 i7-1165G7, Iris Xe G7 96EUs, 42 Wh | HP Pavilion 15-eg i7-1165G7, GeForce MX450, 41 Wh | |
|---|---|---|---|---|---|---|
| Akkulaufzeit | 19% | 40% | 101% | 13% | 5% | |
| Idle (h) | 13.3 | 15 13% | ||||
| WLAN (h) | 6 | 8.3 38% | 8.4 40% | 14 133% | 6.8 13% | 6.6 10% |
| Last (h) | 1.3 | 1.3 0% | 2.2 69% | 1.2 -8% | ||
| H.264 (h) | 12.1 | 15.4 | ||||
| Witcher 3 ultra (h) | 1.2 | 1.8 |
Pro
Contra
Fazit — Erschwingliches OLED
Der Begriff "OLED" impliziert zumeist eine Form von Luxus und dementsprechend hohe Preise. Asus ändert dies, indem sie ein neues 1080p-OLED-Panel für seine Budget-freundlichere VivoBook-Serie einführen und dafür auf die kostspieligeren 4K-OLED-Panels verzichten, welche sich typischerweise bei Higher-End Laptops wiederfinden. Nutzer können jetzt ein System ihr Eigen nennen, welches mit aktuellen CPUs der Core-U-Serie, einer dedizierten GeForce-MX-Grafik und einem hellen OLED-Display mit vollem DCI-P3-Farbraum ausgestattet ist und das für nur knapp über $900 USD (~786 Euro). Wer bislang mit der "nur" 95-Prozent-sRGB-Abdeckung bei den meisten Mittelklasse-Ultrabooks wie dem Lenovo IdeaPad, dem MSI Modern oder dem Dell Inspiron unzufrieden waren, könnte das neue VivoBook mit seinem OLED-Screen durchaus sehr attraktiv finden.
Das VivoBook 15 OLED setzt bei Budget- bis Mittelklasse-Ultrabooks einen neuen Maßstab in Sachen Bildqualität und Farbraumabdeckung. Die Leistung stimmt ebenfalls, während das größtenteils von Plastik geprägte Gehäuse ein paar Upgrades vertragen könnte.
Alles andere am Laptop ist eher Standardware. Es ist jedenfalls schon überraschen ein so scharfes und farbenfrohes OLED-Panel in einem ansonsten billigen Laptop mit Plastik-Gehäuse, schwammigem Touchpad und einem so kleinen Akku anzutreffen. Andererseits muss man ein paar Hunderter mehr auf den Tisch legen, um sich die volle Flaggschiff-Erfahrung mit dem schlankeren ZenBook zu gönnen. Was hingegen Mittelklasselaptops betrifft, so hat das VivoBook 15 K513 eines der besten Displays in seiner Preisklasse.
Preis und Verfügbarkeit
Absurd: Die Asus-Webseite listet das VivoBook 15 OLED in den Spezifikationen mit einem "15,6 Zoll, HD (1366 x 768)"-Display für 599 Euro auf, offensichtlich ein Fehler der deutschen Übersetzung. Händler werden indes noch nicht gelistet, der Laptop dürfte in Zukunft aber besser erhältlich sein.
Asus Vivobook 15 K513EQ
- 30.08.2022 v7 (old)
Allen Ngo
Preisvergleich

