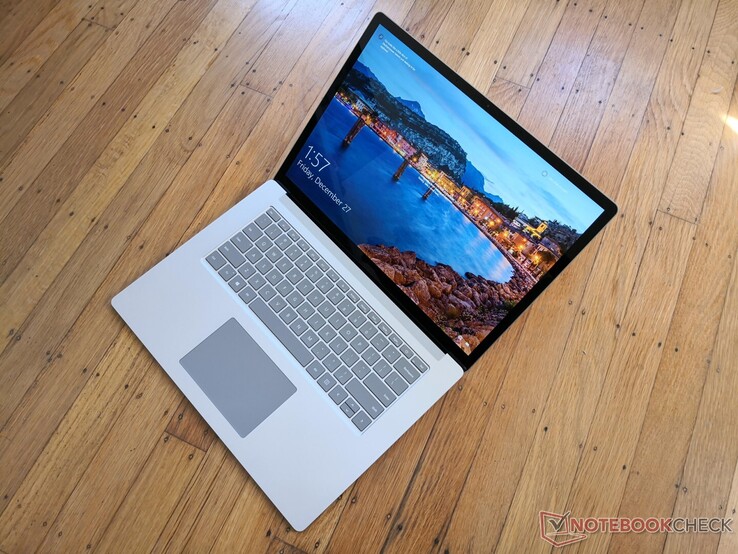
Test Microsoft Surface Laptop 3 15-Zoll Core i7: Besser mit Ice Lake
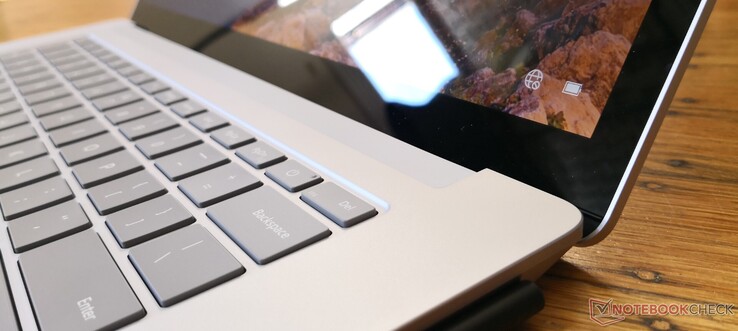
Es gibt vier grundlegend verschiedene Modelle des 15 Zoll großen Microsoft Surface Laptop 3, die im Folgenden vom günstigsten zum teuersten aufgelistet sind: Mit Ryzen 5 3580U, Core i5-1035G7, Ryzen 7 3780U oder Core i7-1065G7. Wir haben uns kürzlich eine Konfiguration mit dem AMD Ryzen 5 angesehen um uns ein Bild vom Leistungsniveau der Basiskonfiguration zu machen. Heute testen wir das Intel-Core-i7-Modell und sehen uns an, was die Topkonfiguration des Surface-Laptops kann.
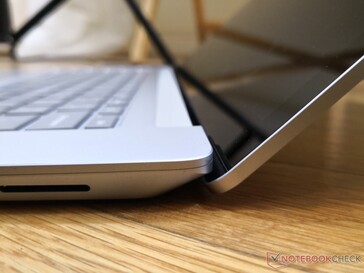
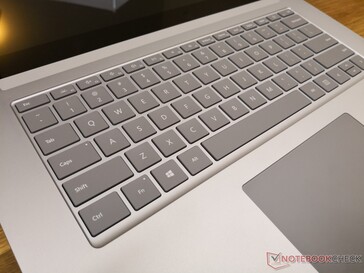
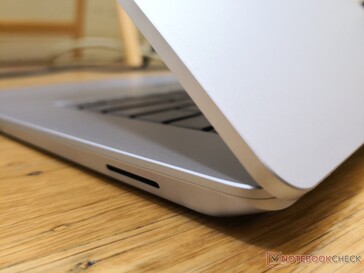
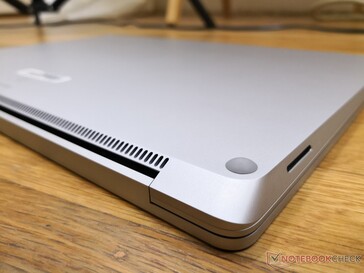
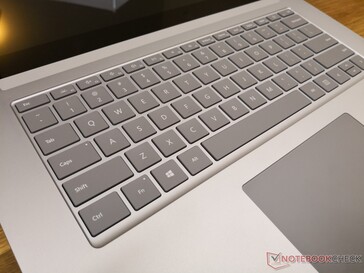
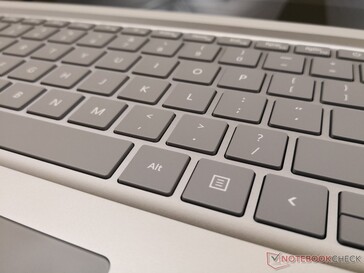
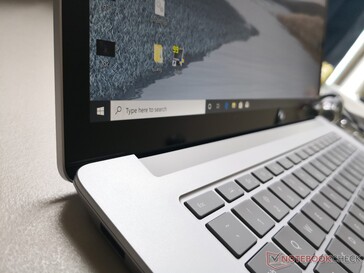
Für mehr Informationen zum Chassis, der Tastatur, dem Display und anderen physikalischen Merkmalen empfehlen wir einen Blick auf unseren bestehenden Test zum Surface Laptop 3 Ryzen 5, da es in Bezug auf diese Charakteristika bei den Intel- und AMD-Modellen keine Unterschiede gibt. In diesem Test werden wir näher auf die internen Unterschiede wie die Temperaturen, die Energieaufnahme, die Akkulaufzeit und natürlich die Leistungsdiskrepanz zwischen dem Intel-Core-i7- und dem AMD-Ryzen-5-Modell eingehen. Vielleicht noch interessanter wäre der Vergleich des Core-i7-Modells mit der Ryzen-7-Konfiguration, dieser muss jedoch noch so lange warten bis uns ein Ryzen-7-Gerät zu Verfügung steht.
Weitere Microsoft-Tests:
Bew. | Datum | Modell | Gewicht | Dicke | Größe | Auflösung | Preis ab |
|---|---|---|---|---|---|---|---|
| 83.9 % v7 (old) | 12 / 2019 | Microsoft Surface Laptop 3 15 i7-1065G7 i7-1065G7, Iris Plus Graphics G7 (Ice Lake 64 EU) | 1.5 kg | 14.7 mm | 15.00" | 2496x1664 | |
| 86.3 % v7 (old) | 09 / 2019 | Dell XPS 15 7590 i5 iGPU FHD i5-9300H, UHD Graphics 630 | 1.9 kg | 17 mm | 15.60" | 1920x1080 | |
| 86 % v7 (old) | 12 / 2019 | Lenovo Yoga C940-15IRH i7-9750H, GeForce GTX 1650 Max-Q | 2 kg | 19.7 mm | 15.60" | 1920x1080 | |
| 83.9 % v7 (old) | 03 / 2019 | HP Spectre x360 15-df0126ng i7-8750H, GeForce GTX 1050 Ti Max-Q | 2.2 kg | 19.3 mm | 15.60" | 3840x2160 | |
| 89.7 % v7 (old) | 12 / 2019 | Apple MacBook Pro 16 2019 i9 5500M i9-9880H, Radeon Pro 5500M | 2 kg | 16.2 mm | 16.00" | 3072x1920 |
Gehäuse
Ausstattung
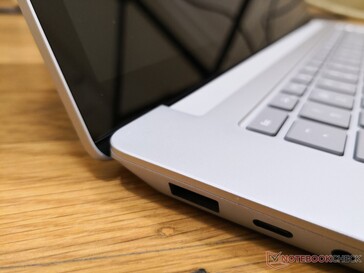
Für einen 15-Zoll-Laptop ist die Anschlussausstattung begrenzt. Das kleinere Huawei MateBook X Pro verfügt beispielsweise über zwei USB-C-Anschlüsse, Thunderbolt 3 und einen USB-A-Anschluss, beim Microsoft-Laptop bekommt man hingegen kein Thunderbolt und nur einen USB-C-Anschluss. Vor allem für Ersteller digitaler Inhalte und Nutzer, die oft unterwegs sind, wäre auch ein SD-Kartenleser nützlich gewesen. Um die Dockingfähigkeiten des Surface Laptop 3 vollständig nutzen zu können, muss man außerdem das teure Surface-Dock kaufen.
Kommunikation
Während bei den Intel-Modellen standardmäßig das Intel AX201 mit WLAN-6-Unterstützung (802.11ax) verbaut ist, kommt bei den AMD-Modellen das langsamere WLAN-5-Modul Atheros/Qualcomm QCA6174 zum Einsatz. Mit ersterem können bis zu doppelt so hohe Übertragungsraten erreicht werden, sofern man einer der wenigen Nutzer ist, der im Besitz eines brandneuen WLAN-6-Router ist. Im Alltag unterscheidet sich die WLAN-Leistung nicht merklich, mit einem WLAN-6-Laptop ist man im Moment hauptsächlich zukunftssicher. Bis auf einige kleinere Hardwareveränderungen im Inneren ist das AX201 mit dem AX200 identisch.
Eingabegeräte
Display
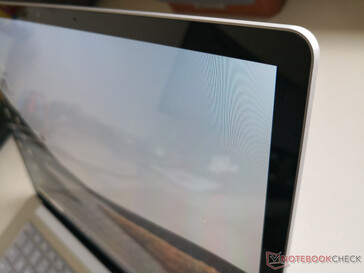
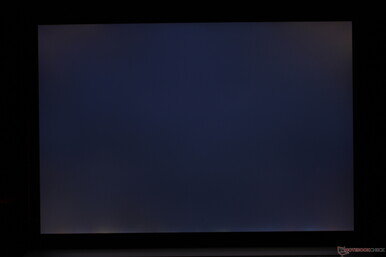
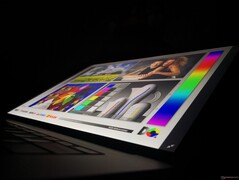
Microsoft setzt bei allen Surface-Laptop-3-Modellen auf das gleiche Sharp-IPS-Panel LQ150P1JX51. Wie unsere unabhängigen Messungen zeigen, sind Eckdaten wie die Helligkeit, der Kontrast, die Farben, die Reaktionszeiten und sogar die Frequenz der Pulsweitenmodulation bei den Displays der Intel- und der AMD-Version identisch. Die konkurrierenden Modelle Apple MacBook Pro 16 und Dell XPS 15 besitzen hellere Displays, die im Freien besser lesbar sind.
| |||||||||||||||||||||||||
Ausleuchtung: 78 %
Helligkeit Akku: 412.4 cd/m²
Kontrast: 1178:1 (Schwarzwert: 0.35 cd/m²)
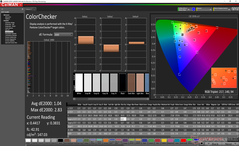
ΔE ColorChecker Calman: 1.04 | ∀{0.5-29.43 Ø4.76}
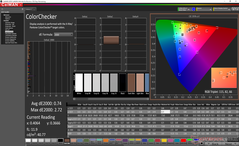
calibrated: 0.74
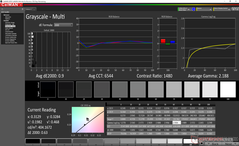
ΔE Greyscale Calman: 1.3 | ∀{0.09-98 Ø5}
98.4% sRGB (Argyll 1.6.3 3D)
62.4% AdobeRGB 1998 (Argyll 1.6.3 3D)
67.8% AdobeRGB 1998 (Argyll 3D)
98.4% sRGB (Argyll 3D)
65.6% Display P3 (Argyll 3D)
Gamma: 2.07
CCT: 6634 K
| Microsoft Surface Laptop 3 15 i7-1065G7 Sharp LQ150P1JX51, IPS, 15", 2496x1664 | Apple MacBook Pro 16 2019 i9 5500M APPA044, IPS, 16", 3072x1920 | Dell XPS 15 7590 i5 iGPU FHD LQ156M1, IPS, 15.6", 1920x1080 | Asus ZenBook 15 UX534FT-DB77 BOE NV156FHM-N63, IPS, 15.6", 1920x1080 | MSI Prestige 15 A10SC Sharp LQ156D1JW42, IPS, 15.6", 3840x2160 | Microsoft Surface Laptop 3 15 Ryzen 5 3580U Sharp LQ150P1JX51, IPS, 15", 2496x1664 | |
|---|---|---|---|---|---|---|
| Display | 1% | -5% | 22% | -1% | ||
| Display P3 Coverage (%) | 65.6 | 66.5 1% | 66.6 2% | 82 25% | 66.9 2% | |
| sRGB Coverage (%) | 98.4 | 98 0% | 87.7 -11% | 98.3 0% | 99.3 1% | |
| AdobeRGB 1998 Coverage (%) | 67.8 | 68.4 1% | 64.1 -5% | 96.2 42% | 63.7 -6% | |
| Response Times | 7% | 11% | 20% | -8% | 10% | |
| Response Time Grey 50% / Grey 80% * (ms) | 56 ? | 52.4 ? 6% | 52.8 ? 6% | 41.2 ? 26% | 60 ? -7% | 47.2 ? 16% |
| Response Time Black / White * (ms) | 38 ? | 34.9 ? 8% | 32 ? 16% | 33.2 ? 13% | 41.2 ? -8% | 36.8 ? 3% |
| PWM Frequency (Hz) | 21370 ? | 131700 | 1020 ? | 26040 ? | 21370 ? | |
| Bildschirm | -14% | -34% | -132% | -65% | -31% | |
| Helligkeit Bildmitte (cd/m²) | 412.4 | 519 26% | 588 43% | 312.6 -24% | 464.5 13% | 416.9 1% |
| Brightness (cd/m²) | 374 | 477 28% | 555 48% | 290 -22% | 451 21% | 389 4% |
| Brightness Distribution (%) | 78 | 86 10% | 89 14% | 85 9% | 92 18% | 86 10% |
| Schwarzwert * (cd/m²) | 0.35 | 0.39 -11% | 0.4 -14% | 0.31 11% | 0.5 -43% | 0.4 -14% |
| Kontrast (:1) | 1178 | 1331 13% | 1470 25% | 1008 -14% | 929 -21% | 1042 -12% |
| Delta E Colorchecker * | 1.04 | 2.28 -119% | 2.5 -140% | 5.78 -456% | 3.36 -223% | 2.75 -164% |
| Colorchecker dE 2000 max. * | 2.83 | 6.54 -131% | 6.3 -123% | 8.86 -213% | 7.06 -149% | 6.64 -135% |
| Colorchecker dE 2000 calibrated * | 0.74 | 0.86 -16% | 0.6 19% | 3.78 -411% | 3.42 -362% | 0.71 4% |
| Delta E Graustufen * | 1.3 | 0.9 31% | 4.5 -246% | 5.4 -315% | 1.3 -0% | 1.8 -38% |
| Gamma | 2.07 106% | 2145 0% | 2.2 100% | 2.21 100% | 2.14 103% | 2.09 105% |
| CCT | 6634 98% | 6572 99% | 6836 95% | 7864 83% | 6596 99% | 6646 98% |
| Farbraum (Prozent von AdobeRGB 1998) (%) | 62.4 | 78 25% | 63.2 1% | 57.1 -8% | 84.8 36% | 63.4 2% |
| Color Space (Percent of sRGB) (%) | 98.4 | 98 0% | 87.4 -11% | 98.3 0% | 99.4 1% | |
| Durchschnitt gesamt (Programm / Settings) | -4% /
-11% | -7% /
-22% | -39% /
-89% | -17% /
-41% | -7% /
-20% |
* ... kleinere Werte sind besser
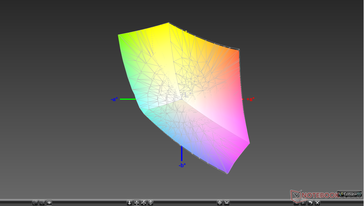
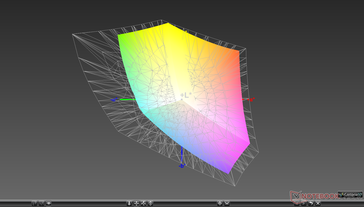
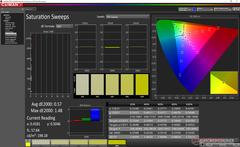
Der sRGB-Farbraum wird vollständig und der AdobeRGB-Farbraum zu ca. 62 Prozent abgedeckt. Im Gegensatz zum XPS 15, Asus ZenBook Pro 15 und dem MSI Prestige 15 findet sucht man hier vergeblich nach einer Variante mit vollständiger AdobeRGB-Abdeckung.
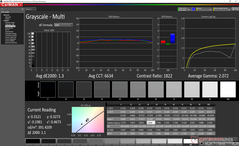
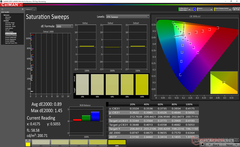
Im Vergleich zu unserem Ryzen-Testgerät ist unser Intel-Gerät ab Werk besser kalibriert. Laut Intel wurde es jedoch nicht nachträglich kalibriert, was darauf hinweist, dass nicht alle Surface-Laptop-3-Modelle gleich gut kalibriert beim Käufer ankommen werden. Hier sind die durchschnittlichen Graustufen- und Farb-DeltaE-Werte mit 1,3 bzw. 0,89 ab Werk jedenfalls niedrig. Durch eine Kalibrierung konnten wir diese Werte nur unwesentlich verbessern.
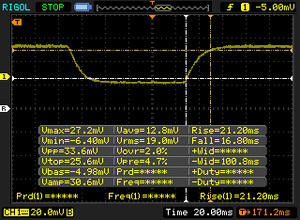
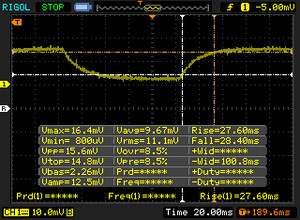
Reaktionszeiten (Response Times) des Displays
| ↔ Reaktionszeiten Schwarz zu Weiß | ||
|---|---|---|
| 38 ms ... steigend ↗ und fallend ↘ kombiniert | ↗ 21.2 ms steigend | |
| ↘ 16.8 ms fallend | ||
| Die gemessenen Reaktionszeiten sind langsam und dadurch für viele Spieler wahrscheinlich zu langsam. Im Vergleich rangierten die bei uns getesteten Geräte von 0.1 (Minimum) zu 240 (Maximum) ms. » 96 % aller Screens waren schneller als der getestete. Daher sind die gemessenen Reaktionszeiten schlechter als der Durchschnitt aller vermessenen Geräte (20.1 ms). | ||
| ↔ Reaktionszeiten 50% Grau zu 80% Grau | ||
| 56 ms ... steigend ↗ und fallend ↘ kombiniert | ↗ 27.6 ms steigend | |
| ↘ 28.4 ms fallend | ||
| Die gemessenen Reaktionszeiten sind langsam und dadurch für viele Spieler wahrscheinlich zu langsam. Im Vergleich rangierten die bei uns getesteten Geräte von 0.165 (Minimum) zu 636 (Maximum) ms. » 92 % aller Screens waren schneller als der getestete. Daher sind die gemessenen Reaktionszeiten schlechter als der Durchschnitt aller vermessenen Geräte (31.5 ms). | ||
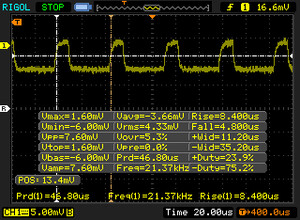
Bildschirm-Flackern / PWM (Pulse-Width Modulation)
| Flackern / PWM festgestellt | 21370 Hz | ≤ 51 % Helligkeit | |
Das Display flackert mit 21370 Hz (im schlimmsten Fall, eventuell durch Pulsweitenmodulation PWM) bei einer eingestellten Helligkeit von 51 % und darunter. Darüber sollte es zu keinem Flackern kommen. Die Frequenz von 21370 Hz ist sehr hoch und sollte daher auch bei empfindlichen Personen zu keinen Problemen führen. Im Vergleich: 53 % aller getesteten Geräte nutzten kein PWM um die Helligkeit zu reduzieren. Wenn PWM eingesetzt wurde, dann bei einer Frequenz von durchschnittlich 8039 (Minimum 5, Maximum 343500) Hz. | |||
Leistung
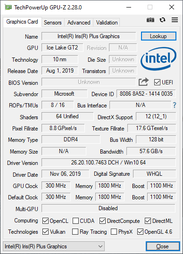
Das Core-i7-1065G7-Modell wird als Microsofts schnellste Surface-Laptop-3-Konfiguration beworben. Es konkurriert im selben Maße mit dem AMD Ryzen 7 3780U wie das Core-i5-1035G7-Modell mit dem Ryzen 5 3580U. Die gleiche Intel-Ice-Lake-CPU findet man übrigens auch im neuesten Surface Pro 7. Auch wenn man keine Spiele spielt kommt einem die zusätzliche Grafikleistung der integrierten Iris Plus G7 bei der Bildbearbeitung, der Videokodierung und -dekodierung und der Verwendung externer Bildschirme mit höheren Auflösungen zugute.
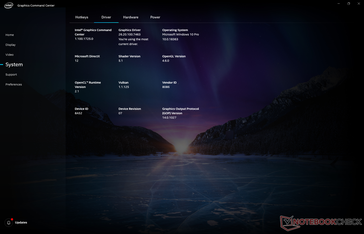
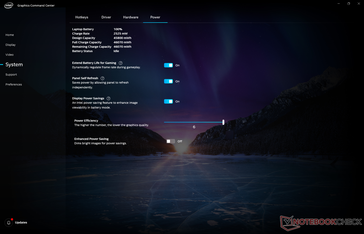
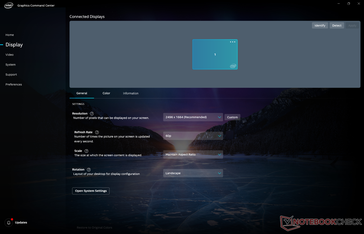
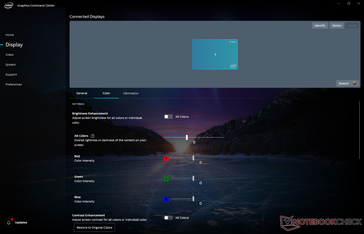
Auf unserem Testgerät ist ab Werk die Software "Intel Command Center", welche das ältere "Intel Graphics Control Center" ablöst, vorinstalliert. Die neue Anwendung verfügt über aussagekräftigere Einstellungen und eine überarbeitete Benutzeroberfläche. Auf zukünftigen Laptops mit Intel-Grafik wird Command Center voraussichtlich ebenfalls vorinstalliert sein.
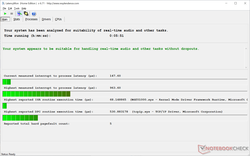
Im Gegensatz zu unserem Ryzen-Gerät zeigt LatencyMon hier unabhängig vom WLAN-Status keine wiederkehrenden, problematischen DPC-Latenzen.
Prozessor
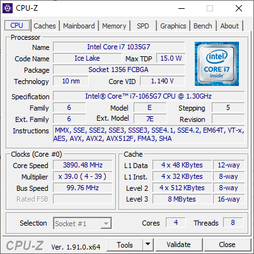
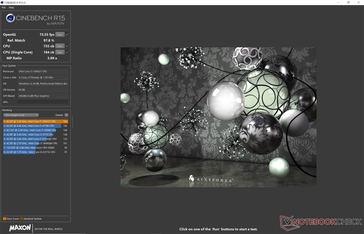
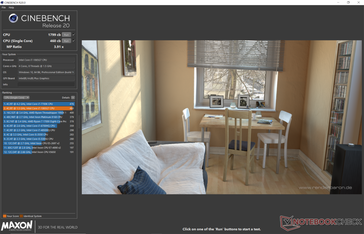
Da dies nun unser 9. Core i7-1065G7 in unserer Datenbank ist, haben wir mittlerweile ein gutes Bild vom Potenzial des Prozessors. Microsofts Implementierung der 25-W-CPU scheint besser zu sein als die der meisten Konkurrenten, da die Cinebench-Multi-Thread-Punktzahl um 11 Prozent höher ist als bei einem durchschnittlichen i7-1065G7. Damit ist die rohe Leistung um 16 Prozent höher als die des Ryzen 5 3580U und innerhalb von wenigen Prozenten des Core i5-9300H.
Die Leistung wird überraschend gut aufrechterhalten, was die überdurchschnittlichen CPU-Benchmarkergebnisse erklärt. Lässt man Cinebench R15 Multi-Thread in einer Schleife laufen, fällt die Leistung im Laufe der Zeit um nur 6 bis 7 Prozent ab, während das ähnlich ausgestattete Lenovo Yoga C940 einen Leistungsabfall von 17 Prozent verzeichnet. Wie das Diagramm unten zeigt ist das Leistungsniveau in dieser Hochlastsituation auch konstanter.
Die hardwarebasierte KI-Beschleunigung ist ein weiterer Vorteil gegenüber der AMD-Alternative. Allerdings können die meisten Anwendungen und auch Windows selbst noch nicht von der neuen Technologie profitieren, wodurch sie sich wenig bis gar nicht auf alltägliche Aufgaben auswirkt.
Weitere technische Informationen und Benchmarkvergleiche finden Sie auf unserer Seite zum Core i7-1065G7.
System Performance
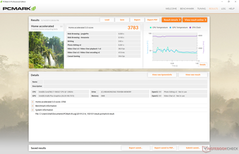
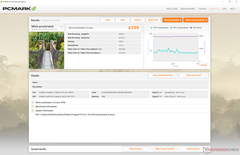
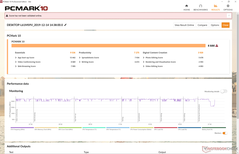
Die PCMark-Punktzahlen liegen je nach Benchmark zwischen 4 und 21 Prozent über denen des Ryzen-5-Modells. Im Digital-Creation-Test ist die Punktzahl beispielsweise um nur 4 Prozent höher als beim AMD, was darauf hindeutet, dass die Leistungsdiskrepanz zwischen Iris Plus und der Vega-8/9/10/11-Reihe in der Praxis nicht so hoch ist, wie Intel einem Glauben machen möchte. Im PCMark-Essentials-Benchmark, das testen soll, wie schnell und flüssig das System zwischen Surfen und dem Starten von Programmen wechseln kann, hat Intel den größten Vorsprung. Der Intel-Chipsatz ist für alltägliche Anwendungsfälle wie diesen vermutlich am besten optimiert.
Während des Testzeitraums sind wir weder auf Software- noch auf Hardwareprobleme gestoßen.
| PCMark 8 Home Score Accelerated v2 | 3783 Punkte | |
| PCMark 8 Work Score Accelerated v2 | 4799 Punkte | |
| PCMark 10 Score | 4644 Punkte | |
Hilfe | ||
Massenspeicher
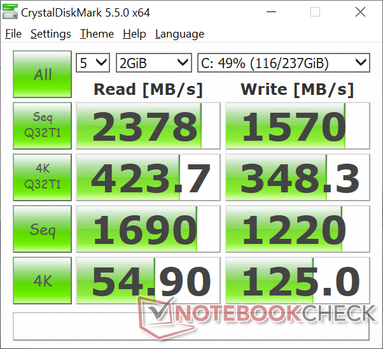
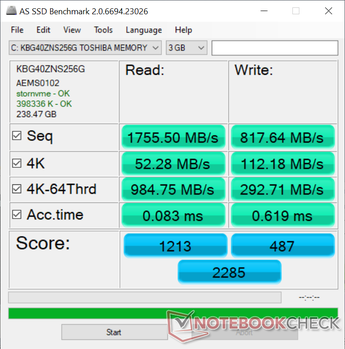
Interessanterweise ist unser Intel-Modell mit der 256 GB großen NVMe-SSD Toshiba KBG40ZNS256G ausgestattet, während in unserem Ryzen-5-Modell eine SK Hynix BC501 mit der gleichen Kapazität steckt; Intel scheint die Speicherlösungen für die Surface-Laptop-3-Reihe also von mehreren Zulieferern zu beziehen. Dadurch ist es Glückssache, welche SSD man schlussendlich bekommt.
Das Toshiba-Laufwerk ist schneller als das SK-Hynix-Laufwerk. Laut AS SSD betragen die sequenziellen Lese- und Schreibraten 1.755 MB/s bzw. 818 MB/s, während das Ryzen-5-Modell 1.122 MB/s bzw. 514 MB/s erreicht. Obwohl sich die Übertragungsraten verbessert haben, sind sie im Vergleich zur Apple- und der Lite-On-SSD im Apple MacBook Pro 16 bzw. Razer Blade Stealth immer noch nur durchschnittlich. Schade, dass Microsoft bei der im hohen Preissegment angesiedelten Laptop-Reihe an dieser Stelle spart.
Weitere Benchmarkvergleiche finden Sie in unserer Festplatten und SSD-Tabelle.
| Microsoft Surface Laptop 3 15 i7-1065G7 Toshiba KBG40ZNS256G NVMe | Apple MacBook Pro 16 2019 i9 5500M Apple SSD AP1024 7171 | Asus ZenBook 15 UX534FT-DB77 Samsung SSD PM981 MZVLB1T0HALR | MSI Prestige 15 A10SC Samsung SSD PM981 MZVLB1T0HALR | Microsoft Surface Laptop 3 15 Ryzen 5 3580U SK hynix BC501 HFM256GDGTNG | Razer Blade Stealth 13, Core i7-1065G7 Lite-On CA3-8D512 | |
|---|---|---|---|---|---|---|
| AS SSD | 82% | 66% | 85% | -21% | 13% | |
| Seq Read (MB/s) | 1756 | 2531 44% | 1887 7% | 1274 -27% | 1122 -36% | 2666 52% |
| Seq Write (MB/s) | 818 | 2289 180% | 1432 75% | 1395 71% | 514 -37% | 1497 83% |
| 4K Read (MB/s) | 52.3 | 15.85 -70% | 52.3 0% | 50.3 -4% | 34.98 -33% | 53.7 3% |
| 4K Write (MB/s) | 112.2 | 39.88 -64% | 146 30% | 119.8 7% | 96.8 -14% | 133.7 19% |
| 4K-64 Read (MB/s) | 985 | 1267 29% | 969 -2% | 1599 62% | 492 -50% | 652 -34% |
| 4K-64 Write (MB/s) | 292.7 | 1749 498% | 1375 370% | 1455 397% | 339.9 16% | 272 -7% |
| Access Time Read * (ms) | 0.083 | 0.122 -47% | 0.034 59% | 0.044 47% | 0.056 33% | 0.075 10% |
| Access Time Write * (ms) | 0.619 | 0.095 85% | 0.075 88% | 0.092 85% | 0.11 82% | 0.032 95% |
| Score Read (Points) | 1213 | 1536 27% | 1210 0% | 1777 46% | 639 -47% | 972 -20% |
| Score Write (Points) | 487 | 2018 314% | 1664 242% | 1714 252% | 488 0% | 555 14% |
| Score Total (Points) | 2285 | 4317 89% | 3483 52% | 4411 93% | 1434 -37% | 1982 -13% |
| Copy ISO MB/s (MB/s) | 1192 | 1995 67% | 1375 15% | 2830 137% | 828 -31% | 1495 25% |
| Copy Program MB/s (MB/s) | 604 | 584 -3% | 468 -23% | 609 1% | 200.5 -67% | 458.4 -24% |
| Copy Game MB/s (MB/s) | 1136 | 1135 0% | 1287 13% | 1424 25% | 387.4 -66% | 964 -15% |
* ... kleinere Werte sind besser
Grafikkarte
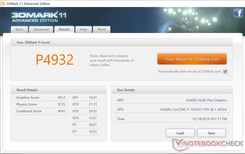
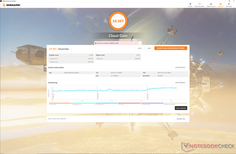
In den 3DMark-Ergebnissen liegt die integrierte Iris-Plus-GPU mit der RX Vega 9 im Ryzen 5 3580U schlimmstenfalls gleichauf und ist bestenfalls um ca. 15 Prozent schneller. Im tatsächlichen Gaming-Betrieb kann die Intel-GPU jedoch viel schneller sein. In Rocket League und F1 2019 ist sie jeweils um bis zu 40 Prozent schneller als die RX Vega 9, während sie sich in anderen Spielen wie Overwatch und Shadow of the Tomb Raider ein Kopf-an-Kopf-Rennen mit dem Intel-Modell liefert. Wenn man in bekannten Titeln wie Fortnite oder Rocket League die maximale Leistung erzielen möchte, sollte man die Intel-Iris-Plus-Varianten in Betracht ziehen. 3DMark bleibt nach wie vor ein schlechter Anhaltspunkt für die tatsächliche Gaming-Leistung der Intel-Iris-Plus- und AMD-RX-Vega-iGPUs.
Weitere Gaming-Benchmarks und Vergleiche finden Sie auf unserer Seite zur Iris Plus G7.
| 3DMark 11 Performance | 4932 Punkte | |
| 3DMark Ice Storm Standard Score | 67987 Punkte | |
| 3DMark Cloud Gate Standard Score | 14347 Punkte | |
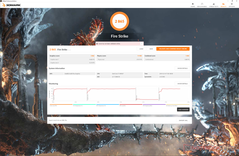
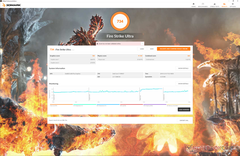
| 3DMark Fire Strike Score | 2865 Punkte | |
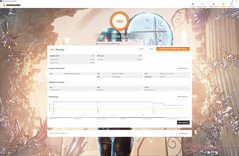
| 3DMark Time Spy Score | 960 Punkte | |
Hilfe | ||
| Borderlands 3 | |
| 1280x720 Very Low Overall Quality (DX11) | |
| Microsoft Surface Laptop 3 15 i7-1065G7 | |
| Durchschnittliche Intel Iris Plus Graphics G7 (Ice Lake 64 EU) (26.7 - 37, n=4) | |
| Microsoft Surface Laptop 3 15 Ryzen 5 3580U | |
| 1920x1080 Medium Overall Quality (DX11) | |
| Microsoft Surface Laptop 3 15 i7-1065G7 | |
| Durchschnittliche Intel Iris Plus Graphics G7 (Ice Lake 64 EU) (11.7 - 16, n=3) | |
| Microsoft Surface Laptop 3 15 Ryzen 5 3580U | |
| 1920x1080 High Overall Quality (DX11) | |
| Microsoft Surface Laptop 3 15 i7-1065G7 | |
| Durchschnittliche Intel Iris Plus Graphics G7 (Ice Lake 64 EU) (7.73 - 10, n=3) | |
| Microsoft Surface Laptop 3 15 Ryzen 5 3580U | |
| min. | mittel | hoch | max. | |
|---|---|---|---|---|
| StarCraft II: Heart of the Swarm (2013) | 358.2 | 100.9 | 64.8 | |
| BioShock Infinite (2013) | 109.6 | 73 | 61.5 | 22.6 |
| The Witcher 3 (2015) | 56.4 | 36.8 | 20.1 | 10 |
| Overwatch (2016) | 90 | 64 | 32.9 | 19.7 |
| Rocket League (2017) | 96.1 | 61 | 42.8 | |
| Shadow of the Tomb Raider (2018) | 31 | |||
| F1 2019 (2019) | 63 | 31 | 27 | 17 |
| Borderlands 3 (2019) | 37 | 16 | 10 |
Emissionen
Geräuschemissionen
Eigentlich hatten wir bei dem Intel- und dem AMD-Modell mit einem jeweils unterschiedlichen Geräuschpegel gerechnet, allerdings hat sich diese Vermutung nicht bestätigt. Unsere Mikrofonmessungen während 3DMark 06, The Witcher 3 und Prime95 ergaben jeweils fast die gleichen Resultate wie im Test der AMD-Konfiguration vom letzten Monat. Das Surface Laptop 3 ist unter niedriger bis mittlerer Last größtenteils unhörbar und die Lüfter drehen nur bei dauerhaft hoher Last wie längerem Spielen hoch.
Bei unserem Testgerät können wir leises Spulenfiepen vernehmen, wenn wir ein Ohr in der Nähe der Tastatur platzieren. Die Geräusche sind leise und somit nicht störend.
| Microsoft Surface Laptop 3 15 i7-1065G7 Iris Plus Graphics G7 (Ice Lake 64 EU), i7-1065G7, Toshiba KBG40ZNS256G NVMe | Apple MacBook Pro 16 2019 i9 5500M Radeon Pro 5500M, i9-9880H, Apple SSD AP1024 7171 | Dell XPS 15 7590 i5 iGPU FHD UHD Graphics 630, i5-9300H, Toshiba XG6 KXG60ZNV512G | Asus ZenBook 15 UX534FT-DB77 GeForce GTX 1650 Max-Q, i7-8565U, Samsung SSD PM981 MZVLB1T0HALR | Razer Blade Stealth i7-8565U GeForce MX150, i7-8565U, Lite-On CA3-8D256-Q11 | Microsoft Surface Laptop 3 15 Ryzen 5 3580U Vega 9, R5 3580U, SK hynix BC501 HFM256GDGTNG | |
|---|---|---|---|---|---|---|
| Geräuschentwicklung | -13% | -2% | -2% | -8% | 2% | |
| aus / Umgebung * (dB) | 28.5 | 29.8 -5% | 29.3 -3% | 28.4 -0% | 28.4 -0% | 28 2% |
| Idle min * (dB) | 28.5 | 29.9 -5% | 29.3 -3% | 28.4 -0% | 28.5 -0% | 28 2% |
| Idle avg * (dB) | 28.5 | 29.9 -5% | 29.3 -3% | 28.4 -0% | 29 -2% | 28 2% |
| Idle max * (dB) | 28.7 | 29.9 -4% | 29.8 -4% | 28.4 1% | 29.1 -1% | 28 2% |
| Last avg * (dB) | 30 | 43 -43% | 32.4 -8% | 33.9 -13% | 42.8 -43% | 29.2 3% |
| Witcher 3 ultra * (dB) | 39.2 | 45.4 -16% | 39.8 -2% | 41.4 -6% | 39 1% | |
| Last max * (dB) | 41.2 | 46.1 -12% | 37.2 10% | 40.2 2% | 41.6 -1% | 41.4 -0% |
* ... kleinere Werte sind besser
Lautstärkediagramm
| Idle |
| 28.5 / 28.5 / 28.7 dB(A) |
| Last |
| 30 / 41.2 dB(A) |
 | ||
30 dB leise 40 dB(A) deutlich hörbar 50 dB(A) störend |
||
min: | ||
Temperatur
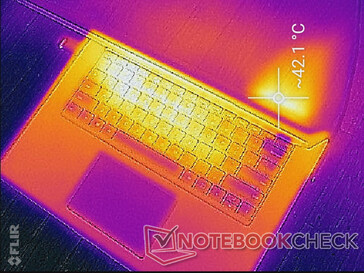
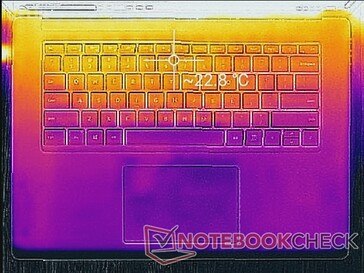
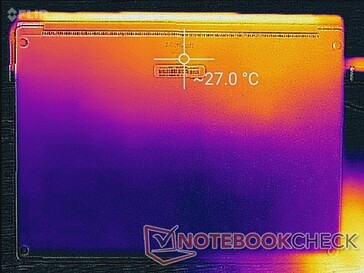
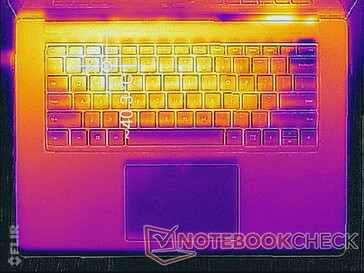
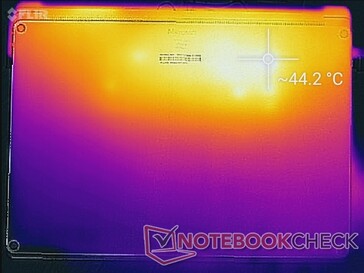
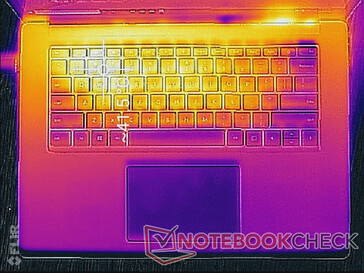
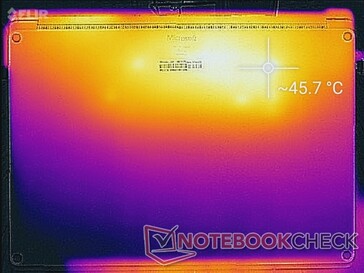
Trotz der Leistungsdifferenz unterscheidet sich die Wärmeentwicklung auf den Oberflächen des Intel- und des AMD-Modells kaum. Während der gleichzeitigen Ausführung von Prime95 und FurMark erreicht das Intel-Gerät stellenweise 41 °C bis 46 °C und das AMD-Gerät 42 °C bis 50 °C. Bei hoher Systemlast wie zum Beispiel im Gaming-Betrieb muss man hier jedoch anders als bei den meisten Gaming-Laptops mit sehr warmen WASD-Tasten rechnen.
Da sich keine Belüftungsschlitze in der Bodenplatte befinden, kann man den Laptop auf dem Schoß verwenden, ohne den Luftstrom zu blockieren. Dafür wird der hintere Bereich des Laptops währenddessen ungewöhnlich warm.
(±) Die maximale Temperatur auf der Oberseite ist 41.8 °C. Im Vergleich liegt der Klassendurchschnitt bei 34.3 °C (von 21.2 bis 62.5 °C für die Klasse Office).
(-) Auf der Unterseite messen wir eine maximalen Wert von 45.6 °C (im Vergleich zum Durchschnitt von 36.8 °C).
(+) Ohne Last messen wir eine durchschnittliche Temperatur von 21.6 °C auf der Oberseite. Der Klassendurchschnitt erreicht 29.5 °C.
(±) Beim längeren Spielen von The Witcher 3 erhitzt sich das Gerät durchschnittlich auf 32.2 °C. Der Durchschnitt der Klasse ist derzeit 29.5 °C.
(+) Die Handballen und der Touchpad-Bereich sind mit gemessenen 29 °C kühler als die typische Hauttemperatur und fühlen sich dadurch kühl an.
(±) Die durchschnittliche Handballen-Temperatur anderer getesteter Geräte war 27.5 °C (-1.5 °C).
Stresstest
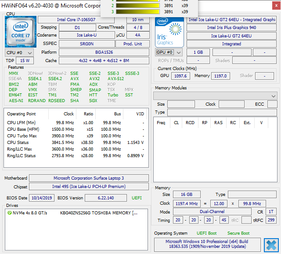
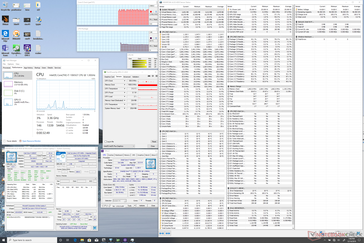
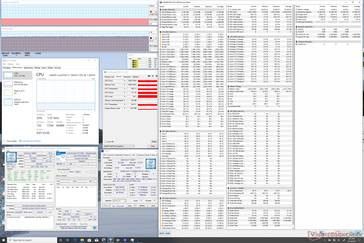
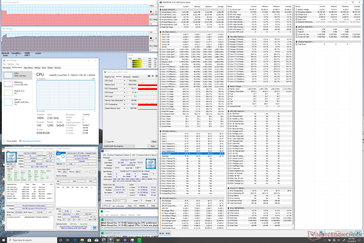
Um es auf potenzielles Drosseln und mögliche Stabilitätsprobleme zu testen, lasten wir das System mit künstlichen Lasten aus. Beim Ausführen von Prime95 beträgt die CPU-Taktfrequenz in den ersten 20 Sekunden 3,5 GHz, wonach die CPU die Temperaturgrenze von 85 °C erreicht. Anschließend fällt die Taktfrequenz auf den 2,6-2,7-GHz-Bereich, um eine niedrigere Kerntemperatur von 75 °C zu ermöglichen. Sowohl die Taktfrequenz (2,7 vs. 2,4 GHz) als auch die Kerntemperaturen (77 °C vs. 66 °C Tctl/Tdie) des Core i7 pendeln sich bei höheren Werten ein als beim Ryzen-5-3580U-Modell. Man sollte jedoch beachten, dass HWiNFO die Kerntemperaturen bei Intel-CPUs anders ermittelt als bei AMD-CPUs, weshalb diese Temperaturmessungen möglicherweise nicht ohne weiteres vergleichbar sind.
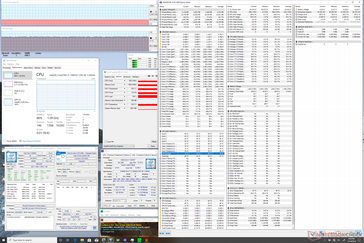
The Witcher 3 zu spielen repräsentiert anspruchsvolle, praktische Lasten jedoch besser. Auch hier sind laut GPU-Z sowohl die GPU-Taktfrequenz als auch die Kerntemperatur des Intel-Modells höher als beim Ryzen-5-Modell (1.050 MHz vs. 800 MHz und 73 °C vs. 58 °C).
Im Akkumodus ist die Leistung nicht eingeschränkt, was bedeutet, dass die volle Leistung des Systems auch zur Verfügung steht, wenn man sich nicht gerade in der Nähe einer Steckdose befindet. Ein Fire-Strike-Durchlauf liefert im Akkumodus Physik- und Grafikpunktzahlen von 12.008 bzw. 3.060 Punkten, während im Netzbetrieb 11.959 bzw. 3.062 Punkte erreicht werden.
| CPU Clock (GHz) | GPU Clock (MHz) | Average CPU Temperature (°C) | |
| System Idle | -- | -- | 34 |
| Prime95 Stress | 2.6 - 2.7 | -- | 77 |
| Prime95 + FurMark Stress | 1.3 | 850 | 71 |
| Witcher 3 Stress | 1.6 | 1050 | 73 |
Lautsprecher

Microsoft Surface Laptop 3 15 i7-1065G7 Audio Analyse
(±) | Mittelmäßig laut spielende Lautsprecher (80.5 dB)
Bass 100 - 315 Hz
(±) | abgesenkter Bass - 5.3% geringer als der Median
(±) | durchschnittlich lineare Bass-Wiedergabe (10.3% Delta zum Vorgänger)
Mitteltöne 400 - 2000 Hz
(+) | ausgeglichene Mitten, vom Median nur 2.7% abweichend
(+) | lineare Mitten (6.7% Delta zum Vorgänger)
Hochtöne 2 - 16 kHz
(+) | ausgeglichene Hochtöne, vom Median nur 2.7% abweichend
(±) | durchschnittlich lineare Hochtöne (8.5% Delta zum Vorgänger)
Gesamt im hörbaren Bereich 100 - 16.000 Hz
(+) | hörbarer Bereich ist sehr linear (11.7% Abstand zum Median
Im Vergleich zu allen Geräten derselben Klasse
» 3% aller getesteten Geräte dieser Klasse waren besser, 2% vergleichbar, 95% schlechter
» Das beste Gerät hat einen Delta-Wert von 7%, durchschnittlich ist 21%, das schlechteste Gerät hat 53%
Im Vergleich zu allen Geräten im Test
» 8% aller getesteten Geräte waren besser, 2% vergleichbar, 90% schlechter
» Das beste Gerät hat einen Delta-Wert von 4%, durchschnittlich ist 24%, das schlechteste Gerät hat 134%
Apple MacBook 12 (Early 2016) 1.1 GHz Audio Analyse
(+) | Die Lautsprecher können relativ laut spielen (83.6 dB)
Bass 100 - 315 Hz
(±) | abgesenkter Bass - 11.3% geringer als der Median
(±) | durchschnittlich lineare Bass-Wiedergabe (14.2% Delta zum Vorgänger)
Mitteltöne 400 - 2000 Hz
(+) | ausgeglichene Mitten, vom Median nur 2.4% abweichend
(+) | lineare Mitten (5.5% Delta zum Vorgänger)
Hochtöne 2 - 16 kHz
(+) | ausgeglichene Hochtöne, vom Median nur 2% abweichend
(+) | sehr lineare Hochtöne (4.5% Delta zum Vorgänger)
Gesamt im hörbaren Bereich 100 - 16.000 Hz
(+) | hörbarer Bereich ist sehr linear (10.2% Abstand zum Median
Im Vergleich zu allen Geräten derselben Klasse
» 7% aller getesteten Geräte dieser Klasse waren besser, 2% vergleichbar, 91% schlechter
» Das beste Gerät hat einen Delta-Wert von 5%, durchschnittlich ist 18%, das schlechteste Gerät hat 53%
Im Vergleich zu allen Geräten im Test
» 4% aller getesteten Geräte waren besser, 1% vergleichbar, 94% schlechter
» Das beste Gerät hat einen Delta-Wert von 4%, durchschnittlich ist 24%, das schlechteste Gerät hat 134%
Energieverwaltung
Energieaufnahme
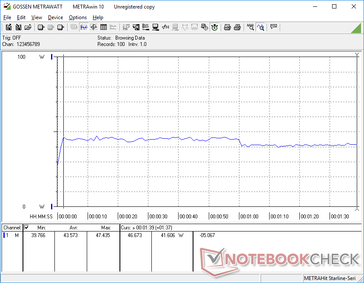
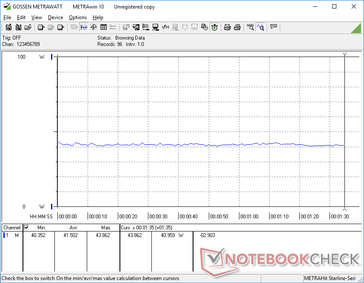
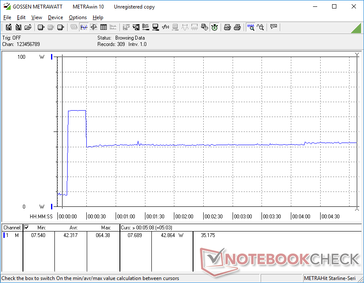
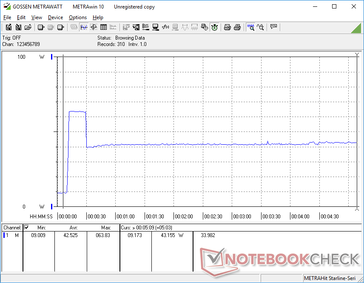
Im Leerlauf auf dem Desktop werden zwischen 4 W und 8 W verbraucht, während das Ryzen-5-Modell zwischen 3 W und 7 W konsumiert. Allerdings vermuten wir, dass unterschiedlich starke Hintergrundaktivität für die Diskrepanz verantwortlich ist, vor allem, weil diese so gering ist. Interessanter wird es beim Verbrauch im Gaming-Betrieb, während dem der Intel-Laptop durchschnittlich knapp 42 W und das Ryzen-5-Modell 45 W verbraucht, obwohl der Intel-Laptop insgesamt die bessere Gaming-Leistung bietet. Bei der Intel-Variante bekommt man also mehr Leistung pro Watt als mit der AMD-Konfiguration.
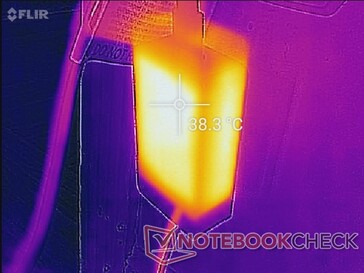
Der maximale Verbrauch, der dem kleinen (~9 x 5 x 2,5 cm) 65-W-Netzteil während der gleichzeitigen Ausführung von Prime95 und FurMark abverlangt wurde, lag bei 64,4 W. Dieser Spitzenwert wird jedoch nur ungefähr 20 Sekunden lange aufrechterhalten und fällt dann aufgrund von erreichten Temperaturgrenzen auf 43 W.
| Aus / Standby | |
| Idle | |
| Last |
|
Legende:
min: | |
| Microsoft Surface Laptop 3 15 i7-1065G7 i7-1065G7, Iris Plus Graphics G7 (Ice Lake 64 EU), Toshiba KBG40ZNS256G NVMe, IPS, 2496x1664, 15" | Dell XPS 15 7590 i5 iGPU FHD i5-9300H, UHD Graphics 630, Toshiba XG6 KXG60ZNV512G, IPS, 1920x1080, 15.6" | Asus ZenBook 15 UX534FT-DB77 i7-8565U, GeForce GTX 1650 Max-Q, Samsung SSD PM981 MZVLB1T0HALR, IPS, 1920x1080, 15.6" | MSI Prestige 15 A10SC i7-10710U, GeForce GTX 1650 Max-Q, Samsung SSD PM981 MZVLB1T0HALR, IPS, 3840x2160, 15.6" | Razer Blade Stealth i7-8565U i7-8565U, GeForce MX150, Lite-On CA3-8D256-Q11, IPS, 1920x1080, 13.3" | Microsoft Surface Laptop 3 15 Ryzen 5 3580U R5 3580U, Vega 9, SK hynix BC501 HFM256GDGTNG, IPS, 2496x1664, 15" | |
|---|---|---|---|---|---|---|
| Stromverbrauch | -17% | -74% | -68% | -28% | 10% | |
| Idle min * (Watt) | 4.4 | 3.79 14% | 5 -14% | 6.1 -39% | 6.7 -52% | 3.3 25% |
| Idle avg * (Watt) | 8.3 | 6.9 17% | 13.2 -59% | 13.2 -59% | 8.6 -4% | 7.1 14% |
| Idle max * (Watt) | 8.6 | 9.2 -7% | 24 -179% | 19.2 -123% | 9.4 -9% | 7.2 16% |
| Last avg * (Watt) | 43.6 | 62 -42% | 70 -61% | 75 -72% | 64.1 -47% | 44.8 -3% |
| Witcher 3 ultra * (Watt) | 41.5 | 63.3 -53% | 74 -78% | 63.7 -53% | 45.1 -9% | |
| Last max * (Watt) | 64.4 | 108 -68% | 114 -77% | 89.7 -39% | 64.1 -0% | 53 18% |
* ... kleinere Werte sind besser
Akkulaufzeit
Für einen 15-Zoll-Laptop fällt die Akkukapazität mit 45 Wh gering aus. Sogar im Huawei MateBook X Pro ist ein größerer 57-Wh-Akku verbaut. Mit guten 8 Stunden ist die praxisnahe WLAN-Laufzeit zwar akzeptabel, jedoch fast eine Stunde kürzer als beim langsameren Ryzen-5-Modell.
Außerdem ist die Tatsache, dass der Laptop im Leerlauf auf dem Desktop auf den niedrigsten Einstellungen und der niedrigsten Helligkeitsstufe ca. 35 Stunden lang durchhält, beachtlich. Obwohl es sich hierbei um ein unrealistisches Szenario handelt, zeigt es, wie weit man die Laufzeit des Akkus bei Bedarf strecken kann.
Den leeren Akku voll aufzuladen dauert ungefähr 2 Stunden. Den Laptop über USB-C mit unserem 130-W-Dell- oder unserem 65-W-Lenovo-Netzteil zu laden funktioniert ebenfalls.
| Microsoft Surface Laptop 3 15 i7-1065G7 i7-1065G7, Iris Plus Graphics G7 (Ice Lake 64 EU), 45 Wh | Apple MacBook Pro 16 2019 i9 5500M i9-9880H, Radeon Pro 5500M, 99.8 Wh | Dell XPS 15 7590 i5 iGPU FHD i5-9300H, UHD Graphics 630, 97 Wh | Lenovo Yoga C940-15IRH i7-9750H, GeForce GTX 1650 Max-Q, 69 Wh | HP Spectre x360 15-df0126ng i7-8750H, GeForce GTX 1050 Ti Max-Q, 84 Wh | Asus ZenBook 15 UX534FT-DB77 i7-8565U, GeForce GTX 1650 Max-Q, 71 Wh | MSI Prestige 15 A10SC i7-10710U, GeForce GTX 1650 Max-Q, 82 Wh | Microsoft Surface Laptop 3 15 Ryzen 5 3580U R5 3580U, Vega 9, 45 Wh | |
|---|---|---|---|---|---|---|---|---|
| Akkulaufzeit | -1% | 31% | -26% | -6% | 5% | -14% | -16% | |
| Idle (h) | 35 | 18.2 -48% | 18.8 -46% | 21.5 -39% | 19.1 -45% | 18.7 -47% | ||
| WLAN (h) | 8.2 | 12 46% | 14.1 72% | 9.7 18% | 8.8 7% | 8.4 2% | 7.6 -7% | 9.1 11% |
| Last (h) | 1.9 | 1 -47% | 1.7 -11% | 1 -47% | 2.3 21% | 2.9 53% | 2.1 11% | 1.7 -11% |
| Witcher 3 ultra (h) | 0.9 |
Pro
Contra
Fazit
Die größten Vorteile unseres Core-i7-Modells gegenüber dem Ryzen-5-Modell sind unter anderem WLAN-6-Kompatibilität, schnellerer Speicher, eine schnellere CPU, integrierte KI-Beschleunigung, eine höhere Gaming-Leistung und mehr Leistung pro Watt. Andere Aspekte wie das Display, die WLAN-Laufzeit, die Oberflächentemperatur und der Geräuschpegel unterscheiden sich hingegen wenig bis gar nicht.
Es ist zwar wenig überraschend, dass unser Core-i7-Modell schneller ist als das günstigere Ryzen-5-Modell, wir sind jedoch hauptsächlich an der Größe des Vorsprungs interessiert. Die reine CPU-Leistung ist nämlich nicht viel höher, weshalb die Prozessorgeschwindigkeit alleine für die Kaufentscheidung nicht ausschlaggebend sein sollte. Auch bei der Gaming-Leistung gibt es keinen eindeutigen Gewinner, teilweise ist Intel schneller, in anderen Spielen liefern sich AMD und Intel ein Kopf-an-Kopf-Rennen. Die KI-Beschleunigung bleibt weiterhin nicht mehr als ein netter Zusatz für Büroanwender, da sie keinen direkten Einfluss auf alltägliche Aufgaben hat. Intel ist in Sachen KI-Funktionen deutlich fortschrittlicher, allerdings bleibt das bedeutlungslos, solange die meisten Standardanwendungen nicht für KI-Beschleunigung optimiert sind.
Alles in allem fallen die Leistungsunterschiede zwischen dem Surface Laptop 3 Core i7 und Ryzen 5 überraschend gering aus, vor allem in Anbetracht des Aufpreises, den Microsoft für die Intel-Modelle verlangt. Enthusiasten, die auf der Suche nach dem schnellstmöglichen Surface-Laptop sind, kommen um die Intel-Optionen vermutlich nicht herum. Alle anderen werden bei der Textverarbeitung, beim Surfen und beim Videostreaming Schwierigkeiten haben, überhaupt einen Unterschied zwischen dem Intel- und AMD-Surface-Laptop-3 festzustellen.
Microsoft Surface Laptop 3 15 i7-1065G7
- 23.02.2020 v7 (old)
Allen Ngo


