Dell XPS 17 9720 RTX 3060 Laptop Test: 50 Prozent schnellerer Prozessor als bisher
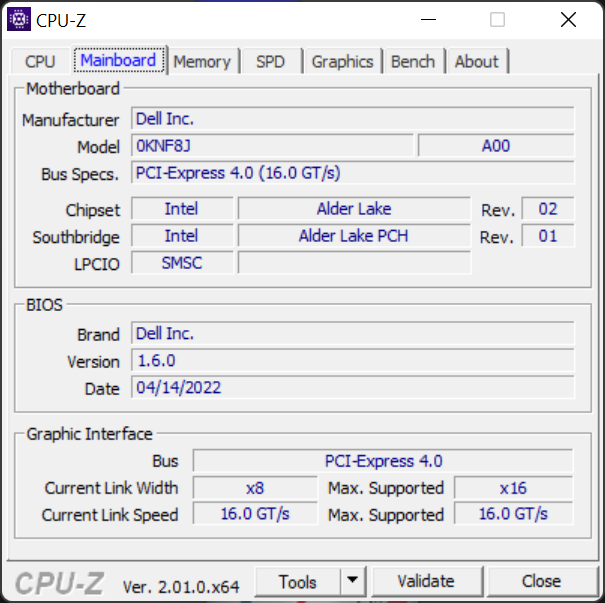
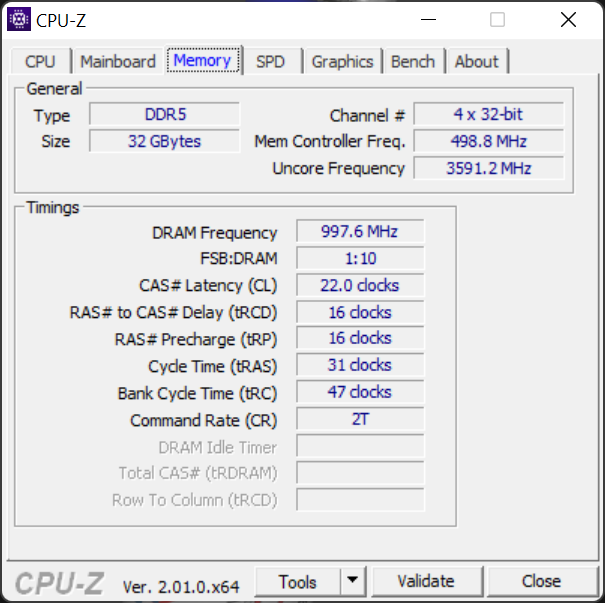
Das Dell XPS 17 9720 ist die dritte Iteration der 17,0-Zoll-XPS-17-Serie, die mit dem 2020er XPS 17 9700 begann. Während die Versionen XPS 17 9700 und 2021 9710 mit Intel CPUs der 10. bzw. 11. Generation ausgeliefert wurden, bietet das 2022 9720 zusätzlich CPUs der 12. Generation und DDR5-RAM-Optionen. Andere Kerneigenschaften wie die Gehäuse und die GPU-Optionen sind ansonsten identisch mit dem XPS 17 9700 oder 9710, weshalb wir empfehlen, einen Blick auf unsere Testberichte zu dieser Serie zu werfen, um mehr über die physikalischen Eigenschaften des Modells zu erfahren.
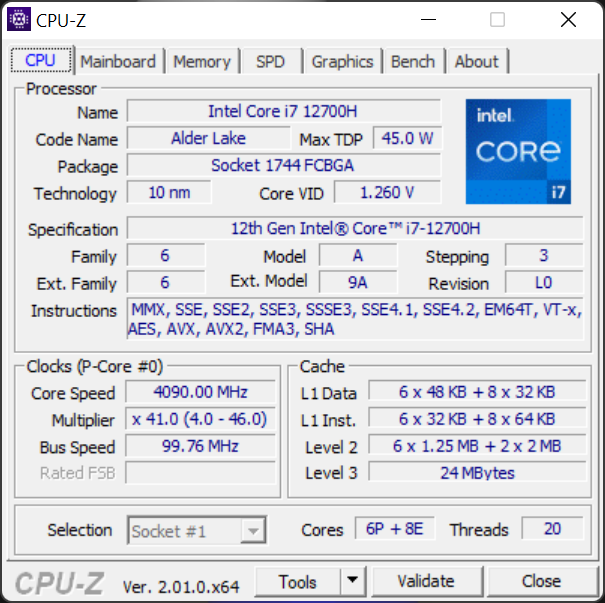
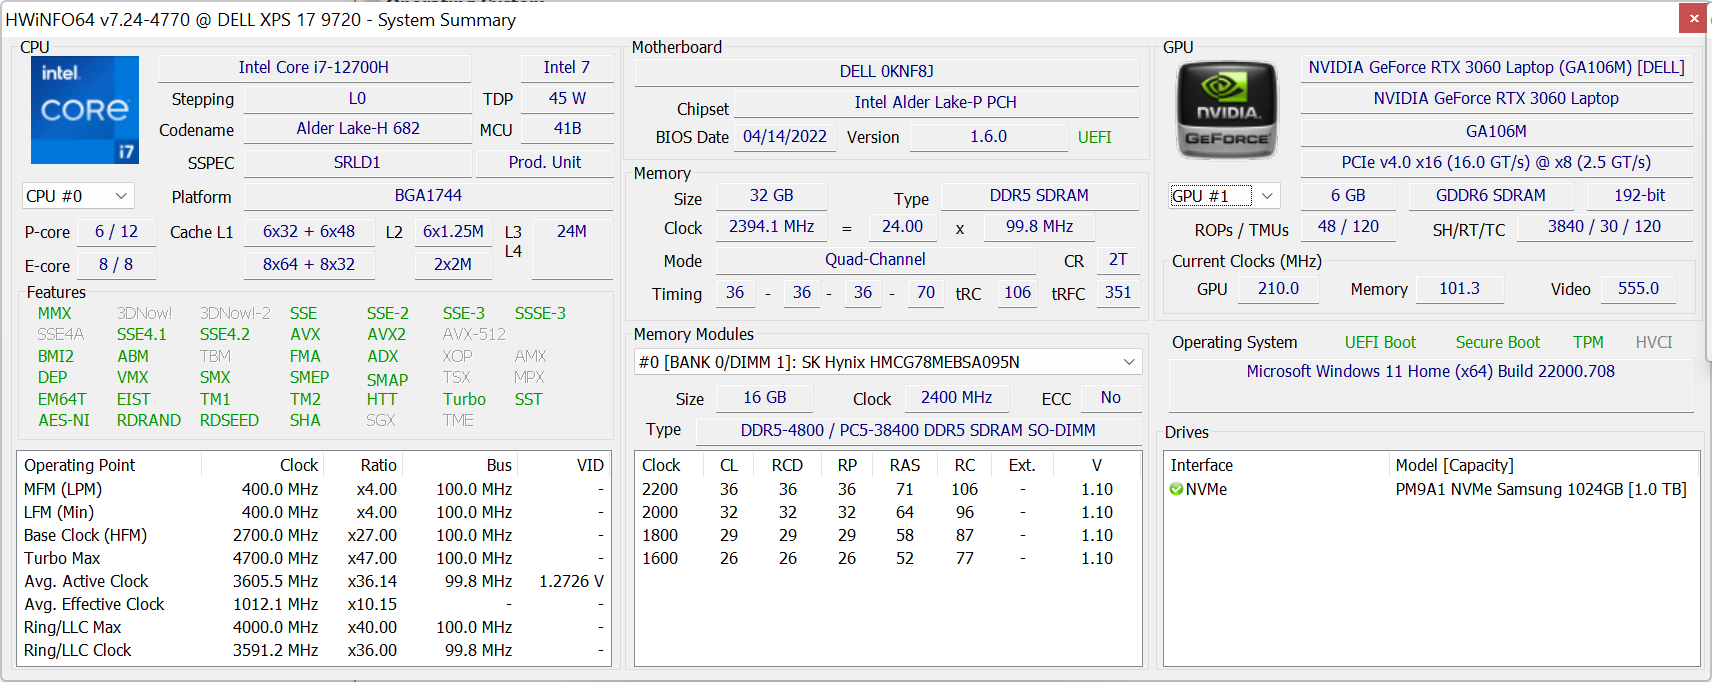
Bei unserem Gerät im Test handelt es sich um eine Konfiguration der oberen Mittelklasse mit Core i7-12700H CPU, UHD+(3.840x2.400)-IPS-Touchscreen und GeForce RTX 3060 GPU für etwa 3.000 USD. Andere SKUs sind auch mit i5-12500H, i9-12900HK, GeForce RTX 3050 Ti, 1.200p-Display oder nur integrierter Grafik erhältlich.
Zu den Konkurrenten des XPS 17 9720 gehören 17,3-Zoll-Multimedia- oder Prosumer-Notebooks wie das Gigabyte Aero 17, Razer Blade 17, HP Envy 17 oder Lenovo Legion 5 17.
Weitere Dell Tests:
Mögliche Konkurrenten im Vergleich
Bew | Datum | Modell | Gewicht | Dicke | Größe | Auflösung | Preis ab |
|---|---|---|---|---|---|---|---|
| 88.8 % v7 (old) | 06 / 2022 | Dell XPS 17 9720 RTX 3060 i7-12700H, GeForce RTX 3060 Laptop GPU | 2.5 kg | 19.5 mm | 17.00" | 3840x2400 | |
| 82.4 % v7 (old) | 08 / 2021 | HP Envy 17-cg i5-1135G7, GeForce MX450 | 2.7 kg | 19.3 mm | 17.30" | 1920x1080 | |
| 87.9 % v7 (old) | 07 / 2021 | Dell XPS 17 9710 Core i7 RTX 3060 i7-11800H, GeForce RTX 3060 Laptop GPU | 2.5 kg | 19.5 mm | 17.00" | 3840x2400 | |
| 87.9 % v7 (old) | 07 / 2020 | Dell XPS 17 9700 Core i7 RTX 2060 Max-Q i7-10875H, GeForce RTX 2060 Max-Q | 2.5 kg | 19.5 mm | 17.00" | 3840x2400 | |
| 85.2 % v7 (old) | 02 / 2022 | Lenovo Legion 5 17ACH6H-82JY0003GE R5 5600H, GeForce RTX 3060 Laptop GPU | 3.1 kg | 24.3 mm | 17.30" | 1920x1080 | |
| 76.5 % v7 (old) | 05 / 2022 | Asus VivoBook 17 F712JA-AU708W i7-1065G7, Iris Plus Graphics G7 (Ice Lake 64 EU) | 2.2 kg | 21.4 mm | 17.30" | 1920x1080 | |
| 90.1 % v7 (old) | 05 / 2022 | Razer Blade 17 (i7-12800H, RTX 3070 Ti) i7-12800H, GeForce RTX 3070 Ti Laptop GPU | 2.8 kg | 19.9 mm | 17.30" | 2560x1440 |
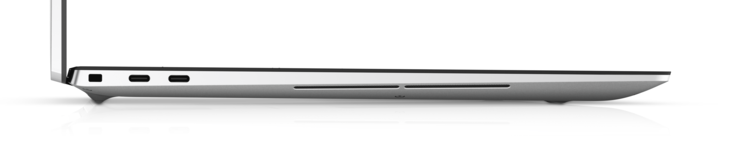
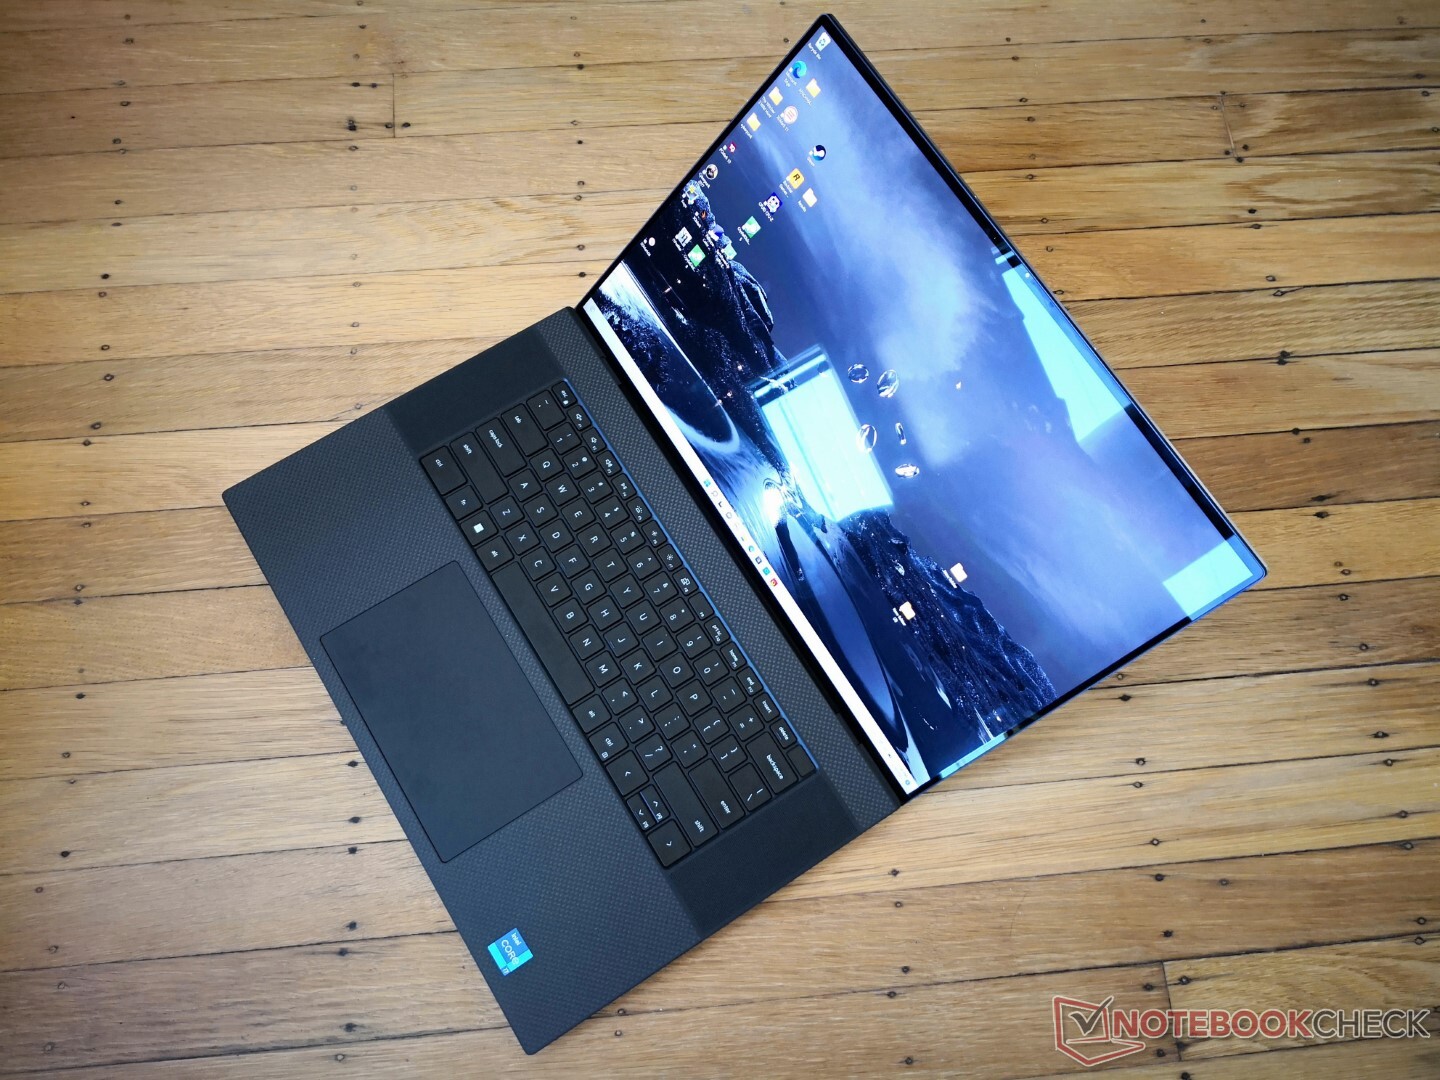
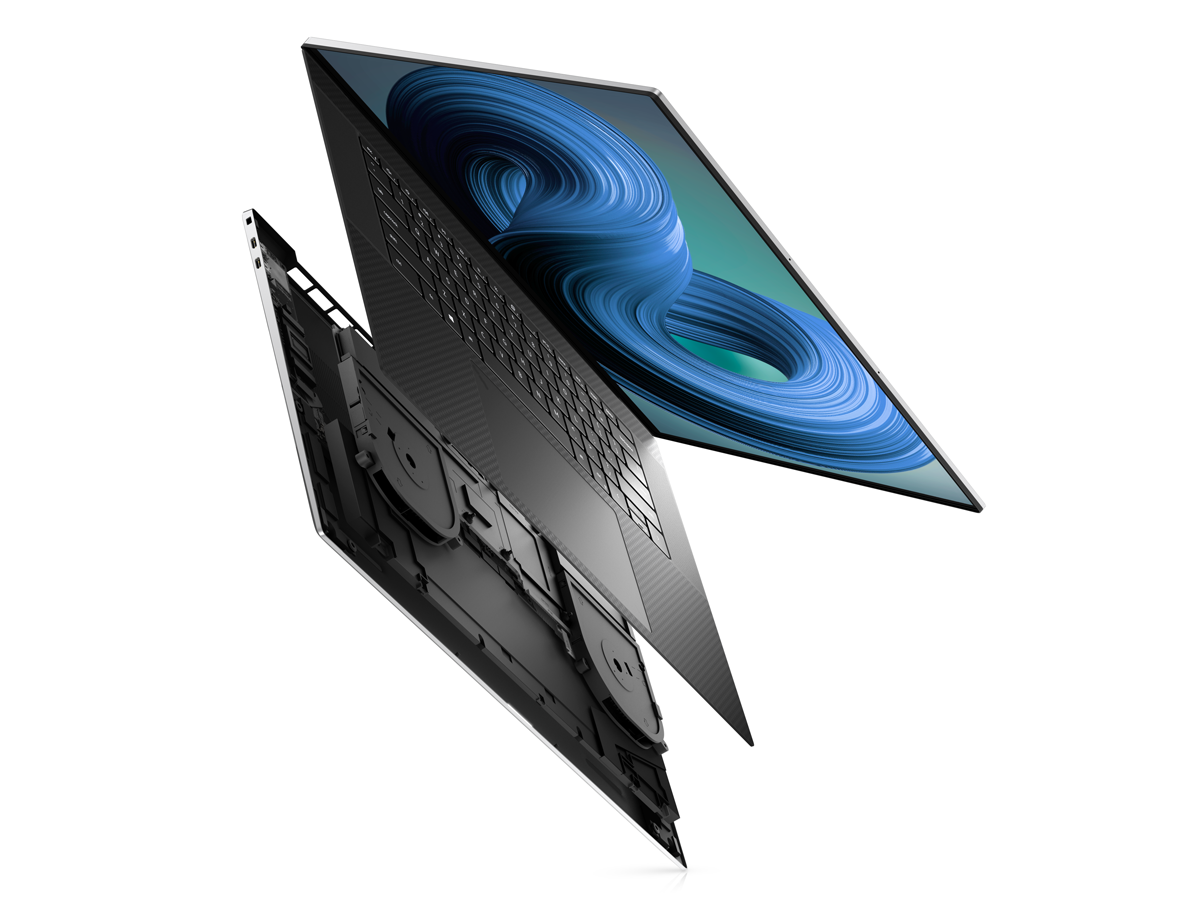
Gehäuse - Gleich, aber immer noch großartig
Die Gehäuse hat sich gegenüber dem XPS 17 9700 oder 9710 nicht verändert. Obwohl es sich um ein zwei Jahre altes Design handelt, ist das Modell dank seinem einzigartigen 16:10-17,0-Zoll-Formfaktor deutlich kleiner und dünner als andere Modelle derselben Größenkategorie.
SD-Kartenleser
| SD Card Reader | |
| average JPG Copy Test (av. of 3 runs) | |
| Dell XPS 17 9720 RTX 3060 (Toshiba Exceria Pro SDXC 64 GB UHS-II) | |
| Dell XPS 17 9700 Core i7 RTX 2060 Max-Q (Toshiba Exceria Pro SDXC 64 GB UHS-II) | |
| Dell XPS 17 9710 Core i7 RTX 3060 (AV PRO microSD 128 GB V60) | |
| Razer Blade 17 (i7-12800H, RTX 3070 Ti) | |
| Lenovo Legion 5 17ACH6H-82JY0003GE (AV Pro SD microSD 128 GB V60) | |
| HP Envy 17-cg (AV Pro microSD 128 GB V60) | |
| Asus VivoBook 17 F712JA-AU708W (AV Pro SD microSD 128 GB V60) | |
| maximum AS SSD Seq Read Test (1GB) | |
| Dell XPS 17 9720 RTX 3060 (Toshiba Exceria Pro SDXC 64 GB UHS-II) | |
| Dell XPS 17 9700 Core i7 RTX 2060 Max-Q (Toshiba Exceria Pro SDXC 64 GB UHS-II) | |
| Razer Blade 17 (i7-12800H, RTX 3070 Ti) | |
| Dell XPS 17 9710 Core i7 RTX 3060 (AV PRO microSD 128 GB V60) | |
| Lenovo Legion 5 17ACH6H-82JY0003GE (AV Pro SD microSD 128 GB V60) | |
| HP Envy 17-cg (AV Pro microSD 128 GB V60) | |
| Asus VivoBook 17 F712JA-AU708W (AV Pro SD microSD 128 GB V60) | |
Kommunikation - Kein Wi-Fi 6E
Dell hat das WLAN des Intel AX1650 im XPS 17 9710 auf den Intel AX1675 (oder AX211) im XPS 17 9720 aufgerüstet. Der neuere Chip unterstützt Wi-Fi 6E, aber die Funktion ist auf dem XPS 17 9720 deaktiviert, ähnlich wie das, was wir beim XPS 15 9520 vorgefunden haben. Somit können sich Nutzer nur mit 2,4-GHz- oder 5-GHz-Netzwerken verbinden und nicht mit 6-GHz-Netzwerken.
| Networking | |
| iperf3 transmit AX12 | |
| HP Envy 17-cg | |
| Dell XPS 17 9710 Core i7 RTX 3060 | |
| Asus VivoBook 17 F712JA-AU708W | |
| Lenovo Legion 5 17ACH6H-82JY0003GE | |
| Dell XPS 17 9700 Core i7 RTX 2060 Max-Q | |
| iperf3 receive AX12 | |
| HP Envy 17-cg | |
| Dell XPS 17 9710 Core i7 RTX 3060 | |
| Dell XPS 17 9700 Core i7 RTX 2060 Max-Q | |
| Asus VivoBook 17 F712JA-AU708W | |
| Lenovo Legion 5 17ACH6H-82JY0003GE | |
| iperf3 receive AXE11000 | |
| Dell XPS 17 9720 RTX 3060 | |
| iperf3 transmit AXE11000 | |
| Dell XPS 17 9720 RTX 3060 | |
Webcam
Die Kamera bietet weiterhin nur 720p und keinen Privacy Shutter. Die niedrige native Auflösung harmoniert schlecht mit dem hochauflösenden Display und führt zu einem unvermeidlich matschigen Bild. Dell sagt, dass die IR- und RGB-Sensoren jetzt getrennt sind, um die Leistung zu verbessern, aber die Pixeldichte ist immer noch sehr niedrig. Im Vergleich dazu wird das Razer Blade 17 mit einer höher auflösenden 1080p-Webcam ausgeliefert.
Windows Hello wird weiterhin unterstützt.


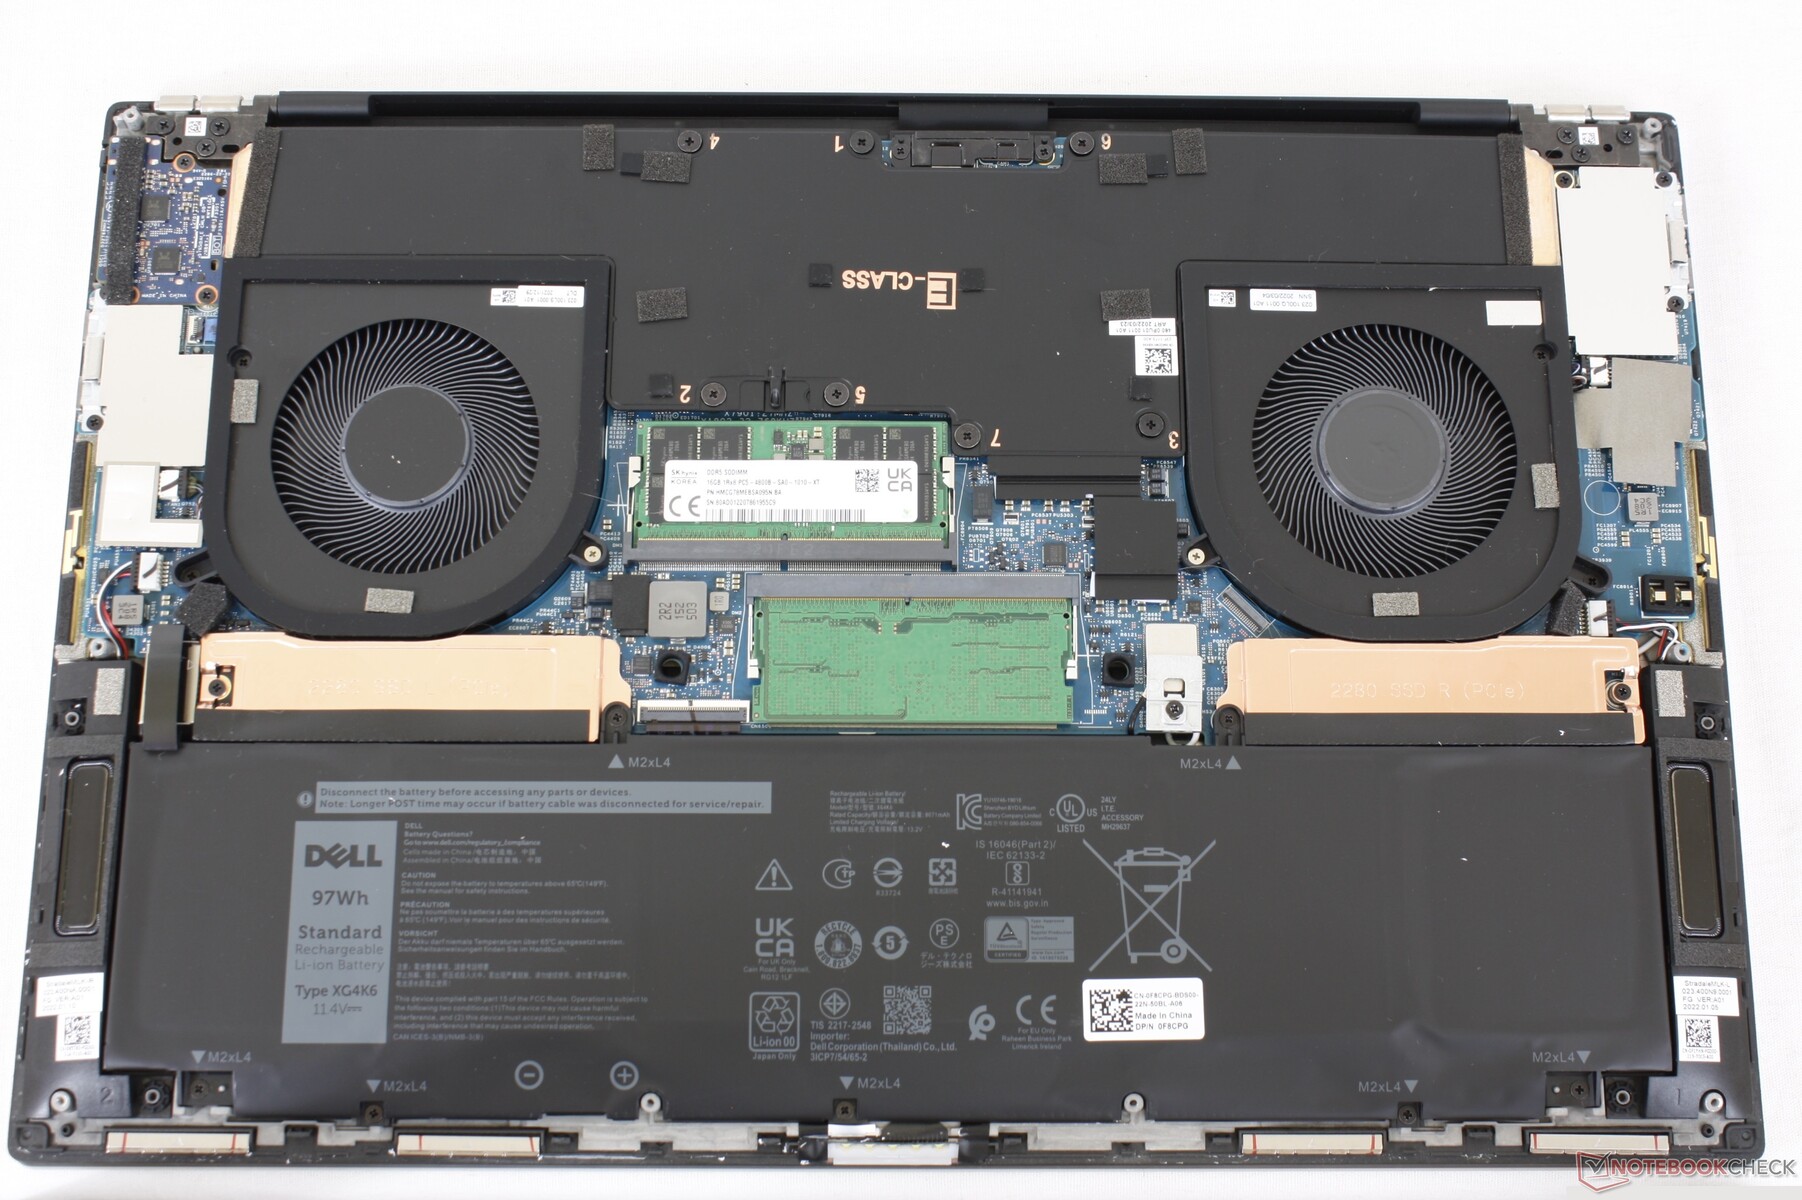
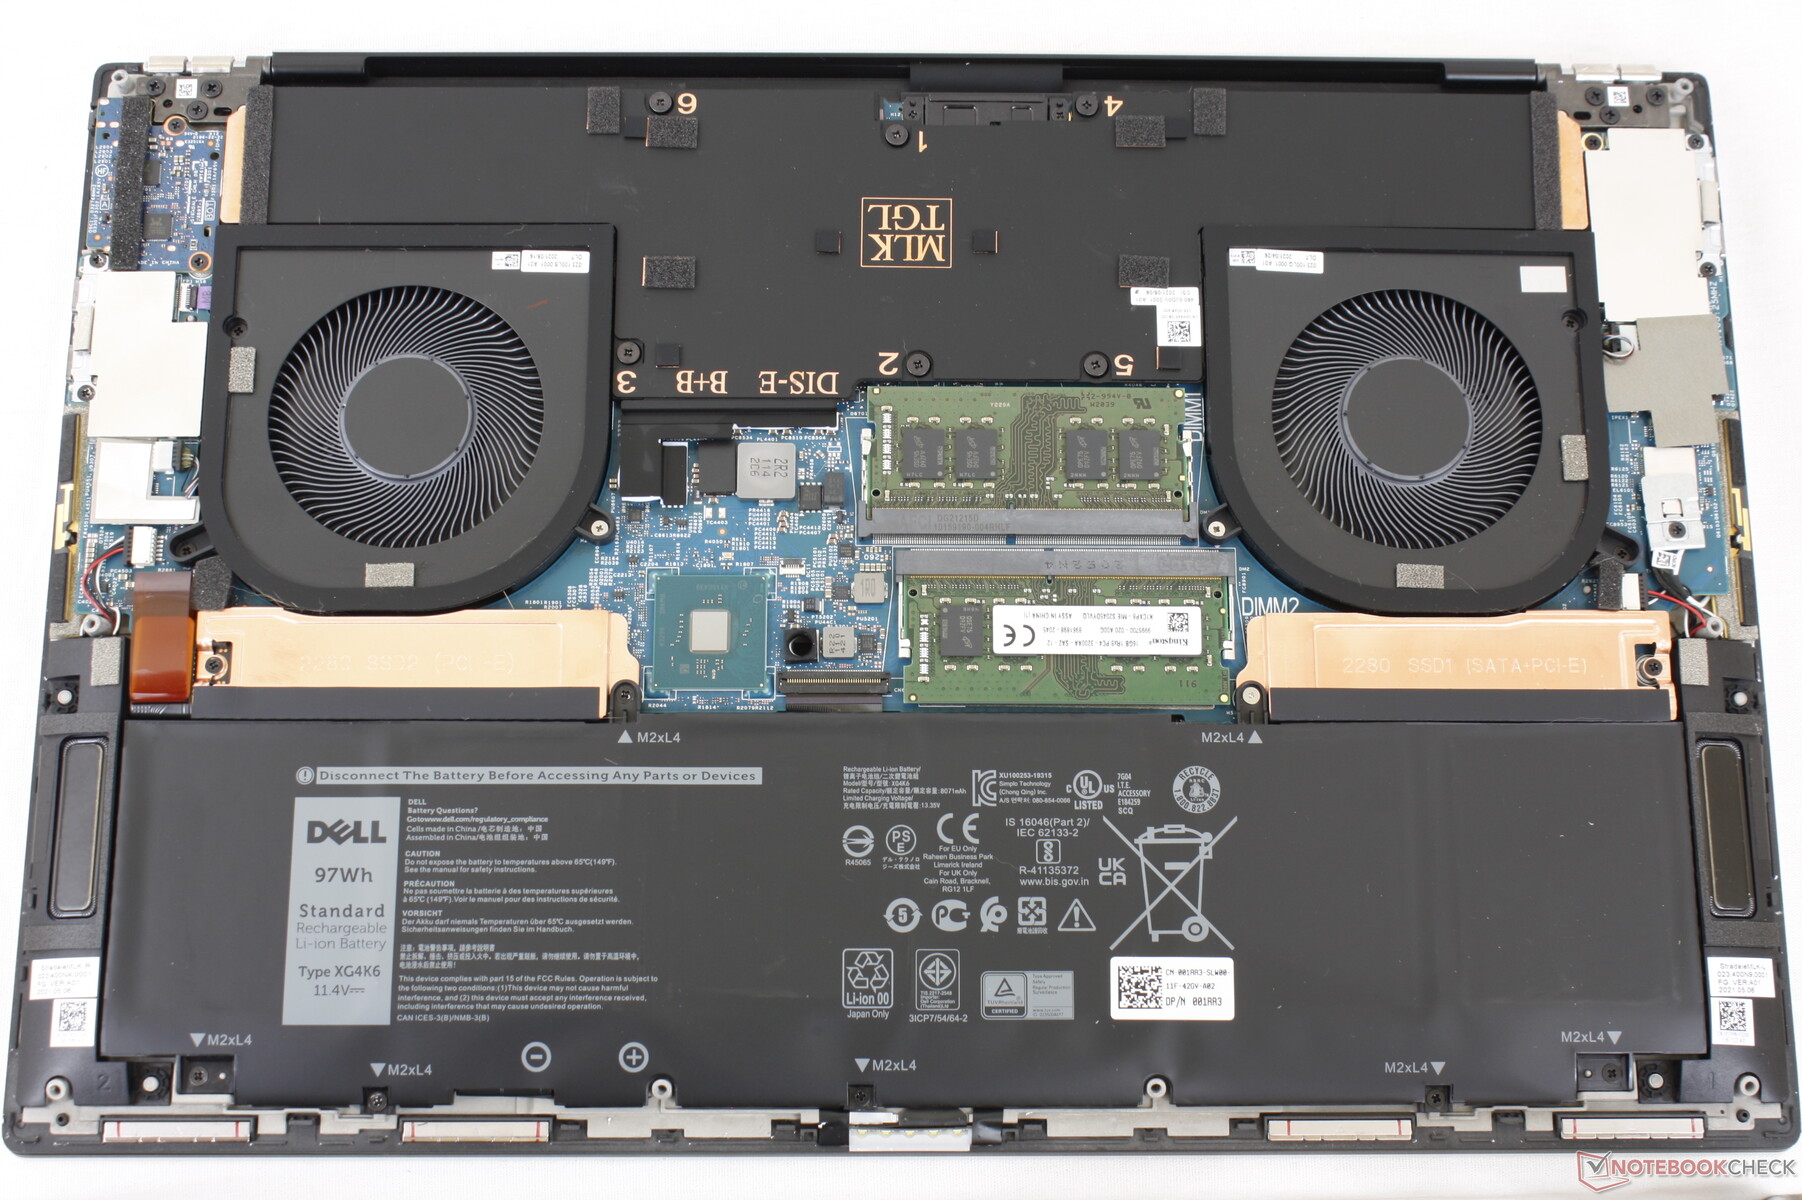
Wartung
Zubehör und Garantie
Das XPS 17 9720 wird mit dem gleichen 130-W-Netzteil und USB-C-auf-HDMI- und USB-A-Adapter geliefert wie das XPS 15 9520, XPS 17 9710 und XPS 17 9700. Beim Kauf in den USA gilt eine einjährige eingeschränkte Herstellergarantie.
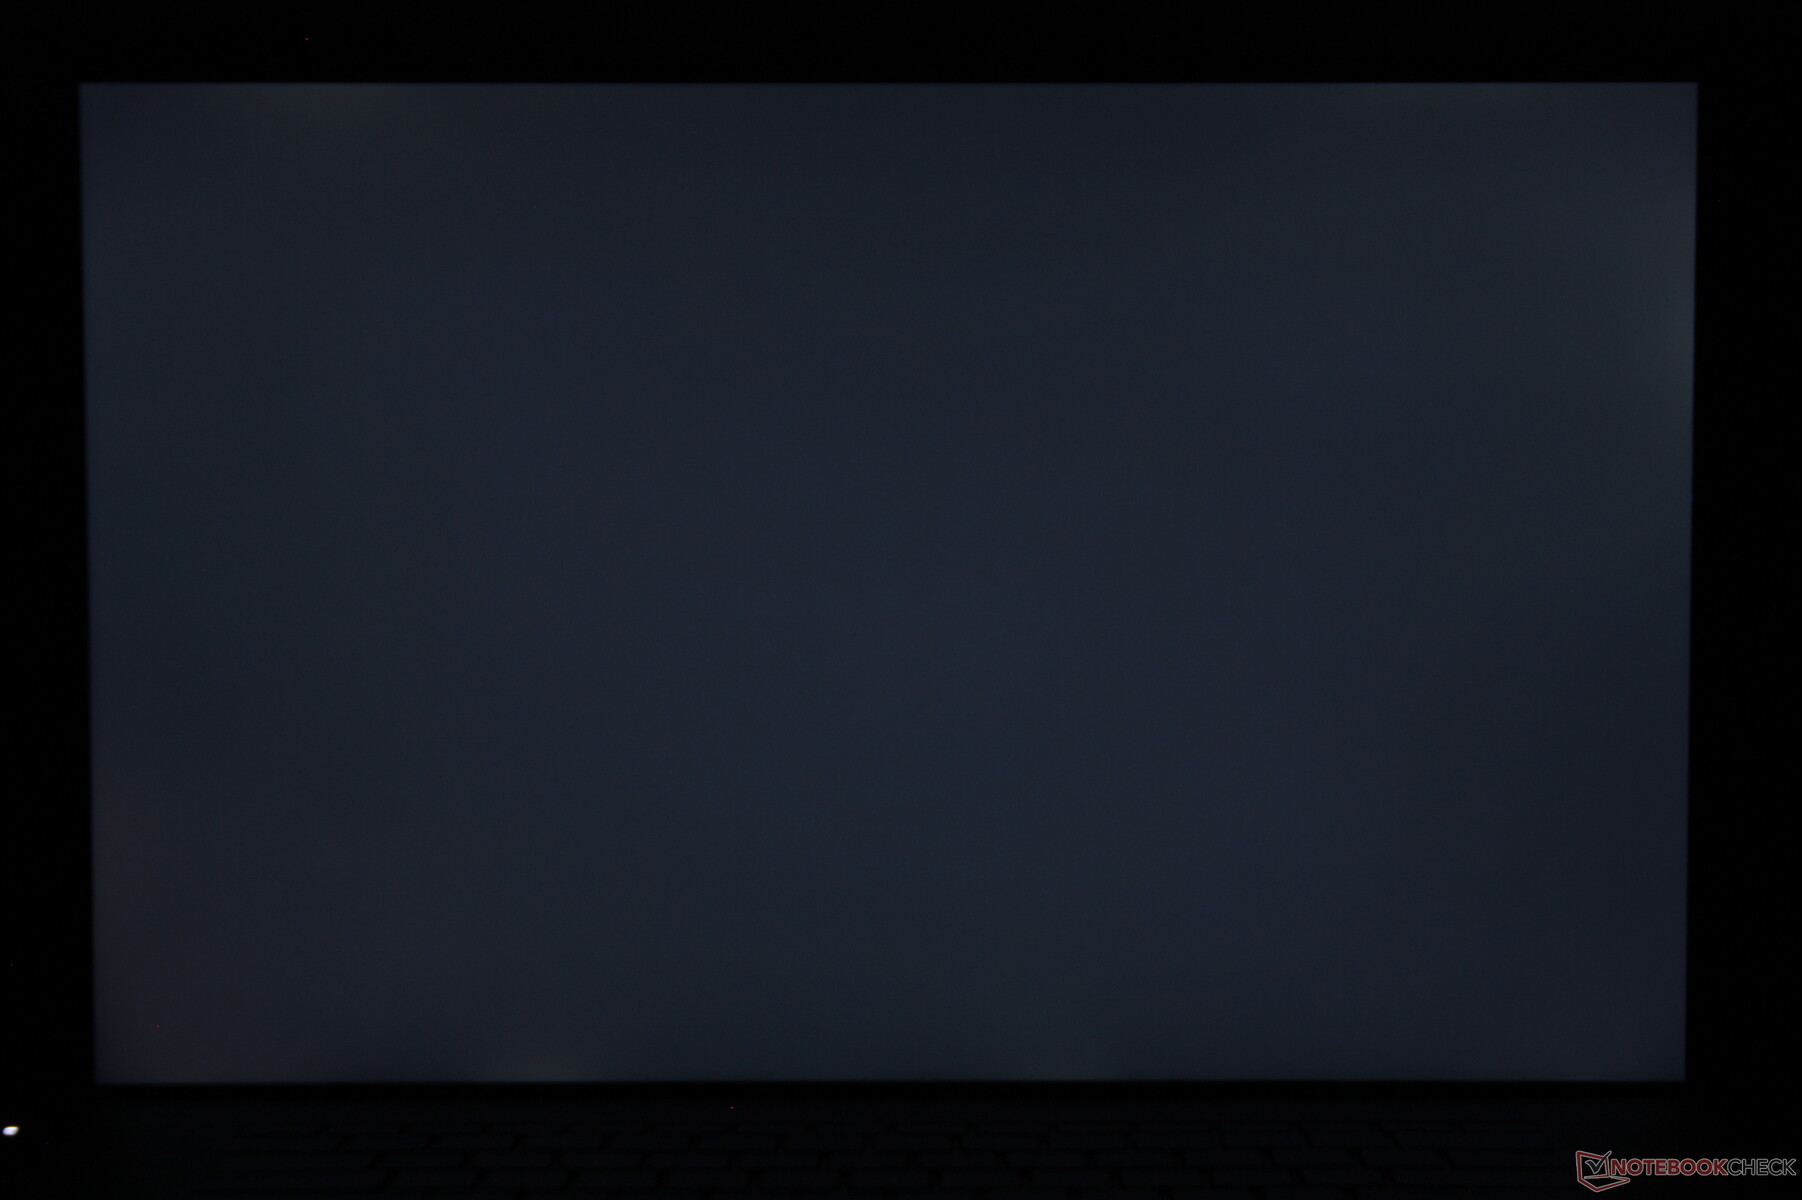
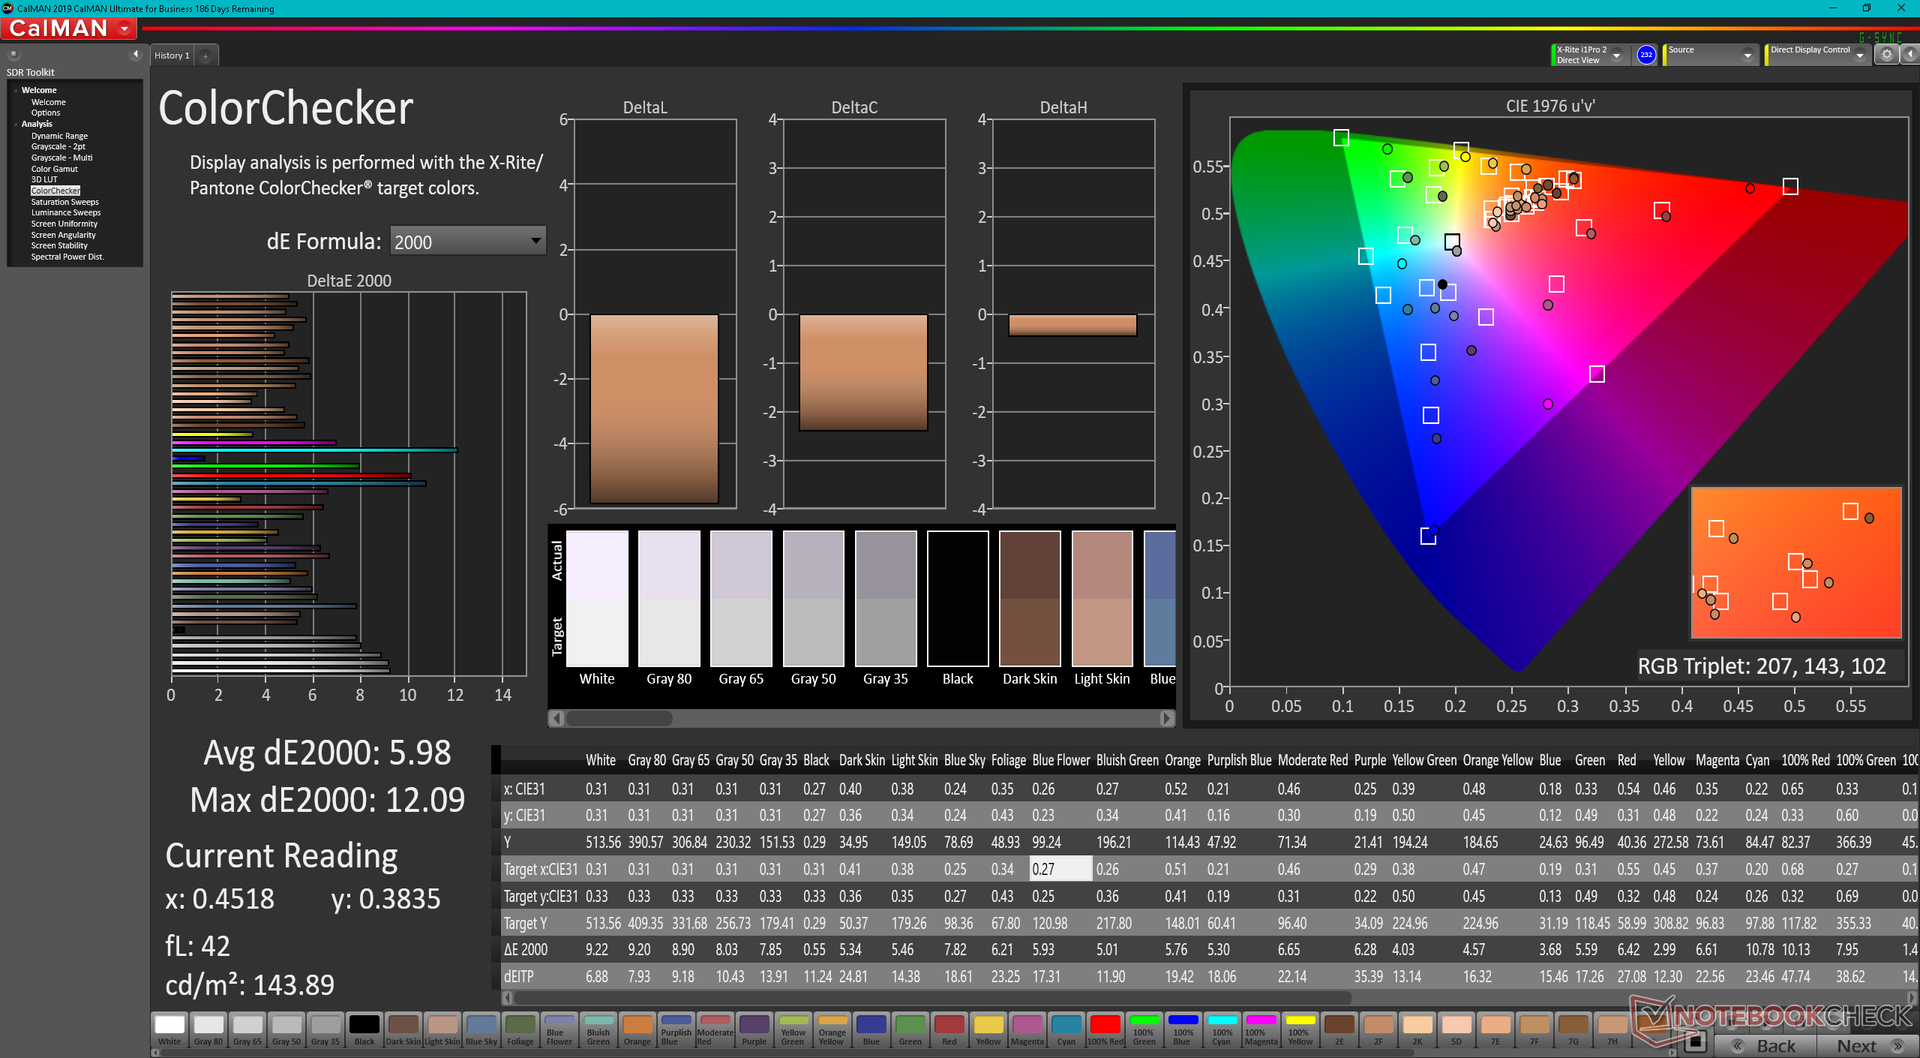
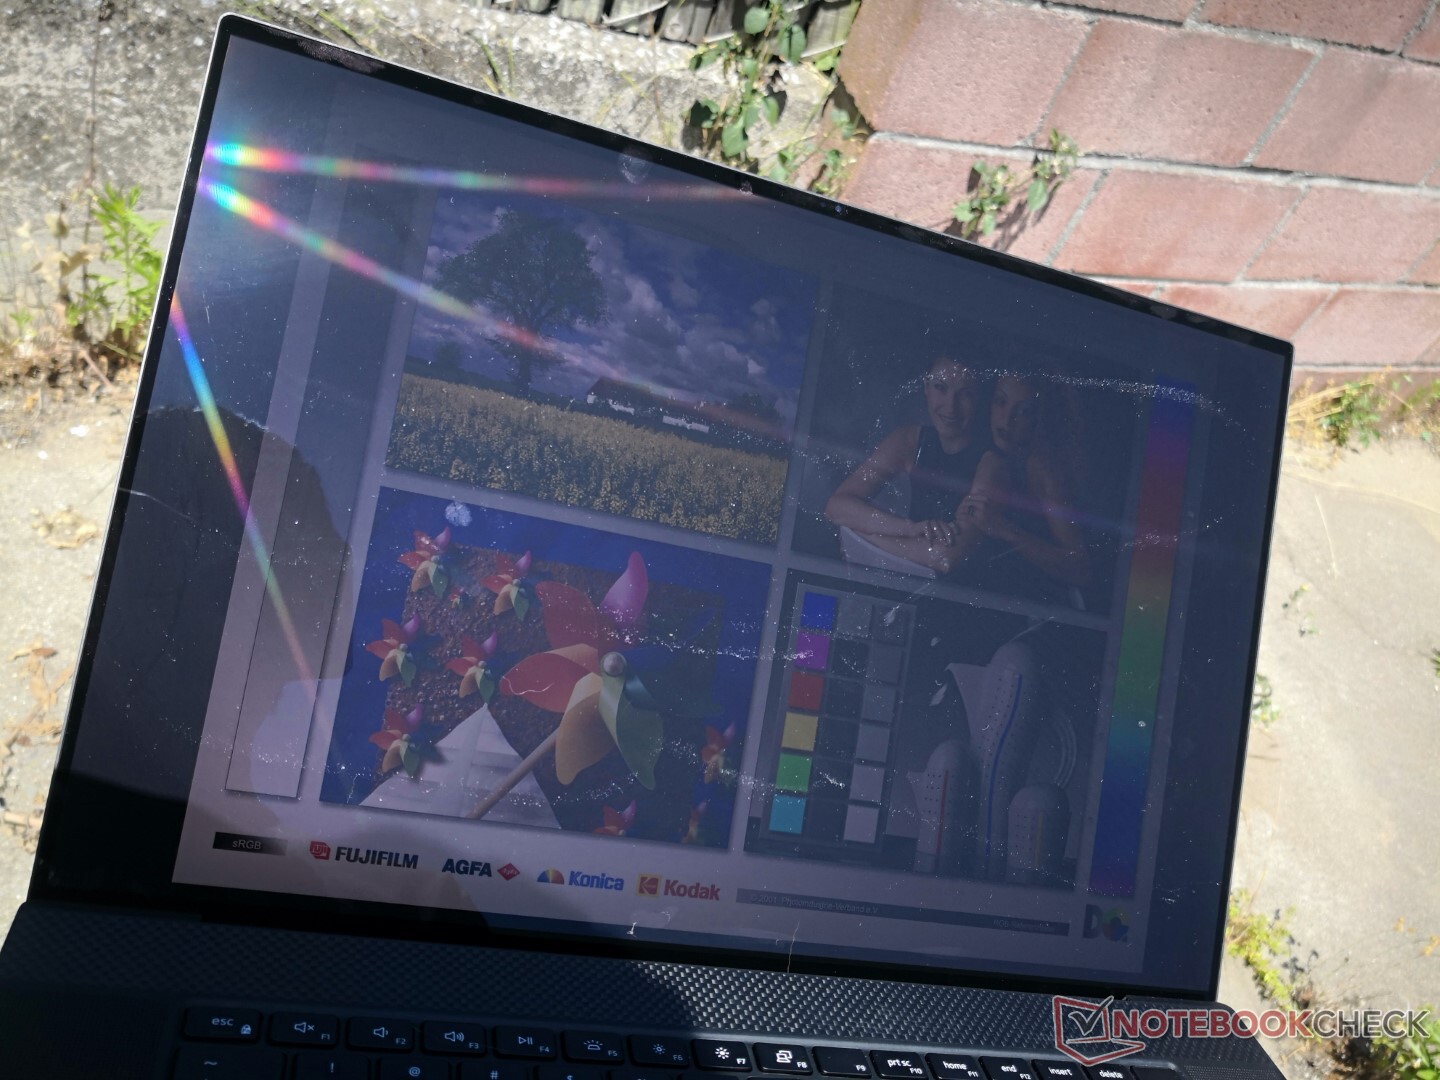
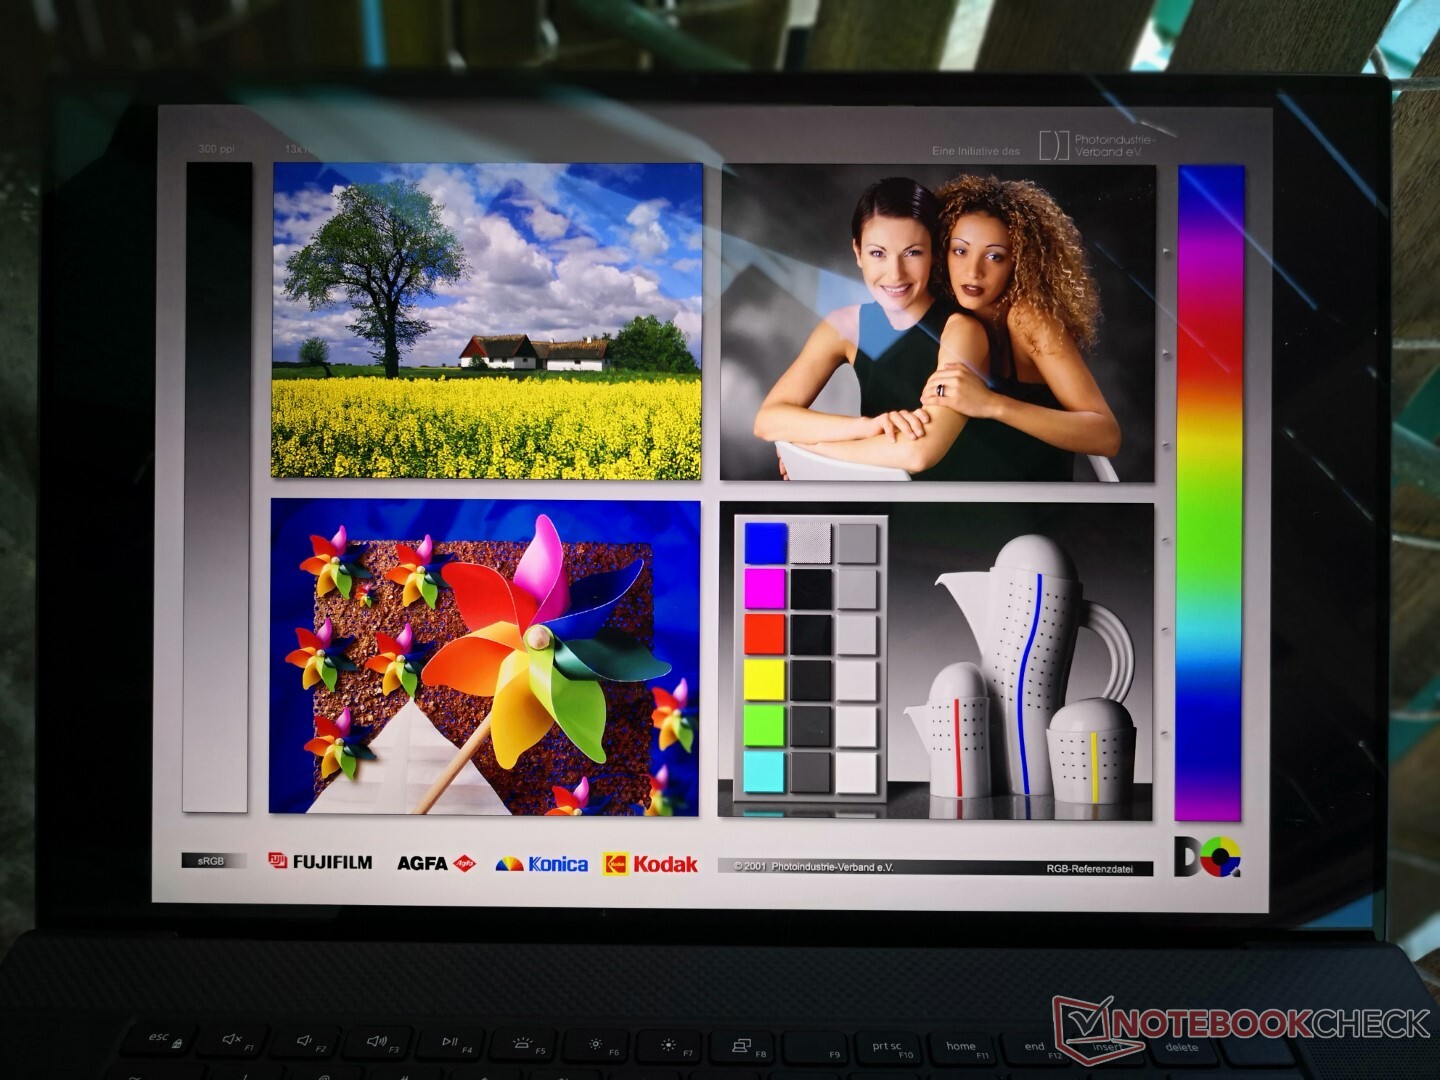
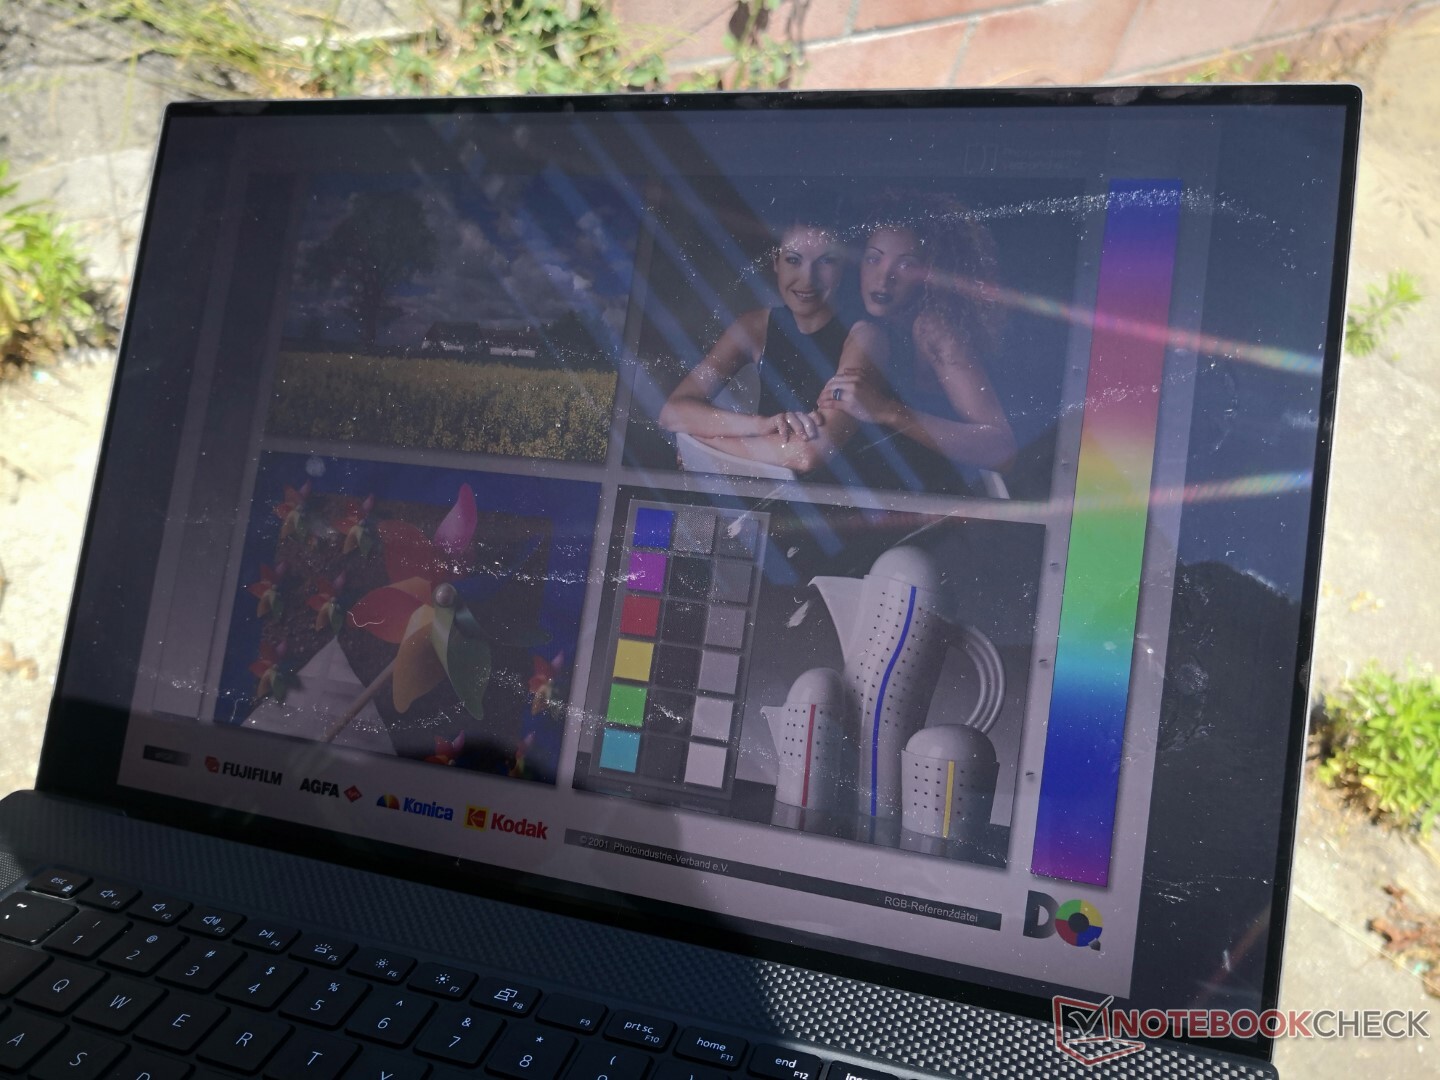
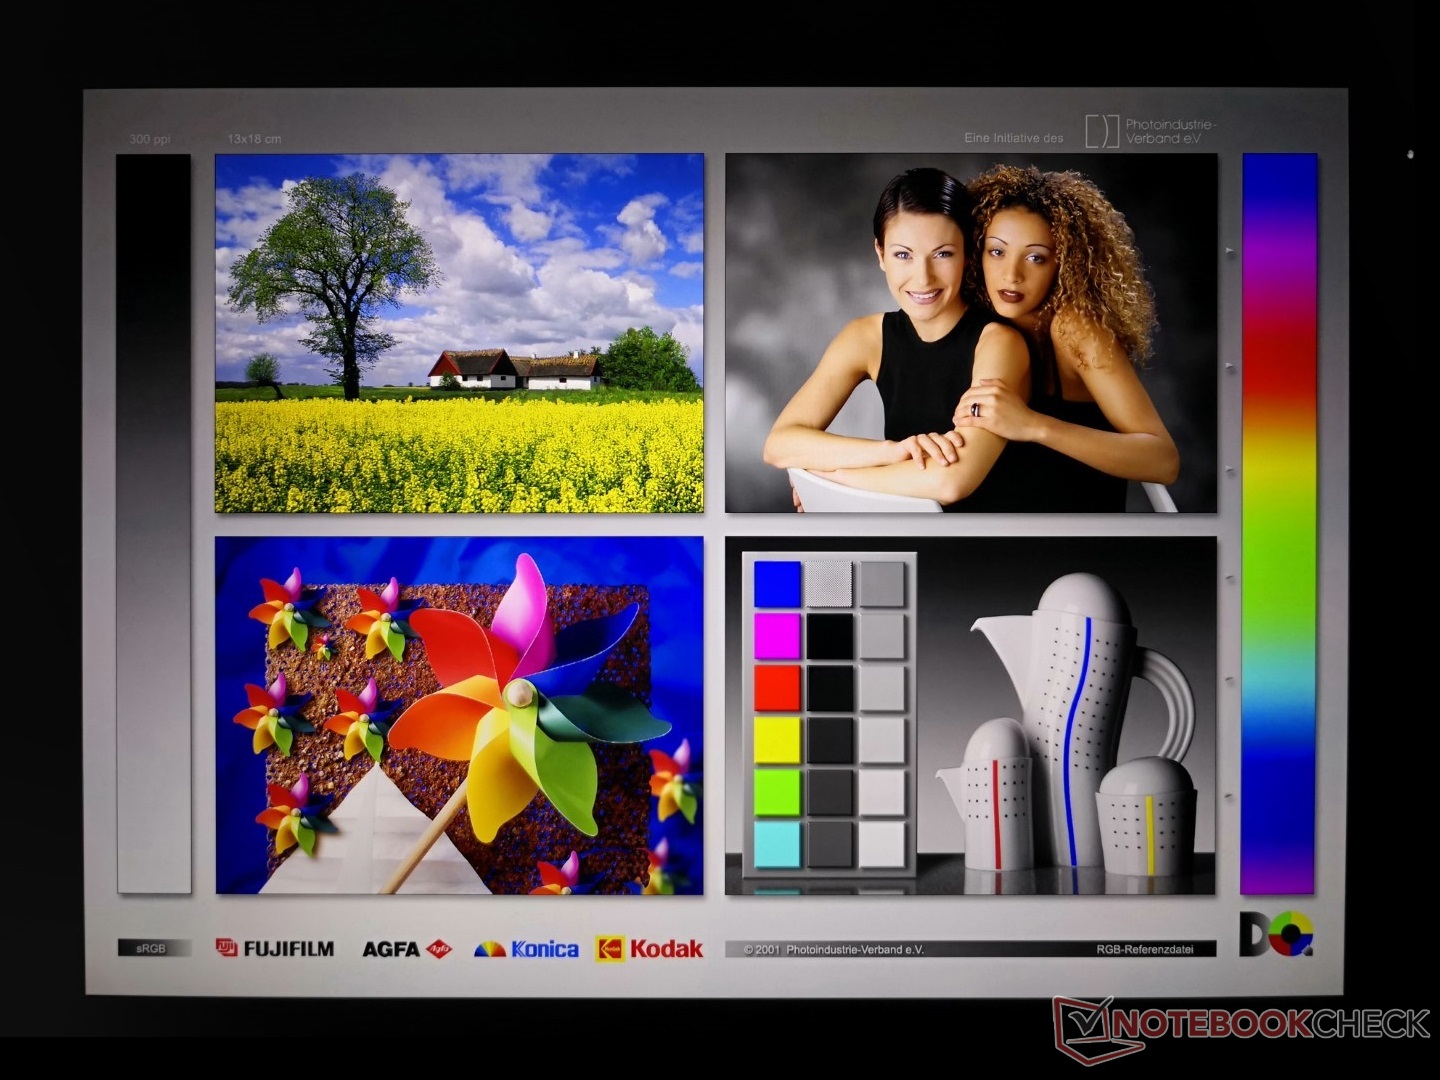
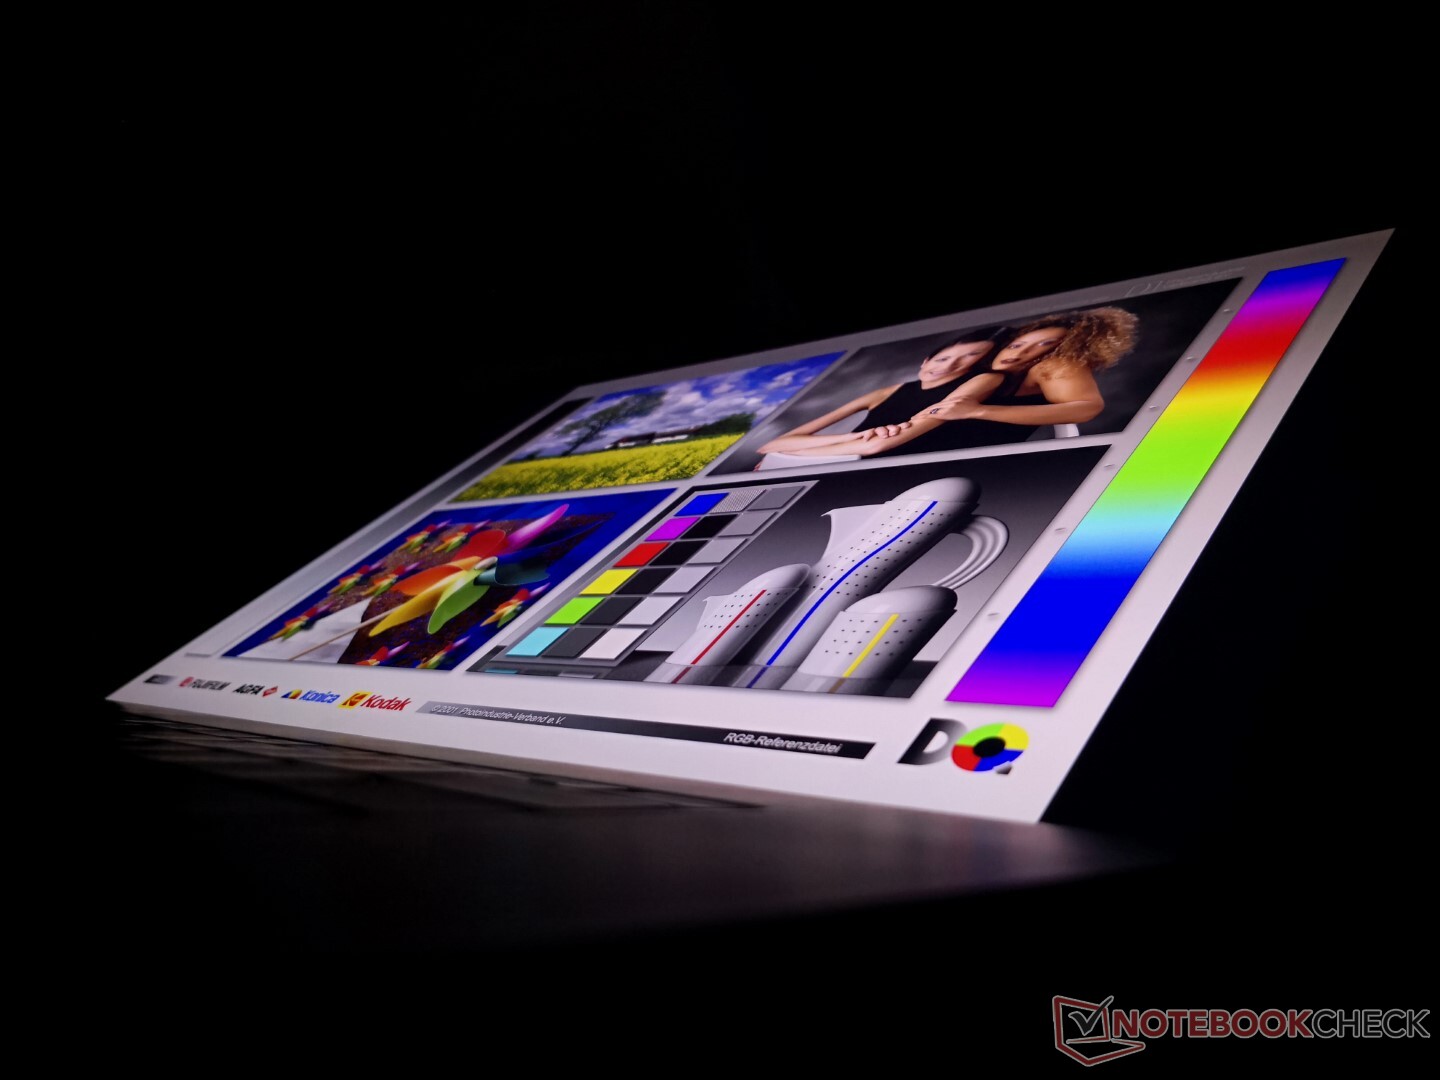
Display - 60-Hz-IPS mit 16:10
Es gibt zwei Display-Optionen zur Auswahl (1.200p und 2.400p) im Vergleich zu drei beim XPS 15 9520. Das Panel auf unserem Gerät ist das gleiche Sharp-LQ170R1-IPS-Panel wie beim XPS 17 9710 oder 9700, was bedeutet, dass sich das Seherlebnis seit dem ursprünglichen 2020er Modell nicht verändert hat. Es war damals ein exzellentes Display und ist es auch heute noch, vor allem in Bezug auf das Kontrastverhältnis im Vergleich zu anderen IPS-Panels. Jedoch würden wir gerne 90 Hz Bildwiederholrate oder schnellere Optionen in der Zukunft sehen, ähnlich wie es bereits beim neuesten IdeaPad Slim 7i Pro oder dem kommenden Zenbook Pro 14 Duo der Fall ist.

| |||||||||||||||||||||||||
Ausleuchtung: 85 %
Helligkeit Akku: 512.7 cd/m²
Kontrast: 1602:1 (Schwarzwert: 0.32 cd/m²)
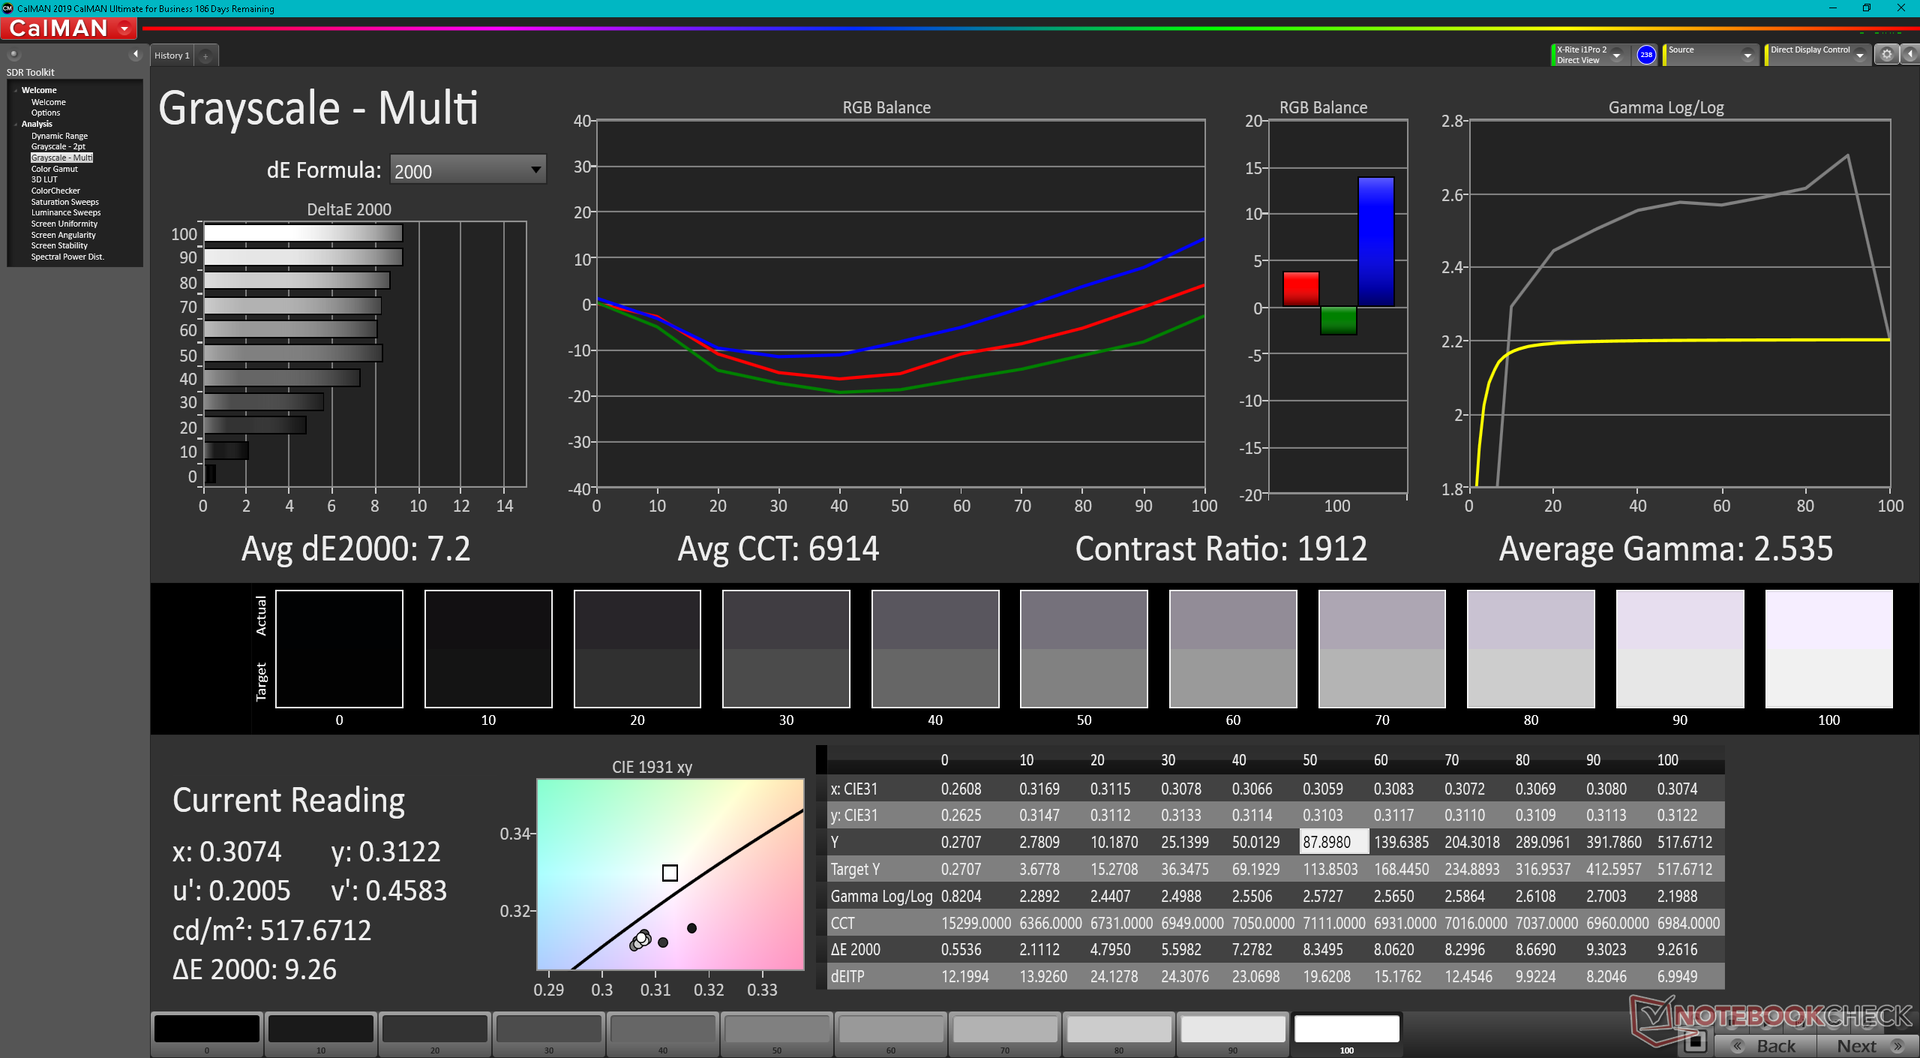
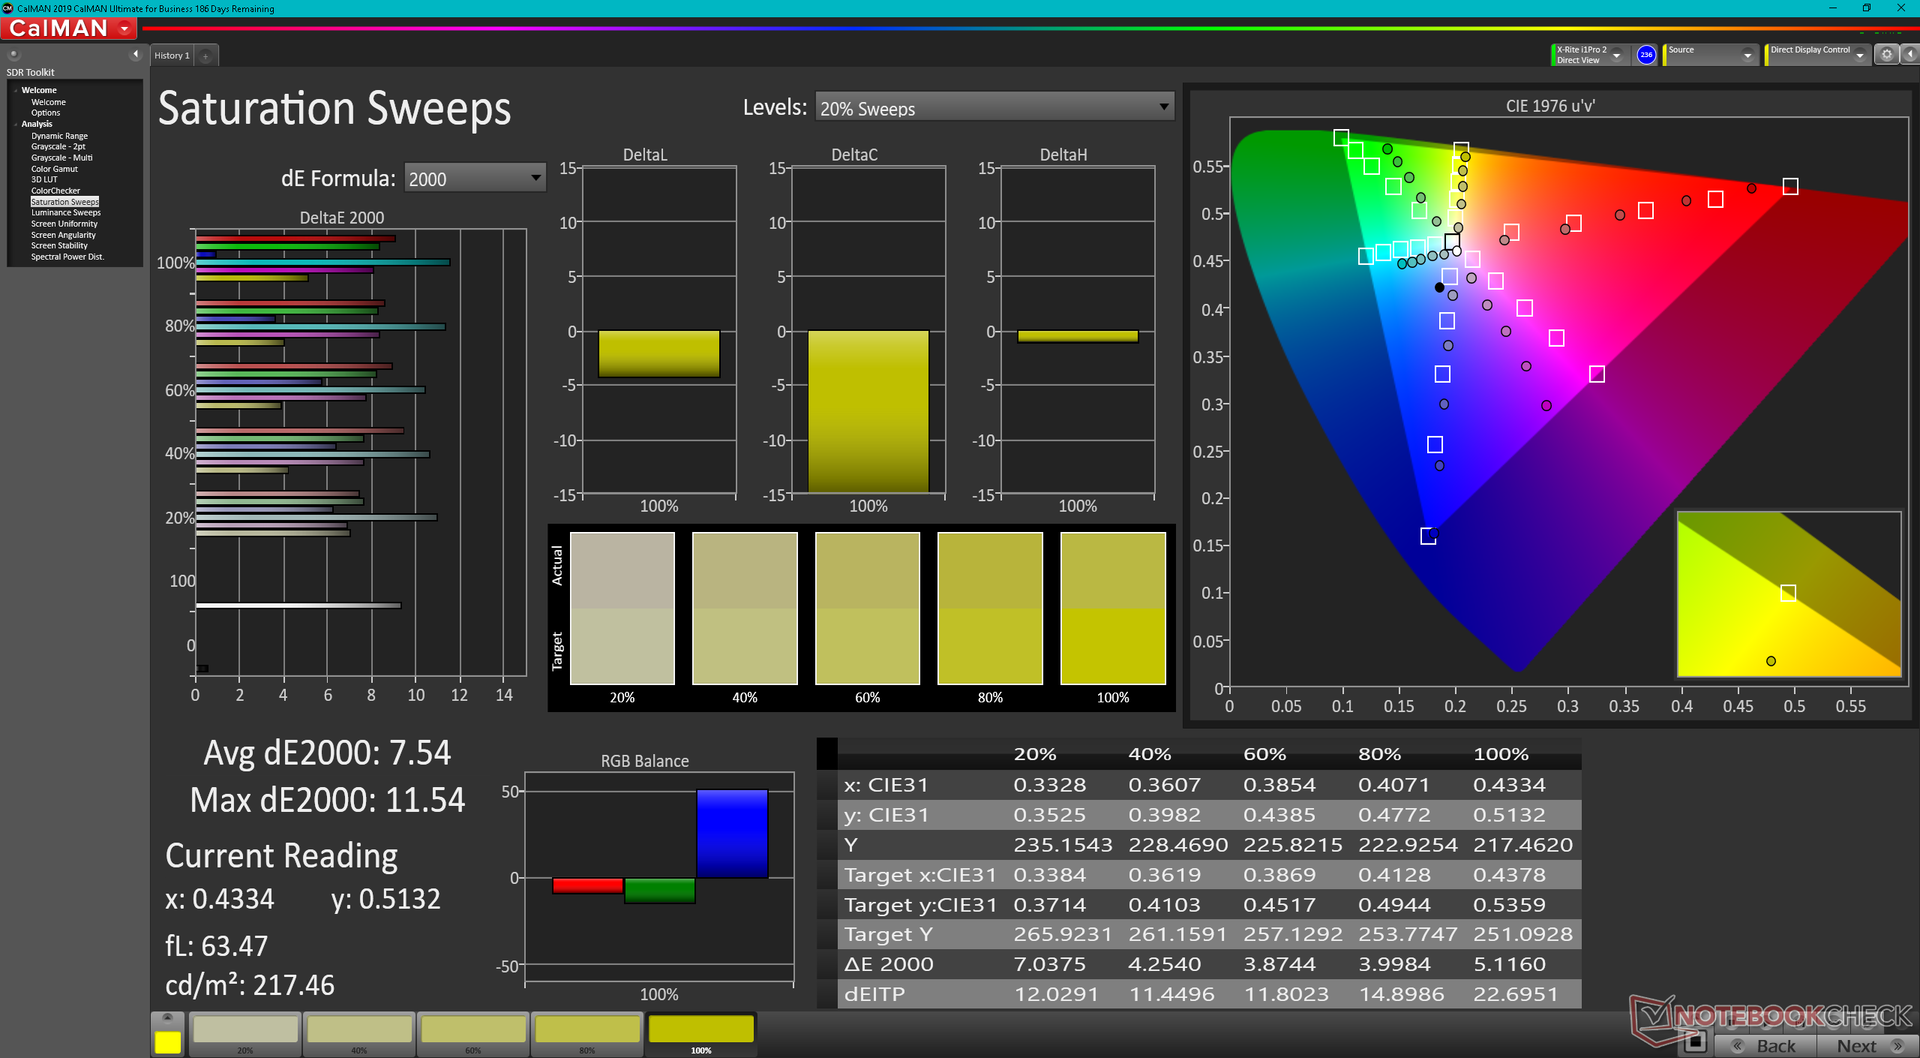
ΔE ColorChecker Calman: 5.98 | ∀{0.5-29.43 Ø4.72}
ΔE Greyscale Calman: 7.2 | ∀{0.09-98 Ø4.97}
85.3% AdobeRGB 1998 (Argyll 3D)
100% sRGB (Argyll 3D)
92.9% Display P3 (Argyll 3D)
Gamma: 2.54
CCT: 6914 K
| Dell XPS 17 9720 RTX 3060 Sharp LQ170R1, IPS, 3840x2400, 17" | Dell XPS 17 9700 Core i7 RTX 2060 Max-Q Sharp LQ170R1, IPS, 3840x2400, 17" | Dell XPS 17 9700 i5-10300H SHP14D7, IPS, 1920x1200, 17.3" | HP Envy 17-cg AU Optronics AUO439D, IPS, 1920x1080, 17.3" | Lenovo Legion 5 17ACH6H-82JY0003GE LEN173FHD, IPS, 1920x1080, 17.3" | Asus VivoBook 17 F712JA-AU708W BOE NV173FHM-N49, IPS, 1920x1080, 17.3" | Razer Blade 17 (i7-12800H, RTX 3070 Ti) BOE CQ NE173QHM-NZ1 (BOE09F9), IPS, 2560x1440, 17.3" | |
|---|---|---|---|---|---|---|---|
| Display | 5% | -9% | -17% | -18% | -50% | 2% | |
| Display P3 Coverage (%) | 92.9 | 90.5 -3% | 77.4 -17% | 68 -27% | 64.8 -30% | 39.53 -57% | 97.9 5% |
| sRGB Coverage (%) | 100 | 100 0% | 100 0% | 95 -5% | 97.2 -3% | 58.85 -41% | 99.9 0% |
| AdobeRGB 1998 Coverage (%) | 85.3 | 99.8 17% | 76.6 -10% | 69 -19% | 66.7 -22% | 40.84 -52% | 85.5 0% |
| Response Times | 5% | -13% | 19% | 73% | 57% | 69% | |
| Response Time Grey 50% / Grey 80% * (ms) | 51.2 ? | 51.2 ? -0% | 60.4 ? -18% | 40 ? 22% | 15 ? 71% | 22 ? 57% | 15.2 ? 70% |
| Response Time Black / White * (ms) | 35.2 ? | 32 ? 9% | 37.6 ? -7% | 30 ? 15% | 9 ? 74% | 15 ? 57% | 11.2 ? 68% |
| PWM Frequency (Hz) | 2500 ? | ||||||
| Bildschirm | 20% | 33% | 6% | 16% | -16% | -9% | |
| Helligkeit Bildmitte (cd/m²) | 512.7 | 539.4 5% | 636 24% | 347 -32% | 323 -37% | 269 -48% | 341 -33% |
| Brightness (cd/m²) | 463 | 494 7% | 580 25% | 329 -29% | 305 -34% | 263 -43% | 308 -33% |
| Brightness Distribution (%) | 85 | 84 -1% | 86 1% | 89 5% | 89 5% | 88 4% | 82 -4% |
| Schwarzwert * (cd/m²) | 0.32 | 0.32 -0% | 0.34 -6% | 0.27 16% | 0.25 22% | 0.3 6% | 0.45 -41% |
| Kontrast (:1) | 1602 | 1686 5% | 1871 17% | 1285 -20% | 1292 -19% | 897 -44% | 758 -53% |
| Delta E Colorchecker * | 5.98 | 4.12 31% | 2.4 60% | 3.75 37% | 1.87 69% | 5.8 3% | 4.16 30% |
| Colorchecker dE 2000 max. * | 12.09 | 7.65 37% | 3.5 71% | 7.53 38% | 4.84 60% | 18.46 -53% | 8.14 33% |
| Delta E Graustufen * | 7.2 | 1.5 79% | 2 72% | 4.88 32% | 2.57 64% | 3.64 49% | 5.09 29% |
| Gamma | 2.54 87% | 2.15 102% | 2.08 106% | 2.53 87% | 2.42 91% | 2.35 94% | 2.48 89% |
| CCT | 6914 94% | 6438 101% | 6704 97% | 6624 98% | 7012 93% | 6995 93% | 6884 94% |
| Colorchecker dE 2000 calibrated * | 3.91 | 1.5 | 0.92 | 3 | |||
| Farbraum (Prozent von AdobeRGB 1998) (%) | 90.4 | 67.5 | |||||
| Color Space (Percent of sRGB) (%) | 100 | 100 | |||||
| Durchschnitt gesamt (Programm / Settings) | 10% /
14% | 4% /
16% | 3% /
3% | 24% /
17% | -3% /
-12% | 21% /
5% |
* ... kleinere Werte sind besser
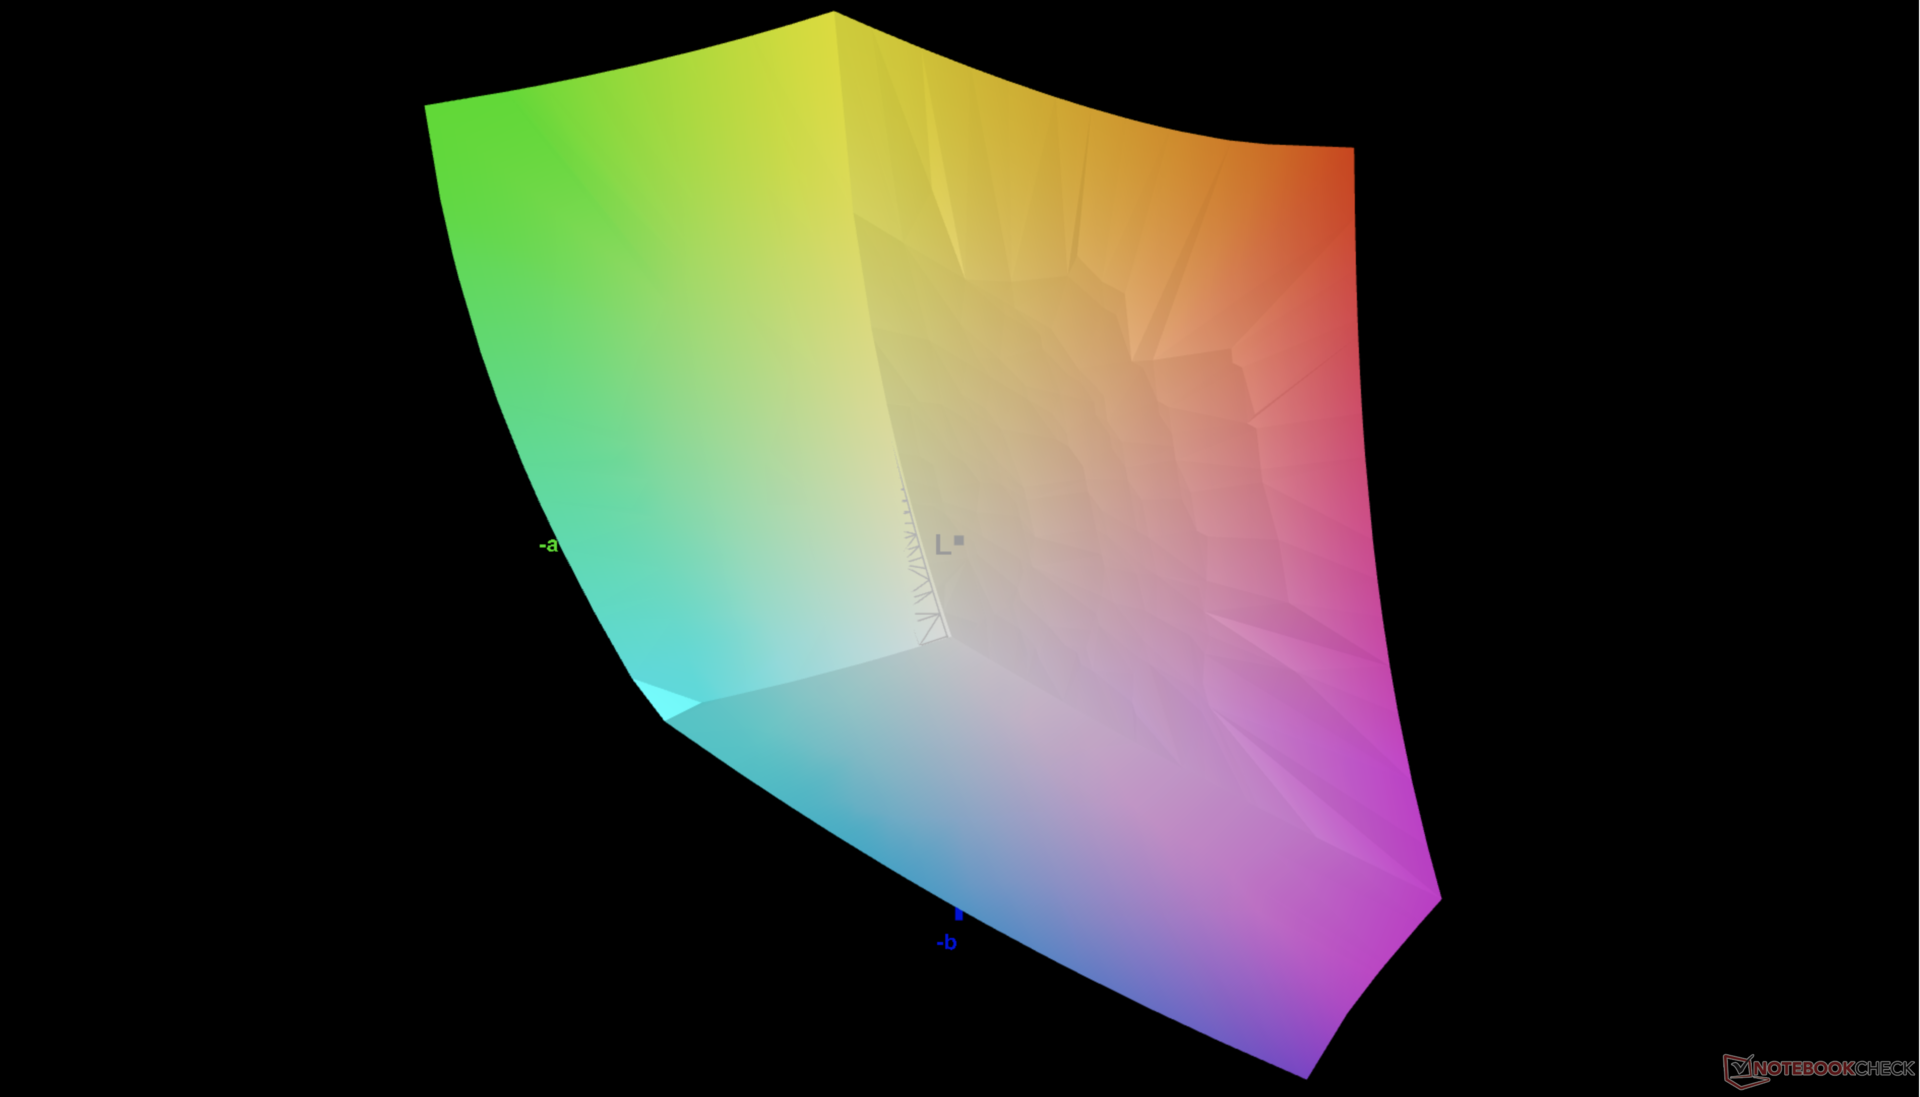
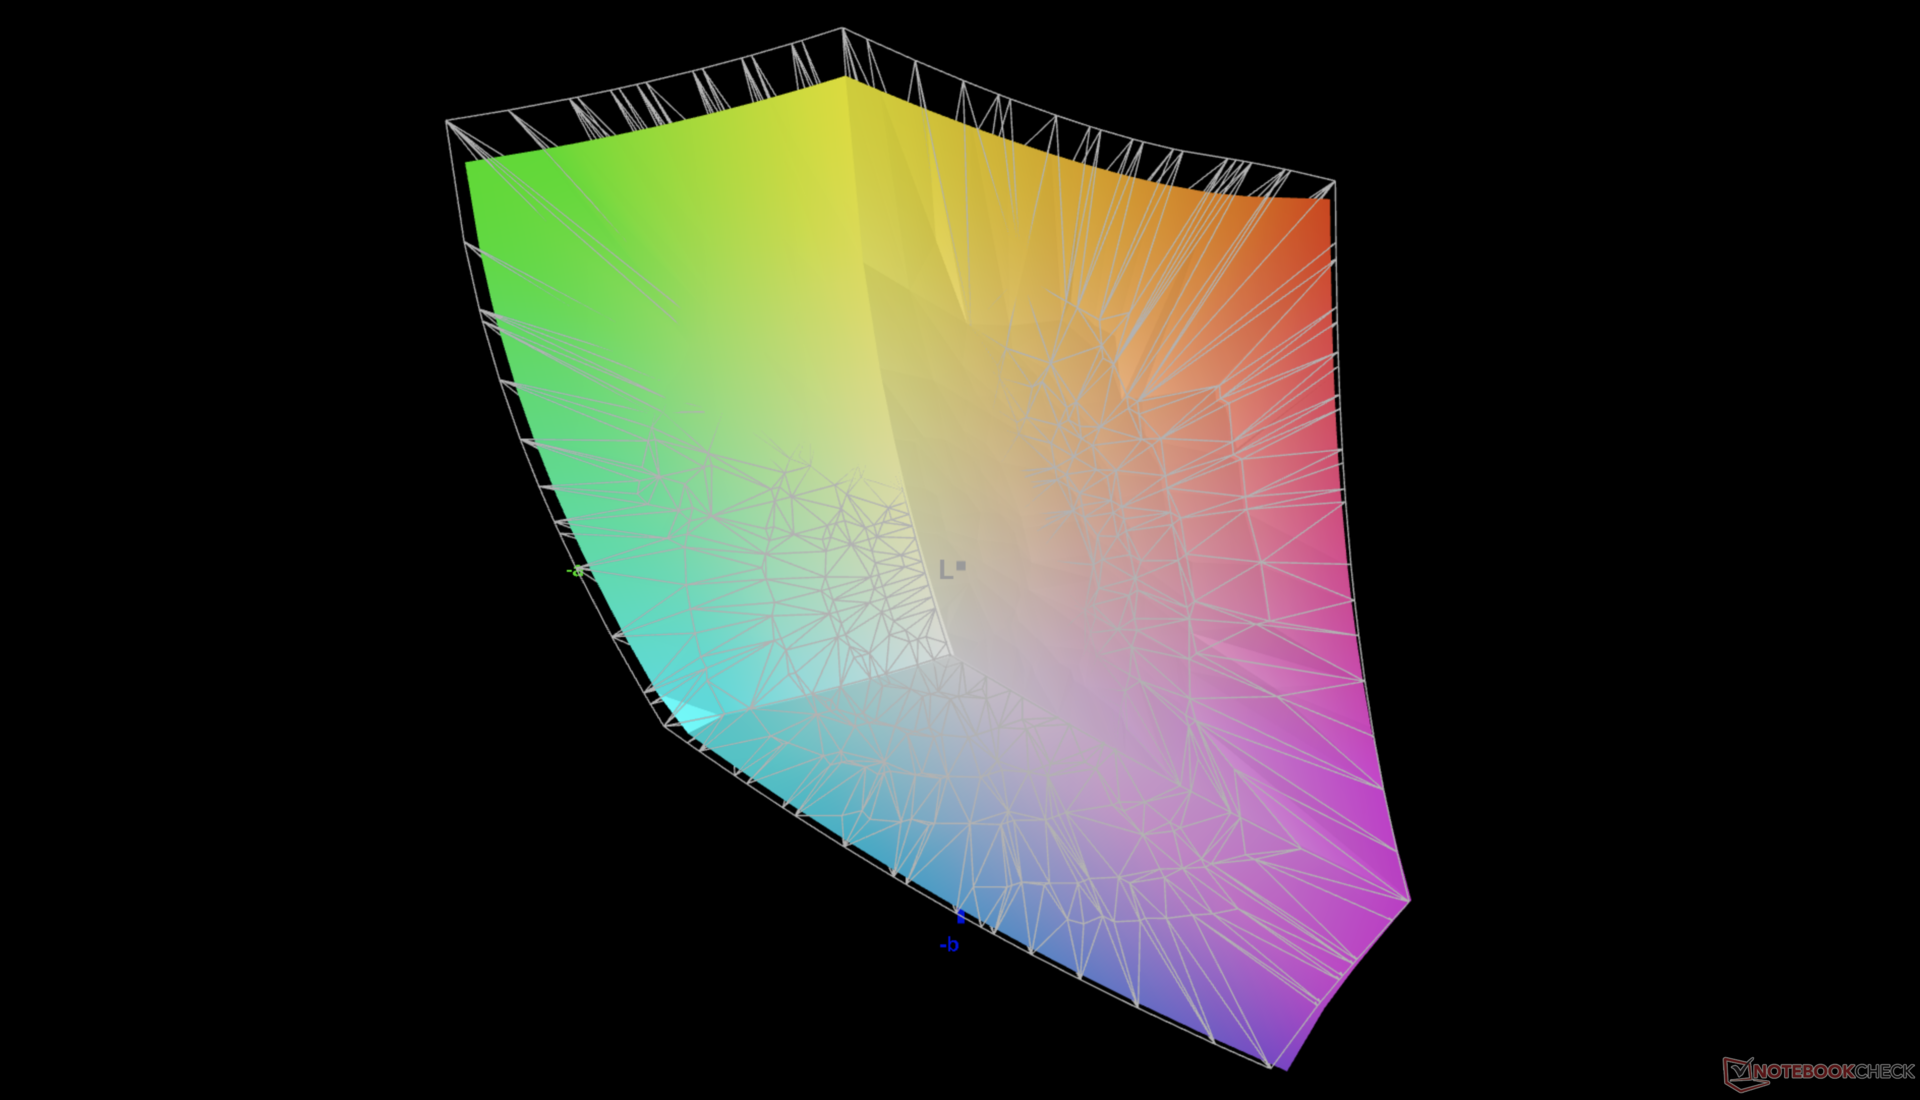
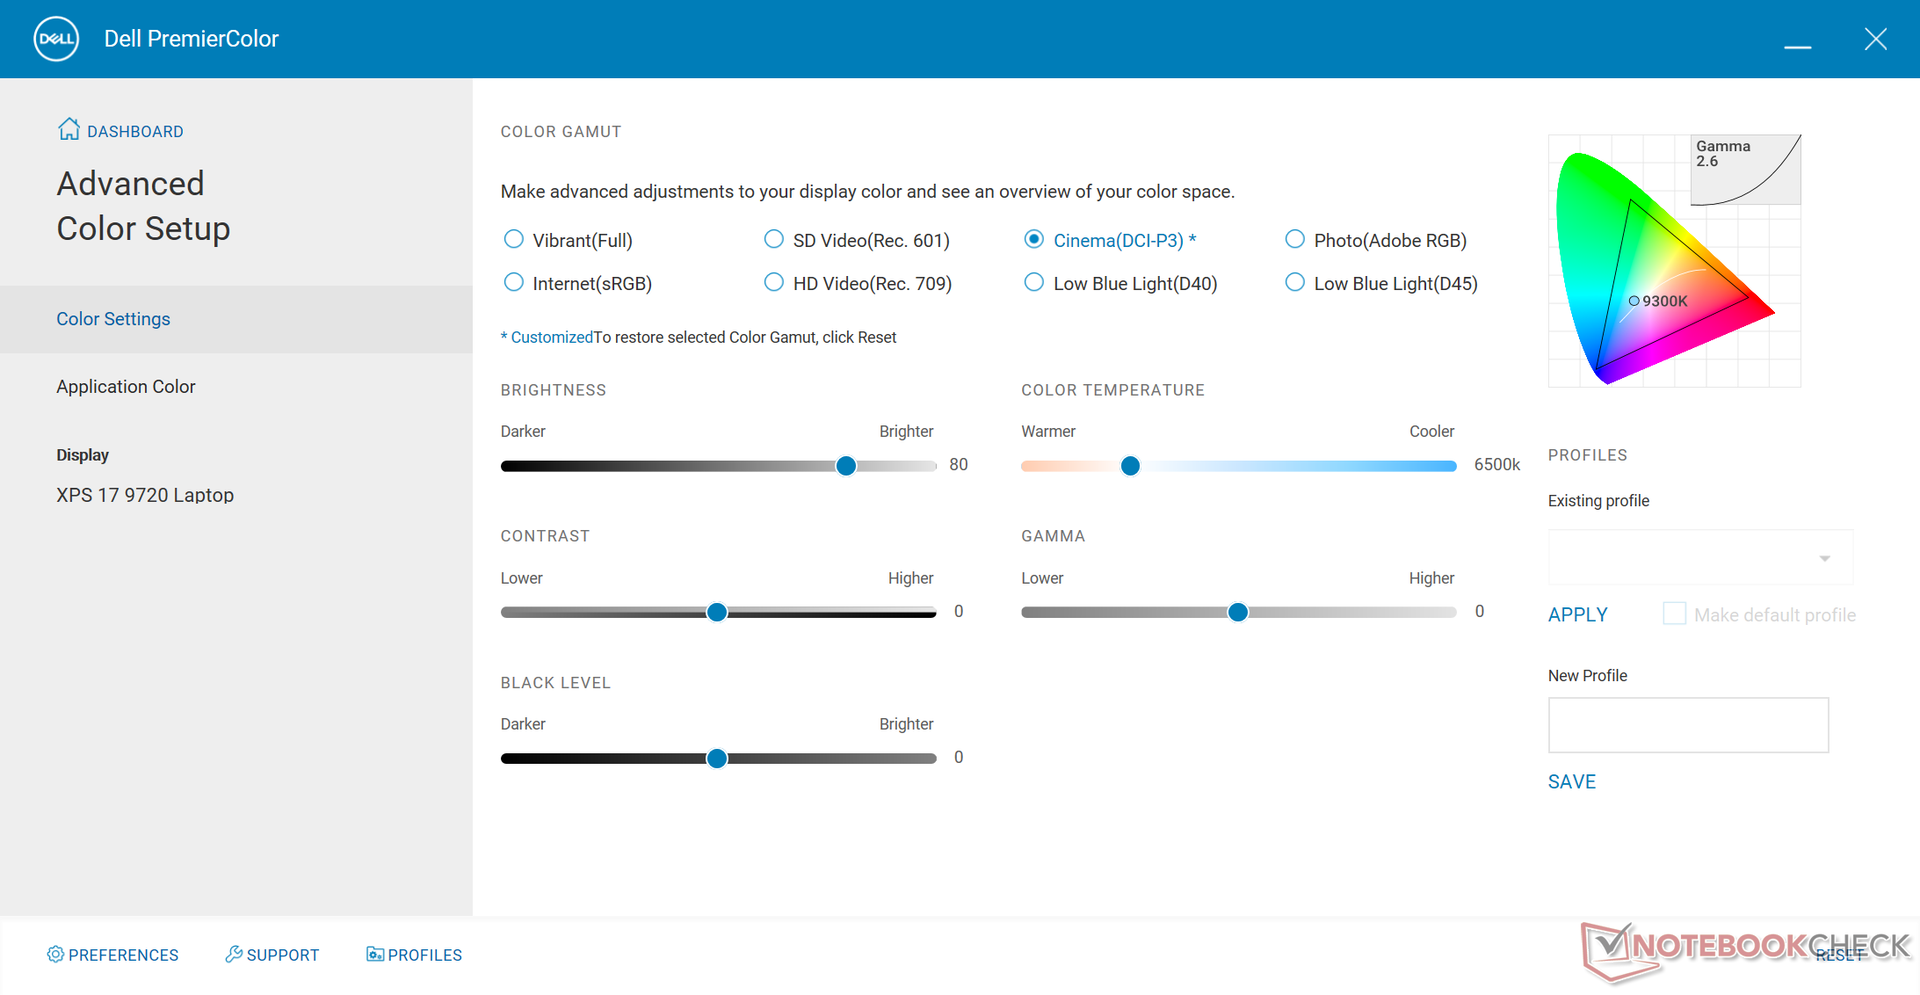
Die Farbtemperatur ist wärmer als erwartet, wenn sie über die Dell PremierColor Software auf die DCI-P3-Farbe Standard eingestellt wird. Im Gegensatz zu vielen professionellen Laptops wie der Dell-Precision-, Gigabyte-Aero- oder HP-ZBook-Serie, ist die XPS Serie nicht werkseitig mit X-Rite kalibriert. Eine Endbenutzerkalibrierung wäre notwendig, um die große Farbskala des Panels besser nutzen zu können.
Reaktionszeiten (Response Times) des Displays
| ↔ Reaktionszeiten Schwarz zu Weiß | ||
|---|---|---|
| 35.2 ms ... steigend ↗ und fallend ↘ kombiniert | ↗ 18.8 ms steigend | 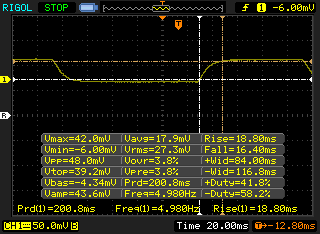 |
| ↘ 16.4 ms fallend | ||
| Die gemessenen Reaktionszeiten sind langsam und dadurch für viele Spieler wahrscheinlich zu langsam. Im Vergleich rangierten die bei uns getesteten Geräte von 0.1 (Minimum) zu 240 (Maximum) ms. » 93 % aller Screens waren schneller als der getestete. Daher sind die gemessenen Reaktionszeiten schlechter als der Durchschnitt aller vermessenen Geräte (19.8 ms). | ||
| ↔ Reaktionszeiten 50% Grau zu 80% Grau | ||
| 51.2 ms ... steigend ↗ und fallend ↘ kombiniert | ↗ 26 ms steigend | 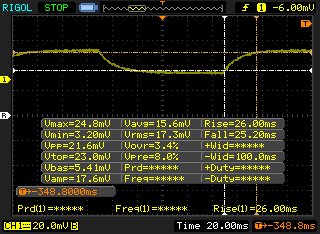 |
| ↘ 25.2 ms fallend | ||
| Die gemessenen Reaktionszeiten sind langsam und dadurch für viele Spieler wahrscheinlich zu langsam. Im Vergleich rangierten die bei uns getesteten Geräte von 0.165 (Minimum) zu 636 (Maximum) ms. » 88 % aller Screens waren schneller als der getestete. Daher sind die gemessenen Reaktionszeiten schlechter als der Durchschnitt aller vermessenen Geräte (31 ms). | ||
Bildschirm-Flackern / PWM (Pulse-Width Modulation)
| Flackern / PWM nicht festgestellt | 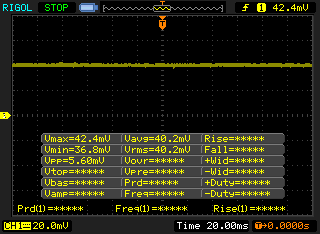 | ||
Im Vergleich: 52 % aller getesteten Geräte nutzten kein PWM um die Helligkeit zu reduzieren. Wenn PWM eingesetzt wurde, dann bei einer Frequenz von durchschnittlich 7769 (Minimum 5, Maximum 343500) Hz. | |||

Performance - Alder Lake-H erhöht den Einsatz
Testbedingungen
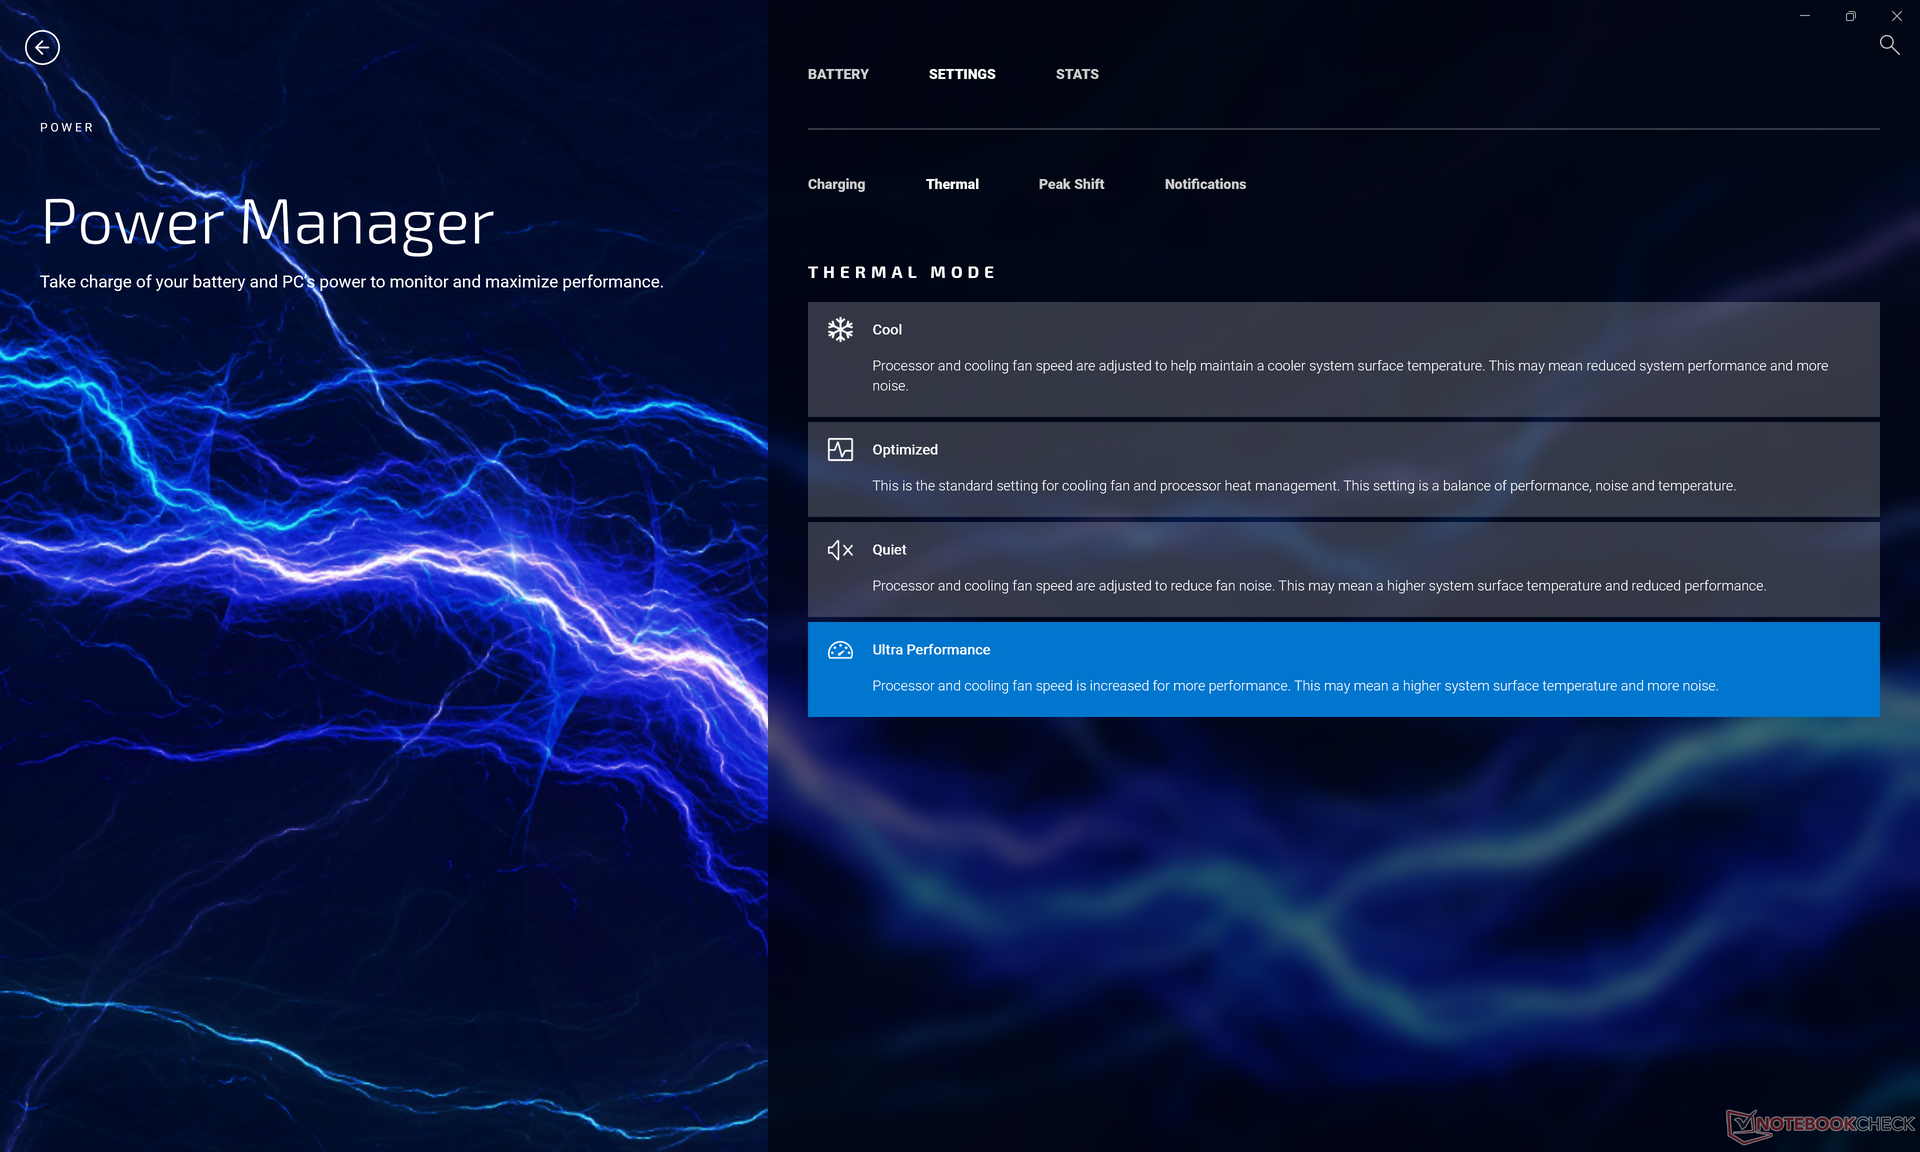
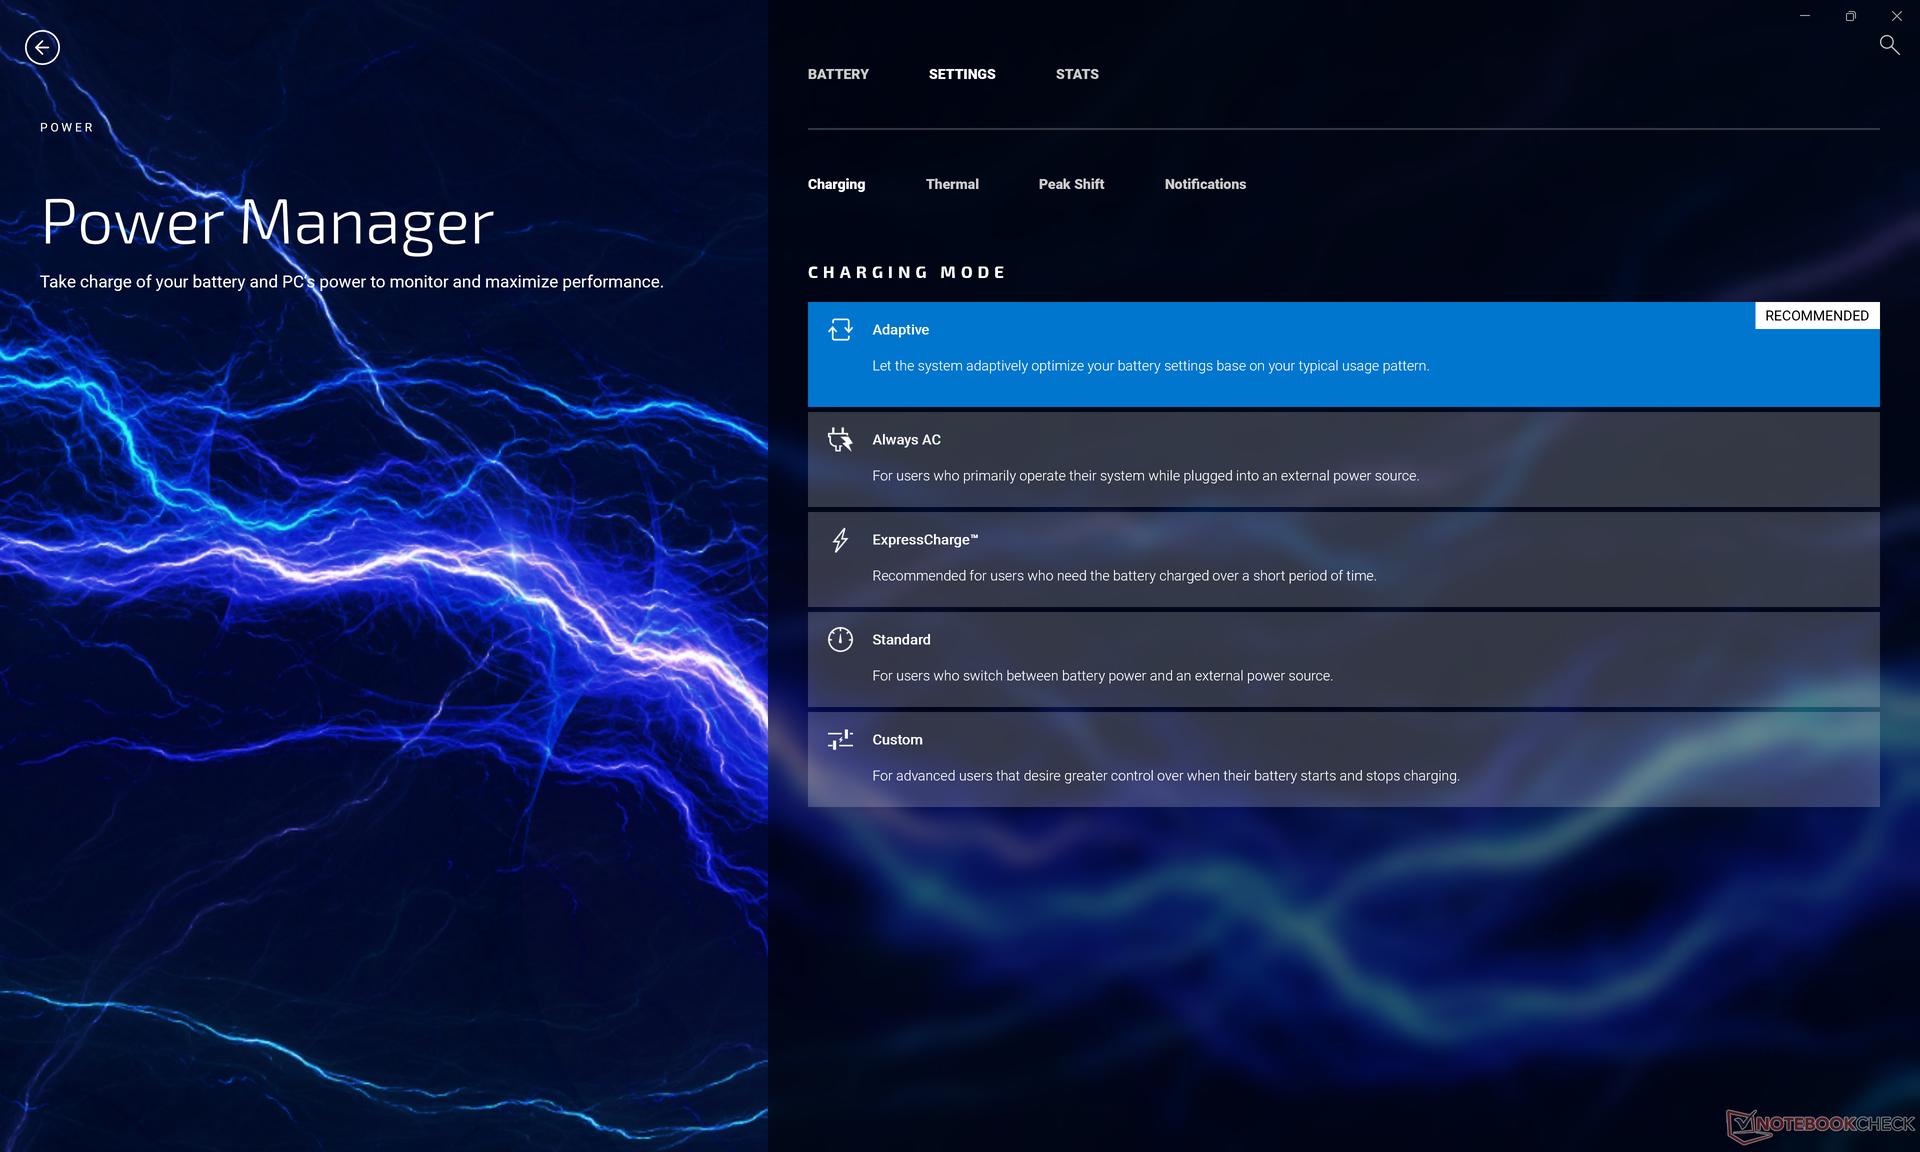
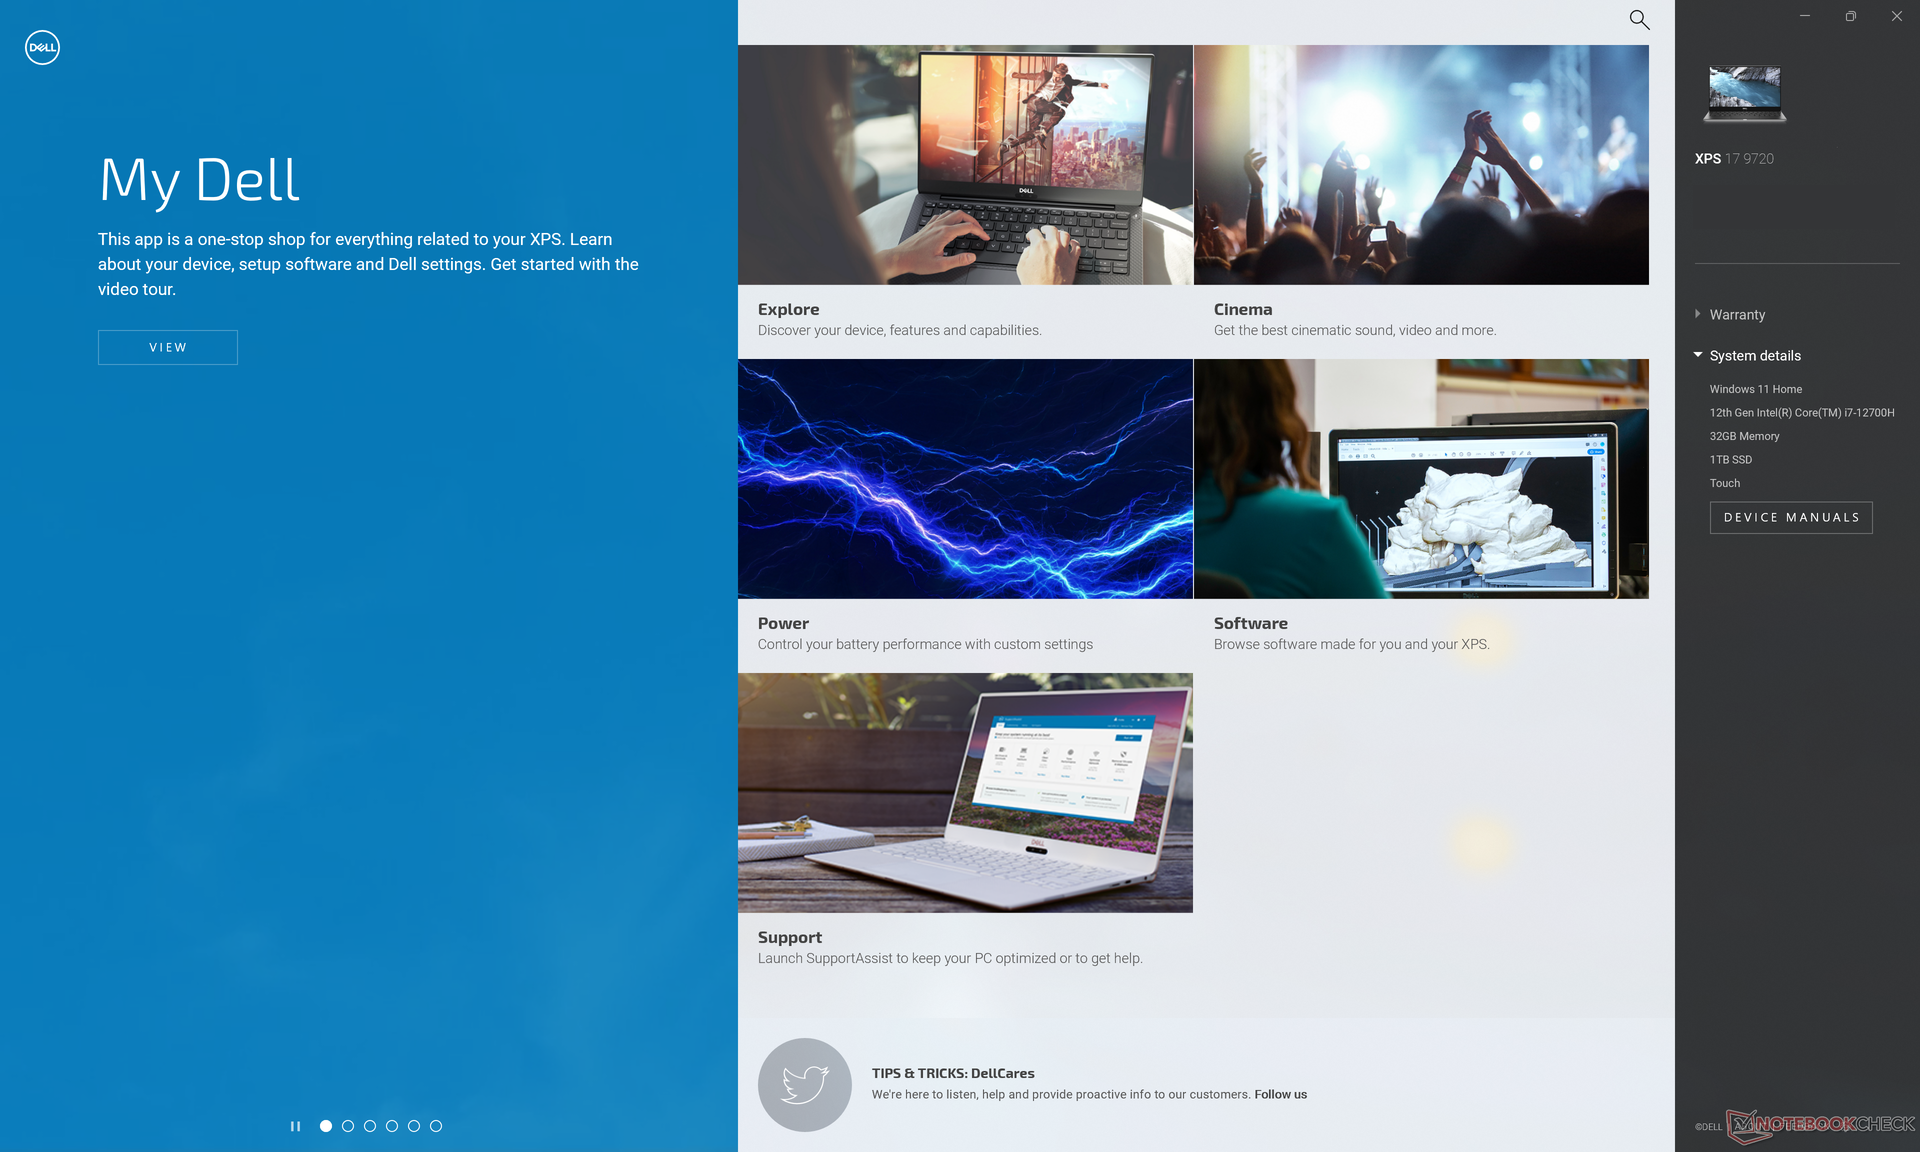
Unser Gerät wurde über die My Dell Software auf den Ultra-Performance-Modus eingestellt, bevor wir die folgenden Benchmarks durchgeführt haben, um die bestmöglichen Ergebnisse zu erzielen. Wir empfehlen Benutzern, sich mit der My-Dell-, Dell-Update- und PremierColor-Software vertraut zu machen, da wichtige Funktionen des Systems über diese Apps umgeschaltet werden.
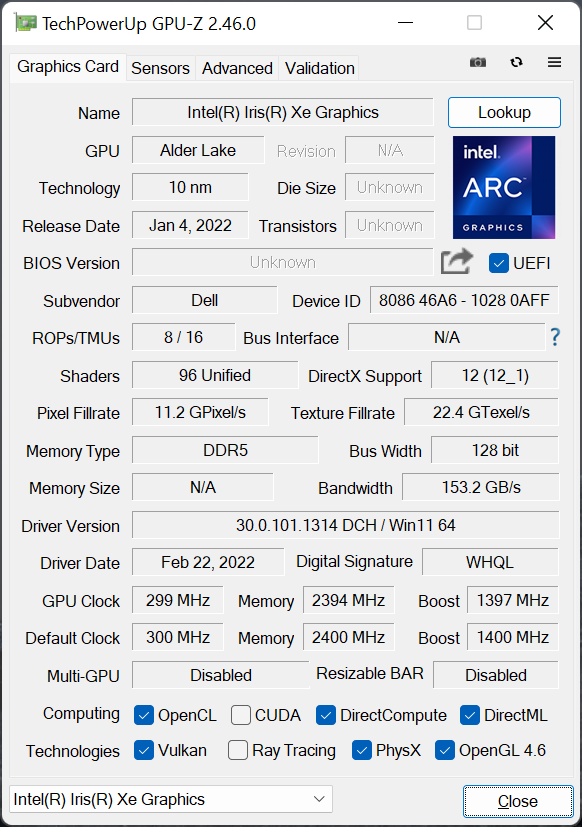
Optimus 1.0 wird mitgeliefert für die automatische Grafikumschaltung zwischen der integrierten GPU und der diskreten GeForce RTX 3060. Interne adaptive Sync und MUX werden nicht unterstützt, da das XPS 17 kein Gaming-Gerät ist.
Prozessor
CineBench xT-Benchmarks und bestimmte AIDA64-Subtests können bis zu 50 % schneller sein als beim XPS 15 9710, das mit der letzten Generation Core i7-11800H ausgestattet ist, was eine signifikante Leistungsverbesserung im Vergleich zum Vorjahr darstellt (Prozessor). Bei anderen Tests, wie z. B. Blender und HWBOT x265, sind die Zuwächse jedoch viel geringer, aber die durchschnittlichen Zuwächse sind immer noch größer als die, die wir zwischen dem XPS 17 9700 und XPS 17 9710 beobachtet haben.
Kurioserweise ist der Core i7-12700H bei einer Reihe von AIDA64-Benchmarks hinter dem 10.-Generation-Core-i7-10875H zurück, wie unten gezeigt.
Einige dickere Laptops mit der gleichen Core-i7-12800H-CPU sind in der Lage, die Prozessor mit höheren Taktraten und bis zu 20 Prozent schneller auszuführen, wie z.B. beim HP Omen 16.
Die Ausführung von CineBench R15 xT in einer Schleife zeigt keine größeren Leistungseinbrüche, wenn das System über einen längeren Zeitraum extremen Belastungen ausgesetzt ist.
Cinebench R15 Multi Loop
Cinebench R23: Multi Core | Single Core
Cinebench R15: CPU Multi 64Bit | CPU Single 64Bit
Blender: v2.79 BMW27 CPU
7-Zip 18.03: 7z b 4 | 7z b 4 -mmt1
Geekbench 5.5: Multi-Core | Single-Core
HWBOT x265 Benchmark v2.2: 4k Preset
LibreOffice : 20 Documents To PDF
R Benchmark 2.5: Overall mean
| Cinebench R23 / Multi Core | |
| Alienware x17 R2 P48E | |
| Dell XPS 17 9720 RTX 3060 | |
| Durchschnittliche Intel Core i7-12700H (4032 - 19330, n=64) | |
| Razer Blade 17 RTX 3080 Ti | |
| Alienware x17 RTX 3080 P48E | |
| MSI GS76 Stealth 11UH | |
| Asus ROG Strix G17 G713QE-RB74 | |
| Dell XPS 17 9710 Core i7 RTX 3060 | |
| Schenker XMG Core 17 (Early 2021) | |
| Acer Nitro 5 AN517-53-54DQ | |
| Cinebench R23 / Single Core | |
| Alienware x17 R2 P48E | |
| Razer Blade 17 RTX 3080 Ti | |
| Dell XPS 17 9720 RTX 3060 | |
| Durchschnittliche Intel Core i7-12700H (778 - 1826, n=63) | |
| MSI GS76 Stealth 11UH | |
| Alienware x17 RTX 3080 P48E | |
| Dell XPS 17 9710 Core i7 RTX 3060 | |
| Acer Nitro 5 AN517-53-54DQ | |
| Asus ROG Strix G17 G713QE-RB74 | |
| Schenker XMG Core 17 (Early 2021) | |
| Geekbench 5.5 / Multi-Core | |
| Alienware x17 R2 P48E | |
| Razer Blade 17 RTX 3080 Ti | |
| Dell XPS 17 9720 RTX 3060 | |
| Durchschnittliche Intel Core i7-12700H (5144 - 13745, n=64) | |
| MSI GS76 Stealth 11UH | |
| Dell XPS 17 9700 Core i7 RTX 2060 Max-Q | |
| Schenker XMG Core 17 (Early 2021) | |
| Acer Nitro 5 AN517-53-54DQ | |
| Dell XPS 17 9700 i5-10300H | |
| Geekbench 5.5 / Single-Core | |
| Alienware x17 R2 P48E | |
| Razer Blade 17 RTX 3080 Ti | |
| Durchschnittliche Intel Core i7-12700H (803 - 1851, n=64) | |
| Dell XPS 17 9720 RTX 3060 | |
| MSI GS76 Stealth 11UH | |
| Acer Nitro 5 AN517-53-54DQ | |
| Dell XPS 17 9700 Core i7 RTX 2060 Max-Q | |
| Schenker XMG Core 17 (Early 2021) | |
| Dell XPS 17 9700 i5-10300H | |
Cinebench R23: Multi Core | Single Core
Cinebench R15: CPU Multi 64Bit | CPU Single 64Bit
Blender: v2.79 BMW27 CPU
7-Zip 18.03: 7z b 4 | 7z b 4 -mmt1
Geekbench 5.5: Multi-Core | Single-Core
HWBOT x265 Benchmark v2.2: 4k Preset
LibreOffice : 20 Documents To PDF
R Benchmark 2.5: Overall mean
* ... kleinere Werte sind besser
| AIDA64 / FP32 Ray-Trace | |
| Eurocom RX315 NH57AF1 | |
| Lenovo Legion 5 17ACH6H-82JY0003GE | |
| Durchschnittliche Intel Core i7-12700H (2585 - 17957, n=64) | |
| Dell XPS 17 9700 Core i7 RTX 2060 Max-Q | |
| Razer Blade 17 (i7-12800H, RTX 3070 Ti) | |
| Dell XPS 17 9720 RTX 3060 | |
| Asus VivoBook 17 F712JA-AU708W | |
| AIDA64 / FPU Julia | |
| Lenovo Legion 5 17ACH6H-82JY0003GE | |
| Eurocom RX315 NH57AF1 | |
| Durchschnittliche Intel Core i7-12700H (12439 - 90760, n=64) | |
| Dell XPS 17 9700 Core i7 RTX 2060 Max-Q | |
| Razer Blade 17 (i7-12800H, RTX 3070 Ti) | |
| Dell XPS 17 9720 RTX 3060 | |
| Asus VivoBook 17 F712JA-AU708W | |
| AIDA64 / CPU SHA3 | |
| Eurocom RX315 NH57AF1 | |
| Durchschnittliche Intel Core i7-12700H (833 - 4242, n=64) | |
| Razer Blade 17 (i7-12800H, RTX 3070 Ti) | |
| Lenovo Legion 5 17ACH6H-82JY0003GE | |
| Dell XPS 17 9720 RTX 3060 | |
| Dell XPS 17 9700 Core i7 RTX 2060 Max-Q | |
| Asus VivoBook 17 F712JA-AU708W | |
| AIDA64 / CPU Queen | |
| Dell XPS 17 9720 RTX 3060 | |
| Durchschnittliche Intel Core i7-12700H (57923 - 103202, n=63) | |
| Razer Blade 17 (i7-12800H, RTX 3070 Ti) | |
| Eurocom RX315 NH57AF1 | |
| Dell XPS 17 9700 Core i7 RTX 2060 Max-Q | |
| Lenovo Legion 5 17ACH6H-82JY0003GE | |
| Asus VivoBook 17 F712JA-AU708W | |
| AIDA64 / FPU SinJulia | |
| Eurocom RX315 NH57AF1 | |
| Razer Blade 17 (i7-12800H, RTX 3070 Ti) | |
| Lenovo Legion 5 17ACH6H-82JY0003GE | |
| Durchschnittliche Intel Core i7-12700H (3249 - 9939, n=64) | |
| Dell XPS 17 9720 RTX 3060 | |
| Dell XPS 17 9700 Core i7 RTX 2060 Max-Q | |
| Asus VivoBook 17 F712JA-AU708W | |
| AIDA64 / FPU Mandel | |
| Lenovo Legion 5 17ACH6H-82JY0003GE | |
| Eurocom RX315 NH57AF1 | |
| Durchschnittliche Intel Core i7-12700H (7135 - 44760, n=64) | |
| Dell XPS 17 9700 Core i7 RTX 2060 Max-Q | |
| Razer Blade 17 (i7-12800H, RTX 3070 Ti) | |
| Dell XPS 17 9720 RTX 3060 | |
| Asus VivoBook 17 F712JA-AU708W | |
| AIDA64 / CPU AES | |
| Eurocom RX315 NH57AF1 | |
| Lenovo Legion 5 17ACH6H-82JY0003GE | |
| Durchschnittliche Intel Core i7-12700H (31839 - 144360, n=64) | |
| Dell XPS 17 9720 RTX 3060 | |
| Razer Blade 17 (i7-12800H, RTX 3070 Ti) | |
| Asus VivoBook 17 F712JA-AU708W | |
| Dell XPS 17 9700 Core i7 RTX 2060 Max-Q | |
| AIDA64 / CPU ZLib | |
| Razer Blade 17 (i7-12800H, RTX 3070 Ti) | |
| Durchschnittliche Intel Core i7-12700H (305 - 1171, n=64) | |
| Dell XPS 17 9720 RTX 3060 | |
| Eurocom RX315 NH57AF1 | |
| Lenovo Legion 5 17ACH6H-82JY0003GE | |
| Dell XPS 17 9700 Core i7 RTX 2060 Max-Q | |
| Asus VivoBook 17 F712JA-AU708W | |
| Dell XPS 17 9710 Core i7 RTX 3060 | |
| HP Envy 17-cg | |
| AIDA64 / FP64 Ray-Trace | |
| Eurocom RX315 NH57AF1 | |
| Lenovo Legion 5 17ACH6H-82JY0003GE | |
| Durchschnittliche Intel Core i7-12700H (1437 - 9692, n=64) | |
| Dell XPS 17 9700 Core i7 RTX 2060 Max-Q | |
| Dell XPS 17 9720 RTX 3060 | |
| Razer Blade 17 (i7-12800H, RTX 3070 Ti) | |
| Asus VivoBook 17 F712JA-AU708W | |
| AIDA64 / CPU PhotoWorxx | |
| Dell XPS 17 9720 RTX 3060 | |
| Durchschnittliche Intel Core i7-12700H (12863 - 52207, n=64) | |
| Razer Blade 17 (i7-12800H, RTX 3070 Ti) | |
| Dell XPS 17 9700 Core i7 RTX 2060 Max-Q | |
| Eurocom RX315 NH57AF1 | |
| Asus VivoBook 17 F712JA-AU708W | |
| Lenovo Legion 5 17ACH6H-82JY0003GE | |
System Performance
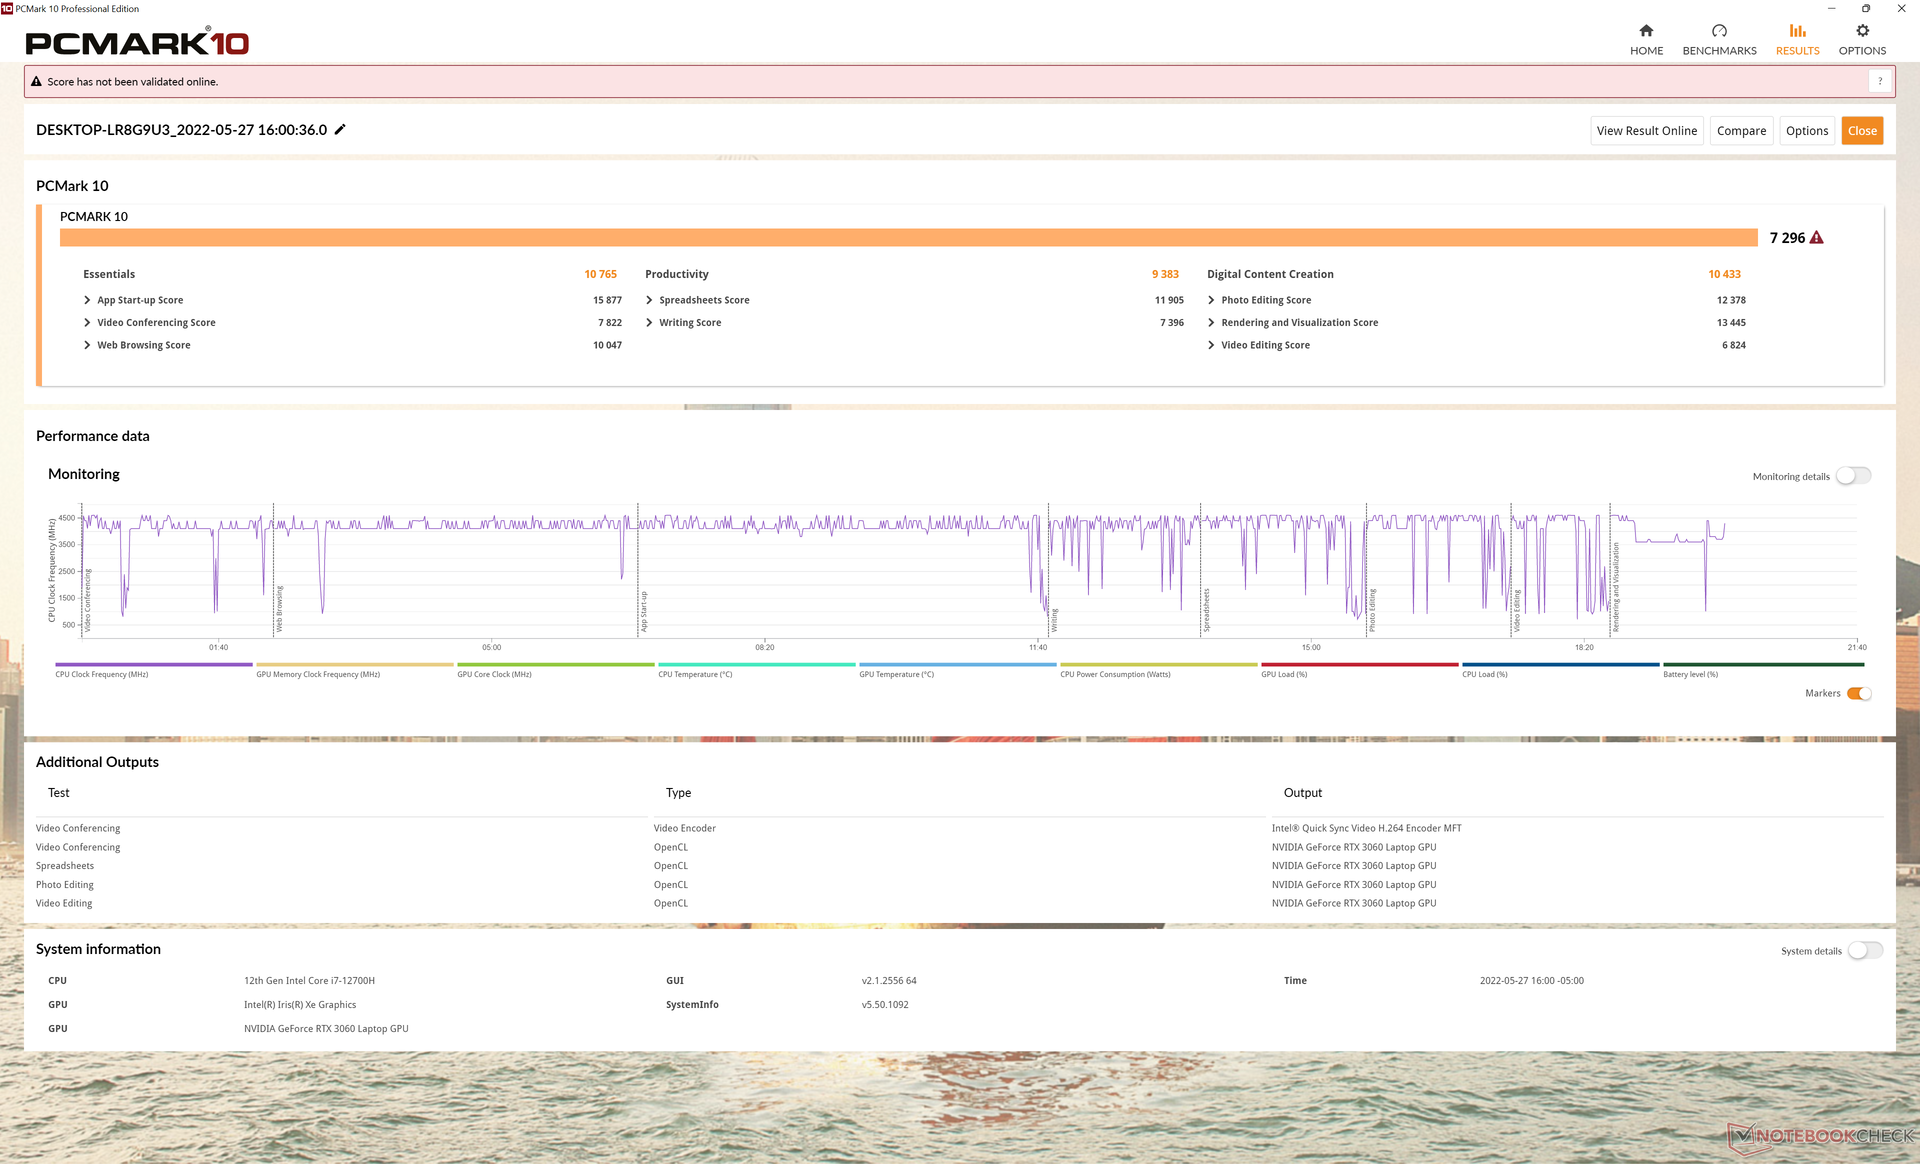
Die PCMark-10-Ergebnisse sind durchweg höher als die des XPS 17 9710, wenn auch nur knapp. Die Ergebnisse des XPS 17 9720 gehören immer noch zu den schnellsten in der Multimedia-Kategorie.
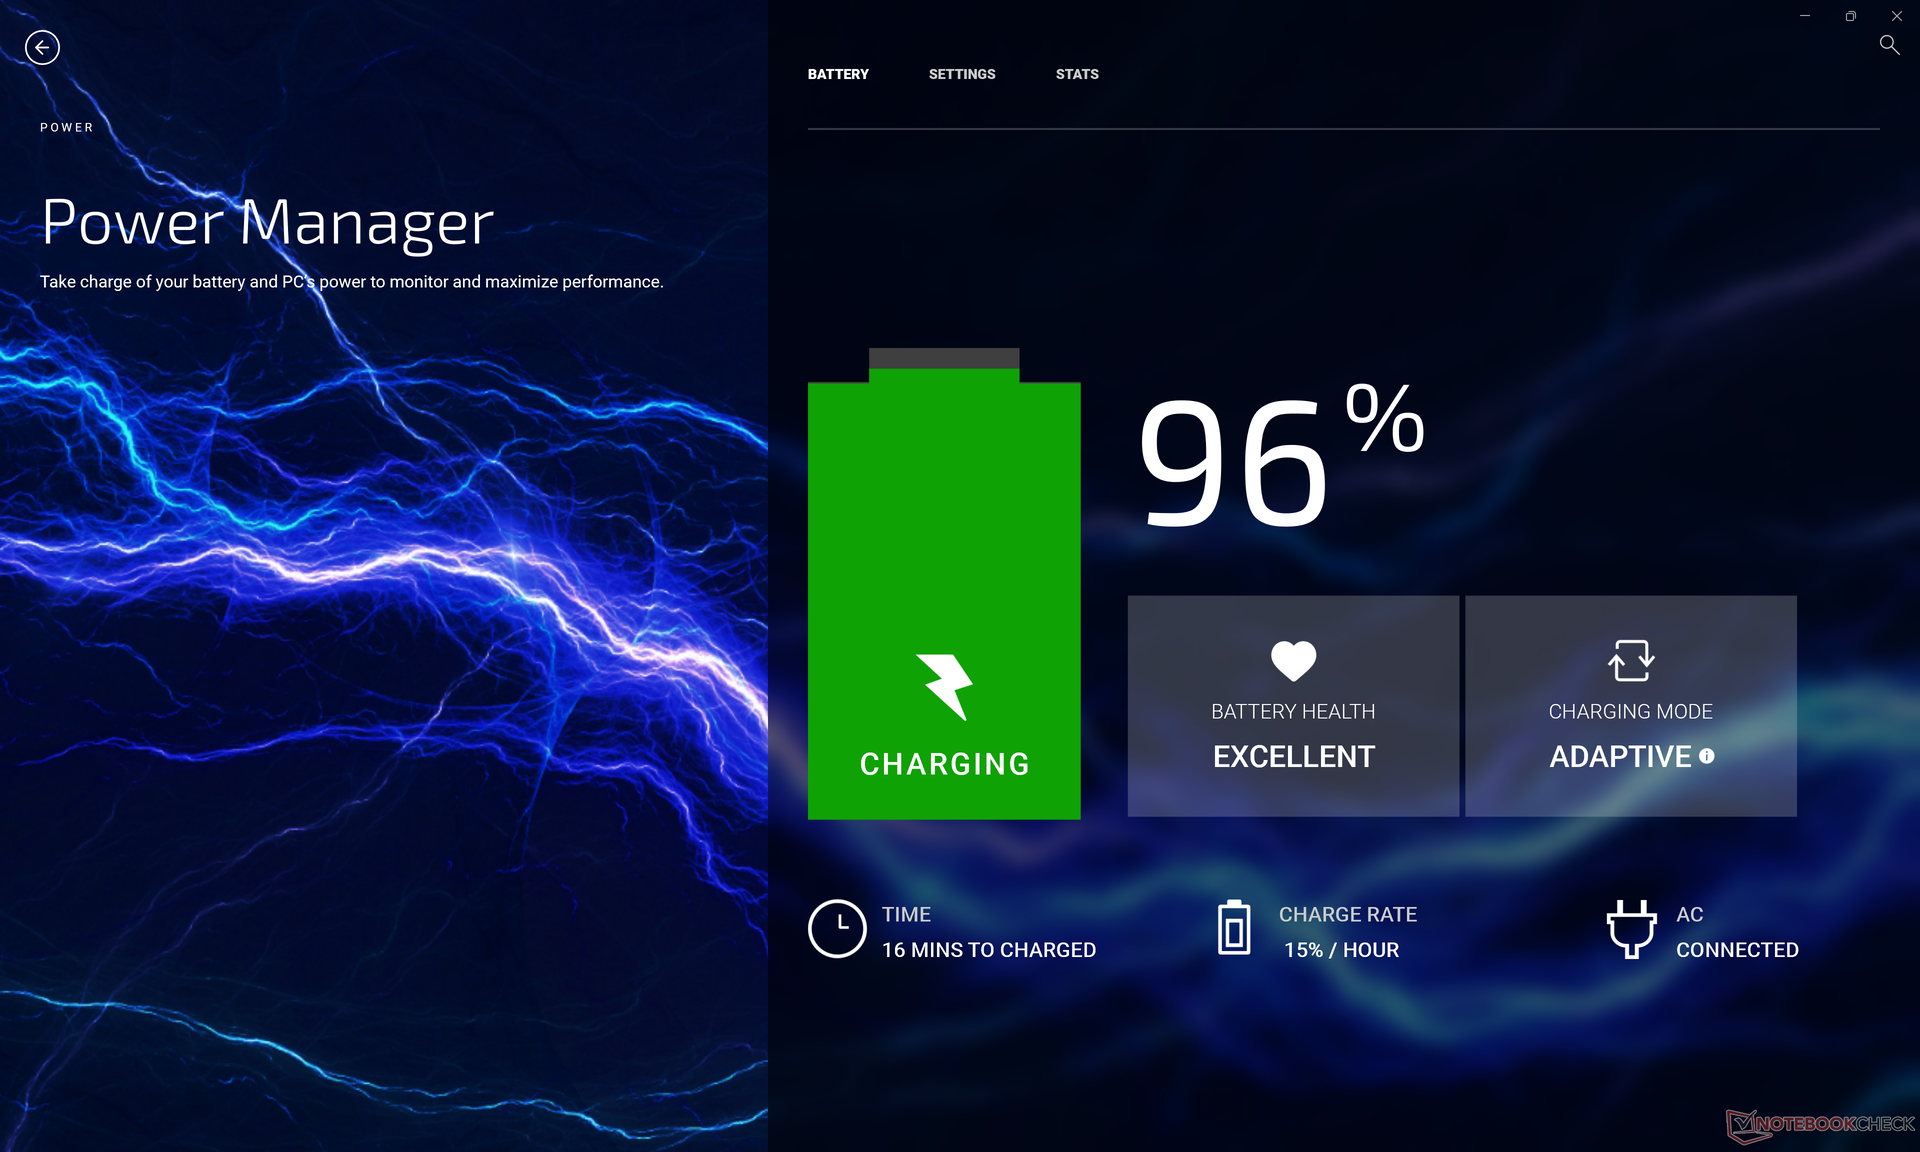
Bei unserem Gerät trat ein Fehler auf, bei dem sich die Leistungsaufnahme im Ruhezustand seltsamerweise bei 40 W stabilisierte, anstatt wie üblich bei <2 W, was zu sehr warmen Oberflächentemperaturen und Energieverschwendung führte. Das Umschalten der Energieprofile über My Dell scheint eine vorübergehende Lösung für das Problem zu sein.
CrossMark: Overall | Productivity | Creativity | Responsiveness
| PCMark 10 / Score | |
| Durchschnitt der Klasse Multimedia (4325 - 10386, n=58, der letzten 2 Jahre) | |
| Dell XPS 17 9720 RTX 3060 | |
| Razer Blade 17 (i7-12800H, RTX 3070 Ti) | |
| Durchschnittliche Intel Core i7-12700H, NVIDIA GeForce RTX 3060 Laptop GPU (5986 - 8156, n=12) | |
| Dell XPS 17 9710 Core i7 RTX 3060 | |
| Lenovo Legion 5 17ACH6H-82JY0003GE | |
| Dell XPS 17 9700 Core i7 RTX 2060 Max-Q | |
| HP Envy 17-cg | |
| Asus VivoBook 17 F712JA-AU708W | |
| PCMark 10 / Essentials | |
| Dell XPS 17 9720 RTX 3060 | |
| Durchschnittliche Intel Core i7-12700H, NVIDIA GeForce RTX 3060 Laptop GPU (9289 - 12144, n=12) | |
| Durchschnitt der Klasse Multimedia (8025 - 11664, n=57, der letzten 2 Jahre) | |
| Razer Blade 17 (i7-12800H, RTX 3070 Ti) | |
| Dell XPS 17 9710 Core i7 RTX 3060 | |
| Lenovo Legion 5 17ACH6H-82JY0003GE | |
| Dell XPS 17 9700 Core i7 RTX 2060 Max-Q | |
| HP Envy 17-cg | |
| Asus VivoBook 17 F712JA-AU708W | |
| PCMark 10 / Productivity | |
| Durchschnitt der Klasse Multimedia (7323 - 18233, n=57, der letzten 2 Jahre) | |
| Dell XPS 17 9720 RTX 3060 | |
| Durchschnittliche Intel Core i7-12700H, NVIDIA GeForce RTX 3060 Laptop GPU (6161 - 10362, n=12) | |
| Razer Blade 17 (i7-12800H, RTX 3070 Ti) | |
| Lenovo Legion 5 17ACH6H-82JY0003GE | |
| Dell XPS 17 9710 Core i7 RTX 3060 | |
| HP Envy 17-cg | |
| Dell XPS 17 9700 Core i7 RTX 2060 Max-Q | |
| Asus VivoBook 17 F712JA-AU708W | |
| PCMark 10 / Digital Content Creation | |
| Razer Blade 17 (i7-12800H, RTX 3070 Ti) | |
| Durchschnittliche Intel Core i7-12700H, NVIDIA GeForce RTX 3060 Laptop GPU (8950 - 12554, n=12) | |
| Dell XPS 17 9720 RTX 3060 | |
| Durchschnitt der Klasse Multimedia (3651 - 16240, n=57, der letzten 2 Jahre) | |
| Dell XPS 17 9710 Core i7 RTX 3060 | |
| Lenovo Legion 5 17ACH6H-82JY0003GE | |
| Dell XPS 17 9700 Core i7 RTX 2060 Max-Q | |
| HP Envy 17-cg | |
| Asus VivoBook 17 F712JA-AU708W | |
| CrossMark / Overall | |
| Dell XPS 17 9720 RTX 3060 | |
| Durchschnitt der Klasse Multimedia (866 - 2728, n=67, der letzten 2 Jahre) | |
| Durchschnittliche Intel Core i7-12700H, NVIDIA GeForce RTX 3060 Laptop GPU (1649 - 2017, n=11) | |
| Razer Blade 17 (i7-12800H, RTX 3070 Ti) | |
| Lenovo Legion 5 17ACH6H-82JY0003GE | |
| Asus VivoBook 17 F712JA-AU708W | |
| CrossMark / Productivity | |
| Dell XPS 17 9720 RTX 3060 | |
| Durchschnitt der Klasse Multimedia (931 - 2489, n=67, der letzten 2 Jahre) | |
| Durchschnittliche Intel Core i7-12700H, NVIDIA GeForce RTX 3060 Laptop GPU (1536 - 1958, n=11) | |
| Razer Blade 17 (i7-12800H, RTX 3070 Ti) | |
| Lenovo Legion 5 17ACH6H-82JY0003GE | |
| Asus VivoBook 17 F712JA-AU708W | |
| CrossMark / Creativity | |
| Durchschnitt der Klasse Multimedia (907 - 3465, n=67, der letzten 2 Jahre) | |
| Dell XPS 17 9720 RTX 3060 | |
| Durchschnittliche Intel Core i7-12700H, NVIDIA GeForce RTX 3060 Laptop GPU (1816 - 2084, n=11) | |
| Razer Blade 17 (i7-12800H, RTX 3070 Ti) | |
| Lenovo Legion 5 17ACH6H-82JY0003GE | |
| Asus VivoBook 17 F712JA-AU708W | |
| CrossMark / Responsiveness | |
| Dell XPS 17 9720 RTX 3060 | |
| Durchschnittliche Intel Core i7-12700H, NVIDIA GeForce RTX 3060 Laptop GPU (1210 - 2207, n=11) | |
| Razer Blade 17 (i7-12800H, RTX 3070 Ti) | |
| Durchschnitt der Klasse Multimedia (605 - 2024, n=67, der letzten 2 Jahre) | |
| Lenovo Legion 5 17ACH6H-82JY0003GE | |
| Asus VivoBook 17 F712JA-AU708W | |
| PCMark 10 Score | 7296 Punkte | |
Hilfe | ||
| AIDA64 / Memory Copy | |
| Dell XPS 17 9720 RTX 3060 | |
| Durchschnittliche Intel Core i7-12700H (25615 - 80511, n=64) | |
| Razer Blade 17 (i7-12800H, RTX 3070 Ti) | |
| Dell XPS 17 9700 Core i7 RTX 2060 Max-Q | |
| Lenovo Legion 5 17ACH6H-82JY0003GE | |
| Asus VivoBook 17 F712JA-AU708W | |
| AIDA64 / Memory Read | |
| Dell XPS 17 9720 RTX 3060 | |
| Durchschnittliche Intel Core i7-12700H (25586 - 79442, n=64) | |
| Razer Blade 17 (i7-12800H, RTX 3070 Ti) | |
| Lenovo Legion 5 17ACH6H-82JY0003GE | |
| Dell XPS 17 9700 Core i7 RTX 2060 Max-Q | |
| Asus VivoBook 17 F712JA-AU708W | |
| AIDA64 / Memory Write | |
| Dell XPS 17 9720 RTX 3060 | |
| Durchschnittliche Intel Core i7-12700H (23679 - 88660, n=64) | |
| Razer Blade 17 (i7-12800H, RTX 3070 Ti) | |
| Dell XPS 17 9700 Core i7 RTX 2060 Max-Q | |
| Lenovo Legion 5 17ACH6H-82JY0003GE | |
| Asus VivoBook 17 F712JA-AU708W | |
| AIDA64 / Memory Latency | |
| Dell XPS 17 9720 RTX 3060 | |
| Asus VivoBook 17 F712JA-AU708W | |
| Lenovo Legion 5 17ACH6H-82JY0003GE | |
| Durchschnittliche Intel Core i7-12700H (76.2 - 133.9, n=62) | |
| Dell XPS 17 9700 Core i7 RTX 2060 Max-Q | |
| Dell XPS 17 9710 Core i7 RTX 3060 | |
| HP Envy 17-cg | |
| Razer Blade 17 (i7-12800H, RTX 3070 Ti) | |
* ... kleinere Werte sind besser
DPC-Latenzzeit
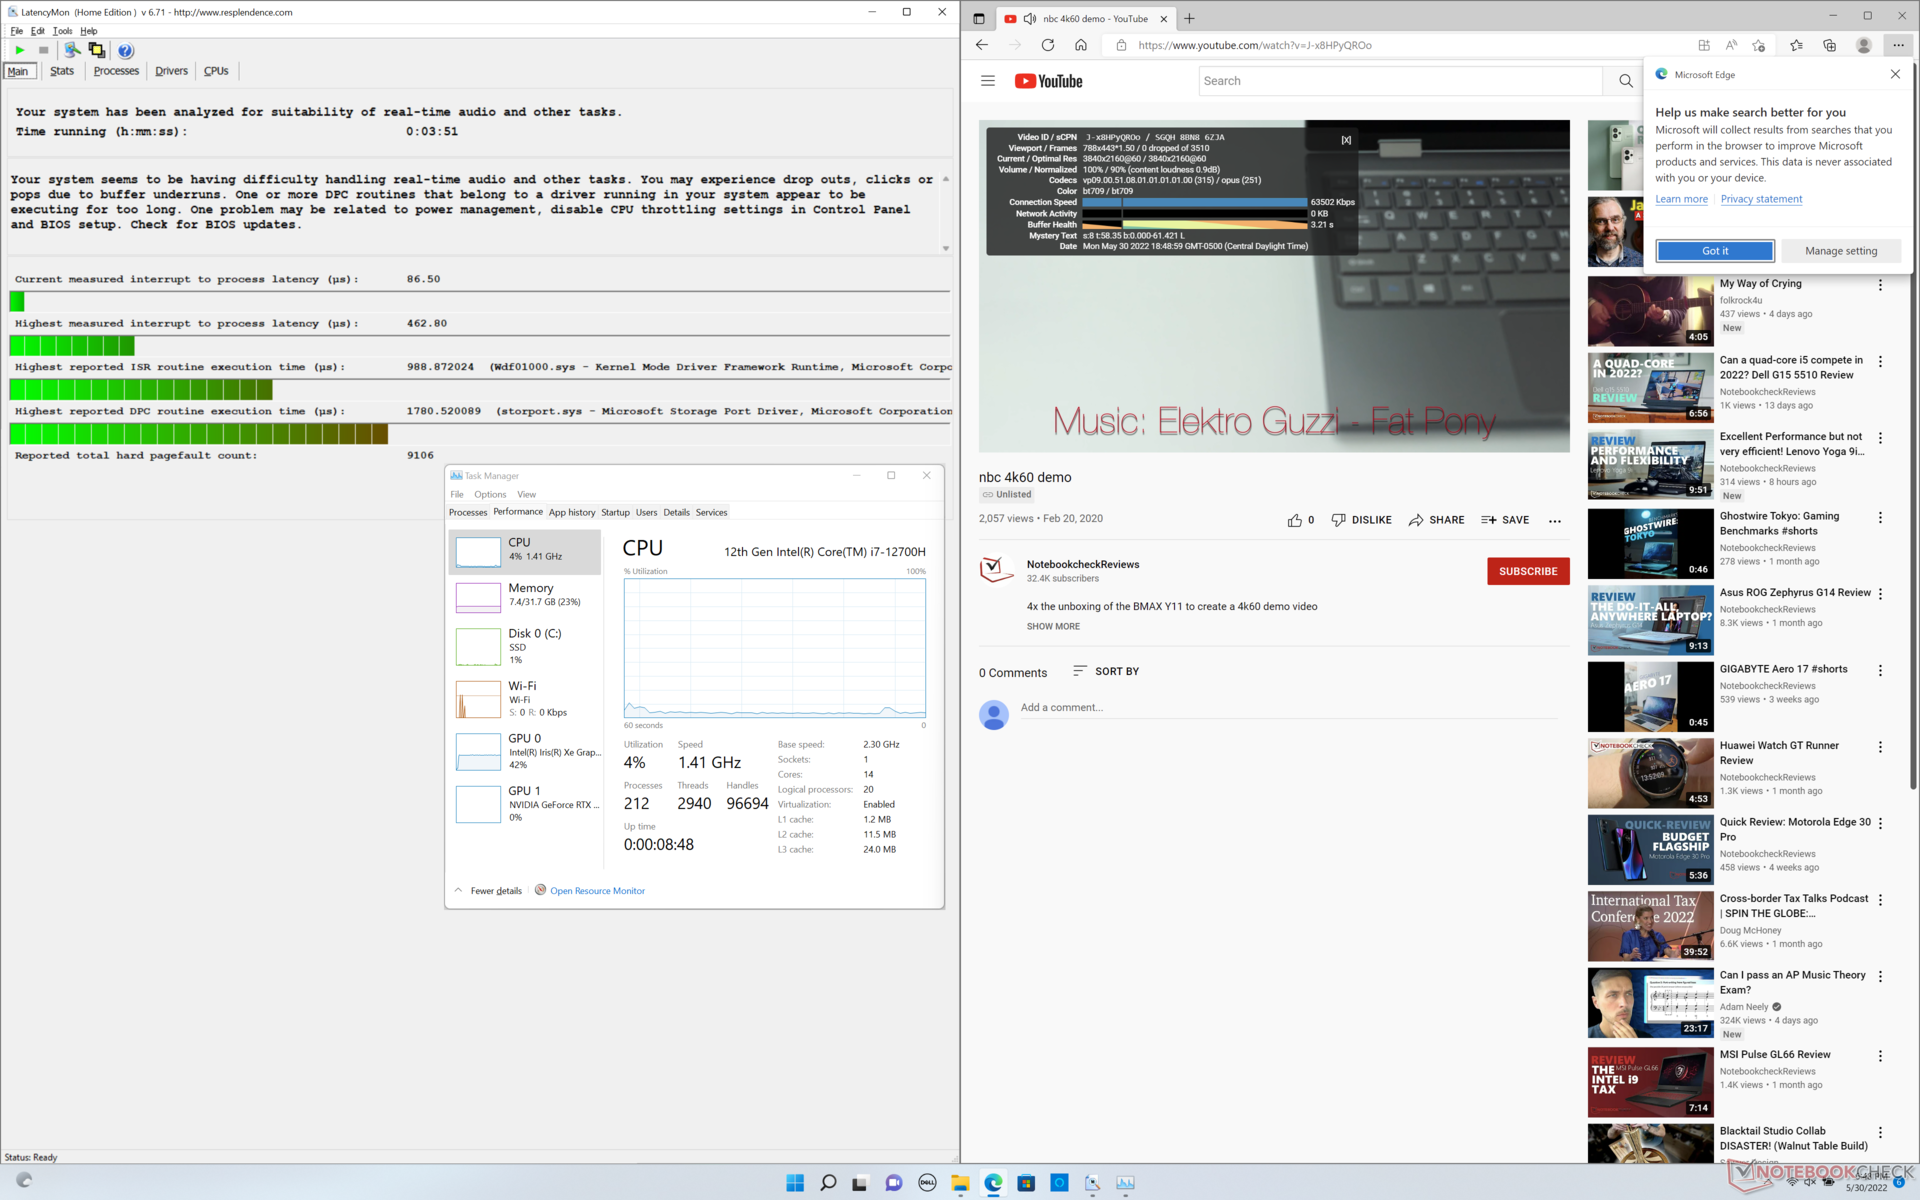
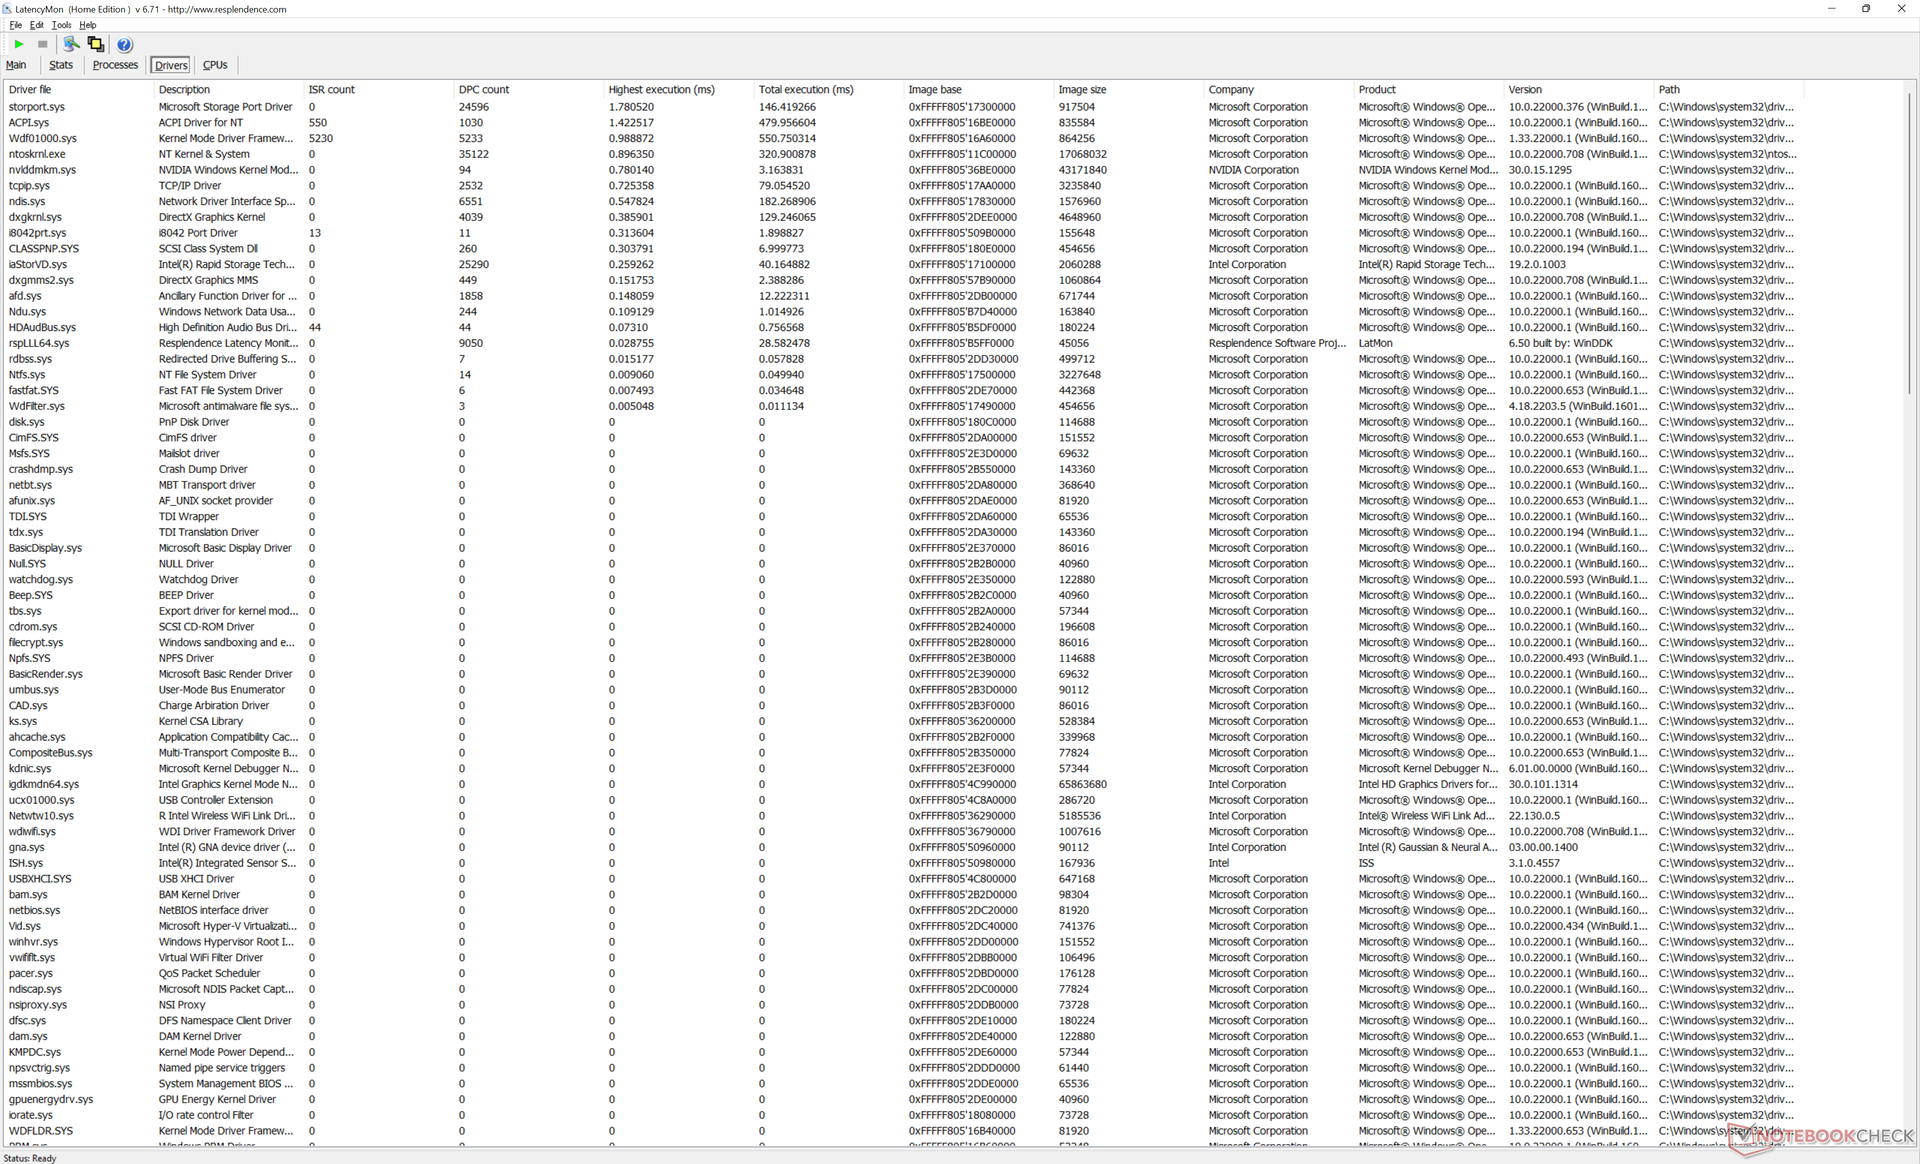
LatencyMon zeigt kleinere DPC-Probleme beim Öffnen mehrerer Browser Tabs auf unserer Homepage, ähnlich wie wir es beim XPS 17 9710 und 9700 beobachtet haben. Die 4K-Videowiedergabe bei 60 fps läuft ansonsten absolut flüssig und ohne Bildaussetzer, wie man es von einem Core-H-Multimedia-Laptop erwarten kann.
| DPC Latencies / LatencyMon - interrupt to process latency (max), Web, Youtube, Prime95 | |
| HP Envy 17-cg | |
| Lenovo Legion 5 17ACH6H-82JY0003GE | |
| Asus VivoBook 17 F712JA-AU708W | |
| Razer Blade 17 (i7-12800H, RTX 3070 Ti) | |
| Dell XPS 17 9700 Core i7 RTX 2060 Max-Q | |
| Dell XPS 17 9710 Core i7 RTX 3060 | |
| Dell XPS 17 9720 RTX 3060 | |
* ... kleinere Werte sind besser
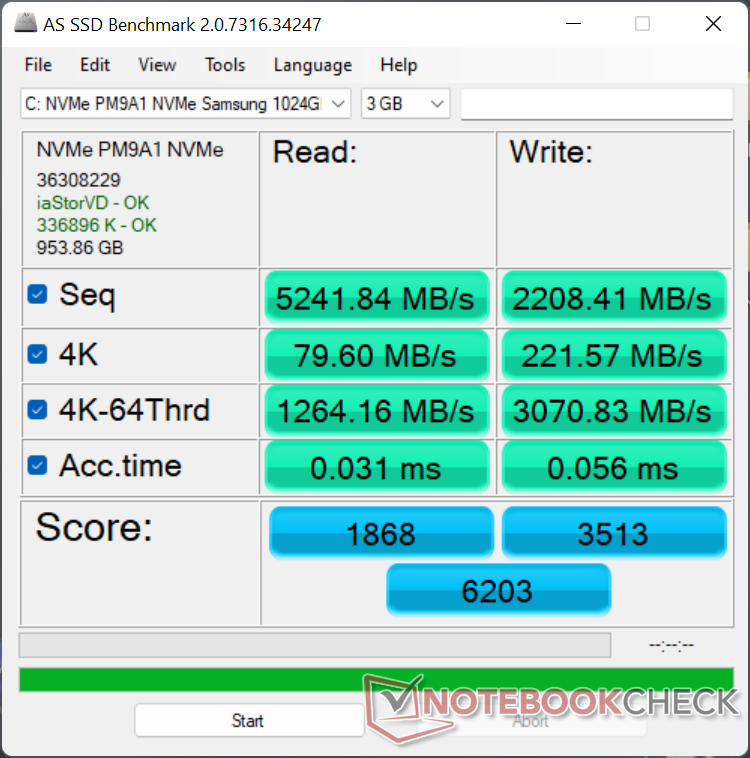
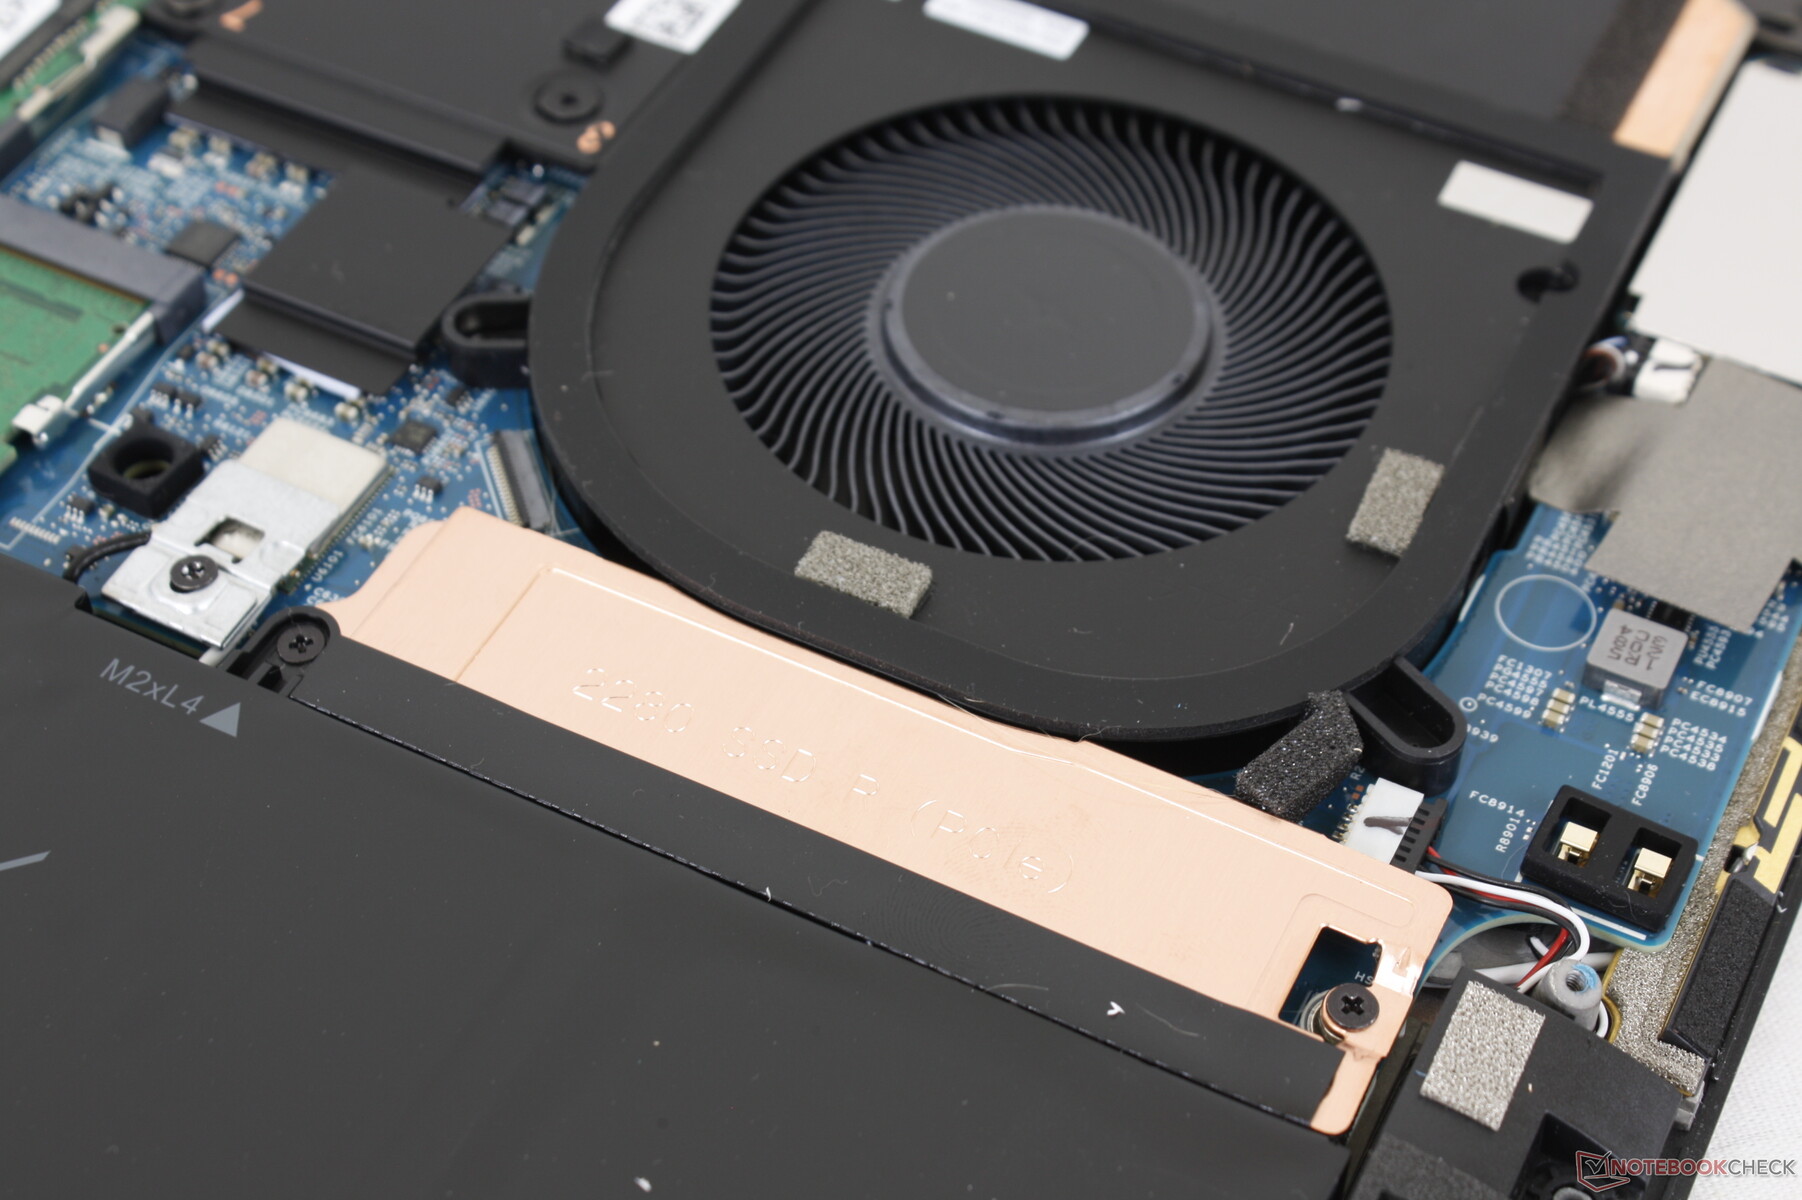
Speichergeräte
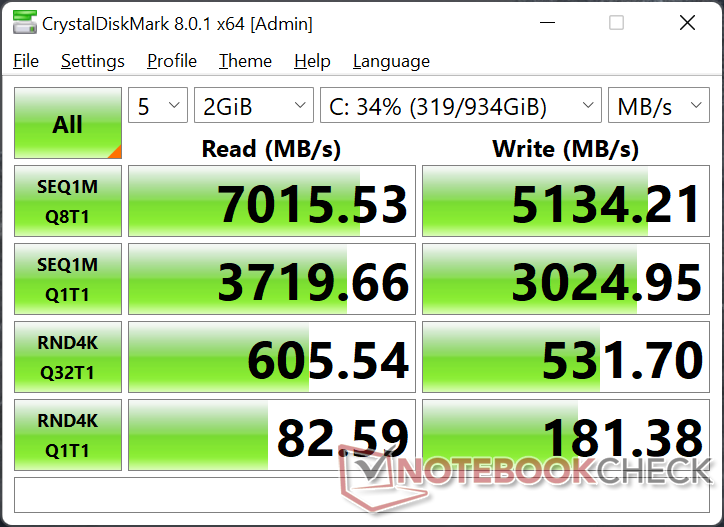
Das XPS 17 9710 wurde zu einer Zeit ausgeliefert, als PCIe4-x4-NVMe-SSDs noch nicht weit verbreitet und die Modelle daher nur mit PCIe3-x4-Optionen erhältlich waren. PCIe4-Laufwerke sind heutzutage glücklicherweise weiter verbreitet, und es ist gut zu sehen, dass das XPS 17 9720 eine schnelle Samsung-PM9A1-Lösung verwendet. Unsere Stresstests zeigen, dass das Laufwerk in unserem Gerät keine Probleme hat, seine maximale sequentielle Leserate von über 7.000 MB/s für längere Zeit aufrechtzuerhalten, ohne dass es gedrosselt werden muss, obwohl die Gesamtleistung immer noch langsamer ist als die des Razer Blade 17, das mit der gleichen 1-TB-Festplatte von Samsung ausgestattet ist.

* ... kleinere Werte sind besser
Dauerleistung Lesen: DiskSpd Read Loop, Queue Depth 8
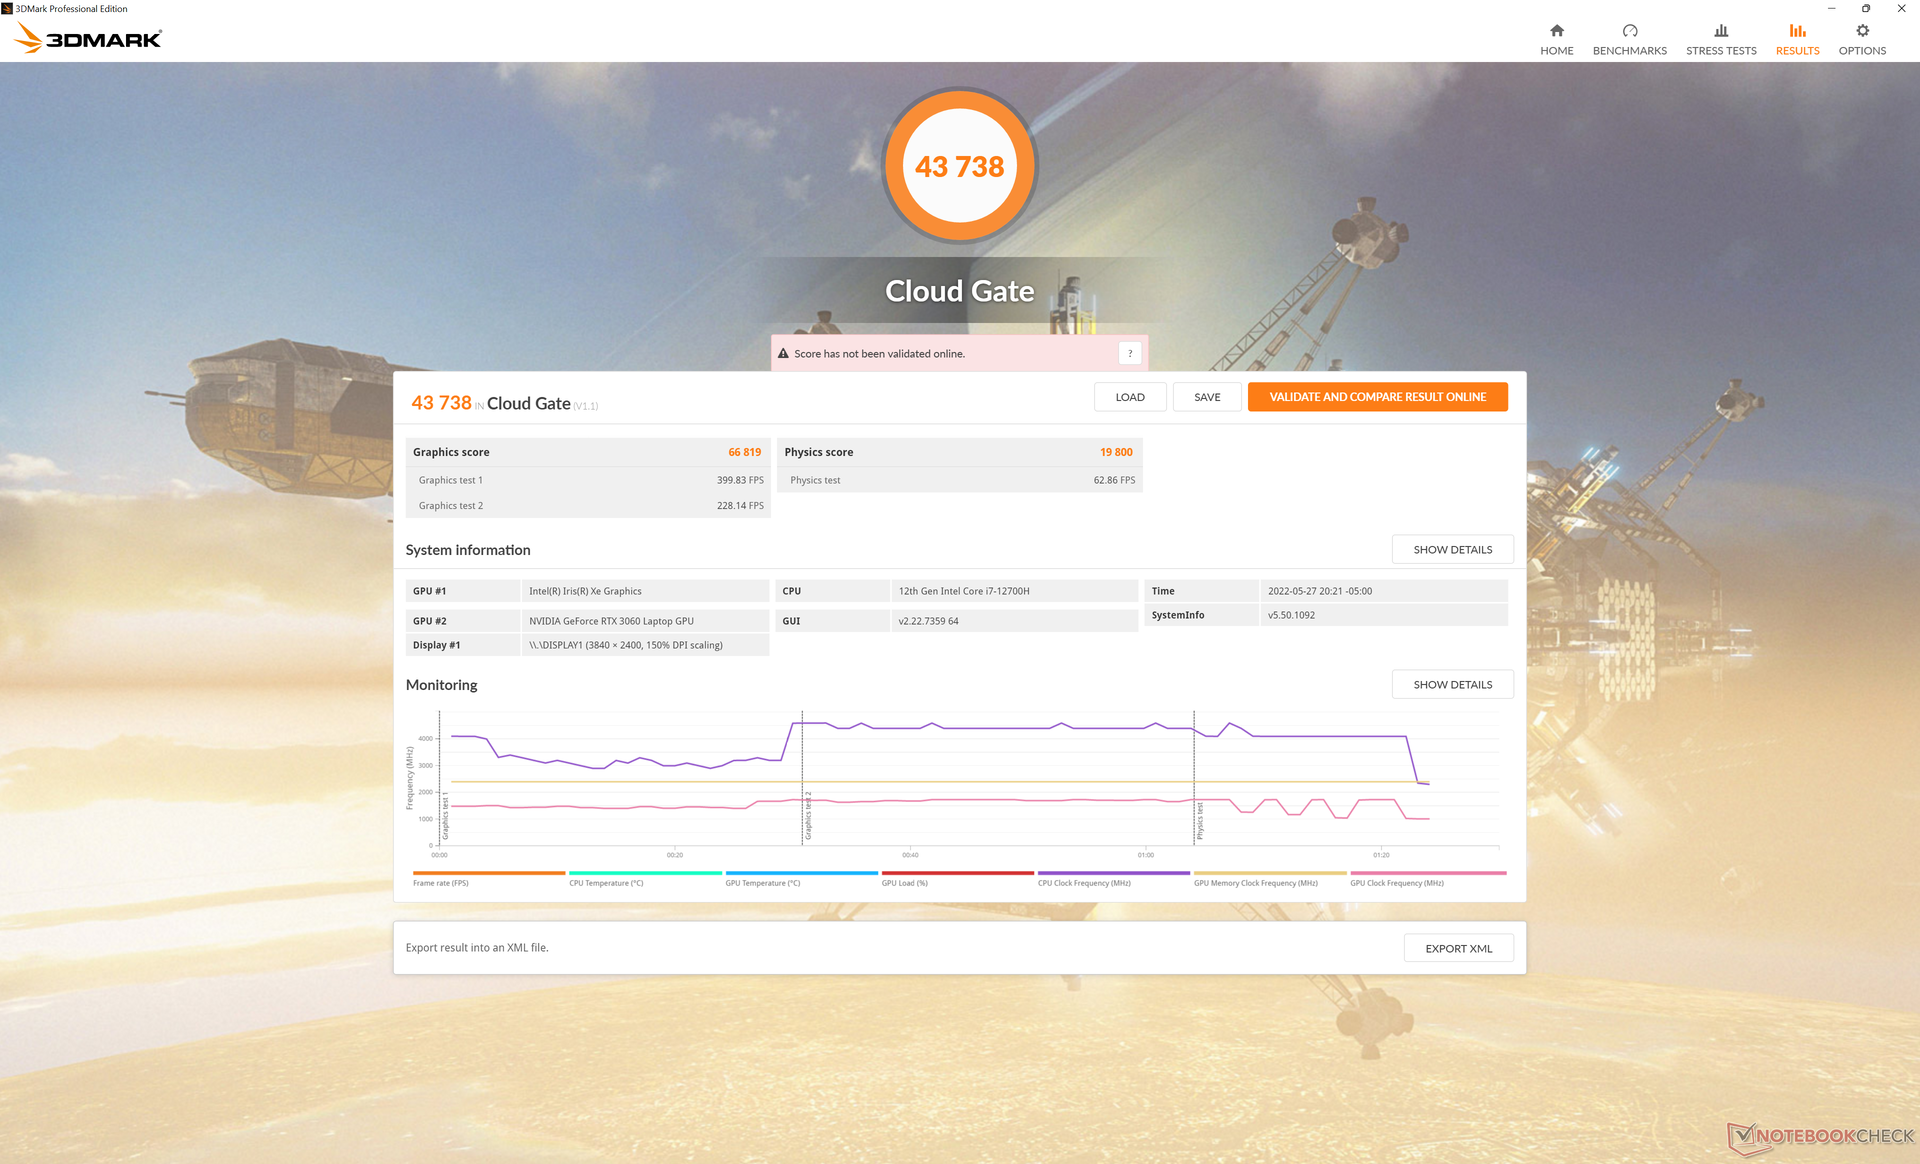
GPU Performance
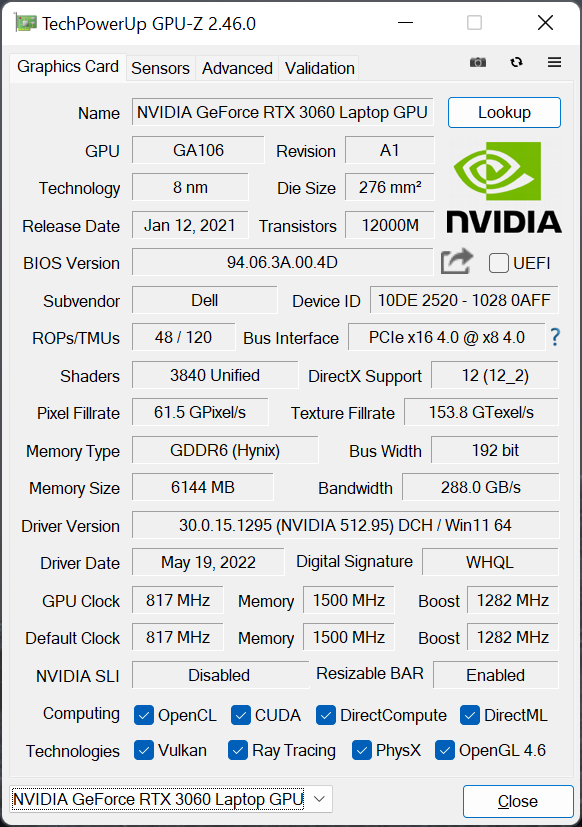
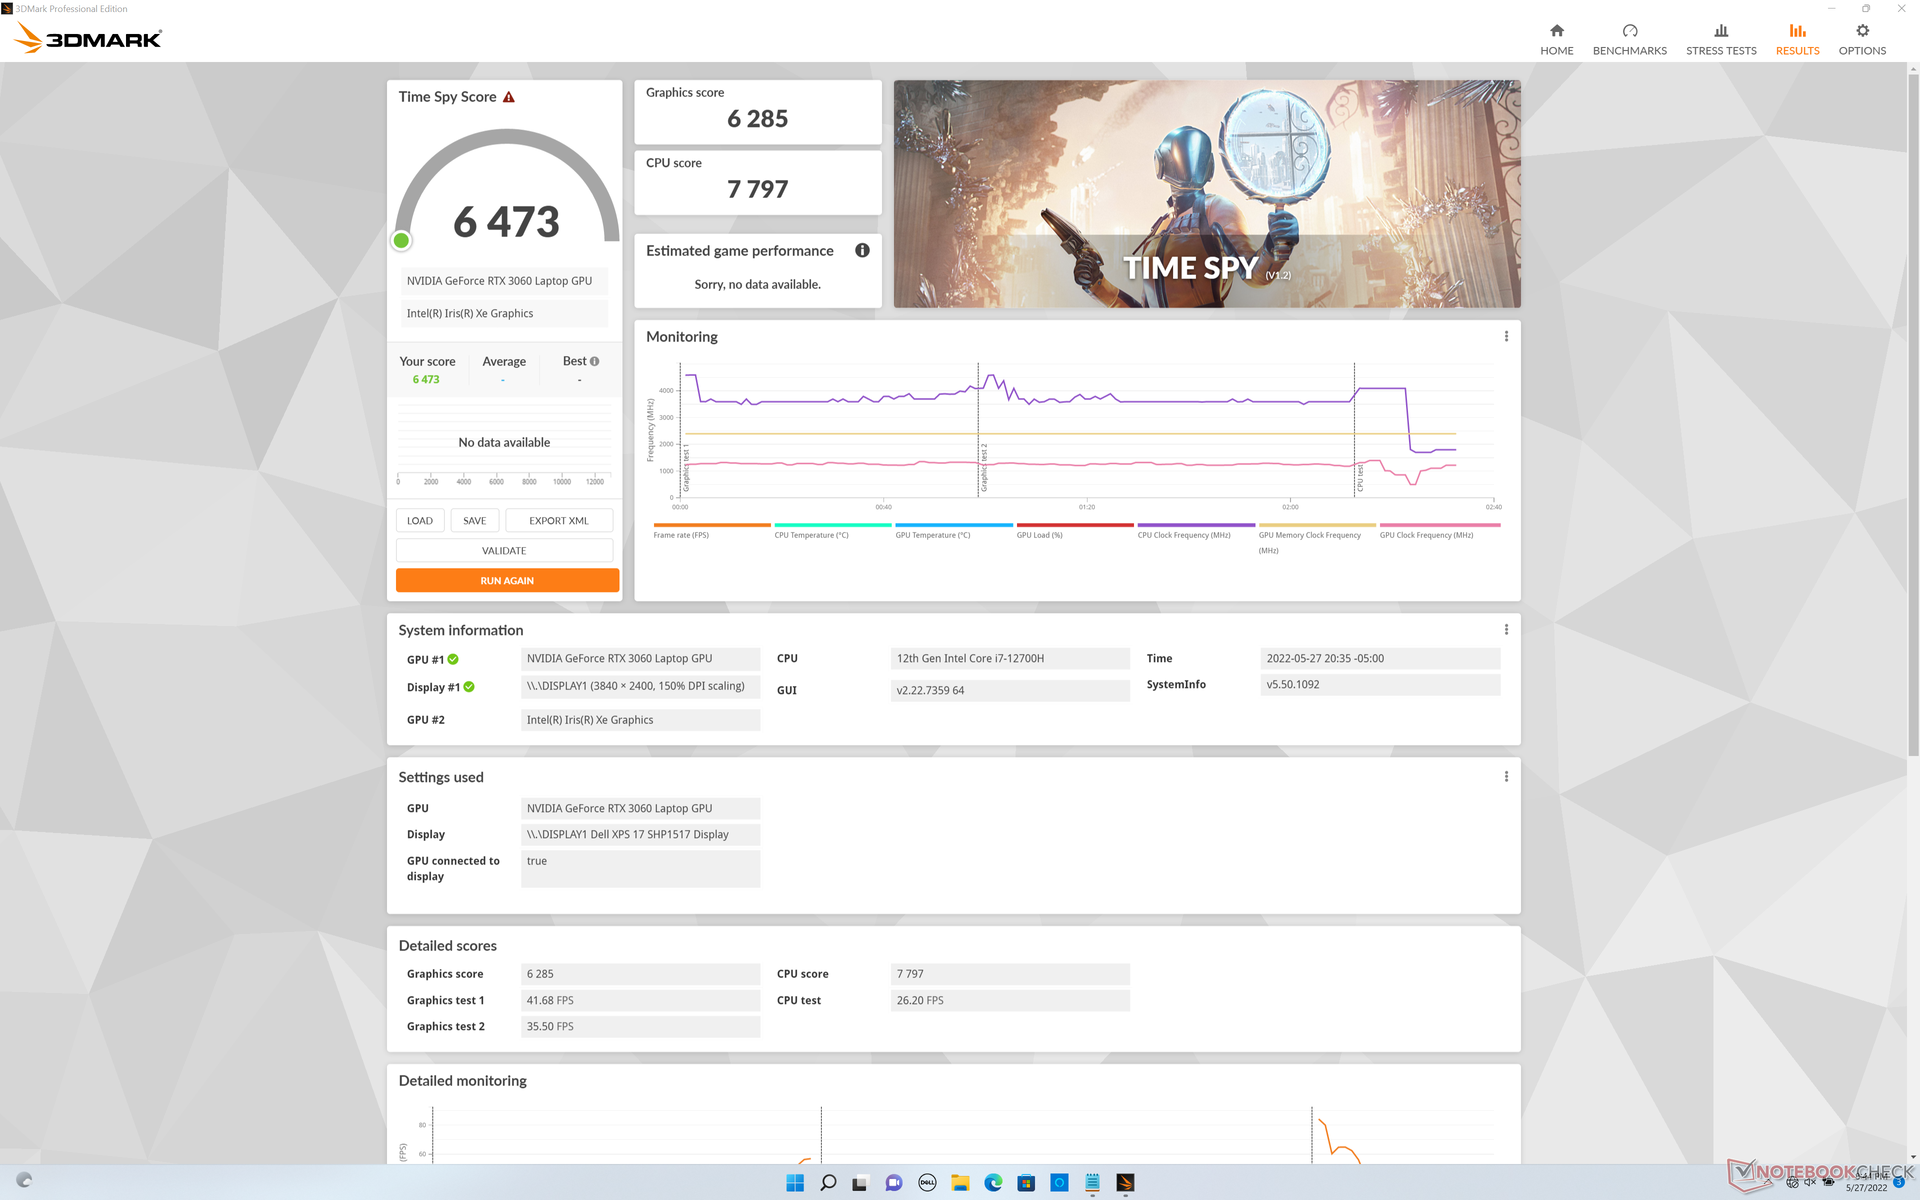
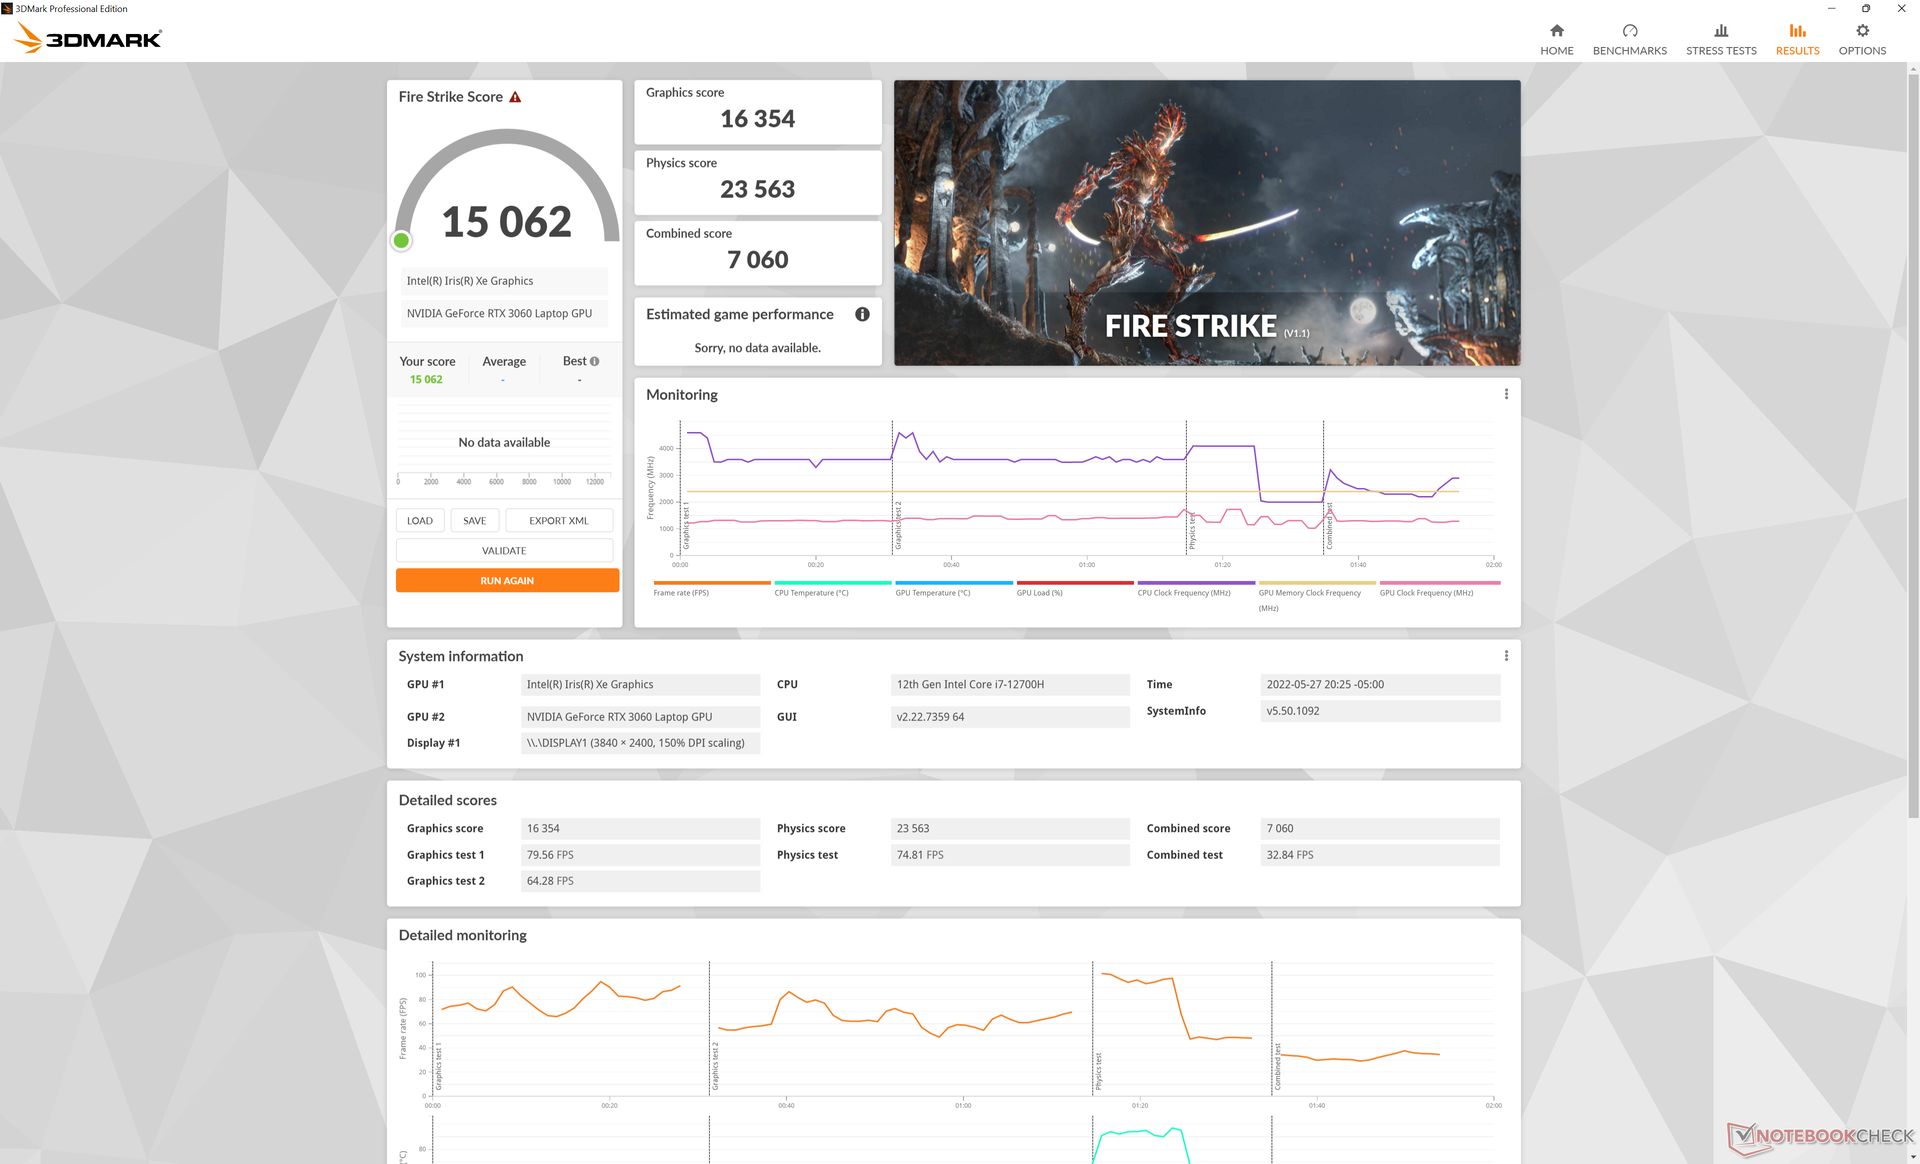
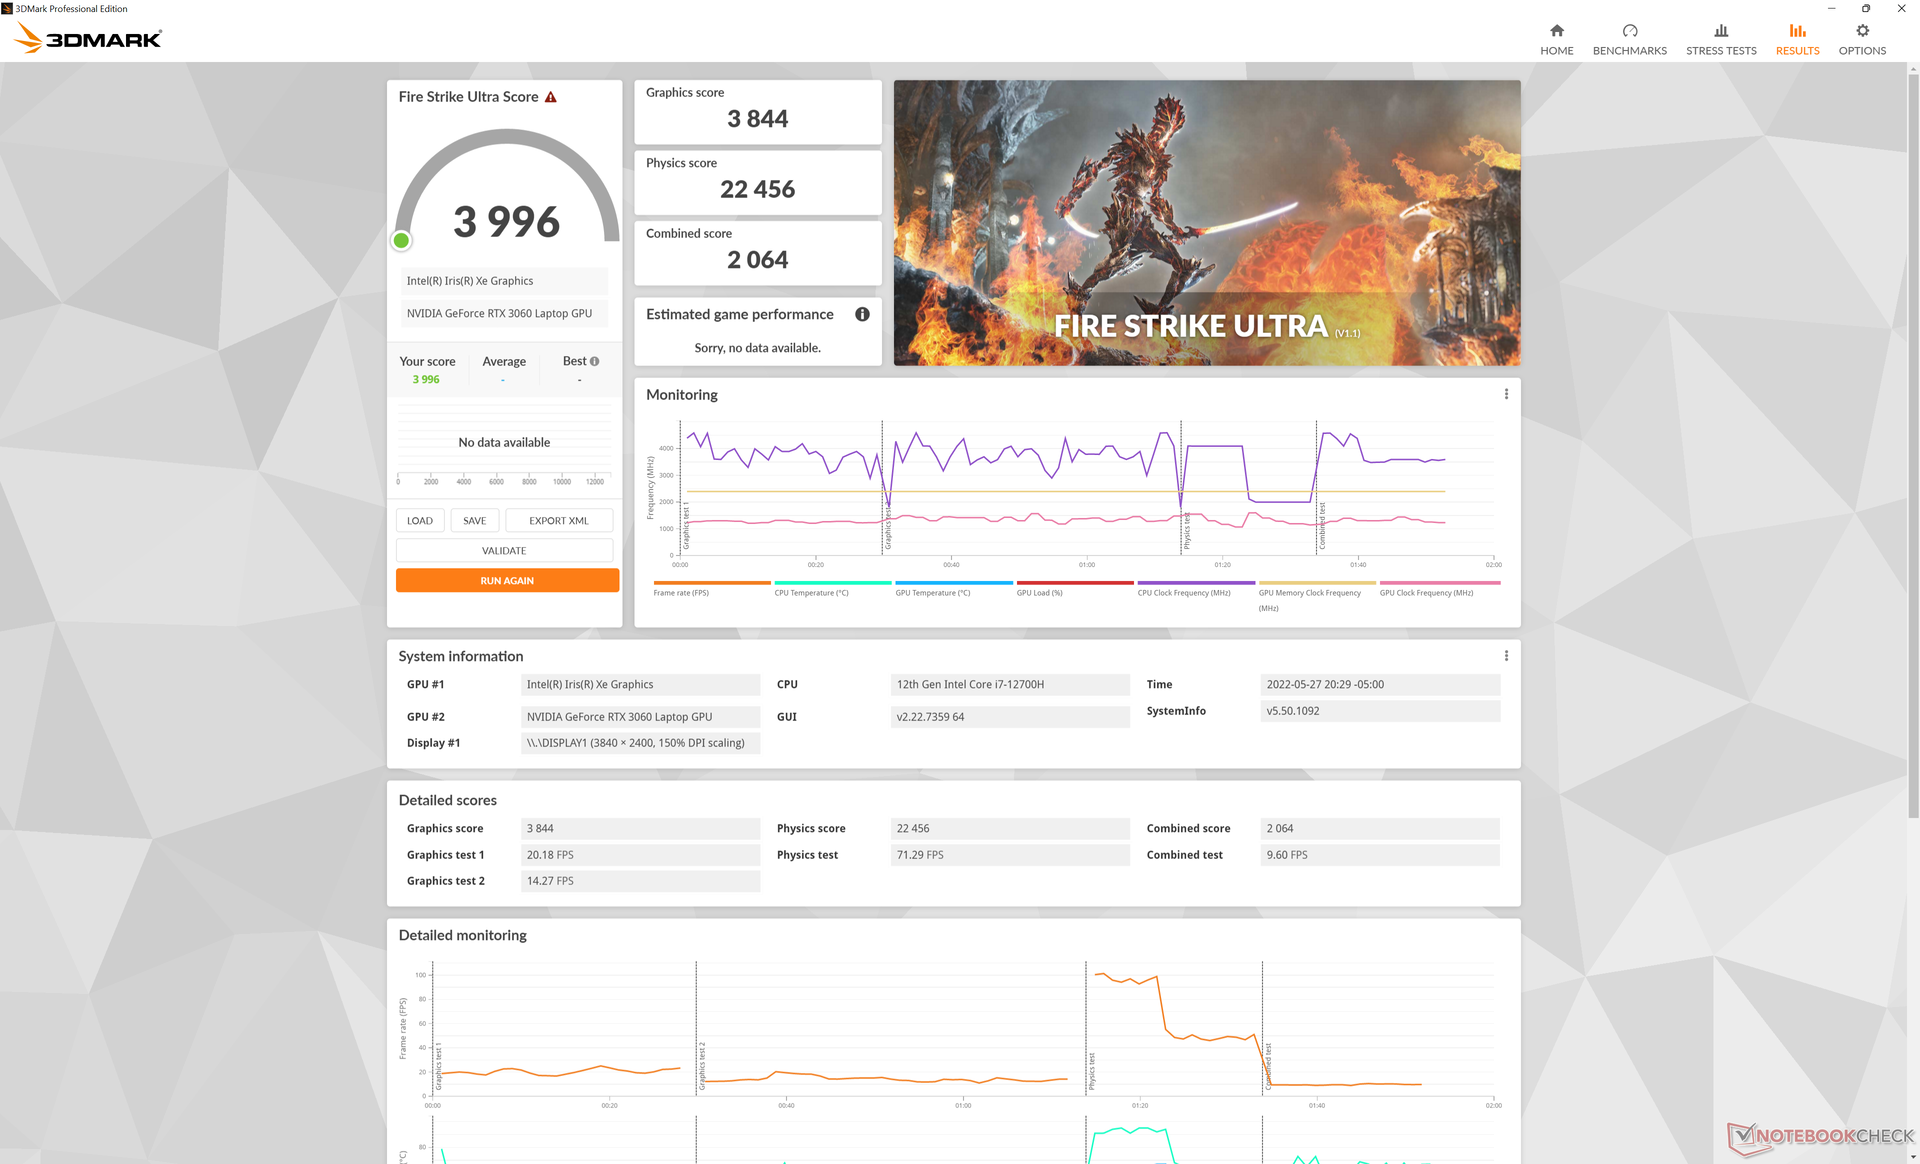
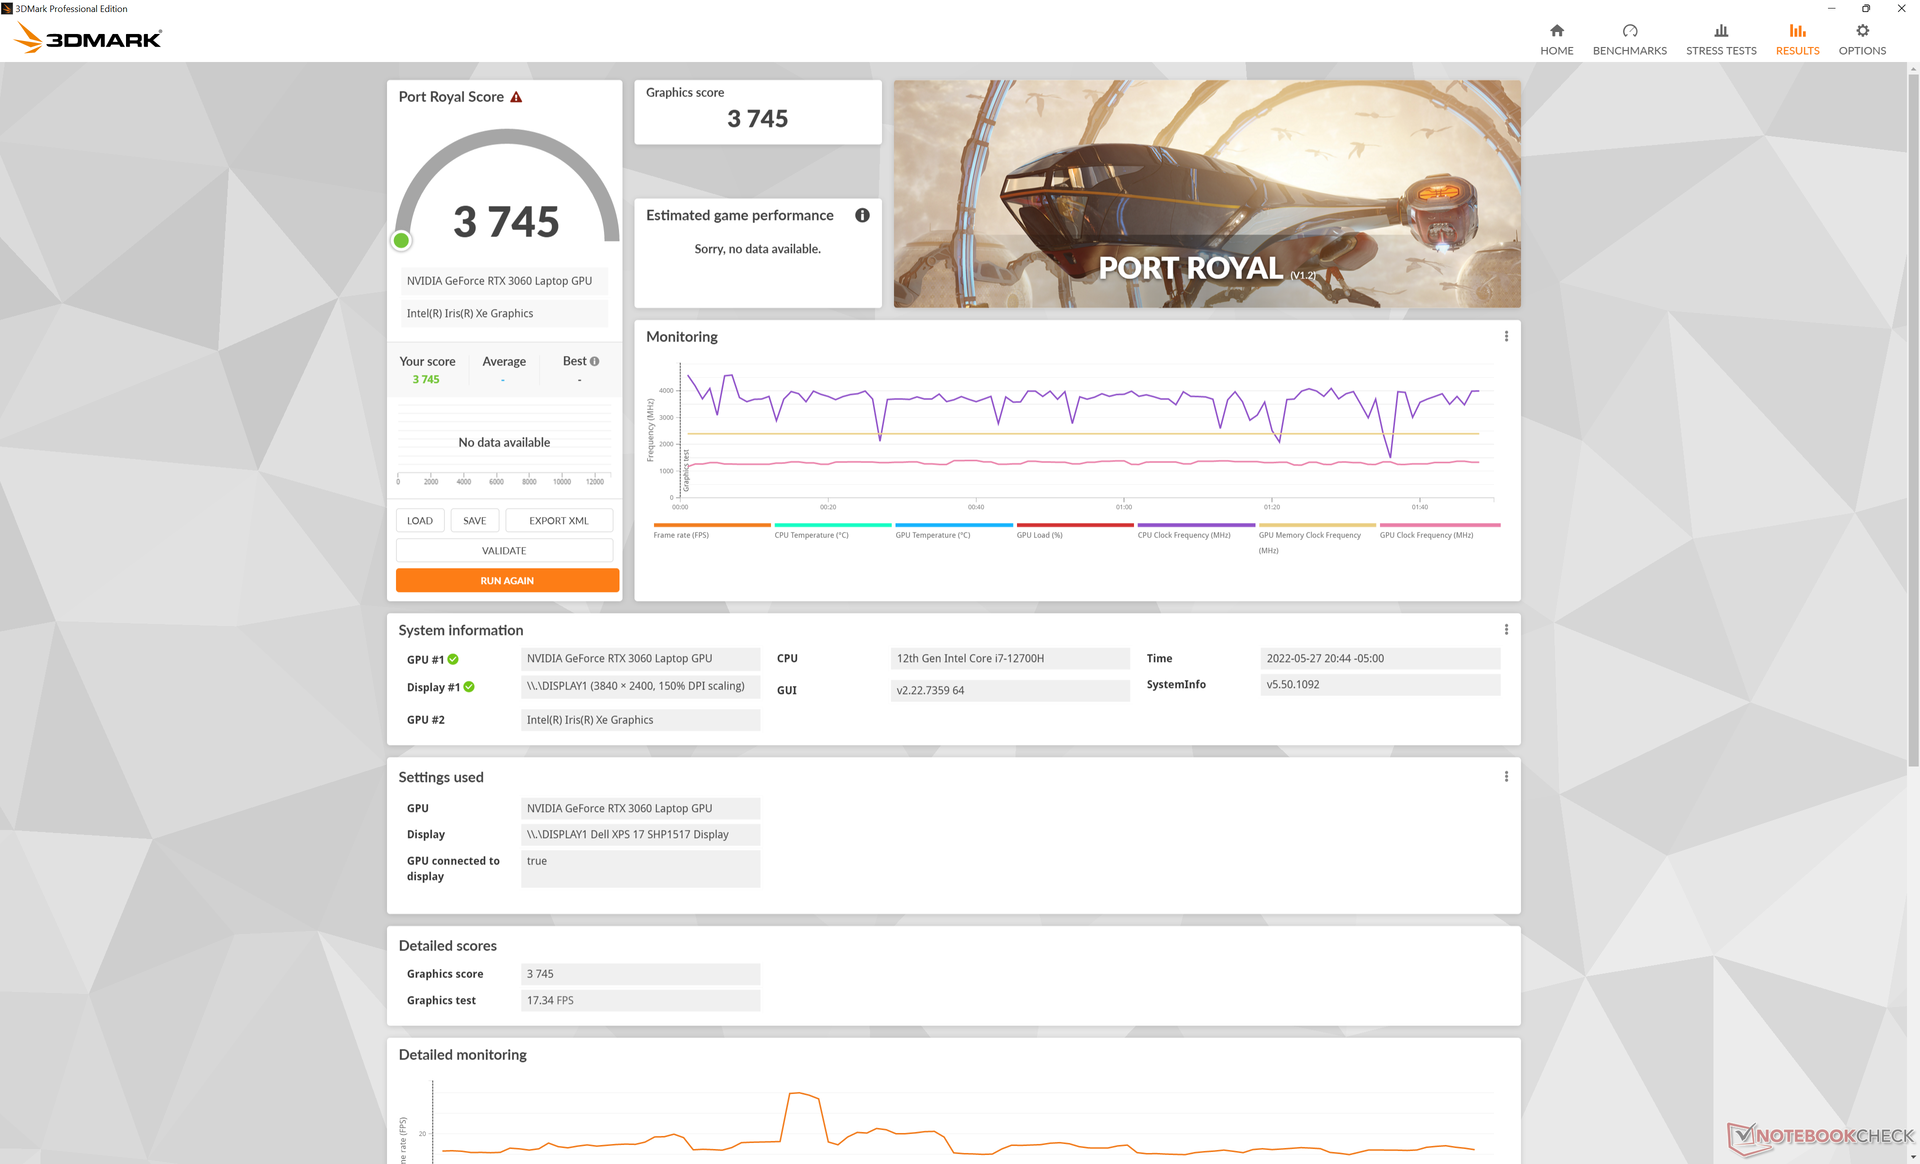
Dell hat die GeForce RTX 3060 TGP von 70 W beim XPS 17 9710 auf 65 W beim XPS 17 9720 heruntergestuft. Obwohl Dell eine 60-W-GPU für das 9720 bewirbt, können wir bestätigen, dass das Nvidia Kontrollfeld stattdessen 65 W anzeigt, was näher an unseren eigenen, unabhängigen Testergebnissen liegt. Die Folge ist eine 10-prozentige Verringerung der reinen Grafikleistung laut 3DMark-Benchmarks und getesteten GPU-gebundenen Spielen wie Witcher 3 final Fantasy XV oder Strange Brigade.
Im Vergleich zu einem durchschnittlichen Notebook mit der gleichen GeForce RTX 3060 GPU ist die GPU im XPS 17 9720 etwa 20 % langsamer. Es ist erwähnenswert, dass die meisten anderen Laptops mit der RTX 3060 typischerweise auf höhere TGP-Grenzwerte von 80 W oder mehr abzielen. Zumindest ist die GPU hier immer noch um etwa 15 % besser als die RTX 2060 Max-Q im ursprünglichen XPS 17 9700. In der Zwischenzeit würde ein Downgrade auf die RTX 3050 Ti SKU zu einem Leistungsdefizit von 25 bis 30 Prozent führen.
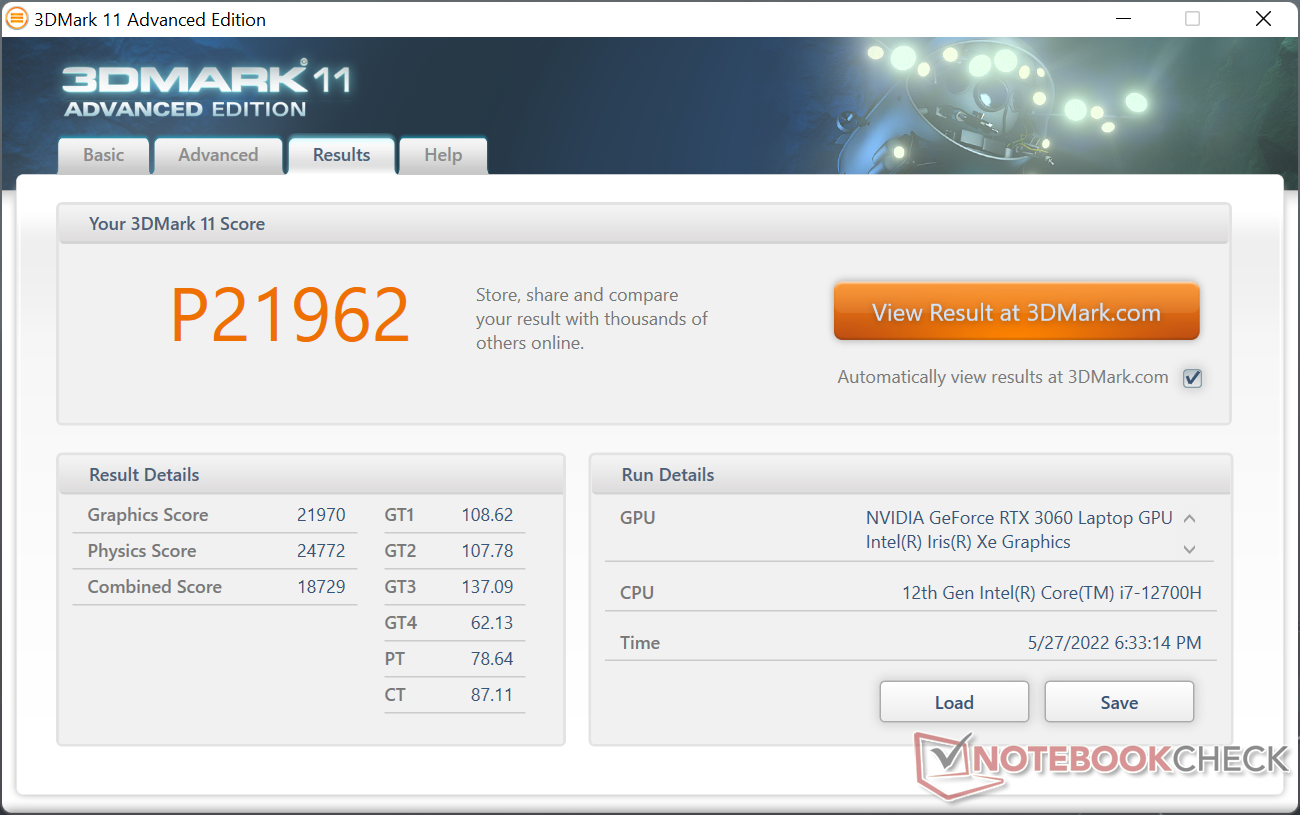
| 3DMark 11 Performance | 21962 Punkte | |
| 3DMark Cloud Gate Standard Score | 43738 Punkte | |
| 3DMark Fire Strike Score | 15062 Punkte | |
| 3DMark Time Spy Score | 6473 Punkte | |
Hilfe | ||
Witcher 3 FPS Chart
| min. | mittel | hoch | max. | QHD | 4K | |
|---|---|---|---|---|---|---|
| GTA V (2015) | 186.6 | 179 | 152.8 | 83.8 | 63.4 | |
| The Witcher 3 (2015) | 347.7 | 214.6 | 133.9 | 67.8 | ||
| Dota 2 Reborn (2015) | 185.7 | 169.9 | 163 | 133.5 | 84.6 | |
| Final Fantasy XV Benchmark (2018) | 137.9 | 90.5 | 69.3 | 49.1 | 28.3 | |
| X-Plane 11.11 (2018) | 133.3 | 111.6 | 93.8 | 92.3 | ||
| Strange Brigade (2018) | 352 | 162.6 | 130.6 | 113.4 | 82.3 | |
| Cyberpunk 2077 1.6 (2022) | 95.4 | 78.1 | 60 | 48.9 | 29 | 11.6 |
Emissionen - Gaming Laptop Lärm und Temperaturen
Systemgeräusche
Das Lüftergeräusch und das Verhalten des Lüfters haben sich seit dem ursprünglichen XPS 17 9700 nicht verändert, was bedeutet, dass das Lüftergeräusch bei Spielen oder anderen hohen Belastungen immer noch bei fast 50 db(A) liegt. Das Geräusch ist vergleichbar mit dem vieler Gaming-Laptops, wenn sie unter solchen Stressbedingungen laufen.
Bei mittlerer bis hoher Last wechseln die Lüfter recht schnell von leise zu laut, weshalb wir das Profil "Leise" empfehlen, um das Pulsieren der Lüfter zu begrenzen, wenn die zusätzliche Leistung nicht benötigt wird.
Lautstärkediagramm
| Idle |
| 24.1 / 24.1 / 24.1 dB(A) |
| Last |
| 43.2 / 48 dB(A) |
 | ||
30 dB leise 40 dB(A) deutlich hörbar 50 dB(A) störend |
||
min: | ||
| Dell XPS 17 9720 RTX 3060 GeForce RTX 3060 Laptop GPU, i7-12700H, Samsung PM9A1 MZVL21T0HCLR | HP Envy 17-cg GeForce MX450, i5-1135G7, Samsung PM991 MZVLQ1T0HALB | Dell XPS 17 9710 Core i7 RTX 3060 GeForce RTX 3060 Laptop GPU, i7-11800H, Micron 2300 1TB MTFDHBA1T0TDV | Dell XPS 17 9700 Core i7 RTX 2060 Max-Q GeForce RTX 2060 Max-Q, i7-10875H, Micron 2200S 1TB MTFDHBA1T0TCK | Lenovo Legion 5 17ACH6H-82JY0003GE GeForce RTX 3060 Laptop GPU, R5 5600H, Samsung PM991a MZALQ512HBLU | Asus VivoBook 17 F712JA-AU708W Iris Plus Graphics G7 (Ice Lake 64 EU), i7-1065G7, Kingston OM8PCP3512F-AB | Razer Blade 17 (i7-12800H, RTX 3070 Ti) GeForce RTX 3070 Ti Laptop GPU, i7-12800H, Samsung PM9A1 MZVL21T0HCLR | |
|---|---|---|---|---|---|---|---|
| Geräuschentwicklung | -9% | -5% | -10% | -6% | -14% | 4% | |
| aus / Umgebung * (dB) | 23.8 | 26 -9% | 25.5 -7% | 28 -18% | 25 -5% | 29.6 -24% | 23 3% |
| Idle min * (dB) | 24.1 | 26 -8% | 25.2 -5% | 28 -16% | 25 -4% | 31.4 -30% | 23 5% |
| Idle avg * (dB) | 24.1 | 31.7 -32% | 25.2 -5% | 28 -16% | 25 -4% | 31.4 -30% | 23 5% |
| Idle max * (dB) | 24.1 | 25.2 -5% | 28 -16% | 30.5 -27% | 31.4 -30% | 23 5% | |
| Last avg * (dB) | 43.2 | 43.2 -0% | 45.9 -6% | 43.2 -0% | 37.5 13% | 36.1 16% | 36.92 15% |
| Witcher 3 ultra * (dB) | 48 | 49 -2% | 49 -2% | 50 -4% | |||
| Last max * (dB) | 48 | 46.6 3% | 50.4 -5% | 50.5 -5% | 51 -6% | 40.1 16% | 50 -4% |
* ... kleinere Werte sind besser
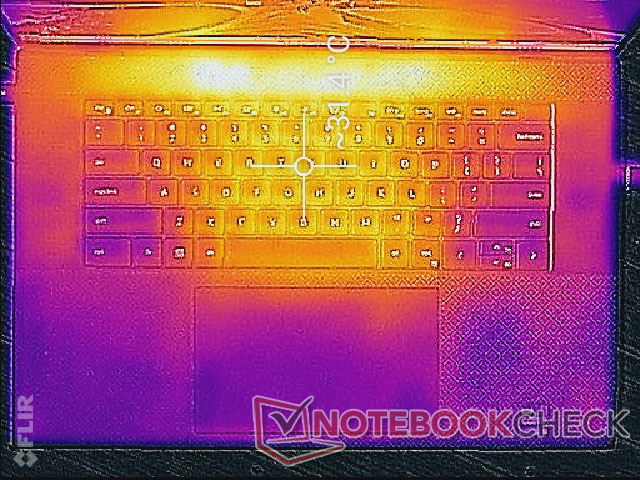
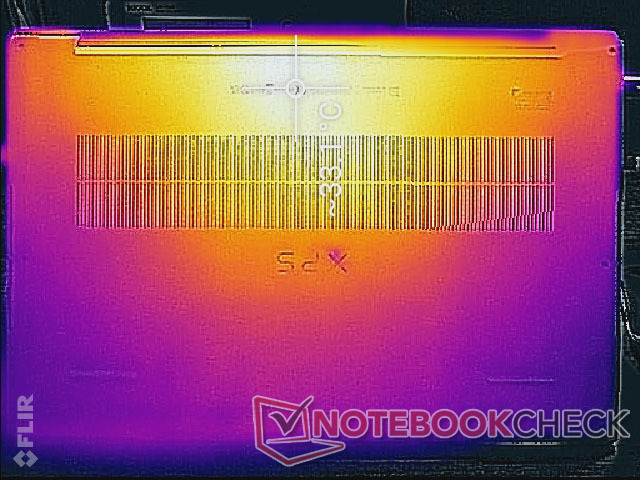
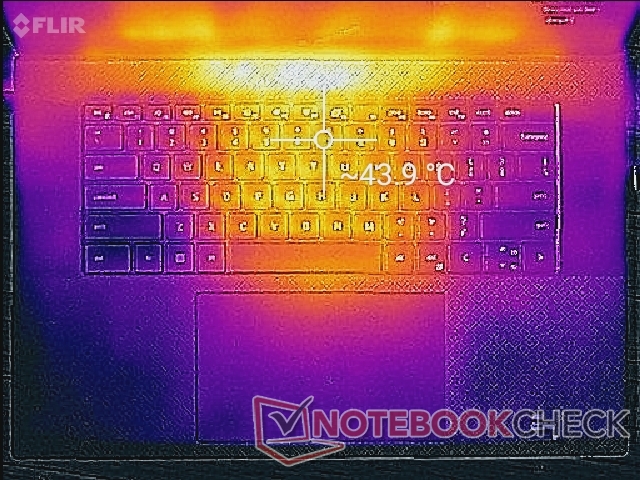
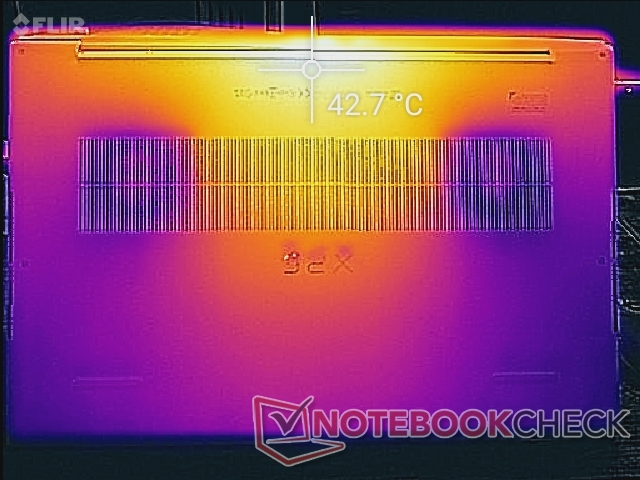
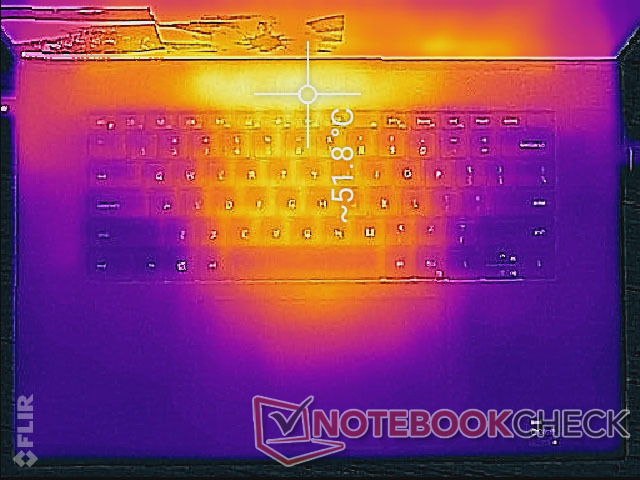
Temperatur
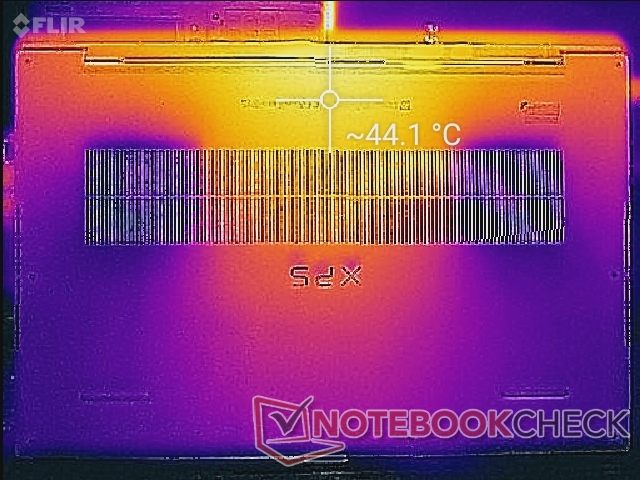
Bei längerer Belastung können an der Ober- und Unterseite über 52 bzw. 44 Grad Celsius erreicht werden. Diese Bereiche befinden sich strategisch günstig auf der Rückseite des Gehäuse und sind von den Handballenablagen und den meisten Tasten entfernt. Die Unterseite fühlt sich jedoch immer noch sehr warm an, da die Bodenplatte aus einem einzigen Stück Metall besteht.
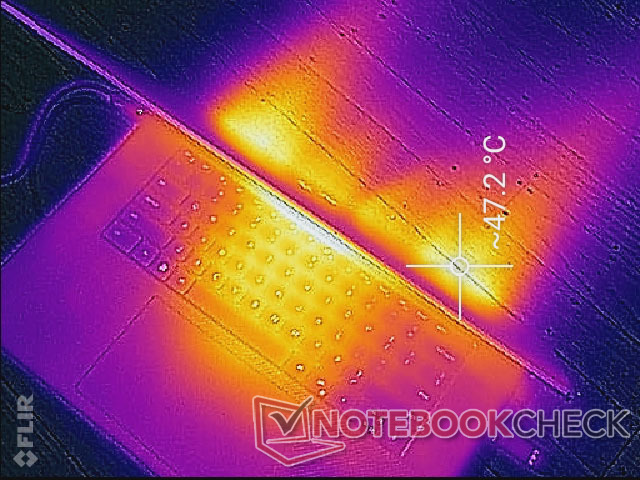
(-) Die maximale Temperatur auf der Oberseite ist 51.8 °C. Im Vergleich liegt der Klassendurchschnitt bei 36.8 °C (von 21 bis 71 °C für die Klasse Multimedia).
(±) Auf der Unterseite messen wir eine maximalen Wert von 44.2 °C (im Vergleich zum Durchschnitt von 39.1 °C).
(+) Ohne Last messen wir eine durchschnittliche Temperatur von 28.6 °C auf der Oberseite. Der Klassendurchschnitt erreicht 31.3 °C.
(±) Beim längeren Spielen von The Witcher 3 erhitzt sich das Gerät durchschnittlich auf 33.9 °C. Der Durchschnitt der Klasse ist derzeit 31.3 °C.
(+) Die Handballen und der Touchpad-Bereich erreichen maximal 33.2 °C und damit die typische Hauttemperatur und fühlen sich daher nicht heiß an.
(-) Die durchschnittliche Handballen-Temperatur anderer getesteter Geräte war 28.7 °C (-4.5 °C).
| Dell XPS 17 9720 RTX 3060 Intel Core i7-12700H, NVIDIA GeForce RTX 3060 Laptop GPU | HP Envy 17-cg Intel Core i5-1135G7, NVIDIA GeForce MX450 | Dell XPS 17 9710 Core i7 RTX 3060 Intel Core i7-11800H, NVIDIA GeForce RTX 3060 Laptop GPU | Dell XPS 17 9700 Core i7 RTX 2060 Max-Q Intel Core i7-10875H, NVIDIA GeForce RTX 2060 Max-Q | Lenovo Legion 5 17ACH6H-82JY0003GE AMD Ryzen 5 5600H, NVIDIA GeForce RTX 3060 Laptop GPU | Asus VivoBook 17 F712JA-AU708W Intel Core i7-1065G7, Intel Iris Plus Graphics G7 (Ice Lake 64 EU) | Razer Blade 17 (i7-12800H, RTX 3070 Ti) Intel Core i7-12800H, NVIDIA GeForce RTX 3070 Ti Laptop GPU | |
|---|---|---|---|---|---|---|---|
| Hitze | 14% | 1% | -1% | 2% | 12% | 6% | |
| Last oben max * (°C) | 51.8 | 45.9 11% | 50.2 3% | 53 -2% | 42.2 19% | 40.2 22% | 43 17% |
| Last unten max * (°C) | 44.2 | 49.7 -12% | 38.4 13% | 39.2 11% | 50.9 -15% | 47.9 -8% | 44 -0% |
| Idle oben max * (°C) | 34.8 | 24.2 30% | 37.6 -8% | 37 -6% | 34.3 1% | 27.3 22% | 32 8% |
| Idle unten max * (°C) | 33.2 | 24.8 25% | 34.2 -3% | 35.8 -8% | 32 4% | 28.9 13% | 34 -2% |
* ... kleinere Werte sind besser
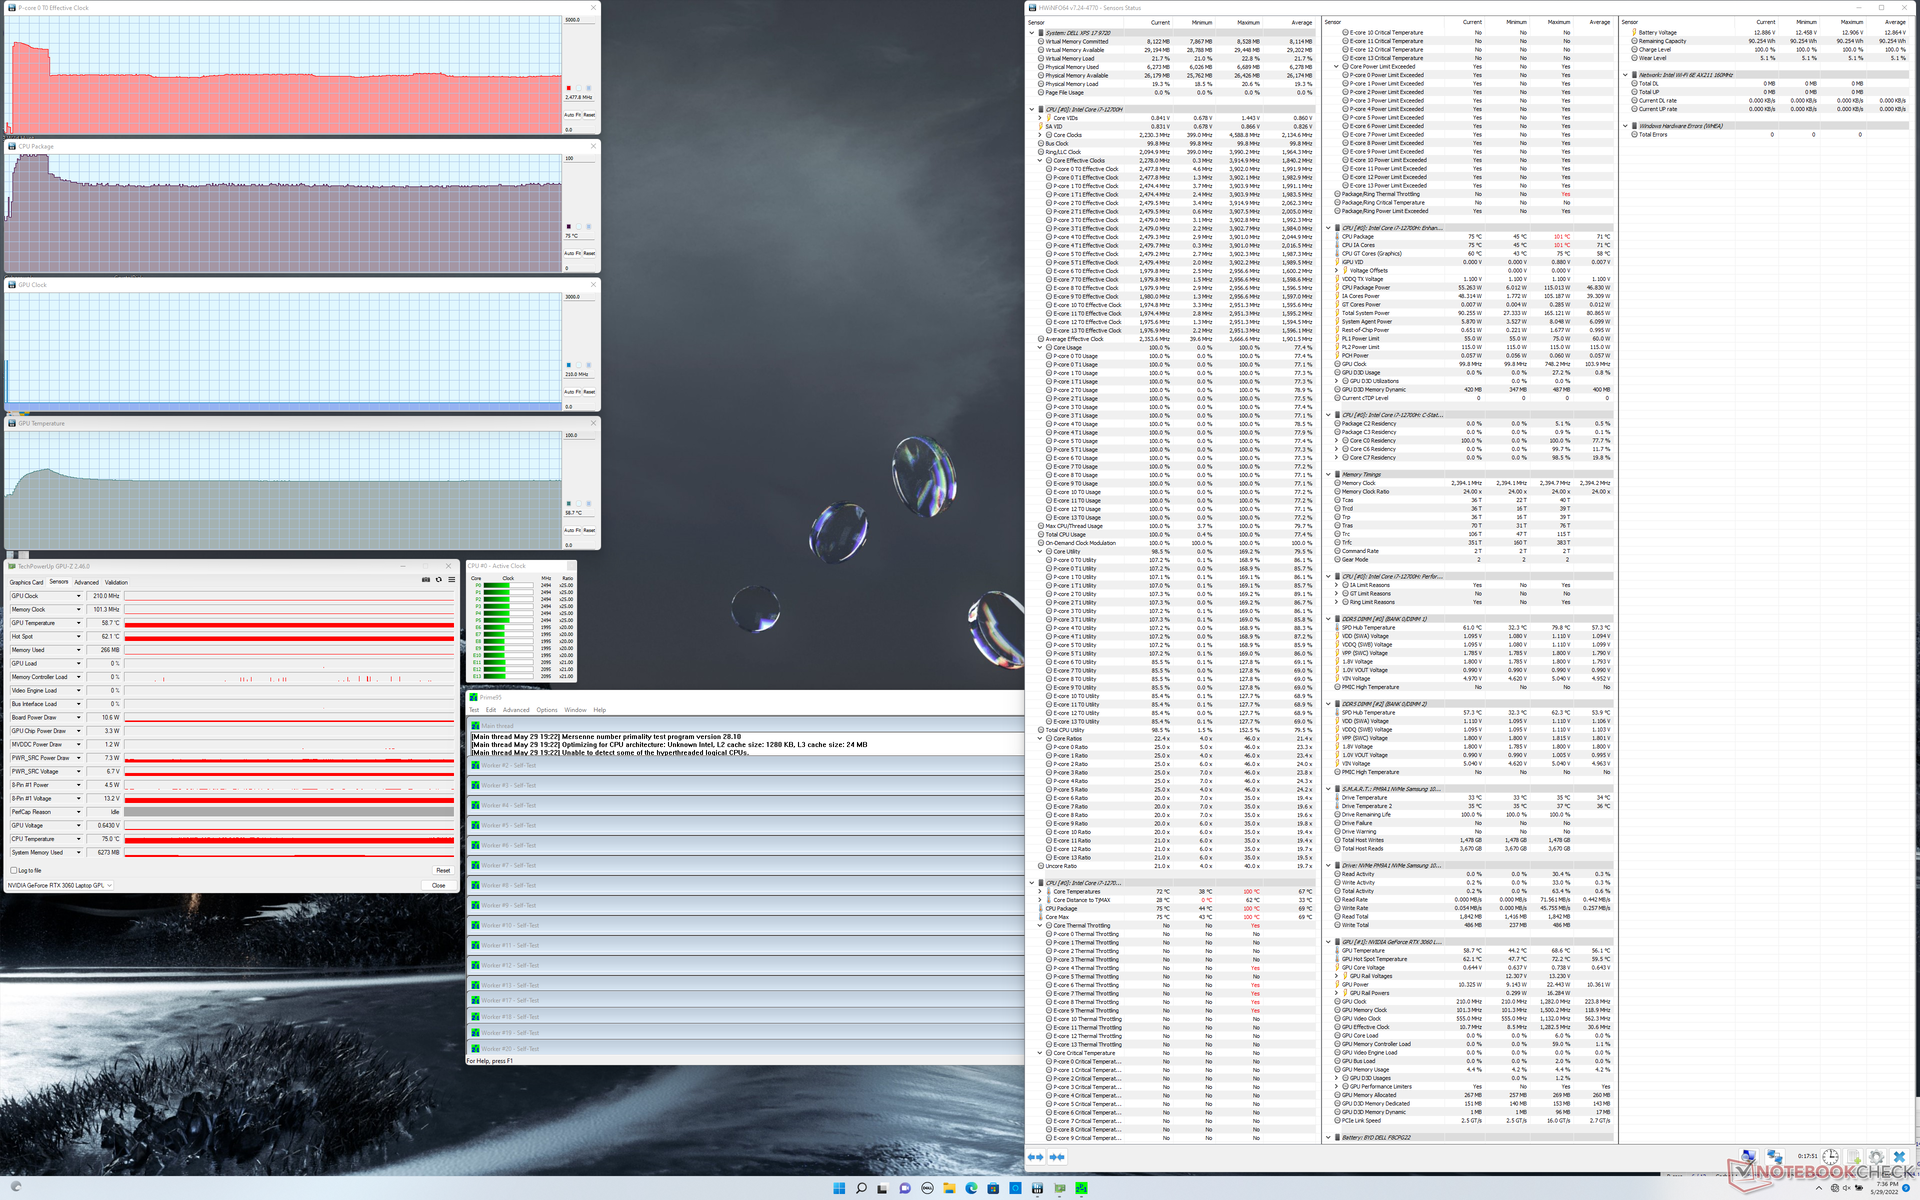
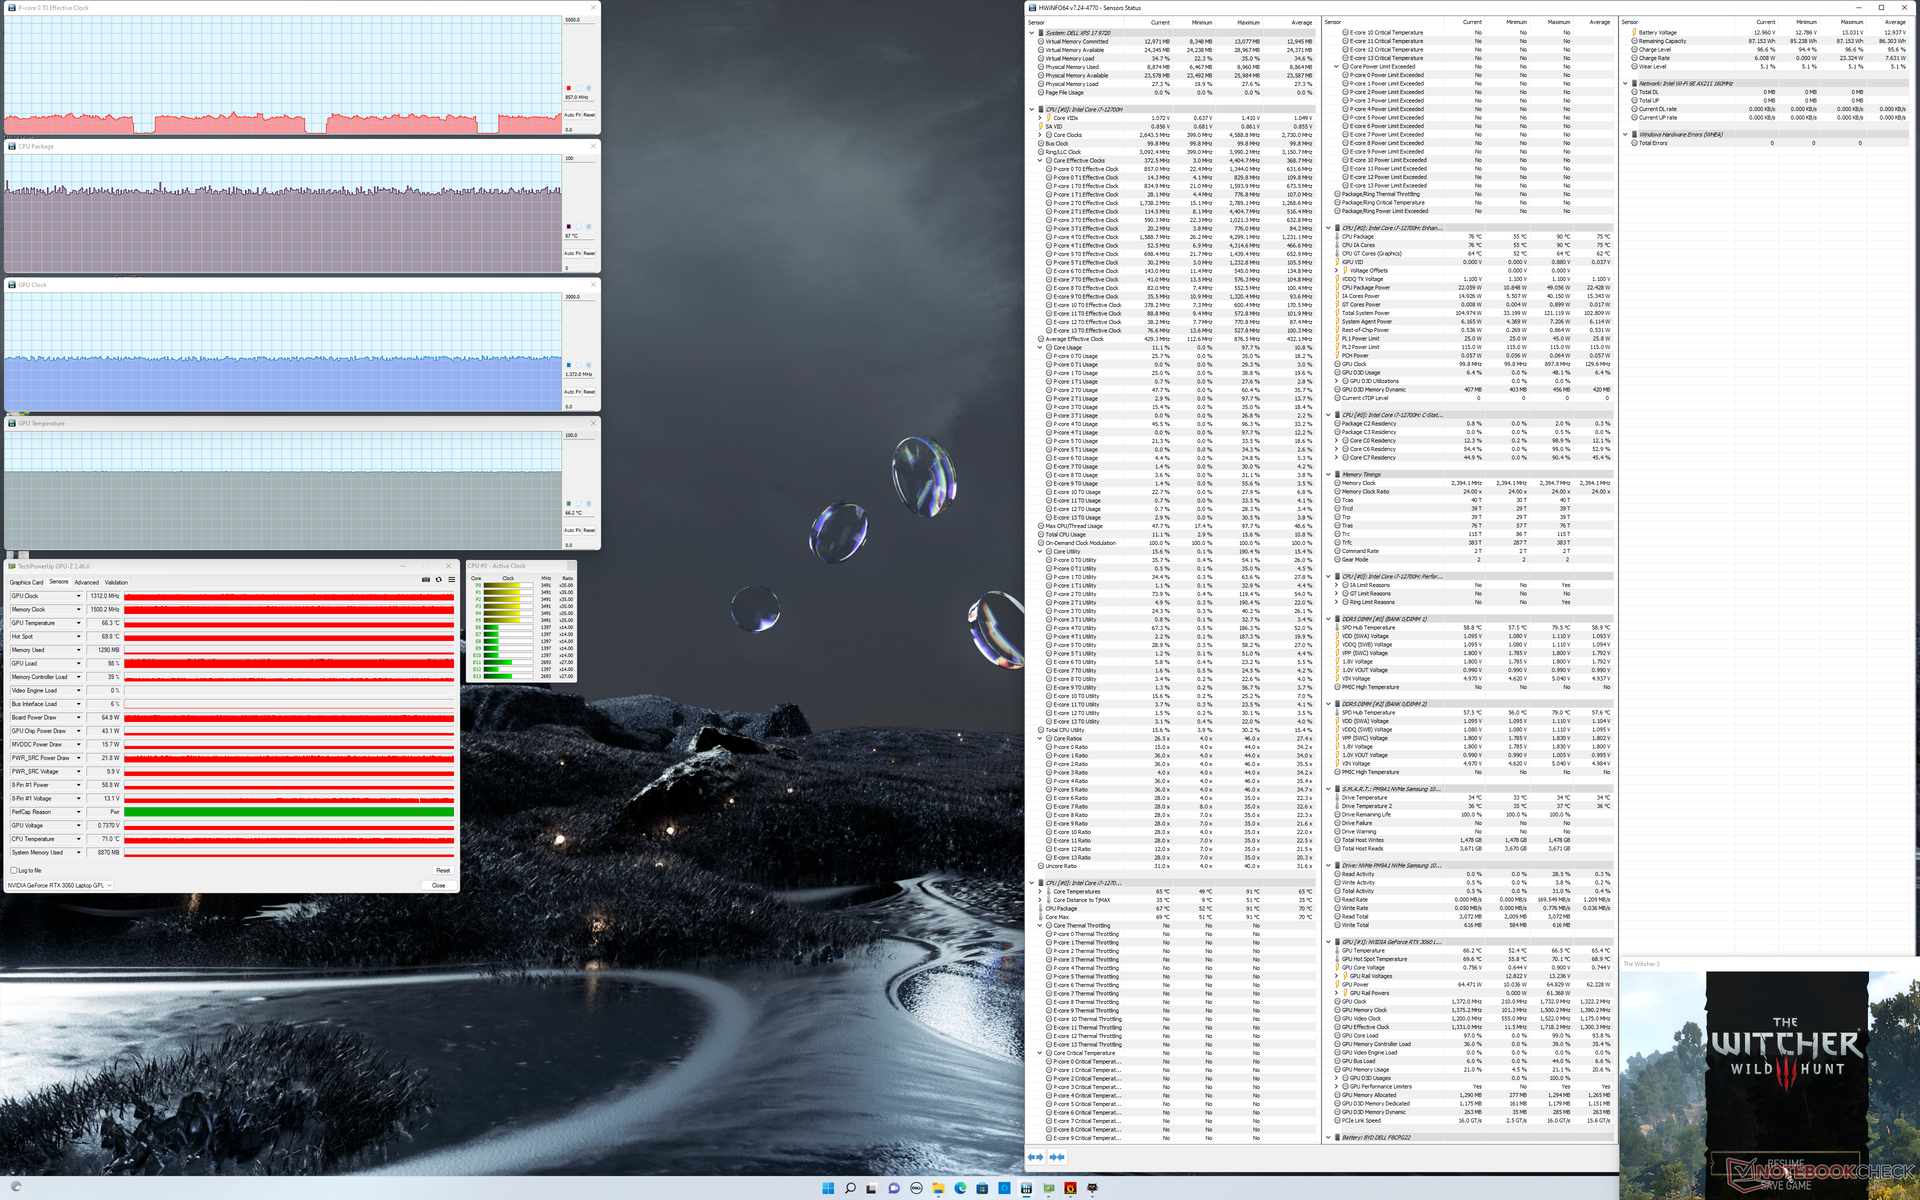
Stresstest
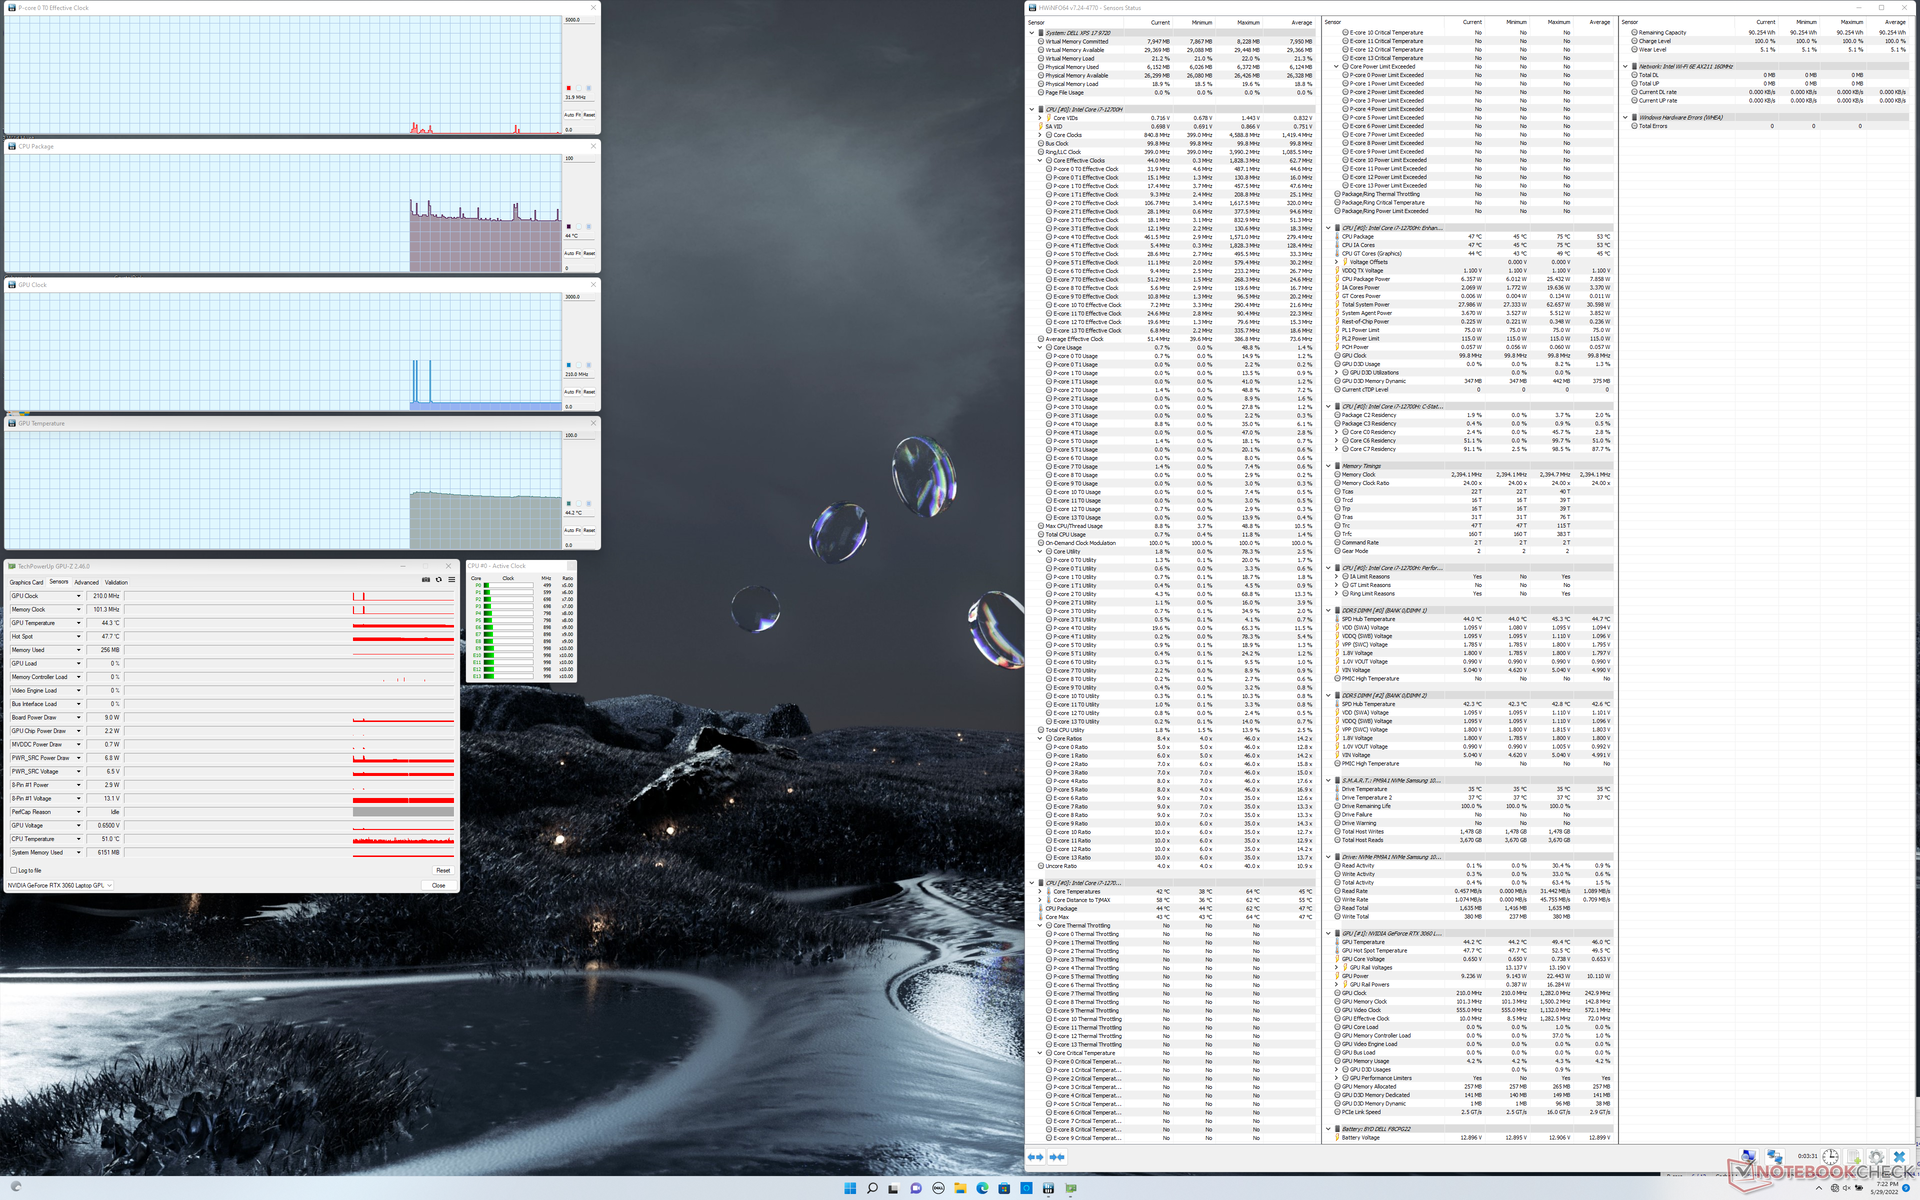
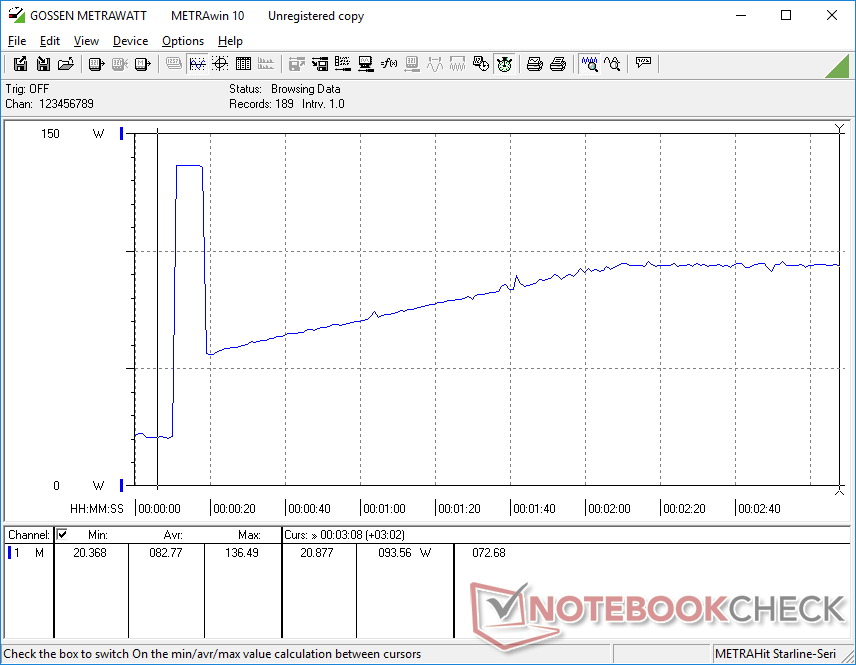
Unter Prime95 stieg die CPU für etwa zehn bis 15 Sekunden auf 3,8 GHz, 100 °C und 115 W, bevor sie abfiel und sich bei 2,5 GHz, 75 °C und 55 W stabilisierte. Im Vergleich zum Core i7-11800H XPS 17 9710 kann unser 9720 eine höhere anfängliche Leistungsaufnahme (115 vs. 87 W) erreichen, während es sich bei einer kühleren Kerntemperatur (75 vs. 82 °C) und bei identischer Leistungsaufnahme (55 W) stabilisiert. Das XPS-System ist also nur in der Lage, die höheren TDP-Bereiche oder Taktraten der Alder-Lake-Plattform für kurze Zeit auszunutzen, bevor die thermischen Einschränkungen einsetzen.
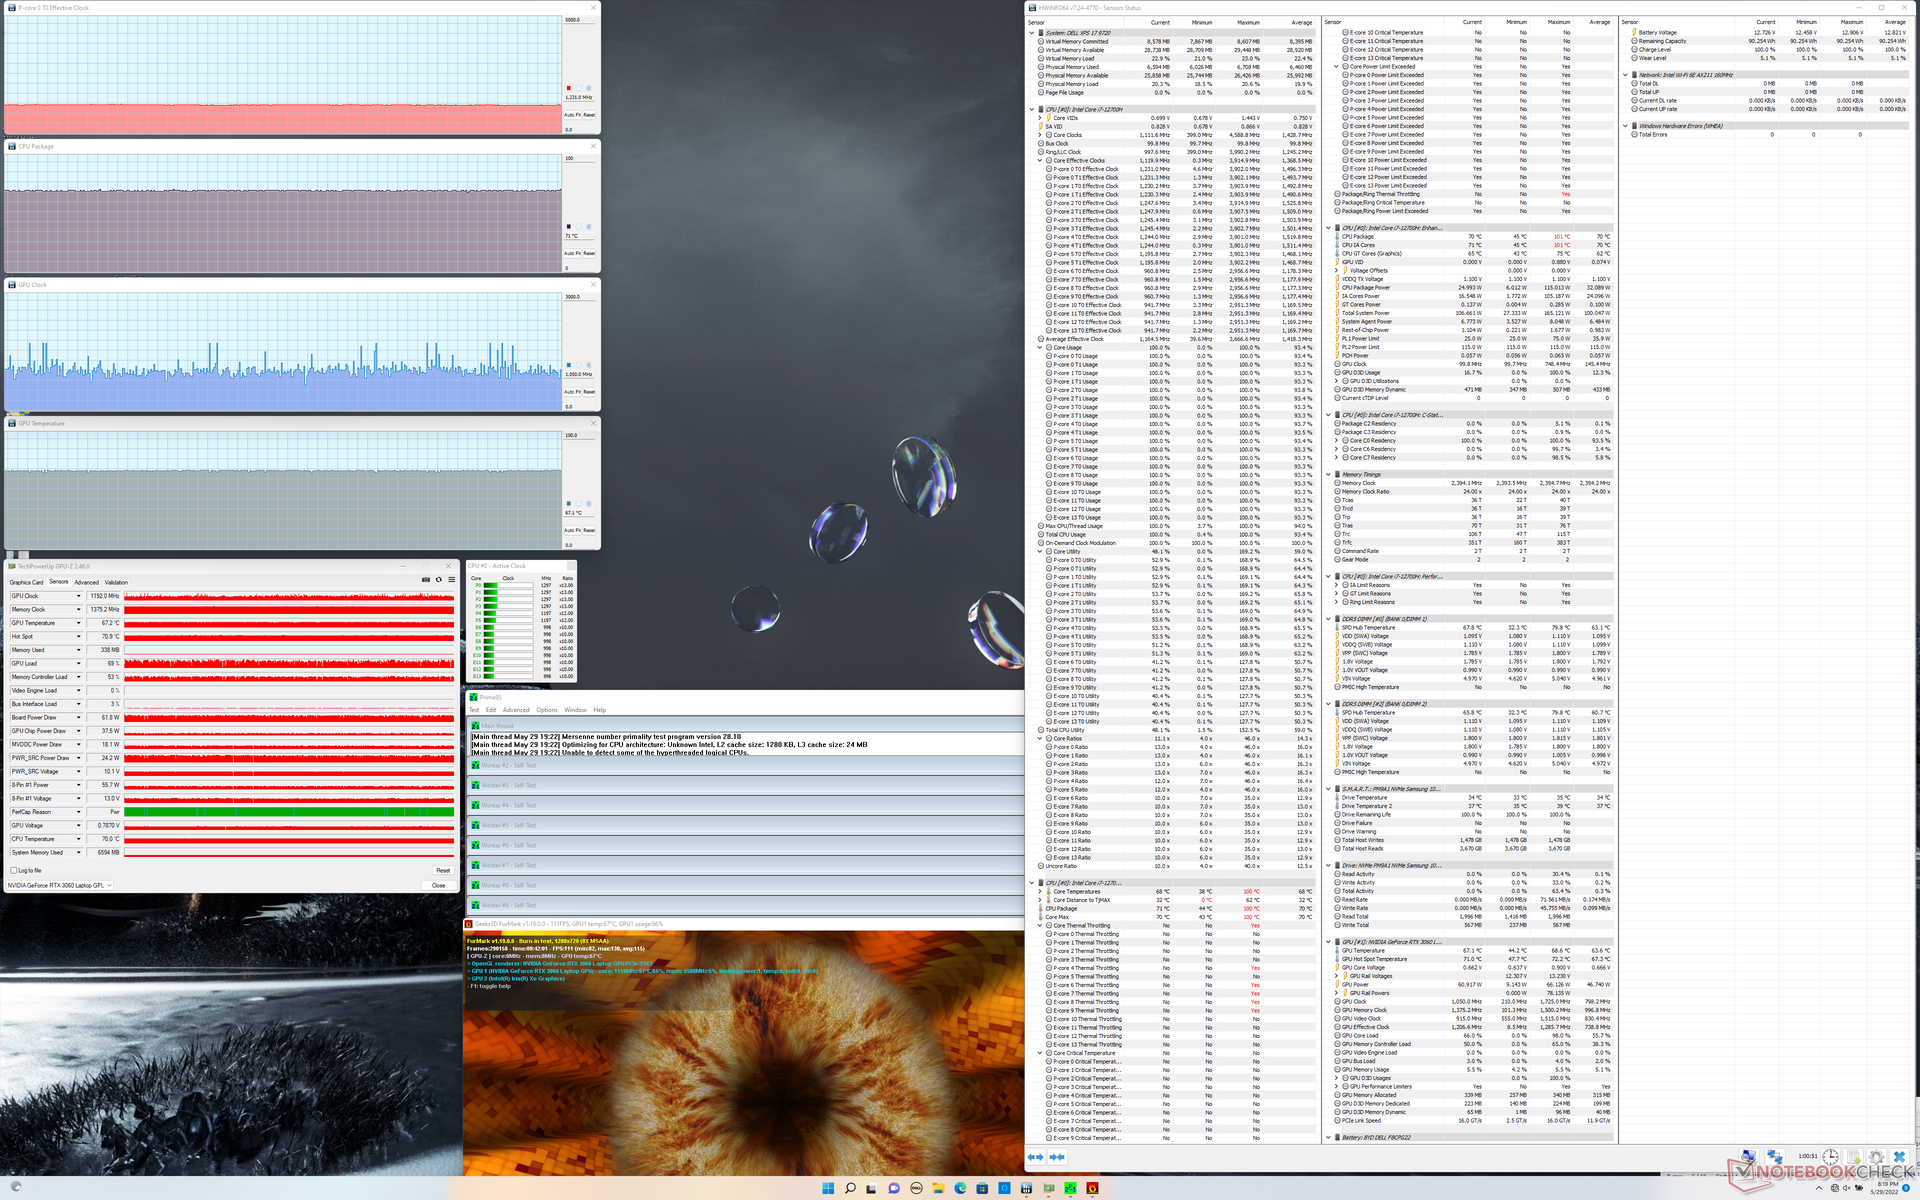
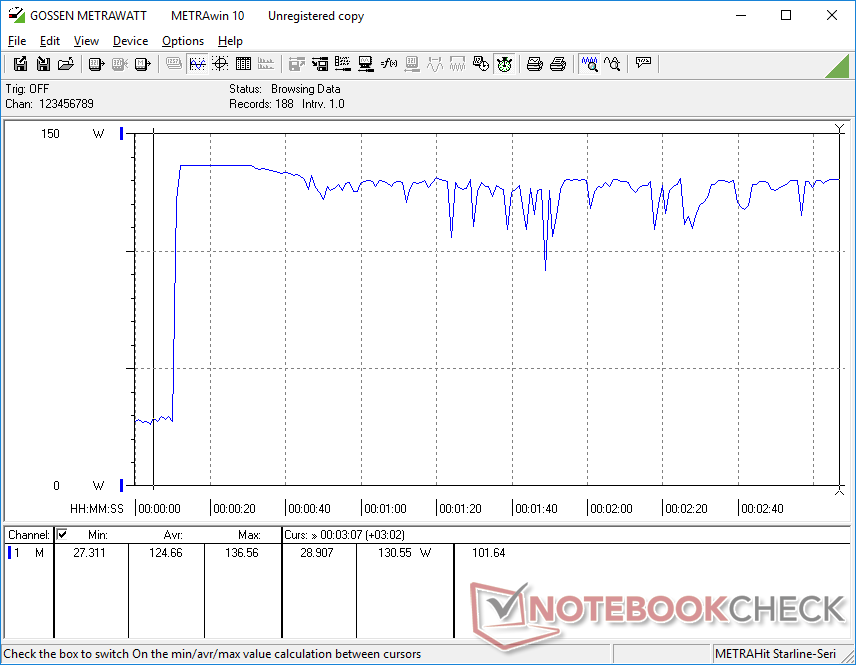
Die GPU-Taktraten, die Temperatur und die Leistungsaufnahme des Boards im Betrieb Witcher 3 würden sich bei 1.312 MHz, 66 °C bzw. 65 W stabilisieren, verglichen mit 1530 MHz, 67 °C und 69 W beim XPS 17 9710. Die insgesamt geringere Grafikleistung im Vergleich zum Vorjahr spiegelt unsere oben aufgezeichneten schlechteren 3DMark Ergebnisse wider.
Der GPU-Leistungsgewinn durch den Betrieb im Ultra-Performance-Modus gegenüber dem optimierten Modus scheint vernachlässigbar zu sein.
Der Akkubetrieb schränkt sowohl die CPU- als auch die GPU-Leistung ein. Ein Fire-Strike-Test im Akkubetrieb liefert Physik- und Grafik-Scores von 14.770 bzw. 24.927 Punkten, verglichen mit 16.354 und 23.563 Punkten im Netzbetrieb.
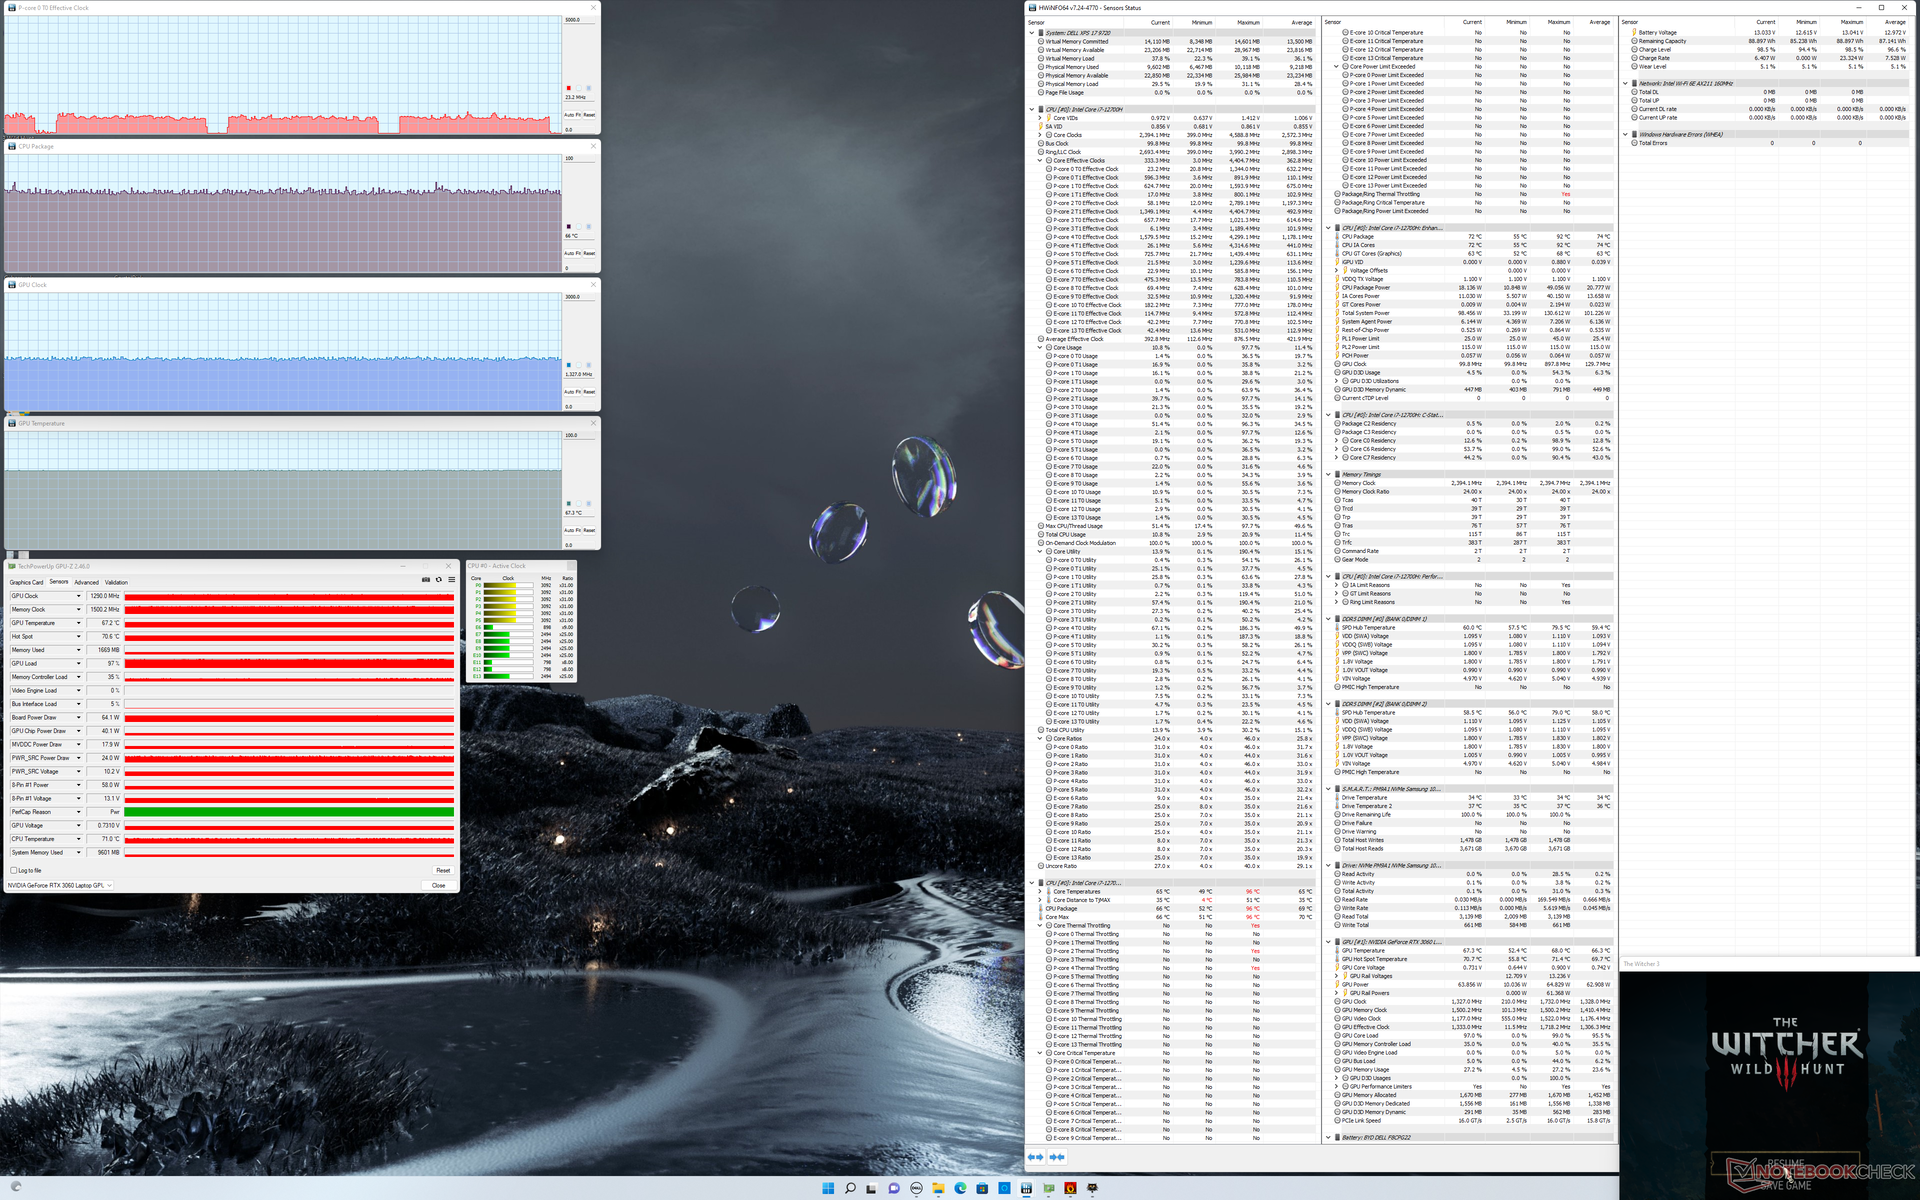
| CPU-Takt (GHz) | GPU-Takt (MHz) | durchschnittliche CPU-Temperatur (°C) | durchschnittliche GPU-Temperatur (°C) | |
| System Leerlauf | -- | -- | 44 | 44 |
| Prime95 Stress | 2,5 | -- | 75 | 59 |
| Prime95 + FurMark Stress | ||||
| Witcher 3 Stress (Optimierter Modus) | ~0,7 | 1290 | 66 | 67 |
| Witcher 3 Stress (Ultra-Performance-Modus) | ~0,8 | 1312 | 67 | 66 |
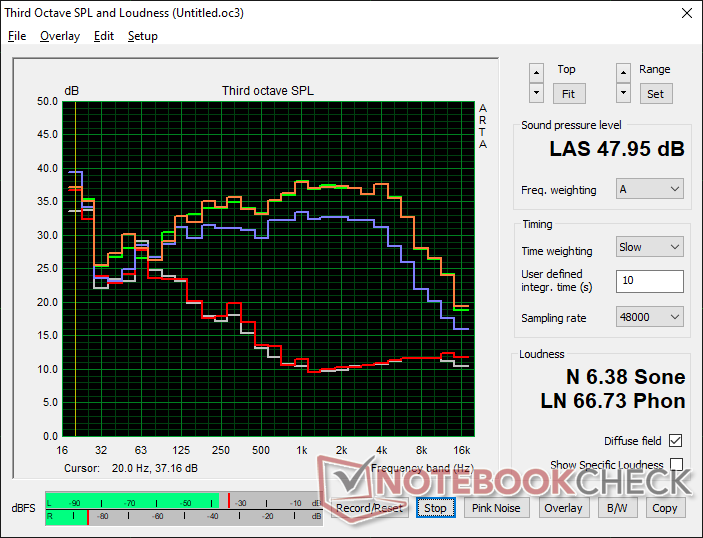
Lautsprecher
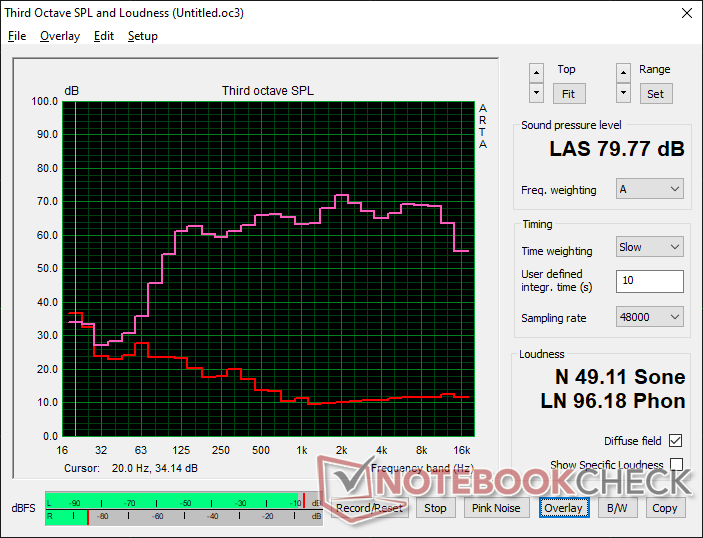
Dell XPS 17 9720 RTX 3060 Audio Analyse
(±) | Mittelmäßig laut spielende Lautsprecher (79.8 dB)
Bass 100 - 315 Hz
(±) | abgesenkter Bass - 5.2% geringer als der Median
(±) | durchschnittlich lineare Bass-Wiedergabe (7% Delta zum Vorgänger)
Mitteltöne 400 - 2000 Hz
(+) | ausgeglichene Mitten, vom Median nur 2.2% abweichend
(+) | lineare Mitten (3.8% Delta zum Vorgänger)
Hochtöne 2 - 16 kHz
(+) | ausgeglichene Hochtöne, vom Median nur 2.8% abweichend
(+) | sehr lineare Hochtöne (3.1% Delta zum Vorgänger)
Gesamt im hörbaren Bereich 100 - 16.000 Hz
(+) | hörbarer Bereich ist sehr linear (8.3% Abstand zum Median
Im Vergleich zu allen Geräten derselben Klasse
» 9% aller getesteten Geräte dieser Klasse waren besser, 2% vergleichbar, 89% schlechter
» Das beste Gerät hat einen Delta-Wert von 5%, durchschnittlich ist 17%, das schlechteste Gerät hat 45%
Im Vergleich zu allen Geräten im Test
» 2% aller getesteten Geräte waren besser, 1% vergleichbar, 97% schlechter
» Das beste Gerät hat einen Delta-Wert von 4%, durchschnittlich ist 24%, das schlechteste Gerät hat 134%
Apple MacBook Pro 16 2021 M1 Pro Audio Analyse
(+) | Die Lautsprecher können relativ laut spielen (84.7 dB)
Bass 100 - 315 Hz
(+) | guter Bass - nur 3.8% Abweichung vom Median
(+) | lineare Bass-Wiedergabe (5.2% Delta zum Vorgänger)
Mitteltöne 400 - 2000 Hz
(+) | ausgeglichene Mitten, vom Median nur 1.3% abweichend
(+) | lineare Mitten (2.1% Delta zum Vorgänger)
Hochtöne 2 - 16 kHz
(+) | ausgeglichene Hochtöne, vom Median nur 1.9% abweichend
(+) | sehr lineare Hochtöne (2.7% Delta zum Vorgänger)
Gesamt im hörbaren Bereich 100 - 16.000 Hz
(+) | hörbarer Bereich ist sehr linear (4.6% Abstand zum Median
Im Vergleich zu allen Geräten derselben Klasse
» 0% aller getesteten Geräte dieser Klasse waren besser, 0% vergleichbar, 100% schlechter
» Das beste Gerät hat einen Delta-Wert von 5%, durchschnittlich ist 17%, das schlechteste Gerät hat 45%
Im Vergleich zu allen Geräten im Test
» 0% aller getesteten Geräte waren besser, 0% vergleichbar, 100% schlechter
» Das beste Gerät hat einen Delta-Wert von 4%, durchschnittlich ist 24%, das schlechteste Gerät hat 134%
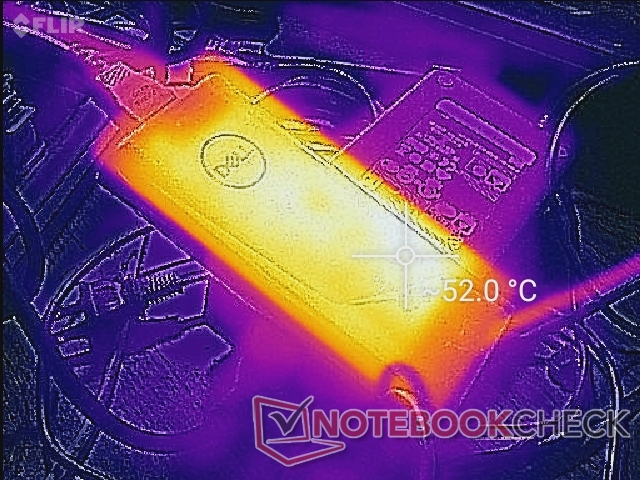
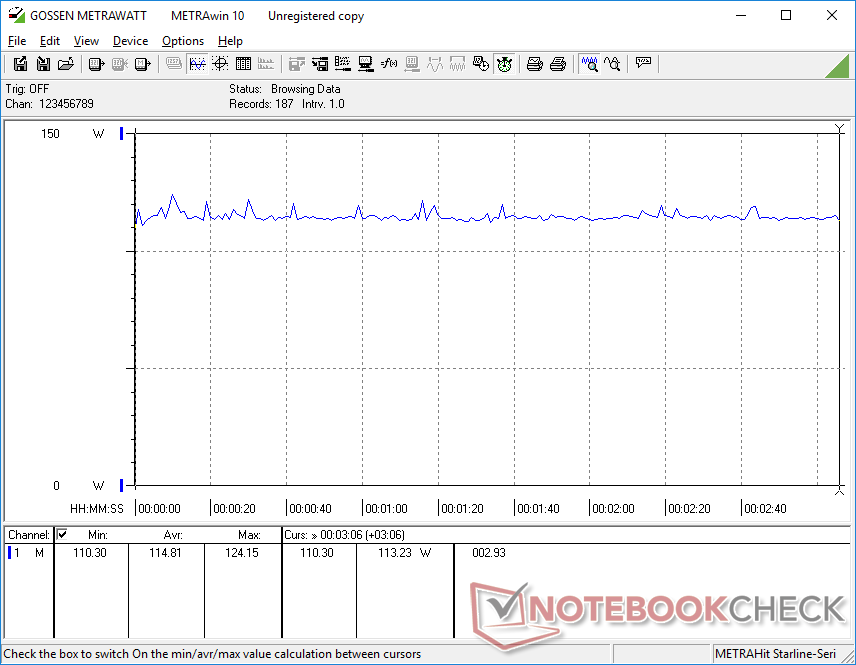
Energieverwaltung - Höhere Turbo-Boost-Leistungsaufnahme
Stromverbrauch
Das XPS 17 9700 hatte Probleme beim Laden, wenn das System nicht mehr als 100 W aus dem 130-W-Netzteil ziehen konnte. Glücklicherweise hat Dell das Problem beim Nachfolger XPS 17 9710 behoben, und beim 9720 ist das nicht anders. Im Betrieb von Witcher 3 verbraucht unser 9720er 115 W und ist damit fast identisch mit dem älteren 9710er. Die XPS-15-Serie und die XPS-17-Serie sind weiterhin die einzigen Modelle auf dem Markt, die mit einem 130-W-USB-C-Adapter ausgeliefert werden.
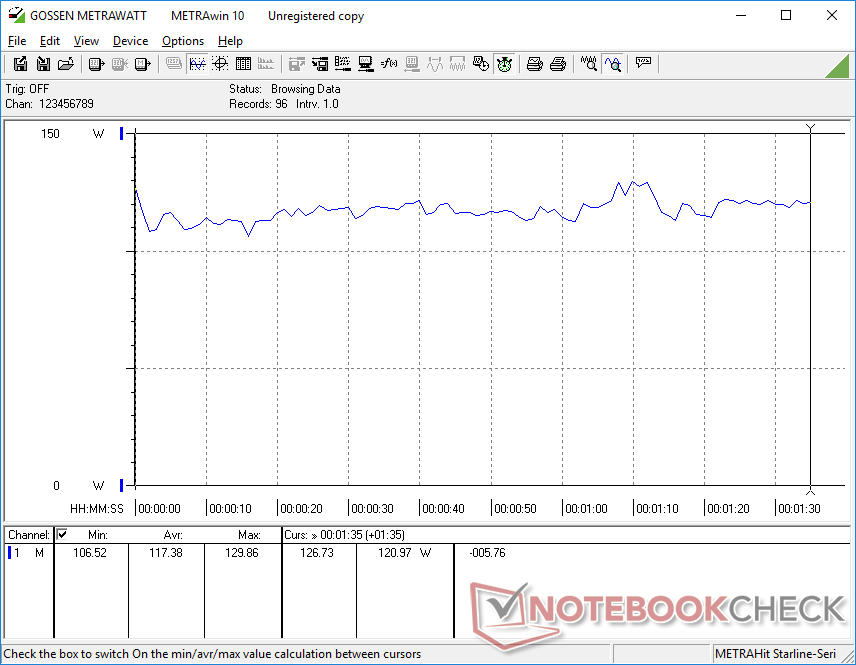
Bemerkenswert ist, dass der Stromverbrauch bei der Ausführung von Prime95 zu Beginn des Tests etwas höher ist als beim 9710, bevor er sich bei jeweils etwa 94 W stabilisiert. Der höhere Stromverbrauch der 12.-Gen-CPU ist also nur von kurzer Dauer, bevor er sich dem 9710-Modell mit 11.-Gen-Prozessoren angleicht.
Der Ladevorgang wird beim Spielen oder bei hoher Last deutlich verlangsamt. Im Betrieb Witcher 3 bei 13 Prozent Akkukapazität und Netzstrom steigt der Akku im Laufe einer Stunde nur um weitere zwölf Prozent an.
| Aus / Standby | |
| Idle | |
| Last |
|
Legende:
min: | |
| Dell XPS 17 9720 RTX 3060 i7-12700H, GeForce RTX 3060 Laptop GPU, Samsung PM9A1 MZVL21T0HCLR, IPS, 3840x2400, 17" | HP Envy 17-cg i5-1135G7, GeForce MX450, Samsung PM991 MZVLQ1T0HALB, IPS, 1920x1080, 17.3" | Dell XPS 17 9710 Core i7 RTX 3060 i7-11800H, GeForce RTX 3060 Laptop GPU, Micron 2300 1TB MTFDHBA1T0TDV, IPS, 3840x2400, 17" | Dell XPS 17 9700 Core i7 RTX 2060 Max-Q i7-10875H, GeForce RTX 2060 Max-Q, Micron 2200S 1TB MTFDHBA1T0TCK, IPS, 3840x2400, 17" | Lenovo Legion 5 17ACH6H-82JY0003GE R5 5600H, GeForce RTX 3060 Laptop GPU, Samsung PM991a MZALQ512HBLU, IPS, 1920x1080, 17.3" | Asus VivoBook 17 F712JA-AU708W i7-1065G7, Iris Plus Graphics G7 (Ice Lake 64 EU), Kingston OM8PCP3512F-AB, IPS, 1920x1080, 17.3" | Razer Blade 17 (i7-12800H, RTX 3070 Ti) i7-12800H, GeForce RTX 3070 Ti Laptop GPU, Samsung PM9A1 MZVL21T0HCLR, IPS, 2560x1440, 17.3" | |
|---|---|---|---|---|---|---|---|
| Stromverbrauch | 46% | 3% | 7% | -40% | 61% | -54% | |
| Idle min * (Watt) | 5.9 | 3.8 36% | 7.5 -27% | 5.8 2% | 15.6 -164% | 4.2 29% | 14.4 -144% |
| Idle avg * (Watt) | 15.8 | 9.4 41% | 15.7 1% | 20.6 -30% | 20.7 -31% | 7.9 50% | 20 -27% |
| Idle max * (Watt) | 26.7 | 10.1 62% | 23.1 13% | 21 21% | 22.9 14% | 8.8 67% | 21.5 19% |
| Last avg * (Watt) | 117.4 | 64.4 45% | 87.2 26% | 104.7 11% | 134 -14% | 29.7 75% | 119 -1% |
| Witcher 3 ultra * (Watt) | 114.8 | 64.4 44% | 116 -1% | 99.2 14% | 135 -18% | 28.8 75% | 218 -90% |
| Last max * (Watt) | 136.6 | 68 50% | 131.6 4% | 107.6 21% | 170 -24% | 44 68% | 248 -82% |
* ... kleinere Werte sind besser
Power Consumption Witcher 3 / Stresstest
Power Consumption external Monitor
Akkulaufzeit
Die Laufzeiten haben sich im Vergleich zu den Vorgängermodellen 9710 und 9700 nicht wesentlich verändert. Erwarten darf man knapp neun Stunden reale WLAN-Nutzung im Energieprofil "Ausbalanciert" oder "Optimiert", wenn die integrierte GPU aktiv ist. Das Aufladen von der leeren bis zur vollen Kapazität dauert etwas mehr als zwei Stunden, vorausgesetzt, man führt keine anspruchsvollen Anwendungen aus, wie oben erwähnt.
| Dell XPS 17 9720 RTX 3060 i7-12700H, GeForce RTX 3060 Laptop GPU, 97 Wh | HP Envy 17-cg i5-1135G7, GeForce MX450, 55.67 Wh | Dell XPS 17 9710 Core i7 RTX 3060 i7-11800H, GeForce RTX 3060 Laptop GPU, 97 Wh | Dell XPS 17 9700 Core i7 RTX 2060 Max-Q i7-10875H, GeForce RTX 2060 Max-Q, 97 Wh | Lenovo Legion 5 17ACH6H-82JY0003GE R5 5600H, GeForce RTX 3060 Laptop GPU, 80 Wh | Asus VivoBook 17 F712JA-AU708W i7-1065G7, Iris Plus Graphics G7 (Ice Lake 64 EU), 32 Wh | Razer Blade 17 (i7-12800H, RTX 3070 Ti) i7-12800H, GeForce RTX 3070 Ti Laptop GPU, 82 Wh | |
|---|---|---|---|---|---|---|---|
| Akkulaufzeit | 46% | 74% | 56% | 21% | 11% | 24% | |
| WLAN (h) | 8.7 | 7.9 -9% | 7.6 -13% | 9.7 11% | 4.4 -49% | 4.4 -49% | 5.9 -32% |
| Last (h) | 1 | 2 100% | 2.6 160% | 2 100% | 1.9 90% | 1.7 70% | 1.8 80% |
| Idle (h) | 17.7 | 17.7 | 23.8 | 5.5 | |||
| H.264 (h) | 3.5 | 4.9 |
Pro
Contra
Fazit - Alles über diese CPU
An der aktualisierten CPU gibt es wenig zu meckern. Es stimmt zwar, dass die Alder-Lake-Plattform sehr stromhungrig sein kann, aber der Leistungszuwachs ist zumindest respektabel. Power-User, die wissen, dass sie die zusätzliche Leistung ausnutzen können, werden den Kompromiss in dieser Hinsicht sicherlich zu schätzen wissen.
Das Dell XPS 17 9720 führt ein brandneues Prozessor ein, der im Vergleich zu den älteren 10er- und 11er-Optionen deutliche Leistungssteigerungen bietet. Abgesehen von der CPU bleiben jedoch die gleichen Nachteile wie beim XPS 17 9710 oder 9700 bestehen.
Leider gibt es ein paar kleinere Nachteile, die auch nach zwei Jahren noch nicht behoben wurden: Die Videoqualität der Webcam ist nach wie vor schlecht, der Ladevorgang ist bei anspruchsvoller Last deutlich langsamer, der Deckel lässt sich mit seinem schlechten Griff nur schwer öffnen, und es gibt immer noch keine Webcam-Sichtschutzblende oder Wi-Fi-6E-Unterstützung. Die Tatsache, dass die GPU scheinbar aus dem Nichts heraus einen Rückschlag erlitten hat, kann für XPS-Enthusiasten eine schwer zu schluckende Pille sein. Die größten Vorteile des XPS 17 9720 im Vergleich zu Alternativen mit mehr Features wie dem Gigabyte Aero 17 sind nach wie vor die kompaktere Gehäusegröße und das Seitenverhältnis von 16:10.
Preis und Verfügbarkeit
Amazon hat zum Beispiel das XPS 17 9720 SKU für 2.799 Euro mit Core i7-12700H, GeForce RTX 3050 und UHD+ 3.840x2.400 gelistet. Für mehr Optionen können Nutzer stattdessen direkt bei Dell bestellen.
Dell XPS 17 9720 RTX 3060
- 31.05.2022 v7 (old)
Allen Ngo
Preisvergleich

