Fazit - Schlanker und leichter mit einigen Kompromissen
Das Dell 16 Plus 2-in-1 ist sowohl ein Upgrade als auch ein Downgrade gegenüber dem letztjährigen Inspiron 16 7640 2-in-1. Es ist etwas leichter und dünner und verfügt über eine viel schnellere Grafikleistung als sein Vorgänger, was für Reisende, Gelegenheitsspieler oder GPU-beschleunigte Aufgaben von Vorteil sein kann.
Einige der Änderungen im Vergleich zum Vorjahr sind vielleicht nicht für jeden etwas. Insbesondere der Wechsel von Core-Ultra-H- zu Core-Ultra-V-Prozessoren hat die rohe Verarbeitungsleistung deutlich reduziert. Inzwischen sind die neu angeordneten Anschlüsse wohl eher zum Nachteil, da beide USB-C-Ports nun eng beieinander liegen, was die Ergonomie beim Andocken beeinträchtigt. Die Akkukapazität wurde ebenfalls deutlich reduziert, so dass Akkulaufzeit kürzer ist als beim Inspiron 16 7640 2-in-1, obwohl das ältere System mit der schnelleren Core-Ultra-H-CPU ausgestattet ist.
Nutzer mit ausgewogenen Anforderungen, die den integrierten Ziffernblock und die relativ schnelle iGPU zu schätzen wissen, werden vielleicht das neuere Dell 16 Plus 2-in-1 bevorzugen. Power User, die sich auf die reine CPU-Leistung verlassen, sollten sich für das ältere Inspiron 16 7640 2-in-1 entscheiden, zumal beide Modelle mit den gleichen Panels ausgestattet sind und ein identisches Seherlebnis bieten.
Pro
Contra
Preis und Verfügbarkeit
Dell liefert jetzt das Dell 16 Plus 2-in-1 ab 1.149 Euro mit einem FHD+-Display oder ab 1.399 Euro mit Mini-LED aus.
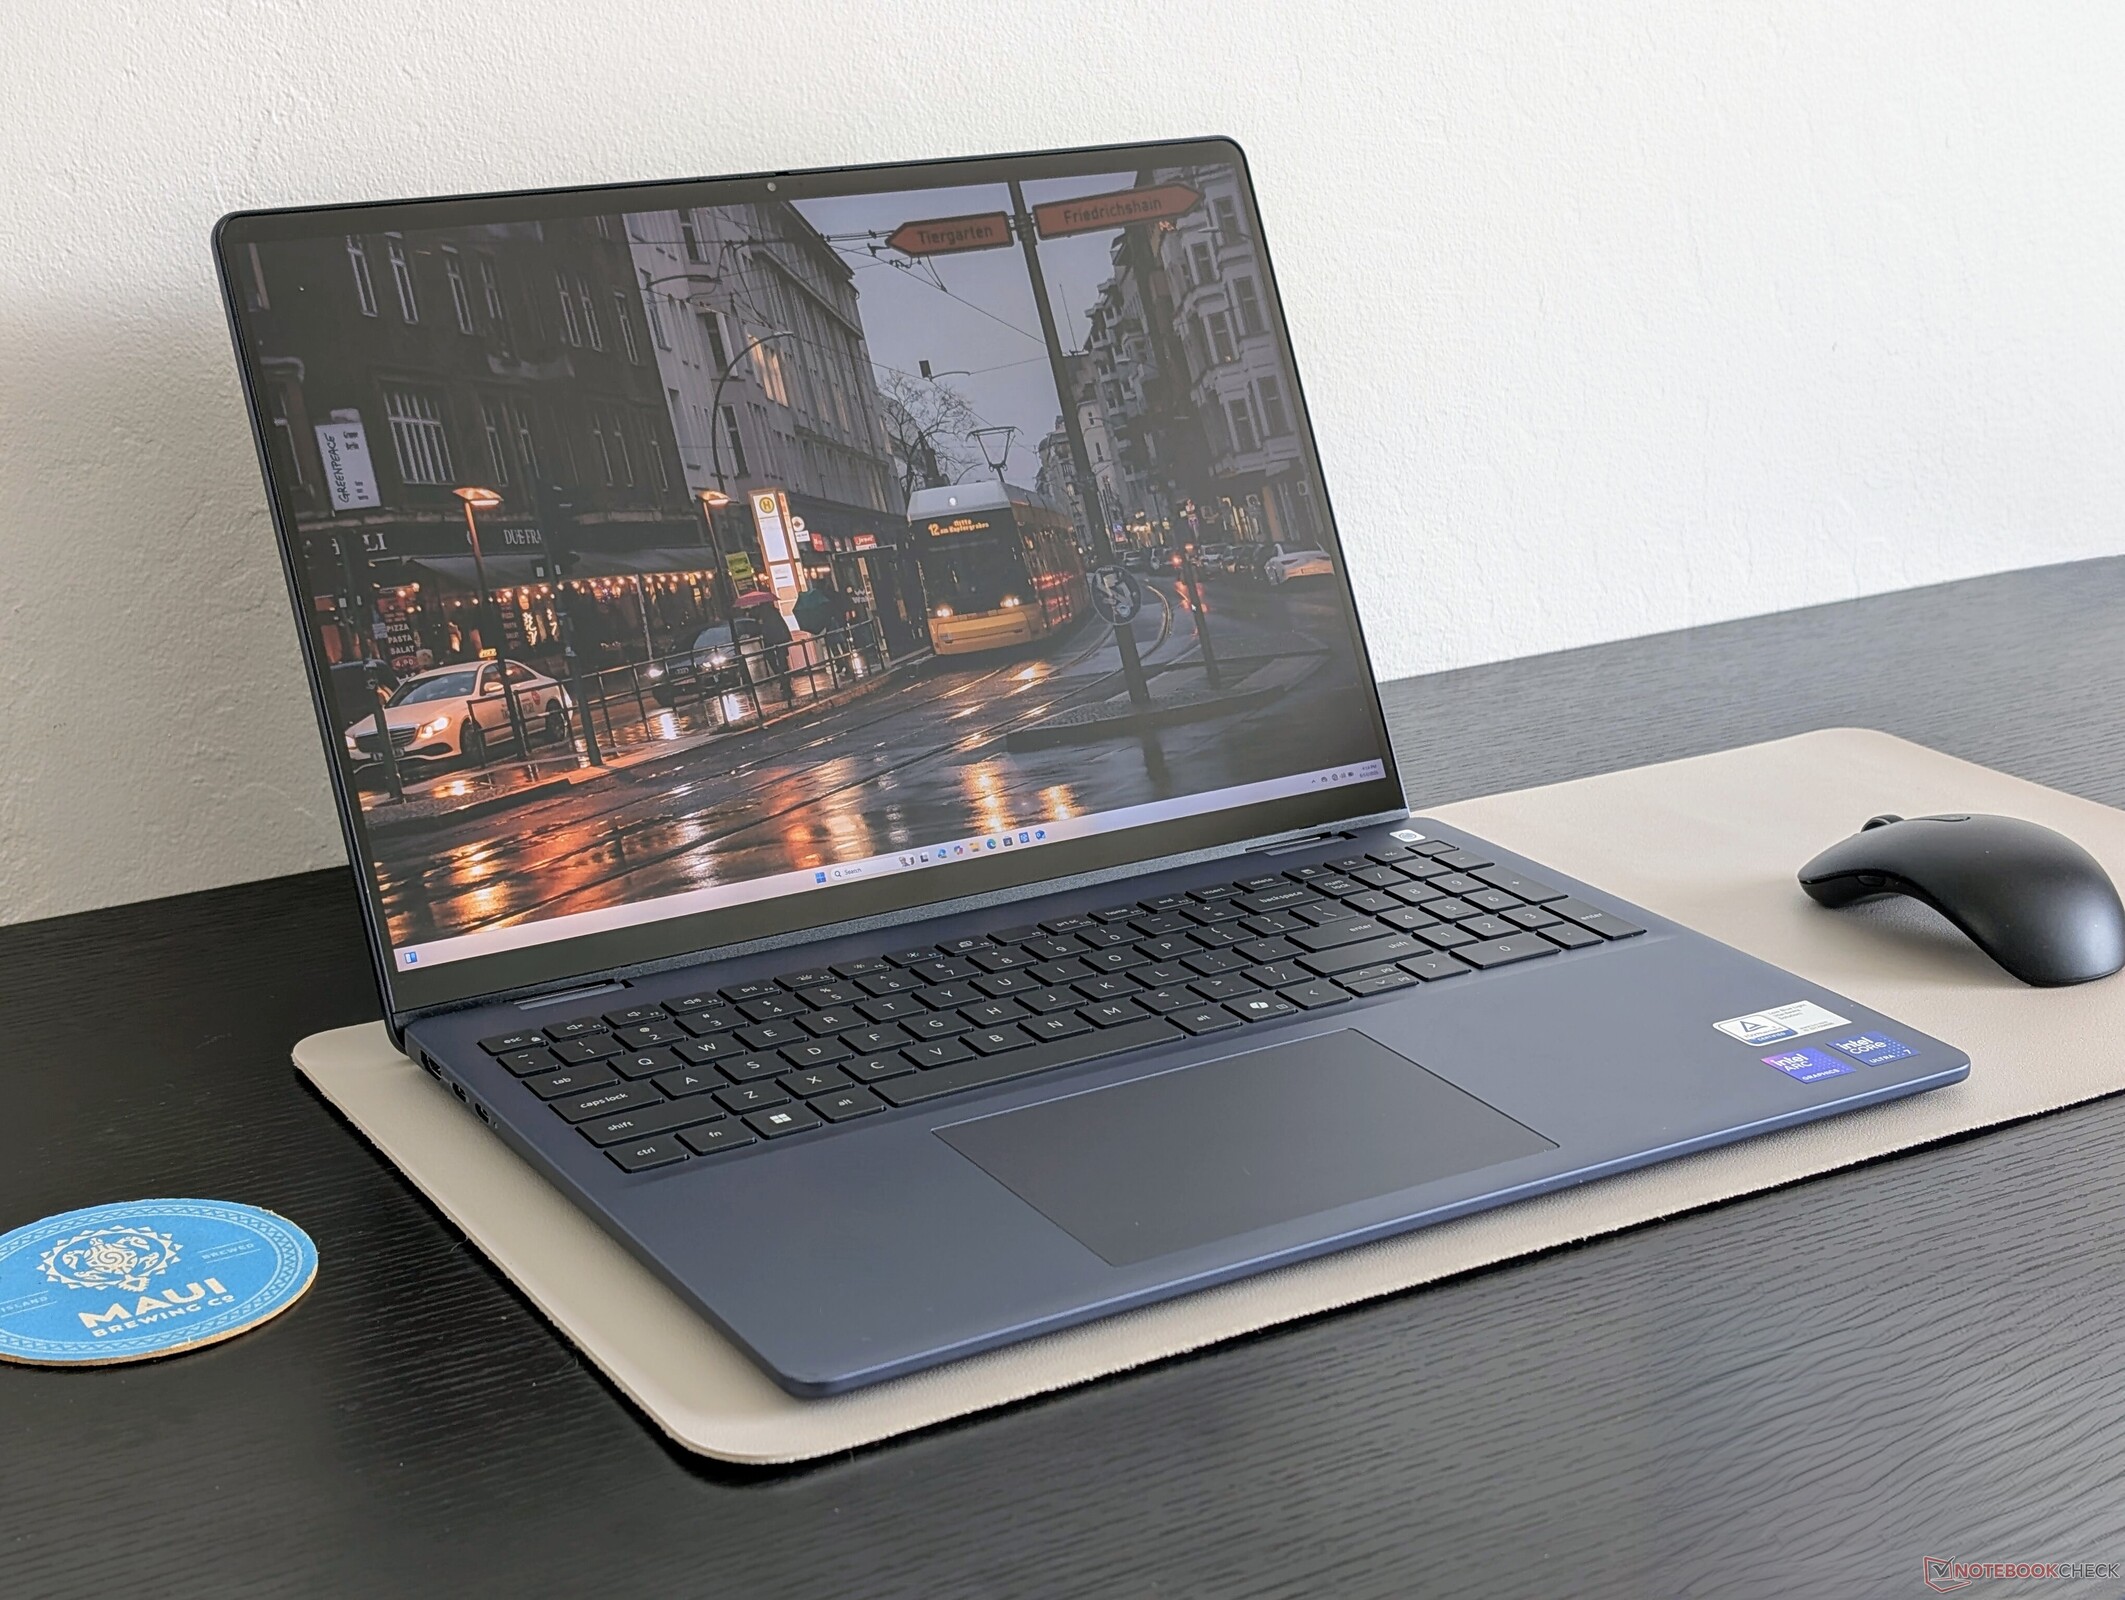
Das Dell 16 Plus 2-in-1 ist die Convertible-Version des Dell-16-Plus-Gehäuses und der direkte Nachfolger des 2024 Inspiron 16 7640 2-in-1. Es stellt den Beginn einer neuen Generation von Mainstream-Notebooks dar, welche die alte Inspiron Namensgebung ablösen soll.
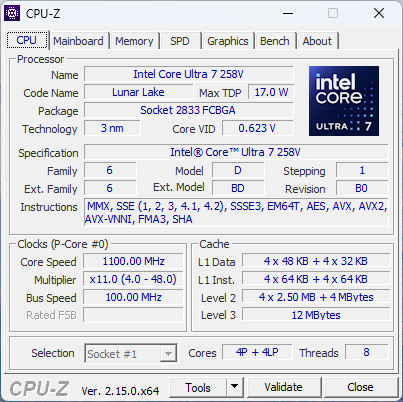
Unser Testgerät ist eine mittlere Konfiguration mit der Core-Ultra-7-256V-CPU und einem 2.5K-90-Hz Mini-LED-Touchscreen für ca. 1.400 US-Dollar. Niedrigere SKUs können mit einem traditionelleren FHD-IPS-Touchscreen ausgestattet sein, während höherwertige SKUs stattdessen mit dem Core Ultra 9 288V ausgeliefert werden.
Zu den Konkurrenten des Dell 16 Plus 2-in-1 gehören andere 16-Zoll-Multimedia-Convertibles wie das HP Envy x360 2-in-1 16, Lenovo Yoga 7 2-in-1 16ILL10 oder Samsung Galaxy Book5 Pro 360.
Weitere Dell Bewertungen:
Spezifikationen
Gehäuse
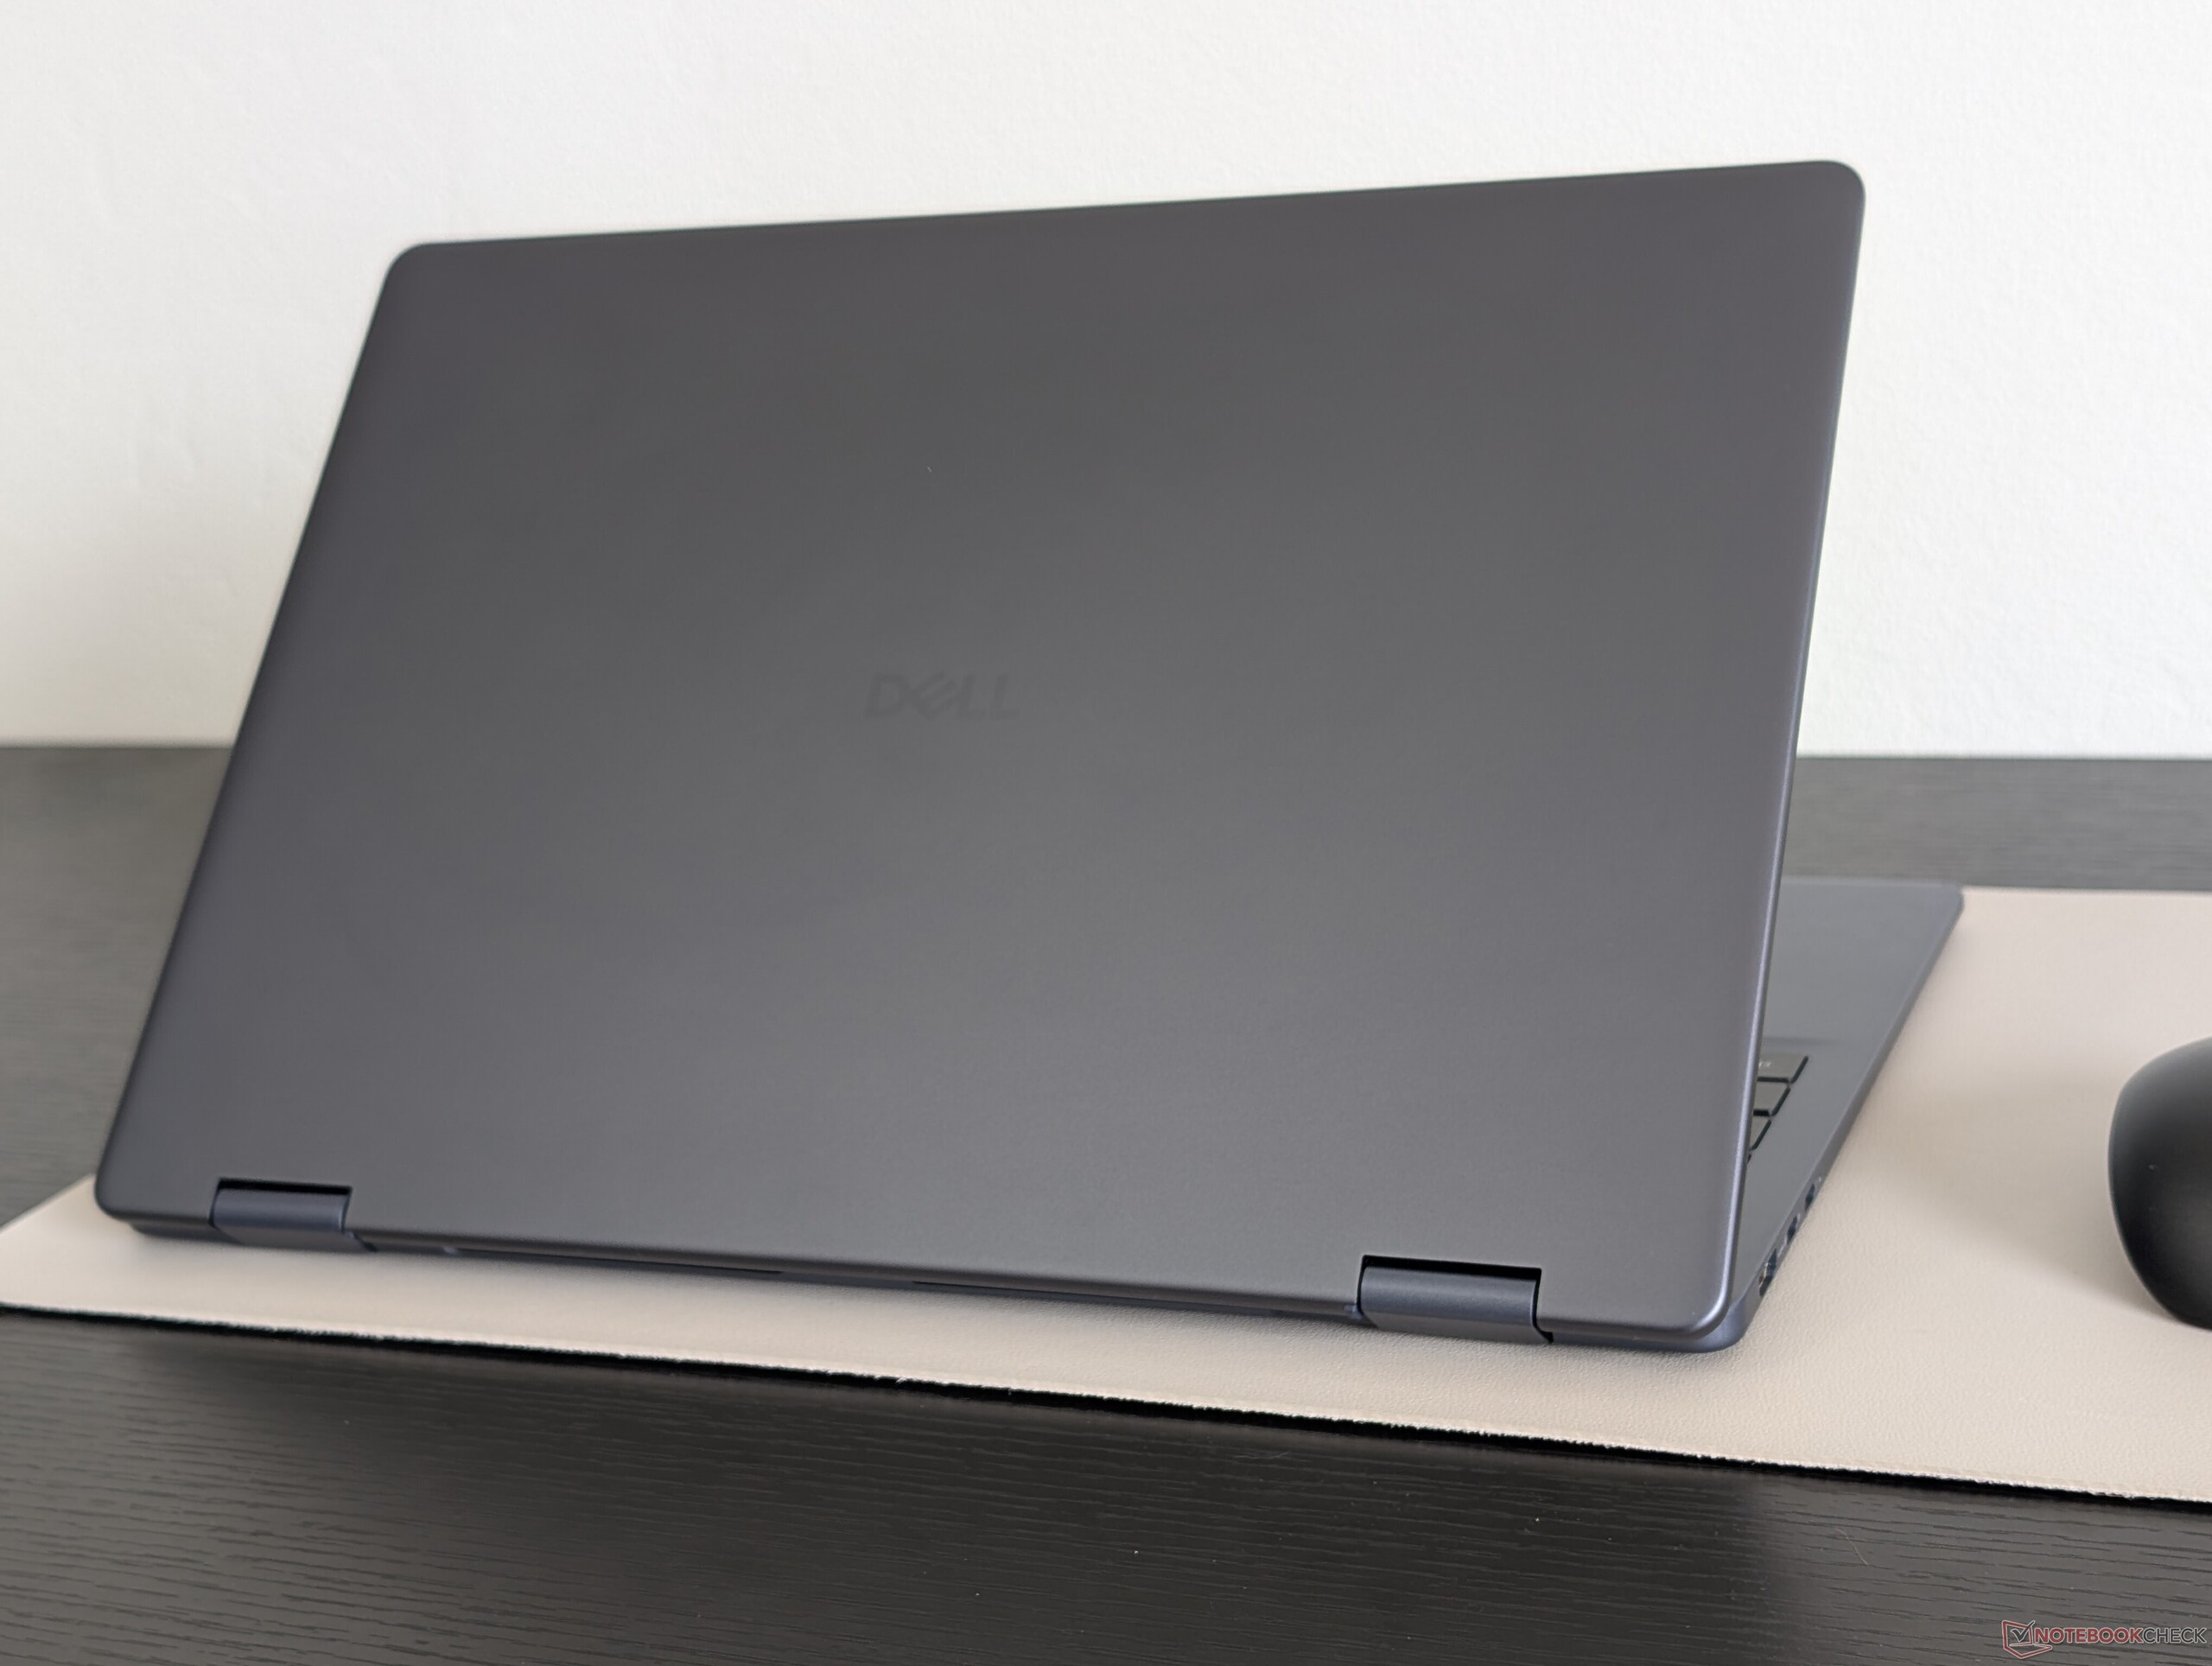
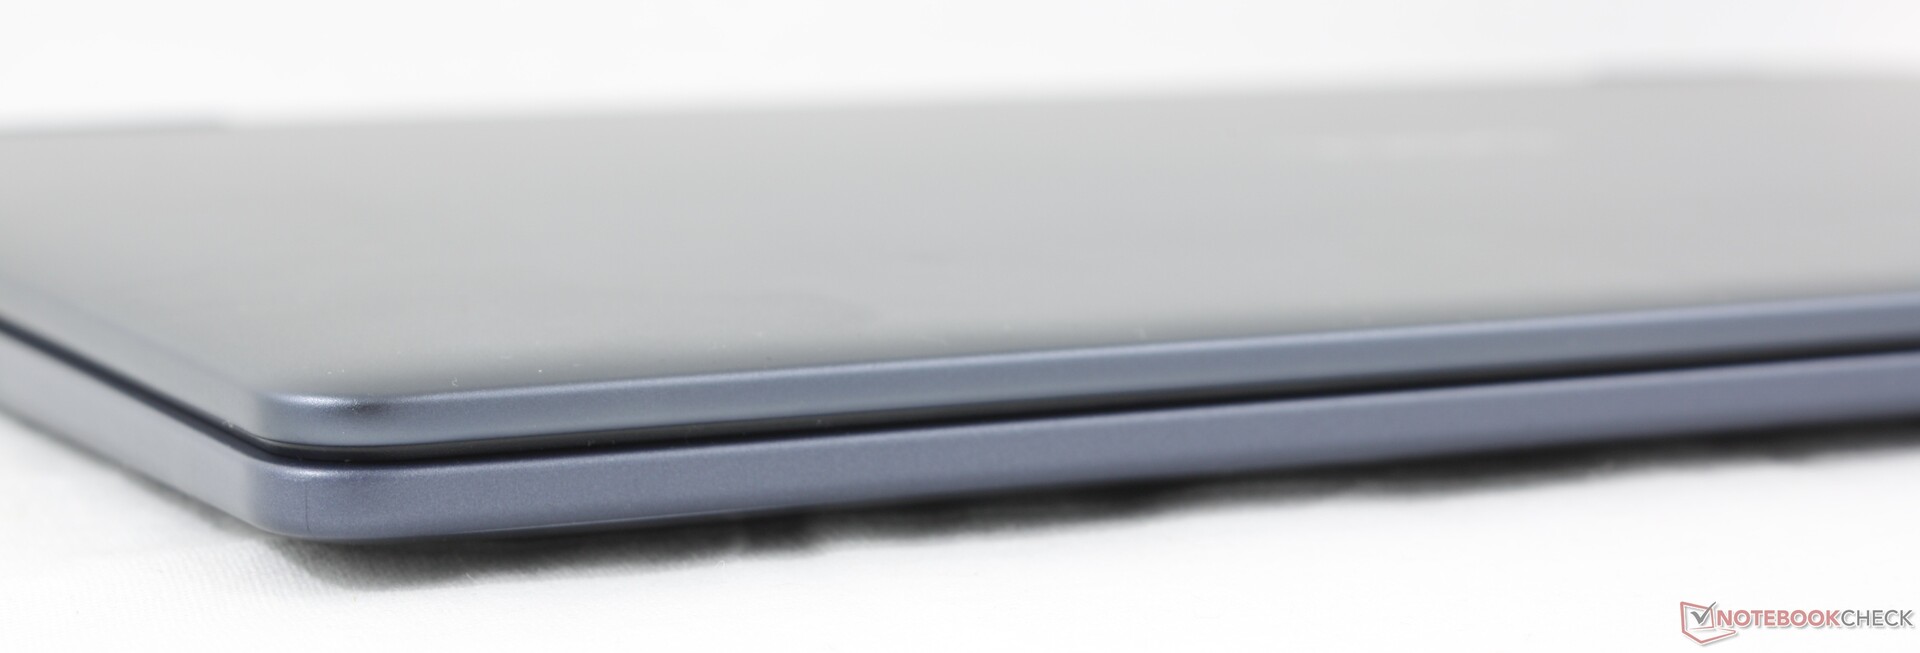
Das Gehäuse ist eine Weiterentwicklung des Inspiron 16 7640 2-in-1 und verwendet ähnliche Aluminium- und Kunststoffmaterialien für das vertraute "Inspiron"-Gefühl und die Qualität. Die Abmessungen und das Gewicht der beiden Modelle sind fast identisch, abgesehen von dem etwas dünneren Profil des neueren Modells.
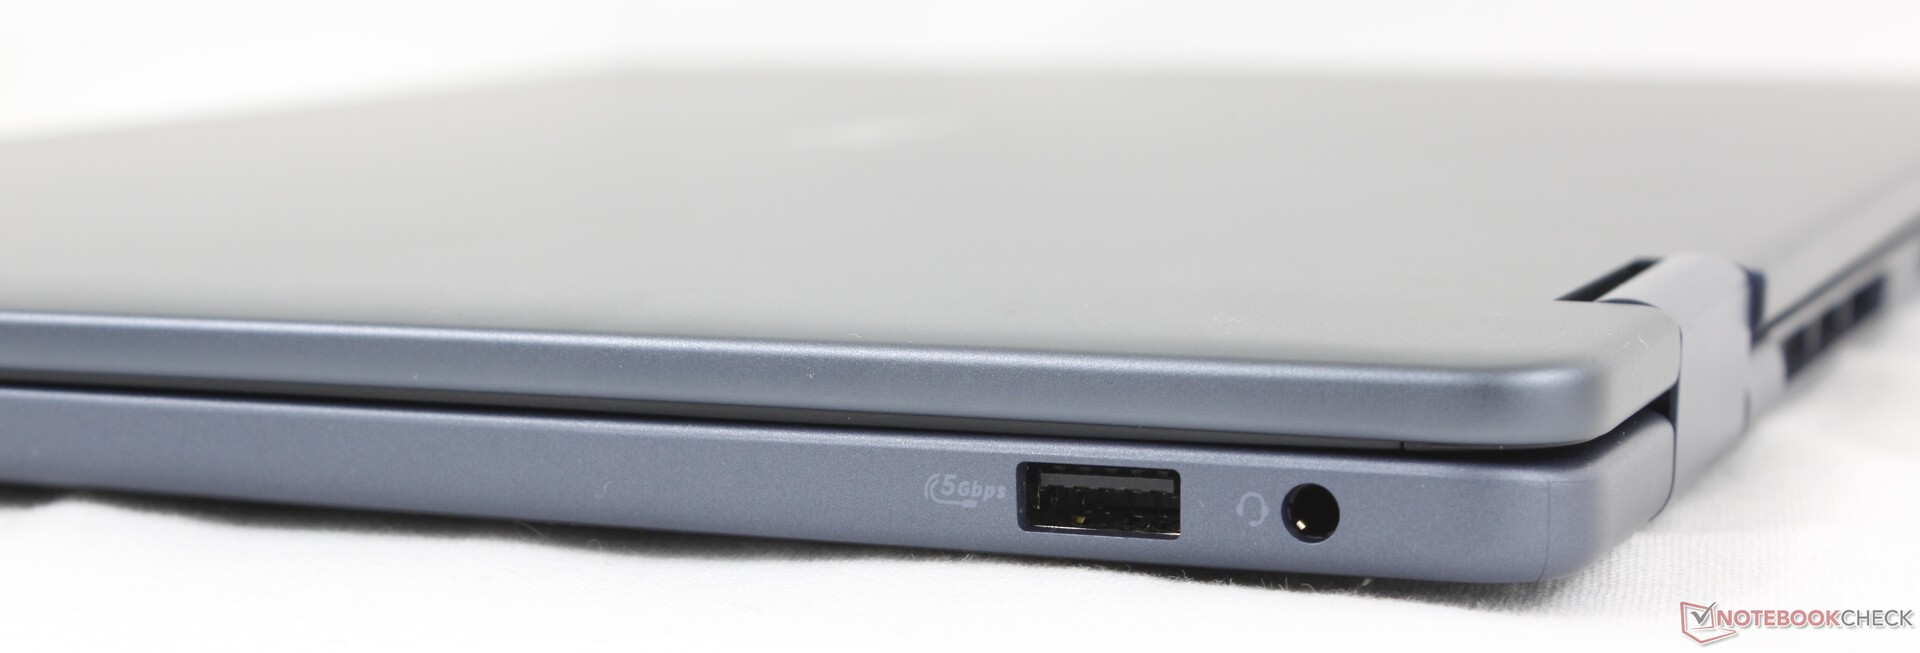
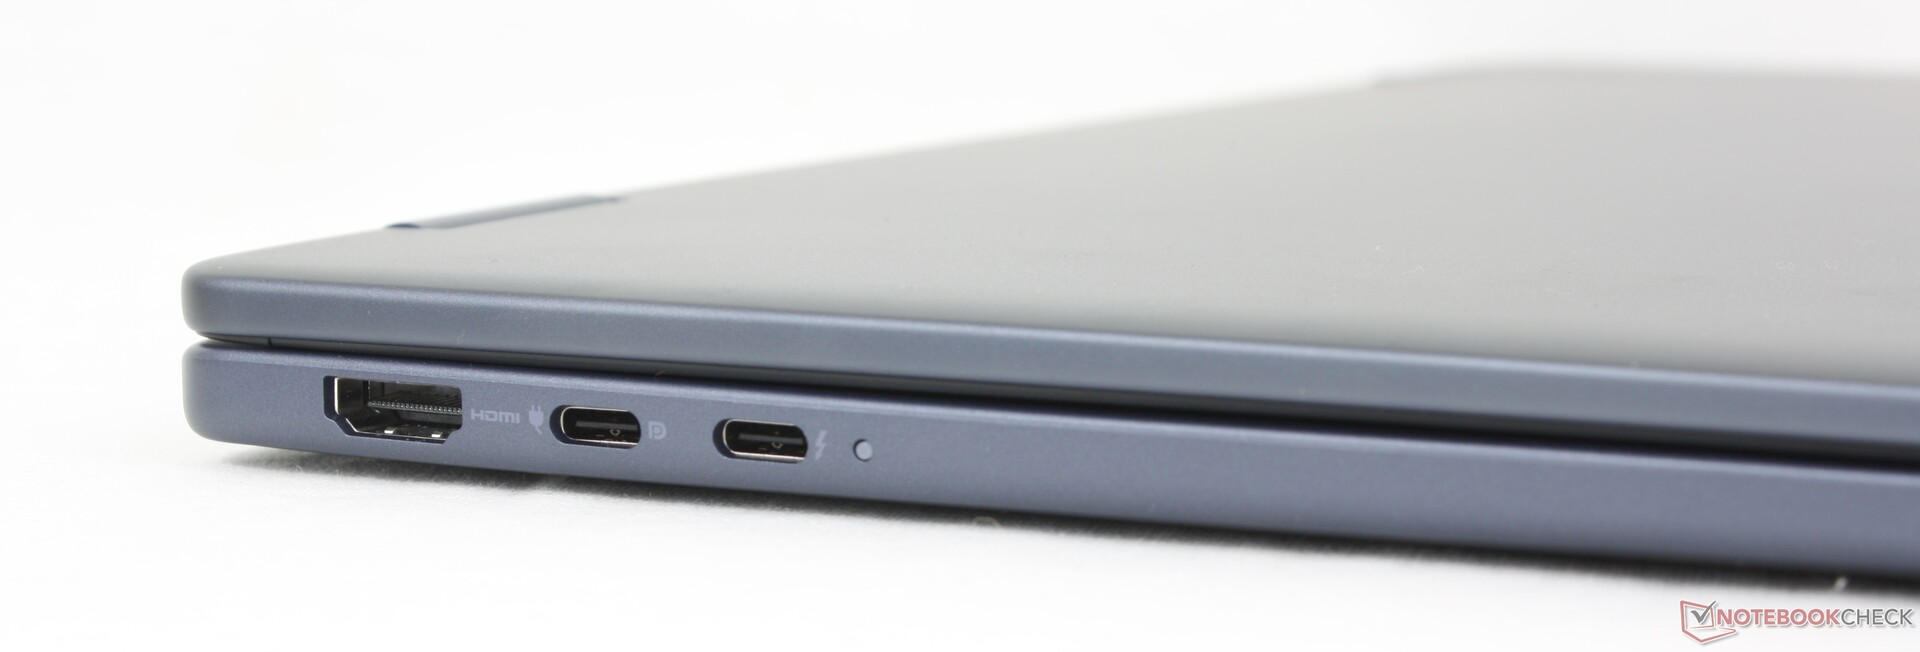
Anschlussausstattung
Die Anschlussoptionen sind identisch mit denen des letztjährigen Inspiron, allerdings mit einem wichtigen Unterschied: dem Wegfall des integrierten SD-Kartenlesers. Die beiden USB-C-Ports wurden ebenfalls neu angeordnet, und zwar zum Nachteil, da man das System nicht mehr an der rechten Kante aufladen kann.

Kommunikation
Webcam
Die 2-MP-Webcam verfügt über einen physischen Auslöser und kein IR.


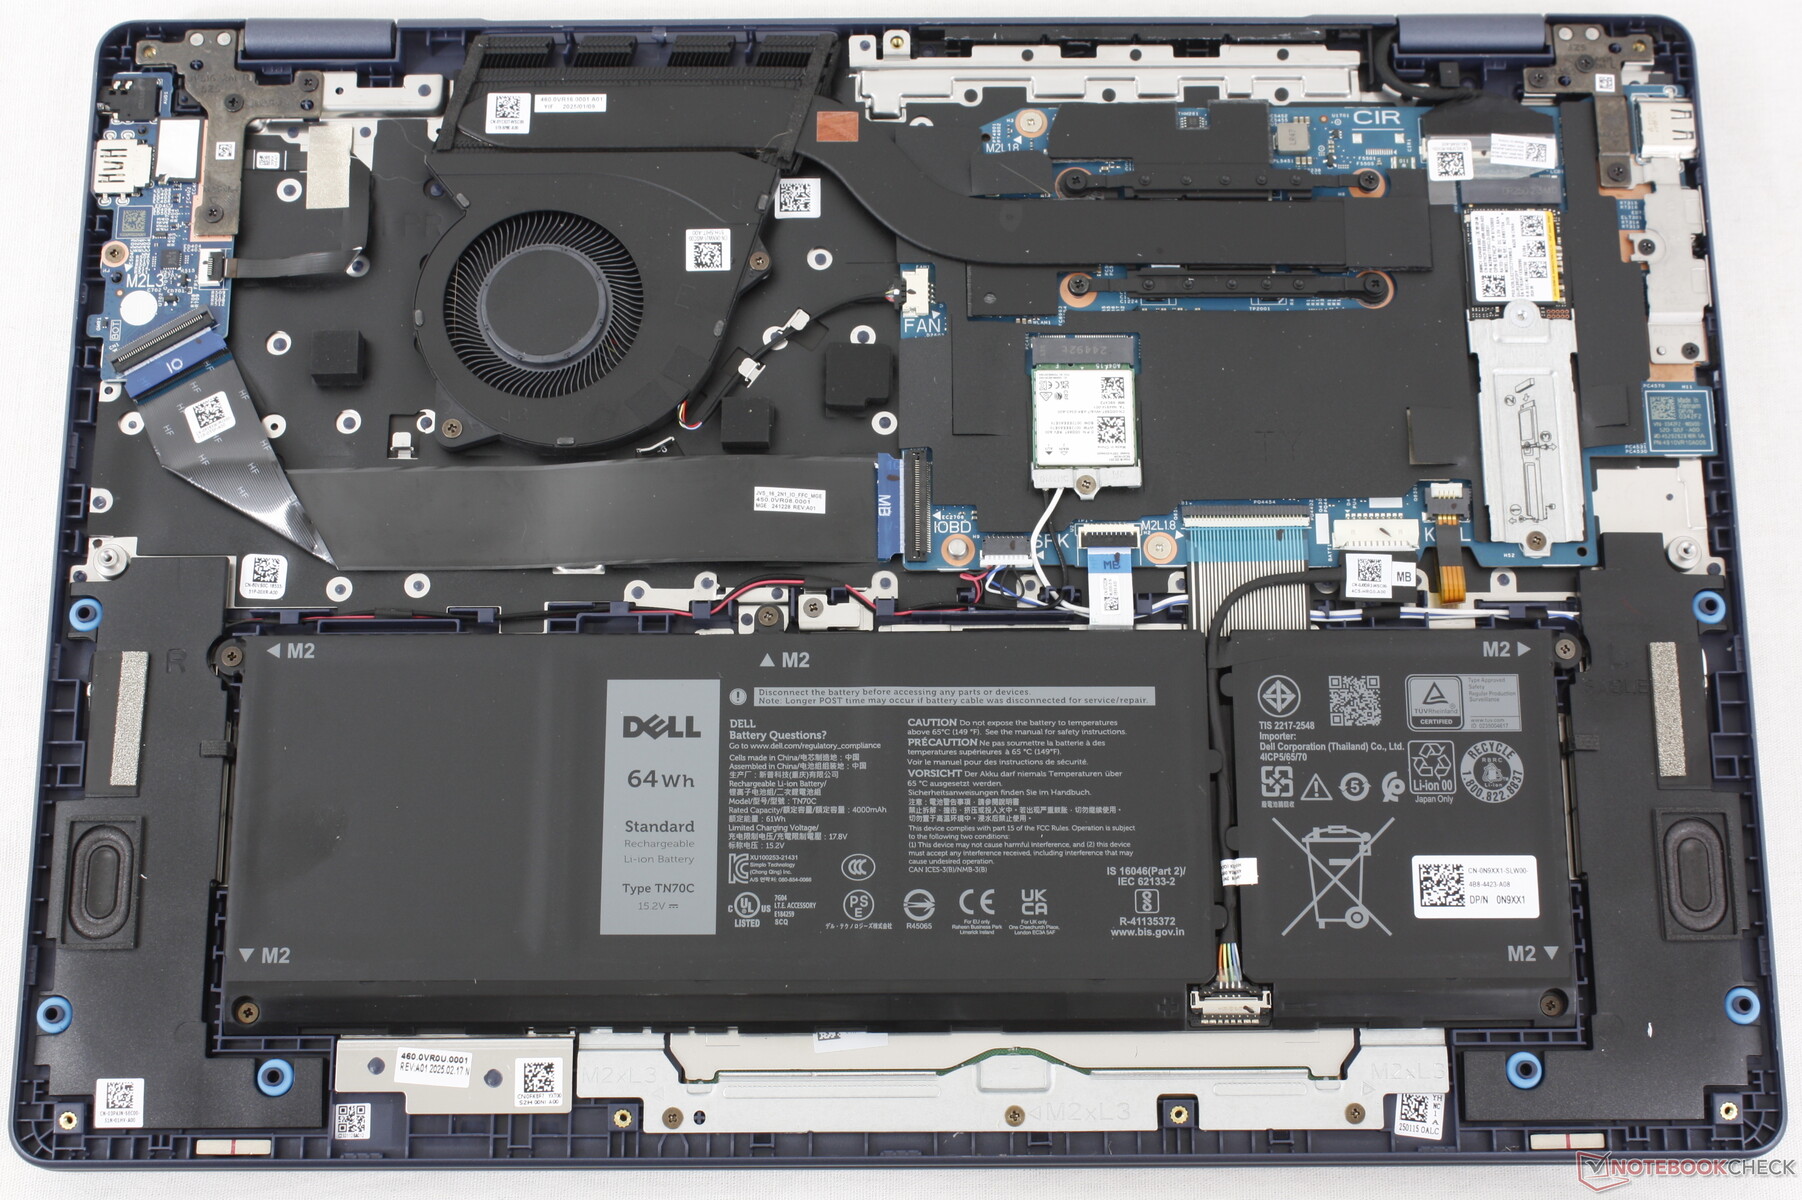
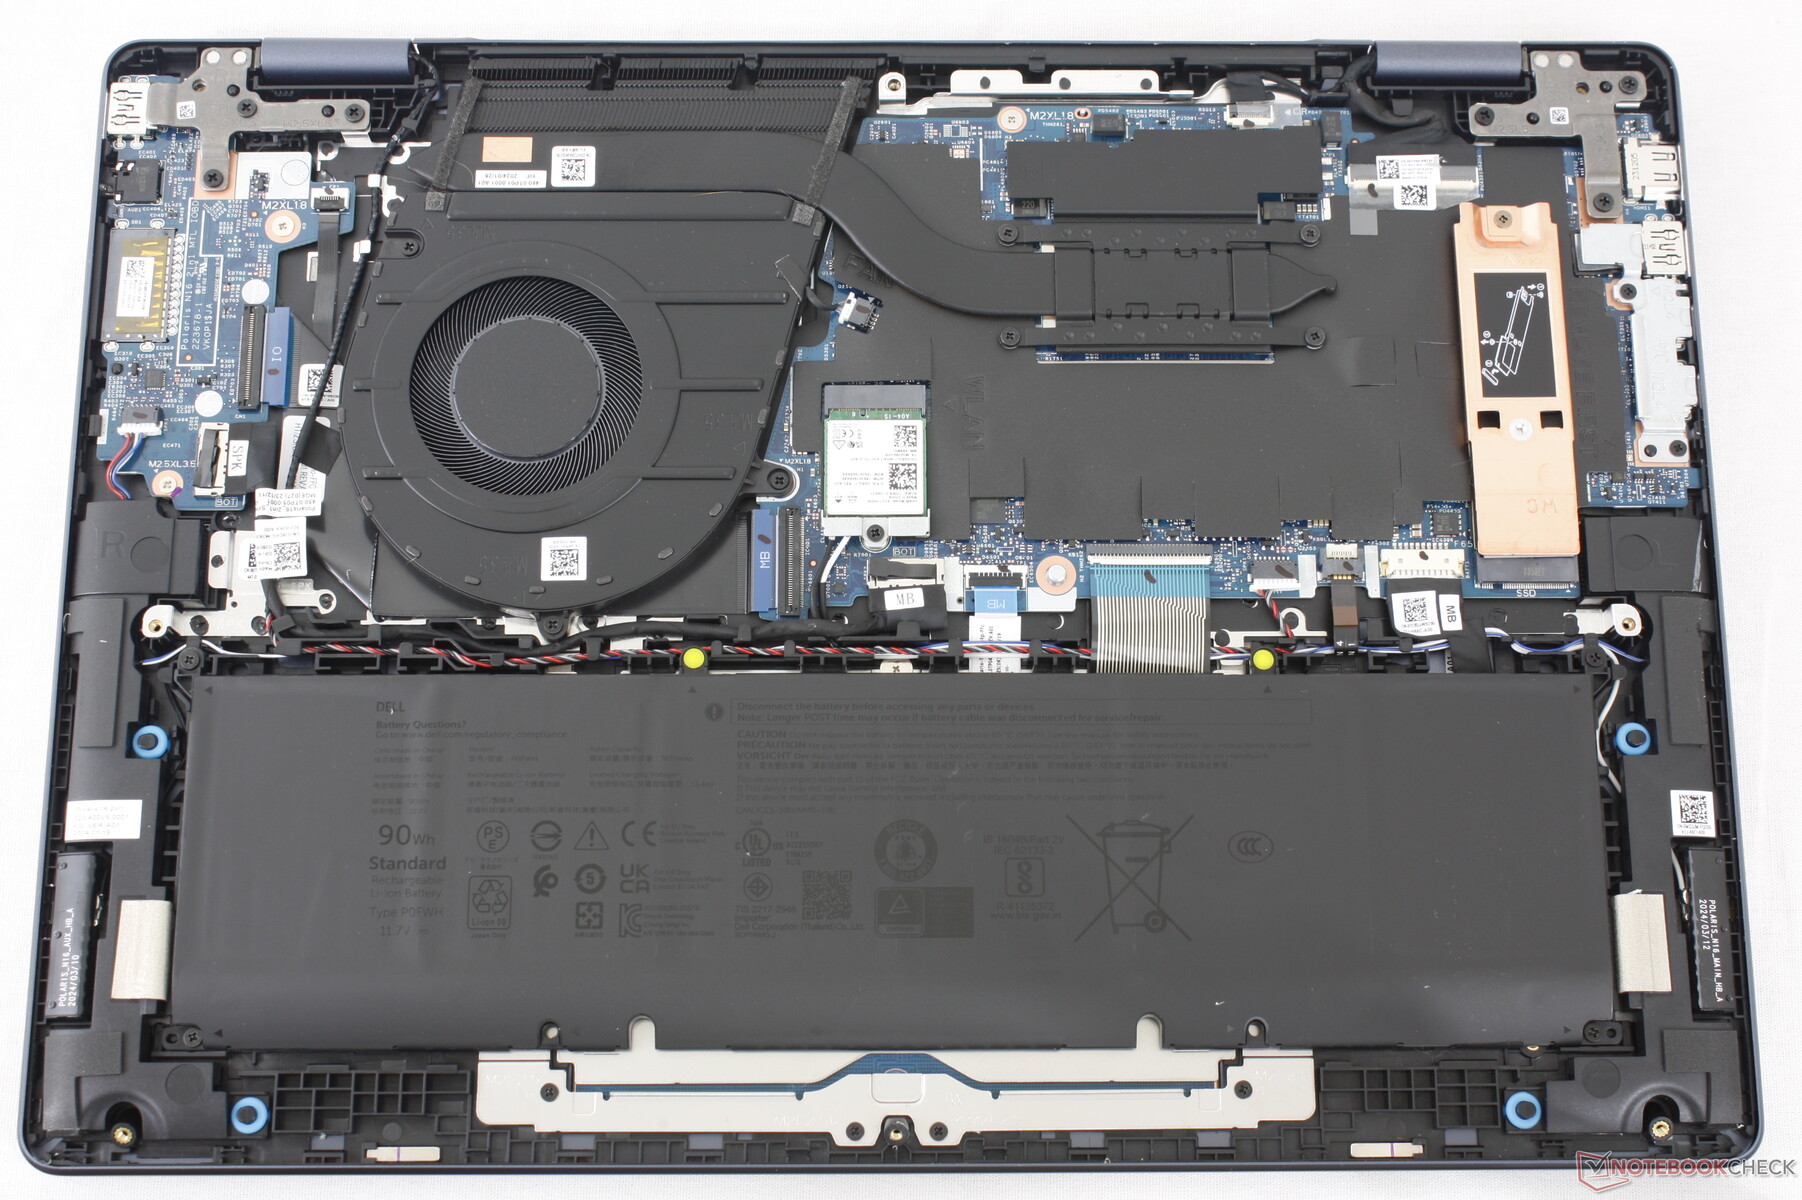
Wartung
Nachhaltigkeit
Dell weist nicht explizit auf recycelte Materialien hin, die bei der Herstellung des Dell 16 Plus 2-in-1 verwendet wurden. Die Verpackung enthält kein Plastik, um das Recycling zu erleichtern.
Zubehör und Garantie
Die Verkaufsverpackung beinhaltet das Netzteil und den Papierkram. Beim Kauf in den USA gilt die übliche einjährige Herstellergarantie.
Eingabegeräte
Tastatur und Touchpad
Die Tastatur und das Clickpad sind 1:1 mit dem Dell-16-Plus-Gehäuse für ein identisches Erlebnis. Es ist ein produktives Upgrade gegenüber dem Inspiron 16 7640 2-in-1 vom letzten Jahr, das große Lautsprechergitter einem integrierten Nummernblock vorzog.
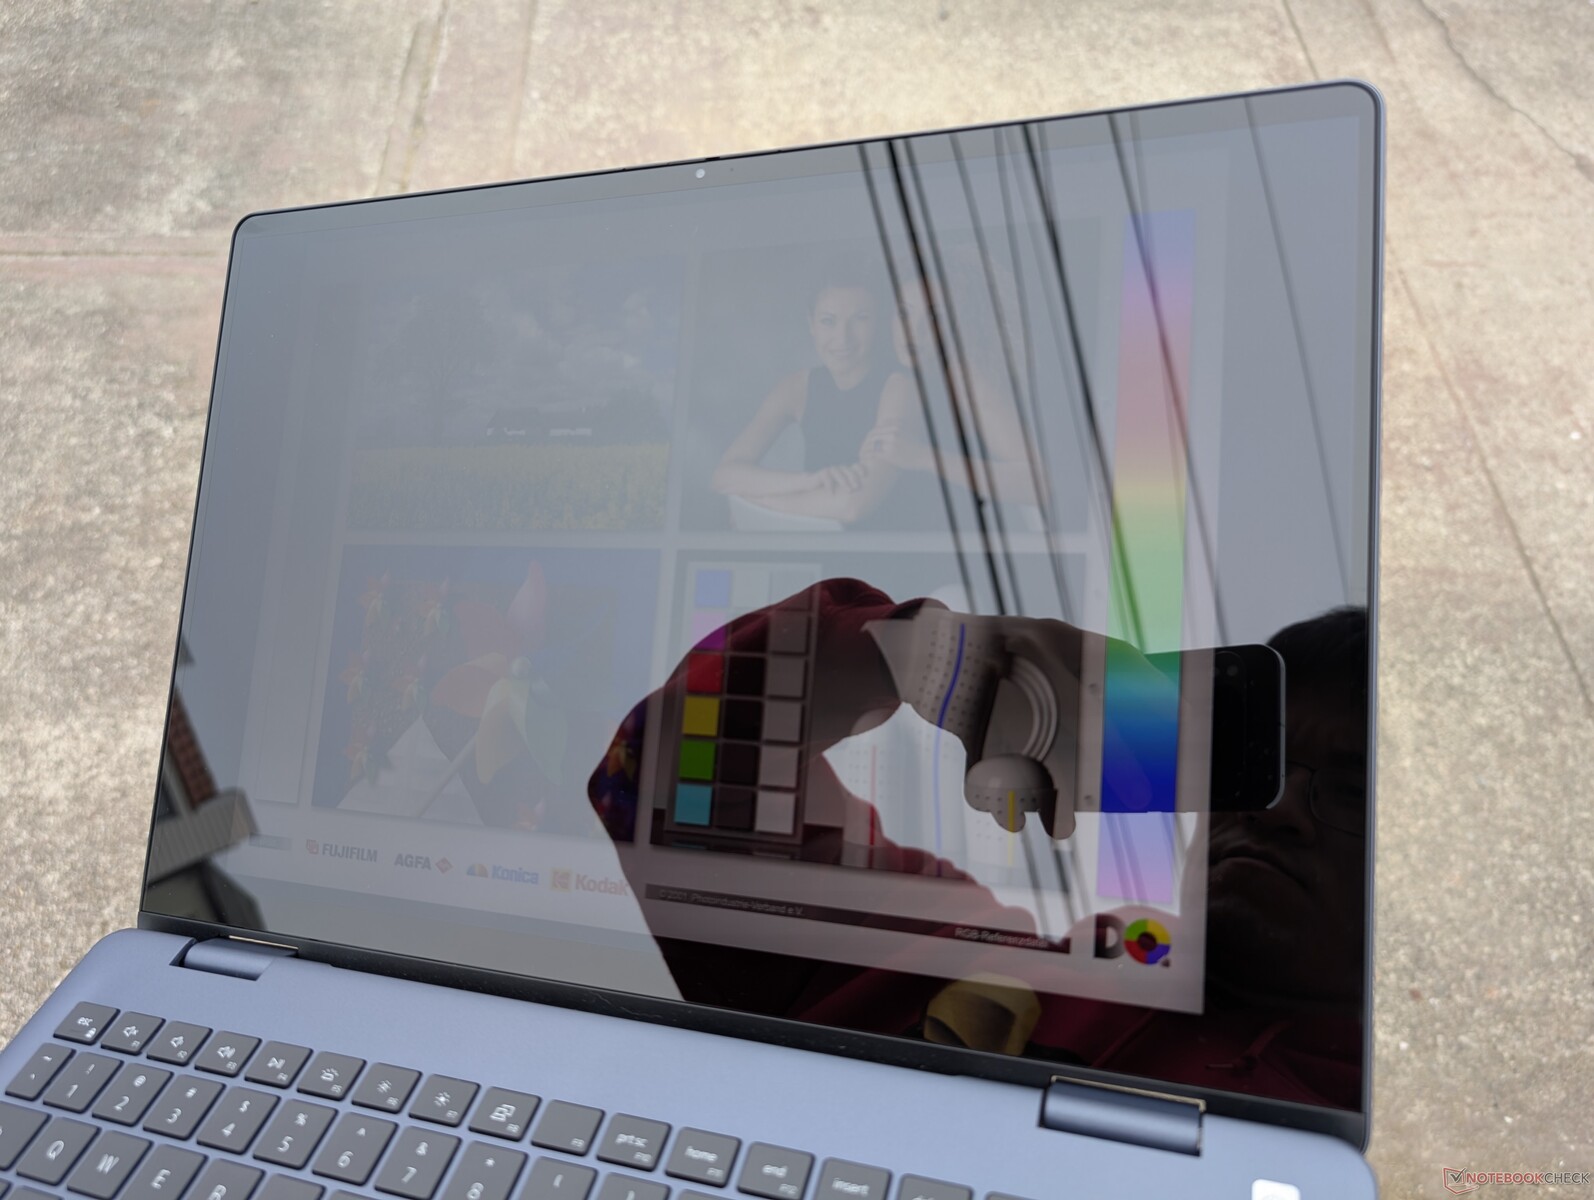
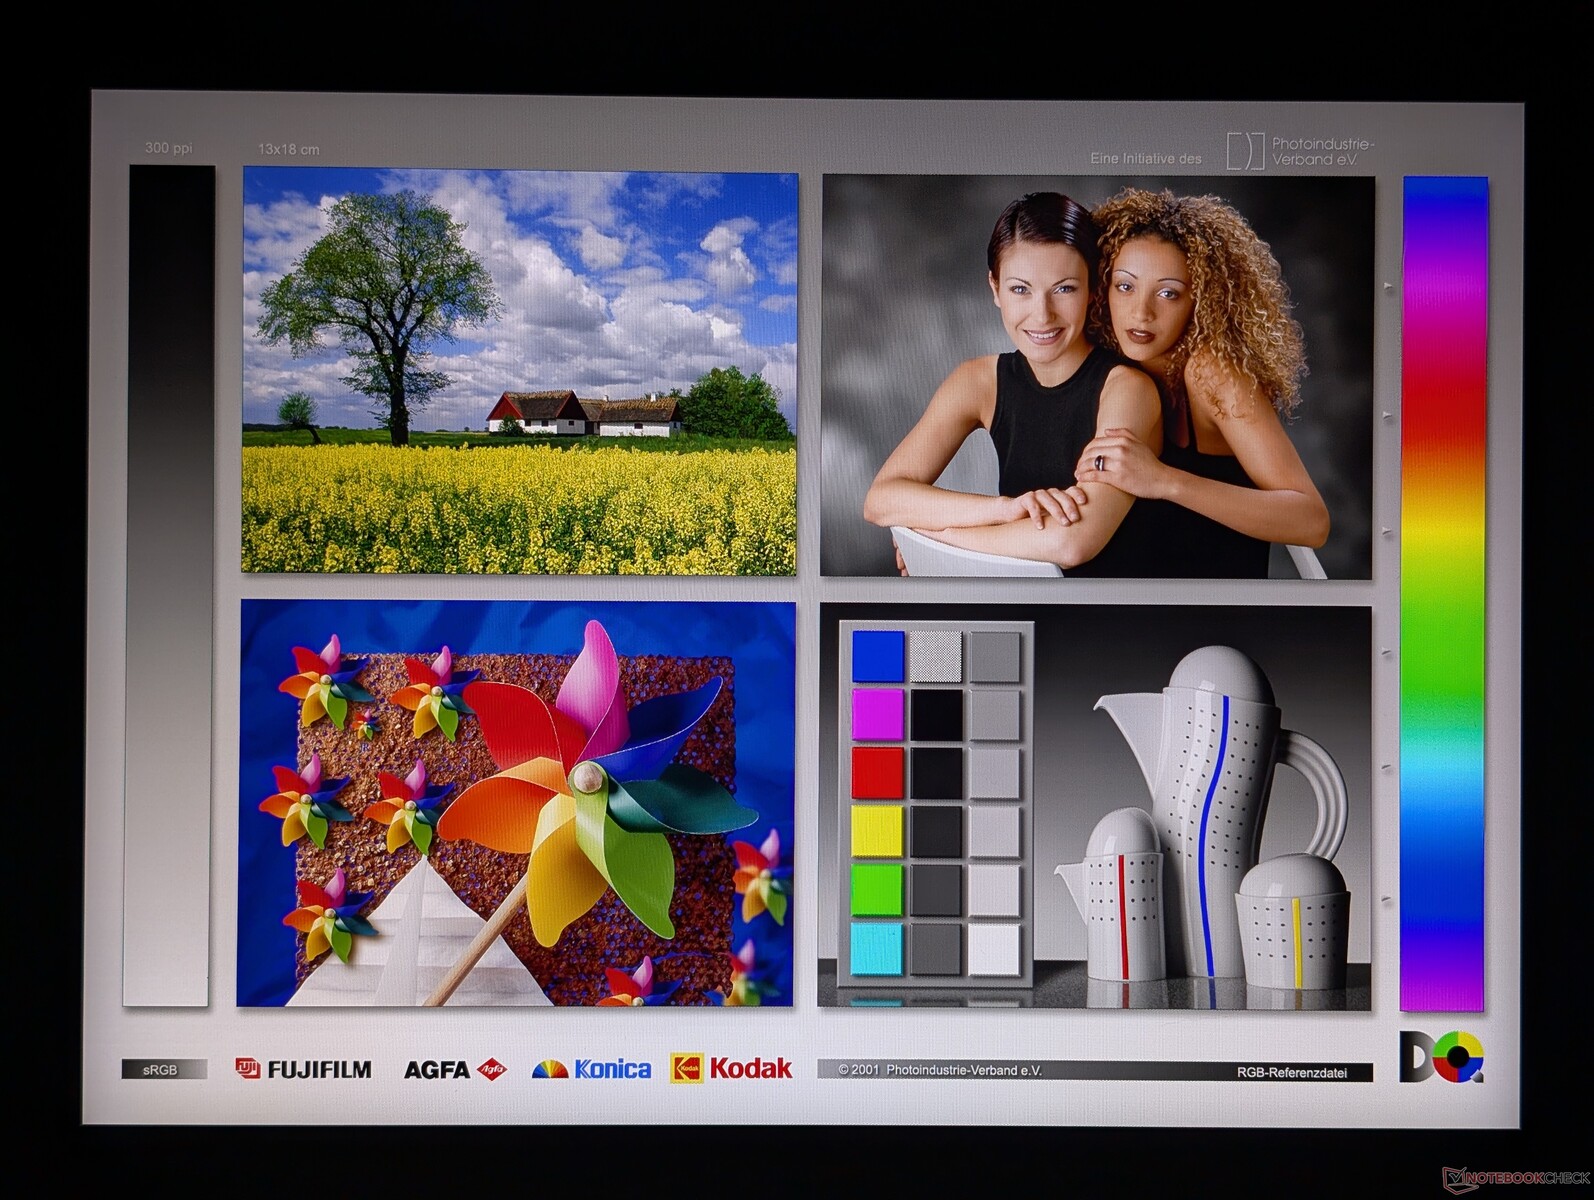
Display

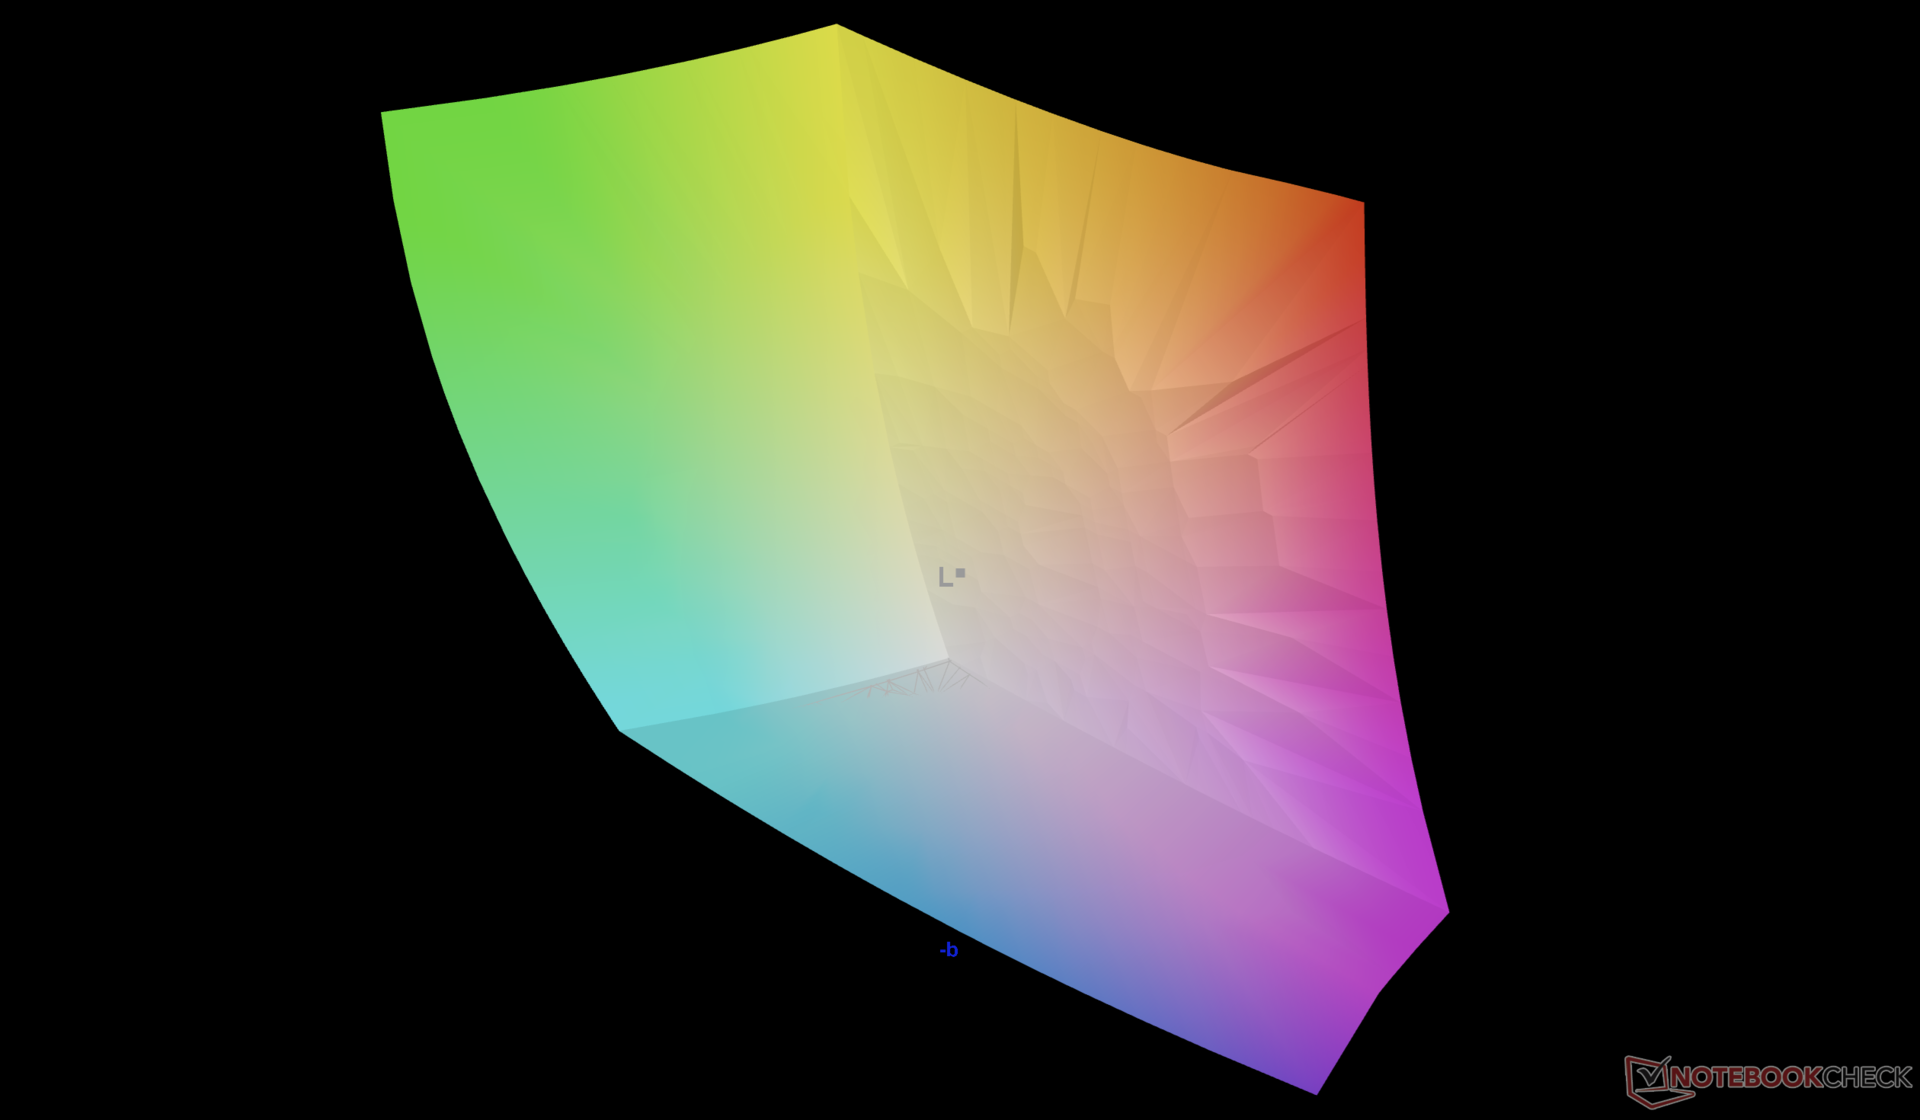
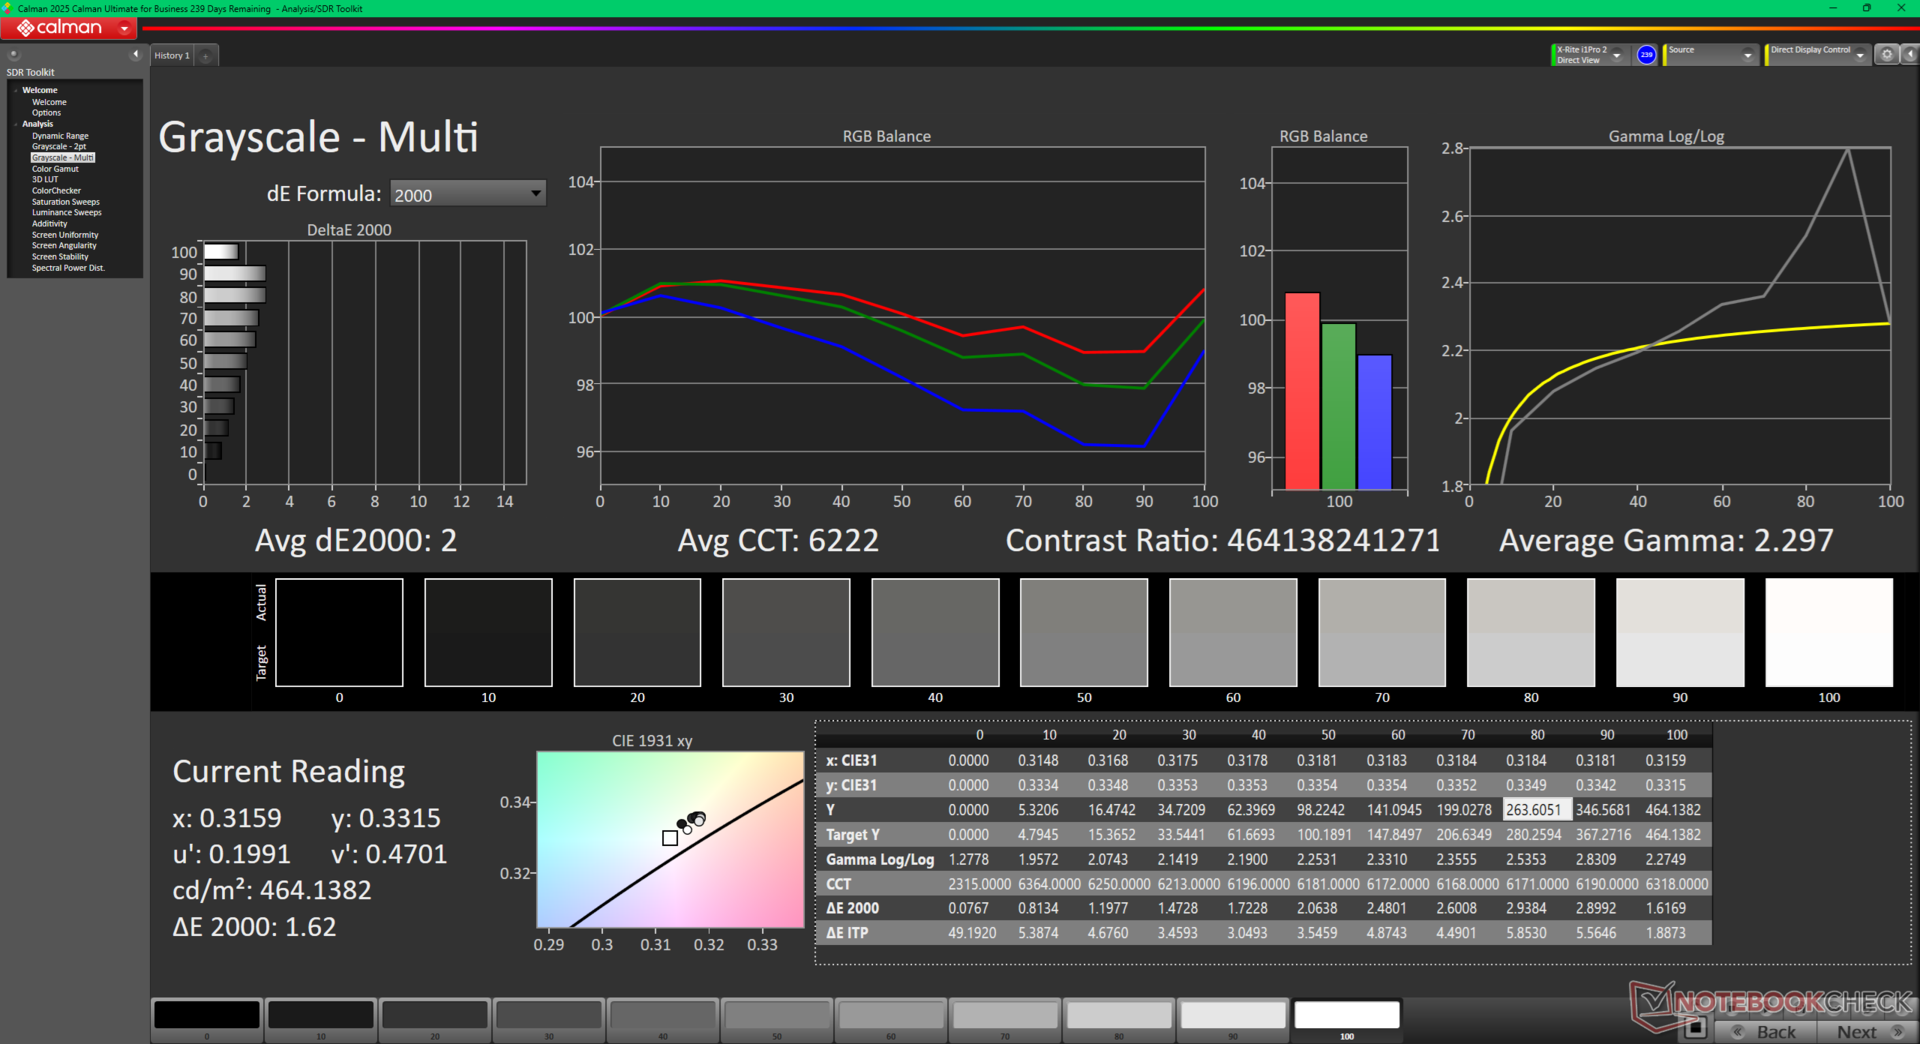
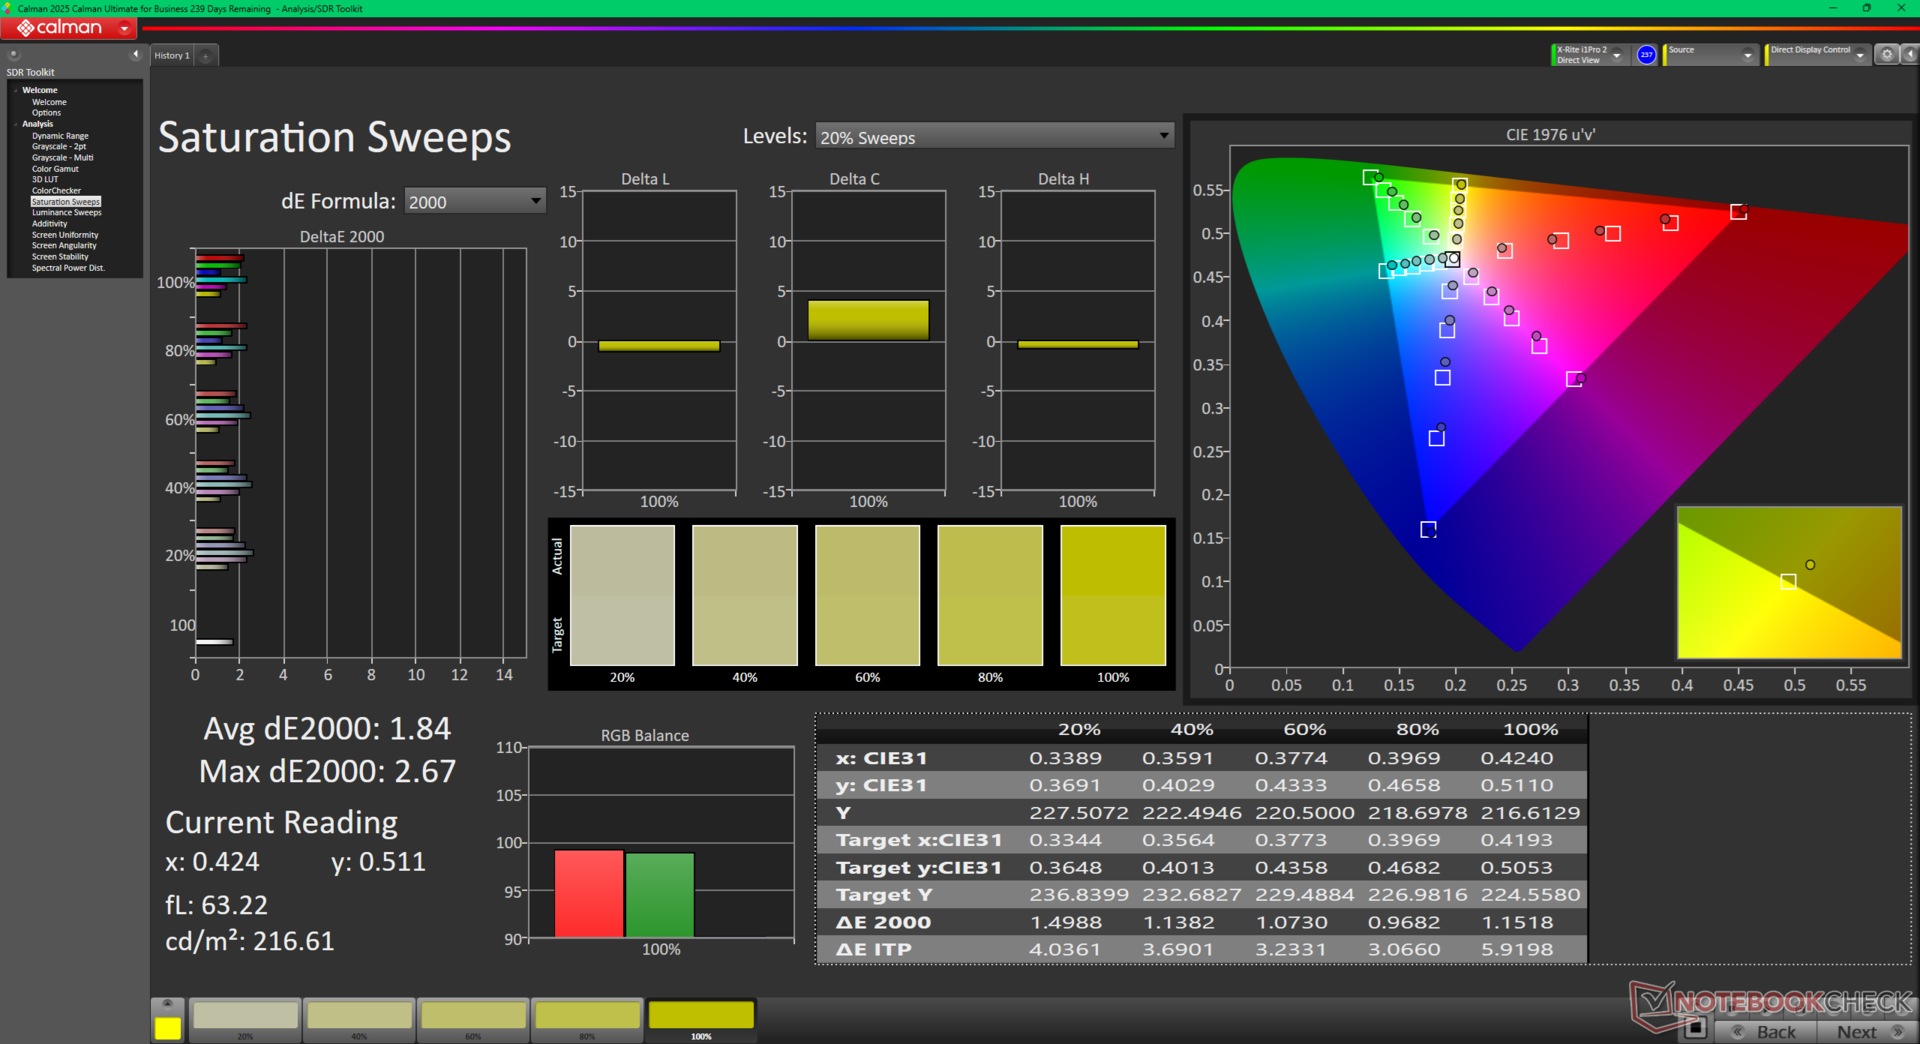
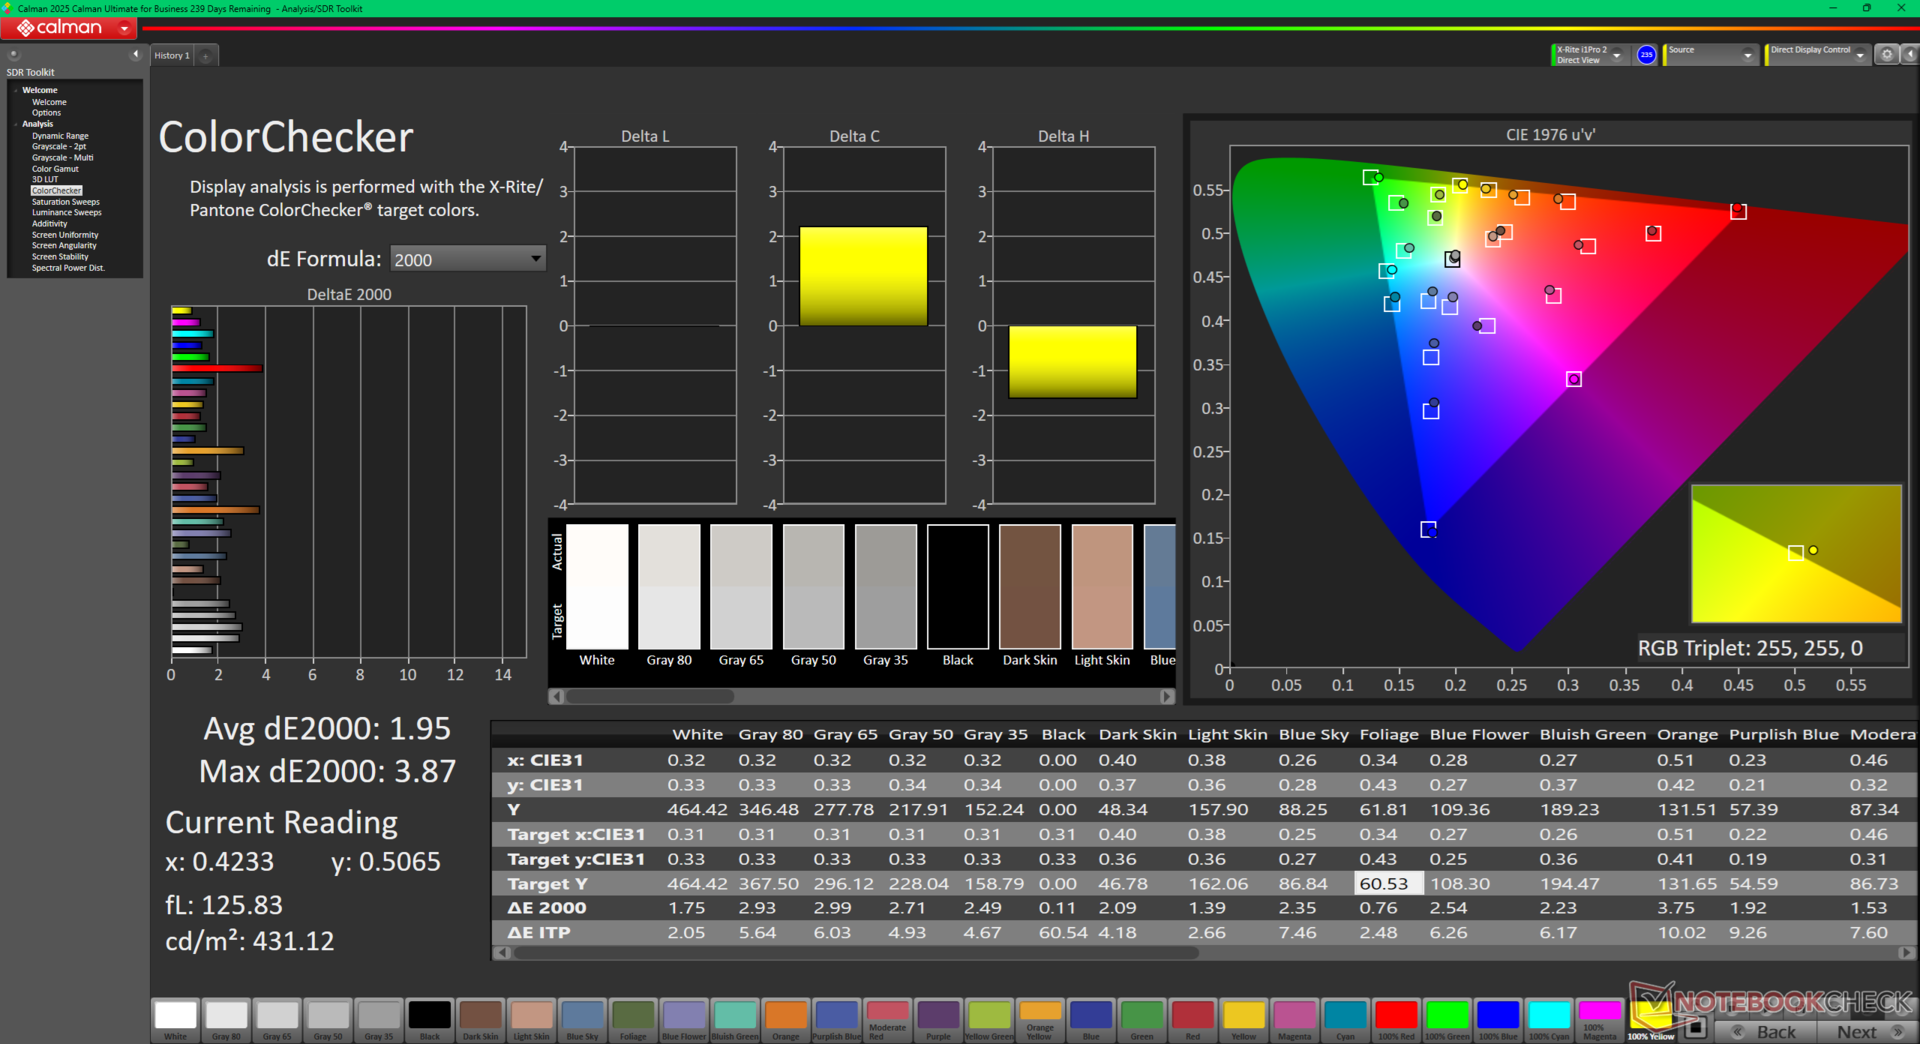
Das System verwendet genau das gleiche AU Optronics B160QAT Mini-LED-Panel wie das Inspiron 16 7640 2-in-1 aus dem letzten Jahr, so dass beide Modelle das gleiche Seherlebnis bieten. Mini-LED-Panels sind in der Regel heller und haben tiefere Farben als die meisten IPS-Panels für eine bessere HDR-Unterstützung, aber sie können Halo-Effekte und schwächere Schwarzwerte aufweisen, die bei OLED-Panels sonst nicht vorkommen.
Die maximale Helligkeit kann 642 Nits erreichen, wenn HDR aktiviert ist oder 432 Nits, wenn der Standard-SDR-Modus aktiviert ist.


| |||||||||||||||||||||||||
Ausleuchtung: 97 %
Helligkeit Akku: 432.1 cd/m²
Kontrast: ∞:1 (Schwarzwert: 0 cd/m²)
ΔE ColorChecker Calman: 1.95 | ∀{0.5-29.43 Ø4.72}
calibrated: 1.16
ΔE Greyscale Calman: 2 | ∀{0.09-98 Ø4.97}
94.2% AdobeRGB 1998 (Argyll 3D)
100% sRGB (Argyll 3D)
99.5% Display P3 (Argyll 3D)
Gamma: 2.3
CCT: 6222 K
| Dell 16 Plus 2-in-1 AU Optronics B160QAT, Mini-LED, 2560x1600, 16", 90 Hz | Dell Inspiron 16 7640 2-in-1 AU Optronics B160QAT, Mini-LED, 2560x1600, 16", 90 Hz | Lenovo Yoga 7 2-in-1 16ILL10 LEN160WUM, IPS, 1920x1200, 16", 60 Hz | Samsung Galaxy Book5 Pro 360 ATNA60CL09-0, OLED, 2880x1800, 16", 120 Hz | MSI Summit A16 AI Plus A3HMTG AU Optronics B16QAN02.N, IPS, 2560x1600, 16", 165 Hz | HP Envy x360 2-in-1 16-ad0097nr Samsung SDC41A6, OLED, 2880x1800, 16", 120 Hz | |
|---|---|---|---|---|---|---|
| Display | -1% | -53% | 1% | -4% | 1% | |
| Display P3 Coverage (%) | 99.5 | 99.4 0% | 39.7 -60% | 99.9 0% | 96.8 -3% | 99.6 0% |
| sRGB Coverage (%) | 100 | 100 0% | 57.9 -42% | 100 0% | 99.8 0% | 100 0% |
| AdobeRGB 1998 Coverage (%) | 94.2 | 92.5 -2% | 41 -56% | 96.6 3% | 84.7 -10% | 96.5 2% |
| Response Times | 32% | 50% | 73% | 80% | 98% | |
| Response Time Grey 50% / Grey 80% * (ms) | 48.8 ? | 15.4 ? 68% | 30 ? 39% | 0.48 ? 99% | 12.9 ? 74% | 0.8 ? 98% |
| Response Time Black / White * (ms) | 57.6 ? | 60.6 ? -5% | 22.5 ? 61% | 0.64 ? 99% | 8.9 ? 85% | 0.89 ? 98% |
| PWM Frequency (Hz) | 2807 ? | 2753.7 ? | 240 ? | 491.8 ? | ||
| PWM Amplitude * (%) | 50 | 40 20% | ||||
| Bildschirm | -49% | -169% | 16% | -22% | -19% | |
| Helligkeit Bildmitte (cd/m²) | 432.1 | 413 -4% | 317.9 -26% | 387 -10% | 475.4 10% | 399.4 -8% |
| Brightness (cd/m²) | 426 | 409 -4% | 304 -29% | 392 -8% | 440 3% | 405 -5% |
| Brightness Distribution (%) | 97 | 97 0% | 90 -7% | 98 1% | 89 -8% | 98 1% |
| Schwarzwert * (cd/m²) | 0.14 | 0.25 | 0.36 | |||
| Delta E Colorchecker * | 1.95 | 3.48 -78% | 7.39 -279% | 1 49% | 2.99 -53% | 4.05 -108% |
| Colorchecker dE 2000 max. * | 3.87 | 6.97 -80% | 21.43 -454% | 1.9 51% | 7.64 -97% | 6.69 -73% |
| Colorchecker dE 2000 calibrated * | 1.16 | 3.06 -164% | 0.74 36% | 1.02 12% | ||
| Delta E Graustufen * | 2 | 4.5 -125% | 6.5 -225% | 1.7 15% | 2.9 -45% | 1.1 45% |
| Gamma | 2.3 96% | 2.15 102% | 2.22 99% | 2.25 98% | 2.31 95% | 2.27 97% |
| CCT | 6222 104% | 6446 101% | 6140 106% | 6325 103% | 6472 100% | 6419 101% |
| Kontrast (:1) | 2950 | 1272 | 1321 | |||
| Durchschnitt gesamt (Programm / Settings) | -6% /
-21% | -57% /
-104% | 30% /
27% | 18% /
-1% | 27% /
5% |
* ... kleinere Werte sind besser

Reaktionszeiten (Response Times) des Displays
| ↔ Reaktionszeiten Schwarz zu Weiß | ||
|---|---|---|
| 57.6 ms ... steigend ↗ und fallend ↘ kombiniert | ↗ 50.4 ms steigend |  |
| ↘ 7.2 ms fallend | ||
| Die gemessenen Reaktionszeiten sind langsam und dadurch für viele Spieler wahrscheinlich zu langsam. Im Vergleich rangierten die bei uns getesteten Geräte von 0.1 (Minimum) zu 240 (Maximum) ms. » 99 % aller Screens waren schneller als der getestete. Daher sind die gemessenen Reaktionszeiten schlechter als der Durchschnitt aller vermessenen Geräte (19.8 ms). | ||
| ↔ Reaktionszeiten 50% Grau zu 80% Grau | ||
| 48.8 ms ... steigend ↗ und fallend ↘ kombiniert | ↗ 33.6 ms steigend | 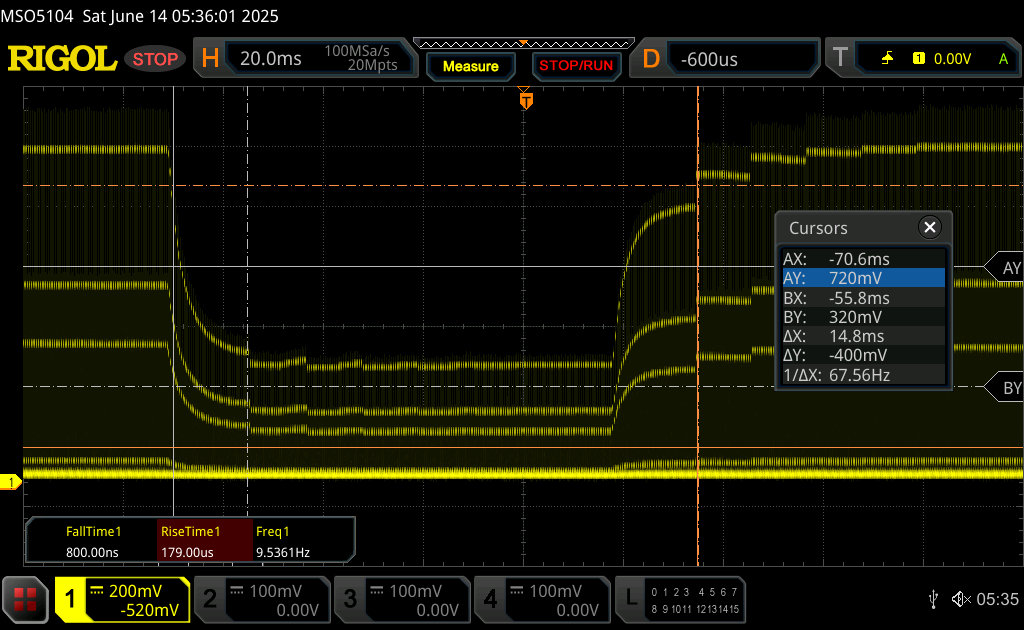 |
| ↘ 15.2 ms fallend | ||
| Die gemessenen Reaktionszeiten sind langsam und dadurch für viele Spieler wahrscheinlich zu langsam. Im Vergleich rangierten die bei uns getesteten Geräte von 0.165 (Minimum) zu 636 (Maximum) ms. » 84 % aller Screens waren schneller als der getestete. Daher sind die gemessenen Reaktionszeiten schlechter als der Durchschnitt aller vermessenen Geräte (31 ms). | ||
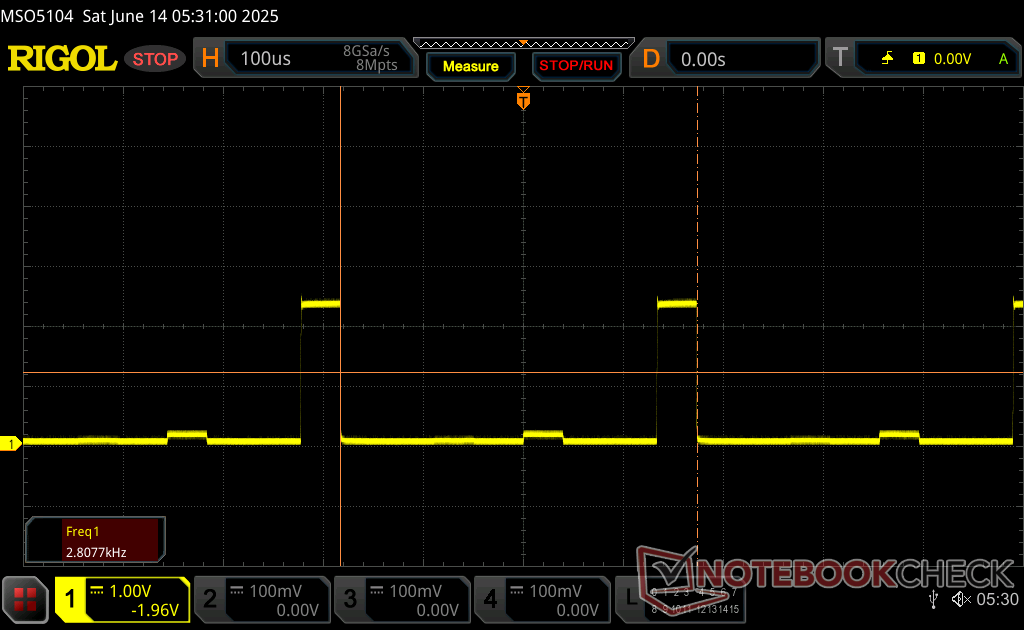
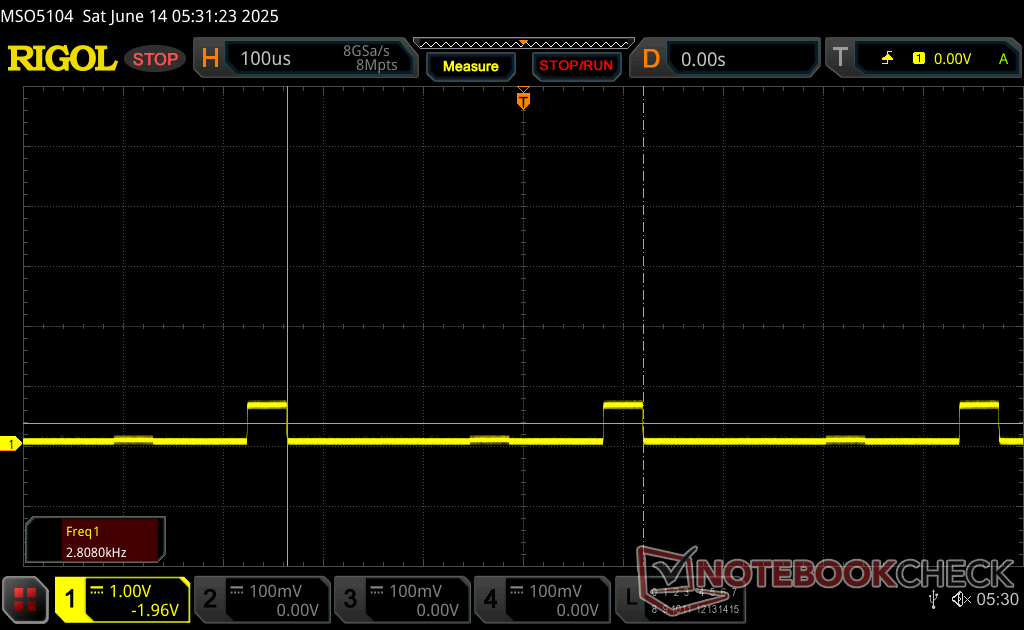
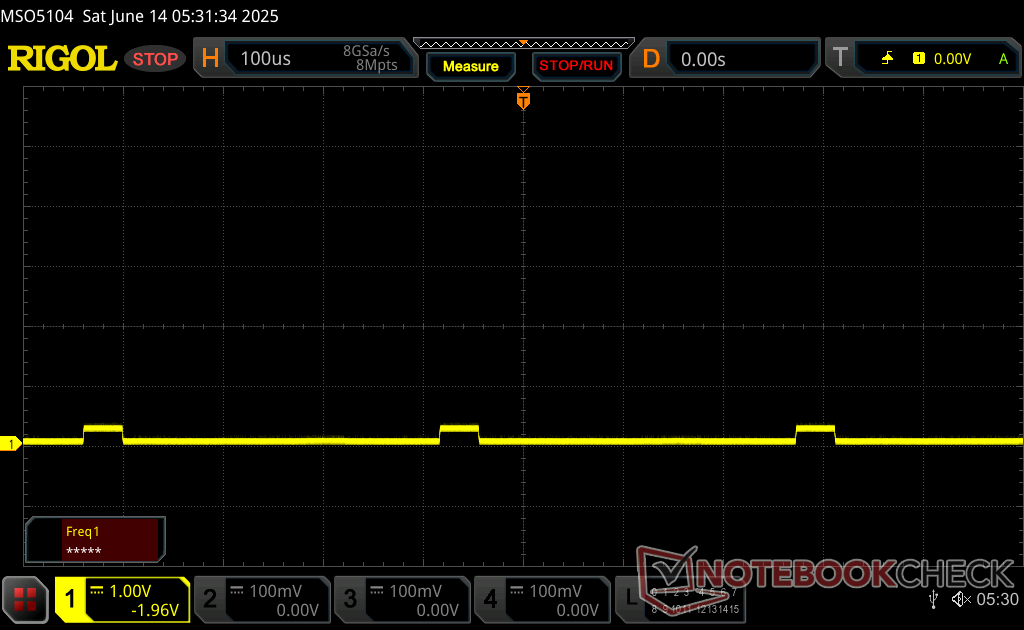
Bildschirm-Flackern / PWM (Pulse-Width Modulation)
| Flackern / PWM festgestellt | 2807 Hz Amplitude: 50 % | ≤ 100 % Helligkeit | 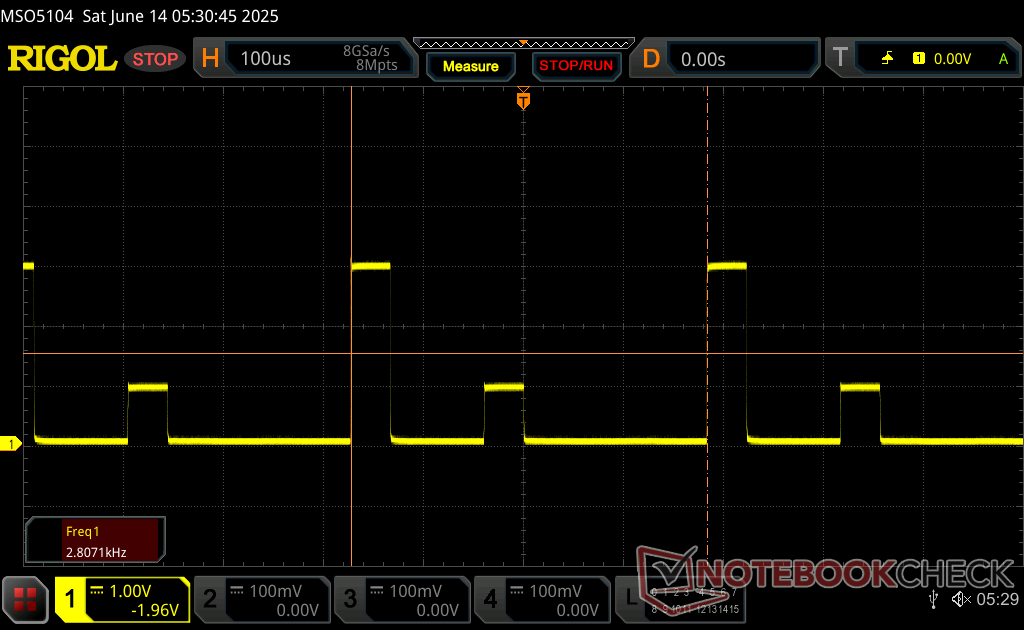 |
Das Display flackert mit 2807 Hz (im schlimmsten Fall, eventuell durch Pulsweitenmodulation PWM) bei einer eingestellten Helligkeit von 100 % und darunter. Darüber sollte es zu keinem Flackern kommen. Die Frequenz von 2807 Hz ist sehr hoch und sollte daher auch bei empfindlichen Personen zu keinen Problemen führen. Im Vergleich: 52 % aller getesteten Geräte nutzten kein PWM um die Helligkeit zu reduzieren. Wenn PWM eingesetzt wurde, dann bei einer Frequenz von durchschnittlich 7772 (Minimum 5, Maximum 343500) Hz. | |||


Performance

Testbedingungen
Wir haben Dell Optimizer auf den Modus Performance eingestellt, bevor wir die folgenden Benchmarks durchgeführt haben.
Prozessor
Dee Core Ultra 7 256V legt den Schwerpunkt auf die Leistung pro Watt und nicht auf die reine Leistung. Daher bietet er nur wenig mehr als die letzte Generation Core Ultra 7 155U oder sogar als der Core i7-1355U, wenn die Benutzer die integrierte NPU nicht nutzen. Vielleicht am bemerkenswertesten ist, dass ein Upgrade auf die teurere Core-Ultra-9-288V-Konfiguration laut unseren Erfahrungen mit dem Acer Swift 16 AI die Leistung bestenfalls um magere 5 Prozent steigern dürfte. Der Core Ultra 7 155H im letztjährigen Inspiron 16 7640 2-in-1 ist etwa 1,5-mal schneller als unser Core Ultra 256V.
Cinebench R15 Multi Loop
Cinebench R23: Multi Core | Single Core
Cinebench R20: CPU (Multi Core) | CPU (Single Core)
Cinebench R15: CPU Multi 64Bit | CPU Single 64Bit
Blender: v2.79 BMW27 CPU
7-Zip 18.03: 7z b 4 | 7z b 4 -mmt1
Geekbench 6.7: Multi-Core | Single-Core
Geekbench 5.5: Multi-Core | Single-Core
HWBOT x265 Benchmark v2.2: 4k Preset
LibreOffice : 20 Documents To PDF
R Benchmark 2.5: Overall mean
* ... kleinere Werte sind besser
AIDA64: FP32 Ray-Trace | FPU Julia | CPU SHA3 | CPU Queen | FPU SinJulia | FPU Mandel | CPU AES | CPU ZLib | FP64 Ray-Trace | CPU PhotoWorxx
| Performance Rating | |
| MSI Summit A16 AI Plus A3HMTG | |
| HP Envy x360 2-in-1 16-ad0097nr | |
| Dell Inspiron 16 7640 2-in-1 | |
| Dell 16 Plus 2-in-1 | |
| Lenovo Yoga 7 2-in-1 16ILL10 | |
| Durchschnittliche Intel Core Ultra 7 258V | |
| Samsung Galaxy Book5 Pro 360 | |
| AIDA64 / FP32 Ray-Trace | |
| MSI Summit A16 AI Plus A3HMTG | |
| HP Envy x360 2-in-1 16-ad0097nr | |
| Dell Inspiron 16 7640 2-in-1 | |
| Dell 16 Plus 2-in-1 | |
| Samsung Galaxy Book5 Pro 360 | |
| Lenovo Yoga 7 2-in-1 16ILL10 | |
| Durchschnittliche Intel Core Ultra 7 258V (8454 - 12781, n=26) | |
| AIDA64 / FPU Julia | |
| MSI Summit A16 AI Plus A3HMTG | |
| HP Envy x360 2-in-1 16-ad0097nr | |
| Dell Inspiron 16 7640 2-in-1 | |
| Samsung Galaxy Book5 Pro 360 | |
| Lenovo Yoga 7 2-in-1 16ILL10 | |
| Dell 16 Plus 2-in-1 | |
| Durchschnittliche Intel Core Ultra 7 258V (40875 - 63401, n=26) | |
| AIDA64 / CPU SHA3 | |
| MSI Summit A16 AI Plus A3HMTG | |
| HP Envy x360 2-in-1 16-ad0097nr | |
| Dell Inspiron 16 7640 2-in-1 | |
| Lenovo Yoga 7 2-in-1 16ILL10 | |
| Durchschnittliche Intel Core Ultra 7 258V (1930 - 2817, n=26) | |
| Samsung Galaxy Book5 Pro 360 | |
| Dell 16 Plus 2-in-1 | |
| AIDA64 / CPU Queen | |
| HP Envy x360 2-in-1 16-ad0097nr | |
| MSI Summit A16 AI Plus A3HMTG | |
| Dell Inspiron 16 7640 2-in-1 | |
| Dell 16 Plus 2-in-1 | |
| Lenovo Yoga 7 2-in-1 16ILL10 | |
| Durchschnittliche Intel Core Ultra 7 258V (48816 - 49818, n=24) | |
| Samsung Galaxy Book5 Pro 360 | |
| AIDA64 / FPU SinJulia | |
| MSI Summit A16 AI Plus A3HMTG | |
| HP Envy x360 2-in-1 16-ad0097nr | |
| Dell Inspiron 16 7640 2-in-1 | |
| Lenovo Yoga 7 2-in-1 16ILL10 | |
| Dell 16 Plus 2-in-1 | |
| Durchschnittliche Intel Core Ultra 7 258V (3817 - 4440, n=26) | |
| Samsung Galaxy Book5 Pro 360 | |
| AIDA64 / FPU Mandel | |
| MSI Summit A16 AI Plus A3HMTG | |
| HP Envy x360 2-in-1 16-ad0097nr | |
| Dell Inspiron 16 7640 2-in-1 | |
| Samsung Galaxy Book5 Pro 360 | |
| Lenovo Yoga 7 2-in-1 16ILL10 | |
| Dell 16 Plus 2-in-1 | |
| Durchschnittliche Intel Core Ultra 7 258V (21670 - 33565, n=26) | |
| AIDA64 / CPU AES | |
| Dell Inspiron 16 7640 2-in-1 | |
| HP Envy x360 2-in-1 16-ad0097nr | |
| MSI Summit A16 AI Plus A3HMTG | |
| Dell 16 Plus 2-in-1 | |
| Lenovo Yoga 7 2-in-1 16ILL10 | |
| Durchschnittliche Intel Core Ultra 7 258V (30957 - 40753, n=26) | |
| Samsung Galaxy Book5 Pro 360 | |
| AIDA64 / CPU ZLib | |
| MSI Summit A16 AI Plus A3HMTG | |
| Dell Inspiron 16 7640 2-in-1 | |
| HP Envy x360 2-in-1 16-ad0097nr | |
| Lenovo Yoga 7 2-in-1 16ILL10 | |
| Dell 16 Plus 2-in-1 | |
| Durchschnittliche Intel Core Ultra 7 258V (422 - 632, n=26) | |
| Samsung Galaxy Book5 Pro 360 | |
| AIDA64 / FP64 Ray-Trace | |
| MSI Summit A16 AI Plus A3HMTG | |
| HP Envy x360 2-in-1 16-ad0097nr | |
| Dell Inspiron 16 7640 2-in-1 | |
| Samsung Galaxy Book5 Pro 360 | |
| Dell 16 Plus 2-in-1 | |
| Lenovo Yoga 7 2-in-1 16ILL10 | |
| Durchschnittliche Intel Core Ultra 7 258V (4258 - 6930, n=26) | |
| AIDA64 / CPU PhotoWorxx | |
| Dell 16 Plus 2-in-1 | |
| Durchschnittliche Intel Core Ultra 7 258V (44223 - 59245, n=26) | |
| Lenovo Yoga 7 2-in-1 16ILL10 | |
| MSI Summit A16 AI Plus A3HMTG | |
| Samsung Galaxy Book5 Pro 360 | |
| Dell Inspiron 16 7640 2-in-1 | |
| HP Envy x360 2-in-1 16-ad0097nr | |
System Performance
Die Ergebnisse des PCMark 10 sind leicht, aber konstant niedriger als beim Lenovo Yoga 7 2-in-1 16ILL10. Die RAM-Leistung ist dank der On-Die-Architektur von Lunar Lake ansonsten sehr schnell.

PCMark 10: Score | Essentials | Productivity | Digital Content Creation
CrossMark: Overall | Productivity | Creativity | Responsiveness
WebXPRT 3: Overall
WebXPRT 4: Overall
Mozilla Kraken 1.1: Total
| Performance Rating | |
| MSI Summit A16 AI Plus A3HMTG | |
| Lenovo Yoga 7 2-in-1 16ILL10 | |
| Dell Inspiron 16 7640 2-in-1 | |
| Dell 16 Plus 2-in-1 | |
| Durchschnittliche Intel Core Ultra 7 258V, Intel Arc Graphics 140V | |
| HP Envy x360 2-in-1 16-ad0097nr | |
| Samsung Galaxy Book5 Pro 360 | |
| PCMark 10 / Score | |
| MSI Summit A16 AI Plus A3HMTG | |
| Lenovo Yoga 7 2-in-1 16ILL10 | |
| Dell Inspiron 16 7640 2-in-1 | |
| HP Envy x360 2-in-1 16-ad0097nr | |
| Durchschnittliche Intel Core Ultra 7 258V, Intel Arc Graphics 140V (6265 - 7420, n=23) | |
| Dell 16 Plus 2-in-1 | |
| Samsung Galaxy Book5 Pro 360 | |
| PCMark 10 / Essentials | |
| Lenovo Yoga 7 2-in-1 16ILL10 | |
| MSI Summit A16 AI Plus A3HMTG | |
| Dell Inspiron 16 7640 2-in-1 | |
| HP Envy x360 2-in-1 16-ad0097nr | |
| Durchschnittliche Intel Core Ultra 7 258V, Intel Arc Graphics 140V (9295 - 11467, n=23) | |
| Dell 16 Plus 2-in-1 | |
| Samsung Galaxy Book5 Pro 360 | |
| PCMark 10 / Productivity | |
| HP Envy x360 2-in-1 16-ad0097nr | |
| MSI Summit A16 AI Plus A3HMTG | |
| Lenovo Yoga 7 2-in-1 16ILL10 | |
| Durchschnittliche Intel Core Ultra 7 258V, Intel Arc Graphics 140V (7357 - 13600, n=23) | |
| Samsung Galaxy Book5 Pro 360 | |
| Dell Inspiron 16 7640 2-in-1 | |
| Dell 16 Plus 2-in-1 | |
| PCMark 10 / Digital Content Creation | |
| MSI Summit A16 AI Plus A3HMTG | |
| Lenovo Yoga 7 2-in-1 16ILL10 | |
| Dell Inspiron 16 7640 2-in-1 | |
| Durchschnittliche Intel Core Ultra 7 258V, Intel Arc Graphics 140V (8160 - 10308, n=23) | |
| Dell 16 Plus 2-in-1 | |
| Samsung Galaxy Book5 Pro 360 | |
| HP Envy x360 2-in-1 16-ad0097nr | |
| CrossMark / Overall | |
| MSI Summit A16 AI Plus A3HMTG | |
| Lenovo Yoga 7 2-in-1 16ILL10 | |
| Dell Inspiron 16 7640 2-in-1 | |
| Dell 16 Plus 2-in-1 | |
| Durchschnittliche Intel Core Ultra 7 258V, Intel Arc Graphics 140V (1275 - 1742, n=22) | |
| HP Envy x360 2-in-1 16-ad0097nr | |
| Samsung Galaxy Book5 Pro 360 | |
| CrossMark / Productivity | |
| Lenovo Yoga 7 2-in-1 16ILL10 | |
| Dell Inspiron 16 7640 2-in-1 | |
| Dell 16 Plus 2-in-1 | |
| HP Envy x360 2-in-1 16-ad0097nr | |
| Durchschnittliche Intel Core Ultra 7 258V, Intel Arc Graphics 140V (1267 - 1684, n=22) | |
| MSI Summit A16 AI Plus A3HMTG | |
| Samsung Galaxy Book5 Pro 360 | |
| CrossMark / Creativity | |
| MSI Summit A16 AI Plus A3HMTG | |
| Lenovo Yoga 7 2-in-1 16ILL10 | |
| Dell Inspiron 16 7640 2-in-1 | |
| Dell 16 Plus 2-in-1 | |
| Durchschnittliche Intel Core Ultra 7 258V, Intel Arc Graphics 140V (1393 - 1977, n=22) | |
| HP Envy x360 2-in-1 16-ad0097nr | |
| Samsung Galaxy Book5 Pro 360 | |
| CrossMark / Responsiveness | |
| Dell Inspiron 16 7640 2-in-1 | |
| MSI Summit A16 AI Plus A3HMTG | |
| HP Envy x360 2-in-1 16-ad0097nr | |
| Lenovo Yoga 7 2-in-1 16ILL10 | |
| Samsung Galaxy Book5 Pro 360 | |
| Durchschnittliche Intel Core Ultra 7 258V, Intel Arc Graphics 140V (999 - 1411, n=22) | |
| Dell 16 Plus 2-in-1 | |
| WebXPRT 3 / Overall | |
| MSI Summit A16 AI Plus A3HMTG | |
| Lenovo Yoga 7 2-in-1 16ILL10 | |
| HP Envy x360 2-in-1 16-ad0097nr | |
| Dell 16 Plus 2-in-1 | |
| Dell Inspiron 16 7640 2-in-1 | |
| Durchschnittliche Intel Core Ultra 7 258V, Intel Arc Graphics 140V (219 - 317, n=22) | |
| Samsung Galaxy Book5 Pro 360 | |
| WebXPRT 4 / Overall | |
| Lenovo Yoga 7 2-in-1 16ILL10 | |
| Dell 16 Plus 2-in-1 | |
| Durchschnittliche Intel Core Ultra 7 258V, Intel Arc Graphics 140V (199.5 - 291, n=22) | |
| MSI Summit A16 AI Plus A3HMTG | |
| Samsung Galaxy Book5 Pro 360 | |
| Dell Inspiron 16 7640 2-in-1 | |
| HP Envy x360 2-in-1 16-ad0097nr | |
| Mozilla Kraken 1.1 / Total | |
| HP Envy x360 2-in-1 16-ad0097nr | |
| Dell Inspiron 16 7640 2-in-1 | |
| Samsung Galaxy Book5 Pro 360 | |
| Durchschnittliche Intel Core Ultra 7 258V, Intel Arc Graphics 140V (468 - 559, n=24) | |
| Dell 16 Plus 2-in-1 | |
| Lenovo Yoga 7 2-in-1 16ILL10 | |
| MSI Summit A16 AI Plus A3HMTG | |
* ... kleinere Werte sind besser
| PCMark 10 Score | 6766 Punkte | |
Hilfe | ||
| AIDA64 / Memory Copy | |
| Durchschnittliche Intel Core Ultra 7 258V (104408 - 114336, n=24) | |
| Dell 16 Plus 2-in-1 | |
| Samsung Galaxy Book5 Pro 360 | |
| Lenovo Yoga 7 2-in-1 16ILL10 | |
| MSI Summit A16 AI Plus A3HMTG | |
| Dell Inspiron 16 7640 2-in-1 | |
| HP Envy x360 2-in-1 16-ad0097nr | |
| AIDA64 / Memory Read | |
| MSI Summit A16 AI Plus A3HMTG | |
| Lenovo Yoga 7 2-in-1 16ILL10 | |
| Dell 16 Plus 2-in-1 | |
| Durchschnittliche Intel Core Ultra 7 258V (82846 - 89417, n=24) | |
| Samsung Galaxy Book5 Pro 360 | |
| Dell Inspiron 16 7640 2-in-1 | |
| HP Envy x360 2-in-1 16-ad0097nr | |
| AIDA64 / Memory Write | |
| Lenovo Yoga 7 2-in-1 16ILL10 | |
| Dell 16 Plus 2-in-1 | |
| Durchschnittliche Intel Core Ultra 7 258V (108824 - 117989, n=24) | |
| Samsung Galaxy Book5 Pro 360 | |
| MSI Summit A16 AI Plus A3HMTG | |
| HP Envy x360 2-in-1 16-ad0097nr | |
| Dell Inspiron 16 7640 2-in-1 | |
| AIDA64 / Memory Latency | |
| Dell Inspiron 16 7640 2-in-1 | |
| HP Envy x360 2-in-1 16-ad0097nr | |
| MSI Summit A16 AI Plus A3HMTG | |
| Dell 16 Plus 2-in-1 | |
| Lenovo Yoga 7 2-in-1 16ILL10 | |
| Durchschnittliche Intel Core Ultra 7 258V (95 - 101.7, n=24) | |
| Samsung Galaxy Book5 Pro 360 | |
* ... kleinere Werte sind besser
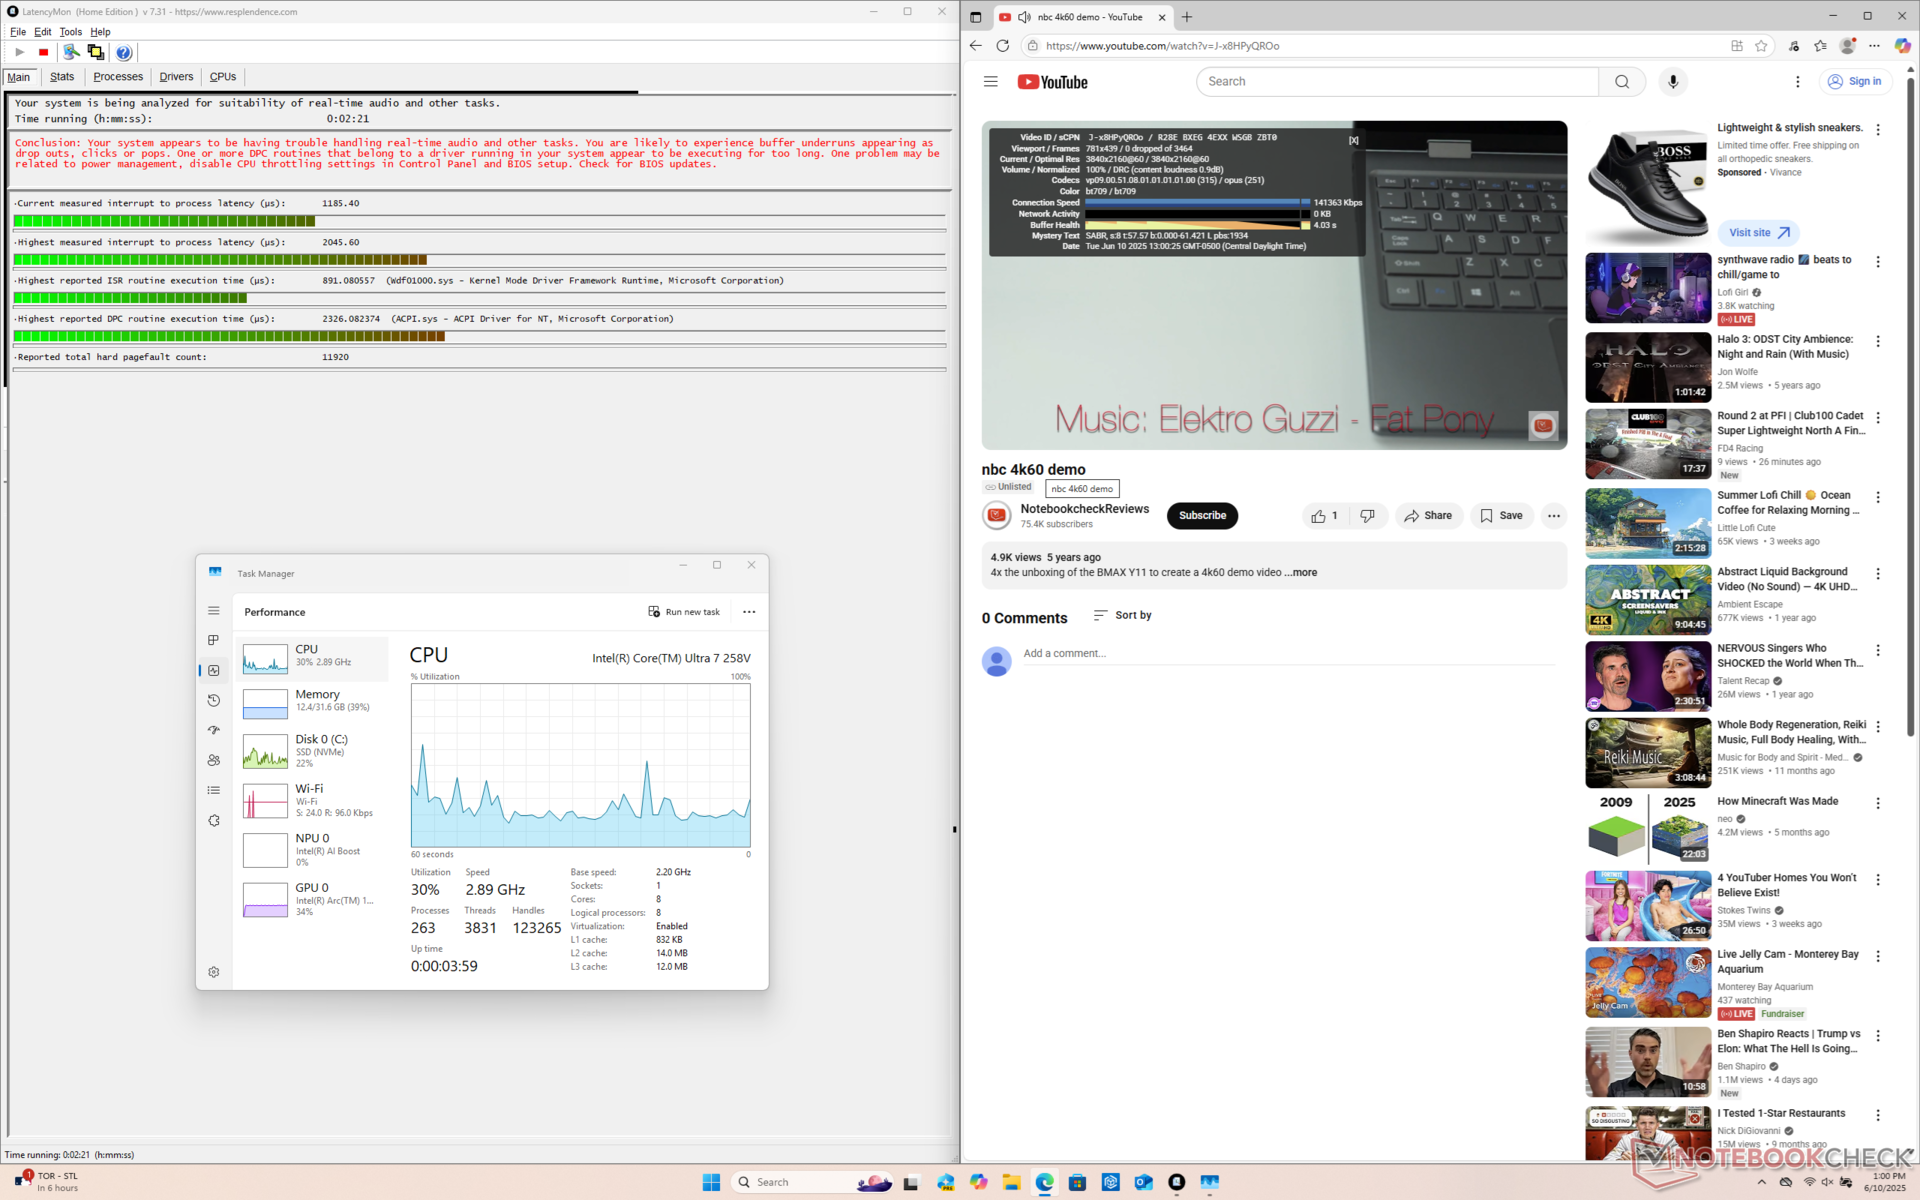
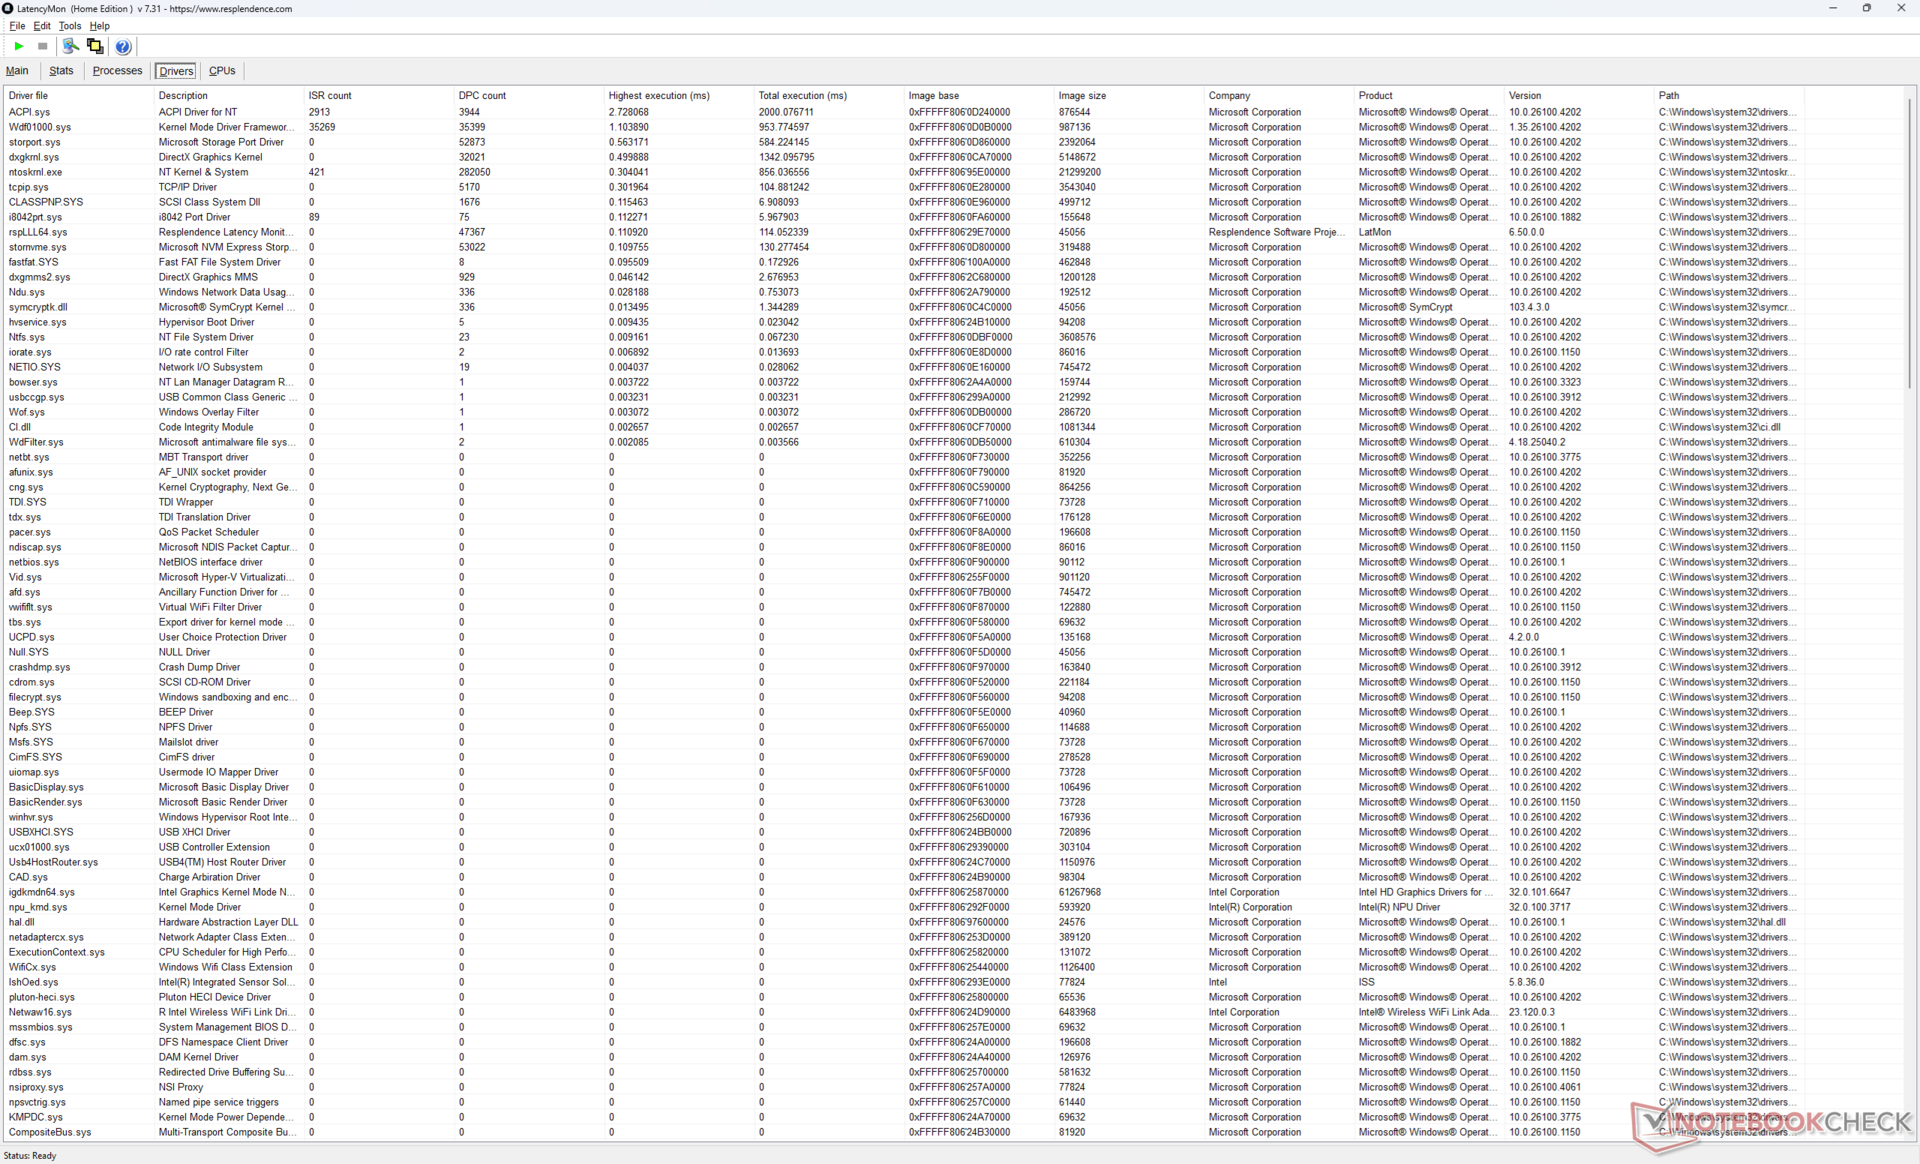
DPC-Latenzzeit
LatencyMon zeigt kleinere DPC-Probleme an, wenn man mehrere Browser Tabs unserer Homepage öffnet. Die 4K-Videowiedergabe bei 60 Hz ist ansonsten perfekt, und es wurden keine Bildaussetzer verzeichnet.
| DPC Latencies / LatencyMon - interrupt to process latency (max), Web, Youtube, Prime95 | |
| MSI Summit A16 AI Plus A3HMTG | |
| Dell 16 Plus 2-in-1 | |
| HP Envy x360 2-in-1 16-ad0097nr | |
| Dell Inspiron 16 7640 2-in-1 | |
| Samsung Galaxy Book5 Pro 360 | |
| Lenovo Yoga 7 2-in-1 16ILL10 | |
* ... kleinere Werte sind besser
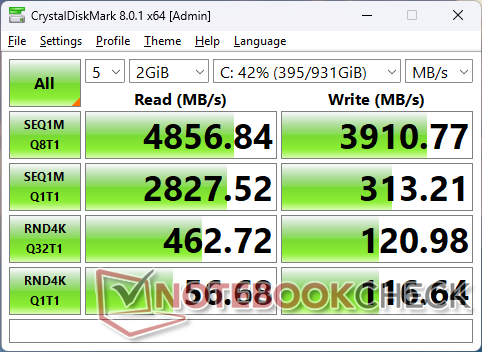
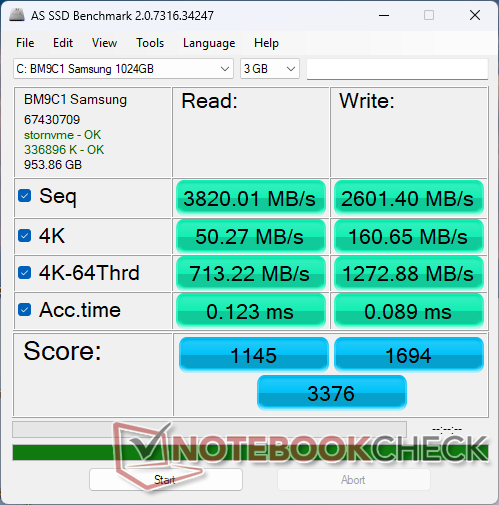
Speichergeräte
Die Samsung BM9C1 PCIe4 NVMe SSD nicht nur langsamer als die Micron 2550 im Vorjahresmodell, sie neigt auch zum Drosseln. Die Transferraten schwanken zwischen 3.400 MB/s und 4.700 MB/s im Vergleich zu den konstanteren ~5.000 MB/s auf dem Inspiron 16 7640 2-in-1, wenn wir unseren DiskSpd-Schleifentest durchführen, wie die Grafik unten zeigt.

| Drive Performance Rating - Percent | |
| Samsung Galaxy Book5 Pro 360 | |
| Dell Inspiron 16 7640 2-in-1 | |
| Lenovo Yoga 7 2-in-1 16ILL10 | |
| MSI Summit A16 AI Plus A3HMTG | |
| Dell 16 Plus 2-in-1 | |
| HP Envy x360 2-in-1 16-ad0097nr | |
* ... kleinere Werte sind besser
Disk Throttling: DiskSpd Read Loop, Queue Depth 8
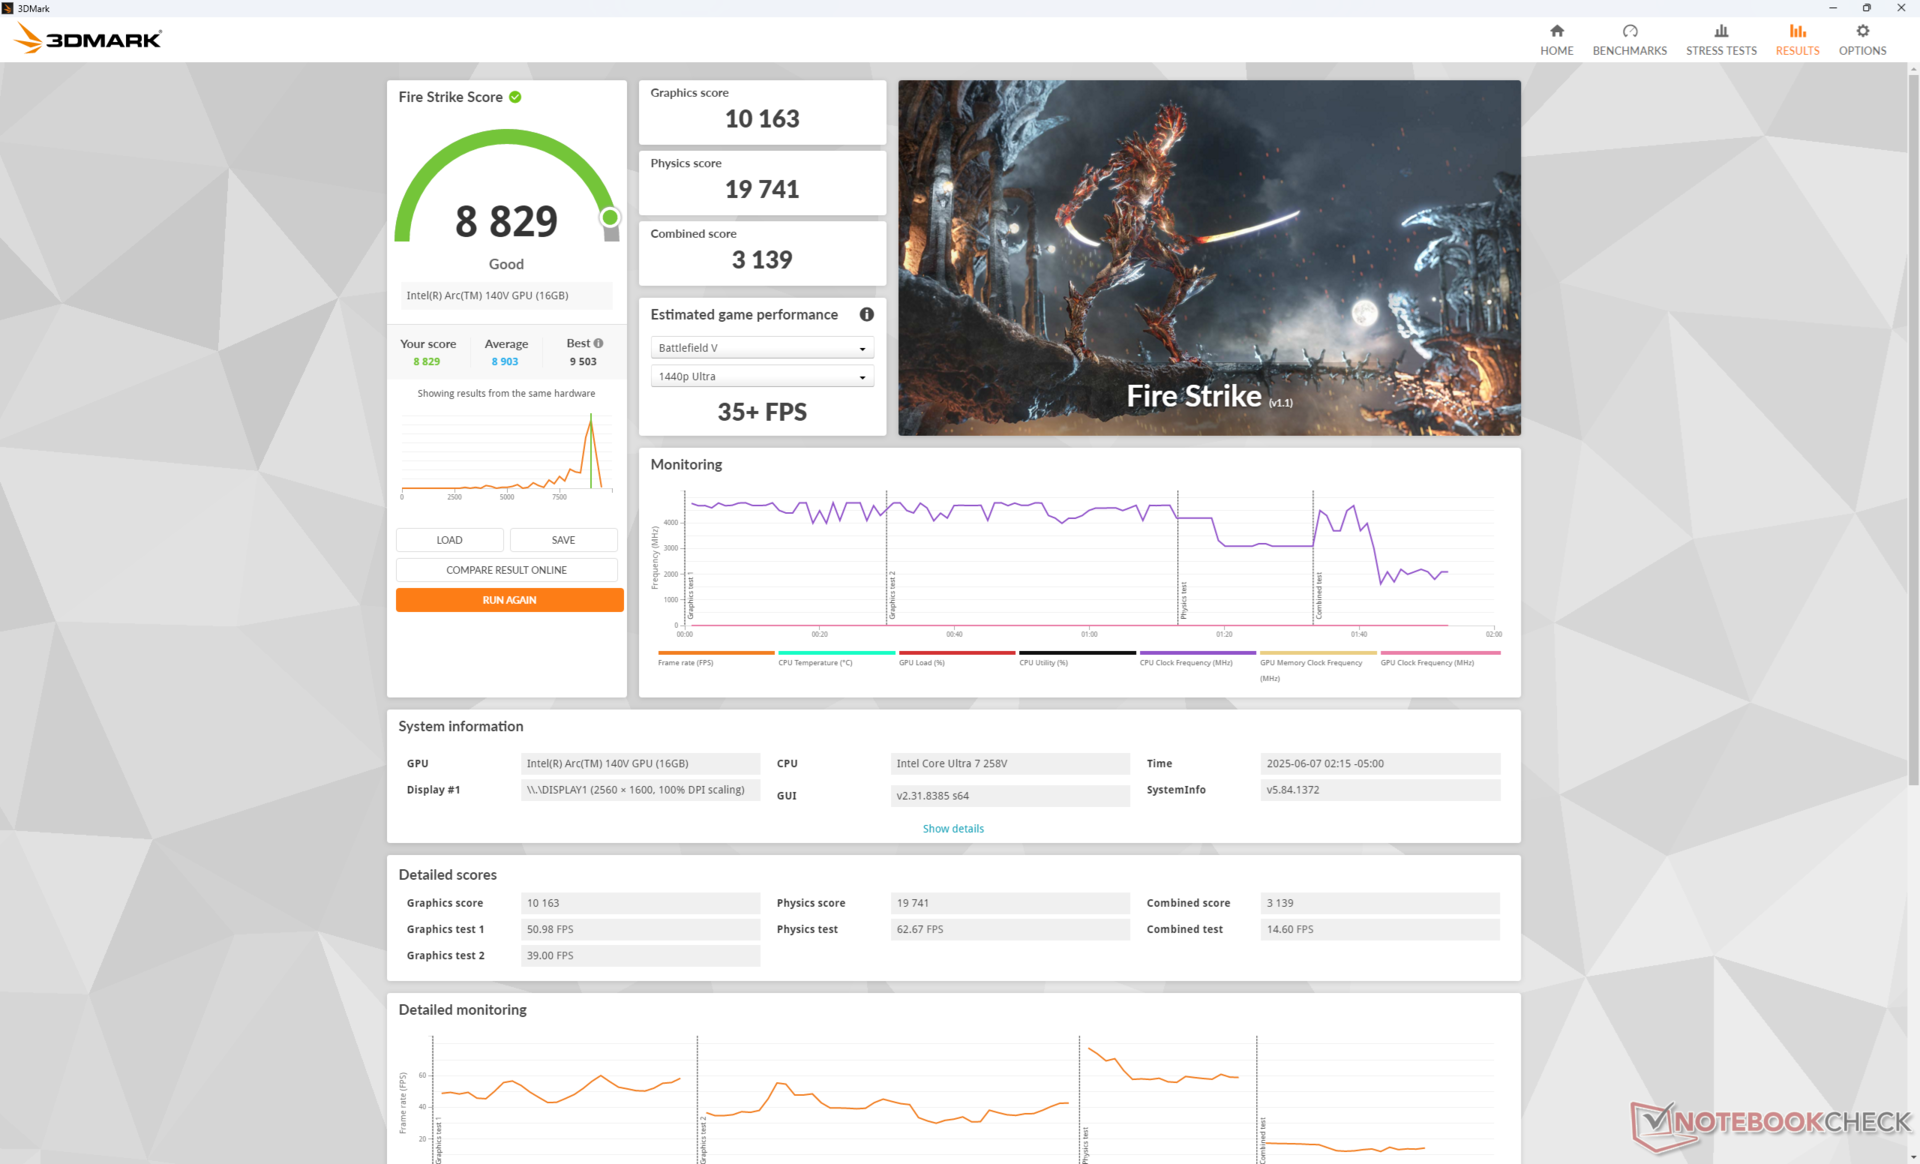
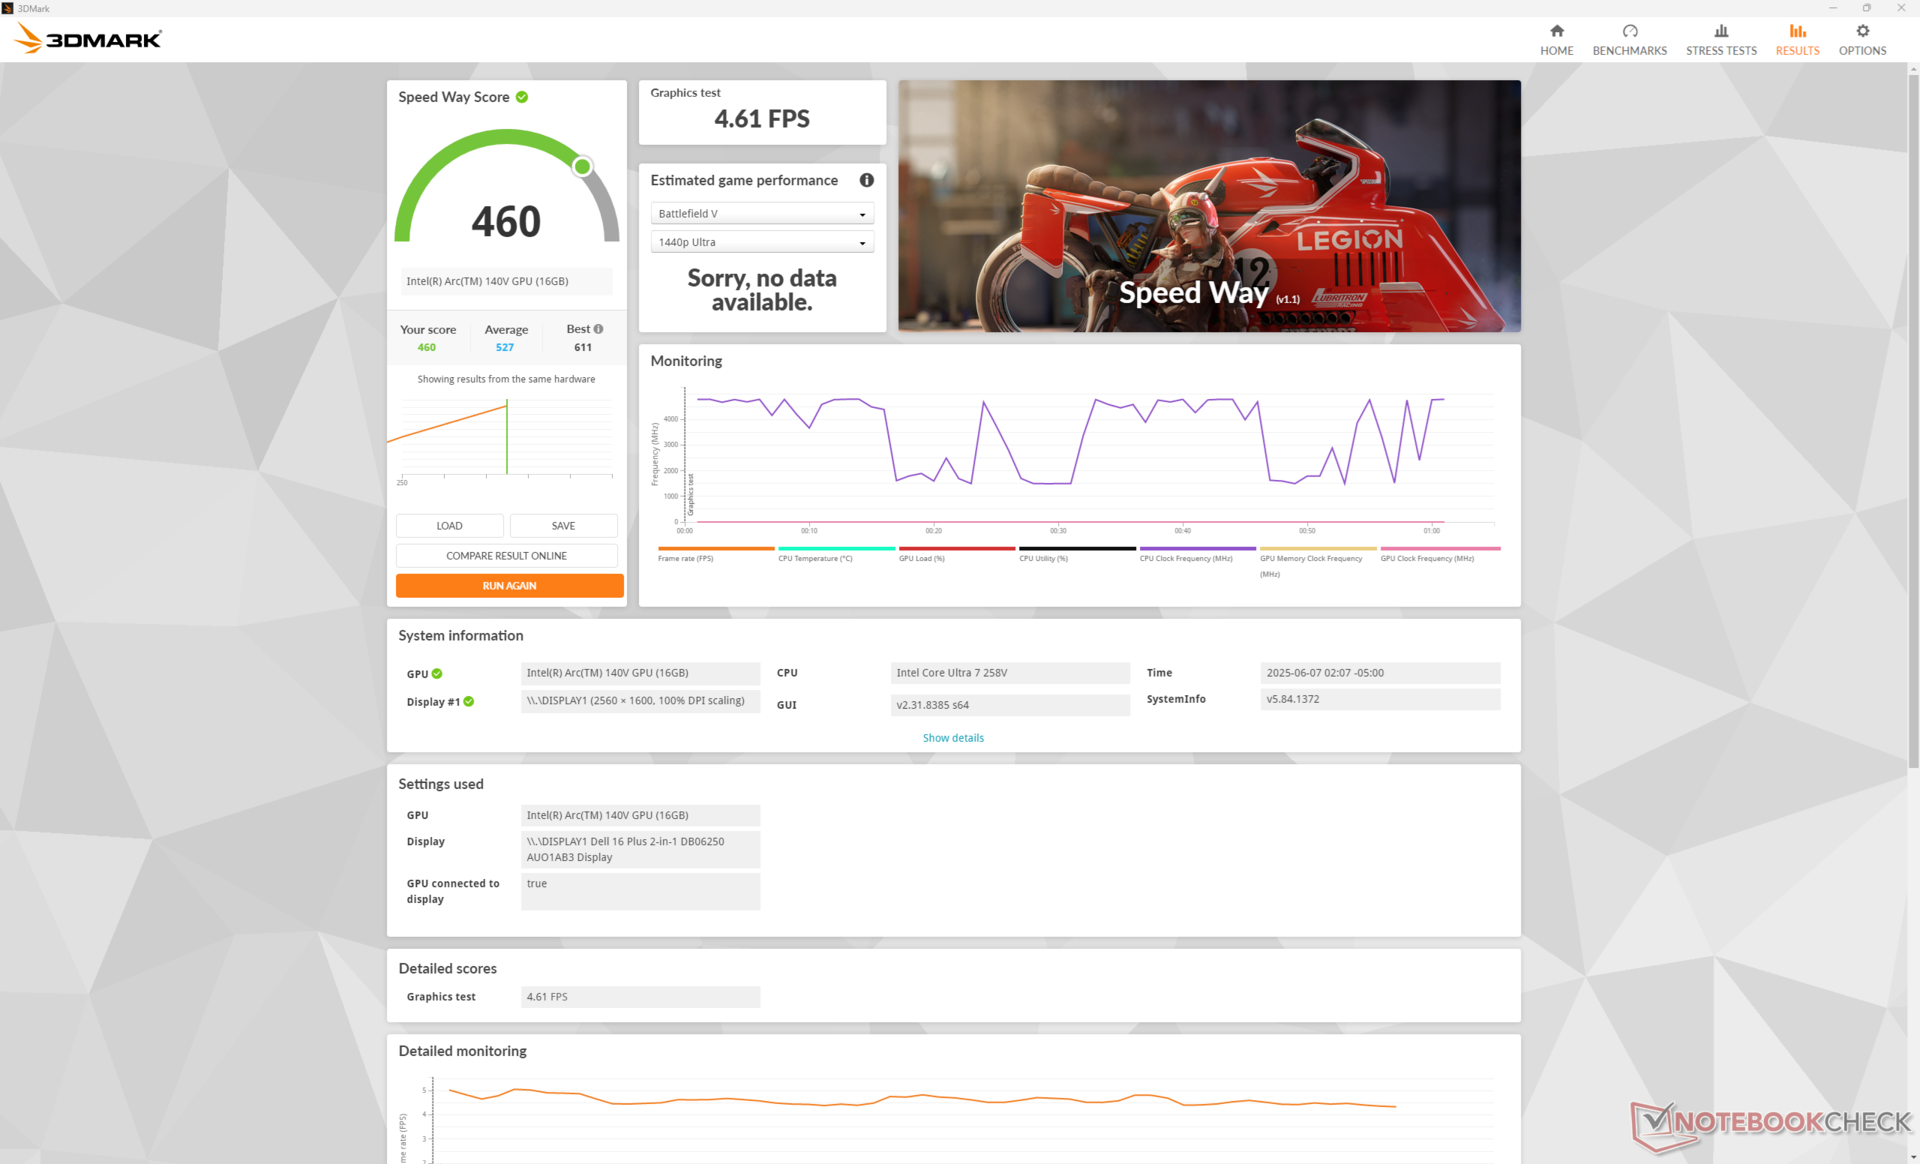
GPU-Performance
Während der Core Ultra 7 258V langsamer ist als der Core Ultra 7 255H im letztjährigen Inspiron, wenn es um die Prozessor Leistung geht, ist das Gegenteil der Fall, wenn man den Arc 140V mit dem Arc 8 vergleicht. Das Dell 16 Plus 2-in-1 ist in der Lage, anspruchsvolle Spiele wie Final Fantasy XV oder Cyberpunk 2077 zwischen 35 und 50 Prozent schneller auszuführen, trotz der langsameren Prozessorleistung.
| Leistungsprofil | Grafics-Punktzahl | Physics-Wertung | Kombinierte Punktzahl |
| Performance-Modus | 10.163 | 19.741 | 3.139 |
| Ausgeglichener Modus | 8.556 (-16 %) | 16.859 (-15 %) | 2.576 (-18 %) |
| Akku-Leistung | 9.568 (-6 %) | 16.911 (-14 %) | 2.651 (-16 %) |
Die Performance sinkt um etwa 15 Prozent, wenn man den Modus "Ausgewogen" anstelle des Modus " Performance " verwendet, wie unsere Fire-Strike-Ergebnistabelle oben zeigt.
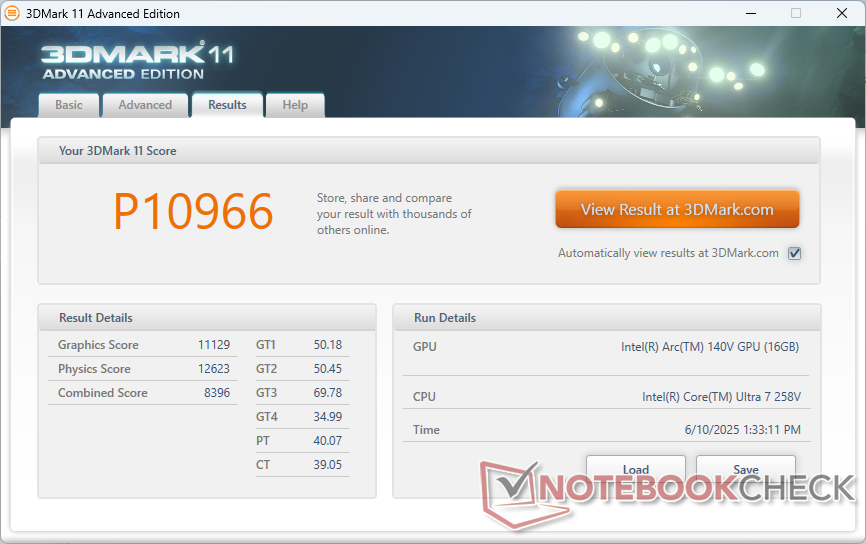
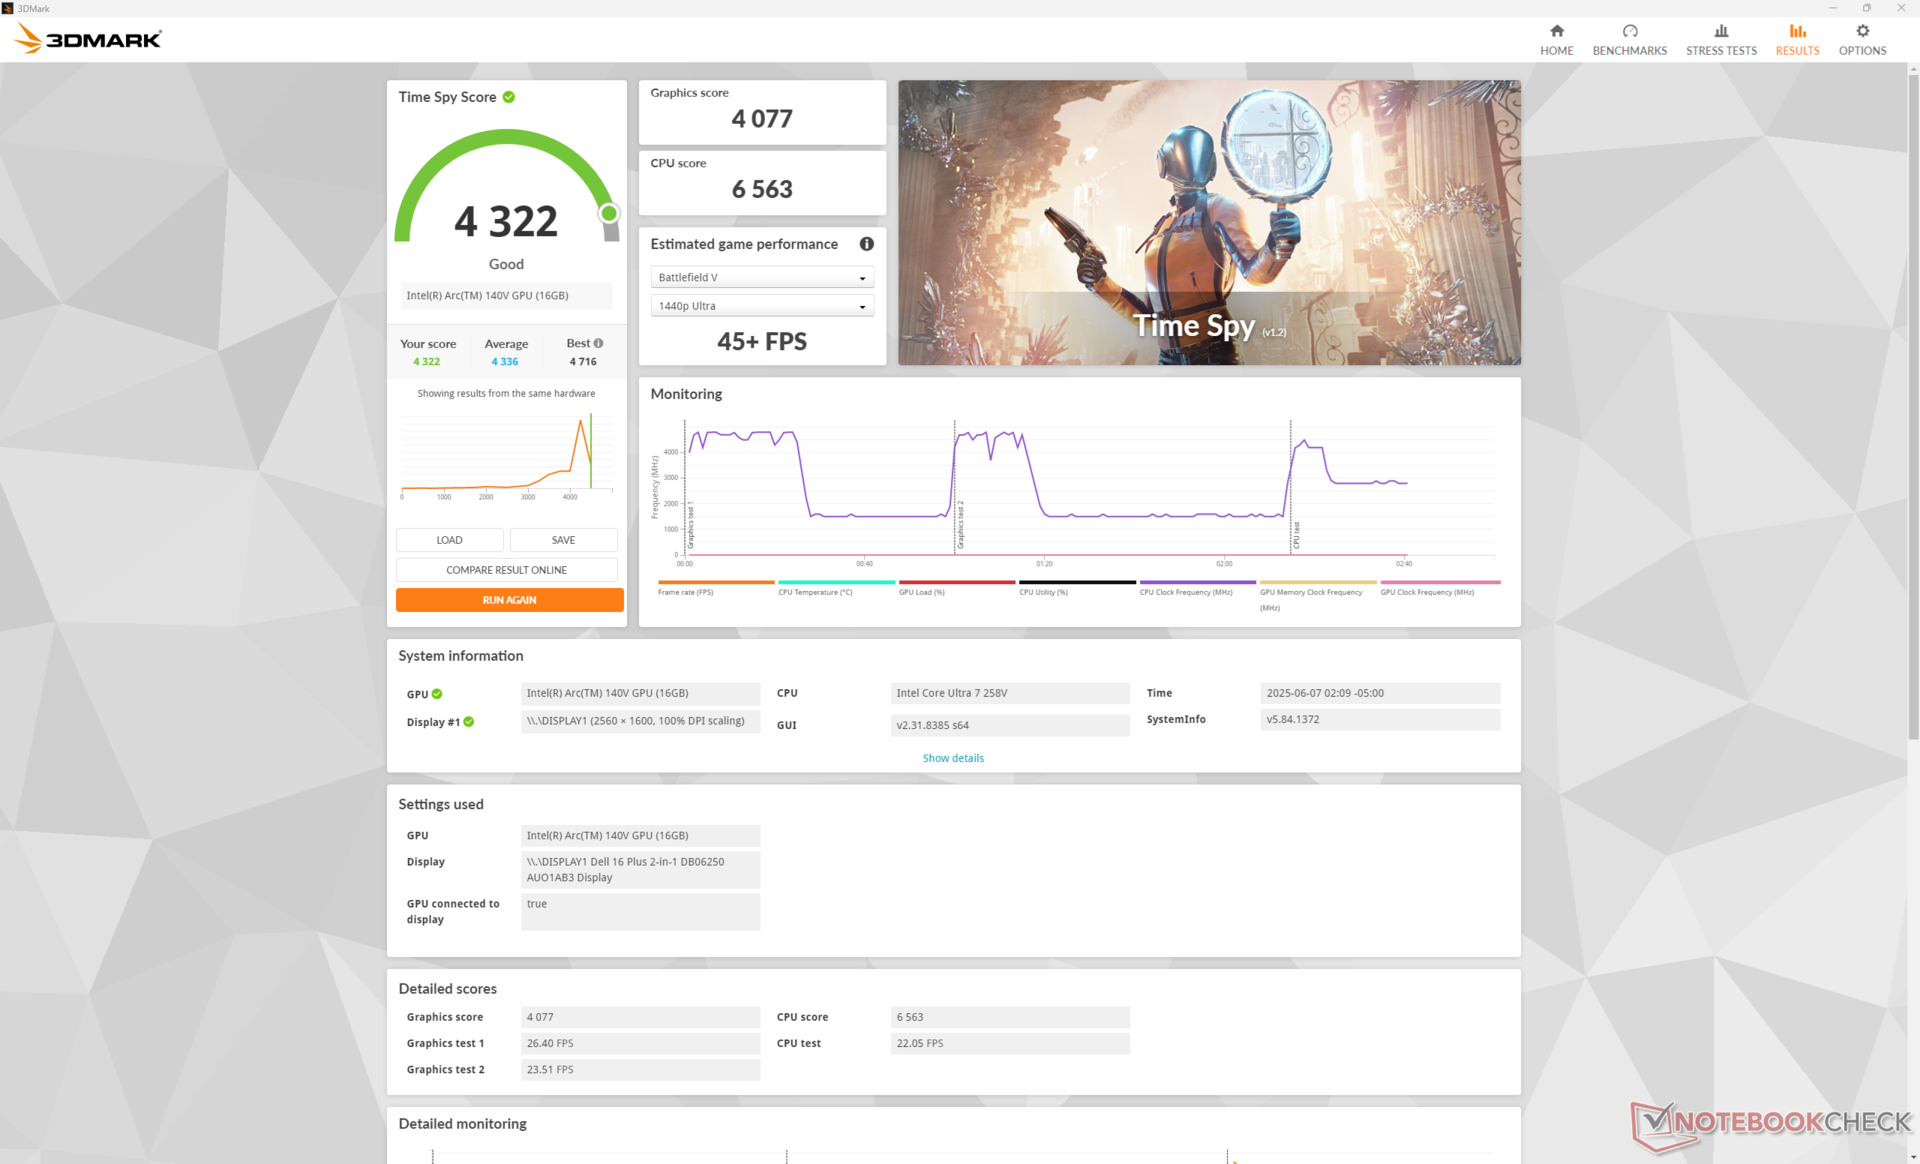
| 3DMark 11 Performance | 10966 Punkte | |
| 3DMark Fire Strike Score | 8829 Punkte | |
| 3DMark Time Spy Score | 4322 Punkte | |
Hilfe | ||
* ... kleinere Werte sind besser
| F1 24 | |
| 1920x1080 Low Preset AA:T AF:16x | |
| Lenovo Yoga 7 2-in-1 16ILL10 | |
| Dell 16 Plus 2-in-1 | |
| Durchschnittliche Intel Arc Graphics 140V (54 - 99, n=25) | |
| Lenovo ThinkPad T16 Gen 3 21MN005XGE | |
| 1920x1080 Medium Preset AA:T AF:16x | |
| Lenovo Yoga 7 2-in-1 16ILL10 | |
| Dell 16 Plus 2-in-1 | |
| Durchschnittliche Intel Arc Graphics 140V (49.2 - 88.2, n=24) | |
| Lenovo ThinkPad T16 Gen 3 21MN005XGE | |
| 1920x1080 High Preset AA:T AF:16x | |
| Dell 16 Plus 2-in-1 | |
| Lenovo Yoga 7 2-in-1 16ILL10 | |
| Durchschnittliche Intel Arc Graphics 140V (34.4 - 66.4, n=27) | |
| Lenovo ThinkPad T16 Gen 3 21MN005XGE | |
| 1920x1080 Ultra High Preset AA:T AF:16x | |
| Lenovo Yoga 7 2-in-1 16ILL10 | |
| Dell 16 Plus 2-in-1 | |
| Durchschnittliche Intel Arc Graphics 140V (14.6 - 22, n=25) | |
| Lenovo ThinkPad T16 Gen 3 21MN005XGE | |
Cyberpunk 2077 ultra fps-Chart
| min. | mittel | hoch | max. | |
|---|---|---|---|---|
| Dota 2 Reborn (2015) | 105.1 | 88.2 | 87.7 | 86 |
| Final Fantasy XV Benchmark (2018) | 83.5 | 48.2 | 35.4 | |
| X-Plane 11.11 (2018) | 46.7 | 37.9 | 31.2 | |
| Strange Brigade (2018) | 228 | 70 | 61 | 54.7 |
| Baldur's Gate 3 (2023) | 42.4 | 35.4 | 31.4 | 31 |
| Cyberpunk 2077 (2023) | 47.7 | 38.8 | 32.9 | 29 |
| F1 24 (2024) | 84.4 | 77.4 | 60.4 | 19.7 |
Emissionen
Systemrauschen
Die Geräuschkulisse des Lüfters ist trotz der Unterschiede in der CPU- und iGPU-Leistung im Wesentlichen unverändert gegenüber dem letztjährigen Modell. Allerdings reagiert der Lüfter des Dell 16 Plus 2-in-1 langsamer auf die Belastung des Bildschirms, so dass das System länger leise bleiben kann, bevor höhere Drehzahlen erforderlich sind.
Lautstärkediagramm
| Idle |
| 23 / 23 / 24.7 dB(A) |
| Last |
| 32.5 / 45.6 dB(A) |
 | ||
30 dB leise 40 dB(A) deutlich hörbar 50 dB(A) störend |
||
min: | ||
| Dell 16 Plus 2-in-1 Arc 140V, Core Ultra 7 258V, Samsung BM9C1 1024GB | Dell Inspiron 16 7640 2-in-1 Arc 8-Core, Ultra 7 155H, Micron 2550 1TB | Lenovo Yoga 7 2-in-1 16ILL10 Arc 140V, Core Ultra 7 256V, WD PC SN7100S SDFPMSL-512G-1101 | Samsung Galaxy Book5 Pro 360 Arc 130V, Core Ultra 5 226V, Samsung PM9B1 512GB MZVL4512HBLU | MSI Summit A16 AI Plus A3HMTG Radeon 880M, Ryzen AI 9 365, Samsung PM9C1 MZVL81T0HELB-00BTW | HP Envy x360 2-in-1 16-ad0097nr Radeon 780M, R7 8840HS, KIOXIA BG5 KBG50ZNV1T02 | |
|---|---|---|---|---|---|---|
| Geräuschentwicklung | -6% | -3% | 3% | -12% | 7% | |
| aus / Umgebung * (dB) | 23.2 | 22.9 1% | 23.3 -0% | 23.6 -2% | 23.8 -3% | 22.9 1% |
| Idle min * (dB) | 23 | 22.9 -0% | 23.3 -1% | 23.6 -3% | 25 -9% | 23 -0% |
| Idle avg * (dB) | 23 | 22.9 -0% | 23.3 -1% | 23.6 -3% | 25 -9% | 23 -0% |
| Idle max * (dB) | 24.7 | 25 -1% | 25.7 -4% | 23.6 4% | 29.5 -19% | 23 7% |
| Last avg * (dB) | 32.5 | 45.1 -39% | 40.2 -24% | 29.4 10% | 37.5 -15% | 23.8 27% |
| Cyberpunk 2077 ultra * (dB) | 42.6 | 44.9 -5% | 41.6 2% | 40.6 5% | 46.5 -9% | |
| Last max * (dB) | 45.6 | 44.9 2% | 41.6 9% | 40.6 11% | 56.1 -23% | 43.8 4% |
| Witcher 3 ultra * (dB) | 43.8 |
* ... kleinere Werte sind besser
Temperatur
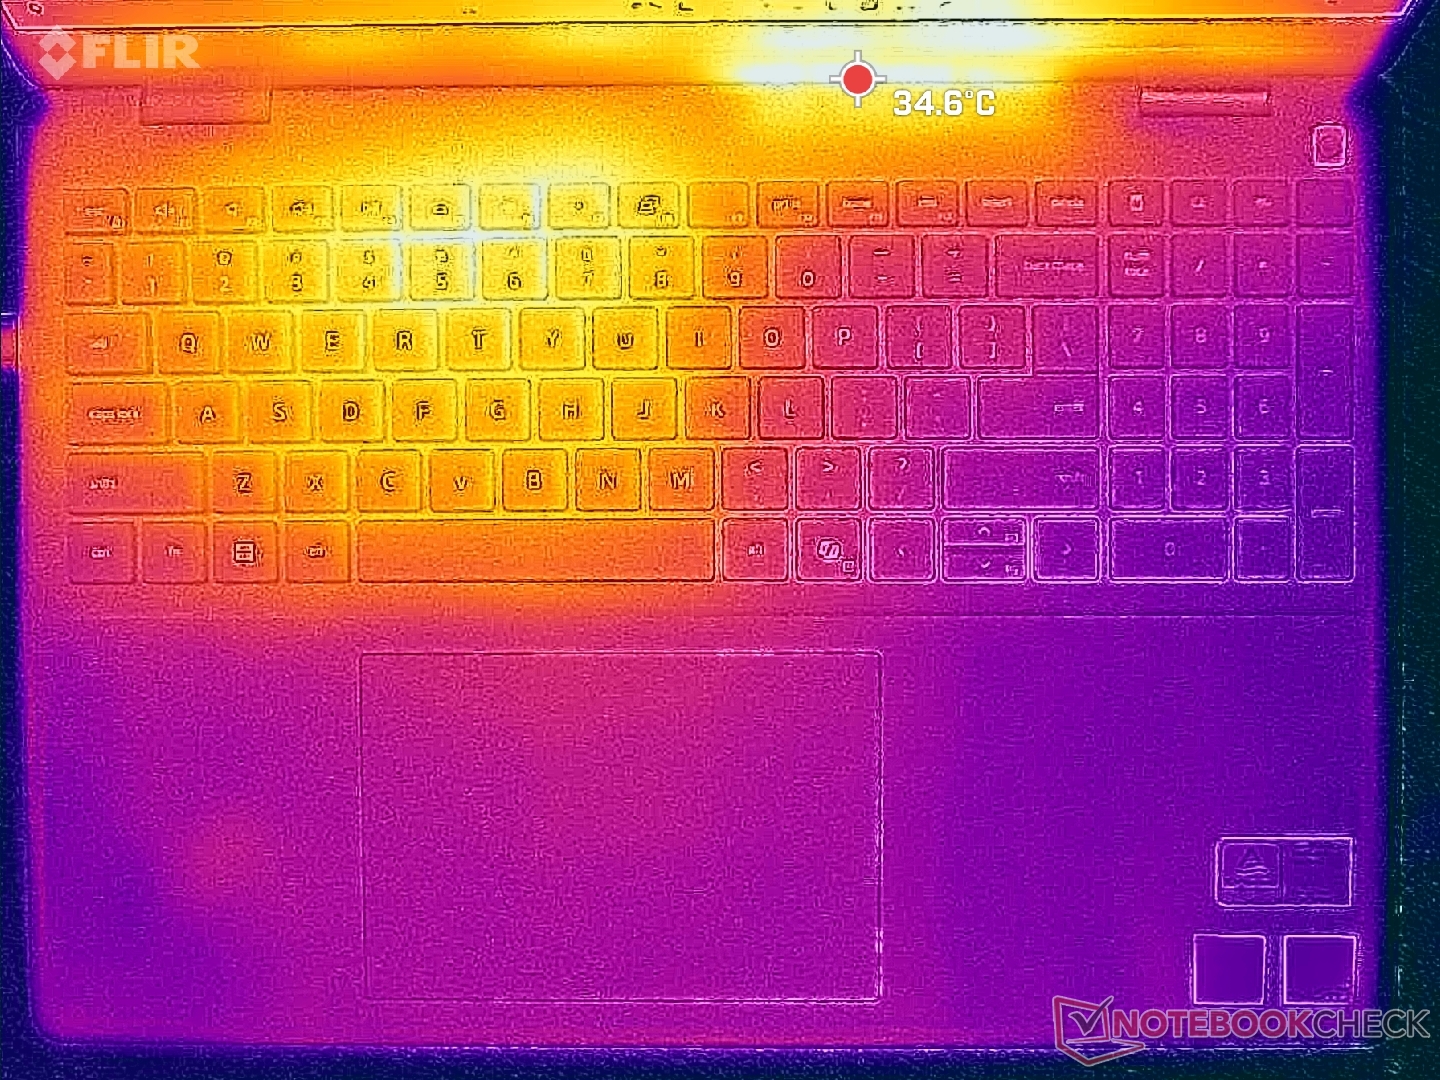
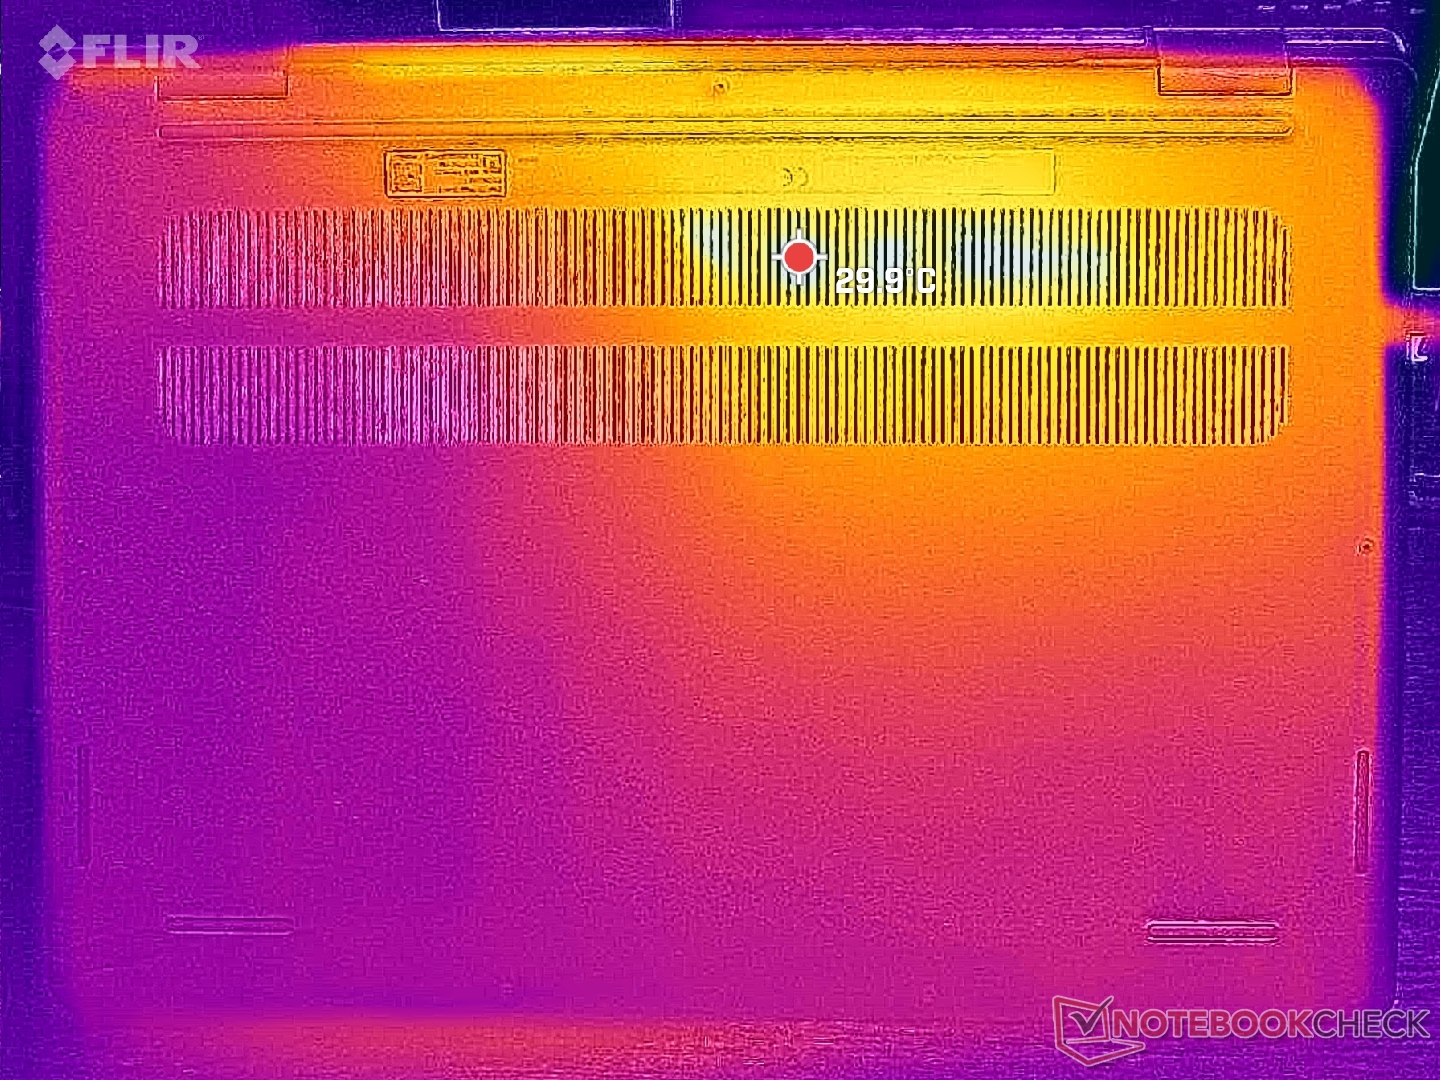
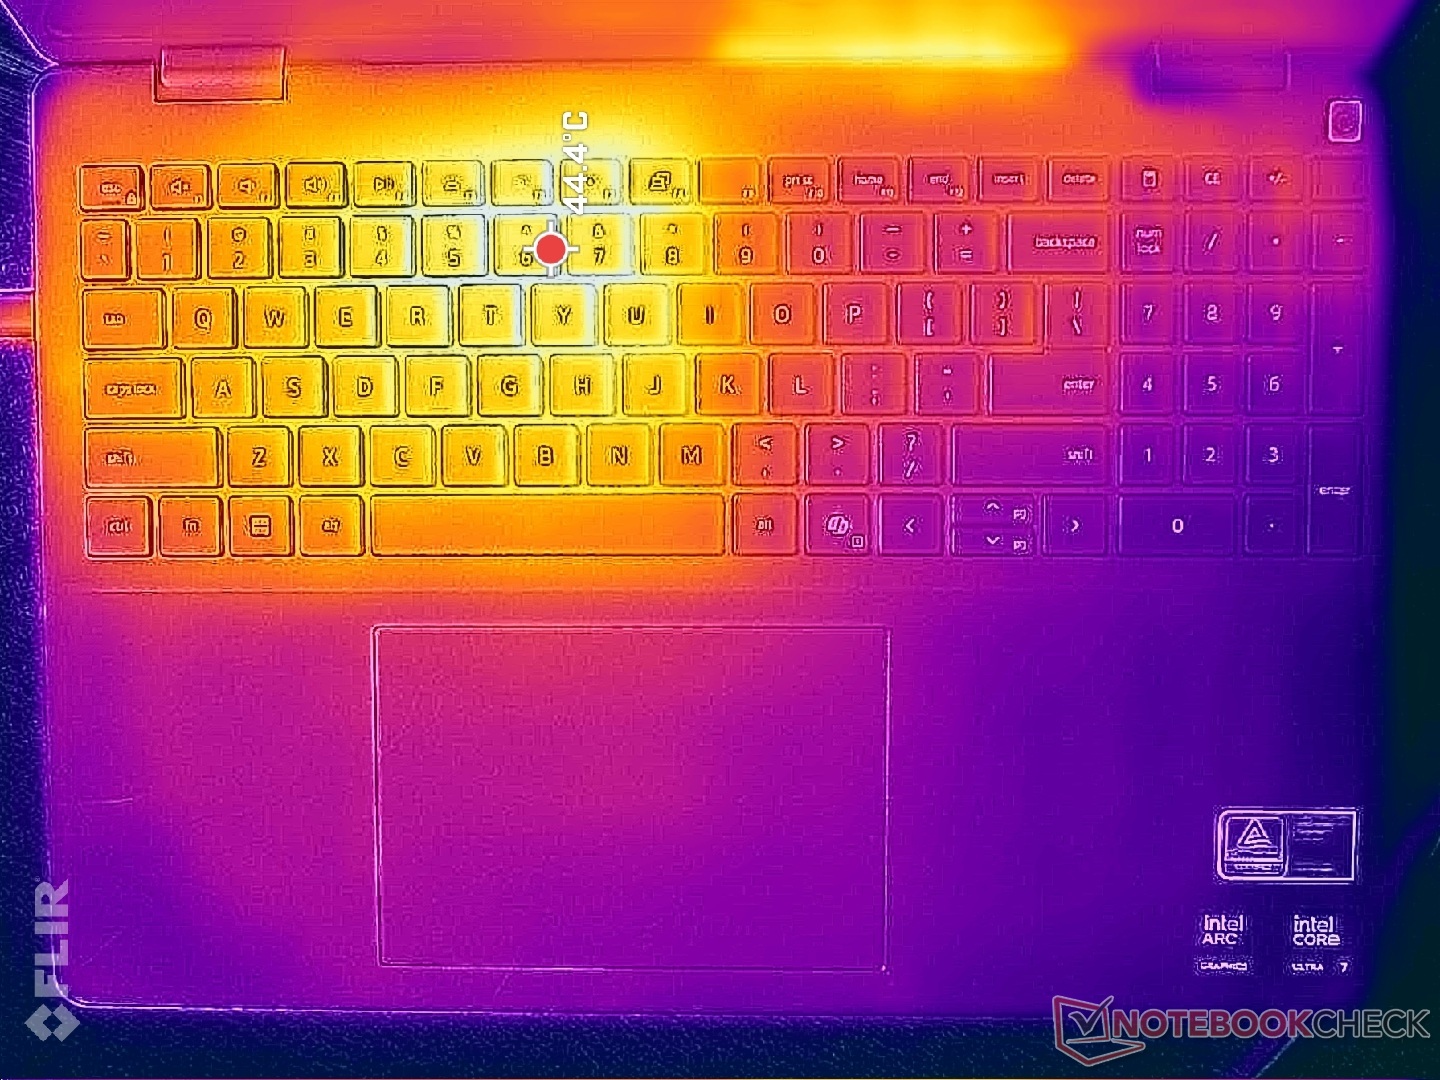
Die Hotspots der Oberflächentemperaturen erreichen knapp über 44 °C auf der Tastatur und 39 °C auf der Unterseite, was nur geringfügig wärmer ist als die Werte, die wir beim Konkurrenzprodukt Lenovo Yoga 7 2-in-1 16ILL10 gemessen haben.
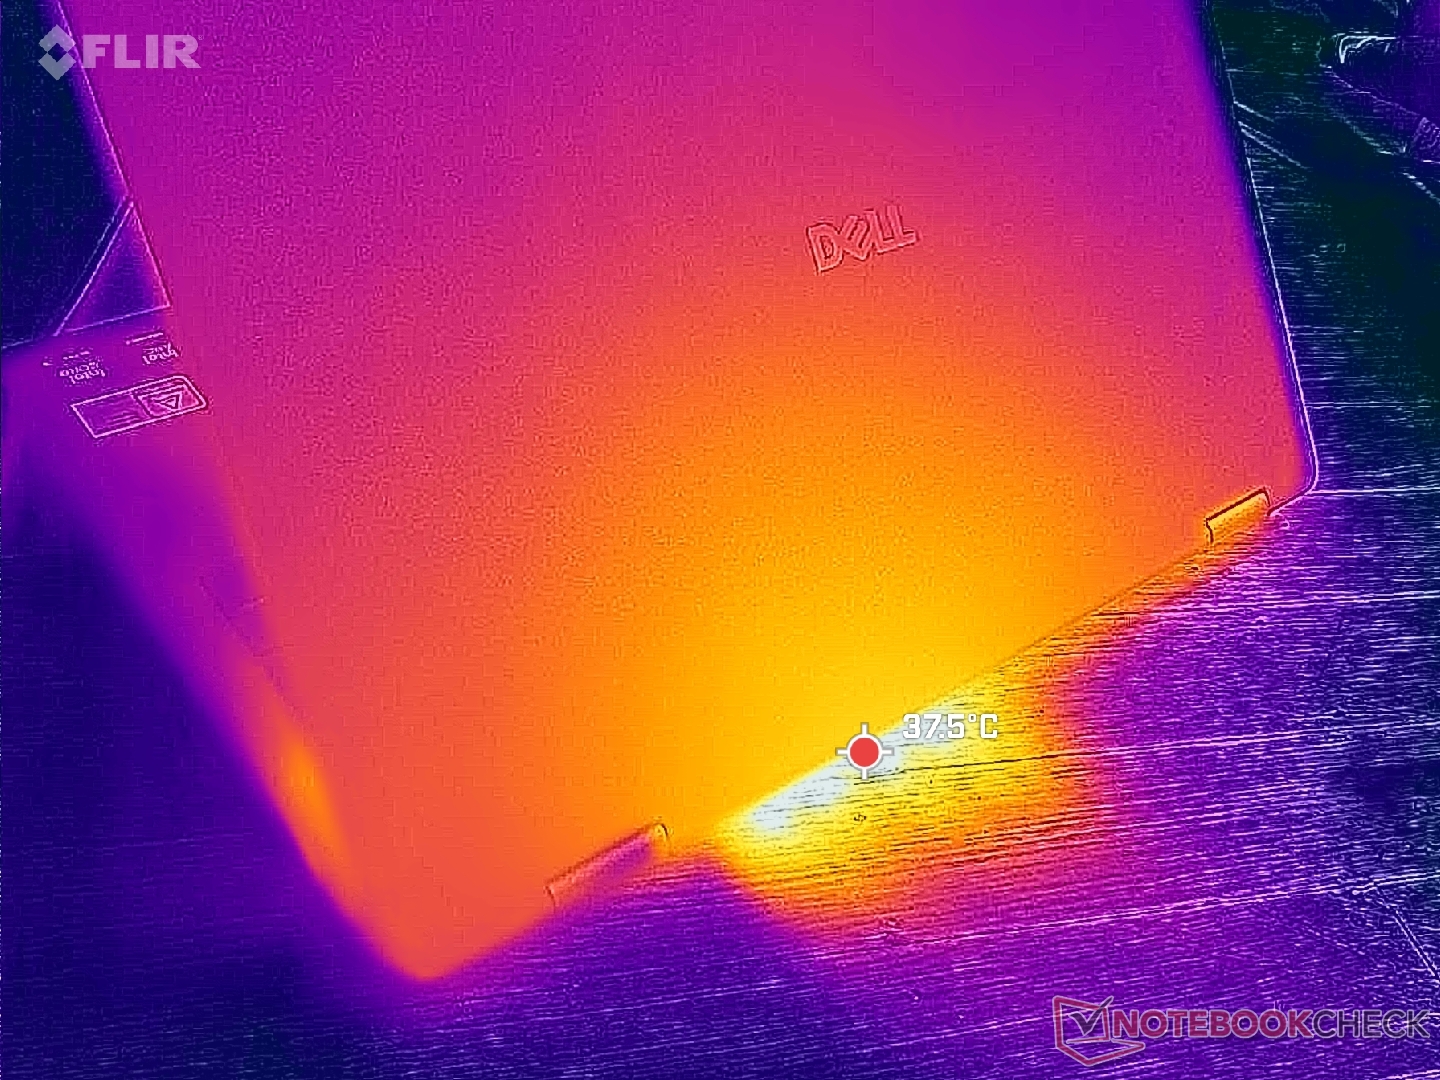
(±) Die maximale Temperatur auf der Oberseite ist 44 °C. Im Vergleich liegt der Klassendurchschnitt bei 35.4 °C (von 19.6 bis 60 °C für die Klasse Convertible).
(+) Auf der Unterseite messen wir eine maximalen Wert von 39.4 °C (im Vergleich zum Durchschnitt von 36.9 °C).
(+) Ohne Last messen wir eine durchschnittliche Temperatur von 28.7 °C auf der Oberseite. Der Klassendurchschnitt erreicht 30.3 °C.
(+) Die Handballen und der Touchpad-Bereich sind mit gemessenen 26.8 °C kühler als die typische Hauttemperatur und fühlen sich dadurch kühl an.
(±) Die durchschnittliche Handballen-Temperatur anderer getesteter Geräte war 28 °C (+1.2 °C).

| Dell 16 Plus 2-in-1 Intel Core Ultra 7 258V, Intel Arc Graphics 140V | Dell Inspiron 16 7640 2-in-1 Intel Core Ultra 7 155H, Intel Arc 8-Core iGPU | Lenovo Yoga 7 2-in-1 16ILL10 Intel Core Ultra 7 256V, Intel Arc Graphics 140V | Samsung Galaxy Book5 Pro 360 Intel Core Ultra 5 226V, Intel Arc Graphics 130V | MSI Summit A16 AI Plus A3HMTG AMD Ryzen AI 9 365, AMD Radeon 880M | HP Envy x360 2-in-1 16-ad0097nr AMD Ryzen 7 8840HS, AMD Radeon 780M | |
|---|---|---|---|---|---|---|
| Hitze | -4% | 12% | 12% | -3% | 4% | |
| Last oben max * (°C) | 44 | 46.8 -6% | 42.6 3% | 40.9 7% | 52.8 -20% | 42.6 3% |
| Last unten max * (°C) | 39.4 | 45.6 -16% | 36.8 7% | 45.1 -14% | 42 -7% | 47.8 -21% |
| Idle oben max * (°C) | 31.8 | 32.2 -1% | 26.4 17% | 23.8 25% | 30.6 4% | 27.4 14% |
| Idle unten max * (°C) | 34.2 | 31.4 8% | 26.6 22% | 23.5 31% | 29.6 13% | 27.8 19% |
* ... kleinere Werte sind besser
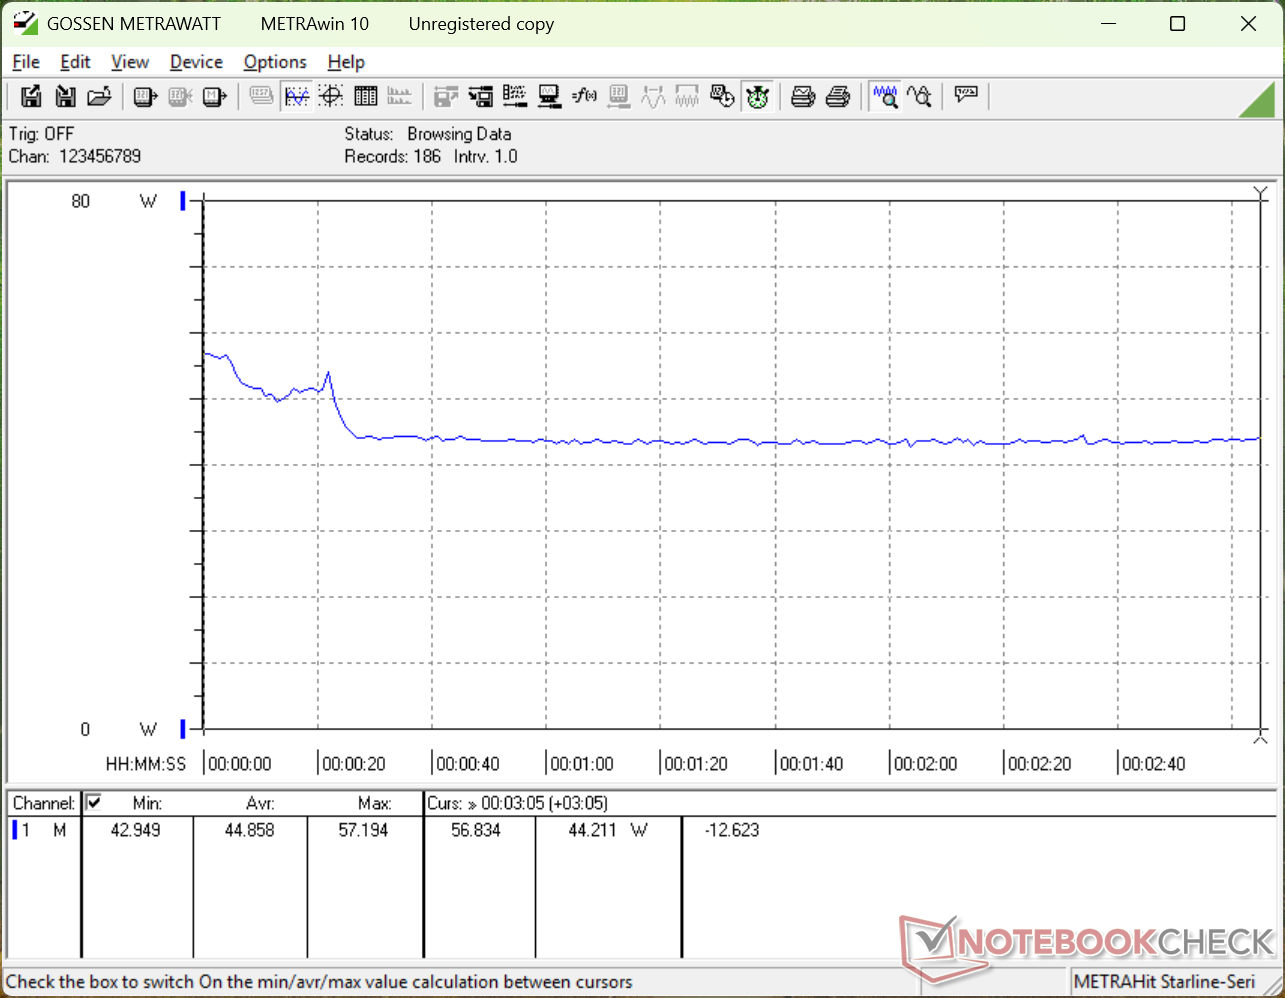
Stresstest
Beim Starten von Prime95 Stress wird die CPU auf 3,4 GHz und 38 W hochgefahren, bis sie einige Sekunden später einen Wert von 93 °C erreicht. Danach sinkt die Leistung auf 2,5 GHz und 22 W, um eine kühlere Kerntemperatur von 72 °C aufrechtzuerhalten. Das ist fast 15 °C kühler als beim Inspiron 16 7640 2-in-1 unter ähnlichen Bedingungen, aber es ist zu bedenken, dass das Dell 16 Plus 2-in-1 ebenfalls mit einem langsameren Prozessor geliefert wird.
Die Kerntemperatur bei der Ausführung von Cyberpunk 2077, die eine typische Spiellast darstellt, ist ebenfalls deutlich kühler als beim Inspiron des letzten Jahres und bietet gleichzeitig eine bessere Gaming-Performance.
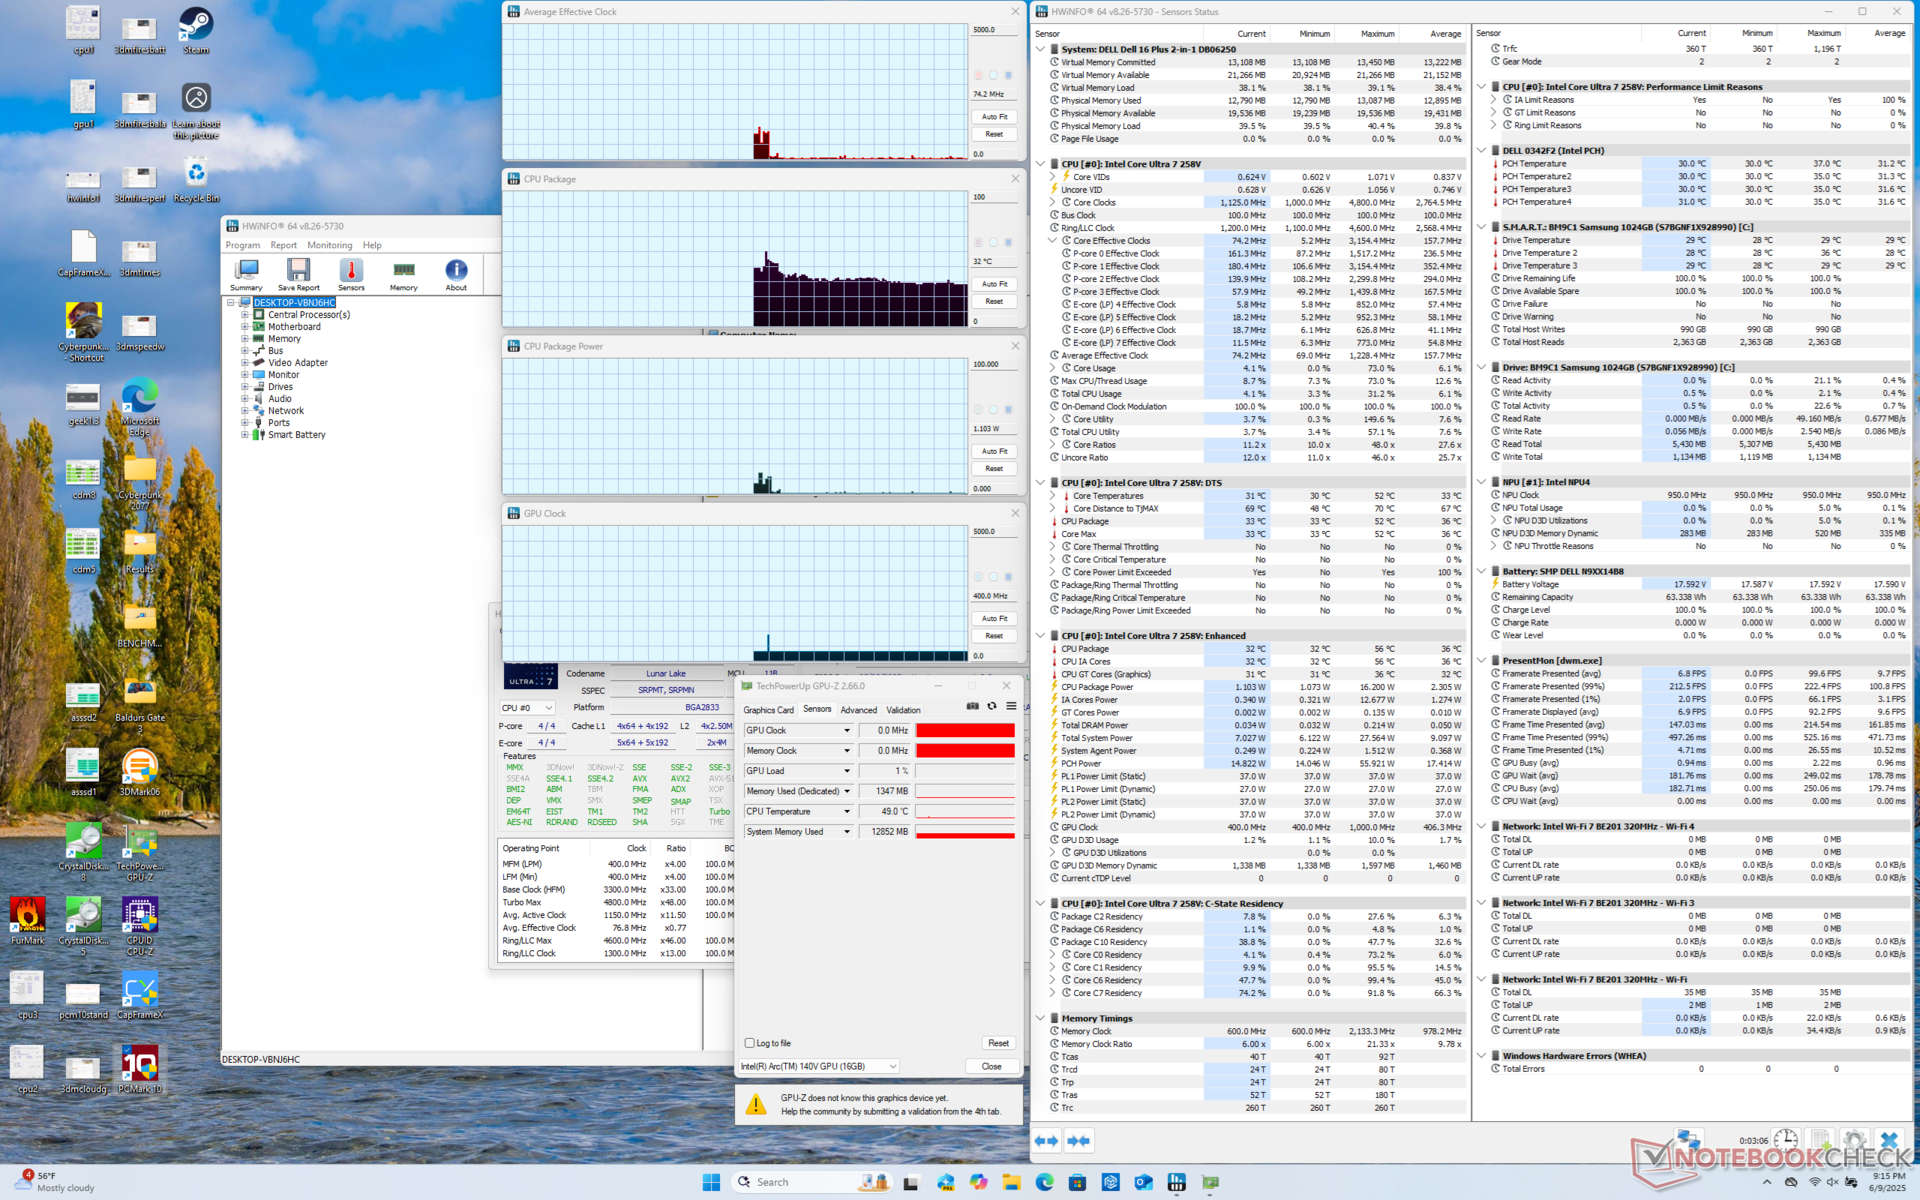
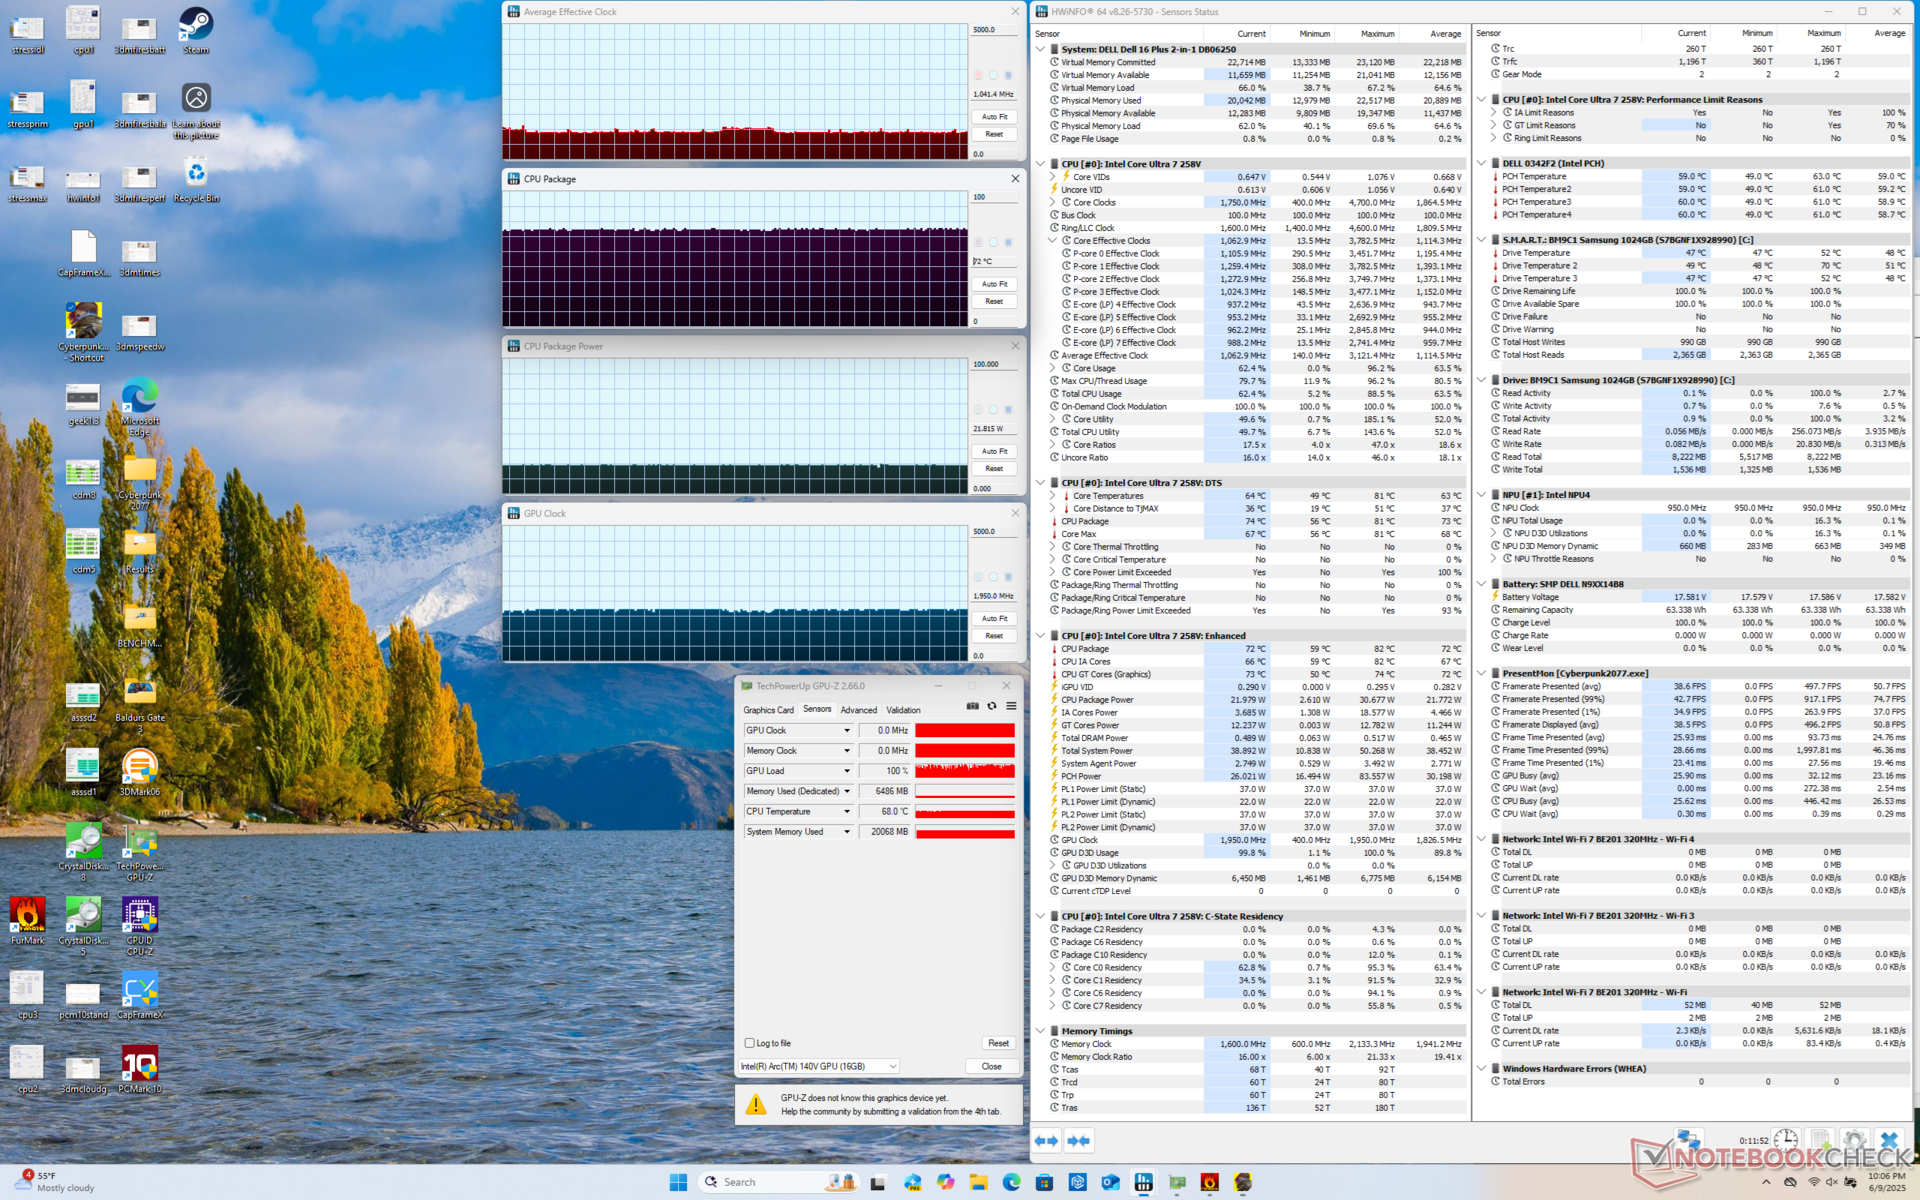
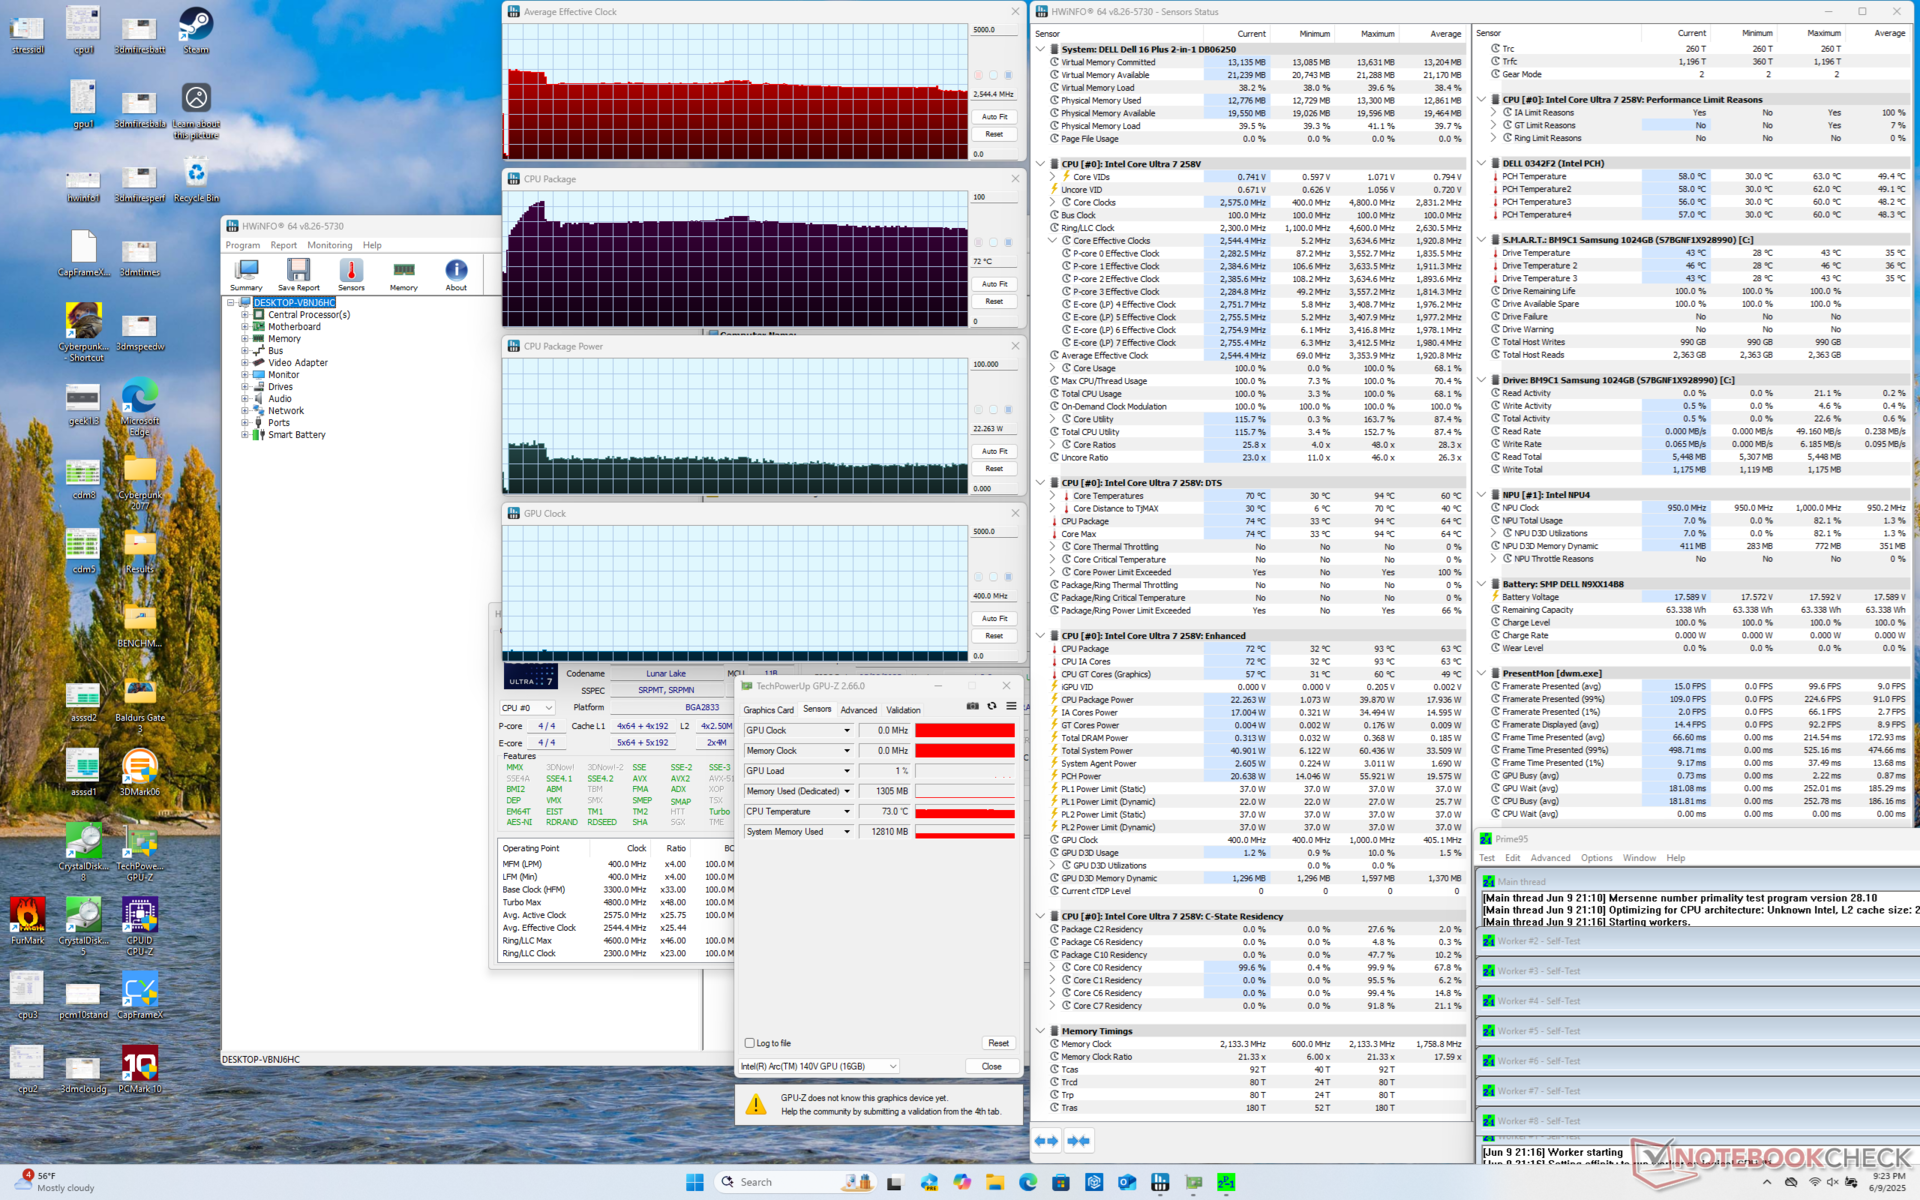

| durchschnittlicher CPU-Takt (GHz) | GPU-Takt (MHz) | durchschnittliche CPU-Temperatur (°C) | |
| System Leerlauf | -- | -- | 32 |
| Prime95 Stress | 2,5 | 400 | 72 |
| Prime95 + FurMark Stress | 2,0 | 1.150 | 73 |
| Cyberpunk 2077 Stress | 1,0 | 1.950 | 72 |
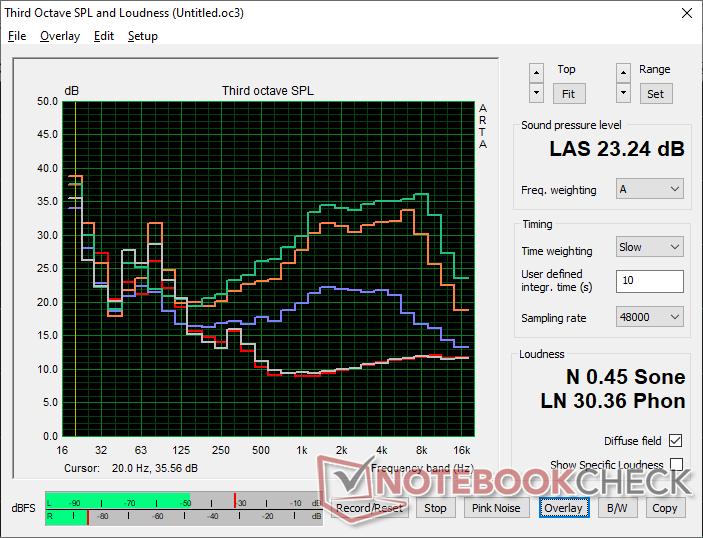
Lautsprecher
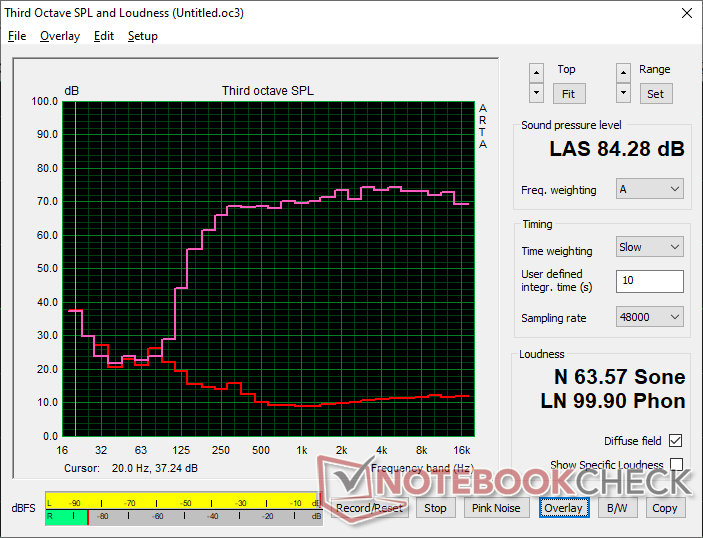
Dell 16 Plus 2-in-1 Audio Analyse
(+) | Die Lautsprecher können relativ laut spielen (82.5 dB)
Bass 100 - 315 Hz
(-) | kaum Bass - 16.2% niedriger als der Median
(±) | durchschnittlich lineare Bass-Wiedergabe (12.1% Delta zum Vorgänger)
Mitteltöne 400 - 2000 Hz
(+) | ausgeglichene Mitten, vom Median nur 0.8% abweichend
(+) | lineare Mitten (1.8% Delta zum Vorgänger)
Hochtöne 2 - 16 kHz
(+) | ausgeglichene Hochtöne, vom Median nur 2.4% abweichend
(+) | sehr lineare Hochtöne (2.9% Delta zum Vorgänger)
Gesamt im hörbaren Bereich 100 - 16.000 Hz
(+) | hörbarer Bereich ist sehr linear (10.5% Abstand zum Median
Im Vergleich zu allen Geräten derselben Klasse
» 7% aller getesteten Geräte dieser Klasse waren besser, 2% vergleichbar, 91% schlechter
» Das beste Gerät hat einen Delta-Wert von 6%, durchschnittlich ist 20%, das schlechteste Gerät hat 57%
Im Vergleich zu allen Geräten im Test
» 5% aller getesteten Geräte waren besser, 1% vergleichbar, 93% schlechter
» Das beste Gerät hat einen Delta-Wert von 4%, durchschnittlich ist 24%, das schlechteste Gerät hat 134%
Apple MacBook Pro 16 2021 M1 Pro Audio Analyse
(+) | Die Lautsprecher können relativ laut spielen (84.7 dB)
Bass 100 - 315 Hz
(+) | guter Bass - nur 3.8% Abweichung vom Median
(+) | lineare Bass-Wiedergabe (5.2% Delta zum Vorgänger)
Mitteltöne 400 - 2000 Hz
(+) | ausgeglichene Mitten, vom Median nur 1.3% abweichend
(+) | lineare Mitten (2.1% Delta zum Vorgänger)
Hochtöne 2 - 16 kHz
(+) | ausgeglichene Hochtöne, vom Median nur 1.9% abweichend
(+) | sehr lineare Hochtöne (2.7% Delta zum Vorgänger)
Gesamt im hörbaren Bereich 100 - 16.000 Hz
(+) | hörbarer Bereich ist sehr linear (4.6% Abstand zum Median
Im Vergleich zu allen Geräten derselben Klasse
» 0% aller getesteten Geräte dieser Klasse waren besser, 0% vergleichbar, 100% schlechter
» Das beste Gerät hat einen Delta-Wert von 5%, durchschnittlich ist 17%, das schlechteste Gerät hat 45%
Im Vergleich zu allen Geräten im Test
» 0% aller getesteten Geräte waren besser, 0% vergleichbar, 100% schlechter
» Das beste Gerät hat einen Delta-Wert von 4%, durchschnittlich ist 24%, das schlechteste Gerät hat 134%
Energieverwaltung
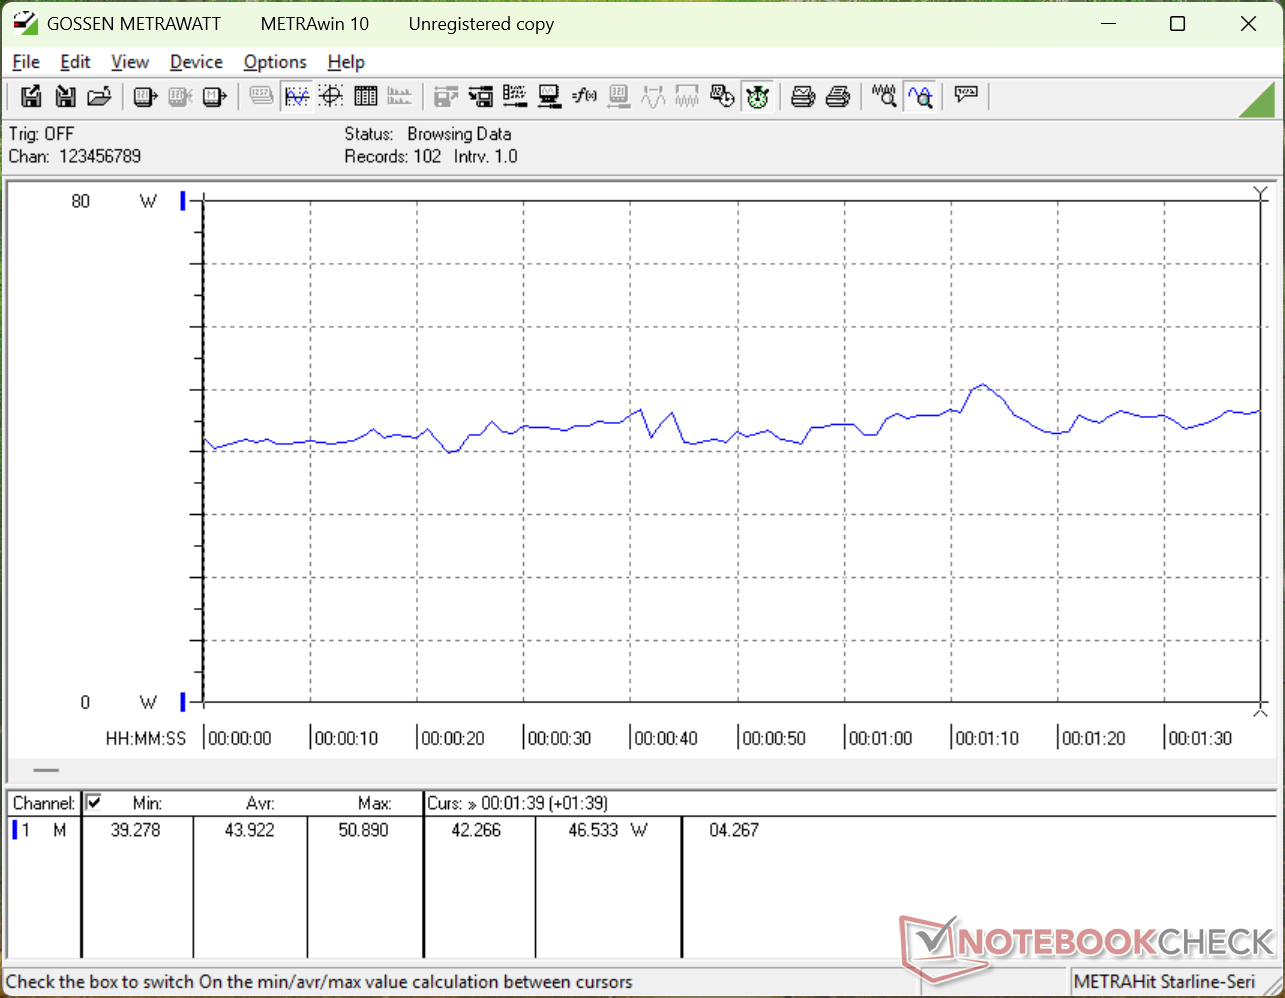
Stromverbrauch
Der Verbrauch im Leerlauf ist ähnlich wie bei unserem letztjährigen Inspiron 16 7640 2-in-1, da mehr als nur ein paar ähnliche Komponenten verwendet werden. Bei anspruchsvolleren Aufgaben benötigt das Dell 16 Plus 2-in-1 jedoch deutlich weniger Strom, da der Core Ultra 7 258V langsamer und effizienter ist als der Core Ultra 7 155H.
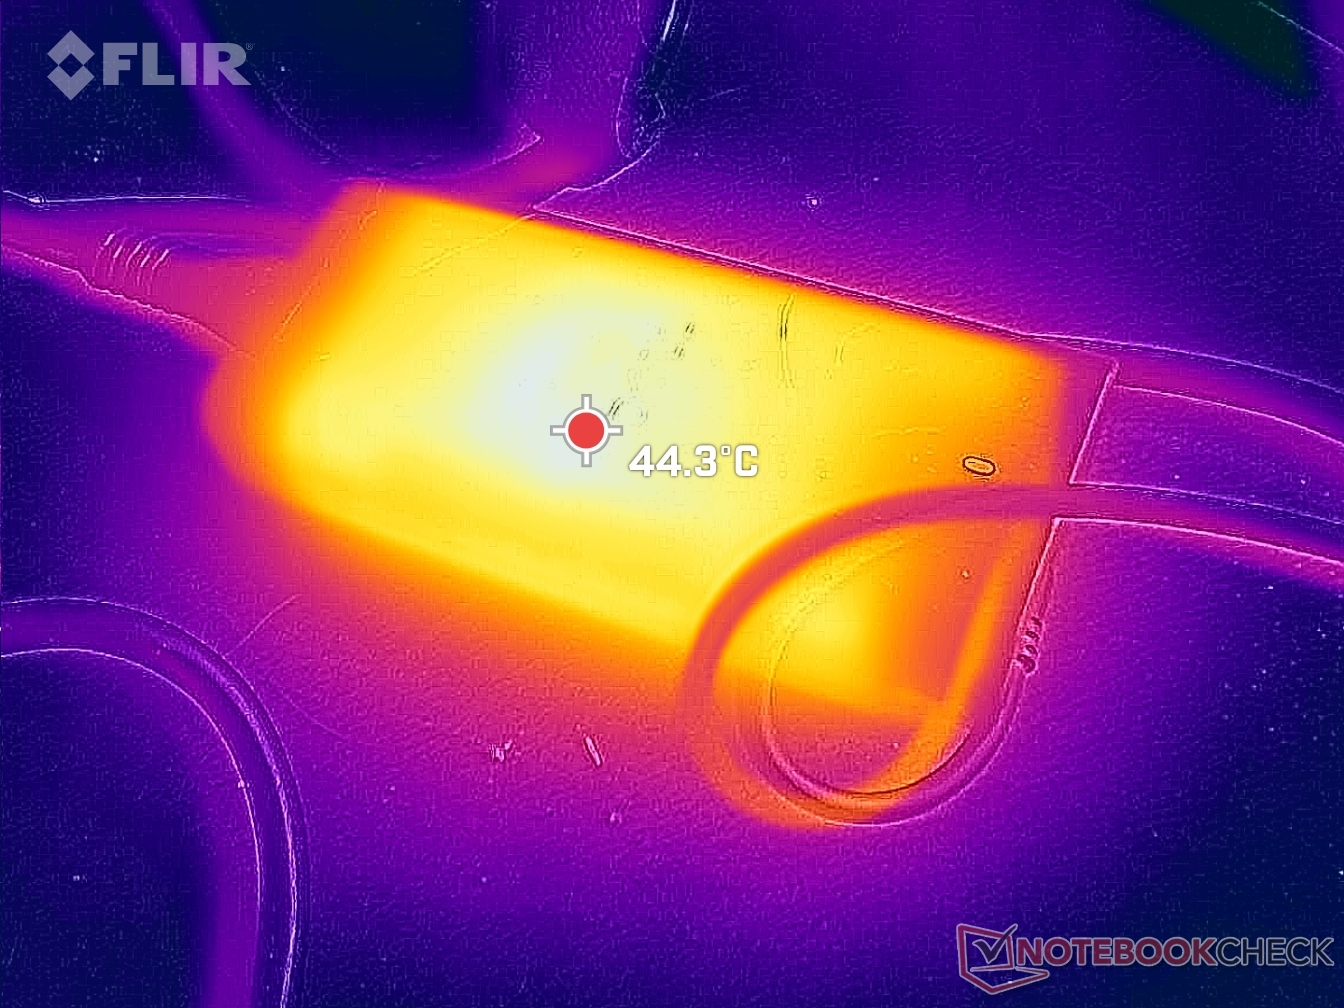
Mit dem kleinen (~11 x 5 x 2,8 cm) 65-W-USB-C-Netzteil konnten wir einen maximalen Verbrauch von 67 W messen.

| Aus / Standby | |
| Idle | |
| Last |
|
Legende:
min: | |
| Dell 16 Plus 2-in-1 Core Ultra 7 258V, Arc 140V, Samsung BM9C1 1024GB, Mini-LED, 2560x1600, 16" | Dell Inspiron 16 7640 2-in-1 Ultra 7 155H, Arc 8-Core, Micron 2550 1TB, Mini-LED, 2560x1600, 16" | Lenovo Yoga 7 2-in-1 16ILL10 Core Ultra 7 256V, Arc 140V, WD PC SN7100S SDFPMSL-512G-1101, IPS, 1920x1200, 16" | Samsung Galaxy Book5 Pro 360 Core Ultra 5 226V, Arc 130V, Samsung PM9B1 512GB MZVL4512HBLU, OLED, 2880x1800, 16" | MSI Summit A16 AI Plus A3HMTG Ryzen AI 9 365, Radeon 880M, Samsung PM9C1 MZVL81T0HELB-00BTW, IPS, 2560x1600, 16" | HP Envy x360 2-in-1 16-ad0097nr R7 8840HS, Radeon 780M, KIOXIA BG5 KBG50ZNV1T02, OLED, 2880x1800, 16" | |
|---|---|---|---|---|---|---|
| Stromverbrauch | -30% | 17% | 19% | -16% | 12% | |
| Idle min * (Watt) | 7 | 6.1 13% | 4.2 40% | 5.3 24% | 5.4 23% | 5 29% |
| Idle avg * (Watt) | 13.2 | 13.5 -2% | 8.3 37% | 6.7 49% | 11 17% | 6.2 53% |
| Idle max * (Watt) | 13.4 | 13.8 -3% | 9.5 29% | 7.3 46% | 11.2 16% | 14.7 -10% |
| Last avg * (Watt) | 43.9 | 63.6 -45% | 40.3 8% | 37.6 14% | 76.6 -74% | 49.9 -14% |
| Cyberpunk 2077 ultra external monitor * (Watt) | 40.7 | 64.6 -59% | 40.8 -0% | 42.8 -5% | 49.2 -21% | |
| Cyberpunk 2077 ultra * (Watt) | 44.9 | 67 -49% | 47.4 -6% | 44.6 1% | 61.1 -36% | |
| Last max * (Watt) | 67.8 | 109.7 -62% | 59 13% | 64.1 5% | 91.8 -35% | 65 4% |
| Witcher 3 ultra * (Watt) | 54.5 |
* ... kleinere Werte sind besser
Energieverbrauch Cyberpunk / Stresstest
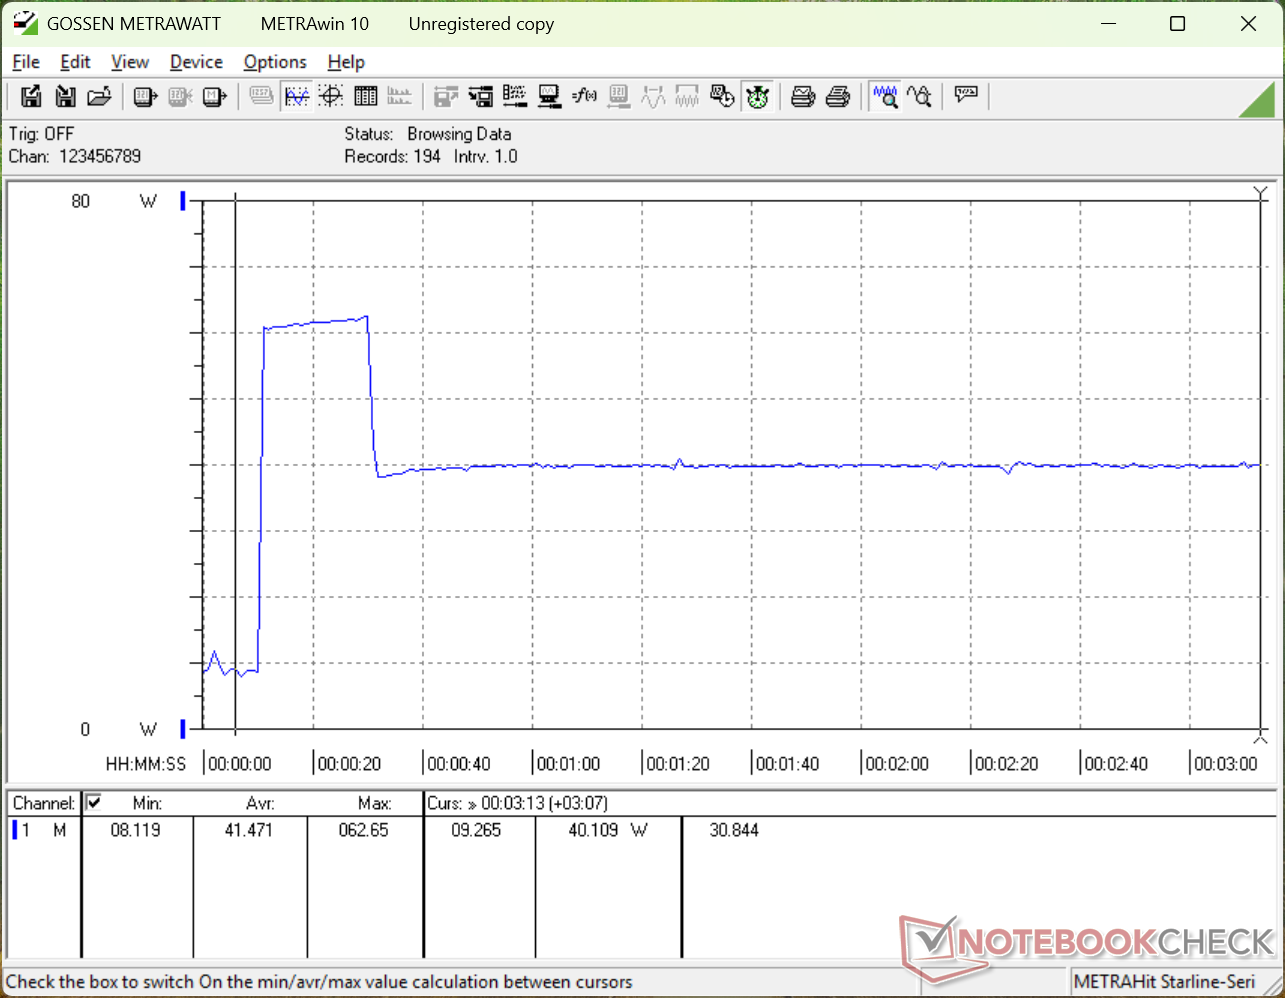
Energieverbrauch externer Monitor
Akkulaufzeit
Die Akkukapazität ist geringer als beim letztjährigen Inspiron 16 7640 2-in-1, was sich negativ auf die WLAN-Laufzeit auswirkt, die aber nur knapp über zwei Stunden beträgt.
| Dell 16 Plus 2-in-1 Core Ultra 7 258V, Arc 140V, 64 Wh | Dell Inspiron 16 7640 2-in-1 Ultra 7 155H, Arc 8-Core, 90 Wh | Lenovo Yoga 7 2-in-1 16ILL10 Core Ultra 7 256V, Arc 140V, 70 Wh | Samsung Galaxy Book5 Pro 360 Core Ultra 5 226V, Arc 130V, 76 Wh | MSI Summit A16 AI Plus A3HMTG Ryzen AI 9 365, Radeon 880M, 82 Wh | HP Envy x360 2-in-1 16-ad0097nr R7 8840HS, Radeon 780M, 68 Wh | |
|---|---|---|---|---|---|---|
| Akkulaufzeit | 28% | 125% | 21% | 2% | -13% | |
| WLAN (h) | 8.9 | 11.4 28% | 20 125% | 10.8 21% | 9.1 2% | 7.7 -13% |
| Idle (h) | 21.8 | 15.6 | ||||
| Last (h) | 1.6 | 2.1 | 1.9 | |||
| H.264 (h) | 19.7 |
Notebookcheck Bewertung
Dell 16 Plus 2-in-1
- 14.06.2025 v8
Allen Ngo
 Total Sustainability Score:
 Potentielle Konkurrenten im Vergleich
Bild | Modell / Test | Preis ab | Gewicht | Dicke | Display |
|---|---|---|---|---|---|
1. 83.5%  | Dell 16 Plus 2-in-1 Intel Core Ultra 7 258V ⎘ Intel Arc Graphics 140V ⎘ 32 GB RAM, 1024 GB SSD | Amazon: 2.891,45 € Geizhals Suche | 2 kg | 16.99 mm | 16.00" 2560x1600 189 PPI Mini-LED |
2. 82.1%  | Dell Inspiron 16 7640 2-in-1 Intel Core Ultra 7 155H ⎘ Intel Arc 8-Core iGPU ⎘ 16 GB RAM, 1024 GB SSD | Amazon: Geizhals Suche | 2.1 kg | 18.99 mm | 16.00" 2560x1600 189 PPI Mini-LED |
3. 84.3%  | Lenovo Yoga 7 2-in-1 16ILL10 Intel Core Ultra 7 256V ⎘ Intel Arc Graphics 140V ⎘ 16 GB RAM, 512 GB SSD | Amazon: Geizhals Suche | 1.9 kg | 15.85 mm | 16.00" 1920x1200 142 PPI IPS |
4. 85.9%  | Samsung Galaxy Book5 Pro 360 Intel Core Ultra 5 226V ⎘ Intel Arc Graphics 130V ⎘ 16 GB RAM, 512 GB SSD | Amazon: 899,00 € Bestpreis 1589€ galaxus.at 2. 1719€ galaxus 3. 1719€ saturn | 1.7 kg | 12.8 mm | 16.00" 2880x1800 212 PPI OLED |
5. 81.9%  | MSI Summit A16 AI Plus A3HMTG AMD Ryzen AI 9 365 ⎘ AMD Radeon 880M ⎘ 32 GB RAM, 1024 GB SSD | Amazon: 1.748,98 € Bestpreis 1699.89€ playox.de 2. 1699.9€ office-partner.de 3. 1714.17€ playox (AT) | 2.1 kg | 16.85 mm | 16.00" 2560x1600 189 PPI IPS |
6. 87.2% v7 (old)  | HP Envy x360 2-in-1 16-ad0097nr AMD Ryzen 7 8840HS ⎘ AMD Radeon 780M ⎘ 16 GB RAM, 1024 GB SSD | Amazon: 1. 759,00 € HP OmniBook X Flip 2-in-1 La... 2. 789,00 € HP OmniBook X Flip 2-in-1 La... 3. 968,15 € HP Spectre x360 2-in-1 Conve... Listenpreis: 1300 USD | 1.8 kg | 18.3 mm | 16.00" 2880x1800 212 PPI OLED |
Transparenz
Die Auswahl der zu testenden Geräte erfolgt innerhalb der Redaktion. Das vorliegende Testmuster wurde dem Autor vom Hersteller oder einem Shop zu Testzwecken leihweise zur Verfügung gestellt. Eine Einflussnahme des Leihstellers auf den Testbericht gab es nicht, der Hersteller erhielt keine Version des Reviews vor der Veröffentlichung. Es bestand keine Verpflichtung zur Publikation. Als eigenständiges, unabhängiges Unternehmen unterliegt Notebookcheck keiner Diktion von Herstellern, Shops und Verlagen.
So testet Notebookcheck
Pro Jahr werden von Notebookcheck hunderte Laptops und Smartphones unabhängig in von uns standardisierten technischen Verfahren getestet, um eine Vergleichbarkeit aller Testergebnisse zu gewährleisten. Seit rund 20 Jahren entwickeln wir diese Testmethoden kontinuierlich weiter und setzen damit Branchenstandards. In unseren Testlaboren kommt ausschließlich hochwertiges Messequipment in die Hände erfahrener Techniker und Redakteure. Die Tests unterliegen einer mehrstufigen Kontrolle. Unsere komplexe Gesamtbewertung basiert auf hunderten fundierten Messergebnissen und Benchmarks, womit Ihnen Objektivität garantiert ist. Weitere Informationen zu unseren Testmethoden gibt es hier.

