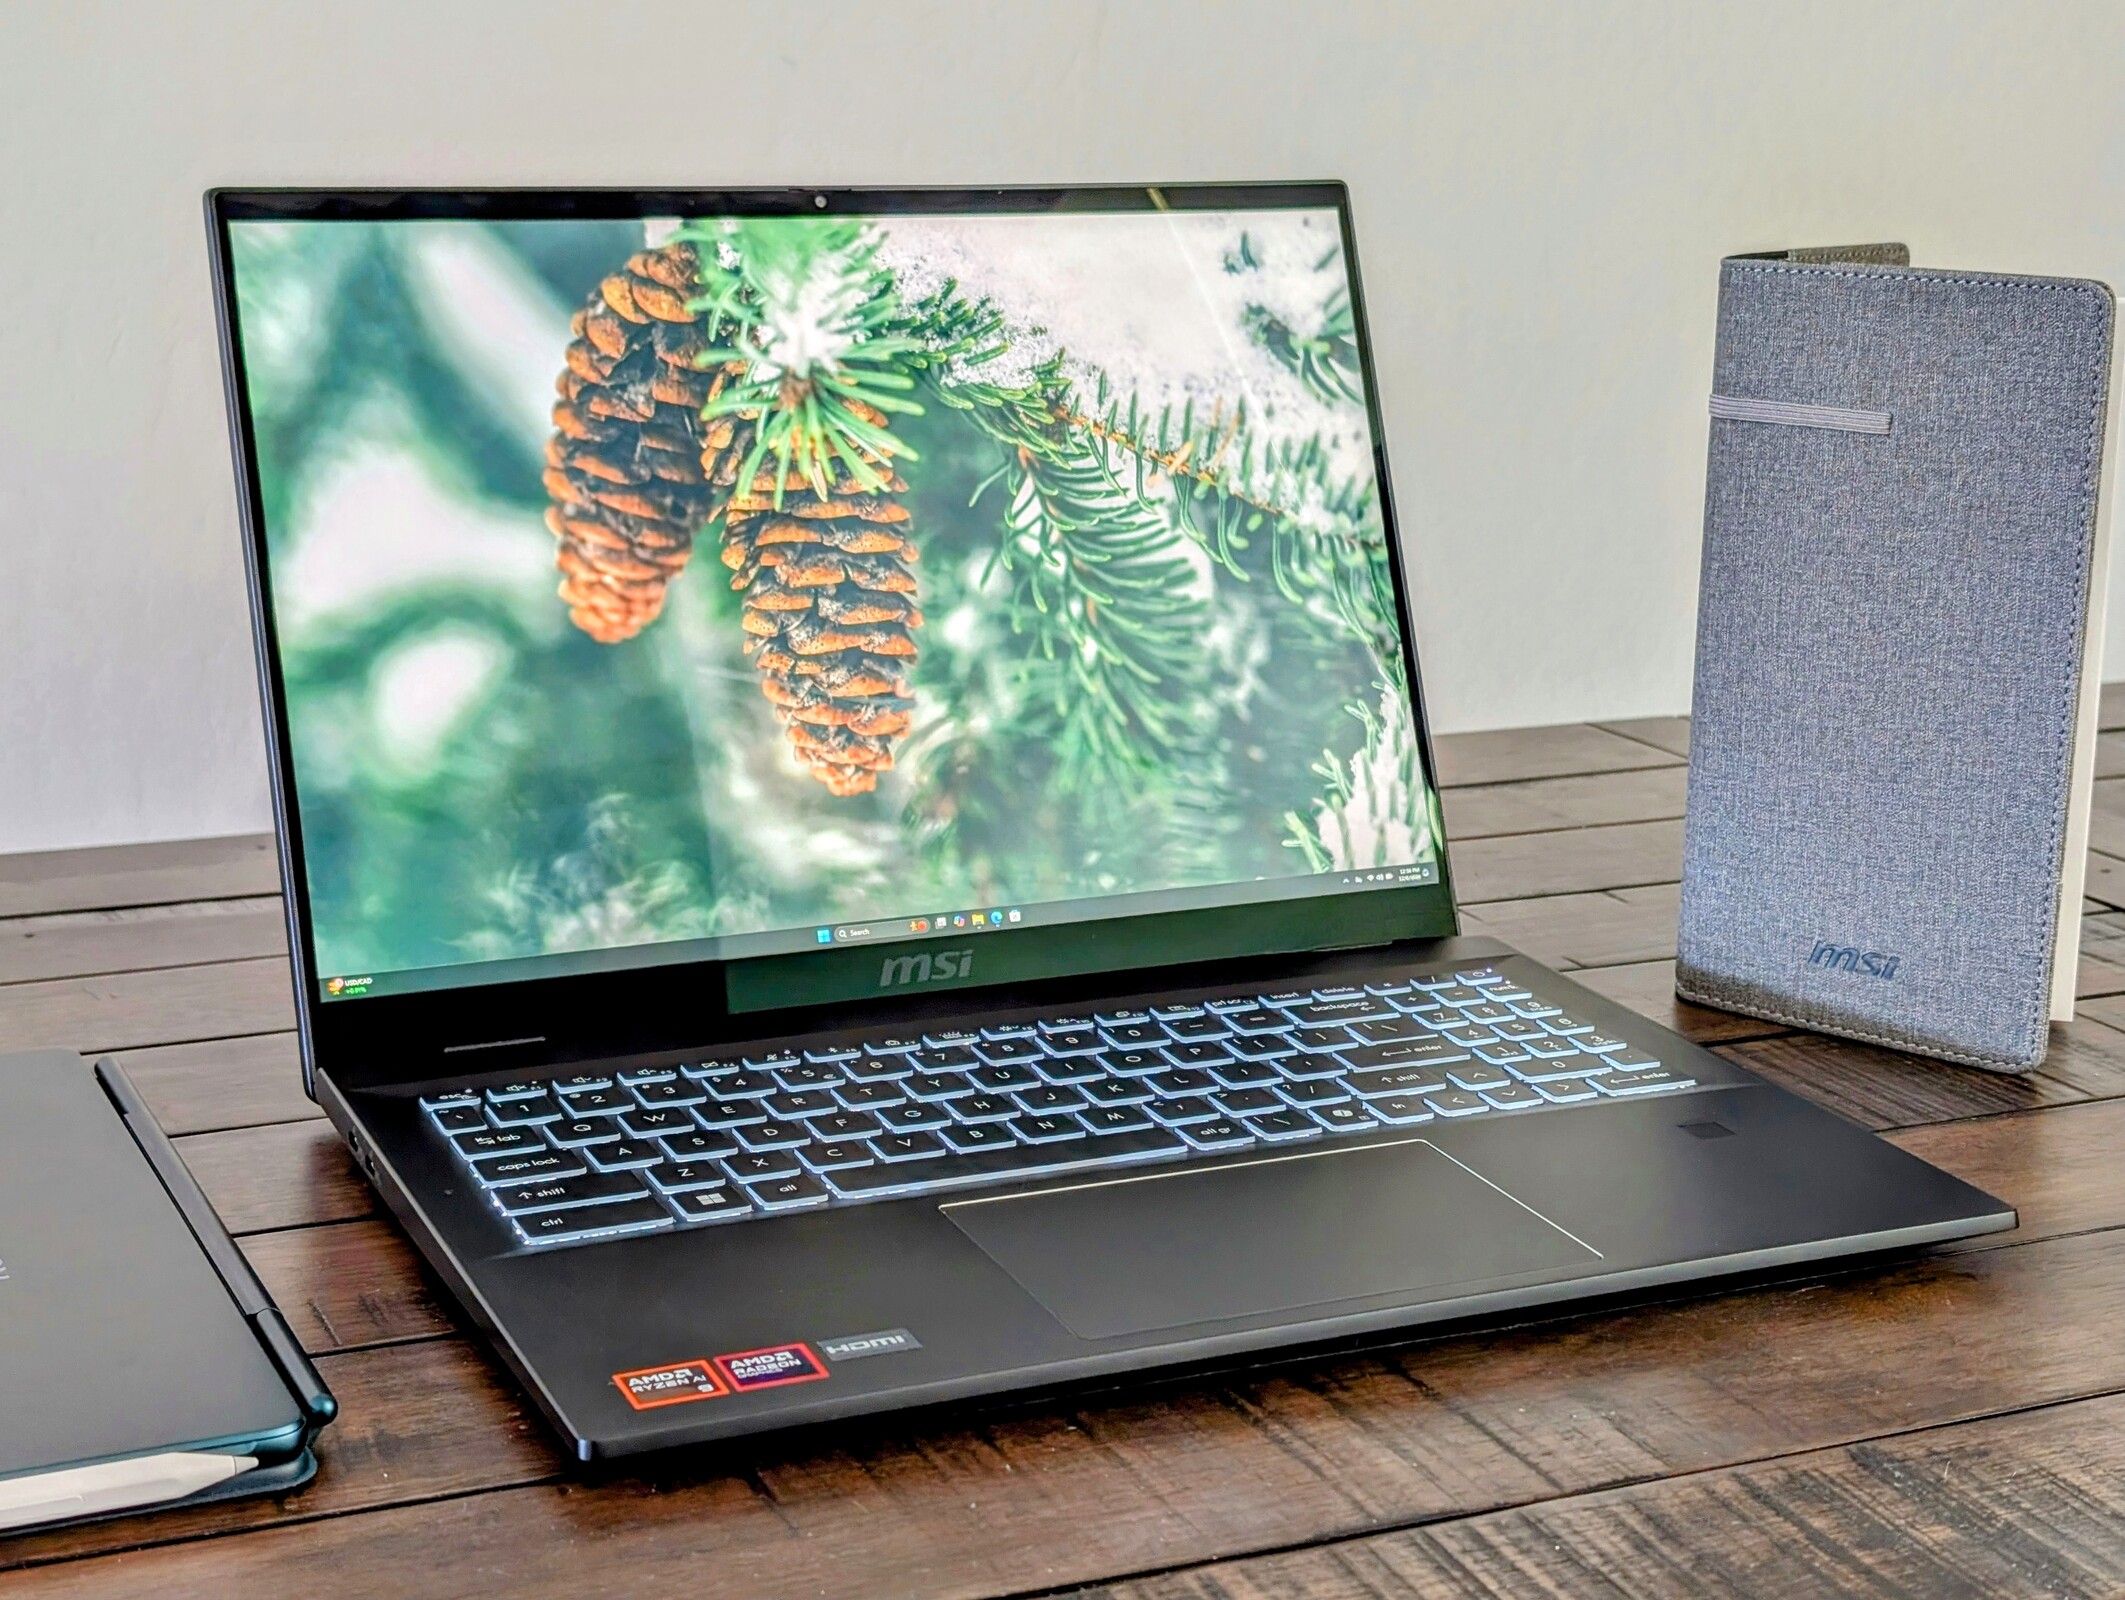
MSI Summit A16 AI Plus im Test: Extrem leistungsstarkes 16-Zoll-Convertible
AMD Ryzen 9 in Höchstform.
Dank der schnellen Zen-5-CPU und der integrierten GPU gehört das MSI Summit A16 AI zu den performantesten in der 16-Zoll-Convertible-Kategorie. Auf Optionen mit eigenständiger GPU wird allerdings verzichtet. Ob und was die Konkurrenz besser macht, erklären wir in diesem Test.Allen Ngo, 👁 Allen Ngo, ✓ Andrea Grüblinger (übersetzt von DeepL / Ninh Duy) Veröffentlicht am 🇺🇸 🇫🇷 ...
Fazit - Extreme CPU-Performance, einige Kompromisse
Die besten Eigenschaften, durch die sich das Summit A16 AI Plus von anderen abhebt, sind die Prozessorleistung und der helle 165 Hz Touchscreen. Die AMD Zen 5-CPU liefert deutlich mehr ab als der Core i7-1280P des Vorgängermodells, während das Display eines der besten 16-Zoll-IPS-Panels auf dem Markt ist.
Allerdings gibt es auch einige Nachteile, die verhindern, dass das MSI zum besten 16-Zoll-Notebook Convertible auf dem Markt wird. Die 2-MP-Webcam, das Fehlen von 3K- oder 4K-OLED-Displayoptionen, die fehlende Option leistungsstarker GPUs oder sekundäre M.2-SSDs könnten Power-User oder -Gamer abschrecken. Das HP Spectre x360 16 bietet im Vergleich eine bessere Grafikleistung und das Samsung Galaxy Book5 Pro 360 16 ist viel leichter und hat einen höher auflösenden OLED-Touchscreen.
Wir hatten bei unserem Testgerät leider auch Probleme im Zusammenhang mit einem nicht funktionierenden Clickpad und manchmal ungewöhnlich langen Boot-Zeiten. Es lohnt sich, dies sofort nach dem Kauf zu überprüfen.
Pro
Contra
Preis und Verfügbarkeit
Die Konfiguration mit 16" QHD+ 165Hz Touch Display, AMD Ryzen AI 9 365, 32GB DDR5 RAM und 1TB SSD ist bei notebooksbilliger.de für 2.000 Euro erhältlich. Auch bei Amazon wird man fündig. Hier kostet das MSI Summit A16 AI derzeit etwa 250 Euro mehr.
Potential Competitors in Comparison
Bild | Modell / Test | Preis ab | Gewicht | Dicke | Display |
|---|---|---|---|---|---|
1. 81.9%  | MSI Summit A16 AI Plus A3HMTG AMD Ryzen AI 9 365 ⎘ AMD Radeon 880M ⎘ 32 GB RAM, 1024 GB SSD | Amazon: 1.886,83 € Bestpreis 1718.99€ playox.de 2. 1733.44€ playox (AT) 3. 1759€ Cyberport Stores Deutschland | 2.1 kg | 16.85 mm | 16.00" 2560x1600 189 PPI IPS |
2. 84.2% v7 (old) 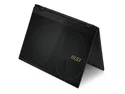 | MSI Summit E16 Flip A12UDT-031 Intel Core i7-1280P ⎘ NVIDIA GeForce RTX 3050 Ti Laptop GPU ⎘ 32 GB RAM, 2048 GB SSD | Amazon: Geizhals Suche | 1.9 kg | 16.85 mm | 16.00" 2560x1600 189 PPI IPS |
3. 91.1% v7 (old) 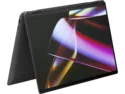 | HP Spectre x360 16 RTX 4050 Intel Core Ultra 7 155H ⎘ NVIDIA GeForce RTX 4050 Laptop GPU ⎘ 16 GB RAM, 1024 GB SSD | Amazon: Geizhals Suche | 2 kg | 19.8 mm | 16.00" 2880x1800 212 PPI OLED |
4. 86.5% v7 (old)  | Asus ExpertBook B5 Flip B5602FBN Intel Core i7-1260P ⎘ Intel Arc A350M ⎘ 16 GB RAM, 1024 GB SSD | Amazon: Geizhals Suche | 1.8 kg | 19.9 mm | 16.00" 3840x2400 283 PPI OLED |
5. 82.8%  | LG gram Pro 2-in-1 16T90SP Intel Core Ultra 7 155H ⎘ Intel Arc 8-Core iGPU ⎘ 16 GB RAM, 1024 GB SSD | Amazon: Geizhals Suche | 1.4 kg | 12.9 mm | 16.00" 2880x1800 212 PPI OLED |
6. 86.7% v7 (old)  | Lenovo Yoga 7 2-in-1 16IML9 Intel Core Ultra 5 125U ⎘ Intel Graphics 4-Core iGPU (Meteor / Arrow Lake) ⎘ 16 GB RAM, 512 GB SSD | Amazon: Geizhals Suche | 2.1 kg | 16.99 mm | 16.00" 1920x1200 142 PPI IPS |
Das 2024 Summit A16 AI Plus ist der Nachfolger des 2022 Summit E16 Flip. Auch wenn die Namen unterschiedlich sind, verwenden sie ansonsten das gleiche 2-in-1-Design. Im Inneren hat das 2024-Modell jedoch die Intel-CPU und die Nvidia-GPU gegen eine AMD Zen 5 Lösung ausgetauscht.
Unser Testgerät ist mit einer Ryzen AI 9 365 CPU, einer integrierten Radeon 880M Grafikkarte und einem 1600p 165 Hz IPS-Touchscreen ausgestattet und kostet in Amerika ca. $1.600. Andere große SKUs waren zum Testzeitpunkt nicht verfügbar.
Zu den Alternativen zum Summit A16 AI Plus gehören andere 16-Zoll-Multimedia-Convertibles wie das Lenovo Yoga 7 2-in-1, das HP Spectre x360 16 oder das LG Gram Pro 2-in-1.
Weitere MSI-Testberichte:
Spezifikationen
Preisvergleich
Gehäuse
Das Gehäuse bleibt identisch mit dem Design von 2022. Trotzdem bleiben Größe und Gewicht konkurrenzfähig gegenüber den aktuellen Alternativen von HP, Lenovo oder Asus.
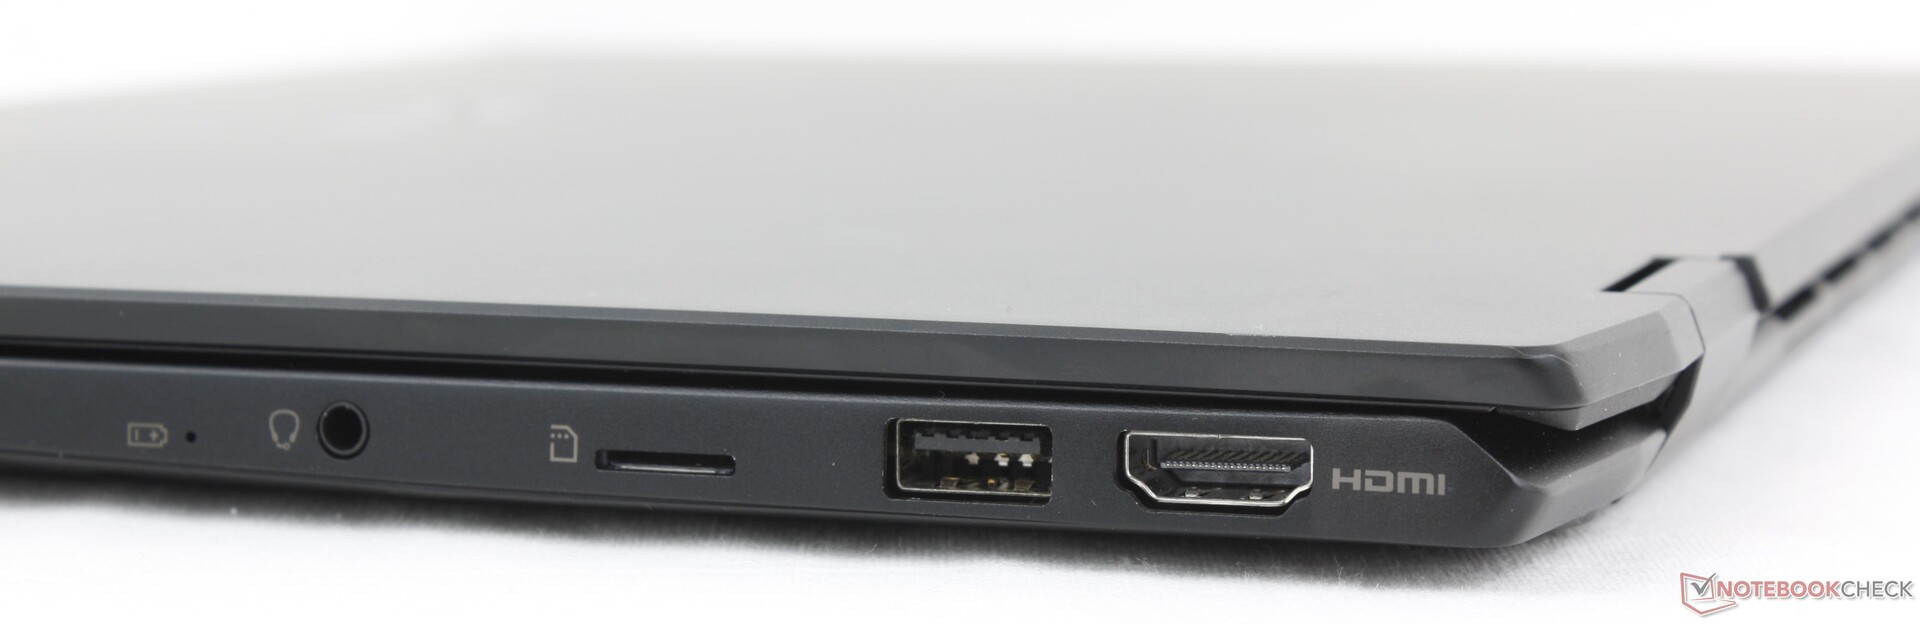
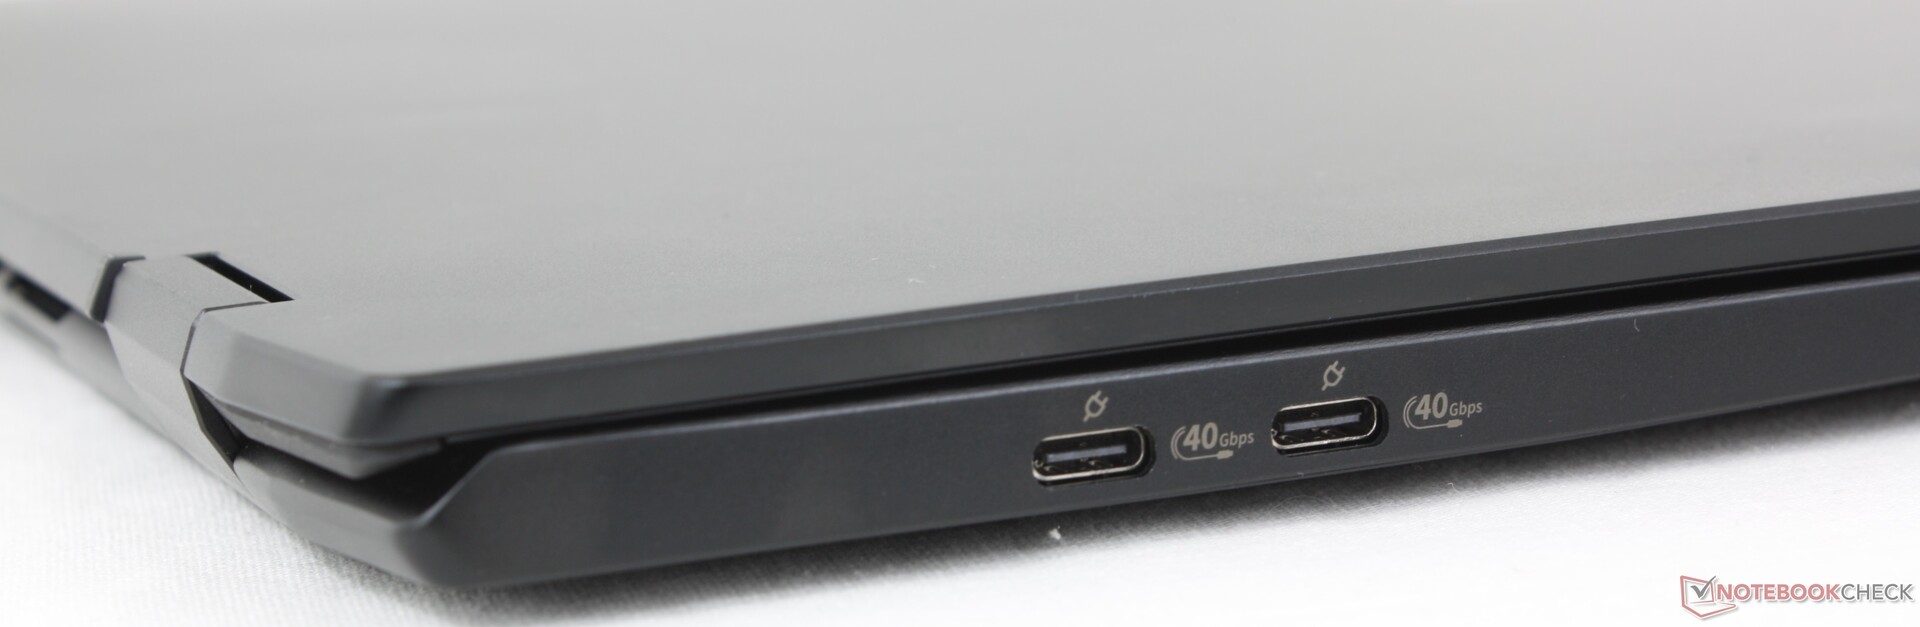
Anschlussausstattung
Die Anschlussmöglichkeiten unterscheiden sich geringfügig von der 2022er-Version. Der HDMI-Anschluss zum Beispiel befindet sich jetzt an der rechten Kante des Systems statt an der linken. Außerdem verfügt das neuere Modell über einen USB-A-Anschluss weniger als das ältere Design.
SD-Kartenleser
| SD Card Reader | |
| average JPG Copy Test (av. of 3 runs) | |
| MSI Summit E16 Flip A12UDT-031 (AV Pro SD microSD 128 GB V60) | |
| MSI Summit A16 AI Plus A3HMTG (AV Pro SD microSD 128 GB V60) | |
| Lenovo Yoga 7 2-in-1 16IML9 (AV Pro SD microSD 128 GB V60) | |
| Asus ExpertBook B5 Flip B5602FBN (AV Pro SD microSD 128 GB V60) | |
| maximum AS SSD Seq Read Test (1GB) | |
| MSI Summit A16 AI Plus A3HMTG (AV Pro SD microSD 128 GB V60) | |
| MSI Summit E16 Flip A12UDT-031 (AV Pro SD microSD 128 GB V60) | |
| Lenovo Yoga 7 2-in-1 16IML9 (AV Pro SD microSD 128 GB V60) | |
| Asus ExpertBook B5 Flip B5602FBN (AV Pro SD microSD 128 GB V60) | |
Kommunikation
Ein Qualcomm FastConnect 7800 kommt standardmäßig für Wi-Fi 7 und Bluetooth 5.4 Unterstützung. Die Performance ist zuverlässig, aber nicht so schnell, wie wir es im Vergleich zum häufigeren Intel AX211 erwartet haben.
Webcam
Die 2-MP-Webcam mit IR und physischem Auslöser bleibt unverändert.


Wartung
Um die Bodenplatte zu entfernen, müssen Sie einen Anti-Manipulations-Aufkleber entfernen. Auch im Inneren ähnelt das Modell dem älteren Summit E16 Flip, allerdings ohne die dedizierte GPU, wie Sie an dem freien Platz links neben den Lüftern erkennen können.


Nachhaltigkeit
MSI wirbt nicht mit irgendwelchen Nachhaltigkeitsmaßnahmen für die Herstellung des Modells. Die Verpackung besteht größtenteils aus Pappe und Papier mit einigen Plastikhüllen für das Zubehör.
Zubehör und Garantie
Die Verkaufsverpackung enthält den MSI Pen 2 Stylus, der Microsoft MPP 2.6 und haptisches Feedback unterstützt.
Es gilt die Standard-Herstellergarantie.
Display
MSI hat keine Änderungen am Touchscreen vorgenommen. Unser 2024-Modell verwendet das gleiche High-End-Panel von AU Optronics B16QAN02.N wie das 2022-Modell. Wozu auch ändern, denn das FreeSync-Panel unterstützt schnelle Reaktionszeiten, tiefe P3-Farben und eine hohe Bildwiederholfrequenz. Trotzdem wären Windows HDR und variable Bildwiederholfrequenz (VRR) eine schöne Ergänzung gewesen.
Beachten Sie, dass die maximale Helligkeit im Akkubetrieb von 475 nits auf 363 nits sinkt, es sei denn, AMD Vari-Bright ist deaktiviert.


| |||||||||||||||||||||||||
Ausleuchtung: 89 %
Helligkeit Akku: 475.4 cd/m²
Kontrast: 1321:1 (Schwarzwert: 0.36 cd/m²)
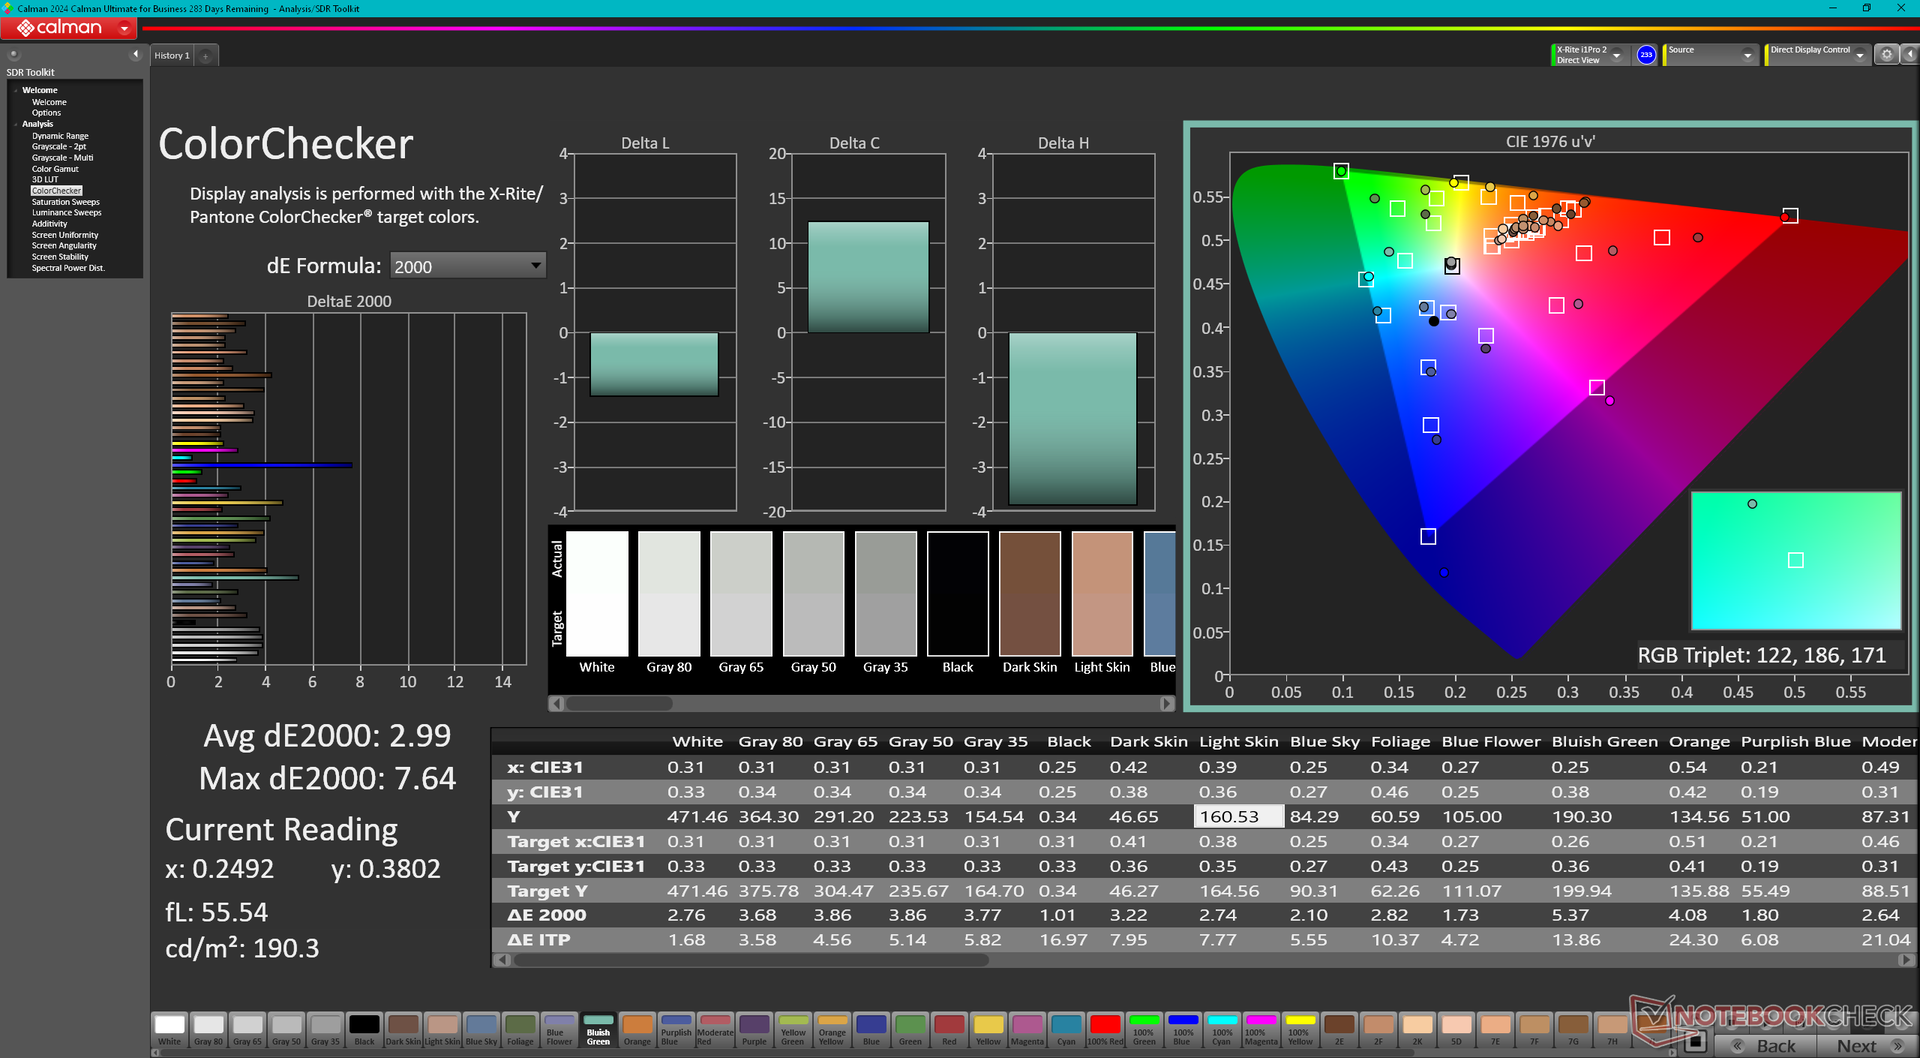
ΔE ColorChecker Calman: 2.99 | ∀{0.5-29.43 Ø4.73}
calibrated: 0.74
ΔE Greyscale Calman: 2.9 | ∀{0.09-98 Ø4.97}
84.7% AdobeRGB 1998 (Argyll 3D)
99.8% sRGB (Argyll 3D)
96.8% Display P3 (Argyll 3D)
Gamma: 2.31
CCT: 6472 K
| MSI Summit A16 AI Plus A3HMTG AU Optronics B16QAN02.N, IPS, 2560x1600, 16", 165 Hz | MSI Summit E16 Flip A12UDT-031 AU Optronics B16QAN02.N, IPS, 2560x1600, 16", 165 Hz | HP Spectre x360 16 RTX 4050 Samsung SDC41A6, OLED, 2880x1800, 16", 120 Hz | Asus ExpertBook B5 Flip B5602FBN Samsung ATNA60YV02-0, OLED, 3840x2400, 16", 60 Hz | LG gram Pro 2-in-1 16T90SP ATNA60CL06-0, OLED, 2880x1800, 16", 120 Hz | Lenovo Yoga 7 2-in-1 16IML9 LEN160FHD, IPS, 1920x1200, 16", 60 Hz | |
|---|---|---|---|---|---|---|
| Display | 1% | 6% | -4% | 4% | -49% | |
| Display P3 Coverage (%) | 96.8 | 98.9 2% | 99.6 3% | 71.7 -26% | 99.9 3% | 40.9 -58% |
| sRGB Coverage (%) | 99.8 | 100 0% | 100 0% | 100 0% | 100 0% | 61.4 -38% |
| AdobeRGB 1998 Coverage (%) | 84.7 | 86.5 2% | 96.7 14% | 97.1 15% | 92.7 9% | 42.3 -50% |
| Response Times | -1% | 92% | 81% | 18% | -147% | |
| Response Time Grey 50% / Grey 80% * (ms) | 12.9 ? | 13 ? -1% | 0.78 ? 94% | 2 ? 84% | 14 ? -9% | 32.1 ? -149% |
| Response Time Black / White * (ms) | 8.9 ? | 9 ? -1% | 0.86 ? 90% | 2 ? 78% | 5 ? 44% | 21.8 ? -145% |
| PWM Frequency (Hz) | 480 ? | 240 ? | 481 | |||
| PWM Amplitude * (%) | 33 | |||||
| Bildschirm | -10% | 13% | 297% | 206% | -51% | |
| Helligkeit Bildmitte (cd/m²) | 475.4 | 314 -34% | 385.2 -19% | 379 -20% | 402 -15% | 313.3 -34% |
| Brightness (cd/m²) | 440 | 294 -33% | 387 -12% | 382 -13% | 403 -8% | 294 -33% |
| Brightness Distribution (%) | 89 | 89 0% | 99 11% | 98 10% | 99 11% | 82 -8% |
| Schwarzwert * (cd/m²) | 0.36 | 0.28 22% | 0.01 97% | 0.017 95% | 0.35 3% | |
| Kontrast (:1) | 1321 | 1121 -15% | 37900 2769% | 23647 1690% | 895 -32% | |
| Delta E Colorchecker * | 2.99 | 3.08 -3% | 1.73 42% | 2.79 7% | 1.67 44% | 4.41 -47% |
| Colorchecker dE 2000 max. * | 7.64 | 5.49 28% | 3.95 48% | 5.29 31% | 2.87 62% | 15.75 -106% |
| Colorchecker dE 2000 calibrated * | 0.74 | 0.88 -19% | 2.5 -238% | 1.32 -78% | 1.84 -149% | |
| Delta E Graustufen * | 2.9 | 3.99 -38% | 2.6 10% | 1.92 34% | 1.27 56% | 4.4 -52% |
| Gamma | 2.31 95% | 2.3 96% | 2.17 101% | 2.38 92% | 2.25 98% | 2.3 96% |
| CCT | 6472 100% | 6219 105% | 6133 106% | 6270 104% | 6724 97% | 7395 88% |
| Durchschnitt gesamt (Programm / Settings) | -3% /
-6% | 37% /
26% | 125% /
202% | 76% /
136% | -82% /
-64% |
* ... kleinere Werte sind besser

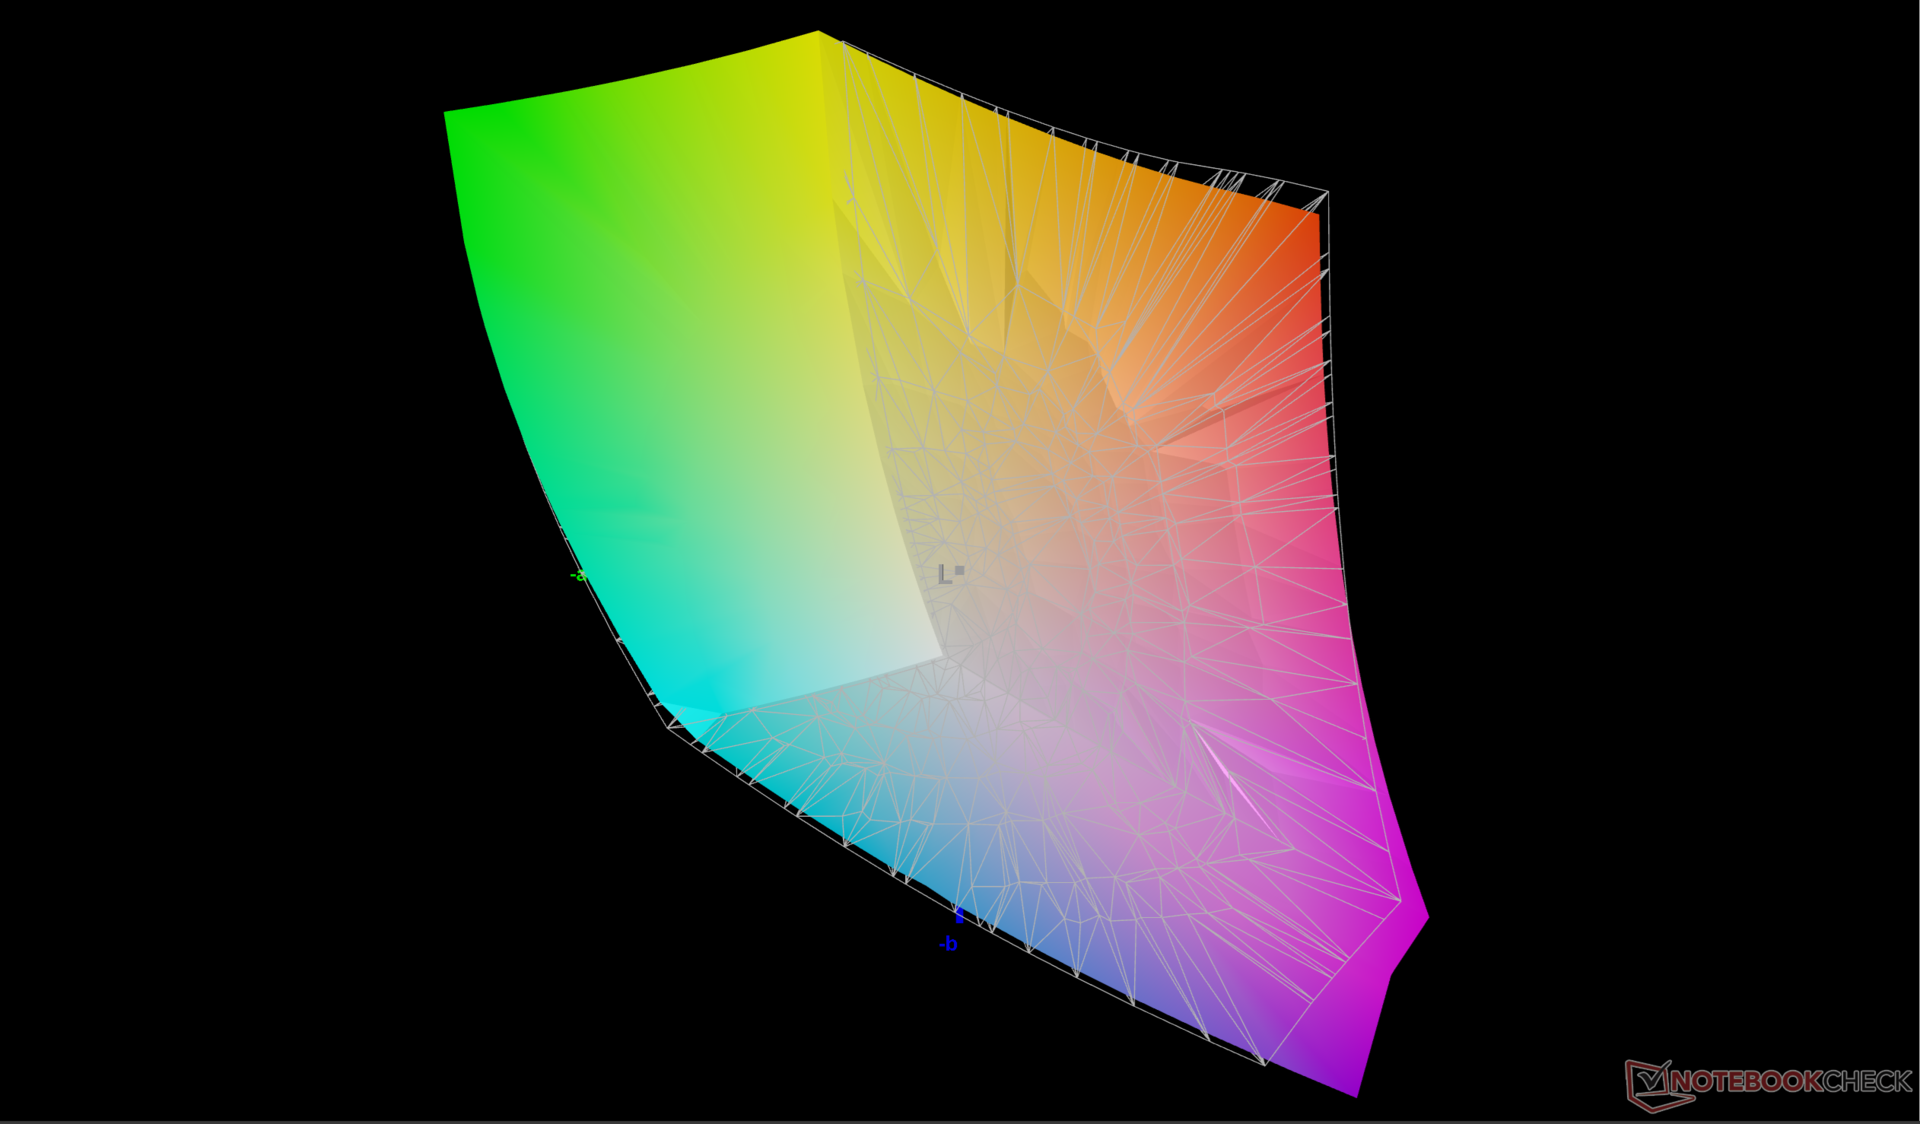
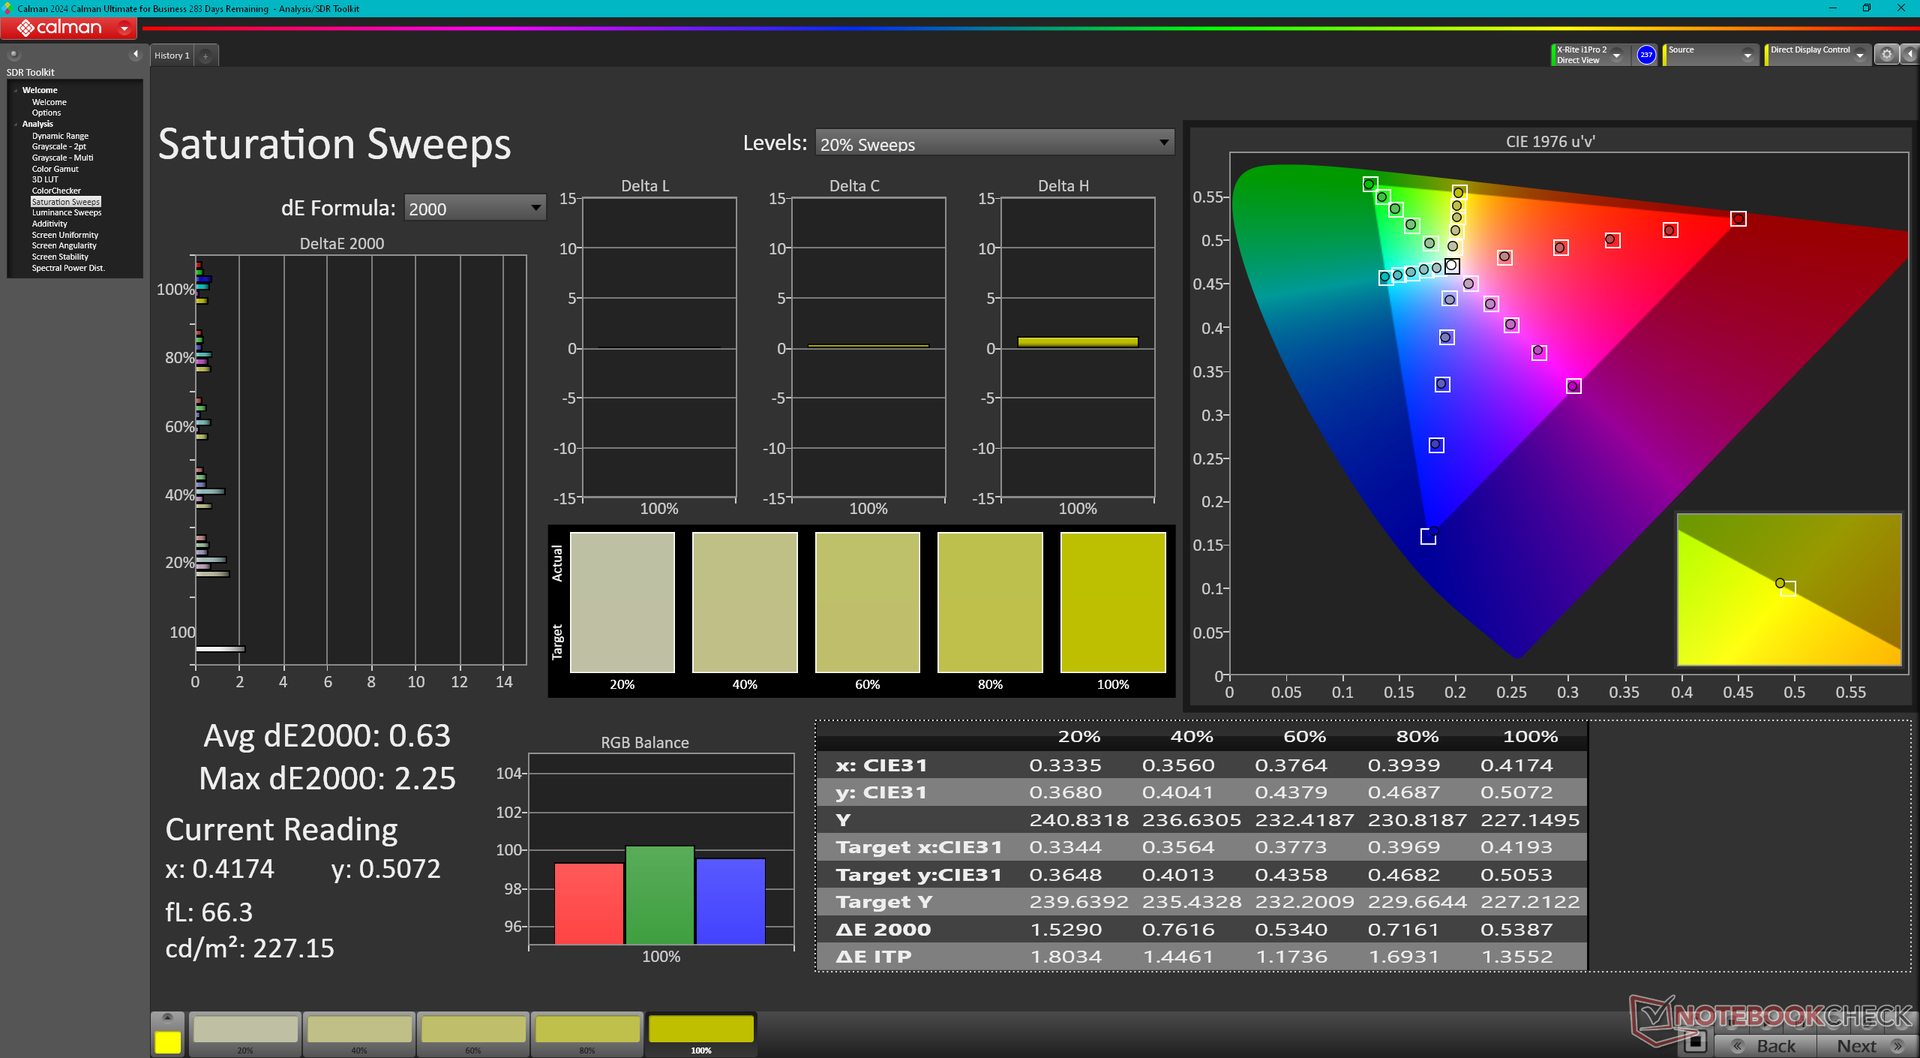
Das Panel ist mit niedrigen durchschnittlichen DeltaE-Werten kalibriert.


Reaktionszeiten (Response Times) des Displays
| ↔ Reaktionszeiten Schwarz zu Weiß | ||
|---|---|---|
| 8.9 ms ... steigend ↗ und fallend ↘ kombiniert | ↗ 4.7 ms steigend |  |
| ↘ 4.2 ms fallend | ||
| Die gemessenen Reaktionszeiten sind kurz wodurch sich der Bildschirm auch für Spiele gut eignen sollte. Im Vergleich rangierten die bei uns getesteten Geräte von 0.1 (Minimum) zu 240 (Maximum) ms. » 25 % aller Screens waren schneller als der getestete. Daher sind die gemessenen Reaktionszeiten besser als der Durchschnitt aller vermessenen Geräte (19.9 ms). | ||
| ↔ Reaktionszeiten 50% Grau zu 80% Grau | ||
| 12.9 ms ... steigend ↗ und fallend ↘ kombiniert | ↗ 6.2 ms steigend |  |
| ↘ 6.7 ms fallend | ||
| Die gemessenen Reaktionszeiten sind gut, für anspruchsvolle Spieler könnten der Bildschirm jedoch zu langsam sein. Im Vergleich rangierten die bei uns getesteten Geräte von 0.165 (Minimum) zu 636 (Maximum) ms. » 26 % aller Screens waren schneller als der getestete. Daher sind die gemessenen Reaktionszeiten besser als der Durchschnitt aller vermessenen Geräte (31.1 ms). | ||
Bildschirm-Flackern / PWM (Pulse-Width Modulation)
| Flackern / PWM nicht festgestellt |  | ||
Im Vergleich: 52 % aller getesteten Geräte nutzten kein PWM um die Helligkeit zu reduzieren. Wenn PWM eingesetzt wurde, dann bei einer Frequenz von durchschnittlich 7794 (Minimum 5, Maximum 343500) Hz. | |||


Performance


Testbedingungen
Wir haben Windows und das MSI Center auf den Modus "Performance" eingestellt, bevor wir die folgenden Benchmarks durchgeführt haben. Ein separater maximaler Lüftermodus namens "Cooler Boost Modus" ist ebenfalls verfügbar.
Prozessor
Die Prozessorleistung des Ryzen AI 9 365 ist eine der schnellsten aller 16-Zoll-Notebooks, die nicht zum Spielen geeignet sind. Im Vergleich zum 2022 Summit E16 Flip und seinem Core i7-1280P ist unsere AMD-CPU etwa 20 bis 25 Prozent schneller. Wenn CineBench R15 xT in einer Schleife läuft, ist die Leistung auch besser als erwartet für ein Convertible, da es zu keinen größeren Einbrüchen kommt.
Cinebench R15 Multi Loop
Cinebench R23: Multi Core | Single Core
Cinebench R20: CPU (Multi Core) | CPU (Single Core)
Cinebench R15: CPU Multi 64Bit | CPU Single 64Bit
Blender: v2.79 BMW27 CPU
7-Zip 18.03: 7z b 4 | 7z b 4 -mmt1
Geekbench 6.7: Multi-Core | Single-Core
Geekbench 5.5: Multi-Core | Single-Core
HWBOT x265 Benchmark v2.2: 4k Preset
LibreOffice : 20 Documents To PDF
R Benchmark 2.5: Overall mean
* ... kleinere Werte sind besser
AIDA64: FP32 Ray-Trace | FPU Julia | CPU SHA3 | CPU Queen | FPU SinJulia | FPU Mandel | CPU AES | CPU ZLib | FP64 Ray-Trace | CPU PhotoWorxx
| Performance Rating | |
| MSI Summit A16 AI Plus A3HMTG | |
| Durchschnittliche AMD Ryzen AI 9 365 | |
| HP Spectre x360 16 RTX 4050 | |
| MSI Summit E16 Flip A12UDT-031 | |
| LG gram Pro 2-in-1 16T90SP | |
| Asus ExpertBook B5 Flip B5602FBN | |
| Lenovo Yoga 7 2-in-1 16IML9 | |
| AIDA64 / FP32 Ray-Trace | |
| MSI Summit A16 AI Plus A3HMTG | |
| Durchschnittliche AMD Ryzen AI 9 365 (17096 - 32742, n=7) | |
| HP Spectre x360 16 RTX 4050 | |
| MSI Summit E16 Flip A12UDT-031 | |
| LG gram Pro 2-in-1 16T90SP | |
| Asus ExpertBook B5 Flip B5602FBN | |
| Lenovo Yoga 7 2-in-1 16IML9 | |
| AIDA64 / FPU Julia | |
| MSI Summit A16 AI Plus A3HMTG | |
| Durchschnittliche AMD Ryzen AI 9 365 (61976 - 126955, n=7) | |
| HP Spectre x360 16 RTX 4050 | |
| MSI Summit E16 Flip A12UDT-031 | |
| LG gram Pro 2-in-1 16T90SP | |
| Asus ExpertBook B5 Flip B5602FBN | |
| Lenovo Yoga 7 2-in-1 16IML9 | |
| AIDA64 / CPU SHA3 | |
| MSI Summit A16 AI Plus A3HMTG | |
| Durchschnittliche AMD Ryzen AI 9 365 (2951 - 5178, n=7) | |
| HP Spectre x360 16 RTX 4050 | |
| MSI Summit E16 Flip A12UDT-031 | |
| LG gram Pro 2-in-1 16T90SP | |
| Asus ExpertBook B5 Flip B5602FBN | |
| Lenovo Yoga 7 2-in-1 16IML9 | |
| AIDA64 / CPU Queen | |
| MSI Summit E16 Flip A12UDT-031 | |
| MSI Summit A16 AI Plus A3HMTG | |
| Durchschnittliche AMD Ryzen AI 9 365 (85333 - 93045, n=7) | |
| HP Spectre x360 16 RTX 4050 | |
| Asus ExpertBook B5 Flip B5602FBN | |
| LG gram Pro 2-in-1 16T90SP | |
| Lenovo Yoga 7 2-in-1 16IML9 | |
| AIDA64 / FPU SinJulia | |
| MSI Summit A16 AI Plus A3HMTG | |
| Durchschnittliche AMD Ryzen AI 9 365 (11586 - 16342, n=7) | |
| HP Spectre x360 16 RTX 4050 | |
| MSI Summit E16 Flip A12UDT-031 | |
| LG gram Pro 2-in-1 16T90SP | |
| Asus ExpertBook B5 Flip B5602FBN | |
| Lenovo Yoga 7 2-in-1 16IML9 | |
| AIDA64 / FPU Mandel | |
| MSI Summit A16 AI Plus A3HMTG | |
| Durchschnittliche AMD Ryzen AI 9 365 (33409 - 67374, n=7) | |
| HP Spectre x360 16 RTX 4050 | |
| MSI Summit E16 Flip A12UDT-031 | |
| LG gram Pro 2-in-1 16T90SP | |
| Asus ExpertBook B5 Flip B5602FBN | |
| Lenovo Yoga 7 2-in-1 16IML9 | |
| AIDA64 / CPU AES | |
| MSI Summit A16 AI Plus A3HMTG | |
| Durchschnittliche AMD Ryzen AI 9 365 (47468 - 99502, n=7) | |
| HP Spectre x360 16 RTX 4050 | |
| MSI Summit E16 Flip A12UDT-031 | |
| LG gram Pro 2-in-1 16T90SP | |
| Asus ExpertBook B5 Flip B5602FBN | |
| Lenovo Yoga 7 2-in-1 16IML9 | |
| AIDA64 / CPU ZLib | |
| MSI Summit A16 AI Plus A3HMTG | |
| Durchschnittliche AMD Ryzen AI 9 365 (706 - 1343, n=7) | |
| HP Spectre x360 16 RTX 4050 | |
| MSI Summit E16 Flip A12UDT-031 | |
| LG gram Pro 2-in-1 16T90SP | |
| Asus ExpertBook B5 Flip B5602FBN | |
| Lenovo Yoga 7 2-in-1 16IML9 | |
| AIDA64 / FP64 Ray-Trace | |
| MSI Summit A16 AI Plus A3HMTG | |
| Durchschnittliche AMD Ryzen AI 9 365 (9061 - 17848, n=7) | |
| HP Spectre x360 16 RTX 4050 | |
| MSI Summit E16 Flip A12UDT-031 | |
| LG gram Pro 2-in-1 16T90SP | |
| Asus ExpertBook B5 Flip B5602FBN | |
| Lenovo Yoga 7 2-in-1 16IML9 | |
| AIDA64 / CPU PhotoWorxx | |
| Durchschnittliche AMD Ryzen AI 9 365 (47654 - 53550, n=7) | |
| MSI Summit A16 AI Plus A3HMTG | |
| LG gram Pro 2-in-1 16T90SP | |
| HP Spectre x360 16 RTX 4050 | |
| Lenovo Yoga 7 2-in-1 16IML9 | |
| MSI Summit E16 Flip A12UDT-031 | |
| Asus ExpertBook B5 Flip B5602FBN | |
Stresstest

Beim Starten von Prime95-Stress wird die CPU nur in den ersten Sekunden auf 3,8 GHz und 71 W hochgefahren, bevor sie auf 3,2 GHz und 50 W sinkt. Die Kerntemperatur stabilisiert sich bei 82 °C, wenn der Cooler Boost ausgeschaltet ist, bzw. bei 74 °C, wenn der Cooler Boost eingeschaltet ist. Der Hauptzweck dieser Funktion besteht darin, die Kerntemperatur zu senken und nicht direkt die Leistung zu erhöhen.
Beim Spielen stabilisiert sich die Kerntemperatur bei 75 °C, verglichen mit 72 °C beim HP Spectre x360 16 mit der schnelleren RTX 4050 Grafik.

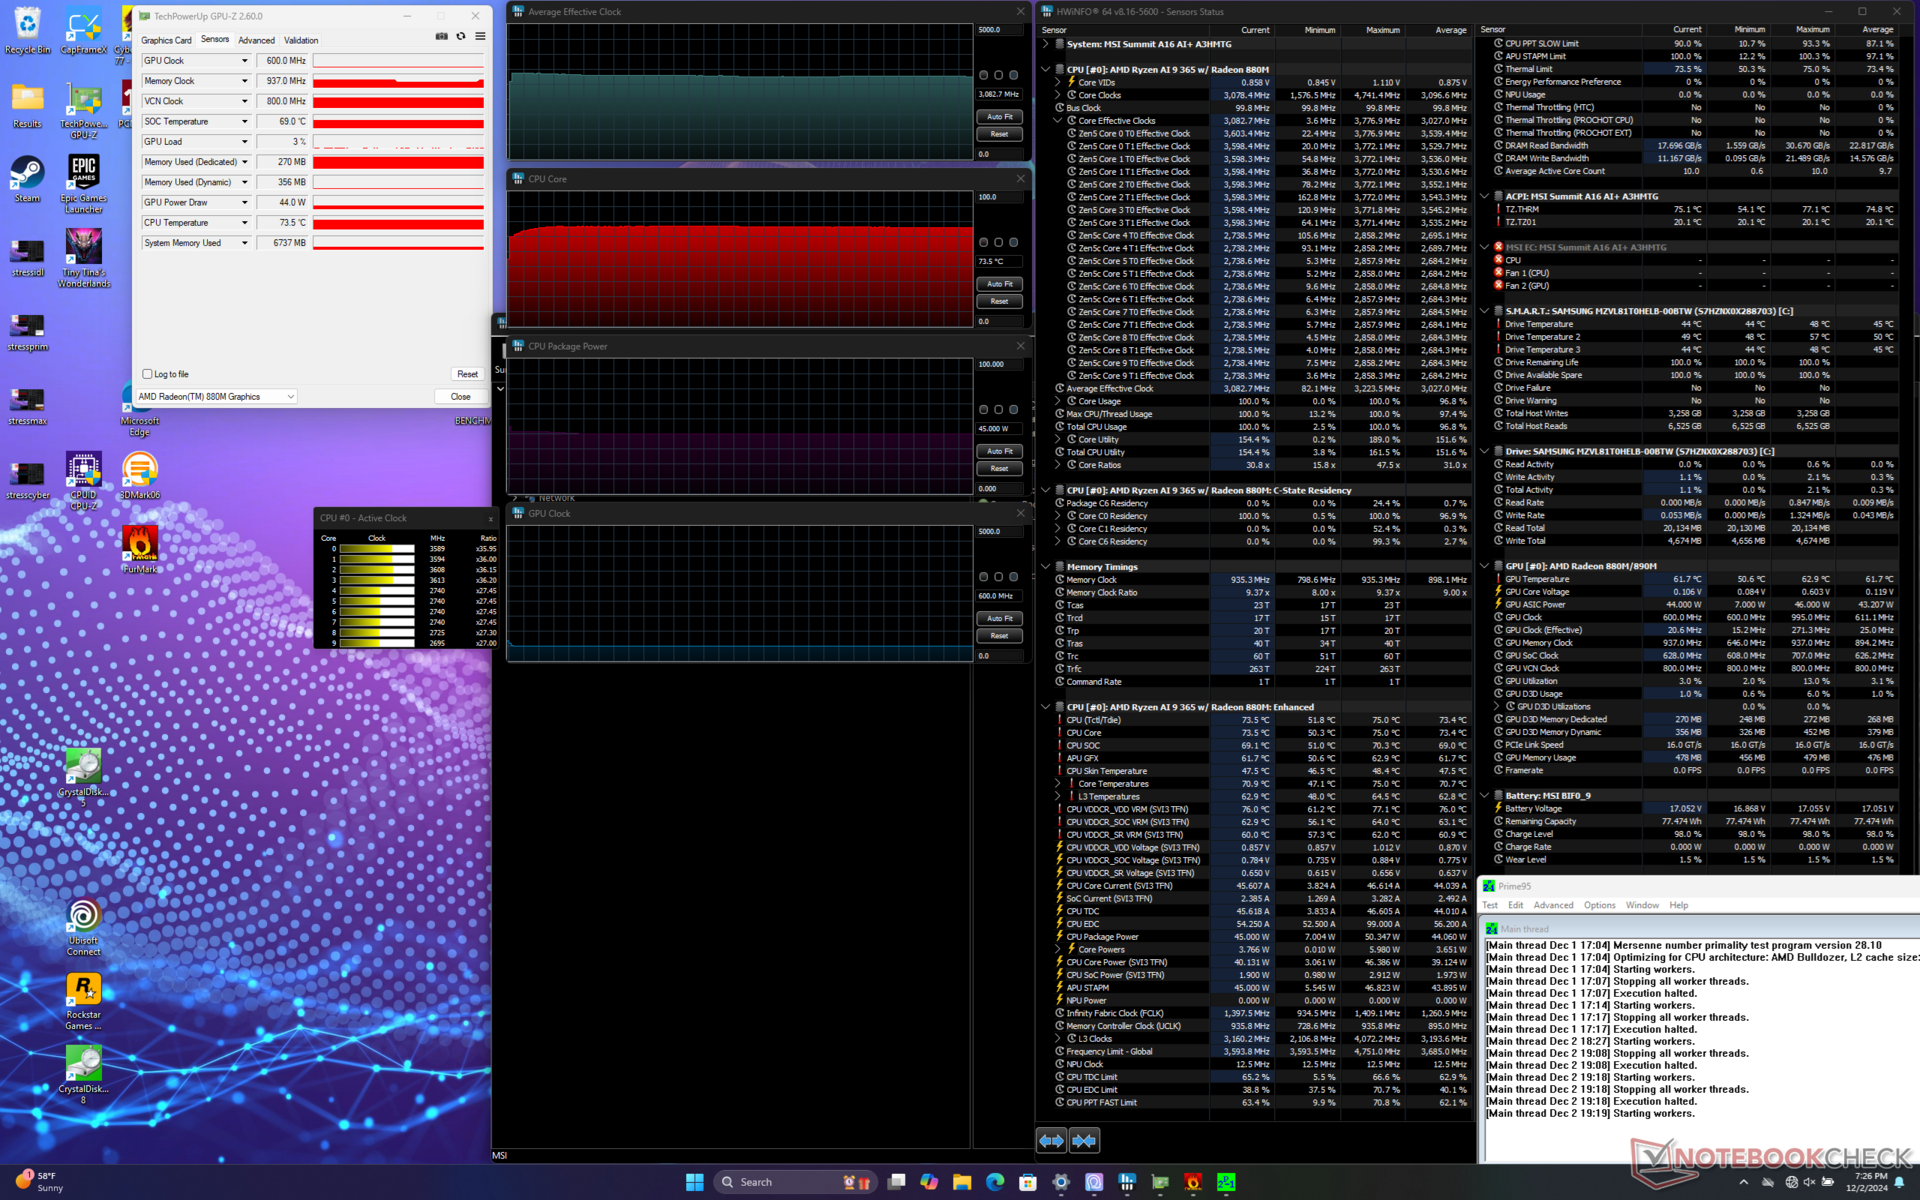
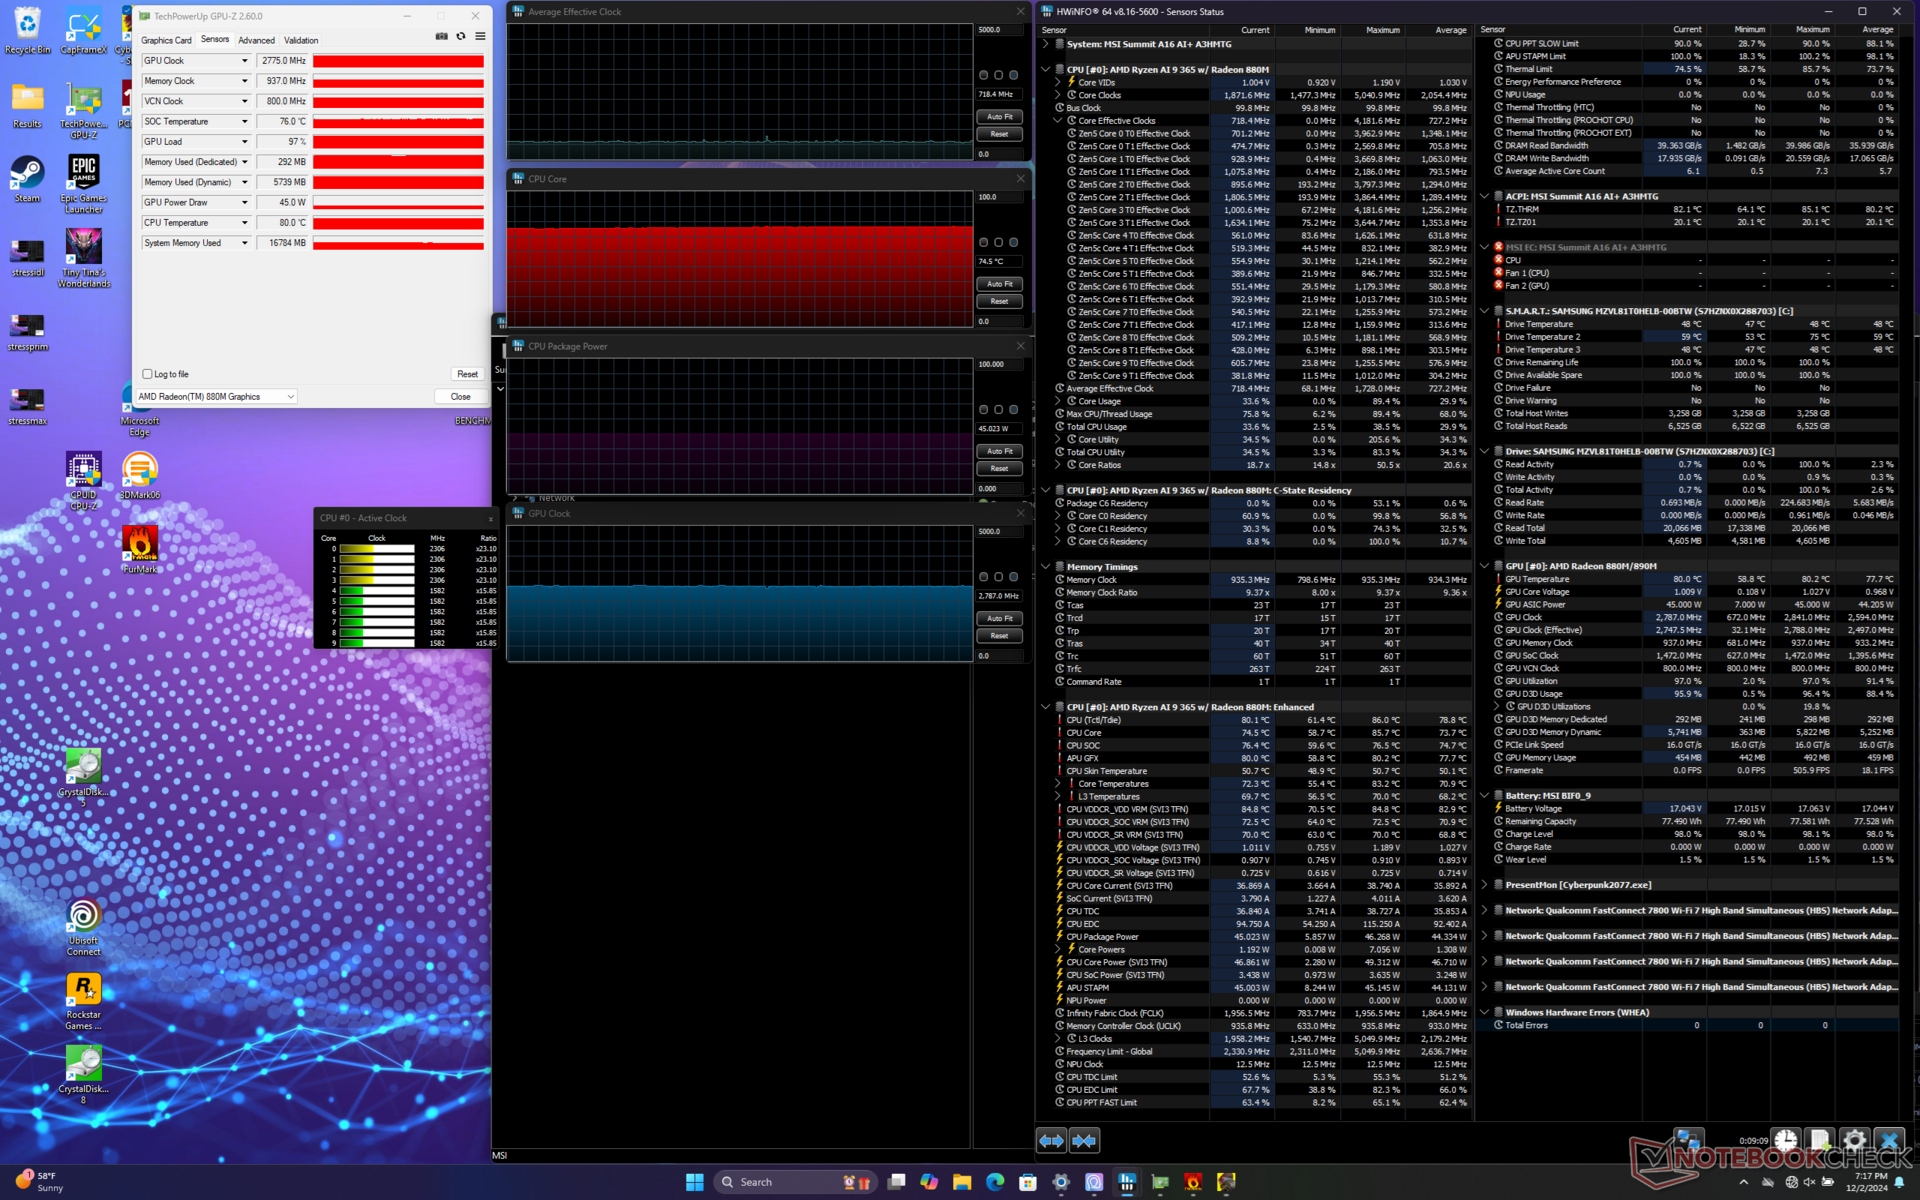

| Durchschnittlicher CPU-Takt (GHz) | GPU-Takt (MHz) | Durchschnittliche CPU-Temperatur (°C) | |
| System Leerlauf | -- | -- | 32 |
| Prime95 Stress (Cooler Boost aus) | 3.2 | -- | 82 |
| Prime95 Stress (Cooler Boost an) | 3.1 | -- | 74 |
| Prime95 + FurMark Stress | 3.2 | 1412 | 81 |
| Cyberpunk 2077 Stress | 0.7 | 2787 | 75 |
Systemperformance
Dank der schnellen Zen-5-CPU und der integrierten GPU gehören die PCMark-Ergebnisse zu den besten in der 16-Zoll-Convertible-Kategorie.

CrossMark: Overall | Productivity | Creativity | Responsiveness
WebXPRT 3: Overall
WebXPRT 4: Overall
Mozilla Kraken 1.1: Total
| PCMark 10 / Score | |
| MSI Summit A16 AI Plus A3HMTG | |
| Durchschnittliche AMD Ryzen AI 9 365, AMD Radeon 880M (7045 - 7641, n=5) | |
| HP Spectre x360 16 RTX 4050 | |
| LG gram Pro 2-in-1 16T90SP | |
| MSI Summit E16 Flip A12UDT-031 | |
| Lenovo Yoga 7 2-in-1 16IML9 | |
| Asus ExpertBook B5 Flip B5602FBN | |
| PCMark 10 / Essentials | |
| MSI Summit A16 AI Plus A3HMTG | |
| Durchschnittliche AMD Ryzen AI 9 365, AMD Radeon 880M (10421 - 11140, n=5) | |
| Lenovo Yoga 7 2-in-1 16IML9 | |
| HP Spectre x360 16 RTX 4050 | |
| LG gram Pro 2-in-1 16T90SP | |
| MSI Summit E16 Flip A12UDT-031 | |
| Asus ExpertBook B5 Flip B5602FBN | |
| PCMark 10 / Productivity | |
| Durchschnittliche AMD Ryzen AI 9 365, AMD Radeon 880M (9841 - 10293, n=5) | |
| MSI Summit A16 AI Plus A3HMTG | |
| HP Spectre x360 16 RTX 4050 | |
| LG gram Pro 2-in-1 16T90SP | |
| Lenovo Yoga 7 2-in-1 16IML9 | |
| MSI Summit E16 Flip A12UDT-031 | |
| Asus ExpertBook B5 Flip B5602FBN | |
| PCMark 10 / Digital Content Creation | |
| MSI Summit A16 AI Plus A3HMTG | |
| Durchschnittliche AMD Ryzen AI 9 365, AMD Radeon 880M (8973 - 10976, n=5) | |
| HP Spectre x360 16 RTX 4050 | |
| MSI Summit E16 Flip A12UDT-031 | |
| LG gram Pro 2-in-1 16T90SP | |
| Asus ExpertBook B5 Flip B5602FBN | |
| Lenovo Yoga 7 2-in-1 16IML9 | |
| CrossMark / Overall | |
| MSI Summit A16 AI Plus A3HMTG | |
| Durchschnittliche AMD Ryzen AI 9 365, AMD Radeon 880M (1658 - 1743, n=4) | |
| Asus ExpertBook B5 Flip B5602FBN | |
| MSI Summit E16 Flip A12UDT-031 | |
| Lenovo Yoga 7 2-in-1 16IML9 | |
| HP Spectre x360 16 RTX 4050 | |
| LG gram Pro 2-in-1 16T90SP | |
| CrossMark / Productivity | |
| Asus ExpertBook B5 Flip B5602FBN | |
| MSI Summit A16 AI Plus A3HMTG | |
| MSI Summit E16 Flip A12UDT-031 | |
| Durchschnittliche AMD Ryzen AI 9 365, AMD Radeon 880M (1508 - 1599, n=4) | |
| LG gram Pro 2-in-1 16T90SP | |
| HP Spectre x360 16 RTX 4050 | |
| Lenovo Yoga 7 2-in-1 16IML9 | |
| CrossMark / Creativity | |
| Durchschnittliche AMD Ryzen AI 9 365, AMD Radeon 880M (2044 - 2074, n=4) | |
| MSI Summit A16 AI Plus A3HMTG | |
| HP Spectre x360 16 RTX 4050 | |
| MSI Summit E16 Flip A12UDT-031 | |
| Asus ExpertBook B5 Flip B5602FBN | |
| LG gram Pro 2-in-1 16T90SP | |
| Lenovo Yoga 7 2-in-1 16IML9 | |
| CrossMark / Responsiveness | |
| Asus ExpertBook B5 Flip B5602FBN | |
| MSI Summit E16 Flip A12UDT-031 | |
| MSI Summit A16 AI Plus A3HMTG | |
| Durchschnittliche AMD Ryzen AI 9 365, AMD Radeon 880M (1124 - 1360, n=4) | |
| LG gram Pro 2-in-1 16T90SP | |
| HP Spectre x360 16 RTX 4050 | |
| Lenovo Yoga 7 2-in-1 16IML9 | |
| WebXPRT 3 / Overall | |
| MSI Summit A16 AI Plus A3HMTG | |
| Durchschnittliche AMD Ryzen AI 9 365, AMD Radeon 880M (309 - 336, n=4) | |
| Asus ExpertBook B5 Flip B5602FBN | |
| HP Spectre x360 16 RTX 4050 | |
| LG gram Pro 2-in-1 16T90SP | |
| MSI Summit E16 Flip A12UDT-031 | |
| Lenovo Yoga 7 2-in-1 16IML9 | |
| WebXPRT 4 / Overall | |
| Durchschnittliche AMD Ryzen AI 9 365, AMD Radeon 880M (255 - 330, n=6) | |
| MSI Summit A16 AI Plus A3HMTG | |
| HP Spectre x360 16 RTX 4050 | |
| LG gram Pro 2-in-1 16T90SP | |
| Asus ExpertBook B5 Flip B5602FBN | |
| MSI Summit E16 Flip A12UDT-031 | |
| Lenovo Yoga 7 2-in-1 16IML9 | |
| Mozilla Kraken 1.1 / Total | |
| Lenovo Yoga 7 2-in-1 16IML9 | |
| MSI Summit E16 Flip A12UDT-031 | |
| LG gram Pro 2-in-1 16T90SP | |
| Asus ExpertBook B5 Flip B5602FBN | |
| HP Spectre x360 16 RTX 4050 | |
| Durchschnittliche AMD Ryzen AI 9 365, AMD Radeon 880M (430 - 456, n=6) | |
| MSI Summit A16 AI Plus A3HMTG | |
* ... kleinere Werte sind besser
| PCMark 10 Score | 7618 Punkte | |
Hilfe | ||
| AIDA64 / Memory Copy | |
| Durchschnittliche AMD Ryzen AI 9 365 (87648 - 94710, n=7) | |
| MSI Summit A16 AI Plus A3HMTG | |
| LG gram Pro 2-in-1 16T90SP | |
| HP Spectre x360 16 RTX 4050 | |
| Lenovo Yoga 7 2-in-1 16IML9 | |
| MSI Summit E16 Flip A12UDT-031 | |
| Asus ExpertBook B5 Flip B5602FBN | |
| AIDA64 / Memory Read | |
| MSI Summit A16 AI Plus A3HMTG | |
| Durchschnittliche AMD Ryzen AI 9 365 (89012 - 104349, n=7) | |
| HP Spectre x360 16 RTX 4050 | |
| LG gram Pro 2-in-1 16T90SP | |
| MSI Summit E16 Flip A12UDT-031 | |
| Lenovo Yoga 7 2-in-1 16IML9 | |
| Asus ExpertBook B5 Flip B5602FBN | |
| AIDA64 / Memory Write | |
| Durchschnittliche AMD Ryzen AI 9 365 (93627 - 106646, n=7) | |
| MSI Summit A16 AI Plus A3HMTG | |
| HP Spectre x360 16 RTX 4050 | |
| LG gram Pro 2-in-1 16T90SP | |
| Lenovo Yoga 7 2-in-1 16IML9 | |
| MSI Summit E16 Flip A12UDT-031 | |
| Asus ExpertBook B5 Flip B5602FBN | |
| AIDA64 / Memory Latency | |
| MSI Summit E16 Flip A12UDT-031 | |
| Lenovo Yoga 7 2-in-1 16IML9 | |
| HP Spectre x360 16 RTX 4050 | |
| LG gram Pro 2-in-1 16T90SP | |
| MSI Summit A16 AI Plus A3HMTG | |
| Durchschnittliche AMD Ryzen AI 9 365 (103.6 - 129.8, n=7) | |
| Asus ExpertBook B5 Flip B5602FBN | |
* ... kleinere Werte sind besser
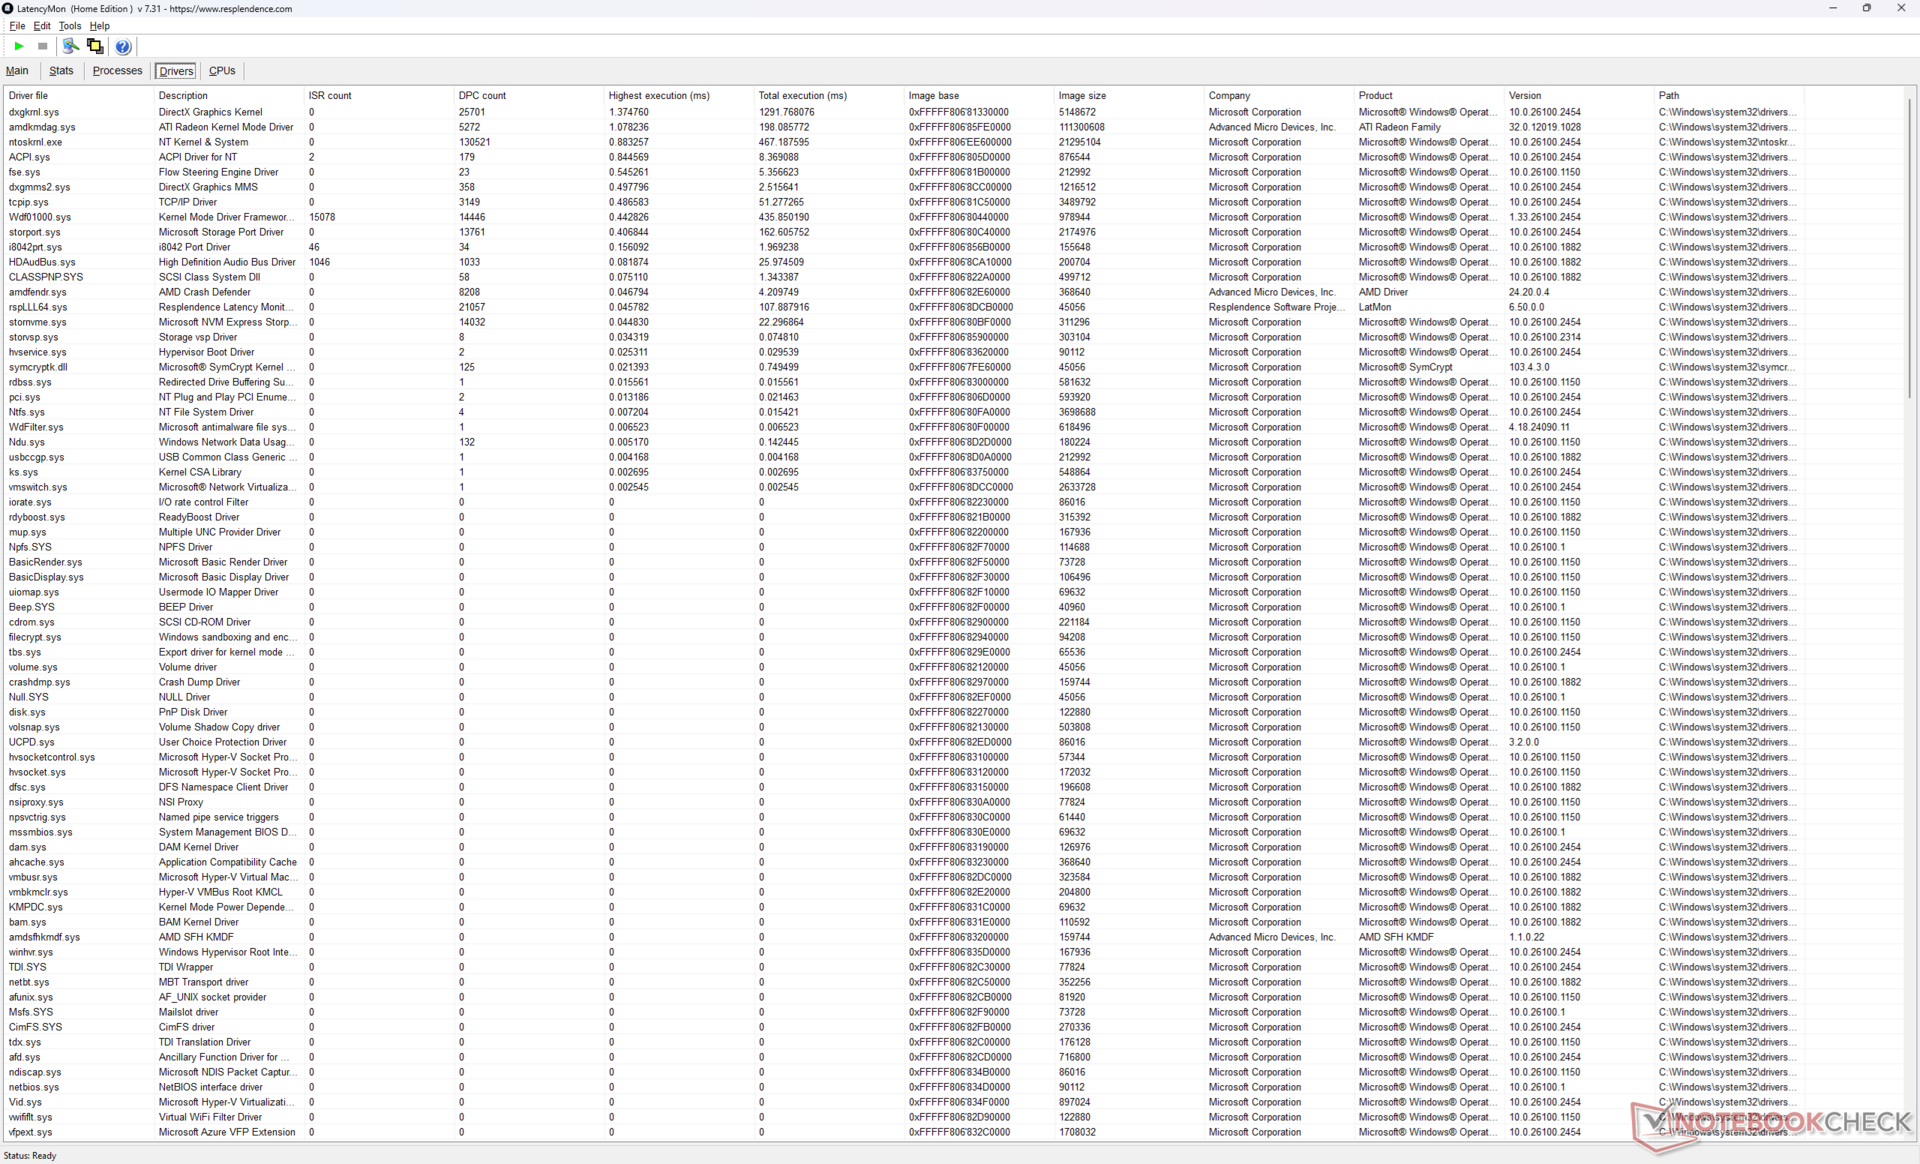
DPC-Latenzzeit
LatencyMon zeigt DPC-Probleme beim Öffnen mehrerer Browser Tabs unserer Homepage. Die 4K-Videowiedergabe bei 60 FPS ist ansonsten perfekt und es wurden keine Bildaussetzer verzeichnet.

| DPC Latencies / LatencyMon - interrupt to process latency (max), Web, Youtube, Prime95 | |
| LG gram Pro 2-in-1 16T90SP | |
| HP Spectre x360 16 RTX 4050 | |
| MSI Summit A16 AI Plus A3HMTG | |
| Asus ExpertBook B5 Flip B5602FBN | |
| MSI Summit E16 Flip A12UDT-031 | |
| Lenovo Yoga 7 2-in-1 16IML9 | |
* ... kleinere Werte sind besser
Storage
Unser Gerät wird mit dem Samsung PM9C1 anstelle der PM9A1, die im Modell 2022 zu finden ist, geliefert. Leider bietet die PM9C1 langsamere Übertragungsraten von über 1500 MB/s, wie unser Vergleichsdiagramm unten zeigt.


* ... kleinere Werte sind besser
Disk Throttling: DiskSpd Read Loop, Queue Depth 8
GPU Performance
Die integrierte Radeon 880M ist ein deutliches Upgrade gegenüber der Iris Xe 96 EUs, die in den meisten Convertibles seit 2020 zu finden ist. Im Vergleich zum vorherigen Champion, der Radeon 780M, ist die Radeon 880M etwa 15 bis 25 Prozent schneller. Das ist schnell genug, um moderne Titel bei niedrigen Einstellungen von 1080p zu spielen, etwa auch anspruchsvolle Titel wie Cyberpunk 2077.
MSI bietet keine SKUs mit der Radeon 890M an, die die Grafikleistung um weitere 10 bis 15 Prozent gesteigert hätte.
| Leistungsprofil | Grafik-Score | Physik-Punktzahl | Kombinierte Punktzahl |
| Performance Modus | 9203 | 26559 | 3122 |
| Ausgeglichener Modus | 8821 (-4%) | 25223 (-5%) | 2948 (-6%) |
| Batteriebetrieb | 8747 (-5%) | 20465 (-23%) | 3098 (-1%) |
Wenn Sie den Modus "Ausgewogen" anstelle des Modus " Performance " verwenden, verringert sich die Leistung nur geringfügig, wie unsere Fire Strike Ergebnistabelle oben zeigt.


| 3DMark 11 Performance | 14646 Punkte | |
| 3DMark Cloud Gate Standard Score | 36919 Punkte | |
| 3DMark Fire Strike Score | 8391 Punkte | |
| 3DMark Time Spy Score | 3399 Punkte | |
| 3DMark Steel Nomad Score | 550 Punkte | |
Hilfe | ||
* ... kleinere Werte sind besser
Cyberpunk 2077 ultra FPS Chart
| min. | mittel | hoch | max. | QHD | |
|---|---|---|---|---|---|
| GTA V (2015) | 170.6 | 80.5 | 32.5 | 22.3 | |
| Dota 2 Reborn (2015) | 156.7 | 133.6 | 47.2 | 46.2 | |
| Final Fantasy XV Benchmark (2018) | 87 | 43.7 | 31.4 | 23.2 | |
| X-Plane 11.11 (2018) | 79.9 | 63.1 | 48.8 | ||
| Far Cry 5 (2018) | 102 | 58 | 53 | 50 | |
| Strange Brigade (2018) | 192.9 | 79.7 | 67 | 56.7 | 35.7 |
| Tiny Tina's Wonderlands (2022) | 84.9 | 61.4 | 40.2 | 31.9 | |
| F1 22 (2022) | 101.1 | 92.5 | 70.3 | 18.3 | 11.2 |
| Baldur's Gate 3 (2023) | 44.1 | 36.1 | 29.9 | 28.9 | |
| Cyberpunk 2077 (2023) | 49.5 | 38.3 | 30.4 | 26.3 | 19.1 |
Emissionen
Lautstärke
Das Lüftergeräusch ist nicht viel leiser als zuvor, obwohl wir keine eigenständige GPU haben. Die Lüfter sind fast immer aktiv, egal wie hoch die Last ist, und sie drehen relativ schnell hoch, wenn höhere Lasten anliegen. Außerdem sind die Lüftergeräusche sehr laut, so dass jede Drehzahländerung deutlicher wahrnehmbar ist.
Mit über 46 dB(A) beim Spielen kann das Summit A16 genauso laut sein wie viele dedizierte Gaming-Notebooks.

Lautstärkediagramm
| Idle |
| 25 / 25 / 29.5 dB(A) |
| Last |
| 37.5 / 56.1 dB(A) |
 | ||
30 dB leise 40 dB(A) deutlich hörbar 50 dB(A) störend |
||
min: | ||
| MSI Summit A16 AI Plus A3HMTG Radeon 880M, Ryzen AI 9 365, Samsung PM9C1 MZVL81T0HELB-00BTW | MSI Summit E16 Flip A12UDT-031 GeForce RTX 3050 Ti Laptop GPU, i7-1280P, Samsung PM9A1 MZVL22T0HBLB | HP Spectre x360 16 RTX 4050 GeForce RTX 4050 Laptop GPU, Ultra 7 155H, SK hynix PC801 HFS001TEJ9X101N | Asus ExpertBook B5 Flip B5602FBN A350M, i7-1260P, WD PC SN735 SDBPNHH-1T00 | LG gram Pro 2-in-1 16T90SP Arc 8-Core, Ultra 7 155H, SK hynix PC801 HFS001TEJ9X101N | Lenovo Yoga 7 2-in-1 16IML9 Graphics 4-Core iGPU (Arrow Lake), Ultra 5 125U, SK hynix HFS512GEJ4X112N | |
|---|---|---|---|---|---|---|
| Geräuschentwicklung | -3% | 17% | -6% | 5% | 15% | |
| aus / Umgebung * (dB) | 23.8 | 25 -5% | 23.3 2% | 27.5 -16% | 25.12 -6% | 22.8 4% |
| Idle min * (dB) | 25 | 25 -0% | 23.6 6% | 27.5 -10% | 25.12 -0% | 22.8 9% |
| Idle avg * (dB) | 25 | 25 -0% | 23.6 6% | 27.5 -10% | 26.17 -5% | 22.8 9% |
| Idle max * (dB) | 29.5 | 28.9 2% | 23.6 20% | 28.3 4% | 26.17 11% | 22.8 23% |
| Last avg * (dB) | 37.5 | 49.3 -31% | 29.2 22% | 40.7 -9% | 36.33 3% | 30.8 18% |
| Cyberpunk 2077 ultra * (dB) | 46.5 | |||||
| Last max * (dB) | 56.1 | 48.2 14% | 32.1 43% | 53.6 4% | 41.61 26% | 40.8 27% |
| Witcher 3 ultra * (dB) | 32.1 | 31 |
* ... kleinere Werte sind besser
Temperatur
An der Rückseite kann es sehr warm werden, bis zu 45 Grad Celsius, wenn anspruchsvolle Aufgaben ausgeführt werden. Die durchschnittliche Oberflächentemperatur ist jedoch kühler als beim 2022-Modell, da unser AMD-Gerät keine dedizierte GPU hat. Dies ist offensichtlich, da die rechte Hälfte unseres 2024 Modells viel kühler ist als die rechte Hälfte des 2022 Modells, wo sich die dGPU befinden würde.
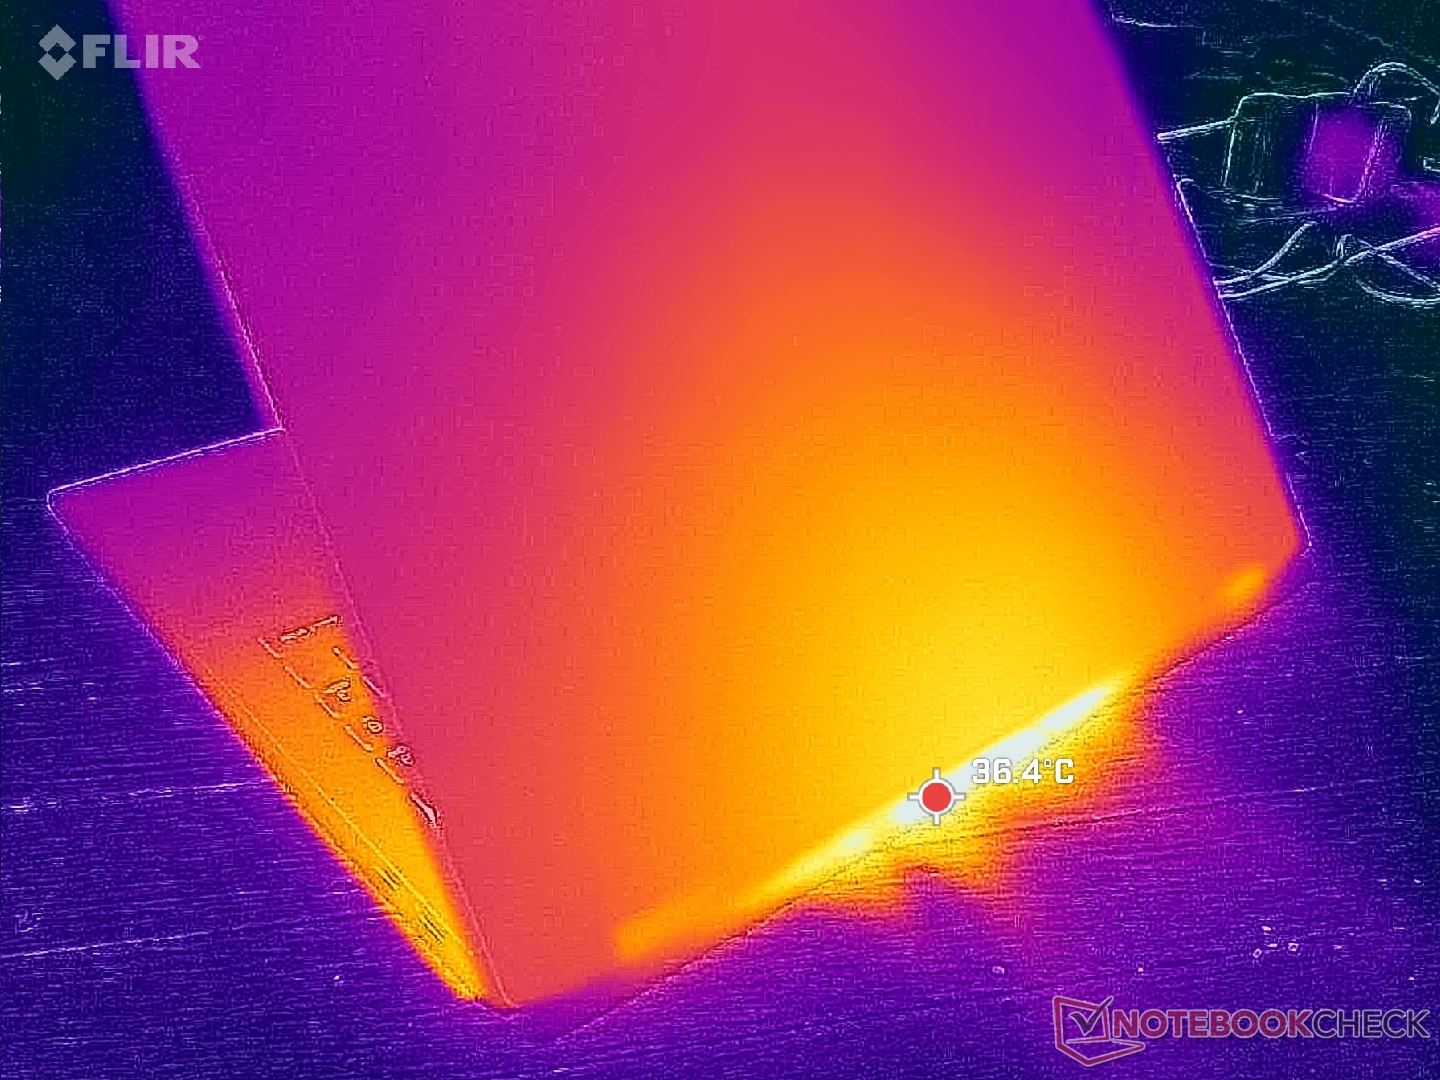

(-) Die maximale Temperatur auf der Oberseite ist 52.8 °C. Im Vergleich liegt der Klassendurchschnitt bei 35.4 °C (von 19.6 bis 60 °C für die Klasse Convertible).
(±) Auf der Unterseite messen wir eine maximalen Wert von 42 °C (im Vergleich zum Durchschnitt von 36.9 °C).
(+) Ohne Last messen wir eine durchschnittliche Temperatur von 25.2 °C auf der Oberseite. Der Klassendurchschnitt erreicht 30.3 °C.
(±) 3: The average temperature for the upper side is 34.9 °C / 95 F, compared to the average of 30.3 °C / 87 F for the class Convertible.
(+) Die Handballen und der Touchpad-Bereich sind mit gemessenen 30.4 °C kühler als die typische Hauttemperatur und fühlen sich dadurch kühl an.
(-) Die durchschnittliche Handballen-Temperatur anderer getesteter Geräte war 28 °C (-2.4 °C).


| MSI Summit A16 AI Plus A3HMTG AMD Ryzen AI 9 365, AMD Radeon 880M | MSI Summit E16 Flip A12UDT-031 Intel Core i7-1280P, NVIDIA GeForce RTX 3050 Ti Laptop GPU | HP Spectre x360 16 RTX 4050 Intel Core Ultra 7 155H, NVIDIA GeForce RTX 4050 Laptop GPU | Asus ExpertBook B5 Flip B5602FBN Intel Core i7-1260P, Intel Arc A350M | LG gram Pro 2-in-1 16T90SP Intel Core Ultra 7 155H, Intel Arc 8-Core iGPU | Lenovo Yoga 7 2-in-1 16IML9 Intel Core Ultra 5 125U, Intel Graphics 4-Core iGPU (Meteor / Arrow Lake) | |
|---|---|---|---|---|---|---|
| Hitze | -3% | 8% | 11% | 3% | 16% | |
| Last oben max * (°C) | 52.8 | 49.2 7% | 39.6 25% | 37.9 28% | 34.5 35% | 37.8 28% |
| Last unten max * (°C) | 42 | 50.2 -20% | 39.2 7% | 39.4 6% | 55.4 -32% | 38.8 8% |
| Idle oben max * (°C) | 30.6 | 29.4 4% | 29 5% | 28.8 6% | 28.7 6% | 25.4 17% |
| Idle unten max * (°C) | 29.6 | 30 -1% | 31.6 -7% | 29.1 2% | 28.7 3% | 26.8 9% |
* ... kleinere Werte sind besser
Lautsprecher
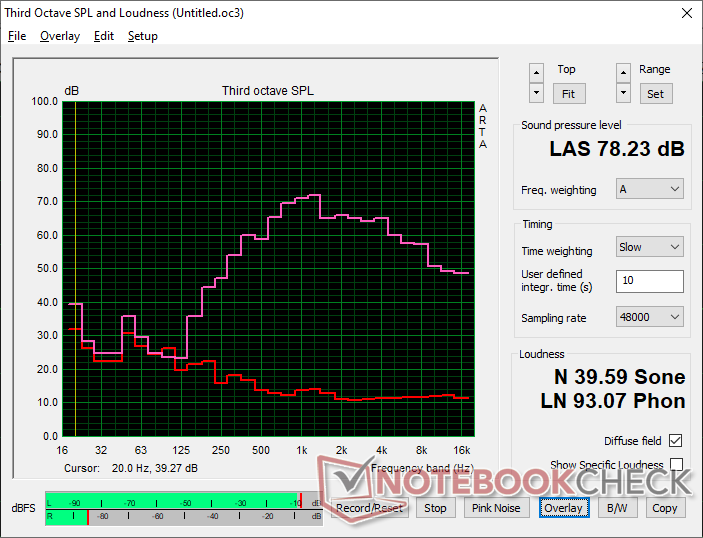
MSI Summit A16 AI Plus A3HMTG Audio Analyse
(±) | Mittelmäßig laut spielende Lautsprecher (78.2 dB)
Bass 100 - 315 Hz
(-) | kaum Bass - 20.8% niedriger als der Median
(±) | durchschnittlich lineare Bass-Wiedergabe (11.7% Delta zum Vorgänger)
Mitteltöne 400 - 2000 Hz
(±) | zu hohe Mitten, vom Median 7.2% abweichend
(±) | Linearität der Mitten ist durchschnittlich (7.7% Delta zum Vorgänger)
Hochtöne 2 - 16 kHz
(+) | ausgeglichene Hochtöne, vom Median nur 4.3% abweichend
(+) | sehr lineare Hochtöne (5.3% Delta zum Vorgänger)
Gesamt im hörbaren Bereich 100 - 16.000 Hz
(±) | hörbarer Bereich ist durchschnittlich linear (23.5% Abstand zum Median)
Im Vergleich zu allen Geräten derselben Klasse
» 71% aller getesteten Geräte dieser Klasse waren besser, 5% vergleichbar, 24% schlechter
» Das beste Gerät hat einen Delta-Wert von 6%, durchschnittlich ist 20%, das schlechteste Gerät hat 57%
Im Vergleich zu allen Geräten im Test
» 70% aller getesteten Geräte waren besser, 6% vergleichbar, 24% schlechter
» Das beste Gerät hat einen Delta-Wert von 4%, durchschnittlich ist 24%, das schlechteste Gerät hat 134%
Apple MacBook Pro 16 2021 M1 Pro Audio Analyse
(+) | Die Lautsprecher können relativ laut spielen (84.7 dB)
Bass 100 - 315 Hz
(+) | guter Bass - nur 3.8% Abweichung vom Median
(+) | lineare Bass-Wiedergabe (5.2% Delta zum Vorgänger)
Mitteltöne 400 - 2000 Hz
(+) | ausgeglichene Mitten, vom Median nur 1.3% abweichend
(+) | lineare Mitten (2.1% Delta zum Vorgänger)
Hochtöne 2 - 16 kHz
(+) | ausgeglichene Hochtöne, vom Median nur 1.9% abweichend
(+) | sehr lineare Hochtöne (2.7% Delta zum Vorgänger)
Gesamt im hörbaren Bereich 100 - 16.000 Hz
(+) | hörbarer Bereich ist sehr linear (4.6% Abstand zum Median
Im Vergleich zu allen Geräten derselben Klasse
» 0% aller getesteten Geräte dieser Klasse waren besser, 0% vergleichbar, 100% schlechter
» Das beste Gerät hat einen Delta-Wert von 5%, durchschnittlich ist 17%, das schlechteste Gerät hat 45%
Im Vergleich zu allen Geräten im Test
» 0% aller getesteten Geräte waren besser, 0% vergleichbar, 100% schlechter
» Das beste Gerät hat einen Delta-Wert von 4%, durchschnittlich ist 24%, das schlechteste Gerät hat 134%
Energieverwaltung
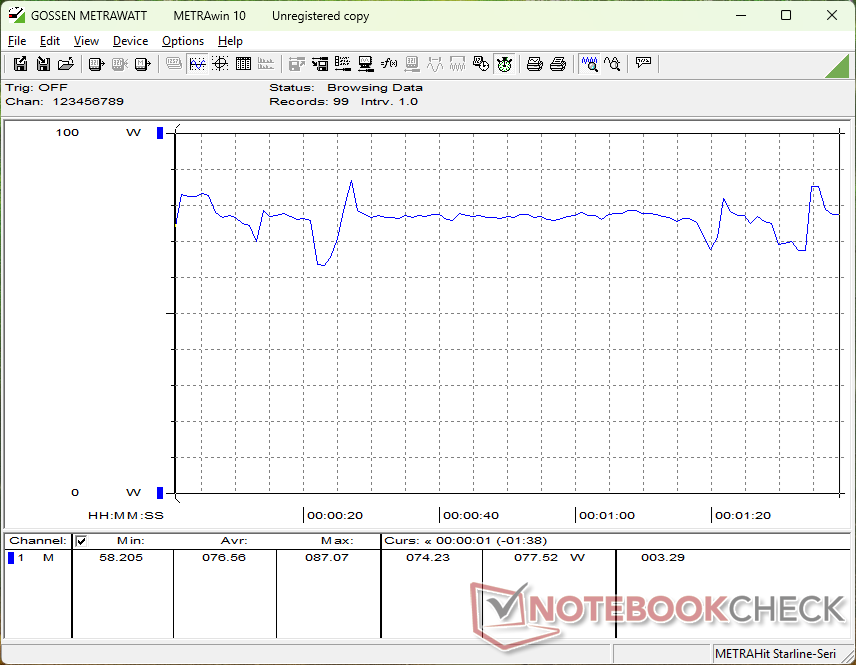
Stromverbrauch
Unser AMD-System verbraucht im Leerlauf auf dem Desktop einige Watt weniger als das Intel-Nvidia 2022 Modell, was zu den allgemein längeren Akkulaufzeit beiträgt, wie im nächsten Abschnitt unten beschrieben. Der Verbrauch kann bei der Ausführung von Prime95 ein paar Watt höher sein, aber das wird durch die schnellere Prozessorleistung ausgeglichen, so dass die Leistung pro Watt immer noch zu Gunsten unseres AMD-Geräts ausfällt.
Das 100-W-USB-C-Netzteil ist mit 7,5 x 7,5 x 2,9 cm recht klein.


| Aus / Standby | |
| Idle | |
| Last |
|
Legende:
min: | |
| MSI Summit A16 AI Plus A3HMTG Ryzen AI 9 365, Radeon 880M, Samsung PM9C1 MZVL81T0HELB-00BTW, IPS, 2560x1600, 16" | MSI Summit E16 Flip A12UDT-031 i7-1280P, GeForce RTX 3050 Ti Laptop GPU, Samsung PM9A1 MZVL22T0HBLB, IPS, 2560x1600, 16" | HP Spectre x360 16 RTX 4050 Ultra 7 155H, GeForce RTX 4050 Laptop GPU, SK hynix PC801 HFS001TEJ9X101N, OLED, 2880x1800, 16" | Asus ExpertBook B5 Flip B5602FBN i7-1260P, A350M, WD PC SN735 SDBPNHH-1T00, OLED, 3840x2400, 16" | LG gram Pro 2-in-1 16T90SP Ultra 7 155H, Arc 8-Core, SK hynix PC801 HFS001TEJ9X101N, OLED, 2880x1800, 16" | Lenovo Yoga 7 2-in-1 16IML9 Ultra 5 125U, Graphics 4-Core iGPU (Arrow Lake), SK hynix HFS512GEJ4X112N, IPS, 1920x1200, 16" | |
|---|---|---|---|---|---|---|
| Stromverbrauch | -38% | -53% | 3% | 24% | 33% | |
| Idle min * (Watt) | 5.4 | 9.8 -81% | 5.8 -7% | 6.5 -20% | 6 -11% | 3 44% |
| Idle avg * (Watt) | 11 | 15.3 -39% | 12.3 -12% | 7.6 31% | 7.5 32% | 8.5 23% |
| Idle max * (Watt) | 11.2 | 16.3 -46% | 33.9 -203% | 9.8 12% | 8.2 27% | 8.9 21% |
| Last avg * (Watt) | 76.6 | 87 -14% | 83.3 -9% | 85 -11% | 45.2 41% | 41.1 46% |
| Cyberpunk 2077 ultra external monitor * (Watt) | 49.2 | |||||
| Cyberpunk 2077 ultra * (Watt) | 61.1 | |||||
| Last max * (Watt) | 91.8 | 100 -9% | 120.8 -32% | 91 1% | 61.4 33% | 64.6 30% |
| Witcher 3 ultra * (Watt) | 86.1 | 89.1 | 85.6 | 38.9 | 30.7 |
* ... kleinere Werte sind besser
Power Consumption Cyberpunk / Stress Test
Power Consumption external Monitor
Akkulaufzeit
Die WLAN-Laufzeit ist etwa zwei Stunden länger als bei unserem 2022er Modell, was vor allem auf das Fehlen einer dedizierten GPU in unserem 2024er Gerät zurückzuführen ist.
| MSI Summit A16 AI Plus A3HMTG Ryzen AI 9 365, Radeon 880M, 82 Wh | MSI Summit E16 Flip A12UDT-031 i7-1280P, GeForce RTX 3050 Ti Laptop GPU, 82 Wh | HP Spectre x360 16 RTX 4050 Ultra 7 155H, GeForce RTX 4050 Laptop GPU, 83 Wh | Asus ExpertBook B5 Flip B5602FBN i7-1260P, A350M, 84 Wh | LG gram Pro 2-in-1 16T90SP Ultra 7 155H, Arc 8-Core, 77 Wh | Lenovo Yoga 7 2-in-1 16IML9 Ultra 5 125U, Graphics 4-Core iGPU (Arrow Lake), 71 Wh | |
|---|---|---|---|---|---|---|
| Akkulaufzeit | -22% | 21% | -11% | 7% | 35% | |
| WLAN (h) | 9.1 | 7.1 -22% | 11 21% | 8.1 -11% | 9.7 7% | 12.3 35% |
| Last (h) | 1.7 |
Notebookcheck Bewertung
MSI Summit A16 AI Plus A3HMTG
- 05.12.2024 v8
Allen Ngo
 Total Sustainability Score:
 Transparenz
Die Auswahl der zu testenden Geräte erfolgt innerhalb der Redaktion. Das vorliegende Testmuster wurde dem Autor vom Hersteller oder einem Shop zu Testzwecken leihweise zur Verfügung gestellt. Eine Einflussnahme des Leihstellers auf den Testbericht gab es nicht, der Hersteller erhielt keine Version des Reviews vor der Veröffentlichung. Es bestand keine Verpflichtung zur Publikation. Als eigenständiges, unabhängiges Unternehmen unterliegt Notebookcheck keiner Diktion von Herstellern, Shops und Verlagen.
So testet Notebookcheck
Pro Jahr werden von Notebookcheck hunderte Laptops und Smartphones unabhängig in von uns standardisierten technischen Verfahren getestet, um eine Vergleichbarkeit aller Testergebnisse zu gewährleisten. Seit rund 20 Jahren entwickeln wir diese Testmethoden kontinuierlich weiter und setzen damit Branchenstandards. In unseren Testlaboren kommt ausschließlich hochwertiges Messequipment in die Hände erfahrener Techniker und Redakteure. Die Tests unterliegen einer mehrstufigen Kontrolle. Unsere komplexe Gesamtbewertung basiert auf hunderten fundierten Messergebnissen und Benchmarks, womit Ihnen Objektivität garantiert ist. Weitere Informationen zu unseren Testmethoden gibt es hier.

