Core Ultra 5 125U Leistungsdebüt: Lenovo Yoga 7 2-in-1 16IML9 Convertible Test

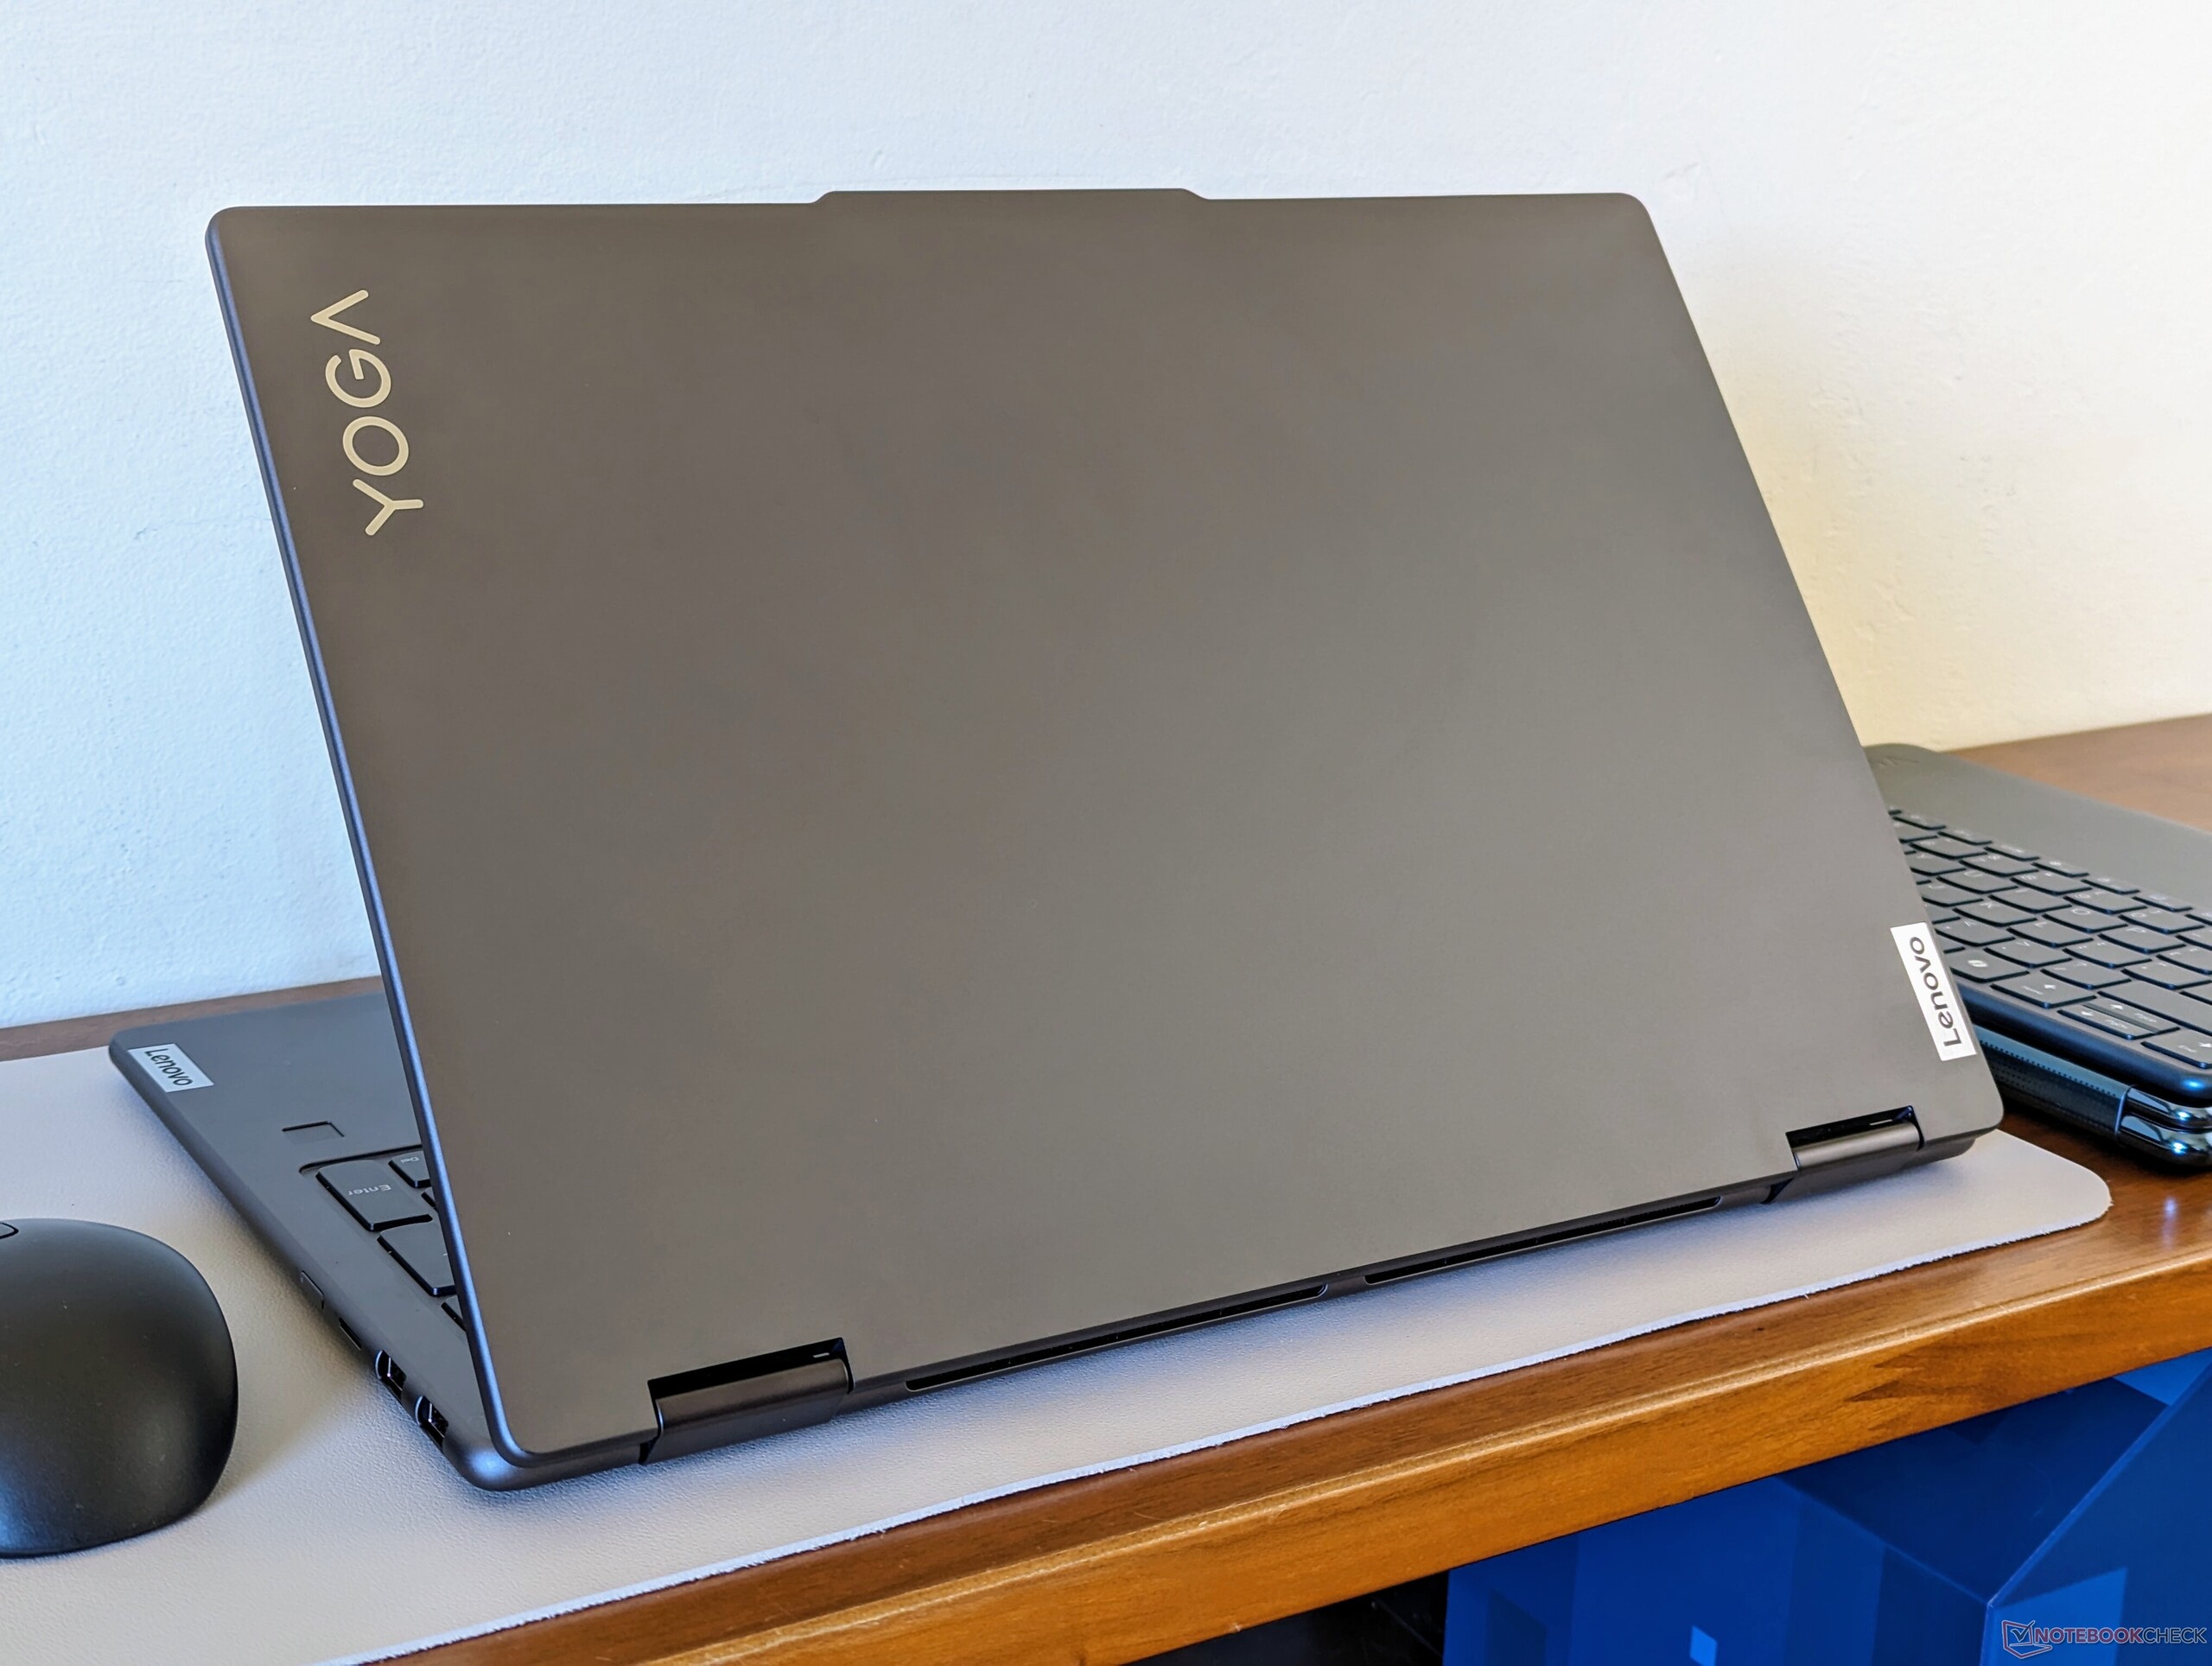
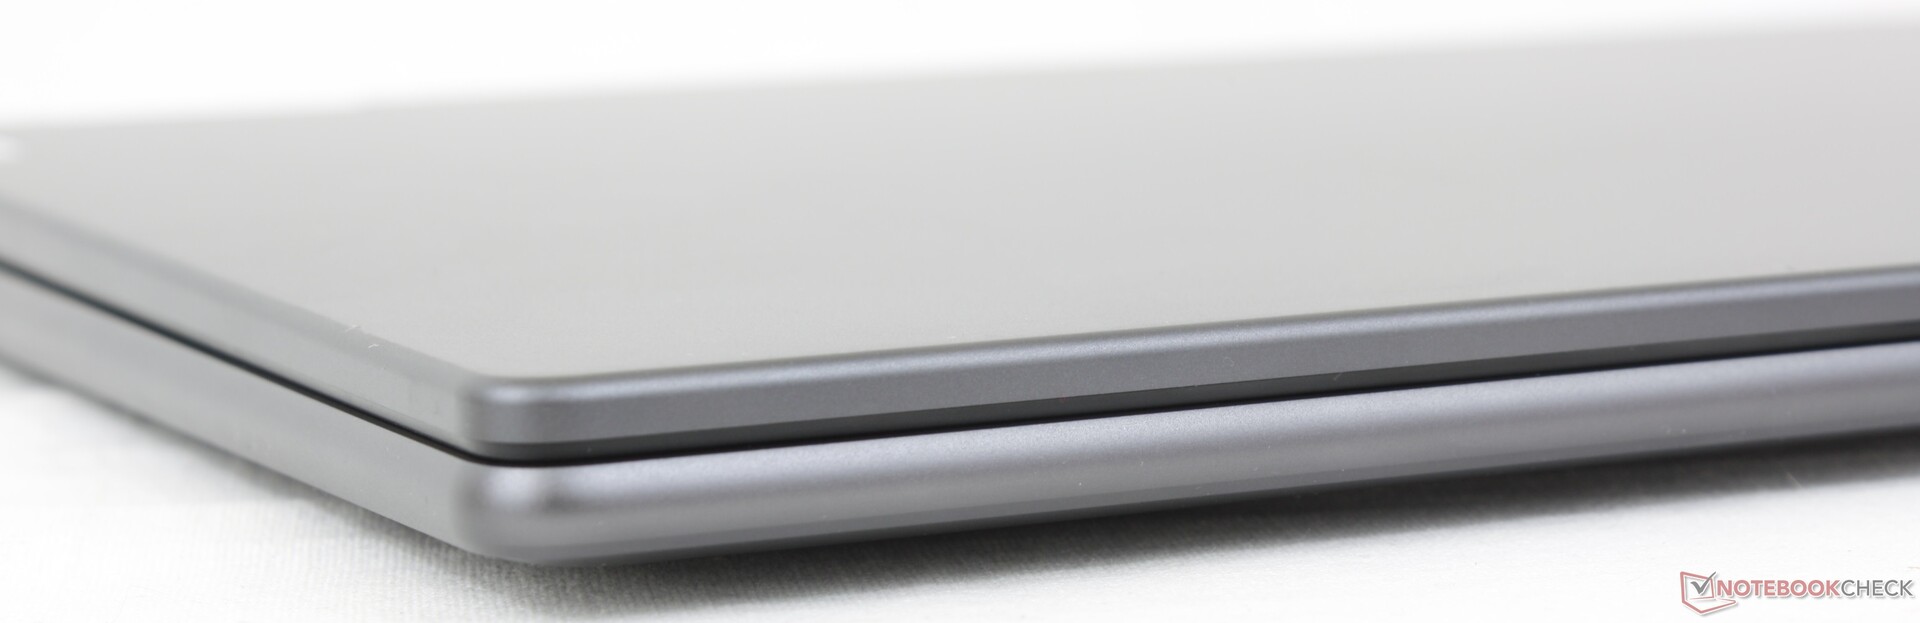
Das Lenovo Yoga 7 2-in-1 16IML9 (oder Yoga 7 2-in-1 16 G9) ist das Nachfolgemodell des preisgünstigen Yoga 7 2-in-1 G8 aus dem letzten Jahr, das mit den neuen Meteor-Lake-U-Prozessoren ausgestattet ist. Das Website-Gehäuse ist ansonsten identisch; wir empfehlen Ihnen daher, einen Blick auf unseren Test des Yoga 7 2-in-1 G8 zu werfen, um mehr über die physischen Eigenschaften des Modells zu erfahren.
Bei unserem Testgerät handelt es sich um die Basiskonfiguration mit der Core-Ultra-5-125U-CPU für ca. 900 US-Dollar im Einzelhandel. Eine höherwertige Option ist mit dem Core Ultra 7 155U ebenfalls erhältlich, wobei alle SKUs derzeit über denselben 1.920x1.200-IPS-Touchscreen und 16 GB schnellen LPDDR5x-7467 gelöteten Arbeitsspeicher verfügen.
Zu den Alternativen zum Yoga 7 2-in-1 16 G9 gehören andere 16-Zoll-Multimedia-Convertibles wie das Dell Inspiron 16 7635 2-in-1 oder das kommende HP Envy x360 16.
Weitere Lenovo Testberichte:
Mögliche Konkurrenten im Vergleich
Bew. | Datum | Modell | Gewicht | Dicke | Größe | Auflösung | Preis ab |
|---|---|---|---|---|---|---|---|
| 86.7 % v7 (old) | 05 / 2024 | Lenovo Yoga 7 2-in-1 16IML9 Ultra 5 125U, Graphics 4-Core iGPU (Arrow Lake) | 2.1 kg | 16.99 mm | 16.00" | 1920x1200 | |
| 85.8 % v7 (old) | 05 / 2023 | Lenovo Yoga 7 16IRL8 i7-1355U, Iris Xe G7 96EUs | 2 kg | 16.99 mm | 16.00" | 1920x1200 | |
| 88.9 % v7 (old) | 03 / 2024 | Samsung Galaxy Book4 Pro 16 Ultra 7 155H, Arc 8-Core | 1.5 kg | 12.5 mm | 16.00" | 2880x1800 | |
| 88.7 % v7 (old) | 02 / 2024 | HP Pavilion Plus 16-ab0456tx i7-13700H, GeForce RTX 3050 6GB Laptop GPU | 1.9 kg | 19.9 mm | 16.00" | 2560x1600 | |
| 85.8 % v7 (old) | 11 / 2023 | LG Gram 2in1 16 16T90R - G.AA78G i7-1360P, Iris Xe G7 96EUs | 1.5 kg | 17.2 mm | 16.00" | 2560x1600 | |
| 84.6 % v7 (old) | 07 / 2023 | Dell Inspiron 16 7635 2-in-1 R5 7530U, Vega 7 | 2 kg | 18.99 mm | 16.00" | 1920x1200 |
Gehäuse - jetzt mit Microsoft Co-Pilot
Der einfachste Weg, das Modell 2024 vom Modell 2023 zu unterscheiden, ist die neue Co-Pilot-Taste auf der Tastatur. Ansonsten gibt es keine optischen Unterschiede zum 2023er Design.
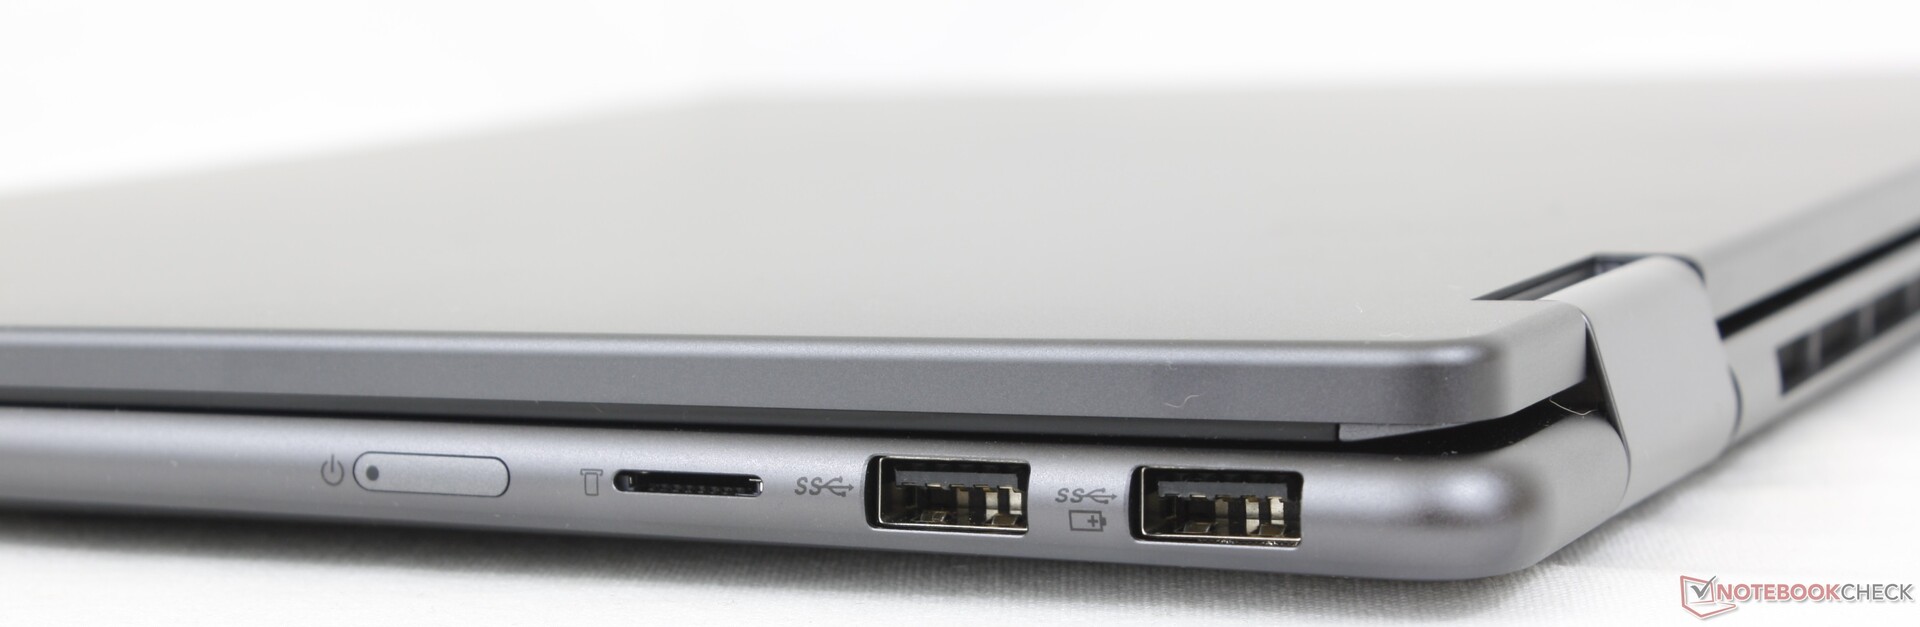
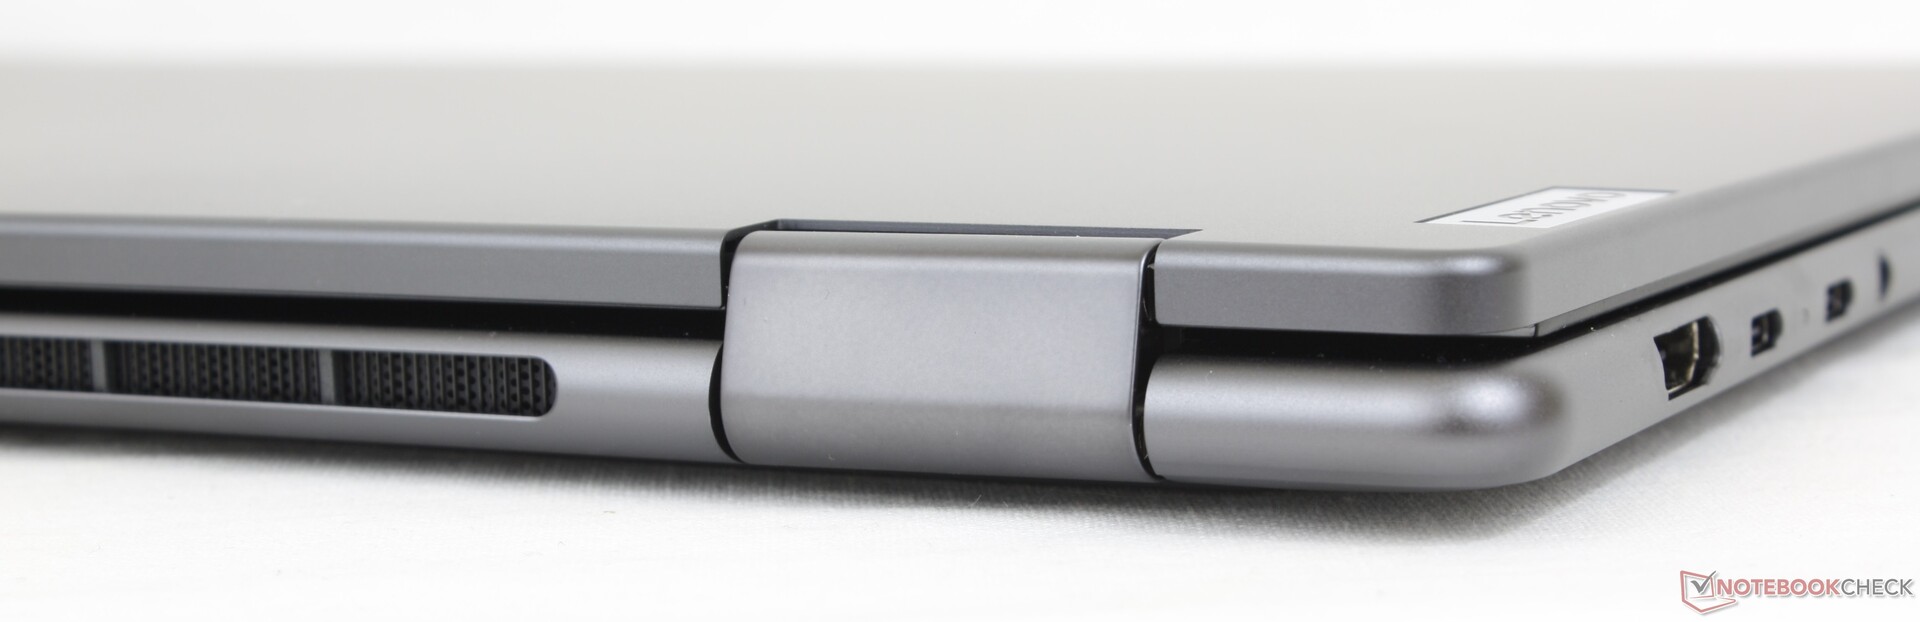
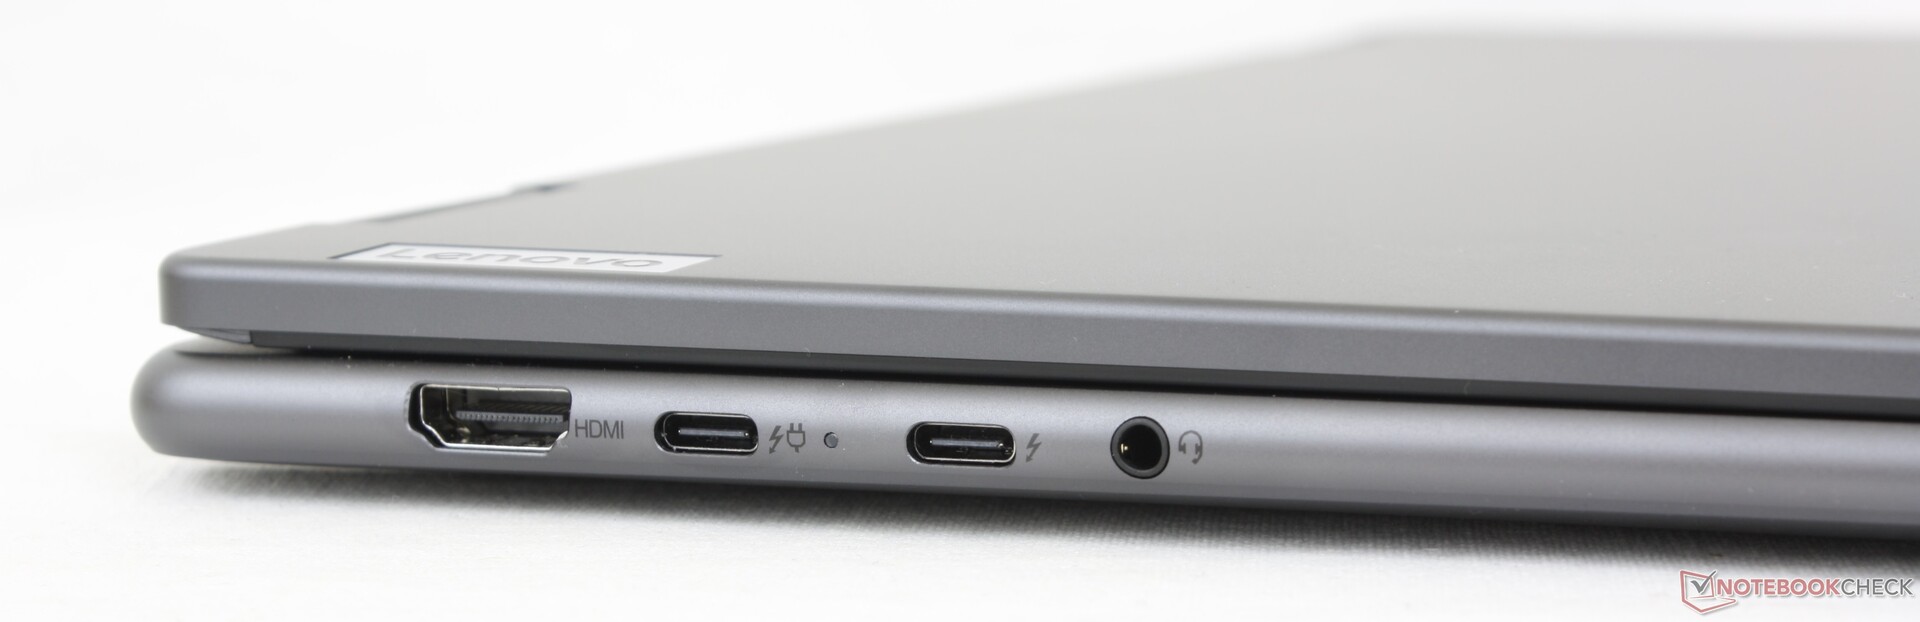
Anschlussausstattung
Die Anschlussoptionen bleiben identisch, mit Ausnahme des HDMI-Anschlusses, der von v1.4 auf v2.1 aufgerüstet wurde.
SD-Kartenleser
| SD Card Reader | |
| average JPG Copy Test (av. of 3 runs) | |
| Lenovo Yoga 7 2-in-1 16IML9 (AV Pro SD microSD 128 GB V60) | |
| Samsung Galaxy Book4 Pro 16 (Angelbird AV Pro V60) | |
| Lenovo Yoga 7 16IRL8 (AV Pro SD microSD 128 GB V60) | |
| Dell Inspiron 16 7635 2-in-1 (PNY EliteX-Pro60 V60 256 GB) | |
| LG Gram 2in1 16 16T90R - G.AA78G | |
| maximum AS SSD Seq Read Test (1GB) | |
| Lenovo Yoga 7 16IRL8 (AV Pro SD microSD 128 GB V60) | |
| Lenovo Yoga 7 2-in-1 16IML9 (AV Pro SD microSD 128 GB V60) | |
| Samsung Galaxy Book4 Pro 16 (Angelbird AV Pro V60) | |
| Dell Inspiron 16 7635 2-in-1 (PNY EliteX-Pro60 V60 256 GB) | |
| LG Gram 2in1 16 16T90R - G.AA78G | |
Kommunikation
Webcam

, Ultra 5 125U, SK hynix HFS512GEJ4X112N")
, Ultra 5 125U, SK hynix HFS512GEJ4X112N")
Wartung
Display
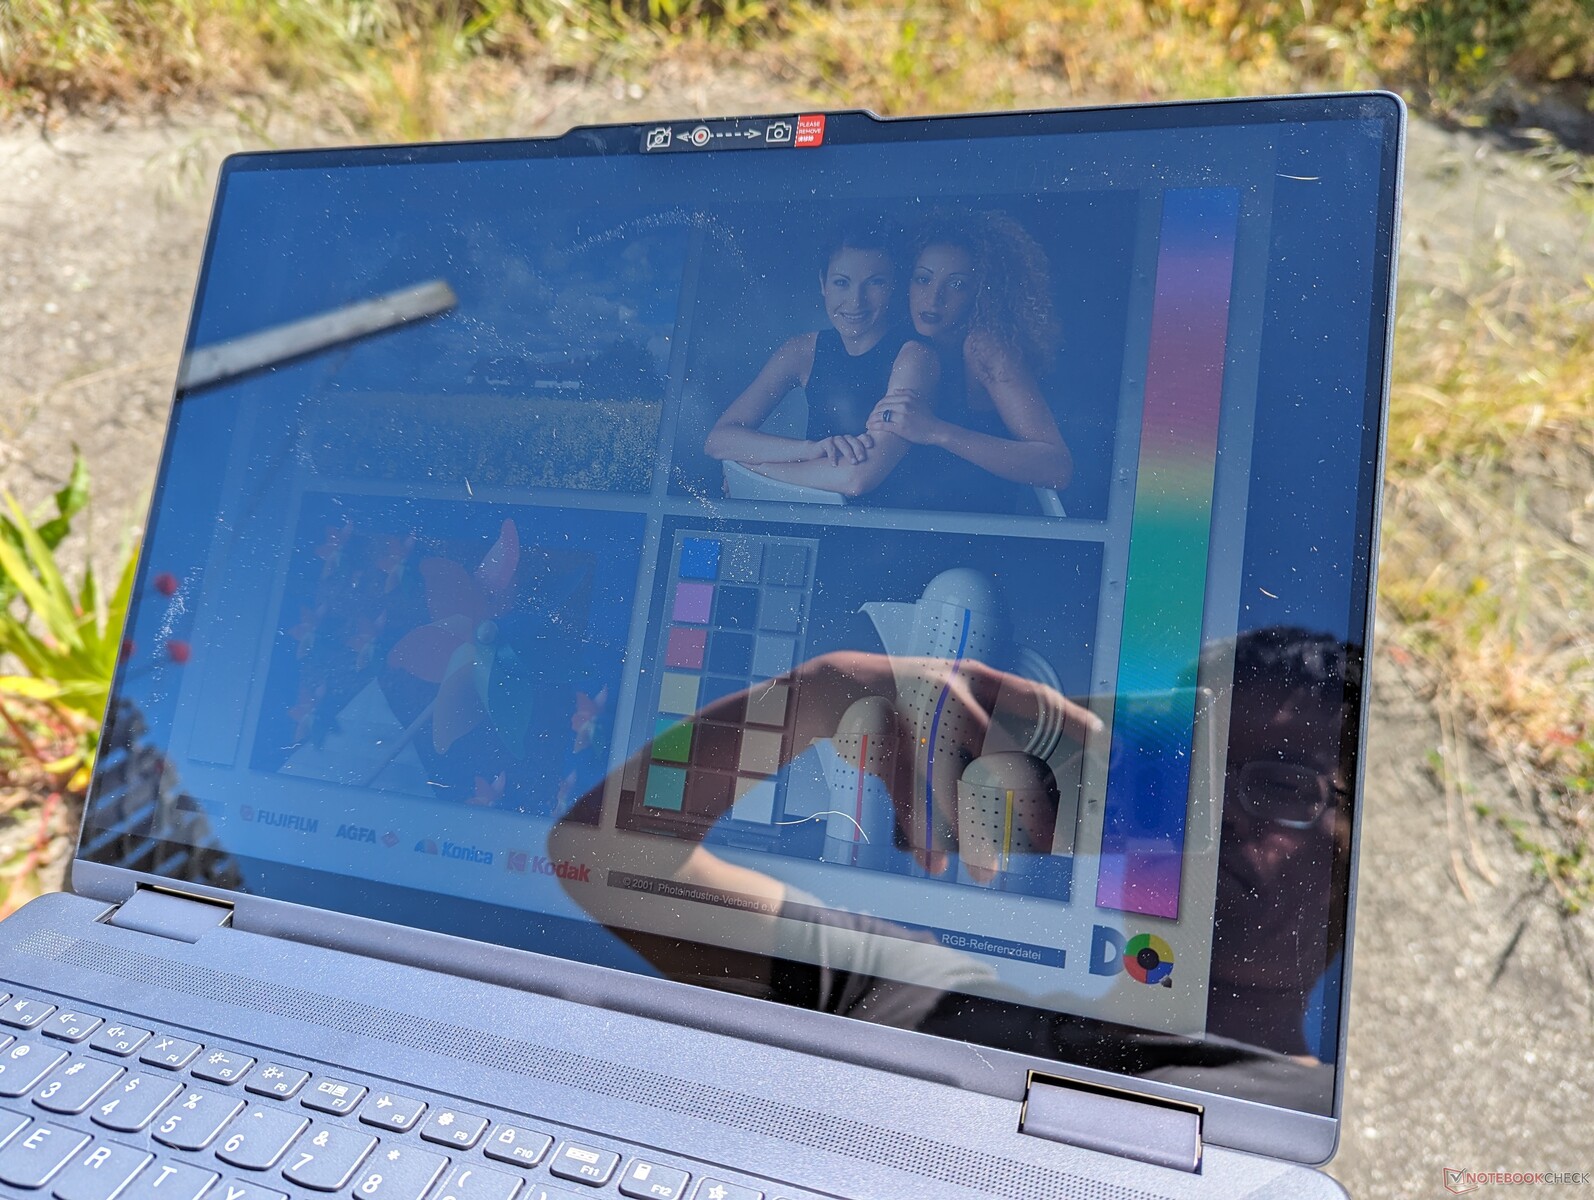
Es sind keine neuen Display-Optionen verfügbar, d. h. alle Konfigurationen verwenden nach wie vor dasselbe IPS-Panel wie beim Modell 2023. Dieses spezielle Panel deckt nur ~60% von sRGB ab (d. h. 45 % NTSC), was es automatisch als Budget-Panel der unteren Preisklasse einstuft. Die meisten anderen 16-Zoll-Notebooks bieten im Vergleich dazu eine vollständige sRGB-Abdeckung, sogar das ähnlich teure Dell Inspiron 16 7635 2-in-1.


| |||||||||||||||||||||||||
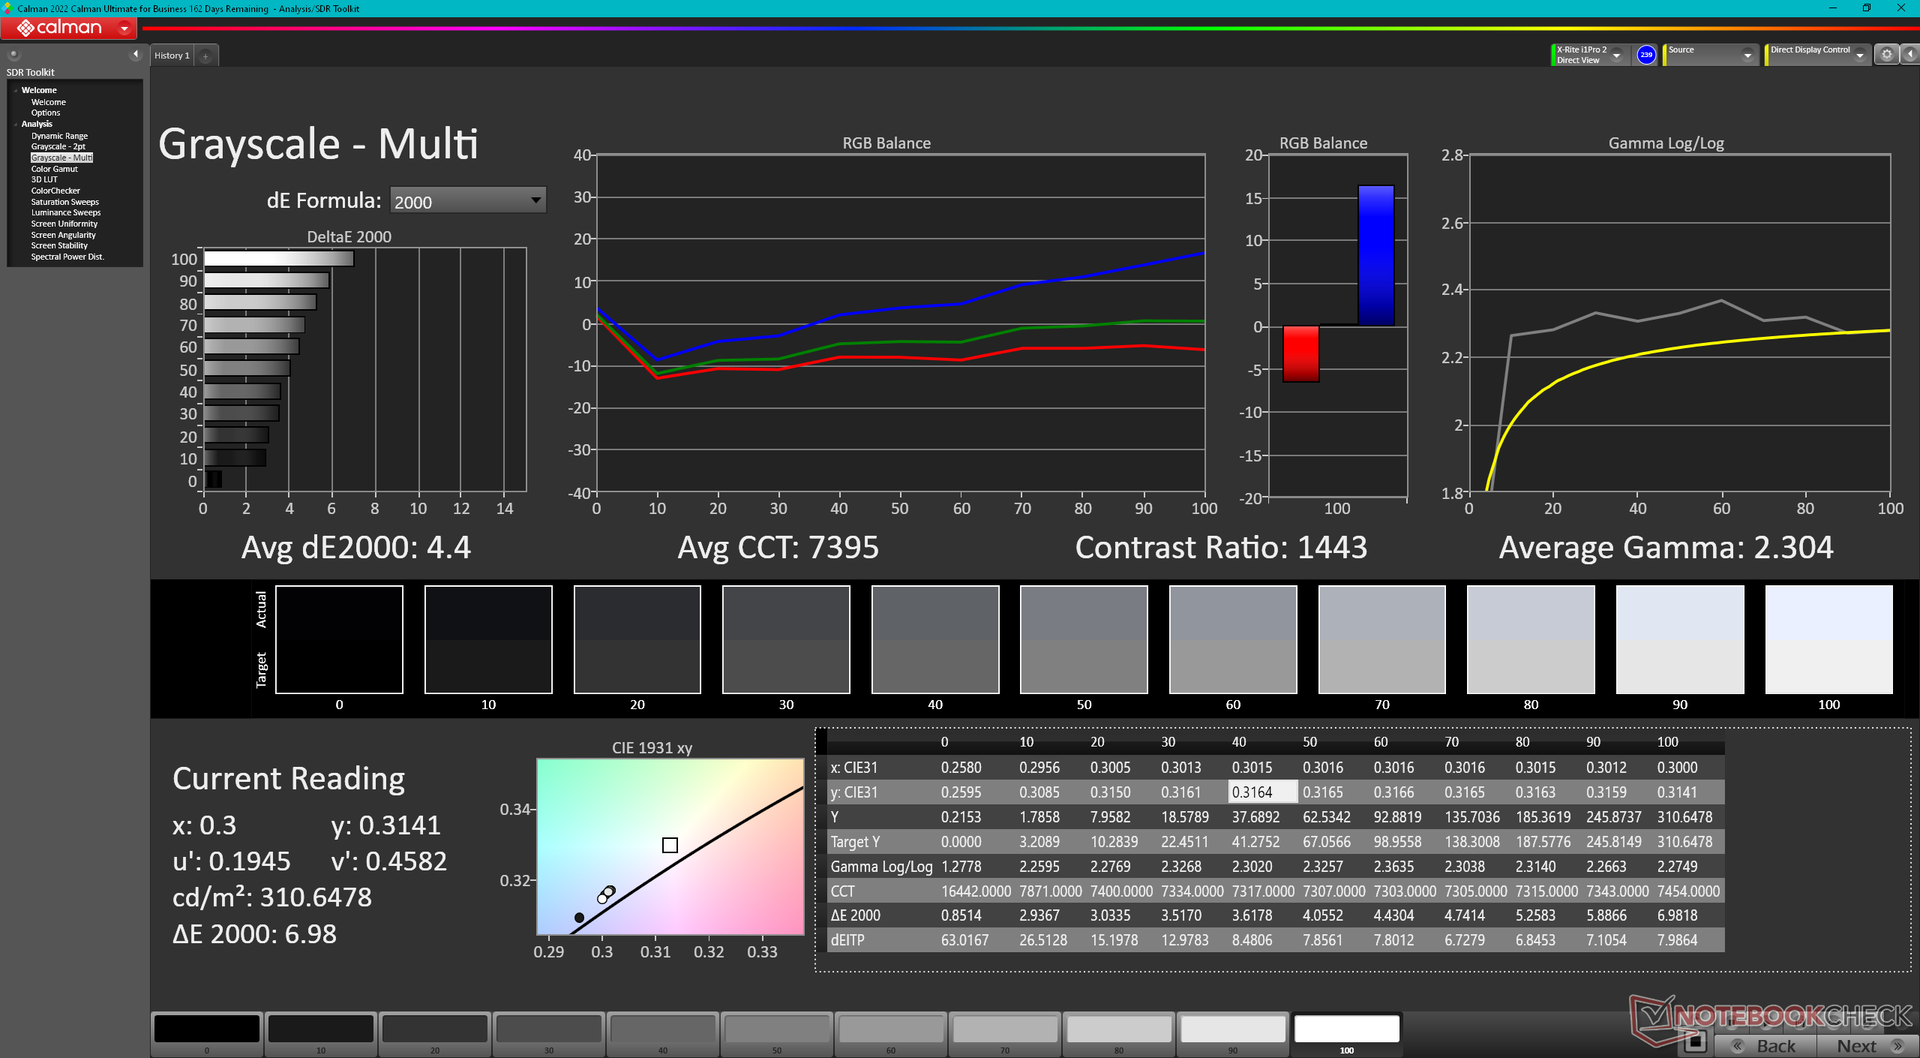
Ausleuchtung: 82 %
Helligkeit Akku: 313.3 cd/m²
Kontrast: 895:1 (Schwarzwert: 0.35 cd/m²)
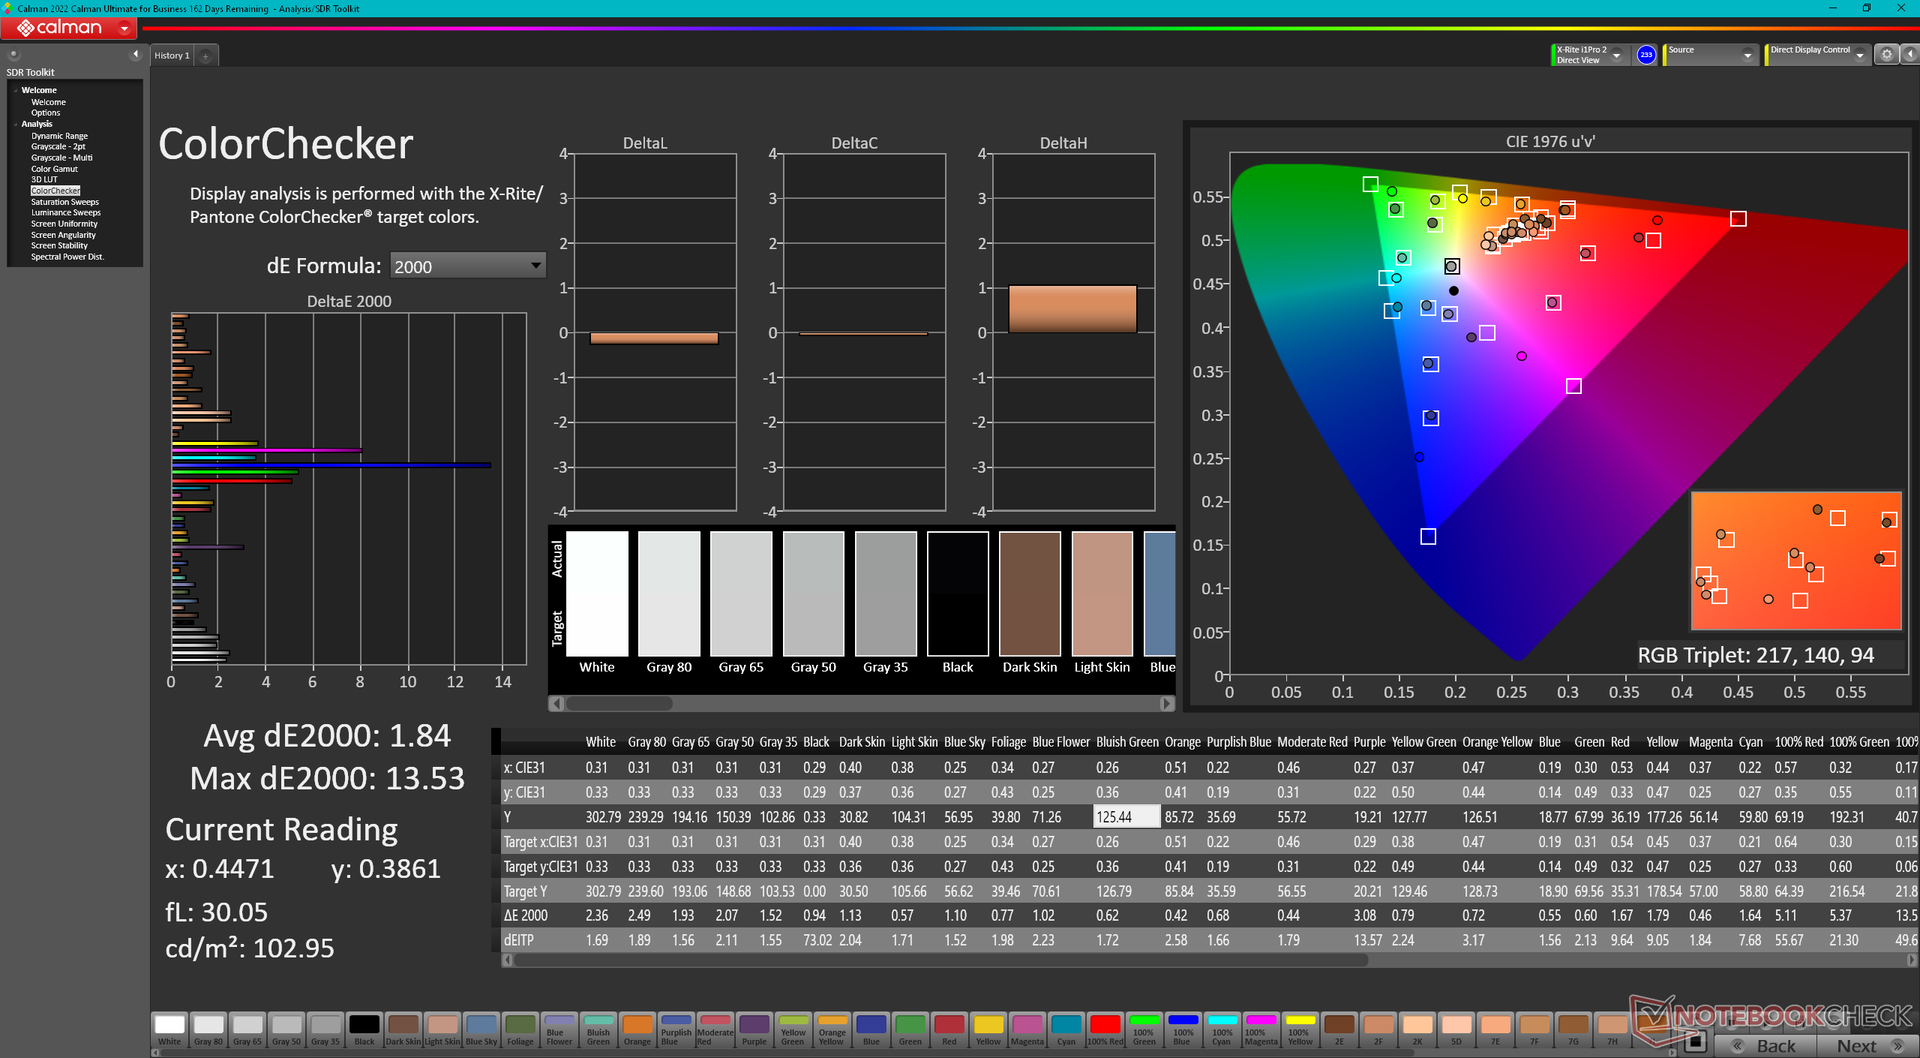
ΔE ColorChecker Calman: 4.41 | ∀{0.5-29.43 Ø4.72}
calibrated: 1.84
ΔE Greyscale Calman: 4.4 | ∀{0.09-98 Ø4.97}
42.3% AdobeRGB 1998 (Argyll 3D)
61.4% sRGB (Argyll 3D)
40.9% Display P3 (Argyll 3D)
Gamma: 2.3
CCT: 7395 K
| Lenovo Yoga 7 2-in-1 16IML9 LEN160FHD, IPS, 1920x1200, 16" | Lenovo Yoga 7 16IRL8 LEN160FHD, IPS, 1920x1200, 16" | Samsung Galaxy Book4 Pro 16 ATNA60CL07-0, OLED, 2880x1800, 16" | HP Pavilion Plus 16-ab0456tx AU Optronics AUOFDA4, IPS, 2560x1600, 16" | LG Gram 2in1 16 16T90R - G.AA78G LP160WQ1-SPB2, IPS, 2560x1600, 16" | Dell Inspiron 16 7635 2-in-1 Chi Mei 160JCA, IPS, 1920x1200, 16" | |
|---|---|---|---|---|---|---|
| Display | 3% | 112% | 75% | 100% | 63% | |
| Display P3 Coverage (%) | 40.9 | 42 3% | 99.5 143% | 74.6 82% | 96.5 136% | 67.4 65% |
| sRGB Coverage (%) | 61.4 | 62.8 2% | 100 63% | 99 61% | 99.9 63% | 98.2 60% |
| AdobeRGB 1998 Coverage (%) | 42.3 | 43.5 3% | 97.5 130% | 76.5 81% | 84.6 100% | 69.5 64% |
| Response Times | 3% | 98% | 71% | -9% | 16% | |
| Response Time Grey 50% / Grey 80% * (ms) | 32.1 ? | 31.8 ? 1% | 0.64 ? 98% | 9.06 ? 72% | 38.4 ? -20% | 27.6 ? 14% |
| Response Time Black / White * (ms) | 21.8 ? | 20.9 ? 4% | 0.68 ? 97% | 6.7 ? 69% | 21.4 ? 2% | 18.2 ? 17% |
| PWM Frequency (Hz) | 240 ? | |||||
| Bildschirm | 4% | 51% | 23% | 9% | 22% | |
| Helligkeit Bildmitte (cd/m²) | 313.3 | 279.4 -11% | 385 23% | 403 29% | 329 5% | 301.3 -4% |
| Brightness (cd/m²) | 294 | 257 -13% | 391 33% | 394 34% | 310 5% | 269 -9% |
| Brightness Distribution (%) | 82 | 81 -1% | 97 18% | 90 10% | 88 7% | 79 -4% |
| Schwarzwert * (cd/m²) | 0.35 | 0.18 49% | 0.34 3% | 0.39 -11% | 0.28 20% | |
| Kontrast (:1) | 895 | 1552 73% | 1185 32% | 844 -6% | 1076 20% | |
| Delta E Colorchecker * | 4.41 | 5.12 -16% | 1.1 75% | 3.13 29% | 3.52 20% | 3.1 30% |
| Colorchecker dE 2000 max. * | 15.75 | 19.42 -23% | 1.8 89% | 6.14 61% | 6.96 56% | 5.5 65% |
| Colorchecker dE 2000 calibrated * | 1.84 | 1.84 -0% | 1.65 10% | 1.15 38% | 0.49 73% | |
| Delta E Graustufen * | 4.4 | 5.5 -25% | 1.4 68% | 4.5 -2% | 5.75 -31% | 3.9 11% |
| Gamma | 2.3 96% | 2.22 99% | 2.24 98% | 2.18 101% | 2.137 103% | 2.19 100% |
| CCT | 7395 88% | 6407 101% | 6444 101% | 6261 104% | 7584 86% | 6186 105% |
| Durchschnitt gesamt (Programm / Settings) | 3% /
3% | 87% /
76% | 56% /
41% | 33% /
26% | 34% /
30% |
* ... kleinere Werte sind besser


Die Farbtemperatur ist etwas zu kühl ab Werk. Wir empfehlen die Anwendung unseres kalibrierten ICM-Profils (siehe oben), um die Farben näher dem sRGB-Standard anzugleichen.


Reaktionszeiten (Response Times) des Displays
| ↔ Reaktionszeiten Schwarz zu Weiß | ||
|---|---|---|
| 21.8 ms ... steigend ↗ und fallend ↘ kombiniert | ↗ 12.6 ms steigend | 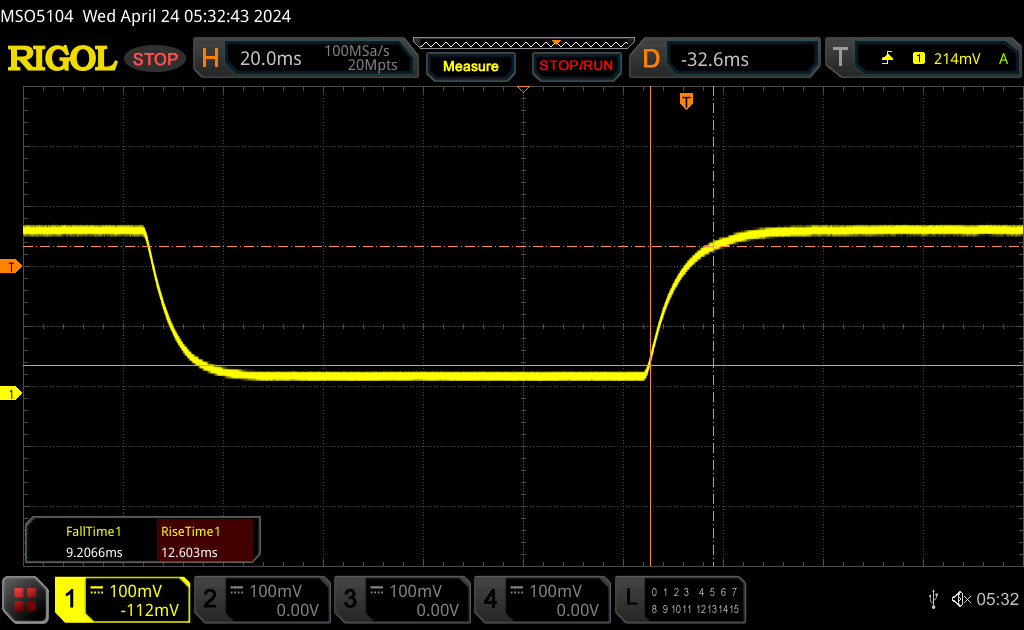 |
| ↘ 9.2 ms fallend | ||
| Die gemessenen Reaktionszeiten sind gut, für anspruchsvolle Spieler könnten der Bildschirm jedoch zu langsam sein. Im Vergleich rangierten die bei uns getesteten Geräte von 0.1 (Minimum) zu 240 (Maximum) ms. » 48 % aller Screens waren schneller als der getestete. Daher sind die gemessenen Reaktionszeiten schlechter als der Durchschnitt aller vermessenen Geräte (19.8 ms). | ||
| ↔ Reaktionszeiten 50% Grau zu 80% Grau | ||
| 32.1 ms ... steigend ↗ und fallend ↘ kombiniert | ↗ 15.3 ms steigend | 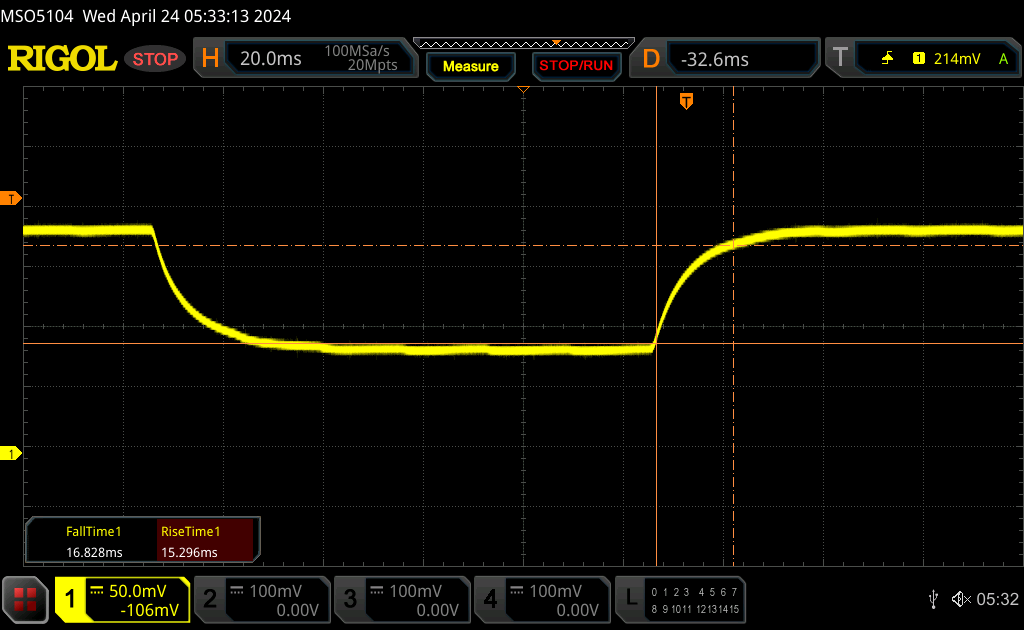 |
| ↘ 16.8 ms fallend | ||
| Die gemessenen Reaktionszeiten sind langsam und dadurch für viele Spieler wahrscheinlich zu langsam. Im Vergleich rangierten die bei uns getesteten Geräte von 0.165 (Minimum) zu 636 (Maximum) ms. » 44 % aller Screens waren schneller als der getestete. Daher sind die gemessenen Reaktionszeiten durchschnittlich (31 ms). | ||
Bildschirm-Flackern / PWM (Pulse-Width Modulation)
| Flackern / PWM nicht festgestellt |  | ||
Im Vergleich: 52 % aller getesteten Geräte nutzten kein PWM um die Helligkeit zu reduzieren. Wenn PWM eingesetzt wurde, dann bei einer Frequenz von durchschnittlich 7763 (Minimum 5, Maximum 343500) Hz. | |||


Performance - Meteor Lake-U für KI-Beschleunigung


Testbedingungen
Wir haben sowohl Windows als auch Lenovo Vantage auf den Modus Performance eingestellt, bevor wir die folgenden Benchmarks durchgeführt haben.


Prozessor
Die rohe Leistung des Core Ultra 5 125U ist fast identisch mit der des letztjährigen Core i5-1335U, auch wenn die neuere CPU als direkter Ersatz dient. In der Tat, der ältere Core i7-1355U wie er im Yoga 7 2-in-1 16IRL8 zu finden ist, kann den Core Ultra 5 125U um 5 bis 10 Prozent übertreffen. Nutzer, die den Core Ultra 5 125U bevorzugen, sollten sich daher für seine integrierte NPU entscheiden, um bestimmte KI-Aufgaben zu beschleunigen, die in naher Zukunft auf Windows zukommen werden.
Ein Upgrade auf die Core Ultra 7 155U-Konfiguration dürfte die Leistung nur geringfügig steigern, wie wir in unserer Zeit mit dem Yoga Book 9 feststellen konnten.
Cinebench R15 Multi Loop
Cinebench R23: Multi Core | Single Core
Cinebench R20: CPU (Multi Core) | CPU (Single Core)
Cinebench R15: CPU Multi 64Bit | CPU Single 64Bit
Blender: v2.79 BMW27 CPU
7-Zip 18.03: 7z b 4 | 7z b 4 -mmt1
Geekbench 6.7: Multi-Core | Single-Core
Geekbench 5.5: Multi-Core | Single-Core
HWBOT x265 Benchmark v2.2: 4k Preset
LibreOffice : 20 Documents To PDF
R Benchmark 2.5: Overall mean
| Geekbench 6.7 / Multi-Core | |
| Lenovo Yoga Pro 9 16IMH9 | |
| Lenovo ThinkPad Z16 Gen 2 | |
| Samsung Galaxy Book4 Pro 16 | |
| HP Pavilion Plus 16-ab0456tx | |
| LG Gram 2in1 16 16T90R - G.AA78G | |
| Lenovo Yoga 7 2-in-1 16IML9 | |
| Durchschnittliche Intel Core Ultra 5 125U (8384 - 9601, n=9) | |
| Lenovo Thinkpad X1 Fold 16 | |
| Lenovo ThinkPad E16 G1 Core i5-1335U | |
| Geekbench 6.7 / Single-Core | |
| Lenovo ThinkPad Z16 Gen 2 | |
| HP Pavilion Plus 16-ab0456tx | |
| Lenovo Yoga Pro 9 16IMH9 | |
| Samsung Galaxy Book4 Pro 16 | |
| LG Gram 2in1 16 16T90R - G.AA78G | |
| Lenovo Thinkpad X1 Fold 16 | |
| Durchschnittliche Intel Core Ultra 5 125U (2129 - 2177, n=9) | |
| Lenovo Yoga 7 2-in-1 16IML9 | |
Cinebench R23: Multi Core | Single Core
Cinebench R20: CPU (Multi Core) | CPU (Single Core)
Cinebench R15: CPU Multi 64Bit | CPU Single 64Bit
Blender: v2.79 BMW27 CPU
7-Zip 18.03: 7z b 4 | 7z b 4 -mmt1
Geekbench 6.7: Multi-Core | Single-Core
Geekbench 5.5: Multi-Core | Single-Core
HWBOT x265 Benchmark v2.2: 4k Preset
LibreOffice : 20 Documents To PDF
R Benchmark 2.5: Overall mean
* ... kleinere Werte sind besser
AIDA64: FP32 Ray-Trace | FPU Julia | CPU SHA3 | CPU Queen | FPU SinJulia | FPU Mandel | CPU AES | CPU ZLib | FP64 Ray-Trace | CPU PhotoWorxx
| Performance Rating | |
| HP Pavilion Plus 16-ab0456tx | |
| Samsung Galaxy Book4 Pro 16 | |
| LG Gram 2in1 16 16T90R - G.AA78G | |
| Dell Inspiron 16 7635 2-in-1 | |
| Lenovo Yoga 7 2-in-1 16IML9 | |
| Durchschnittliche Intel Core Ultra 5 125U | |
| Lenovo Yoga 7 16IRL8 | |
| AIDA64 / FP32 Ray-Trace | |
| HP Pavilion Plus 16-ab0456tx | |
| Samsung Galaxy Book4 Pro 16 | |
| Dell Inspiron 16 7635 2-in-1 | |
| LG Gram 2in1 16 16T90R - G.AA78G | |
| LG Gram 2in1 16 16T90R - G.AA78G | |
| Lenovo Yoga 7 2-in-1 16IML9 | |
| Durchschnittliche Intel Core Ultra 5 125U (5784 - 9282, n=9) | |
| Lenovo Yoga 7 16IRL8 | |
| AIDA64 / FPU Julia | |
| HP Pavilion Plus 16-ab0456tx | |
| Samsung Galaxy Book4 Pro 16 | |
| Dell Inspiron 16 7635 2-in-1 | |
| LG Gram 2in1 16 16T90R - G.AA78G | |
| Lenovo Yoga 7 2-in-1 16IML9 | |
| Durchschnittliche Intel Core Ultra 5 125U (29578 - 47366, n=9) | |
| Lenovo Yoga 7 16IRL8 | |
| AIDA64 / CPU SHA3 | |
| Samsung Galaxy Book4 Pro 16 | |
| HP Pavilion Plus 16-ab0456tx | |
| LG Gram 2in1 16 16T90R - G.AA78G | |
| Durchschnittliche Intel Core Ultra 5 125U (1565 - 2669, n=9) | |
| Lenovo Yoga 7 2-in-1 16IML9 | |
| Lenovo Yoga 7 16IRL8 | |
| Dell Inspiron 16 7635 2-in-1 | |
| AIDA64 / CPU Queen | |
| HP Pavilion Plus 16-ab0456tx | |
| Samsung Galaxy Book4 Pro 16 | |
| LG Gram 2in1 16 16T90R - G.AA78G | |
| Dell Inspiron 16 7635 2-in-1 | |
| Lenovo Yoga 7 16IRL8 | |
| Lenovo Yoga 7 2-in-1 16IML9 | |
| Durchschnittliche Intel Core Ultra 5 125U (44385 - 47868, n=9) | |
| AIDA64 / FPU SinJulia | |
| Samsung Galaxy Book4 Pro 16 | |
| HP Pavilion Plus 16-ab0456tx | |
| Dell Inspiron 16 7635 2-in-1 | |
| LG Gram 2in1 16 16T90R - G.AA78G | |
| Lenovo Yoga 7 2-in-1 16IML9 | |
| Durchschnittliche Intel Core Ultra 5 125U (4390 - 5507, n=9) | |
| Lenovo Yoga 7 16IRL8 | |
| AIDA64 / FPU Mandel | |
| HP Pavilion Plus 16-ab0456tx | |
| Dell Inspiron 16 7635 2-in-1 | |
| Samsung Galaxy Book4 Pro 16 | |
| LG Gram 2in1 16 16T90R - G.AA78G | |
| Lenovo Yoga 7 2-in-1 16IML9 | |
| Durchschnittliche Intel Core Ultra 5 125U (14563 - 24922, n=9) | |
| Lenovo Yoga 7 16IRL8 | |
| AIDA64 / CPU AES | |
| LG Gram 2in1 16 16T90R - G.AA78G | |
| Samsung Galaxy Book4 Pro 16 | |
| HP Pavilion Plus 16-ab0456tx | |
| Lenovo Yoga 7 2-in-1 16IML9 | |
| Durchschnittliche Intel Core Ultra 5 125U (33640 - 48114, n=9) | |
| Lenovo Yoga 7 16IRL8 | |
| Dell Inspiron 16 7635 2-in-1 | |
| AIDA64 / CPU ZLib | |
| HP Pavilion Plus 16-ab0456tx | |
| Samsung Galaxy Book4 Pro 16 | |
| LG Gram 2in1 16 16T90R - G.AA78G | |
| Lenovo Yoga 7 2-in-1 16IML9 | |
| Durchschnittliche Intel Core Ultra 5 125U (457 - 779, n=9) | |
| Lenovo Yoga 7 16IRL8 | |
| Dell Inspiron 16 7635 2-in-1 | |
| AIDA64 / FP64 Ray-Trace | |
| HP Pavilion Plus 16-ab0456tx | |
| Samsung Galaxy Book4 Pro 16 | |
| LG Gram 2in1 16 16T90R - G.AA78G | |
| Dell Inspiron 16 7635 2-in-1 | |
| Lenovo Yoga 7 2-in-1 16IML9 | |
| Durchschnittliche Intel Core Ultra 5 125U (2904 - 4846, n=9) | |
| Lenovo Yoga 7 16IRL8 | |
| AIDA64 / CPU PhotoWorxx | |
| Samsung Galaxy Book4 Pro 16 | |
| Lenovo Yoga 7 2-in-1 16IML9 | |
| LG Gram 2in1 16 16T90R - G.AA78G | |
| Lenovo Yoga 7 16IRL8 | |
| HP Pavilion Plus 16-ab0456tx | |
| Durchschnittliche Intel Core Ultra 5 125U (24082 - 47875, n=9) | |
| Dell Inspiron 16 7635 2-in-1 | |
Stresstest
Die Kerntemperatur ist im Allgemeinen um einige Grad Celsius höher als beim letztjährigen Modell. Wenn Prime95 oder Witcher 3 läuft, stabilisiert sich die CPU beispielsweise bei 79 bzw. 68 °C, verglichen mit 64 bzw. 63 °C beim Yoga 7 16IRL8. Die CPU stieg auf 4,1 GHz und 41 W an bei Prime95 Stress, bevor sie schnell abfällt und sich bei 2,4 GHz und 28 W stabilisiert, um die begrenzte Nachhaltigkeit des Turbo Boost zu demonstrieren.


| CPU-Takt (GHz) | GPU-Takt (MHz) | Durchschnittliche CPU-Temperatur (°C) | |
| System Leerlauf | -- | -- | 44 |
| Prime95 Stress | ~2.8 | 400 | 79 |
| Prime95 + FurMark Stress | ~2.1 | 950 - 1450 | 74 |
| Witcher 3 Stress | ~0.4 | 1850 | 68 |
System Performance
Die PCMark Ergebnisse sind fast identisch mit denen des Vorjahresmodells und zeigen keine größeren Leistungssteigerungen beim täglichen Surfen oder bei der Bearbeitung von Aufgaben.

CrossMark: Overall | Productivity | Creativity | Responsiveness
WebXPRT 3: Overall
WebXPRT 4: Overall
Mozilla Kraken 1.1: Total
| PCMark 10 / Score | |
| Samsung Galaxy Book4 Pro 16 | |
| HP Pavilion Plus 16-ab0456tx | |
| Dell Inspiron 16 7635 2-in-1 | |
| Lenovo Yoga 7 16IRL8 | |
| Durchschnittliche Intel Core Ultra 5 125U, Intel Graphics 4-Core iGPU (Meteor / Arrow Lake) (5639 - 6421, n=9) | |
| Lenovo Yoga 7 2-in-1 16IML9 | |
| LG Gram 2in1 16 16T90R - G.AA78G | |
| PCMark 10 / Essentials | |
| Lenovo Yoga 7 16IRL8 | |
| LG Gram 2in1 16 16T90R - G.AA78G | |
| Samsung Galaxy Book4 Pro 16 | |
| Lenovo Yoga 7 2-in-1 16IML9 | |
| Dell Inspiron 16 7635 2-in-1 | |
| Durchschnittliche Intel Core Ultra 5 125U, Intel Graphics 4-Core iGPU (Meteor / Arrow Lake) (8926 - 10827, n=9) | |
| HP Pavilion Plus 16-ab0456tx | |
| PCMark 10 / Productivity | |
| Dell Inspiron 16 7635 2-in-1 | |
| HP Pavilion Plus 16-ab0456tx | |
| Samsung Galaxy Book4 Pro 16 | |
| Durchschnittliche Intel Core Ultra 5 125U, Intel Graphics 4-Core iGPU (Meteor / Arrow Lake) (7548 - 11478, n=9) | |
| Lenovo Yoga 7 2-in-1 16IML9 | |
| Lenovo Yoga 7 16IRL8 | |
| LG Gram 2in1 16 16T90R - G.AA78G | |
| PCMark 10 / Digital Content Creation | |
| Samsung Galaxy Book4 Pro 16 | |
| HP Pavilion Plus 16-ab0456tx | |
| LG Gram 2in1 16 16T90R - G.AA78G | |
| Durchschnittliche Intel Core Ultra 5 125U, Intel Graphics 4-Core iGPU (Meteor / Arrow Lake) (6367 - 7087, n=9) | |
| Lenovo Yoga 7 16IRL8 | |
| Lenovo Yoga 7 2-in-1 16IML9 | |
| Dell Inspiron 16 7635 2-in-1 | |
| CrossMark / Overall | |
| HP Pavilion Plus 16-ab0456tx | |
| Samsung Galaxy Book4 Pro 16 | |
| Lenovo Yoga 7 2-in-1 16IML9 | |
| Lenovo Yoga 7 16IRL8 | |
| LG Gram 2in1 16 16T90R - G.AA78G | |
| Durchschnittliche Intel Core Ultra 5 125U, Intel Graphics 4-Core iGPU (Meteor / Arrow Lake) (1363 - 1648, n=9) | |
| Dell Inspiron 16 7635 2-in-1 | |
| CrossMark / Productivity | |
| Samsung Galaxy Book4 Pro 16 | |
| HP Pavilion Plus 16-ab0456tx | |
| Lenovo Yoga 7 16IRL8 | |
| LG Gram 2in1 16 16T90R - G.AA78G | |
| Durchschnittliche Intel Core Ultra 5 125U, Intel Graphics 4-Core iGPU (Meteor / Arrow Lake) (1310 - 1467, n=9) | |
| Lenovo Yoga 7 2-in-1 16IML9 | |
| Dell Inspiron 16 7635 2-in-1 | |
| CrossMark / Creativity | |
| HP Pavilion Plus 16-ab0456tx | |
| Samsung Galaxy Book4 Pro 16 | |
| Lenovo Yoga 7 16IRL8 | |
| LG Gram 2in1 16 16T90R - G.AA78G | |
| Durchschnittliche Intel Core Ultra 5 125U, Intel Graphics 4-Core iGPU (Meteor / Arrow Lake) (1433 - 1561, n=9) | |
| Lenovo Yoga 7 2-in-1 16IML9 | |
| Dell Inspiron 16 7635 2-in-1 | |
| CrossMark / Responsiveness | |
| Samsung Galaxy Book4 Pro 16 | |
| LG Gram 2in1 16 16T90R - G.AA78G | |
| HP Pavilion Plus 16-ab0456tx | |
| Lenovo Yoga 7 16IRL8 | |
| Durchschnittliche Intel Core Ultra 5 125U, Intel Graphics 4-Core iGPU (Meteor / Arrow Lake) (1066 - 1443, n=9) | |
| Lenovo Yoga 7 2-in-1 16IML9 | |
| Dell Inspiron 16 7635 2-in-1 | |
| WebXPRT 3 / Overall | |
| Lenovo Yoga 7 16IRL8 | |
| HP Pavilion Plus 16-ab0456tx | |
| Samsung Galaxy Book4 Pro 16 | |
| Dell Inspiron 16 7635 2-in-1 | |
| LG Gram 2in1 16 16T90R - G.AA78G | |
| Durchschnittliche Intel Core Ultra 5 125U, Intel Graphics 4-Core iGPU (Meteor / Arrow Lake) (237 - 260, n=9) | |
| Lenovo Yoga 7 2-in-1 16IML9 | |
| WebXPRT 4 / Overall | |
| HP Pavilion Plus 16-ab0456tx | |
| Samsung Galaxy Book4 Pro 16 | |
| Lenovo Yoga 7 16IRL8 | |
| Lenovo Yoga 7 2-in-1 16IML9 | |
| Durchschnittliche Intel Core Ultra 5 125U, Intel Graphics 4-Core iGPU (Meteor / Arrow Lake) (224 - 231, n=9) | |
| Dell Inspiron 16 7635 2-in-1 | |
| Mozilla Kraken 1.1 / Total | |
| LG Gram 2in1 16 16T90R - G.AA78G | |
| Dell Inspiron 16 7635 2-in-1 | |
| Lenovo Yoga 7 2-in-1 16IML9 | |
| Durchschnittliche Intel Core Ultra 5 125U, Intel Graphics 4-Core iGPU (Meteor / Arrow Lake) (579 - 594, n=9) | |
| Samsung Galaxy Book4 Pro 16 | |
| Lenovo Yoga 7 16IRL8 | |
| HP Pavilion Plus 16-ab0456tx | |
* ... kleinere Werte sind besser
| PCMark 10 Score | 5895 Punkte | |
Hilfe | ||
| AIDA64 / Memory Copy | |
| Samsung Galaxy Book4 Pro 16 | |
| Lenovo Yoga 7 2-in-1 16IML9 | |
| Durchschnittliche Intel Core Ultra 5 125U (35467 - 82786, n=9) | |
| HP Pavilion Plus 16-ab0456tx | |
| Lenovo Yoga 7 16IRL8 | |
| LG Gram 2in1 16 16T90R - G.AA78G | |
| Dell Inspiron 16 7635 2-in-1 | |
| AIDA64 / Memory Read | |
| Samsung Galaxy Book4 Pro 16 | |
| HP Pavilion Plus 16-ab0456tx | |
| Lenovo Yoga 7 2-in-1 16IML9 | |
| Lenovo Yoga 7 16IRL8 | |
| LG Gram 2in1 16 16T90R - G.AA78G | |
| Durchschnittliche Intel Core Ultra 5 125U (38849 - 63159, n=9) | |
| Dell Inspiron 16 7635 2-in-1 | |
| AIDA64 / Memory Write | |
| Lenovo Yoga 7 16IRL8 | |
| HP Pavilion Plus 16-ab0456tx | |
| LG Gram 2in1 16 16T90R - G.AA78G | |
| Samsung Galaxy Book4 Pro 16 | |
| Lenovo Yoga 7 2-in-1 16IML9 | |
| Durchschnittliche Intel Core Ultra 5 125U (36830 - 63484, n=9) | |
| Dell Inspiron 16 7635 2-in-1 | |
| AIDA64 / Memory Latency | |
| Lenovo Yoga 7 2-in-1 16IML9 | |
| Durchschnittliche Intel Core Ultra 5 125U (125.5 - 159.1, n=9) | |
| Samsung Galaxy Book4 Pro 16 | |
| LG Gram 2in1 16 16T90R - G.AA78G | |
| Dell Inspiron 16 7635 2-in-1 | |
| Lenovo Yoga 7 16IRL8 | |
| HP Pavilion Plus 16-ab0456tx | |
* ... kleinere Werte sind besser
DPC-Latenzzeit
LatencyMon zeigt keine größeren DPC-Probleme und keine dropped frames für eine perfekte 4K60-Videowiedergabe.


| DPC Latencies / LatencyMon - interrupt to process latency (max), Web, Youtube, Prime95 | |
| LG Gram 2in1 16 16T90R - G.AA78G | |
| HP Pavilion Plus 16-ab0456tx | |
| Samsung Galaxy Book4 Pro 16 | |
| Lenovo Yoga 7 16IRL8 | |
| Lenovo Yoga 7 2-in-1 16IML9 | |
| Dell Inspiron 16 7635 2-in-1 | |
* ... kleinere Werte sind besser
Speichergeräte
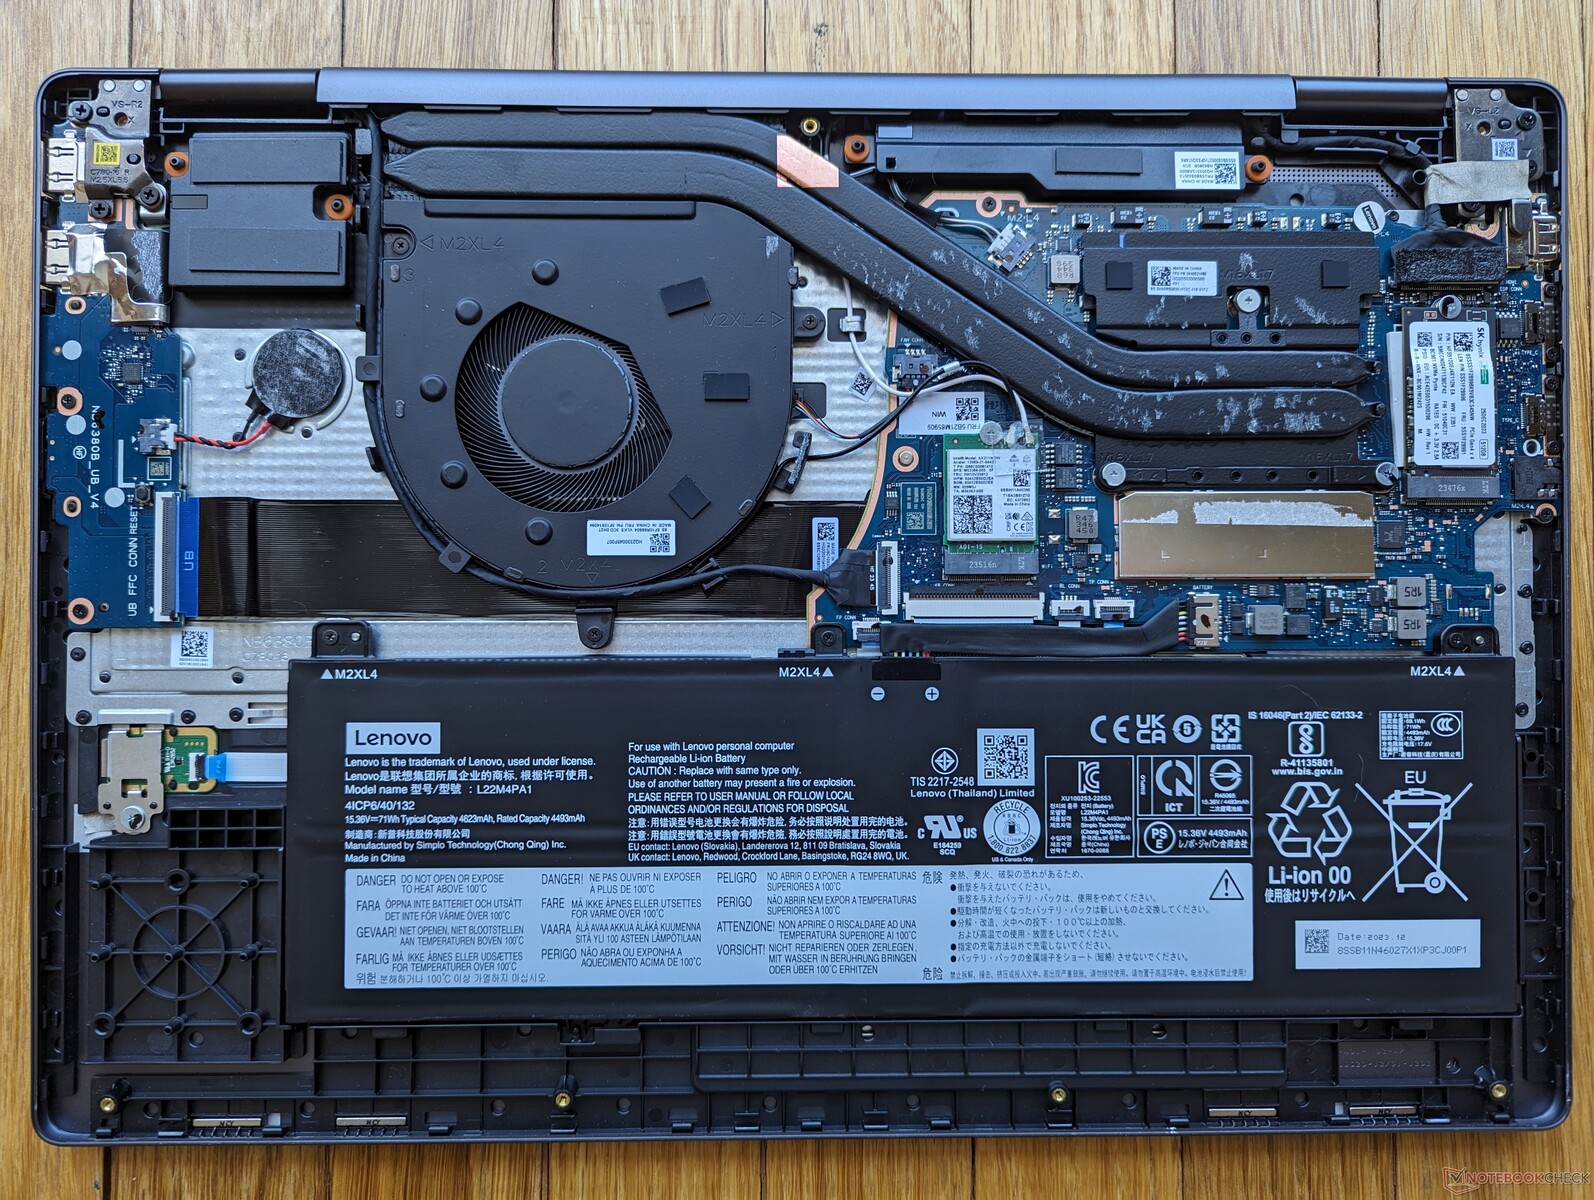
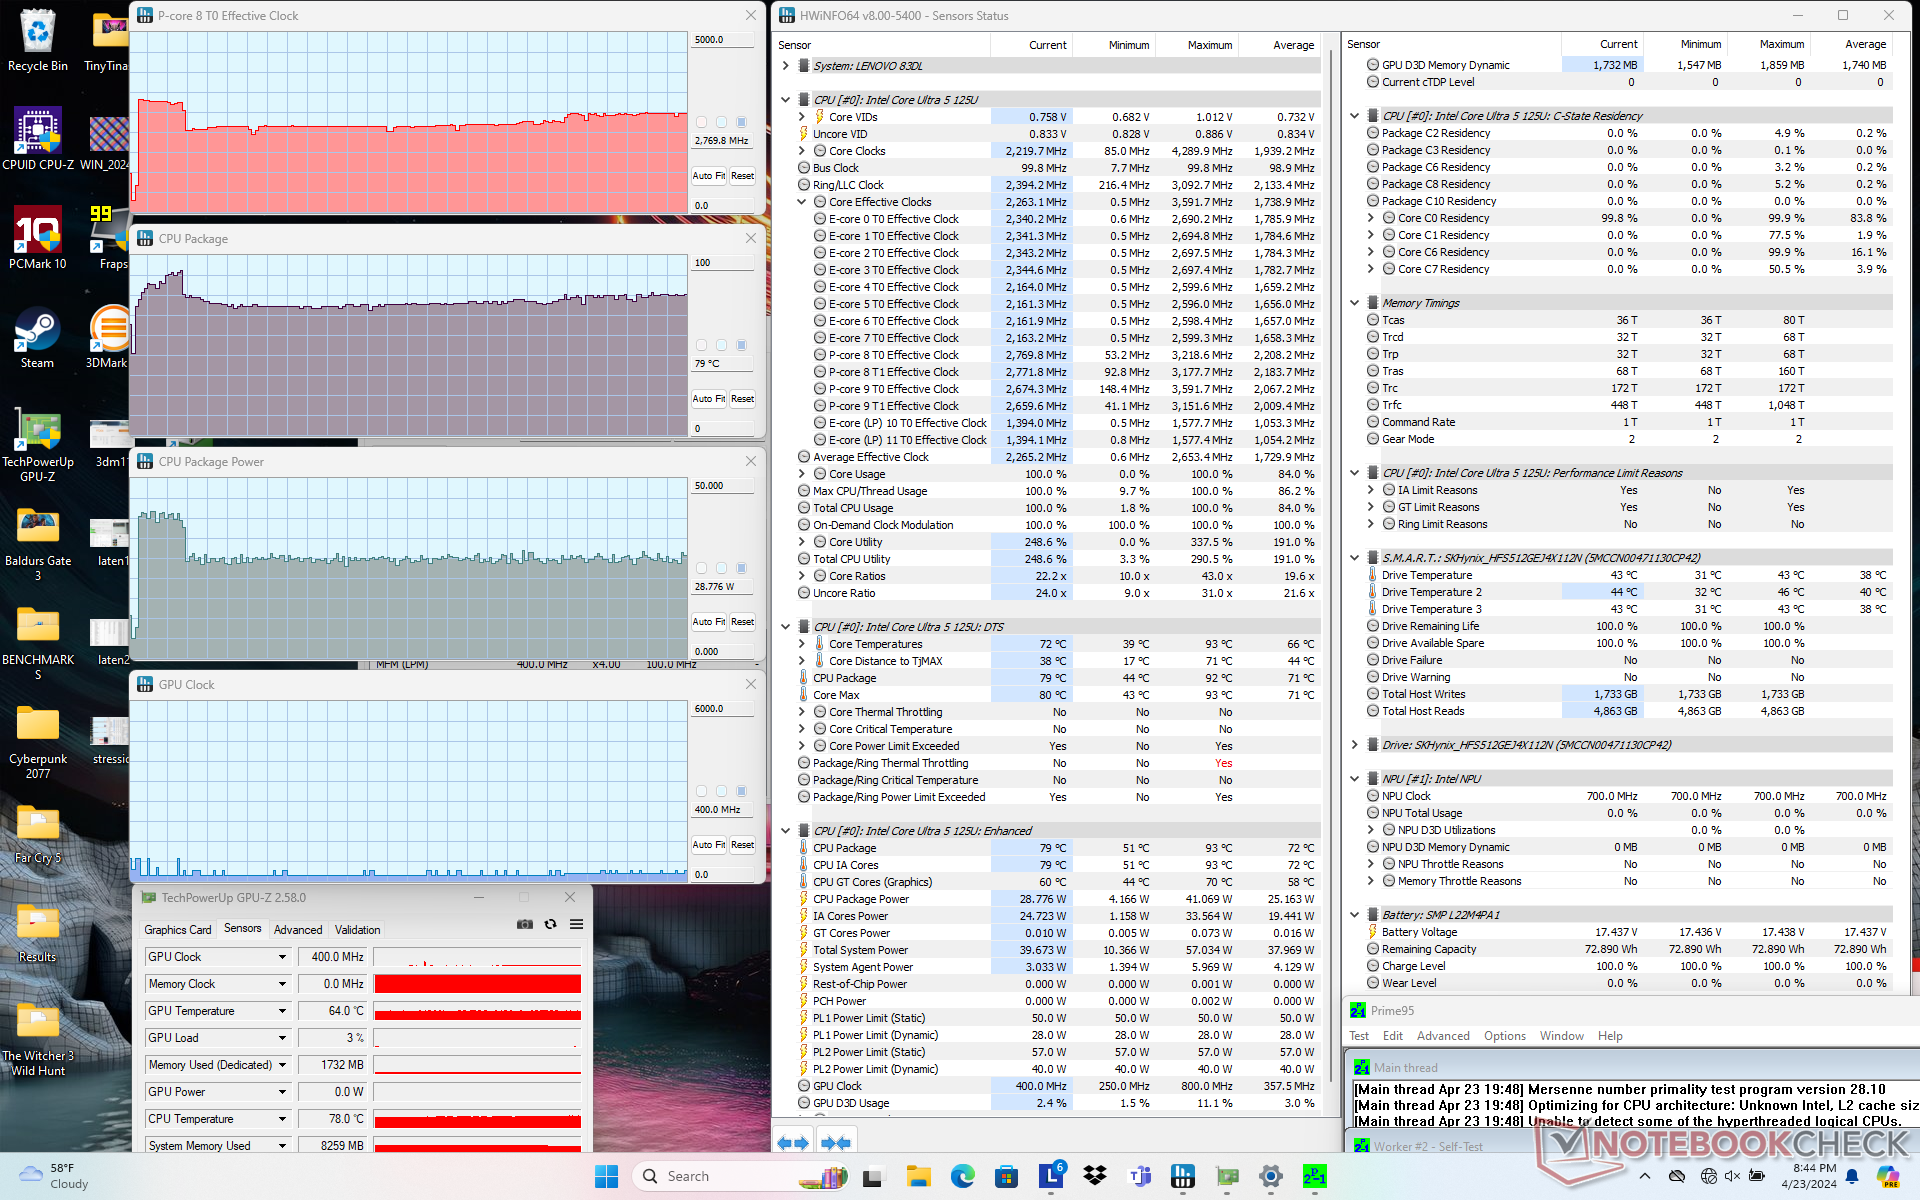
Unser Gerät wird mit dem SK Hynix HFS512GEJ4X112N geliefert, während das letztjährige Modell mit dem Western Digital PC SN740 ausgestattet war. Leider ist das SK-Hynix-Laufwerk etwas langsamer und zeigte sogar Probleme mit der Übertragungsrate, wenn es mit DiskSpd belastet wurde, wie unsere Grafik unten darstellt. Die kurzen Leistungseinbrüche traten auch nach wiederholten Tests auf, um ihre Reproduzierbarkeit zu bestätigen. Das Problem wirkt sich glücklicherweise nicht auf die tägliche Nutzung aus, es ist dennoch ungut zu sehen.


* ... kleinere Werte sind besser
Disk Throttling: DiskSpd Read Loop, Queue Depth 8
GPU Performance
Wie bereits in unserem Test des Yoga Book 9 erwähnt, bietet der integrierte Arc 4 fast die gleiche Leistung wie die älteren Iris Xe 96 EUs und liegt gleichzeitig über den Iris Xe 80 EUs um etwa 30 Prozent. Lediglich die Arc-8-Serie kann eine deutlichere Leistungssteigerung im Vergleich zum Vorjahr bieten, aber eine solche Option ist nur für Core-Ultra-H-Prozessoren verfügbar. Das Yoga 7 2-in-1 16IML9 wird ausschließlich mit Core-Ultra-U-Prozessoren ausgeliefert.
| Leistungsprofil | Grafik-Punktzahl | Physik-Wertung | Kombinierte Punktzahl |
| Performance Modus | 4.786 | 19.672 | 1.816 |
| Ausgeglichener Modus | 4.568 (-5 %) | 19.430 | 1.778 |
| Akku-Leistung | 4.870 | 19.706 | 1.709 |
Der Betrieb im ausgeglichenen Modus oder im Akkubetrieb bringt keine größeren Leistungseinbußen mit sich, wie unsere Fire-Strike-Ergebnistabelle oben zeigt.
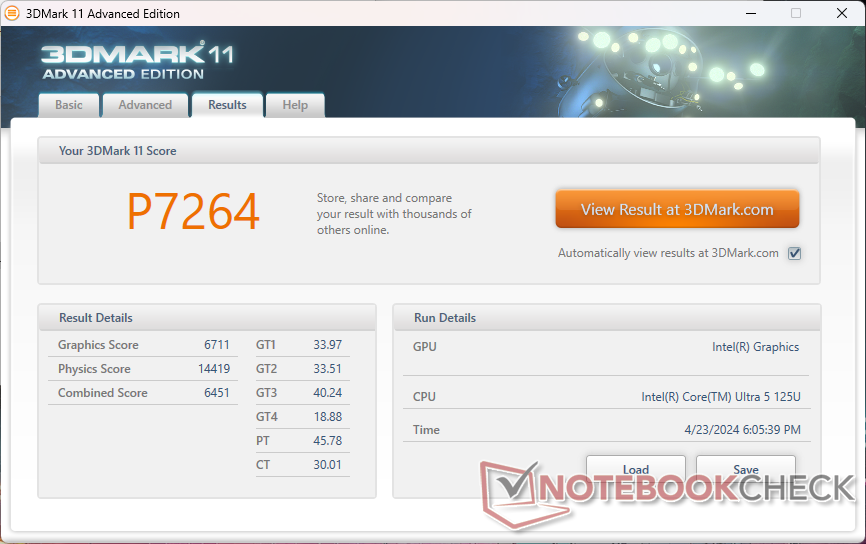


| 3DMark 11 Performance | 7264 Punkte | |
| 3DMark Cloud Gate Standard Score | 21927 Punkte | |
| 3DMark Fire Strike Score | 4557 Punkte | |
| 3DMark Time Spy Score | 1919 Punkte | |
Hilfe | ||
* ... kleinere Werte sind besser
| Performance Rating - Percent | |
| HP Pavilion Plus 16-ab0456tx | |
| Samsung Galaxy Book4 Pro 16 | |
| Lenovo Yoga 7 16IRL8 -1! | |
| LG Gram 2in1 16 16T90R - G.AA78G | |
| Lenovo Yoga 7 2-in-1 16IML9 | |
| Dell Inspiron 16 7635 2-in-1 | |
| The Witcher 3 - 1920x1080 Ultra Graphics & Postprocessing (HBAO+) | |
| HP Pavilion Plus 16-ab0456tx | |
| Samsung Galaxy Book4 Pro 16 | |
| Dell Inspiron 16 7635 2-in-1 | |
| Lenovo Yoga 7 16IRL8 | |
| Lenovo Yoga 7 2-in-1 16IML9 | |
| LG Gram 2in1 16 16T90R - G.AA78G | |
| Final Fantasy XV Benchmark - 1920x1080 High Quality | |
| HP Pavilion Plus 16-ab0456tx | |
| Samsung Galaxy Book4 Pro 16 | |
| Lenovo Yoga 7 16IRL8 | |
| LG Gram 2in1 16 16T90R - G.AA78G | |
| Lenovo Yoga 7 2-in-1 16IML9 | |
| Dell Inspiron 16 7635 2-in-1 | |
| Strange Brigade - 1920x1080 ultra AA:ultra AF:16 | |
| HP Pavilion Plus 16-ab0456tx | |
| Samsung Galaxy Book4 Pro 16 | |
| Lenovo Yoga 7 2-in-1 16IML9 | |
| LG Gram 2in1 16 16T90R - G.AA78G | |
| Dell Inspiron 16 7635 2-in-1 | |
| Dota 2 Reborn - 1920x1080 ultra (3/3) best looking | |
| HP Pavilion Plus 16-ab0456tx | |
| Samsung Galaxy Book4 Pro 16 | |
| LG Gram 2in1 16 16T90R - G.AA78G | |
| Lenovo Yoga 7 16IRL8 | |
| Lenovo Yoga 7 2-in-1 16IML9 | |
| Dell Inspiron 16 7635 2-in-1 | |
| X-Plane 11.11 - 1920x1080 high (fps_test=3) | |
| HP Pavilion Plus 16-ab0456tx | |
| Lenovo Yoga 7 16IRL8 | |
| LG Gram 2in1 16 16T90R - G.AA78G | |
| Samsung Galaxy Book4 Pro 16 | |
| Dell Inspiron 16 7635 2-in-1 | |
| Lenovo Yoga 7 2-in-1 16IML9 | |
Witcher 3 FPS Chart
| min. | mittel | hoch | max. | |
|---|---|---|---|---|
| The Witcher 3 (2015) | 86.8 | 49.6 | 28.4 | 15 |
| Dota 2 Reborn (2015) | 101.9 | 60.7 | 61.1 | 57.6 |
| Final Fantasy XV Benchmark (2018) | 37.6 | 23 | 16.3 | |
| X-Plane 11.11 (2018) | 36.5 | 28 | 23.4 | |
| Far Cry 5 (2018) | 46 | 25 | 25 | 23 |
| Strange Brigade (2018) | 120.4 | 50 | 39.2 | 30.2 |
| Tiny Tina's Wonderlands (2022) | 29.9 | 24 | 16.1 | 12.7 |
| F1 22 (2022) | 41.7 | 39.7 | ||
| Baldur's Gate 3 (2023) | 15.4 | |||
| Cyberpunk 2077 (2023) | 20.9 | 16.9 | 14.3 | 12.5 |
Emissionen - leiser, aber wärmer
Systemrauschen
Die Lüftergeräusche sind leiser als beim letztjährigen Modell, was wahrscheinlich mit dem geringeren Stromverbrauch von Meteor Lake-U und den etwas wärmeren Kerntemperaturen zusammenhängt. Beim 3DMark 06 zum Beispiel kann unser 2024er Modell im Vergleich zum 2023er Modell über längere Zeiträume deutlich leiser bleiben, und das Gleiche gilt auch für Spielelasten. Das temporäre Maximum von >40 dB(A) kann immer noch erreicht werden, wenn Prime95 läuft.

Lautstärkediagramm
| Idle |
| 22.8 / 22.8 / 22.8 dB(A) |
| Last |
| 30.8 / 40.8 dB(A) |
 | ||
30 dB leise 40 dB(A) deutlich hörbar 50 dB(A) störend |
||
min: | ||
| Lenovo Yoga 7 2-in-1 16IML9 Graphics 4-Core iGPU (Arrow Lake), Ultra 5 125U, SK hynix HFS512GEJ4X112N | Lenovo Yoga 7 16IRL8 Iris Xe G7 96EUs, i7-1355U, WD PC SN740 512GB SDDPMQD-512G-1101 | Samsung Galaxy Book4 Pro 16 Arc 8-Core, Ultra 7 155H, Samsung PM9B1 512GB MZVL4512HBLU | HP Pavilion Plus 16-ab0456tx GeForce RTX 3050 6GB Laptop GPU, i7-13700H, WDC PC SN810 1TB | LG Gram 2in1 16 16T90R - G.AA78G Iris Xe G7 96EUs, i7-1360P, Samsung PM9A1 MZVL21T0HCLR | Dell Inspiron 16 7635 2-in-1 Vega 7, R5 7530U, Kioxia BG5 KBG50ZNS512G | |
|---|---|---|---|---|---|---|
| Geräuschentwicklung | -13% | -14% | -9% | -10% | -14% | |
| aus / Umgebung * (dB) | 22.8 | 22.8 -0% | 24.6 -8% | 22.22 3% | 25.1 -10% | 23.6 -4% |
| Idle min * (dB) | 22.8 | 22.9 -0% | 24.6 -8% | 22.22 3% | 25.1 -10% | 23.6 -4% |
| Idle avg * (dB) | 22.8 | 22.9 -0% | 24.6 -8% | 22.22 3% | 25.1 -10% | 23.6 -4% |
| Idle max * (dB) | 22.8 | 26.9 -18% | 26.4 -16% | 22.22 3% | 26.1 -14% | 23.6 -4% |
| Last avg * (dB) | 30.8 | 41.7 -35% | 40 -30% | 42.03 -36% | 31.4 -2% | 40.3 -31% |
| Witcher 3 ultra * (dB) | 31 | 41.5 -34% | 40 -29% | 42.1 -36% | 41.1 -33% | 44.2 -43% |
| Last max * (dB) | 40.8 | 43.6 -7% | 40 2% | 42.1 -3% | 36.6 10% | 44.2 -8% |
* ... kleinere Werte sind besser
Temperatur
Die Oberflächentemperaturen sind auf der linken Seite des Systems am wärmsten, wo Hotspots sowohl auf der Ober- als auch auf der Unterseite 38 °C erreichen können. Das ist nur geringfügig kühler als bei dem teureren Galaxy Book4 Pro 16, welches mit dem viel schnelleren Core Ultra 7 155H ausgestattet ist.


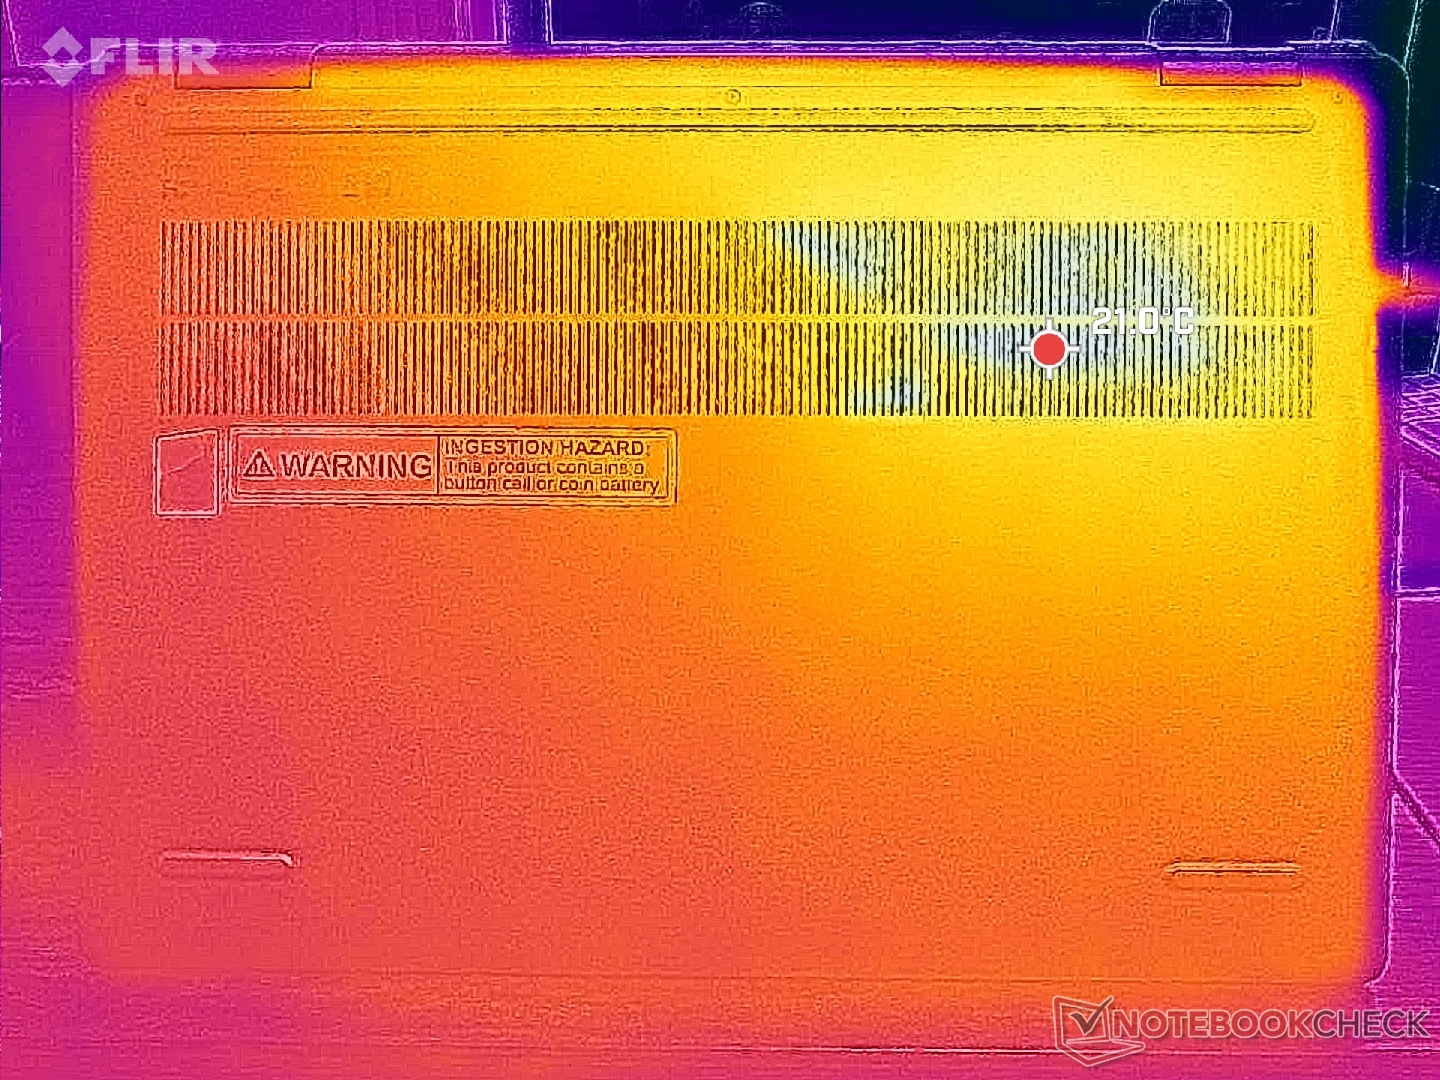
(+) Die maximale Temperatur auf der Oberseite ist 37.8 °C. Im Vergleich liegt der Klassendurchschnitt bei 35.4 °C (von 19.6 bis 60 °C für die Klasse Convertible).
(+) Auf der Unterseite messen wir eine maximalen Wert von 38.8 °C (im Vergleich zum Durchschnitt von 36.9 °C).
(+) Ohne Last messen wir eine durchschnittliche Temperatur von 24.2 °C auf der Oberseite. Der Klassendurchschnitt erreicht 30.3 °C.
(+) Die Handballen und der Touchpad-Bereich sind mit gemessenen 29.6 °C kühler als die typische Hauttemperatur und fühlen sich dadurch kühl an.
(±) Die durchschnittliche Handballen-Temperatur anderer getesteter Geräte war 28 °C (-1.6 °C).


| Lenovo Yoga 7 2-in-1 16IML9 Intel Core Ultra 5 125U, Intel Graphics 4-Core iGPU (Meteor / Arrow Lake) | Lenovo Yoga 7 16IRL8 Intel Core i7-1355U, Intel Iris Xe Graphics G7 96EUs | Samsung Galaxy Book4 Pro 16 Intel Core Ultra 7 155H, Intel Arc 8-Core iGPU | HP Pavilion Plus 16-ab0456tx Intel Core i7-13700H, NVIDIA GeForce RTX 3050 6GB Laptop GPU | LG Gram 2in1 16 16T90R - G.AA78G Intel Core i7-1360P, Intel Iris Xe Graphics G7 96EUs | Dell Inspiron 16 7635 2-in-1 AMD Ryzen 5 7530U, AMD Radeon RX Vega 7 | |
|---|---|---|---|---|---|---|
| Hitze | -9% | -2% | -34% | -35% | -9% | |
| Last oben max * (°C) | 37.8 | 37.6 1% | 40.9 -8% | 49.6 -31% | 55 -46% | 41.6 -10% |
| Last unten max * (°C) | 38.8 | 40 -3% | 42.6 -10% | 45.8 -18% | 55.4 -43% | 39 -1% |
| Idle oben max * (°C) | 25.4 | 30.4 -20% | 24.5 4% | 39.2 -54% | 34.9 -37% | 29.4 -16% |
| Idle unten max * (°C) | 26.8 | 30.6 -14% | 24.8 7% | 35.4 -32% | 30 -12% | 28.6 -7% |
* ... kleinere Werte sind besser
Lautsprecher

Lenovo Yoga 7 2-in-1 16IML9 Audio Analyse
(±) | Mittelmäßig laut spielende Lautsprecher (79.9 dB)
Bass 100 - 315 Hz
(-) | kaum Bass - 15.7% niedriger als der Median
(±) | durchschnittlich lineare Bass-Wiedergabe (7.2% Delta zum Vorgänger)
Mitteltöne 400 - 2000 Hz
(+) | ausgeglichene Mitten, vom Median nur 4.3% abweichend
(+) | lineare Mitten (4.8% Delta zum Vorgänger)
Hochtöne 2 - 16 kHz
(+) | ausgeglichene Hochtöne, vom Median nur 2.6% abweichend
(+) | sehr lineare Hochtöne (6.3% Delta zum Vorgänger)
Gesamt im hörbaren Bereich 100 - 16.000 Hz
(+) | hörbarer Bereich ist sehr linear (14.9% Abstand zum Median
Im Vergleich zu allen Geräten derselben Klasse
» 24% aller getesteten Geräte dieser Klasse waren besser, 5% vergleichbar, 72% schlechter
» Das beste Gerät hat einen Delta-Wert von 6%, durchschnittlich ist 20%, das schlechteste Gerät hat 57%
Im Vergleich zu allen Geräten im Test
» 20% aller getesteten Geräte waren besser, 4% vergleichbar, 76% schlechter
» Das beste Gerät hat einen Delta-Wert von 4%, durchschnittlich ist 23%, das schlechteste Gerät hat 134%
Apple MacBook Pro 16 2021 M1 Pro Audio Analyse
(+) | Die Lautsprecher können relativ laut spielen (84.7 dB)
Bass 100 - 315 Hz
(+) | guter Bass - nur 3.8% Abweichung vom Median
(+) | lineare Bass-Wiedergabe (5.2% Delta zum Vorgänger)
Mitteltöne 400 - 2000 Hz
(+) | ausgeglichene Mitten, vom Median nur 1.3% abweichend
(+) | lineare Mitten (2.1% Delta zum Vorgänger)
Hochtöne 2 - 16 kHz
(+) | ausgeglichene Hochtöne, vom Median nur 1.9% abweichend
(+) | sehr lineare Hochtöne (2.7% Delta zum Vorgänger)
Gesamt im hörbaren Bereich 100 - 16.000 Hz
(+) | hörbarer Bereich ist sehr linear (4.6% Abstand zum Median
Im Vergleich zu allen Geräten derselben Klasse
» 0% aller getesteten Geräte dieser Klasse waren besser, 0% vergleichbar, 100% schlechter
» Das beste Gerät hat einen Delta-Wert von 5%, durchschnittlich ist 17%, das schlechteste Gerät hat 45%
Im Vergleich zu allen Geräten im Test
» 0% aller getesteten Geräte waren besser, 0% vergleichbar, 100% schlechter
» Das beste Gerät hat einen Delta-Wert von 4%, durchschnittlich ist 23%, das schlechteste Gerät hat 134%
Energieverwaltung
Stromverbrauch
Der Betrieb von Witcher 3 unter hoher Last verbraucht 30 W, verglichen mit 44 W beim 2023er Modell. Wenn man bedenkt, dass unser integrierter Arc 4 eine ähnliche Leistung erbringt wie die älteren Iris Xe 96 EUs, ist der Gewinn an Leistung pro Watt signifikant und ein Highlight der Meteor-Lake-Serie. Die Energieeinsparungen stehen im Einklang mit dem allgemein leiseren Lüftergeräusch und der längeren Akkulaufzeit, wie in den entsprechenden Abschnitten beschrieben.
Interessanterweise wird das Modell 2024 mit einem anderen 65-W-USB-C-Netzteil ausgeliefert als das Modell 2023. Das neuere Netzteil ist schlanker, aber länger (~9 x 4,6 x 2,8 cm) und erfordert ein separates NEMA-Netzkabel im Gegensatz zu dem älteren Steckernetzteil.
(Anmerkung der Redaktion: Dieser Abschnitt wird aktualisiert, wenn die Reparaturen an unserem Metrahit Energy Multimeter im Laufe dieses Monats abgeschlossen sind. Wir bitten um Entschuldigung für die Unannehmlichkeiten.)
| Aus / Standby | |
| Idle | |
| Last |
|
Legende:
min: | |
| Lenovo Yoga 7 2-in-1 16IML9 Ultra 5 125U, Graphics 4-Core iGPU (Arrow Lake), SK hynix HFS512GEJ4X112N, IPS, 1920x1200, 16" | Lenovo Yoga 7 16IRL8 i7-1355U, Iris Xe G7 96EUs, WD PC SN740 512GB SDDPMQD-512G-1101, IPS, 1920x1200, 16" | Samsung Galaxy Book4 Pro 16 Ultra 7 155H, Arc 8-Core, Samsung PM9B1 512GB MZVL4512HBLU, OLED, 2880x1800, 16" | HP Pavilion Plus 16-ab0456tx i7-13700H, GeForce RTX 3050 6GB Laptop GPU, WDC PC SN810 1TB, IPS, 2560x1600, 16" | LG Gram 2in1 16 16T90R - G.AA78G i7-1360P, Iris Xe G7 96EUs, Samsung PM9A1 MZVL21T0HCLR, IPS, 2560x1600, 16" | Dell Inspiron 16 7635 2-in-1 R5 7530U, Vega 7, Kioxia BG5 KBG50ZNS512G, IPS, 1920x1200, 16" | |
|---|---|---|---|---|---|---|
| Stromverbrauch | -21% | -6% | -79% | -33% | -17% | |
| Idle min * (Watt) | 3 | 3.3 -10% | 3.6 -20% | 3.3 -10% | 5.5 -83% | 4.8 -60% |
| Idle avg * (Watt) | 8.5 | 10.2 -20% | 5.7 33% | 7.3 14% | 7.2 15% | 7.6 11% |
| Idle max * (Watt) | 8.9 | 10.3 -16% | 6.1 31% | 14.24 -60% | 12.9 -45% | 8.7 2% |
| Last avg * (Watt) | 41.1 | 55.2 -34% | 52.5 -28% | 91.7 -123% | 55 -34% | 47.1 -15% |
| Witcher 3 ultra * (Watt) | 30.7 | 43.8 -43% | 46.6 -52% | 96.2 -213% | 47 -53% | 46.6 -52% |
| Last max * (Watt) | 64.6 | 65.7 -2% | 64.7 -0% | 115.8 -79% | 63.6 2% | 56.4 13% |
* ... kleinere Werte sind besser
Akkulaufzeit
Die WLAN-Laufzeit hat sich um drei Stunden auf insgesamt über zwölf Stunden bei realer Nutzung erhöht. Dieser Anstieg steht im Einklang mit der oben erwähnten allgemein höheren Energieeffizienz. Tatsächlich ist die Akkulaufzeit bei fast allen Systemen, die auf Meteor-Lake-U-CPUs laufen, gestiegen.
| Lenovo Yoga 7 2-in-1 16IML9 Ultra 5 125U, Graphics 4-Core iGPU (Arrow Lake), 71 Wh | Lenovo Yoga 7 16IRL8 i7-1355U, Iris Xe G7 96EUs, 71 Wh | Samsung Galaxy Book4 Pro 16 Ultra 7 155H, Arc 8-Core, 76 Wh | HP Pavilion Plus 16-ab0456tx i7-13700H, GeForce RTX 3050 6GB Laptop GPU, 68 Wh | LG Gram 2in1 16 16T90R - G.AA78G i7-1360P, Iris Xe G7 96EUs, 80 Wh | Dell Inspiron 16 7635 2-in-1 R5 7530U, Vega 7, 64 Wh | |
|---|---|---|---|---|---|---|
| Akkulaufzeit | -24% | -13% | -15% | -3% | 18% | |
| WLAN (h) | 12.3 | 9.4 -24% | 10.7 -13% | 10.4 -15% | 11.9 -3% | 14.5 18% |
| Idle (h) | 19 | 26 | ||||
| Last (h) | 2.1 | 1.7 | 2 | 1.9 | ||
| H.264 (h) | 19.1 | 12 |
Pro
Contra
Fazit - Leiser, langlebiger und effizienter

Das Yoga 7 2-in-1 16 G9 ist bestenfalls ein kleines Update gegenüber dem Yoga 7 2-in-1 16 G8. Die bemerkenswertesten Vorteile gegenüber dem 2023er Modell sind die höhere Effizienz, die sowohl längere Laufzeiten als auch leisere Lüfter ermöglicht. Während eine bessere Akkulaufzeit immer willkommen ist, war sie beim letztjährigen Modell nicht einmal besonders schlecht, und wir hätten uns daher Verbesserungen an anderer Stelle gewünscht, wie z. B. zusätzliche Display-Optionen oder eine höhere Qualität der Lautsprecher und eine Webkamera.
Das 2024 Yoga 7 2-in-1 16IML9 bringt integrierte KI und eine längere Akkulaufzeit mit sich. Ansonsten gibt es nicht viel, was es von dem optisch identischen 2023 Modell unterscheidet.
Die neuen Optionen des Meteor-Lake-U-Prozessors zeichnen sich durch ihre integrierten NPUs zur Beschleunigung lokaler KI-Aufgaben aus. Diese Funktionen sind jedoch noch nicht weit verbreitet, so dass die große Mehrheit der Nutzer die NPU noch nicht nutzen kann. Die neuen Core Ultra 5 125U und Ultra 7 155U sind ansonsten identisch mit dem Core i7-1355U, sowohl was die CPU- als auch die GPU-Leistung betrifft.
Eine starke Alternative zum Yoga 7 2-in-1 16IML9 ist das ähnlich teure AMD betriebene Dell Inspiron 16 7635 2-in-1 und sein lebendigerer sRGB-Touchscreen. Wenn Sie dennoch das Lenovo bevorzugen, dann empfehlen wir Ihnen, das günstigere 2023 Yoga 7 2-in-1 16 G8 in Betracht zu ziehen, das im Wesentlichen die gleiche Benutzererfahrung wie das 2024er Modell für weniger Geld bieten kann.
Preis und Verfügbarkeit
Im deutschsprachigen Raum kann das Lenovo Yoga 7 2-in-1 in der Basiskonfiguration mit Core Ultra 5 und 512-GB-SSD 125U für 1.139 Euro bei Lenovo.de direkt bezogen werden. Für die Konfiguration mit Core Ultra 7 155U und 1-TB-SSD werden 1.309 Euro aufgerufen.
Lenovo Yoga 7 2-in-1 16IML9
- 28.04.2024 v7 (old)
Allen Ngo
Transparenz
Die Auswahl der zu testenden Geräte erfolgt innerhalb der Redaktion. Das vorliegende Testmuster wurde dem Autor vom Hersteller oder einem Shop zu Testzwecken leihweise zur Verfügung gestellt. Eine Einflussnahme des Leihstellers auf den Testbericht gab es nicht, der Hersteller erhielt keine Version des Reviews vor der Veröffentlichung. Es bestand keine Verpflichtung zur Publikation. Als eigenständiges, unabhängiges Unternehmen unterliegt Notebookcheck keiner Diktion von Herstellern, Shops und Verlagen.
So testet Notebookcheck
Pro Jahr werden von Notebookcheck hunderte Laptops und Smartphones unabhängig in von uns standardisierten technischen Verfahren getestet, um eine Vergleichbarkeit aller Testergebnisse zu gewährleisten. Seit rund 20 Jahren entwickeln wir diese Testmethoden kontinuierlich weiter und setzen damit Branchenstandards. In unseren Testlaboren kommt ausschließlich hochwertiges Messequipment in die Hände erfahrener Techniker und Redakteure. Die Tests unterliegen einer mehrstufigen Kontrolle. Unsere komplexe Gesamtbewertung basiert auf hunderten fundierten Messergebnissen und Benchmarks, womit Ihnen Objektivität garantiert ist. Weitere Informationen zu unseren Testmethoden gibt es hier.
Preisvergleich

