Lenovo ThinkPad E16 G1 Intel im Test: Core i5 liefert sich Kopf-an-Kopf-Rennen mit AMD Ryzen 7

Die ThinkPad-E-Serie besteht aus erschwinglichen Modellen für Businessanwender im Gegensatz zur luxuriöseren ThinkPad-T-Serie oder ThinkPad-X-Serie. In diesem Jahr wird die 16 Zoll ThinkPad E16 Familie eingeführt, die die bestehenden 14-Zoll ThinkPad E14 und 15-Zoll ThinkPad E15 Optionen ergänzt. Das ThinkPad E16 ist zum Start in zwei Versionen mit Intel- oder AMD-Prozessoren erhältlich. Wir haben vor uns kurzem die AMD Ryzen 7 Version des ThinkPad E16 angeschaut und jetzt ist es an der Zeit, die Intel Core i5 Version des ThinkPad E16 zu testen, um zu sehen, wie sich die beiden Versionen voneinander unterscheiden.
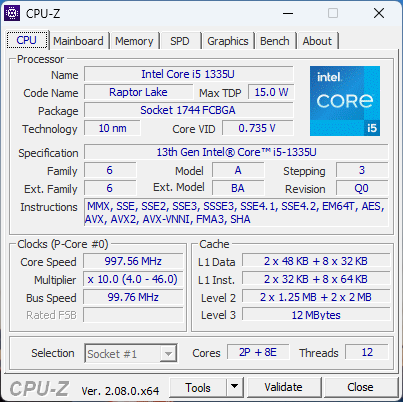
Bei unserem speziellen Intel-Testgerät handelt es sich um eine US-Konfiguration mit dem Core i5-1335U und einem 1200p-Touchscreen. Andere Konfigurationen mit Core i7-1365U, Core i7-1360P oder Core i7-13700H mit GeForce MX550-Grafik und einem höher auflösenden 1600p-Display sind zum Zeitpunkt der Veröffentlichung nicht verfügbar.
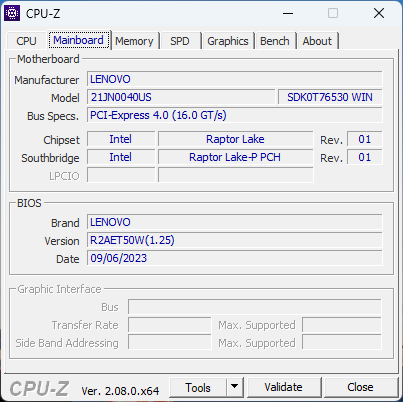
Alternativen zum ThinkPad E16 sind andere 16-Zoll-Multimedia- oder Business-Notebooks wie das Acer TravelMate P4, Samsung Galaxy Book3 Pro 16, oder LG Gram 16. Wir empfehlen Ihnen einen Blick auf unseren bestehenden Test über das ThinkPad E16 G1 AMD-Version, da unsere Intel-Version das gleiche Gehäusedesign und die gleichen physischen Eigenschaften aufweist.
Weitere Lenovo Testberichte:
Mögliche Konkurrenten im Vergleich
Bew. | Datum | Modell | Gewicht | Dicke | Größe | Auflösung | Preis ab |
|---|---|---|---|---|---|---|---|
| 85.5 % v7 (old) | 11 / 2023 | Lenovo ThinkPad E16 G1 Core i5-1335U i5-1335U, Iris Xe G7 80EUs | 1.8 kg | 19.85 mm | 16.00" | 1920x1200 | |
| 88.1 % v7 (old) | 09 / 2023 | Lenovo ThinkPad E16 G1-21JUS08X00 R7 7730U, Vega 8 | 1.8 kg | 19.85 mm | 16.00" | 2560x1600 | |
| 84.6 % v7 (old) | 07 / 2023 | Dell Inspiron 16 7635 2-in-1 R5 7530U, Vega 7 | 2 kg | 18.99 mm | 16.00" | 1920x1200 | |
| 86 % v7 (old) | 03 / 2023 | Acer TravelMate P4 TMP416-51-55KN i5-1240P, Iris Xe G7 80EUs | 1.6 kg | 18.5 mm | 16.00" | 1920x1200 | |
| 85.6 % v7 (old) | 05 / 2023 | Samsung Galaxy Book3 Pro 16 i5-1340P, Iris Xe G7 80EUs | 1.6 kg | 12.5 mm | 16.00" | 2880x1800 | |
| 86.6 % v7 (old) | 01 / 2023 | LG Gram 16Z90Q i7-1260P, Iris Xe G7 96EUs | 1.2 kg | 16.8 mm | 16.00" | 2560x1600 |
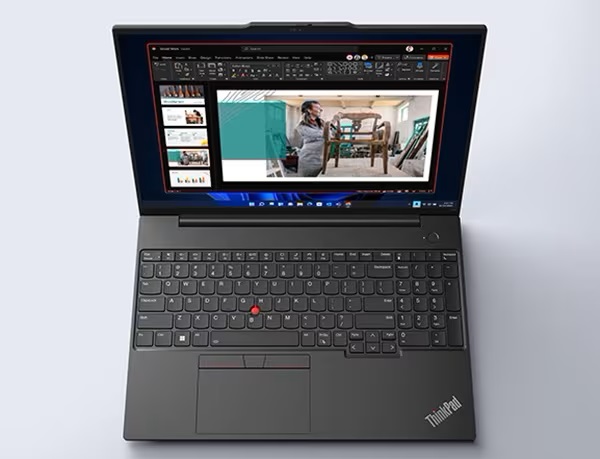
Gehäuse
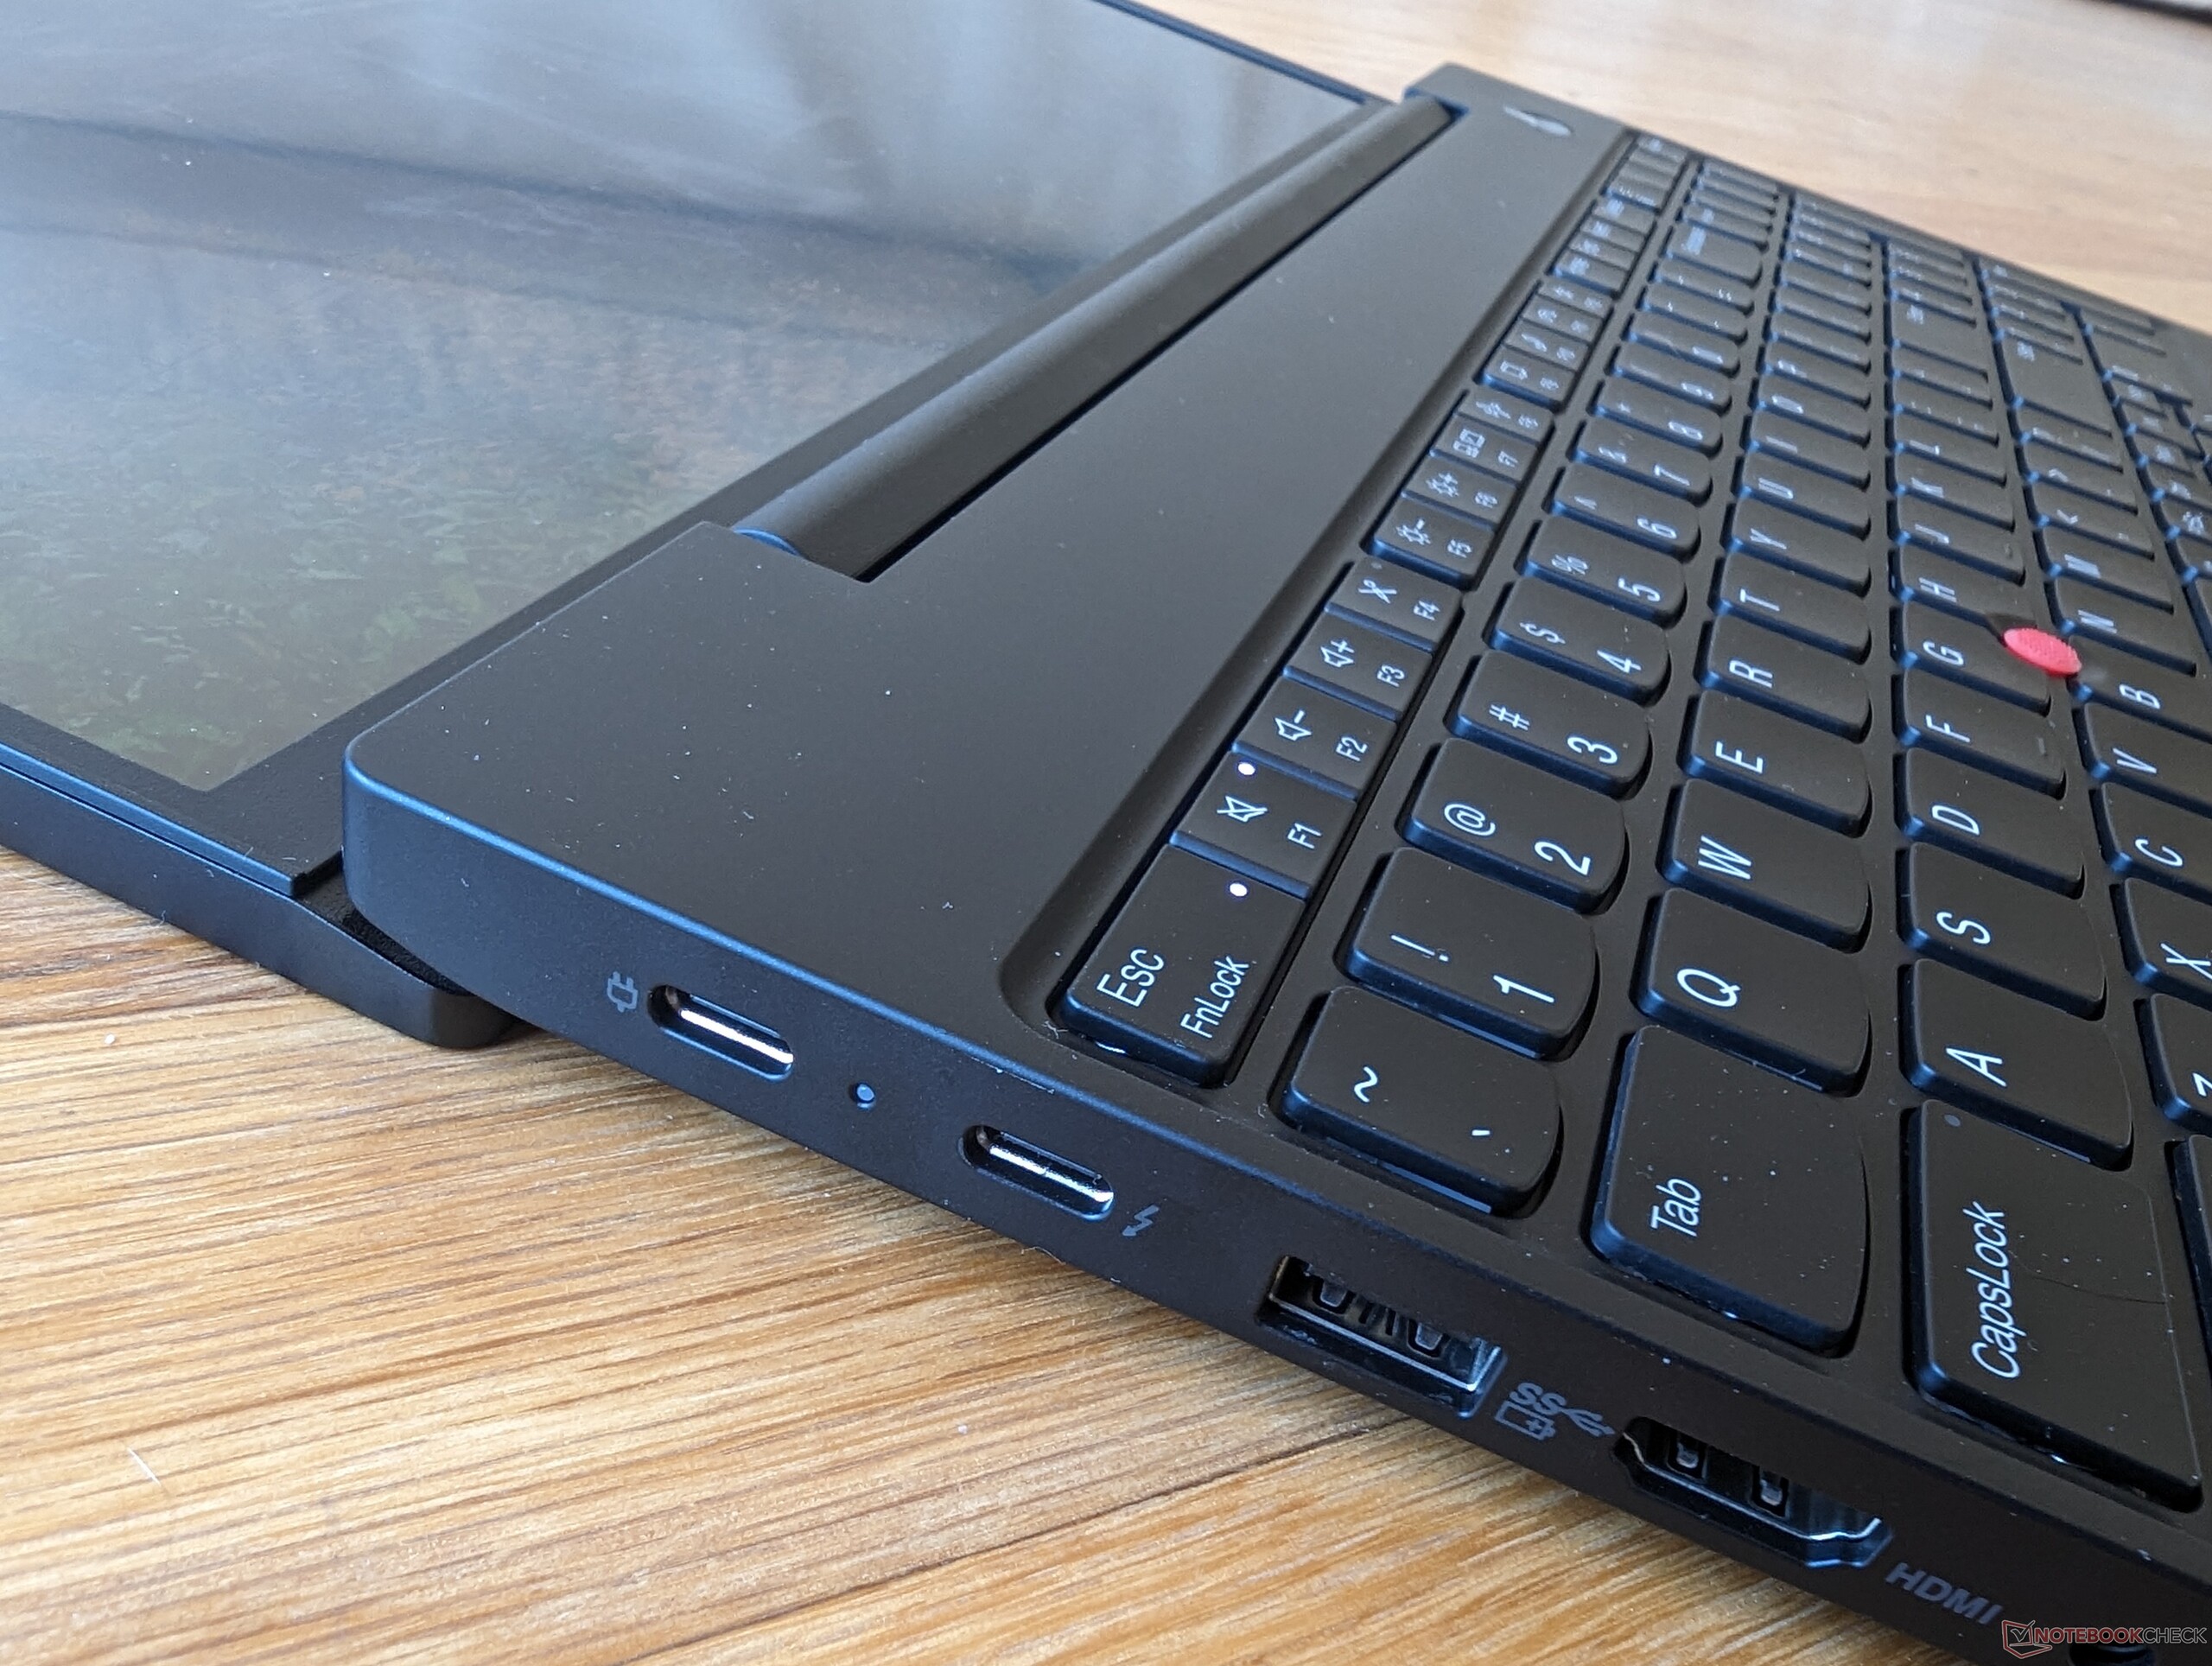
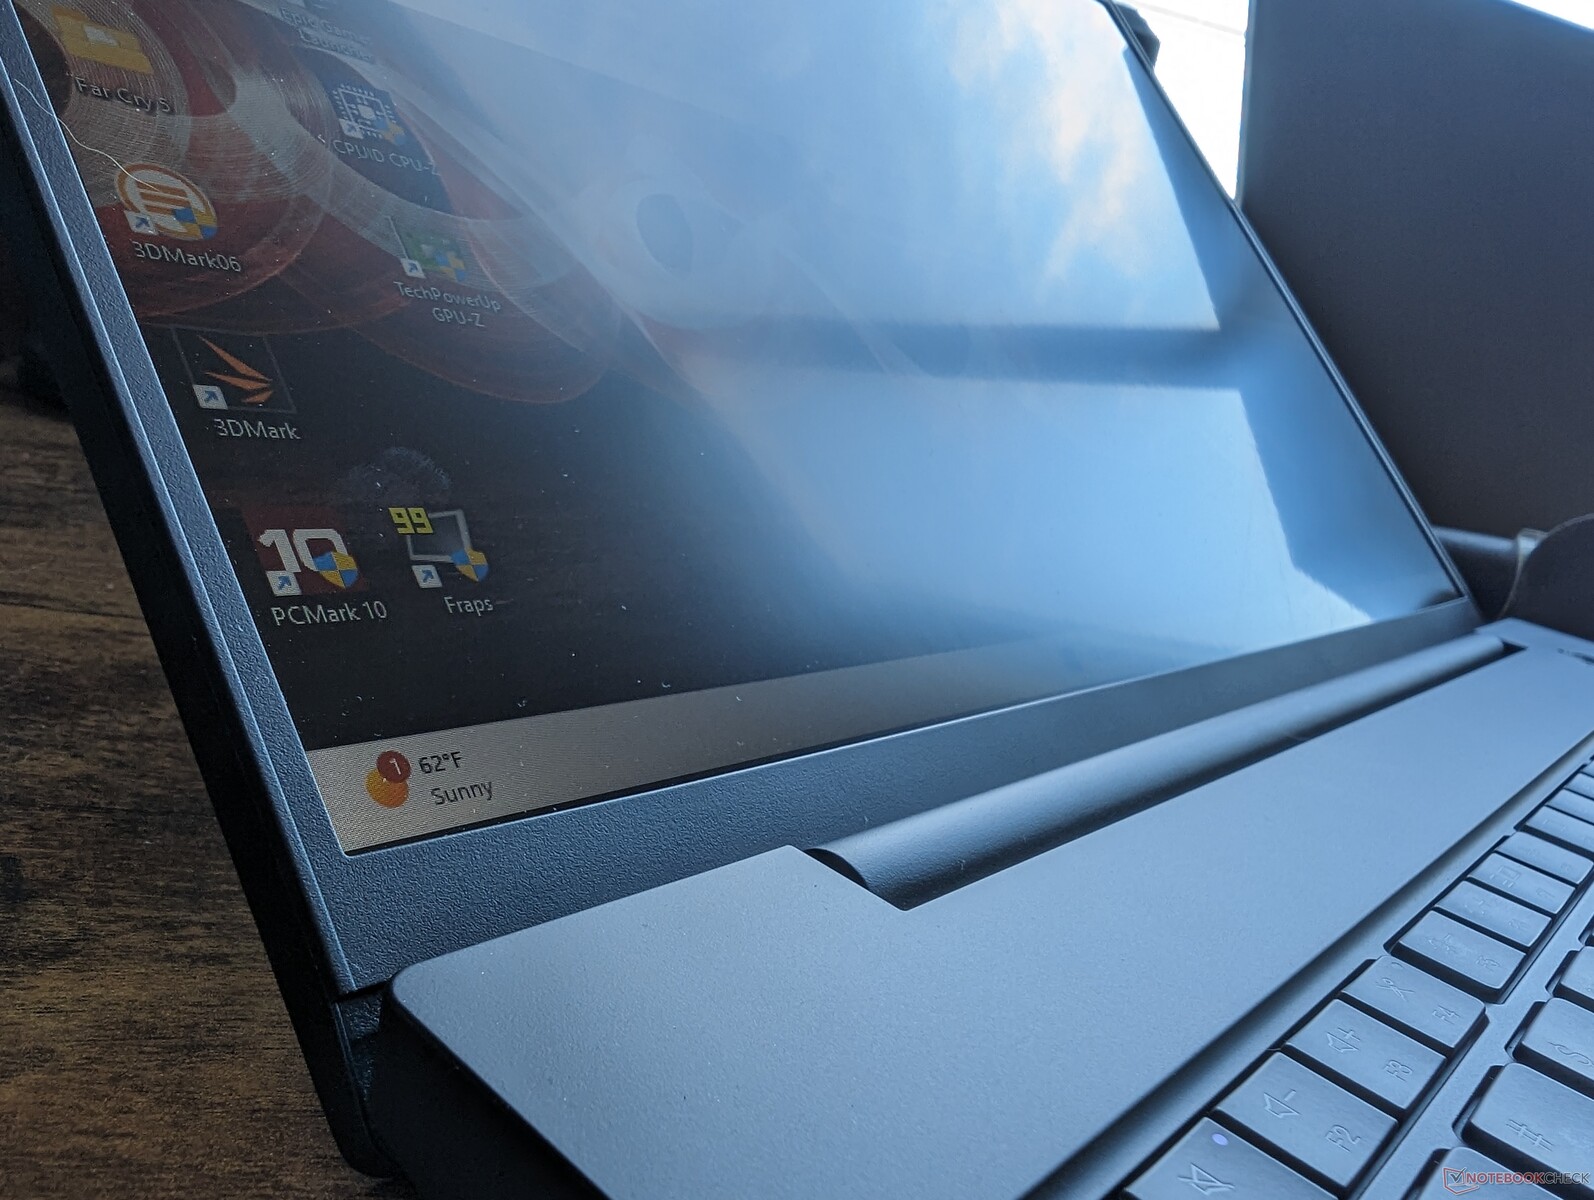
Der einfachste Weg, eine Intel-Version von einer AMD-Version zu unterscheiden, ist die Suche nach dem Thunderbolt-Logo am linken Rand. Thunderbolt wird nur von den Intel-Versionen unterstützt, da die aktuellen AMD-Versionen nicht mit USB4 ausgeliefert werden.
Kommunikation
Webcam


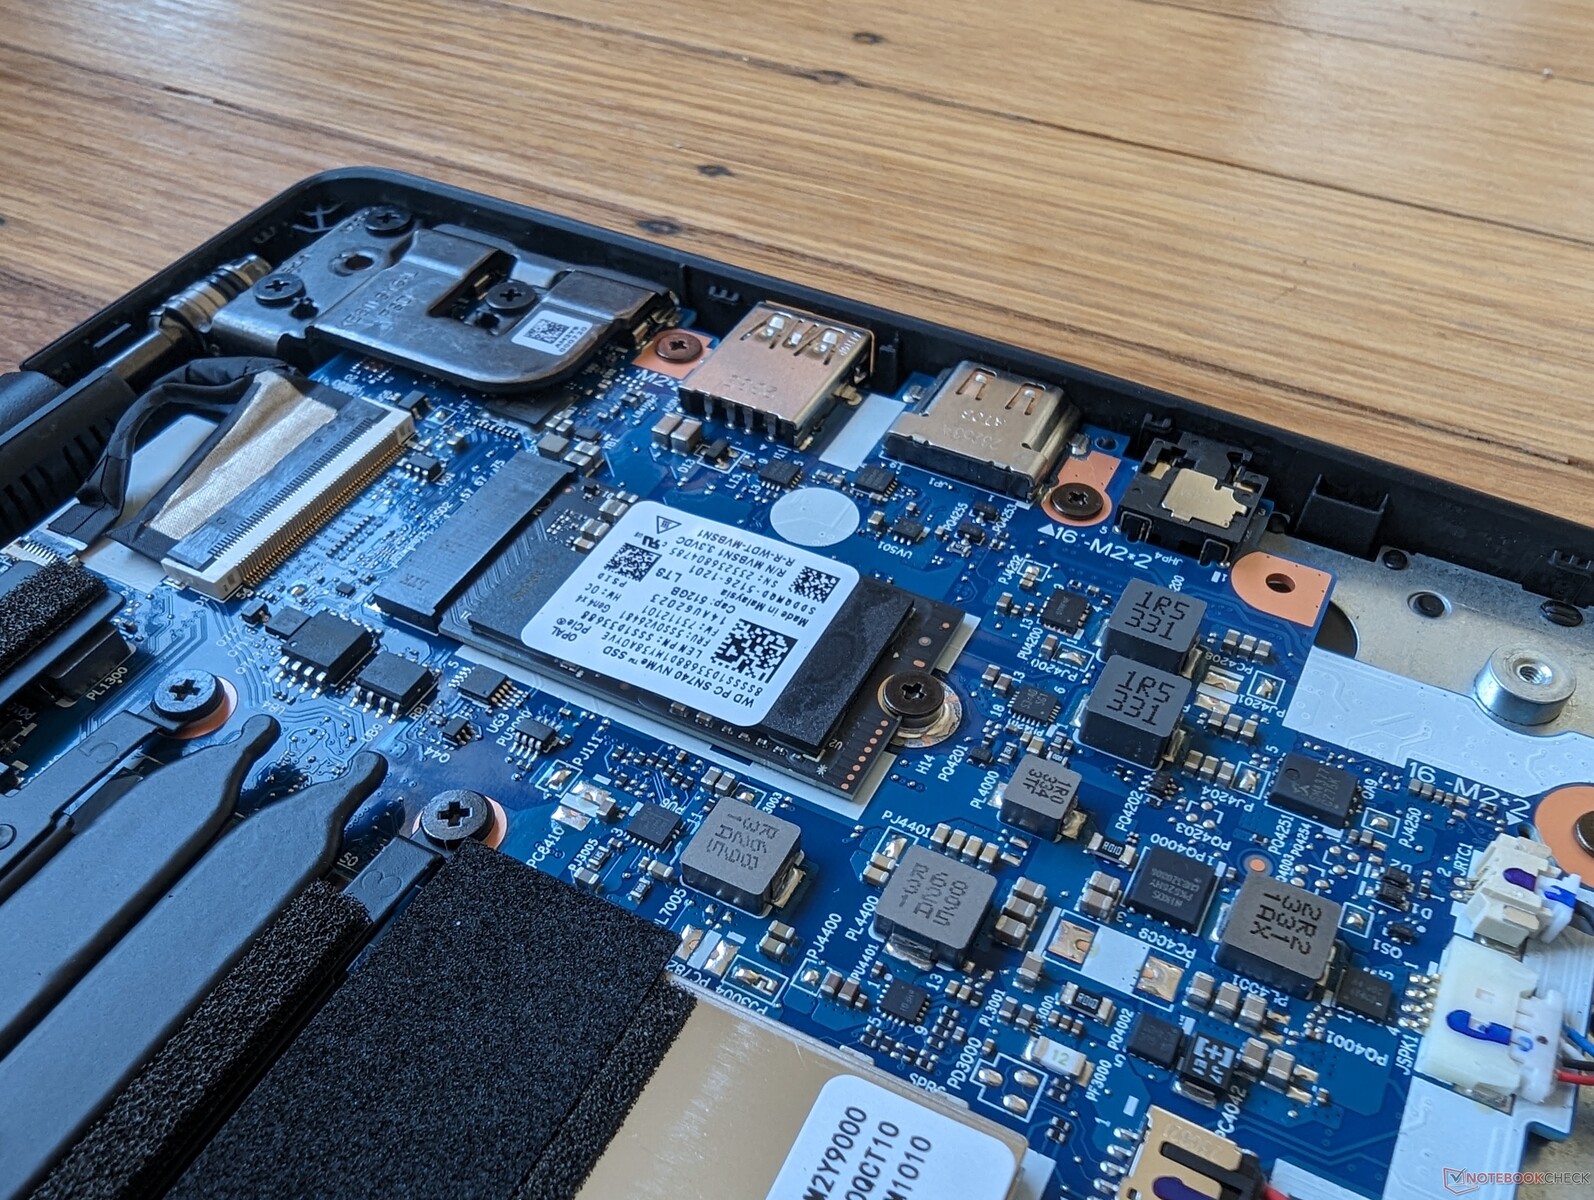
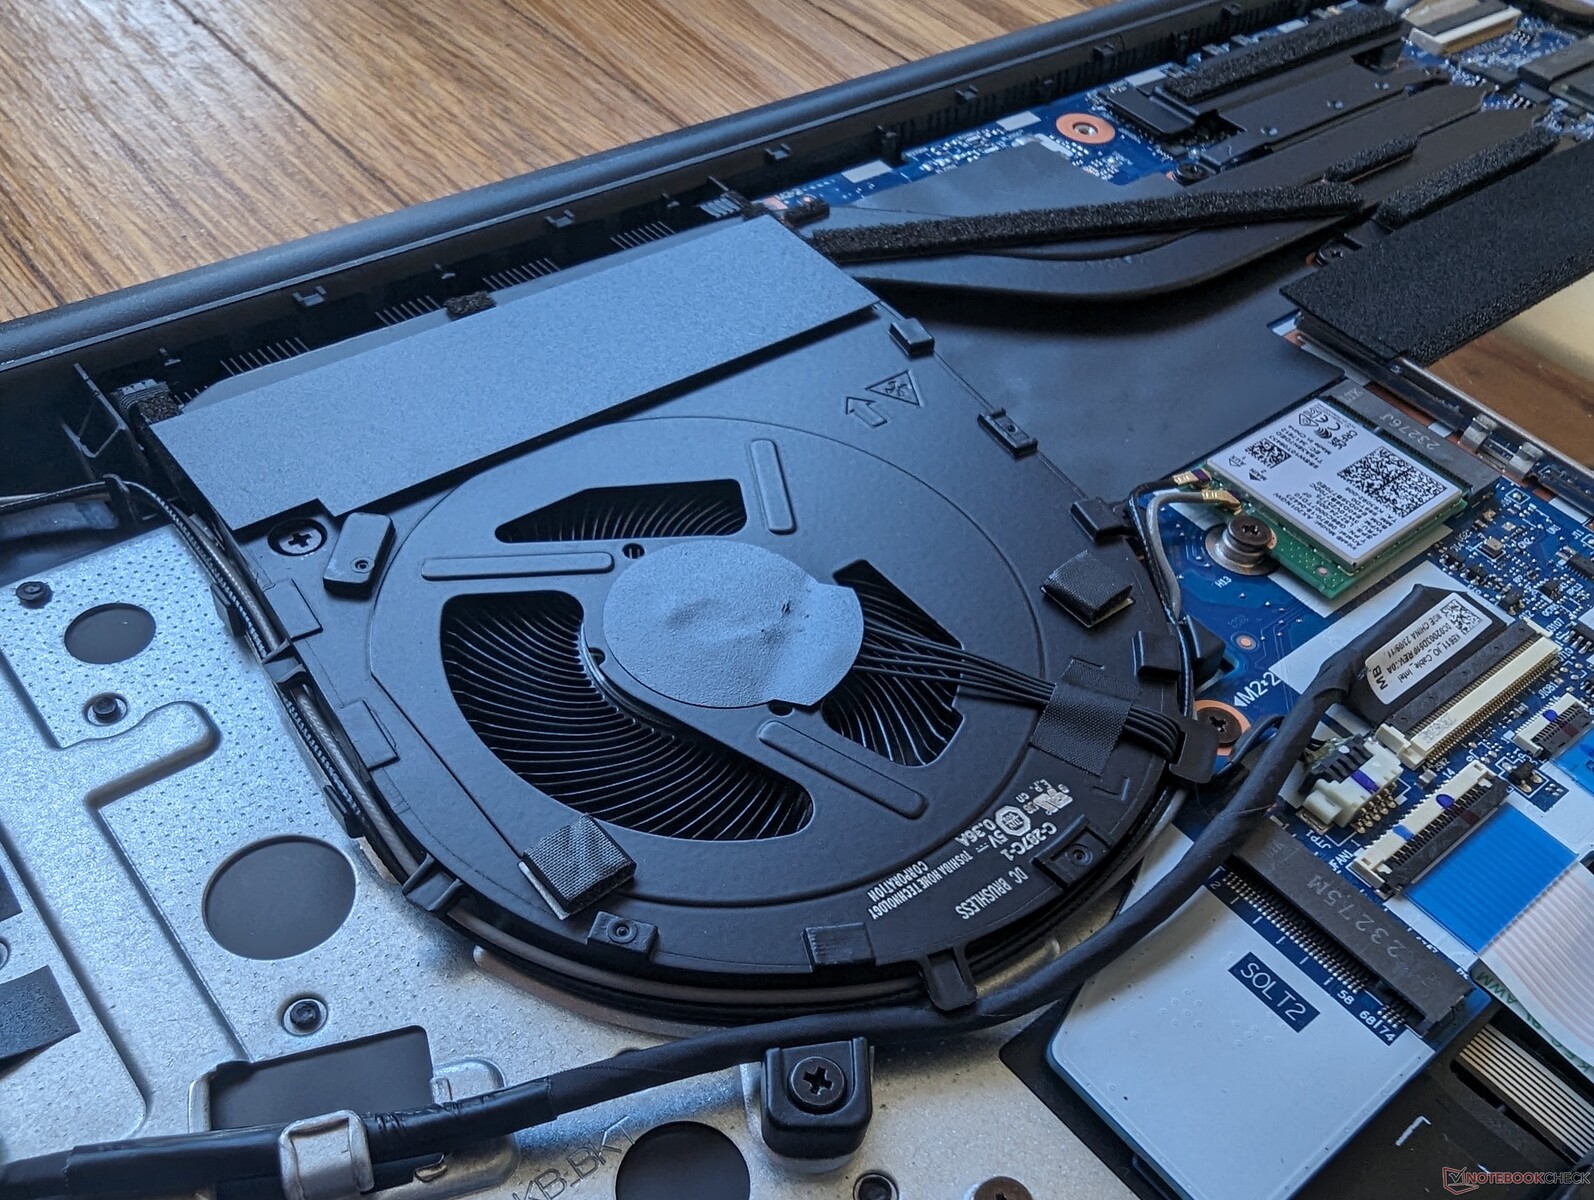
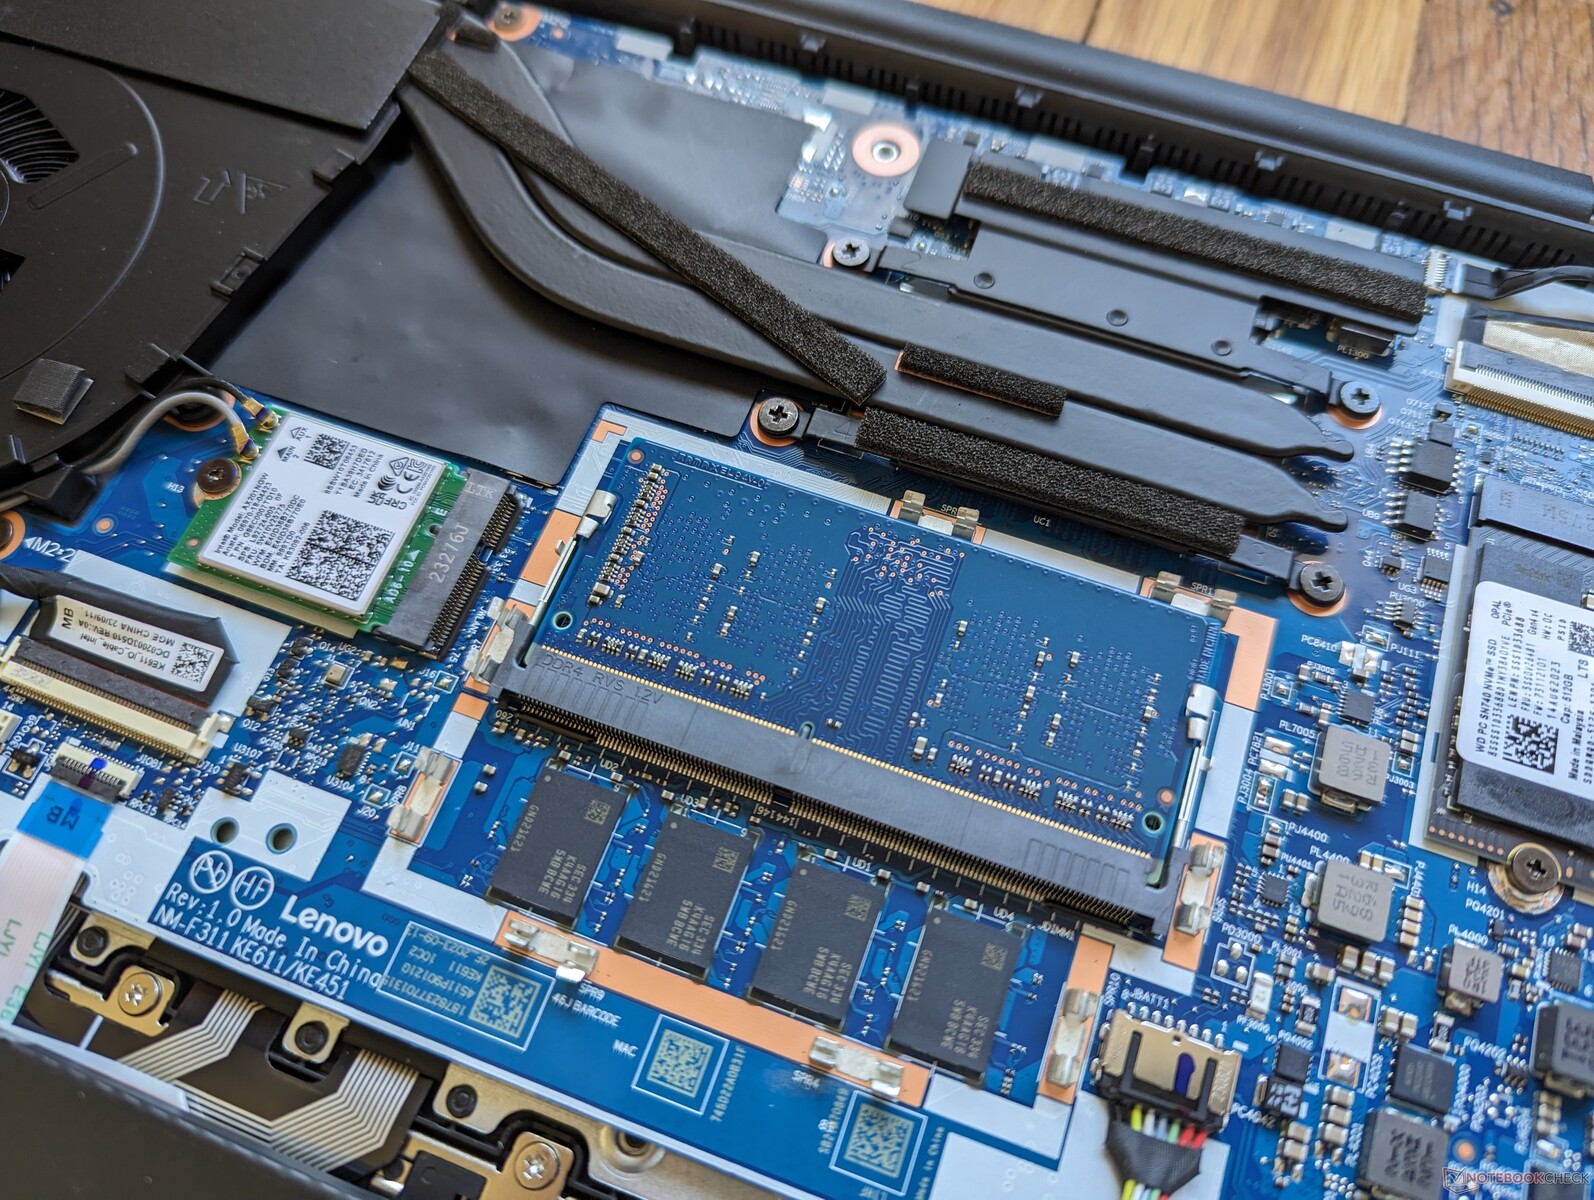
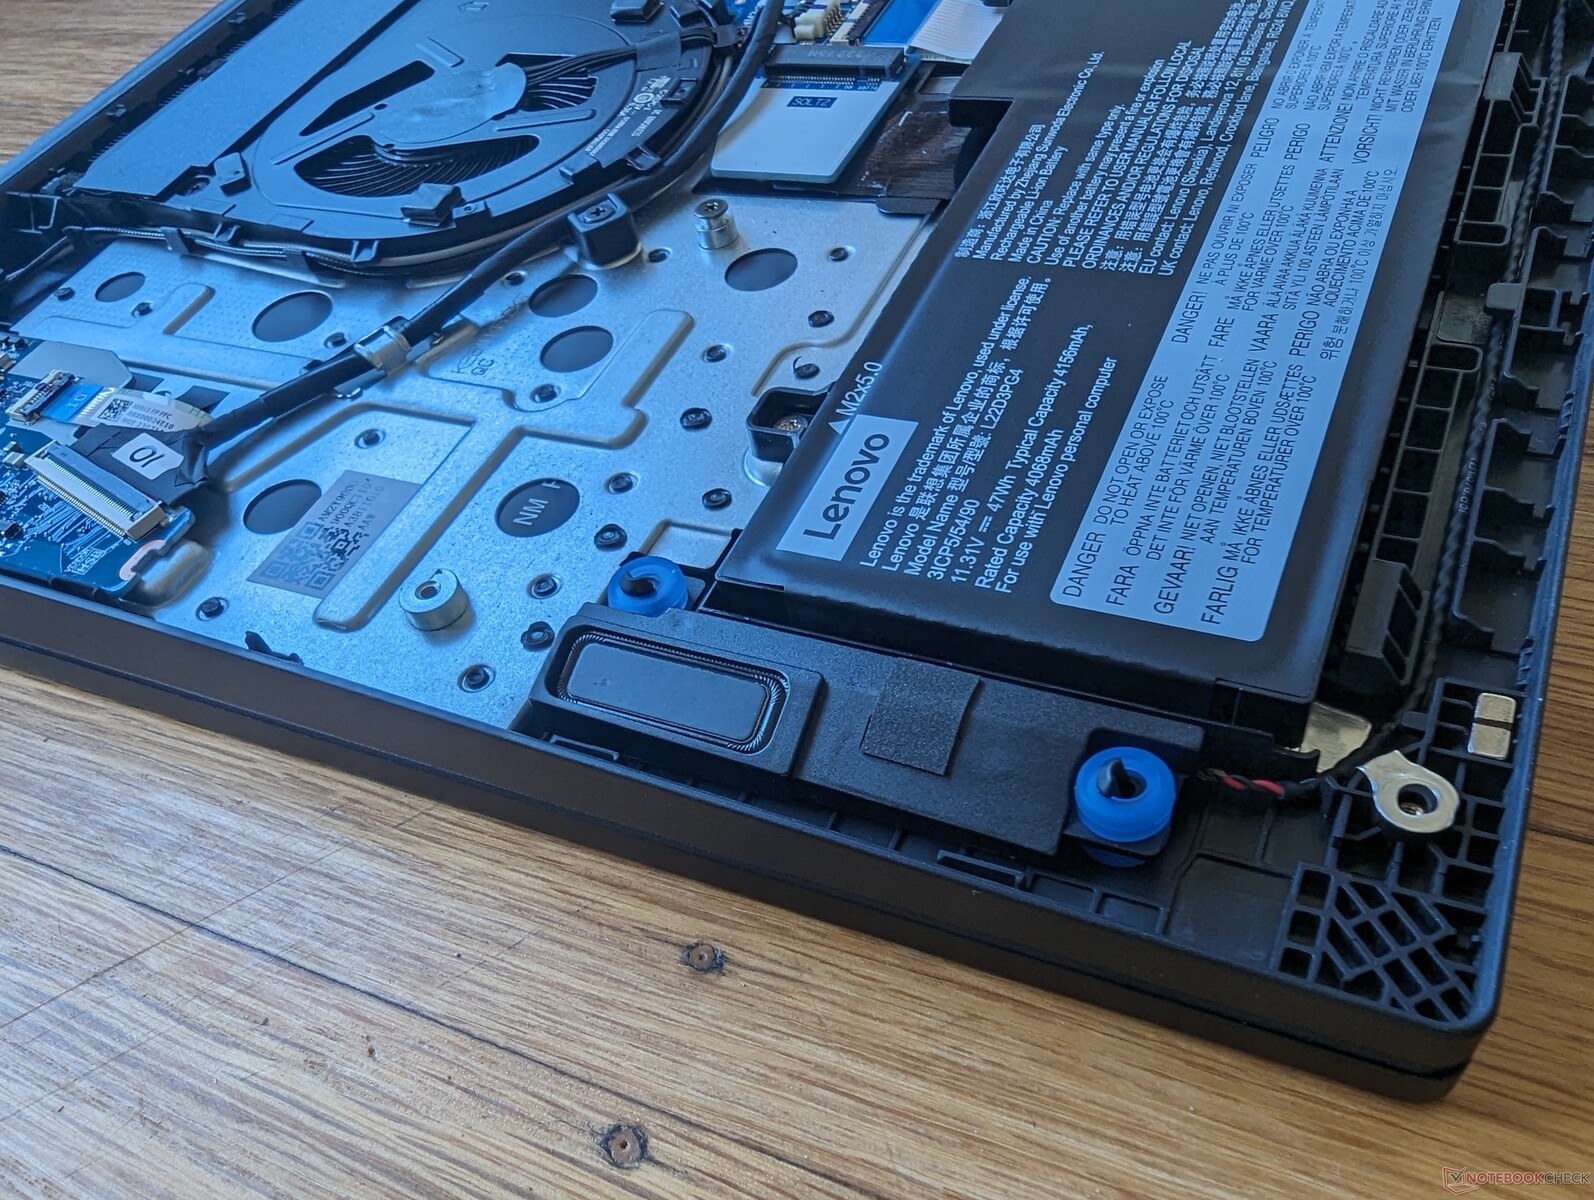
Wartung
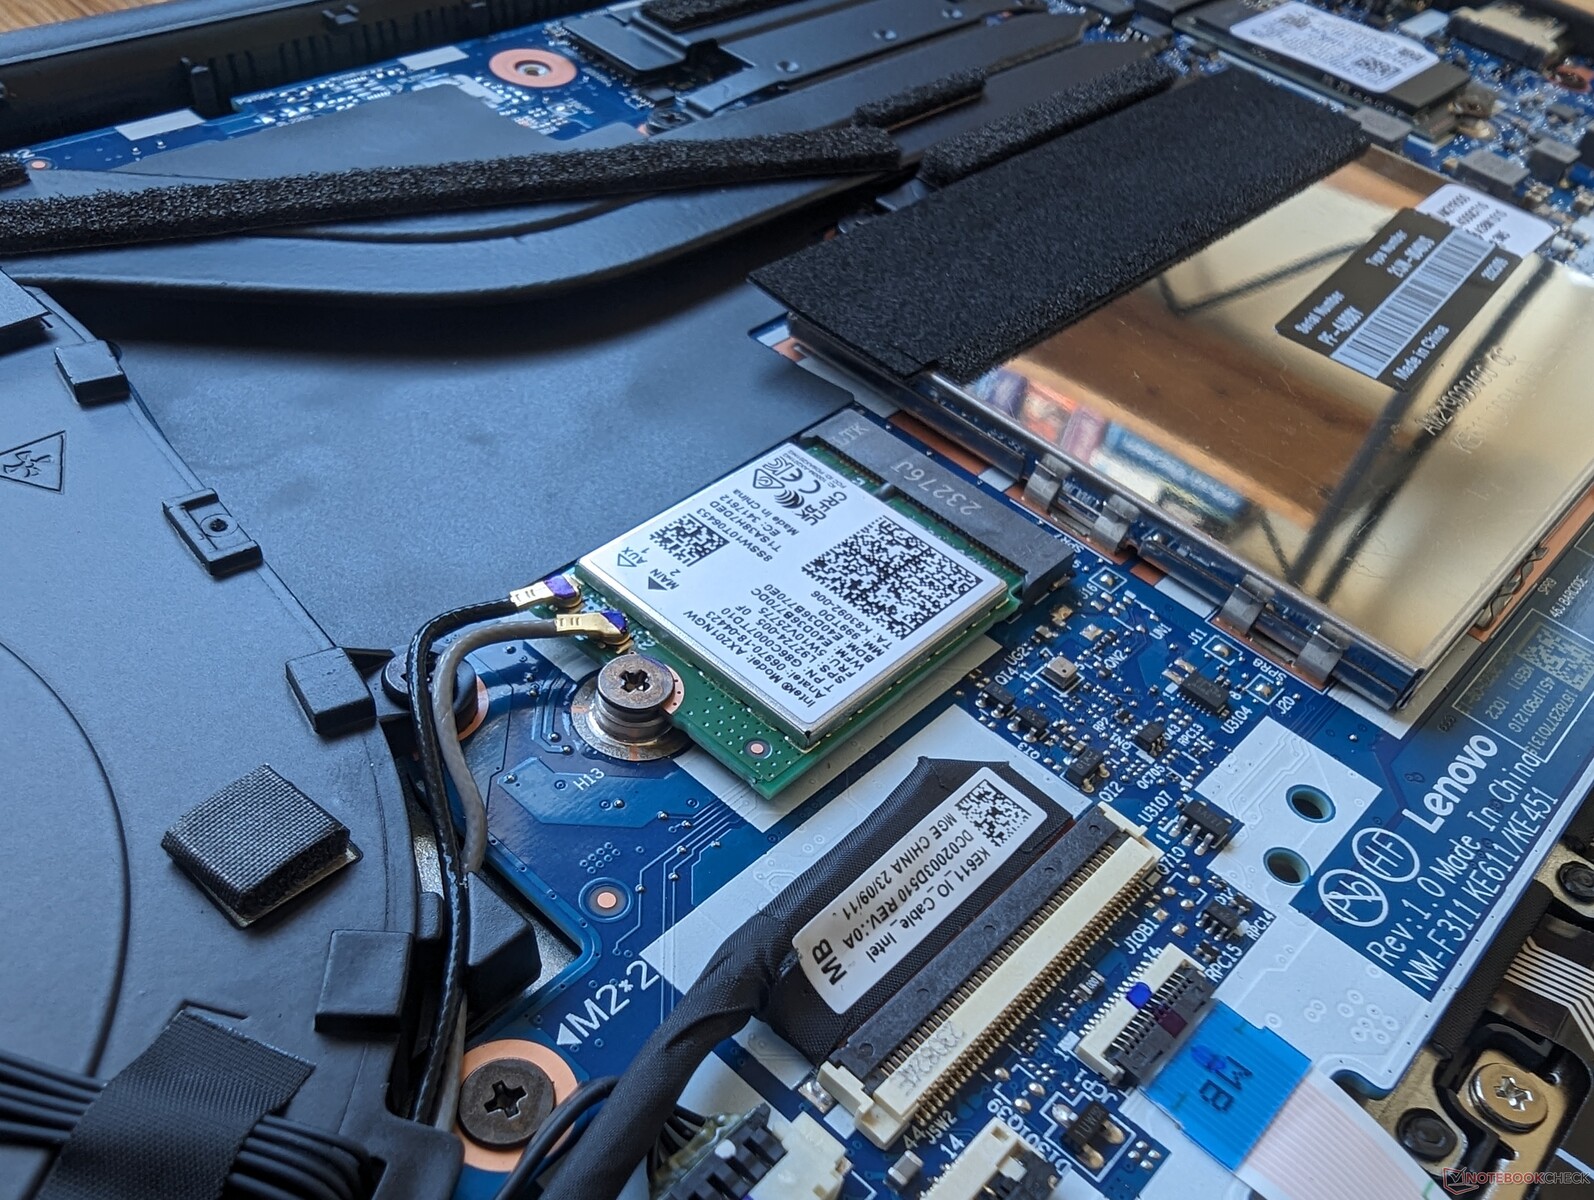
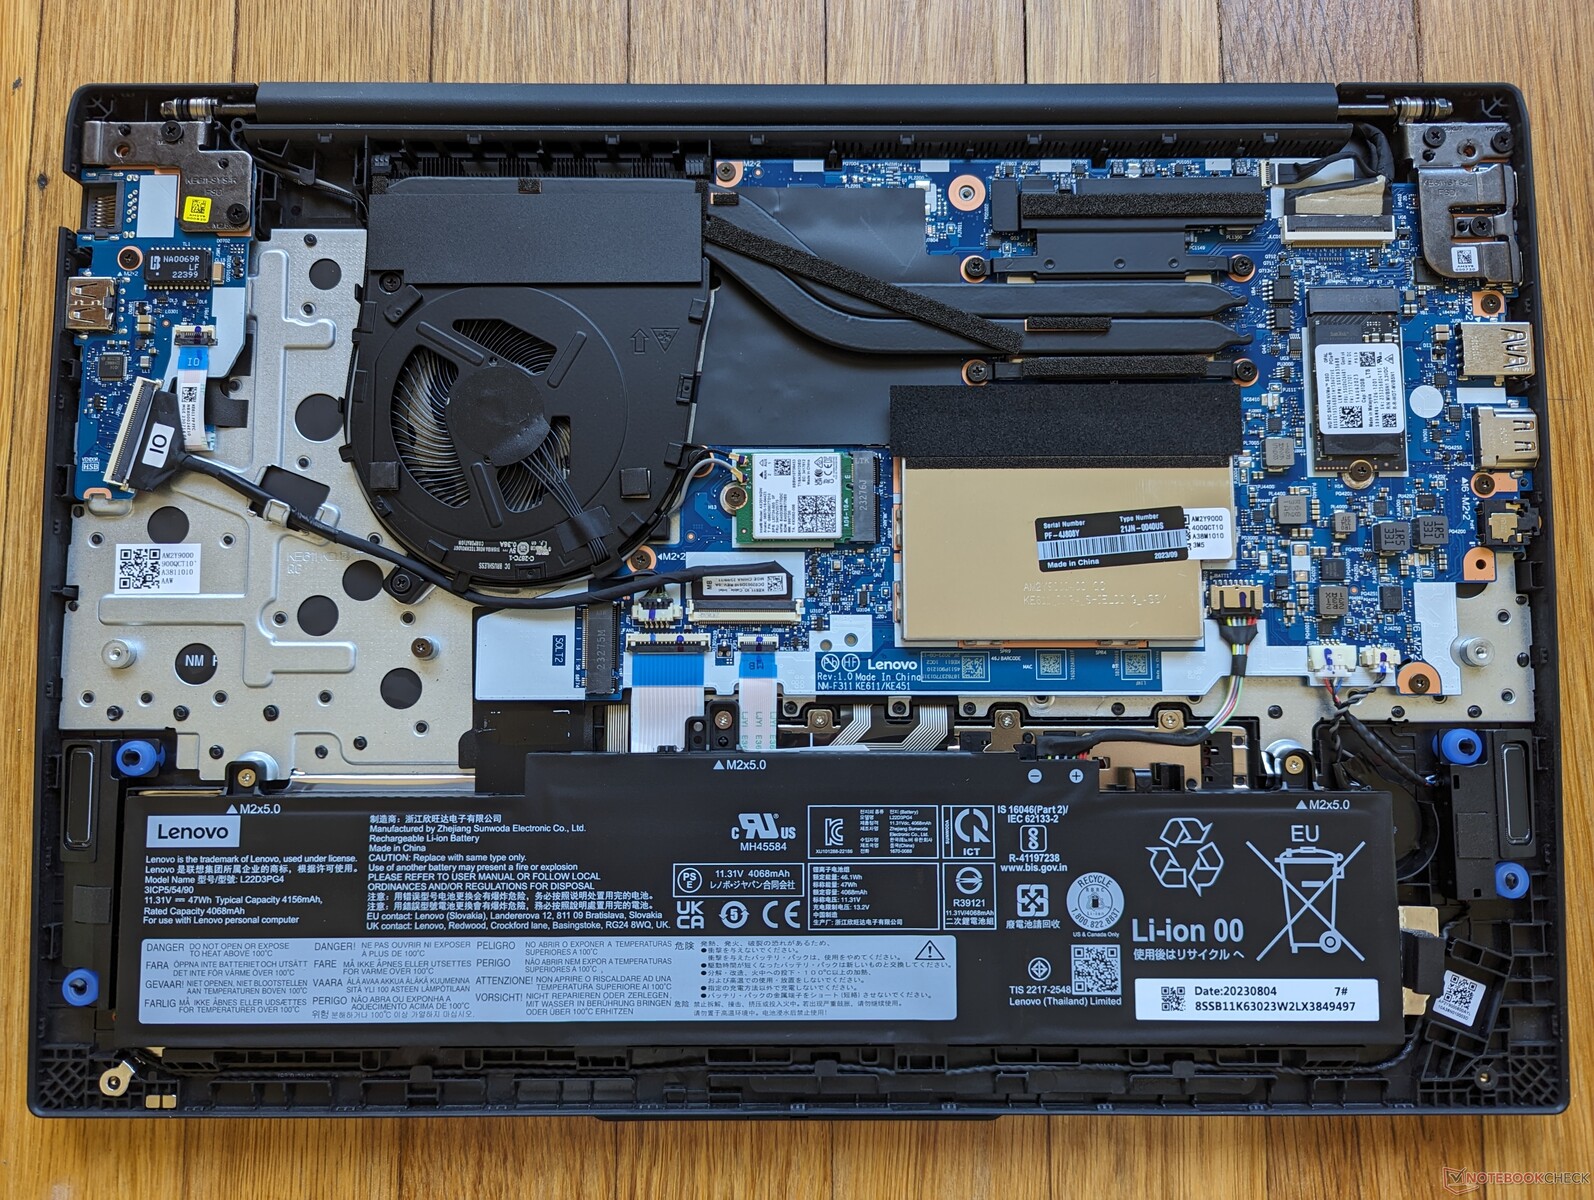
Sowohl die Intel- als auch die AMD-Version unterstützen jeweils bis zu zwei M.2 SSDs. Die Intel-Version unterstützt jedoch nur Laufwerke mit einer Länge von bis zu 42 mm, die AMD-Version Laufwerke mit einer Länge von bis zu 80 mm. Dies ist vergleichbar mit dem, was wir bei den kleineren 14 Zoll ThinkPad E14 G5 Intel- und AMD-Versionen beobachtet haben.
Garantie
Beim Kauf in den USA und in Deutschland gilt eine einjährige eingeschränkte Herstellergarantie. Höherwertige ThinkPad Modelle der T-Serie oder der X-Serie haben für in der Regel eine dreijährige Garantie.
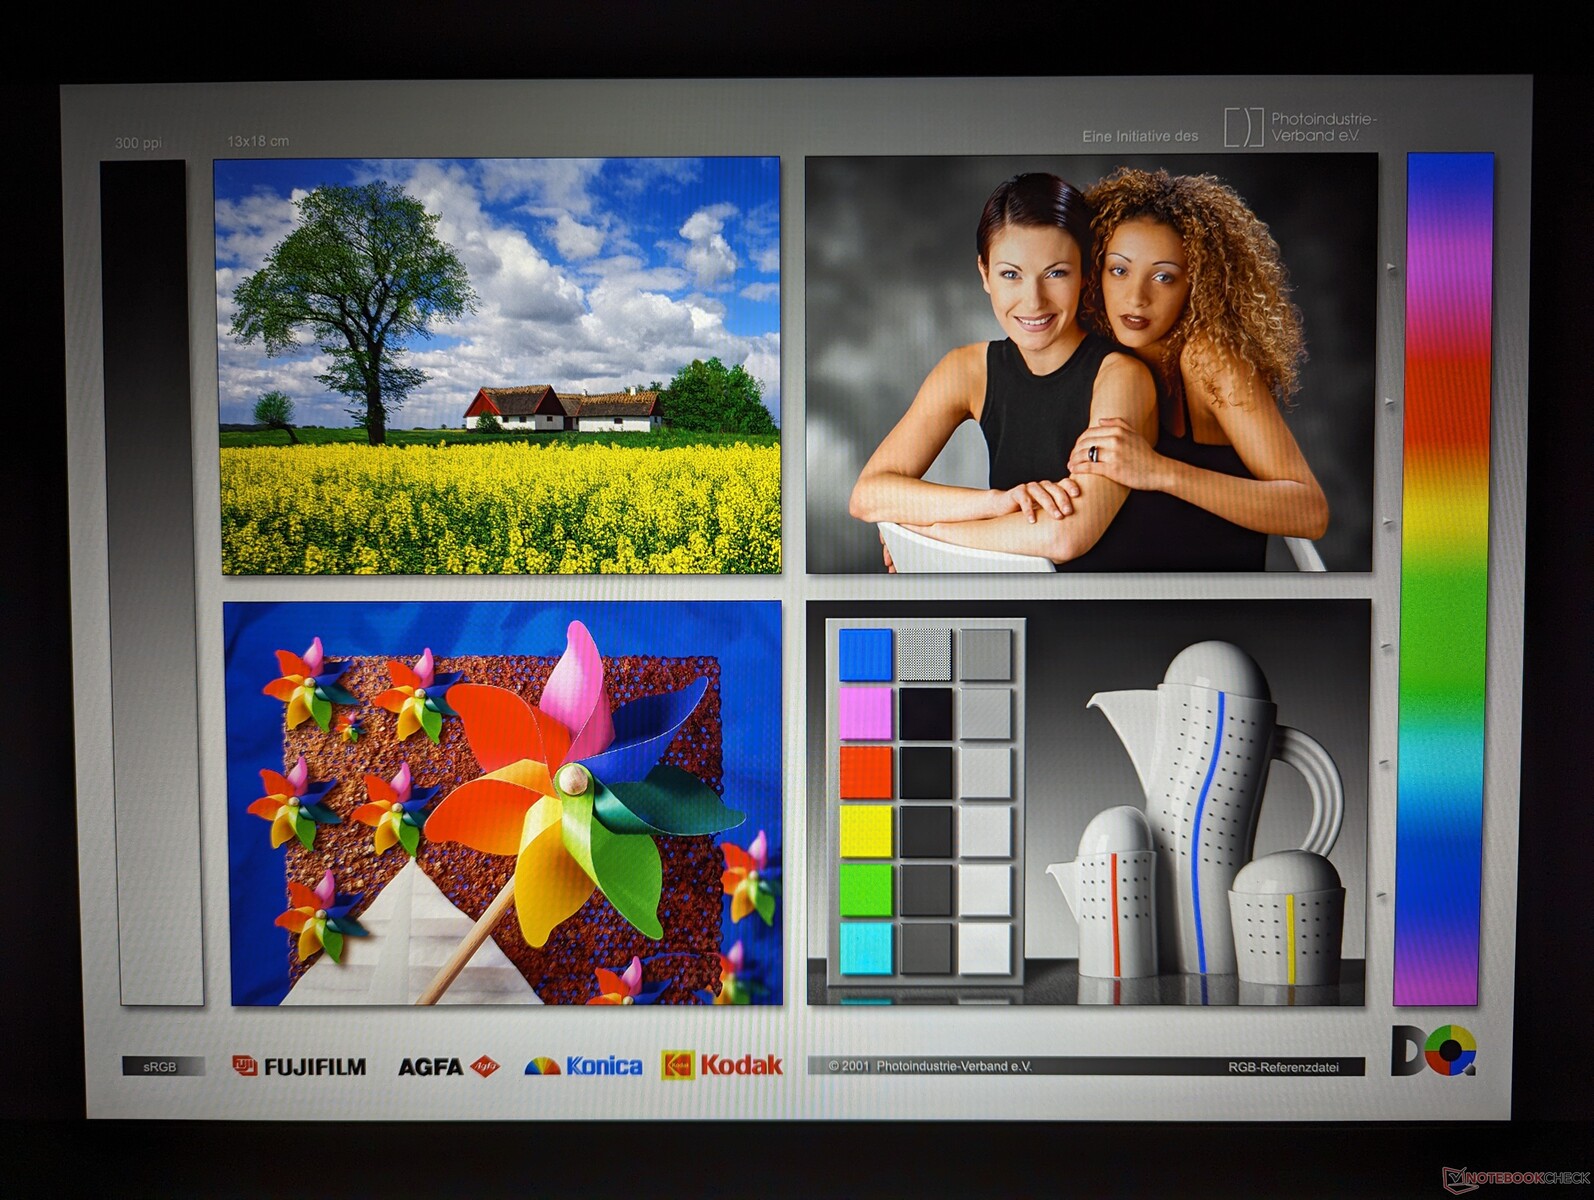
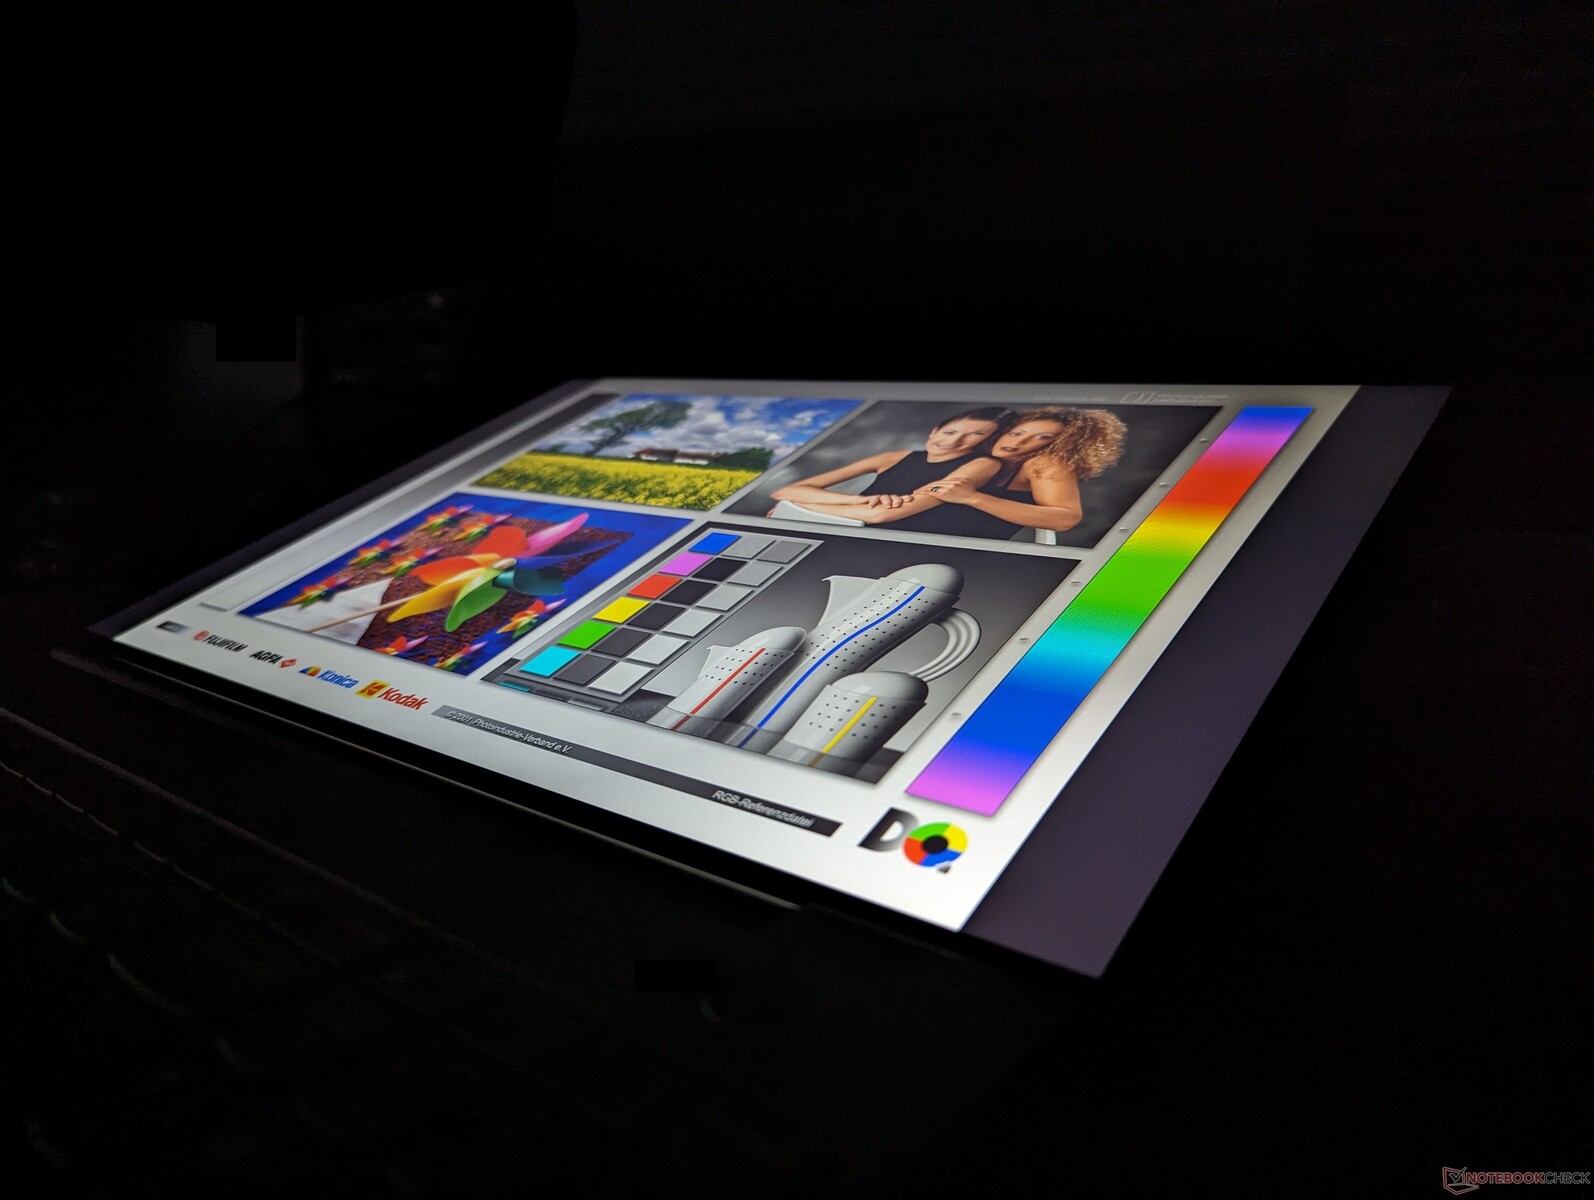
Display
Es sind vier matte IPS-Optionen verfügbar:
- 1200p, 60% sRGB, 300 nits, 60 Hz, Non-Touch
- 1200p, 60% sRGB, 300 nits, 60 Hz, Touch
- 1200p, 100% sRGB, 300 nits, 60 Hz, ohne Berührung
- 1600p, 100% sRGB, 400 nits, 60 Hz, berührungslos
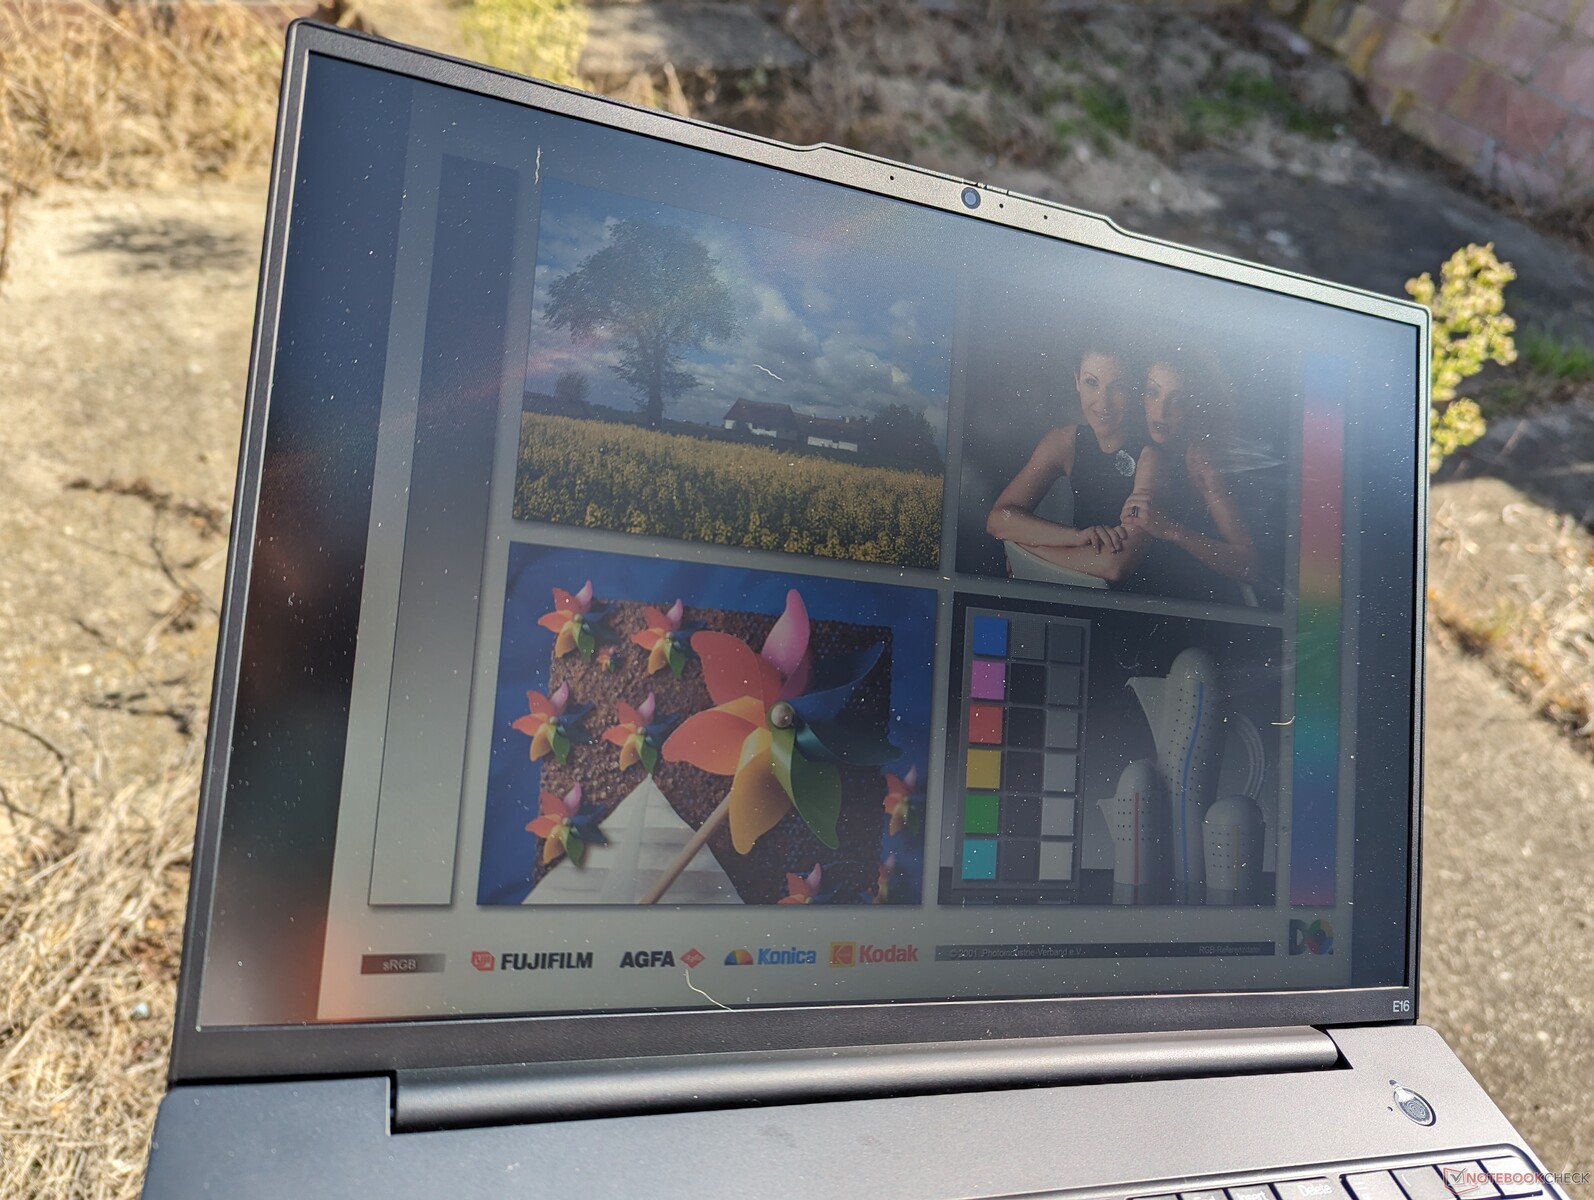
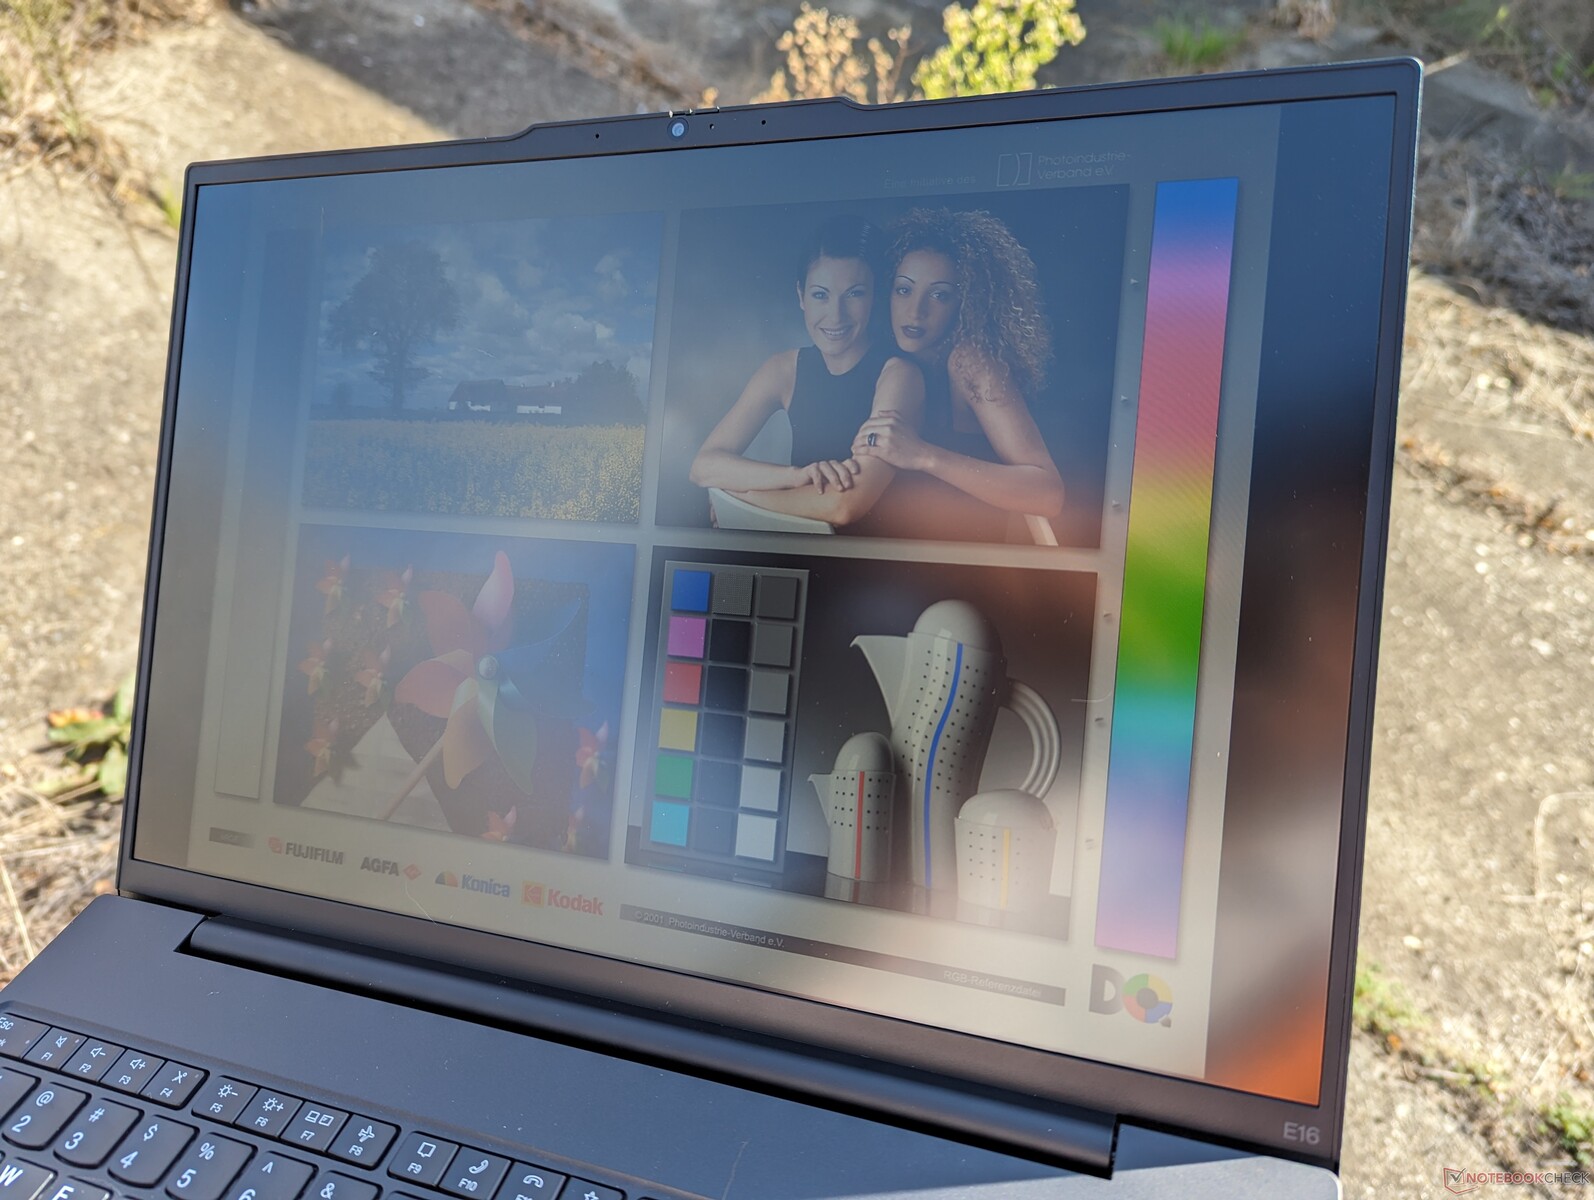
Unser Intel-Testgerät verfügt über die oben fett gedruckte Option, während unser AMD-Gerät mit der 1600p-Option ausgestattet ist. Die Bildqualität ist wie Tag und Nacht zwischen den beiden. Die des AMDs erscheint schärfer und lebendiger. Außerdem hat das AMD-Gerät eine schnellere Reaktionszeit, was zu einem deutlich besseren Seherlebnis führt. Daher empfehlen wir, die spezielle Panel-Option unseres Intels zu vermeiden, es sei denn, die Touchscreen-Funktionalität ist ein Muss.


| |||||||||||||||||||||||||
Ausleuchtung: 91 %
Helligkeit Akku: 318.6 cd/m²
Kontrast: 1099:1 (Schwarzwert: 0.29 cd/m²)
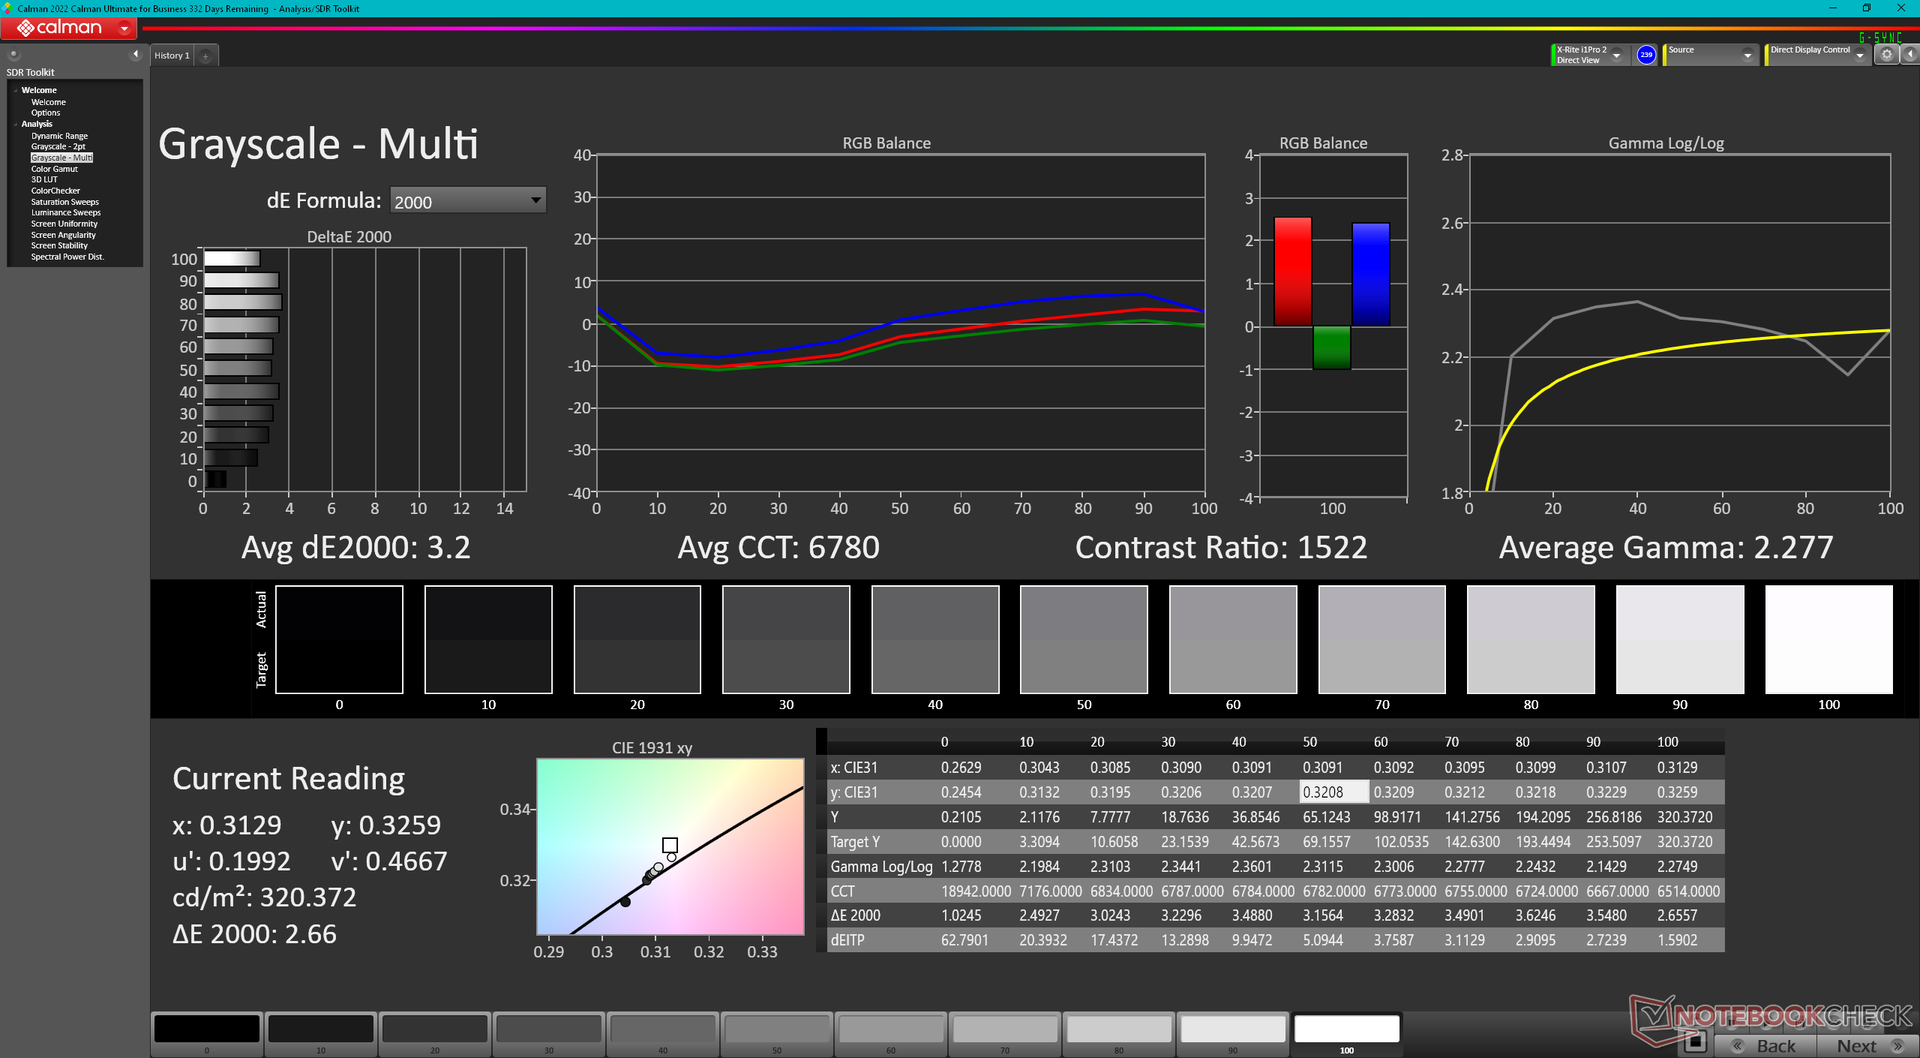
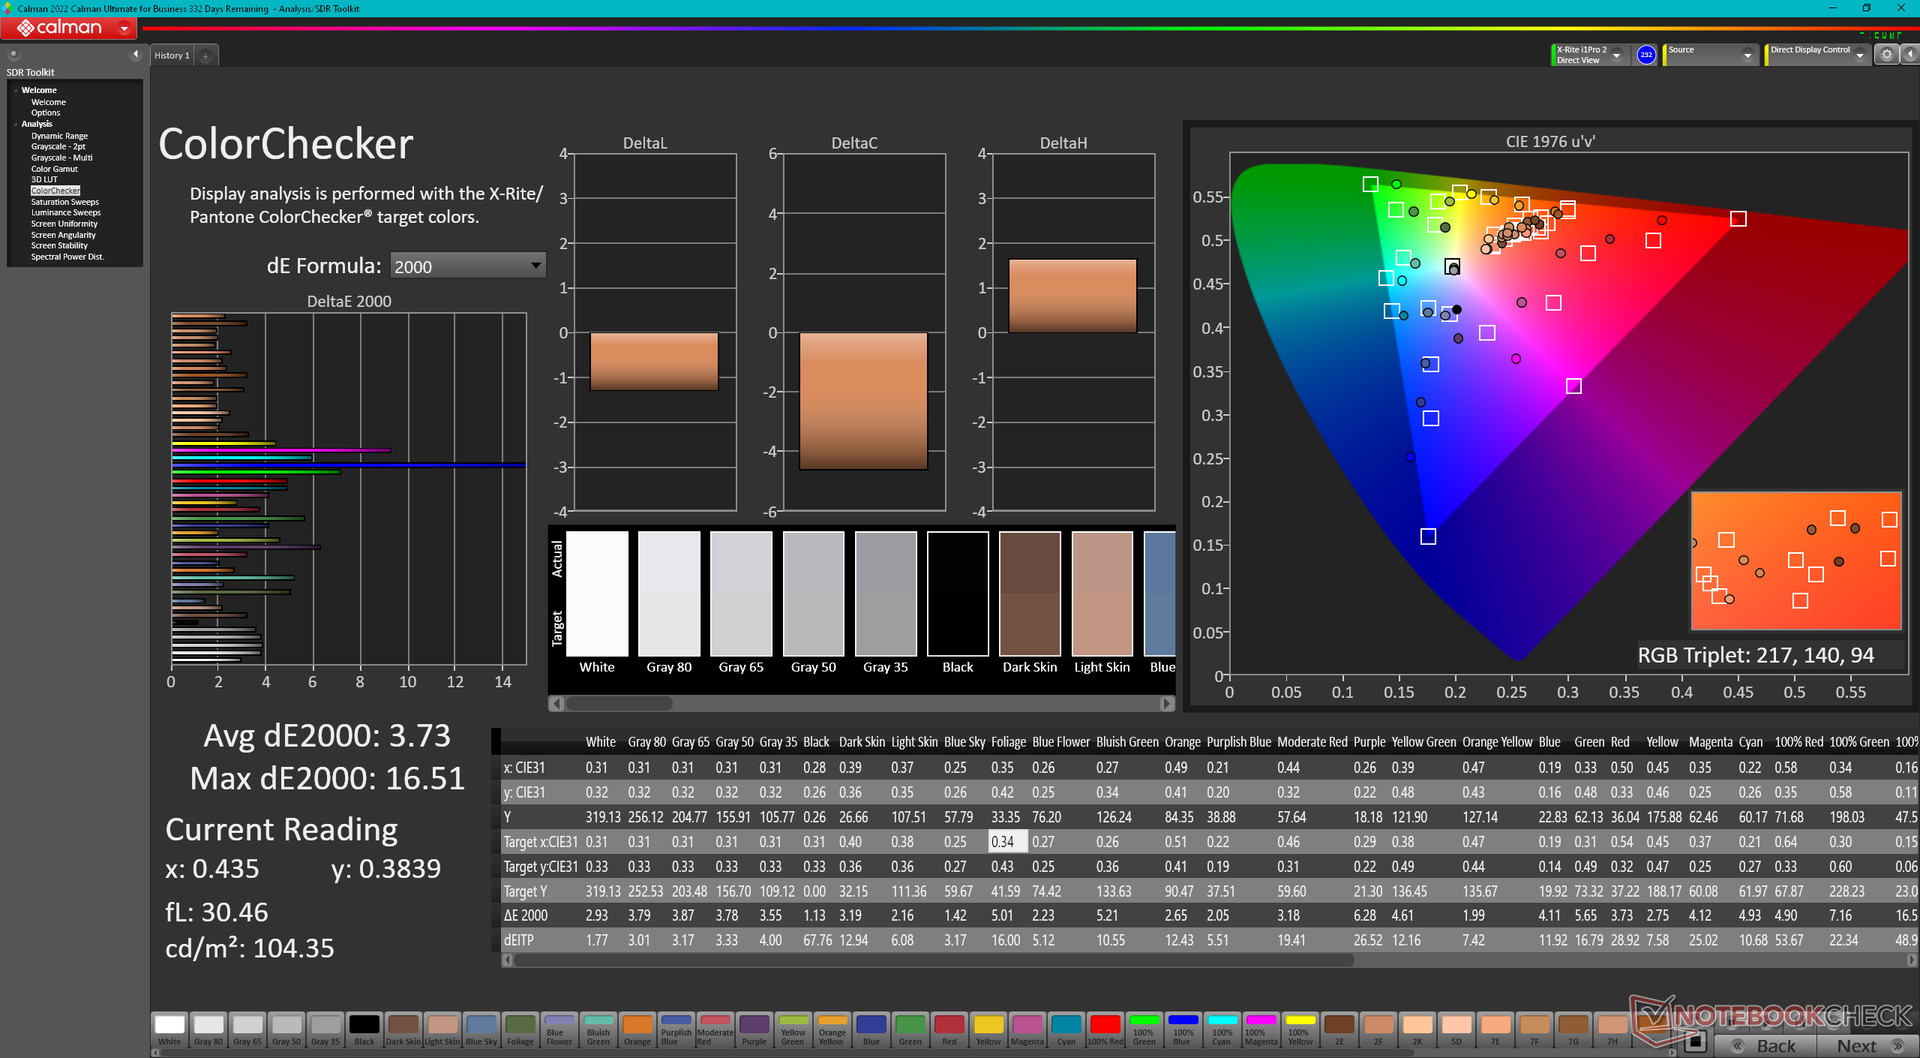
ΔE ColorChecker Calman: 3.73 | ∀{0.5-29.43 Ø4.72}
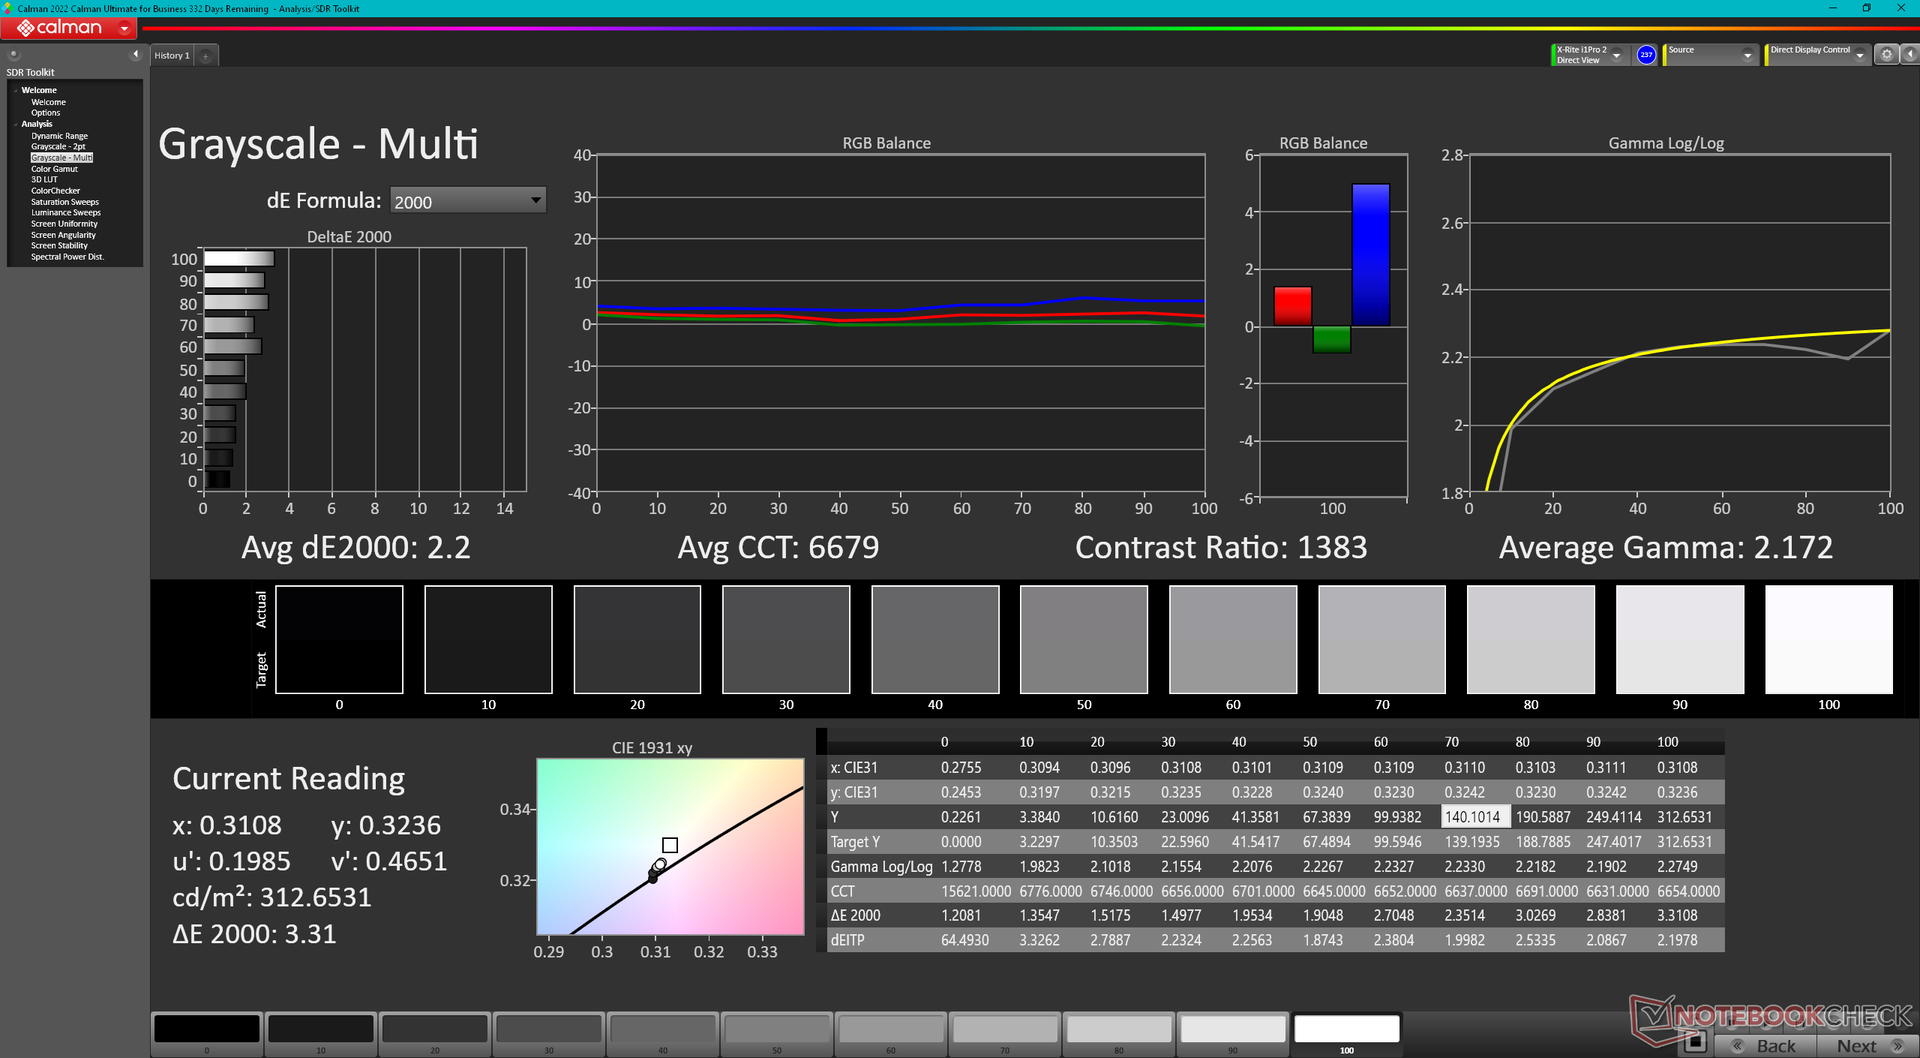
calibrated: 2.03
ΔE Greyscale Calman: 3.2 | ∀{0.09-98 Ø4.97}
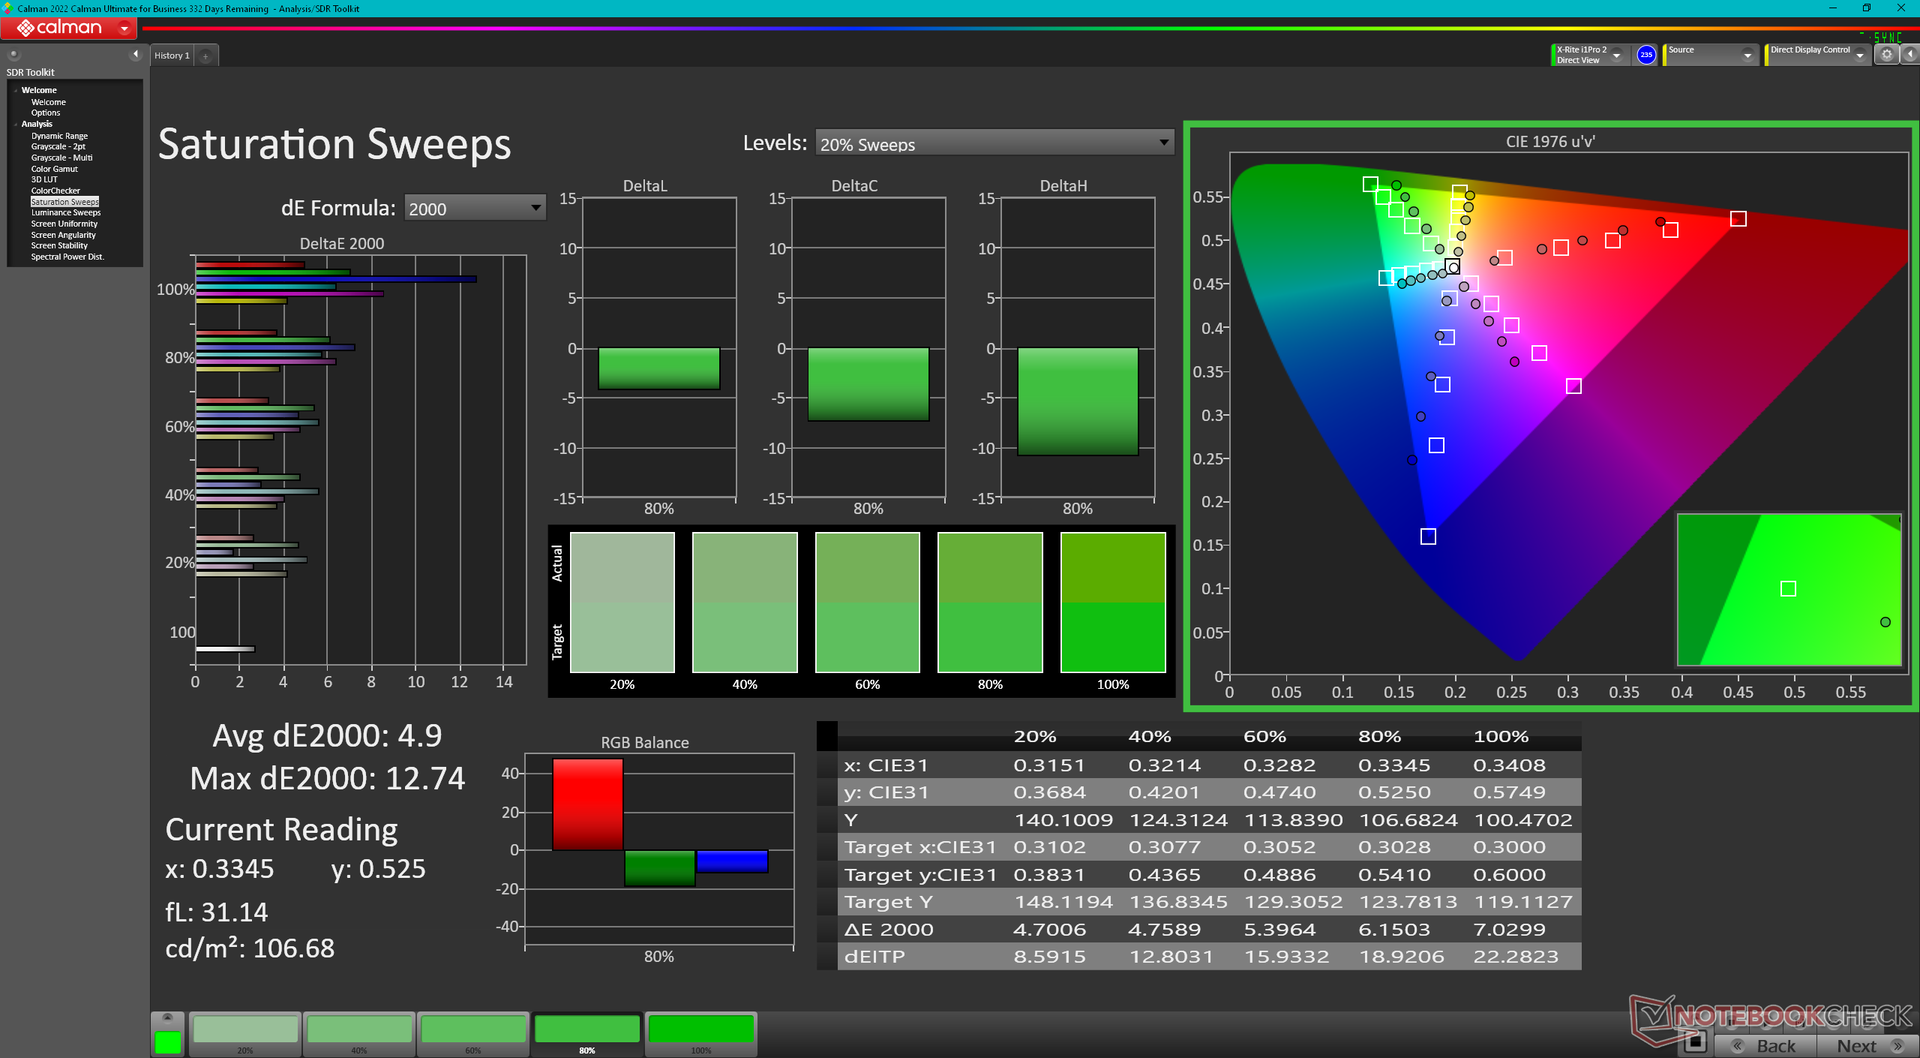
43.3% AdobeRGB 1998 (Argyll 3D)
62.6% sRGB (Argyll 3D)
42% Display P3 (Argyll 3D)
Gamma: 2.28
CCT: 6780 K
| Lenovo ThinkPad E16 G1 Core i5-1335U R160NW41 R2, IPS, 1920x1200, 16" | Lenovo ThinkPad E16 G1-21JUS08X00 MNG007DA1-C, IPS, 2560x1600, 16" | Dell Inspiron 16 7635 2-in-1 Chi Mei 160JCA, IPS, 1920x1200, 16" | Acer TravelMate P4 TMP416-51-55KN BOE BOE0A32, IPS, 1920x1200, 16" | Samsung Galaxy Book3 Pro 16 Samsung ATNA60CL03-0, AMOLED, 2880x1800, 16" | LG Gram 16Z90Q LG LP160WQ1-SPB2 (LGD06EB), IPS, 2560x1600, 16" | |
|---|---|---|---|---|---|---|
| Display | 58% | 59% | -7% | 107% | 95% | |
| Display P3 Coverage (%) | 42 | 67.6 61% | 67.4 60% | 38.9 -7% | 99.7 137% | 96.8 130% |
| sRGB Coverage (%) | 62.6 | 95.3 52% | 98.2 57% | 58.1 -7% | 100 60% | 99.9 60% |
| AdobeRGB 1998 Coverage (%) | 43.3 | 70 62% | 69.5 61% | 40.2 -7% | 97 124% | 84.6 95% |
| Response Times | 30% | 38% | 62% | 95% | 16% | |
| Response Time Grey 50% / Grey 80% * (ms) | 46.4 ? | 32.4 ? 30% | 27.6 ? 41% | 20 ? 57% | 2 ? 96% | 45.7 ? 2% |
| Response Time Black / White * (ms) | 27.6 ? | 19.6 ? 29% | 18.2 ? 34% | 9 ? 67% | 2 ? 93% | 19.7 ? 29% |
| PWM Frequency (Hz) | ||||||
| Bildschirm | 30% | 12% | -20% | 295% | 13% | |
| Helligkeit Bildmitte (cd/m²) | 318.6 | 404 27% | 301.3 -5% | 269 -16% | 412 29% | 366 15% |
| Brightness (cd/m²) | 302 | 389 29% | 269 -11% | 265 -12% | 412 36% | 347 15% |
| Brightness Distribution (%) | 91 | 91 0% | 79 -13% | 94 3% | 98 8% | 89 -2% |
| Schwarzwert * (cd/m²) | 0.29 | 0.24 17% | 0.28 3% | 0.305 -5% | 0.015 95% | 0.32 -10% |
| Kontrast (:1) | 1099 | 1683 53% | 1076 -2% | 882 -20% | 27467 2399% | 1144 4% |
| Delta E Colorchecker * | 3.73 | 2.1 44% | 3.1 17% | 4.89 -31% | 2.34 37% | 2.82 24% |
| Colorchecker dE 2000 max. * | 16.51 | 4.2 75% | 5.5 67% | 8.81 47% | 3.34 80% | 4.65 72% |
| Colorchecker dE 2000 calibrated * | 2.03 | 1.4 31% | 0.49 76% | 5.12 -152% | 2.95 -45% | 2.69 -33% |
| Delta E Graustufen * | 3.2 | 3.3 -3% | 3.9 -22% | 2.91 9% | 2.78 13% | 2.3 28% |
| Gamma | 2.28 96% | 2.24 98% | 2.19 100% | 2.28 96% | 2.5 88% | 1.971 112% |
| CCT | 6780 96% | 7038 92% | 6186 105% | 6920 94% | 6879 94% | 6796 96% |
| Durchschnitt gesamt (Programm / Settings) | 39% /
36% | 36% /
26% | 12% /
-5% | 166% /
226% | 41% /
31% |
* ... kleinere Werte sind besser
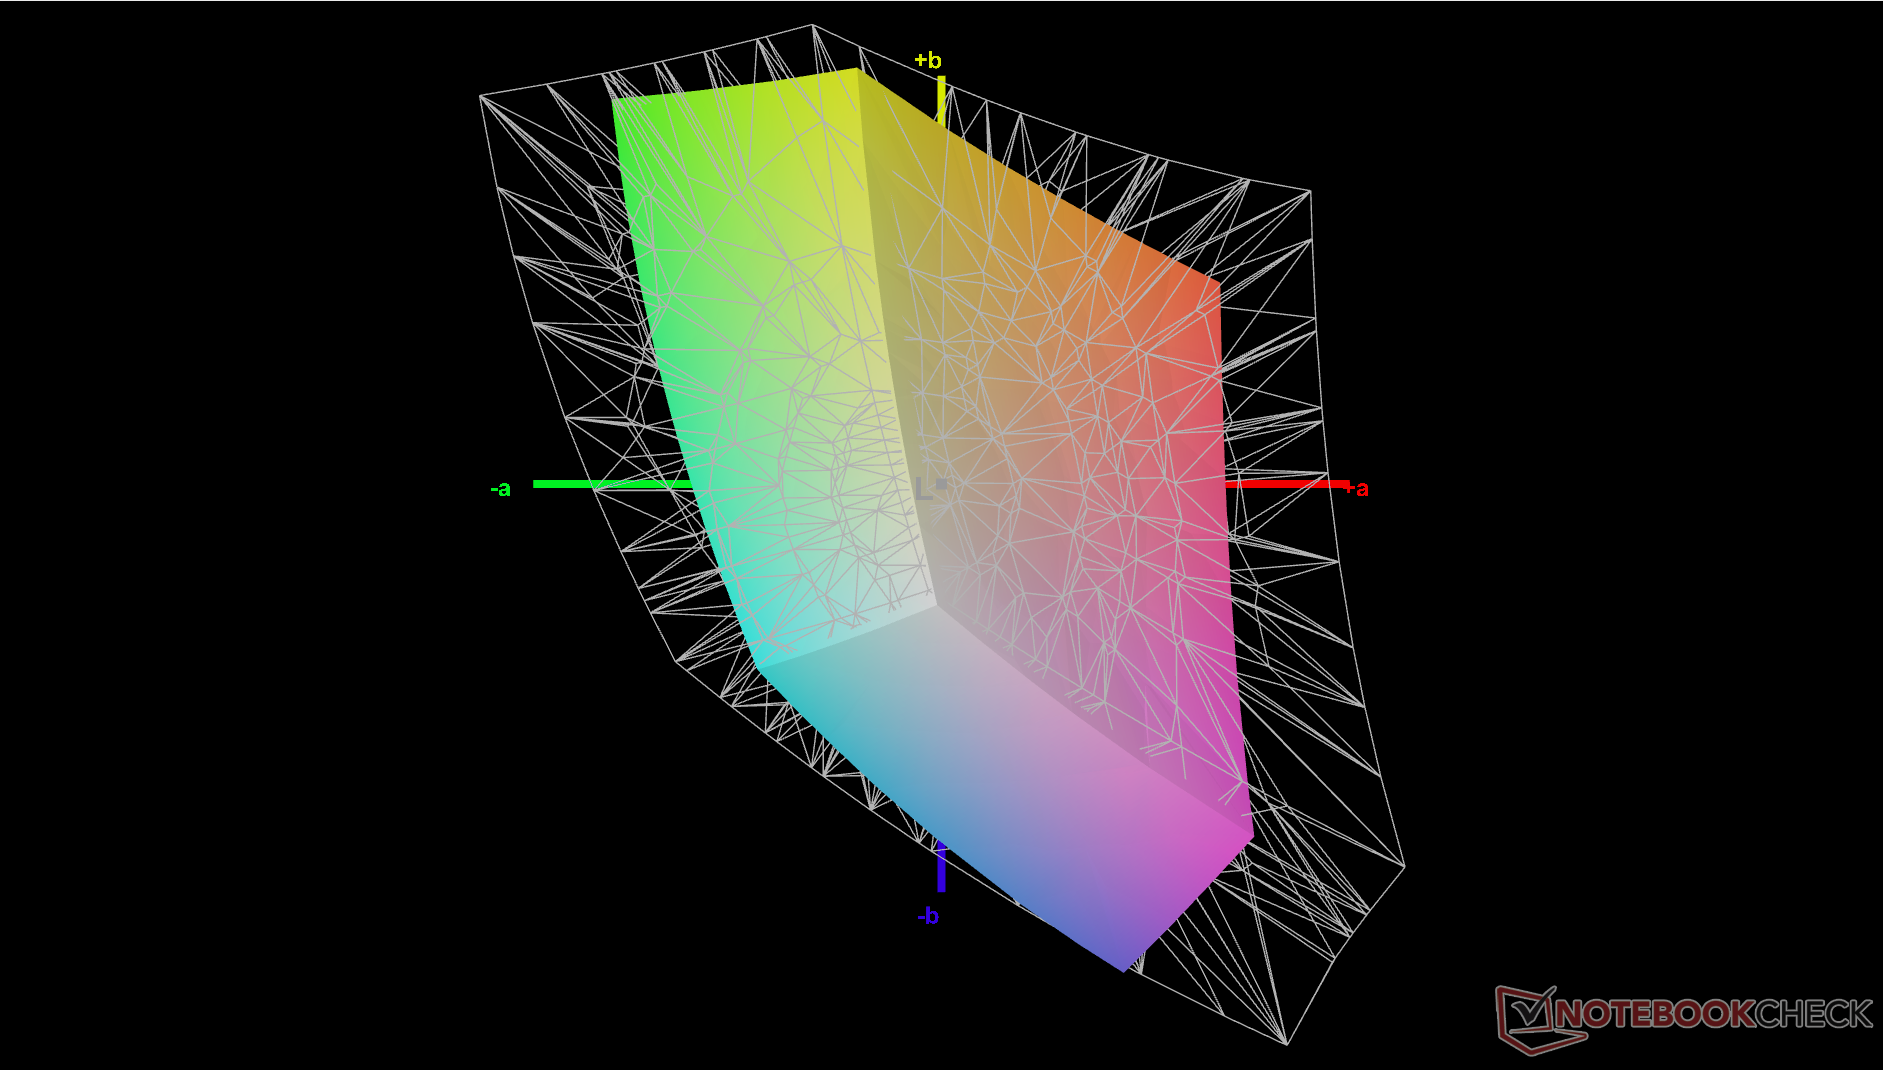
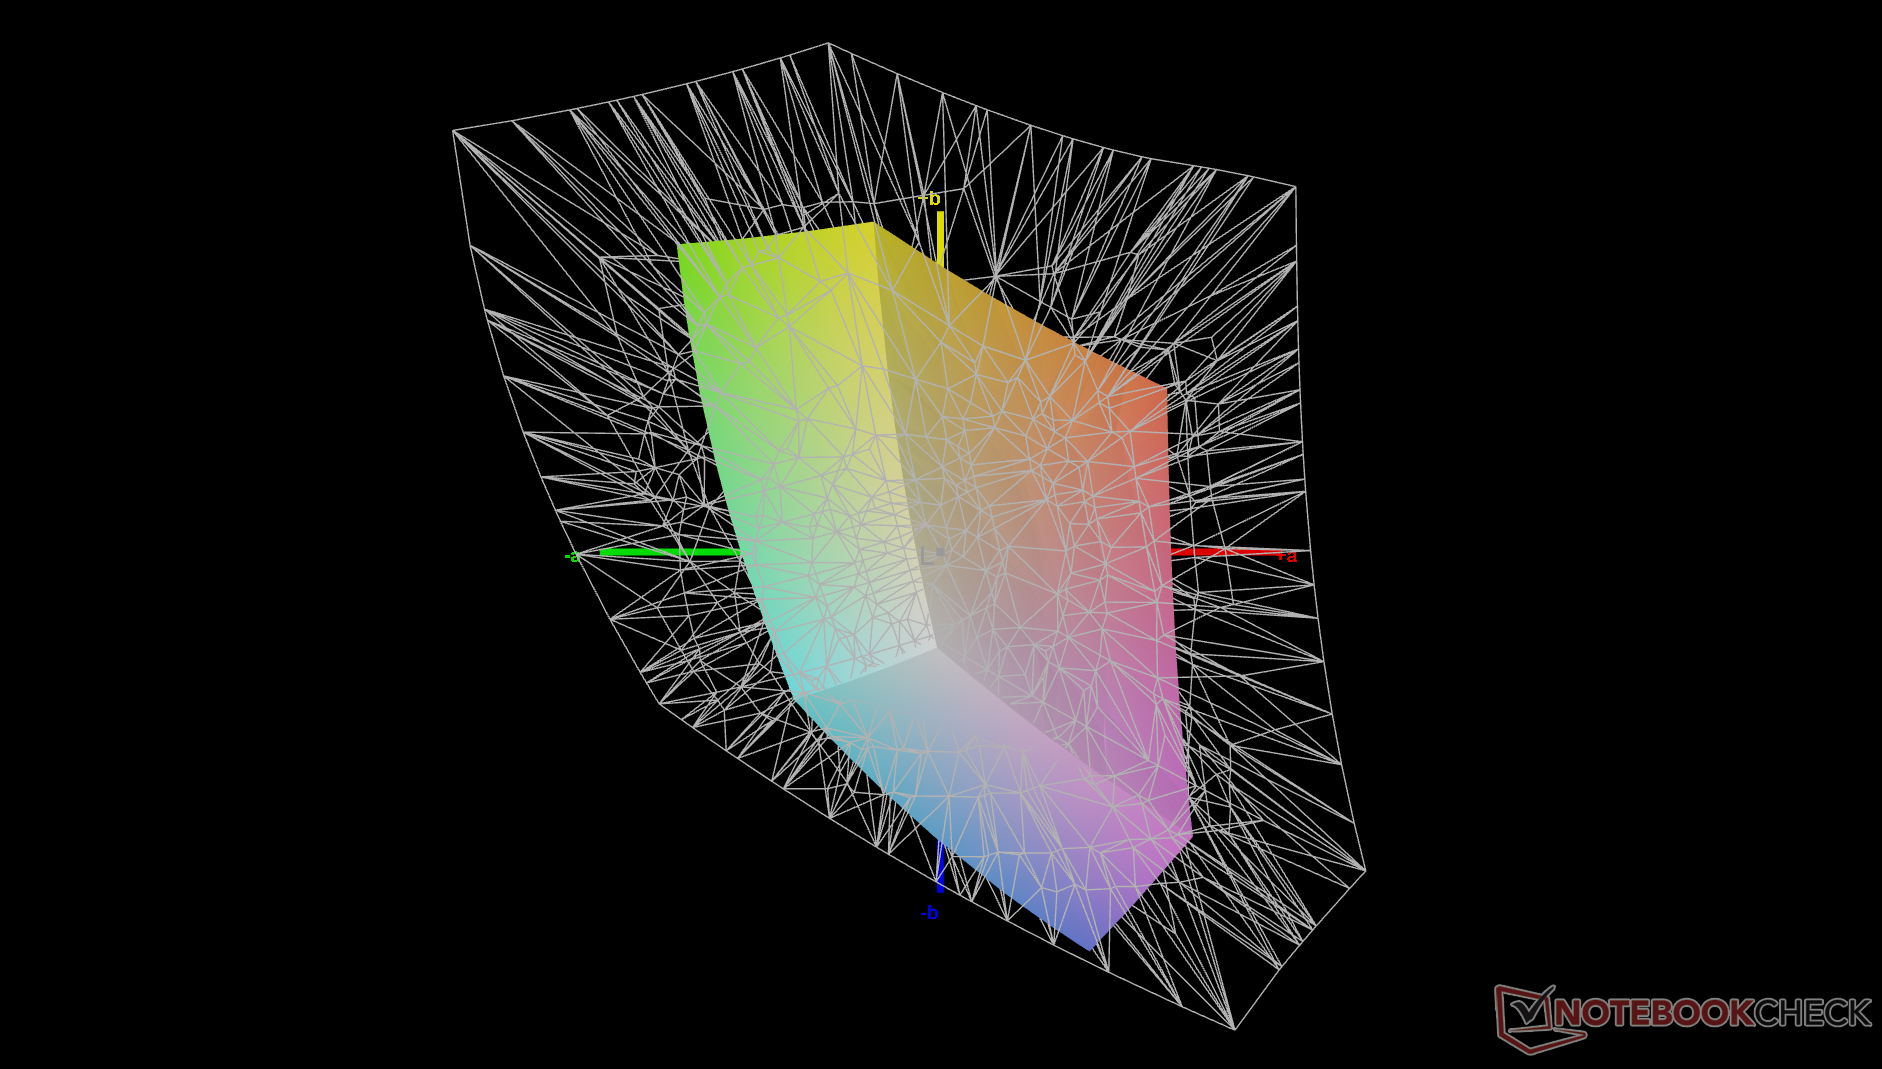
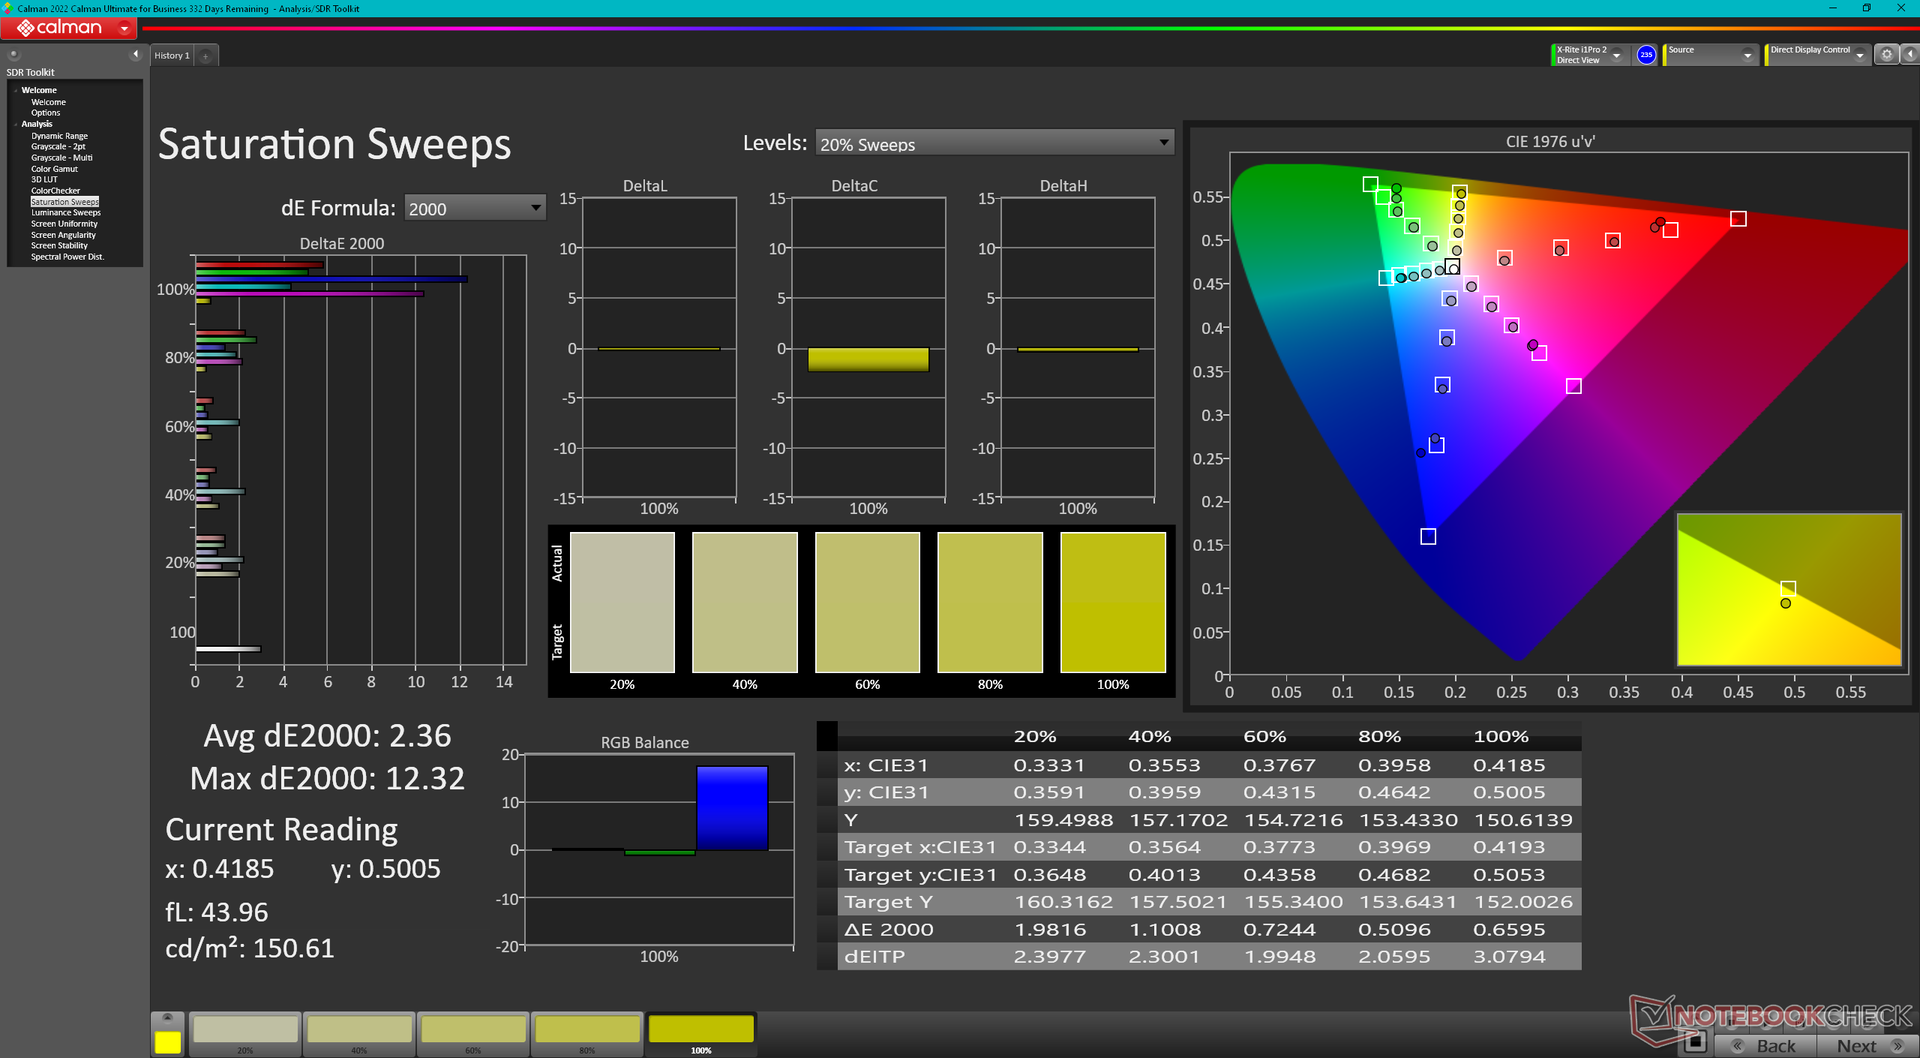
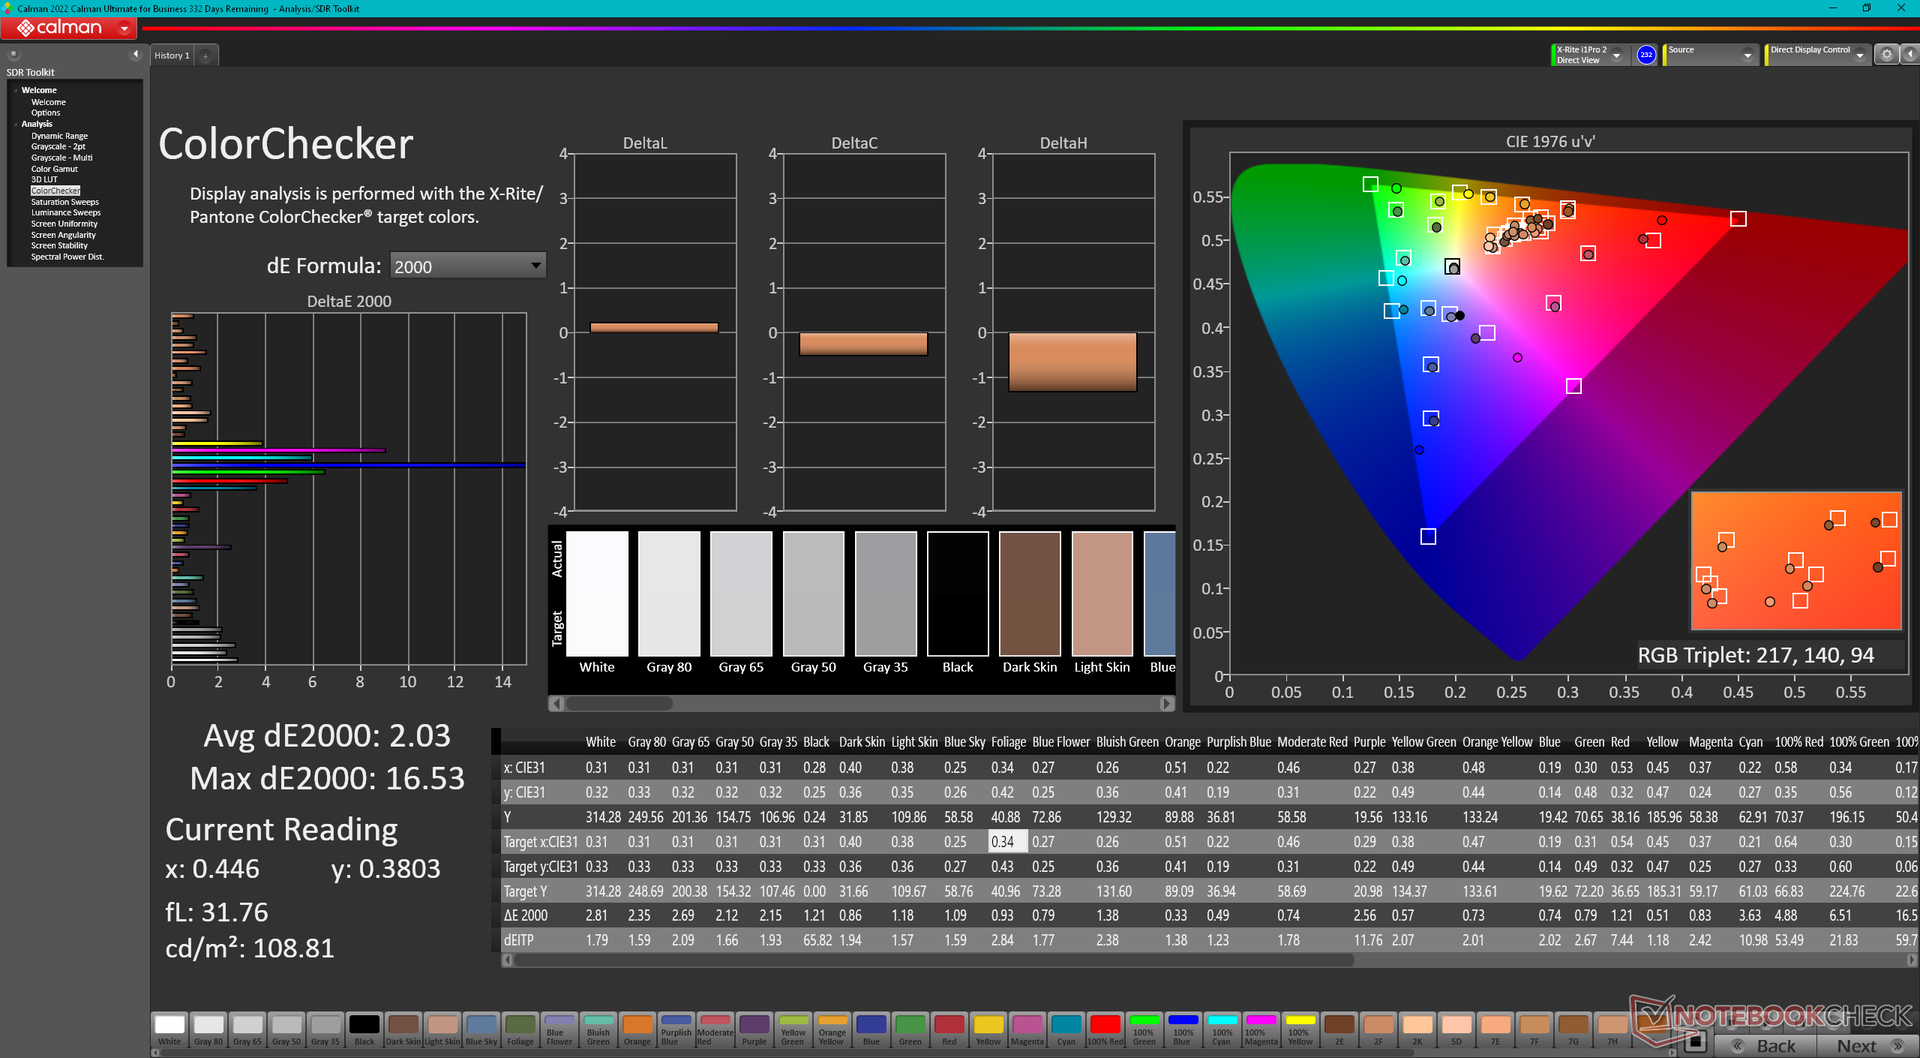
Die Kalibrierung des Bildschirms mit einem X-Rite Kolorimeter würde die durchschnittlichen Graustufen- und Farb-DeltaE-Werte leicht von 3,2 und 3,73 auf 2,2 bzw. 2,03 verbessern. Allerdings werden die Farben bei höheren Sättigungswerten aufgrund der oben erwähnten engen sRGB-Farbabdeckung immer noch zunehmend ungenau.
Reaktionszeiten (Response Times) des Displays
| ↔ Reaktionszeiten Schwarz zu Weiß | ||
|---|---|---|
| 27.6 ms ... steigend ↗ und fallend ↘ kombiniert | ↗ 12.9 ms steigend | 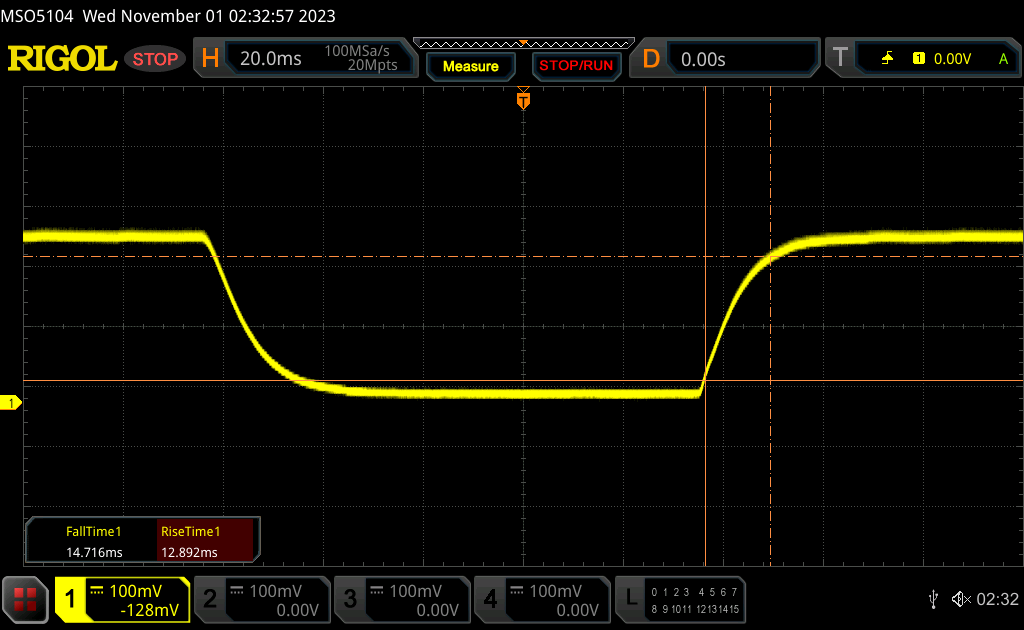 |
| ↘ 14.7 ms fallend | ||
| Die gemessenen Reaktionszeiten sind mittelmäßig und dadurch für Spieler eventuell zu langsam. Im Vergleich rangierten die bei uns getesteten Geräte von 0.1 (Minimum) zu 240 (Maximum) ms. » 70 % aller Screens waren schneller als der getestete. Daher sind die gemessenen Reaktionszeiten schlechter als der Durchschnitt aller vermessenen Geräte (19.8 ms). | ||
| ↔ Reaktionszeiten 50% Grau zu 80% Grau | ||
| 46.4 ms ... steigend ↗ und fallend ↘ kombiniert | ↗ 19.5 ms steigend | 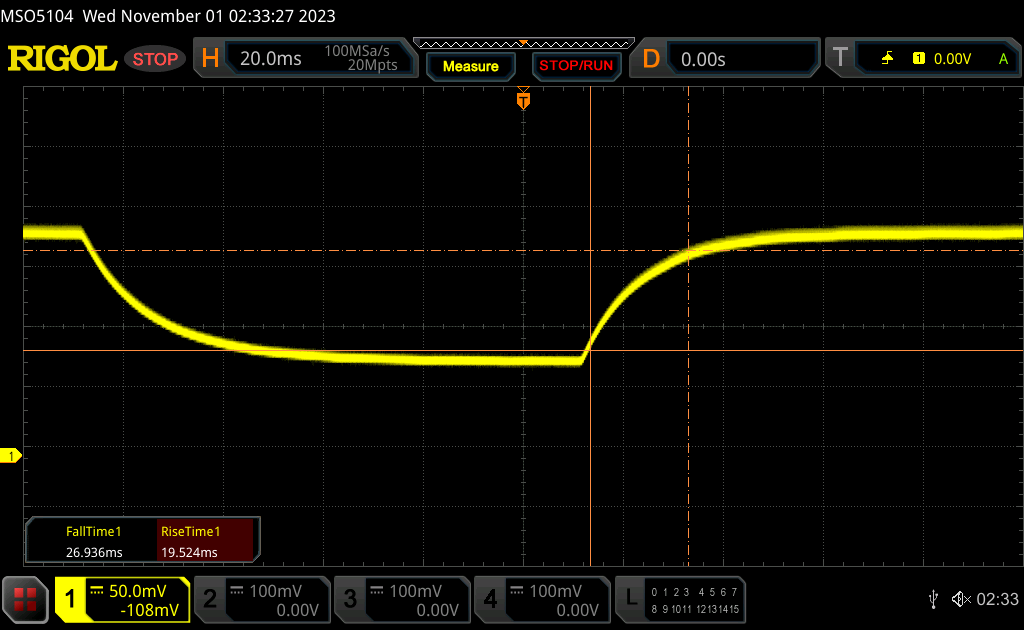 |
| ↘ 26.9 ms fallend | ||
| Die gemessenen Reaktionszeiten sind langsam und dadurch für viele Spieler wahrscheinlich zu langsam. Im Vergleich rangierten die bei uns getesteten Geräte von 0.165 (Minimum) zu 636 (Maximum) ms. » 80 % aller Screens waren schneller als der getestete. Daher sind die gemessenen Reaktionszeiten schlechter als der Durchschnitt aller vermessenen Geräte (31 ms). | ||
Bildschirm-Flackern / PWM (Pulse-Width Modulation)
| Flackern / PWM nicht festgestellt |  | ||
Im Vergleich: 52 % aller getesteten Geräte nutzten kein PWM um die Helligkeit zu reduzieren. Wenn PWM eingesetzt wurde, dann bei einer Frequenz von durchschnittlich 7778 (Minimum 5, Maximum 343500) Hz. | |||

Performance
Testbedingungen
Wir haben Windows auf den Modus Performance eingestellt, bevor wir die untenstehenden Benchmarks durchgeführt haben. Benutzer sollten sich mit der integrierten Vantage Software vertraut machen, da sie die zentrale Anlaufstelle für Lenovo-spezifische Funktionen und BIOS-Updates ist.


Prozessor
Im Gegensatz zu den meisten anderen Core i5 und Core i7 CPUs ist der Core i5-1335U viel näher an der Leistung des teureren Core i7-1355U als man zunächst erwarten könnte. In Benchmarks ist unser Core i5-1335U nur 5 bis 10 Prozent langsamer als der Core i7-1355U. Das bedeutet, dass Sie mehrere hundert Euro sparen können, wenn Sie sich für die Core i5-Konfiguration entscheiden und sich nicht an dem geringen Leistungsdefizit der CPU stören. Der wichtigste Grund für die Wahl der Core i7-Option ist jedoch die integrierte Grafik, wie der Abschnitt GPU Performance unten zeigt.
Im Vergleich zur Version mit Ryzen 7 7730U ist unsere Intel Core i5 Version bei der Multi-Thread-Leistung etwa 10 bis 15 Prozent langsamer, während bei der Single-Thread-Leistung das Gegenteil der Fall ist.
Cinebench R15 Multi Loop
Cinebench R23: Multi Core | Single Core
Cinebench R20: CPU (Multi Core) | CPU (Single Core)
Cinebench R15: CPU Multi 64Bit | CPU Single 64Bit
Blender: v2.79 BMW27 CPU
7-Zip 18.03: 7z b 4 | 7z b 4 -mmt1
Geekbench 5.5: Multi-Core | Single-Core
HWBOT x265 Benchmark v2.2: 4k Preset
LibreOffice : 20 Documents To PDF
R Benchmark 2.5: Overall mean
* ... kleinere Werte sind besser
AIDA64: FP32 Ray-Trace | FPU Julia | CPU SHA3 | CPU Queen | FPU SinJulia | FPU Mandel | CPU AES | CPU ZLib | FP64 Ray-Trace | CPU PhotoWorxx
| Performance Rating | |
| Lenovo ThinkPad E16 G1-21JUS08X00 | |
| Samsung Galaxy Book3 Pro 16 | |
| Dell Inspiron 16 7635 2-in-1 | |
| Acer TravelMate P4 TMP416-51-55KN | |
| Lenovo ThinkPad E16 G1 Core i5-1335U | |
| Durchschnittliche Intel Core i5-1335U | |
| LG Gram 16Z90Q | |
| AIDA64 / FP32 Ray-Trace | |
| Lenovo ThinkPad E16 G1-21JUS08X00 | |
| Dell Inspiron 16 7635 2-in-1 | |
| Acer TravelMate P4 TMP416-51-55KN | |
| Samsung Galaxy Book3 Pro 16 | |
| Lenovo ThinkPad E16 G1 Core i5-1335U | |
| Durchschnittliche Intel Core i5-1335U (5661 - 7809, n=11) | |
| LG Gram 16Z90Q | |
| AIDA64 / FPU Julia | |
| Lenovo ThinkPad E16 G1-21JUS08X00 | |
| Dell Inspiron 16 7635 2-in-1 | |
| Samsung Galaxy Book3 Pro 16 | |
| Acer TravelMate P4 TMP416-51-55KN | |
| Lenovo ThinkPad E16 G1 Core i5-1335U | |
| Durchschnittliche Intel Core i5-1335U (29483 - 43636, n=11) | |
| LG Gram 16Z90Q | |
| AIDA64 / CPU SHA3 | |
| Samsung Galaxy Book3 Pro 16 | |
| Lenovo ThinkPad E16 G1-21JUS08X00 | |
| Acer TravelMate P4 TMP416-51-55KN | |
| Lenovo ThinkPad E16 G1 Core i5-1335U | |
| Dell Inspiron 16 7635 2-in-1 | |
| Durchschnittliche Intel Core i5-1335U (1515 - 2278, n=11) | |
| LG Gram 16Z90Q | |
| AIDA64 / CPU Queen | |
| Lenovo ThinkPad E16 G1-21JUS08X00 | |
| Samsung Galaxy Book3 Pro 16 | |
| Acer TravelMate P4 TMP416-51-55KN | |
| LG Gram 16Z90Q | |
| Dell Inspiron 16 7635 2-in-1 | |
| Lenovo ThinkPad E16 G1 Core i5-1335U | |
| Durchschnittliche Intel Core i5-1335U (53839 - 60992, n=11) | |
| AIDA64 / FPU SinJulia | |
| Lenovo ThinkPad E16 G1-21JUS08X00 | |
| Dell Inspiron 16 7635 2-in-1 | |
| Samsung Galaxy Book3 Pro 16 | |
| Acer TravelMate P4 TMP416-51-55KN | |
| Lenovo ThinkPad E16 G1 Core i5-1335U | |
| LG Gram 16Z90Q | |
| Durchschnittliche Intel Core i5-1335U (3873 - 5008, n=11) | |
| AIDA64 / FPU Mandel | |
| Lenovo ThinkPad E16 G1-21JUS08X00 | |
| Dell Inspiron 16 7635 2-in-1 | |
| Samsung Galaxy Book3 Pro 16 | |
| Acer TravelMate P4 TMP416-51-55KN | |
| Lenovo ThinkPad E16 G1 Core i5-1335U | |
| Durchschnittliche Intel Core i5-1335U (14376 - 20553, n=11) | |
| LG Gram 16Z90Q | |
| AIDA64 / CPU AES | |
| Samsung Galaxy Book3 Pro 16 | |
| Acer TravelMate P4 TMP416-51-55KN | |
| Lenovo ThinkPad E16 G1 Core i5-1335U | |
| Lenovo ThinkPad E16 G1-21JUS08X00 | |
| Durchschnittliche Intel Core i5-1335U (31154 - 65997, n=11) | |
| Dell Inspiron 16 7635 2-in-1 | |
| LG Gram 16Z90Q | |
| AIDA64 / CPU ZLib | |
| Samsung Galaxy Book3 Pro 16 | |
| Acer TravelMate P4 TMP416-51-55KN | |
| Lenovo ThinkPad E16 G1 Core i5-1335U | |
| Lenovo ThinkPad E16 G1-21JUS08X00 | |
| Dell Inspiron 16 7635 2-in-1 | |
| Durchschnittliche Intel Core i5-1335U (378 - 676, n=11) | |
| LG Gram 16Z90Q | |
| AIDA64 / FP64 Ray-Trace | |
| Lenovo ThinkPad E16 G1-21JUS08X00 | |
| Dell Inspiron 16 7635 2-in-1 | |
| Acer TravelMate P4 TMP416-51-55KN | |
| Samsung Galaxy Book3 Pro 16 | |
| Lenovo ThinkPad E16 G1 Core i5-1335U | |
| LG Gram 16Z90Q | |
| Durchschnittliche Intel Core i5-1335U (2878 - 4214, n=11) | |
| AIDA64 / CPU PhotoWorxx | |
| Samsung Galaxy Book3 Pro 16 | |
| LG Gram 16Z90Q | |
| Durchschnittliche Intel Core i5-1335U (13584 - 41123, n=11) | |
| Acer TravelMate P4 TMP416-51-55KN | |
| Lenovo ThinkPad E16 G1 Core i5-1335U | |
| Dell Inspiron 16 7635 2-in-1 | |
| Lenovo ThinkPad E16 G1-21JUS08X00 | |
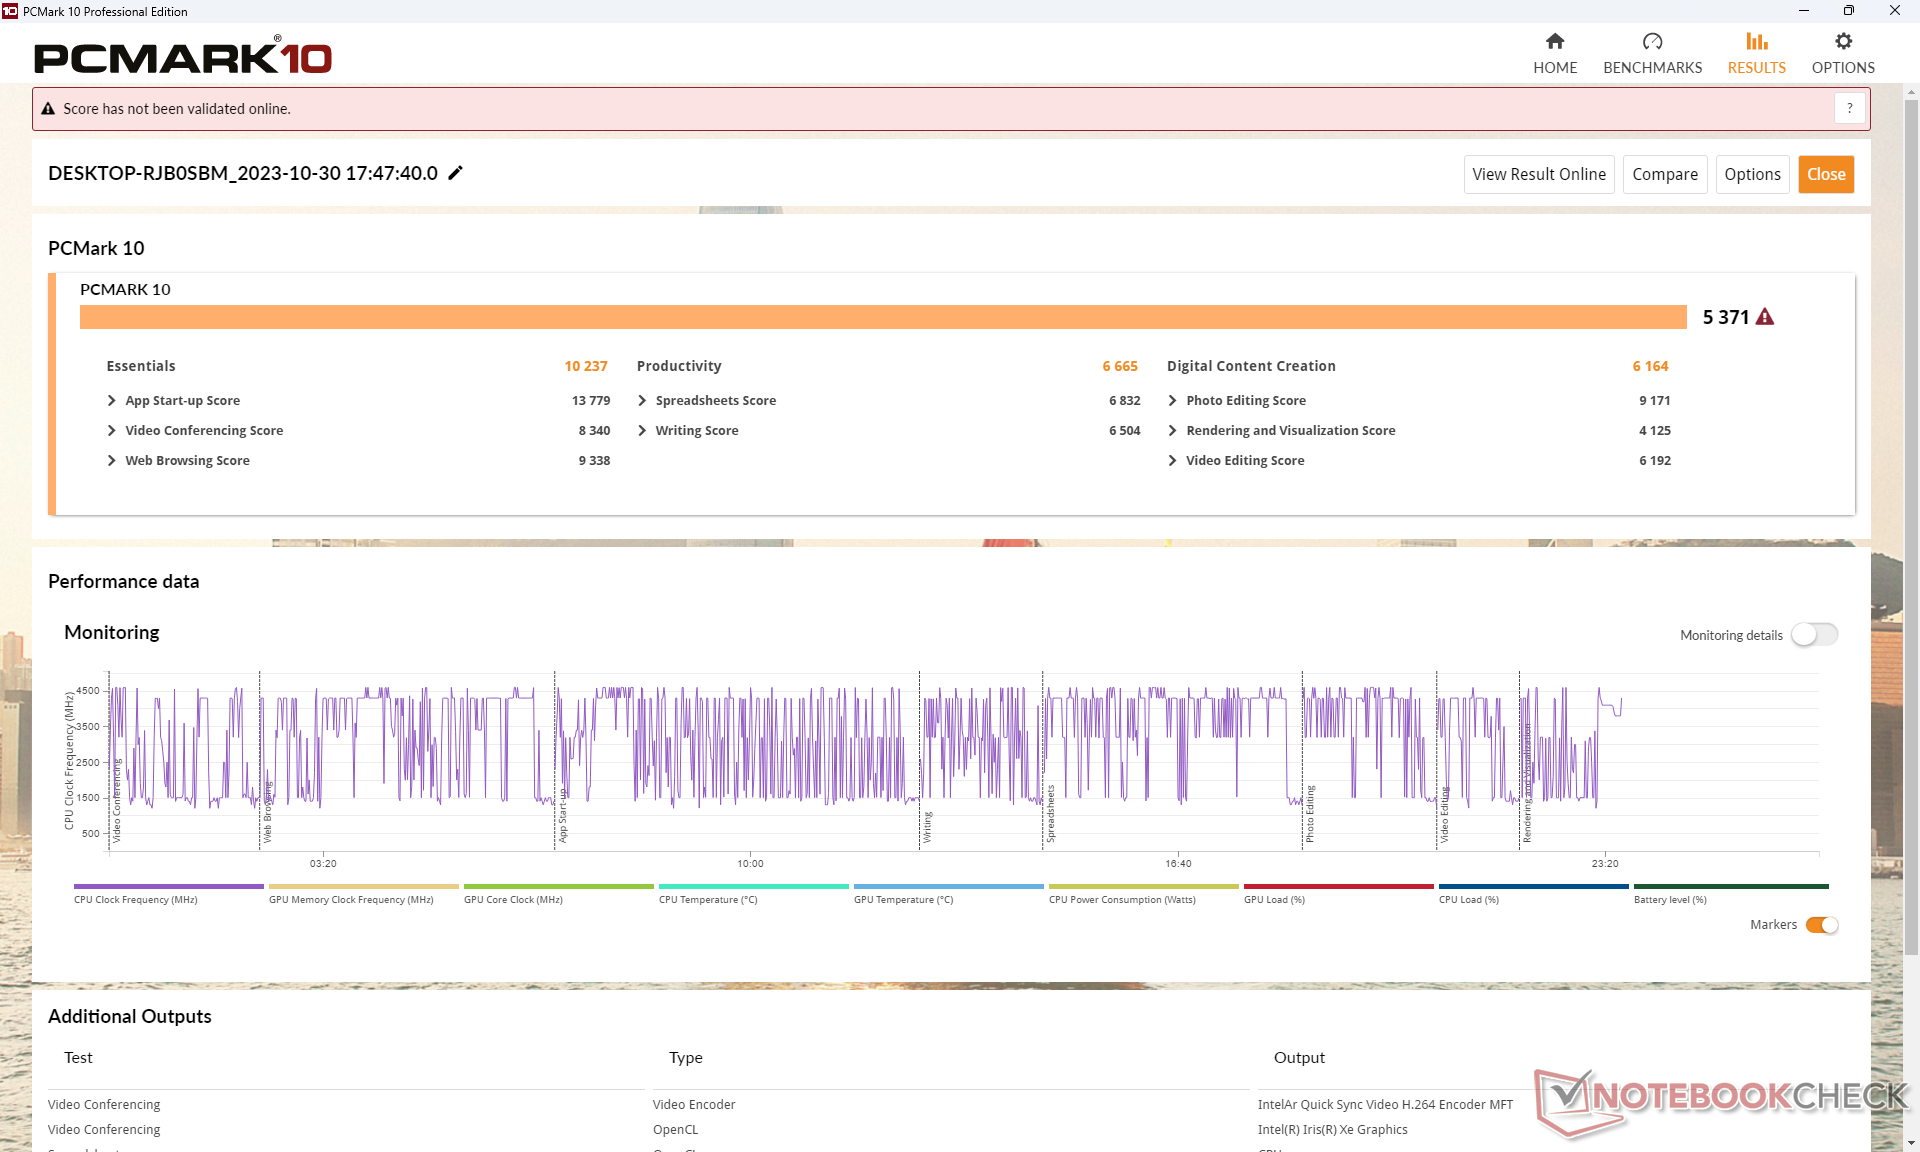
System Performance
Die PCMark-Ergebnisse sind ähnlich der der Ryzen 7 AMD-Alternative, außer im Untertest Produktivität. Das liegt an der überlegenen Multi-Thread-Leistung des Ryzen 7 7730U gegenüber der unseres Core i5-1335U.
CrossMark: Overall | Productivity | Creativity | Responsiveness
| PCMark 10 / Score | |
| Dell Inspiron 16 7635 2-in-1 | |
| Lenovo ThinkPad E16 G1-21JUS08X00 | |
| Samsung Galaxy Book3 Pro 16 | |
| Lenovo ThinkPad E16 G1 Core i5-1335U | |
| Durchschnittliche Intel Core i5-1335U, Intel Iris Xe Graphics G7 80EUs (5068 - 5600, n=11) | |
| Acer TravelMate P4 TMP416-51-55KN | |
| LG Gram 16Z90Q | |
| PCMark 10 / Essentials | |
| Dell Inspiron 16 7635 2-in-1 | |
| Samsung Galaxy Book3 Pro 16 | |
| Lenovo ThinkPad E16 G1-21JUS08X00 | |
| Durchschnittliche Intel Core i5-1335U, Intel Iris Xe Graphics G7 80EUs (9828 - 11912, n=11) | |
| Lenovo ThinkPad E16 G1 Core i5-1335U | |
| LG Gram 16Z90Q | |
| Acer TravelMate P4 TMP416-51-55KN | |
| PCMark 10 / Productivity | |
| Dell Inspiron 16 7635 2-in-1 | |
| Lenovo ThinkPad E16 G1-21JUS08X00 | |
| Durchschnittliche Intel Core i5-1335U, Intel Iris Xe Graphics G7 80EUs (6196 - 7261, n=11) | |
| Acer TravelMate P4 TMP416-51-55KN | |
| Samsung Galaxy Book3 Pro 16 | |
| Lenovo ThinkPad E16 G1 Core i5-1335U | |
| LG Gram 16Z90Q | |
| PCMark 10 / Digital Content Creation | |
| Samsung Galaxy Book3 Pro 16 | |
| Acer TravelMate P4 TMP416-51-55KN | |
| Lenovo ThinkPad E16 G1 Core i5-1335U | |
| Lenovo ThinkPad E16 G1-21JUS08X00 | |
| LG Gram 16Z90Q | |
| Dell Inspiron 16 7635 2-in-1 | |
| Durchschnittliche Intel Core i5-1335U, Intel Iris Xe Graphics G7 80EUs (5361 - 6164, n=11) | |
| CrossMark / Overall | |
| Samsung Galaxy Book3 Pro 16 | |
| Acer TravelMate P4 TMP416-51-55KN | |
| Durchschnittliche Intel Core i5-1335U, Intel Iris Xe Graphics G7 80EUs (1339 - 1599, n=11) | |
| Lenovo ThinkPad E16 G1 Core i5-1335U | |
| Lenovo ThinkPad E16 G1-21JUS08X00 | |
| Dell Inspiron 16 7635 2-in-1 | |
| CrossMark / Productivity | |
| Samsung Galaxy Book3 Pro 16 | |
| Acer TravelMate P4 TMP416-51-55KN | |
| Durchschnittliche Intel Core i5-1335U, Intel Iris Xe Graphics G7 80EUs (1337 - 1638, n=11) | |
| Lenovo ThinkPad E16 G1 Core i5-1335U | |
| Lenovo ThinkPad E16 G1-21JUS08X00 | |
| Dell Inspiron 16 7635 2-in-1 | |
| CrossMark / Creativity | |
| Samsung Galaxy Book3 Pro 16 | |
| Acer TravelMate P4 TMP416-51-55KN | |
| Durchschnittliche Intel Core i5-1335U, Intel Iris Xe Graphics G7 80EUs (1315 - 1620, n=11) | |
| Lenovo ThinkPad E16 G1 Core i5-1335U | |
| Lenovo ThinkPad E16 G1-21JUS08X00 | |
| Dell Inspiron 16 7635 2-in-1 | |
| CrossMark / Responsiveness | |
| Acer TravelMate P4 TMP416-51-55KN | |
| Samsung Galaxy Book3 Pro 16 | |
| Durchschnittliche Intel Core i5-1335U, Intel Iris Xe Graphics G7 80EUs (1023 - 1868, n=11) | |
| Lenovo ThinkPad E16 G1 Core i5-1335U | |
| Lenovo ThinkPad E16 G1-21JUS08X00 | |
| Dell Inspiron 16 7635 2-in-1 | |
| PCMark 10 Score | 5371 Punkte | |
Hilfe | ||
| AIDA64 / Memory Copy | |
| LG Gram 16Z90Q | |
| Samsung Galaxy Book3 Pro 16 | |
| Durchschnittliche Intel Core i5-1335U (22417 - 60884, n=11) | |
| Acer TravelMate P4 TMP416-51-55KN | |
| Dell Inspiron 16 7635 2-in-1 | |
| Lenovo ThinkPad E16 G1 Core i5-1335U | |
| Lenovo ThinkPad E16 G1-21JUS08X00 | |
| AIDA64 / Memory Read | |
| LG Gram 16Z90Q | |
| Samsung Galaxy Book3 Pro 16 | |
| Acer TravelMate P4 TMP416-51-55KN | |
| Durchschnittliche Intel Core i5-1335U (23104 - 61555, n=11) | |
| Dell Inspiron 16 7635 2-in-1 | |
| Lenovo ThinkPad E16 G1-21JUS08X00 | |
| Lenovo ThinkPad E16 G1 Core i5-1335U | |
| AIDA64 / Memory Write | |
| Samsung Galaxy Book3 Pro 16 | |
| LG Gram 16Z90Q | |
| Durchschnittliche Intel Core i5-1335U (22936 - 72584, n=11) | |
| Acer TravelMate P4 TMP416-51-55KN | |
| Lenovo ThinkPad E16 G1 Core i5-1335U | |
| Dell Inspiron 16 7635 2-in-1 | |
| Lenovo ThinkPad E16 G1-21JUS08X00 | |
| AIDA64 / Memory Latency | |
| Dell Inspiron 16 7635 2-in-1 | |
| LG Gram 16Z90Q | |
| Durchschnittliche Intel Core i5-1335U (78.6 - 112.8, n=11) | |
| Samsung Galaxy Book3 Pro 16 | |
| Lenovo ThinkPad E16 G1-21JUS08X00 | |
| Lenovo ThinkPad E16 G1 Core i5-1335U | |
| Acer TravelMate P4 TMP416-51-55KN | |
* ... kleinere Werte sind besser
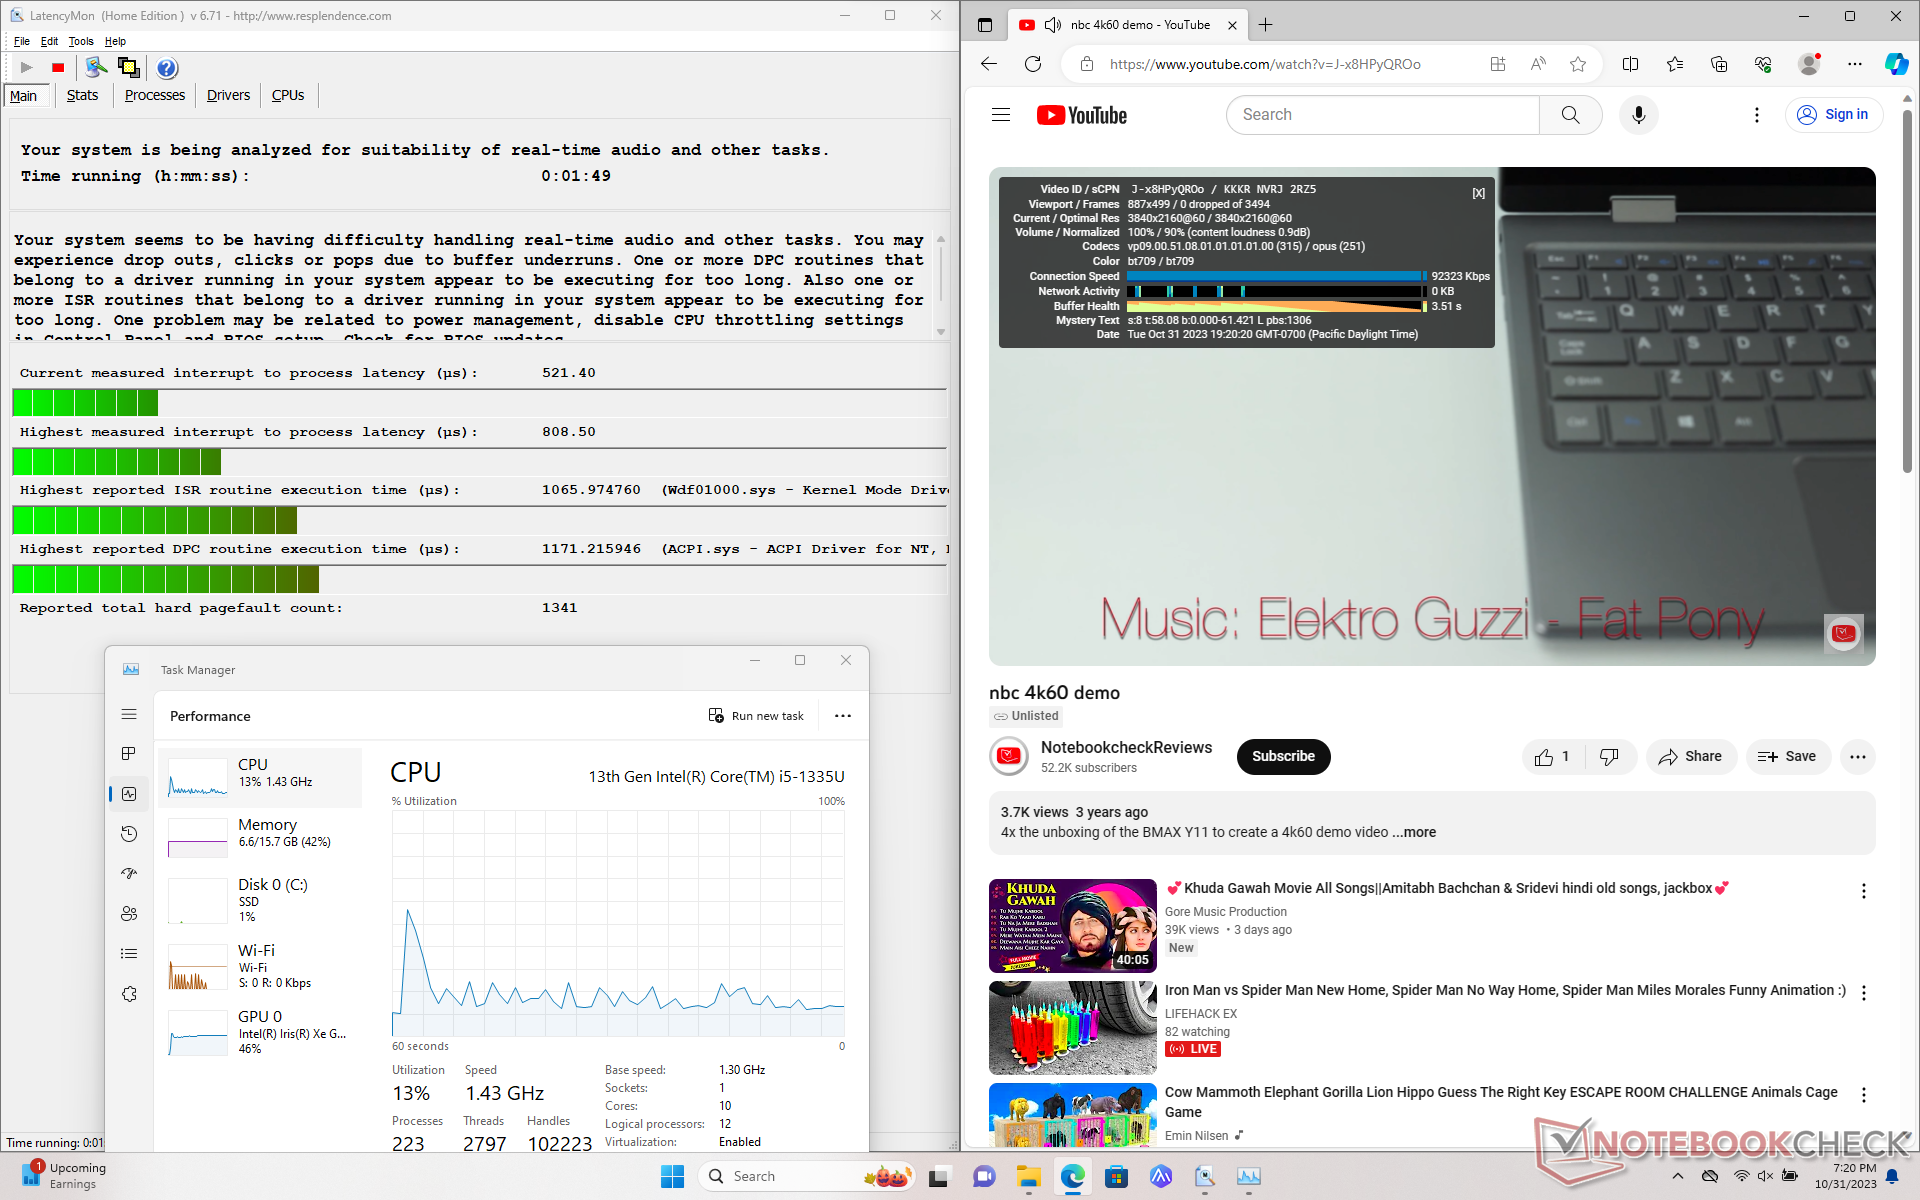
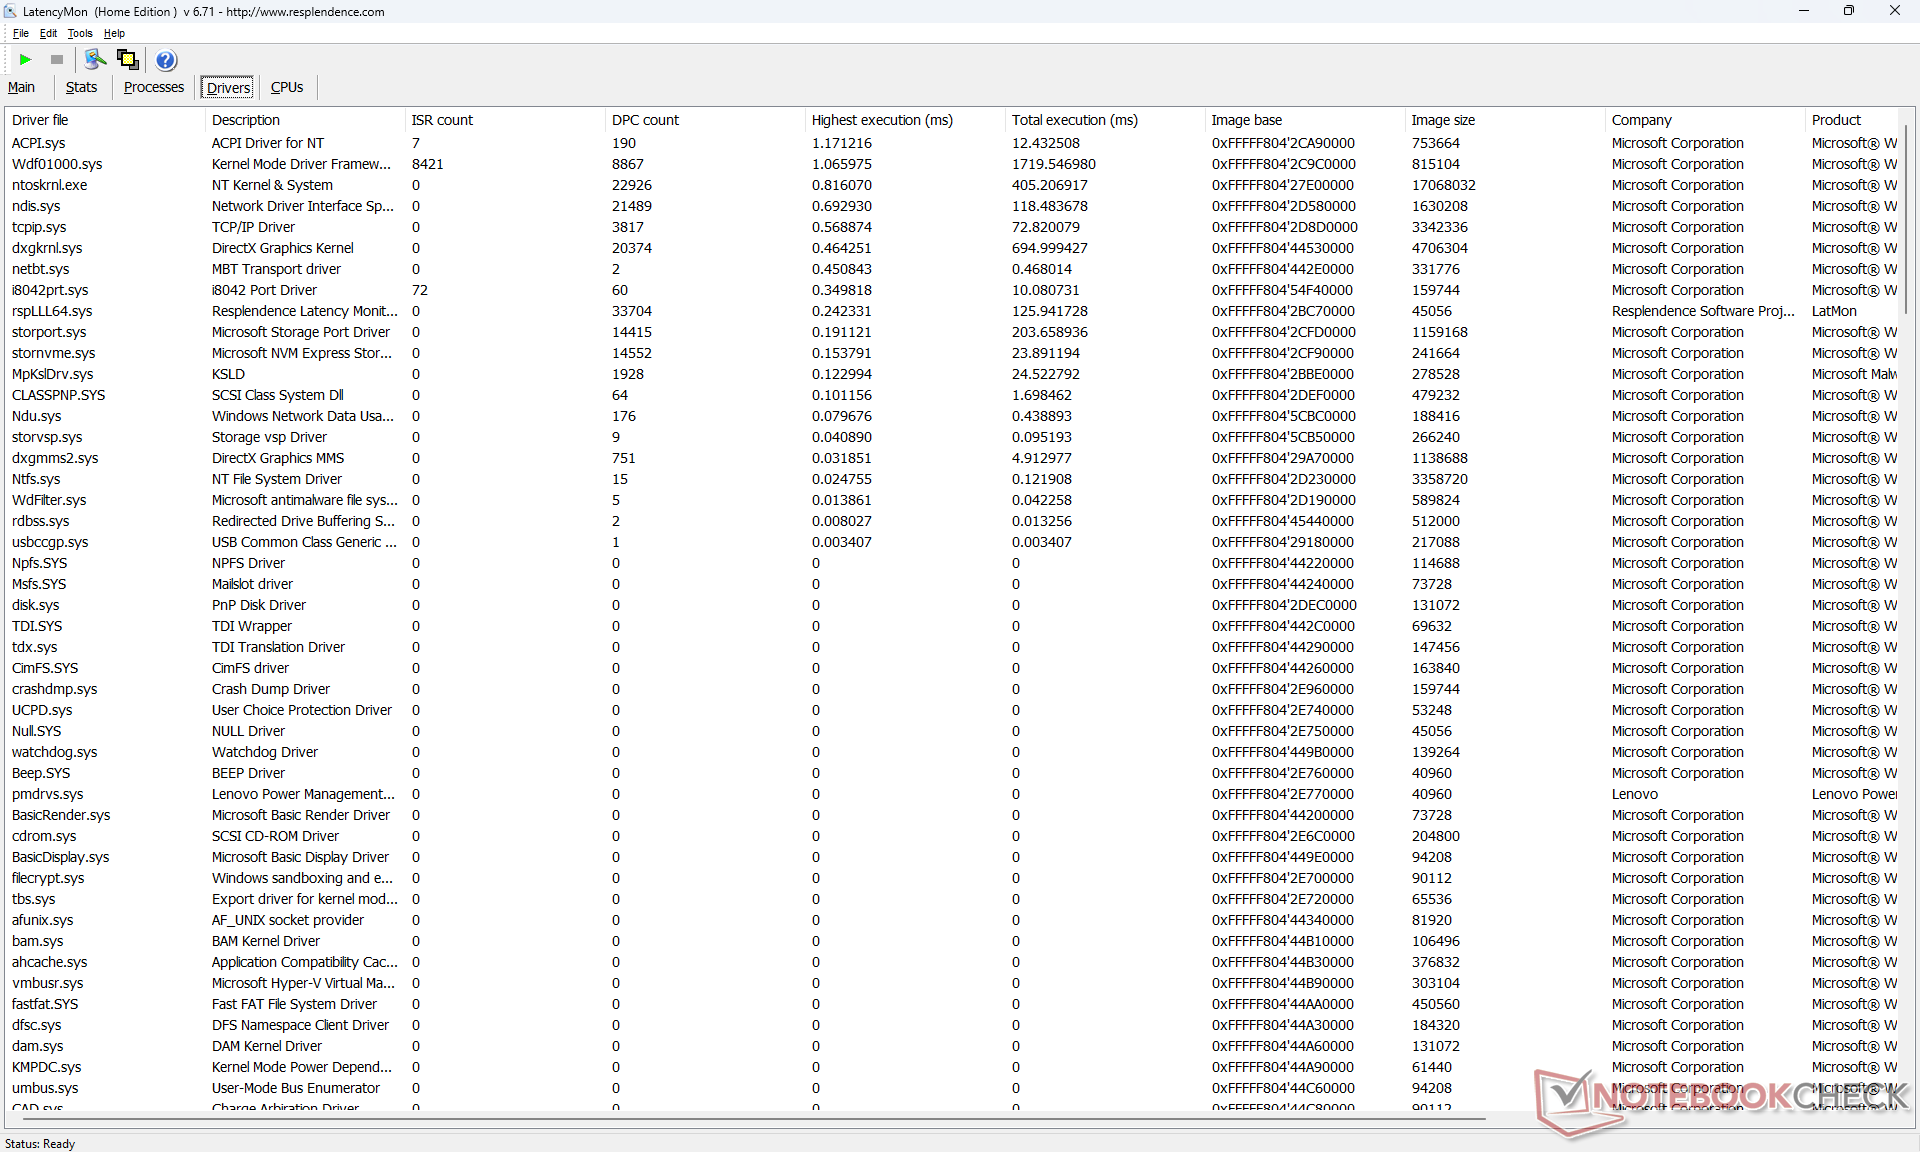
DPC-Latenzzeit
LatencyMon zeigt nur geringe DPC-Probleme beim Öffnen mehrerer Browsertabs unserer Homepage. Die 4K-Videowiedergabe bei 60 FPS ist ansonsten vollkommen flüssig und es wurden keine Bildaussetzer verzeichnet.
| DPC Latencies / LatencyMon - interrupt to process latency (max), Web, Youtube, Prime95 | |
| Acer TravelMate P4 TMP416-51-55KN | |
| LG Gram 16Z90Q | |
| Lenovo ThinkPad E16 G1-21JUS08X00 | |
| Lenovo ThinkPad E16 G1 Core i5-1335U | |
| Dell Inspiron 16 7635 2-in-1 | |
| Samsung Galaxy Book3 Pro 16 | |
* ... kleinere Werte sind besser
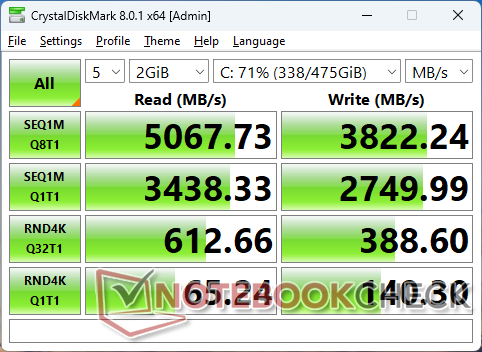
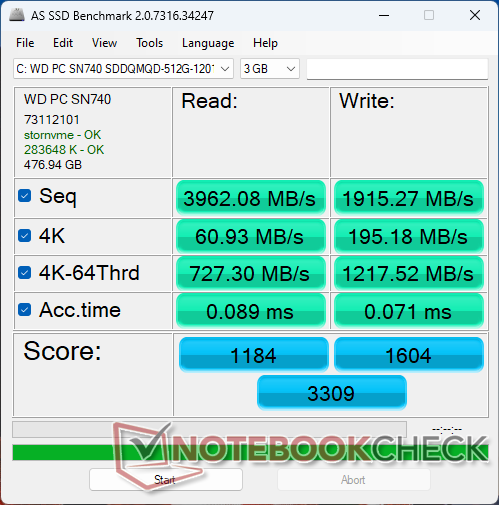
Speichergeräte
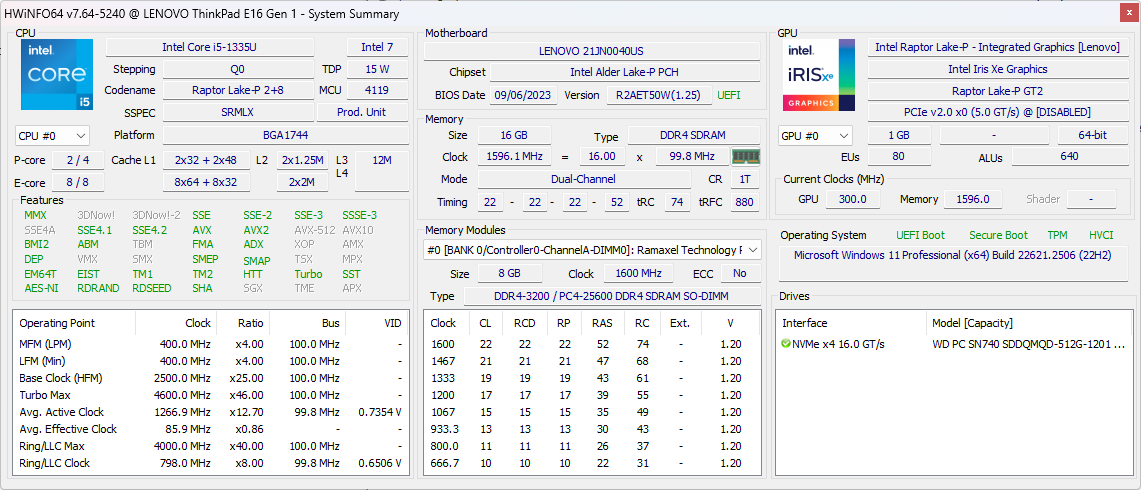
Unser Testgerät enthält die Western Digital SN740, eine PCIe4 x4 NVMe SSD der Mittelklasse, die unter realen Bedingungen sequenzielle Lese- und Schreibgeschwindigkeiten von bis zu 5100 MB/s bzw. 3900 MB/s bietet. Das 2242-Laufwerk hatte keine Probleme, diese maximalen Raten aufrechtzuerhalten, obwohl es keine Wärmepads oder Kühlungshilfen besitzt.

* ... kleinere Werte sind besser
Disk Throttling: DiskSpd Read Loop, Queue Depth 8
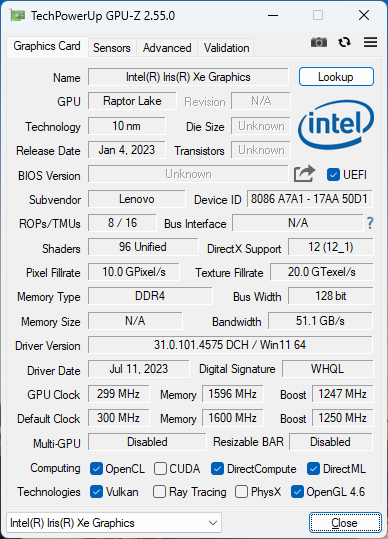
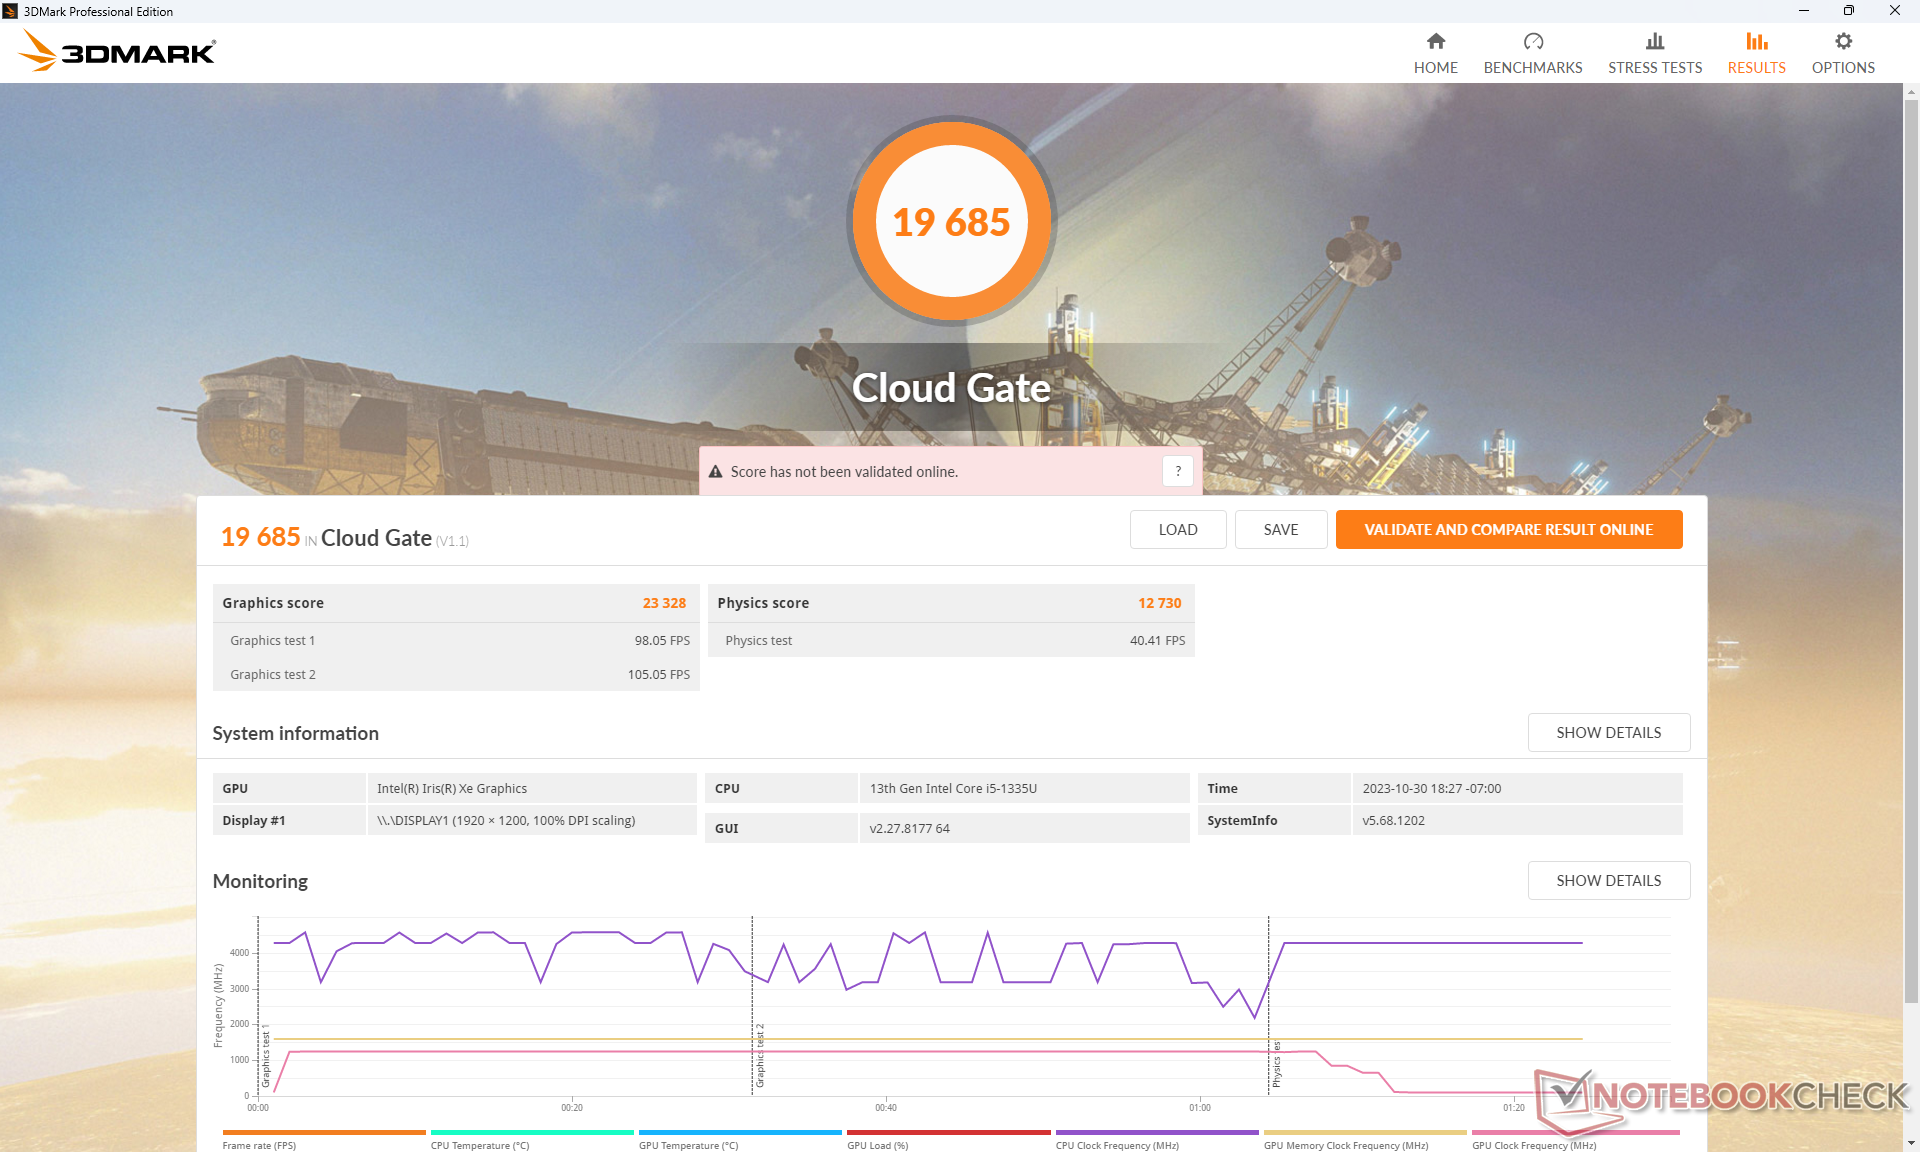
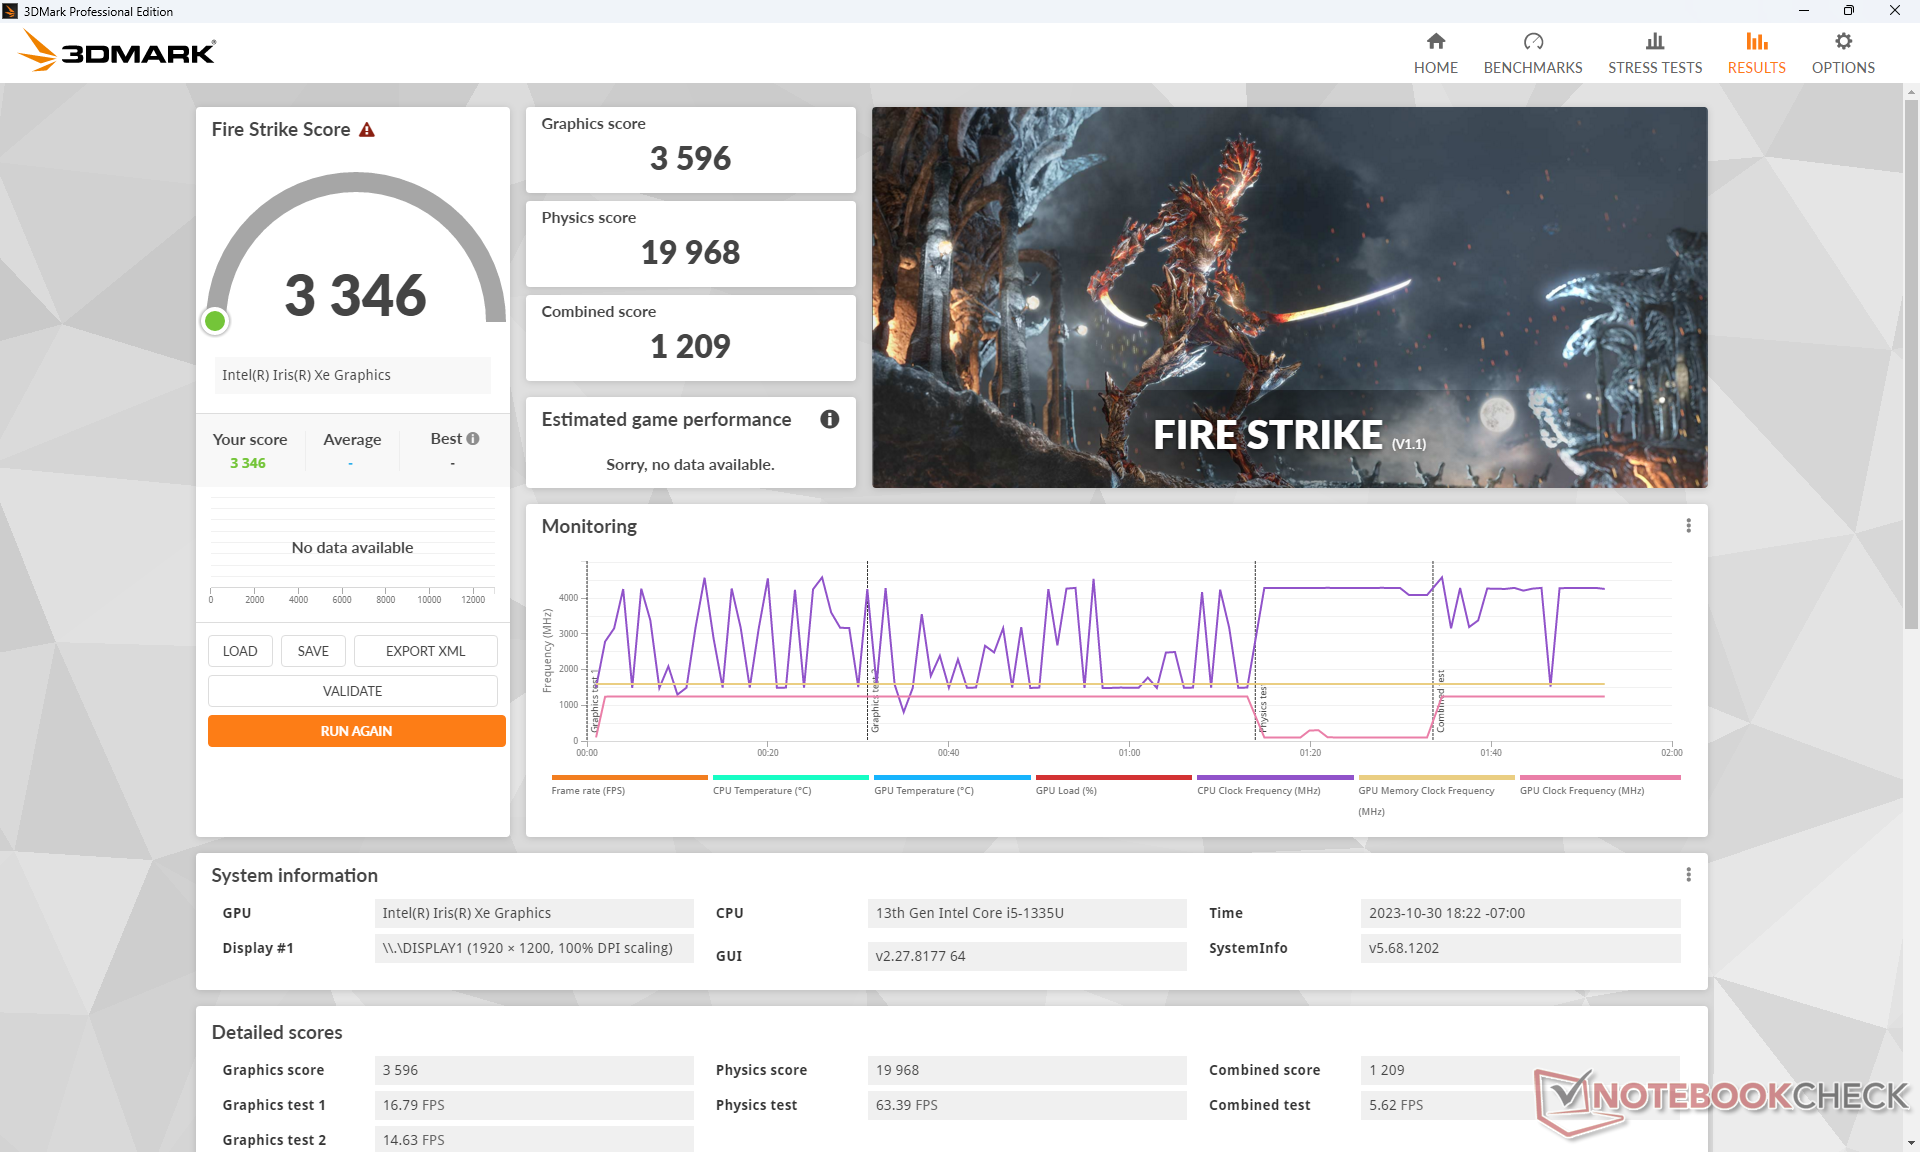
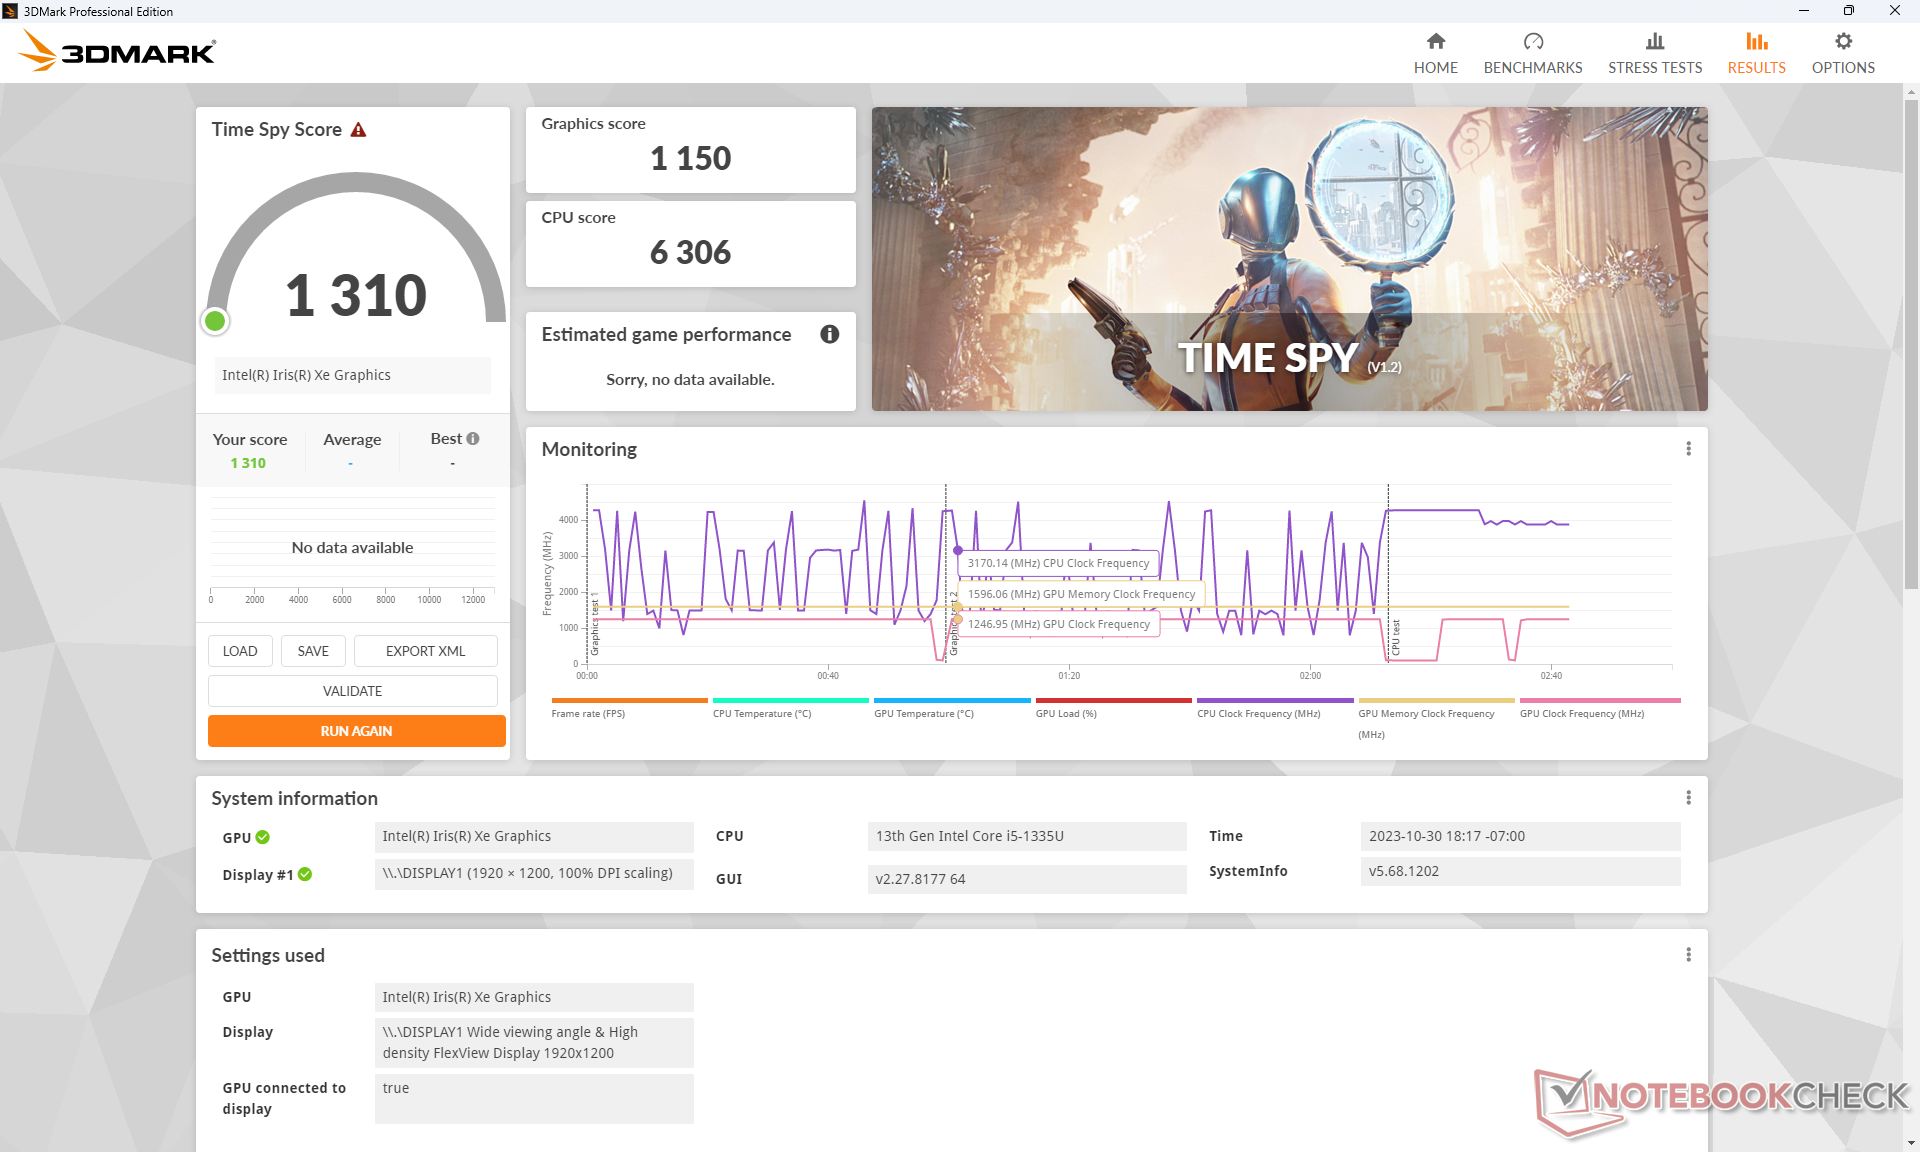
GPU Performance
Unsere integrierte Iris Xe 80 EUs ist im Vergleich zu anderen Laptops mit der gleichen GPU so leistungsfähig, wie wir es erwarten, wenn nicht sogar etwas langsamer. Ein Upgrade auf die Core i7 Konfiguration mit der Iris Xe 96 EUs oder GeForce MX550 würde die Leistung um etwa 25 bis 30 Prozent bzw. 70 bis 100 Prozent steigern.
Achten Sie darauf, dass Sie die Konfiguration mit Dual-Channel-RAM vornehmen, da sonst die iGPU-Leistung erheblich leidet.
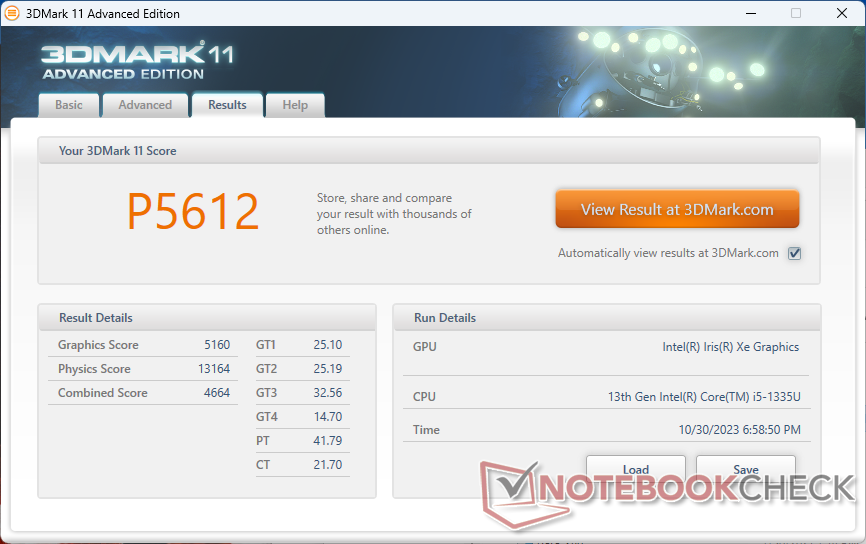
| 3DMark 11 Performance | 5612 Punkte | |
| 3DMark Cloud Gate Standard Score | 19685 Punkte | |
| 3DMark Fire Strike Score | 3346 Punkte | |
| 3DMark Time Spy Score | 1310 Punkte | |
Hilfe | ||
* ... kleinere Werte sind besser
Die Bildraten im Leerlauf auf Witcher 3 fielen zu Beginn des Tests ziemlich stark ab, was auf eine störende Hintergrundaktivität hindeutet. Glücklicherweise trat dies im weiteren Verlauf des Tests nicht mehr auf.
Witcher 3 FPS Chart
| min. | mittel | hoch | max. | |
|---|---|---|---|---|
| GTA V (2015) | 84.5 | 68.8 | 13.2 | 5.41 |
| The Witcher 3 (2015) | 73.6 | 45.1 | 22.1 | 11.1 |
| Dota 2 Reborn (2015) | 100.7 | 75.2 | 49.2 | 45 |
| Final Fantasy XV Benchmark (2018) | 31 | 16.9 | 12.1 | |
| X-Plane 11.11 (2018) | 28.6 | 22.5 | 21 | |
| Far Cry 5 (2018) | 40 | 19 | 18 | 17 |
| Strange Brigade (2018) | 70.3 | 27.3 | 22.4 | 18.3 |
| Cyberpunk 2077 1.6 (2022) | 14.1 | |||
| Tiny Tina's Wonderlands (2022) | 20.6 | 15.3 | 10.4 | 8.1 |
| F1 22 (2022) | 32.8 | 29.1 | 21.3 | 16.5 |
Emissionen
Systemrauschen
Die Lüftergeräusche sind im Allgemeinen lauter als die bei der Ryzen-7-Version, was wahrscheinlich auf den höheren Energiebedarf unserer Intel-Version zurückzuführen ist. Bei der Ausführung des 3DMark 06 beispielsweise bleibt das Lüftergeräusch mit knapp 25 dB(A) relativ leise, verglichen mit fast 33 dB(A) bei unserer Intel-Version.
Lautstärkediagramm
| Idle |
| 24.6 / 24.6 / 24.6 dB(A) |
| Last |
| 32.7 / 39.2 dB(A) |
 | ||
30 dB leise 40 dB(A) deutlich hörbar 50 dB(A) störend |
||
min: | ||
| Lenovo ThinkPad E16 G1 Core i5-1335U Iris Xe G7 80EUs, i5-1335U | Lenovo ThinkPad E16 G1-21JUS08X00 Vega 8, R7 7730U, WD PC SN740 SDDPNQD-1T00 | Dell Inspiron 16 7635 2-in-1 Vega 7, R5 7530U, Kioxia BG5 KBG50ZNS512G | Acer TravelMate P4 TMP416-51-55KN Iris Xe G7 80EUs, i5-1240P, Micron 2450 512GB MTFDKBA512TFK | Samsung Galaxy Book3 Pro 16 Iris Xe G7 80EUs, i5-1340P, WD PC SN740 256GB SDDPNQD-256G | LG Gram 16Z90Q Iris Xe G7 96EUs, i7-1260P, Samsung PM9A1 MZVL21T0HCLR | |
|---|---|---|---|---|---|---|
| Geräuschentwicklung | 11% | -7% | -10% | -14% | -7% | |
| aus / Umgebung * (dB) | 24.6 | 22.4 9% | 23.6 4% | 25.4 -3% | 25.2 -2% | 25 -2% |
| Idle min * (dB) | 24.6 | 22.4 9% | 23.6 4% | 25.4 -3% | 25.2 -2% | 26 -6% |
| Idle avg * (dB) | 24.6 | 22.4 9% | 23.6 4% | 25.4 -3% | 25.2 -2% | 27 -10% |
| Idle max * (dB) | 24.6 | 23.7 4% | 23.6 4% | 25.4 -3% | 29.3 -19% | 28 -14% |
| Last avg * (dB) | 32.7 | 24.8 24% | 40.3 -23% | 43.9 -34% | 46.4 -42% | 38 -16% |
| Witcher 3 ultra * (dB) | 34.7 | 29.8 14% | 44.2 -27% | 37 -7% | ||
| Last max * (dB) | 39.2 | 36.1 8% | 44.2 -13% | 43.7 -11% | 46.4 -18% | 38 3% |
* ... kleinere Werte sind besser
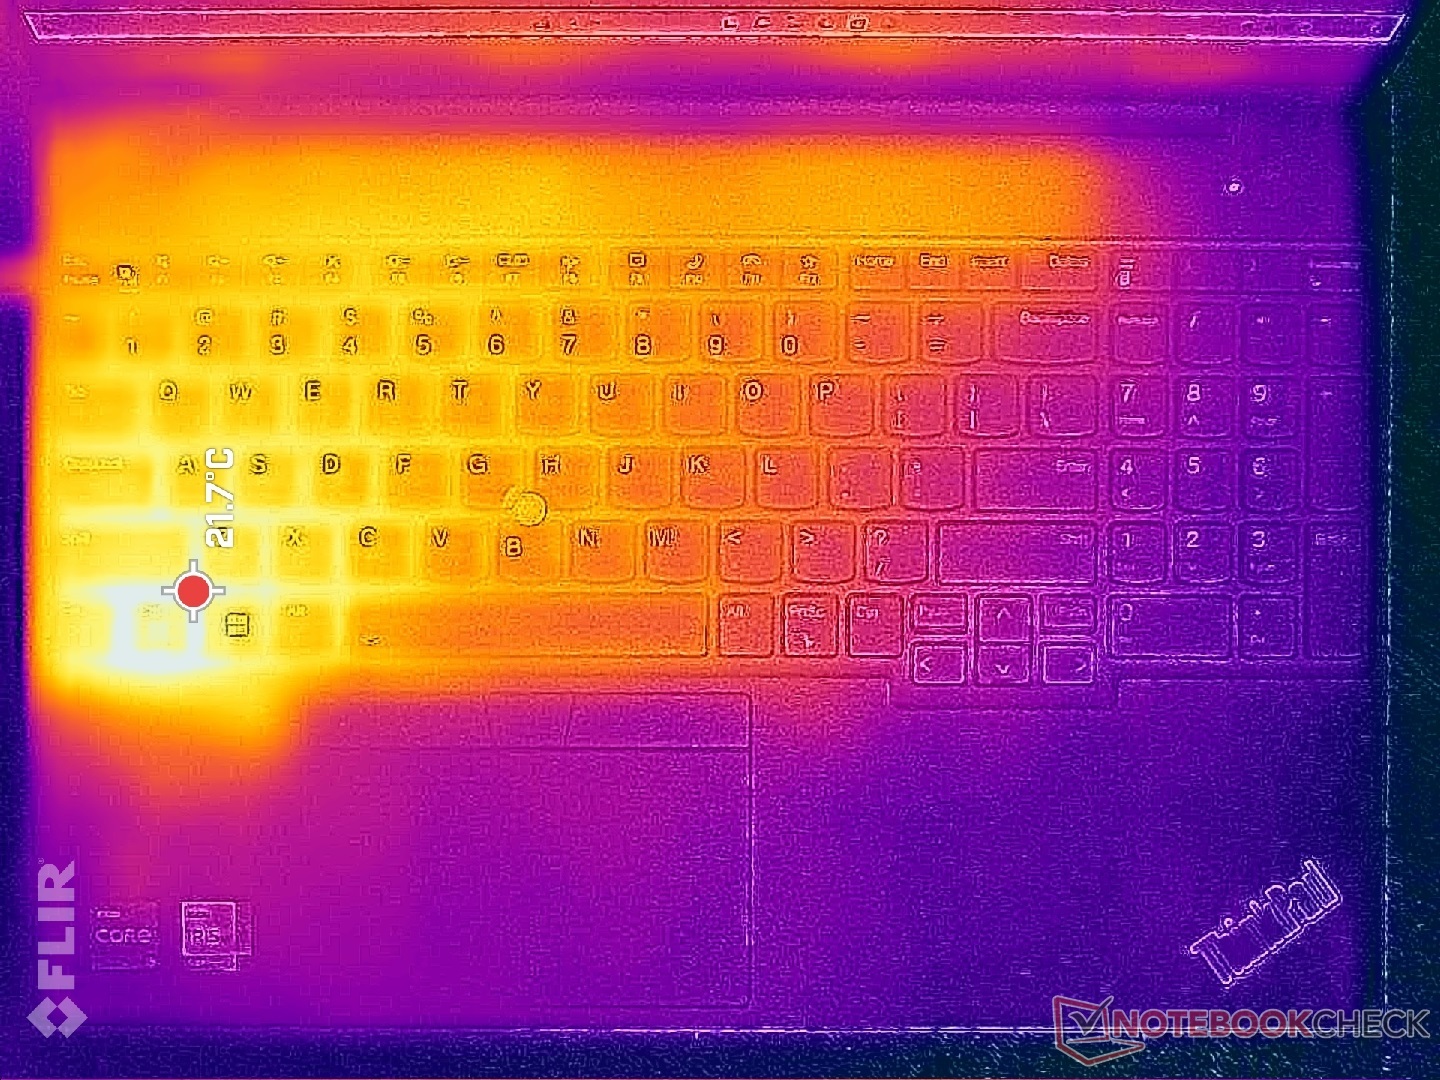
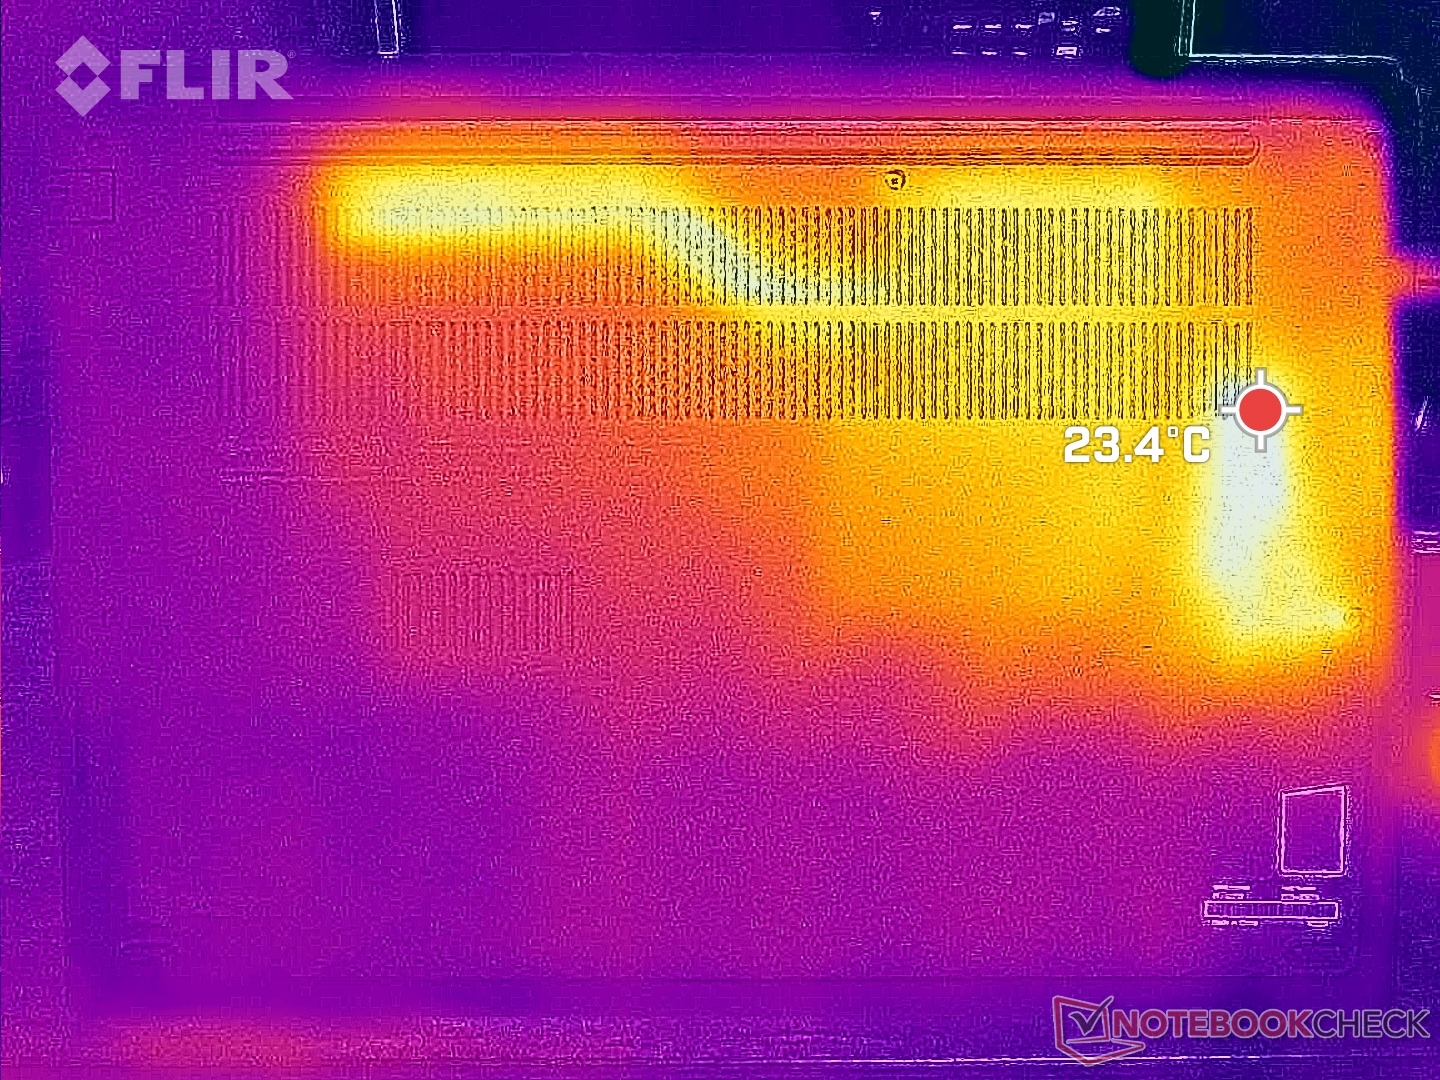
Temperatur
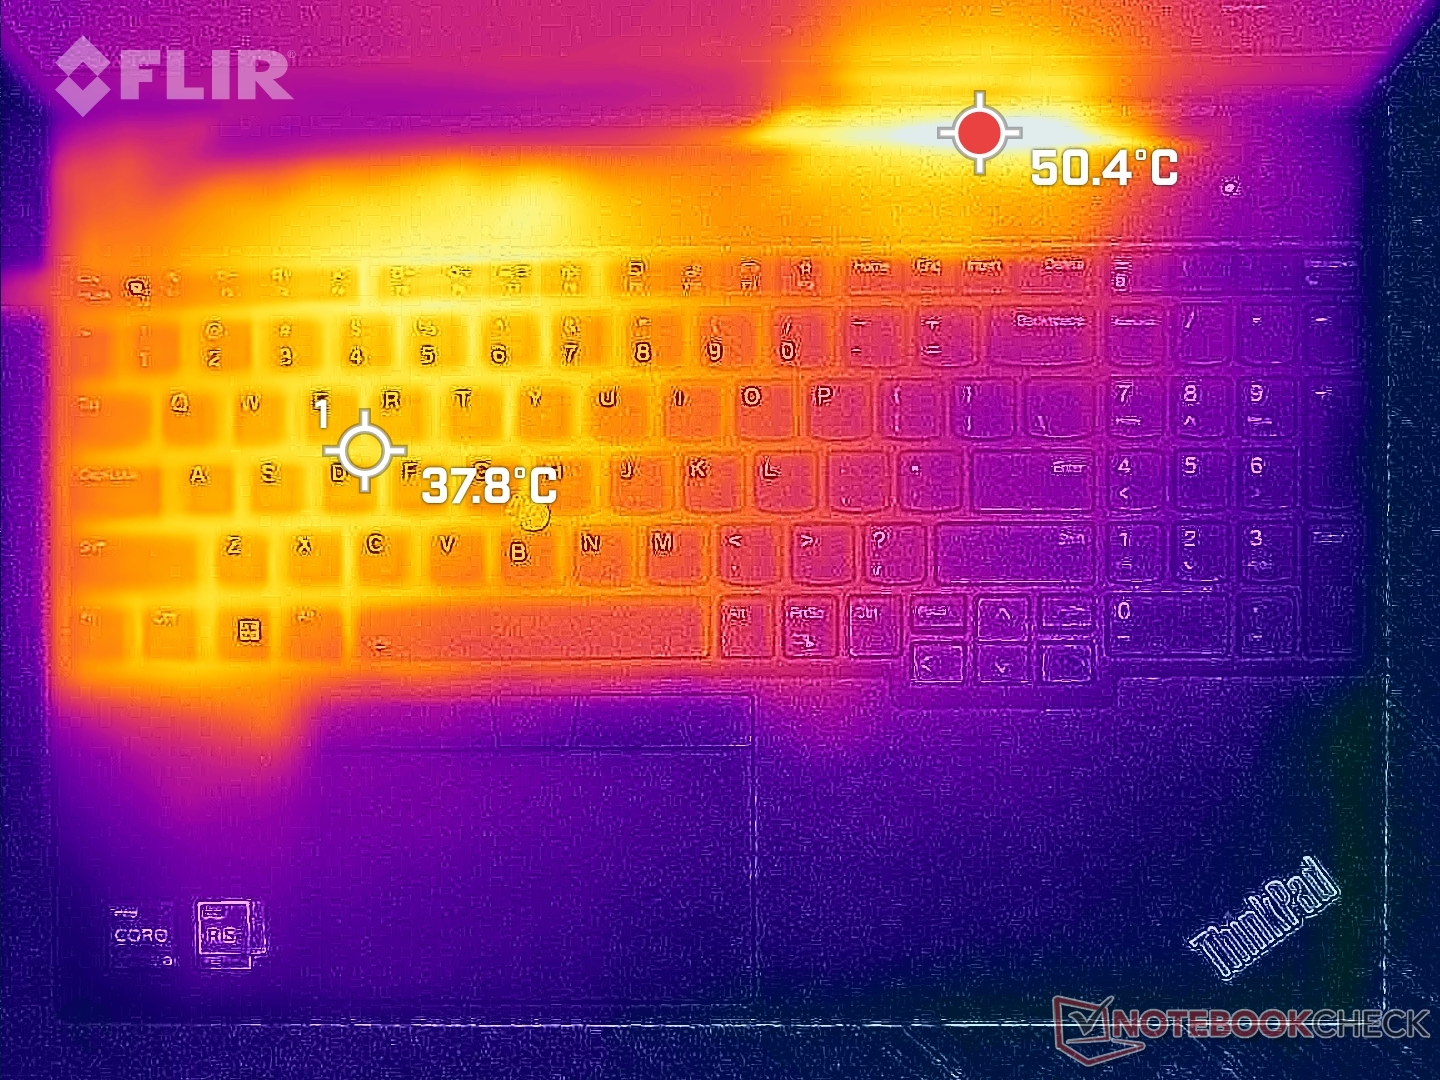
Die Oberflächentemperaturen sind auf der linken Hälfte des Laptops wärmer als auf der rechten, einfach aufgrund der Positionierung des Prozessors und der Kühllösung im Inneren. Hot Spots bei anspruchsvoller Last können bis zu 38° C bzw. 45° C auf der Ober- und Unterseite erreichen, wie die Temperaturkarten unten zeigen. Die Ergebnisse sind tatsächlich ein paar Grad Celsius kühler als bei der AMD-Konfiguration, was vielleicht auf den oben erwähnten lauteren Lüfter zurückzuführen ist. Die Temperaturunterschiede zwischen dem wärmeren und dem kühleren Quadranten sind zwar spürbar, aber während der Nutzung nicht unangenehm oder störend.
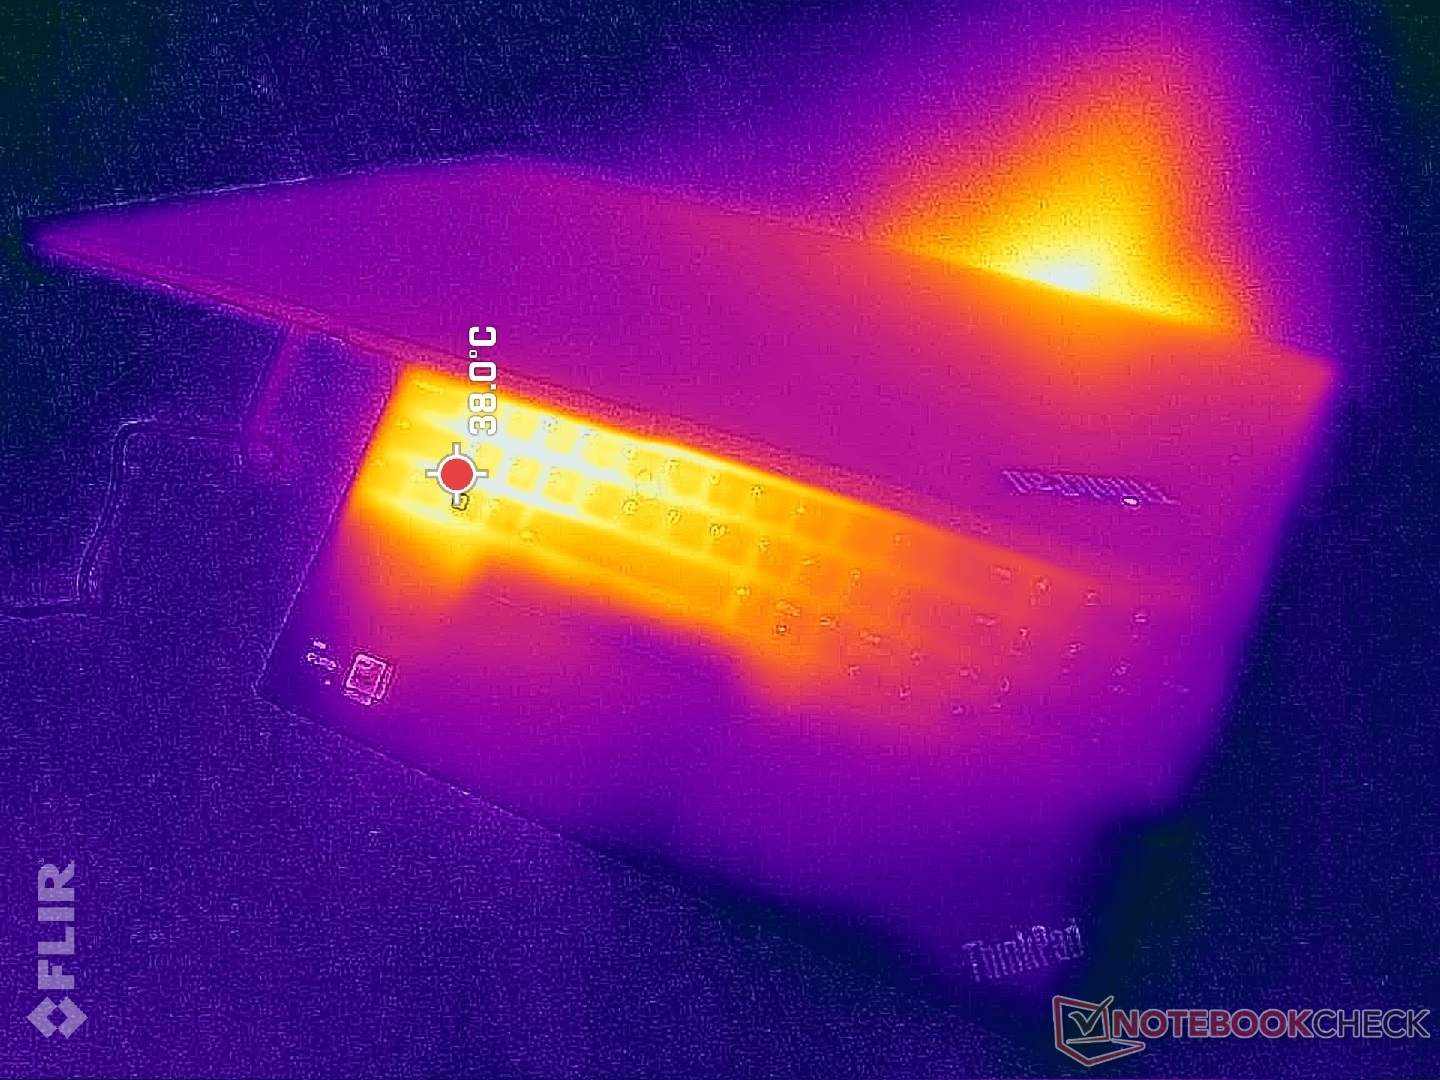

(±) Die maximale Temperatur auf der Oberseite ist 44 °C. Im Vergleich liegt der Klassendurchschnitt bei 34.3 °C (von 21.2 bis 62.5 °C für die Klasse Office).
(-) Auf der Unterseite messen wir eine maximalen Wert von 50.4 °C (im Vergleich zum Durchschnitt von 36.8 °C).
(+) Ohne Last messen wir eine durchschnittliche Temperatur von 24.3 °C auf der Oberseite. Der Klassendurchschnitt erreicht 29.5 °C.
(+) Die Handballen und der Touchpad-Bereich sind mit gemessenen 27 °C kühler als die typische Hauttemperatur und fühlen sich dadurch kühl an.
(±) Die durchschnittliche Handballen-Temperatur anderer getesteter Geräte war 27.5 °C (+0.5 °C).

| Lenovo ThinkPad E16 G1 Core i5-1335U Intel Core i5-1335U, Intel Iris Xe Graphics G7 80EUs | Lenovo ThinkPad E16 G1-21JUS08X00 AMD Ryzen 7 7730U, AMD Radeon RX Vega 8 (Ryzen 4000/5000) | Dell Inspiron 16 7635 2-in-1 AMD Ryzen 5 7530U, AMD Radeon RX Vega 7 | Acer TravelMate P4 TMP416-51-55KN Intel Core i5-1240P, Intel Iris Xe Graphics G7 80EUs | Samsung Galaxy Book3 Pro 16 Intel Core i5-1340P, Intel Iris Xe Graphics G7 80EUs | LG Gram 16Z90Q Intel Core i7-1260P, Intel Iris Xe Graphics G7 96EUs | |
|---|---|---|---|---|---|---|
| Hitze | 0% | 4% | -1% | -5% | 6% | |
| Last oben max * (°C) | 44 | 46.1 -5% | 41.6 5% | 38.6 12% | 41.6 5% | 45 -2% |
| Last unten max * (°C) | 50.4 | 52.2 -4% | 39 23% | 44.4 12% | 45 11% | 43 15% |
| Idle oben max * (°C) | 27.2 | 25.7 6% | 29.4 -8% | 28.9 -6% | 31 -14% | 26 4% |
| Idle unten max * (°C) | 27.8 | 26.7 4% | 28.6 -3% | 34 -22% | 33.6 -21% | 26 6% |
* ... kleinere Werte sind besser
Stresstest
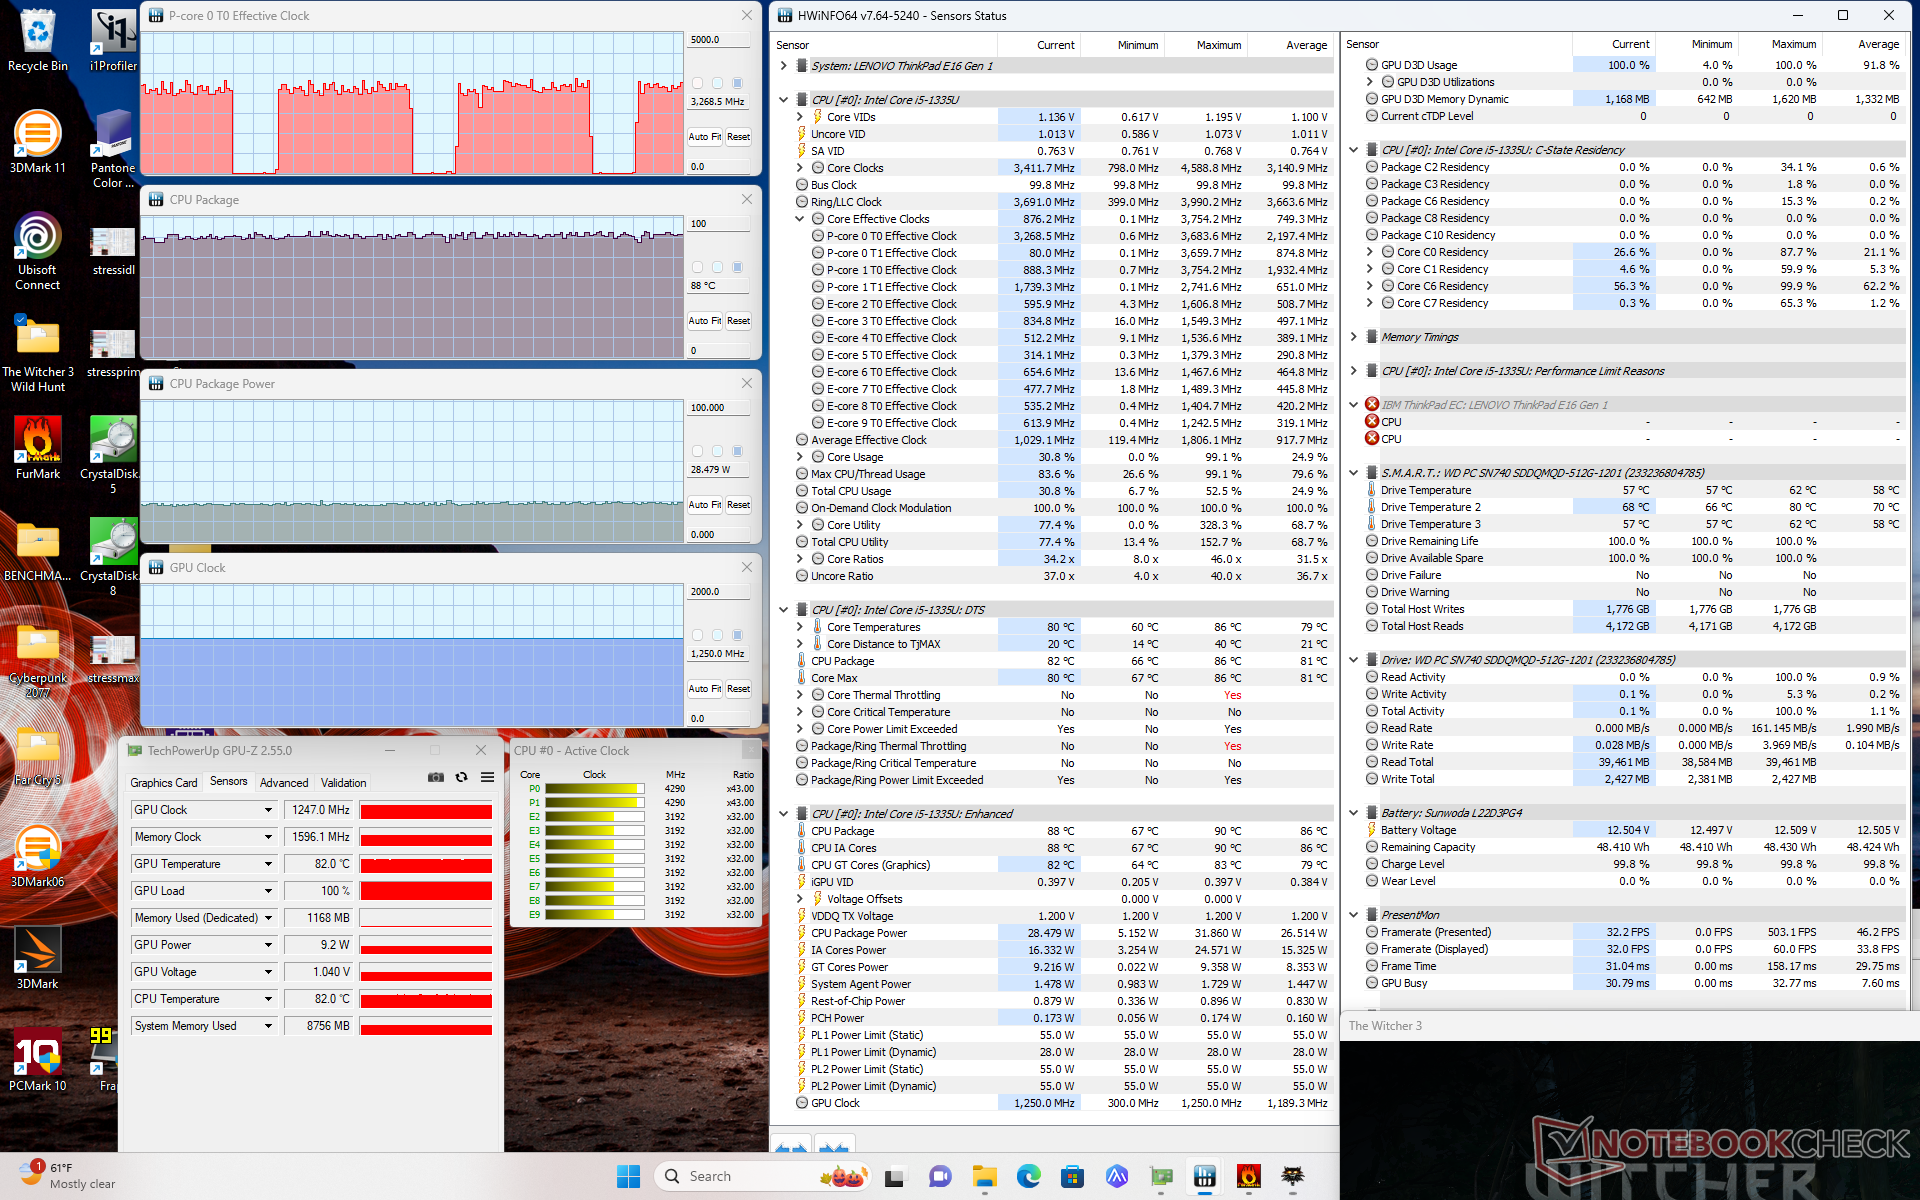
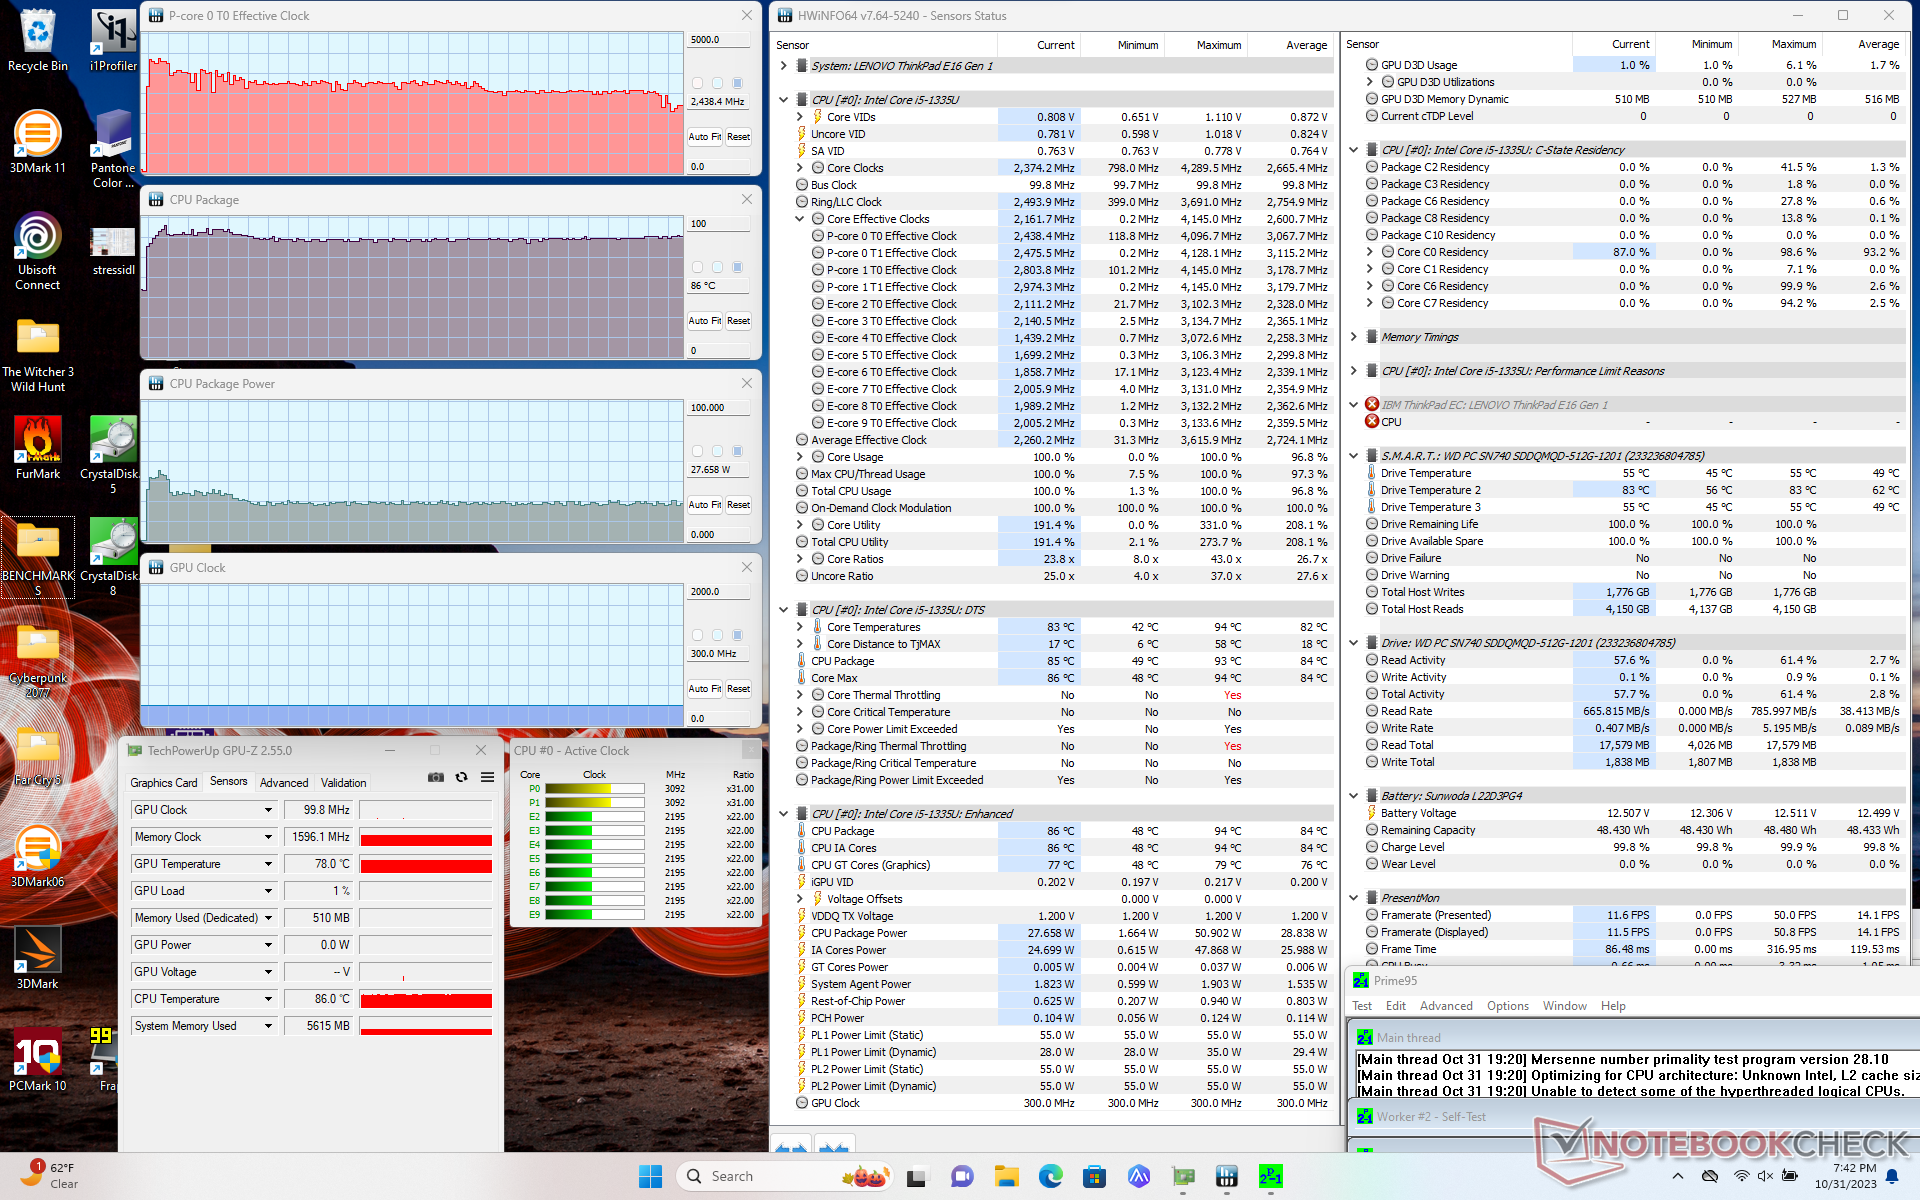
Bei der Ausführung von Prime95 stieg die CPU nur in den ersten paar Sekunden auf 4 GHz, 50 W und 94 C, bevor sie stetig abfiel und sich bei 2,4 GHz, 86 C und 28 W stabilisierte, da der Turbo-Boost-Spitzenwert nicht zu halten war. Der hohe Temperaturbereich von 80° C ist ziemlich warm für ein 16-Zoll-Notebook der Core-U-Serie. Den gleichen Test mit dem Acer Swift Edge 16 mit dem Ryzen 7 7840U durchgeführt, ergibt eine Stabilisation der CPU bei nur 64° C.
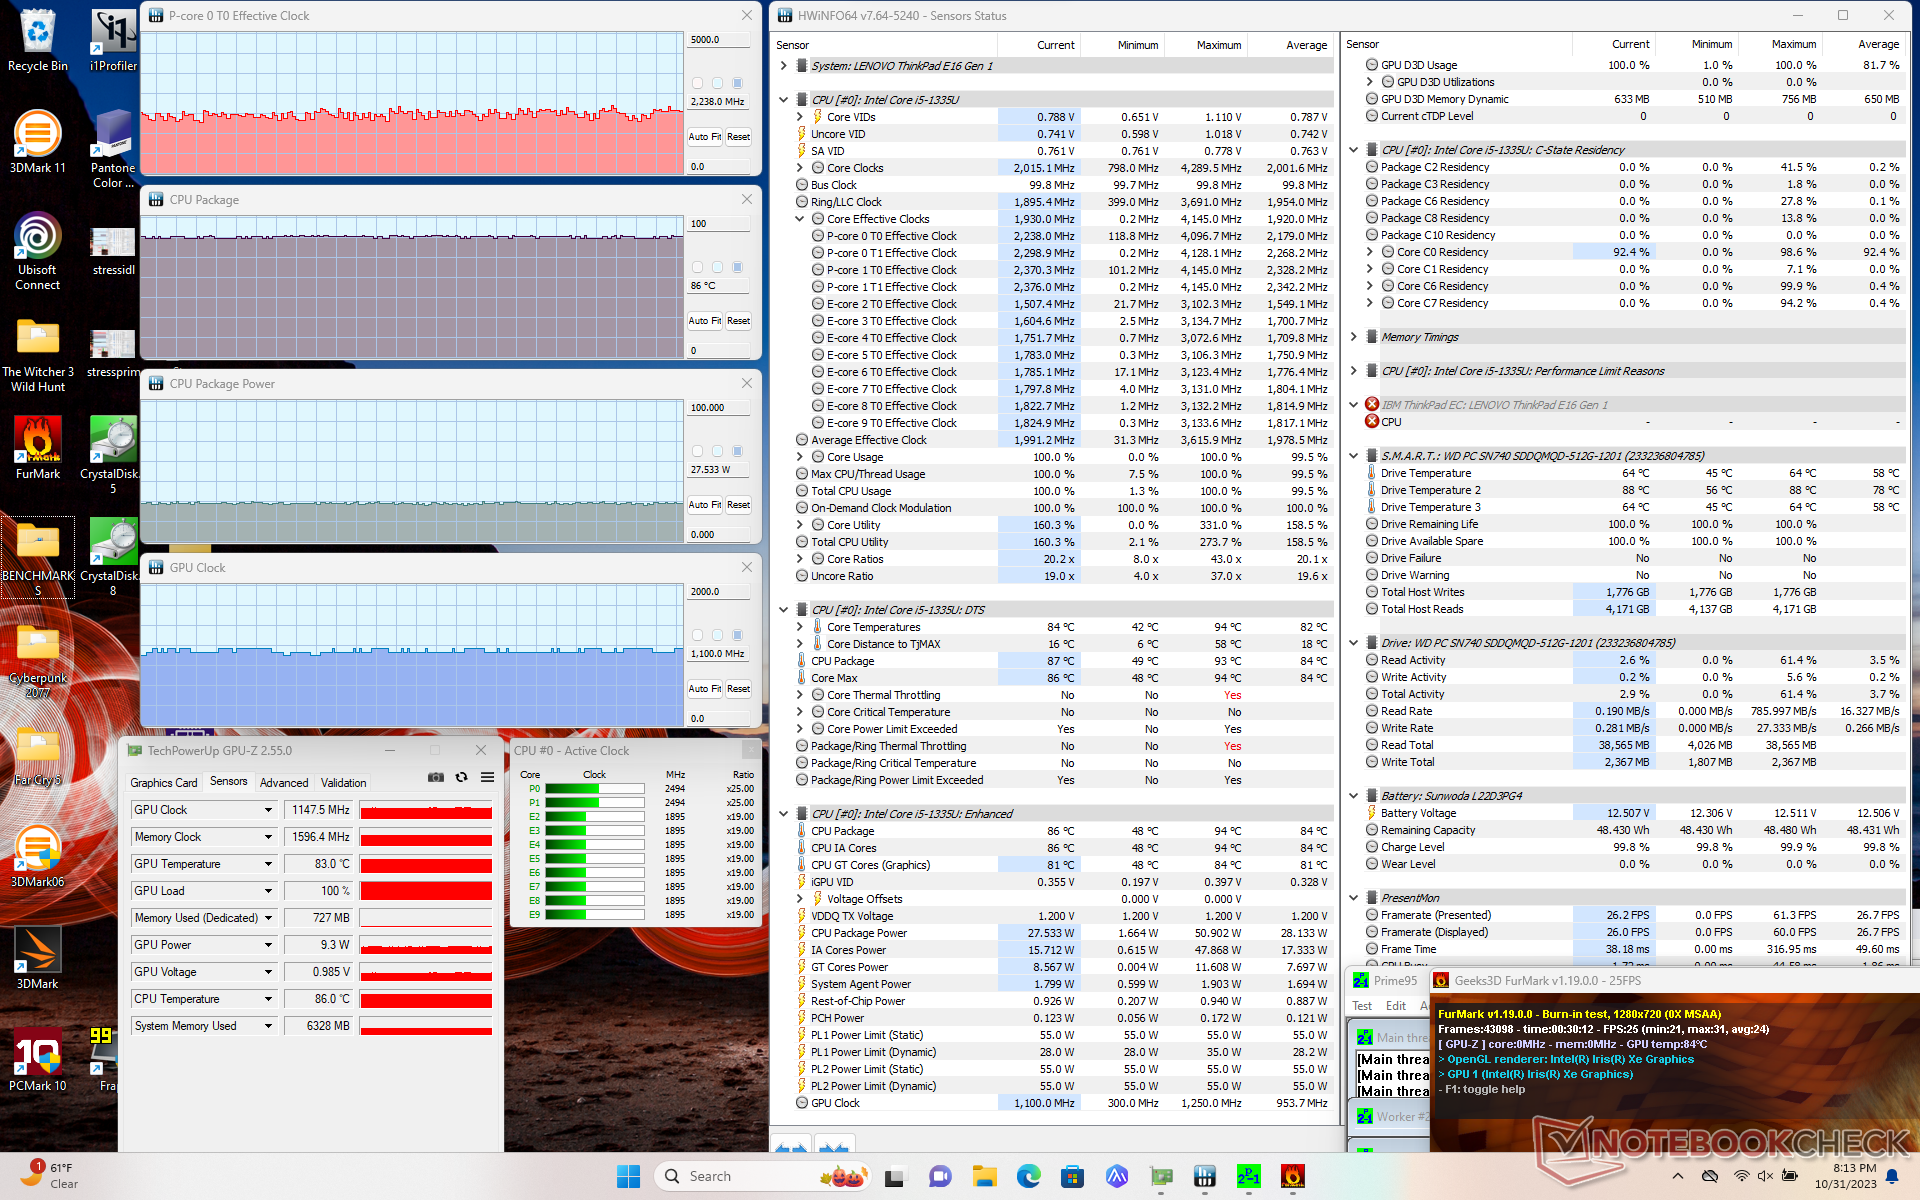
| CPU-Takt (GHz) | GPU-Takt (MHz) | Durchschnittliche CPU-Temperatur (°C) | |
| System Leerlauf | -- | -- | 48 |
| Prime95 Stress | 2.4 | -- | 86 |
| Prime95 + FurMark Stress | ~2.2 | 1100 | 86 |
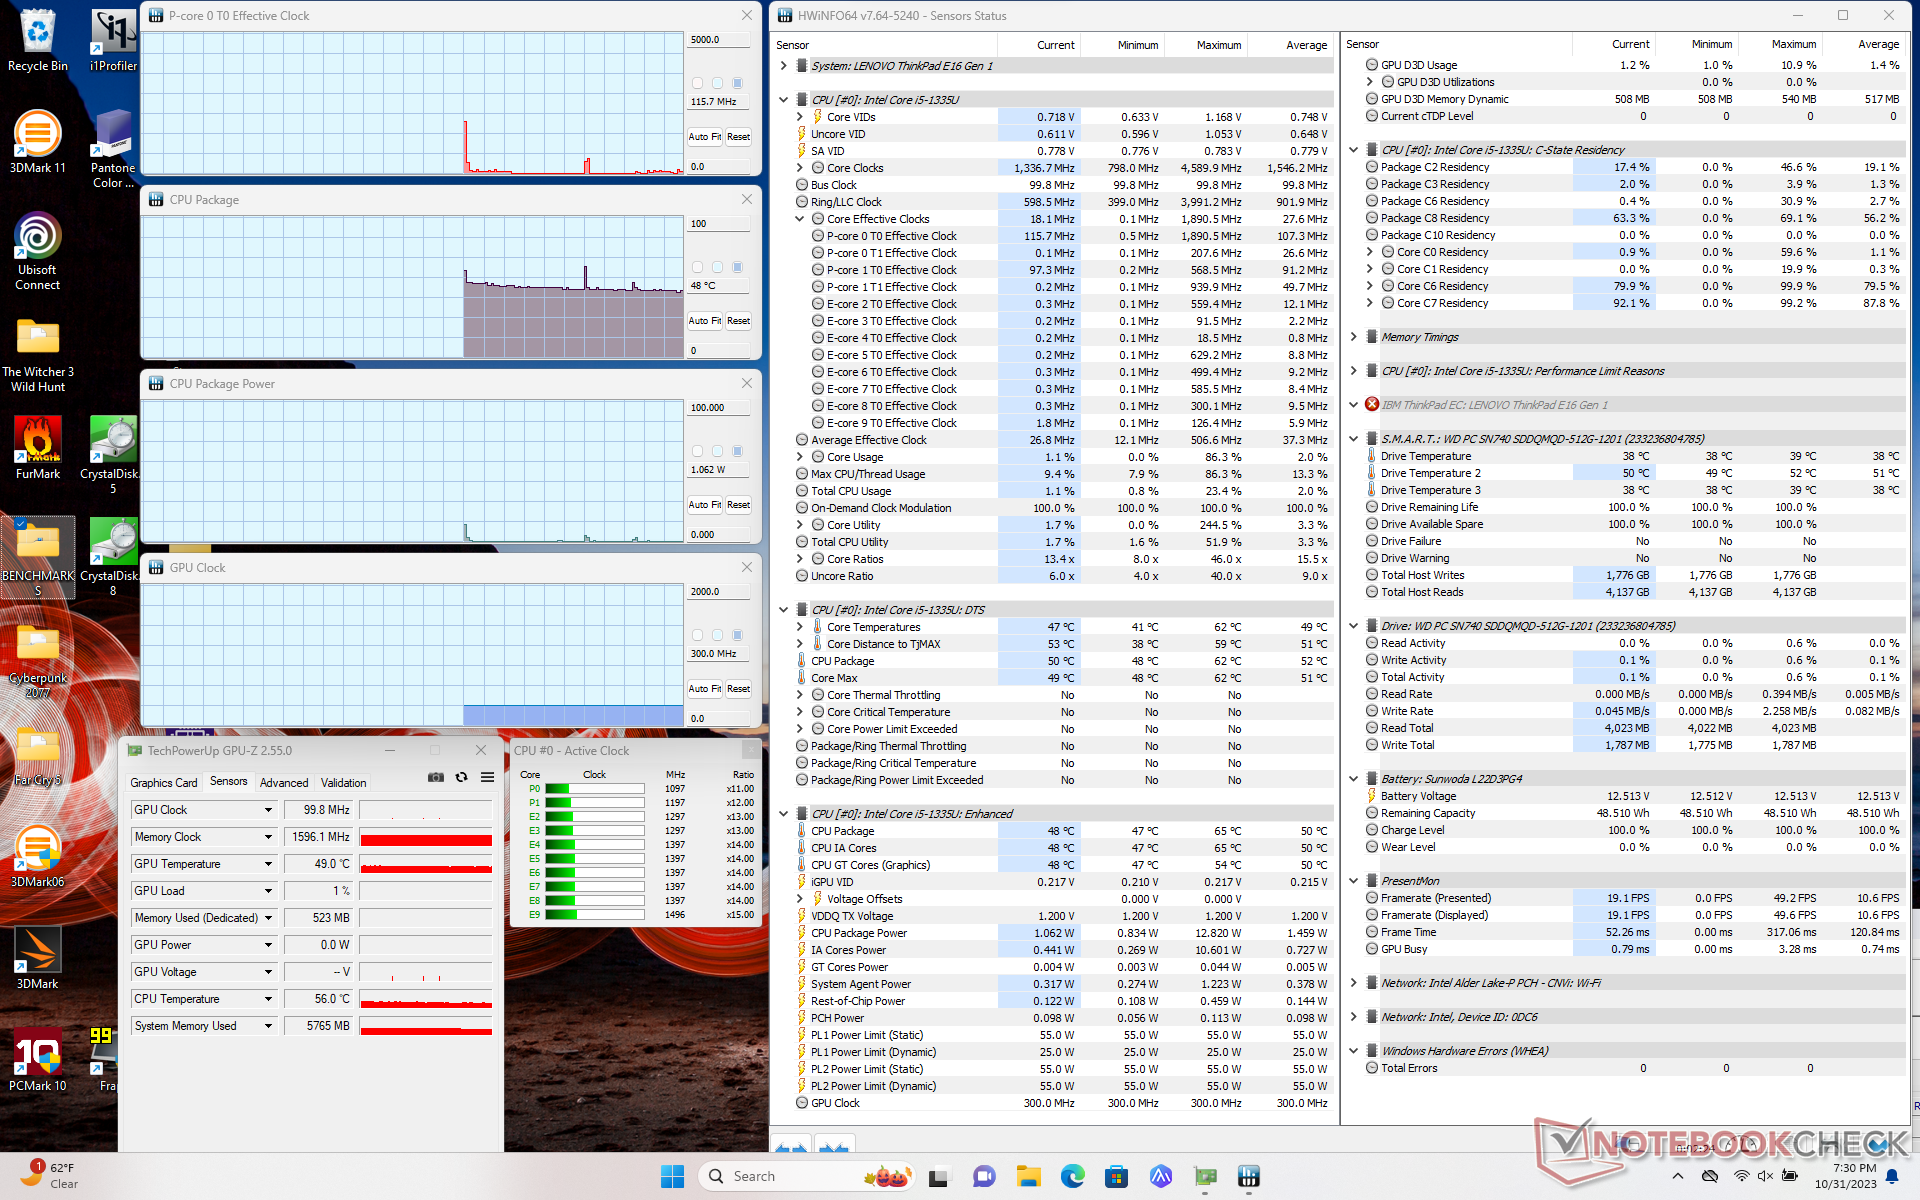
| Witcher 3 Stress | ~3.2 | 1250 | 88 |
Lautsprecher
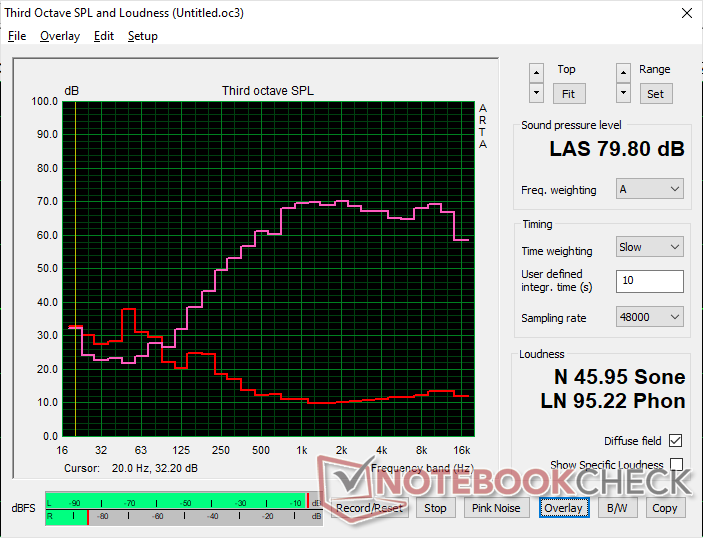
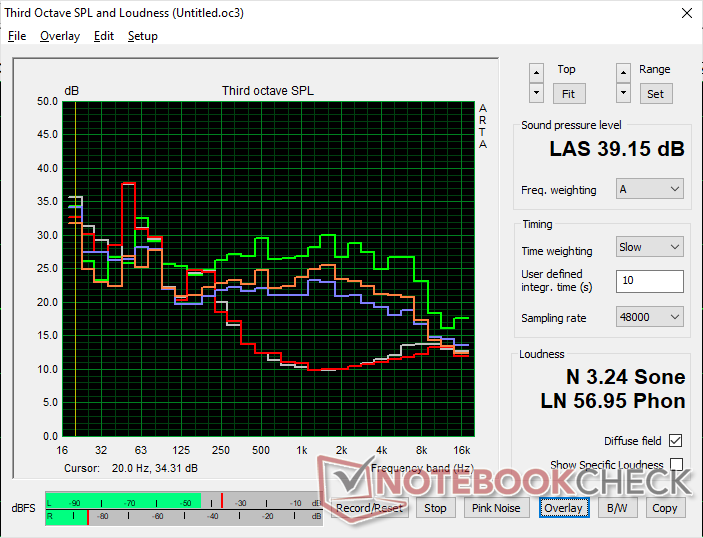
Lenovo ThinkPad E16 G1 Core i5-1335U Audio Analyse
(±) | Mittelmäßig laut spielende Lautsprecher (79.8 dB)
Bass 100 - 315 Hz
(-) | kaum Bass - 24.7% niedriger als der Median
(±) | durchschnittlich lineare Bass-Wiedergabe (8.8% Delta zum Vorgänger)
Mitteltöne 400 - 2000 Hz
(+) | ausgeglichene Mitten, vom Median nur 4.8% abweichend
(+) | lineare Mitten (4.8% Delta zum Vorgänger)
Hochtöne 2 - 16 kHz
(+) | ausgeglichene Hochtöne, vom Median nur 2.1% abweichend
(+) | sehr lineare Hochtöne (2.7% Delta zum Vorgänger)
Gesamt im hörbaren Bereich 100 - 16.000 Hz
(±) | hörbarer Bereich ist durchschnittlich linear (18.4% Abstand zum Median)
Im Vergleich zu allen Geräten derselben Klasse
» 33% aller getesteten Geräte dieser Klasse waren besser, 7% vergleichbar, 60% schlechter
» Das beste Gerät hat einen Delta-Wert von 7%, durchschnittlich ist 21%, das schlechteste Gerät hat 53%
Im Vergleich zu allen Geräten im Test
» 41% aller getesteten Geräte waren besser, 8% vergleichbar, 52% schlechter
» Das beste Gerät hat einen Delta-Wert von 4%, durchschnittlich ist 24%, das schlechteste Gerät hat 134%
Apple MacBook Pro 16 2021 M1 Pro Audio Analyse
(+) | Die Lautsprecher können relativ laut spielen (84.7 dB)
Bass 100 - 315 Hz
(+) | guter Bass - nur 3.8% Abweichung vom Median
(+) | lineare Bass-Wiedergabe (5.2% Delta zum Vorgänger)
Mitteltöne 400 - 2000 Hz
(+) | ausgeglichene Mitten, vom Median nur 1.3% abweichend
(+) | lineare Mitten (2.1% Delta zum Vorgänger)
Hochtöne 2 - 16 kHz
(+) | ausgeglichene Hochtöne, vom Median nur 1.9% abweichend
(+) | sehr lineare Hochtöne (2.7% Delta zum Vorgänger)
Gesamt im hörbaren Bereich 100 - 16.000 Hz
(+) | hörbarer Bereich ist sehr linear (4.6% Abstand zum Median
Im Vergleich zu allen Geräten derselben Klasse
» 0% aller getesteten Geräte dieser Klasse waren besser, 0% vergleichbar, 100% schlechter
» Das beste Gerät hat einen Delta-Wert von 5%, durchschnittlich ist 17%, das schlechteste Gerät hat 45%
Im Vergleich zu allen Geräten im Test
» 0% aller getesteten Geräte waren besser, 0% vergleichbar, 100% schlechter
» Das beste Gerät hat einen Delta-Wert von 4%, durchschnittlich ist 24%, das schlechteste Gerät hat 134%
Energieverwaltung
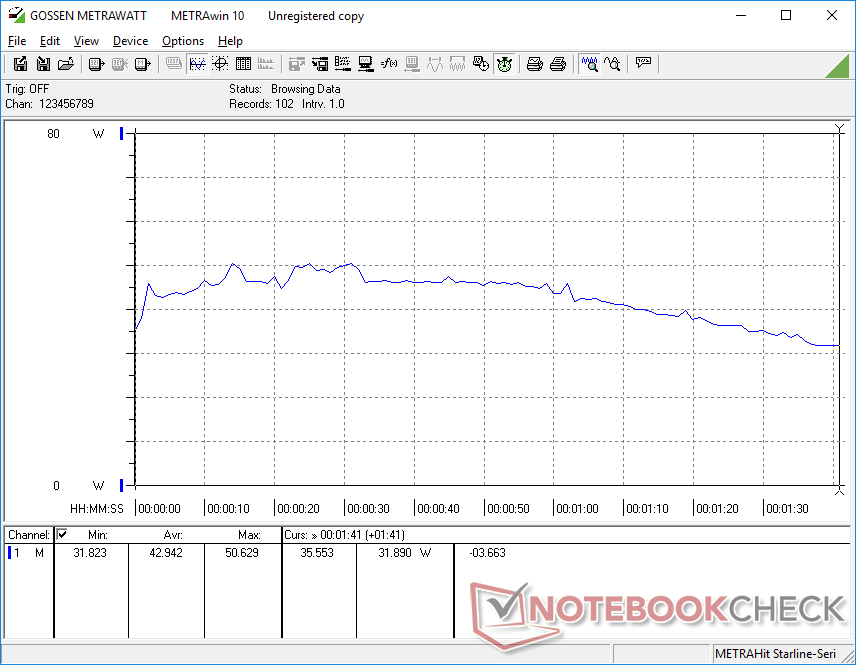
Stromverbrauch
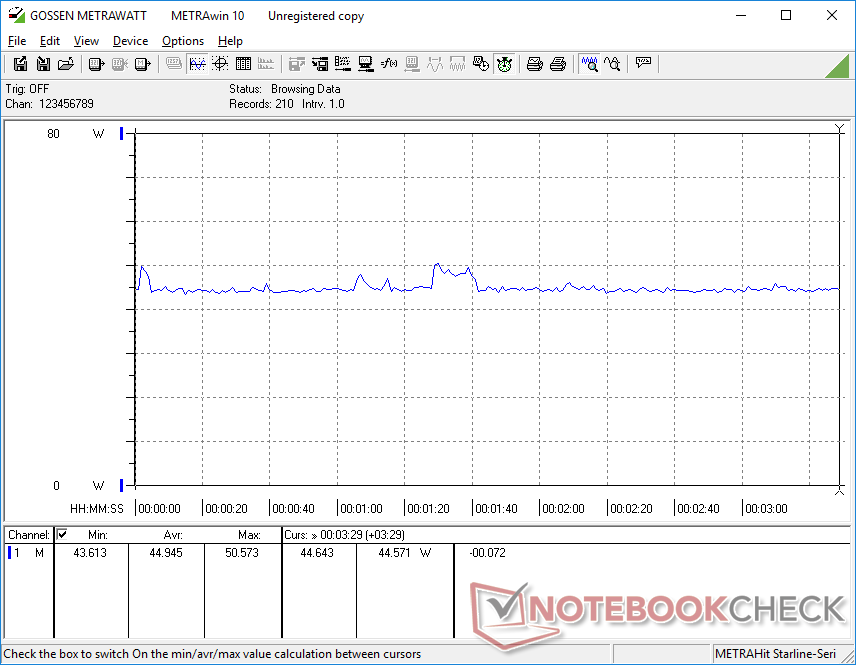
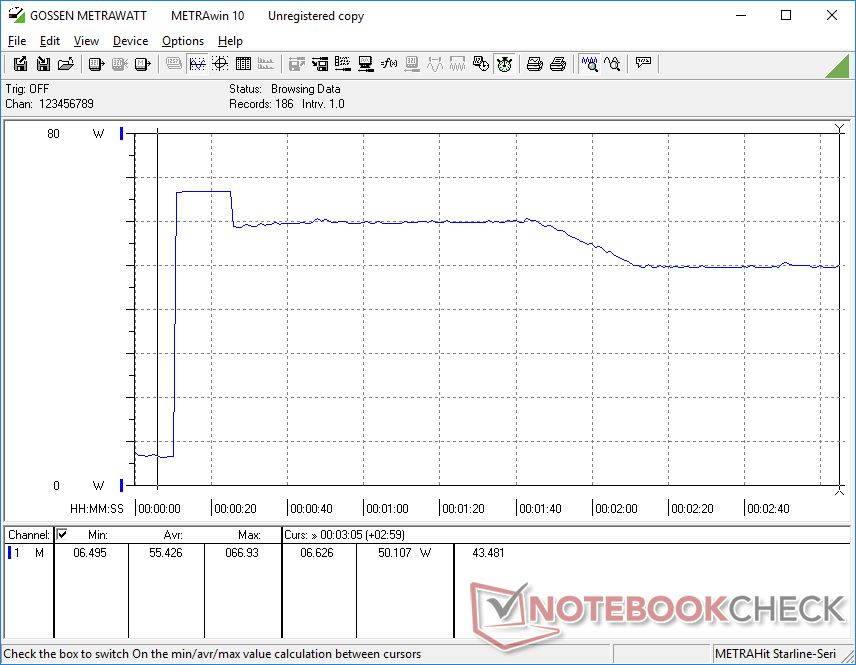
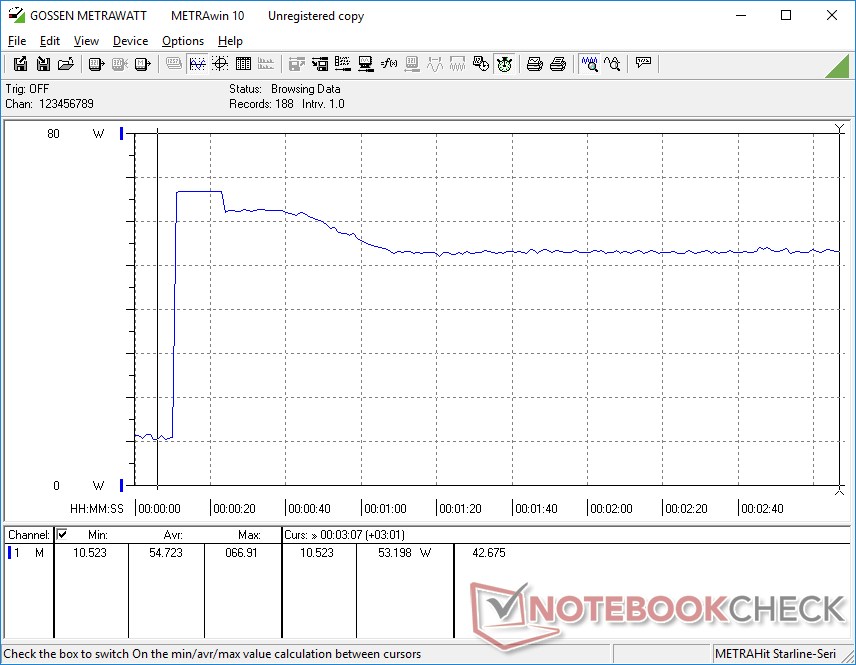
Das Intel-System ist im Allgemeinen anspruchsvoller als die AMD-Version, wenn es um CPU-intensive Aufgaben geht, obwohl der AMD-Prozessor bei Multi-Thread-Lasten im Allgemeinen schneller ist als der Intel. Wenn wir beispielsweise CineBench R15 xT starten, verbraucht unser Intel-Gerät 68 W, AMD nur 45 W. Ähnliche Ergebnisse können auch bei der Ausführung von Prime95 beobachtet werden. Der Gesamtverbrauch im Leerlauf auf dem Desktop oder bei der Ausführung GPU-intensiver Aufgaben wie Witcher 3 ist bei beiden Geräten ungefähr gleich.
| Aus / Standby | |
| Idle | |
| Last |
|
Legende:
min: | |
| Lenovo ThinkPad E16 G1 Core i5-1335U i5-1335U, Iris Xe G7 80EUs, , IPS, 1920x1200, 16" | Lenovo ThinkPad E16 G1-21JUS08X00 R7 7730U, Vega 8, WD PC SN740 SDDPNQD-1T00, IPS, 2560x1600, 16" | Dell Inspiron 16 7635 2-in-1 R5 7530U, Vega 7, Kioxia BG5 KBG50ZNS512G, IPS, 1920x1200, 16" | Acer TravelMate P4 TMP416-51-55KN i5-1240P, Iris Xe G7 80EUs, Micron 2450 512GB MTFDKBA512TFK, IPS, 1920x1200, 16" | Samsung Galaxy Book3 Pro 16 i5-1340P, Iris Xe G7 80EUs, WD PC SN740 256GB SDDPNQD-256G, AMOLED, 2880x1800, 16" | LG Gram 16Z90Q i7-1260P, Iris Xe G7 96EUs, Samsung PM9A1 MZVL21T0HCLR, IPS, 2560x1600, 16" | |
|---|---|---|---|---|---|---|
| Stromverbrauch | -3% | 2% | 1% | 9% | -7% | |
| Idle min * (Watt) | 4.9 | 4.1 16% | 4.8 2% | 5.2 -6% | 3.9 20% | 5 -2% |
| Idle avg * (Watt) | 8.3 | 9.6 -16% | 7.6 8% | 7.1 14% | 4.8 42% | 8 4% |
| Idle max * (Watt) | 8.6 | 10.2 -19% | 8.7 -1% | 9.6 -12% | 10 -16% | 14 -63% |
| Last avg * (Watt) | 42.9 | 47.3 -10% | 47.1 -10% | 47 -10% | 44 -3% | 47 -10% |
| Witcher 3 ultra * (Watt) | 44.9 | 46.7 -4% | 46.6 -4% | 43.3 4% | 42.3 6% | 37.8 16% |
| Last max * (Watt) | 67 | 55.7 17% | 56.4 16% | 56 16% | 63 6% | 56 16% |
* ... kleinere Werte sind besser
Power Consumption Witcher 3 / Stresstest
Power Consumption external Monitor
Akkulaufzeit
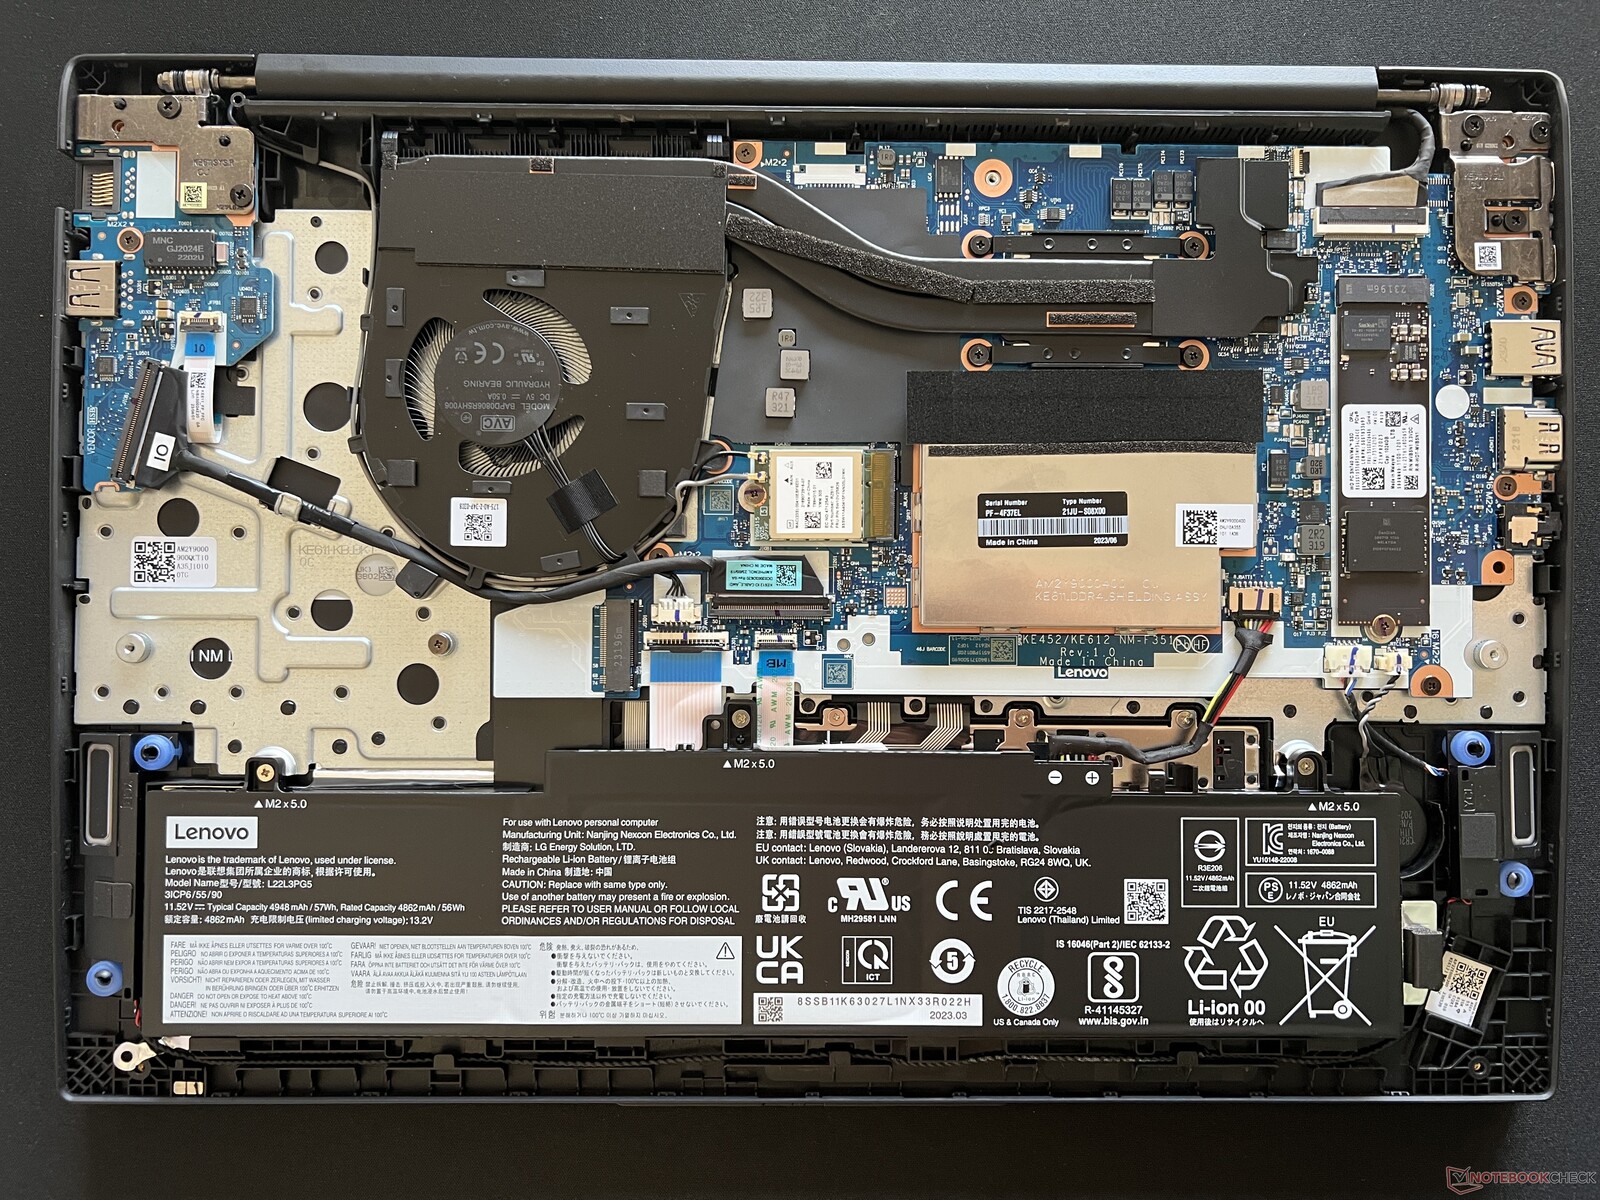
Das Modell wird mit zwei Akkukapazitäten angeboten: 47 Wh und 57 Wh. Unser Intel-Gerät ist mit der kleineren Option ausgestattet, unser AMD-Gerät mit der größeren. Die Akkulaufzeit ist nur etwa halb so lang wie bei unserem AMD-Gerät, und das bei einer realen Nutzungsdauer von nur 5 Stunden beim Surfen. Für ein 16-Zoll-Notebook ist die 47-Wh-Option viel kleiner als erwartet und ein deutliches Manko.
Das Aufladen von der leeren bis zur vollen Kapazität geht glücklicherweise mit etwas mehr als einer Stunde recht schnell.
| Lenovo ThinkPad E16 G1 Core i5-1335U i5-1335U, Iris Xe G7 80EUs, 47 Wh | Lenovo ThinkPad E16 G1-21JUS08X00 R7 7730U, Vega 8, 57 Wh | Dell Inspiron 16 7635 2-in-1 R5 7530U, Vega 7, 64 Wh | Acer TravelMate P4 TMP416-51-55KN i5-1240P, Iris Xe G7 80EUs, 56 Wh | Samsung Galaxy Book3 Pro 16 i5-1340P, Iris Xe G7 80EUs, 76 Wh | LG Gram 16Z90Q i7-1260P, Iris Xe G7 96EUs, 80 Wh | |
|---|---|---|---|---|---|---|
| Akkulaufzeit | 117% | 179% | 81% | 96% | 94% | |
| WLAN (h) | 5.2 | 11.3 117% | 14.5 179% | 9.4 81% | 10.2 96% | 10.1 94% |
| H.264 (h) | 11.7 | 14.4 | ||||
| Last (h) | 1.3 | 1.9 | 2 | 2.6 | ||
| Idle (h) | 26 | 30.4 | 18.1 |
Pro
Contra
Fazit - AMD gewinnt groß bei Akkulaufzeit
Wenn Sie sich beim ThinkPad E16 G1 für Intel anstelle von AMD entscheiden, erhalten Sie Thunderbolt-Unterstützung, schnellere Single-Thread- und integrierte Grafikleistung, vorausgesetzt, Sie wählen den Core i7-1355U. Allerdings verblassen diese Vorteile wohl im Vergleich zu dem, was die AMD-Version bietet: deutlich längere Akkulaufzeit, höhere Leistung pro Watt, schnellere Multi-Thread-Leistung und Unterstützung für M.2 2280 SSDs. Sie müssen also die überlegenen Docking-Fähigkeiten der Intel-Version wirklich zu schätzen wissen, wenn Sie sich dafür entscheiden, die AMD-Optionen auszulassen.
Wenn Sie nicht vorhaben, Thunderbolt-Monitore oder eGPUs an Ihr ThinkPad E16 G1 anzuschließen, dann bieten die AMD-Versionen sowohl eine längere Akkulaufzeit als auch eine schnellere Multi-Thread-Leistung als die Intel-Optionen zum ungefähr gleichen Preis.
Unabhängig davon, welche Version Sie bevorzugen, sollten Sie sich vor dem Kauf über die Größe des Displays und des Akkus informieren. Leider listet nicht jeder Händler die Farbabdeckung oder die Akkukapazität auf, so dass es leicht passieren kann, dass Sie versehentlich eine Konfiguration mit dem schlechteren Display oder dem kleineren 47-Wh-Akku kaufen. Wir empfehlen, nach Möglichkeit die volle sRGB-Abdeckung und den größeren 57-Wh-Akku anzustreben, da dies ein deutlicher Zugewinn gegenüber der Basiskonfiguration ist.
Preis und Verfügbarkeit
Lenovo ThinkPad E16 G1 Core i5-1335U
- 02.11.2023 v7 (old)
Allen Ngo
Transparenz
Die Auswahl der zu testenden Geräte erfolgt innerhalb der Redaktion. Das vorliegende Testmuster wurde dem Autor vom Hersteller oder einem Shop zu Testzwecken leihweise zur Verfügung gestellt. Eine Einflussnahme des Leihstellers auf den Testbericht gab es nicht, der Hersteller erhielt keine Version des Reviews vor der Veröffentlichung. Es bestand keine Verpflichtung zur Publikation. Als eigenständiges, unabhängiges Unternehmen unterliegt Notebookcheck keiner Diktion von Herstellern, Shops und Verlagen.
So testet Notebookcheck
Pro Jahr werden von Notebookcheck hunderte Laptops und Smartphones unabhängig in von uns standardisierten technischen Verfahren getestet, um eine Vergleichbarkeit aller Testergebnisse zu gewährleisten. Seit rund 20 Jahren entwickeln wir diese Testmethoden kontinuierlich weiter und setzen damit Branchenstandards. In unseren Testlaboren kommt ausschließlich hochwertiges Messequipment in die Hände erfahrener Techniker und Redakteure. Die Tests unterliegen einer mehrstufigen Kontrolle. Unsere komplexe Gesamtbewertung basiert auf hunderten fundierten Messergebnissen und Benchmarks, womit Ihnen Objektivität garantiert ist. Weitere Informationen zu unseren Testmethoden gibt es hier.
Preisvergleich

