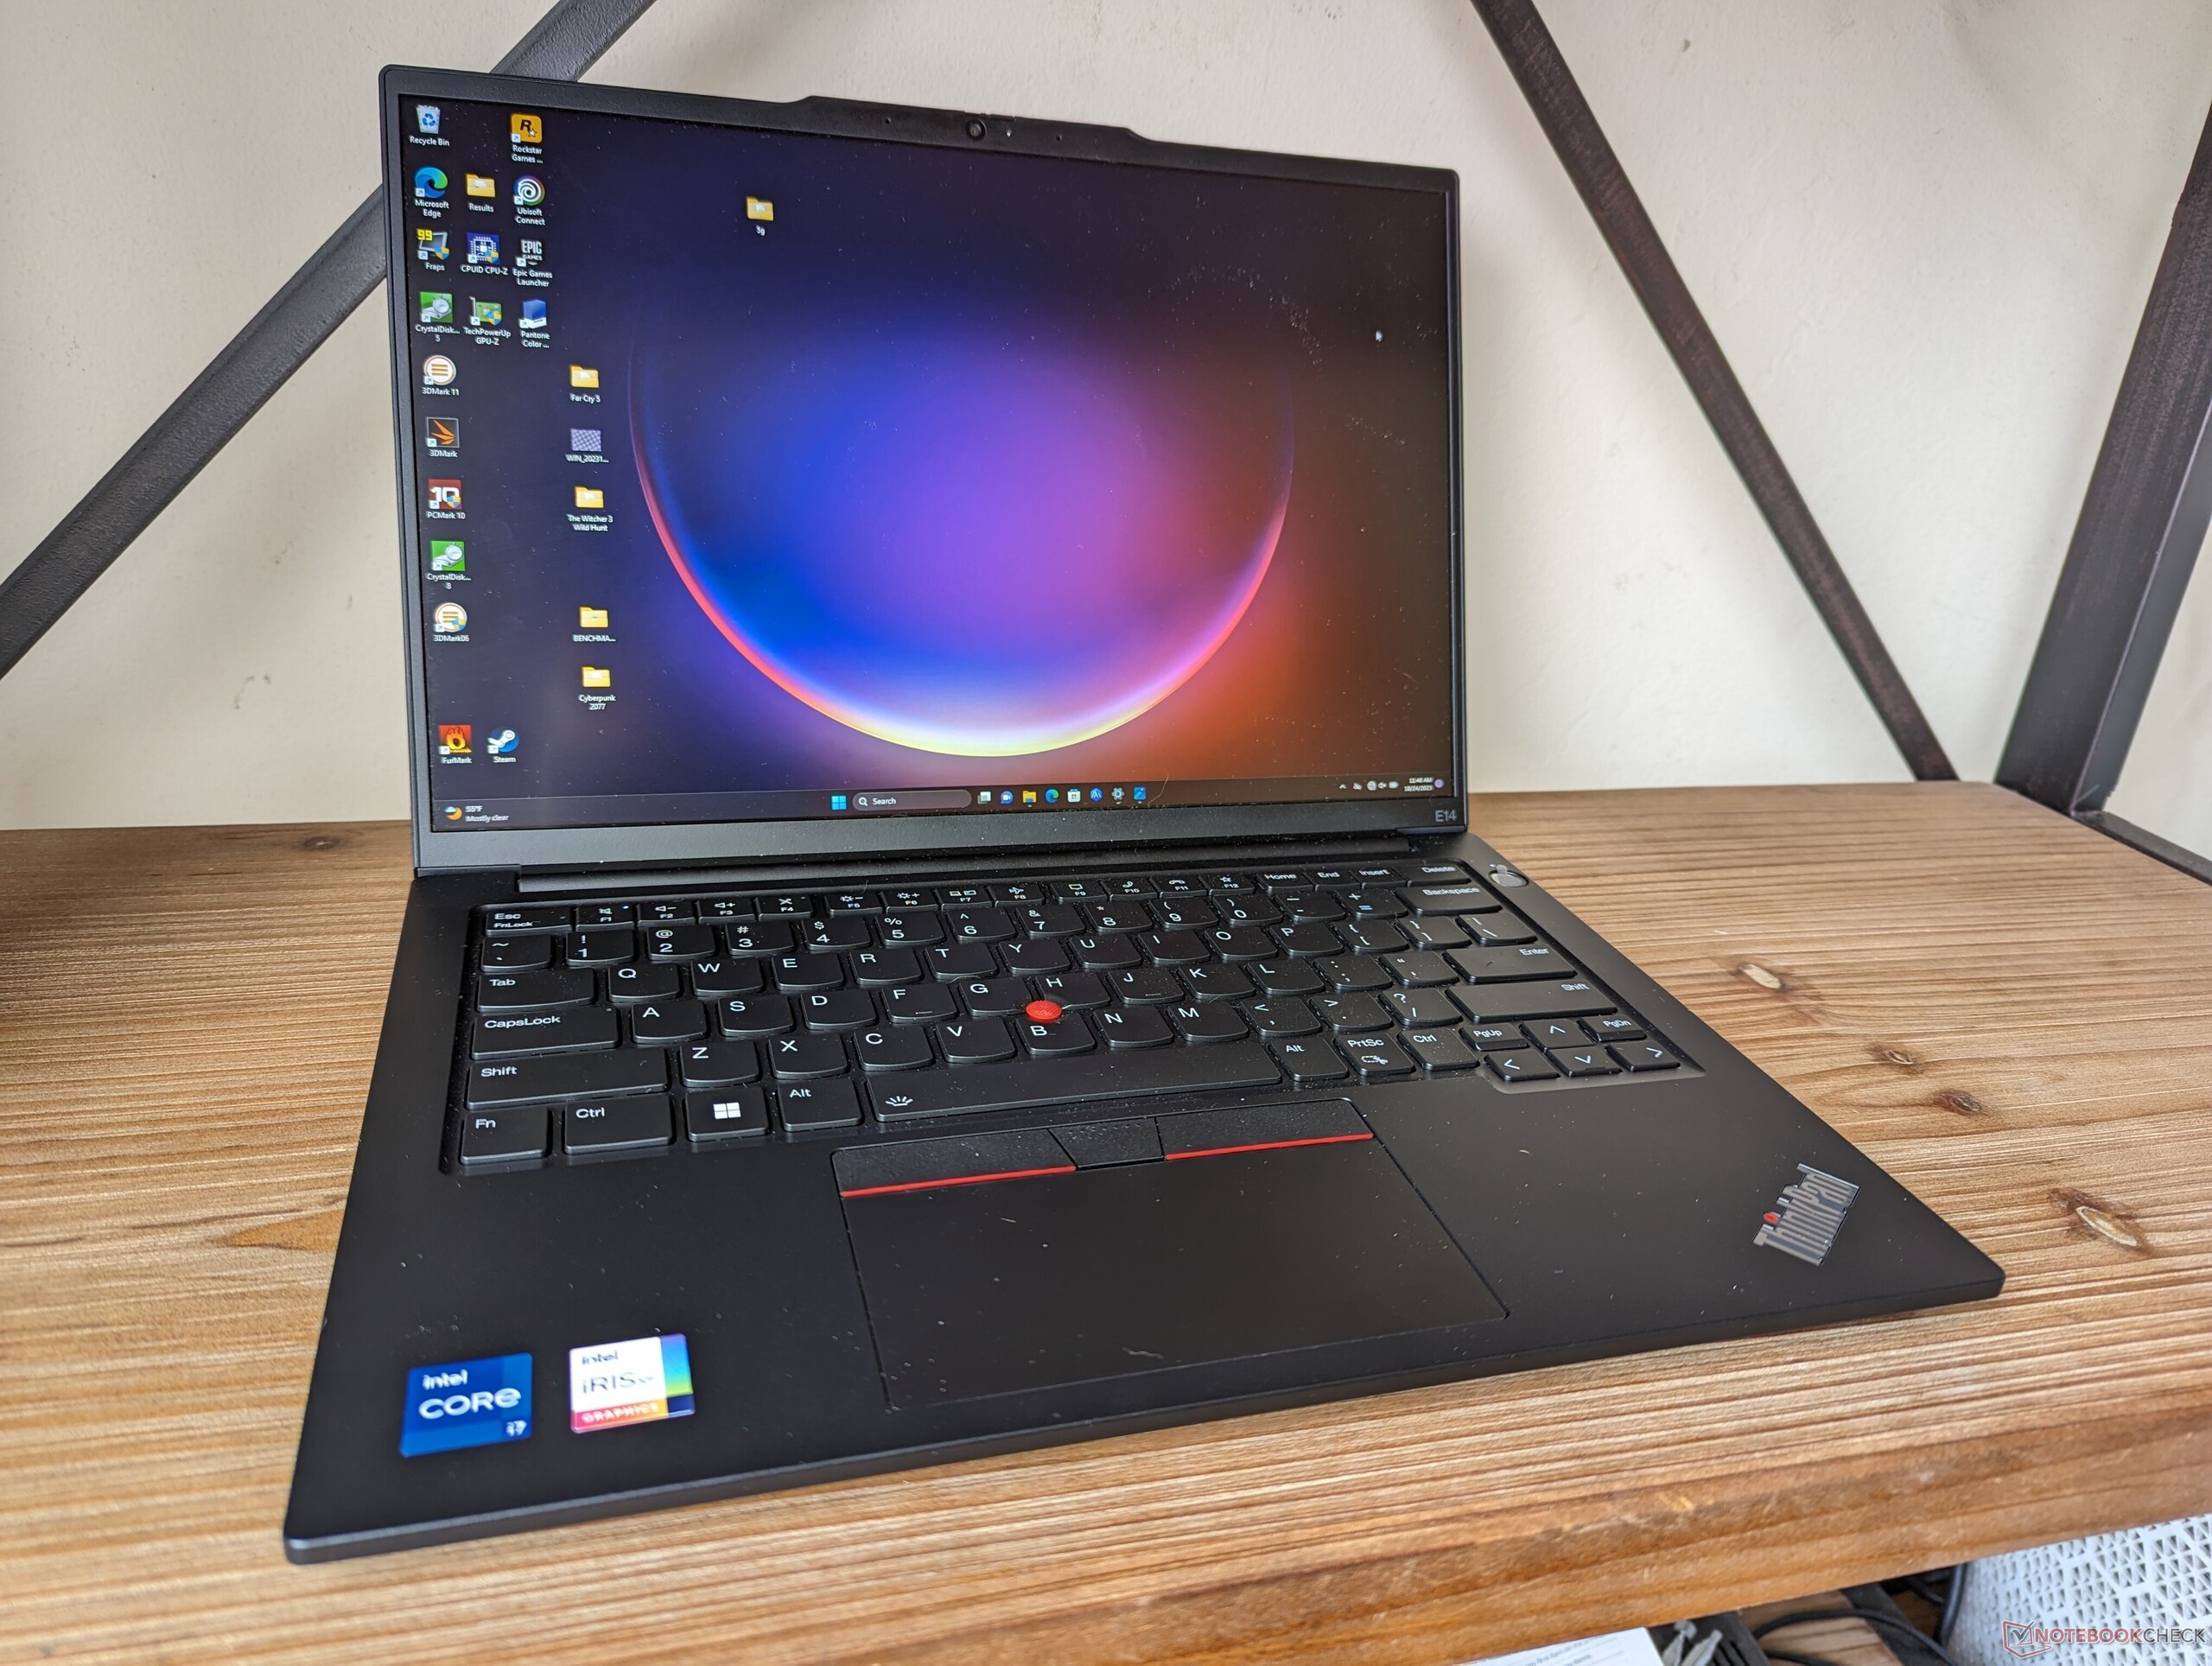
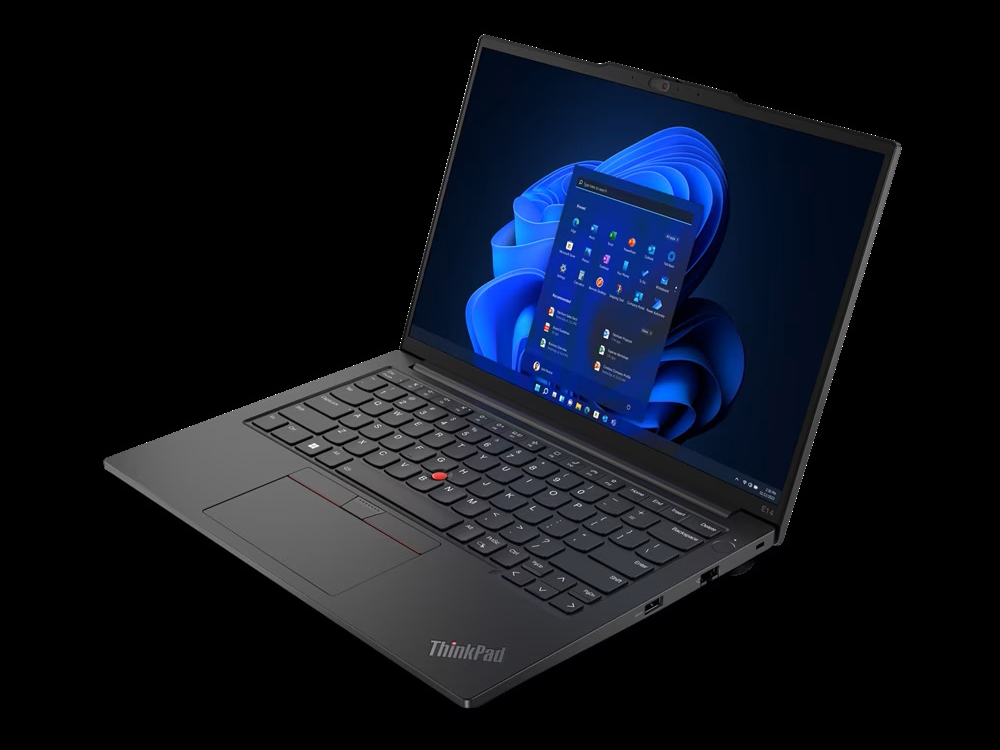
Lenovo ThinkPad E14 G5 Intel laptop im Test: Core i7-1355U vs. Ryzen 7 7730U

Nachdem wir vor kurzem die AMD-Version des ThinkPad E14 G5 getestet haben, sind wir nun bereit, uns mit der Intel-Version des ThinkPad E14 G5 zu beschäftigen. Beide Versionen haben das gleiche Gehäusedesign, weshalb wir empfehlen, einen Blick auf unseren Test der AMD-Version zu werfen, um mehr über die Eigenschaften des Modells zu erfahren. Nichtsdestotrotz gibt es ein paar interne Unterschiede zwischen den beiden, die wir im folgenden Testbericht erwähnen werden.
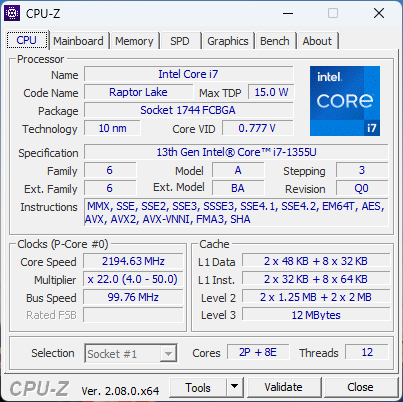
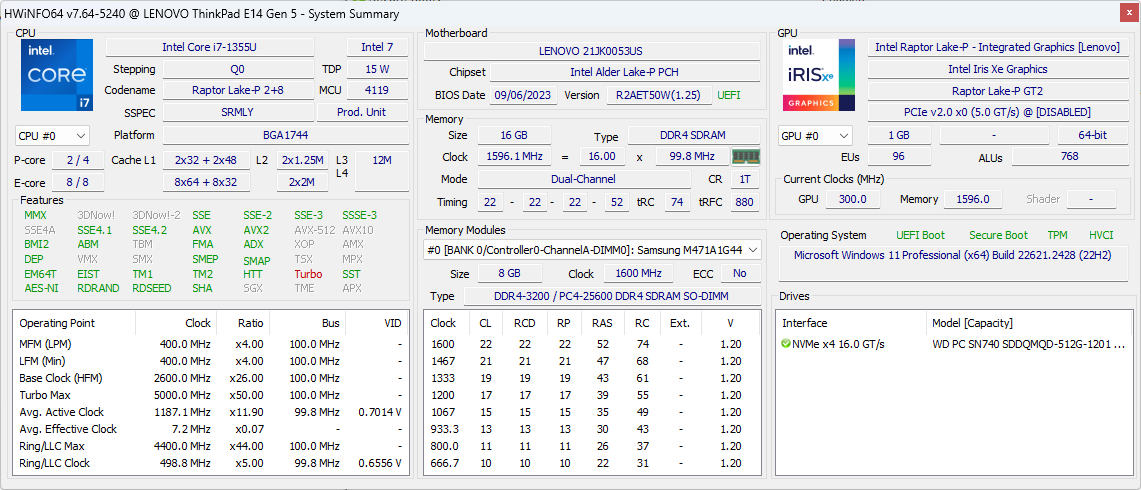
Bei unserem Testgerät handelt es sich um eine mittlere Intel-Konfiguration mit der 13th Gen Raptor Lake Core i7-1355U CPU und 1200p FHD+ Display für ca. 1.200 Euro. Andere SKUs reichen vom Core i3-1315U bis zum Core i7-13700H mit optionaler GeForce MX550-Grafik und einem höher auflösenden 2240 x 1400 IPS-Display. Die Konfigurationsmöglichkeiten sind umfangreicher als erwartet, insbesondere für ein 14-Zoll-Subnotebook.
Alternativen zum ThinkPad E14 G5 sind andere Business-Subnotebooks der oberen Mittelklasse wie das HP EliteBook 845 oder das Dell Latitude 7440.
Weitere Lenovo Bewertungen:
Mögliche Konkurrenten im Vergleich
Bew. | Datum | Modell | Gewicht | Dicke | Größe | Auflösung | Preis ab |
|---|---|---|---|---|---|---|---|
| 86 % v7 (old) | 10 / 2023 | Lenovo ThinkPad E14 G5 i7-1355U i7-1355U, Iris Xe G7 96EUs | 1.5 kg | 17.99 mm | 14.00" | 1920x1200 | |
| 88.3 % v7 (old) | 08 / 2023 | Lenovo ThinkPad E14 G5-21JSS05C00 R7 7730U, Vega 8 | 1.4 kg | 18 mm | 14.00" | 2240x1400 | |
| 90.1 % v7 (old) | 08 / 2023 | HP EliteBook 845 G10 818N0EA R9 PRO 7940HS, Radeon 780M | 1.5 kg | 17.9 mm | 14.00" | 2560x1600 | |
| 85.3 % v7 (old) | 06 / 2023 | Asus ZenBook 14 UM3402Y R7 7730U, Vega 8 | 1.4 kg | 16.9 mm | 14.00" | 2880x1800 | |
| 86.6 % v7 (old) | 10 / 2022 | LG Gram 14Z90Q i5-1240P, Iris Xe G7 80EUs | 980 g | 16.8 mm | 14.00" | 1920x1200 | |
| 90.3 % v7 (old) | 07 / 2023 | Dell Latitude 7440 i5-1345U, Iris Xe G7 80EUs | 1.2 kg | 17.95 mm | 14.00" | 2560x1600 |
Gehäuse
Der vielleicht einfachste Weg, um zwischen der Intel- und der AMD-Version des ThinkPad E14 G5 zu unterscheiden, ist die Suche nach dem Thunderbolt-Logo am linken Rand. Bei den AMD-Versionen fehlt sowohl die Thunderbolt- als auch die USB4-Unterstützung, weshalb die Intel-Versionen in Bezug auf ihre Docking-Fähigkeiten die Nase vorn haben.
Kommunikation
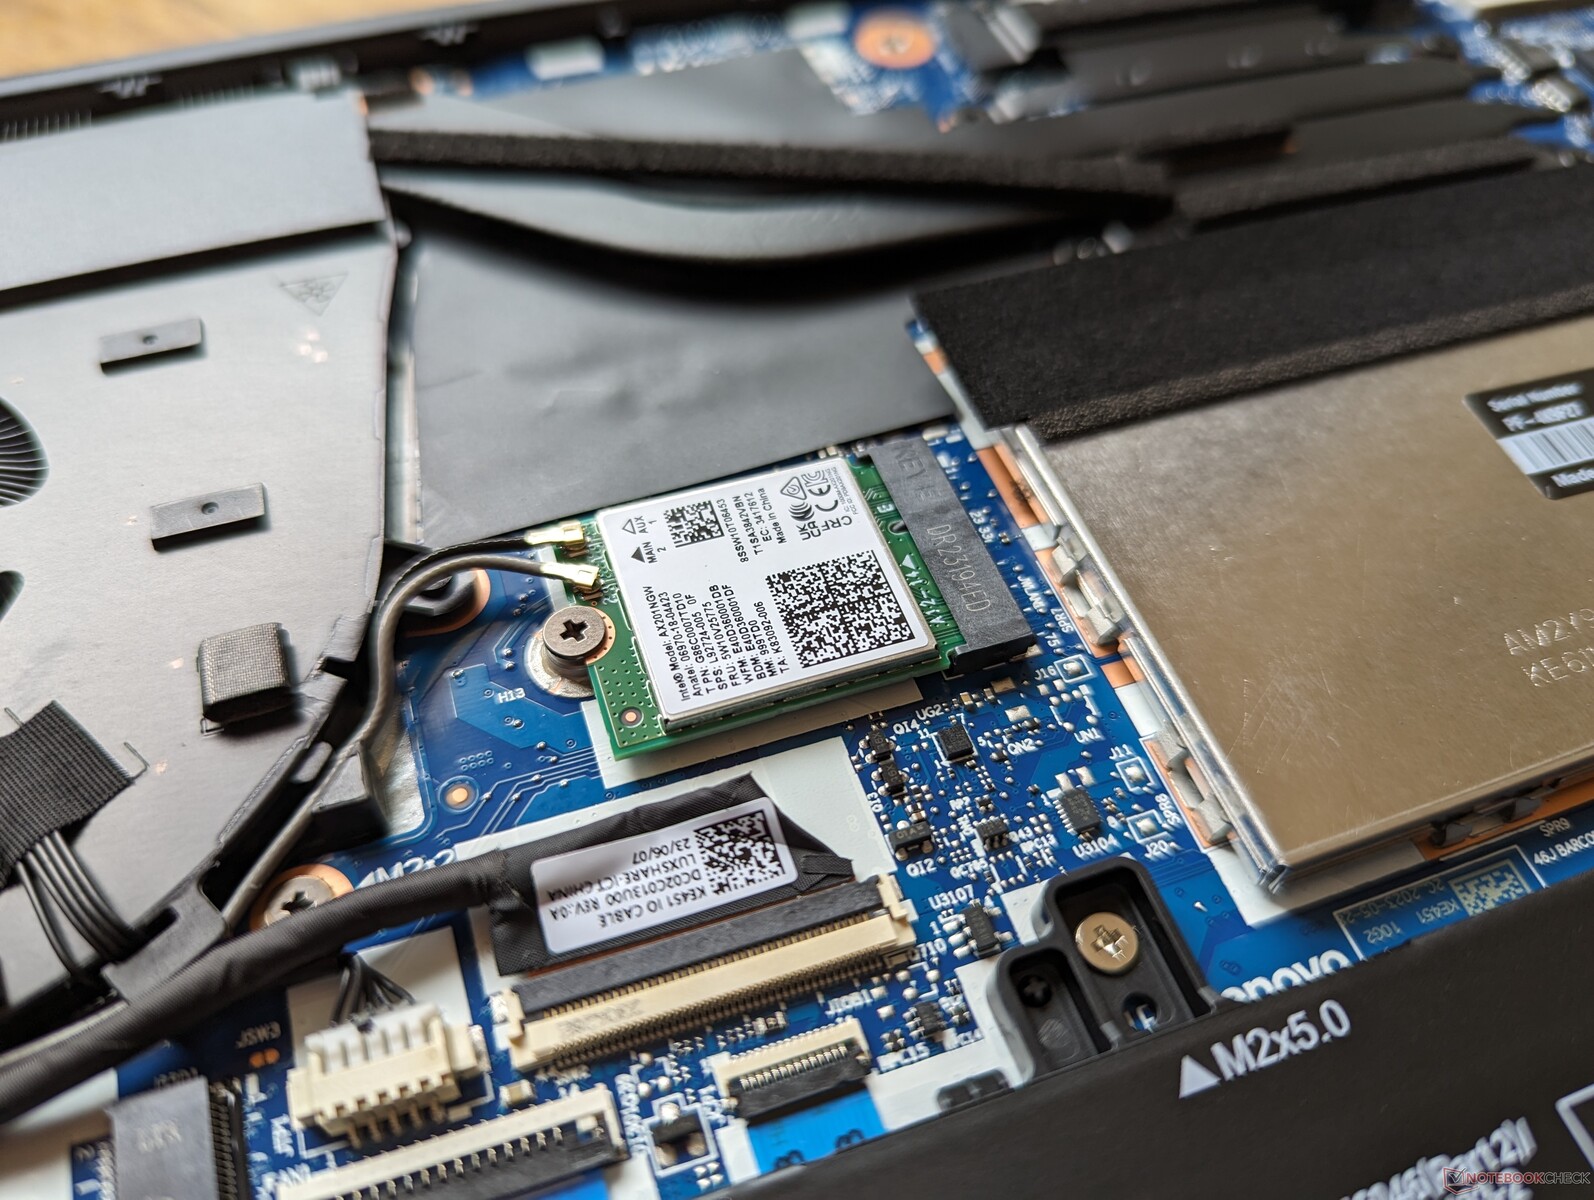
Im Intel AX201 sind Wi-Fi 6 und Bluetooth 5.1 unterstützt. Benutzer, die Wi-Fi 6E-Konnektivität wünschen, können den teureren AX211 wählen.
| Networking | |
| iperf3 transmit AXE11000 | |
| Lenovo ThinkPad E14 G5-21JSS05C00 | |
| Lenovo ThinkPad E14 G5 i7-1355U | |
| Dell Latitude 7440 | |
| Asus ZenBook 14 UM3402Y | |
| iperf3 receive AXE11000 | |
| Lenovo ThinkPad E14 G5-21JSS05C00 | |
| Lenovo ThinkPad E14 G5 i7-1355U | |
| Asus ZenBook 14 UM3402Y | |
| Dell Latitude 7440 | |
| iperf3 transmit AXE11000 6GHz | |
| HP EliteBook 845 G10 818N0EA | |
| Asus ZenBook 14 UM3402Y | |
| Dell Latitude 7440 | |
| iperf3 receive AXE11000 6GHz | |
| HP EliteBook 845 G10 818N0EA | |
| LG Gram 14Z90Q | |
| Asus ZenBook 14 UM3402Y | |
| Dell Latitude 7440 | |
Webcam
Während der Privacy Shutter bei allen Produkten (SKUs) standardmäßig enthalten ist, sind die 1080p-Auflösung und der IR-Sensor optional. Bei den günstigeren Varianten (Niedrigere SKUs) könnte ein 720p-Sensor verwendet werden.


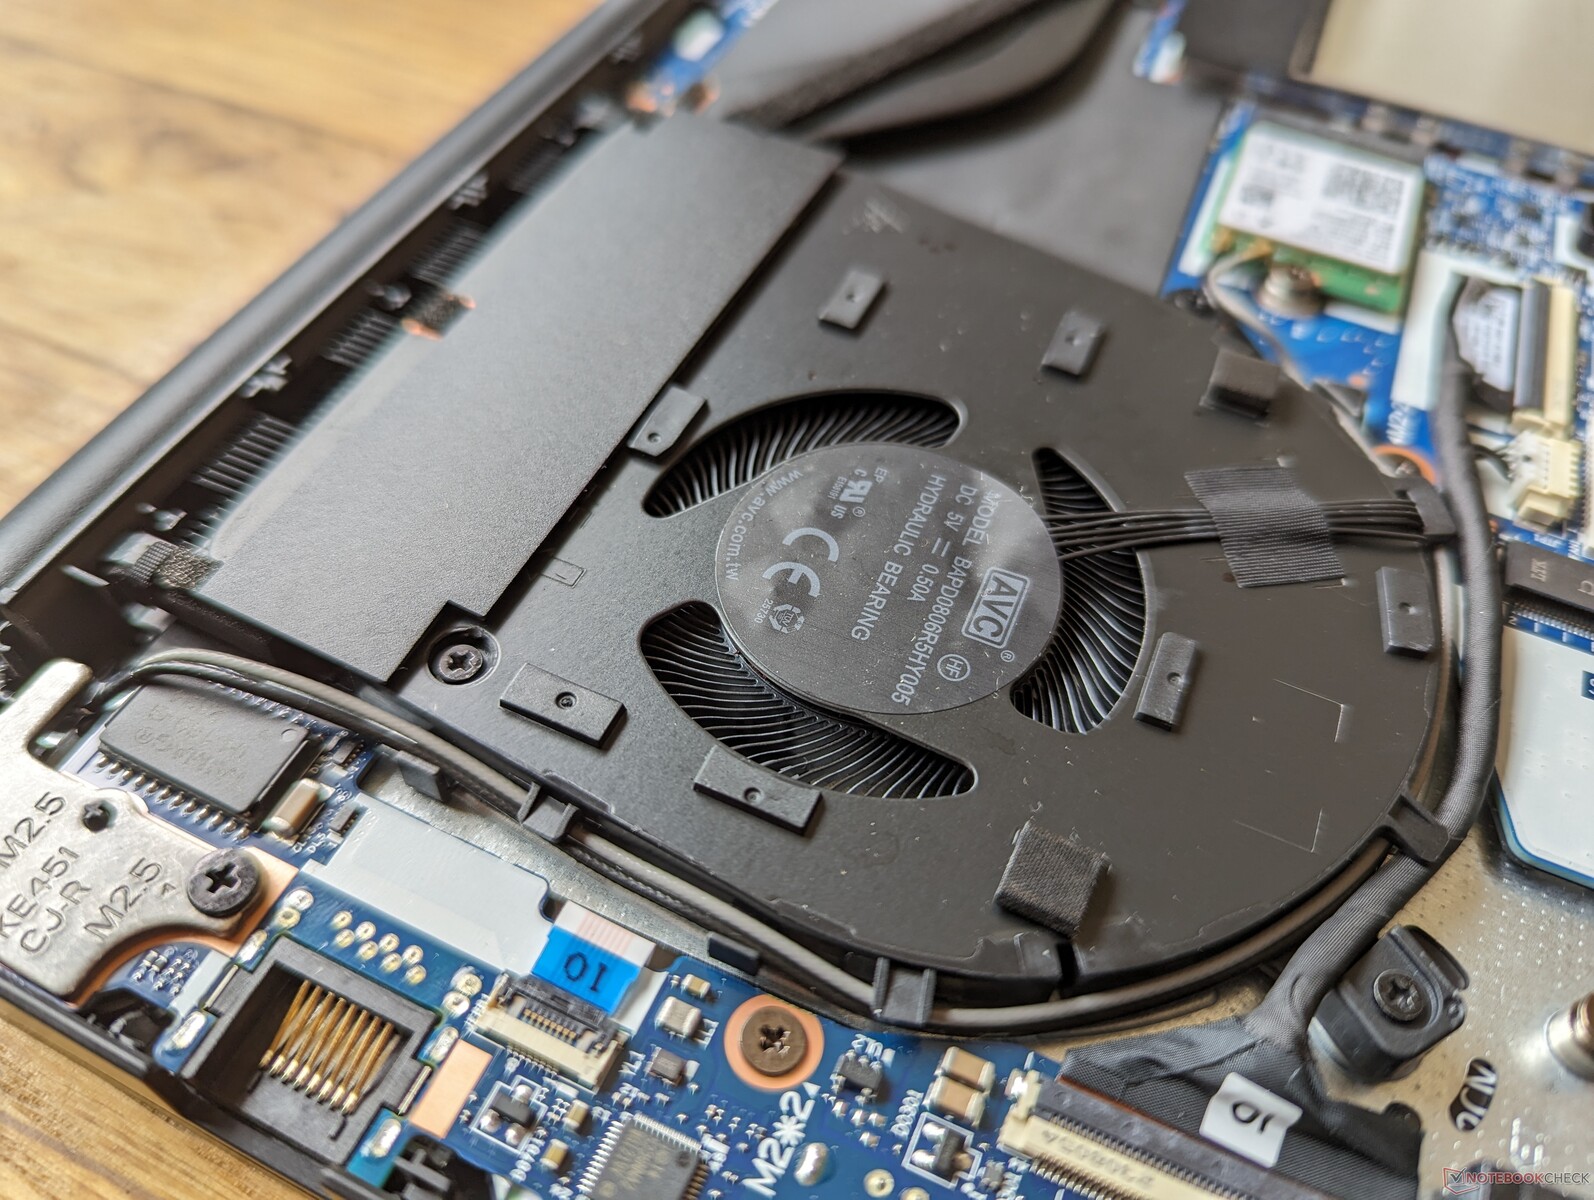
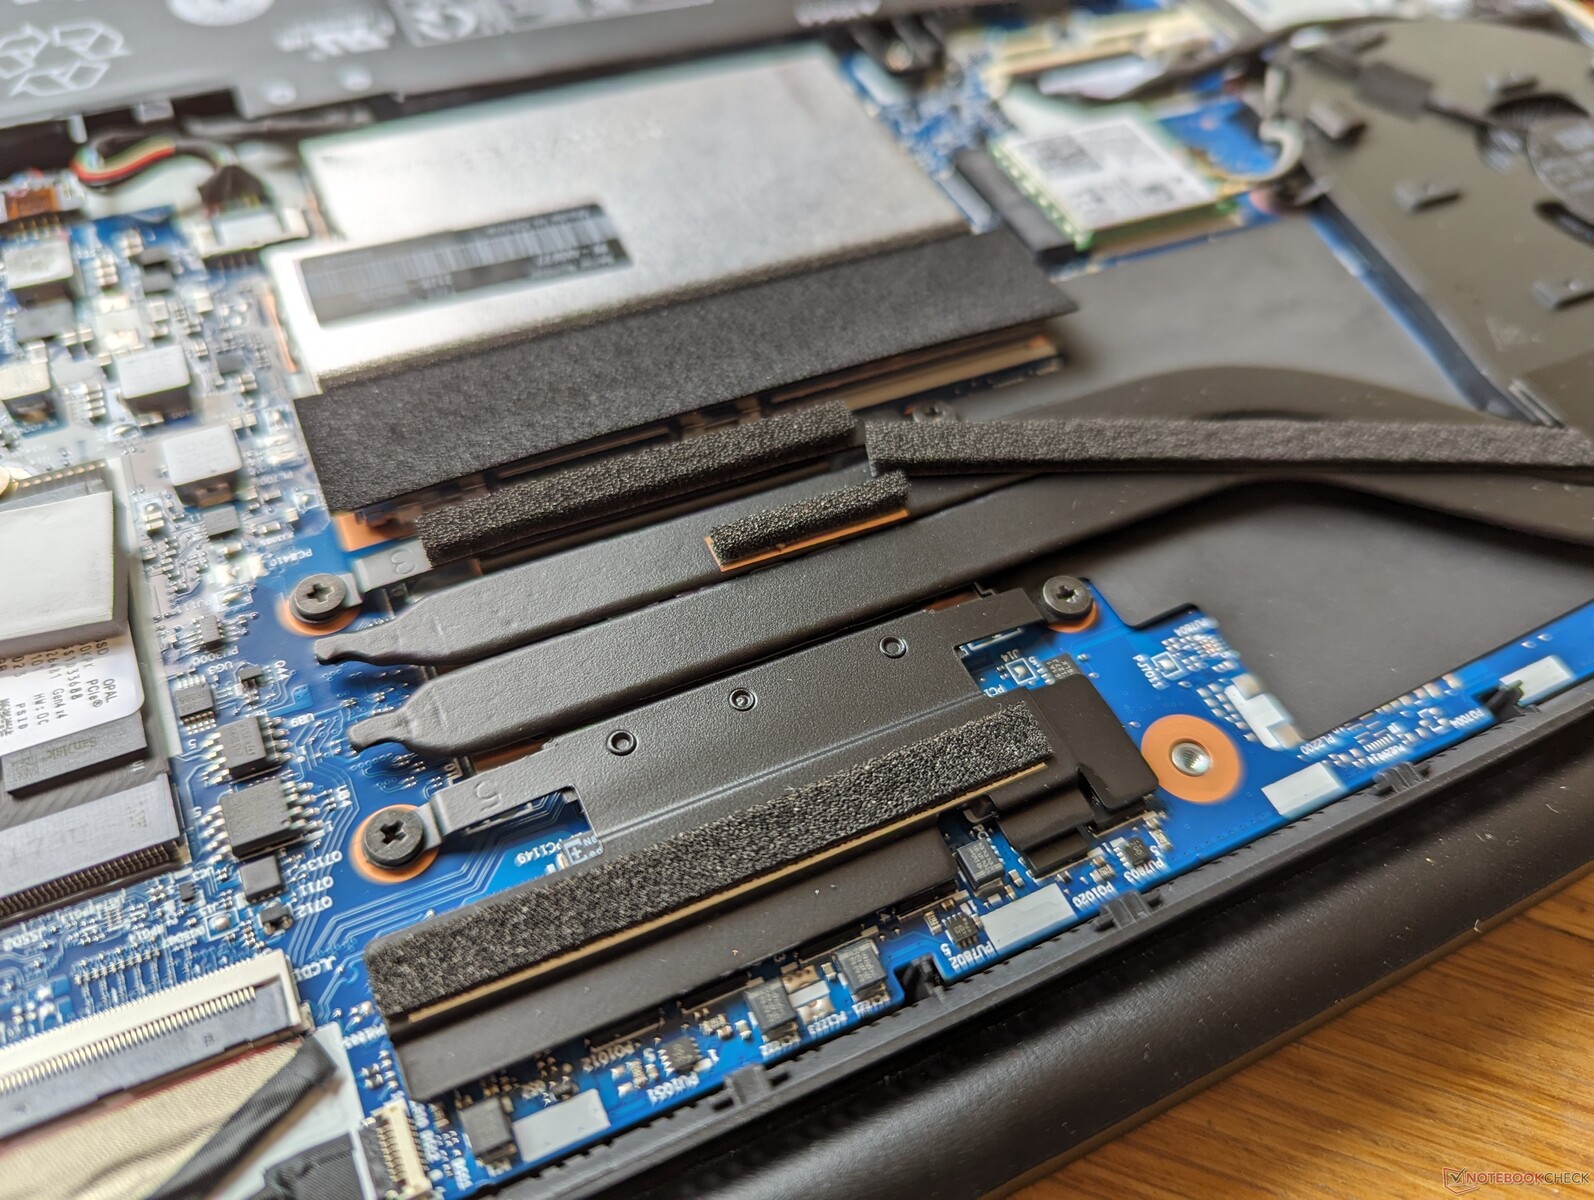
Wartung
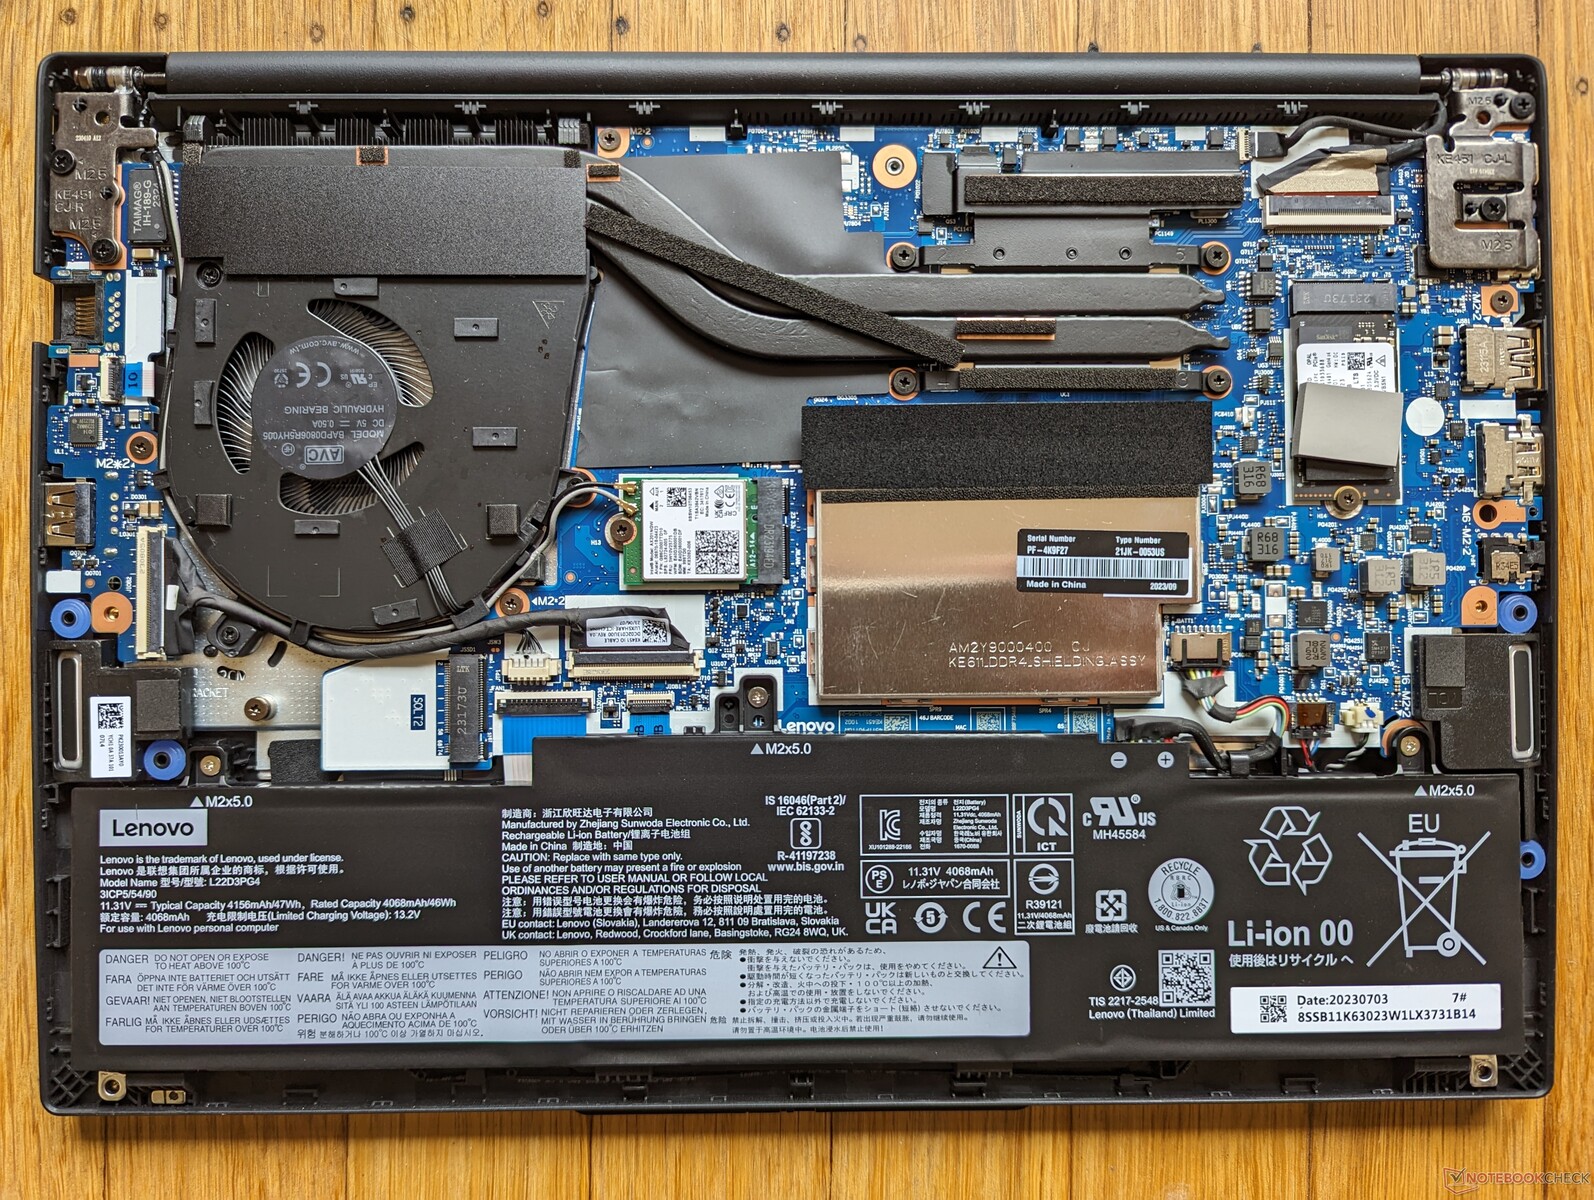
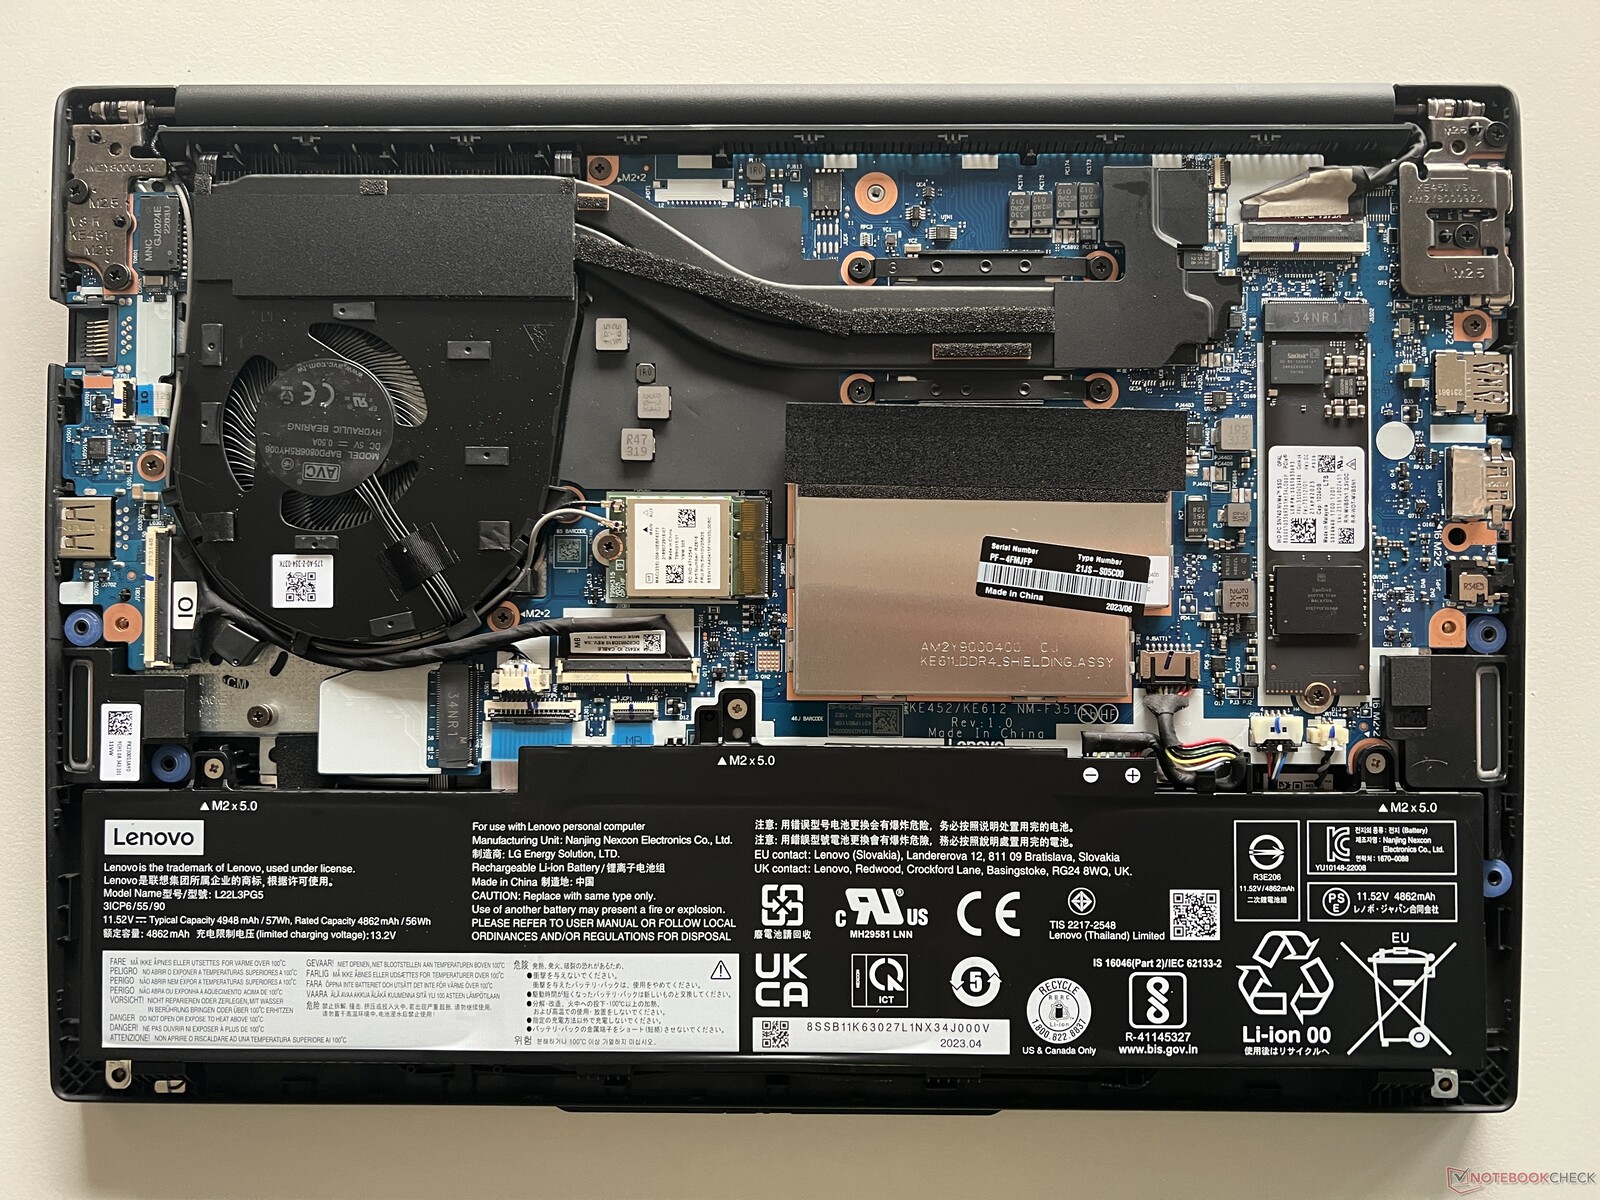
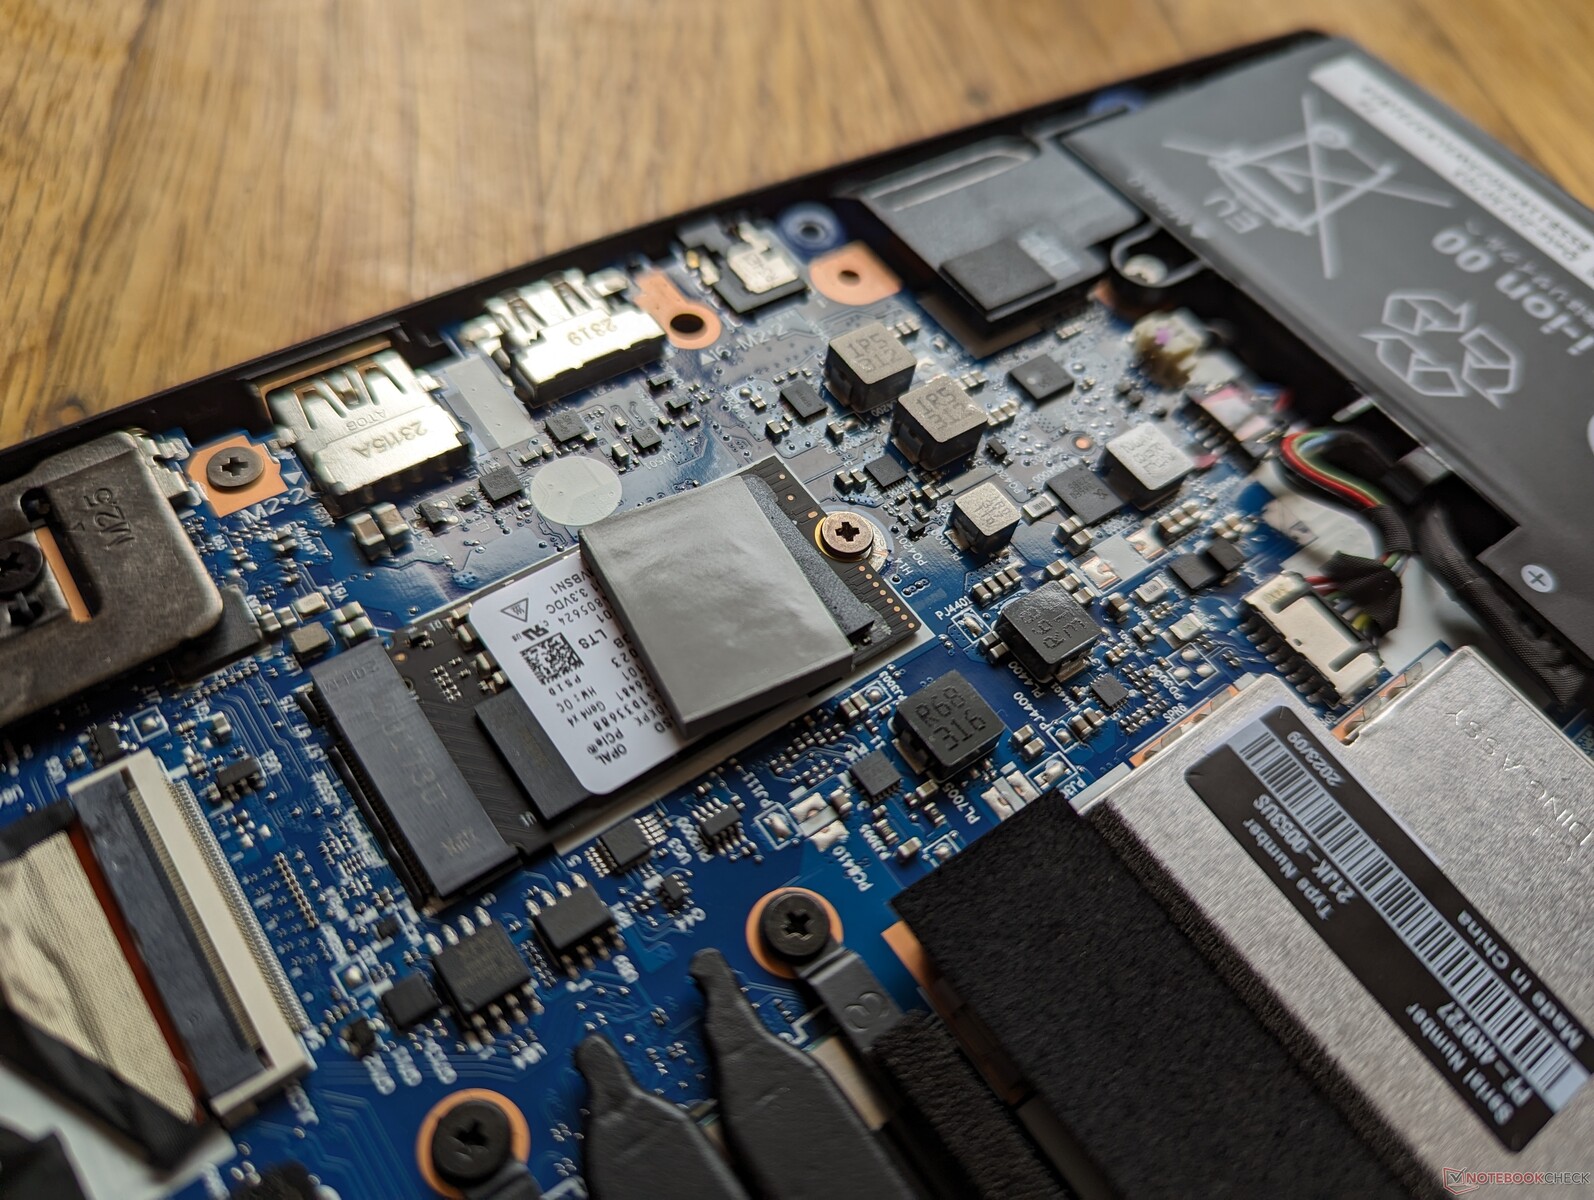
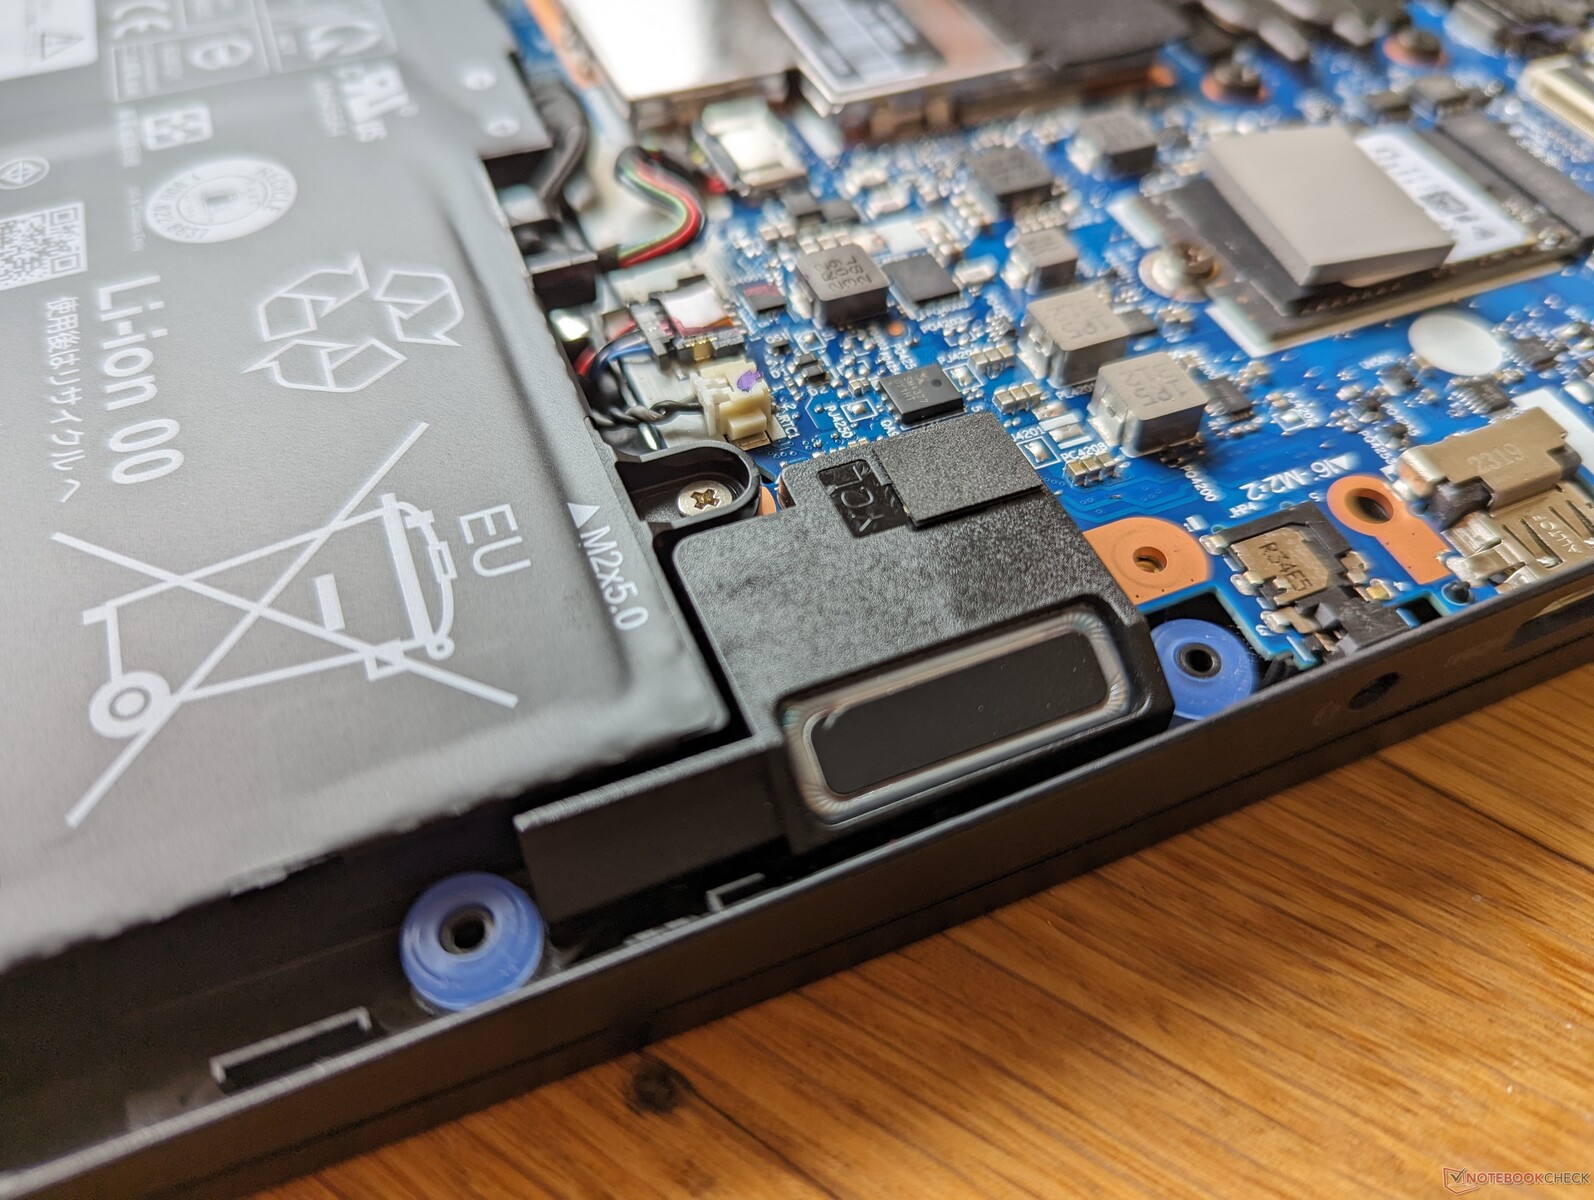
Ein interessanter Unterschied zwischen der Intel- und der AMD-Version besteht darin, dass die Intel-Version keine M.2 2280 SSDs in voller Länge unterstützt, wie die Vergleichsbilder unten zeigen. Es können immer hin bis zu zwei Laufwerke (PCIe4 x4 + PCIe3 x4) installiert werden, jedoch dürfen sie jeweils maximal 42 mm (2242) lang sein.
Zubehör & Garantie
In der Verpackung befinden sich außer dem Netzgerät und dem Papierkram keine weiteren Extras. Beim Kauf in Deutschalnd gilt eine eingeschränkte Herstellergarantie von einem Jahr.
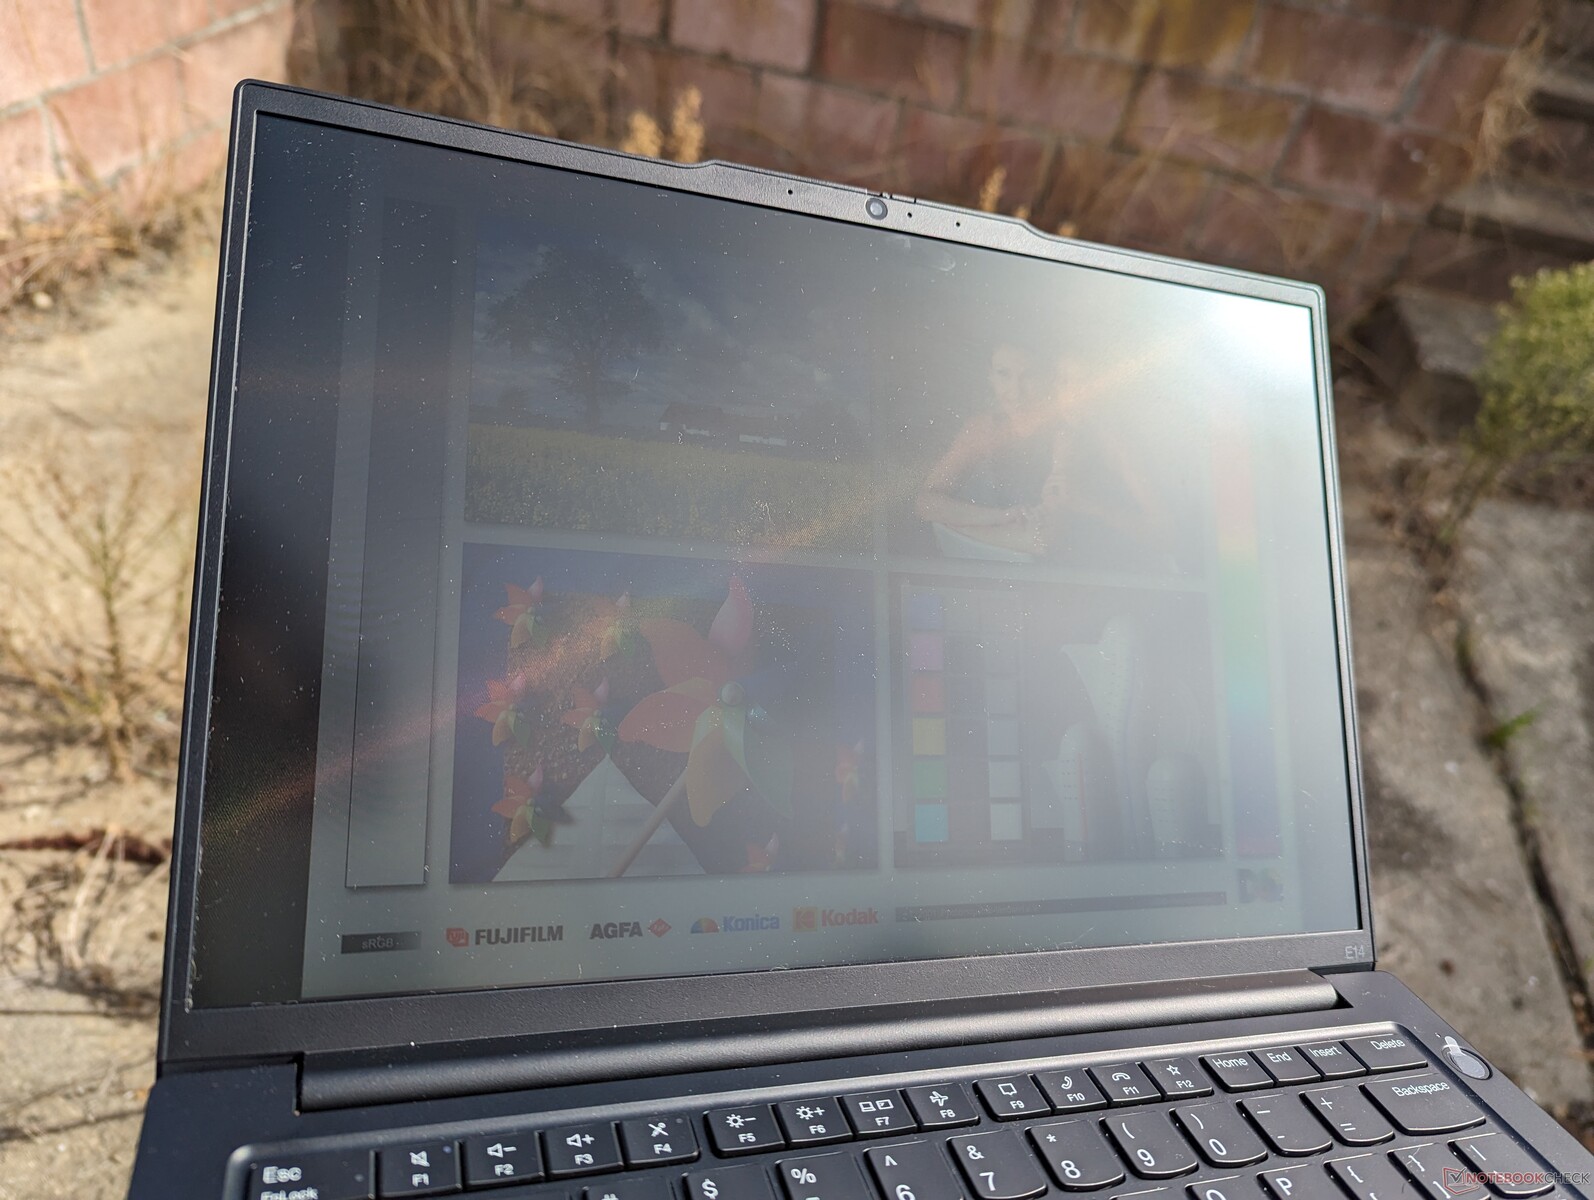
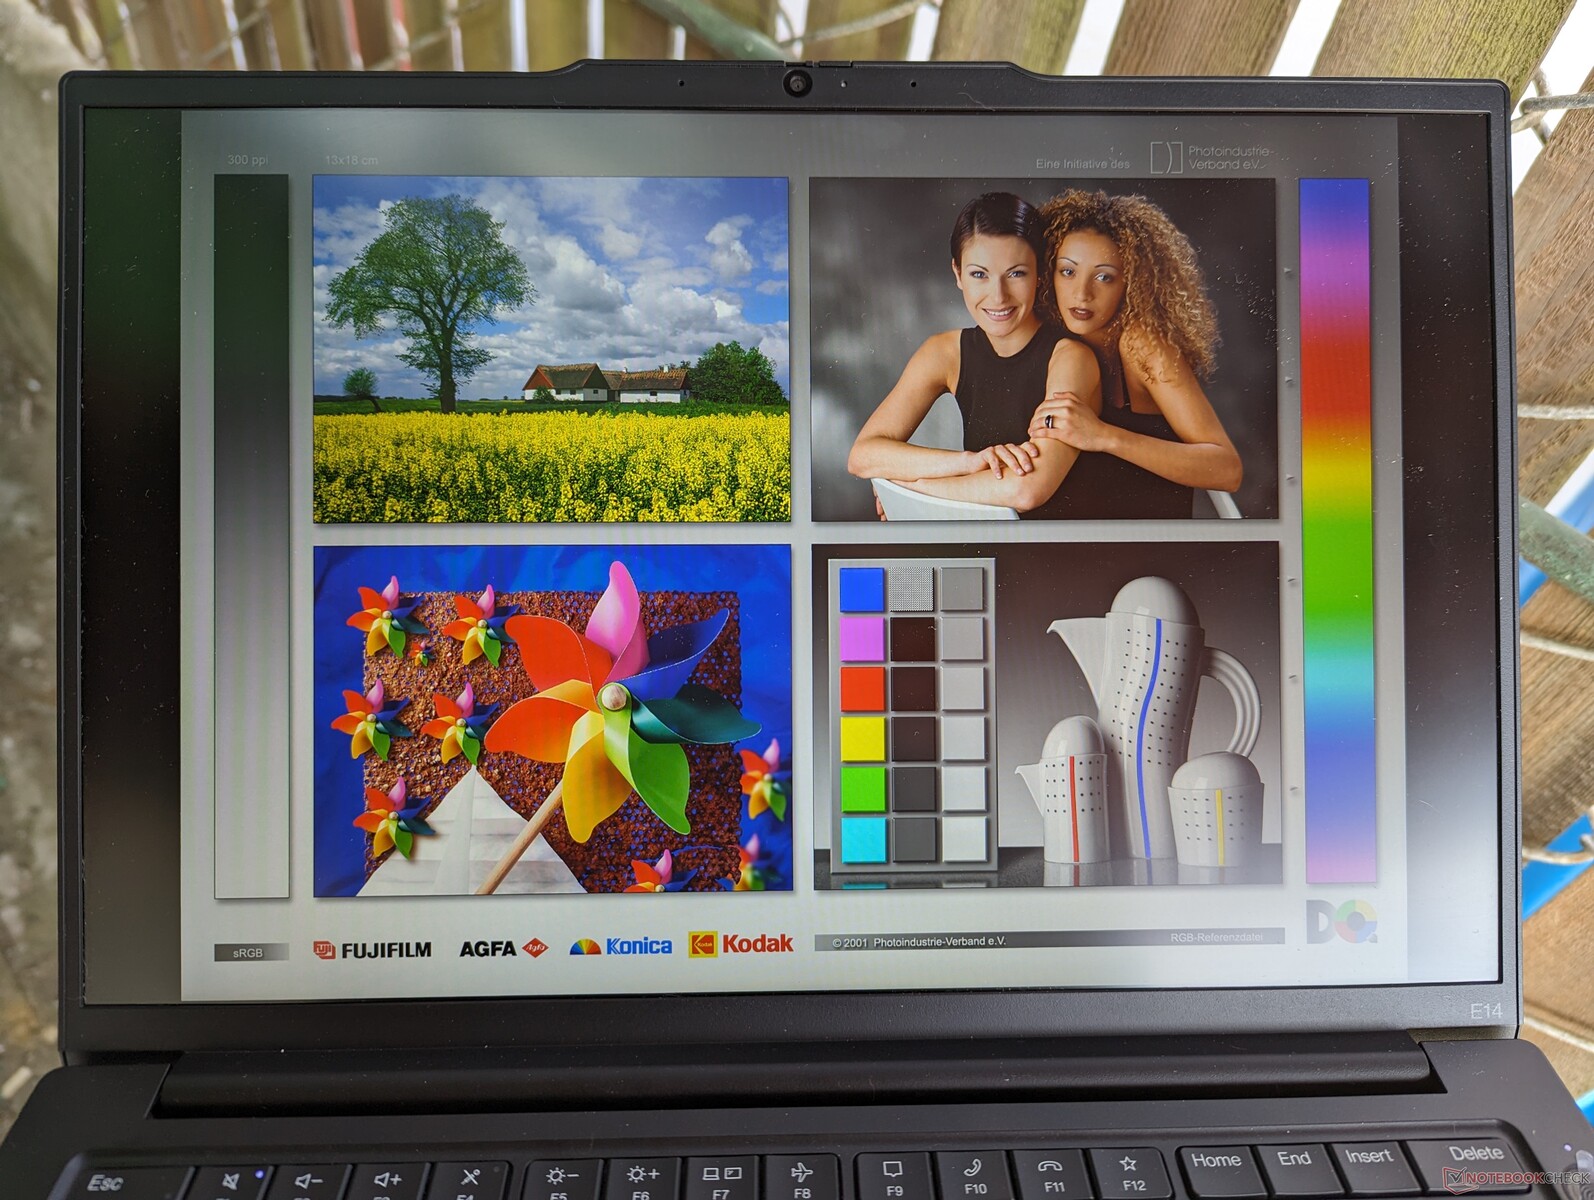
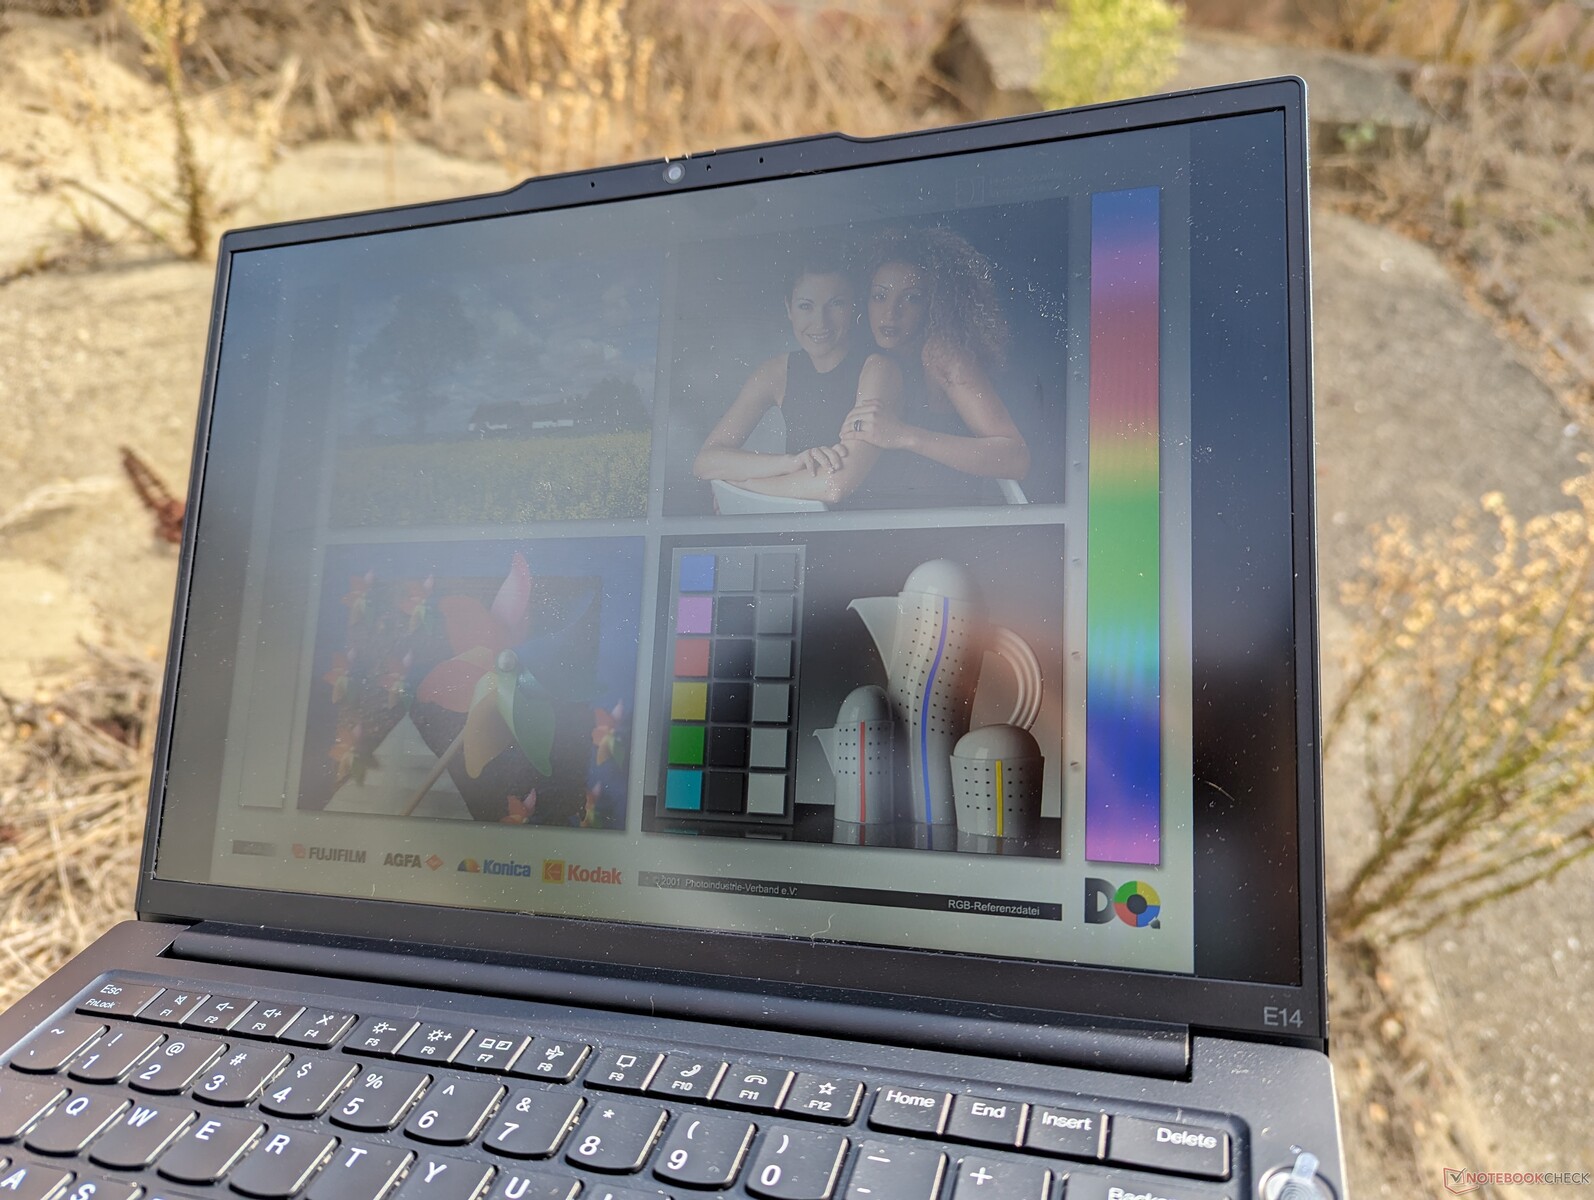
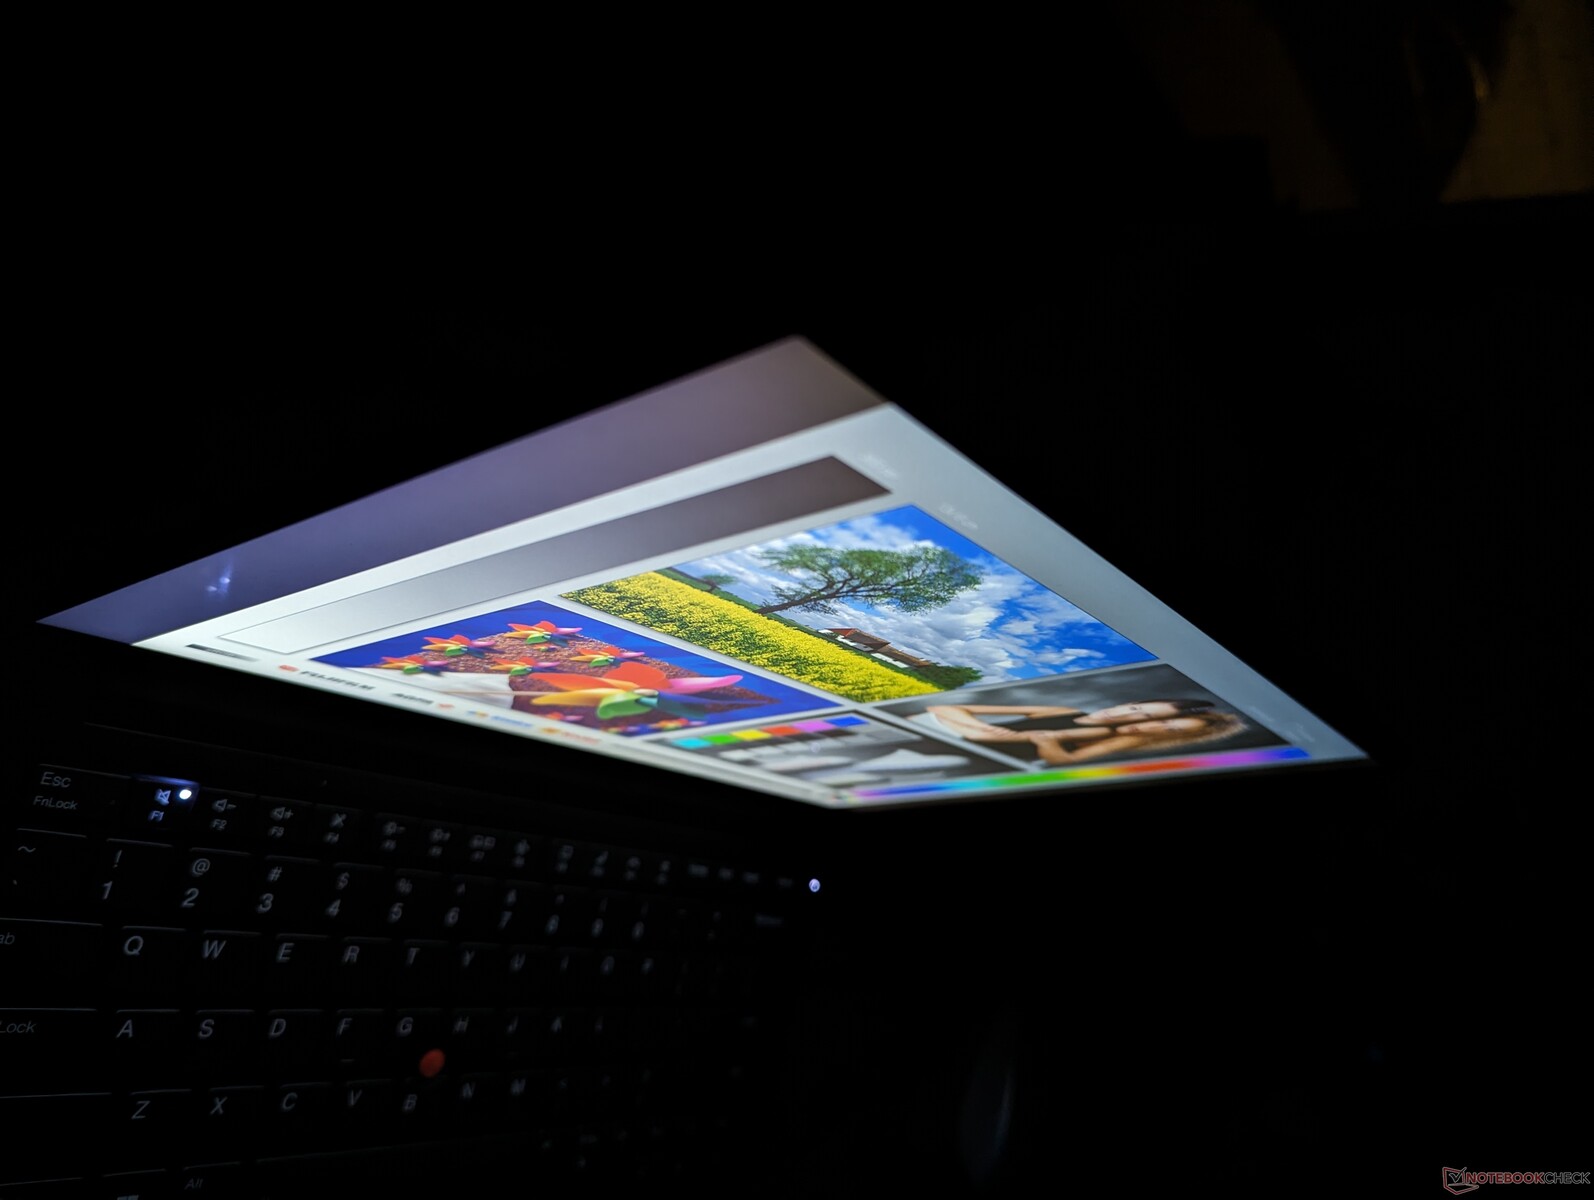
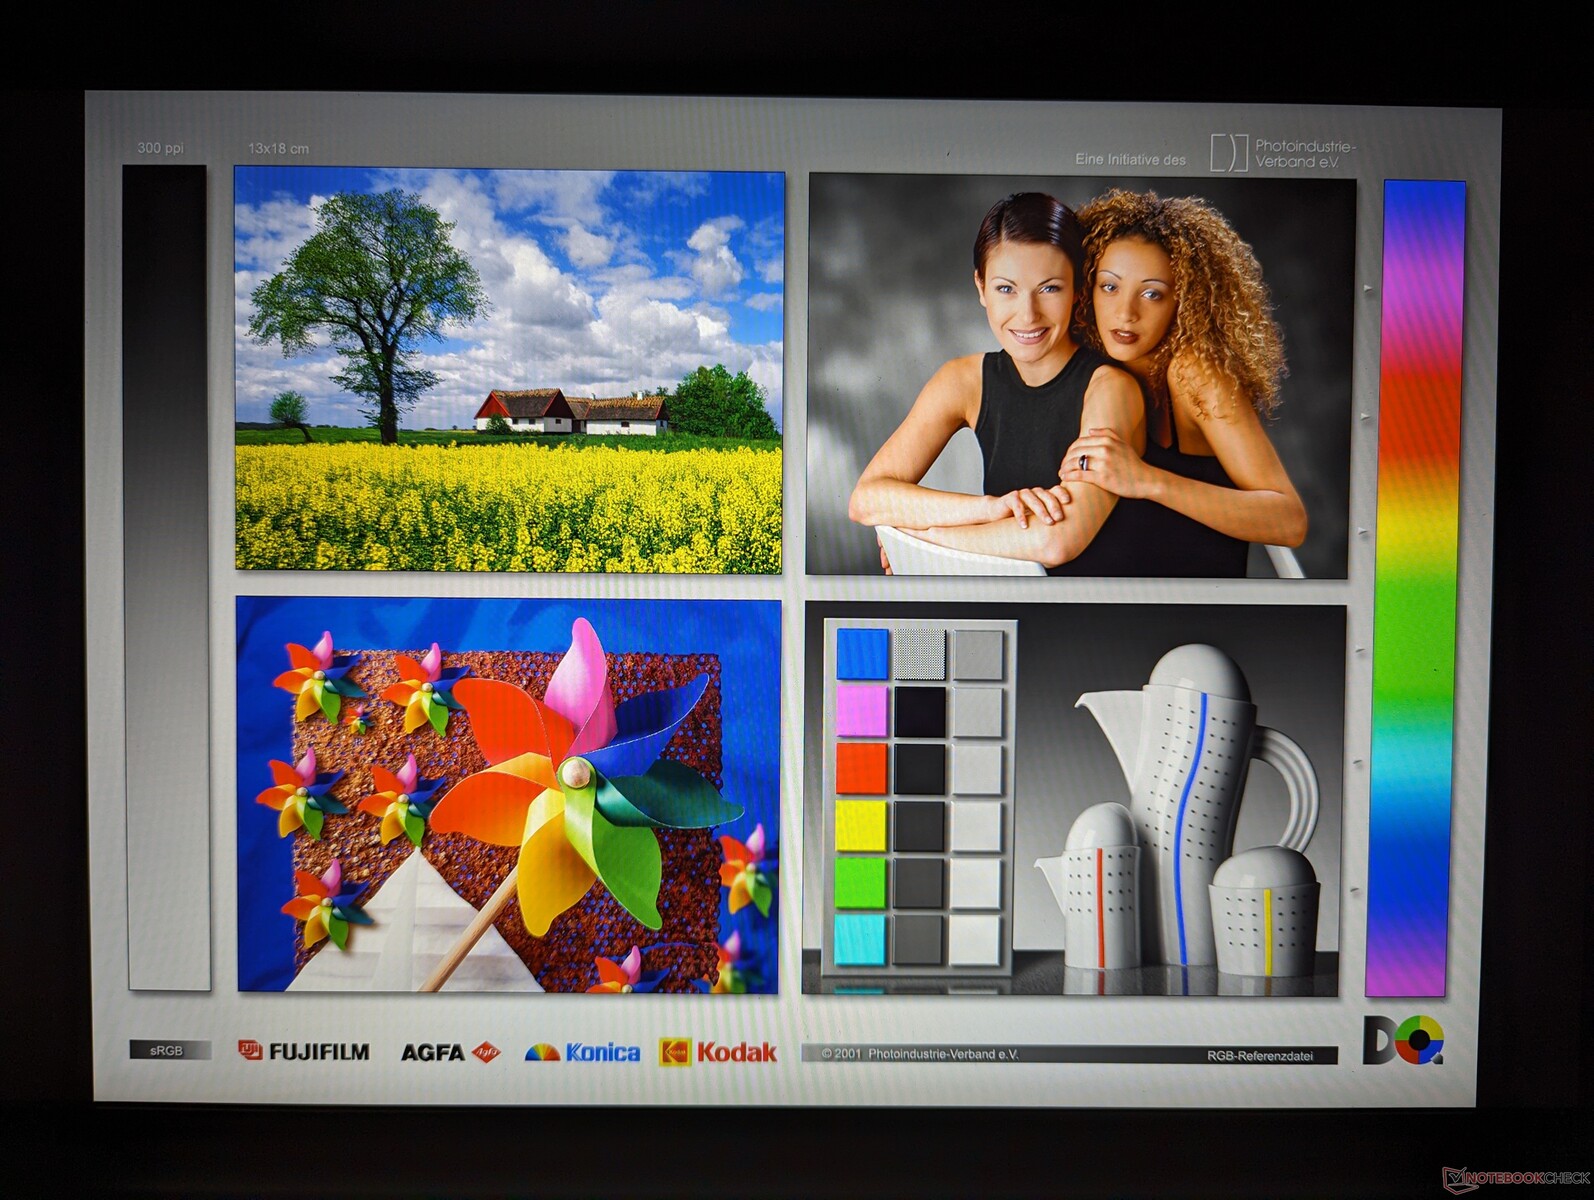
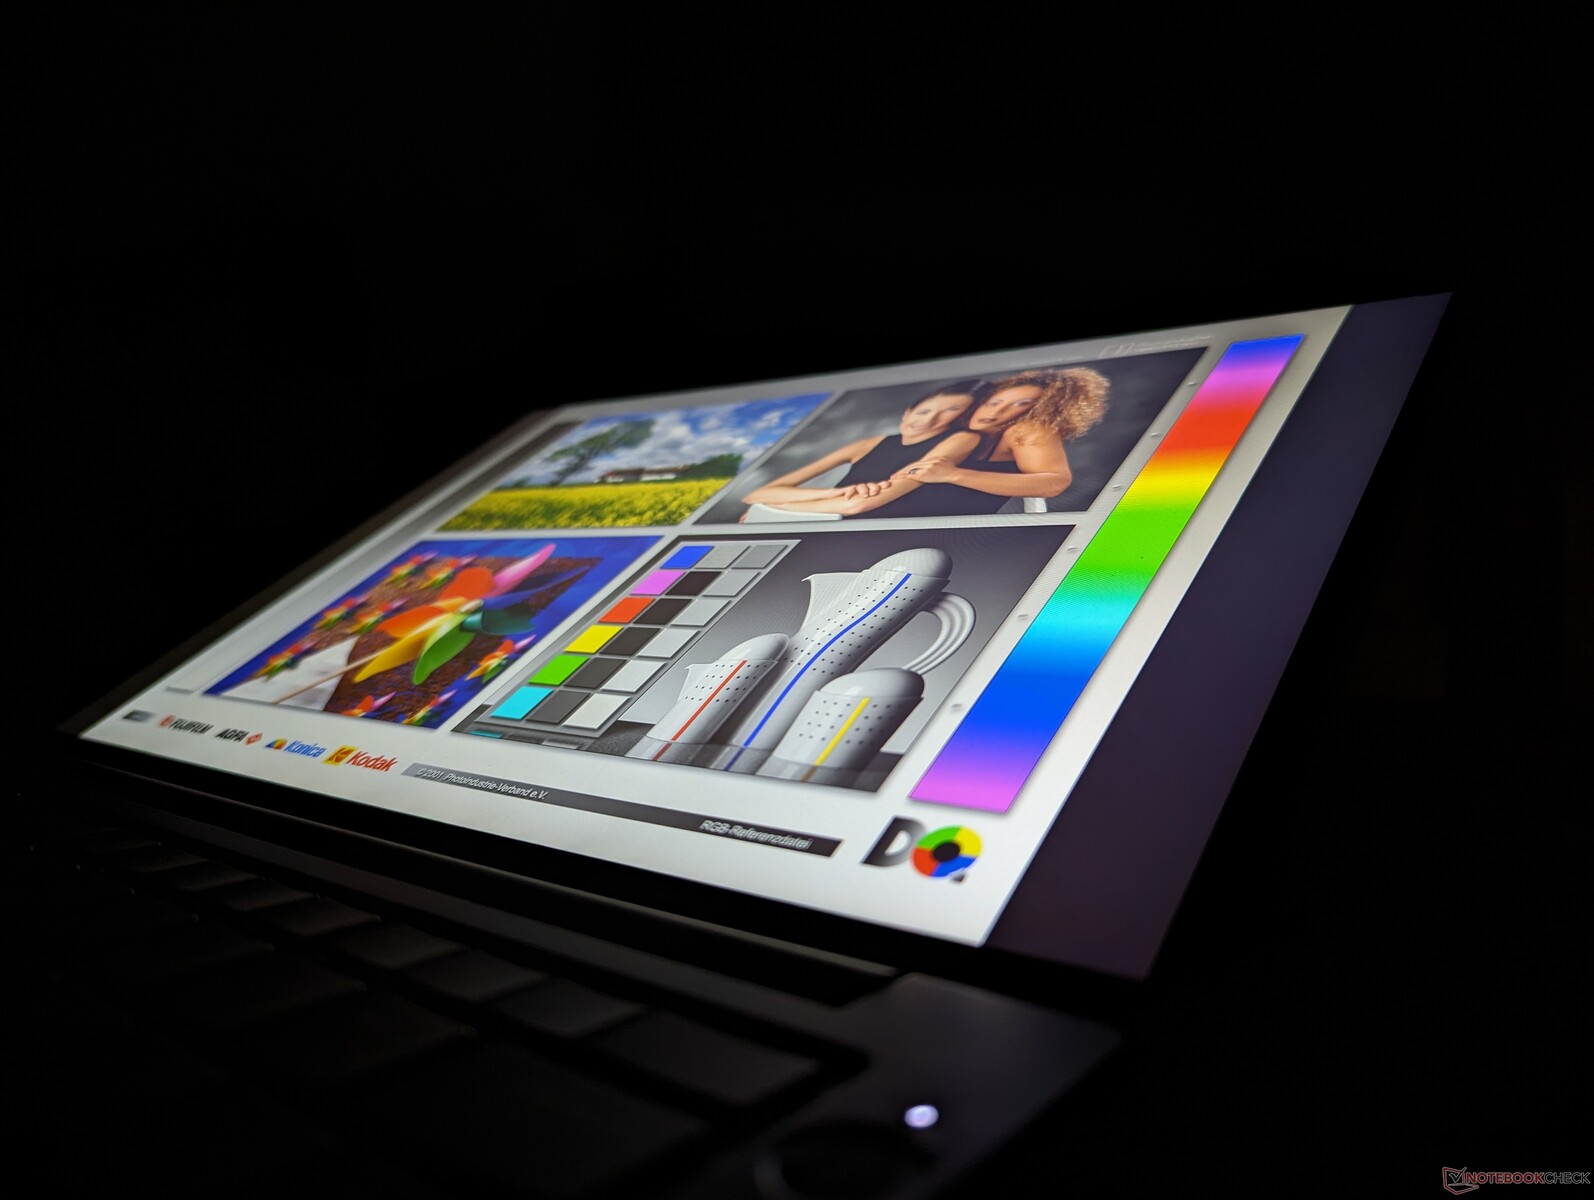
Display
Die folgenden drei Display-Optionen stehen zur Verfügung:
- 1920 x 1200, IPS, 60% sRGB, 60 Hz, 300-nits, Non-Touch, Matt
- 1920 x 1200, IPS, 60% sRGB, 60 Hz, 300-nits, Touch, Matt
- 2240 x 1400, IPS, 100% sRGB, 60 Hz, 300-nits, Non-Touch, Matt
Während unser AMD-Gerät mit dem 1400p-Panel konfiguriert war, verfügt unser Intel-Gerät über die fettgedruckte Option. Wir empfehlen das 1400p-Panel, wenn Ihre Arbeitslasten genauere Farben und ein höheres Kontrastverhältnis erfordern. Ansonsten scheinen andere Eigenschaften wie Helligkeit und Schwarz-Weiß-Reaktionszeiten bei allen Optionen gleich zu sein.
| |||||||||||||||||||||||||
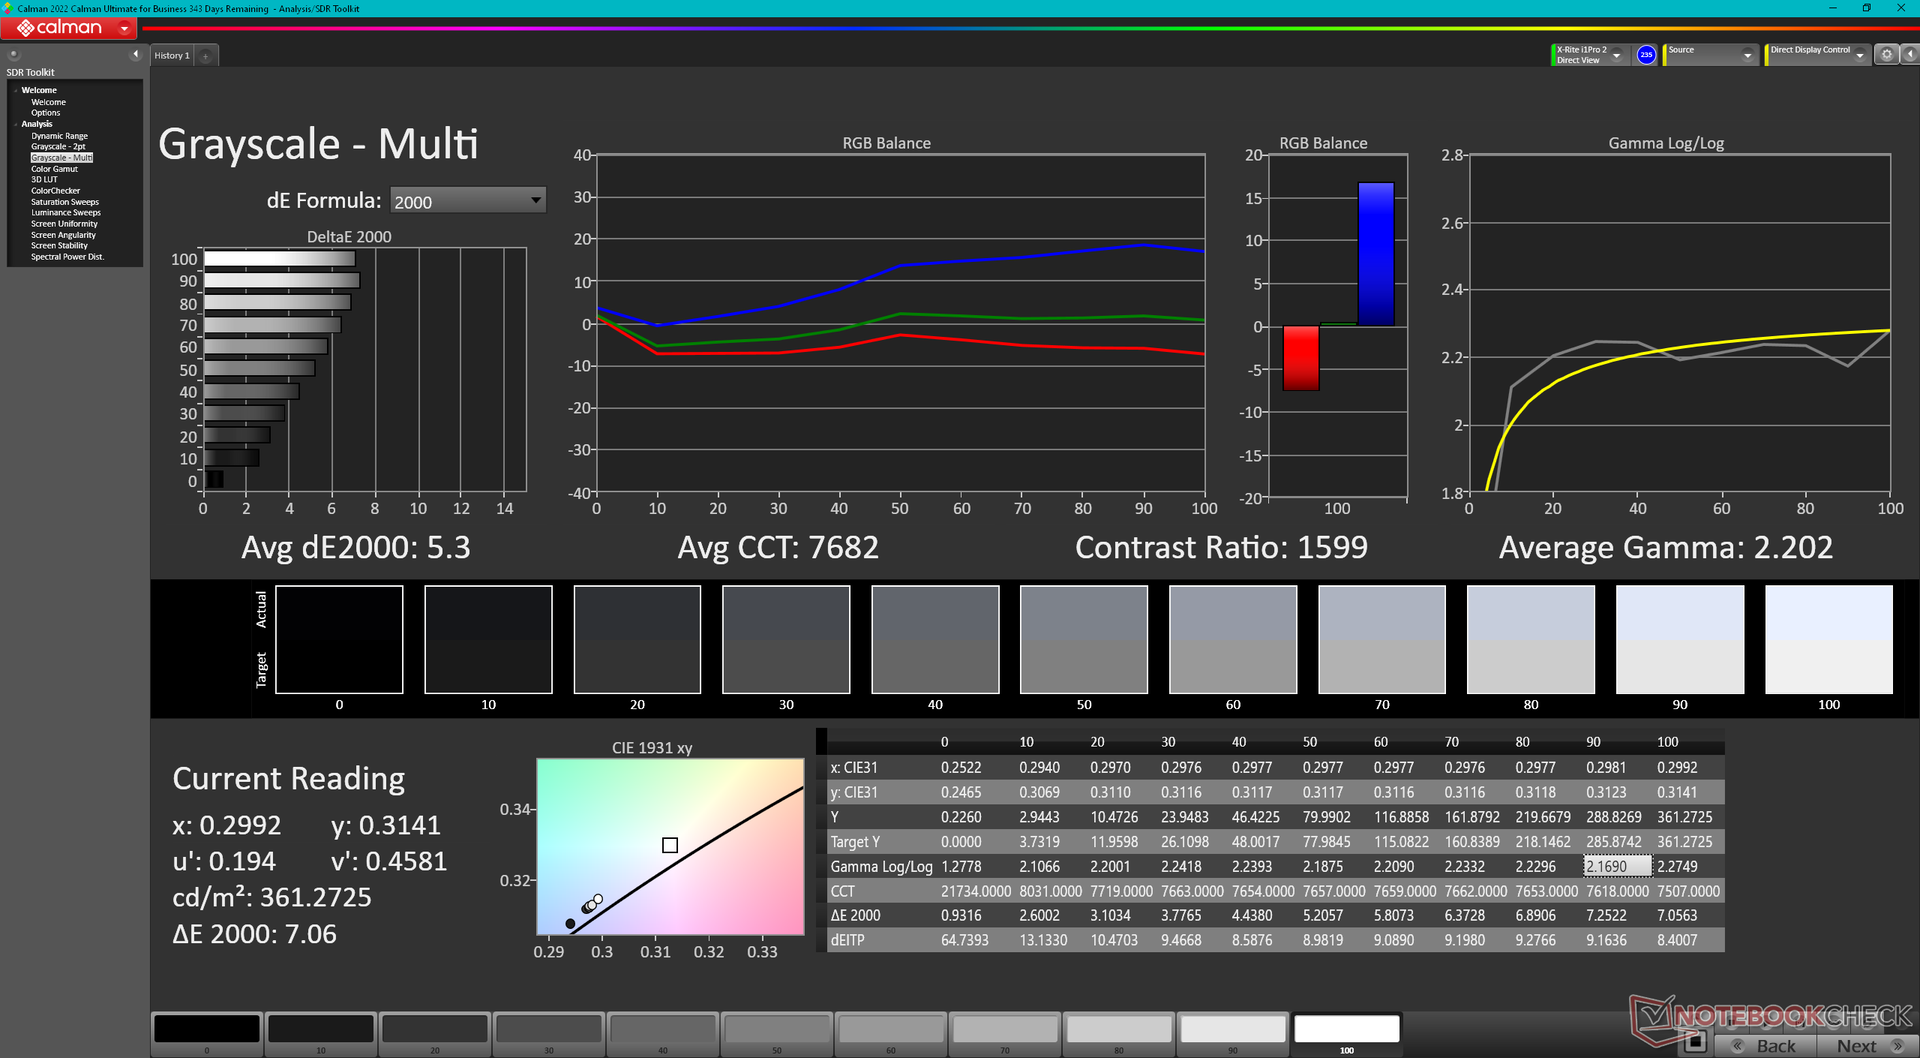
Ausleuchtung: 86 %
Helligkeit Akku: 352.3 cd/m²
Kontrast: 1305:1 (Schwarzwert: 0.27 cd/m²)
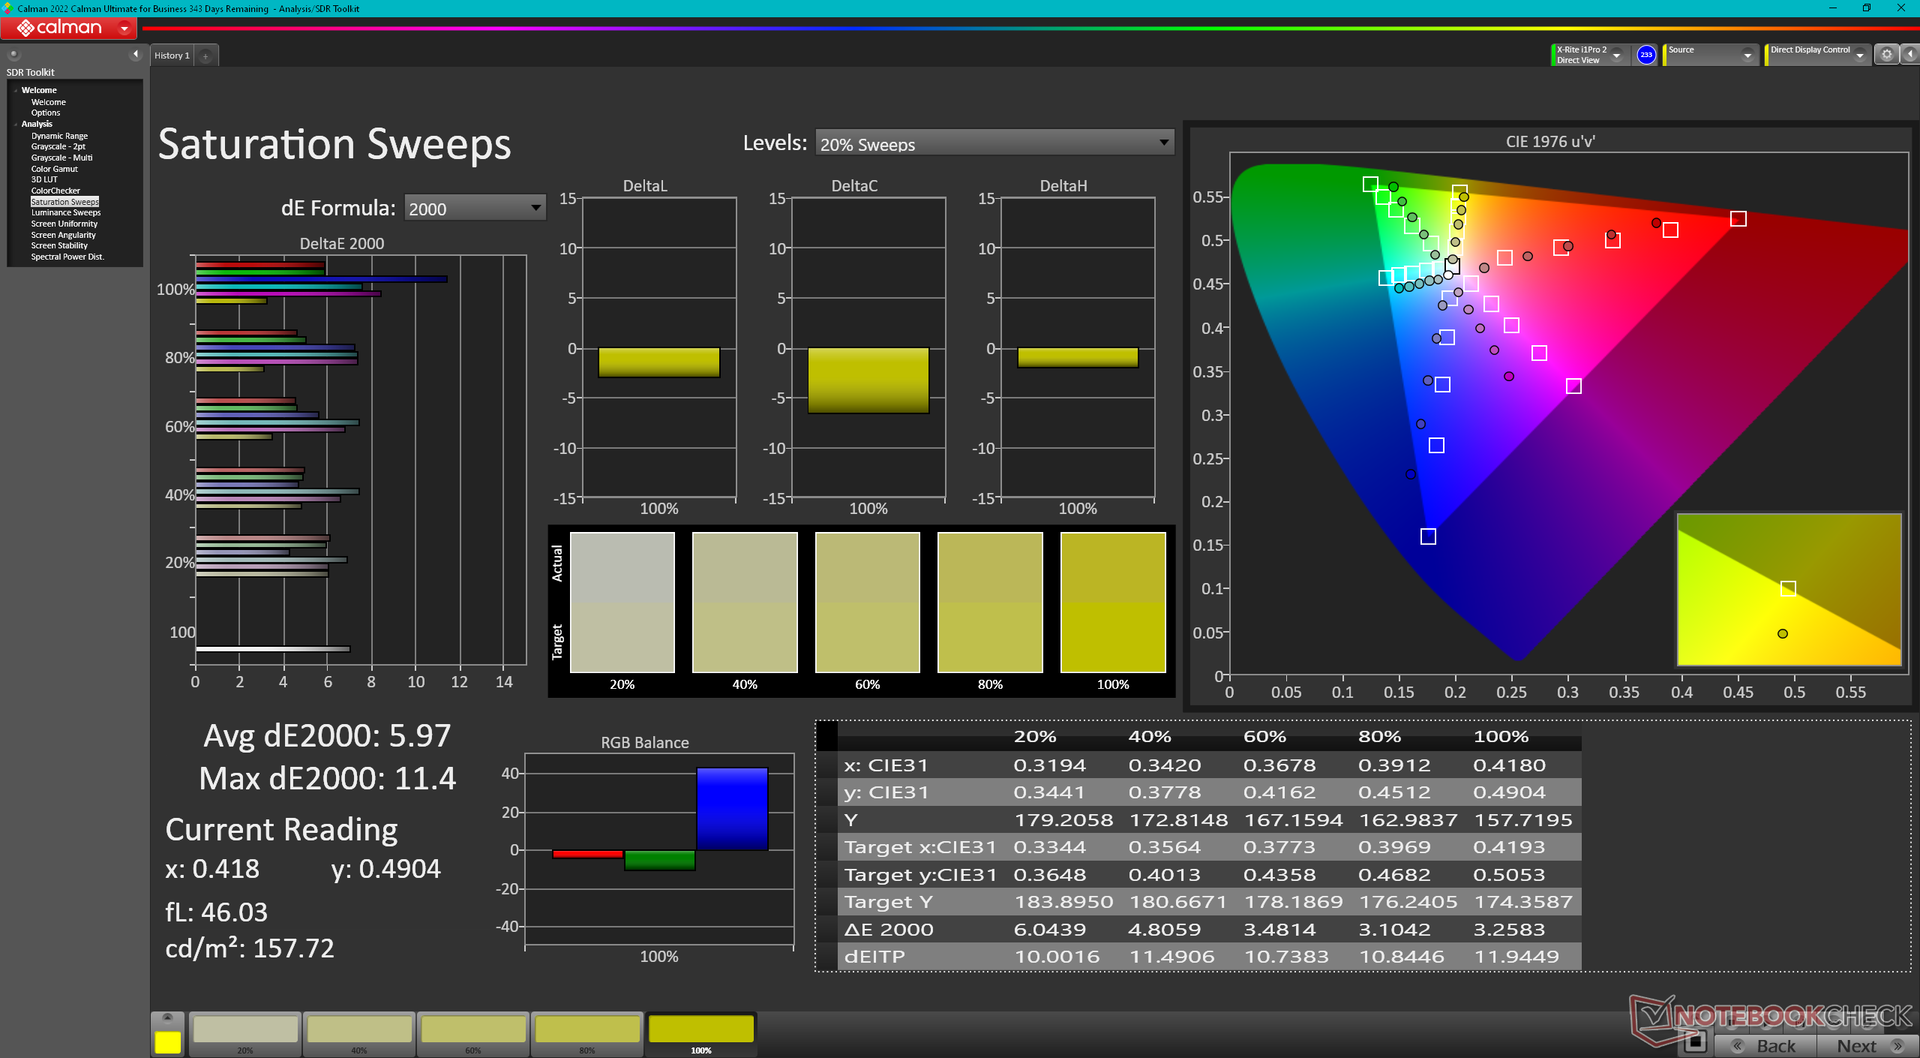
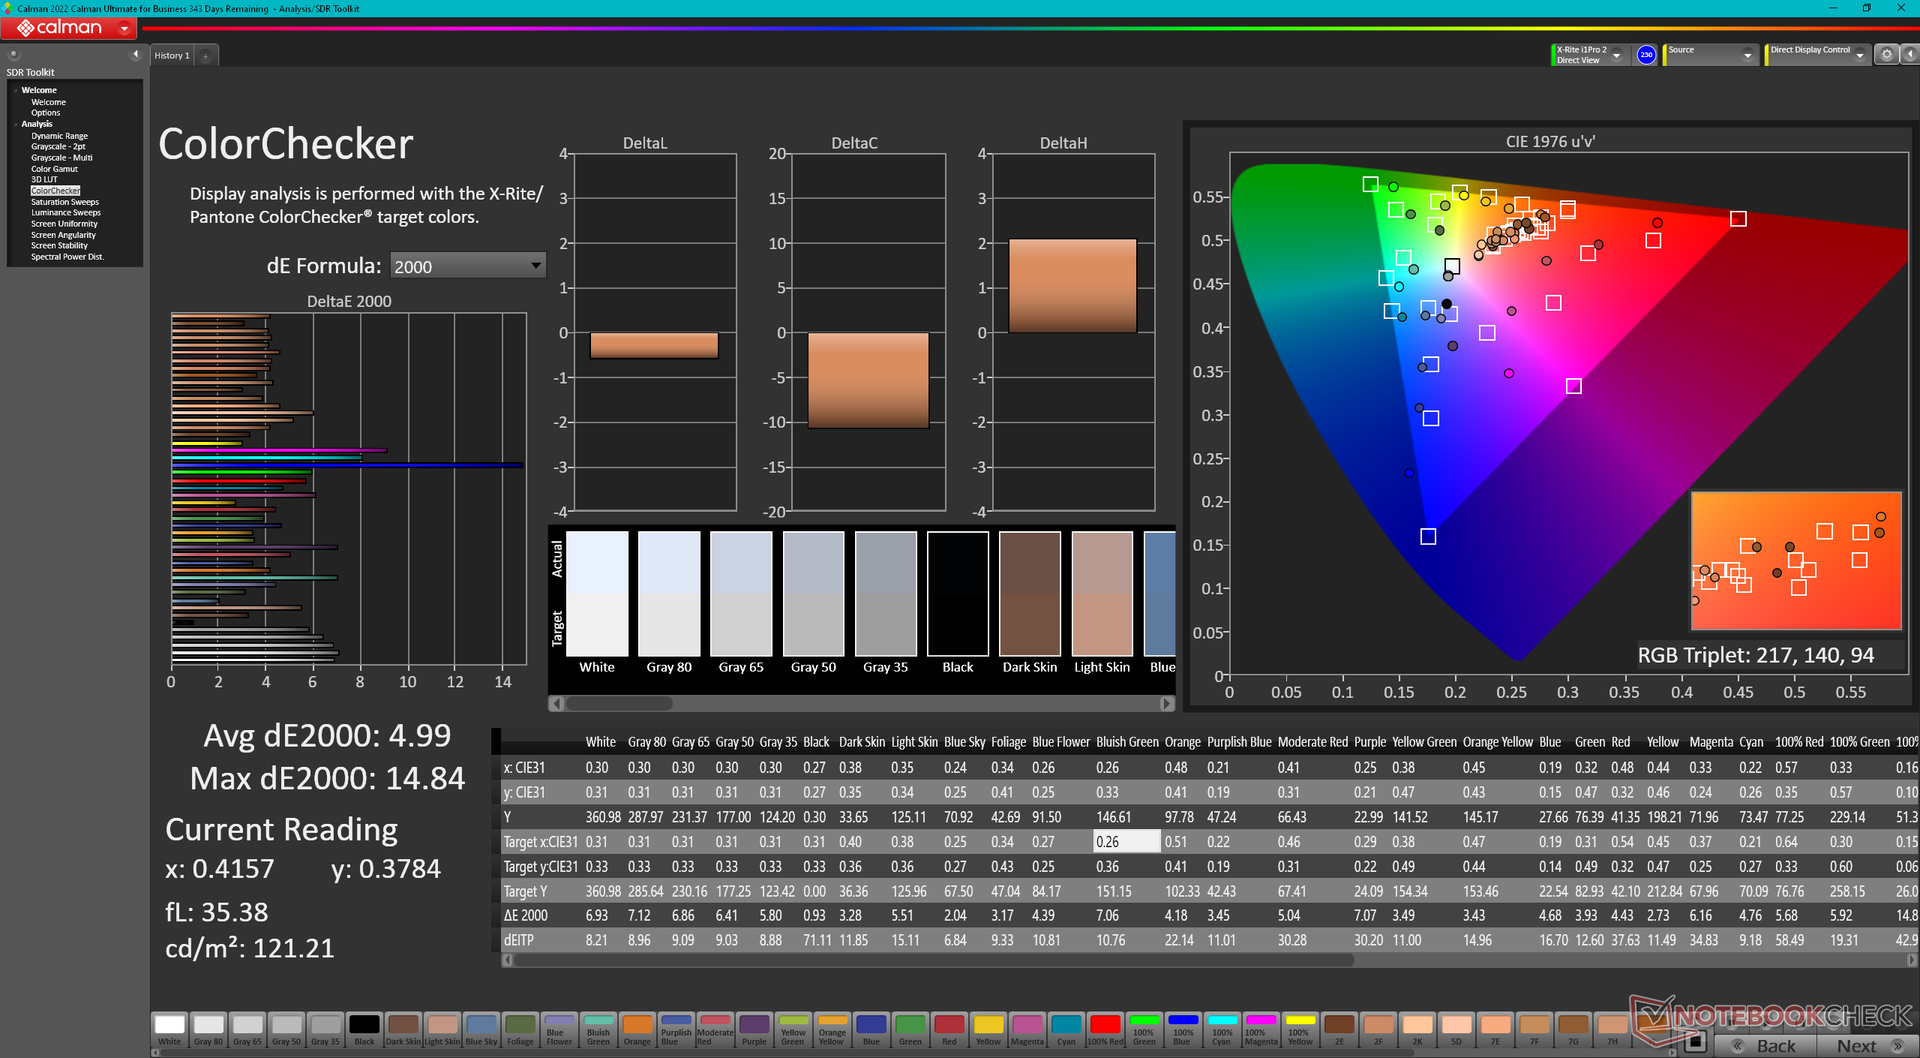
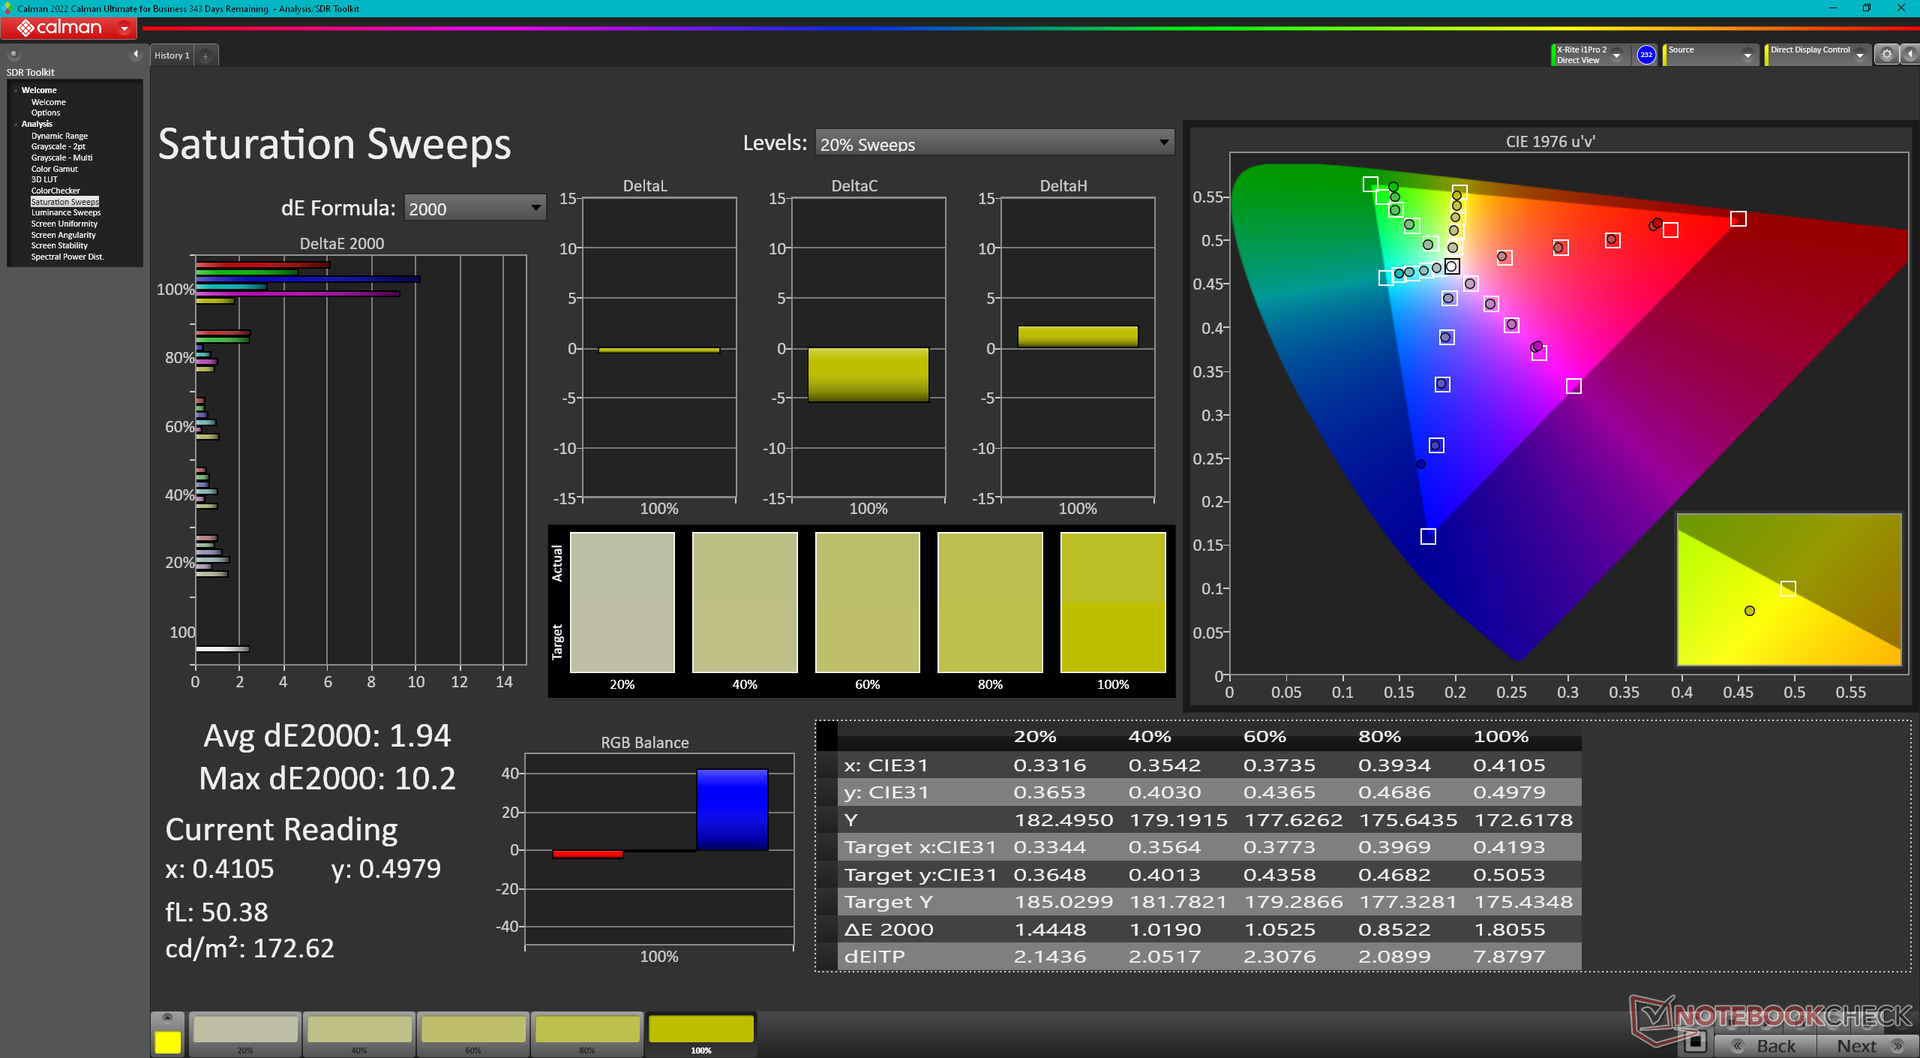
ΔE ColorChecker Calman: 4.99 | ∀{0.5-29.43 Ø4.72}
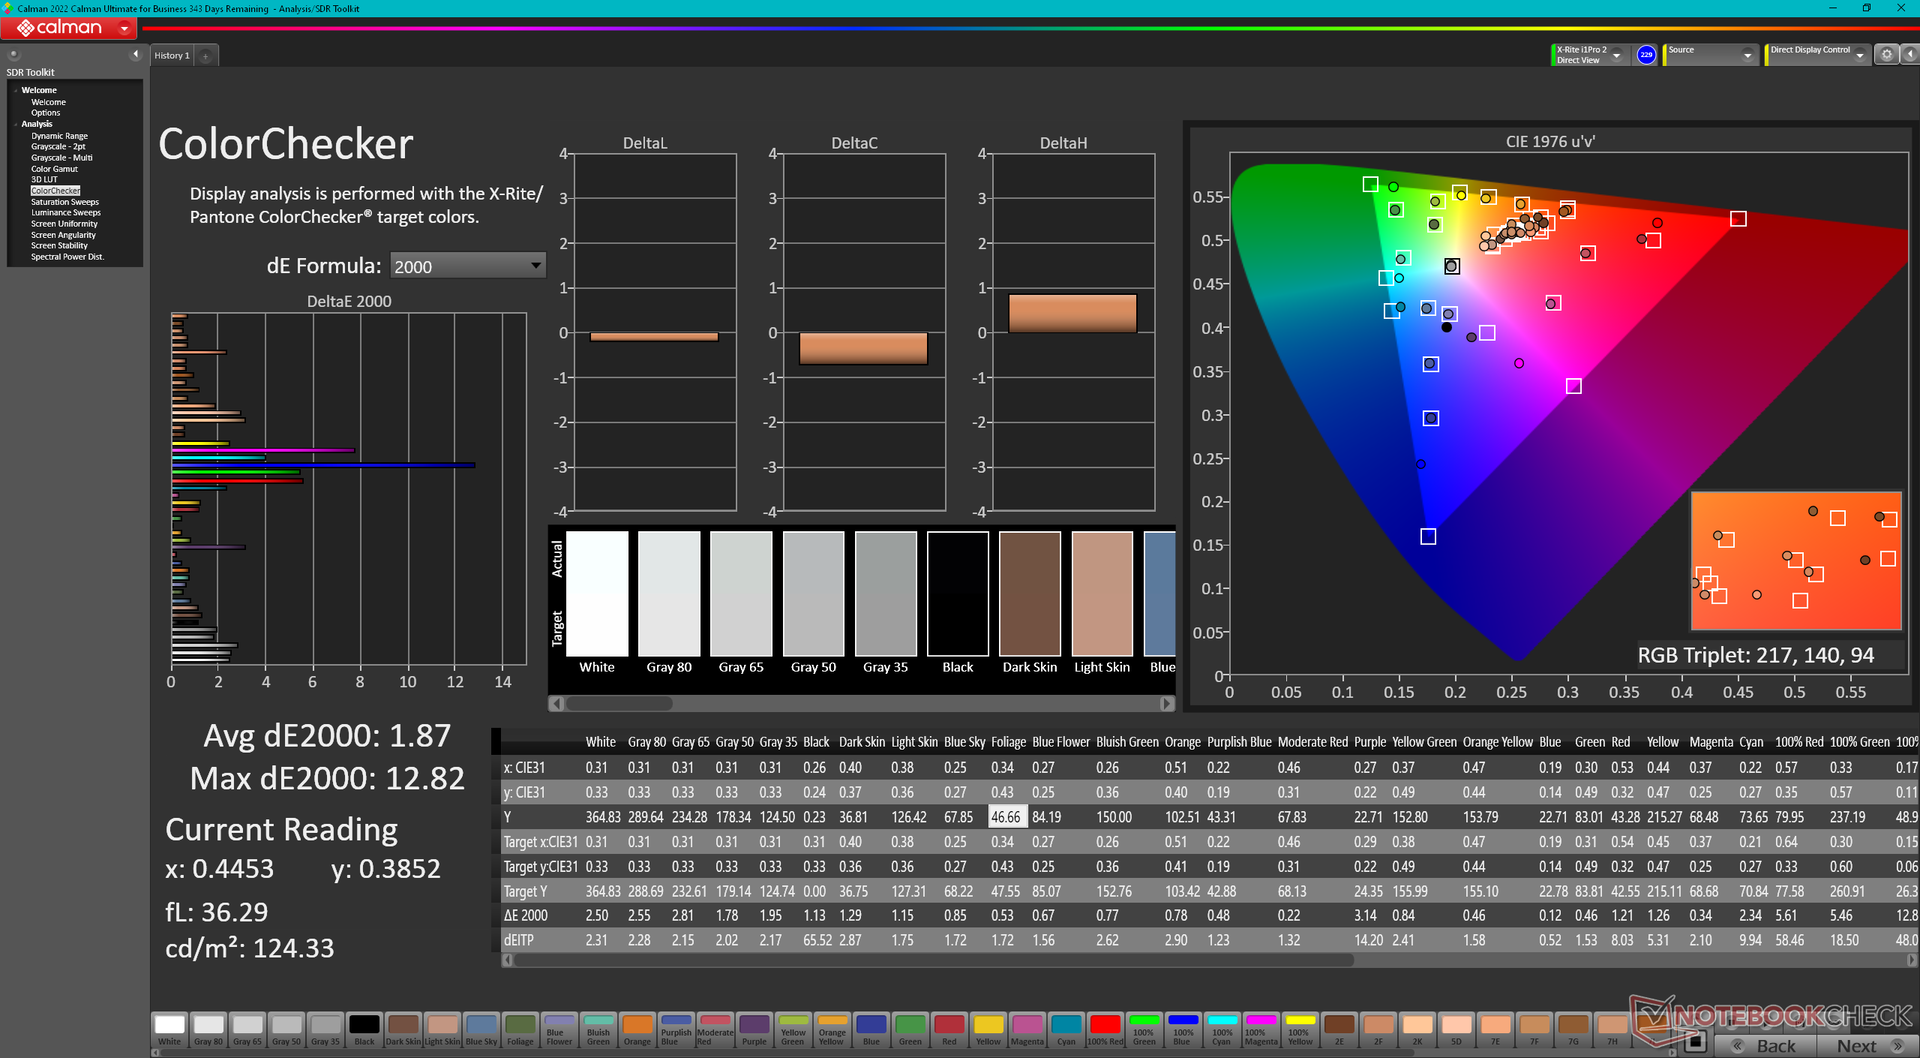
calibrated: 1.87
ΔE Greyscale Calman: 5.3 | ∀{0.09-98 Ø4.97}
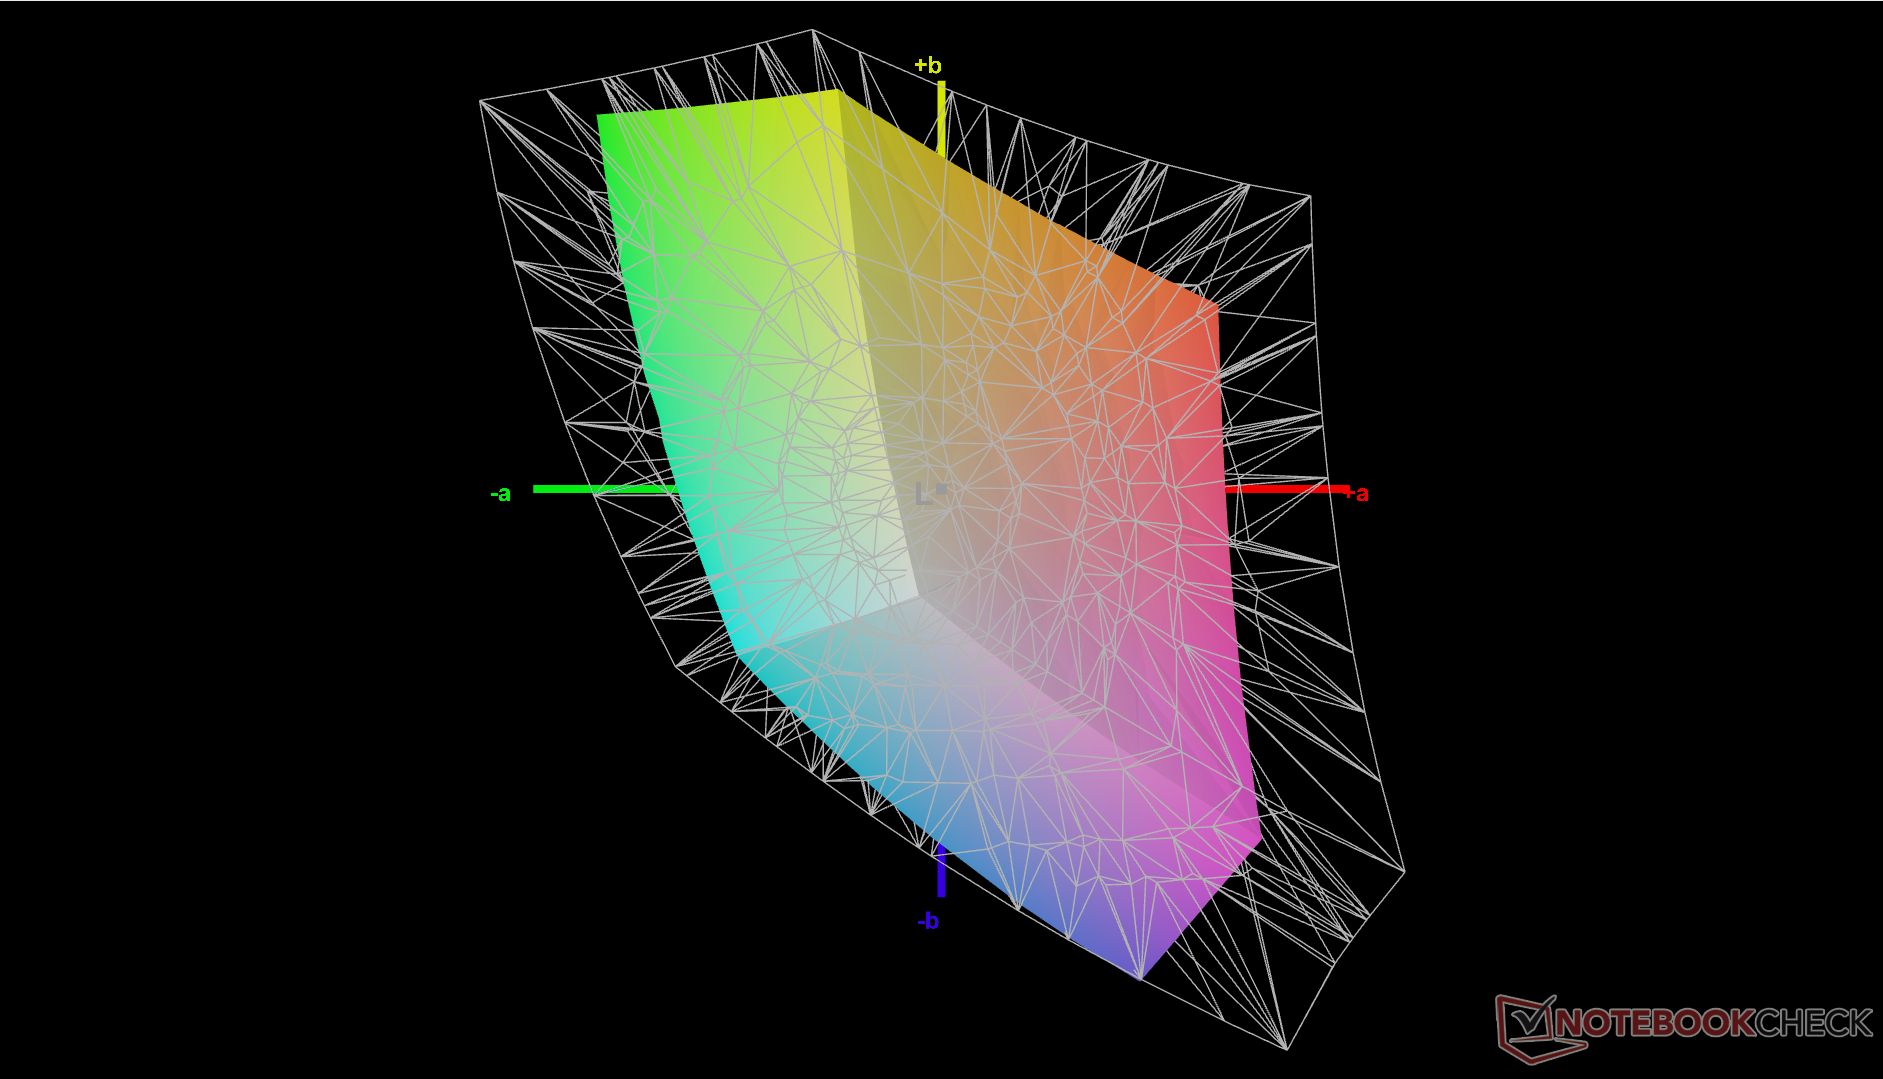
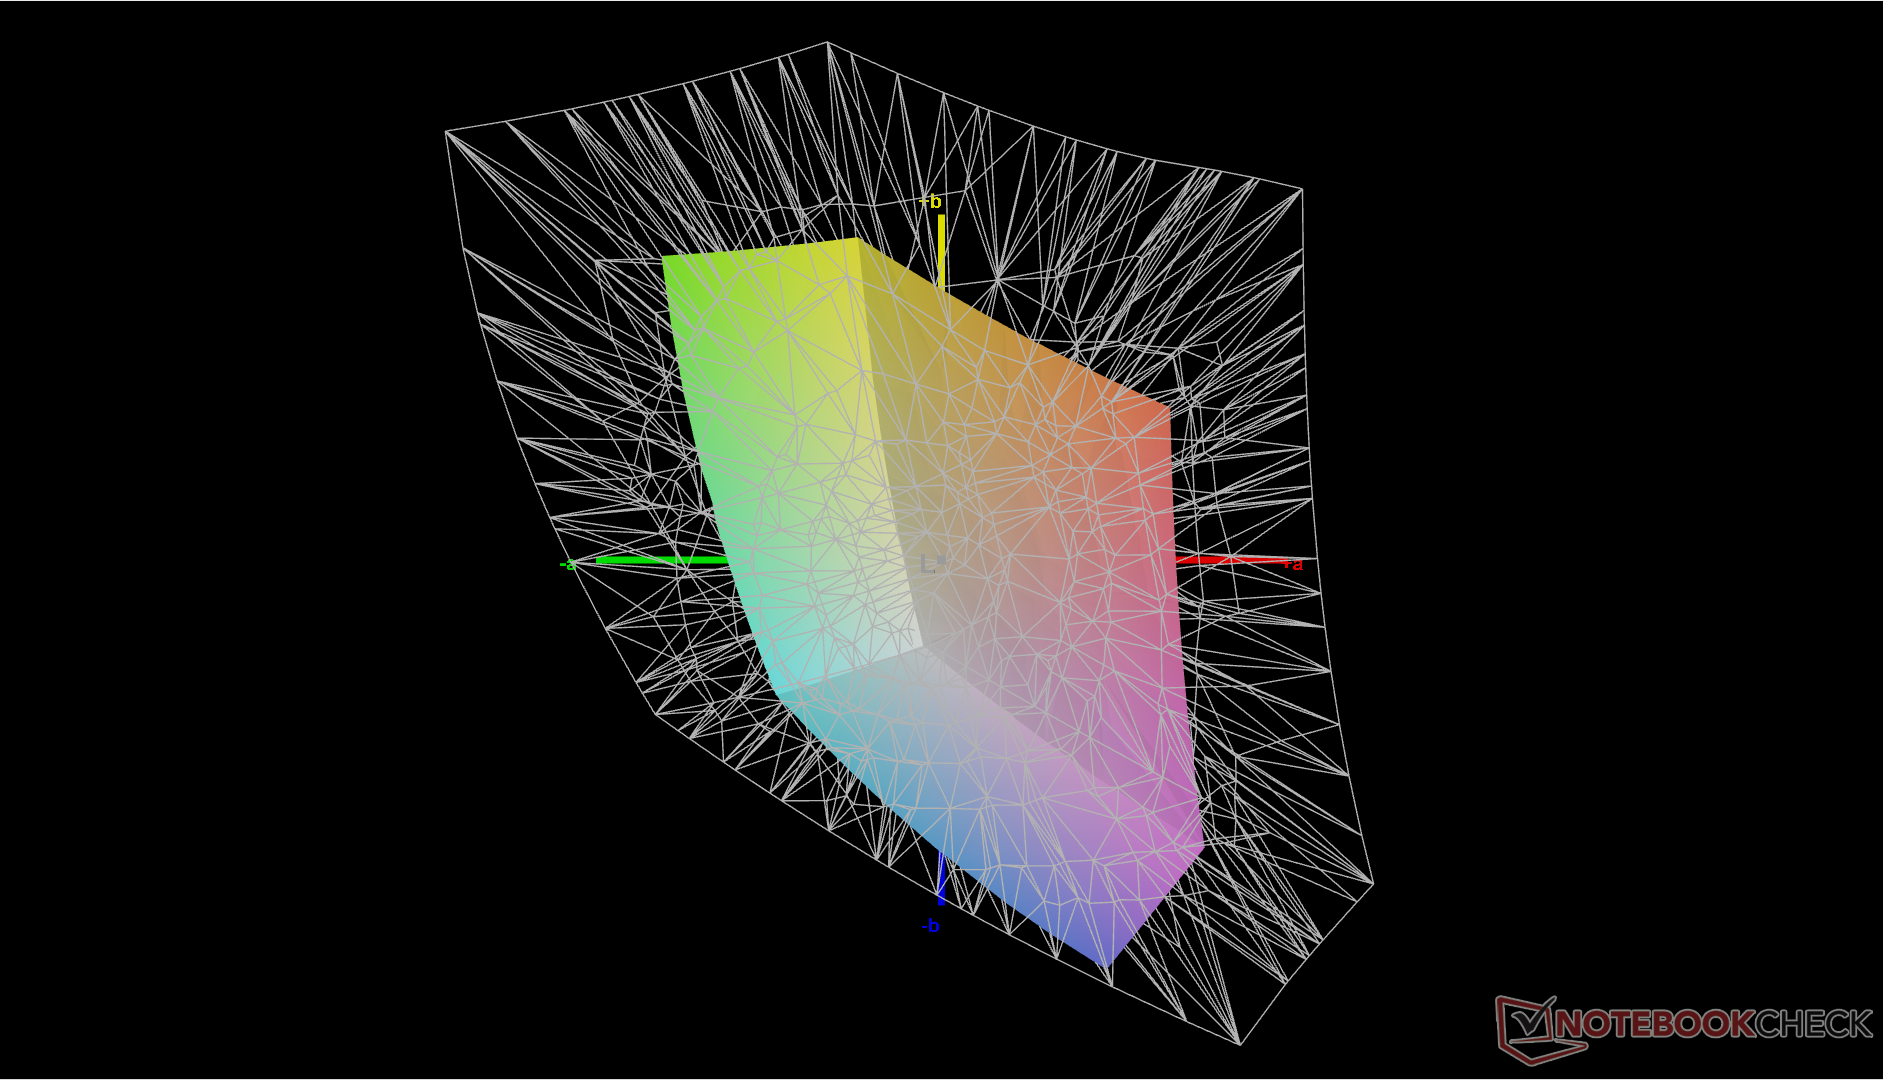
43.3% AdobeRGB 1998 (Argyll 3D)
63% sRGB (Argyll 3D)
41.9% Display P3 (Argyll 3D)
Gamma: 2.2
CCT: 7682 K
| Lenovo ThinkPad E14 G5 i7-1355U R140NW4D R5, IPS, 1920x1200, 14" | Lenovo ThinkPad E14 G5-21JSS05C00 M140NWHE R1, IPS, 2240x1400, 14" | HP EliteBook 845 G10 818N0EA AUO6DA8, IPS, 2560x1600, 14" | Asus ZenBook 14 UM3402Y Samsung ATNA40YK07-1, OLED, 2880x1800, 14" | LG Gram 14Z90Q LG LP140WU1-SPF1, IPS, 1920x1200, 14" | Dell Latitude 7440 AU Optronics B140QAX, IPS, 2560x1600, 14" | |
|---|---|---|---|---|---|---|
| Display | 61% | 97% | 108% | 97% | 72% | |
| Display P3 Coverage (%) | 41.9 | 69.3 65% | 98.3 135% | 99.9 138% | 98.4 135% | 75.4 80% |
| sRGB Coverage (%) | 63 | 97.6 55% | 99.8 58% | 100 59% | 99.9 59% | 99.9 59% |
| AdobeRGB 1998 Coverage (%) | 43.3 | 70.4 63% | 86.2 99% | 98.3 127% | 85.9 98% | 76.2 76% |
| Response Times | -9% | 60% | 94% | -40% | -70% | |
| Response Time Grey 50% / Grey 80% * (ms) | 30.7 ? | 36.3 ? -18% | 12.7 ? 59% | 1.19 ? 96% | 47.5 ? -55% | 56 ? -82% |
| Response Time Black / White * (ms) | 19.6 ? | 19.5 ? 1% | 7.9 ? 60% | 1.62 ? 92% | 24.5 ? -25% | 30.8 ? -57% |
| PWM Frequency (Hz) | 362.3 ? | |||||
| Bildschirm | 33% | 38% | 41% | 14% | 22% | |
| Helligkeit Bildmitte (cd/m²) | 352.3 | 362 3% | 546 55% | 336.6 -4% | 341 -3% | 517.3 47% |
| Brightness (cd/m²) | 344 | 354 3% | 564 64% | 339 -1% | 305 -11% | 488 42% |
| Brightness Distribution (%) | 86 | 91 6% | 86 0% | 98 14% | 87 1% | 88 2% |
| Schwarzwert * (cd/m²) | 0.27 | 0.18 33% | 0.38 -41% | 0.26 4% | 0.34 -26% | |
| Kontrast (:1) | 1305 | 2011 54% | 1437 10% | 1312 1% | 1521 17% | |
| Delta E Colorchecker * | 4.99 | 2.6 48% | 1.3 74% | 0.84 83% | 3.11 38% | 3.3 34% |
| Colorchecker dE 2000 max. * | 14.84 | 3.7 75% | 5.3 64% | 3.1 79% | 8.29 44% | 7.81 47% |
| Colorchecker dE 2000 calibrated * | 1.87 | 1.1 41% | 1.2 36% | 0.83 56% | 1.02 45% | |
| Delta E Graustufen * | 5.3 | 3.3 38% | 1.1 79% | 1.4 74% | 5.3 -0% | 5.6 -6% |
| Gamma | 2.2 100% | 2.28 96% | 2.27 97% | 2.24 98% | 2.037 108% | 2.37 93% |
| CCT | 7682 85% | 6761 96% | 6463 101% | 6439 101% | 7571 86% | 6804 96% |
| Durchschnitt gesamt (Programm / Settings) | 28% /
33% | 65% /
54% | 81% /
69% | 24% /
24% | 8% /
20% |
* ... kleinere Werte sind besser
Das Display wird nicht werkseitig kalibriert ausgeliefert. Wenn wir das Panel selbst mit einem X-Rite-Kolorimeter kalibrieren, verbessern sich die durchschnittlichen Graustufen- und Farb-DeltaE-Werte von 5,3 und 4,99 auf nur 1,8 bzw. 1,87. Unser ICM-Profil steht oben zum kostenlosen Download zur Verfügung.

Reaktionszeiten (Response Times) des Displays
| ↔ Reaktionszeiten Schwarz zu Weiß | ||
|---|---|---|
| 19.6 ms ... steigend ↗ und fallend ↘ kombiniert | ↗ 9.8 ms steigend | 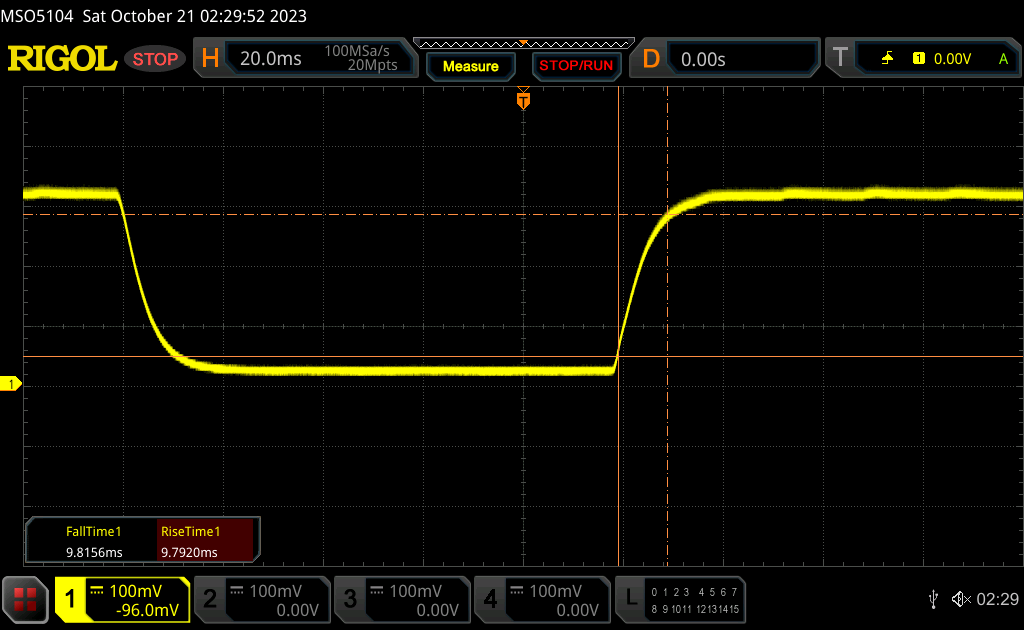 |
| ↘ 9.8 ms fallend | ||
| Die gemessenen Reaktionszeiten sind gut, für anspruchsvolle Spieler könnten der Bildschirm jedoch zu langsam sein. Im Vergleich rangierten die bei uns getesteten Geräte von 0.1 (Minimum) zu 240 (Maximum) ms. » 43 % aller Screens waren schneller als der getestete. Daher sind die gemessenen Reaktionszeiten durchschnittlich (19.8 ms). | ||
| ↔ Reaktionszeiten 50% Grau zu 80% Grau | ||
| 30.7 ms ... steigend ↗ und fallend ↘ kombiniert | ↗ 14.7 ms steigend | 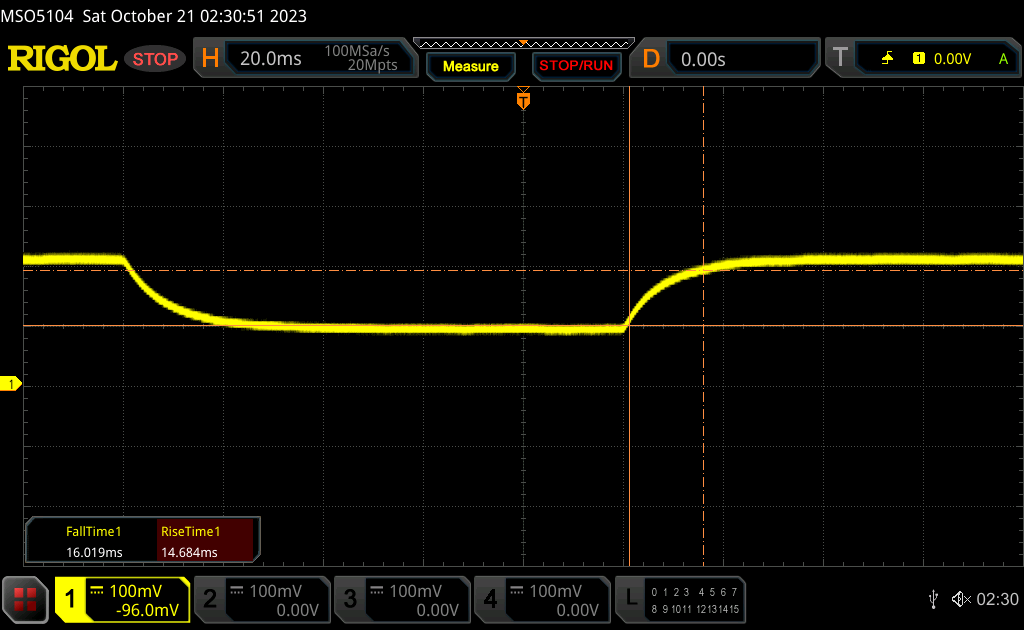 |
| ↘ 16 ms fallend | ||
| Die gemessenen Reaktionszeiten sind langsam und dadurch für viele Spieler wahrscheinlich zu langsam. Im Vergleich rangierten die bei uns getesteten Geräte von 0.165 (Minimum) zu 636 (Maximum) ms. » 41 % aller Screens waren schneller als der getestete. Daher sind die gemessenen Reaktionszeiten durchschnittlich (31 ms). | ||
Bildschirm-Flackern / PWM (Pulse-Width Modulation)
| Flackern / PWM nicht festgestellt | 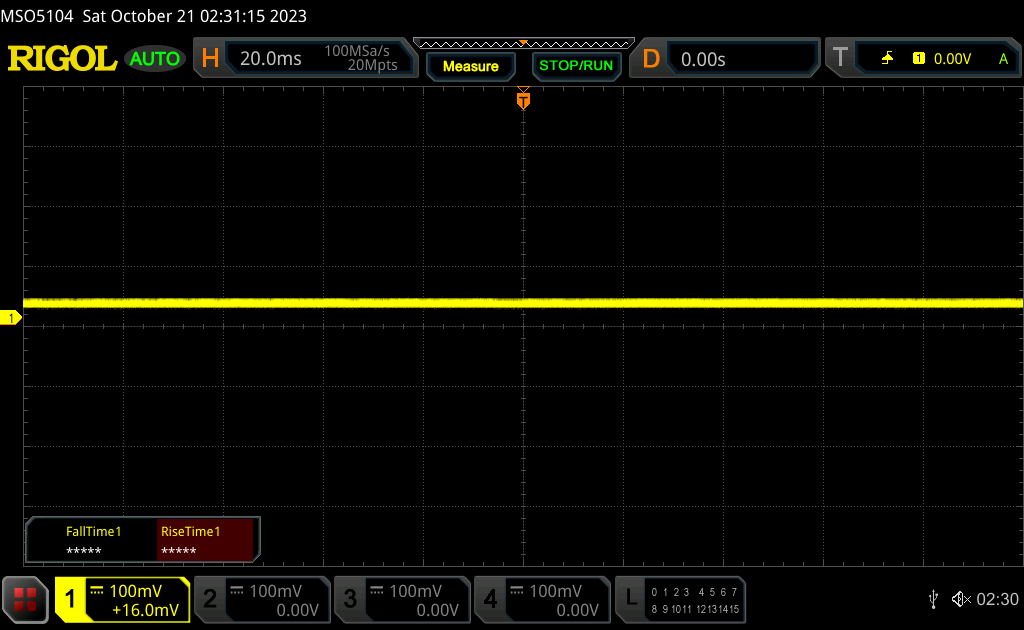 | ||
Im Vergleich: 52 % aller getesteten Geräte nutzten kein PWM um die Helligkeit zu reduzieren. Wenn PWM eingesetzt wurde, dann bei einer Frequenz von durchschnittlich 7778 (Minimum 5, Maximum 343500) Hz. | |||
Leistung
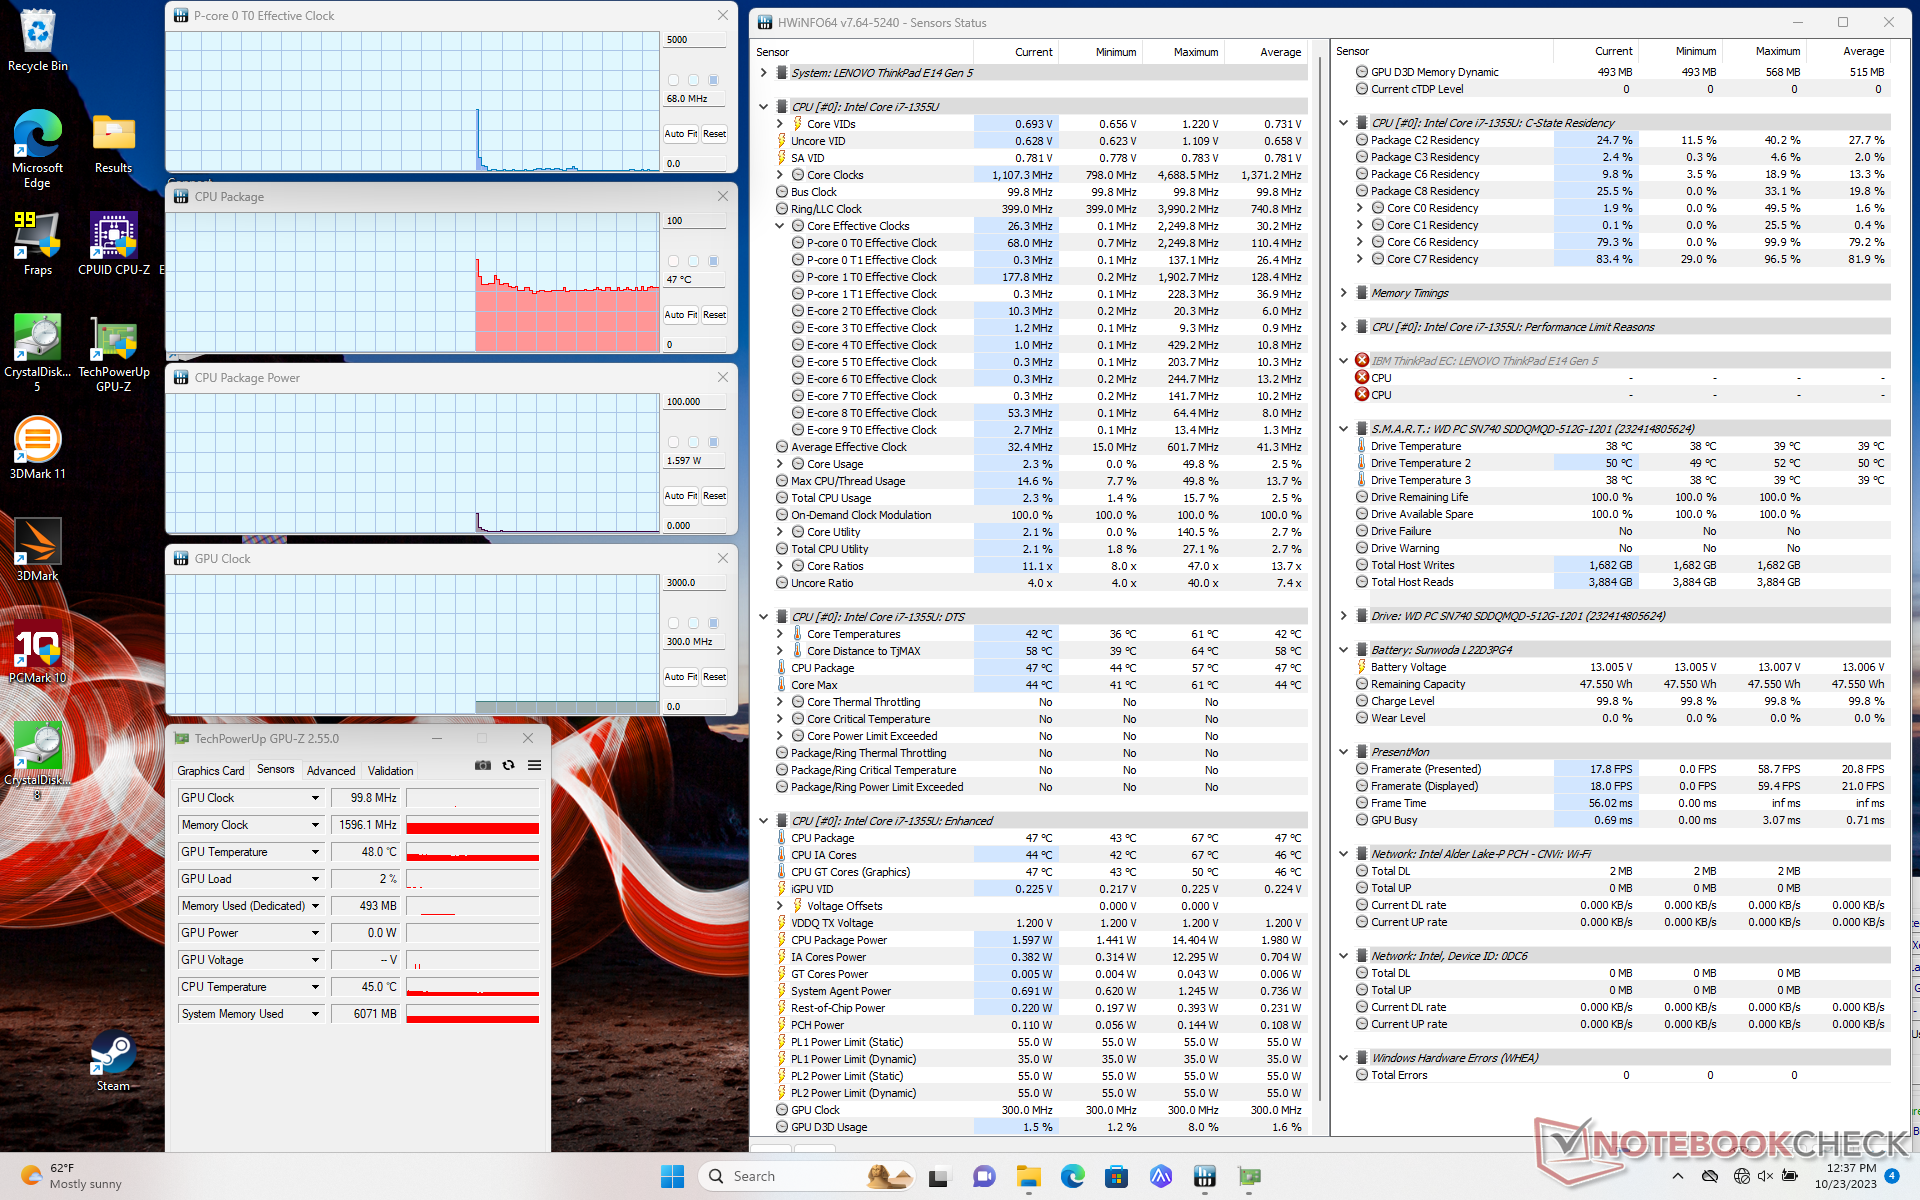
Testbedingungen
Vor dem Test haben wir den Performance-Modus in Windows aktiviert. Lenovo bietet keine spezifischen Energieprofile an und verlässt sich stattdessen auf die Windows-Energieprofile, um Verwirrung zu vermeiden.

Prozessor
Die Prozessorleistung ist schwächer als erwartet und etwa 10 bis 15 Prozent langsamer als der Durchschnittslaptop in unserer Datenbank, der mit dem gleichen Core i7-1355U ausgestattet ist. Dieses Defizit kann auf die schwache Turbo-Boost-Tauglichkeit des Systems zurückgeführt werden. Wenn der CineBench R15 xT in einer Schleife ausgeführt wird, fällt der anfängliche Wert von 1539 Punkten in der zweiten Schleife um 35 bis 40 Prozent, wie die Grafik unten zeigt.
Im Vergleich zum Ryzen 7 7730U im AMD-basierten ThinkPad E14 G5 bietet unser Core i7-1355U eine 25 bis 30 Prozent schnellere Single-Thread-Leistung, aber eine 25 bis 30 Prozent langsamere Multi-Thread-Leistung, sobald die Drosselung berücksichtigt wird.
Cinebench R15 Multi Dauertest
Cinebench R23: Multi Core | Single Core
Cinebench R20: CPU (Multi Core) | CPU (Single Core)
Cinebench R15: CPU Multi 64Bit | CPU Single 64Bit
Blender: v2.79 BMW27 CPU
7-Zip 18.03: 7z b 4 | 7z b 4 -mmt1
Geekbench 5.5: Multi-Core | Single-Core
HWBOT x265 Benchmark v2.2: 4k Preset
LibreOffice : 20 Documents To PDF
R Benchmark 2.5: Overall mean
* ... kleinere Werte sind besser
AIDA64: FP32 Ray-Trace | FPU Julia | CPU SHA3 | CPU Queen | FPU SinJulia | FPU Mandel | CPU AES | CPU ZLib | FP64 Ray-Trace | CPU PhotoWorxx
| Performance Rating | |
| HP EliteBook 845 G10 818N0EA | |
| Asus ZenBook 14 UM3402Y | |
| Lenovo ThinkPad E14 G5-21JSS05C00 | |
| Dell Latitude 7440 | |
| Durchschnittliche Intel Core i7-1355U | |
| Lenovo ThinkPad E14 G5 i7-1355U | |
| LG Gram 14Z90Q | |
| AIDA64 / FP32 Ray-Trace | |
| HP EliteBook 845 G10 818N0EA | |
| Asus ZenBook 14 UM3402Y | |
| Lenovo ThinkPad E14 G5-21JSS05C00 | |
| Dell Latitude 7440 | |
| Durchschnittliche Intel Core i7-1355U (5673 - 8424, n=18) | |
| Lenovo ThinkPad E14 G5 i7-1355U | |
| LG Gram 14Z90Q | |
| AIDA64 / FPU Julia | |
| HP EliteBook 845 G10 818N0EA | |
| Asus ZenBook 14 UM3402Y | |
| Lenovo ThinkPad E14 G5-21JSS05C00 | |
| Dell Latitude 7440 | |
| Durchschnittliche Intel Core i7-1355U (29580 - 42706, n=18) | |
| Lenovo ThinkPad E14 G5 i7-1355U | |
| LG Gram 14Z90Q | |
| AIDA64 / CPU SHA3 | |
| HP EliteBook 845 G10 818N0EA | |
| Asus ZenBook 14 UM3402Y | |
| Lenovo ThinkPad E14 G5-21JSS05C00 | |
| Dell Latitude 7440 | |
| Durchschnittliche Intel Core i7-1355U (1529 - 2200, n=18) | |
| Lenovo ThinkPad E14 G5 i7-1355U | |
| LG Gram 14Z90Q | |
| AIDA64 / CPU Queen | |
| HP EliteBook 845 G10 818N0EA | |
| Asus ZenBook 14 UM3402Y | |
| Lenovo ThinkPad E14 G5-21JSS05C00 | |
| LG Gram 14Z90Q | |
| Lenovo ThinkPad E14 G5 i7-1355U | |
| Dell Latitude 7440 | |
| Durchschnittliche Intel Core i7-1355U (21547 - 66907, n=18) | |
| AIDA64 / FPU SinJulia | |
| HP EliteBook 845 G10 818N0EA | |
| Asus ZenBook 14 UM3402Y | |
| Lenovo ThinkPad E14 G5-21JSS05C00 | |
| Dell Latitude 7440 | |
| Lenovo ThinkPad E14 G5 i7-1355U | |
| Durchschnittliche Intel Core i7-1355U (4045 - 5426, n=18) | |
| LG Gram 14Z90Q | |
| AIDA64 / FPU Mandel | |
| HP EliteBook 845 G10 818N0EA | |
| Asus ZenBook 14 UM3402Y | |
| Lenovo ThinkPad E14 G5-21JSS05C00 | |
| Dell Latitude 7440 | |
| Durchschnittliche Intel Core i7-1355U (14596 - 21627, n=18) | |
| Lenovo ThinkPad E14 G5 i7-1355U | |
| LG Gram 14Z90Q | |
| AIDA64 / CPU AES | |
| HP EliteBook 845 G10 818N0EA | |
| Asus ZenBook 14 UM3402Y | |
| Lenovo ThinkPad E14 G5-21JSS05C00 | |
| Dell Latitude 7440 | |
| Durchschnittliche Intel Core i7-1355U (31432 - 75408, n=18) | |
| Lenovo ThinkPad E14 G5 i7-1355U | |
| LG Gram 14Z90Q | |
| AIDA64 / CPU ZLib | |
| HP EliteBook 845 G10 818N0EA | |
| Asus ZenBook 14 UM3402Y | |
| Lenovo ThinkPad E14 G5-21JSS05C00 | |
| Dell Latitude 7440 | |
| Durchschnittliche Intel Core i7-1355U (454 - 684, n=18) | |
| Lenovo ThinkPad E14 G5 i7-1355U | |
| LG Gram 14Z90Q | |
| AIDA64 / FP64 Ray-Trace | |
| HP EliteBook 845 G10 818N0EA | |
| Asus ZenBook 14 UM3402Y | |
| Lenovo ThinkPad E14 G5-21JSS05C00 | |
| Dell Latitude 7440 | |
| Durchschnittliche Intel Core i7-1355U (2991 - 4453, n=18) | |
| LG Gram 14Z90Q | |
| Lenovo ThinkPad E14 G5 i7-1355U | |
| AIDA64 / CPU PhotoWorxx | |
| Dell Latitude 7440 | |
| Durchschnittliche Intel Core i7-1355U (21800 - 46154, n=18) | |
| HP EliteBook 845 G10 818N0EA | |
| LG Gram 14Z90Q | |
| Lenovo ThinkPad E14 G5 i7-1355U | |
| Asus ZenBook 14 UM3402Y | |
| Lenovo ThinkPad E14 G5-21JSS05C00 | |
System Performance
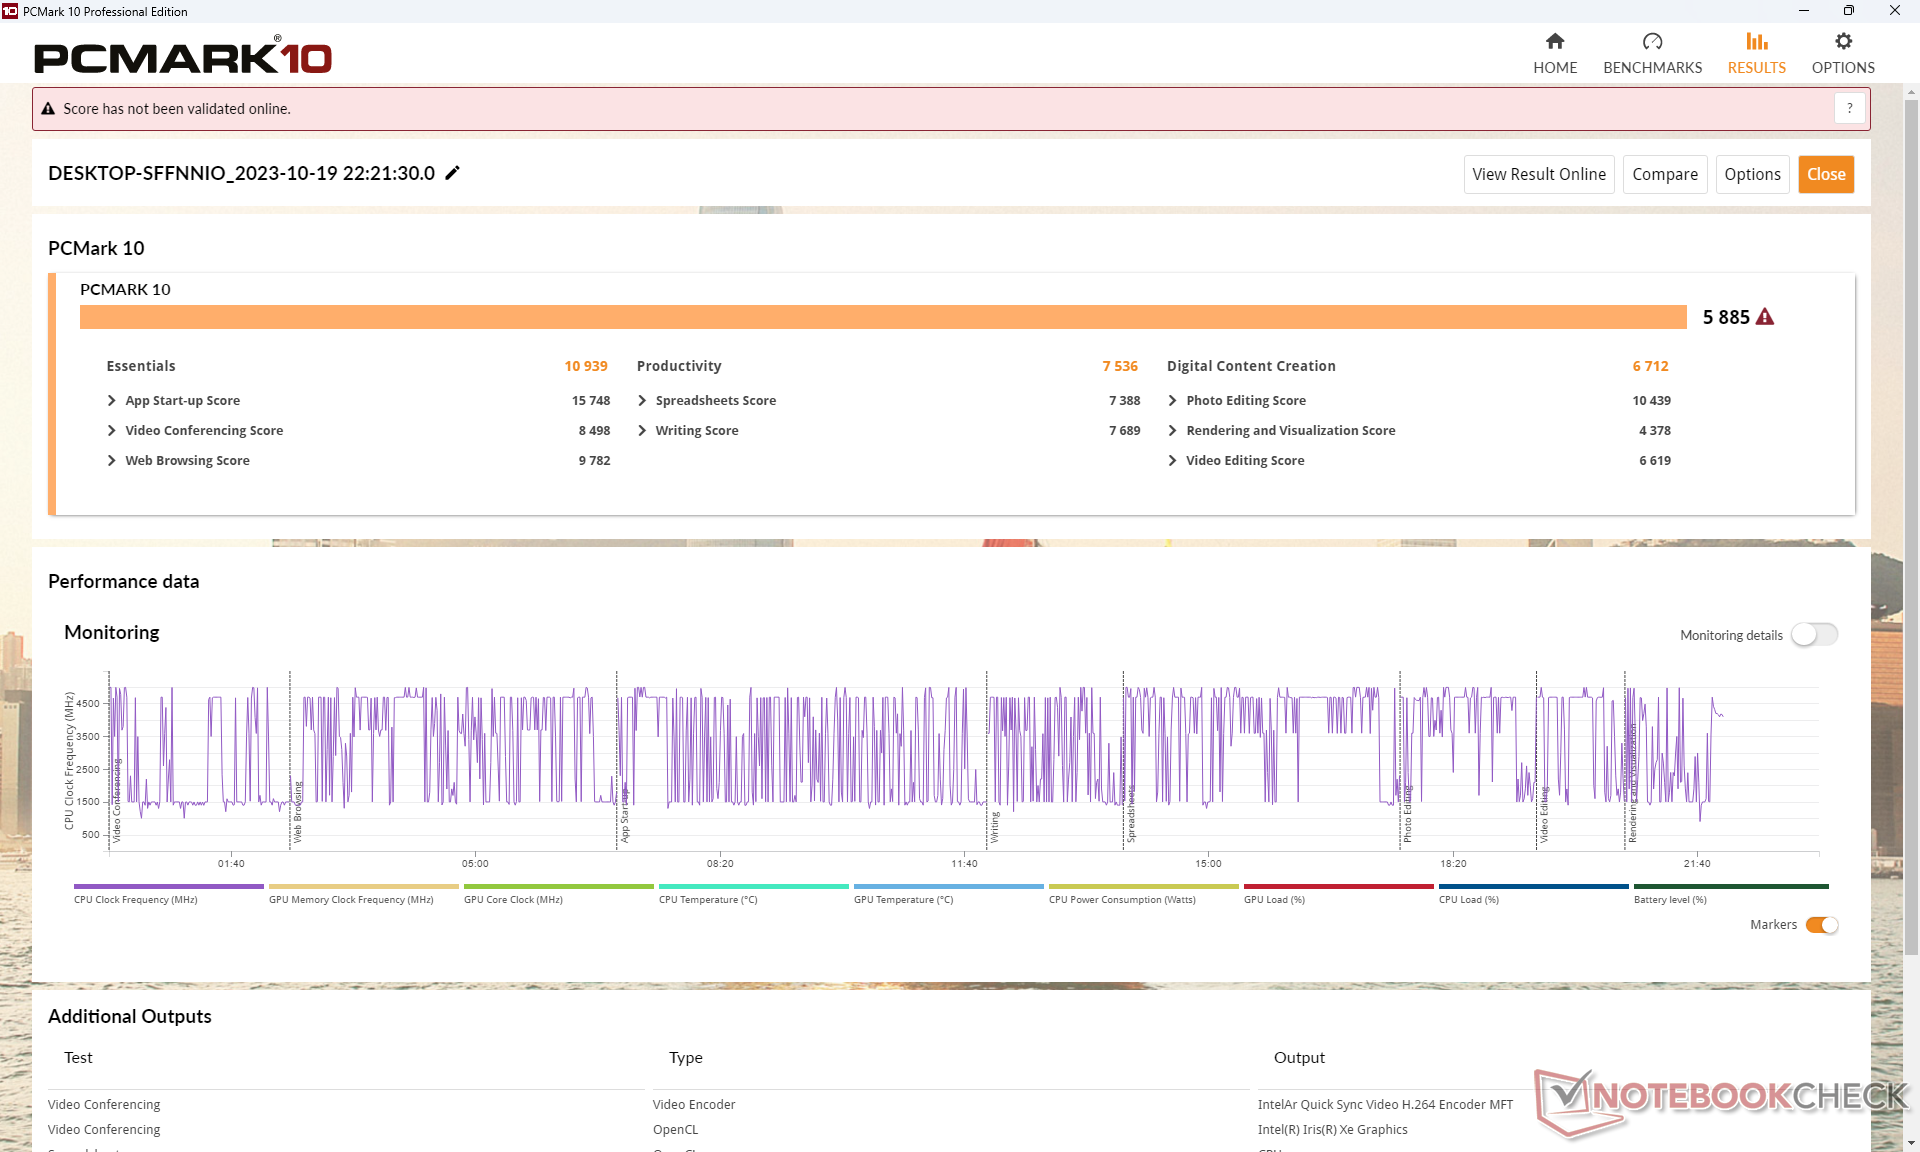
Die PCMark-Ergebnisse sind im Allgemeinen niedriger als bei der AMD-Konfiguration, besonders im Untertest "Produktivität", wo die Multi-Thread-Leistung entscheidend ist
CrossMark: Overall | Productivity | Creativity | Responsiveness
| PCMark 10 / Score | |
| HP EliteBook 845 G10 818N0EA | |
| Lenovo ThinkPad E14 G5-21JSS05C00 | |
| Asus ZenBook 14 UM3402Y | |
| Lenovo ThinkPad E14 G5 i7-1355U | |
| Durchschnittliche Intel Core i7-1355U, Intel Iris Xe Graphics G7 96EUs (5455 - 5933, n=15) | |
| Dell Latitude 7440 | |
| LG Gram 14Z90Q | |
| PCMark 10 / Essentials | |
| Durchschnittliche Intel Core i7-1355U, Intel Iris Xe Graphics G7 96EUs (10203 - 11822, n=15) | |
| Lenovo ThinkPad E14 G5 i7-1355U | |
| Dell Latitude 7440 | |
| Lenovo ThinkPad E14 G5-21JSS05C00 | |
| Asus ZenBook 14 UM3402Y | |
| HP EliteBook 845 G10 818N0EA | |
| LG Gram 14Z90Q | |
| PCMark 10 / Productivity | |
| Asus ZenBook 14 UM3402Y | |
| Lenovo ThinkPad E14 G5-21JSS05C00 | |
| HP EliteBook 845 G10 818N0EA | |
| Lenovo ThinkPad E14 G5 i7-1355U | |
| Durchschnittliche Intel Core i7-1355U, Intel Iris Xe Graphics G7 96EUs (6763 - 7536, n=15) | |
| Dell Latitude 7440 | |
| LG Gram 14Z90Q | |
| PCMark 10 / Digital Content Creation | |
| HP EliteBook 845 G10 818N0EA | |
| Lenovo ThinkPad E14 G5 i7-1355U | |
| Durchschnittliche Intel Core i7-1355U, Intel Iris Xe Graphics G7 96EUs (5723 - 6712, n=15) | |
| Lenovo ThinkPad E14 G5-21JSS05C00 | |
| Asus ZenBook 14 UM3402Y | |
| Dell Latitude 7440 | |
| LG Gram 14Z90Q | |
| CrossMark / Overall | |
| Durchschnittliche Intel Core i7-1355U, Intel Iris Xe Graphics G7 96EUs (1478 - 1643, n=15) | |
| Lenovo ThinkPad E14 G5 i7-1355U | |
| HP EliteBook 845 G10 818N0EA | |
| Asus ZenBook 14 UM3402Y | |
| Lenovo ThinkPad E14 G5-21JSS05C00 | |
| CrossMark / Productivity | |
| Durchschnittliche Intel Core i7-1355U, Intel Iris Xe Graphics G7 96EUs (1444 - 1665, n=15) | |
| Lenovo ThinkPad E14 G5 i7-1355U | |
| HP EliteBook 845 G10 818N0EA | |
| Asus ZenBook 14 UM3402Y | |
| Lenovo ThinkPad E14 G5-21JSS05C00 | |
| CrossMark / Creativity | |
| Durchschnittliche Intel Core i7-1355U, Intel Iris Xe Graphics G7 96EUs (1563 - 1732, n=15) | |
| Lenovo ThinkPad E14 G5 i7-1355U | |
| HP EliteBook 845 G10 818N0EA | |
| Asus ZenBook 14 UM3402Y | |
| Lenovo ThinkPad E14 G5-21JSS05C00 | |
| CrossMark / Responsiveness | |
| Durchschnittliche Intel Core i7-1355U, Intel Iris Xe Graphics G7 96EUs (1217 - 1681, n=15) | |
| Lenovo ThinkPad E14 G5 i7-1355U | |
| HP EliteBook 845 G10 818N0EA | |
| Asus ZenBook 14 UM3402Y | |
| Lenovo ThinkPad E14 G5-21JSS05C00 | |
| PCMark 10 Score | 5885 Punkte | |
Hilfe | ||
| AIDA64 / Memory Copy | |
| Dell Latitude 7440 | |
| Durchschnittliche Intel Core i7-1355U (35017 - 71600, n=18) | |
| LG Gram 14Z90Q | |
| Asus ZenBook 14 UM3402Y | |
| Lenovo ThinkPad E14 G5 i7-1355U | |
| HP EliteBook 845 G10 818N0EA | |
| Lenovo ThinkPad E14 G5-21JSS05C00 | |
| AIDA64 / Memory Read | |
| LG Gram 14Z90Q | |
| Durchschnittliche Intel Core i7-1355U (38551 - 73377, n=18) | |
| Dell Latitude 7440 | |
| Asus ZenBook 14 UM3402Y | |
| Lenovo ThinkPad E14 G5-21JSS05C00 | |
| Lenovo ThinkPad E14 G5 i7-1355U | |
| HP EliteBook 845 G10 818N0EA | |
| AIDA64 / Memory Write | |
| Dell Latitude 7440 | |
| Durchschnittliche Intel Core i7-1355U (35910 - 93342, n=18) | |
| LG Gram 14Z90Q | |
| Lenovo ThinkPad E14 G5 i7-1355U | |
| Asus ZenBook 14 UM3402Y | |
| HP EliteBook 845 G10 818N0EA | |
| Lenovo ThinkPad E14 G5-21JSS05C00 | |
| AIDA64 / Memory Latency | |
| LG Gram 14Z90Q | |
| Durchschnittliche Intel Core i7-1355U (72.2 - 346, n=18) | |
| Asus ZenBook 14 UM3402Y | |
| HP EliteBook 845 G10 818N0EA | |
| Dell Latitude 7440 | |
| Lenovo ThinkPad E14 G5-21JSS05C00 | |
| Lenovo ThinkPad E14 G5 i7-1355U | |
* ... kleinere Werte sind besser
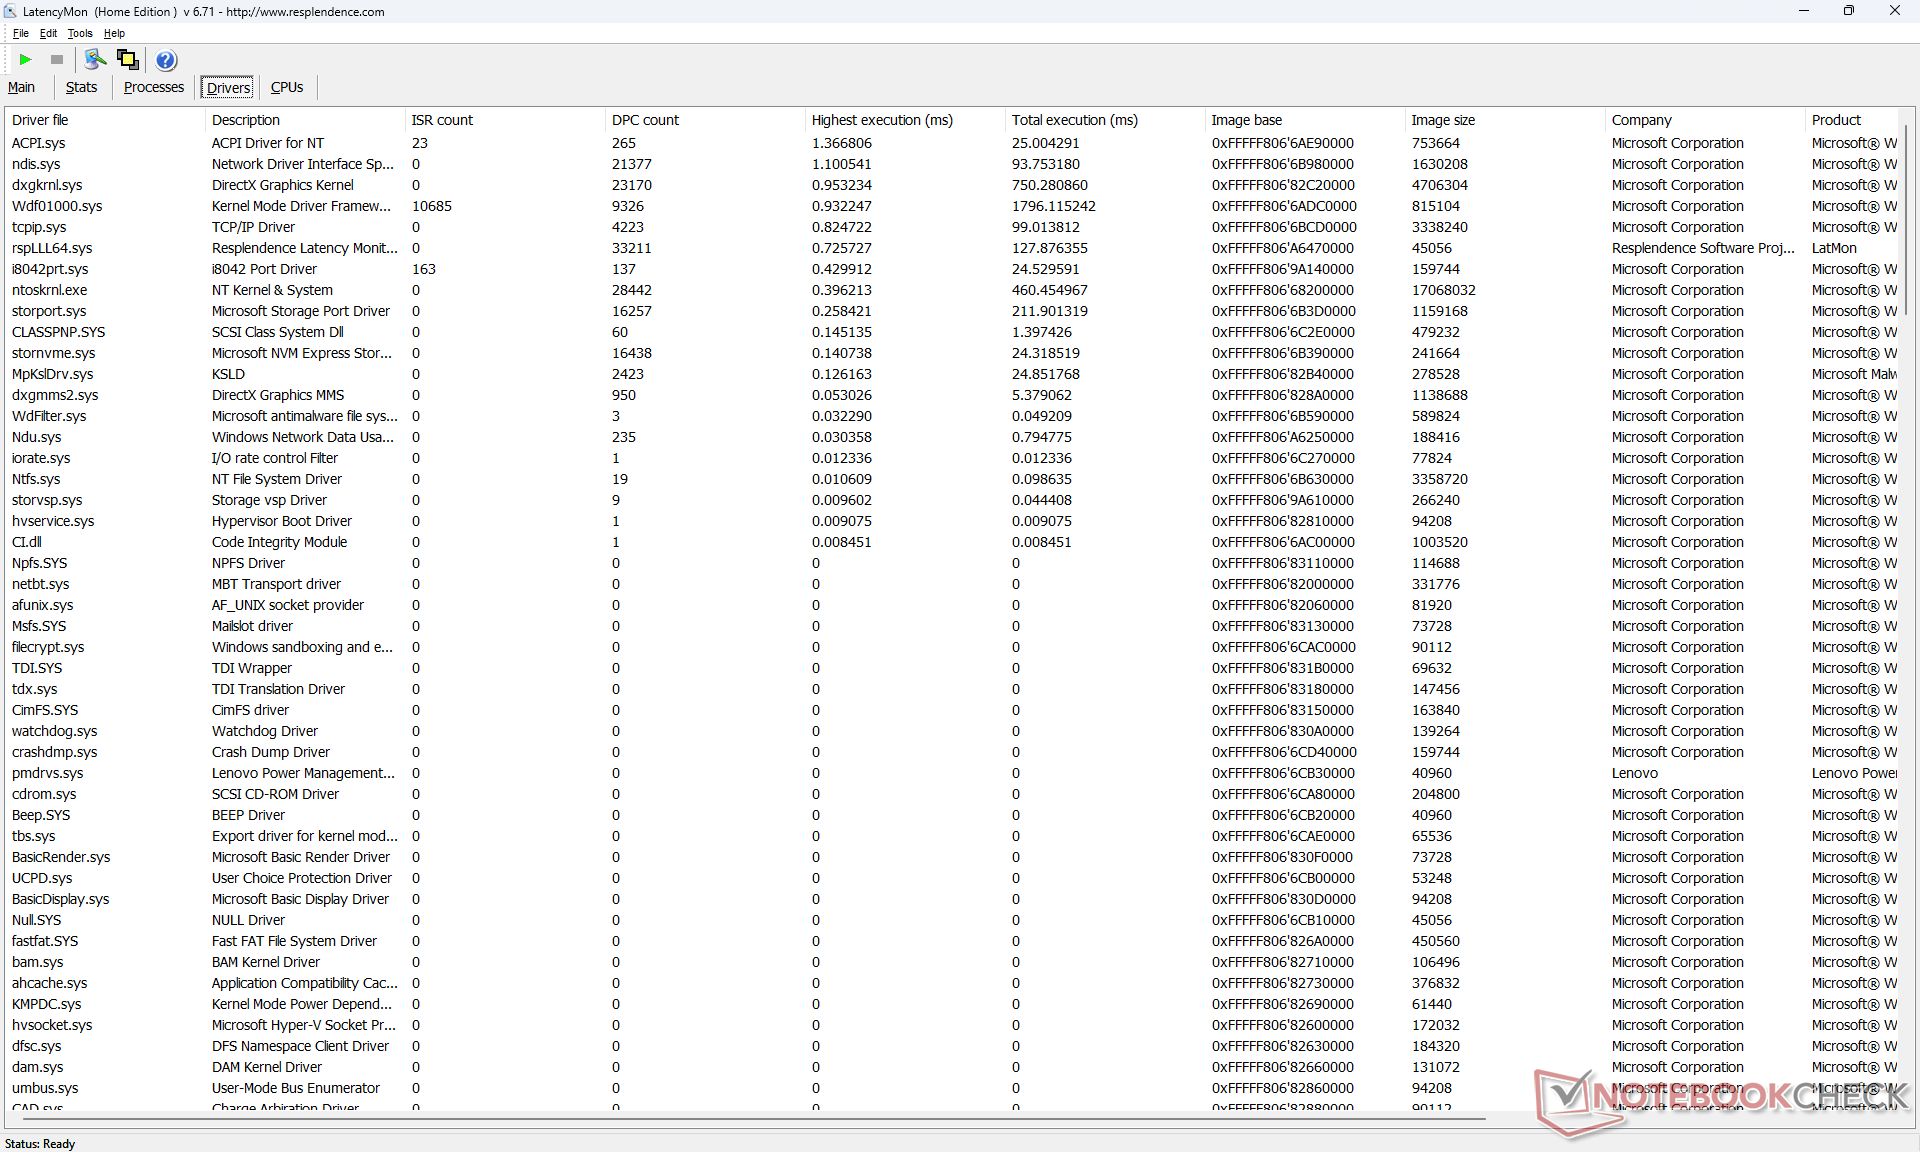
DPC-Latenzen
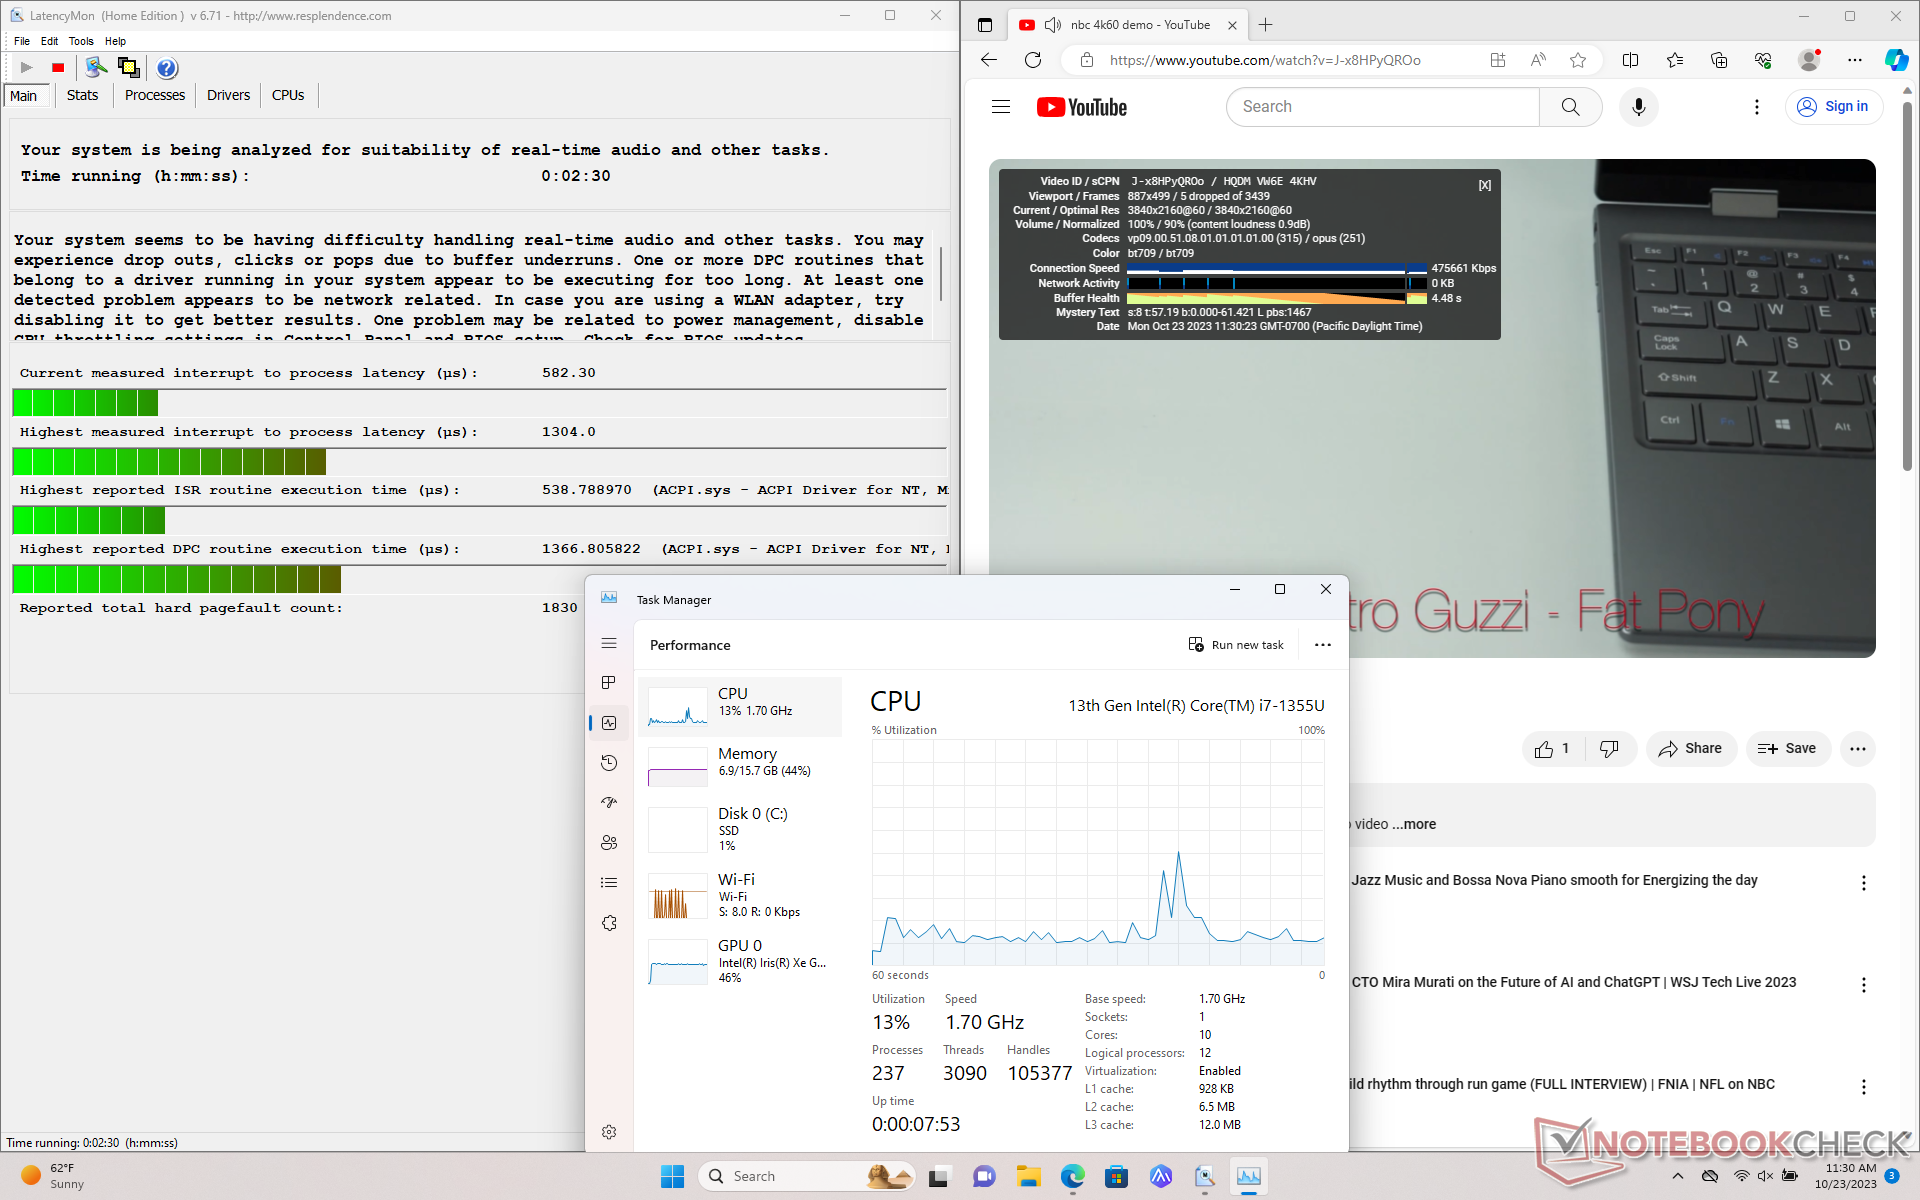
LatencyMon zeigt DPC-Probleme beim Öffnen mehrerer Browser-Tabs unserer Homepage an. Auch die 4K-Videowiedergabe bei 60 FPS ist nicht optimal. Innerhalb eines Zeitraums von 60 Sekunden wurden 5 ausgelassene Frames aufgezeichnet.
| DPC Latencies / LatencyMon - interrupt to process latency (max), Web, Youtube, Prime95 | |
| Asus ZenBook 14 UM3402Y | |
| Lenovo ThinkPad E14 G5-21JSS05C00 | |
| Lenovo ThinkPad E14 G5 i7-1355U | |
| Dell Latitude 7440 | |
| LG Gram 14Z90Q | |
| HP EliteBook 845 G10 818N0EA | |
* ... kleinere Werte sind besser
Massenspeicher
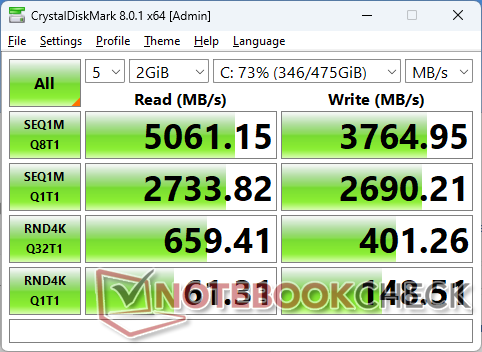
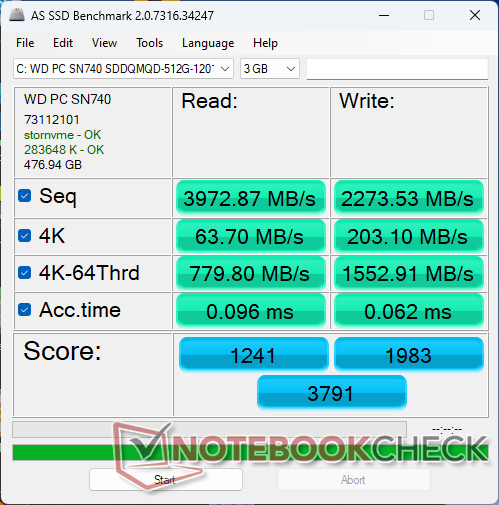
Unser Gerät ist mit der 42-mm-Version der WD PC SN740 ausgestattet, während die AMD-Konfiguration mit der 80-mm-Version der WD PC SN740 geliefert wird. Diese Mittelklasse-PCIe4-x4-NVMe-SSD bietet Lesewerte von bis zu 5.000 MB/s, jedoch nur für einige Minuten, bevor die Drosselung einsetzt, wie die Grafik unten zeigt.

| Drive Performance Rating - Percent | |
| LG Gram 14Z90Q | |
| HP EliteBook 845 G10 818N0EA | |
| Lenovo ThinkPad E14 G5 i7-1355U | |
| Dell Latitude 7440 | |
| Lenovo ThinkPad E14 G5-21JSS05C00 | |
| Asus ZenBook 14 UM3402Y | |
* ... kleinere Werte sind besser
Disk-Throttling: DiskSpd Read Loop, 8 Runden
GPU Performance
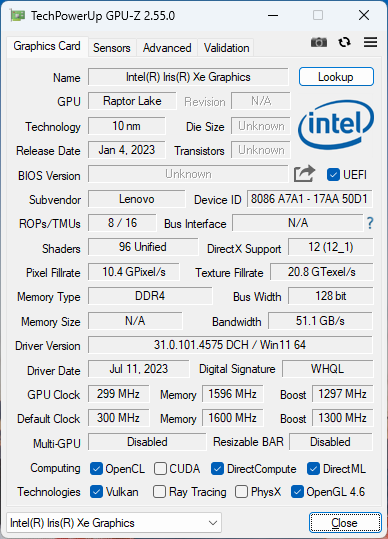
Der Arbeitsspeicher ist mit DDR4-3200 etwas langsamer als der Durchschnitt, was sich negativ auf die integrierte Grafikleistung auswirkt. Aufgrund der drosselnden CPU und des langsamen Arbeitsspeichers ist unsere Iris Xe 96 EUs etwa 10 bis 15 Prozent langsamer als der Durchschnittslaptop in unserer Datenbank mit derselben GPU. Die Gesamtleistung entspricht ungefähr der der RX Vega 8 in der Ryzen 7 7730U-Version.
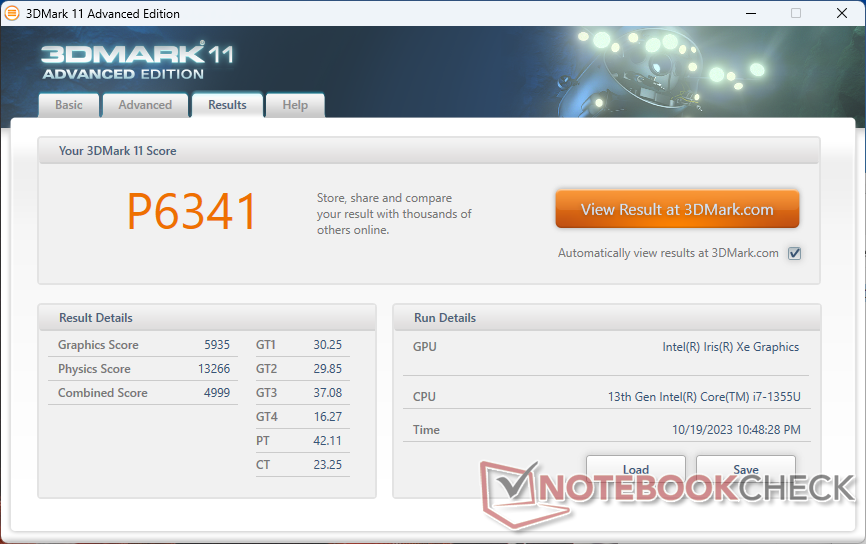
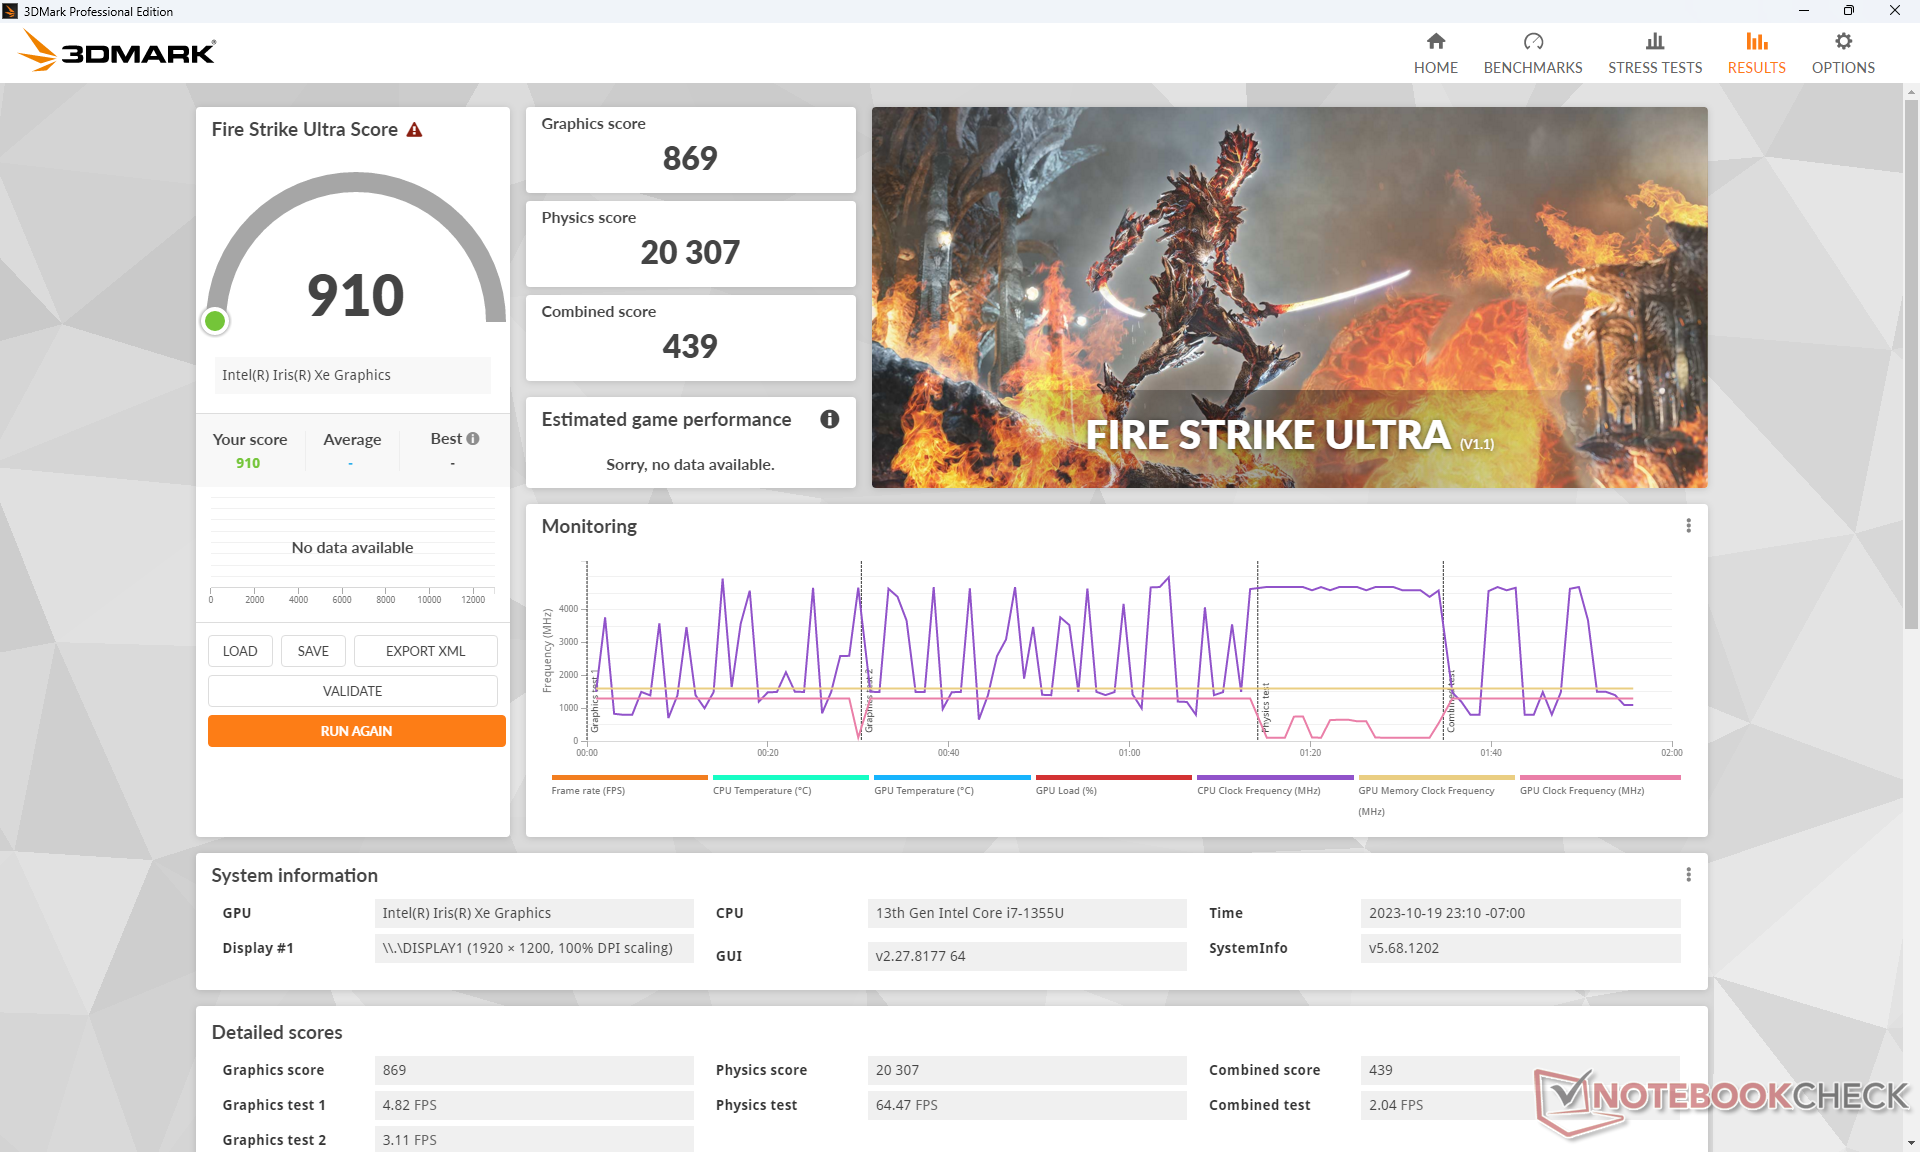
| 3DMark 11 Performance | 6341 Punkte | |
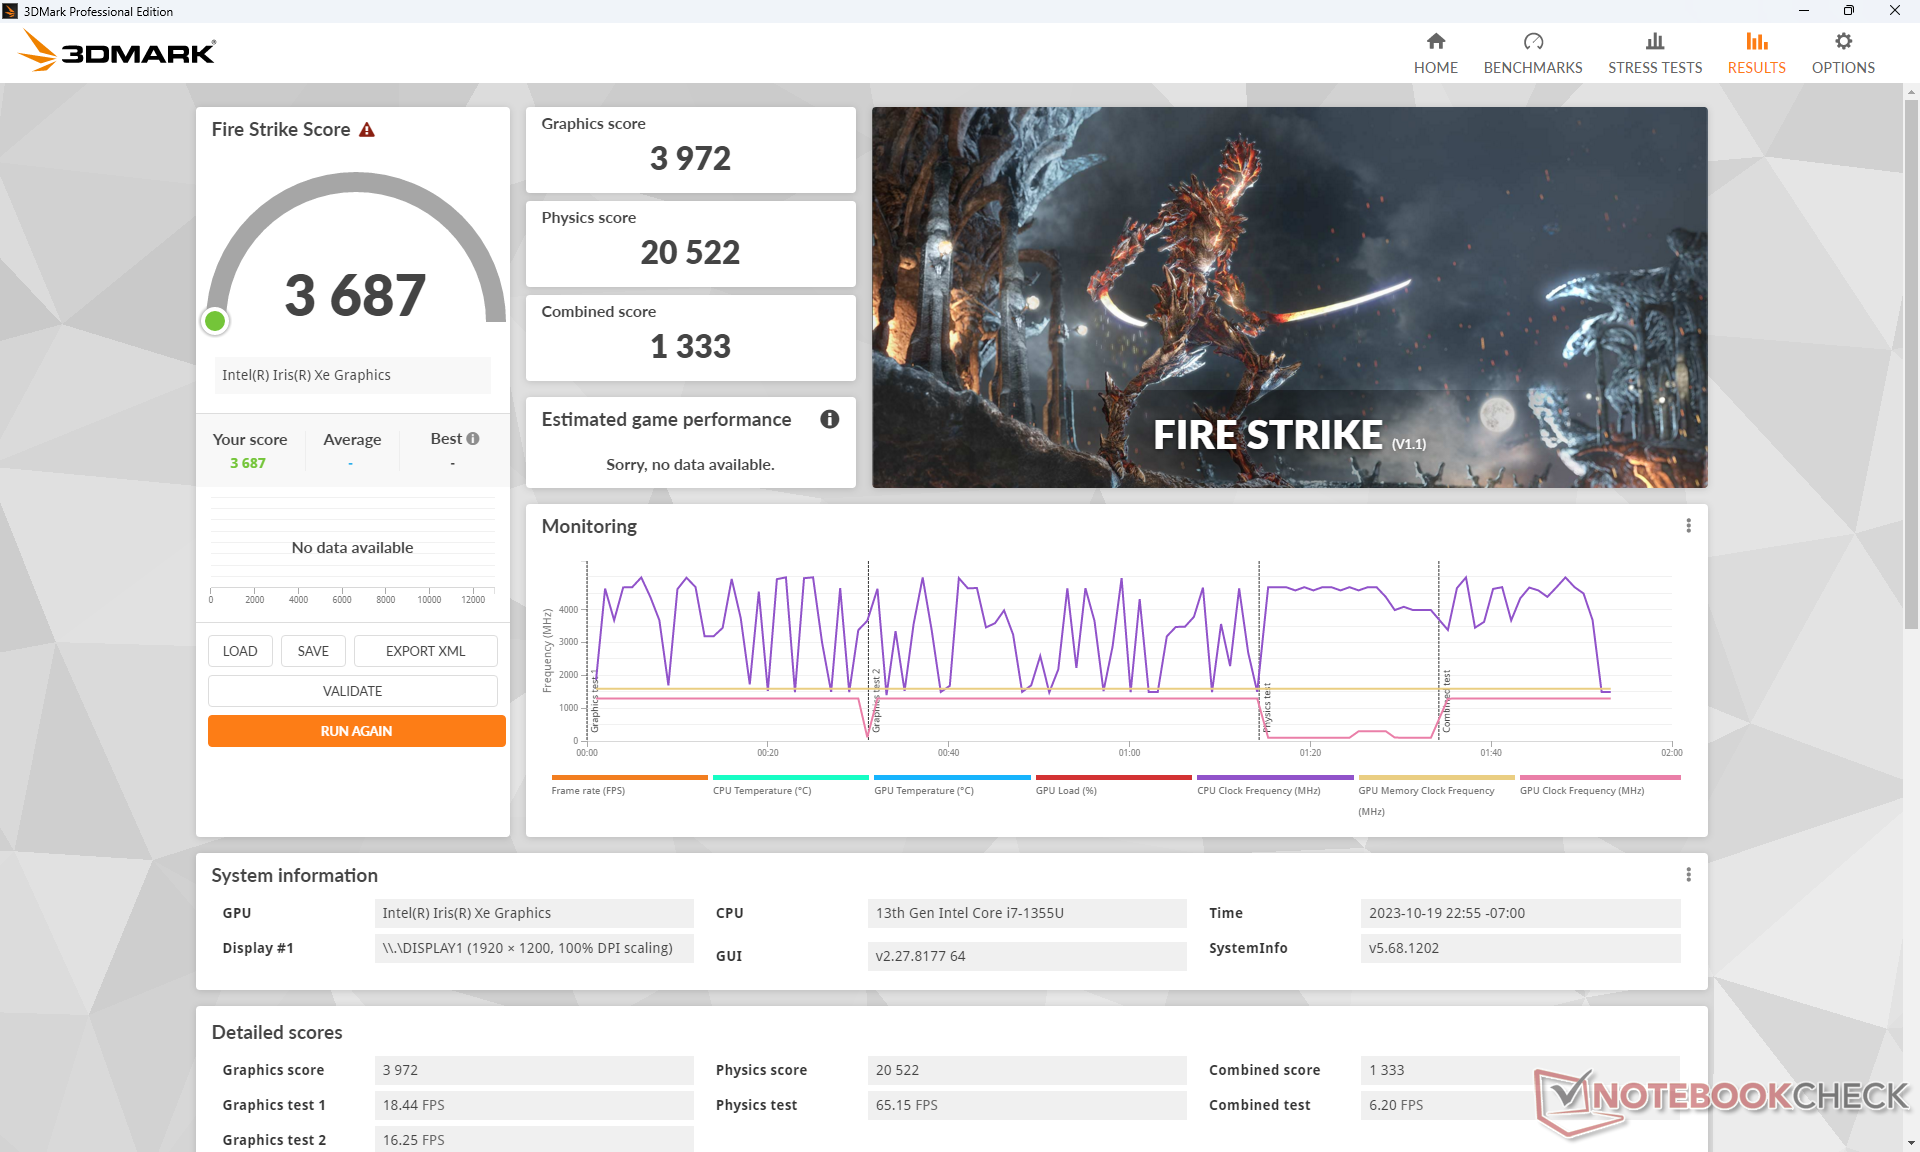
| 3DMark Fire Strike Score | 3687 Punkte | |
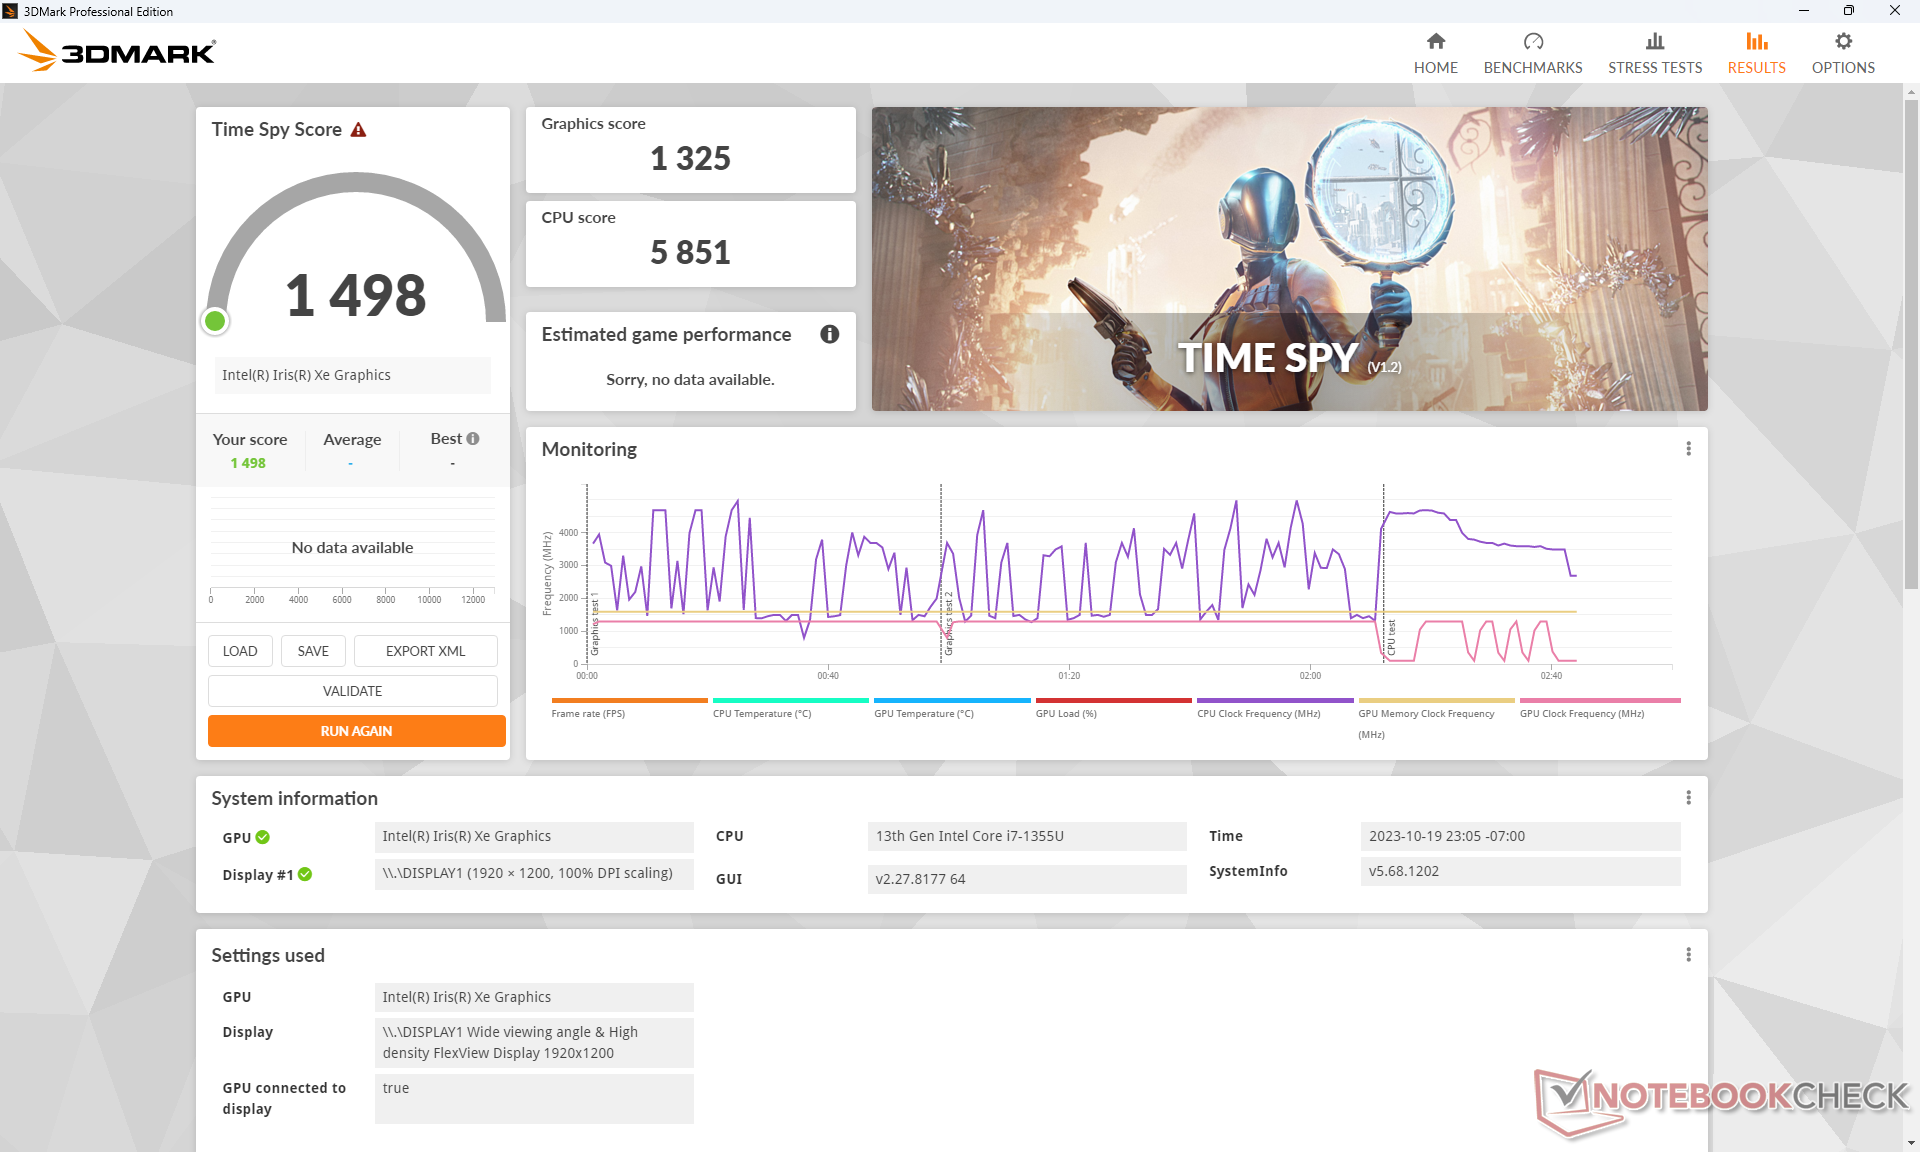
| 3DMark Time Spy Score | 1498 Punkte | |
Hilfe | ||
* ... kleinere Werte sind besser
| Tiny Tina's Wonderlands | |
| 1280x720 Lowest Preset (DX12) | |
| Dell Inspiron 14 7435 2-in-1 | |
| Durchschnittliche Intel Iris Xe Graphics G7 96EUs (25.9 - 67.3, n=32) | |
| Lenovo ThinkPad E14 G5 i7-1355U | |
| 1920x1080 Low Preset (DX12) | |
| Durchschnittliche Intel Iris Xe Graphics G7 96EUs (22.3 - 53, n=32) | |
| Dell Inspiron 14 7435 2-in-1 | |
| Dell Latitude 7440 | |
| Lenovo ThinkPad E14 G5 i7-1355U | |
| HP Envy 14-eb0252ng | |
| 1920x1080 Medium Preset (DX12) | |
| Durchschnittliche Intel Iris Xe Graphics G7 96EUs (17 - 40.1, n=30) | |
| Dell Latitude 7440 | |
| Lenovo ThinkPad E14 G5 i7-1355U | |
| HP Envy 14-eb0252ng | |
| 1920x1080 High Preset (DX12) | |
| Durchschnittliche Intel Iris Xe Graphics G7 96EUs (10.6 - 24.1, n=29) | |
| Dell Latitude 7440 | |
| Lenovo ThinkPad E14 G5 i7-1355U | |
| HP Envy 14-eb0252ng | |
| 1920x1080 Badass Preset (DX12) | |
| Durchschnittliche Intel Iris Xe Graphics G7 96EUs (8.4 - 18.4, n=26) | |
| Dell Latitude 7440 | |
| Lenovo ThinkPad E14 G5 i7-1355U | |
Witcher 3 FPS-Diagramm
| min. | mittel | hoch | max. | |
|---|---|---|---|---|
| GTA V (2015) | 85.2 | 67 | 13.7 | 5.57 |
| The Witcher 3 (2015) | 74.9 | 48.9 | 24.1 | 12.1 |
| Dota 2 Reborn (2015) | 104.5 | 77.3 | 51.5 | 47.3 |
| Final Fantasy XV Benchmark (2018) | 34.3 | 18.1 | 13.1 | |
| X-Plane 11.11 (2018) | 34.2 | 28.2 | 25.6 | |
| Far Cry 5 (2018) | 40 | 20 | 19 | 18 |
| Strange Brigade (2018) | 74.5 | 28.4 | 24.2 | 19.3 |
| Cyberpunk 2077 1.6 (2022) | 13 | |||
| Tiny Tina's Wonderlands (2022) | 23.8 | 17 | 10.6 | 9.1 |
| F1 22 (2022) | 35.3 | 32.3 | 23.6 | 18.3 |
Emissionen
Geräuschemissionen
Die Lüftergeräusche der AMD- und Intel-Versionen unterscheiden sich nicht signifikant. Unter hoher Last, wie beim Spielen, erreichen beide Versionen ähnliche Maximalwerte von knapp über 40 dB(A), während bei geringerer Last, wie Surfen oder Streaming, immer noch ein leichtes Lüfterpulsieren zu hören ist. Ansonsten ist der Lüfter bei niedrigen bis mittleren Anforderungen leicht zu ignorieren.
Lautstärkediagramm
| Idle |
| 23.2 / 23.2 / 23.2 dB(A) |
| Last |
| 36 / 41 dB(A) |
 | ||
30 dB leise 40 dB(A) deutlich hörbar 50 dB(A) störend |
||
min: | ||
| Lenovo ThinkPad E14 G5 i7-1355U Iris Xe G7 96EUs, i7-1355U, WD PC SN740 512GB SDDQMQD-512G | Lenovo ThinkPad E14 G5-21JSS05C00 Vega 8, R7 7730U, WD PC SN740 SDDPNQD-1T00 | HP EliteBook 845 G10 818N0EA Radeon 780M, R9 PRO 7940HS, SK hynix PC801 HFS001TEJ9X101N | Asus ZenBook 14 UM3402Y Vega 8, R7 7730U, Micron 2400 MTFDKBA512QFM | LG Gram 14Z90Q Iris Xe G7 80EUs, i5-1240P, Samsung PM9A1 MZVL2512HCJQ | Dell Latitude 7440 Iris Xe G7 80EUs, i5-1345U, Samsung MZ9L4512HBLU-00BMV | |
|---|---|---|---|---|---|---|
| Geräuschentwicklung | -1% | -7% | -7% | -5% | 9% | |
| aus / Umgebung * (dB) | 23.2 | 24.4 -5% | 25.3 -9% | 22.6 3% | 25 -8% | 22.8 2% |
| Idle min * (dB) | 23.2 | 24.4 -5% | 25.3 -9% | 22.6 3% | 26 -12% | 22.8 2% |
| Idle avg * (dB) | 23.2 | 24.4 -5% | 25.3 -9% | 22.6 3% | 27 -16% | 22.8 2% |
| Idle max * (dB) | 23.2 | 25.7 -11% | 25.3 -9% | 22.6 3% | 28 -21% | 22.8 2% |
| Last avg * (dB) | 36 | 31.8 12% | 34.4 4% | 40.7 -13% | 35 3% | 26.3 27% |
| Witcher 3 ultra * (dB) | 38.5 | 36.7 5% | 43.4 -13% | 46.6 -21% | 36 6% | 30 22% |
| Last max * (dB) | 41 | 41.2 -0% | 43.4 -6% | 52.5 -28% | 36 12% | 38.3 7% |
* ... kleinere Werte sind besser
Temperatur
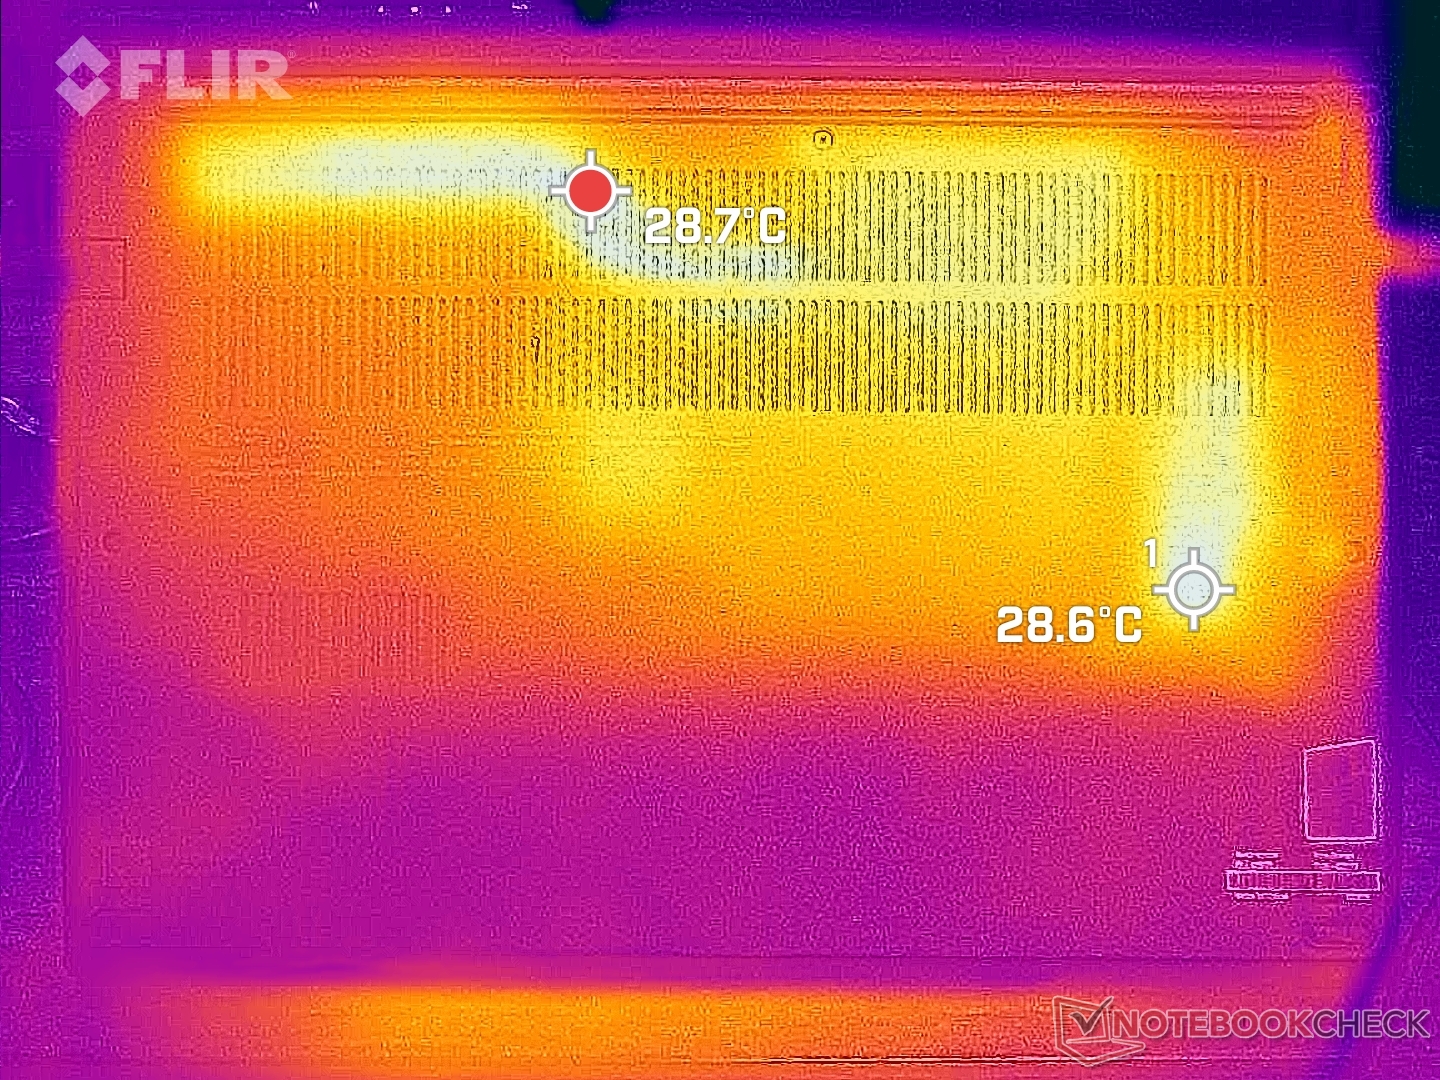
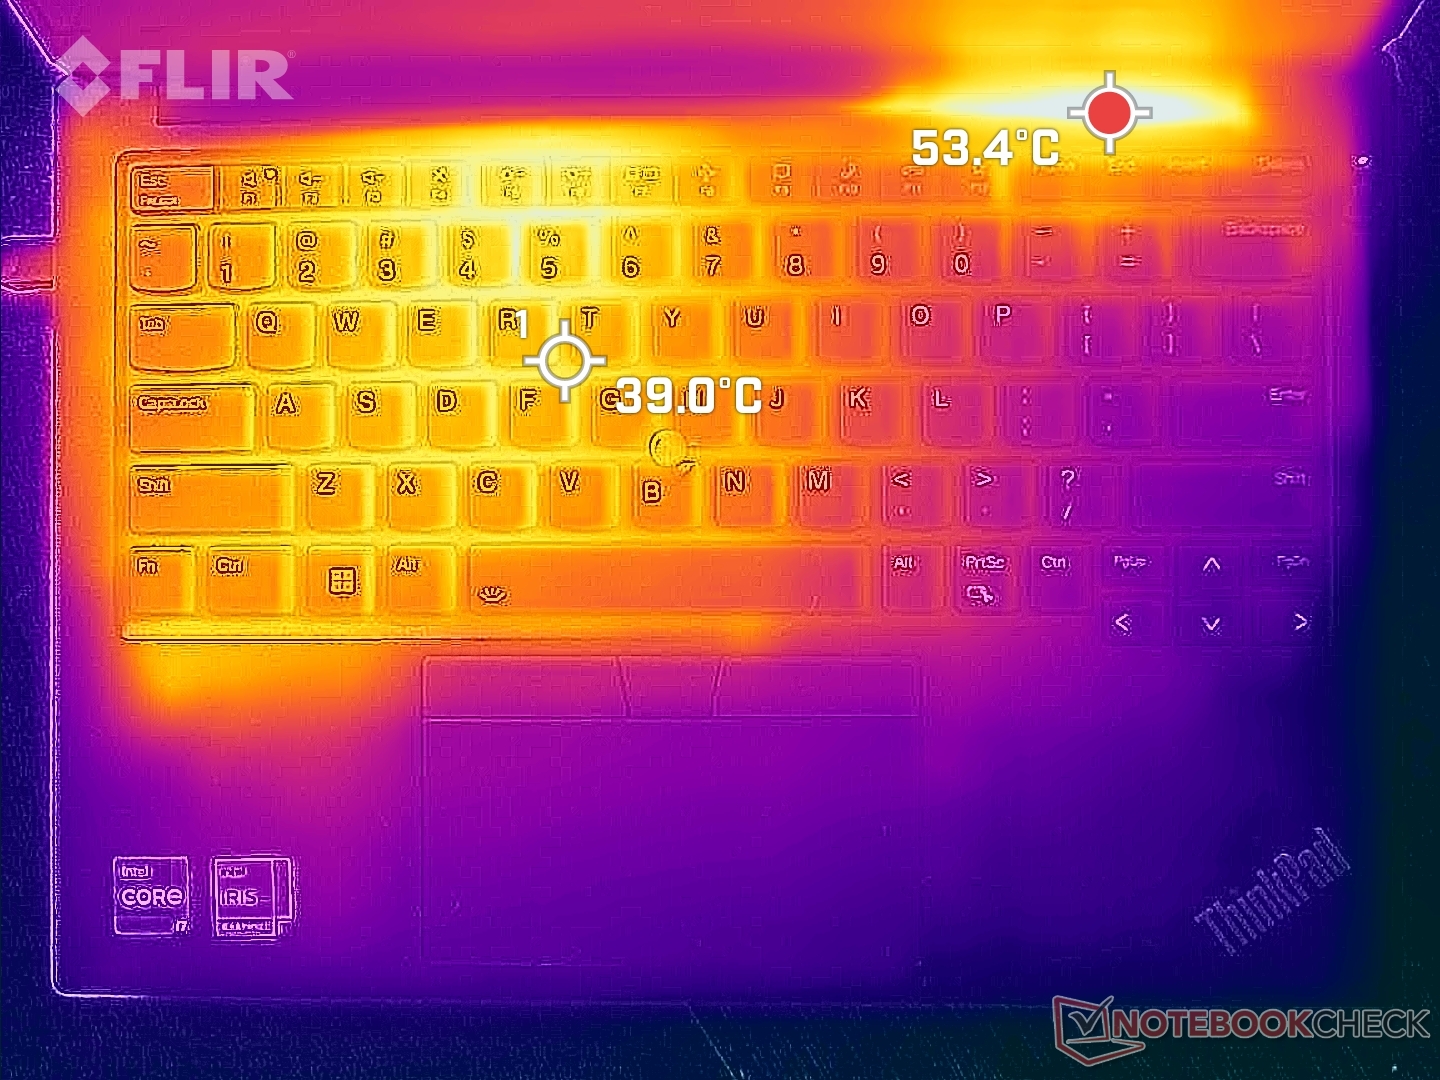
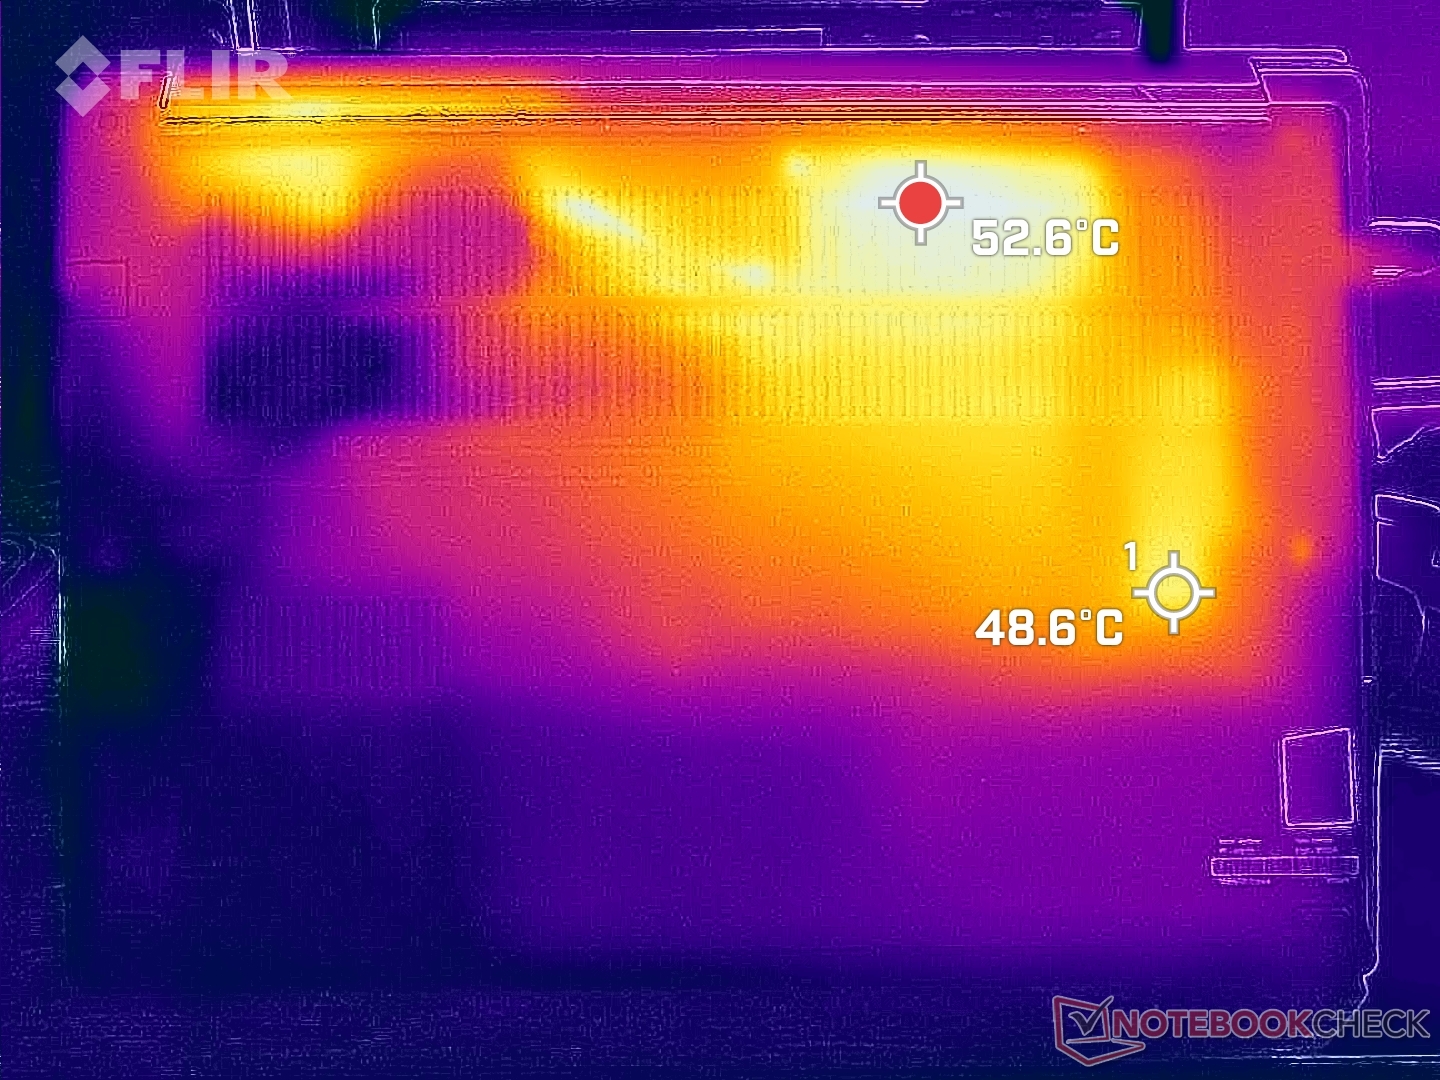
Die Oberflächentemperaturen sind in der linken Hälfte des Gehäuses und in der Nähe der hinteren Lüftungsgitter am wärmsten. Heiße Stellen auf der Tastatur und der Unterseite können bis zu 41 °C bzw. 54 °C erreichen, ähnlich wie bei der AMD-Konfiguration.
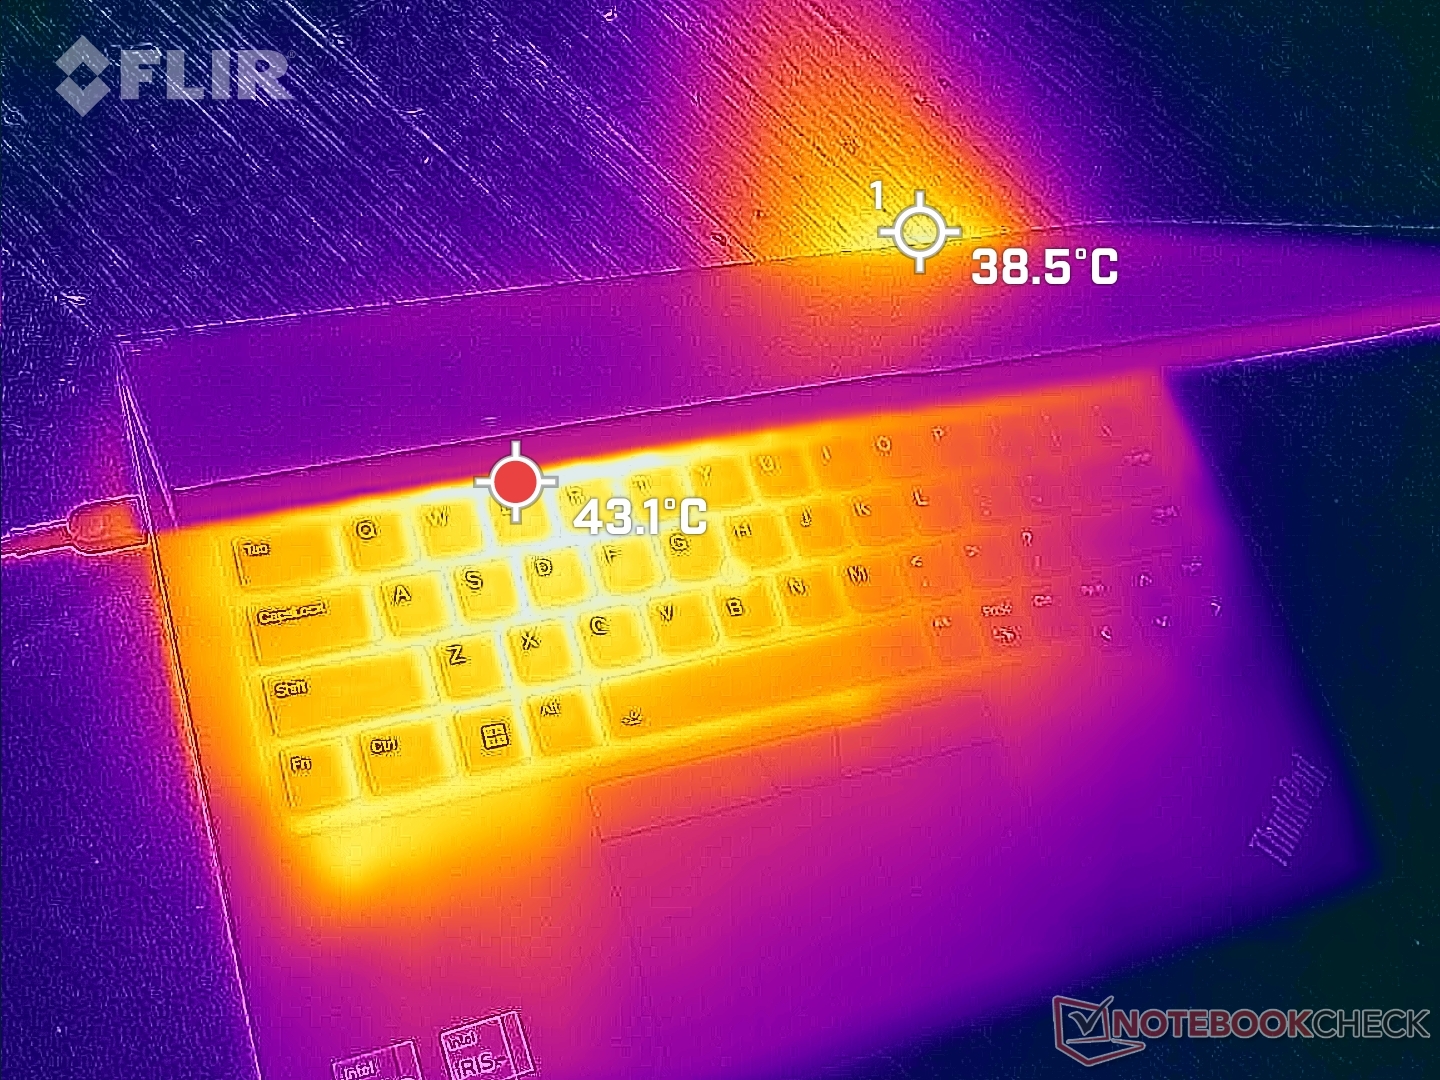
(-) Die maximale Temperatur auf der Oberseite ist 45.4 °C. Im Vergleich liegt der Klassendurchschnitt bei 34.3 °C (von 21.2 bis 62.5 °C für die Klasse Office).
(-) Auf der Unterseite messen wir eine maximalen Wert von 50.8 °C (im Vergleich zum Durchschnitt von 36.8 °C).
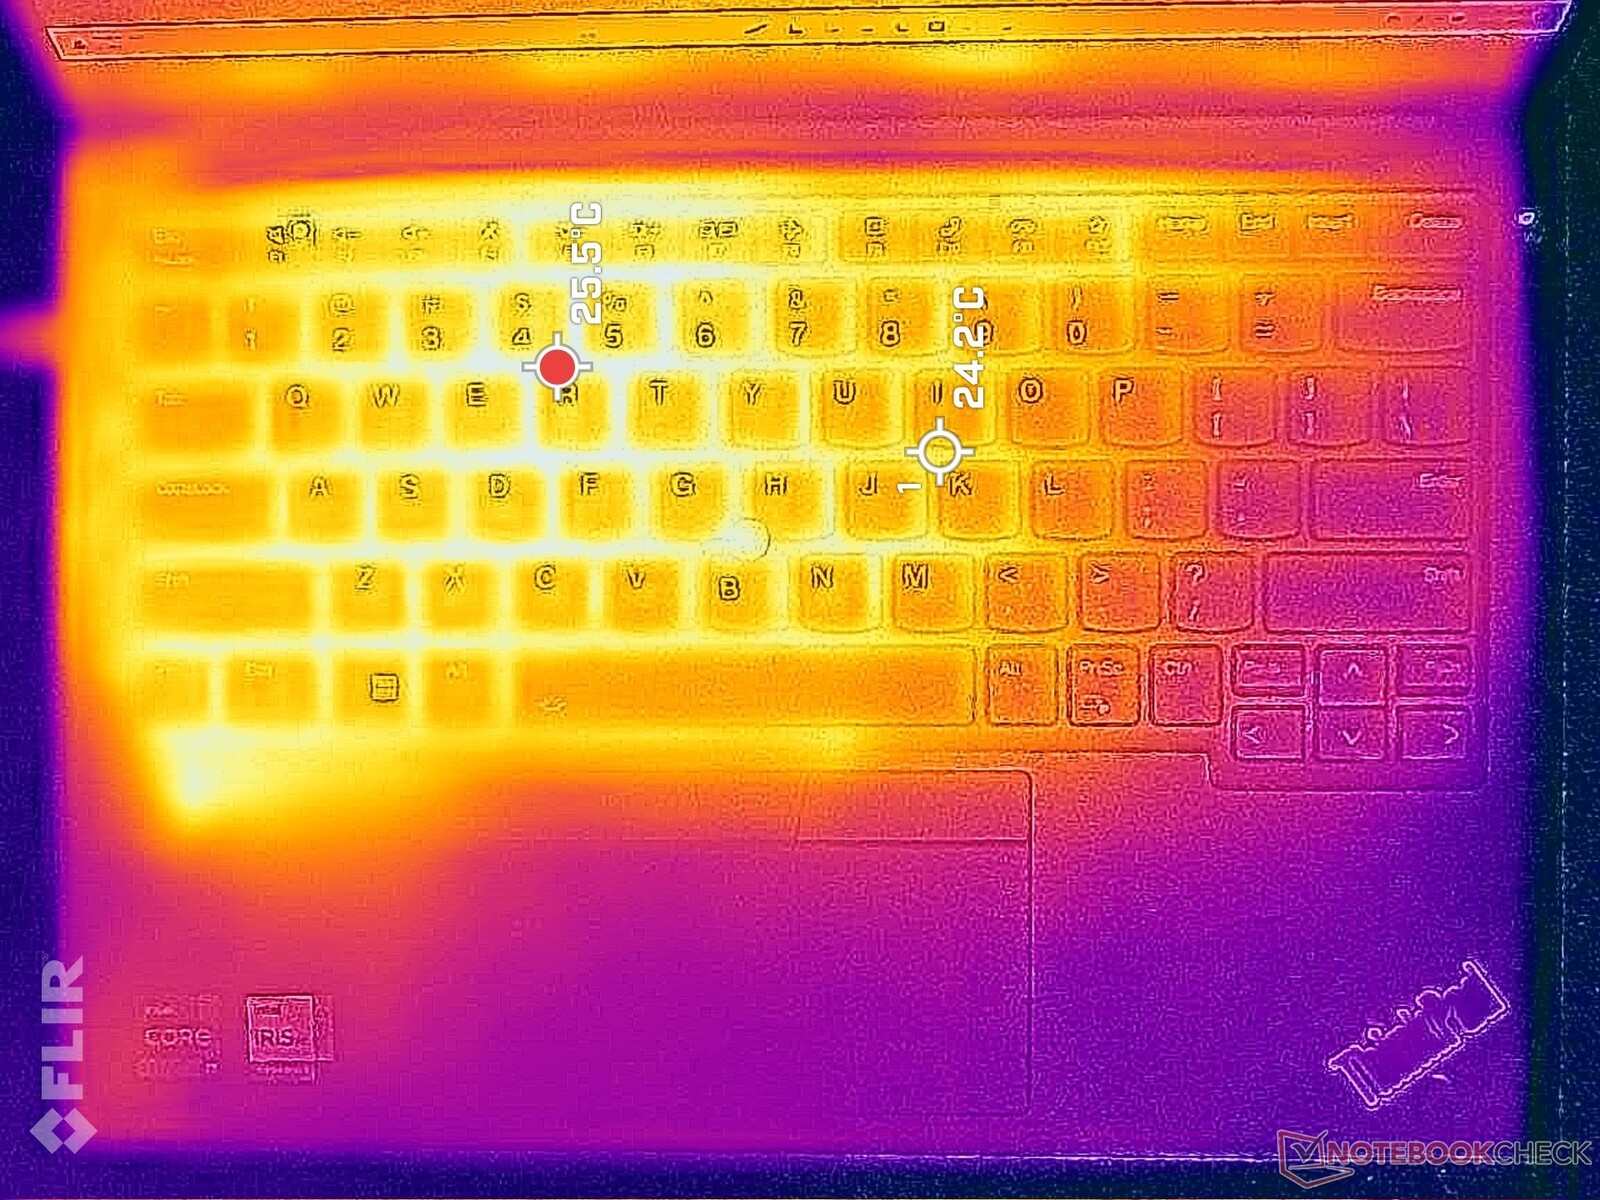
(+) Ohne Last messen wir eine durchschnittliche Temperatur von 28.8 °C auf der Oberseite. Der Klassendurchschnitt erreicht 29.5 °C.
(+) Die Handballen und der Touchpad-Bereich sind mit gemessenen 29.8 °C kühler als die typische Hauttemperatur und fühlen sich dadurch kühl an.
(-) Die durchschnittliche Handballen-Temperatur anderer getesteter Geräte war 27.5 °C (-2.3 °C).
| Lenovo ThinkPad E14 G5 i7-1355U Intel Core i7-1355U, Intel Iris Xe Graphics G7 96EUs | Lenovo ThinkPad E14 G5-21JSS05C00 AMD Ryzen 7 7730U, AMD Radeon RX Vega 8 (Ryzen 4000/5000) | HP EliteBook 845 G10 818N0EA AMD Ryzen 9 PRO 7940HS, AMD Radeon 780M | Asus ZenBook 14 UM3402Y AMD Ryzen 7 7730U, AMD Radeon RX Vega 8 (Ryzen 4000/5000) | LG Gram 14Z90Q Intel Core i5-1240P, Intel Iris Xe Graphics G7 80EUs | Dell Latitude 7440 Intel Core i5-1345U, Intel Iris Xe Graphics G7 80EUs | |
|---|---|---|---|---|---|---|
| Hitze | 8% | 7% | 10% | 11% | 14% | |
| Last oben max * (°C) | 45.4 | 42.6 6% | 45.6 -0% | 39.4 13% | 43 5% | 39 14% |
| Last unten max * (°C) | 50.8 | 55.3 -9% | 51.9 -2% | 43.2 15% | 45 11% | 40.6 20% |
| Idle oben max * (°C) | 30.2 | 25.8 15% | 26.5 12% | 28.6 5% | 27 11% | 28 7% |
| Idle unten max * (°C) | 33.4 | 27.4 18% | 27 19% | 30.6 8% | 28 16% | 28.8 14% |
* ... kleinere Werte sind besser
Stresstest
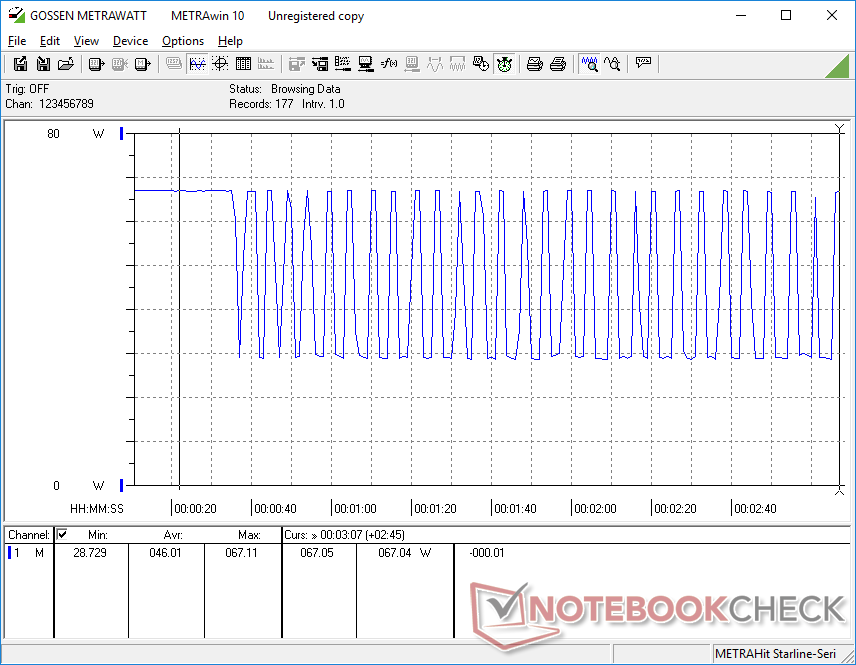
Die CPU-Taktfrequenz und die Leistungsaufnahme des Boards steigen bei Prime95-Stress auf 4 GHz bzw. 52 W, was etwa 30 Sekunden lang und bei einer Kerntemperatur von 97 °C anhält. Der Prozessor wechselt dann zwischen 1,6 GHz und 3,9 GHz und 14 W bis 43 W, um die Kerntemperaturen kühler zu halten, wie der Screenshot unten zeigt. Der Bereich der Taktraten-Drosselung ist sehr groß, was die oben erwähnten CineBench-Ergebnisse, die langsamer als erwartet ausfielen, und die breit gefächerten Stromverbrauchswerte im nächsten Abschnitt erklärt.
Die Kerntemperatur würde sich bei starker Belastung um die 80 °C bewegen, während sie beim Dell Latitude 7440 knapp unter 70 °C liegt.
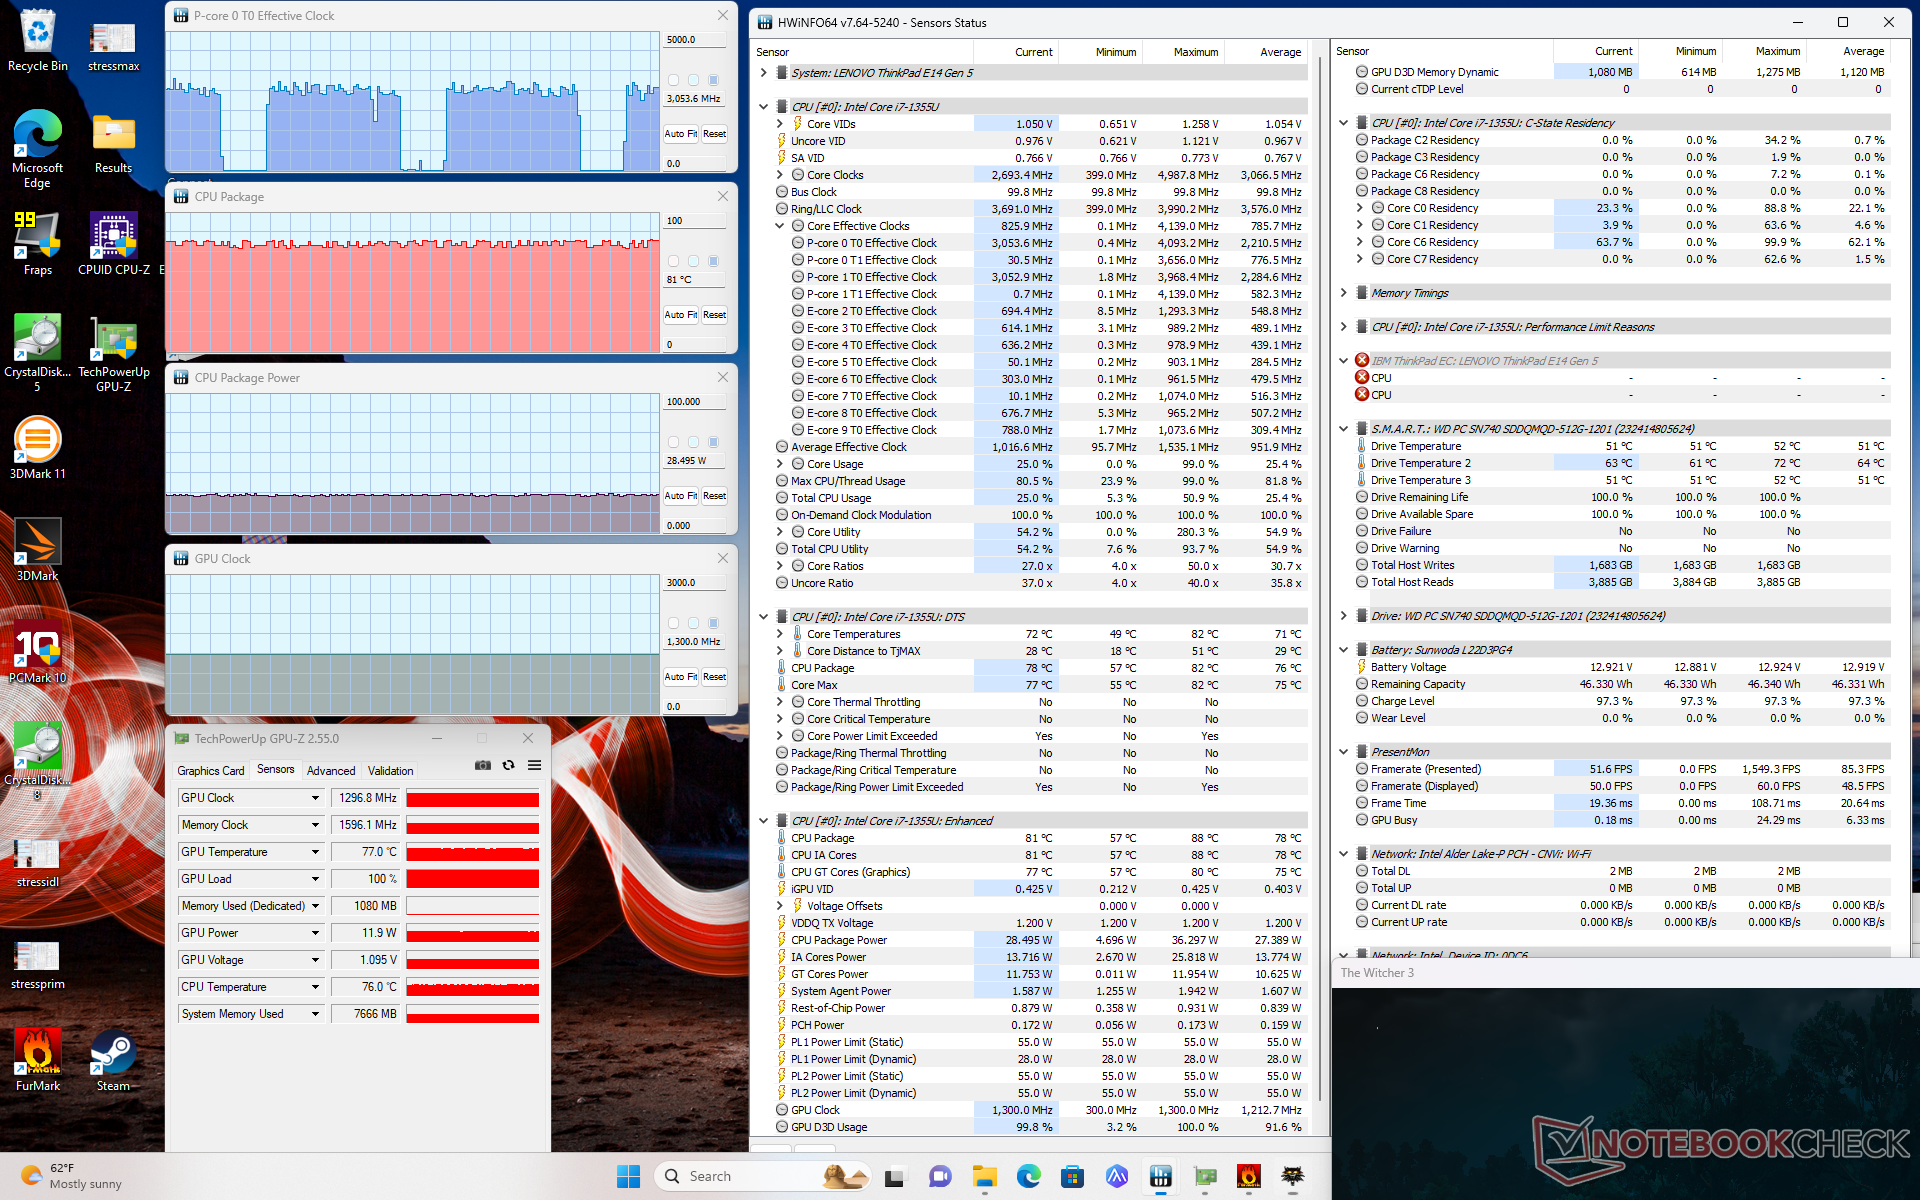
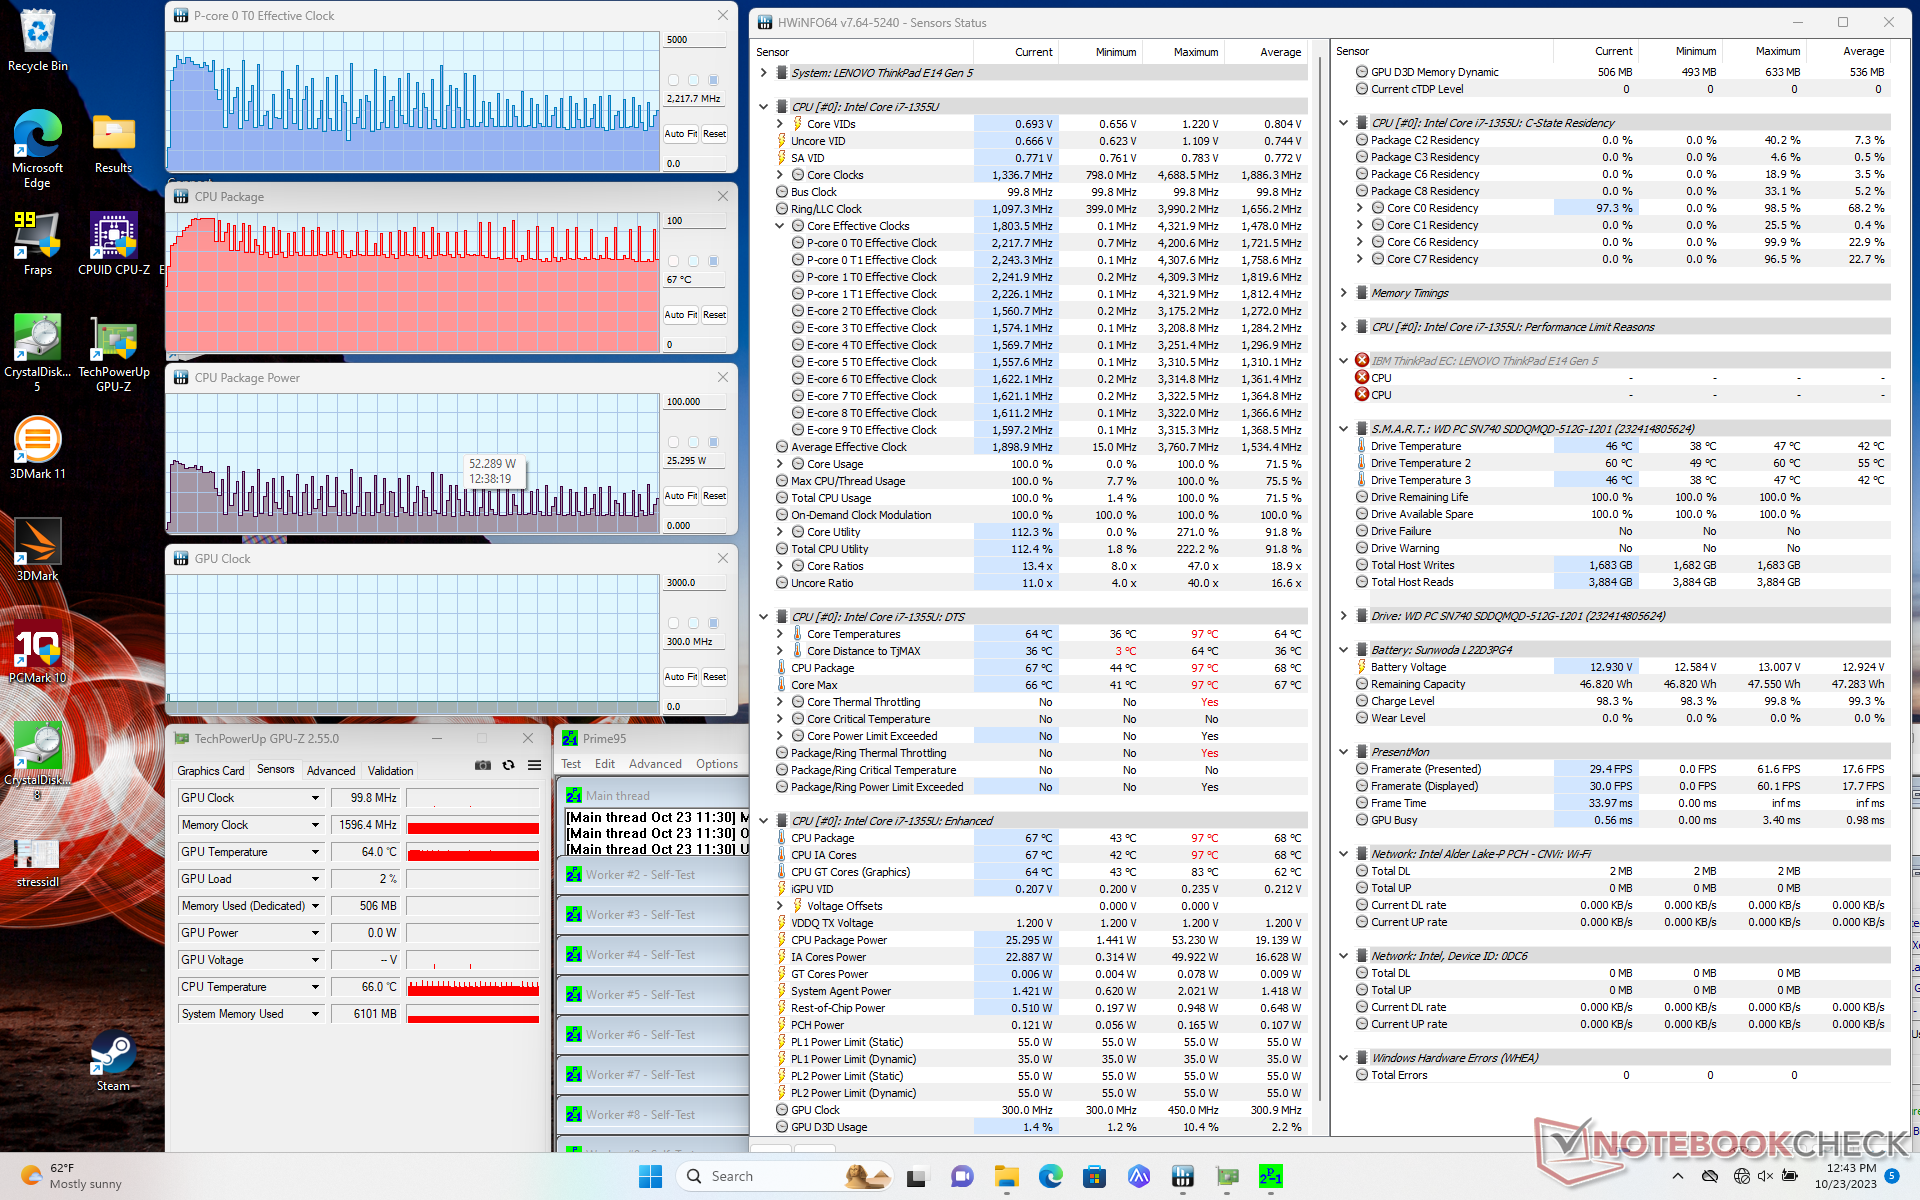
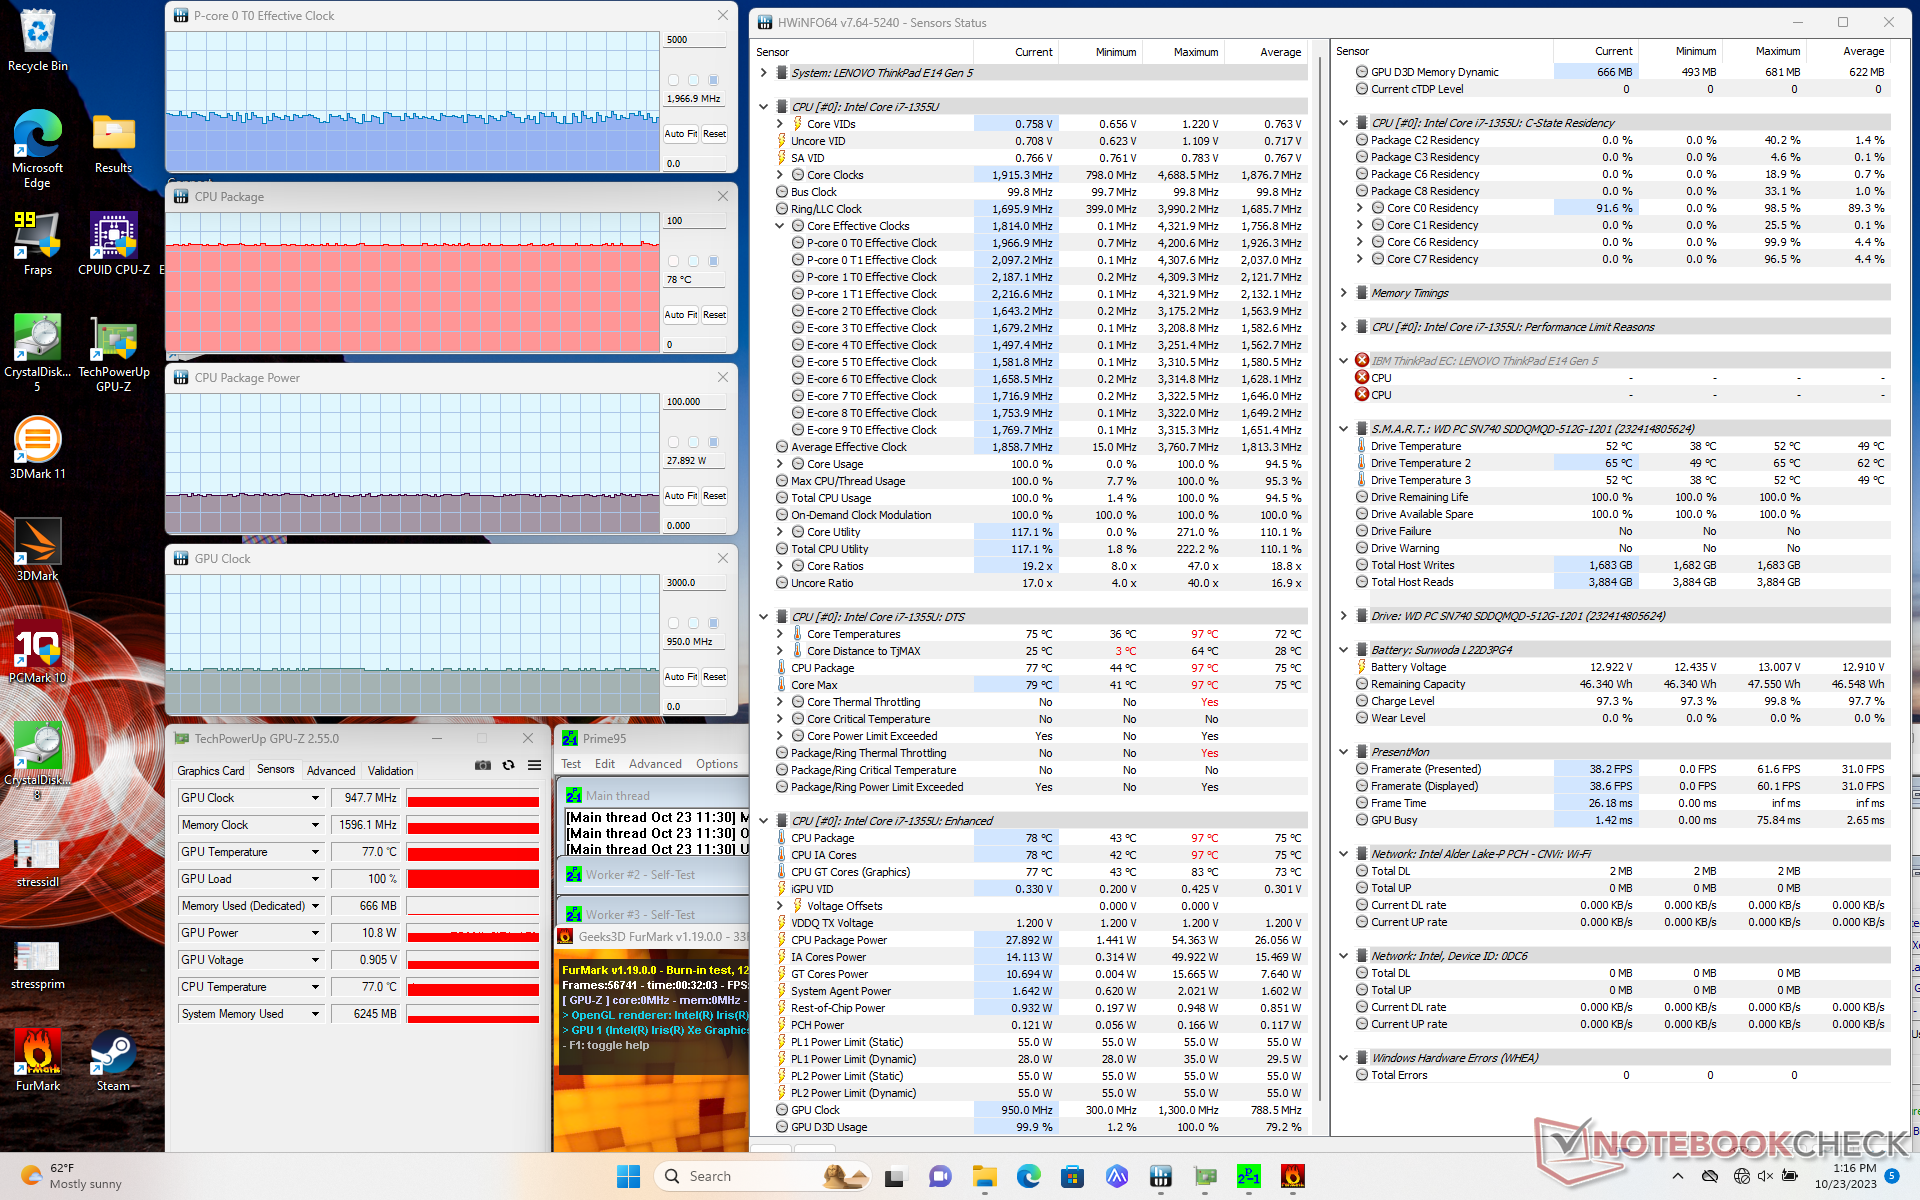
| CPU-Takt (GHz) | GPU Takt (MHz) | Durchschnittliche CPU-Temperatur (°C) | |
| System im Leerlauf | -- | -- | 47 |
| Prime95 Stresstest | 1.6 - 3.9 | -- | 70 - 90 |
| Prime95 + FurMark Stresstest | ~2.0 | 950 | 78 |
| Witcher 3 Stresstest | ~3.0 | 1300 | 81 |
Lautsprecher
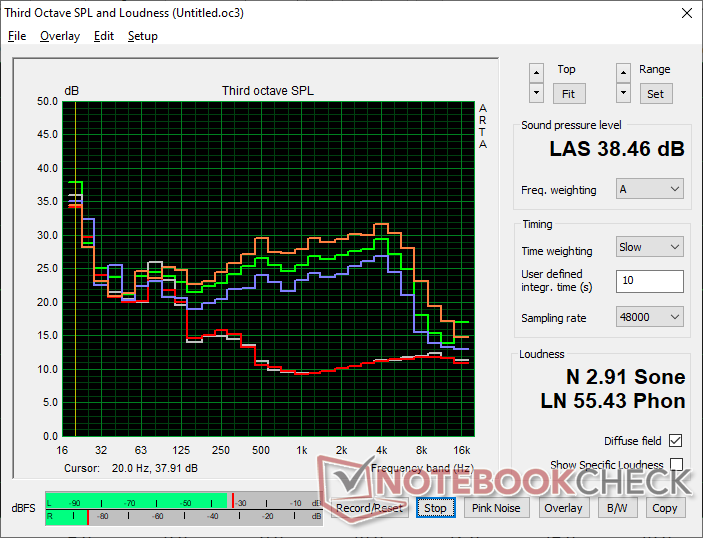
Lenovo ThinkPad E14 G5 i7-1355U Audio Analyse
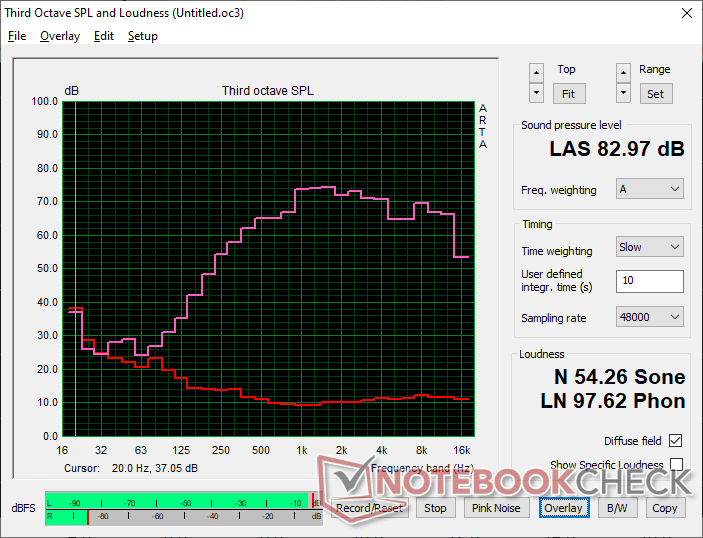
(+) | Die Lautsprecher können relativ laut spielen (83 dB)
Bass 100 - 315 Hz
(-) | kaum Bass - 20.3% niedriger als der Median
(±) | durchschnittlich lineare Bass-Wiedergabe (9.6% Delta zum Vorgänger)
Mitteltöne 400 - 2000 Hz
(+) | ausgeglichene Mitten, vom Median nur 4.8% abweichend
(+) | lineare Mitten (4.3% Delta zum Vorgänger)
Hochtöne 2 - 16 kHz
(+) | ausgeglichene Hochtöne, vom Median nur 3.7% abweichend
(+) | sehr lineare Hochtöne (4.4% Delta zum Vorgänger)
Gesamt im hörbaren Bereich 100 - 16.000 Hz
(±) | hörbarer Bereich ist durchschnittlich linear (16.9% Abstand zum Median)
Im Vergleich zu allen Geräten derselben Klasse
» 23% aller getesteten Geräte dieser Klasse waren besser, 7% vergleichbar, 70% schlechter
» Das beste Gerät hat einen Delta-Wert von 7%, durchschnittlich ist 21%, das schlechteste Gerät hat 53%
Im Vergleich zu allen Geräten im Test
» 30% aller getesteten Geräte waren besser, 8% vergleichbar, 62% schlechter
» Das beste Gerät hat einen Delta-Wert von 4%, durchschnittlich ist 24%, das schlechteste Gerät hat 134%
Apple MacBook Pro 16 2021 M1 Pro Audio Analyse
(+) | Die Lautsprecher können relativ laut spielen (84.7 dB)
Bass 100 - 315 Hz
(+) | guter Bass - nur 3.8% Abweichung vom Median
(+) | lineare Bass-Wiedergabe (5.2% Delta zum Vorgänger)
Mitteltöne 400 - 2000 Hz
(+) | ausgeglichene Mitten, vom Median nur 1.3% abweichend
(+) | lineare Mitten (2.1% Delta zum Vorgänger)
Hochtöne 2 - 16 kHz
(+) | ausgeglichene Hochtöne, vom Median nur 1.9% abweichend
(+) | sehr lineare Hochtöne (2.7% Delta zum Vorgänger)
Gesamt im hörbaren Bereich 100 - 16.000 Hz
(+) | hörbarer Bereich ist sehr linear (4.6% Abstand zum Median
Im Vergleich zu allen Geräten derselben Klasse
» 0% aller getesteten Geräte dieser Klasse waren besser, 0% vergleichbar, 100% schlechter
» Das beste Gerät hat einen Delta-Wert von 5%, durchschnittlich ist 17%, das schlechteste Gerät hat 45%
Im Vergleich zu allen Geräten im Test
» 0% aller getesteten Geräte waren besser, 0% vergleichbar, 100% schlechter
» Das beste Gerät hat einen Delta-Wert von 4%, durchschnittlich ist 24%, das schlechteste Gerät hat 134%
Energieverwaltung
Energieaufnahme
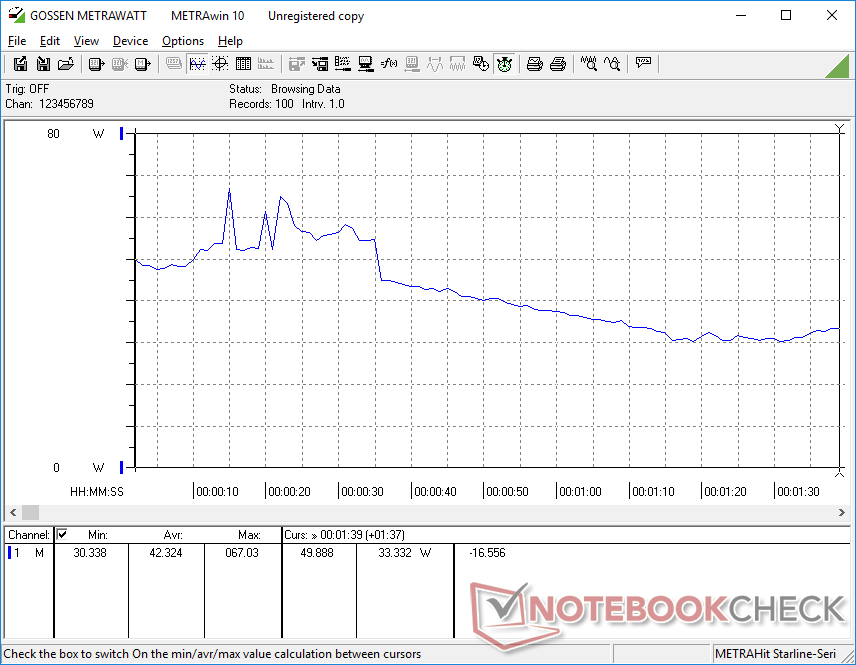
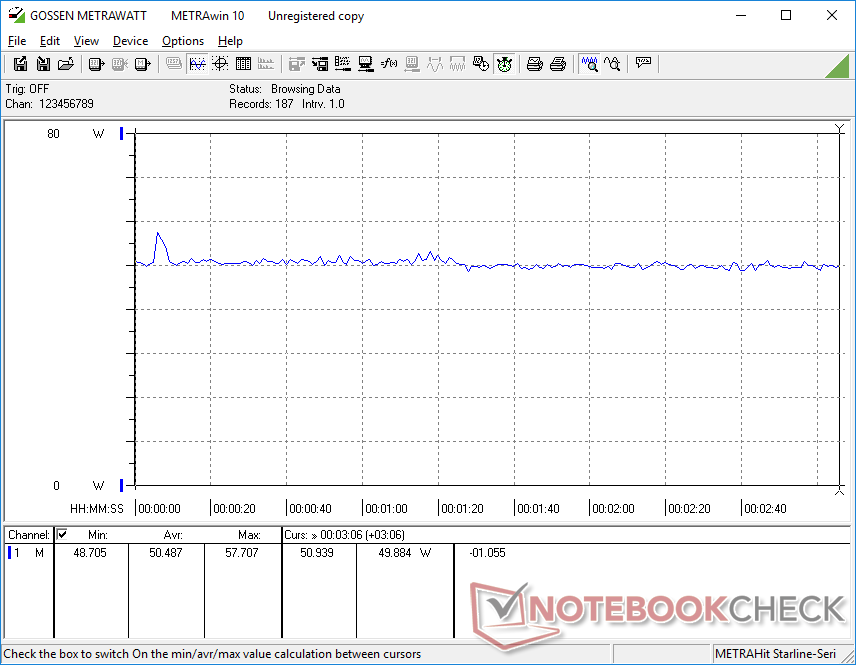
Das Verhalten des Energieverbrauchs spiegelt das oben erwähnte steile CPU-Drosselungsverhalten wider. Bei der Ausführung von Prime95 schwankt der Verbrauch beispielsweise zwischen 29 W und 67 W, während derselbe Test auf dem AMD ThinkPad E14 G5 eine konstantere Leistung von 47 W ergibt.
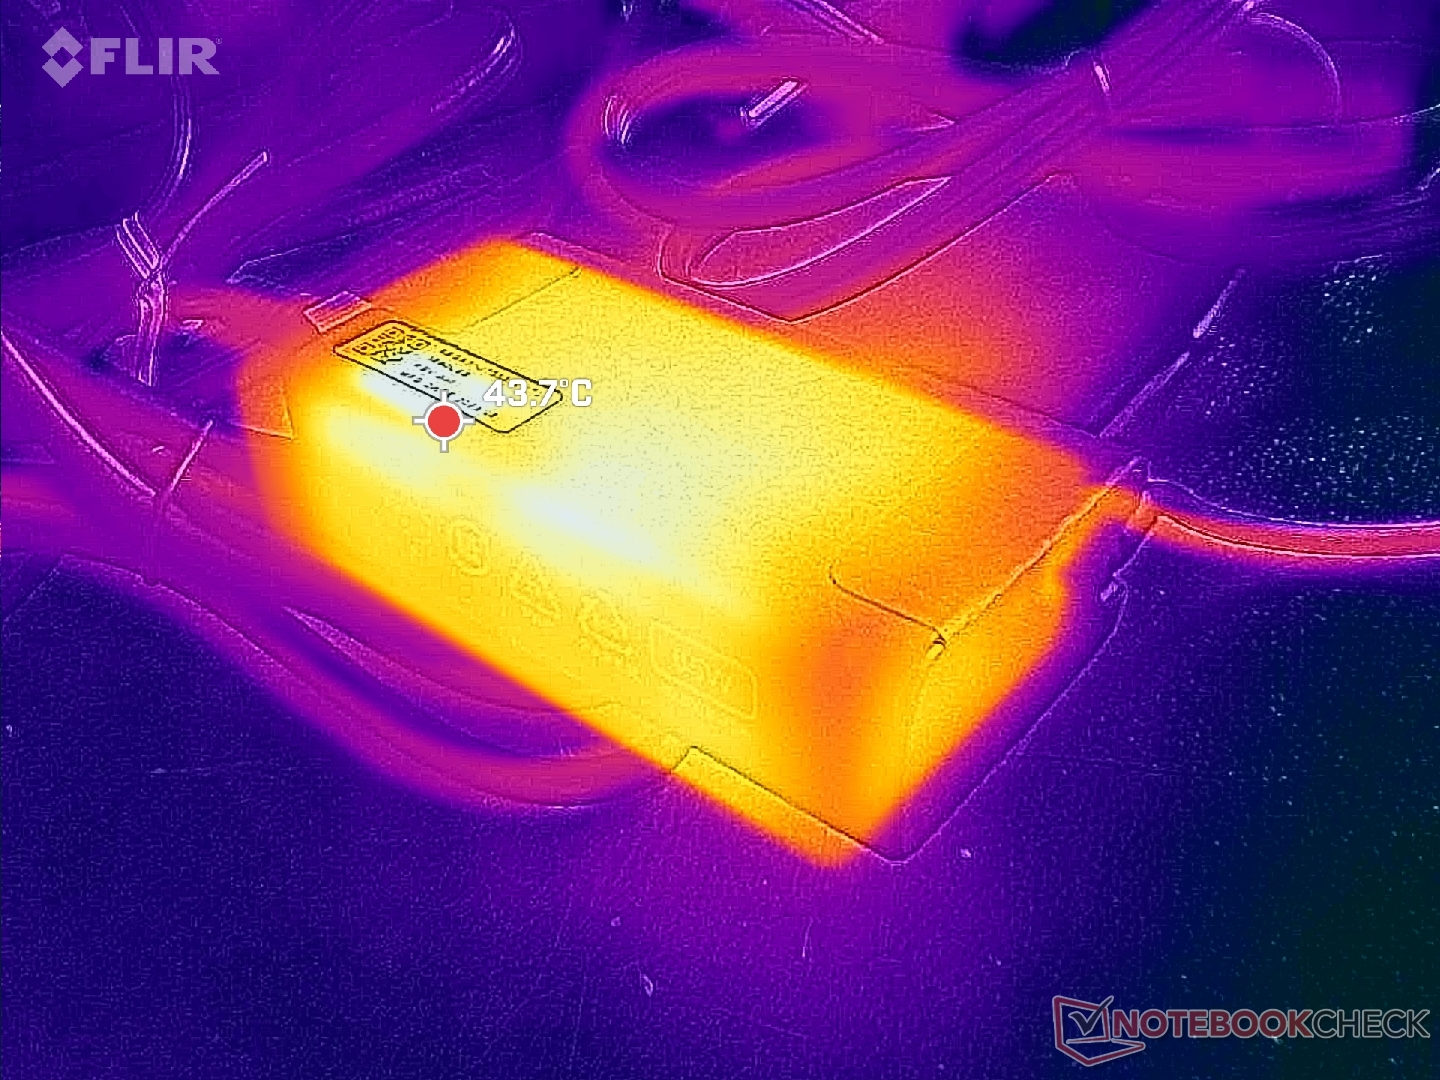
Das kleine (9 x 4,7 x 2,7 cm) 65-W-USB-C-Netzteil kann bis zu 67 W liefern, wenn die CPU zu 100 Prozent ausgelastet ist. Das Intel-System ist also stromhungriger als das AMD-System, wenn der Turbo Boost am schnellsten läuft, zum Beispiel beim Multitasking oder beim Starten von Anwendungen. Dies ist auch beim Starten des CineBench R15 xT Benchmarks zu beobachten, wie die untenstehende Vergleichsgrafik zeigt. Ansonsten ist der Verbrauch zwischen den beiden Versionen im Leerlauf auf dem Desktop oder bei weniger anspruchsvoller Last in etwa gleich.
| Aus / Standby | |
| Idle | |
| Last |
|
Legende:
min: | |
| Lenovo ThinkPad E14 G5 i7-1355U i7-1355U, Iris Xe G7 96EUs, WD PC SN740 512GB SDDQMQD-512G, IPS, 1920x1200, 14" | Lenovo ThinkPad E14 G5-21JSS05C00 R7 7730U, Vega 8, WD PC SN740 SDDPNQD-1T00, IPS, 2240x1400, 14" | HP EliteBook 845 G10 818N0EA R9 PRO 7940HS, Radeon 780M, SK hynix PC801 HFS001TEJ9X101N, IPS, 2560x1600, 14" | Asus ZenBook 14 UM3402Y R7 7730U, Vega 8, Micron 2400 MTFDKBA512QFM, OLED, 2880x1800, 14" | LG Gram 14Z90Q i5-1240P, Iris Xe G7 80EUs, Samsung PM9A1 MZVL2512HCJQ, IPS, 1920x1200, 14" | Dell Latitude 7440 i5-1345U, Iris Xe G7 80EUs, Samsung MZ9L4512HBLU-00BMV, IPS, 2560x1600, 14" | |
|---|---|---|---|---|---|---|
| Stromverbrauch | -3% | -33% | -42% | -0% | -5% | |
| Idle min * (Watt) | 3.6 | 3.3 8% | 4.3 -19% | 7.9 -119% | 3 17% | 4.5 -25% |
| Idle avg * (Watt) | 6.9 | 7.6 -10% | 10.1 -46% | 8.8 -28% | 6 13% | 6.5 6% |
| Idle max * (Watt) | 7 | 8.9 -27% | 11.2 -60% | 14.7 -110% | 12 -71% | 7.3 -4% |
| Last avg * (Watt) | 42.3 | 47.3 -12% | 64.4 -52% | 46.9 -11% | 40 5% | 52.5 -24% |
| Witcher 3 ultra * (Watt) | 50.5 | 45.1 11% | 59.4 -18% | 44.9 11% | 36.5 28% | 46.2 9% |
| Last max * (Watt) | 67 | 57.8 14% | 66.7 -0% | 65.2 3% | 63 6% | 63 6% |
* ... kleinere Werte sind besser
Energieverbrauch Witcher 3 / Stresstest
Energieverbrauch externer Monitor
Akkulaufzeit
Der Akku ist bei einigen Intel-Konfigurationen kleiner als bei unserer AMD-Konfiguration (47 Wh gegenüber 57 Wh), daher sollten Nutzer mit einer kürzeren Laufzeit rechnen, wenn sie die kleinere Option wählen. Wir können etwa 5,5 Stunden im Internet surfen, bevor sich das Gerät automatisch abschaltet, verglichen mit fast 10 Stunden bei der AMD-Version.
Das Aufladen von leer auf volle Kapazität erfolgt ansonsten sehr schnell, in etwas mehr als einer Stunde, wenn das mitgelieferte Netzteil verwendet wird. Rapid Charge ist standardmäßig aktiviert.
| Lenovo ThinkPad E14 G5 i7-1355U i7-1355U, Iris Xe G7 96EUs, 47 Wh | Lenovo ThinkPad E14 G5-21JSS05C00 R7 7730U, Vega 8, 57 Wh | HP EliteBook 845 G10 818N0EA R9 PRO 7940HS, Radeon 780M, 51 Wh | Asus ZenBook 14 UM3402Y R7 7730U, Vega 8, 75 Wh | LG Gram 14Z90Q i5-1240P, Iris Xe G7 80EUs, 72 Wh | Dell Latitude 7440 i5-1345U, Iris Xe G7 80EUs, 57 Wh | |
|---|---|---|---|---|---|---|
| Akkulaufzeit | 80% | 44% | 120% | 116% | 136% | |
| WLAN (h) | 5.5 | 9.9 80% | 7.9 44% | 12.1 120% | 11.9 116% | 13 136% |
| H.264 (h) | 10.8 | 9.3 | ||||
| Last (h) | 1.2 | 0.9 | 3.4 | 2.8 | 2.7 | |
| Idle (h) | 18.5 | 28.9 | 23.8 |
Pro
Contra
Fazit — Gut, aber schwieriger zu empfehlen als die AMD Ryzen 7 Version
Unser Intel-Gerät in der Konfiguration mit Core i7-CPU, 16 GB RAM, 1200p-Touchscreen und 512 GB SSD kostet etwa 1100 Euro im Vergleich zu 900 Euro für die Ryzen 7-Version mit demselben RAM, Touchscreen und SSD. Wenn Sie sich für die AMD-Version entscheiden, erhalten Sie eine schnellere Multi-Thread-Leistung, eine längere Akkulaufzeit und Unterstützung für die M.2 2280 SSD, während Sie mit der Intel-Version eine schnellere Single-Thread-Leistung und Thunderbolt-Unterstützung erhalten. Andere Aspekte wie Grafikleistung, Oberflächentemperatur und Lüftergeräusche sind bei beiden Versionen sehr ähnlich. Wenn Sie also keinen großen Wert auf Single-Thread-Leistung und Thunderbolt legen, ist die AMD-Version für die Mehrheit der interessierten Käufer eher zu empfehlen als die Intel-Version.
Das Intel-basierte ThinkPad E14 G5 zeigt ein stärkeres Throttling-Verhalten als seine günstigere Ryzen 7-Alternative.
Einige unternehmensorientierte Zusatzfunktionen wie WAN und Smart Card fehlen, jedoch ist dies beabsichtigt, da die ThinkPad E-Serie als eine kostengünstigere Alternative zu den hochwertigeren und deutlich teureren ThinkPad T- oder X-Serien ist.
Preis und Verfügbarkeit
Lenovo ThinkPad E14 G5 i7-1355U
- 26.10.2023 v7 (old)
Allen Ngo
Transparenz
Die Auswahl der zu testenden Geräte erfolgt innerhalb der Redaktion. Das vorliegende Testmuster wurde dem Autor vom Hersteller oder einem Shop zu Testzwecken leihweise zur Verfügung gestellt. Eine Einflussnahme des Leihstellers auf den Testbericht gab es nicht, der Hersteller erhielt keine Version des Reviews vor der Veröffentlichung. Es bestand keine Verpflichtung zur Publikation. Als eigenständiges, unabhängiges Unternehmen unterliegt Notebookcheck keiner Diktion von Herstellern, Shops und Verlagen.
So testet Notebookcheck
Pro Jahr werden von Notebookcheck hunderte Laptops und Smartphones unabhängig in von uns standardisierten technischen Verfahren getestet, um eine Vergleichbarkeit aller Testergebnisse zu gewährleisten. Seit rund 20 Jahren entwickeln wir diese Testmethoden kontinuierlich weiter und setzen damit Branchenstandards. In unseren Testlaboren kommt ausschließlich hochwertiges Messequipment in die Hände erfahrener Techniker und Redakteure. Die Tests unterliegen einer mehrstufigen Kontrolle. Unsere komplexe Gesamtbewertung basiert auf hunderten fundierten Messergebnissen und Benchmarks, womit Ihnen Objektivität garantiert ist. Weitere Informationen zu unseren Testmethoden gibt es hier.
Preisvergleich

