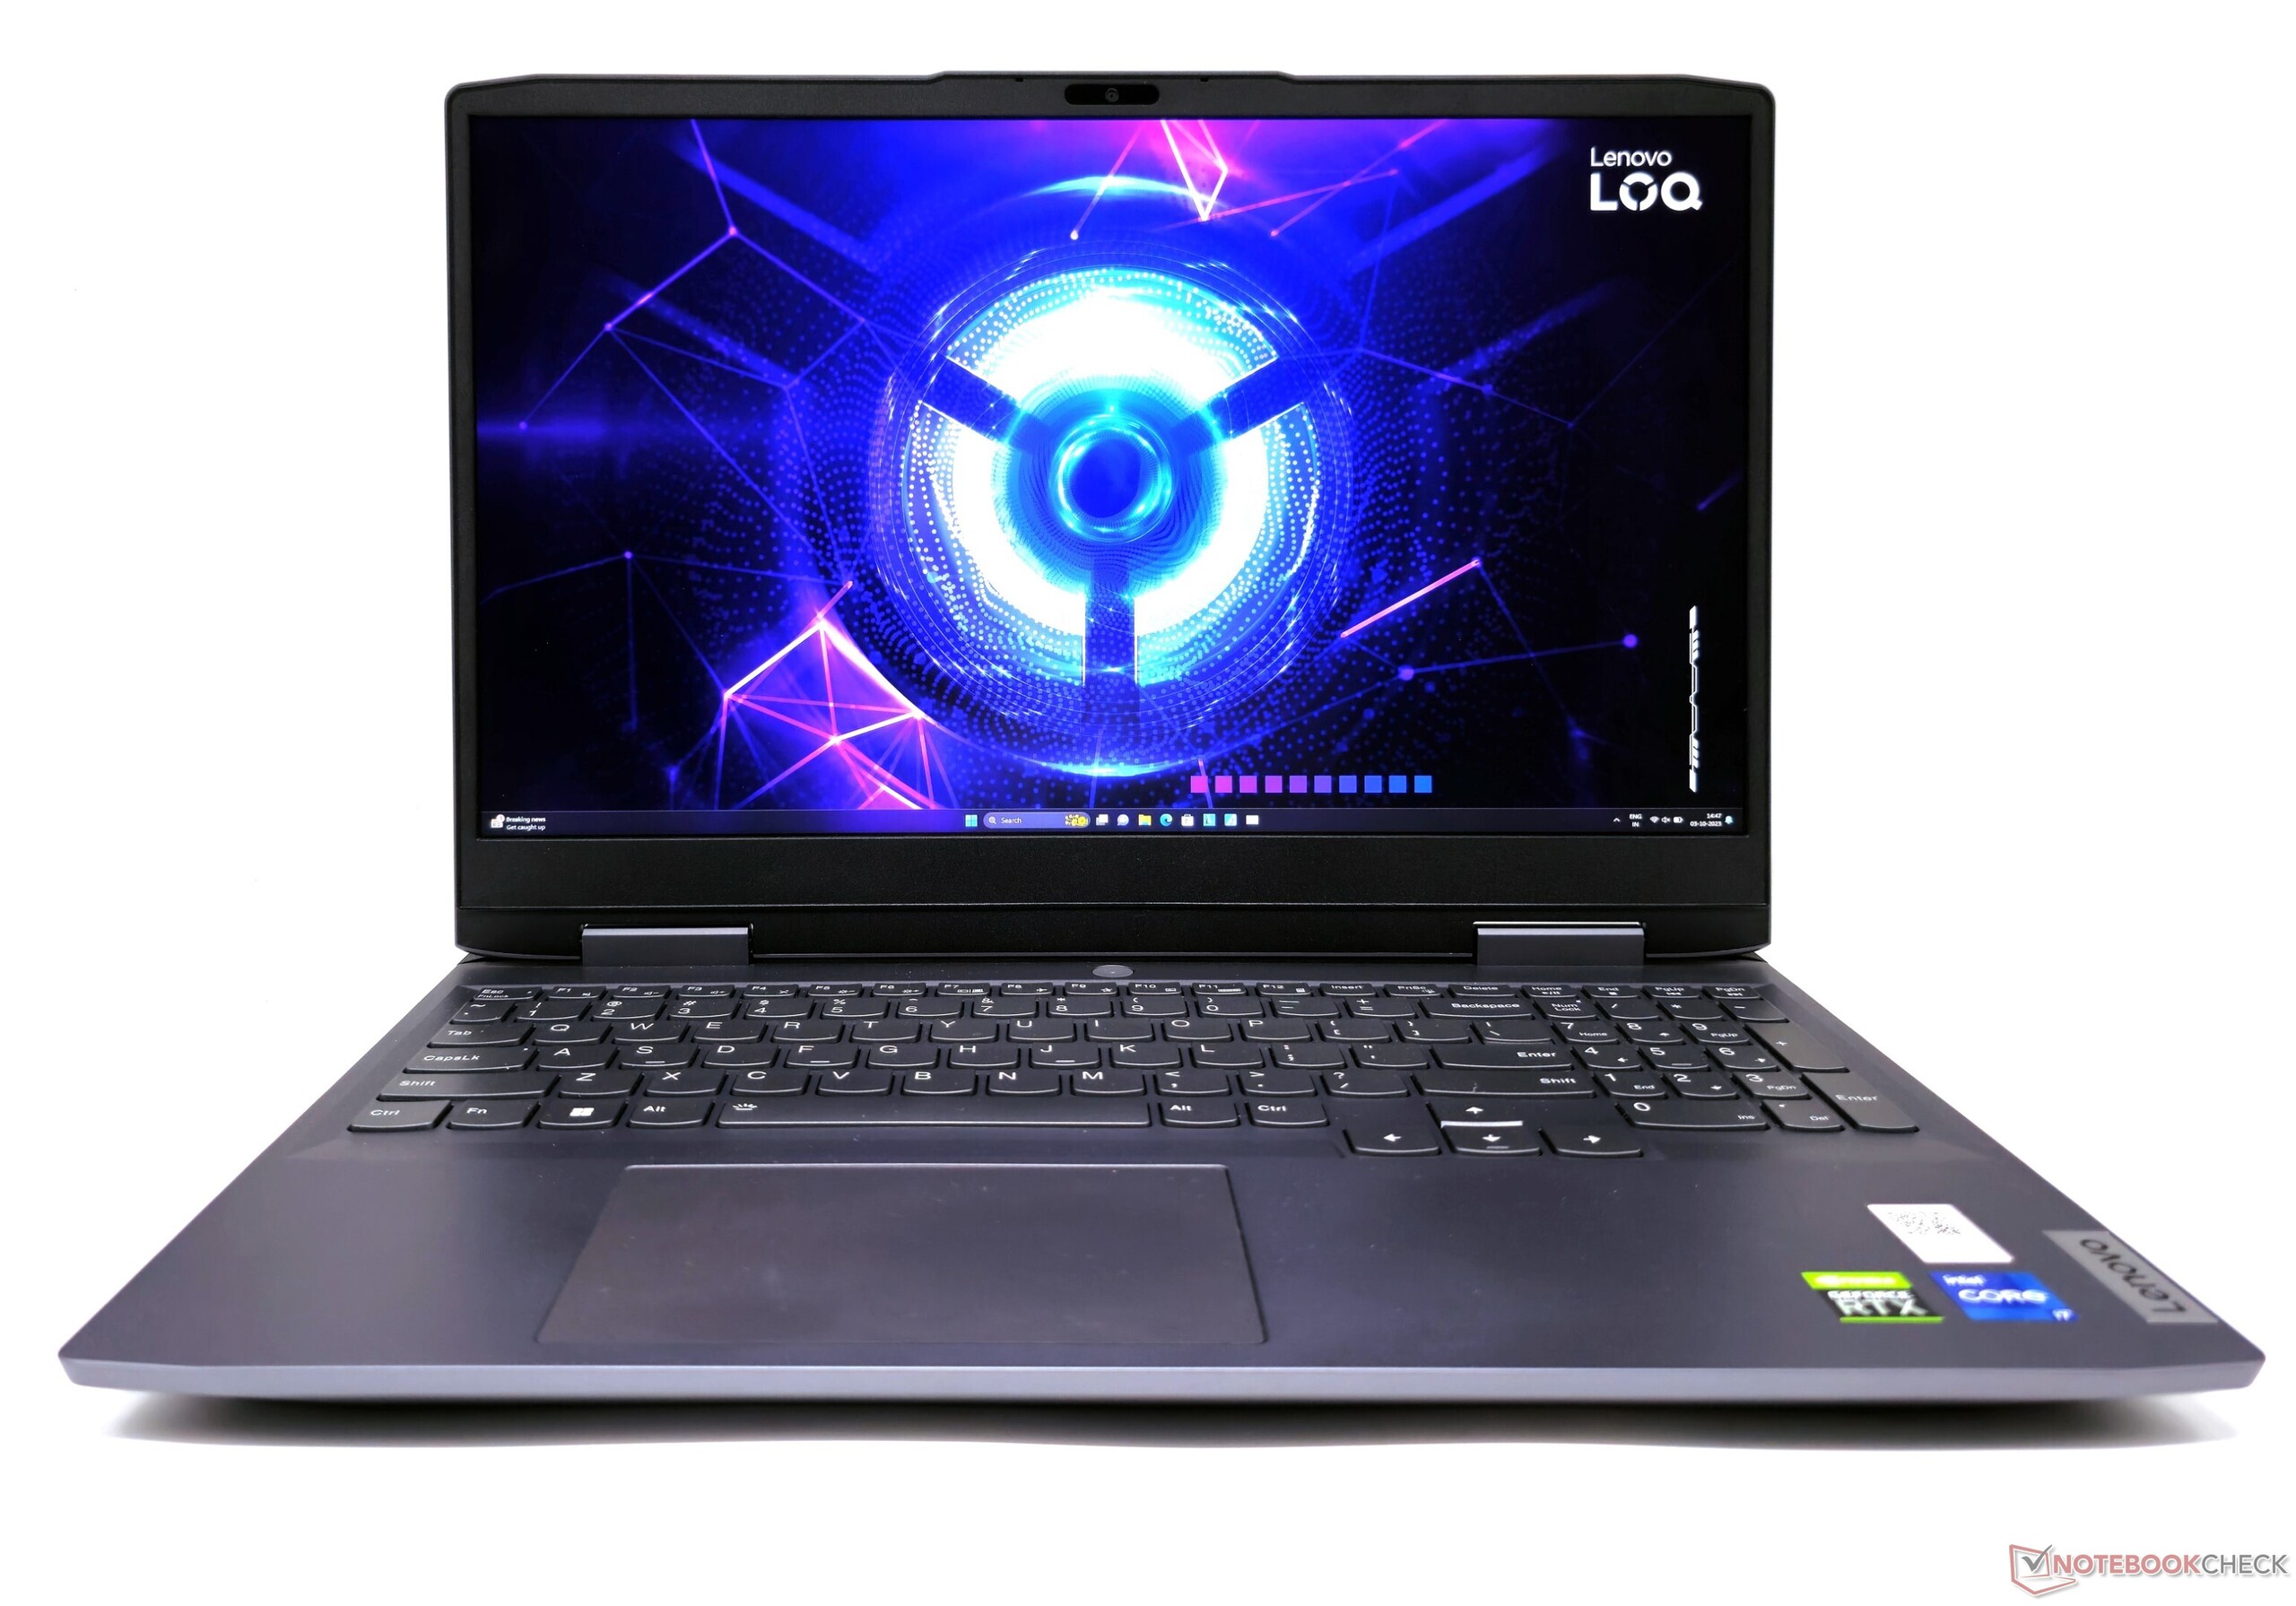
Lenovo LOQ 15 Core i7 im Test: Günstige Legion-Alternative wirft Intel-vs-AMD-Dilemma auf

Die Lenovo-LOQ-Reihe richtet sich an Einstiegsgamer mit begrenztem Budget und reiht sich unter Mitstreiter der Serien Dell G, HP Victus, Asus TUF, MSI Katana und Acer Nitro ein. Wir haben kürzlich das LOQ 15APH8 mit einem AMD Ryzen 7 7840HS und Nvidia RTX 4050 Laptop GPU getestet und auch das LOQ 16IRH8 mit Intel Core i7-13620H und Nvidia RTX 4060 stand schon auf unserem Schreibtisch.
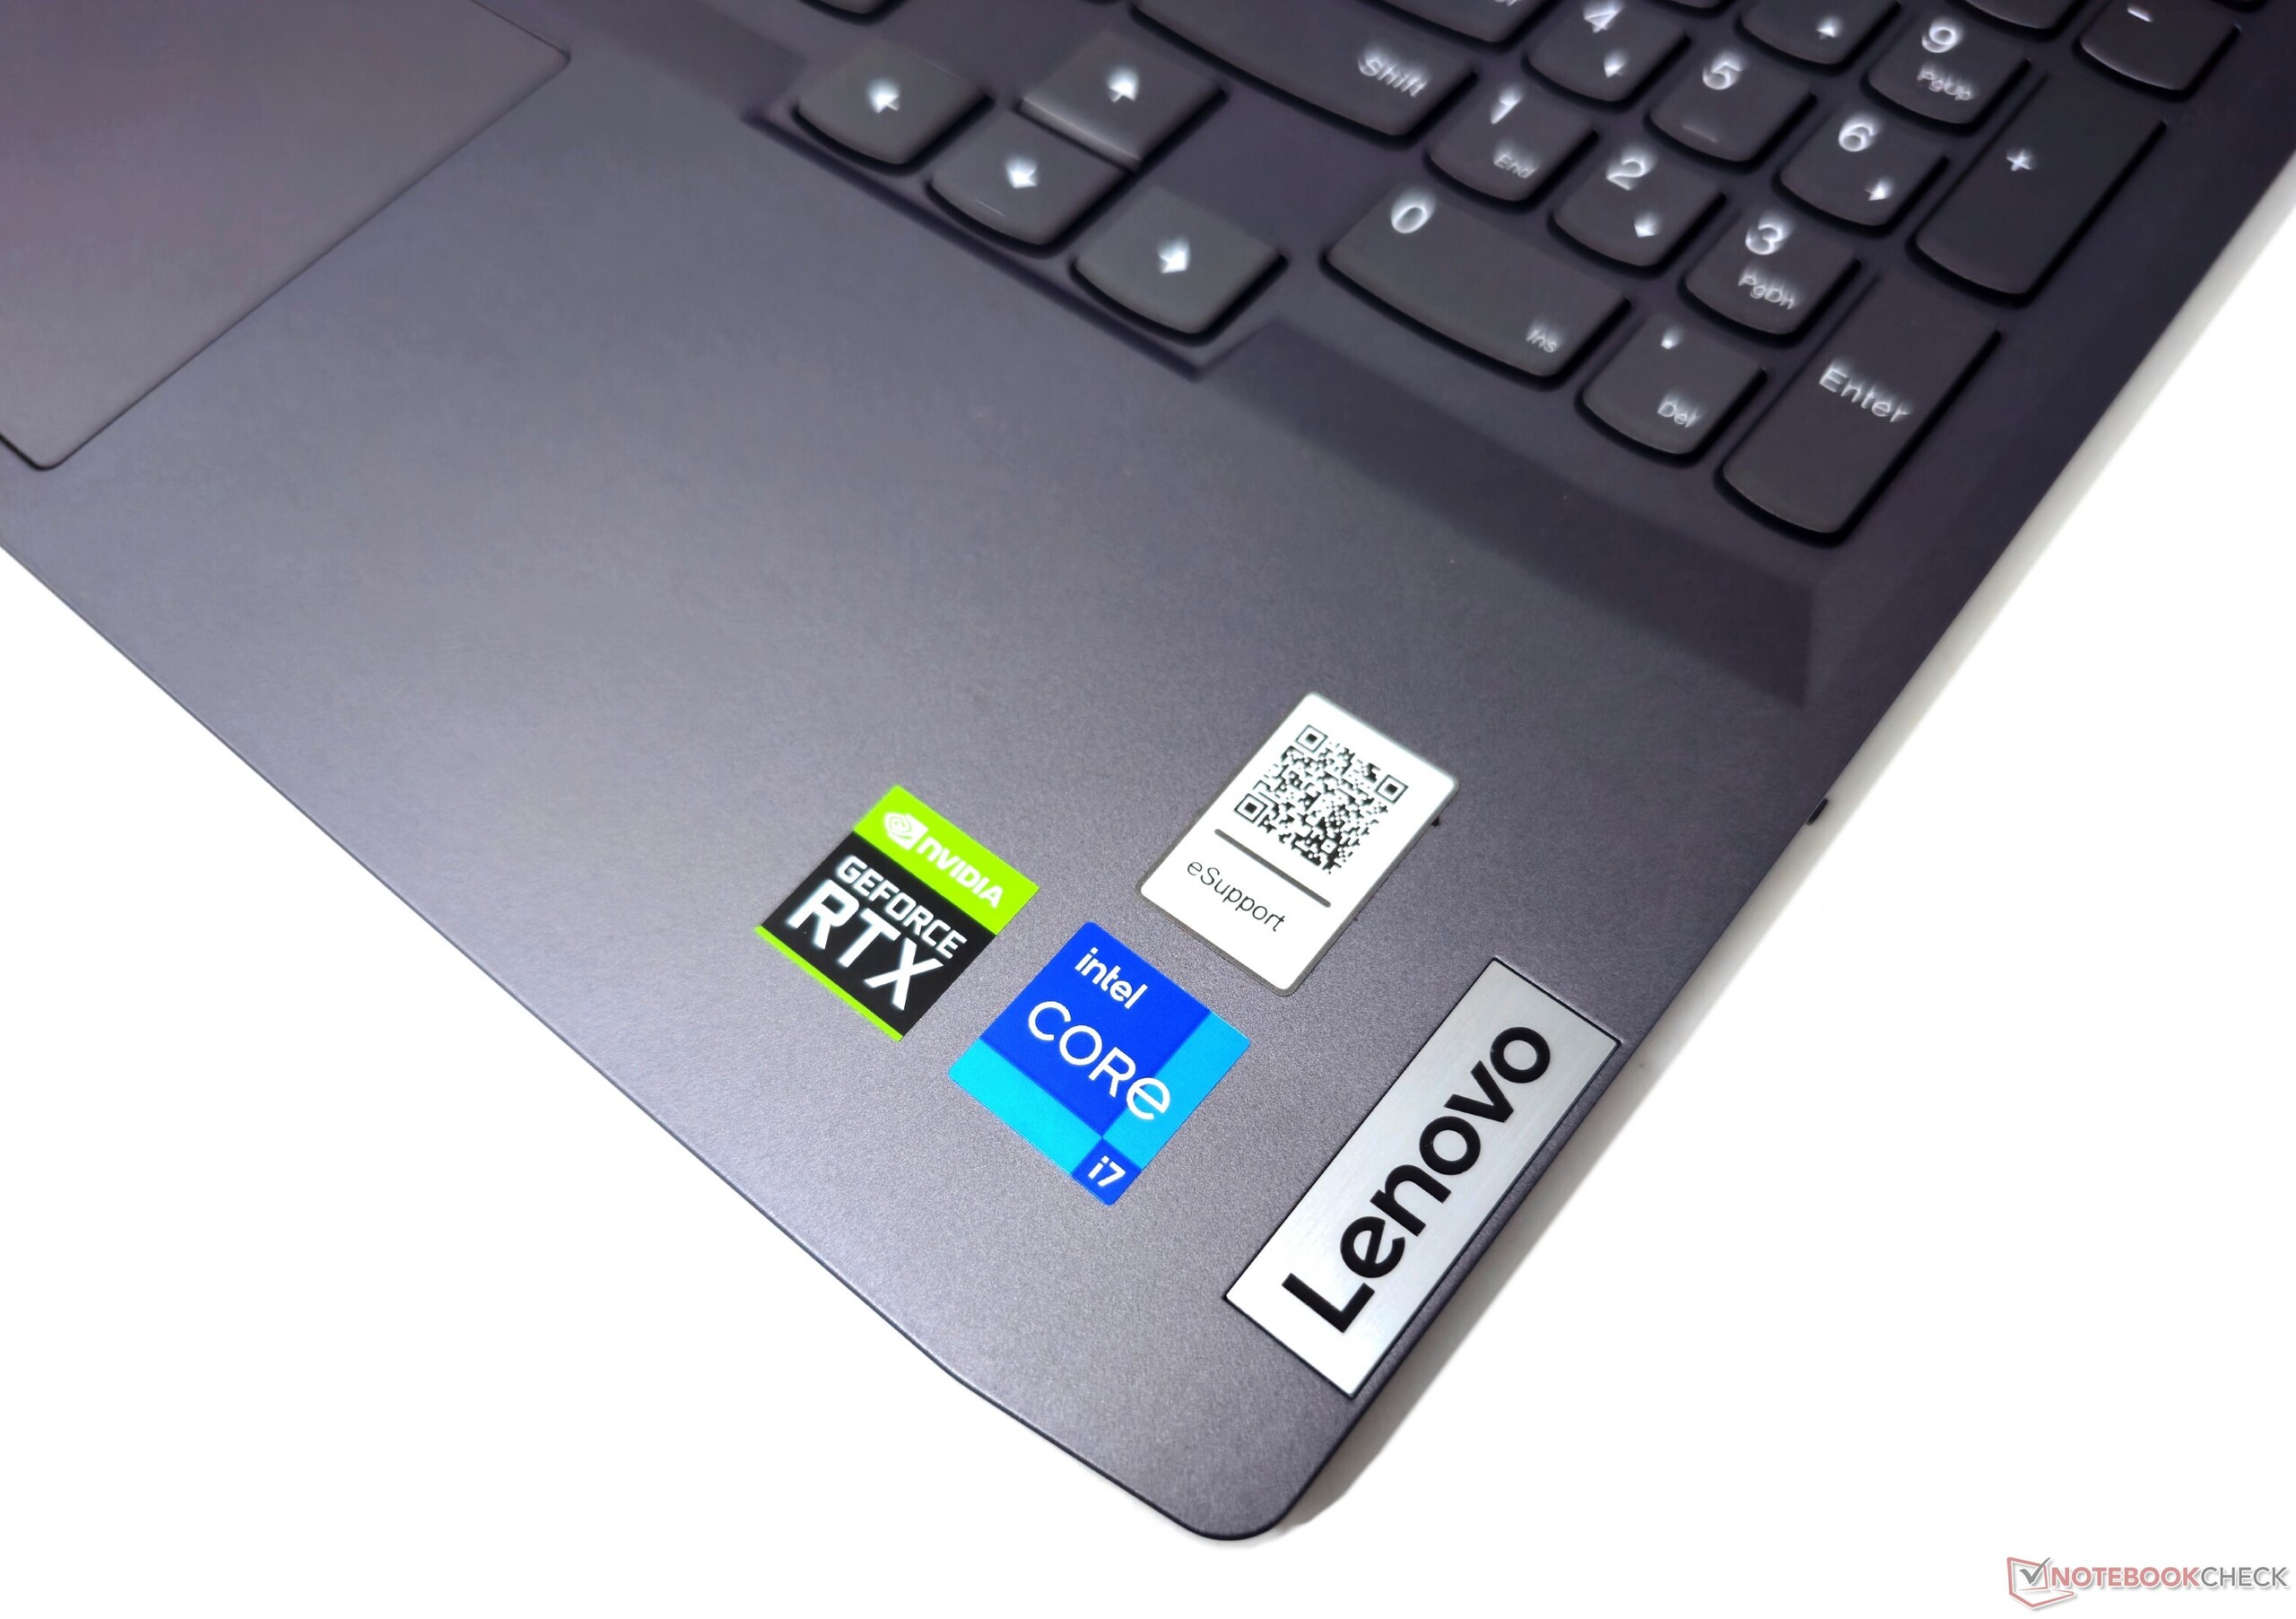
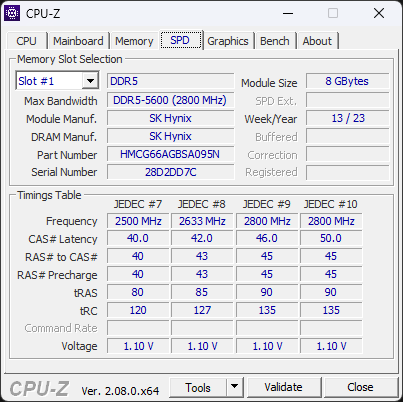
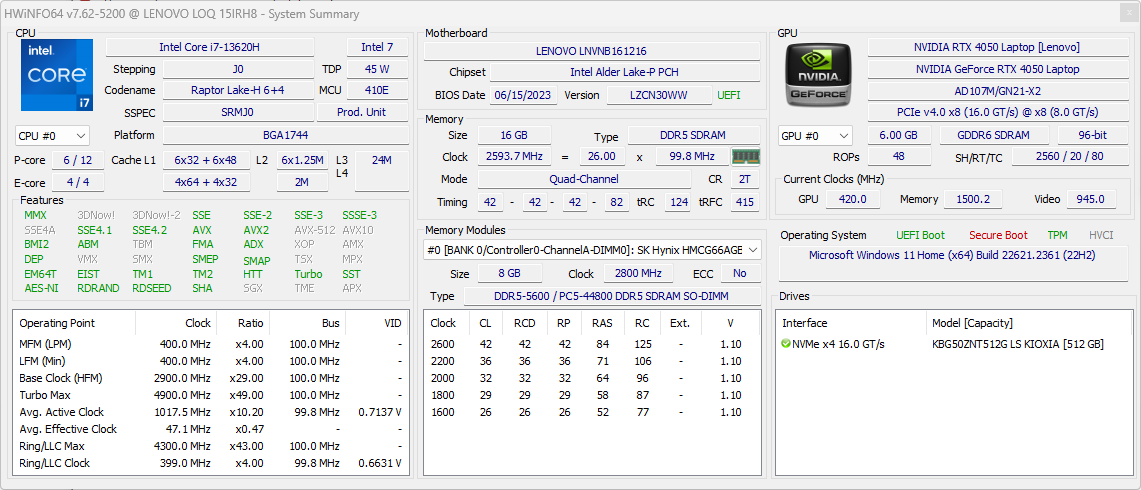
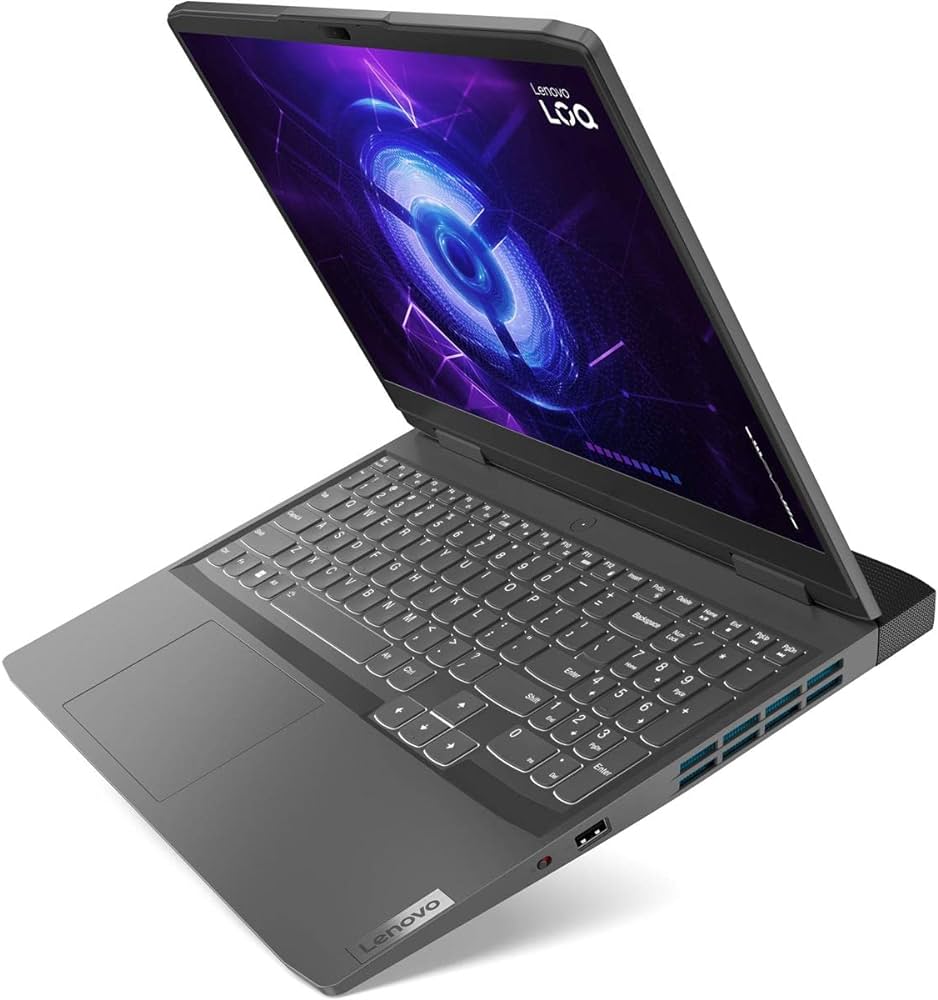
Heute beschäftigen wir uns mit dem 15 Zoll großen LOQ 15IRH8 mit Core i7-13620H und RTX 4050. Unser Testgerät ist mit einem 16 GB großen DDR5-5200-Speicher, einer 512-GB-PCIe-Gen4-NVMe-SSD und einem 165-Hz-QHD-G-Sync-Display ausgestattet.
Diese Konfiguration der oberen Mittelklasse ist für rund 1500 Euro zu haben.
Mögliche Mitstreiter im Vergleich
Bew. | Datum | Modell | Gewicht | Dicke | Größe | Auflösung | Preis ab |
|---|---|---|---|---|---|---|---|
| 85.9 % v7 (old) | 10 / 2023 | Lenovo LOQ 15IRH8 Core i7 i7-13620H, GeForce RTX 4050 Laptop GPU | 2.4 kg | 25.2 mm | 15.60" | 2560x1440 | |
| 87.3 % v7 (old) | 09 / 2023 | Lenovo LOQ 16IRH8 i7-13620H, GeForce RTX 4060 Laptop GPU | 2.7 kg | 25.9 mm | 16.00" | 2560x1600 | |
| 85.7 % v7 (old) | 07 / 2023 | Lenovo LOQ 15APH8 R7 7840HS, GeForce RTX 4050 Laptop GPU | 2.5 kg | 25.2 mm | 15.60" | 1920x1080 | |
| 82.1 % v7 (old) | 02 / 2023 | MSI Katana 17 B13VFK i7-13620H, GeForce RTX 4060 Laptop GPU | 2.8 kg | 25.2 mm | 17.30" | 1920x1080 | |
| 89 % v7 (old) | 07 / 2023 | Lenovo Legion Pro 5 16ARX8 (R5 7645HX, RTX 4050) R5 7645HX, GeForce RTX 4050 Laptop GPU | 2.5 kg | 27.3 mm | 16.00" | 2560x1600 | |
| 85.1 % v7 (old) | 09 / 2023 | HP Victus 16-r0077ng i7-13700H, GeForce RTX 4070 Laptop GPU | 2.4 kg | 24 mm | 16.10" | 1920x1080 | |
| 84.2 % v7 (old) | 06 / 2023 | Dell G15 5530 i7-13650HX, GeForce RTX 4060 Laptop GPU | 3 kg | 26.95 mm | 15.60" | 1920x1080 | |
| 86.9 % v7 (old) | 06 / 2023 | Asus TUF Gaming A16 FA617XS R9 7940HS, Radeon RX 7600S | 2.2 kg | 22.1 mm | 16.00" | 1920x1200 |
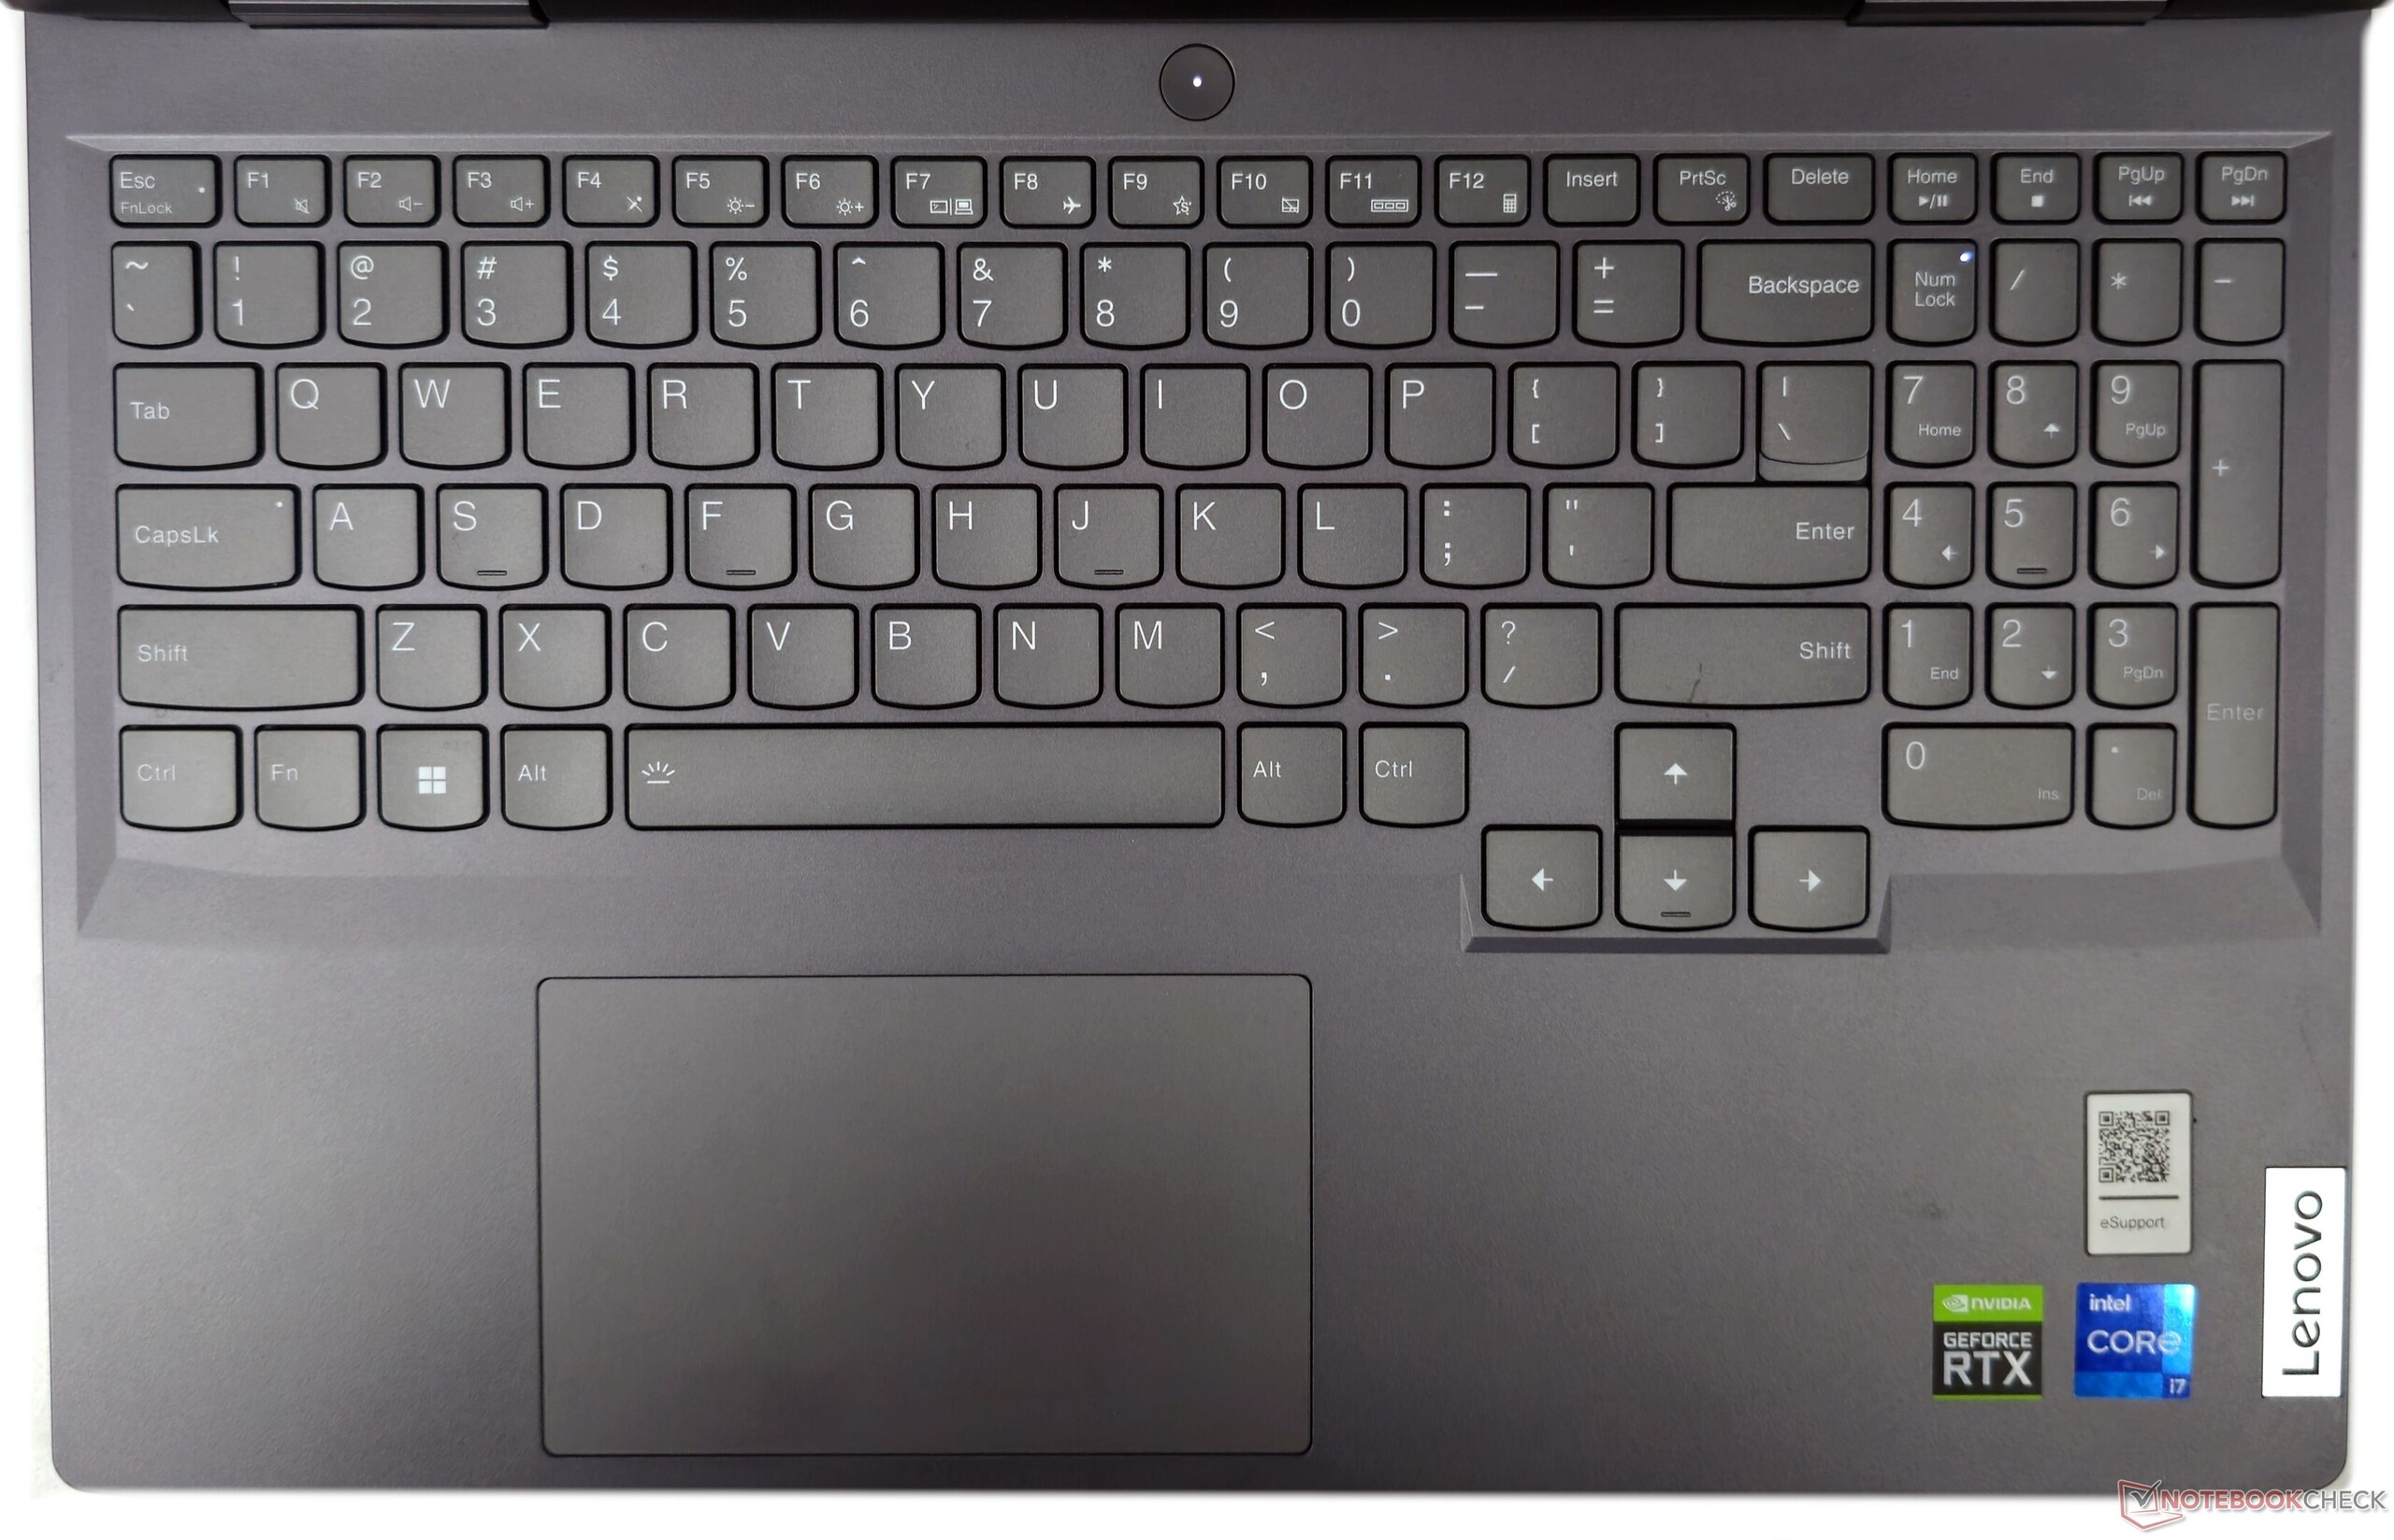
Gehäuse und Eingabegeräte: Gleiche Plastikkonstruktion wie AMD-Variante
Eine detailliertere Bewertung von Gehäuse, Wartungsmöglichkeiten und Eingabegeräten finden Sie in unserem Testbericht zum LOQ 15APH8 — unter diesen Aspekten unterscheiden sich die Intel- und AMD-Modelle des Lenovo LOQ nicht.
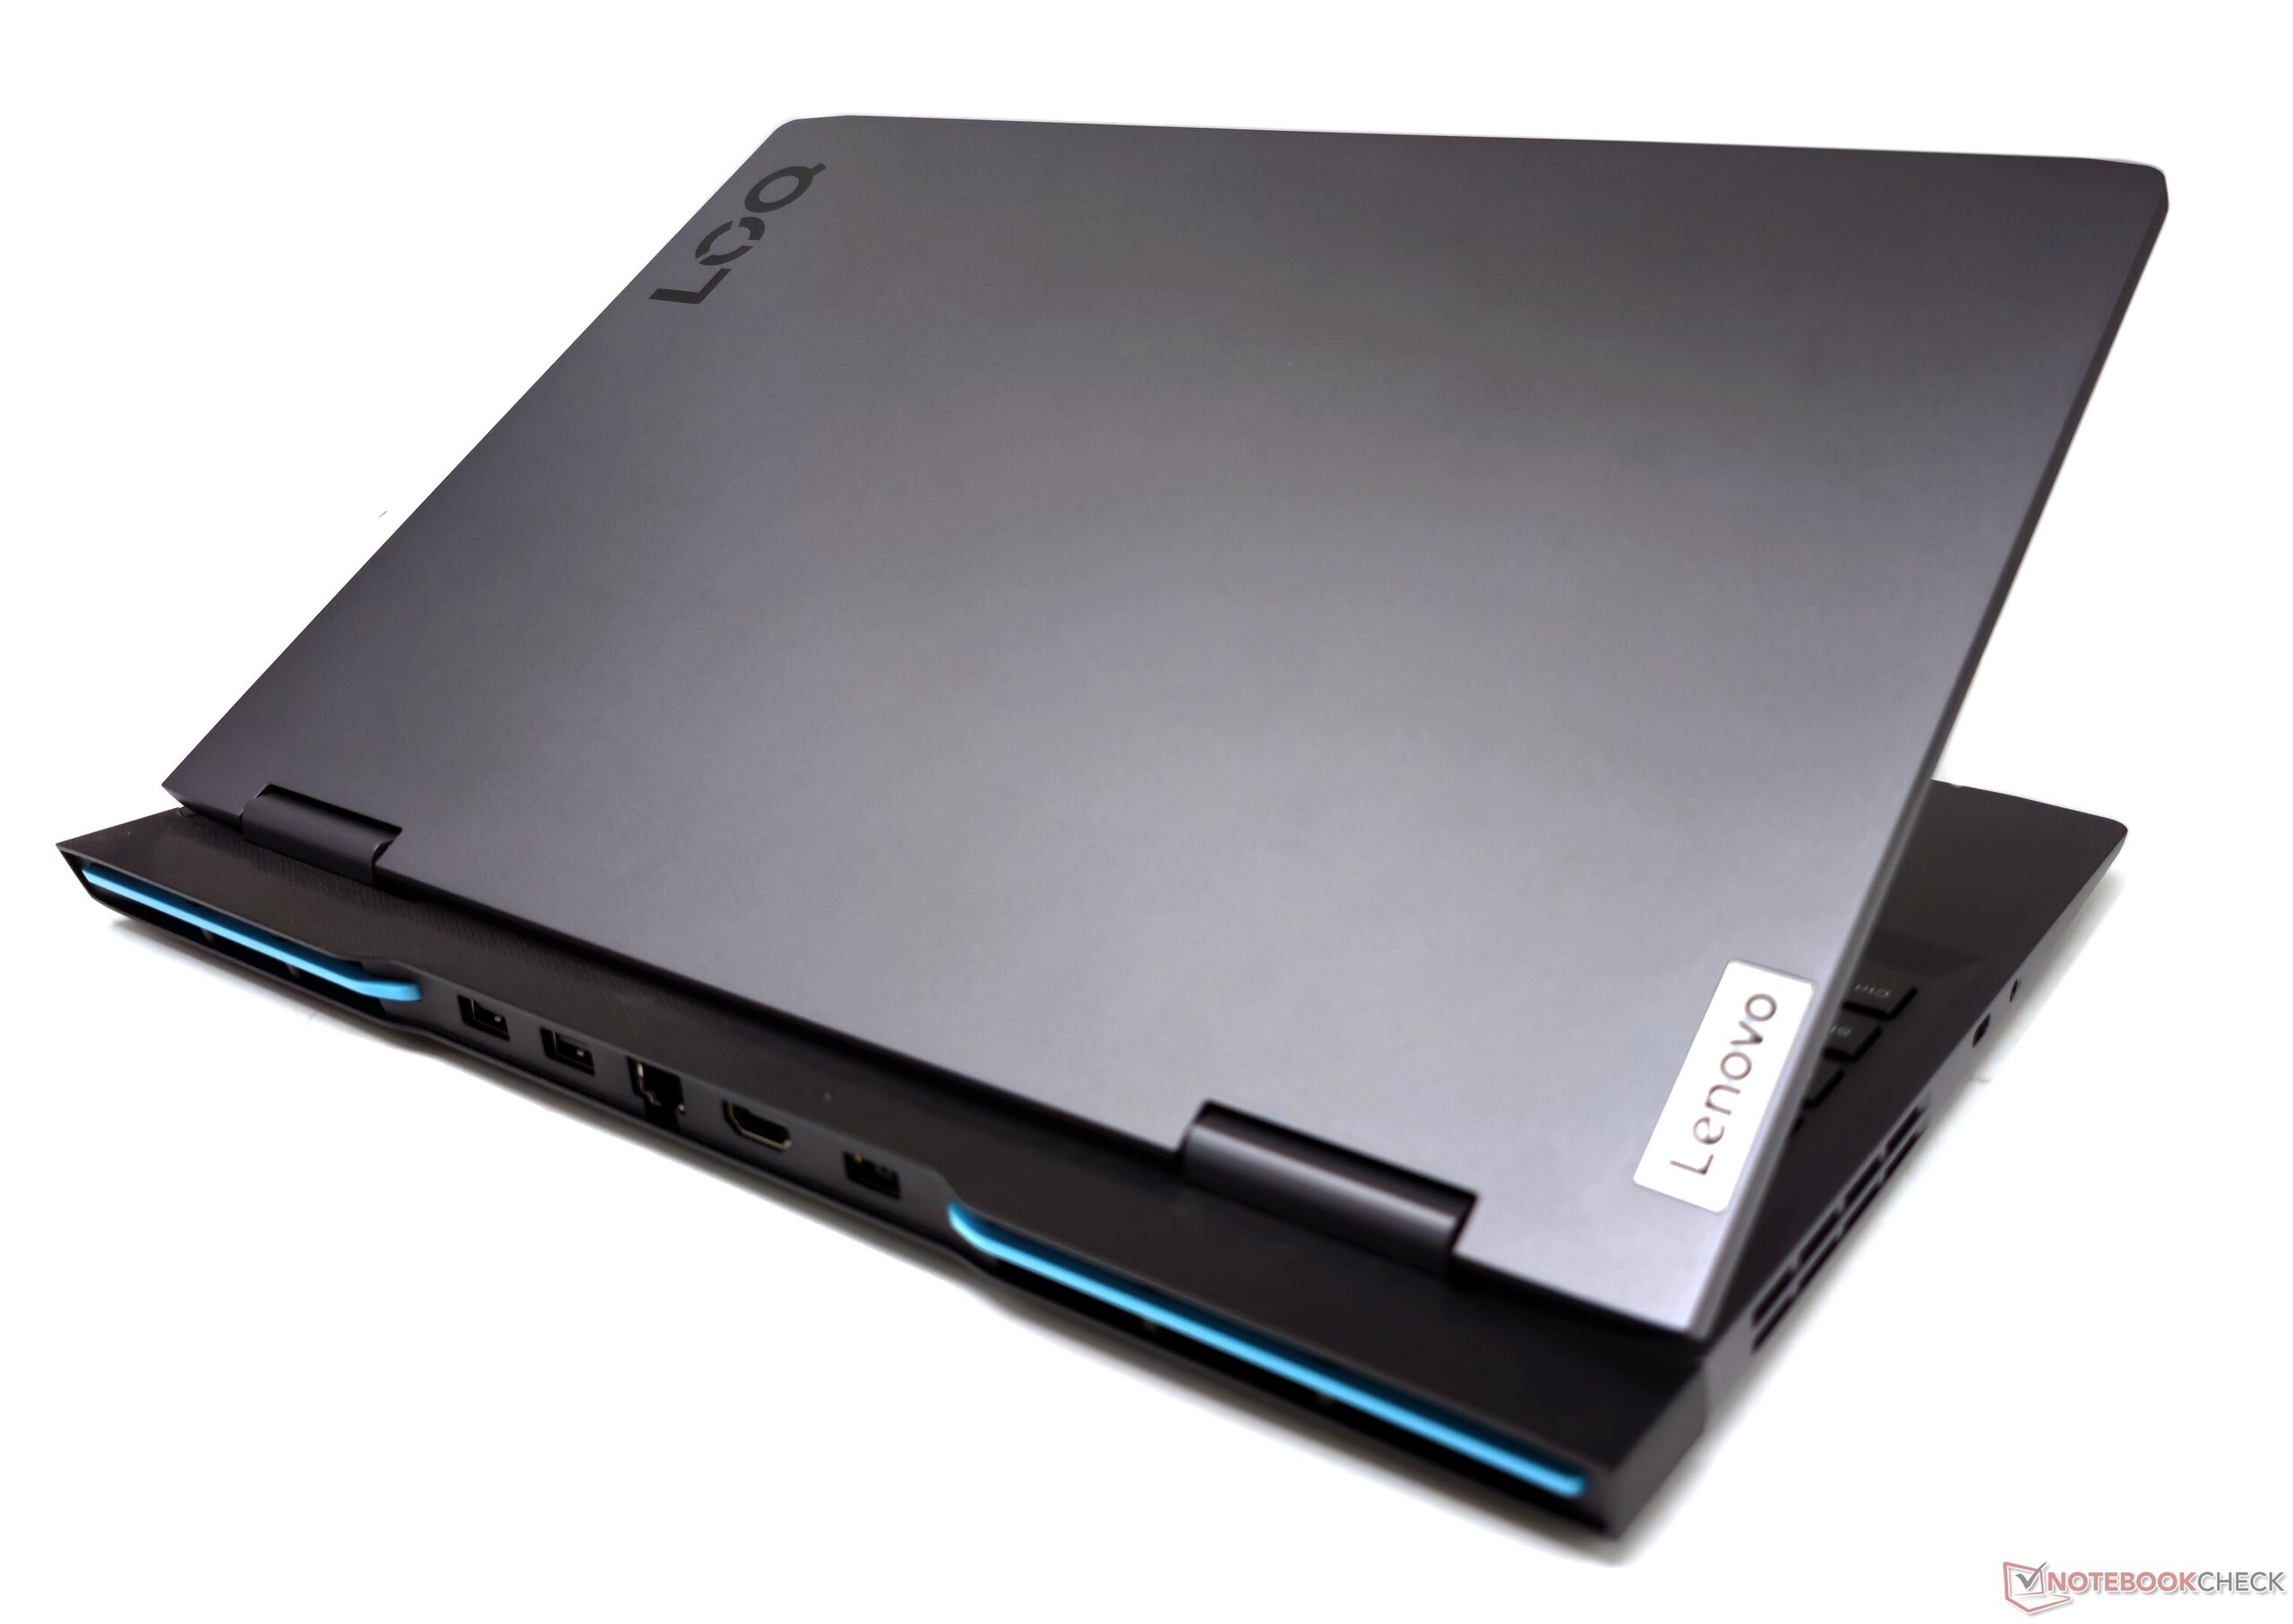
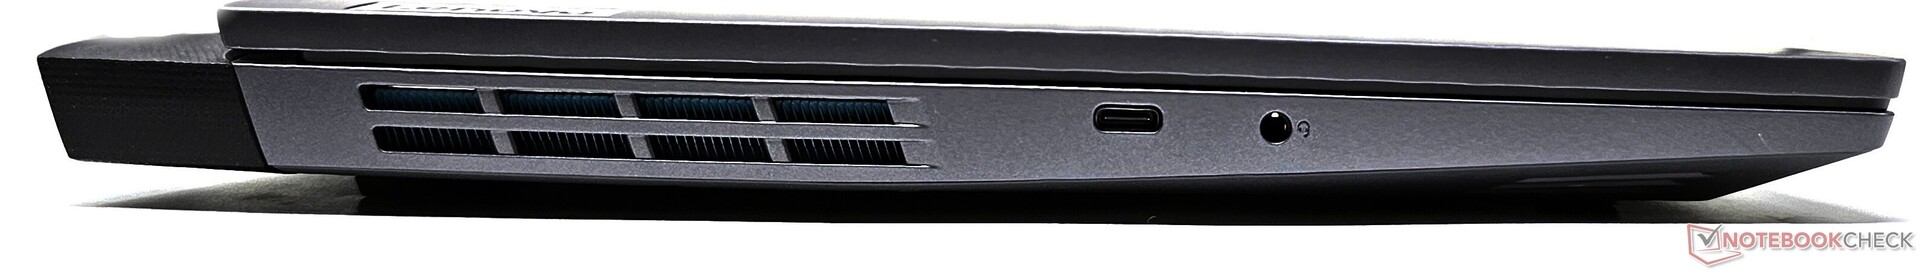
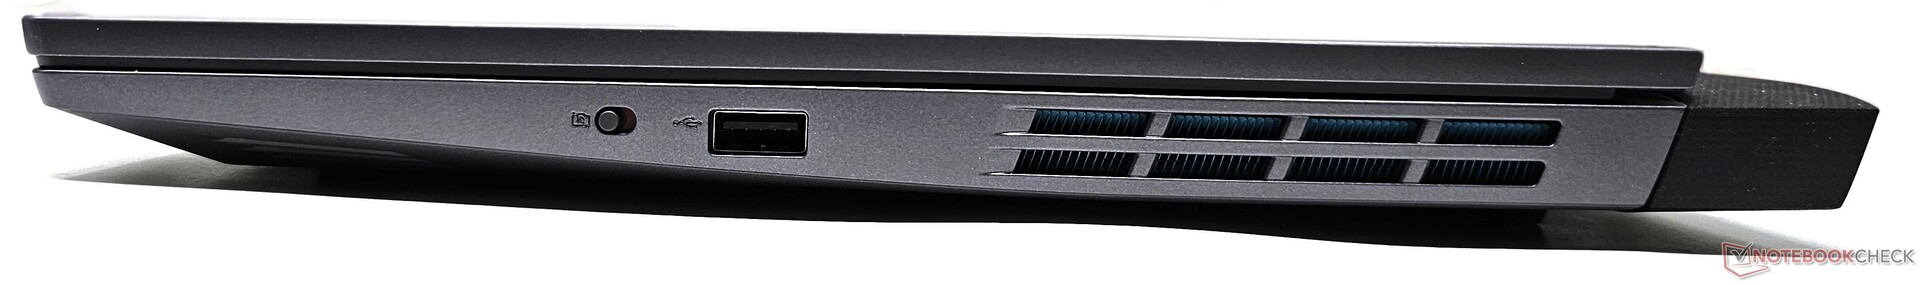
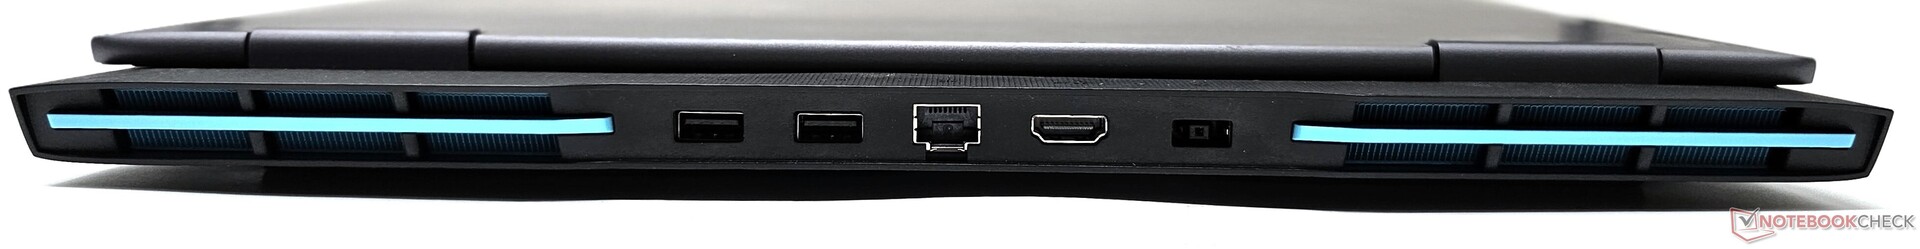
Ausstattung: 140-W-Power-Delivery über USB-C , Thunderbolt 4 fehlt
Die Anschlussauswahl und -positionierung entspricht 1:1 dem LOQ 16 mit Intel-Prozessor. Während das LOQ 15APH8 auch einen USB 2.0-Anschluss bietet, konzentriert sich die Intel-Variante ausschließlich auf USB 3.2.
Laut Lenovo ist der einzige USB-3.2-Gen2-Typ-C-Anschluss für eine Leistungsaufnahme von 140 W ausgelegt. Ein USB-4- oder Thunderbolt 4-Port ist nicht vorhanden.
Kommunikation
Die WLAN-Leistung entspricht den Erwartungen an ein Realtek Wi-Fi-6-Modul. Sowohl die Sende- als auch die Empfangstests wiesen mit unserem Referenzrouter Asus ROG Rapture GT-AXE11000 einen stabilen Durchsatz auf.
| Networking / iperf3 transmit AXE11000 | |
| Lenovo Legion Pro 5 16ARX8 (R5 7645HX, RTX 4050) | |
| Dell G15 5530 | |
| MSI Katana 17 B13VFK | |
| Durchschnitt der Klasse Gaming (560 - 1862, n=94, der letzten 2 Jahre) | |
| Lenovo LOQ 15IRH8 Core i7 | |
| Lenovo LOQ 15APH8 | |
| Durchschnittliche Realtek RTL8852BE (536 - 943, n=71) | |
| Asus TUF Gaming A16 FA617XS | |
| Lenovo LOQ 16IRH8 | |
| HP Victus 16-r0077ng | |
| Networking / iperf3 receive AXE11000 | |
| MSI Katana 17 B13VFK | |
| Lenovo Legion Pro 5 16ARX8 (R5 7645HX, RTX 4050) | |
| Dell G15 5530 | |
| Durchschnitt der Klasse Gaming (680 - 1745, n=94, der letzten 2 Jahre) | |
| Lenovo LOQ 15IRH8 Core i7 | |
| Asus TUF Gaming A16 FA617XS | |
| Durchschnittliche Realtek RTL8852BE (455 - 985, n=72) | |
| Lenovo LOQ 16IRH8 | |
| Lenovo LOQ 15APH8 | |
| HP Victus 16-r0077ng | |
Webcam
Die 1080p-Webcam zeigt ausgenommen von Weiß bei allen Farben eine hohe Abweichung. Die Bildqualität ist bei gutem Umgebungslicht dennoch brauchbar. Ein elektronischer Shutter befindet sich auf der rechten Seite des Geräts.


Garantie
Lenovo bietet für das LOQ 15 2 Jahre Garantie mit Kurierabholung oder Einsendung durch den Kunden.
Display: Das QHD-G-Sync-Panel mit 165 Hz ist ein guter Grund für ein Upgrade
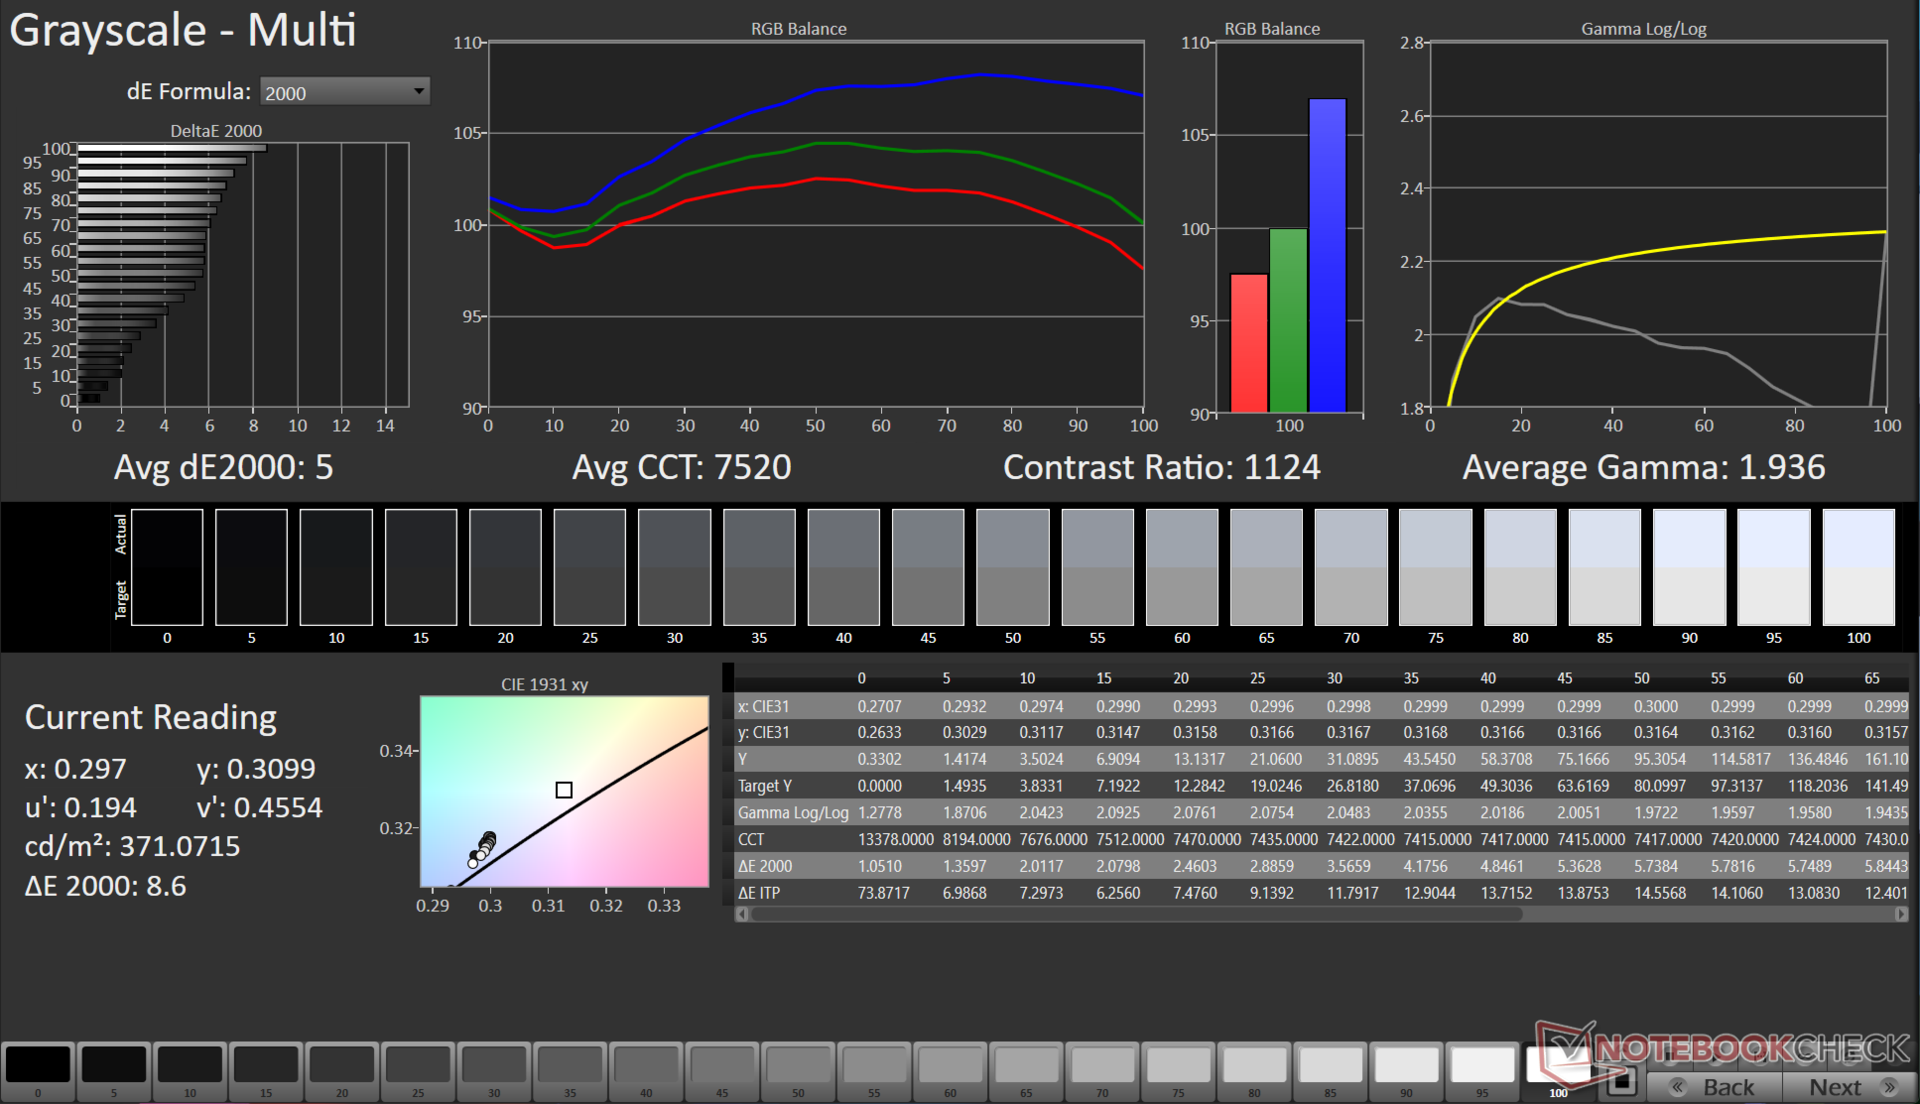
Unser LOQ 15 ist mit einem QHD-Panel von BOE mit 165-Hz-Bildwiederholrate ausgestattet. Ist die dedizierte GPU aktiviert, unterstützt das Display Nvidia G-Sync. Laut Lenovo hat das Display eine Helligkeit von 350 cd/m². Unsere eigene Messung ergab aber an der hellsten Stelle einen Wert von 383 cd/m².
In den Ecken zeigen sich Lichthöfe, dennoch ist die Ausleuchtung mit 90 Prozent gut. Die Schwarzwerte und das Kontrastverhältnis können das QHD+-Panel von AUO im LOQ 16IRH8 überbieten.

| |||||||||||||||||||||||||
Ausleuchtung: 90 %
Helligkeit Akku: 372 cd/m²
Kontrast: 1130:1 (Schwarzwert: 0.33 cd/m²)
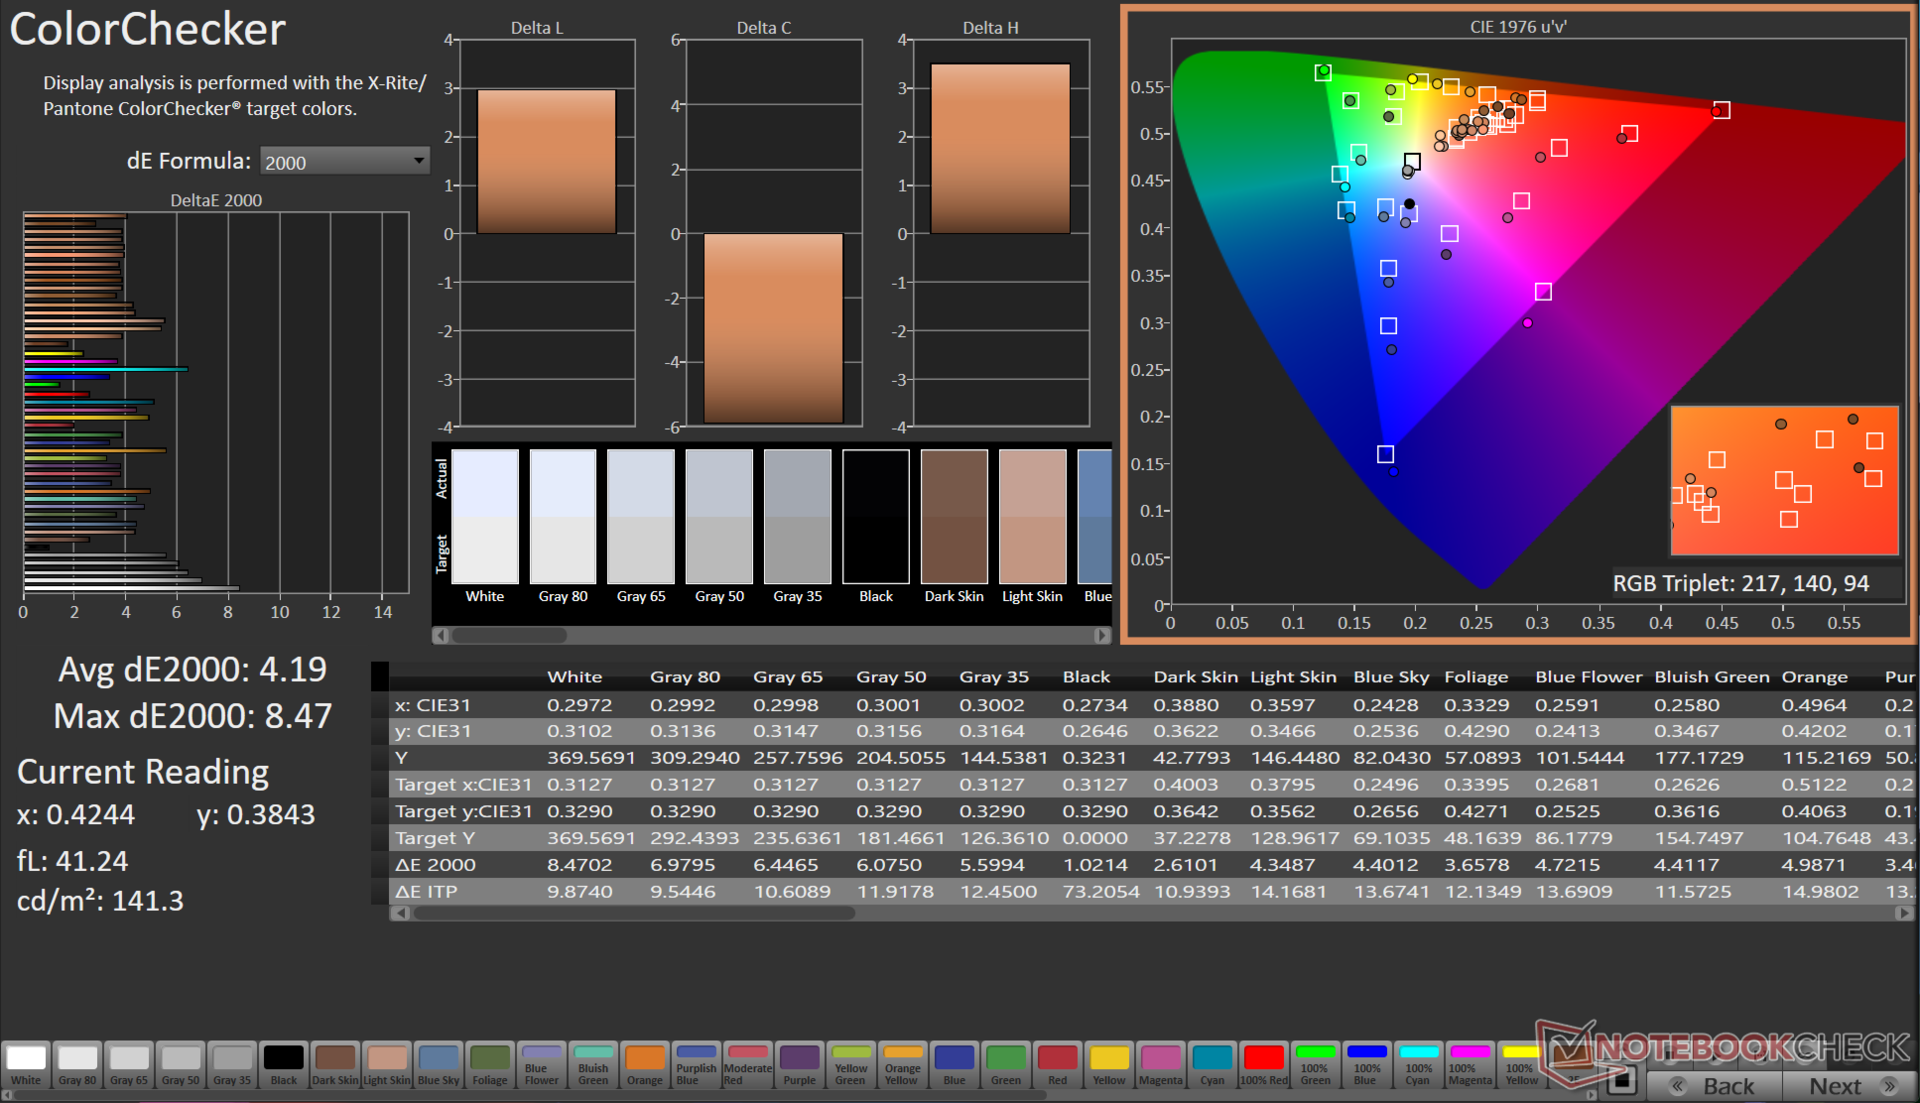
ΔE ColorChecker Calman: 4.19 | ∀{0.5-29.43 Ø4.72}
calibrated: 1.07
ΔE Greyscale Calman: 5 | ∀{0.09-98 Ø4.97}
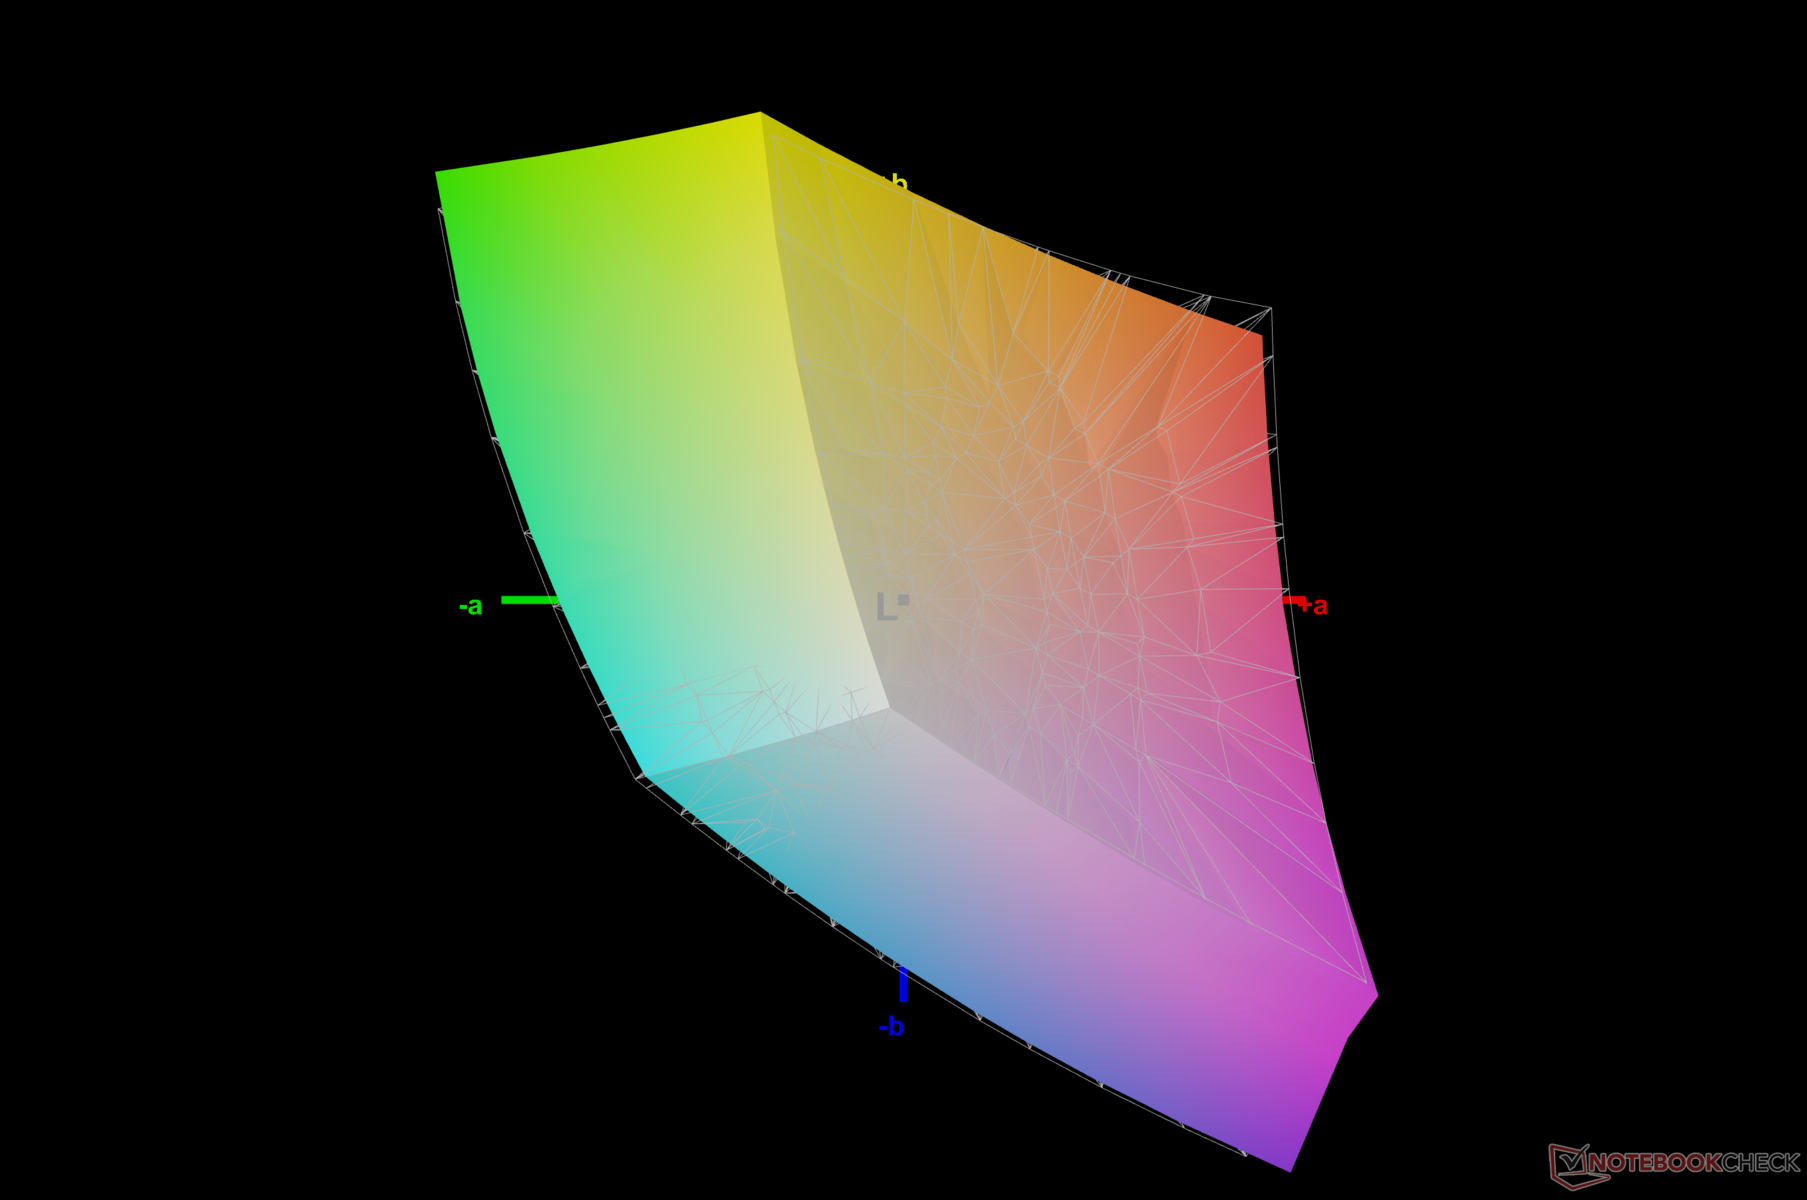
67.7% AdobeRGB 1998 (Argyll 3D)
96.6% sRGB (Argyll 3D)
66.3% Display P3 (Argyll 3D)
Gamma: 1.93
CCT: 7520 K
| Lenovo LOQ 15IRH8 Core i7 BOE CQ NE156QHM-NY4, IPS, 2560x1440, 15.6" | Lenovo LOQ 16IRH8 AUOC1A5 (B160QAN03.L), IPS, 2560x1600, 16" | Lenovo LOQ 15APH8 BOE NJ NE156FHM-NX3, IPS, 1920x1080, 15.6" | MSI Katana 17 B13VFK B173HAN04.9, IPS LED, 1920x1080, 17.3" | Lenovo Legion Pro 5 16ARX8 (R5 7645HX, RTX 4050) CSOT T3 MNG007DA2-2, IPS, 2560x1600, 16" | HP Victus 16-r0077ng CMN162D, IPS, 1920x1080, 16.1" | Dell G15 5530 AUO B156HAN, IPS, 1920x1080, 15.6" | Asus TUF Gaming A16 FA617XS BOE NE160WUM-NX2, IPS, 1920x1200, 16" | |
|---|---|---|---|---|---|---|---|---|
| Display | 5% | -39% | -38% | 6% | 1% | 7% | 3% | |
| Display P3 Coverage (%) | 66.3 | 70.5 6% | 40.2 -39% | 40.8 -38% | 71.6 8% | 66.7 1% | 73.1 10% | 69.3 5% |
| sRGB Coverage (%) | 96.6 | 98.9 2% | 60.2 -38% | 61 -37% | 99.8 3% | 98 1% | 98.4 2% | 97.3 1% |
| AdobeRGB 1998 Coverage (%) | 67.7 | 72.6 7% | 41.5 -39% | 42.2 -38% | 72.9 8% | 69 2% | 74.4 10% | 70.7 4% |
| Response Times | -16% | -473% | -385% | -51% | -82% | 34% | -116% | |
| Response Time Grey 50% / Grey 80% * (ms) | 5 ? | 7.2 ? -44% | 42.7 ? -754% | 33 ? -560% | 12 ? -140% | 13.3 ? -166% | 3.39 ? 32% | 15.6 ? -212% |
| Response Time Black / White * (ms) | 8.41 ? | 7.4 ? 12% | 24.5 ? -191% | 26 ? -209% | 5.2 ? 38% | 8.2 ? 2% | 5.35 ? 36% | 10 ? -19% |
| PWM Frequency (Hz) | 21620 ? | |||||||
| Bildschirm | 17% | -17% | -46% | 20% | 23% | -5% | 20% | |
| Helligkeit Bildmitte (cd/m²) | 373 | 407 9% | 346.2 -7% | 267 -28% | 543 46% | 308 -17% | 320 -14% | 301 -19% |
| Brightness (cd/m²) | 365 | 369 1% | 329 -10% | 256 -30% | 516 41% | 285 -22% | 316 -13% | 294 -19% |
| Brightness Distribution (%) | 90 | 85 -6% | 81 -10% | 93 3% | 87 -3% | 85 -6% | 94 4% | 94 4% |
| Schwarzwert * (cd/m²) | 0.33 | 0.45 -36% | 0.31 6% | 0.21 36% | 0.58 -76% | 0.25 24% | 0.21 36% | 0.21 36% |
| Kontrast (:1) | 1130 | 904 -20% | 1117 -1% | 1271 12% | 936 -17% | 1232 9% | 1524 35% | 1433 27% |
| Delta E Colorchecker * | 4.19 | 1.43 66% | 4.19 -0% | 4.7 -12% | 1.35 68% | 1.3 69% | 4.55 -9% | 1.79 57% |
| Colorchecker dE 2000 max. * | 8.47 | 3.58 58% | 19.19 -127% | 20.4 -141% | 3.22 62% | 2.76 67% | 9.83 -16% | 3.48 59% |
| Colorchecker dE 2000 calibrated * | 1.07 | 1.07 -0% | 1.66 -55% | 4.5 -321% | 1.31 -22% | 0.92 14% | 1.51 -41% | 1.2 -12% |
| Delta E Graustufen * | 5 | 1.13 77% | 2.6 48% | 1.5 70% | 1.03 79% | 1.7 66% | 6.2 -24% | 2.5 50% |
| Gamma | 1.93 114% | 2.5 88% | 2.19 100% | 2.12 104% | 2.38 92% | 2.167 102% | 2.07 106% | 2.265 97% |
| CCT | 7520 86% | 6526 100% | 6749 96% | 6552 99% | 6452 101% | 6767 96% | 6479 100% | 6157 106% |
| Durchschnitt gesamt (Programm / Settings) | 2% /
9% | -176% /
-87% | -156% /
-92% | -8% /
7% | -19% /
3% | 12% /
3% | -31% /
-3% |
* ... kleinere Werte sind besser
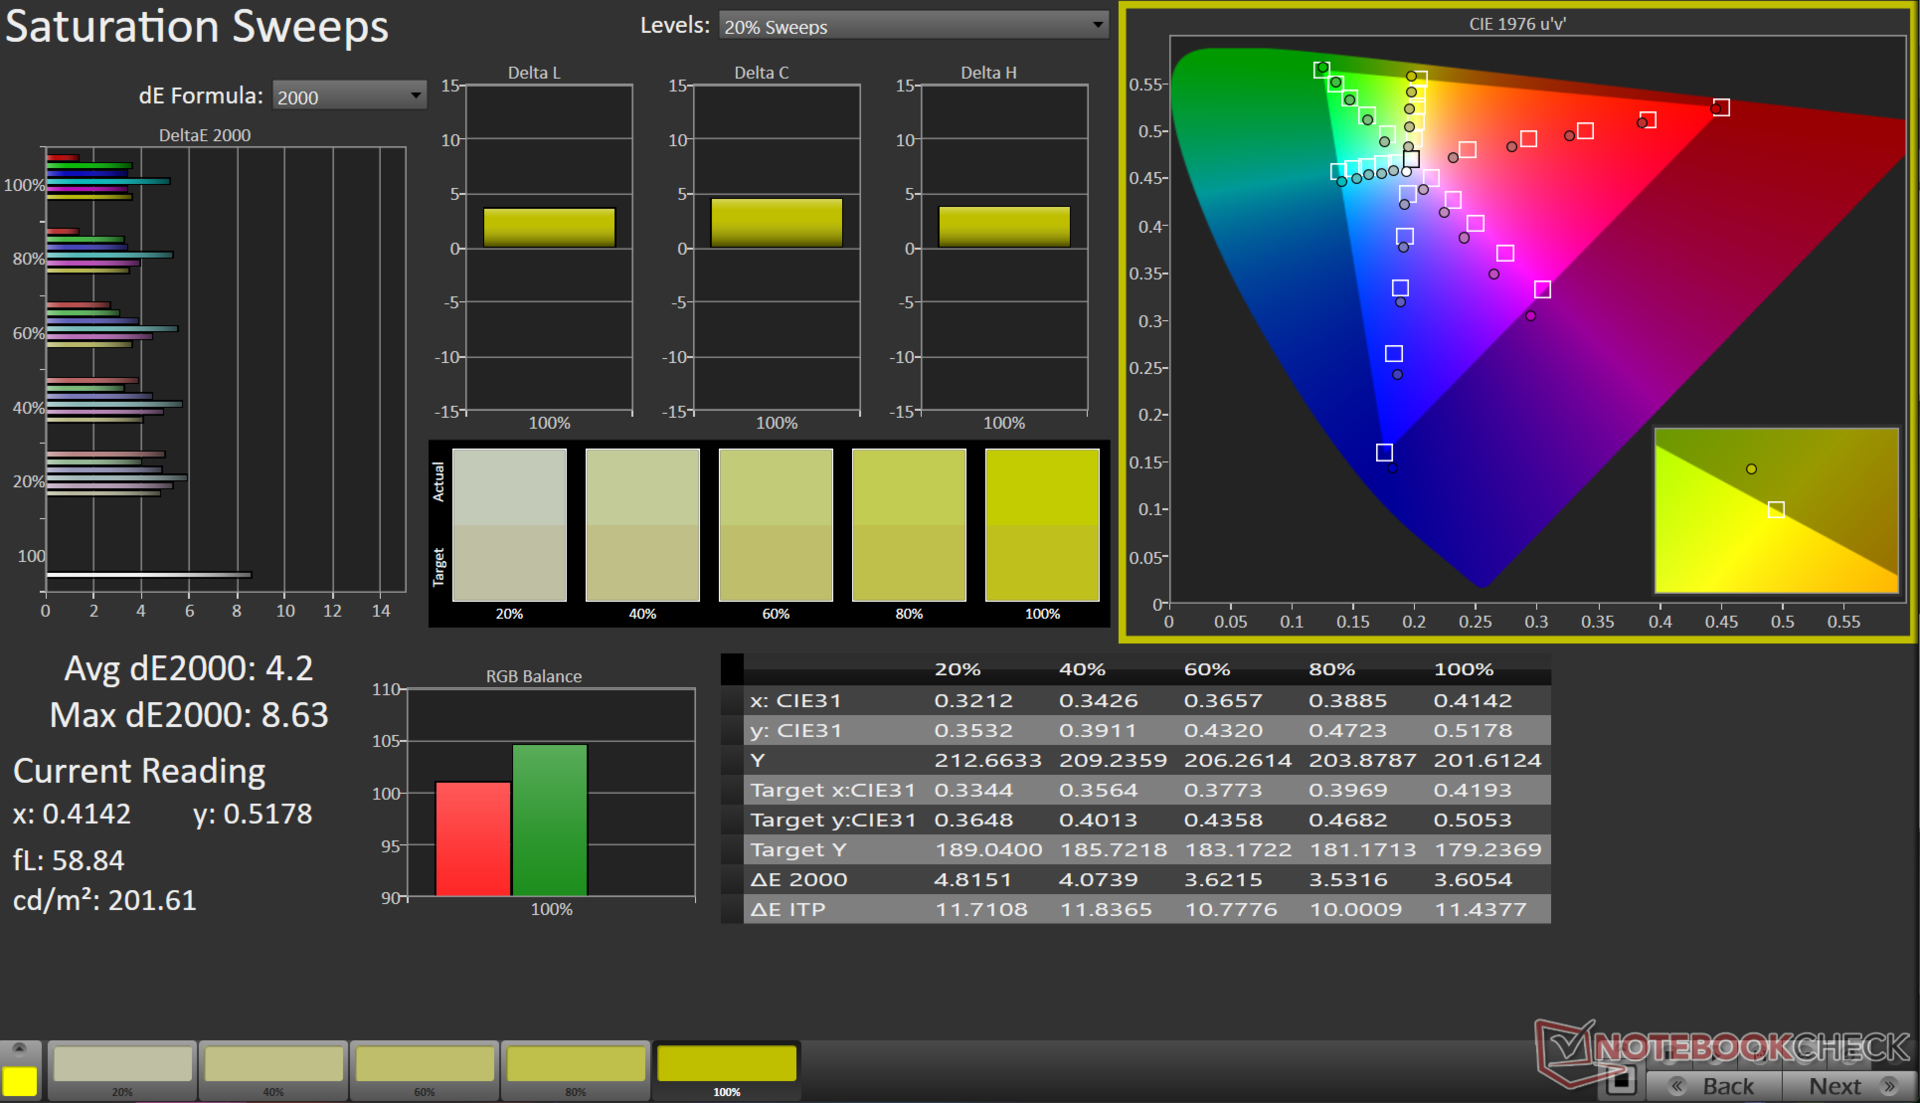
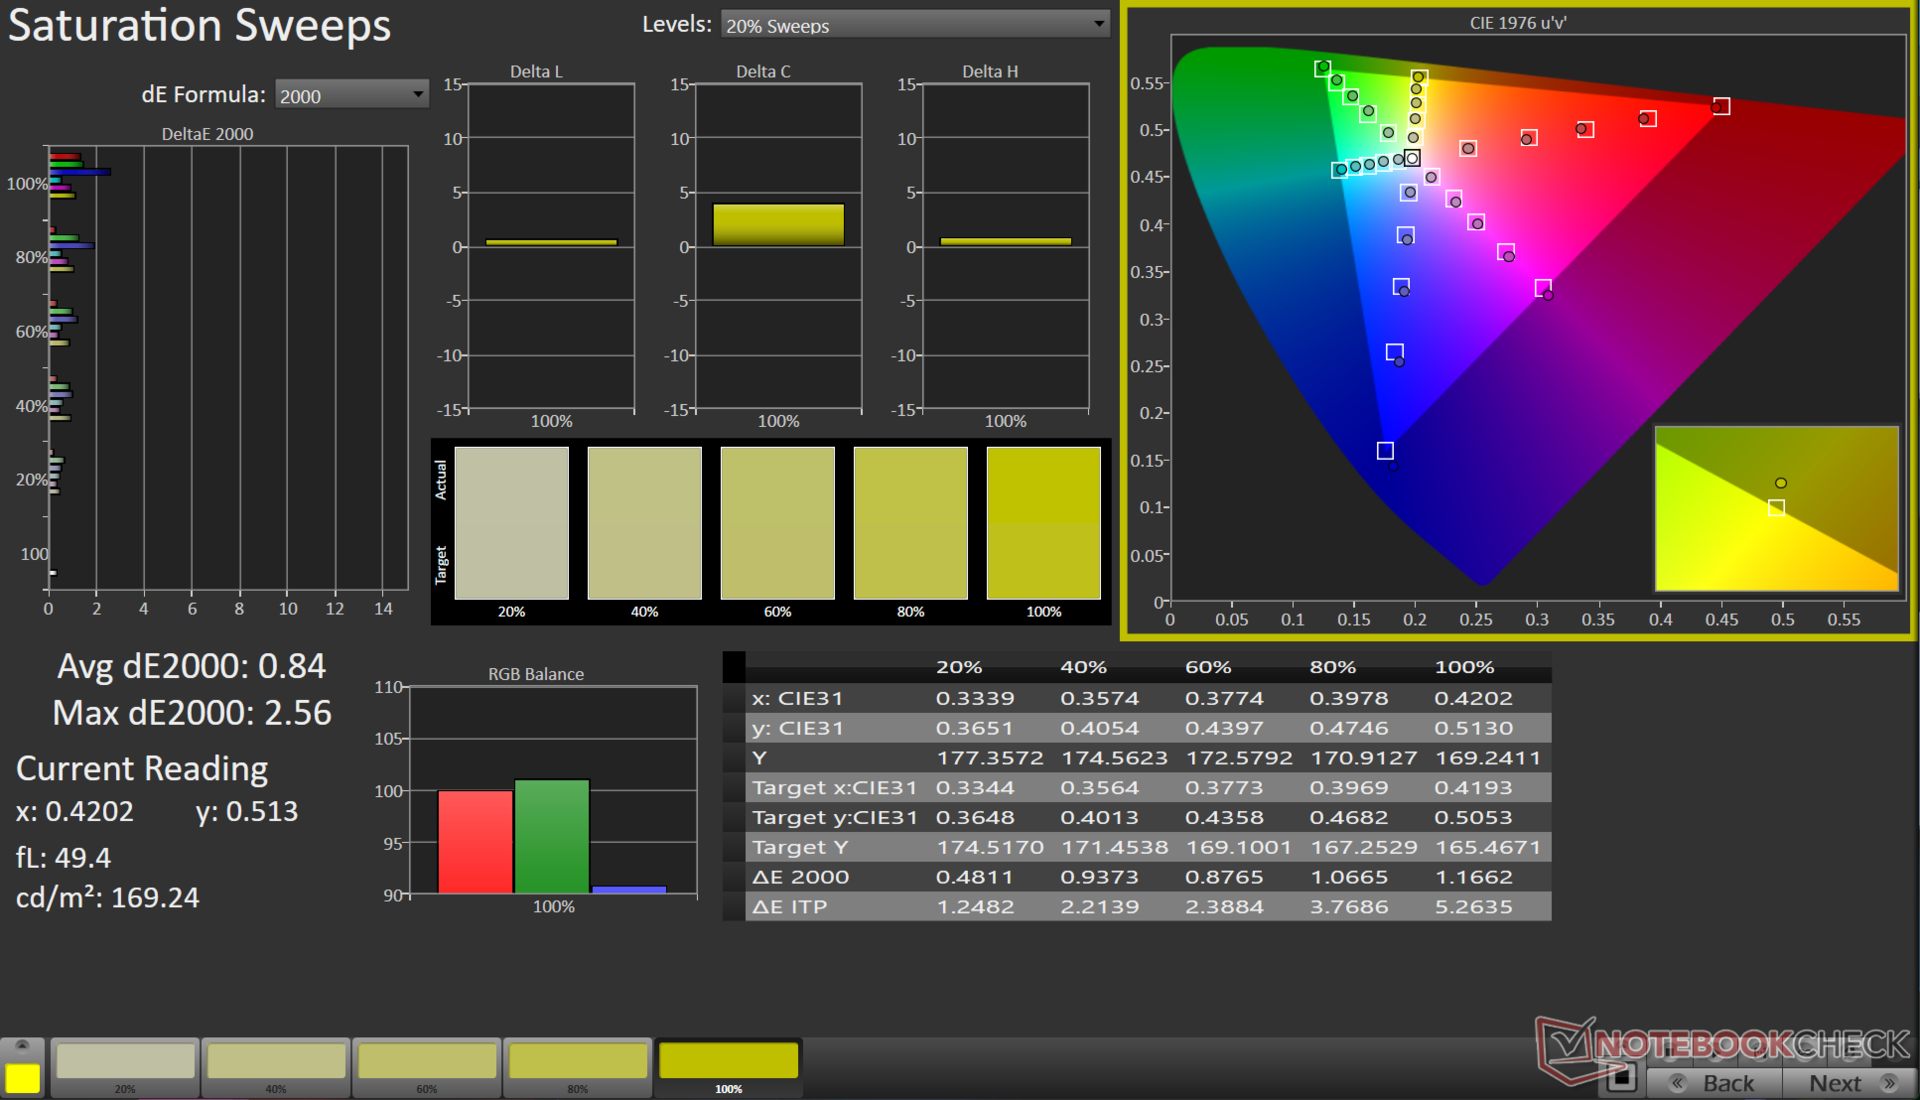
Das Display deckt fast 97 Prozent des sRGB-Farbraums ab. Das sollte für die meisten Gaming- und Webinhalte ausreichen. Die Abdeckung der Farbräume Adobe RGB und Display P3 ist jedoch nur mittelmäßig.
Nichtsdestotrotz erreicht das QHD-Panel des LOQ 15IRH8 deutlich bessere Farbwerte als das 1080p-Panel mit 144 Hz im mit einem AMD-Prozessor ausgestatteten LOQ 15APH8.
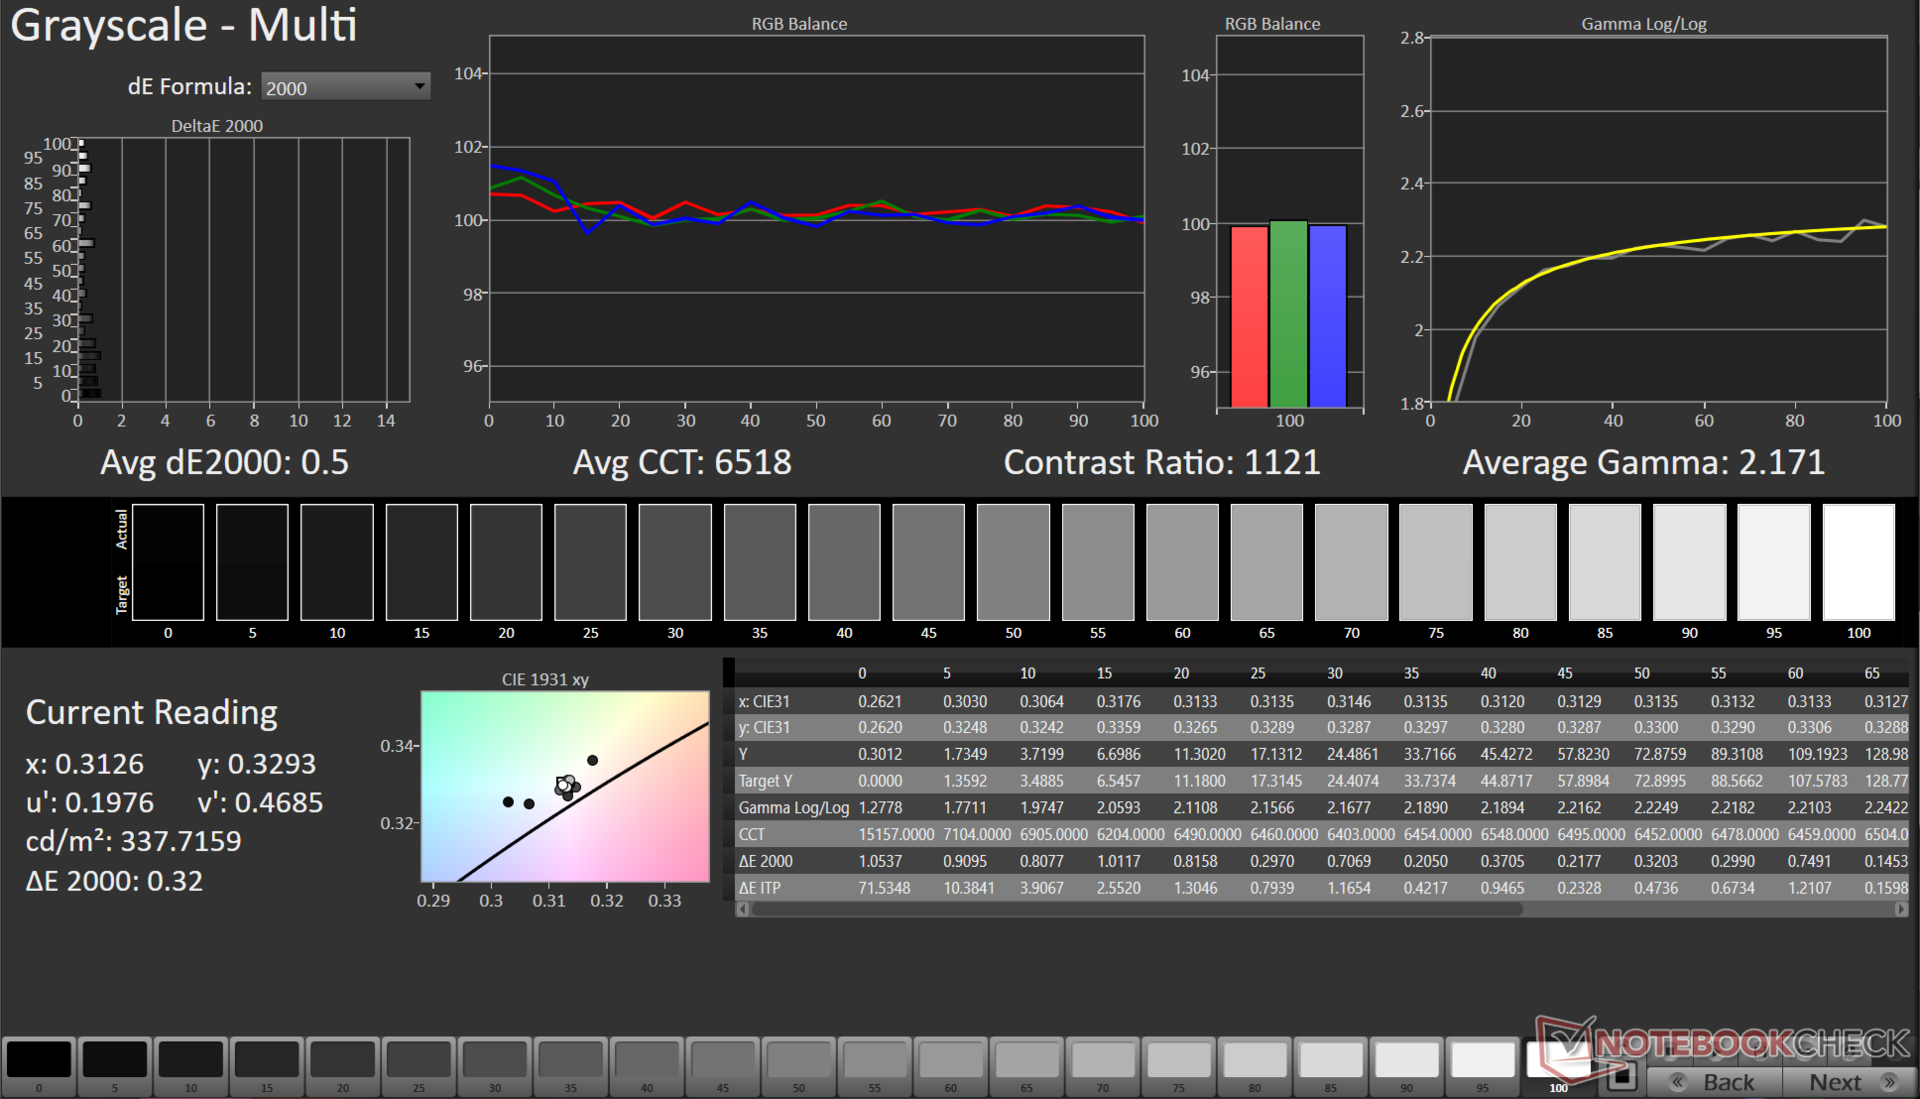
Im Auslieferungszustand haben wir große Abweichungen festgestellt. Durch die Kalibrierung mit dem X-Rite i1Basic Pro 3 Spektralfotometer und der Software Calman Ultimate von Portrait Displays konnten wir die Delta-E-Werte sowohl im Bereich der Graustufen als auch der Farben noch deutlich verbessern.
Das Panel hat weiterhin Schwierigkeiten, 100 Prozent Blau korrekt wiederzugeben.

Unsere kalibrierte ICC-Datei können Sie über den Link oben herunterladen.
Reaktionszeiten (Response Times) des Displays
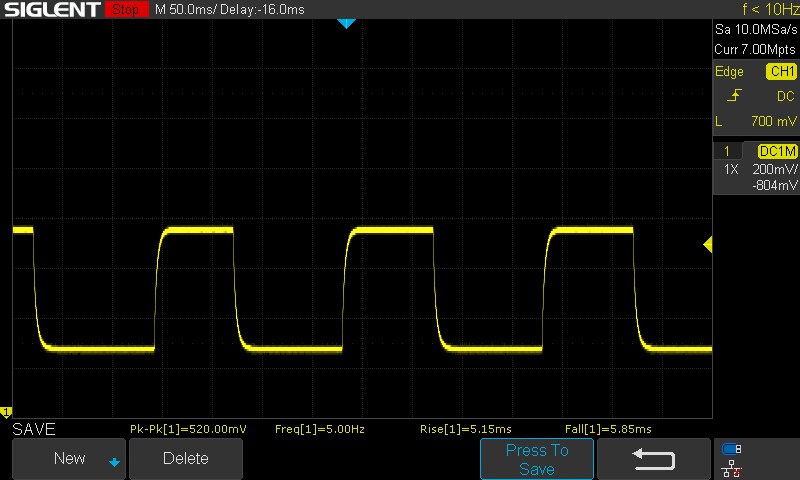
| ↔ Reaktionszeiten Schwarz zu Weiß | ||
|---|---|---|
| 8.41 ms ... steigend ↗ und fallend ↘ kombiniert | ↗ 3.96 ms steigend | 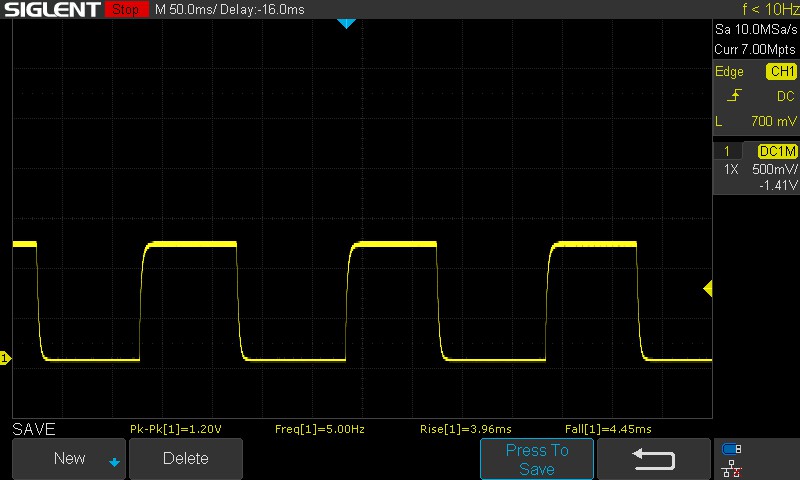 |
| ↘ 4.45 ms fallend | ||
| Die gemessenen Reaktionszeiten sind kurz wodurch sich der Bildschirm auch für Spiele gut eignen sollte. Im Vergleich rangierten die bei uns getesteten Geräte von 0.1 (Minimum) zu 240 (Maximum) ms. » 24 % aller Screens waren schneller als der getestete. Daher sind die gemessenen Reaktionszeiten besser als der Durchschnitt aller vermessenen Geräte (19.8 ms). | ||
| ↔ Reaktionszeiten 50% Grau zu 80% Grau | ||
| 5 ms ... steigend ↗ und fallend ↘ kombiniert | ↗ 2.16 ms steigend | 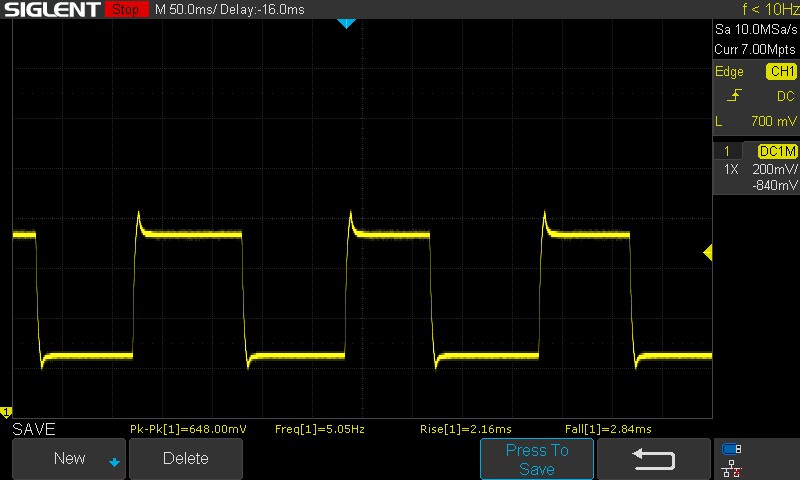 |
| ↘ 2.84 ms fallend | ||
| Die gemessenen Reaktionszeiten sind sehr kurz, wodurch sich der Bildschirm auch für schnelle 3D Spiele eignen sollte. Im Vergleich rangierten die bei uns getesteten Geräte von 0.165 (Minimum) zu 636 (Maximum) ms. » 17 % aller Screens waren schneller als der getestete. Daher sind die gemessenen Reaktionszeiten besser als der Durchschnitt aller vermessenen Geräte (31 ms). | ||
Die Reaktionszeit ist deutlich besser als beim 1080p-Panel im LOQ 15APH8. Das Panel nutzt standardmäßig Overdrive, was einen schnellen Übergang von 50 % Grau auf 80 % Grau in 5 ms ermöglicht. Wird Overdrive über Lenovo Vantage deaktiviert, steigt die Reaktionszeit von 50 % Grau auf 80 % Grau auf 11 ms.
Das Panel zeigt auf keiner Helligkeitsstufe PWM-Flimmern. Weitere Informationen über PWM finden Sie in unserem Artikel "Warum wir von Pulsweitenmodulation (PWM) Kopfweh bekommen" sowie in unserem PWM Ranking, bei dem die gemessenen PWM-Werte aller getesteten Geräte verglichen werden können.
Bildschirm-Flackern / PWM (Pulse-Width Modulation)
| Flackern / PWM nicht festgestellt | ≤ 100 % Helligkeit | 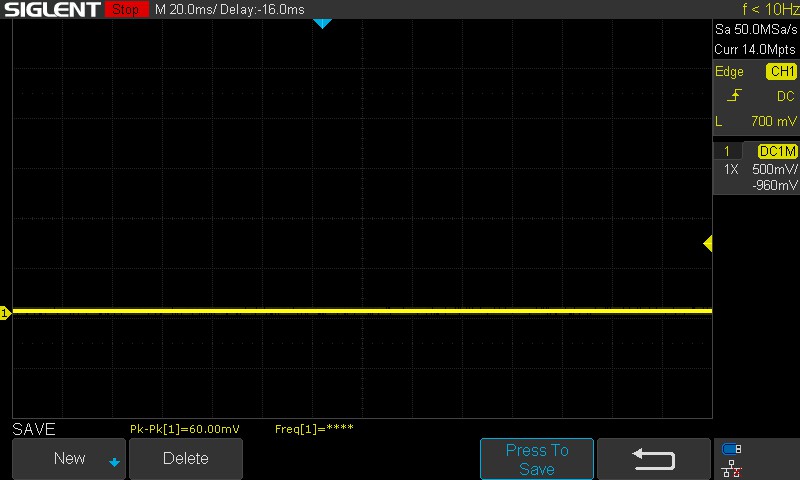 | |
Im Vergleich: 52 % aller getesteten Geräte nutzten kein PWM um die Helligkeit zu reduzieren. Wenn PWM eingesetzt wurde, dann bei einer Frequenz von durchschnittlich 7778 (Minimum 5, Maximum 343500) Hz. | |||
Die Lesbarkeit im Freien ist für den allgemeinen Gebrauch ausreichend — besonders helle Sonnentage könnten den 350-cd/m²-Bildschirm allerdings überfordern. Die Blickwinkel sind relativ stabil, der Helligkeits- und Farbverlust ist selbst bei extrem breiten Einblickswinkeln noch gering.


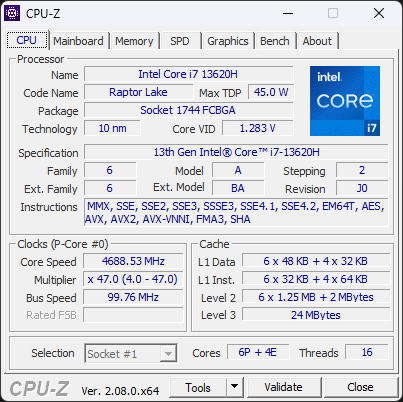
Leistung: Core i7-13620H mit etwas wackeligem Durchhaltevermögen
Lenovo bietet mehrere LOQ-15-Modelle an, die entweder mit Intel- oder AMD-Prozessoren ausgestattet sind. Die Intel-Optionen reichen vom Core i5-13420H bis zum Core i7-13700H. Bei den AMD-Prozessoren können Käufer zwischen dem Ryzen 5 7640HS und dem Ryzen 7 7840HS wählen. Außerdem stehen die Grafikkarten RTX 4050 oder RTX 4060 zur Auswahl.
Testkonditionen
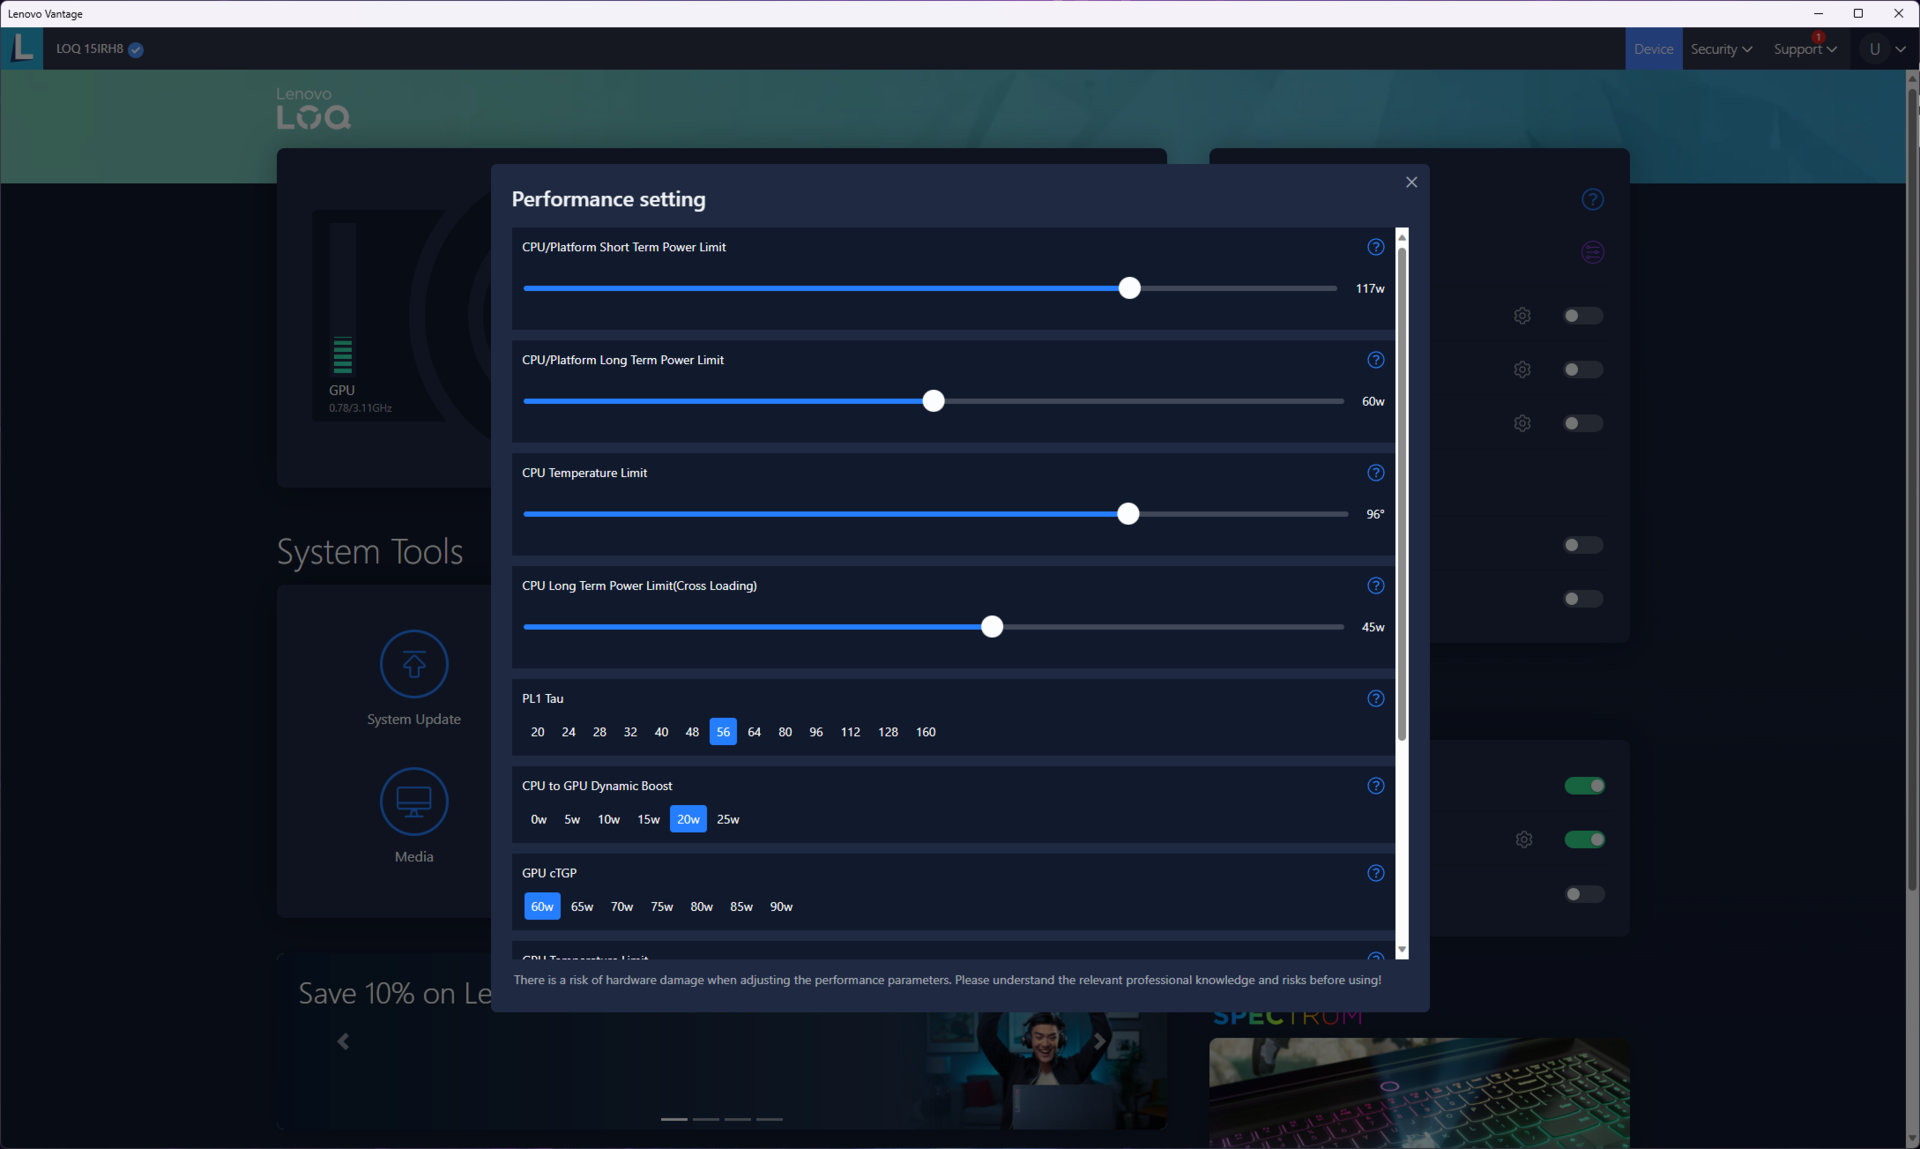
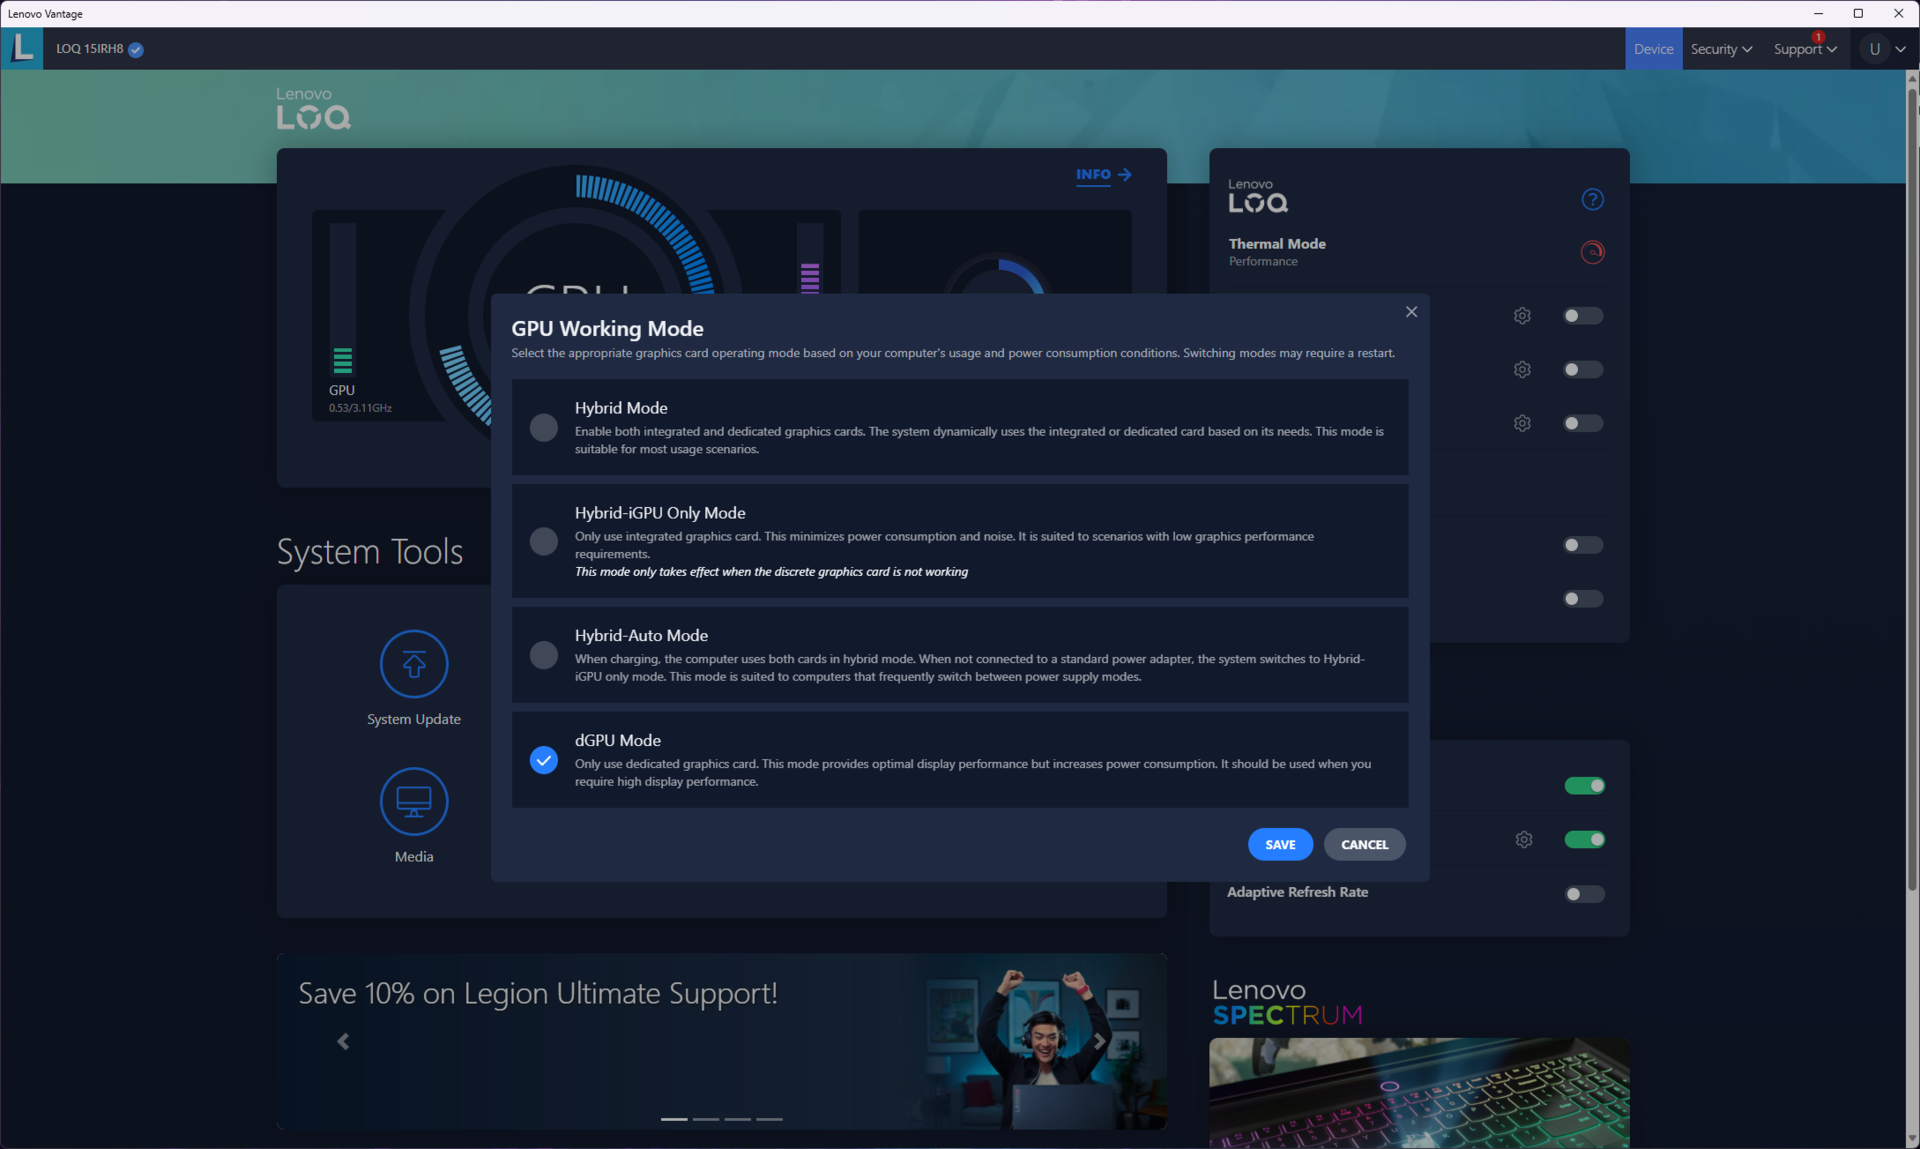
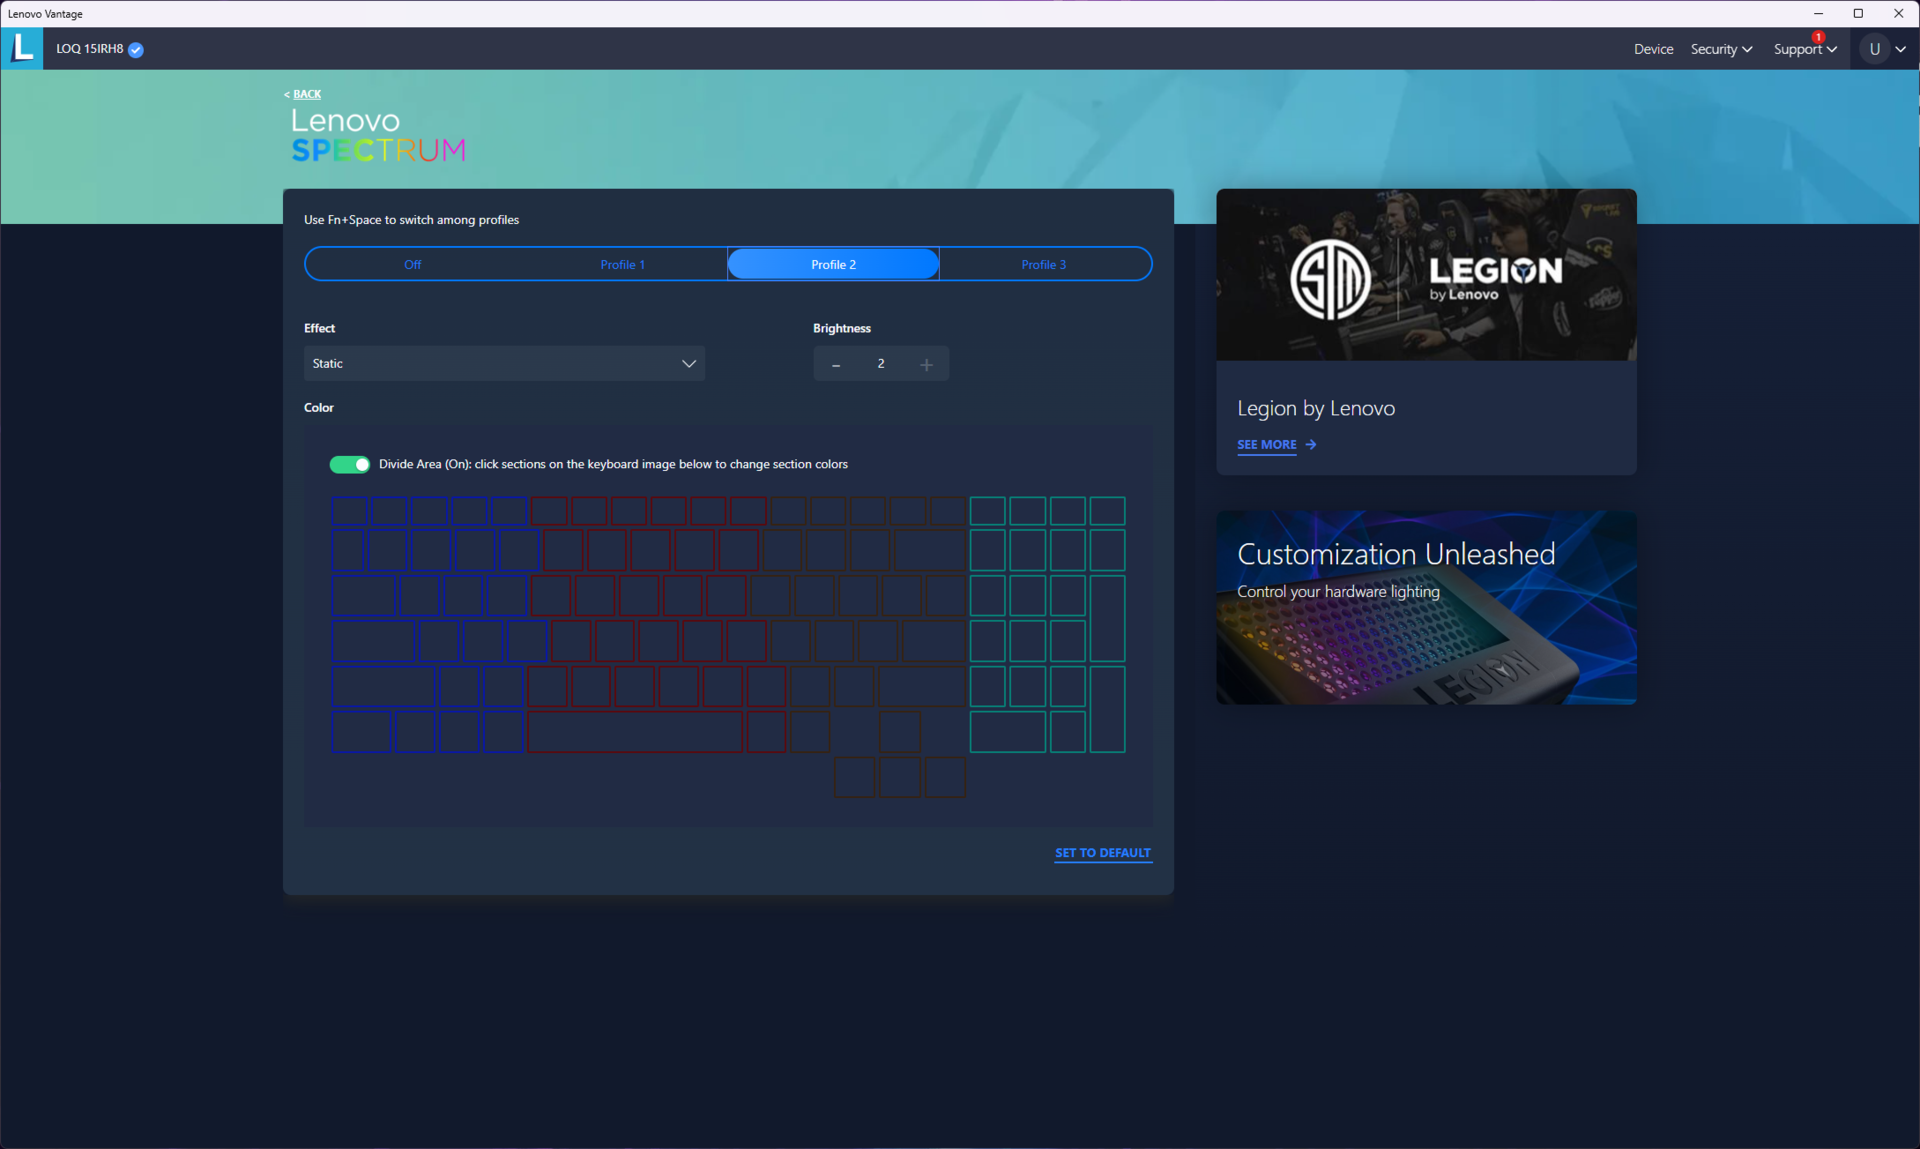
Über Lenovo Vantage lassen sich Energieprofile, RGB-Effekte und andere Eigenschaften des LOQ 15 einfach und bequem anpassen. Erfahrene Nutzer können hier etwa auch eigene CPU-Powerlimits, Zeitlimits, Temperaturlimits, die TDP der GPU oder den Nvidia Dynamic Boost wie gewünscht einstellen.

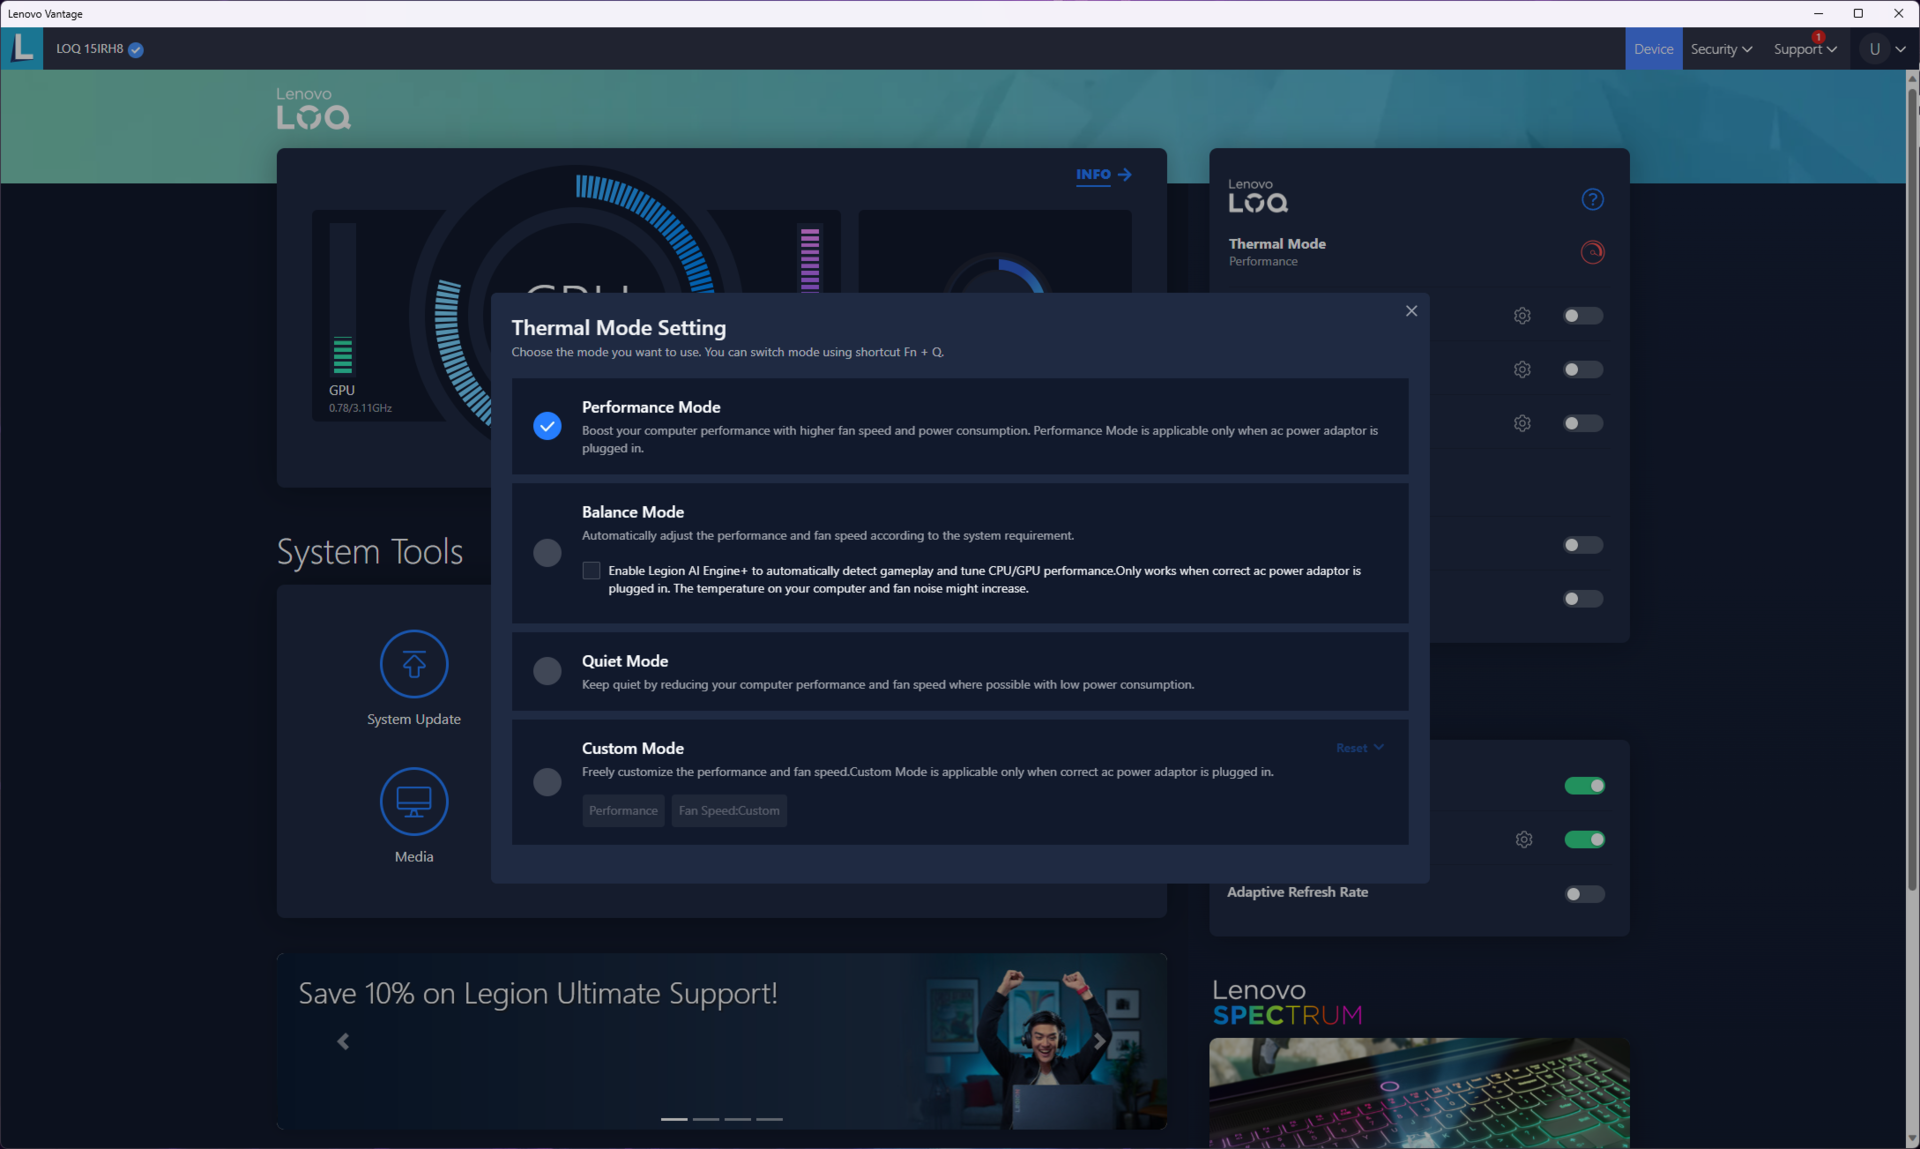
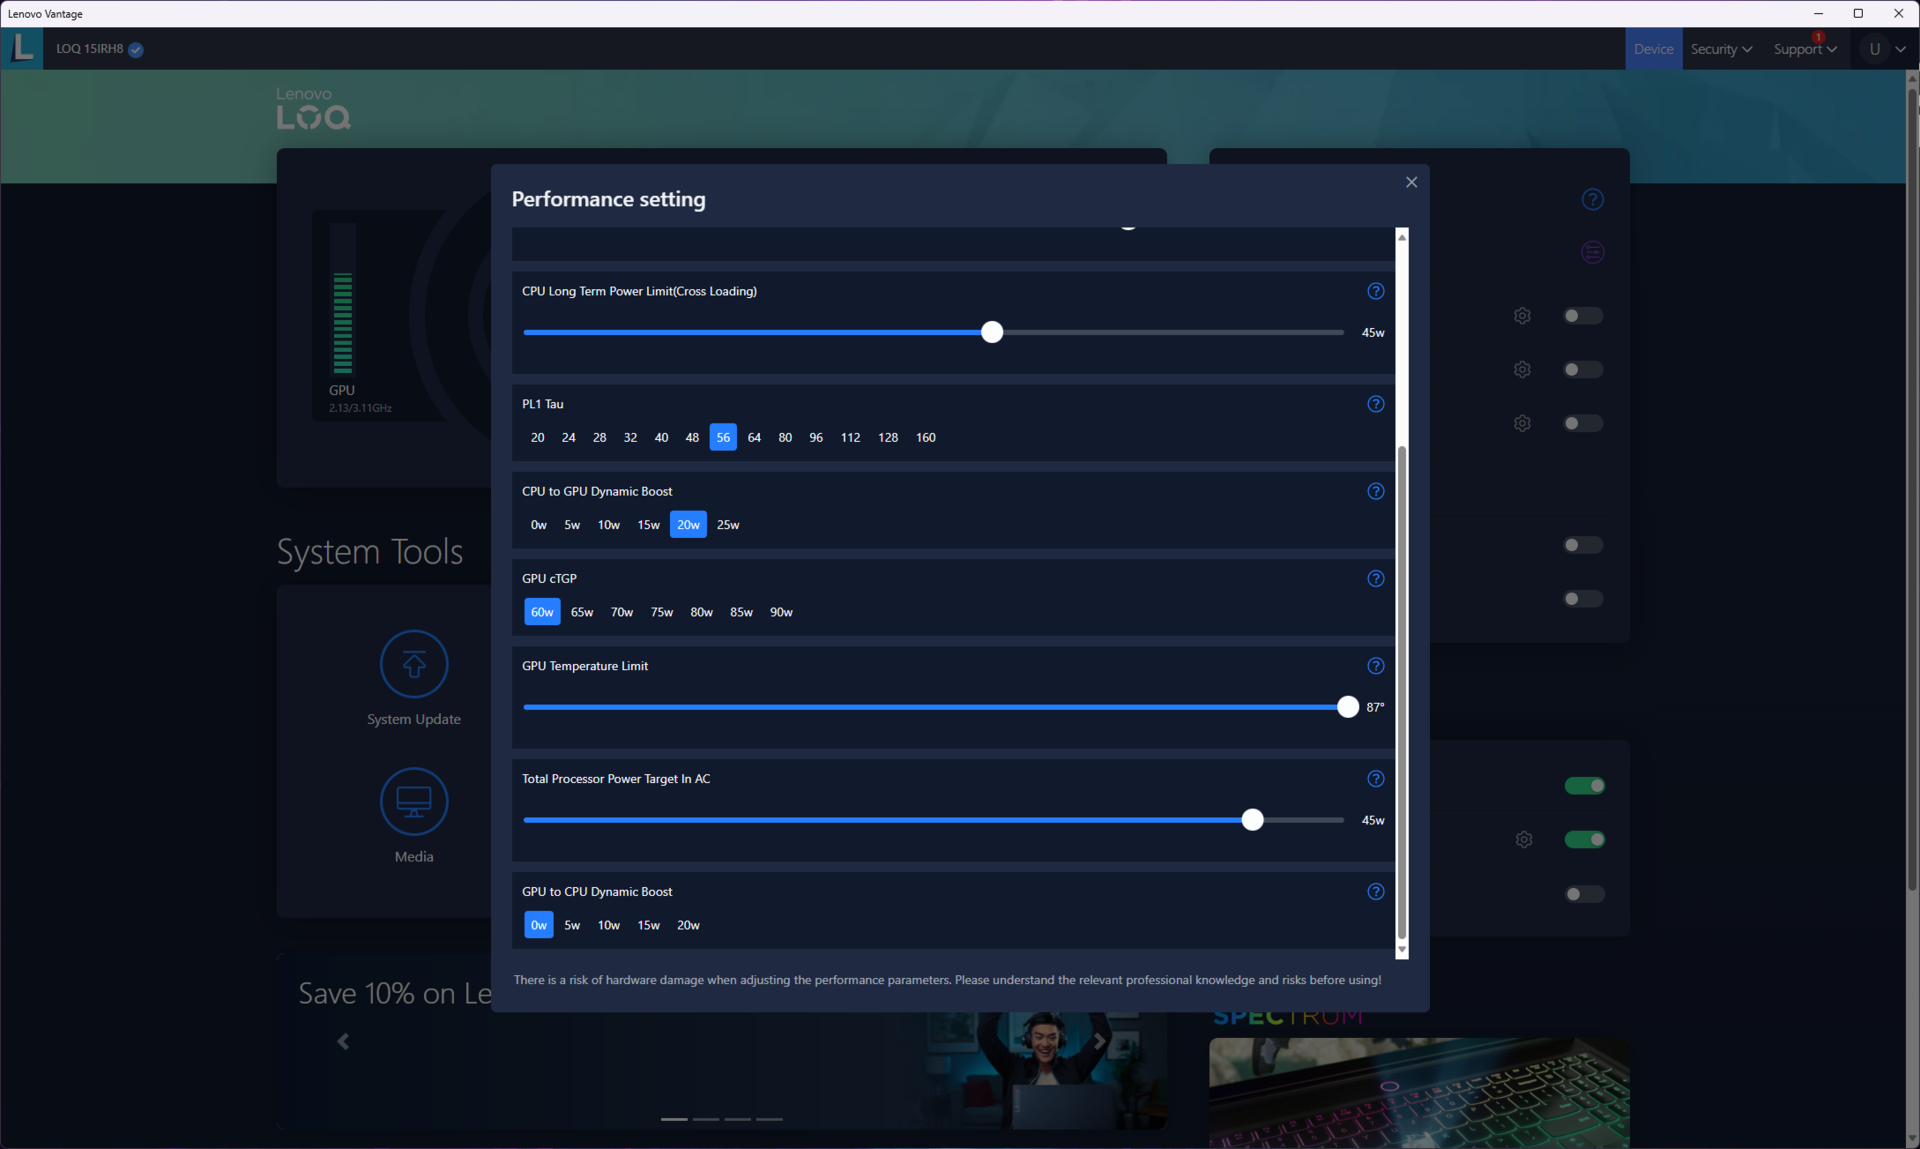
Die Tabelle unten zeigt den Einfluss von Standard-Energieprofilen auf die PL1 und PL2 des Prozessors. Unsere Benchmarks liefen alle im Performance-Modus mit dedizierter GPU, damit Core i7-13620H und RTX 4050 ihre volle Leistungsfähigkeit entfalten können. Die Akkulaufzeit wurde im Quiet-Modus mit der GPU im Hybrid-Modus getestet.
| Energieprofil | PL1 (PBP) / Tau | PL2 (MTP) / Tau | PL4 | Cinebench R15 Multi | Cinebench R15 Multi (30 Schleifen) |
|---|---|---|---|---|---|
| Quiet | 45 W / 56 s | 55 W / 2,44 ms | 210 W | 1,879 (-17,98 %) | 1,412 (-26,34 %) |
| Balance | 60 W / 56 s | 117 W / 2,44 ms | 210 W | 2,178 (-4,93 %) | 1,657 (-13,56 %) |
| Performance | 70 W / 56 s | 135 W / 2,44 ms | 210 W | 2.291 (100 %) | 1.917 (100 %) |
Prozessor
Der Core i7-13620H im LOQ 15IRH8 hinkt der Ryzen 7 7840HS im LOQ 15 APH8 im Cinebench Multi-Core-Test trotz gleicher Thread-Zahlen um bis zu 16 Prozent hinterher. Vermutlich liegt das an der höheren Taktrate des Ryzen-Chips. Im Geekbench Multi-Core-Test kehren sich die Rollen um. Auch in den Single-Core-Benchmarks liefert der Intel-Prozessor eine gute Leistung.
Das Gehäuse und Kühlsystem des LOQ 15IRH8 hat Schwierigkeiten, die Cinebench-R15-Multi-Core-Schleifeaufrechtzuerhalten. Im LOQ 16IRH8 scheint sich der Core i7-1360H etwas wohler zu fühlen, denn dort ist die Leistung des Prozessors sehr stabil.
Cinebench-R15-Multi-Schleife
Cinebench R23: Multi Core | Single Core
Cinebench R20: CPU (Multi Core) | CPU (Single Core)
Cinebench R15: CPU Multi 64Bit | CPU Single 64Bit
Blender: v2.79 BMW27 CPU
7-Zip 18.03: 7z b 4 | 7z b 4 -mmt1
Geekbench 5.5: Multi-Core | Single-Core
HWBOT x265 Benchmark v2.2: 4k Preset
LibreOffice : 20 Documents To PDF
R Benchmark 2.5: Overall mean
| CPU Performance Rating | |
| Durchschnitt der Klasse Gaming | |
| Dell G15 5530 | |
| Asus TUF Gaming A16 FA617XS | |
| Lenovo LOQ 15APH8 | |
| Lenovo LOQ 16IRH8 | |
| Lenovo Legion Pro 5 16ARX8 (R5 7645HX, RTX 4050) | |
| Lenovo LOQ 15IRH8 Core i7 | |
| MSI Katana 17 B13VFK | |
| Durchschnittliche Intel Core i7-13620H | |
| HP Victus 16-r0077ng | |
| Cinebench R23 / Multi Core | |
| Durchschnitt der Klasse Gaming (10488 - 40970, n=112, der letzten 2 Jahre) | |
| Dell G15 5530 | |
| Lenovo LOQ 15APH8 | |
| Asus TUF Gaming A16 FA617XS | |
| MSI Katana 17 B13VFK | |
| HP Victus 16-r0077ng | |
| Lenovo LOQ 16IRH8 | |
| Lenovo LOQ 15IRH8 Core i7 | |
| Durchschnittliche Intel Core i7-13620H (10819 - 15496, n=7) | |
| Lenovo Legion Pro 5 16ARX8 (R5 7645HX, RTX 4050) | |
| Cinebench R23 / Single Core | |
| Durchschnitt der Klasse Gaming (1166 - 2356, n=112, der letzten 2 Jahre) | |
| Lenovo LOQ 16IRH8 | |
| Lenovo LOQ 15IRH8 Core i7 | |
| Dell G15 5530 | |
| Durchschnittliche Intel Core i7-13620H (1716 - 1871, n=7) | |
| Lenovo Legion Pro 5 16ARX8 (R5 7645HX, RTX 4050) | |
| MSI Katana 17 B13VFK | |
| Asus TUF Gaming A16 FA617XS | |
| Lenovo LOQ 15APH8 | |
| HP Victus 16-r0077ng | |
| Cinebench R20 / CPU (Multi Core) | |
| Durchschnitt der Klasse Gaming (4029 - 16108, n=111, der letzten 2 Jahre) | |
| Dell G15 5530 | |
| Lenovo LOQ 15APH8 | |
| Asus TUF Gaming A16 FA617XS | |
| MSI Katana 17 B13VFK | |
| HP Victus 16-r0077ng | |
| Lenovo LOQ 15IRH8 Core i7 | |
| Lenovo LOQ 16IRH8 | |
| Lenovo Legion Pro 5 16ARX8 (R5 7645HX, RTX 4050) | |
| Durchschnittliche Intel Core i7-13620H (4214 - 5905, n=7) | |
| Cinebench R20 / CPU (Single Core) | |
| Durchschnitt der Klasse Gaming (442 - 895, n=111, der letzten 2 Jahre) | |
| Lenovo LOQ 15IRH8 Core i7 | |
| Dell G15 5530 | |
| Lenovo LOQ 16IRH8 | |
| Asus TUF Gaming A16 FA617XS | |
| Lenovo Legion Pro 5 16ARX8 (R5 7645HX, RTX 4050) | |
| Durchschnittliche Intel Core i7-13620H (657 - 719, n=7) | |
| Lenovo LOQ 15APH8 | |
| MSI Katana 17 B13VFK | |
| HP Victus 16-r0077ng | |
| Cinebench R15 / CPU Multi 64Bit | |
| Durchschnitt der Klasse Gaming (1578 - 6271, n=111, der letzten 2 Jahre) | |
| Dell G15 5530 | |
| Lenovo LOQ 15APH8 | |
| Asus TUF Gaming A16 FA617XS | |
| Lenovo LOQ 16IRH8 | |
| MSI Katana 17 B13VFK | |
| HP Victus 16-r0077ng | |
| Lenovo LOQ 15IRH8 Core i7 | |
| Lenovo Legion Pro 5 16ARX8 (R5 7645HX, RTX 4050) | |
| Durchschnittliche Intel Core i7-13620H (1681 - 2492, n=7) | |
| Cinebench R15 / CPU Single 64Bit | |
| Durchschnitt der Klasse Gaming (188.8 - 343, n=111, der letzten 2 Jahre) | |
| Lenovo Legion Pro 5 16ARX8 (R5 7645HX, RTX 4050) | |
| Asus TUF Gaming A16 FA617XS | |
| Lenovo LOQ 15APH8 | |
| Dell G15 5530 | |
| Lenovo LOQ 16IRH8 | |
| Lenovo LOQ 15IRH8 Core i7 | |
| Durchschnittliche Intel Core i7-13620H (250 - 269, n=7) | |
| MSI Katana 17 B13VFK | |
| HP Victus 16-r0077ng | |
| Blender / v2.79 BMW27 CPU | |
| Lenovo LOQ 15IRH8 Core i7 | |
| Durchschnittliche Intel Core i7-13620H (215 - 297, n=7) | |
| Lenovo Legion Pro 5 16ARX8 (R5 7645HX, RTX 4050) | |
| Lenovo LOQ 16IRH8 | |
| MSI Katana 17 B13VFK | |
| HP Victus 16-r0077ng | |
| Asus TUF Gaming A16 FA617XS | |
| Lenovo LOQ 15APH8 | |
| Dell G15 5530 | |
| Durchschnitt der Klasse Gaming (80 - 330, n=109, der letzten 2 Jahre) | |
| 7-Zip 18.03 / 7z b 4 | |
| Durchschnitt der Klasse Gaming (33491 - 148086, n=110, der letzten 2 Jahre) | |
| Dell G15 5530 | |
| Asus TUF Gaming A16 FA617XS | |
| HP Victus 16-r0077ng | |
| MSI Katana 17 B13VFK | |
| Lenovo Legion Pro 5 16ARX8 (R5 7645HX, RTX 4050) | |
| Lenovo LOQ 15APH8 | |
| Lenovo LOQ 16IRH8 | |
| Lenovo LOQ 15IRH8 Core i7 | |
| Durchschnittliche Intel Core i7-13620H (45092 - 62324, n=7) | |
| 7-Zip 18.03 / 7z b 4 -mmt1 | |
| Lenovo Legion Pro 5 16ARX8 (R5 7645HX, RTX 4050) | |
| Asus TUF Gaming A16 FA617XS | |
| Durchschnitt der Klasse Gaming (4199 - 7436, n=110, der letzten 2 Jahre) | |
| Lenovo LOQ 15APH8 | |
| Durchschnittliche Intel Core i7-13620H (5648 - 6326, n=7) | |
| Lenovo LOQ 15IRH8 Core i7 | |
| Lenovo LOQ 16IRH8 | |
| Dell G15 5530 | |
| MSI Katana 17 B13VFK | |
| HP Victus 16-r0077ng | |
| Geekbench 5.5 / Multi-Core | |
| Durchschnitt der Klasse Gaming (6460 - 27010, n=110, der letzten 2 Jahre) | |
| Dell G15 5530 | |
| Lenovo LOQ 16IRH8 | |
| Asus TUF Gaming A16 FA617XS | |
| HP Victus 16-r0077ng | |
| Lenovo LOQ 15IRH8 Core i7 | |
| MSI Katana 17 B13VFK | |
| Durchschnittliche Intel Core i7-13620H (8112 - 12223, n=7) | |
| Lenovo Legion Pro 5 16ARX8 (R5 7645HX, RTX 4050) | |
| Lenovo LOQ 15APH8 | |
| Geekbench 5.5 / Single-Core | |
| Durchschnitt der Klasse Gaming (986 - 2474, n=110, der letzten 2 Jahre) | |
| Asus TUF Gaming A16 FA617XS | |
| Lenovo Legion Pro 5 16ARX8 (R5 7645HX, RTX 4050) | |
| Lenovo LOQ 15IRH8 Core i7 | |
| Dell G15 5530 | |
| Lenovo LOQ 15APH8 | |
| Lenovo LOQ 16IRH8 | |
| Durchschnittliche Intel Core i7-13620H (1703 - 1865, n=7) | |
| MSI Katana 17 B13VFK | |
| HP Victus 16-r0077ng | |
| HWBOT x265 Benchmark v2.2 / 4k Preset | |
| Durchschnitt der Klasse Gaming (11.5 - 44.3, n=110, der letzten 2 Jahre) | |
| Dell G15 5530 | |
| Asus TUF Gaming A16 FA617XS | |
| Lenovo Legion Pro 5 16ARX8 (R5 7645HX, RTX 4050) | |
| Lenovo LOQ 15APH8 | |
| MSI Katana 17 B13VFK | |
| Lenovo LOQ 16IRH8 | |
| Lenovo LOQ 15IRH8 Core i7 | |
| HP Victus 16-r0077ng | |
| Durchschnittliche Intel Core i7-13620H (12.2 - 17.7, n=7) | |
| LibreOffice / 20 Documents To PDF | |
| HP Victus 16-r0077ng | |
| MSI Katana 17 B13VFK | |
| Lenovo Legion Pro 5 16ARX8 (R5 7645HX, RTX 4050) | |
| Durchschnittliche Intel Core i7-13620H (41.5 - 78.9, n=7) | |
| Durchschnitt der Klasse Gaming (19 - 88.8, n=110, der letzten 2 Jahre) | |
| Dell G15 5530 | |
| Lenovo LOQ 16IRH8 | |
| Lenovo LOQ 15IRH8 Core i7 | |
| Asus TUF Gaming A16 FA617XS | |
| Lenovo LOQ 15APH8 | |
| R Benchmark 2.5 / Overall mean | |
| HP Victus 16-r0077ng | |
| Durchschnittliche Intel Core i7-13620H (0.4438 - 0.4762, n=7) | |
| Lenovo LOQ 15IRH8 Core i7 | |
| Lenovo LOQ 15APH8 | |
| Lenovo LOQ 16IRH8 | |
| MSI Katana 17 B13VFK | |
| Lenovo Legion Pro 5 16ARX8 (R5 7645HX, RTX 4050) | |
| Durchschnitt der Klasse Gaming (0.3439 - 0.759, n=111, der letzten 2 Jahre) | |
| Dell G15 5530 | |
| Asus TUF Gaming A16 FA617XS | |
* ... kleinere Werte sind besser
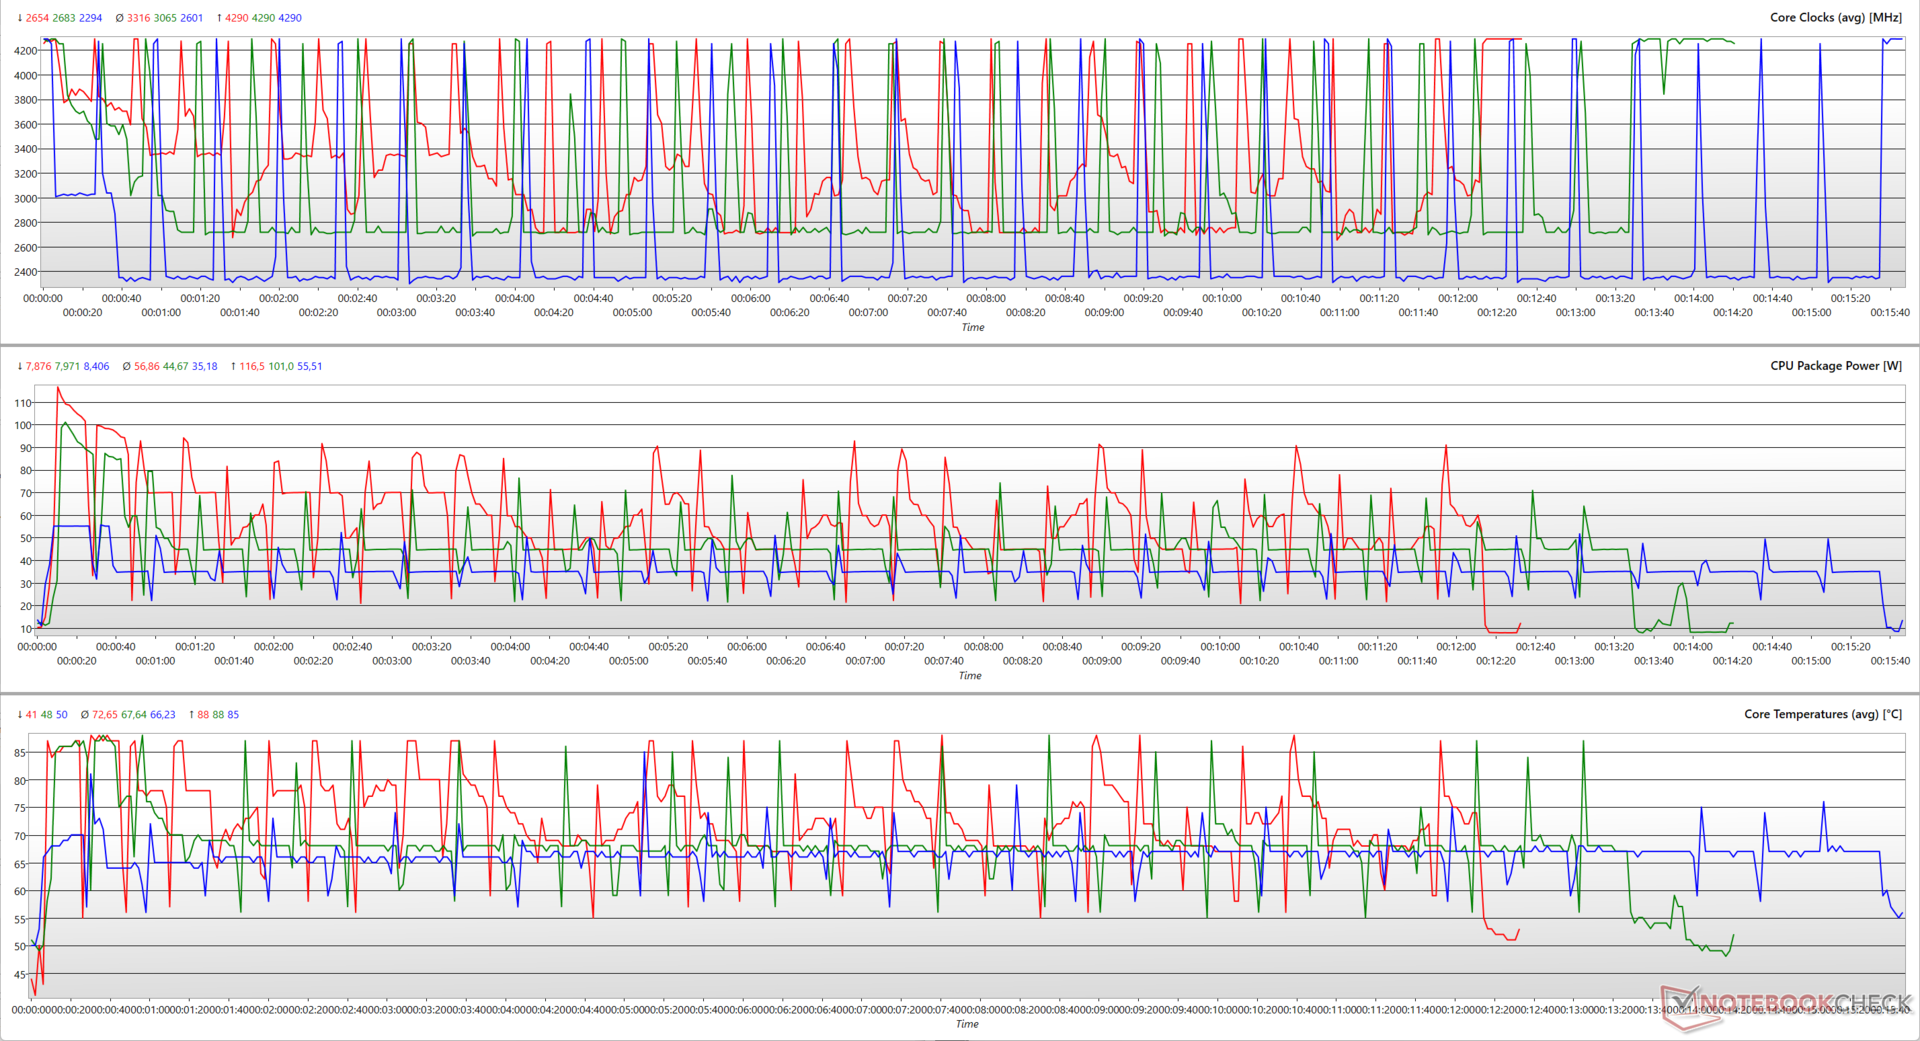
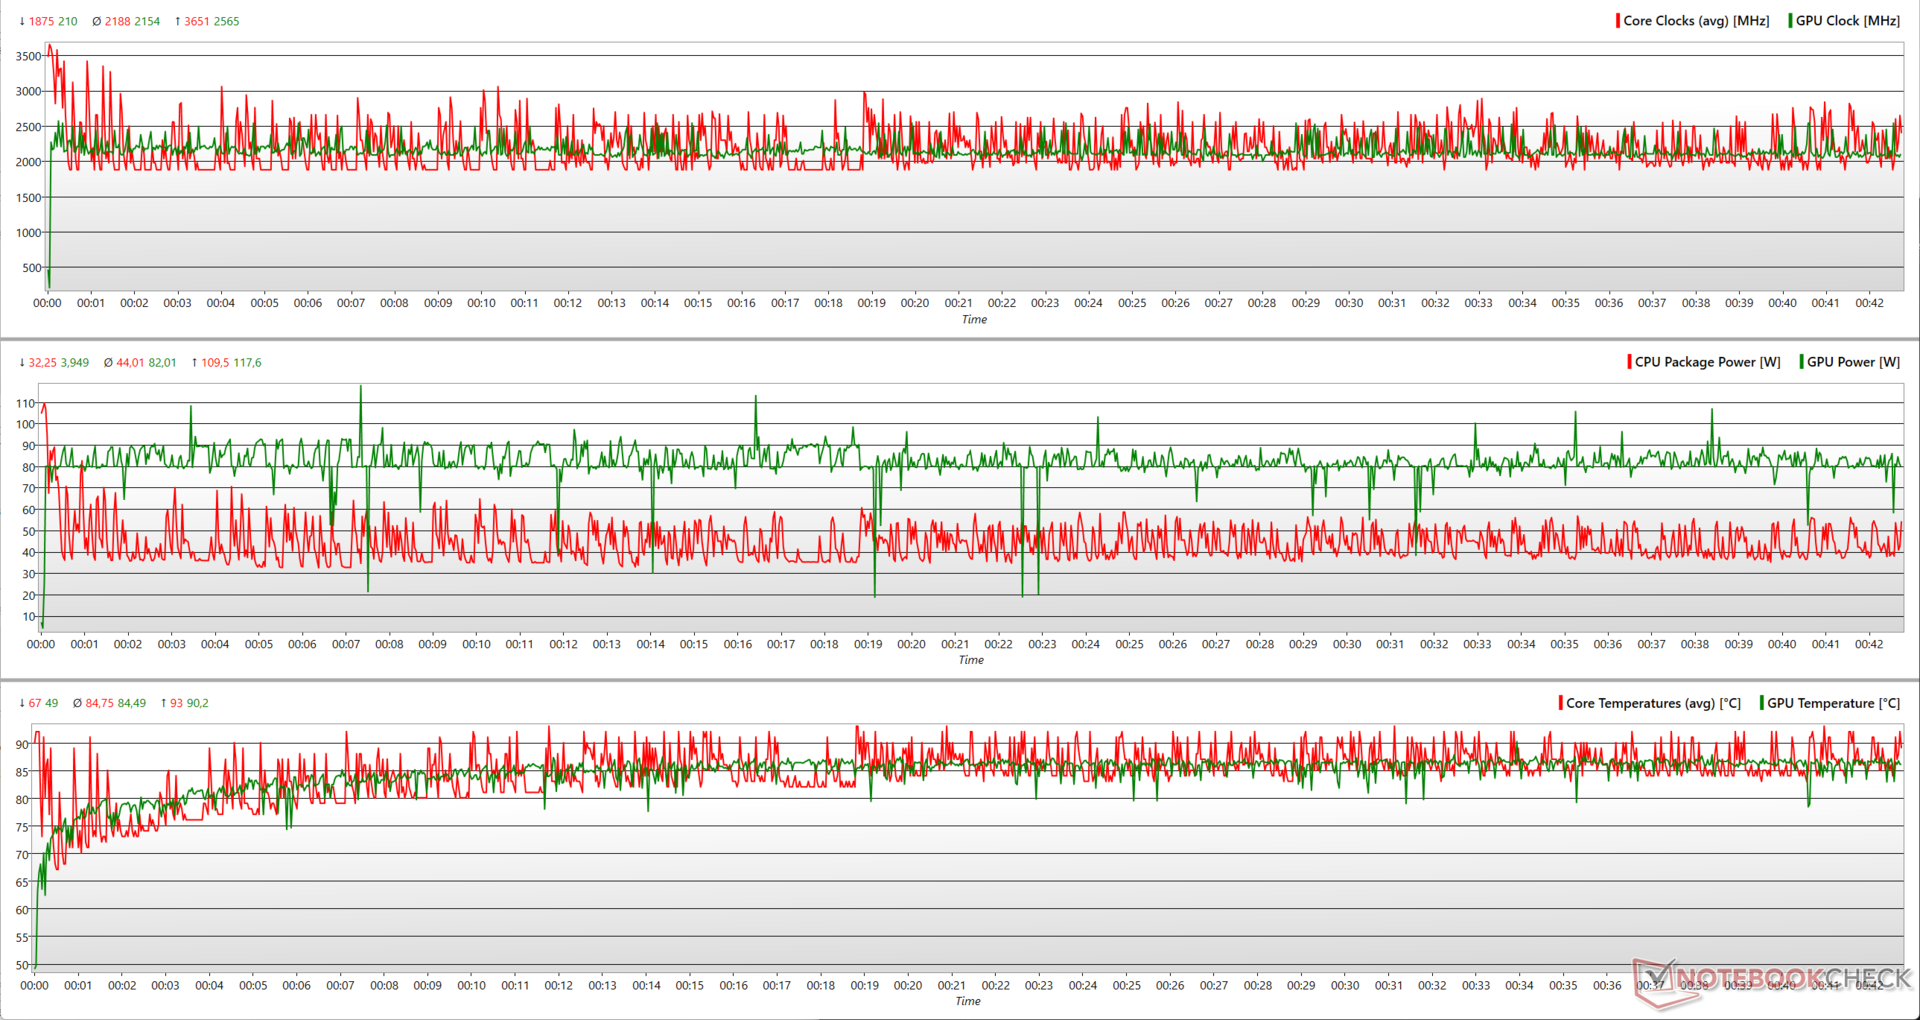
Eine Analyse der CineBench-R15-Multi-Core-Schleife zeigt, wie die vorhandenen Energieprofile die verschiedenen CPU-Parameter beeinflussen.
Obwohl der Performance-Modus dem Prozessor einen PL2 von bis zu 135 W ermöglichen sollte, werden nur 116,5 W erreicht. Auch im Balance-Modus ist die Leistungsaufnahme niedriger als notwendig (101 W statt 117 W), hier bleibt die Leistung im Gegensatz zum Performance-Modus allerdings stabiler.
Möglicherweise kommt auch das Kühlsystem des LOQ 15IRH8 an seine Grenzen, sobald eine Leistungsaufnahme von 116 W überschritten wird. Das würde das schlechte Durchhaltevermögen in diesem Benchmark erklären.
Die Ergebnisse des CineBench-R20-Multi-Core fallen im Akkumodus um 23 Prozent ab. Die Single-Core-Leistung ist davon nur minimal betroffen.
AIDA64: FP32 Ray-Trace | FPU Julia | CPU SHA3 | CPU Queen | FPU SinJulia | FPU Mandel | CPU AES | CPU ZLib | FP64 Ray-Trace | CPU PhotoWorxx
| Performance Rating | |
| Durchschnitt der Klasse Gaming | |
| Asus TUF Gaming A16 FA617XS | |
| Lenovo LOQ 15APH8 | |
| Dell G15 5530 | |
| Lenovo Legion Pro 5 16ARX8 (R5 7645HX, RTX 4050) | |
| HP Victus 16-r0077ng | |
| MSI Katana 17 B13VFK | |
| Lenovo LOQ 16IRH8 | |
| Lenovo LOQ 15IRH8 Core i7 | |
| Durchschnittliche Intel Core i7-13620H | |
| AIDA64 / FP32 Ray-Trace | |
| Durchschnitt der Klasse Gaming (10227 - 85542, n=109, der letzten 2 Jahre) | |
| Lenovo LOQ 15APH8 | |
| Asus TUF Gaming A16 FA617XS | |
| Lenovo Legion Pro 5 16ARX8 (R5 7645HX, RTX 4050) | |
| Dell G15 5530 | |
| HP Victus 16-r0077ng | |
| MSI Katana 17 B13VFK | |
| Lenovo LOQ 16IRH8 | |
| Durchschnittliche Intel Core i7-13620H (10779 - 13601, n=7) | |
| Lenovo LOQ 15IRH8 Core i7 | |
| AIDA64 / FPU Julia | |
| Durchschnitt der Klasse Gaming (51376 - 238426, n=109, der letzten 2 Jahre) | |
| Lenovo LOQ 15APH8 | |
| Asus TUF Gaming A16 FA617XS | |
| Lenovo Legion Pro 5 16ARX8 (R5 7645HX, RTX 4050) | |
| Dell G15 5530 | |
| HP Victus 16-r0077ng | |
| MSI Katana 17 B13VFK | |
| Lenovo LOQ 16IRH8 | |
| Lenovo LOQ 15IRH8 Core i7 | |
| Durchschnittliche Intel Core i7-13620H (54287 - 67187, n=7) | |
| AIDA64 / CPU SHA3 | |
| Durchschnitt der Klasse Gaming (2180 - 9817, n=109, der letzten 2 Jahre) | |
| Lenovo LOQ 15APH8 | |
| Asus TUF Gaming A16 FA617XS | |
| Dell G15 5530 | |
| Lenovo Legion Pro 5 16ARX8 (R5 7645HX, RTX 4050) | |
| HP Victus 16-r0077ng | |
| MSI Katana 17 B13VFK | |
| Lenovo LOQ 16IRH8 | |
| Durchschnittliche Intel Core i7-13620H (2327 - 2773, n=7) | |
| Lenovo LOQ 15IRH8 Core i7 | |
| AIDA64 / CPU Queen | |
| Asus TUF Gaming A16 FA617XS | |
| Lenovo LOQ 15APH8 | |
| Durchschnitt der Klasse Gaming (49785 - 173351, n=98, der letzten 2 Jahre) | |
| Dell G15 5530 | |
| Lenovo Legion Pro 5 16ARX8 (R5 7645HX, RTX 4050) | |
| HP Victus 16-r0077ng | |
| Lenovo LOQ 15IRH8 Core i7 | |
| Lenovo LOQ 16IRH8 | |
| MSI Katana 17 B13VFK | |
| Durchschnittliche Intel Core i7-13620H (66885 - 78867, n=7) | |
| AIDA64 / FPU SinJulia | |
| Asus TUF Gaming A16 FA617XS | |
| Lenovo LOQ 15APH8 | |
| Durchschnitt der Klasse Gaming (4424 - 33636, n=109, der letzten 2 Jahre) | |
| Lenovo Legion Pro 5 16ARX8 (R5 7645HX, RTX 4050) | |
| Dell G15 5530 | |
| HP Victus 16-r0077ng | |
| MSI Katana 17 B13VFK | |
| Lenovo LOQ 16IRH8 | |
| Durchschnittliche Intel Core i7-13620H (6737 - 8421, n=7) | |
| Lenovo LOQ 15IRH8 Core i7 | |
| AIDA64 / FPU Mandel | |
| Durchschnitt der Klasse Gaming (25115 - 128721, n=109, der letzten 2 Jahre) | |
| Lenovo LOQ 15APH8 | |
| Asus TUF Gaming A16 FA617XS | |
| Lenovo Legion Pro 5 16ARX8 (R5 7645HX, RTX 4050) | |
| Dell G15 5530 | |
| HP Victus 16-r0077ng | |
| MSI Katana 17 B13VFK | |
| Lenovo LOQ 16IRH8 | |
| Lenovo LOQ 15IRH8 Core i7 | |
| Durchschnittliche Intel Core i7-13620H (27242 - 32787, n=7) | |
| AIDA64 / CPU AES | |
| Durchschnitt der Klasse Gaming (39258 - 247074, n=109, der letzten 2 Jahre) | |
| Asus TUF Gaming A16 FA617XS | |
| Dell G15 5530 | |
| Lenovo LOQ 15APH8 | |
| HP Victus 16-r0077ng | |
| Durchschnittliche Intel Core i7-13620H (48646 - 85895, n=7) | |
| MSI Katana 17 B13VFK | |
| Lenovo LOQ 16IRH8 | |
| Lenovo Legion Pro 5 16ARX8 (R5 7645HX, RTX 4050) | |
| Lenovo LOQ 15IRH8 Core i7 | |
| AIDA64 / CPU ZLib | |
| Durchschnitt der Klasse Gaming (574 - 2531, n=109, der letzten 2 Jahre) | |
| Dell G15 5530 | |
| Lenovo LOQ 15APH8 | |
| Asus TUF Gaming A16 FA617XS | |
| HP Victus 16-r0077ng | |
| Lenovo Legion Pro 5 16ARX8 (R5 7645HX, RTX 4050) | |
| Lenovo LOQ 16IRH8 | |
| MSI Katana 17 B13VFK | |
| Durchschnittliche Intel Core i7-13620H (688 - 835, n=7) | |
| Lenovo LOQ 15IRH8 Core i7 | |
| AIDA64 / FP64 Ray-Trace | |
| Durchschnitt der Klasse Gaming (5509 - 45446, n=109, der letzten 2 Jahre) | |
| Lenovo LOQ 15APH8 | |
| Asus TUF Gaming A16 FA617XS | |
| Lenovo Legion Pro 5 16ARX8 (R5 7645HX, RTX 4050) | |
| Dell G15 5530 | |
| HP Victus 16-r0077ng | |
| MSI Katana 17 B13VFK | |
| Lenovo LOQ 16IRH8 | |
| Durchschnittliche Intel Core i7-13620H (5919 - 7364, n=7) | |
| Lenovo LOQ 15IRH8 Core i7 | |
| AIDA64 / CPU PhotoWorxx | |
| Durchschnitt der Klasse Gaming (12271 - 89891, n=109, der letzten 2 Jahre) | |
| HP Victus 16-r0077ng | |
| Dell G15 5530 | |
| MSI Katana 17 B13VFK | |
| Lenovo LOQ 15IRH8 Core i7 | |
| Lenovo LOQ 16IRH8 | |
| Asus TUF Gaming A16 FA617XS | |
| Lenovo Legion Pro 5 16ARX8 (R5 7645HX, RTX 4050) | |
| Durchschnittliche Intel Core i7-13620H (19421 - 34544, n=7) | |
| Lenovo LOQ 15APH8 | |
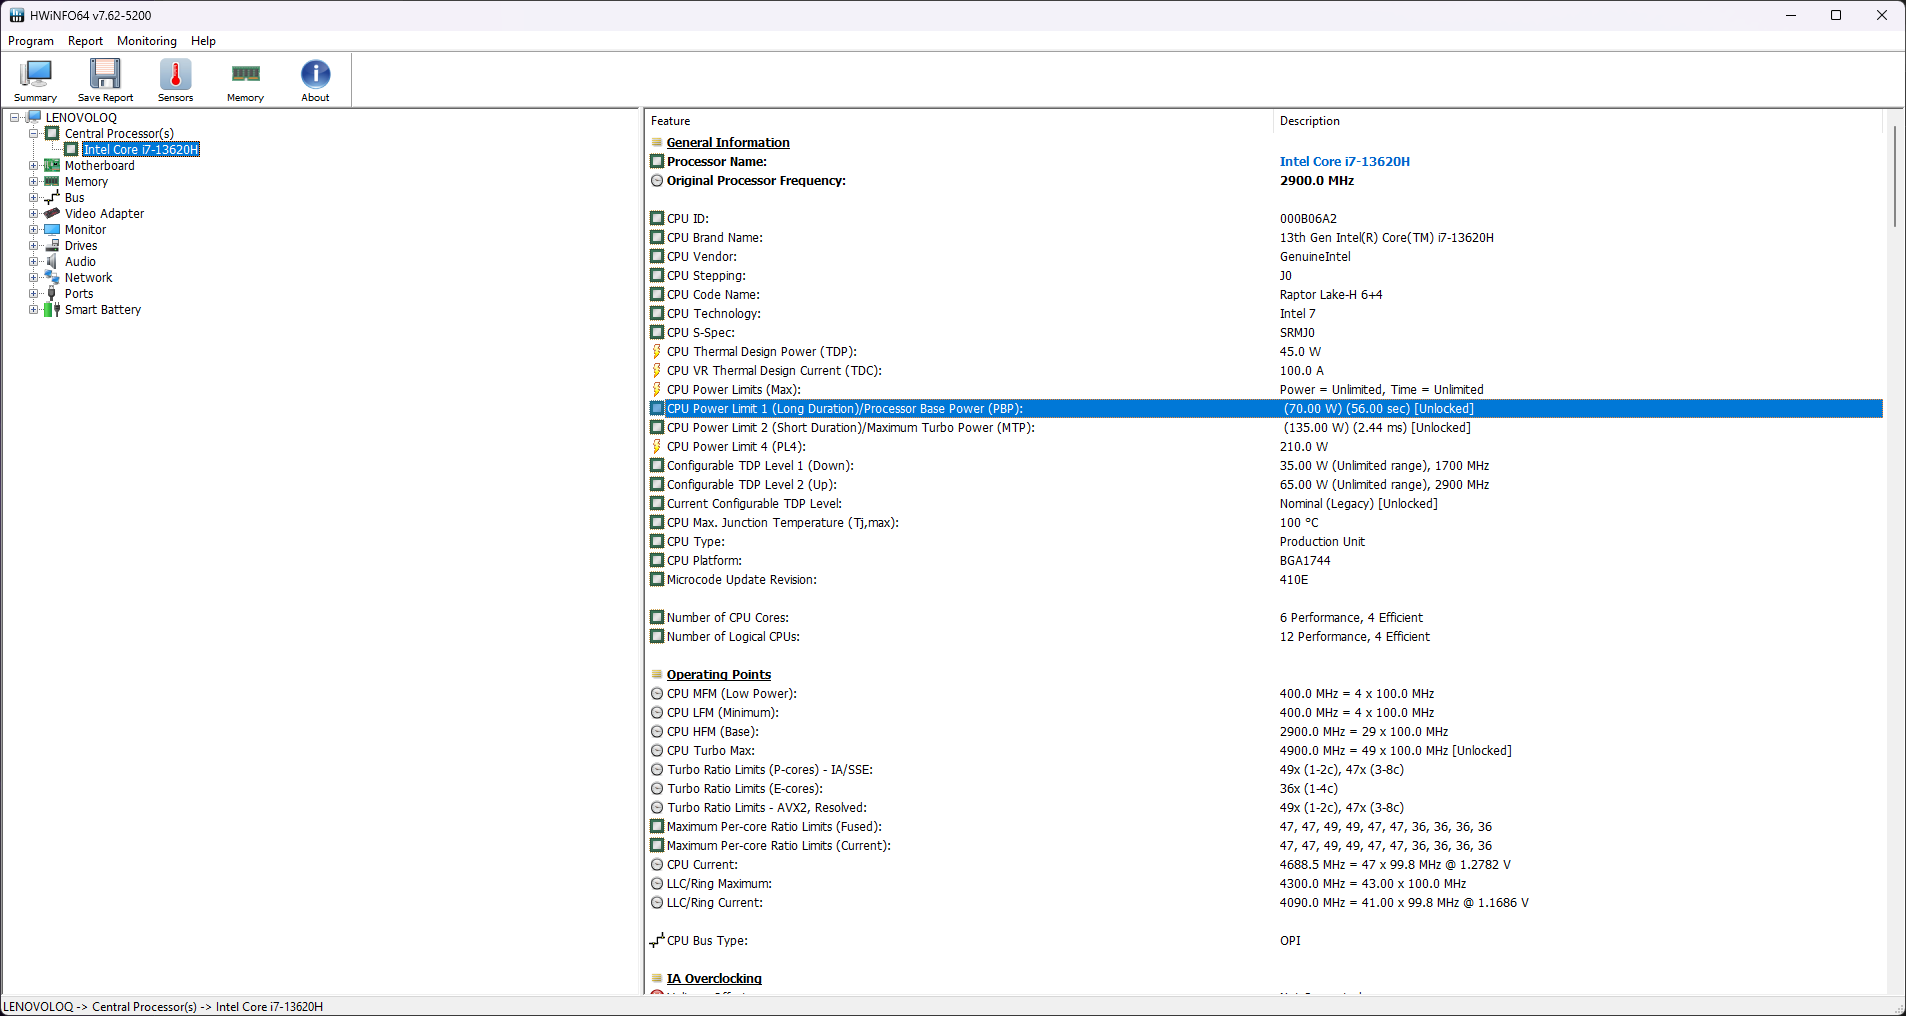
Weitere Informationen und Vergleiche finden Sie auf unserer Seite über den Intel Core i7-13620H.
Systemleistung
Der LOQ 15IRH8 hat im CrossMark gegenüber seinem AMD-Pendant LOQ 15APH8 19 Prozent Vorsprung, im PCMark liegen beide Modelle nahezu gleichauf. In der alltäglichen Systemleistung kam es weder bei produktiven Tätigkeiten noch beim Gamen zu Problemen.
CrossMark: Overall | Productivity | Creativity | Responsiveness
AIDA64: Memory Copy | Memory Read | Memory Write | Memory Latency
| PCMark 10 / Score | |
| Durchschnitt der Klasse Gaming (5828 - 11574, n=96, der letzten 2 Jahre) | |
| Lenovo Legion Pro 5 16ARX8 (R5 7645HX, RTX 4050) | |
| Asus TUF Gaming A16 FA617XS | |
| Lenovo LOQ 15APH8 | |
| Lenovo LOQ 15IRH8 Core i7 | |
| Durchschnittliche Intel Core i7-13620H, NVIDIA GeForce RTX 4050 Laptop GPU (n=1) | |
| MSI Katana 17 B13VFK | |
| HP Victus 16-r0077ng | |
| Dell G15 5530 | |
| Lenovo LOQ 16IRH8 | |
| PCMark 10 / Essentials | |
| Lenovo Legion Pro 5 16ARX8 (R5 7645HX, RTX 4050) | |
| Dell G15 5530 | |
| Lenovo LOQ 15IRH8 Core i7 | |
| Durchschnittliche Intel Core i7-13620H, NVIDIA GeForce RTX 4050 Laptop GPU (n=1) | |
| Asus TUF Gaming A16 FA617XS | |
| MSI Katana 17 B13VFK | |
| HP Victus 16-r0077ng | |
| Durchschnitt der Klasse Gaming (8810 - 12600, n=100, der letzten 2 Jahre) | |
| Lenovo LOQ 15APH8 | |
| Lenovo LOQ 16IRH8 | |
| PCMark 10 / Productivity | |
| Lenovo Legion Pro 5 16ARX8 (R5 7645HX, RTX 4050) | |
| Durchschnitt der Klasse Gaming (6845 - 21327, n=98, der letzten 2 Jahre) | |
| Asus TUF Gaming A16 FA617XS | |
| Dell G15 5530 | |
| Lenovo LOQ 15APH8 | |
| Lenovo LOQ 15IRH8 Core i7 | |
| Durchschnittliche Intel Core i7-13620H, NVIDIA GeForce RTX 4050 Laptop GPU (n=1) | |
| MSI Katana 17 B13VFK | |
| HP Victus 16-r0077ng | |
| Lenovo LOQ 16IRH8 | |
| PCMark 10 / Digital Content Creation | |
| Durchschnitt der Klasse Gaming (7602 - 19657, n=98, der letzten 2 Jahre) | |
| Asus TUF Gaming A16 FA617XS | |
| Lenovo LOQ 15APH8 | |
| Lenovo LOQ 15IRH8 Core i7 | |
| Durchschnittliche Intel Core i7-13620H, NVIDIA GeForce RTX 4050 Laptop GPU (n=1) | |
| Lenovo Legion Pro 5 16ARX8 (R5 7645HX, RTX 4050) | |
| HP Victus 16-r0077ng | |
| MSI Katana 17 B13VFK | |
| Lenovo LOQ 16IRH8 | |
| Dell G15 5530 | |
| CrossMark / Overall | |
| Durchschnitt der Klasse Gaming (1366 - 2409, n=97, der letzten 2 Jahre) | |
| Lenovo LOQ 16IRH8 | |
| Lenovo Legion Pro 5 16ARX8 (R5 7645HX, RTX 4050) | |
| Lenovo LOQ 15IRH8 Core i7 | |
| Durchschnittliche Intel Core i7-13620H, NVIDIA GeForce RTX 4050 Laptop GPU (n=1) | |
| MSI Katana 17 B13VFK | |
| Dell G15 5530 | |
| Asus TUF Gaming A16 FA617XS | |
| Lenovo LOQ 15APH8 | |
| CrossMark / Productivity | |
| Lenovo Legion Pro 5 16ARX8 (R5 7645HX, RTX 4050) | |
| Lenovo LOQ 16IRH8 | |
| Durchschnitt der Klasse Gaming (1386 - 2254, n=97, der letzten 2 Jahre) | |
| Lenovo LOQ 15IRH8 Core i7 | |
| Durchschnittliche Intel Core i7-13620H, NVIDIA GeForce RTX 4050 Laptop GPU (n=1) | |
| MSI Katana 17 B13VFK | |
| Dell G15 5530 | |
| Asus TUF Gaming A16 FA617XS | |
| Lenovo LOQ 15APH8 | |
| CrossMark / Creativity | |
| Durchschnitt der Klasse Gaming (1343 - 2729, n=97, der letzten 2 Jahre) | |
| Dell G15 5530 | |
| Lenovo LOQ 16IRH8 | |
| Lenovo Legion Pro 5 16ARX8 (R5 7645HX, RTX 4050) | |
| MSI Katana 17 B13VFK | |
| Lenovo LOQ 15IRH8 Core i7 | |
| Durchschnittliche Intel Core i7-13620H, NVIDIA GeForce RTX 4050 Laptop GPU (n=1) | |
| Asus TUF Gaming A16 FA617XS | |
| Lenovo LOQ 15APH8 | |
| CrossMark / Responsiveness | |
| Lenovo LOQ 16IRH8 | |
| Lenovo Legion Pro 5 16ARX8 (R5 7645HX, RTX 4050) | |
| Lenovo LOQ 15IRH8 Core i7 | |
| Durchschnittliche Intel Core i7-13620H, NVIDIA GeForce RTX 4050 Laptop GPU (n=1) | |
| MSI Katana 17 B13VFK | |
| Durchschnitt der Klasse Gaming (1226 - 2334, n=97, der letzten 2 Jahre) | |
| Dell G15 5530 | |
| Asus TUF Gaming A16 FA617XS | |
| Lenovo LOQ 15APH8 | |
| AIDA64 / Memory Copy | |
| Durchschnitt der Klasse Gaming (21750 - 129946, n=109, der letzten 2 Jahre) | |
| HP Victus 16-r0077ng | |
| Asus TUF Gaming A16 FA617XS | |
| Dell G15 5530 | |
| Lenovo LOQ 15IRH8 Core i7 | |
| Durchschnittliche Intel Core i7-13620H, NVIDIA GeForce RTX 4050 Laptop GPU (n=1) | |
| Lenovo LOQ 16IRH8 | |
| MSI Katana 17 B13VFK | |
| Lenovo Legion Pro 5 16ARX8 (R5 7645HX, RTX 4050) | |
| Lenovo LOQ 15APH8 | |
| AIDA64 / Memory Read | |
| Durchschnitt der Klasse Gaming (22956 - 118858, n=109, der letzten 2 Jahre) | |
| HP Victus 16-r0077ng | |
| Dell G15 5530 | |
| Lenovo LOQ 16IRH8 | |
| Lenovo LOQ 15IRH8 Core i7 | |
| Durchschnittliche Intel Core i7-13620H, NVIDIA GeForce RTX 4050 Laptop GPU (n=1) | |
| MSI Katana 17 B13VFK | |
| Asus TUF Gaming A16 FA617XS | |
| Lenovo Legion Pro 5 16ARX8 (R5 7645HX, RTX 4050) | |
| Lenovo LOQ 15APH8 | |
| AIDA64 / Memory Write | |
| Durchschnitt der Klasse Gaming (22297 - 135096, n=109, der letzten 2 Jahre) | |
| Asus TUF Gaming A16 FA617XS | |
| HP Victus 16-r0077ng | |
| Dell G15 5530 | |
| Lenovo LOQ 15IRH8 Core i7 | |
| Durchschnittliche Intel Core i7-13620H, NVIDIA GeForce RTX 4050 Laptop GPU (n=1) | |
| Lenovo LOQ 16IRH8 | |
| Lenovo Legion Pro 5 16ARX8 (R5 7645HX, RTX 4050) | |
| MSI Katana 17 B13VFK | |
| Lenovo LOQ 15APH8 | |
| AIDA64 / Memory Latency | |
| Lenovo LOQ 15IRH8 Core i7 | |
| Durchschnittliche Intel Core i7-13620H, NVIDIA GeForce RTX 4050 Laptop GPU (n=1) | |
| Lenovo LOQ 16IRH8 | |
| Durchschnitt der Klasse Gaming (75.3 - 259, n=109, der letzten 2 Jahre) | |
| MSI Katana 17 B13VFK | |
| Lenovo LOQ 15APH8 | |
| HP Victus 16-r0077ng | |
| Dell G15 5530 | |
| Asus TUF Gaming A16 FA617XS | |
| Lenovo Legion Pro 5 16ARX8 (R5 7645HX, RTX 4050) | |
* ... kleinere Werte sind besser
| PCMark 8 Home Score Accelerated v2 | 5795 Punkte | |
| PCMark 8 Work Score Accelerated v2 | 6177 Punkte | |
| PCMark 10 Score | 7656 Punkte | |
Hilfe | ||
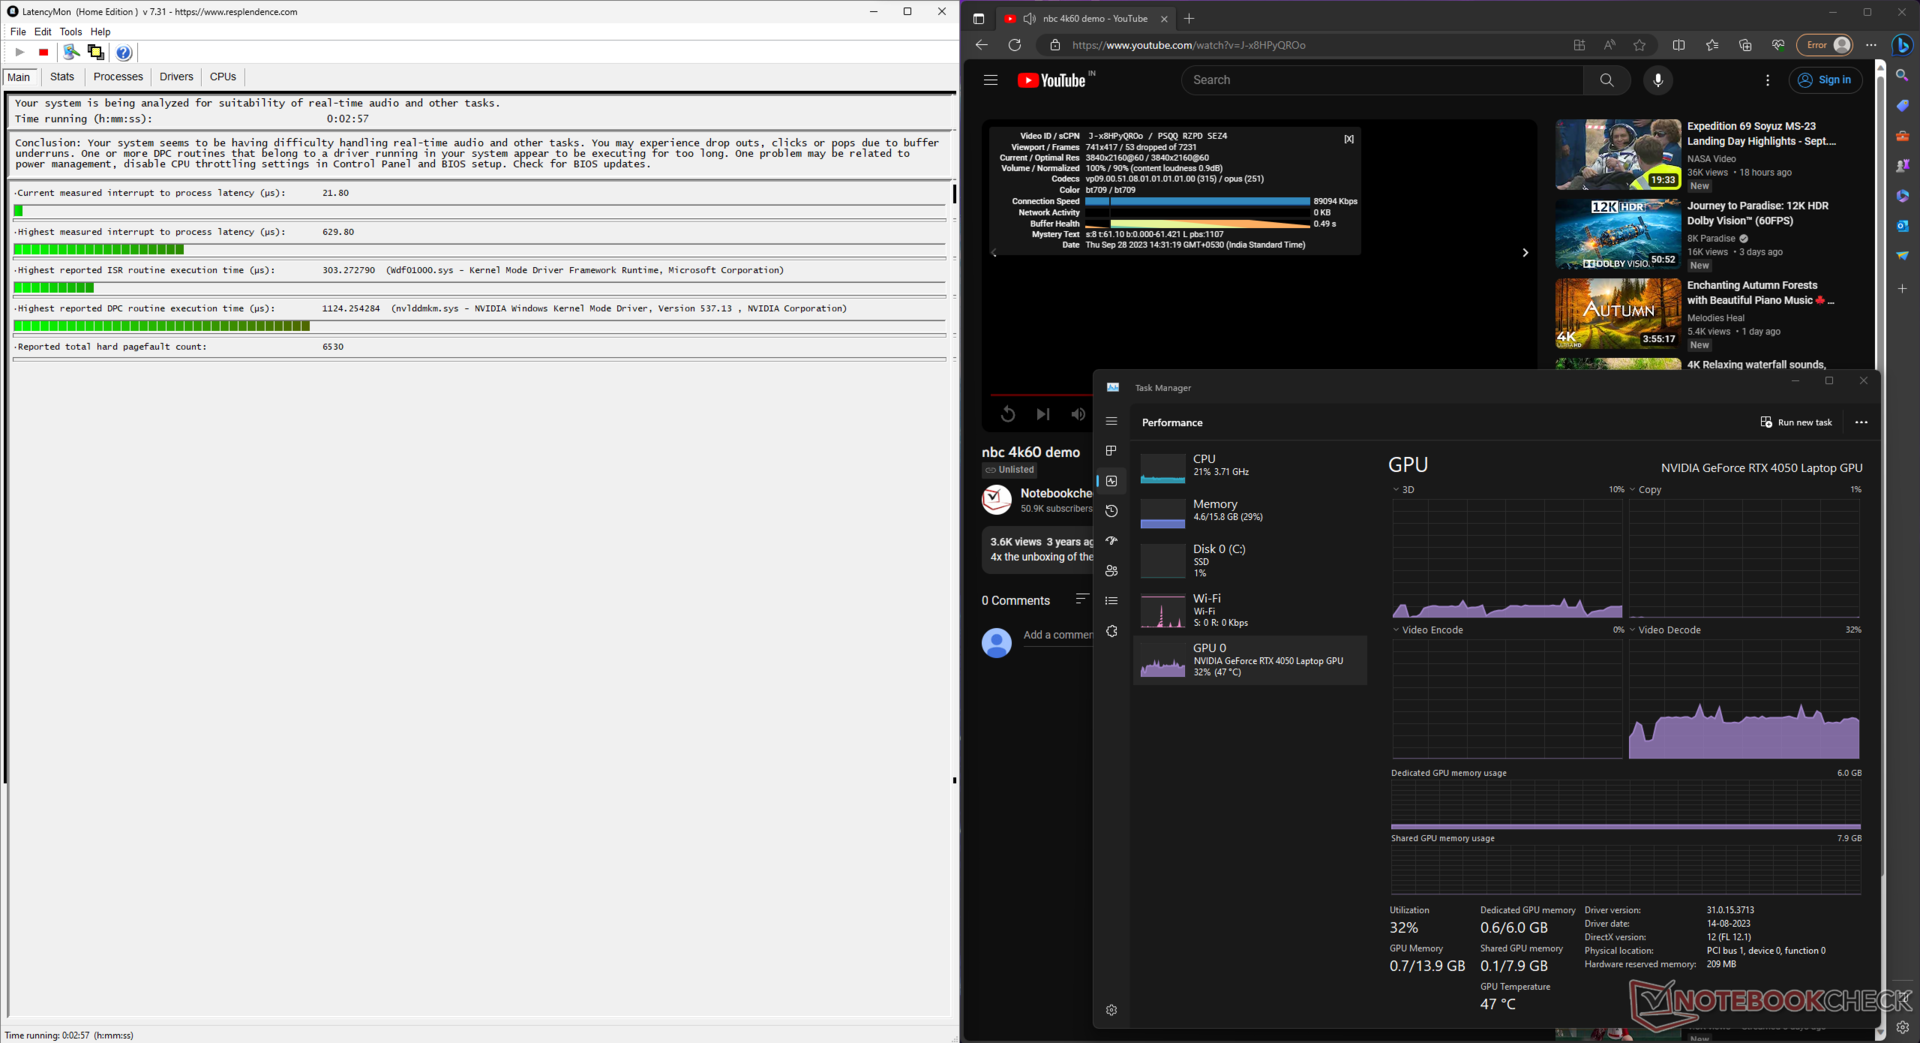
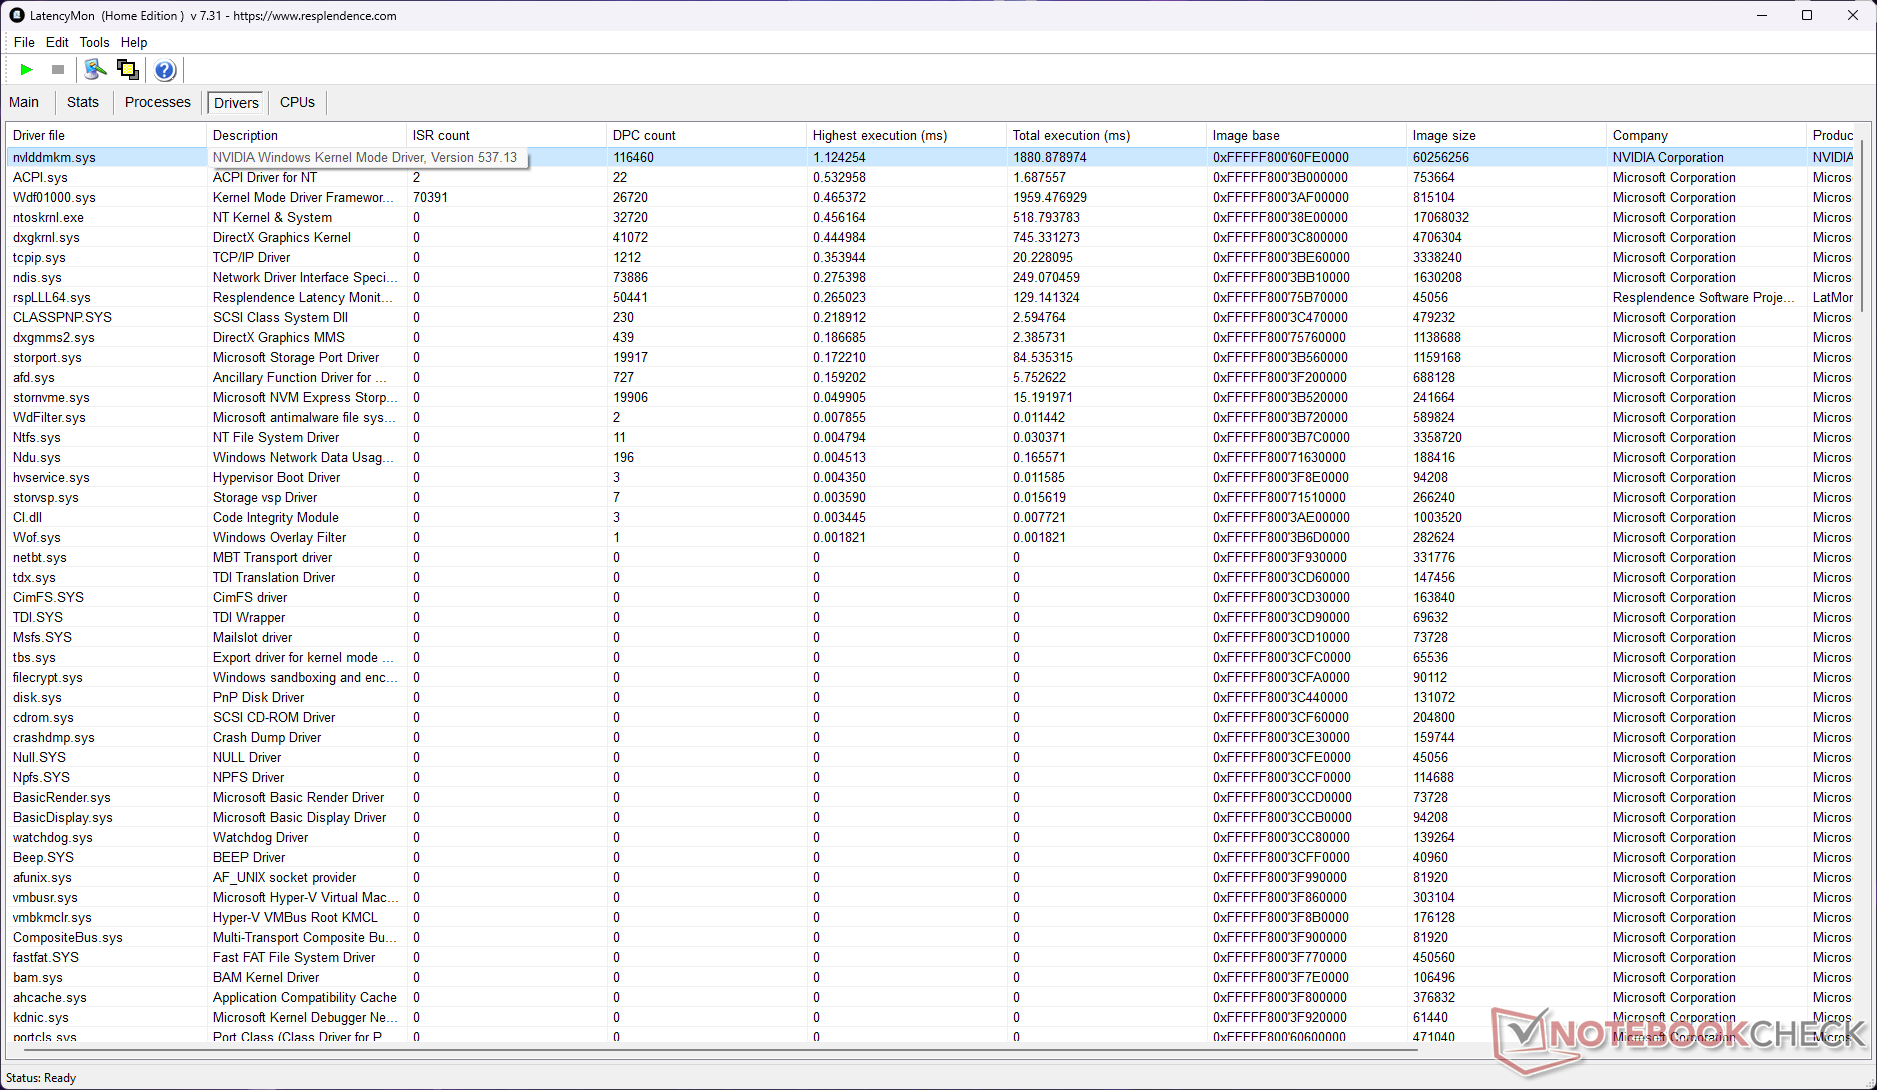
DPC-Latenzen
Die DPC-Latenzen sind recht hoch, im Vergleich zu seinen Mitstreitern maht sich das LOQ 15 Core i7 aber dennoch als positiv bemerkbar.
| DPC Latencies / LatencyMon - interrupt to process latency (max), Web, Youtube, Prime95 | |
| Dell G15 5530 | |
| MSI Katana 17 B13VFK | |
| HP Victus 16-r0077ng | |
| Lenovo LOQ 15APH8 | |
| Lenovo LOQ 16IRH8 | |
| Asus TUF Gaming A16 FA617XS | |
| Lenovo Legion Pro 5 16ARX8 (R5 7645HX, RTX 4050) | |
| Lenovo LOQ 15IRH8 Core i7 | |
* ... kleinere Werte sind besser
Auf unserer Seite zum DPC-Latenz-Ranking finden Sie eine Übersicht der in allen getesteten Geräten gemessenen Latenzen.
Massenspeichergeräte
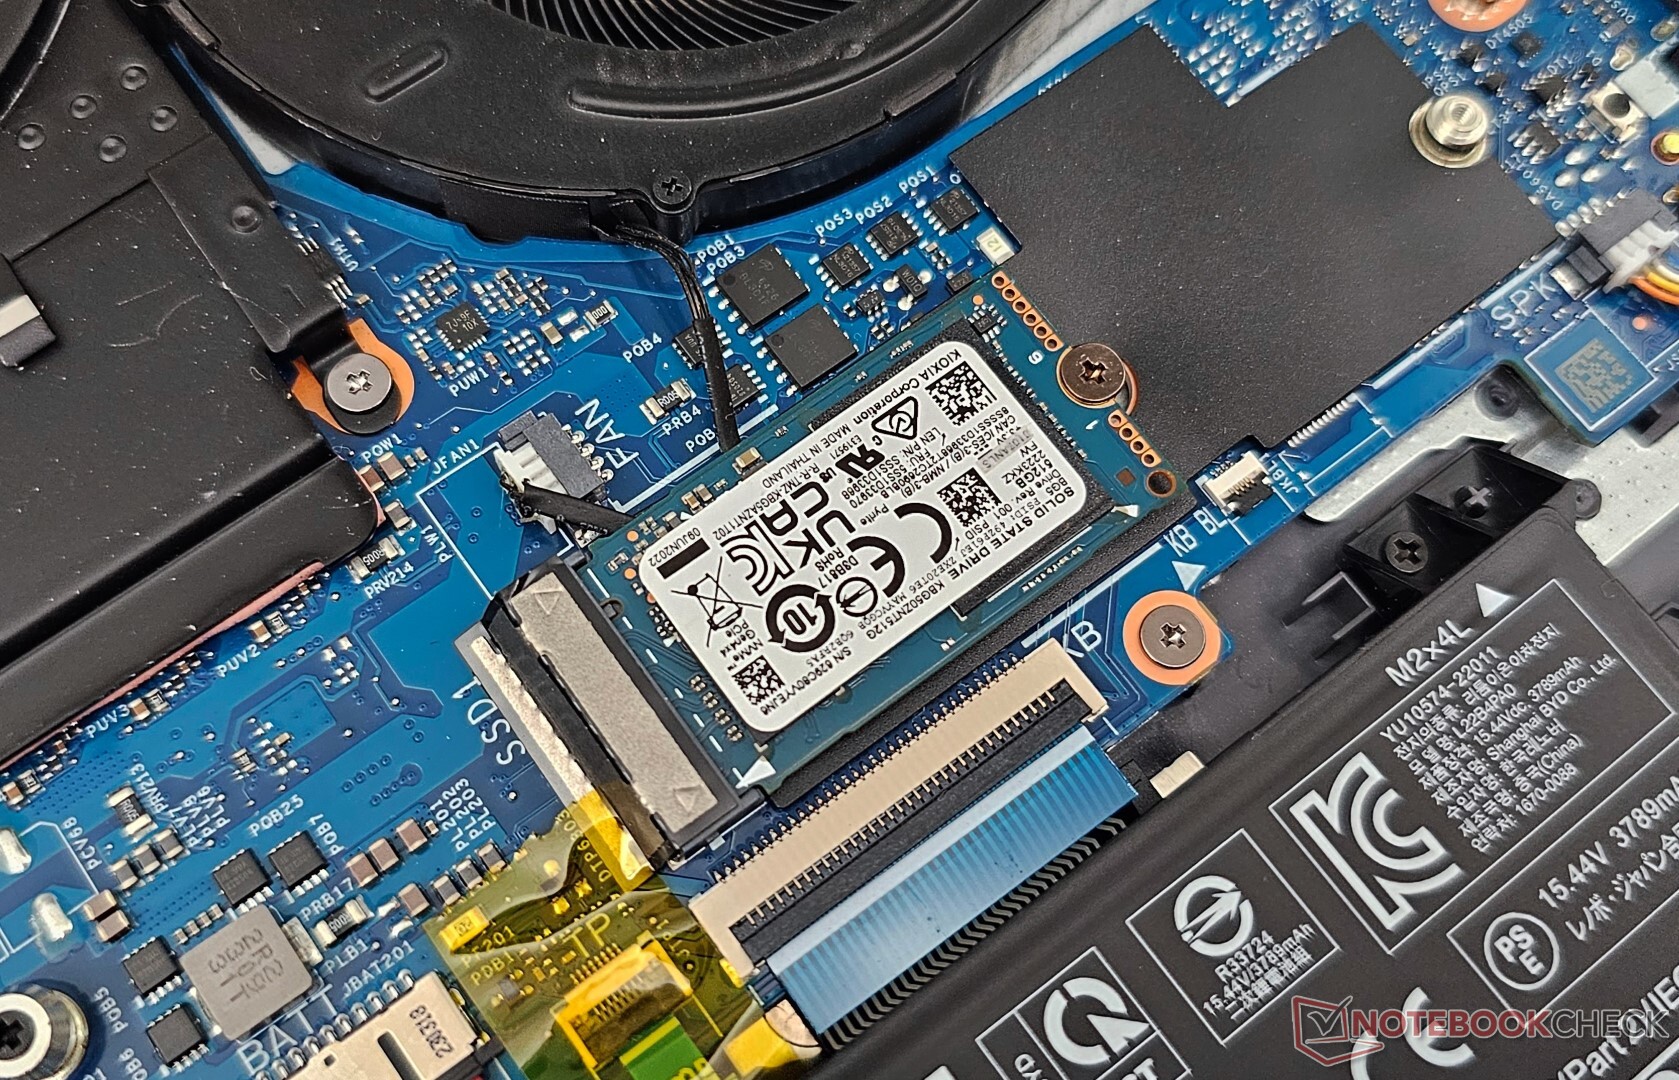
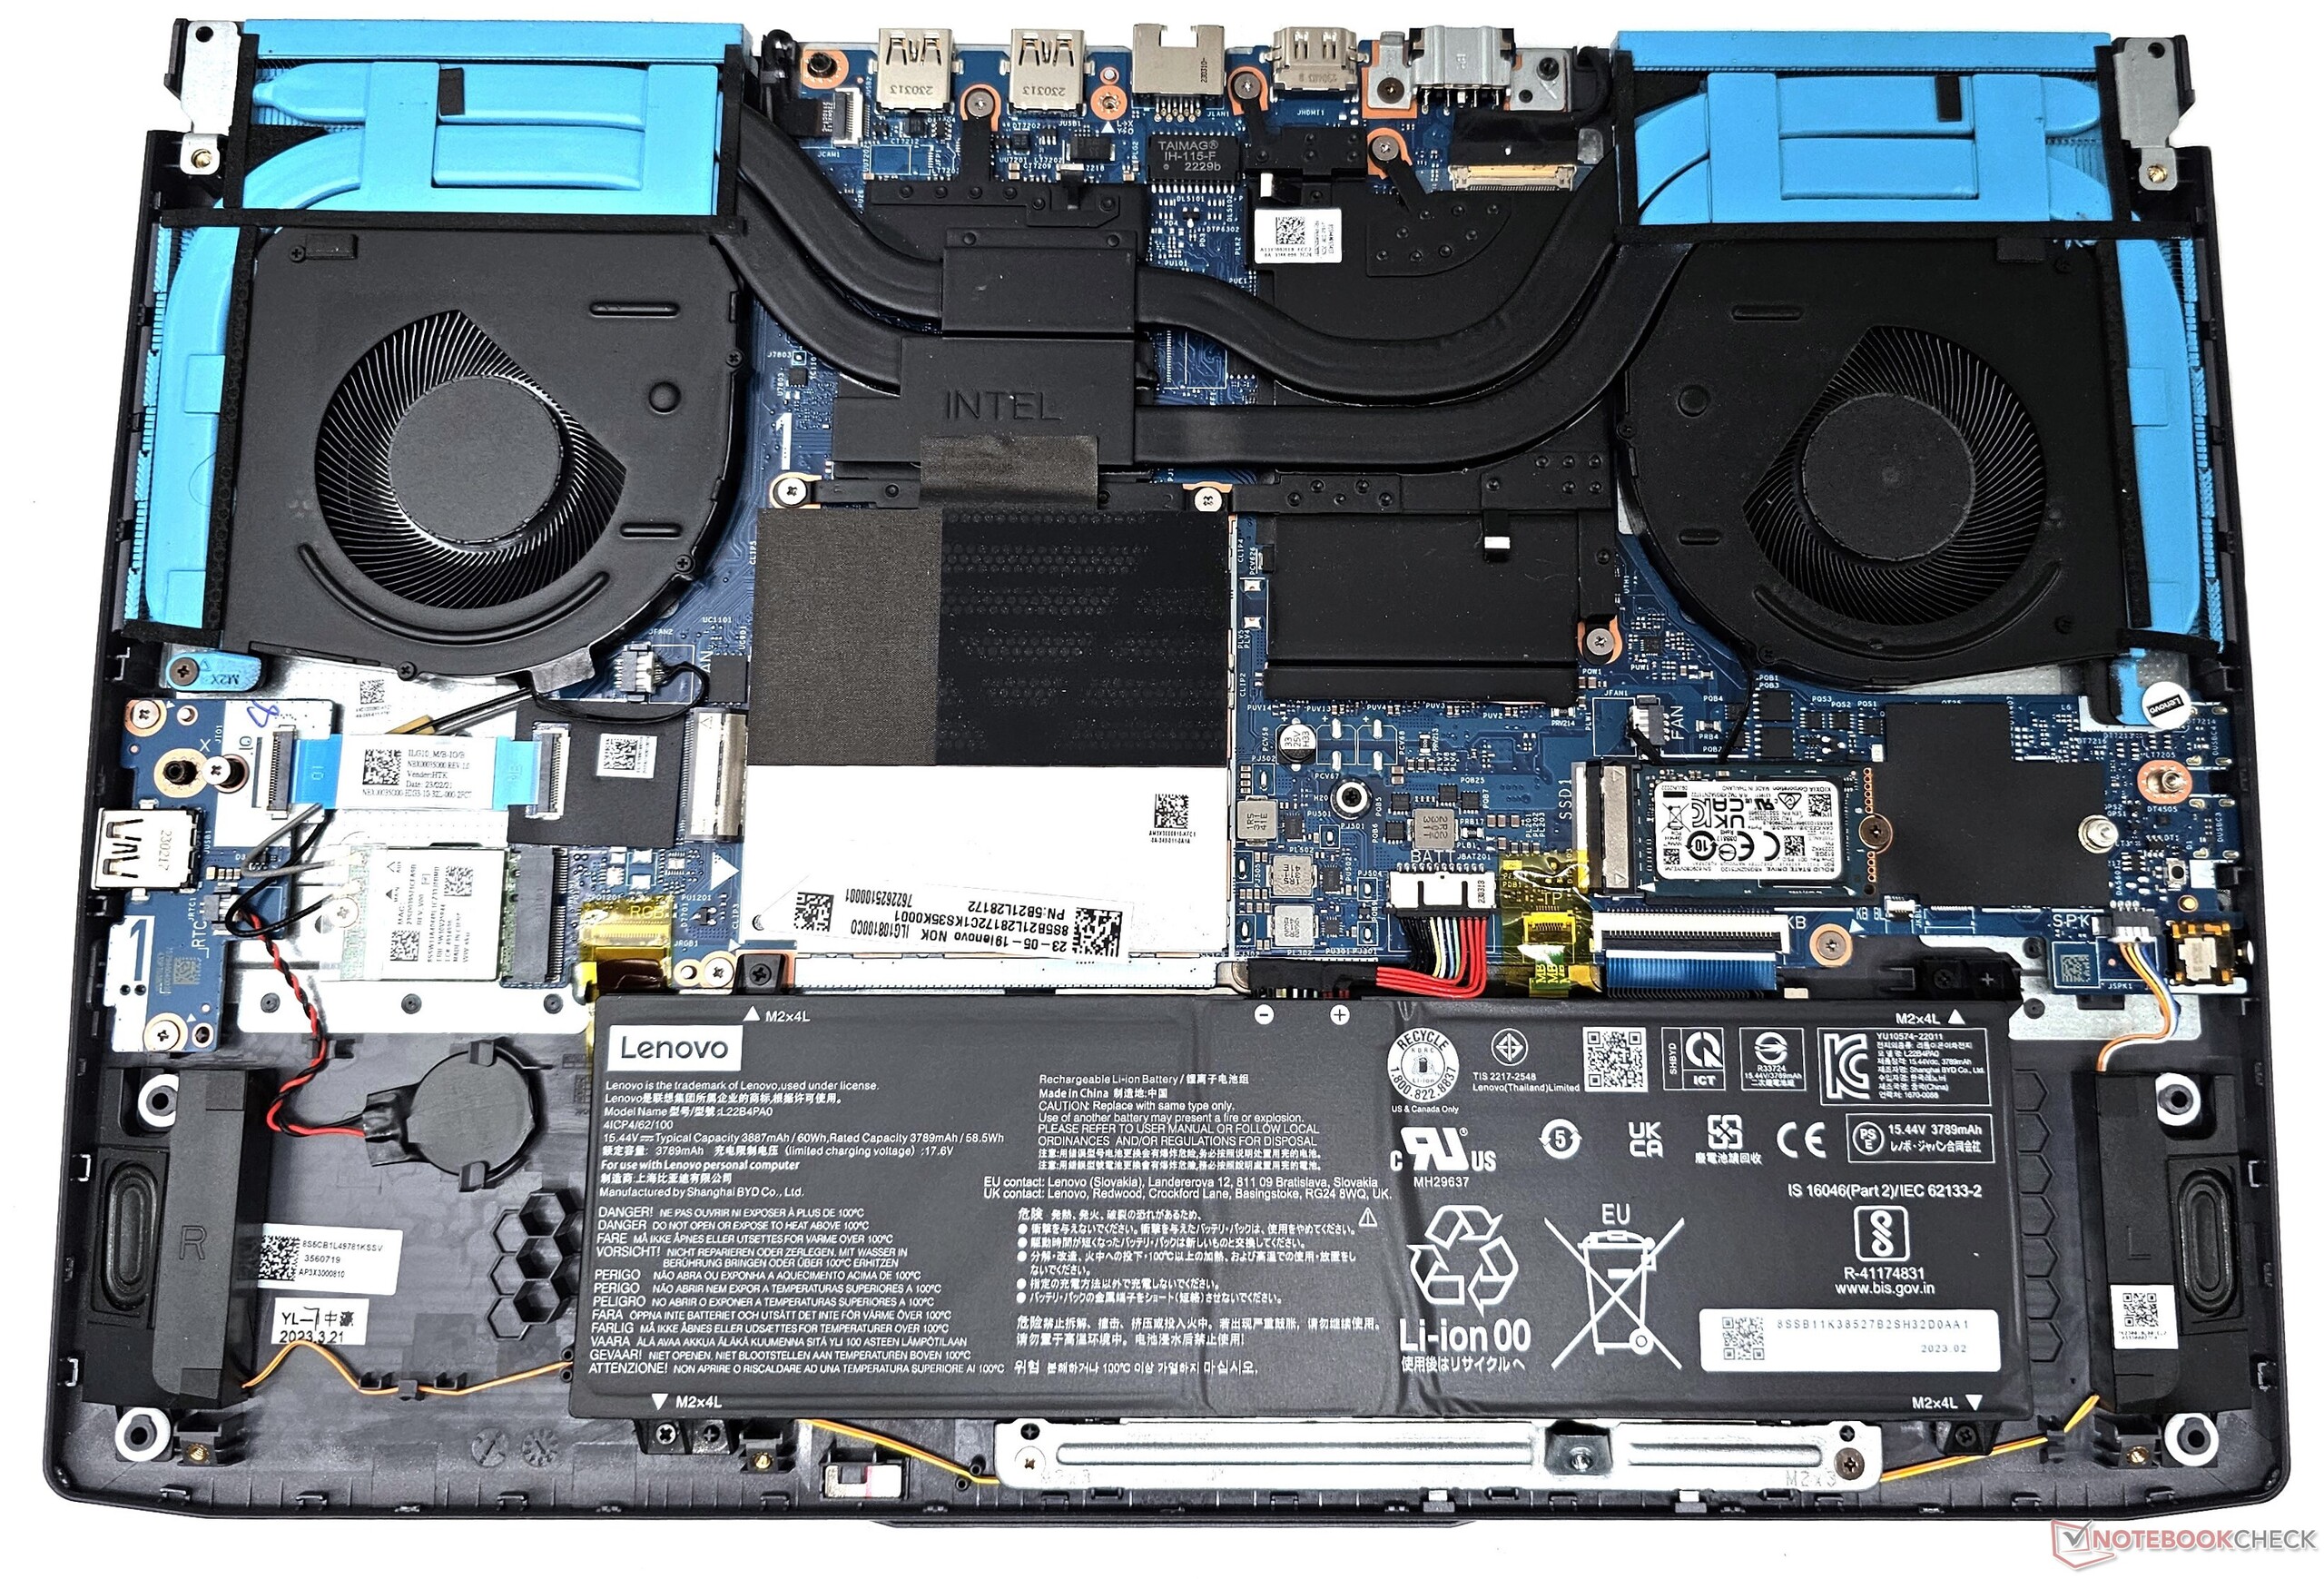
Unser Testgerät ist mit einer Kioxia M.2-2230-PCIe-Gen4-NVMe-SSD mit 512 GB ausgestattet. Falls erwünscht, kann diese SSD auch mit einer größeren M.2280-SSD ersetzt werden. Außerdem kann der Speicherplatz über den freien M.2-2280-Slot erweitert werden.
Die Leistung unserer Kioxia-SSD hinkt hinter der 1-TB-Kioxia-SSD im HP Victus 16 hinterher. Die SSD hat Schwierigkeiten, eine gleichbleibende Lesegeschwindigkeit zu erreichen und die Leistung bricht nach der 25. Runde unserer DiskSpd-Leseschleife mit einer Warteschlangentiefe von 8 ein.

* ... kleinere Werte sind besser
Dauerleistung Lesen: DiskSpd Read Loop, Queue Depth 8
Weitere Informationen und Performance-Vergleiche finden Sie auf unserer Seite über HDD- und SSD-Benchmarks.
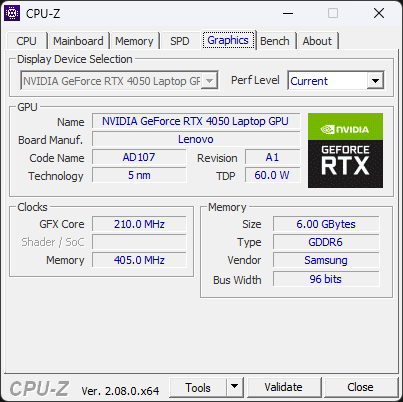
Grafikkarte
Die RTX-4050-Laptop-GPU im LOQ 15IRH8 hat eine TGP von 95 W, bietet in Stresssituationen aber noch Raum für eine höhere Leistungsaufnahme. Die gleiche GPU im LOQ 15APH8 ist in kumulativen 3DMark-Tests um etwa 6 Prozent schneller unterwegs.
Interessant ist, dass diese 95-W-RTX-4050 nur knapp hinter der 140-W-Variante im Lenovo Legion Pro 5 liegt. Allerdings gleicht das Legion dieses Defizit im Blender CUDA-Benchmark aus.
| 3DMark 11 Performance | 27474 Punkte | |
| 3DMark Ice Storm Standard Score | 229274 Punkte | |
| 3DMark Cloud Gate Standard Score | 49040 Punkte | |
| 3DMark Fire Strike Score | 19230 Punkte | |
| 3DMark Fire Strike Extreme Score | 9873 Punkte | |
| 3DMark Time Spy Score | 8701 Punkte | |
Hilfe | ||
| Blender / v3.3 Classroom OPTIX/RTX | |
| Durchschnittliche NVIDIA GeForce RTX 4050 Laptop GPU (25 - 37, n=40) | |
| Lenovo Legion Pro 5 16ARX8 (R5 7645HX, RTX 4050) | |
| Lenovo LOQ 15IRH8 Core i7 | |
| MSI Katana 17 B13VFK | |
| Lenovo LOQ 15APH8 | |
| HP Victus 16-r0077ng | |
| Lenovo LOQ 16IRH8 | |
| Dell G15 5530 | |
| Durchschnitt der Klasse Gaming (9 - 32, n=111, der letzten 2 Jahre) | |
| Blender / v3.3 Classroom CUDA | |
| Durchschnittliche NVIDIA GeForce RTX 4050 Laptop GPU (47 - 68, n=39) | |
| Lenovo LOQ 15IRH8 Core i7 | |
| Lenovo LOQ 15APH8 | |
| Lenovo Legion Pro 5 16ARX8 (R5 7645HX, RTX 4050) | |
| MSI Katana 17 B13VFK | |
| Lenovo LOQ 16IRH8 | |
| Dell G15 5530 | |
| HP Victus 16-r0077ng | |
| Durchschnitt der Klasse Gaming (15 - 228, n=111, der letzten 2 Jahre) | |
| Blender / v3.3 Classroom CPU | |
| Lenovo LOQ 15IRH8 Core i7 | |
| Durchschnittliche NVIDIA GeForce RTX 4050 Laptop GPU (243 - 907, n=40) | |
| Lenovo LOQ 16IRH8 | |
| HP Victus 16-r0077ng | |
| Lenovo Legion Pro 5 16ARX8 (R5 7645HX, RTX 4050) | |
| MSI Katana 17 B13VFK | |
| Asus TUF Gaming A16 FA617XS | |
| Lenovo LOQ 15APH8 | |
| Dell G15 5530 | |
| Durchschnitt der Klasse Gaming (122 - 565, n=107, der letzten 2 Jahre) | |
* ... kleinere Werte sind besser
Gaming Performance
Auch in den Gaming-Benchmarks kommen ähnliche Trends zum Vorschein. Die 95-W-RTX-4050 im LOQ15 und die 140-W-RTX-4050 im Legion Pro 5 erreichen in kumulativen 1080p-Ultra-Gamingtests fast identische Ergebnisse. Die höhere Leistungsaufnahme des Legion verschafft in QHD Ultra allerdings einen spürbaren Vorteil.
Das LOQ 15IRH8 ist im Wesentlichen für 1080p-Gaming geschaffen. Bei etwas älteren Titeln können spielbare Frameraten auch in QHD-Ultra erreicht werden. Spieler, die in QHD oder 4K mehr Frames erzielen möchten, müssen je nach Titel zwangsläufig auf Upscaling-Technologien wie AMD FSR, Nvidia DLSS oder Intel XeSS zurückgreifen.
| The Witcher 3 - 1920x1080 Ultra Graphics & Postprocessing (HBAO+) | |
| Durchschnitt der Klasse Gaming (95 - 240, n=8, der letzten 2 Jahre) | |
| HP Victus 16-r0077ng | |
| MSI Katana 17 B13VFK | |
| Dell G15 5530 | |
| Lenovo LOQ 16IRH8 | |
| Asus TUF Gaming A16 FA617XS | |
| Lenovo Legion Pro 5 16ARX8 (R5 7645HX, RTX 4050) | |
| Lenovo LOQ 15IRH8 Core i7 | |
| Lenovo LOQ 15APH8 | |
| The Witcher 3 - 2560x1440 Ultra Graphics & Postprocessing (HBAO+) | |
| Durchschnitt der Klasse Gaming (70 - 199.1, n=6, der letzten 2 Jahre) | |
| Lenovo LOQ 16IRH8 | |
| Lenovo LOQ 15IRH8 Core i7 | |
| Durchschnittliche NVIDIA GeForce RTX 4050 Laptop GPU (39 - 61.3, n=8) | |
| Cyberpunk 2077 1.6 | |
| 1920x1080 Ultra Preset | |
| Dell G15 5530 | |
| MSI Katana 17 B13VFK | |
| Lenovo LOQ 15APH8 | |
| Lenovo LOQ 15IRH8 Core i7 | |
| Durchschnittliche NVIDIA GeForce RTX 4050 Laptop GPU (44.4 - 79.4, n=14) | |
| 2560x1440 Ultra Preset | |
| MSI Katana 17 B13VFK | |
| Lenovo LOQ 15IRH8 Core i7 | |
| Durchschnittliche NVIDIA GeForce RTX 4050 Laptop GPU (27.2 - 43.1, n=10) | |
| 1920x1080 Ray Tracing Ultra Preset (DLSS off) | |
| Dell G15 5530 | |
| Durchschnittliche NVIDIA GeForce RTX 4050 Laptop GPU (15.8 - 65.6, n=5) | |
| MSI Katana 17 B13VFK | |
| Lenovo LOQ 15IRH8 Core i7 | |
The Witcher 3 FPS-Tabelle
Während die inkonsistente CPU-Leistung des LOQ 15 Fragen aufwirft, scheint die Kühlung des Laptops für die RTX-4050-Laptop-GPU durchaus angemessen zu sein. Das zeigen die relativ konstanten Framerates in The Witcher 3 bei 1080p Ultra.
| min. | mittel | hoch | max. | QHD | |
|---|---|---|---|---|---|
| GTA V (2015) | 185.9 | 179.7 | 168.9 | 93.2 | 66 |
| The Witcher 3 (2015) | 390 | 286 | 167.6 | 85.6 | 61.3 |
| Dota 2 Reborn (2015) | 196.3 | 178.3 | 171.1 | 162.2 | |
| Final Fantasy XV Benchmark (2018) | 192.9 | 121.2 | 84 | 60.9 | |
| X-Plane 11.11 (2018) | 159.9 | 139.8 | 110.2 | ||
| Far Cry 5 (2018) | 156 | 135 | 128 | 121 | 83 |
| Strange Brigade (2018) | 475 | 211 | 171.8 | 149.2 | 95.5 |
| Cyberpunk 2077 1.6 (2022) | 103.3 | 85.5 | 72.9 | 67.8 | 41 |
| F1 22 (2022) | 233 | 224 | 172.3 | 55 | 33.9 |
| F1 23 (2023) | 228 | 222 | 158.4 | 44.1 | 34.1 |
Emissionen: Hohe Oberflächentemperaturen unter Last
Geräuschemissionen
Im Leerlauf entspricht das Lüftergeräusch des LOQ 15IRH8 großteils dem Profil der AMD-Variante des LOQ 15 — unter Last waren die Lüfter des AMD-Pendants allerdings um rund 7 Prozent lauter. Lenovo hat den Geräuschpegel des Lüfters je nach ausgewähltem Energieprofil auf bestimmte Schwellenwerte begrenzt (siehe Tabelle).
Im Performance-Modus bleiben die Geräuschemissionen unter Last knapp unter der 50-dB(A)-Marke. Der Quiet-Modus wirkt sich stark auf die CPU-Leistung aus, für ein im Vergleich zum Performance-Modus angenehmes Gaming-Erlebnis sollte die Leistung in diesem Profil allerdings noch ausreichen.
Lautstärkediagramm
| Idle |
| 29.03 / 29.03 / 29.03 dB(A) |
| Last |
| 48.7 / 48.7 dB(A) |
 | ||
30 dB leise 40 dB(A) deutlich hörbar 50 dB(A) störend |
||
min: | ||
| Energieprofil | Leerlauf dB(A) | Durchschnittl. Last dB(A) | Maximale Last dB(A) | The Witcher 3 1080p Ultra dB(A) |
|---|---|---|---|---|
| Quiet | 25,28 | 33,09 | 36,07 | 36,69 / 78 fps |
| Balance | 25,28 | 40,40 | 45,15 | 45,42 / 83 fps |
| Performance | 29,03 | 48,72 | 48,71 | 48,52 / 85 fps |
| Lenovo LOQ 15IRH8 Core i7 i7-13620H, GeForce RTX 4050 Laptop GPU | Lenovo LOQ 16IRH8 i7-13620H, GeForce RTX 4060 Laptop GPU | Lenovo LOQ 15APH8 R7 7840HS, GeForce RTX 4050 Laptop GPU | MSI Katana 17 B13VFK i7-13620H, GeForce RTX 4060 Laptop GPU | Lenovo Legion Pro 5 16ARX8 (R5 7645HX, RTX 4050) R5 7645HX, GeForce RTX 4050 Laptop GPU | HP Victus 16-r0077ng i7-13700H, GeForce RTX 4070 Laptop GPU | Dell G15 5530 i7-13650HX, GeForce RTX 4060 Laptop GPU | Asus TUF Gaming A16 FA617XS R9 7940HS, Radeon RX 7600S | |
|---|---|---|---|---|---|---|---|---|
| Geräuschentwicklung | 3% | 9% | -6% | 14% | 2% | 12% | 3% | |
| aus / Umgebung * (dB) | 23.69 | 23 3% | 23.1 2% | 24.5 -3% | 23 3% | 25 -6% | 20.41 14% | 25 -6% |
| Idle min * (dB) | 29.03 | 23 21% | 23.1 20% | 24.5 16% | 23 21% | 28 4% | 26.85 8% | 25 14% |
| Idle avg * (dB) | 29.03 | 23 21% | 23.1 20% | 24.5 16% | 23 21% | 29 -0% | 26.85 8% | 26 10% |
| Idle max * (dB) | 29.03 | 27.66 5% | 25.2 13% | 40 -38% | 24.42 16% | 30 -3% | 26.85 8% | 28 4% |
| Last avg * (dB) | 48.7 | 53.62 -10% | 44.3 9% | 48.3 1% | 34.94 28% | 43 12% | 27.65 43% | 43 12% |
| Witcher 3 ultra * (dB) | 48.5 | 53.5 -10% | 45.8 6% | 56 -15% | 43.79 10% | 46 5% | 47.9 1% | 51 -5% |
| Last max * (dB) | 48.7 | 53.5 -10% | 52 -7% | 59.1 -21% | 50 -3% | 48 1% | 47.86 2% | 53 -9% |
* ... kleinere Werte sind besser
Temperatur
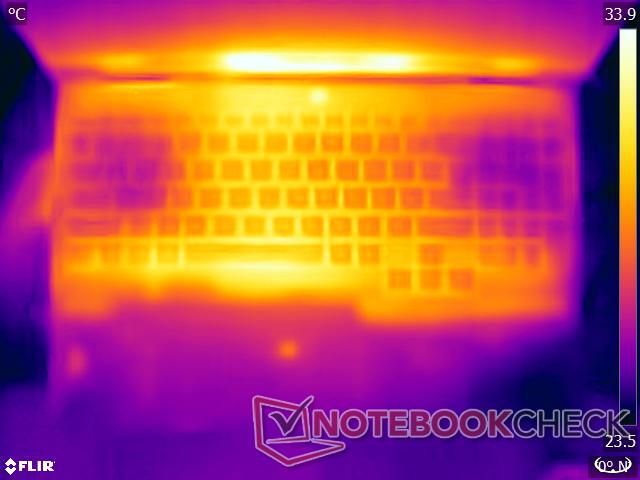
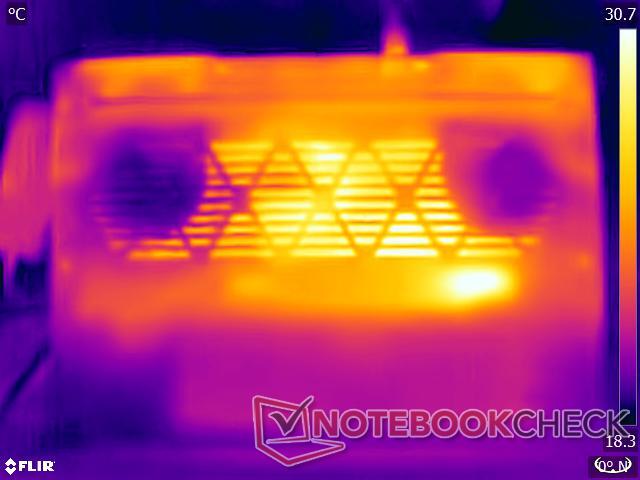
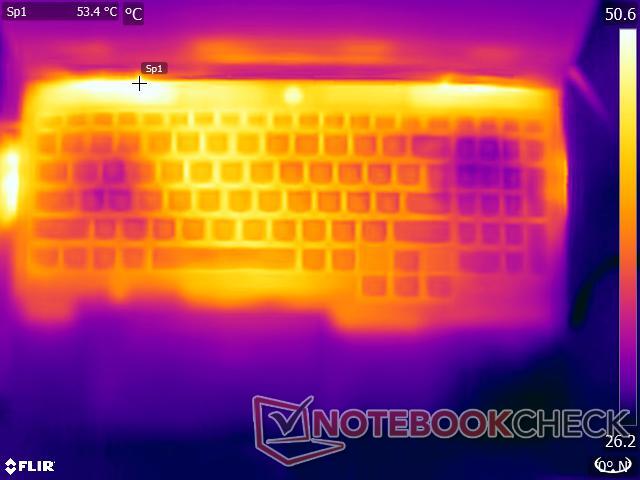
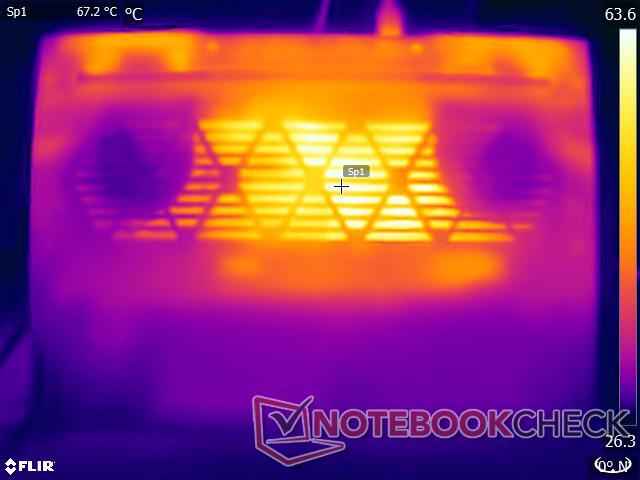
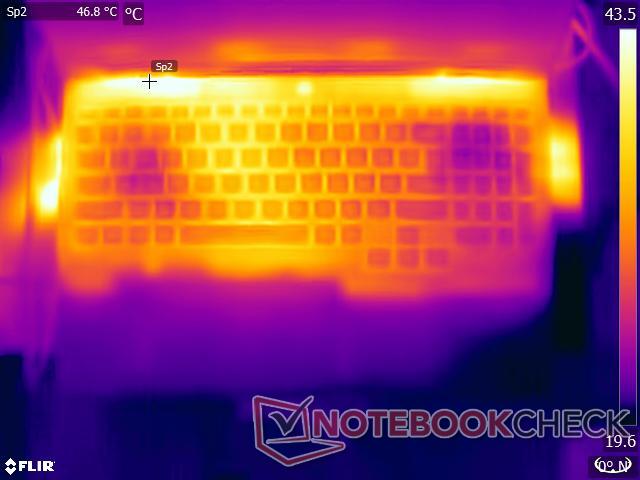
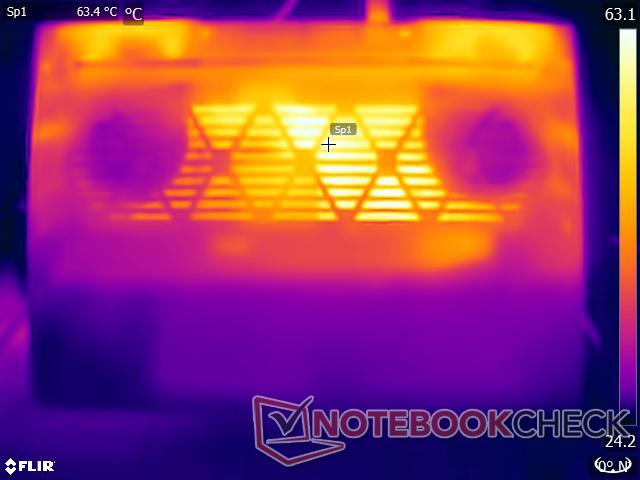
Unter hoher Last können die Oberflächentemperaturen im Performance-Modus insbesondere auf der Unterseite recht hoch werden. Obwohl unsere Stresstests einem Extremszenario entsprechen, würden wir Nutzern davon abraten, dieses Gerät bei mittlerer bis hoher Belastung auf dem Schoß zu verwenden.
(-) Die maximale Temperatur auf der Oberseite ist 46.4 °C. Im Vergleich liegt der Klassendurchschnitt bei 40.4 °C (von 21.2 bis 68.8 °C für die Klasse Gaming).
(-) Auf der Unterseite messen wir eine maximalen Wert von 59.2 °C (im Vergleich zum Durchschnitt von 43.2 °C).
(±) Ohne Last messen wir eine durchschnittliche Temperatur von 32.7 °C auf der Oberseite. Der Klassendurchschnitt erreicht 33.9 °C.
(-) Beim längeren Spielen von The Witcher 3 erhitzt sich das Gerät durchschnittlich auf 39.4 °C. Der Durchschnitt der Klasse ist derzeit 33.9 °C.
(+) Die Handballen und der Touchpad-Bereich erreichen maximal 34 °C und damit die typische Hauttemperatur und fühlen sich daher nicht heiß an.
(-) Die durchschnittliche Handballen-Temperatur anderer getesteter Geräte war 28.8 °C (-5.2 °C).
| Lenovo LOQ 15IRH8 Core i7 Intel Core i7-13620H, NVIDIA GeForce RTX 4050 Laptop GPU | Lenovo LOQ 16IRH8 Intel Core i7-13620H, NVIDIA GeForce RTX 4060 Laptop GPU | Lenovo LOQ 15APH8 AMD Ryzen 7 7840HS, NVIDIA GeForce RTX 4050 Laptop GPU | MSI Katana 17 B13VFK Intel Core i7-13620H, NVIDIA GeForce RTX 4060 Laptop GPU | Lenovo Legion Pro 5 16ARX8 (R5 7645HX, RTX 4050) AMD Ryzen 5 7645HX, NVIDIA GeForce RTX 4050 Laptop GPU | HP Victus 16-r0077ng Intel Core i7-13700H, NVIDIA GeForce RTX 4070 Laptop GPU | Dell G15 5530 Intel Core i7-13650HX, NVIDIA GeForce RTX 4060 Laptop GPU | Asus TUF Gaming A16 FA617XS AMD Ryzen 9 7940HS, AMD Radeon RX 7600S | |
|---|---|---|---|---|---|---|---|---|
| Hitze | 10% | 13% | 11% | 1% | 3% | -3% | 9% | |
| Last oben max * (°C) | 46.4 | 48 -3% | 44.4 4% | 41.6 10% | 45 3% | 51 -10% | 54 -16% | 53 -14% |
| Last unten max * (°C) | 59.2 | 59 -0% | 52 12% | 43.1 27% | 54 9% | 54 9% | 62.2 -5% | 48 19% |
| Idle oben max * (°C) | 34.4 | 28 19% | 28 19% | 32 7% | 36 -5% | 37 -8% | 33.4 3% | 30 13% |
| Idle unten max * (°C) | 36.2 | 28 23% | 29.6 18% | 35.8 1% | 38 -5% | 29 20% | 33.4 8% | 30 17% |
* ... kleinere Werte sind besser
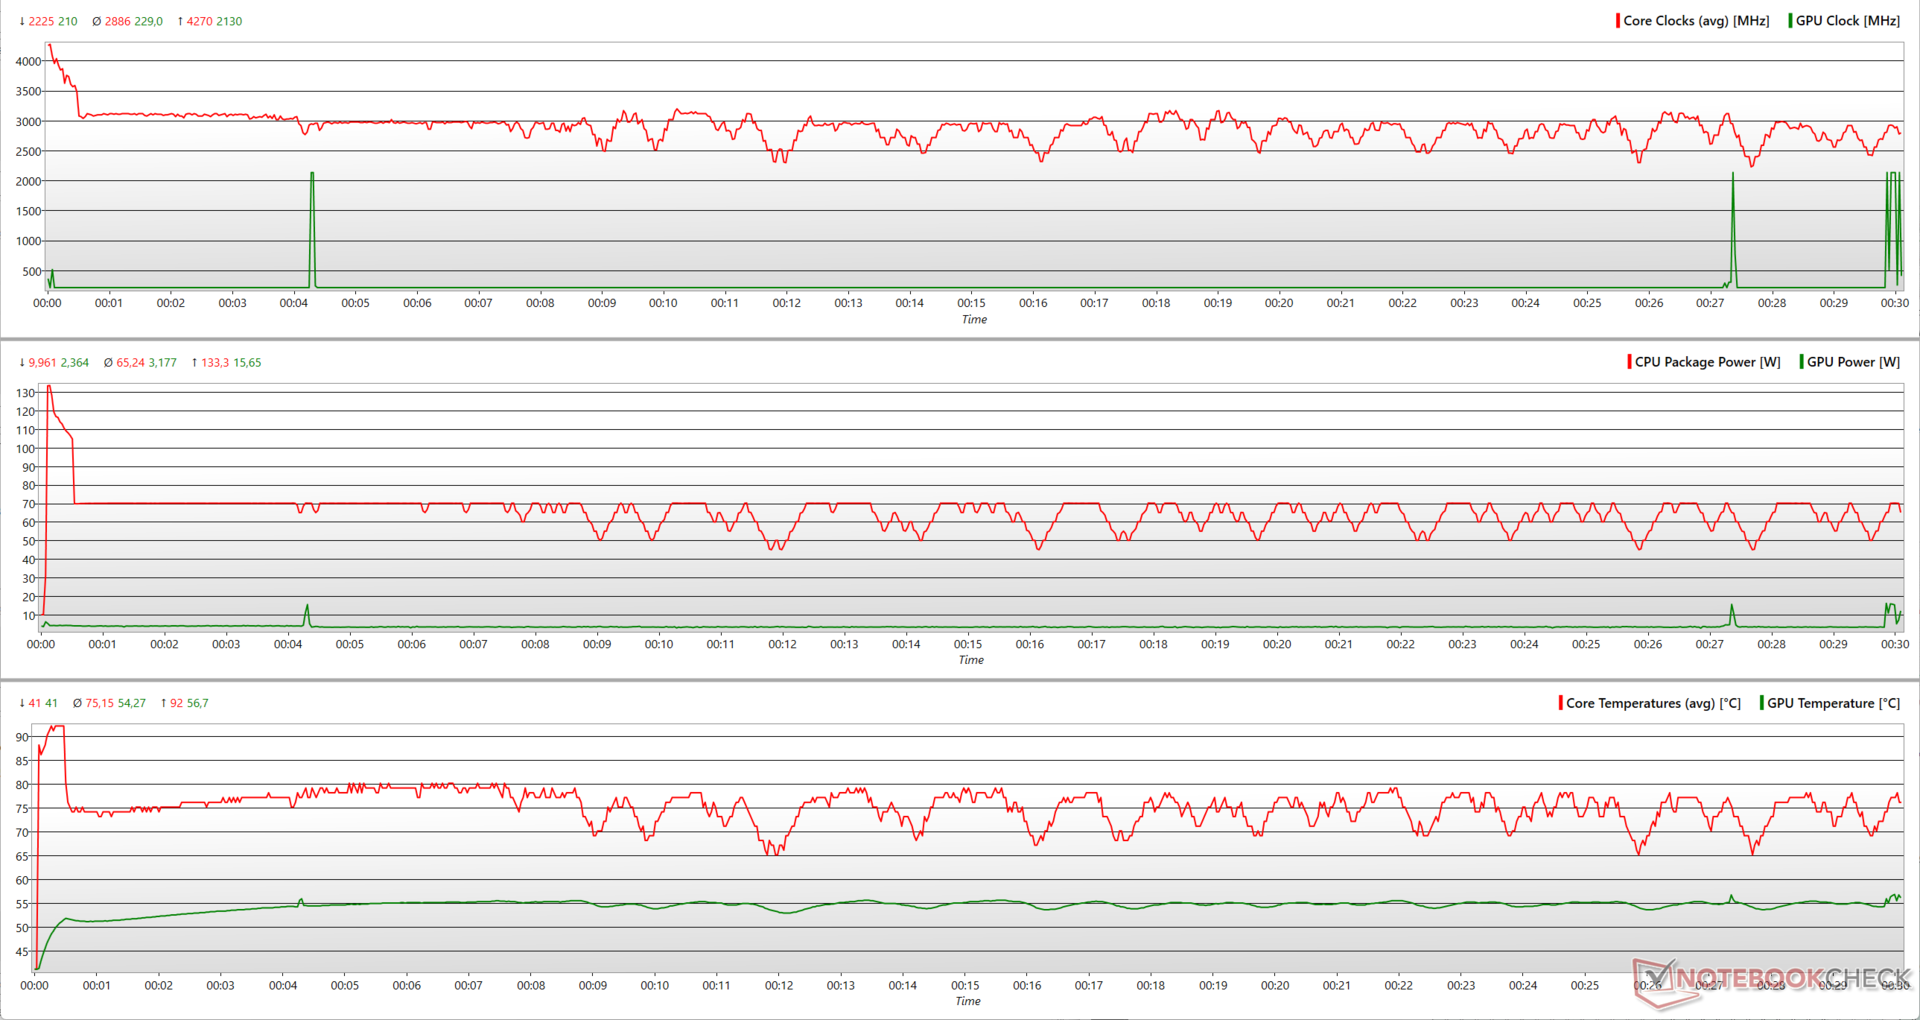
Stresstest
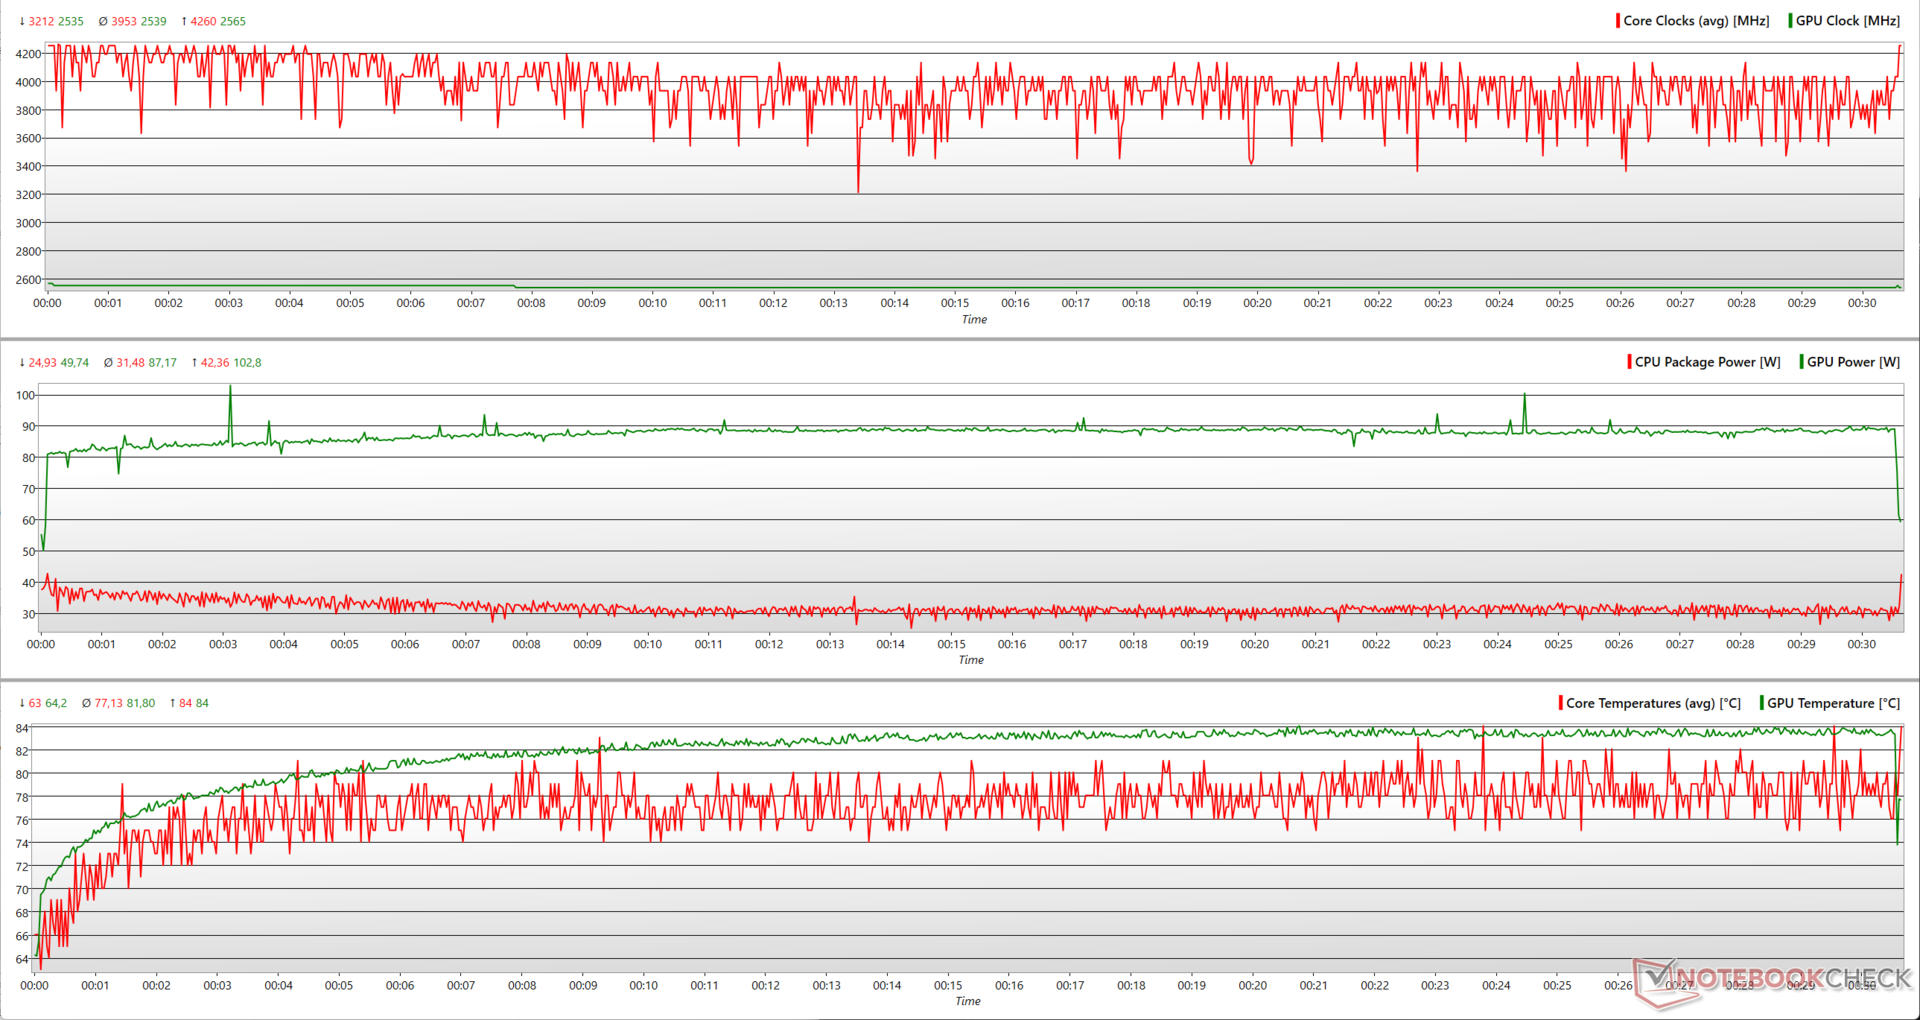
Im Gegensatz zu den Ergebnissen der CineBench-R15-Multi-Core-Schleife erreicht das LOQ 15 bzw. der Core i7-13620H im Prime95-Stresstest endlich 133 W und eine maximale Taktrate von 4,27 GHz. Dieser Maximalwert ist allerdings nur kurzlebig und der Prozessor stabilisiert sich schließlich bei einer durchschnittlichen Leistungsaufnahme von 65 W.
Bei kombinierter Last aus Prime95 und FurMark erreicht die RTX 4050 bis zu 117 W und eine maximale Taktrate von 2.565 MHz. Der Core i7-13620H muss hier mit einem Maximalturbo von 3,6 GHz auskommen, da sich der Prozessor die Temperatur- und Leistungsreserven mit der Grafikkarte teilen muss.
| Stresstest | CPU-Taktrate (GHz) | GPU-Taktrate (MHz) | Durchschnittl. CPU-Temperatur (°C) | Durchschnittl. GPU-Temperatur (°C) |
| Leerlauf | 4,3 | 210 | 37 | 38,4 |
| Prime95 | 4,8 | 210 | 75 | 54,2 |
| Prime95 + FurMark | 3,2 | 2.220 | 77 | 79,7 |
| The Witcher 3 1080p Ultra | 4,8 | 2.535 | 76 | 80,5 |
Im The Witcher 3 1080p-Ultra-Stresstest erreichte die RTX 4050 die gleiche Taktrate von 2.565 MHz, allerdings bei einer deutlich niedrigeren maximalen TGP von 103 W. Das schafft Raum für den Core i7-13620H, der bis zu 42 W nutzen kann und einen maximalen Turbo von 4,26 GHz erreicht.
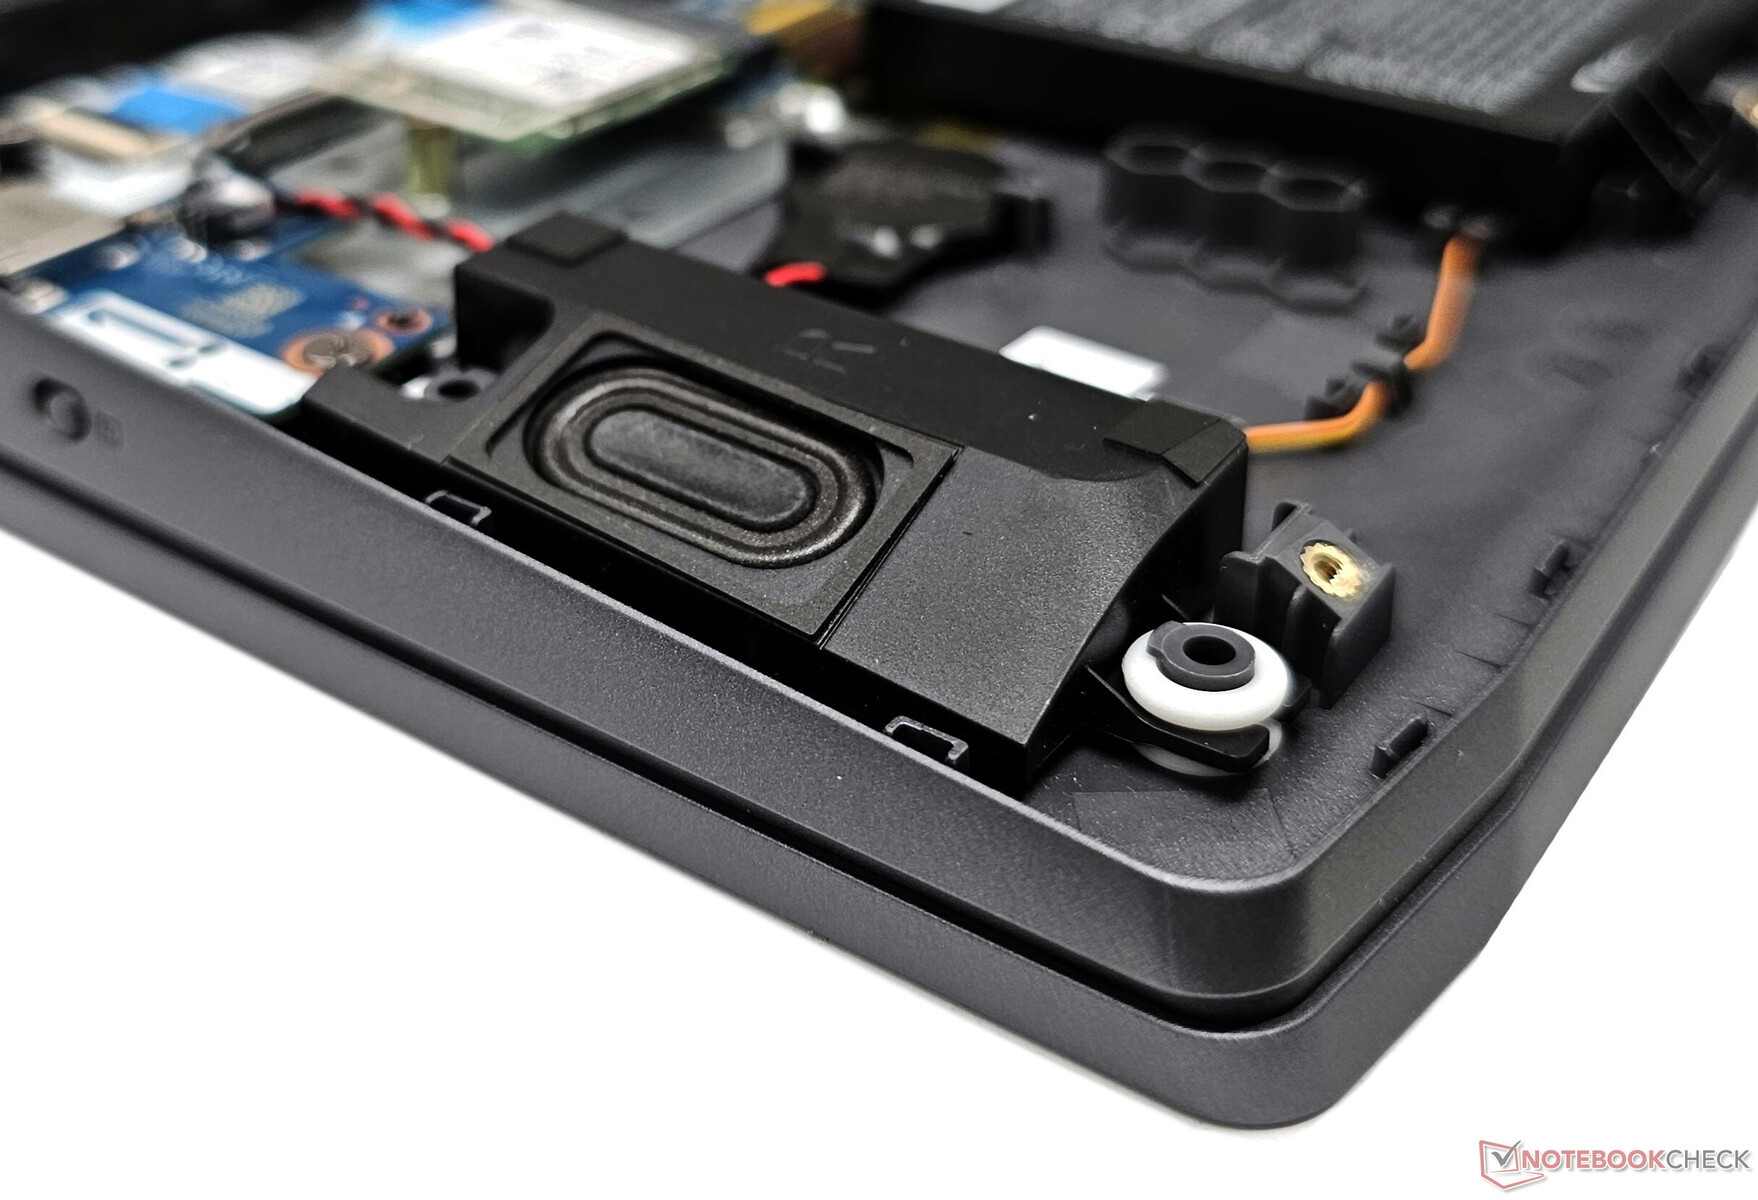
Lautsprecher
Die Lautsprecher des LOQ 15IRH8 haben eine gute Lautstärke. Der Bass ist nicht besonders tief, doch die Mitten und Höhen werden gut wiedergegeben. Für ein noch besseres Audioerlebnis können Nutzer über den Audioausgang oder Bluetooth 5.2 Lautsprecher verbinden.
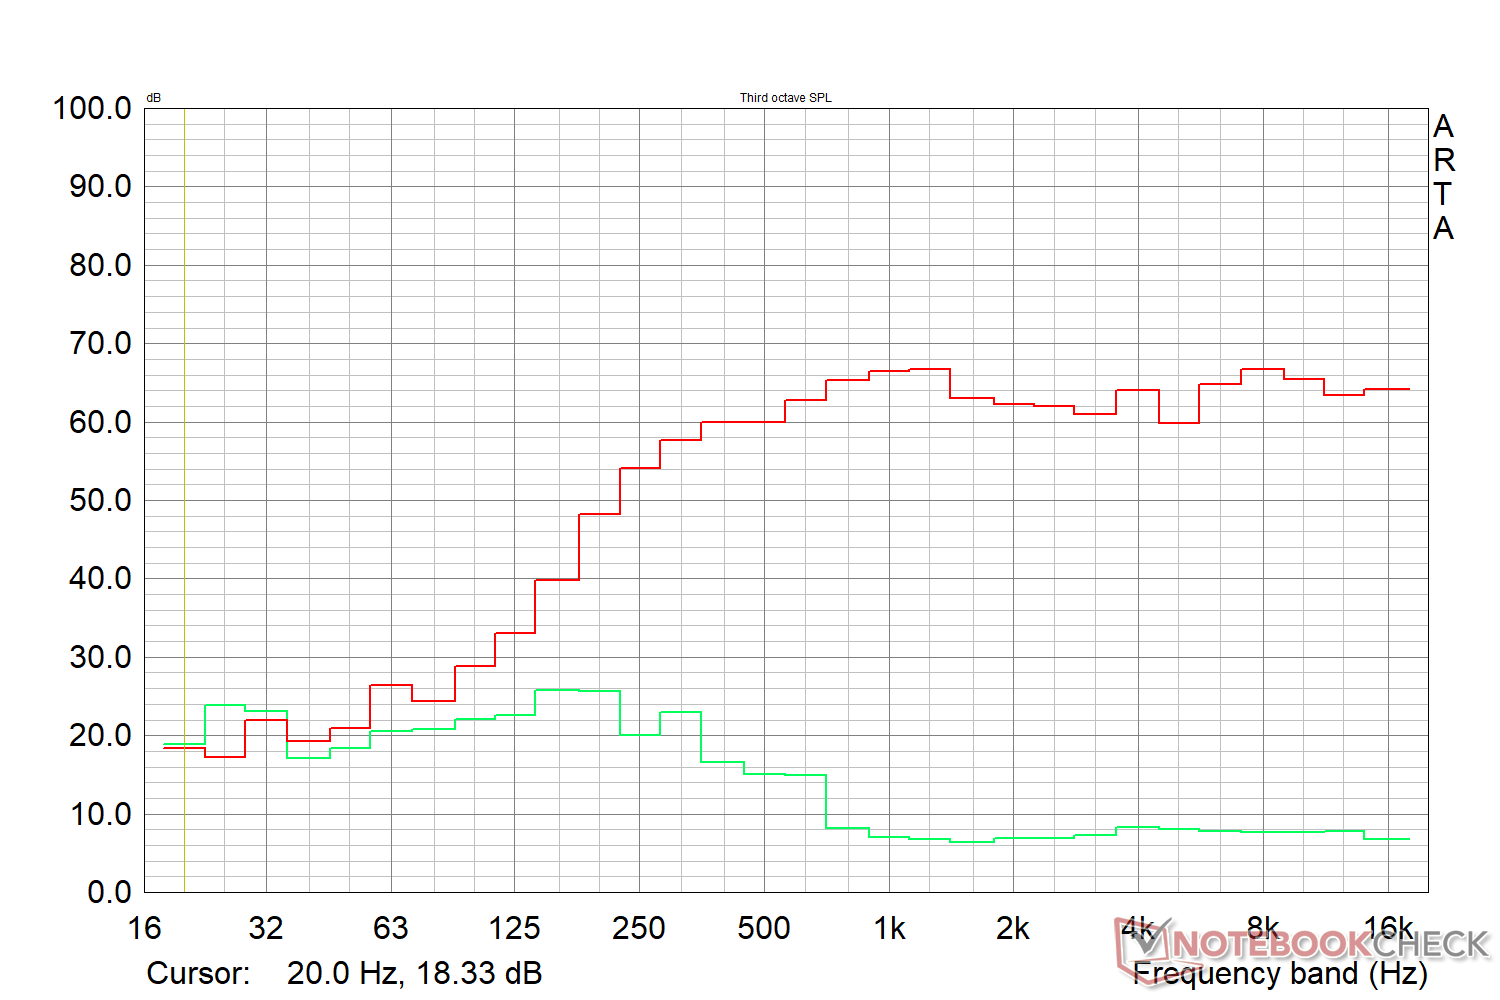
Lenovo LOQ 15IRH8 Core i7 Audio Analyse
(±) | Mittelmäßig laut spielende Lautsprecher (75.9 dB)
Bass 100 - 315 Hz
(-) | kaum Bass - 18.6% niedriger als der Median
(±) | durchschnittlich lineare Bass-Wiedergabe (10.2% Delta zum Vorgänger)
Mitteltöne 400 - 2000 Hz
(+) | ausgeglichene Mitten, vom Median nur 2.2% abweichend
(+) | lineare Mitten (3.1% Delta zum Vorgänger)
Hochtöne 2 - 16 kHz
(+) | ausgeglichene Hochtöne, vom Median nur 2.3% abweichend
(+) | sehr lineare Hochtöne (4.4% Delta zum Vorgänger)
Gesamt im hörbaren Bereich 100 - 16.000 Hz
(+) | hörbarer Bereich ist sehr linear (13.7% Abstand zum Median
Im Vergleich zu allen Geräten derselben Klasse
» 21% aller getesteten Geräte dieser Klasse waren besser, 7% vergleichbar, 72% schlechter
» Das beste Gerät hat einen Delta-Wert von 6%, durchschnittlich ist 18%, das schlechteste Gerät hat 132%
Im Vergleich zu allen Geräten im Test
» 15% aller getesteten Geräte waren besser, 4% vergleichbar, 81% schlechter
» Das beste Gerät hat einen Delta-Wert von 4%, durchschnittlich ist 24%, das schlechteste Gerät hat 134%
Apple MacBook Pro 16 2021 M1 Pro Audio Analyse
(+) | Die Lautsprecher können relativ laut spielen (84.7 dB)
Bass 100 - 315 Hz
(+) | guter Bass - nur 3.8% Abweichung vom Median
(+) | lineare Bass-Wiedergabe (5.2% Delta zum Vorgänger)
Mitteltöne 400 - 2000 Hz
(+) | ausgeglichene Mitten, vom Median nur 1.3% abweichend
(+) | lineare Mitten (2.1% Delta zum Vorgänger)
Hochtöne 2 - 16 kHz
(+) | ausgeglichene Hochtöne, vom Median nur 1.9% abweichend
(+) | sehr lineare Hochtöne (2.7% Delta zum Vorgänger)
Gesamt im hörbaren Bereich 100 - 16.000 Hz
(+) | hörbarer Bereich ist sehr linear (4.6% Abstand zum Median
Im Vergleich zu allen Geräten derselben Klasse
» 0% aller getesteten Geräte dieser Klasse waren besser, 0% vergleichbar, 100% schlechter
» Das beste Gerät hat einen Delta-Wert von 5%, durchschnittlich ist 17%, das schlechteste Gerät hat 45%
Im Vergleich zu allen Geräten im Test
» 0% aller getesteten Geräte waren besser, 0% vergleichbar, 100% schlechter
» Das beste Gerät hat einen Delta-Wert von 4%, durchschnittlich ist 24%, das schlechteste Gerät hat 134%
Energieverwaltung: AMD-Variante scheint sparsamer zu sein
Energieaufnahme
Die Energieaufnahme unter Last ist im Vergleich zu den Mitstreitern eher gering. Trotz der Unterschiede beim Display verbraucht die Ryzen-7-7840HS-Konfiguration des LOQ 15APH8 insgesamt etwa 18 Prozent weniger Energie als unser Intel-Modell LOQ 15 IRH8.
Das Asus TUF Gaming A16 mit AMD-Prozessor ist das sparsamste Gerät in unserem Vergleichsfeld, hat unter Last allerdings eine ähnliche Energieaufnahme wie das LOQ 15IRH8. Die Energieaufnahme unter maximaler Last übersteigt die Nennleistung des inkludierten 170-W-Netzgeräts.
| Aus / Standby | |
| Idle | |
| Last |
|
Legende:
min: | |
| Lenovo LOQ 15IRH8 Core i7 i7-13620H, GeForce RTX 4050 Laptop GPU, IPS, 2560x1440, 15.6" | Lenovo LOQ 16IRH8 i7-13620H, GeForce RTX 4060 Laptop GPU, IPS, 2560x1600, 16" | Lenovo LOQ 15APH8 R7 7840HS, GeForce RTX 4050 Laptop GPU, IPS, 1920x1080, 15.6" | MSI Katana 17 B13VFK i7-13620H, GeForce RTX 4060 Laptop GPU, IPS LED, 1920x1080, 17.3" | Lenovo Legion Pro 5 16ARX8 (R5 7645HX, RTX 4050) R5 7645HX, GeForce RTX 4050 Laptop GPU, IPS, 2560x1600, 16" | HP Victus 16-r0077ng i7-13700H, GeForce RTX 4070 Laptop GPU, IPS, 1920x1080, 16.1" | Dell G15 5530 i7-13650HX, GeForce RTX 4060 Laptop GPU, IPS, 1920x1080, 15.6" | Asus TUF Gaming A16 FA617XS R9 7940HS, Radeon RX 7600S, IPS, 1920x1200, 16" | Durchschnittliche NVIDIA GeForce RTX 4050 Laptop GPU | Durchschnitt der Klasse Gaming | |
|---|---|---|---|---|---|---|---|---|---|---|
| Stromverbrauch | 6% | 18% | 19% | 15% | 20% | 12% | 31% | 25% | 3% | |
| Idle min * (Watt) | 18.52 | 17.2 7% | 15 19% | 12.2 34% | 13 30% | 8 57% | 8.4 55% | 7 62% | 9.95 ? 46% | 13.1 ? 29% |
| Idle avg * (Watt) | 22.54 | 19.3 14% | 17.7 21% | 14.9 34% | 17.4 23% | 13 42% | 14.98 34% | 10 56% | 15.8 ? 30% | 18.7 ? 17% |
| Idle max * (Watt) | 29.79 | 21.2 29% | 21.5 28% | 15.8 47% | 21.8 27% | 22 26% | 15.56 48% | 15 50% | 20.1 ? 33% | 24.4 ? 18% |
| Last avg * (Watt) | 94.5 | 90 5% | 73.5 22% | 85.22 10% | 96.4 -2% | 86 9% | 96.8 -2% | 86 9% | 88 ? 7% | 108.1 ? -14% |
| Witcher 3 ultra * (Watt) | 154.4 | 168 -9% | 138.6 10% | 151.1 2% | 125 19% | 141.8 8% | 186 -20% | 160.6 -4% | ||
| Last max * (Watt) | 190.4 | 211 -11% | 176.5 7% | 212.8 -12% | 204 -7% | 233 -22% | 271.42 -43% | 172 10% | 176.3 ? 7% | 254 ? -33% |
* ... kleinere Werte sind besser
Energieaufnahme: The Witcher 3 / Stresstest
Energieaufnahme: Externer Monitor
Akkulaufzeit
Die Akkulaufzeit ähnelt der des LOQ 16IRH8, wohingegen die niedrigere Energieaufnahme des LOQ 15APH8 im Vergleich zum LOQ 15IRH8 eine um 25 Prozent längere Akkulaufzeit ermöglicht.
Das inkludierte 170-W-Netzgerät unterstützt Rapid Charge. Dies lässt sich in der Lenovo-Vantage-App aktivieren und ermöglicht, dass das Gerät innerhalb von rund 45 Minuten von 0 auf 100 Prozent geladen wird.
| Lenovo LOQ 15IRH8 Core i7 i7-13620H, GeForce RTX 4050 Laptop GPU, 60 Wh | Lenovo LOQ 16IRH8 i7-13620H, GeForce RTX 4060 Laptop GPU, 80 Wh | Lenovo LOQ 15APH8 R7 7840HS, GeForce RTX 4050 Laptop GPU, 60 Wh | MSI Katana 17 B13VFK i7-13620H, GeForce RTX 4060 Laptop GPU, 53.5 Wh | Lenovo Legion Pro 5 16ARX8 (R5 7645HX, RTX 4050) R5 7645HX, GeForce RTX 4050 Laptop GPU, 80 Wh | HP Victus 16-r0077ng i7-13700H, GeForce RTX 4070 Laptop GPU, 83 Wh | Dell G15 5530 i7-13650HX, GeForce RTX 4060 Laptop GPU, 86 Wh | Asus TUF Gaming A16 FA617XS R9 7940HS, Radeon RX 7600S, 90 Wh | Durchschnitt der Klasse Gaming | |
|---|---|---|---|---|---|---|---|---|---|
| Akkulaufzeit | 6% | 25% | -51% | -8% | 20% | 11% | 107% | 27% | |
| H.264 (h) | 6.1 | 6.4 5% | 5.4 -11% | 6.8 11% | 12.4 103% | 8.26 ? 35% | |||
| WLAN (h) | 5.9 | 6.3 7% | 7.4 25% | 2.9 -51% | 5.6 -5% | 7.1 20% | 6.5 10% | 12.4 110% | 7.04 ? 19% |
| Last (h) | 1.5 | 1.1 | 1 | 0.8 | 0.9 | 1.47 ? | |||
| Idle (h) | 9.8 | 20.3 | 8.71 ? | ||||||
| Witcher 3 ultra (h) | 0.8 | 0.8 |
Pro
Contra
Fazit: Leistbares Gaming in 1080p Ultra
Das LOQ 15 Core i7 ist trotz der niedrigen Kosten mit einem 165-Hz-QHD-G-Sync-Display und einer 1080p-Webcam ausgestattet. Insbesondere das QHD-Panel beeindruckt mit deutlich besseren Farben und Reaktionszeiten als die FHD-144-Hz-Option.
Die Gehäusequalität leidet (verständlicherweise) unter dem ausgiebigen Plastikeinsatz. Noch besorgniserregender ist, dass das LOQ 15IRH8 damit kämpft, seine Leistung längerfristig aufrechtzuerhalten. Mit diesem Problem ist das AMD Ryzen 7 7840HS im LOQ 15APH8 und selbst das LOQ 16IRH8 nicht konfrontiert.
Dennoch reicht die Leistung für gleichmäßiges Gaming mit 1080p-Auflösung aus, da der Intel-Prozessor i7-13620H und die RTX-Grafikkarte RTX 4050 die eigentliche TGP übersteigen können.
Das Lenovo LOQ 15 Core i7 lässt kaum einen Wunsch offen. Wenn Sie auf der Suche nach einem leistungsfähigen Gaming-Laptop mit 1080p-Display im Preisbereich von 1500 Euro sind, darf dieser Gamer definitiv mit in die engere Auswahl. Nur im Bereich der Gehäusequalität und der Temperaturentwicklung dürfen Sie sich nicht zu viel erwarten.
Ein weiterer Bereich, in dem der Intel-LOQ 15 enttäuscht, ist die Temperaturentwicklung. Die Geräuschemissionen sind allerdings akzeptabel und das Gamen mit 1080p-Auflösung ist auch bei niedrigeren Energieprofilen möglich.
Die Wahl zwischen den einem LOQ-15-Modell mit Intel- oder AMD-Prozessor hängt von Ihren Prioritäten ab. Die Intel-Version eignet sich besser zum Gamen und hat bei hoher Auslastung niedrigere Geräuschemissionen. Die AMD-Variante ist hinsichtlich allgemeiner CPU-Leistung, Temperaturentwicklung, Energieeffizienz und Akkulaufzeit überlegen.
Insgesamt haben beide LOQ-15-Modelle im Vergleich zum Legion Pro 5 16 viel zu bieten. Laptops wie das HP Victus 16 und das MSI Katana 17 schneiden in den Ranglisten deutlich besser ab, preislich scheinen sie aber im Vergleich zum LOQ 15 nicht mit der angebotenen Hardware mithalten zu können.
Preis und Verfügbarkeit
Das LOQ 15 mit Intel-Core-Prozessor ist in verschiedenen Konfigurationen direkt bei Lenovo erhältlich.
Lenovo LOQ 15IRH8 Core i7
- 13.10.2023 v7 (old)
Vaidyanathan Subramaniam
Transparenz
Die Auswahl der zu testenden Geräte erfolgt innerhalb der Redaktion. Das vorliegende Testmuster wurde dem Autor vom Hersteller oder einem Shop zu Testzwecken leihweise zur Verfügung gestellt. Eine Einflussnahme des Leihstellers auf den Testbericht gab es nicht, der Hersteller erhielt keine Version des Reviews vor der Veröffentlichung. Es bestand keine Verpflichtung zur Publikation. Als eigenständiges, unabhängiges Unternehmen unterliegt Notebookcheck keiner Diktion von Herstellern, Shops und Verlagen.
So testet Notebookcheck
Pro Jahr werden von Notebookcheck hunderte Laptops und Smartphones unabhängig in von uns standardisierten technischen Verfahren getestet, um eine Vergleichbarkeit aller Testergebnisse zu gewährleisten. Seit rund 20 Jahren entwickeln wir diese Testmethoden kontinuierlich weiter und setzen damit Branchenstandards. In unseren Testlaboren kommt ausschließlich hochwertiges Messequipment in die Hände erfahrener Techniker und Redakteure. Die Tests unterliegen einer mehrstufigen Kontrolle. Unsere komplexe Gesamtbewertung basiert auf hunderten fundierten Messergebnissen und Benchmarks, womit Ihnen Objektivität garantiert ist. Weitere Informationen zu unseren Testmethoden gibt es hier.
Preisvergleich

