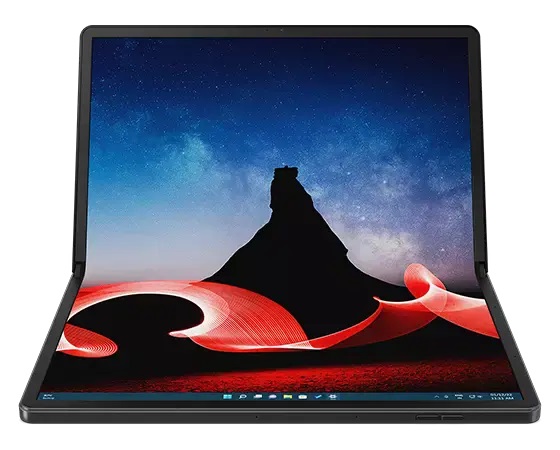
Lenovo ThinkPad X1 Fold 16 im Laptop-Test: Die Zukunft entfalten

Lenovo war einer der ersten Hersteller, die 2021 mit dem ThinkPad X1 Fold 13 einen faltbaren Laptop herausgebracht haben. Zwar war ein gewisser "Wow"-Faktor nicht zu leugnen, aber die limitierte Leistung und die gewöhnungsbedürftige Ergonomie ließen das Modell eher wie einen Feldversuch erscheinen, es wirkte wenig ausgereift. 2024 hat Lenovo aber aus dem Launch des ursprünglichen ThinkPad X1 Fold 13 gelernt und bringt nun sogar ein größeres 16-Zoll-4:3-ThinkPad-X1-Fold-16 heraus.
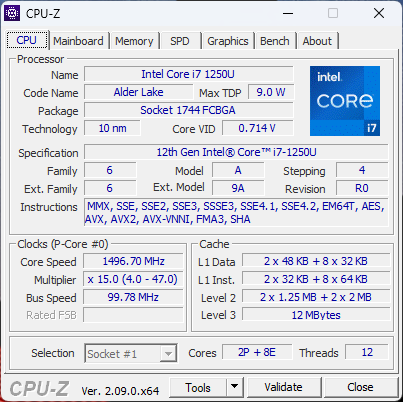
Unsere Testkonfiguration ist mit einem Core 7-1250U ausgestattet, daneben gibt es weitere SKUs mit Core i7-1260U vPro und WWAN, um auch für größere Unternehmen interessant zu sein. Alle Konfigurationen verwenden den gleichen, sofort ins Auge stechenden, weil faltbaren 16,3-Zoll-Touchscreen mit einer Auflösung von 2.560 x 2.024.
Direkte Konkurrenten für das ThinkPad X1 Fold 16 finden sich unserer Ansicht nach im Asus Zenbook 17 Fold und dem HP Spectre Foldable 17. Außerdem kann es als Alternative zur Microsoft-Surface-Pro-Serie betrachtet werden.
Weitere Lenovo-Tests:
Potentielle Konkurrenten im Vergleich
Bew. | Datum | Modell | Gewicht | Dicke | Größe | Auflösung | Preis ab |
|---|---|---|---|---|---|---|---|
| 84.4 % v7 (old) | 02 / 2024 | Lenovo Thinkpad X1 Fold 16 i7-1250U, Iris Xe G7 96EUs | 1.9 kg | 8.6 mm | 16.30" | 2560x2024 | |
| 77.8 % v7 (old) | 03 / 2021 | Lenovo ThinkPad X1 Fold 20RL000FGE i5-L16G7, UHD Graphics G7 (Lakefield GT2 64 EU) | 1.2 kg | 11.5 mm | 13.30" | 2048x1536 | |
| 84.5 % v7 (old) | 10 / 2022 | Asus Zenbook 17 Fold UX9702 i7-1250U, Iris Xe G7 80EUs | 1.8 kg | 12.9 mm | 17.30" | 2560x1920 | |
| 88.4 % v7 (old) | 01 / 2023 | Microsoft Surface Pro 9, i7-1255U i7-1255U, Iris Xe G7 96EUs | 877 g | 9.3 mm | 13.00" | 2880x1920 | |
| 90.3 % v7 (old) | 12 / 2022 | HP Elite Dragonfly Folio 13.5 G3 i7-1265U, Iris Xe G7 96EUs | 1.4 kg | 17.8 mm | 13.50" | 1920x1280 | |
| 89.1 % v7 (old) | 11 / 2023 | Lenovo ThinkPad X1 Carbon G11 21HNS54T00 i7-1370P, Iris Xe G7 96EUs | 1.2 kg | 15.36 mm | 14.00" | 2880x1800 |
Gehäuse — Packt das Buch ins ThinkBook
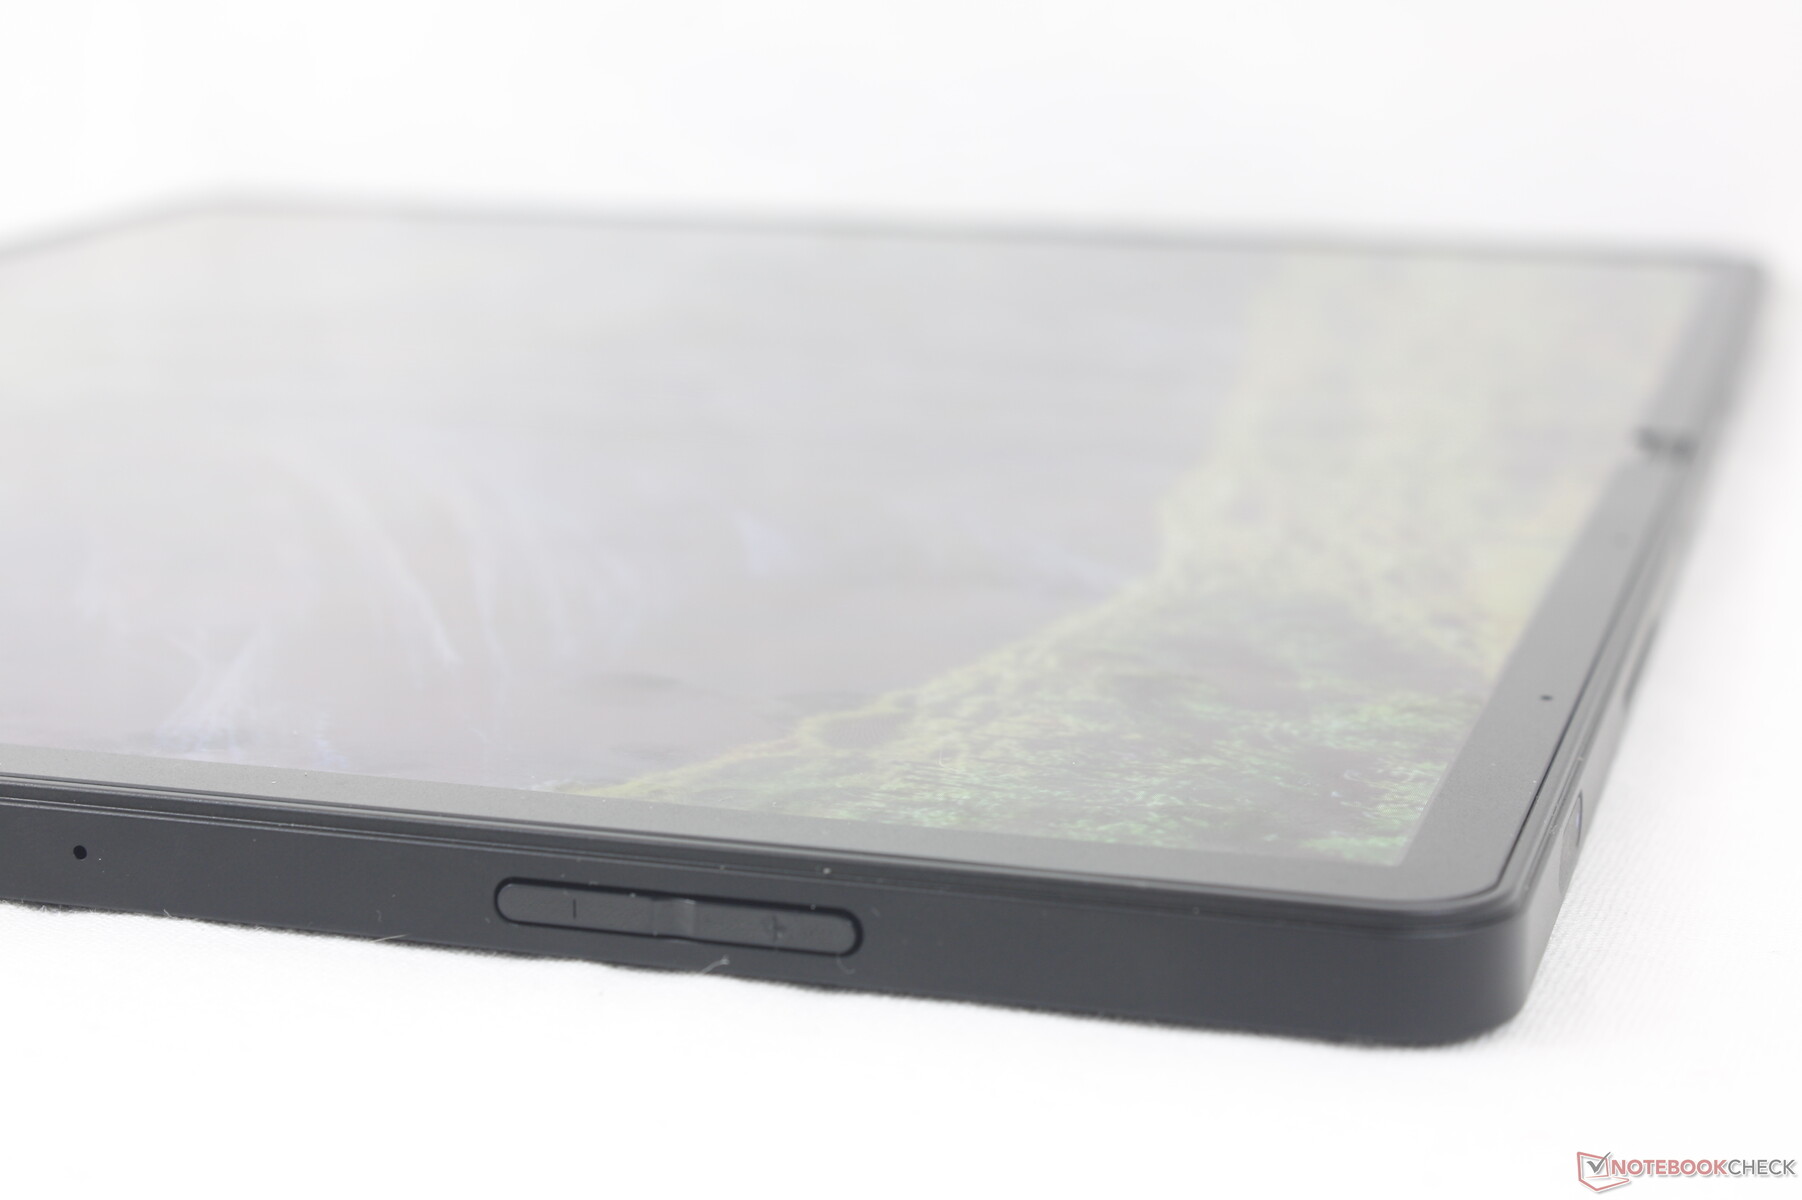
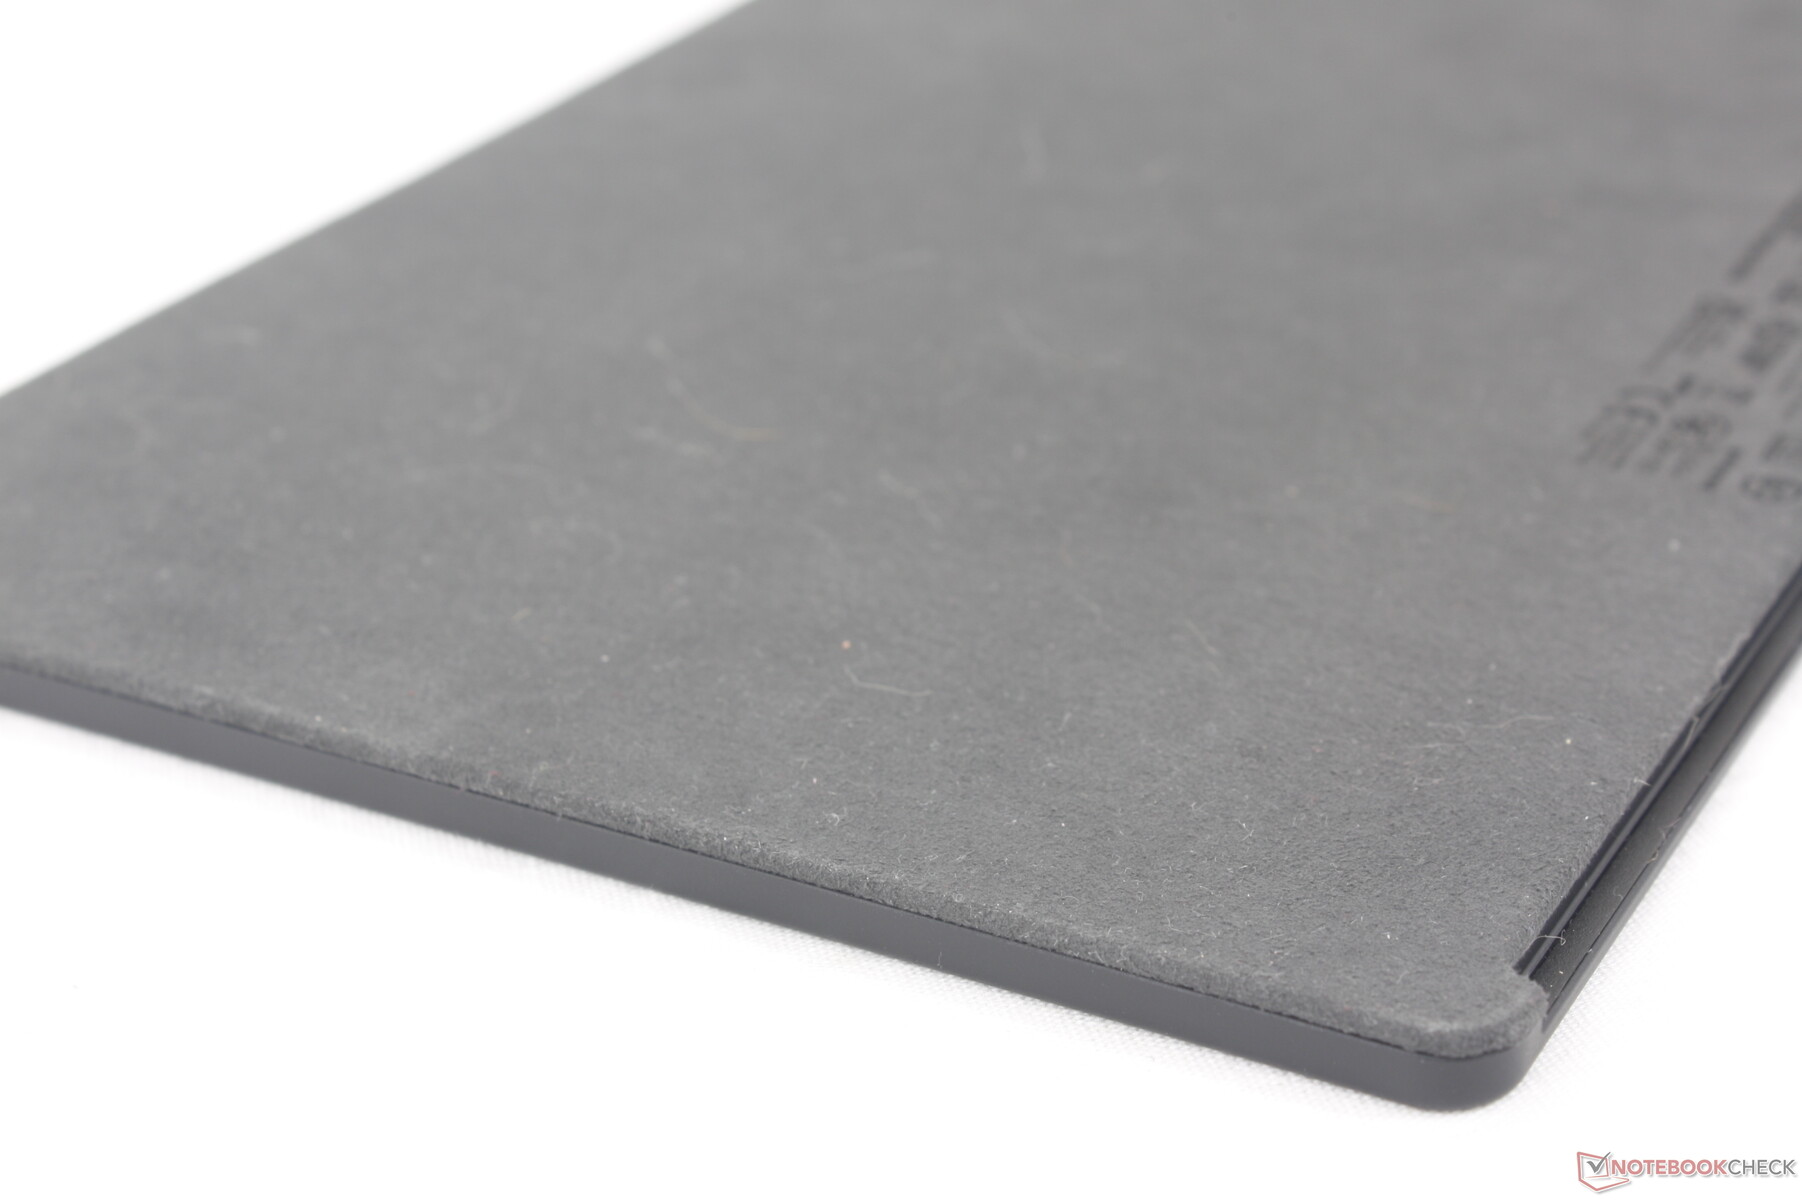
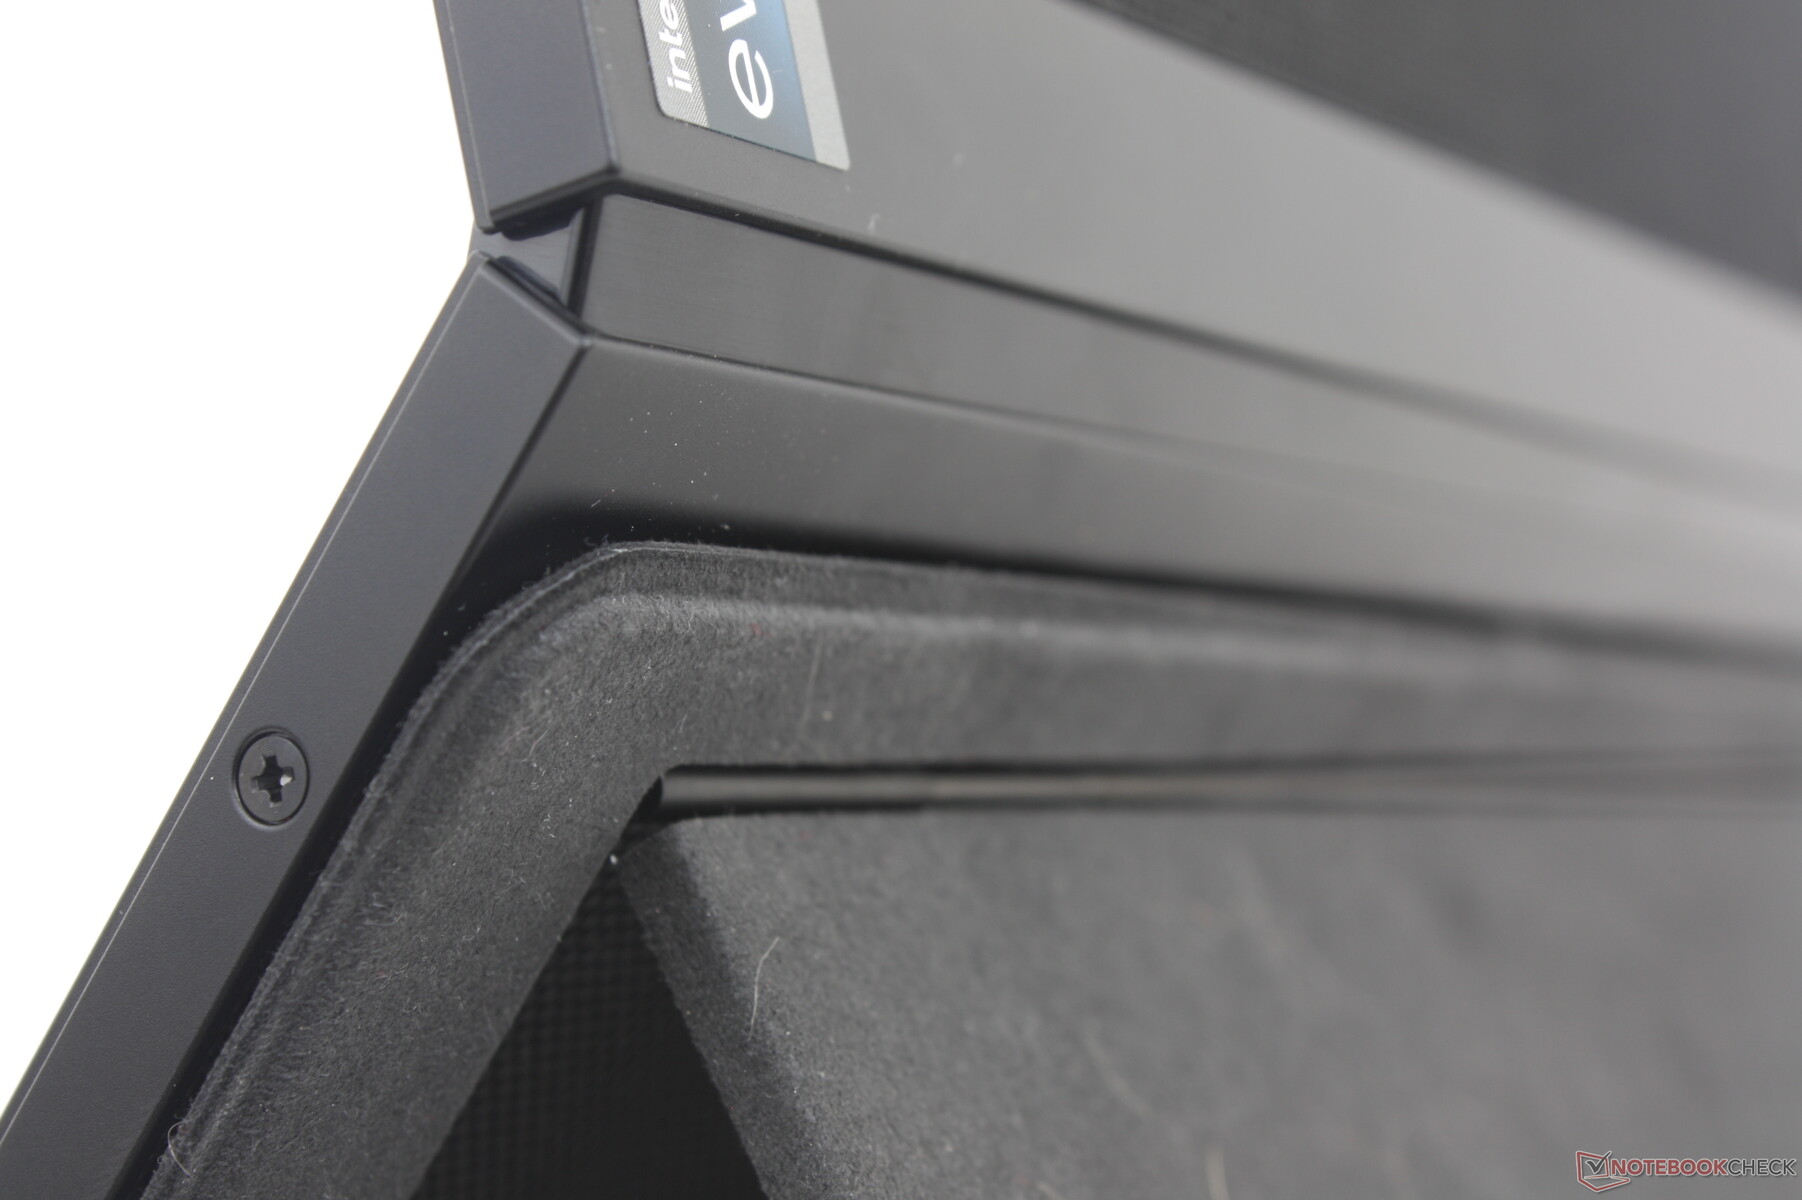
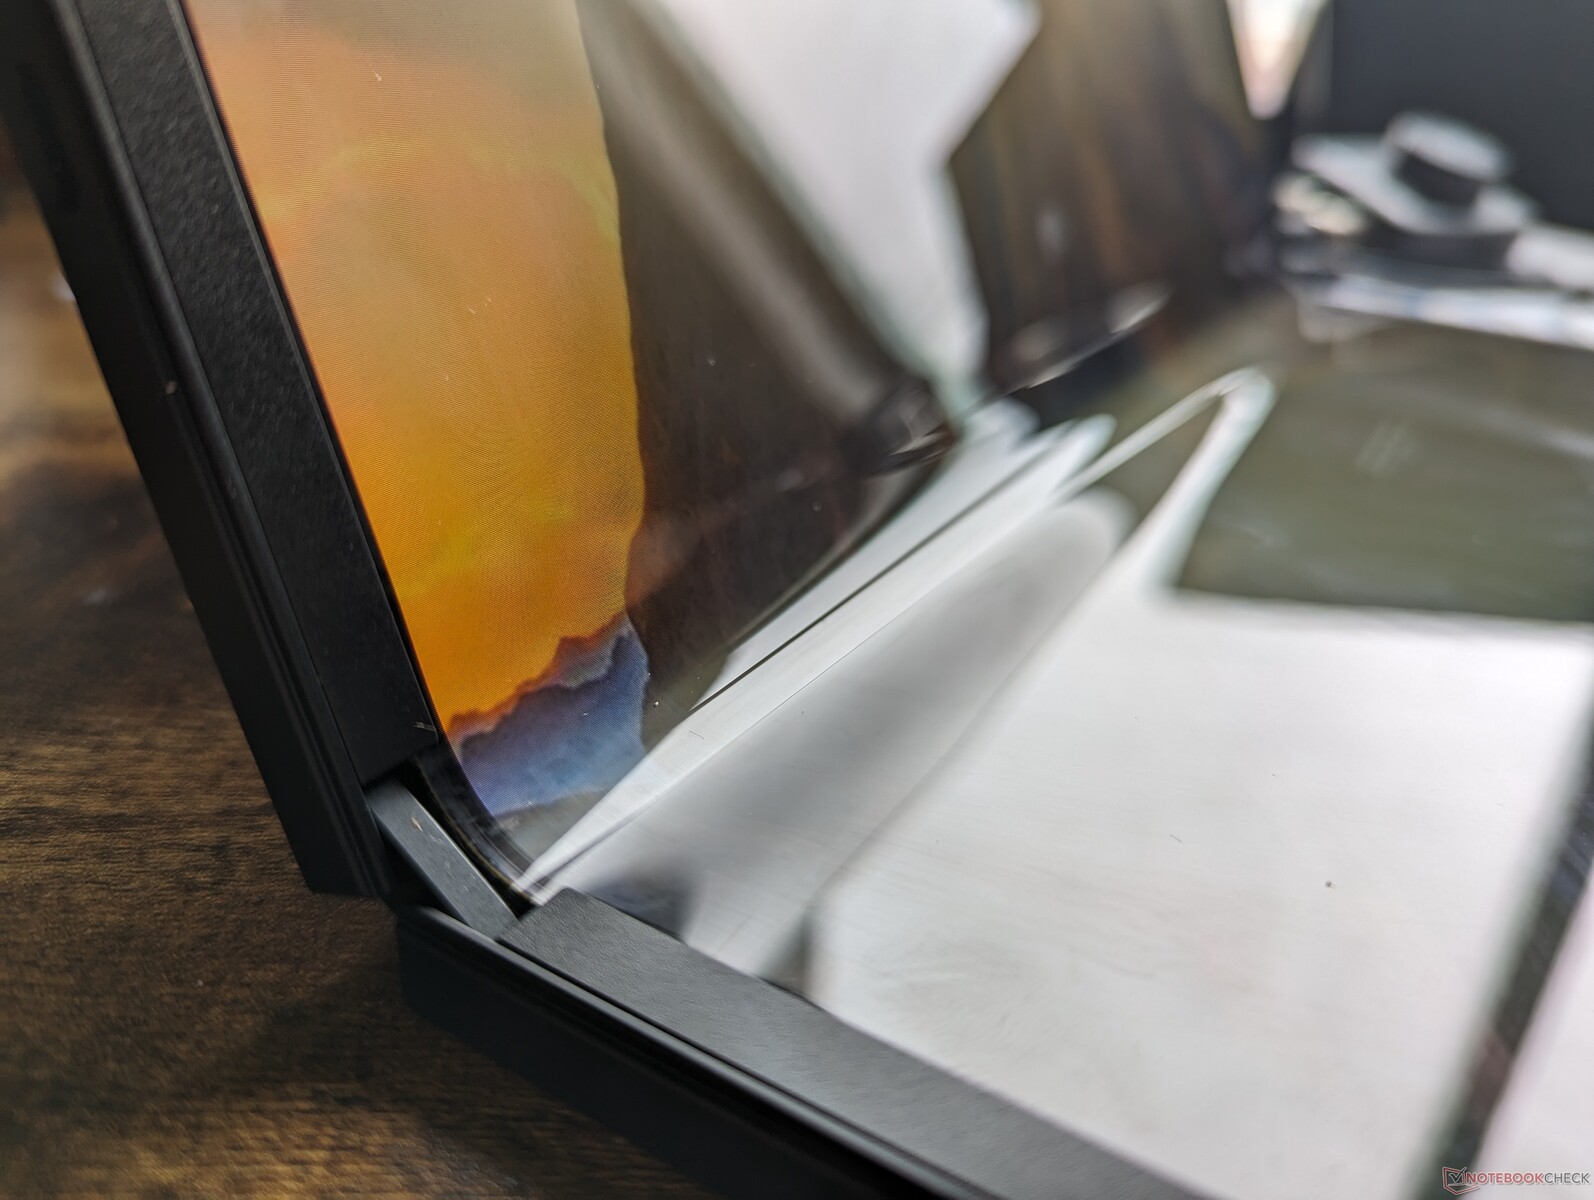
Das Gehäuse bedient sich des gleichen schwarz-grauen Farbschemas wie im 13-Zoll-Original von 2021, fügt aber jetzt eine Oberfläche aus gewebten Stoff hinzu, wodurch sich das Gerät noch professioneller und exklusiver anfühlt. Auffällig ist vor allem, dass es nun keinen unschönen Spalt mehr zwischen dem Bildschirm gibt, wenn dieser geschlossen ist, das Design wirkt dadurch flacher und sauberer.
Die Gehäusestabilität ist ebenfalls ausgezeichnet. Übt man Druck auf die Rückseite oder den Touchscreen aus, biegen sich die Oberflächen kaum sichtbar durch, gleiches gilt für unseren Verbiegungsversuch von den Kanten aus. Wir hören dabei ein leichtes Knarzen, aber das bleibt gering genug, um keine Sorgen aufkommen zu lassen. Die Stabilität und das Design stellen eine klare Verbesserung zum Original dar.
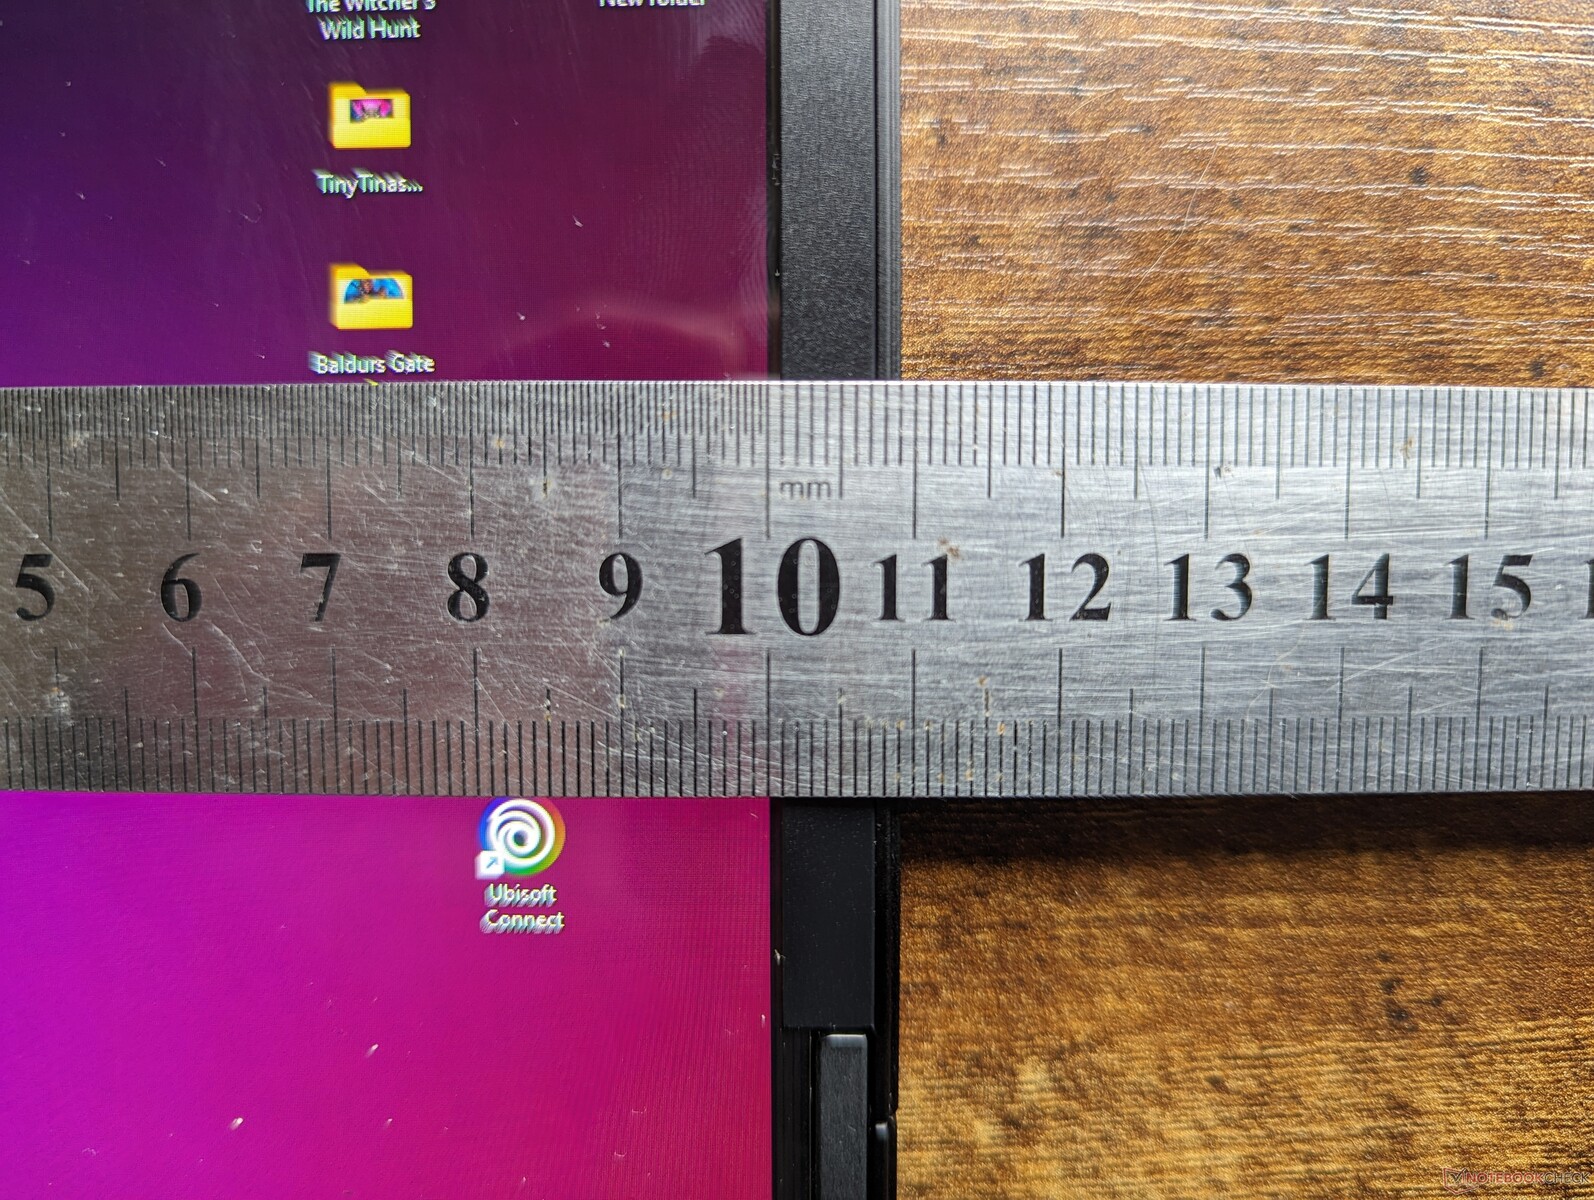
An einigen Punkten sehen wir dennoch Optimierungspotential: Einerseits gestaltet sich das Öffnen des Tablets schwieriger als es sein müsste, da die glatten Kanten keinen Angriffspunkt bieten, und andererseits öffnet sich das Tablet auch "nur" zu 178 oder 179 statt 180 Grad. Das mag nach wenig klingen, aber der Unterschied ist groß genug, dass die Falte in der Mitte dadurch noch mehr auffällt.

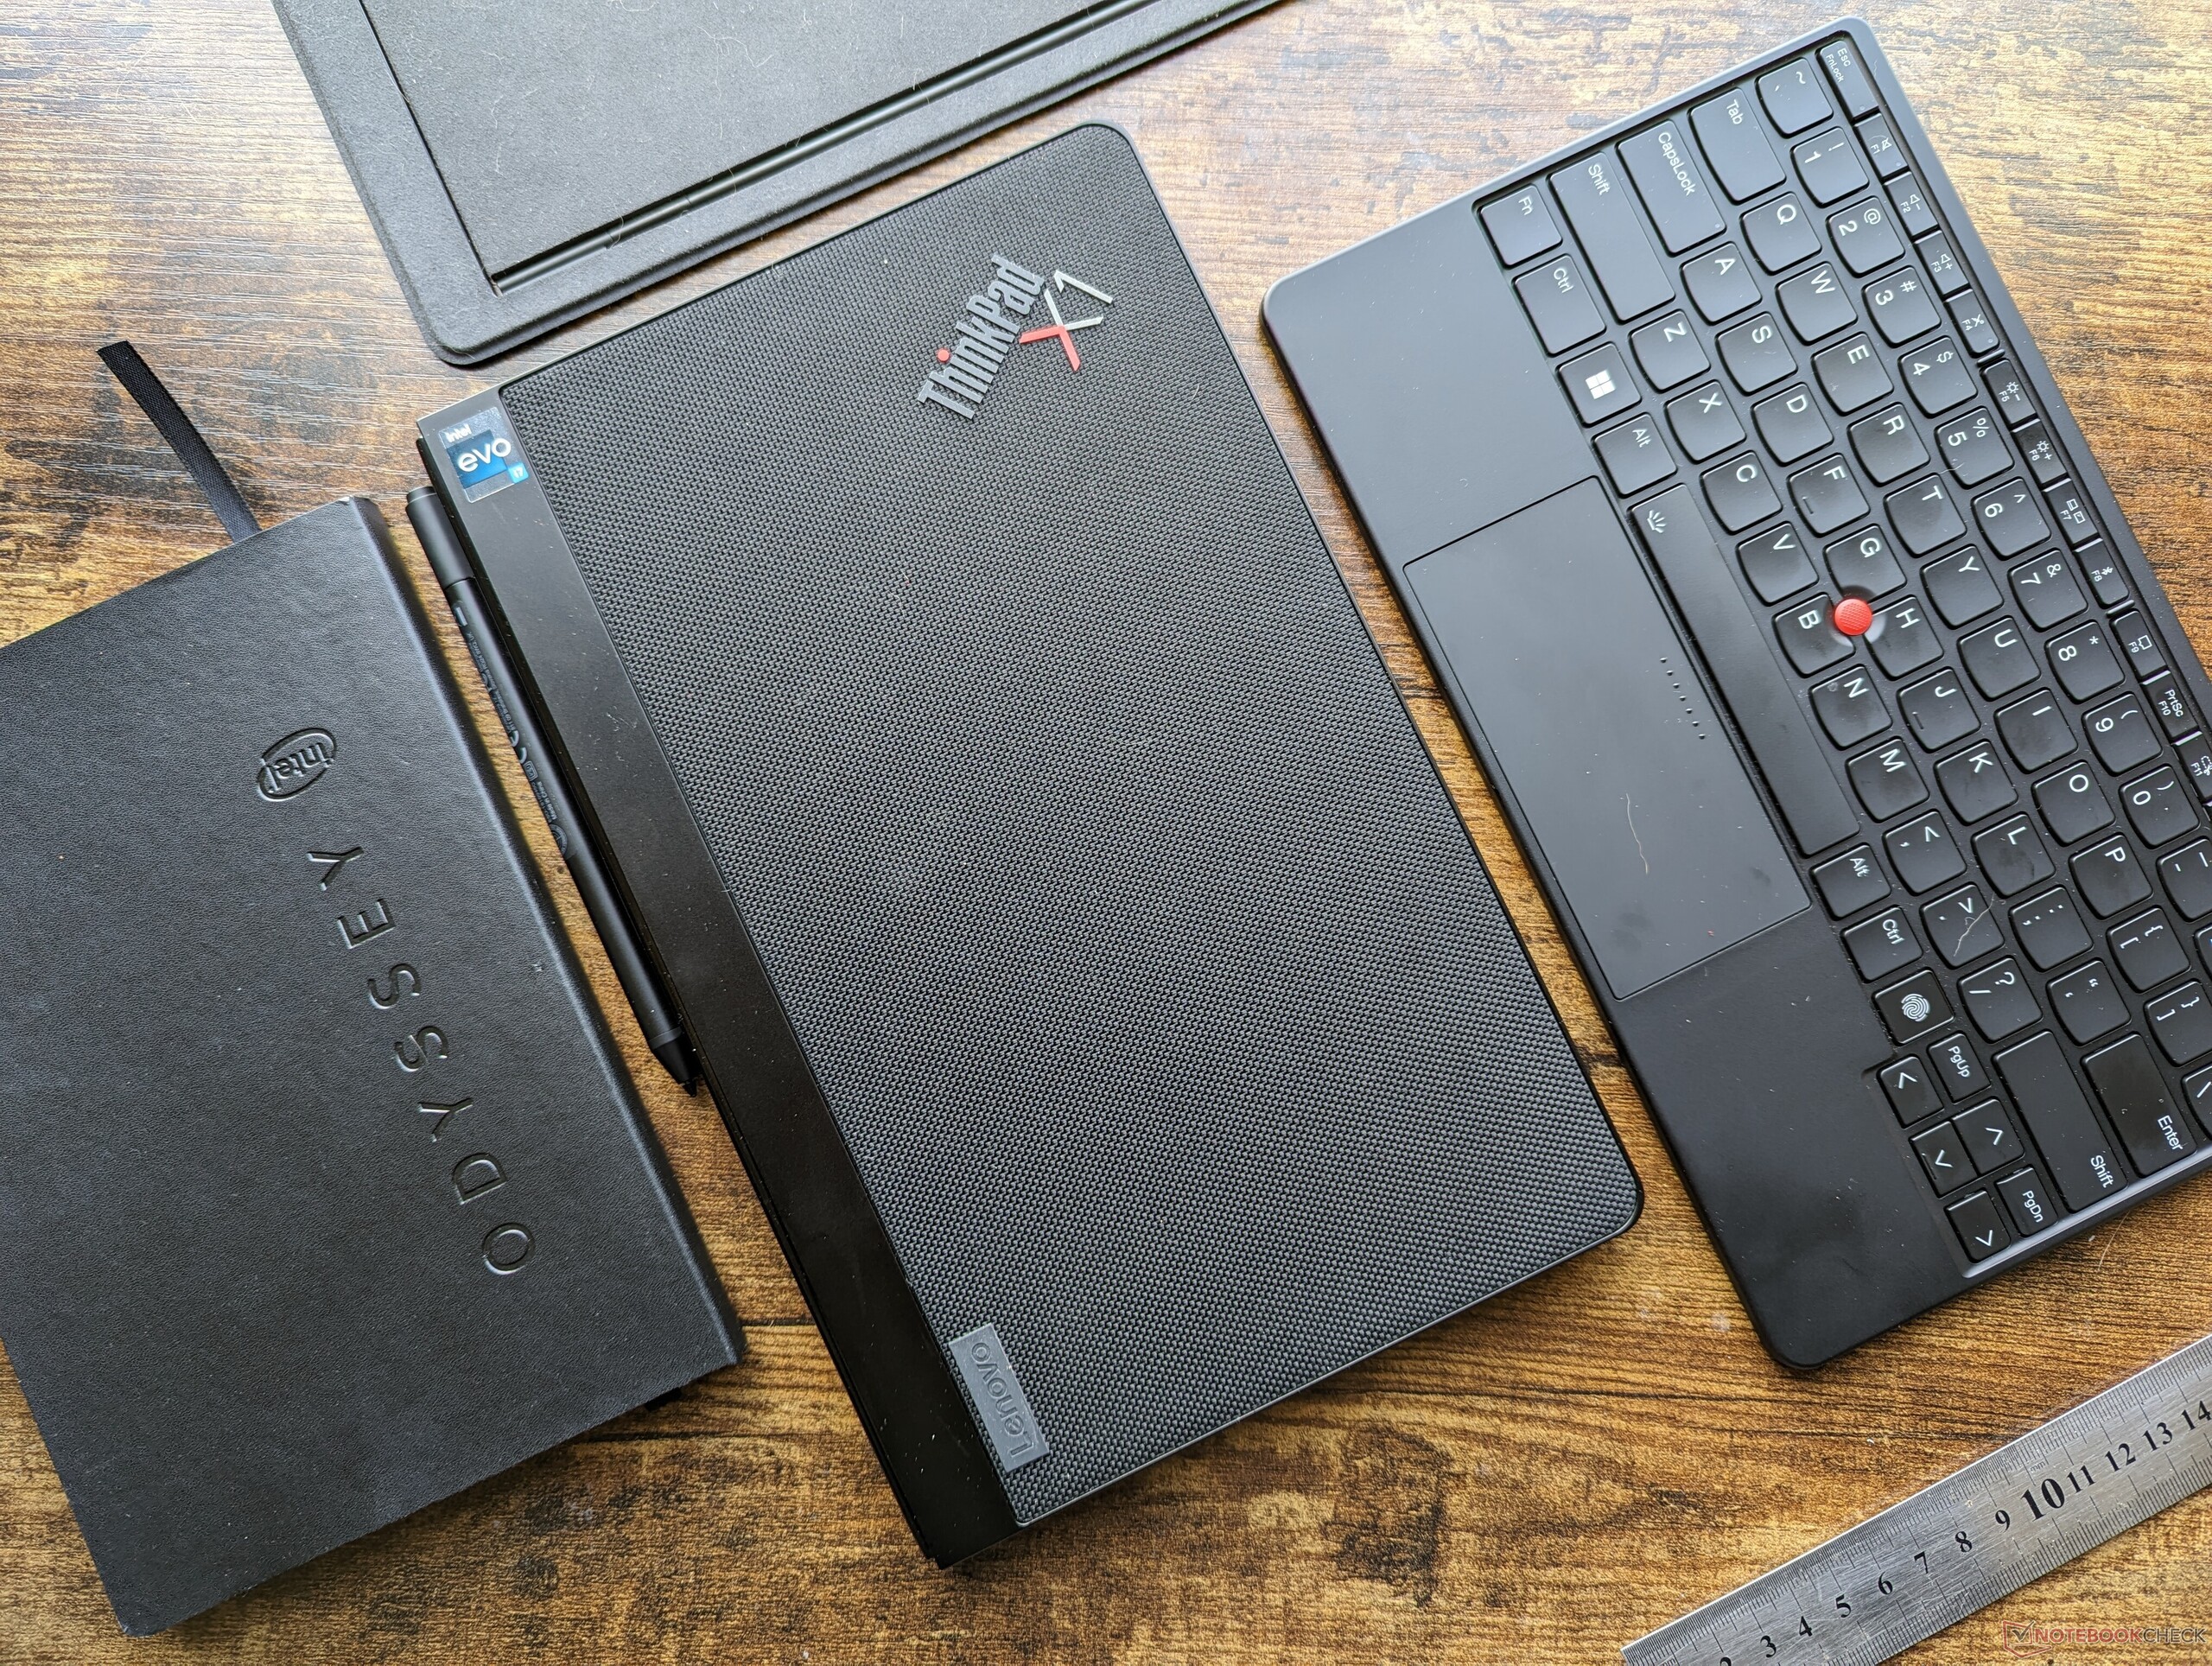
Ist das Tablet geöffnet, so wird es genauso dünn wie klassische Tablets, allerdings ist das Lenovo-Modell deutlich größer und mit 1,3 kg leider auch spürbar schwerer. Als Windows-Gerät ist zudem die inkludierte Bluetooth-Tastatur notwendig, da das OS weniger gut auf reine Toucheingaben optimiert ist als Android oder iOS. Folglich kommt das Gesamtgewicht aus Tablet plus Tastatur und Kickstand an das vollwertiger Laptops wie dem Dell XPS 15 heran.
Alleine für sich ist das Tablet etwa 200 g leichter als das Zenbook 17 Fold und zudem spürbar kleiner und dünner. Dennoch ist es nicht besonders reisefreundlich, da die meisten Nutzer die Tastatur und den Kickstand ebenfalls dabei haben wollen.
| Faltbares Tablet | Bluetooth-Tastatur | Back Cover/Kickstand | Total |
| 1.299 g | 327 g | 293 g | 1.919 g |
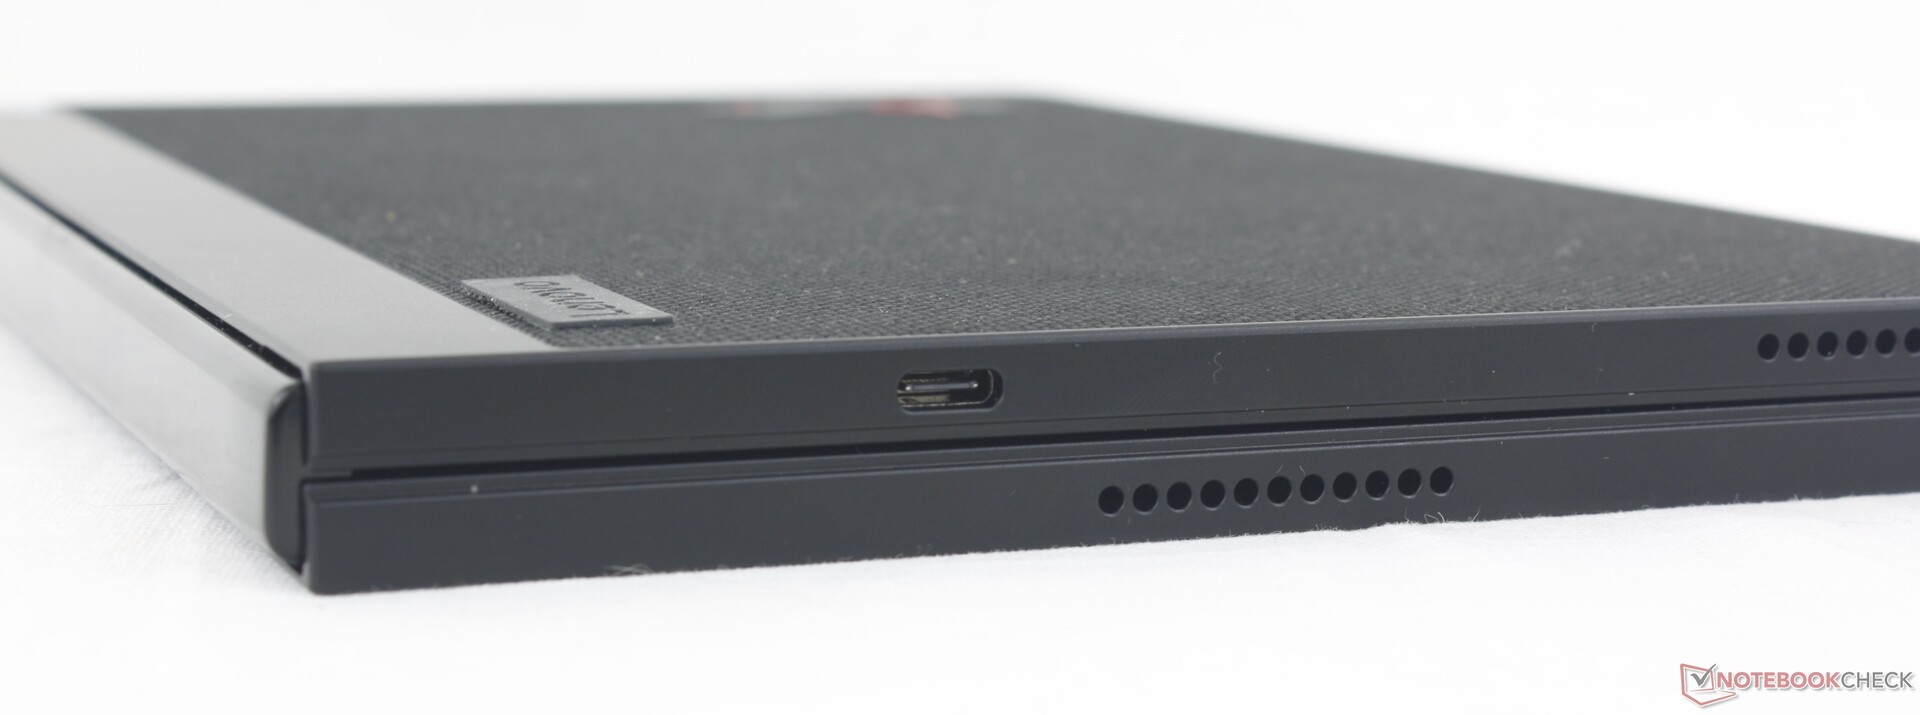
Anschlüsse
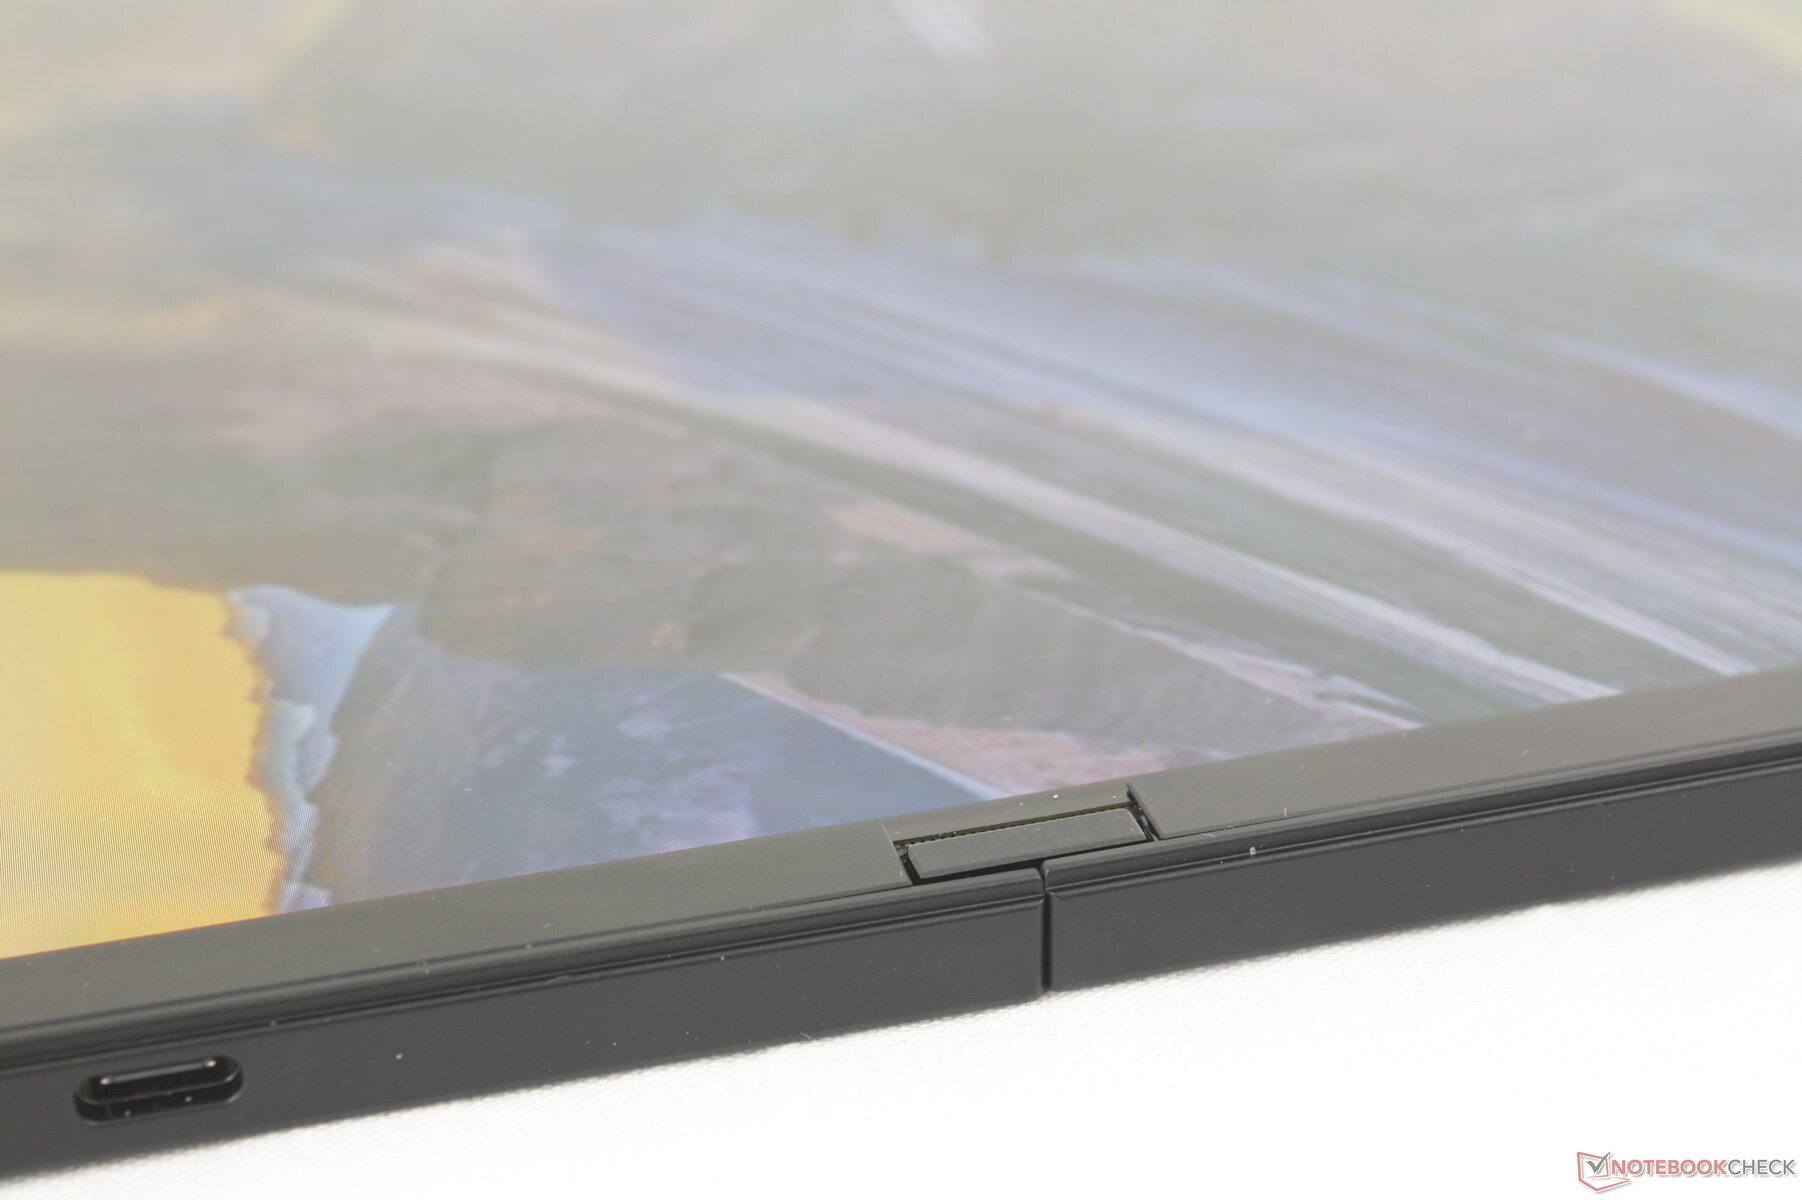
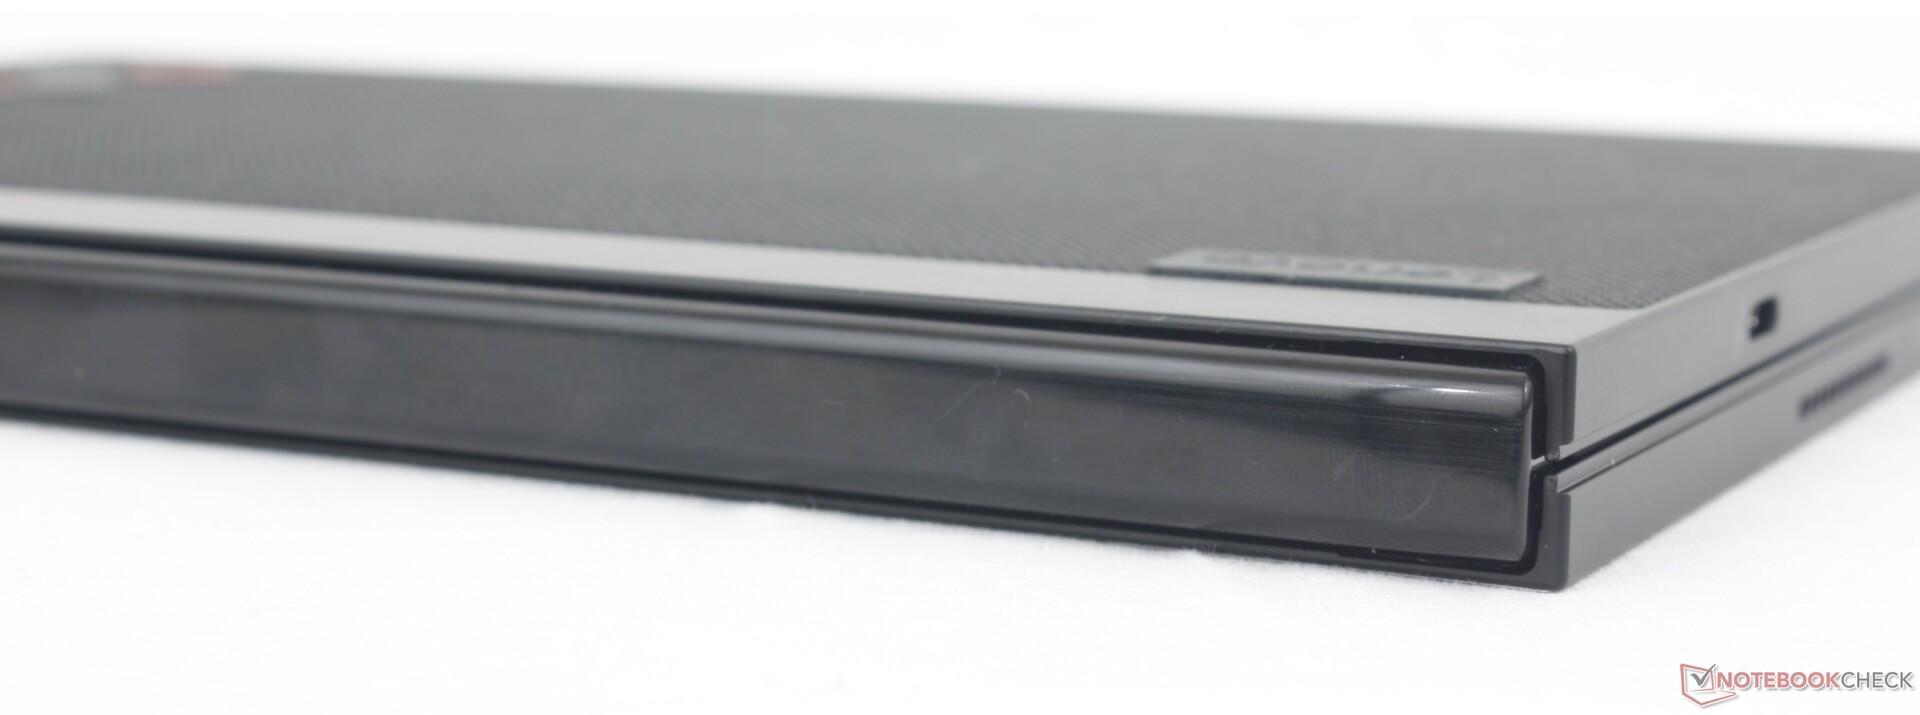
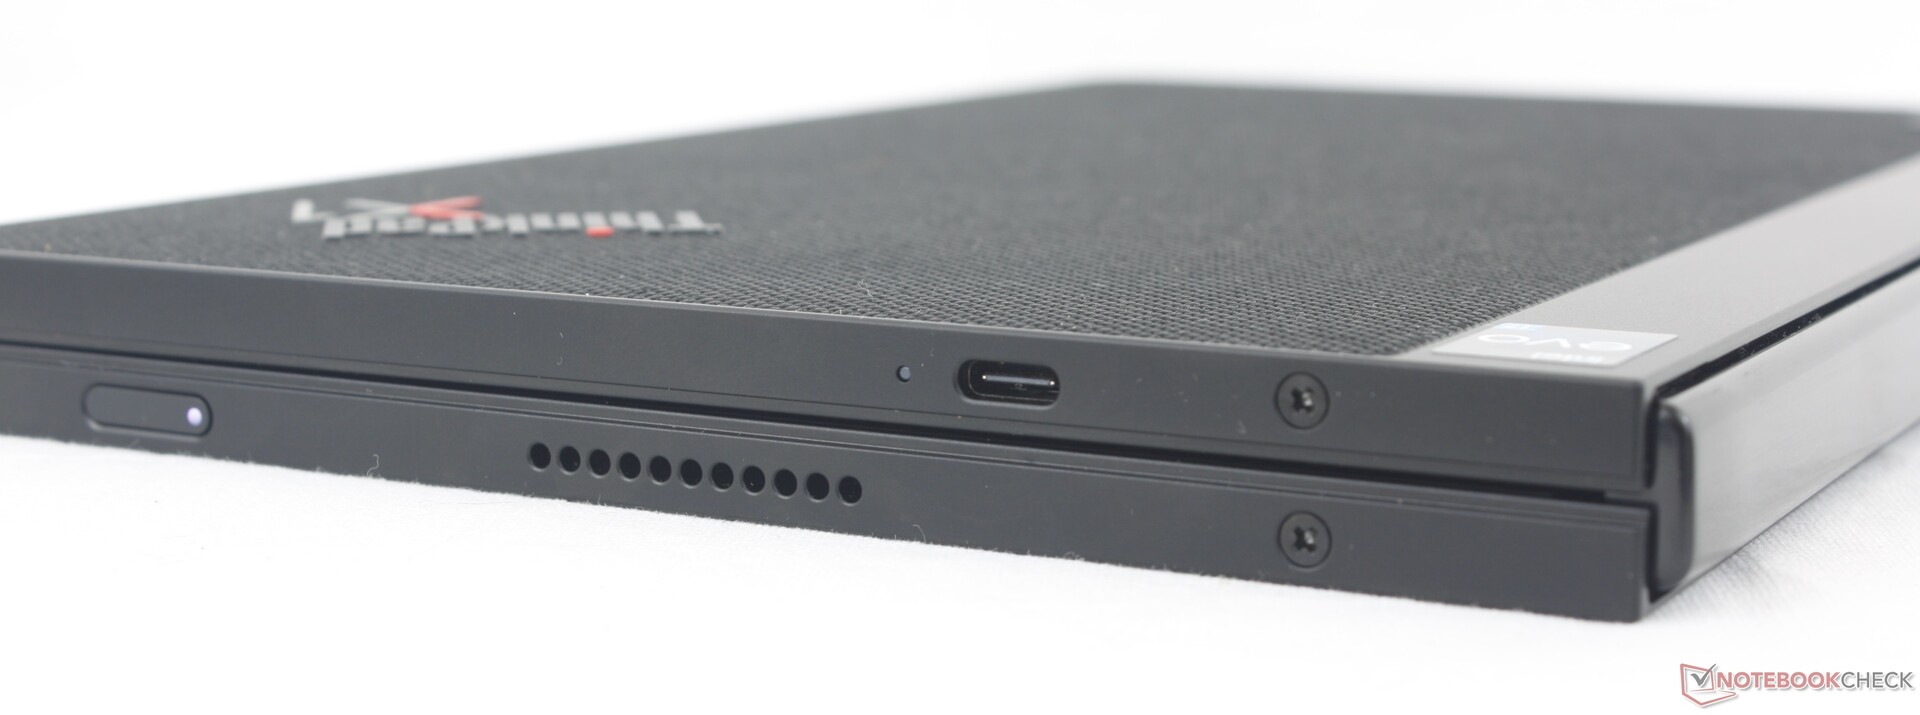
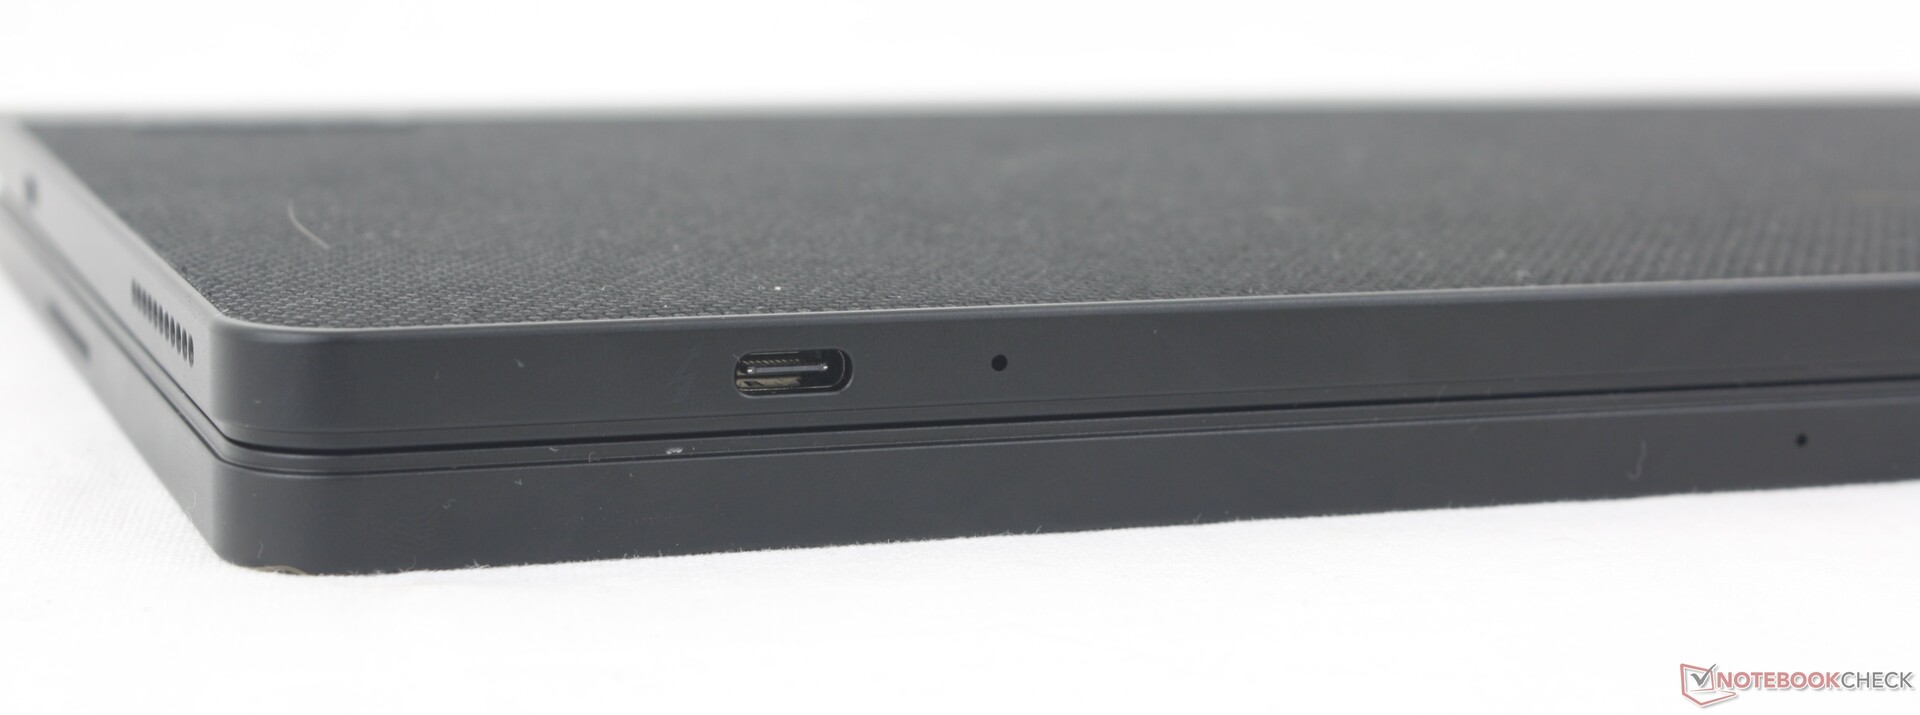
Am Lenovo finden sich drei USB-C-Ports, das Zenbook 17 Fold hat hingegen nur zwei. Dafür fehlt dem Lenovo ein 3,5 mm Klinkenanschluss, was einige Nutzer verärgern dürfte. Wir begrüßen aber, dass es auf beiden Seiten einen USB-C-Port gibt, so ist man bei den verschiedenen Aufstellmöglichkeiten des faltbaren Designs flexibler.
Beachten sollte man, dass nur zwei der drei USB-C-Ports mit Thunderbolt 4 kompatibel sind, dafür kann jeder der Anschlüsse zum Laden des Tablets oder für externe Displays verwendet werden.
Die kabellose Tastatur verfügt ebenfalls über einen USB-C-Port, der aber nur zum Aufladen dient.
Kommunikation
Ein Intel AX211 dient als WiFi-Modul und beherrscht den Standard WiFi 6E, das 2021er Modell war noch auf WiFi 6 beschränkt. Wir messen eine konstante Übertragungsleistung an unserem Testrouter Asus AXE11000.
Konfigurationen mit WWAN verfügen über einen Nano-SIM-Slot mit 4G-Support.
| Networking | |
| iperf3 transmit AX12 | |
| Lenovo ThinkPad X1 Fold 20RL000FGE | |
| iperf3 receive AX12 | |
| Lenovo ThinkPad X1 Fold 20RL000FGE | |
| iperf3 transmit AXE11000 | |
| Lenovo Thinkpad X1 Fold 16 | |
| HP Elite Dragonfly Folio 13.5 G3 | |
| Lenovo ThinkPad X1 Carbon G11 21HNS54T00 | |
| iperf3 receive AXE11000 | |
| Lenovo ThinkPad X1 Carbon G11 21HNS54T00 | |
| Lenovo Thinkpad X1 Fold 16 | |
| HP Elite Dragonfly Folio 13.5 G3 | |
| iperf3 transmit AXE11000 6GHz | |
| Microsoft Surface Pro 9, i7-1255U | |
| Asus Zenbook 17 Fold UX9702 | |
| HP Elite Dragonfly Folio 13.5 G3 | |
| Lenovo Thinkpad X1 Fold 16 | |
| Lenovo ThinkPad X1 Carbon G11 21HNS54T00 | |
| iperf3 receive AXE11000 6GHz | |
| Asus Zenbook 17 Fold UX9702 | |
| Microsoft Surface Pro 9, i7-1255U | |
| Lenovo ThinkPad X1 Carbon G11 21HNS54T00 | |
| HP Elite Dragonfly Folio 13.5 G3 | |
| Lenovo Thinkpad X1 Fold 16 | |
Webcam
Unser Testmodell hat eine 5-MP-Webcam mit IR für Windows Hello verbaut, ähnlich der Originalversion von 2021. Leider gibt es noch immer keinen Shutter, was bei einem solch teuren Produkt stark verwundert.


Wartung
Wie die meisten Tablets, speziell die faltbaren, sind die Wartungsmöglichkeiten beim ThinkPad X1 Fold 16 stark eingeschränkt. RAM-Upgrades sind nicht möglich und auch der Austausch der SSD empfiehlt sich wegen drohendem Garantieverfall eher nicht.
Zubehör und Garantie
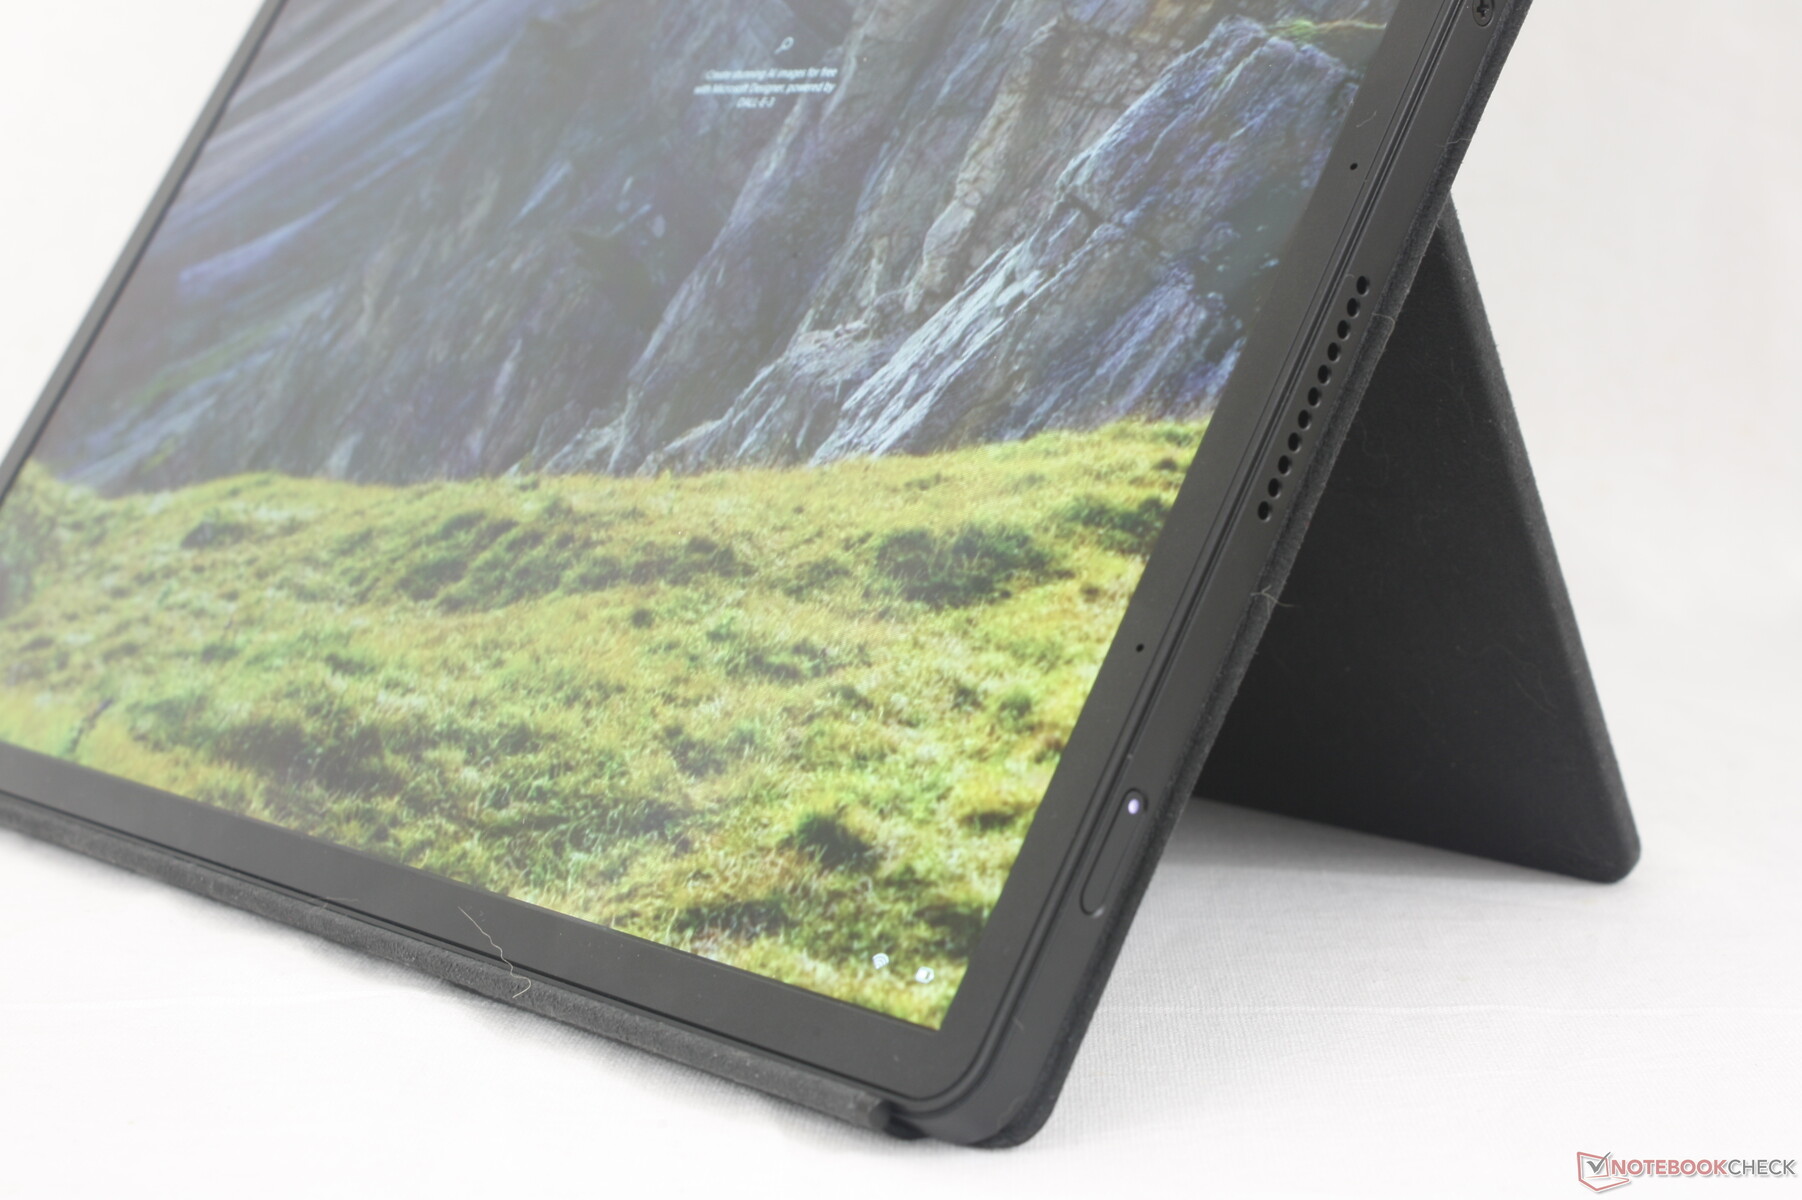
In der Verpackung liegt ein Lenovo Precision Pen 2, die magnetische Bluetooth-Tastatur und eine magnetischer Abdeckung, die gleichzeitig als Kickstand dient. Besonders die Tastatur und der Kickstand sind eigentlich unerlässlich für die Bedienung des X1 Fold, daher freuen wir uns, dass die Artikel beiliegen anstatt separat als Zubehör verkauft zu werden.
In Deutschland greift der 3-Jahre-Lenovo-Premium-Support.
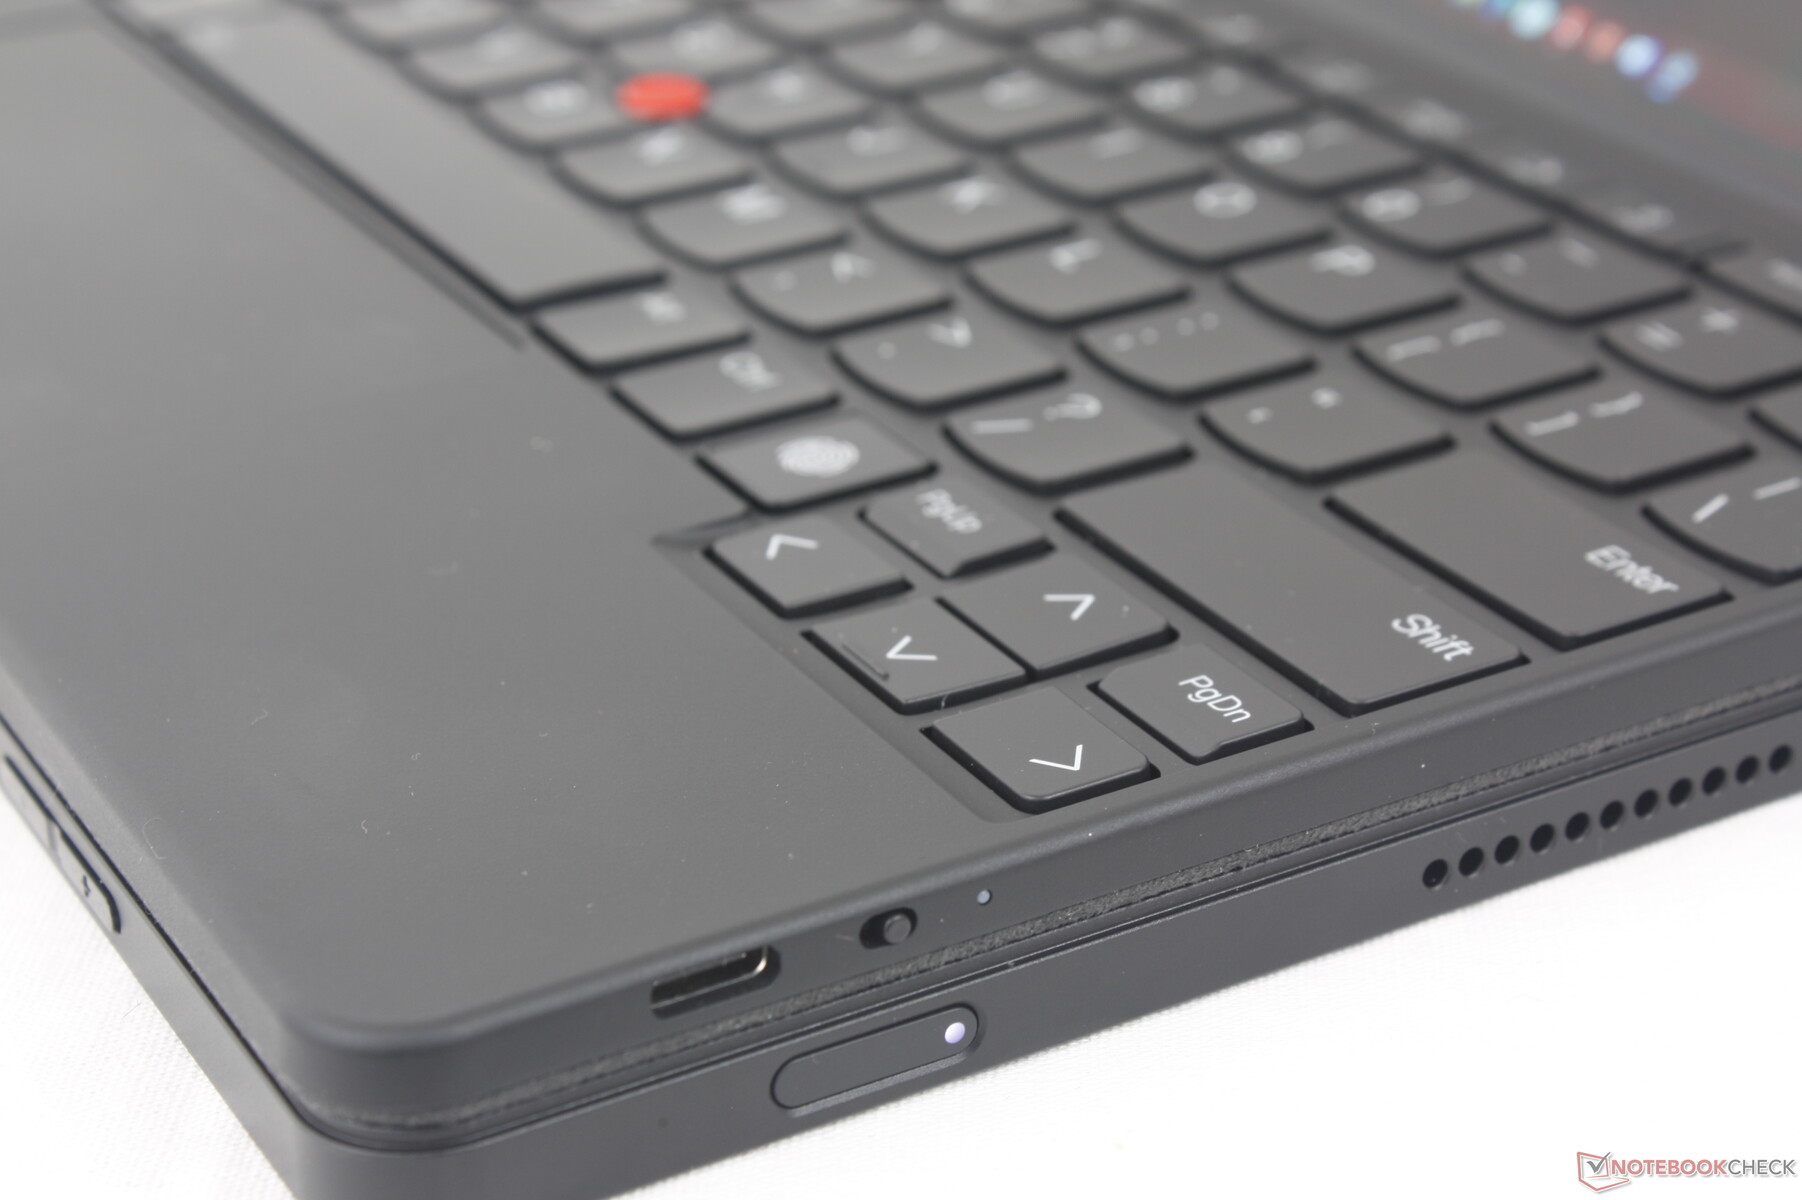
Eingabegeräte — In der Praxis etwas umständlich
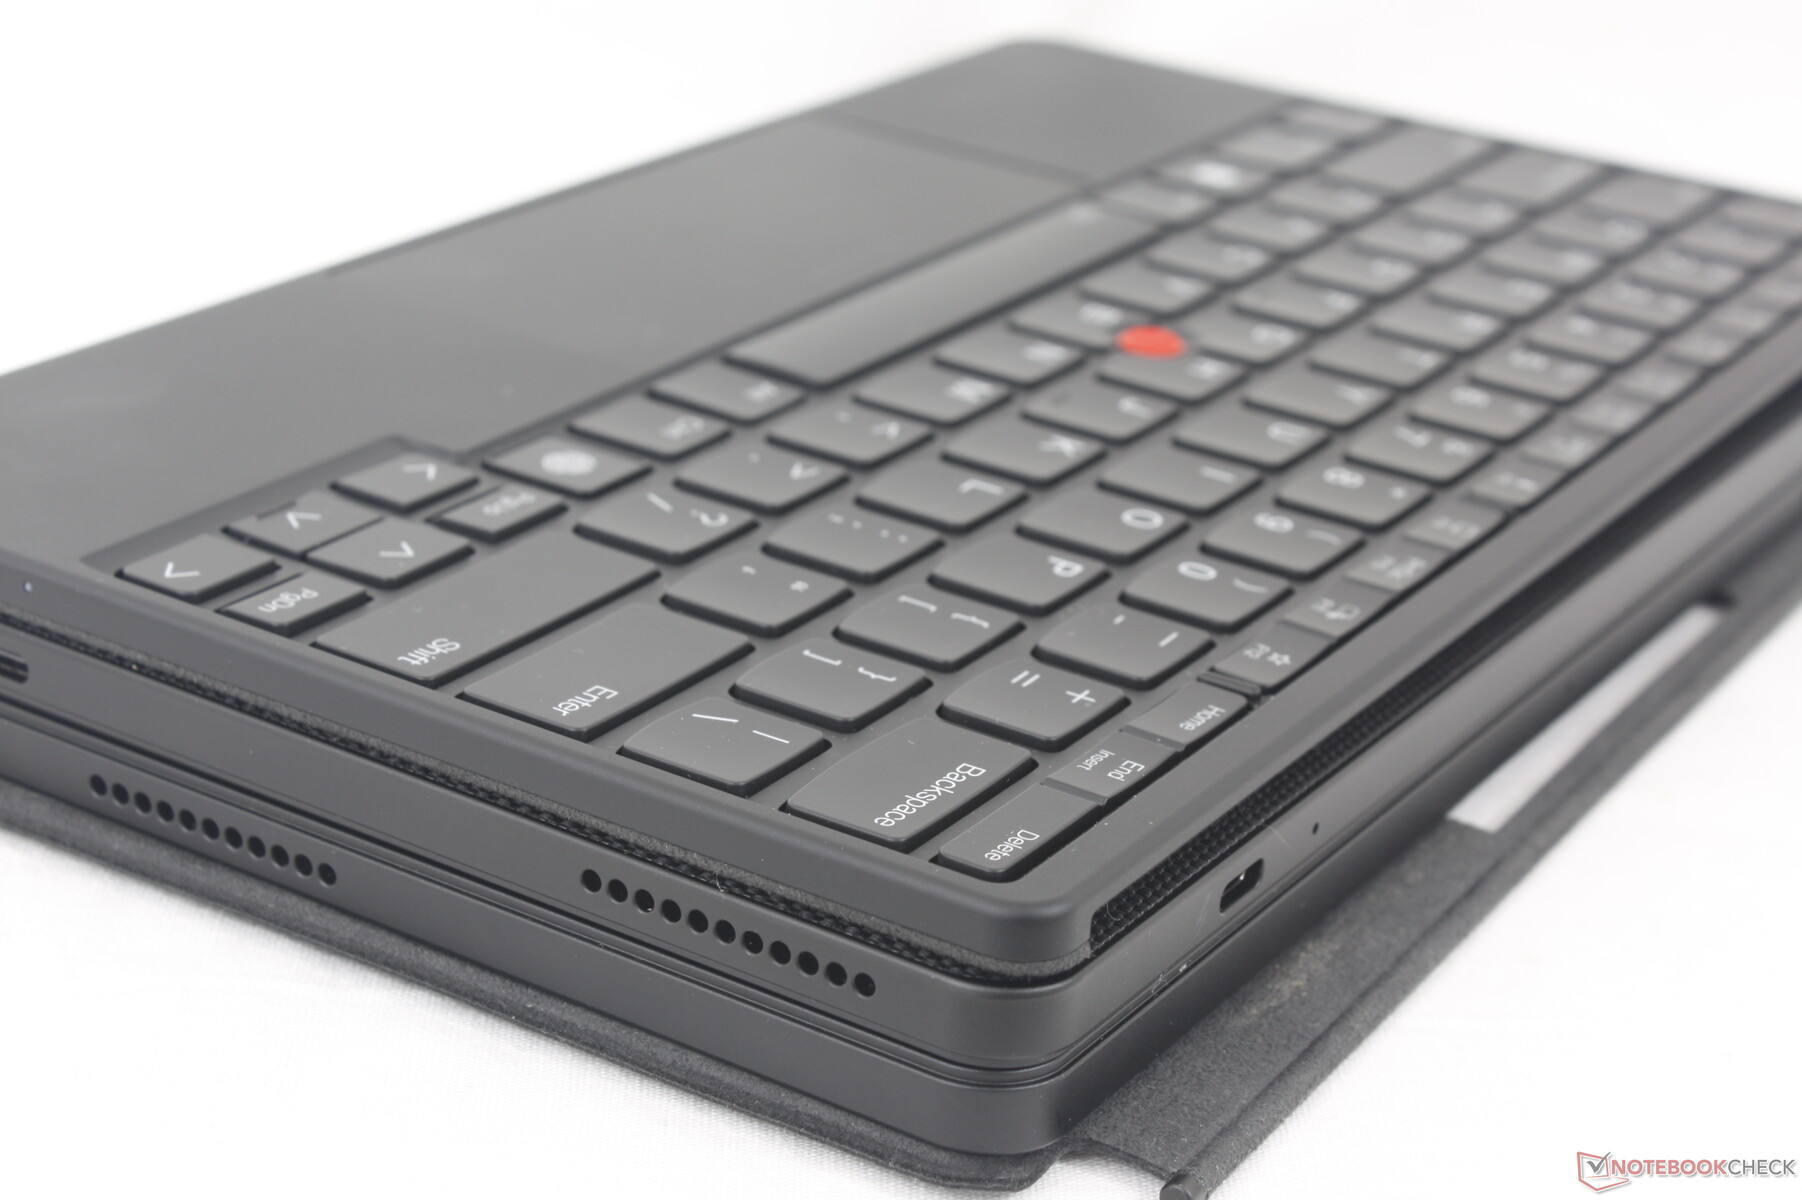
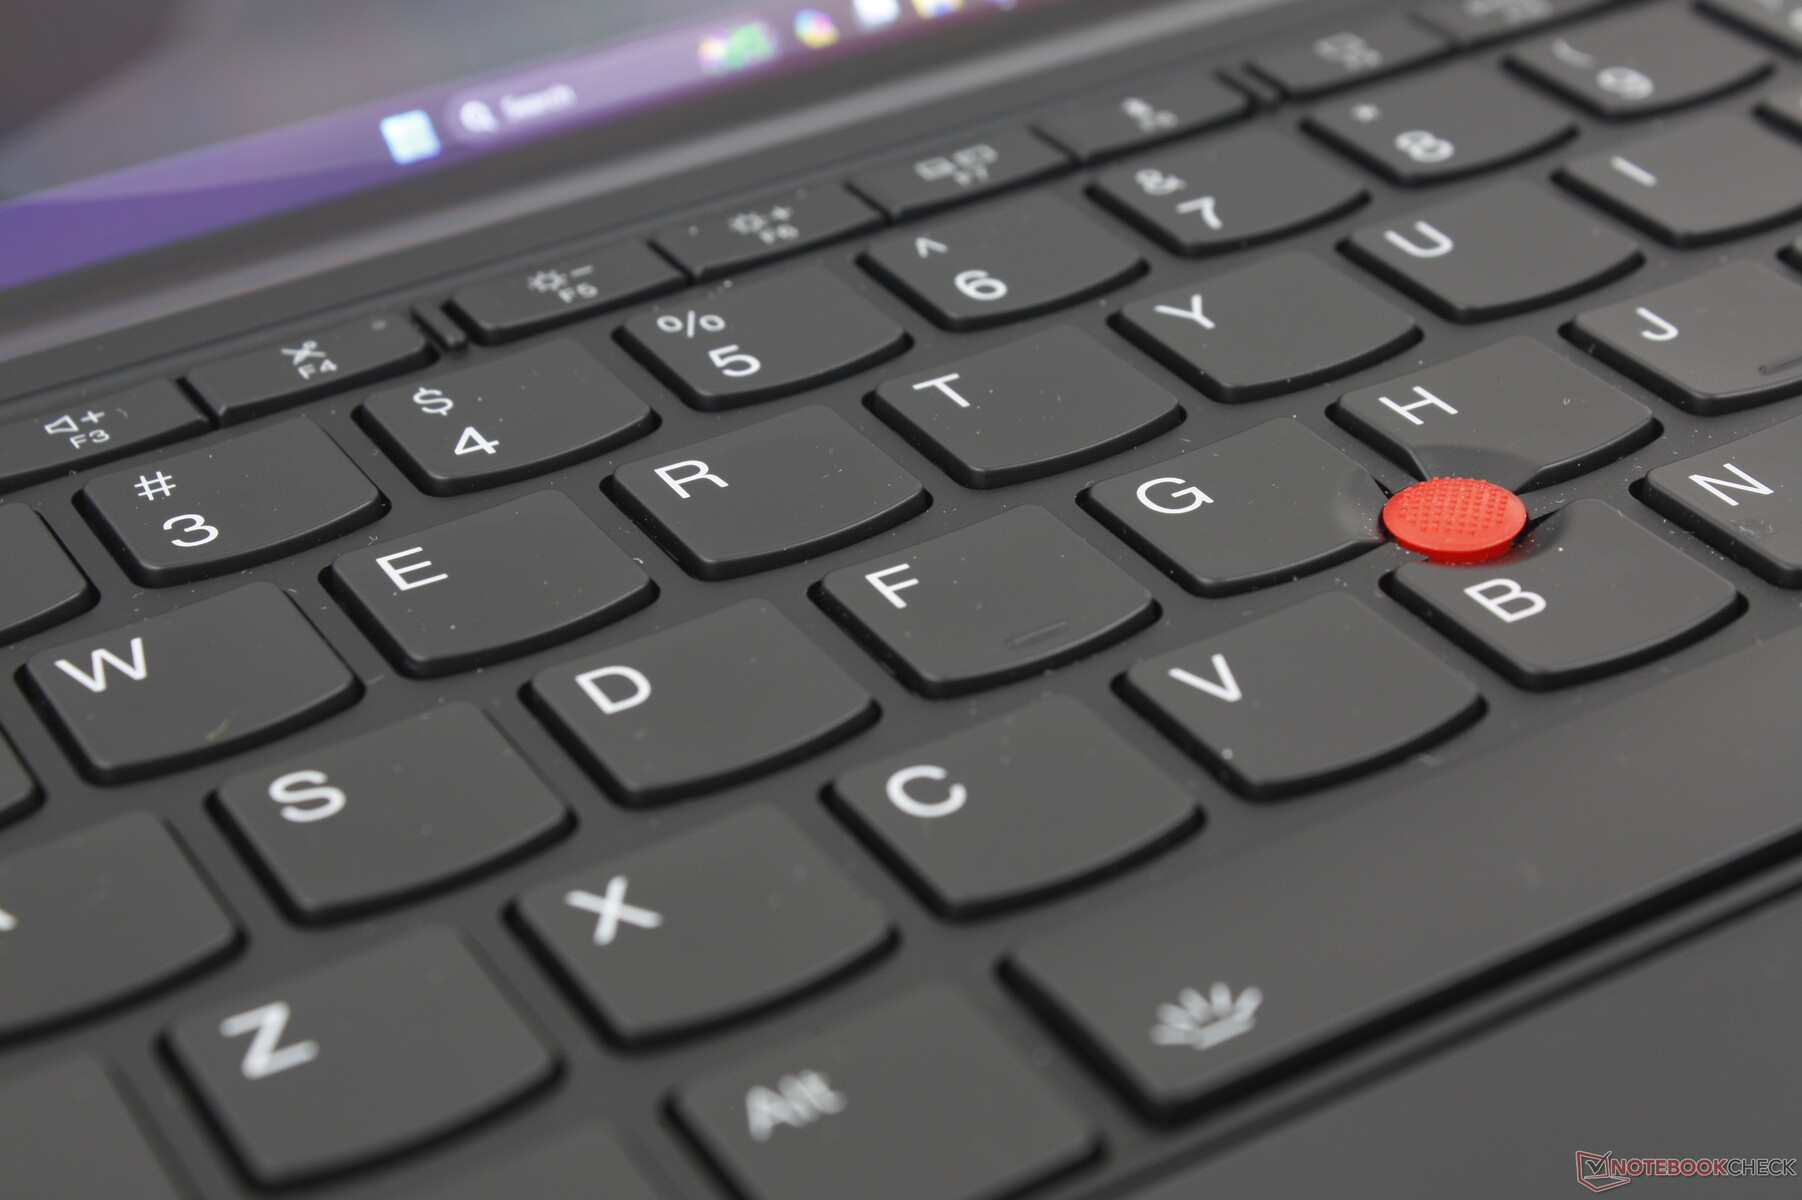
Tastatur
Layout und Größe der beleuchteten Tastatur erinnern an die Tastatur des ThinkPad T14s. Allerdings fühlen sich der Hub sowie das Feedback weicher an, eher vergleichbar mit denen in der IdeaPad-Reihe und weniger wie die klassischen ThinkPad-Tastaturen. Wer das Schreiben auf einem ThinkPad gewöhnt ist, könnte die Tasten hier etwas zu weich finden.
Die Tastatur ist nicht exklusiv an das ThinkPad X1 Fold gebunden und kann somit per USB auch an anderen PCs verwendet werden.
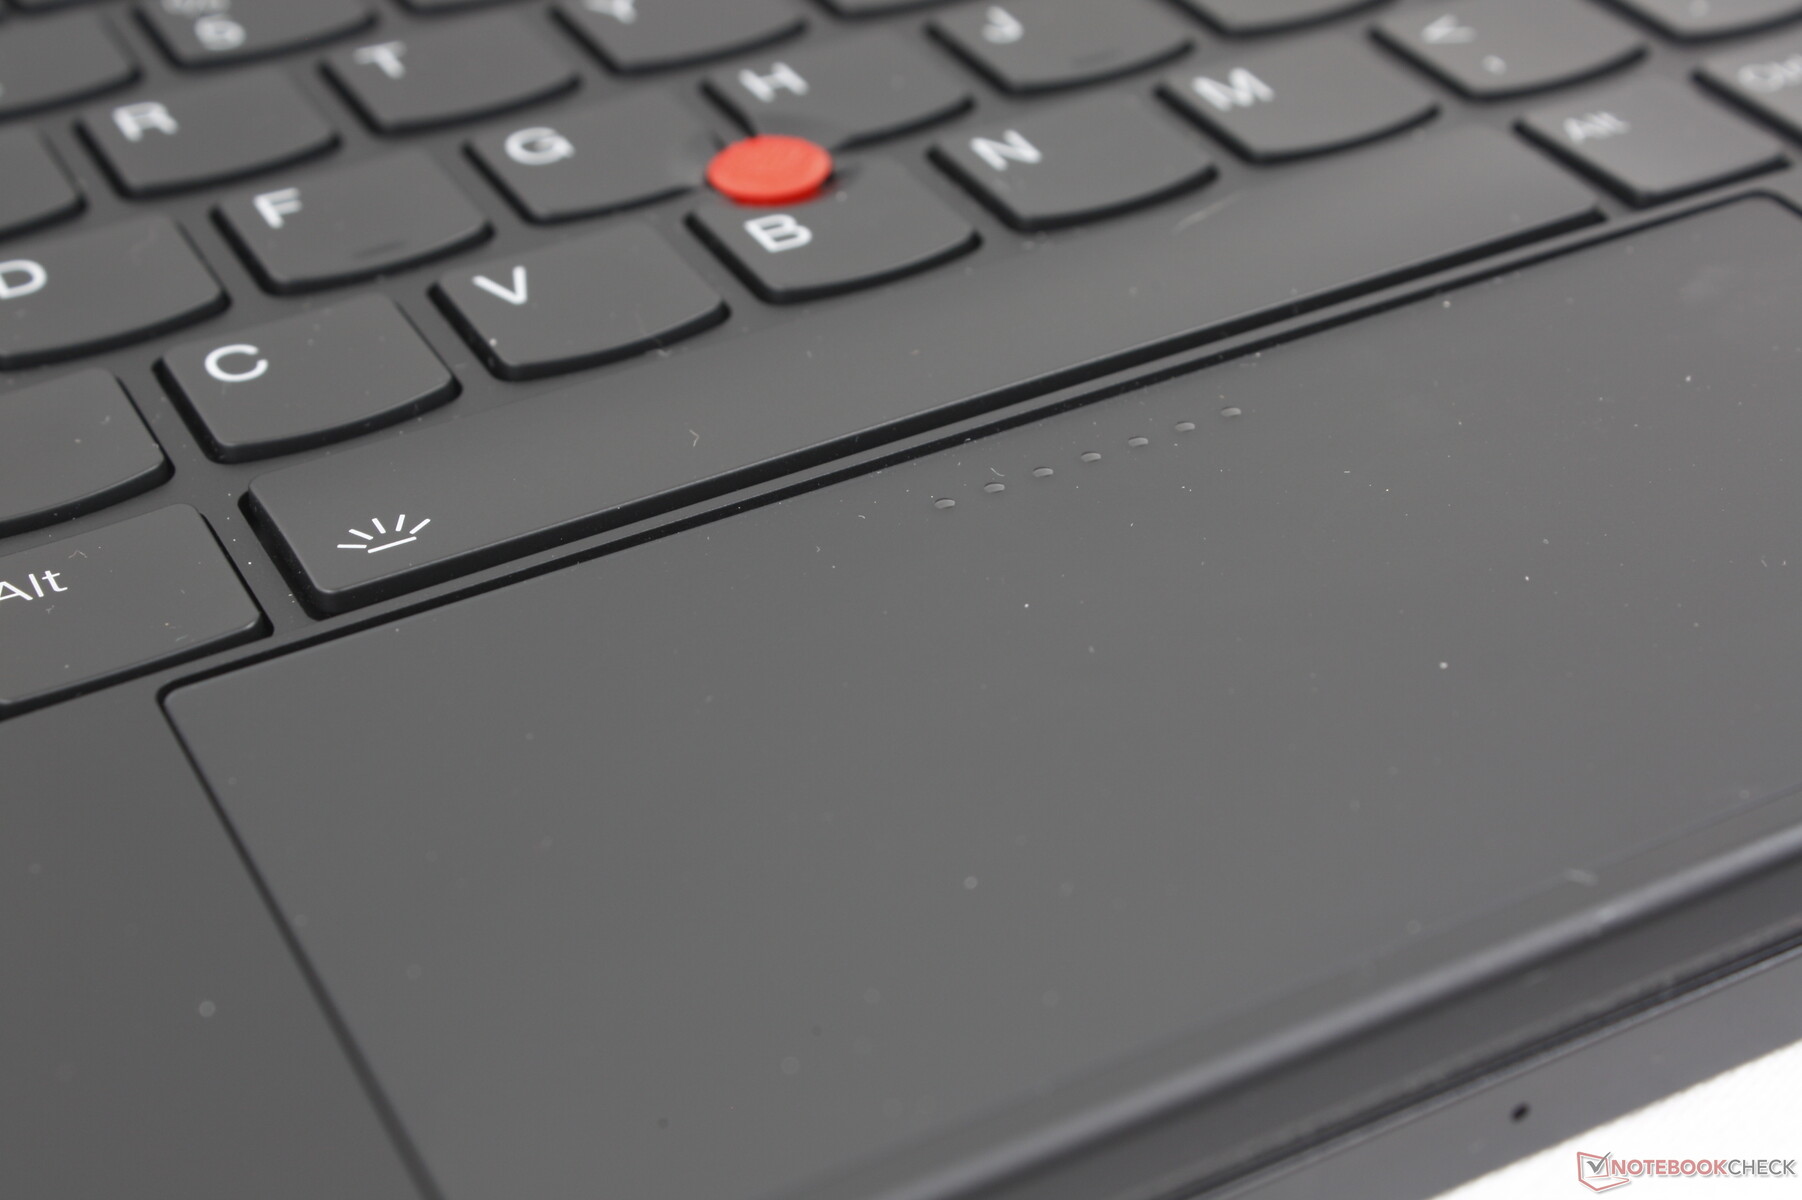
Touchpad
Während wir die Tastatur als bequemer empfunden haben als wir erwartet hätten, entspricht unser Eindruck des Touchpads eher dem Gegenteil. Die sehr kleinen Abmessungen (11 x 5 cm) vertragen sich nicht so gut mit dem großen 4:3-Bildschirm, sodass sich Multi-Touch-Eingaben etwas eingeengt anfühlen. Zusätzlich würden wir das Klickfeedback als schwammig und extrem seicht bezeichnen. Insgesamt führt dies zu einer unbefriedigenden Erfahrung. Es wird schnell klar, dass Lenovo von den Nutzern erwartet eine Maus griffbereit zu haben oder wann immer möglich den Touchscreen anstelle des winzigen Touchpads zu nutzen.

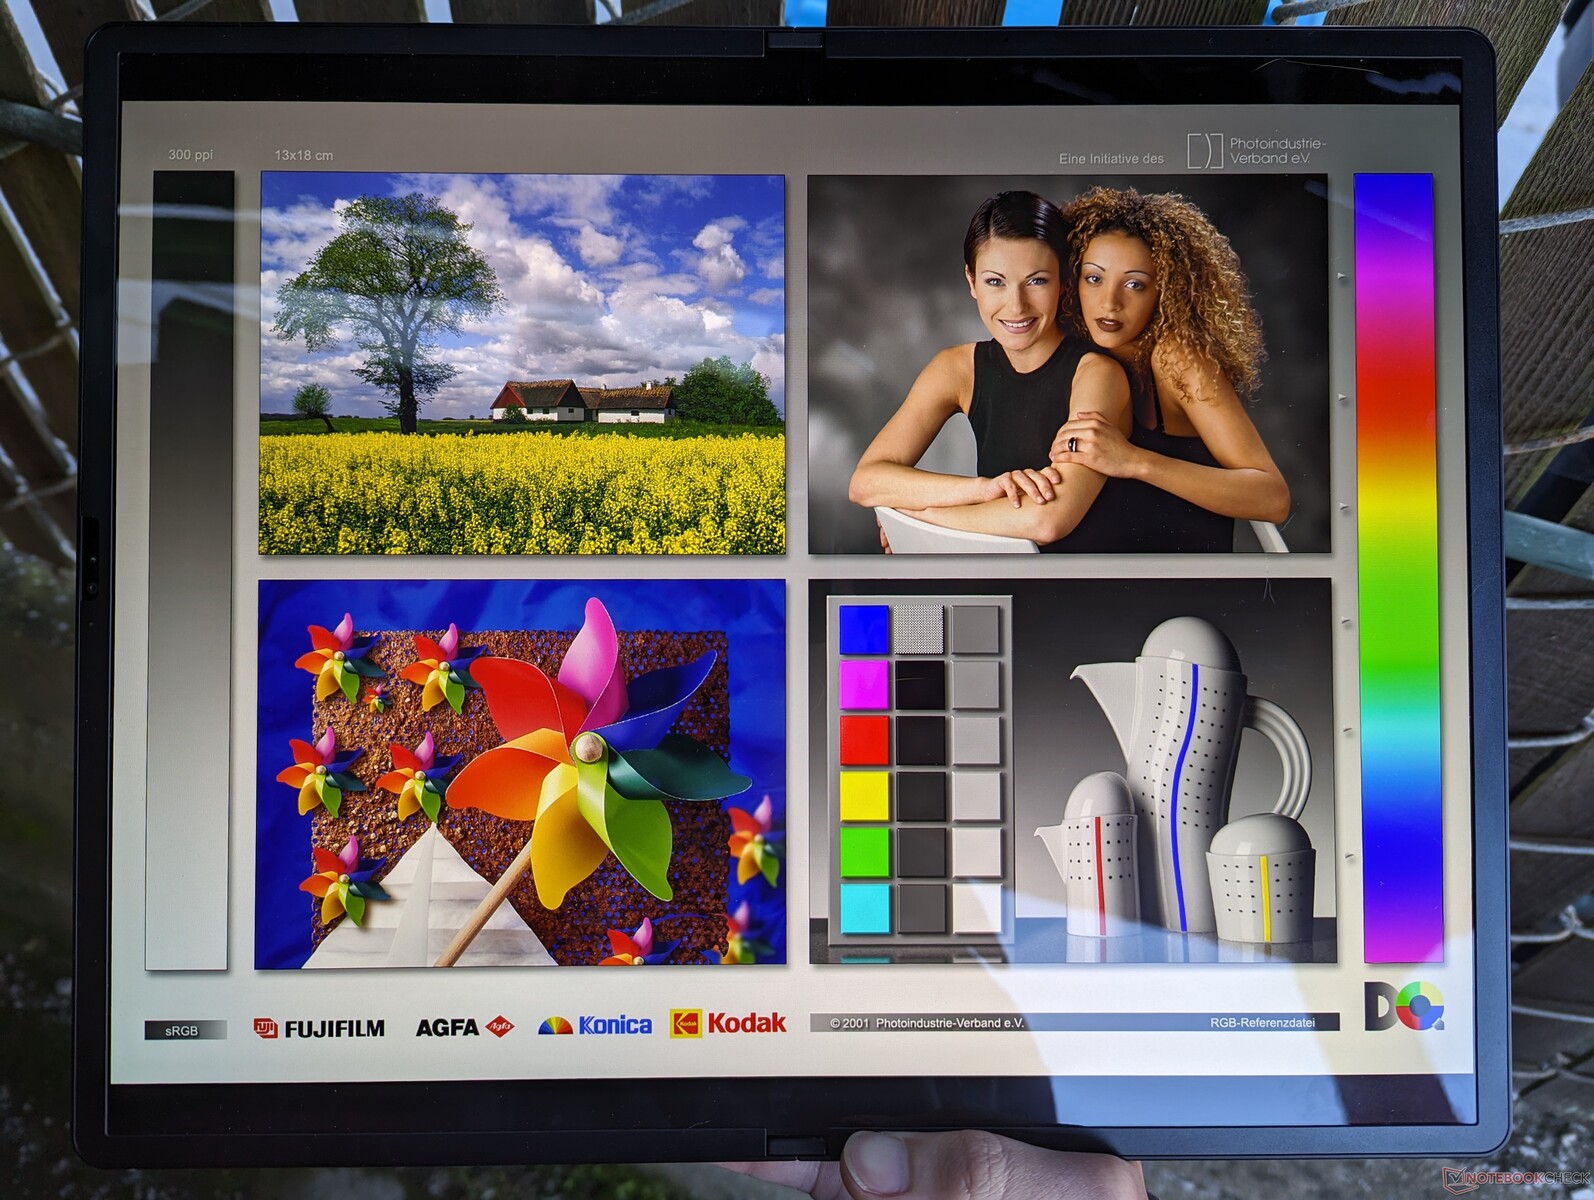
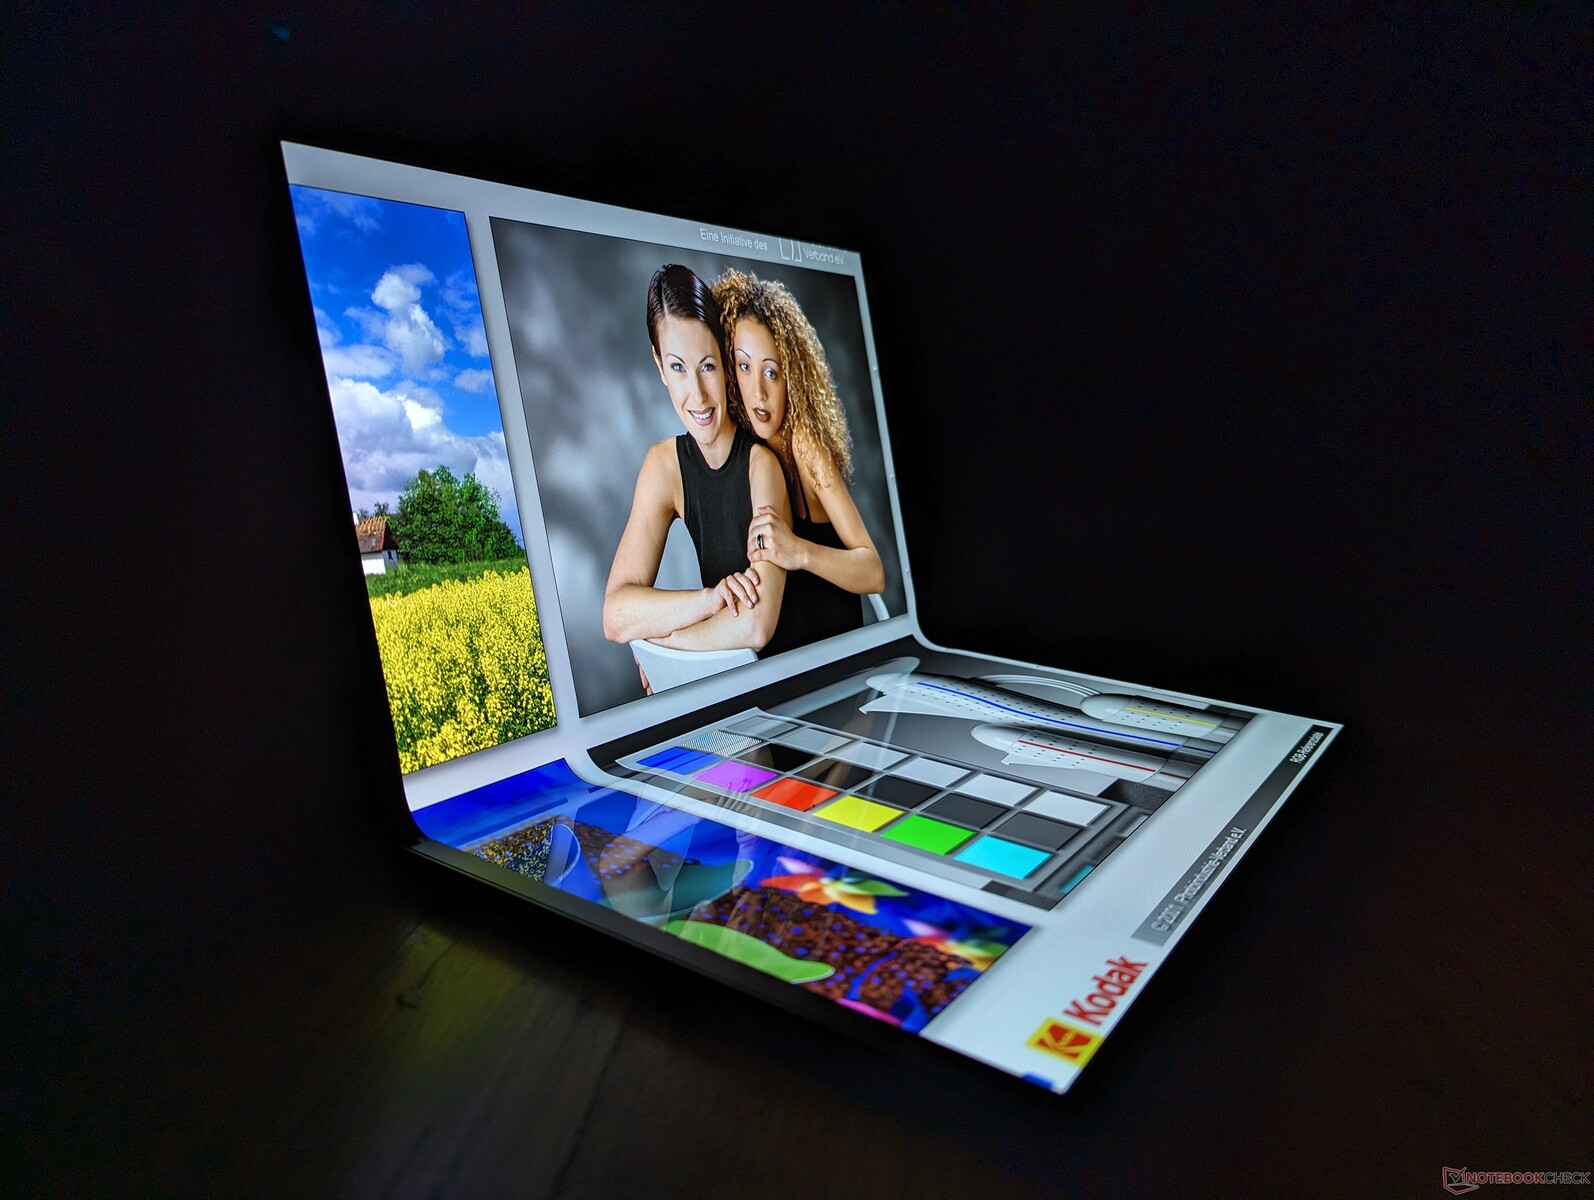
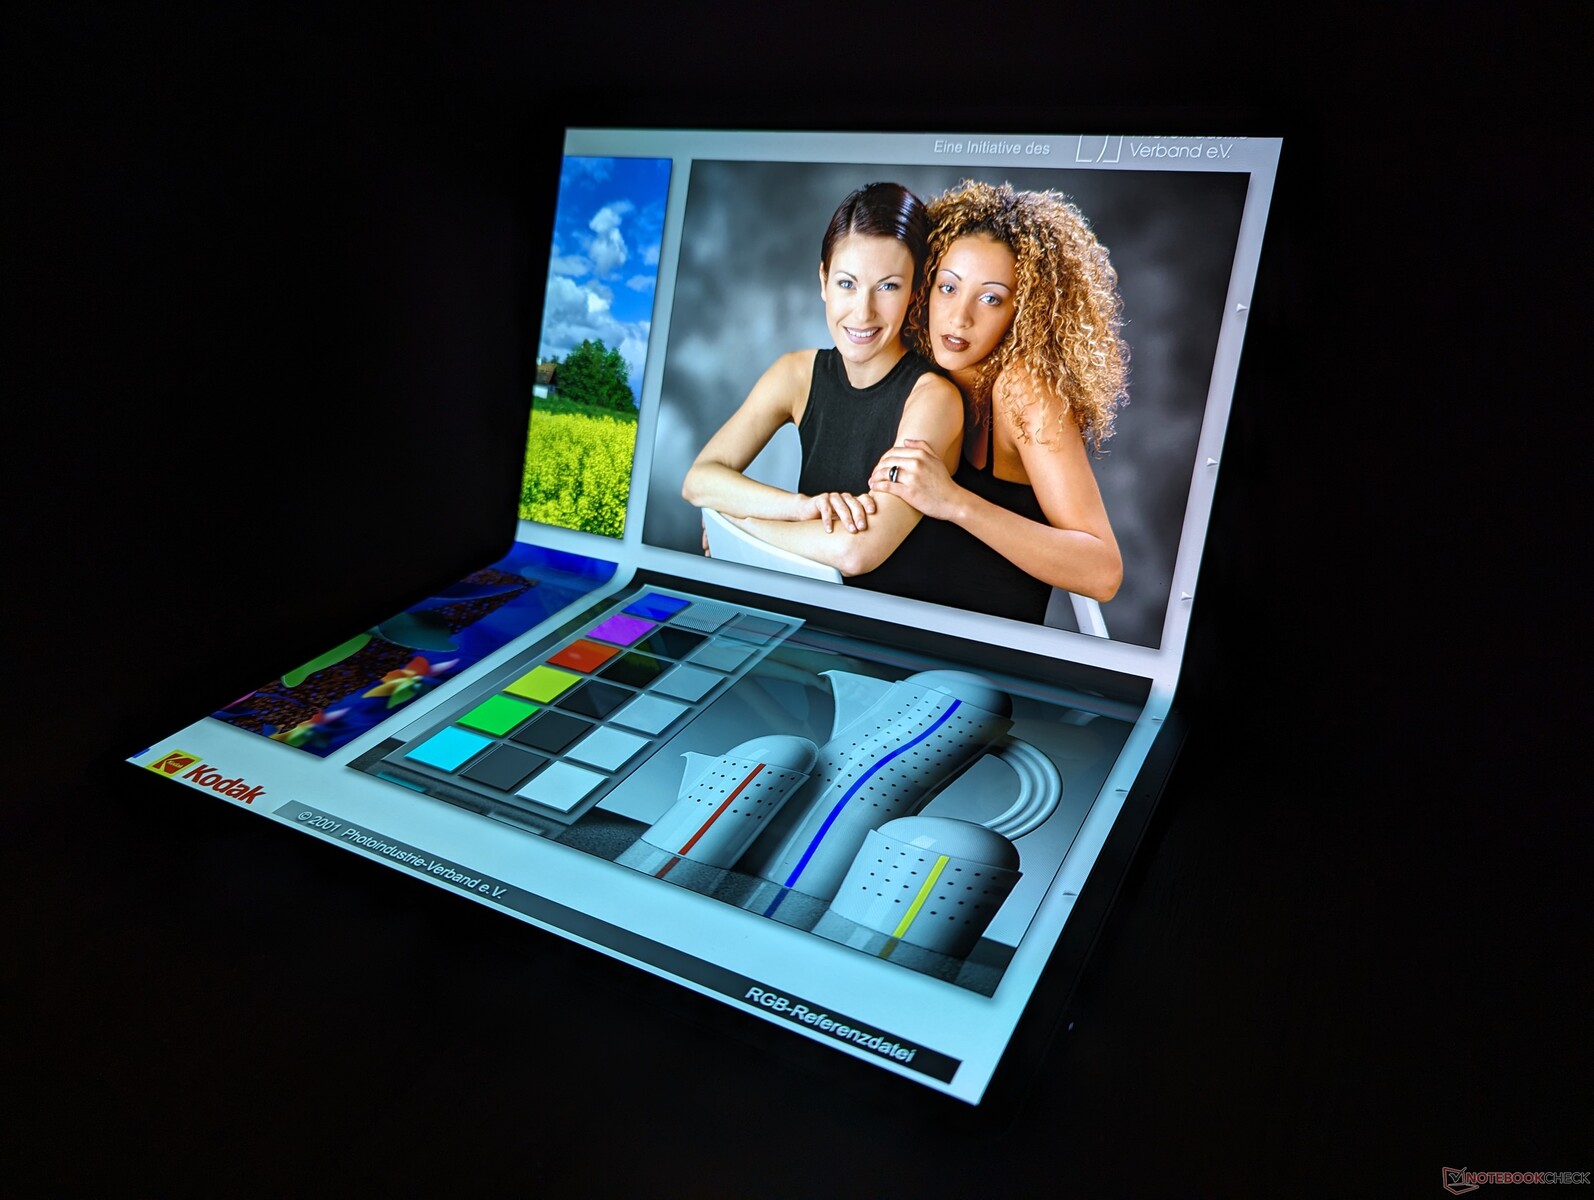
Display — Der Star der Show

Lenovo verbaut das 60-Hz-Display Sharp LJ163B1JX01 OLED. Das Panel findet sich aktuell in keinem anderen Laptop aus unserer Datenbank. Neben den typischen Vorteilen von OLED-Displays, wie einem perfekten Schwarzwert und schnellen Reaktionszeiten, deckt der Bildschirm DCI-P3 komplett ab. Anders als bei anderen OLEDs verzichtet Lenovo hier jedoch auf eine Glasschicht, sodass der Bildschirm weniger widerstandsfähig gegen Beschädigungen und die Verwendung mit dem beiliegenden Stylus etwas "holpriger" ist.
Die große 16,3-Zoll-Fläche im geräumigen 4:3-Seitenverhältnis sind die Highlights des faltbaren Touchscreen. Bei der Bildwiederholrate fällt das Modell allerdings etwas hinter der Konkurrenz zurück, beispielsweise bieten Laptops wie das Asus VivoBook Pro 16 schon OLED-Optionen mit 120 Hz.
Dafür wird HDR600 unterstützt, was das ThinkPad Z1 Fold 16 zu einem großartigen Multimediaplayer im Tabletmodus macht. Wenn Windows HDR deaktiviert ist, fällt die Helligkeit in SDR auf etwa 400 Nits zurück.
| |||||||||||||||||||||||||
Ausleuchtung: 89 %
Helligkeit Akku: 403.4 cd/m²
Kontrast: ∞:1 (Schwarzwert: 0 cd/m²)
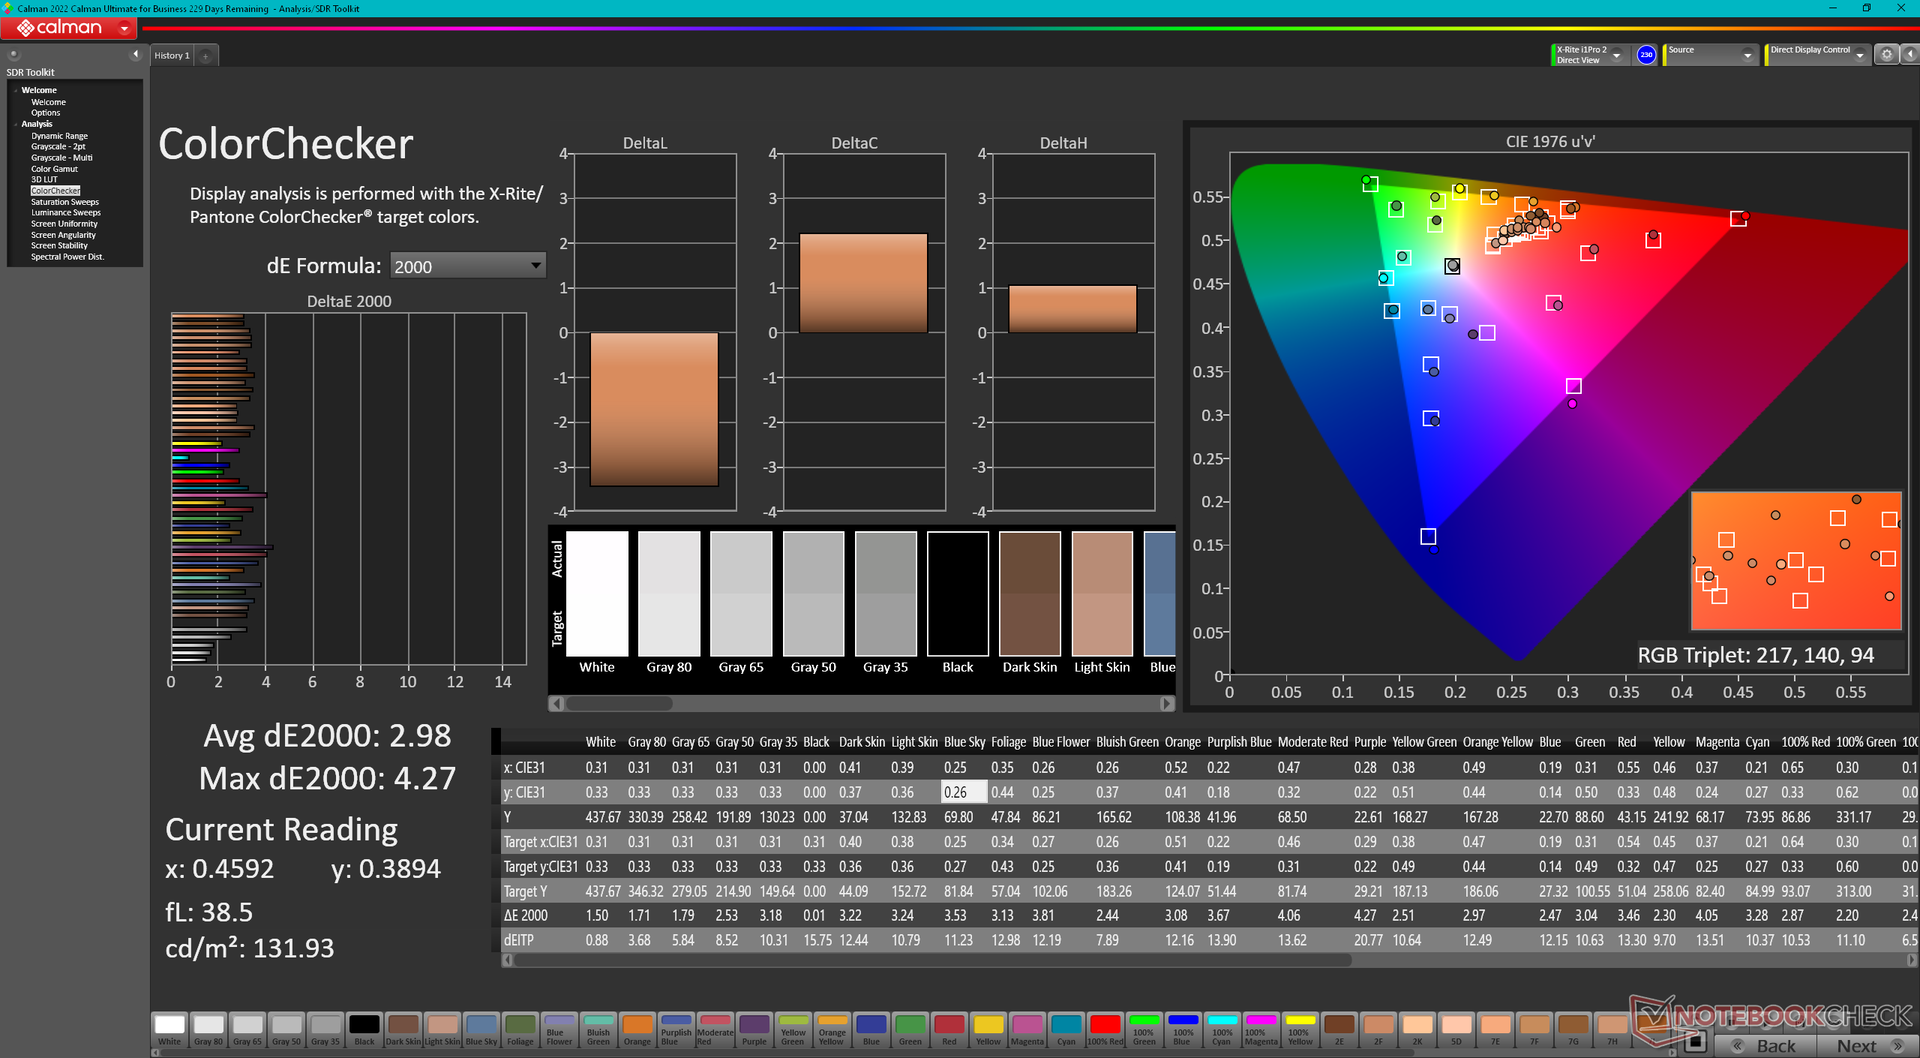
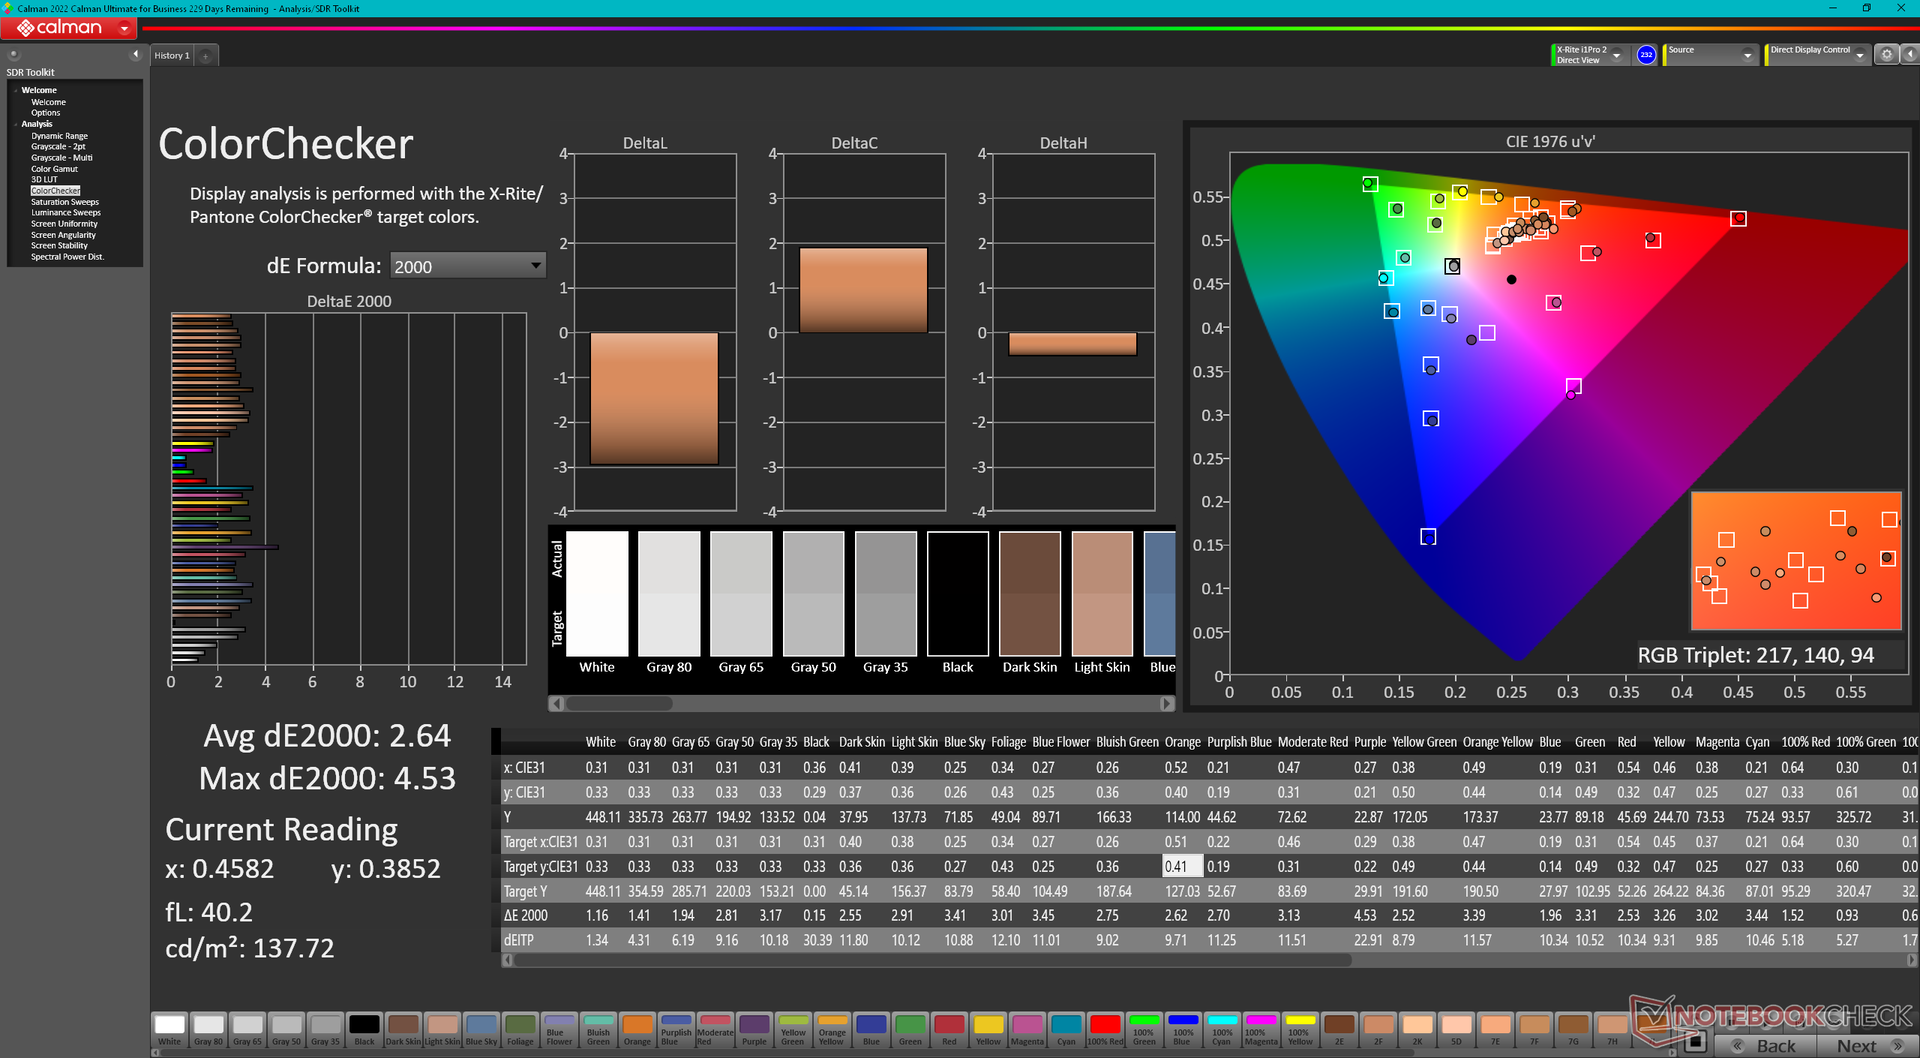
ΔE ColorChecker Calman: 2.98 | ∀{0.5-29.43 Ø4.72}
calibrated: 2.64
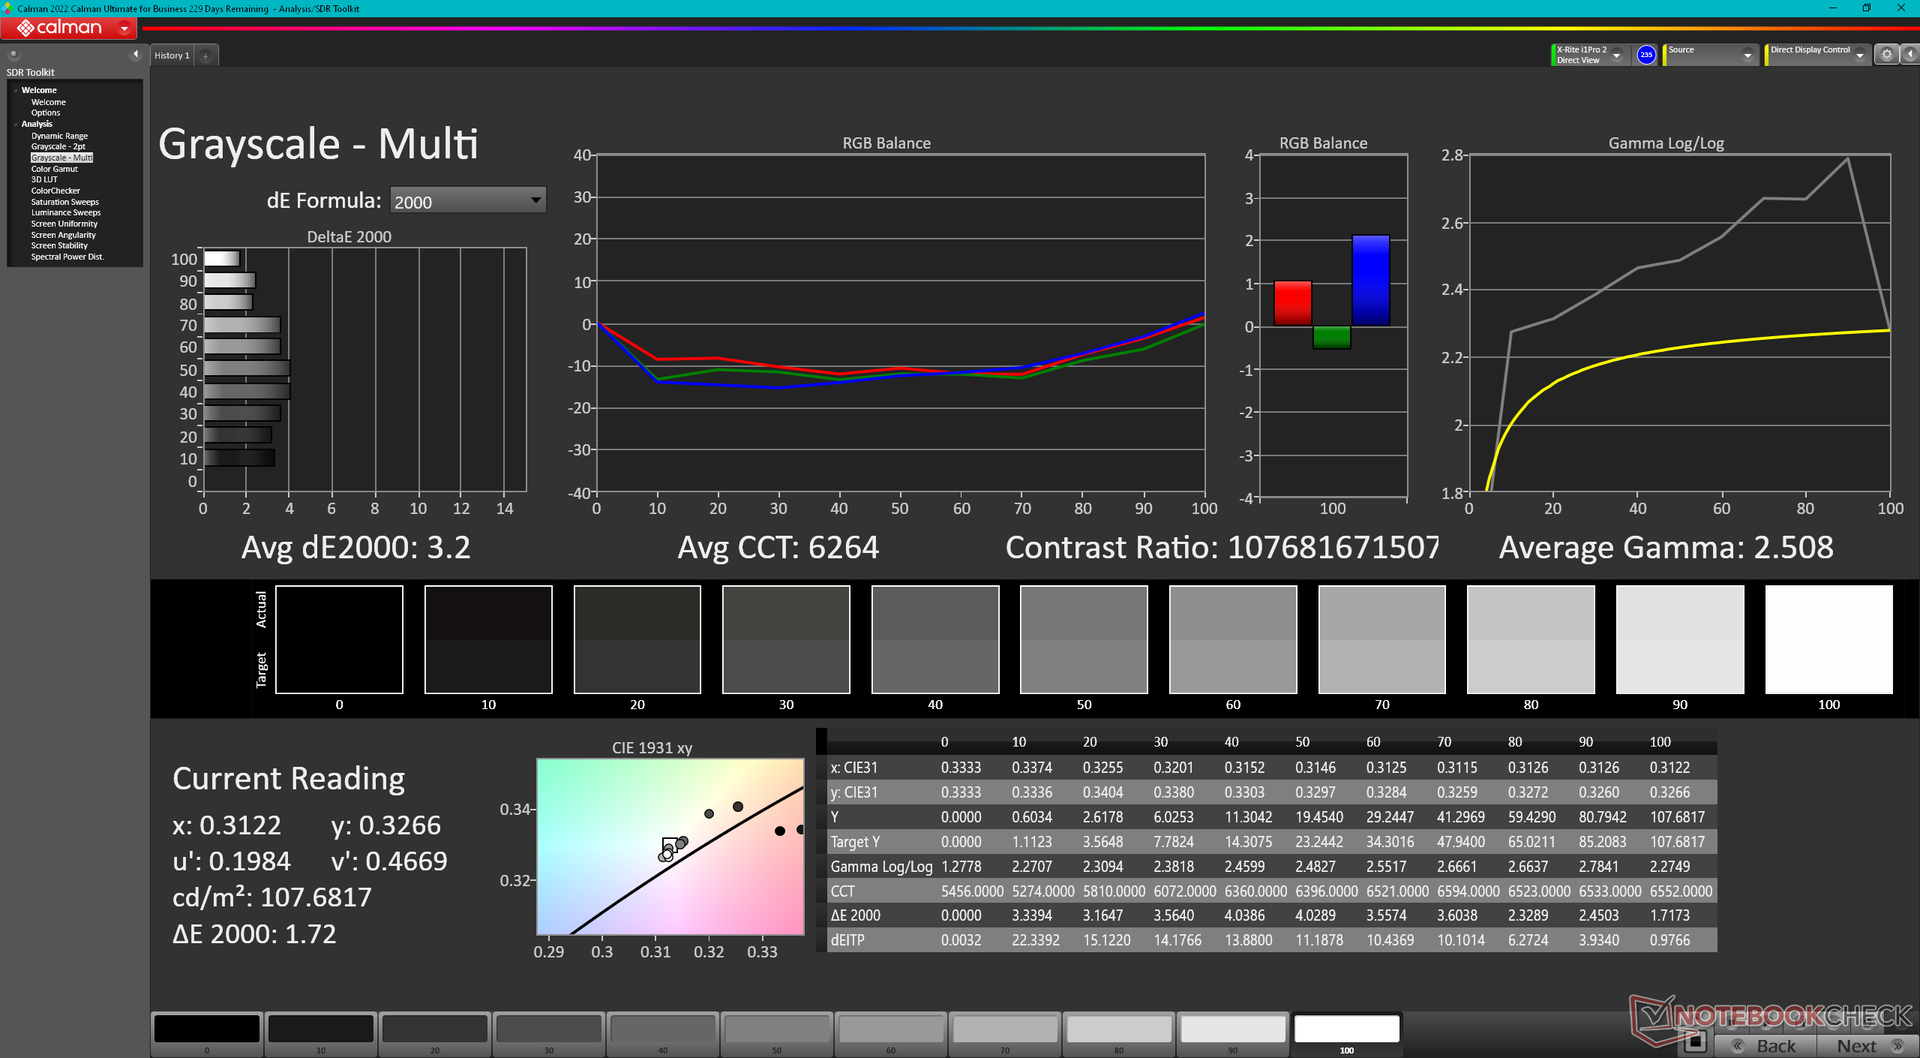
ΔE Greyscale Calman: 3.2 | ∀{0.09-98 Ø4.97}
96% AdobeRGB 1998 (Argyll 3D)
100% sRGB (Argyll 3D)
99.9% Display P3 (Argyll 3D)
Gamma: 2.51
CCT: 6264 K
| Lenovo Thinkpad X1 Fold 16 Sharp LJ163B1JX01, OLED, 2560x2024, 16.3" | Lenovo ThinkPad X1 Fold 20RL000FGE LEN4142, OLED, 2048x1536, 13.3" | Asus Zenbook 17 Fold UX9702 BOE9C40, OLED, 2560x1920, 17.3" | Microsoft Surface Pro 9, i7-1255U LP129WT2-SPA6, IPS, 2880x1920, 13" | HP Elite Dragonfly Folio 13.5 G3 Chi Mei CMN13C0, IPS, 1920x1280, 13.5" | Lenovo ThinkPad X1 Carbon G11 21HNS54T00 ATNA40YK15-0, OLED, 2880x1800, 14" | |
|---|---|---|---|---|---|---|
| Display | -0% | 1% | -22% | -20% | 0% | |
| Display P3 Coverage (%) | 99.9 | 94.6 -5% | 99.9 0% | 65.6 -34% | 68.3 -32% | 99.9 0% |
| sRGB Coverage (%) | 100 | 100 0% | 100 0% | 97.7 -2% | 98.6 -1% | 100 0% |
| AdobeRGB 1998 Coverage (%) | 96 | 100 4% | 99.6 4% | 67.7 -29% | 70.2 -27% | 97 1% |
| Response Times | -156% | -9% | -1489% | -5408% | -41% | |
| Response Time Grey 50% / Grey 80% * (ms) | 0.99 ? | 2.4 ? -142% | 1.12 ? -13% | 13 ? -1213% | 66.8 ? -6647% | 1.19 ? -20% |
| Response Time Black / White * (ms) | 1.04 ? | 2.8 ? -169% | 1.08 ? -4% | 19.4 ? -1765% | 44.4 ? -4169% | 1.68 ? -62% |
| PWM Frequency (Hz) | 240.6 ? | 119 | 240 ? | 29896 ? | 363 ? | |
| Bildschirm | -67% | -15% | 25% | 11% | -24% | |
| Helligkeit Bildmitte (cd/m²) | 403.4 | 239 -41% | 333 -17% | 455 13% | 369.5 -8% | 427 6% |
| Brightness (cd/m²) | 423 | 235 -44% | 327 -23% | 453 7% | 350 -17% | 427 1% |
| Brightness Distribution (%) | 89 | 95 7% | 95 7% | 94 6% | 87 -2% | 98 10% |
| Schwarzwert * (cd/m²) | 0.01 | 0.38 | 0.24 | |||
| Delta E Colorchecker * | 2.98 | 6.5 -118% | 3.2 -7% | 1.7 43% | 2.3 23% | 4.5 -51% |
| Colorchecker dE 2000 max. * | 4.27 | 10.3 -141% | 8.6 -101% | 3.8 11% | 4.34 -2% | 9.6 -125% |
| Colorchecker dE 2000 calibrated * | 2.64 | 3.4 -29% | 1.5 43% | 0.6 77% | 5 -89% | |
| Delta E Graustufen * | 3.2 | 6.5 -103% | 1.5 53% | 1.5 53% | 3.1 3% | 0.7 78% |
| Gamma | 2.51 88% | 1.79 123% | 2.21 100% | 2.17 101% | 2.1 105% | 2.2 100% |
| CCT | 6264 104% | 6221 104% | 6583 99% | 6761 96% | 6248 104% | 6470 100% |
| Farbraum (Prozent von AdobeRGB 1998) (%) | 91.9 | |||||
| Color Space (Percent of sRGB) (%) | 100 | |||||
| Kontrast (:1) | 33300 | 1197 | 1540 | |||
| Durchschnitt gesamt (Programm / Settings) | -74% /
-65% | -8% /
-9% | -495% /
-239% | -1806% /
-900% | -22% /
-21% |
* ... kleinere Werte sind besser
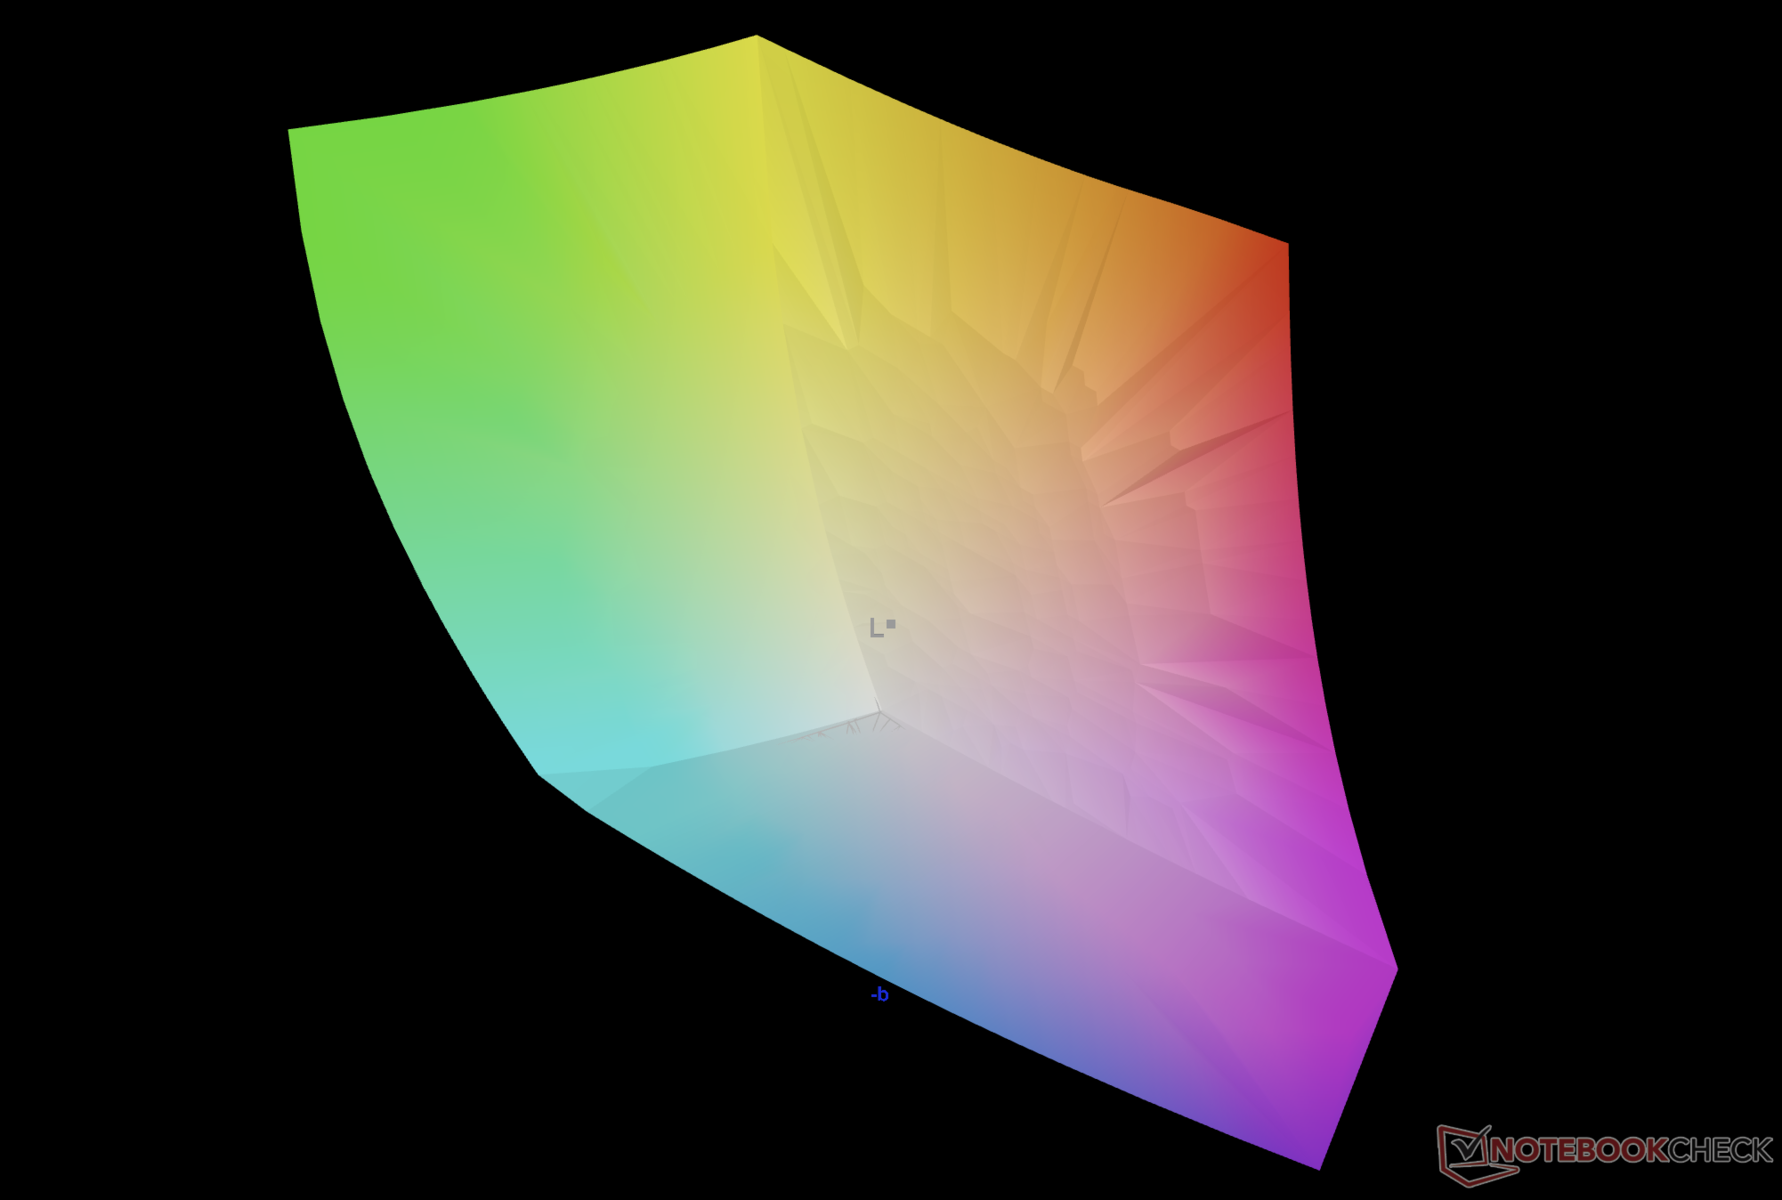
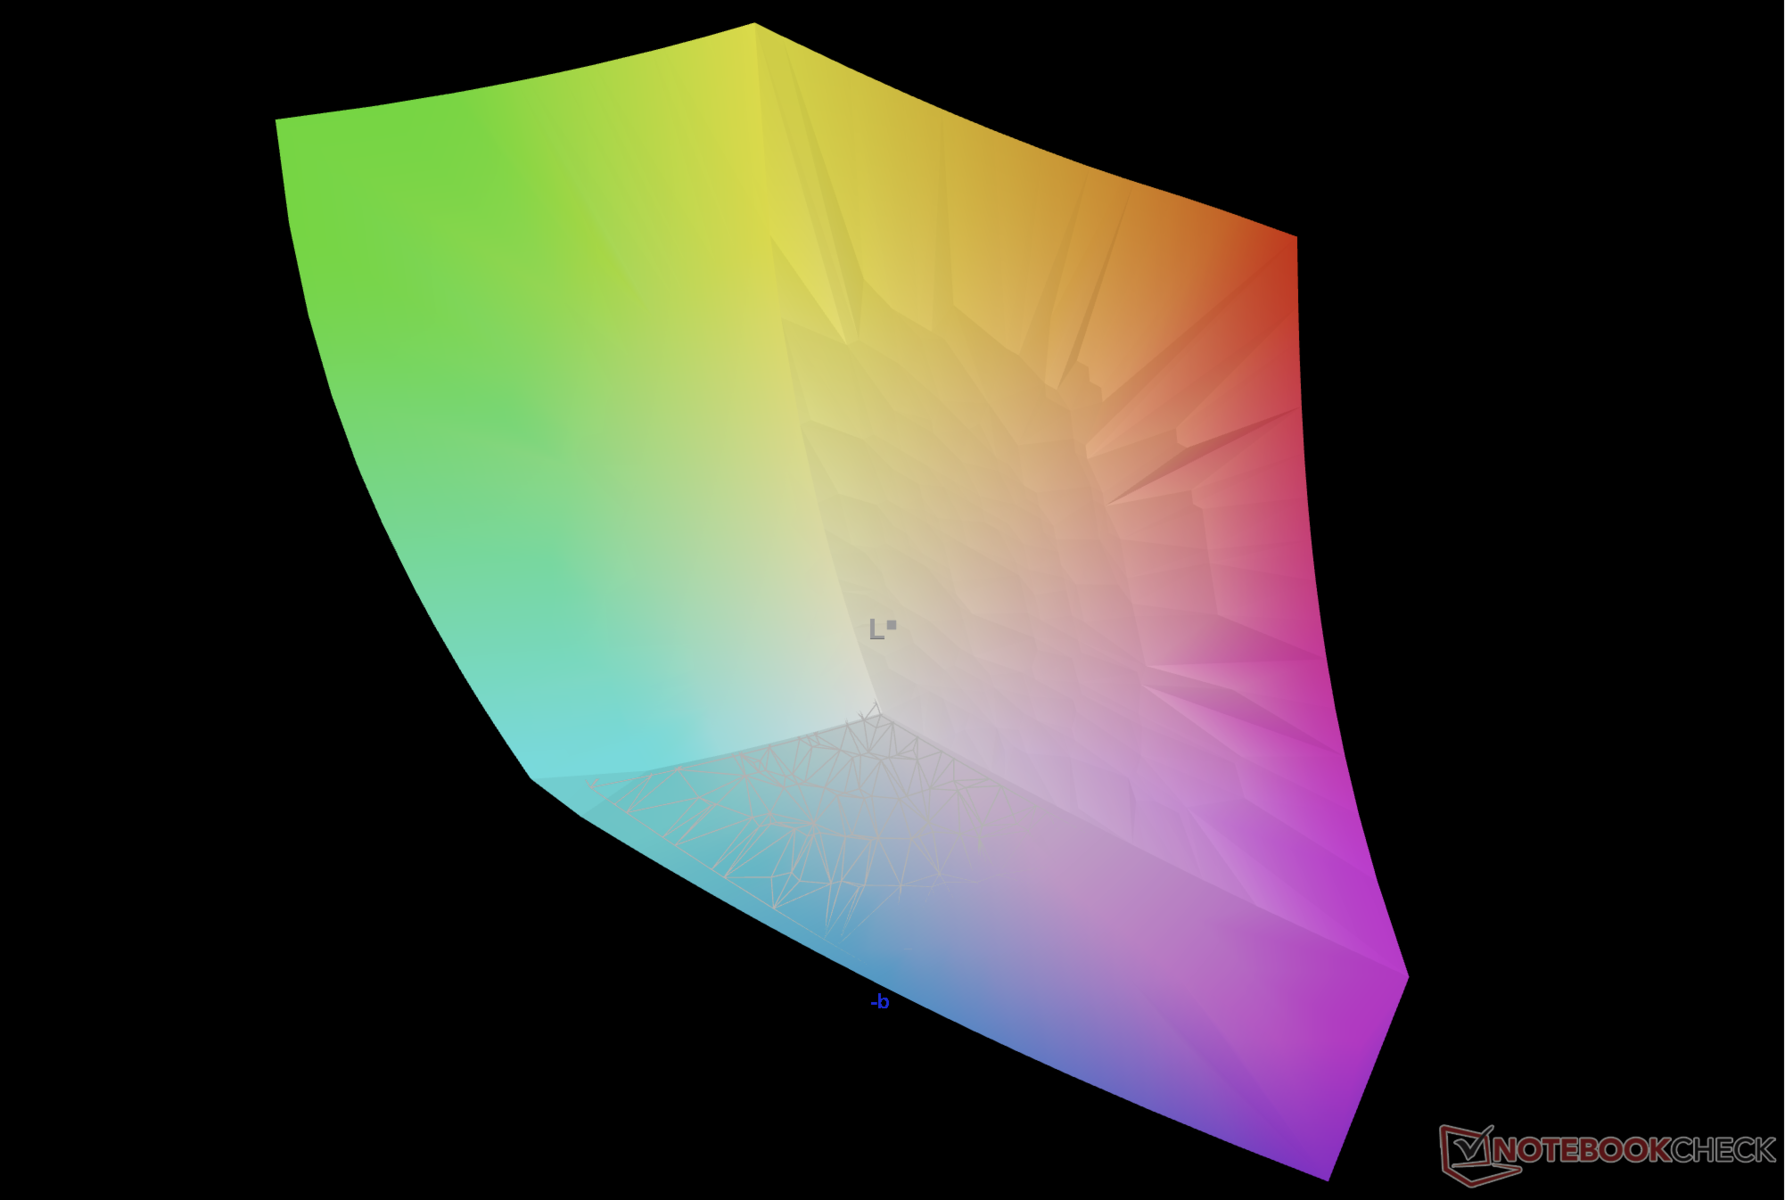
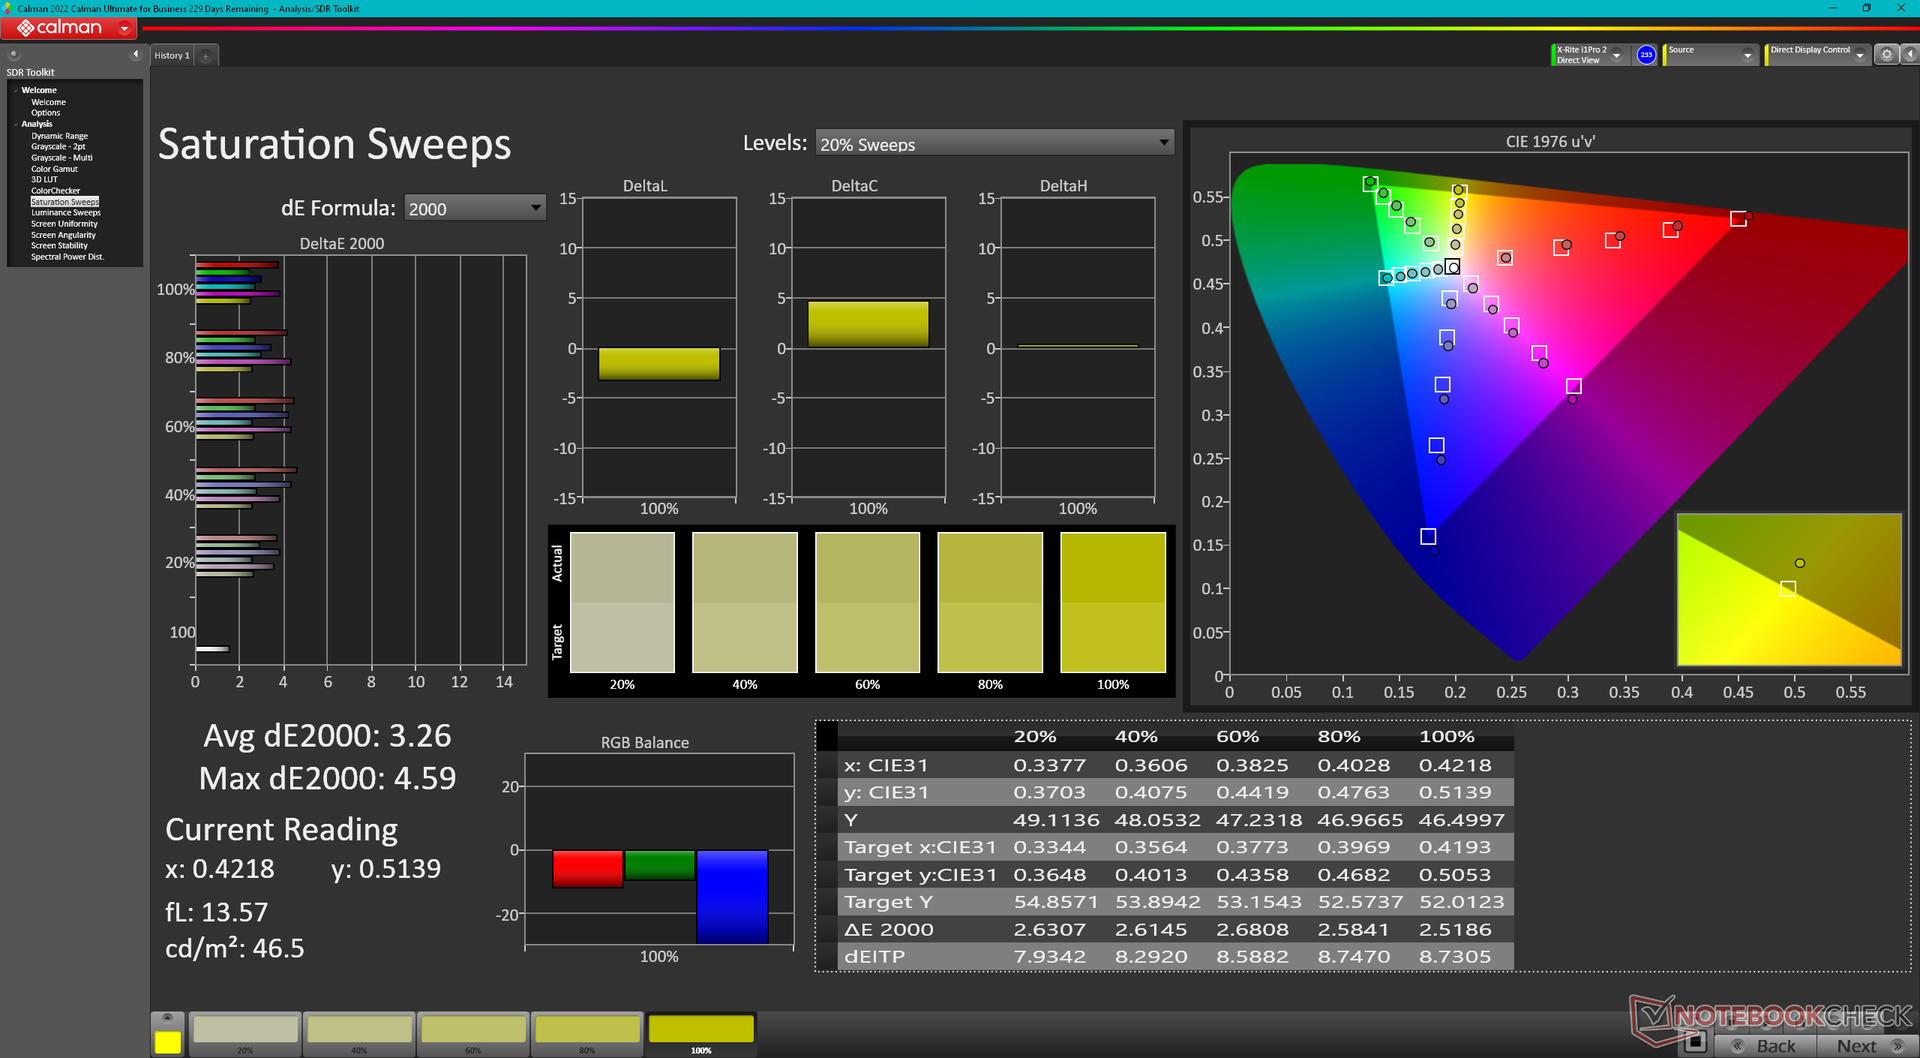
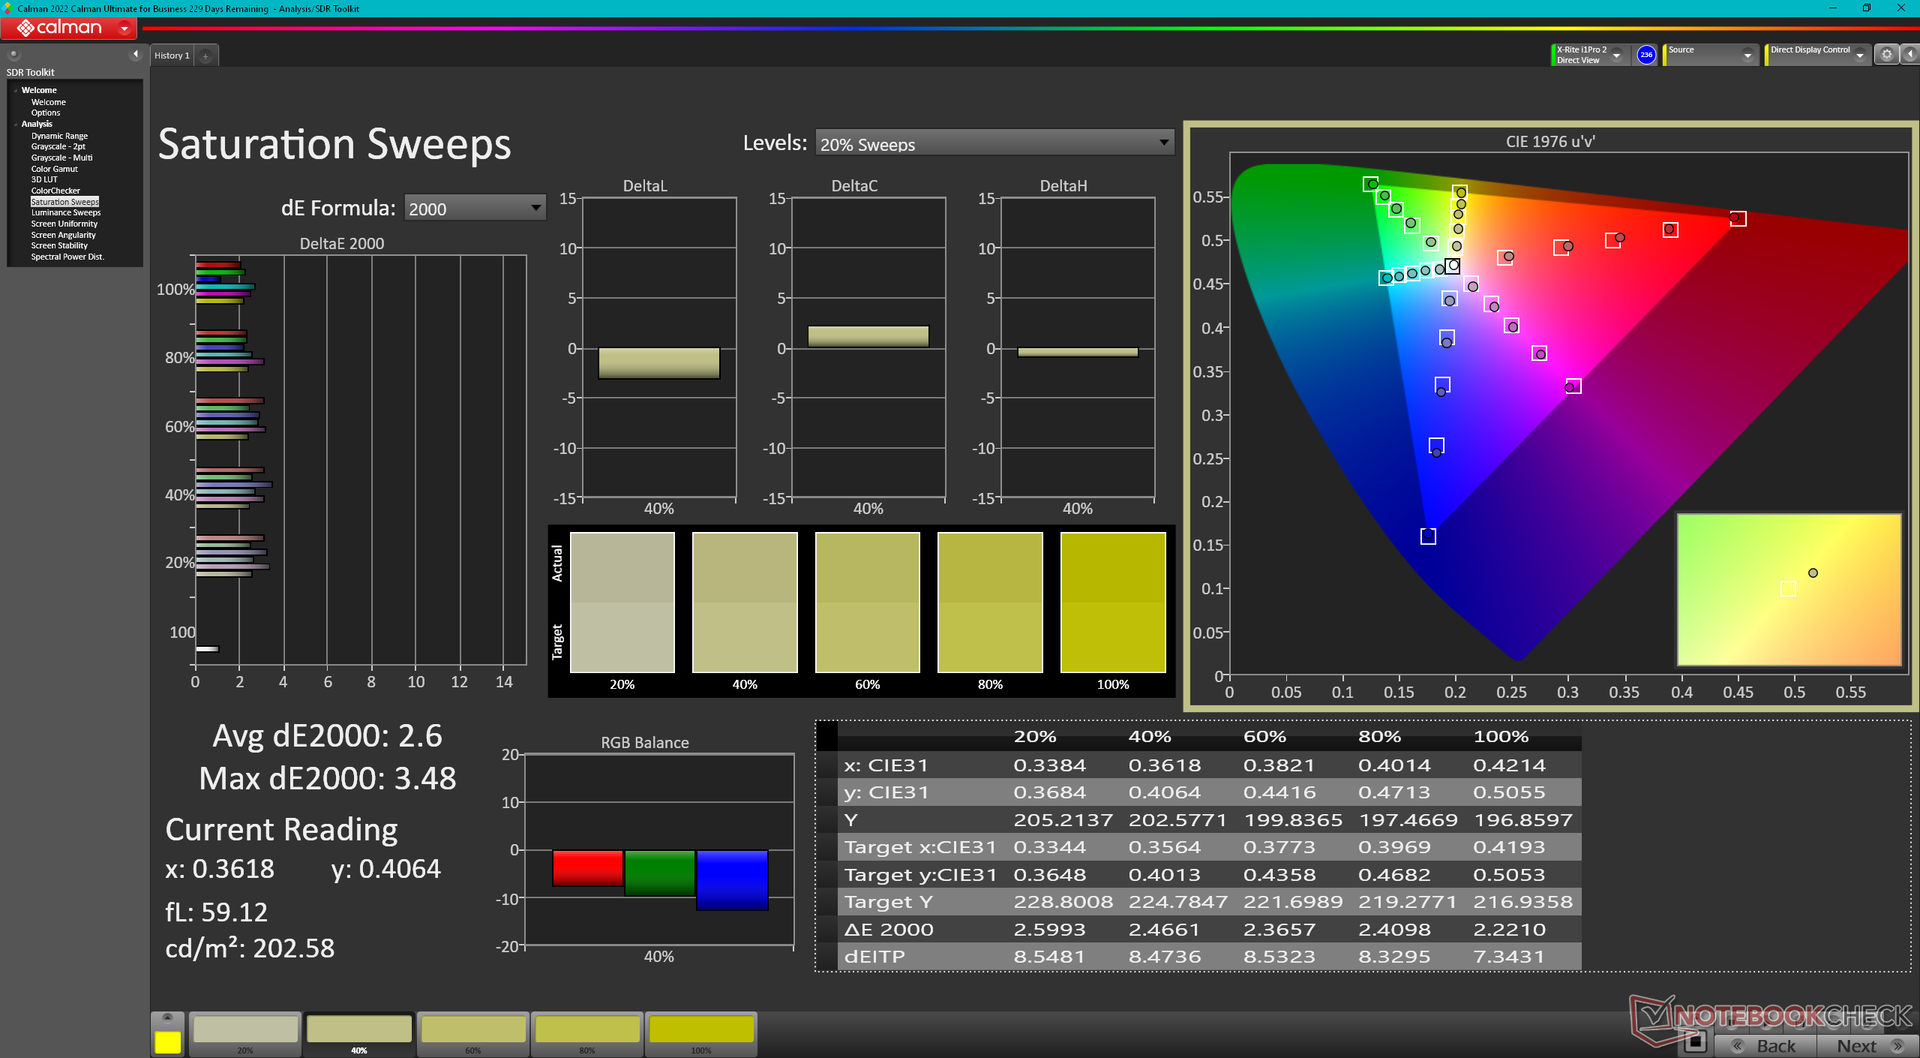
Standardmäßig ist das Display auf sRGB eingestellt, obwohl es DCI-P3-Farben unterstützt. Ab Werk ist es nur ordentlich am sRGB-Standard kalibriert, mit durchschnittlichen DeltaE-Werten von 3,2 und 2,98 für die Graustufen und Farben.
Reaktionszeiten (Response Times) des Displays
| ↔ Reaktionszeiten Schwarz zu Weiß | ||
|---|---|---|
| 1.04 ms ... steigend ↗ und fallend ↘ kombiniert | ↗ 0.44 ms steigend | 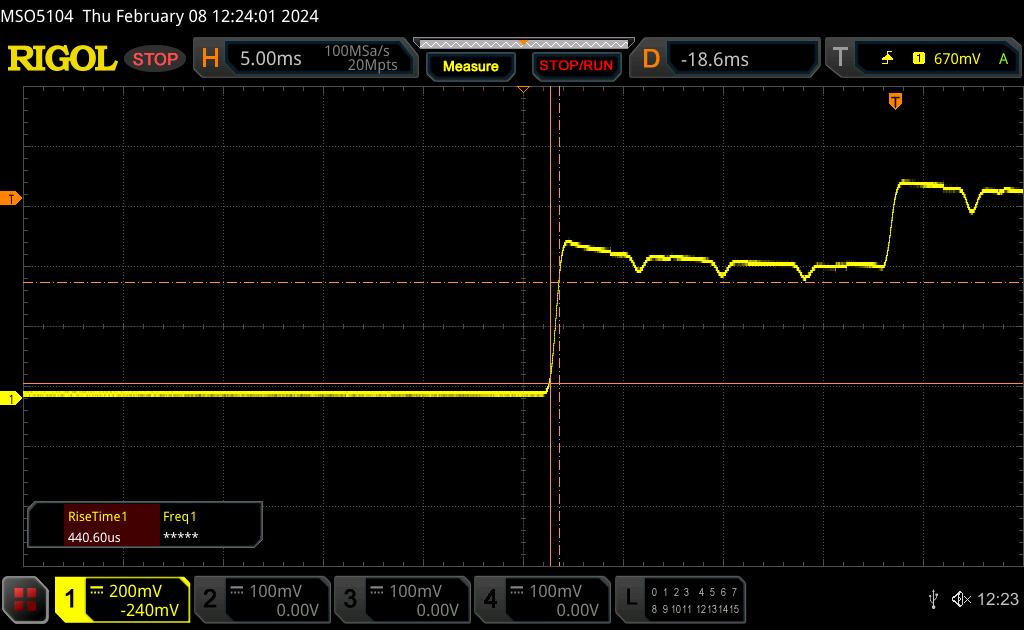 |
| ↘ 0.6 ms fallend | ||
| Die gemessenen Reaktionszeiten sind sehr kurz, wodurch sich der Bildschirm auch für schnelle 3D Spiele eignen sollte. Im Vergleich rangierten die bei uns getesteten Geräte von 0.1 (Minimum) zu 240 (Maximum) ms. » 4 % aller Screens waren schneller als der getestete. Daher sind die gemessenen Reaktionszeiten besser als der Durchschnitt aller vermessenen Geräte (19.8 ms). | ||
| ↔ Reaktionszeiten 50% Grau zu 80% Grau | ||
| 0.99 ms ... steigend ↗ und fallend ↘ kombiniert | ↗ 0.5 ms steigend |  |
| ↘ 0.49 ms fallend | ||
| Die gemessenen Reaktionszeiten sind sehr kurz, wodurch sich der Bildschirm auch für schnelle 3D Spiele eignen sollte. Im Vergleich rangierten die bei uns getesteten Geräte von 0.165 (Minimum) zu 636 (Maximum) ms. » 4 % aller Screens waren schneller als der getestete. Daher sind die gemessenen Reaktionszeiten besser als der Durchschnitt aller vermessenen Geräte (31 ms). | ||
Bildschirm-Flackern / PWM (Pulse-Width Modulation)
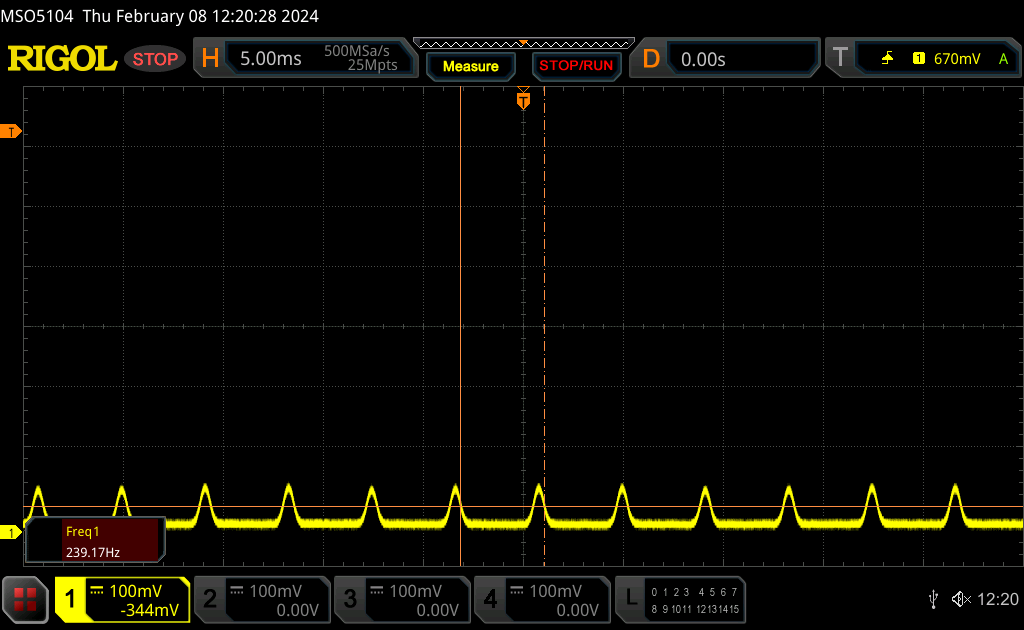
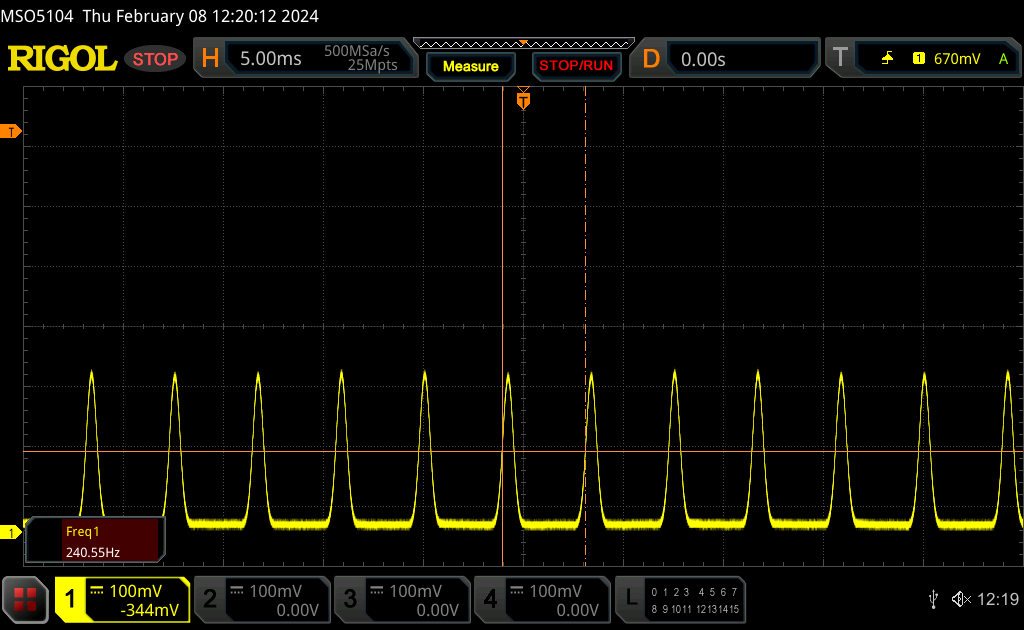
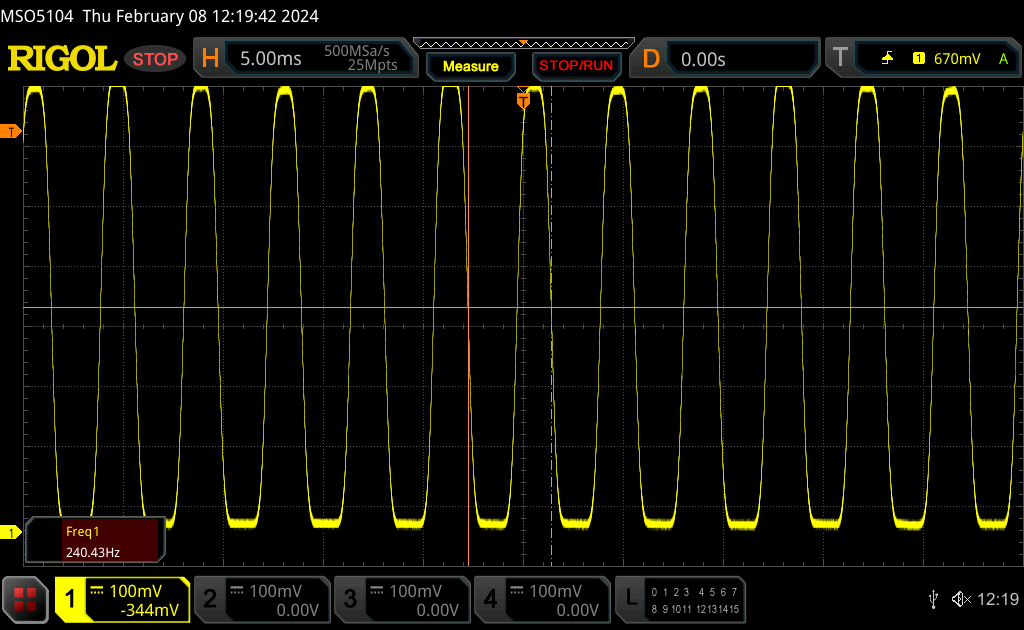
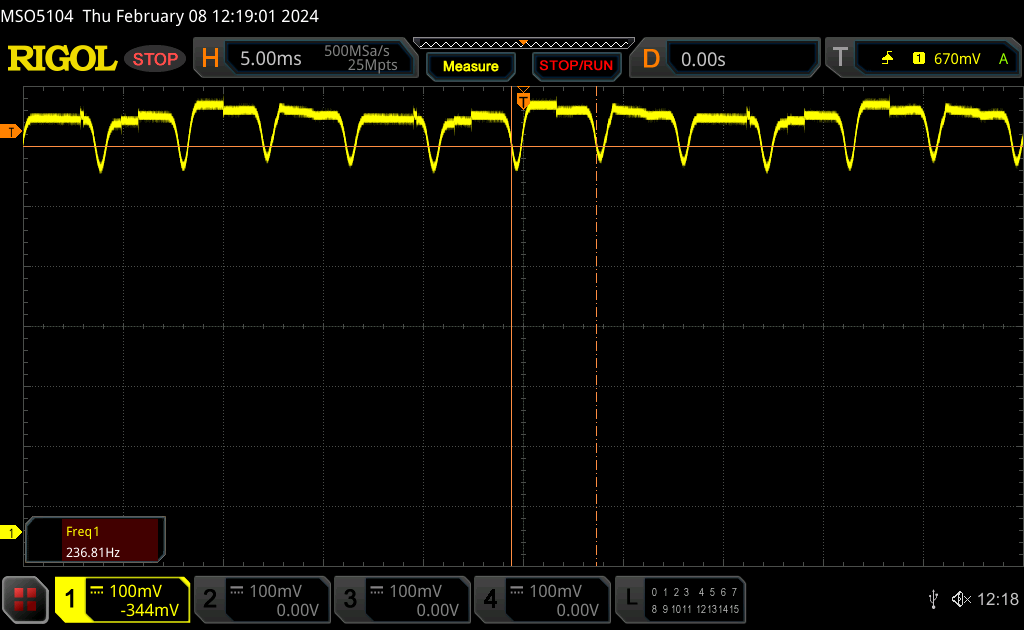
| Flackern / PWM festgestellt | 240.6 Hz | ≤ 100 % Helligkeit | 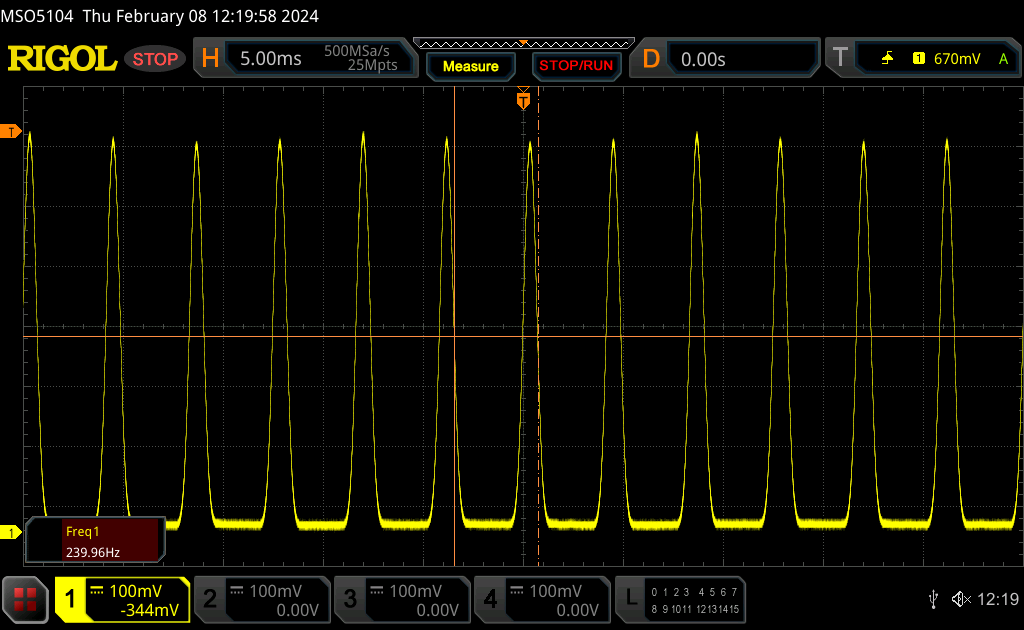 |
Das Display flackert mit 240.6 Hz (im schlimmsten Fall, eventuell durch Pulsweitenmodulation PWM) bei einer eingestellten Helligkeit von 100 % und darunter. Darüber sollte es zu keinem Flackern kommen. Die Frequenz von 240.6 Hz ist relativ gering und daher sollte es bei sensiblen Personen zu Problemen wie Flackern oder Augenbeschwerden führen. Im Vergleich: 52 % aller getesteten Geräte nutzten kein PWM um die Helligkeit zu reduzieren. Wenn PWM eingesetzt wurde, dann bei einer Frequenz von durchschnittlich 7772 (Minimum 5, Maximum 343500) Hz. | |||
PWM oder Flackern ist bei einer Frequenz von 240 Hz auf allen Helligkeitsstufen vorhanden, ähnlich wie auf dem Zenbook 17 Fold.
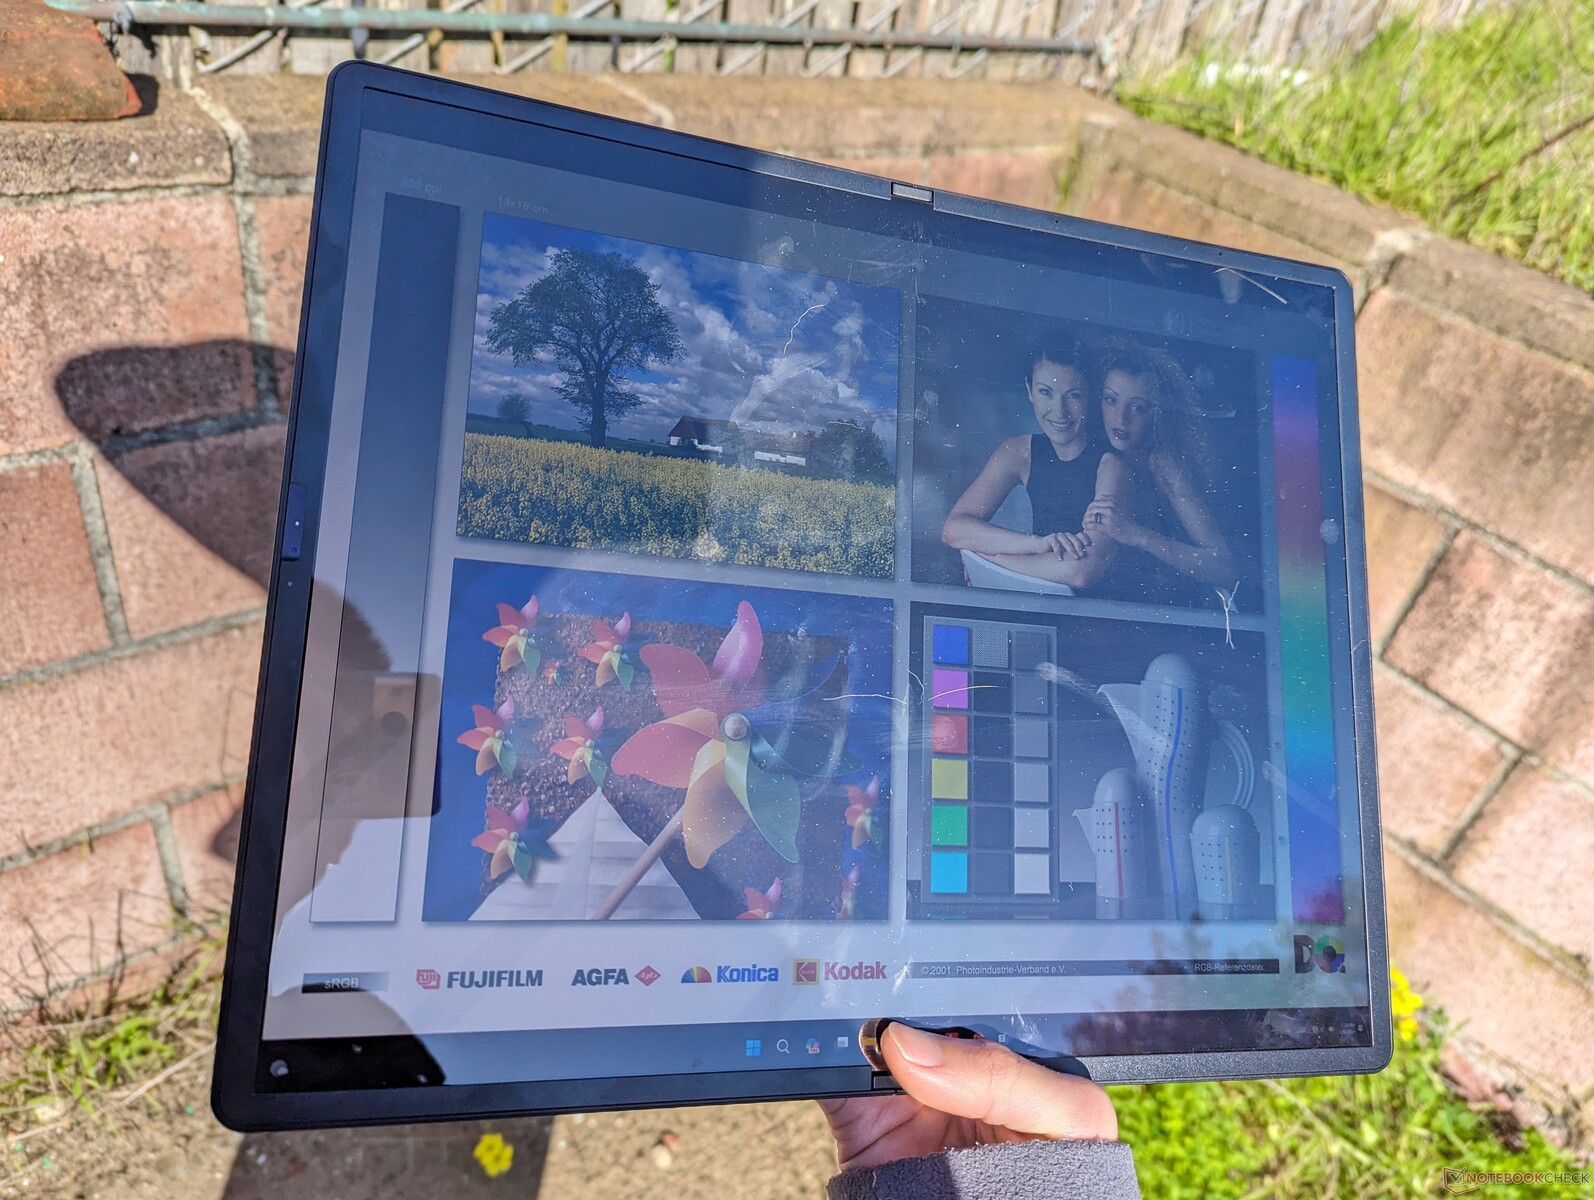
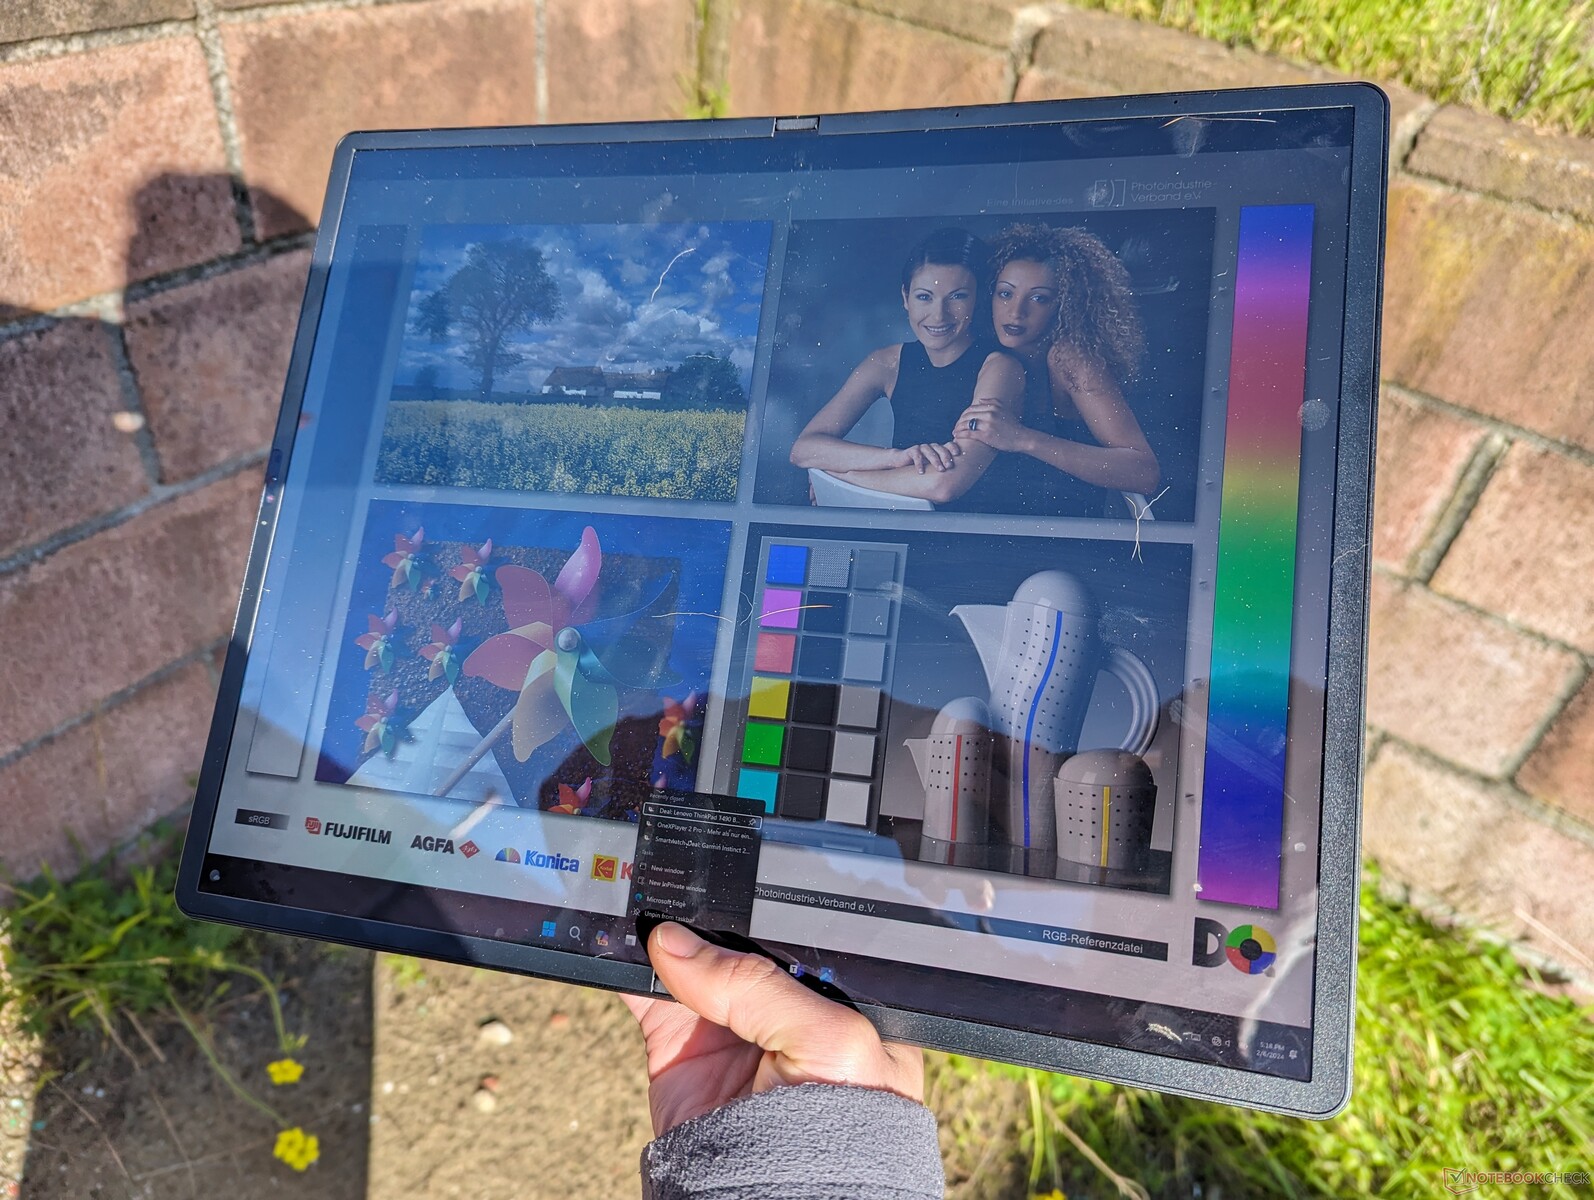
Im Schatten geht die Sichtbarkeit im Freien noch in Ordnung. Unter helleren Lichtbedingungen wird es auch aufgrund der starken Spiegelungen schwieriger. Mit 400 Nits ist das Display rund 30 Prozent dunkler als das eines iPad Pro 11. Spiegelungen sind eigentlich immer sichtbar.
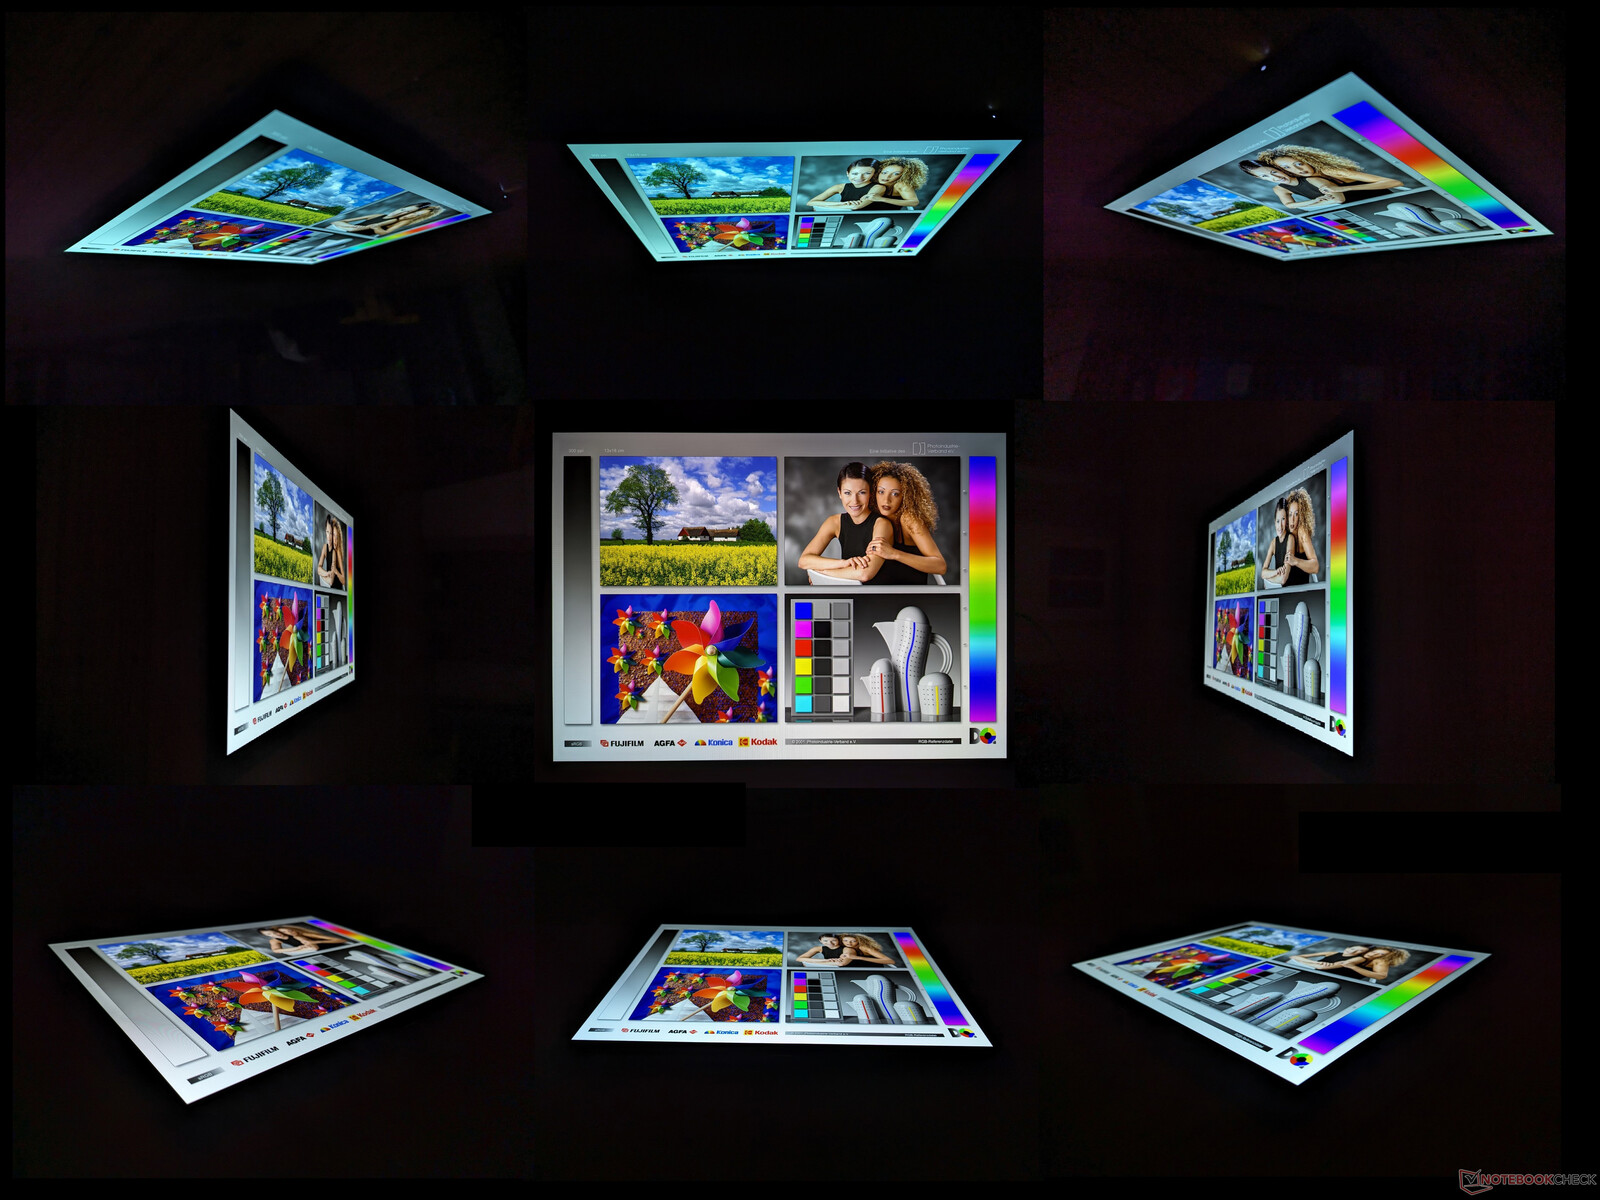
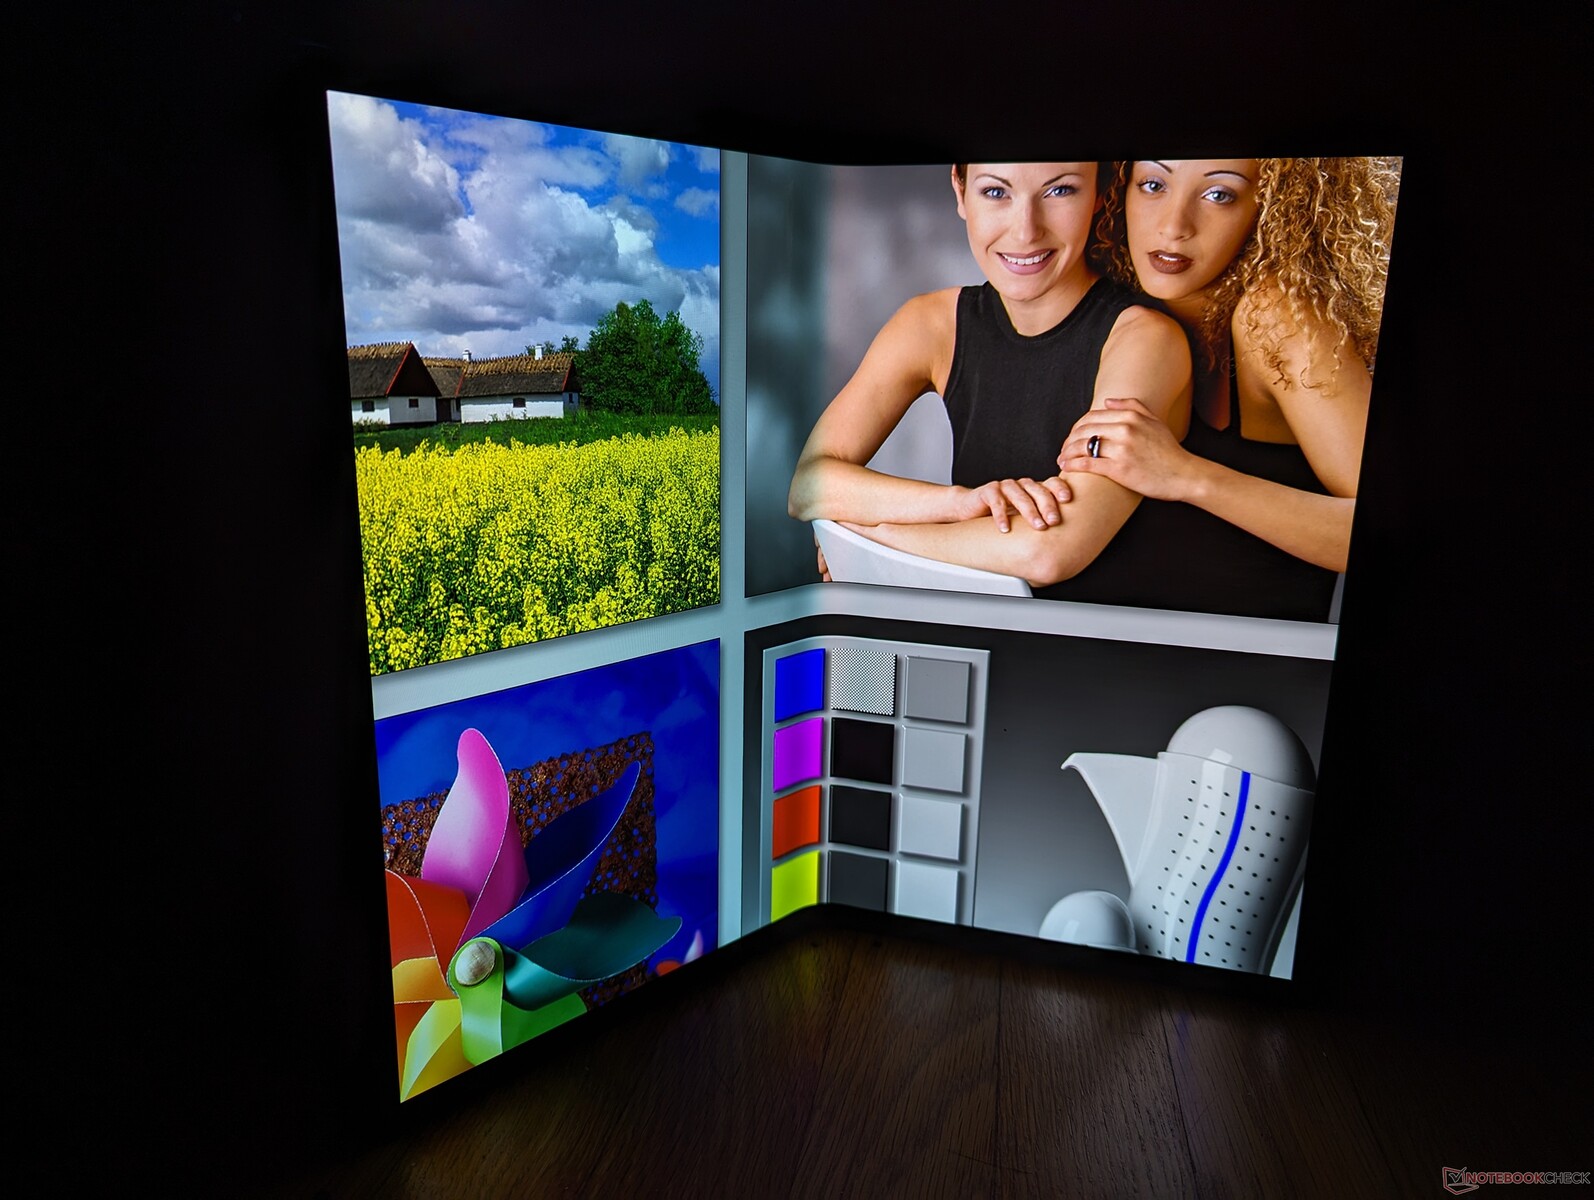
OLED-Blickwinkel sind eigentlich immer sehr weit, im ThinkPad X1 Fold geraten sie jedoch zur Herausforderung. Speziell der untere Teil des Displays leidet im Laptopmodus unter Helligkeits- und Farbverlusten, da der Blickwinkel des Nutzers darauf ungleich größer ist als zum Rest des Bildschirms. Die Unterschiede sind nicht so groß, dass Test nicht mehr lesbar wäre, aber wenn es auf Farbtreue beim Content ankommt, sollte dieser eher auf der oberen Hälfte angezeigt werden.
Leistung — Gut, aber nicht großartig
Testbedingungen
Wir haben Windows in den Leistungsmodus versetzt, um die besten Benchmarkergebnisse zu erzielen. Die Leistungsprofile in Lenovo Commercial Advantage sind mit den Windows-Profilen synchronisiert.

Prozessor
Einer der Hauptkritikpunkte am 13-Zoll-Modell war dessen ungewöhnlich lahmer 7-W-Core i5-L16G7-Prozessor. Glücklicherweise hat Lenovo auf die Beschwerden reagiert und stattet die 16-Zoll-Version nun mit einer 9-W-CPU der U-Serie aus. Dennoch hat der Core i7-1250U bereits zwei Generation vor sich und ist nicht besonders gut gealtert, nicht einmal im Vergleich zu Mittelklasse-CPUs wie dem Ryzen 5 7530U. Es ist schon deutlich schneller als der Core i5-L16G7, kommt aber nicht einmal in die Leistungsnähe eines typischen 15- oder 16-Zoll-Laptops. Auch dem Microsoft Surface Pro 9 hinkt es deutlich hinterher.
Auch der Ansatz der Passivkühlung beeinträchtigt die Leistung. Beim CineBench-R15-Loop fällt beispielsweise der Anfangsscore von 1.085 Punkten nach nur zwei bis drei Durchgängen auf 820 Punkten, was einem Leistungsverlust von 25 Prozent über die Zeit darstellt. Dies zeigt, dass das ThinkPad X1 Fold 16 besser für kurze Lasten als für längere, anspruchsvolle Arbeiten gemacht wurde, da Letztere dazu führen, dass die CPU schnell gedrosselt wird.
Cinebench R15 Multi Loop
Cinebench R23: Multi Core | Single Core
Cinebench R20: CPU (Multi Core) | CPU (Single Core)
Cinebench R15: CPU Multi 64Bit | CPU Single 64Bit
Blender: v2.79 BMW27 CPU
7-Zip 18.03: 7z b 4 | 7z b 4 -mmt1
Geekbench 6.7: Multi-Core | Single-Core
Geekbench 5.5: Multi-Core | Single-Core
HWBOT x265 Benchmark v2.2: 4k Preset
LibreOffice : 20 Documents To PDF
R Benchmark 2.5: Overall mean
| Geekbench 6.7 / Multi-Core | |
| Lenovo ThinkPad X1 Carbon G11 21HNS54T00 | |
| Asus ROG Flow X13 GV302XV | |
| LG Gram 2in1 16 16T90R - G.AA78G | |
| Lenovo Thinkpad X1 Fold 16 | |
| Durchschnittliche Intel Core i7-1250U (n=1) | |
| HP Envy x360 15-fh0077ng | |
| Geekbench 6.7 / Single-Core | |
| Lenovo ThinkPad X1 Carbon G11 21HNS54T00 | |
| Asus ROG Flow X13 GV302XV | |
| LG Gram 2in1 16 16T90R - G.AA78G | |
| Lenovo Thinkpad X1 Fold 16 | |
| Durchschnittliche Intel Core i7-1250U (n=1) | |
| HP Envy x360 15-fh0077ng | |
Cinebench R23: Multi Core | Single Core
Cinebench R20: CPU (Multi Core) | CPU (Single Core)
Cinebench R15: CPU Multi 64Bit | CPU Single 64Bit
Blender: v2.79 BMW27 CPU
7-Zip 18.03: 7z b 4 | 7z b 4 -mmt1
Geekbench 6.7: Multi-Core | Single-Core
Geekbench 5.5: Multi-Core | Single-Core
HWBOT x265 Benchmark v2.2: 4k Preset
LibreOffice : 20 Documents To PDF
R Benchmark 2.5: Overall mean
* ... kleinere Werte sind besser
AIDA64: FP32 Ray-Trace | FPU Julia | CPU SHA3 | CPU Queen | FPU SinJulia | FPU Mandel | CPU AES | CPU ZLib | FP64 Ray-Trace | CPU PhotoWorxx
| Performance Rating | |
| Lenovo ThinkPad X1 Fold 20RL000FGE | |
| Microsoft Surface Pro 9, i7-1255U | |
| Lenovo ThinkPad X1 Carbon G11 21HNS54T00 | |
| HP Elite Dragonfly Folio 13.5 G3 | |
| Asus Zenbook 17 Fold UX9702 | |
| Durchschnittliche Intel Core i7-1250U | |
| Lenovo Thinkpad X1 Fold 16 | |
| AIDA64 / FP32 Ray-Trace | |
| Microsoft Surface Pro 9, i7-1255U | |
| HP Elite Dragonfly Folio 13.5 G3 | |
| Durchschnittliche Intel Core i7-1250U (5093 - 7187, n=3) | |
| Asus Zenbook 17 Fold UX9702 | |
| Lenovo ThinkPad X1 Carbon G11 21HNS54T00 | |
| Lenovo Thinkpad X1 Fold 16 | |
| Lenovo ThinkPad X1 Fold 20RL000FGE | |
| AIDA64 / FPU Julia | |
| Microsoft Surface Pro 9, i7-1255U | |
| HP Elite Dragonfly Folio 13.5 G3 | |
| Lenovo ThinkPad X1 Fold 20RL000FGE | |
| Asus Zenbook 17 Fold UX9702 | |
| Durchschnittliche Intel Core i7-1250U (25253 - 35312, n=3) | |
| Lenovo ThinkPad X1 Carbon G11 21HNS54T00 | |
| Lenovo Thinkpad X1 Fold 16 | |
| AIDA64 / CPU SHA3 | |
| Lenovo ThinkPad X1 Fold 20RL000FGE | |
| Microsoft Surface Pro 9, i7-1255U | |
| Asus Zenbook 17 Fold UX9702 | |
| HP Elite Dragonfly Folio 13.5 G3 | |
| Durchschnittliche Intel Core i7-1250U (1296 - 1840, n=3) | |
| Lenovo ThinkPad X1 Carbon G11 21HNS54T00 | |
| Lenovo Thinkpad X1 Fold 16 | |
| AIDA64 / CPU Queen | |
| Lenovo ThinkPad X1 Carbon G11 21HNS54T00 | |
| Lenovo ThinkPad X1 Fold 20RL000FGE | |
| Microsoft Surface Pro 9, i7-1255U | |
| HP Elite Dragonfly Folio 13.5 G3 | |
| Lenovo Thinkpad X1 Fold 16 | |
| Durchschnittliche Intel Core i7-1250U (53235 - 53961, n=3) | |
| Asus Zenbook 17 Fold UX9702 | |
| AIDA64 / FPU SinJulia | |
| Lenovo ThinkPad X1 Carbon G11 21HNS54T00 | |
| Lenovo ThinkPad X1 Fold 20RL000FGE | |
| Microsoft Surface Pro 9, i7-1255U | |
| HP Elite Dragonfly Folio 13.5 G3 | |
| Durchschnittliche Intel Core i7-1250U (3617 - 4347, n=3) | |
| Asus Zenbook 17 Fold UX9702 | |
| Lenovo Thinkpad X1 Fold 16 | |
| AIDA64 / FPU Mandel | |
| Lenovo ThinkPad X1 Carbon G11 21HNS54T00 | |
| Microsoft Surface Pro 9, i7-1255U | |
| HP Elite Dragonfly Folio 13.5 G3 | |
| Asus Zenbook 17 Fold UX9702 | |
| Durchschnittliche Intel Core i7-1250U (12480 - 17594, n=3) | |
| Lenovo ThinkPad X1 Fold 20RL000FGE | |
| Lenovo Thinkpad X1 Fold 16 | |
| AIDA64 / CPU AES | |
| Lenovo ThinkPad X1 Fold 20RL000FGE | |
| Microsoft Surface Pro 9, i7-1255U | |
| HP Elite Dragonfly Folio 13.5 G3 | |
| Asus Zenbook 17 Fold UX9702 | |
| Lenovo ThinkPad X1 Carbon G11 21HNS54T00 | |
| Durchschnittliche Intel Core i7-1250U (26729 - 36135, n=3) | |
| Lenovo Thinkpad X1 Fold 16 | |
| AIDA64 / CPU ZLib | |
| Lenovo ThinkPad X1 Fold 20RL000FGE | |
| Microsoft Surface Pro 9, i7-1255U | |
| HP Elite Dragonfly Folio 13.5 G3 | |
| Asus Zenbook 17 Fold UX9702 | |
| Durchschnittliche Intel Core i7-1250U (391 - 550, n=3) | |
| Lenovo ThinkPad X1 Carbon G11 21HNS54T00 | |
| Lenovo Thinkpad X1 Fold 16 | |
| AIDA64 / FP64 Ray-Trace | |
| Microsoft Surface Pro 9, i7-1255U | |
| HP Elite Dragonfly Folio 13.5 G3 | |
| Durchschnittliche Intel Core i7-1250U (2687 - 3755, n=3) | |
| Lenovo ThinkPad X1 Carbon G11 21HNS54T00 | |
| Asus Zenbook 17 Fold UX9702 | |
| Lenovo ThinkPad X1 Fold 20RL000FGE | |
| Lenovo Thinkpad X1 Fold 16 | |
| AIDA64 / CPU PhotoWorxx | |
| Lenovo ThinkPad X1 Fold 20RL000FGE | |
| Microsoft Surface Pro 9, i7-1255U | |
| HP Elite Dragonfly Folio 13.5 G3 | |
| Asus Zenbook 17 Fold UX9702 | |
| Durchschnittliche Intel Core i7-1250U (31653 - 36020, n=3) | |
| Lenovo ThinkPad X1 Carbon G11 21HNS54T00 | |
| Lenovo Thinkpad X1 Fold 16 | |
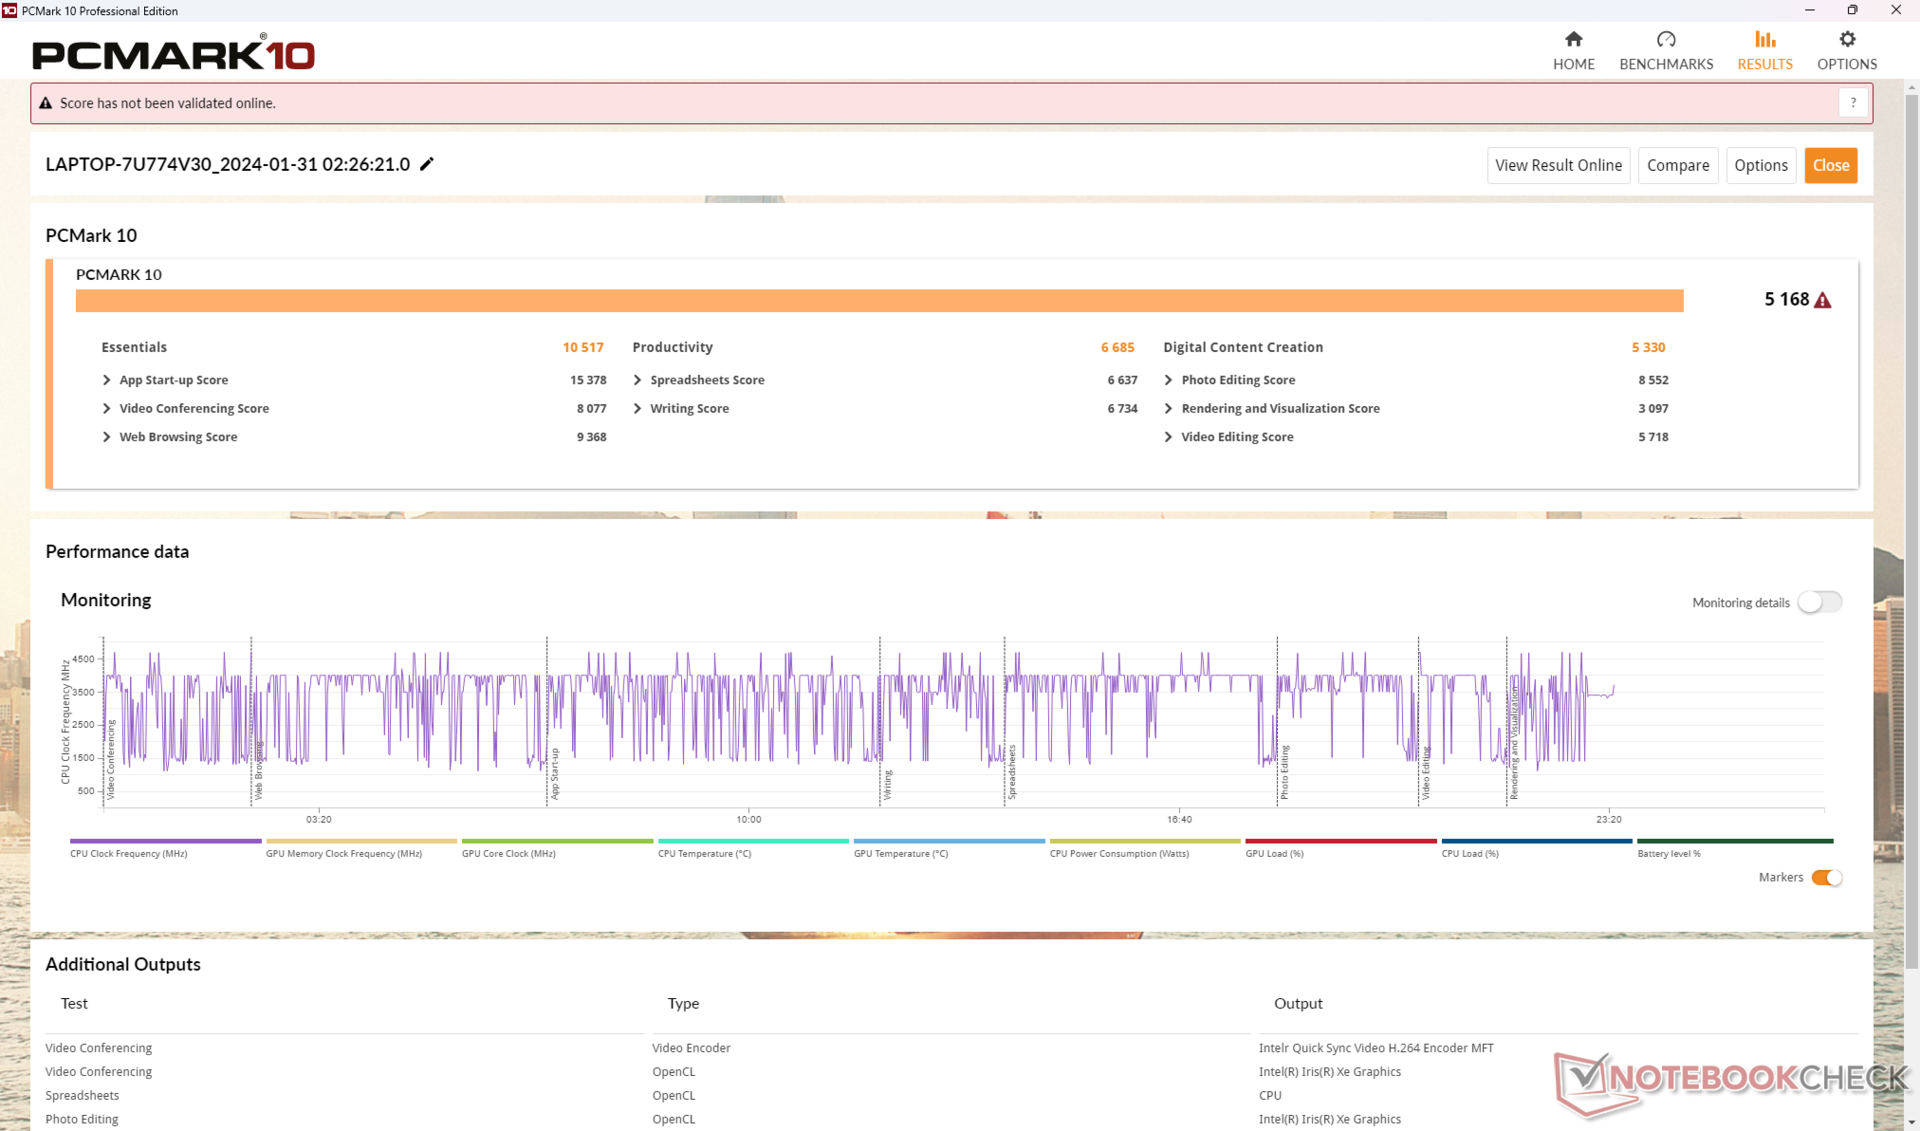
Systemleistung
Die PCMark-Ergebnisse fallen gegenüber dem 13-Zoll-Vorgänge ganze 2,5x höher aus, die Leistung hat sich also stark erhöht. Der Unterschied ist groß genug, um Nutzern beim simplen Navigieren unter Windows sowie dem Starten von Apps oder dem Wechseln von Browsertabs aufzufallen. Allgemein liegt die Nutzererfahrung nun deutlich näher an einem klassischen Laptop und ist nun deutlich flüssiger als noch beim alten 13-Zoll-Modell.
CrossMark: Overall | Productivity | Creativity | Responsiveness
WebXPRT 3: Overall
WebXPRT 4: Overall
Mozilla Kraken 1.1: Total
| PCMark 10 / Score | |
| HP Elite Dragonfly Folio 13.5 G3 | |
| Lenovo ThinkPad X1 Carbon G11 21HNS54T00 | |
| Microsoft Surface Pro 9, i7-1255U | |
| Durchschnittliche Intel Core i7-1250U, Intel Iris Xe Graphics G7 96EUs (5168 - 5207, n=2) | |
| Lenovo Thinkpad X1 Fold 16 | |
| Asus Zenbook 17 Fold UX9702 | |
| Lenovo ThinkPad X1 Fold 20RL000FGE | |
| PCMark 10 / Essentials | |
| HP Elite Dragonfly Folio 13.5 G3 | |
| Lenovo ThinkPad X1 Carbon G11 21HNS54T00 | |
| Durchschnittliche Intel Core i7-1250U, Intel Iris Xe Graphics G7 96EUs (10517 - 10742, n=2) | |
| Lenovo Thinkpad X1 Fold 16 | |
| Asus Zenbook 17 Fold UX9702 | |
| Microsoft Surface Pro 9, i7-1255U | |
| Lenovo ThinkPad X1 Fold 20RL000FGE | |
| PCMark 10 / Productivity | |
| Lenovo ThinkPad X1 Carbon G11 21HNS54T00 | |
| HP Elite Dragonfly Folio 13.5 G3 | |
| Durchschnittliche Intel Core i7-1250U, Intel Iris Xe Graphics G7 96EUs (6685 - 7062, n=2) | |
| Asus Zenbook 17 Fold UX9702 | |
| Lenovo Thinkpad X1 Fold 16 | |
| Microsoft Surface Pro 9, i7-1255U | |
| Lenovo ThinkPad X1 Fold 20RL000FGE | |
| PCMark 10 / Digital Content Creation | |
| HP Elite Dragonfly Folio 13.5 G3 | |
| Microsoft Surface Pro 9, i7-1255U | |
| Lenovo ThinkPad X1 Carbon G11 21HNS54T00 | |
| Lenovo Thinkpad X1 Fold 16 | |
| Durchschnittliche Intel Core i7-1250U, Intel Iris Xe Graphics G7 96EUs (5052 - 5330, n=2) | |
| Asus Zenbook 17 Fold UX9702 | |
| Lenovo ThinkPad X1 Fold 20RL000FGE | |
| CrossMark / Overall | |
| Lenovo ThinkPad X1 Carbon G11 21HNS54T00 | |
| HP Elite Dragonfly Folio 13.5 G3 | |
| Microsoft Surface Pro 9, i7-1255U | |
| Asus Zenbook 17 Fold UX9702 | |
| Lenovo Thinkpad X1 Fold 16 | |
| Durchschnittliche Intel Core i7-1250U, Intel Iris Xe Graphics G7 96EUs (1338 - 1361, n=2) | |
| CrossMark / Productivity | |
| Lenovo ThinkPad X1 Carbon G11 21HNS54T00 | |
| HP Elite Dragonfly Folio 13.5 G3 | |
| Microsoft Surface Pro 9, i7-1255U | |
| Asus Zenbook 17 Fold UX9702 | |
| Lenovo Thinkpad X1 Fold 16 | |
| Durchschnittliche Intel Core i7-1250U, Intel Iris Xe Graphics G7 96EUs (1333 - 1345, n=2) | |
| CrossMark / Creativity | |
| Lenovo ThinkPad X1 Carbon G11 21HNS54T00 | |
| HP Elite Dragonfly Folio 13.5 G3 | |
| Microsoft Surface Pro 9, i7-1255U | |
| Asus Zenbook 17 Fold UX9702 | |
| Lenovo Thinkpad X1 Fold 16 | |
| Durchschnittliche Intel Core i7-1250U, Intel Iris Xe Graphics G7 96EUs (1400 - 1461, n=2) | |
| CrossMark / Responsiveness | |
| HP Elite Dragonfly Folio 13.5 G3 | |
| Lenovo ThinkPad X1 Carbon G11 21HNS54T00 | |
| Microsoft Surface Pro 9, i7-1255U | |
| Asus Zenbook 17 Fold UX9702 | |
| Durchschnittliche Intel Core i7-1250U, Intel Iris Xe Graphics G7 96EUs (1140 - 1180, n=2) | |
| Lenovo Thinkpad X1 Fold 16 | |
| WebXPRT 3 / Overall | |
| Lenovo ThinkPad X1 Carbon G11 21HNS54T00 | |
| Lenovo ThinkPad X1 Carbon G11 21HNS54T00 | |
| HP Elite Dragonfly Folio 13.5 G3 | |
| Asus Zenbook 17 Fold UX9702 | |
| Durchschnittliche Intel Core i7-1250U, Intel Iris Xe Graphics G7 96EUs (265 - 267, n=2) | |
| Microsoft Surface Pro 9, i7-1255U | |
| Lenovo Thinkpad X1 Fold 16 | |
| Lenovo ThinkPad X1 Fold 20RL000FGE | |
| WebXPRT 4 / Overall | |
| HP Elite Dragonfly Folio 13.5 G3 | |
| Asus Zenbook 17 Fold UX9702 | |
| Durchschnittliche Intel Core i7-1250U, Intel Iris Xe Graphics G7 96EUs (228 - 229, n=2) | |
| Microsoft Surface Pro 9, i7-1255U | |
| Lenovo Thinkpad X1 Fold 16 | |
| Mozilla Kraken 1.1 / Total | |
| Lenovo ThinkPad X1 Fold 20RL000FGE | |
| Durchschnittliche Intel Core i7-1250U, Intel Iris Xe Graphics G7 96EUs (577 - 587, n=2) | |
| Lenovo Thinkpad X1 Fold 16 | |
| Microsoft Surface Pro 9, i7-1255U | |
| Asus Zenbook 17 Fold UX9702 | |
| HP Elite Dragonfly Folio 13.5 G3 | |
| Lenovo ThinkPad X1 Carbon G11 21HNS54T00 | |
| Lenovo ThinkPad X1 Carbon G11 21HNS54T00 | |
* ... kleinere Werte sind besser
| PCMark 10 Score | 5168 Punkte | |
Hilfe | ||
| AIDA64 / Memory Copy | |
| Lenovo ThinkPad X1 Carbon G11 21HNS54T00 | |
| Microsoft Surface Pro 9, i7-1255U | |
| HP Elite Dragonfly Folio 13.5 G3 | |
| Asus Zenbook 17 Fold UX9702 | |
| Durchschnittliche Intel Core i7-1250U (54484 - 61468, n=3) | |
| Lenovo Thinkpad X1 Fold 16 | |
| AIDA64 / Memory Read | |
| HP Elite Dragonfly Folio 13.5 G3 | |
| Lenovo ThinkPad X1 Fold 20RL000FGE | |
| Lenovo ThinkPad X1 Carbon G11 21HNS54T00 | |
| Microsoft Surface Pro 9, i7-1255U | |
| Durchschnittliche Intel Core i7-1250U (50867 - 56328, n=3) | |
| Lenovo Thinkpad X1 Fold 16 | |
| Asus Zenbook 17 Fold UX9702 | |
| AIDA64 / Memory Write | |
| Lenovo ThinkPad X1 Fold 20RL000FGE | |
| Lenovo ThinkPad X1 Carbon G11 21HNS54T00 | |
| HP Elite Dragonfly Folio 13.5 G3 | |
| Microsoft Surface Pro 9, i7-1255U | |
| Durchschnittliche Intel Core i7-1250U (59356 - 65429, n=3) | |
| Asus Zenbook 17 Fold UX9702 | |
| Lenovo Thinkpad X1 Fold 16 | |
| AIDA64 / Memory Latency | |
| Asus Zenbook 17 Fold UX9702 | |
| Durchschnittliche Intel Core i7-1250U (89.3 - 145.7, n=3) | |
| HP Elite Dragonfly Folio 13.5 G3 | |
| Microsoft Surface Pro 9, i7-1255U | |
| Lenovo ThinkPad X1 Carbon G11 21HNS54T00 | |
| Lenovo Thinkpad X1 Fold 16 | |
| Lenovo ThinkPad X1 Fold 20RL000FGE | |
* ... kleinere Werte sind besser
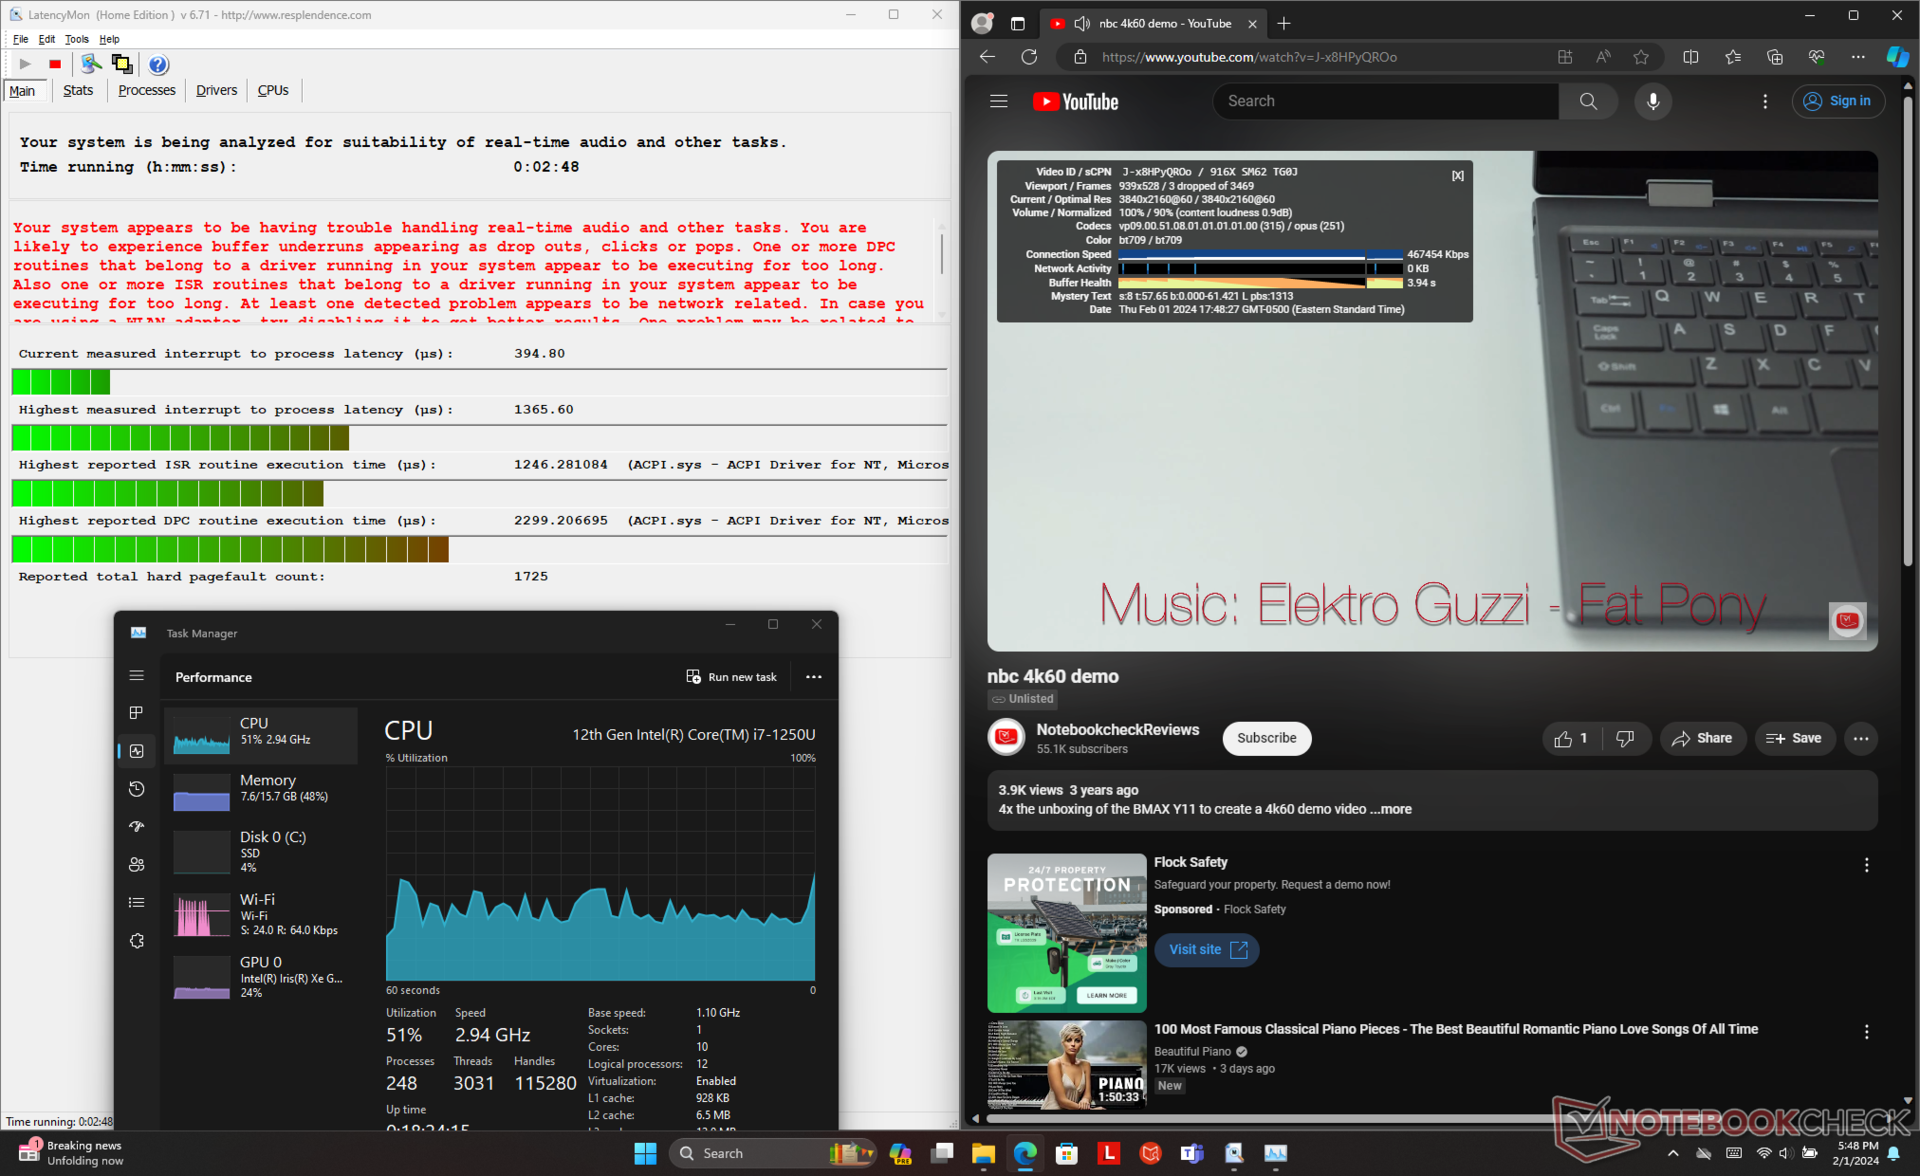
DPC Latency
LatencyMon enthüllt sowohl DPC-Probleme als auch 3 ausgelassene Bilder bei der Wiedergabe unseres 4K/60-FPS-YouTubevideos. Ersteres ist nicht ungewöhnlich, aber wir erwarten 0 ausgelassene Frames von einem System, auf dem eine Core-i7-U-CPU rechnet.

| DPC Latencies / LatencyMon - interrupt to process latency (max), Web, Youtube, Prime95 | |
| HP Elite Dragonfly Folio 13.5 G3 | |
| Lenovo ThinkPad X1 Fold 20RL000FGE | |
| Microsoft Surface Pro 9, i7-1255U | |
| Lenovo Thinkpad X1 Fold 16 | |
| Lenovo ThinkPad X1 Carbon G11 21HNS54T00 | |
| Asus Zenbook 17 Fold UX9702 | |
* ... kleinere Werte sind besser
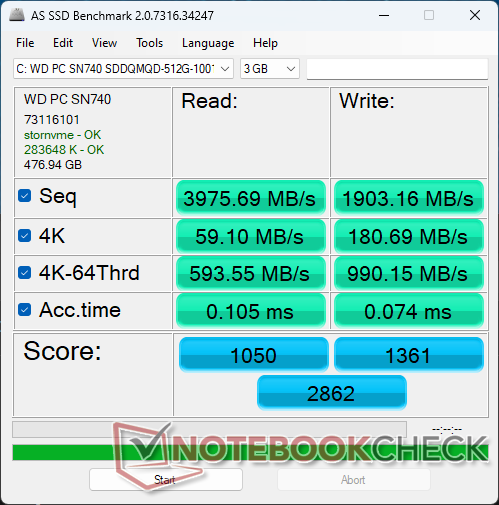
Massenspeicher
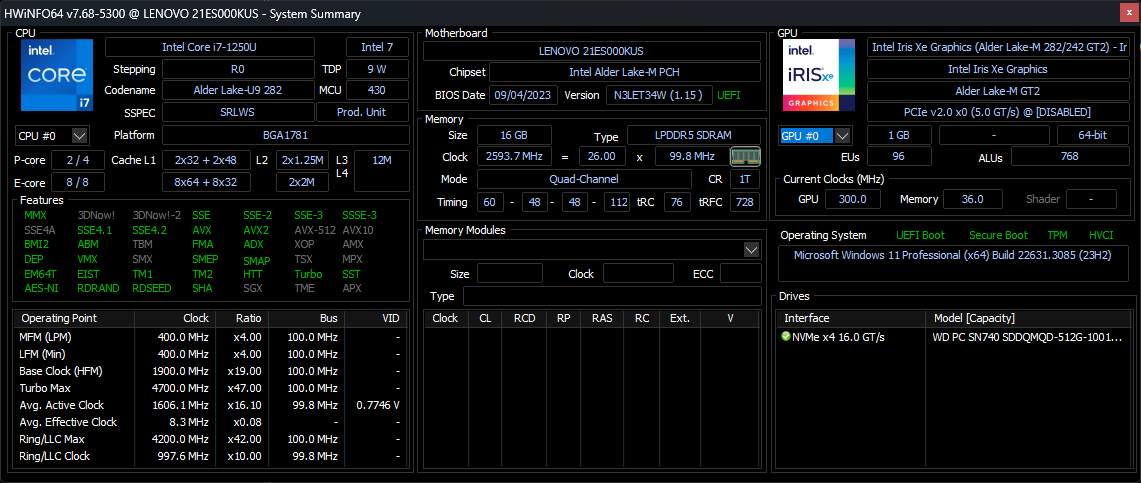
Unsere Testeinheit ist mit der 512 GB großen (oder kleinen) PCIe4-x4-NVMe-SSD Western Digital SN740 SDDQMQD bestückt, welche sequentielle Lese- und Schreibraten von annähernd 5.000 MB/s und 3.200 MB/s liefert. Das kleine M.2-2242-Laufwerk zeigt auch im minutenlangen Stress mittels DiskSpd keinerlei Drosselprobleme.


* ... kleinere Werte sind besser
Disk Throttling: DiskSpd Read Loop, Queue Depth 8
Grafikleistung
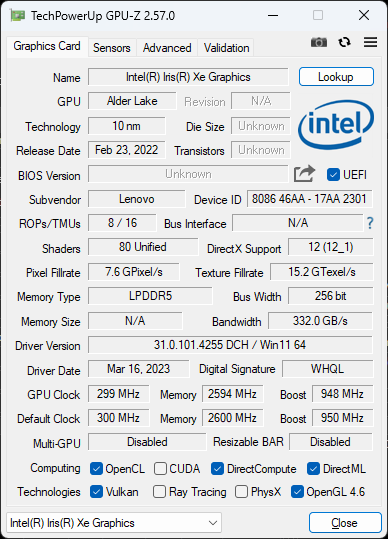
Auch die Grafikleistung ist zwei- bis dreimal höher als die UHD-Graphics-Lösung im 13-Zoll-ThinkPad-Fold. Allerdings kommt sie nicht auf das Niveau von anderen Laptops mit der gleichen integrierten Iris Xe 96 EUs, welche einen durchschnittlichen Vorsprung von 15 bis 20 Prozent haben. Das Defizit dürfte ebenfalls dem lüfterlosen Design und der generell schwächeren CPU-Leistung zuzuschreiben sein.
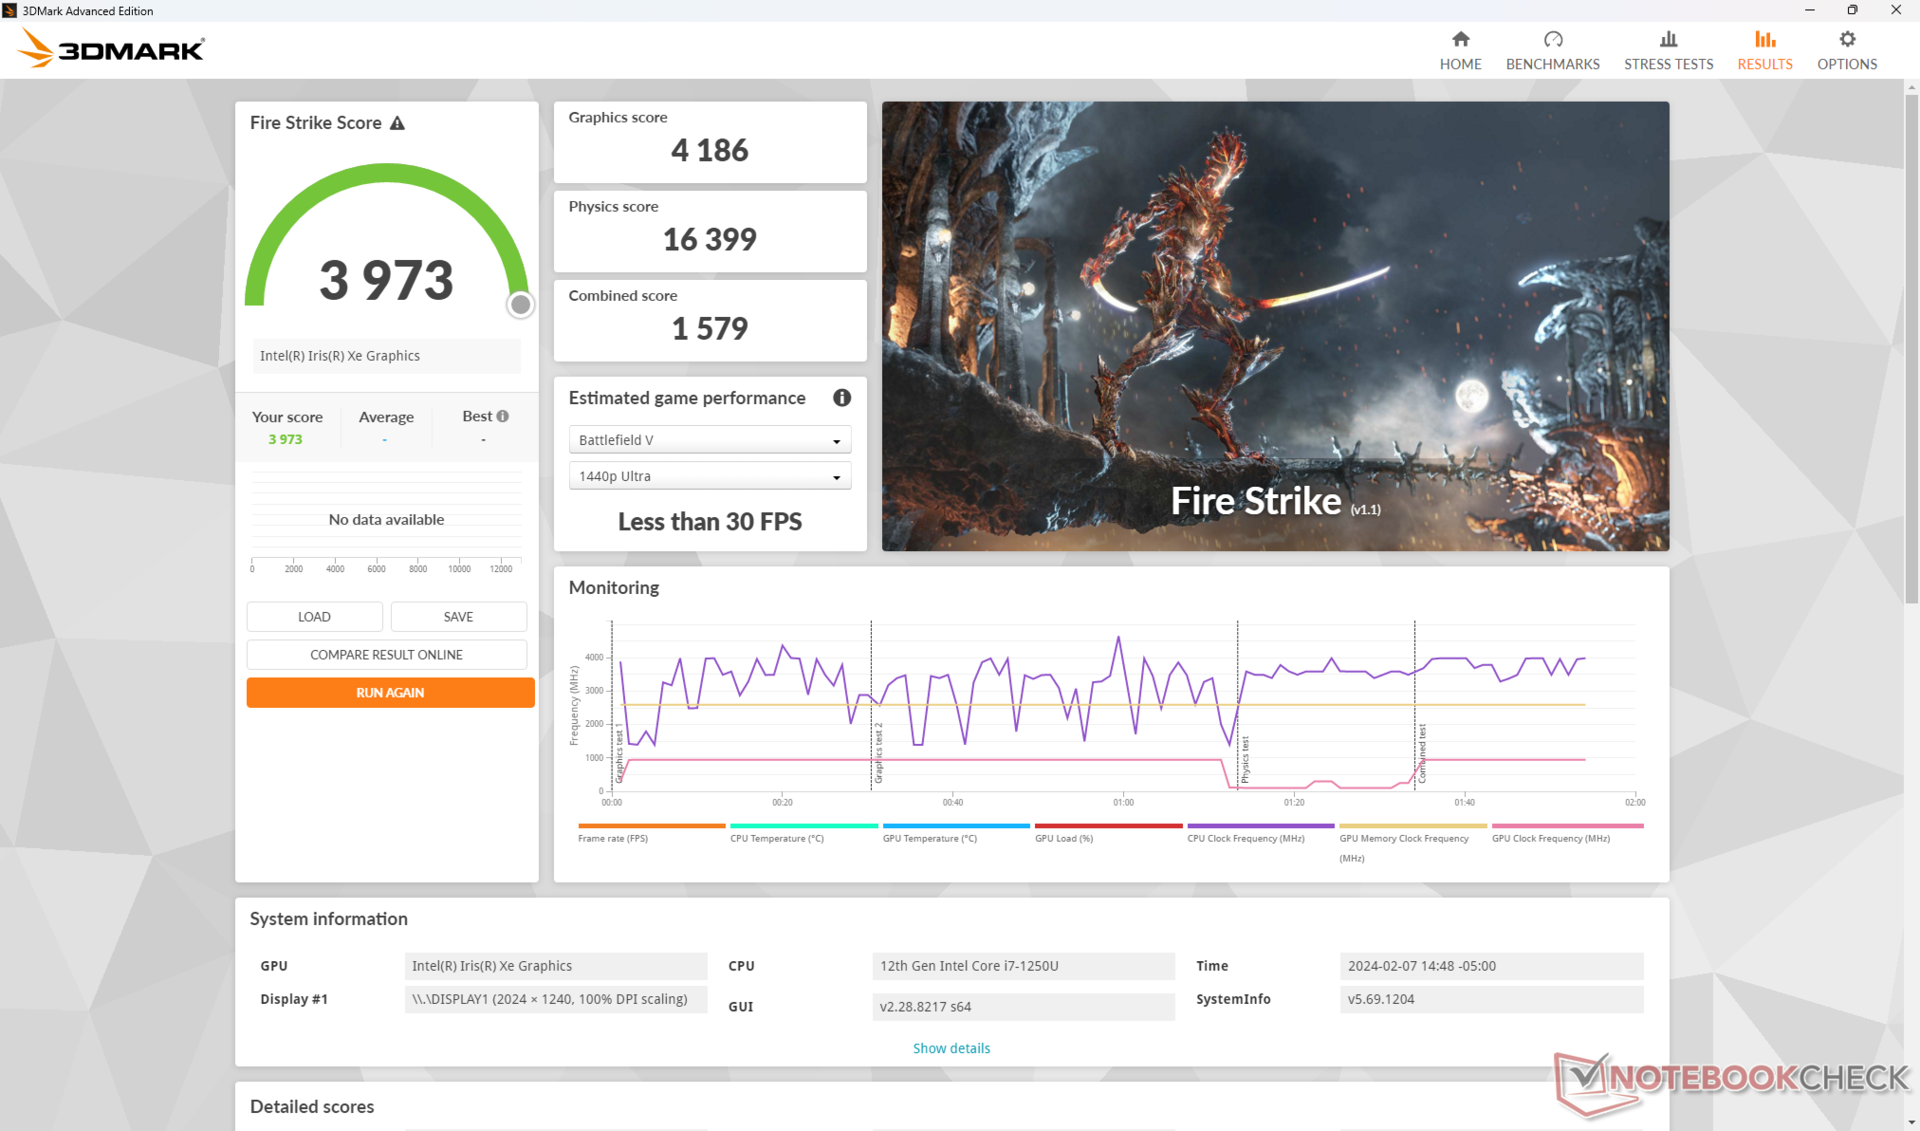
Die allgemeine Leistung verändert sich nicht signifikant, wenn man das System im Ausbalancierten- oder selbst dem Akkumodus laufen lässt, wie die Tabelle zum Fire Strike unten zeigt.
| Leistungsprofil | Graphics Score | Physics Score | Combined Score |
| Modus Leistung | 4186 | 16399 | 1579 |
| Modus Ausbalanciert | 4195 | 16489 | 1582 |
| Modus Akku | 4139 | 16246 | 1572 |
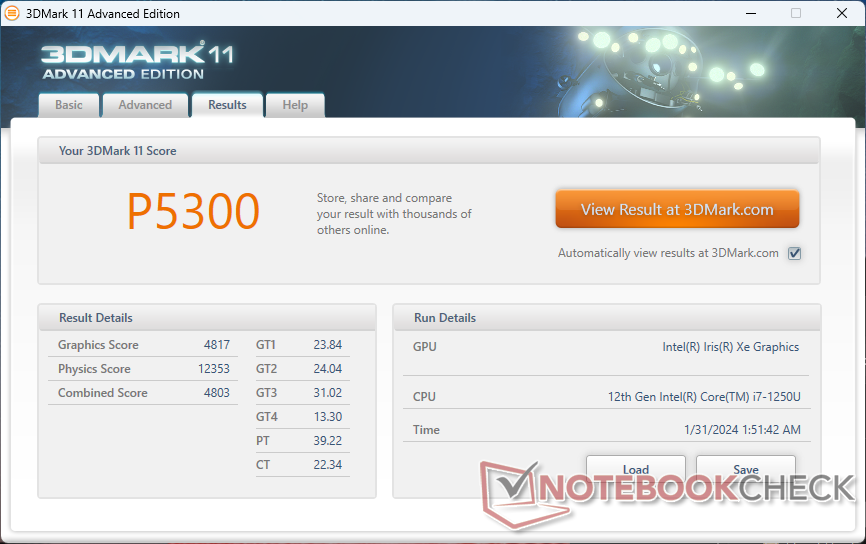
| 3DMark 11 Performance | 5300 Punkte | |
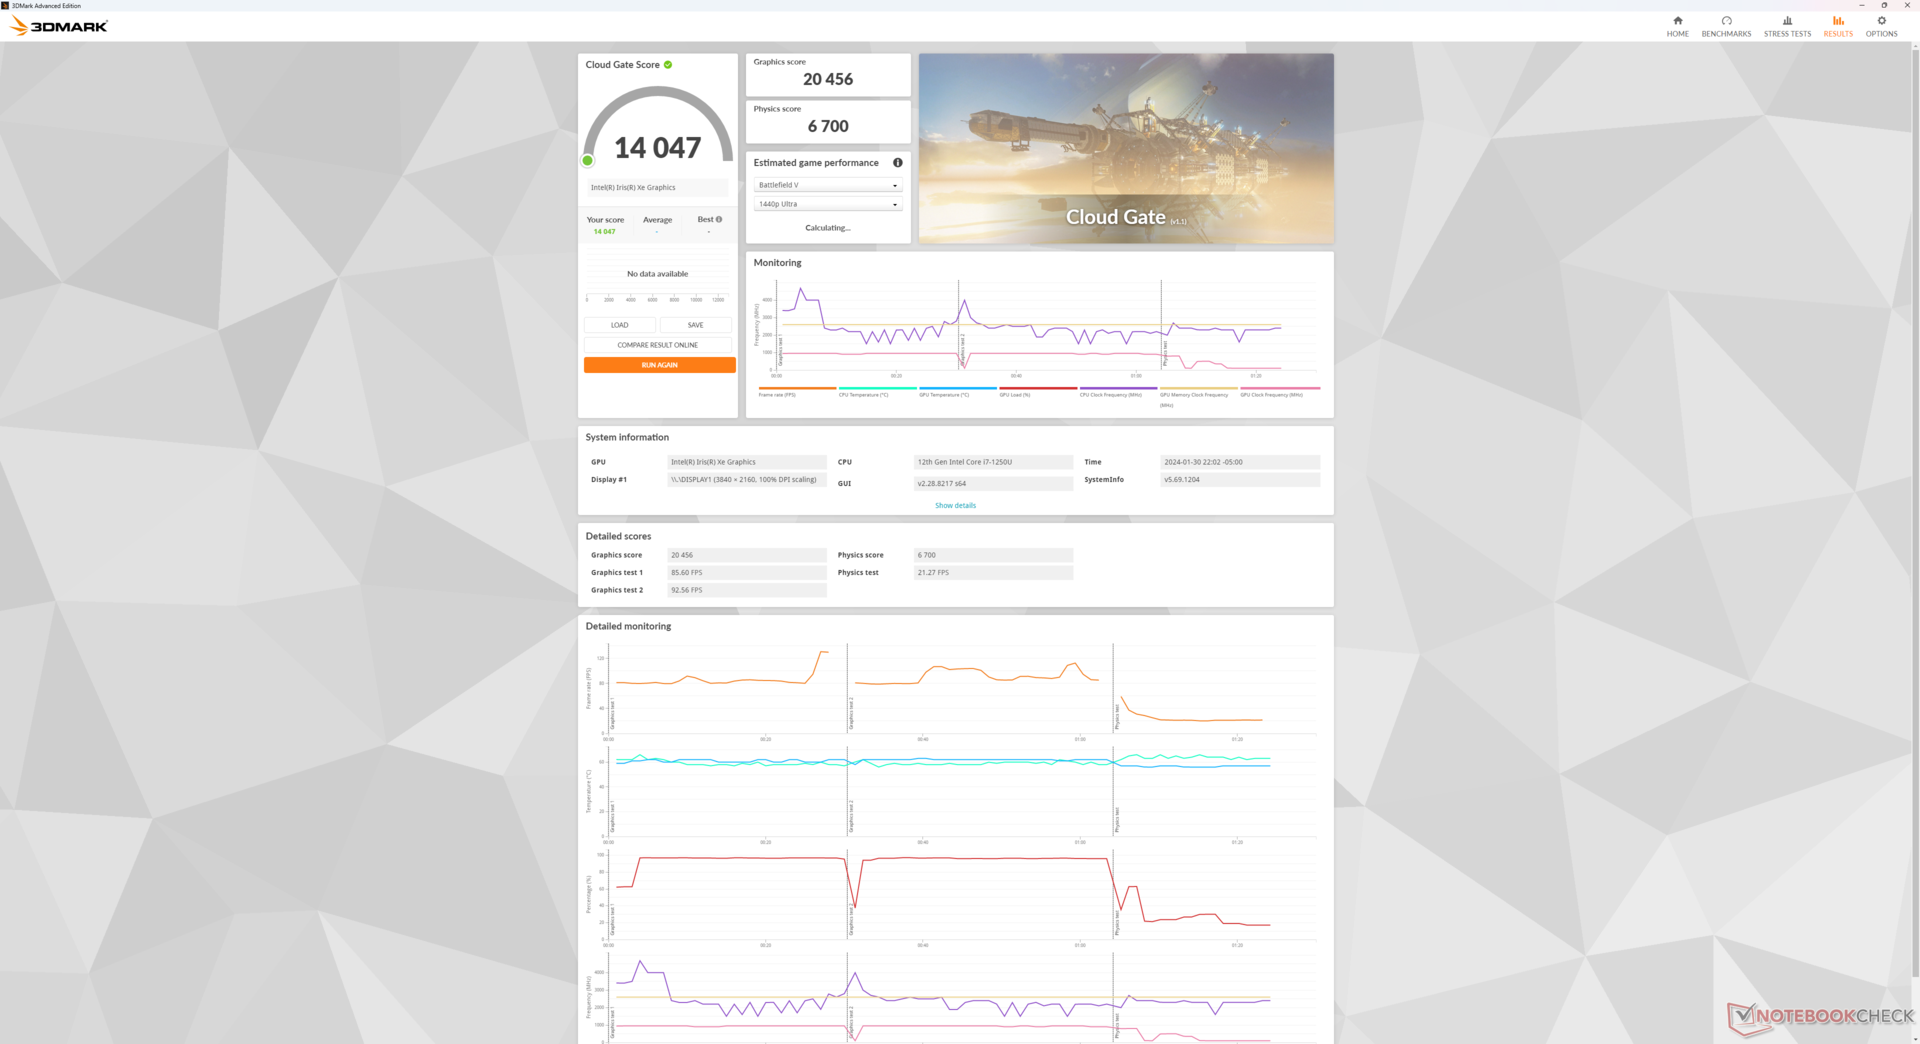
| 3DMark Cloud Gate Standard Score | 14047 Punkte | |
| 3DMark Fire Strike Score | 3973 Punkte | |
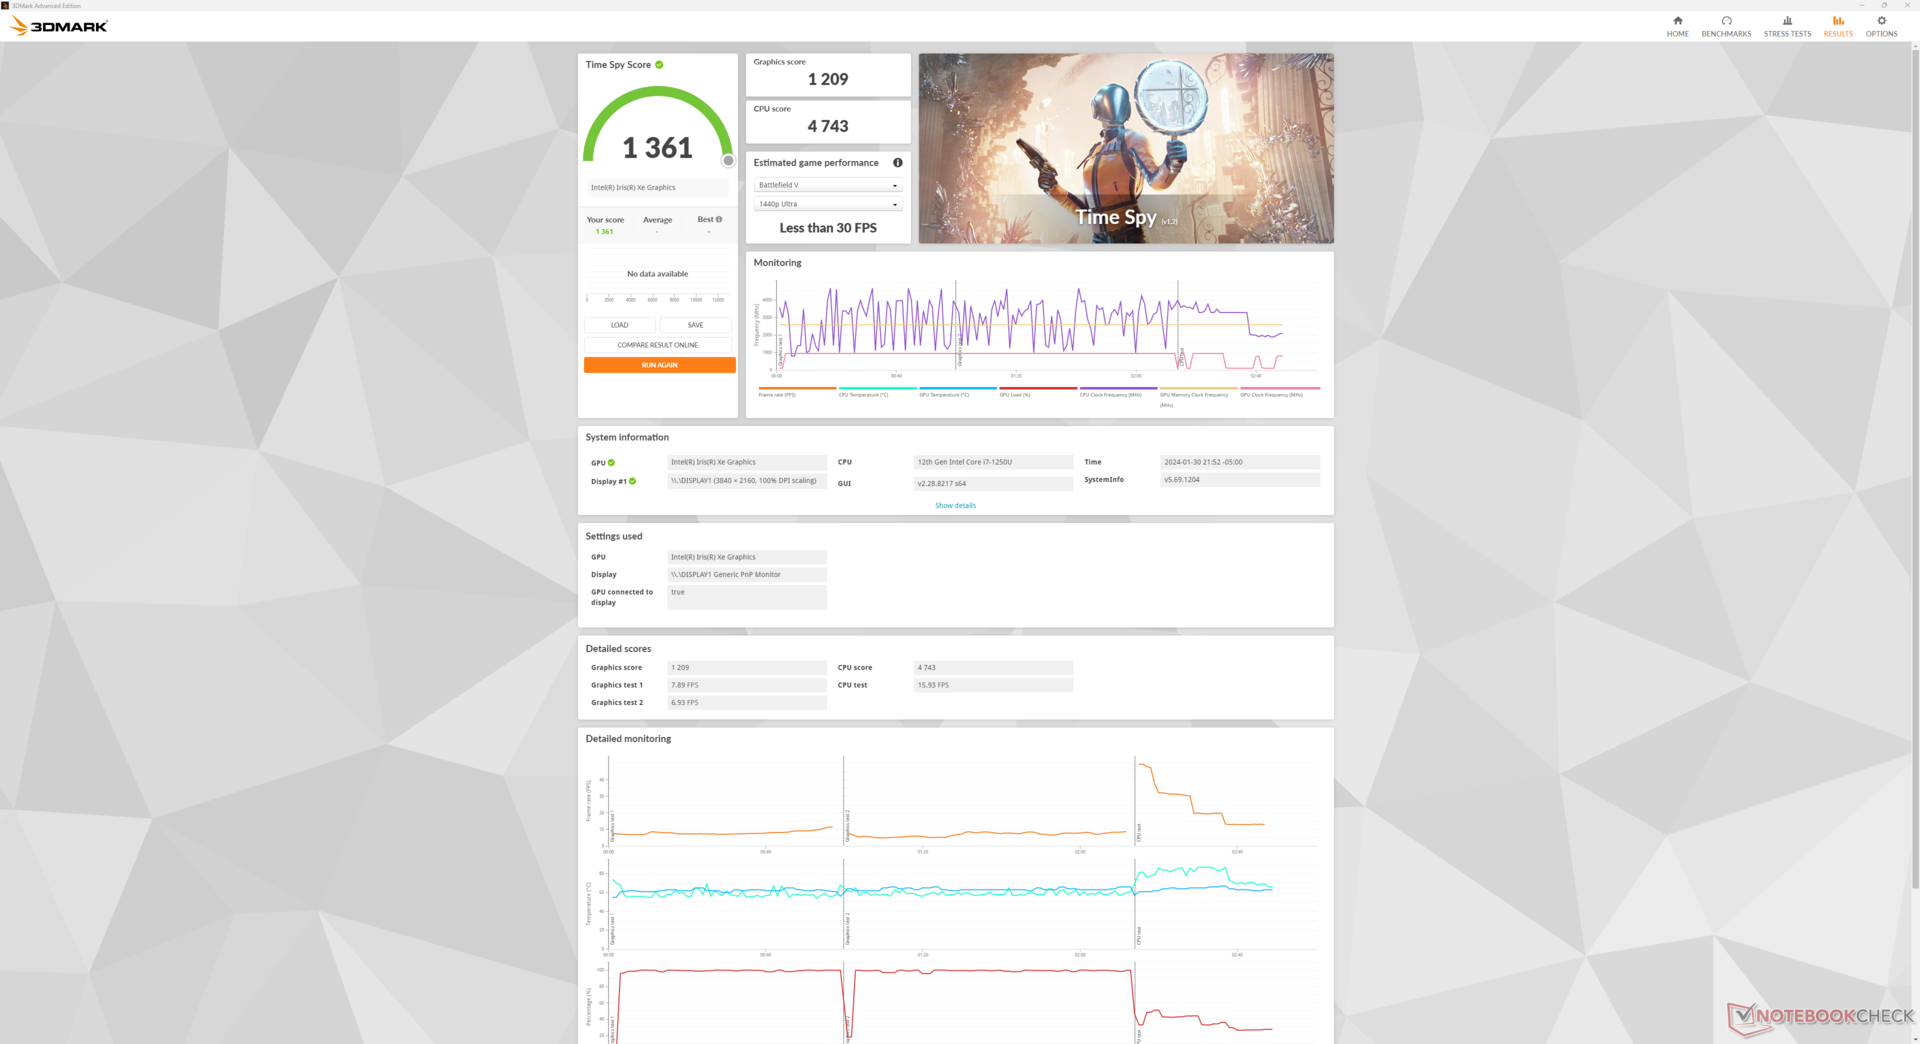
| 3DMark Time Spy Score | 1361 Punkte | |
Hilfe | ||
* ... kleinere Werte sind besser
| Cyberpunk 2077 - 1280x720 Low Preset (FSR off) | |
| LG Gram 2in1 16 16T90R - G.AA78G | |
| Durchschnittliche Intel Iris Xe Graphics G7 96EUs (21.4 - 37.3, n=17) | |
| Lenovo Thinkpad X1 Fold 16 | |
Lassen wir Witcher 3 in niedrigen Einstellungen laufen, so startet das Spiel bei stabilen 75 FPS. Die Werte fallen jedoch nach einigen Minuten, ab da an pendeln die Bildraten zwischen 50 und 70 FPS. Diese Instabilität resultiert aus den fluktuierenden GPU-Taktraten, worauf wir im Stresstest weiter unten noch genauer eingehen. Die meisten Laptops mit integrierter Iris Xe Graphics kommen über die Zeit auf stabilere Bildraten. Das instabile Leistungsverhalten zeigt, dass das ThinkPad X1 Fold 16 nicht geeignet ist, um die meisten Games nativ wiederzugeben.
Witcher 3 FPS Chart
| min. | mittel | hoch | max. | |
|---|---|---|---|---|
| GTA V (2015) | 71.4 | 66.4 | 19.2 | 8.01 |
| The Witcher 3 (2015) | 75.3 | 47.7 | 25.8 | 11.6 |
| Dota 2 Reborn (2015) | 89.8 | 69 | 55.3 | 41.3 |
| Final Fantasy XV Benchmark (2018) | 33.2 | 18.5 | 15.7 | |
| X-Plane 11.11 (2018) | 40.7 | 32 | 28.8 | |
| Far Cry 5 (2018) | 27 | 18 | 16 | 15 |
| Strange Brigade (2018) | 70.2 | 31.5 | 24.1 | 19 |
| F1 22 (2022) | 34.8 | 28 | 22 | 16.1 |
| Cyberpunk 2077 (2023) | 13.1 |
Emissionen — Keine Lüfter!
Systemlautstärke
Ein definierendes Merkmal des ThinkPad X1 Fold 16 ist sein lüfterloses Design, verglichen mit dem aktiv gekühlten Zenbook 17 Fold, dem Surface Pro 9 oder auch dem Original mit 13-Zoll. Wir hören auch keinerlei elektronische Störgeräusche, sodass unsere Testeinheit wirklich stets komplett still bleibt. Vor allem unter anspruchsvolleren Lasten kommt dies gut zur Geltung, da hier die Lüfter der zuvor erwähnten Alternativen von Asus oder Microsoft Lautstärken von teils über 40 dB(A) verursachen.
| Lenovo Thinkpad X1 Fold 16 Iris Xe G7 96EUs, i7-1250U, WD PC SN740 512GB SDDQMQD-512G | Lenovo ThinkPad X1 Fold 20RL000FGE UHD Graphics G7 (Lakefield GT2 64 EU), i5-L16G7, Toshiba KBG40ZNS256G NVMe | Asus Zenbook 17 Fold UX9702 Iris Xe G7 80EUs, i7-1250U, Samsung PM9A1 MZVL21T0HCLR | Microsoft Surface Pro 9, i7-1255U Iris Xe G7 96EUs, i7-1255U, Samsung MZ9L4512HBLU-00BMV | HP Elite Dragonfly Folio 13.5 G3 Iris Xe G7 96EUs, i7-1265U, Samsung PM9A1 MZVL2512HCJQ | Lenovo ThinkPad X1 Carbon G11 21HNS54T00 Iris Xe G7 96EUs, i7-1370P, WDC PC SN810 2TB | |
|---|---|---|---|---|---|---|
| Geräuschentwicklung | ||||||
| aus / Umgebung * (dB) | 25.1 | 23.4 | 24.3 | 24.6 | 23.3 | |
| Idle min * (dB) | 25.1 | 24.3 | 24.3 | 24.6 | 23.3 | |
| Idle avg * (dB) | 25.1 | 24.3 | 24.3 | 24.6 | 23.3 | |
| Idle max * (dB) | 25.1 | 24.3 | 24.3 | 24.6 | 23.3 | |
| Last avg * (dB) | 25.1 | 27.9 | 37.9 | 27.8 | 35.9 | |
| Last max * (dB) | 26.8 | 43.4 | 41.8 | 33.4 | 40.9 | |
| Witcher 3 ultra * (dB) | 43.4 | 39.6 | 33.4 | 41 |
* ... kleinere Werte sind besser
Temperatur
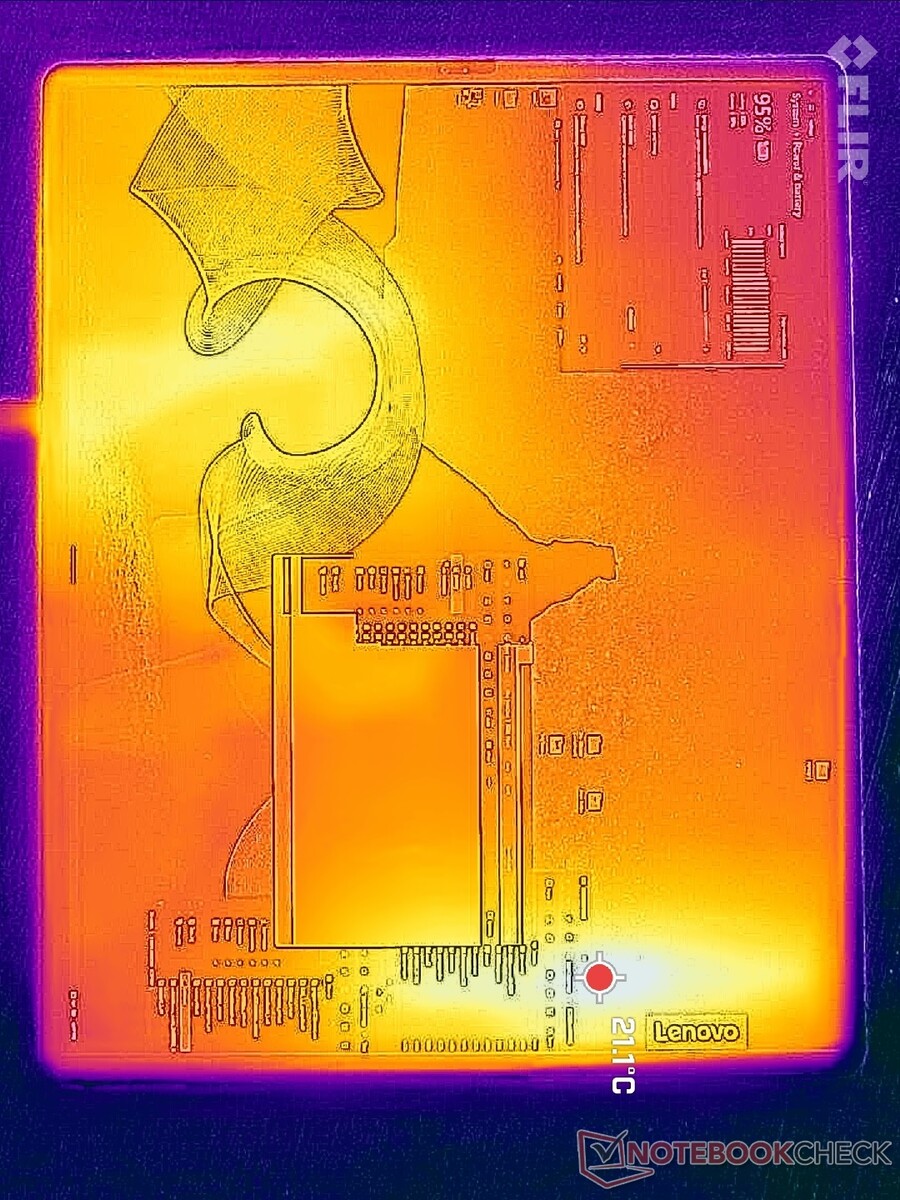
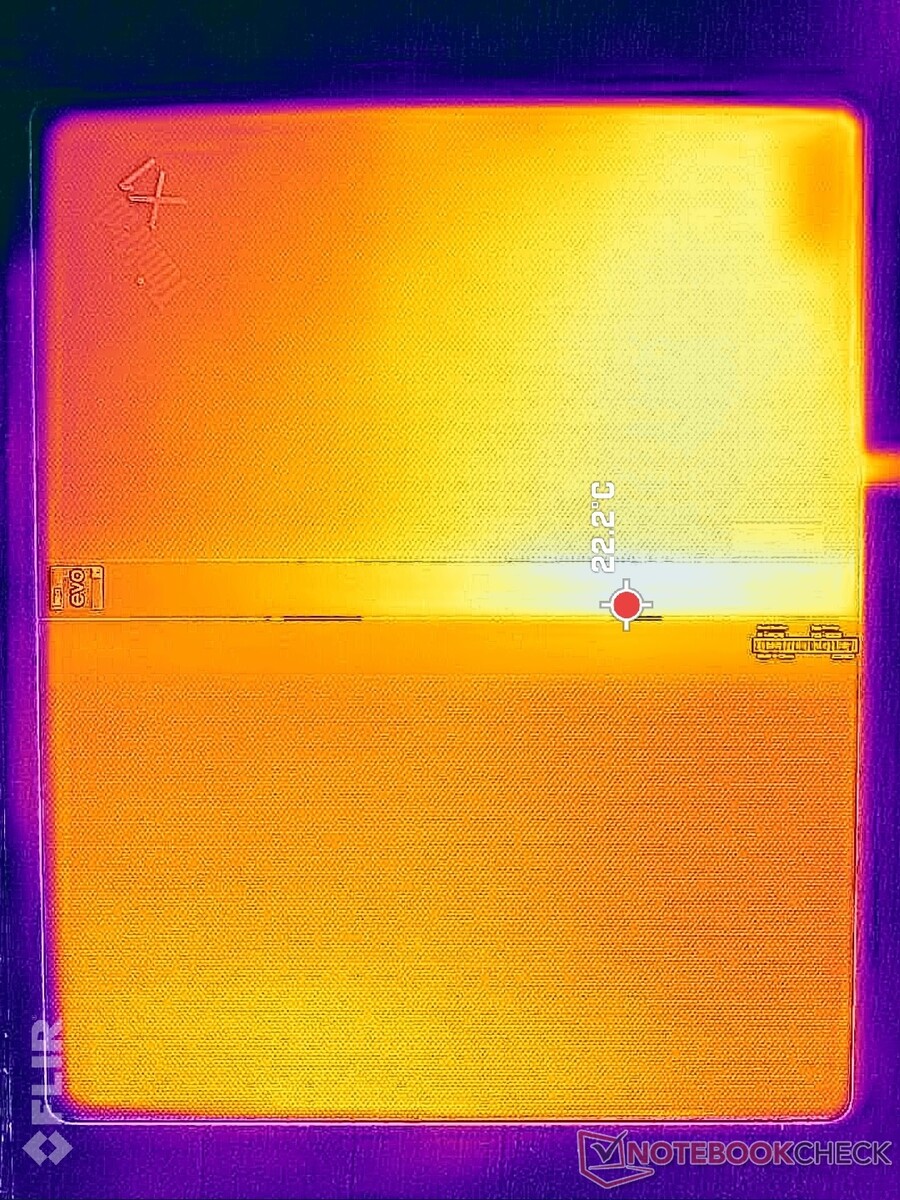
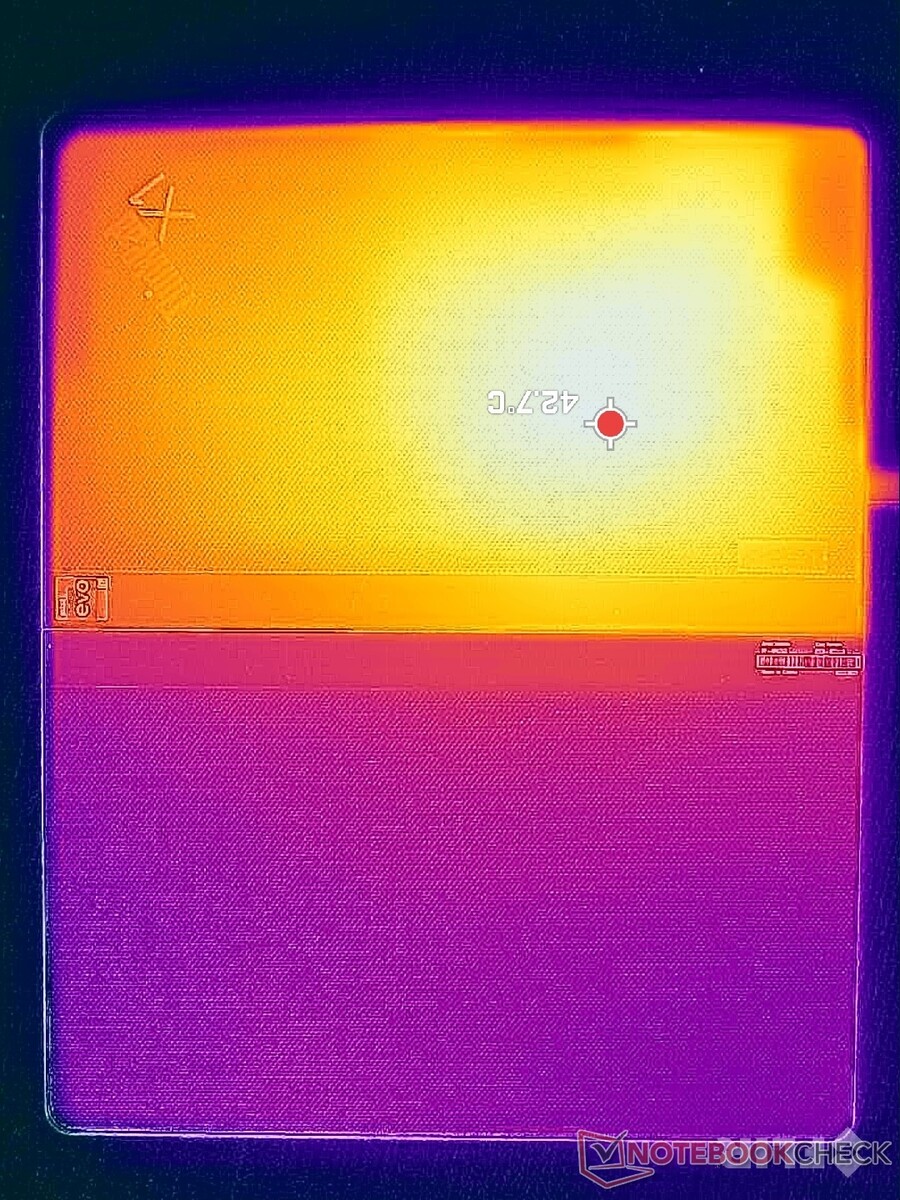
Im Portrait-Modus fallen die Oberflächentemperaturen auf der oberen Tablethälfte deutlich höher aus als auf der unteren. Das liegt an der Position des Mainboards, ähnlich wie beim Zenbook 17 Fold. Hot Spots auf der Vorder- und Rückseite können bis zu 43 °C warm werden. Womöglich ist es kein Zufall, dass das Zenbook 17 Fold sowie das Surface Pro 9 unter den gleichen Bedingungen ähnlich warm werden, trotz Aktivkühlung. Die Hot Spots konzentrieren sich auf das Displayzentrum, die Außenkanten werden hingegen nie ungemütlich warm, sodass man auch im Tabletmodus keine Probleme beim Halten bekommt.
(±) Die maximale Temperatur auf der Oberseite ist 41.6 °C. Im Vergleich liegt der Klassendurchschnitt bei 35.4 °C (von 19.6 bis 60 °C für die Klasse Convertible).
(±) Auf der Unterseite messen wir eine maximalen Wert von 44.8 °C (im Vergleich zum Durchschnitt von 36.9 °C).
(+) Ohne Last messen wir eine durchschnittliche Temperatur von 26.2 °C auf der Oberseite. Der Klassendurchschnitt erreicht 30.3 °C.
(+) Die Handballen und der Touchpad-Bereich sind mit gemessenen 27.6 °C kühler als die typische Hauttemperatur und fühlen sich dadurch kühl an.
(±) Die durchschnittliche Handballen-Temperatur anderer getesteter Geräte war 28 °C (+0.4 °C).

| Lenovo Thinkpad X1 Fold 16 Intel Core i7-1250U, Intel Iris Xe Graphics G7 96EUs | Lenovo ThinkPad X1 Fold 20RL000FGE Intel Core i5-L16G7, Intel UHD Graphics G7 (Lakefield GT2 64 EU) | Asus Zenbook 17 Fold UX9702 Intel Core i7-1250U, Intel Iris Xe Graphics G7 80EUs | Microsoft Surface Pro 9, i7-1255U Intel Core i7-1255U, Intel Iris Xe Graphics G7 96EUs | HP Elite Dragonfly Folio 13.5 G3 Intel Core i7-1265U, Intel Iris Xe Graphics G7 96EUs | Lenovo ThinkPad X1 Carbon G11 21HNS54T00 Intel Core i7-1370P, Intel Iris Xe Graphics G7 96EUs | |
|---|---|---|---|---|---|---|
| Hitze | -7% | 0% | 1% | 16% | -11% | |
| Last oben max * (°C) | 41.6 | 45.1 -8% | 44.5 -7% | 44.6 -7% | 32.8 21% | 42.2 -1% |
| Last unten max * (°C) | 44.8 | 39.8 11% | 41.8 7% | 45.9 -2% | 33.4 25% | 43.8 2% |
| Idle oben max * (°C) | 27.2 | 33 -21% | 28.9 -6% | 24.8 9% | 24.6 10% | 32 -18% |
| Idle unten max * (°C) | 26.4 | 29.2 -11% | 24.7 6% | 25.3 4% | 24.6 7% | 33.7 -28% |
* ... kleinere Werte sind besser
Stresstest
Beim Stress mit Prime95 boostet die CPU auf bis zu 2,6 GHz und 29 W hoch. Wenn die Kerntemperaturen ein bis zwei Minuten später 89 °C erreichen, fallen die Taktraten und stabilisieren sich bei 2 GHz und 17 W, dabei halten sie eine niedrigere Kerntemperatur von 75 °C. Das limitierte Turbo-Boost-Potential kommt bei einem lüfterlosen Design nicht überraschend und reflektiert unsere CineBench-Ergebnisse weiter oben.
Unter Witcher 3 als Repräsentant praxisnaher Lasten pendeln die CPU-Takte zwischen 650 und 950 MHz, was mit den oben erwähnten instabilen Frameraten korreliert.
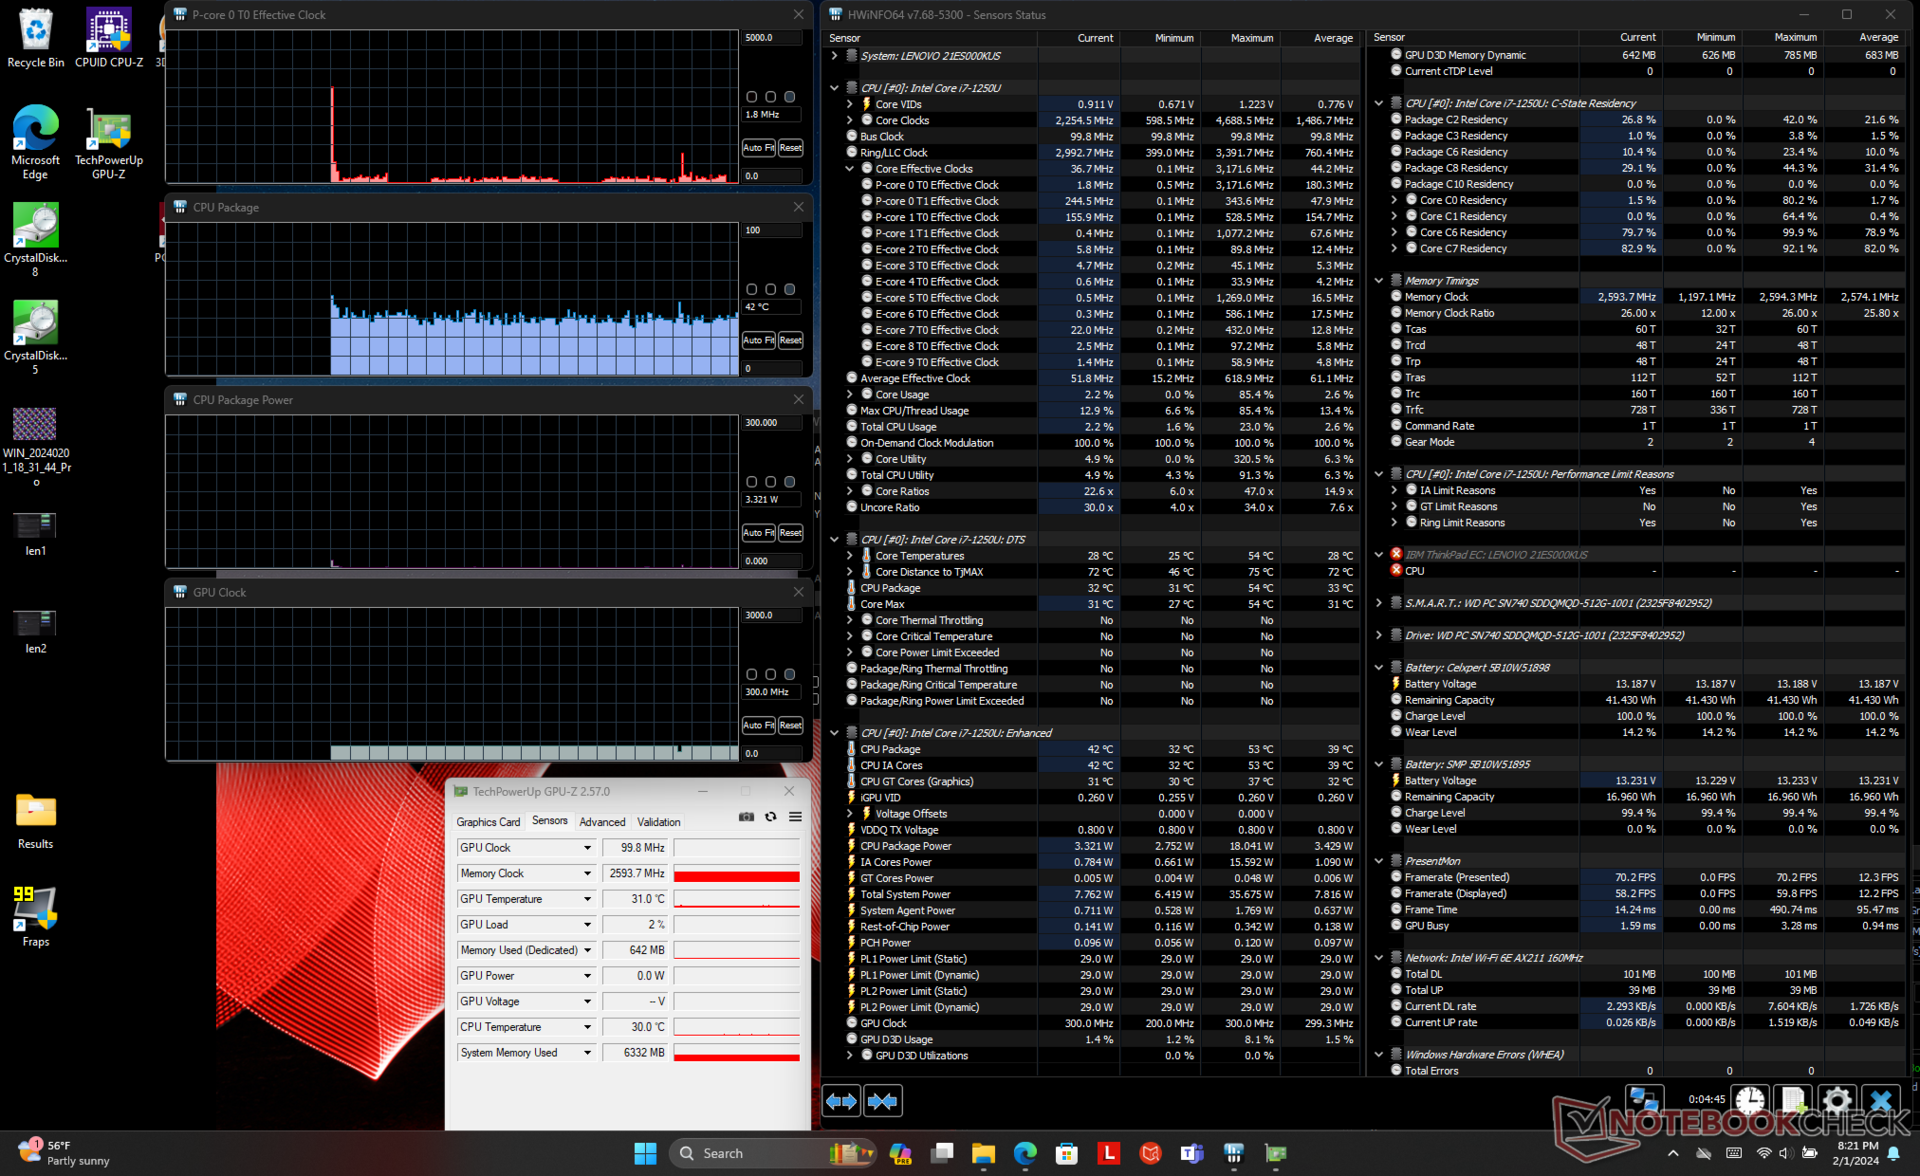
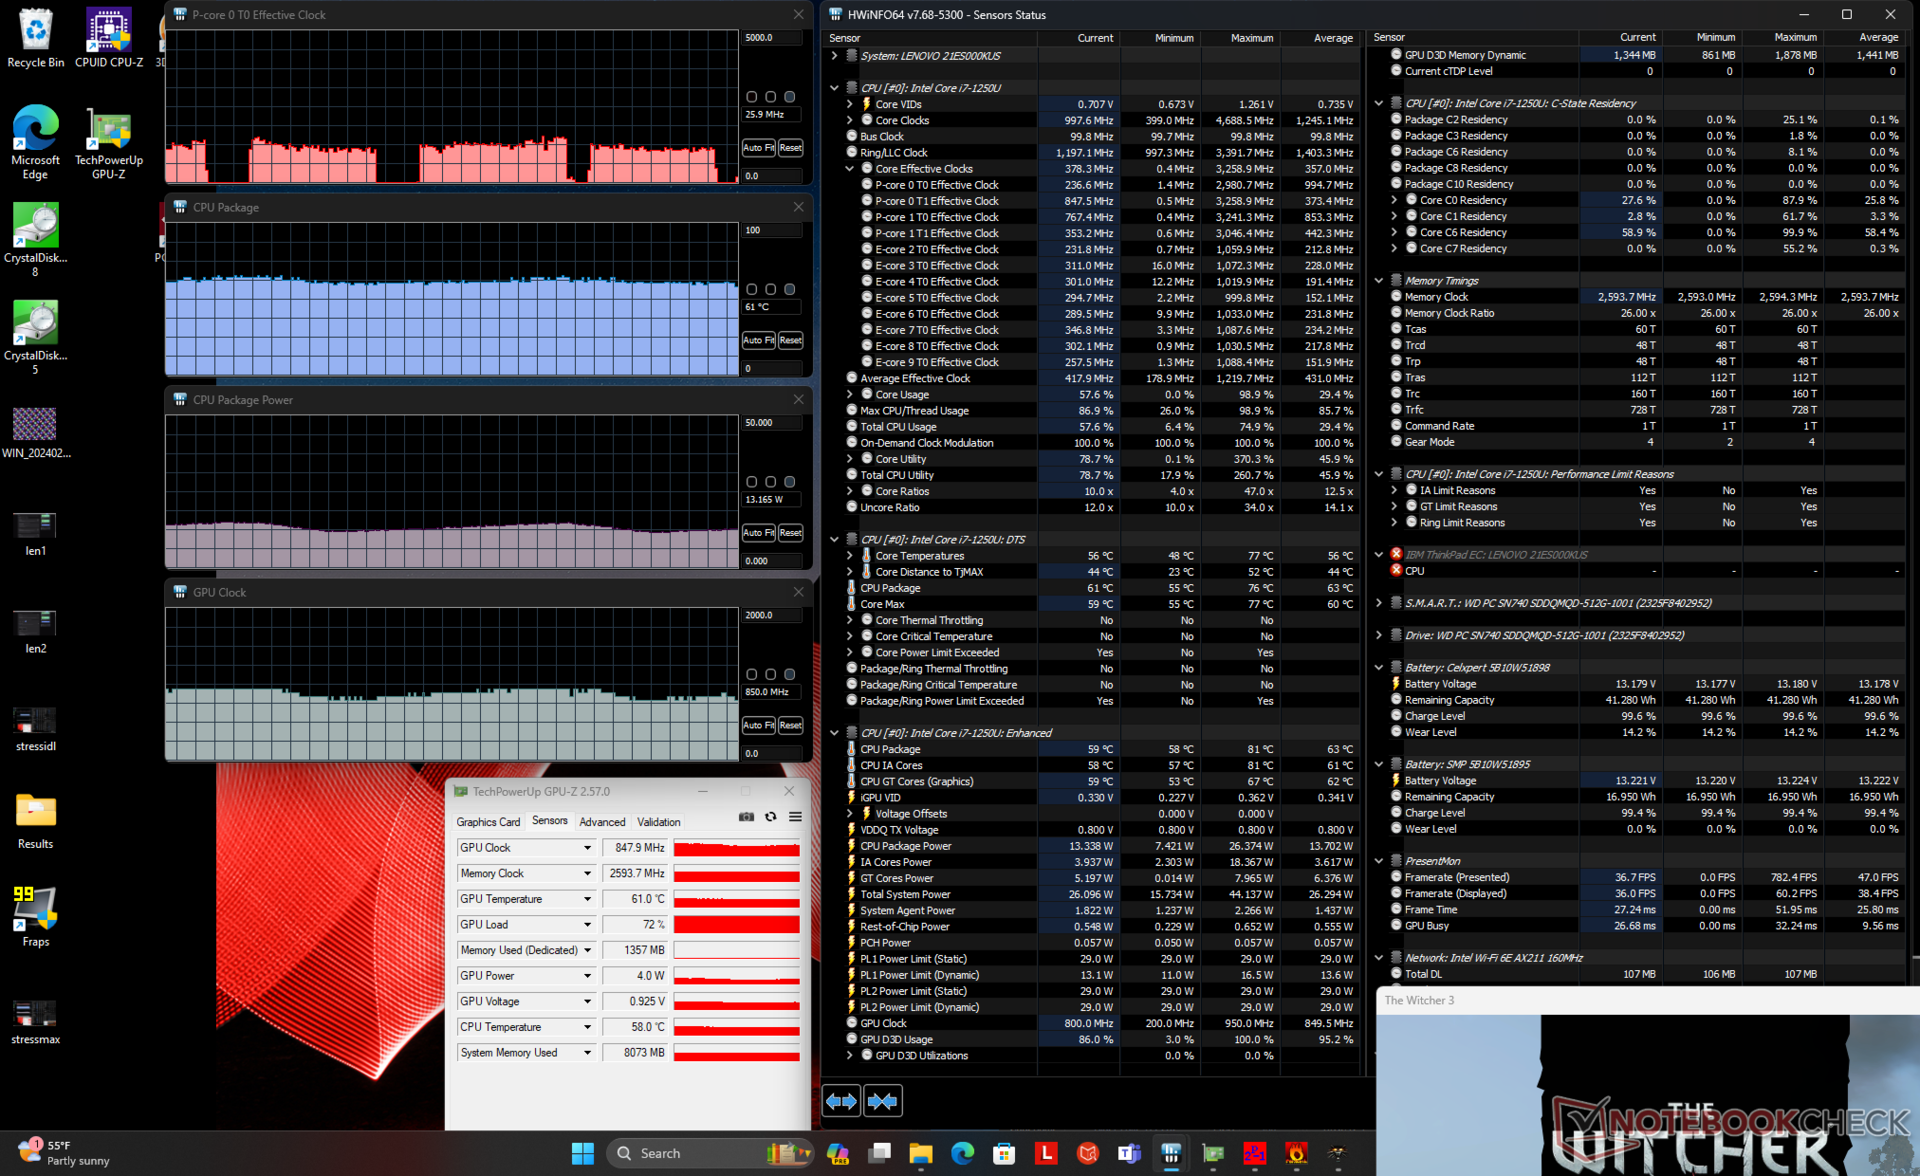
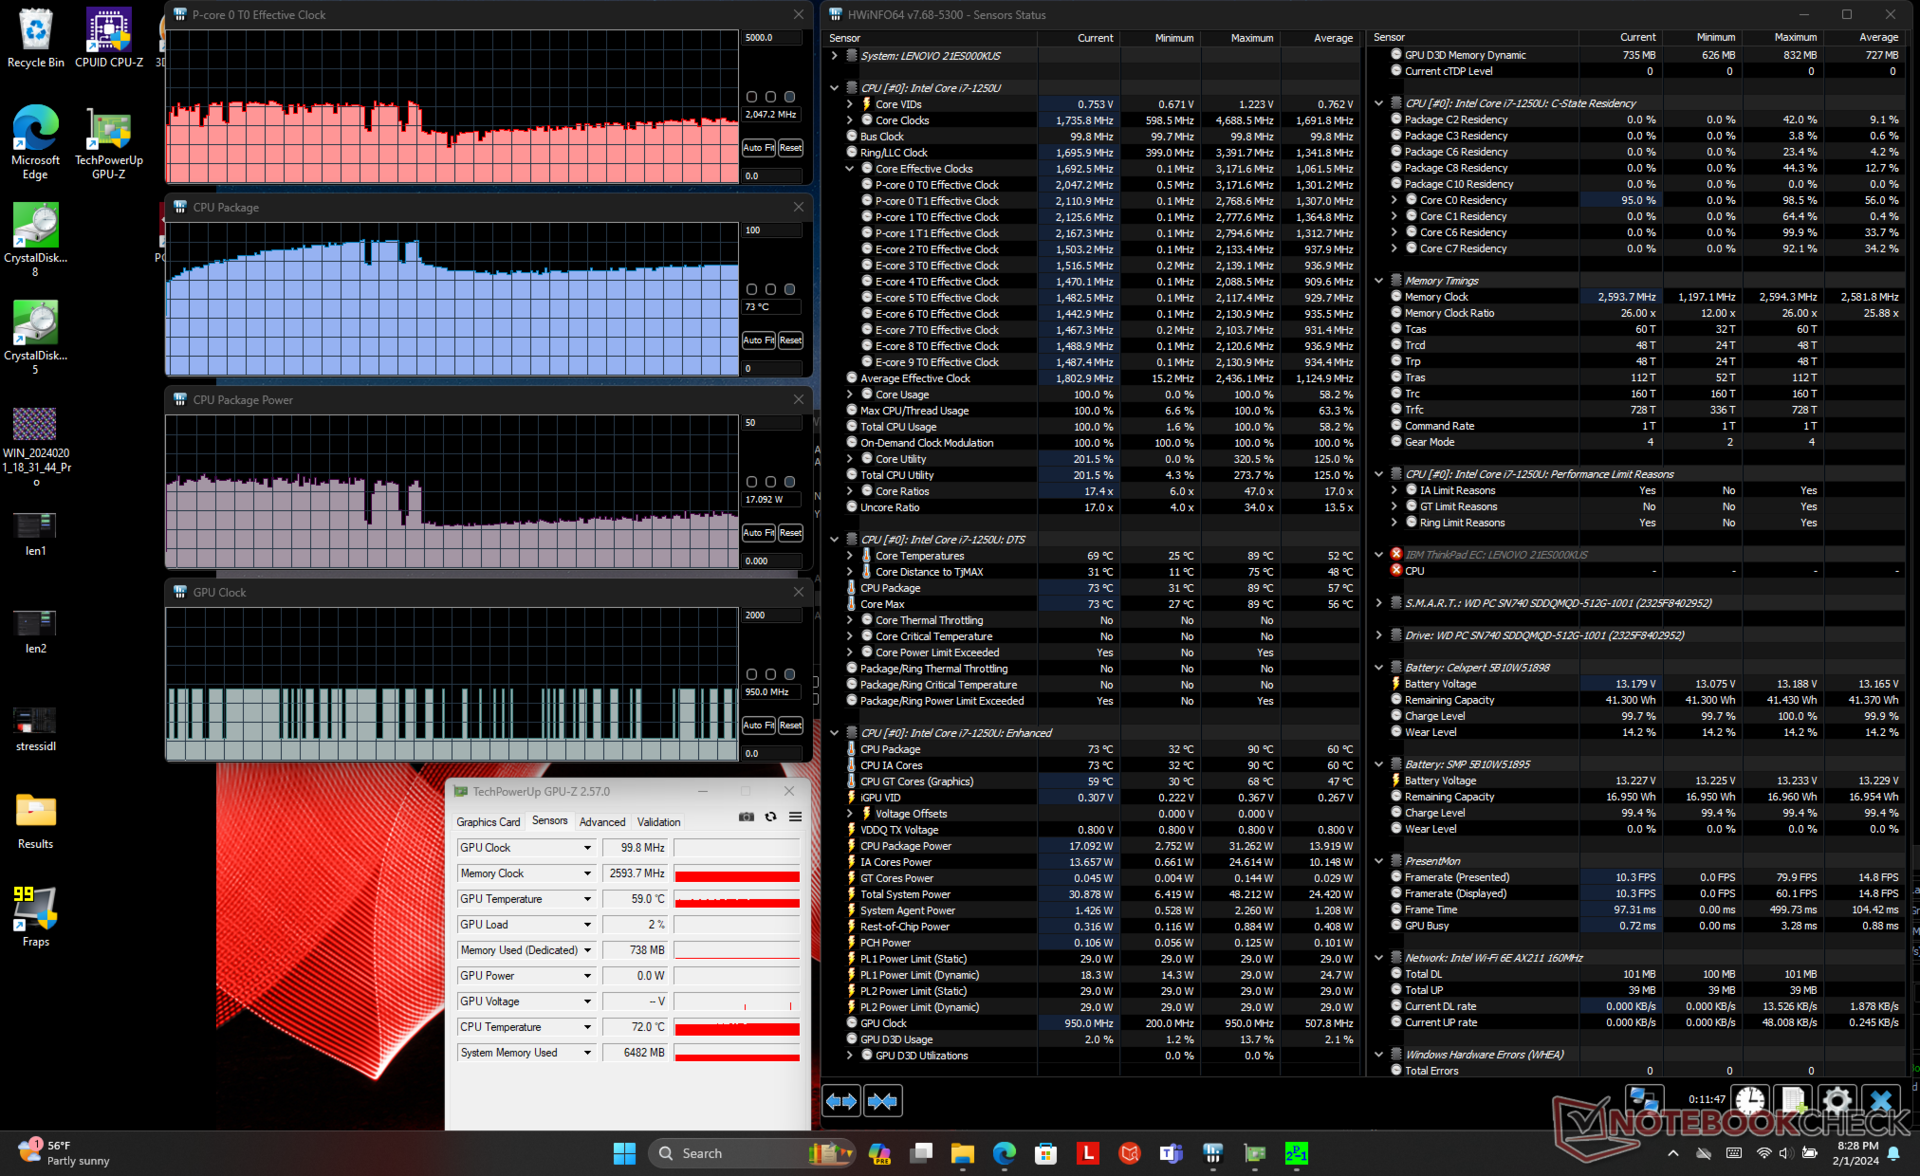
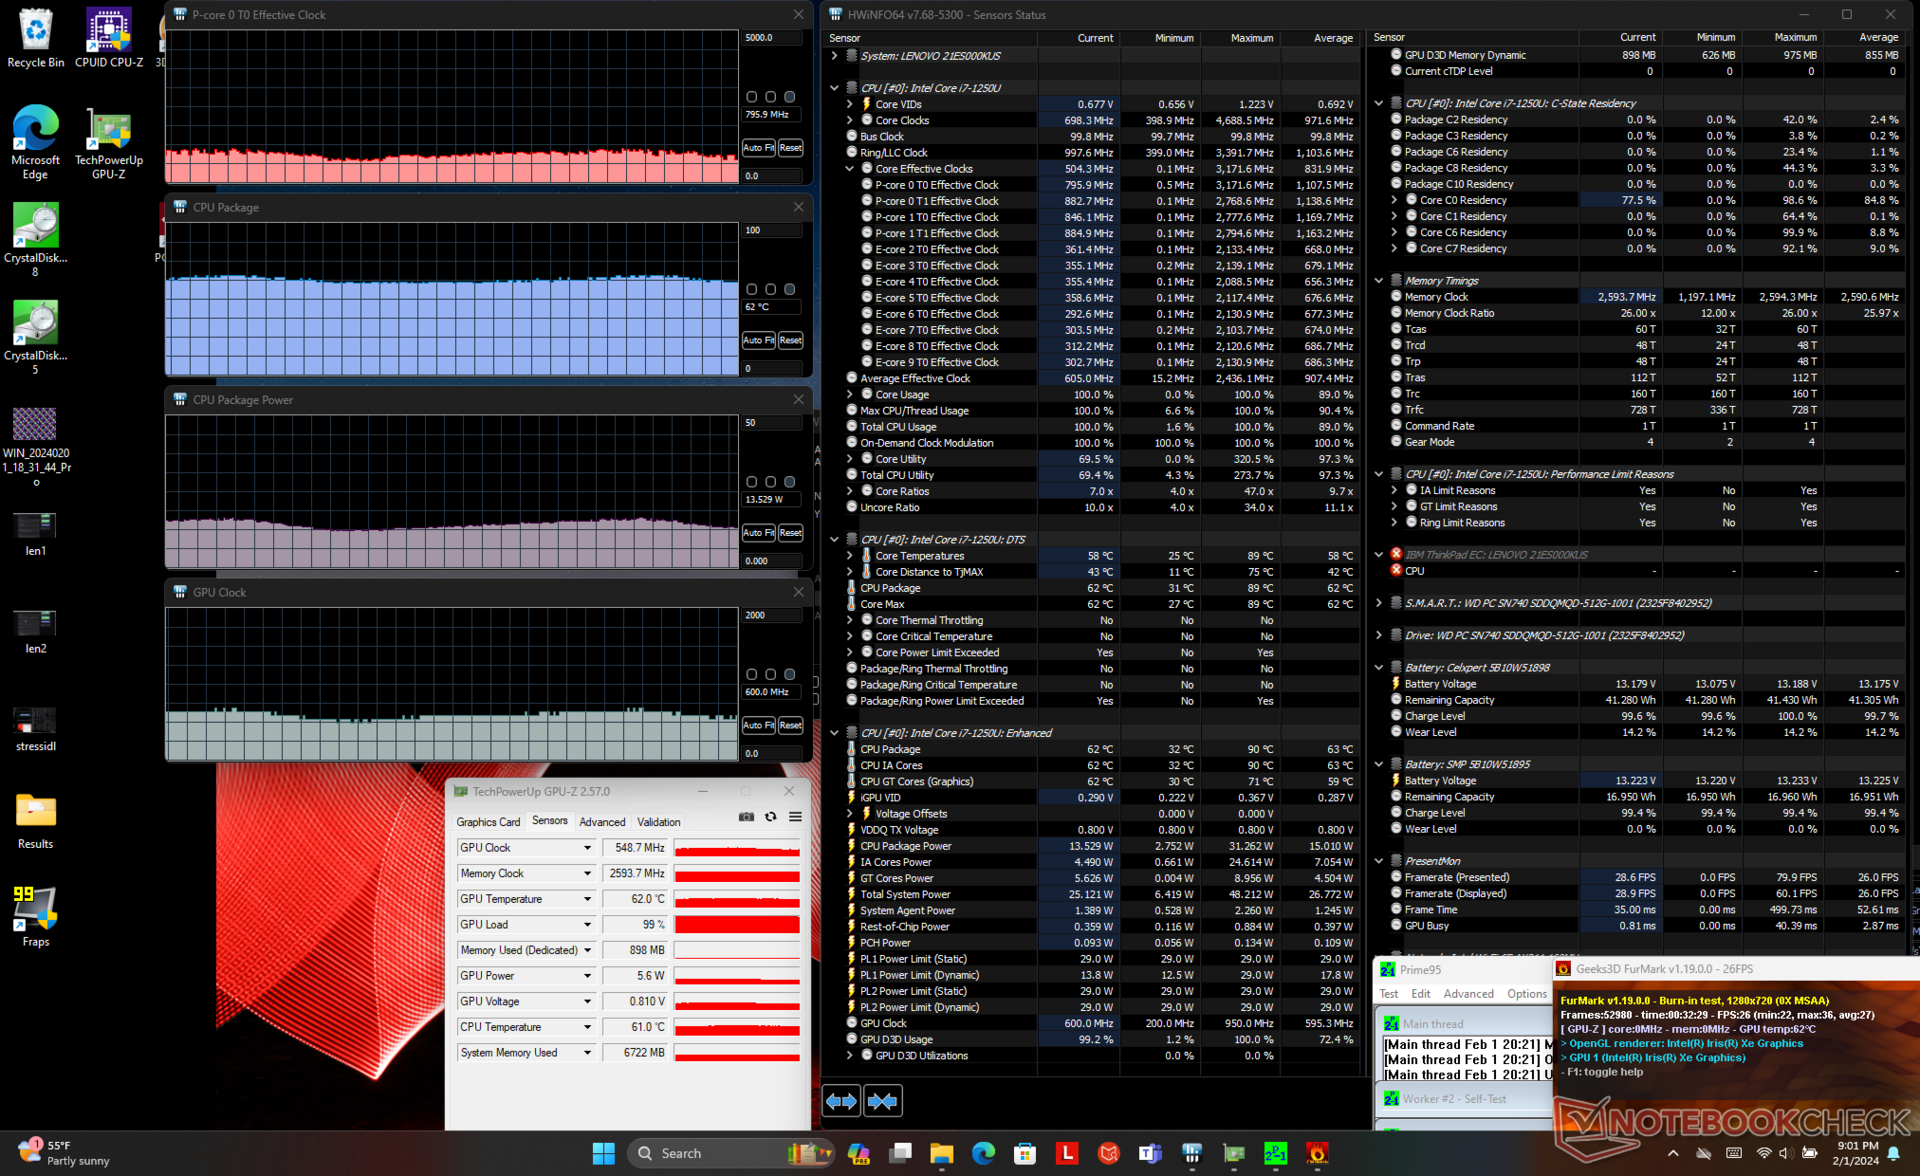
| CPU-Takt(GHz) | GPU-Takt(MHz) | Durchschnittliche CPU-Temperatur (°C) | |
| System Idle | -- | -- | 41 |
| Prime95 Stress | 2,0 | -- | 75 |
| Prime95 + FurMark Stress | 0,8 - 1,0 | 500 - 750 | 62 - 65 |
| Witcher 3 Stress | 0,8 | 650 - 950 | 61 |
Lautsprecher
Das Modell integriert drei 2-W-Lautsprecher anstelle der sonst üblichen zwei in den meisten anderen Laptops und Tablets. Zwar fällt die Audioqualität angesichts des Formfaktors respektabel aus, allerdings könnte das Ganze etwas lauter aufspielen. Beispielsweise schaffen die Lautsprecher im Dragonfly Folio 13.5 G3 über 88 dB(A), während die Varianten im Lenovo nur 82 dB(A) erreichen.
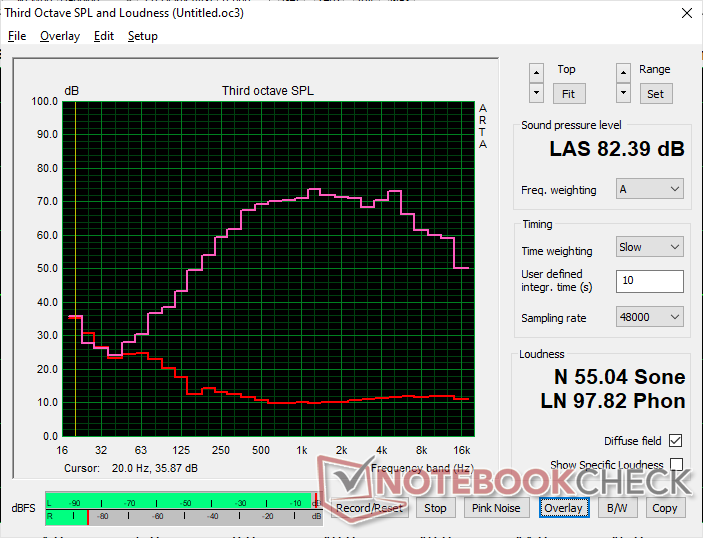
Lenovo Thinkpad X1 Fold 16 Audio Analyse
(+) | Die Lautsprecher können relativ laut spielen (82.4 dB)
Bass 100 - 315 Hz
(-) | kaum Bass - 16.2% niedriger als der Median
(±) | durchschnittlich lineare Bass-Wiedergabe (7.6% Delta zum Vorgänger)
Mitteltöne 400 - 2000 Hz
(+) | ausgeglichene Mitten, vom Median nur 3.3% abweichend
(+) | lineare Mitten (3.2% Delta zum Vorgänger)
Hochtöne 2 - 16 kHz
(+) | ausgeglichene Hochtöne, vom Median nur 4% abweichend
(+) | sehr lineare Hochtöne (5.3% Delta zum Vorgänger)
Gesamt im hörbaren Bereich 100 - 16.000 Hz
(+) | hörbarer Bereich ist sehr linear (14.7% Abstand zum Median
Im Vergleich zu allen Geräten derselben Klasse
» 23% aller getesteten Geräte dieser Klasse waren besser, 3% vergleichbar, 73% schlechter
» Das beste Gerät hat einen Delta-Wert von 6%, durchschnittlich ist 20%, das schlechteste Gerät hat 57%
Im Vergleich zu allen Geräten im Test
» 19% aller getesteten Geräte waren besser, 4% vergleichbar, 77% schlechter
» Das beste Gerät hat einen Delta-Wert von 4%, durchschnittlich ist 24%, das schlechteste Gerät hat 134%
Apple MacBook Pro 16 2021 M1 Pro Audio Analyse
(+) | Die Lautsprecher können relativ laut spielen (84.7 dB)
Bass 100 - 315 Hz
(+) | guter Bass - nur 3.8% Abweichung vom Median
(+) | lineare Bass-Wiedergabe (5.2% Delta zum Vorgänger)
Mitteltöne 400 - 2000 Hz
(+) | ausgeglichene Mitten, vom Median nur 1.3% abweichend
(+) | lineare Mitten (2.1% Delta zum Vorgänger)
Hochtöne 2 - 16 kHz
(+) | ausgeglichene Hochtöne, vom Median nur 1.9% abweichend
(+) | sehr lineare Hochtöne (2.7% Delta zum Vorgänger)
Gesamt im hörbaren Bereich 100 - 16.000 Hz
(+) | hörbarer Bereich ist sehr linear (4.6% Abstand zum Median
Im Vergleich zu allen Geräten derselben Klasse
» 0% aller getesteten Geräte dieser Klasse waren besser, 0% vergleichbar, 100% schlechter
» Das beste Gerät hat einen Delta-Wert von 5%, durchschnittlich ist 17%, das schlechteste Gerät hat 45%
Im Vergleich zu allen Geräten im Test
» 0% aller getesteten Geräte waren besser, 0% vergleichbar, 100% schlechter
» Das beste Gerät hat einen Delta-Wert von 4%, durchschnittlich ist 24%, das schlechteste Gerät hat 134%
Energiemanagement — Großes OLED bedeutet großer Energiehunger
Energieverbrauch
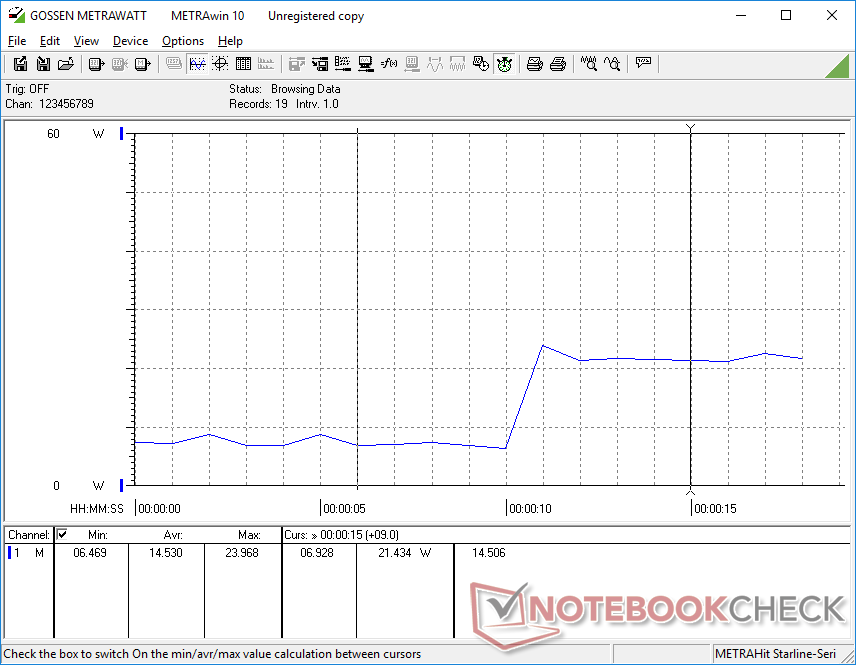
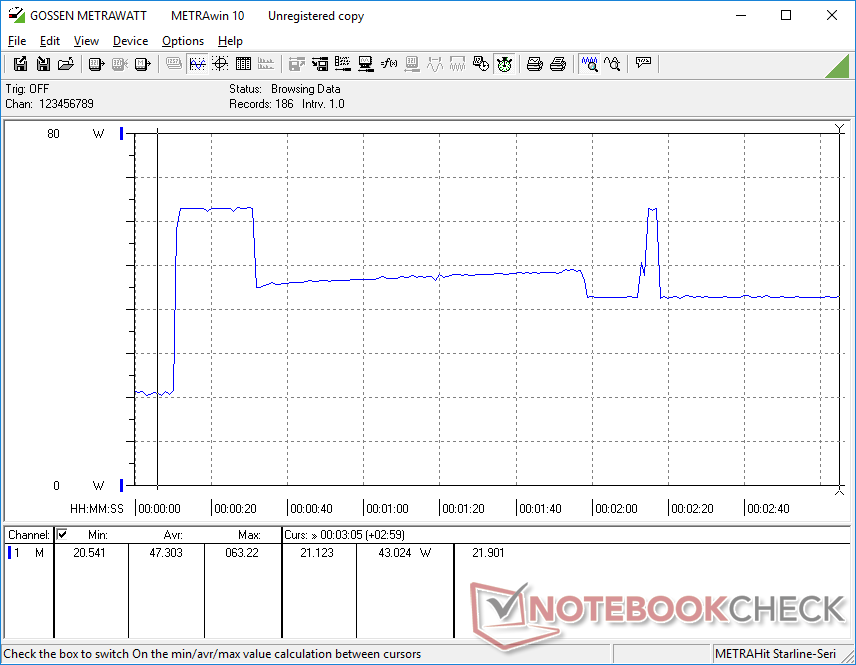
Insgesamt liegt der Verbrauch auf dem Niveau traditioneller Laptops. Während das lüfterlose Design Energie spart, macht der große OLED-Touchscreen den Sparansatz wieder mehr als zunichte. Beispielsweise verbraucht der Leerlauf auf einem hellen Hintergrund (bspw. eine Webseite oder Word) bei maximaler Helligkeit 22 W auf unserem ThinkPad X1 Fold, verglichen mit nur 11 oder 10 W auf einem Microsoft Surface Pro 9 oder HP Elite Dragonfly Folio mit IPS-Display.
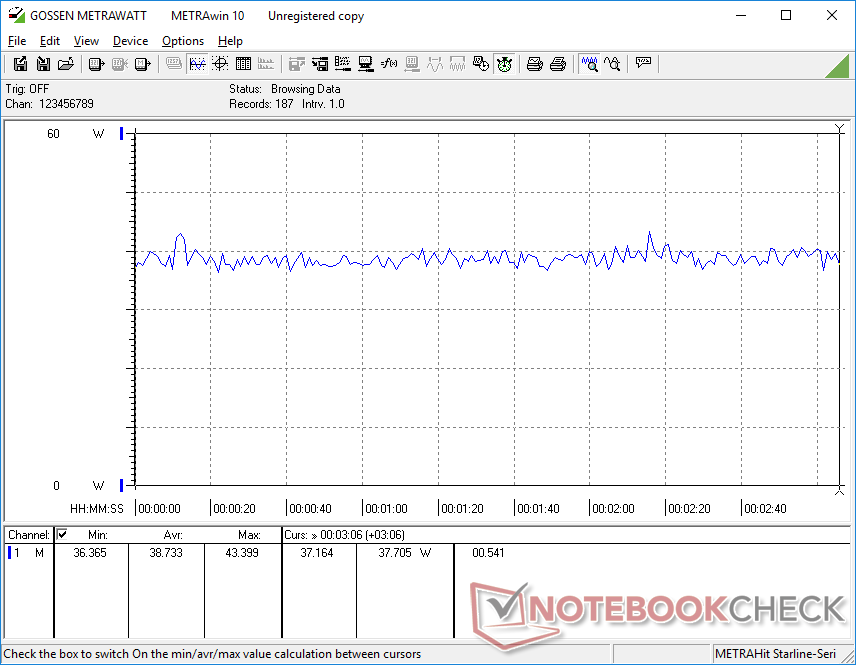
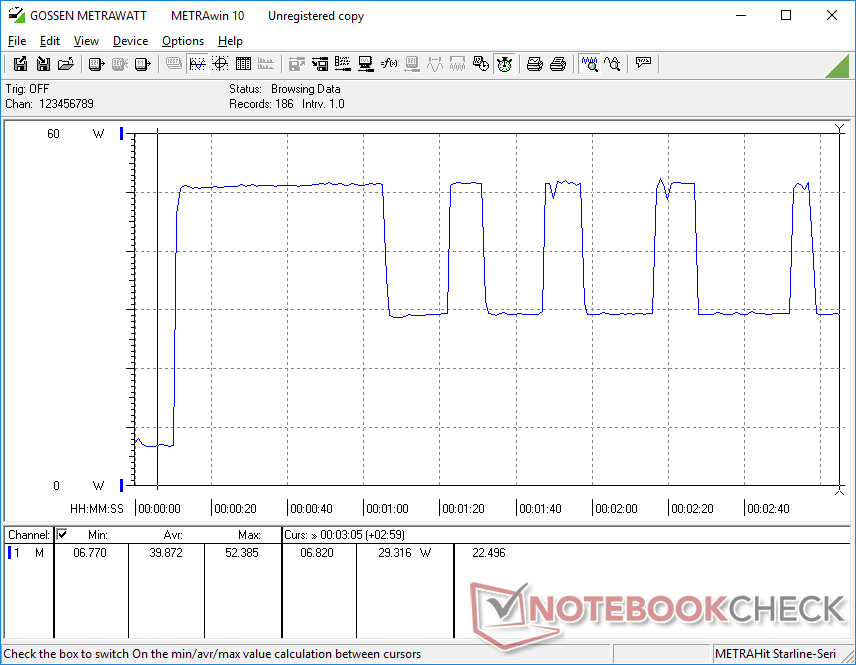
Anspruchsvollere Lasten wie Witcher 3 schluckt genauso viel Energie wie auf den gerade erwähnten Microsoft- oder HP-Modellen. Allerdings fluktuiert der Verbrauch des ThinkPad X1 Fold 16 nach einigen Minuten zwischen 30 und 40 W, parallel zu den instabilen Taktraten, die wir weiter oben erwähnt haben.
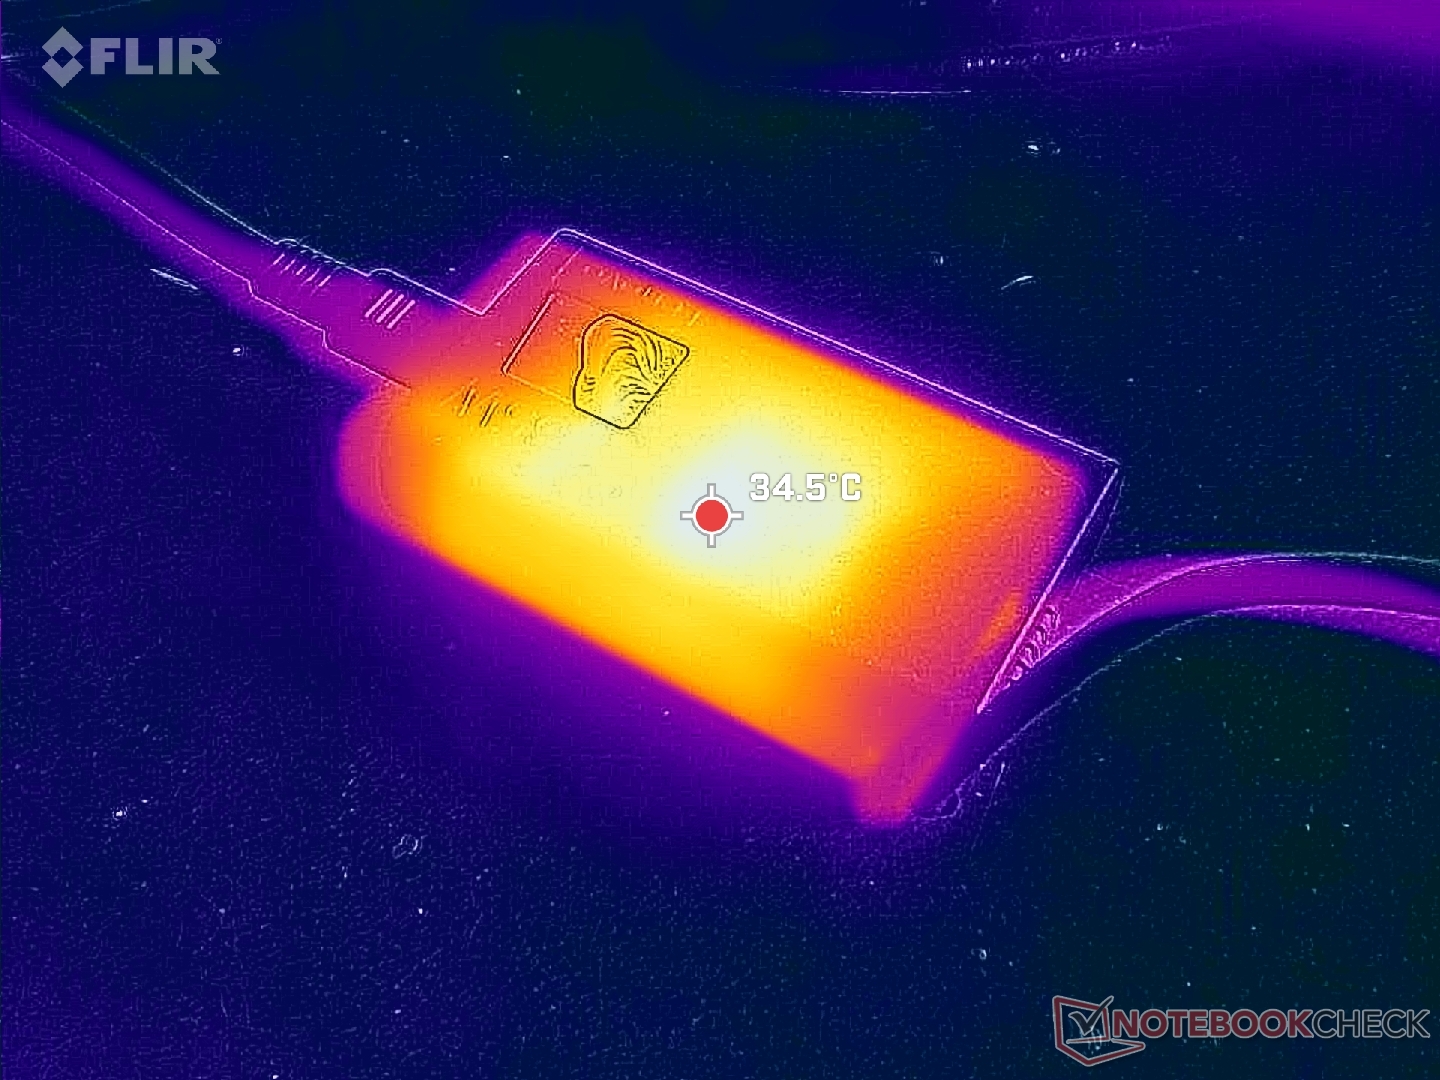
Wir messen ein temporäres Maximum von 64 W aus dem kleinen (~8,8 x 5 x 2,3 cm) 65-W-USB-C-Netzteil, wenn sowohl CPU als auch GPU zu 100 Prozent ausgelastet sind.
| Aus / Standby | |
| Idle | |
| Last |
|
Legende:
min: | |
| Lenovo Thinkpad X1 Fold 16 i7-1250U, Iris Xe G7 96EUs, WD PC SN740 512GB SDDQMQD-512G, OLED, 2560x2024, 16.3" | Lenovo ThinkPad X1 Fold 20RL000FGE i5-L16G7, UHD Graphics G7 (Lakefield GT2 64 EU), Toshiba KBG40ZNS256G NVMe, OLED, 2048x1536, 13.3" | Asus Zenbook 17 Fold UX9702 i7-1250U, Iris Xe G7 80EUs, Samsung PM9A1 MZVL21T0HCLR, OLED, 2560x1920, 17.3" | Microsoft Surface Pro 9, i7-1255U i7-1255U, Iris Xe G7 96EUs, Samsung MZ9L4512HBLU-00BMV, IPS, 2880x1920, 13" | HP Elite Dragonfly Folio 13.5 G3 i7-1265U, Iris Xe G7 96EUs, Samsung PM9A1 MZVL2512HCJQ, IPS, 1920x1280, 13.5" | Lenovo ThinkPad X1 Carbon G11 21HNS54T00 i7-1370P, Iris Xe G7 96EUs, WDC PC SN810 2TB, OLED, 2880x1800, 14" | |
|---|---|---|---|---|---|---|
| Stromverbrauch | 24% | -9% | -4% | 18% | -3% | |
| Idle min * (Watt) | 5.2 | 7.2 -38% | 7.6 -46% | 5.1 2% | 3.4 35% | 7 -35% |
| Idle avg * (Watt) | 6.7 | 7.5 -12% | 12.3 -84% | 9.8 -46% | 4.9 27% | 7.9 -18% |
| Idle max * (Watt) | 22 | 7.7 65% | 12.9 41% | 11.3 49% | 9.3 58% | 8.1 63% |
| Last avg * (Watt) | 36.9 | 20.5 44% | 35.2 5% | 47.5 -29% | 41.9 -14% | 40.5 -10% |
| Witcher 3 ultra * (Watt) | 38.7 | 30.4 21% | 36 7% | 36.4 6% | 43 -11% | |
| Last max * (Watt) | 63.3 | 24.8 61% | 56.6 11% | 68.5 -8% | 67.5 -7% | 66 -4% |
* ... kleinere Werte sind besser
Energieverbrauch Witcher 3 / Stresstest
Energieverbrauch externer Monitor
Akkulaufzeit
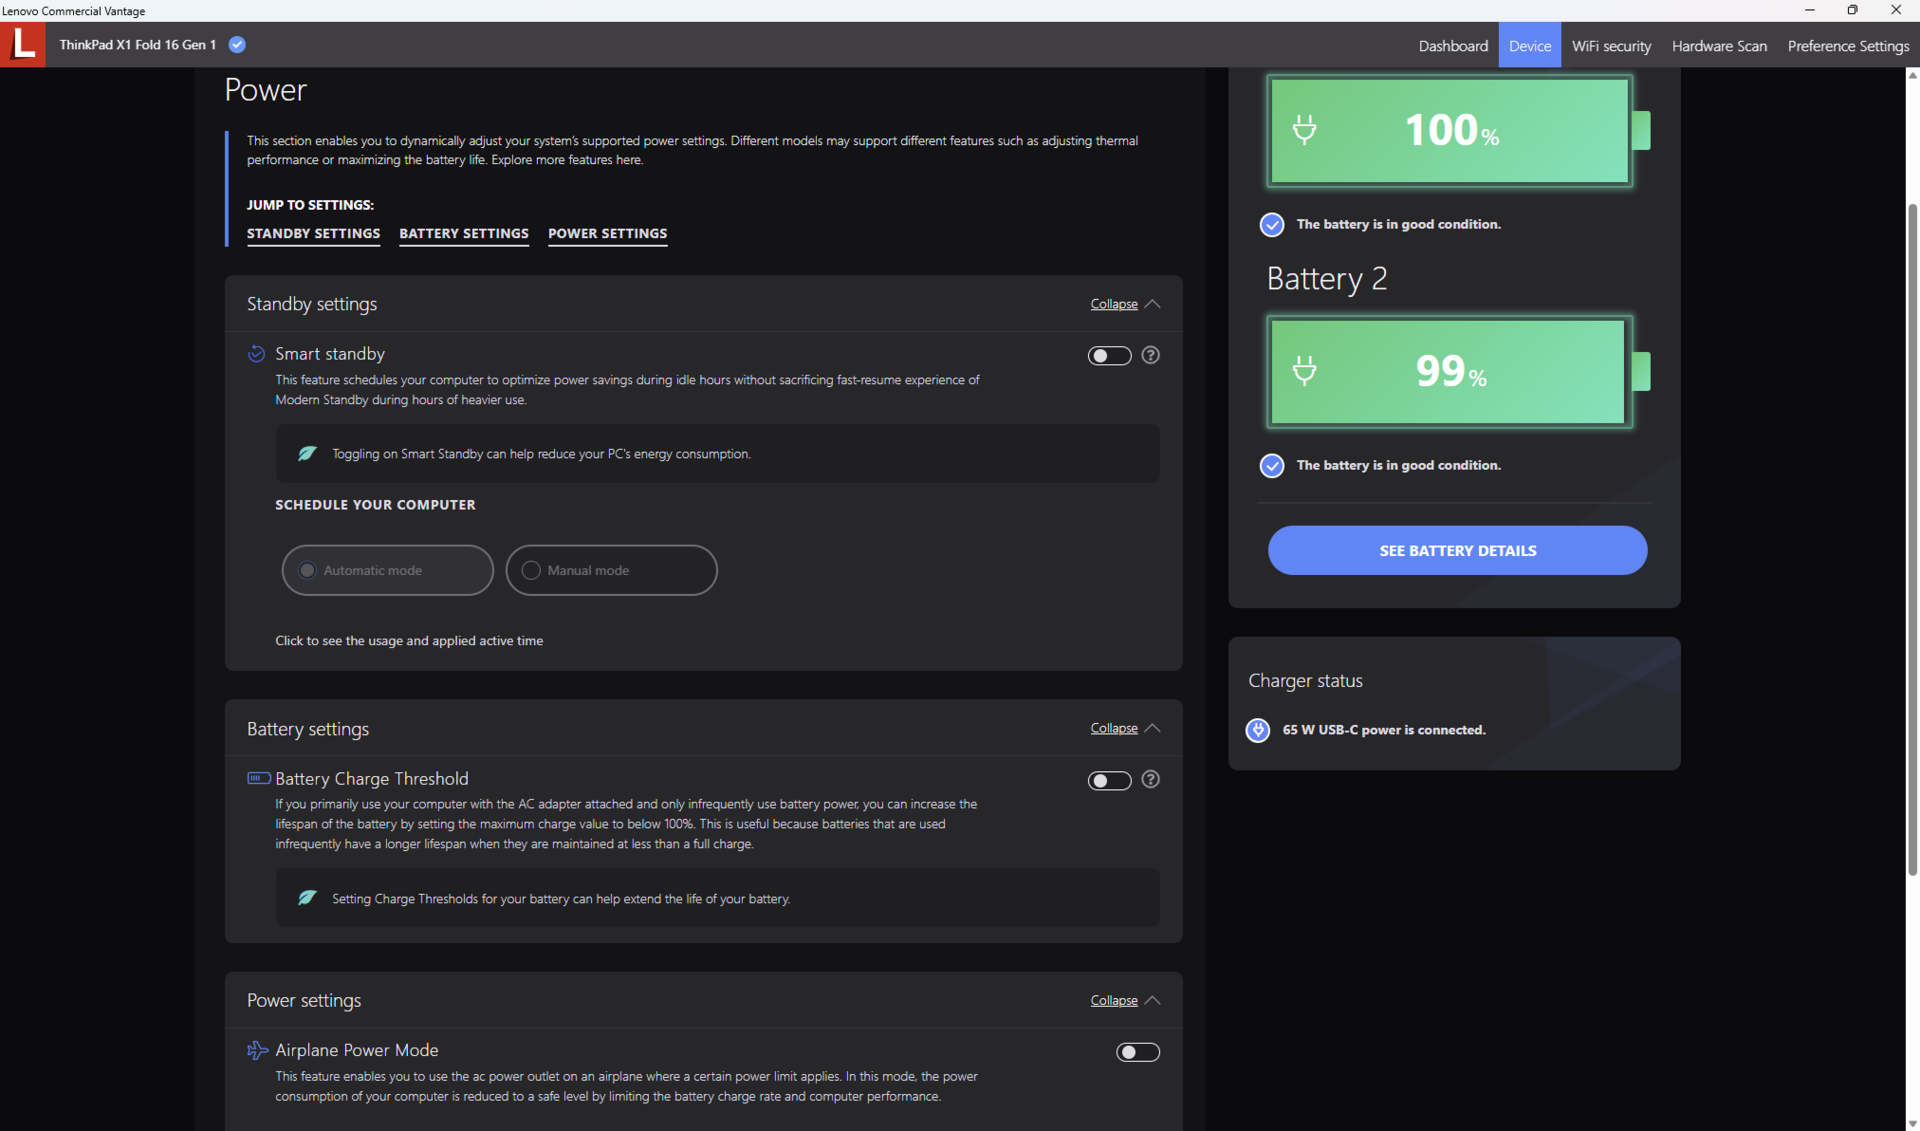
Anders als beim Vorgänger wurde der Akku hier für eine bessere Gewichtsverteilung der oberen und unteren Tablethälfte in zwei Elemente getrennt (48 Wh + 16 Wh). Die kombinierte Kapazität von 74 Wh ist beinahe 50 Prozent höher als im 13-Zoll-Modell und damit in etwa so groß wie die Akkus in vielen klassischen Laptops.
Dennoch fallen die Laufzeiten bestenfalls durchschnittlich aus, wir messen rund 5,5 Stunden Surfen im Ausbalancierten Profil, was nicht wesentlich länger ist als beim Vorgänger. Die größere Akkukapazität wird demnach vom fordernden OLED wieder aufgewogen. Im Laptopmodus kommt man bei nur einer aktivierten Displayhälfte auf spürbar länger Laufzeiten. Dann wiederum verzichtet man aber auf das besondere Merkmal des Faltdesigns.
Eine komplette Aufladung von 0 auf 100 dauert etwa 2 Stunden, was sich an den meisten Clamshell-Laptops orientiert. Beide Akkupacks laden dabei gleichzeitig auf, wenn das Gerät am Stromnetz hängt.
| Lenovo Thinkpad X1 Fold 16 i7-1250U, Iris Xe G7 96EUs, 64 Wh | Lenovo ThinkPad X1 Fold 20RL000FGE i5-L16G7, UHD Graphics G7 (Lakefield GT2 64 EU), 50 Wh | Asus Zenbook 17 Fold UX9702 i7-1250U, Iris Xe G7 80EUs, 75 Wh | Microsoft Surface Pro 9, i7-1255U i7-1255U, Iris Xe G7 96EUs, 47.7 Wh | HP Elite Dragonfly Folio 13.5 G3 i7-1265U, Iris Xe G7 96EUs, 53 Wh | Lenovo ThinkPad X1 Carbon G11 21HNS54T00 i7-1370P, Iris Xe G7 96EUs, 57 Wh | |
|---|---|---|---|---|---|---|
| Akkulaufzeit | 91% | 107% | 22% | 98% | 9% | |
| Idle (h) | 12.2 | 27.3 124% | ||||
| WLAN (h) | 5.5 | 5.3 -4% | 6.7 22% | 7.5 36% | 9.4 71% | 6.5 18% |
| Last (h) | 1.3 | 3.7 185% | 3.8 192% | 1.4 8% | 2.6 100% | 1.3 0% |
| H.264 (h) | 6 | 11 | 9.4 |
Pro
Contra
Fazit — Größtenteils verbessert, aber mit einer herausfordernden Ergonomie
Das ThinkPad X1 Fold 16 stellt eine massive Verbesserung zum 2021er Original in 13-Zoll dar. Quasi alles, von der Leistung, über die Verarbeitungsqualität bis hin zur Tastatur, wurde auf ein Level gebracht, das sich deutlich näher an den klassischen ThinkPad-Laptops orientiert. Im Guten kann das ThinkPad X1 Fold 16 mehr Bildschirmfläche mit tieferen Farben bieten als ein Surface Pro, ohne dabei mehr Platz in der Tasche zu beanspruchen.
Signifikante Herausforderungen durch das Faltdesign erbt das neue Modell aber vom Vorgänger. Beispielsweise ist das Modell schwerer als es aussieht, insbesondere in Kombination mit der magnetischen, kabellosen Tastatur und dem Kickstand. Zweitens sind die Gleiteigenschaften des OLED-Displays stockender und unebener als auf den flachen Glasoberflächen eines Surface Pro oder der meisten Tablets. Wer viel skizziert oder Notizen schreibt, könnte die weniger uniforme Oberfläche des Faltbildschirms mit der Zeit etwas nervig finden. Und drittens sind die separate Tastatur sowie der Kickstand umständlich zu transportieren. Dieser Umstand wird dann noch verstärkt, wenn die Tastatur im Laptopmodus erst entfernt werden muss, bevor sich der Bildschirm schließen lässt, ganz im Gegensatz zu normalen Laptops. Das Reisen ohne diese beiden Zubehörartikel sind aber auch nicht empfehlenswert, da beide gebraucht werden, um das Nutzererlebnis zu maximieren.
Das riesige, faltbare OLED-Display macht ohne Zweifel Spaß bei der Benutzung. Zumindest am Anfang, denn die separate Tastatur und der Kickstand sowie der suboptimale Windows-Support behindern die Produktivität.
Andere Aspekte wie die Akkulaufzeit oder der limitierte Windows-Support für faltbare Displays haben sich weniger verbessert. Die Leistung ist nun deutlich besser, aber angesichts des hohen Preises immer noch bestenfalls moderat.
Klar ist, dass der aufgerufene Preis von $4000 größtenteils auf die Neuheit des faltbaren OLED-Touchscreens entfällt. Der große Faltbildschirm hat seine Vorteile bei der Multimedia-Wiedergabe, besonders in engen Umgebunden wie auf Flügen, aber seine Produktivität ist zu großen Teilen von der etwas umständlichen Ergonomie abhängig, die an die von regulären Laptops oder Convertibles nicht heranreicht. Traditionellere Systeme wie das Surface Pro 9 oder das ThinkPad X1 Carbon sind allgemein leichter, schneller und in den meisten Nutzungsszenarien auch komfortabler, auch wenn sie etwas "langweiliger" in der Nutzung sind.
Preis und Verfügbarkeit
Bislang ist das ThinkPad X1 Fold 16 noch nicht in Deutschland erhältlich. Auf der Lenovo-Webseite gibt es allerdings schon einen Button, mit dem man sich benachrichtigen lassen kann, wenn sich dieser Umstand ändert, was laut Lenovo sehr bald der Fall sein soll.
Lenovo Thinkpad X1 Fold 16
- 14.02.2024 v7 (old)
Allen Ngo
Transparenz
Die Auswahl der zu testenden Geräte erfolgt innerhalb der Redaktion. Das vorliegende Testmuster wurde dem Autor vom Hersteller oder einem Shop zu Testzwecken leihweise zur Verfügung gestellt. Eine Einflussnahme des Leihstellers auf den Testbericht gab es nicht, der Hersteller erhielt keine Version des Reviews vor der Veröffentlichung. Es bestand keine Verpflichtung zur Publikation. Als eigenständiges, unabhängiges Unternehmen unterliegt Notebookcheck keiner Diktion von Herstellern, Shops und Verlagen.
So testet Notebookcheck
Pro Jahr werden von Notebookcheck hunderte Laptops und Smartphones unabhängig in von uns standardisierten technischen Verfahren getestet, um eine Vergleichbarkeit aller Testergebnisse zu gewährleisten. Seit rund 20 Jahren entwickeln wir diese Testmethoden kontinuierlich weiter und setzen damit Branchenstandards. In unseren Testlaboren kommt ausschließlich hochwertiges Messequipment in die Hände erfahrener Techniker und Redakteure. Die Tests unterliegen einer mehrstufigen Kontrolle. Unsere komplexe Gesamtbewertung basiert auf hunderten fundierten Messergebnissen und Benchmarks, womit Ihnen Objektivität garantiert ist. Weitere Informationen zu unseren Testmethoden gibt es hier.
Preisvergleich

