Lenovo ThinkPad T14s G4 Core i7 Laptop im Test: Ein harter Kampf gegen AMD Ryzen 7

Die ehrwürdige ThinkPad T14s-Serie kehrt dieses Jahr mit einer breiten Palette an SKUs zurück, die Intel-, AMD-, IPS- und OLED-Optionen umfassen. Nachdem wir bereits die AMD- und OLED-Systeme getestet haben, ist jetzt der perfekte Zeitpunkt, um eine Intel IPS-Konfiguration zu prüfen und zu sehen, wie sie im Vergleich abschneidet.
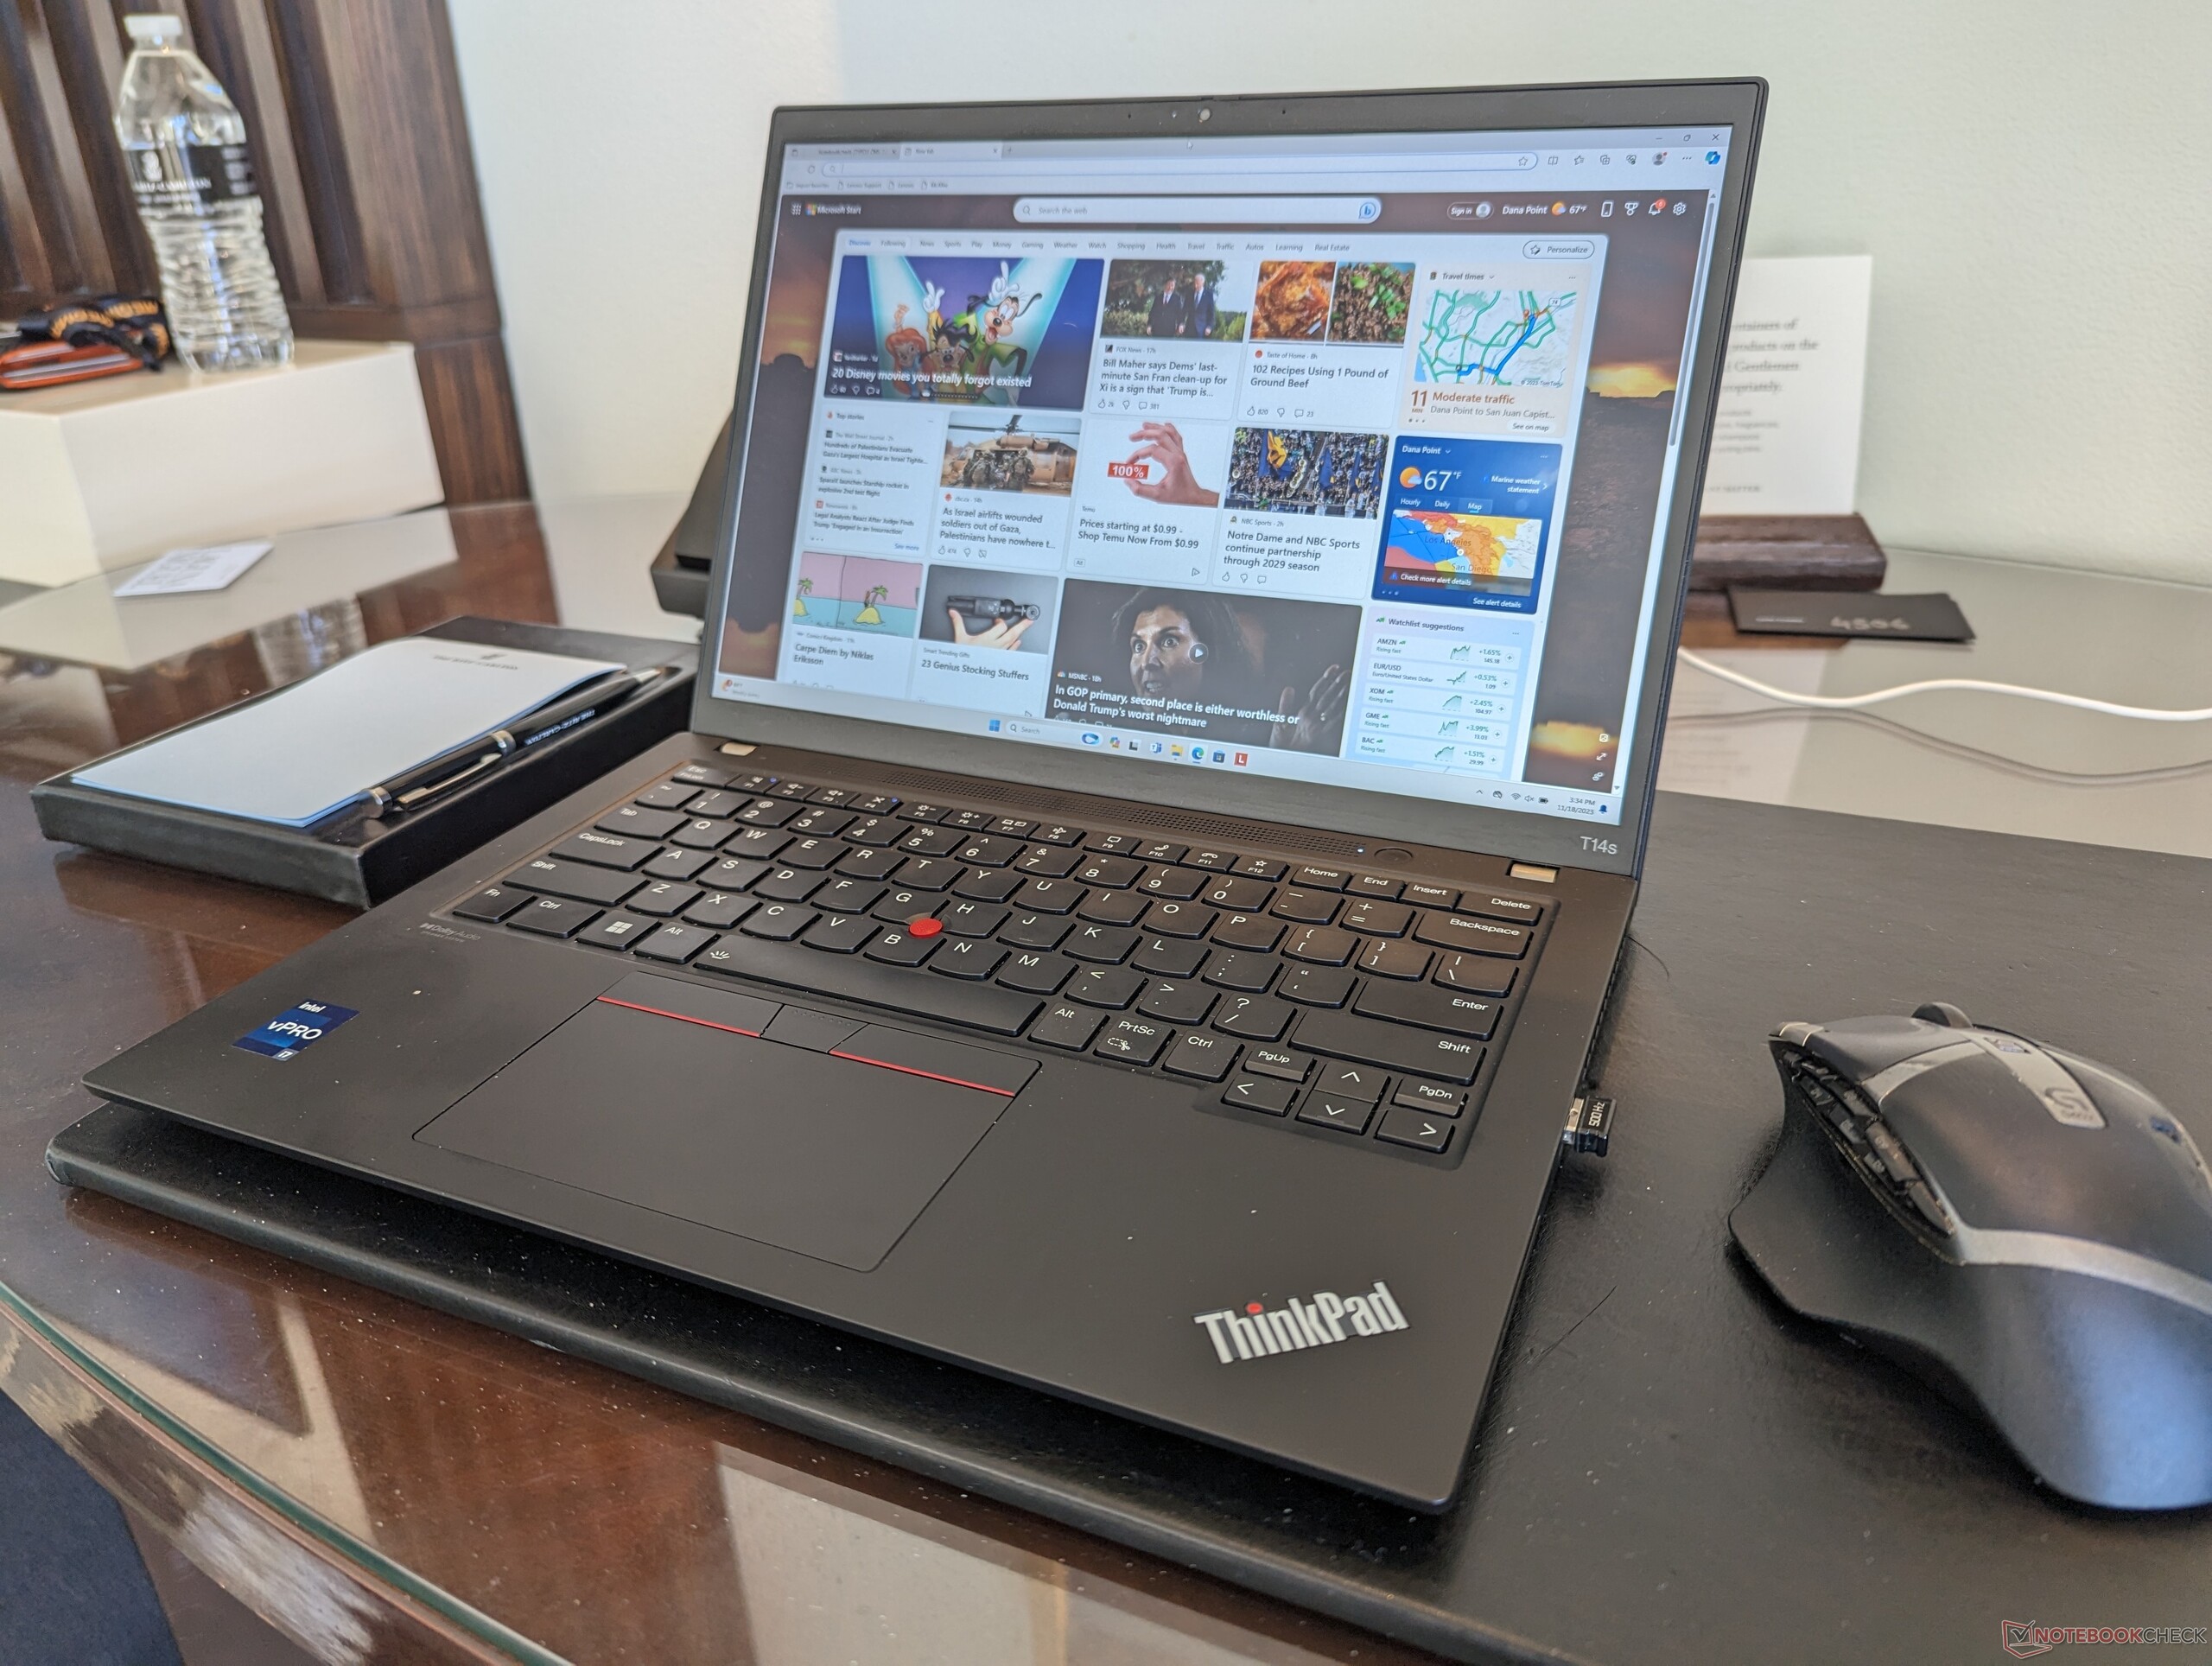
Unser Testgerät wird mit dem Core i7-1365U vPro und einem 1200p IPS-Display für etwa 1.959 Euro ausgeliefert. Es handelt sich um eine der kostengünstigeren Konfigurationen, da es einige Luxusmerkmale wie WAN, Smart Card und die 5-MP-Webcam nicht enthält.
Das ThinkPad T14s konkurriert mit anderen 14-Zoll-Business-Subnotebooks wie dem Dell Latitude 7440, HP EliteBook 845 G10 oder dem Asus ExpertBook B9.
Weitere Lenovo Bewertungen:
Potential Competitors in Comparison
Bew. | Datum | Modell | Gewicht | Dicke | Größe | Auflösung | Preis ab |
|---|---|---|---|---|---|---|---|
| 88.9 % v7 (old) | 11 / 2023 | Lenovo ThinkPad T14s G4 i7-1365U i7-1365U, Iris Xe G7 96EUs | 1.4 kg | 16.9 mm | 14.00" | 1920x1200 | |
| 90.4 % v7 (old) | 10 / 2023 | Lenovo ThinkPad T14s G4-21F8002TGE R7 7840U, Radeon 780M | 1.4 kg | 16.9 mm | 14.00" | 1920x1200 | |
| 88.5 % v7 (old) | 09 / 2023 | Lenovo ThinkPad T14 G4 21HD0043GE i5-1335U, Iris Xe G7 80EUs | 1.4 kg | 17.9 mm | 14.00" | 1920x1200 | |
| 90.5 % v7 (old) | 09 / 2023 | HP EliteBook 845 G10 5Z4X0ES R7 7840U, Radeon 780M | 1.5 kg | 17.9 mm | 14.00" | 1920x1200 | |
| 90.3 % v7 (old) | 07 / 2023 | Dell Latitude 7440 i5-1345U, Iris Xe G7 80EUs | 1.2 kg | 17.95 mm | 14.00" | 2560x1600 | |
| 91.5 % v7 (old) | 11 / 2023 | Asus ExpertBook B9 B9403CVA-KM0153X i7-1355U, Iris Xe G7 96EUs | 1 kg | 17.6 mm | 14.00" | 2880x1800 |
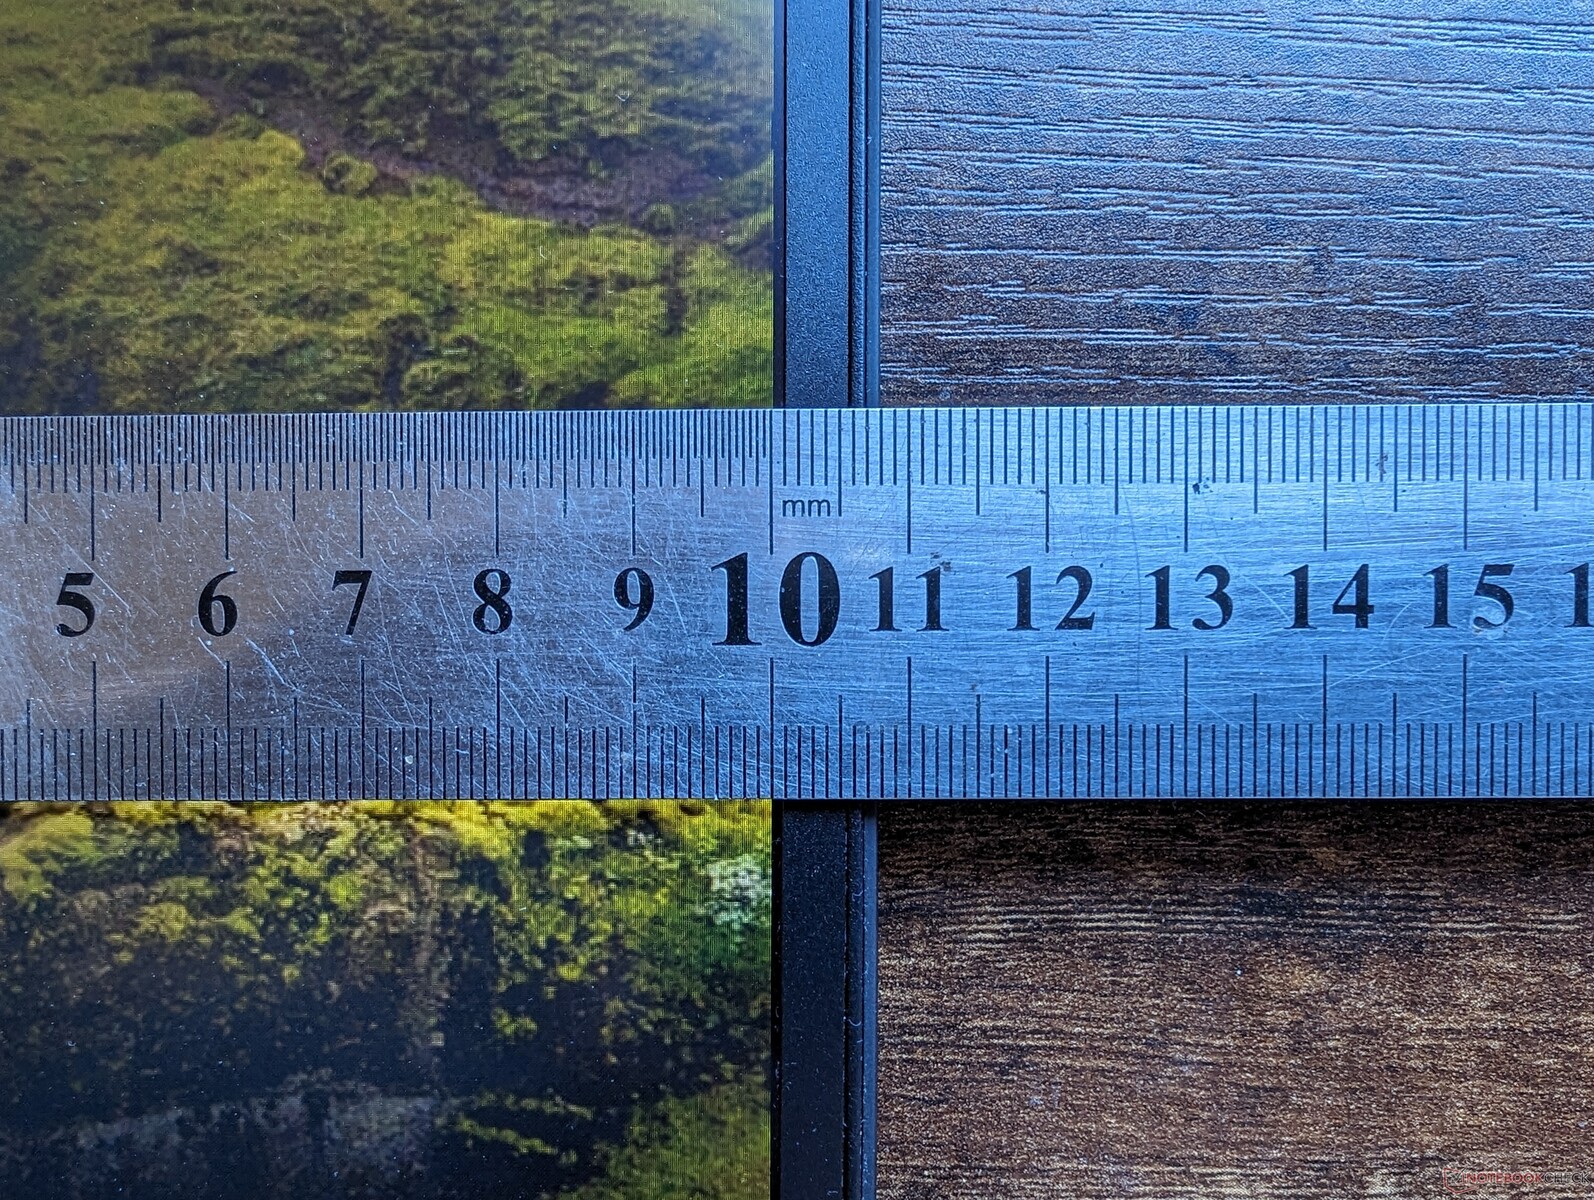
Gehäuse
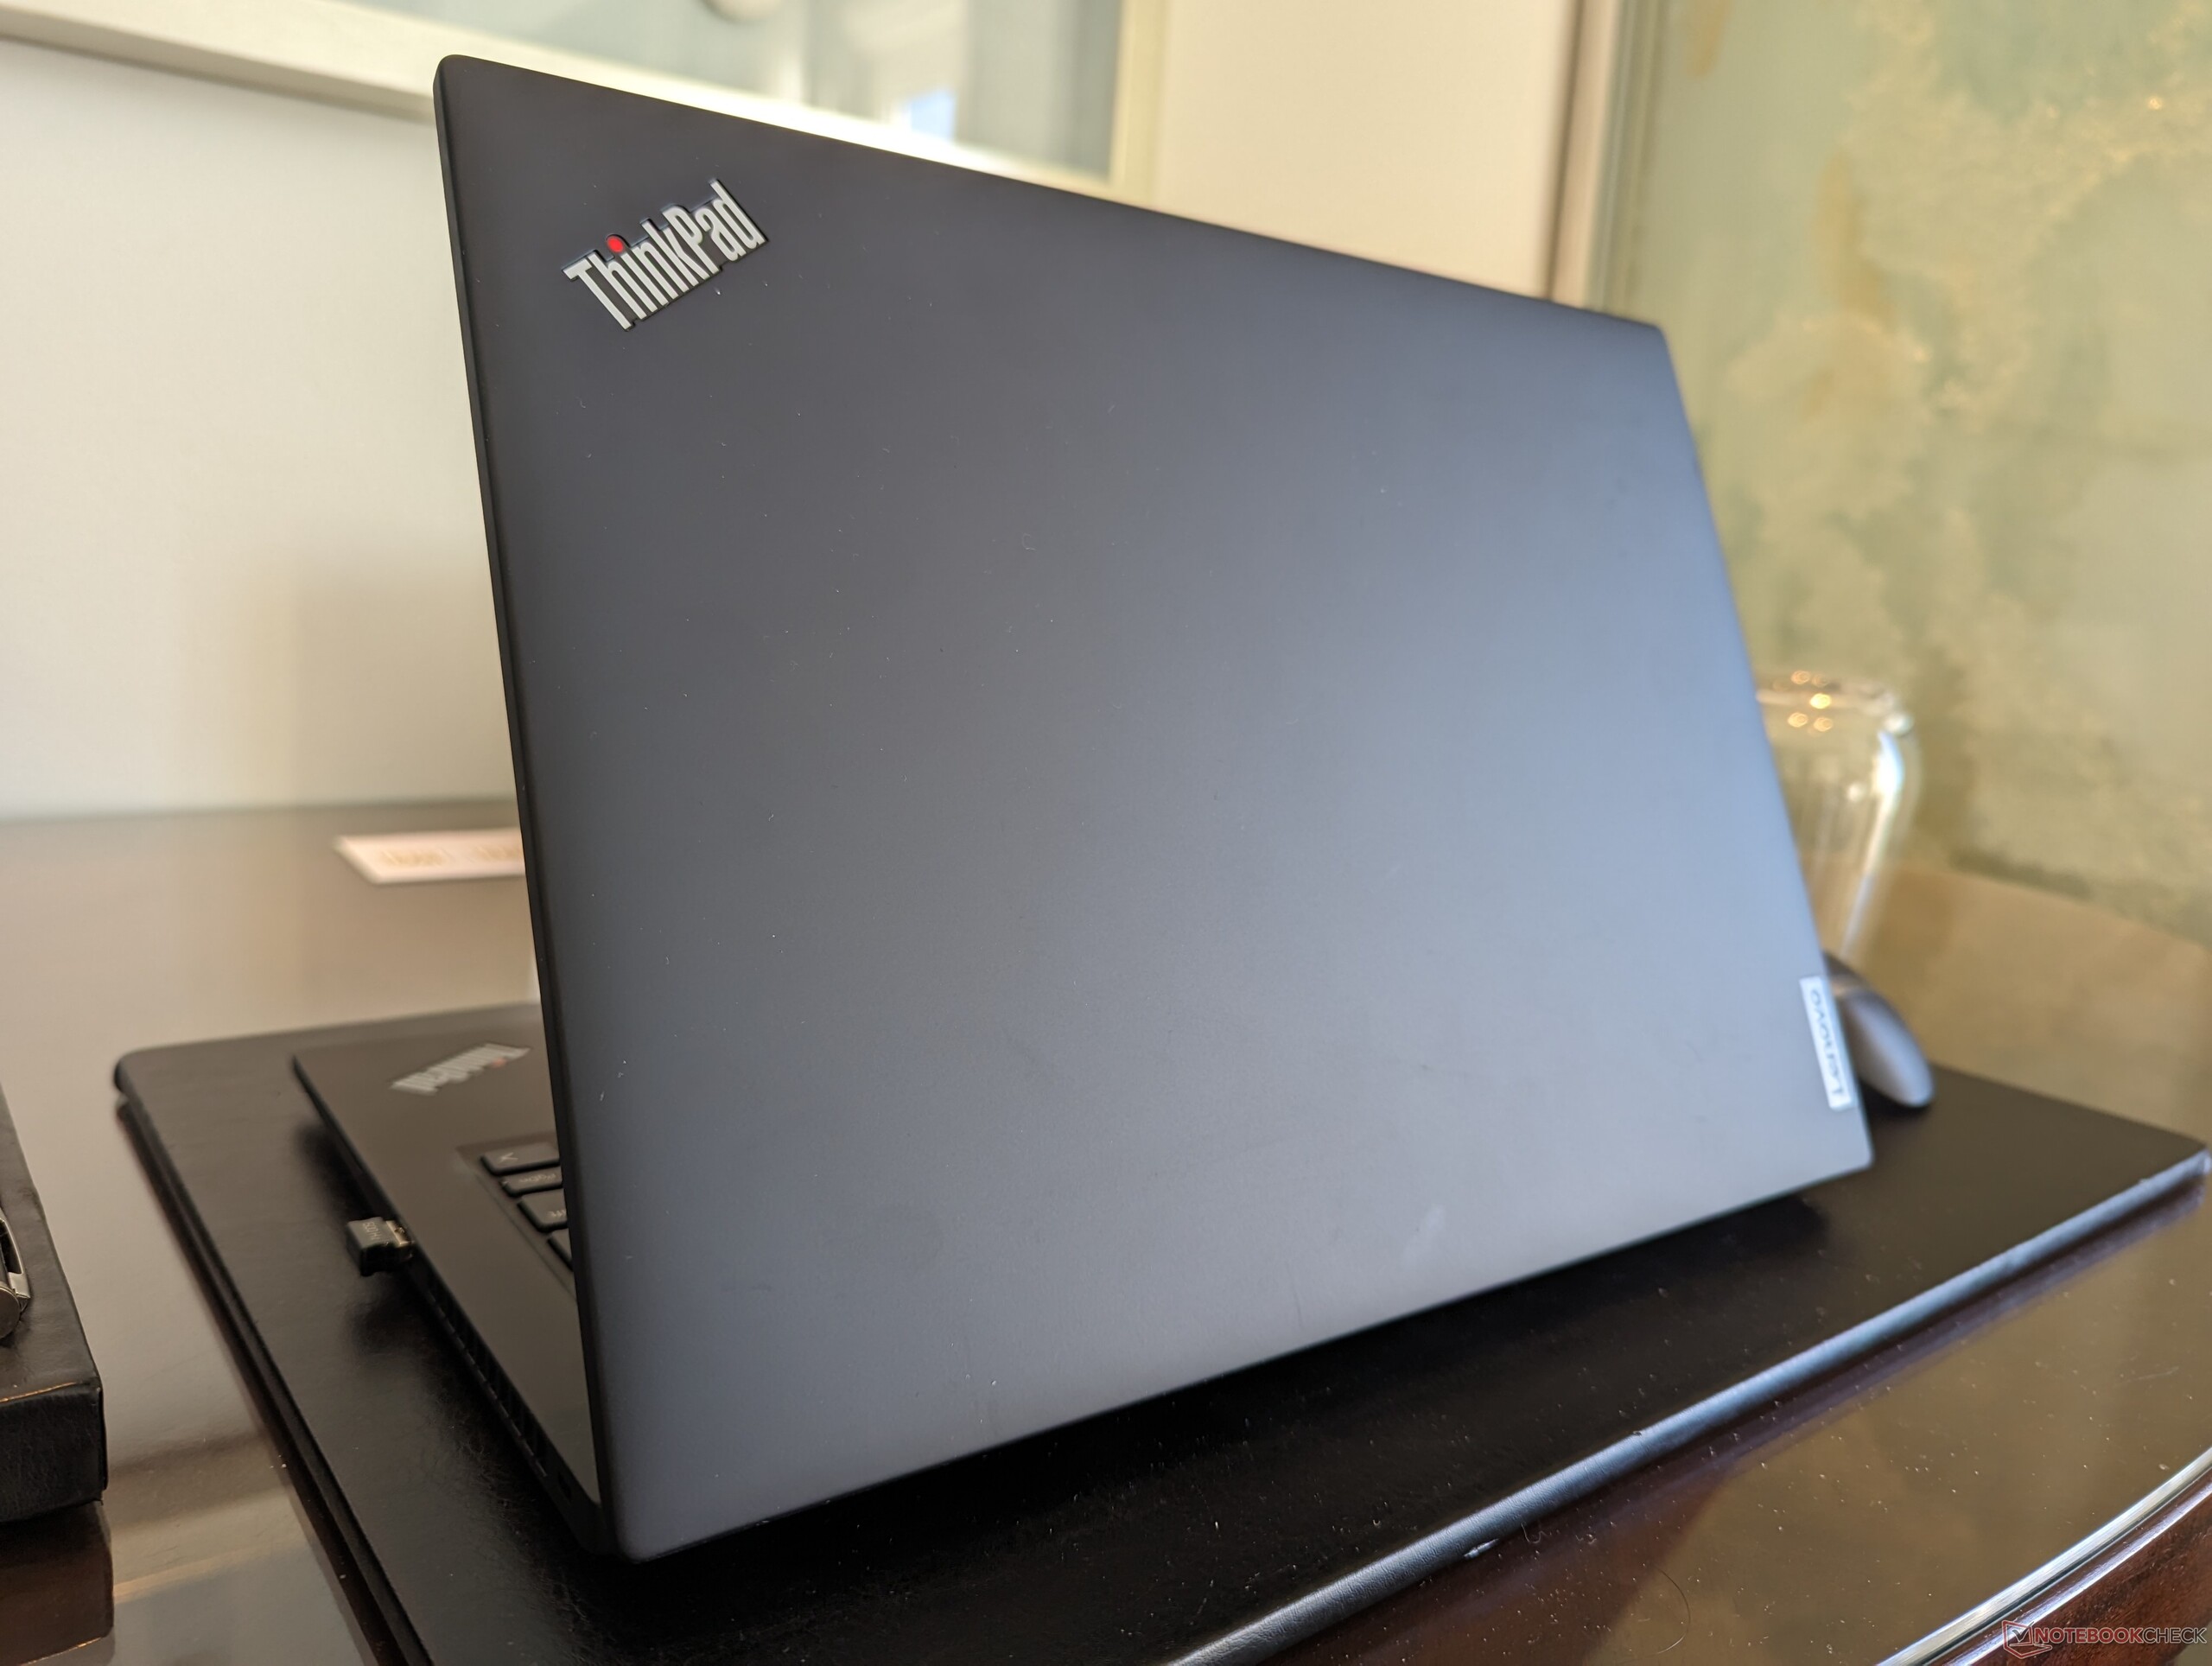
Eine einfache Möglichkeit, eine Intel-Konfiguration von einer AMD-Konfiguration zu unterscheiden - abgesehen von ihren Logo-Aufklebern - ist das Thunderbolt-Symbol neben den USB-C-Anschlüssen. Ansonsten teilen sich die Intel- und AMD-Modelle das gleiche Gehäusedesign, ohne weitere optische Unterschiede.
Kommunikation
Die WLAN-Leistung ist gleichmäßig und ausgezeichnet, wenn das Gerät mit unserem Wi-Fi 6E (6 GHz) Netzwerk verbunden ist. Bei Wi-Fi 6 (5 GHz) zeigt die Leistung leichte Schwankungen, wie in der Grafik unten dargestellt, bleibt jedoch zuverlässig und ist absolut nutzbar.
Webcam
Unser Testgerät ist mit einer 2-MP-Webcam ausgestattet und nicht, wie bei unserem AMD-Gerät, mit einer 5-MP-Webcam. Infrarot (IR) ist optional, während der Schieberegler für die Privatsphäre standardmäßig vorhanden ist.


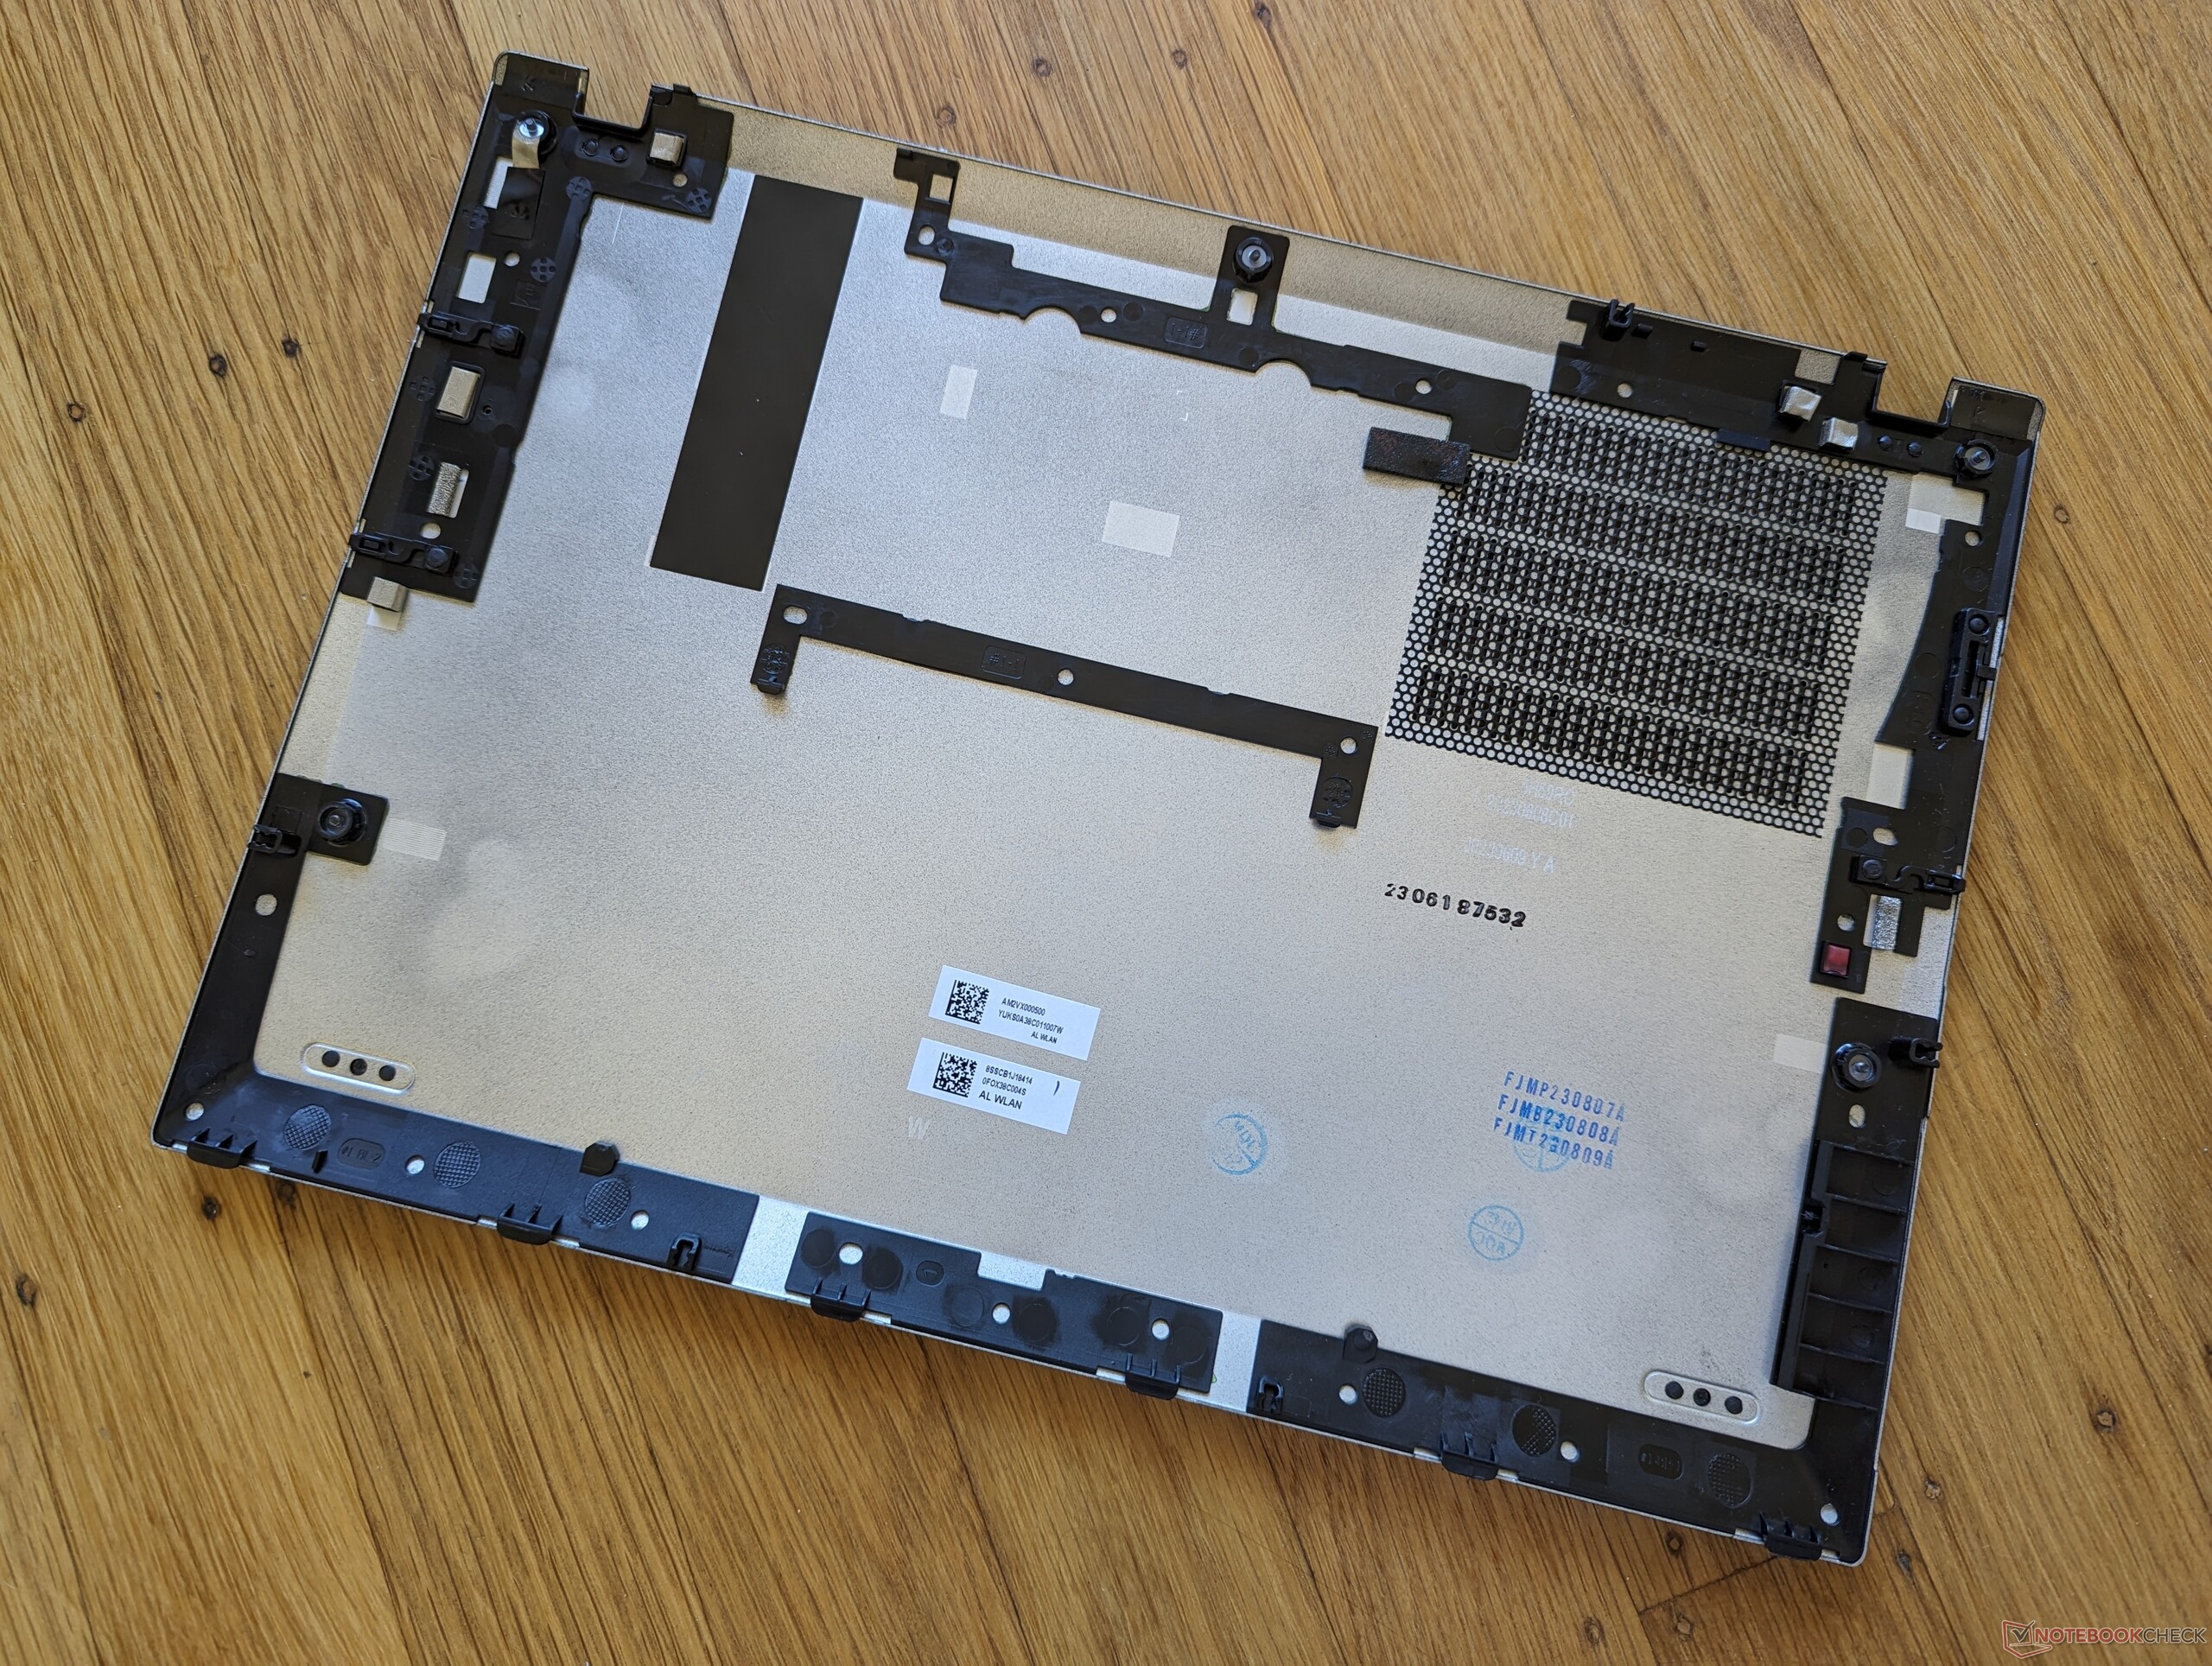
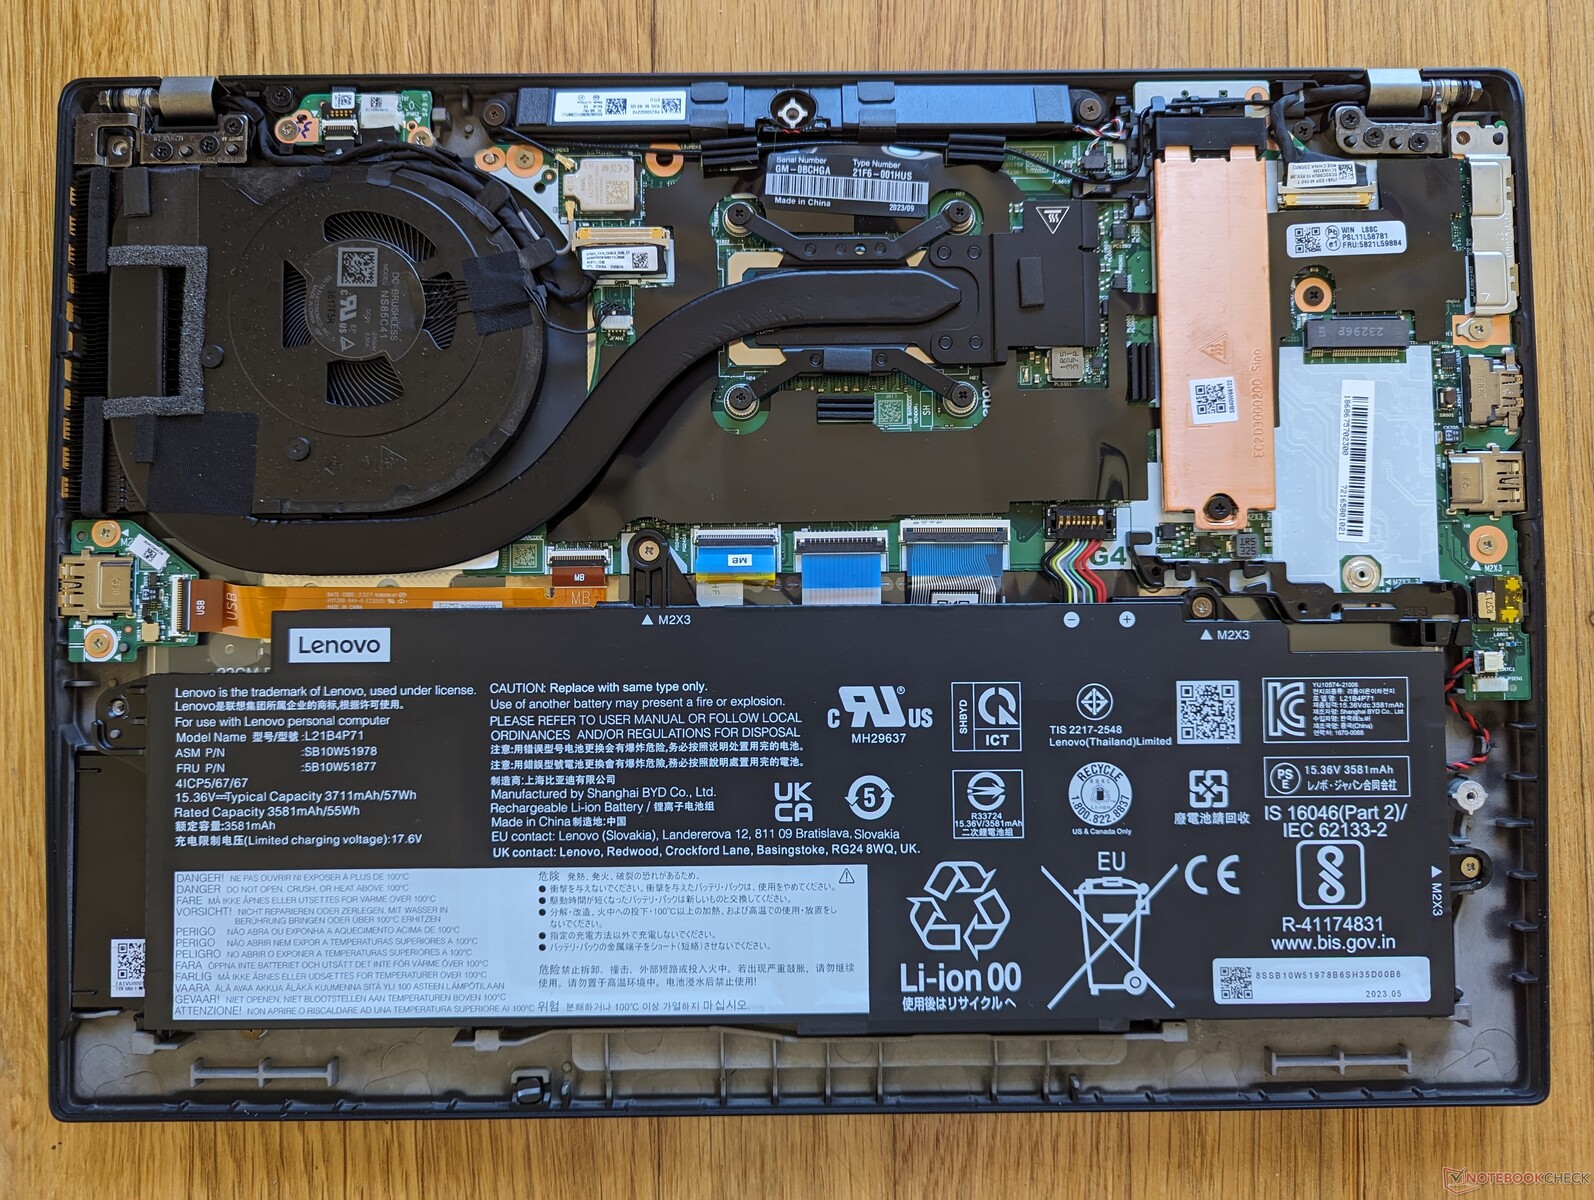
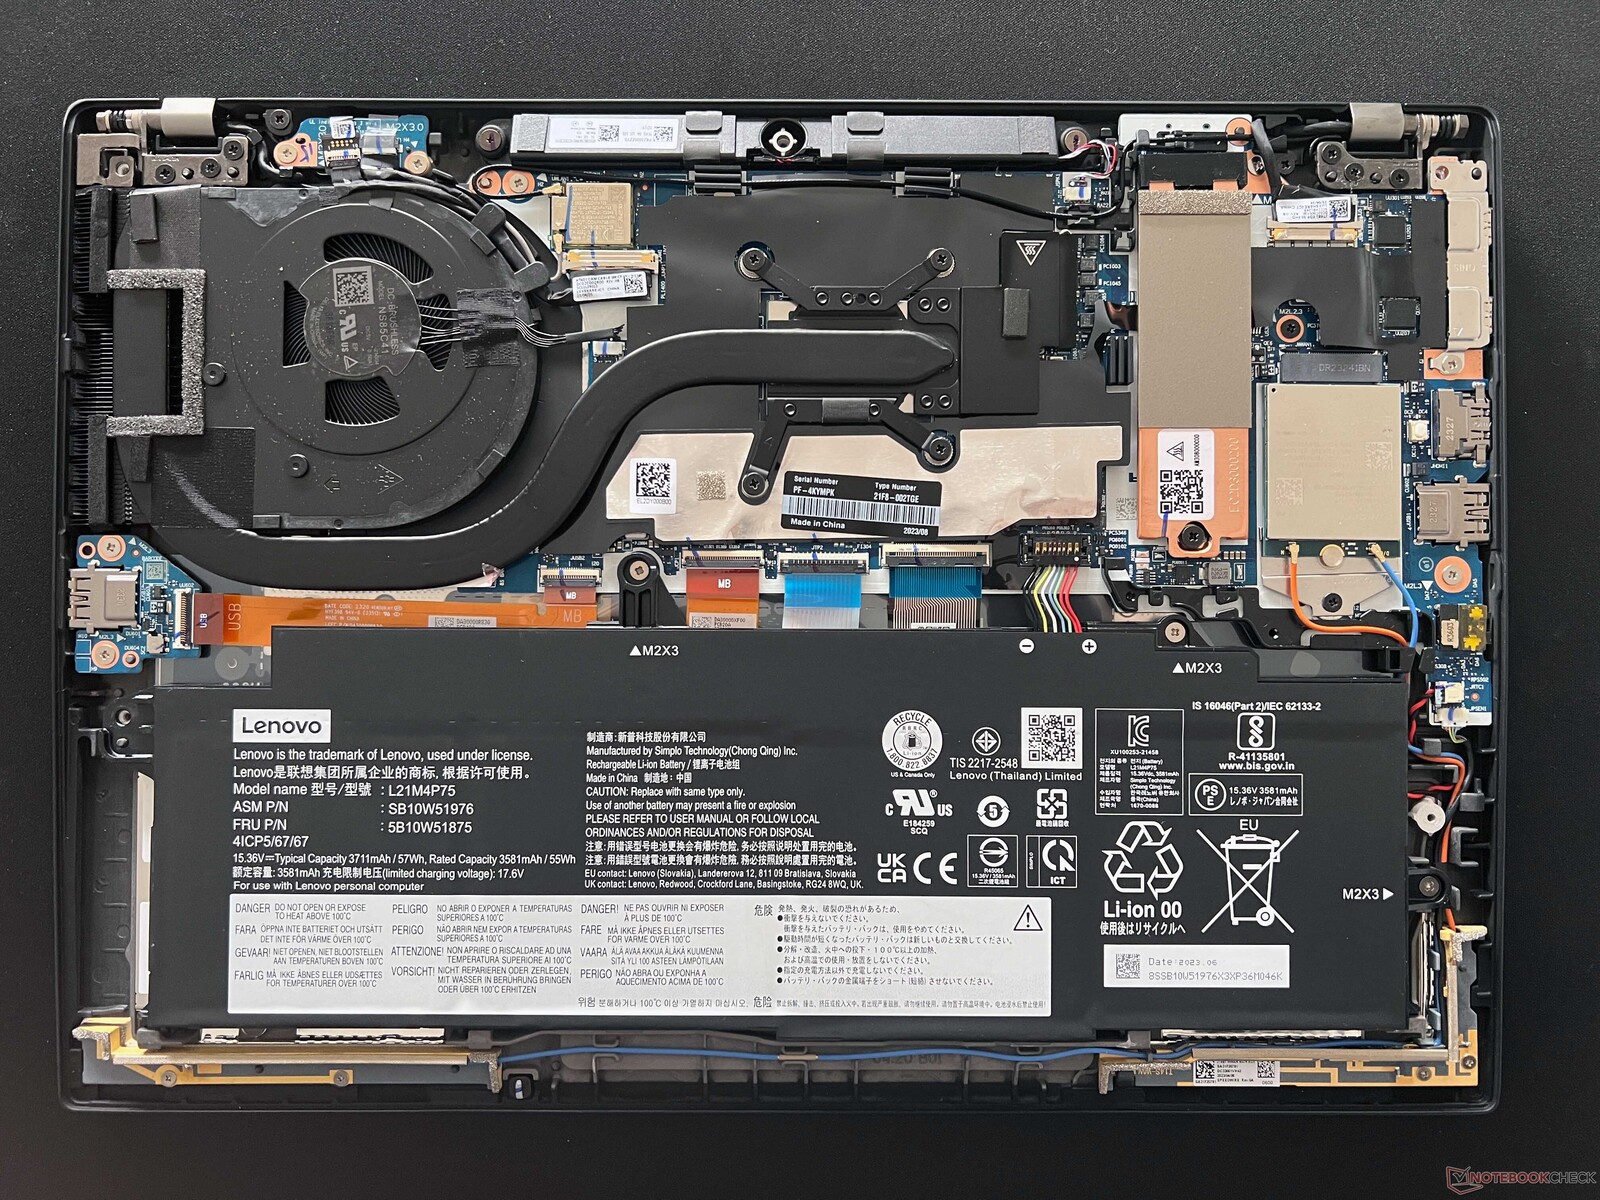
Wartung
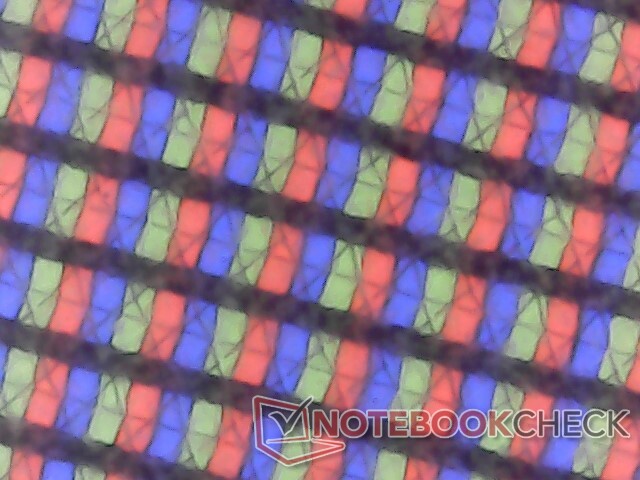
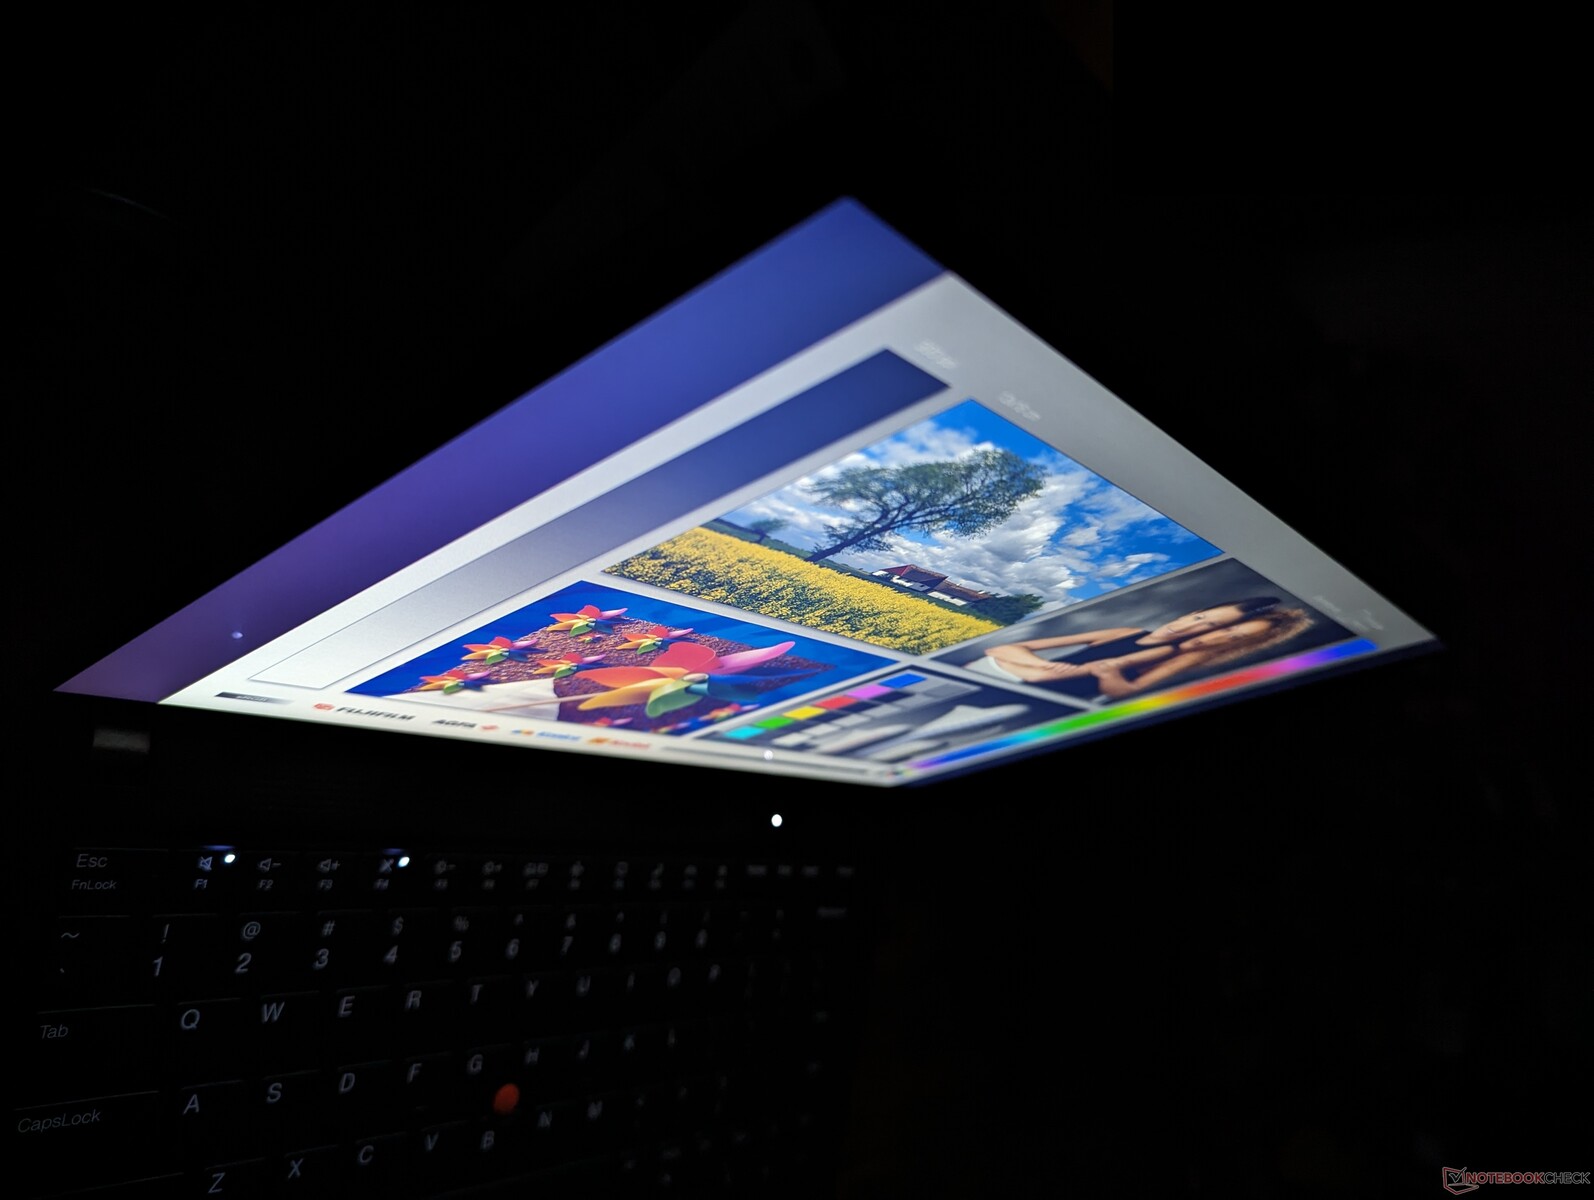
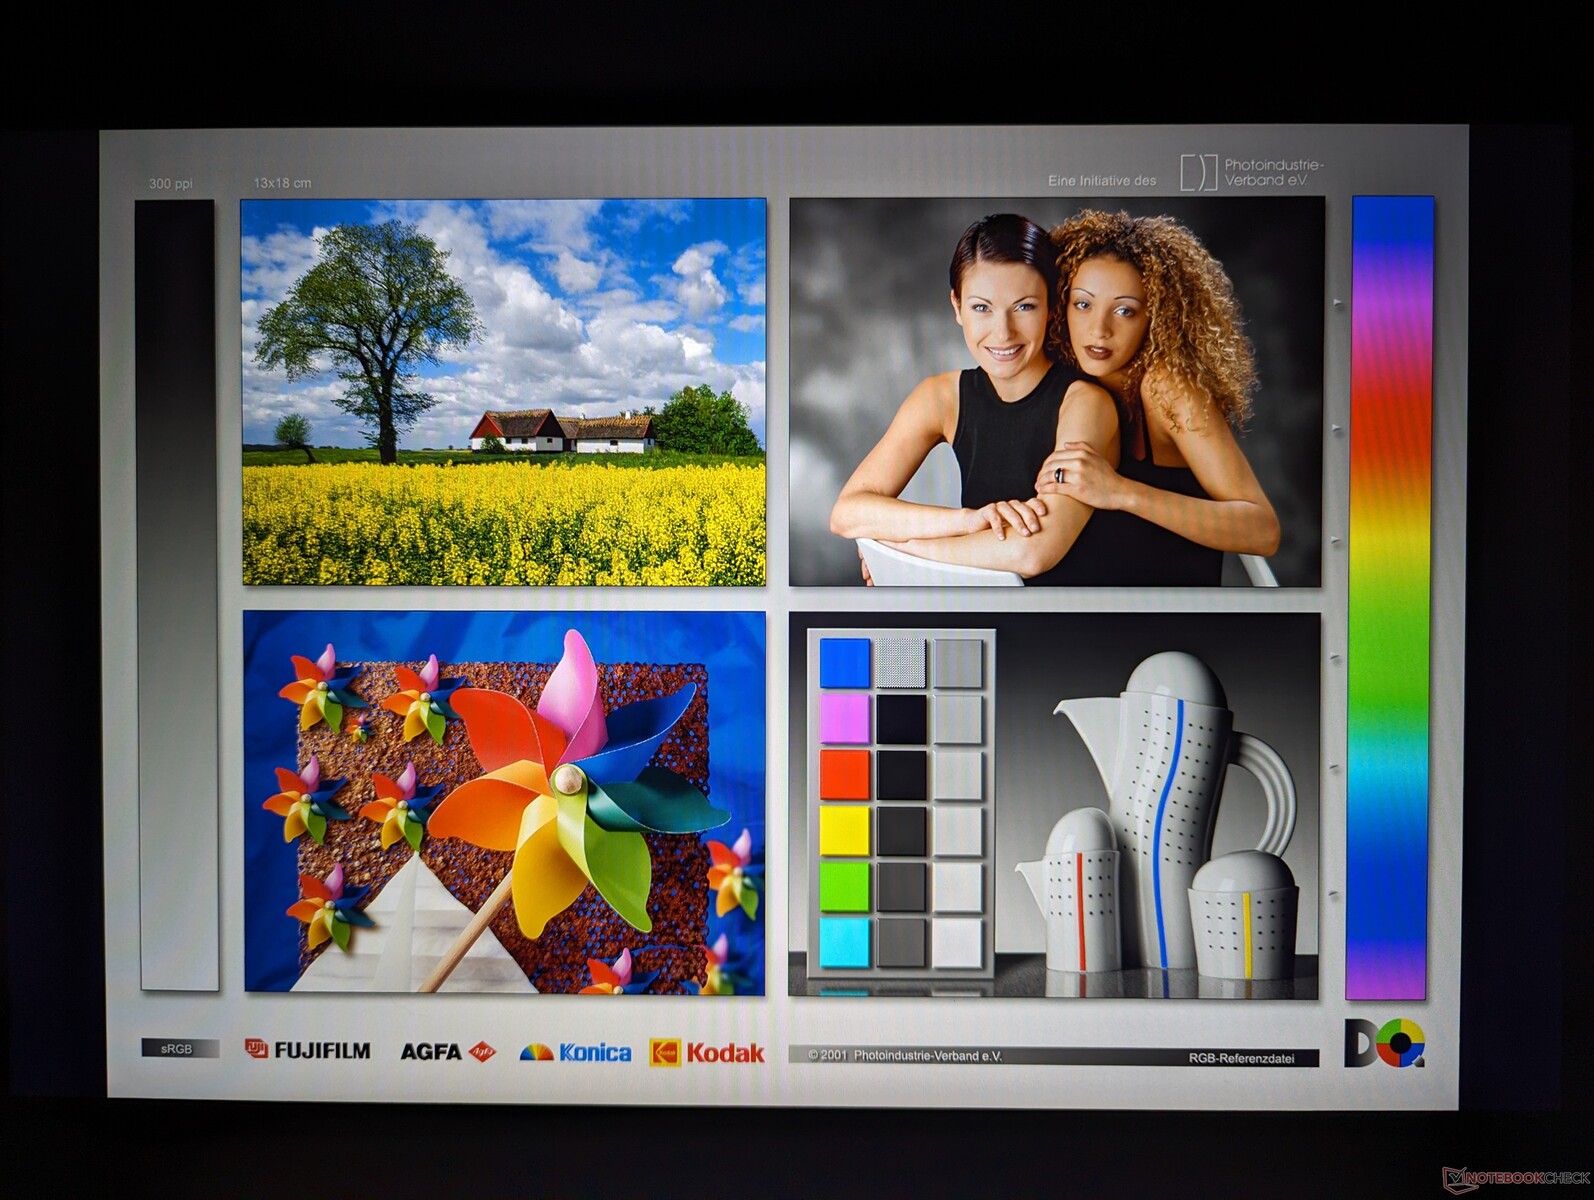
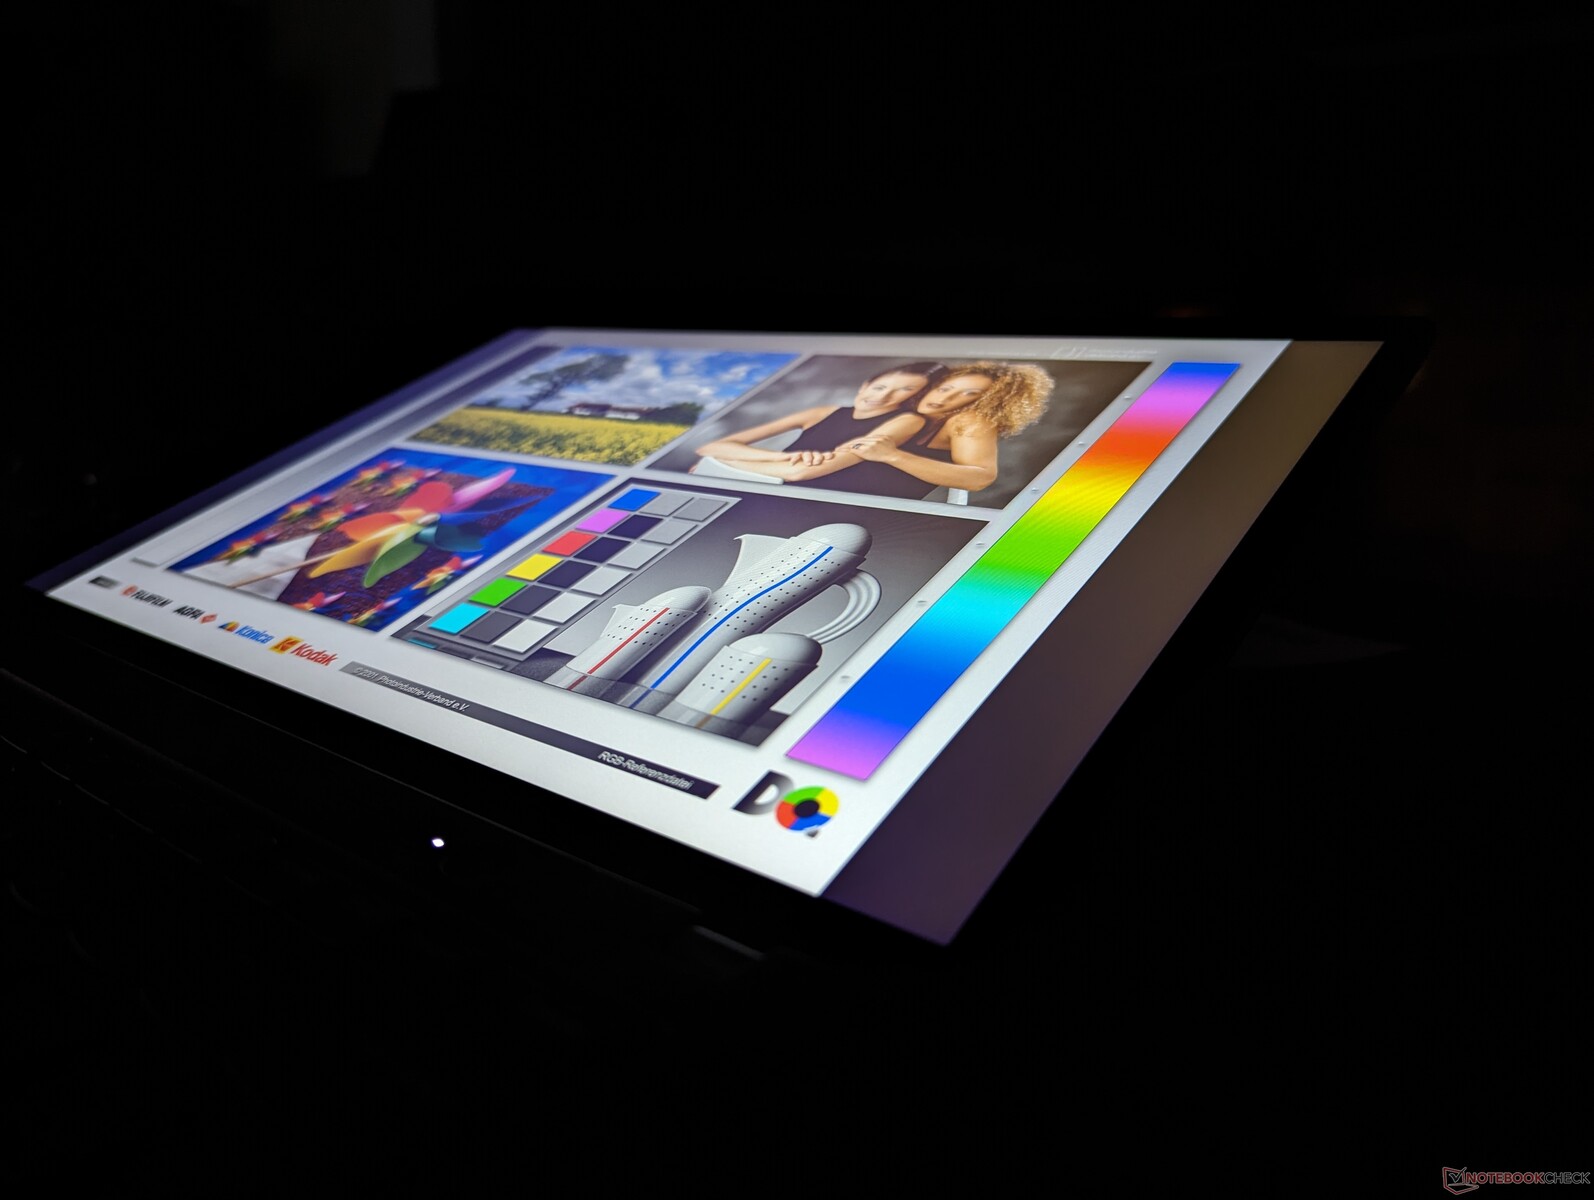
Display
Es stehen insgesamt sechs (!) Display-Optionen zur Verfügung, die unten aufgeführt sind. Unser Testgerät wurde mit der fettgedruckten Option konfiguriert, die zu den kostengünstigeren Optionen gehört.
- 1920 x 1200, IPS, 300 Nits, Touchscreen, matt, ~60% sRGB
- 1920 x 1200, IPS, 300 Nits, matt, ~60% sRGB
- 2240 x 1400, IPS, 300 nNits, matt, ~60% sRGB
- 1920 x 1200, IPS, 400 Nits, matt, 100% sRGB
- 2800 x 1800, OLED, 400 Nits (500 nits HDR), glänzend, 100% DCI-P3
- 1920 x 1200, IPS, 500 Nits, Touchscreen, matt, 100% sRGB
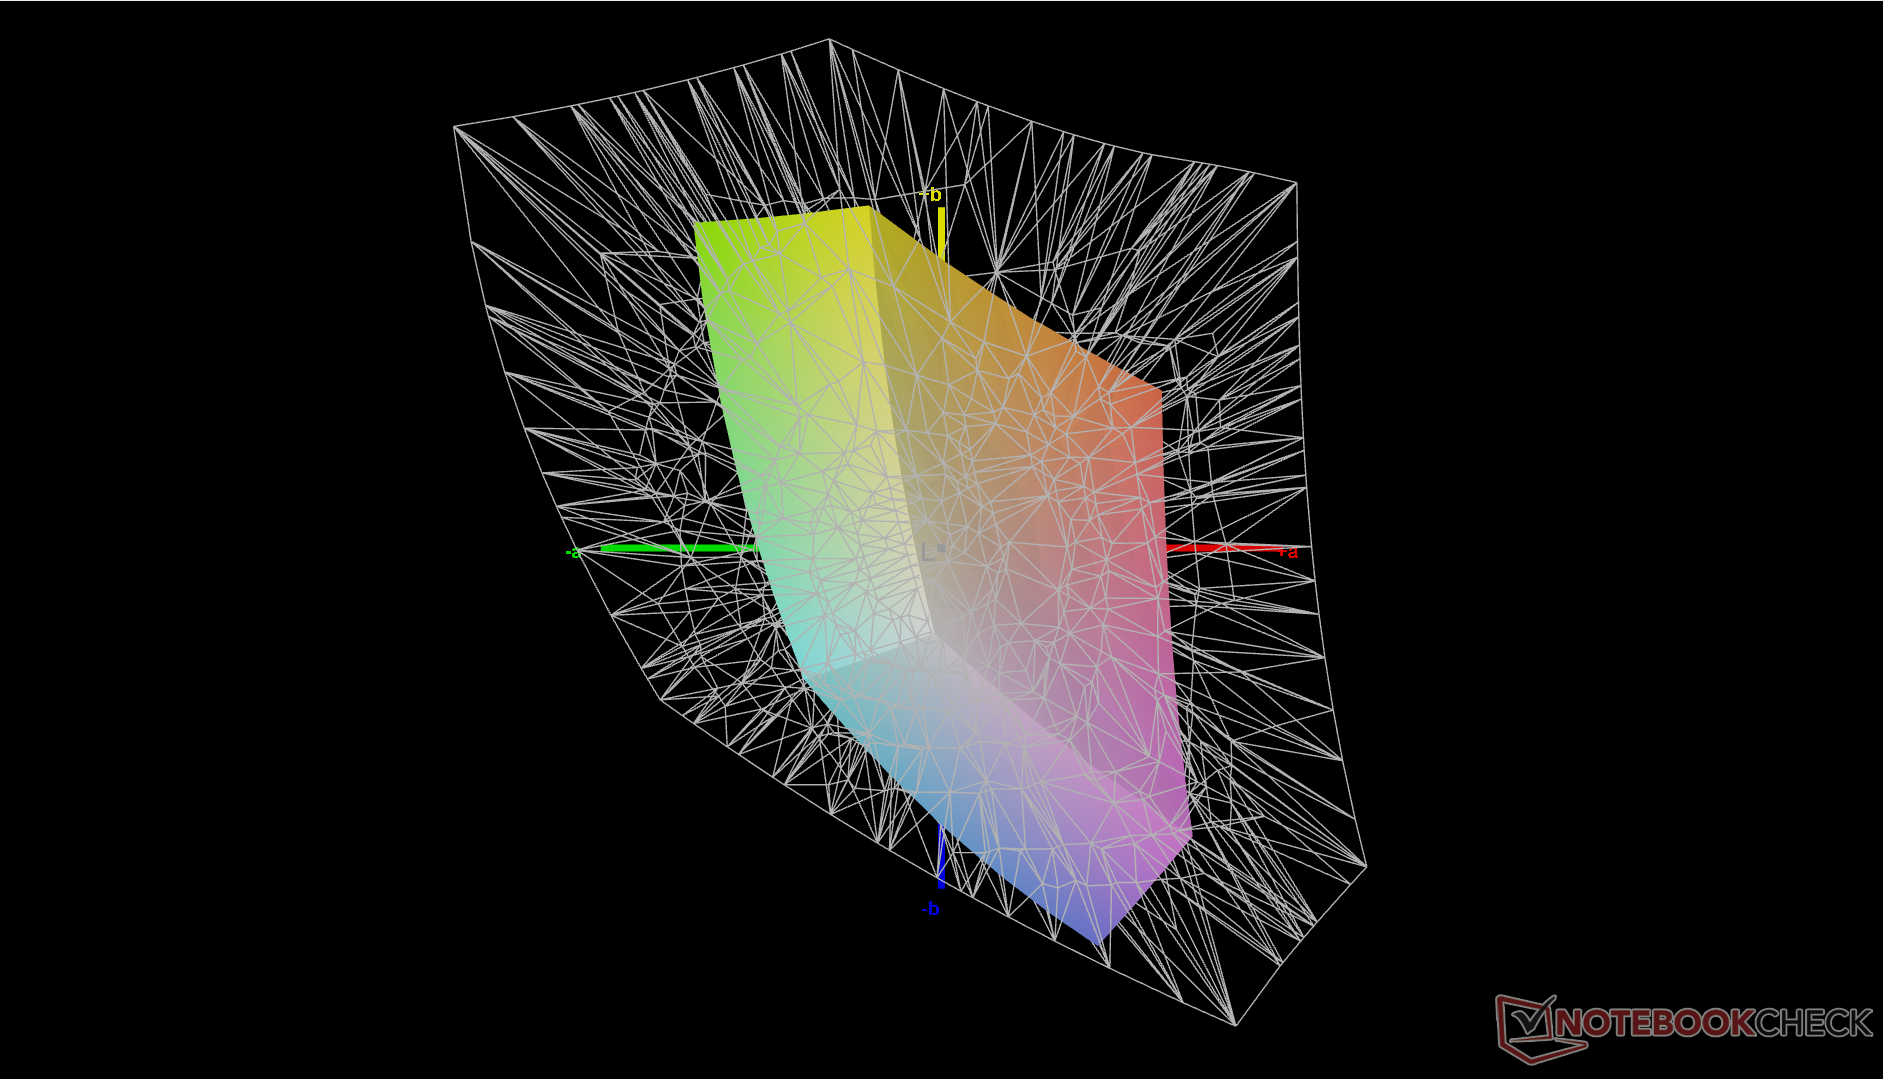
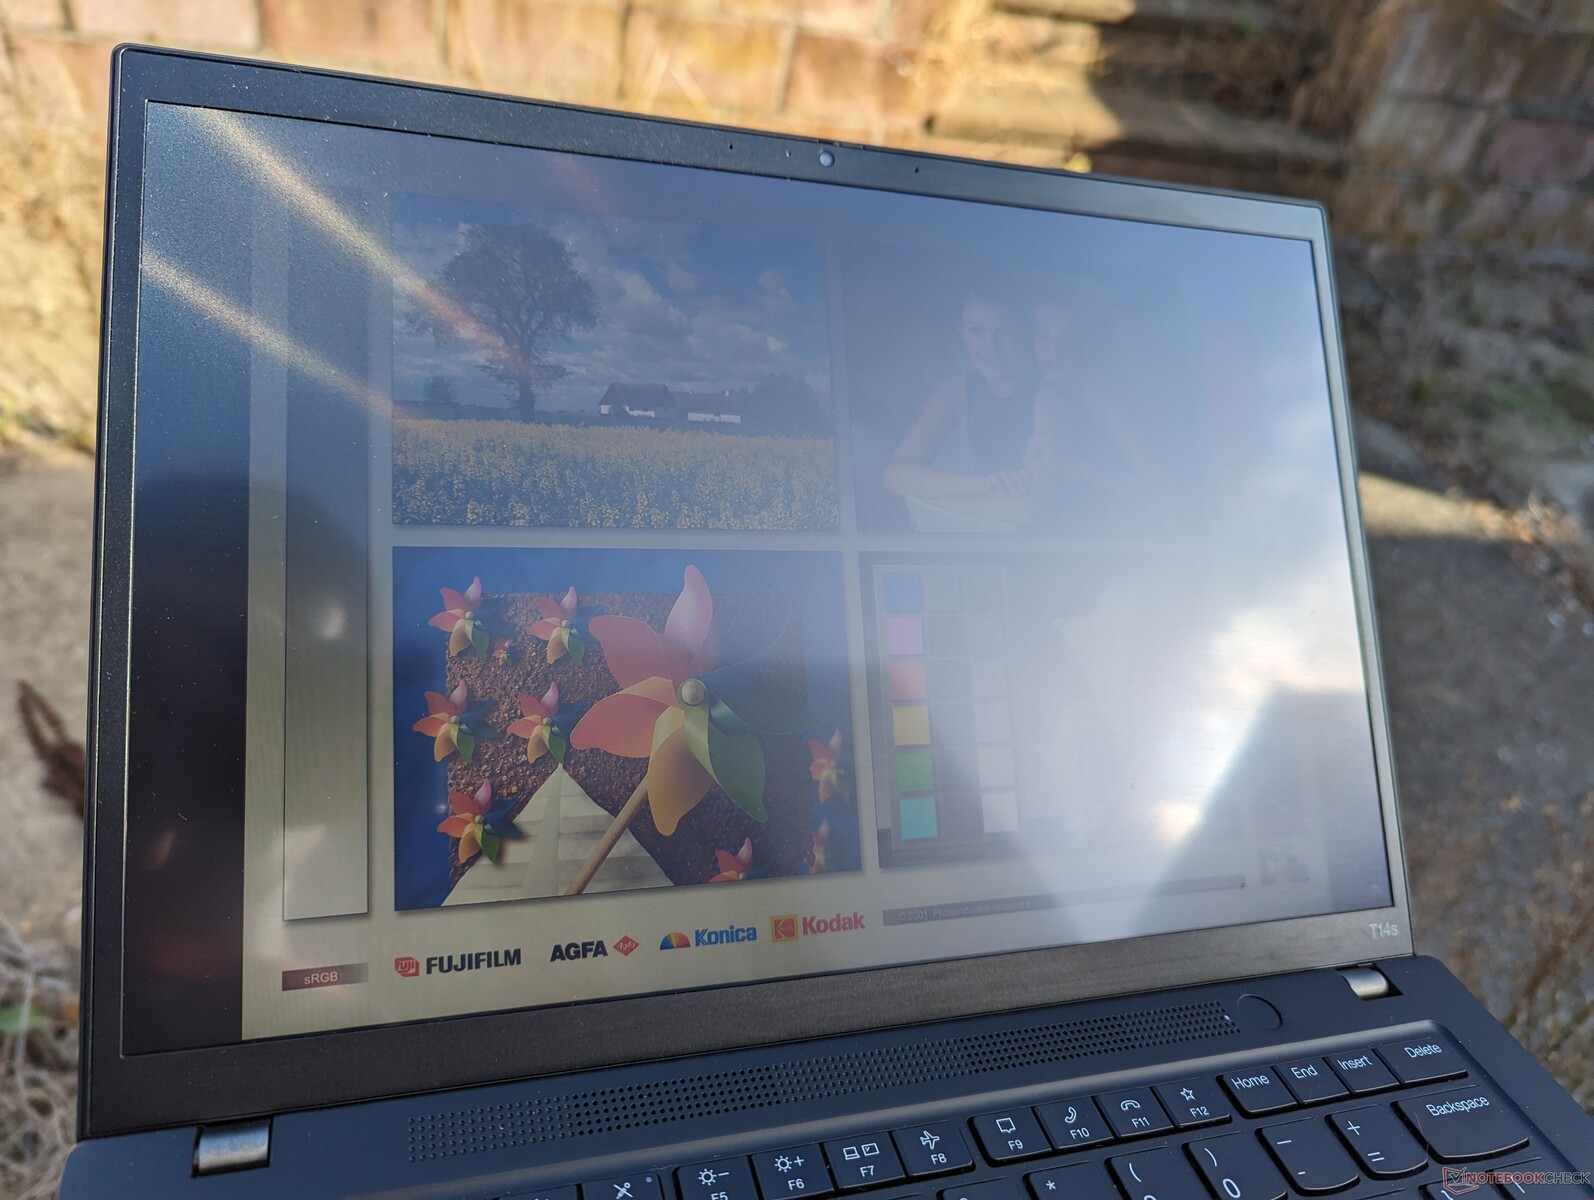
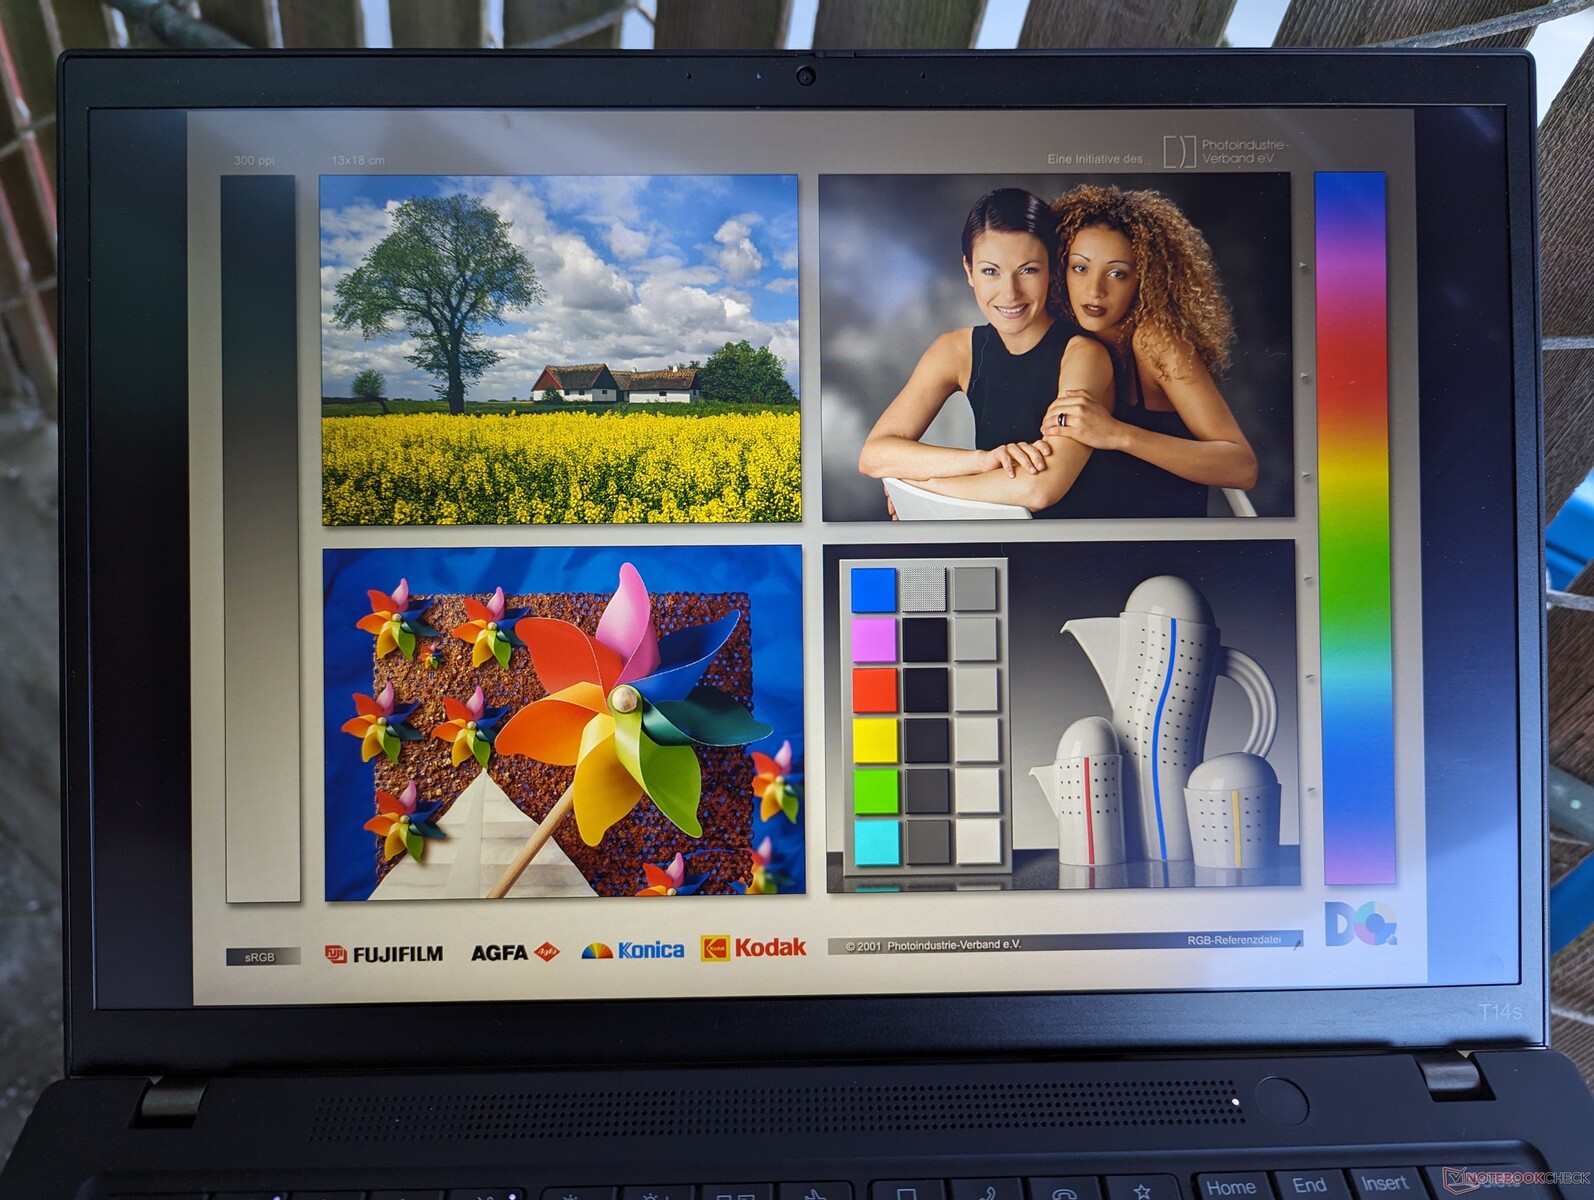
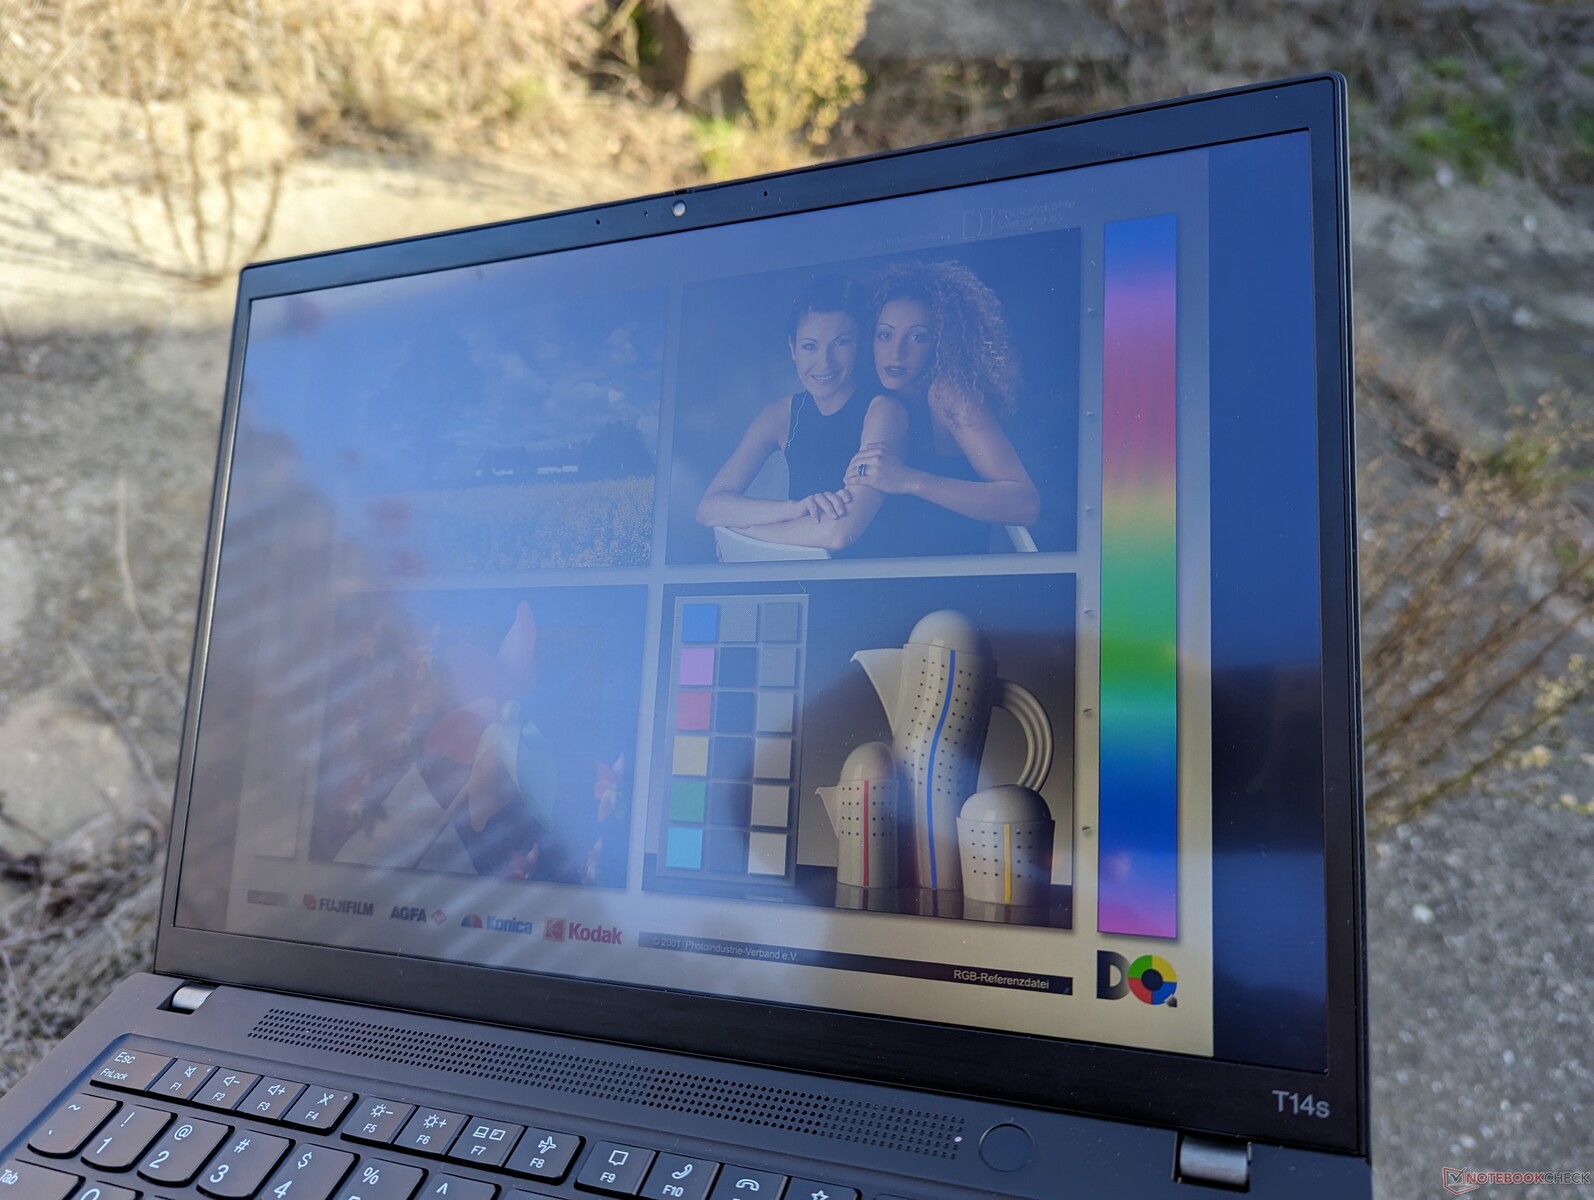
Wie unsere Messungen unten zeigen, führt die Entscheidung für das günstigere Panel zu spürbaren Einbußen bei Farben und Helligkeit im Vergleich zu den höherwertigen Optionen. Wir empfehlen zumindest die vierte Option mit voller sRGB-Abdeckung, insbesondere für die Grafikbearbeitung und zur Verbesserung der Sichtbarkeit im Freien.
Es gibt leider keine Display-Optionen mit mehr als 60 Hz, was bedauerlich ist, da konkurrierende 14-Zoll-Subnotebooks wie das Asus ExpertBook B9 über OLED-Panels mit 90 Hz verfügen.

| |||||||||||||||||||||||||
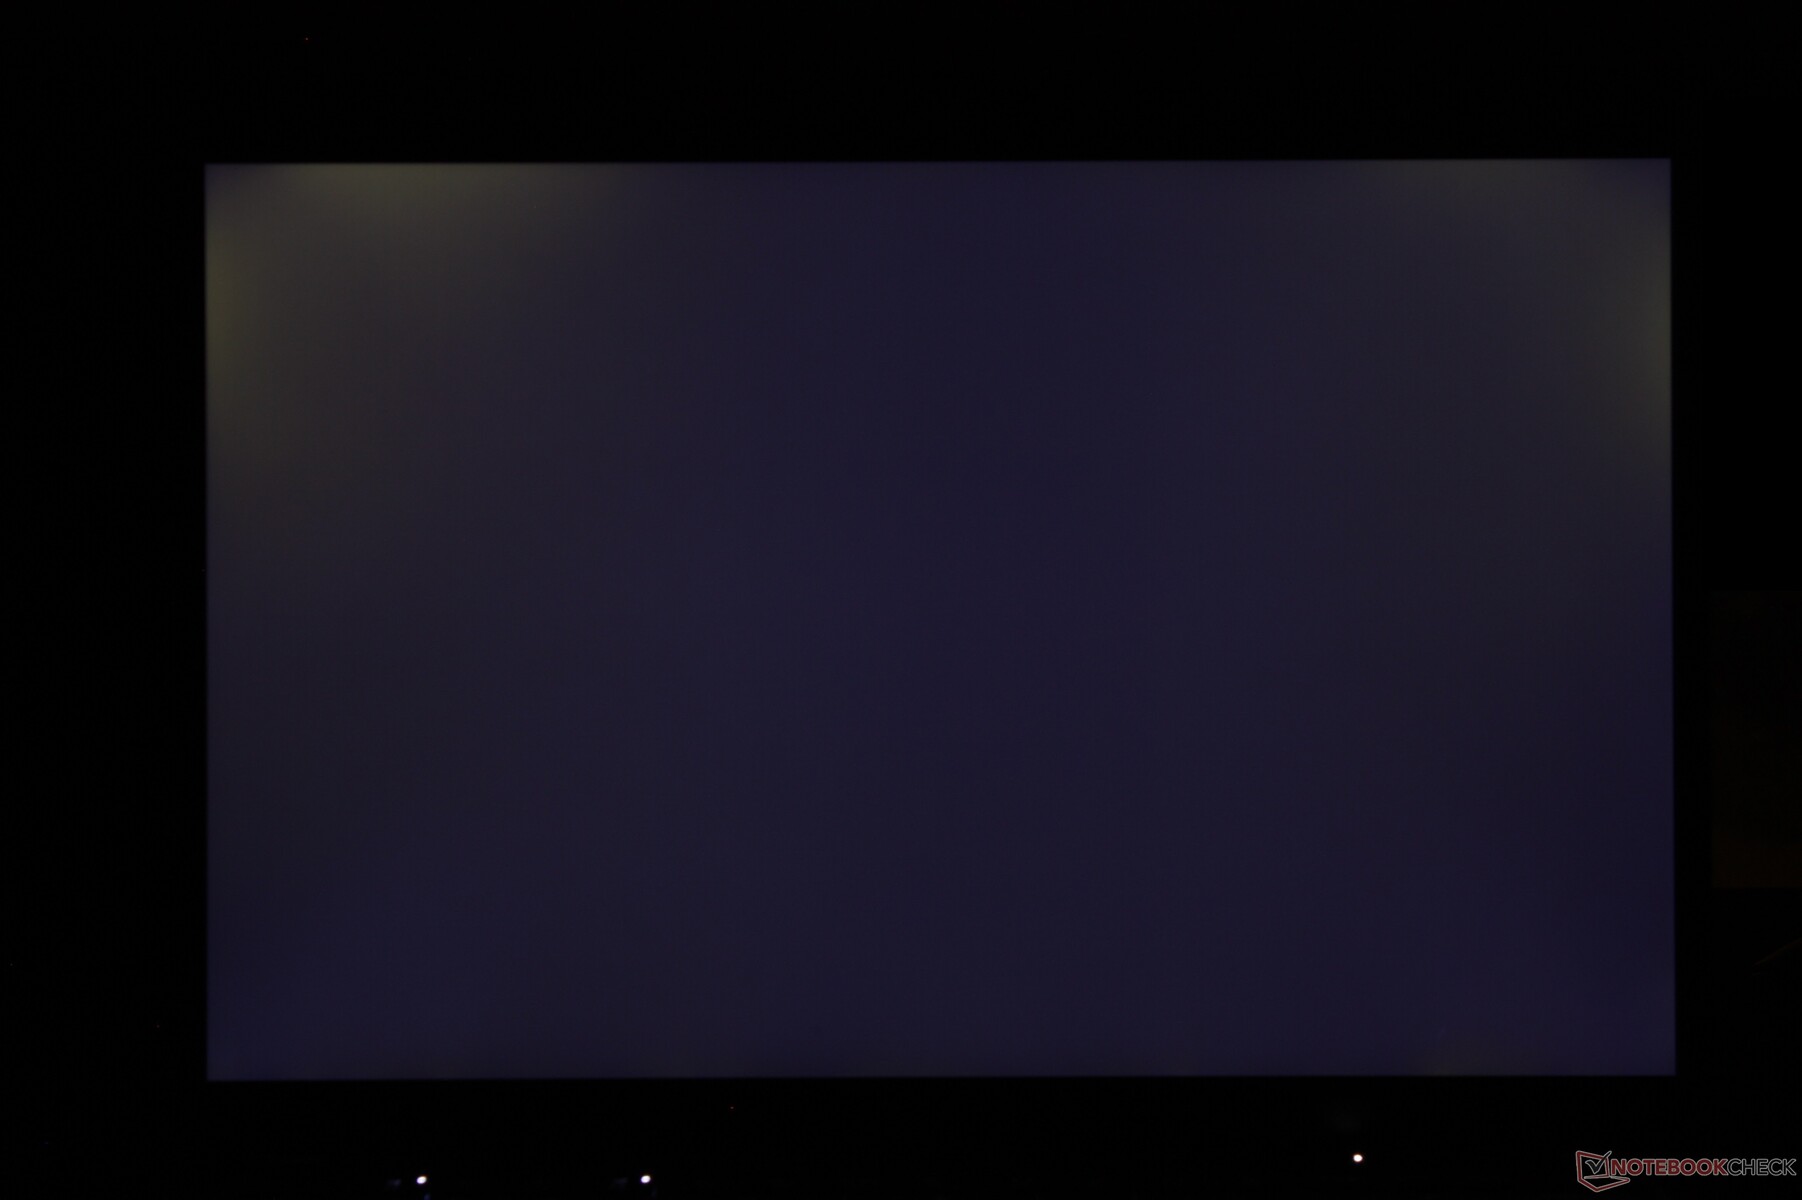
Ausleuchtung: 85 %
Helligkeit Akku: 322.5 cd/m²
Kontrast: 733:1 (Schwarzwert: 0.44 cd/m²)
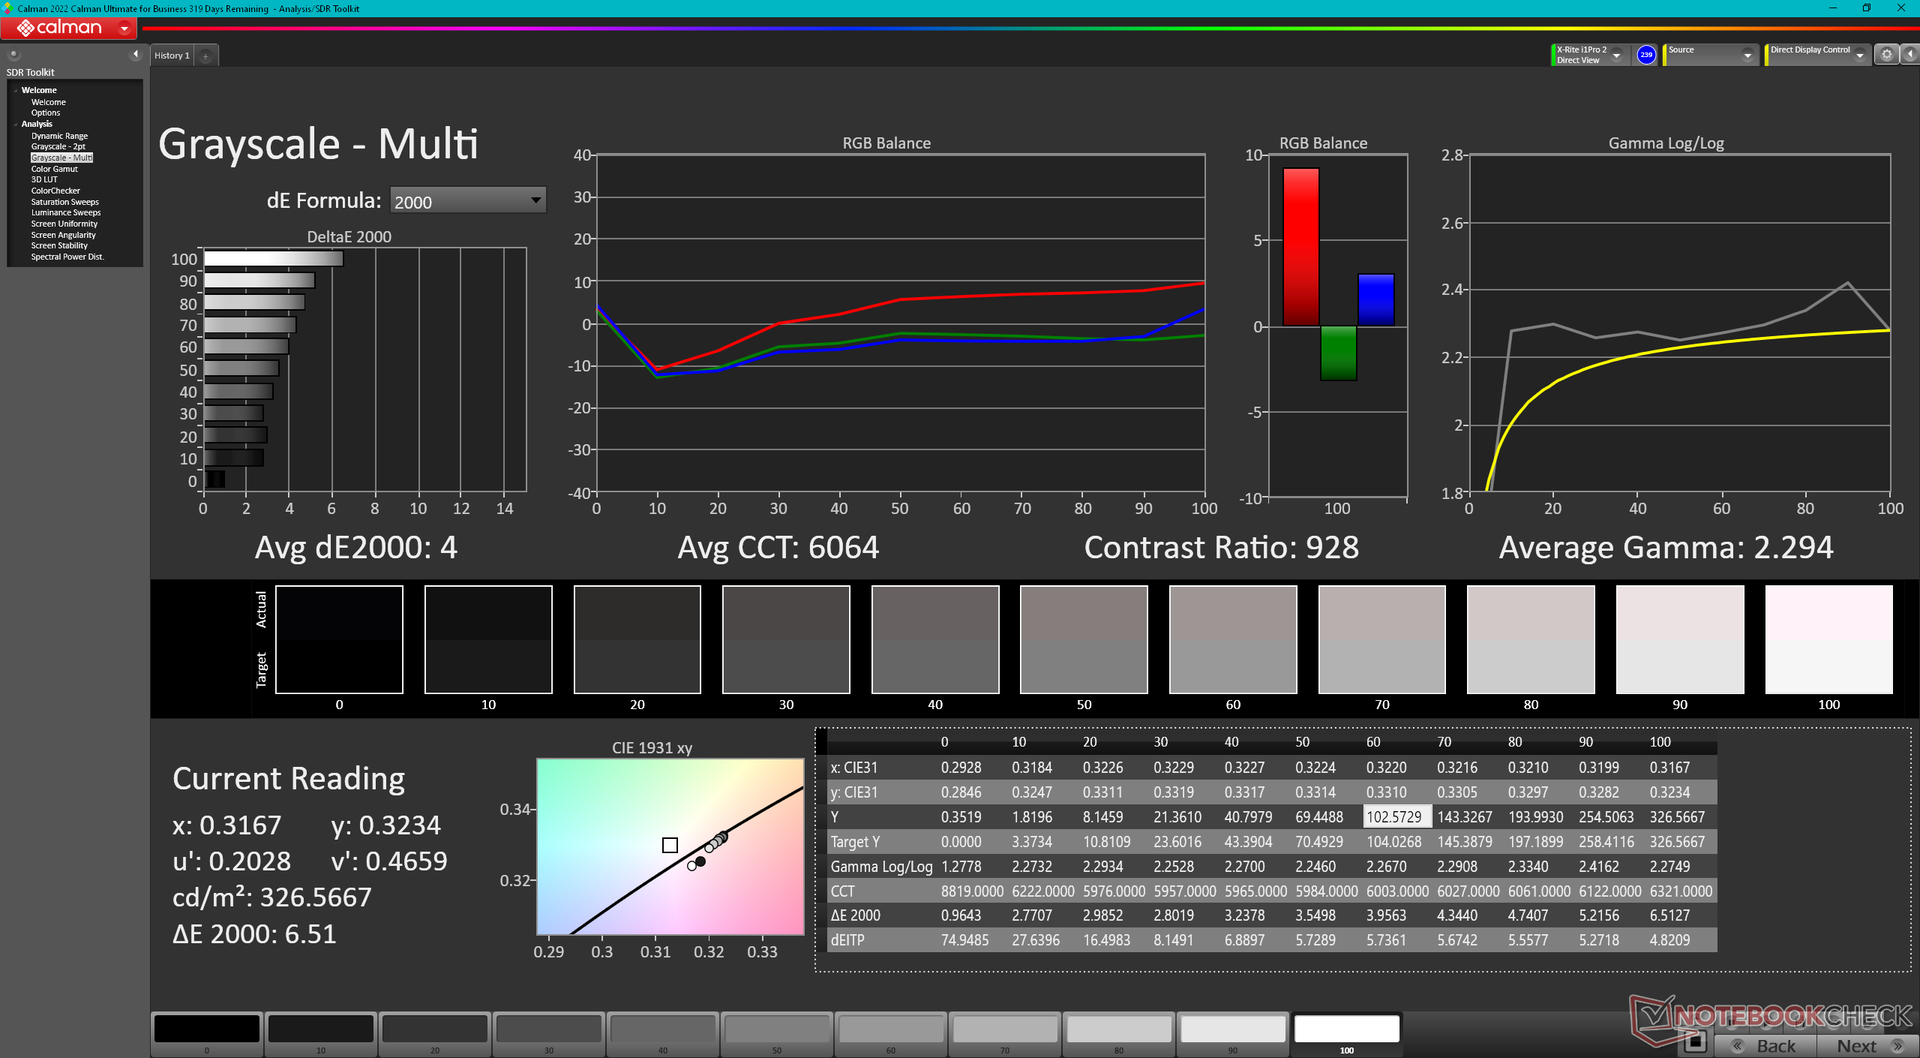
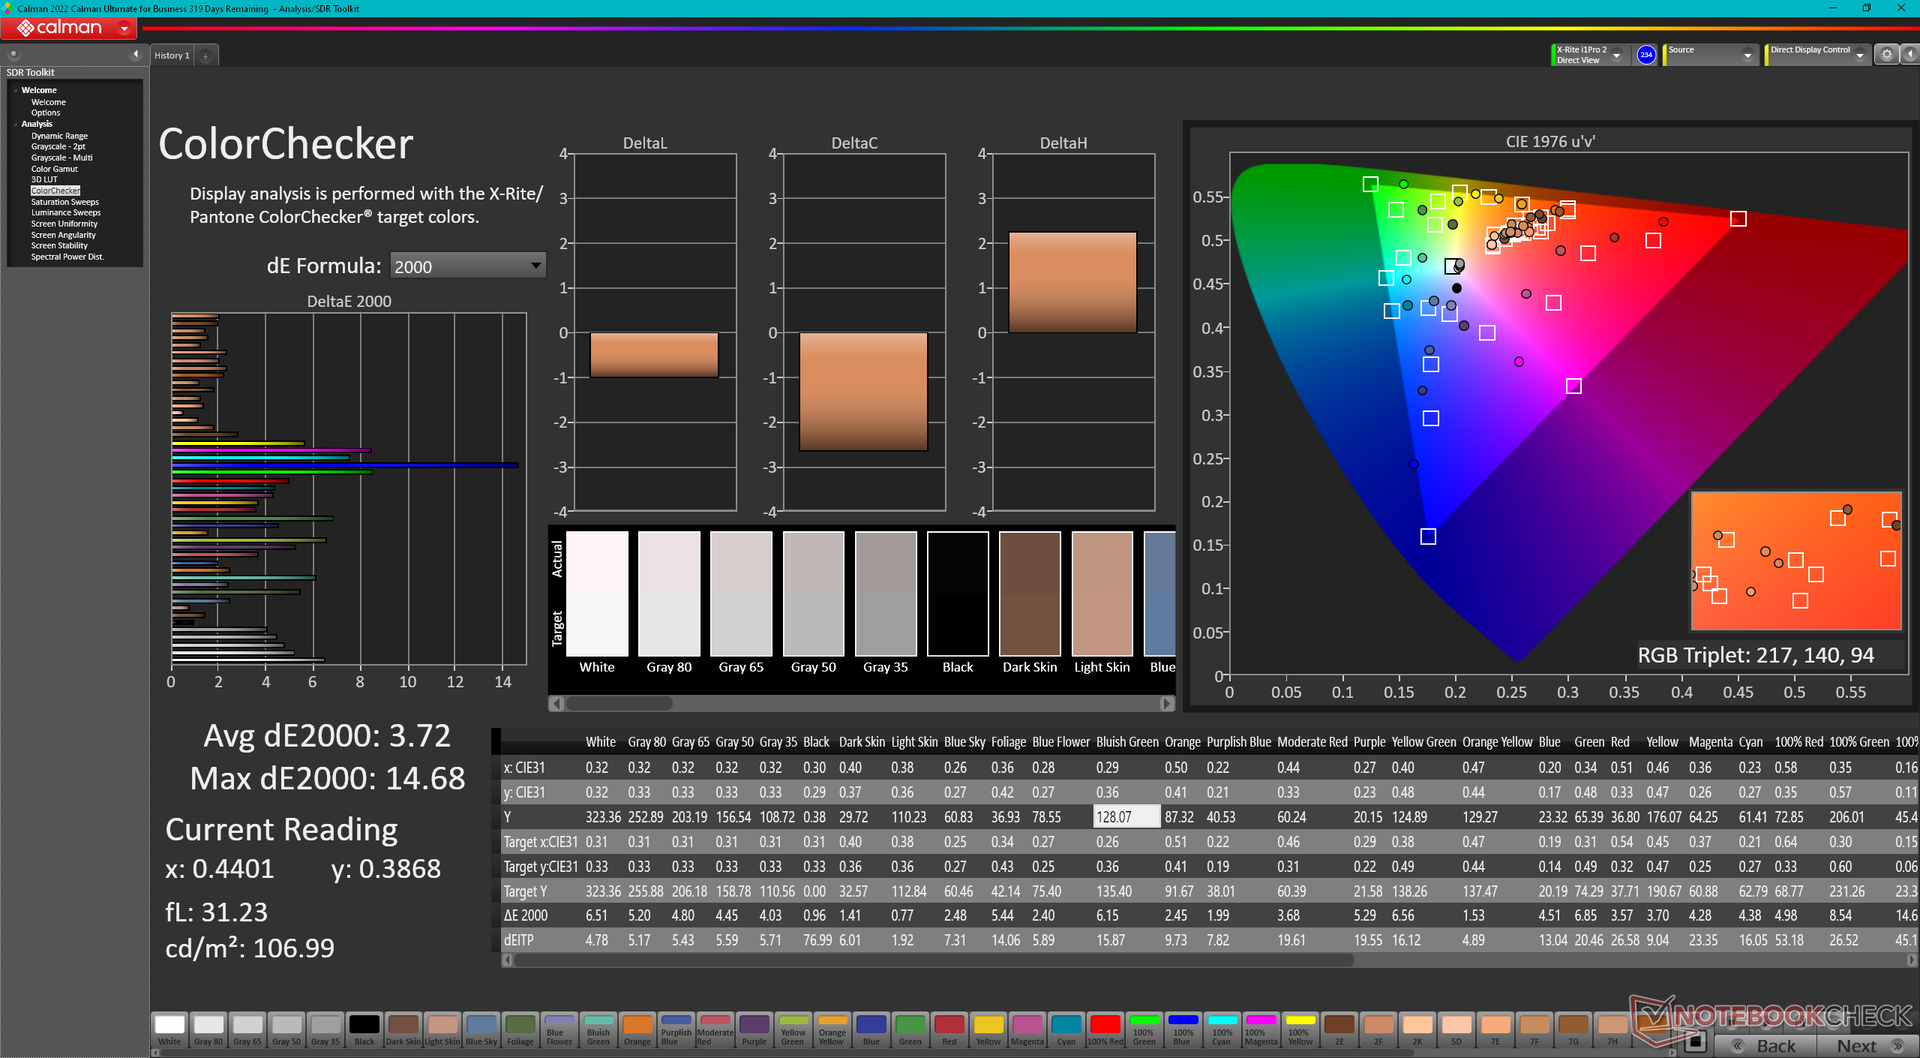
ΔE ColorChecker Calman: 3.72 | ∀{0.5-29.43 Ø4.72}
calibrated: 1.9
ΔE Greyscale Calman: 4 | ∀{0.09-98 Ø4.97}
41.2% AdobeRGB 1998 (Argyll 3D)
59.7% sRGB (Argyll 3D)
39.9% Display P3 (Argyll 3D)
Gamma: 2.29
CCT: 6064 K
| Lenovo ThinkPad T14s G4 i7-1365U B140UAK01.2, IPS, 1920x1200, 14" | Lenovo ThinkPad T14s G4-21F8002TGE LP140WU1-SPB2, IPS, 1920x1200, 14" | Lenovo ThinkPad T14 G4 21HD0043GE B140UAN02.1, IPS-AHVA LTPS wLED, 1920x1200, 14" | HP EliteBook 845 G10 5Z4X0ES CMN1435, IPS, 1920x1200, 14" | Dell Latitude 7440 AU Optronics B140QAX, IPS, 2560x1600, 14" | Asus ExpertBook B9 B9403CVA-KM0153X ATNA40YK07-1 SDC4171, OLED, 2880x1800, 14" | |
|---|---|---|---|---|---|---|
| Display | 68% | 80% | 74% | 80% | 115% | |
| Display P3 Coverage (%) | 39.9 | 68.3 71% | 74.8 87% | 70.6 77% | 75.4 89% | 99.9 150% |
| sRGB Coverage (%) | 59.7 | 96.5 62% | 98.9 66% | 100 68% | 99.9 67% | 100 68% |
| AdobeRGB 1998 Coverage (%) | 41.2 | 70.6 71% | 76.7 86% | 72.4 76% | 76.2 85% | 93.6 127% |
| Response Times | -54% | -90% | -88% | -98% | 90% | |
| Response Time Grey 50% / Grey 80% * (ms) | 27.7 ? | 41.6 ? -50% | 48.3 ? -74% | 59.7 ? -116% | 56 ? -102% | 2 ? 93% |
| Response Time Black / White * (ms) | 15.9 ? | 25.1 ? -58% | 32.6 ? -105% | 25.5 ? -60% | 30.8 ? -94% | 2 ? 87% |
| PWM Frequency (Hz) | 360 ? | |||||
| Bildschirm | 48% | 21% | 46% | 36% | 160% | |
| Helligkeit Bildmitte (cd/m²) | 322.5 | 455 41% | 376 17% | 409 27% | 517.3 60% | 389.9 21% |
| Brightness (cd/m²) | 296 | 453 53% | 369 25% | 391 32% | 488 65% | 390 32% |
| Brightness Distribution (%) | 85 | 90 6% | 86 1% | 92 8% | 88 4% | 99 16% |
| Schwarzwert * (cd/m²) | 0.44 | 0.24 45% | 0.23 48% | 0.27 39% | 0.34 23% | 0.0497 89% |
| Kontrast (:1) | 733 | 1896 159% | 1635 123% | 1515 107% | 1521 108% | 7845 970% |
| Delta E Colorchecker * | 3.72 | 2.8 25% | 4.3 -16% | 2.3 38% | 3.3 11% | 2.22 40% |
| Colorchecker dE 2000 max. * | 14.68 | 4.2 71% | 9.9 33% | 4.4 70% | 7.81 47% | 3.75 74% |
| Colorchecker dE 2000 calibrated * | 1.9 | 1.2 37% | 1.6 16% | 0.9 53% | 1.02 46% | |
| Delta E Graustufen * | 4 | 4.3 -8% | 6.4 -60% | 2.4 40% | 5.6 -40% | 2.4 40% |
| Gamma | 2.29 96% | 2.11 104% | 2.24 98% | 2.06 107% | 2.37 93% | 2.187 101% |
| CCT | 6064 107% | 7268 89% | 6019 108% | 6293 103% | 6804 96% | 6426 101% |
| Durchschnitt gesamt (Programm / Settings) | 21% /
38% | 4% /
18% | 11% /
33% | 6% /
26% | 122% /
139% |
* ... kleinere Werte sind besser

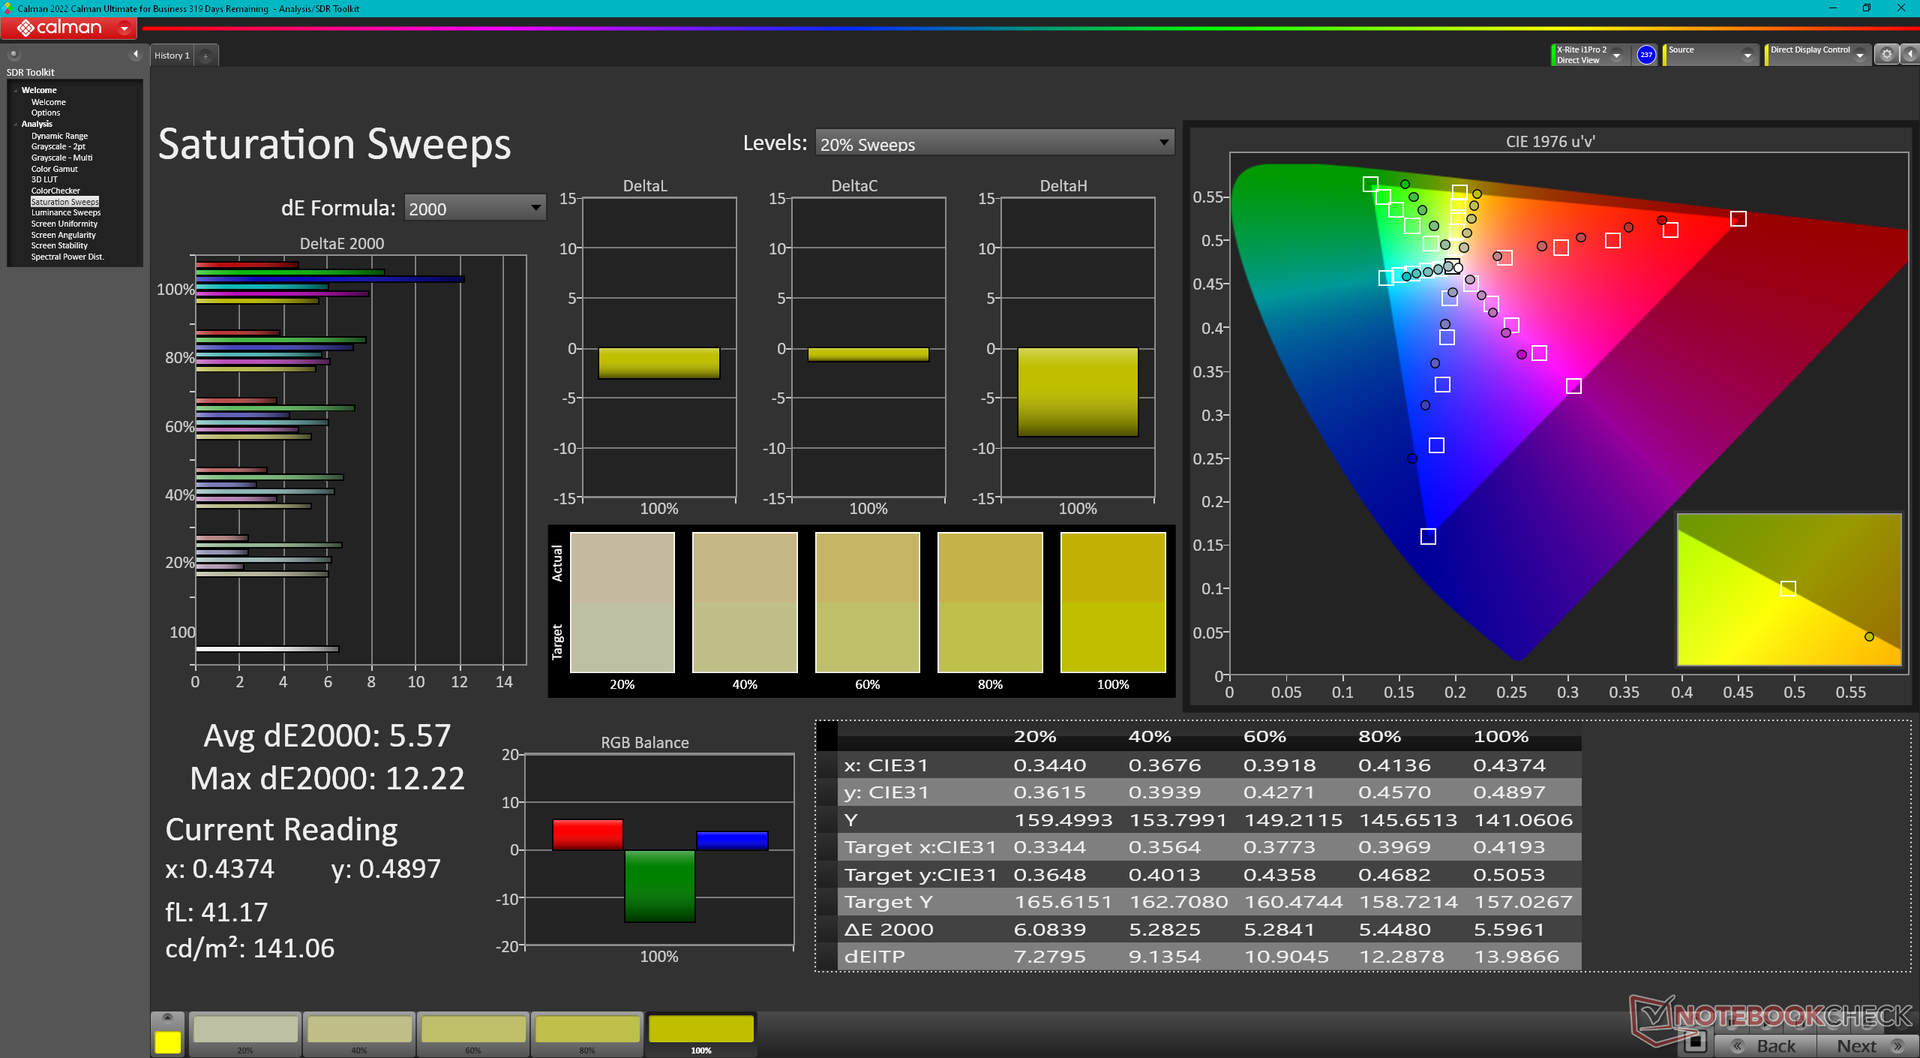
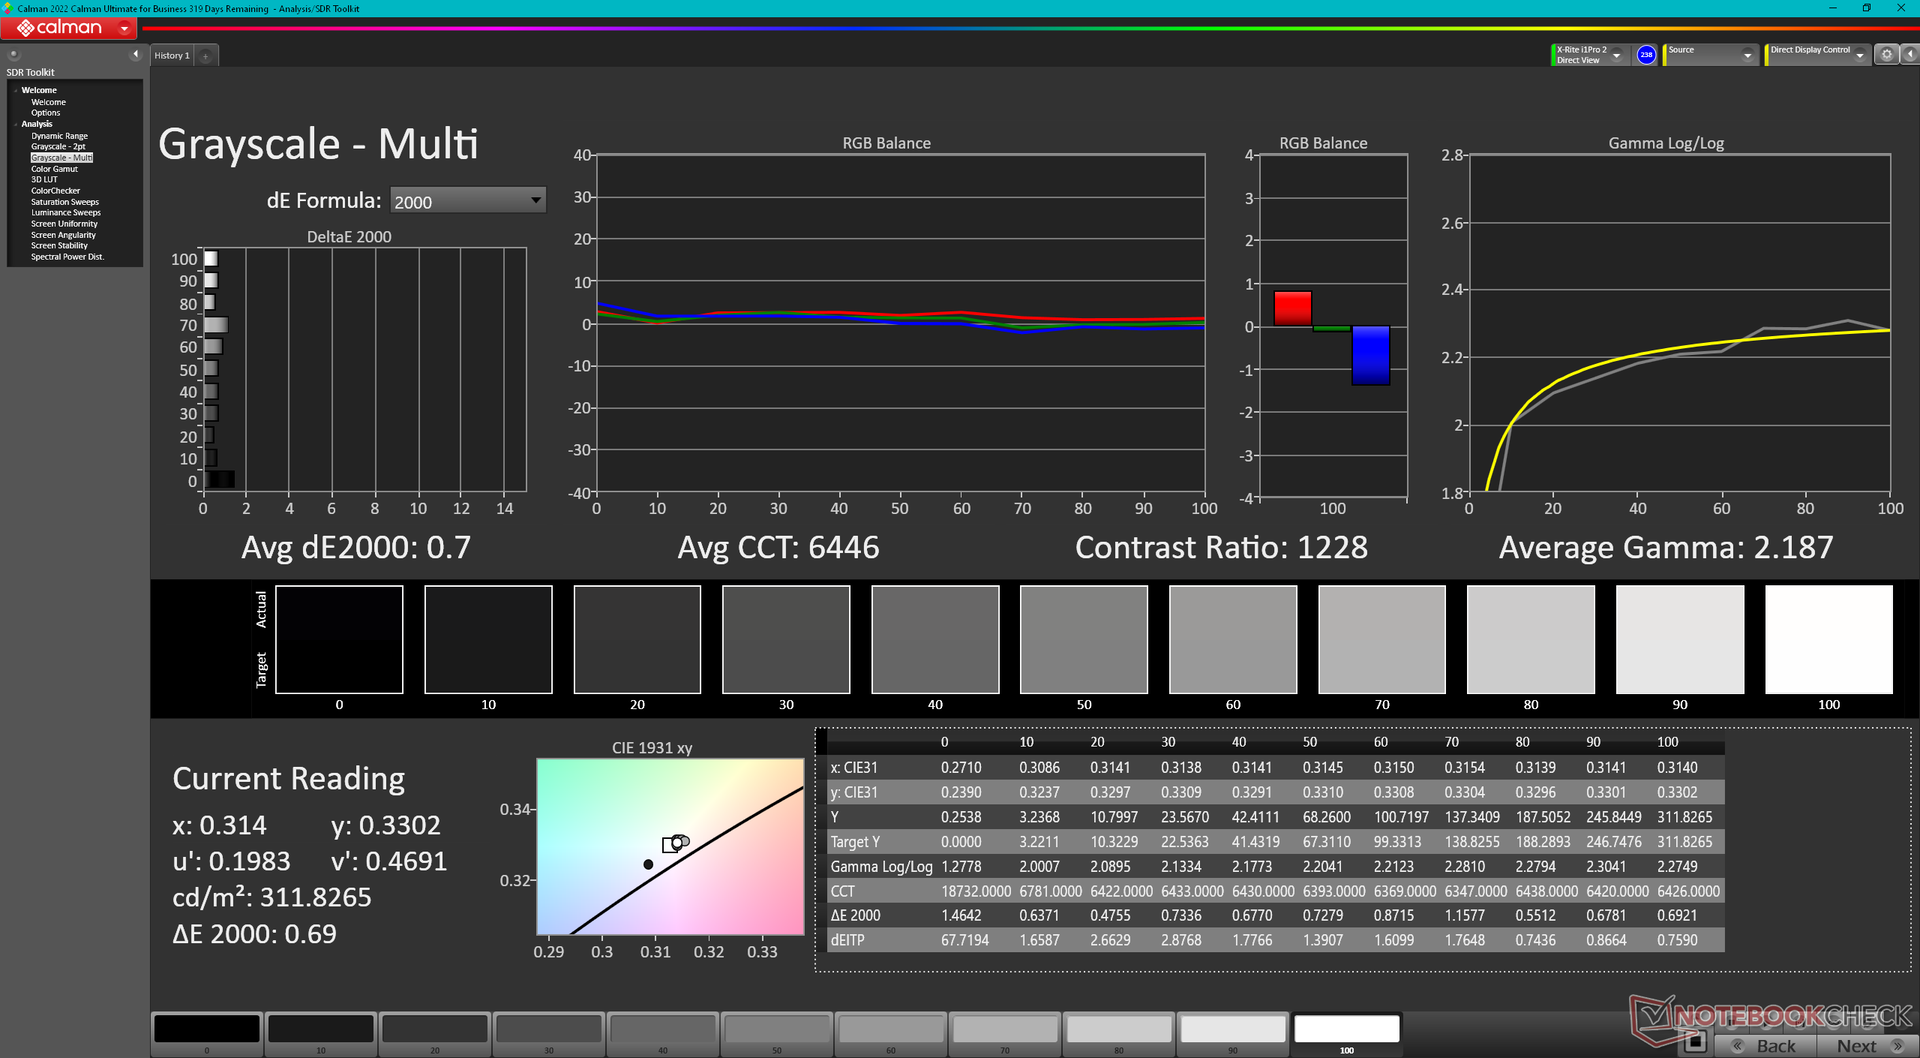
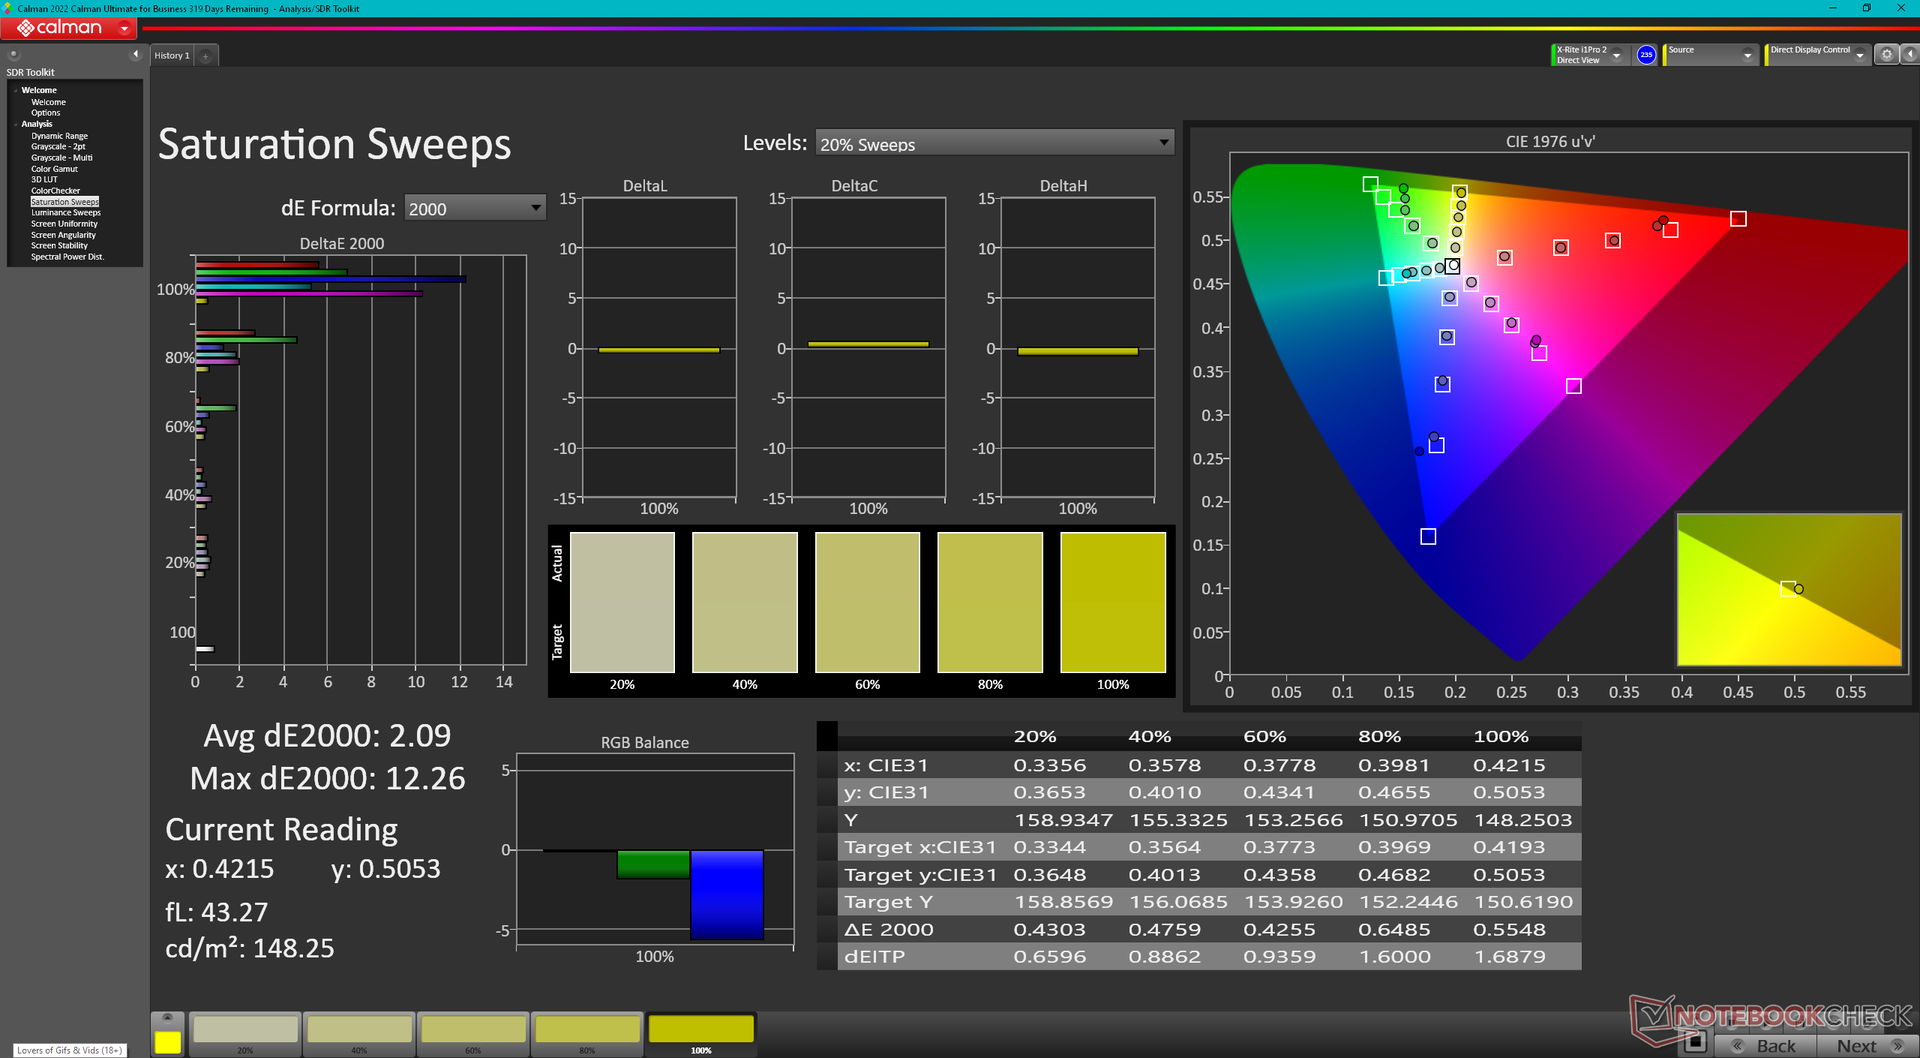
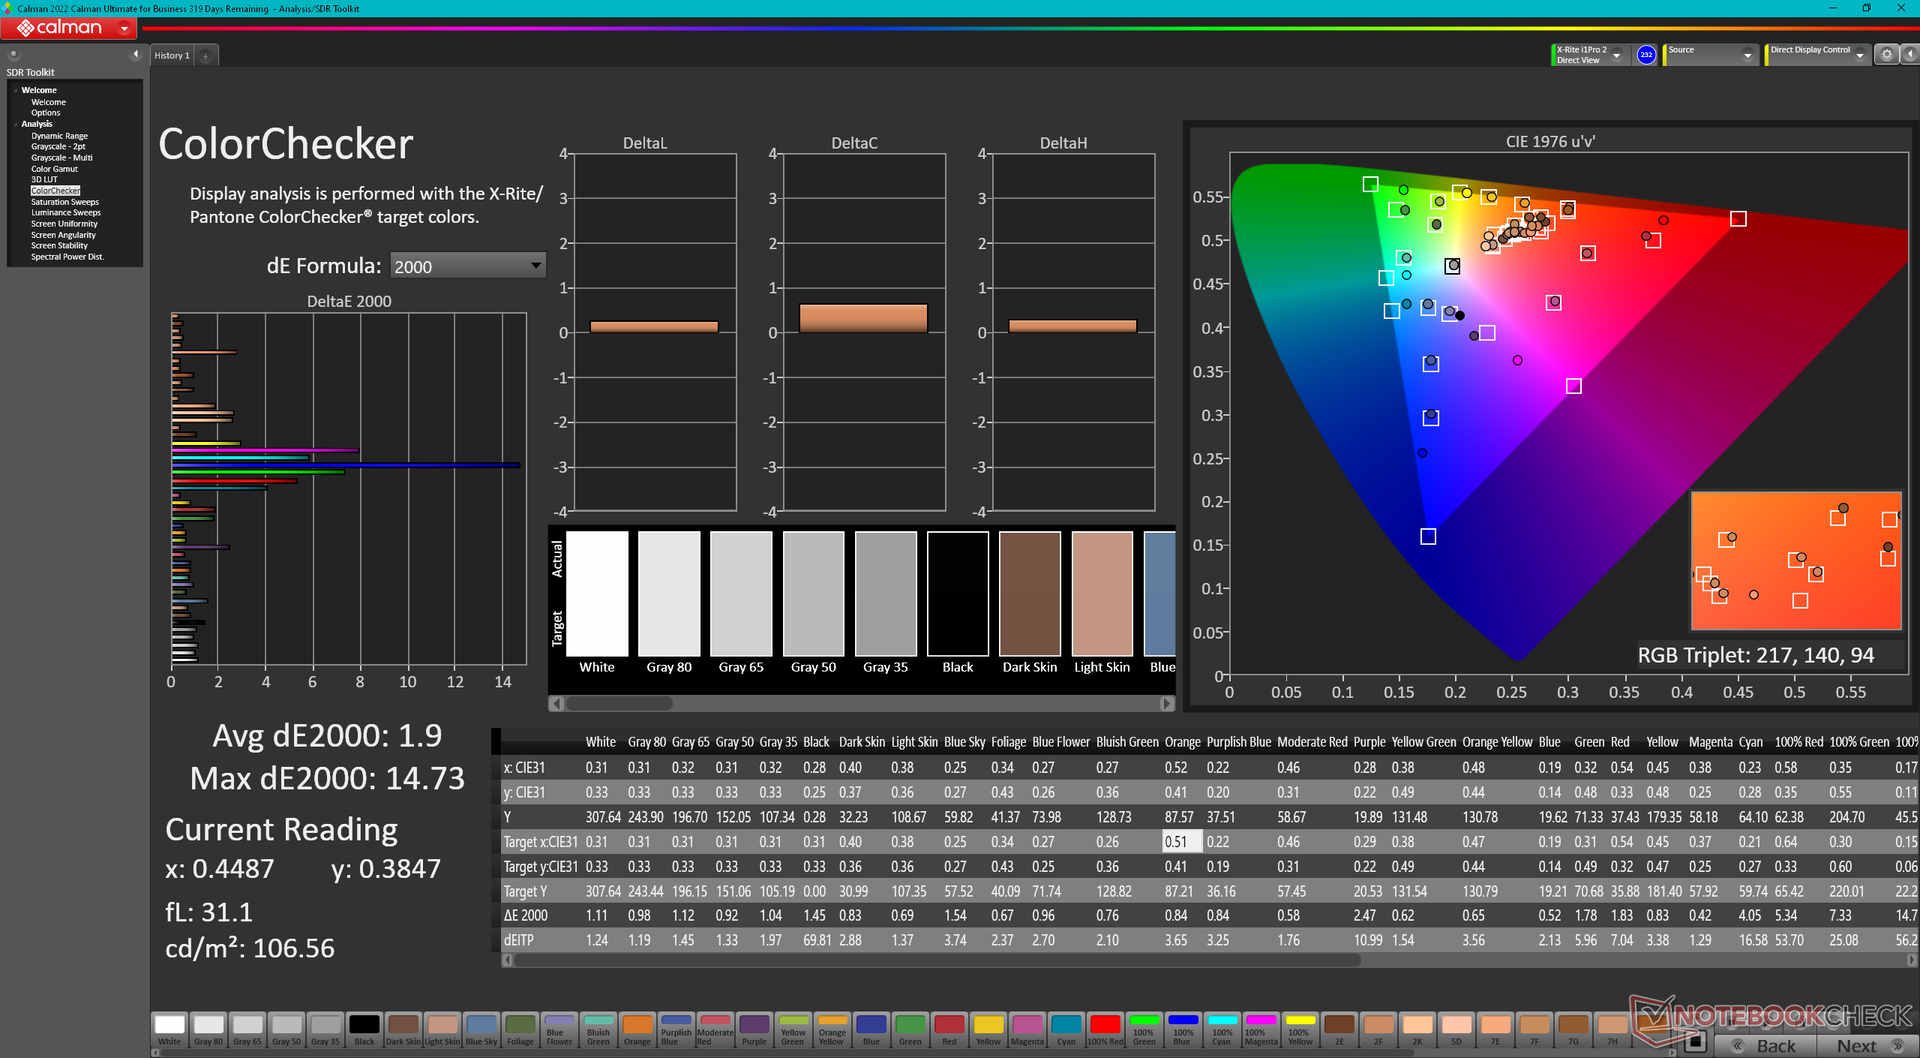
Der Bildschirm wird mit durchschnittlichen Graustufen- und Farb-DeltaE-Werten von 4 bzw. 3,72 unkalibriert geliefert. Durch unsere eigene Kalibrierung konnten wir die zu warme Farbtemperatur korrigieren und genauere Graustufen und Farben erzielen, wie unsere CalMAN-Screenshots unten zeigen. Dennoch bleibt das Display bei höheren Sättigungswerten aufgrund der oben erwähnten geringen Farbabdeckung etwas ungenau.
Reaktionszeiten (Response Times) des Displays
| ↔ Reaktionszeiten Schwarz zu Weiß | ||
|---|---|---|
| 15.9 ms ... steigend ↗ und fallend ↘ kombiniert | ↗ 8.1 ms steigend | 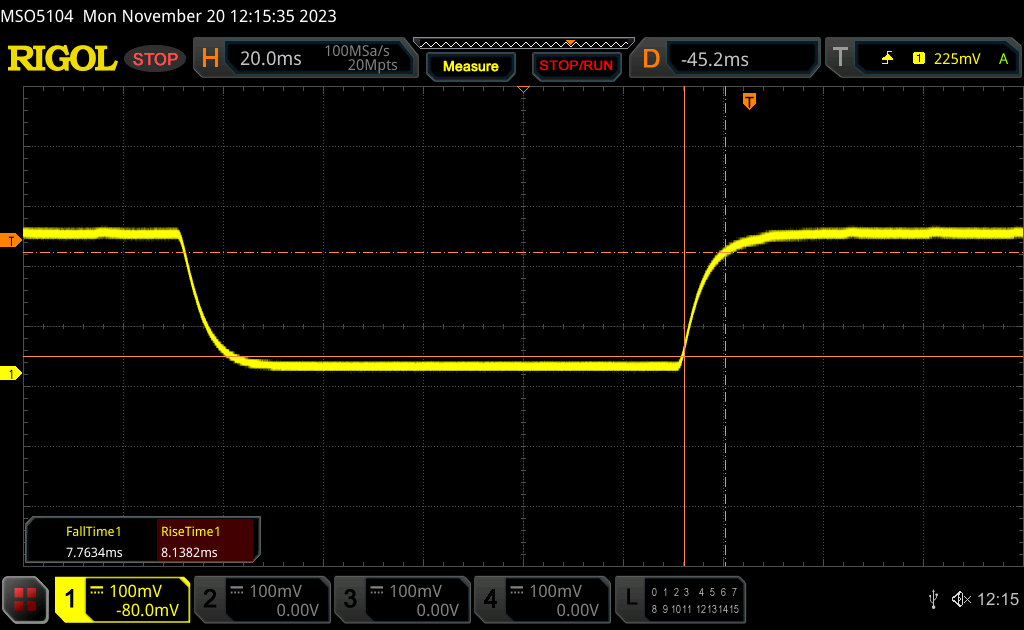 |
| ↘ 7.8 ms fallend | ||
| Die gemessenen Reaktionszeiten sind gut, für anspruchsvolle Spieler könnten der Bildschirm jedoch zu langsam sein. Im Vergleich rangierten die bei uns getesteten Geräte von 0.1 (Minimum) zu 240 (Maximum) ms. » 37 % aller Screens waren schneller als der getestete. Daher sind die gemessenen Reaktionszeiten besser als der Durchschnitt aller vermessenen Geräte (19.8 ms). | ||
| ↔ Reaktionszeiten 50% Grau zu 80% Grau | ||
| 27.7 ms ... steigend ↗ und fallend ↘ kombiniert | ↗ 12.2 ms steigend |  |
| ↘ 15.5 ms fallend | ||
| Die gemessenen Reaktionszeiten sind mittelmäßig und dadurch für Spieler eventuell zu langsam. Im Vergleich rangierten die bei uns getesteten Geräte von 0.165 (Minimum) zu 636 (Maximum) ms. » 38 % aller Screens waren schneller als der getestete. Daher sind die gemessenen Reaktionszeiten besser als der Durchschnitt aller vermessenen Geräte (31 ms). | ||
Bildschirm-Flackern / PWM (Pulse-Width Modulation)
| Flackern / PWM nicht festgestellt | 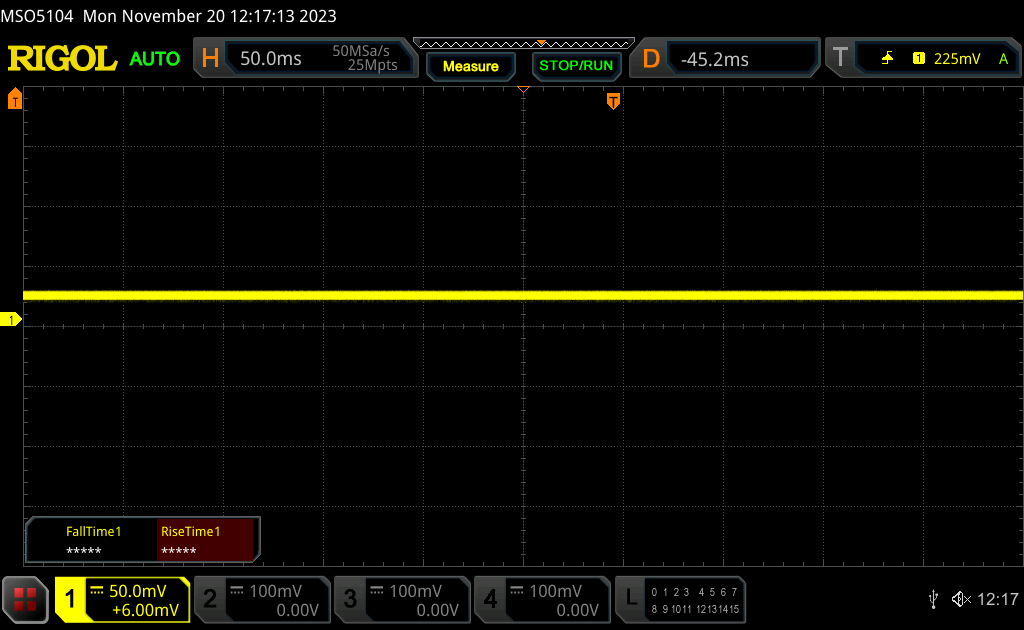 | ||
Im Vergleich: 52 % aller getesteten Geräte nutzten kein PWM um die Helligkeit zu reduzieren. Wenn PWM eingesetzt wurde, dann bei einer Frequenz von durchschnittlich 7763 (Minimum 5, Maximum 343500) Hz. | |||
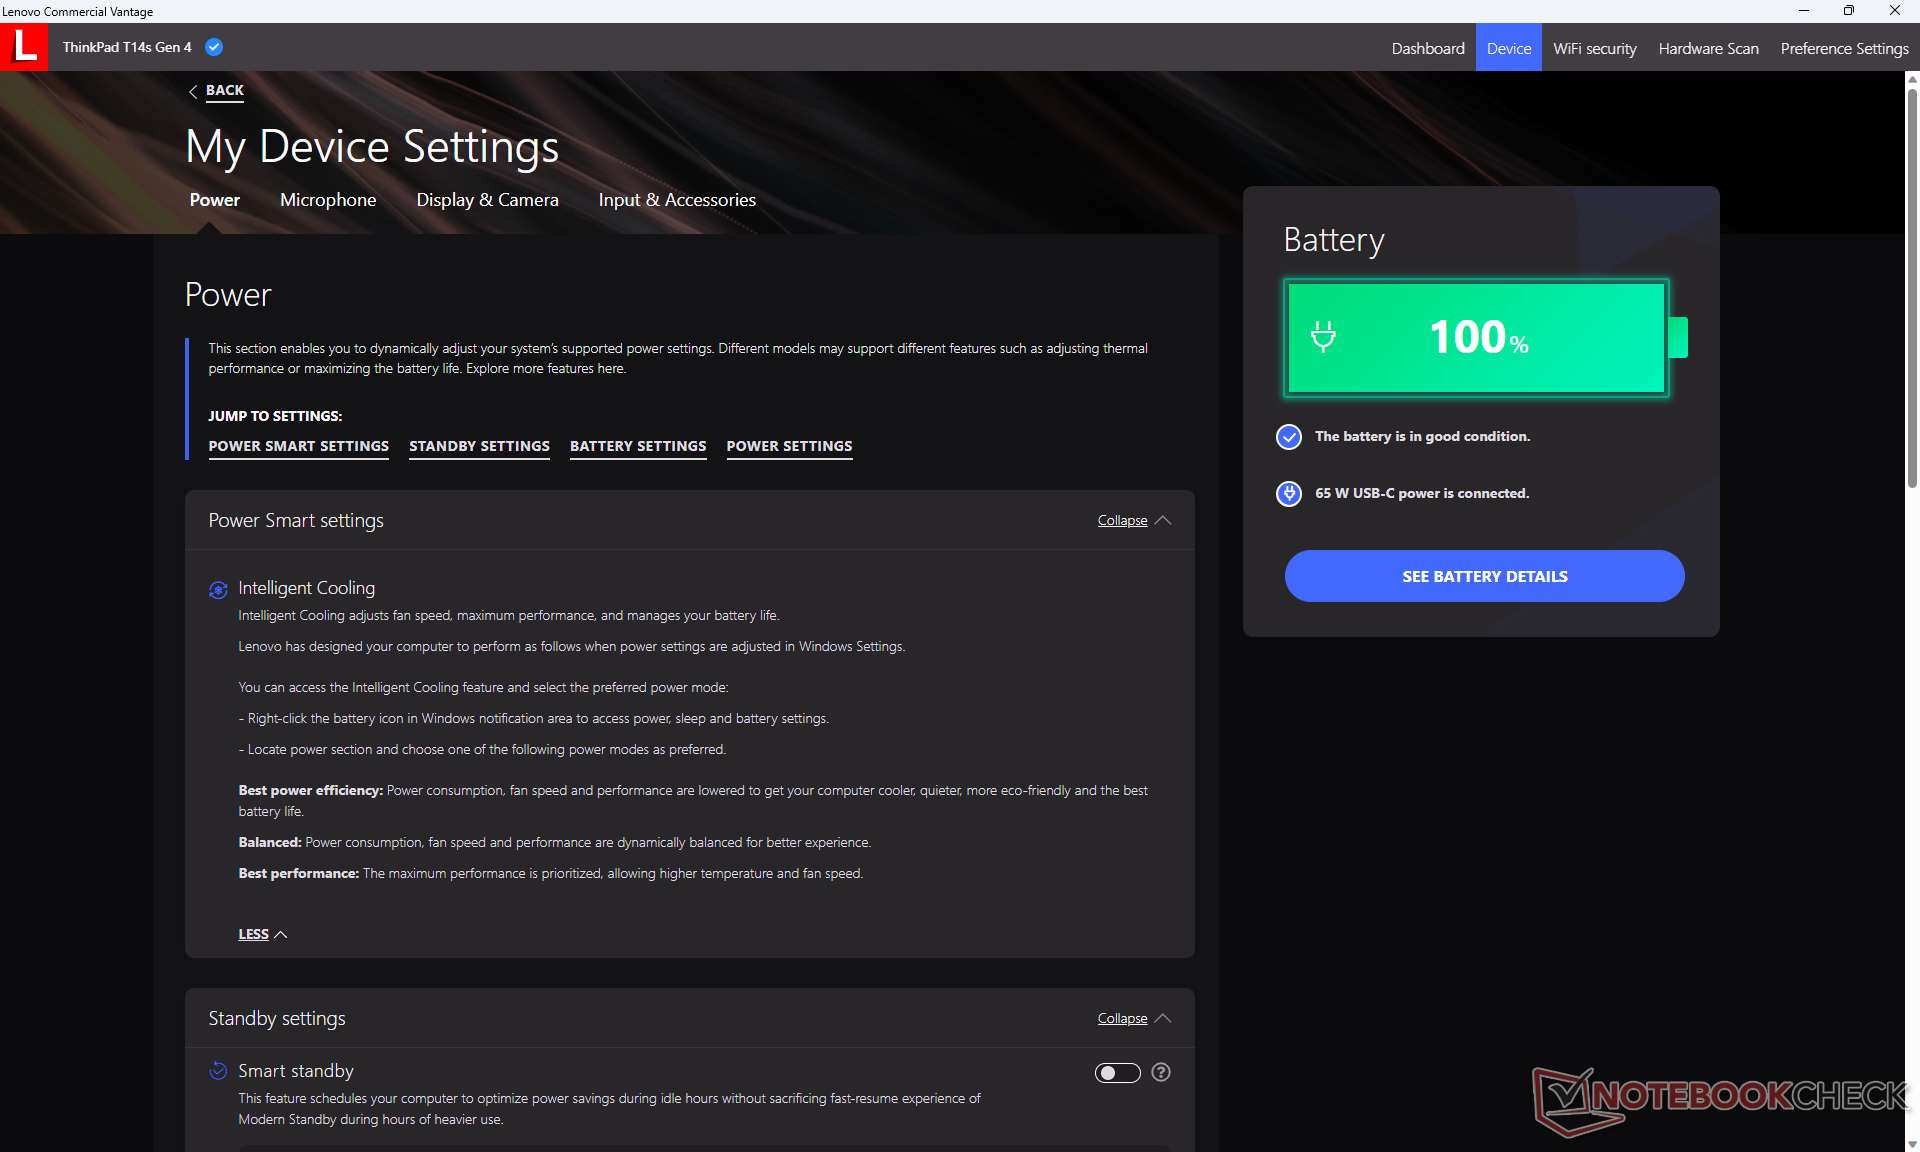
Leistung

Testbedingungen
Wir haben Windows im Performance-Modus eingestellt, bevor wir die folgenden Benchmarks durchgeführt haben. Lenovo Vantage verwendet keinen eigenen Satz von Energieprofilen, um Verwirrung zu vermeiden

Prozessor
Der Core i7-1365U bietet lediglich eine 10 Prozent schnellere Single-Thread-Leistung im Vergleich zum Core i5-1335U. Ansonsten sind die beiden CPUs in Bezug auf Multi-Thread-Leistung nahezu identisch. Für signifikant mehr Leistung sollten Sie die AMD Zen 4-Konfigurationen in Betracht ziehen.
Die Nachhaltigkeit der Leistung ist nur durchschnittlich. Wenn der CineBench R15 xT in einer Schleife läuft, sinkt die Multi-Thread-Leistung im Laufe der Zeit um etwa 20 %, was auf eine nachlassende Turbo-Boost-Geschwindigkeit hinweist.
Cinebench R15 Multi Dauertest
Cinebench R23: Multi Core | Single Core
Cinebench R20: CPU (Multi Core) | CPU (Single Core)
Cinebench R15: CPU Multi 64Bit | CPU Single 64Bit
Blender: v2.79 BMW27 CPU
7-Zip 18.03: 7z b 4 | 7z b 4 -mmt1
Geekbench 5.5: Multi-Core | Single-Core
HWBOT x265 Benchmark v2.2: 4k Preset
LibreOffice : 20 Documents To PDF
R Benchmark 2.5: Overall mean
* ... kleinere Werte sind besser
AIDA64: FP32 Ray-Trace | FPU Julia | CPU SHA3 | CPU Queen | FPU SinJulia | FPU Mandel | CPU AES | CPU ZLib | FP64 Ray-Trace | CPU PhotoWorxx
| Performance Rating | |
| HP EliteBook 845 G10 5Z4X0ES | |
| Dell Latitude 7440 | |
| Durchschnittliche Intel Core i7-1365U | |
| Lenovo ThinkPad T14s G4 i7-1365U | |
| Asus ExpertBook B9 B9403CVA-KM0153X | |
| Lenovo ThinkPad T14 G4 21HD0043GE | |
| AIDA64 / FP32 Ray-Trace | |
| HP EliteBook 845 G10 5Z4X0ES | |
| Dell Latitude 7440 | |
| Durchschnittliche Intel Core i7-1365U (6720 - 8270, n=4) | |
| Lenovo ThinkPad T14s G4 i7-1365U | |
| Asus ExpertBook B9 B9403CVA-KM0153X | |
| Lenovo ThinkPad T14 G4 21HD0043GE | |
| AIDA64 / FPU Julia | |
| HP EliteBook 845 G10 5Z4X0ES | |
| Dell Latitude 7440 | |
| Durchschnittliche Intel Core i7-1365U (33777 - 41487, n=4) | |
| Lenovo ThinkPad T14s G4 i7-1365U | |
| Asus ExpertBook B9 B9403CVA-KM0153X | |
| Lenovo ThinkPad T14 G4 21HD0043GE | |
| AIDA64 / CPU SHA3 | |
| HP EliteBook 845 G10 5Z4X0ES | |
| Dell Latitude 7440 | |
| Durchschnittliche Intel Core i7-1365U (1754 - 2216, n=4) | |
| Lenovo ThinkPad T14s G4 i7-1365U | |
| Asus ExpertBook B9 B9403CVA-KM0153X | |
| Lenovo ThinkPad T14 G4 21HD0043GE | |
| AIDA64 / CPU Queen | |
| HP EliteBook 845 G10 5Z4X0ES | |
| Durchschnittliche Intel Core i7-1365U (67557 - 69991, n=4) | |
| Lenovo ThinkPad T14s G4 i7-1365U | |
| Dell Latitude 7440 | |
| Lenovo ThinkPad T14 G4 21HD0043GE | |
| Asus ExpertBook B9 B9403CVA-KM0153X | |
| AIDA64 / FPU SinJulia | |
| HP EliteBook 845 G10 5Z4X0ES | |
| Dell Latitude 7440 | |
| Durchschnittliche Intel Core i7-1365U (4589 - 5145, n=4) | |
| Lenovo ThinkPad T14s G4 i7-1365U | |
| Asus ExpertBook B9 B9403CVA-KM0153X | |
| Lenovo ThinkPad T14 G4 21HD0043GE | |
| AIDA64 / FPU Mandel | |
| HP EliteBook 845 G10 5Z4X0ES | |
| Dell Latitude 7440 | |
| Durchschnittliche Intel Core i7-1365U (16808 - 20668, n=4) | |
| Lenovo ThinkPad T14s G4 i7-1365U | |
| Asus ExpertBook B9 B9403CVA-KM0153X | |
| Lenovo ThinkPad T14 G4 21HD0043GE | |
| AIDA64 / CPU AES | |
| HP EliteBook 845 G10 5Z4X0ES | |
| Dell Latitude 7440 | |
| Lenovo ThinkPad T14s G4 i7-1365U | |
| Durchschnittliche Intel Core i7-1365U (34968 - 41413, n=4) | |
| Lenovo ThinkPad T14 G4 21HD0043GE | |
| Asus ExpertBook B9 B9403CVA-KM0153X | |
| AIDA64 / CPU ZLib | |
| HP EliteBook 845 G10 5Z4X0ES | |
| Dell Latitude 7440 | |
| Durchschnittliche Intel Core i7-1365U (519 - 650, n=4) | |
| Lenovo ThinkPad T14s G4 i7-1365U | |
| Lenovo ThinkPad T14 G4 21HD0043GE | |
| Asus ExpertBook B9 B9403CVA-KM0153X | |
| AIDA64 / FP64 Ray-Trace | |
| HP EliteBook 845 G10 5Z4X0ES | |
| Dell Latitude 7440 | |
| Durchschnittliche Intel Core i7-1365U (3513 - 4367, n=4) | |
| Lenovo ThinkPad T14s G4 i7-1365U | |
| Asus ExpertBook B9 B9403CVA-KM0153X | |
| Lenovo ThinkPad T14 G4 21HD0043GE | |
| AIDA64 / CPU PhotoWorxx | |
| Durchschnittliche Intel Core i7-1365U (37846 - 43780, n=4) | |
| Dell Latitude 7440 | |
| Lenovo ThinkPad T14s G4 i7-1365U | |
| Asus ExpertBook B9 B9403CVA-KM0153X | |
| HP EliteBook 845 G10 5Z4X0ES | |
| Lenovo ThinkPad T14 G4 21HD0043GE | |
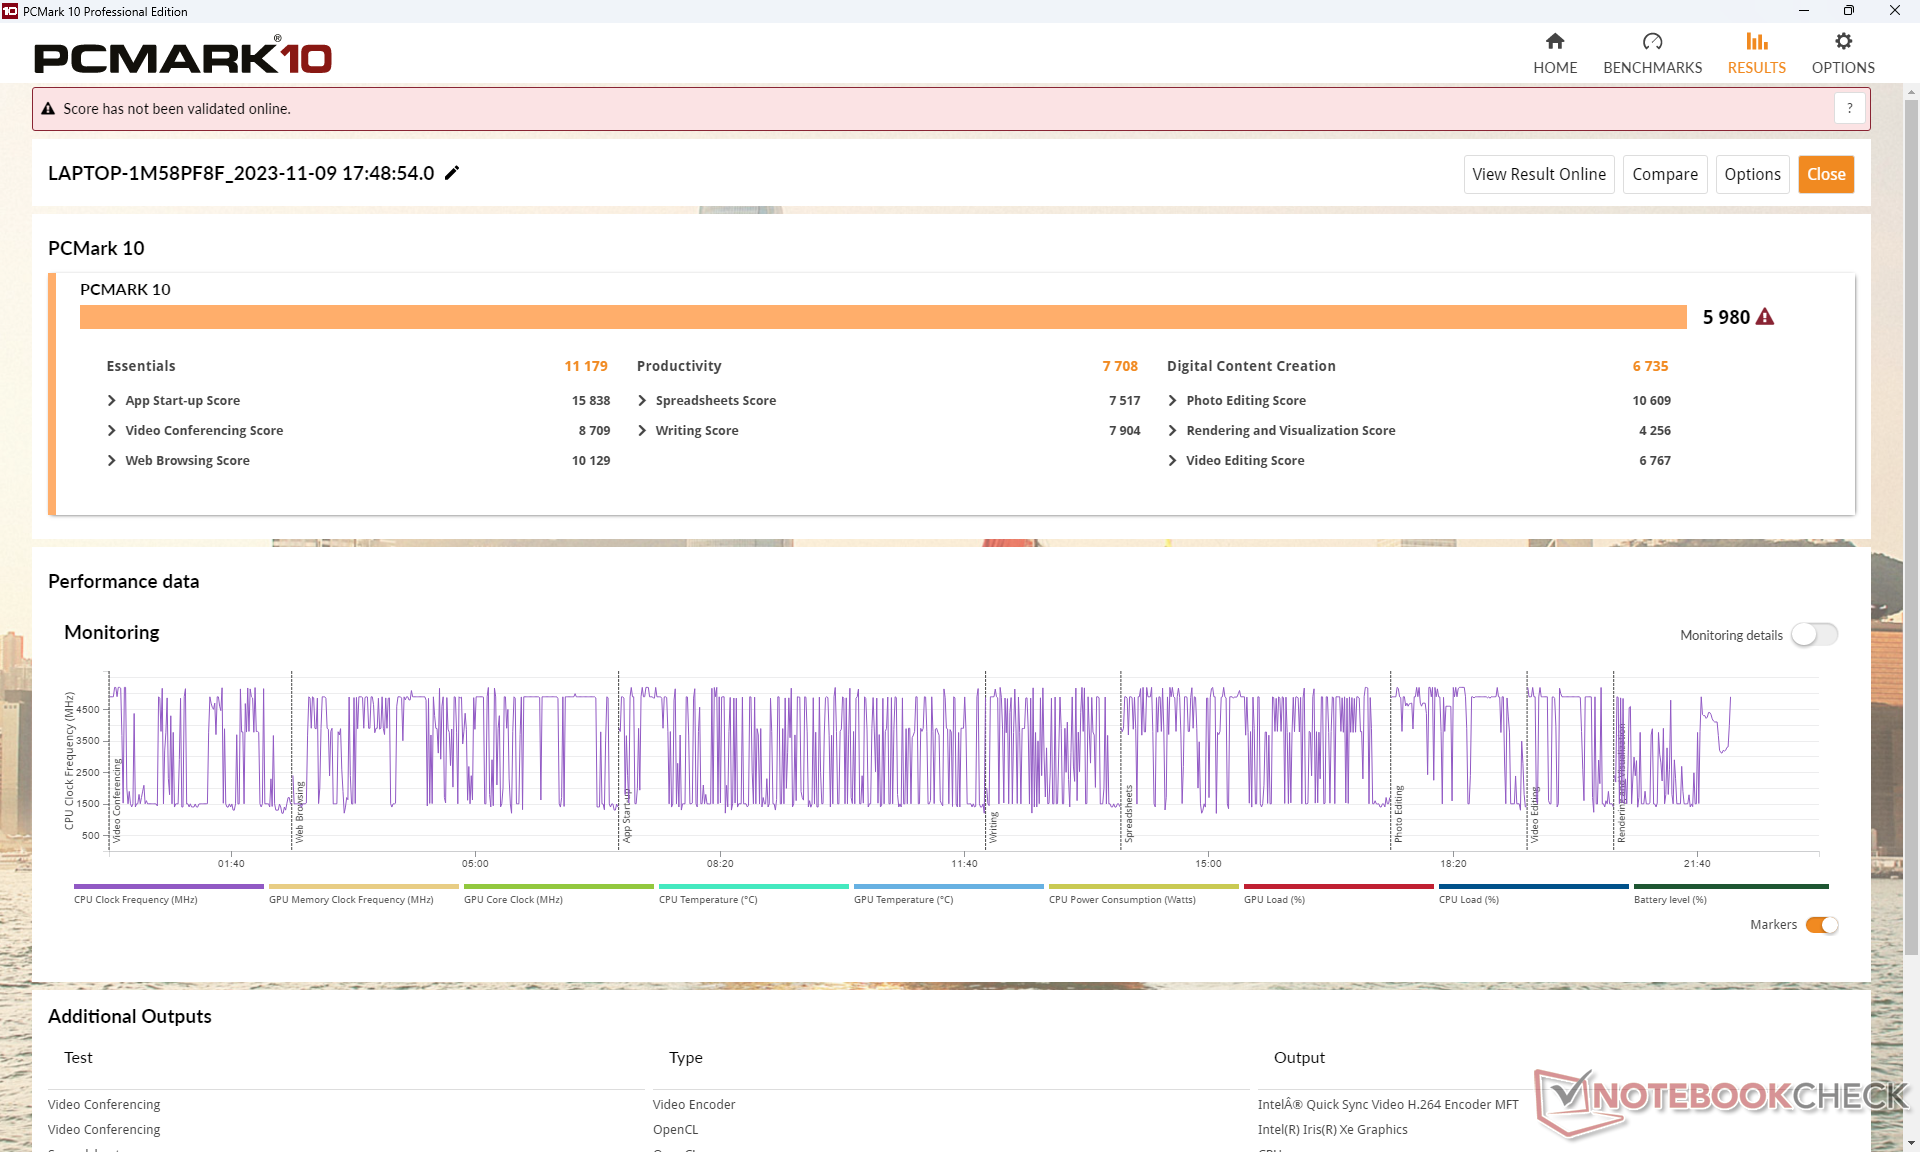
System Performance
Die Ergebnisse der PCMark Productivity und Digital Content Creation Subtests liegen deutlich hinter denen des AMD-basierten ThinkPad T14s G4. Dies ist auf die langsamere CPU-Multi-Thread-Leistung und die integrierte GPU-Leistung unseres Intel-Modells zurückzuführen.
CrossMark: Overall | Productivity | Creativity | Responsiveness
| PCMark 10 / Score | |
| HP EliteBook 845 G10 5Z4X0ES | |
| Lenovo ThinkPad T14s G4-21F8002TGE | |
| Lenovo ThinkPad T14s G4 i7-1365U | |
| Durchschnittliche Intel Core i7-1365U, Intel Iris Xe Graphics G7 96EUs (5690 - 5980, n=4) | |
| Asus ExpertBook B9 B9403CVA-KM0153X | |
| Dell Latitude 7440 | |
| Lenovo ThinkPad T14 G4 21HD0043GE | |
| PCMark 10 / Essentials | |
| Lenovo ThinkPad T14s G4 i7-1365U | |
| Durchschnittliche Intel Core i7-1365U, Intel Iris Xe Graphics G7 96EUs (10635 - 11827, n=4) | |
| Asus ExpertBook B9 B9403CVA-KM0153X | |
| Dell Latitude 7440 | |
| HP EliteBook 845 G10 5Z4X0ES | |
| Lenovo ThinkPad T14 G4 21HD0043GE | |
| Lenovo ThinkPad T14s G4-21F8002TGE | |
| PCMark 10 / Productivity | |
| HP EliteBook 845 G10 5Z4X0ES | |
| Lenovo ThinkPad T14s G4-21F8002TGE | |
| Lenovo ThinkPad T14s G4 i7-1365U | |
| Asus ExpertBook B9 B9403CVA-KM0153X | |
| Durchschnittliche Intel Core i7-1365U, Intel Iris Xe Graphics G7 96EUs (7206 - 7708, n=4) | |
| Lenovo ThinkPad T14 G4 21HD0043GE | |
| Dell Latitude 7440 | |
| PCMark 10 / Digital Content Creation | |
| HP EliteBook 845 G10 5Z4X0ES | |
| Lenovo ThinkPad T14s G4-21F8002TGE | |
| Lenovo ThinkPad T14s G4 i7-1365U | |
| Durchschnittliche Intel Core i7-1365U, Intel Iris Xe Graphics G7 96EUs (6392 - 6735, n=4) | |
| Dell Latitude 7440 | |
| Lenovo ThinkPad T14 G4 21HD0043GE | |
| Asus ExpertBook B9 B9403CVA-KM0153X | |
| CrossMark / Overall | |
| Durchschnittliche Intel Core i7-1365U, Intel Iris Xe Graphics G7 96EUs (1605 - 1675, n=4) | |
| Lenovo ThinkPad T14s G4 i7-1365U | |
| Asus ExpertBook B9 B9403CVA-KM0153X | |
| Lenovo ThinkPad T14s G4-21F8002TGE | |
| HP EliteBook 845 G10 5Z4X0ES | |
| Lenovo ThinkPad T14 G4 21HD0043GE | |
| CrossMark / Productivity | |
| Durchschnittliche Intel Core i7-1365U, Intel Iris Xe Graphics G7 96EUs (1582 - 1650, n=4) | |
| Lenovo ThinkPad T14s G4 i7-1365U | |
| Asus ExpertBook B9 B9403CVA-KM0153X | |
| Lenovo ThinkPad T14s G4-21F8002TGE | |
| HP EliteBook 845 G10 5Z4X0ES | |
| Lenovo ThinkPad T14 G4 21HD0043GE | |
| CrossMark / Creativity | |
| Durchschnittliche Intel Core i7-1365U, Intel Iris Xe Graphics G7 96EUs (1713 - 1797, n=4) | |
| Lenovo ThinkPad T14s G4 i7-1365U | |
| HP EliteBook 845 G10 5Z4X0ES | |
| Lenovo ThinkPad T14s G4-21F8002TGE | |
| Asus ExpertBook B9 B9403CVA-KM0153X | |
| Lenovo ThinkPad T14 G4 21HD0043GE | |
| CrossMark / Responsiveness | |
| Durchschnittliche Intel Core i7-1365U, Intel Iris Xe Graphics G7 96EUs (1373 - 1427, n=4) | |
| Lenovo ThinkPad T14s G4 i7-1365U | |
| Asus ExpertBook B9 B9403CVA-KM0153X | |
| HP EliteBook 845 G10 5Z4X0ES | |
| Lenovo ThinkPad T14s G4-21F8002TGE | |
| Lenovo ThinkPad T14 G4 21HD0043GE | |
| PCMark 10 Score | 5980 Punkte | |
Hilfe | ||
| AIDA64 / Memory Copy | |
| Lenovo ThinkPad T14s G4-21F8002TGE | |
| Durchschnittliche Intel Core i7-1365U (57654 - 69736, n=4) | |
| HP EliteBook 845 G10 5Z4X0ES | |
| Asus ExpertBook B9 B9403CVA-KM0153X | |
| Dell Latitude 7440 | |
| Lenovo ThinkPad T14s G4 i7-1365U | |
| Lenovo ThinkPad T14 G4 21HD0043GE | |
| AIDA64 / Memory Read | |
| HP EliteBook 845 G10 5Z4X0ES | |
| Durchschnittliche Intel Core i7-1365U (49203 - 54068, n=4) | |
| Dell Latitude 7440 | |
| Lenovo ThinkPad T14s G4 i7-1365U | |
| Asus ExpertBook B9 B9403CVA-KM0153X | |
| Lenovo ThinkPad T14s G4-21F8002TGE | |
| Lenovo ThinkPad T14 G4 21HD0043GE | |
| AIDA64 / Memory Write | |
| Lenovo ThinkPad T14s G4-21F8002TGE | |
| HP EliteBook 845 G10 5Z4X0ES | |
| Durchschnittliche Intel Core i7-1365U (70434 - 85570, n=4) | |
| Asus ExpertBook B9 B9403CVA-KM0153X | |
| Lenovo ThinkPad T14s G4 i7-1365U | |
| Dell Latitude 7440 | |
| Lenovo ThinkPad T14 G4 21HD0043GE | |
| AIDA64 / Memory Latency | |
| Lenovo ThinkPad T14s G4-21F8002TGE | |
| Lenovo ThinkPad T14s G4 i7-1365U | |
| Dell Latitude 7440 | |
| Asus ExpertBook B9 B9403CVA-KM0153X | |
| Durchschnittliche Intel Core i7-1365U (90.2 - 102.2, n=4) | |
| HP EliteBook 845 G10 5Z4X0ES | |
| Lenovo ThinkPad T14 G4 21HD0043GE | |
* ... kleinere Werte sind besser
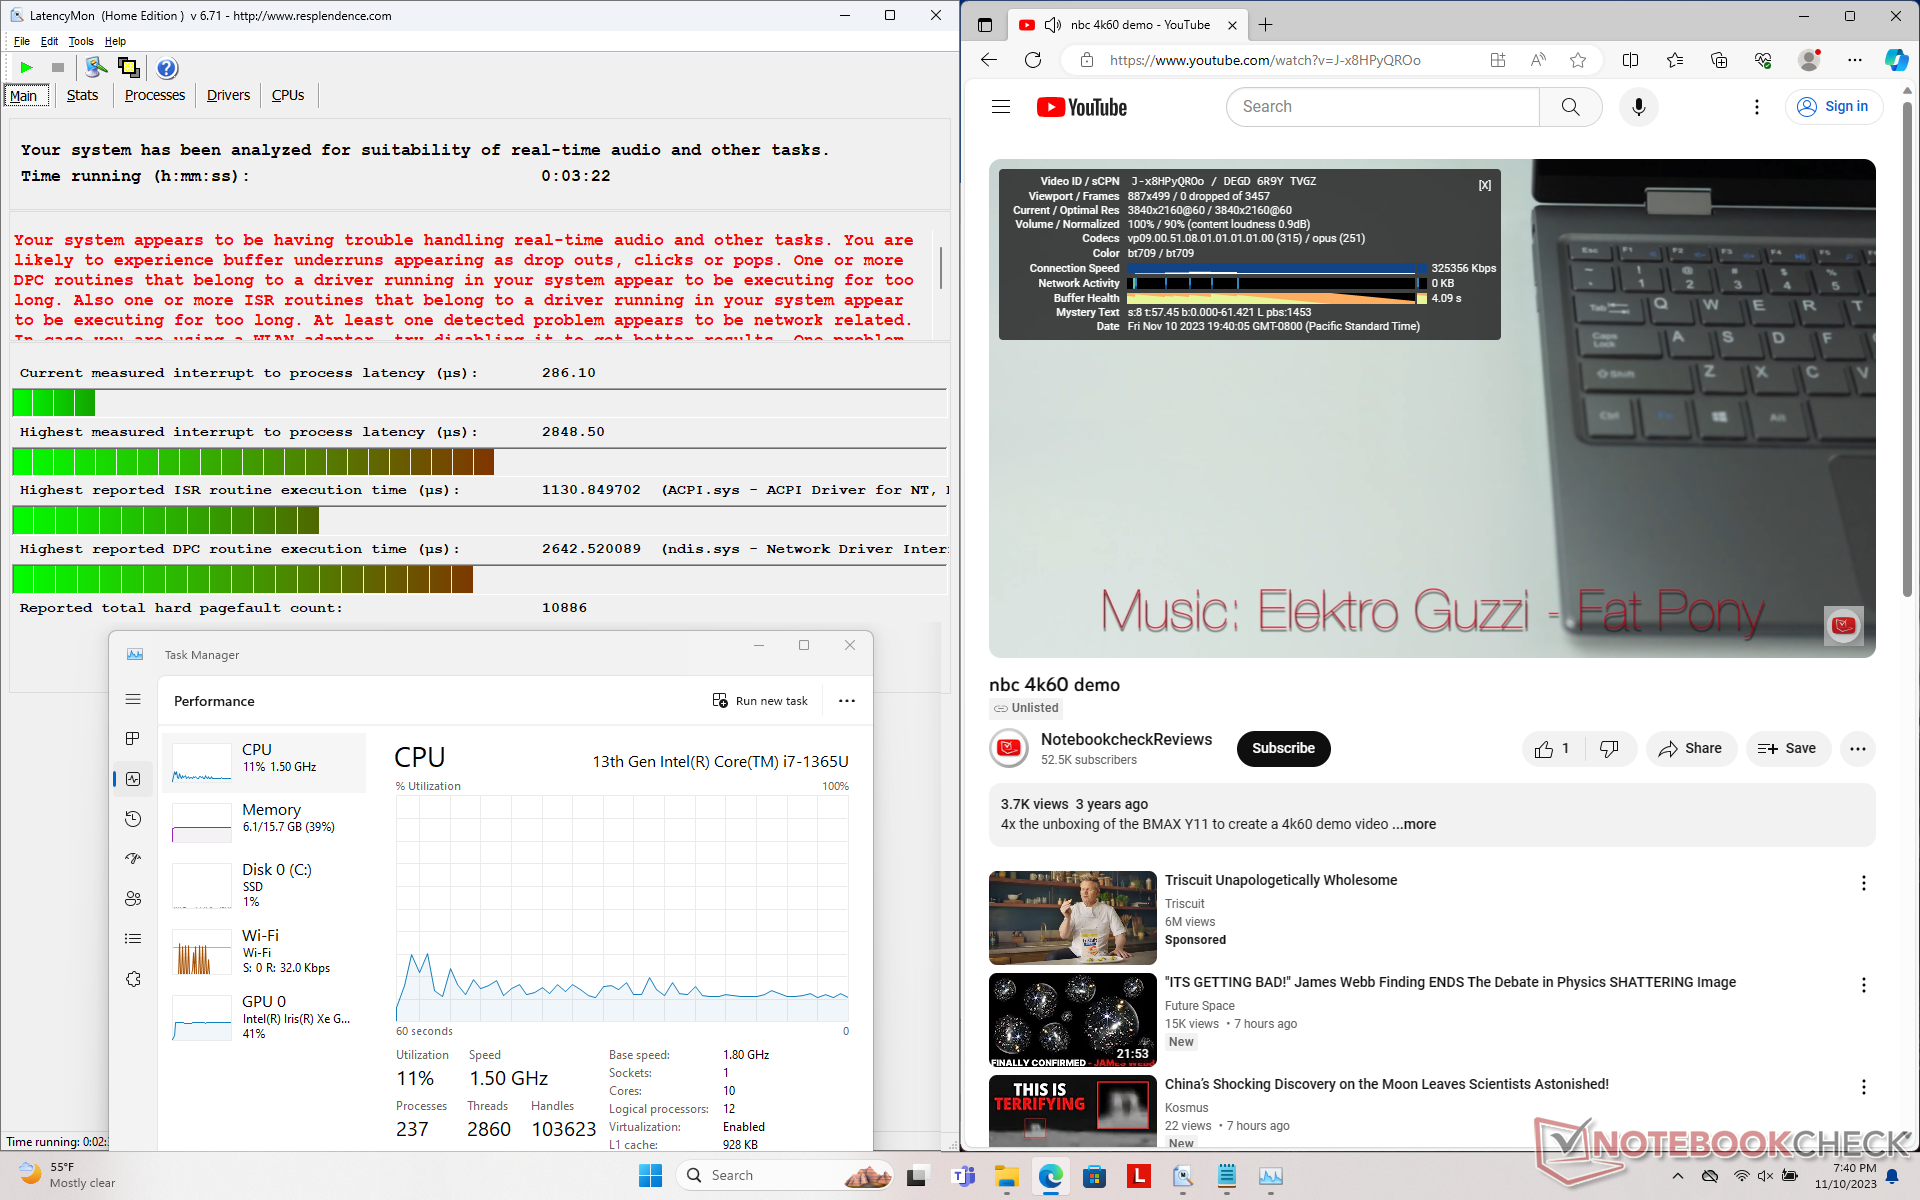
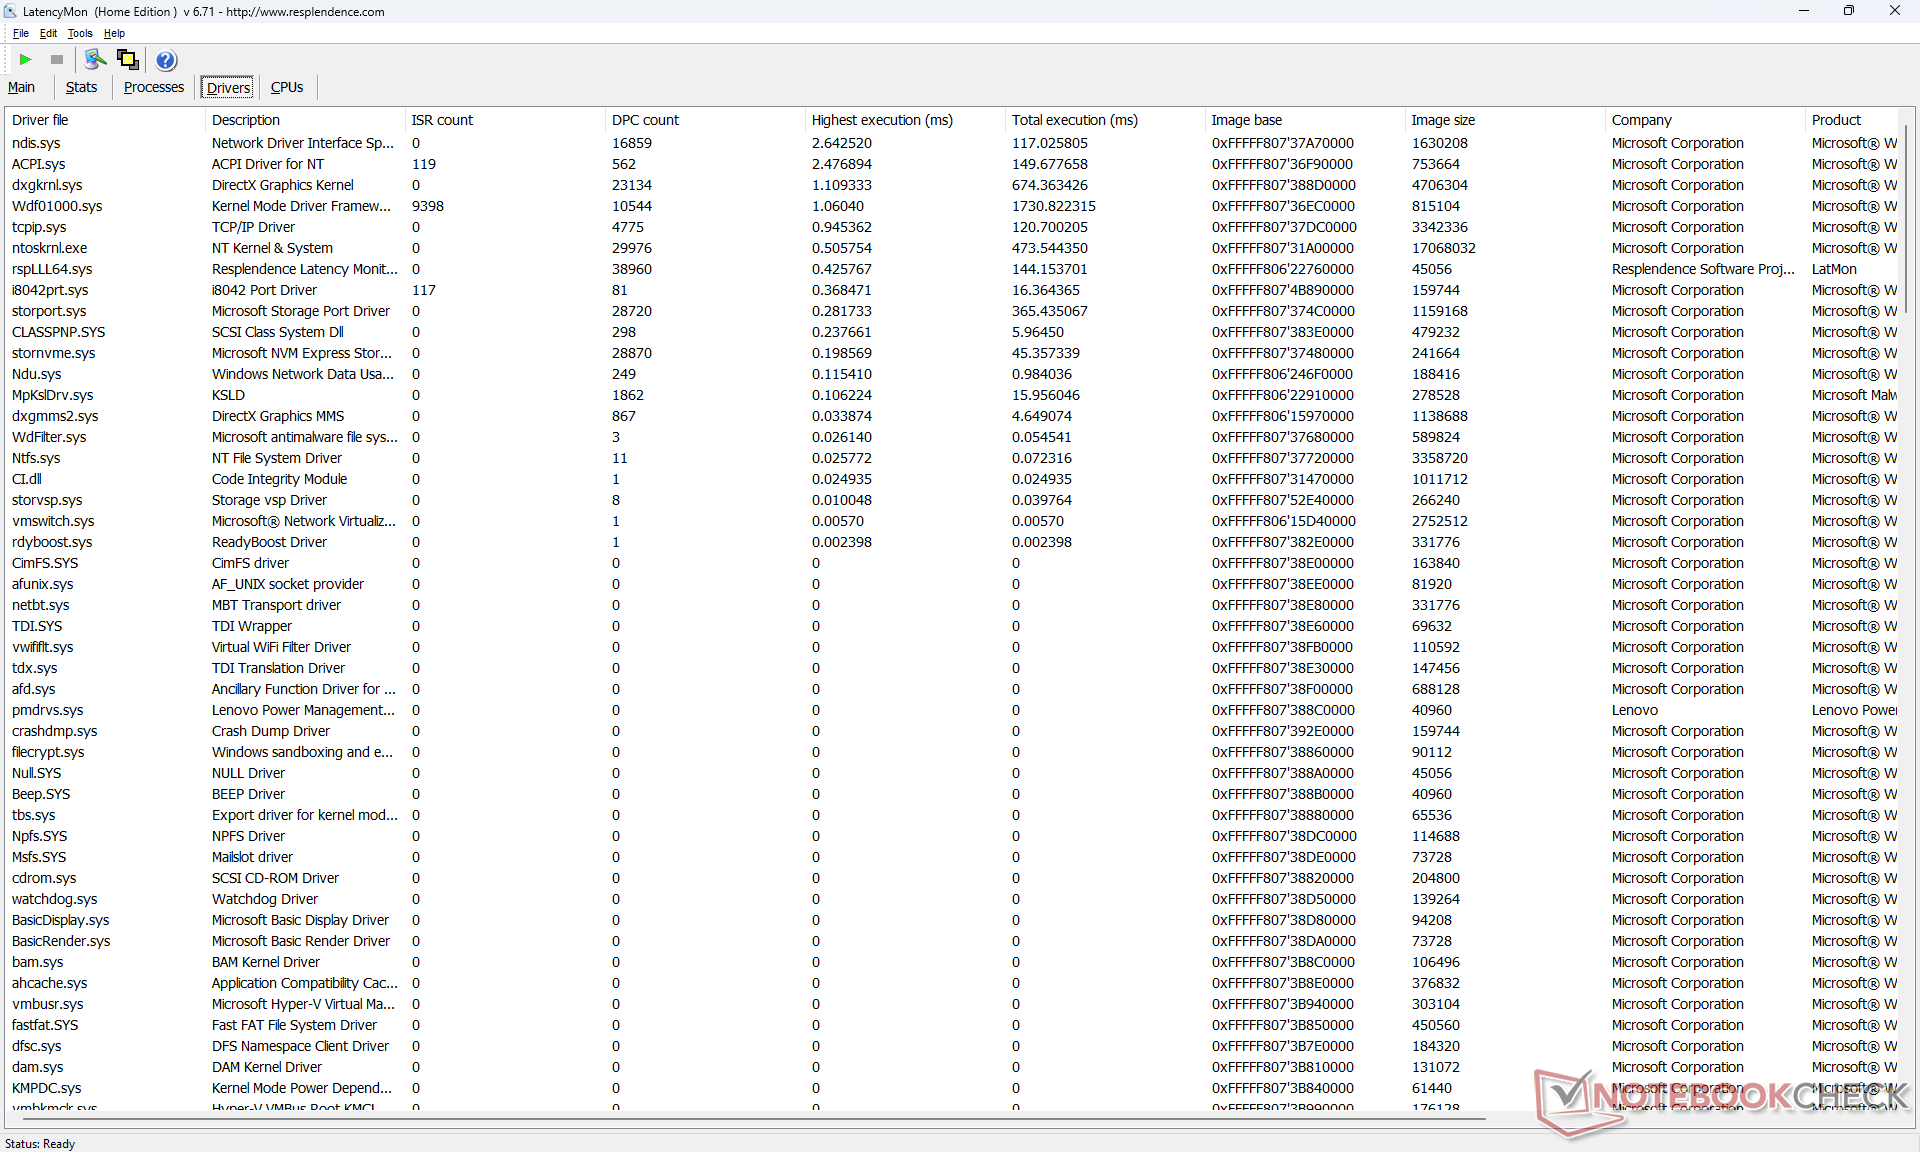
DPC-Latenzen
LatencyMon zeigt DPC-Probleme beim Öffnen mehrerer Browser-Tabs unserer Homepage. Die 4K-Videowiedergabe bei 60 FPS ist ansonsten perfekt, und es wurden keine Bildaussetzer aufgezeichnet.
| DPC Latencies / LatencyMon - interrupt to process latency (max), Web, Youtube, Prime95 | |
| Lenovo ThinkPad T14s G4 i7-1365U | |
| Lenovo ThinkPad T14 G4 21HD0043GE | |
| Dell Latitude 7440 | |
| Asus ExpertBook B9 B9403CVA-KM0153X | |
| HP EliteBook 845 G10 5Z4X0ES | |
| Lenovo ThinkPad T14s G4-21F8002TGE | |
* ... kleinere Werte sind besser
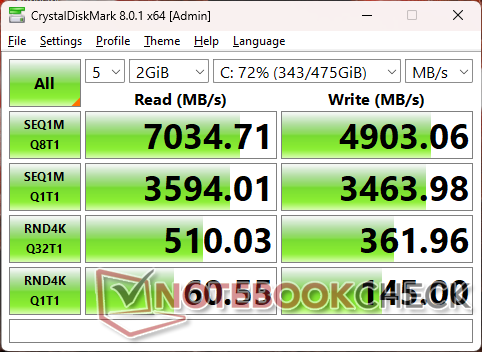
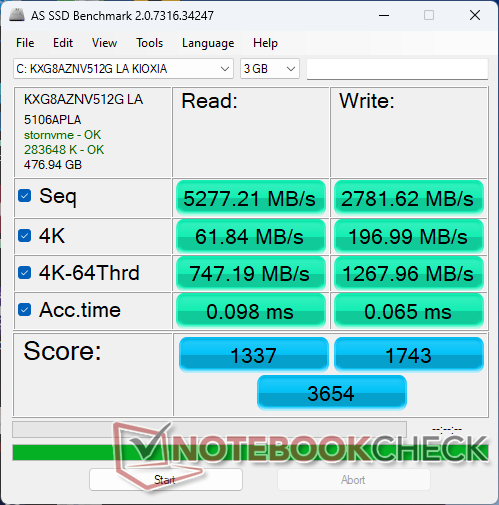
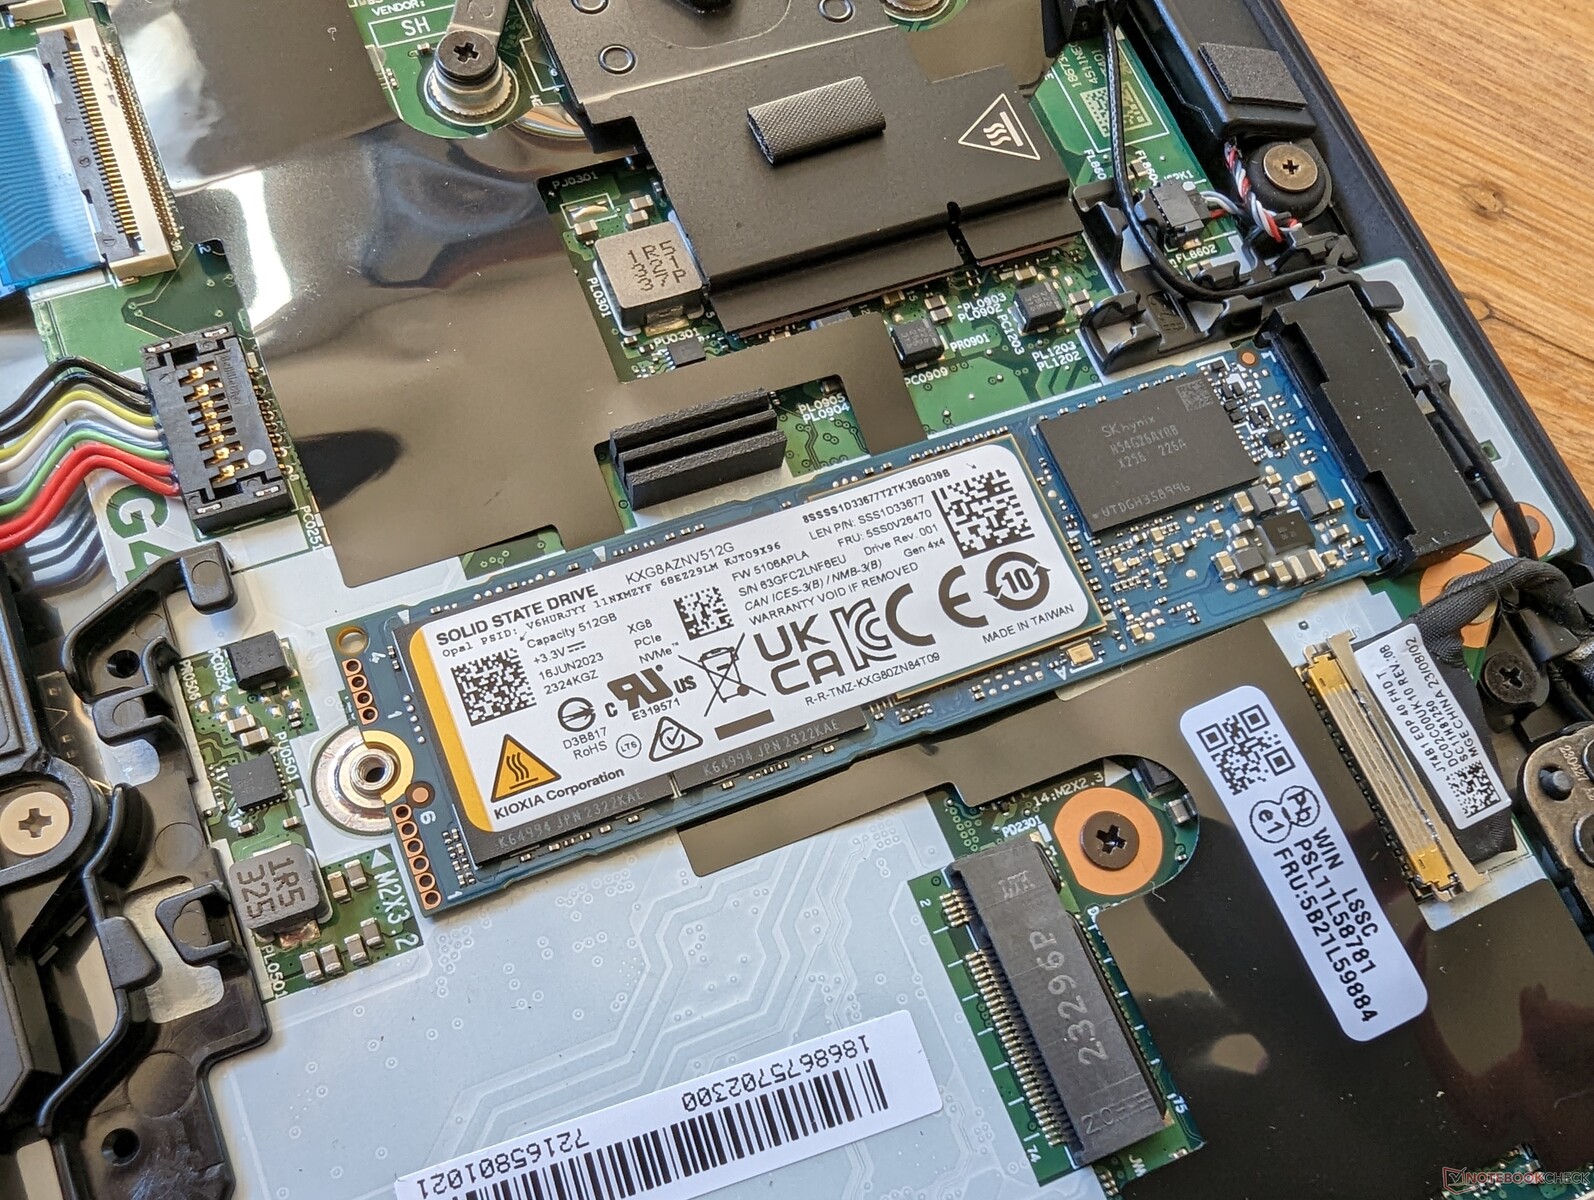
Massenspeicher
Unser Testgerät enthält eine 512 GB Kioxia XG8 KXG8AZNV512G, die sequentielle Lese- und Schreibgeschwindigkeiten von bis zu 7000 MB/s bzw. 5000 MB/s verspricht. Das Laufwerk in unserem Gerät kann tatsächlich 7000 MB/s erreichen, aber diese Leistung hält nur für ein oder zwei Minuten an, bevor es beginnt, in den Bereich von 5000 MB/s zu drosseln, wie unsere DiskSpd-Schleifenergebnisse unten zeigen. Im Vergleich dazu hat der Samsung PM9A1a in der AMD-Version unseres ThinkPad T14s G4 keine Probleme, die maximale Geschwindigkeit über längere Zeit aufrechtzuerhalten. Wir vermuten, dass der Controller des Kioxia seine Temperaturgrenze schneller erreicht als der des Samsung.

* ... kleinere Werte sind besser
Disk-Throttling: DiskSpd Read Loop, 8 Runden
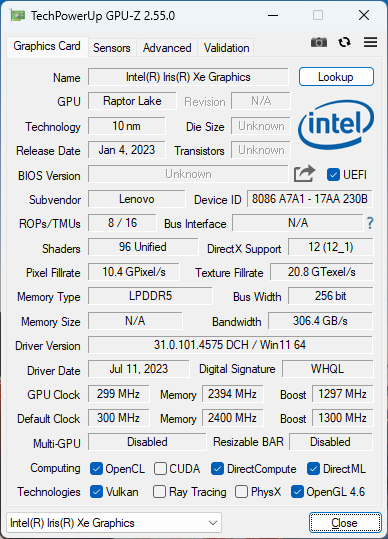
GPU Performance
Die Iris Xe 96 EUs ist fällig für ein Upgrade, da sie hinter die aktuellen Alternativen von AMD zurückgefallen ist. Die Radeon 780M in der AMD-Version des ThinkPad 14s G4 kann 40 bis 60 Prozent mehr Leistung bieten, was keineswegs unbedeutend ist. Ein Downgrade auf die Core i5-1335U-Konfiguration mit den Iris Xe 80 EUs anstelle unserer Iris Xe 96 EUs wirkt sich um 25 bis 30 Prozent auf die Grafikleistung aus.
Interessanterweise bleibt die Gesamtleistung im Akkubetrieb sowie im Balanced-Modus und im Performance-Modus ungefähr gleich, wie unsere 3DMark 11-Ergebnistabelle unten zeigt.
| Energieprofile | CPU-Leistung | Grafikleistung | Gesamtwert |
| Battery Power | 13557 | 6293 | 6359 |
| Balanced-Modus | 12255 | 6424 | 6148 |
| Performance-Modus | 12580 | 6403 | 6268 |
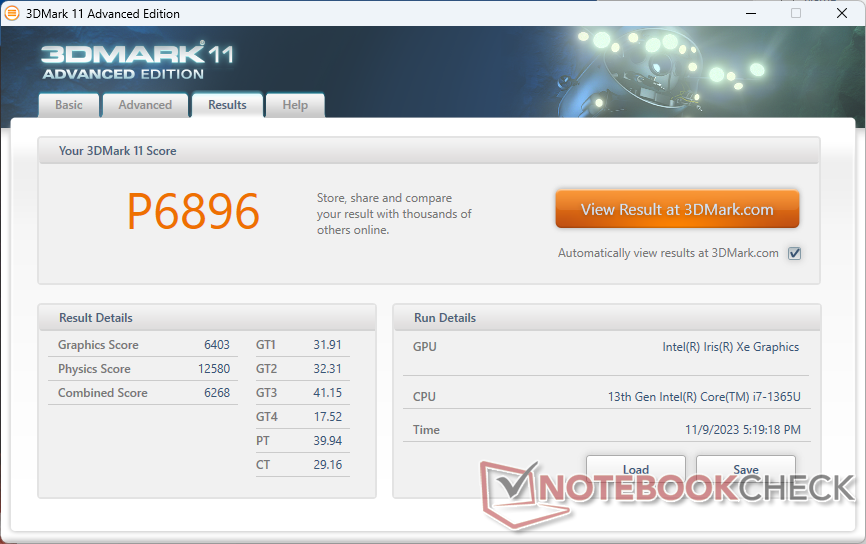

| 3DMark 11 Performance | 6896 Punkte | |
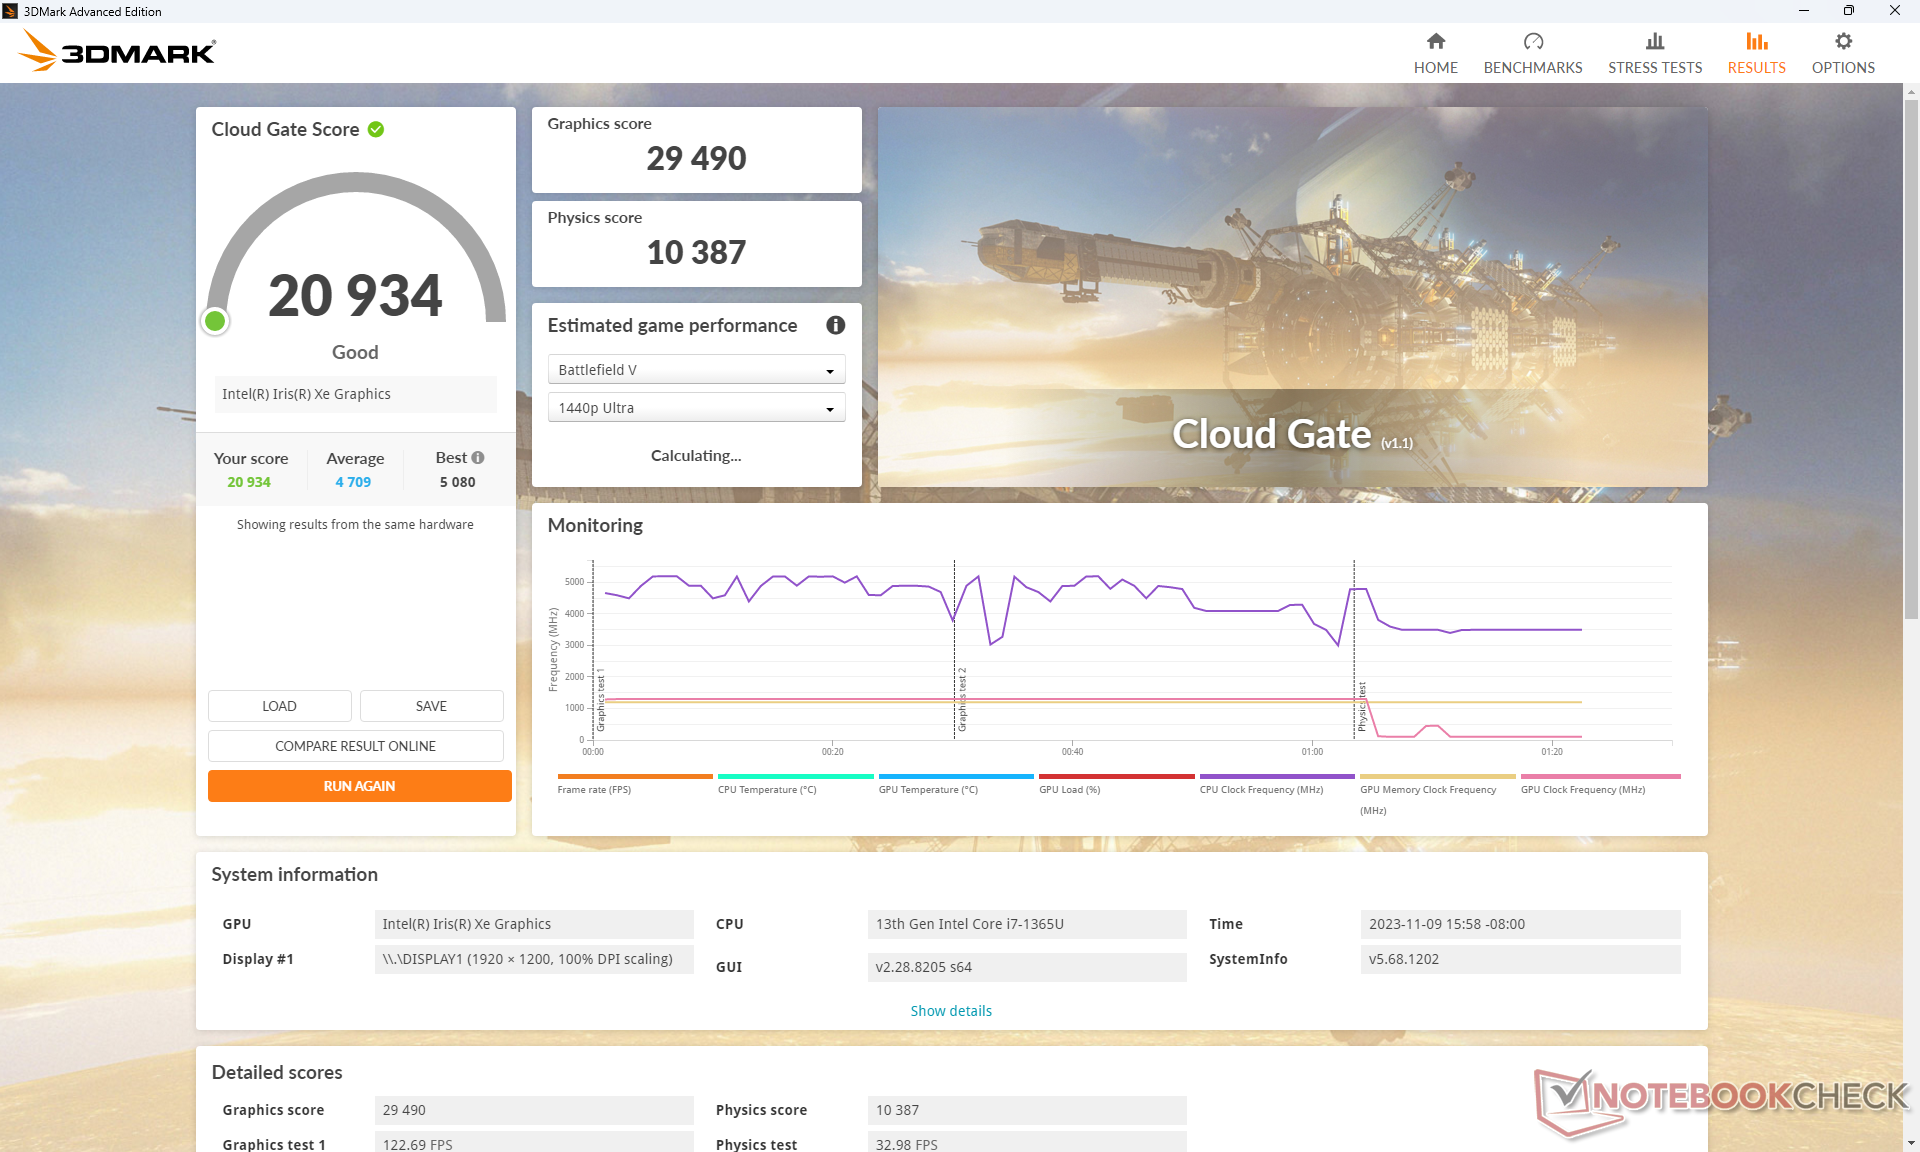
| 3DMark Cloud Gate Standard Score | 20934 Punkte | |
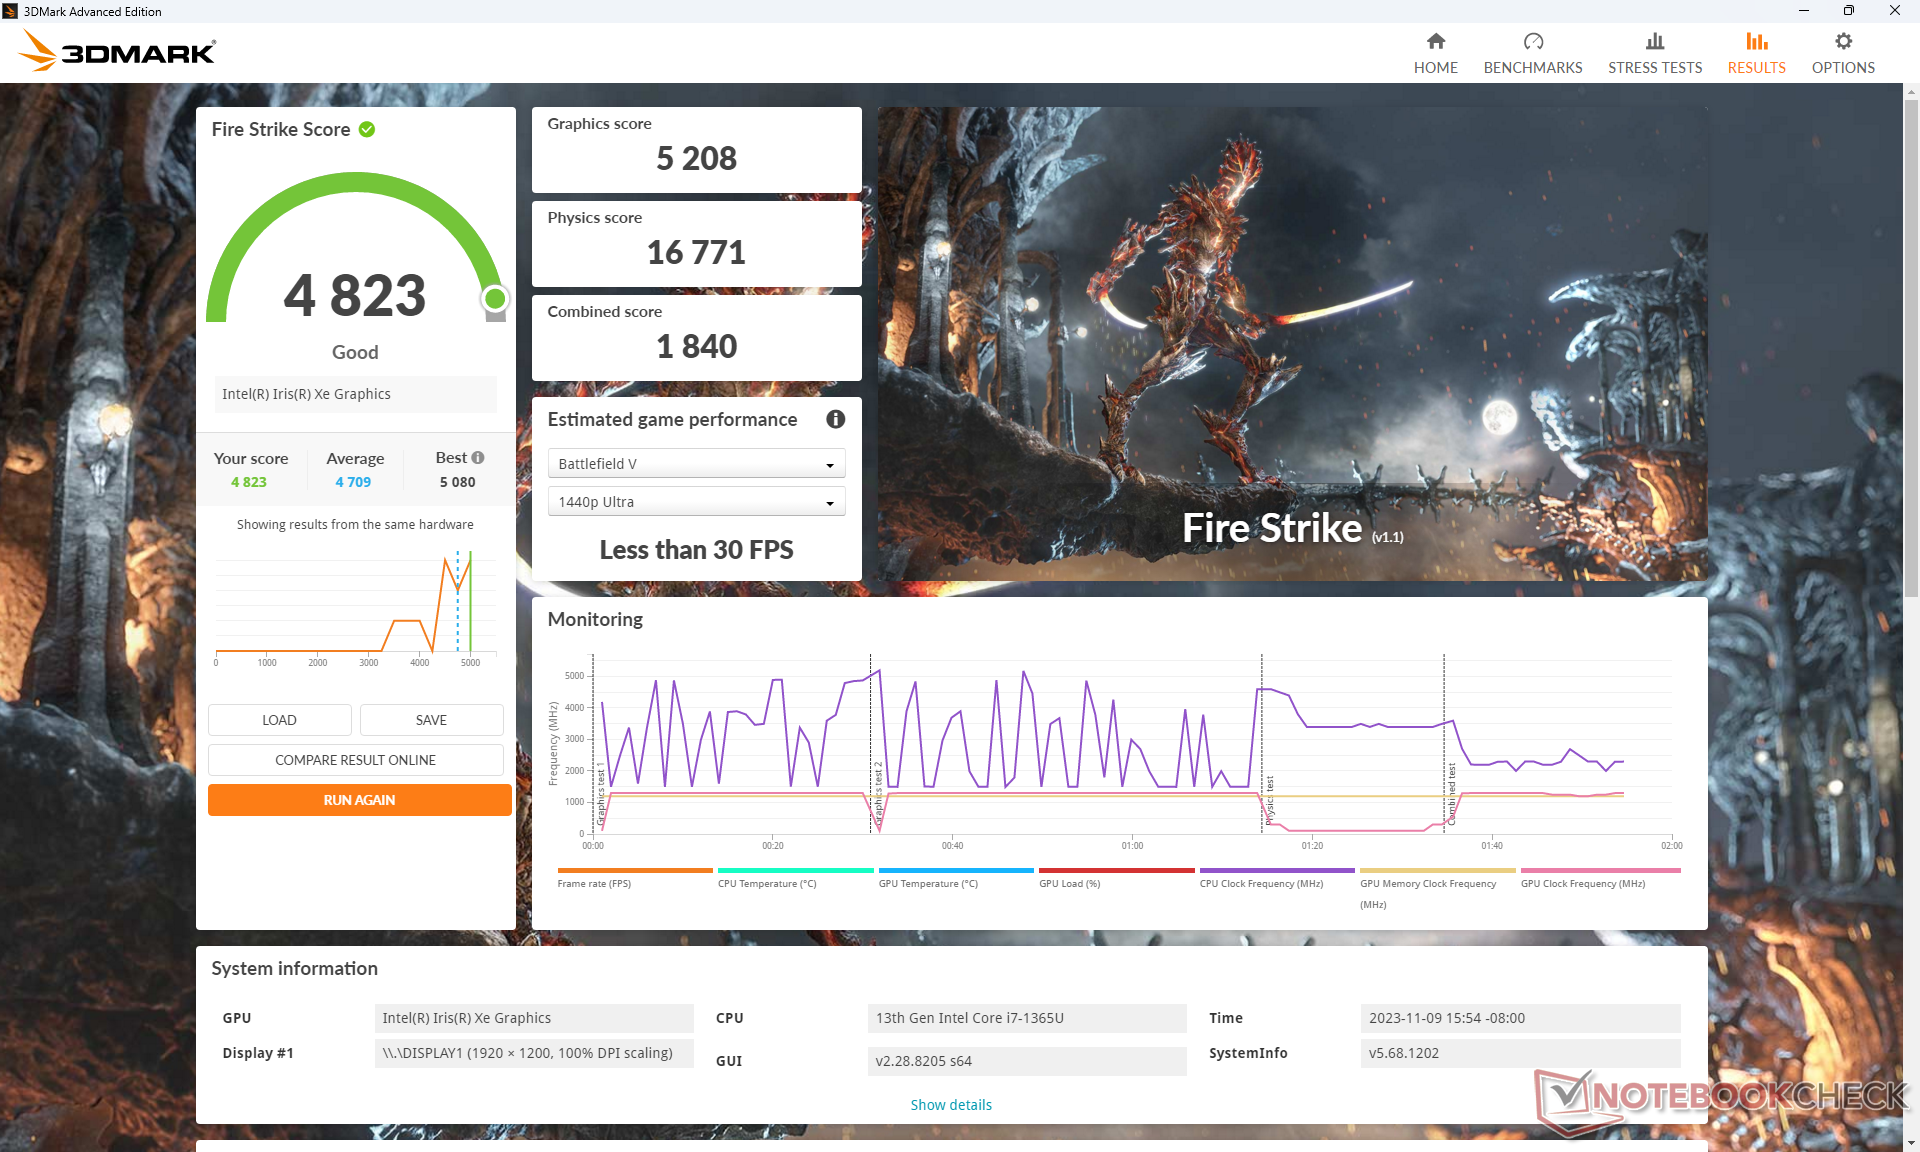
| 3DMark Fire Strike Score | 4823 Punkte | |
| 3DMark Time Spy Score | 1774 Punkte | |
Hilfe | ||
* ... kleinere Werte sind besser
| Tiny Tina's Wonderlands | |
| 1280x720 Lowest Preset (DX12) | |
| Durchschnittliche Intel Iris Xe Graphics G7 96EUs (25.9 - 67.3, n=32) | |
| Lenovo ThinkPad T14s G4 i7-1365U | |
| 1920x1080 Low Preset (DX12) | |
| Durchschnittliche Intel Iris Xe Graphics G7 96EUs (22.3 - 53, n=32) | |
| Lenovo ThinkPad T14s G4 i7-1365U | |
| Dell Latitude 7440 | |
Idling on Witcher 3 shows steady performance aside from a single instance where frame rates would temporarily dip to the single-digit range. The inconsistency was fortunately not repeatable.
Witcher 3 FPS-Diagramm
| min. | mittel | hoch | max. | |
|---|---|---|---|---|
| GTA V (2015) | 103.3 | 89.6 | 10.1 | |
| The Witcher 3 (2015) | 85.5 | 55.7 | 30.2 | 14.7 |
| Dota 2 Reborn (2015) | 101.6 | 77.7 | 61.6 | 54.2 |
| Final Fantasy XV Benchmark (2018) | 42.8 | 23.9 | 17.1 | |
| X-Plane 11.11 (2018) | 47.2 | 36.4 | 31.7 | |
| Far Cry 5 (2018) | 48 | 29 | 27 | 25 |
| Strange Brigade (2018) | 89.3 | 38.2 | 30.8 | 24.7 |
| Cyberpunk 2077 1.6 (2022) | 17.8 | |||
| Tiny Tina's Wonderlands (2022) | 27.1 | |||
| F1 22 (2022) | 46 | 41.3 | 30.4 | 22.9 |
Emissionen
Geräuschemissionen
Das Lüftergeräusch, genauer gesagt das Fehlen davon, ist einer der besten Aspekte des ThinkPad T14s G4. Insbesondere unser Intel-Gerät läuft etwas leiser als die AMD-Konfiguration, wenn anspruchsvolle Lasten eingeführt werden. Mit anderen Worten: Der interne Lüfter ist in der Lage, länger leise zu bleiben, bevor höhere Drehzahlen erforderlich sind.
Lautstärkediagramm
| Idle |
| 23.2 / 23.2 / 23.6 dB(A) |
| Last |
| 24.3 / 35.7 dB(A) |
 | ||
30 dB leise 40 dB(A) deutlich hörbar 50 dB(A) störend |
||
min: | ||
| Lenovo ThinkPad T14s G4 i7-1365U Iris Xe G7 96EUs, i7-1365U | Lenovo ThinkPad T14s G4-21F8002TGE Radeon 780M, R7 7840U, Samsung PM9A1a MZVL21T0HDLU | Lenovo ThinkPad T14 G4 21HD0043GE Iris Xe G7 80EUs, i5-1335U, Kioxia BG5 KBG5AZNV512G | HP EliteBook 845 G10 5Z4X0ES Radeon 780M, R7 7840U, WD PC SN740 512GB SDDPNQD-512G | Dell Latitude 7440 Iris Xe G7 80EUs, i5-1345U, Samsung MZ9L4512HBLU-00BMV | Asus ExpertBook B9 B9403CVA-KM0153X Iris Xe G7 96EUs, i7-1355U, Samsung PM9A1 MZVL21T0HCLR | |
|---|---|---|---|---|---|---|
| Geräuschentwicklung | -9% | -4% | 3% | 1% | -15% | |
| aus / Umgebung * (dB) | 23.2 | 24.6 -6% | 23 1% | 22.9 1% | 22.8 2% | 24.9 -7% |
| Idle min * (dB) | 23.2 | 24.6 -6% | 23 1% | 22.9 1% | 22.8 2% | 24.9 -7% |
| Idle avg * (dB) | 23.2 | 24.6 -6% | 23 1% | 22.9 1% | 22.8 2% | 24.9 -7% |
| Idle max * (dB) | 23.6 | 26 -10% | 24.9 -6% | 22.9 3% | 22.8 3% | 24.9 -6% |
| Last avg * (dB) | 24.3 | 29.8 -23% | 26.1 -7% | 24.3 -0% | 26.3 -8% | 33 -36% |
| Witcher 3 ultra * (dB) | 35.7 | 36.1 -1% | 38.4 -8% | 32.4 9% | 30 16% | |
| Last max * (dB) | 35.7 | 39.2 -10% | 38.5 -8% | 33.9 5% | 38.3 -7% | 45 -26% |
* ... kleinere Werte sind besser
Temperatur
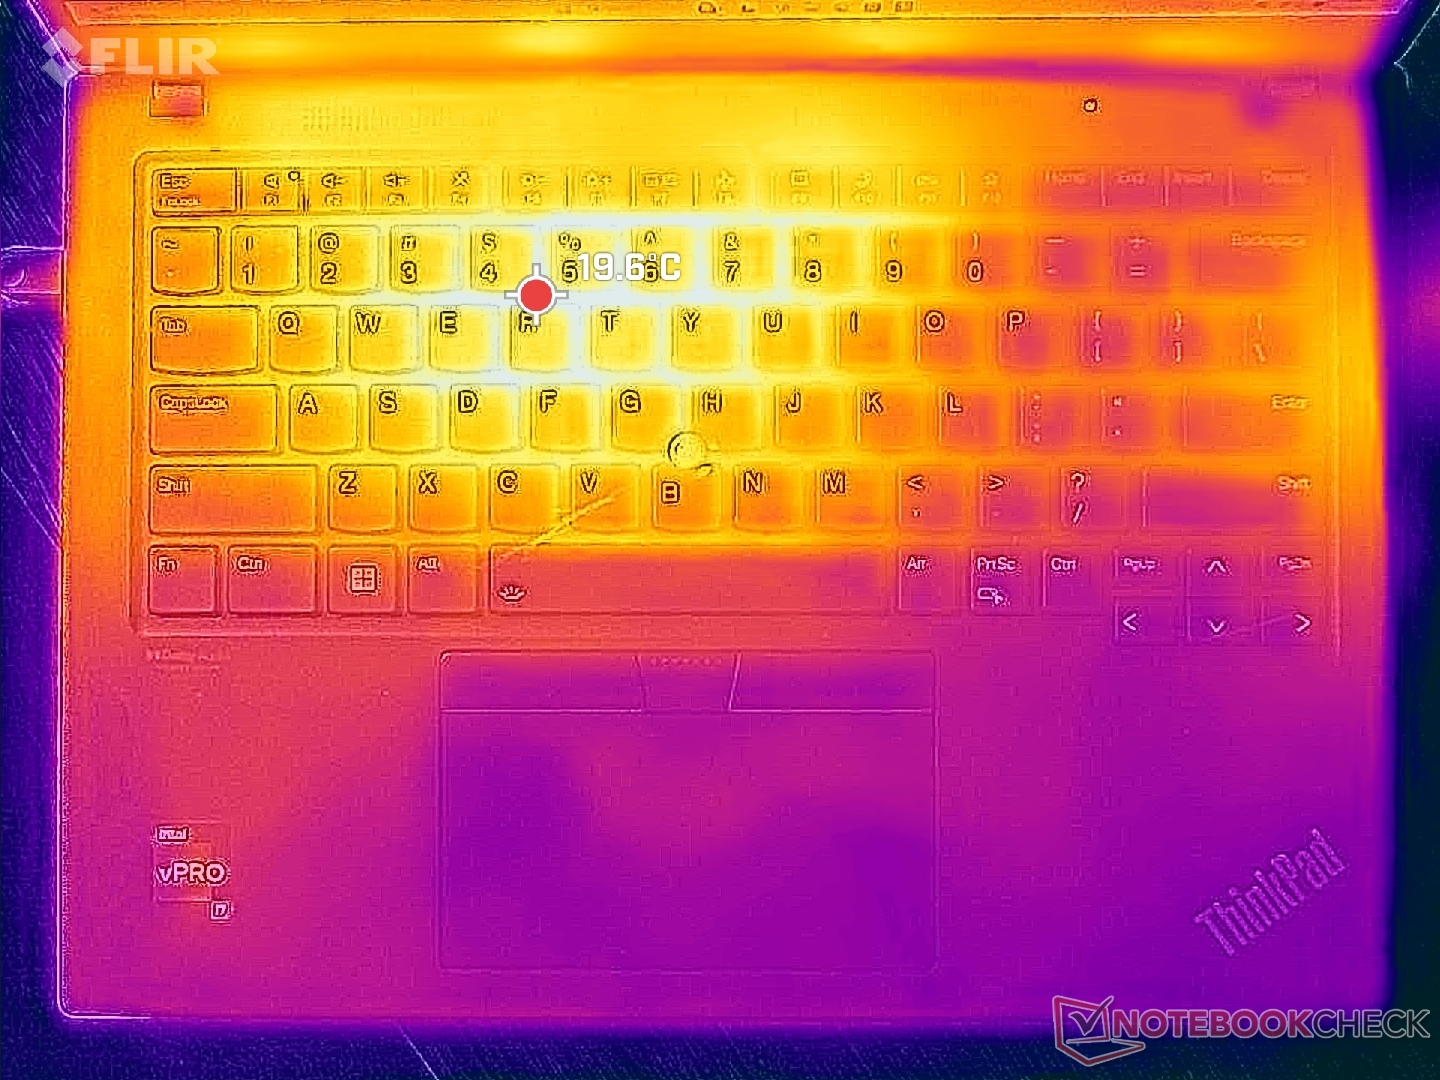
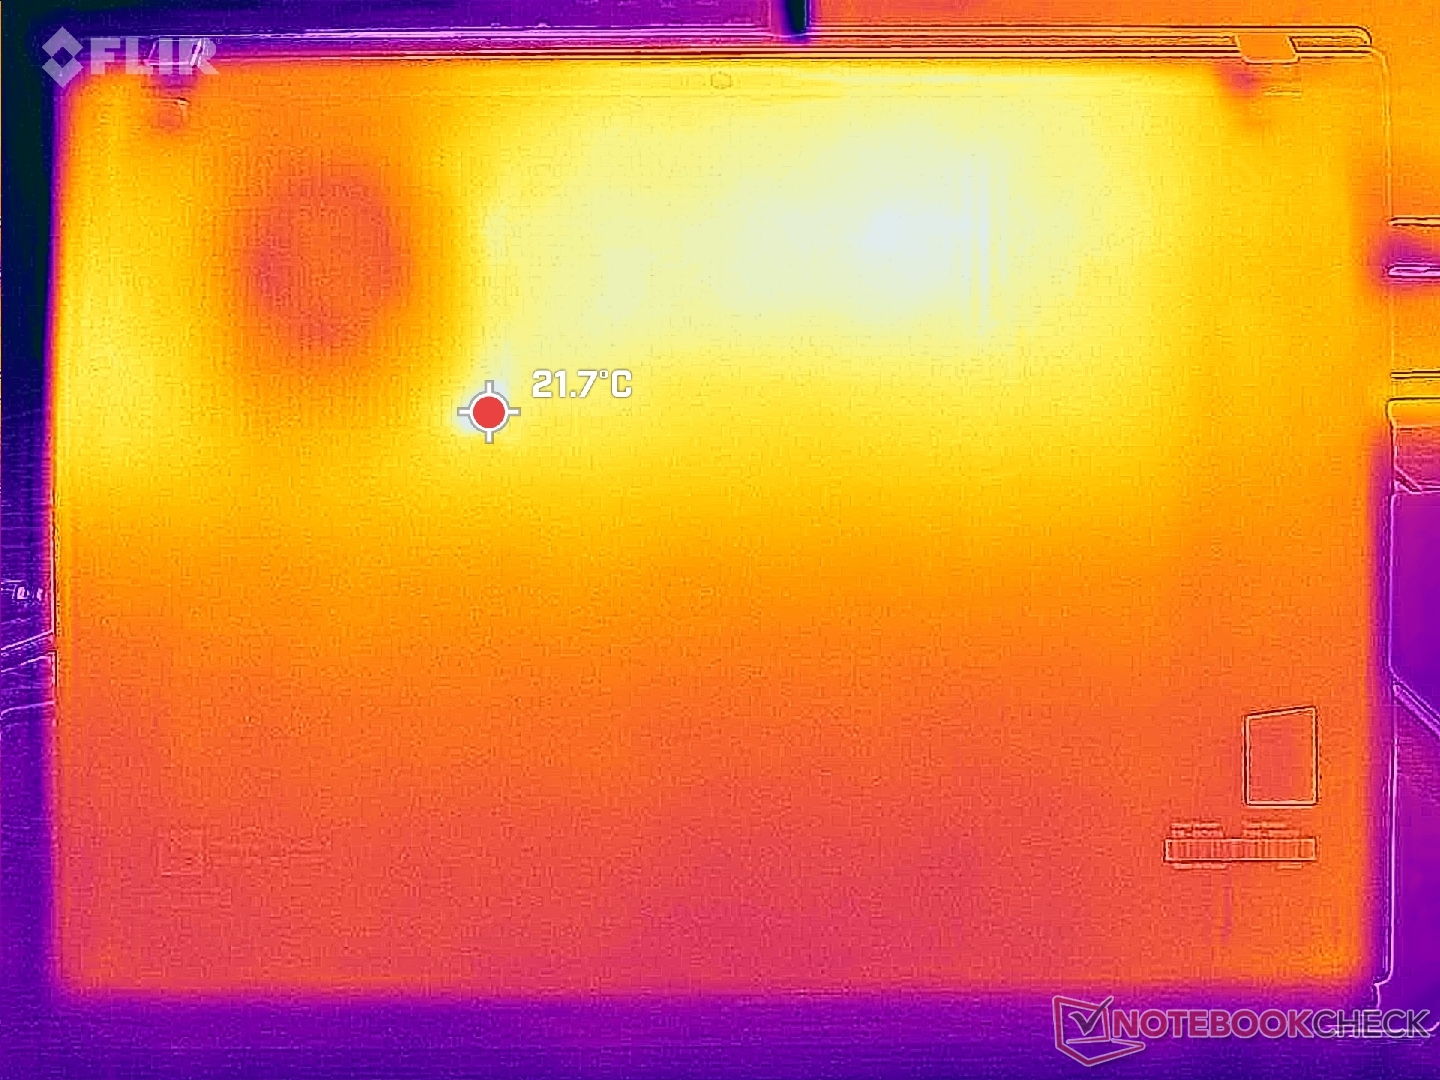
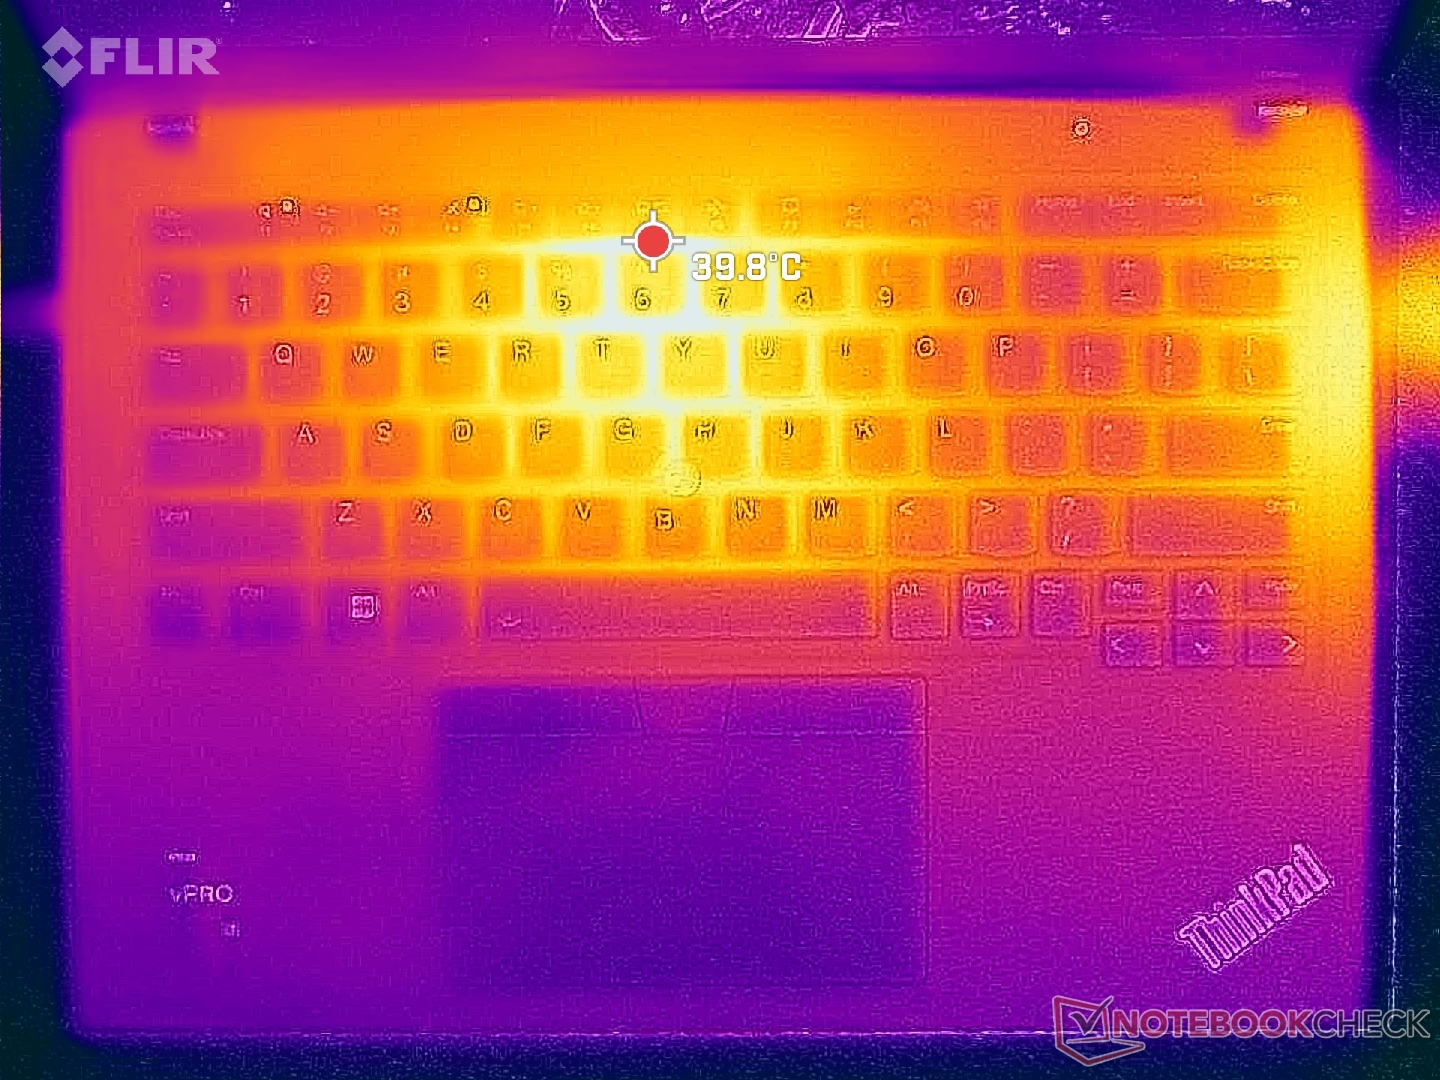
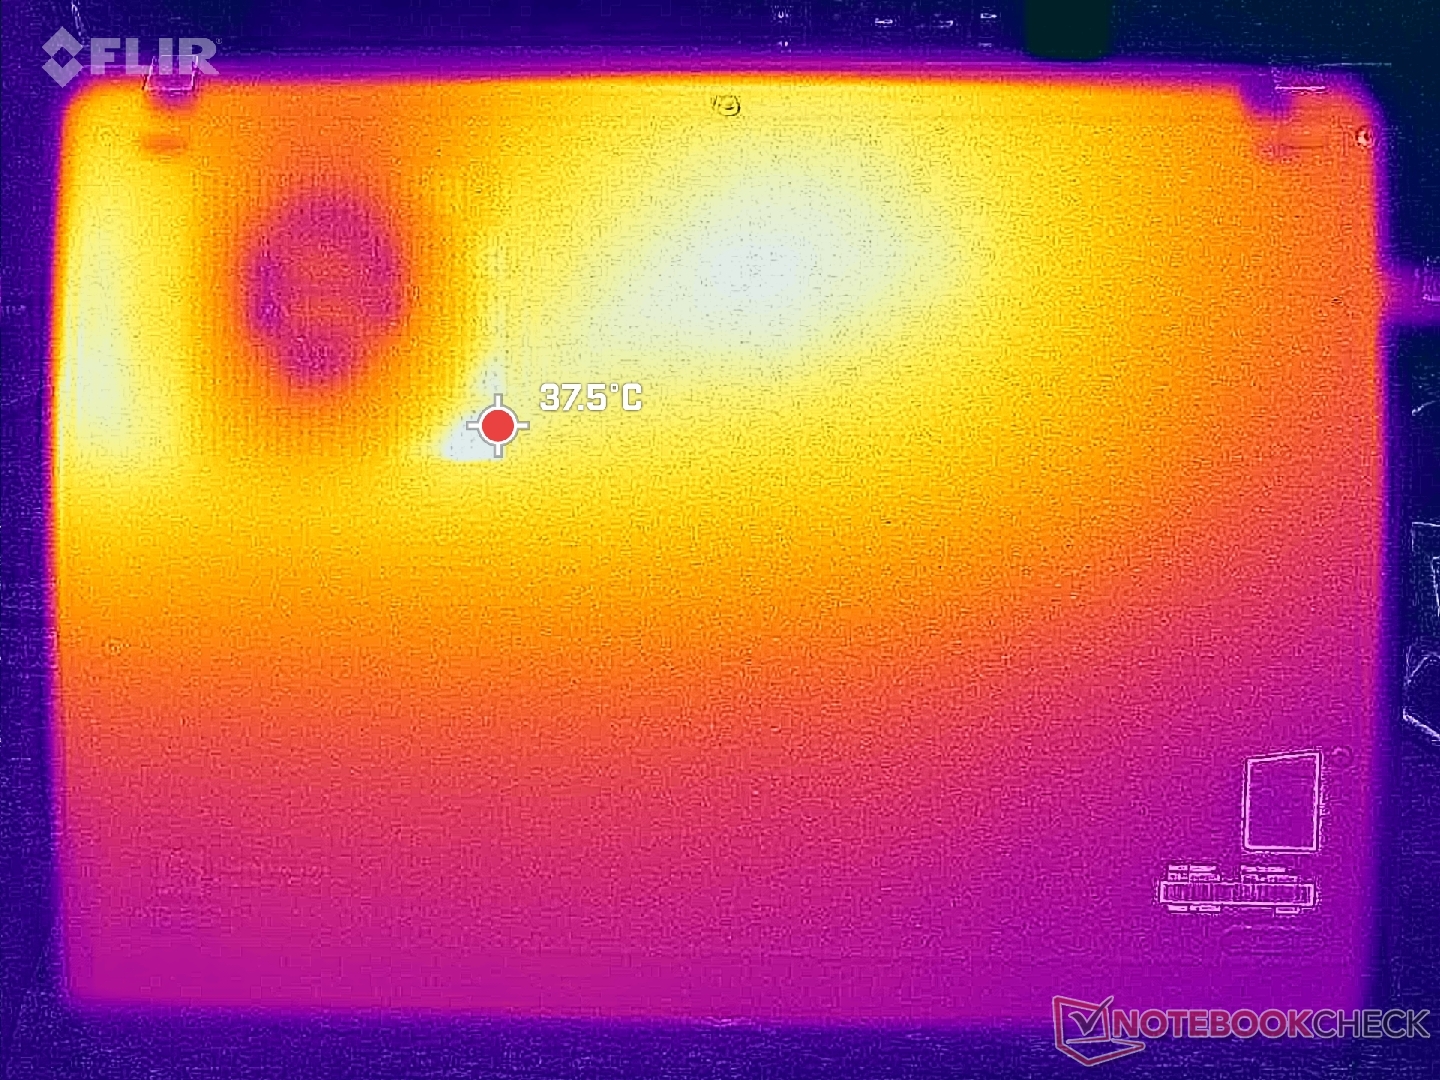
Die Oberflächentemperaturen erreichen 40 °C auf der Ober- und Unterseite (C- und D-Abdeckung), wenn anspruchsvolle Aufgaben ausgeführt werden, ähnlich wie bei der AMD-Version. Die heißen Stellen befinden sich auf der Rückseite, weit weg von den Handballenablagen und vielen der häufig verwendeten Tasten.
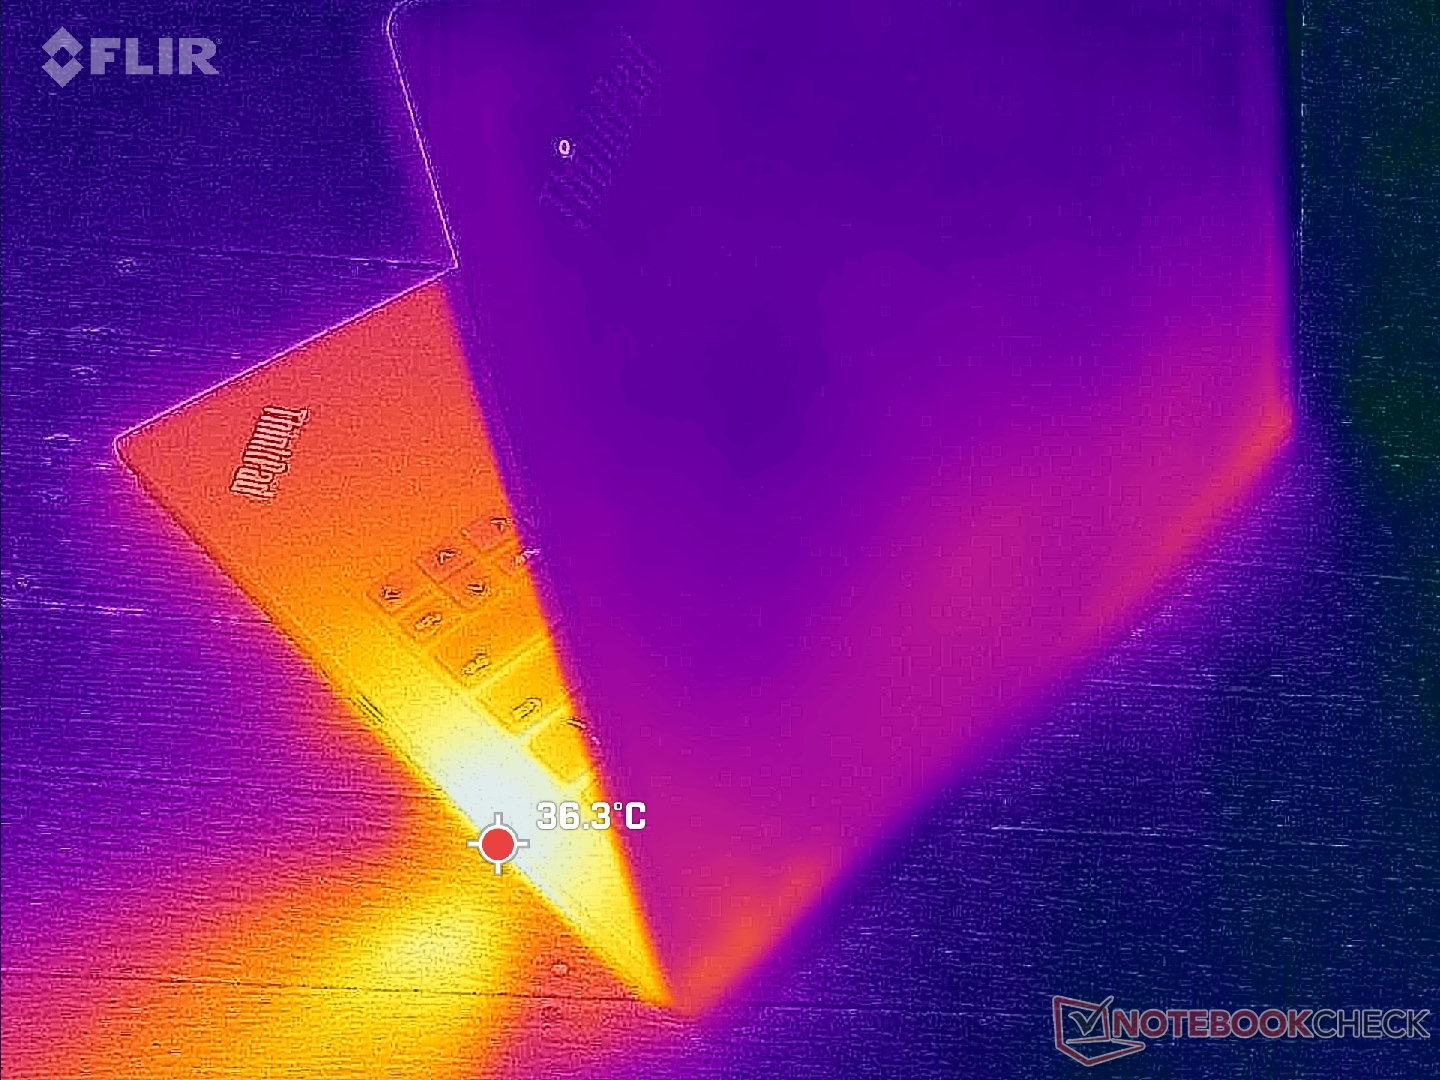

(+) Die maximale Temperatur auf der Oberseite ist 39.8 °C. Im Vergleich liegt der Klassendurchschnitt bei 34.3 °C (von 21.2 bis 62.5 °C für die Klasse Office).
(+) Auf der Unterseite messen wir eine maximalen Wert von 35.2 °C (im Vergleich zum Durchschnitt von 36.8 °C).
(+) Ohne Last messen wir eine durchschnittliche Temperatur von 23.6 °C auf der Oberseite. Der Klassendurchschnitt erreicht 29.5 °C.
(+) Die Handballen und der Touchpad-Bereich sind mit gemessenen 26.2 °C kühler als die typische Hauttemperatur und fühlen sich dadurch kühl an.
(±) Die durchschnittliche Handballen-Temperatur anderer getesteter Geräte war 27.5 °C (+1.3 °C).
| Lenovo ThinkPad T14s G4 i7-1365U Intel Core i7-1365U, Intel Iris Xe Graphics G7 96EUs | Lenovo ThinkPad T14s G4-21F8002TGE AMD Ryzen 7 7840U, AMD Radeon 780M | Lenovo ThinkPad T14 G4 21HD0043GE Intel Core i5-1335U, Intel Iris Xe Graphics G7 80EUs | HP EliteBook 845 G10 5Z4X0ES AMD Ryzen 7 7840U, AMD Radeon 780M | Dell Latitude 7440 Intel Core i5-1345U, Intel Iris Xe Graphics G7 80EUs | Asus ExpertBook B9 B9403CVA-KM0153X Intel Core i7-1355U, Intel Iris Xe Graphics G7 96EUs | |
|---|---|---|---|---|---|---|
| Hitze | -1% | -12% | -18% | -10% | -39% | |
| Last oben max * (°C) | 39.8 | 42.1 -6% | 41.5 -4% | 45.4 -14% | 39 2% | 48.8 -23% |
| Last unten max * (°C) | 35.2 | 39.7 -13% | 43 -22% | 50.6 -44% | 40.6 -15% | 56.5 -61% |
| Idle oben max * (°C) | 25.6 | 23 10% | 27.8 -9% | 26.8 -5% | 28 -9% | 33.3 -30% |
| Idle unten max * (°C) | 24.4 | 22.8 7% | 27.8 -14% | 26.8 -10% | 28.8 -18% | 35 -43% |
* ... kleinere Werte sind besser
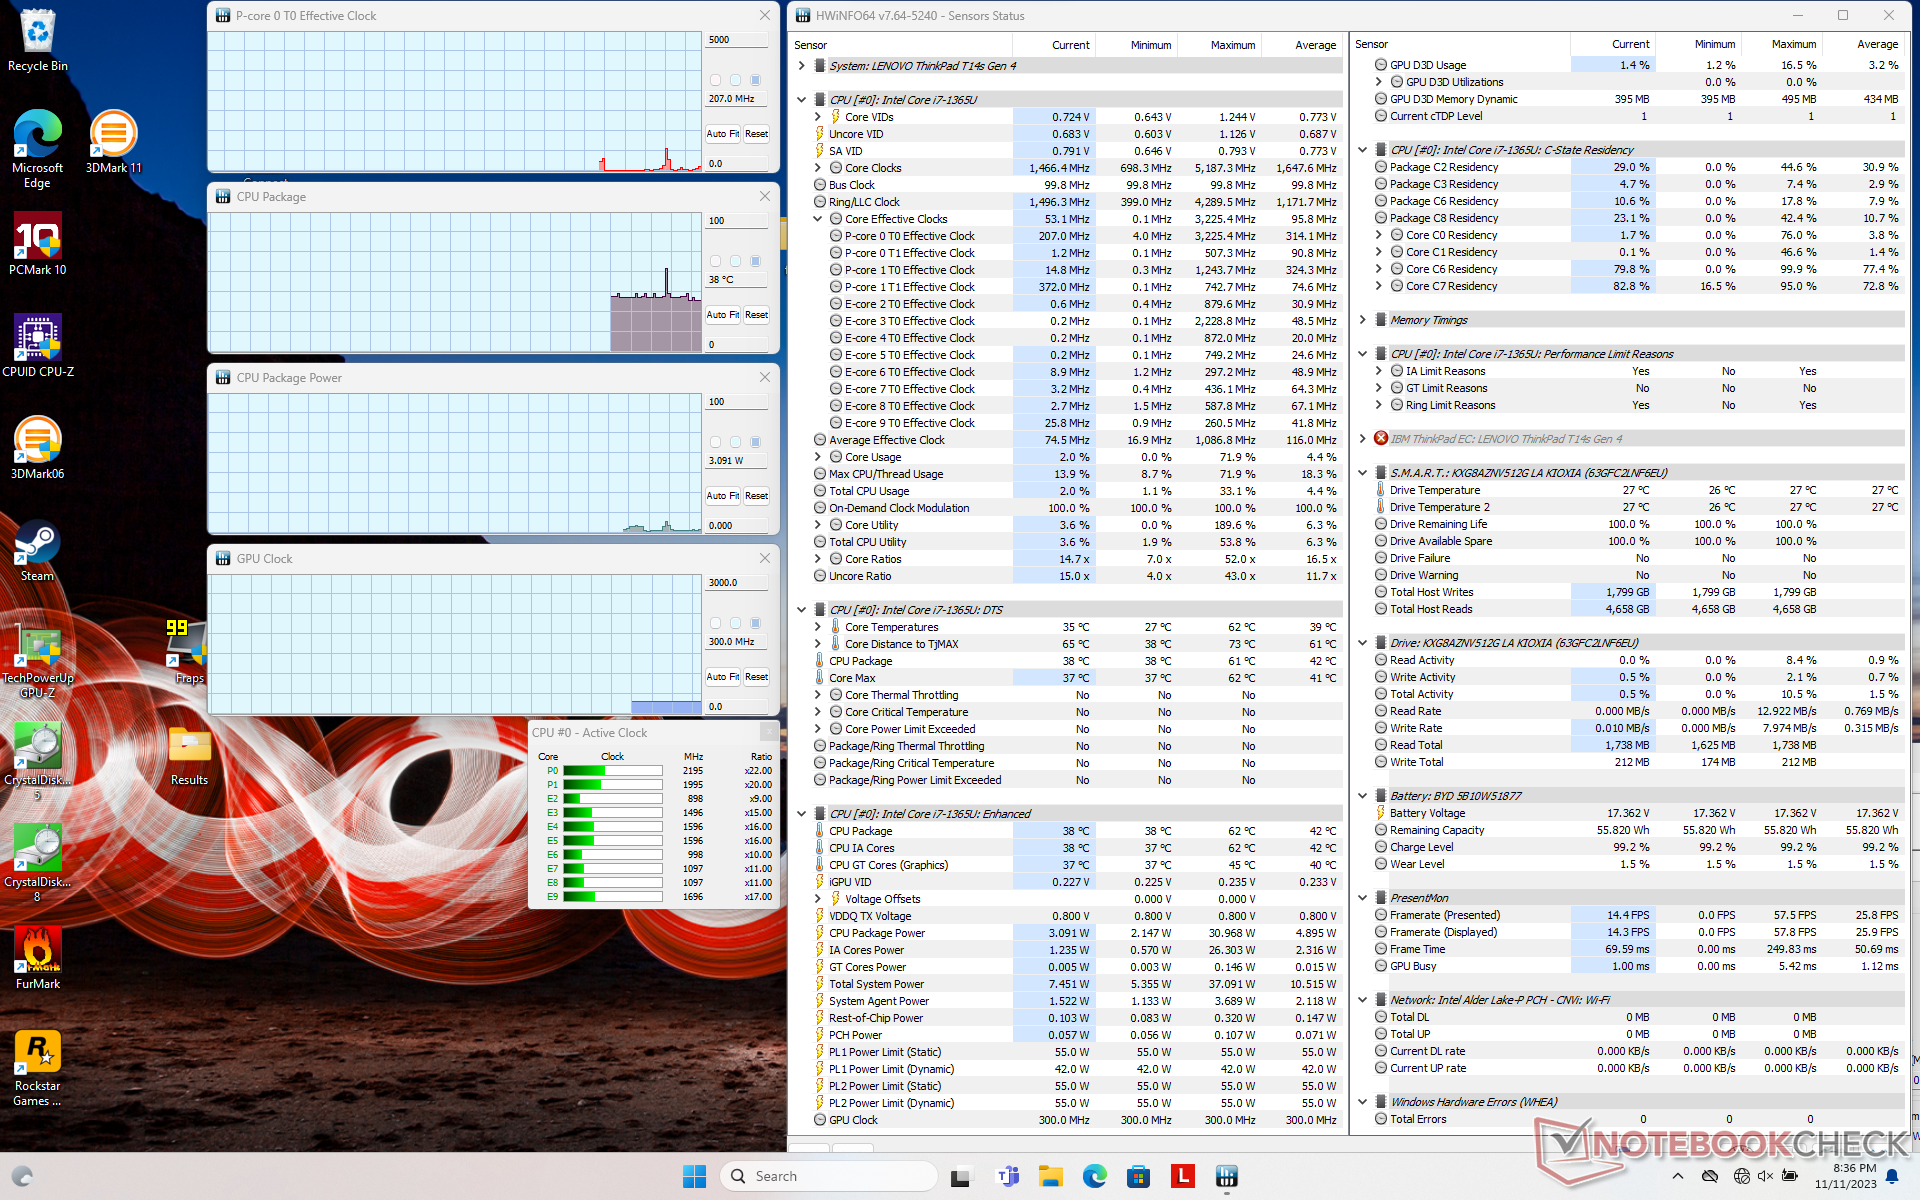
Stress Test
Bei der Prime95-Belastung erhöht sich die CPU auf 3,8 GHz, 53 W und 100 °C. Nach etwa 10 Sekunden sinkt die CPU jedoch auf 2,5 GHz und 23 W, um eine kontrollierbare Kerntemperatur von 77 °C aufrechtzuerhalten. Das kurzlebige Turbo-Boost-Potenzial ist bei Ultrabooks der U-Serie üblich und stimmt mit unseren obigen CineBench R15 xT Ergebnissen überein.
Die Kerntemperatur bei der Ausführung von Witcher 3, das eine hohe GPU-Last darstellt, würde sich bei 73 °C stabilisieren, verglichen mit 77 °C auf dem aktuellen Pavilion Plus 14 mit dem schnelleren Ryzen 7 7840U.
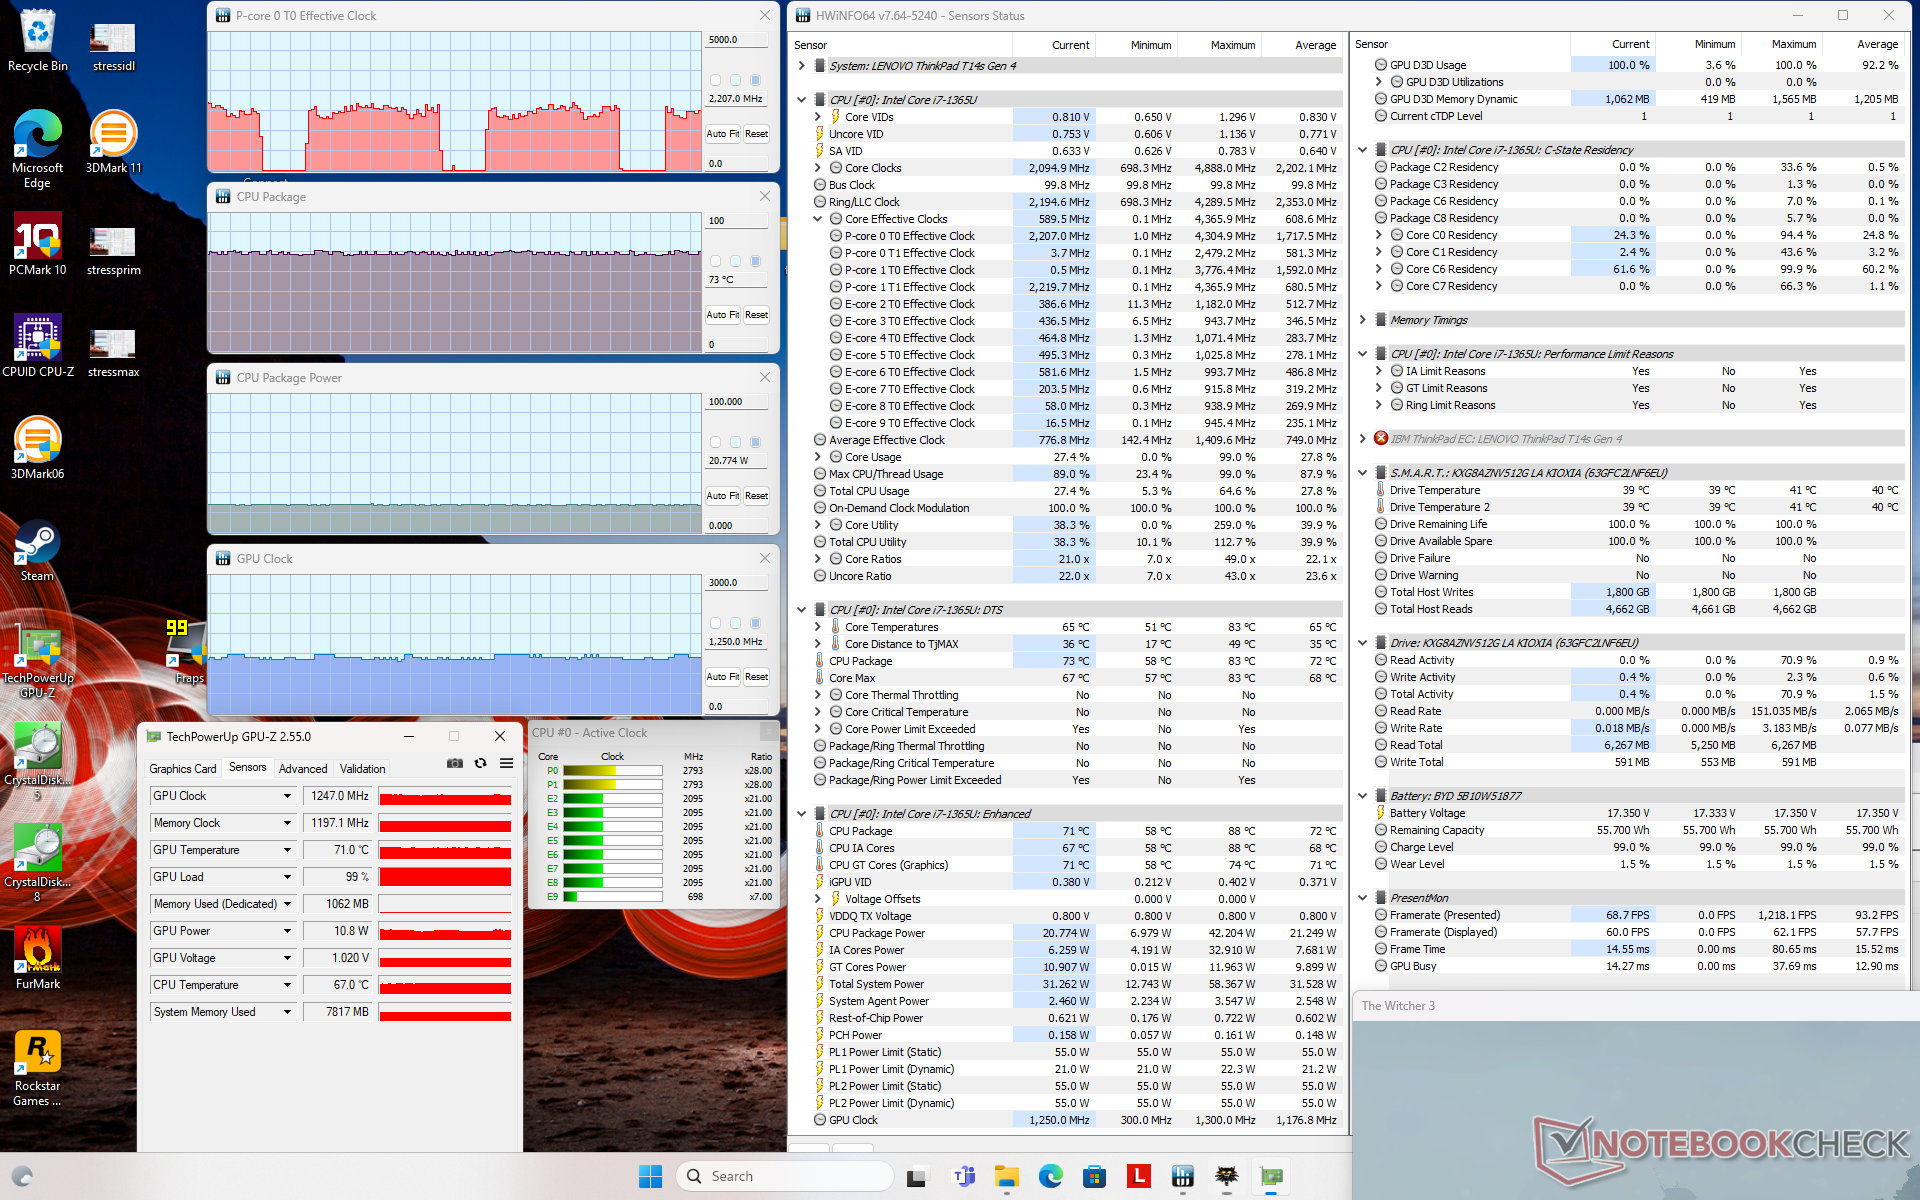
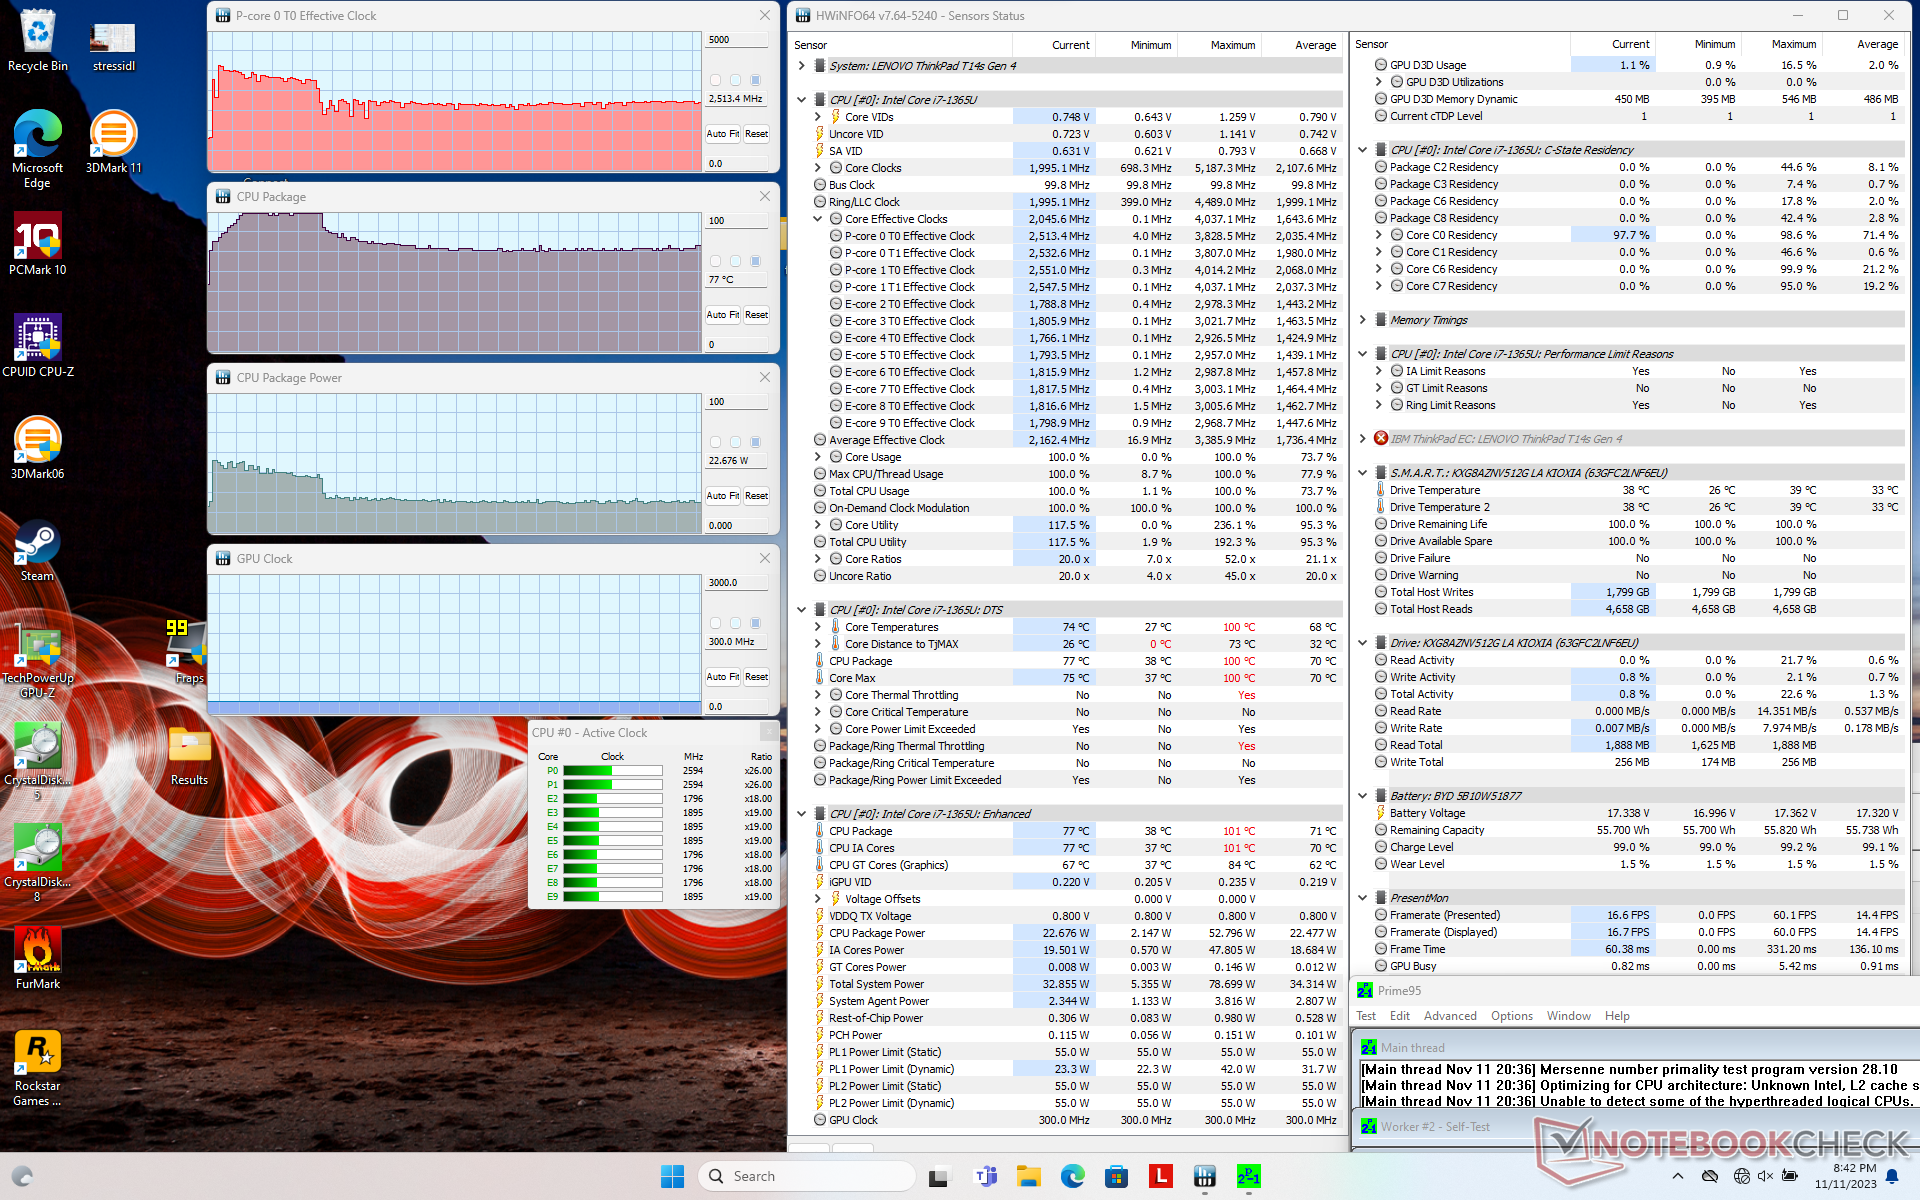
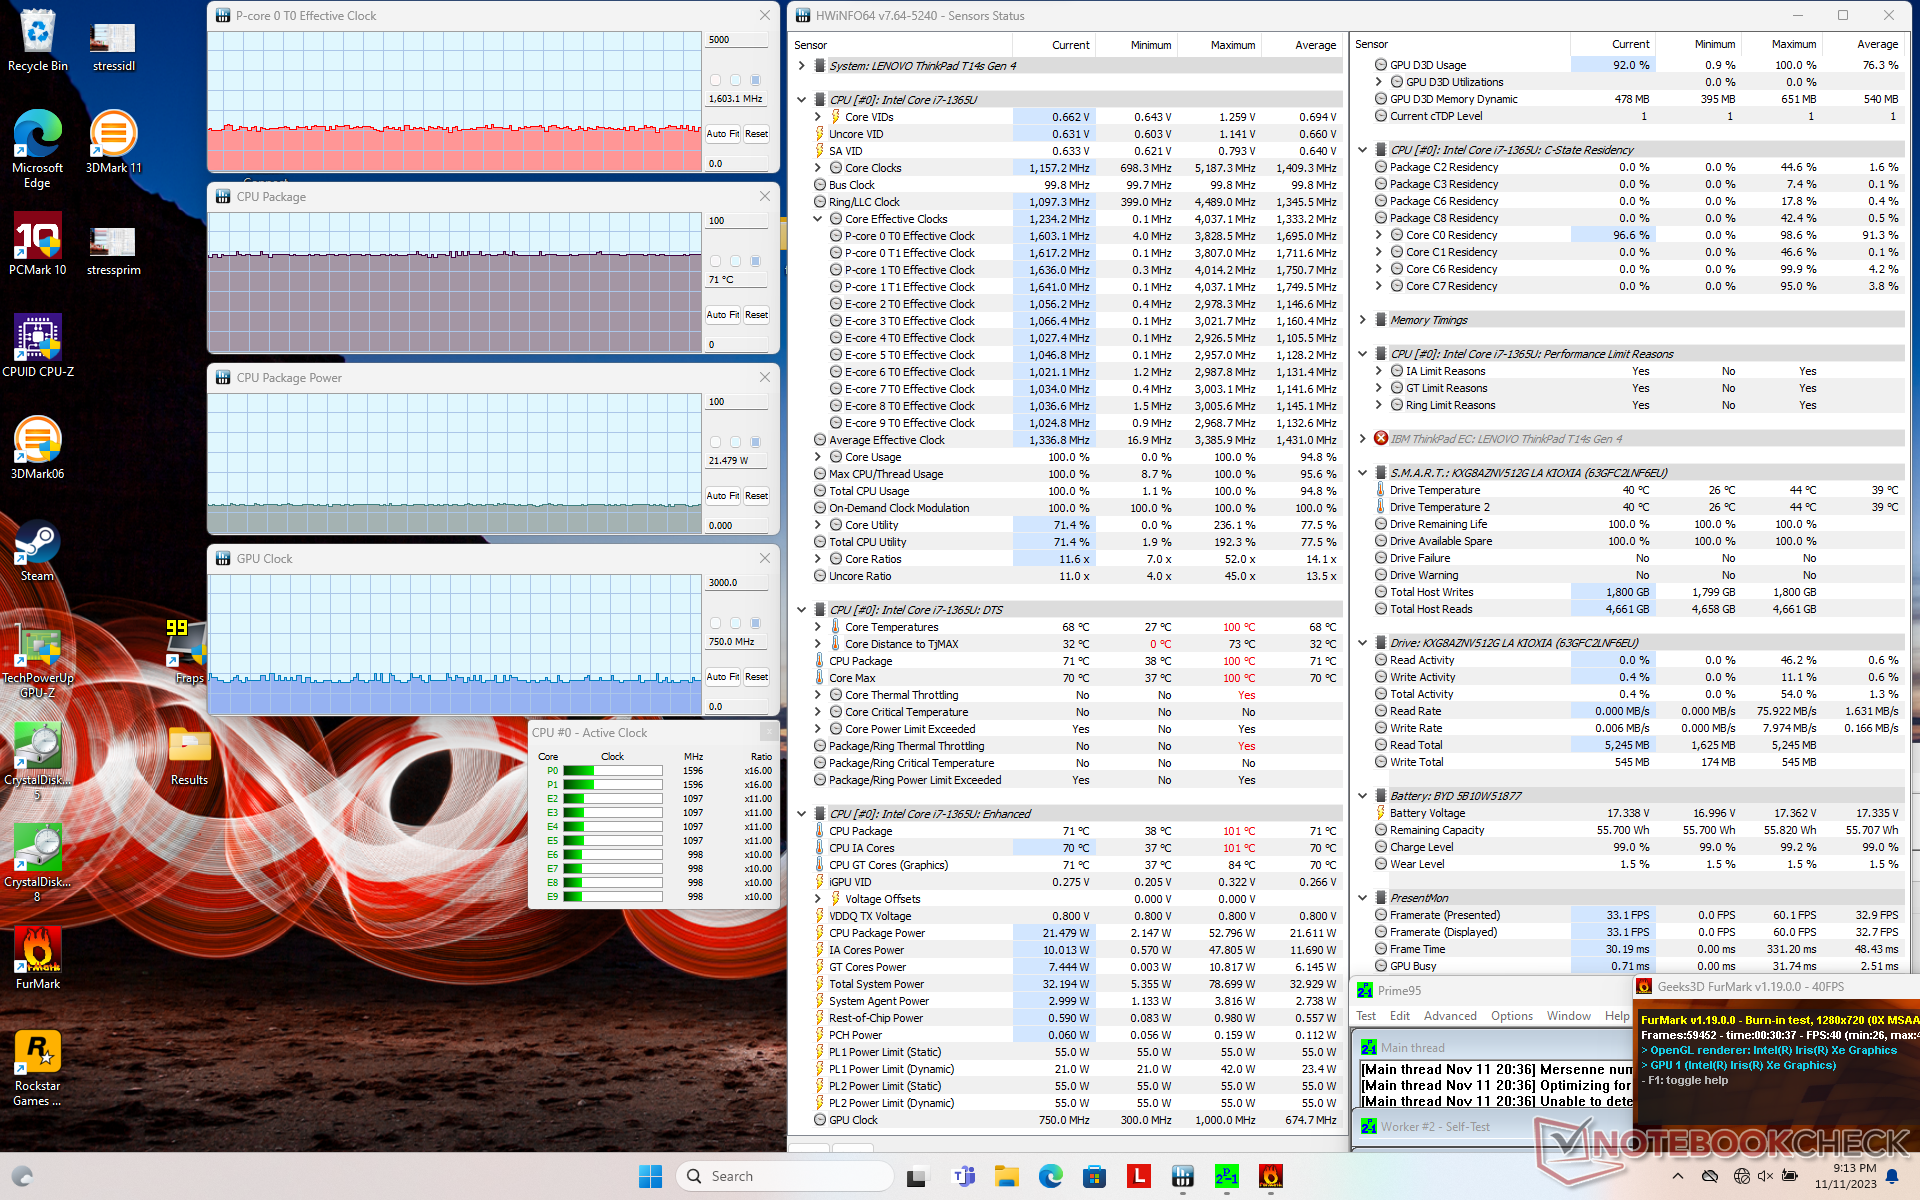
| CPU-Takt (GHz) | GPU-Takt (MHz) | Durchschnittliche CPU-Temperatur (°C) | |
| System im Leerlauf | -- | -- | 38 |
| Prime95 Stresstest | 2.5 | -- | 77 |
| Prime95 + FurMark Stresstest | 1.6 | 71 | 750 |
| Witcher 3 Stresstest | ~2.2 | 1250 | 73 |
Lautsprecher
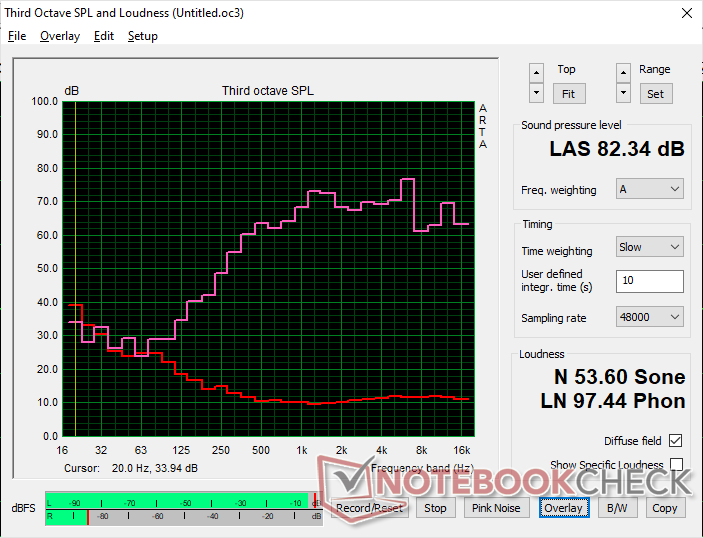
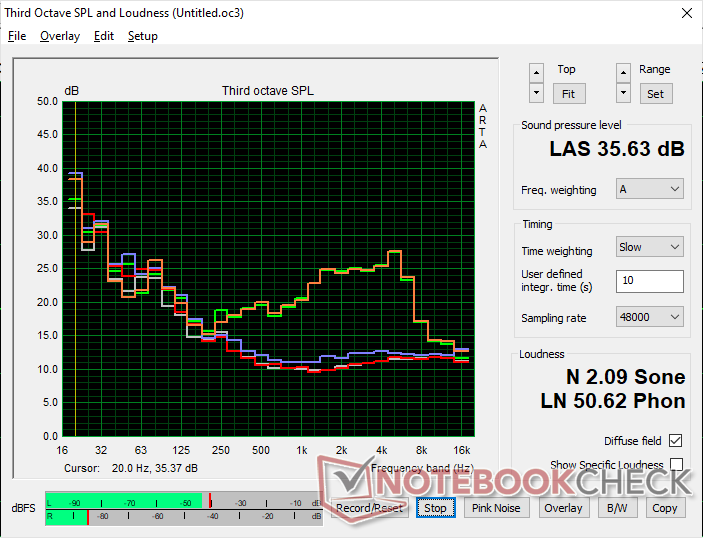
Lenovo ThinkPad T14s G4 i7-1365U Audio Analyse
(+) | Die Lautsprecher können relativ laut spielen (82.3 dB)
Bass 100 - 315 Hz
(-) | kaum Bass - 21.9% niedriger als der Median
(±) | durchschnittlich lineare Bass-Wiedergabe (8.3% Delta zum Vorgänger)
Mitteltöne 400 - 2000 Hz
(+) | ausgeglichene Mitten, vom Median nur 4.2% abweichend
(+) | lineare Mitten (6.2% Delta zum Vorgänger)
Hochtöne 2 - 16 kHz
(±) | zu hohe Hochtöne, vom Median nur 5.6% abweichend
(±) | durchschnittlich lineare Hochtöne (7.8% Delta zum Vorgänger)
Gesamt im hörbaren Bereich 100 - 16.000 Hz
(±) | hörbarer Bereich ist durchschnittlich linear (18.4% Abstand zum Median)
Im Vergleich zu allen Geräten derselben Klasse
» 33% aller getesteten Geräte dieser Klasse waren besser, 7% vergleichbar, 60% schlechter
» Das beste Gerät hat einen Delta-Wert von 7%, durchschnittlich ist 21%, das schlechteste Gerät hat 53%
Im Vergleich zu allen Geräten im Test
» 41% aller getesteten Geräte waren besser, 8% vergleichbar, 52% schlechter
» Das beste Gerät hat einen Delta-Wert von 4%, durchschnittlich ist 24%, das schlechteste Gerät hat 134%
Apple MacBook Pro 16 2021 M1 Pro Audio Analyse
(+) | Die Lautsprecher können relativ laut spielen (84.7 dB)
Bass 100 - 315 Hz
(+) | guter Bass - nur 3.8% Abweichung vom Median
(+) | lineare Bass-Wiedergabe (5.2% Delta zum Vorgänger)
Mitteltöne 400 - 2000 Hz
(+) | ausgeglichene Mitten, vom Median nur 1.3% abweichend
(+) | lineare Mitten (2.1% Delta zum Vorgänger)
Hochtöne 2 - 16 kHz
(+) | ausgeglichene Hochtöne, vom Median nur 1.9% abweichend
(+) | sehr lineare Hochtöne (2.7% Delta zum Vorgänger)
Gesamt im hörbaren Bereich 100 - 16.000 Hz
(+) | hörbarer Bereich ist sehr linear (4.6% Abstand zum Median
Im Vergleich zu allen Geräten derselben Klasse
» 0% aller getesteten Geräte dieser Klasse waren besser, 0% vergleichbar, 100% schlechter
» Das beste Gerät hat einen Delta-Wert von 5%, durchschnittlich ist 17%, das schlechteste Gerät hat 45%
Im Vergleich zu allen Geräten im Test
» 0% aller getesteten Geräte waren besser, 0% vergleichbar, 100% schlechter
» Das beste Gerät hat einen Delta-Wert von 4%, durchschnittlich ist 24%, das schlechteste Gerät hat 134%
Energieverwaltung
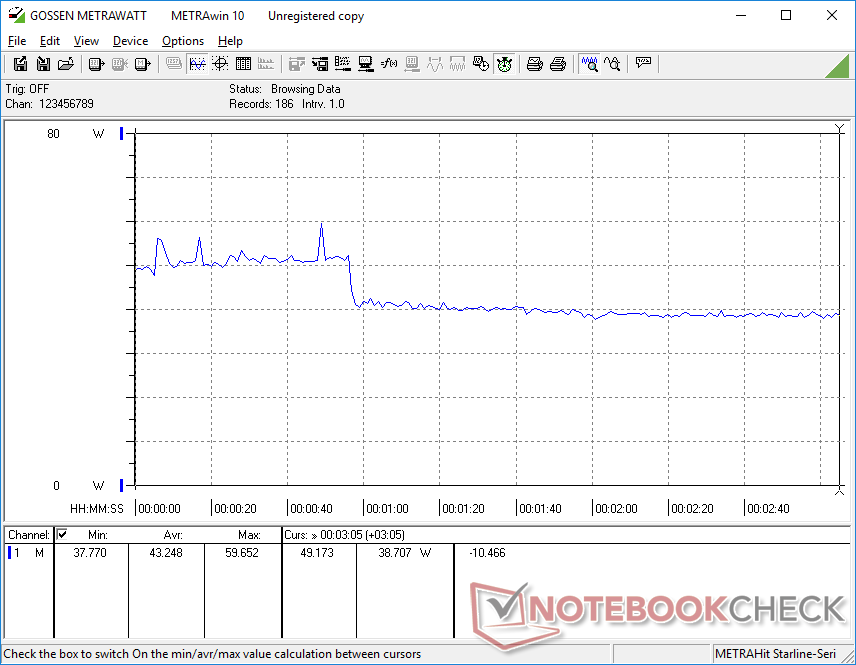
Energieaufnahme
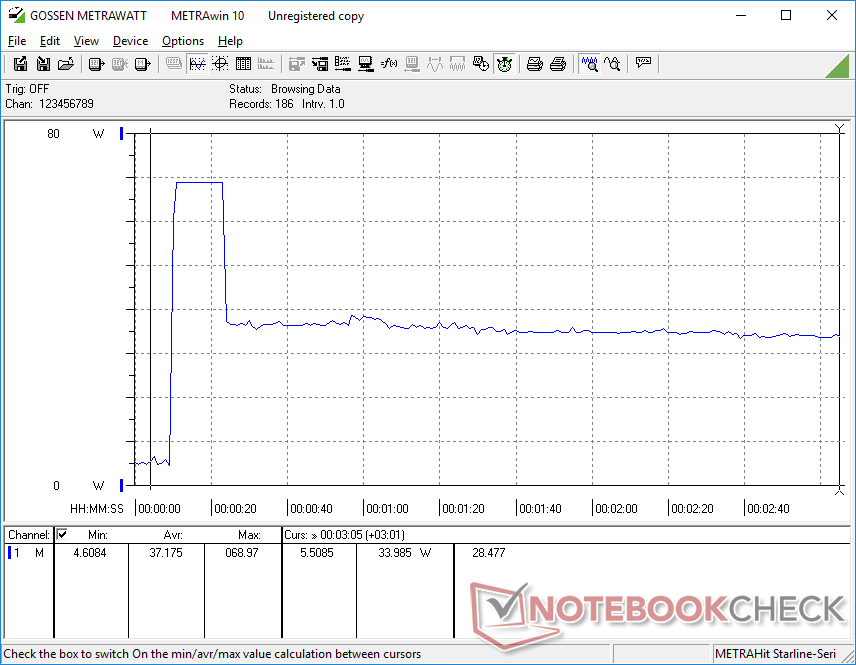
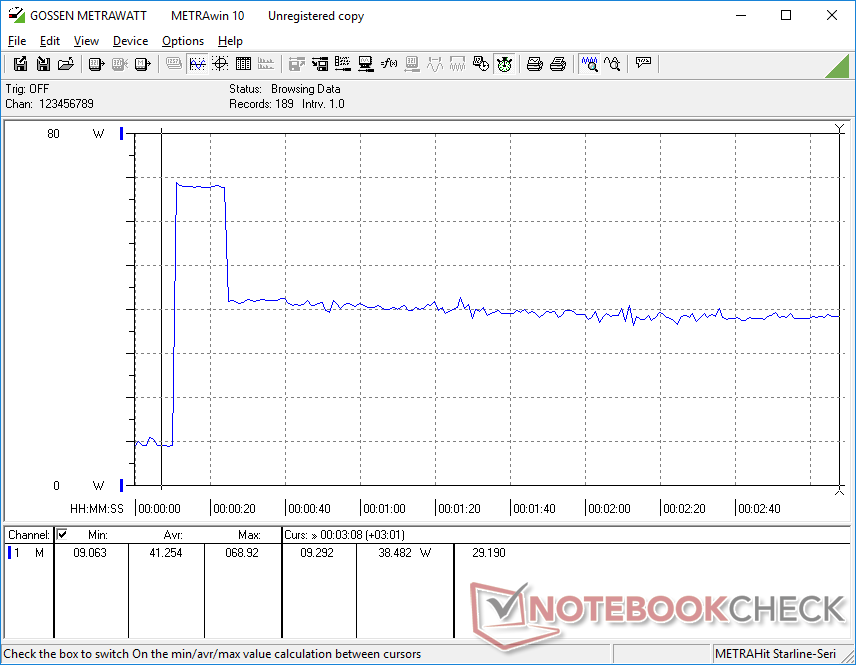
Our Intel system is slightly more demanding than the AMD version by a few watts when idling on desktop. Extend this by several hours and the minor differences can add up as exemplified by our battery life results in the next section.
Power consumption when initiating CPU-intensive tasks will draw much more power with our Intel unit than an AMD unit due to the generally higher Turbo Boost potential of the Core series. However, the power spike would only last for just a few seconds before consumption normalizes between the Intel and AMD models as shown by our comparison graphs below.
Performance-per-watt is clearly in AMD's favor. Running Witcher 3 or Prime95, for example, demands about the same from each model after accounting for throttling and yet the AMD Ryzen 7 configuration would provide noticeably faster multi-thread CPU performance and graphics performance than our Intel Core i7 configuration.

| Aus / Standby | |
| Idle | |
| Last |
|
Legende:
min: | |
| Lenovo ThinkPad T14s G4 i7-1365U i7-1365U, Iris Xe G7 96EUs, , IPS, 1920x1200, 14" | Lenovo ThinkPad T14s G4-21F8002TGE R7 7840U, Radeon 780M, Samsung PM9A1a MZVL21T0HDLU, IPS, 1920x1200, 14" | Lenovo ThinkPad T14 G4 21HD0043GE i5-1335U, Iris Xe G7 80EUs, Kioxia BG5 KBG5AZNV512G, IPS-AHVA LTPS wLED, 1920x1200, 14" | HP EliteBook 845 G10 5Z4X0ES R7 7840U, Radeon 780M, WD PC SN740 512GB SDDPNQD-512G, IPS, 1920x1200, 14" | Dell Latitude 7440 i5-1345U, Iris Xe G7 80EUs, Samsung MZ9L4512HBLU-00BMV, IPS, 2560x1600, 14" | Asus ExpertBook B9 B9403CVA-KM0153X i7-1355U, Iris Xe G7 96EUs, Samsung PM9A1 MZVL21T0HCLR, OLED, 2880x1800, 14" | |
|---|---|---|---|---|---|---|
| Stromverbrauch | 17% | 20% | 16% | -11% | -45% | |
| Idle min * (Watt) | 3.1 | 2.7 13% | 2.4 23% | 3.2 -3% | 4.5 -45% | 4.9 -58% |
| Idle avg * (Watt) | 6.5 | 5.2 20% | 4.5 31% | 5.1 22% | 6.5 -0% | 12.5 -92% |
| Idle max * (Watt) | 7.9 | 5.6 29% | 5.6 29% | 5.4 32% | 7.3 8% | 16.8 -113% |
| Last avg * (Watt) | 40 | 40.1 -0% | 29.5 26% | 39.1 2% | 52.5 -31% | 43.8 -10% |
| Witcher 3 ultra * (Watt) | 43.2 | 40.2 7% | 40.8 6% | 39.8 8% | 46.2 -7% | 41.2 5% |
| Last max * (Watt) | 69 | 48.3 30% | 67.2 3% | 46.6 32% | 63 9% | 68.1 1% |
* ... kleinere Werte sind besser
Energieverbrauch Witcher 3 / Stresstest
Energieverbrauch externer Monitor
Akkulaufzeit
Die WLAN-Laufzeit ist spürbar kürzer als beim AMD-Modell, um mehrere Stunden, obwohl die Akkukapazität beider Modelle gleich ist. Wir konnten fast 8 Stunden Surfen in der Realität aufzeichnen, verglichen mit über 13 Stunden bei der AMD-basierten Version. Das ist immer noch gut, aber dennoch nicht überzeugend im Vergleich zum HP EliteBook 845 G10 oder dem Latitude 7440.
| Lenovo ThinkPad T14s G4 i7-1365U i7-1365U, Iris Xe G7 96EUs, 57 Wh | Lenovo ThinkPad T14s G4-21F8002TGE R7 7840U, Radeon 780M, 57 Wh | Lenovo ThinkPad T14 G4 21HD0043GE i5-1335U, Iris Xe G7 80EUs, 52.5 Wh | HP EliteBook 845 G10 5Z4X0ES R7 7840U, Radeon 780M, 51 Wh | Dell Latitude 7440 i5-1345U, Iris Xe G7 80EUs, 57 Wh | Asus ExpertBook B9 B9403CVA-KM0153X i7-1355U, Iris Xe G7 96EUs, 63 Wh | |
|---|---|---|---|---|---|---|
| Akkulaufzeit | 67% | 41% | 65% | 65% | 29% | |
| WLAN (h) | 7.9 | 13.2 67% | 11.1 41% | 13 65% | 13 65% | 10.2 29% |
| H.264 (h) | 16.5 | 12.7 | 10.1 | |||
| Last (h) | 1.7 | 1.6 | 1.4 | 2.7 | 2.3 | |
| Idle (h) | 23.8 |
Pro
Contra
Fazit — Harte Konkurrenz von AMD
Die Core i7 vPro-Variante des ThinkPad T14s G4 stellt die schnellste verfügbare Intel-Konfiguration dar, ist jedoch in der Multi-Thread-CPU-Leistung und Grafikleistung langsamer als die kostengünstigere Ryzen 7 Pro-Konfiguration. Zusätzlich ist die Akkulaufzeit trotz der insgesamt geringeren Leistung kürzer als bei der AMD-Option. Diese Nachteile allein machen die AMD Ryzen 7-Konfiguration zu einer einfacheren Empfehlung, die für ~1100 Euro erhältlich ist – weniger als unsere Core i7-Testkonfiguration mit gleichen Spezifikationen von 16 GB RAM, 512 GB SSD und 1200p IPS-Touchscreen.
Das Core i7 ThinkPad T14s G4 ist keineswegs schlecht. Stattdessen werden die aktuellen AMD Zen 4 CPUs besonders durch den beeindruckenden Ryzen 7 7840U gegenüber der Intel U-Serie übertroffen.
Obwohl die Intel-SKUs von der Thunderbolt-Unterstützung profitieren, werden die AMD-Optionen mit USB4 geliefert, das die meisten Thunderbolt-Geräte wie eGPUs und Monitore unterstützt. Die Vorteile, die sich aus der Entscheidung für Intel statt AMD ergeben, sind daher für die große Mehrheit der Nutzer sehr gering. Nutzer können Geld sparen oder mehr für ihr Geld bekommen, wenn sie sich für ein Ryzen 7-Gerät entscheiden und es mit zusätzlichen Optionen wie WAN oder Smart Card konfigurieren.
Preis und Verfügbarkeit
Lenovo liefert das ThinkPad T14s ab sofort in verschiedenen Konfigurationen aus. Unsere spezielle Intel Core i7-Konfiguration wird für rund 1.959 Euro angeboten.
Lenovo ThinkPad T14s G4 i7-1365U
- 22.11.2023 v7 (old)
Allen Ngo
Transparenz
Die Auswahl der zu testenden Geräte erfolgt innerhalb der Redaktion. Das vorliegende Testmuster wurde dem Autor vom Hersteller oder einem Shop zu Testzwecken leihweise zur Verfügung gestellt. Eine Einflussnahme des Leihstellers auf den Testbericht gab es nicht, der Hersteller erhielt keine Version des Reviews vor der Veröffentlichung. Es bestand keine Verpflichtung zur Publikation. Als eigenständiges, unabhängiges Unternehmen unterliegt Notebookcheck keiner Diktion von Herstellern, Shops und Verlagen.
So testet Notebookcheck
Pro Jahr werden von Notebookcheck hunderte Laptops und Smartphones unabhängig in von uns standardisierten technischen Verfahren getestet, um eine Vergleichbarkeit aller Testergebnisse zu gewährleisten. Seit rund 20 Jahren entwickeln wir diese Testmethoden kontinuierlich weiter und setzen damit Branchenstandards. In unseren Testlaboren kommt ausschließlich hochwertiges Messequipment in die Hände erfahrener Techniker und Redakteure. Die Tests unterliegen einer mehrstufigen Kontrolle. Unsere komplexe Gesamtbewertung basiert auf hunderten fundierten Messergebnissen und Benchmarks, womit Ihnen Objektivität garantiert ist. Weitere Informationen zu unseren Testmethoden gibt es hier.
Preisvergleich

