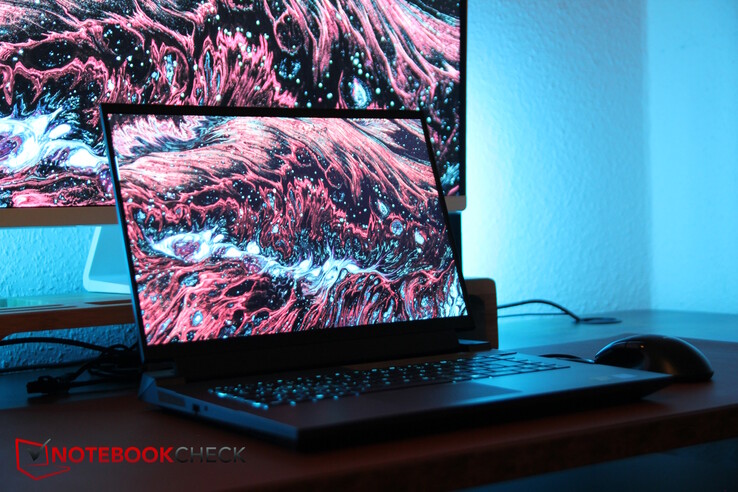
Dell G16 im Laptop-Test: Preiswerte Alienware-Alternative vom gleichen Hersteller?
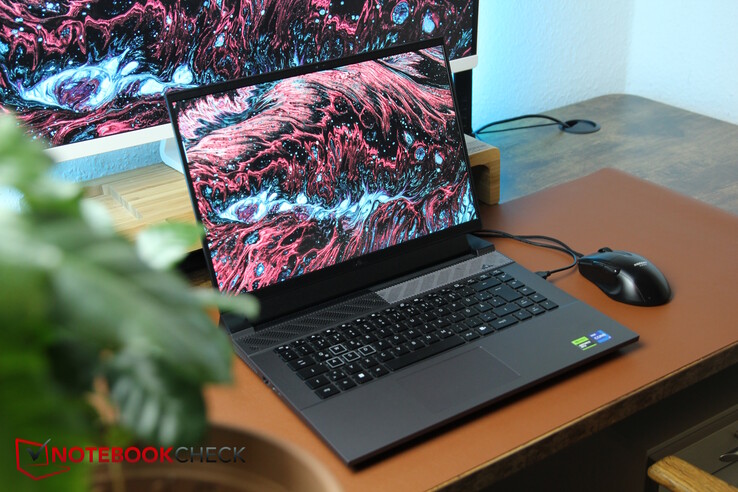
Ende 2022 haben wir zuletzt und gleichzeitig erstmals das 16-Zoll-Modell der relativ neuen G-Serie, Dells Gaming-Laptops der Budget- bis Mittelklasse, getestet. Damals war das Dell G16 mit Intel-Gen12-CPU und RTX 3060 ausgestattet. Beim hiesigen Modell wechselt der Hersteller auf Intel Gen13 und RTX 4060 (es gibt weitere GPU-Optionen). Das Display bekommt eine leicht beschleunigte Variante als Option.
Wir schauen zudem, ob Dell das doch recht dicke Gehäuse wieder verschlankt hat. Zudem muss sich das G16 natürlich gegen andere Budget- und Mittelklasse-Gamer wie dem MSI Raider GE68 HX 13VF, dem Lenovo Legion Slim 5 16APH8 und dem Lenovo LOQ 16, außerdem vergleichen wir natürlich auch mit dem Vorgänger sowie dem etwas teureren Alienware m16 R1.
Mögliche Konkurrenten im Vergleich
Bew. | Datum | Modell | Gewicht | Dicke | Größe | Auflösung | Preis ab |
|---|---|---|---|---|---|---|---|
| 85.5 % v7 (old) | 02 / 2024 | Dell G16, i7-13650HX, RTX 4060 i7-13650HX, GeForce RTX 4060 Laptop GPU | 2.8 kg | 25.65 mm | 16.00" | 2560x1600 | |
| 86.1 % v7 (old) | 10 / 2022 | Dell G16 7620 i7-12700H, GeForce RTX 3060 Laptop GPU | 2.6 kg | 26.9 mm | 16.00" | 2560x1600 | |
| 86.9 % v7 (old) | 10 / 2023 | MSI Raider GE68HX 13VF i9-13950HX, GeForce RTX 4060 Laptop GPU | 2.7 kg | 27.9 mm | 16.00" | 1900x1200 | |
| 87.7 % v7 (old) | 08 / 2023 | Lenovo Legion Slim 5 16APH8 R7 7840HS, GeForce RTX 4060 Laptop GPU | 2.4 kg | 25.2 mm | 16.00" | 2560x1600 | |
| 88.3 % v7 (old) | 09 / 2023 | Alienware m16 R1 Intel i7-13700HX, GeForce RTX 4060 Laptop GPU | 3 kg | 25.4 mm | 16.00" | 2560x1600 | |
| 87.3 % v7 (old) | 09 / 2023 | Lenovo LOQ 16IRH8 i7-13620H, GeForce RTX 4060 Laptop GPU | 2.7 kg | 25.9 mm | 16.00" | 2560x1600 |
Gehäuse - Alu im Deckel, sonst grauer Kunststoff
Das zum Vorgänger veränderte Gehäuse ist größtenteils aus grauem Kunststoff gefertigt, nur am Deckel kommt Aluminium zum Einsatz, was ihm eine gute Stabilität verleiht. Auch die Basis ist stabil und lässt sich kaum verwinden. Das lange Scharnier hält das Display gut in Position, wir nehmen beim Öffnen und Schließen aber leichte Reibungsgeräusche und teils auch Quietschen wahr, was sich hoffentlich nicht negativ auf die Langlebigkeit auswirkt. Die Verarbeitung ist ordentlich, wirkt aber weniger hochwertig als bei den teureren Dell- und Alienware-Modellen.
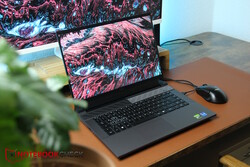
Auf der Oberseite prangt das Dell-Logo, ansonsten gibt es eher kaum Farbakzente. Wirklich schlicht wirkt der offensichtliche Gamer dennoch nicht, was vor allem am nach hinten ausladenden Kühlsystem liegt. Insgesamt wirkt das G16 wenig elegant, eher klobig und schwer.
Das teurere Alienware m16 R1 ist sogar noch etwas breiter als unser G16 und ähnlich dick. Sogar noch etwas dicker ist das MSI Raider GE68HX, die sonstigen Abmessungen sind beinahe identisch. Selbst das Lenovo Legion Slim 5 ist nicht wesentlich dünner, obwohl das G16 recht dick wirkt, allerdings ist Ersteres etwas kleiner.
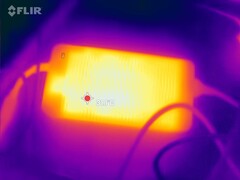
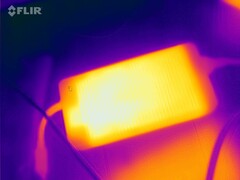
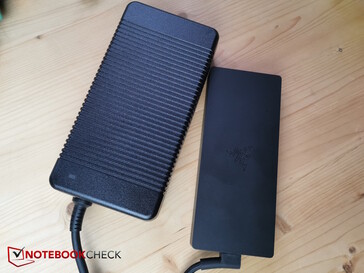
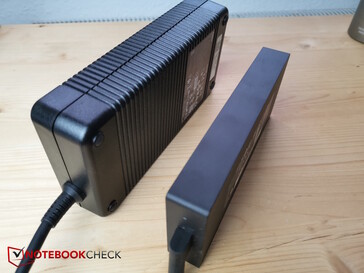
Gegenüber dem Vorgänger ist es tatsächlich etwas dünner geworden, gleichzeitig hat es an Tiefe zugelegt. Zugelegt hat es auch beim Gewicht (+ 200 g), sodass es nun nach dem Alienware aus gleichem Hause der schwerste 16-Zoll-Gamer mit RTX 4060 im Vergleich ist. Zudem verschickt Dell selbst das SKU mit RTX 4060 mit einem riesigen und schweren 330-W-Netzteil, das alleine schon über 1,5 kg wiegt.
Ausstattung - Thunderbolt nicht für alle G16-Modelle
Die Anschlussverteilung ist mit einer Ausnahme gleich geblieben: Hinten wurden die Ports etwas durcheinandergewürfelt. Hatte der HDMI-Port im Vorgänger viel Platz, sitzt er nun genau zwischen dem USB-A- und dem USB-C-Port, mit Ersterem könnte es bei großen Steckern jetzt zu Platzproblemen kommen, eine fragwürdige Entscheidung von Dell.
Vorsicht: Der Stromstecker sitzt nicht allzu fest und rutscht beim Bewegen des Laptops recht leicht heraus, wozu auch das schwere Netzteil beiträgt.
Ebenfalls fragwürdig ist die Unterstützung von Thunderbolt (4), die im Vorgänger durchgängig gegeben war. Jetzt hängt diese offenbar von der verwendeten Grafikkarte ab. Bis zur RTX 4060 wird Thunderbolt laut Dell nicht unterstützt, ab der RTX 4070 aber doch wieder. Das ist ungewöhnlich und für Kunden der kleineren Konfigurationen ärgerlich. PowerDelivery unterstützt der Port nicht.
Kommunikation
Webcam
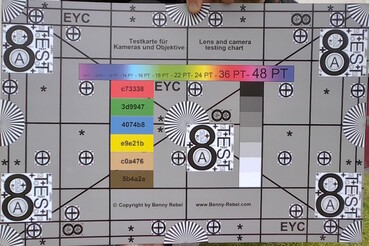
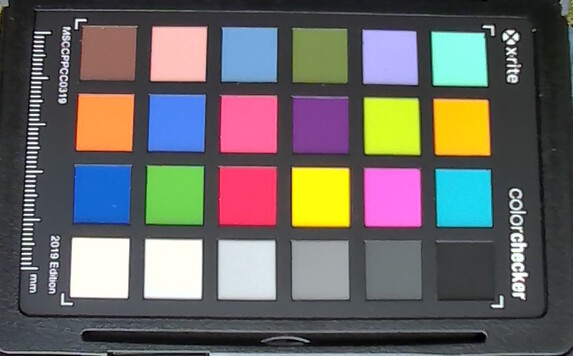
Spätestens bei der schlappen 720p-Webcam zeigt sich der Sparansatz beim Dell. Viele Konkurrenten haben mittlerweile eine Full-HD-Kamera oder gar besser verbaut. Auch hinsichtlich der Farbabweichungen und der Bildschärfe gibt es deutlich bessere Modelle.
Sicherheit
Physische Sicherheitsmerkmale besitzt das G16 eher nicht, denn es fehlen sowohl ein Fingerabdrucksensor als auch ein Kensington-Anschluss. TPM ist natürlich in den Prozessor integriert.
Zubehör und Garantie
Wartung
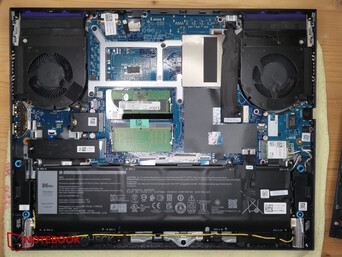
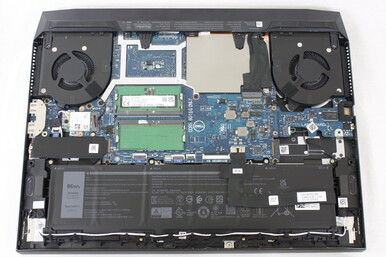
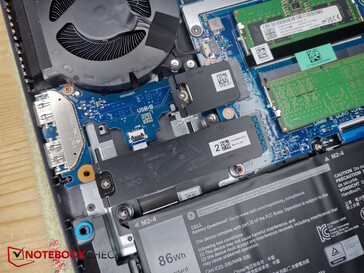
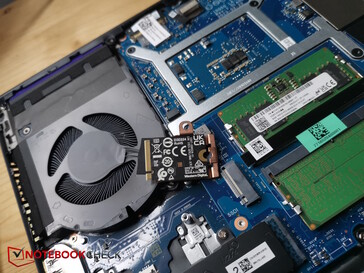
10 Kreuzschrauben halten die Bodenplatte fest. Vier davon sind länger als die anderen, fallen dafür aber nicht aus ihren Löchern heraus, sodass es eigentlich keine Verwechslungsgefahr gibt. Löst man die Schrauben, so springt die Unterseite schon beinahe von alleine ab, zusätzliches Werkzeug ist nicht vonnöten.
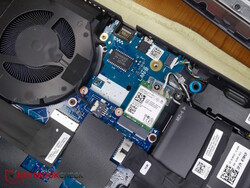
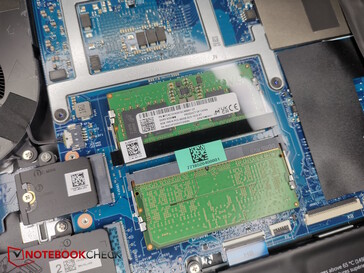
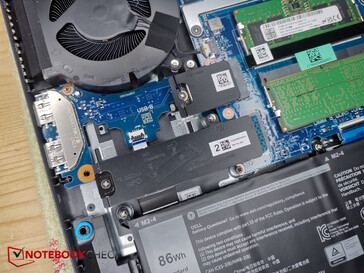
Im Inneren sind keine auffälligen Kupferheatpipes wie bei den meisten Gaming-Konkurrenten zu sehen. Man erhält Zugang zu den Lüftern, den zwei RAM-Slots, dem WiFi-Modul, dem Akku und den beiden M.2-SSD-Slots, von denen nur der kleinere vom Format 2230 belegt ist.
Eingabegeräte - 5 konfigurierbare Sondertasten
Tastatur
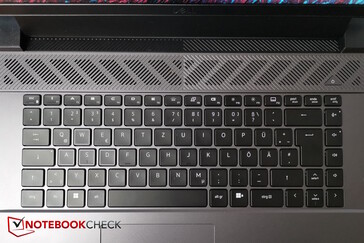
Ein Numpad besitzt das G16 nicht, dadurch haben aber alle Tasten genügend Platz, das gilt auch für die normalgroßen Pfeiltasten. Am rechten Rand befinden sich dafür ein paar Sondertasten (Lautstärke, Mikrofon-Stummschaltung). Die normalen Tasten messen etwa 1,6 x 1,6 cm, die F-Tasten sind in der Höhe halbiert. Die WASD-Tasten sind weiß umrandet.
Da einige Sondertasten rechts sitzen, können F2 bis F6 manuell konfiguriert, z.B. auch mit Makros belegt, werden.
Der Hub ist nicht sehr tief, das Feedback geht jedoch in Ordnung und es lässt sich angenehm und schnell tippen. Die dabei entstehenden Geräusche sind sehr moderat. Die linke Pfeiltaste unseres Testgerätes klingt anders als alle anderen (Pfeil-) Tasten, etwas hohl, als ob innen etwas mitschwingt, dies könnte ein Hinweis auf einen Qualitätsfehler sein, der hoffentlich nur unser Gerät betrifft.
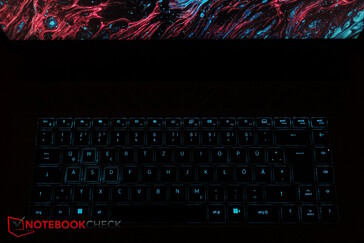
Eine zweistufige Hintergrundbeleuchtung ist verfügbar, sie ist einzonig, lässt aber diverse RGB-Effekte zu, die im Command-Center auswählbar sind (raindrop, pulsing etc.).
Touchpad
Das Touchpad ist eher klein (ca. 10,5 x 6,5 cm), die meisten Gamer dürften eine Maus verwenden, mag sich Dell denken. Die Oberfläche ist gleitfreudig, bei sehr langsamen Bewegungen oder etwas Feuchtigkeit kann es aber stocken.
Die integrierten Tasten lösen zuverlässig aus, das Klickgeräusch ist etwas lauter als das der Tasten, aber keineswegs störend.
Display - DCI-P3 oder doch nur sRGB?
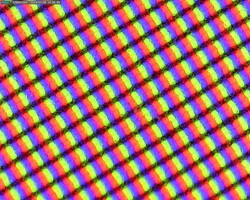
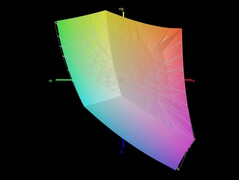
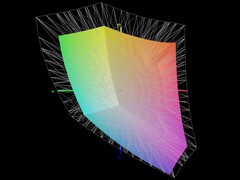
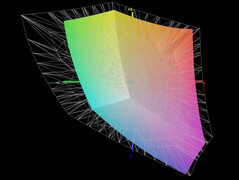
Dell wechselt trotz gleicher Auflösung von BOE zu Chi Mei. Das matte IPS-Display hat eine Auflösung von 2.560 x 1.600 Pixel. Aber Achtung: Obwohl die Webseite derzeit nur ein Display für das G16 anbietet, nämlich das QHD+-Display (2.560 x 1.600) mit 240 Hz, 3 ms, NVIDIA G-SYNC und 100 Prozent DCI-P3, ist in unserem Testmodell ein Panel mit der gleichen Auflösung, aber "nur" 165 Hz und vor allem nur sRGB statt DCI-P3 verbaut! Man muss schon ins Handbuch schauen, um beide Varianten zu entdecken.
Wir messen eine Durchschnittshelligkeit von 344 Nits, die Ausleuchtung liegt bei guten 89 Prozent. Allerdings ist in dunklen Szenen an quasi allen Kanten leichtes Backlight Bleeding auszumachen.
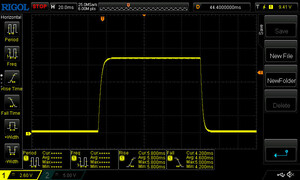
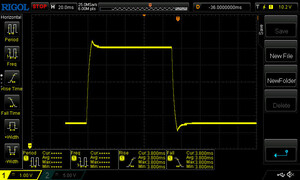
Der Schwarzwert ist trotz gleicher Helligkeit jetzt besser, wovon auch der Kontrast profitiert. Insgesamt haben wir hier einen recht guten sRGB-Bildschirm, auch die Reaktionszeiten sind ausreichend schnell.
| |||||||||||||||||||||||||
Ausleuchtung: 89 %
Helligkeit Akku: 369 cd/m²
Kontrast: 1419:1 (Schwarzwert: 0.26 cd/m²)
ΔE ColorChecker Calman: 3.04 | ∀{0.5-29.43 Ø4.76}
calibrated: 2.35
ΔE Greyscale Calman: 3.38 | ∀{0.09-98 Ø5}
69.3% AdobeRGB 1998 (Argyll 3D)
98.5% sRGB (Argyll 3D)
67.5% Display P3 (Argyll 3D)
Gamma: 2.47
CCT: 6040 K
| Dell G16, i7-13650HX, RTX 4060 Chi Mei CMN161D (160GME), IPS, 2560x1600, 16" | Dell G16 7620 BOE NE16QDM, IPS, 2560x1600, 16" | MSI Raider GE68HX 13VF Chi Mei N160JME-GTK, IPS, 1900x1200, 16" | Lenovo Legion Slim 5 16APH8 BOE NJ NE160QDM-NYC, IPS, 2560x1600, 16" | Alienware m16 R1 Intel BOE NE16NYB, IPS, 2560x1600, 16" | Lenovo LOQ 16IRH8 AUOC1A5 (B160QAN03.L), IPS, 2560x1600, 16" | |
|---|---|---|---|---|---|---|
| Display | 1% | -38% | 2% | 0% | 3% | |
| Display P3 Coverage (%) | 67.5 | 68.3 1% | 41.6 -38% | 69.3 3% | 67.7 0% | 70.5 4% |
| sRGB Coverage (%) | 98.5 | 98 -1% | 62.2 -37% | 100 2% | 97.2 -1% | 98.9 0% |
| AdobeRGB 1998 Coverage (%) | 69.3 | 70.5 2% | 43 -38% | 70 1% | 70 1% | 72.6 5% |
| Response Times | -7% | -131% | -8% | 39% | 17% | |
| Response Time Grey 50% / Grey 80% * (ms) | 7.6 ? | 8.6 ? -13% | 17.3 ? -128% | 10.7 ? -41% | 4 ? 47% | 7.2 ? 5% |
| Response Time Black / White * (ms) | 10.4 ? | 10.4 ? -0% | 24.2 ? -133% | 7.8 ? 25% | 7.3 ? 30% | 7.4 ? 29% |
| PWM Frequency (Hz) | ||||||
| Bildschirm | 7% | -37% | 15% | 4% | 13% | |
| Helligkeit Bildmitte (cd/m²) | 369 | 369.4 0% | 300.9 -18% | 371.6 1% | 306 -17% | 407 10% |
| Brightness (cd/m²) | 344 | 348 1% | 302 -12% | 343 0% | 302 -12% | 369 7% |
| Brightness Distribution (%) | 89 | 83 -7% | 93 4% | 84 -6% | 89 0% | 85 -4% |
| Schwarzwert * (cd/m²) | 0.26 | 0.32 -23% | 0.31 -19% | 0.44 -69% | 0.3 -15% | 0.45 -73% |
| Kontrast (:1) | 1419 | 1154 -19% | 971 -32% | 845 -40% | 1020 -28% | 904 -36% |
| Delta E Colorchecker * | 3.04 | 1.78 41% | 4.6 -51% | 1.52 50% | 2.57 15% | 1.43 53% |
| Colorchecker dE 2000 max. * | 5.56 | 4.41 21% | 17.6 -217% | 2.68 52% | 4.26 23% | 3.58 36% |
| Colorchecker dE 2000 calibrated * | 2.35 | 1.22 48% | 2.04 13% | 0.33 86% | 0.85 64% | 1.07 54% |
| Delta E Graustufen * | 3.38 | 3.2 5% | 3.3 2% | 1.2 64% | 3.3 2% | 1.13 67% |
| Gamma | 2.47 89% | 2.2 100% | 2.09 105% | 2.1 105% | 1.997 110% | 2.5 88% |
| CCT | 6040 108% | 6750 96% | 7151 91% | 6503 100% | 6895 94% | 6526 100% |
| Durchschnitt gesamt (Programm / Settings) | 0% /
4% | -69% /
-50% | 3% /
9% | 14% /
8% | 11% /
11% |
* ... kleinere Werte sind besser
Ab Werk ist das Display nicht optimal kalibriert. Unsere eigene Kalibrierung mittels X-Rite-Farbmessgerät und der Calman-Software drückt vor allem die Abweichungen bei den Grauwerten ordentlich nach unten, die Verbesserungen bei den Farben fallen geringfügiger aus.
Reaktionszeiten (Response Times) des Displays
| ↔ Reaktionszeiten Schwarz zu Weiß | ||
|---|---|---|
| 10.4 ms ... steigend ↗ und fallend ↘ kombiniert | ↗ 5.8 ms steigend | |
| ↘ 4.6 ms fallend | ||
| Die gemessenen Reaktionszeiten sind gut, für anspruchsvolle Spieler könnten der Bildschirm jedoch zu langsam sein. Im Vergleich rangierten die bei uns getesteten Geräte von 0.1 (Minimum) zu 240 (Maximum) ms. » 27 % aller Screens waren schneller als der getestete. Daher sind die gemessenen Reaktionszeiten besser als der Durchschnitt aller vermessenen Geräte (20.1 ms). | ||
| ↔ Reaktionszeiten 50% Grau zu 80% Grau | ||
| 7.6 ms ... steigend ↗ und fallend ↘ kombiniert | ↗ 3.8 ms steigend | |
| ↘ 3.8 ms fallend | ||
| Die gemessenen Reaktionszeiten sind sehr kurz, wodurch sich der Bildschirm auch für schnelle 3D Spiele eignen sollte. Im Vergleich rangierten die bei uns getesteten Geräte von 0.165 (Minimum) zu 636 (Maximum) ms. » 19 % aller Screens waren schneller als der getestete. Daher sind die gemessenen Reaktionszeiten besser als der Durchschnitt aller vermessenen Geräte (31.5 ms). | ||
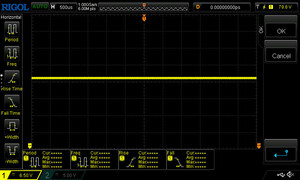
Bildschirm-Flackern / PWM (Pulse-Width Modulation)
| Flackern / PWM nicht festgestellt | |||
Im Vergleich: 53 % aller getesteten Geräte nutzten kein PWM um die Helligkeit zu reduzieren. Wenn PWM eingesetzt wurde, dann bei einer Frequenz von durchschnittlich 8082 (Minimum 5, Maximum 343500) Hz. | |||
Leistung - Alles auf Erwartungsniveau beim G16
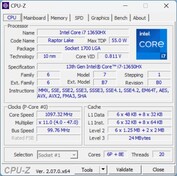
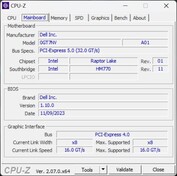
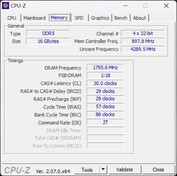
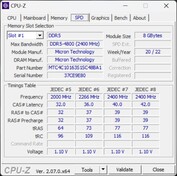
Wir haben mit dem Dell G16 einen typischen Gaming-Laptop der Budget- bis Mittelklasse. Als CPU rechnet ein Intel Core i7-13650HX, dazu gibt es eine RTX 4060 mit 140 W, 16 GB RAM sowie eine 1 TB große NVMe-SSD. Damit sollten alle auch aktuellen Spiele in Full-HD spielbar sein. Der ordentliche bis gute 16:10-Bildschirm komplettiert die Hardwareausstattung.
Testbedingungen
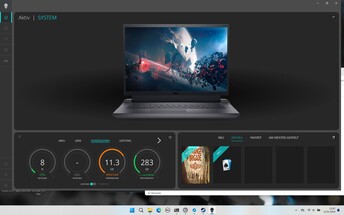
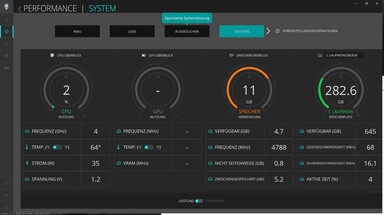
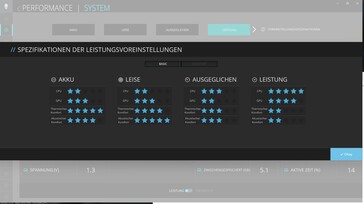
Dell installiert mindestens (s. McAffee) zwei Apps vor. Da wäre zum Einen My Dell, das auch bei den Non-Gamern vorinstalliert ist, hinzu kommt das Alienware Command Center der Alienware-Modelle. My Dell inkludiert Service, Updates usw. während das Command Center das Einstellen unterschiedlicher Leistungsmodi (Akku, Leise, Ausgeglichen, Leistung, Manuell), der Tastenbeleuchtung und weiterer Optionen ermöglicht.
Ganz ausgereift ist das Command Center trotz langer Entwicklung noch immer nicht. Beispielsweise kann sich das Fenster nicht ordentlich maximieren, am unteren Rand sehen wir weiterhin den Desktop.
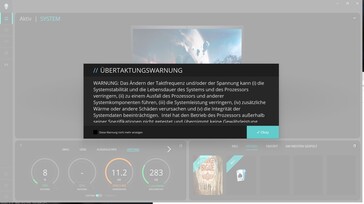
Ebenfalls ein Bug dürfte sein, dass wir einen Warnhinweis bekommen, sobald wir auf Leistung stellen. Das ist sehr verunsichernd, da der Hinweis suggeriert, dass hier die Garantie erlöschen könnte, wenn man die Hardware außerhalb der empfohlenen Spezifikationen betreibt. Wir vermuten aber eher, dass sich die Warnung auf den manuellen Modus bezieht, nicht auf den von Dell selbst spezifizierten Leistungsmodus - sehr verwirrend!
Nervig ist hingegen, dass McAffee nicht nur vorinstalliert ist, sondern uns Dell per Nachricht auch noch regelmäßig dazu auffordert diesen Service in Anspruch zu nehmen (wir haben deinstalliert) und diese Nachricht spätestens täglich immer wieder kommt.
Prozessor
Eine Raptor-Lake-CPU, der Intel Core i7-13650HX mit 14 Kernen (6 P, 8E) und 20 Threads, steckt im Dell. Die P-Kerne können einzeln auf bis zu 4,9 GHz hochtakten, der Basistakt der Effizienzkerne liegt bei 1,9 GHz. Den stärkeren i9-13900HX bekommt man nur in Kombination mit einer RTX 4070, was 450 Euro Aufpreis kostet.
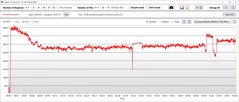
Im Cinebench-R15-Loop rechnet das G16 mit konstant hoher Leistung, ohne Performanceverlust nach den ersten Durchgängen.
Über alle unsere CPU-Benchmarks agiert der i7-13650HX in etwa auf Erwartungsniveau und ungefähr 15 bis 19 Prozent schneller als der i7-12700H im Vorgänger.
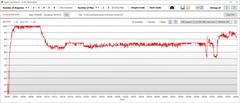
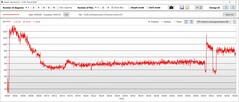
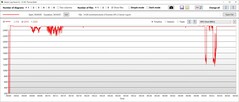
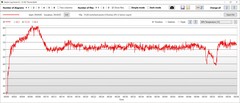
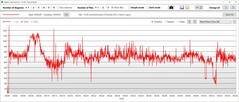
In den Modis Leistung, Ausgeglichen und Leise werden jeweils zu Beginn eines Cinebench-Durchlaufs 159 W Leistungsaufnahme erreicht, sodass der Score bei einmaliger Messung in allen diesen Modi gleich ist. Im weiteren Verlauf bleibt diese TDP allerdings nur im Leistungsmodus weitestgehend konstant. In den anderen beiden Modi sinkt die TDP ab dem zweiten Durchlauf auf etwa 50 W ab.
Zieht man den Stromstecker, so wechselt das System automatisch in den Akkumodus. Dieser erreicht im Cinebench R15 Multi nur noch eine Ausgangs-TDP von 86 W, nach dem ersten Durchgang fällt die TDP auf nur noch 24 W.
Cinebench R15 Multi Dauertest
Cinebench R23: Multi Core | Single Core
Cinebench R20: CPU (Multi Core) | CPU (Single Core)
Cinebench R15: CPU Multi 64Bit | CPU Single 64Bit
Blender: v2.79 BMW27 CPU
7-Zip 18.03: 7z b 4 | 7z b 4 -mmt1
Geekbench 6.5: Multi-Core | Single-Core
Geekbench 5.5: Multi-Core | Single-Core
HWBOT x265 Benchmark v2.2: 4k Preset
LibreOffice : 20 Documents To PDF
R Benchmark 2.5: Overall mean
| CPU Performance Rating | |
| MSI Raider GE68HX 13VF | |
| Durchschnitt der Klasse Gaming | |
| Alienware m16 R1 Intel | |
| Durchschnittliche Intel Core i7-13650HX | |
| Dell G16, i7-13650HX, RTX 4060 | |
| Lenovo Legion Slim 5 16APH8 -2! | |
| Lenovo LOQ 16IRH8 | |
| Dell G16 7620 -2! | |
| Cinebench R23 / Multi Core | |
| MSI Raider GE68HX 13VF | |
| Durchschnitt der Klasse Gaming (5668 - 40970, n=136, der letzten 2 Jahre) | |
| Alienware m16 R1 Intel | |
| Dell G16, i7-13650HX, RTX 4060 | |
| Durchschnittliche Intel Core i7-13650HX (18744 - 21006, n=6) | |
| Dell G16 7620 | |
| Lenovo Legion Slim 5 16APH8 | |
| Lenovo LOQ 16IRH8 | |
| Cinebench R23 / Single Core | |
| MSI Raider GE68HX 13VF | |
| Durchschnitt der Klasse Gaming (1136 - 2267, n=136, der letzten 2 Jahre) | |
| Alienware m16 R1 Intel | |
| Dell G16, i7-13650HX, RTX 4060 | |
| Lenovo LOQ 16IRH8 | |
| Durchschnittliche Intel Core i7-13650HX (1693 - 1903, n=6) | |
| Lenovo Legion Slim 5 16APH8 | |
| Dell G16 7620 | |
| Cinebench R20 / CPU (Multi Core) | |
| MSI Raider GE68HX 13VF | |
| Durchschnitt der Klasse Gaming (2179 - 16108, n=135, der letzten 2 Jahre) | |
| Alienware m16 R1 Intel | |
| Dell G16, i7-13650HX, RTX 4060 | |
| Durchschnittliche Intel Core i7-13650HX (7197 - 8021, n=5) | |
| Lenovo Legion Slim 5 16APH8 | |
| Dell G16 7620 | |
| Lenovo LOQ 16IRH8 | |
| Cinebench R20 / CPU (Single Core) | |
| MSI Raider GE68HX 13VF | |
| Durchschnitt der Klasse Gaming (439 - 870, n=135, der letzten 2 Jahre) | |
| Alienware m16 R1 Intel | |
| Dell G16, i7-13650HX, RTX 4060 | |
| Durchschnittliche Intel Core i7-13650HX (700 - 728, n=5) | |
| Lenovo LOQ 16IRH8 | |
| Lenovo Legion Slim 5 16APH8 | |
| Dell G16 7620 | |
| Cinebench R15 / CPU Multi 64Bit | |
| MSI Raider GE68HX 13VF | |
| Durchschnitt der Klasse Gaming (1537 - 6271, n=135, der letzten 2 Jahre) | |
| Alienware m16 R1 Intel | |
| Durchschnittliche Intel Core i7-13650HX (2864 - 3147, n=5) | |
| Dell G16, i7-13650HX, RTX 4060 | |
| Lenovo Legion Slim 5 16APH8 | |
| Dell G16 7620 | |
| Lenovo LOQ 16IRH8 | |
| Cinebench R15 / CPU Single 64Bit | |
| MSI Raider GE68HX 13VF | |
| Durchschnitt der Klasse Gaming (188.8 - 343, n=134, der letzten 2 Jahre) | |
| Lenovo Legion Slim 5 16APH8 | |
| Alienware m16 R1 Intel | |
| Dell G16, i7-13650HX, RTX 4060 | |
| Durchschnittliche Intel Core i7-13650HX (256 - 275, n=5) | |
| Lenovo LOQ 16IRH8 | |
| Dell G16 7620 | |
| Blender / v2.79 BMW27 CPU | |
| Lenovo LOQ 16IRH8 | |
| Lenovo Legion Slim 5 16APH8 | |
| Dell G16 7620 | |
| Durchschnittliche Intel Core i7-13650HX (158 - 226, n=5) | |
| Dell G16, i7-13650HX, RTX 4060 | |
| Alienware m16 R1 Intel | |
| Durchschnitt der Klasse Gaming (80 - 517, n=131, der letzten 2 Jahre) | |
| MSI Raider GE68HX 13VF | |
| 7-Zip 18.03 / 7z b 4 | |
| MSI Raider GE68HX 13VF | |
| Durchschnitt der Klasse Gaming (23795 - 148086, n=133, der letzten 2 Jahre) | |
| Alienware m16 R1 Intel | |
| Durchschnittliche Intel Core i7-13650HX (73927 - 80057, n=5) | |
| Dell G16, i7-13650HX, RTX 4060 | |
| Lenovo Legion Slim 5 16APH8 | |
| Dell G16 7620 | |
| Lenovo LOQ 16IRH8 | |
| 7-Zip 18.03 / 7z b 4 -mmt1 | |
| MSI Raider GE68HX 13VF | |
| Lenovo Legion Slim 5 16APH8 | |
| Alienware m16 R1 Intel | |
| Durchschnitt der Klasse Gaming (4199 - 7508, n=133, der letzten 2 Jahre) | |
| Durchschnittliche Intel Core i7-13650HX (5828 - 6125, n=5) | |
| Dell G16, i7-13650HX, RTX 4060 | |
| Lenovo LOQ 16IRH8 | |
| Dell G16 7620 | |
| Geekbench 6.5 / Multi-Core | |
| MSI Raider GE68HX 13VF | |
| Durchschnitt der Klasse Gaming (5340 - 22104, n=134, der letzten 2 Jahre) | |
| Alienware m16 R1 Intel | |
| Durchschnittliche Intel Core i7-13650HX (13554 - 14378, n=3) | |
| Dell G16, i7-13650HX, RTX 4060 | |
| Lenovo LOQ 16IRH8 | |
| Geekbench 6.5 / Single-Core | |
| MSI Raider GE68HX 13VF | |
| Durchschnitt der Klasse Gaming (1490 - 3259, n=134, der letzten 2 Jahre) | |
| Alienware m16 R1 Intel | |
| Lenovo LOQ 16IRH8 | |
| Dell G16, i7-13650HX, RTX 4060 | |
| Durchschnittliche Intel Core i7-13650HX (2505 - 2595, n=3) | |
| Geekbench 5.5 / Multi-Core | |
| MSI Raider GE68HX 13VF | |
| Durchschnitt der Klasse Gaming (4557 - 27010, n=133, der letzten 2 Jahre) | |
| Alienware m16 R1 Intel | |
| Durchschnittliche Intel Core i7-13650HX (12509 - 14778, n=5) | |
| Dell G16, i7-13650HX, RTX 4060 | |
| Lenovo LOQ 16IRH8 | |
| Dell G16 7620 | |
| Lenovo Legion Slim 5 16APH8 | |
| Geekbench 5.5 / Single-Core | |
| MSI Raider GE68HX 13VF | |
| Durchschnitt der Klasse Gaming (986 - 2474, n=133, der letzten 2 Jahre) | |
| Lenovo Legion Slim 5 16APH8 | |
| Dell G16, i7-13650HX, RTX 4060 | |
| Alienware m16 R1 Intel | |
| Durchschnittliche Intel Core i7-13650HX (1810 - 1866, n=5) | |
| Lenovo LOQ 16IRH8 | |
| Dell G16 7620 | |
| HWBOT x265 Benchmark v2.2 / 4k Preset | |
| MSI Raider GE68HX 13VF | |
| Durchschnitt der Klasse Gaming (7.7 - 44.3, n=133, der letzten 2 Jahre) | |
| Alienware m16 R1 Intel | |
| Lenovo Legion Slim 5 16APH8 | |
| Durchschnittliche Intel Core i7-13650HX (18.9 - 23.6, n=5) | |
| Dell G16, i7-13650HX, RTX 4060 | |
| Dell G16 7620 | |
| Lenovo LOQ 16IRH8 | |
| LibreOffice / 20 Documents To PDF | |
| Dell G16 7620 | |
| Dell G16, i7-13650HX, RTX 4060 | |
| Durchschnittliche Intel Core i7-13650HX (38.9 - 58.8, n=5) | |
| Durchschnitt der Klasse Gaming (19 - 88.8, n=133, der letzten 2 Jahre) | |
| Lenovo LOQ 16IRH8 | |
| Alienware m16 R1 Intel | |
| Lenovo Legion Slim 5 16APH8 | |
| MSI Raider GE68HX 13VF | |
| R Benchmark 2.5 / Overall mean | |
| Dell G16 7620 | |
| Lenovo LOQ 16IRH8 | |
| Alienware m16 R1 Intel | |
| Lenovo Legion Slim 5 16APH8 | |
| Durchschnittliche Intel Core i7-13650HX (0.4217 - 0.4461, n=6) | |
| Durchschnitt der Klasse Gaming (0.3439 - 0.759, n=134, der letzten 2 Jahre) | |
| Dell G16, i7-13650HX, RTX 4060 | |
| Dell G16, i7-13650HX, RTX 4060 | |
| MSI Raider GE68HX 13VF | |
* ... kleinere Werte sind besser
AIDA64: FP32 Ray-Trace | FPU Julia | CPU SHA3 | CPU Queen | FPU SinJulia | FPU Mandel | CPU AES | CPU ZLib | FP64 Ray-Trace | CPU PhotoWorxx
| Performance Rating | |
| MSI Raider GE68HX 13VF | |
| Durchschnitt der Klasse Gaming | |
| Lenovo Legion Slim 5 16APH8 | |
| Alienware m16 R1 Intel | |
| Dell G16, i7-13650HX, RTX 4060 | |
| Durchschnittliche Intel Core i7-13650HX | |
| Dell G16 7620 | |
| Lenovo LOQ 16IRH8 | |
| AIDA64 / FP32 Ray-Trace | |
| Durchschnitt der Klasse Gaming (7192 - 85542, n=133, der letzten 2 Jahre) | |
| Lenovo Legion Slim 5 16APH8 | |
| MSI Raider GE68HX 13VF | |
| Alienware m16 R1 Intel | |
| Dell G16, i7-13650HX, RTX 4060 | |
| Durchschnittliche Intel Core i7-13650HX (13404 - 20012, n=5) | |
| Dell G16 7620 | |
| Lenovo LOQ 16IRH8 | |
| AIDA64 / FPU Julia | |
| MSI Raider GE68HX 13VF | |
| Durchschnitt der Klasse Gaming (35040 - 238426, n=133, der letzten 2 Jahre) | |
| Lenovo Legion Slim 5 16APH8 | |
| Alienware m16 R1 Intel | |
| Dell G16, i7-13650HX, RTX 4060 | |
| Durchschnittliche Intel Core i7-13650HX (68241 - 97317, n=5) | |
| Dell G16 7620 | |
| Lenovo LOQ 16IRH8 | |
| AIDA64 / CPU SHA3 | |
| MSI Raider GE68HX 13VF | |
| Durchschnitt der Klasse Gaming (1728 - 9817, n=133, der letzten 2 Jahre) | |
| Lenovo Legion Slim 5 16APH8 | |
| Alienware m16 R1 Intel | |
| Dell G16, i7-13650HX, RTX 4060 | |
| Durchschnittliche Intel Core i7-13650HX (3127 - 4487, n=5) | |
| Dell G16 7620 | |
| Lenovo LOQ 16IRH8 | |
| AIDA64 / CPU Queen | |
| MSI Raider GE68HX 13VF | |
| Lenovo Legion Slim 5 16APH8 | |
| Durchschnitt der Klasse Gaming (49785 - 173351, n=133, der letzten 2 Jahre) | |
| Alienware m16 R1 Intel | |
| Durchschnittliche Intel Core i7-13650HX (108627 - 110589, n=5) | |
| Dell G16, i7-13650HX, RTX 4060 | |
| Dell G16 7620 | |
| Lenovo LOQ 16IRH8 | |
| AIDA64 / FPU SinJulia | |
| MSI Raider GE68HX 13VF | |
| Lenovo Legion Slim 5 16APH8 | |
| Durchschnitt der Klasse Gaming (4424 - 33636, n=133, der letzten 2 Jahre) | |
| Alienware m16 R1 Intel | |
| Dell G16, i7-13650HX, RTX 4060 | |
| Durchschnittliche Intel Core i7-13650HX (9134 - 10887, n=5) | |
| Dell G16 7620 | |
| Lenovo LOQ 16IRH8 | |
| AIDA64 / FPU Mandel | |
| MSI Raider GE68HX 13VF | |
| Durchschnitt der Klasse Gaming (17585 - 128721, n=133, der letzten 2 Jahre) | |
| Lenovo Legion Slim 5 16APH8 | |
| Alienware m16 R1 Intel | |
| Dell G16, i7-13650HX, RTX 4060 | |
| Durchschnittliche Intel Core i7-13650HX (33391 - 48323, n=5) | |
| Dell G16 7620 | |
| Lenovo LOQ 16IRH8 | |
| AIDA64 / CPU AES | |
| Alienware m16 R1 Intel | |
| MSI Raider GE68HX 13VF | |
| Durchschnitt der Klasse Gaming (19065 - 247074, n=133, der letzten 2 Jahre) | |
| Dell G16, i7-13650HX, RTX 4060 | |
| Durchschnittliche Intel Core i7-13650HX (64436 - 85343, n=5) | |
| Dell G16 7620 | |
| Lenovo Legion Slim 5 16APH8 | |
| Lenovo LOQ 16IRH8 | |
| AIDA64 / CPU ZLib | |
| MSI Raider GE68HX 13VF | |
| Durchschnitt der Klasse Gaming (373 - 2531, n=133, der letzten 2 Jahre) | |
| Alienware m16 R1 Intel | |
| Dell G16, i7-13650HX, RTX 4060 | |
| Durchschnittliche Intel Core i7-13650HX (1136 - 1285, n=5) | |
| Lenovo Legion Slim 5 16APH8 | |
| Dell G16 7620 | |
| Lenovo LOQ 16IRH8 | |
| AIDA64 / FP64 Ray-Trace | |
| Durchschnitt der Klasse Gaming (3856 - 45446, n=133, der letzten 2 Jahre) | |
| Lenovo Legion Slim 5 16APH8 | |
| MSI Raider GE68HX 13VF | |
| Alienware m16 R1 Intel | |
| Dell G16, i7-13650HX, RTX 4060 | |
| Durchschnittliche Intel Core i7-13650HX (7270 - 10900, n=5) | |
| Dell G16 7620 | |
| Lenovo LOQ 16IRH8 | |
| AIDA64 / CPU PhotoWorxx | |
| MSI Raider GE68HX 13VF | |
| Durchschnitt der Klasse Gaming (10805 - 62916, n=133, der letzten 2 Jahre) | |
| Durchschnittliche Intel Core i7-13650HX (36170 - 43289, n=5) | |
| Dell G16, i7-13650HX, RTX 4060 | |
| Alienware m16 R1 Intel | |
| Dell G16 7620 | |
| Lenovo LOQ 16IRH8 | |
| Lenovo Legion Slim 5 16APH8 | |
System Performance
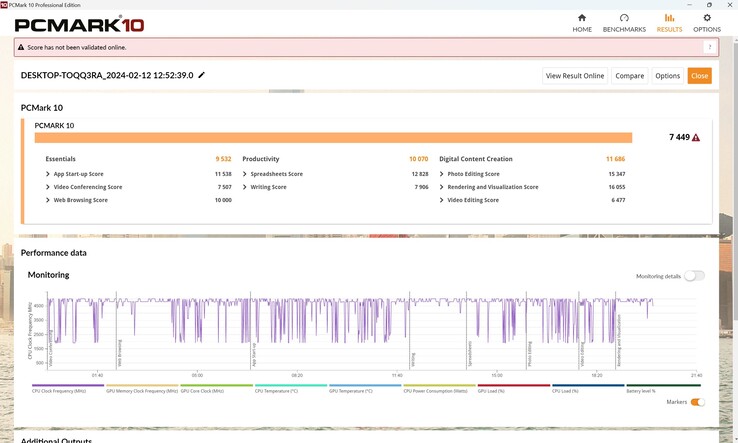
Im PCMark 10 schneidet das G16 insgesamt gut ab, offenbart jedoch Schwächen im Essentials-Untertest. Gleiches gilt für den Productivity-Test von CrossMark. Über alle Tests ordnet sich unser Testmodell jedoch leicht oberhalb aller Laptops mit der gleichen CPU/GPU-Ausstattung aus unserer Datenbank ein, sodass diese Ausreißer nicht so sehr ins Gewicht fallen.
CrossMark: Overall | Productivity | Creativity | Responsiveness
WebXPRT 3: Overall
WebXPRT 4: Overall
Mozilla Kraken 1.1: Total
| PCMark 10 / Score | |
| MSI Raider GE68HX 13VF | |
| Durchschnitt der Klasse Gaming (5776 - 10060, n=112, der letzten 2 Jahre) | |
| Lenovo Legion Slim 5 16APH8 | |
| Dell G16, i7-13650HX, RTX 4060 | |
| Durchschnittliche Intel Core i7-13650HX, NVIDIA GeForce RTX 4060 Laptop GPU (6984 - 7613, n=3) | |
| Alienware m16 R1 Intel | |
| Dell G16 7620 | |
| Lenovo LOQ 16IRH8 | |
| PCMark 10 / Essentials | |
| MSI Raider GE68HX 13VF | |
| Lenovo Legion Slim 5 16APH8 | |
| Alienware m16 R1 Intel | |
| Durchschnitt der Klasse Gaming (8810 - 12600, n=116, der letzten 2 Jahre) | |
| Durchschnittliche Intel Core i7-13650HX, NVIDIA GeForce RTX 4060 Laptop GPU (9532 - 11151, n=3) | |
| Dell G16 7620 | |
| Lenovo LOQ 16IRH8 | |
| Dell G16, i7-13650HX, RTX 4060 | |
| PCMark 10 / Productivity | |
| Lenovo Legion Slim 5 16APH8 | |
| Durchschnittliche Intel Core i7-13650HX, NVIDIA GeForce RTX 4060 Laptop GPU (9961 - 10204, n=3) | |
| Dell G16, i7-13650HX, RTX 4060 | |
| Durchschnitt der Klasse Gaming (6662 - 16716, n=114, der letzten 2 Jahre) | |
| MSI Raider GE68HX 13VF | |
| Alienware m16 R1 Intel | |
| Dell G16 7620 | |
| Lenovo LOQ 16IRH8 | |
| PCMark 10 / Digital Content Creation | |
| MSI Raider GE68HX 13VF | |
| Durchschnitt der Klasse Gaming (7440 - 19351, n=114, der letzten 2 Jahre) | |
| Lenovo Legion Slim 5 16APH8 | |
| Dell G16, i7-13650HX, RTX 4060 | |
| Dell G16 7620 | |
| Durchschnittliche Intel Core i7-13650HX, NVIDIA GeForce RTX 4060 Laptop GPU (8323 - 11686, n=3) | |
| Alienware m16 R1 Intel | |
| Lenovo LOQ 16IRH8 | |
| CrossMark / Overall | |
| Alienware m16 R1 Intel | |
| Durchschnitt der Klasse Gaming (1247 - 2344, n=112, der letzten 2 Jahre) | |
| MSI Raider GE68HX 13VF | |
| Lenovo LOQ 16IRH8 | |
| Durchschnittliche Intel Core i7-13650HX, NVIDIA GeForce RTX 4060 Laptop GPU (1839 - 1951, n=3) | |
| Dell G16, i7-13650HX, RTX 4060 | |
| Lenovo Legion Slim 5 16APH8 | |
| Dell G16 7620 | |
| CrossMark / Productivity | |
| Alienware m16 R1 Intel | |
| Lenovo LOQ 16IRH8 | |
| Durchschnitt der Klasse Gaming (1299 - 2211, n=112, der letzten 2 Jahre) | |
| MSI Raider GE68HX 13VF | |
| Durchschnittliche Intel Core i7-13650HX, NVIDIA GeForce RTX 4060 Laptop GPU (1730 - 1864, n=3) | |
| Lenovo Legion Slim 5 16APH8 | |
| Dell G16, i7-13650HX, RTX 4060 | |
| Dell G16 7620 | |
| CrossMark / Creativity | |
| MSI Raider GE68HX 13VF | |
| Alienware m16 R1 Intel | |
| Durchschnitt der Klasse Gaming (1275 - 2729, n=112, der letzten 2 Jahre) | |
| Durchschnittliche Intel Core i7-13650HX, NVIDIA GeForce RTX 4060 Laptop GPU (2020 - 2063, n=3) | |
| Lenovo LOQ 16IRH8 | |
| Dell G16, i7-13650HX, RTX 4060 | |
| Lenovo Legion Slim 5 16APH8 | |
| Dell G16 7620 | |
| CrossMark / Responsiveness | |
| Alienware m16 R1 Intel | |
| Lenovo LOQ 16IRH8 | |
| Durchschnitt der Klasse Gaming (1030 - 2330, n=112, der letzten 2 Jahre) | |
| Durchschnittliche Intel Core i7-13650HX, NVIDIA GeForce RTX 4060 Laptop GPU (1544 - 1907, n=3) | |
| Dell G16, i7-13650HX, RTX 4060 | |
| MSI Raider GE68HX 13VF | |
| Dell G16 7620 | |
| Lenovo Legion Slim 5 16APH8 | |
| WebXPRT 3 / Overall | |
| MSI Raider GE68HX 13VF | |
| Lenovo Legion Slim 5 16APH8 | |
| Lenovo LOQ 16IRH8 | |
| Lenovo LOQ 16IRH8 | |
| Durchschnitt der Klasse Gaming (237 - 532, n=115, der letzten 2 Jahre) | |
| Alienware m16 R1 Intel | |
| Durchschnittliche Intel Core i7-13650HX, NVIDIA GeForce RTX 4060 Laptop GPU (268 - 302, n=3) | |
| Dell G16 7620 | |
| Dell G16, i7-13650HX, RTX 4060 | |
| WebXPRT 4 / Overall | |
| MSI Raider GE68HX 13VF | |
| Durchschnitt der Klasse Gaming (176.4 - 345, n=113, der letzten 2 Jahre) | |
| Alienware m16 R1 Intel | |
| Durchschnittliche Intel Core i7-13650HX, NVIDIA GeForce RTX 4060 Laptop GPU (260 - 276, n=2) | |
| Lenovo Legion Slim 5 16APH8 | |
| Dell G16 7620 | |
| Mozilla Kraken 1.1 / Total | |
| Dell G16 7620 | |
| Durchschnittliche Intel Core i7-13650HX, NVIDIA GeForce RTX 4060 Laptop GPU (507 - 511, n=3) | |
| Lenovo LOQ 16IRH8 | |
| Lenovo LOQ 16IRH8 | |
| Dell G16, i7-13650HX, RTX 4060 | |
| Alienware m16 R1 Intel | |
| Lenovo Legion Slim 5 16APH8 | |
| Durchschnitt der Klasse Gaming (397 - 674, n=124, der letzten 2 Jahre) | |
| MSI Raider GE68HX 13VF | |
* ... kleinere Werte sind besser
| PCMark 10 Score | 7449 Punkte | |
Hilfe | ||
| AIDA64 / Memory Copy | |
| MSI Raider GE68HX 13VF | |
| Durchschnitt der Klasse Gaming (21750 - 108104, n=133, der letzten 2 Jahre) | |
| Lenovo Legion Slim 5 16APH8 | |
| Durchschnittliche Intel Core i7-13650HX (59266 - 66372, n=5) | |
| Dell G16, i7-13650HX, RTX 4060 | |
| Alienware m16 R1 Intel | |
| Dell G16 7620 | |
| Lenovo LOQ 16IRH8 | |
| AIDA64 / Memory Read | |
| MSI Raider GE68HX 13VF | |
| Durchschnitt der Klasse Gaming (22956 - 104349, n=133, der letzten 2 Jahre) | |
| Durchschnittliche Intel Core i7-13650HX (67305 - 71022, n=5) | |
| Alienware m16 R1 Intel | |
| Dell G16, i7-13650HX, RTX 4060 | |
| Dell G16 7620 | |
| Lenovo LOQ 16IRH8 | |
| Lenovo Legion Slim 5 16APH8 | |
| AIDA64 / Memory Write | |
| Lenovo Legion Slim 5 16APH8 | |
| MSI Raider GE68HX 13VF | |
| Durchschnitt der Klasse Gaming (22297 - 133486, n=133, der letzten 2 Jahre) | |
| Durchschnittliche Intel Core i7-13650HX (58028 - 68225, n=5) | |
| Alienware m16 R1 Intel | |
| Dell G16, i7-13650HX, RTX 4060 | |
| Dell G16 7620 | |
| Lenovo LOQ 16IRH8 | |
| AIDA64 / Memory Latency | |
| Lenovo LOQ 16IRH8 | |
| Durchschnitt der Klasse Gaming (59.5 - 259, n=133, der letzten 2 Jahre) | |
| Dell G16 7620 | |
| Lenovo Legion Slim 5 16APH8 | |
| Dell G16, i7-13650HX, RTX 4060 | |
| Durchschnittliche Intel Core i7-13650HX (83.7 - 90.8, n=5) | |
| Alienware m16 R1 Intel | |
| MSI Raider GE68HX 13VF | |
* ... kleinere Werte sind besser
DPC-Latenzen
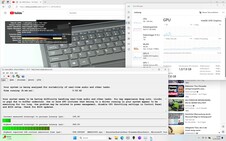
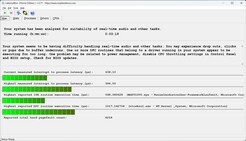
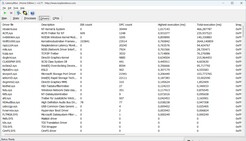
Beim Öffnen unserer Homepage treten leichte Latenzen auf, die die Software LatencyMon jedoch noch nicht als kritisch betrachtet. Daran ändert auch das Öffnen mehrerer Tabs nicht. Der Verzögerungswert erhöht sich jedoch leicht beim Abspielen unseres 4K/60-fps-YouTubevideos, sodass unser Messtool doch auf Probleme hinweist. Im Vergleich sind die Verzögerungen dennoch eher gering und das Testvideo wurde ohne ausgelassene Bilder abgespielt.
| DPC Latencies / LatencyMon - interrupt to process latency (max), Web, Youtube, Prime95 | |
| Alienware m16 R1 Intel | |
| MSI Raider GE68HX 13VF | |
| Lenovo LOQ 16IRH8 | |
| Lenovo Legion Slim 5 16APH8 | |
| Dell G16, i7-13650HX, RTX 4060 | |
| Dell G16 7620 | |
* ... kleinere Werte sind besser
Massenspeicher
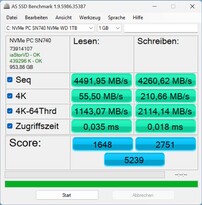
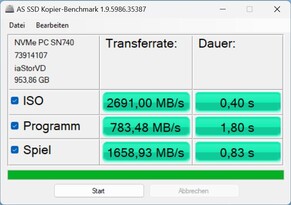
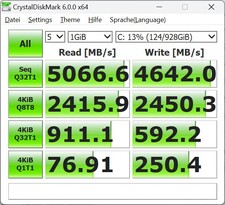
Dell verbaut eine SN740 von Western Digital im kleinen Formfaktor M.2 2230. Ein zweiter, größerer M.2-2280-Slot ist noch frei. Die PCIe-4-NVMe-SSD belegt in unserer SSD-Bestenliste Rang 142. Eigentlich ist deren Ausgangsleistung besser als die der SSDs im MSI Raider oder dem Lenovo LOQ 16. Im Gegensatz zu diesen und auch den anderen Konkurrenten wird das Speichermedium im G16 allerdings schon nach recht kurzer Zeit thermisch gedrosselt.
Die Transferraten brechen dann um mehr als die Hälfte ein. Der Vorgänger hatte übrigens ein schnelleres Modell, auch wenn dieses ebenfalls von Drosslungsproblemen betroffen war. Diese setzten jedoch deutlich später ein.
* ... kleinere Werte sind besser
Dauerleistung Lesen: DiskSpd Read Loop, Queue Depth 8
Grafikkarte
Dell spendiert dem G16 eine RTX 4060 mit 140 W. Whisper Mode, Max-Q, Dynamic Boost und sogar Advanced Optimus werden allesamt unterstützt. Allerdings nervt Letzteres regelmäßig, da die Grafikumschaltung bei jeder 3D-Anwendung (Starten und Verlassen) stets mehrere Sekunden benötigt, in denen der Bildschirm einfriert.
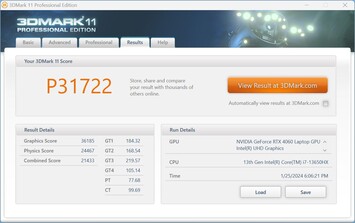
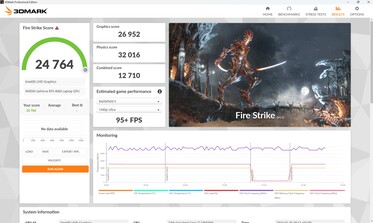
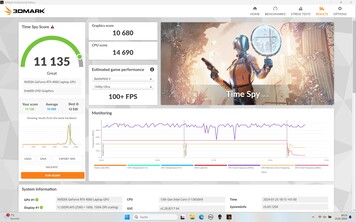
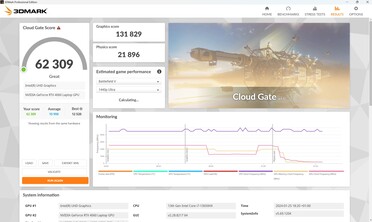
Die Leistung in den synthetischen 3DMarks liegt indes auf Erwartungsniveau, wenn nicht sogar leicht darüber. Zum Vorgänger mit RTX 3060 und i7-12700H beträgt der Vorsprung etwa 22 Prozent.
Abseits der Steckdose sinkt die 3D-Leistung weniger drastisch als erwartet. In einem erneuten Fire-Strike-Durchgang messen wir einen Rückgang um etwa 20 Prozent.
| 3DMark 11 Performance | 31722 Punkte | |
| 3DMark Cloud Gate Standard Score | 62309 Punkte | |
| 3DMark Fire Strike Score | 24764 Punkte | |
| 3DMark Time Spy Score | 11135 Punkte | |
Hilfe | ||
* ... kleinere Werte sind besser
Gaming Performance
Als wir über die Systemsteuerung den Nvidia-GPU-only-Modus für die Gaming-Banchmarks anschalten, beobachten wir, dass es in bestimmten Einstellungen (z.B. Witcher 3 Full-HD Ultra, Strange Brigade QHD) zu deutlich geringeren Frameraten kommt als im Optimus- bzw. Automatikmodus. Das ist eher ungewöhnlich und könnte für Frust sorgen.
Ansonsten können wir uns aber nicht über die Gaming-Leistung beschweren, im Vergleich ordnet sich unser G16 fünf Prozent hinter dem MSI Raider mit i9-13950HX und RTX 4060 ein, das Alienware sowie das Lenovo LOQ folgen aber nur knapp dahinter.
Letztlich lassen sich alle auch aktuellen Spiele in FHD in Ultra-Einstellungen mit über 60 fps abspielen. In der nativen 1.600p-Auflösung reicht es oftmals nicht mehr für über 60 fps, flüssig laufen die Spiele mit über 40 fps dennoch.
| The Witcher 3 - 1920x1080 Ultra Graphics & Postprocessing (HBAO+) | |
| Durchschnitt der Klasse Gaming (80.2 - 240, n=36, der letzten 2 Jahre) | |
| Dell G16, i7-13650HX, RTX 4060 | |
| Alienware m16 R1 Intel | |
| Lenovo LOQ 16IRH8 | |
| MSI Raider GE68HX 13VF | |
| Lenovo Legion Slim 5 16APH8 | |
| Dell G16 7620 | |
| GTA V - 1920x1080 Highest AA:4xMSAA + FX AF:16x | |
| Durchschnitt der Klasse Gaming (47.9 - 186.9, n=118, der letzten 2 Jahre) | |
| Dell G16, i7-13650HX, RTX 4060 | |
| Lenovo LOQ 16IRH8 | |
| Dell G16 7620 | |
| Lenovo Legion Slim 5 16APH8 | |
| Final Fantasy XV Benchmark - 1920x1080 High Quality | |
| Durchschnitt der Klasse Gaming (37.9 - 215, n=126, der letzten 2 Jahre) | |
| Alienware m16 R1 Intel | |
| Dell G16, i7-13650HX, RTX 4060 | |
| MSI Raider GE68HX 13VF | |
| Lenovo LOQ 16IRH8 | |
| Lenovo Legion Slim 5 16APH8 | |
| Dell G16 7620 | |
| Strange Brigade - 1920x1080 ultra AA:ultra AF:16 | |
| Durchschnitt der Klasse Gaming (76.3 - 456, n=116, der letzten 2 Jahre) | |
| Dell G16, i7-13650HX, RTX 4060 | |
| MSI Raider GE68HX 13VF | |
| Alienware m16 R1 Intel | |
| Lenovo LOQ 16IRH8 | |
| Lenovo Legion Slim 5 16APH8 | |
| Dell G16 7620 | |
| Dota 2 Reborn - 1920x1080 ultra (3/3) best looking | |
| MSI Raider GE68HX 13VF | |
| Durchschnitt der Klasse Gaming (65.1 - 248, n=133, der letzten 2 Jahre) | |
| Alienware m16 R1 Intel | |
| Lenovo LOQ 16IRH8 | |
| Dell G16, i7-13650HX, RTX 4060 | |
| Dell G16 7620 | |
| Lenovo Legion Slim 5 16APH8 | |
In Witcher 3 Ultra zeigt unser G16 gar seine beste Leistung und übertrifft die Frameraten der Konkurrenz leicht (Alienware) bis deutlich (Legion Slim 5, GPU Automatik).
Die unten stehende Tabelle listet für Witcher 3 (FHD Ultra) die FPS sowie Lautstärke- und Verbrauchsverhalten in Abhängigkeit von den drei Leistungsmodi.
| Leistungsmodus/Wert | fps Beginn | fps Durchschnitt | Lautstärke | Verbrauch |
|---|---|---|---|---|
| Leistung | 108 | 105,6 | 47,89 dB | 185 W |
| Ausbalanciert | 100 | 97,6 | 39 - 43 dB | 178 W |
| Leise | 99 | 97,6 | 35,52 dB | 168 W |
Witcher 3 FPS-Diagramm
| min. | mittel | hoch | max. | QHD | 4K | |
|---|---|---|---|---|---|---|
| GTA V (2015) | 185.8 | 183.2 | 176.2 | 117.4 | 50.8 | |
| The Witcher 3 (2015) | 340.4 | 193.1 | 110 | 108 | 42.4 | |
| Dota 2 Reborn (2015) | 177 | 168.7 | 160.8 | 149 | 126.2 | |
| Final Fantasy XV Benchmark (2018) | 219 | 150.1 | 103.7 | 75.9 | ||
| X-Plane 11.11 (2018) | 160.4 | 144.6 | 114.9 | 119.6 | ||
| Far Cry 5 (2018) | 176 | 148 | 141 | 135 | 105 | |
| Strange Brigade (2018) | 478 | 291 | 228 | 194.9 | 129 | |
| Cyberpunk 2077 (2023) | 131.1 | 75.6 | 69.8 | 45.6 |
Emissionen - Bleibt auch beim Gaming recht ruhig
Geräuschemissionen
Im Idle sind die Lüfter bei allen anderen Modi außer "Leistung" aus. Im 3DMark06, unserem Durchschnittslastscenario, verbleibt der Laptop im gleichen Geräuschpegel wie beim Idle (Leistungsmodus, ca. 28 dB), dreht also nicht weiter auf.
Und auch beim Gaming und unter Volllast bleibt das Dell G16 mit deutlich unterhalb von 50 dB spürbar ruhiger als die Konkurrenz, hier zahlt sich das wuchtige Kühlsystem scheinbar aus.
Lautstärkediagramm
| Idle |
| 23 / 23 / 27.96 dB(A) |
| Last |
| 27.96 / 47.89 dB(A) |
 | ||
30 dB leise 40 dB(A) deutlich hörbar 50 dB(A) störend |
||
min: | ||
| Dell G16, i7-13650HX, RTX 4060 GeForce RTX 4060 Laptop GPU, i7-13650HX, WD PC SN740 SDDPNQD-1T00 | Dell G16 7620 GeForce RTX 3060 Laptop GPU, i7-12700H, WDC PC SN810 512GB | MSI Raider GE68HX 13VF GeForce RTX 4060 Laptop GPU, i9-13950HX, Samsung PM9B1 1024GB MZVL41T0HBLB | Lenovo Legion Slim 5 16APH8 GeForce RTX 4060 Laptop GPU, R7 7840HS, SK hynix PC801 HFS512GEJ9X115N | Alienware m16 R1 Intel GeForce RTX 4060 Laptop GPU, i7-13700HX, Kioxia KXG70ZNV512G | Lenovo LOQ 16IRH8 GeForce RTX 4060 Laptop GPU, i7-13620H, Solidigm SSDPFINW512GZL | |
|---|---|---|---|---|---|---|
| Geräuschentwicklung | -10% | -26% | -6% | -19% | -16% | |
| aus / Umgebung * (dB) | 23 | 23.2 -1% | 23.3 -1% | 22.9 -0% | 25 -9% | 23 -0% |
| Idle min * (dB) | 23 | 28.3 -23% | 25 -9% | 23.1 -0% | 25 -9% | 23 -0% |
| Idle avg * (dB) | 23 | 28.8 -25% | 31.3 -36% | 23.1 -0% | 26 -13% | 23 -0% |
| Idle max * (dB) | 27.96 | 28.9 -3% | 37.5 -34% | 27.7 1% | 27 3% | 27.66 1% |
| Last avg * (dB) | 27.96 | 32.4 -16% | 44 -57% | 33.3 -19% | 52 -86% | 53.62 -92% |
| Witcher 3 ultra * (dB) | 47.89 | 48.3 -1% | 57 -19% | 54 -13% | 51 -6% | 53.5 -12% |
| Last max * (dB) | 47.89 | 48.1 -0% | 60.1 -25% | 54 -13% | 53 -11% | 53.5 -12% |
* ... kleinere Werte sind besser
Temperatur
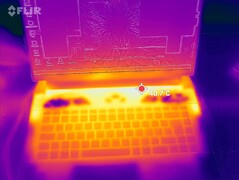
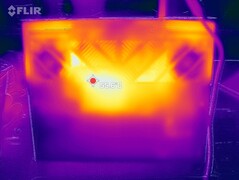
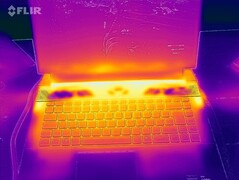
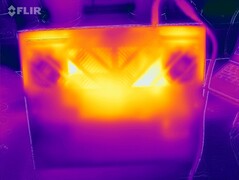
Die vergleichsweise niedrige Geräuschkulisse hat aber auch leichte Nachteile. So erhitzt sich die Oberfläche des G16 eher stärker als die der Konkurrenten. Wir messen unter maximaler Last Hot Spots von bis zu 58 °C an der Unterseite! Nur das Lenovo LOQ 16 und der Vorgänger werden ähnlich heiß, die übrigen Vergleichsgeräte bleiben knapp unterhalb von 50 °C. Immerhin sind die Handballenauflagen stets kühl, auch der Bereich der WASD-Tasten verbleibt im annehmbaren Bereich.
(-) Die maximale Temperatur auf der Oberseite ist 49 °C. Im Vergleich liegt der Klassendurchschnitt bei 40.4 °C (von 21.2 bis 68.8 °C für die Klasse Gaming).
(-) Auf der Unterseite messen wir eine maximalen Wert von 58 °C (im Vergleich zum Durchschnitt von 43.3 °C).
(+) Ohne Last messen wir eine durchschnittliche Temperatur von 30 °C auf der Oberseite. Der Klassendurchschnitt erreicht 33.9 °C.
(±) Beim längeren Spielen von The Witcher 3 erhitzt sich das Gerät durchschnittlich auf 34.4 °C. Der Durchschnitt der Klasse ist derzeit 33.9 °C.
(+) Die Handballen und der Touchpad-Bereich sind mit gemessenen 25 °C kühler als die typische Hauttemperatur und fühlen sich dadurch kühl an.
(+) Die durchschnittliche Handballen-Temperatur anderer getesteter Geräte war 28.8 °C (+3.8 °C).
| Dell G16, i7-13650HX, RTX 4060 Intel Core i7-13650HX, NVIDIA GeForce RTX 4060 Laptop GPU | Dell G16 7620 Intel Core i7-12700H, NVIDIA GeForce RTX 3060 Laptop GPU | MSI Raider GE68HX 13VF Intel Core i9-13950HX, NVIDIA GeForce RTX 4060 Laptop GPU | Lenovo Legion Slim 5 16APH8 AMD Ryzen 7 7840HS, NVIDIA GeForce RTX 4060 Laptop GPU | Alienware m16 R1 Intel Intel Core i7-13700HX, NVIDIA GeForce RTX 4060 Laptop GPU | Lenovo LOQ 16IRH8 Intel Core i7-13620H, NVIDIA GeForce RTX 4060 Laptop GPU | |
|---|---|---|---|---|---|---|
| Hitze | 19% | 16% | 23% | -2% | 10% | |
| Last oben max * (°C) | 49 | 47.6 3% | 41.4 16% | 40.6 17% | 49 -0% | 48 2% |
| Last unten max * (°C) | 58 | 54 7% | 45.4 22% | 42 28% | 48 17% | 59 -2% |
| Idle oben max * (°C) | 35 | 23 34% | 29.8 15% | 27.8 21% | 40 -14% | 28 20% |
| Idle unten max * (°C) | 35 | 24.6 30% | 31.4 10% | 26.6 24% | 39 -11% | 28 20% |
* ... kleinere Werte sind besser
Stresstest
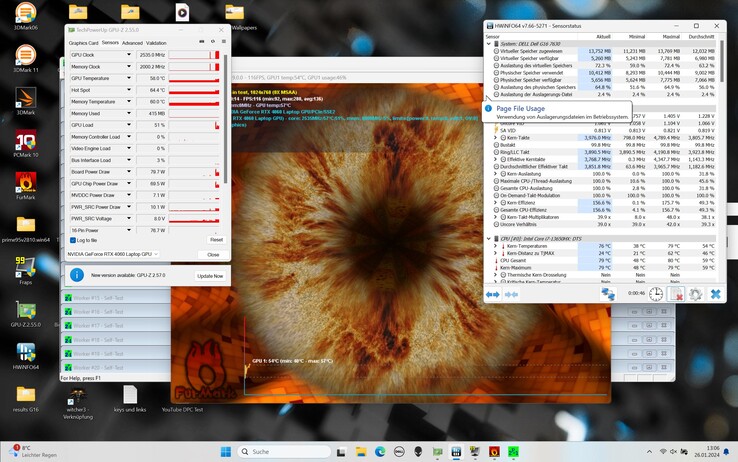
Beim Stresstest takten die Kerne kurzzeitig auf 4,1 GHz hoch. Dadurch erhitzt sich die CPU jedoch auf bis zu 100 °C, woraufhin die Leistungsaufnahme von ursprünglich 128 W absinkt uns sich bei etwa 70 W stabilisiert. Die CPU-Taktrate pendelt sich bei etwa 2,9 GHz ein, die Temperaturen bei rund 85 °C.
Dem gegenüber bleiben die GPU-Taktraten über die gesamte Laufzeit recht stabil bei etwa 2,4 bis 2,5 GHz. Gleiches gilt für den Speichertakt (2 GHz). Die Chiptemperatur pegelt sich bei etwa 72 °C ein, die Leistungsaufnahme liegt im Schnitt bei 71 W.
| CPU Clock (GHz) | GPU Clock (MHz) | Average CPU Temperature (°C) | Average GPU Temperature (°C) | |
| Prime95 + FurMark Stress | 2,9 | 2.490 | 85 | 72 |
| Witcher 3 Stress | 0,538 | 2.500 | 81 | 73 |
Lautsprecher
Die Stereo-Lautsprecher überzeugen wenig: Kaum Bass, tendenziell zu leise und selbst Mitten und Höhen sind wenig ausgeglichen bzw. linear. Als analoger Audioanschluss steht nur ein 3,5-mm-Headset-Anschluss zur Verfügung.
Dell G16, i7-13650HX, RTX 4060 Audio Analyse
(±) | Mittelmäßig laut spielende Lautsprecher (80.55 dB)
Bass 100 - 315 Hz
(-) | kaum Bass - 25.1% niedriger als der Median
(-) | keine lineare Bass-Wiedergabe (18.9% Delta zum Vorgänger)
Mitteltöne 400 - 2000 Hz
(±) | zu hohe Mitten, vom Median 8% abweichend
(+) | lineare Mitten (5.9% Delta zum Vorgänger)
Hochtöne 2 - 16 kHz
(+) | ausgeglichene Hochtöne, vom Median nur 3.5% abweichend
(±) | durchschnittlich lineare Hochtöne (8.6% Delta zum Vorgänger)
Gesamt im hörbaren Bereich 100 - 16.000 Hz
(±) | hörbarer Bereich ist durchschnittlich linear (23.4% Abstand zum Median)
Im Vergleich zu allen Geräten derselben Klasse
» 85% aller getesteten Geräte dieser Klasse waren besser, 5% vergleichbar, 11% schlechter
» Das beste Gerät hat einen Delta-Wert von 6%, durchschnittlich ist 18%, das schlechteste Gerät hat 132%
Im Vergleich zu allen Geräten im Test
» 69% aller getesteten Geräte waren besser, 6% vergleichbar, 24% schlechter
» Das beste Gerät hat einen Delta-Wert von 4%, durchschnittlich ist 24%, das schlechteste Gerät hat 134%
Apple MacBook Pro 16 2021 M1 Pro Audio Analyse
(+) | Die Lautsprecher können relativ laut spielen (84.7 dB)
Bass 100 - 315 Hz
(+) | guter Bass - nur 3.8% Abweichung vom Median
(+) | lineare Bass-Wiedergabe (5.2% Delta zum Vorgänger)
Mitteltöne 400 - 2000 Hz
(+) | ausgeglichene Mitten, vom Median nur 1.3% abweichend
(+) | lineare Mitten (2.1% Delta zum Vorgänger)
Hochtöne 2 - 16 kHz
(+) | ausgeglichene Hochtöne, vom Median nur 1.9% abweichend
(+) | sehr lineare Hochtöne (2.7% Delta zum Vorgänger)
Gesamt im hörbaren Bereich 100 - 16.000 Hz
(+) | hörbarer Bereich ist sehr linear (4.6% Abstand zum Median
Im Vergleich zu allen Geräten derselben Klasse
» 0% aller getesteten Geräte dieser Klasse waren besser, 0% vergleichbar, 100% schlechter
» Das beste Gerät hat einen Delta-Wert von 5%, durchschnittlich ist 17%, das schlechteste Gerät hat 45%
Im Vergleich zu allen Geräten im Test
» 0% aller getesteten Geräte waren besser, 0% vergleichbar, 100% schlechter
» Das beste Gerät hat einen Delta-Wert von 4%, durchschnittlich ist 24%, das schlechteste Gerät hat 134%
Energieverwaltung - Dell G16 liegt im Klassendurchschnitt
Energieaufnahme
Gemessen an der Leistung geht der Verbrauch mehr als in Ordnung. Insgesamt ist das G16 gar effizienter geworden. Vor allem im Idle verbraucht es nun weniger als der Vorgänger. Beim Gaming sind es nur etwa 5 Prozent mehr bei gleichzeitiger Leistungssteigerung um etwa 14 Prozent!
Beim Gaming verbrauchen die ähnlich schnellen Alienware und MSI Raider quasi genauso viel, nämlich im Schnitt 185 W unter Witcher 3. Der kurzzeitige Maximalverbrauch liegt bei 255 W.
Vor diesem Hintergrund verwundert es schon sehr, dass Dell dem G16 mit RTX 4060 ein riesiges, klobiges und schweres 330-W-Netzteil beiliegt. Dieses ist für die Hardwareausstattung völlig überdimensioniert. Vermutlich verschifft Dell einfach das gleiche Netzteil für alle Ausstattungen, sodass man auch für den i9-13900HX und RTX 4070 gerüstet ist. Ein kleineres, leichteres Netzteil wäre hier für die Kunden dieser SKU angenehmer gewesen.
| Aus / Standby | |
| Idle | |
| Last |
|
Legende:
min: | |
| Dell G16, i7-13650HX, RTX 4060 i7-13650HX, GeForce RTX 4060 Laptop GPU, WD PC SN740 SDDPNQD-1T00, IPS, 2560x1600, 16" | Dell G16 7620 i7-12700H, GeForce RTX 3060 Laptop GPU, WDC PC SN810 512GB, IPS, 2560x1600, 16" | MSI Raider GE68HX 13VF i9-13950HX, GeForce RTX 4060 Laptop GPU, Samsung PM9B1 1024GB MZVL41T0HBLB, IPS, 1900x1200, 16" | Lenovo Legion Slim 5 16APH8 R7 7840HS, GeForce RTX 4060 Laptop GPU, SK hynix PC801 HFS512GEJ9X115N, IPS, 2560x1600, 16" | Alienware m16 R1 Intel i7-13700HX, GeForce RTX 4060 Laptop GPU, Kioxia KXG70ZNV512G, IPS, 2560x1600, 16" | Lenovo LOQ 16IRH8 i7-13620H, GeForce RTX 4060 Laptop GPU, Solidigm SSDPFINW512GZL, IPS, 2560x1600, 16" | Durchschnittliche NVIDIA GeForce RTX 4060 Laptop GPU | Durchschnitt der Klasse Gaming | |
|---|---|---|---|---|---|---|---|---|
| Stromverbrauch | -21% | -32% | 9% | -9% | -12% | -1% | -23% | |
| Idle min * (Watt) | 11 | 14.4 -31% | 15.8 -44% | 9.4 15% | 10 9% | 17.2 -56% | 11.5 ? -5% | 13.7 ? -25% |
| Idle avg * (Watt) | 14.8 | 17.8 -20% | 19.4 -31% | 15.5 -5% | 14 5% | 19.3 -30% | 16 ? -8% | 19.5 ? -32% |
| Idle max * (Watt) | 16.8 | 31.5 -88% | 27.3 -63% | 24.4 -45% | 21 -25% | 21.2 -26% | 20.3 ? -21% | 25.7 ? -53% |
| Last avg * (Watt) | 103.7 | 101.2 2% | 114.7 -11% | 74.1 29% | 119 -15% | 90 13% | 92.9 ? 10% | 110.2 ? -6% |
| Witcher 3 ultra * (Watt) | 185 | 176.9 4% | 185.5 -0% | 112.9 39% | 186.7 -1% | 168 9% | ||
| Last max * (Watt) | 255 | 242.9 5% | 364.2 -43% | 206.5 19% | 323 -27% | 211 17% | 210 ? 18% | 257 ? -1% |
* ... kleinere Werte sind besser
Energieaufnahme Witcher 3 / Stresstest
Energieaufnahme mit externem Monitor
Akkulaufzeit
Dell verbaut einen Akku mit 86 Wh. Die Konkurrenz ist ähnlich bestückt. Dies reicht beim G16 für etwa 5,5 Stunden (Maximale Helligkeit) bis annähernd 6,5 Stunden (150 Nits) Surfen oder Video-schauen. Damit orientiert sich der Dell-Gamer in etwa am Klassendurchschnitt.
| Dell G16, i7-13650HX, RTX 4060 i7-13650HX, GeForce RTX 4060 Laptop GPU, 86 Wh | Dell G16 7620 i7-12700H, GeForce RTX 3060 Laptop GPU, 84 Wh | MSI Raider GE68HX 13VF i9-13950HX, GeForce RTX 4060 Laptop GPU, 99.9 Wh | Lenovo Legion Slim 5 16APH8 R7 7840HS, GeForce RTX 4060 Laptop GPU, 80 Wh | Alienware m16 R1 Intel i7-13700HX, GeForce RTX 4060 Laptop GPU, 86 Wh | Lenovo LOQ 16IRH8 i7-13620H, GeForce RTX 4060 Laptop GPU, 80 Wh | Durchschnitt der Klasse Gaming | |
|---|---|---|---|---|---|---|---|
| Akkulaufzeit | -34% | 23% | 3% | -20% | 5% | 15% | |
| H.264 (h) | 6.4 | 5.6 -13% | 6.4 0% | 7.93 ? 24% | |||
| WLAN (h) | 6.3 | 5 -21% | 6.8 8% | 7.1 13% | 4.8 -24% | 6.3 0% | 6.73 ? 7% |
| Last (h) | 1.3 | 0.7 -46% | 1.8 38% | 1.2 -8% | 1 -23% | 1.5 15% | 1.472 ? 13% |
| Idle (h) | 7.1 | 8.8 | 11.7 | 6.4 | 9.23 ? |
Pro
Contra
Fazit - Preiswerte Alienware-Alternative mit kleinen Ärgernissen
Das Dell G16 7630 wirkt etwas schlichter und ist preiswerter als die Alienware-Reihe von Dell. Die Leistung stimmt dennoch, richtig gut ist außerdem, dass der Gamer auch beim Spielen ruhiger bleibt als viele Konkurrenten.
Den Rotstift hat Dell vor allem bei der Webcam und der Verarbeitung angesetzt, was für Kunden mit engeren Budgetgrenzen wohl verschmerzbar, aber manchmal etwas ärgerlich ist: So zum Beispiel der Netzstecker, der bei leichter Bewegung des Laptops Stück für Stück heraus rutscht, oder das klobige und schwere Netzteil, oder der Fakt, dass nur die Version mit i9-13900HX und RTX 4070 Thunderbolt unterstützt, unsere Testeinheit mit i7-13650H und RTX 4060 hingegen nicht, Letzteres wirkt genauso undurchsichtig für die Kunden wie die zwei Displaytypen, die nur im Manual gelistet werden und sich ausschließlich im Farbraum und der Bildwiederholrate unterscheiden.
Das Dell G16 7630 ist ein recht großer und schwerer Mittelklasse-Gamer mit guter Leistung und ruhigem Auftritt. Bei der Ausstattung und der Verarbeitung könnte Dell aber noch zulegen.
Wer es etwas schlichter und sparsamer mag, könnte sich das leicht schwächere Dell Inspiron 16 Plus 7630 anschauen. Eine weitere Alternative wäre ein Lenovo Legion Slim 5, wenn es etwas teurer sein darf auch gleich das Legion Pro 5 16.
Preis und Verfügbarkeit
Im Dell-Shop kostet unsere Ausstattungsvariante, aber mit 32 statt 16 GB RAM, 1.399 Euro. Vorsicht: Bei Amazon zahlt man aktuell Mondpreise von 2.800 bis über 5.000 Euro für das G16 - irre!
Die Version mit i9-13900HX und RTX 4070 kostet 450 Euro mehr.
Dell G16, i7-13650HX, RTX 4060
- 13.02.2024 v7 (old)
Christian Hintze
Transparenz
Die Auswahl der zu testenden Geräte erfolgt innerhalb der Redaktion. Das vorliegende Testmuster wurde dem Autor vom Hersteller oder einem Shop zu Testzwecken leihweise zur Verfügung gestellt. Eine Einflussnahme des Leihstellers auf den Testbericht gab es nicht, der Hersteller erhielt keine Version des Reviews vor der Veröffentlichung. Es bestand keine Verpflichtung zur Publikation. Als eigenständiges, unabhängiges Unternehmen unterliegt Notebookcheck keiner Diktion von Herstellern, Shops und Verlagen.
So testet Notebookcheck
Pro Jahr werden von Notebookcheck hunderte Laptops und Smartphones unabhängig in von uns standardisierten technischen Verfahren getestet, um eine Vergleichbarkeit aller Testergebnisse zu gewährleisten. Seit rund 20 Jahren entwickeln wir diese Testmethoden kontinuierlich weiter und setzen damit Branchenstandards. In unseren Testlaboren kommt ausschließlich hochwertiges Messequipment in die Hände erfahrener Techniker und Redakteure. Die Tests unterliegen einer mehrstufigen Kontrolle. Unsere komplexe Gesamtbewertung basiert auf hunderten fundierten Messergebnissen und Benchmarks, womit Ihnen Objektivität garantiert ist. Weitere Informationen zu unseren Testmethoden gibt es hier.


