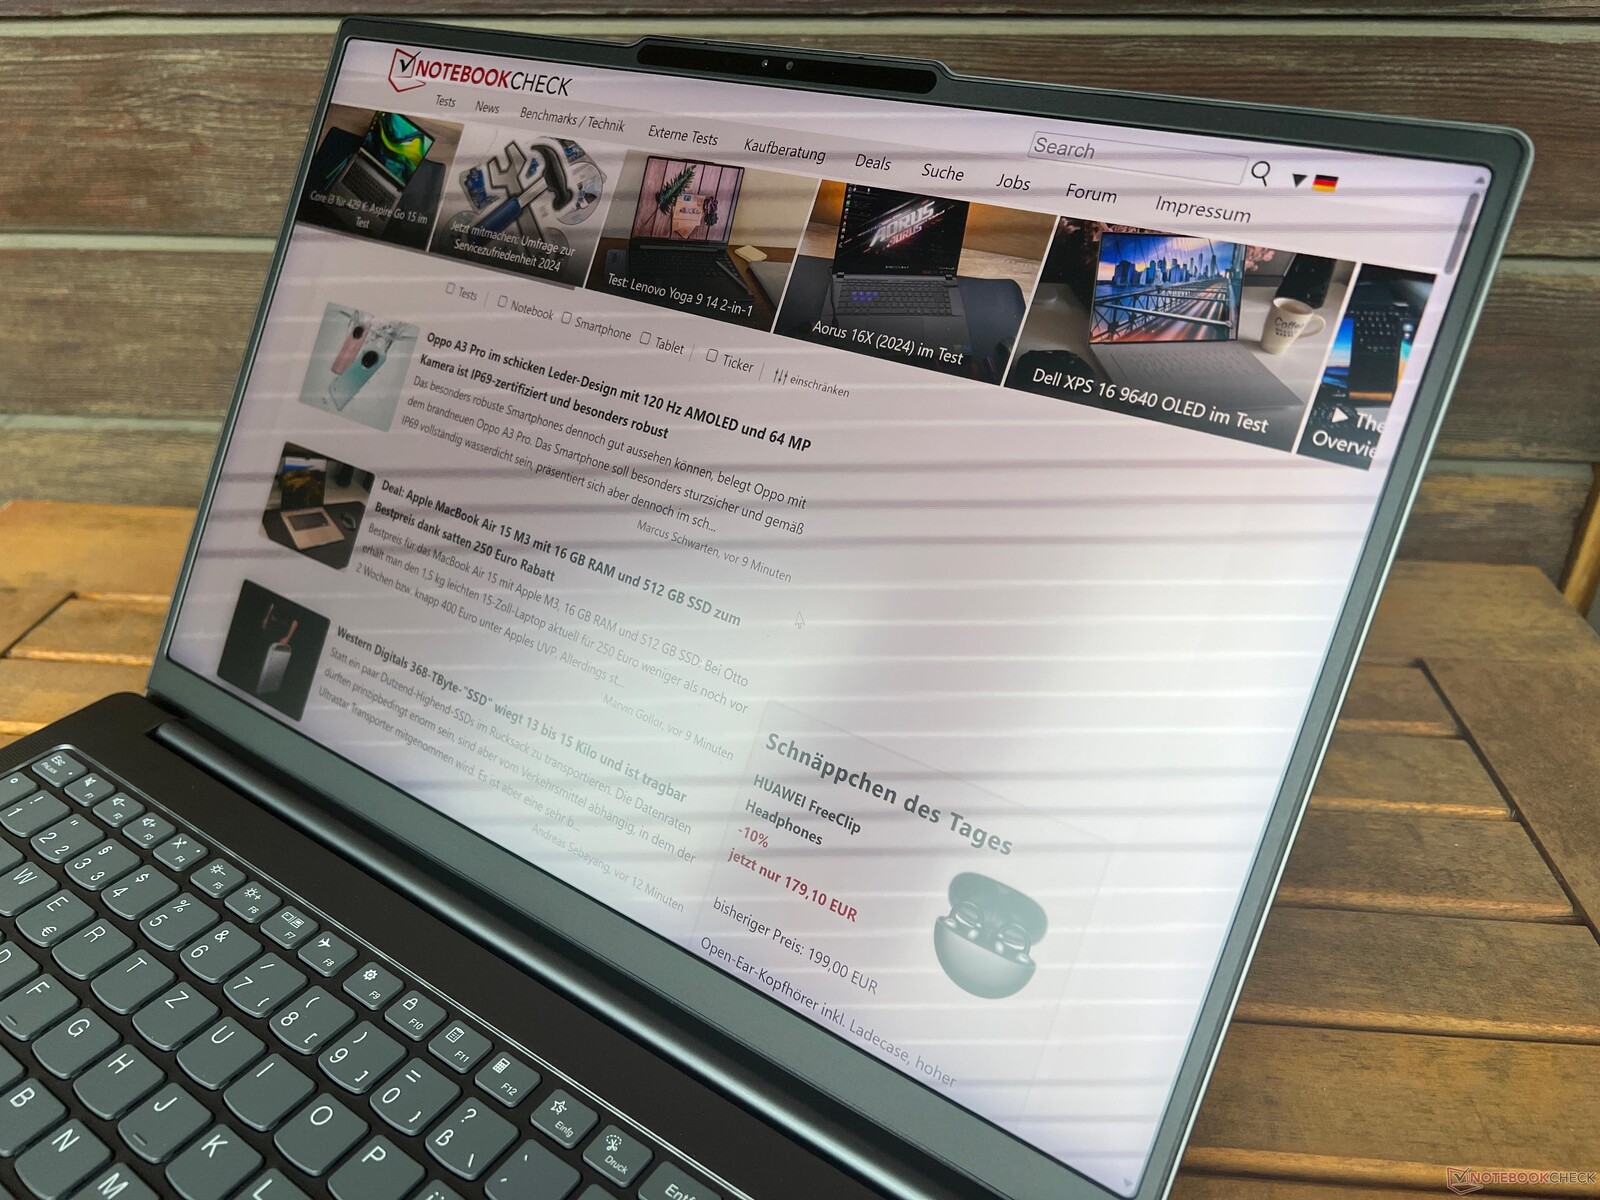
Lenovo Yoga Pro 9i 16 G9 Laptop im Test - MiniLED mit 1.200 Nits und Core Ultra 9
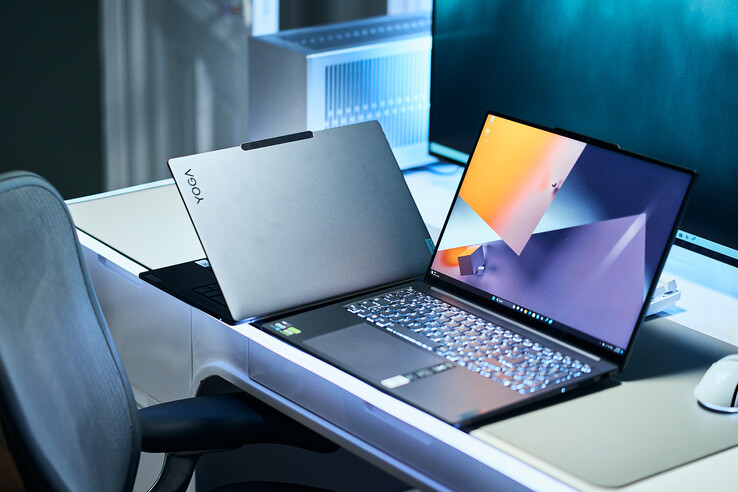
Das Yoga Pro 9i 16 ist Lenovos bester Multimedia-Laptop für Privatkunden und mit dem hochauflösende Mini-LED-Panel und der guten Leistung war es eines der besten Multimedia-Geräte im Jahr 2023. Für das neue G9-Modell gibt es einige Veränderungen inklusive einem aktuellen Meteor-Lake-Prozessor von Intel sowie der Wechsel von einem spiegelnden auf ein mattes Mini-LED-Panel, welches mit bis zu 1.200 Nits weiterhin extrem hell sein kann. Bei den Grafikkarten bleibt es bei den GeForce-RTX-4000-Modellen bis zur RTX 4070 Laptop mit 100 Watt TGP.
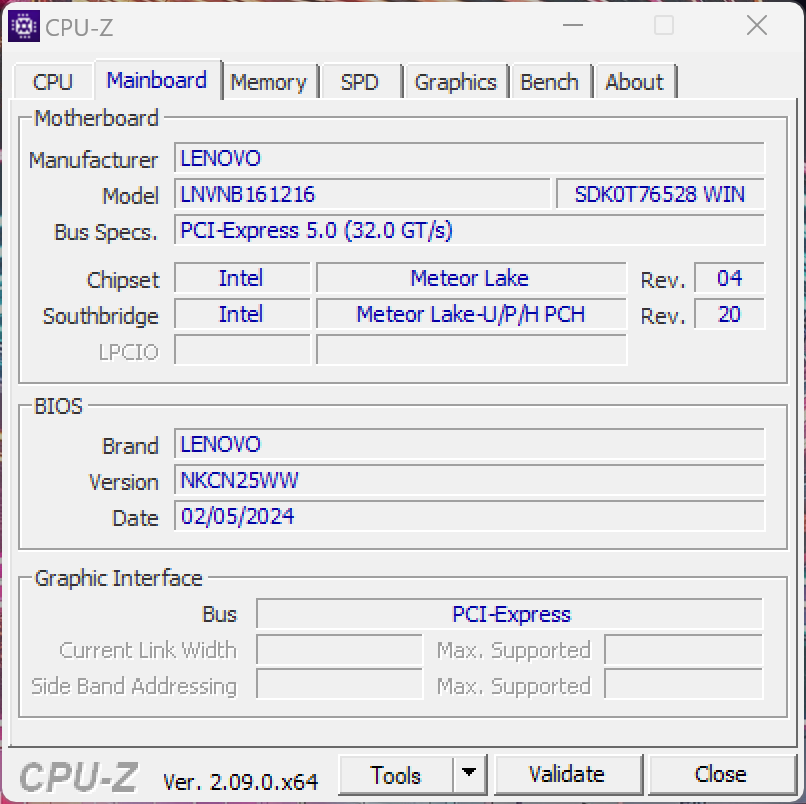
Unser Testgerät mit der Modellnummer 83DN006HGE ist die High-End-Variante für 2.700 Euro (bzw. 2.429 Euro im Campus-Programm) und bietet neben dem Core Ultra 9 185H die GeForce RTX 4070 Laptop, zudem gibt es 32 GB RAM, eine 1-TB-SSD sowie das helle Mini-LED-Panel. Für 2.300 Euro gibt es das schwächere Modell mit dem Core Ultra 7 155H sowie der GeForce RTX 4060 Laptop, die restliche Ausstattung ist aber identisch.
Mögliche Konkurrenten im Vergleich
Bew. | Datum | Modell | Gewicht | Dicke | Größe | Auflösung | Preis ab |
|---|---|---|---|---|---|---|---|
| 88.7 % v7 (old) | 04 / 2024 | Lenovo Yoga Pro 9 16IMH9 Ultra 9 185H, GeForce RTX 4070 Laptop GPU | 2.1 kg | 18.3 mm | 16.00" | 3200x2000 | |
| 88.6 % v7 (old) | 04 / 2024 | Dell XPS 16 9640 Ultra 7 155H, GeForce RTX 4070 Laptop GPU | 2.3 kg | 18.7 mm | 16.30" | 3840x2400 | |
| 90 % v7 (old) | 02 / 2024 | Honor MagicBook Pro 16 2024 Ultra 7 155H, GeForce RTX 4060 Laptop GPU | 1.9 kg | 17.9 mm | 16.00" | 3072x1920 | |
| 90.4 % v7 (old) | 03 / 2024 | Samsung Galaxy Book4 Ultra Ultra 7 155H, GeForce RTX 4050 Laptop GPU | 1.8 kg | 17 mm | 16.00" | 2880x1800 | |
| 89.6 % v7 (old) | 01 / 2024 | Framework Laptop 16 R9 7940HS, Radeon RX 7700S | 2.4 kg | 20.95 mm | 16.00" | 2560x1600 | |
| 88.6 % v7 (old) | 07 / 2023 | Schenker VISION 16 Pro (M23) i7-13700H, GeForce RTX 4070 Laptop GPU | 1.6 kg | 17.1 mm | 16.00" | 2560x1600 |
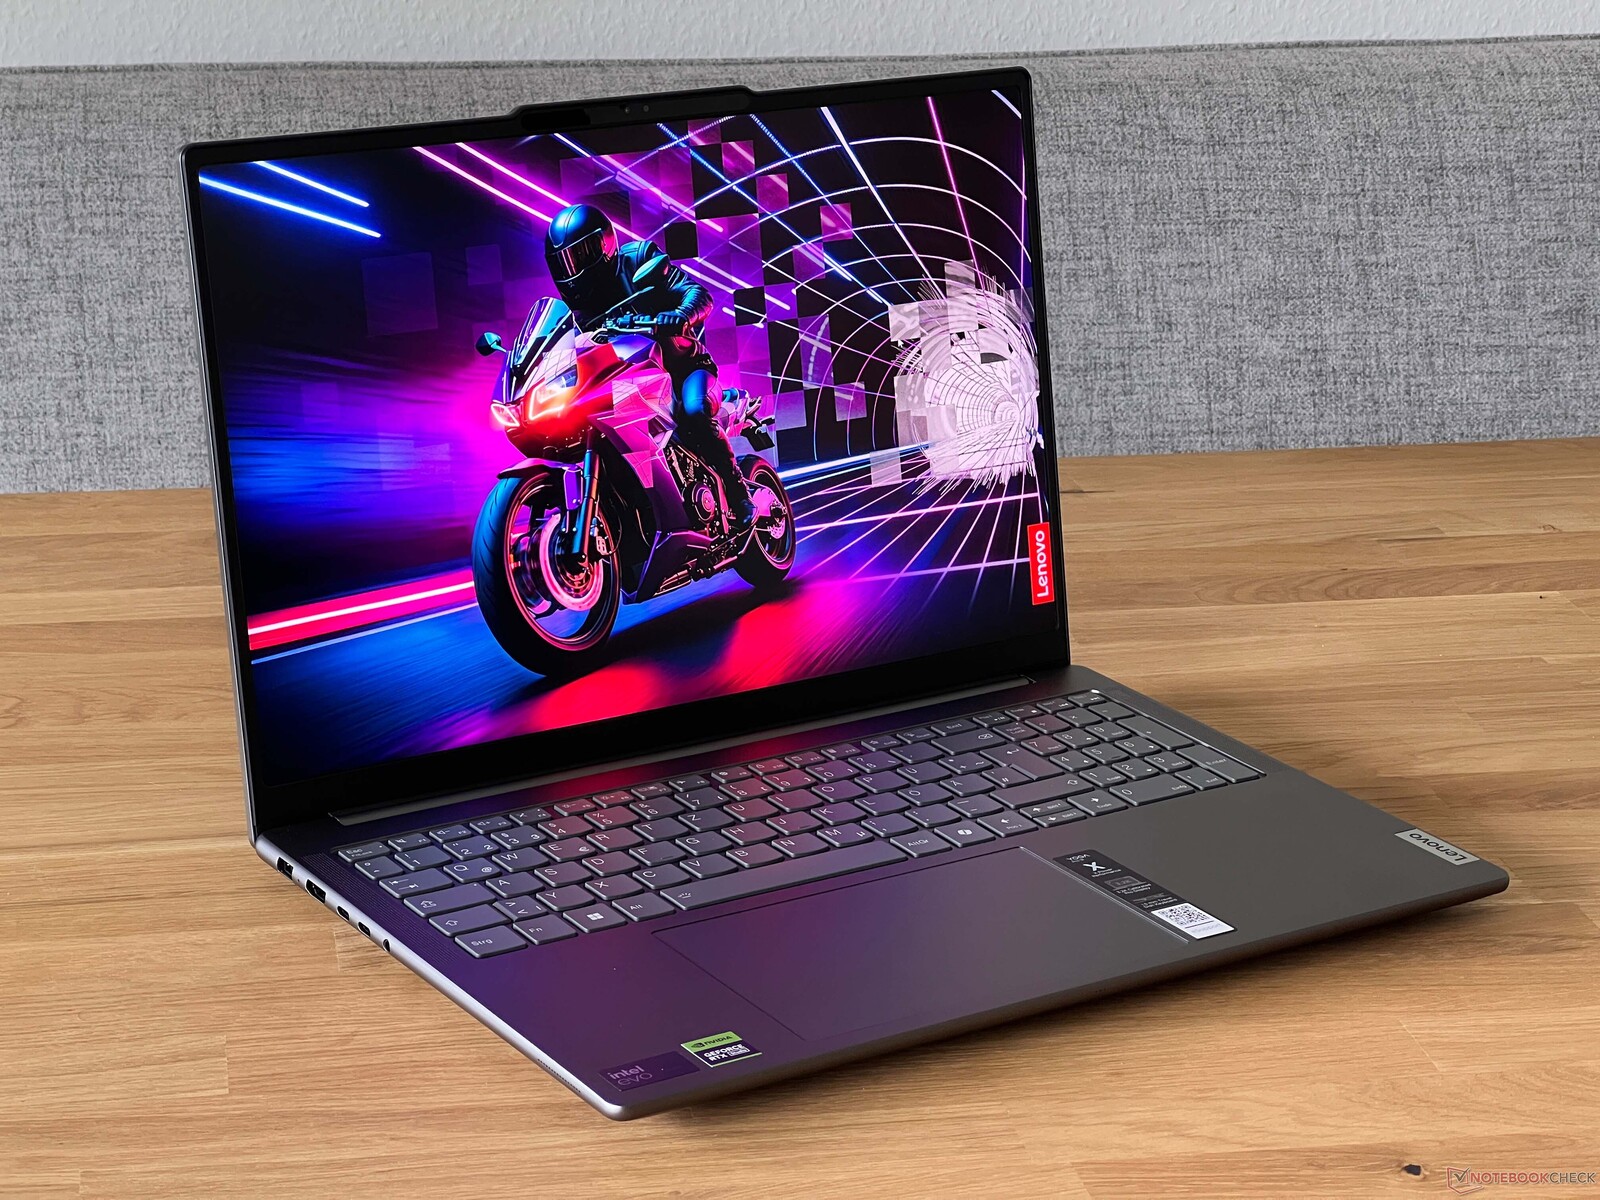
Gehäuse - Aluminium und dünne Bodenplatte
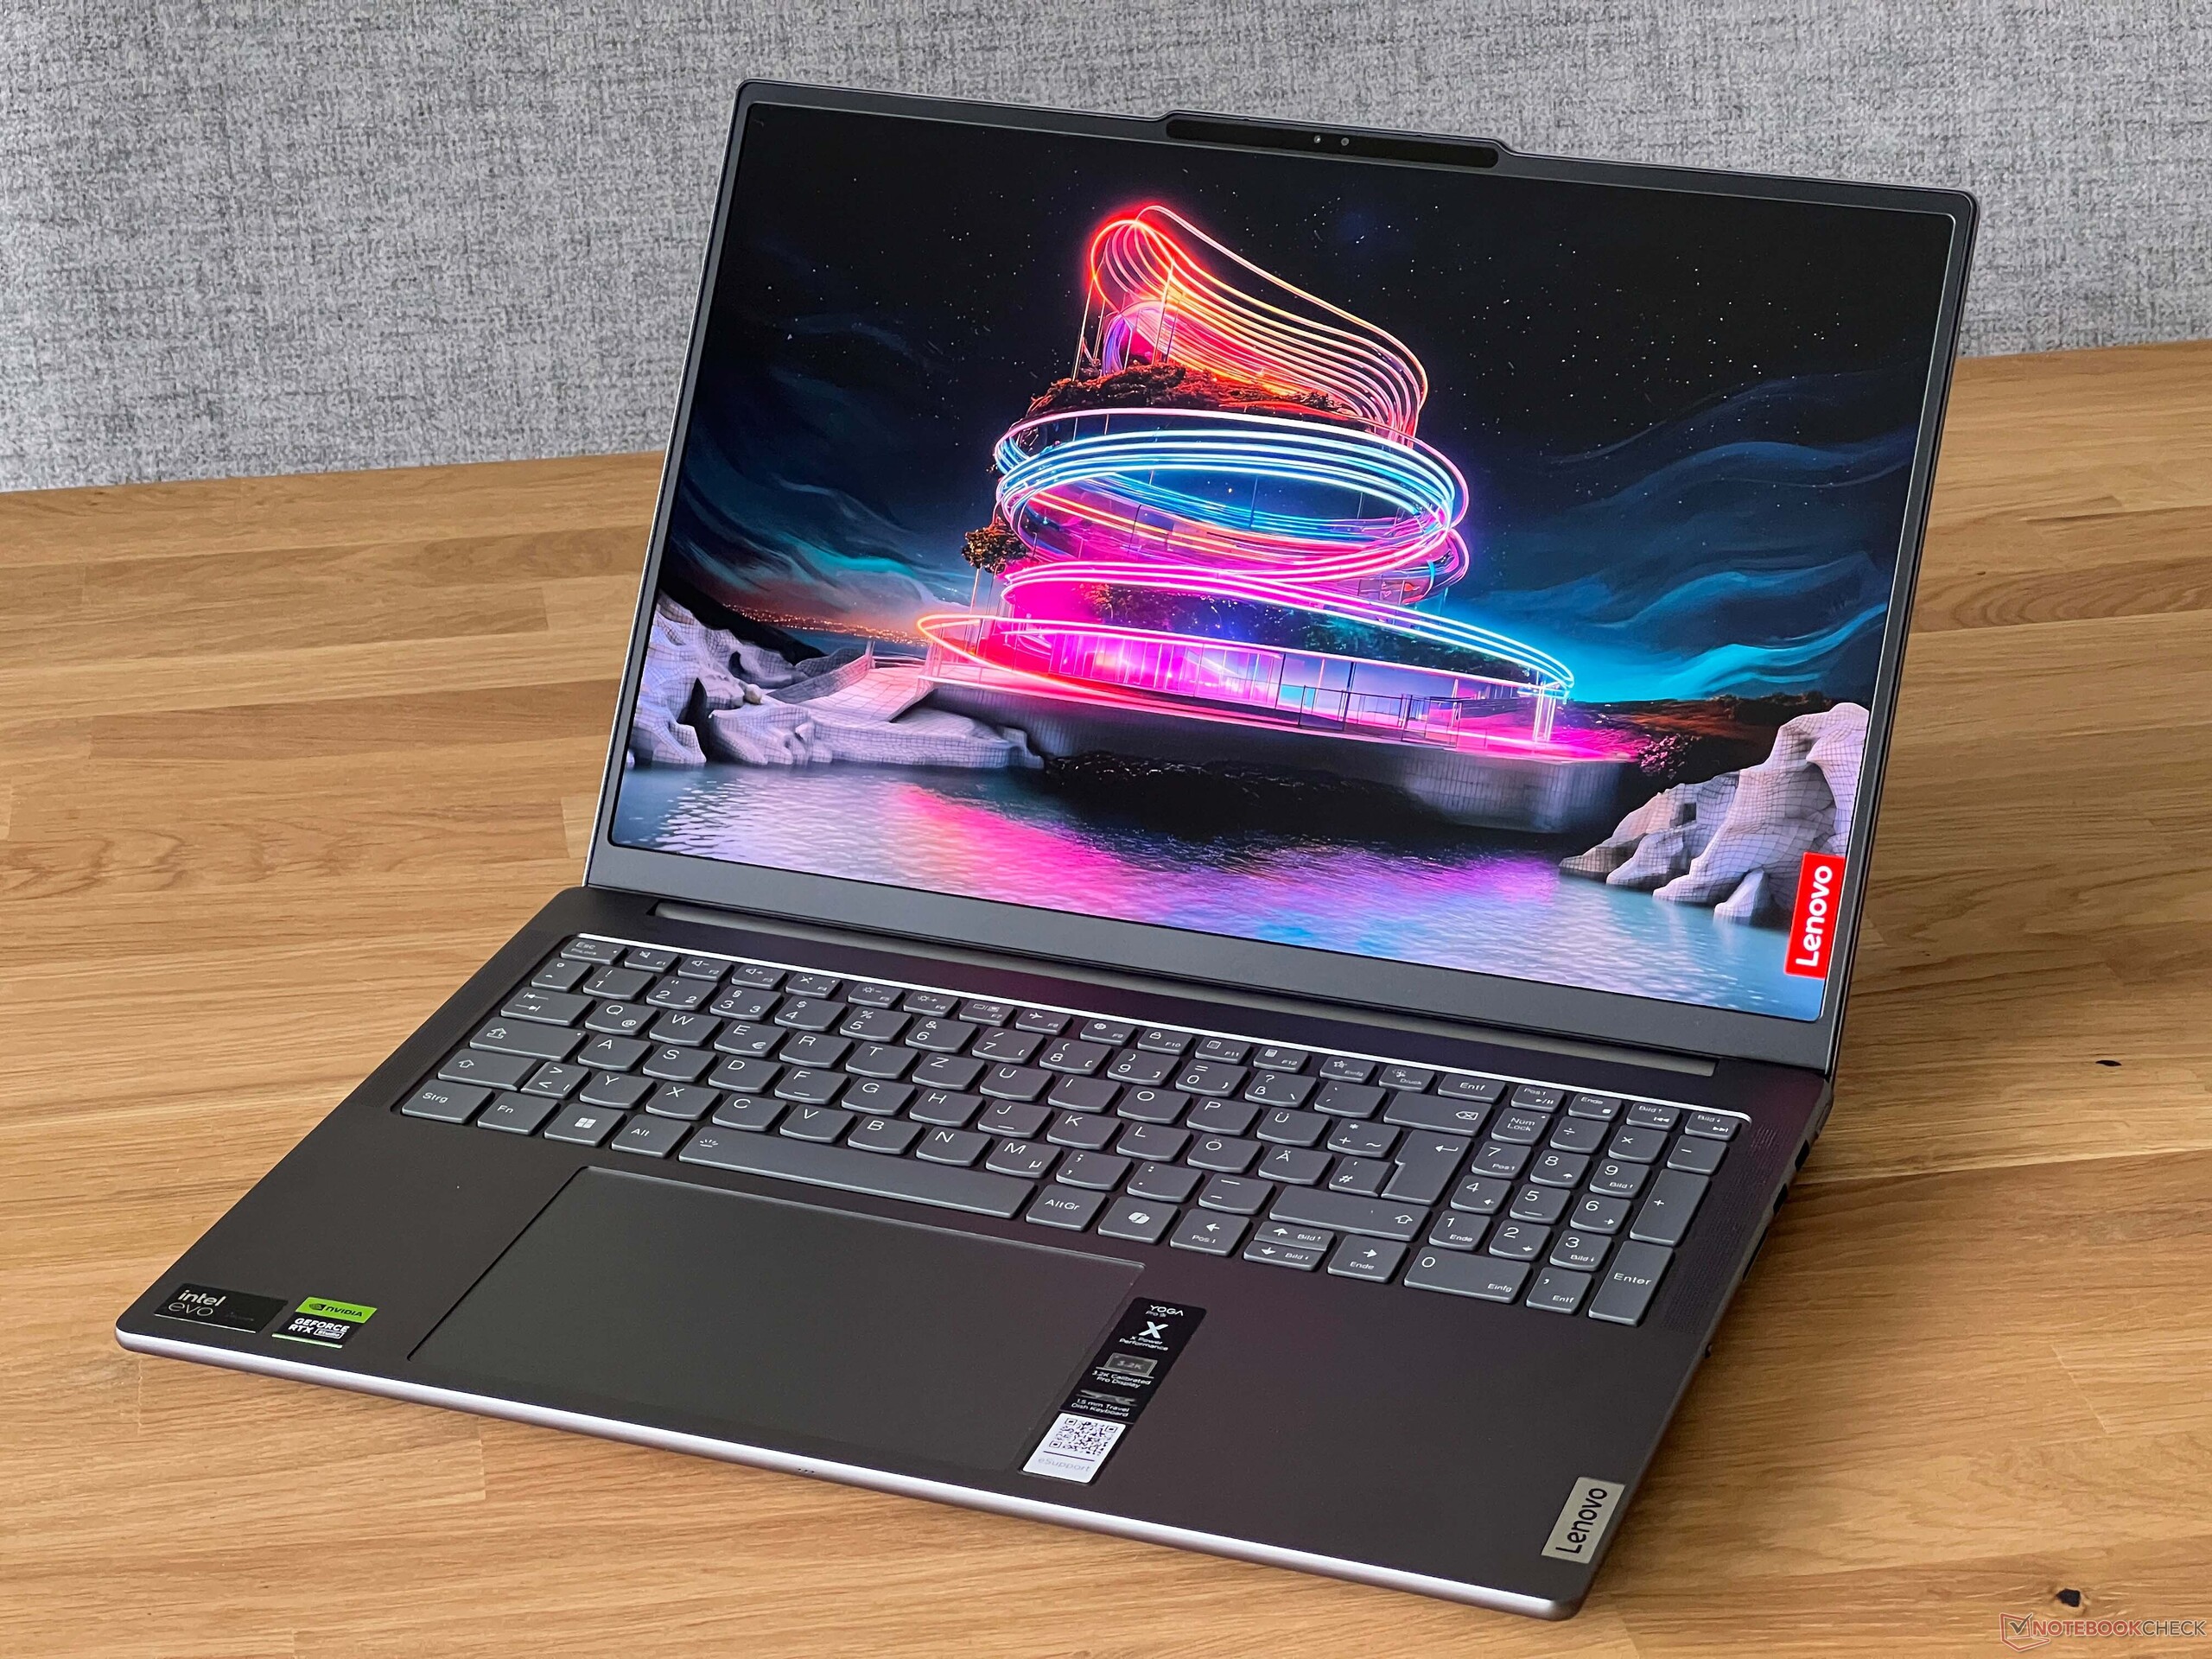
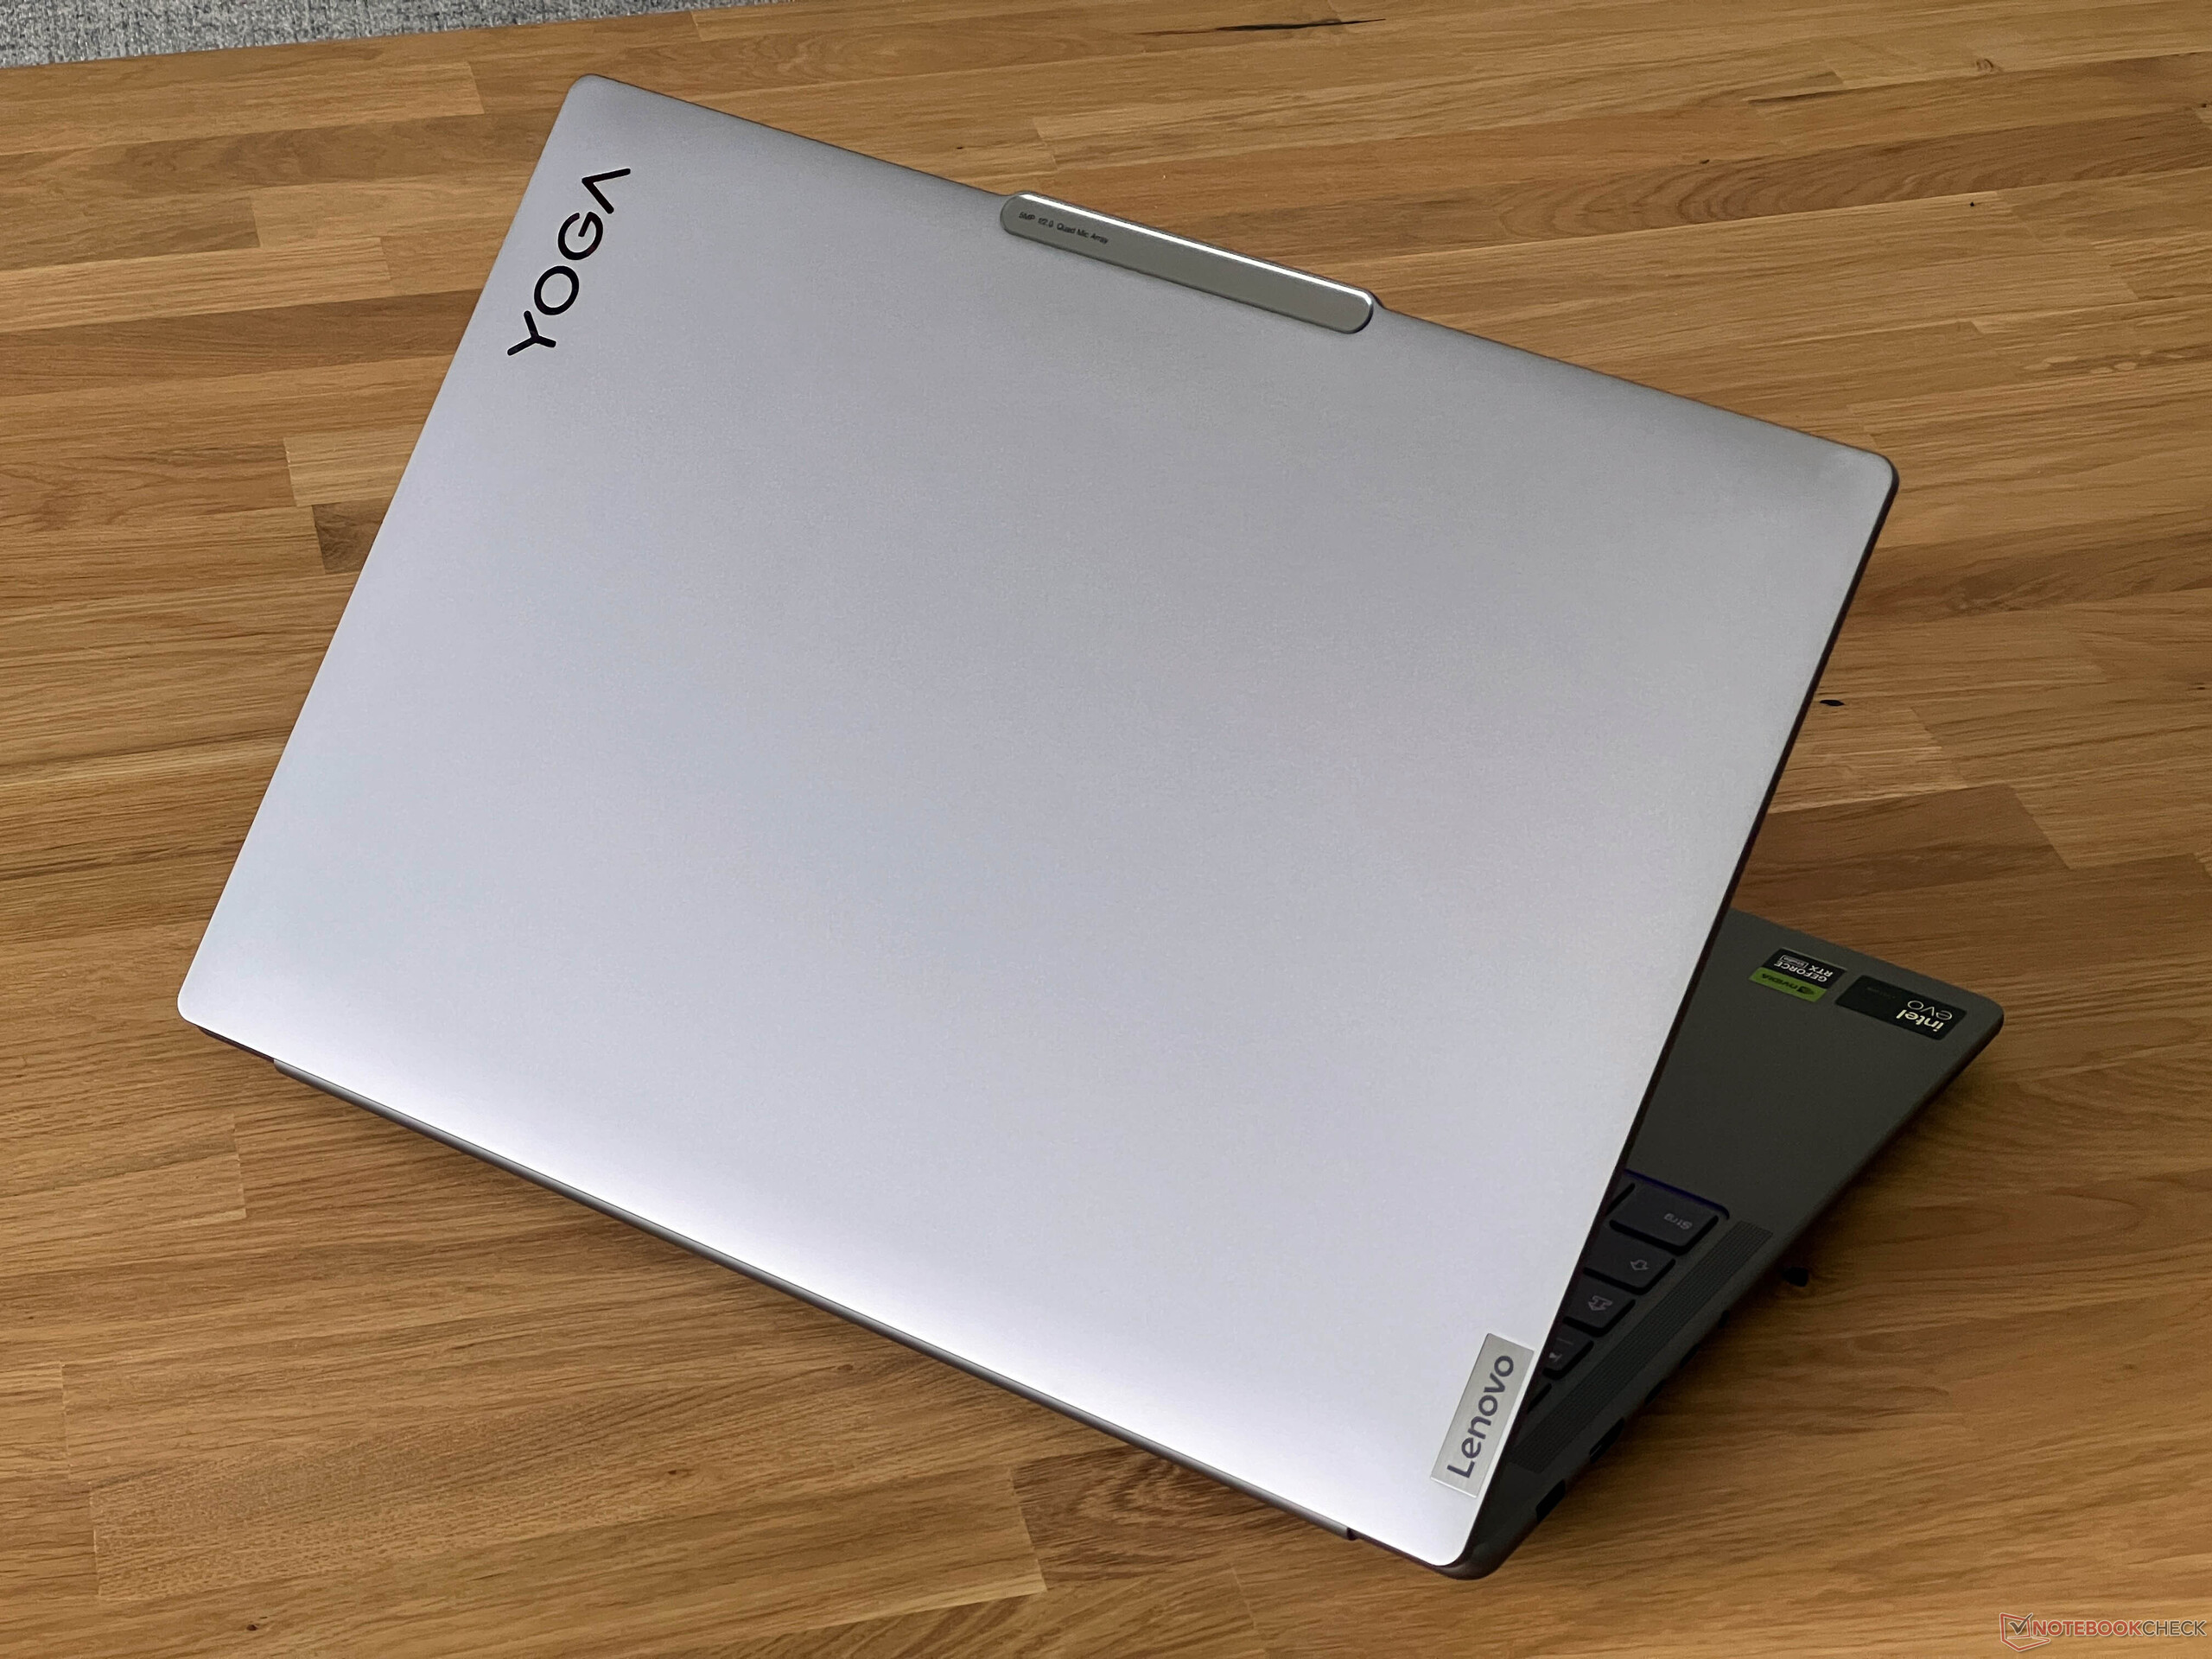
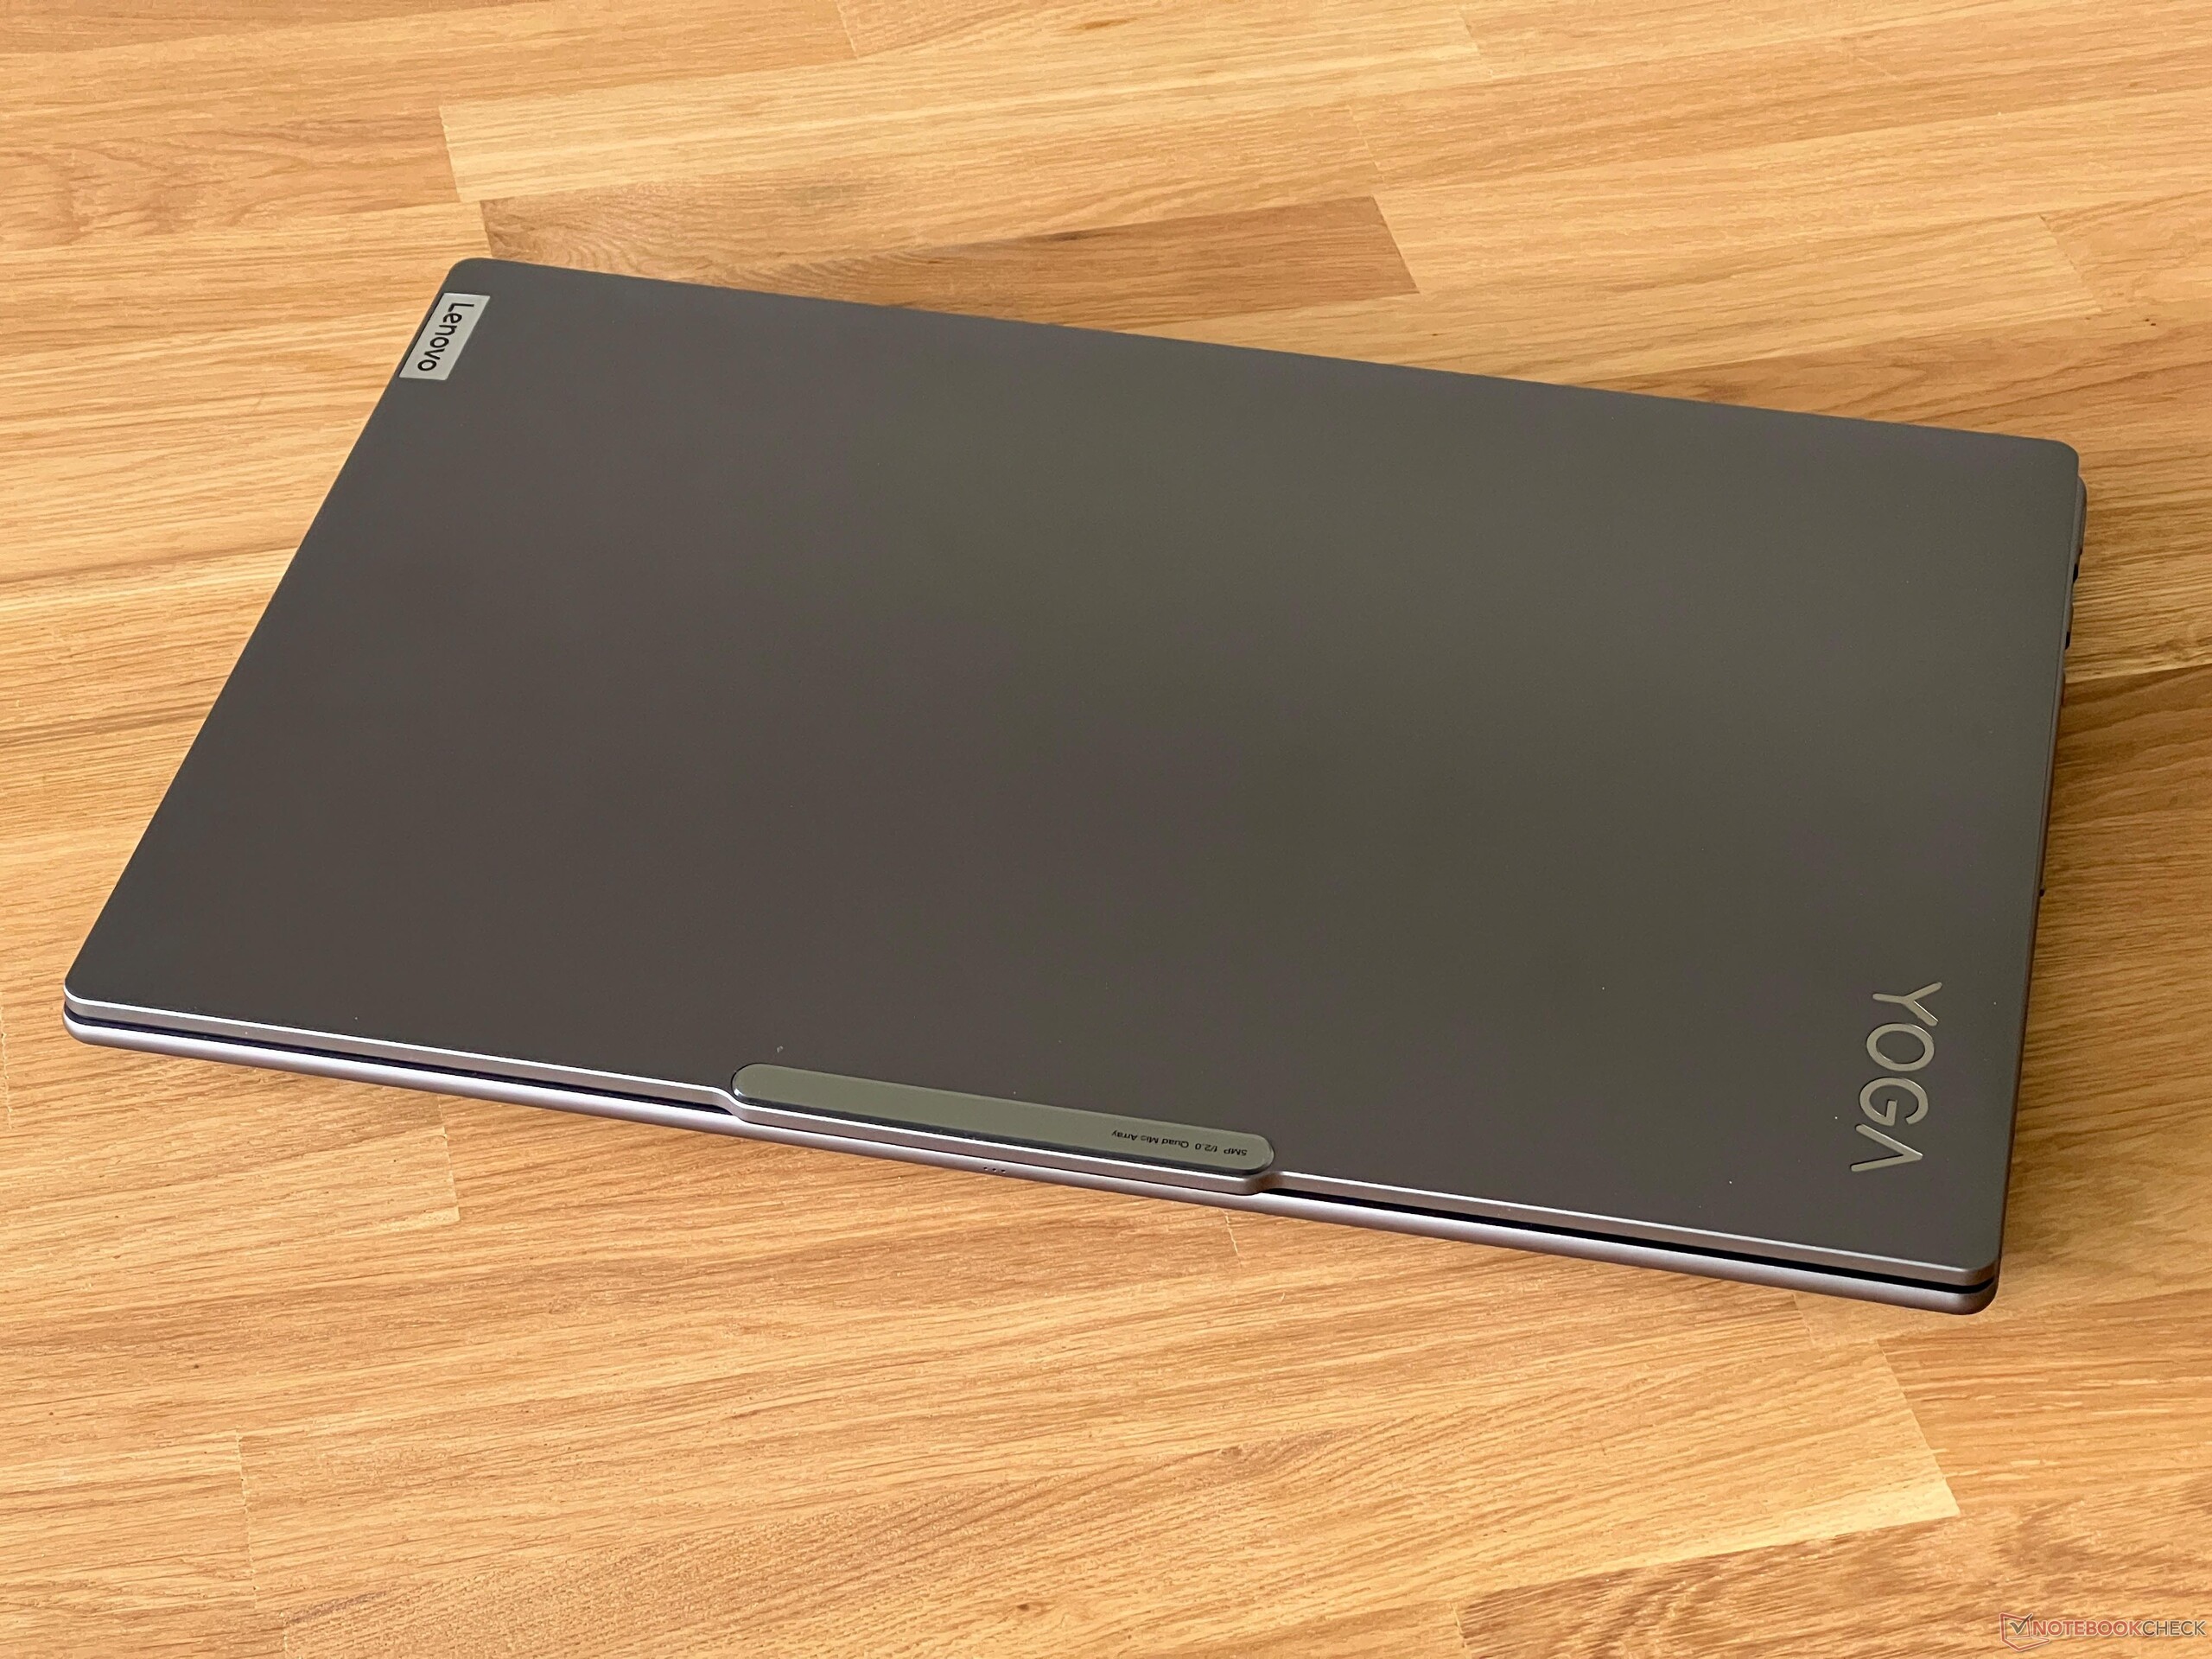
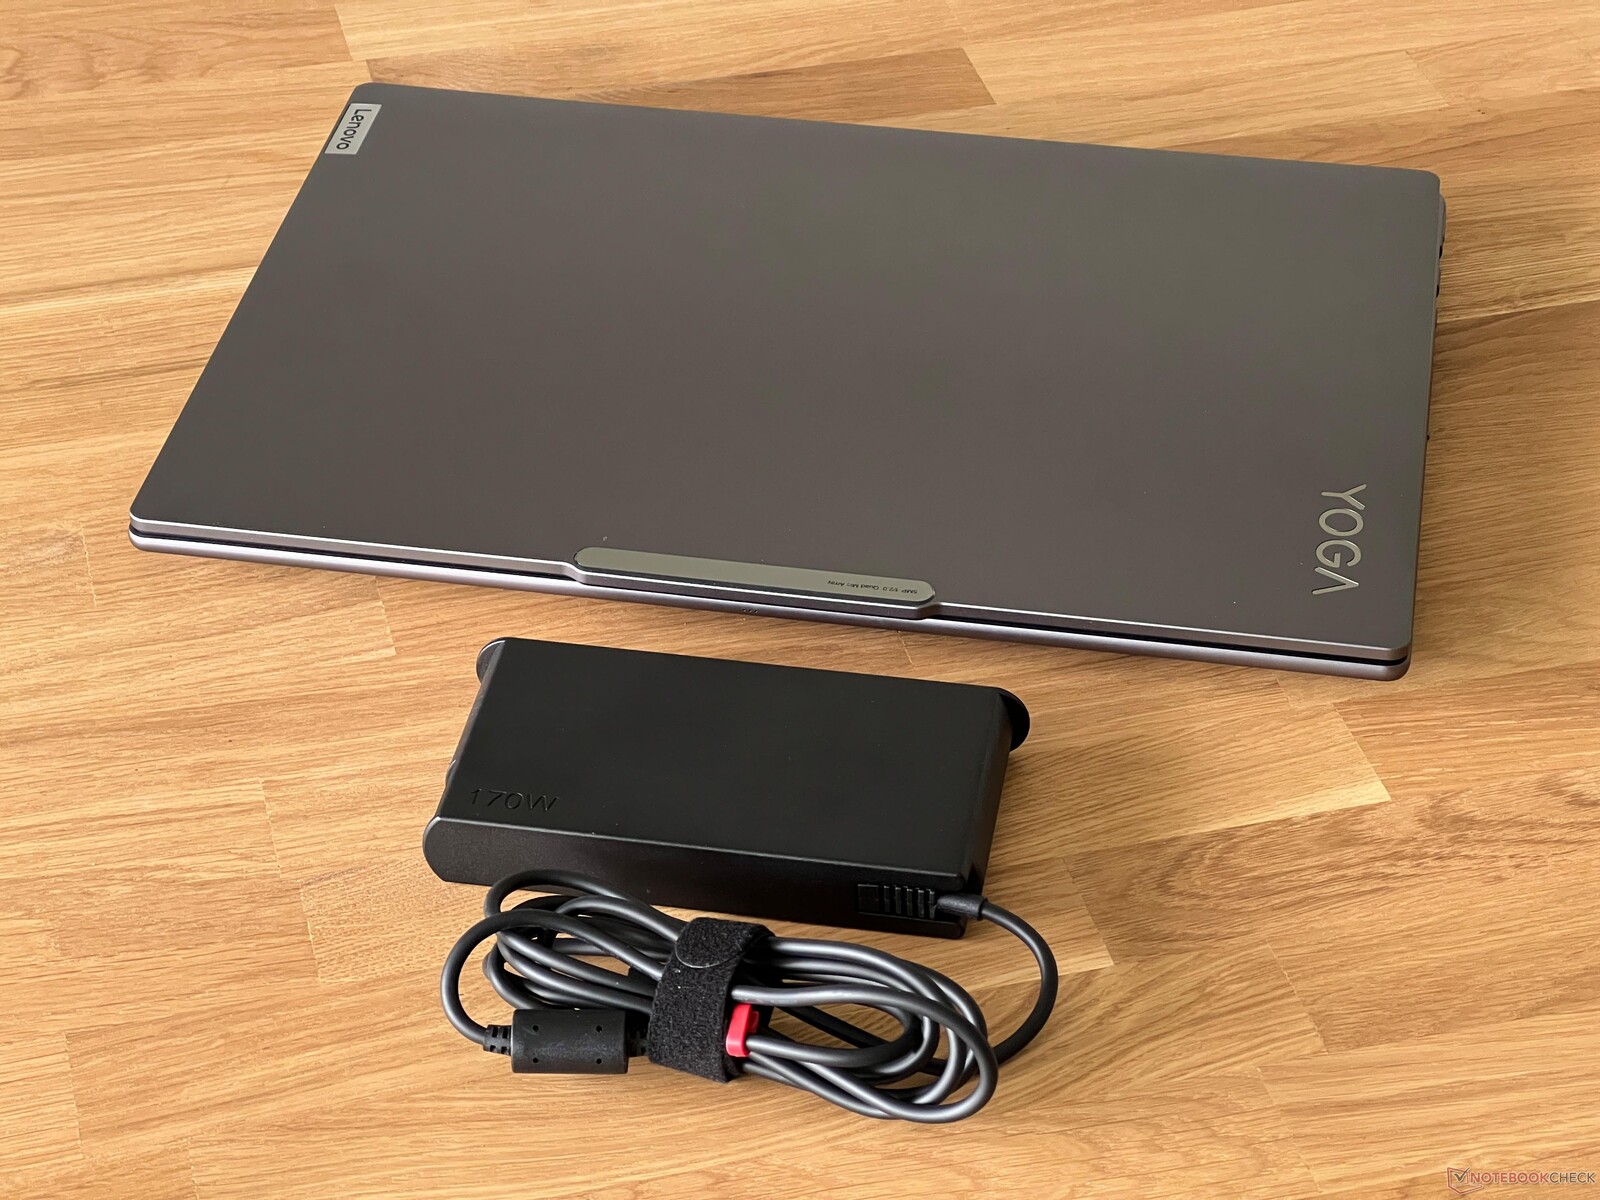
Das Gehäusedesign wurde unverändert vom alten Modell übernommen und das Aluminium-Gehäuse in Dunkelgrau (alternativ in Türkis) sieht gut aus, allerdings gibt es optisch auch keinen großen Unterschied zu einem aktuellen IdeaPad Pro 16. Das Design wirkt modern, lediglich der große Kamerabuckel stört den Eindruck etwas.
Qualitativ hinterlässt das Testgerät einen guten Eindruck, lediglich die weiterhin sehr dünne Bodenplatte führt zu gelegentlichen Knarzgeräuschen. Die Baseunit selbst ist aber sehr stabil und lediglich der mittlere Bereich lässt sich minimal eindrücken. Der Bildschirmdeckel ist etwas flexibler, wir konnten aber keine Bildfehler provozieren. Die Scharniere sind gut eingestellt und der maximale Öffnungswinkel liegt bei 180 Grad.
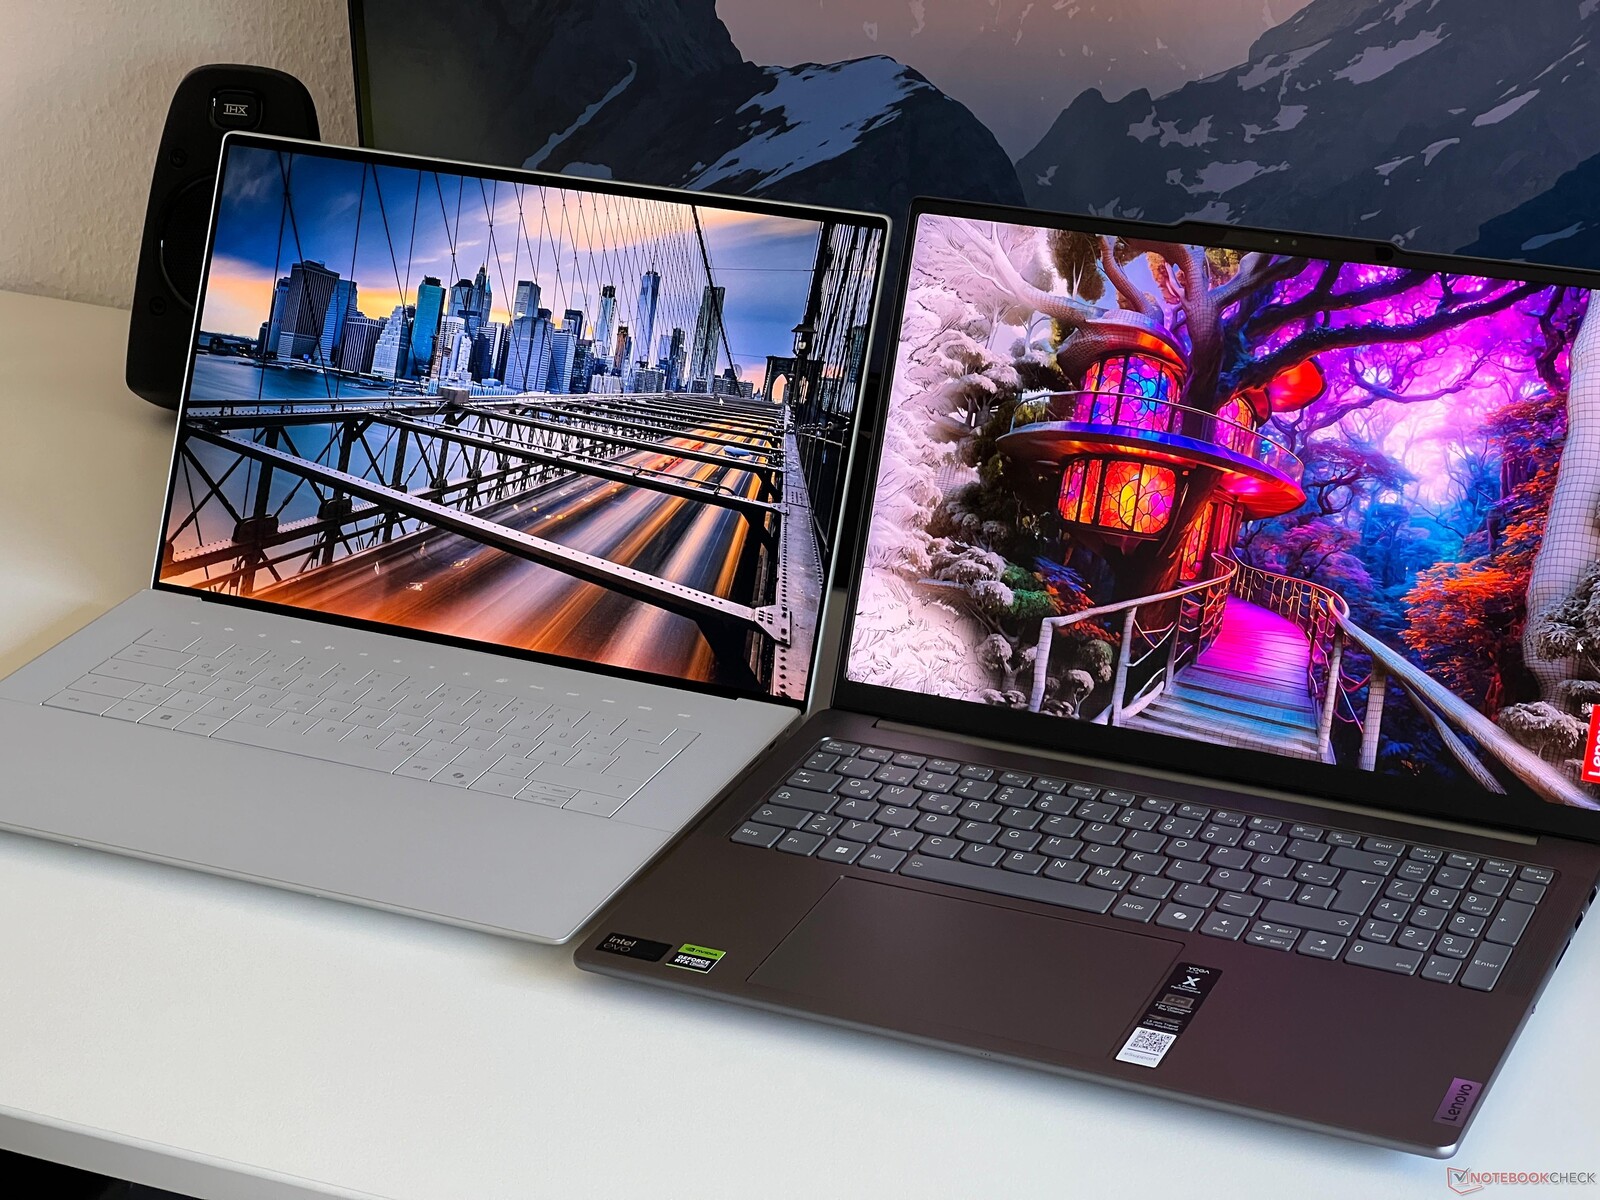
Mit einem Gewicht von etwas mehr als 2 kg liegt das Yoga Pro im Mittelfeld, nimmt aber eine etwas größere Stellfläche ein als beispielsweise das neue Dell XPS 16. Das 170-Watt-Netzteil wiegt 566 Gramm.
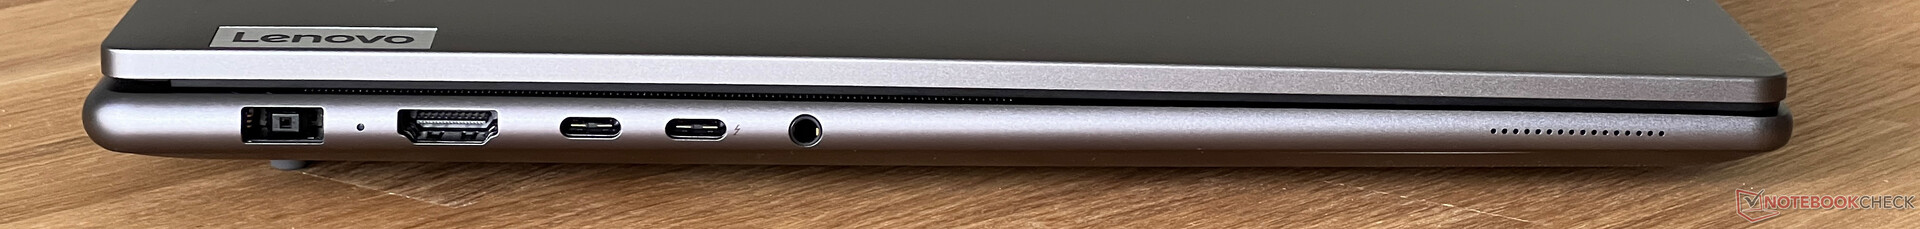
Ausstattung - Thunderbolt 4 & HDMI 2.1
Während das letztjährige Modell noch Einschränkungen beim HDMI-Ausgang aufwies, steht nun ein moderner HDMI-2.1-Ausgang zur Verfügung. Zudem gibt es Thunderbolt 4 und ausreichend USB-Anschlüsse. Alle Videoausgänge sind über die iGPU angebunden, bei der Verwendung eines externen Monitors muss also nicht die ganze Zeit die GeForce-GPU mitlaufen, was den Stromverbrauch reduziert.
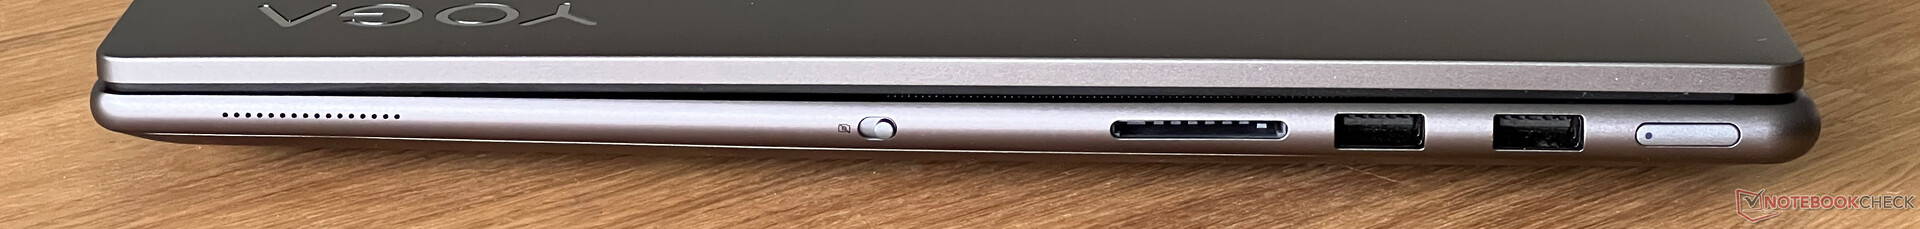
SD Card Reader
Der Kartenleser auf der rechten Seite bietet ein durchschnittliche Transferraten von 80-90 MB/s in Verbindung mit unserer Referenzkarte (Angelbird AV Pro V60) und eingesetzte Karten ragen etwa 1,5 cm aus dem Gehäuse hervor.
| SD Card Reader | |
| average JPG Copy Test (av. of 3 runs) | |
| Dell XPS 16 9640 (Angelbird AV Pro V60) | |
| Durchschnitt der Klasse Multimedia (23 - 531, n=43, der letzten 2 Jahre) | |
| Samsung Galaxy Book4 Ultra (Angelbird AV Pro V60) | |
| Lenovo Yoga Pro 9 16IMH9 (Angelbird AV Pro V60) | |
| Lenovo Yoga Pro 9 16-IRP G8 (Angelibird AV Pro V60) | |
| Schenker VISION 16 Pro (M23) (Angelbird AV Pro V60) | |
| maximum AS SSD Seq Read Test (1GB) | |
| Dell XPS 16 9640 (Angelbird AV Pro V60) | |
| Durchschnitt der Klasse Multimedia (27.9 - 1455, n=42, der letzten 2 Jahre) | |
| Lenovo Yoga Pro 9 16IMH9 (Angelbird AV Pro V60) | |
| Samsung Galaxy Book4 Ultra (Angelbird AV Pro V60) | |
| Lenovo Yoga Pro 9 16-IRP G8 (Angelibird AV Pro V60) | |
| Schenker VISION 16 Pro (M23) (Angelbird AV Pro V60) | |
Kommunikation
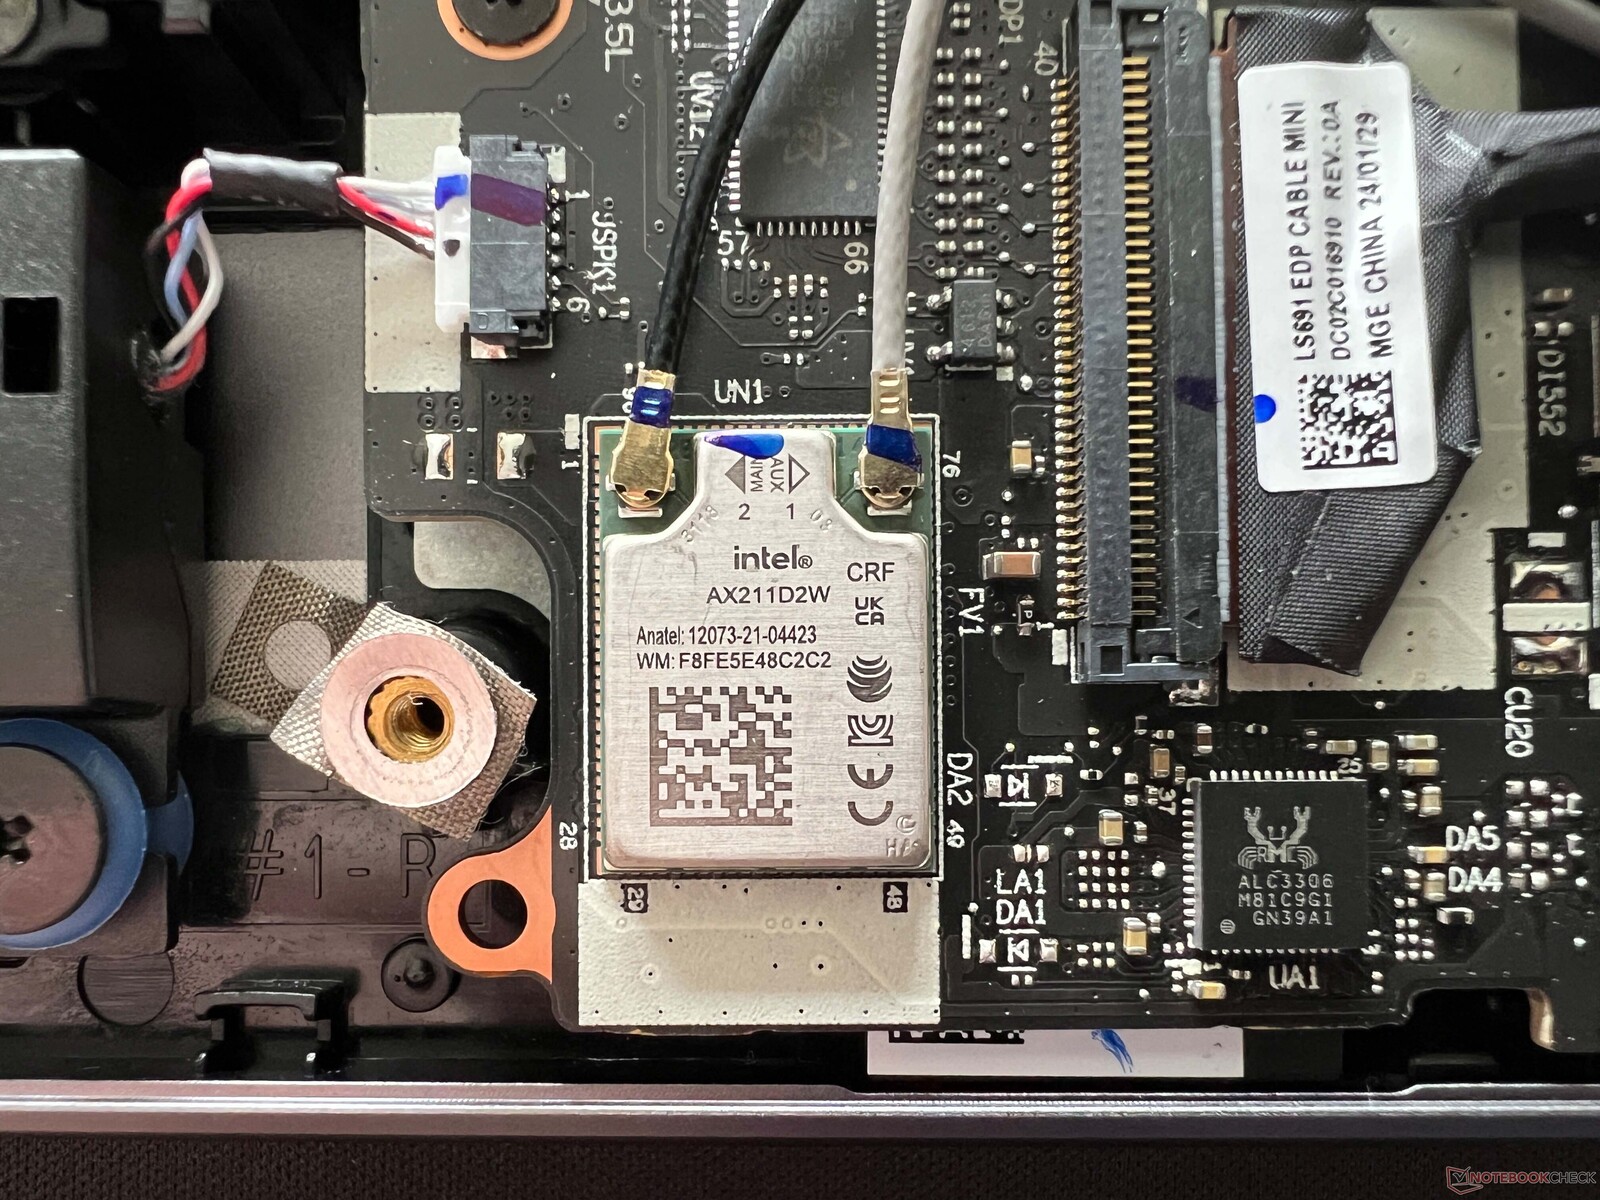
Das WLAN-Modul AX211 von Intel ist verlötet und unterstützt neben dem Wi-Fi-6E-Standard sowie Bluetooth 5.3. Wir hatten während des Tests keine Probleme mit der WLAN-Verbindung und in Verbindung mit unserem Referenzrouter von Asus waren die Transferraten insgesamt sehr gut und stabil. Auf ein Wi-Fi-7-Modul verzichtet Lenovo.
| Networking | |
| Lenovo Yoga Pro 9 16IMH9 | |
| iperf3 transmit AXE11000 | |
| iperf3 receive AXE11000 | |
| Dell XPS 16 9640 | |
| iperf3 transmit AXE11000 | |
| iperf3 receive AXE11000 | |
| Honor MagicBook Pro 16 2024 | |
| iperf3 transmit AXE11000 | |
| iperf3 receive AXE11000 | |
| Samsung Galaxy Book4 Ultra | |
| iperf3 transmit AXE11000 | |
| iperf3 receive AXE11000 | |
| Framework Laptop 16 | |
| iperf3 transmit AXE11000 | |
| iperf3 receive AXE11000 | |
| iperf3 transmit AXE11000 6GHz | |
| iperf3 receive AXE11000 6GHz | |
| Schenker VISION 16 Pro (M23) | |
| iperf3 transmit AXE11000 | |
| iperf3 receive AXE11000 | |
| Lenovo Yoga Pro 9 16-IRP G8 | |
| iperf3 transmit AXE11000 | |
| iperf3 receive AXE11000 | |
Webcam
Die 5-MP-Kamera bietet eine ordentliche Bildqualität und zudem ist noch ein IR-Sensor für die Gesichtserkennung via Windows Hello verbaut. In Verbindung mit der NPU des Prozessors stehen auch die Studio-Effekte (Weichzeichner, Head-Tracking etc.) direkt in Windows und unabhängig von der Anwendung zur Verfügung. Die Webcam verfügt über eine elektronische Blende mit einer Taste auf der rechten Seite des Gehäuses.


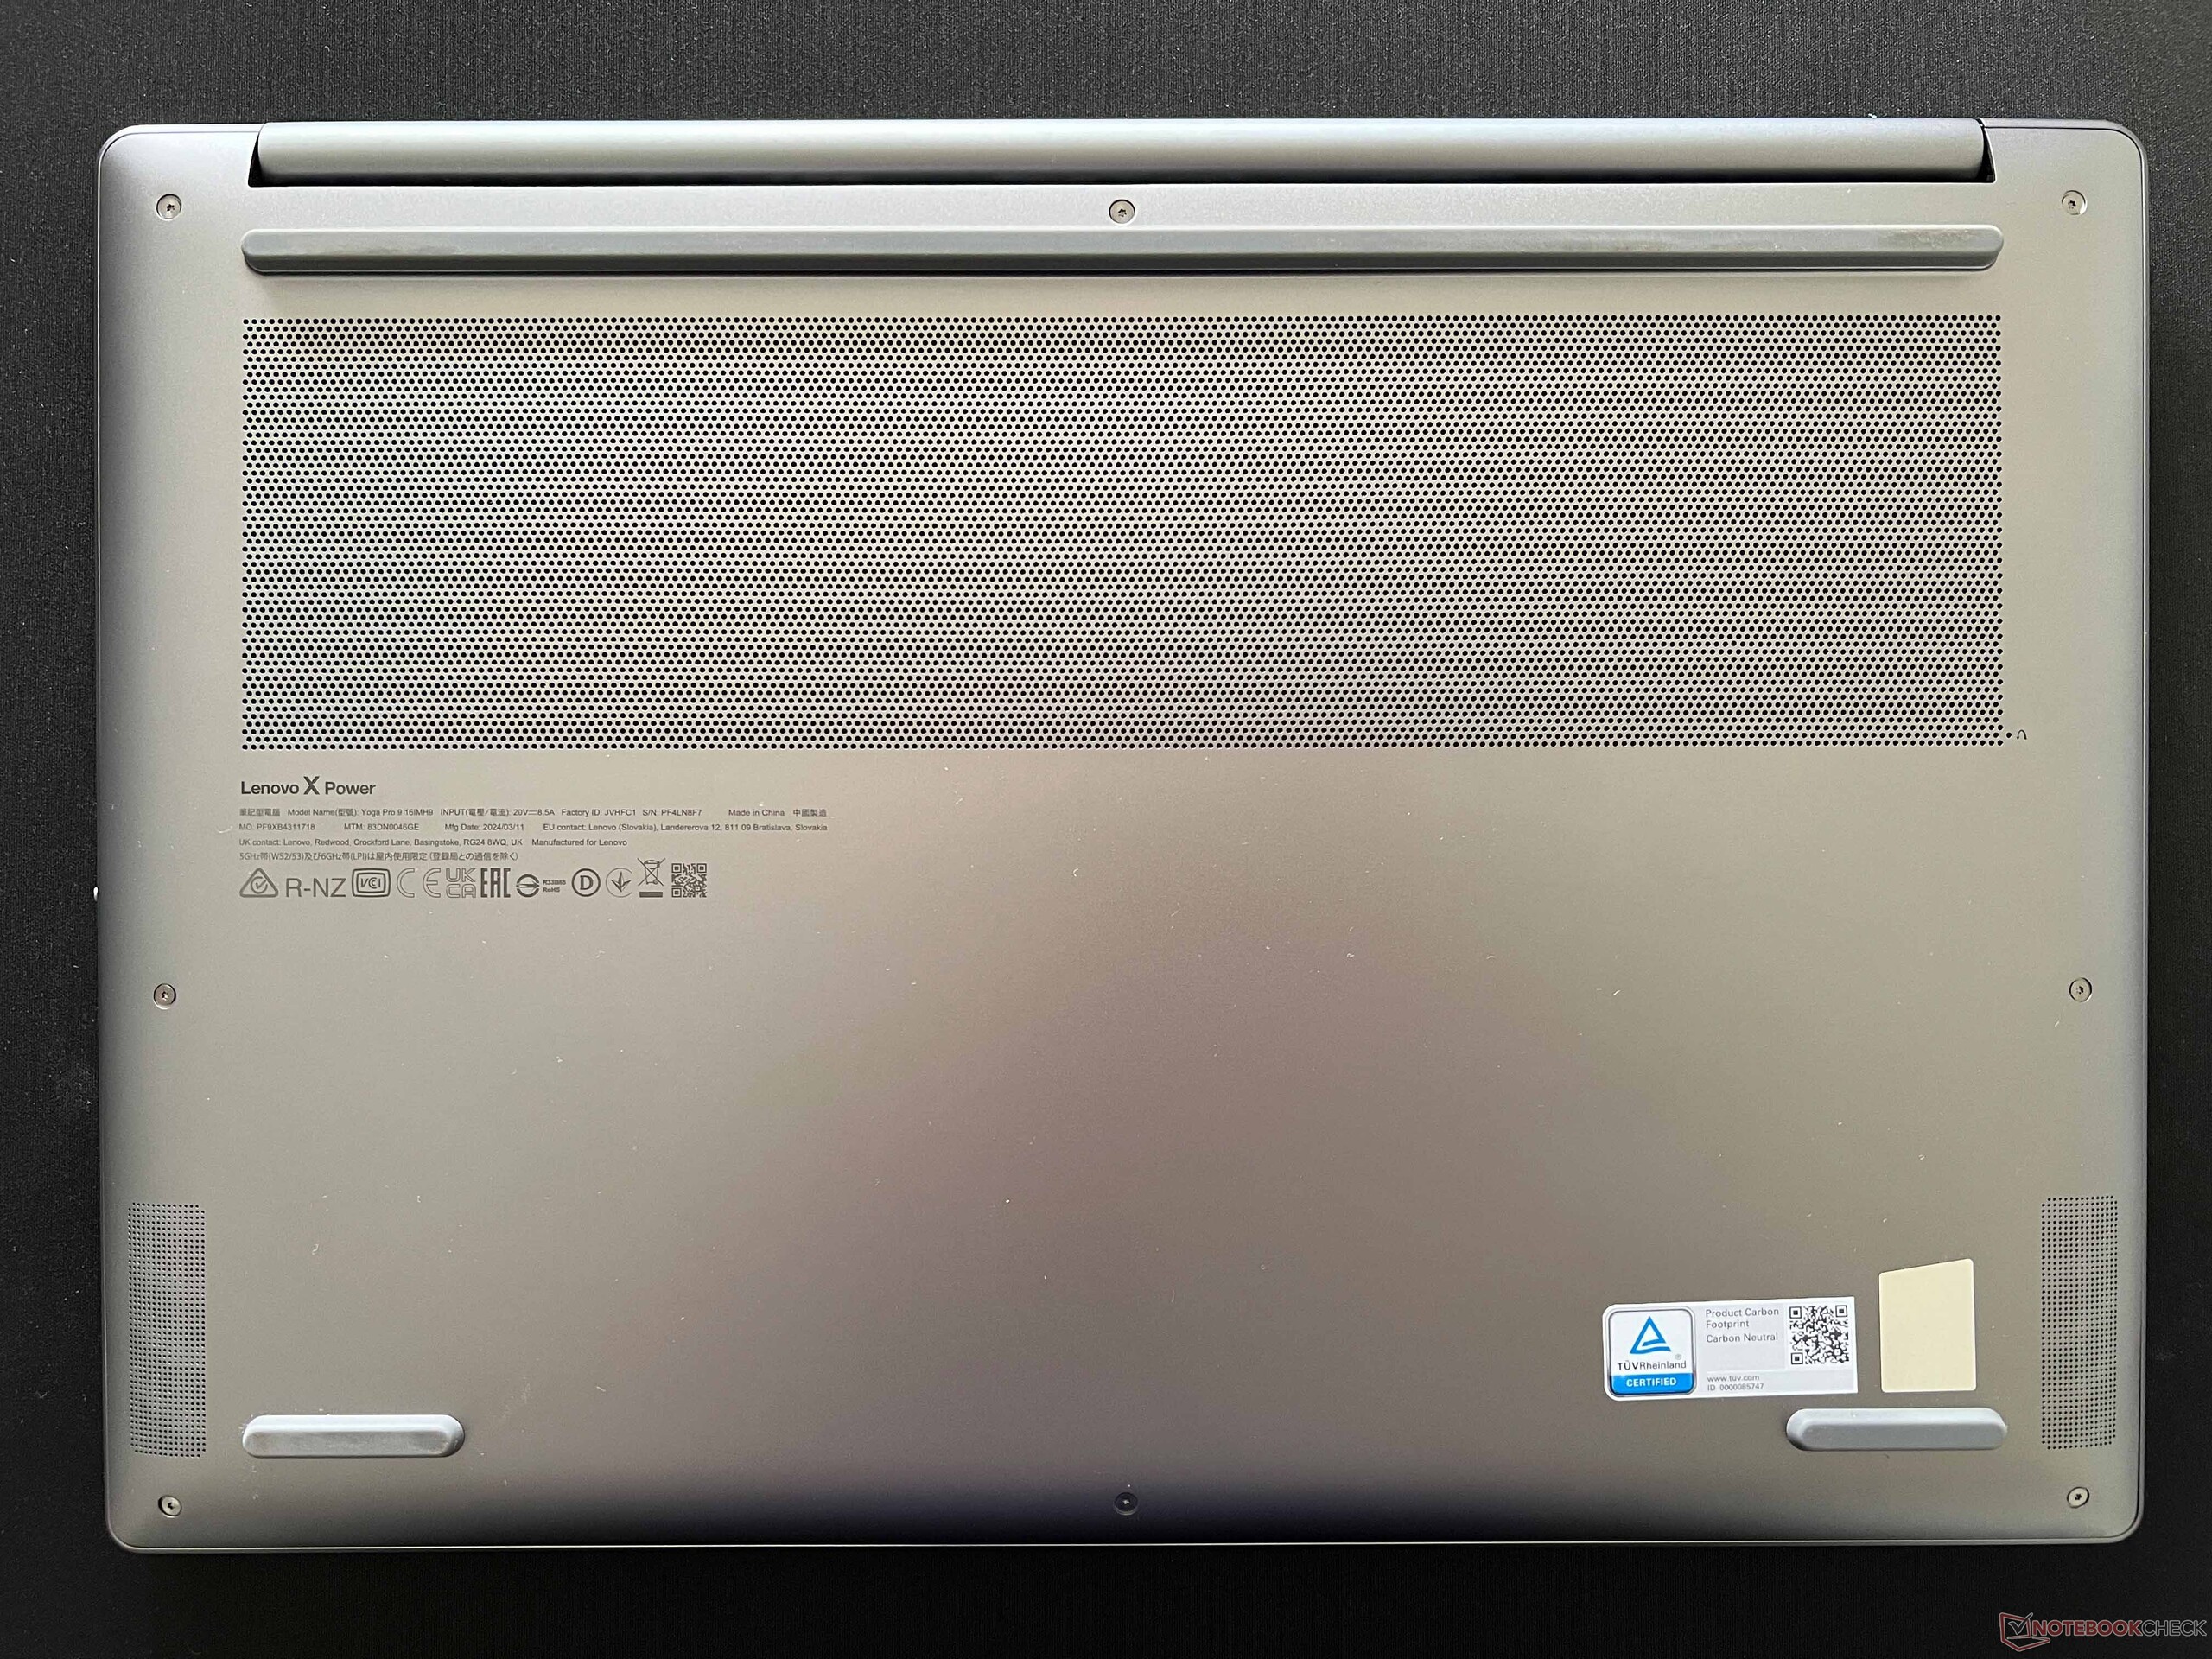
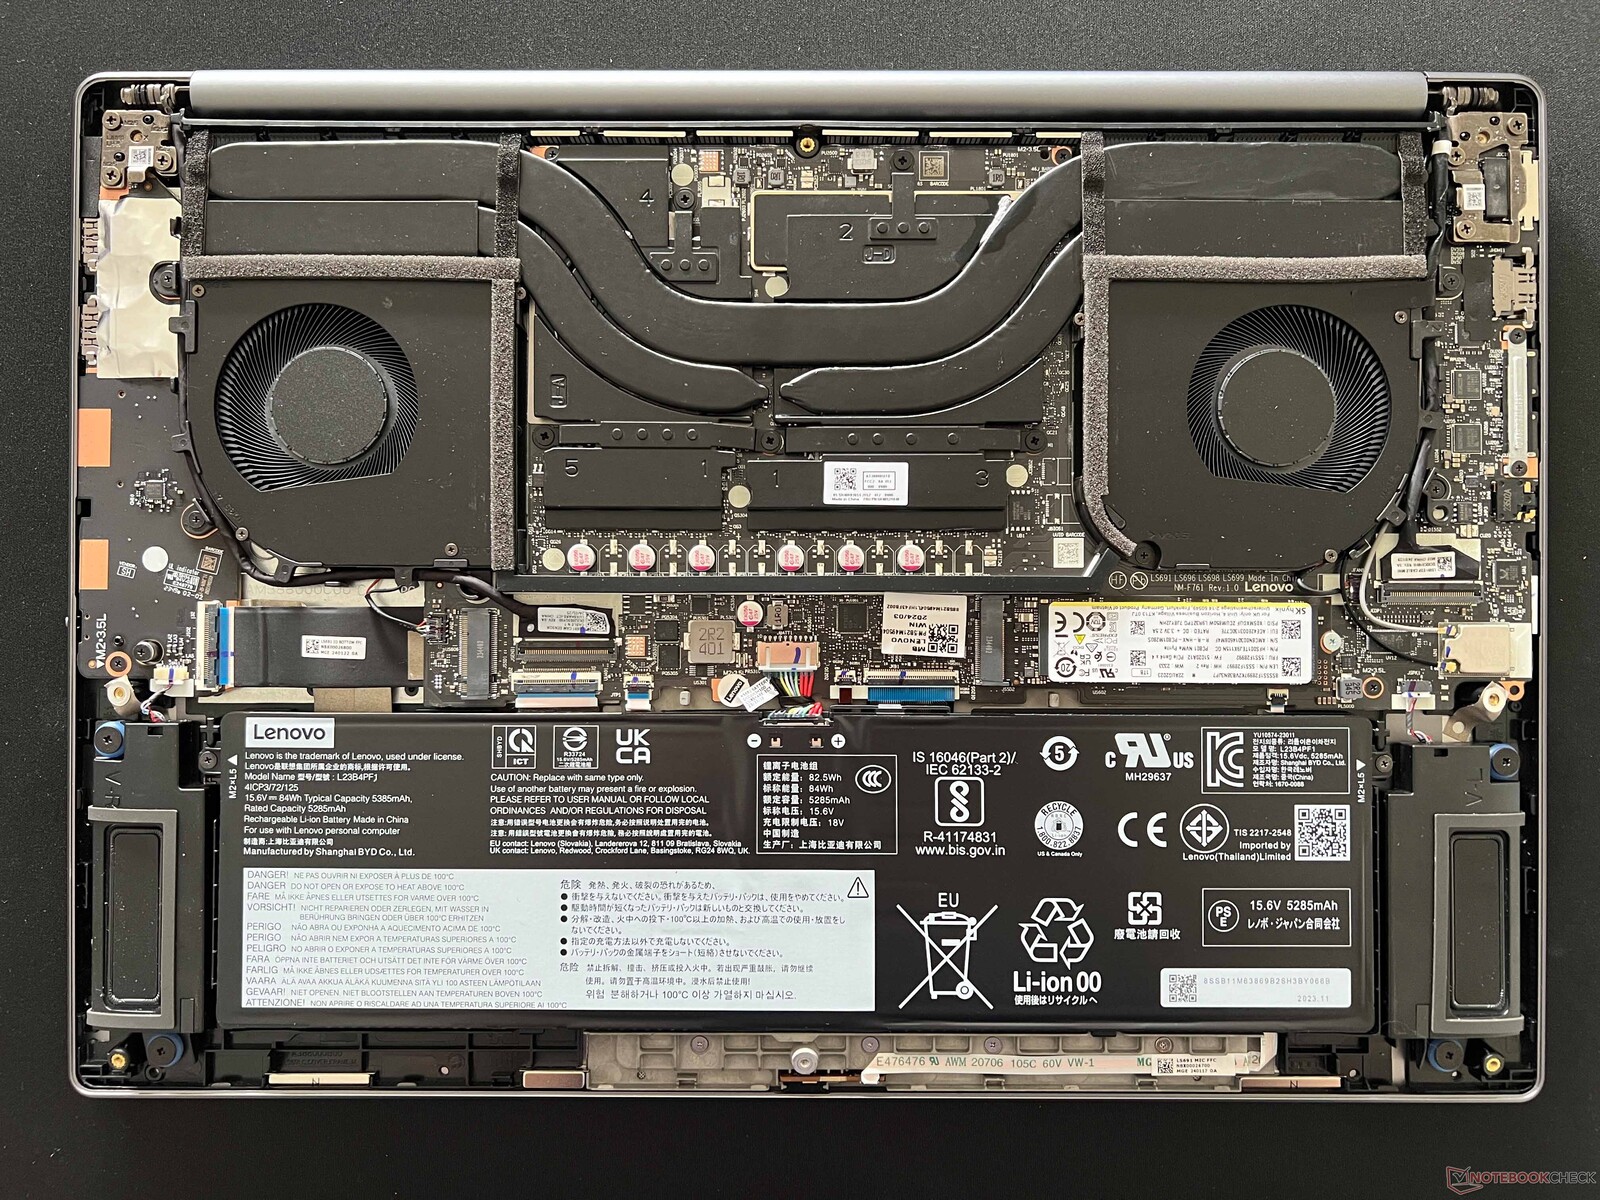
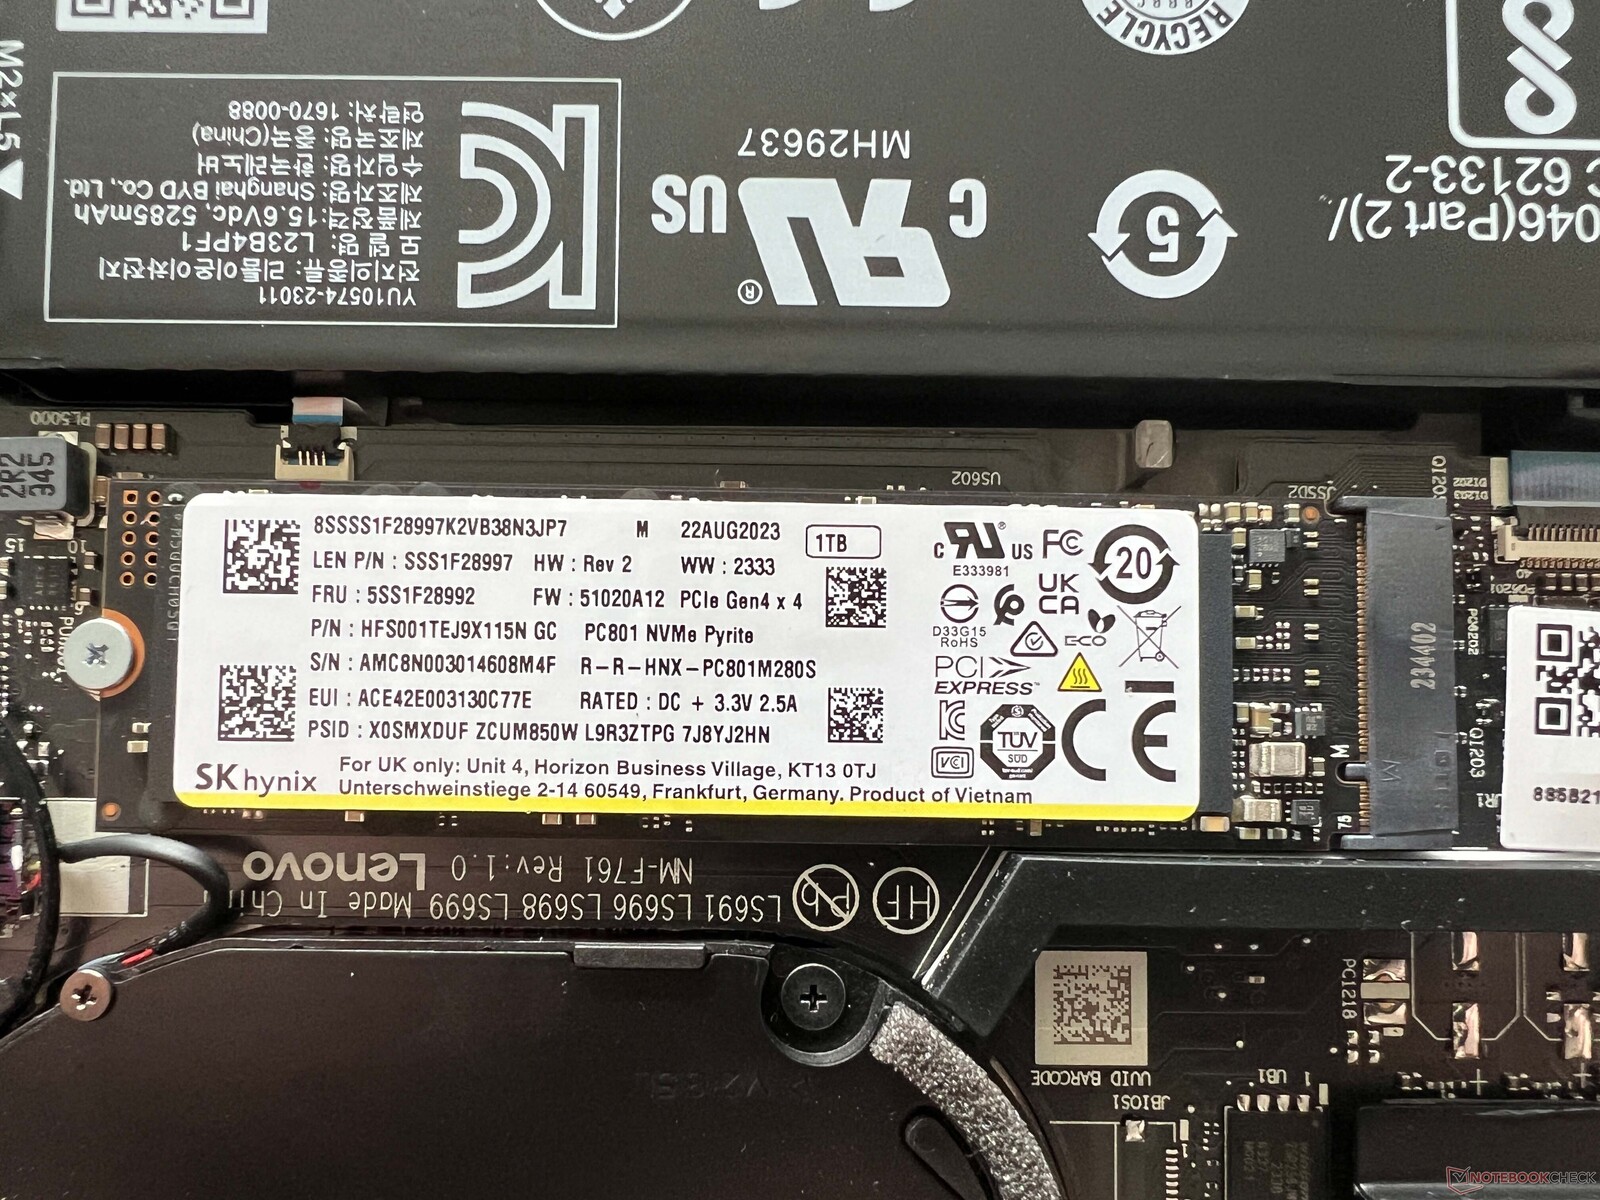
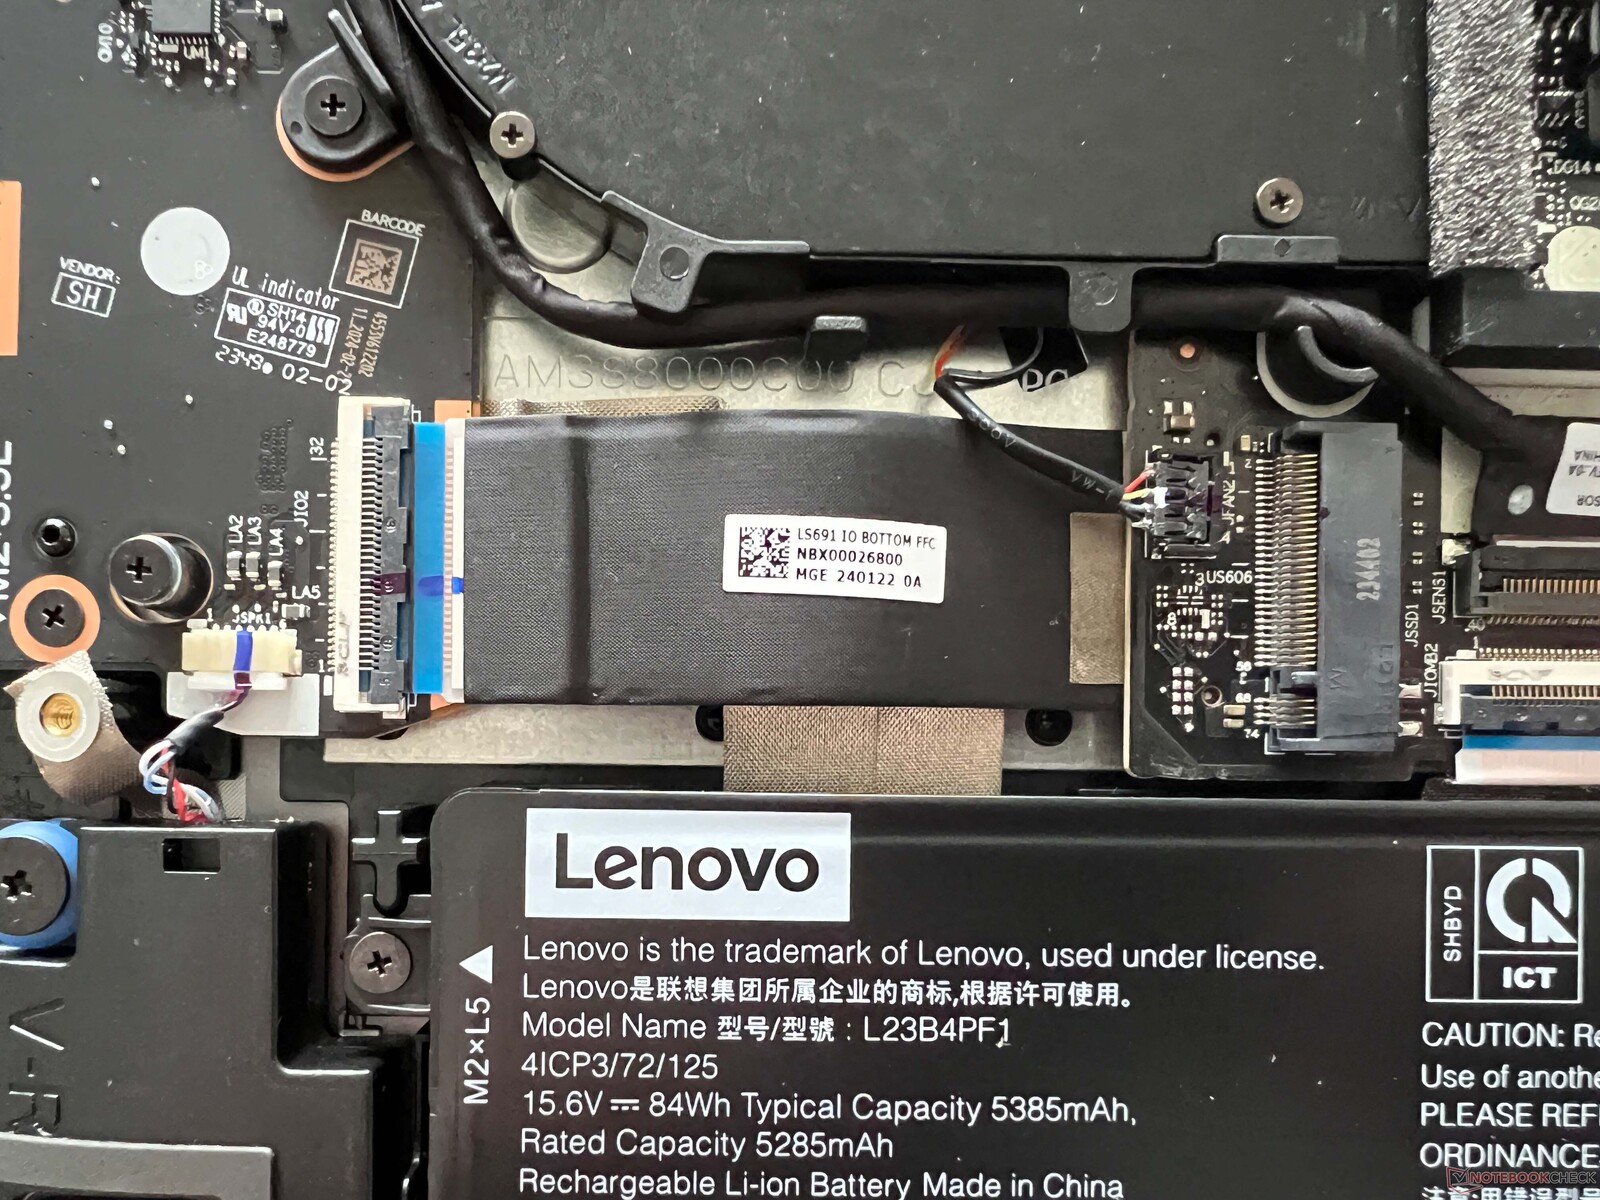
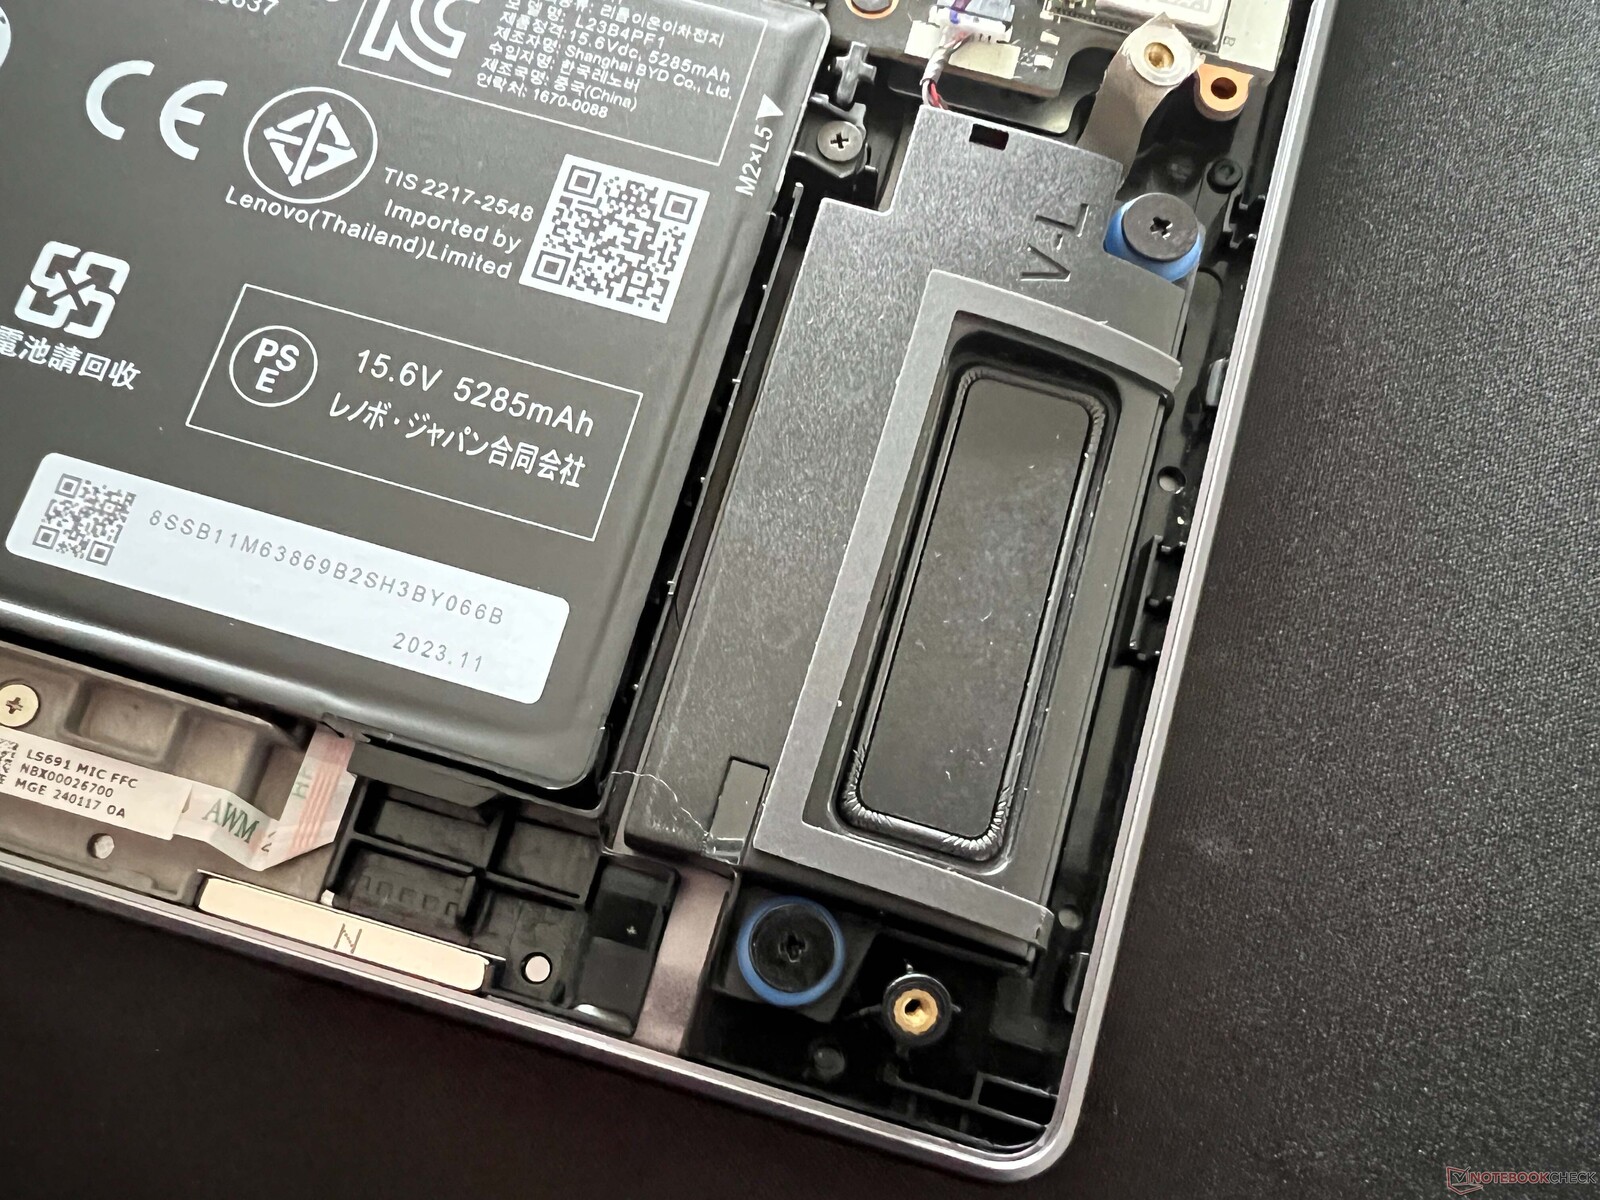
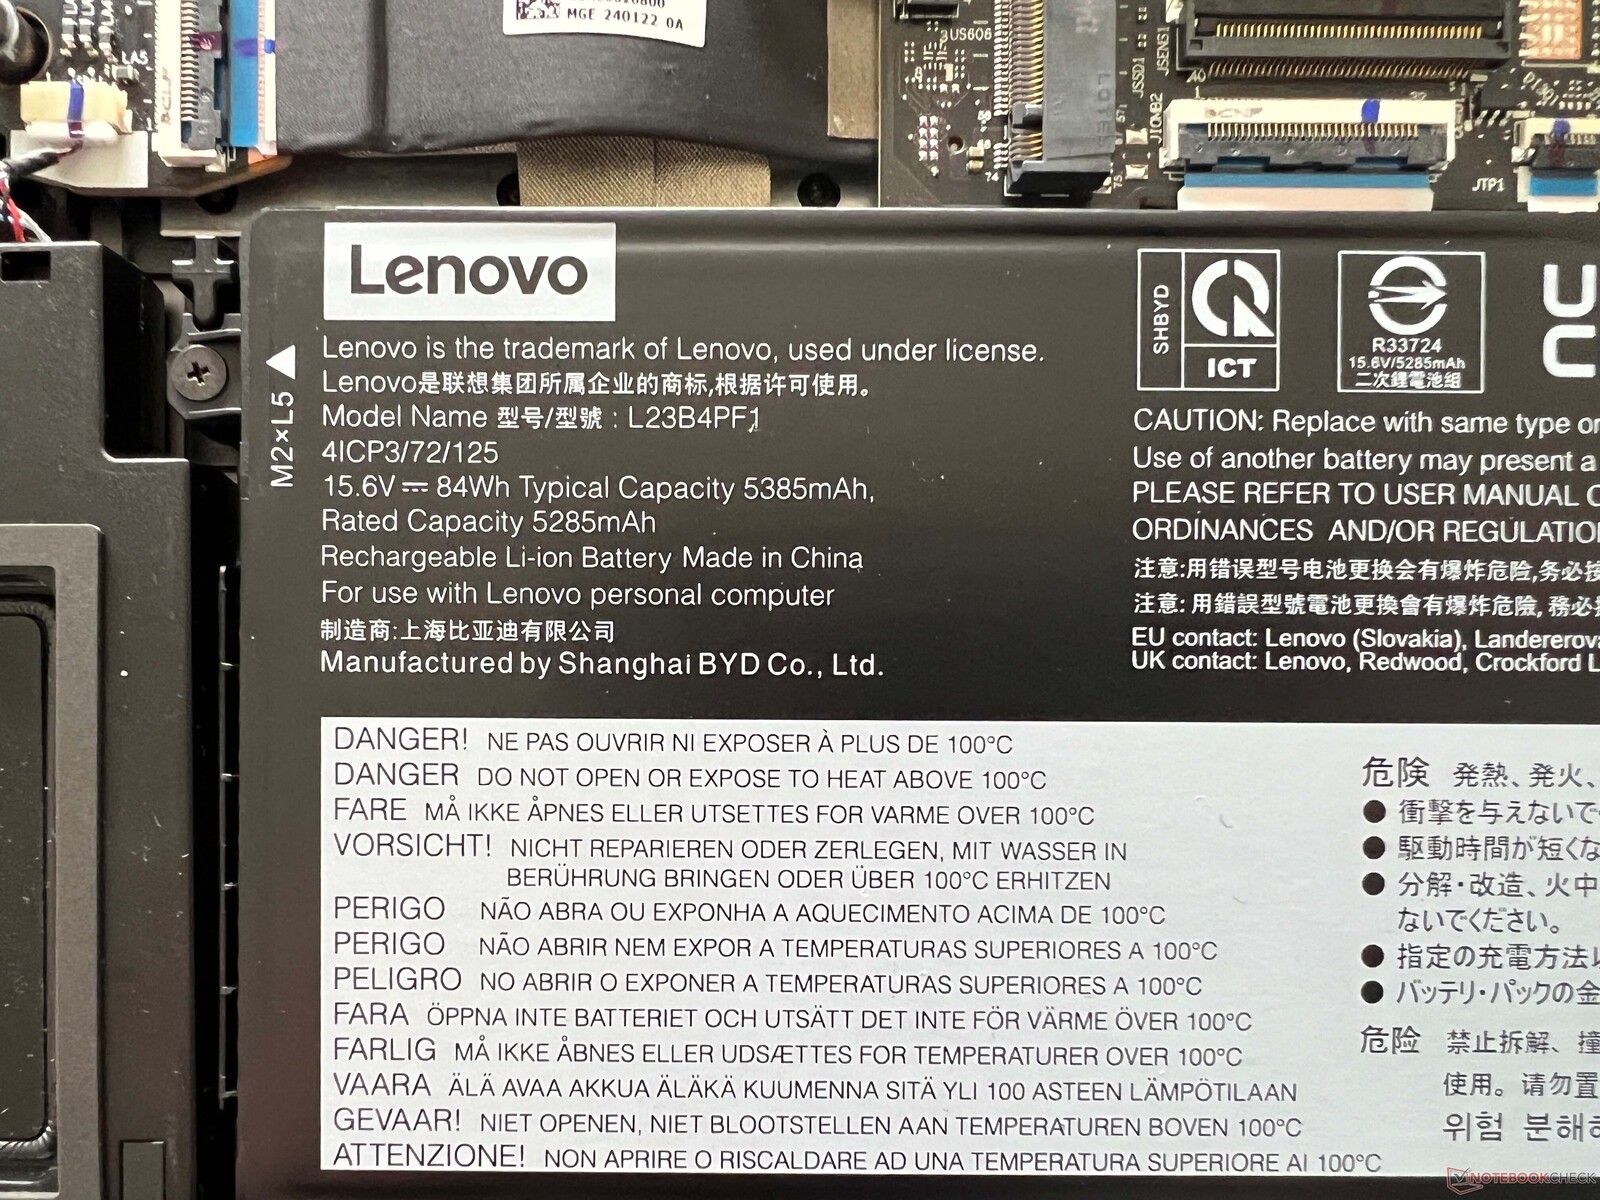
Wartung
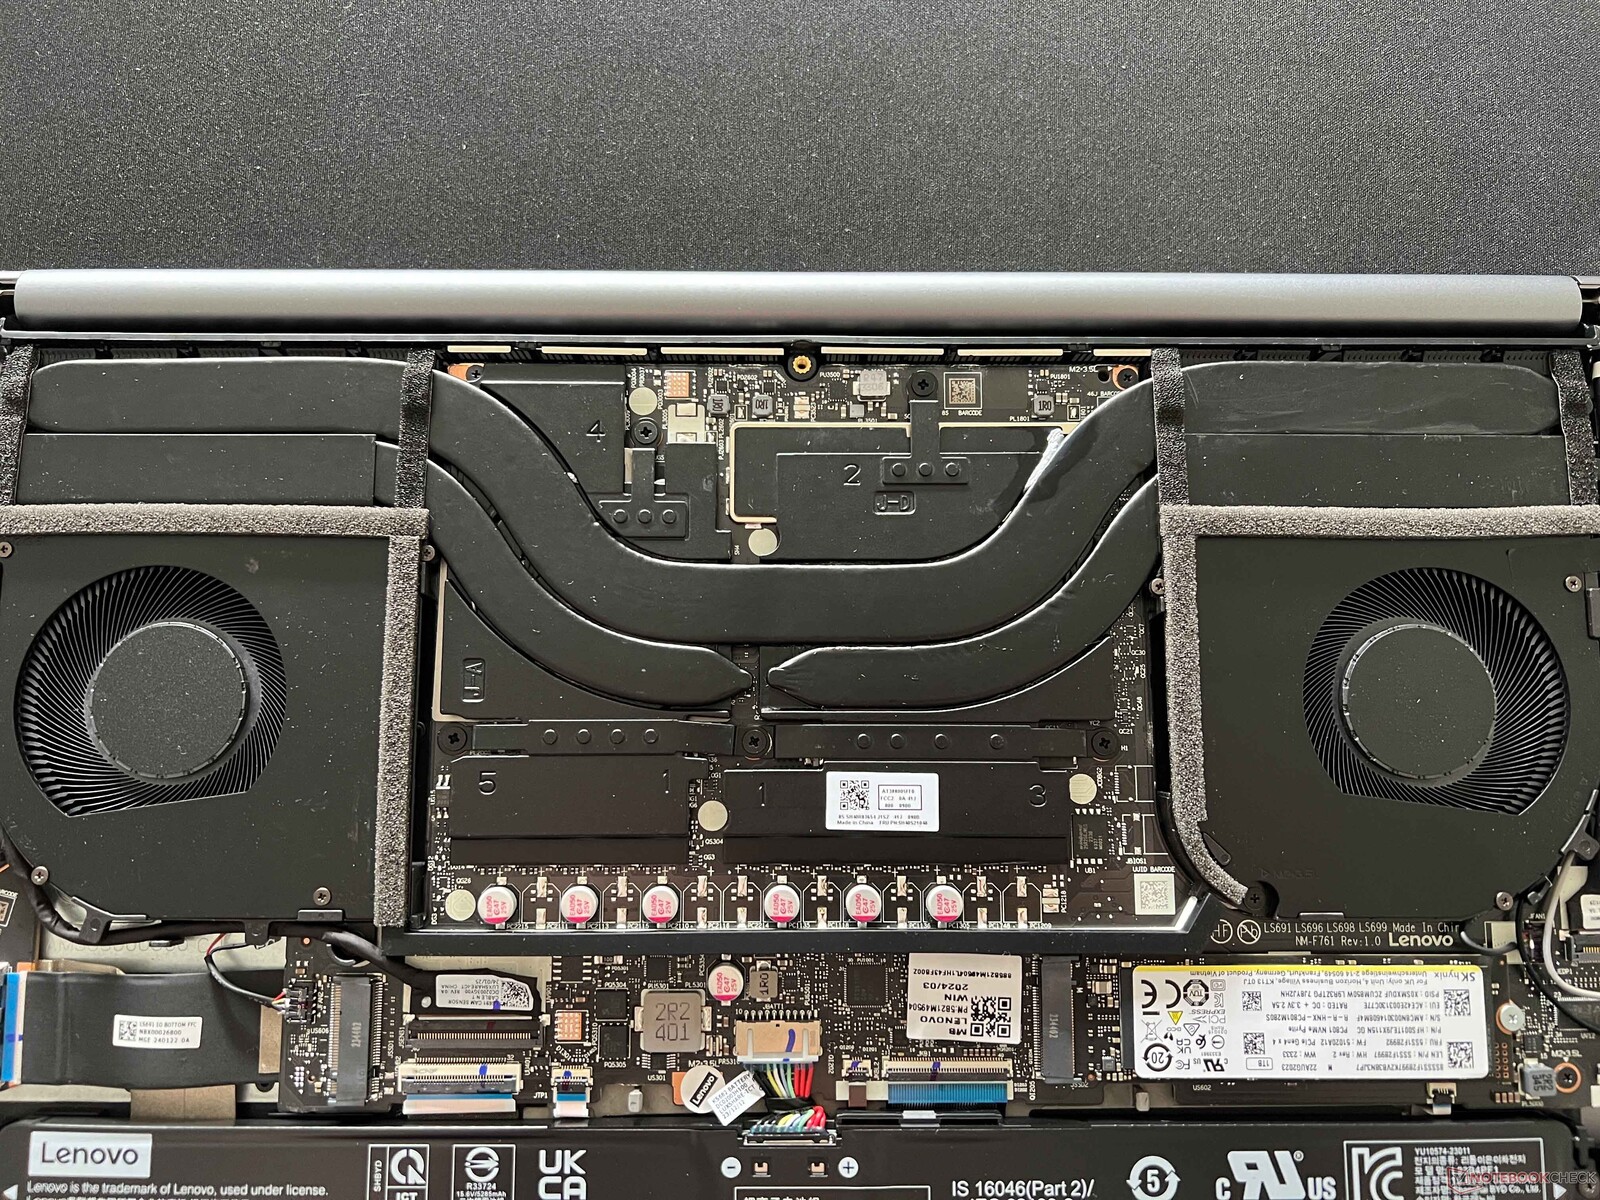
Die untere Abdeckung ist mit Torx-Schrauben (T5) gesichert und lässt sich leicht abnehmen. Im Inneren hat sich das Layout gegenüber dem alten Modell verändert, unter anderem, um mehr Platz für einen größeren Akku zu schaffen. Der Arbeitsspeicher und das WLAN-Modul sind nach wie vor verlötet. Es gibt weiterhin zwei Steckplätze für M.2-2280-SSDs und man kann sowohl die Lüfter reinigen als auch den Akku wechseln (falls nötig).
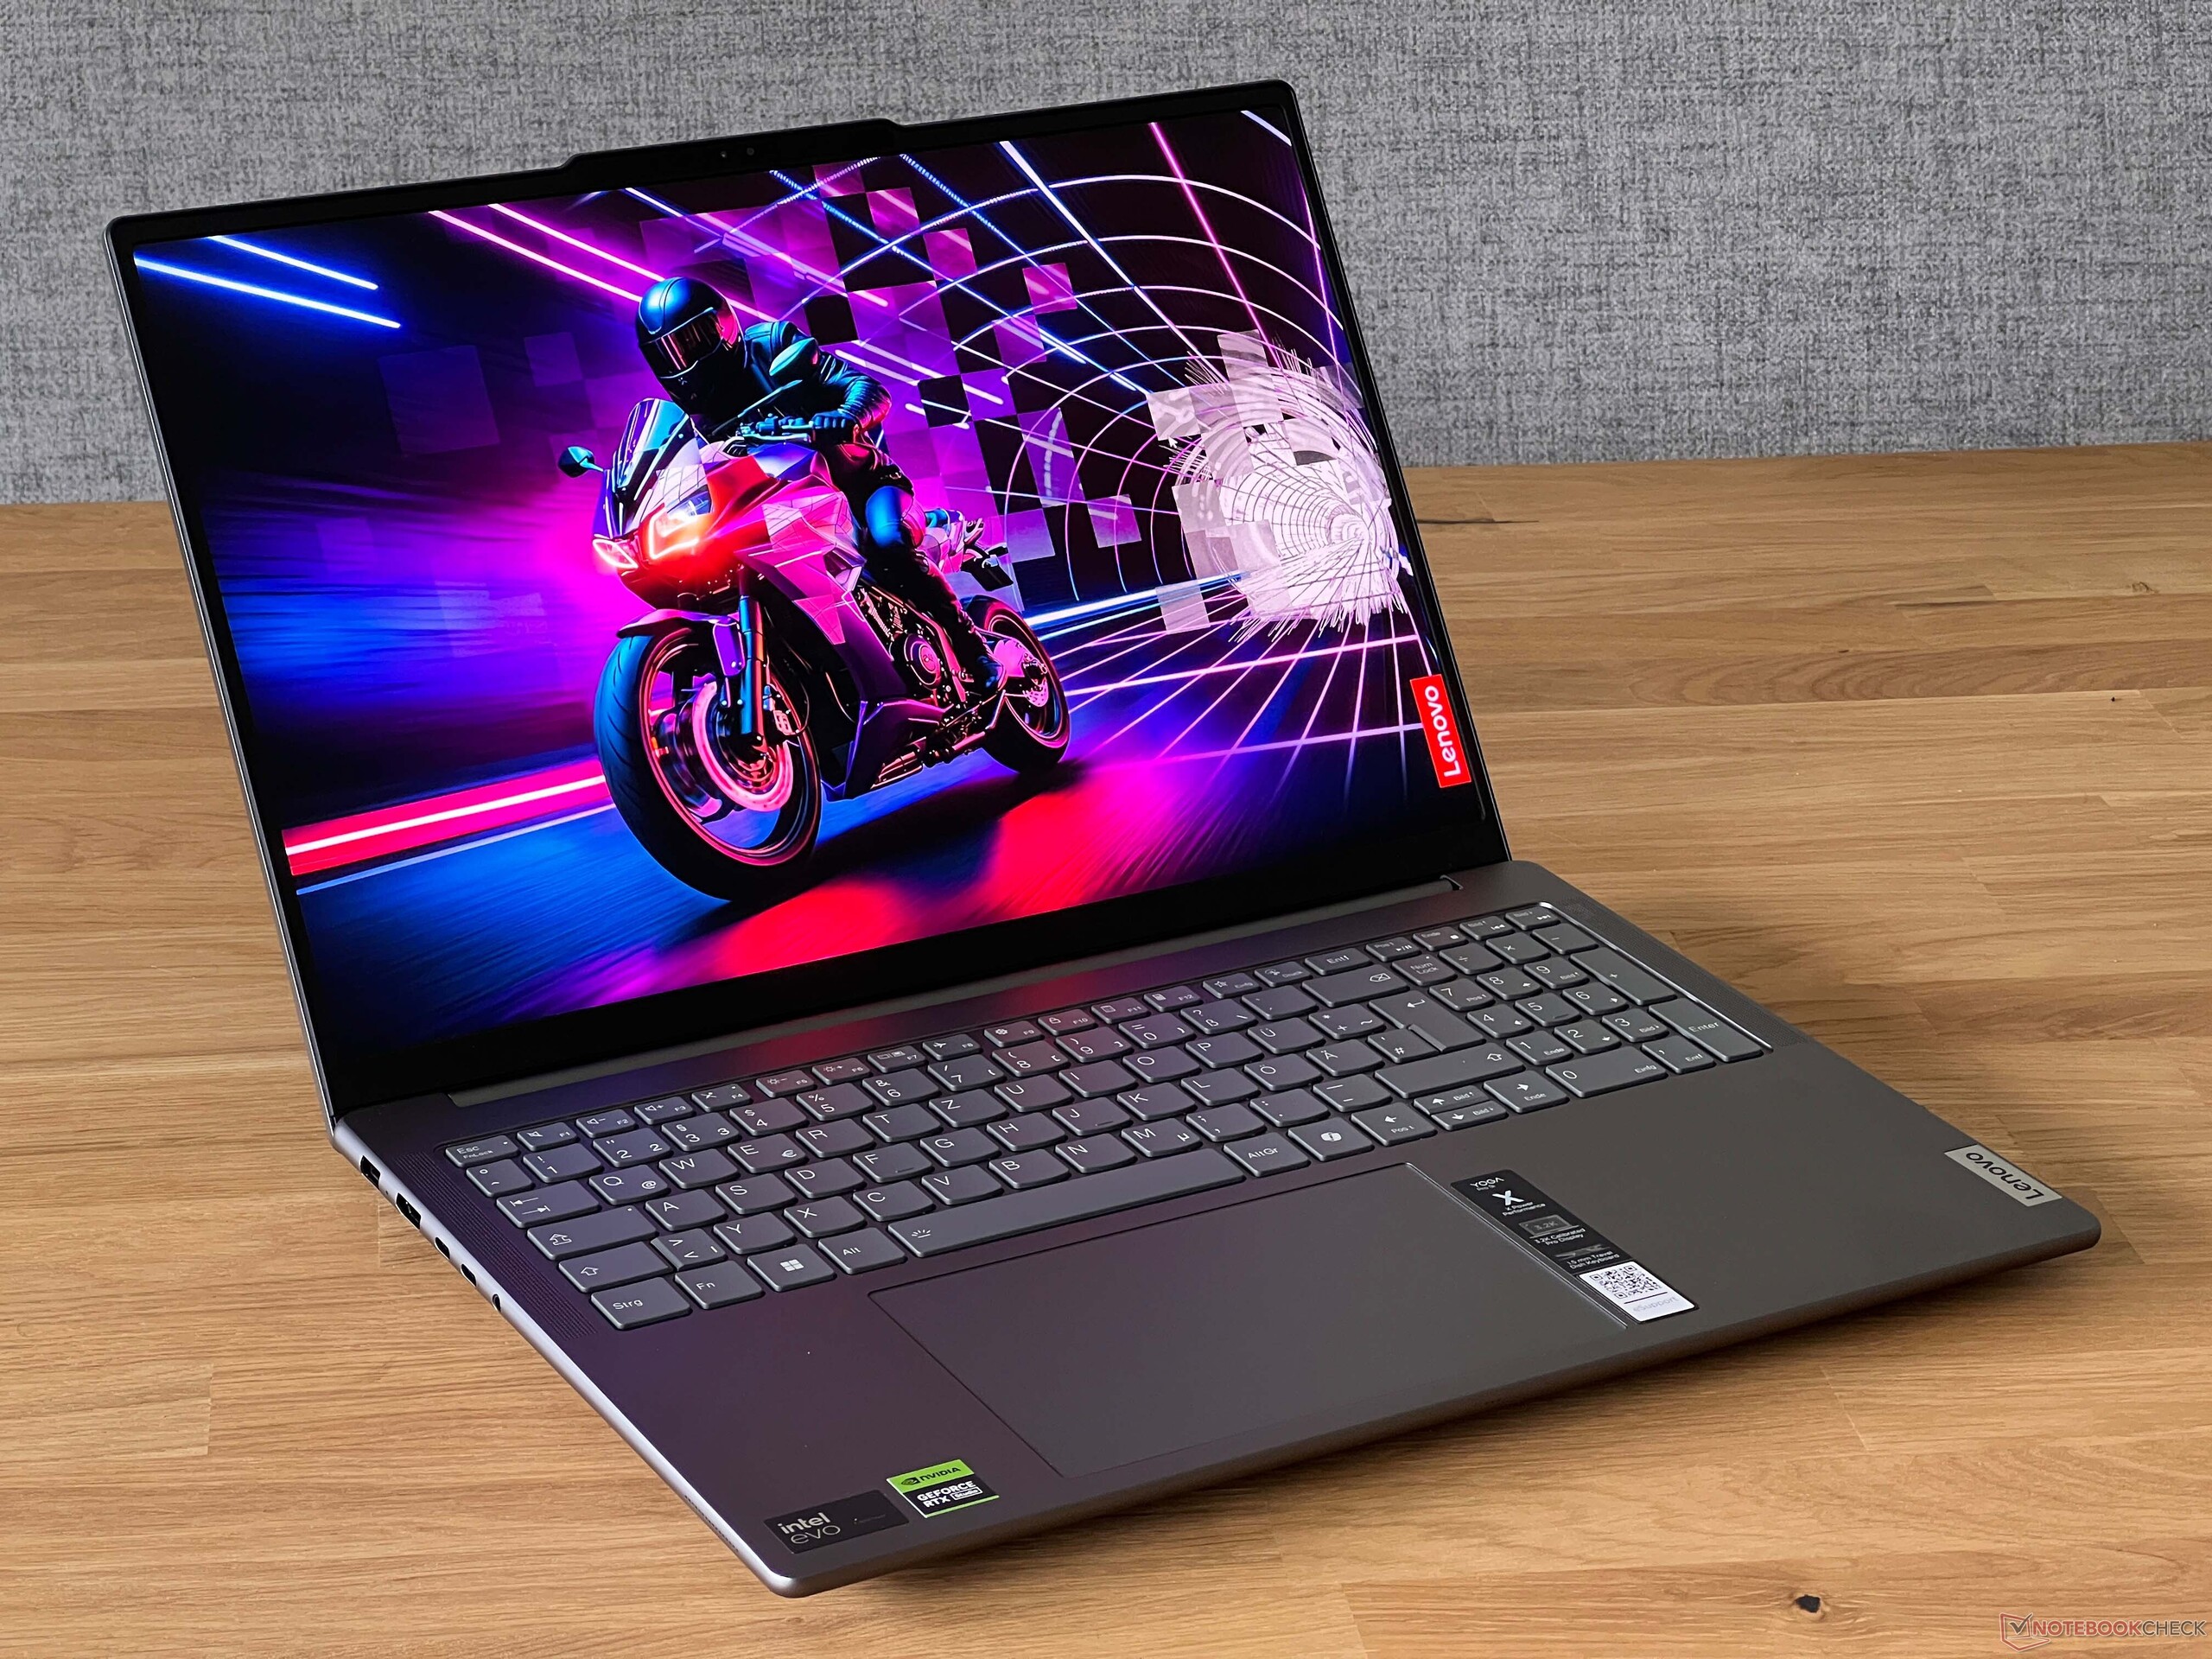
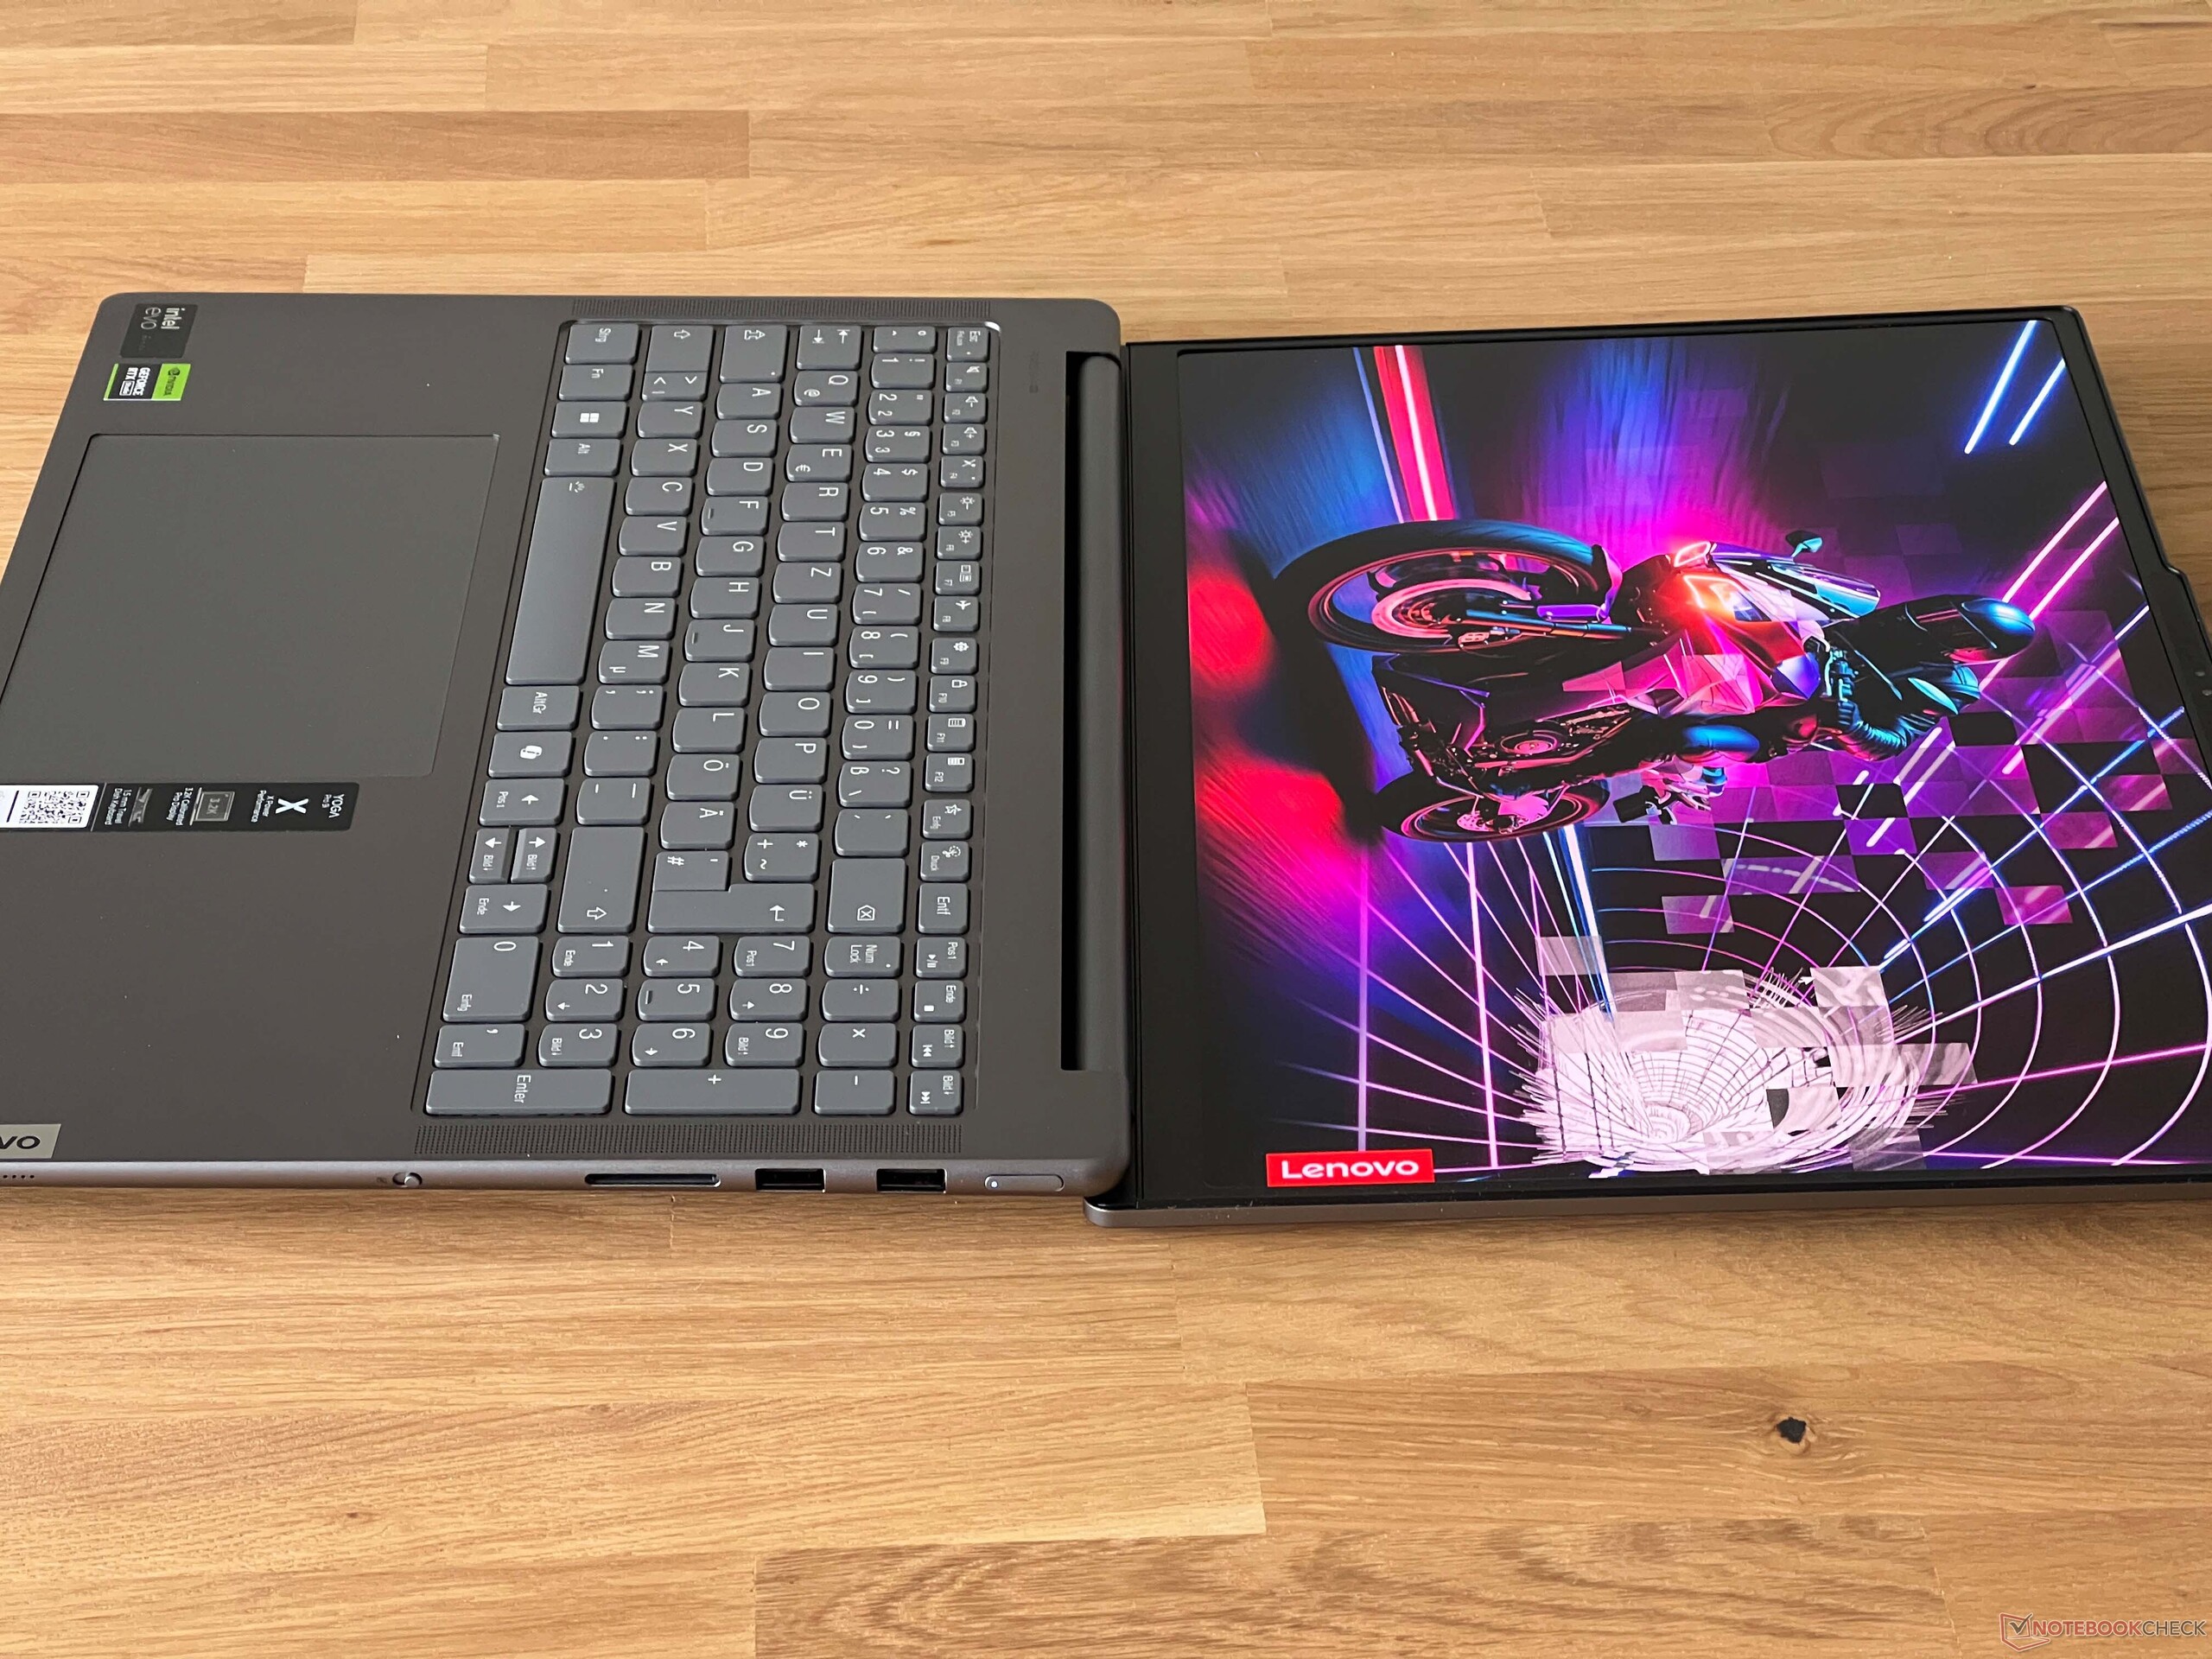
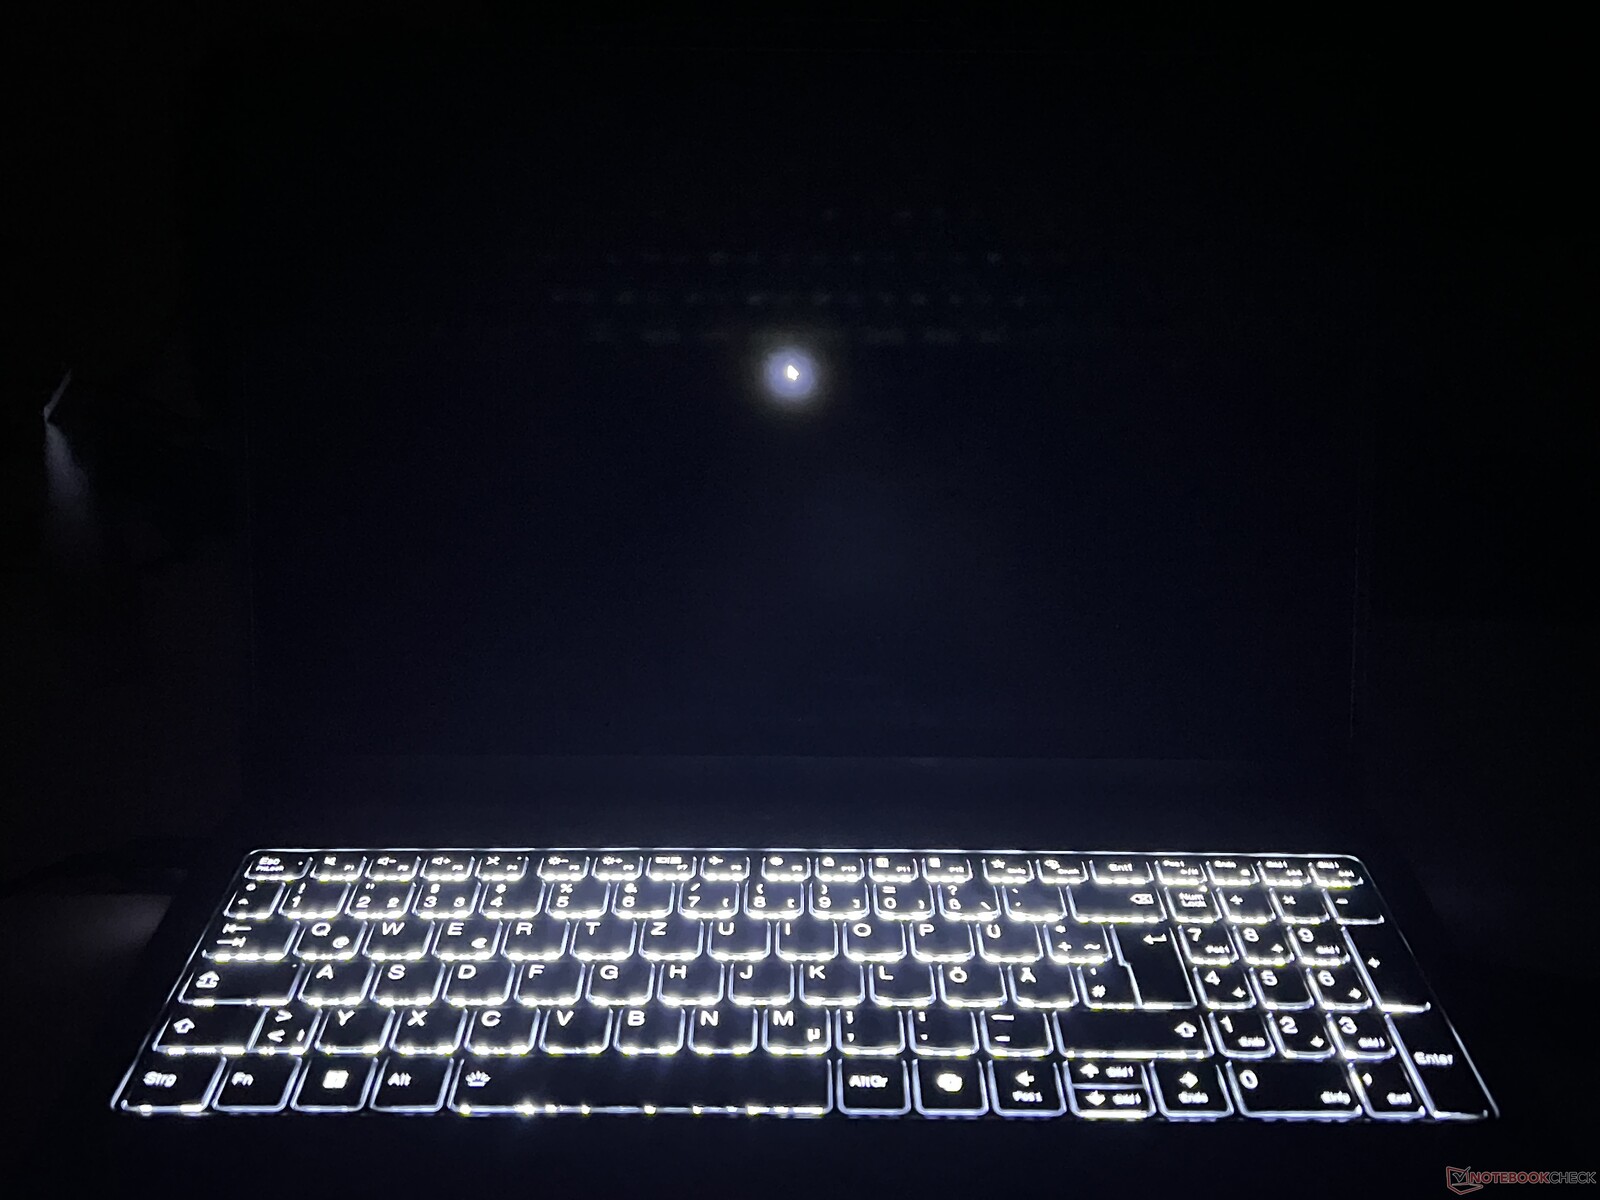
Eingabegeräte - 1,5 mm Hub und Nummernblock
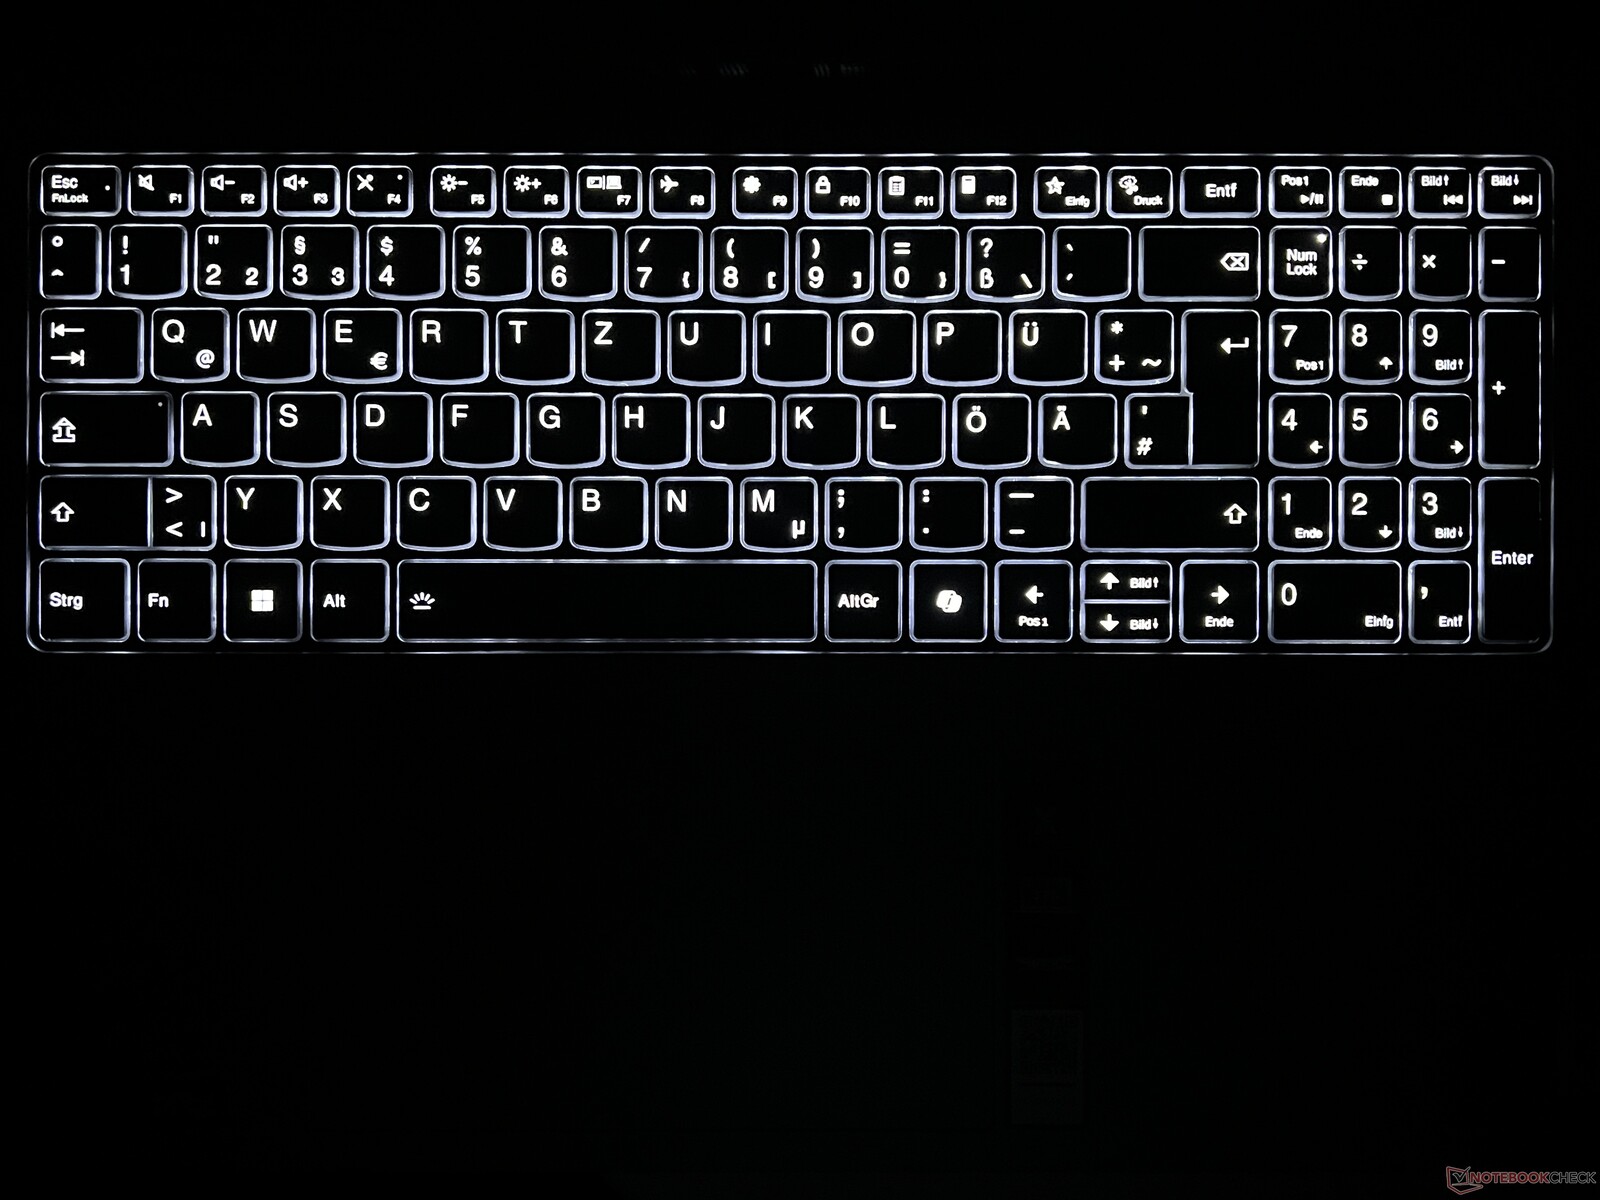
Bei den Eingabegeräten gibt es abgesehen von der neuen Copilot-Taste (anstelle der rechten Strg-Taste) keine Veränderungen. Die komfortable Tastatur bietet einen ausreichend langen Hub (1,5 mm) und auch lange Texte lassen sich problemlos tippen. Die zweistufige weiße Beleuchtung kann via Sensor automatisch aktiviert werden.
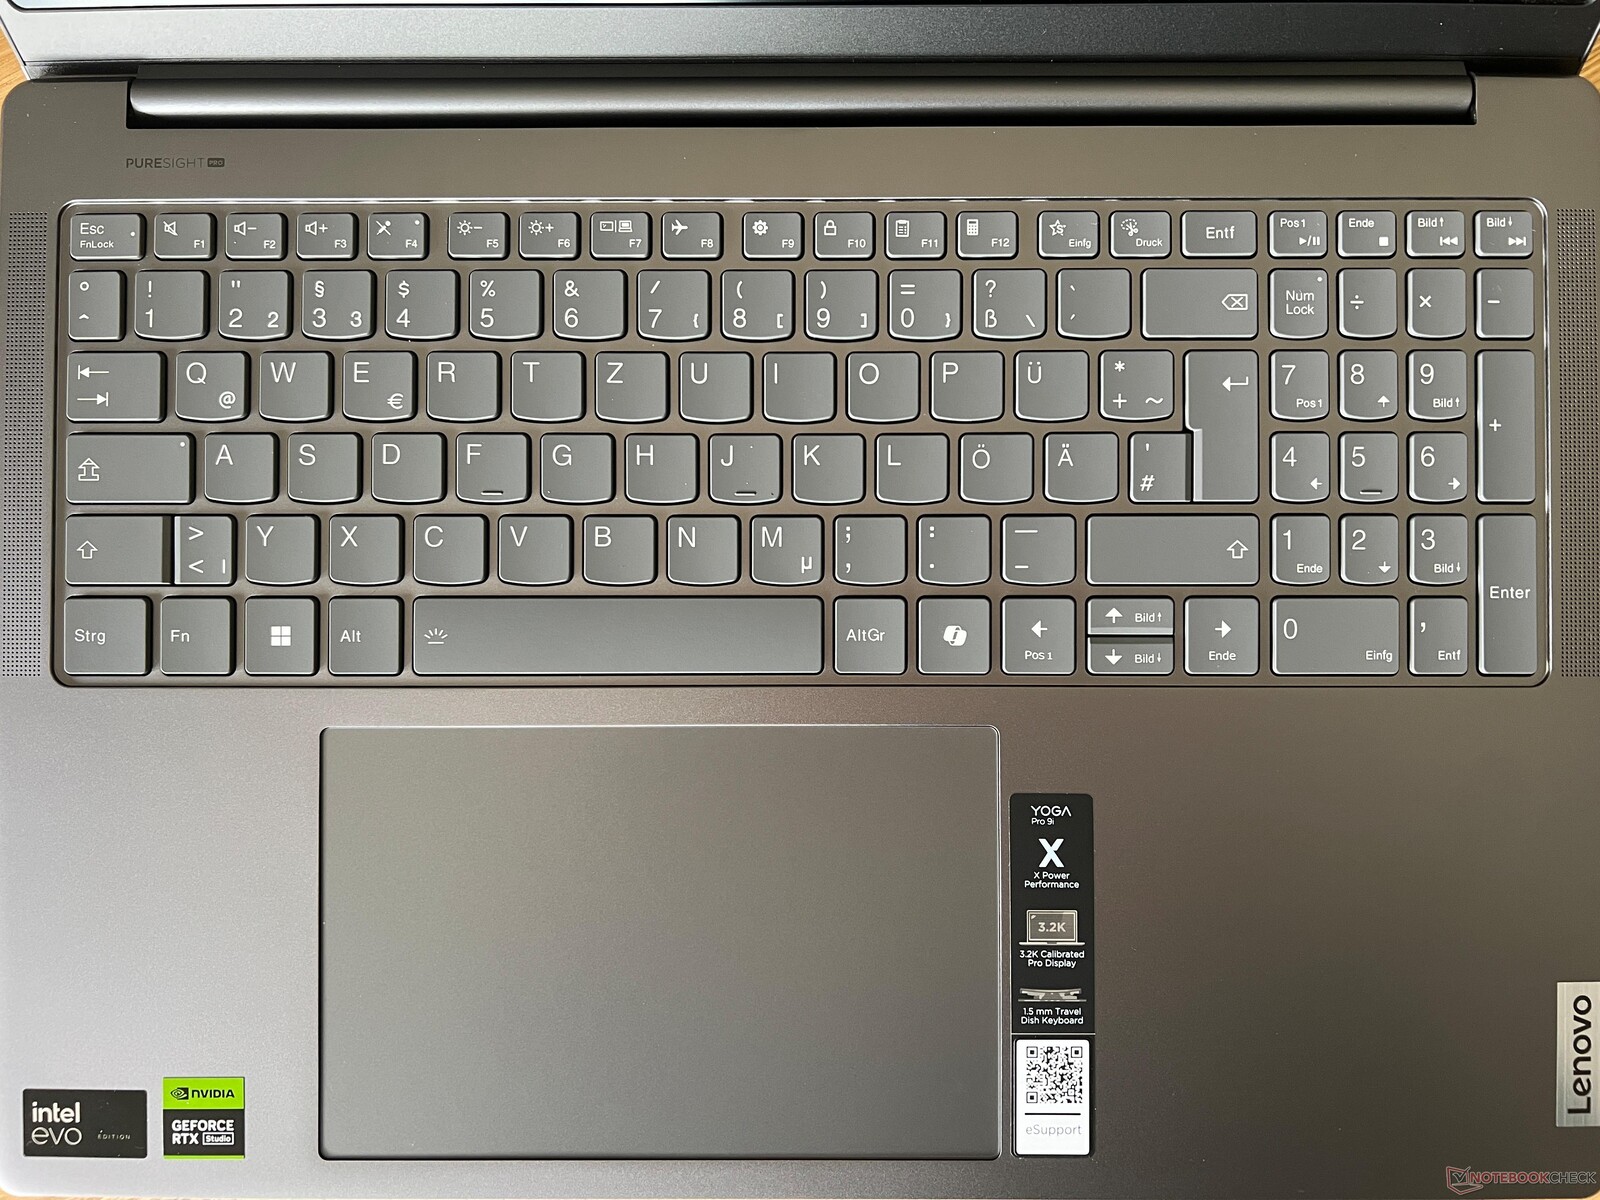
Die Größe des Clickpads bleibt mit 15 x 9,5 cm unverändert, Lenovo hat sich aber anscheinend unserer Kritik angenommen und die Mechanik überarbeitet. Während die Klicks beim alten Modell laut und billig wirkten, sind die Klickgeräusche nun viel dumpfer und machen einen sehr wertigen Eindruck. Die Gleiteigenschaften sind weiterhin hervorragend und bei der Bedienung gibt es keinerlei Probleme.
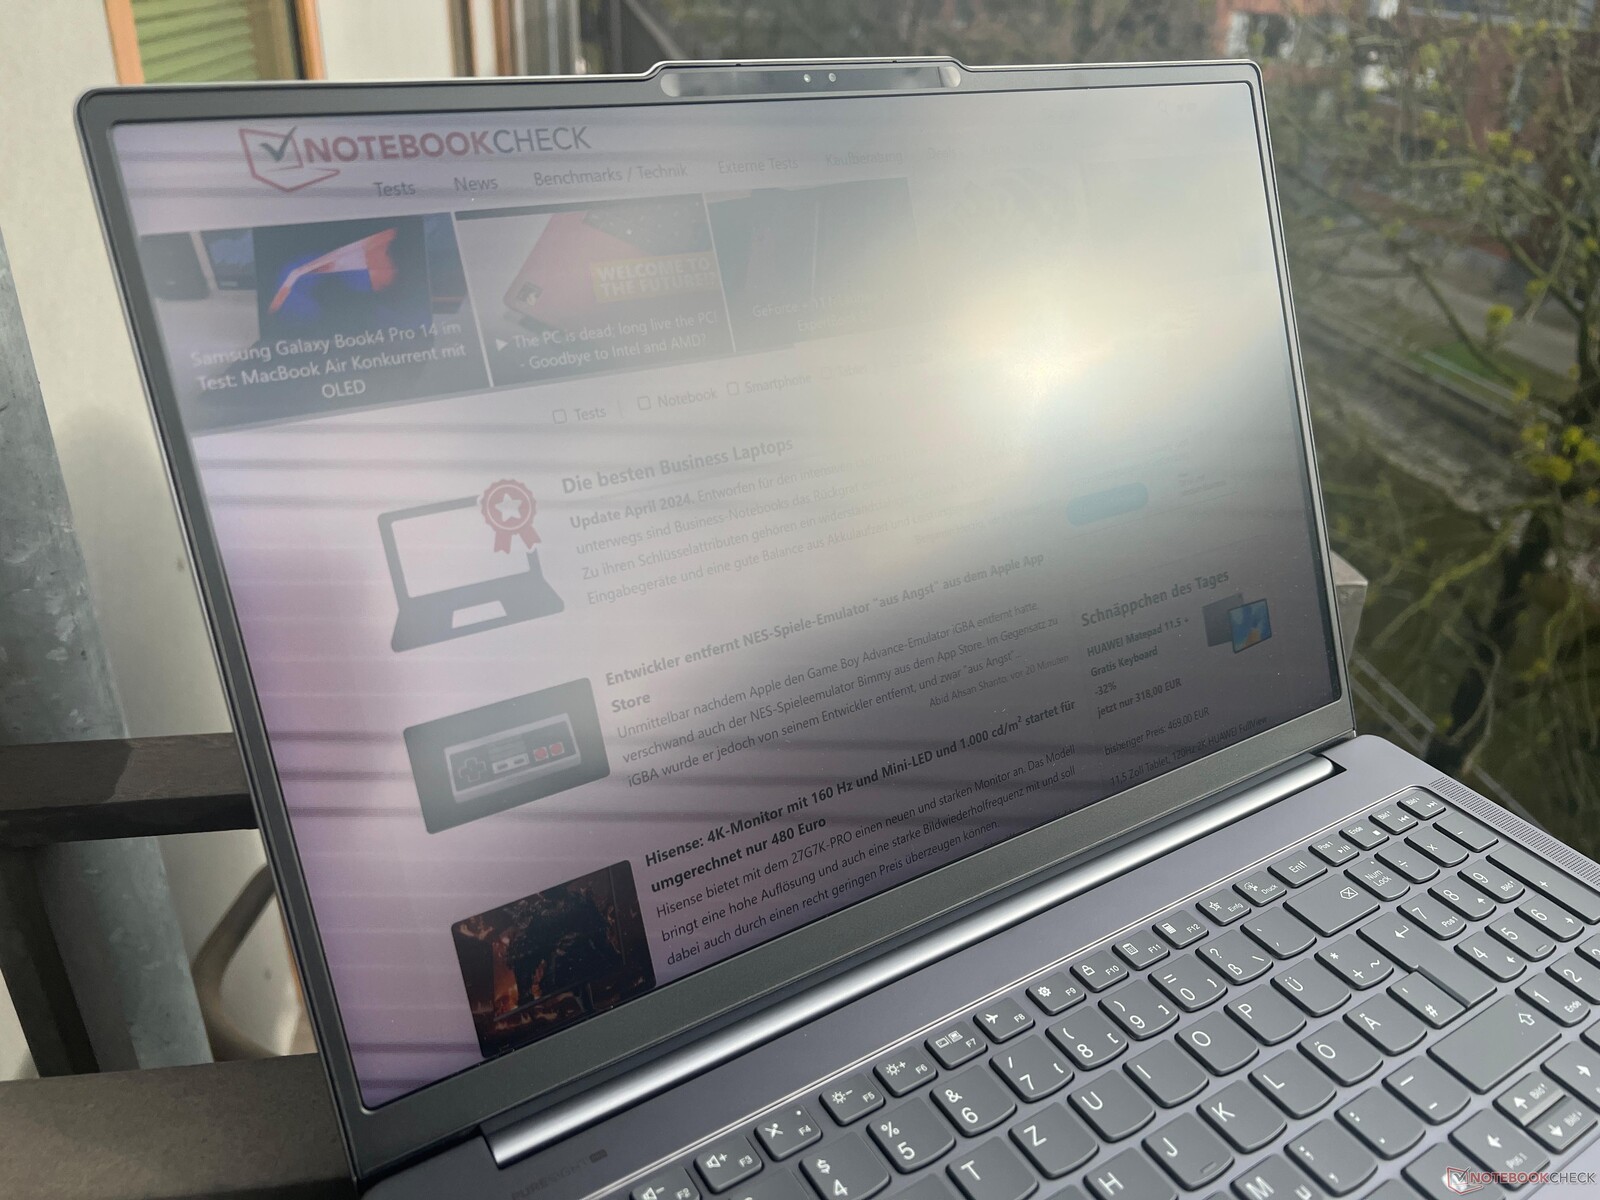
Display - Mattes Mini-LED-Panel
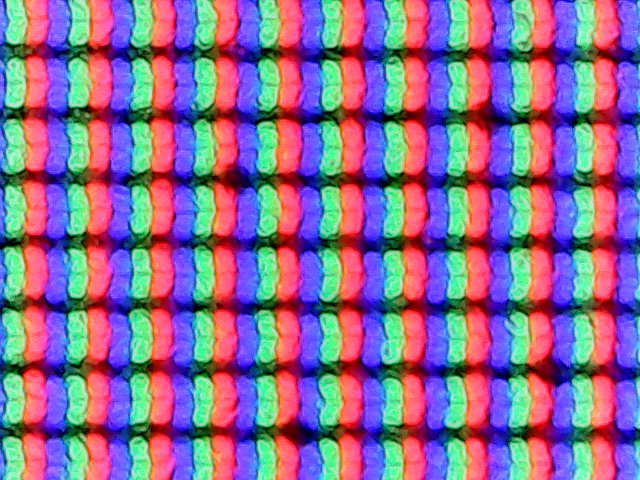
Lenovo bietet verschiedene Panels für das Yoga Pro 9i 16 G9 an und in unserem Testgerät ist der matte Mini-LED-Bildschirm mit einer Auflösung von 3.200 x 2.000 Pixeln verbaut. Die spiegelnde Variante inklusive Touchscreen, die wir beim Vorgänger getestet haben, ist nach wie vor verfügbar. Bewegungen sind dank der hohen Frequenz sehr flüssig und Farben wirken sehr kräftig, zudem wirken auch helle Flächen trotz der matten Oberfläche nicht körnig. Das Mini-LED-Panel flackert bei einer konstanten Frequenz von 4800 Hz, was für die große Mehrheit der Nutzer kein Problem darstellen sollte. Die Reaktionszeiten sind etwas langsamer als beim alten Modell, doch im Alltag gab es kein Ghosting.
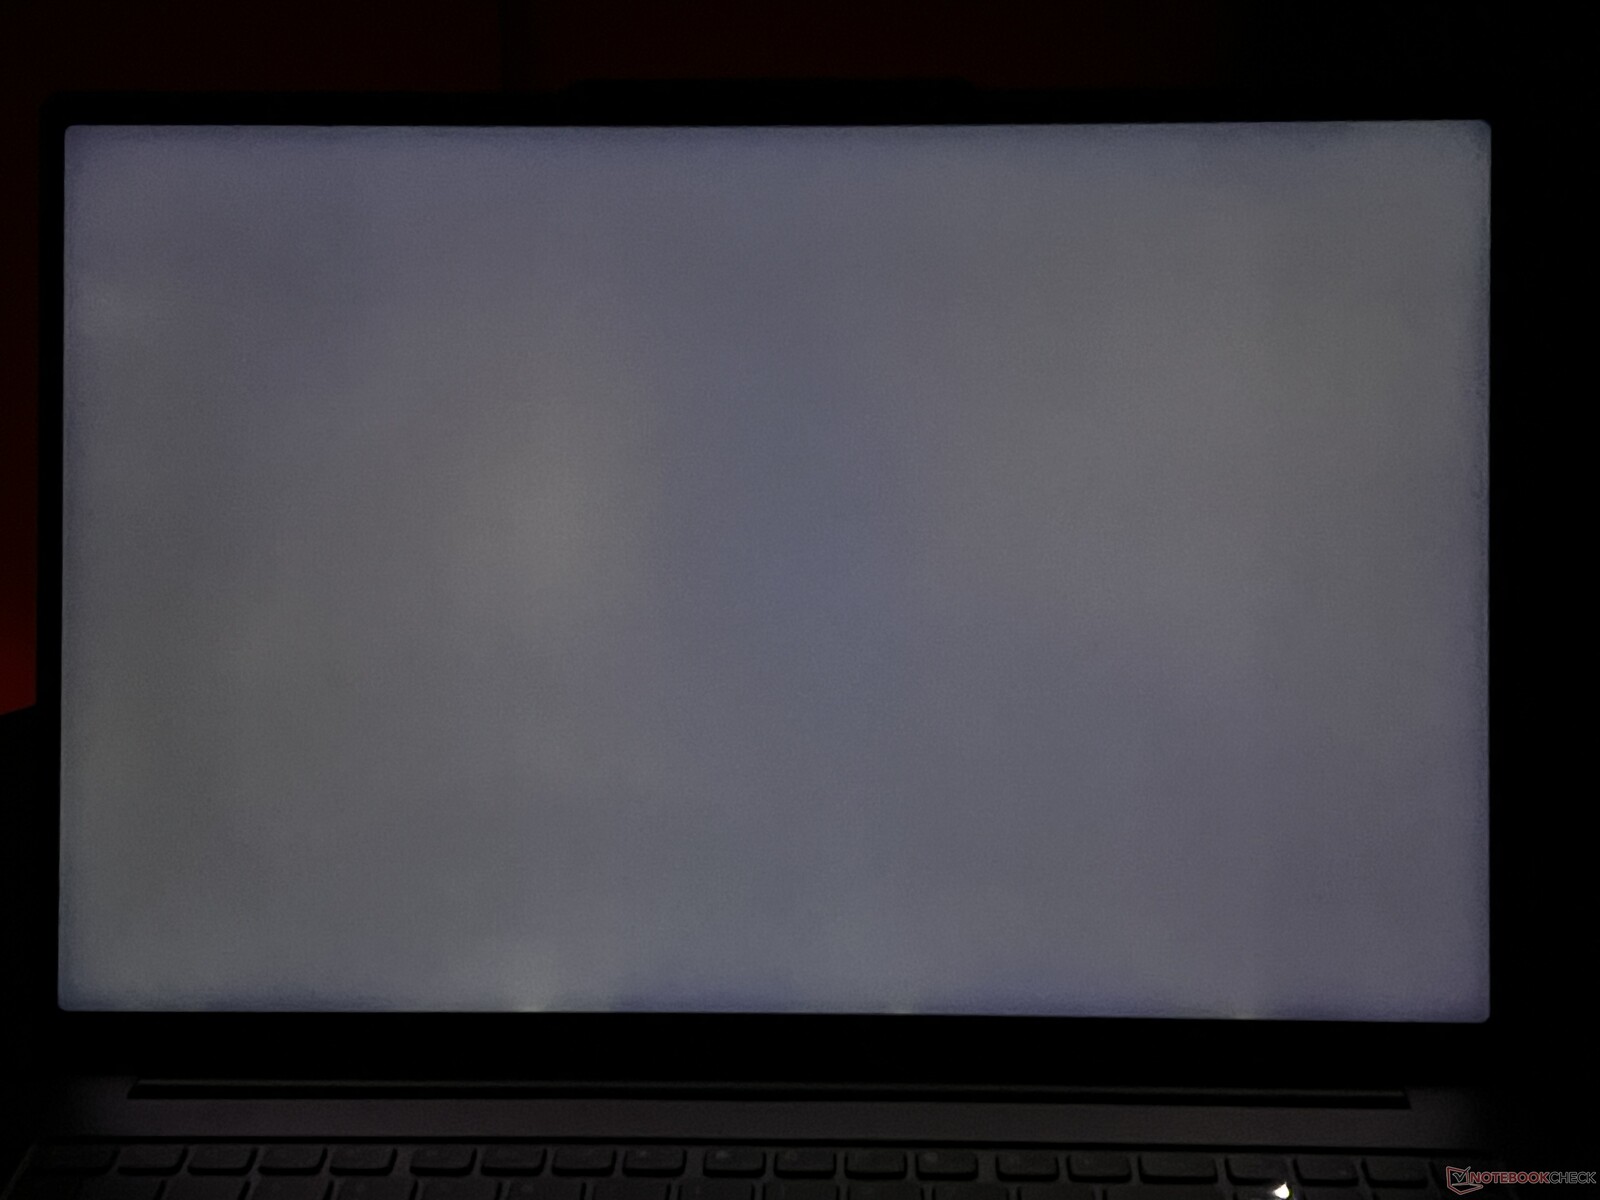
Das Mini-LED-Panel verhält sich nach wie vor anders, als man es erwarten könnte. Im SDR-Betrieb verhält sich das Panel wie ein regulärer IPS-Bildschirm und hier ist Schwarz auch nicht komplett Schwarz. Die Helligkeit liegt hier durchschnittlich bei sehr guten 670 cd/m² und der Schwarzwert ist mit 0,22 cd/m² gering, was zu einem maximalen Kontrastverhältnis von knapp 3.000:1 führt.
Erst bei der Aktivierung des HDR-Modus wechselt das Panel auf Local Dimming und jetzt ist Schwarz auch wirklich Schwarz, allerdings kommt es bei hellen Objekten auf dunkeln Hintergründen auch zu sichtbaren Halo-Effekten. Die maximale HDR-Helligkeit liegt bei 1.230 cd/m², sowohl bei kleinen Bildausschnitten als auch einem fast vollständig weißen Bild. Das ist eine sehr gute Leistung, die HDR-Implementierung von Windows ist aber immer noch problematisch. Der HDR-Modus muss nach wie vor manuell aktiviert werden und für den Dauerbetrieb eignet er sich nicht, denn normale SDR-Inhalte (wie beispielsweise auch der Windows-Desktop) wirken dann deutlich blasser als im SDR-Modus.
| |||||||||||||||||||||||||
Ausleuchtung: 93 %
Helligkeit Akku: 651 cd/m²
Kontrast: 2959:1 (Schwarzwert: 0.22 cd/m²)
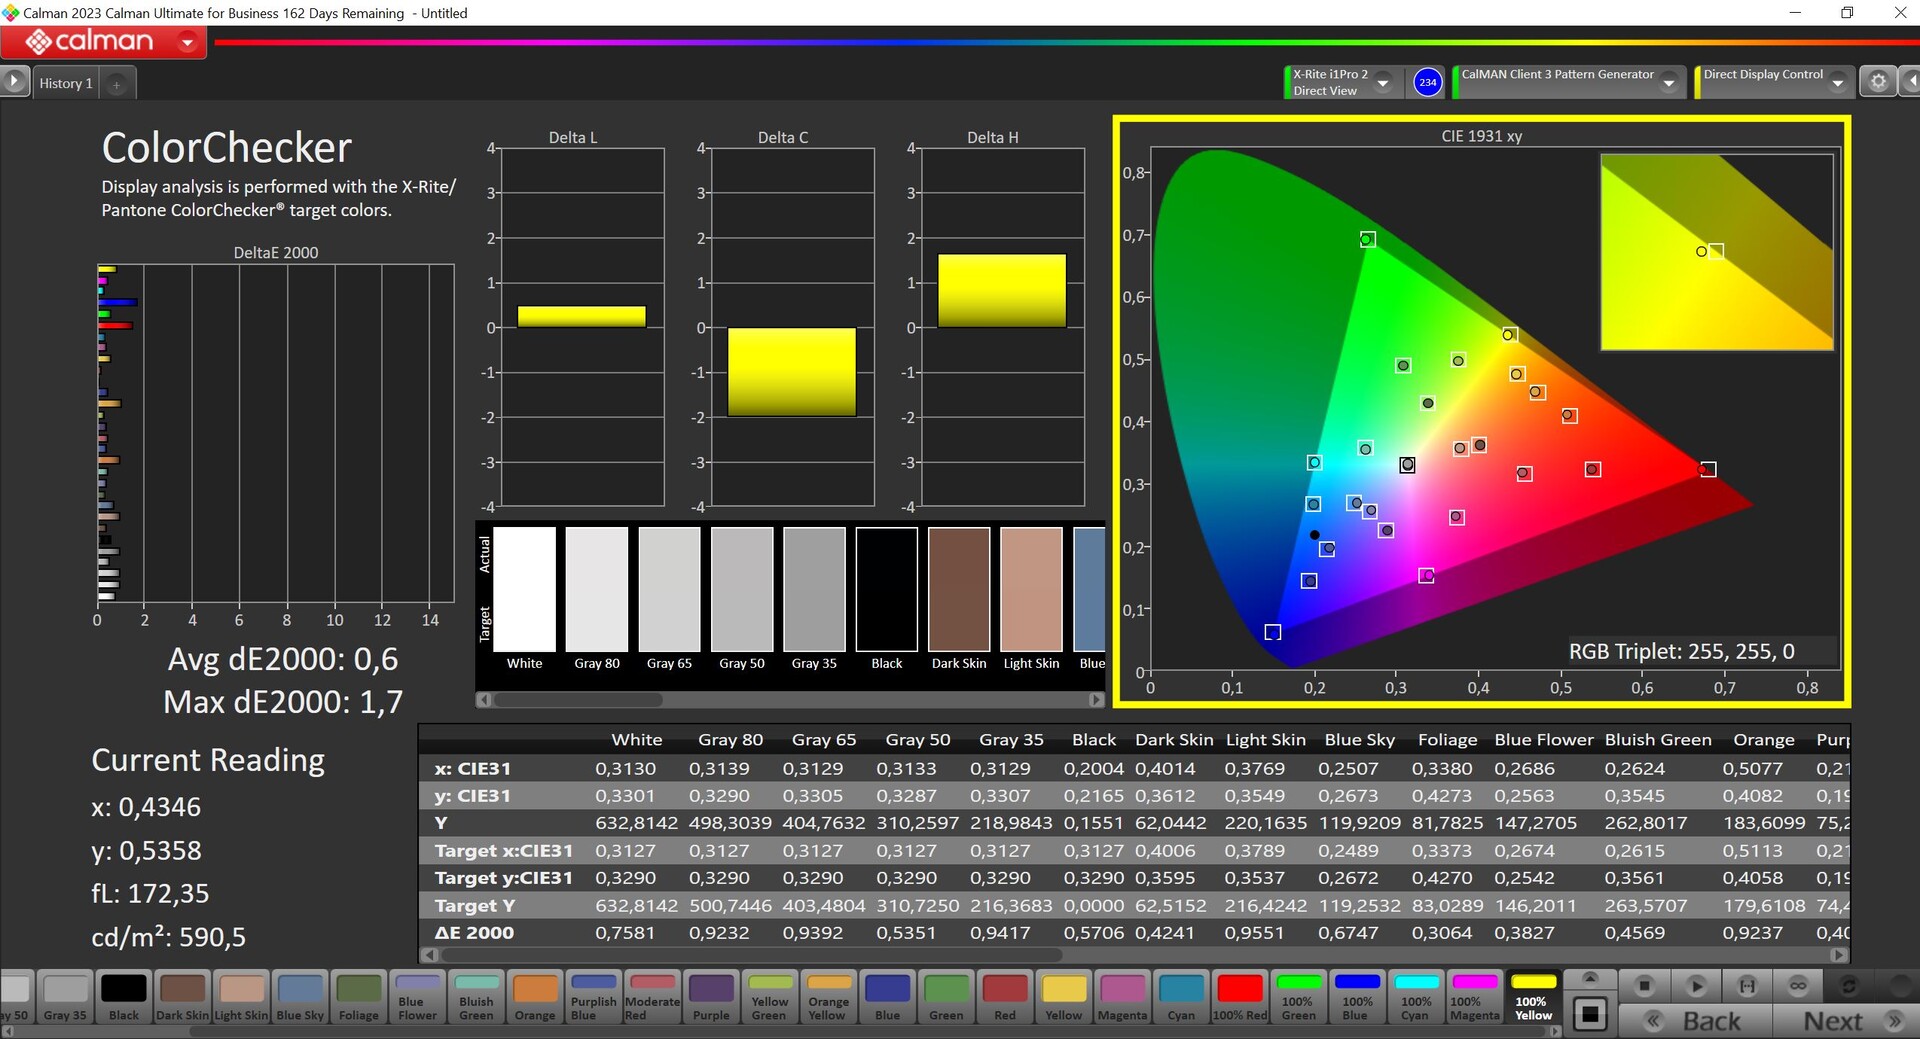
ΔE ColorChecker Calman: 1.9 | ∀{0.5-29.43 Ø4.72}
calibrated: 0.6
ΔE Greyscale Calman: 3 | ∀{0.09-98 Ø4.97}
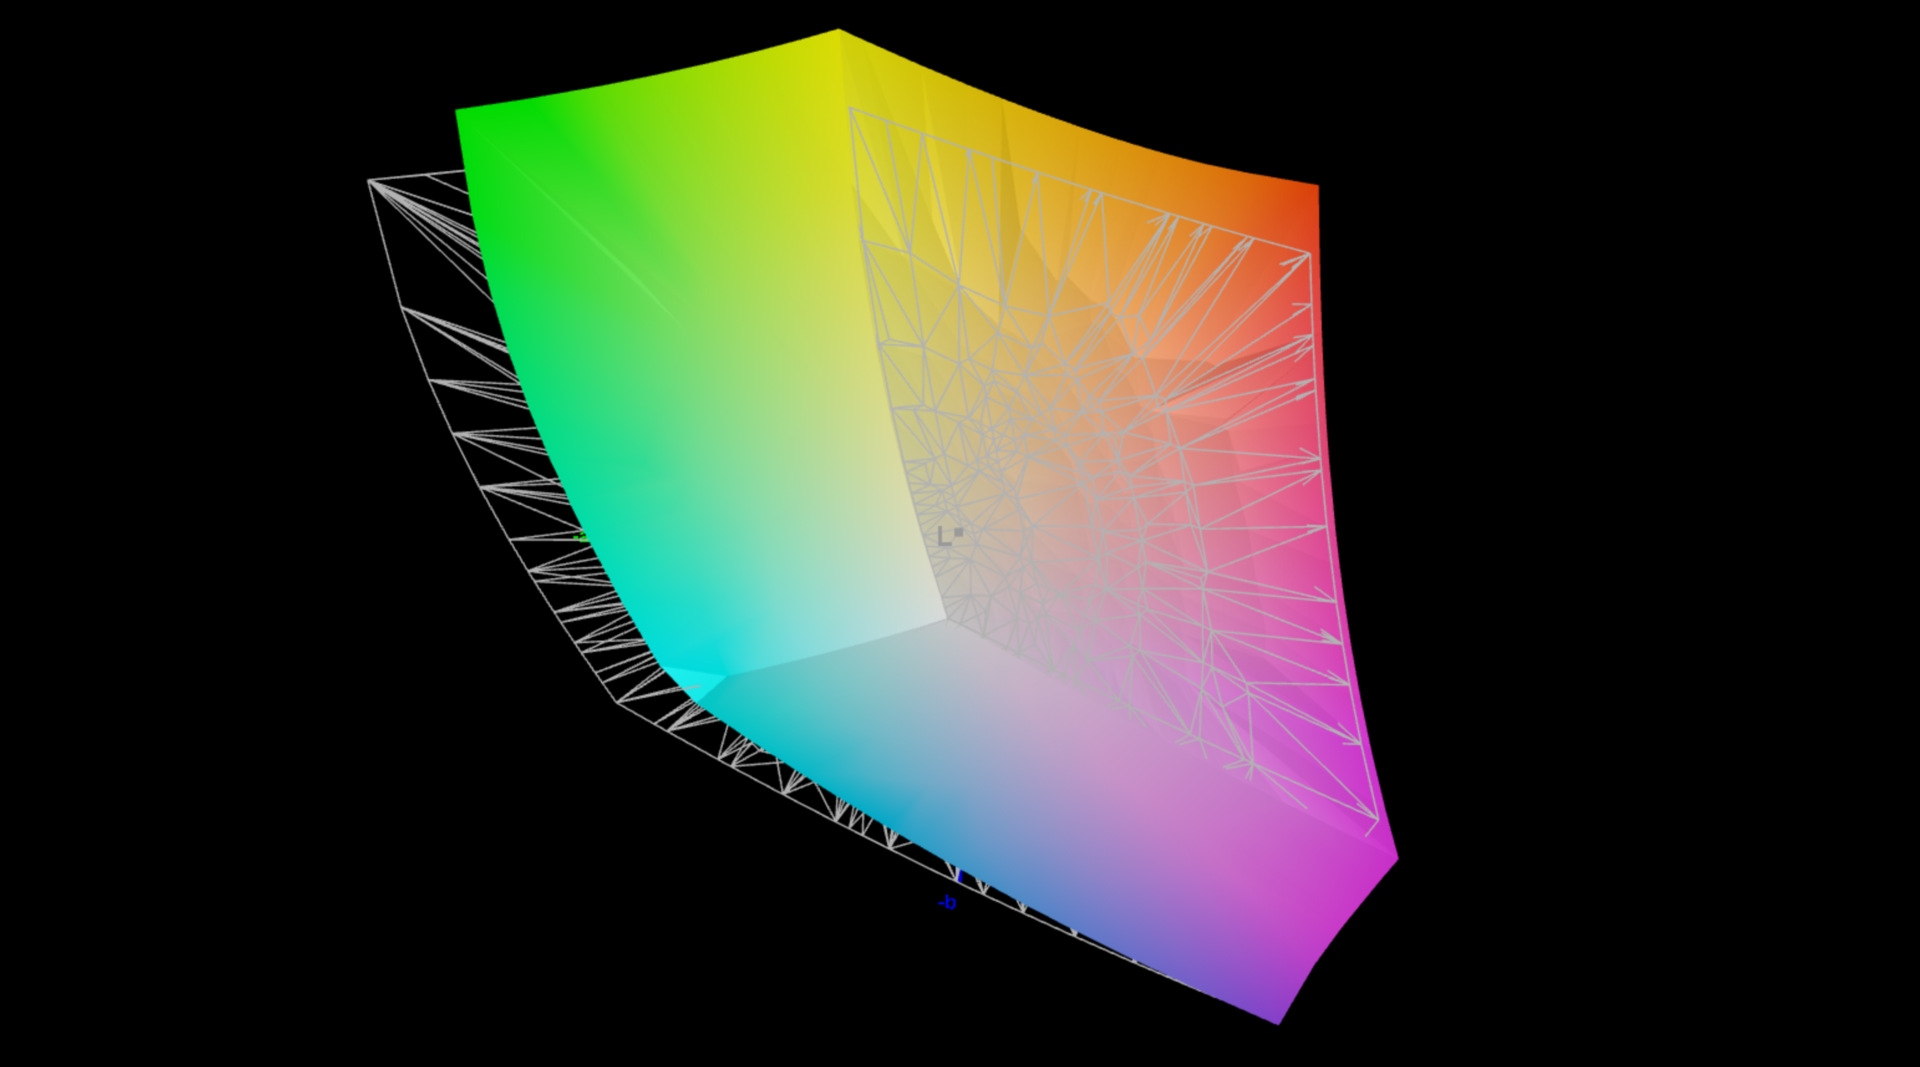
86.6% AdobeRGB 1998 (Argyll 3D)
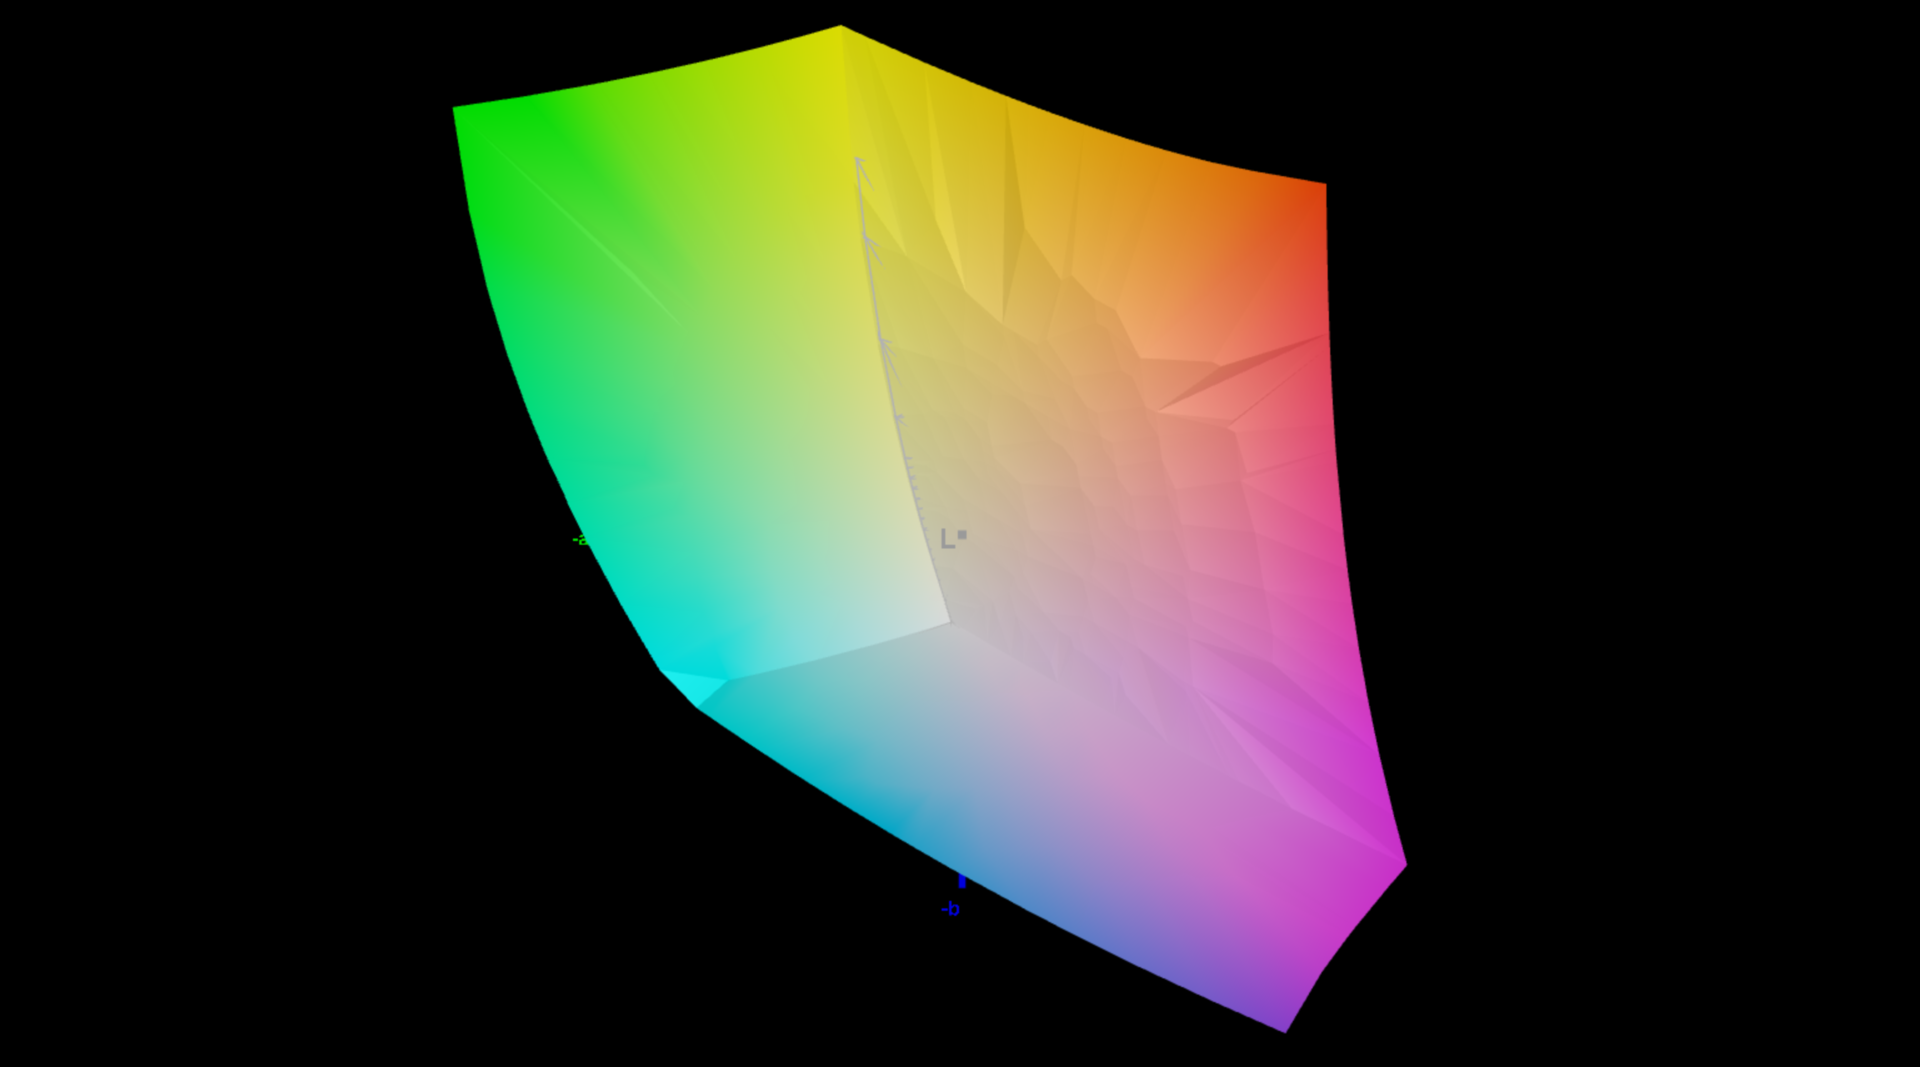
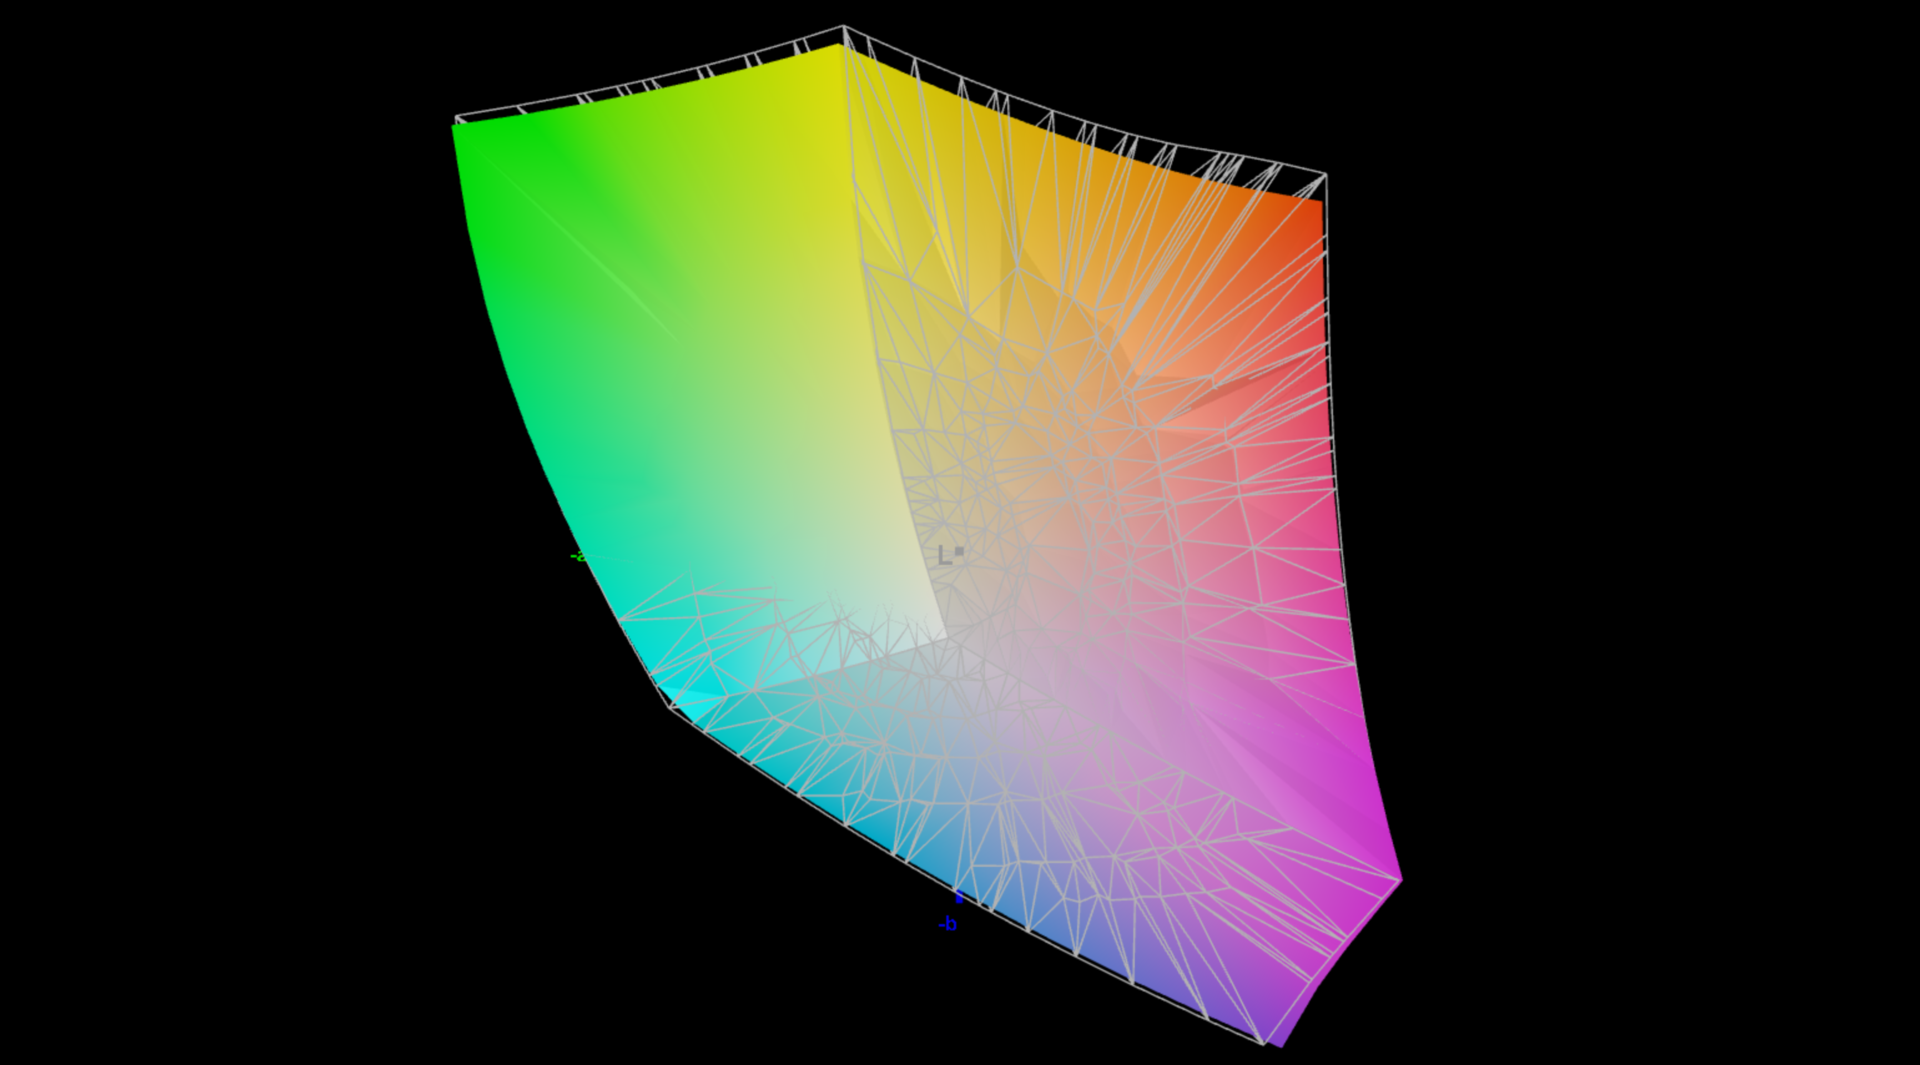
99.9% sRGB (Argyll 3D)
97% Display P3 (Argyll 3D)
Gamma: 2.18
CCT: 6738 K
| Lenovo Yoga Pro 9 16IMH9 LEN160-3.2K, Mini-LED, 3200x2000, 16" | Dell XPS 16 9640 SDC4196, OLED, 3840x2400, 16.3" | Honor MagicBook Pro 16 2024 TL160MDMP01, IPS, 3072x1920, 16" | Samsung Galaxy Book4 Ultra ATNA60CL07-0, OLED, 2880x1800, 16" | Framework Laptop 16 2560x1600, 16" | Schenker VISION 16 Pro (M23) NE160QDM-NZ1, IPS, 2560x1600, 16" | Lenovo Yoga Pro 9 16-IRP G8 LEN160-3.2K, Mini-LED, 3200x2000, 16" | |
|---|---|---|---|---|---|---|---|
| Display | 1% | 2% | 1% | 0% | -16% | 3% | |
| Display P3 Coverage (%) | 97 | 98.3 1% | 98.8 2% | 98.6 2% | 97.7 1% | 68.8 -29% | 97 0% |
| sRGB Coverage (%) | 99.9 | 100 0% | 100 0% | 99.9 0% | 99.7 0% | 98.8 -1% | 99.8 0% |
| AdobeRGB 1998 Coverage (%) | 86.6 | 87.8 1% | 89.1 3% | 88.5 2% | 87 0% | 70 -19% | 95.1 10% |
| Response Times | 96% | 70% | 97% | 34% | 45% | 42% | |
| Response Time Grey 50% / Grey 80% * (ms) | 22.2 ? | 0.82 ? 96% | 6.3 ? 72% | 0.54 ? 98% | 14.6 ? 34% | 13.7 ? 38% | 14 ? 37% |
| Response Time Black / White * (ms) | 17 ? | 0.85 ? 95% | 5.6 ? 67% | 0.69 ? 96% | 11.3 ? 34% | 8.1 ? 52% | 9.2 ? 46% |
| PWM Frequency (Hz) | 4840 ? | 360 ? | 240 ? | 5800 ? | |||
| Bildschirm | -11% | -30% | 3% | -23% | -57% | 11% | |
| Helligkeit Bildmitte (cd/m²) | 651 | 366 -44% | 551 -15% | 390 -40% | 504.8 -22% | 384 -41% | 539 -17% |
| Brightness (cd/m²) | 673 | 367 -45% | 524 -22% | 393 -42% | 490 -27% | 371 -45% | 546 -19% |
| Brightness Distribution (%) | 93 | 96 3% | 91 -2% | 98 5% | 84 -10% | 88 -5% | 96 3% |
| Schwarzwert * (cd/m²) | 0.22 | 0.52 -136% | 0.41 -86% | 0.3 -36% | 0.18 18% | ||
| Kontrast (:1) | 2959 | 1060 -64% | 1231 -58% | 1280 -57% | 2994 1% | ||
| Delta E Colorchecker * | 1.9 | 1.3 32% | 1.7 11% | 1.4 26% | 1.23 35% | 3.4 -79% | 1.4 26% |
| Colorchecker dE 2000 max. * | 4.2 | 3.6 14% | 4.1 2% | 2.7 36% | 3.74 11% | 9.2 -119% | 2.1 50% |
| Colorchecker dE 2000 calibrated * | 0.6 | 1 -67% | 1 -67% | 1.1 -83% | 1.3 -117% | ||
| Delta E Graustufen * | 3 | 2.2 27% | 2.4 20% | 2.1 30% | 2 33% | 3.4 -13% | 2.2 27% |
| Gamma | 2.18 101% | 2.14 103% | 2.2 100% | 2.27 97% | 2.22 99% | 2.16 102% | 2.19 100% |
| CCT | 6738 96% | 6680 97% | 6842 95% | 6431 101% | 6670 97% | 7462 87% | 6479 100% |
| Durchschnitt gesamt (Programm / Settings) | 29% /
9% | 14% /
-9% | 34% /
19% | 4% /
-10% | -9% /
-34% | 19% /
14% |
* ... kleinere Werte sind besser
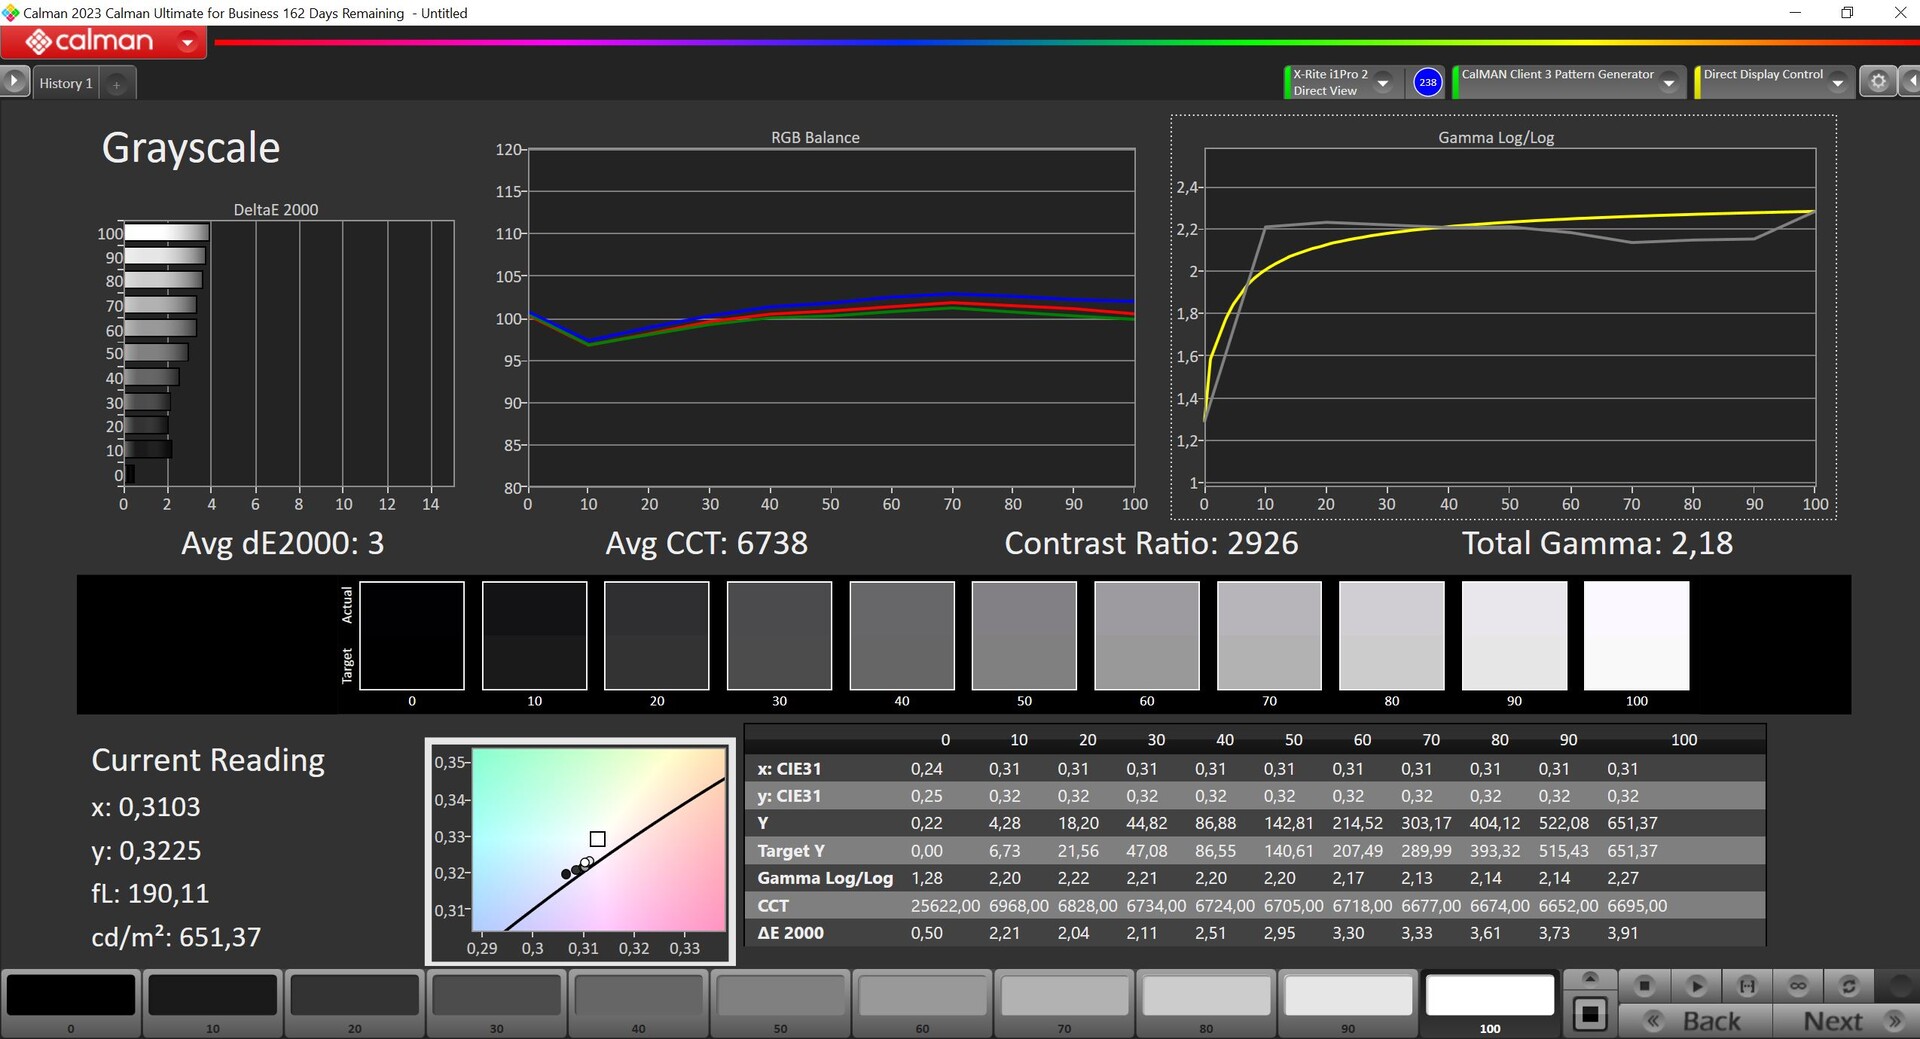

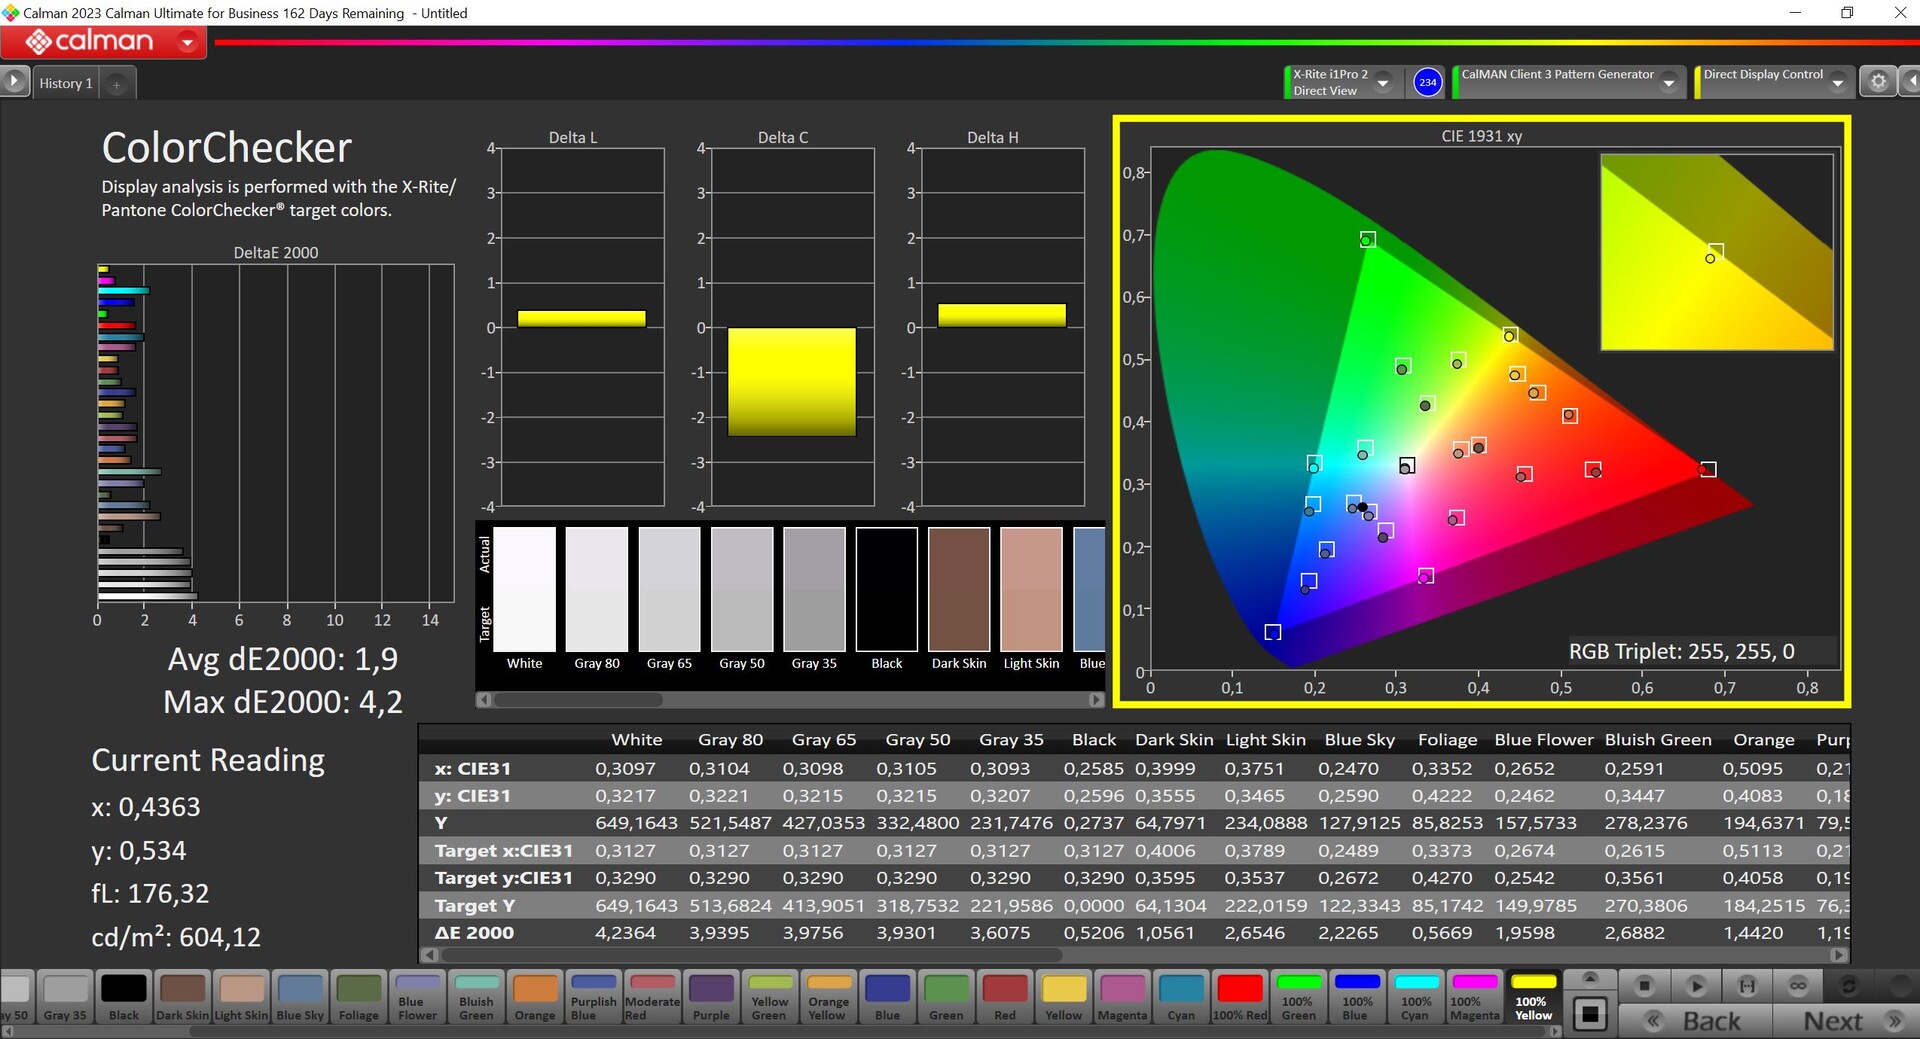
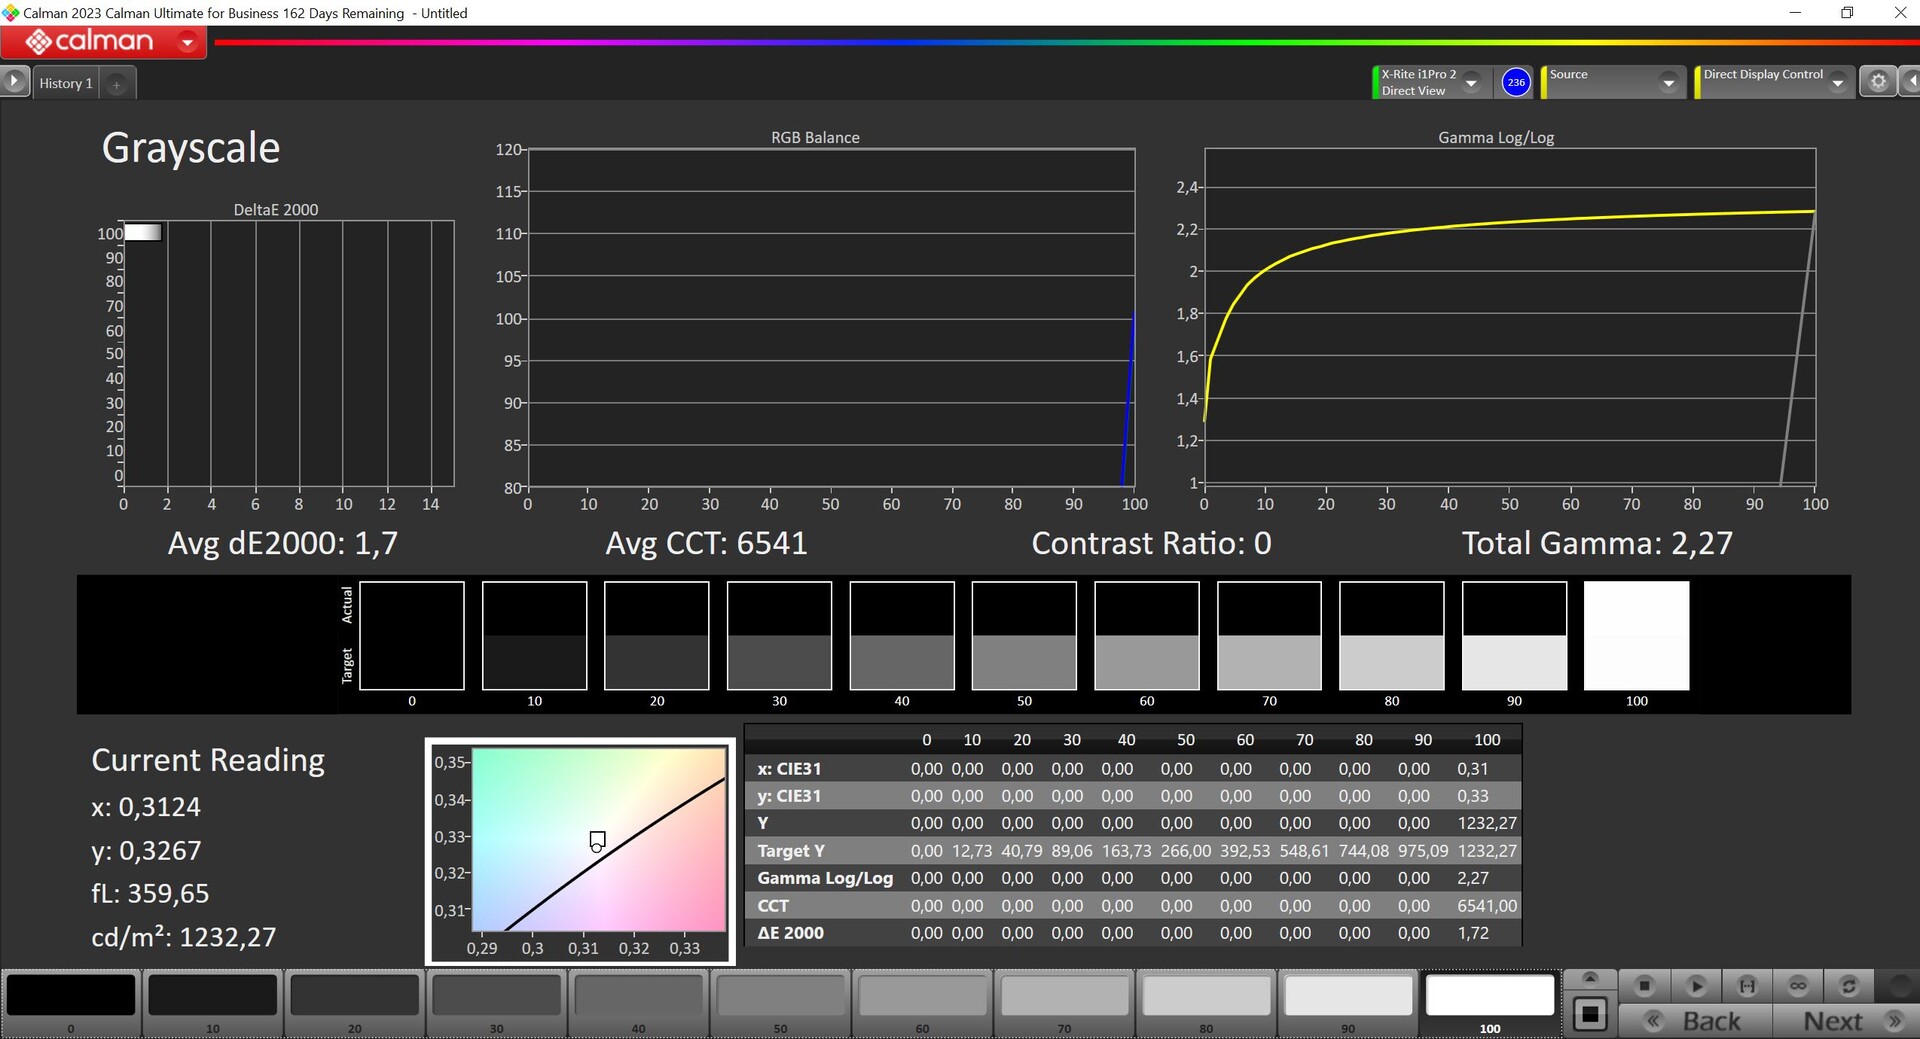
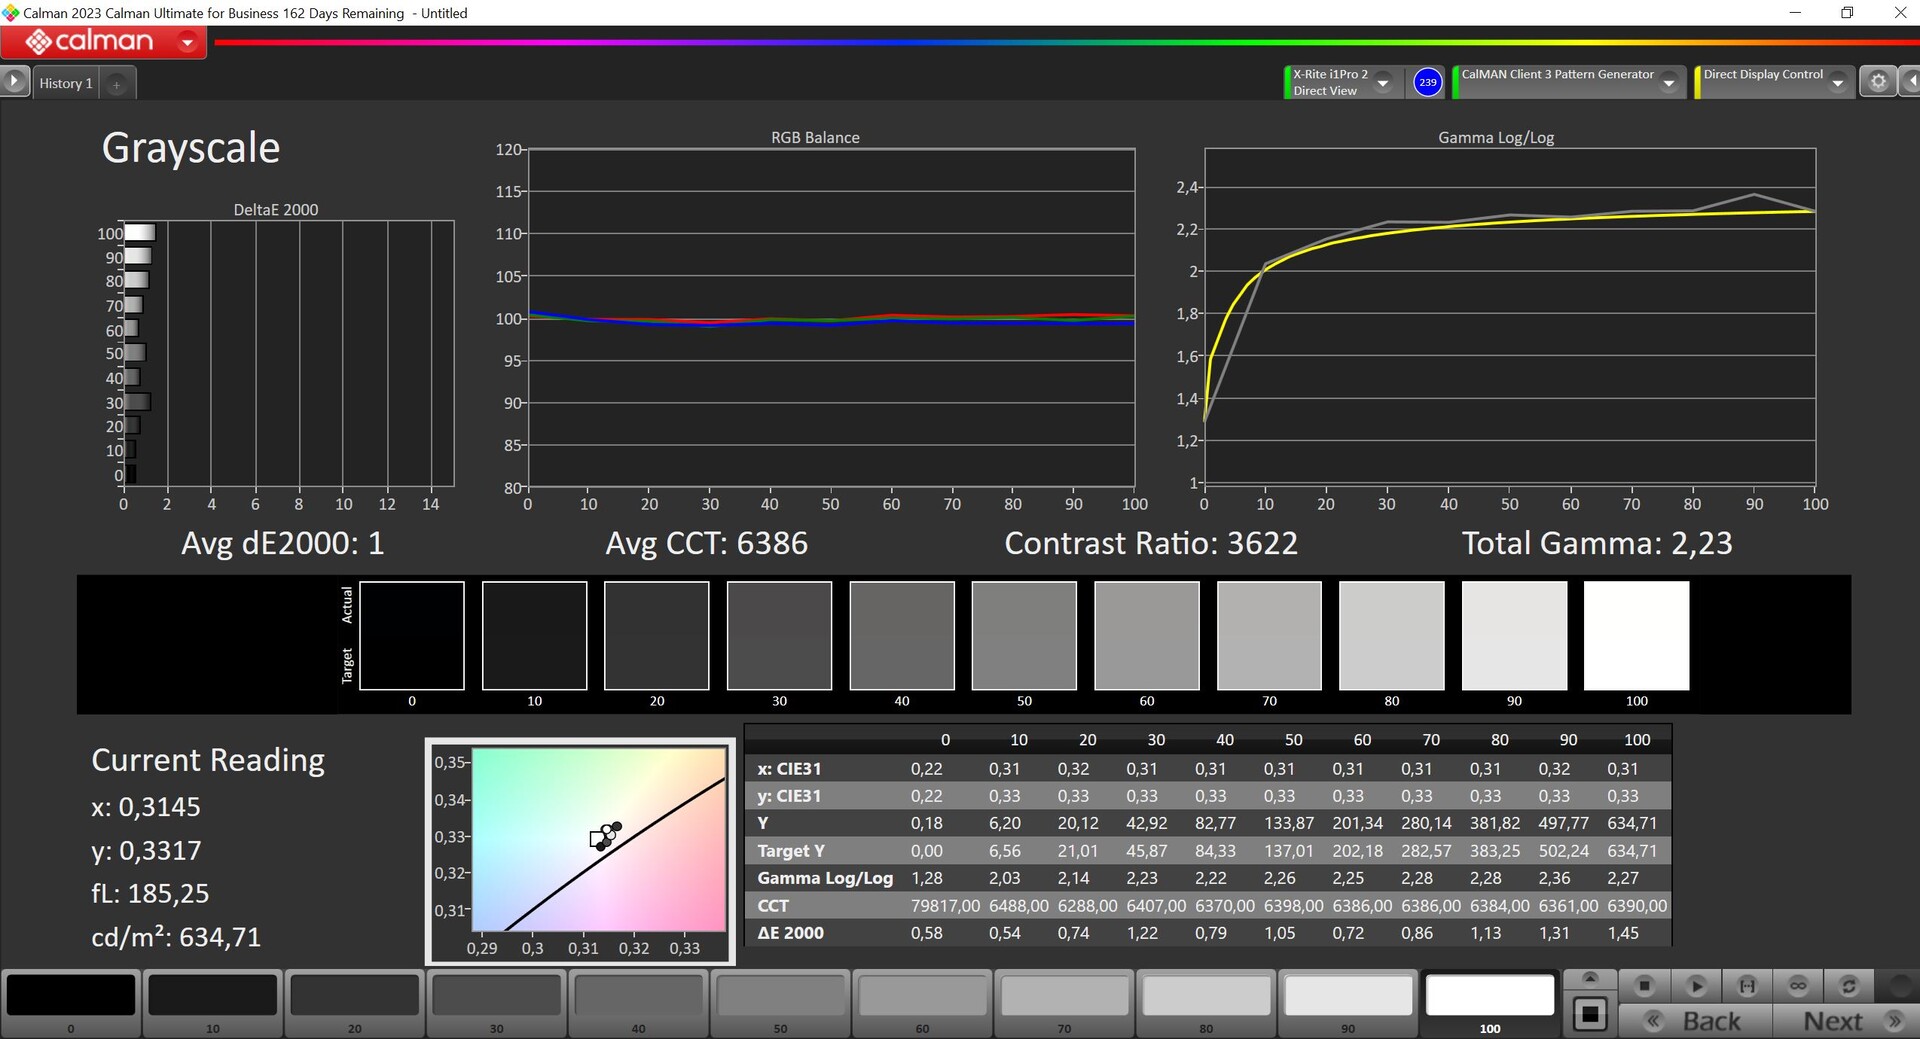
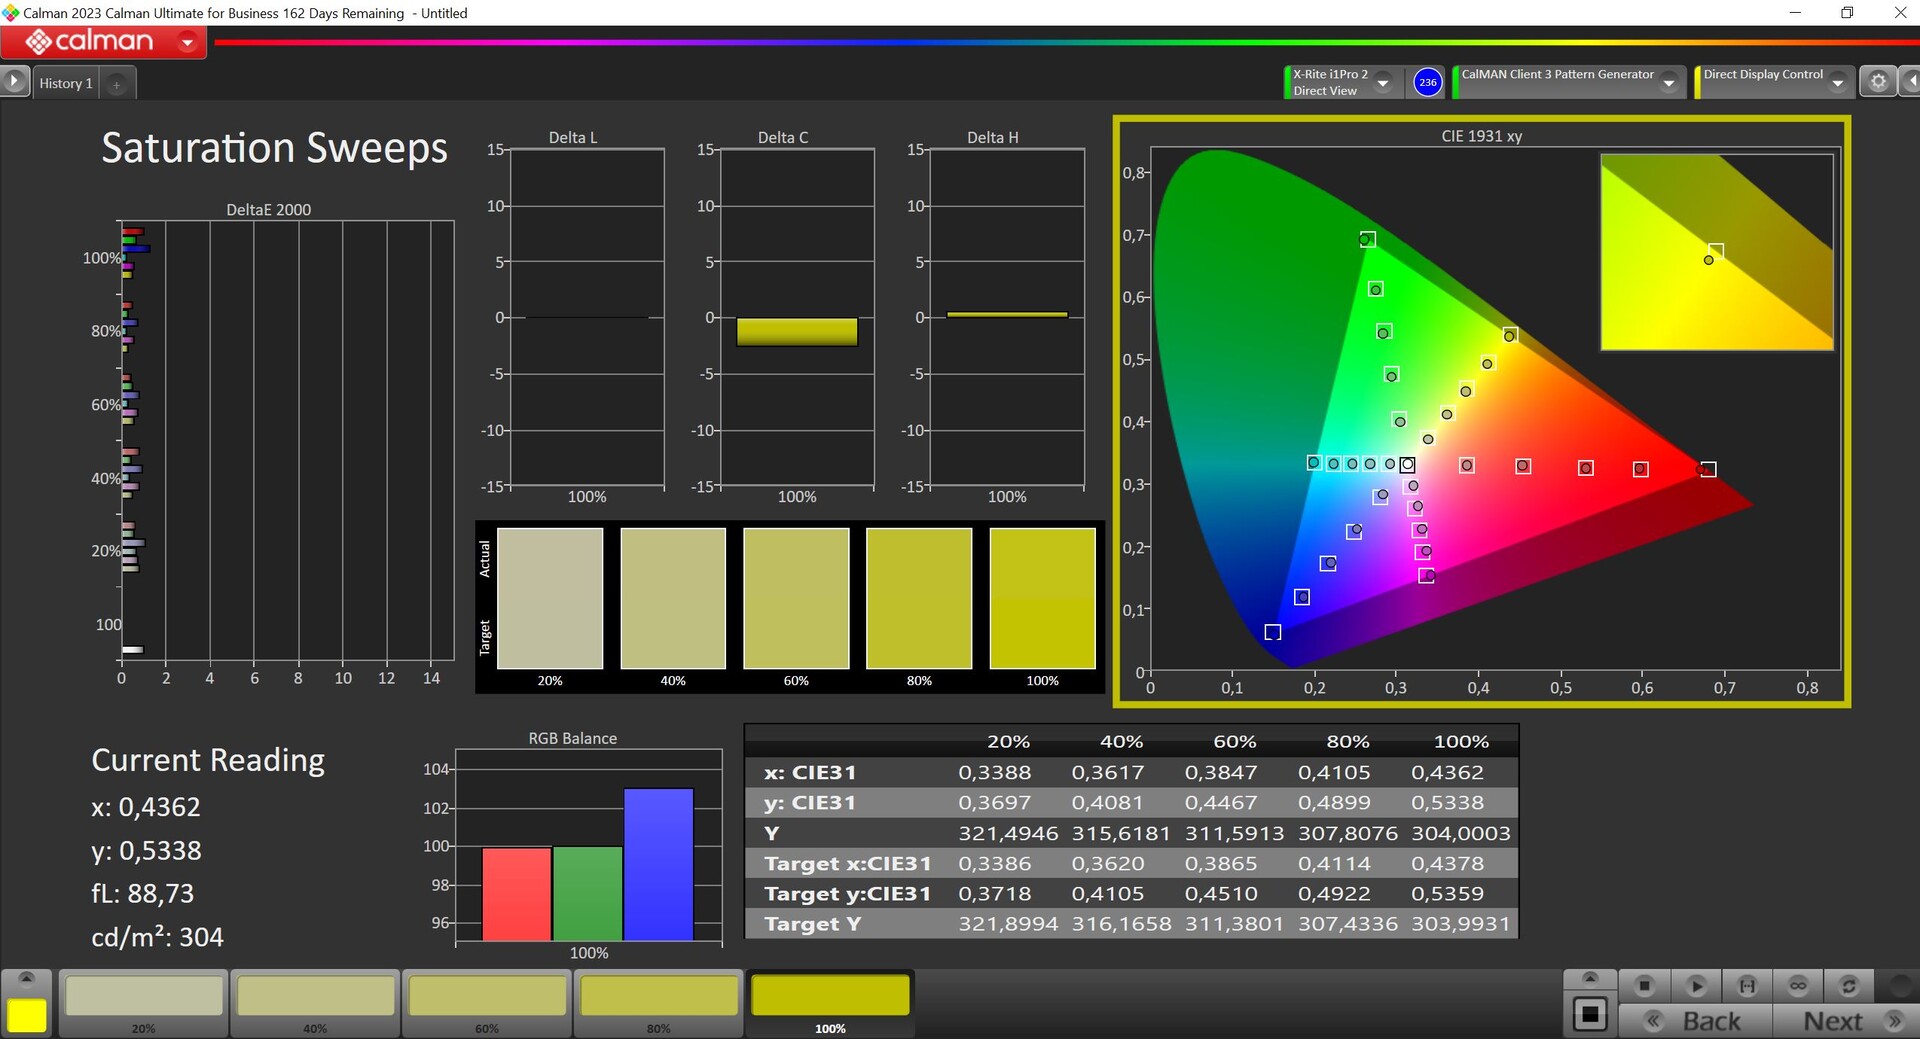
Wir haben das Panel mit der professionellen CalMAN-Software (X-Rite i1 Pro 2) analysiert und waren überrascht, dass die Lenovo Vantage-Software keine Farbprofile für die verschiedenen Farbräume mehr zur Verfügung stellt. Lenovo bewirbt nach wie vor AdobeRGB, doch das einzige Profil ist für den P3-Farbraum. Warum es zu dieser Einschränkung kommt ist unklar, aber auf jeden Fall ärgerlich. Im Auslieferungszustand ist die Darstellung bereits ordentlich, mit unserer eigenen Kalibrierung (Profil steht weiter oben zum kostenlosen Download zur Verfügung) können wir die Bildqualität aber noch einmal deutlich verbessern.
Reaktionszeiten (Response Times) des Displays
| ↔ Reaktionszeiten Schwarz zu Weiß | ||
|---|---|---|
| 17 ms ... steigend ↗ und fallend ↘ kombiniert | ↗ 8.2 ms steigend | 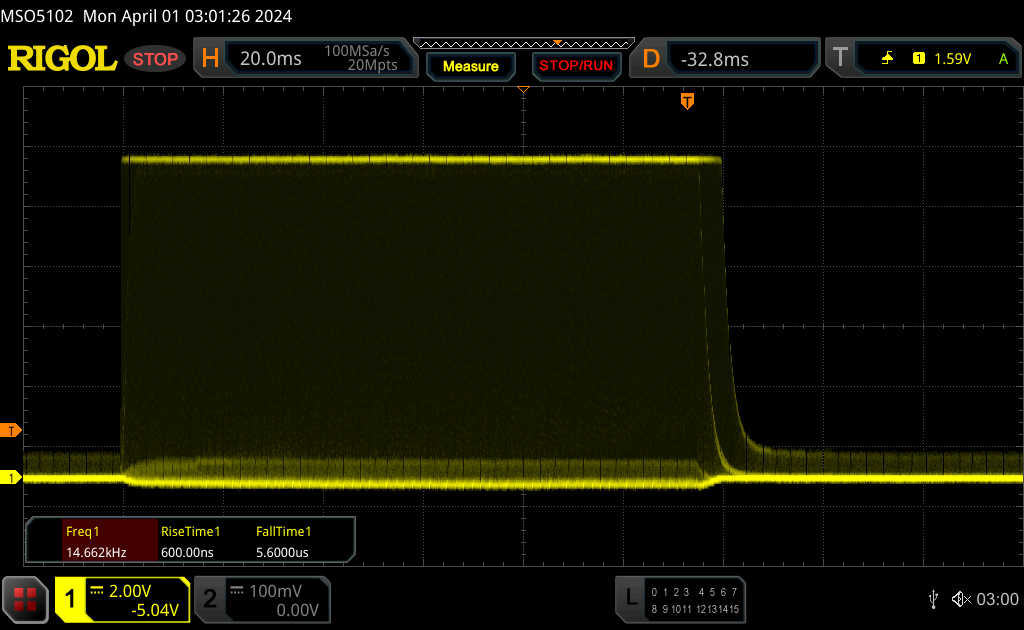 |
| ↘ 8.8 ms fallend | ||
| Die gemessenen Reaktionszeiten sind gut, für anspruchsvolle Spieler könnten der Bildschirm jedoch zu langsam sein. Im Vergleich rangierten die bei uns getesteten Geräte von 0.1 (Minimum) zu 240 (Maximum) ms. » 39 % aller Screens waren schneller als der getestete. Daher sind die gemessenen Reaktionszeiten besser als der Durchschnitt aller vermessenen Geräte (19.8 ms). | ||
| ↔ Reaktionszeiten 50% Grau zu 80% Grau | ||
| 22.2 ms ... steigend ↗ und fallend ↘ kombiniert | ↗ 9.6 ms steigend | 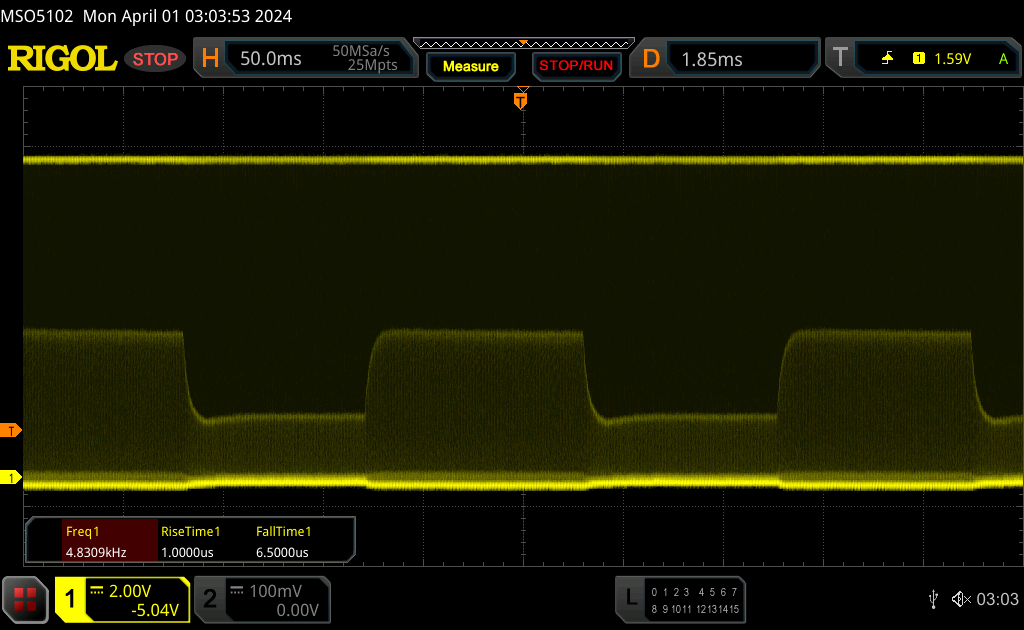 |
| ↘ 12.6 ms fallend | ||
| Die gemessenen Reaktionszeiten sind gut, für anspruchsvolle Spieler könnten der Bildschirm jedoch zu langsam sein. Im Vergleich rangierten die bei uns getesteten Geräte von 0.165 (Minimum) zu 636 (Maximum) ms. » 34 % aller Screens waren schneller als der getestete. Daher sind die gemessenen Reaktionszeiten besser als der Durchschnitt aller vermessenen Geräte (31 ms). | ||
Bildschirm-Flackern / PWM (Pulse-Width Modulation)
| Flackern / PWM festgestellt | 4840 Hz | ≤ 100 % Helligkeit | 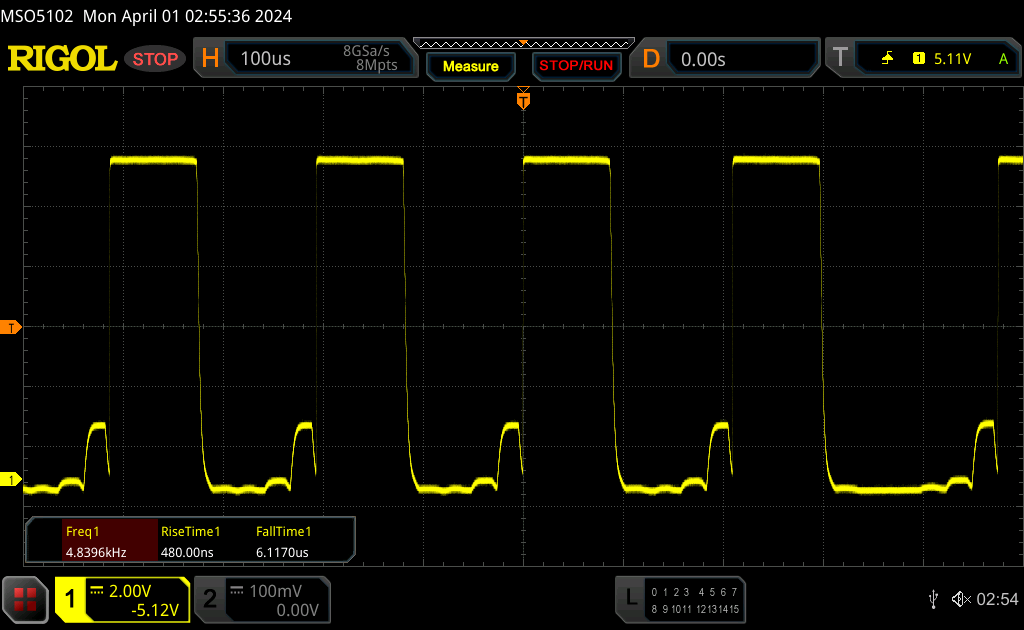 |
Das Display flackert mit 4840 Hz (im schlimmsten Fall, eventuell durch Pulsweitenmodulation PWM) bei einer eingestellten Helligkeit von 100 % und darunter. Darüber sollte es zu keinem Flackern kommen. Die Frequenz von 4840 Hz ist sehr hoch und sollte daher auch bei empfindlichen Personen zu keinen Problemen führen. Im Vergleich: 52 % aller getesteten Geräte nutzten kein PWM um die Helligkeit zu reduzieren. Wenn PWM eingesetzt wurde, dann bei einer Frequenz von durchschnittlich 7763 (Minimum 5, Maximum 343500) Hz. | |||
Im Freien schlägt sich die matte Variante des Mini-LED-Panels natürlich besser als der spiegelnde Touchscreen. Wenn man Reflexionen von direkten Lichtquellen vermeidet, lässt sich das Gerät auch problemlos in sehr hellen Umgebungen verwenden. Bei der Blickwinkelstabilität gibt es ebenfalls keine Kritik.

Leistung - RTX 4070 Laptop mit Advanced Optimus
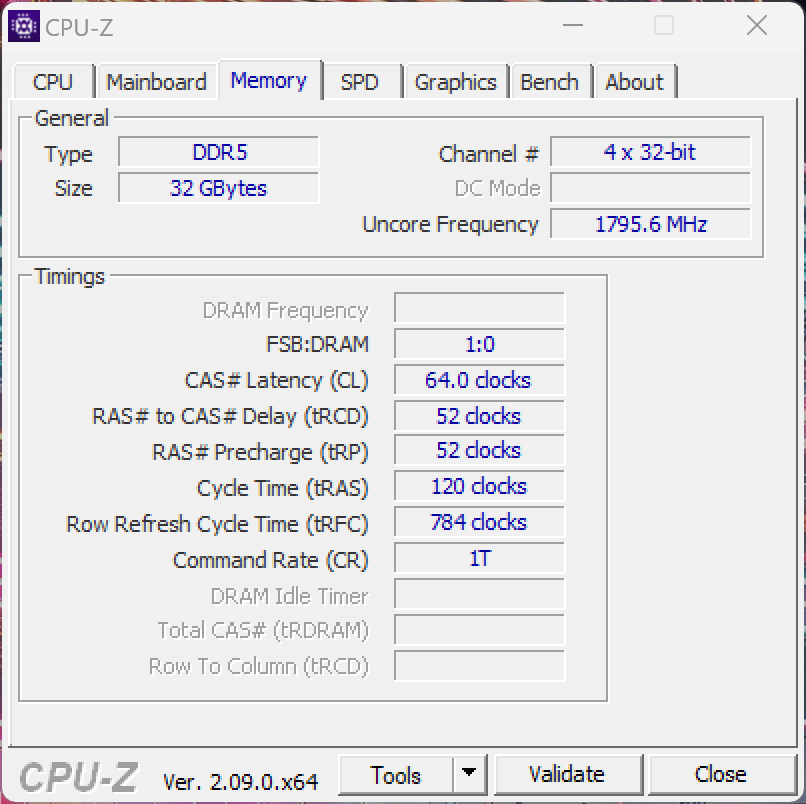
Lenovo bietet das Yoga Pro 9i 16 G9 ausschließlich mit den neuen Meteor-Lake-Prozessoren von Intel (Core Ultra 7 oder 9) sowie den beiden GeForce-Modelle RTX 4060/4070 Laptop an. Standardmäßig sind 32 GB RAM (LPDDR5x-7467), bei der Wahl des Core Ultra 9 185H lässt sich die Menge des Arbeitsspeichers für 130 Euro auf 64 GB verdoppeln.
Testbedingungen
Lenovo bietet verschiedene Energieprofile und die entsprechenden TDP/TGP-Werte haben wir in der nachfolgenden Tabelle zusammengefasst. Wir haben die Benchmarks und Messungen im Modus Leistung durchgeführt.
| Energieprofil | CPU-Last | CB R23 Multi | GPU-Last | Time Spy Graphics | Cyberpunk 2077 QHD Ultra |
max. Lüfterlautstärke |
|---|---|---|---|---|---|---|
| Akkusparmodus | 40 -> 30 Watt | 12.824 Punkte | 22 Watt | 2.655 Punkte | 10,3 FPS | 30,9 dB(A) |
| Auto | 78 -> 65 Watt | 18.849 Punkte | 65 Watt | 10.032 Punkte | 38,6 FPS | 44,9 dB(A) |
| Leistung | 115 -> 80 Watt | 19.851 Punkte | 100 Watt | 12.181 Punkte | 47,8 FPS | 53,9 dB(A) |
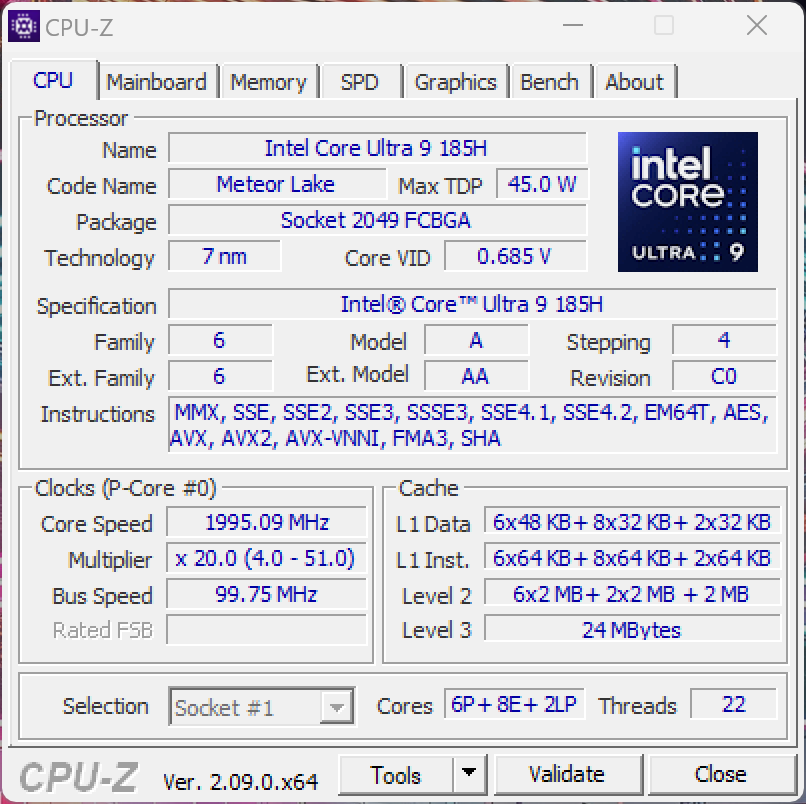
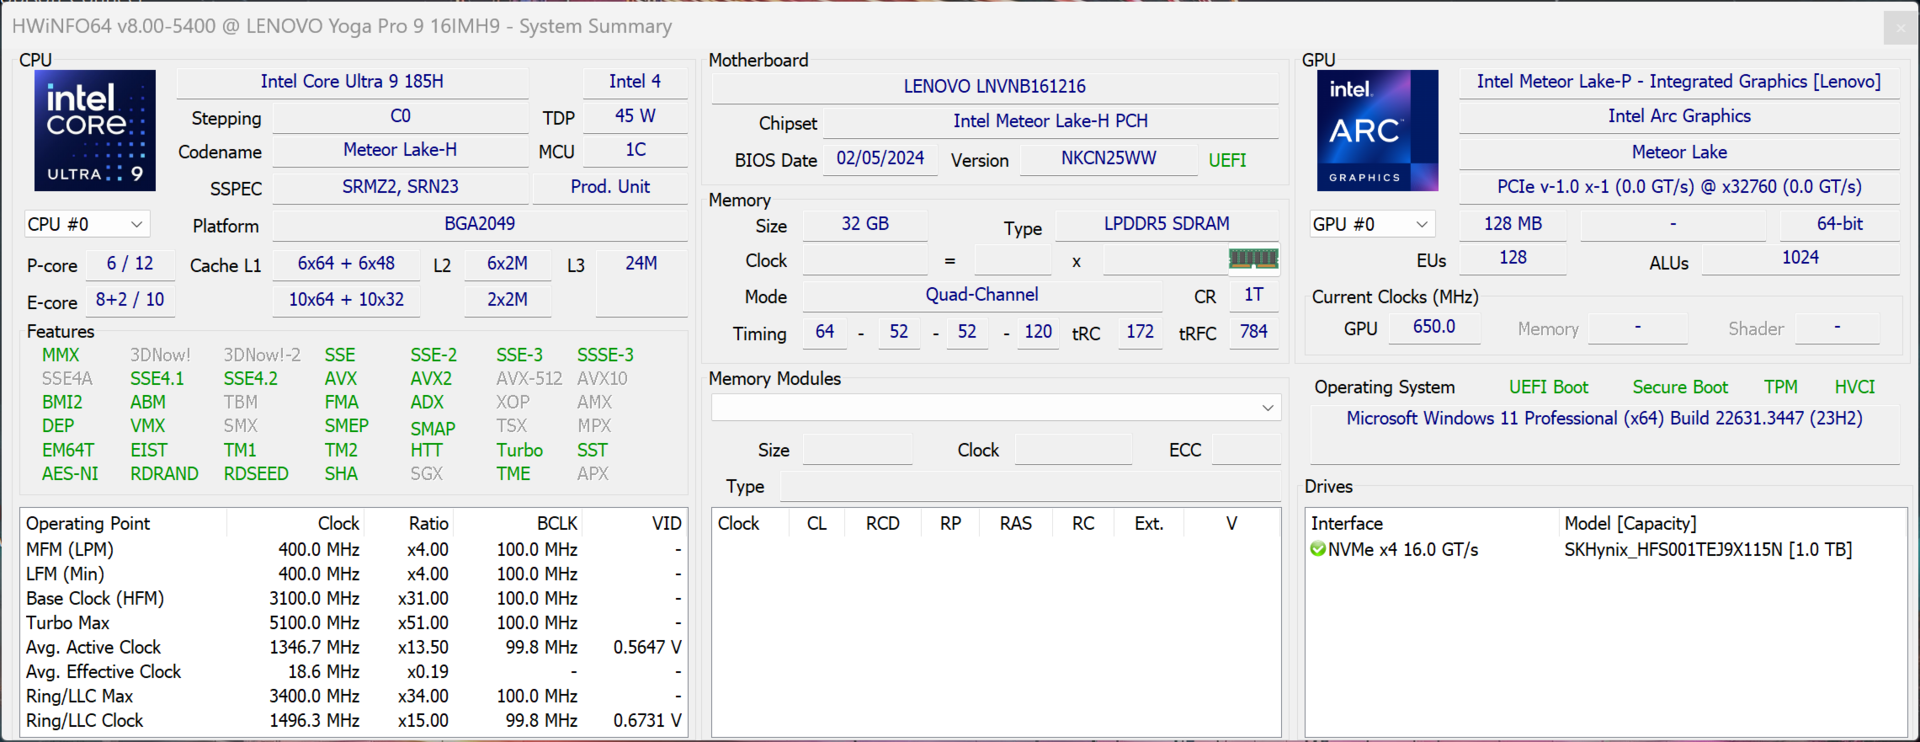
Prozessor - Core Ultra 9 185H
Der Core Ultra 9 185H ist der Nachfolger des Core i9-13900H und bietet 16 Kerne (22 Threads). Im Vergleich zum Core Ultra 7 155H erreicht der 185H einen höheren maximalen Takt von bis zu 5,1 GHz. Dank der hohen Power Limits ist die Leistung sehr gut, aber man sieht auch, dass die Multi-Core-Leistung grundsätzlich nur unwesentlich besser ist, als bei den alten Raptor-Lake-Chips und durchschnittlich liegt der Core Ultra 9 in allen CPU-Benchmarks gerade einmal 2 % vor dem Core i7-13705H des Vorgängers. Bei dauerhafter Belastung bleibt die Leistung ebenfalls sehr stabil.
Im Akkubetrieb darf der Prozessor maximal 80 Watt verbrauchen, weshalb die Leistung hier nur unwesentlich geringer ausfällt als im Netzbetrieb. Weitere CPU-Benchmarks stehen in unserer Techniksektion zur Verfügung.
Cinebench R15 Multi Dauertest
Cinebench R23: Multi Core | Single Core
Cinebench R20: CPU (Multi Core) | CPU (Single Core)
Cinebench R15: CPU Multi 64Bit | CPU Single 64Bit
Blender: v2.79 BMW27 CPU
7-Zip 18.03: 7z b 4 | 7z b 4 -mmt1
Geekbench 6.7: Multi-Core | Single-Core
Geekbench 5.5: Multi-Core | Single-Core
HWBOT x265 Benchmark v2.2: 4k Preset
LibreOffice : 20 Documents To PDF
R Benchmark 2.5: Overall mean
| CPU Performance Rating | |
| Lenovo Yoga Pro 9 16IMH9 | |
| Lenovo Yoga Pro 9 16-IRP G8 | |
| Framework Laptop 16 | |
| Honor MagicBook Pro 16 2024 | |
| Dell XPS 16 9640 | |
| Durchschnitt der Klasse Multimedia | |
| Durchschnittliche Intel Core Ultra 9 185H | |
| Samsung Galaxy Book4 Ultra | |
| Schenker VISION 16 Pro (M23) -2! | |
| Cinebench R23 / Multi Core | |
| Lenovo Yoga Pro 9 16IMH9 | |
| Lenovo Yoga Pro 9 16-IRP G8 | |
| Honor MagicBook Pro 16 2024 | |
| Dell XPS 16 9640 | |
| Durchschnittliche Intel Core Ultra 9 185H (11072 - 19851, n=20) | |
| Durchschnitt der Klasse Multimedia (4861 - 33362, n=80, der letzten 2 Jahre) | |
| Framework Laptop 16 | |
| Samsung Galaxy Book4 Ultra | |
| Schenker VISION 16 Pro (M23) | |
| Cinebench R23 / Single Core | |
| Durchschnitt der Klasse Multimedia (1128 - 2459, n=72, der letzten 2 Jahre) | |
| Lenovo Yoga Pro 9 16IMH9 | |
| Schenker VISION 16 Pro (M23) | |
| Lenovo Yoga Pro 9 16-IRP G8 | |
| Dell XPS 16 9640 | |
| Samsung Galaxy Book4 Ultra | |
| Durchschnittliche Intel Core Ultra 9 185H (1166 - 1912, n=20) | |
| Honor MagicBook Pro 16 2024 | |
| Framework Laptop 16 | |
| Cinebench R20 / CPU (Multi Core) | |
| Lenovo Yoga Pro 9 16IMH9 | |
| Lenovo Yoga Pro 9 16-IRP G8 | |
| Honor MagicBook Pro 16 2024 | |
| Dell XPS 16 9640 | |
| Durchschnittliche Intel Core Ultra 9 185H (4198 - 7651, n=20) | |
| Framework Laptop 16 | |
| Durchschnitt der Klasse Multimedia (1887 - 12912, n=63, der letzten 2 Jahre) | |
| Samsung Galaxy Book4 Ultra | |
| Schenker VISION 16 Pro (M23) | |
| Cinebench R20 / CPU (Single Core) | |
| Lenovo Yoga Pro 9 16IMH9 | |
| Lenovo Yoga Pro 9 16-IRP G8 | |
| Schenker VISION 16 Pro (M23) | |
| Durchschnitt der Klasse Multimedia (425 - 853, n=63, der letzten 2 Jahre) | |
| Samsung Galaxy Book4 Ultra | |
| Honor MagicBook Pro 16 2024 | |
| Durchschnittliche Intel Core Ultra 9 185H (442 - 735, n=20) | |
| Framework Laptop 16 | |
| Dell XPS 16 9640 | |
| Cinebench R15 / CPU Multi 64Bit | |
| Lenovo Yoga Pro 9 16IMH9 | |
| Lenovo Yoga Pro 9 16-IRP G8 | |
| Honor MagicBook Pro 16 2024 | |
| Dell XPS 16 9640 | |
| Durchschnittliche Intel Core Ultra 9 185H (1582 - 3165, n=22) | |
| Framework Laptop 16 | |
| Durchschnitt der Klasse Multimedia (856 - 5224, n=67, der letzten 2 Jahre) | |
| Samsung Galaxy Book4 Ultra | |
| Schenker VISION 16 Pro (M23) | |
| Cinebench R15 / CPU Single 64Bit | |
| Lenovo Yoga Pro 9 16IMH9 | |
| Durchschnitt der Klasse Multimedia (184.8 - 326, n=65, der letzten 2 Jahre) | |
| Framework Laptop 16 | |
| Schenker VISION 16 Pro (M23) | |
| Lenovo Yoga Pro 9 16-IRP G8 | |
| Honor MagicBook Pro 16 2024 | |
| Durchschnittliche Intel Core Ultra 9 185H (191.9 - 281, n=20) | |
| Dell XPS 16 9640 | |
| Samsung Galaxy Book4 Ultra | |
| Blender / v2.79 BMW27 CPU | |
| Durchschnitt der Klasse Multimedia (100 - 557, n=64, der letzten 2 Jahre) | |
| Schenker VISION 16 Pro (M23) | |
| Samsung Galaxy Book4 Ultra | |
| Durchschnittliche Intel Core Ultra 9 185H (163 - 285, n=20) | |
| Framework Laptop 16 | |
| Honor MagicBook Pro 16 2024 | |
| Dell XPS 16 9640 | |
| Lenovo Yoga Pro 9 16-IRP G8 | |
| Lenovo Yoga Pro 9 16IMH9 | |
| 7-Zip 18.03 / 7z b 4 | |
| Lenovo Yoga Pro 9 16-IRP G8 | |
| Lenovo Yoga Pro 9 16IMH9 | |
| Framework Laptop 16 | |
| Dell XPS 16 9640 | |
| Honor MagicBook Pro 16 2024 | |
| Durchschnittliche Intel Core Ultra 9 185H (51289 - 76331, n=20) | |
| Samsung Galaxy Book4 Ultra | |
| Schenker VISION 16 Pro (M23) | |
| Durchschnitt der Klasse Multimedia (26062 - 130368, n=61, der letzten 2 Jahre) | |
| 7-Zip 18.03 / 7z b 4 -mmt1 | |
| Framework Laptop 16 | |
| Schenker VISION 16 Pro (M23) | |
| Lenovo Yoga Pro 9 16-IRP G8 | |
| Durchschnitt der Klasse Multimedia (3666 - 7545, n=62, der letzten 2 Jahre) | |
| Lenovo Yoga Pro 9 16IMH9 | |
| Samsung Galaxy Book4 Ultra | |
| Honor MagicBook Pro 16 2024 | |
| Dell XPS 16 9640 | |
| Durchschnittliche Intel Core Ultra 9 185H (4199 - 5781, n=20) | |
| Geekbench 6.7 / Multi-Core | |
| Durchschnitt der Klasse Multimedia (4983 - 29415, n=75, der letzten 2 Jahre) | |
| Lenovo Yoga Pro 9 16-IRP G8 | |
| Lenovo Yoga Pro 9 16IMH9 | |
| Dell XPS 16 9640 | |
| Durchschnittliche Intel Core Ultra 9 185H (9140 - 14540, n=20) | |
| Framework Laptop 16 | |
| Honor MagicBook Pro 16 2024 | |
| Samsung Galaxy Book4 Ultra | |
| Geekbench 6.7 / Single-Core | |
| Durchschnitt der Klasse Multimedia (1534 - 4335, n=74, der letzten 2 Jahre) | |
| Framework Laptop 16 | |
| Lenovo Yoga Pro 9 16-IRP G8 | |
| Lenovo Yoga Pro 9 16IMH9 | |
| Honor MagicBook Pro 16 2024 | |
| Samsung Galaxy Book4 Ultra | |
| Dell XPS 16 9640 | |
| Durchschnittliche Intel Core Ultra 9 185H (1490 - 2573, n=20) | |
| Geekbench 5.5 / Multi-Core | |
| Lenovo Yoga Pro 9 16-IRP G8 | |
| Lenovo Yoga Pro 9 16IMH9 | |
| Dell XPS 16 9640 | |
| Honor MagicBook Pro 16 2024 | |
| Durchschnittliche Intel Core Ultra 9 185H (9330 - 14230, n=20) | |
| Durchschnitt der Klasse Multimedia (4652 - 20422, n=61, der letzten 2 Jahre) | |
| Samsung Galaxy Book4 Ultra | |
| Framework Laptop 16 | |
| Schenker VISION 16 Pro (M23) | |
| Geekbench 5.5 / Single-Core | |
| Framework Laptop 16 | |
| Durchschnitt der Klasse Multimedia (805 - 2974, n=61, der letzten 2 Jahre) | |
| Lenovo Yoga Pro 9 16IMH9 | |
| Schenker VISION 16 Pro (M23) | |
| Samsung Galaxy Book4 Ultra | |
| Honor MagicBook Pro 16 2024 | |
| Lenovo Yoga Pro 9 16-IRP G8 | |
| Dell XPS 16 9640 | |
| Durchschnittliche Intel Core Ultra 9 185H (986 - 1902, n=20) | |
| HWBOT x265 Benchmark v2.2 / 4k Preset | |
| Lenovo Yoga Pro 9 16IMH9 | |
| Lenovo Yoga Pro 9 16-IRP G8 | |
| Framework Laptop 16 | |
| Dell XPS 16 9640 | |
| Honor MagicBook Pro 16 2024 | |
| Durchschnittliche Intel Core Ultra 9 185H (13.7 - 22.7, n=20) | |
| Durchschnitt der Klasse Multimedia (5.26 - 36.1, n=62, der letzten 2 Jahre) | |
| Samsung Galaxy Book4 Ultra | |
| Schenker VISION 16 Pro (M23) | |
| LibreOffice / 20 Documents To PDF | |
| Durchschnitt der Klasse Multimedia (23.9 - 146.7, n=63, der letzten 2 Jahre) | |
| Lenovo Yoga Pro 9 16-IRP G8 | |
| Schenker VISION 16 Pro (M23) | |
| Durchschnittliche Intel Core Ultra 9 185H (34.5 - 73.5, n=20) | |
| Honor MagicBook Pro 16 2024 | |
| Samsung Galaxy Book4 Ultra | |
| Dell XPS 16 9640 | |
| Framework Laptop 16 | |
| Lenovo Yoga Pro 9 16IMH9 | |
| R Benchmark 2.5 / Overall mean | |
| Dell XPS 16 9640 | |
| Durchschnittliche Intel Core Ultra 9 185H (0.4313 - 0.759, n=21) | |
| Samsung Galaxy Book4 Ultra | |
| Durchschnitt der Klasse Multimedia (0.3604 - 0.947, n=62, der letzten 2 Jahre) | |
| Honor MagicBook Pro 16 2024 | |
| Lenovo Yoga Pro 9 16-IRP G8 | |
| Framework Laptop 16 | |
| Lenovo Yoga Pro 9 16IMH9 | |
| Schenker VISION 16 Pro (M23) | |
* ... kleinere Werte sind besser
AIDA64: FP32 Ray-Trace | FPU Julia | CPU SHA3 | CPU Queen | FPU SinJulia | FPU Mandel | CPU AES | CPU ZLib | FP64 Ray-Trace | CPU PhotoWorxx
| Performance Rating | |
| Framework Laptop 16 | |
| Lenovo Yoga Pro 9 16IMH9 | |
| Honor MagicBook Pro 16 2024 | |
| Lenovo Yoga Pro 9 16-IRP G8 | |
| Dell XPS 16 9640 | |
| Durchschnittliche Intel Core Ultra 9 185H | |
| Durchschnitt der Klasse Multimedia | |
| Samsung Galaxy Book4 Ultra | |
| Schenker VISION 16 Pro (M23) | |
| AIDA64 / FP32 Ray-Trace | |
| Framework Laptop 16 | |
| Lenovo Yoga Pro 9 16IMH9 | |
| Lenovo Yoga Pro 9 16-IRP G8 | |
| Durchschnitt der Klasse Multimedia (2214 - 50388, n=59, der letzten 2 Jahre) | |
| Honor MagicBook Pro 16 2024 | |
| Dell XPS 16 9640 | |
| Durchschnittliche Intel Core Ultra 9 185H (9220 - 18676, n=20) | |
| Samsung Galaxy Book4 Ultra | |
| Schenker VISION 16 Pro (M23) | |
| AIDA64 / FPU Julia | |
| Framework Laptop 16 | |
| Lenovo Yoga Pro 9 16IMH9 | |
| Honor MagicBook Pro 16 2024 | |
| Lenovo Yoga Pro 9 16-IRP G8 | |
| Dell XPS 16 9640 | |
| Durchschnittliche Intel Core Ultra 9 185H (48865 - 96463, n=20) | |
| Durchschnitt der Klasse Multimedia (12867 - 201874, n=60, der letzten 2 Jahre) | |
| Samsung Galaxy Book4 Ultra | |
| Schenker VISION 16 Pro (M23) | |
| AIDA64 / CPU SHA3 | |
| Framework Laptop 16 | |
| Honor MagicBook Pro 16 2024 | |
| Lenovo Yoga Pro 9 16IMH9 | |
| Lenovo Yoga Pro 9 16-IRP G8 | |
| Dell XPS 16 9640 | |
| Durchschnittliche Intel Core Ultra 9 185H (2394 - 4534, n=20) | |
| Durchschnitt der Klasse Multimedia (626 - 8623, n=60, der letzten 2 Jahre) | |
| Samsung Galaxy Book4 Ultra | |
| Schenker VISION 16 Pro (M23) | |
| AIDA64 / CPU Queen | |
| Framework Laptop 16 | |
| Lenovo Yoga Pro 9 16-IRP G8 | |
| Schenker VISION 16 Pro (M23) | |
| Lenovo Yoga Pro 9 16IMH9 | |
| Dell XPS 16 9640 | |
| Durchschnittliche Intel Core Ultra 9 185H (66785 - 95241, n=20) | |
| Samsung Galaxy Book4 Ultra | |
| Honor MagicBook Pro 16 2024 | |
| Durchschnitt der Klasse Multimedia (13483 - 181505, n=47, der letzten 2 Jahre) | |
| AIDA64 / FPU SinJulia | |
| Framework Laptop 16 | |
| Lenovo Yoga Pro 9 16IMH9 | |
| Lenovo Yoga Pro 9 16-IRP G8 | |
| Honor MagicBook Pro 16 2024 | |
| Dell XPS 16 9640 | |
| Durchschnittliche Intel Core Ultra 9 185H (7255 - 11392, n=20) | |
| Samsung Galaxy Book4 Ultra | |
| Schenker VISION 16 Pro (M23) | |
| Durchschnitt der Klasse Multimedia (886 - 28794, n=60, der letzten 2 Jahre) | |
| AIDA64 / FPU Mandel | |
| Framework Laptop 16 | |
| Lenovo Yoga Pro 9 16IMH9 | |
| Dell XPS 16 9640 | |
| Honor MagicBook Pro 16 2024 | |
| Lenovo Yoga Pro 9 16-IRP G8 | |
| Durchschnitt der Klasse Multimedia (6395 - 105740, n=59, der letzten 2 Jahre) | |
| Durchschnittliche Intel Core Ultra 9 185H (24004 - 48020, n=20) | |
| Samsung Galaxy Book4 Ultra | |
| Schenker VISION 16 Pro (M23) | |
| AIDA64 / CPU AES | |
| Framework Laptop 16 | |
| Honor MagicBook Pro 16 2024 | |
| Lenovo Yoga Pro 9 16IMH9 | |
| Durchschnittliche Intel Core Ultra 9 185H (53116 - 154066, n=20) | |
| Lenovo Yoga Pro 9 16-IRP G8 | |
| Dell XPS 16 9640 | |
| Samsung Galaxy Book4 Ultra | |
| Schenker VISION 16 Pro (M23) | |
| Durchschnitt der Klasse Multimedia (8171 - 126790, n=60, der letzten 2 Jahre) | |
| AIDA64 / CPU ZLib | |
| Lenovo Yoga Pro 9 16IMH9 | |
| Honor MagicBook Pro 16 2024 | |
| Lenovo Yoga Pro 9 16-IRP G8 | |
| Dell XPS 16 9640 | |
| Durchschnittliche Intel Core Ultra 9 185H (678 - 1341, n=20) | |
| Durchschnitt der Klasse Multimedia (143.8 - 2022, n=60, der letzten 2 Jahre) | |
| Samsung Galaxy Book4 Ultra | |
| Schenker VISION 16 Pro (M23) | |
| Framework Laptop 16 | |
| AIDA64 / FP64 Ray-Trace | |
| Framework Laptop 16 | |
| Lenovo Yoga Pro 9 16IMH9 | |
| Durchschnitt der Klasse Multimedia (1014 - 26875, n=60, der letzten 2 Jahre) | |
| Lenovo Yoga Pro 9 16-IRP G8 | |
| Dell XPS 16 9640 | |
| Honor MagicBook Pro 16 2024 | |
| Durchschnittliche Intel Core Ultra 9 185H (4428 - 10078, n=20) | |
| Schenker VISION 16 Pro (M23) | |
| Samsung Galaxy Book4 Ultra | |
| AIDA64 / CPU PhotoWorxx | |
| Lenovo Yoga Pro 9 16IMH9 | |
| Lenovo Yoga Pro 9 16-IRP G8 | |
| Dell XPS 16 9640 | |
| Samsung Galaxy Book4 Ultra | |
| Durchschnitt der Klasse Multimedia (8187 - 88154, n=60, der letzten 2 Jahre) | |
| Durchschnittliche Intel Core Ultra 9 185H (44547 - 53918, n=20) | |
| Honor MagicBook Pro 16 2024 | |
| Schenker VISION 16 Pro (M23) | |
| Framework Laptop 16 | |
System Performance
Die Ergebnisse in den synthetischen Benchmarks sind gut und im Alltag ist das Yoga Pro 9 16 ein sehr schnelles Gerät. Lediglich beim Wechsel auf die dedizierte Grafikkarte kommt es zu einer kurzen Verzögerung, das ist bei Geräten mit Advanced Optimus aber normal. Sonstige Probleme sind uns im Test nicht aufgefallen.
CrossMark: Overall | Productivity | Creativity | Responsiveness
WebXPRT 3: Overall
WebXPRT 4: Overall
Mozilla Kraken 1.1: Total
| PCMark 10 / Score | |
| Framework Laptop 16 | |
| Durchschnitt der Klasse Multimedia (4325 - 10386, n=57, der letzten 2 Jahre) | |
| Durchschnittliche Intel Core Ultra 9 185H, NVIDIA GeForce RTX 4070 Laptop GPU (7443 - 7761, n=4) | |
| Lenovo Yoga Pro 9 16IMH9 | |
| Schenker VISION 16 Pro (M23) | |
| Lenovo Yoga Pro 9 16-IRP G8 | |
| Dell XPS 16 9640 | |
| Samsung Galaxy Book4 Ultra | |
| Honor MagicBook Pro 16 2024 | |
| PCMark 10 / Essentials | |
| Framework Laptop 16 | |
| Lenovo Yoga Pro 9 16IMH9 | |
| Lenovo Yoga Pro 9 16-IRP G8 | |
| Schenker VISION 16 Pro (M23) | |
| Durchschnitt der Klasse Multimedia (8025 - 11664, n=56, der letzten 2 Jahre) | |
| Durchschnittliche Intel Core Ultra 9 185H, NVIDIA GeForce RTX 4070 Laptop GPU (9728 - 11133, n=4) | |
| Samsung Galaxy Book4 Ultra | |
| Dell XPS 16 9640 | |
| Honor MagicBook Pro 16 2024 | |
| PCMark 10 / Productivity | |
| Durchschnitt der Klasse Multimedia (7323 - 18233, n=56, der letzten 2 Jahre) | |
| Framework Laptop 16 | |
| Schenker VISION 16 Pro (M23) | |
| Durchschnittliche Intel Core Ultra 9 185H, NVIDIA GeForce RTX 4070 Laptop GPU (9067 - 9555, n=4) | |
| Dell XPS 16 9640 | |
| Samsung Galaxy Book4 Ultra | |
| Lenovo Yoga Pro 9 16IMH9 | |
| Lenovo Yoga Pro 9 16-IRP G8 | |
| Honor MagicBook Pro 16 2024 | |
| PCMark 10 / Digital Content Creation | |
| Framework Laptop 16 | |
| Durchschnittliche Intel Core Ultra 9 185H, NVIDIA GeForce RTX 4070 Laptop GPU (11369 - 13194, n=4) | |
| Lenovo Yoga Pro 9 16IMH9 | |
| Lenovo Yoga Pro 9 16-IRP G8 | |
| Schenker VISION 16 Pro (M23) | |
| Honor MagicBook Pro 16 2024 | |
| Durchschnitt der Klasse Multimedia (3651 - 16240, n=56, der letzten 2 Jahre) | |
| Dell XPS 16 9640 | |
| Samsung Galaxy Book4 Ultra | |
| CrossMark / Overall | |
| Schenker VISION 16 Pro (M23) | |
| Durchschnitt der Klasse Multimedia (866 - 2728, n=66, der letzten 2 Jahre) | |
| Dell XPS 16 9640 | |
| Lenovo Yoga Pro 9 16-IRP G8 | |
| Durchschnittliche Intel Core Ultra 9 185H, NVIDIA GeForce RTX 4070 Laptop GPU (1663 - 1917, n=3) | |
| Samsung Galaxy Book4 Ultra | |
| Honor MagicBook Pro 16 2024 | |
| Lenovo Yoga Pro 9 16IMH9 | |
| Framework Laptop 16 | |
| CrossMark / Productivity | |
| Schenker VISION 16 Pro (M23) | |
| Dell XPS 16 9640 | |
| Durchschnitt der Klasse Multimedia (931 - 2489, n=66, der letzten 2 Jahre) | |
| Lenovo Yoga Pro 9 16-IRP G8 | |
| Durchschnittliche Intel Core Ultra 9 185H, NVIDIA GeForce RTX 4070 Laptop GPU (1573 - 1849, n=3) | |
| Honor MagicBook Pro 16 2024 | |
| Samsung Galaxy Book4 Ultra | |
| Lenovo Yoga Pro 9 16IMH9 | |
| Framework Laptop 16 | |
| CrossMark / Creativity | |
| Durchschnitt der Klasse Multimedia (907 - 3465, n=66, der letzten 2 Jahre) | |
| Lenovo Yoga Pro 9 16-IRP G8 | |
| Dell XPS 16 9640 | |
| Schenker VISION 16 Pro (M23) | |
| Lenovo Yoga Pro 9 16IMH9 | |
| Durchschnittliche Intel Core Ultra 9 185H, NVIDIA GeForce RTX 4070 Laptop GPU (1872 - 2008, n=3) | |
| Samsung Galaxy Book4 Ultra | |
| Framework Laptop 16 | |
| Honor MagicBook Pro 16 2024 | |
| CrossMark / Responsiveness | |
| Schenker VISION 16 Pro (M23) | |
| Dell XPS 16 9640 | |
| Honor MagicBook Pro 16 2024 | |
| Lenovo Yoga Pro 9 16-IRP G8 | |
| Durchschnittliche Intel Core Ultra 9 185H, NVIDIA GeForce RTX 4070 Laptop GPU (1338 - 1856, n=3) | |
| Durchschnitt der Klasse Multimedia (605 - 2024, n=66, der letzten 2 Jahre) | |
| Samsung Galaxy Book4 Ultra | |
| Framework Laptop 16 | |
| Lenovo Yoga Pro 9 16IMH9 | |
| WebXPRT 3 / Overall | |
| Framework Laptop 16 | |
| Durchschnitt der Klasse Multimedia (136.4 - 596, n=69, der letzten 2 Jahre) | |
| Schenker VISION 16 Pro (M23) | |
| Lenovo Yoga Pro 9 16-IRP G8 | |
| Lenovo Yoga Pro 9 16IMH9 | |
| Honor MagicBook Pro 16 2024 | |
| Dell XPS 16 9640 | |
| Samsung Galaxy Book4 Ultra | |
| Durchschnittliche Intel Core Ultra 9 185H, NVIDIA GeForce RTX 4070 Laptop GPU (240 - 295, n=5) | |
| WebXPRT 4 / Overall | |
| Durchschnitt der Klasse Multimedia (167.3 - 402, n=70, der letzten 2 Jahre) | |
| Schenker VISION 16 Pro (M23) | |
| Lenovo Yoga Pro 9 16IMH9 | |
| Framework Laptop 16 | |
| Lenovo Yoga Pro 9 16-IRP G8 | |
| Honor MagicBook Pro 16 2024 | |
| Samsung Galaxy Book4 Ultra | |
| Durchschnittliche Intel Core Ultra 9 185H, NVIDIA GeForce RTX 4070 Laptop GPU (248 - 268, n=5) | |
| Dell XPS 16 9640 | |
| Mozilla Kraken 1.1 / Total | |
| Durchschnittliche Intel Core Ultra 9 185H, NVIDIA GeForce RTX 4070 Laptop GPU (494 - 549, n=5) | |
| Honor MagicBook Pro 16 2024 | |
| Lenovo Yoga Pro 9 16-IRP G8 | |
| Schenker VISION 16 Pro (M23) | |
| Lenovo Yoga Pro 9 16IMH9 | |
| Framework Laptop 16 | |
| Durchschnitt der Klasse Multimedia (228 - 835, n=72, der letzten 2 Jahre) | |
| Samsung Galaxy Book4 Ultra | |
* ... kleinere Werte sind besser
| PCMark 10 Score | 7547 Punkte | |
Hilfe | ||
| AIDA64 / Memory Copy | |
| Lenovo Yoga Pro 9 16IMH9 | |
| Dell XPS 16 9640 | |
| Samsung Galaxy Book4 Ultra | |
| Durchschnittliche Intel Core Ultra 9 185H (69929 - 95718, n=20) | |
| Honor MagicBook Pro 16 2024 | |
| Durchschnitt der Klasse Multimedia (11299 - 132135, n=60, der letzten 2 Jahre) | |
| Framework Laptop 16 | |
| Lenovo Yoga Pro 9 16-IRP G8 | |
| Schenker VISION 16 Pro (M23) | |
| AIDA64 / Memory Read | |
| Samsung Galaxy Book4 Ultra | |
| Lenovo Yoga Pro 9 16IMH9 | |
| Dell XPS 16 9640 | |
| Durchschnitt der Klasse Multimedia (11624 - 174586, n=60, der letzten 2 Jahre) | |
| Durchschnittliche Intel Core Ultra 9 185H (64619 - 87768, n=20) | |
| Lenovo Yoga Pro 9 16-IRP G8 | |
| Honor MagicBook Pro 16 2024 | |
| Schenker VISION 16 Pro (M23) | |
| Framework Laptop 16 | |
| AIDA64 / Memory Write | |
| Lenovo Yoga Pro 9 16-IRP G8 | |
| Framework Laptop 16 | |
| Durchschnitt der Klasse Multimedia (11755 - 134998, n=60, der letzten 2 Jahre) | |
| Honor MagicBook Pro 16 2024 | |
| Samsung Galaxy Book4 Ultra | |
| Lenovo Yoga Pro 9 16IMH9 | |
| Dell XPS 16 9640 | |
| Durchschnittliche Intel Core Ultra 9 185H (51114 - 93871, n=20) | |
| Schenker VISION 16 Pro (M23) | |
| AIDA64 / Memory Latency | |
| Durchschnittliche Intel Core Ultra 9 185H (121.4 - 259, n=20) | |
| Honor MagicBook Pro 16 2024 | |
| Samsung Galaxy Book4 Ultra | |
| Dell XPS 16 9640 | |
| Lenovo Yoga Pro 9 16IMH9 | |
| Durchschnitt der Klasse Multimedia (7 - 535, n=59, der letzten 2 Jahre) | |
| Lenovo Yoga Pro 9 16-IRP G8 | |
| Framework Laptop 16 | |
| Schenker VISION 16 Pro (M23) | |
* ... kleinere Werte sind besser
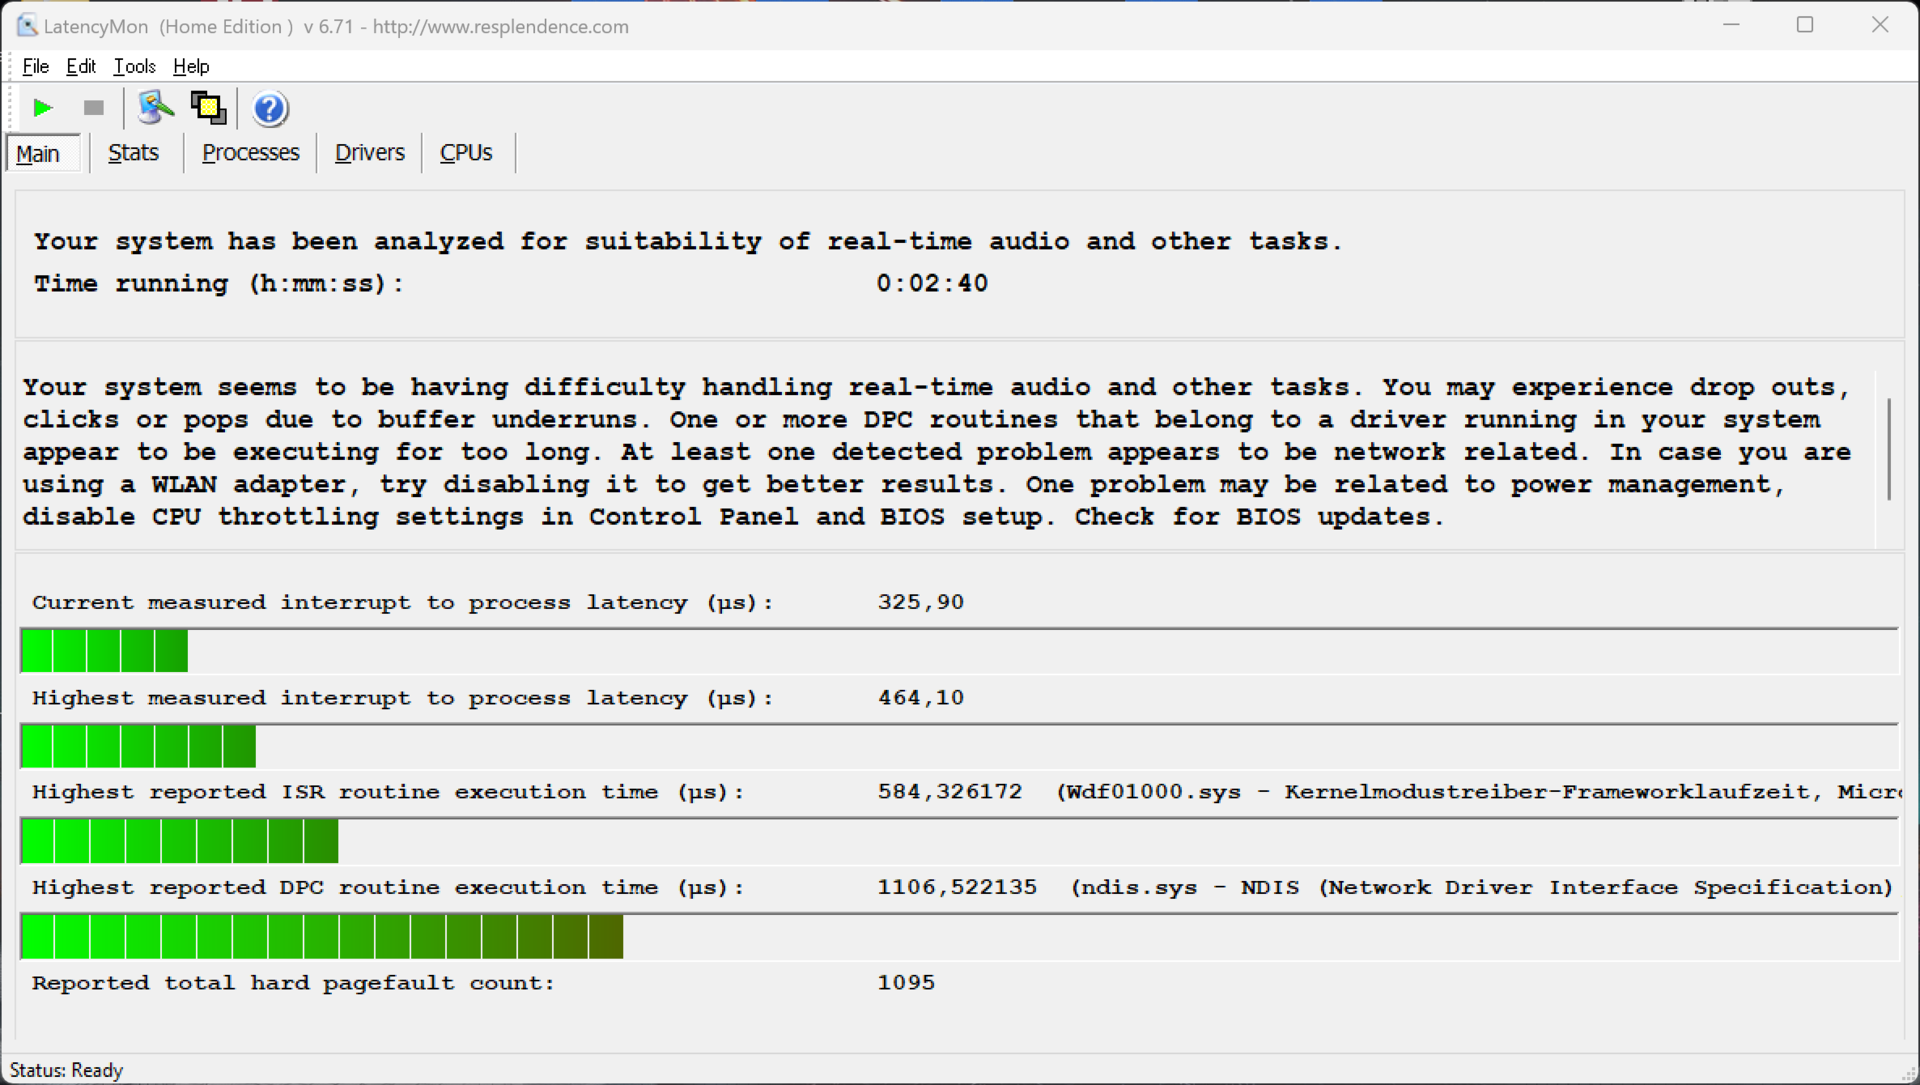
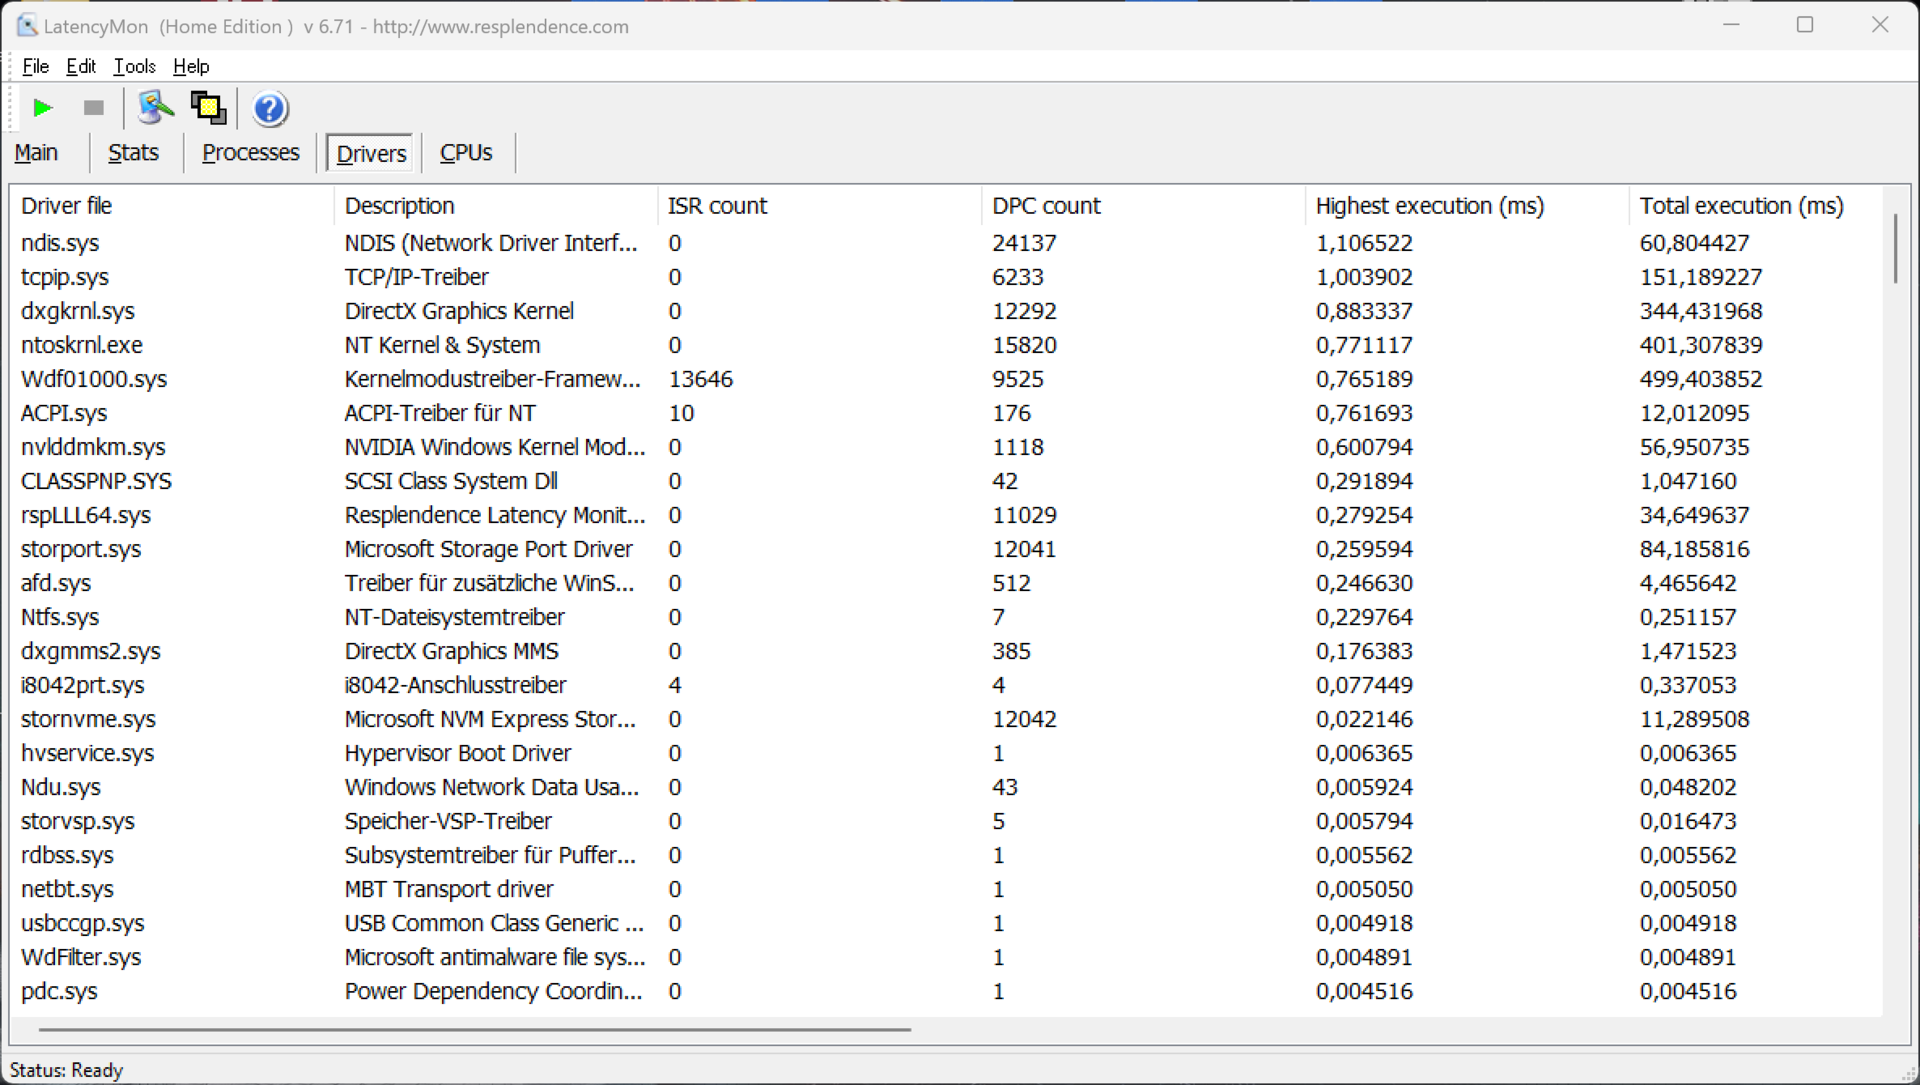
DPC-Latenzen
In unserem standardisierten Latency-Test (Surfen im Internet, 4K-YouTube-Wiedergabe, CPU-Last) zeigt das Testgerät mit der aktuellen BIOS-Version keine Probleme bei der Nutzung von Echtzeit-Audioanwendungen. Ein Treiber schlägt zwar etwas aus, doch der wichtige "interrupt-to-process-latency"-Wert ist sehr gering.
| DPC Latencies / LatencyMon - interrupt to process latency (max), Web, Youtube, Prime95 | |
| Lenovo Yoga Pro 9 16-IRP G8 | |
| Honor MagicBook Pro 16 2024 | |
| Framework Laptop 16 | |
| Dell XPS 16 9640 | |
| Schenker VISION 16 Pro (M23) | |
| Samsung Galaxy Book4 Ultra | |
| Lenovo Yoga Pro 9 16IMH9 | |
* ... kleinere Werte sind besser
Massenspeicher
Lenovo verbaut in unserem Testgerät eine PCIe-4.0-SSD von SK Hynix mit einer Kapazität von 1 TB, wovon nach der ersten Inbetriebnahme noch 877 GB zur Verfügung stehen. Die Benchmark-Ergebnisse sind aber nur durchschnittlich, was im Alltag aber kein Problem sein wird. Zumindest bleibt die Leistung auch bei längerer Belastung stabil. Das Yoga Pro bietet noch einen zweiten Steckplatz für eine PCIe-4.0-SSD. Weitere SSD-Benchmarks sind hier gelistet.

* ... kleinere Werte sind besser
Dauerleistung Lesen: DiskSpd Read Loop, Queue Depth 8
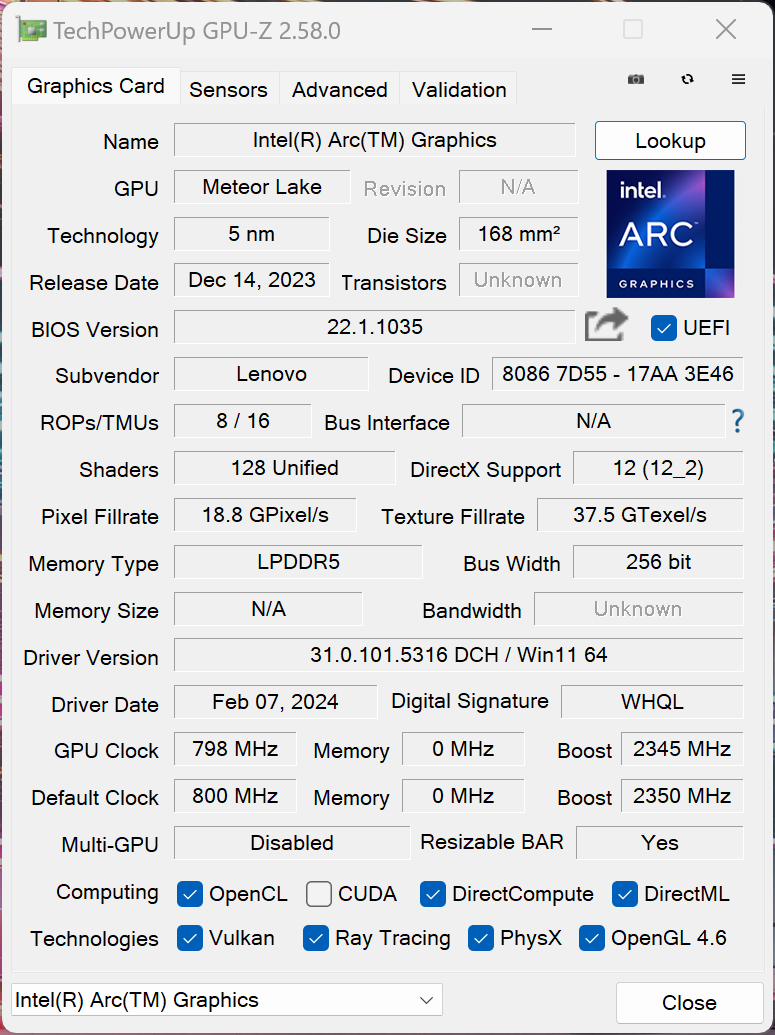
Grafikkarte
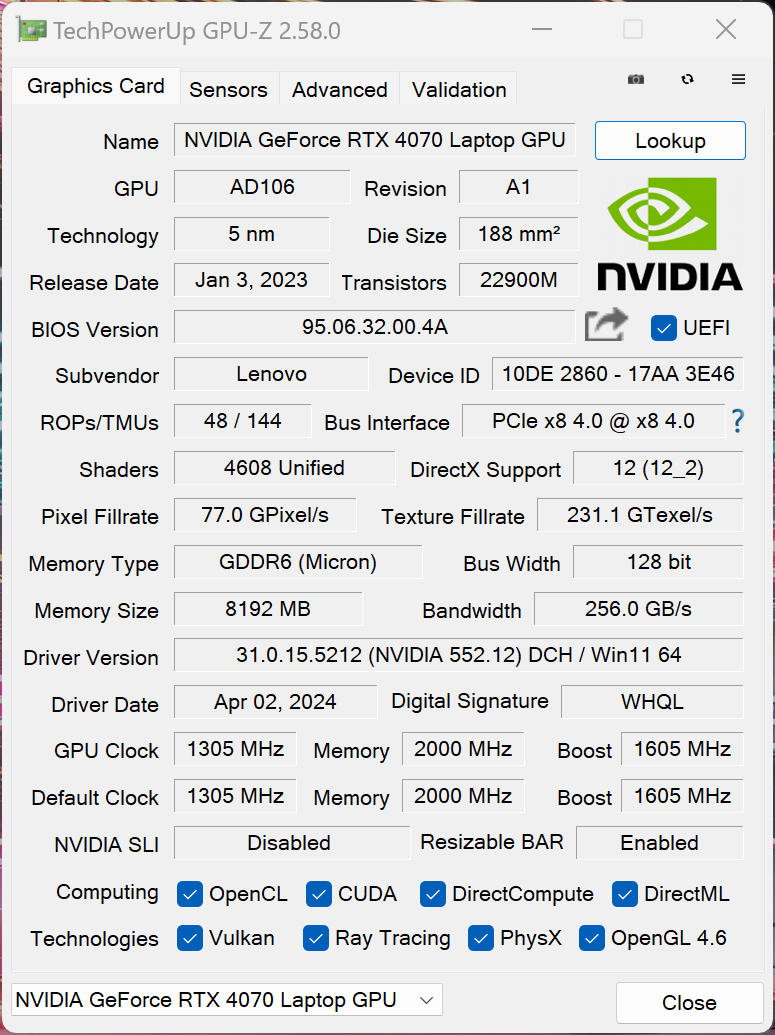
Bei den dedizierten Grafikkarten hat sich nichts verändert, denn das Yoga Pro ist nach wie vor mit der Nvidia GeForce RTX 4060 Laptop oder RTX 4070 Laptop verfügbar. Für die Grafikumschaltung ist nun allerdings Advanced Optimus integriert, was beim alten Modell noch nicht der Fall war. In unserem Testgerät ist die schnellere RTX 4070 Laptop mit einer TGP von 100 Watt verbaut und die Benchmark-Ergebnisse sind insgesamt sehr gut. Optional kann die Grafikkarte auch noch übertaktet werden.
Auch in den Gaming-Benchmarks macht das Yoga eine gute Figur und auch moderne Titel lassen sich problemlos mit maximalen Details in der QHD-Auflösung spielen, zudem bleibt die Leistung auch bei längeren Sessions vollkommen stabil.
Im Akkubetrieb darf die Grafikkarte maximal 65 Watt verbrauchen, weshalb die Leistung hier rund 18 % geringer ausfällt. Weitere GPU-Benchmarks sind in unserer Techniksektion gelistet.
| 3DMark 11 Performance | 34118 Punkte | |
| 3DMark Fire Strike Score | 26981 Punkte | |
| 3DMark Time Spy Score | 12105 Punkte | |
Hilfe | ||
| Blender / v3.3 Classroom OPTIX/RTX | |
| Durchschnitt der Klasse Multimedia (12 - 105, n=24, der letzten 2 Jahre) | |
| Samsung Galaxy Book4 Ultra | |
| Lenovo Yoga Pro 9 16-IRP G8 | |
| Schenker VISION 16 Pro (M23) | |
| Honor MagicBook Pro 16 2024 | |
| Durchschnittliche NVIDIA GeForce RTX 4070 Laptop GPU (18 - 30, n=68) | |
| Dell XPS 16 9640 | |
| Lenovo Yoga Pro 9 16IMH9 | |
| Blender / v3.3 Classroom CUDA | |
| Durchschnitt der Klasse Multimedia (20 - 186, n=24, der letzten 2 Jahre) | |
| Samsung Galaxy Book4 Ultra | |
| Lenovo Yoga Pro 9 16-IRP G8 | |
| Honor MagicBook Pro 16 2024 | |
| Dell XPS 16 9640 | |
| Schenker VISION 16 Pro (M23) | |
| Durchschnittliche NVIDIA GeForce RTX 4070 Laptop GPU (32 - 50, n=67) | |
| Lenovo Yoga Pro 9 16IMH9 | |
| Blender / v3.3 Classroom CPU | |
| Durchschnitt der Klasse Multimedia (134.5 - 1042, n=66, der letzten 2 Jahre) | |
| Schenker VISION 16 Pro (M23) | |
| Samsung Galaxy Book4 Ultra | |
| Honor MagicBook Pro 16 2024 | |
| Framework Laptop 16 | |
| Lenovo Yoga Pro 9 16-IRP G8 | |
| Dell XPS 16 9640 | |
| Durchschnittliche NVIDIA GeForce RTX 4070 Laptop GPU (158 - 440, n=67) | |
| Lenovo Yoga Pro 9 16IMH9 | |
* ... kleinere Werte sind besser
| The Witcher 3 - 1920x1080 Ultra Graphics & Postprocessing (HBAO+) | |
| Lenovo Yoga Pro 9 16IMH9 | |
| Schenker VISION 16 Pro (M23) | |
| Lenovo Yoga Pro 9 16-IRP G8 | |
| Dell XPS 16 9640 | |
| Framework Laptop 16 | |
| Honor MagicBook Pro 16 2024 | |
| Samsung Galaxy Book4 Ultra | |
| Durchschnitt der Klasse Multimedia (11 - 121, n=11, der letzten 2 Jahre) | |
| Horizon Forbidden West | |
| 1920x1080 Very High Preset AA:T | |
| Lenovo Yoga Pro 9 16IMH9 | |
| Durchschnittliche NVIDIA GeForce RTX 4070 Laptop GPU (53.2 - 76.7, n=10) | |
| Dell XPS 16 9640 | |
| Durchschnitt der Klasse Multimedia (12.4 - 64.4, n=3, der letzten 2 Jahre) | |
| 2560x1440 Very High Preset AA:T | |
| Lenovo Yoga Pro 9 16IMH9 | |
| Durchschnittliche NVIDIA GeForce RTX 4070 Laptop GPU (40.3 - 59.1, n=9) | |
| Durchschnitt der Klasse Multimedia (n=1der letzten 2 Jahre) | |
| Dell XPS 16 9640 | |
Witcher 3 FPS-Diagramm
| min. | mittel | hoch | max. | QHD | |
|---|---|---|---|---|---|
| GTA V (2015) | 171.4 | 110.9 | 90.4 | ||
| The Witcher 3 (2015) | 242 | 107.8 | 89 | ||
| Dota 2 Reborn (2015) | 171.7 | 155.7 | 148.1 | 139 | |
| Final Fantasy XV Benchmark (2018) | 189.6 | 156.2 | 115.7 | 85.6 | |
| X-Plane 11.11 (2018) | 133.9 | 118.7 | 90.5 | ||
| Far Cry 5 (2018) | 156 | 133 | 130 | 116 | 109 |
| Strange Brigade (2018) | 418 | 300 | 244 | 213 | 139 |
| F1 23 (2023) | 229 | 239 | 209 | 68.9 | 44 |
| Baldur's Gate 3 (2023) | 166.3 | 136.6 | 119.9 | 117.7 | 79.8 |
| Cyberpunk 2077 (2023) | 129.6 | 106.8 | 90.5 | 76.9 | 47.8 |
| Horizon Forbidden West (2024) | 110.5 | 104.2 | 75.4 | 65.4 | 56.1 |
Emissionen - Laute Lüfter, Top lautsprecher
Geräuschemissionen
Im Leerlauf und bei wenig Last bleiben die Lüfter in den meisten Fällen deaktiviert oder kaum hörbar. Unter Last wird es dann aber schnell laut, sowohl im Auto- als auch im Leistungsmodus. Wir haben die Ergebnisse für die verschiedenen Energieprofile in der nachfolgenden Tabelle zusammengefasst. Im Akkusparmodus bleibt das Gerät zu jeder Zeit sehr ruhig, doch die Leistung ist massiv reduziert und zum Spielen reicht es hier nicht mehr. Sonstige elektronische Geräusche gab es bei unserem Testgerät nicht.
| Energieprofil | 3DMark 06 | Witcher 3 | Cyberpunk 2077 | Stresstest |
|---|---|---|---|---|
| Akkusparmodus | 29,5 dB(A) | 29,5 dB(A) | 29,5 dB(A) | 30,9 dB(A) |
| Auto | 44,9 dB(A) | 44,9 dB(A) | 44,9 dB(A) | 44,9 dB(A) |
| Leistung | 48,1 dB(A) | 49,7 dB(A) | 49,7 dB(A) | 53,9 dB(A) |
Lautstärkediagramm
| Idle |
| 24.3 / 24.3 / 25.8 dB(A) |
| Last |
| 48.1 / 53.9 dB(A) |
 | ||
30 dB leise 40 dB(A) deutlich hörbar 50 dB(A) störend |
||
min: | ||
| Lenovo Yoga Pro 9 16IMH9 GeForce RTX 4070 Laptop GPU, Ultra 9 185H, SK Hynix HFS001TEJ9X115N | Dell XPS 16 9640 GeForce RTX 4070 Laptop GPU, Ultra 7 155H, Kioxia XG8 KXG80ZNV1T02 | Honor MagicBook Pro 16 2024 GeForce RTX 4060 Laptop GPU, Ultra 7 155H, WD PC SN740 SDDPNQD-1T00 | Samsung Galaxy Book4 Ultra GeForce RTX 4050 Laptop GPU, Ultra 7 155H, Samsung PM9A1 MZVL2512HCJQ | Framework Laptop 16 Radeon RX 7700S, R9 7940HS, WDC PC SN810 1TB | Schenker VISION 16 Pro (M23) GeForce RTX 4070 Laptop GPU, i7-13700H, Samsung 990 Pro 1 TB | Lenovo Yoga Pro 9 16-IRP G8 GeForce RTX 4060 Laptop GPU, i7-13705H, Samsung PM9A1 MZVL21T0HCLR | |
|---|---|---|---|---|---|---|---|
| Geräuschentwicklung | 2% | 10% | 9% | 7% | -7% | -0% | |
| aus / Umgebung * (dB) | 24.3 | 24.5 -1% | 24 1% | 24.2 -0% | 23.8 2% | 25.9 -7% | 24.7 -2% |
| Idle min * (dB) | 24.3 | 24.5 -1% | 24 1% | 24.2 -0% | 23.9 2% | 25.9 -7% | 24.7 -2% |
| Idle avg * (dB) | 24.3 | 24.5 -1% | 24 1% | 24.2 -0% | 23.9 2% | 25.9 -7% | 26.2 -8% |
| Idle max * (dB) | 25.8 | 27.5 -7% | 27.2 -5% | 24.2 6% | 23.9 7% | 32 -24% | 26.2 -2% |
| Last avg * (dB) | 48.1 | 39.6 18% | 29 40% | 37.9 21% | 28.5 41% | 47.2 2% | 39.7 17% |
| Witcher 3 ultra * (dB) | 49.7 | 49.7 -0% | 42.1 15% | 41.7 16% | 51.9 -4% | 53.1 -7% | 53.2 -7% |
| Last max * (dB) | 53.9 | 49.7 8% | 45 17% | 41.7 23% | 53.7 -0% | 53.1 1% | 53.2 1% |
* ... kleinere Werte sind besser
Temperatur
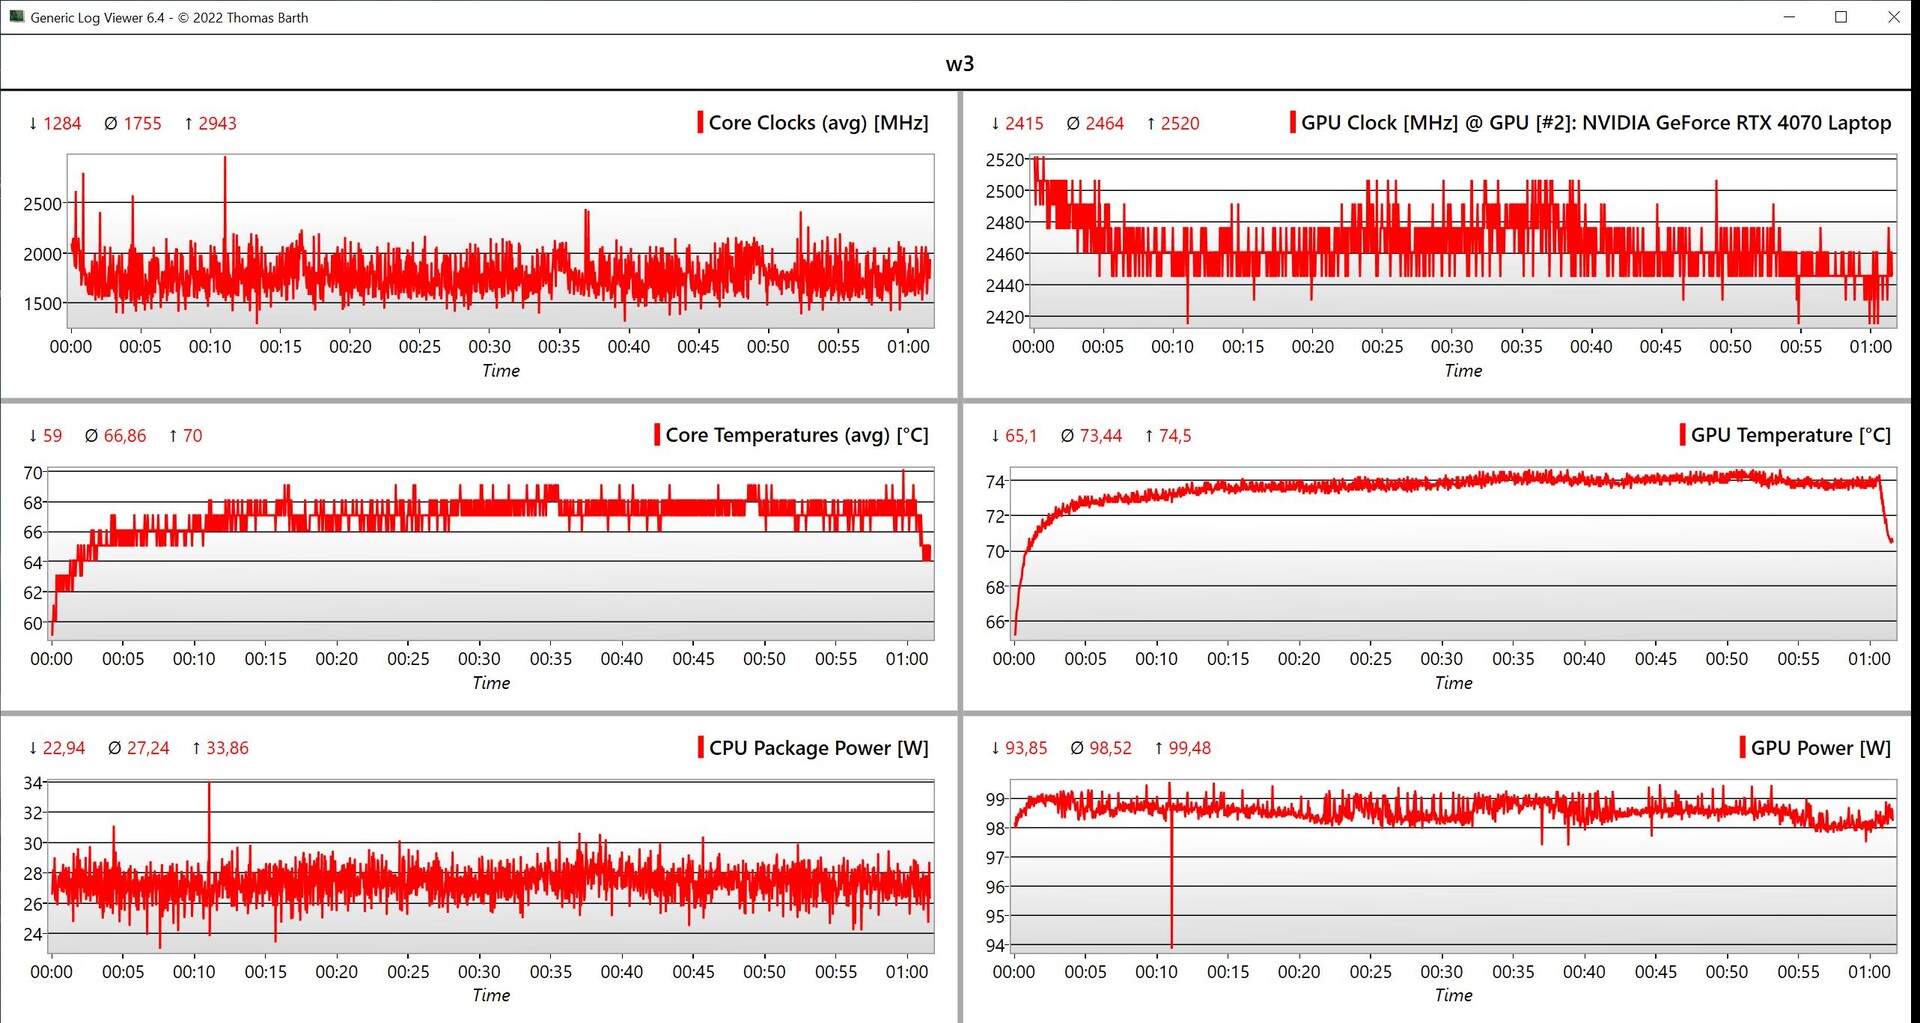
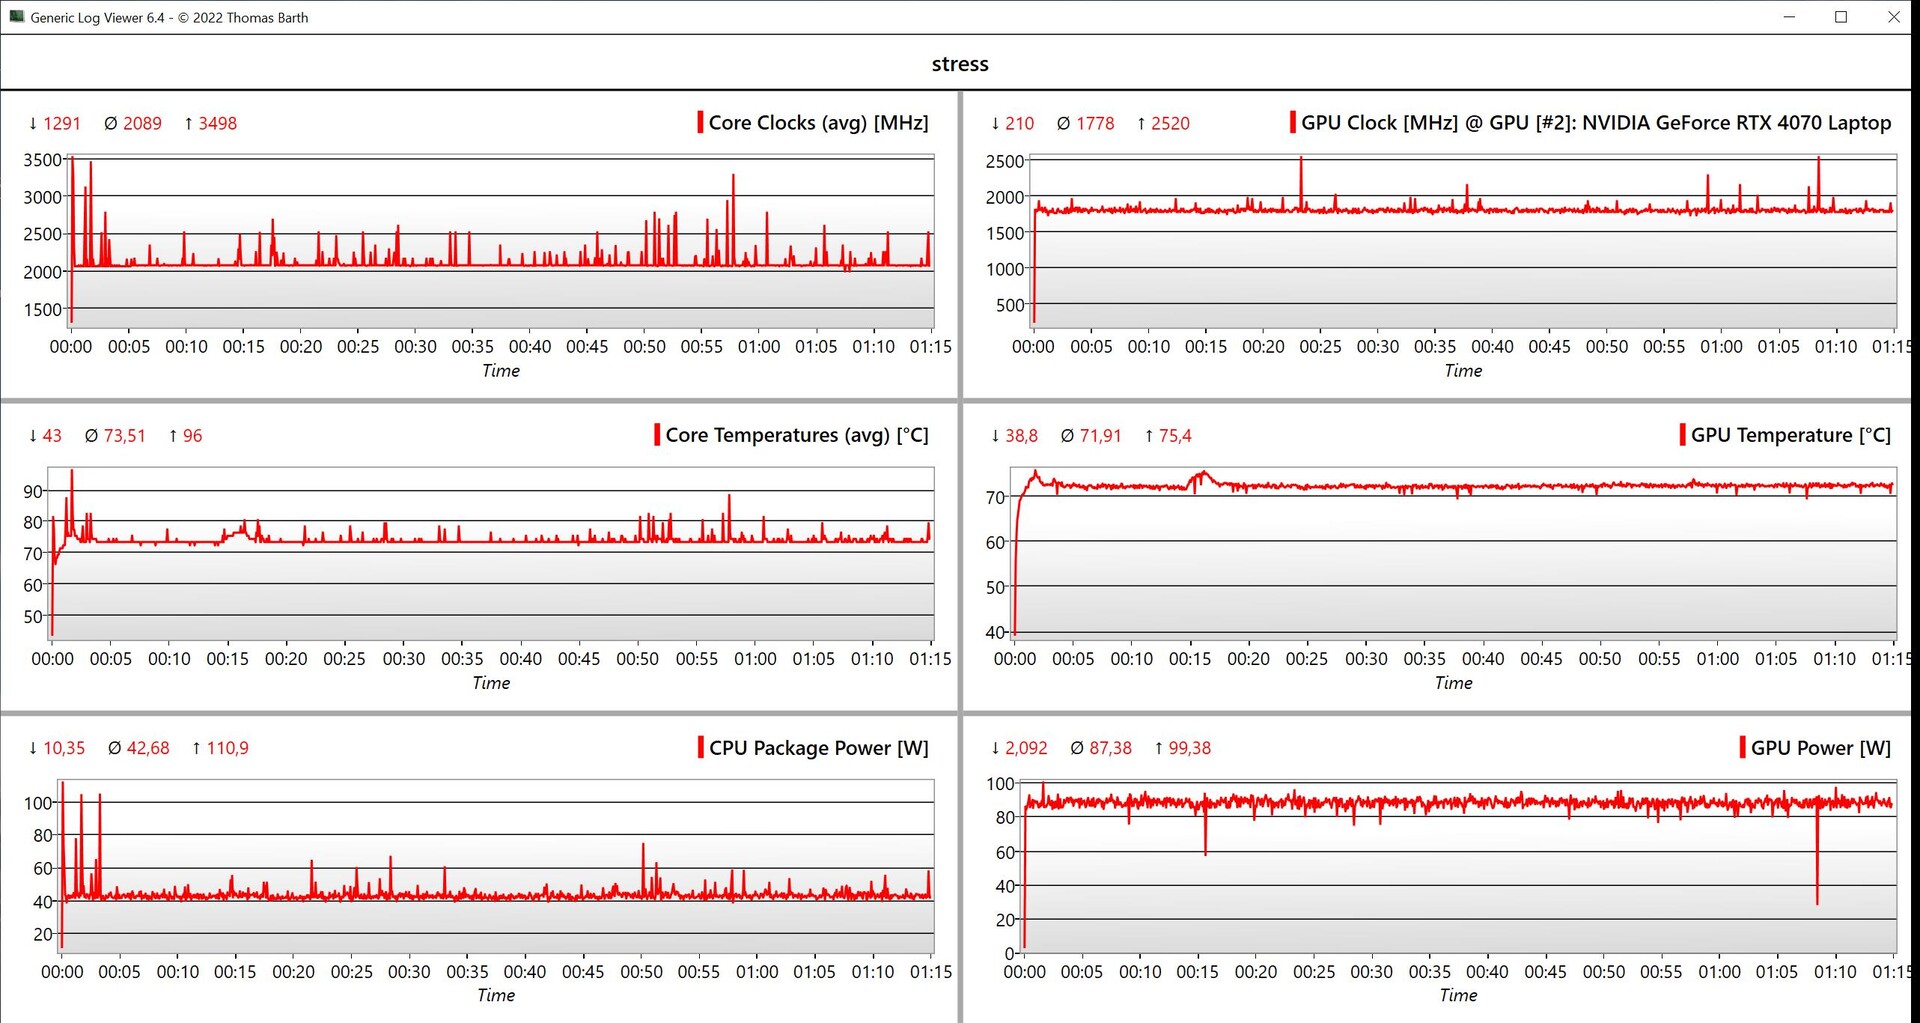
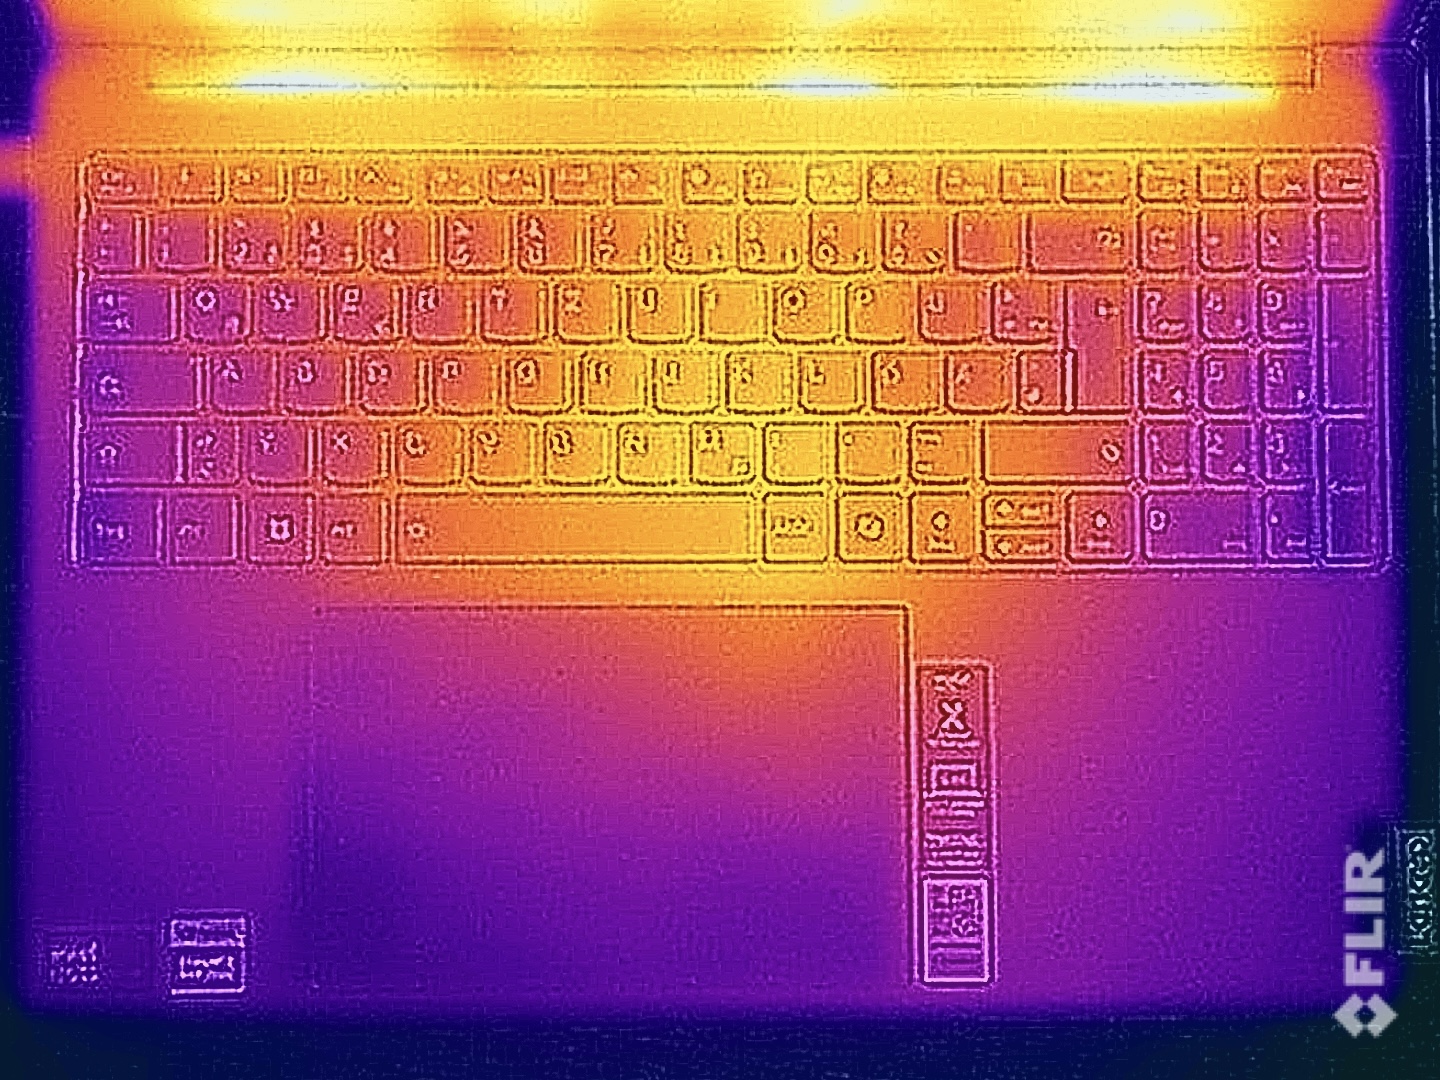
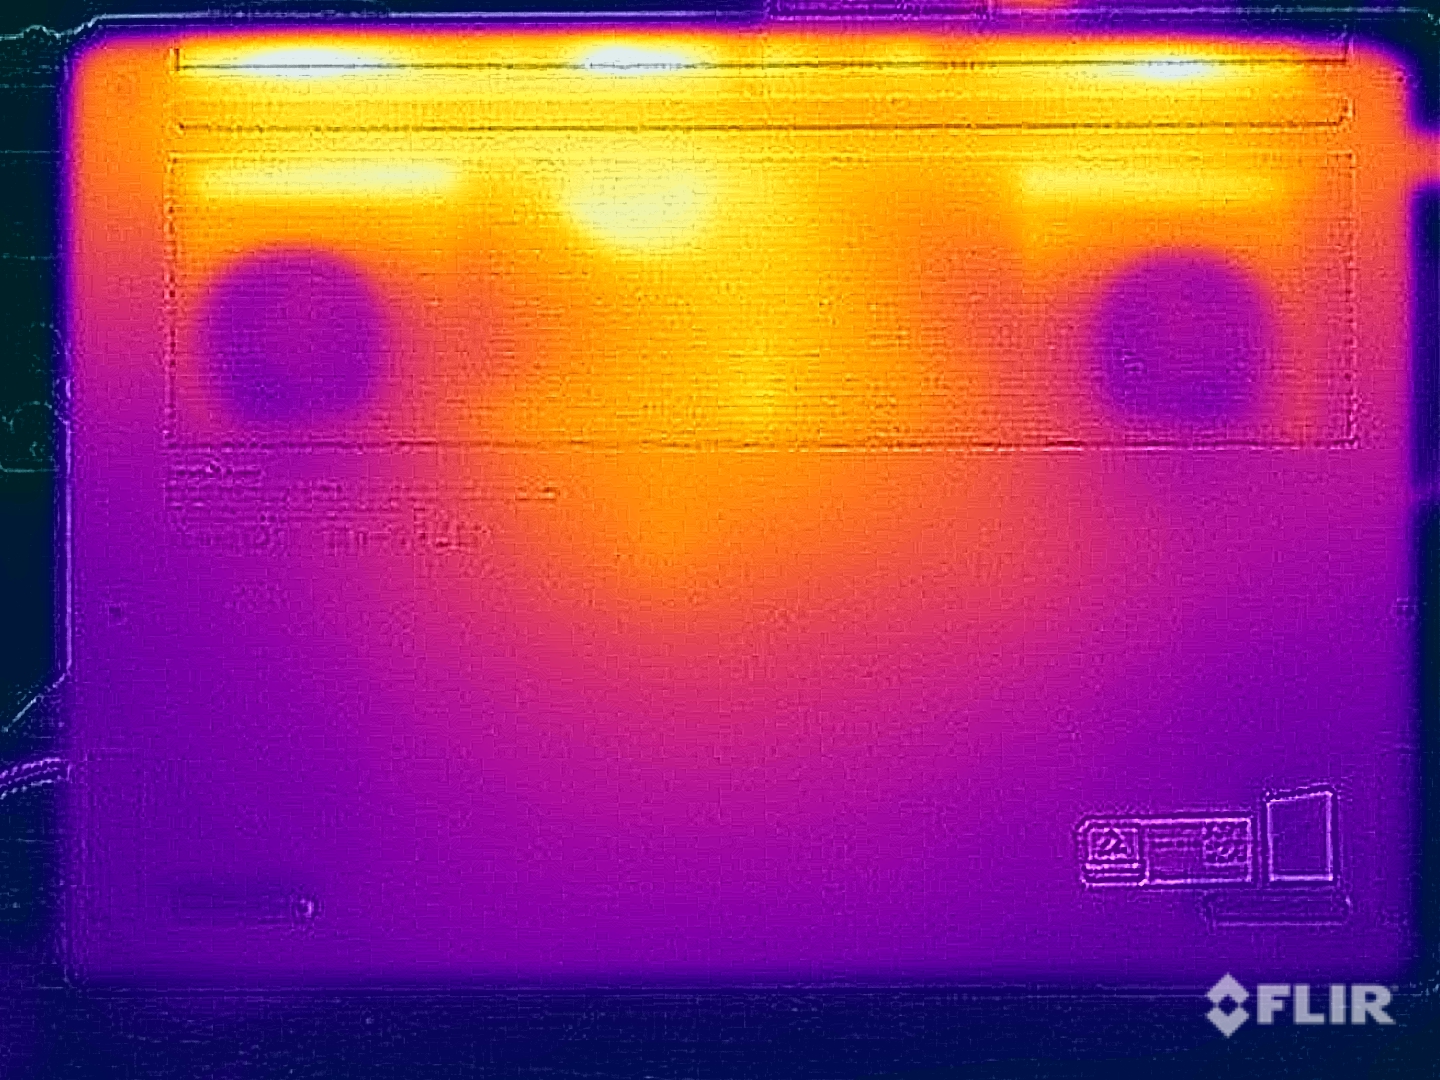
Bei einfachen Aufgaben bleibt das Gehäuse angenehm kühl und auch unter Last fällt die maximale Temperatur etwas geringer aus. Dennoch merkt man mehr als 45 °C auf der Unterseite natürlich und hier sollte man das Gerät auch nicht auf den Oberschenkel abstellen. Sowohl die Tastatur als auch die Baseunit bleiben deutlich kühler. Im Stresstest mit kombinierter CPU/GPU-Last arbeitet die Grafikkarte konstant mit etwa 87 Watt und der Prozessor mit 42 Watt. Das ist insgesamt eine gute Leistung.
(±) Die maximale Temperatur auf der Oberseite ist 41.7 °C. Im Vergleich liegt der Klassendurchschnitt bei 36.8 °C (von 21 bis 71 °C für die Klasse Multimedia).
(-) Auf der Unterseite messen wir eine maximalen Wert von 46.3 °C (im Vergleich zum Durchschnitt von 39.1 °C).
(+) Ohne Last messen wir eine durchschnittliche Temperatur von 25.5 °C auf der Oberseite. Der Klassendurchschnitt erreicht 31.3 °C.
(±) Beim längeren Spielen von The Witcher 3 erhitzt sich das Gerät durchschnittlich auf 35.4 °C. Der Durchschnitt der Klasse ist derzeit 31.3 °C.
(+) Die Handballen und der Touchpad-Bereich sind mit gemessenen 31 °C kühler als die typische Hauttemperatur und fühlen sich dadurch kühl an.
(-) Die durchschnittliche Handballen-Temperatur anderer getesteter Geräte war 28.7 °C (-2.3 °C).
| Lenovo Yoga Pro 9 16IMH9 Intel Core Ultra 9 185H, NVIDIA GeForce RTX 4070 Laptop GPU | Dell XPS 16 9640 Intel Core Ultra 7 155H, NVIDIA GeForce RTX 4070 Laptop GPU | Honor MagicBook Pro 16 2024 Intel Core Ultra 7 155H, NVIDIA GeForce RTX 4060 Laptop GPU | Samsung Galaxy Book4 Ultra Intel Core Ultra 7 155H, NVIDIA GeForce RTX 4050 Laptop GPU | Framework Laptop 16 AMD Ryzen 9 7940HS, AMD Radeon RX 7700S | Schenker VISION 16 Pro (M23) Intel Core i7-13700H, NVIDIA GeForce RTX 4070 Laptop GPU | Lenovo Yoga Pro 9 16-IRP G8 Intel Core i7-13705H, NVIDIA GeForce RTX 4060 Laptop GPU | |
|---|---|---|---|---|---|---|---|
| Hitze | 4% | 9% | 10% | -3% | -7% | -3% | |
| Last oben max * (°C) | 41.7 | 39.4 6% | 39.7 5% | 38.5 8% | 42.4 -2% | 46.7 -12% | 41.6 -0% |
| Last unten max * (°C) | 46.3 | 36.9 20% | 42.9 7% | 41.2 11% | 40.8 12% | 54.1 -17% | 50 -8% |
| Idle oben max * (°C) | 26.2 | 28.2 -8% | 23.7 10% | 23.5 10% | 31.4 -20% | 26.5 -1% | 26.8 -2% |
| Idle unten max * (°C) | 27.2 | 27.4 -1% | 23.5 14% | 24.1 11% | 27.8 -2% | 26.8 1% | 27.9 -3% |
* ... kleinere Werte sind besser
Lautsprecher
Das Soundsystem mit den 6 Modulen gehört nach wie vor zu den besten Modellen im Multimedia-Segment und kann hier auch viele Konkurrenten übertreffen. Auf externe Lautsprecher kann man in vielen Fällen verzichten, beim Spielen hat man von den Lautsprechern aufgrund der lauten Lüfter allerdings nicht und man sollte ein Headset verwenden.
Lenovo Yoga Pro 9 16IMH9 Audio Analyse
(+) | Die Lautsprecher können relativ laut spielen (84.5 dB)
Bass 100 - 315 Hz
(±) | abgesenkter Bass - 7% geringer als der Median
(±) | durchschnittlich lineare Bass-Wiedergabe (7.2% Delta zum Vorgänger)
Mitteltöne 400 - 2000 Hz
(+) | ausgeglichene Mitten, vom Median nur 3.9% abweichend
(+) | lineare Mitten (4.5% Delta zum Vorgänger)
Hochtöne 2 - 16 kHz
(+) | ausgeglichene Hochtöne, vom Median nur 2.8% abweichend
(+) | sehr lineare Hochtöne (3.2% Delta zum Vorgänger)
Gesamt im hörbaren Bereich 100 - 16.000 Hz
(+) | hörbarer Bereich ist sehr linear (8.8% Abstand zum Median
Im Vergleich zu allen Geräten derselben Klasse
» 11% aller getesteten Geräte dieser Klasse waren besser, 2% vergleichbar, 87% schlechter
» Das beste Gerät hat einen Delta-Wert von 5%, durchschnittlich ist 17%, das schlechteste Gerät hat 45%
Im Vergleich zu allen Geräten im Test
» 3% aller getesteten Geräte waren besser, 1% vergleichbar, 97% schlechter
» Das beste Gerät hat einen Delta-Wert von 4%, durchschnittlich ist 23%, das schlechteste Gerät hat 134%
Dell XPS 16 9640 Audio Analyse
(+) | Die Lautsprecher können relativ laut spielen (83.4 dB)
Bass 100 - 315 Hz
(±) | abgesenkter Bass - 11.2% geringer als der Median
(±) | durchschnittlich lineare Bass-Wiedergabe (8.9% Delta zum Vorgänger)
Mitteltöne 400 - 2000 Hz
(+) | ausgeglichene Mitten, vom Median nur 4.5% abweichend
(+) | lineare Mitten (3% Delta zum Vorgänger)
Hochtöne 2 - 16 kHz
(+) | ausgeglichene Hochtöne, vom Median nur 1.4% abweichend
(+) | sehr lineare Hochtöne (2% Delta zum Vorgänger)
Gesamt im hörbaren Bereich 100 - 16.000 Hz
(+) | hörbarer Bereich ist sehr linear (10% Abstand zum Median
Im Vergleich zu allen Geräten derselben Klasse
» 13% aller getesteten Geräte dieser Klasse waren besser, 2% vergleichbar, 84% schlechter
» Das beste Gerät hat einen Delta-Wert von 5%, durchschnittlich ist 17%, das schlechteste Gerät hat 45%
Im Vergleich zu allen Geräten im Test
» 4% aller getesteten Geräte waren besser, 1% vergleichbar, 94% schlechter
» Das beste Gerät hat einen Delta-Wert von 4%, durchschnittlich ist 23%, das schlechteste Gerät hat 134%
Honor MagicBook Pro 16 2024 Audio Analyse
(±) | Mittelmäßig laut spielende Lautsprecher (81.3 dB)
Bass 100 - 315 Hz
(±) | abgesenkter Bass - 6.8% geringer als der Median
(±) | durchschnittlich lineare Bass-Wiedergabe (9% Delta zum Vorgänger)
Mitteltöne 400 - 2000 Hz
(+) | ausgeglichene Mitten, vom Median nur 2.1% abweichend
(+) | lineare Mitten (5.2% Delta zum Vorgänger)
Hochtöne 2 - 16 kHz
(+) | ausgeglichene Hochtöne, vom Median nur 2.1% abweichend
(+) | sehr lineare Hochtöne (6.5% Delta zum Vorgänger)
Gesamt im hörbaren Bereich 100 - 16.000 Hz
(+) | hörbarer Bereich ist sehr linear (8.7% Abstand zum Median
Im Vergleich zu allen Geräten derselben Klasse
» 11% aller getesteten Geräte dieser Klasse waren besser, 2% vergleichbar, 87% schlechter
» Das beste Gerät hat einen Delta-Wert von 5%, durchschnittlich ist 17%, das schlechteste Gerät hat 45%
Im Vergleich zu allen Geräten im Test
» 3% aller getesteten Geräte waren besser, 1% vergleichbar, 97% schlechter
» Das beste Gerät hat einen Delta-Wert von 4%, durchschnittlich ist 23%, das schlechteste Gerät hat 134%
Samsung Galaxy Book4 Ultra Audio Analyse
(+) | Die Lautsprecher können relativ laut spielen (85 dB)
Bass 100 - 315 Hz
(±) | abgesenkter Bass - 14.4% geringer als der Median
(±) | durchschnittlich lineare Bass-Wiedergabe (11.3% Delta zum Vorgänger)
Mitteltöne 400 - 2000 Hz
(+) | ausgeglichene Mitten, vom Median nur 3.4% abweichend
(+) | lineare Mitten (3.4% Delta zum Vorgänger)
Hochtöne 2 - 16 kHz
(+) | ausgeglichene Hochtöne, vom Median nur 3% abweichend
(+) | sehr lineare Hochtöne (5.6% Delta zum Vorgänger)
Gesamt im hörbaren Bereich 100 - 16.000 Hz
(+) | hörbarer Bereich ist sehr linear (11.5% Abstand zum Median
Im Vergleich zu allen Geräten derselben Klasse
» 18% aller getesteten Geräte dieser Klasse waren besser, 4% vergleichbar, 78% schlechter
» Das beste Gerät hat einen Delta-Wert von 5%, durchschnittlich ist 17%, das schlechteste Gerät hat 45%
Im Vergleich zu allen Geräten im Test
» 8% aller getesteten Geräte waren besser, 2% vergleichbar, 90% schlechter
» Das beste Gerät hat einen Delta-Wert von 4%, durchschnittlich ist 23%, das schlechteste Gerät hat 134%
Energieverwaltung - Größerer Akku gegen kurze Laufzeiten
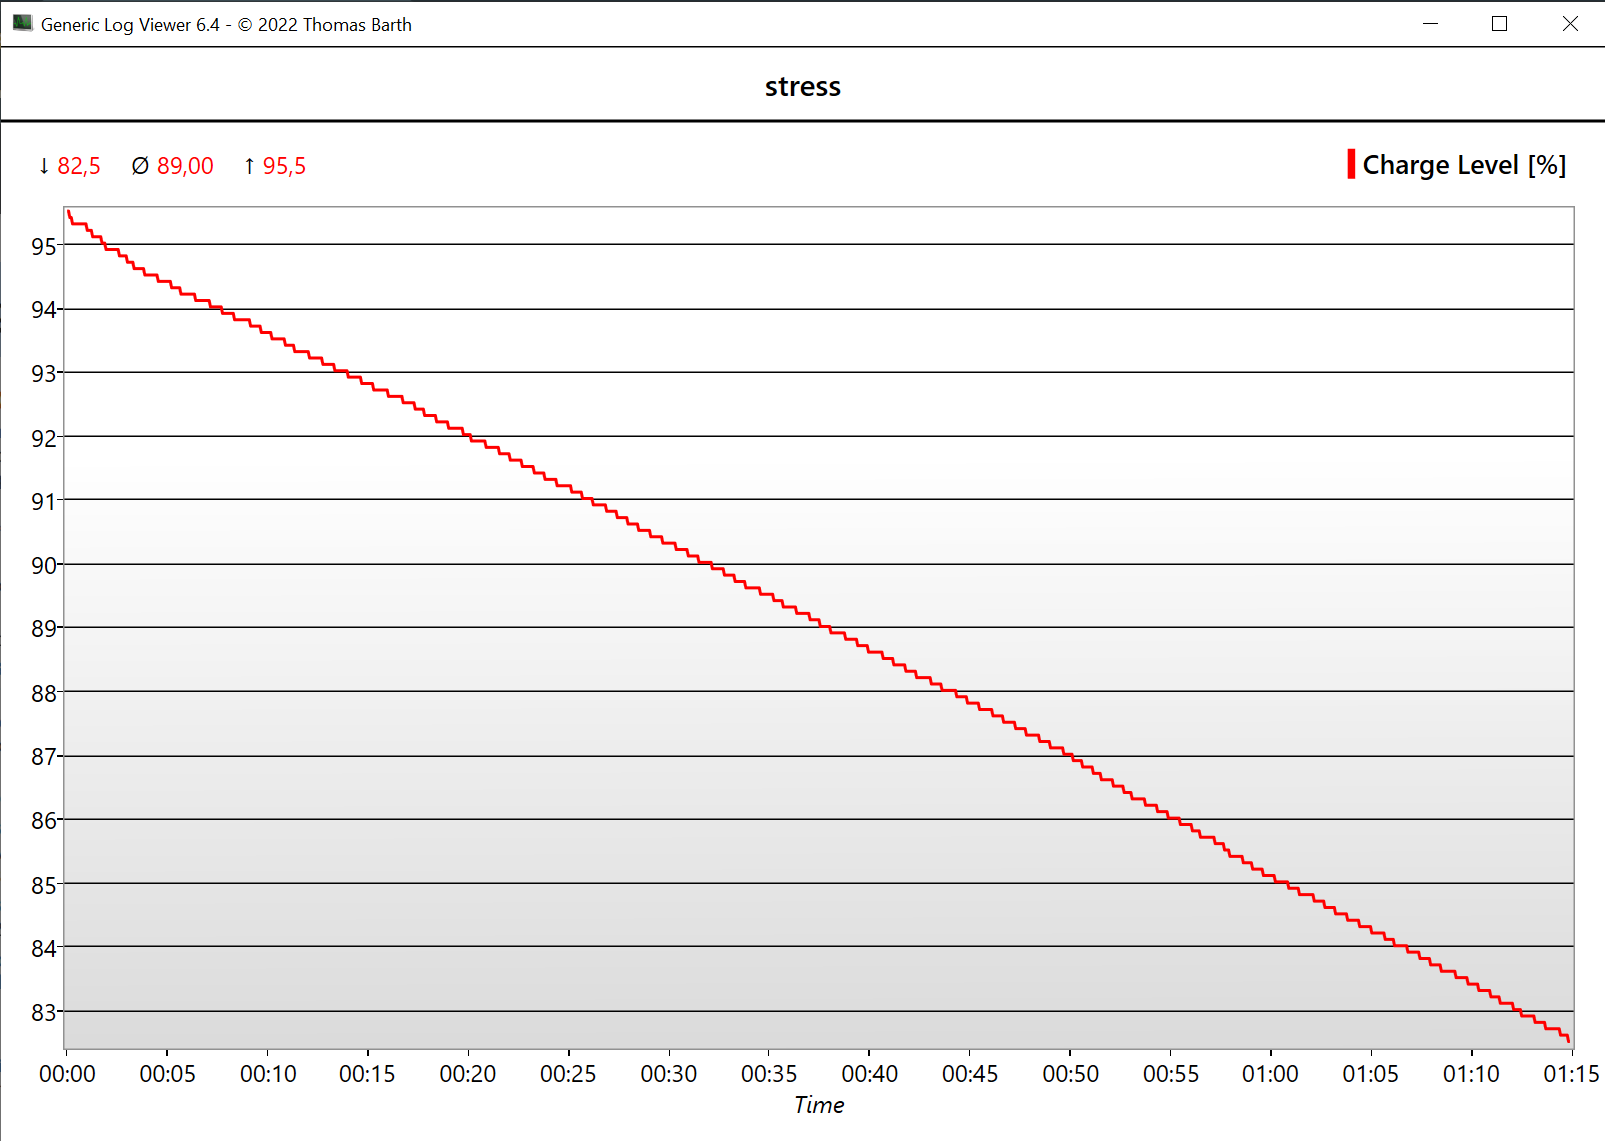
Energieaufnahme
Bei den Verbrauchsmessungen gibt es keine signifikanten Veränderungen gegenüber dem Vorgänger. Allerdings zeigt sich hier ein anderes Problem, denn das mitgelieferte 170-Watt-Netzteil reicht nicht aus, um den maximalen Verbrauch zu decken und das Gerät muss den Akku anzapfen. Und zwar nicht nur kurz, sondern dauerhaft, was man auch gut an der nachfolgenden Grafik erkennen kann. Während des Stresstests ist fällt die Akkukapazität in 75 Minuten um 12 %. Unser Stresstest ist zwar das Worst-Case-Szenario und nicht alle Kunden werden den Leistungsmodus verwenden, doch das ist ganz klar ein Problem und Lenovo spart hier an der falschen Stelle. Das Yoga Pro 9i 16 hätte mindestens mit einem 200-Watt-Netzteil ausgeliefert werden müssen.
| Aus / Standby | |
| Idle | |
| Last |
|
Legende:
min: | |
| Lenovo Yoga Pro 9 16IMH9 Ultra 9 185H, GeForce RTX 4070 Laptop GPU, SK Hynix HFS001TEJ9X115N, Mini-LED, 3200x2000, 16" | Dell XPS 16 9640 Ultra 7 155H, GeForce RTX 4070 Laptop GPU, Kioxia XG8 KXG80ZNV1T02, OLED, 3840x2400, 16.3" | Honor MagicBook Pro 16 2024 Ultra 7 155H, GeForce RTX 4060 Laptop GPU, WD PC SN740 SDDPNQD-1T00, IPS, 3072x1920, 16" | Samsung Galaxy Book4 Ultra Ultra 7 155H, GeForce RTX 4050 Laptop GPU, Samsung PM9A1 MZVL2512HCJQ, OLED, 2880x1800, 16" | Framework Laptop 16 R9 7940HS, Radeon RX 7700S, WDC PC SN810 1TB, , 2560x1600, 16" | Schenker VISION 16 Pro (M23) i7-13700H, GeForce RTX 4070 Laptop GPU, Samsung 990 Pro 1 TB, IPS, 2560x1600, 16" | Lenovo Yoga Pro 9 16-IRP G8 i7-13705H, GeForce RTX 4060 Laptop GPU, Samsung PM9A1 MZVL21T0HCLR, Mini-LED, 3200x2000, 16" | Durchschnittliche NVIDIA GeForce RTX 4070 Laptop GPU | Durchschnitt der Klasse Multimedia | |
|---|---|---|---|---|---|---|---|---|---|
| Stromverbrauch | 32% | 21% | 47% | 8% | 22% | -1% | -10% | 42% | |
| Idle min * (Watt) | 10.3 | 7.7 25% | 5.2 50% | 4.8 53% | 9.5 8% | 8.6 17% | 10.9 -6% | 13.2 ? -28% | 5.65 ? 45% |
| Idle avg * (Watt) | 21.9 | 10.3 53% | 14.4 34% | 7.5 66% | 17 22% | 12 45% | 22.6 -3% | 18.2 ? 17% | 10 ? 54% |
| Idle max * (Watt) | 22.4 | 10.6 53% | 15.4 31% | 7.9 65% | 17.2 23% | 12.4 45% | 23.5 -5% | 24.6 ? -10% | 12.3 ? 45% |
| Last avg * (Watt) | 96.9 | 76.5 21% | 105.4 -9% | 79.3 18% | 96.2 1% | 80 17% | 84.6 13% | 97 ? -0% | 65.1 ? 33% |
| Witcher 3 ultra * (Watt) | 159.6 | 126.4 21% | 107.6 33% | 79.2 50% | 171.9 -8% | 147.7 7% | 159.5 -0% | ||
| Last max * (Watt) | 173.8 | 138.5 20% | 195.2 -12% | 125 28% | 175.7 -1% | 173.1 -0% | 177.3 -2% | 221 ? -27% | 112.5 ? 35% |
* ... kleinere Werte sind besser
Energieaufnahme Witcher 3 / Stresstest
Energieaufnahme mit externem Monitor
Akkulaufzeit

Die Akkulaufzeiten gehörten nicht zu den Stärken des alten Modells, was natürlich auch an dem sehr hellen Display lag. Lenovo hat die Akkukapazität für das neue G9-Modell daher von 75 auf 84 Watt erhöht. Das führt auch zu einer Verbesserung und vor allem bei einer angepassten Helligkeit von 150 cd/m² schneidet das neue Yoga besser ab, auch wenn die Konkurrenten oftmals noch einen Vorteil haben. Im WLAN-Test ermitteln wir 8:46 Stunden bei 60 Hz (~7,5 Stunden bei 165 Hz), aber gerade einmal 4,5 Stunden bei voller SDR-Helligkeit und 60 Hz (4:10 Stunden bei 165 Hz). Im Videotest sind es sehr gute 11,5 Stunden, doch ein HDR-Video bei voller Helligkeit läuft gerade einmal für 2:40 Stunden und unter voller Last ist nach 73 Minuten Schluss. Ein vollständiger Ladevorgang dauert bei eingeschaltetem Gerät 96 Minuten.
| Lenovo Yoga Pro 9 16IMH9 Ultra 9 185H, GeForce RTX 4070 Laptop GPU, 84 Wh | Dell XPS 16 9640 Ultra 7 155H, GeForce RTX 4070 Laptop GPU, 99.5 Wh | Honor MagicBook Pro 16 2024 Ultra 7 155H, GeForce RTX 4060 Laptop GPU, 75 Wh | Samsung Galaxy Book4 Ultra Ultra 7 155H, GeForce RTX 4050 Laptop GPU, 76 Wh | Framework Laptop 16 R9 7940HS, Radeon RX 7700S, 85 Wh | Schenker VISION 16 Pro (M23) i7-13700H, GeForce RTX 4070 Laptop GPU, 80 Wh | Lenovo Yoga Pro 9 16-IRP G8 i7-13705H, GeForce RTX 4060 Laptop GPU, 75 Wh | Durchschnitt der Klasse Multimedia | |
|---|---|---|---|---|---|---|---|---|
| Akkulaufzeit | 29% | 12% | 29% | 14% | -12% | -35% | 39% | |
| H.264 (h) | 11.5 | 16.5 43% | 13.1 14% | 17.9 56% | 7.8 -32% | 7.5 -35% | 16.2 ? 41% | |
| WLAN (h) | 8.8 | 10.5 19% | 12.2 39% | 10.9 24% | 9.1 3% | 7.8 -11% | 6.4 -27% | 12 ? 36% |
| Last (h) | 1.2 | 1.5 25% | 1 -17% | 1.3 8% | 1.5 25% | 1.3 8% | 0.7 -42% | 1.669 ? 39% |
Pro
Contra
Fazit - Yoga Pro 9i 16 G9 nicht nur mit Verbesserungen

Lenovo hat sein Multimedia-Notebook Yoga Pro 9i 16 G9 an einigen Stellen verbessert, unter anderem ist nun ein aktueller HDMI-Ausgang verbaut, es gibt Advanced Optimus und auch die Mechanik vom ClickPad wurde verbessert. Zudem ist der Akku nun größer und die Laufzeiten fallen etwas besser aus, doch wenn man die maximale Helligkeit des Mini-LED-Panels ausnutzt, darf man weiterhin keine Wunder erwarten.
Bei der Leistung schlägt sich das Yoga weiterhin sehr gut, allerdings bietet der neue Core Ultra 9 185H keine wirklichen Leistungsvorteil gegenüber den alten Raptor-Lake-Chips. Auch die Gaming-Performance passt und der matte Mini-LED-Bildschirm sieht sehr gut aus, vor allem bei HDR-Inhalten. Problematisch ist allerdings, dass Lenovo keine Farbprofile mehr für sRGB und AdobeRGB anbietet, was beim alten Modell noch der Fall war.
Lenovo bietet mit dem Yoga Pro 9 16 G9 wieder ein sehr gutes Multimedia-Notebook mit schnellen Komponenten und einem extrem hellen Mini-LED-Panel. Allerdings gibt es auch Nachteile wie die lauten Lüfter, das zu schwache Netzteil und die kurzen Akkulaufzeiten, wenn man das helle Panel auch nutzt.
Die Kühlung wird unter Last nach wie vor sehr laut und problematisch ist auch das unzureichende Netzteil, denn bei dauerhafter Belastung muss das Yoga konstant den Akku anzapfen. Alles in allem überwiegen aber die positiven Aspekte und mit dem Mini-LED-Panel hat das Yoga im Windows-Segment auch kaum Konkurrenten. Die OLED-Panels werden bei weitem nicht so hell, die schlechte HDR-Implementierung von Windows bleibt aber problematisch. Vor allem bei der Leistung kann das Yoga Pro andere Multimedia-Konkurrenten wie beispielsweise das neue Dell XPS 16 9640 deutlich überbieten.
Preis und Verfügbarkeit
Das neue Yoga Pro 9 16 G9 kann direkt bei Lenovo ab rund 2.000 Euro konfiguriert und bestellt werden. Bei unserem Leihsteller Campuspoint ist das Testgerät für bezugsberechtigte Personen 2.429 Euro verfügbar.
Lenovo Yoga Pro 9 16IMH9
- 20.04.2024 v7 (old)
Andreas Osthoff
Transparenz
Die Auswahl der zu testenden Geräte erfolgt innerhalb der Redaktion. Das vorliegende Testmuster wurde dem Autor vom Hersteller oder einem Shop zu Testzwecken leihweise zur Verfügung gestellt. Eine Einflussnahme des Leihstellers auf den Testbericht gab es nicht, der Hersteller erhielt keine Version des Reviews vor der Veröffentlichung. Es bestand keine Verpflichtung zur Publikation. Als eigenständiges, unabhängiges Unternehmen unterliegt Notebookcheck keiner Diktion von Herstellern, Shops und Verlagen.
So testet Notebookcheck
Pro Jahr werden von Notebookcheck hunderte Laptops und Smartphones unabhängig in von uns standardisierten technischen Verfahren getestet, um eine Vergleichbarkeit aller Testergebnisse zu gewährleisten. Seit rund 20 Jahren entwickeln wir diese Testmethoden kontinuierlich weiter und setzen damit Branchenstandards. In unseren Testlaboren kommt ausschließlich hochwertiges Messequipment in die Hände erfahrener Techniker und Redakteure. Die Tests unterliegen einer mehrstufigen Kontrolle. Unsere komplexe Gesamtbewertung basiert auf hunderten fundierten Messergebnissen und Benchmarks, womit Ihnen Objektivität garantiert ist. Weitere Informationen zu unseren Testmethoden gibt es hier.
Preisvergleich
