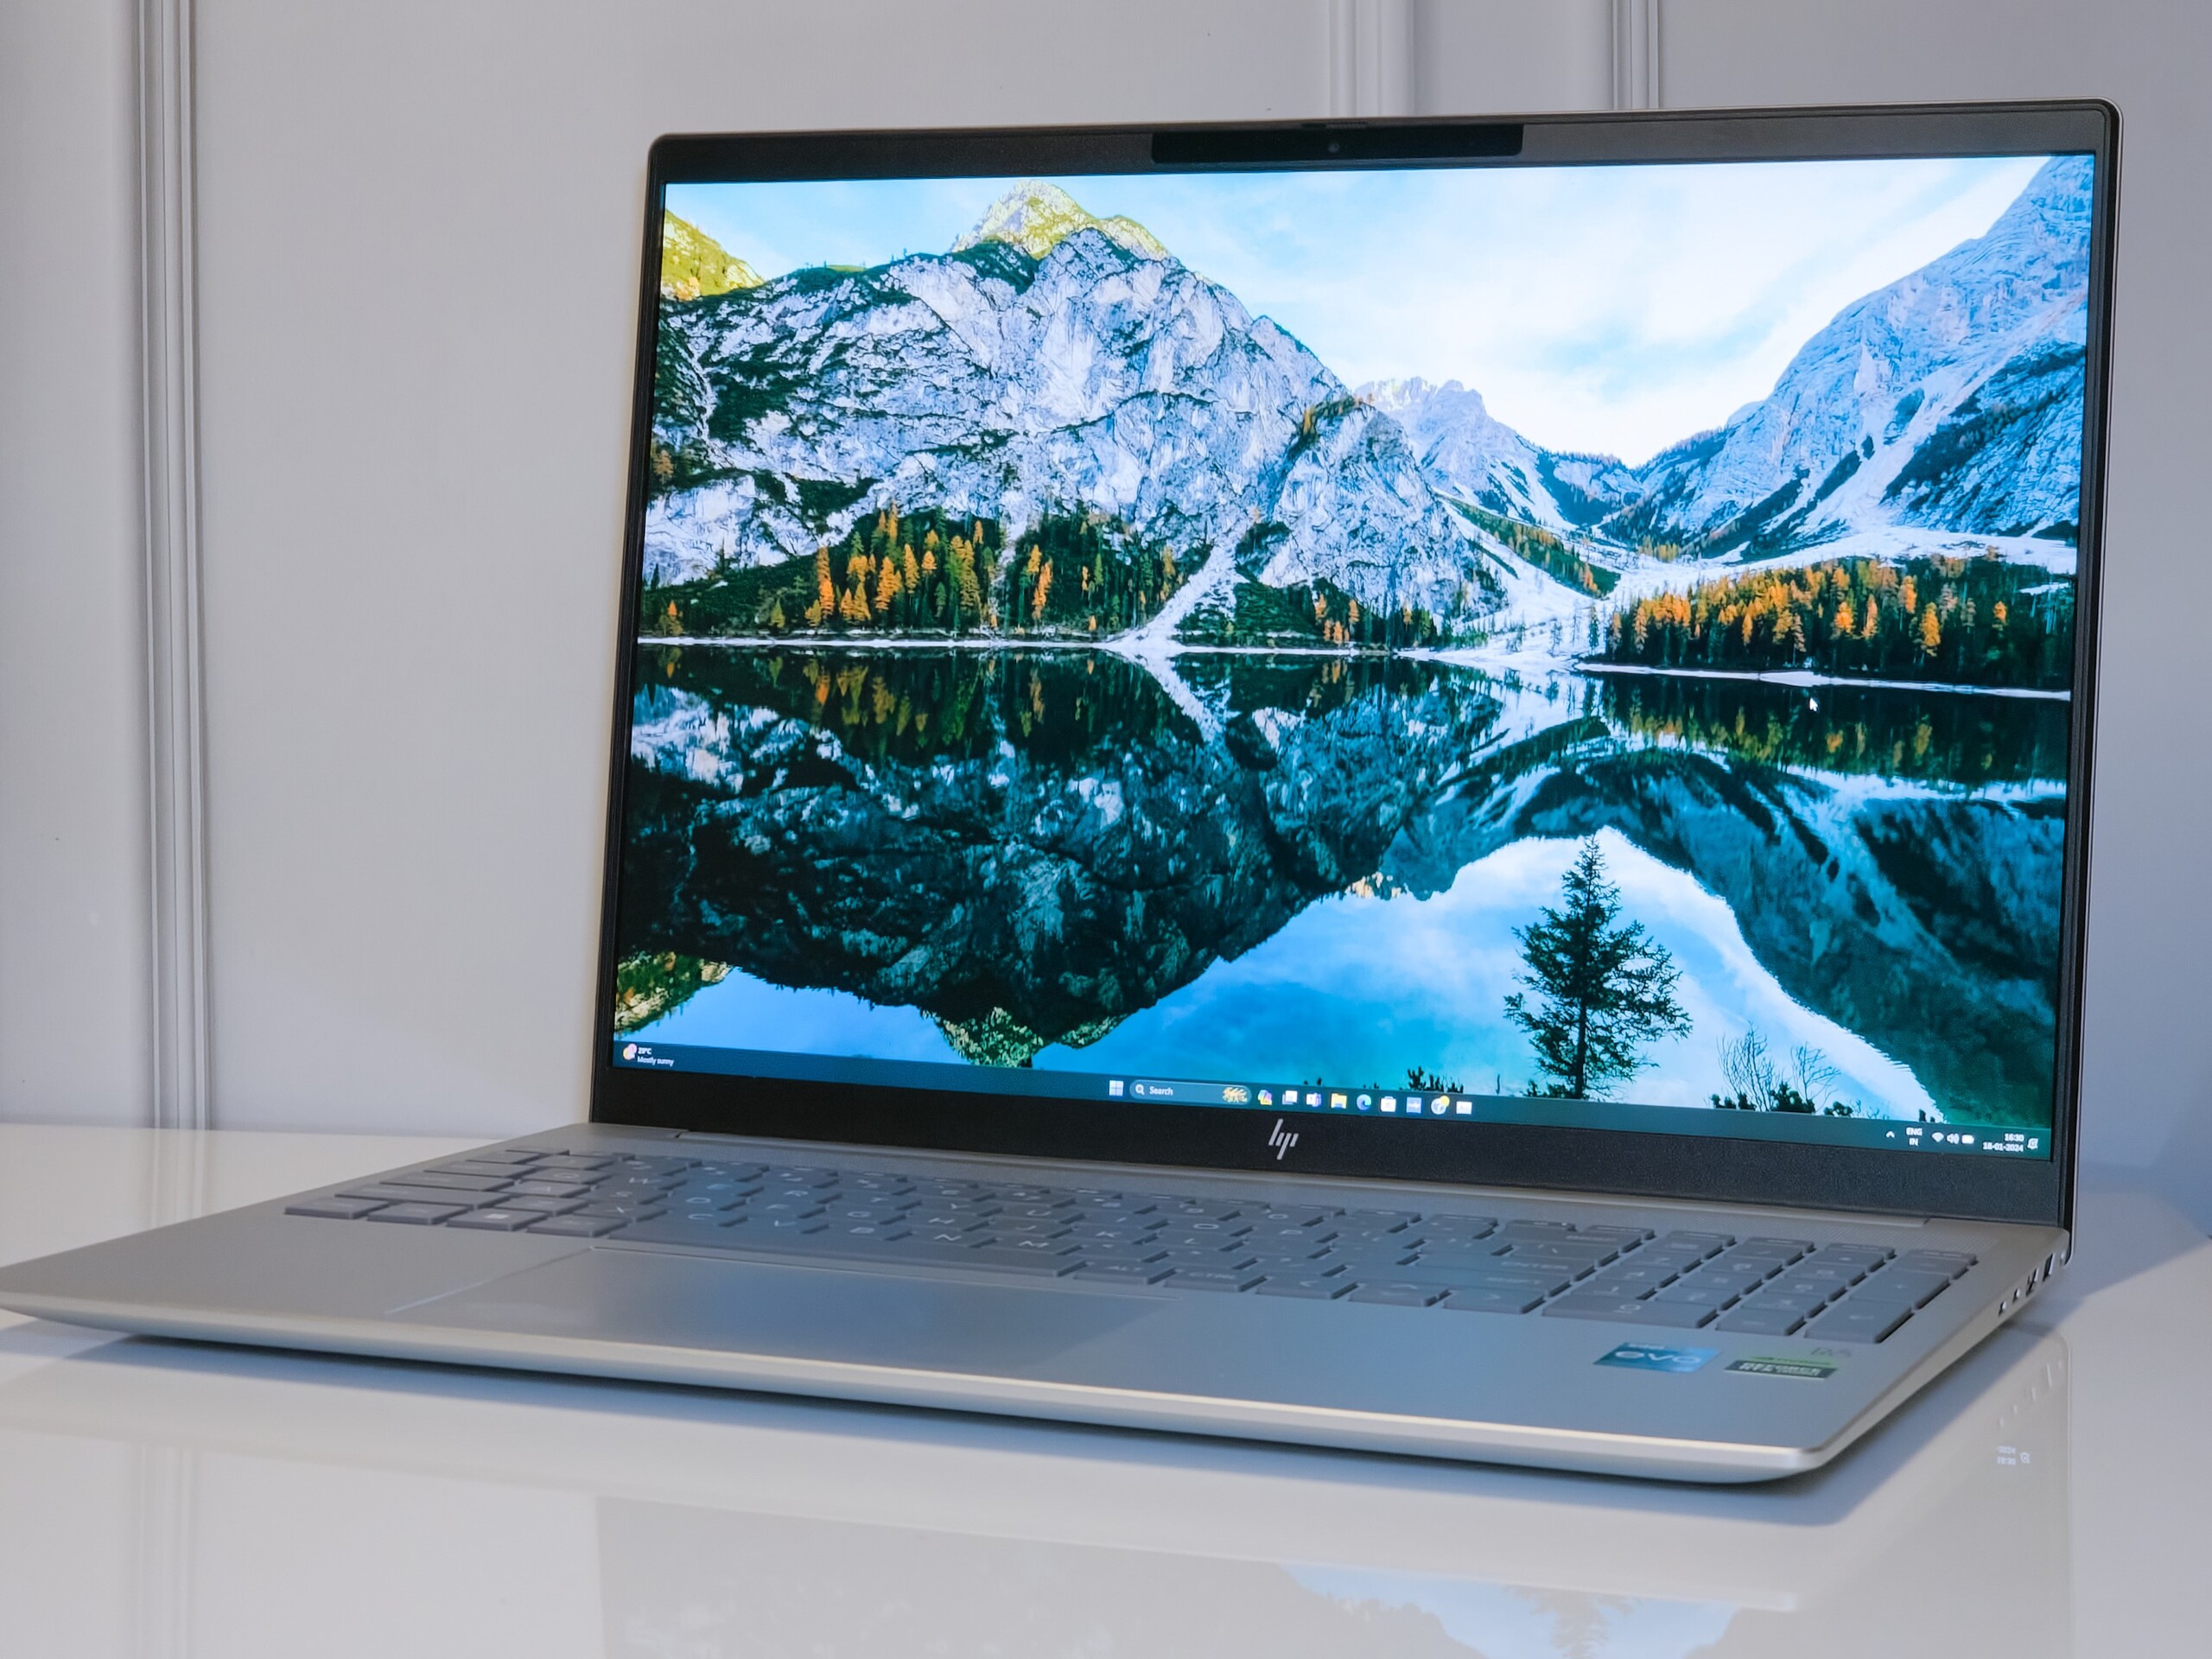
HP Pavilion Plus 16 im Test: Premium-Multimedia-Laptop, der von einer RTX 4050 hätte profitieren können
 im Test")
HP hat kürzlich zwei neue Pavilion-Plus-Modelle als günstigere Alternative zur Envy Serie vorgestellt. Wir haben bereits das Pavilion Plus 14 in beiden Varianten getestet: mit Intel Raptor Lake und mit AMD Zen 4. Jetzt werfen wir einen Blick auf das größere Pavilion Plus 16.
Das Pavilion Plus 16 verzichtet auf das "IMAX Enhanced"-OLED-Panel des Pavilion Plus 14 und bietet stattdessen einen H-Series-Prozessor und eine optionale Nvidia Grafik.
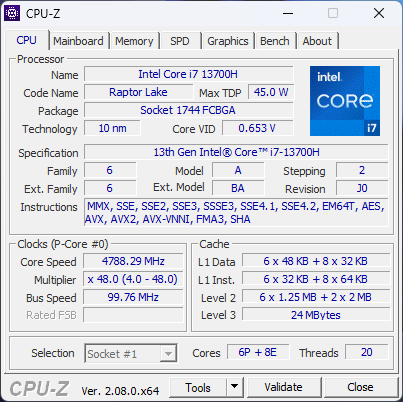
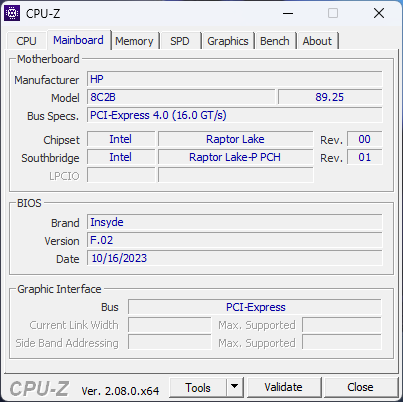
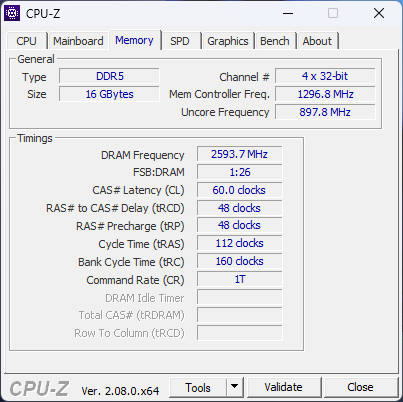
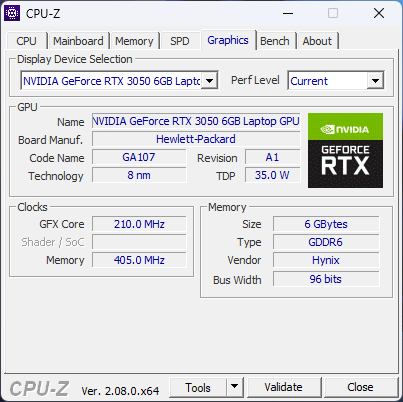
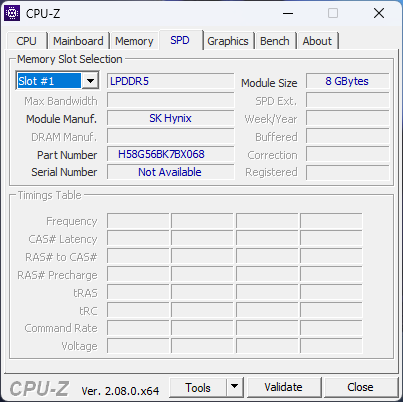
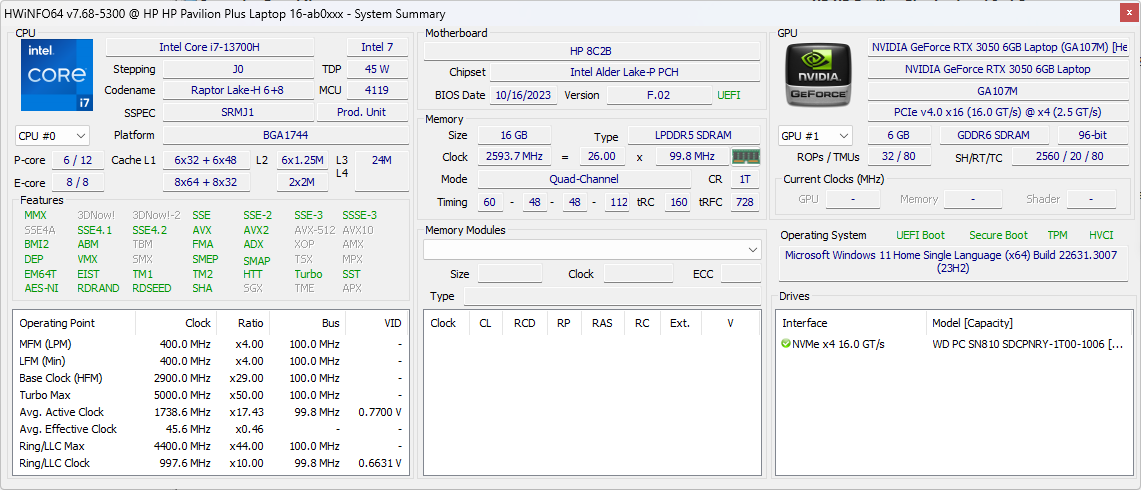
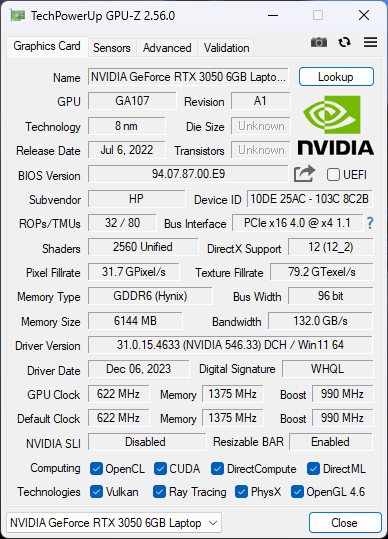
Unser Pavilion-Plus-16-Gerät ist mit einem Intel Core i7-13700H Prozessor zusammen mit 16 GB RAM, 1-TB-SSD und einem 16-Zoll-IPS-Display mit 2.560 x 1.600 Auflösung und 120 Hz ausgestattet. Das Pavilion Plus 16 gehört zu der Handvoll Laptops, die über die Nvidia GeForce RTX 3050 6 GB Laptop GPU verfügen. Diese Konfiguration kostet 1.350 US-Dollar im offiziellen HP India Store.
Mögliche Konkurrenten im Vergleich
Bew. | Datum | Modell | Gewicht | Dicke | Größe | Auflösung | Preis ab |
|---|---|---|---|---|---|---|---|
| 88.7 % v7 (old) | 02 / 2024 | HP Pavilion Plus 16-ab0456tx i7-13700H, GeForce RTX 3050 6GB Laptop GPU | 1.9 kg | 19.9 mm | 16.00" | 2560x1600 | |
| 88.2 % v7 (old) | 01 / 2024 | Schenker Vision 14 M23 RTX 3050 i7-13700H, GeForce RTX 3050 6GB Laptop GPU | 1.3 kg | 16.6 mm | 14.00" | 2880x1800 | |
| 87.1 % v7 (old) | 09 / 2023 | Dell Inspiron 16 Plus 7630 i7-13700H, GeForce RTX 4060 Laptop GPU | 2.2 kg | 19.95 mm | 16.00" | 2560x1600 | |
| 85.6 % v7 (old) | 08 / 2023 | Asus VivoBook 14X K3405 i5-13500H, GeForce RTX 3050 4GB Laptop GPU | 1.4 kg | 18.9 mm | 14.00" | 2880x1800 | |
| 89.2 % v7 (old) | 04 / 2023 | Lenovo Slim Pro 7 14ARP8 R7 7735HS, GeForce RTX 3050 6GB Laptop GPU | 1.6 kg | 15.6 mm | 14.50" | 2560x1600 | |
| 87.6 % v7 (old) | 11 / 2023 | Asus VivoBook Pro 16 K6602VU i9-13900H, GeForce RTX 4050 Laptop GPU | 1.9 kg | 19 mm | 16.00" | 3200x2000 | |
| 89.4 % v7 (old) | 04 / 2023 | Samsung Galaxy Book3 Ultra 16 i7-13700H, GeForce RTX 4050 Laptop GPU | 1.8 kg | 16.5 mm | 16.00" | 2880x1800 |
Gehäuse: Robuste Ganzmetallkonstruktion
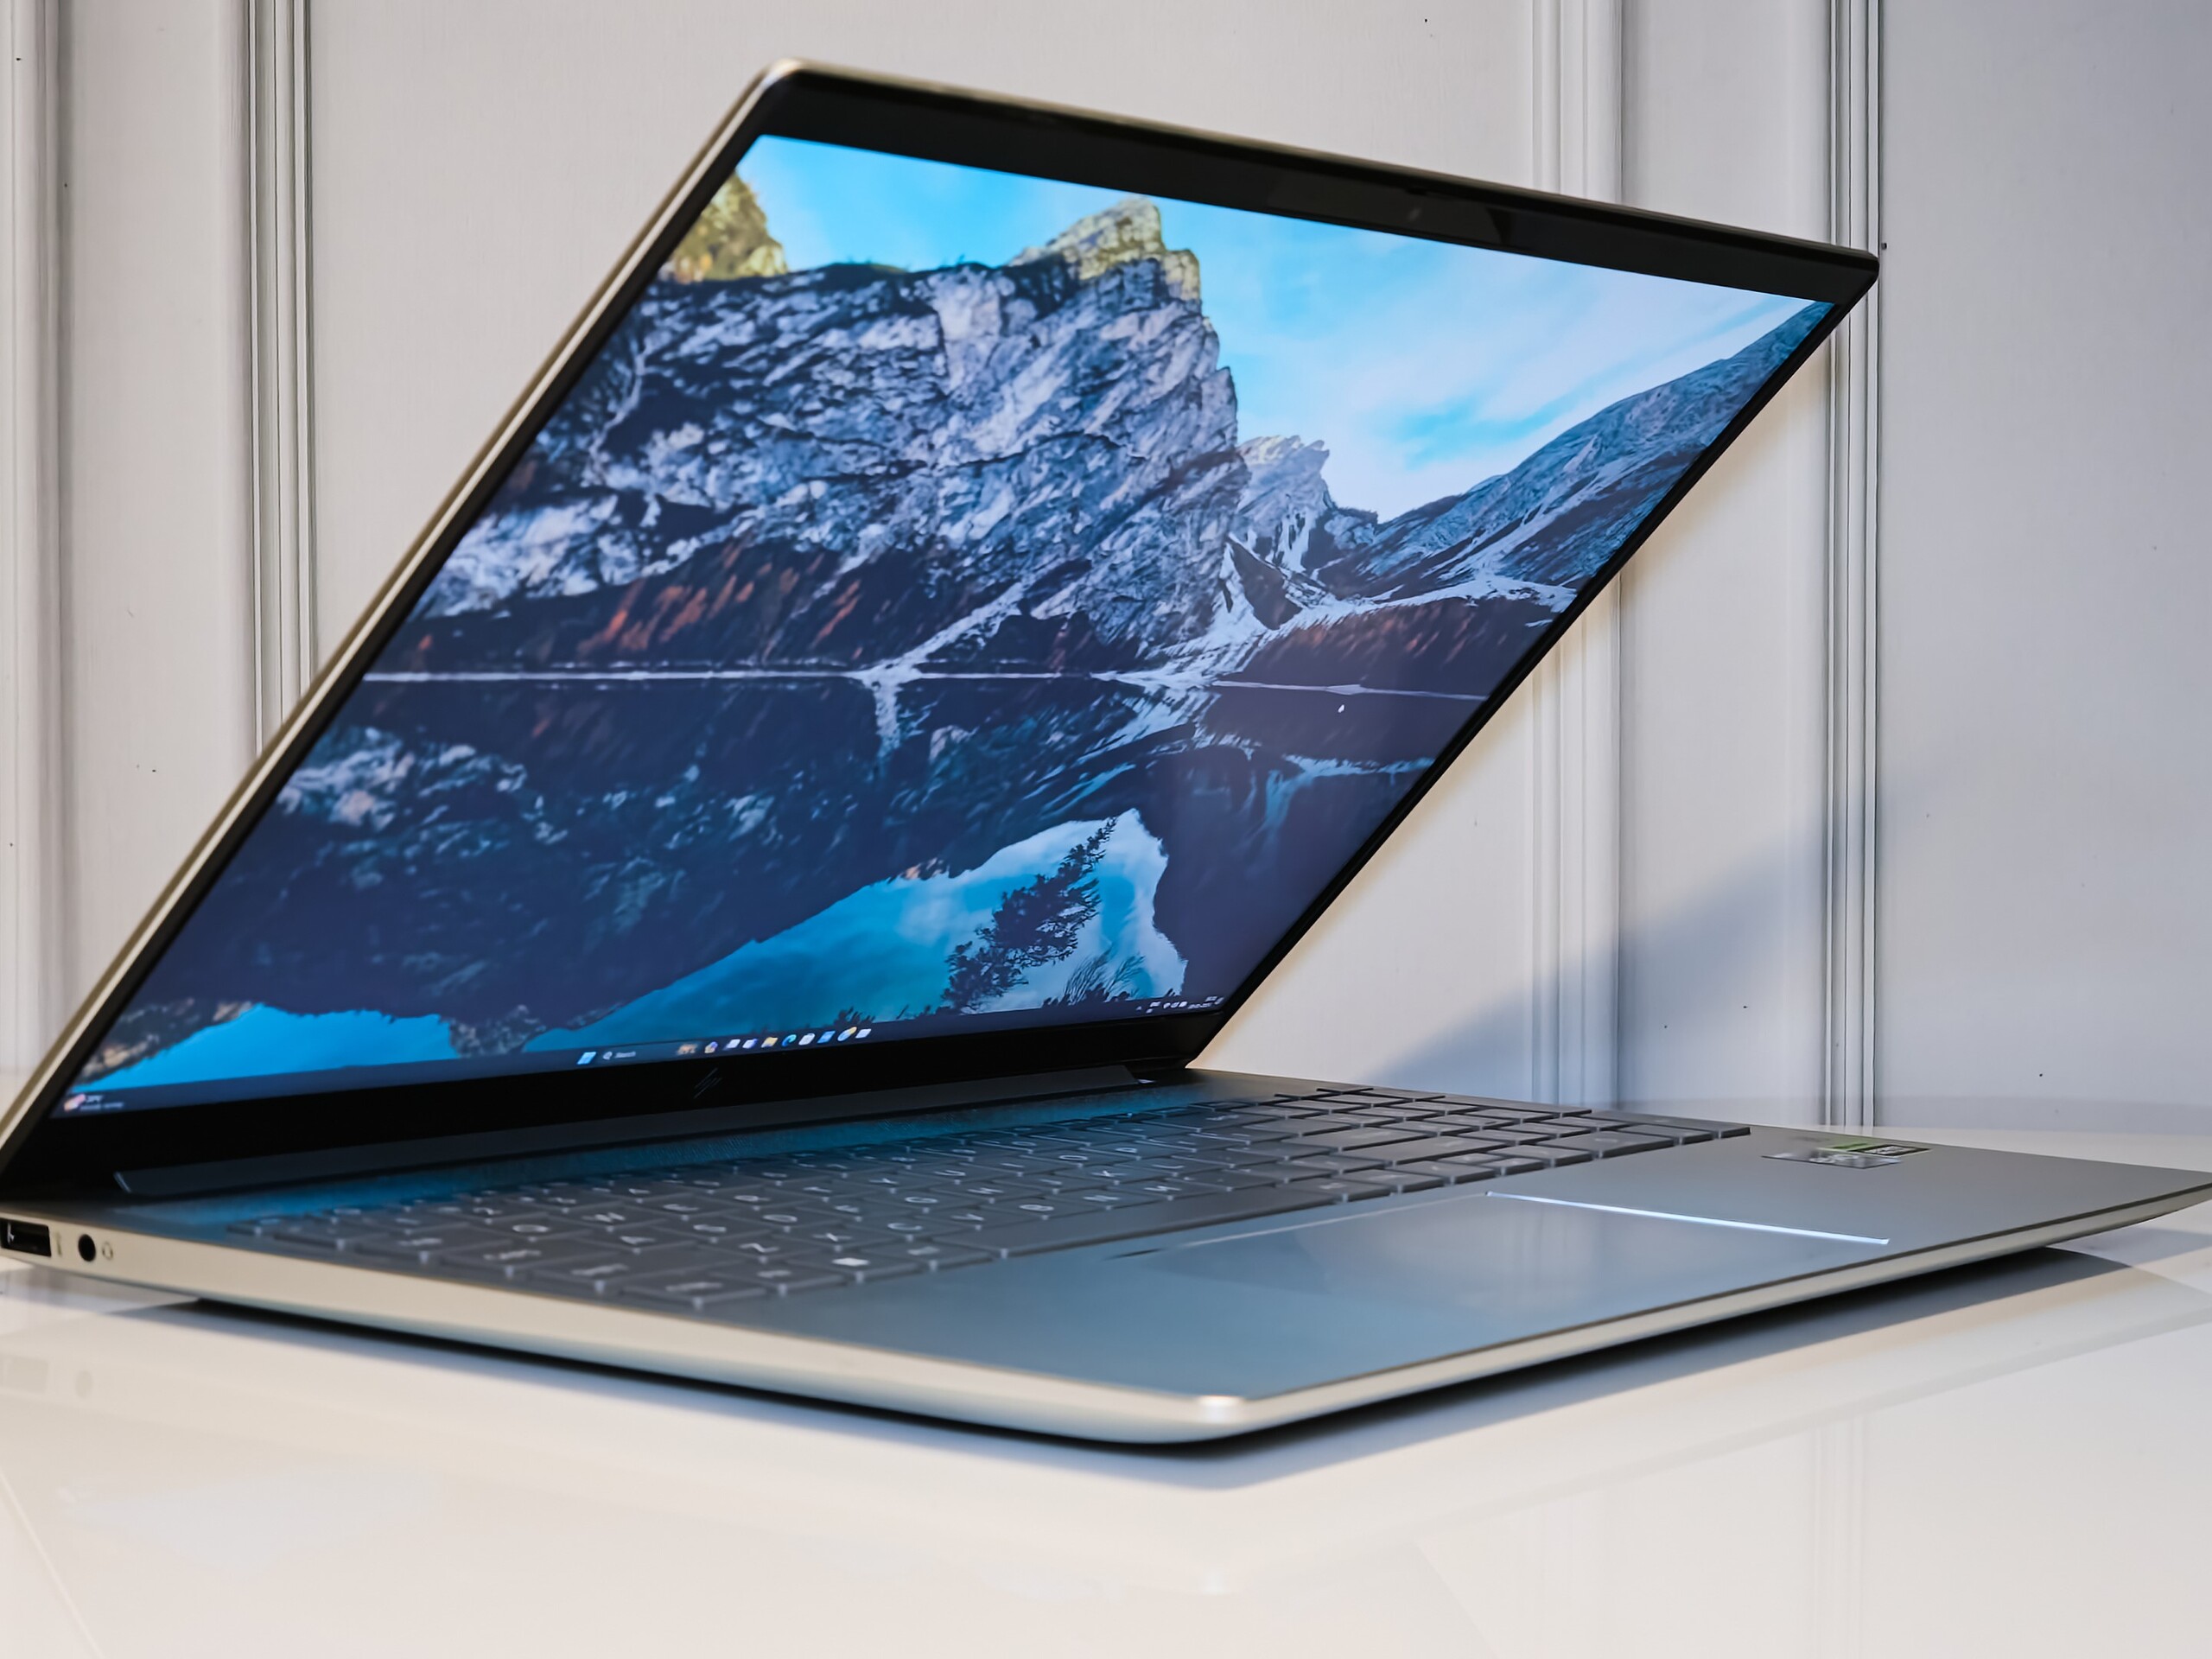
Ähnlich wie das Pavilion Plus 14 ist das Pavilion Plus 16 mit einer Natural-Silver-Metallic-Konstruktion für die A-, C- und D-Abdeckungen ausgestattet, während der Deckel aus Aluminium gefertigt ist.
Die allgemeine Verarbeitungsqualität lässt wenig Raum für Beschwerden. Wir haben keine besondere Biegung des Deckels oder des Tastaturdecks festgestellt.
HP wirbt mit einem Verhältnis von Bildschirm zu Gehäuse von 89,74 %, doch der gemessene Wert liegt bei 83 %. Mit 1,9 kg wiegt das Notebook ähnlich viel wie andere 16-Zoll-Multimedia-Notebooks, die im Trend liegen.

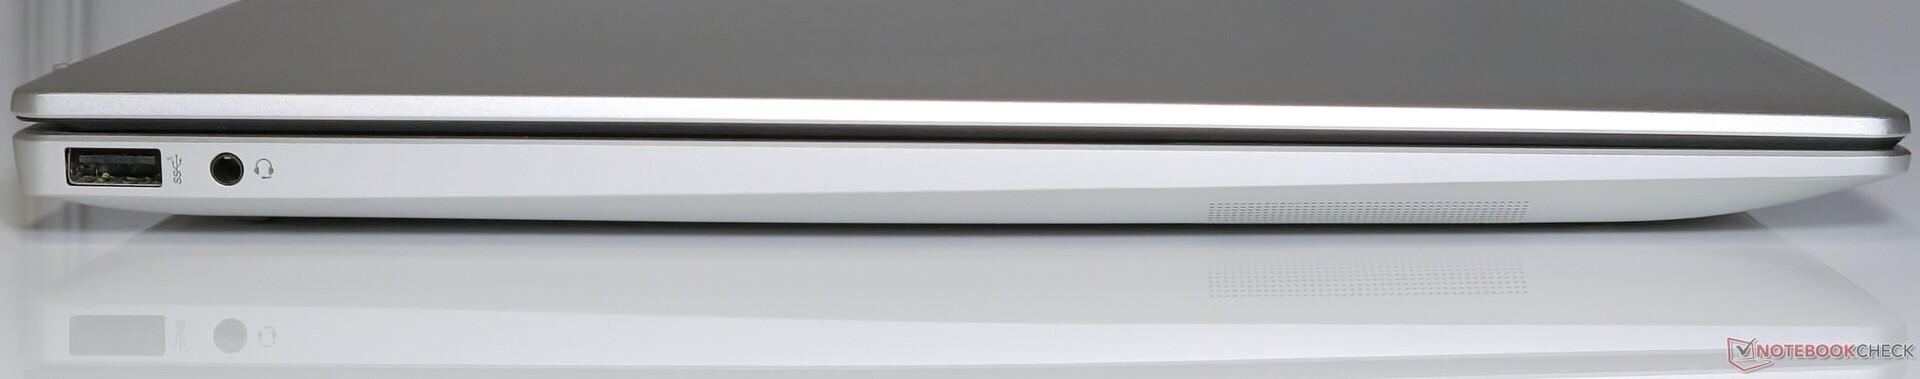
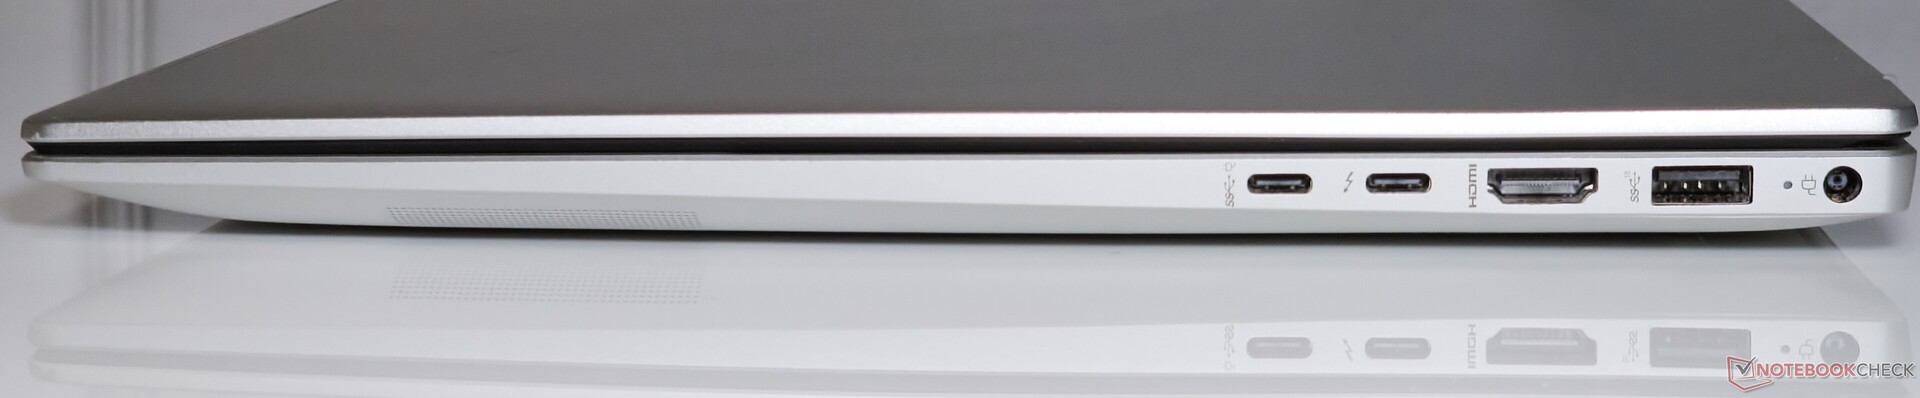
Anschlussausstattung: Konsistenter Wlan-Durchsatz
Das Pavilion Plus 16 bietet eine ordentliche Auswahl an Anschlüssen, darunter USB-Typ-A- und USB-Typ-C-Ports einschließlich Thunderbolt 4.
Die Platzierung der Anschlüsse ist in Ordnung und behindert keine Anschlüsse von benachbarten Peripheriegeräten. Allerdings wäre einer der Type-C-Ports für eine gleichmäßigere Verteilung auch auf der linken Seite sinnvoll.
Kommunikation
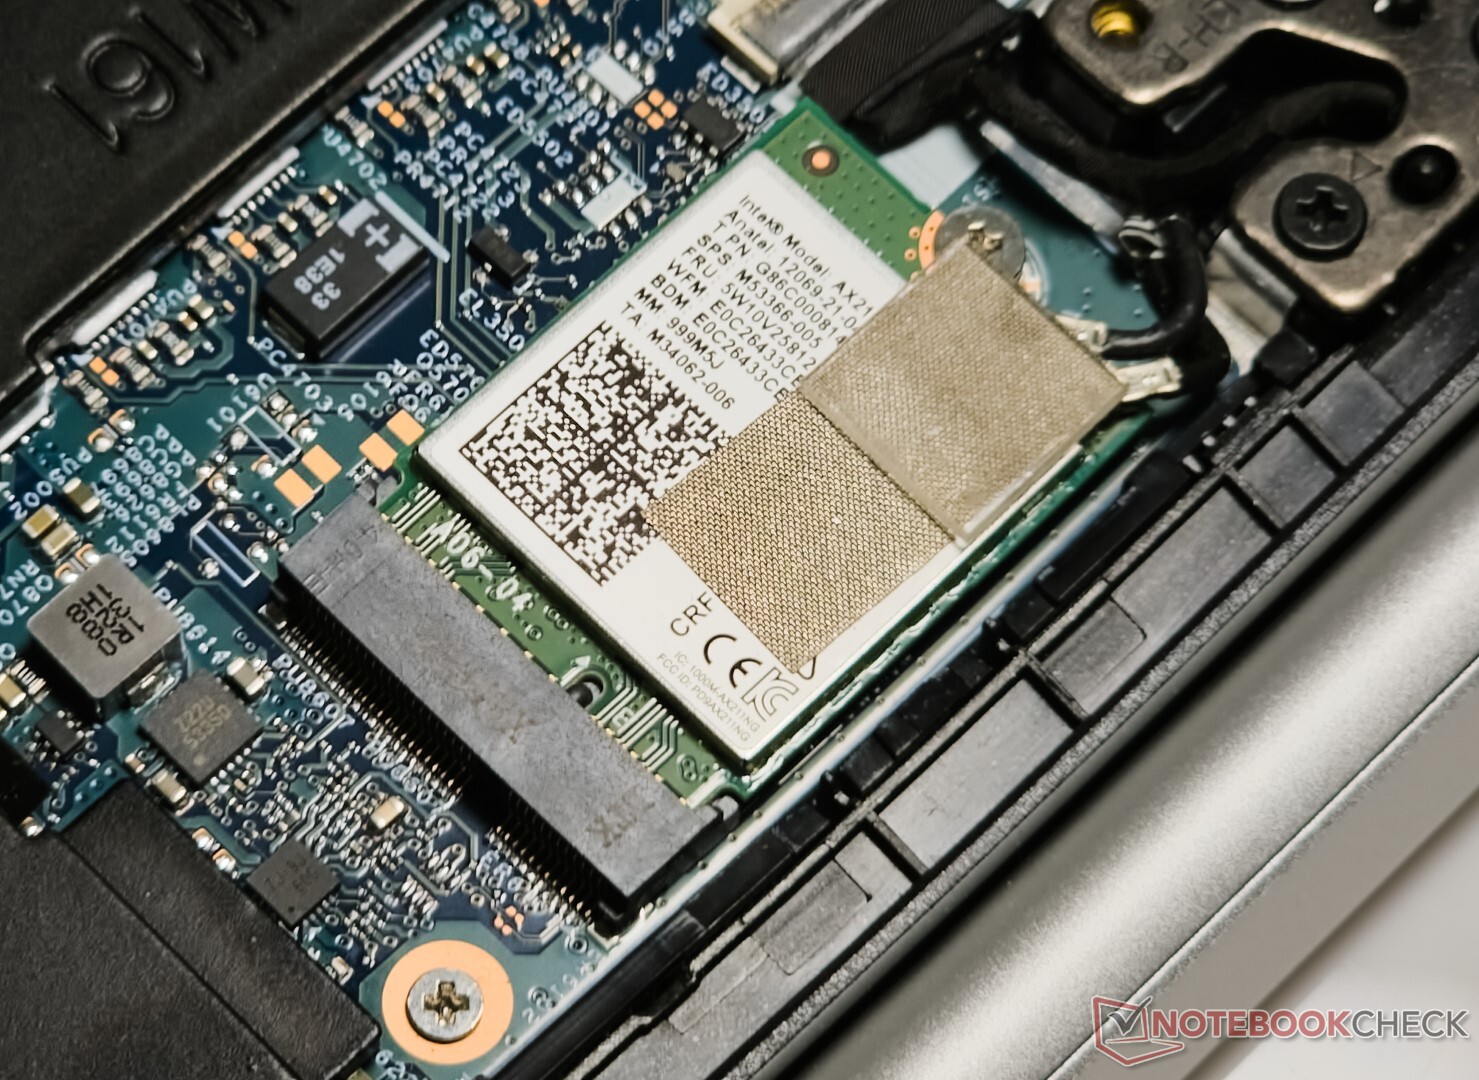
Die iPerf3-Leistung des Pavilion Plus 16 im 5-GHz-Band ist etwas langsamer als die, die wir beim Asus VivoBook Pro 16 mit der gleichen Intel-Wi-Fi-6E-AX211-Wlan-Karte vorfinden.
Das Pavilion macht diesen Rückstand gegenüber dem VivoBook Pro 16 bei der Empfangsleistung im 6-GHz-Band wieder wett, aber nicht viel.
Die iPerf3-Leistung ist sowohl im 5-GHz- als auch im 6-GHz-Band ziemlich konstant und ohne Schluckauf, im Gegensatz zu dem, was wir beim Lenovo Slim Pro 7 mit einem MediaTek-Wi-Fi-6E-MT7922-Chip antreffen.
| Networking / iperf3 transmit AXE11000 | |
| Asus VivoBook 14X K3405 | |
| HP Pavilion Plus 16-ab0456tx | |
| Asus VivoBook Pro 16 K6602VU | |
| Samsung Galaxy Book3 Ultra 16 | |
| Durchschnitt der Klasse Multimedia (606 - 1978, n=61, der letzten 2 Jahre) | |
| Lenovo Slim Pro 7 14ARP8 | |
| Dell Inspiron 16 Plus 7630 | |
| Durchschnittliche Intel Wi-Fi 6E AX211 (64 - 1921, n=276) | |
| Networking / iperf3 receive AXE11000 | |
| Asus VivoBook 14X K3405 | |
| Asus VivoBook Pro 16 K6602VU | |
| HP Pavilion Plus 16-ab0456tx | |
| Samsung Galaxy Book3 Ultra 16 | |
| Lenovo Slim Pro 7 14ARP8 | |
| Durchschnittliche Intel Wi-Fi 6E AX211 (582 - 1890, n=276) | |
| Durchschnitt der Klasse Multimedia (682 - 1818, n=61, der letzten 2 Jahre) | |
| Dell Inspiron 16 Plus 7630 | |
| Networking / iperf3 transmit AXE11000 6GHz | |
| HP Pavilion Plus 16-ab0456tx | |
| Dell Inspiron 16 Plus 7630 | |
| Durchschnitt der Klasse Multimedia (869 - 2373, n=25, der letzten 2 Jahre) | |
| Asus VivoBook 14X K3405 | |
| Asus VivoBook Pro 16 K6602VU | |
| Durchschnittliche Intel Wi-Fi 6E AX211 (385 - 1851, n=226) | |
| Networking / iperf3 receive AXE11000 6GHz | |
| HP Pavilion Plus 16-ab0456tx | |
| Durchschnitt der Klasse Multimedia (1212 - 2361, n=25, der letzten 2 Jahre) | |
| Asus VivoBook Pro 16 K6602VU | |
| Asus VivoBook 14X K3405 | |
| Durchschnittliche Intel Wi-Fi 6E AX211 (700 - 1857, n=226) | |
| Dell Inspiron 16 Plus 7630 | |
Webcam
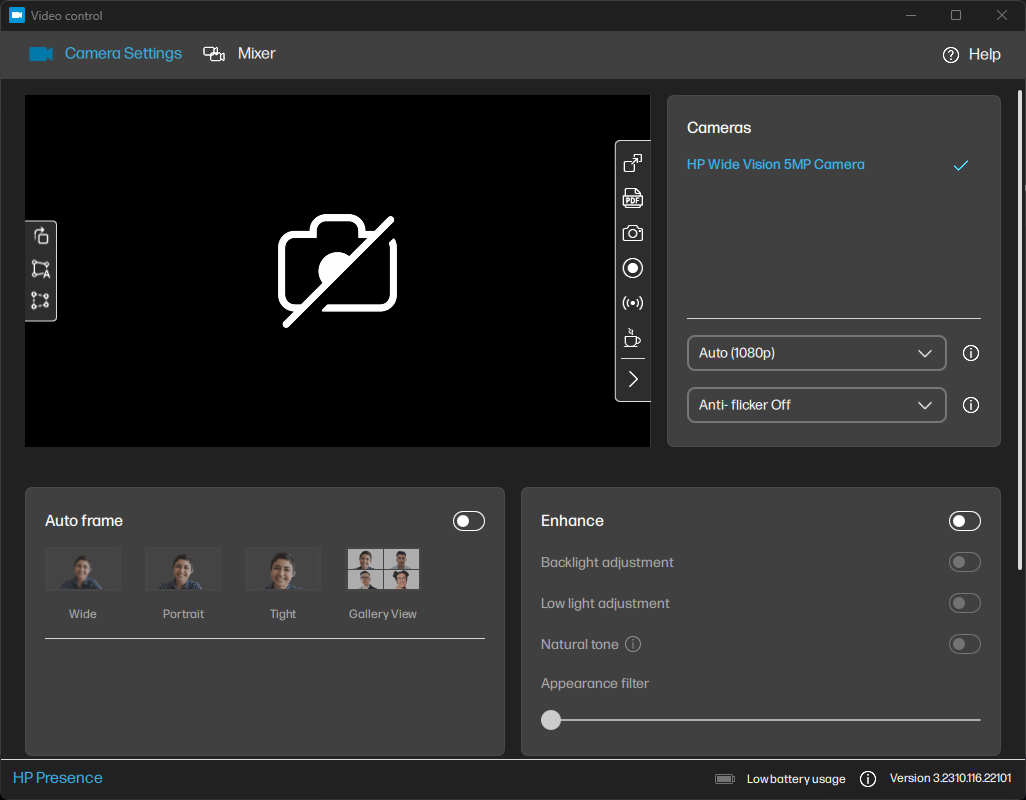
Die 5-MP-Webcam liefert ordentliche Bilder, die für Videokonferenzen durchaus brauchbar sind. Für eine Laptop-Webcam sind die Details recht gut erhalten, aber die Kamera kann bei schlechten Lichtverhältnissen Probleme haben.
HP stellt einige nützliche Funktionen zur Verfügung, z. B. HP Enhanced Lighting, das den Bildschirm um das Motiv herum aufhellt, und die App Video Control, die zusätzliche Optionen für den Bildausschnitt und die Bildeinstellung bietet.


Sicherheit
HP liefert eine Windows Hello-kompatible IR-Kamera für das Pavilion Plus 16 zusammen mit einem Privacy Shutter für die Webcam. Die IR-Kamera funktionierte während unserer Zeit mit dem Gerät recht schnell.
Außerdem ist ein TPM 2.0 Modul vorhanden, um die Sicherheitsanforderungen von Windows 11 zu erfüllen.
Zubehör und Garantie
Außer dem 135-W-Netzteil und dem üblichen Papierkram befindet sich kein weiteres Zubehör in der Verpackung.
HP bietet eine einjährige Garantie für das Pavilion Plus 16 in Indien. Käufer können diese Garantie um bis zu drei weitere Jahre verlängern, indem sie geeignete HP Care Packs erwerben.
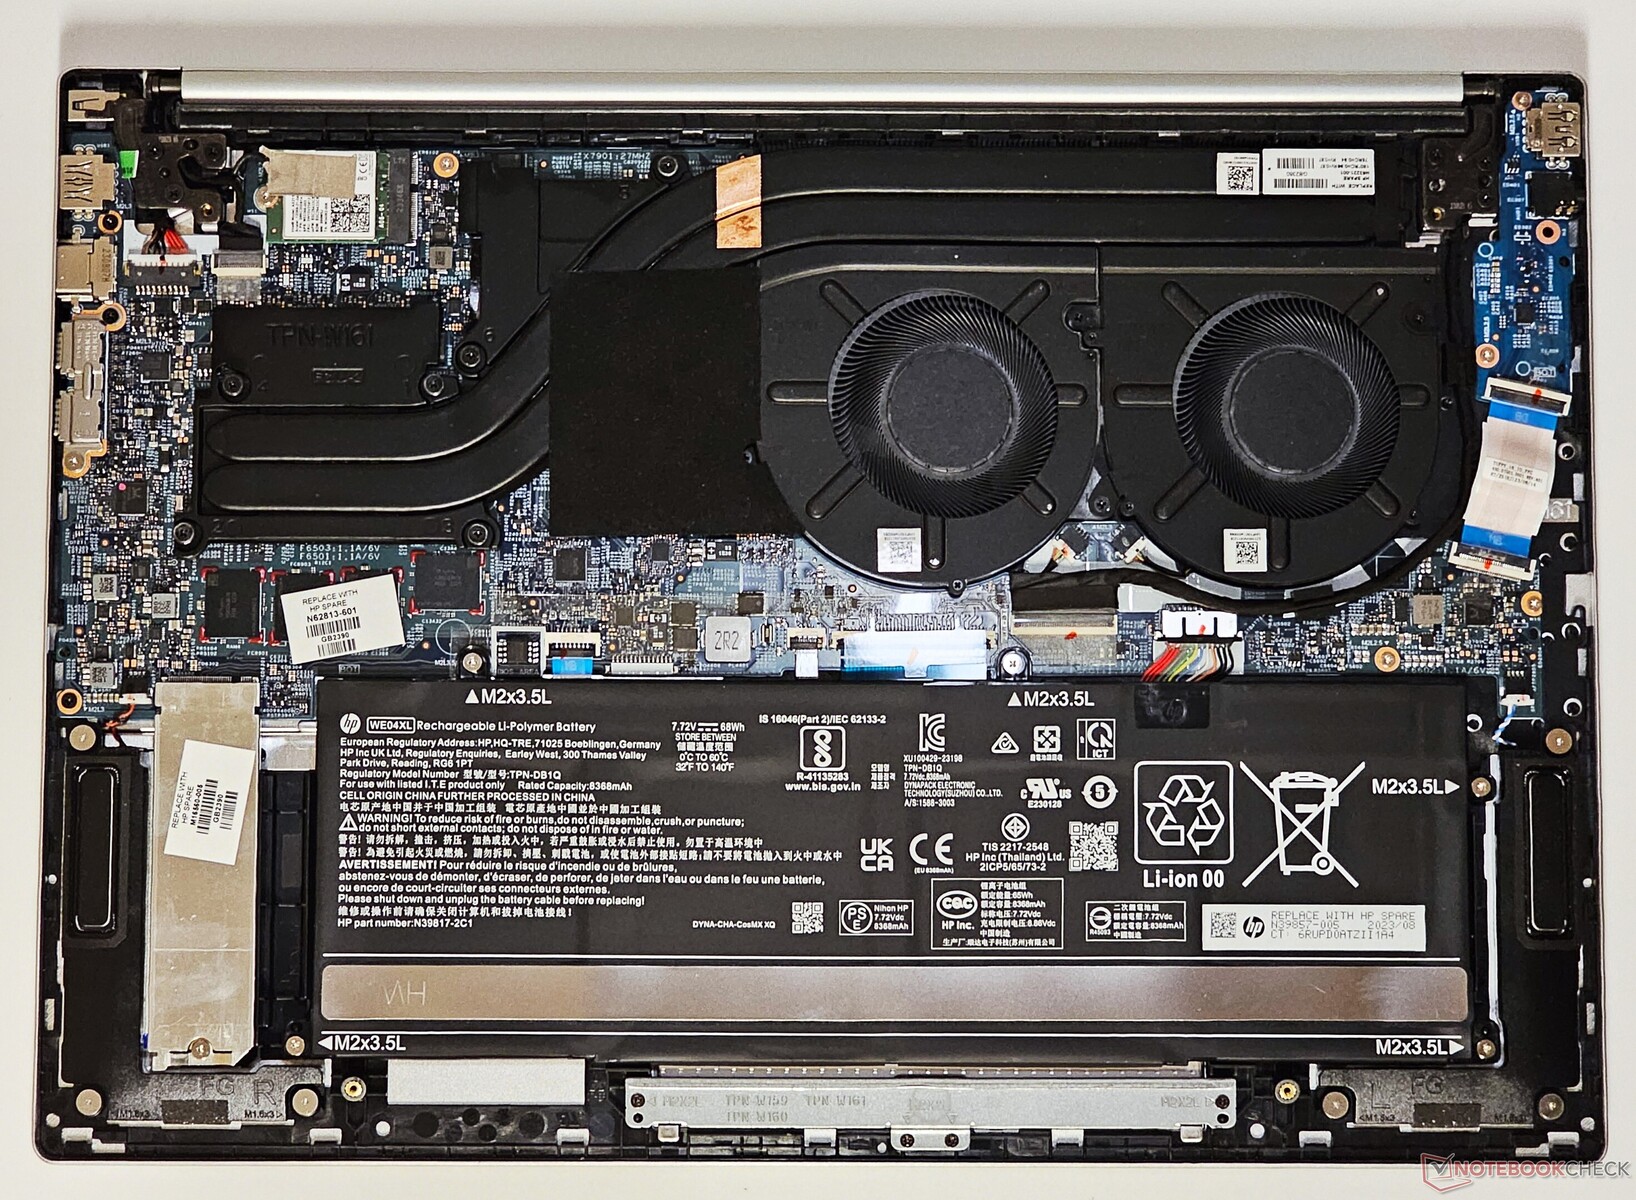
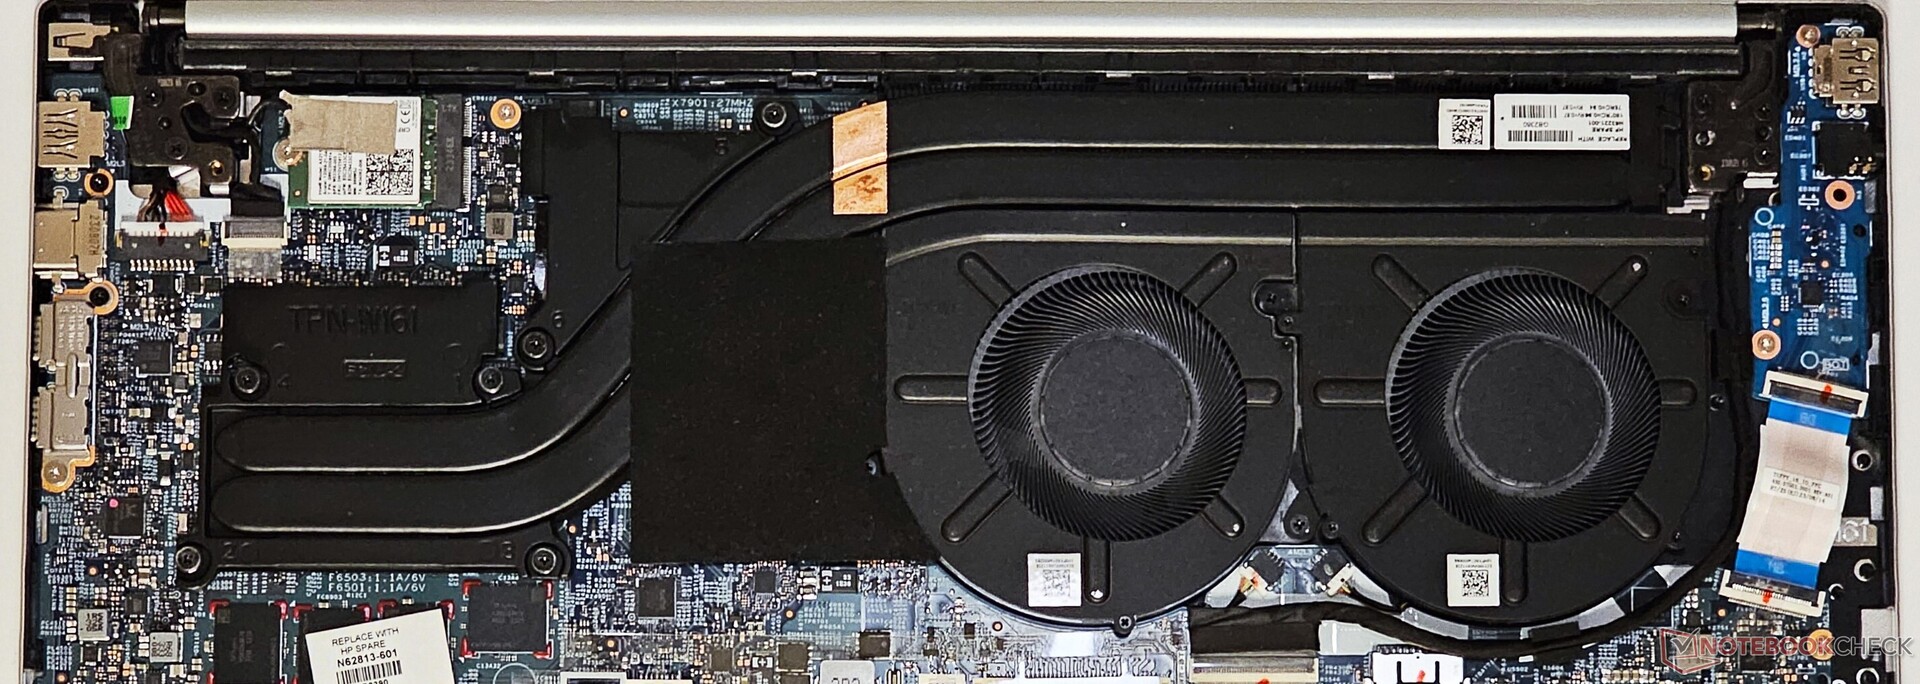
Wartung
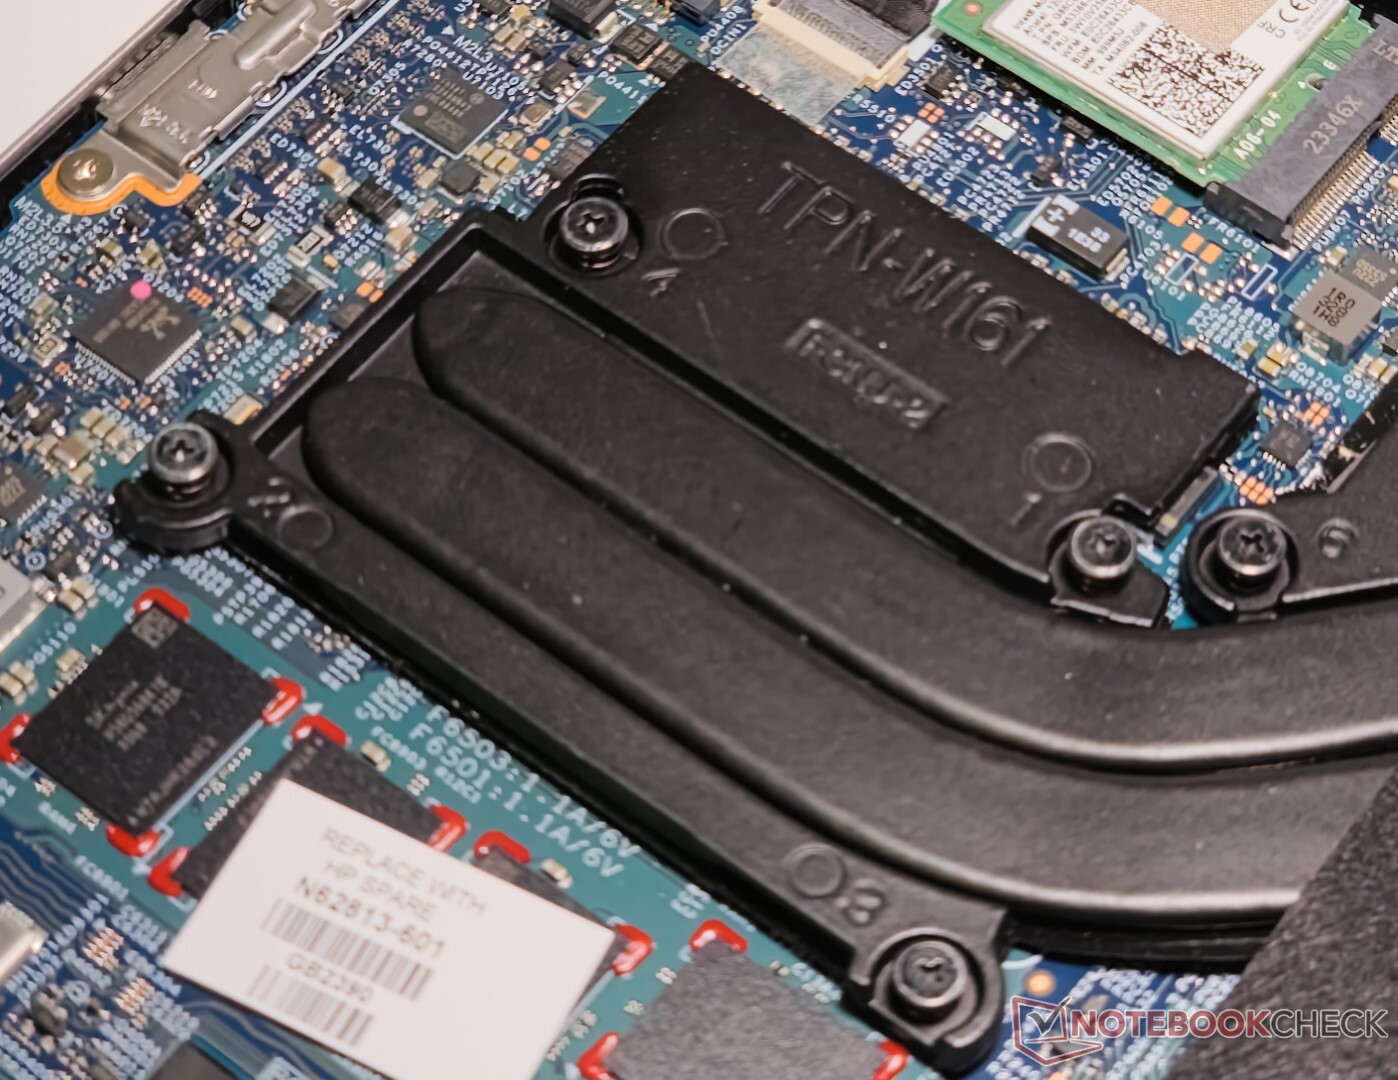
Die Bodenplatte kann nach dem Entfernen der vier PH0-Schrauben aufgehebelt werden. Der Speicher ist fest verlötet, aber die Wlan-Karte, die NVMe-SSD und der Akku sind bei Bedarf austauschbar.
Eingabegeräte: Numpad in voller Größe mit anständiger Taktilität
Tastatur
Die Tastatur des Pavilion Plus 16 bietet ein anständiges Tipperlebnis. Die grauen Tastenkappen haben einen guten Kontrast zu der Gehäusfarbe Natural Silver. Der Ziffernblock ist geräumig und eignet sich gut für Zahlenkombinationen in Excel. Es fehlt allerdings eine Num-Lock-Anzeige.
Die Einschalttaste befindet sich direkt neben der Entf-Taste, was für Erstbenutzer verwirrend sein könnte. Auch die oberen und unteren Pfeiltasten fühlen sich beengt an. Eine dreistufige weiße Hintergrundbeleuchtung hilft bei schlechten Lichtverhältnissen.
Touchpad
Das 12,5 cm x 8 cm große Touchpad fühlt sich geräumig an und bietet ein reibungsloses Gleiten mit gutem Feedback. Allerdings ist der Hubweg nicht so tief.
Das gesamte Touchpad funktioniert wie die linke Maustaste. Klicks in der Mitte und am unteren Rand des Touchpads sind reaktionsschneller als die am oberen Rand.
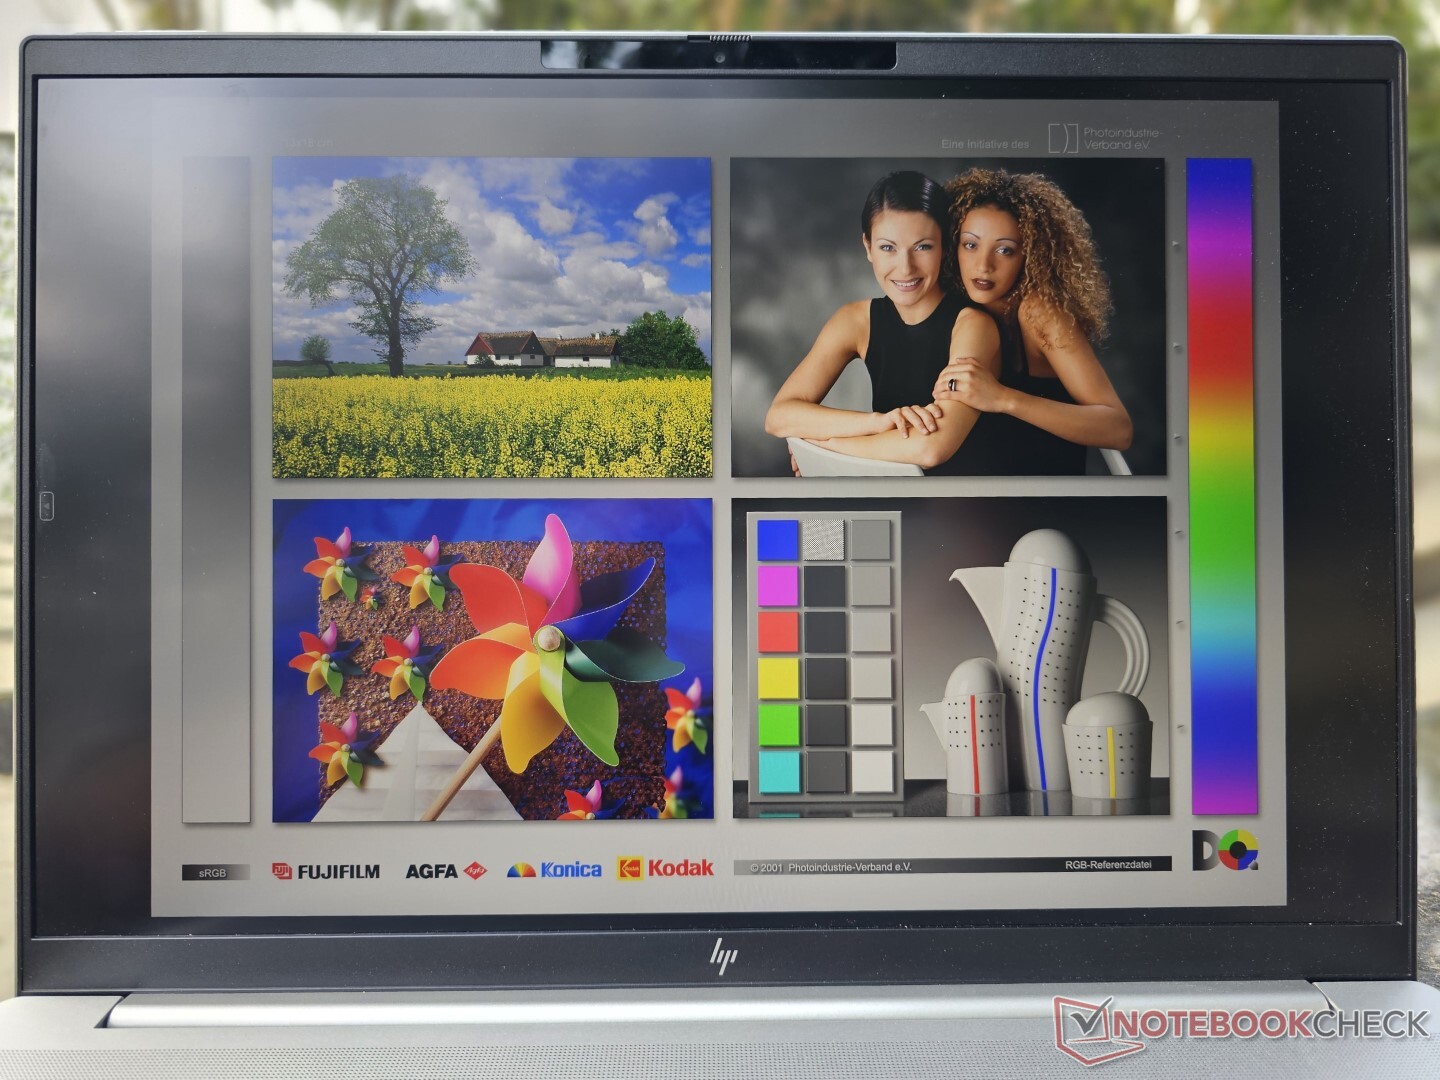
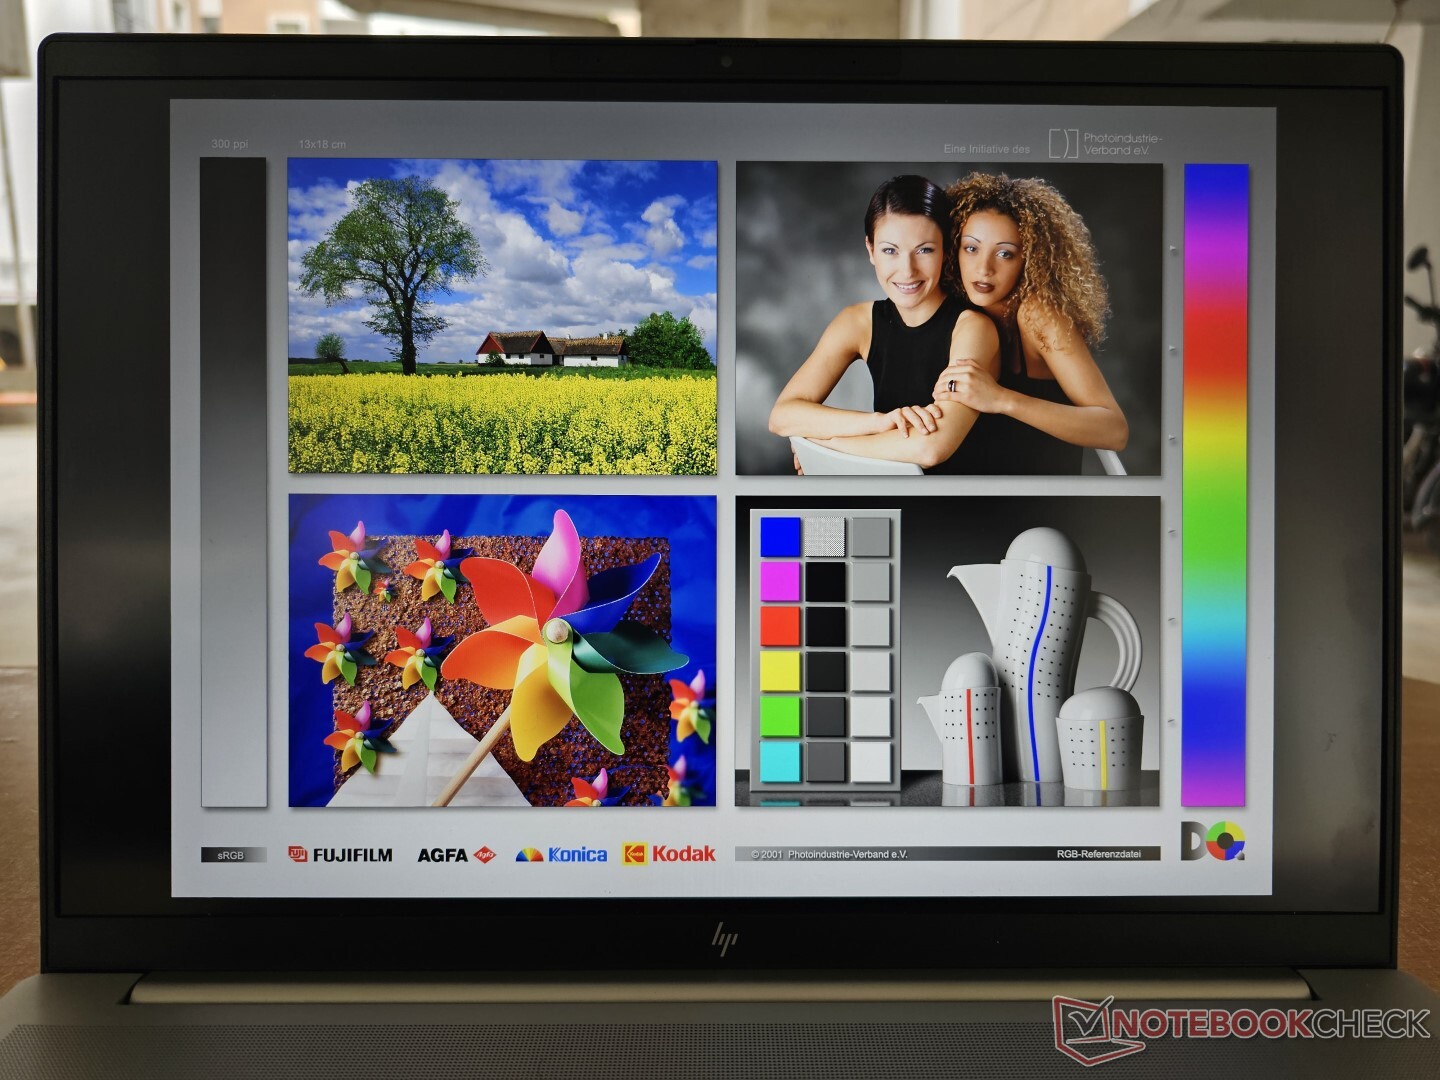
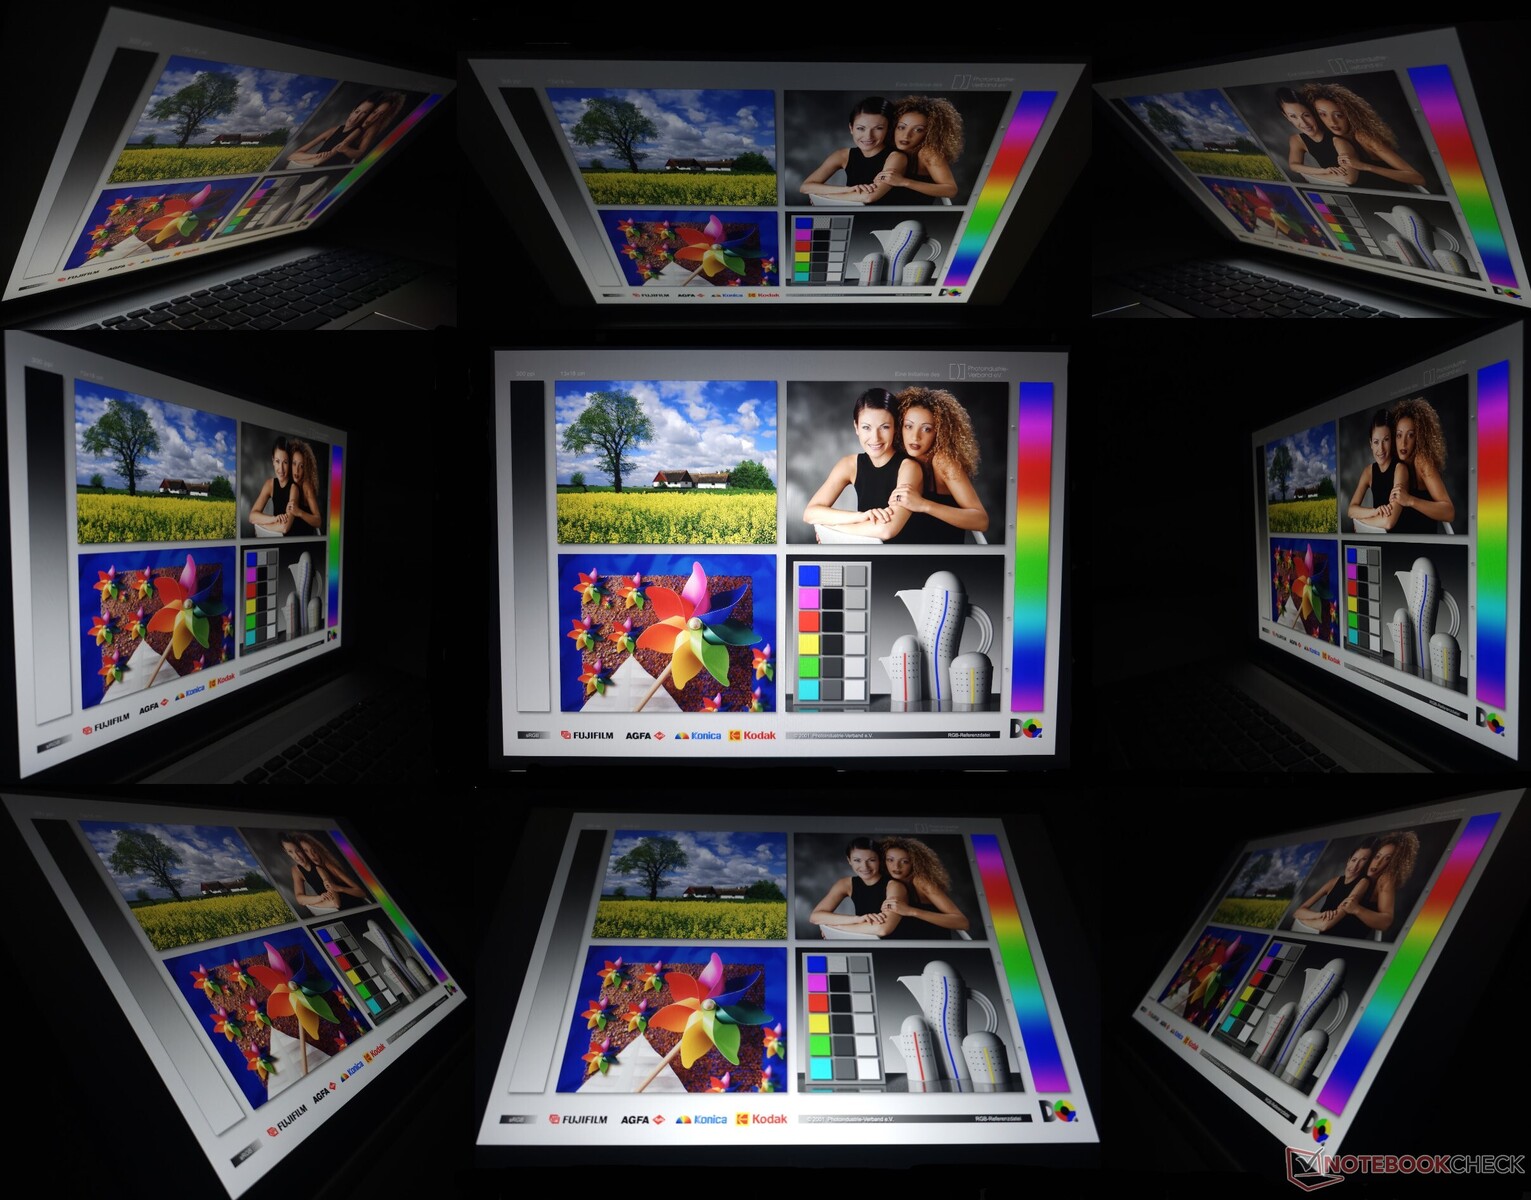
Display: 120-Hz-WQXGA-Panel mit ordentlichem Farbprofil und ohne PWM
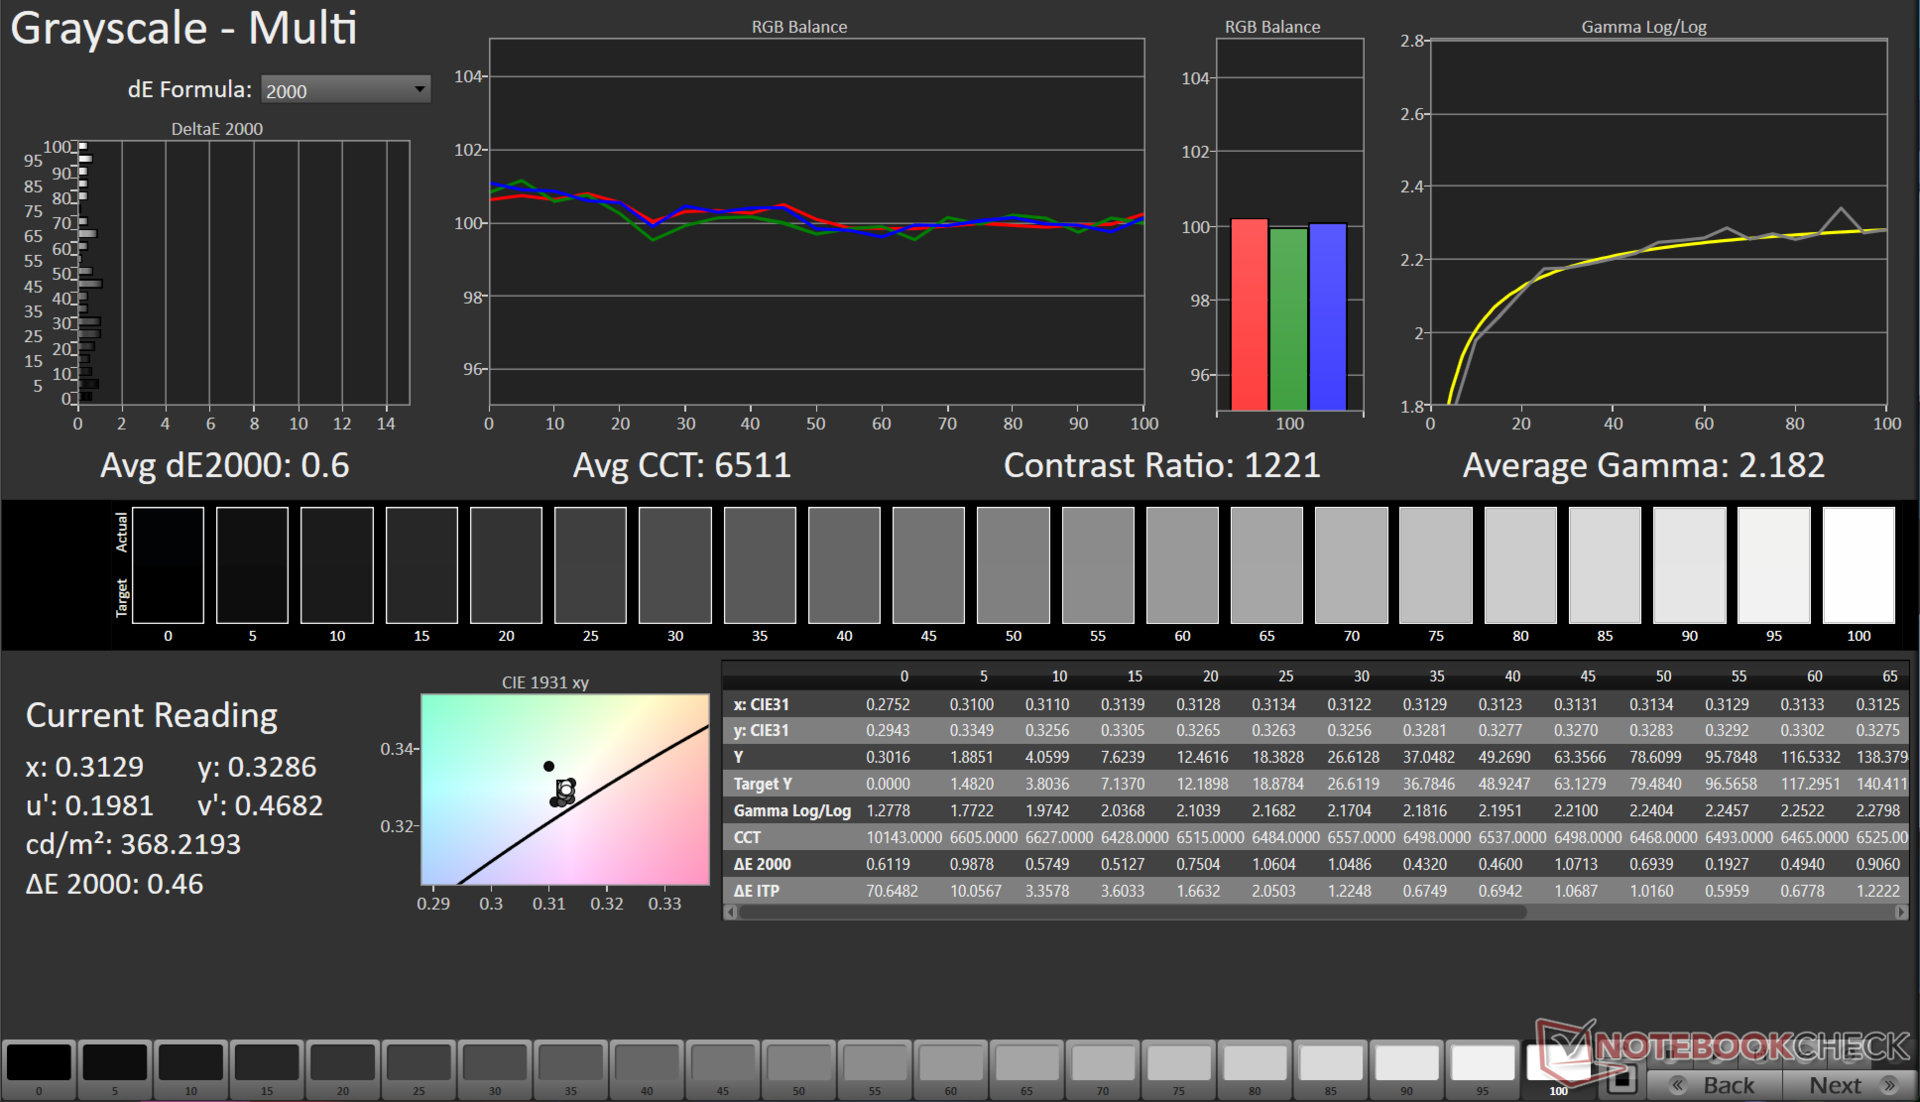
Das Pavilion Plus 16 verfügt über ein 16-Zoll-16:10-2.560x1.600-WQXGA-IPS-Panel mit einer Bildwiederholfrequenz von 120 Hz und einer Helligkeit von 400 Nits.
Wir haben eine maximale Helligkeit von 415 Nits gemessen, mit einer durchschnittlichen Helligkeit von 394 Nits und einer guten Verteilung von 90 %. Da es sich um ein IPS-Panel handelt, ist das Display nicht immun gegen Backlight Bleeding - dies ist bei langer Belichtung in den unteren Ecken zu beobachten.
Subjektiv gesehen bietet das Pavilion Plus 16 ein gutes Seherlebnis, das sowohl für die Arbeit als auch für Unterhaltung geeignet sein sollte.

| |||||||||||||||||||||||||
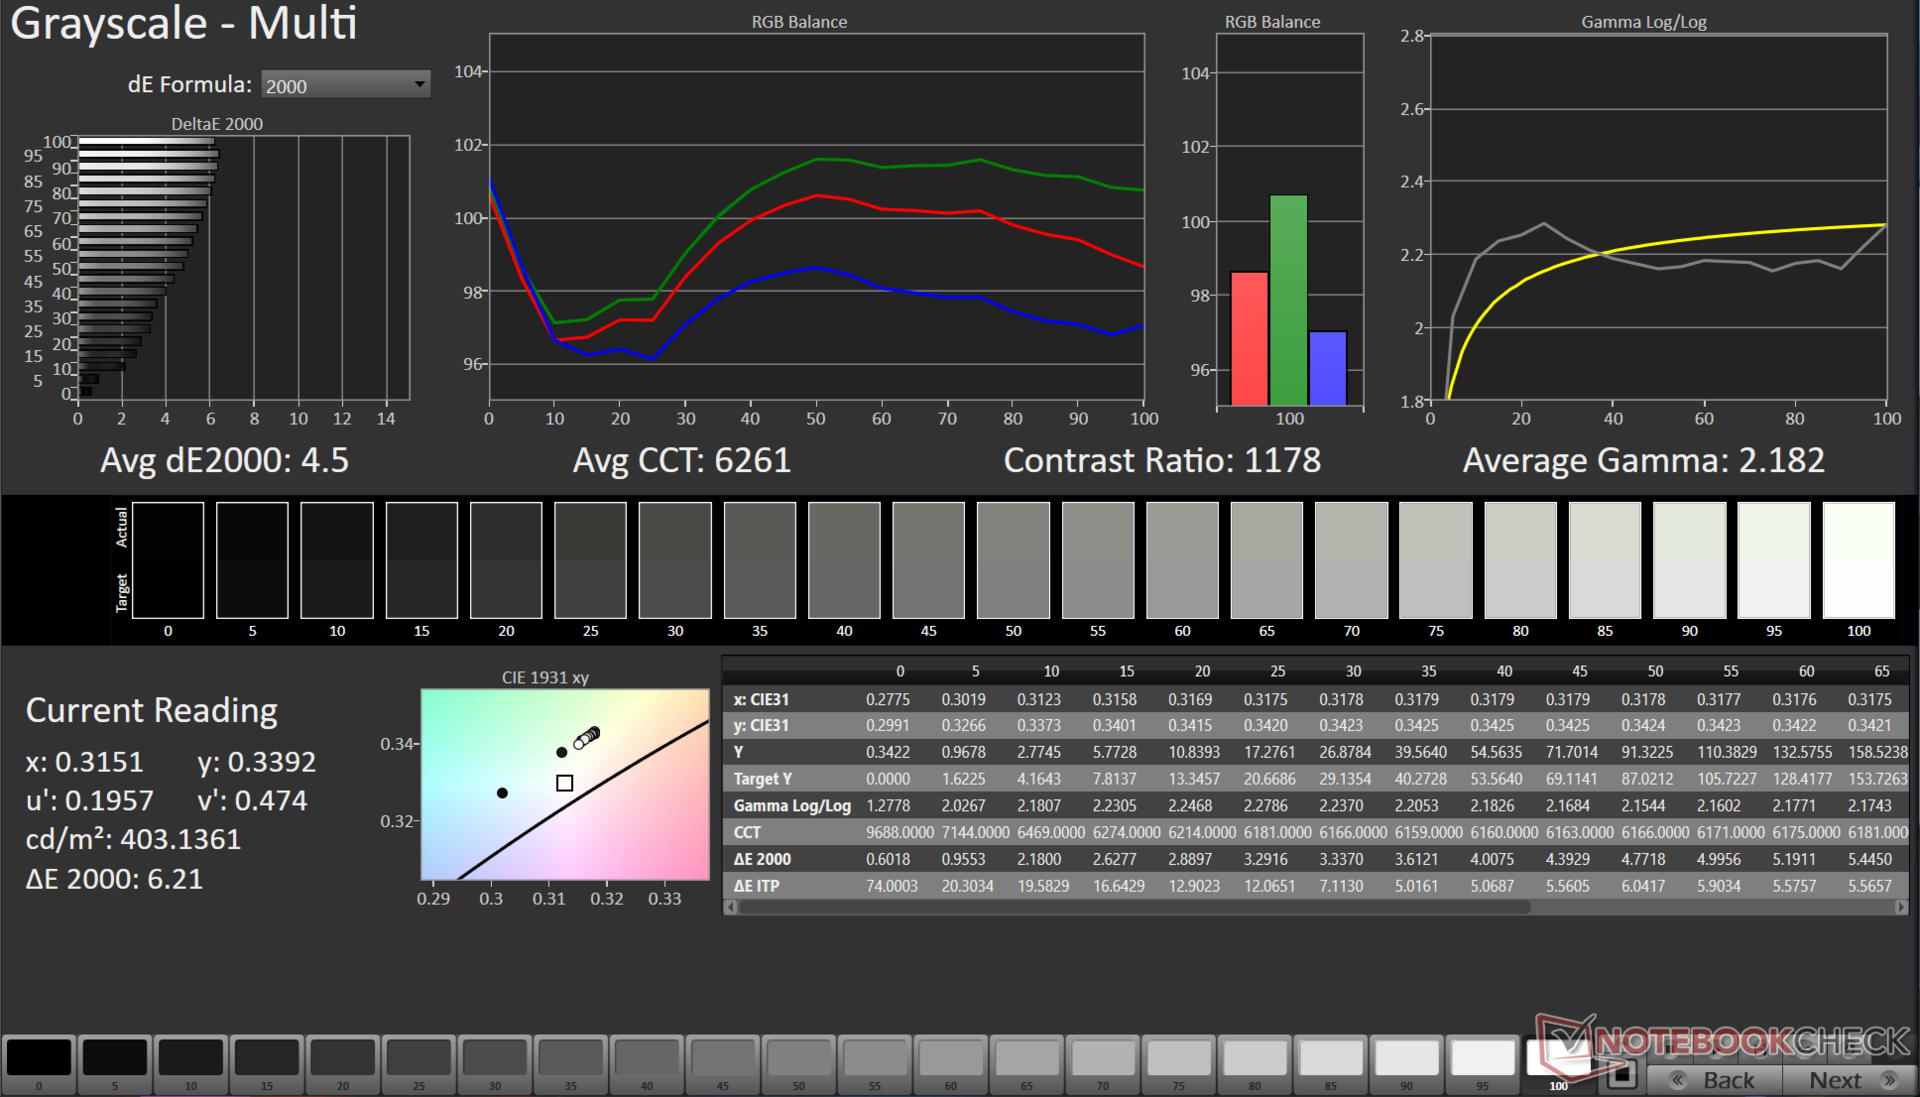
Ausleuchtung: 90 %
Helligkeit Akku: 401 cd/m²
Kontrast: 1185:1 (Schwarzwert: 0.34 cd/m²)
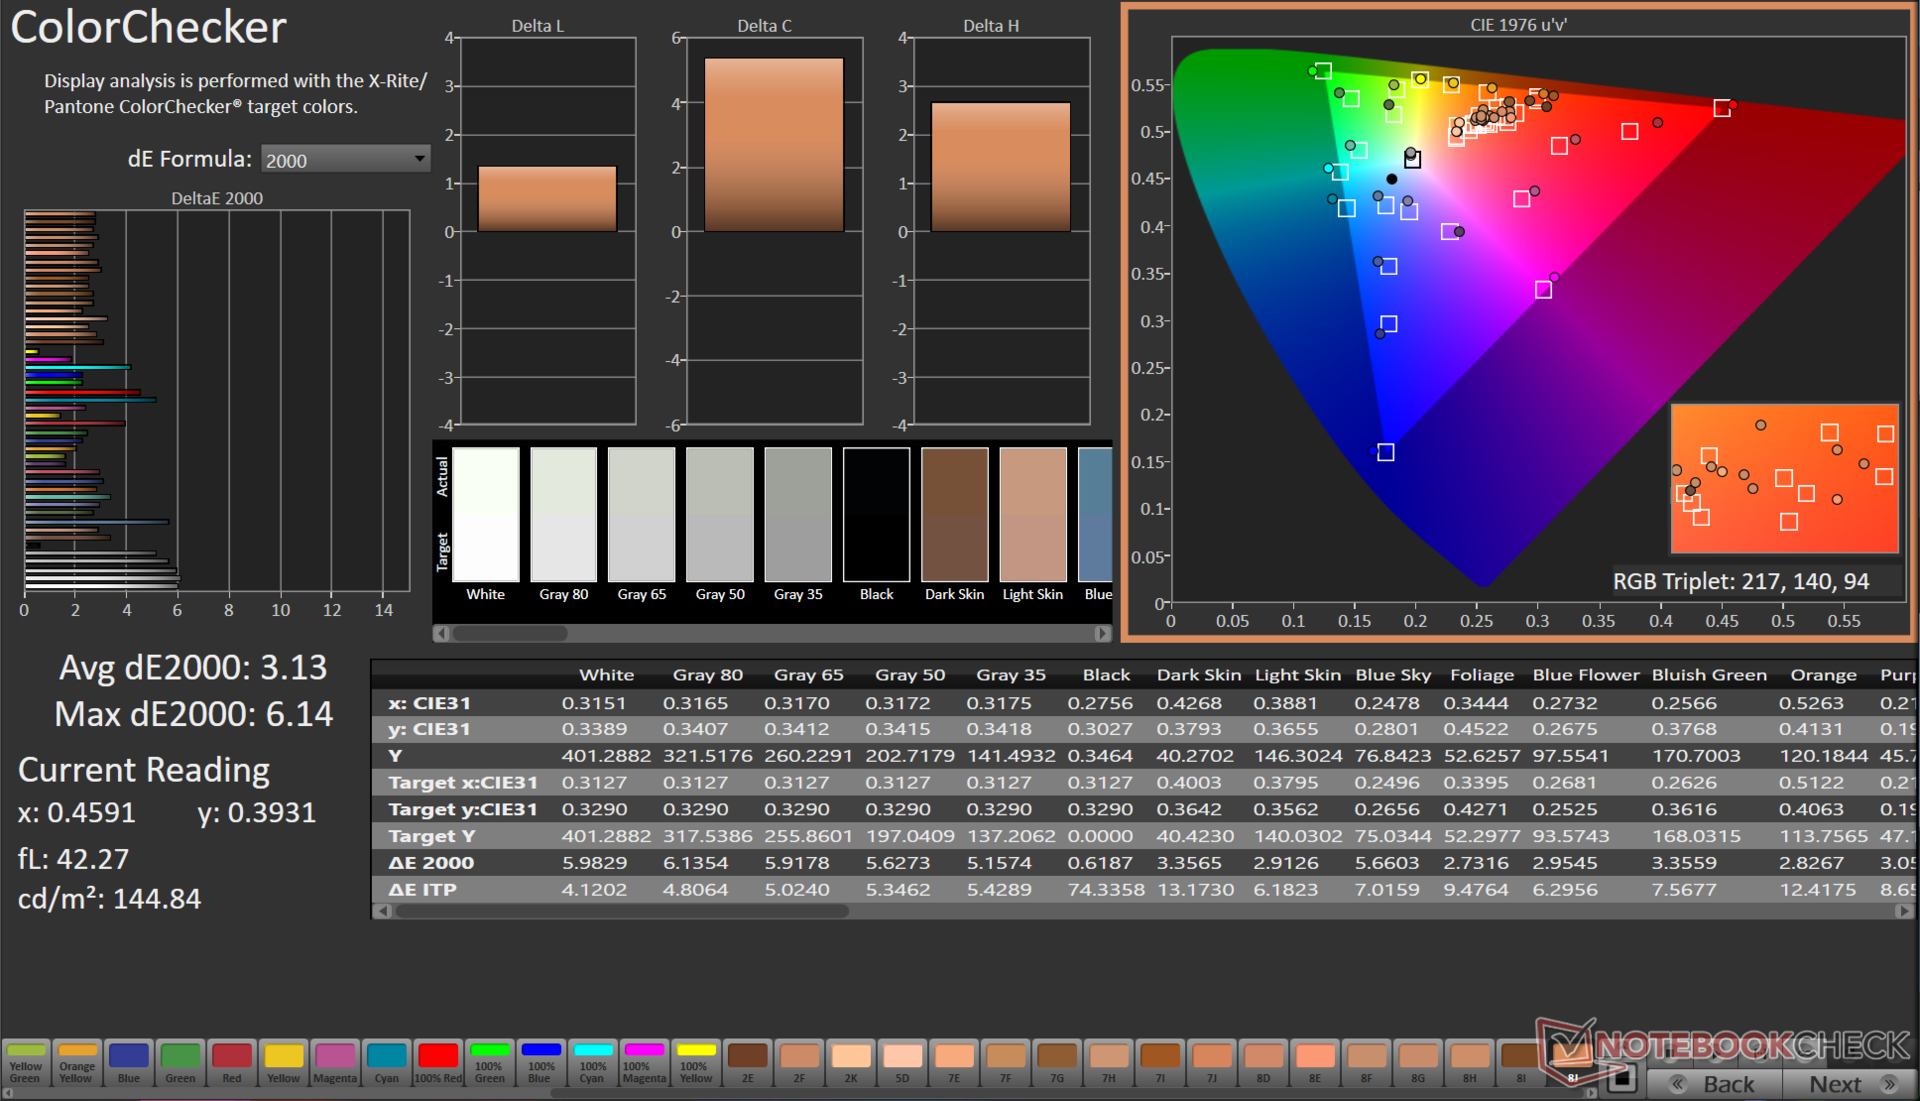
ΔE ColorChecker Calman: 3.13 | ∀{0.5-29.43 Ø4.72}
calibrated: 1.65
ΔE Greyscale Calman: 4.5 | ∀{0.09-98 Ø4.97}
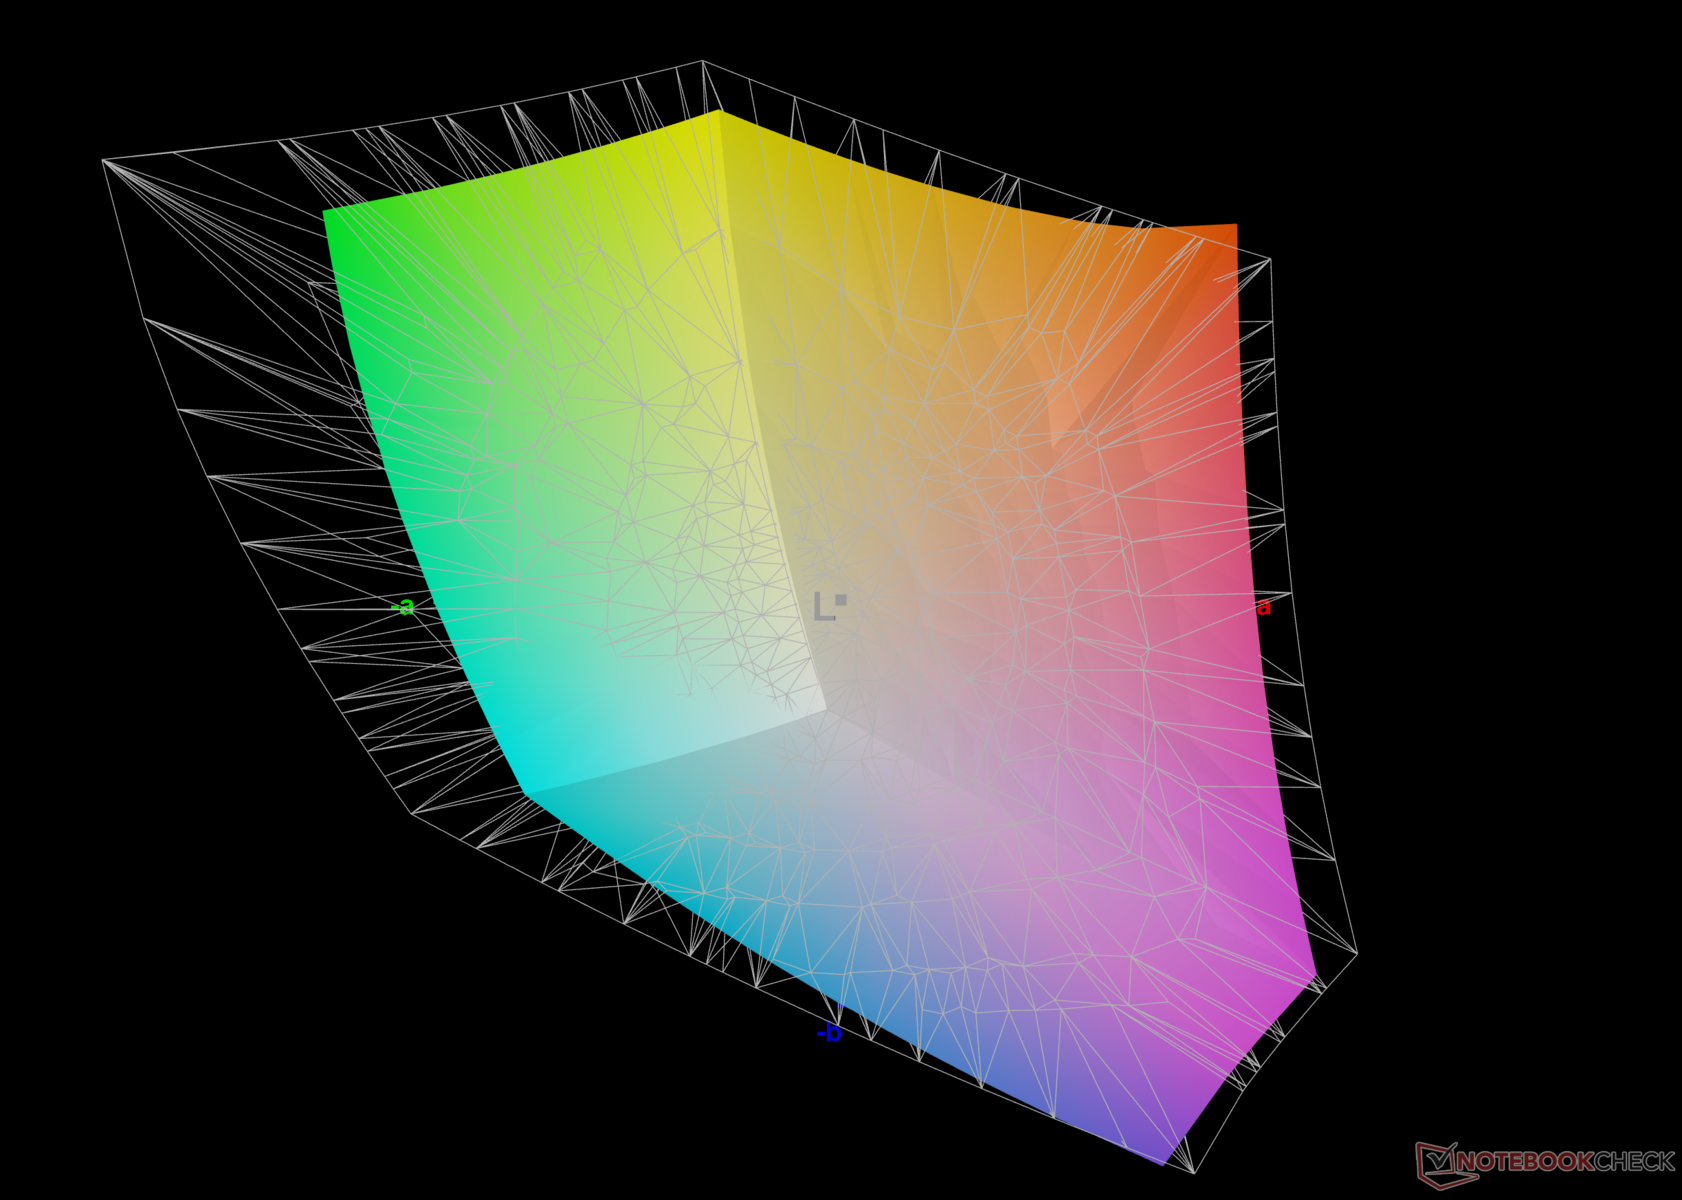
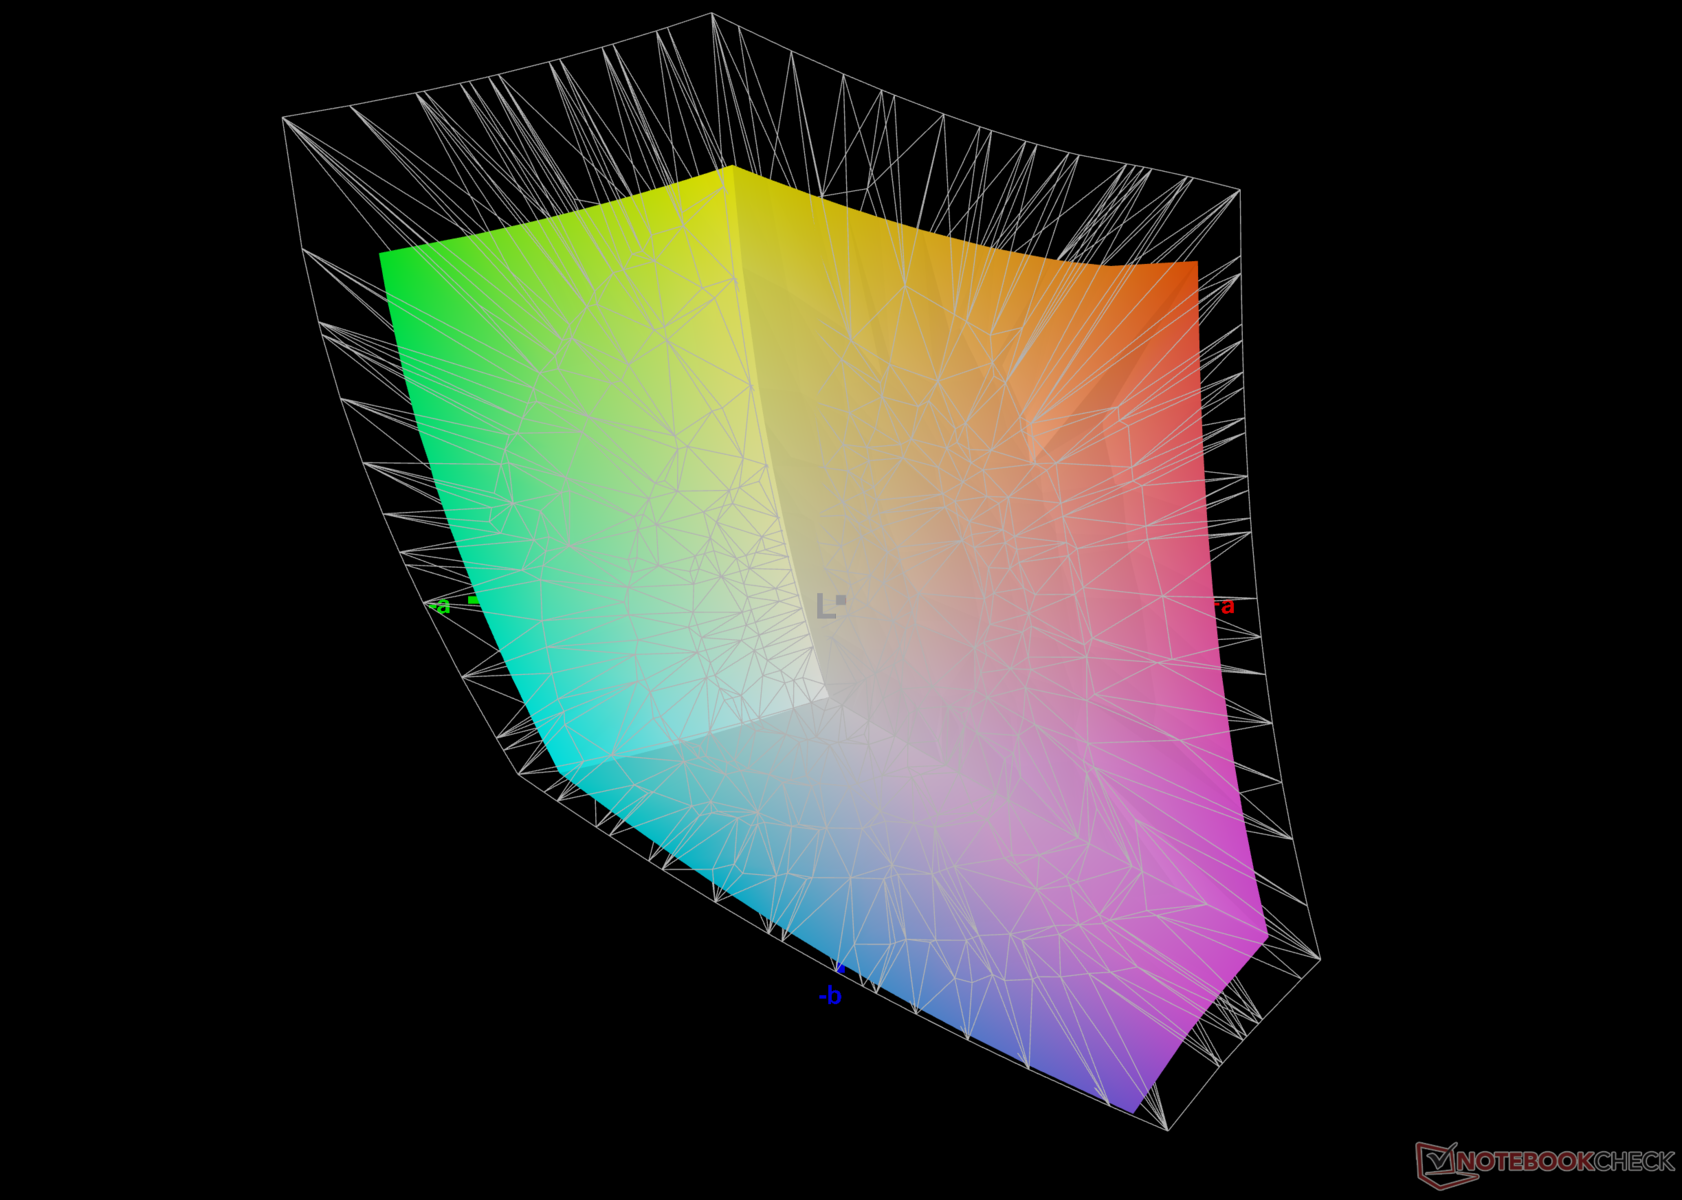
76.5% AdobeRGB 1998 (Argyll 3D)
99% sRGB (Argyll 3D)
74.6% Display P3 (Argyll 3D)
Gamma: 2.18
CCT: 6261 K
| HP Pavilion Plus 16-ab0456tx AU Optronics AUOFDA4, IPS, 2560x1600, 16" | Schenker Vision 14 2023 CSOT T3 MNE007ZA1-3, IPS, 2880x1800, 14" | Dell Inspiron 16 Plus 7630 LG Philips 160WQ2, IPS, 2560x1600, 16" | Asus VivoBook 14X K3405 Samsung ATNA40YK07-1, , 2880x1800, 14" | Lenovo Slim Pro 7 14ARP8 LEN89C1, IPS, 2560x1600, 14.5" | Asus VivoBook Pro 16 K6602VU Samsung ATNA60BX01-1, OLED, 3200x2000, 16" | Samsung Galaxy Book3 Ultra 16 Samsung ATNA60CL03-0, AMOLED, 2880x1800, 16" | |
|---|---|---|---|---|---|---|---|
| Display | 0% | -3% | 20% | -2% | 20% | 20% | |
| Display P3 Coverage (%) | 74.6 | 74.7 0% | 70.1 -6% | 99.9 34% | 72.9 -2% | 98.7 32% | 99.9 34% |
| sRGB Coverage (%) | 99 | 99.6 1% | 99.6 1% | 100 1% | 98.2 -1% | 99.7 1% | 100 1% |
| AdobeRGB 1998 Coverage (%) | 76.5 | 75.8 -1% | 72.3 -5% | 96.5 26% | 74.6 -2% | 96.5 26% | 96.3 26% |
| Response Times | -193% | -274% | -14% | -220% | -3% | 93% | |
| Response Time Grey 50% / Grey 80% * (ms) | 9.06 ? | 32.2 ? -255% | 35 ? -286% | 1.15 ? 87% | 31.8 ? -251% | 0.68 ? 92% | 0.49 ? 95% |
| Response Time Black / White * (ms) | 6.7 ? | 15.4 ? -130% | 24.2 ? -261% | 14.4 ? -115% | 19.3 ? -188% | 13.2 ? -97% | 0.65 ? 90% |
| PWM Frequency (Hz) | 90.02 ? | 240 ? | 240 ? | ||||
| Bildschirm | 21% | 1% | 5% | 3% | -10% | 135% | |
| Helligkeit Bildmitte (cd/m²) | 403 | 402 0% | 299.4 -26% | 369 -8% | 344.7 -14% | 353 -12% | 400 -1% |
| Brightness (cd/m²) | 394 | 371 -6% | 290 -26% | 364 -8% | 334 -15% | 354 -10% | 399 1% |
| Brightness Distribution (%) | 90 | 86 -4% | 92 2% | 85 -6% | 92 2% | 98 9% | 93 3% |
| Schwarzwert * (cd/m²) | 0.34 | 0.27 21% | 0.21 38% | 0.31 9% | 0.03 91% | ||
| Kontrast (:1) | 1185 | 1489 26% | 1426 20% | 1112 -6% | 13333 1025% | ||
| Delta E Colorchecker * | 3.13 | 1.8 42% | 4.25 -36% | 2.85 9% | 3.01 4% | 4.23 -35% | 2.3 27% |
| Colorchecker dE 2000 max. * | 6.14 | 3.6 41% | 6.71 -9% | 4.22 31% | 6.3 -3% | 7.13 -16% | 4.15 32% |
| Colorchecker dE 2000 calibrated * | 1.65 | 1.5 9% | 0.52 68% | 2.18 -32% | 0.83 50% | 2.42 -47% | 1.66 -1% |
| Delta E Graustufen * | 4.5 | 1.8 60% | 5.5 -22% | 2.2 51% | 4.6 -2% | 2.5 44% | 2.7 40% |
| Gamma | 2.18 101% | 2.27 97% | 2.35 94% | 2.15 102% | 2.28 96% | 2.4 92% | 2.266 97% |
| CCT | 6261 104% | 6695 97% | 6368 102% | 6518 100% | 6420 101% | 6642 98% | 7047 92% |
| Durchschnitt gesamt (Programm / Settings) | -57% /
-14% | -92% /
-39% | 4% /
6% | -73% /
-30% | 2% /
-1% | 83% /
105% |
* ... kleinere Werte sind besser
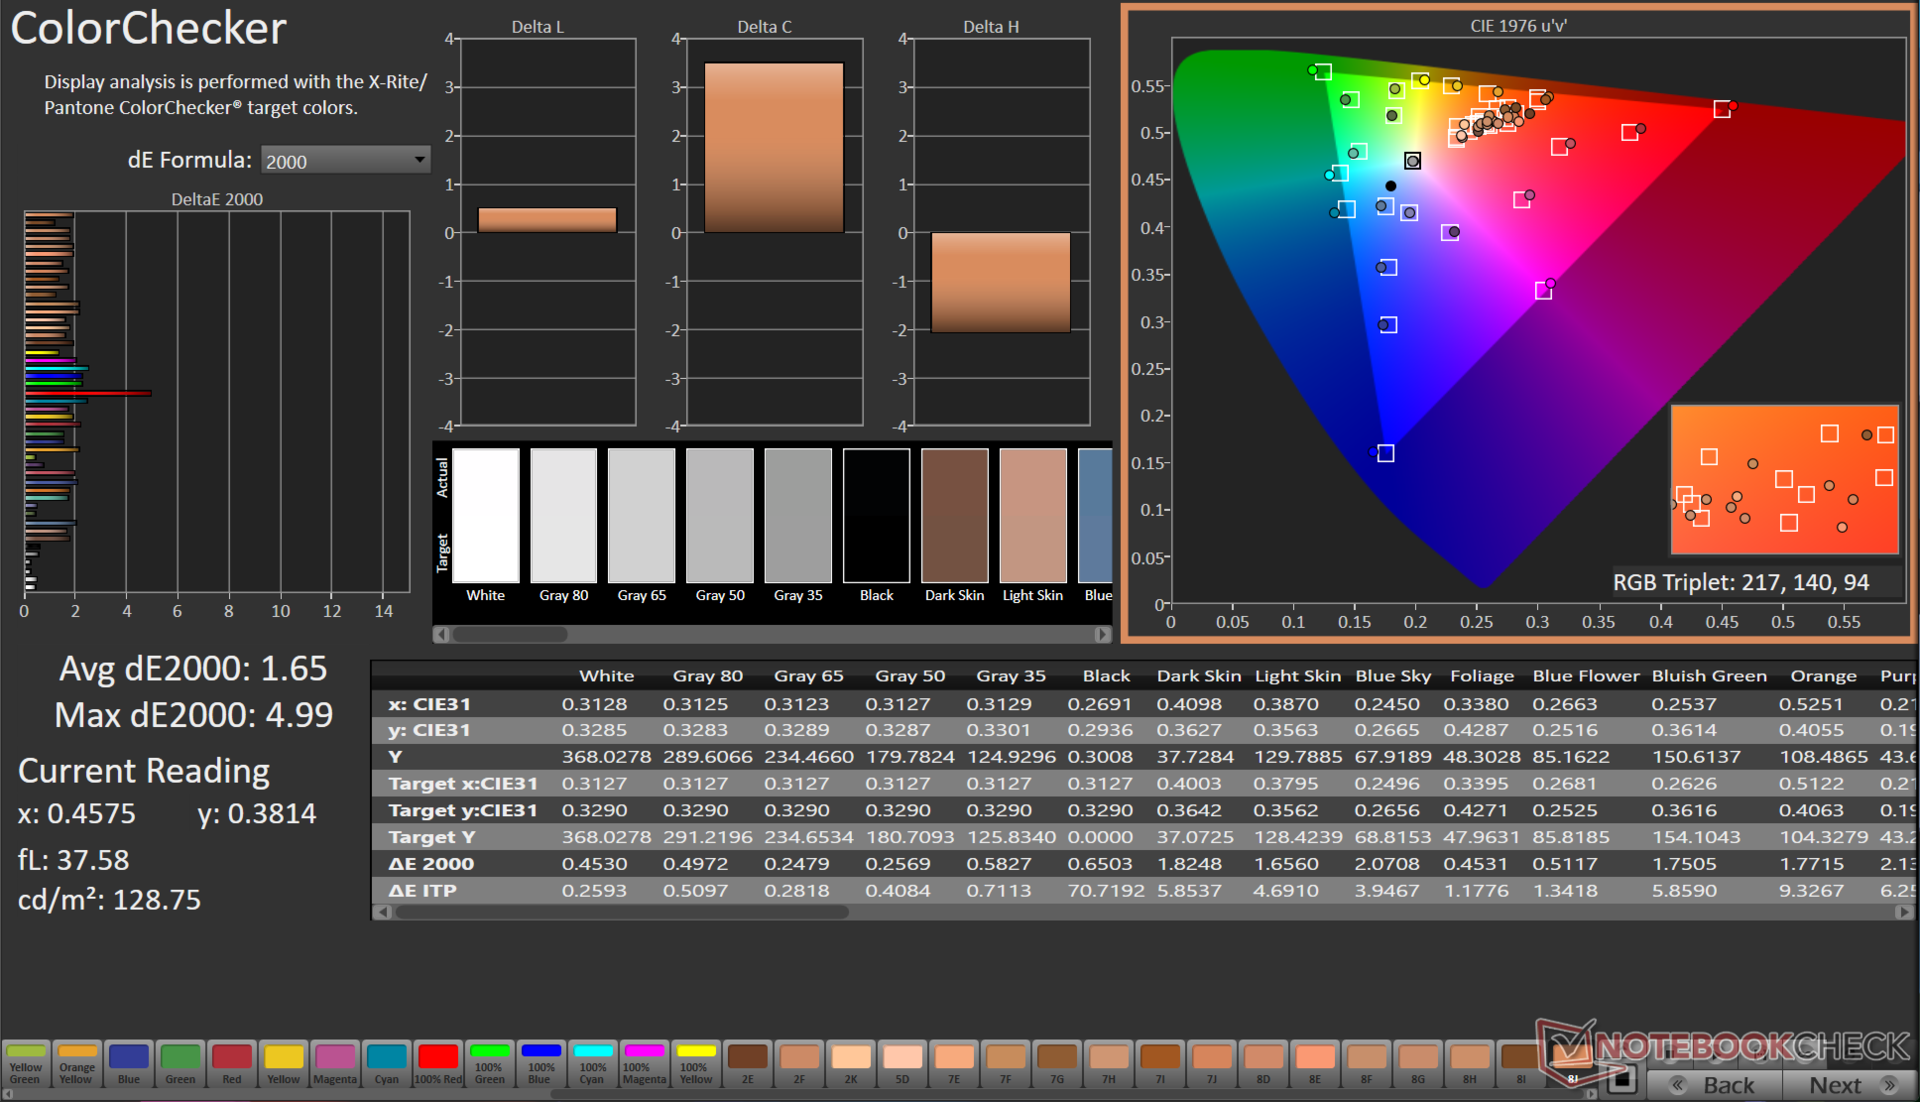
Das Panel deckt 99 % des sRGB-Farbraums ab und bietet gleichzeitig eine angemessene Adobe-RGB- und Display-P3-Wiedergabe. Damit eignet sich das Pavilion Plus 16 für den allgemeinen Multimediakonsum und auch für grundlegende Bearbeitungs-Workflows, insbesondere für Webinhalte.
Mit dem X-Rite-i1Basic-Pro-3-Spektralfotometer und der Calman Ultimate Software von Portrait Displays konnten wir die durchschnittlichen Graustufen- und ColorChecker-DeltaE-2000-Werte von 4,5 auf 0,6 bzw. von 3,13 auf 1,65 verbessern.
Unsere kalibrierte Datei können Sie über den Link oben herunterladen.
Reaktionszeiten (Response Times) des Displays
| ↔ Reaktionszeiten Schwarz zu Weiß | ||
|---|---|---|
| 6.7 ms ... steigend ↗ und fallend ↘ kombiniert | ↗ 3.6 ms steigend | 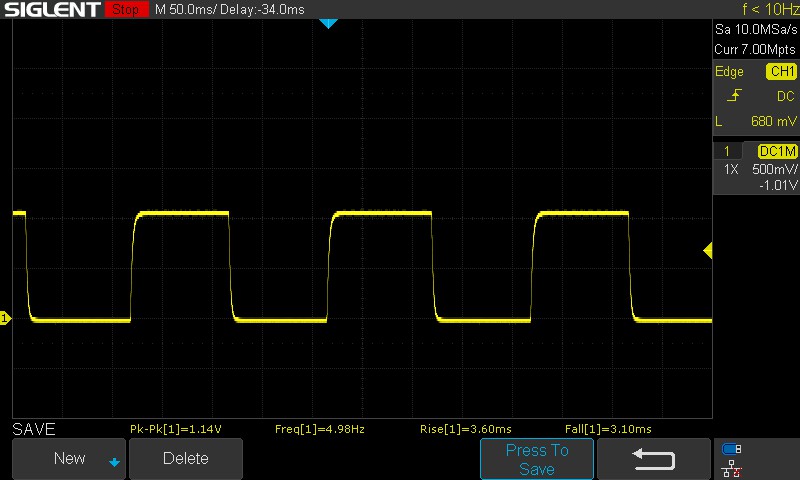 |
| ↘ 3.1 ms fallend | ||
| Die gemessenen Reaktionszeiten sind sehr kurz, wodurch sich der Bildschirm auch für schnelle 3D Spiele eignen sollte. Im Vergleich rangierten die bei uns getesteten Geräte von 0.1 (Minimum) zu 240 (Maximum) ms. » 21 % aller Screens waren schneller als der getestete. Daher sind die gemessenen Reaktionszeiten besser als der Durchschnitt aller vermessenen Geräte (19.8 ms). | ||
| ↔ Reaktionszeiten 50% Grau zu 80% Grau | ||
| 9.06 ms ... steigend ↗ und fallend ↘ kombiniert | ↗ 4.27 ms steigend | 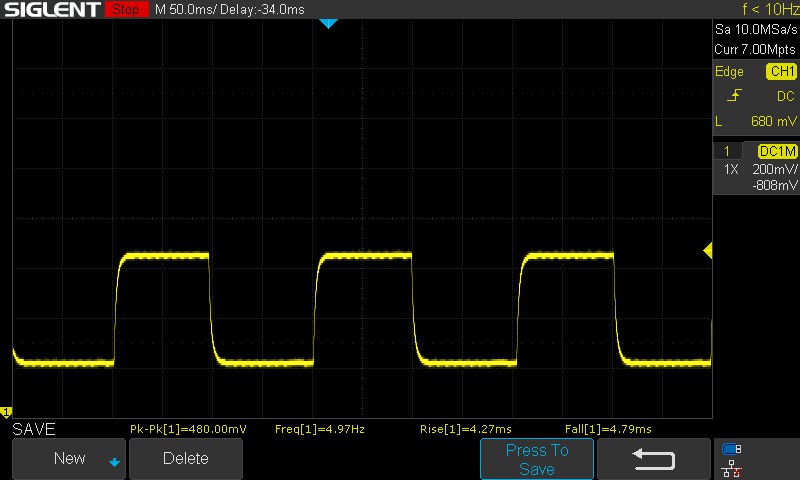 |
| ↘ 4.79 ms fallend | ||
| Die gemessenen Reaktionszeiten sind kurz wodurch sich der Bildschirm auch für Spiele gut eignen sollte. Im Vergleich rangierten die bei uns getesteten Geräte von 0.165 (Minimum) zu 636 (Maximum) ms. » 23 % aller Screens waren schneller als der getestete. Daher sind die gemessenen Reaktionszeiten besser als der Durchschnitt aller vermessenen Geräte (31 ms). | ||
Bildschirm-Flackern / PWM (Pulse-Width Modulation)
| Flackern / PWM nicht festgestellt | ≤ 100 % Helligkeit | 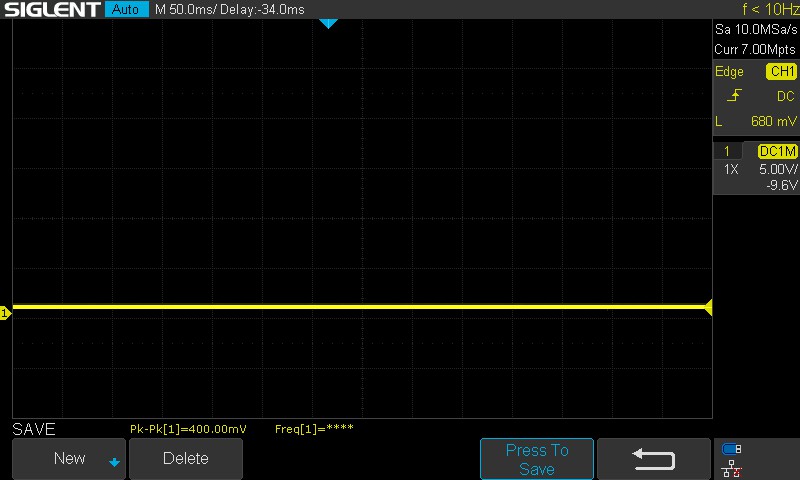 | |
Im Vergleich: 52 % aller getesteten Geräte nutzten kein PWM um die Helligkeit zu reduzieren. Wenn PWM eingesetzt wurde, dann bei einer Frequenz von durchschnittlich 7772 (Minimum 5, Maximum 343500) Hz. | |||
Die Reaktionszeiten sind anständig, wenn man bedenkt, dass das Pavilion Plus 16 nicht auf das Gaming-Publikum ausgerichtet ist. Wir haben bei allen getesteten Helligkeitsstufen kein PWM beobachtet, was eine gute Sache ist.
Weitere Informationen finden Sie in unserem Artikel "Warum PWM so viel Kopfzerbrechen bereitet". Unsere PWM-Rangliste bietet einen Überblick über die gemessenen PWM-Werte der getesteten Geräte.
Die Anzeige im Freien ist im Allgemeinen bei maximaler Helligkeit in Ordnung, solange kein direktes Sonnenlicht auf das Display fällt. Die Betrachtungswinkel sind stabil, aber wir haben einen Verlust an Helligkeit und Farbinformationen bei den Extremen beobachtet.
Performance: Core i7-13700H eingeschränkt durch niedrige PL2
Je nach Region bietet HP das Pavilion Plus 16 mit Core i5-13500H und Core i7-13700H zusammen mit der optionalen RTX-3050-6-GB-Grafikkarte an.
Testbedingungen
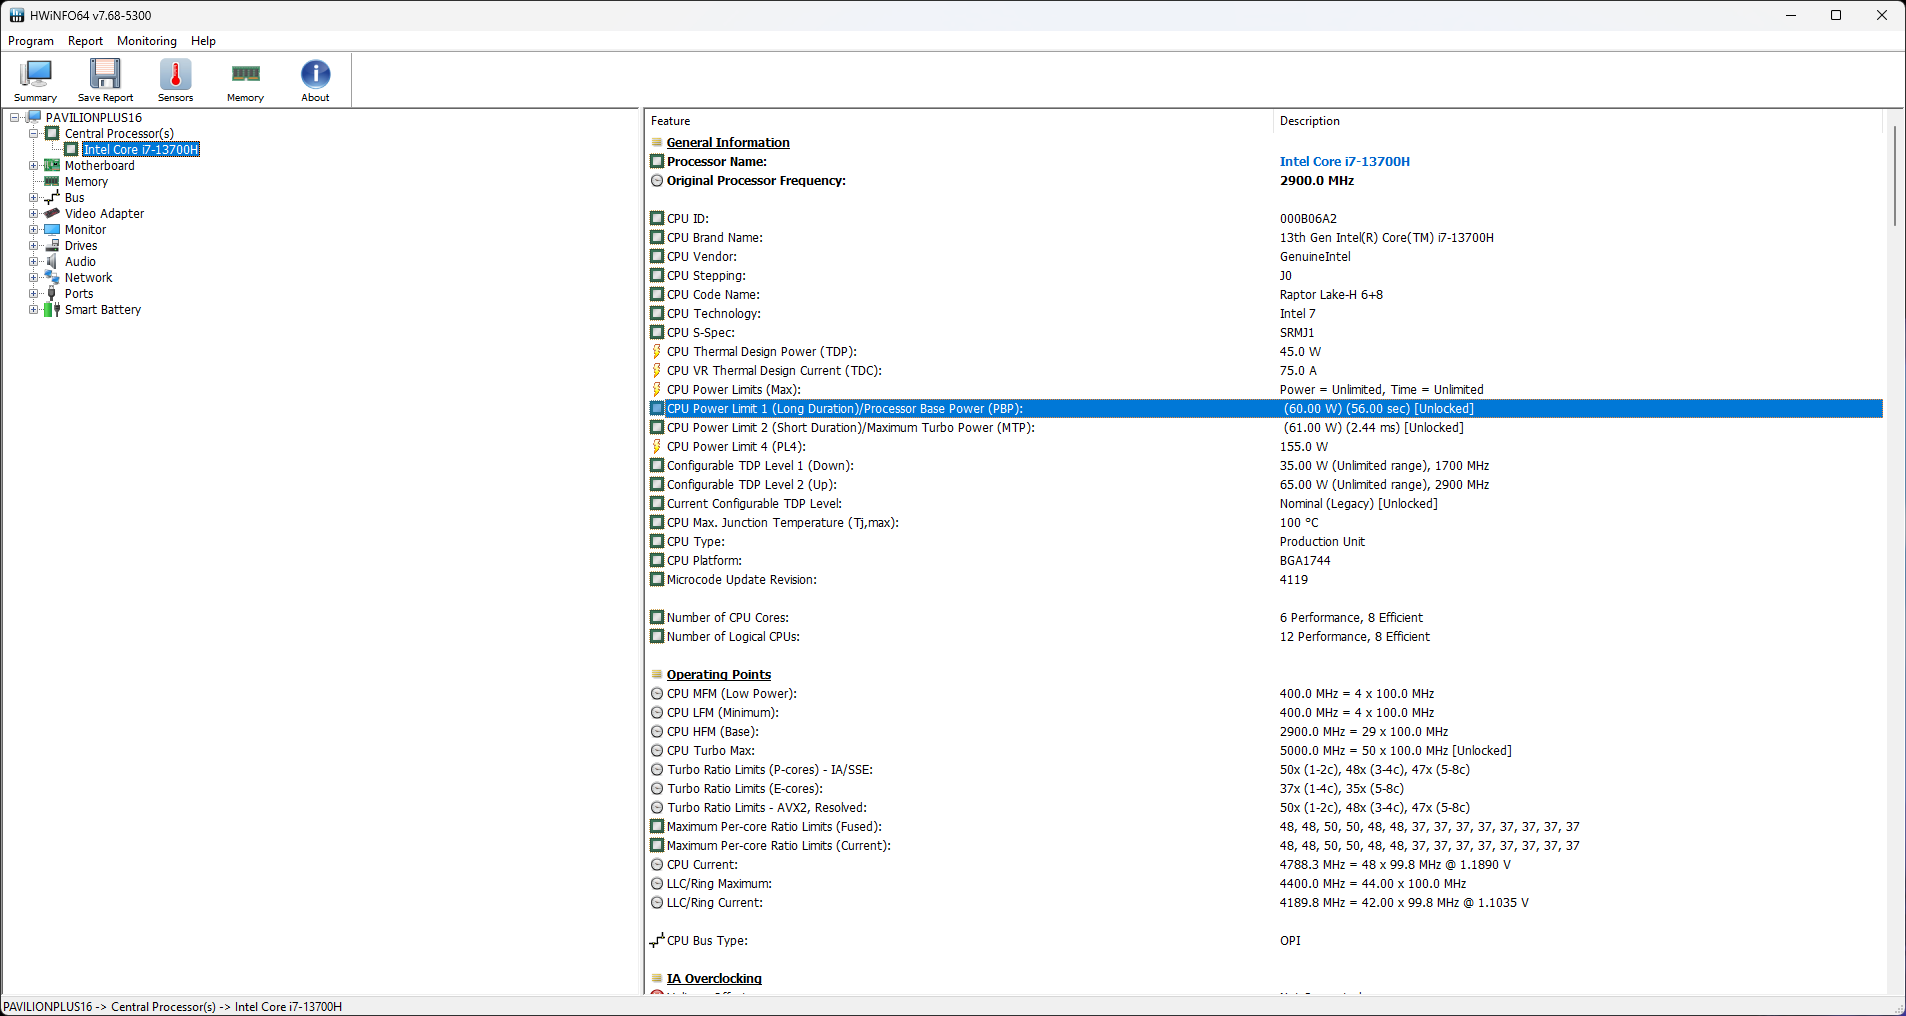
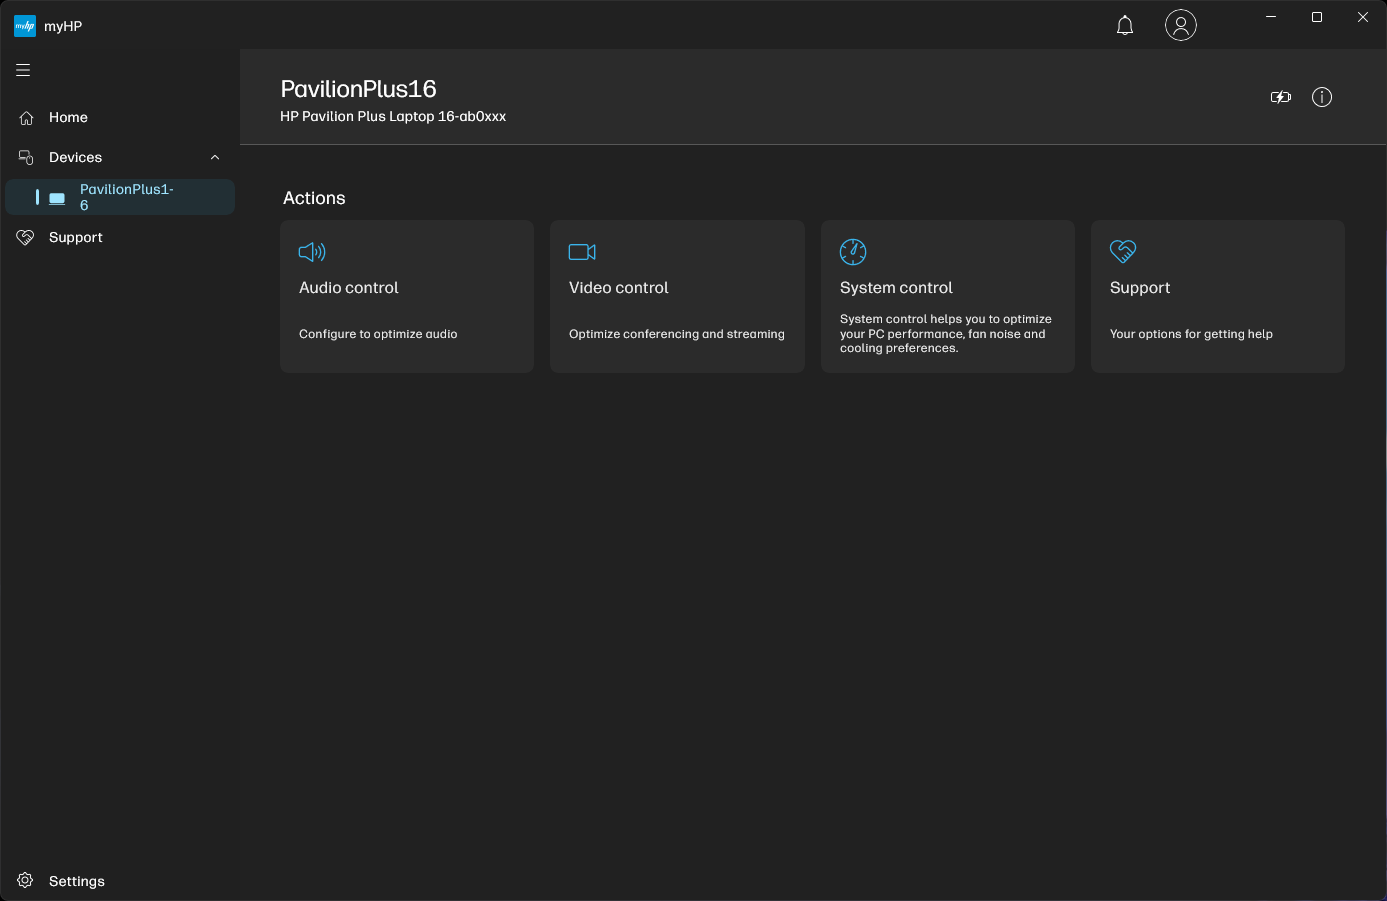
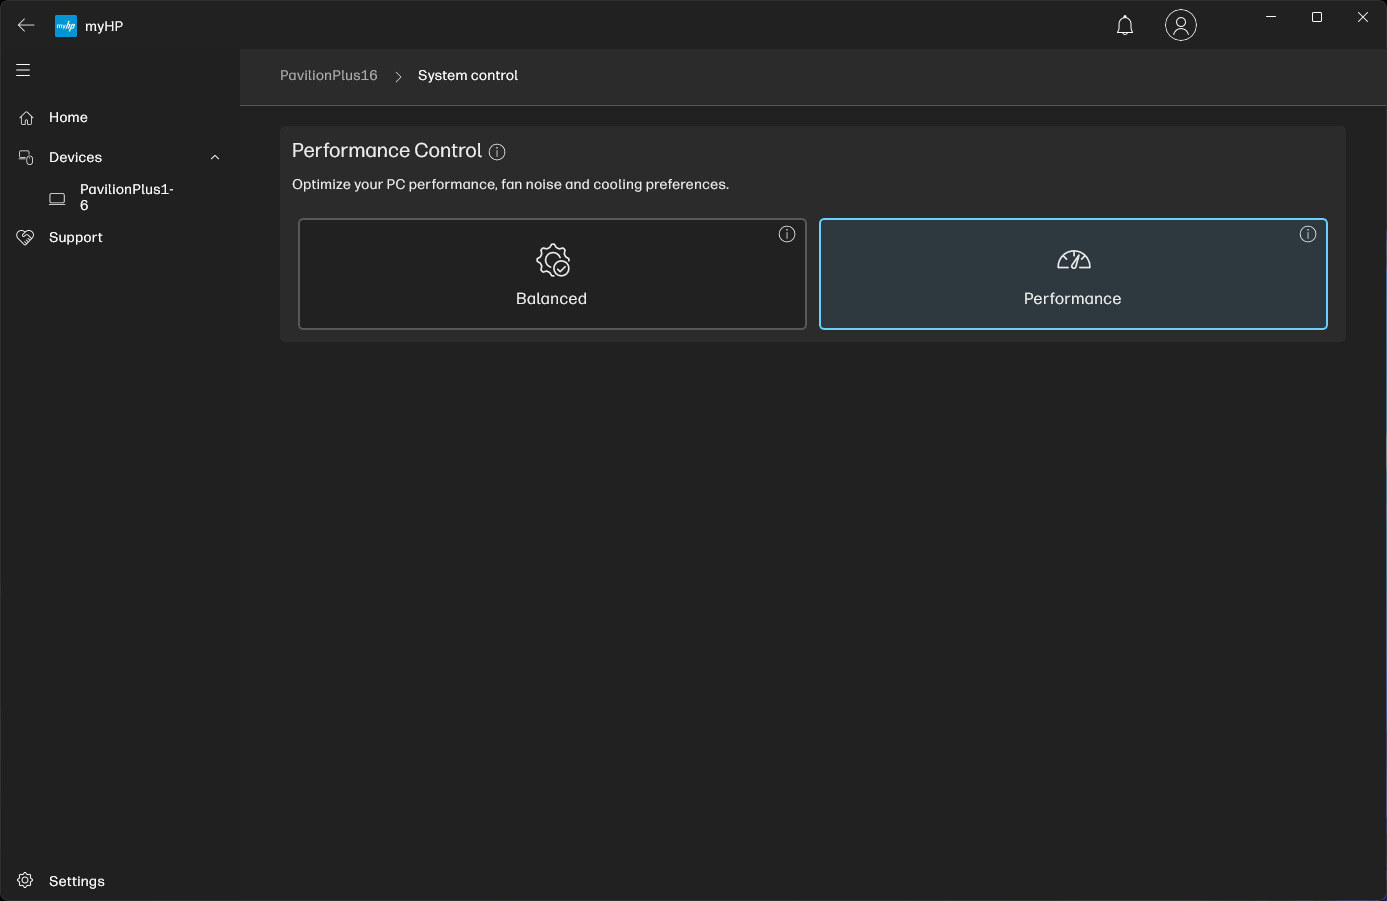
Mit der myHP-App können Sie zwischen zwei Betriebsmodi wählen: Ausbalanciert und Performance. Im Modus Ausbalanciert wird ein 50-W-PL1 verwendet, der im Modus Performance auf 60 W ansteigt. PL2 ist in beiden Modi auf 61 W begrenzt.
Die RTX-3050-6-GB-GPU läuft standardmäßig im MSHybrid-/Optimus-Modus, wobei keine MUX-Umschaltung möglich ist.
Wir haben den Performance-Modus für alle Benchmarks verwendet. Der PL1/PL2 sinkt im Akkubetrieb auf 35 W/35 W.
Prozessor
Der Core i7-13700H des Pavilion Plus 16 wird durch einen niedrigen PL2-Wert gebremst. Dies wird vor allem bei Multi-Core-Benchmarks deutlich, wo er deutlich hinter den Werten des Dell Inspiron 16 Plus 7630 liegt, das mit einem 89-W-PL2-Core-i7-13700H ausgestattet ist.
Davon abgesehen scheint die Kühlung des Pavilion Plus 16 sehr effektiv zu sein, da sie während unseres Cinebench-R15-Multi-Core-Loop-Tests für eine gleichbleibende Leistung sorgt.
Das Pavilion Plus 16 führt die meisten CPU-Single-Core-Charts an, aber das Schenker Vision 14 M23 ist ihm in diesen Tests dicht auf den Fersen.
Cinebench R15 Multi Loop
Cinebench R23: Multi Core | Single Core
Cinebench R20: CPU (Multi Core) | CPU (Single Core)
Cinebench R15: CPU Multi 64Bit | CPU Single 64Bit
Blender: v2.79 BMW27 CPU
7-Zip 18.03: 7z b 4 | 7z b 4 -mmt1
Geekbench 6.7: Multi-Core | Single-Core
Geekbench 5.5: Multi-Core | Single-Core
HWBOT x265 Benchmark v2.2: 4k Preset
LibreOffice : 20 Documents To PDF
R Benchmark 2.5: Overall mean
| CPU Performance Rating | |
| Durchschnitt der Klasse Multimedia | |
| Dell Inspiron 16 Plus 7630 | |
| Durchschnittliche Intel Core i7-13700H | |
| HP Pavilion Plus 16-ab0456tx | |
| Asus VivoBook Pro 16 K6602VU | |
| Samsung Galaxy Book3 Ultra 16 -2! | |
| Schenker Vision 14 M23 RTX 3050 | |
| Asus VivoBook 14X K3405 -2! | |
| Lenovo Slim Pro 7 14ARP8 -2! | |
| Cinebench R23 / Multi Core | |
| Durchschnitt der Klasse Multimedia (4861 - 33362, n=81, der letzten 2 Jahre) | |
| Dell Inspiron 16 Plus 7630 | |
| Samsung Galaxy Book3 Ultra 16 | |
| Durchschnittliche Intel Core i7-13700H (5890 - 20034, n=29) | |
| Asus VivoBook Pro 16 K6602VU | |
| Asus VivoBook 14X K3405 | |
| Schenker Vision 14 M23 RTX 3050 | |
| Lenovo Slim Pro 7 14ARP8 | |
| HP Pavilion Plus 16-ab0456tx | |
| Cinebench R23 / Single Core | |
| Durchschnitt der Klasse Multimedia (1128 - 2459, n=73, der letzten 2 Jahre) | |
| HP Pavilion Plus 16-ab0456tx | |
| Schenker Vision 14 M23 RTX 3050 | |
| Dell Inspiron 16 Plus 7630 | |
| Durchschnittliche Intel Core i7-13700H (1323 - 1914, n=29) | |
| Asus VivoBook Pro 16 K6602VU | |
| Asus VivoBook 14X K3405 | |
| Samsung Galaxy Book3 Ultra 16 | |
| Lenovo Slim Pro 7 14ARP8 | |
| Cinebench R20 / CPU (Multi Core) | |
| Durchschnitt der Klasse Multimedia (1887 - 12912, n=64, der letzten 2 Jahre) | |
| Dell Inspiron 16 Plus 7630 | |
| Samsung Galaxy Book3 Ultra 16 | |
| Durchschnittliche Intel Core i7-13700H (2322 - 7674, n=29) | |
| HP Pavilion Plus 16-ab0456tx | |
| Asus VivoBook Pro 16 K6602VU | |
| Asus VivoBook 14X K3405 | |
| Schenker Vision 14 M23 RTX 3050 | |
| Lenovo Slim Pro 7 14ARP8 | |
| Cinebench R20 / CPU (Single Core) | |
| HP Pavilion Plus 16-ab0456tx | |
| Schenker Vision 14 M23 RTX 3050 | |
| Dell Inspiron 16 Plus 7630 | |
| Durchschnitt der Klasse Multimedia (425 - 853, n=64, der letzten 2 Jahre) | |
| Durchschnittliche Intel Core i7-13700H (508 - 741, n=29) | |
| Asus VivoBook Pro 16 K6602VU | |
| Asus VivoBook 14X K3405 | |
| Samsung Galaxy Book3 Ultra 16 | |
| Lenovo Slim Pro 7 14ARP8 | |
| Cinebench R15 / CPU Multi 64Bit | |
| Durchschnitt der Klasse Multimedia (856 - 5224, n=68, der letzten 2 Jahre) | |
| Samsung Galaxy Book3 Ultra 16 | |
| Asus VivoBook Pro 16 K6602VU | |
| Dell Inspiron 16 Plus 7630 | |
| Durchschnittliche Intel Core i7-13700H (905 - 2982, n=29) | |
| Asus VivoBook 14X K3405 | |
| HP Pavilion Plus 16-ab0456tx | |
| Lenovo Slim Pro 7 14ARP8 | |
| Schenker Vision 14 M23 RTX 3050 | |
| Cinebench R15 / CPU Single 64Bit | |
| Durchschnitt der Klasse Multimedia (184.8 - 326, n=66, der letzten 2 Jahre) | |
| HP Pavilion Plus 16-ab0456tx | |
| Schenker Vision 14 M23 RTX 3050 | |
| Dell Inspiron 16 Plus 7630 | |
| Durchschnittliche Intel Core i7-13700H (213 - 278, n=29) | |
| Asus VivoBook Pro 16 K6602VU | |
| Asus VivoBook 14X K3405 | |
| Samsung Galaxy Book3 Ultra 16 | |
| Lenovo Slim Pro 7 14ARP8 | |
| Blender / v2.79 BMW27 CPU | |
| Schenker Vision 14 M23 RTX 3050 | |
| Durchschnitt der Klasse Multimedia (100 - 557, n=65, der letzten 2 Jahre) | |
| Lenovo Slim Pro 7 14ARP8 | |
| Asus VivoBook 14X K3405 | |
| Durchschnittliche Intel Core i7-13700H (169 - 555, n=29) | |
| Samsung Galaxy Book3 Ultra 16 | |
| Dell Inspiron 16 Plus 7630 | |
| HP Pavilion Plus 16-ab0456tx | |
| Asus VivoBook Pro 16 K6602VU | |
| 7-Zip 18.03 / 7z b 4 | |
| Asus VivoBook Pro 16 K6602VU | |
| HP Pavilion Plus 16-ab0456tx | |
| Samsung Galaxy Book3 Ultra 16 | |
| Durchschnittliche Intel Core i7-13700H (27322 - 76344, n=29) | |
| Dell Inspiron 16 Plus 7630 | |
| Durchschnitt der Klasse Multimedia (26062 - 130368, n=62, der letzten 2 Jahre) | |
| Lenovo Slim Pro 7 14ARP8 | |
| Schenker Vision 14 M23 RTX 3050 | |
| Asus VivoBook 14X K3405 | |
| 7-Zip 18.03 / 7z b 4 -mmt1 | |
| Schenker Vision 14 M23 RTX 3050 | |
| HP Pavilion Plus 16-ab0456tx | |
| Durchschnitt der Klasse Multimedia (3666 - 7545, n=63, der letzten 2 Jahre) | |
| Durchschnittliche Intel Core i7-13700H (4825 - 6238, n=29) | |
| Asus VivoBook Pro 16 K6602VU | |
| Dell Inspiron 16 Plus 7630 | |
| Asus VivoBook 14X K3405 | |
| Samsung Galaxy Book3 Ultra 16 | |
| Lenovo Slim Pro 7 14ARP8 | |
| Geekbench 6.7 / Multi-Core | |
| Durchschnitt der Klasse Multimedia (4983 - 29415, n=76, der letzten 2 Jahre) | |
| Dell Inspiron 16 Plus 7630 | |
| HP Pavilion Plus 16-ab0456tx | |
| Schenker Vision 14 M23 RTX 3050 | |
| Durchschnittliche Intel Core i7-13700H (8415 - 13832, n=13) | |
| Asus VivoBook Pro 16 K6602VU | |
| Geekbench 6.7 / Single-Core | |
| Durchschnitt der Klasse Multimedia (1534 - 4335, n=75, der letzten 2 Jahre) | |
| Schenker Vision 14 M23 RTX 3050 | |
| Dell Inspiron 16 Plus 7630 | |
| HP Pavilion Plus 16-ab0456tx | |
| Durchschnittliche Intel Core i7-13700H (2316 - 2639, n=13) | |
| Asus VivoBook Pro 16 K6602VU | |
| Geekbench 5.5 / Multi-Core | |
| Durchschnitt der Klasse Multimedia (4652 - 20422, n=62, der letzten 2 Jahre) | |
| Dell Inspiron 16 Plus 7630 | |
| Durchschnittliche Intel Core i7-13700H (6165 - 14215, n=29) | |
| Samsung Galaxy Book3 Ultra 16 | |
| HP Pavilion Plus 16-ab0456tx | |
| Schenker Vision 14 M23 RTX 3050 | |
| Asus VivoBook Pro 16 K6602VU | |
| Asus VivoBook 14X K3405 | |
| Lenovo Slim Pro 7 14ARP8 | |
| Geekbench 5.5 / Single-Core | |
| Durchschnitt der Klasse Multimedia (805 - 2974, n=62, der letzten 2 Jahre) | |
| Dell Inspiron 16 Plus 7630 | |
| Schenker Vision 14 M23 RTX 3050 | |
| HP Pavilion Plus 16-ab0456tx | |
| Durchschnittliche Intel Core i7-13700H (1362 - 1919, n=29) | |
| Asus VivoBook Pro 16 K6602VU | |
| Samsung Galaxy Book3 Ultra 16 | |
| Asus VivoBook 14X K3405 | |
| Lenovo Slim Pro 7 14ARP8 | |
| HWBOT x265 Benchmark v2.2 / 4k Preset | |
| Durchschnitt der Klasse Multimedia (5.26 - 36.1, n=63, der letzten 2 Jahre) | |
| Samsung Galaxy Book3 Ultra 16 | |
| Asus VivoBook Pro 16 K6602VU | |
| Durchschnittliche Intel Core i7-13700H (6.72 - 21.2, n=29) | |
| HP Pavilion Plus 16-ab0456tx | |
| Lenovo Slim Pro 7 14ARP8 | |
| Dell Inspiron 16 Plus 7630 | |
| Asus VivoBook 14X K3405 | |
| Schenker Vision 14 M23 RTX 3050 | |
| LibreOffice / 20 Documents To PDF | |
| HP Pavilion Plus 16-ab0456tx | |
| Lenovo Slim Pro 7 14ARP8 | |
| Schenker Vision 14 M23 RTX 3050 | |
| Asus VivoBook Pro 16 K6602VU | |
| Durchschnitt der Klasse Multimedia (23.9 - 146.7, n=64, der letzten 2 Jahre) | |
| Samsung Galaxy Book3 Ultra 16 | |
| Durchschnittliche Intel Core i7-13700H (31.3 - 62.4, n=29) | |
| Asus VivoBook 14X K3405 | |
| Dell Inspiron 16 Plus 7630 | |
| R Benchmark 2.5 / Overall mean | |
| Lenovo Slim Pro 7 14ARP8 | |
| Asus VivoBook 14X K3405 | |
| Samsung Galaxy Book3 Ultra 16 | |
| Asus VivoBook Pro 16 K6602VU | |
| Durchschnittliche Intel Core i7-13700H (0.4308 - 0.607, n=29) | |
| Durchschnitt der Klasse Multimedia (0.3604 - 0.947, n=63, der letzten 2 Jahre) | |
| Schenker Vision 14 M23 RTX 3050 | |
| HP Pavilion Plus 16-ab0456tx | |
| Dell Inspiron 16 Plus 7630 | |
* ... kleinere Werte sind besser
AIDA64: FP32 Ray-Trace | FPU Julia | CPU SHA3 | CPU Queen | FPU SinJulia | FPU Mandel | CPU AES | CPU ZLib | FP64 Ray-Trace | CPU PhotoWorxx
| Performance Rating | |
| Durchschnitt der Klasse Multimedia | |
| Asus VivoBook Pro 16 K6602VU | |
| Lenovo Slim Pro 7 14ARP8 | |
| HP Pavilion Plus 16-ab0456tx | |
| Samsung Galaxy Book3 Ultra 16 | |
| Durchschnittliche Intel Core i7-13700H | |
| Dell Inspiron 16 Plus 7630 | |
| Asus VivoBook 14X K3405 | |
| Schenker Vision 14 M23 RTX 3050 | |
| AIDA64 / FP32 Ray-Trace | |
| Durchschnitt der Klasse Multimedia (2214 - 50388, n=60, der letzten 2 Jahre) | |
| Lenovo Slim Pro 7 14ARP8 | |
| HP Pavilion Plus 16-ab0456tx | |
| Samsung Galaxy Book3 Ultra 16 | |
| Durchschnittliche Intel Core i7-13700H (4986 - 18908, n=29) | |
| Dell Inspiron 16 Plus 7630 | |
| Asus VivoBook Pro 16 K6602VU | |
| Asus VivoBook 14X K3405 | |
| Schenker Vision 14 M23 RTX 3050 | |
| AIDA64 / FPU Julia | |
| Lenovo Slim Pro 7 14ARP8 | |
| Durchschnitt der Klasse Multimedia (12867 - 201874, n=61, der letzten 2 Jahre) | |
| HP Pavilion Plus 16-ab0456tx | |
| Asus VivoBook Pro 16 K6602VU | |
| Durchschnittliche Intel Core i7-13700H (25360 - 92359, n=29) | |
| Samsung Galaxy Book3 Ultra 16 | |
| Dell Inspiron 16 Plus 7630 | |
| Asus VivoBook 14X K3405 | |
| Schenker Vision 14 M23 RTX 3050 | |
| AIDA64 / CPU SHA3 | |
| Durchschnitt der Klasse Multimedia (626 - 8623, n=61, der letzten 2 Jahre) | |
| Asus VivoBook 14X K3405 | |
| HP Pavilion Plus 16-ab0456tx | |
| Asus VivoBook Pro 16 K6602VU | |
| Samsung Galaxy Book3 Ultra 16 | |
| Durchschnittliche Intel Core i7-13700H (1339 - 4224, n=29) | |
| Lenovo Slim Pro 7 14ARP8 | |
| Dell Inspiron 16 Plus 7630 | |
| Schenker Vision 14 M23 RTX 3050 | |
| AIDA64 / CPU Queen | |
| Dell Inspiron 16 Plus 7630 | |
| Samsung Galaxy Book3 Ultra 16 | |
| HP Pavilion Plus 16-ab0456tx | |
| Durchschnittliche Intel Core i7-13700H (59324 - 107159, n=29) | |
| Asus VivoBook Pro 16 K6602VU | |
| Lenovo Slim Pro 7 14ARP8 | |
| Schenker Vision 14 M23 RTX 3050 | |
| Asus VivoBook 14X K3405 | |
| Durchschnitt der Klasse Multimedia (13483 - 181505, n=48, der letzten 2 Jahre) | |
| AIDA64 / FPU SinJulia | |
| Lenovo Slim Pro 7 14ARP8 | |
| HP Pavilion Plus 16-ab0456tx | |
| Samsung Galaxy Book3 Ultra 16 | |
| Durchschnitt der Klasse Multimedia (886 - 28794, n=61, der letzten 2 Jahre) | |
| Dell Inspiron 16 Plus 7630 | |
| Asus VivoBook Pro 16 K6602VU | |
| Durchschnittliche Intel Core i7-13700H (4800 - 11050, n=29) | |
| Schenker Vision 14 M23 RTX 3050 | |
| Asus VivoBook 14X K3405 | |
| AIDA64 / FPU Mandel | |
| Lenovo Slim Pro 7 14ARP8 | |
| Durchschnitt der Klasse Multimedia (6395 - 105740, n=60, der letzten 2 Jahre) | |
| HP Pavilion Plus 16-ab0456tx | |
| Samsung Galaxy Book3 Ultra 16 | |
| Durchschnittliche Intel Core i7-13700H (12321 - 45118, n=29) | |
| Asus VivoBook Pro 16 K6602VU | |
| Dell Inspiron 16 Plus 7630 | |
| Asus VivoBook 14X K3405 | |
| Schenker Vision 14 M23 RTX 3050 | |
| AIDA64 / CPU AES | |
| Asus VivoBook Pro 16 K6602VU | |
| Asus VivoBook 14X K3405 | |
| Durchschnittliche Intel Core i7-13700H (28769 - 151254, n=29) | |
| HP Pavilion Plus 16-ab0456tx | |
| Samsung Galaxy Book3 Ultra 16 | |
| Durchschnitt der Klasse Multimedia (8171 - 126790, n=61, der letzten 2 Jahre) | |
| Dell Inspiron 16 Plus 7630 | |
| Schenker Vision 14 M23 RTX 3050 | |
| Lenovo Slim Pro 7 14ARP8 | |
| AIDA64 / CPU ZLib | |
| Samsung Galaxy Book3 Ultra 16 | |
| Durchschnitt der Klasse Multimedia (143.8 - 2022, n=61, der letzten 2 Jahre) | |
| HP Pavilion Plus 16-ab0456tx | |
| Asus VivoBook Pro 16 K6602VU | |
| Durchschnittliche Intel Core i7-13700H (389 - 1215, n=29) | |
| Asus VivoBook 14X K3405 | |
| Dell Inspiron 16 Plus 7630 | |
| Schenker Vision 14 M23 RTX 3050 | |
| Lenovo Slim Pro 7 14ARP8 | |
| AIDA64 / FP64 Ray-Trace | |
| Durchschnitt der Klasse Multimedia (1014 - 26875, n=61, der letzten 2 Jahre) | |
| HP Pavilion Plus 16-ab0456tx | |
| Lenovo Slim Pro 7 14ARP8 | |
| Samsung Galaxy Book3 Ultra 16 | |
| Asus VivoBook Pro 16 K6602VU | |
| Durchschnittliche Intel Core i7-13700H (2540 - 10135, n=29) | |
| Dell Inspiron 16 Plus 7630 | |
| Asus VivoBook 14X K3405 | |
| Schenker Vision 14 M23 RTX 3050 | |
| AIDA64 / CPU PhotoWorxx | |
| Durchschnitt der Klasse Multimedia (8187 - 88154, n=61, der letzten 2 Jahre) | |
| Samsung Galaxy Book3 Ultra 16 | |
| Schenker Vision 14 M23 RTX 3050 | |
| HP Pavilion Plus 16-ab0456tx | |
| Durchschnittliche Intel Core i7-13700H (12872 - 52727, n=29) | |
| Asus VivoBook Pro 16 K6602VU | |
| Dell Inspiron 16 Plus 7630 | |
| Lenovo Slim Pro 7 14ARP8 | |
| Asus VivoBook 14X K3405 | |
Sehen Sie sich unsere spezielle Seite zum Intel Core i7-13700H an für weitere Leistungsvergleiche.
System Performance
Das Pavilion Plus 16 schafft es irgendwie, das VivoBook Pro 16 mit Core i9-13900H und RTX 4050 in den CrossMark-Tests zu überholen, verliert aber im PCMark 10 6 % gegenüber Letzterem.
Ansonsten fühlt sich das System für die tägliche Produktivität und das Surfen im Internet recht reaktionsschnell an.
CrossMark: Overall | Productivity | Creativity | Responsiveness
AIDA64: Memory Copy | Memory Read | Memory Write | Memory Latency
WebXPRT 3: Overall
WebXPRT 4: Overall
Mozilla Kraken 1.1: Total
| PCMark 10 / Score | |
| Durchschnitt der Klasse Multimedia (4325 - 10386, n=58, der letzten 2 Jahre) | |
| Dell Inspiron 16 Plus 7630 | |
| Asus VivoBook Pro 16 K6602VU | |
| Samsung Galaxy Book3 Ultra 16 | |
| Asus VivoBook 14X K3405 | |
| HP Pavilion Plus 16-ab0456tx | |
| Durchschnittliche Intel Core i7-13700H, NVIDIA GeForce RTX 3050 6GB Laptop GPU (6290 - 6597, n=2) | |
| Lenovo Slim Pro 7 14ARP8 | |
| Schenker Vision 14 M23 RTX 3050 | |
| PCMark 10 / Essentials | |
| Dell Inspiron 16 Plus 7630 | |
| Samsung Galaxy Book3 Ultra 16 | |
| Durchschnitt der Klasse Multimedia (8025 - 11664, n=57, der letzten 2 Jahre) | |
| Asus VivoBook Pro 16 K6602VU | |
| Asus VivoBook 14X K3405 | |
| HP Pavilion Plus 16-ab0456tx | |
| Durchschnittliche Intel Core i7-13700H, NVIDIA GeForce RTX 3050 6GB Laptop GPU (9943 - 10112, n=2) | |
| Lenovo Slim Pro 7 14ARP8 | |
| Schenker Vision 14 M23 RTX 3050 | |
| PCMark 10 / Productivity | |
| Durchschnitt der Klasse Multimedia (7323 - 18233, n=57, der letzten 2 Jahre) | |
| Dell Inspiron 16 Plus 7630 | |
| Asus VivoBook 14X K3405 | |
| Schenker Vision 14 M23 RTX 3050 | |
| Durchschnittliche Intel Core i7-13700H, NVIDIA GeForce RTX 3050 6GB Laptop GPU (8803 - 8950, n=2) | |
| HP Pavilion Plus 16-ab0456tx | |
| Asus VivoBook Pro 16 K6602VU | |
| Samsung Galaxy Book3 Ultra 16 | |
| Lenovo Slim Pro 7 14ARP8 | |
| PCMark 10 / Digital Content Creation | |
| Dell Inspiron 16 Plus 7630 | |
| Asus VivoBook Pro 16 K6602VU | |
| Durchschnitt der Klasse Multimedia (3651 - 16240, n=57, der letzten 2 Jahre) | |
| Samsung Galaxy Book3 Ultra 16 | |
| Lenovo Slim Pro 7 14ARP8 | |
| HP Pavilion Plus 16-ab0456tx | |
| Asus VivoBook 14X K3405 | |
| Durchschnittliche Intel Core i7-13700H, NVIDIA GeForce RTX 3050 6GB Laptop GPU (7590 - 8752, n=2) | |
| Schenker Vision 14 M23 RTX 3050 | |
| CrossMark / Overall | |
| Durchschnitt der Klasse Multimedia (866 - 2728, n=67, der letzten 2 Jahre) | |
| Dell Inspiron 16 Plus 7630 | |
| HP Pavilion Plus 16-ab0456tx | |
| Asus VivoBook Pro 16 K6602VU | |
| Asus VivoBook 14X K3405 | |
| Durchschnittliche Intel Core i7-13700H, NVIDIA GeForce RTX 3050 6GB Laptop GPU (1504 - 1752, n=2) | |
| Samsung Galaxy Book3 Ultra 16 | |
| Schenker Vision 14 M23 RTX 3050 | |
| Lenovo Slim Pro 7 14ARP8 | |
| CrossMark / Productivity | |
| Dell Inspiron 16 Plus 7630 | |
| Durchschnitt der Klasse Multimedia (931 - 2489, n=67, der letzten 2 Jahre) | |
| Asus VivoBook Pro 16 K6602VU | |
| HP Pavilion Plus 16-ab0456tx | |
| Asus VivoBook 14X K3405 | |
| Durchschnittliche Intel Core i7-13700H, NVIDIA GeForce RTX 3050 6GB Laptop GPU (1417 - 1657, n=2) | |
| Samsung Galaxy Book3 Ultra 16 | |
| Schenker Vision 14 M23 RTX 3050 | |
| Lenovo Slim Pro 7 14ARP8 | |
| CrossMark / Creativity | |
| Durchschnitt der Klasse Multimedia (907 - 3465, n=67, der letzten 2 Jahre) | |
| Dell Inspiron 16 Plus 7630 | |
| HP Pavilion Plus 16-ab0456tx | |
| Asus VivoBook Pro 16 K6602VU | |
| Durchschnittliche Intel Core i7-13700H, NVIDIA GeForce RTX 3050 6GB Laptop GPU (1711 - 1970, n=2) | |
| Schenker Vision 14 M23 RTX 3050 | |
| Asus VivoBook 14X K3405 | |
| Samsung Galaxy Book3 Ultra 16 | |
| Lenovo Slim Pro 7 14ARP8 | |
| CrossMark / Responsiveness | |
| Dell Inspiron 16 Plus 7630 | |
| Asus VivoBook Pro 16 K6602VU | |
| Durchschnitt der Klasse Multimedia (605 - 2024, n=67, der letzten 2 Jahre) | |
| Samsung Galaxy Book3 Ultra 16 | |
| Asus VivoBook 14X K3405 | |
| HP Pavilion Plus 16-ab0456tx | |
| Durchschnittliche Intel Core i7-13700H, NVIDIA GeForce RTX 3050 6GB Laptop GPU (1220 - 1458, n=2) | |
| Schenker Vision 14 M23 RTX 3050 | |
| Lenovo Slim Pro 7 14ARP8 | |
| AIDA64 / Memory Copy | |
| Durchschnitt der Klasse Multimedia (11299 - 132135, n=61, der letzten 2 Jahre) | |
| Samsung Galaxy Book3 Ultra 16 | |
| Schenker Vision 14 M23 RTX 3050 | |
| Durchschnittliche Intel Core i7-13700H, NVIDIA GeForce RTX 3050 6GB Laptop GPU (64356 - 65837, n=2) | |
| HP Pavilion Plus 16-ab0456tx | |
| Dell Inspiron 16 Plus 7630 | |
| Asus VivoBook Pro 16 K6602VU | |
| Lenovo Slim Pro 7 14ARP8 | |
| Asus VivoBook 14X K3405 | |
| AIDA64 / Memory Read | |
| Durchschnitt der Klasse Multimedia (11624 - 174586, n=61, der letzten 2 Jahre) | |
| Schenker Vision 14 M23 RTX 3050 | |
| Samsung Galaxy Book3 Ultra 16 | |
| Durchschnittliche Intel Core i7-13700H, NVIDIA GeForce RTX 3050 6GB Laptop GPU (65825 - 70861, n=2) | |
| Dell Inspiron 16 Plus 7630 | |
| Asus VivoBook Pro 16 K6602VU | |
| HP Pavilion Plus 16-ab0456tx | |
| Lenovo Slim Pro 7 14ARP8 | |
| Asus VivoBook 14X K3405 | |
| AIDA64 / Memory Write | |
| Samsung Galaxy Book3 Ultra 16 | |
| Durchschnitt der Klasse Multimedia (11755 - 134998, n=61, der letzten 2 Jahre) | |
| HP Pavilion Plus 16-ab0456tx | |
| Durchschnittliche Intel Core i7-13700H, NVIDIA GeForce RTX 3050 6GB Laptop GPU (68174 - 76930, n=2) | |
| Schenker Vision 14 M23 RTX 3050 | |
| Asus VivoBook Pro 16 K6602VU | |
| Dell Inspiron 16 Plus 7630 | |
| Lenovo Slim Pro 7 14ARP8 | |
| Asus VivoBook 14X K3405 | |
| AIDA64 / Memory Latency | |
| Durchschnitt der Klasse Multimedia (7 - 535, n=60, der letzten 2 Jahre) | |
| Lenovo Slim Pro 7 14ARP8 | |
| Samsung Galaxy Book3 Ultra 16 | |
| Dell Inspiron 16 Plus 7630 | |
| Asus VivoBook Pro 16 K6602VU | |
| HP Pavilion Plus 16-ab0456tx | |
| Asus VivoBook 14X K3405 | |
| Durchschnittliche Intel Core i7-13700H, NVIDIA GeForce RTX 3050 6GB Laptop GPU (85.7 - 89.7, n=2) | |
| Schenker Vision 14 M23 RTX 3050 | |
| WebXPRT 3 / Overall | |
| Durchschnitt der Klasse Multimedia (136.4 - 596, n=70, der letzten 2 Jahre) | |
| Dell Inspiron 16 Plus 7630 | |
| Schenker Vision 14 M23 RTX 3050 | |
| Durchschnittliche Intel Core i7-13700H, NVIDIA GeForce RTX 3050 6GB Laptop GPU (286 - 300, n=2) | |
| HP Pavilion Plus 16-ab0456tx | |
| Asus VivoBook 14X K3405 | |
| Lenovo Slim Pro 7 14ARP8 | |
| Samsung Galaxy Book3 Ultra 16 | |
| WebXPRT 4 / Overall | |
| Schenker Vision 14 M23 RTX 3050 | |
| Durchschnittliche Intel Core i7-13700H, NVIDIA GeForce RTX 3050 6GB Laptop GPU (273 - 325, n=2) | |
| Durchschnitt der Klasse Multimedia (167.3 - 402, n=71, der letzten 2 Jahre) | |
| Dell Inspiron 16 Plus 7630 | |
| HP Pavilion Plus 16-ab0456tx | |
| Asus VivoBook 14X K3405 | |
| Asus VivoBook Pro 16 K6602VU | |
| Samsung Galaxy Book3 Ultra 16 | |
| Lenovo Slim Pro 7 14ARP8 | |
| Mozilla Kraken 1.1 / Total | |
| Lenovo Slim Pro 7 14ARP8 | |
| Samsung Galaxy Book3 Ultra 16 | |
| Asus VivoBook 14X K3405 | |
| Asus VivoBook Pro 16 K6602VU | |
| Dell Inspiron 16 Plus 7630 | |
| Schenker Vision 14 M23 RTX 3050 | |
| Durchschnittliche Intel Core i7-13700H, NVIDIA GeForce RTX 3050 6GB Laptop GPU (490 - 496, n=2) | |
| HP Pavilion Plus 16-ab0456tx | |
| Durchschnitt der Klasse Multimedia (228 - 835, n=73, der letzten 2 Jahre) | |
* ... kleinere Werte sind besser
| PCMark 8 Home Score Accelerated v2 | 5525 Punkte | |
| PCMark 8 Work Score Accelerated v2 | 5653 Punkte | |
| PCMark 10 Score | 6597 Punkte | |
Hilfe | ||
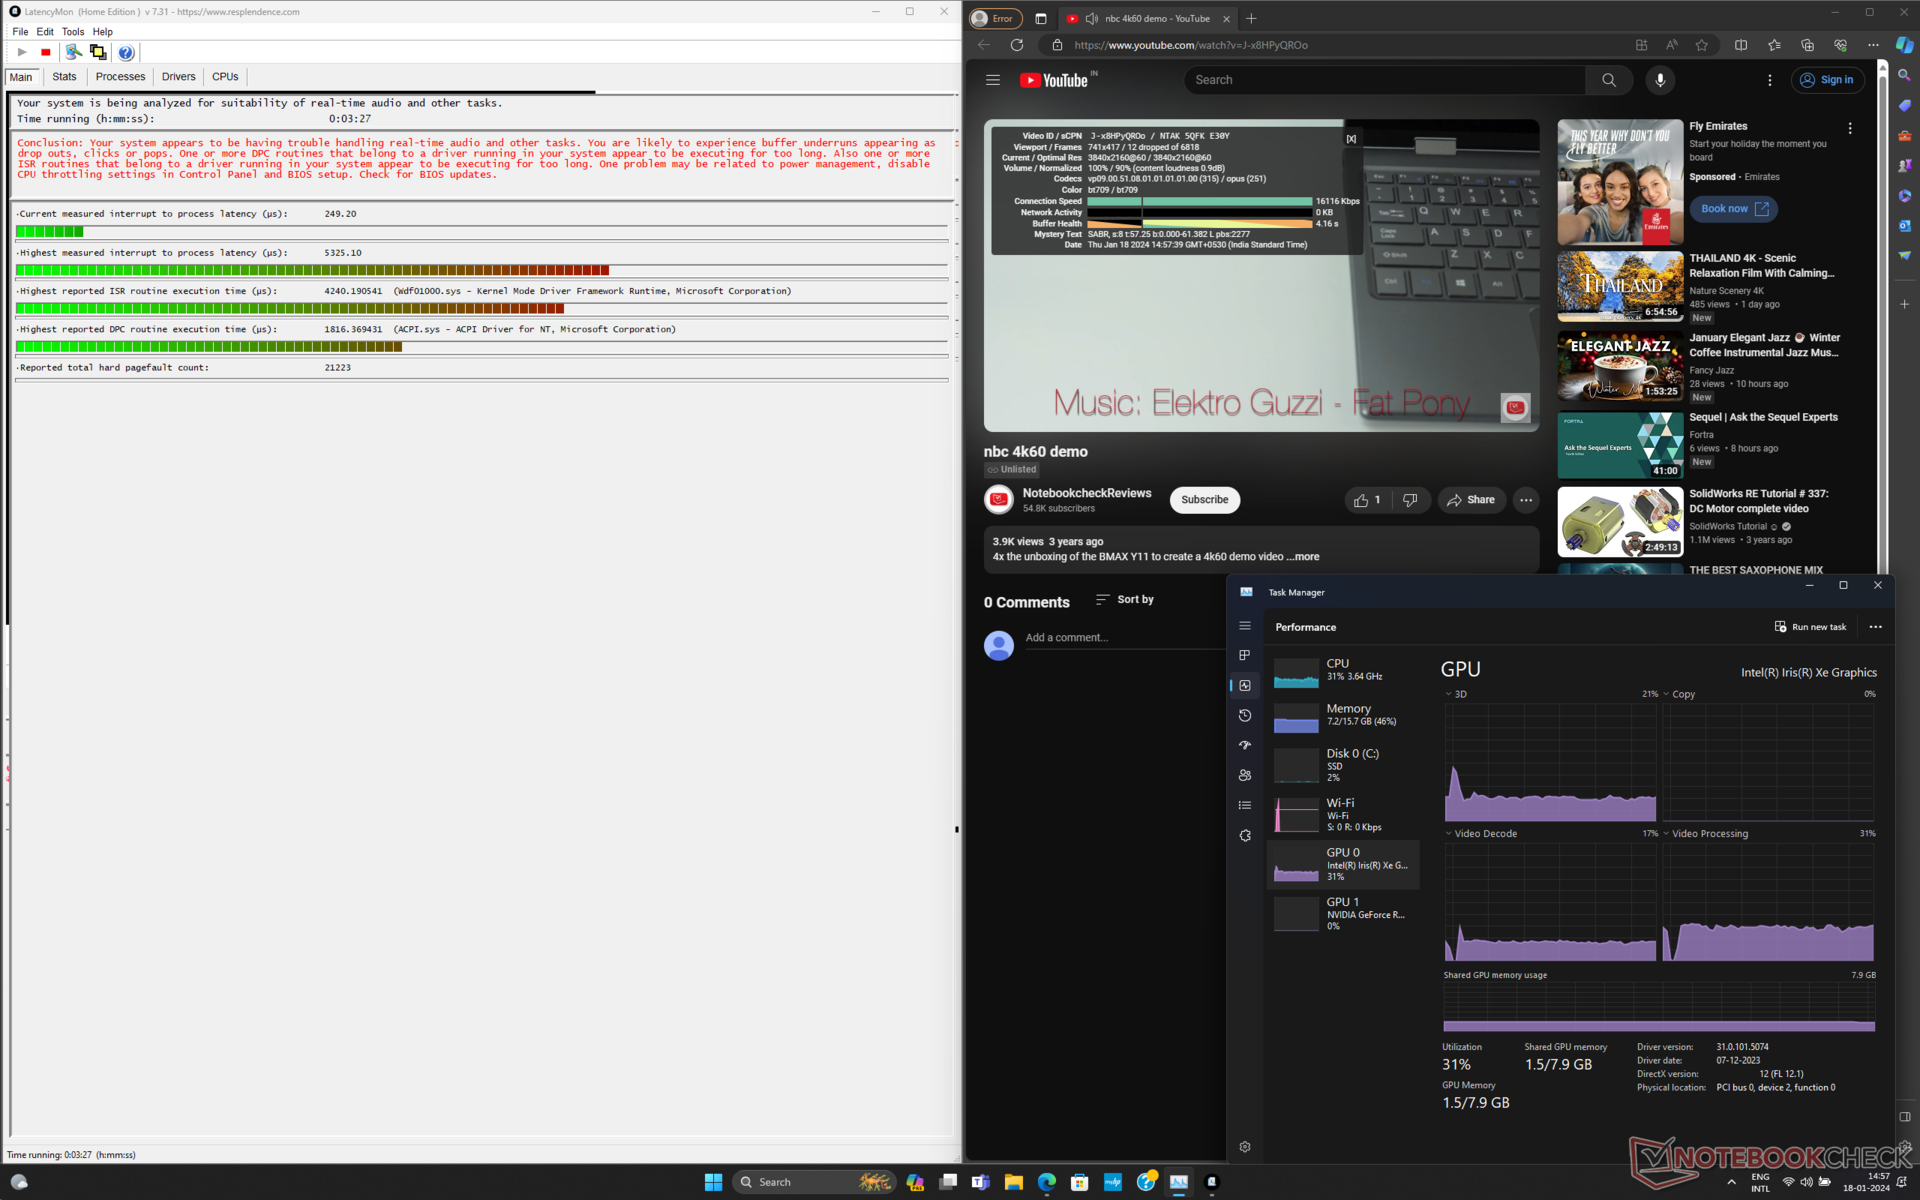
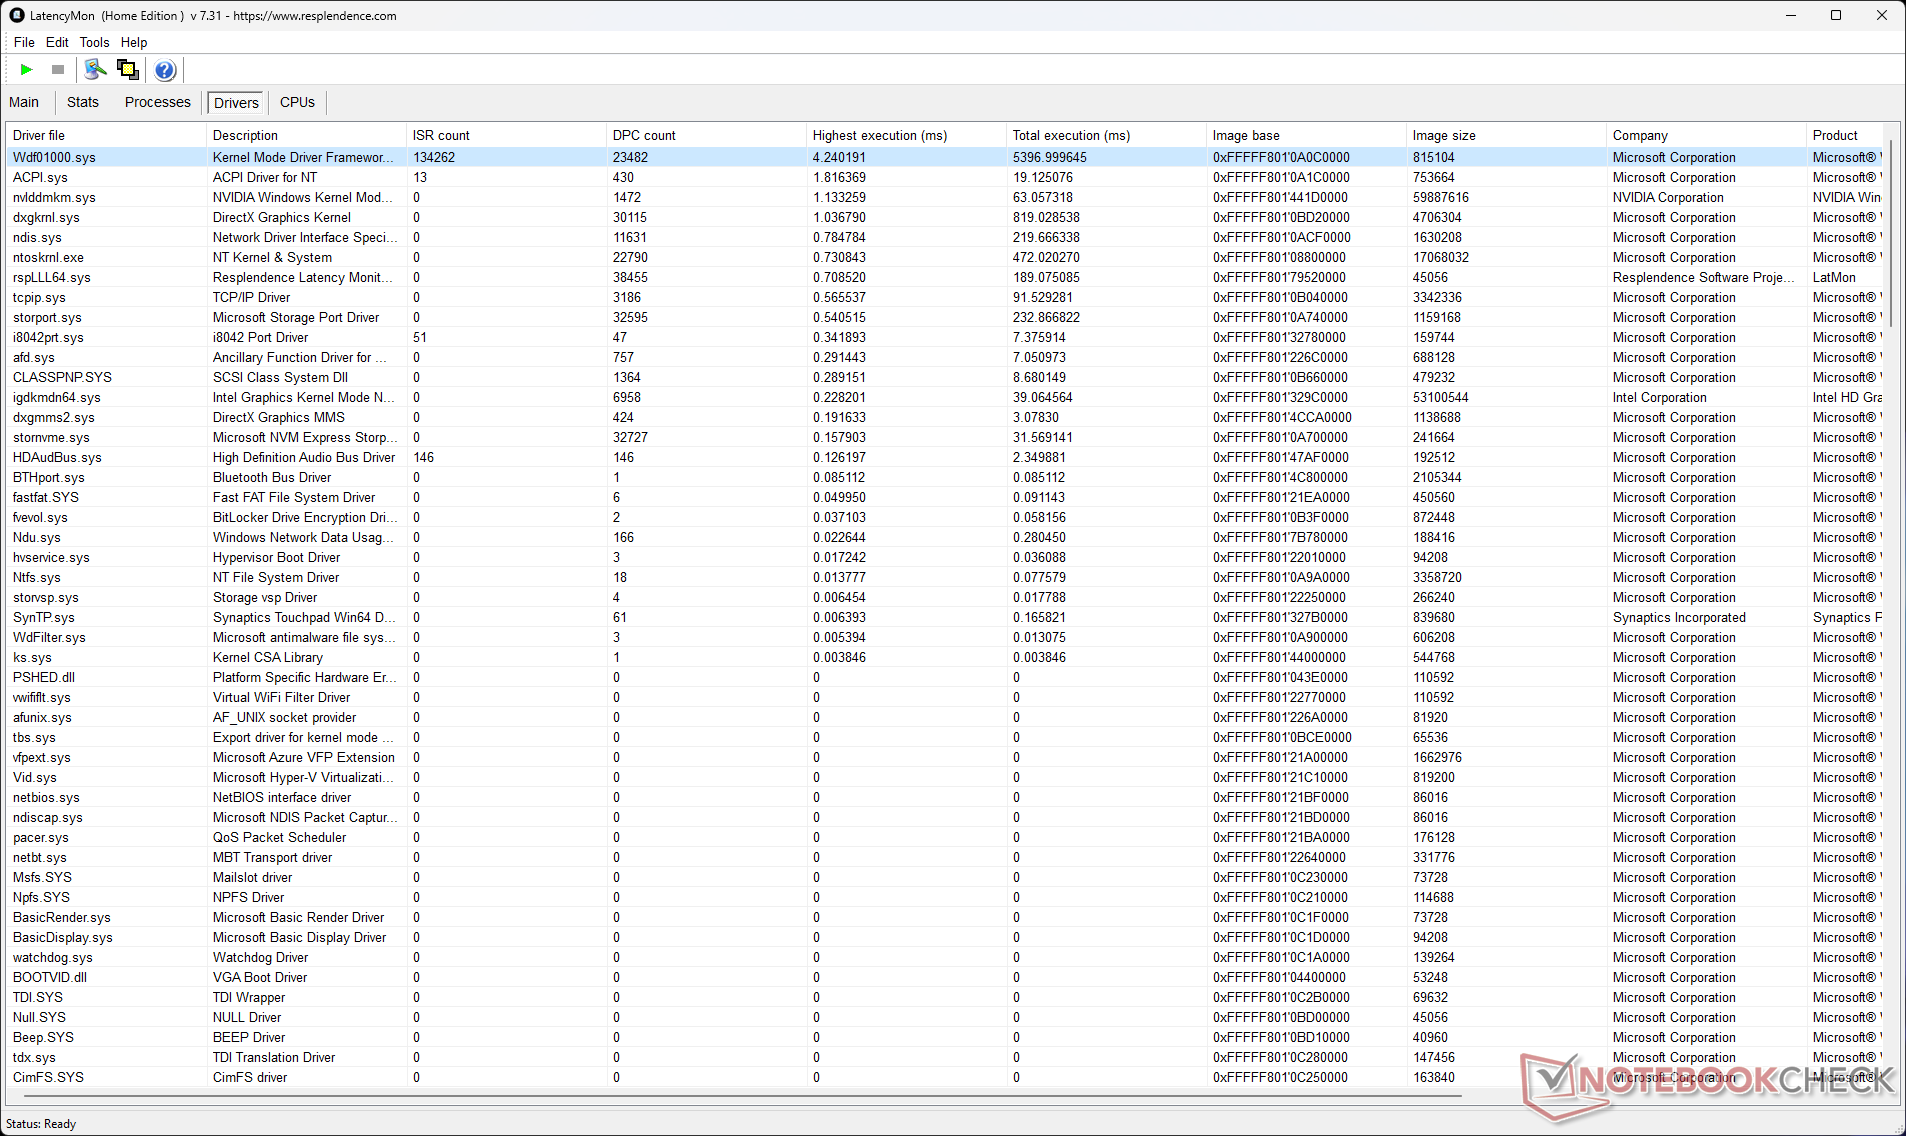
DPC-Latenzzeit
Die gemessene Interrupt-to-Process-Latenz des Pavilion Plus 16 von 5325,1 μs liegt eher höher, was für diejenigen, die sich mit Echtzeit-Audio- und Video-Workflows beschäftigen, ein Problem darstellen kann.
| DPC Latencies / LatencyMon - interrupt to process latency (max), Web, Youtube, Prime95 | |
| HP Pavilion Plus 16-ab0456tx | |
| Samsung Galaxy Book3 Ultra 16 | |
| Asus VivoBook Pro 16 K6602VU | |
| Schenker Vision 14 M23 RTX 3050 | |
| Lenovo Slim Pro 7 14ARP8 | |
| Asus VivoBook 14X K3405 | |
| Dell Inspiron 16 Plus 7630 | |
* ... kleinere Werte sind besser
Unser DPC-Latenz-Ranking bietet weitere Latenzvergleiche zwischen getesteten Geräten.
Speichergeräte

Ein Western Digital PC SN810 1 TB NVMe Laufwerk ist in unserem Pavilion-Plus-16-Gerät installiert. Die kumulative Laufwerksleistung ist etwa 10 % langsamer als die des Samsung 990 Pro im Schenker Vision 14 M23 und ca. 16 % langsamer als die des Samsung PM9A1 im Samsung Galaxy Book3 Ultra 16.
Die geringere 4K-Lese-/Schreibleistung trägt hauptsächlich zu diesem Leistungsdefizit bei.
Leider kann nur eine SSD in das Gehäuse eingebaut werden. Es gibt auch keine Möglichkeit, 2,5-Zoll-Laufwerke hinzuzufügen.

* ... kleinere Werte sind besser
Drosselung der Festplatte: DiskSpd Read Loop, Queue Depth: 8
Obwohl HP eine thermische Abdeckung für die SSD bereitstellt, reicht diese offenbar nicht aus um zu verhindern, dass das Laufwerk während unseres DiskSpd-Leseschleifentests bei einer Warteschlangentiefe von 8 nach der 25sten Schleife drosselt.
Weitere Speicher-Benchmarks finden Sie auf unserer SSD-Vergleichsseite.
GPU Performance
Das Pavilion Plus 16 ist neben dem Lenovo Slim Pro 7 und dem Schenker Vision 14 M23 das einzige andere Notebook, das wir getestet haben, das mit der neueren RTX-3050-6-GB-Laptop-GPU ausgestattet ist.
Die RTX 3050 6 GB im HP Notebook ist mit einem TGP von 60 W bewertet, während die Implementierungen von Schenker und Lenovo 50 bzw. 63 W aufweisen.
Dementsprechend hat das Slim 7 Pro einen leichten Vorsprung bei der kumulativen 3DMark-Leistung gegenüber dem Pavilion Plus 16, während das Vision 14 M23 um 5 % hinter dem HP liegt.
| 3DMark 11 Performance | 17282 Punkte | |
| 3DMark Ice Storm Standard Score | 82182 Punkte | |
| 3DMark Cloud Gate Standard Score | 43015 Punkte | |
| 3DMark Fire Strike Score | 10890 Punkte | |
| 3DMark Fire Strike Extreme Score | 5641 Punkte | |
Hilfe | ||
| Blender / v3.3 Classroom OPTIX/RTX | |
| Asus VivoBook 14X K3405 | |
| Schenker Vision 14 M23 RTX 3050 | |
| Durchschnittliche NVIDIA GeForce RTX 3050 4GB Laptop GPU (53 - 99, n=12) | |
| Lenovo Slim Pro 7 14ARP8 | |
| HP Pavilion Plus 16-ab0456tx | |
| Durchschnitt der Klasse Multimedia (12 - 105, n=24, der letzten 2 Jahre) | |
| Samsung Galaxy Book3 Ultra 16 | |
| Asus VivoBook Pro 16 K6602VU | |
| Dell Inspiron 16 Plus 7630 | |
| Blender / v3.3 Classroom CUDA | |
| Asus VivoBook 14X K3405 | |
| Asus VivoBook 14X K3405 | |
| Durchschnittliche NVIDIA GeForce RTX 3050 4GB Laptop GPU (97 - 152, n=13) | |
| Schenker Vision 14 M23 RTX 3050 | |
| Lenovo Slim Pro 7 14ARP8 | |
| HP Pavilion Plus 16-ab0456tx | |
| Samsung Galaxy Book3 Ultra 16 | |
| Durchschnitt der Klasse Multimedia (20 - 186, n=24, der letzten 2 Jahre) | |
| Asus VivoBook Pro 16 K6602VU | |
| Dell Inspiron 16 Plus 7630 | |
| Blender / v3.3 Classroom CPU | |
| Durchschnittliche NVIDIA GeForce RTX 3050 4GB Laptop GPU (388 - 937, n=11) | |
| Schenker Vision 14 M23 RTX 3050 | |
| Asus VivoBook 14X K3405 | |
| Lenovo Slim Pro 7 14ARP8 | |
| Dell Inspiron 16 Plus 7630 | |
| Durchschnitt der Klasse Multimedia (134.5 - 1042, n=67, der letzten 2 Jahre) | |
| Samsung Galaxy Book3 Ultra 16 | |
| HP Pavilion Plus 16-ab0456tx | |
| Asus VivoBook Pro 16 K6602VU | |
* ... kleinere Werte sind besser
Spiele-Performance
Wir sehen einen kumulativen Vorteil von etwa 10 % bei 1.080p-Spielen mit der RTX 3050 6 GB im Vergleich zum RTX-3050-4-GB-Durchschnitt.
Die RTX 3050 des Pavilion Plus 16 zeigt gute Zuwächse bei der kumulativen 1.080p-Gaming-Performance gegenüber dem Slim Pro 7 und dem Vision 14 M23, während sie um 25 % hinter der 65-W-RTX-4050-Laptop-GPU im VivoBook Pro 16 zurückbleibt.
Interessanterweise ist das Pavilion Plus 16 auch in der Lage, das Galaxy Book3 Ultra 16 mit einer RTX 4050 im Gesamtspiel auszustechen, aber das liegt an der schlechten Leistung von Letzterem in Dota 2 Reborn und X-Plane 11.
Die RTX 3050 6 GB kann ältere Titel bei 1.080p Ultra flüssig wiedergeben, aber moderne AAA-Spiele haben mit allen Einstellungen über 1.080p High zu kämpfen.
Die Witcher-3-fps-Tabelle
Wir haben kein wahrnehmbares Throttling während eines Stresstests mit The Witcher 3 bei 1.080p Ultra festgestellt, was auf eine effiziente Kühlung hindeutet.
| min. | mittel | hoch | max. | QHD | |
|---|---|---|---|---|---|
| GTA V (2015) | 177.9 | 172 | 123.3 | 62.7 | 42.7 |
| The Witcher 3 (2015) | 244 | 159.1 | 91.4 | 50.1 | 37 |
| Dota 2 Reborn (2015) | 155.2 | 131 | 124.2 | 116.9 | |
| Final Fantasy XV Benchmark (2018) | 128.2 | 70.9 | 52 | 37.4 | |
| X-Plane 11.11 (2018) | 140.6 | 117 | 97.3 | ||
| Far Cry 5 (2018) | 89 | 82 | 76 | 52 | |
| Strange Brigade (2018) | 256 | 112.8 | 91.9 | 80.5 | 57.1 |
| F1 22 (2022) | 150.2 | 145.3 | 109.5 | 34 | 20.1 |
| F1 23 (2023) | 150.1 | 141.2 | 97.5 | 26 | 14.3 |
| Cyberpunk 2077 (2023) | 67.6 | 52.1 | 43.2 | 36.9 | 21.3 |
| Assassin's Creed Mirage (2023) | 70 | 63 | 55 | 41 | 31 |
| Avatar Frontiers of Pandora (2023) | 39.5 | 36.3 | 31.5 | 23.4 | 15.1 |
Siehe unser spezielle Seite zur Nvidia-GeForce-RTX-3050-6-GB-Laptop-GPU für weitere Informationen.
Emissionen: Erträgliches Lüftergeräusch, aber hohe Oberflächentemperaturen unter Last
Systemrauschen
Wir haben einen Schalldruckpegel (SPL) von 42,1 dB(A) im Modus Performance bei maximaler Belastung gemessen. Es scheint, dass HP für das Lüftergeräusch Grenzwerte festgelegt hat, die unter 35 db(A) im Modus Balanced und 45 dB(A) im Modus Performance liegen.
Lautstärkediagramm
| Idle |
| 22.22 / 22.22 / 22.22 dB(A) |
| Last |
| 42.03 / 42.1 dB(A) |
 | ||
30 dB leise 40 dB(A) deutlich hörbar 50 dB(A) störend |
||
min: | ||
| Performance Modus | Leerlauf dB(A) | Last durchschnittlich dB(A) | Last maximal dB(A) | The Witcher 3 1.080p Ultra dB(A) |
|---|---|---|---|---|
| Balanced | 22,22 | 33,81 | 34,08 | 34,41 / 48 fps |
| Performance | 22,22 | 42,03 | 42,1 | 42,1 / 50 fps |
| HP Pavilion Plus 16-ab0456tx i7-13700H, GeForce RTX 3050 6GB Laptop GPU | Schenker Vision 14 M23 RTX 3050 i7-13700H, GeForce RTX 3050 6GB Laptop GPU | Dell Inspiron 16 Plus 7630 i7-13700H, GeForce RTX 4060 Laptop GPU | Asus VivoBook 14X K3405 i5-13500H, GeForce RTX 3050 4GB Laptop GPU | Lenovo Slim Pro 7 14ARP8 R7 7735HS, GeForce RTX 3050 6GB Laptop GPU | Asus VivoBook Pro 16 K6602VU i9-13900H, GeForce RTX 4050 Laptop GPU | Samsung Galaxy Book3 Ultra 16 i7-13700H, GeForce RTX 4050 Laptop GPU | |
|---|---|---|---|---|---|---|---|
| Geräuschentwicklung | -10% | -7% | -10% | -4% | -14% | -9% | |
| aus / Umgebung * (dB) | 22.22 | 23.5 -6% | 23.2 -4% | 21.46 3% | 22.7 -2% | 20.96 6% | 25 -13% |
| Idle min * (dB) | 22.22 | 23.5 -6% | 23.2 -4% | 22.08 1% | 22.8 -3% | 25.28 -14% | 26 -17% |
| Idle avg * (dB) | 22.22 | 23.5 -6% | 23.2 -4% | 22.08 1% | 22.8 -3% | 25.28 -14% | 27 -22% |
| Idle max * (dB) | 22.22 | 26 -17% | 23.2 -4% | 22.08 1% | 22.8 -3% | 25.28 -14% | 28 -26% |
| Last avg * (dB) | 42.03 | 43.6 -4% | 35.1 16% | 52.98 -26% | 43.8 -4% | 51.88 -23% | 40 5% |
| Witcher 3 ultra * (dB) | 42.1 | 48.7 -16% | 52.5 -25% | 52.7 -25% | 43.8 -4% | 49 -16% | 39 7% |
| Last max * (dB) | 42.1 | 49.1 -17% | 52.5 -25% | 52.67 -25% | 47.1 -12% | 51.8 -23% | 41 3% |
* ... kleinere Werte sind besser
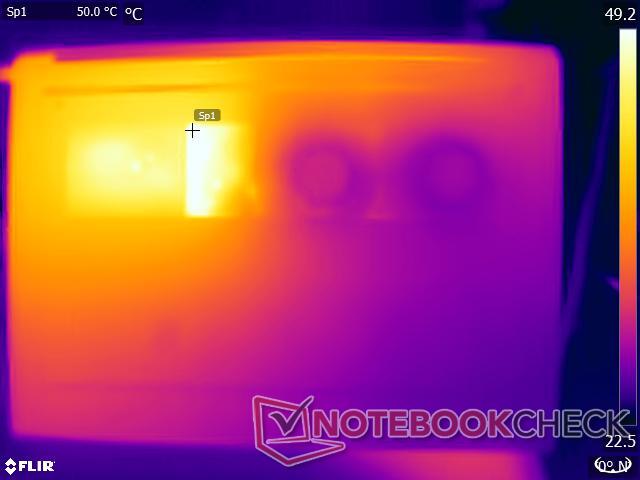
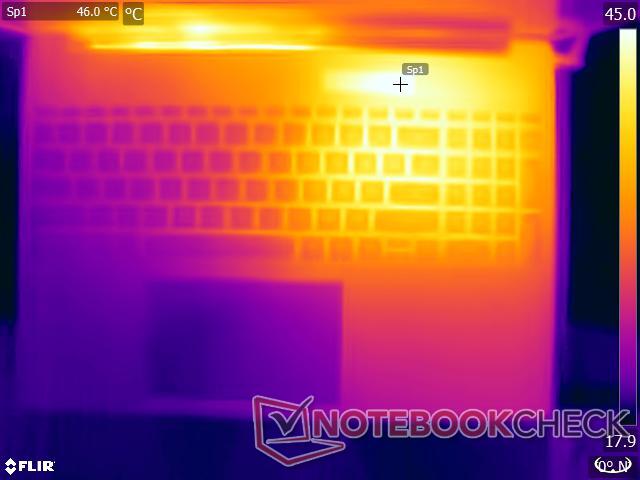
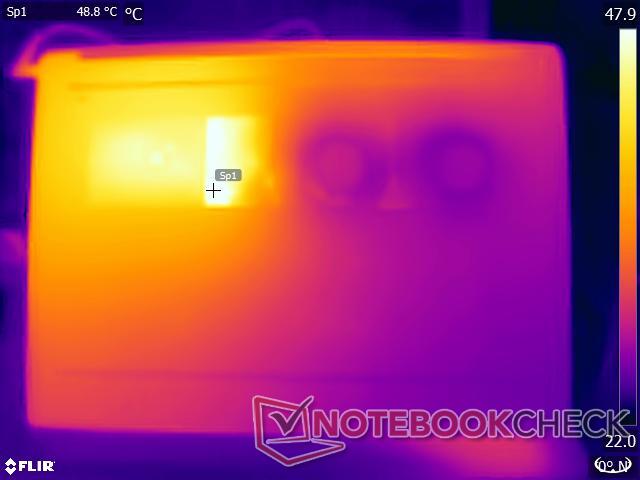
Temperatur
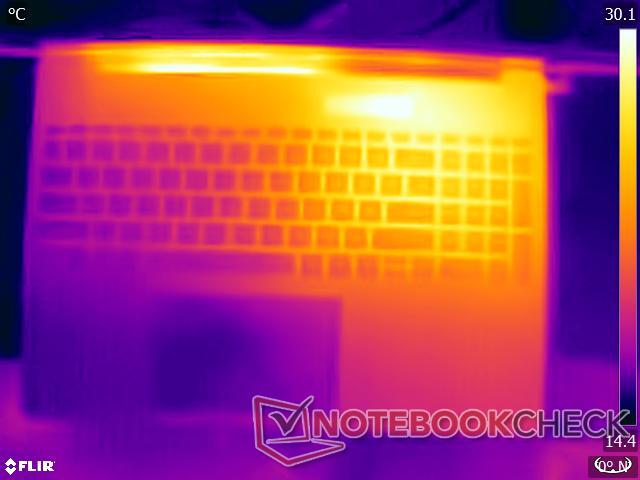
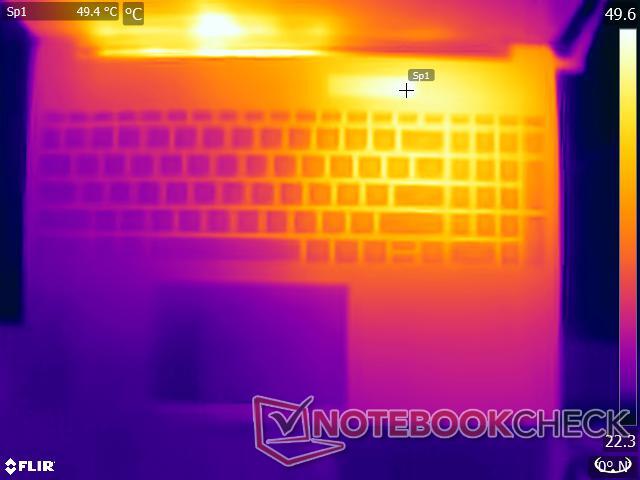
Das Pavilion Plus 16 verwendet ein Dual-Lüfter-Dual-Heatpipe-System zur Kühlung der CPU und GPU. Während unserer Stresstests wurde dieses System bis an die Grenzen ausgereizt: Die Oberflächentemperaturen erreichten 49,6 °C an der Oberseite und 45,8 °C an der Unterseite.
Obwohl das Gerät bei leichten Aufgaben bequem auf dem Schoß verwendbar ist, kann es bei hoher Arbeitsbelastung unangenehm werden.
(-) Die maximale Temperatur auf der Oberseite ist 49.6 °C. Im Vergleich liegt der Klassendurchschnitt bei 36.8 °C (von 21 bis 71 °C für die Klasse Multimedia).
(-) Auf der Unterseite messen wir eine maximalen Wert von 45.8 °C (im Vergleich zum Durchschnitt von 39.1 °C).
(±) Ohne Last messen wir eine durchschnittliche Temperatur von 32.3 °C auf der Oberseite. Der Klassendurchschnitt erreicht 31.3 °C.
(-) Beim längeren Spielen von The Witcher 3 erhitzt sich das Gerät durchschnittlich auf 39.7 °C. Der Durchschnitt der Klasse ist derzeit 31.3 °C.
(+) Die Handballen und der Touchpad-Bereich erreichen maximal 35 °C und damit die typische Hauttemperatur und fühlen sich daher nicht heiß an.
(-) Die durchschnittliche Handballen-Temperatur anderer getesteter Geräte war 28.7 °C (-6.3 °C).
| HP Pavilion Plus 16-ab0456tx Intel Core i7-13700H, NVIDIA GeForce RTX 3050 6GB Laptop GPU | Schenker Vision 14 M23 RTX 3050 Intel Core i7-13700H, NVIDIA GeForce RTX 3050 6GB Laptop GPU | Dell Inspiron 16 Plus 7630 Intel Core i7-13700H, NVIDIA GeForce RTX 4060 Laptop GPU | Asus VivoBook 14X K3405 Intel Core i5-13500H, NVIDIA GeForce RTX 3050 4GB Laptop GPU | Lenovo Slim Pro 7 14ARP8 AMD Ryzen 7 7735HS, NVIDIA GeForce RTX 3050 6GB Laptop GPU | Asus VivoBook Pro 16 K6602VU Intel Core i9-13900H, NVIDIA GeForce RTX 4050 Laptop GPU | Samsung Galaxy Book3 Ultra 16 Intel Core i7-13700H, NVIDIA GeForce RTX 4050 Laptop GPU | |
|---|---|---|---|---|---|---|---|
| Hitze | 10% | 6% | -2% | 19% | -1% | 22% | |
| Last oben max * (°C) | 49.6 | 48.5 2% | 47.8 4% | 49.2 1% | 42.2 15% | 42.6 14% | 41 17% |
| Last unten max * (°C) | 45.8 | 52.8 -15% | 42.2 8% | 54 -18% | 49 -7% | 48.4 -6% | 44 4% |
| Idle oben max * (°C) | 39.2 | 27.6 30% | 35.2 10% | 33.6 14% | 24.4 38% | 39.4 -1% | 23 41% |
| Idle unten max * (°C) | 35.4 | 27 24% | 35 1% | 37.6 -6% | 25.2 29% | 39.8 -12% | 26 27% |
* ... kleinere Werte sind besser
Stresstest
Während einer hohen Prime95-FFT-Belastung taktet der Core i7-13700H des Pavilion Plus 16 mit durchschnittlich 2,2 GHz und verbraucht dabei durchschnittlich 53 W Leistung.
Wenn Sie FurMark hinzufügen, konkurrieren der Core i7-13700H und die RTX 3050 um den Strom, was zu einem zeitweiligen Ansteigen und Abfallen des Taktes sowohl bei der CPU als auch bei der GPU führt.
Im Durchschnitt kann der Core i7-13700H nur mit bis zu 1,96 GHz takten, während die RTX 3050 mit 910 MHz arbeitet und durchschnittlich 41 bzw. 39 W verbraucht.
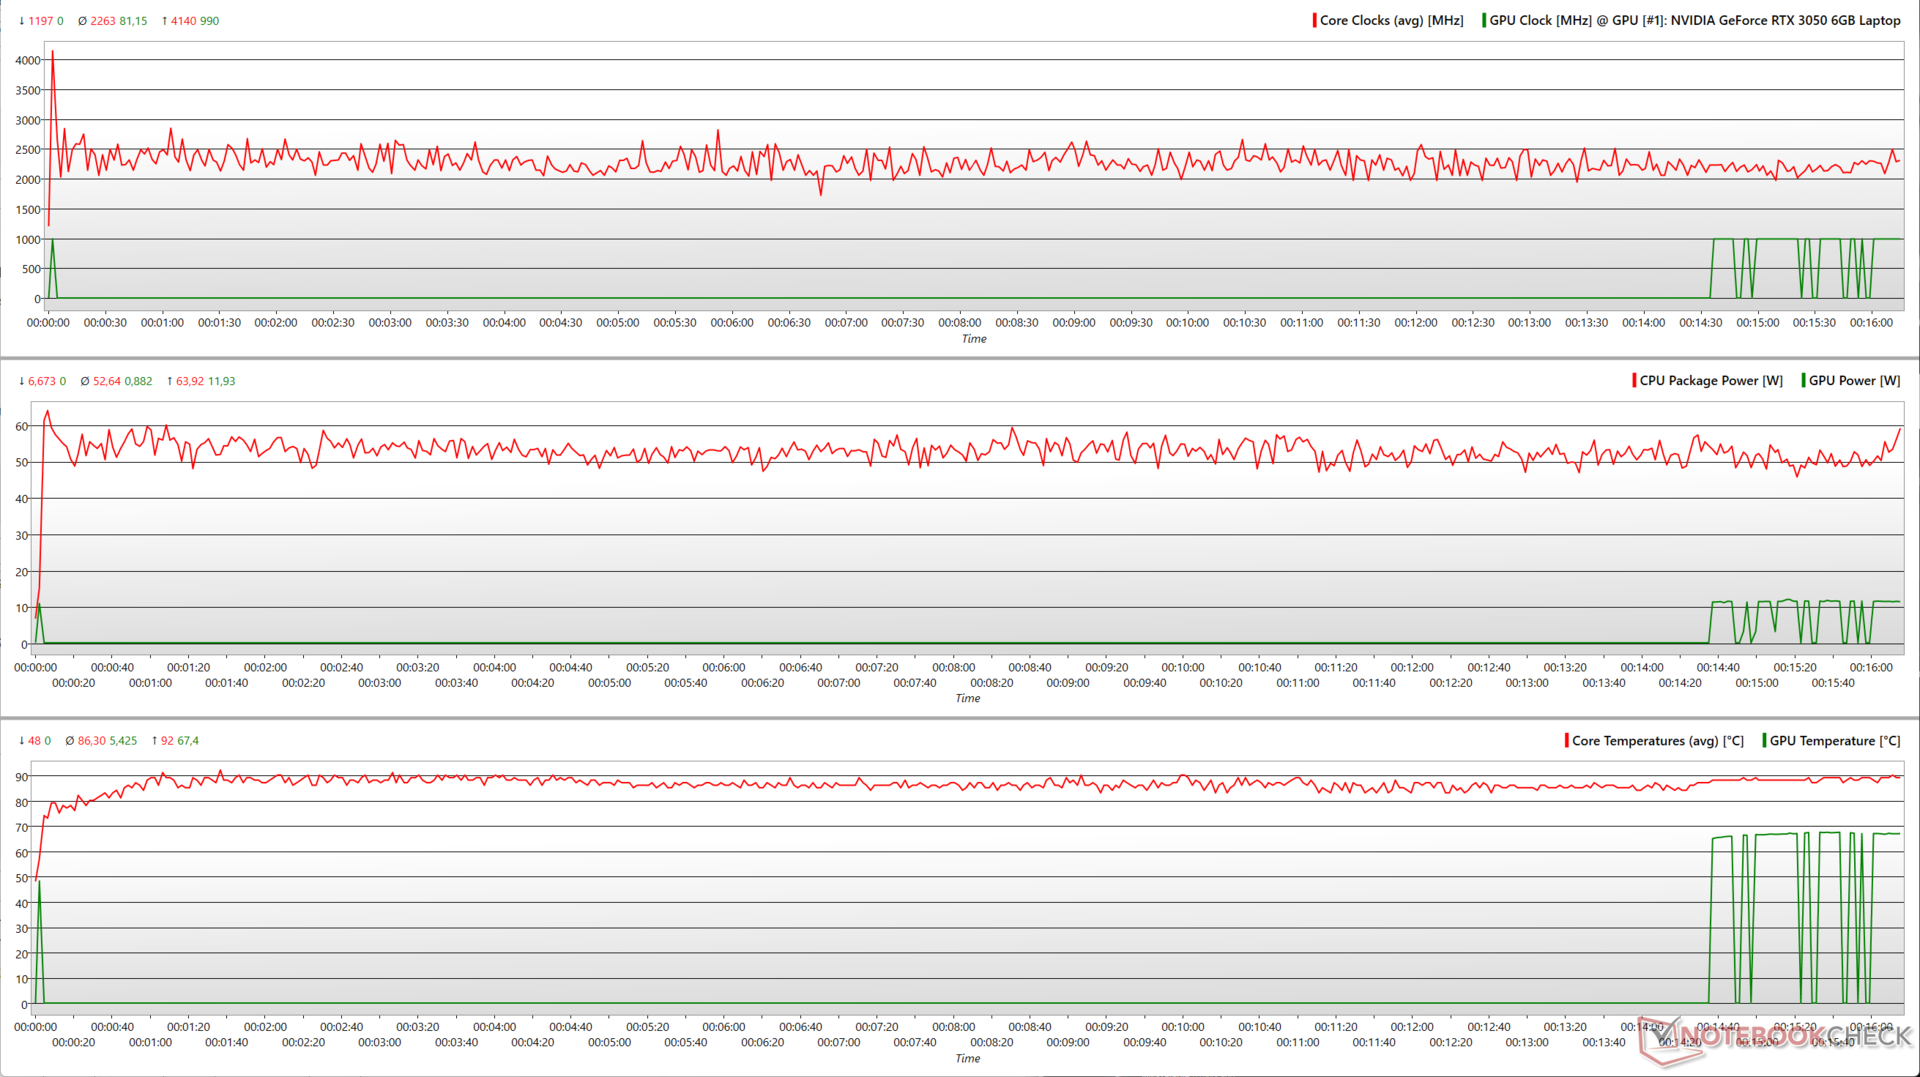
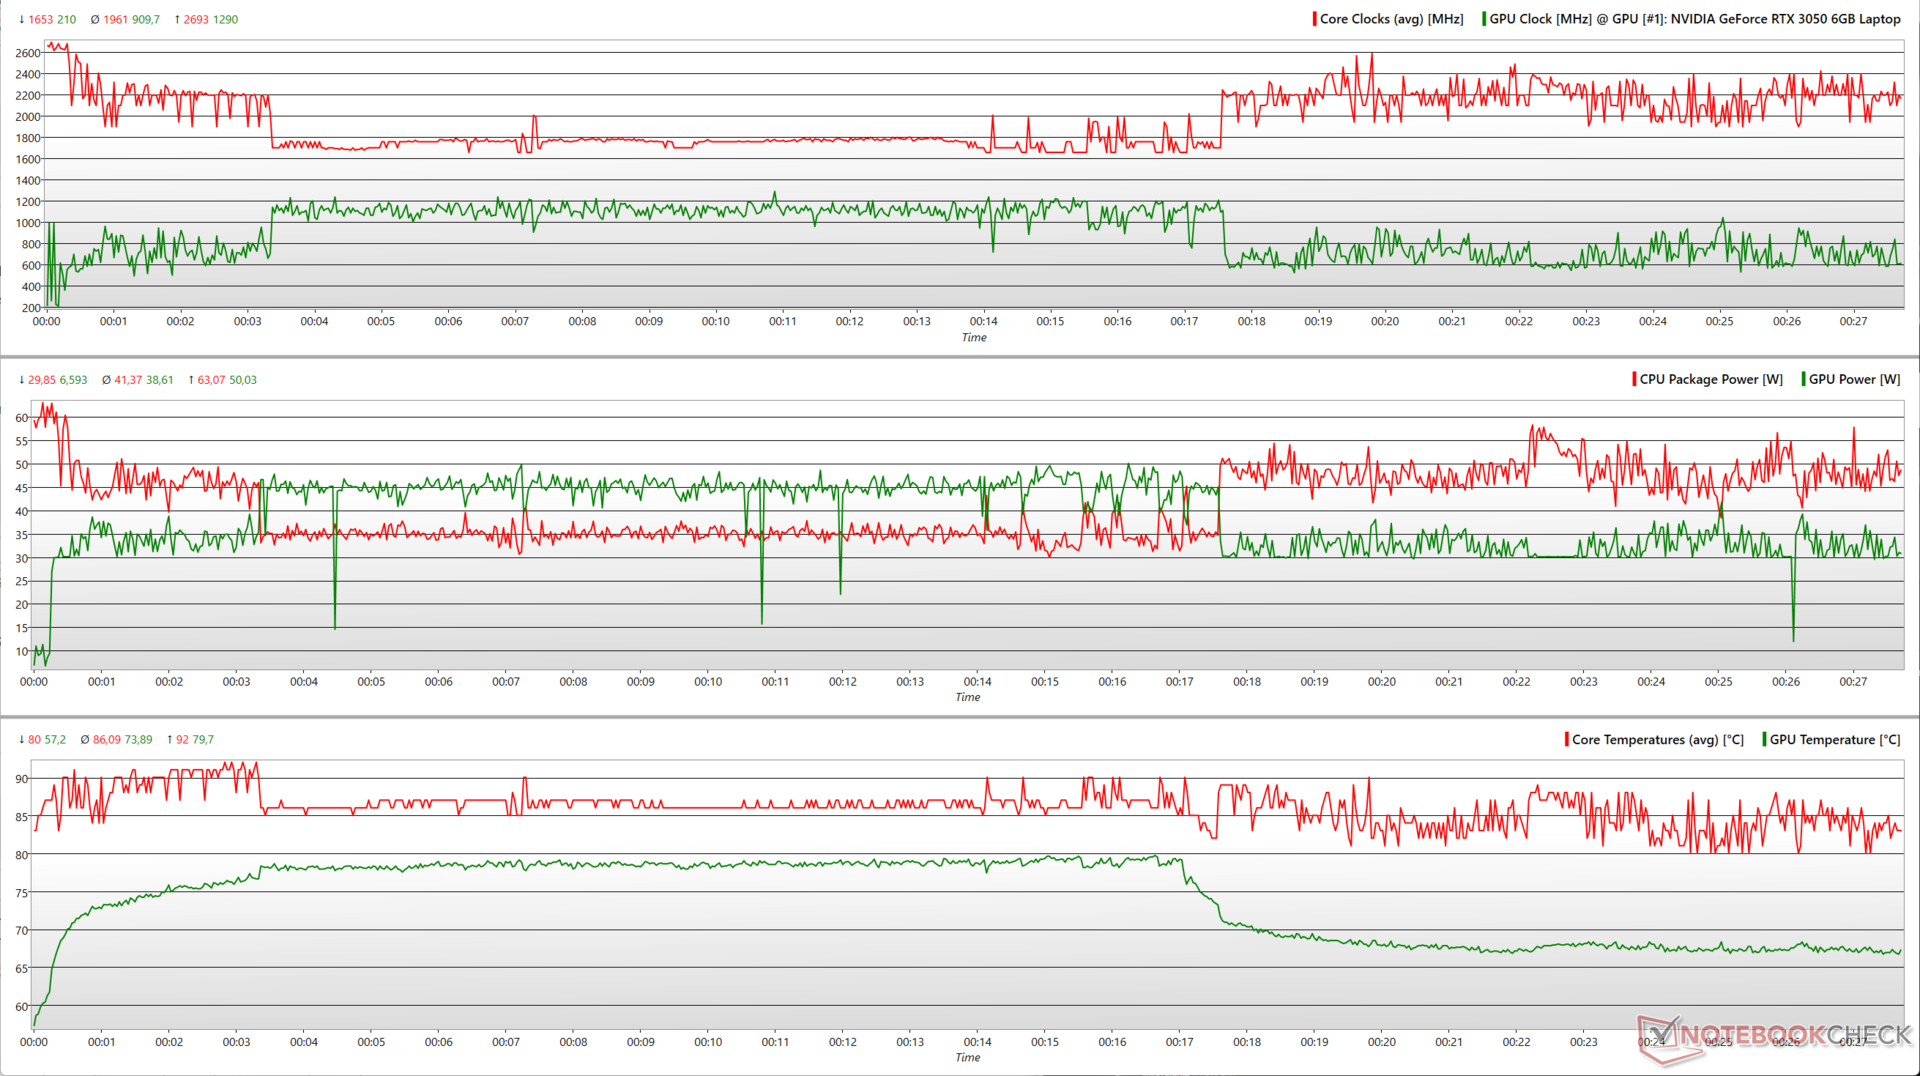
Die Dinge werden mit The Witcher 3 bei 1.080p Ultra viel berechenbarer. Die RTX 3050 ist jetzt in der Lage, ihr maximales TGP von fast 60 W konstant auszunutzen.
Interessanterweise beginnen die Kerntemperaturen nach einer Weile zu sinken, selbst wenn die CPU-/GPU-Takte und die Leistung relativ unverändert bleiben.
| Stresstest | CPU-Takt (GHz) | GPU-Takt (MHz) | durchschnittliche CPU-Temperatur (°C) | durchschnittliche GPU-Temperatur (°C) |
| System Leerlauf | 3,74 | - | 52 | 31,1 |
| Prime95 | 2,1 | - | 86 | 67,4 |
| Prime95 + FurMark | 1,93 | 735 | 86 | 73,5 |
| The Witcher 3 1.080p Ultra | 2,2 | 1,717 | 71 | 74,2 |
Lautsprecher
Das Pavilion Plus 16 wird mit einem Paar Stereolautsprechern geliefert, die mit 74,2 dB(A) recht laut sind, was in den meisten durchschnittlich großen Räumen ausreichen sollte. Der Bass ist wahrnehmbar, aber nicht sehr ausgeprägt. Die Mitten und Höhen sind jedoch relativ klar definiert.
Nichtsdestotrotz können Sie über externe Lautsprecher oder Bluetooth 5.3 einen besseren Klang bekommen.
HP Pavilion Plus 16-ab0456tx Audio Analyse
(±) | Mittelmäßig laut spielende Lautsprecher (74.2 dB)
Bass 100 - 315 Hz
(±) | abgesenkter Bass - 14.7% geringer als der Median
(±) | durchschnittlich lineare Bass-Wiedergabe (7.8% Delta zum Vorgänger)
Mitteltöne 400 - 2000 Hz
(+) | ausgeglichene Mitten, vom Median nur 3.4% abweichend
(+) | lineare Mitten (4.2% Delta zum Vorgänger)
Hochtöne 2 - 16 kHz
(+) | ausgeglichene Hochtöne, vom Median nur 4.6% abweichend
(+) | sehr lineare Hochtöne (4.8% Delta zum Vorgänger)
Gesamt im hörbaren Bereich 100 - 16.000 Hz
(±) | hörbarer Bereich ist durchschnittlich linear (16.7% Abstand zum Median)
Im Vergleich zu allen Geräten derselben Klasse
» 44% aller getesteten Geräte dieser Klasse waren besser, 8% vergleichbar, 48% schlechter
» Das beste Gerät hat einen Delta-Wert von 5%, durchschnittlich ist 17%, das schlechteste Gerät hat 45%
Im Vergleich zu allen Geräten im Test
» 29% aller getesteten Geräte waren besser, 7% vergleichbar, 64% schlechter
» Das beste Gerät hat einen Delta-Wert von 4%, durchschnittlich ist 24%, das schlechteste Gerät hat 134%
Apple MacBook Pro 16 2021 M1 Pro Audio Analyse
(+) | Die Lautsprecher können relativ laut spielen (84.7 dB)
Bass 100 - 315 Hz
(+) | guter Bass - nur 3.8% Abweichung vom Median
(+) | lineare Bass-Wiedergabe (5.2% Delta zum Vorgänger)
Mitteltöne 400 - 2000 Hz
(+) | ausgeglichene Mitten, vom Median nur 1.3% abweichend
(+) | lineare Mitten (2.1% Delta zum Vorgänger)
Hochtöne 2 - 16 kHz
(+) | ausgeglichene Hochtöne, vom Median nur 1.9% abweichend
(+) | sehr lineare Hochtöne (2.7% Delta zum Vorgänger)
Gesamt im hörbaren Bereich 100 - 16.000 Hz
(+) | hörbarer Bereich ist sehr linear (4.6% Abstand zum Median
Im Vergleich zu allen Geräten derselben Klasse
» 0% aller getesteten Geräte dieser Klasse waren besser, 0% vergleichbar, 100% schlechter
» Das beste Gerät hat einen Delta-Wert von 5%, durchschnittlich ist 17%, das schlechteste Gerät hat 45%
Im Vergleich zu allen Geräten im Test
» 0% aller getesteten Geräte waren besser, 0% vergleichbar, 100% schlechter
» Das beste Gerät hat einen Delta-Wert von 4%, durchschnittlich ist 24%, das schlechteste Gerät hat 134%
Energieverwaltung: Sparsame Leistungsaufnahme und gute Akkulaufzeit
Stromverbrauch
Das Pavilion Plus 16 verbraucht bei der gegebenen Hardware insgesamt relativ wenig Strom. Während das Schenker Vision 14 M23 und das Lenovo Slim Pro 7 bei durchschnittlicher Last und The Witcher 3 sparsamer sind, ist das Pavilion Plus 16 bei maximaler Last ökonomischer.
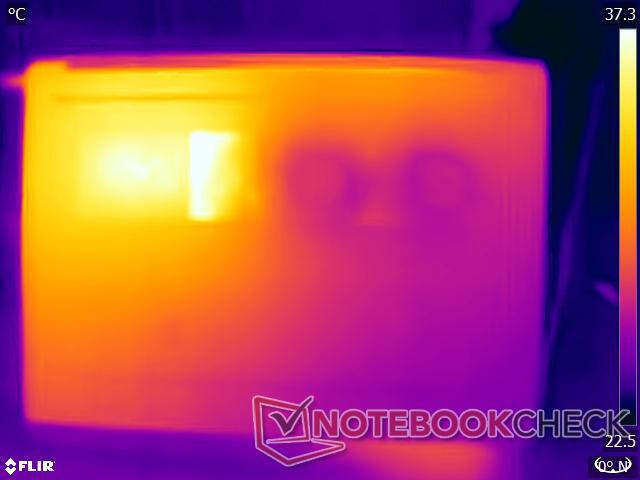
Das mitgelieferte 135-W-Netzteil ist mehr als ausreichend, um das Notebook unter Stress zu betreiben.
| Aus / Standby | |
| Idle | |
| Last |
|
Legende:
min: | |
| HP Pavilion Plus 16-ab0456tx i7-13700H, GeForce RTX 3050 6GB Laptop GPU, IPS, 2560x1600, 16" | Schenker Vision 14 M23 RTX 3050 i7-13700H, GeForce RTX 3050 6GB Laptop GPU, IPS, 2880x1800, 14" | Dell Inspiron 16 Plus 7630 i7-13700H, GeForce RTX 4060 Laptop GPU, IPS, 2560x1600, 16" | Asus VivoBook 14X K3405 i5-13500H, GeForce RTX 3050 4GB Laptop GPU, , 2880x1800, 14" | Lenovo Slim Pro 7 14ARP8 R7 7735HS, GeForce RTX 3050 6GB Laptop GPU, IPS, 2560x1600, 14.5" | Asus VivoBook Pro 16 K6602VU i9-13900H, GeForce RTX 4050 Laptop GPU, OLED, 3200x2000, 16" | Samsung Galaxy Book3 Ultra 16 i7-13700H, GeForce RTX 4050 Laptop GPU, AMOLED, 2880x1800, 16" | Durchschnittliche NVIDIA GeForce RTX 3050 6GB Laptop GPU | Durchschnitt der Klasse Multimedia | |
|---|---|---|---|---|---|---|---|---|---|
| Stromverbrauch | -2% | -100% | 6% | -30% | -141% | 20% | -8% | -12% | |
| Idle min * (Watt) | 3.3 | 5.2 -58% | 15.6 -373% | 4.96 -50% | 7.6 -130% | 21.06 -538% | 3 9% | 4.55 ? -38% | 5.64 ? -71% |
| Idle avg * (Watt) | 7.3 | 7.8 -7% | 17.7 -142% | 7.54 -3% | 12.2 -67% | 24.27 -232% | 5 32% | 8.63 ? -18% | 10 ? -37% |
| Idle max * (Watt) | 14.24 | 9 37% | 20.6 -45% | 9.31 35% | 12.8 10% | 25.12 -76% | 11 23% | 11.7 ? 18% | 12.2 ? 14% |
| Last avg * (Watt) | 91.7 | 78.6 14% | 87.4 5% | 83.4 9% | 76.5 17% | 52.4 43% | 72 21% | 86.6 ? 6% | 64.8 ? 29% |
| Witcher 3 ultra * (Watt) | 96.2 | 86.8 10% | 121.7 -27% | 73.3 24% | 89.5 7% | 110.2 -15% | 69.7 28% | ||
| Last max * (Watt) | 115.8 | 121.2 -5% | 138 -19% | 91.74 21% | 135.7 -17% | 146 -26% | 108 7% | 127.6 ? -10% | 111.7 ? 4% |
* ... kleinere Werte sind besser
Power Consumption: The Witcher 3 / Stress test
Power Consumption: External monitor
Akkulaufzeit
Die leistungsstarken, aber stromsparenden Innereien helfen bei der guten Akkulaufzeit. Bei einer Helligkeit von 150 Nits kann der 68-Wh-Akku des Pavilion Plus 16 fast 10,5 Stunden Webbrowsing und 12 Stunden 1.080p-Videowiedergabe ermöglichen, was beeindruckende Laufzeiten sind.
| HP Pavilion Plus 16-ab0456tx i7-13700H, GeForce RTX 3050 6GB Laptop GPU, 68 Wh | Schenker Vision 14 M23 RTX 3050 i7-13700H, GeForce RTX 3050 6GB Laptop GPU, 99 Wh | Dell Inspiron 16 Plus 7630 i7-13700H, GeForce RTX 4060 Laptop GPU, 86 Wh | Asus VivoBook 14X K3405 i5-13500H, GeForce RTX 3050 4GB Laptop GPU, 63 Wh | Lenovo Slim Pro 7 14ARP8 R7 7735HS, GeForce RTX 3050 6GB Laptop GPU, 73 Wh | Asus VivoBook Pro 16 K6602VU i9-13900H, GeForce RTX 4050 Laptop GPU, 96 Wh | Samsung Galaxy Book3 Ultra 16 i7-13700H, GeForce RTX 4050 Laptop GPU, 76 Wh | Durchschnitt der Klasse Multimedia | |
|---|---|---|---|---|---|---|---|---|
| Akkulaufzeit | 16% | -10% | -18% | 1% | -11% | 2% | 26% | |
| H.264 (h) | 12 | 10.4 -13% | 9.8 -18% | 13.4 12% | 16.4 ? 37% | |||
| WLAN (h) | 10.4 | 12.1 16% | 9.4 -10% | 8.1 -22% | 10.5 1% | 10.1 -3% | 9.6 -8% | 12 ? 15% |
| Idle (h) | 17.6 | 18.2 | 25.2 ? | |||||
| Last (h) | 1.4 | 1.1 | 1.8 | 1.675 ? | ||||
| Witcher 3 ultra (h) | 1.3 |
Pro
Contra
Fazit: Großes Potenzial durch Kompromisse gebremst
Das HP Pavilion Plus 16 erfüllt die meisten Anforderungen, die man an ein modernes Multimedia-Notebook für Arbeit und Unterhaltung stellen würde. Das Pavilion Plus 16 zeigt sich in einer Ganzmetallkonstruktion, die ein hochwertigen Eindruck ohne unnötige Biegungen vermittelt, und eine Anschlussauswahl, die das Wesentliche abdeckt.
Das 2.560x1.600-120-Hz-Panel verfügt nicht über HDR oder eine umfangreiche Adobe-RGB- und Display-P3-Abdeckung wie beim Pavilion-Plus-142.8K-OLED-Panel zu sehen ist. Die Grundlagen sind jedoch gut, mit guten Reaktionszeiten und ohne PWM-Flimmern.
Das HP Pavilion Plus 16 ist ein fähiger Allround-Multimedia- und Produktivitäts-Laptop, doch für den aufgerufenen Preis hätte man idealerweise zumindest eine RTX 4050 einbauen können.
Die Leistungseinschränkungen werden deutlich, wenn man sie denen der Konkurrenz gegenüberstellt. Die 60-W-PL2 erweisen sich als besonders nachteilig für das Pavilion Plus 16 im Multicore-Bereich, wenn man es mit dem Dell Inspiron 16 Plus 7630 und sogar dem Samsung Galaxy Book3 Ultra 16 vergleicht, die mit einem Core i7-13700H mit höherer Wattzahl ausgestattet sind.
HP hätte leicht 80-W-PL2 oder mehr in einem zusätzlichen Leistungsprofil zulassen können, um das Potenzial des Chips zu maximieren. Allerdings scheint das Kühlungs-Subsystem bereits mit der aktuellen Konfiguration unter Last überlastet zu sein.
Die Nvidia GeForce RTX 3050 6 GB bleibt in Bezug auf Leistung und Energieeffizienz hinter der Ada Generation zurück. Obwohl bei 1.080p-Spielen ein spürbarer Anstieg gegenüber der RTX 3050 4 GB zu verzeichnen ist, zeigen synthetische Tests keinen nennenswerten Anreiz.
Mit einer Preisvorstellung von 1.350 US-Dollar auf der HP Website ist das Pavilion Plus 16 100 US-Dollar teurer als das Inspiron 16 Plus 7630, das eine 60 W RTX 4060 und einen leistungsfähigeren Core i7-13700H bietet. Trotzdem ist das Pavilion Plus 16 auf dem indischen Markt preiswerter als das Inspiron 16 Plus 7630.
Das Asus VivoBook Pro 16 mit einem 3,2K-OLED-Display, Core i9-13900H und bis zu einer RTX 4060 ist eine hervorragende Alternative für angehende Kreative, solange das Plastik und der zusätzliche Aufpreis von 300 US-Dollar sie nicht davon abhalten.
Preis und Verfügbarkeit
Das getestete HP Pavilion Plus 16-ab0456tx ist derzeit nur über die offizielle HP India Website beziehbar. Die Variante HP Pavilion Plus Laptop 16-ab0010nr, mit i7 Core, 16 GB RAM und 512-GB-SSD kann aktuell auf der HP US-Website zu einem Sonderpreis von 799 US-Dollar (regulär 1.099 US-Dollar) konfiguriert werden.
Auf dem deutschsprachigen Markt ist das Pavilion Plus 16 (noch) nicht verfügbar.
HP Pavilion Plus 16-ab0456tx
- 07.02.2024 v7 (old)
Vaidyanathan Subramaniam
Transparenz
Die Auswahl der zu testenden Geräte erfolgt innerhalb der Redaktion. Das vorliegende Testmuster wurde dem Autor vom Hersteller oder einem Shop zu Testzwecken leihweise zur Verfügung gestellt. Eine Einflussnahme des Leihstellers auf den Testbericht gab es nicht, der Hersteller erhielt keine Version des Reviews vor der Veröffentlichung. Es bestand keine Verpflichtung zur Publikation. Als eigenständiges, unabhängiges Unternehmen unterliegt Notebookcheck keiner Diktion von Herstellern, Shops und Verlagen.
So testet Notebookcheck
Pro Jahr werden von Notebookcheck hunderte Laptops und Smartphones unabhängig in von uns standardisierten technischen Verfahren getestet, um eine Vergleichbarkeit aller Testergebnisse zu gewährleisten. Seit rund 20 Jahren entwickeln wir diese Testmethoden kontinuierlich weiter und setzen damit Branchenstandards. In unseren Testlaboren kommt ausschließlich hochwertiges Messequipment in die Hände erfahrener Techniker und Redakteure. Die Tests unterliegen einer mehrstufigen Kontrolle. Unsere komplexe Gesamtbewertung basiert auf hunderten fundierten Messergebnissen und Benchmarks, womit Ihnen Objektivität garantiert ist. Weitere Informationen zu unseren Testmethoden gibt es hier.
Preisvergleich

