Schenker Vision 14 M23 im Test - Magnesium-Ultrabook jetzt mit GeForce RTX 3050 6 GB
Die iGPU-Variante des aktuellen Schenker Vision 14 haben wir bereits getestet, nun ist noch das Modell mit der GeForce RTX 3050 (Refresh, 6 GB VRAM) an der Reihe, die nun anstatt der GeForce RTX 3050 Ti (4 GB VRAM) zum Einsatz kommt. Doch ist das wirklich ein Upgrade und wie groß ist der Unterschied zur Konkurrenz, die mittlerweile fast vollständig auf die neue GeForce RTX 4050 Laptop gewechselt ist? Unser Testgerät mit dem Core i7-13700H, der GeForce RTX 3050, 32 GB RAM, einer 1-TB-SSD sowie dem matten 3K-IPS-Display kostet knapp 2.000 Euro.
In vielen Aspekten wie dem Gehäuse, den Anschlüssen, den Eingabegeräten, dem Bildschirm und den Lautsprechern gibt es keine Unterschiede zur bereits getesteten iGPU-Variante. Wir werden uns in diesem Test daher vorrangig auf die Leistung und die Auswirkungen der dedizierten GPU auf die Emissionen konzentrieren. Für alle weiteren Informationen steht unser Testbericht zum Vision 14 M23 iGPU zur Verfügung.
Mögliche Konkurrenten im Vergleich
Bew. | Datum | Modell | Gewicht | Dicke | Größe | Auflösung | Preis ab |
|---|---|---|---|---|---|---|---|
| 88.2 % v7 (old) | 01 / 2024 | Schenker Vision 14 M23 RTX 3050 i7-13700H, GeForce RTX 3050 6GB Laptop GPU | 1.3 kg | 16.6 mm | 14.00" | 2880x1800 | |
| 89.8 % v7 (old) | 07 / 2023 | Lenovo Yoga Pro 9-14IRP G8 i7-13705H, GeForce RTX 4050 Laptop GPU | 1.7 kg | 17.6 mm | 14.50" | 3072x1920 | |
| 90.2 % v7 (old) | 05 / 2023 | Lenovo Yoga Pro 7 14IRH G8 i7-13700H, GeForce RTX 4050 Laptop GPU | 1.5 kg | 15.6 mm | 14.50" | 3072x1920 | |
| 86.3 % v7 (old) | 07 / 2023 | Acer Swift X SFX14-71G i7-13700H, GeForce RTX 4050 Laptop GPU | 1.5 kg | 17.9 mm | 14.50" | 2880x1800 | |
| 85.6 % v7 (old) | 08 / 2023 | Asus VivoBook 14X K3405 i5-13500H, GeForce RTX 3050 4GB Laptop GPU | 1.4 kg | 18.9 mm | 14.00" | 2880x1800 | |
| 89.4 % v7 (old) | 05 / 2023 | Gigabyte Aero 14 OLED BMF i7-13700H, GeForce RTX 4050 Laptop GPU | 1.4 kg | 17 mm | 14.00" | 2880x1800 |
Unterschiede zum iGPU-Modell
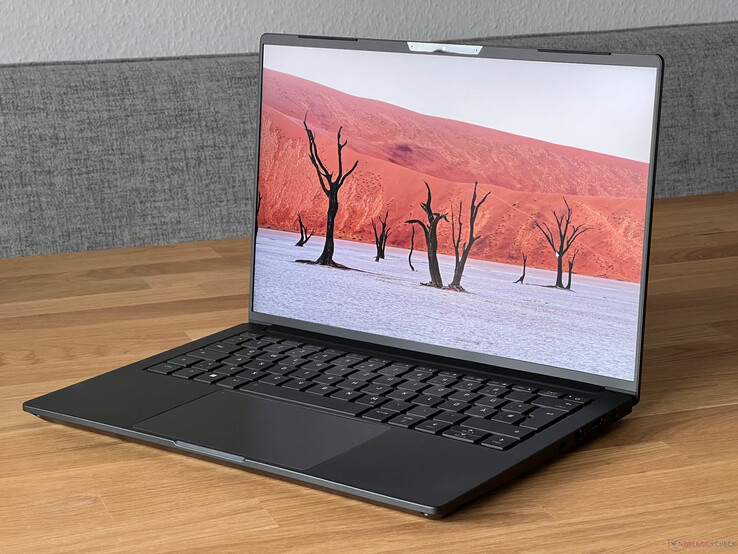
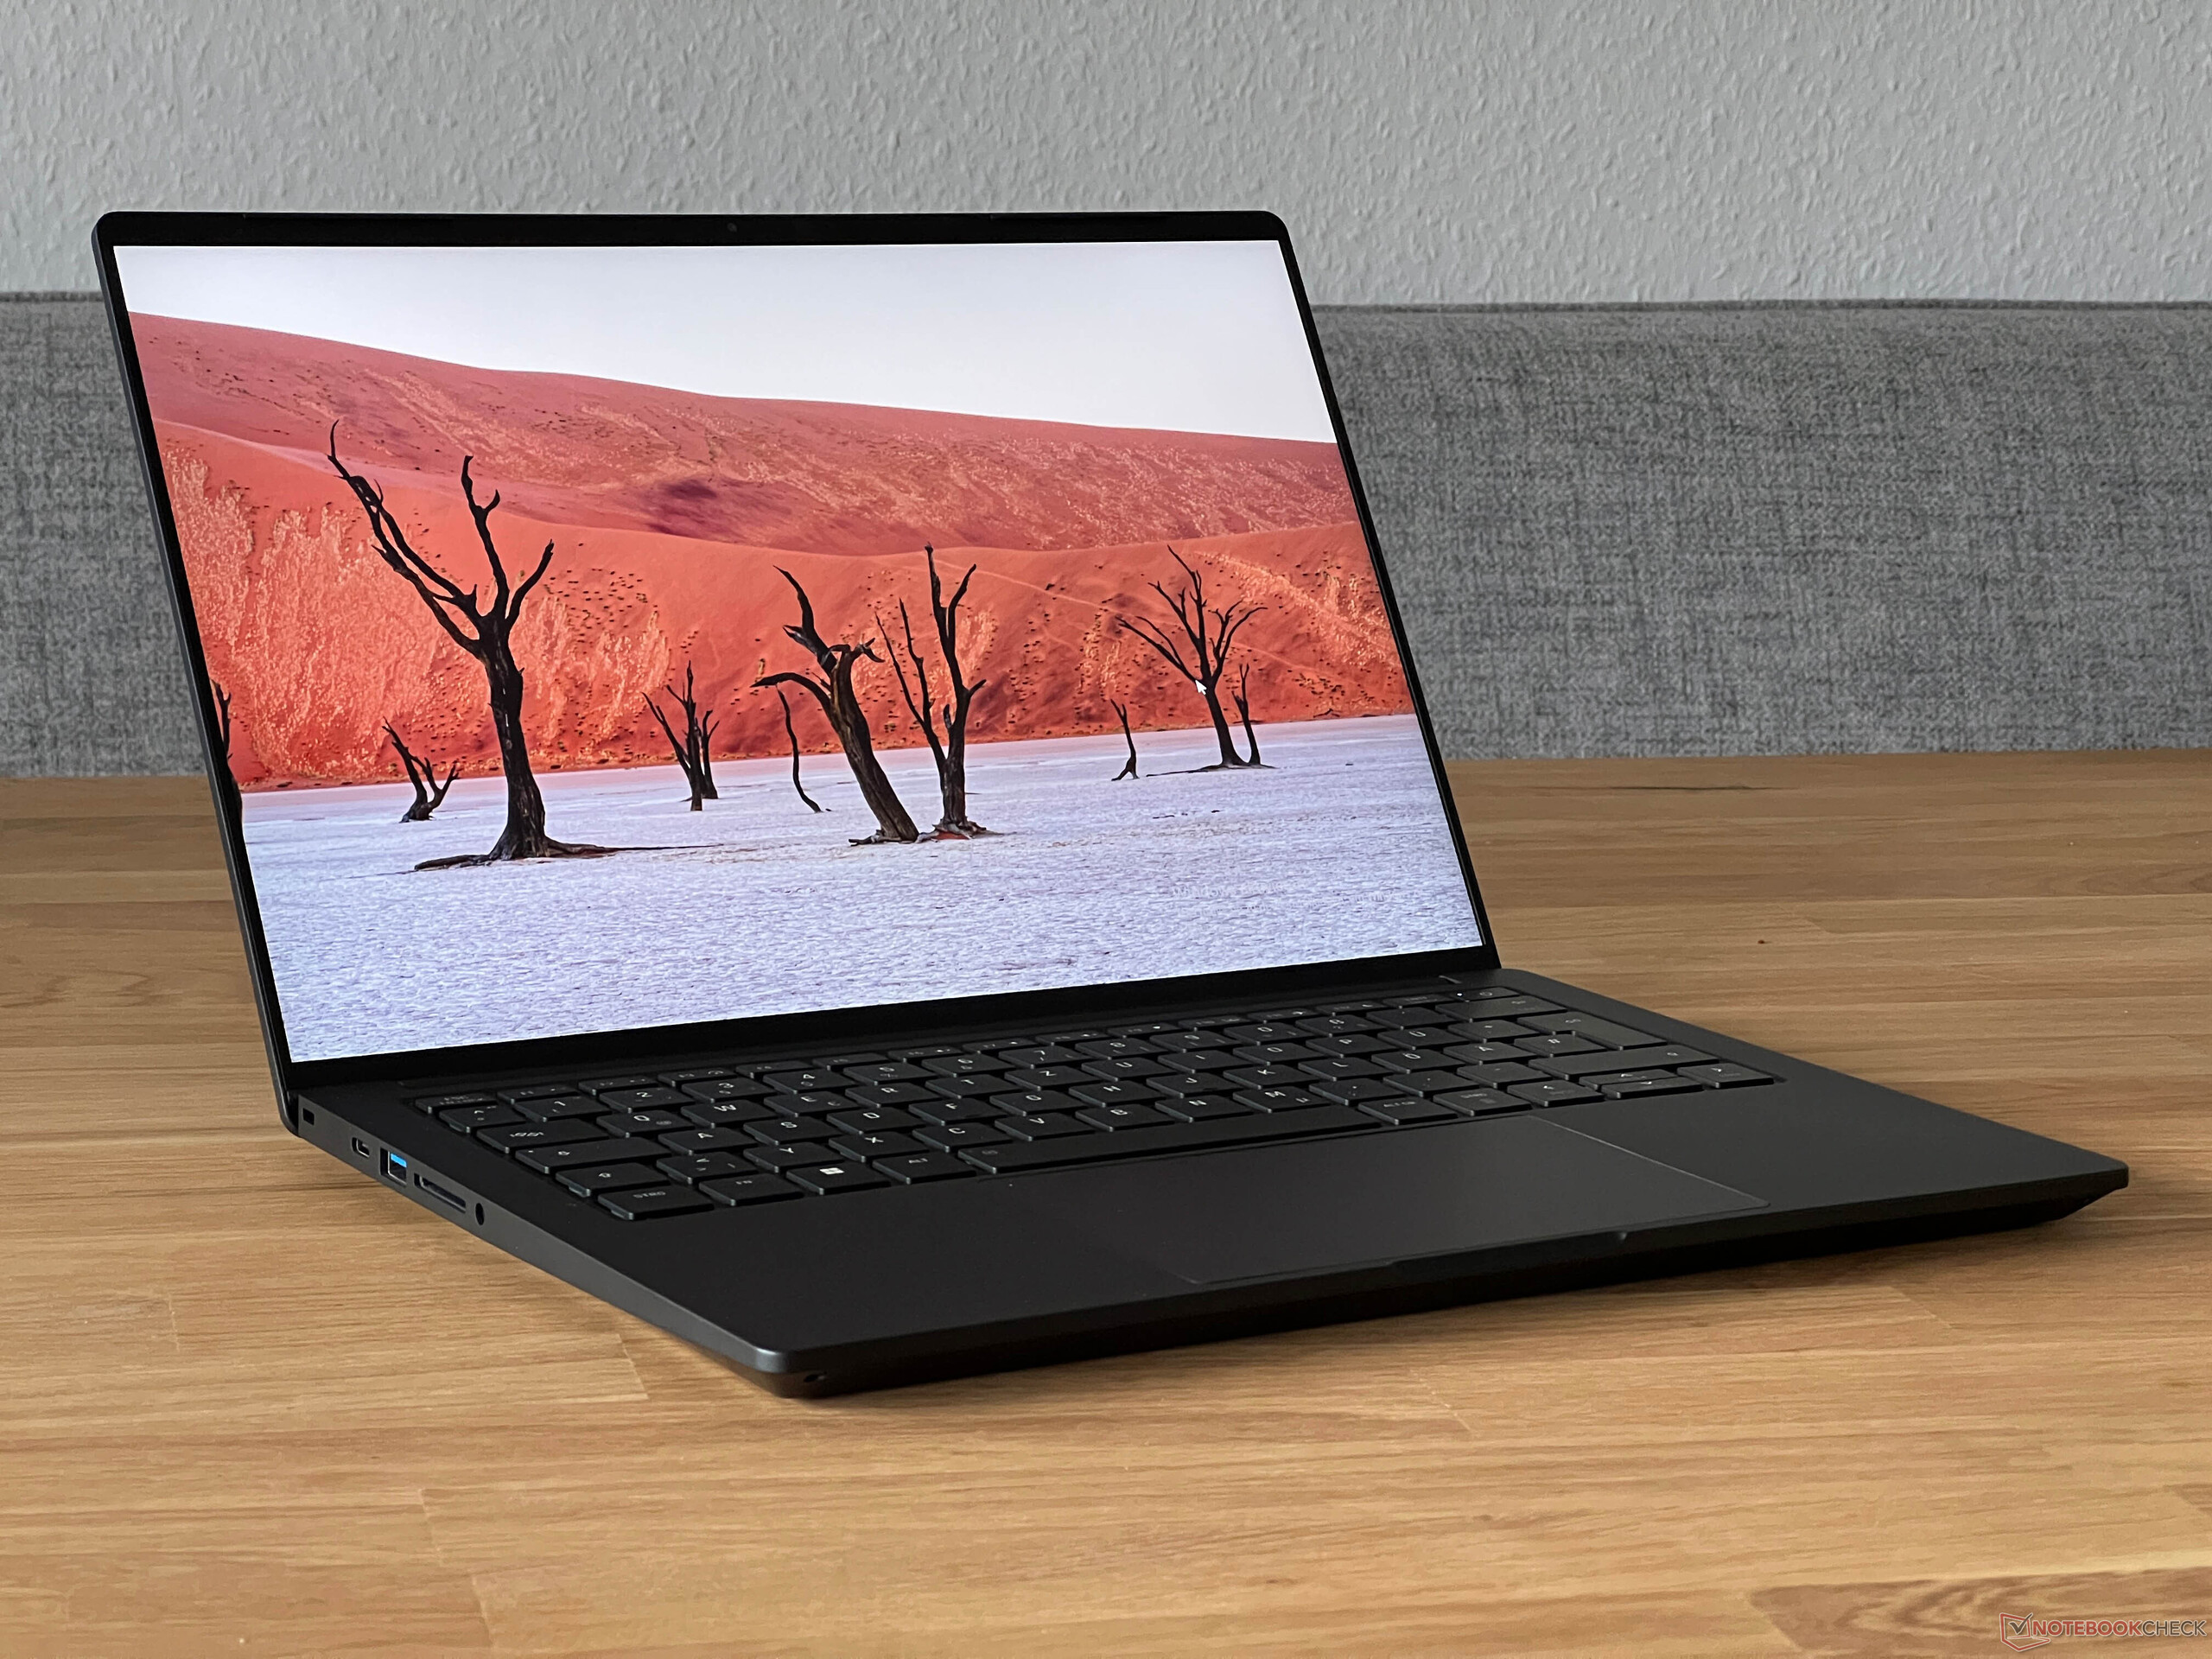
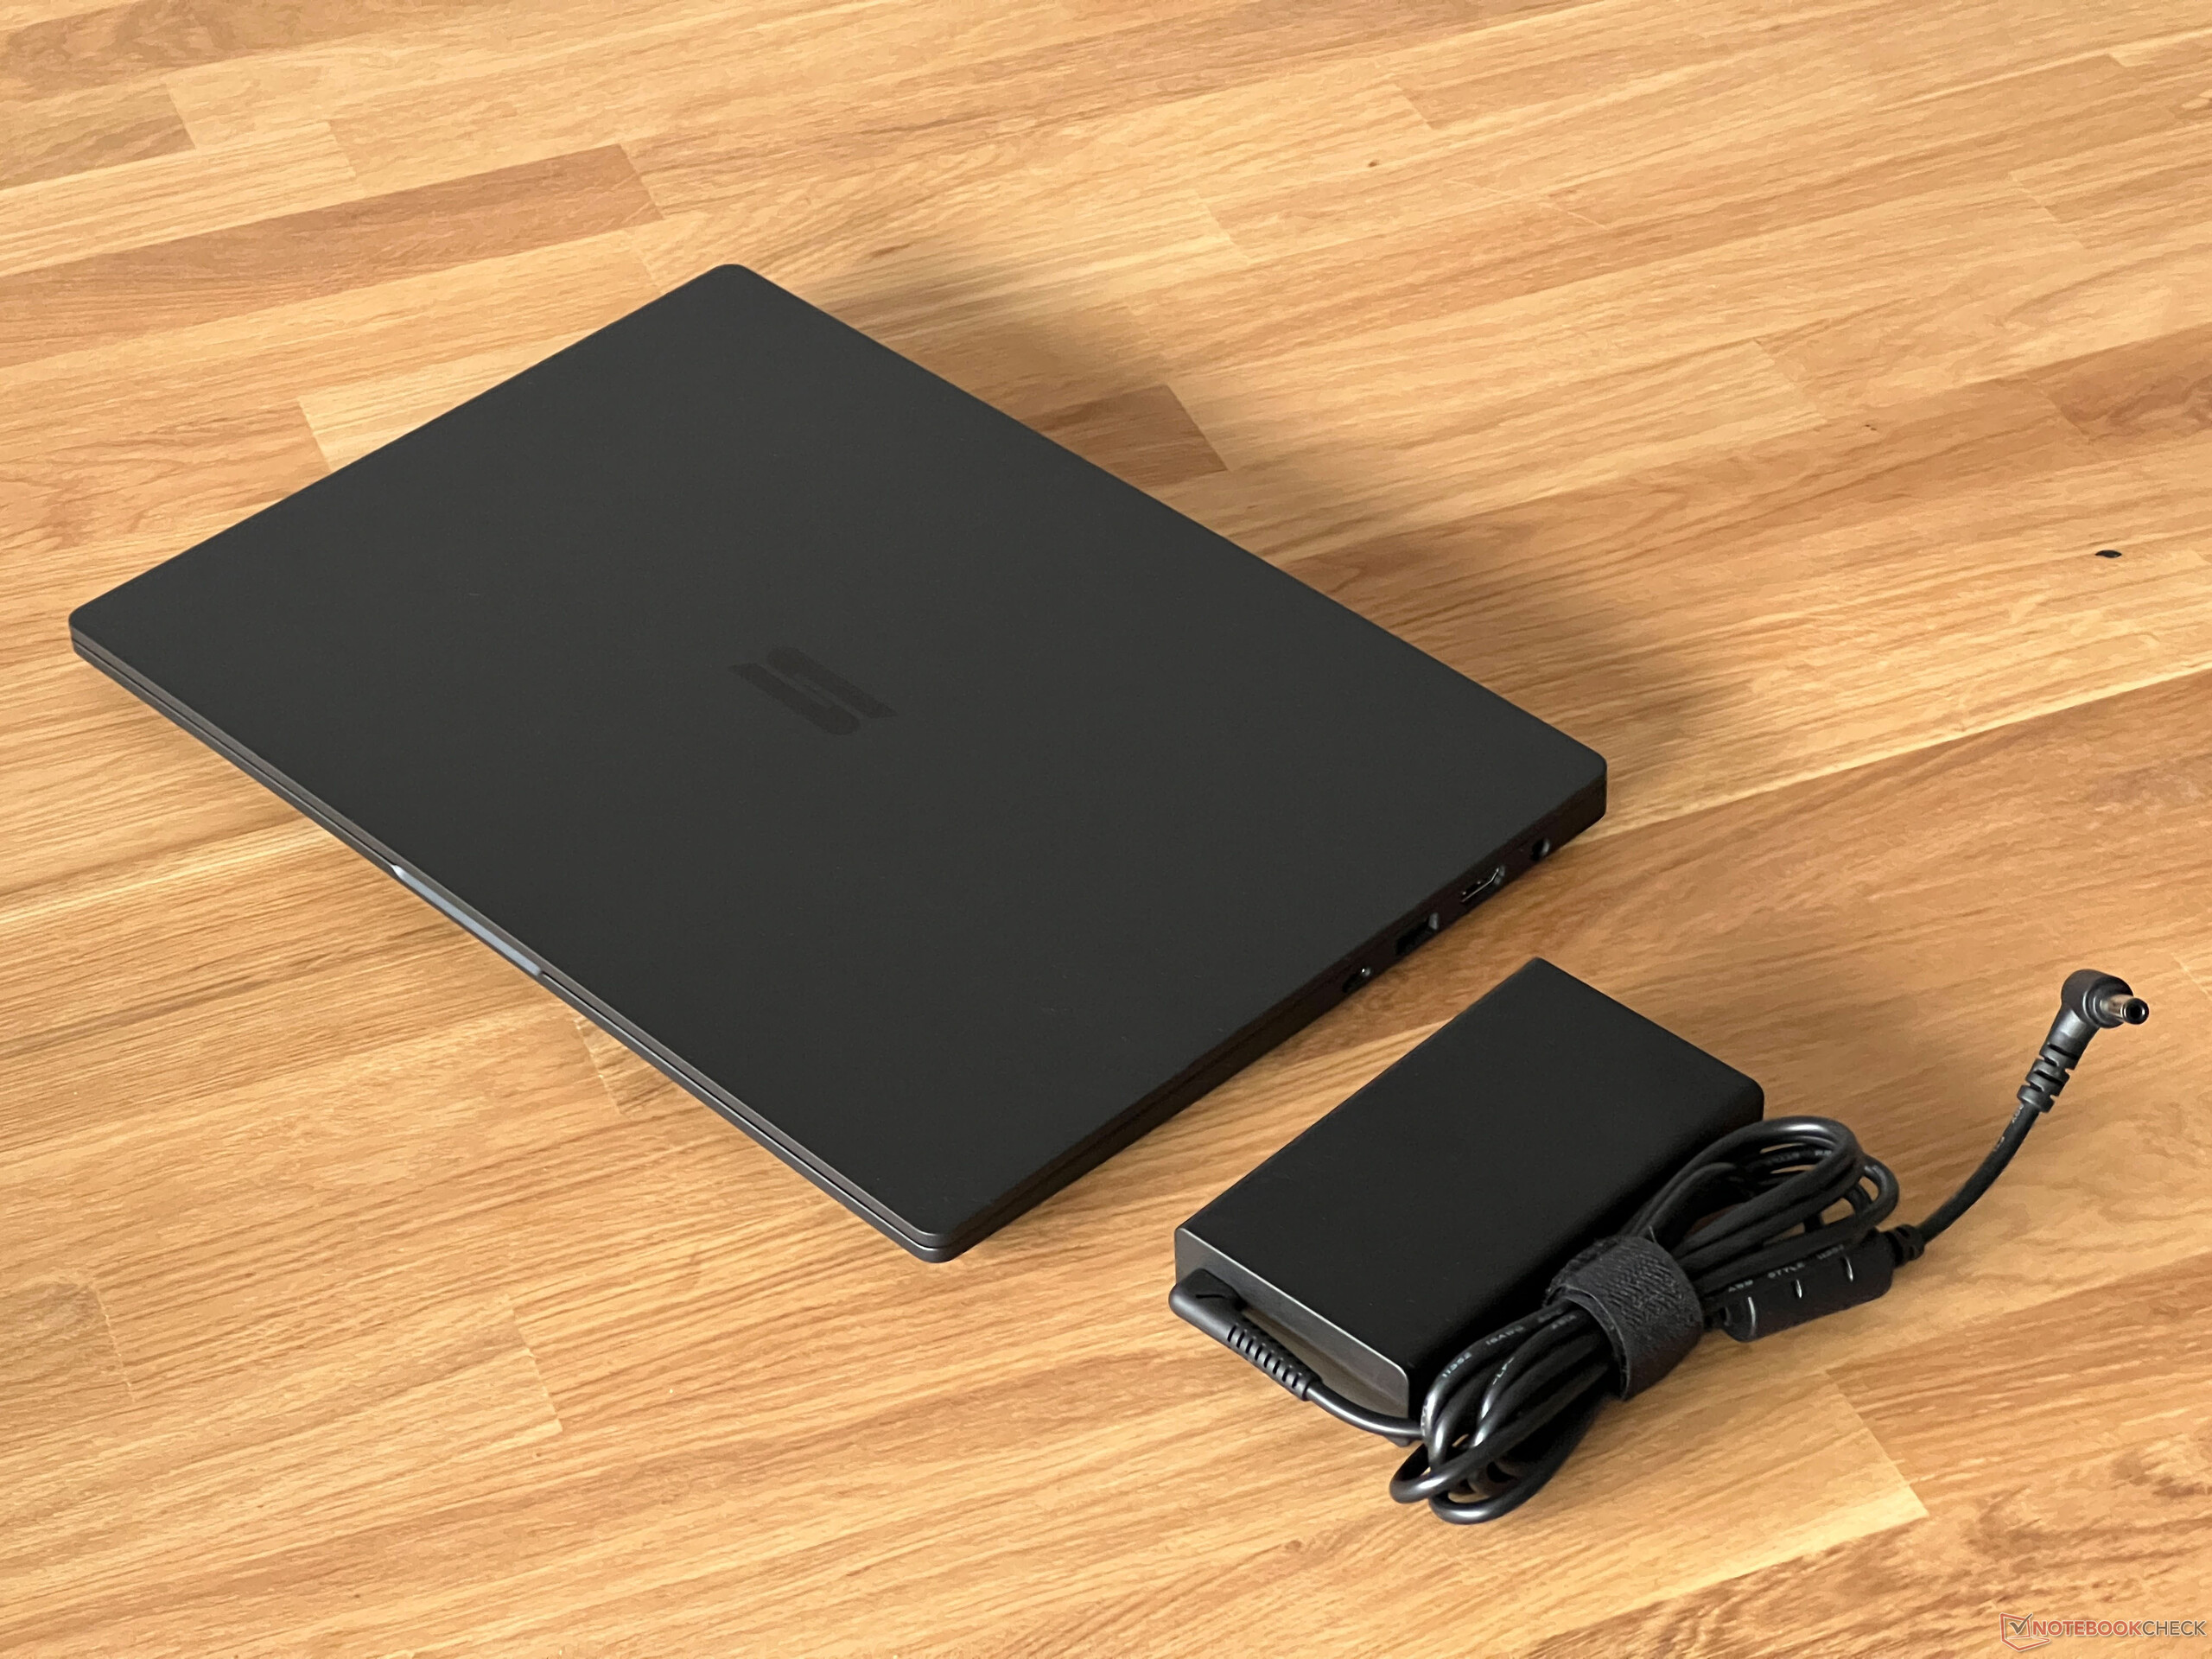
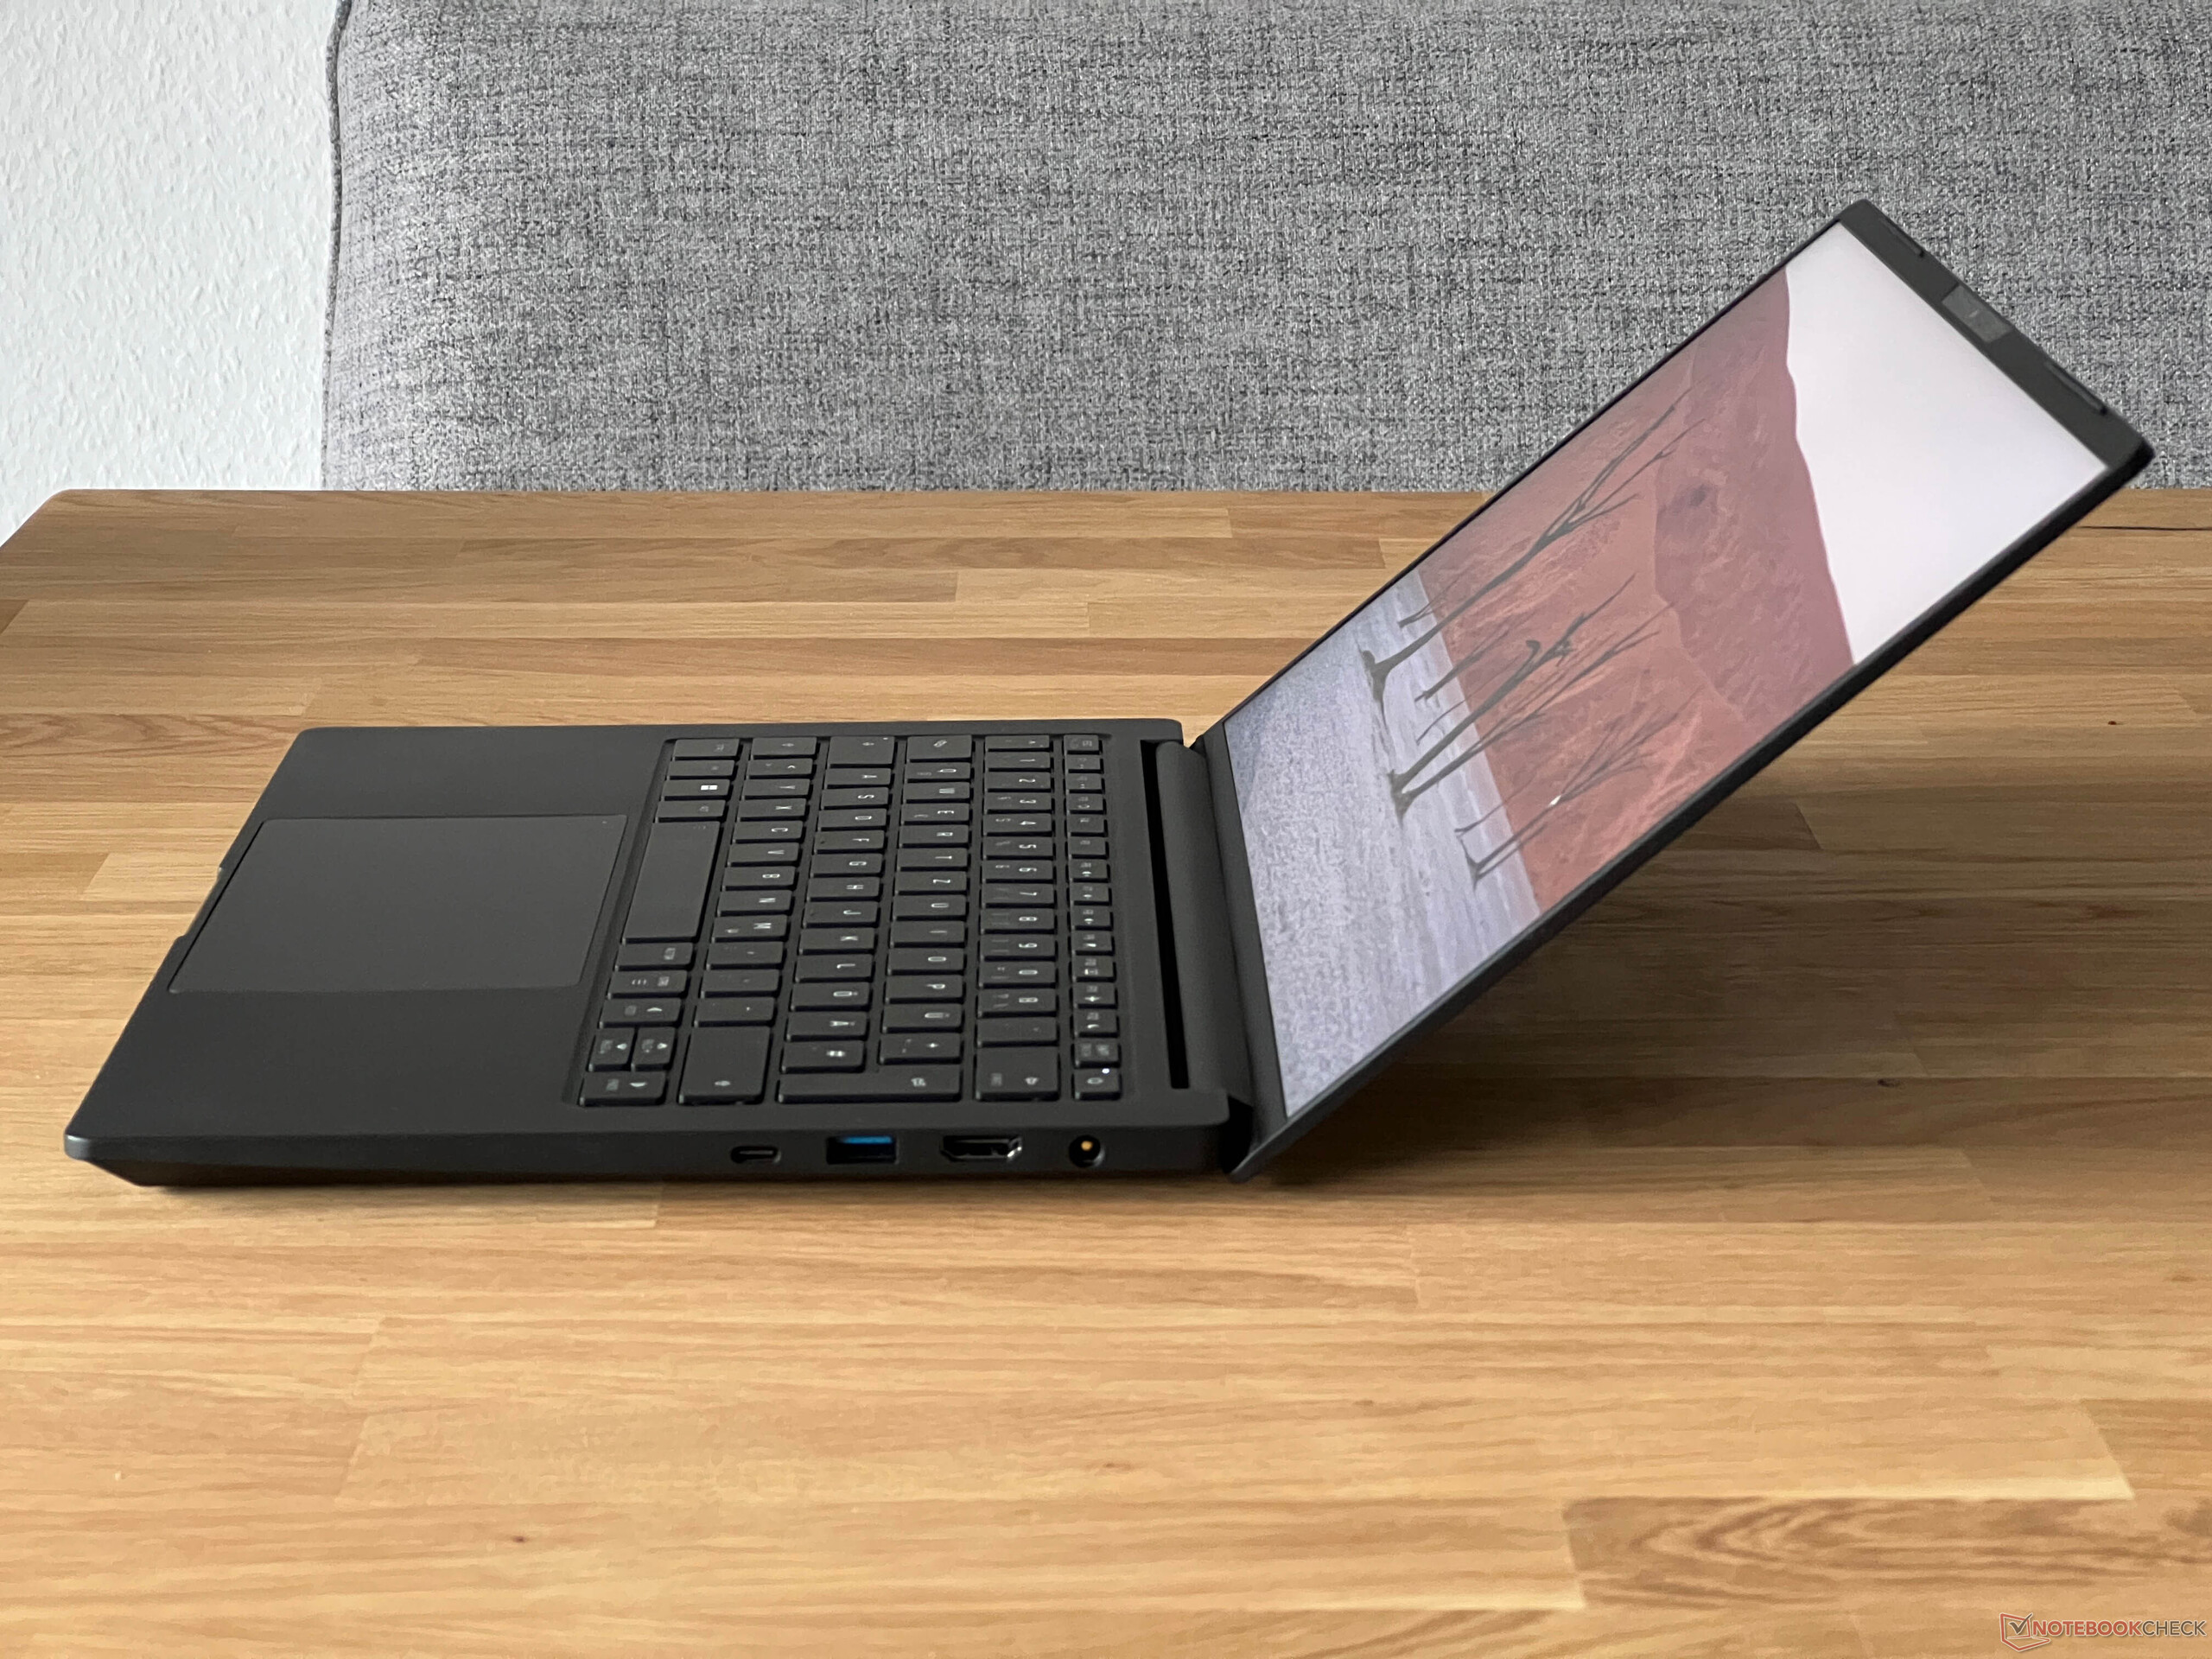
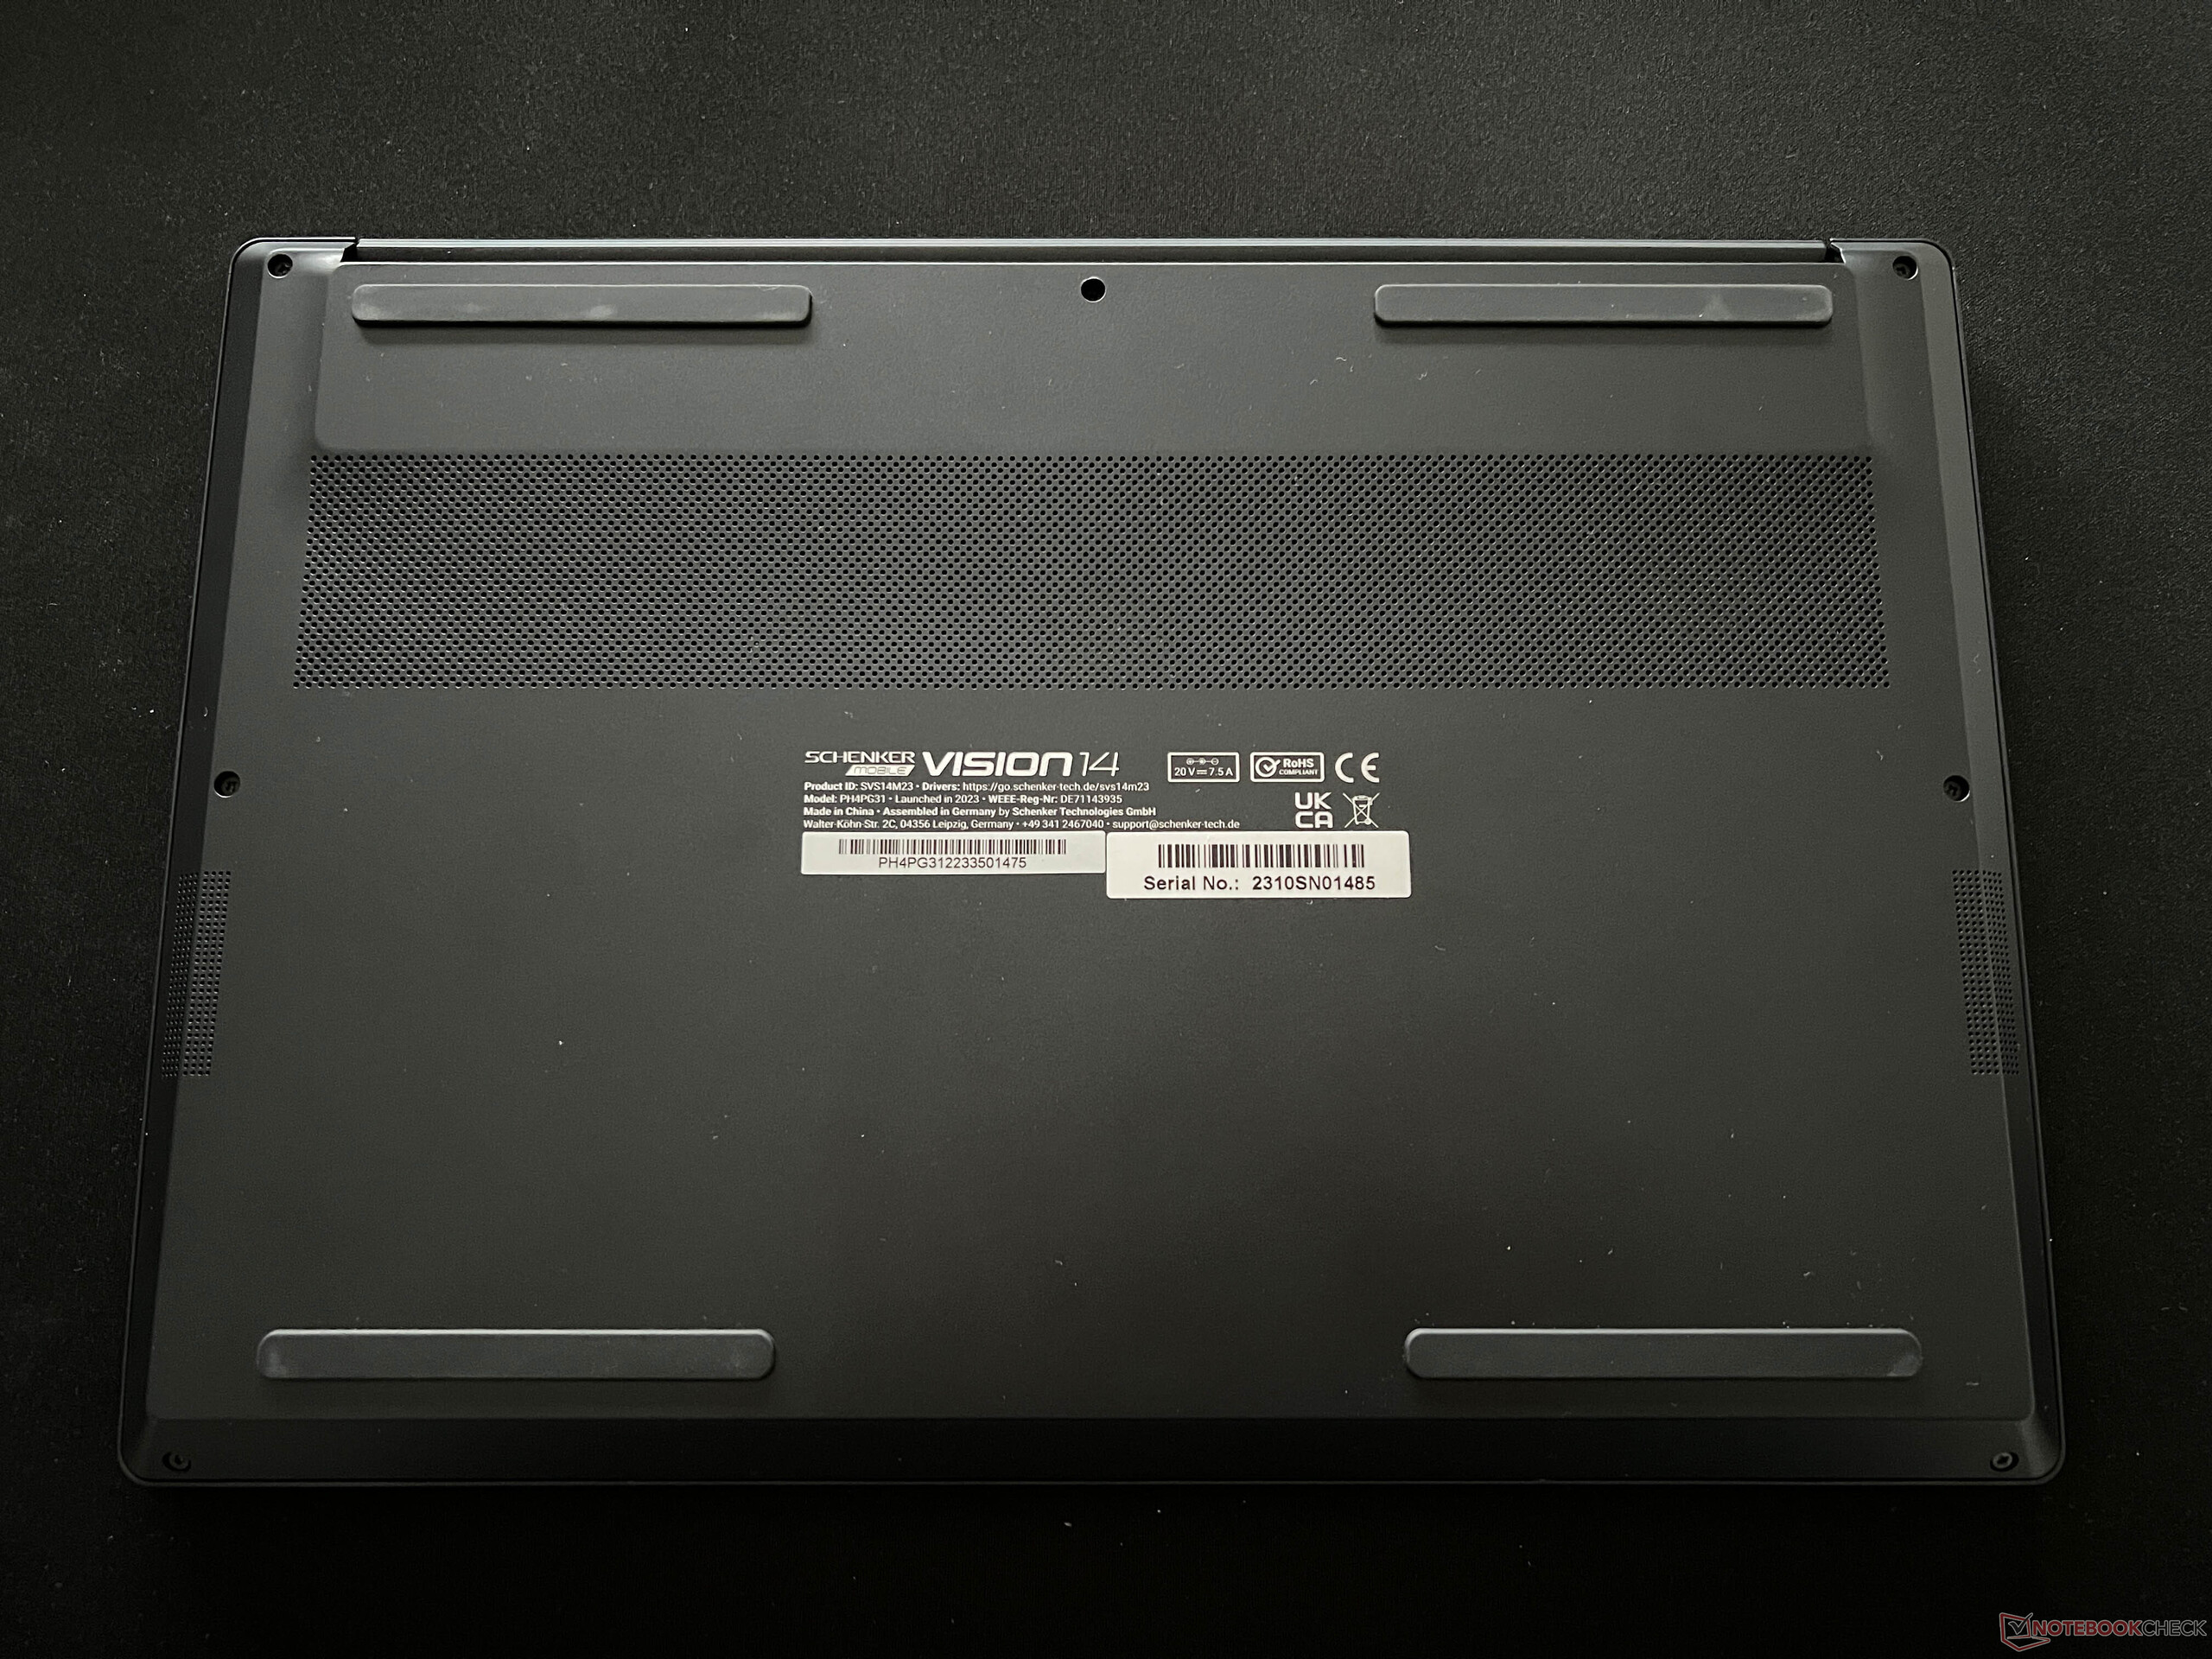
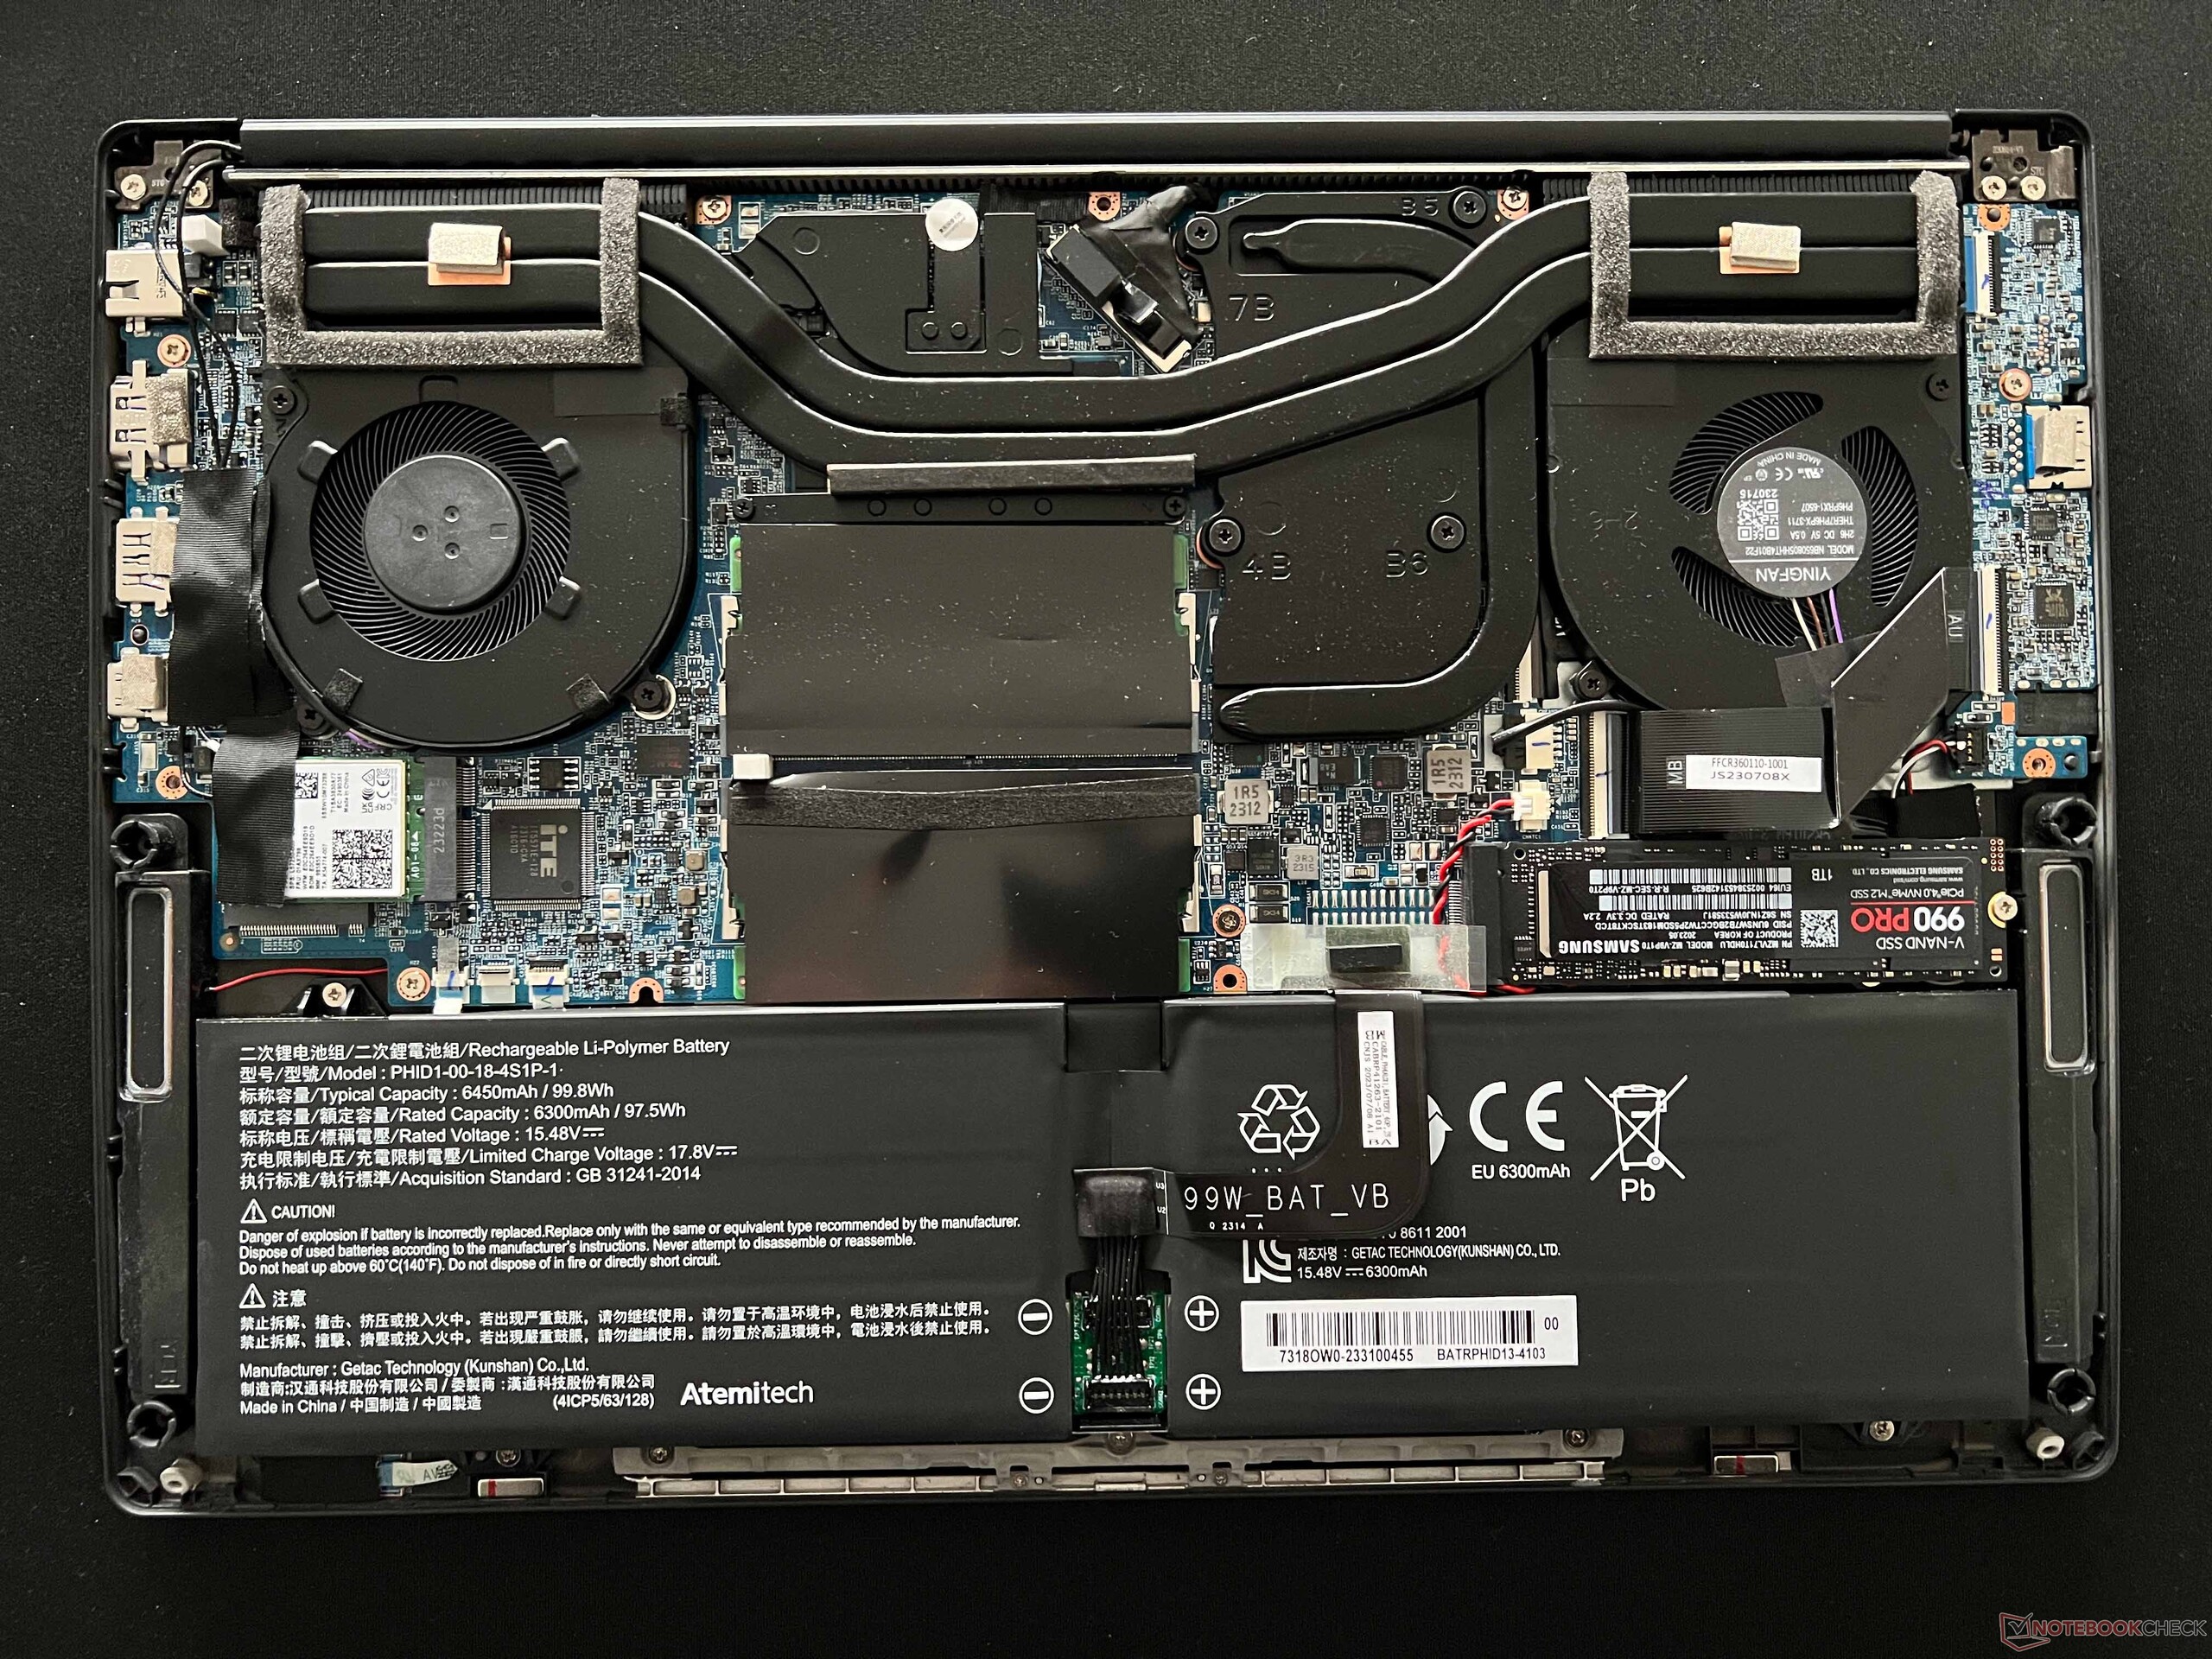
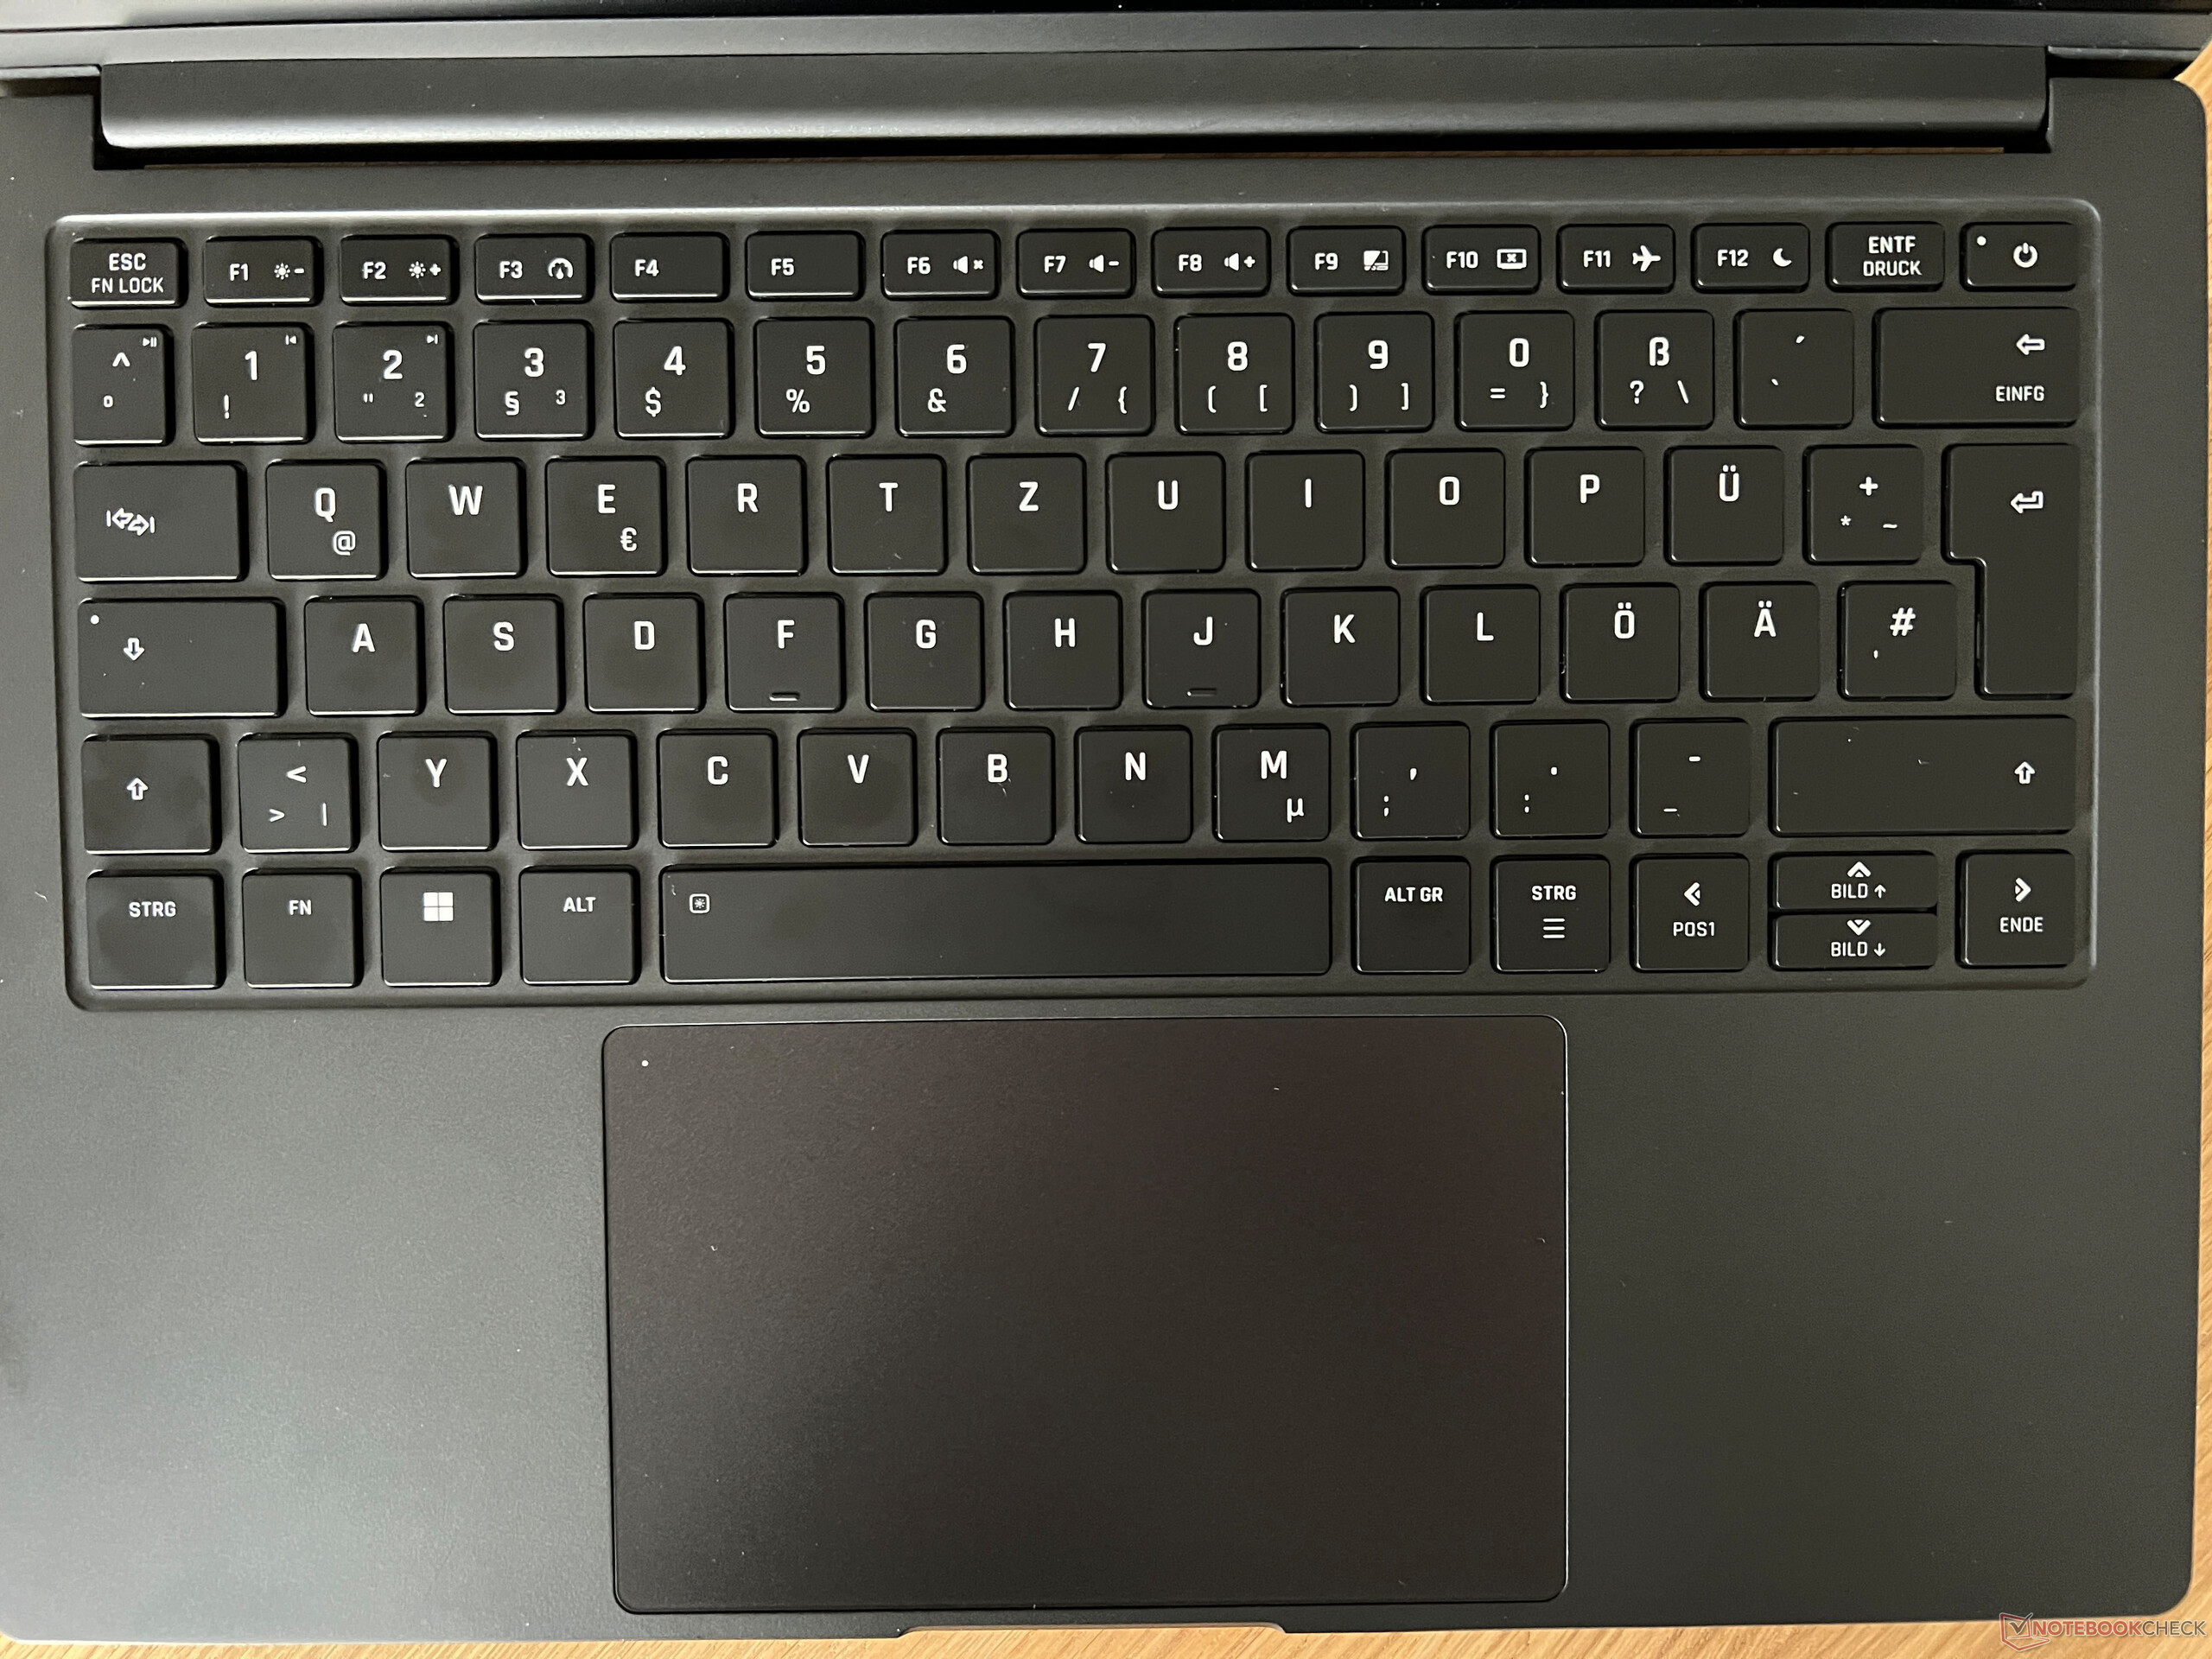
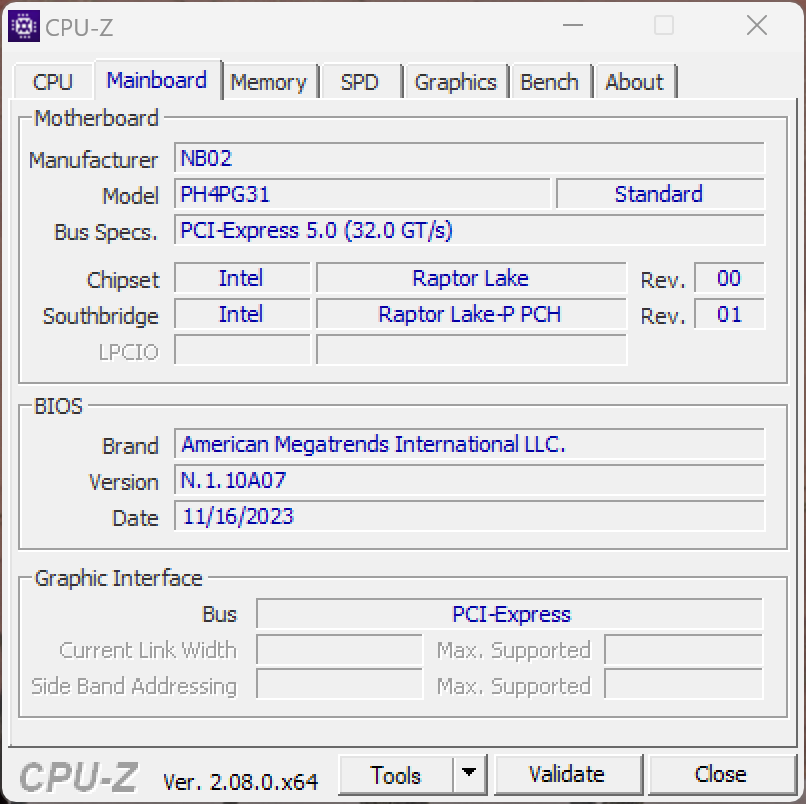
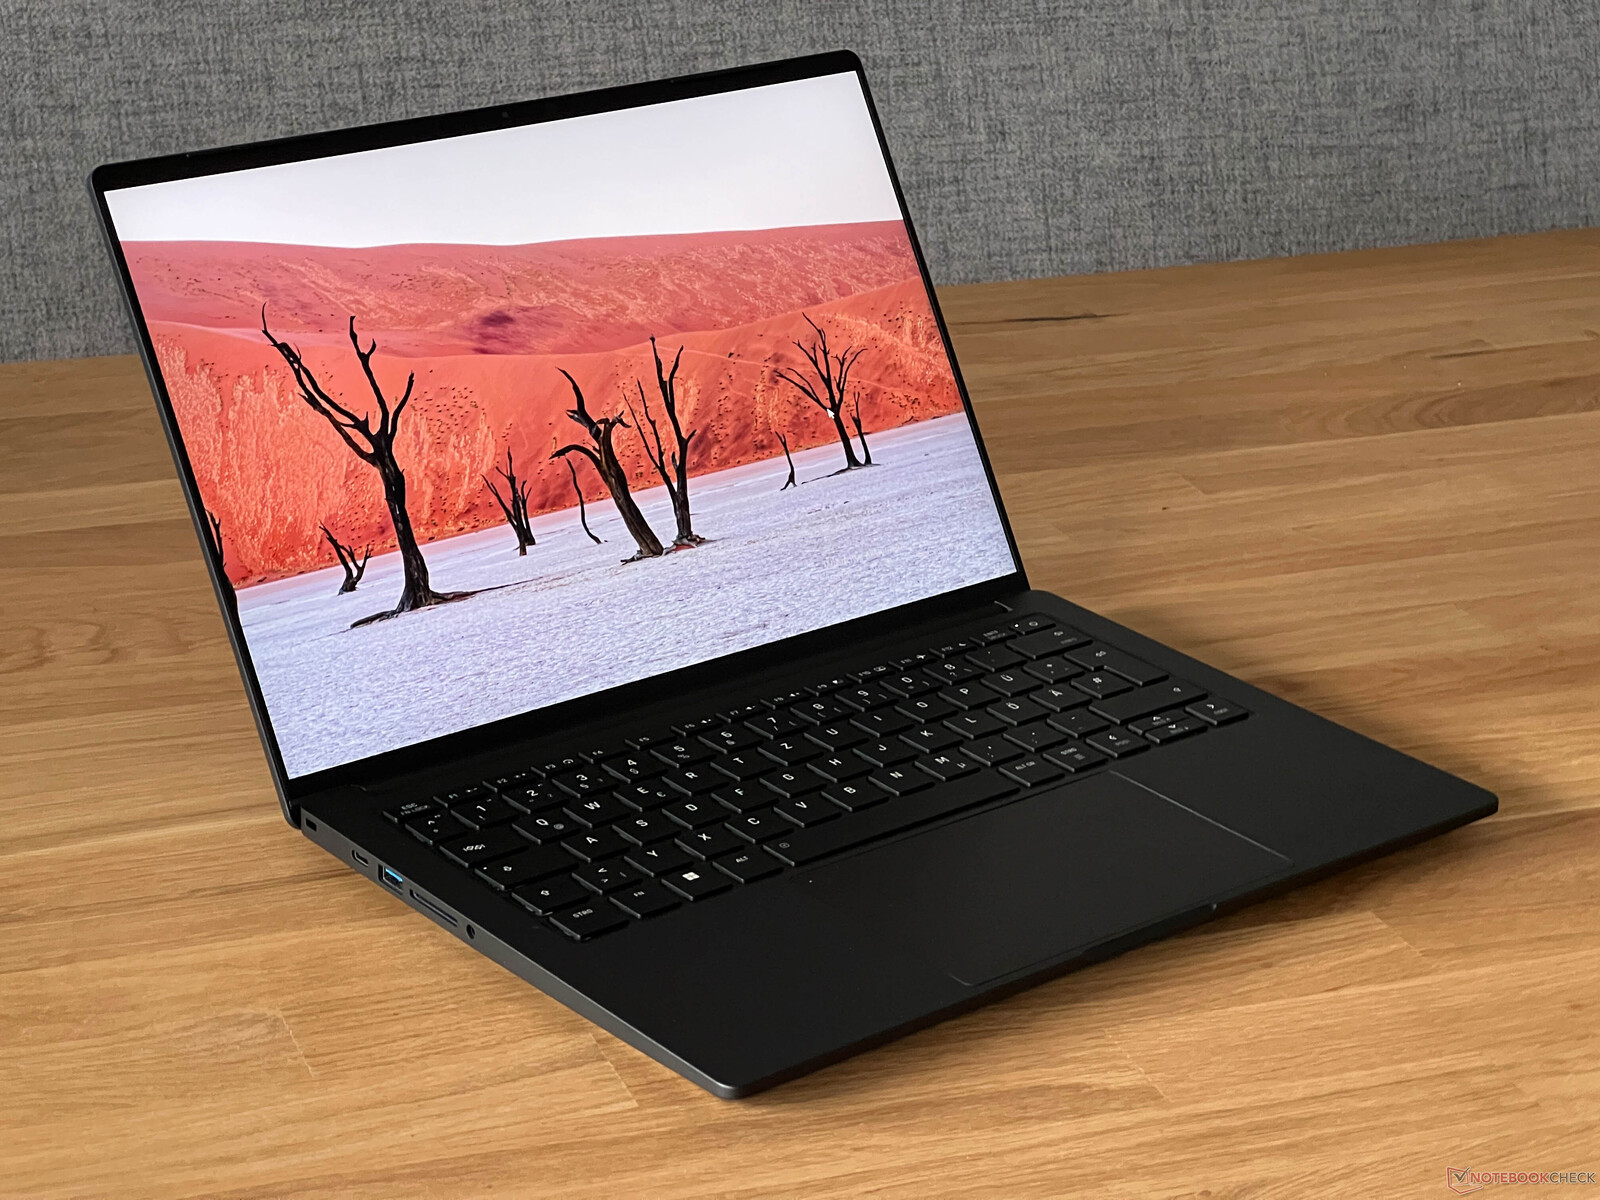
Unser jetziges Testgerät ist die schwarze Ausführung des Vision 14, das Gehäuse (Magnesiumlegierung) an sich ist aber identisch zur bereits getesteten iGPU-Variante. Subjektiv gefällt uns die silberne Version besser, da sie deutlich unempfindlicher gegenüber Schmutz und Fingerabdrücken ist. Auch im Inneren gibt es Unterschiede bei der Kühlung und natürlich ist die dedizierte Nvidia-GPU verbaut. Dadurch steigt as Gesamtgewicht um rund 80 Gramm auf ~1,35 kg an. Die dGPU-Version wird zudem mit dem stärkeren 150-Watt-Netzteil ausgeliefert, welches aber sogar kompakter und minimal leichter ist als die 120-Watt-Variante.
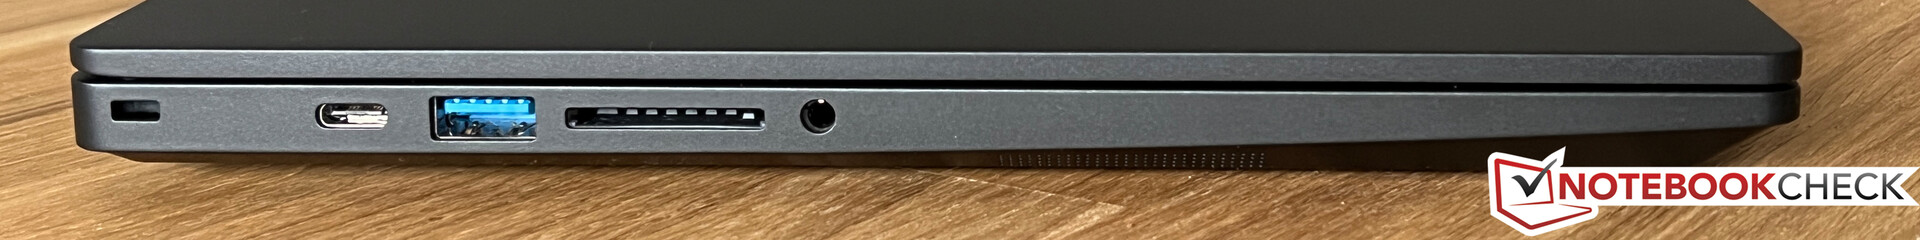
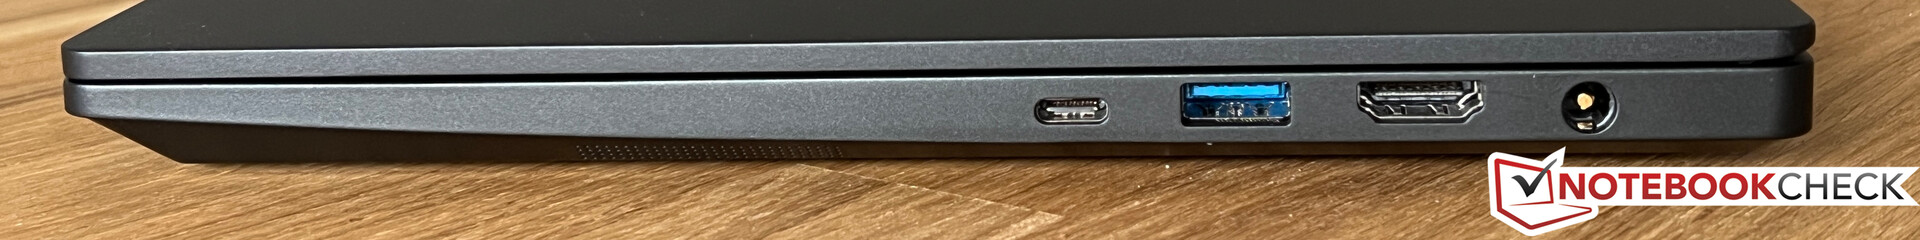
Im Konkurrenzvergleich ist das Vision 14 dGPU aber trotzdem noch das kompakteste und leichteste Gerät, zudem bietet es Vorteile bei den Anschlüssen und den Wartungsmöglichkeiten dank zwei RAM-Steckplätzen.


Leistung - Raptor Lake & RTX 3050
Testbedingungen
Im vorinstallierten Control Center gibt es mit Leise und Leistung zwei verschiedene Unterprofile, wobei das Profil Leistung noch zwei Unterprofile Ausbalanciert sowie Enthusiast bietet. Die Auswirkungen der drei Profile haben wir in der nachfolgenden Tabelle zusammengefasst. Für die maximale GPU-Leistung sollte man Leistung/Enthusiast verwenden, was wir für die nachfolgenden Benchmarks und Messungen ebenfalls getan haben. Gerade bei einfachen Aufgaben kann man aber auch problemlos das Profil Leise nutzen.
| Profil | CPU-Last | CB R23 Multi | GPU-Last | Time Spy Graphics | W3 Ultra | max. Lüfterlautstärke |
|---|---|---|---|---|---|---|
| Leise | 15 Watt | 5.509 Punkte | 35 Watt | 3.811 Punkte | 36,7 FPS | 35,7 dB(A) |
| Leistung (Ausbalanciert) |
45 Watt | 12.692 Punkte | 35 Watt | 3.814 Punkte | 37,2 FPS | 46,9 dB(A) |
| Leistung (Enthusiast) |
45 Watt | 13.401 Punkte | 50 Watt | 4.501 Punkte | 43,7 FPS | 49,1 dB(A) |
Prozessor - Core i7-13700H
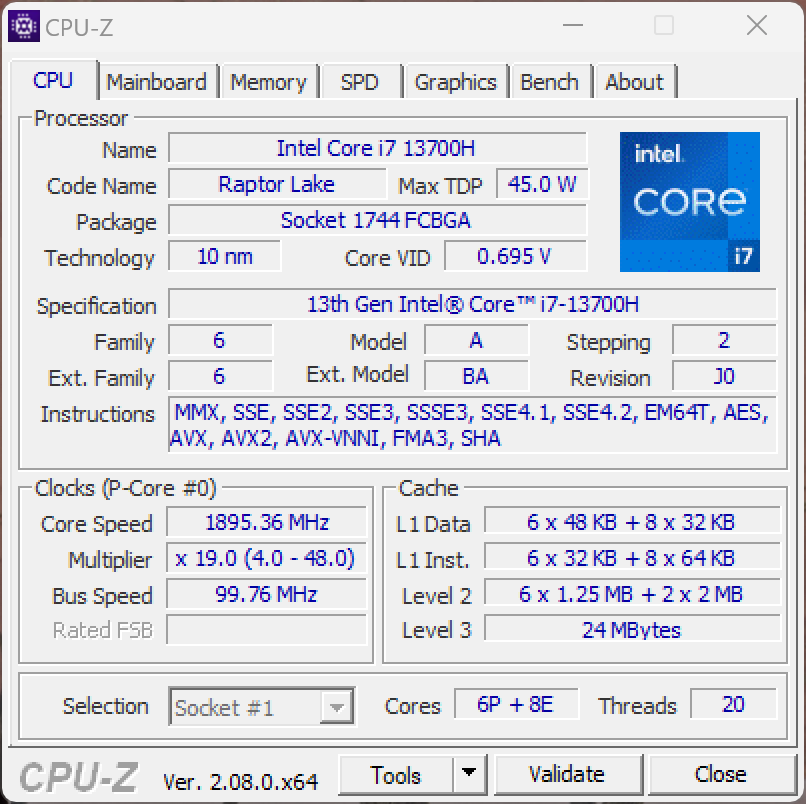
Der Core i7-13700H (Raptor Lake) bietet insgesamt 14 Kerne (6 Performance, 8 Efficiency) und kann maximal 20 Threads gleichzeitig bearbeiten. Im aktuellen Vision 14 darf der Prozessor kurzzeitig maximal 45 Watt verbrauchen und fällt dann schnell auf 40 Watt ab. Insgesamt ist das eine Reduzierung gegenüber dem Vorgänger, bei dem die Power Limits noch bei 60/40 Watt lagen. Daher ist das alte Modell mit dem Core i7-12700H in den ersten Minuten bei Multi-Core-Belastung auch schneller, das wird durch die schwächere Single-Core-Leistung insgesamt aber wieder ausgeglichen. Die Leistung ist damit grundsätzlich in Ordnung, es wäre aber mehr drin gewesen. Im Akkubetrieb darf der Prozessor maximal 36 Watt verbrauchen, weshalb die Multi-Core-Leistung rund 15 % geringer ausfällt. Weitere CPU-Benchmarks stehen in unserer Techniksektion zur Verfügung.
Cinebench R15 Multi Dauertest
Cinebench R23: Multi Core | Single Core
Cinebench R20: CPU (Multi Core) | CPU (Single Core)
Cinebench R15: CPU Multi 64Bit | CPU Single 64Bit
Blender: v2.79 BMW27 CPU
7-Zip 18.03: 7z b 4 | 7z b 4 -mmt1
Geekbench 5.5: Multi-Core | Single-Core
HWBOT x265 Benchmark v2.2: 4k Preset
LibreOffice : 20 Documents To PDF
R Benchmark 2.5: Overall mean
| CPU Performance Rating | |
| Lenovo Yoga Pro 9-14IRP G8 | |
| Lenovo Yoga Pro 7 14IRH G8 | |
| Gigabyte Aero 14 OLED BMF | |
| Acer Swift X SFX14-71G | |
| Durchschnittliche Intel Core i7-13700H | |
| Schenker Vision 14 2022 RTX 3050 Ti | |
| Schenker Vision 14 2023 | |
| Schenker Vision 14 M23 RTX 3050 | |
| Asus VivoBook 14X K3405 | |
| Durchschnitt der Klasse Subnotebook | |
| Cinebench R23 / Multi Core | |
| Lenovo Yoga Pro 9-14IRP G8 | |
| Lenovo Yoga Pro 7 14IRH G8 | |
| Acer Swift X SFX14-71G | |
| Durchschnittliche Intel Core i7-13700H (5890 - 20034, n=29) | |
| Schenker Vision 14 2022 RTX 3050 Ti | |
| Asus VivoBook 14X K3405 | |
| Gigabyte Aero 14 OLED BMF | |
| Schenker Vision 14 M23 RTX 3050 | |
| Schenker Vision 14 2023 | |
| Durchschnitt der Klasse Subnotebook (1555 - 21812, n=59, der letzten 2 Jahre) | |
| Cinebench R23 / Single Core | |
| Schenker Vision 14 2023 | |
| Schenker Vision 14 M23 RTX 3050 | |
| Acer Swift X SFX14-71G | |
| Lenovo Yoga Pro 7 14IRH G8 | |
| Lenovo Yoga Pro 9-14IRP G8 | |
| Gigabyte Aero 14 OLED BMF | |
| Durchschnittliche Intel Core i7-13700H (1323 - 1914, n=29) | |
| Durchschnitt der Klasse Subnotebook (358 - 2213, n=60, der letzten 2 Jahre) | |
| Asus VivoBook 14X K3405 | |
| Schenker Vision 14 2022 RTX 3050 Ti | |
| Cinebench R20 / CPU (Multi Core) | |
| Lenovo Yoga Pro 9-14IRP G8 | |
| Lenovo Yoga Pro 7 14IRH G8 | |
| Acer Swift X SFX14-71G | |
| Durchschnittliche Intel Core i7-13700H (2322 - 7674, n=29) | |
| Schenker Vision 14 2022 RTX 3050 Ti | |
| Asus VivoBook 14X K3405 | |
| Gigabyte Aero 14 OLED BMF | |
| Schenker Vision 14 M23 RTX 3050 | |
| Schenker Vision 14 2023 | |
| Durchschnitt der Klasse Subnotebook (579 - 8541, n=56, der letzten 2 Jahre) | |
| Cinebench R20 / CPU (Single Core) | |
| Schenker Vision 14 M23 RTX 3050 | |
| Schenker Vision 14 2023 | |
| Acer Swift X SFX14-71G | |
| Lenovo Yoga Pro 7 14IRH G8 | |
| Lenovo Yoga Pro 9-14IRP G8 | |
| Gigabyte Aero 14 OLED BMF | |
| Schenker Vision 14 2022 RTX 3050 Ti | |
| Durchschnittliche Intel Core i7-13700H (508 - 741, n=29) | |
| Asus VivoBook 14X K3405 | |
| Durchschnitt der Klasse Subnotebook (128 - 832, n=56, der letzten 2 Jahre) | |
| Cinebench R15 / CPU Multi 64Bit | |
| Lenovo Yoga Pro 9-14IRP G8 | |
| Lenovo Yoga Pro 7 14IRH G8 | |
| Gigabyte Aero 14 OLED BMF | |
| Acer Swift X SFX14-71G | |
| Durchschnittliche Intel Core i7-13700H (905 - 2982, n=29) | |
| Asus VivoBook 14X K3405 | |
| Schenker Vision 14 2022 RTX 3050 Ti | |
| Schenker Vision 14 2023 | |
| Durchschnitt der Klasse Subnotebook (327 - 3345, n=56, der letzten 2 Jahre) | |
| Schenker Vision 14 M23 RTX 3050 | |
| Cinebench R15 / CPU Single 64Bit | |
| Schenker Vision 14 2023 | |
| Acer Swift X SFX14-71G | |
| Lenovo Yoga Pro 7 14IRH G8 | |
| Lenovo Yoga Pro 9-14IRP G8 | |
| Schenker Vision 14 M23 RTX 3050 | |
| Gigabyte Aero 14 OLED BMF | |
| Schenker Vision 14 2022 RTX 3050 Ti | |
| Durchschnitt der Klasse Subnotebook (72.4 - 322, n=56, der letzten 2 Jahre) | |
| Durchschnittliche Intel Core i7-13700H (213 - 278, n=29) | |
| Asus VivoBook 14X K3405 | |
| Blender / v2.79 BMW27 CPU | |
| Durchschnitt der Klasse Subnotebook (159 - 2271, n=57, der letzten 2 Jahre) | |
| Acer Swift X SFX14-71G | |
| Schenker Vision 14 2022 RTX 3050 Ti | |
| Schenker Vision 14 M23 RTX 3050 | |
| Asus VivoBook 14X K3405 | |
| Schenker Vision 14 2023 | |
| Gigabyte Aero 14 OLED BMF | |
| Durchschnittliche Intel Core i7-13700H (169 - 555, n=29) | |
| Lenovo Yoga Pro 7 14IRH G8 | |
| Lenovo Yoga Pro 9-14IRP G8 | |
| 7-Zip 18.03 / 7z b 4 | |
| Lenovo Yoga Pro 9-14IRP G8 | |
| Lenovo Yoga Pro 7 14IRH G8 | |
| Durchschnittliche Intel Core i7-13700H (27322 - 76344, n=29) | |
| Gigabyte Aero 14 OLED BMF | |
| Acer Swift X SFX14-71G | |
| Schenker Vision 14 M23 RTX 3050 | |
| Schenker Vision 14 2023 | |
| Asus VivoBook 14X K3405 | |
| Schenker Vision 14 2022 RTX 3050 Ti | |
| Durchschnitt der Klasse Subnotebook (11668 - 77867, n=56, der letzten 2 Jahre) | |
| 7-Zip 18.03 / 7z b 4 -mmt1 | |
| Schenker Vision 14 2023 | |
| Schenker Vision 14 M23 RTX 3050 | |
| Acer Swift X SFX14-71G | |
| Lenovo Yoga Pro 9-14IRP G8 | |
| Gigabyte Aero 14 OLED BMF | |
| Lenovo Yoga Pro 7 14IRH G8 | |
| Durchschnittliche Intel Core i7-13700H (4825 - 6238, n=29) | |
| Schenker Vision 14 2022 RTX 3050 Ti | |
| Asus VivoBook 14X K3405 | |
| Durchschnitt der Klasse Subnotebook (2643 - 6699, n=58, der letzten 2 Jahre) | |
| Geekbench 5.5 / Multi-Core | |
| Lenovo Yoga Pro 9-14IRP G8 | |
| Lenovo Yoga Pro 7 14IRH G8 | |
| Durchschnittliche Intel Core i7-13700H (6165 - 14215, n=29) | |
| Acer Swift X SFX14-71G | |
| Schenker Vision 14 2022 RTX 3050 Ti | |
| Gigabyte Aero 14 OLED BMF | |
| Durchschnitt der Klasse Subnotebook (2557 - 17218, n=48, der letzten 2 Jahre) | |
| Schenker Vision 14 2023 | |
| Schenker Vision 14 M23 RTX 3050 | |
| Asus VivoBook 14X K3405 | |
| Geekbench 5.5 / Single-Core | |
| Durchschnitt der Klasse Subnotebook (726 - 2224, n=48, der letzten 2 Jahre) | |
| Lenovo Yoga Pro 9-14IRP G8 | |
| Lenovo Yoga Pro 7 14IRH G8 | |
| Schenker Vision 14 M23 RTX 3050 | |
| Gigabyte Aero 14 OLED BMF | |
| Acer Swift X SFX14-71G | |
| Schenker Vision 14 2023 | |
| Durchschnittliche Intel Core i7-13700H (1362 - 1919, n=29) | |
| Schenker Vision 14 2022 RTX 3050 Ti | |
| Asus VivoBook 14X K3405 | |
| HWBOT x265 Benchmark v2.2 / 4k Preset | |
| Lenovo Yoga Pro 7 14IRH G8 | |
| Lenovo Yoga Pro 9-14IRP G8 | |
| Durchschnittliche Intel Core i7-13700H (6.72 - 21.2, n=29) | |
| Asus VivoBook 14X K3405 | |
| Gigabyte Aero 14 OLED BMF | |
| Schenker Vision 14 2023 | |
| Schenker Vision 14 M23 RTX 3050 | |
| Schenker Vision 14 2022 RTX 3050 Ti | |
| Acer Swift X SFX14-71G | |
| Durchschnitt der Klasse Subnotebook (0.97 - 25.1, n=56, der letzten 2 Jahre) | |
| LibreOffice / 20 Documents To PDF | |
| Durchschnitt der Klasse Subnotebook (39.9 - 220, n=55, der letzten 2 Jahre) | |
| Schenker Vision 14 M23 RTX 3050 | |
| Schenker Vision 14 2023 | |
| Durchschnittliche Intel Core i7-13700H (31.3 - 62.4, n=29) | |
| Asus VivoBook 14X K3405 | |
| Lenovo Yoga Pro 9-14IRP G8 | |
| Lenovo Yoga Pro 7 14IRH G8 | |
| Schenker Vision 14 2022 RTX 3050 Ti | |
| Gigabyte Aero 14 OLED BMF | |
| Acer Swift X SFX14-71G | |
| R Benchmark 2.5 / Overall mean | |
| Durchschnitt der Klasse Subnotebook (0.4024 - 1.456, n=57, der letzten 2 Jahre) | |
| Asus VivoBook 14X K3405 | |
| Durchschnittliche Intel Core i7-13700H (0.4308 - 0.607, n=29) | |
| Schenker Vision 14 2022 RTX 3050 Ti | |
| Schenker Vision 14 M23 RTX 3050 | |
| Gigabyte Aero 14 OLED BMF | |
| Schenker Vision 14 2023 | |
| Acer Swift X SFX14-71G | |
| Lenovo Yoga Pro 7 14IRH G8 | |
| Lenovo Yoga Pro 9-14IRP G8 | |
* ... kleinere Werte sind besser
AIDA64: FP32 Ray-Trace | FPU Julia | CPU SHA3 | CPU Queen | FPU SinJulia | FPU Mandel | CPU AES | CPU ZLib | FP64 Ray-Trace | CPU PhotoWorxx
| Performance Rating | |
| Lenovo Yoga Pro 9-14IRP G8 | |
| Lenovo Yoga Pro 7 14IRH G8 | |
| Gigabyte Aero 14 OLED BMF | |
| Durchschnittliche Intel Core i7-13700H | |
| Asus VivoBook 14X K3405 | |
| Schenker Vision 14 M23 RTX 3050 | |
| Schenker Vision 14 2022 RTX 3050 Ti | |
| Schenker Vision 14 2023 | |
| Durchschnitt der Klasse Subnotebook | |
| Acer Swift X SFX14-71G | |
| AIDA64 / FP32 Ray-Trace | |
| Lenovo Yoga Pro 9-14IRP G8 | |
| Lenovo Yoga Pro 7 14IRH G8 | |
| Durchschnitt der Klasse Subnotebook (1135 - 32888, n=57, der letzten 2 Jahre) | |
| Durchschnittliche Intel Core i7-13700H (4986 - 18908, n=29) | |
| Asus VivoBook 14X K3405 | |
| Gigabyte Aero 14 OLED BMF | |
| Schenker Vision 14 M23 RTX 3050 | |
| Schenker Vision 14 2023 | |
| Schenker Vision 14 2022 RTX 3050 Ti | |
| Acer Swift X SFX14-71G | |
| AIDA64 / FPU Julia | |
| Lenovo Yoga Pro 9-14IRP G8 | |
| Lenovo Yoga Pro 7 14IRH G8 | |
| Durchschnittliche Intel Core i7-13700H (25360 - 92359, n=29) | |
| Asus VivoBook 14X K3405 | |
| Schenker Vision 14 M23 RTX 3050 | |
| Gigabyte Aero 14 OLED BMF | |
| Schenker Vision 14 2023 | |
| Durchschnitt der Klasse Subnotebook (5218 - 123315, n=57, der letzten 2 Jahre) | |
| Schenker Vision 14 2022 RTX 3050 Ti | |
| Acer Swift X SFX14-71G | |
| AIDA64 / CPU SHA3 | |
| Lenovo Yoga Pro 9-14IRP G8 | |
| Lenovo Yoga Pro 7 14IRH G8 | |
| Asus VivoBook 14X K3405 | |
| Durchschnittliche Intel Core i7-13700H (1339 - 4224, n=29) | |
| Durchschnitt der Klasse Subnotebook (444 - 5287, n=57, der letzten 2 Jahre) | |
| Gigabyte Aero 14 OLED BMF | |
| Schenker Vision 14 M23 RTX 3050 | |
| Schenker Vision 14 2023 | |
| Schenker Vision 14 2022 RTX 3050 Ti | |
| Acer Swift X SFX14-71G | |
| AIDA64 / CPU Queen | |
| Gigabyte Aero 14 OLED BMF | |
| Lenovo Yoga Pro 7 14IRH G8 | |
| Lenovo Yoga Pro 9-14IRP G8 | |
| Acer Swift X SFX14-71G | |
| Durchschnittliche Intel Core i7-13700H (59324 - 107159, n=29) | |
| Schenker Vision 14 2022 RTX 3050 Ti | |
| Schenker Vision 14 M23 RTX 3050 | |
| Asus VivoBook 14X K3405 | |
| Schenker Vision 14 2023 | |
| Durchschnitt der Klasse Subnotebook (10579 - 95002, n=50, der letzten 2 Jahre) | |
| AIDA64 / FPU SinJulia | |
| Lenovo Yoga Pro 9-14IRP G8 | |
| Lenovo Yoga Pro 7 14IRH G8 | |
| Durchschnittliche Intel Core i7-13700H (4800 - 11050, n=29) | |
| Gigabyte Aero 14 OLED BMF | |
| Schenker Vision 14 2022 RTX 3050 Ti | |
| Schenker Vision 14 M23 RTX 3050 | |
| Asus VivoBook 14X K3405 | |
| Schenker Vision 14 2023 | |
| Durchschnitt der Klasse Subnotebook (744 - 18418, n=57, der letzten 2 Jahre) | |
| Acer Swift X SFX14-71G | |
| AIDA64 / FPU Mandel | |
| Lenovo Yoga Pro 9-14IRP G8 | |
| Lenovo Yoga Pro 7 14IRH G8 | |
| Durchschnittliche Intel Core i7-13700H (12321 - 45118, n=29) | |
| Asus VivoBook 14X K3405 | |
| Durchschnitt der Klasse Subnotebook (3341 - 65433, n=57, der letzten 2 Jahre) | |
| Gigabyte Aero 14 OLED BMF | |
| Schenker Vision 14 M23 RTX 3050 | |
| Schenker Vision 14 2023 | |
| Schenker Vision 14 2022 RTX 3050 Ti | |
| Acer Swift X SFX14-71G | |
| AIDA64 / CPU AES | |
| Gigabyte Aero 14 OLED BMF | |
| Asus VivoBook 14X K3405 | |
| Acer Swift X SFX14-71G | |
| Lenovo Yoga Pro 9-14IRP G8 | |
| Durchschnittliche Intel Core i7-13700H (28769 - 151254, n=29) | |
| Lenovo Yoga Pro 7 14IRH G8 | |
| Schenker Vision 14 2022 RTX 3050 Ti | |
| Schenker Vision 14 M23 RTX 3050 | |
| Schenker Vision 14 2023 | |
| Durchschnitt der Klasse Subnotebook (638 - 96917, n=57, der letzten 2 Jahre) | |
| AIDA64 / CPU ZLib | |
| Lenovo Yoga Pro 9-14IRP G8 | |
| Lenovo Yoga Pro 7 14IRH G8 | |
| Schenker Vision 14 2022 RTX 3050 Ti | |
| Durchschnittliche Intel Core i7-13700H (389 - 1215, n=29) | |
| Asus VivoBook 14X K3405 | |
| Gigabyte Aero 14 OLED BMF | |
| Schenker Vision 14 2023 | |
| Schenker Vision 14 M23 RTX 3050 | |
| Durchschnitt der Klasse Subnotebook (164.9 - 1379, n=57, der letzten 2 Jahre) | |
| Acer Swift X SFX14-71G | |
| AIDA64 / FP64 Ray-Trace | |
| Lenovo Yoga Pro 9-14IRP G8 | |
| Lenovo Yoga Pro 7 14IRH G8 | |
| Durchschnitt der Klasse Subnotebook (610 - 17495, n=57, der letzten 2 Jahre) | |
| Durchschnittliche Intel Core i7-13700H (2540 - 10135, n=29) | |
| Asus VivoBook 14X K3405 | |
| Schenker Vision 14 M23 RTX 3050 | |
| Gigabyte Aero 14 OLED BMF | |
| Schenker Vision 14 2023 | |
| Schenker Vision 14 2022 RTX 3050 Ti | |
| Acer Swift X SFX14-71G | |
| AIDA64 / CPU PhotoWorxx | |
| Gigabyte Aero 14 OLED BMF | |
| Lenovo Yoga Pro 9-14IRP G8 | |
| Durchschnitt der Klasse Subnotebook (6569 - 85600, n=57, der letzten 2 Jahre) | |
| Schenker Vision 14 2023 | |
| Schenker Vision 14 M23 RTX 3050 | |
| Lenovo Yoga Pro 7 14IRH G8 | |
| Acer Swift X SFX14-71G | |
| Durchschnittliche Intel Core i7-13700H (12872 - 52727, n=29) | |
| Schenker Vision 14 2022 RTX 3050 Ti | |
| Asus VivoBook 14X K3405 | |
System Performance
Der subjektive Leistungseindruck des Vision 14 ist sehr gut und auch in den synthetischen Benchmarks gibt es keine Auffälligkeiten, auch wenn die Konkurrenten mit der RTX 4050 Laptop meistens besser abschneiden. Im Alltag wird man diese Unterschiede aber nicht bemerken.
CrossMark: Overall | Productivity | Creativity | Responsiveness
WebXPRT 3: Overall
WebXPRT 4: Overall
Mozilla Kraken 1.1: Total
| PCMark 10 / Score | |
| Lenovo Yoga Pro 9-14IRP G8 | |
| Lenovo Yoga Pro 7 14IRH G8 | |
| Gigabyte Aero 14 OLED BMF | |
| Acer Swift X SFX14-71G | |
| Durchschnitt der Klasse Subnotebook (4920 - 9939, n=44, der letzten 2 Jahre) | |
| Asus VivoBook 14X K3405 | |
| Schenker Vision 14 2022 RTX 3050 Ti | |
| Durchschnittliche Intel Core i7-13700H, NVIDIA GeForce RTX 3050 6GB Laptop GPU (6290 - 6597, n=2) | |
| Schenker Vision 14 M23 RTX 3050 | |
| Schenker Vision 14 2023 | |
| PCMark 10 / Essentials | |
| Gigabyte Aero 14 OLED BMF | |
| Acer Swift X SFX14-71G | |
| Lenovo Yoga Pro 9-14IRP G8 | |
| Lenovo Yoga Pro 7 14IRH G8 | |
| Schenker Vision 14 2022 RTX 3050 Ti | |
| Durchschnitt der Klasse Subnotebook (8552 - 11646, n=44, der letzten 2 Jahre) | |
| Schenker Vision 14 2023 | |
| Asus VivoBook 14X K3405 | |
| Durchschnittliche Intel Core i7-13700H, NVIDIA GeForce RTX 3050 6GB Laptop GPU (9943 - 10112, n=2) | |
| Schenker Vision 14 M23 RTX 3050 | |
| PCMark 10 / Productivity | |
| Durchschnitt der Klasse Subnotebook (5435 - 16606, n=44, der letzten 2 Jahre) | |
| Acer Swift X SFX14-71G | |
| Gigabyte Aero 14 OLED BMF | |
| Lenovo Yoga Pro 7 14IRH G8 | |
| Lenovo Yoga Pro 9-14IRP G8 | |
| Asus VivoBook 14X K3405 | |
| Schenker Vision 14 M23 RTX 3050 | |
| Durchschnittliche Intel Core i7-13700H, NVIDIA GeForce RTX 3050 6GB Laptop GPU (8803 - 8950, n=2) | |
| Schenker Vision 14 2022 RTX 3050 Ti | |
| Schenker Vision 14 2023 | |
| PCMark 10 / Digital Content Creation | |
| Lenovo Yoga Pro 9-14IRP G8 | |
| Lenovo Yoga Pro 7 14IRH G8 | |
| Acer Swift X SFX14-71G | |
| Gigabyte Aero 14 OLED BMF | |
| Durchschnitt der Klasse Subnotebook (5722 - 13779, n=44, der letzten 2 Jahre) | |
| Schenker Vision 14 2022 RTX 3050 Ti | |
| Asus VivoBook 14X K3405 | |
| Durchschnittliche Intel Core i7-13700H, NVIDIA GeForce RTX 3050 6GB Laptop GPU (7590 - 8752, n=2) | |
| Schenker Vision 14 M23 RTX 3050 | |
| Schenker Vision 14 2023 | |
| CrossMark / Overall | |
| Acer Swift X SFX14-71G | |
| Lenovo Yoga Pro 9-14IRP G8 | |
| Gigabyte Aero 14 OLED BMF | |
| Lenovo Yoga Pro 7 14IRH G8 | |
| Schenker Vision 14 2022 RTX 3050 Ti | |
| Durchschnitt der Klasse Subnotebook (365 - 2356, n=59, der letzten 2 Jahre) | |
| Asus VivoBook 14X K3405 | |
| Durchschnittliche Intel Core i7-13700H, NVIDIA GeForce RTX 3050 6GB Laptop GPU (1504 - 1752, n=2) | |
| Schenker Vision 14 2023 | |
| Schenker Vision 14 M23 RTX 3050 | |
| CrossMark / Productivity | |
| Acer Swift X SFX14-71G | |
| Gigabyte Aero 14 OLED BMF | |
| Lenovo Yoga Pro 9-14IRP G8 | |
| Lenovo Yoga Pro 7 14IRH G8 | |
| Schenker Vision 14 2022 RTX 3050 Ti | |
| Asus VivoBook 14X K3405 | |
| Durchschnitt der Klasse Subnotebook (364 - 2277, n=59, der letzten 2 Jahre) | |
| Durchschnittliche Intel Core i7-13700H, NVIDIA GeForce RTX 3050 6GB Laptop GPU (1417 - 1657, n=2) | |
| Schenker Vision 14 2023 | |
| Schenker Vision 14 M23 RTX 3050 | |
| CrossMark / Creativity | |
| Lenovo Yoga Pro 9-14IRP G8 | |
| Lenovo Yoga Pro 7 14IRH G8 | |
| Acer Swift X SFX14-71G | |
| Gigabyte Aero 14 OLED BMF | |
| Durchschnitt der Klasse Subnotebook (372 - 2743, n=59, der letzten 2 Jahre) | |
| Durchschnittliche Intel Core i7-13700H, NVIDIA GeForce RTX 3050 6GB Laptop GPU (1711 - 1970, n=2) | |
| Schenker Vision 14 2022 RTX 3050 Ti | |
| Schenker Vision 14 M23 RTX 3050 | |
| Asus VivoBook 14X K3405 | |
| Schenker Vision 14 2023 | |
| CrossMark / Responsiveness | |
| Acer Swift X SFX14-71G | |
| Gigabyte Aero 14 OLED BMF | |
| Schenker Vision 14 2022 RTX 3050 Ti | |
| Lenovo Yoga Pro 9-14IRP G8 | |
| Asus VivoBook 14X K3405 | |
| Schenker Vision 14 2023 | |
| Lenovo Yoga Pro 7 14IRH G8 | |
| Durchschnitt der Klasse Subnotebook (312 - 1854, n=59, der letzten 2 Jahre) | |
| Durchschnittliche Intel Core i7-13700H, NVIDIA GeForce RTX 3050 6GB Laptop GPU (1220 - 1458, n=2) | |
| Schenker Vision 14 M23 RTX 3050 | |
| WebXPRT 3 / Overall | |
| Durchschnitt der Klasse Subnotebook (156 - 530, n=55, der letzten 2 Jahre) | |
| Acer Swift X SFX14-71G | |
| Lenovo Yoga Pro 9-14IRP G8 | |
| Lenovo Yoga Pro 7 14IRH G8 | |
| Schenker Vision 14 2022 RTX 3050 Ti | |
| Schenker Vision 14 M23 RTX 3050 | |
| Schenker Vision 14 2023 | |
| Durchschnittliche Intel Core i7-13700H, NVIDIA GeForce RTX 3050 6GB Laptop GPU (286 - 300, n=2) | |
| Gigabyte Aero 14 OLED BMF | |
| Asus VivoBook 14X K3405 | |
| WebXPRT 4 / Overall | |
| Schenker Vision 14 M23 RTX 3050 | |
| Durchschnittliche Intel Core i7-13700H, NVIDIA GeForce RTX 3050 6GB Laptop GPU (273 - 325, n=2) | |
| Durchschnitt der Klasse Subnotebook (132 - 378, n=60, der letzten 2 Jahre) | |
| Acer Swift X SFX14-71G | |
| Lenovo Yoga Pro 9-14IRP G8 | |
| Schenker Vision 14 2023 | |
| Lenovo Yoga Pro 7 14IRH G8 | |
| Gigabyte Aero 14 OLED BMF | |
| Schenker Vision 14 2022 RTX 3050 Ti | |
| Asus VivoBook 14X K3405 | |
| Mozilla Kraken 1.1 / Total | |
| Asus VivoBook 14X K3405 | |
| Schenker Vision 14 2022 RTX 3050 Ti | |
| Gigabyte Aero 14 OLED BMF | |
| Schenker Vision 14 2023 | |
| Lenovo Yoga Pro 9-14IRP G8 | |
| Schenker Vision 14 M23 RTX 3050 | |
| Lenovo Yoga Pro 7 14IRH G8 | |
| Acer Swift X SFX14-71G | |
| Durchschnittliche Intel Core i7-13700H, NVIDIA GeForce RTX 3050 6GB Laptop GPU (490 - 496, n=2) | |
| Durchschnitt der Klasse Subnotebook (234 - 1104, n=60, der letzten 2 Jahre) | |
* ... kleinere Werte sind besser
| PCMark 10 Score | 6290 Punkte | |
Hilfe | ||
| AIDA64 / Memory Copy | |
| Durchschnitt der Klasse Subnotebook (14554 - 131023, n=57, der letzten 2 Jahre) | |
| Lenovo Yoga Pro 9-14IRP G8 | |
| Gigabyte Aero 14 OLED BMF | |
| Schenker Vision 14 M23 RTX 3050 | |
| Schenker Vision 14 2023 | |
| Lenovo Yoga Pro 7 14IRH G8 | |
| Durchschnittliche Intel Core i7-13700H (24334 - 78081, n=29) | |
| Acer Swift X SFX14-71G | |
| Schenker Vision 14 2022 RTX 3050 Ti | |
| Asus VivoBook 14X K3405 | |
| AIDA64 / Memory Read | |
| Durchschnitt der Klasse Subnotebook (15948 - 127174, n=57, der letzten 2 Jahre) | |
| Gigabyte Aero 14 OLED BMF | |
| Lenovo Yoga Pro 9-14IRP G8 | |
| Schenker Vision 14 M23 RTX 3050 | |
| Schenker Vision 14 2023 | |
| Lenovo Yoga Pro 7 14IRH G8 | |
| Durchschnittliche Intel Core i7-13700H (23681 - 79656, n=29) | |
| Acer Swift X SFX14-71G | |
| Asus VivoBook 14X K3405 | |
| Schenker Vision 14 2022 RTX 3050 Ti | |
| AIDA64 / Memory Write | |
| Gigabyte Aero 14 OLED BMF | |
| Lenovo Yoga Pro 9-14IRP G8 | |
| Durchschnitt der Klasse Subnotebook (15709 - 135141, n=57, der letzten 2 Jahre) | |
| Acer Swift X SFX14-71G | |
| Lenovo Yoga Pro 7 14IRH G8 | |
| Schenker Vision 14 M23 RTX 3050 | |
| Schenker Vision 14 2023 | |
| Durchschnittliche Intel Core i7-13700H (22986 - 99898, n=29) | |
| Schenker Vision 14 2022 RTX 3050 Ti | |
| Asus VivoBook 14X K3405 | |
| AIDA64 / Memory Latency | |
| Acer Swift X SFX14-71G | |
| Lenovo Yoga Pro 7 14IRH G8 | |
| Durchschnitt der Klasse Subnotebook (6.1 - 159.9, n=55, der letzten 2 Jahre) | |
| Durchschnittliche Intel Core i7-13700H (82.4 - 136.8, n=29) | |
| Lenovo Yoga Pro 9-14IRP G8 | |
| Gigabyte Aero 14 OLED BMF | |
| Schenker Vision 14 2022 RTX 3050 Ti | |
| Asus VivoBook 14X K3405 | |
| Schenker Vision 14 2023 | |
| Schenker Vision 14 M23 RTX 3050 | |
* ... kleinere Werte sind besser
DPC-Latenzen
In unserem standardisierten Latency-Test (Surfen im Internet, 4K-YouTube-Wiedergabe, CPU-Last) zeigt das Testgerät mit der aktuellen BIOS-Version leichte Einschränkungen bei der Nutzung von Echtzeit-Audioanwendungen. Zudem gab es bei der Videowiedergabe viele übersprungene Einzelbilder (111 von 3.683).
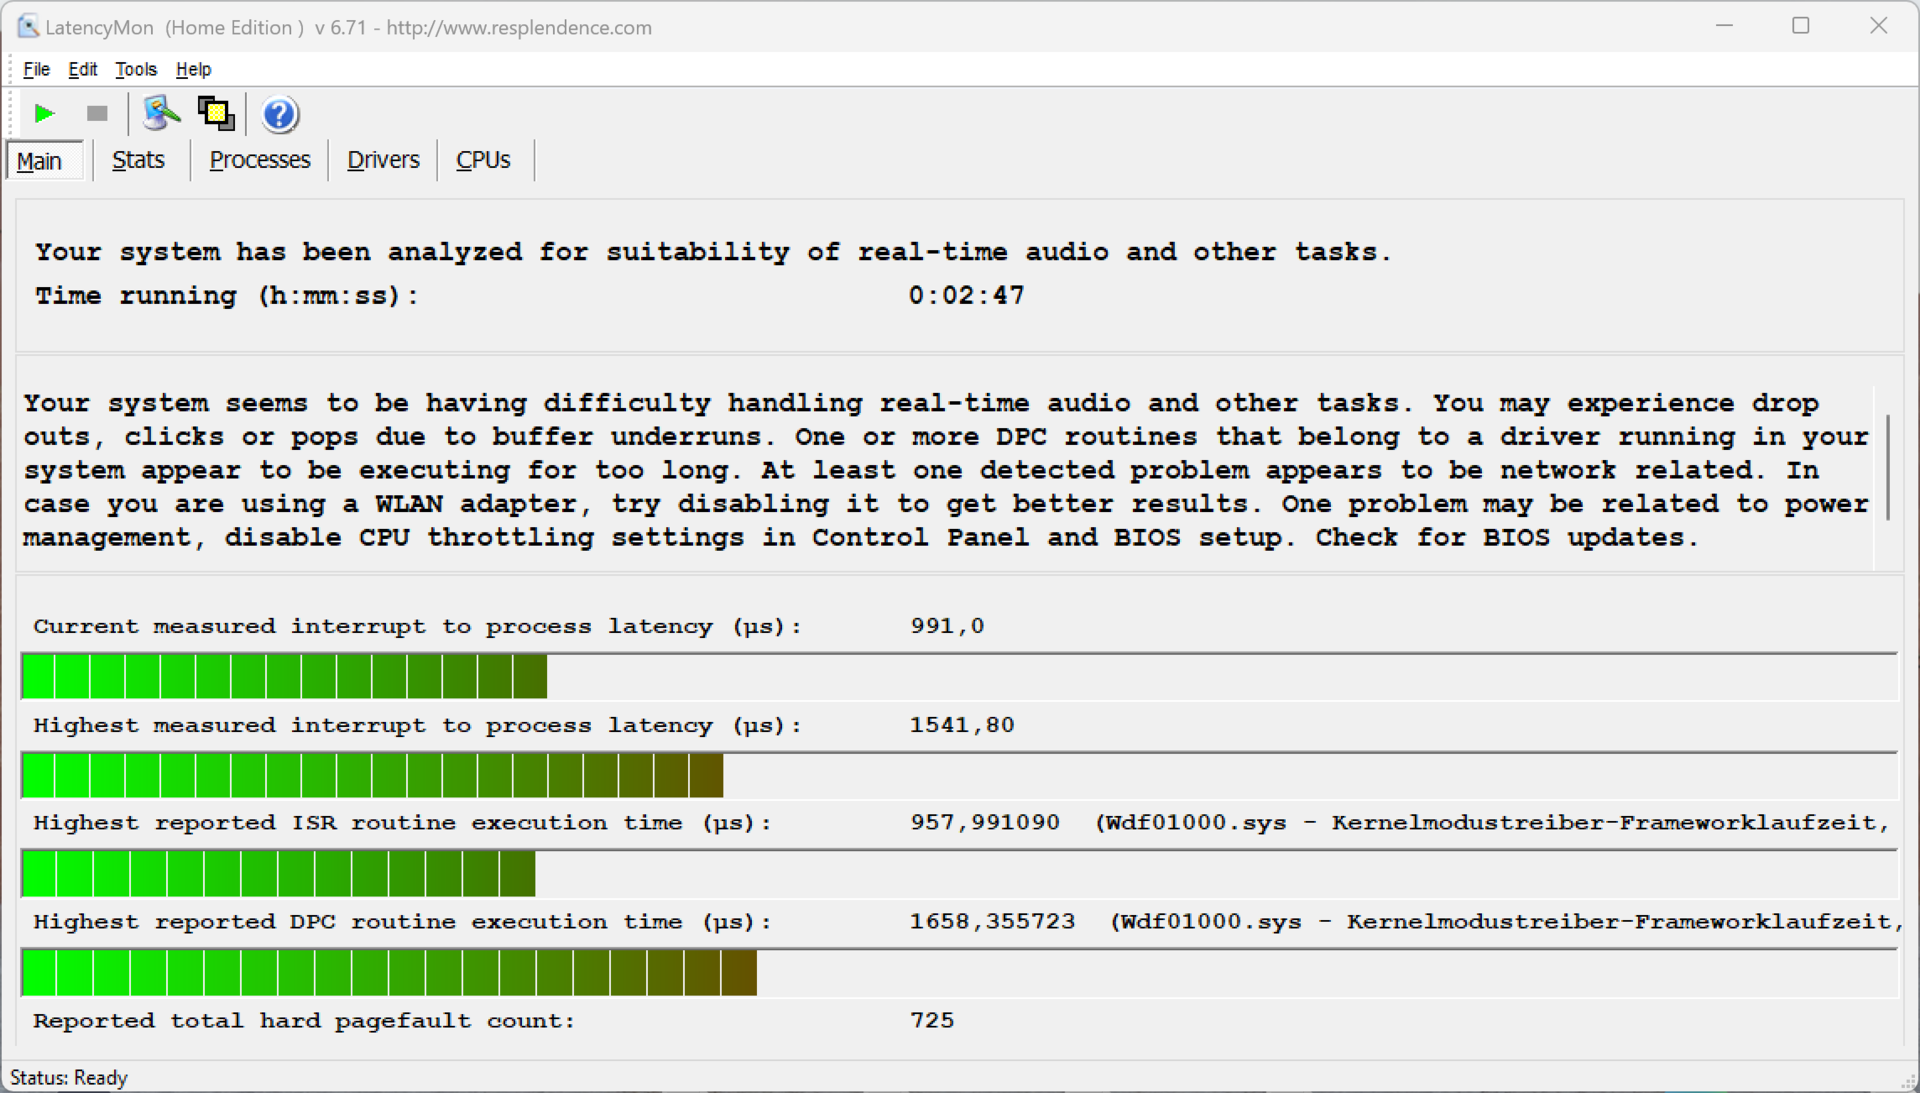
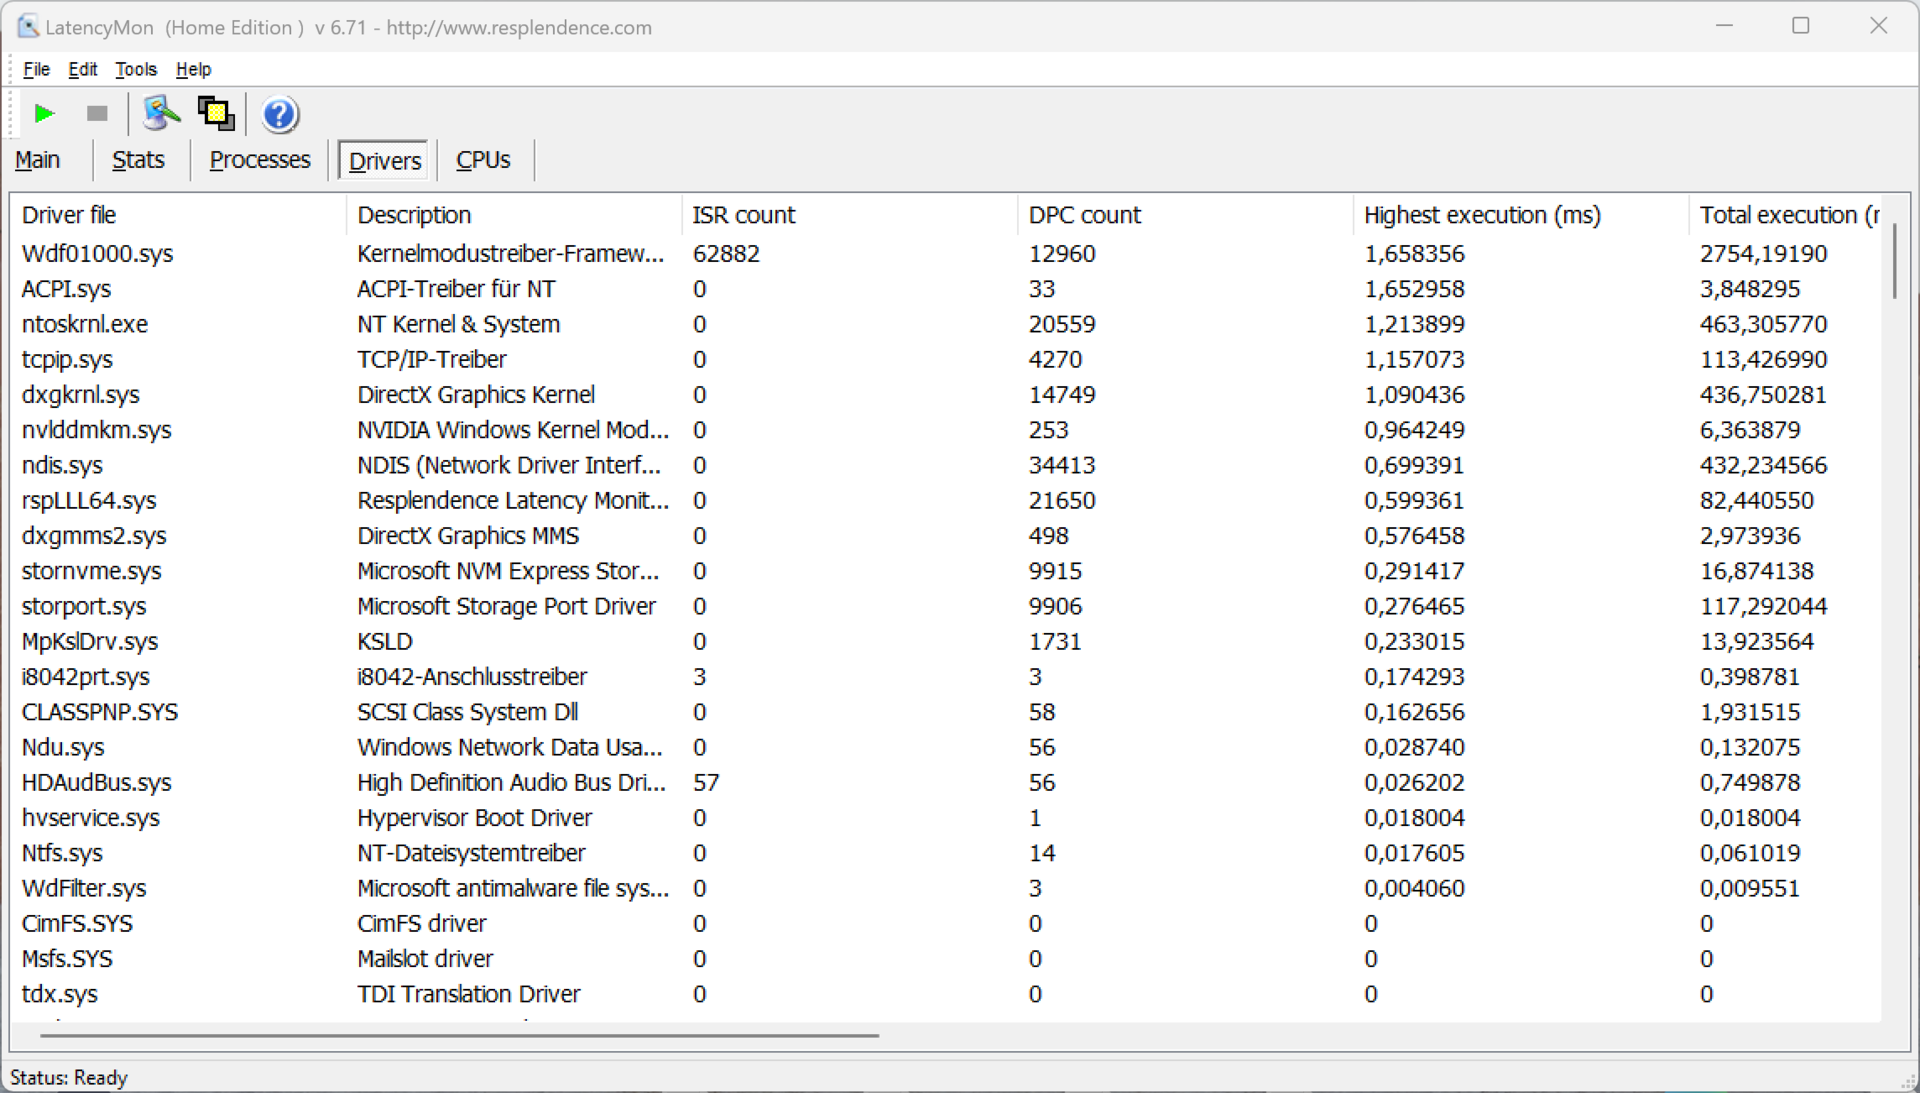
| DPC Latencies / LatencyMon - interrupt to process latency (max), Web, Youtube, Prime95 | |
| Acer Swift X SFX14-71G | |
| Schenker Vision 14 2023 | |
| Gigabyte Aero 14 OLED BMF | |
| Schenker Vision 14 M23 RTX 3050 | |
| Asus VivoBook 14X K3405 | |
| Lenovo Yoga Pro 7 14IRH G8 | |
| Lenovo Yoga Pro 9-14IRP G8 | |
| Schenker Vision 14 2022 RTX 3050 Ti | |
* ... kleinere Werte sind besser
Massenspeicher
Unser Testgerät des Vision 14 ist mit der 1-TB-Version der Samsung 990 Pro ausgestattet. Die PCIe-4.0-SSD erreicht sehr hohe Transferraten und die Leistung bleibt auch bei längerer Belastung konstant, was bei kompakten Laptops keine Selbstverständlichkeit ist. Insgesamt ist die Leistung aber auch etwas schlechter als bei der iGPU-Variante, wobei es hier im Alltag keine Einschränkungen gibt. Nach der ersten Inbetriebnahme stehen dem Nutzer 873 GB zur freien Verfügung. Weitere SSD-Benchmarks sind hier gelistet.

* ... kleinere Werte sind besser
Dauerleistung Lesen: DiskSpd Read Loop, Queue Depth 8
Grafikkarte
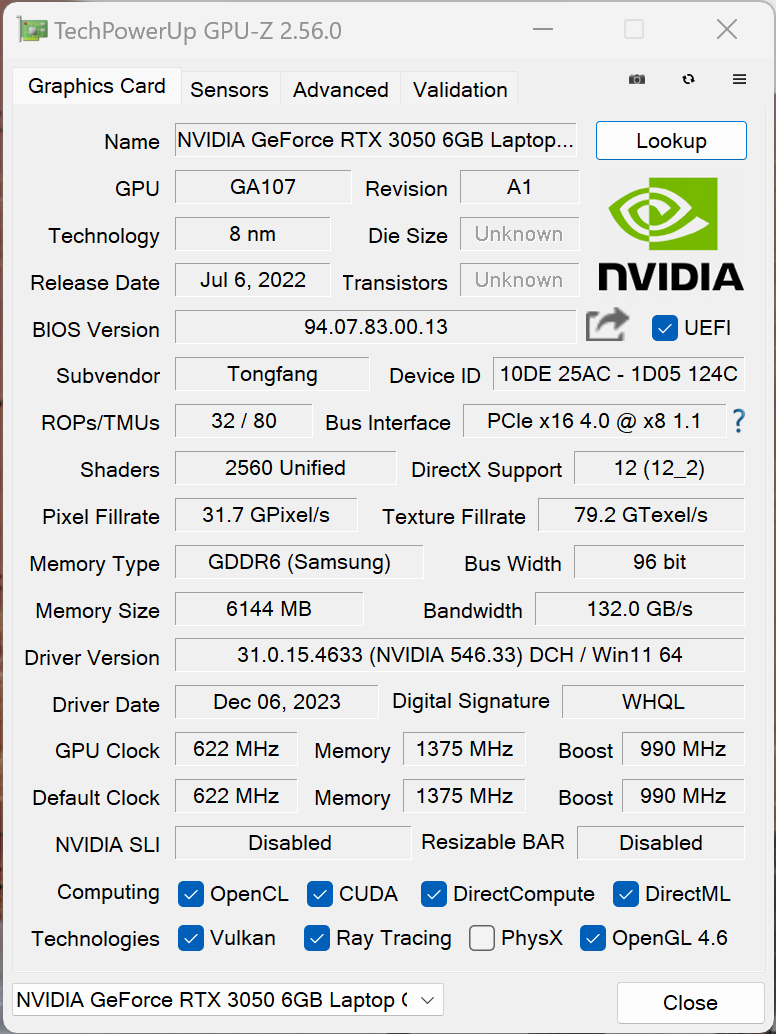
Schenker hat die dedizierte RTX 3050 Ti (4 GB) gegen die RTX 3050 Refresh getauscht, die mit 6 GB VRAM ausgestattet ist. Das ist durchaus eine Überraschung, denn der logische Schritt (den auch die Konkurrenten gegangen sind) wäre der Wechsel auf die neue RTX 4050 Laptop gewesen. Dank zusätzlichem Videospeicher kann die GPU Vorteile bei höheren Auflösungen haben, in den synthetischen Benchmarks fällt die Leistung allerdings etwas geringer aus als bei der alten RTX 3050 Ti, obwohl die TGP mit 50 Watt jetzt sogar 5 Watt höher ist. Die neue RTX 4050 Laptop ist je nach TGP deutlich schneller (33-87 Prozent).
In den Gaming-Benchmarks bestätigt sich dieses Bild und in unseren standardmäßig durchgeführten Tests in 1080p und maximalen Details ist die RTX 3050 6 GB erneut etwas langsamer als die alte RTX 3050 Ti. Die RTX-4050-Laptop-Konkurrenten sind erneut deutlich schneller und damit auch zukunftssicherer. Bei aktuellen Titeln wie Cyberpunk 2077 muss man auf die maximalen Details in 1080p verzichten, um noch flüssig spielen zu können.
Bei dauerhafter Belastung bleibt die Grafikleistung aber zumindest stabil. Im Akkubetrieb darf die GPU maximal 35 Watt verbrauchen, weshalb die Leistung um etwa 17 % abfällt. Weitere GPU-Benchmarks sind hier verfügbar.
| 3DMark 11 Performance | 15844 Punkte | |
| 3DMark Fire Strike Score | 10765 Punkte | |
| 3DMark Time Spy Score | 4933 Punkte | |
Hilfe | ||
| Blender / v3.3 Classroom OPTIX/RTX | |
| Asus VivoBook 14X K3405 | |
| Schenker Vision 14 M23 RTX 3050 | |
| Durchschnittliche NVIDIA GeForce RTX 3050 6GB Laptop GPU (68 - 72, n=4) | |
| Schenker Vision 14 2022 RTX 3050 Ti | |
| Gigabyte Aero 14 OLED BMF | |
| Lenovo Yoga Pro 7 14IRH G8 | |
| Acer Swift X SFX14-71G | |
| Lenovo Yoga Pro 9-14IRP G8 | |
| Blender / v3.3 Classroom CUDA | |
| Asus VivoBook 14X K3405 | |
| Asus VivoBook 14X K3405 | |
| Schenker Vision 14 M23 RTX 3050 | |
| Durchschnittliche NVIDIA GeForce RTX 3050 6GB Laptop GPU (107 - 115, n=4) | |
| Schenker Vision 14 2022 RTX 3050 Ti | |
| Gigabyte Aero 14 OLED BMF | |
| Acer Swift X SFX14-71G | |
| Lenovo Yoga Pro 7 14IRH G8 | |
| Lenovo Yoga Pro 9-14IRP G8 | |
| Blender / v3.3 Classroom CPU | |
| Acer Swift X SFX14-71G | |
| Durchschnitt der Klasse Subnotebook (241 - 861, n=59, der letzten 2 Jahre) | |
| Schenker Vision 14 2022 RTX 3050 Ti | |
| Schenker Vision 14 M23 RTX 3050 | |
| Schenker Vision 14 2023 | |
| Gigabyte Aero 14 OLED BMF | |
| Asus VivoBook 14X K3405 | |
| Durchschnittliche NVIDIA GeForce RTX 3050 6GB Laptop GPU (383 - 434, n=4) | |
| Lenovo Yoga Pro 7 14IRH G8 | |
| Lenovo Yoga Pro 9-14IRP G8 | |
* ... kleinere Werte sind besser
Witcher 3 FPS-Diagramm
| min. | mittel | hoch | max. | QHD | |
|---|---|---|---|---|---|
| GTA V (2015) | 178.2 | 172.6 | 95.3 | 53 | 36.5 |
| The Witcher 3 (2015) | 187 | 118 | 71 | 43.7 | |
| Dota 2 Reborn (2015) | 152.8 | 137.8 | 112.6 | 99.5 | |
| Final Fantasy XV Benchmark (2018) | 111.6 | 59.9 | 44.2 | 32 | |
| X-Plane 11.11 (2018) | 144.7 | 116.2 | 97.1 | ||
| Far Cry 5 (2018) | 132 | 76 | 70 | 65 | |
| Strange Brigade (2018) | 210 | 96.5 | 80.9 | 70.7 | |
| F1 2021 (2021) | 218 | 127.4 | 104.8 | 61.9 | 40 |
| F1 22 (2022) | 110.9 | 106.1 | 85.5 | 30.7 | 18.1 |
| F1 23 (2023) | 113.9 | 109 | 86.9 | 20.5 | 10.6 |
| Cyberpunk 2077 (2023) | 55.2 | 43.7 | 36.6 | 31.4 |
Emissionen & Energie
Geräuschemissionen
Die Lüfterlautstärke und -aktivität hängt maßgeblich von dem verwendeten Energieprofil ab. Wenn man das Profil Leistung verwendet, kommt es auch bei sehr einfachen Aktivitäten zu einem Rauschen, weshalb wir für den Alltag das Profil Leise empfehlen. Auch beim Spielen lohnt es sich durchaus, die Leistung zu überprüfen, da viele Spiele vor allem auf die GPU angewiesen sind. Unter Last und beim Spielen wird es dann deutlich lauter und wir messen rund 49 dB(A). In den beiden schwächeren Modi sind es maximal 46,9 dB(A) (Leistung/Ausbalanciert) bzw. 35,7 dB(A) (Leise). Sonstige elektronische Geräusche konnten wir nicht erkennen.
Lautstärkediagramm
| Idle |
| 23.5 / 23.5 / 26 dB(A) |
| Last |
| 43.6 / 49.1 dB(A) |
 | ||
30 dB leise 40 dB(A) deutlich hörbar 50 dB(A) störend |
||
min: | ||
| Schenker Vision 14 M23 RTX 3050 GeForce RTX 3050 6GB Laptop GPU, i7-13700H, Samsung 990 Pro 1 TB | Lenovo Yoga Pro 9-14IRP G8 GeForce RTX 4050 Laptop GPU, i7-13705H, Samsung PM9A1 MZVL21T0HCLR | Acer Swift X SFX14-71G GeForce RTX 4050 Laptop GPU, i7-13700H, Samsung PM9A1 MZVL21T0HCLR | Asus VivoBook 14X K3405 GeForce RTX 3050 4GB Laptop GPU, i5-13500H, Samsung PM9B1 512GB MZVL4512HBLU | Gigabyte Aero 14 OLED BMF GeForce RTX 4050 Laptop GPU, i7-13700H, Gigabyte AG470S1TB-SI B10 | Schenker Vision 14 2022 RTX 3050 Ti GeForce RTX 3050 Ti Laptop GPU, i7-12700H, Samsung SSD 980 Pro 1TB MZ-V8P1T0BW | Schenker Vision 14 2023 Iris Xe G7 96EUs, i7-13700H, Samsung 990 Pro 1 TB | Lenovo Yoga Pro 7 14IRH G8 GeForce RTX 4050 Laptop GPU, i7-13700H, Samsung PM9A1 MZVL21T0HCLR | |
|---|---|---|---|---|---|---|---|---|
| Geräuschentwicklung | -6% | -11% | -0% | -5% | -2% | 0% | -3% | |
| aus / Umgebung * (dB) | 23.5 | 24.8 -6% | 24.8 -6% | 21.46 9% | 24 -2% | 24.4 -4% | 24.5 -4% | 22.9 3% |
| Idle min * (dB) | 23.5 | 24.8 -6% | 28.2 -20% | 22.08 6% | 24 -2% | 24.4 -4% | 24.5 -4% | 22.9 3% |
| Idle avg * (dB) | 23.5 | 24.8 -6% | 31.8 -35% | 22.08 6% | 24 -2% | 24.4 -4% | 24.5 -4% | 22.9 3% |
| Idle max * (dB) | 26 | 24.8 5% | 31.8 -22% | 22.08 15% | 35.71 -37% | 27.8 -7% | 30.4 -17% | 36.8 -42% |
| Last avg * (dB) | 43.6 | 47.4 -9% | 38.2 12% | 52.98 -22% | 43.3 1% | 39.5 9% | 43.7 -0% | |
| Witcher 3 ultra * (dB) | 48.7 | 52.9 -9% | 50 -3% | 52.7 -8% | 40.22 17% | 48.2 1% | 41.7 14% | 46.2 5% |
| Last max * (dB) | 49.1 | 52.9 -8% | 52.2 -6% | 52.67 -7% | 51.93 -6% | 48.8 1% | 44.9 9% | 46.2 6% |
* ... kleinere Werte sind besser
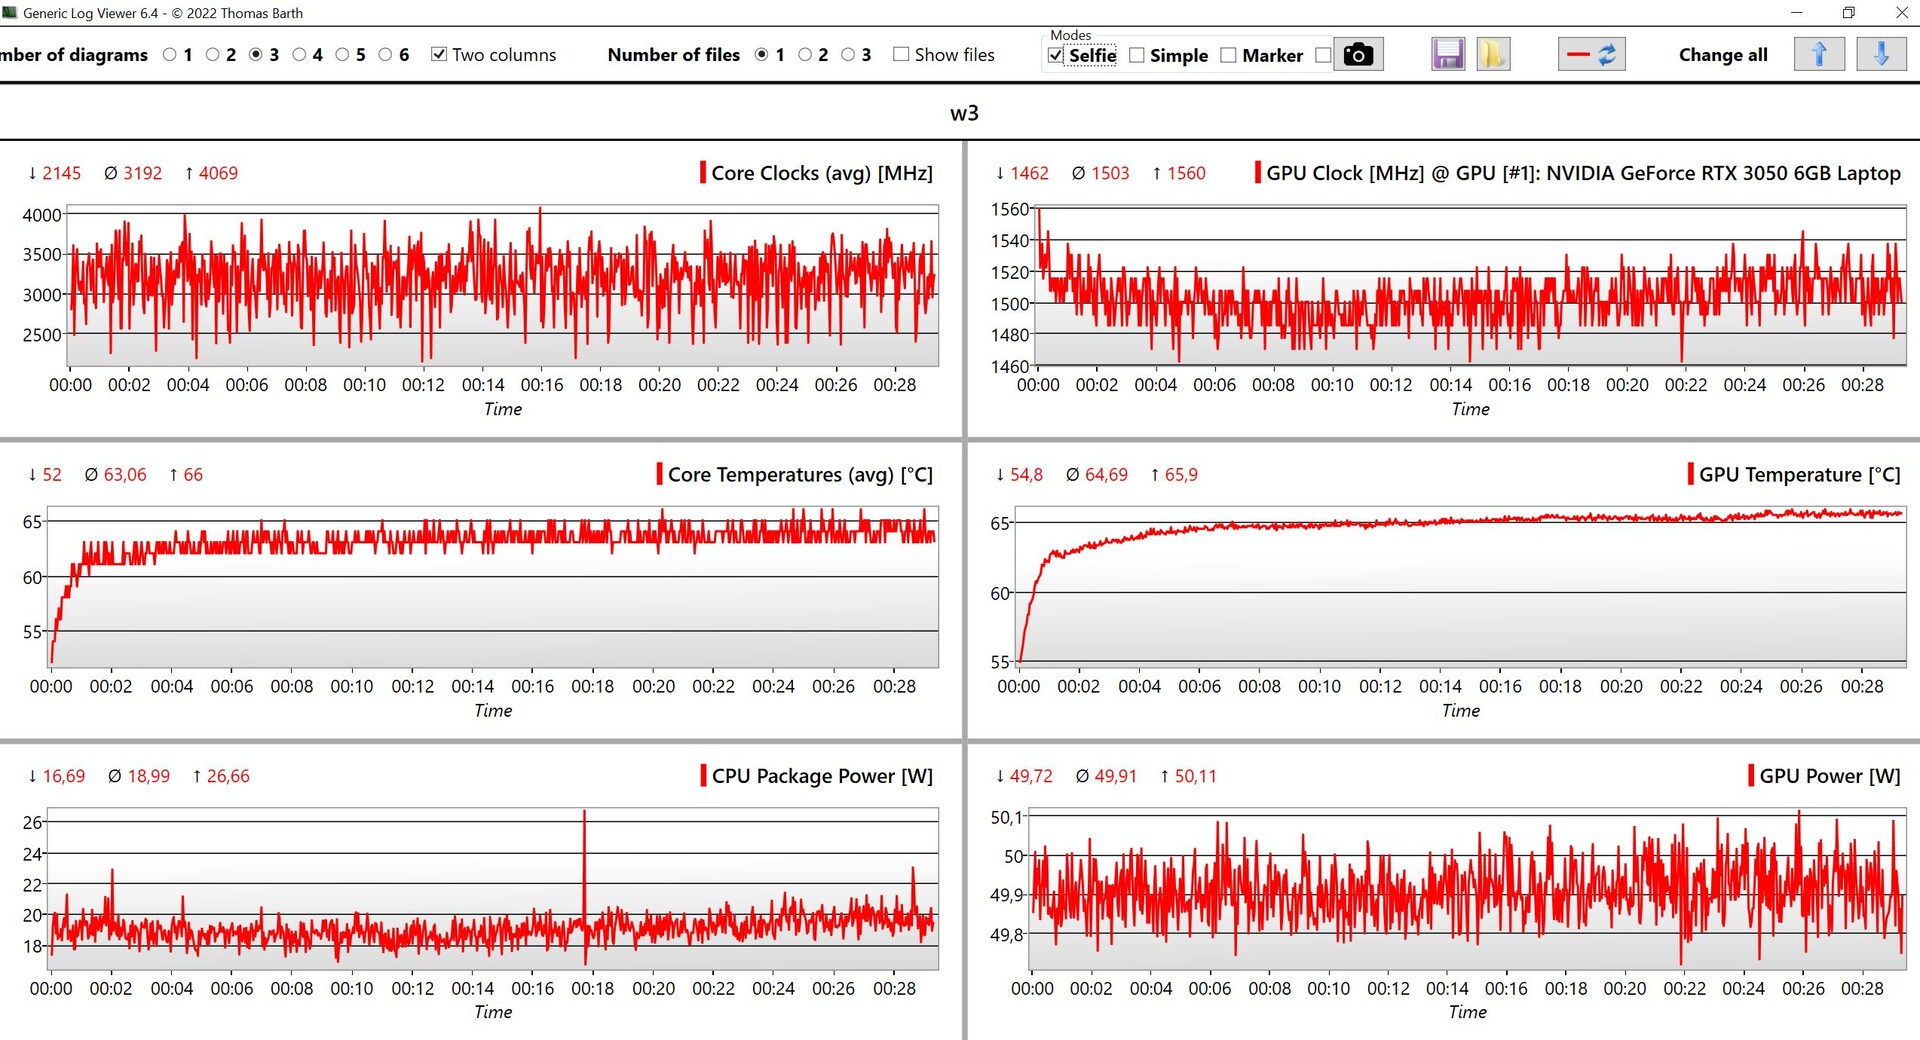
Temperatur
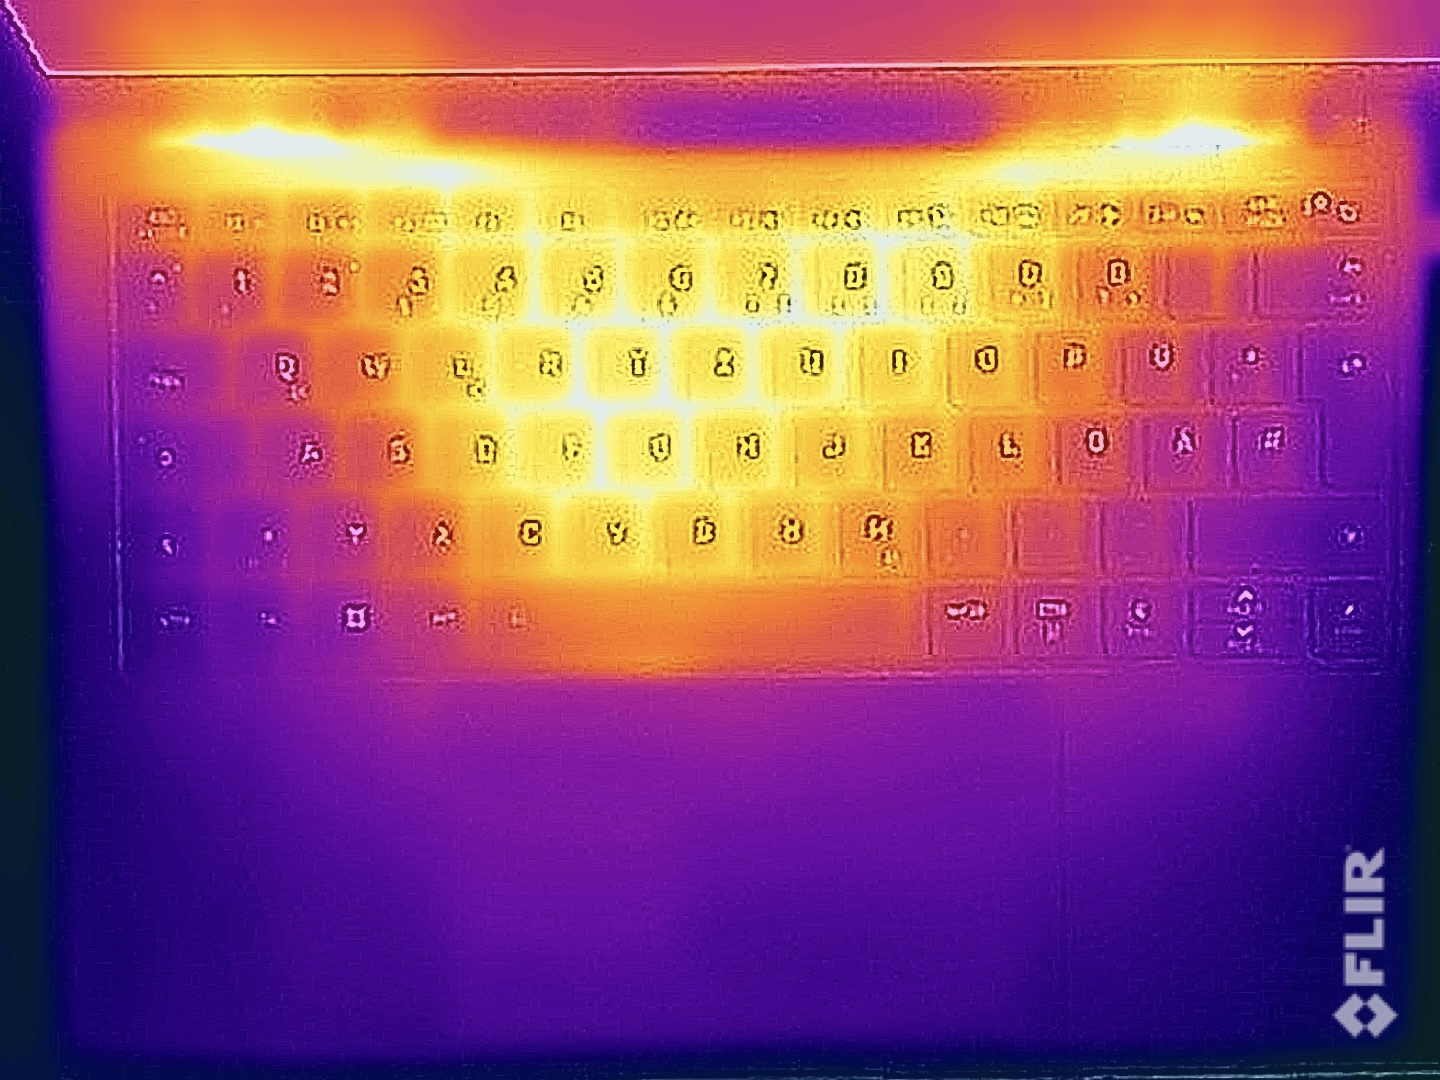
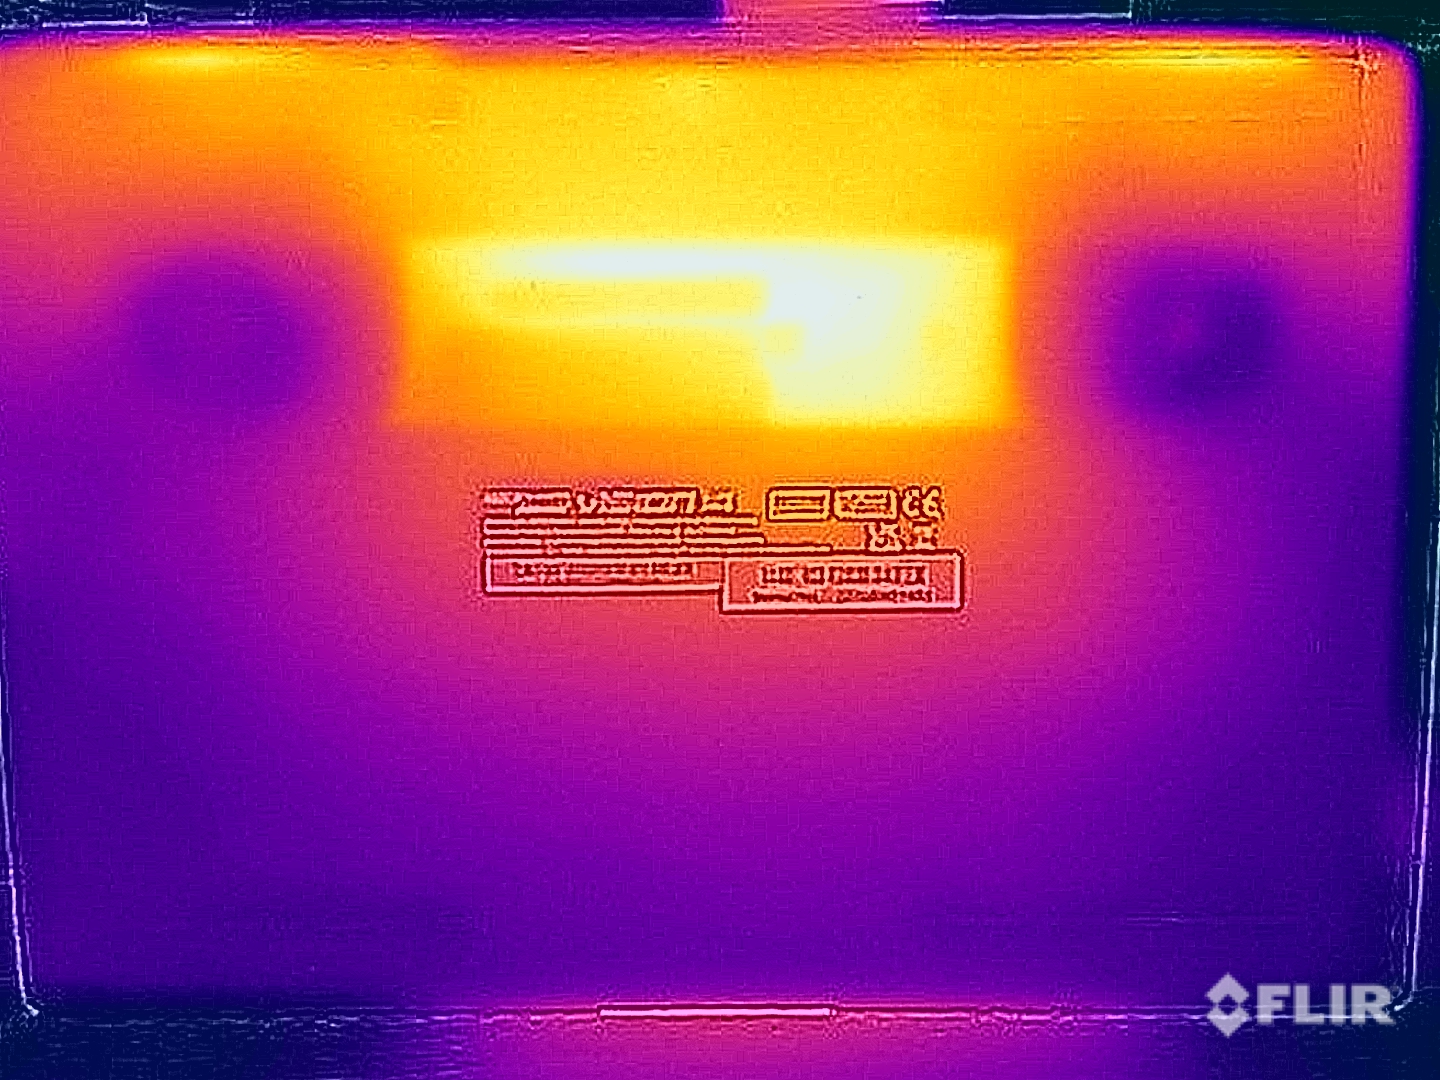
Bei wenig Last sind die Oberflächentemperaturen des Vision 14 vollkommen unproblematisch, sobald man die Komponenten aber stärker fordert, zeigt sich, dass die Kühlung an ihr Limit kommt. Wir messen auf der Oberseite der Baseunit großflächig mehr als 45 °C und auf der Unterseite im mittleren Bereich mehr als 50 °C. Hier sollte man das Gerät also nicht mehr auf den Oberschenkeln abstellen.
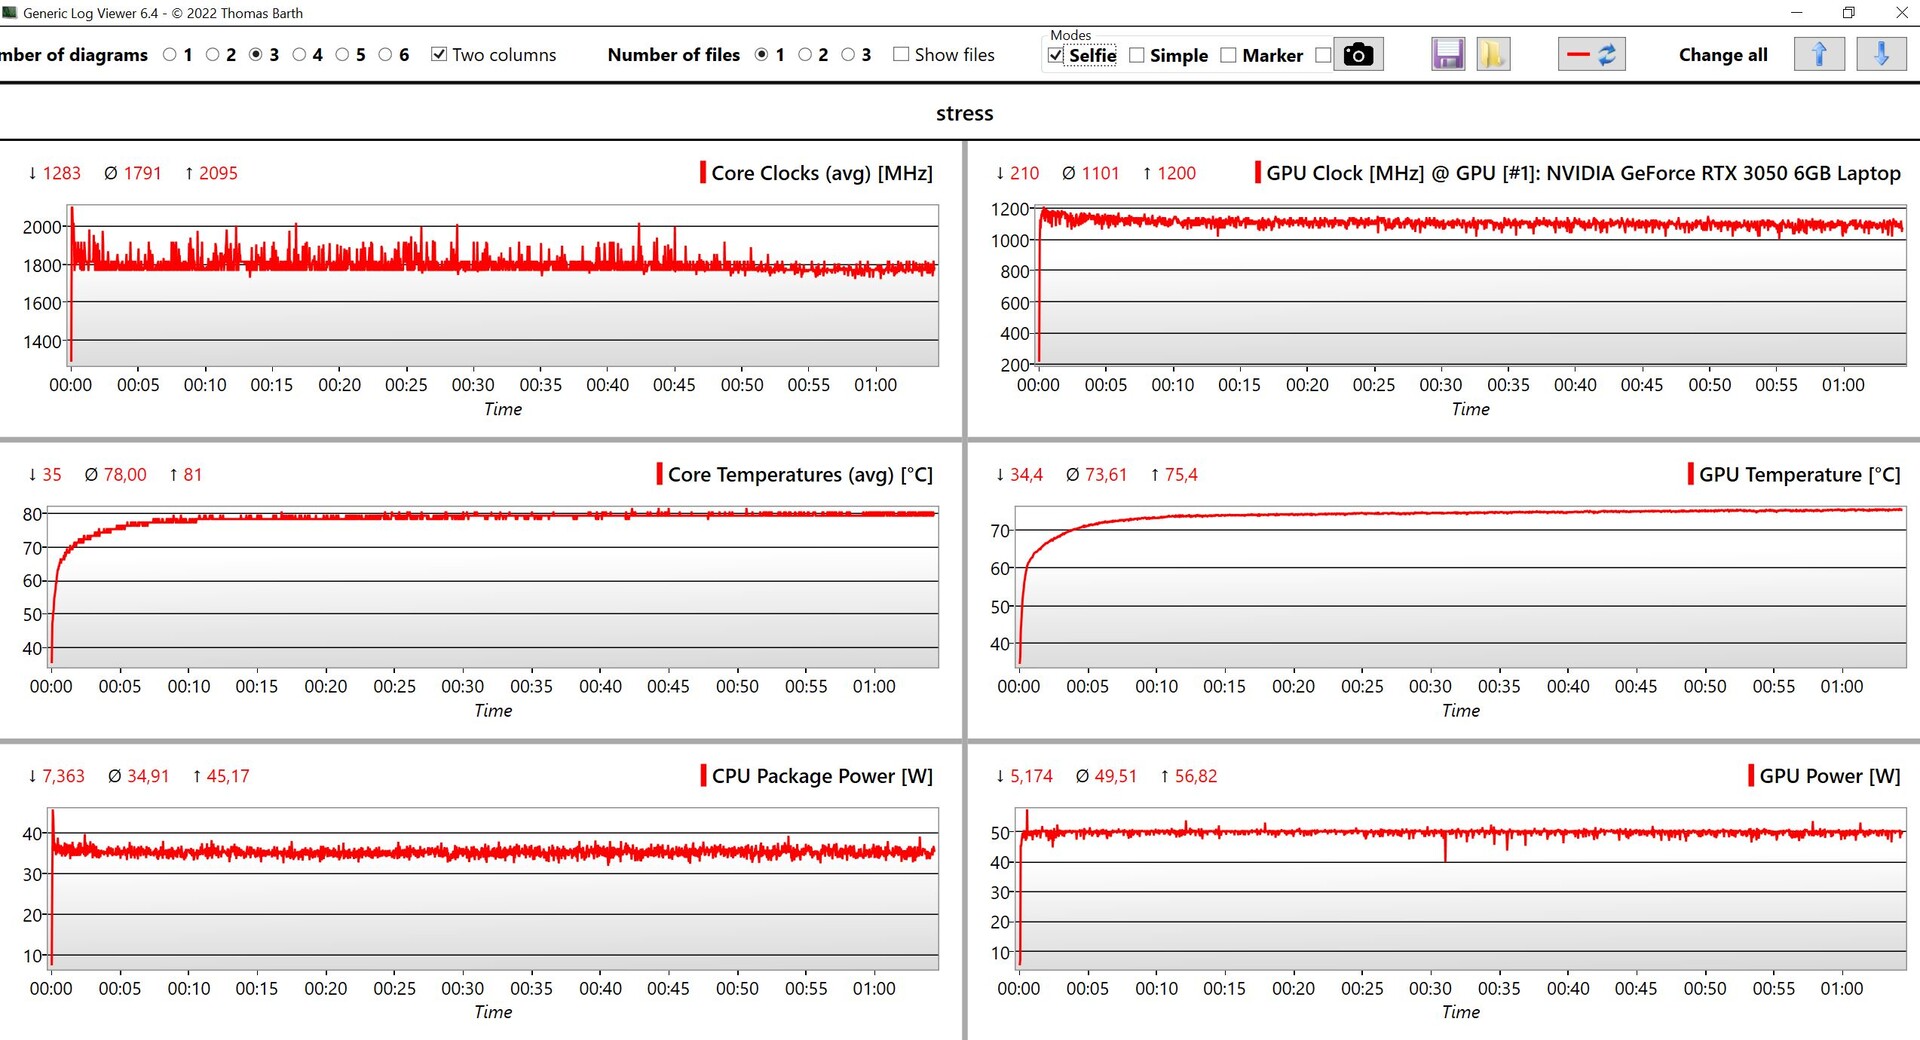
Im Stresstest wird die Grafikkarte bevorzugt, denn sie wird mit konstant mit den vollen 50 Watt betrieben. Der Prozessor hingegen arbeitet zu Beginn kurz mit 45 Watt und pendelt sich dann sofort bei 35 Watt ein.
(-) Die maximale Temperatur auf der Oberseite ist 48.5 °C. Im Vergleich liegt der Klassendurchschnitt bei 35.9 °C (von 21.4 bis 59 °C für die Klasse Subnotebook).
(-) Auf der Unterseite messen wir eine maximalen Wert von 52.8 °C (im Vergleich zum Durchschnitt von 39.2 °C).
(+) Ohne Last messen wir eine durchschnittliche Temperatur von 25.8 °C auf der Oberseite. Der Klassendurchschnitt erreicht 30.8 °C.
(±) Beim längeren Spielen von The Witcher 3 erhitzt sich das Gerät durchschnittlich auf 35.9 °C. Der Durchschnitt der Klasse ist derzeit 30.8 °C.
(+) Die Handballen und der Touchpad-Bereich sind mit gemessenen 26.3 °C kühler als die typische Hauttemperatur und fühlen sich dadurch kühl an.
(±) Die durchschnittliche Handballen-Temperatur anderer getesteter Geräte war 28.2 °C (+1.9 °C).
| Schenker Vision 14 M23 RTX 3050 Intel Core i7-13700H, NVIDIA GeForce RTX 3050 6GB Laptop GPU | Lenovo Yoga Pro 9-14IRP G8 Intel Core i7-13705H, NVIDIA GeForce RTX 4050 Laptop GPU | Acer Swift X SFX14-71G Intel Core i7-13700H, NVIDIA GeForce RTX 4050 Laptop GPU | Asus VivoBook 14X K3405 Intel Core i5-13500H, NVIDIA GeForce RTX 3050 4GB Laptop GPU | Gigabyte Aero 14 OLED BMF Intel Core i7-13700H, NVIDIA GeForce RTX 4050 Laptop GPU | Schenker Vision 14 2022 RTX 3050 Ti Intel Core i7-12700H, NVIDIA GeForce RTX 3050 Ti Laptop GPU | Schenker Vision 14 2023 Intel Core i7-13700H, Intel Iris Xe Graphics G7 96EUs | Lenovo Yoga Pro 7 14IRH G8 Intel Core i7-13700H, NVIDIA GeForce RTX 4050 Laptop GPU | |
|---|---|---|---|---|---|---|---|---|
| Hitze | 0% | 4% | -16% | 5% | -4% | 7% | 3% | |
| Last oben max * (°C) | 48.5 | 41 15% | 46.4 4% | 49.2 -1% | 42 13% | 48.4 -0% | 45.8 6% | 41.6 14% |
| Last unten max * (°C) | 52.8 | 56.7 -7% | 49 7% | 54 -2% | 52 2% | 57.1 -8% | 42 20% | 55.7 -5% |
| Idle oben max * (°C) | 27.6 | 27.4 1% | 26.5 4% | 33.6 -22% | 26 6% | 28.1 -2% | 27.5 -0% | 25.9 6% |
| Idle unten max * (°C) | 27 | 29.1 -8% | 26.6 1% | 37.6 -39% | 27 -0% | 29 -7% | 27.1 -0% | 28 -4% |
* ... kleinere Werte sind besser
Energieaufnahme
Der Idle-Verbrauch des Testgerätes ist etwas höher als bei der iGPU-Version, aber insgesamt sind die Unterschiede gering. Maximal genehmigt sich das Vision 14 im Stresstest 121 Watt, pendelt sich dann aber schnell bei etwa 110 Watt ein und bleibt auf diesem Niveau. Das mitgelieferte 150-Watt-Netzteil ist damit ausreichend dimensioniert und hat auch noch Spielraum, um den Akku in Last-Szenarien zu Laden, falls das nötig sein sollte.
| Aus / Standby | |
| Idle | |
| Last |
|
Legende:
min: | |
Energieaufnahme Witcher 3 / Stresstest
Energieaufnahme mit externem Monitor
Akkulaufzeit
Analog zum höheren Idle-Verbrauch fallen die Akkulaufzeiten etwas geringer aus als bei der iGPU-Version, im Vergleich zum alten Vision 14 mit der RTX 3050 Ti gibt es aber trotzdem Verbesserungen. Mit dem 99-Wh-Akku erreicht das Testgerät im WLAN-Test bei einer Helligkeit von 150 cd/m² (entspricht beim Testgerät 35 % von der maximalen Helligkeit) eine sehr gute Laufzeit von 12 Stunden und selbst bei voller Helligkeit noch 09:40 Stunden. Mit diesen Ergebnissen kann sich das Vision 14 auch spürbar vor den restlichen Vergleichsgeräten platzieren.
Pro
Contra
Fazit - Schenker Vision 14 fällt hinter die Konkurrenz zurück
Vor allem das 2022er-Modell des Schenker Vision 14 mit dem Intel-H45-Prozessor in Verbindung mit der Nvidia GeForce RTX 3050 Ti im kompakten Gehäuse war ein extrem ansprechendes Gesamtpaket. Die guten Eigenschaften wie das hochwertige Gehäuse mit vielen Anschlüssen, guten Wartungsmöglichkeiten (vor allem die beiden RAM-Slots muss man in der heutigen Zeit einfach positiv erwähnen), das hochauflösende Display die langen Akkulaufzeiten sind weiterhin positive Aspekte.
Das 2023er-Modell zeigt jetzt allerdings langsam sein Alter. Der Raptor-Lake-Prozessor Core i7-13700H ist aufgrund von reduzierten Power Limits sogar etwas langsamer als der Alder-Lake-Vorgänger und auch die "neue" GeForce RTX 3050 mit 6 GB VRAM ist insgesamt auf dem Niveau der alten GeForce RTX 3050 Ti mit 4 GB VRAM. Das große Problem hierbei ist einfach, dass die Multimedia-Konkurrenz durchgängig auf die neue GeForce RTX 4050 Laptop gewechselt ist, die einfach deutlich mehr Grafikleistung bietet.
Das Vision 14 M23 fällt bei der Grafikleistung hinter die Konkurrenz zurück, denn die GeForce RTX 3050 6GB Laptop kann einfach nicht mit der neuen GeForce RTX 4050 Laptop mithalten.
Für sich gesehen ist das Vision 14 mit der RTX 3050 Refresh weiterhin ein sehr gutes Subnotebook, welches sich vor allem mit den guten Wartungsmöglichkeiten von der Konkurrenz abhebt. Allerdings bieten diese nun einfach mehr Leistung und wer sich für ein kompaktes Subnotebook/Multimedia-Notebook mit dedizierter GPU interessiert, ist bei der Konkurrenz aktuell oftmals Fällen besser aufgehoben. Der wohl stärkste Konkurrent ist das Yoga Pro 7 14 mit dem Core i7-13700H, der RTX 4050 Laptop sowie dem 3K-IPS-Display mit 120 Hz. Es ist mit rund 1.700 Euro günstiger, allerdings sind die Akkulaufzeiten schlechter und der Arbeitsspeicher (16 GB) kann nicht erweitert werden.
Preis und Verfügbarkeit
Das Schenker Vision 14 M23 kann bei Bestware ab 1.399 Euro konfiguriert werden.
Schenker Vision 14 M23 RTX 3050
- 11.01.2024 v7 (old)
Andreas Osthoff
Transparenz
Die Auswahl der zu testenden Geräte erfolgt innerhalb der Redaktion. Das vorliegende Testmuster wurde dem Autor vom Hersteller oder einem Shop zu Testzwecken leihweise zur Verfügung gestellt. Eine Einflussnahme des Leihstellers auf den Testbericht gab es nicht, der Hersteller erhielt keine Version des Reviews vor der Veröffentlichung. Es bestand keine Verpflichtung zur Publikation. Als eigenständiges, unabhängiges Unternehmen unterliegt Notebookcheck keiner Diktion von Herstellern, Shops und Verlagen.
So testet Notebookcheck
Pro Jahr werden von Notebookcheck hunderte Laptops und Smartphones unabhängig in von uns standardisierten technischen Verfahren getestet, um eine Vergleichbarkeit aller Testergebnisse zu gewährleisten. Seit rund 20 Jahren entwickeln wir diese Testmethoden kontinuierlich weiter und setzen damit Branchenstandards. In unseren Testlaboren kommt ausschließlich hochwertiges Messequipment in die Hände erfahrener Techniker und Redakteure. Die Tests unterliegen einer mehrstufigen Kontrolle. Unsere komplexe Gesamtbewertung basiert auf hunderten fundierten Messergebnissen und Benchmarks, womit Ihnen Objektivität garantiert ist. Weitere Informationen zu unseren Testmethoden gibt es hier.
Preisvergleich
