Radeon RX 6550M Leistungsdebüt: Lenovo ThinkPad Z16 Gen 2 im Test

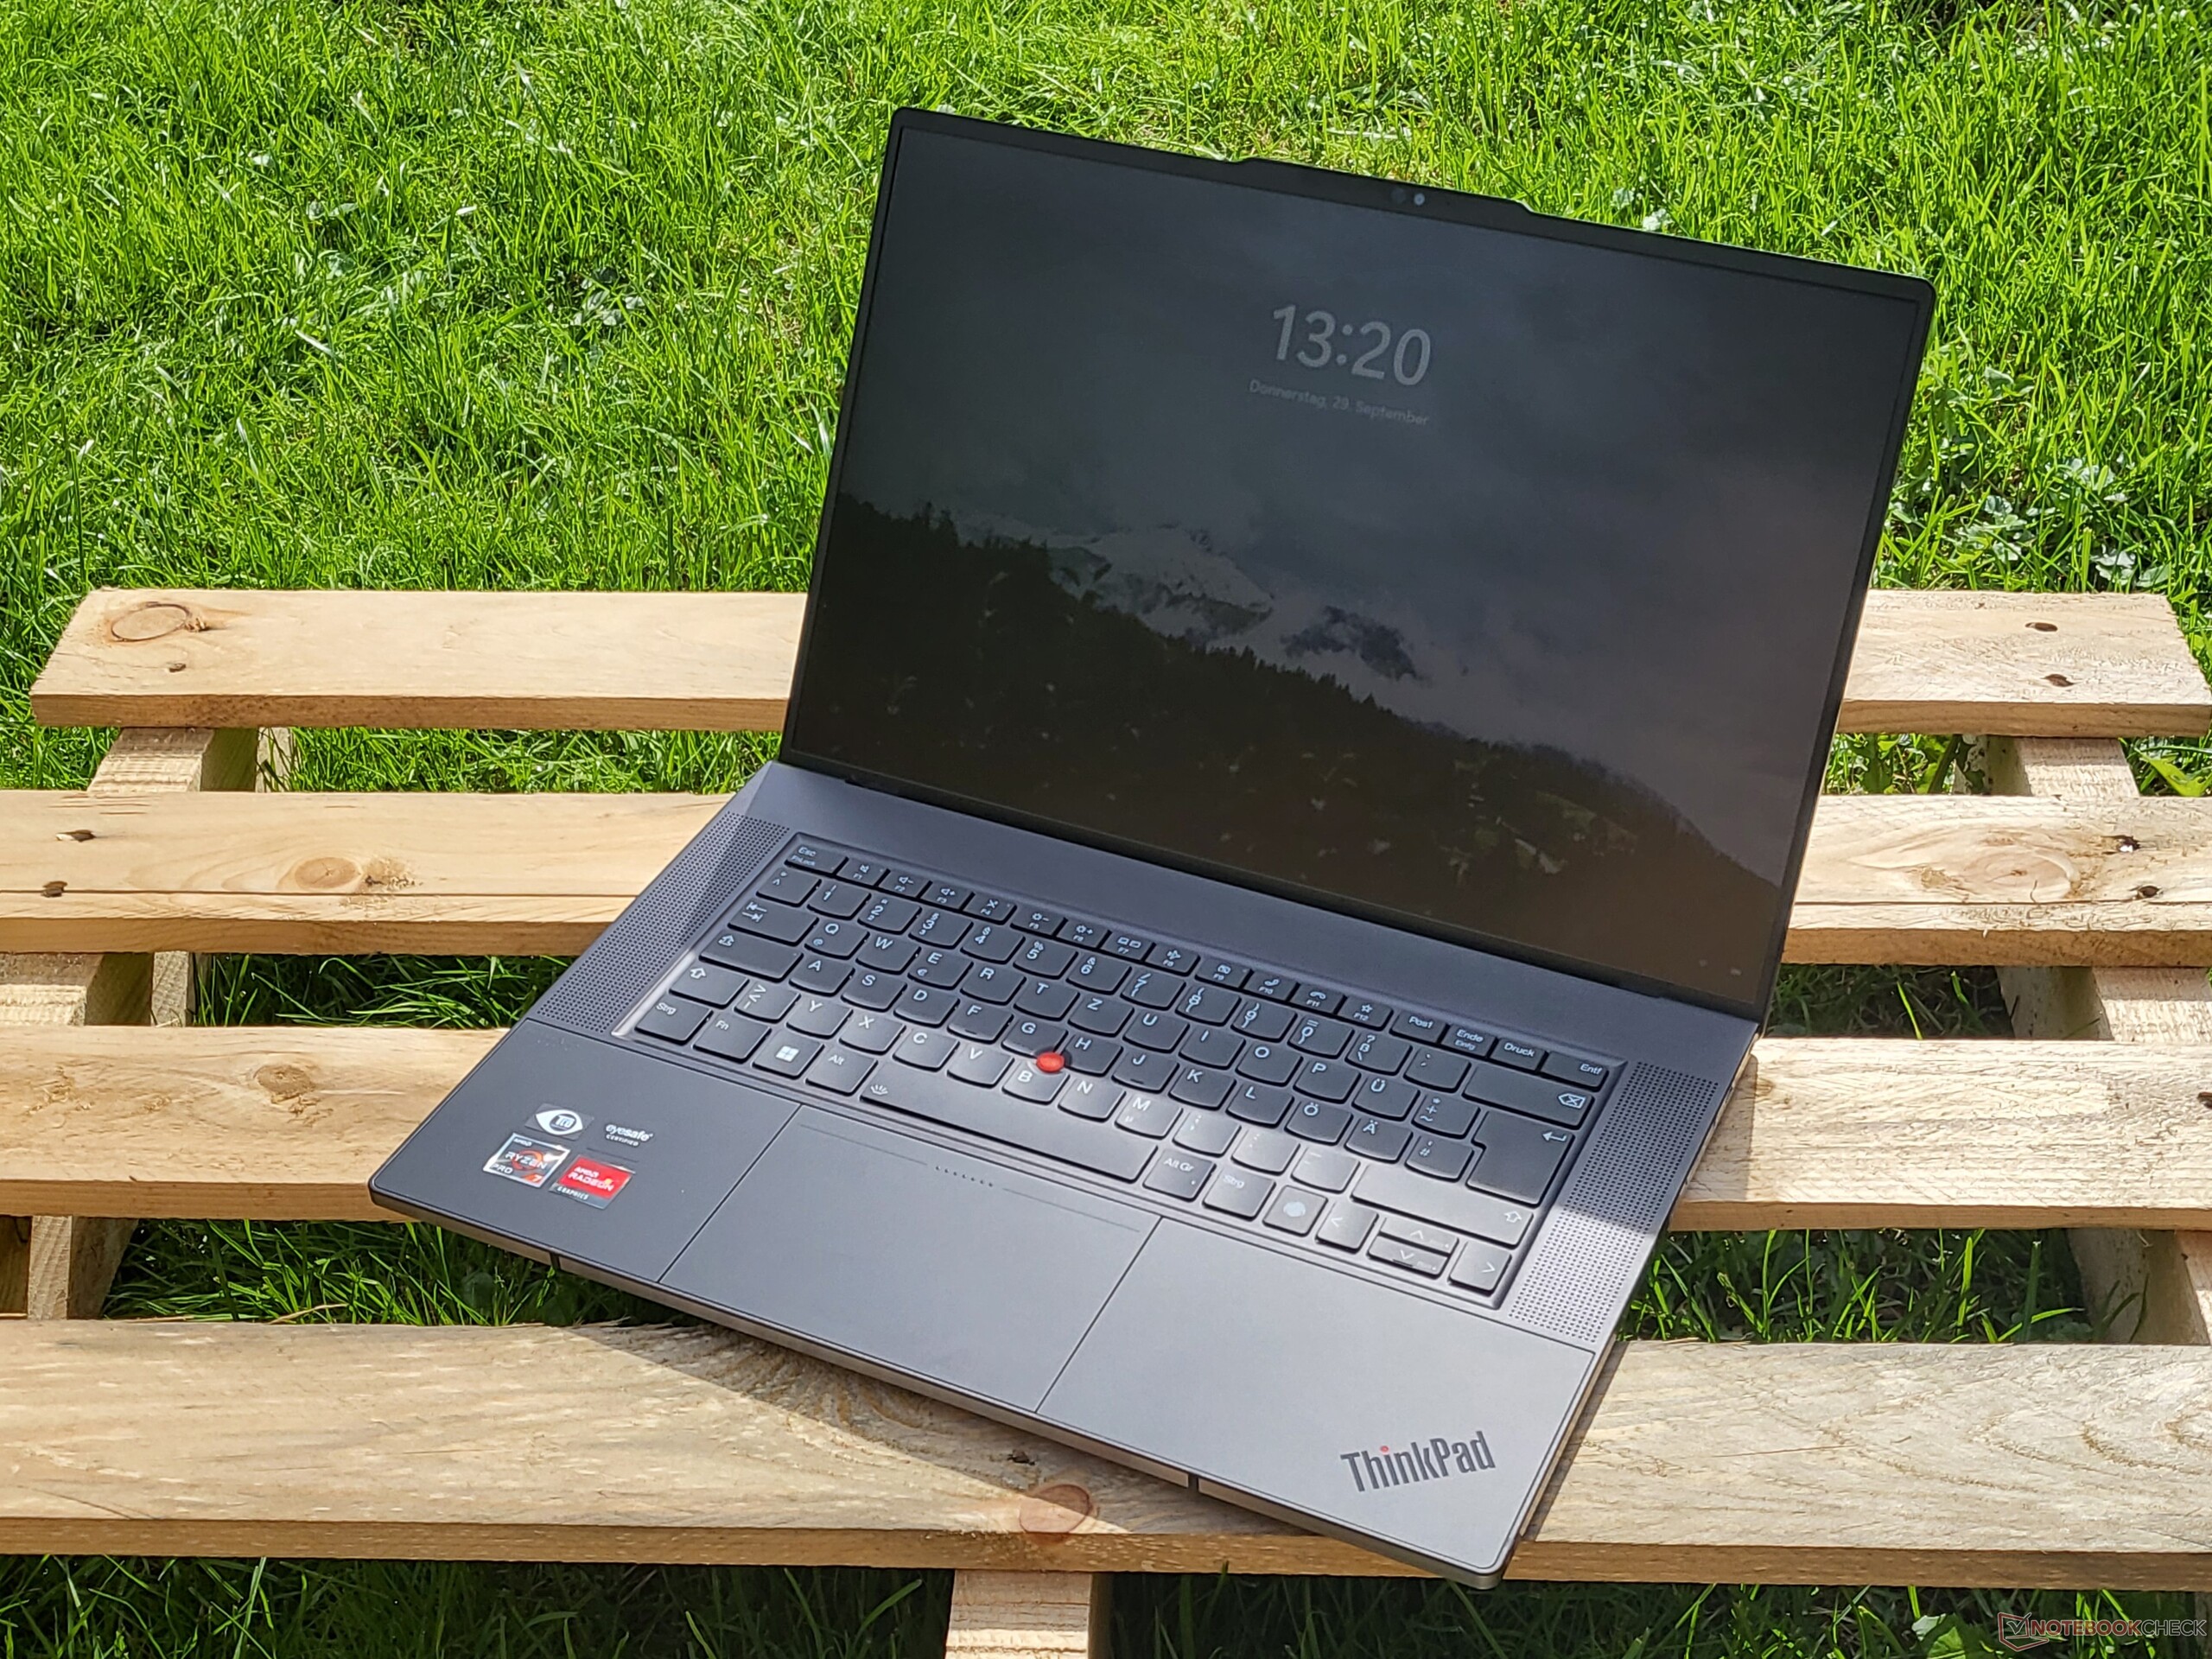
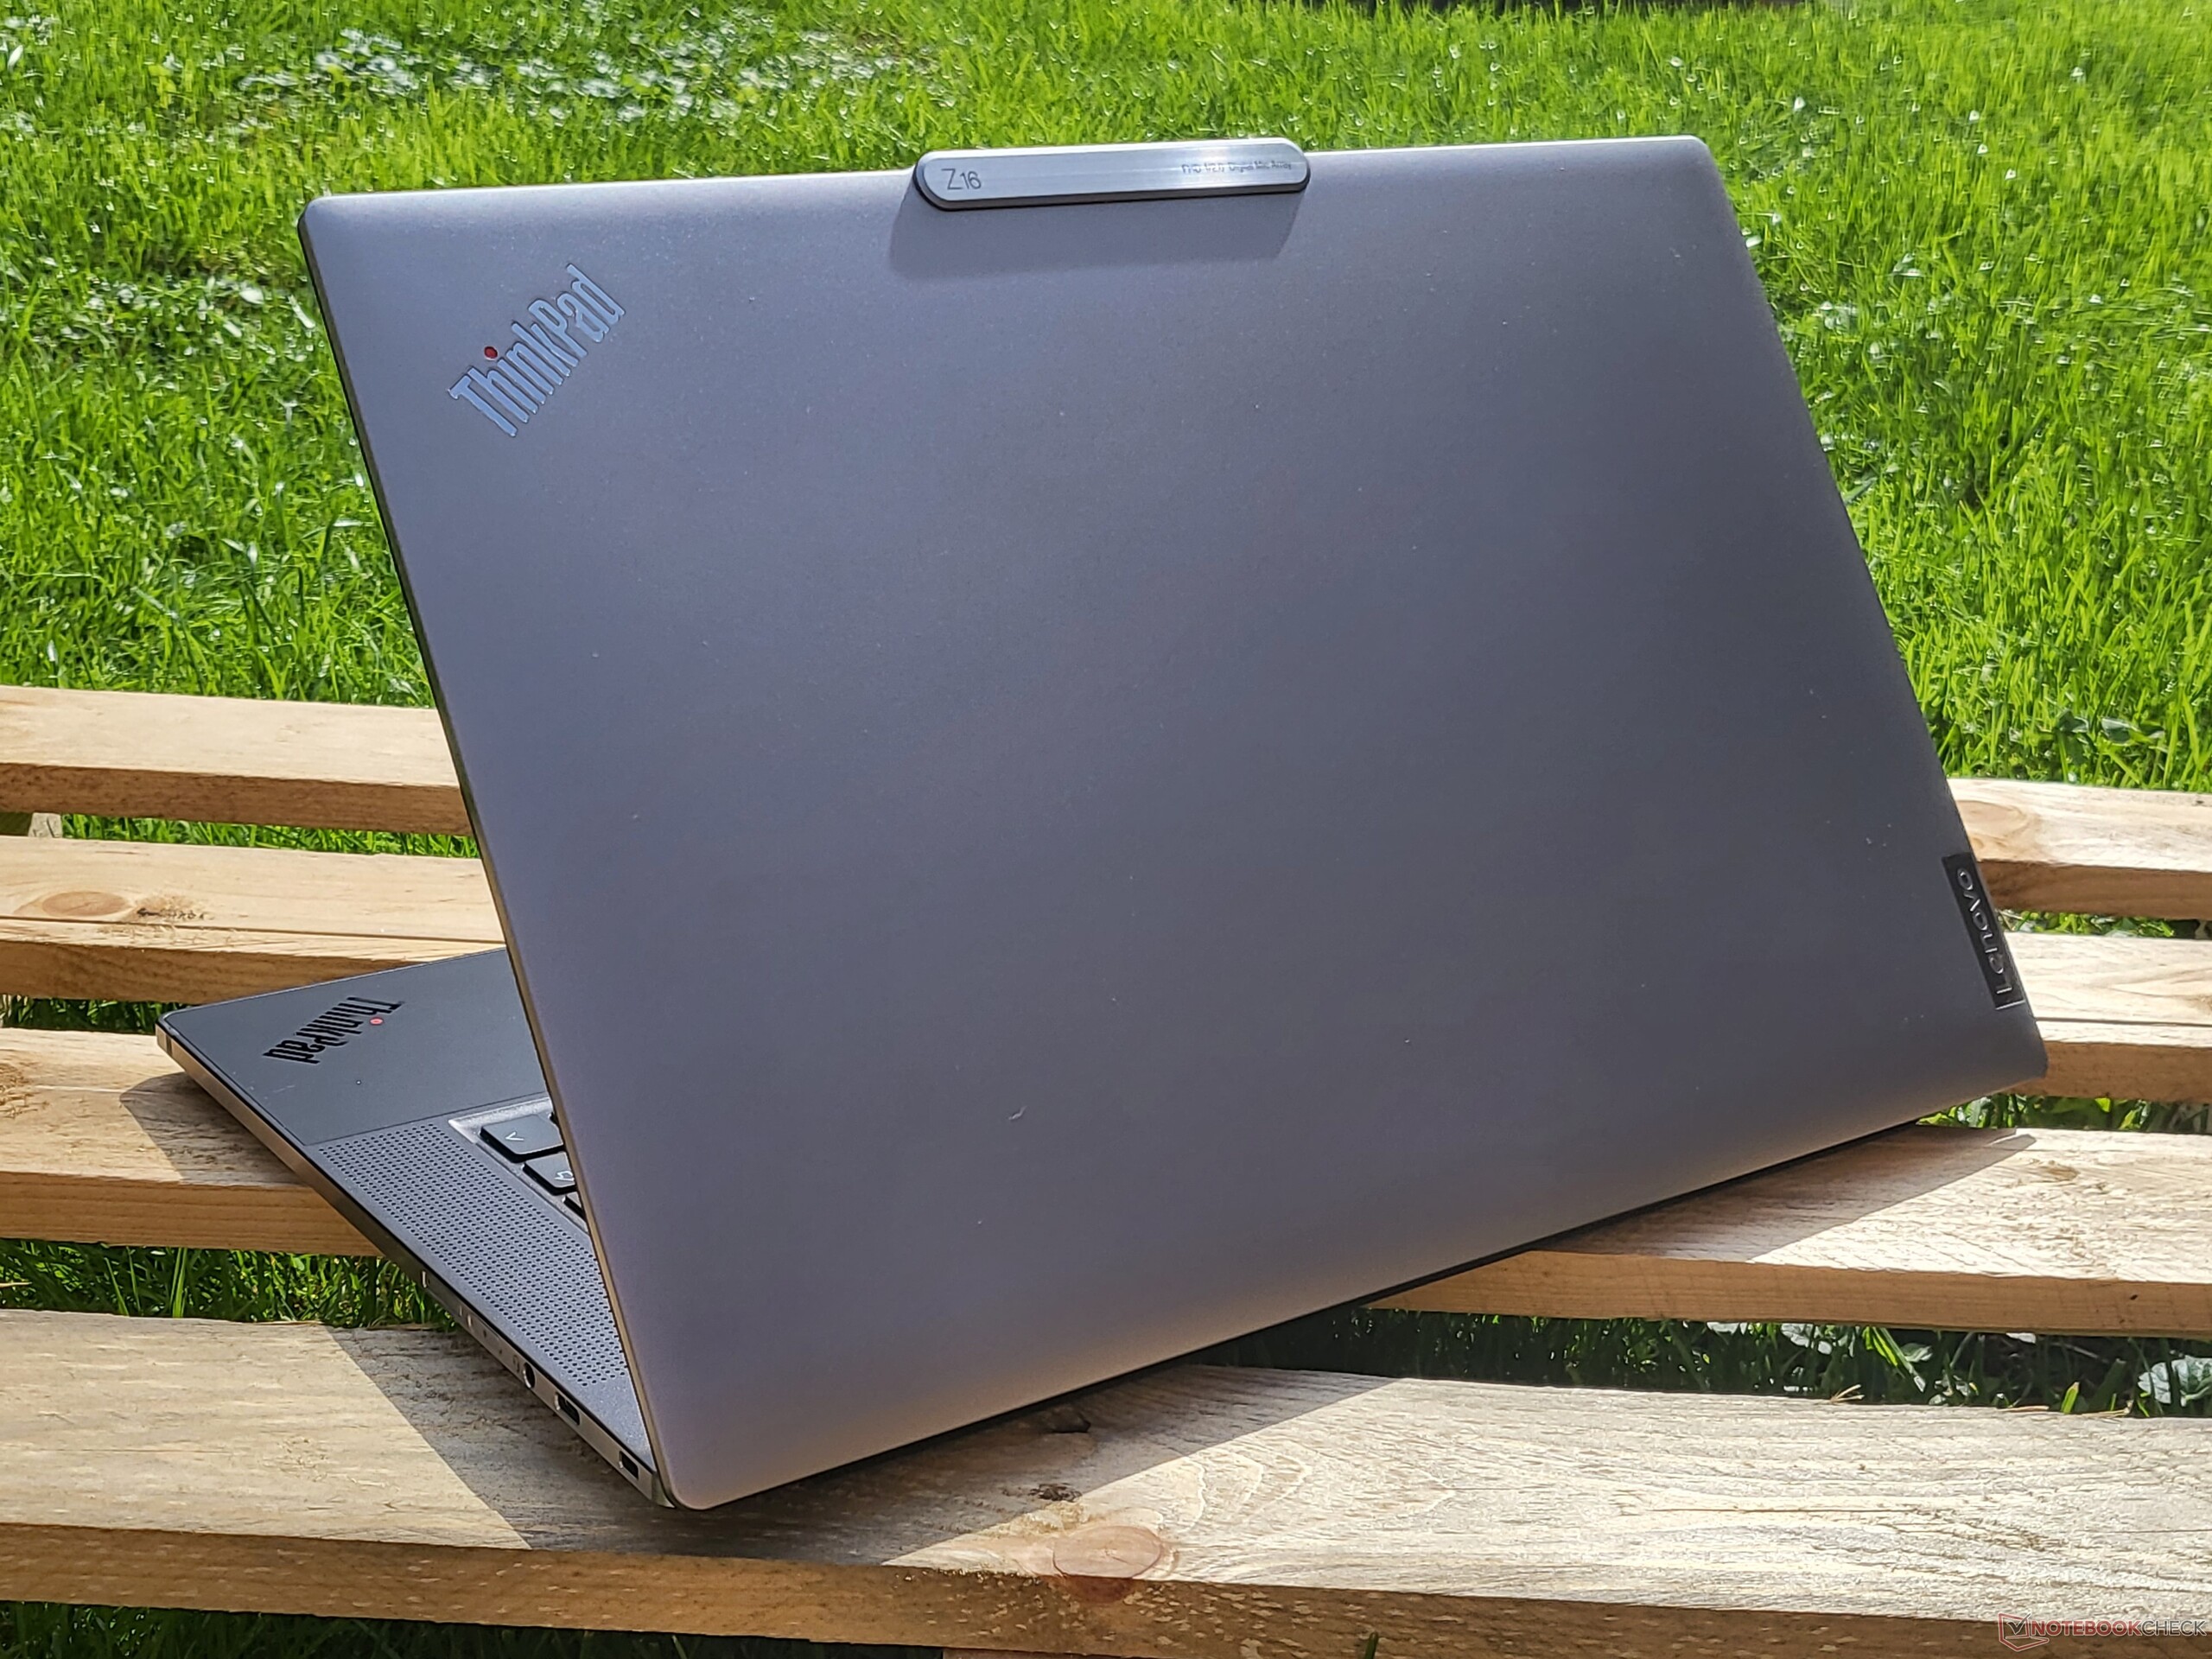
Das ThinkPad Z16 G2 ist der Nachfolger des ein Jahr alten ThinkPad Z16 G1 mit neuen AMD Zen 4 CPU-Optionen, schnellerer Radeon RX-Grafik und einem neuen 2400p OLED-Touchscreen. Es ist außerdem eines der wenigen Notebooks mit der ungewöhnlichen Einstiegsgrafik Radeon RX 6550M. Das Gehäuse ist identisch mit dem des ThinkPad Z16 G1, weshalb wir empfehlen, einen Blick auf unseren Testbericht der ersten Generation zu werfen, um mehr über die physischen Eigenschaften und Anschlussmöglichkeiten der Serie zu erfahren.
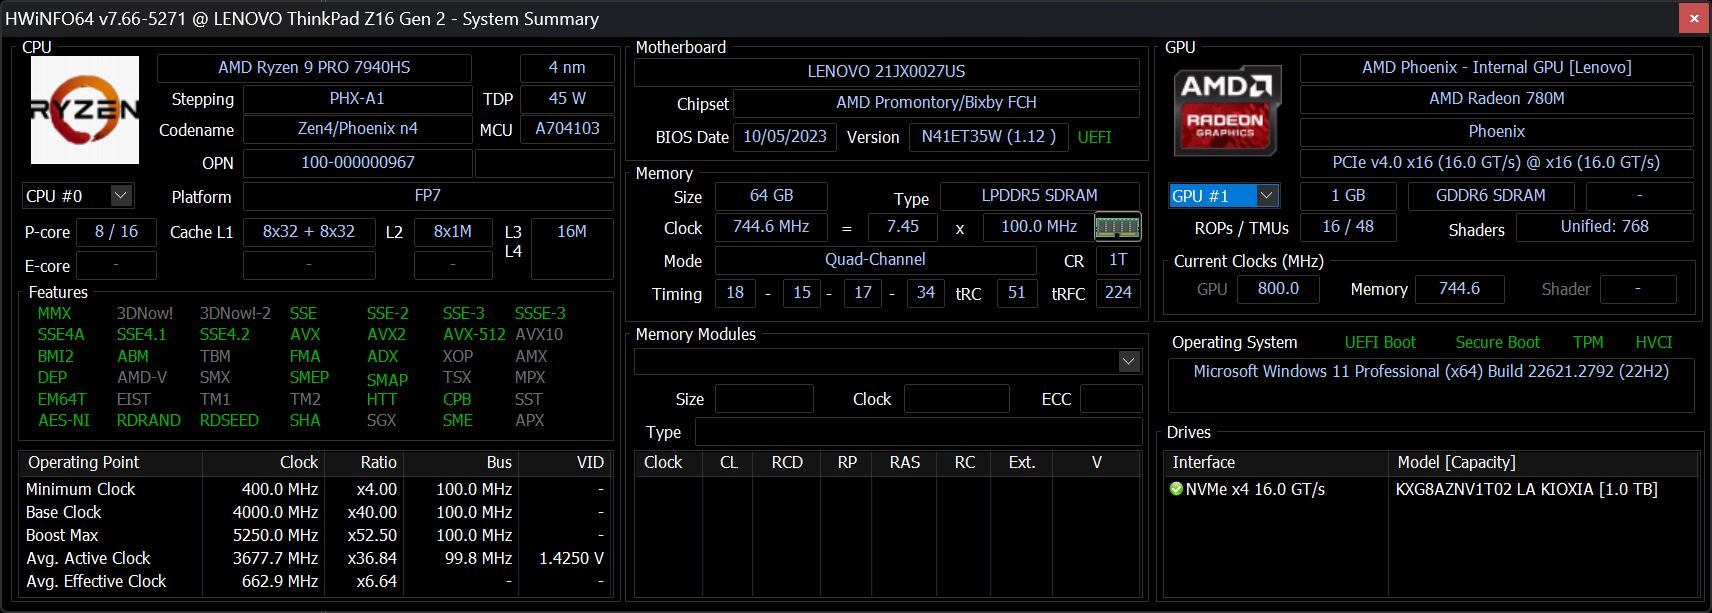
Bei unserem Testgerät handelt es sich um die High-End-Konfiguration mit Ryzen 9 Pro 7940HS, Radeon RX 6550M, OLED-Touchscreen und 64 GB Arbeitsspeicher für ca. 2.700 Euro. Niedrigere SKUs beginnen mit dem Ryzen 5 Pro 7640HS, integrierter Grafik und einem 1200p IPS-Display für 2.000 Euro. Das ThinkPad Z16 kann als semiprofessionelles Multimedia- oder Content-Creator-Notebook betrachtet werden, da es mit Ryzen Pro-CPUs ausgestattet ist und nicht mit den typischen Nicht-Pro-Optionen.
Alternativen zum ThinkPad Z16 G2 sind andere 16-Zoll-Laptops der Spitzenklasse wie das MSI Creator Z16P, das Apple MacBook Pro 16, das Asus Vivobook Pro 16X oder die Dell XPS-Serie.
Weitere Lenovo Bewertungen:
Potential Competitors in Comparison
Bew. | Datum | Modell | Gewicht | Dicke | Größe | Auflösung | Preis ab |
|---|---|---|---|---|---|---|---|
| 88.6 % v7 (old) | 12 / 2023 | Lenovo ThinkPad Z16 Gen 2 R9 PRO 7940HS, Radeon RX 6550M | 1.8 kg | 15.8 mm | 16.00" | 3840x2400 | |
| 87.3 % v7 (old) | 09 / 2022 | Lenovo ThinkPad Z16 G1 21D5S00T00 R7 PRO 6850H, Radeon RX 6500M | 1.9 kg | 15.8 mm | 16.00" | 1920x1200 | |
| 85.7 % v7 (old) | 11 / 2023 | Lenovo ThinkBook 16 G6 ABP R5 7530U, Vega 7 | 1.8 kg | 17.5 mm | 16.00" | 1920x1200 | |
| 83.7 % v7 (old) | 06 / 2022 | MSI Creator Z16P B12UHST i9-12900H, GeForce RTX 3080 Ti Laptop GPU | 2.4 kg | 20.4 mm | 16.00" | 2560x1600 | |
| 93.7 % v7 (old) | 11 / 2023 | Apple MacBook Pro 16 2023 M3 Pro Apple M3 Pro 12-Core, M3 Pro 18-Core GPU | 2.1 kg | 16.9 mm | 16.20" | 3456x2234 | |
| 86.2 % v7 (old) | 07 / 2023 | Asus Vivobook Pro 16X K6604JV-MX016W i9-13980HX, GeForce RTX 4060 Laptop GPU | 2.1 kg | 22.8 mm | 16.00" | 3200x2000 |
Gehäuse
SD Card Reader
| SD Card Reader | |
| average JPG Copy Test (av. of 3 runs) | |
| Lenovo ThinkPad Z16 Gen 2 (Toshiba Exceria Pro SDXC 64 GB UHS-II) | |
| Asus Vivobook Pro 16X K6604JV-MX016W | |
| Lenovo ThinkPad Z16 G1 21D5S00T00 | |
| Lenovo ThinkBook 16 G6 ABP (Angelbird AV Pro V60) | |
| MSI Creator Z16P B12UHST (AV PRO microSD 128 GB V60) | |
| maximum AS SSD Seq Read Test (1GB) | |
| Lenovo ThinkPad Z16 G1 21D5S00T00 | |
| Lenovo ThinkPad Z16 Gen 2 (Toshiba Exceria Pro SDXC 64 GB UHS-II) | |
| Asus Vivobook Pro 16X K6604JV-MX016W | |
| Lenovo ThinkBook 16 G6 ABP (Angelbird AV Pro V60) | |
Kommunikation
Lenovo hat den Qualcomm WCN685x aus dem letztjährigen Modell gegen einen MediaTek MT7922 ausgetauscht, der in diesem Jahr zum Einsatz kommt. Die Übertragungsraten bleiben konstant und ausgezeichnet, wenn es mit unseren Wi-Fi 6- oder Wi-Fi 6E-Netzwerken verbunden ist.
| Networking | |
| iperf3 transmit AXE11000 | |
| Lenovo ThinkPad Z16 G1 21D5S00T00 | |
| Asus Vivobook Pro 16X K6604JV-MX016W | |
| Lenovo ThinkPad Z16 Gen 2 | |
| Lenovo ThinkBook 16 G6 ABP | |
| iperf3 receive AXE11000 | |
| Lenovo ThinkPad Z16 G1 21D5S00T00 | |
| Asus Vivobook Pro 16X K6604JV-MX016W | |
| MSI Creator Z16P B12UHST | |
| Lenovo ThinkPad Z16 Gen 2 | |
| Lenovo ThinkBook 16 G6 ABP | |
| iperf3 transmit AXE11000 6GHz | |
| Lenovo ThinkPad Z16 G1 21D5S00T00 | |
| Asus Vivobook Pro 16X K6604JV-MX016W | |
| Lenovo ThinkPad Z16 Gen 2 | |
| iperf3 receive AXE11000 6GHz | |
| Lenovo ThinkPad Z16 G1 21D5S00T00 | |
| Asus Vivobook Pro 16X K6604JV-MX016W | |
| Lenovo ThinkPad Z16 Gen 2 | |
Webcam
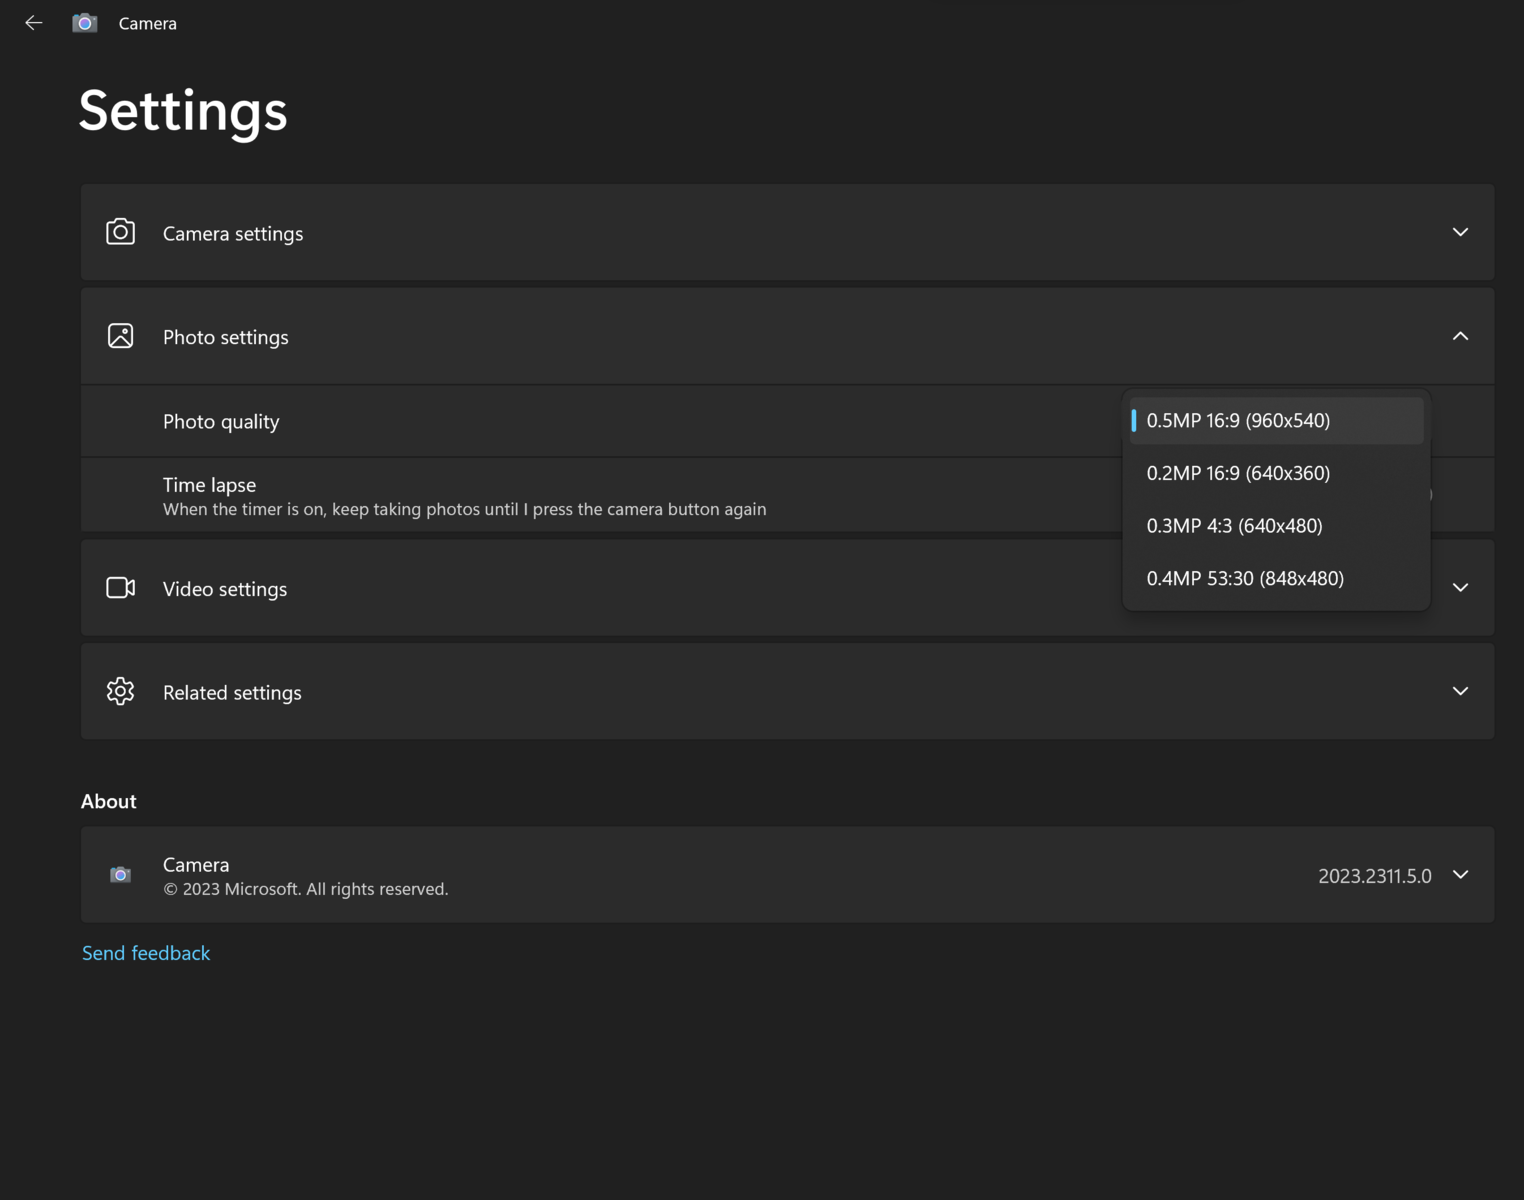
Obwohl Lenovo mit einer 2-MP-Webcam wirbt, können wir in der eingebauten Kamera-App nur bis zu 0,5 MP auswählen, wie der Screenshot auf der rechten Seite zeigt. Wir haben Lenovo über den Fehler informiert und werden diesen Abschnitt aktualisieren, sobald wir eine Antwort erhalten.


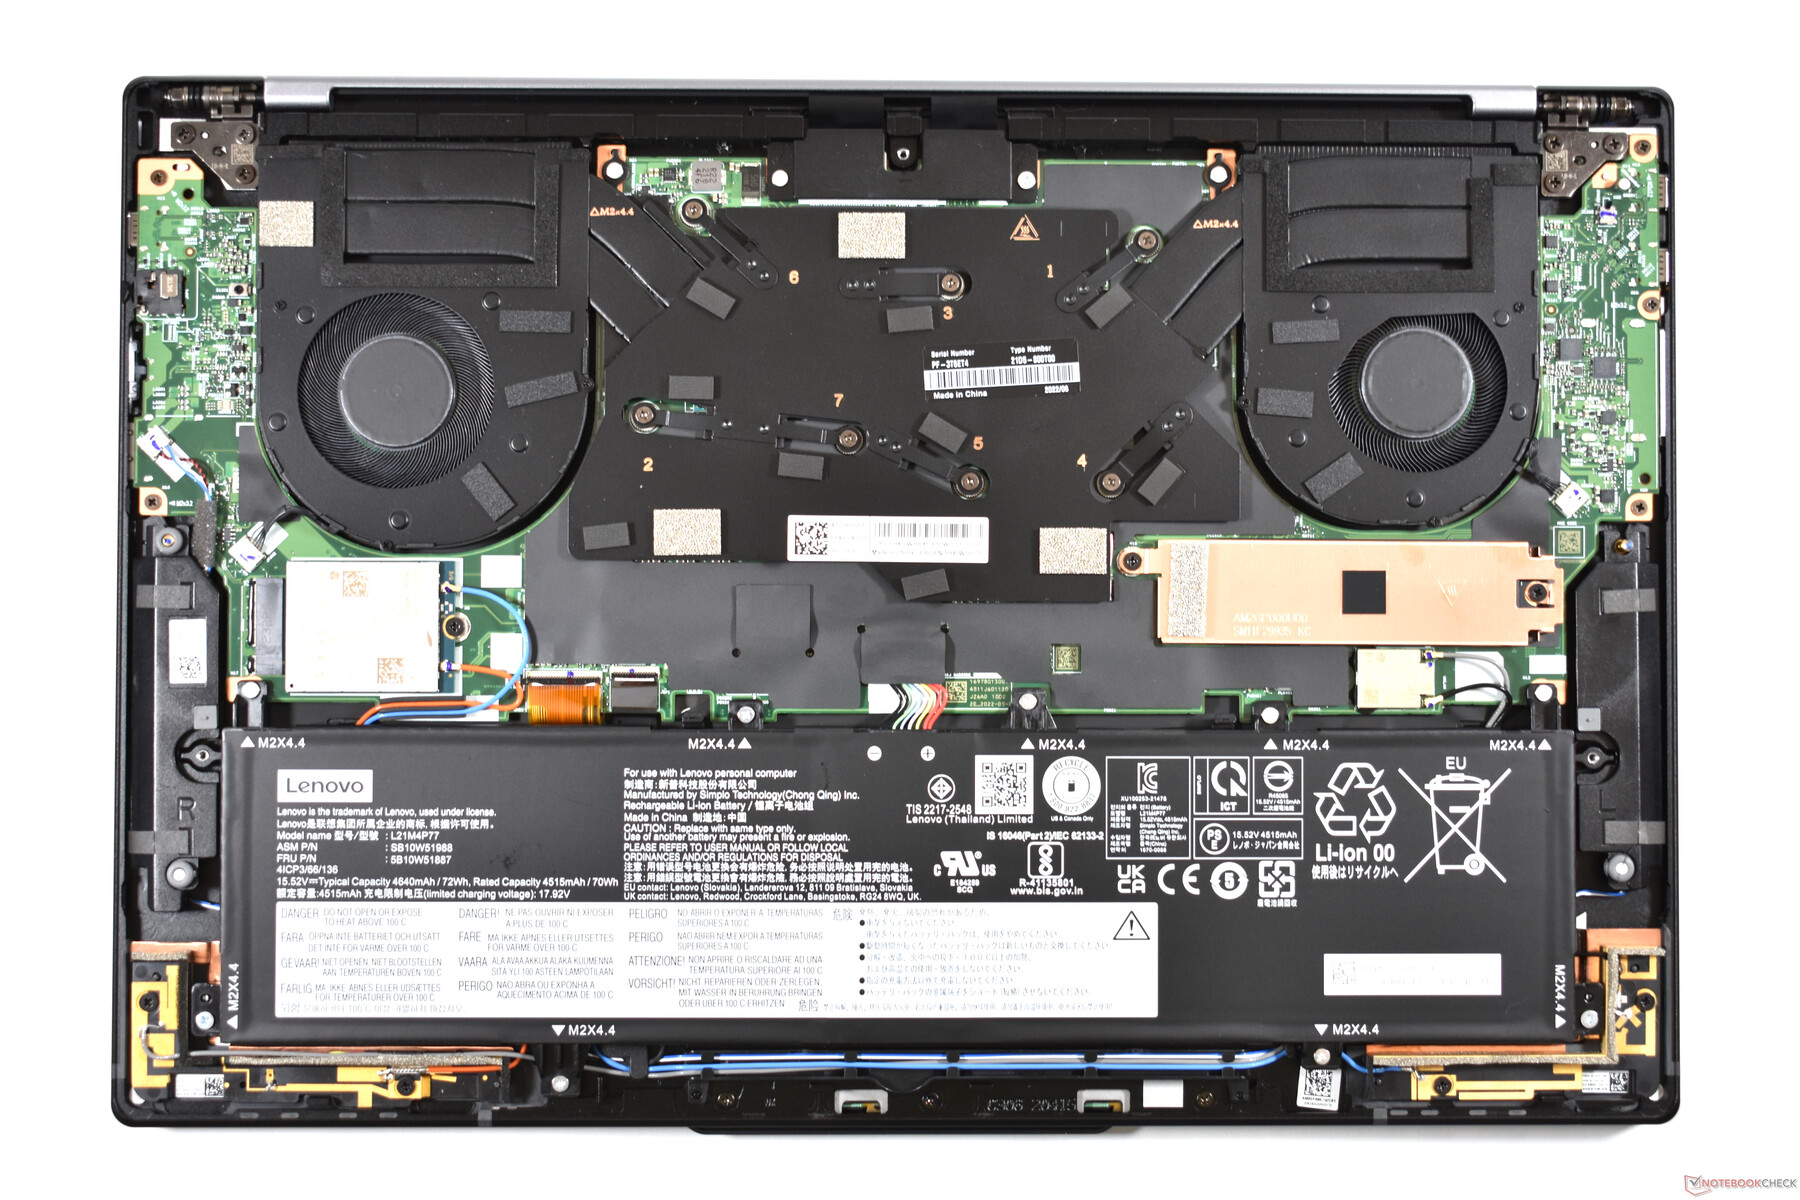
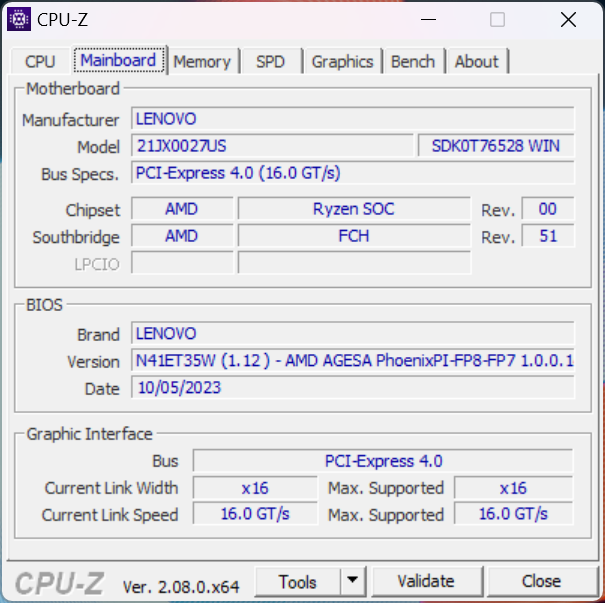
Wartung
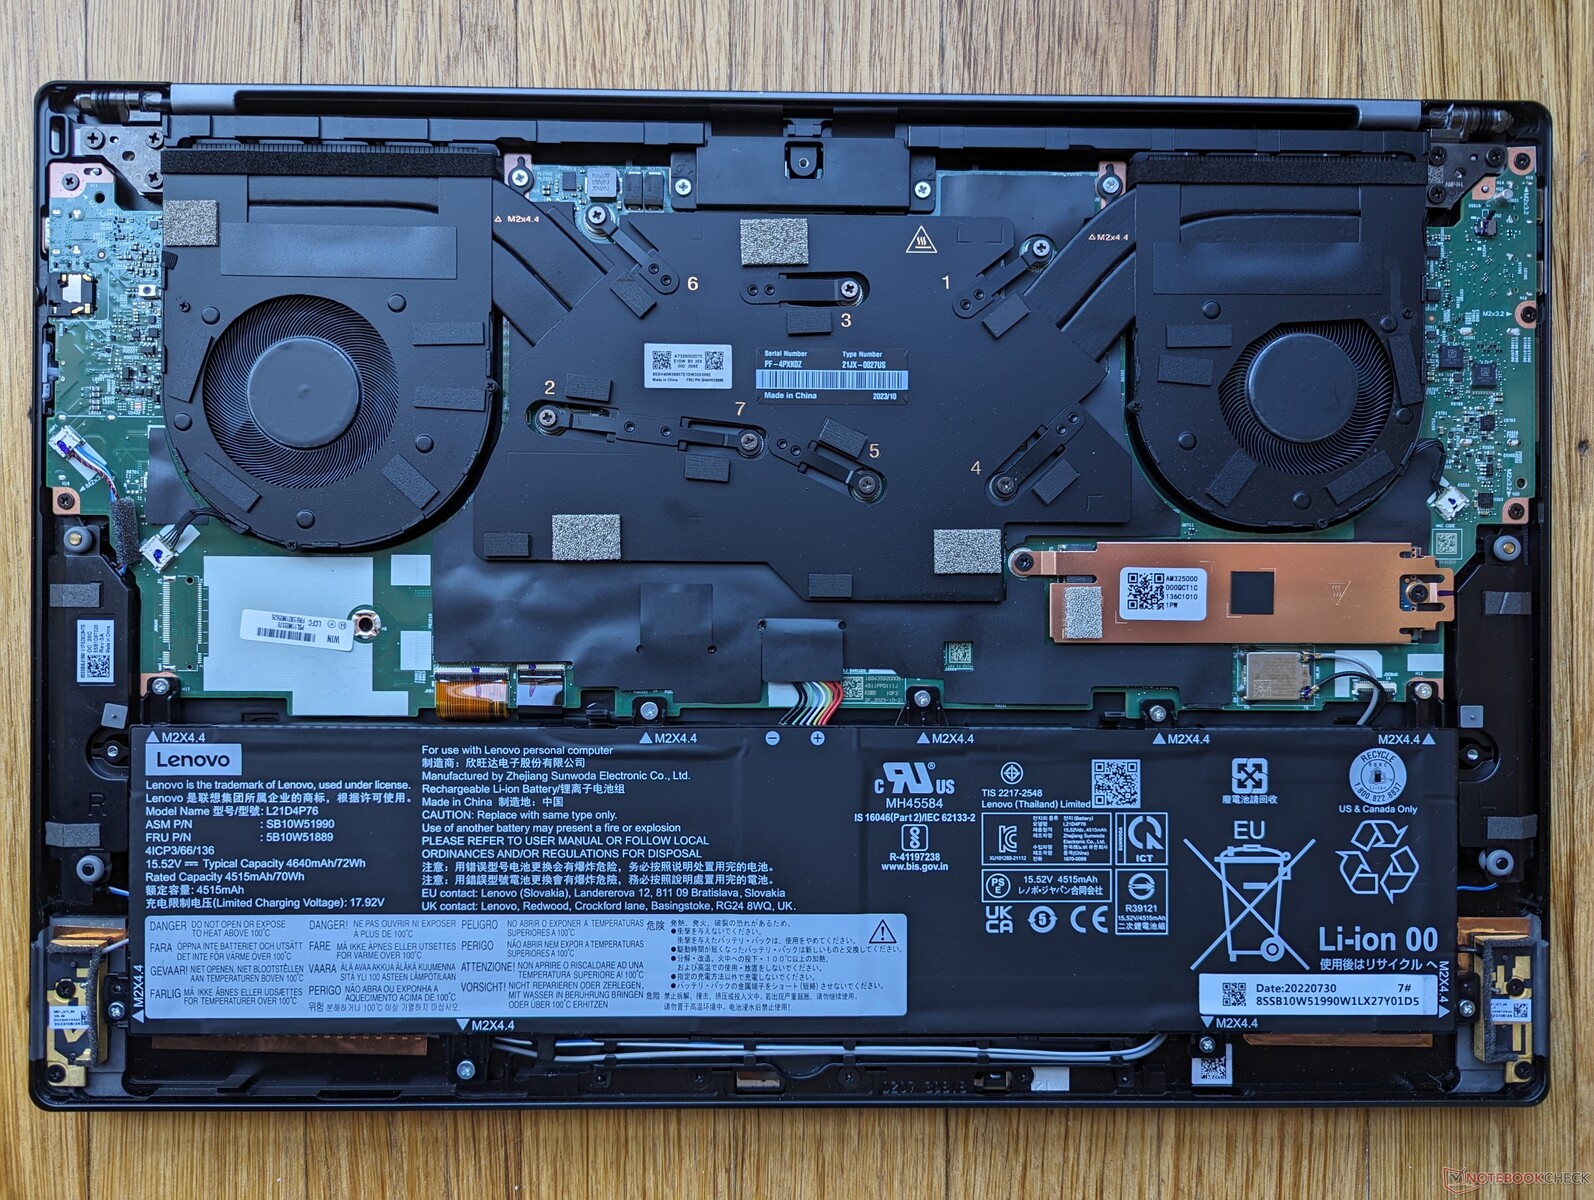
Wenn man die untere Abdeckung entfernt, sind keine großen internen Unterschiede zwischen der Gen 1- und der Gen 2-Version zu erkennen. Unsere Gen 2-Konfiguration enthält jedoch keine WAN-Unterstützung, wodurch der M.2-WAN-Steckplatz und die Antenne fehlen. Leider bedeutet dies, dass Benutzer keine SKU ohne WAN-Unterstützung erwerben können, um später beabsichtigt ein WAN-Modul hinzuzufügen.
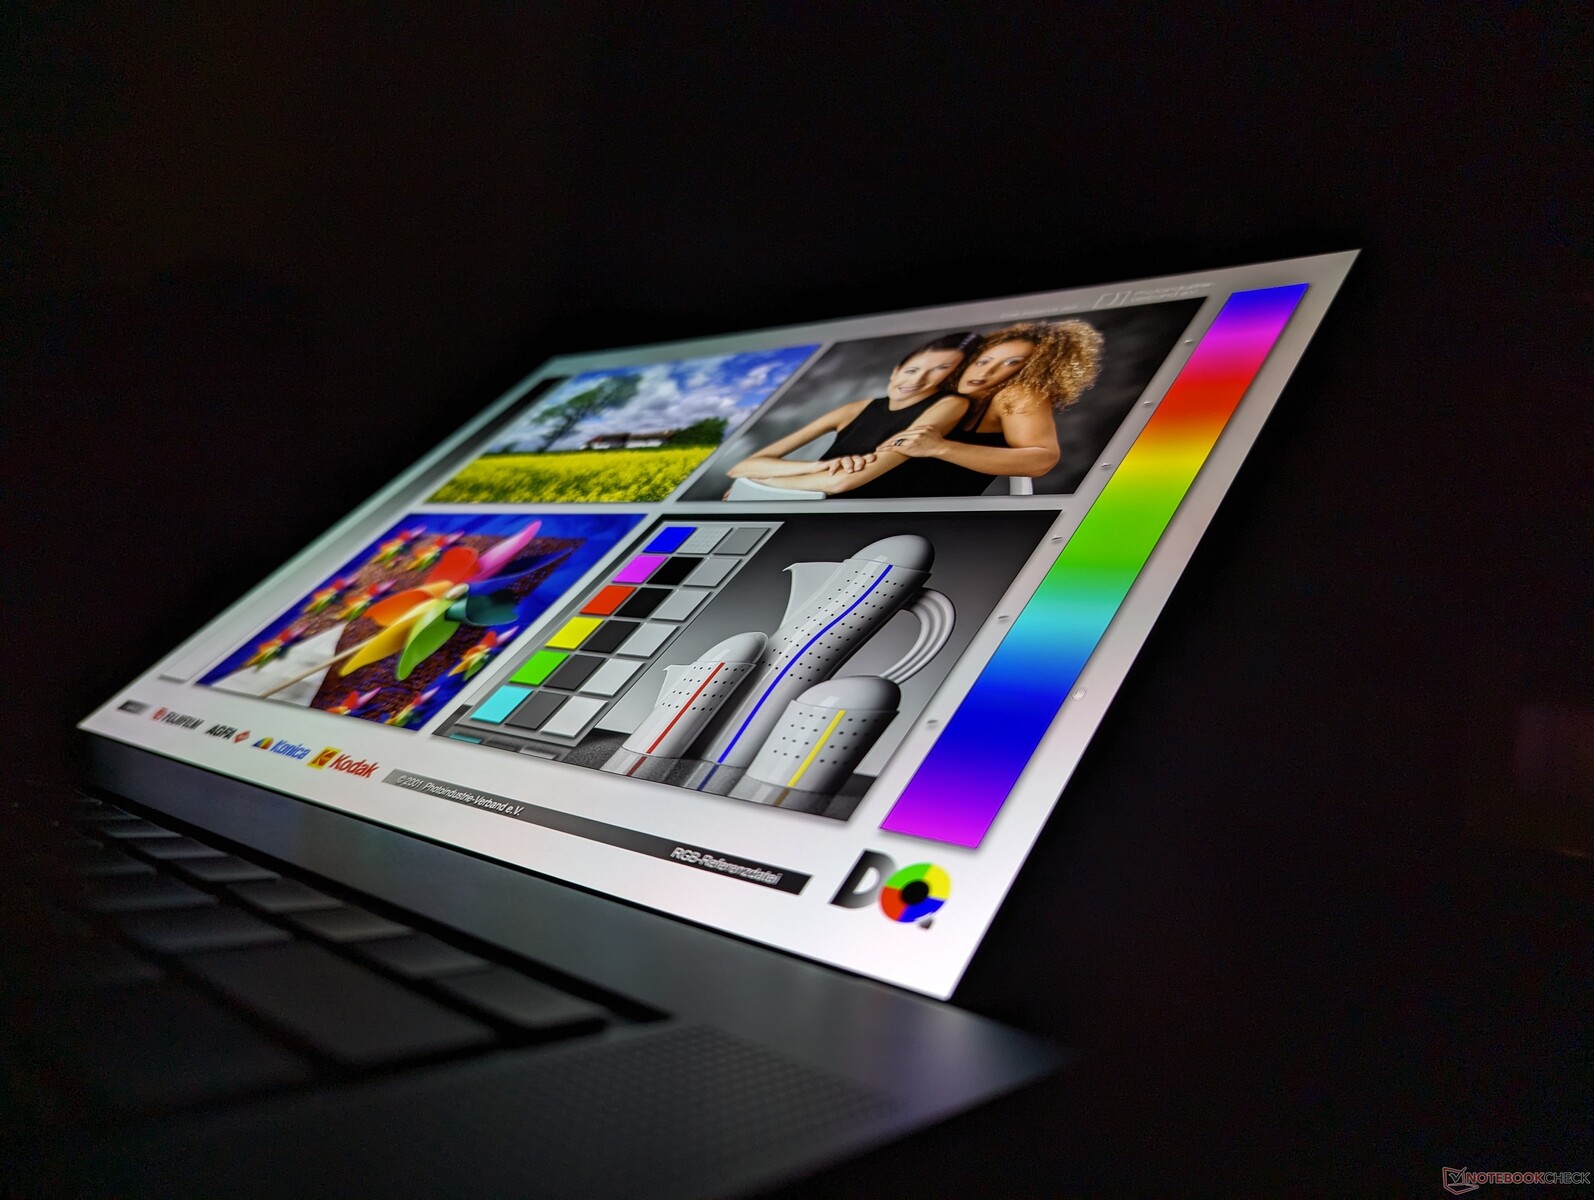
Display

Lenovo bietet die folgenden vier Display-Optionen an, die alle nur eine Bildwiederholrate von 60 Hz aufweisen und keine FreeSync-Unterstützung anbieten:
- 1920 x 1200, IPS, matt, ohne Touch, 100% sRGB, 400 nits
- 1920 x 1200, IPS, glänzend, Touch, 100% sRGB, 400 nits
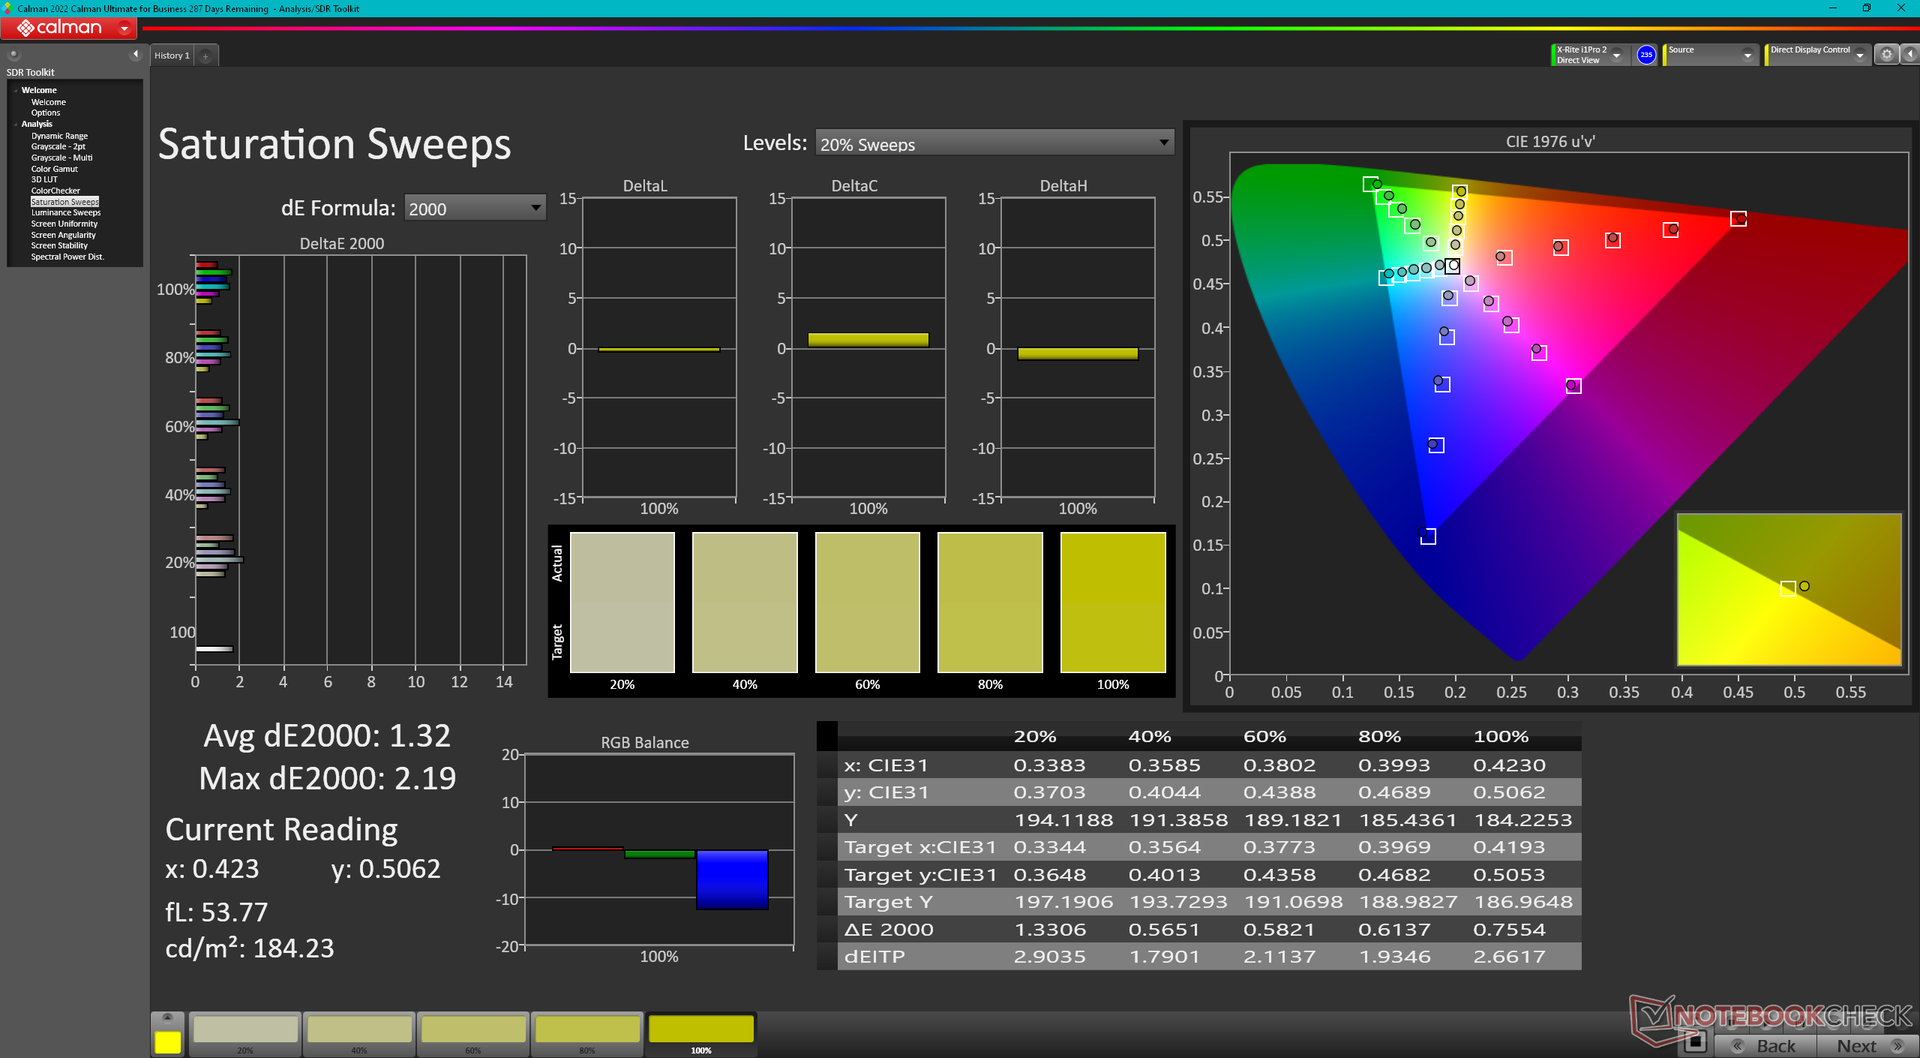
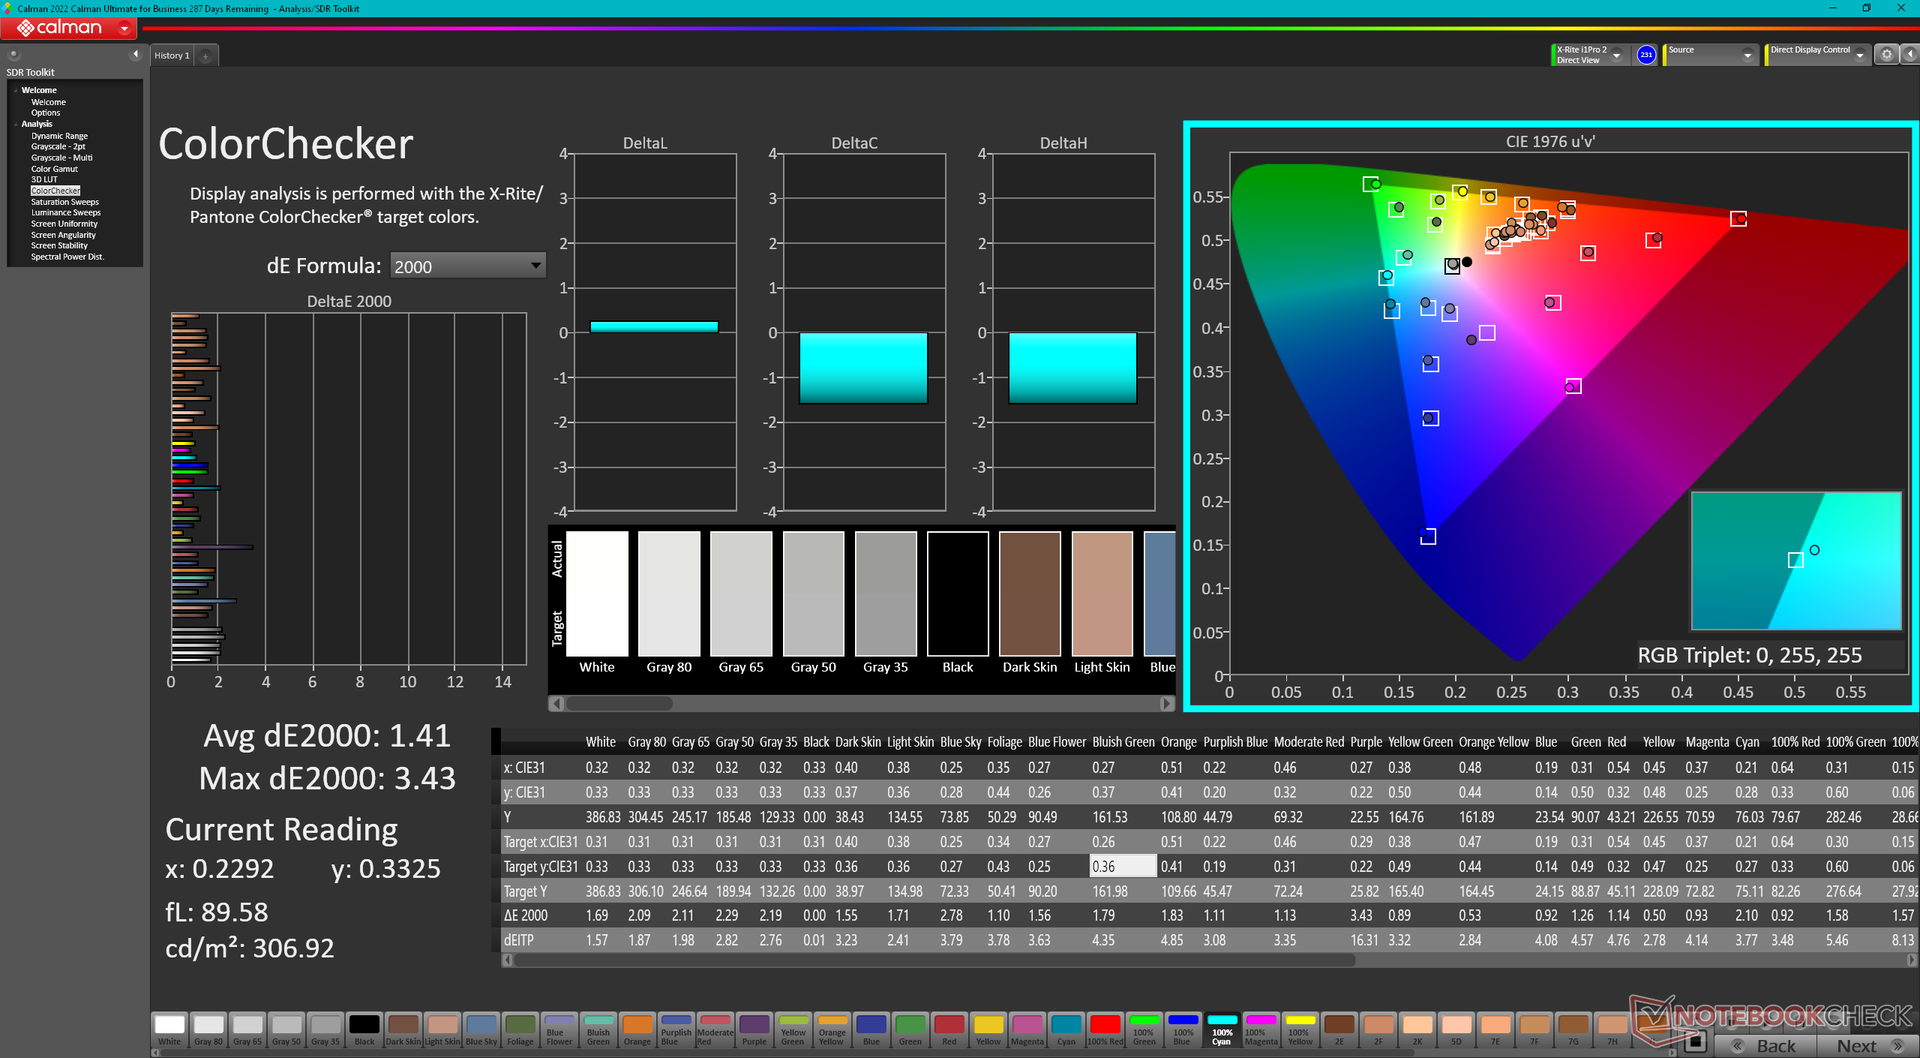
- 3840 x 2400, OLED, glänzend, Touch, 100% DCI-P3, 400 nits, HDR400
Dasselbe Samsung ATNA60YV04-0 OLED-Panel, wie es in unserem Testgerät zu finden ist, kommt auch im aktuellen ThinkPad P1 G6 zum Einsatz, wodurch das Seherlebnis bei diesen beiden Modellen ähnlich ist. Es ist nicht ungewöhnlich, dass ein Hersteller die gleichen Panel-Optionen für mehrere Modelle verwendet.
Im Vergleich zum 1200p-Panel auf unserem Gen-1-Gerät bietet das OLED-Panel tiefere Schwarzwerte, HDR-Unterstützung, schnellere Schwarz-Weiß-Reaktionszeiten, lebendigere Farben und eine höhere native Auflösung. Unabhängig von der Option sind wir erfreut, dass die volle sRGB-Abdeckung zum Standard gehört und keine Low-End-SKUs vermieden werden. Wir hoffen, dass zukünftige Revisionen hochauflösende Panels wie bei der Asus VivoBook-Serie enthalten werden.

| |||||||||||||||||||||||||
Ausleuchtung: 97 %
Helligkeit Akku: 390.1 cd/m²
Kontrast: ∞:1 (Schwarzwert: 0 cd/m²)
ΔE ColorChecker Calman: 1.41 | ∀{0.5-29.43 Ø4.71}
ΔE Greyscale Calman: 2 | ∀{0.09-98 Ø4.96}
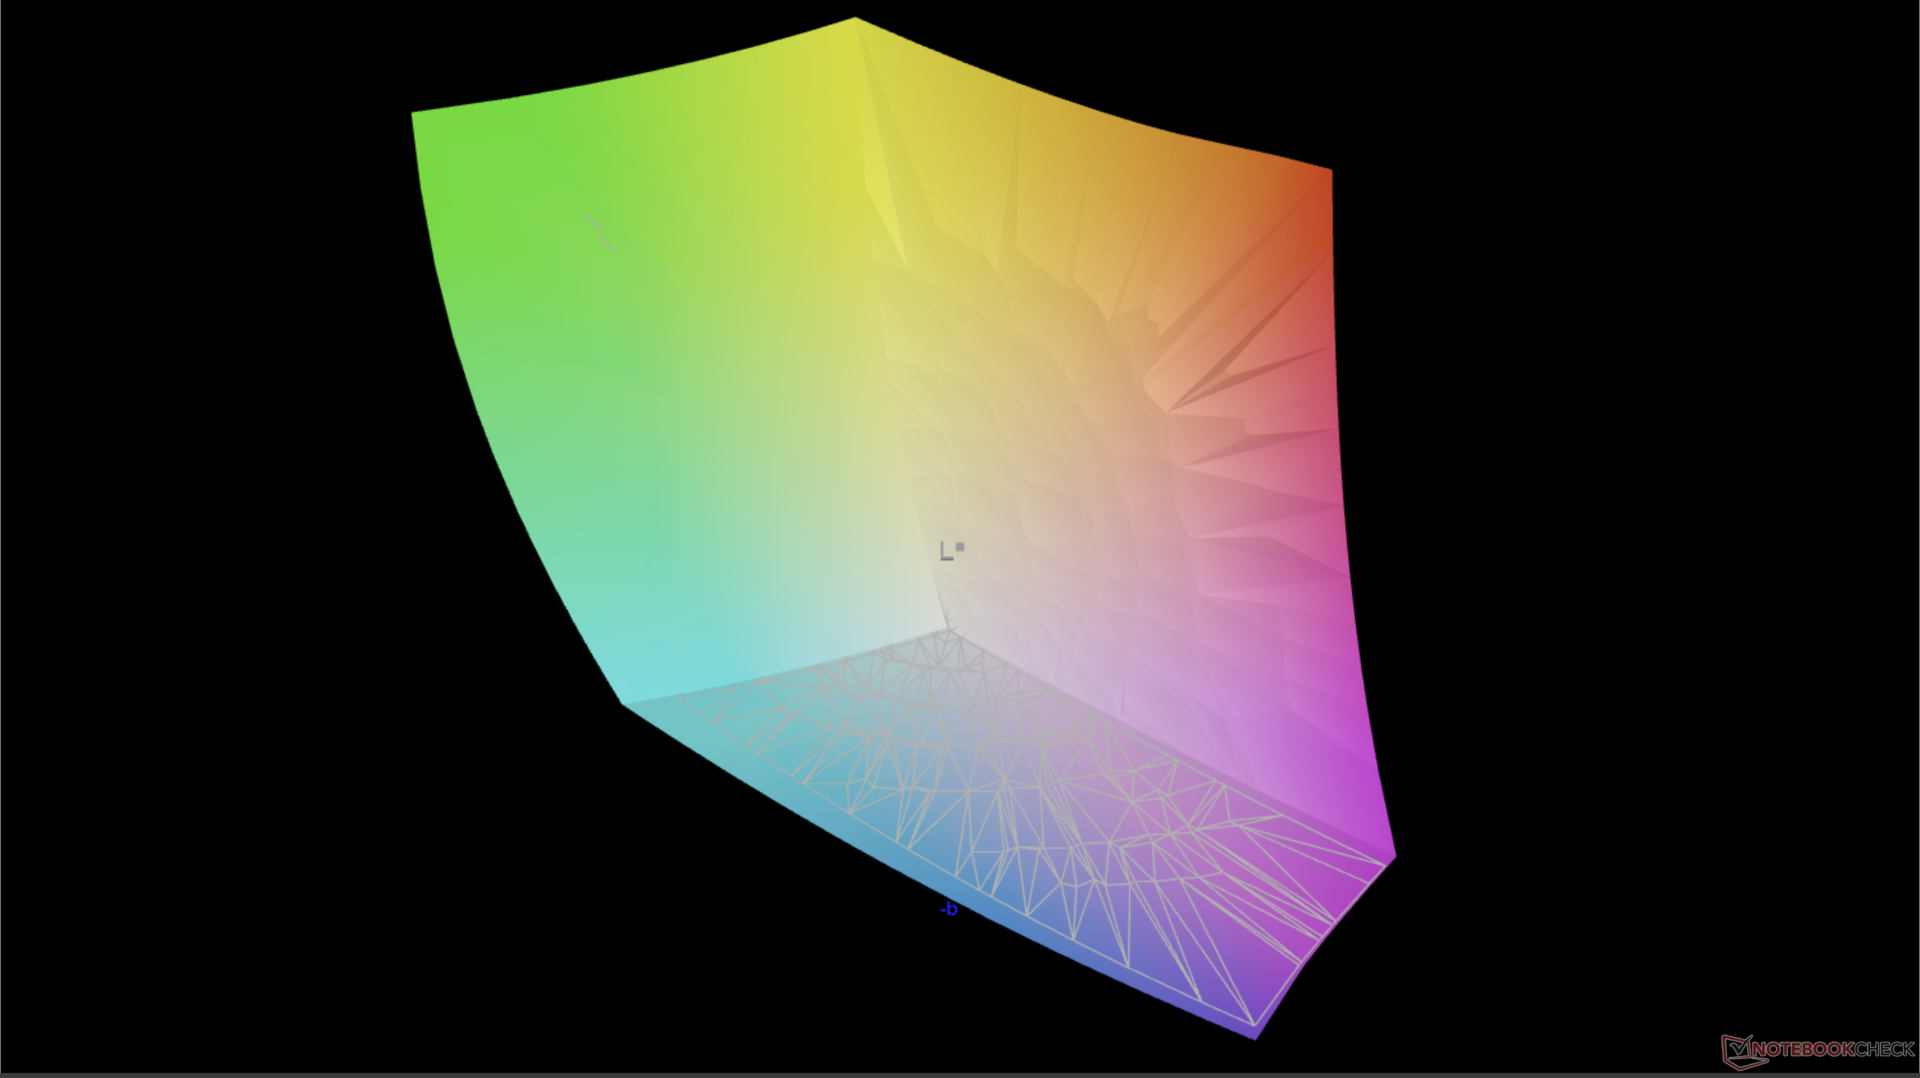
96.7% AdobeRGB 1998 (Argyll 3D)
100% sRGB (Argyll 3D)
99.7% Display P3 (Argyll 3D)
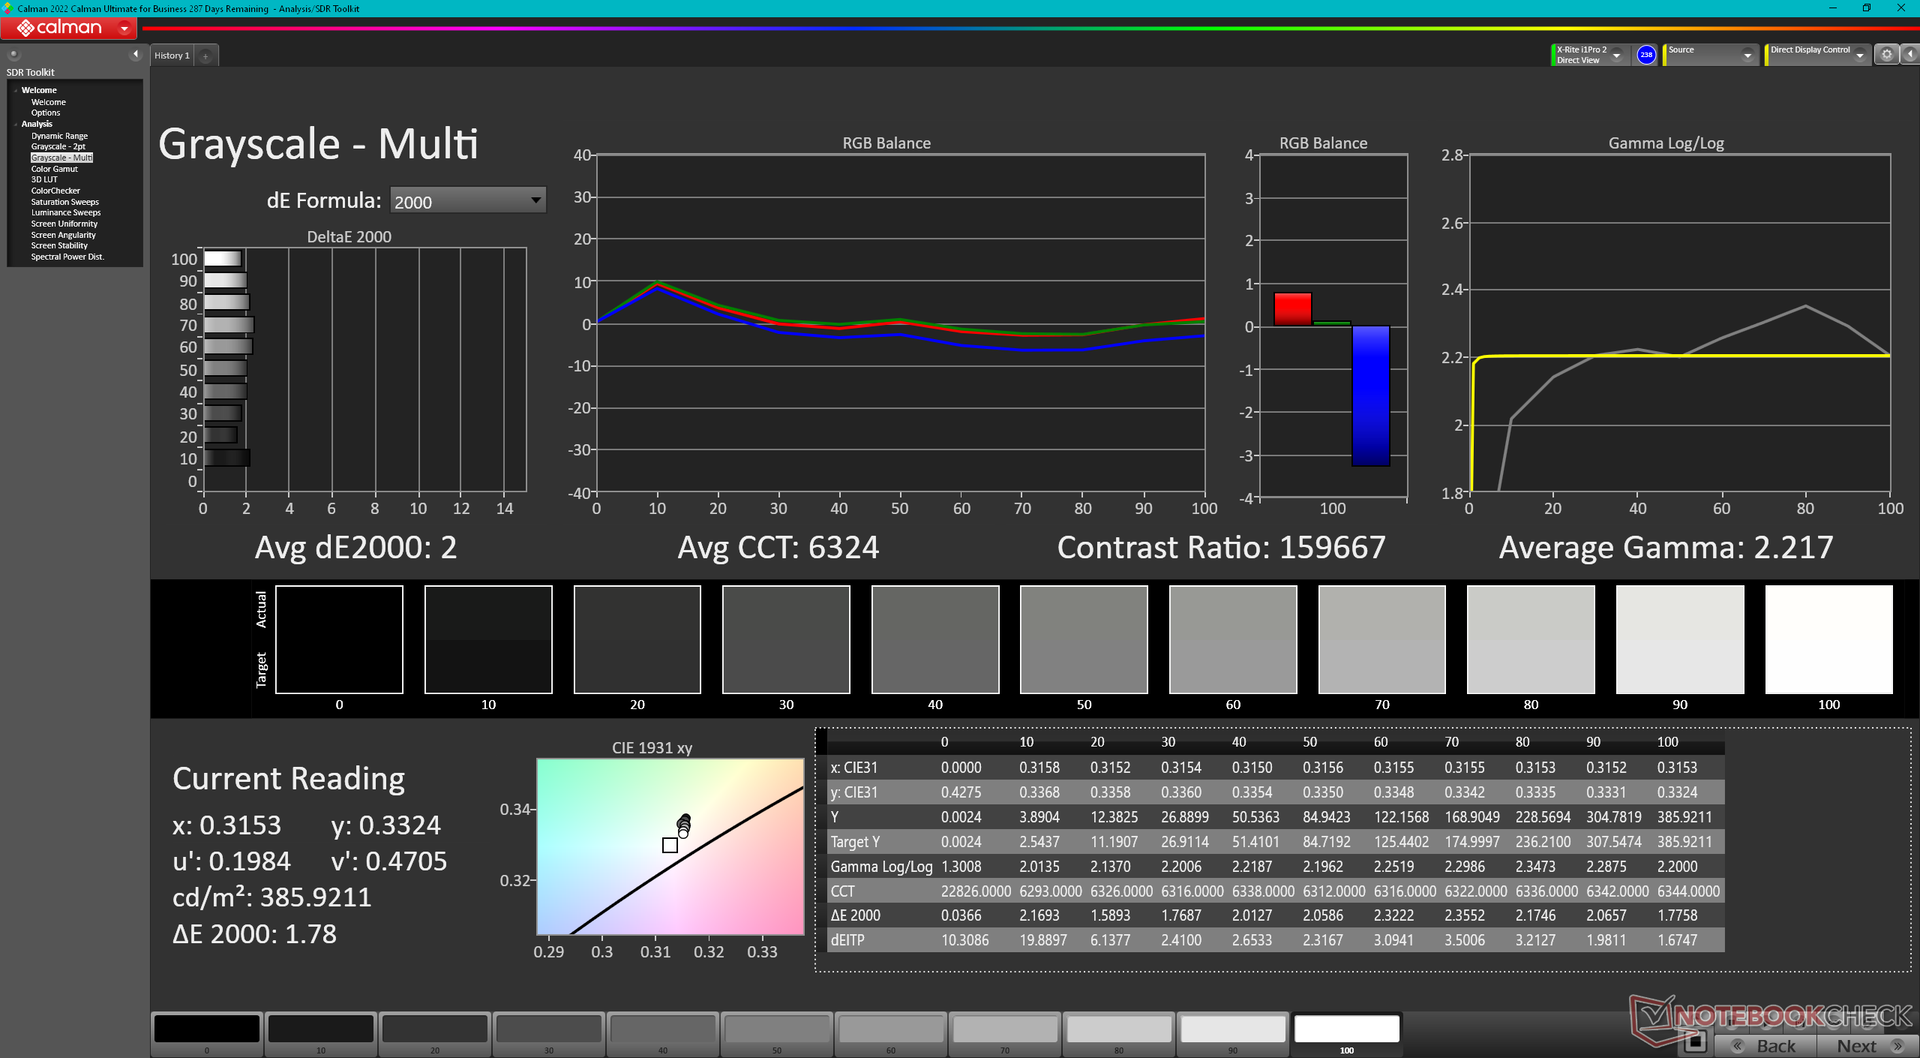
Gamma: 2.22
CCT: 6324 K
| Lenovo ThinkPad Z16 Gen 2 Samsung ATNA60YV04-0, OLED, 3840x2400, 16" | Lenovo ThinkPad Z16 G1 21D5S00T00 NE160WUM-N62 , IPS LED, 1920x1200, 16" | Lenovo ThinkBook 16 G6 ABP LEN160WUXGA, IPS, 1920x1200, 16" | MSI Creator Z16P B12UHST AUOD298, IPS True Pixel (~100% DCI-P3), 2560x1600, 16" | Asus Vivobook Pro 16X K6604JV-MX016W Samsung SDC4178 ATNA60BX01-1, OLED, 3200x2000, 16" | Apple MacBook Pro 16 2023 M3 Max Mini-LED, 3456x2234, 16" | |
|---|---|---|---|---|---|---|
| Display | -18% | -52% | -4% | -1% | -1% | |
| Display P3 Coverage (%) | 99.7 | 70 -30% | 40.4 -59% | 97.6 -2% | 98.4 -1% | 99.2 -1% |
| sRGB Coverage (%) | 100 | 99.7 0% | 59.8 -40% | 99.9 0% | 99.7 0% | |
| AdobeRGB 1998 Coverage (%) | 96.7 | 72.1 -25% | 42 -57% | 86.8 -10% | 95.8 -1% | |
| Response Times | -1637% | -1414% | -417% | 20% | -2852% | |
| Response Time Grey 50% / Grey 80% * (ms) | 1.86 ? | 40 ? -2051% | 32.8 ? -1663% | 12.9 ? -594% | 1.6 ? 14% | 66.9 ? -3497% |
| Response Time Black / White * (ms) | 1.89 ? | 25 ? -1223% | 23.9 ? -1165% | 6.4 ? -239% | 1.4 ? 26% | 43.6 ? -2207% |
| PWM Frequency (Hz) | 60 ? | 120 ? | 14877 | |||
| Bildschirm | -3% | -185% | -23% | -5% | 25% | |
| Helligkeit Bildmitte (cd/m²) | 390.1 | 487 25% | 310 -21% | 428 10% | 347 -11% | 630 61% |
| Brightness (cd/m²) | 393 | 446 13% | 290 -26% | 394 0% | 346 -12% | 604 54% |
| Brightness Distribution (%) | 97 | 83 -14% | 86 -11% | 86 -11% | 97 0% | 94 -3% |
| Schwarzwert * (cd/m²) | 0.31 | 0.22 | 0.42 | 0.06 | ||
| Delta E Colorchecker * | 1.41 | 1.8 -28% | 6.2 -340% | 1.67 -18% | 1.89 -34% | 1.2 15% |
| Colorchecker dE 2000 max. * | 3.43 | 3.3 4% | 24.7 -620% | 5.71 -66% | 3.26 5% | 2.8 18% |
| Delta E Graustufen * | 2 | 2.3 -15% | 3.8 -90% | 3.1 -55% | 1.55 22% | 1.9 5% |
| Gamma | 2.22 99% | 2.16 102% | 2.22 99% | 2.195 100% | 2.39 92% | 2.29 96% |
| CCT | 6324 103% | 6867 95% | 6011 108% | 6498 100% | 6458 101% | 6812 95% |
| Kontrast (:1) | 1571 | 1409 | 1019 | 5783 | ||
| Colorchecker dE 2000 calibrated * | 0.8 | 5.3 | 0.71 | 1.97 | ||
| Durchschnitt gesamt (Programm / Settings) | -553% /
-304% | -550% /
-372% | -148% /
-90% | 5% /
1% | -943% /
-617% |
* ... kleinere Werte sind besser

Das OLED-Display ist bereits im Auslieferungszustand gut kalibriert, mit durchschnittlichen Graustufen- und Farb-DeltaE-Werten von nur 2,0 bzw. 1,41. Eine Kalibrierung durch den Endnutzer ist daher für die große Mehrheit nicht erforderlich.
Reaktionszeiten (Response Times) des Displays
| ↔ Reaktionszeiten Schwarz zu Weiß | ||
|---|---|---|
| 1.89 ms ... steigend ↗ und fallend ↘ kombiniert | ↗ ms steigend | 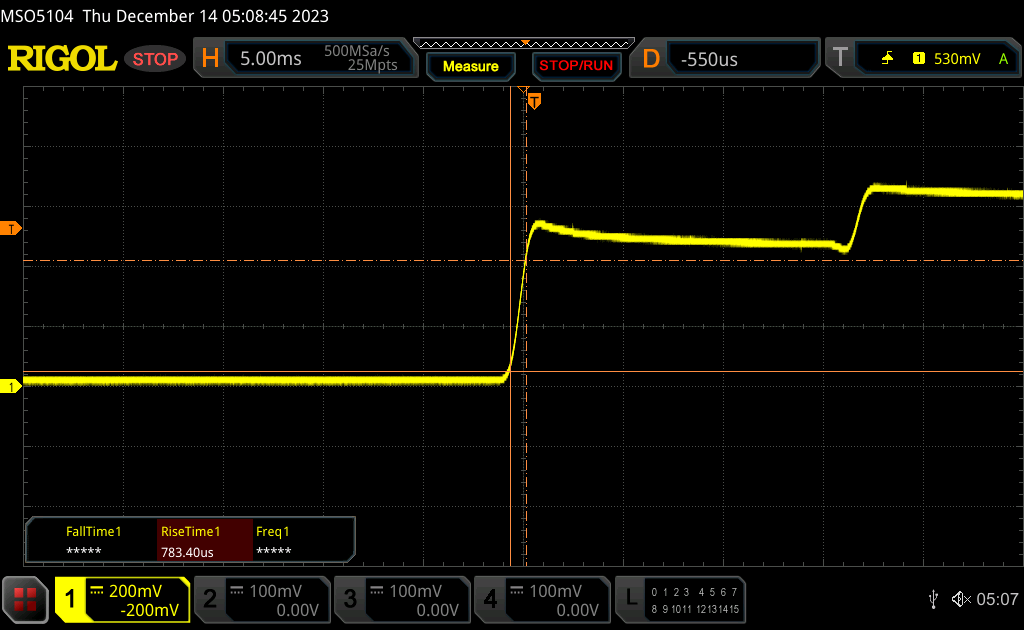 |
| ↘ 0.89 ms fallend | ||
| Die gemessenen Reaktionszeiten sind sehr kurz, wodurch sich der Bildschirm auch für schnelle 3D Spiele eignen sollte. Im Vergleich rangierten die bei uns getesteten Geräte von 0.1 (Minimum) zu 240 (Maximum) ms. » 11 % aller Screens waren schneller als der getestete. Daher sind die gemessenen Reaktionszeiten besser als der Durchschnitt aller vermessenen Geräte (19.8 ms). | ||
| ↔ Reaktionszeiten 50% Grau zu 80% Grau | ||
| 1.86 ms ... steigend ↗ und fallend ↘ kombiniert | ↗ 0.96 ms steigend | 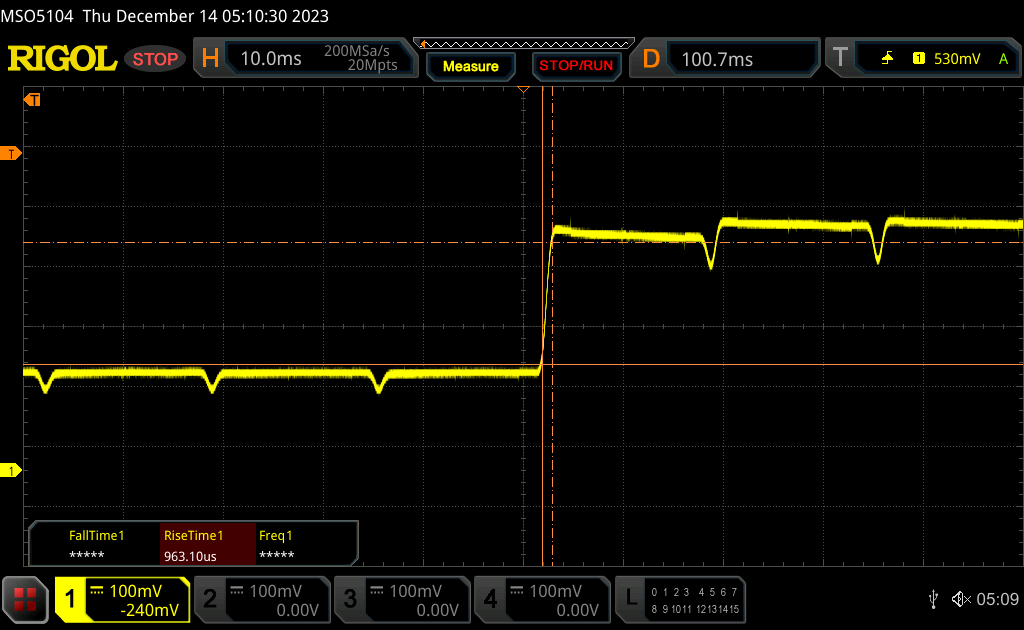 |
| ↘ 0.9 ms fallend | ||
| Die gemessenen Reaktionszeiten sind sehr kurz, wodurch sich der Bildschirm auch für schnelle 3D Spiele eignen sollte. Im Vergleich rangierten die bei uns getesteten Geräte von 0.165 (Minimum) zu 636 (Maximum) ms. » 9 % aller Screens waren schneller als der getestete. Daher sind die gemessenen Reaktionszeiten besser als der Durchschnitt aller vermessenen Geräte (31 ms). | ||
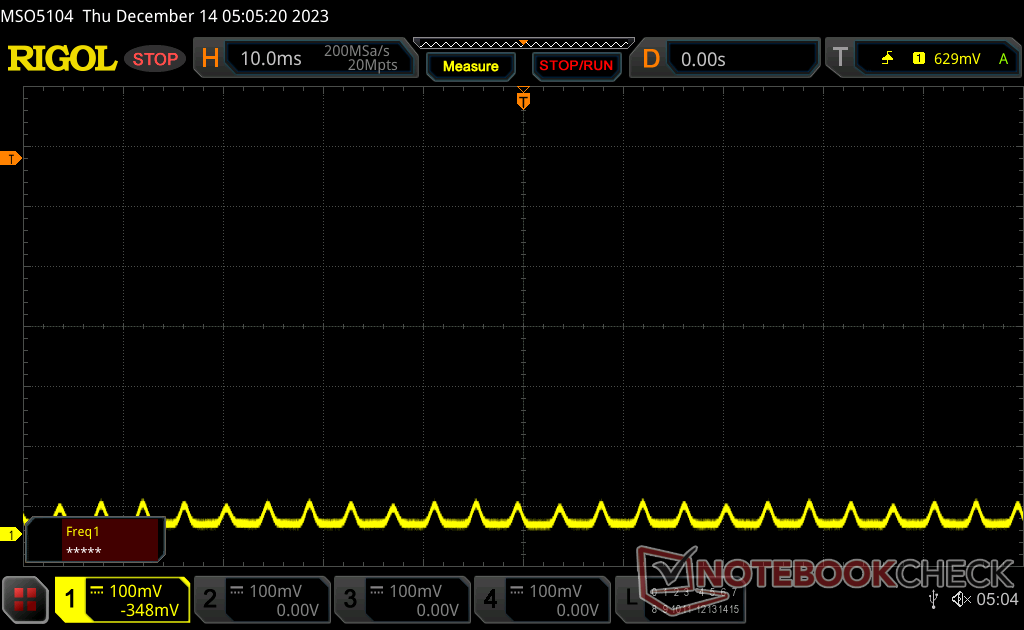
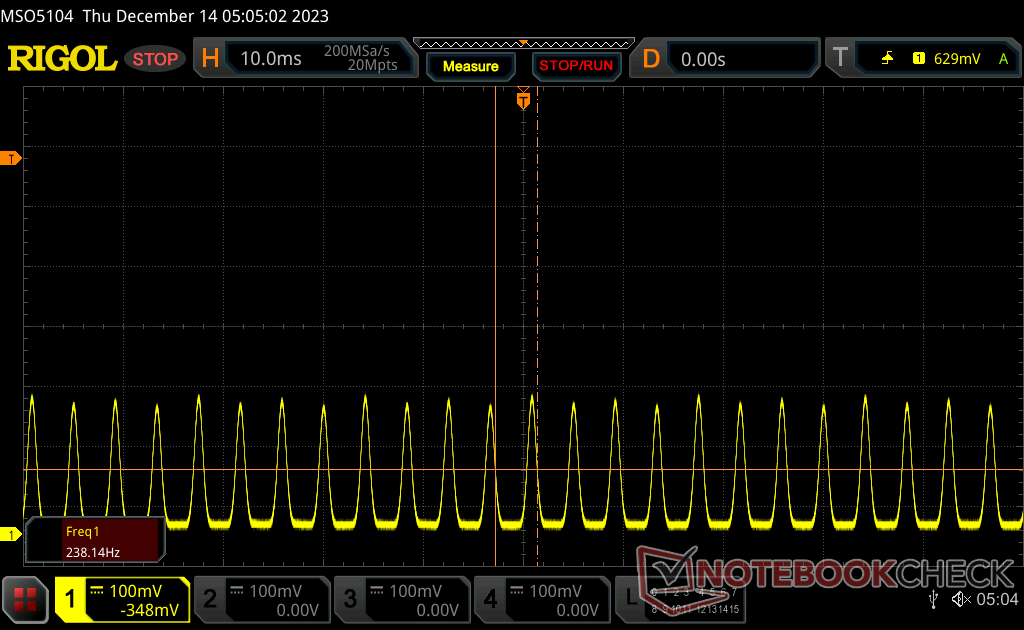
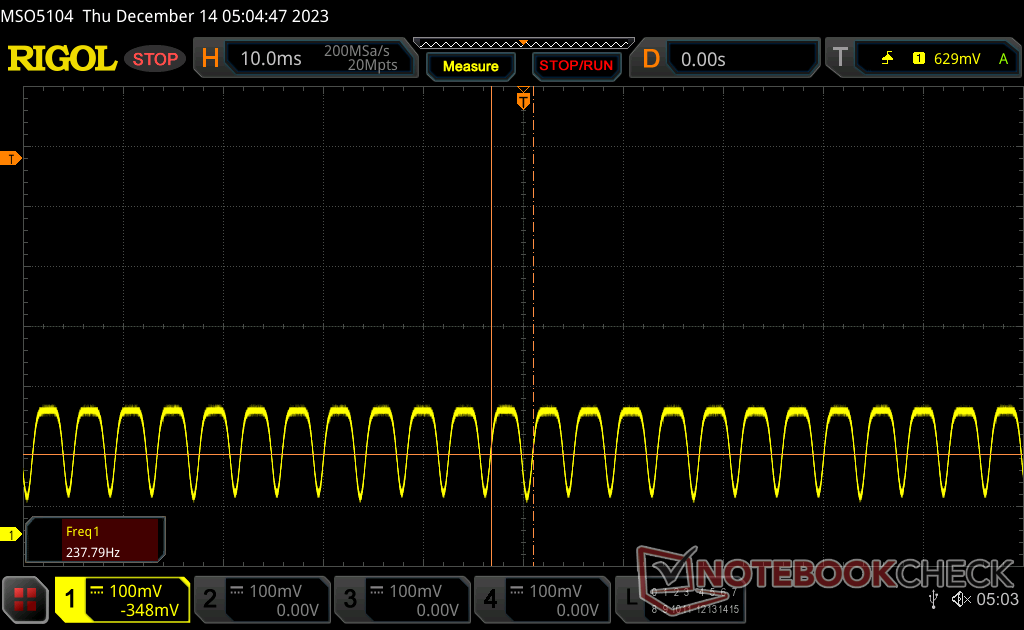
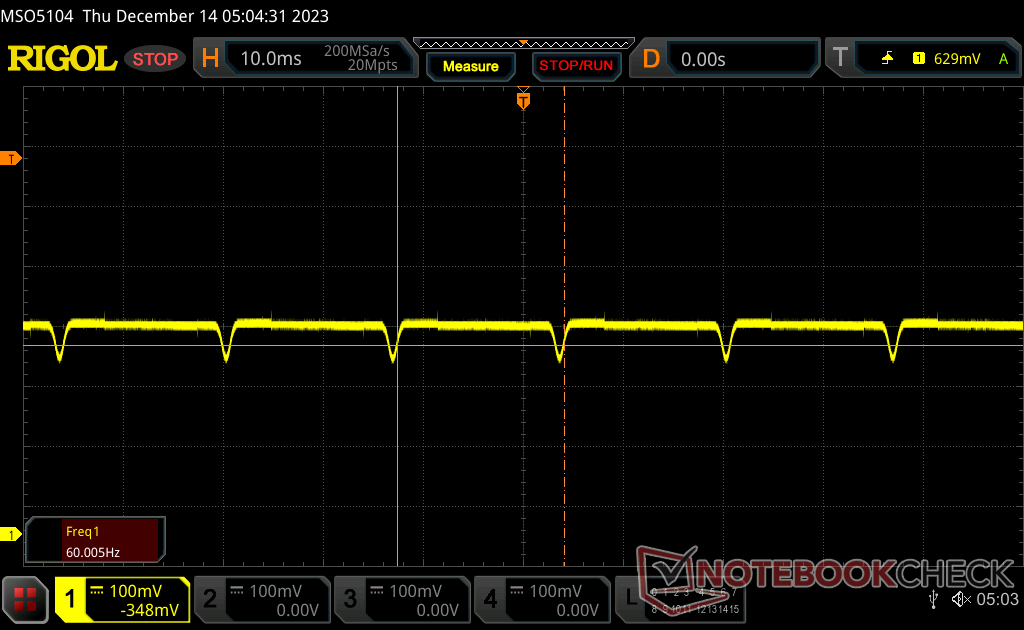
Bildschirm-Flackern / PWM (Pulse-Width Modulation)
| Flackern / PWM festgestellt | 60 Hz | ≤ 100 % Helligkeit | 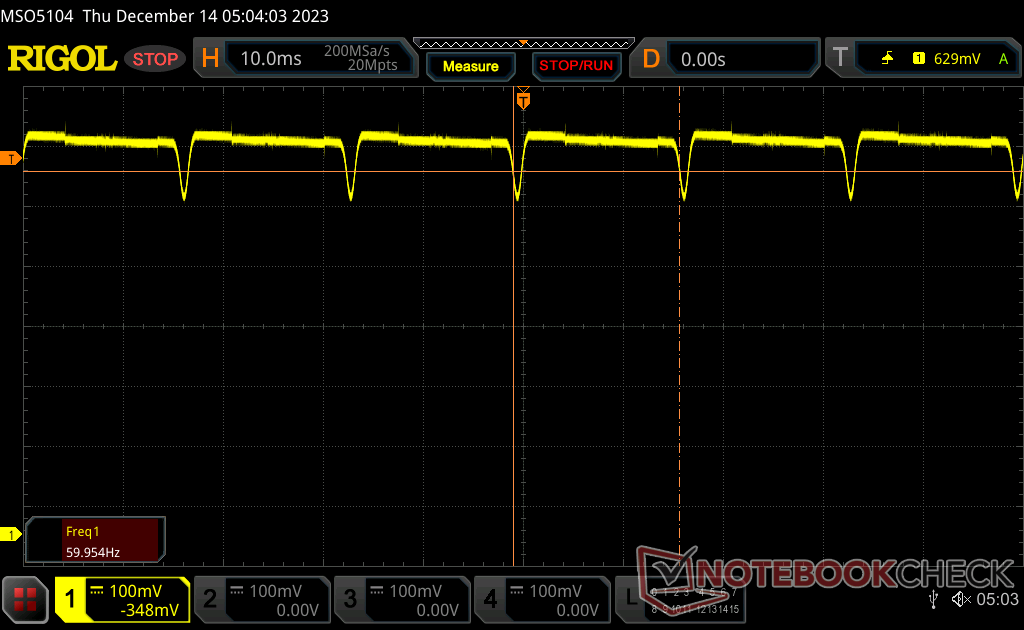 |
Das Display flackert mit 60 Hz (im schlimmsten Fall, eventuell durch Pulsweitenmodulation PWM) bei einer eingestellten Helligkeit von 100 % und darunter. Darüber sollte es zu keinem Flackern kommen. Die Frequenz von 60 Hz ist sehr gering und daher kann es bei allen Usern zu sichtbaren Flackern, brennenden Augen oder Kopfweh kommen. Im Vergleich: 52 % aller getesteten Geräte nutzten kein PWM um die Helligkeit zu reduzieren. Wenn PWM eingesetzt wurde, dann bei einer Frequenz von durchschnittlich 7757 (Minimum 5, Maximum 343500) Hz. | |||
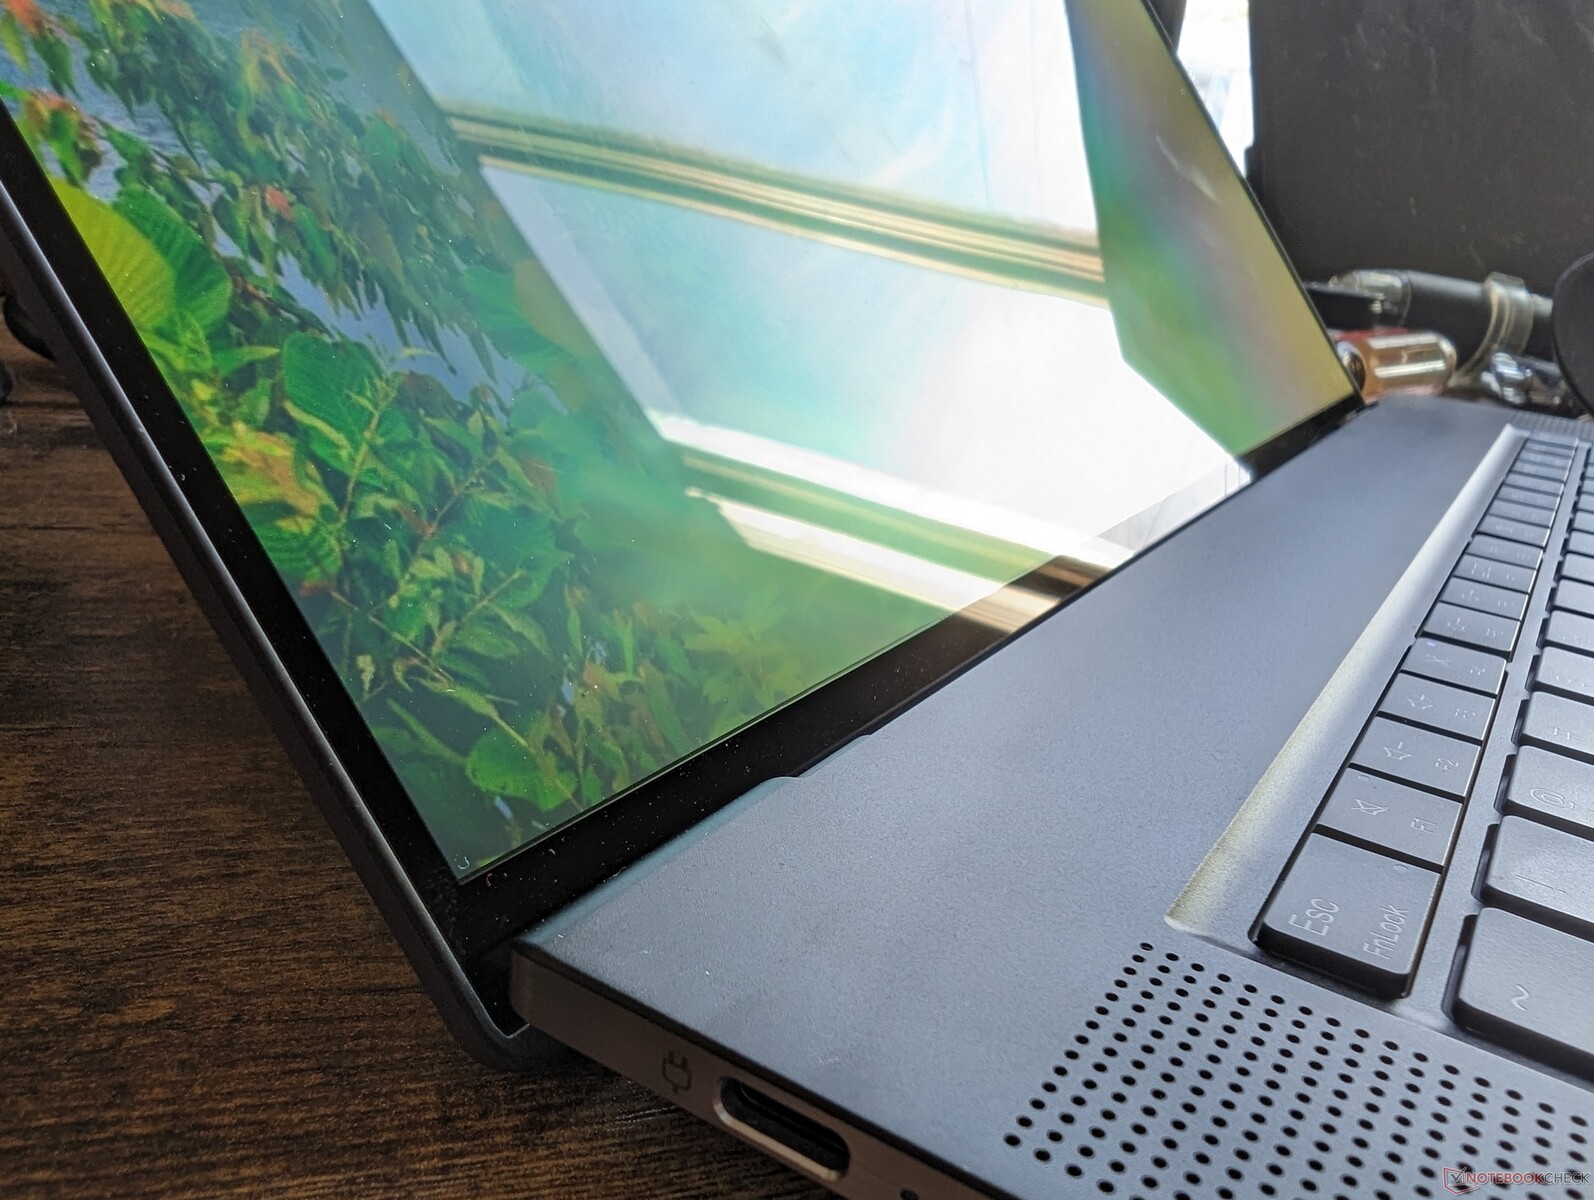
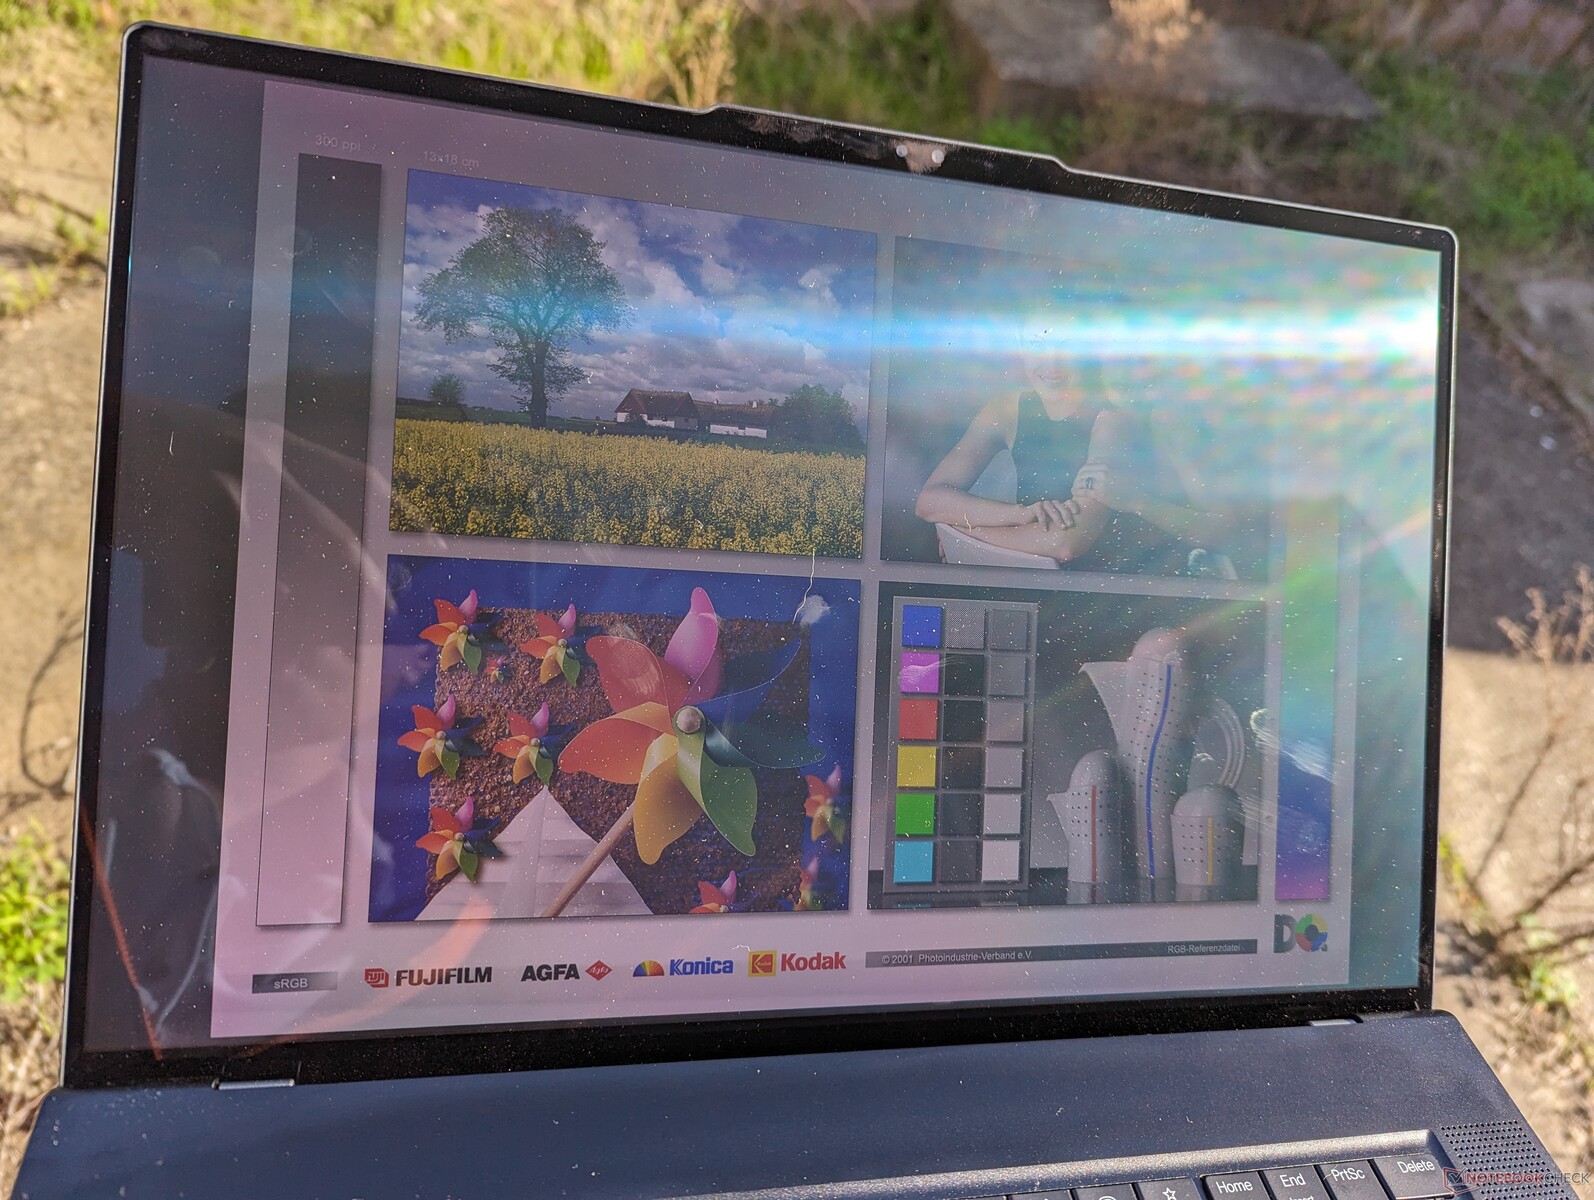
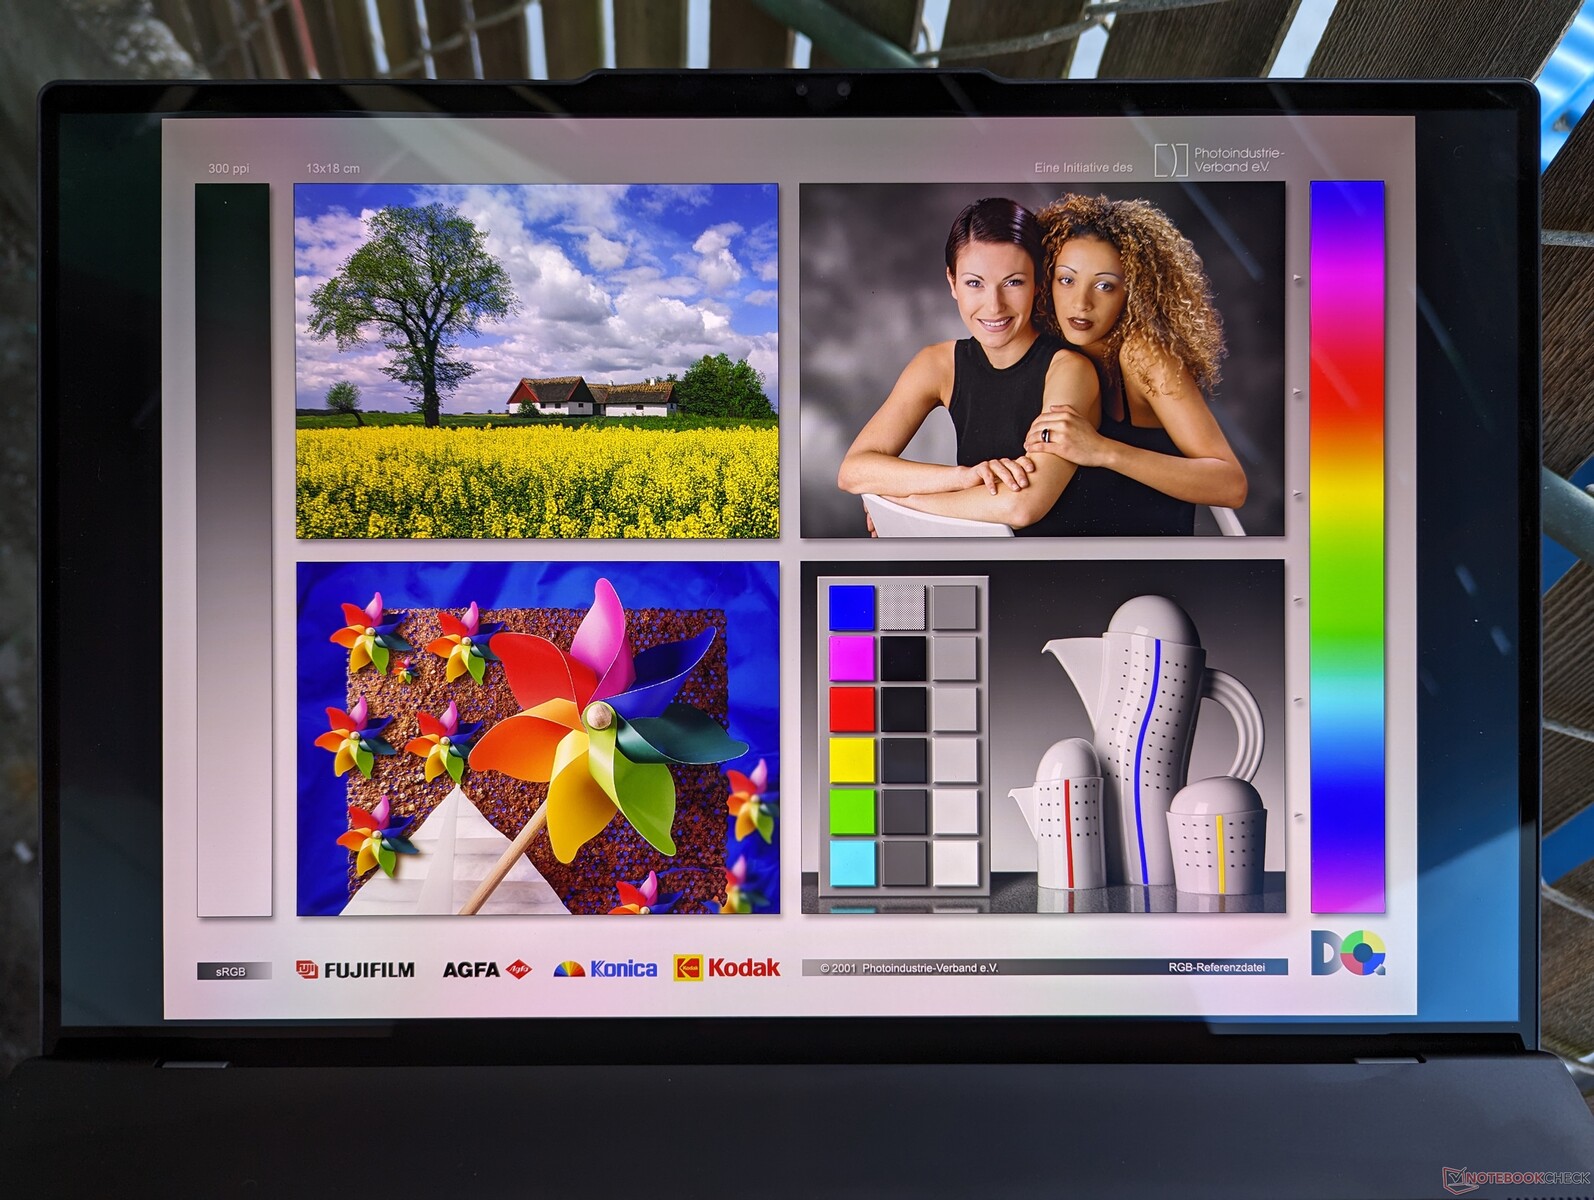
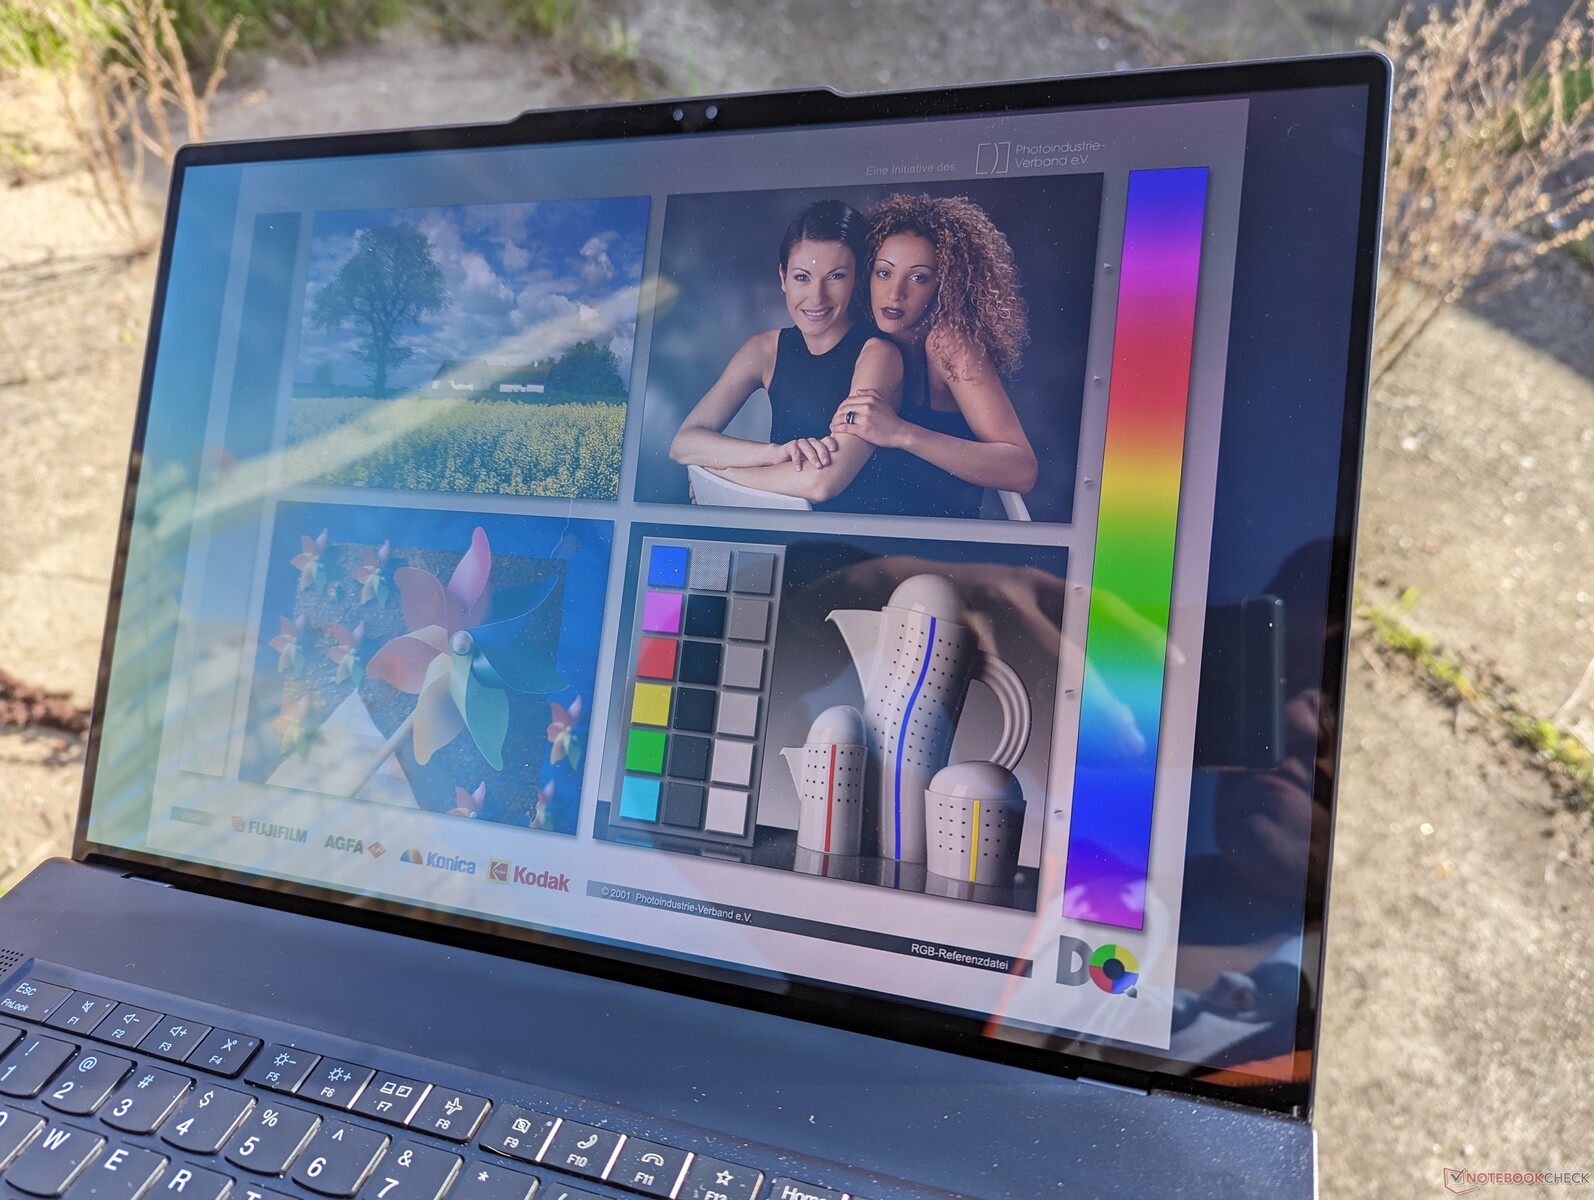
Die Betrachtungswinkel sind größer als bei IPS, und die tieferen Schwarzwerte tragen dazu bei, dass die Farben bei hellem Umgebungslicht erhalten bleiben. Dennoch sind Blendeffekte durch das glänzende Overlay unvermeidbar, und die maximale Helligkeit ist nicht höher als bei der IPS-Basiskonfiguration mit 1200p. Im Vergleich dazu ist der Bildschirm des MacBook Pro 16 um 50 % heller, was die Sichtbarkeit im Freien verbessert.


Performance
Testbedingungen
Wir haben Windows auf den Performance-Modus eingestellt, bevor wir die folgenden Benchmarks durchgeführt haben. Die vorinstallierte Lenovo Commercial Vantage Software enthält keine zusätzlichen Energieprofileinstellungen neben der üblichen Windows-Auswahl. Sie ist jedoch unerlässlich für BIOS-Updates und die Anpassung des Akkuladeverhaltens.
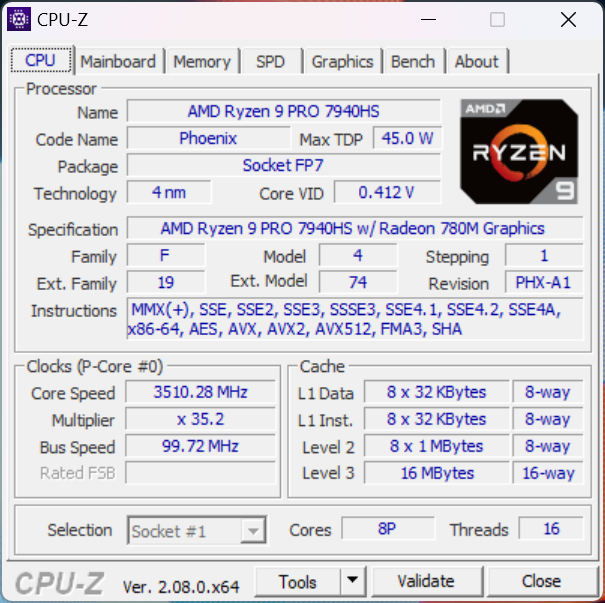
Prozessor
Die Leistung des Ryzen 9 Pro 7940HS ist identisch mit der des Ryzen 9 7940HS, der im Asus TUF Gaming A16 zu finden ist. Nutzer müssen also keine Abstriche bei der Leistung machen, um die Vorteile der Pro-Funktionen zu nutzen. Die Gesamtleistung ist sowohl bei Single- als auch bei Multi-Thread-Workloads vergleichbar mit dem letztjährigen Core i9-12900H der 12. Generation.
Die Leistungsunterschiede zwischen unserem Zen 4 Ryzen 9 Pro 7940HS und dem Zen 3+ Ryzen 7 Pro 6850H im letztjährigen ThinkPad Z16 Gen 1 können bei Multi-Thread-Workloads aufgrund der größeren Anzahl von Kernen mit 35 bis 45 Prozent recht signifikant sein. Daher ist die Leistungssteigerung mit Zen 4 einer der Hauptgründe für die Wahl der Gen 2-Version des ThinkPad Z16 anstelle der Gen 1-Version.
In den günstigeren Konfigurationen wird stattdessen der Ryzen 7 Pro 7840HS oder Ryzen 5 Pro 7640HS angeboten. Die Ryzen 7-Option ist nach unseren Erfahrungen mit dem Lenovo Legion Slim 5 16 fast identisch mit der Ryzen 9-Option. Daher ist es empfehlenswert, eine Ryzen 7-Konfiguration zu wählen, um Kosten zu sparen. Tatsächlich verfügt der Ryzen 7 Pro 7840HS über die exakt gleiche Anzahl an Kernen und Funktionen wie der Ryzen 9 Pro 7940HS, mit nur sehr geringen Unterschieden von 100 bis 200 MHz bei den Zieltaktraten.
Ein Downgrade auf die Ryzen 5 Pro 7640HS-Konfiguration dürfte die Prozessorleistung um etwa 30 bis 35 Prozent beeinträchtigen, wie wir in unserer Zeit mit dem HP ZBook Firefly 14 G10 feststellen konnten. Daher sind die Leistungsunterschiede zwischen den Ryzen-5-, Ryzen-7- und Ryzen-9-Optionen stark zwischen den Ryzen-5- und Ryzen-7-SKUs verzerrt.
Cinebench R15 Multi Dauertest
Cinebench R23: Multi Core | Single Core
Cinebench R20: CPU (Multi Core) | CPU (Single Core)
Cinebench R15: CPU Multi 64Bit | CPU Single 64Bit
Blender: v2.79 BMW27 CPU
7-Zip 18.03: 7z b 4 | 7z b 4 -mmt1
Geekbench 5.5: Multi-Core | Single-Core
HWBOT x265 Benchmark v2.2: 4k Preset
LibreOffice : 20 Documents To PDF
R Benchmark 2.5: Overall mean
| Cinebench R20 / CPU (Multi Core) | |
| Asus Zephyrus Duo 16 GX650PY-NM006W | |
| MSI Raider GE68HX 13VF | |
| Asus Vivobook Pro 16X K6604JV-MX016W | |
| Alienware m16 R1 AMD | |
| MSI Raider GE68 HX 13VG, i7-13700HX | |
| MSI Stealth 16 Mercedes-AMG Motorsport A13VG | |
| HP Victus 16-r0076TX | |
| MSI Creator Z16P B12UHST | |
| Lenovo ThinkPad P1 G6 21FV001KUS | |
| Lenovo Legion Slim 5 16APH8 | |
| Lenovo ThinkPad Z16 Gen 2 | |
| Lenovo Legion Slim 7 16APH8 | |
| Durchschnittliche AMD Ryzen 9 PRO 7940HS (5790 - 6601, n=3) | |
| Lenovo ThinkPad Z16 G1 21D5S00T00 | |
| HP ZBook Firefly 14 G10 A | |
| LG Gram 2in1 16 16T90R - G.AA78G | |
| Lenovo ThinkBook 16 G6 ABP | |
| Cinebench R20 / CPU (Single Core) | |
| MSI Raider GE68HX 13VF | |
| MSI Stealth 16 Mercedes-AMG Motorsport A13VG | |
| Lenovo ThinkPad P1 G6 21FV001KUS | |
| Asus Zephyrus Duo 16 GX650PY-NM006W | |
| MSI Creator Z16P B12UHST | |
| MSI Raider GE68 HX 13VG, i7-13700HX | |
| Alienware m16 R1 AMD | |
| Asus Vivobook Pro 16X K6604JV-MX016W | |
| Lenovo Legion Slim 5 16APH8 | |
| Lenovo ThinkPad Z16 Gen 2 | |
| Lenovo Legion Slim 7 16APH8 | |
| Durchschnittliche AMD Ryzen 9 PRO 7940HS (611 - 695, n=3) | |
| LG Gram 2in1 16 16T90R - G.AA78G | |
| HP Victus 16-r0076TX | |
| HP ZBook Firefly 14 G10 A | |
| Lenovo ThinkPad Z16 G1 21D5S00T00 | |
| Lenovo ThinkBook 16 G6 ABP | |
| Cinebench R15 / CPU Single 64Bit | |
| Asus Zephyrus Duo 16 GX650PY-NM006W | |
| MSI Raider GE68HX 13VF | |
| Alienware m16 R1 AMD | |
| Asus Vivobook Pro 16X K6604JV-MX016W | |
| Lenovo ThinkPad P1 G6 21FV001KUS | |
| Lenovo Legion Slim 5 16APH8 | |
| MSI Stealth 16 Mercedes-AMG Motorsport A13VG | |
| Lenovo ThinkPad Z16 Gen 2 | |
| MSI Creator Z16P B12UHST | |
| MSI Raider GE68 HX 13VG, i7-13700HX | |
| Lenovo Legion Slim 7 16APH8 | |
| Durchschnittliche AMD Ryzen 9 PRO 7940HS (247 - 280, n=3) | |
| HP ZBook Firefly 14 G10 A | |
| Lenovo ThinkPad Z16 G1 21D5S00T00 | |
| LG Gram 2in1 16 16T90R - G.AA78G | |
| HP Victus 16-r0076TX | |
| Lenovo ThinkBook 16 G6 ABP | |
| HWBOT x265 Benchmark v2.2 / 4k Preset | |
| Asus Zephyrus Duo 16 GX650PY-NM006W | |
| MSI Raider GE68HX 13VF | |
| Alienware m16 R1 AMD | |
| Asus Vivobook Pro 16X K6604JV-MX016W | |
| MSI Raider GE68 HX 13VG, i7-13700HX | |
| Lenovo Legion Slim 5 16APH8 | |
| Lenovo ThinkPad Z16 Gen 2 | |
| HP Victus 16-r0076TX | |
| Lenovo Legion Slim 7 16APH8 | |
| Lenovo ThinkPad P1 G6 21FV001KUS | |
| MSI Creator Z16P B12UHST | |
| Durchschnittliche AMD Ryzen 9 PRO 7940HS (17 - 20.4, n=3) | |
| Lenovo ThinkPad Z16 G1 21D5S00T00 | |
| HP ZBook Firefly 14 G10 A | |
| MSI Stealth 16 Mercedes-AMG Motorsport A13VG | |
| Lenovo ThinkBook 16 G6 ABP | |
| LG Gram 2in1 16 16T90R - G.AA78G | |
| LibreOffice / 20 Documents To PDF | |
| Lenovo Legion Slim 7 16APH8 | |
| Asus Zephyrus Duo 16 GX650PY-NM006W | |
| MSI Stealth 16 Mercedes-AMG Motorsport A13VG | |
| LG Gram 2in1 16 16T90R - G.AA78G | |
| HP ZBook Firefly 14 G10 A | |
| Lenovo ThinkBook 16 G6 ABP | |
| MSI Raider GE68 HX 13VG, i7-13700HX | |
| Asus Vivobook Pro 16X K6604JV-MX016W | |
| Lenovo ThinkPad Z16 G1 21D5S00T00 | |
| Durchschnittliche AMD Ryzen 9 PRO 7940HS (46.1 - 55, n=3) | |
| Lenovo ThinkPad Z16 Gen 2 | |
| Lenovo ThinkPad P1 G6 21FV001KUS | |
| Alienware m16 R1 AMD | |
| MSI Creator Z16P B12UHST | |
| Lenovo Legion Slim 5 16APH8 | |
| MSI Raider GE68HX 13VF | |
Cinebench R23: Multi Core | Single Core
Cinebench R20: CPU (Multi Core) | CPU (Single Core)
Cinebench R15: CPU Multi 64Bit | CPU Single 64Bit
Blender: v2.79 BMW27 CPU
7-Zip 18.03: 7z b 4 | 7z b 4 -mmt1
Geekbench 5.5: Multi-Core | Single-Core
HWBOT x265 Benchmark v2.2: 4k Preset
LibreOffice : 20 Documents To PDF
R Benchmark 2.5: Overall mean
* ... kleinere Werte sind besser
AIDA64: FP32 Ray-Trace | FPU Julia | CPU SHA3 | CPU Queen | FPU SinJulia | FPU Mandel | CPU AES | CPU ZLib | FP64 Ray-Trace | CPU PhotoWorxx
| Performance Rating | |
| Lenovo ThinkPad Z16 Gen 2 | |
| Asus Vivobook Pro 16X K6604JV-MX016W | |
| Durchschnittliche AMD Ryzen 9 PRO 7940HS | |
| Lenovo ThinkPad Z16 G1 21D5S00T00 | |
| MSI Creator Z16P B12UHST | |
| Lenovo ThinkBook 16 G6 ABP | |
| AIDA64 / FP32 Ray-Trace | |
| Lenovo ThinkPad Z16 Gen 2 | |
| Durchschnittliche AMD Ryzen 9 PRO 7940HS (24034 - 27411, n=3) | |
| Asus Vivobook Pro 16X K6604JV-MX016W | |
| Lenovo ThinkPad Z16 G1 21D5S00T00 | |
| Lenovo ThinkBook 16 G6 ABP | |
| MSI Creator Z16P B12UHST | |
| AIDA64 / FPU Julia | |
| Lenovo ThinkPad Z16 Gen 2 | |
| Asus Vivobook Pro 16X K6604JV-MX016W | |
| Durchschnittliche AMD Ryzen 9 PRO 7940HS (101262 - 116960, n=3) | |
| Lenovo ThinkPad Z16 G1 21D5S00T00 | |
| Lenovo ThinkBook 16 G6 ABP | |
| MSI Creator Z16P B12UHST | |
| AIDA64 / CPU SHA3 | |
| Asus Vivobook Pro 16X K6604JV-MX016W | |
| Lenovo ThinkPad Z16 Gen 2 | |
| Durchschnittliche AMD Ryzen 9 PRO 7940HS (4418 - 4944, n=3) | |
| Lenovo ThinkPad Z16 G1 21D5S00T00 | |
| MSI Creator Z16P B12UHST | |
| Lenovo ThinkBook 16 G6 ABP | |
| AIDA64 / CPU Queen | |
| Asus Vivobook Pro 16X K6604JV-MX016W | |
| Lenovo ThinkPad Z16 Gen 2 | |
| Durchschnittliche AMD Ryzen 9 PRO 7940HS (112873 - 124565, n=3) | |
| MSI Creator Z16P B12UHST | |
| Lenovo ThinkPad Z16 G1 21D5S00T00 | |
| Lenovo ThinkBook 16 G6 ABP | |
| AIDA64 / FPU SinJulia | |
| Lenovo ThinkPad Z16 Gen 2 | |
| Durchschnittliche AMD Ryzen 9 PRO 7940HS (14147 - 15304, n=3) | |
| Asus Vivobook Pro 16X K6604JV-MX016W | |
| Lenovo ThinkPad Z16 G1 21D5S00T00 | |
| MSI Creator Z16P B12UHST | |
| Lenovo ThinkBook 16 G6 ABP | |
| AIDA64 / FPU Mandel | |
| Lenovo ThinkPad Z16 Gen 2 | |
| Durchschnittliche AMD Ryzen 9 PRO 7940HS (54003 - 62357, n=3) | |
| Asus Vivobook Pro 16X K6604JV-MX016W | |
| Lenovo ThinkPad Z16 G1 21D5S00T00 | |
| Lenovo ThinkBook 16 G6 ABP | |
| MSI Creator Z16P B12UHST | |
| AIDA64 / CPU AES | |
| Asus Vivobook Pro 16X K6604JV-MX016W | |
| MSI Creator Z16P B12UHST | |
| Lenovo ThinkPad Z16 Gen 2 | |
| Durchschnittliche AMD Ryzen 9 PRO 7940HS (76133 - 88705, n=3) | |
| Lenovo ThinkPad Z16 G1 21D5S00T00 | |
| Lenovo ThinkBook 16 G6 ABP | |
| AIDA64 / CPU ZLib | |
| Asus Vivobook Pro 16X K6604JV-MX016W | |
| MSI Creator Z16P B12UHST | |
| Lenovo ThinkPad Z16 Gen 2 | |
| Durchschnittliche AMD Ryzen 9 PRO 7940HS (976 - 1079, n=3) | |
| Lenovo ThinkPad Z16 G1 21D5S00T00 | |
| Lenovo ThinkBook 16 G6 ABP | |
| AIDA64 / FP64 Ray-Trace | |
| Lenovo ThinkPad Z16 Gen 2 | |
| Durchschnittliche AMD Ryzen 9 PRO 7940HS (12715 - 14590, n=3) | |
| Asus Vivobook Pro 16X K6604JV-MX016W | |
| Lenovo ThinkPad Z16 G1 21D5S00T00 | |
| Lenovo ThinkBook 16 G6 ABP | |
| MSI Creator Z16P B12UHST | |
| AIDA64 / CPU PhotoWorxx | |
| Asus Vivobook Pro 16X K6604JV-MX016W | |
| MSI Creator Z16P B12UHST | |
| Lenovo ThinkPad Z16 Gen 2 | |
| Durchschnittliche AMD Ryzen 9 PRO 7940HS (24030 - 37800, n=3) | |
| Lenovo ThinkPad Z16 G1 21D5S00T00 | |
| Lenovo ThinkBook 16 G6 ABP | |
System Performance
CrossMark: Overall | Productivity | Creativity | Responsiveness
WebXPRT 3: Overall
WebXPRT 4: Overall
Mozilla Kraken 1.1: Total
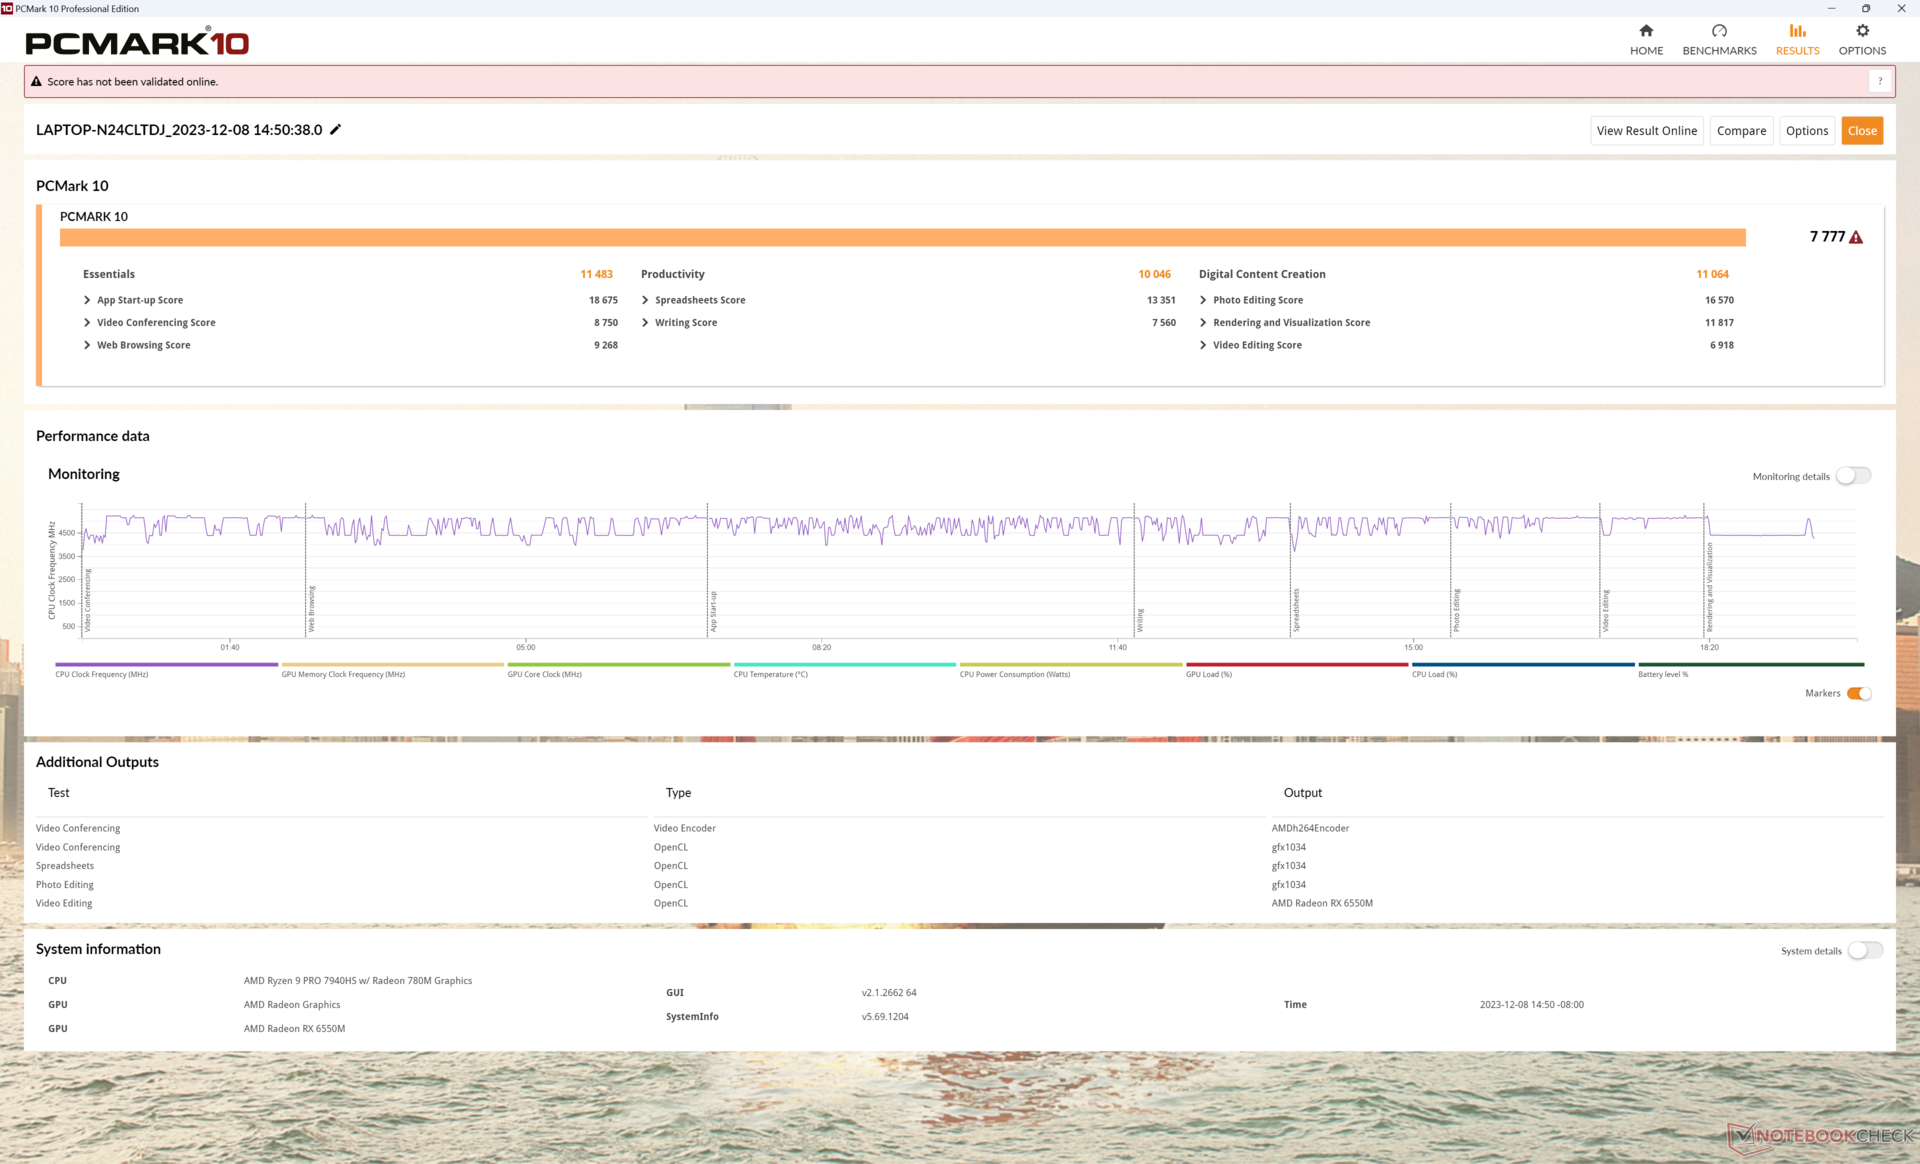
| PCMark 10 / Score | |
| MSI Creator Z16P B12UHST | |
| Lenovo ThinkPad Z16 Gen 2 | |
| Durchschnittliche AMD Ryzen 9 PRO 7940HS, AMD Radeon RX 6550M (n=1) | |
| Asus Vivobook Pro 16X K6604JV-MX016W | |
| Lenovo ThinkPad Z16 G1 21D5S00T00 | |
| Lenovo ThinkBook 16 G6 ABP | |
| PCMark 10 / Essentials | |
| Lenovo ThinkPad Z16 Gen 2 | |
| Durchschnittliche AMD Ryzen 9 PRO 7940HS, AMD Radeon RX 6550M (n=1) | |
| MSI Creator Z16P B12UHST | |
| Lenovo ThinkBook 16 G6 ABP | |
| Asus Vivobook Pro 16X K6604JV-MX016W | |
| Lenovo ThinkPad Z16 G1 21D5S00T00 | |
| PCMark 10 / Productivity | |
| MSI Creator Z16P B12UHST | |
| Lenovo ThinkPad Z16 Gen 2 | |
| Durchschnittliche AMD Ryzen 9 PRO 7940HS, AMD Radeon RX 6550M (n=1) | |
| Lenovo ThinkBook 16 G6 ABP | |
| Asus Vivobook Pro 16X K6604JV-MX016W | |
| Lenovo ThinkPad Z16 G1 21D5S00T00 | |
| PCMark 10 / Digital Content Creation | |
| MSI Creator Z16P B12UHST | |
| Lenovo ThinkPad Z16 Gen 2 | |
| Durchschnittliche AMD Ryzen 9 PRO 7940HS, AMD Radeon RX 6550M (n=1) | |
| Asus Vivobook Pro 16X K6604JV-MX016W | |
| Lenovo ThinkPad Z16 G1 21D5S00T00 | |
| Lenovo ThinkBook 16 G6 ABP | |
| CrossMark / Overall | |
| Asus Vivobook Pro 16X K6604JV-MX016W | |
| Apple MacBook Pro 16 2023 M3 Pro | |
| Lenovo ThinkPad Z16 Gen 2 | |
| Durchschnittliche AMD Ryzen 9 PRO 7940HS, AMD Radeon RX 6550M (n=1) | |
| Lenovo ThinkPad Z16 G1 21D5S00T00 | |
| Lenovo ThinkBook 16 G6 ABP | |
| CrossMark / Productivity | |
| Asus Vivobook Pro 16X K6604JV-MX016W | |
| Apple MacBook Pro 16 2023 M3 Pro | |
| Lenovo ThinkPad Z16 Gen 2 | |
| Durchschnittliche AMD Ryzen 9 PRO 7940HS, AMD Radeon RX 6550M (n=1) | |
| Lenovo ThinkPad Z16 G1 21D5S00T00 | |
| Lenovo ThinkBook 16 G6 ABP | |
| CrossMark / Creativity | |
| Apple MacBook Pro 16 2023 M3 Pro | |
| Asus Vivobook Pro 16X K6604JV-MX016W | |
| Lenovo ThinkPad Z16 Gen 2 | |
| Durchschnittliche AMD Ryzen 9 PRO 7940HS, AMD Radeon RX 6550M (n=1) | |
| Lenovo ThinkPad Z16 G1 21D5S00T00 | |
| Lenovo ThinkBook 16 G6 ABP | |
| CrossMark / Responsiveness | |
| Asus Vivobook Pro 16X K6604JV-MX016W | |
| Apple MacBook Pro 16 2023 M3 Pro | |
| Lenovo ThinkPad Z16 Gen 2 | |
| Durchschnittliche AMD Ryzen 9 PRO 7940HS, AMD Radeon RX 6550M (n=1) | |
| Lenovo ThinkPad Z16 G1 21D5S00T00 | |
| Lenovo ThinkBook 16 G6 ABP | |
| WebXPRT 3 / Overall | |
| Apple MacBook Pro 16 2023 M3 Pro | |
| MSI Creator Z16P B12UHST | |
| Lenovo ThinkPad Z16 Gen 2 | |
| Durchschnittliche AMD Ryzen 9 PRO 7940HS, AMD Radeon RX 6550M (n=1) | |
| Asus Vivobook Pro 16X K6604JV-MX016W | |
| Lenovo ThinkBook 16 G6 ABP | |
| Lenovo ThinkPad Z16 G1 21D5S00T00 | |
| WebXPRT 4 / Overall | |
| Lenovo ThinkPad Z16 Gen 2 | |
| Durchschnittliche AMD Ryzen 9 PRO 7940HS, AMD Radeon RX 6550M (n=1) | |
| Asus Vivobook Pro 16X K6604JV-MX016W | |
| Lenovo ThinkBook 16 G6 ABP | |
| Lenovo ThinkPad Z16 G1 21D5S00T00 | |
| Mozilla Kraken 1.1 / Total | |
| Lenovo ThinkBook 16 G6 ABP | |
| Lenovo ThinkPad Z16 G1 21D5S00T00 | |
| Lenovo ThinkPad Z16 Gen 2 | |
| Durchschnittliche AMD Ryzen 9 PRO 7940HS, AMD Radeon RX 6550M (n=1) | |
| Asus Vivobook Pro 16X K6604JV-MX016W | |
| MSI Creator Z16P B12UHST | |
| Apple MacBook Pro 16 2023 M3 Pro | |
* ... kleinere Werte sind besser
| PCMark 10 Score | 7777 Punkte | |
Hilfe | ||
| AIDA64 / Memory Copy | |
| Asus Vivobook Pro 16X K6604JV-MX016W | |
| Lenovo ThinkPad Z16 Gen 2 | |
| MSI Creator Z16P B12UHST | |
| Lenovo ThinkPad Z16 G1 21D5S00T00 | |
| Durchschnittliche AMD Ryzen 9 PRO 7940HS (34339 - 66740, n=3) | |
| Lenovo ThinkBook 16 G6 ABP | |
| AIDA64 / Memory Read | |
| Asus Vivobook Pro 16X K6604JV-MX016W | |
| MSI Creator Z16P B12UHST | |
| Lenovo ThinkPad Z16 Gen 2 | |
| Lenovo ThinkPad Z16 G1 21D5S00T00 | |
| Lenovo ThinkBook 16 G6 ABP | |
| Durchschnittliche AMD Ryzen 9 PRO 7940HS (30289 - 50398, n=3) | |
| AIDA64 / Memory Write | |
| Lenovo ThinkPad Z16 Gen 2 | |
| Asus Vivobook Pro 16X K6604JV-MX016W | |
| MSI Creator Z16P B12UHST | |
| Durchschnittliche AMD Ryzen 9 PRO 7940HS (39877 - 91516, n=3) | |
| Lenovo ThinkPad Z16 G1 21D5S00T00 | |
| Lenovo ThinkBook 16 G6 ABP | |
| AIDA64 / Memory Latency | |
| Lenovo ThinkPad Z16 G1 21D5S00T00 | |
| Lenovo ThinkPad Z16 Gen 2 | |
| Durchschnittliche AMD Ryzen 9 PRO 7940HS (102.2 - 121.3, n=3) | |
| Lenovo ThinkBook 16 G6 ABP | |
| MSI Creator Z16P B12UHST | |
| Asus Vivobook Pro 16X K6604JV-MX016W | |
* ... kleinere Werte sind besser
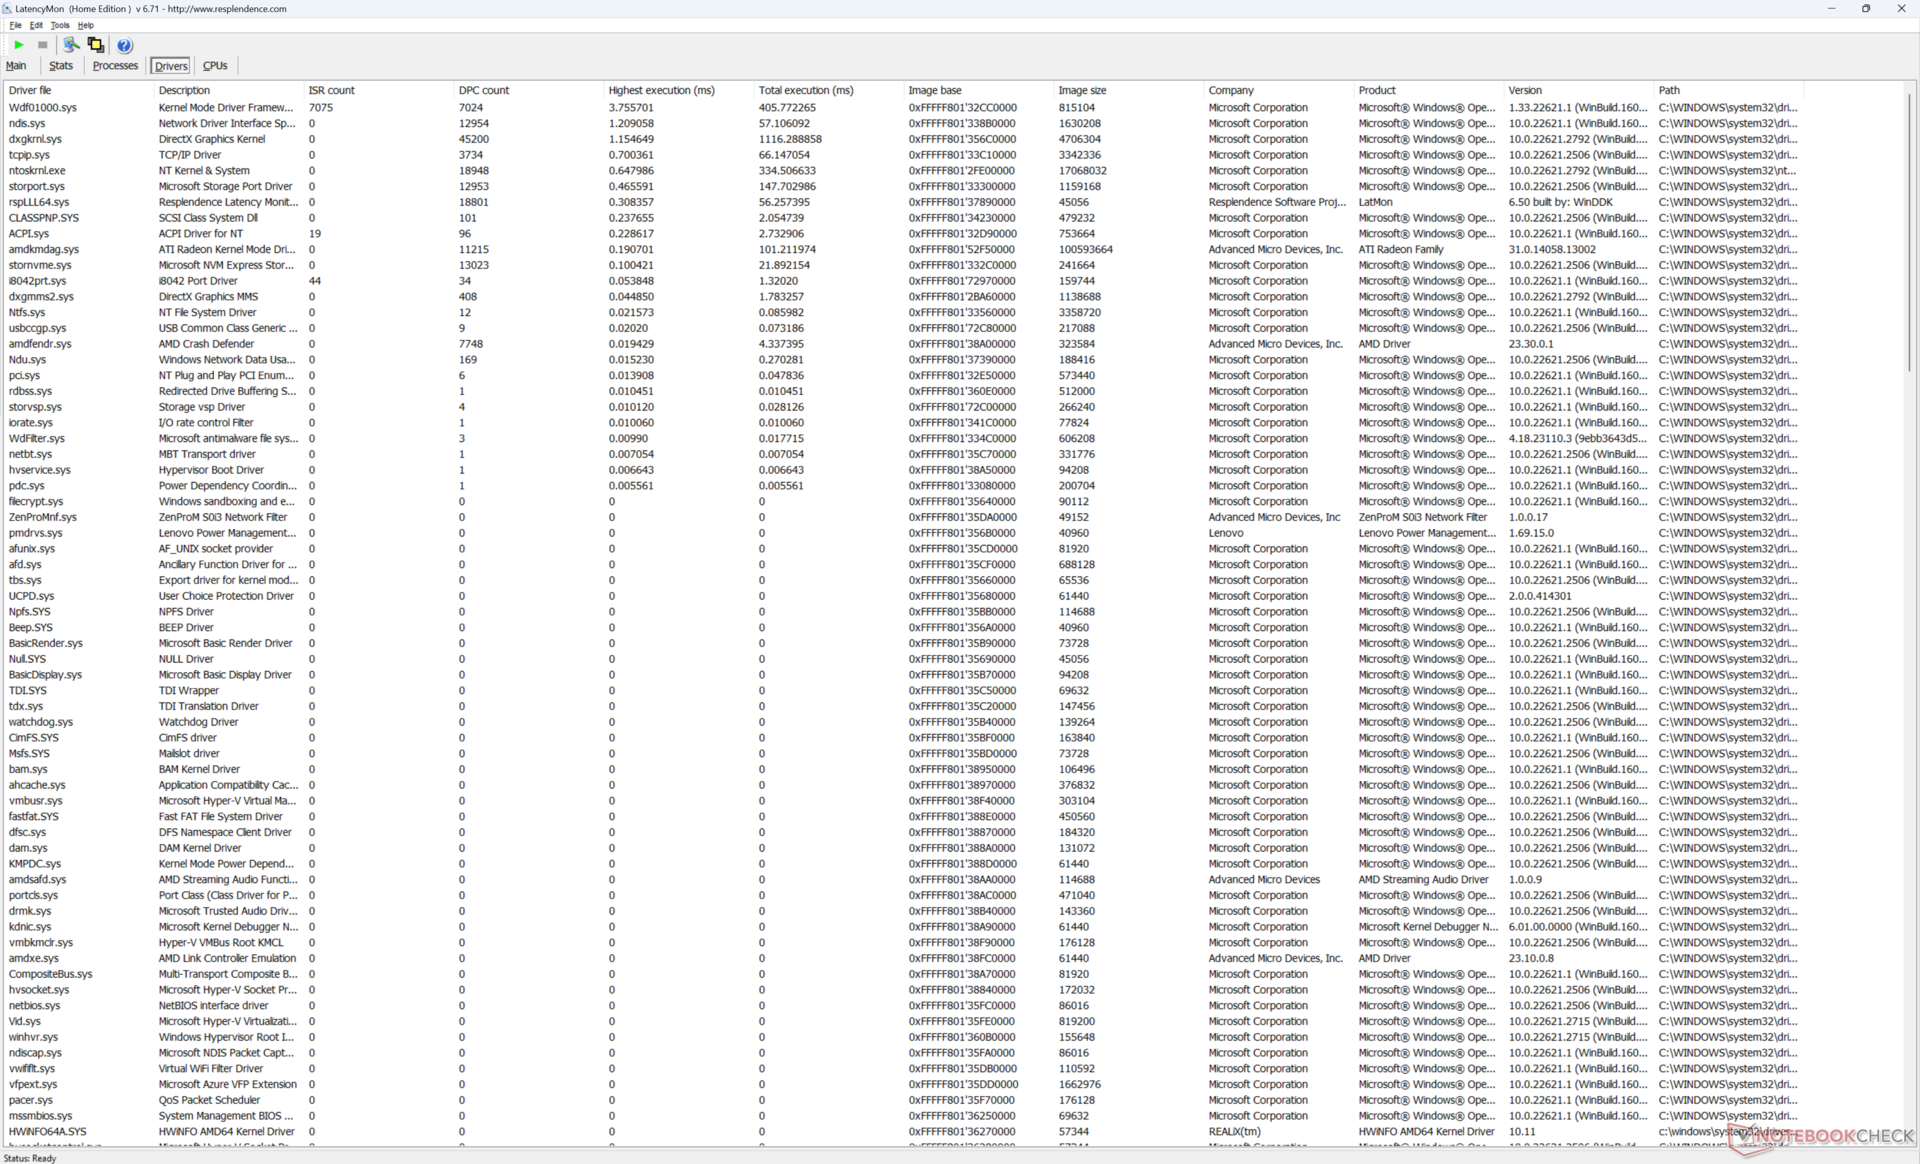
DPC-Latenzen
LatencyMon zeigt kleinere DPC-Probleme beim Öffnen mehrerer Browser-Tabs unserer Homepage. Die 4K-Videowiedergabe bei 60 FPS ist ansonsten perfekt, und es gibt keine Bildaussetzer, wie wir sie beim kürzlich erschienenen Intel-Nvidia-betriebenen ThinkPad P1 G6 erlebt haben.

| DPC Latencies / LatencyMon - interrupt to process latency (max), Web, Youtube, Prime95 | |
| Asus Vivobook Pro 16X K6604JV-MX016W | |
| Lenovo ThinkPad Z16 Gen 2 | |
| Lenovo ThinkBook 16 G6 ABP | |
| MSI Creator Z16P B12UHST | |
| Lenovo ThinkPad Z16 G1 21D5S00T00 | |
* ... kleinere Werte sind besser
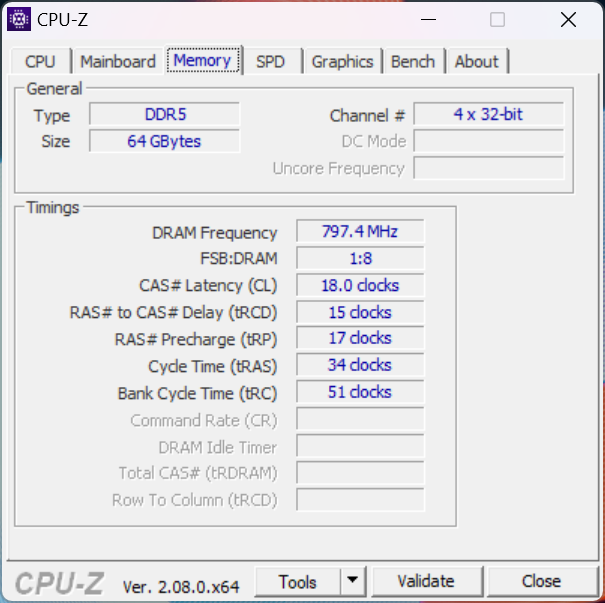
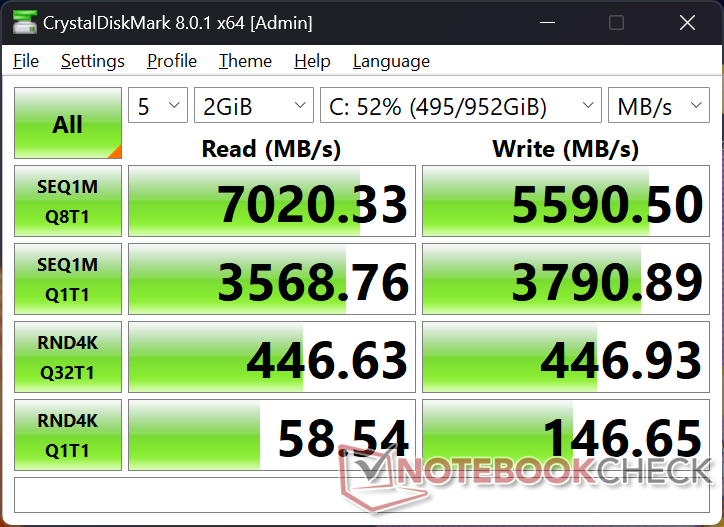
Massenspeicher
Unser Testgerät ist mit der Kioxia XG8 ausgestattet, während unser älteres ThinkPad Z16 Gen 1 mit der Samsung PM9A1 ausgeliefert wurde. Dennoch handelt es sich bei beiden SSDs um High-End-PCIe-4.0-x4-NVMe-Laufwerke mit ähnlichen maximalen Leseraten von jeweils ~7000 MB/s.
Leider zeigte auch das Kioxia-Laufwerk nach ein paar Minuten Belastung Probleme mit der Leistungsdrosselung, ähnlich wie das Samsung-Laufwerk in unserem ThinkPad Z16 Gen 1, wie die Vergleichsgrafik unten zeigt. Die Leseraten fielen im Laufe der Zeit von ~7000 MB/s auf ~5800 MB/s, was wahrscheinlich auf eine unzureichende Wärmeableitung zurückzuführen ist. Der Einbau eines großen Wärmeleitpads zwischen der SSD und der unteren Metallabdeckung könnte die Leistung verbessern.
Der Arbeitsspeicher ist verlötet, und es gibt keine Unterstützung für eine zweite SSD, anders als beim MSI Creator Z16P, das über zwei RAM- und zwei M.2-SSD-Slots.


| Drive Performance Rating - Percent | |
| MSI Creator Z16P B12UHST | |
| Lenovo ThinkPad Z16 G1 21D5S00T00 | |
| Lenovo ThinkPad Z16 Gen 2 | |
| Lenovo ThinkBook 16 G6 ABP | |
| Asus Vivobook Pro 16X K6604JV-MX016W | |
* ... kleinere Werte sind besser
Disk-Throttling: DiskSpd Read Loop, 8 Runden
GPU Performance
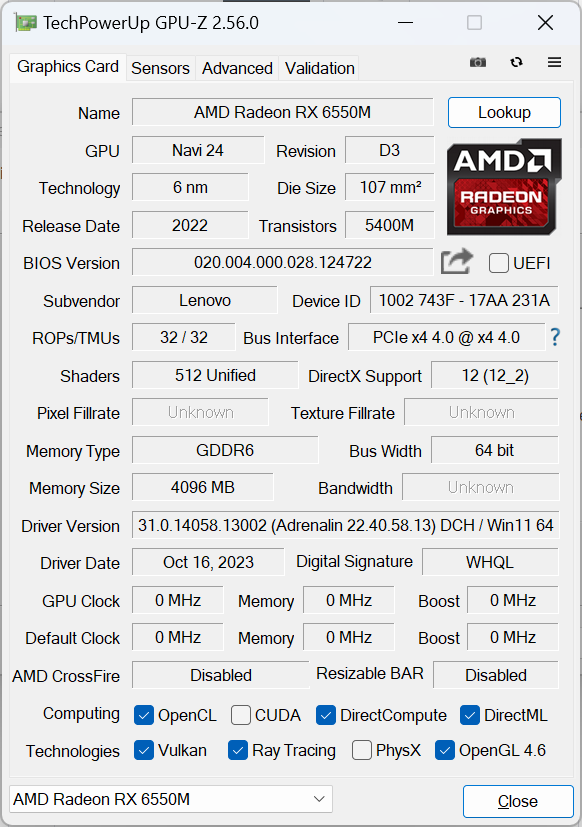
Das Verhältnis zwischen der Radeon RX 6550M und der RX 6500M ist ähnlich wie das zwischen der GeForce RTX 3050 Ti und der RTX 3050; ihre Unterschiede sind gering und liegen im Durchschnitt innerhalb von 10 Prozentpunkten. Die beiden Radeon-GPUs haben die gleiche 64-Bit-Speicherbusbreite, RDNA2-Architektur, 1024 Stream-Prozessoren, 4 GB GDDR6-VRAM und mehr. Die Radeon RX 6550M erreicht geringfügig höhere Zieltaktraten (2560 MHz vs. 2191 MHz) und maximalen TGP (60 W vs. 55 W) als die 6500M, aber das war es auch schon.
Die geringfügige Erhöhung der Taktraten führt nur zu marginalen Steigerungen bei den Benchmark-Ergebnissen, wie die unten stehende Vergleichstabelle zeigt.
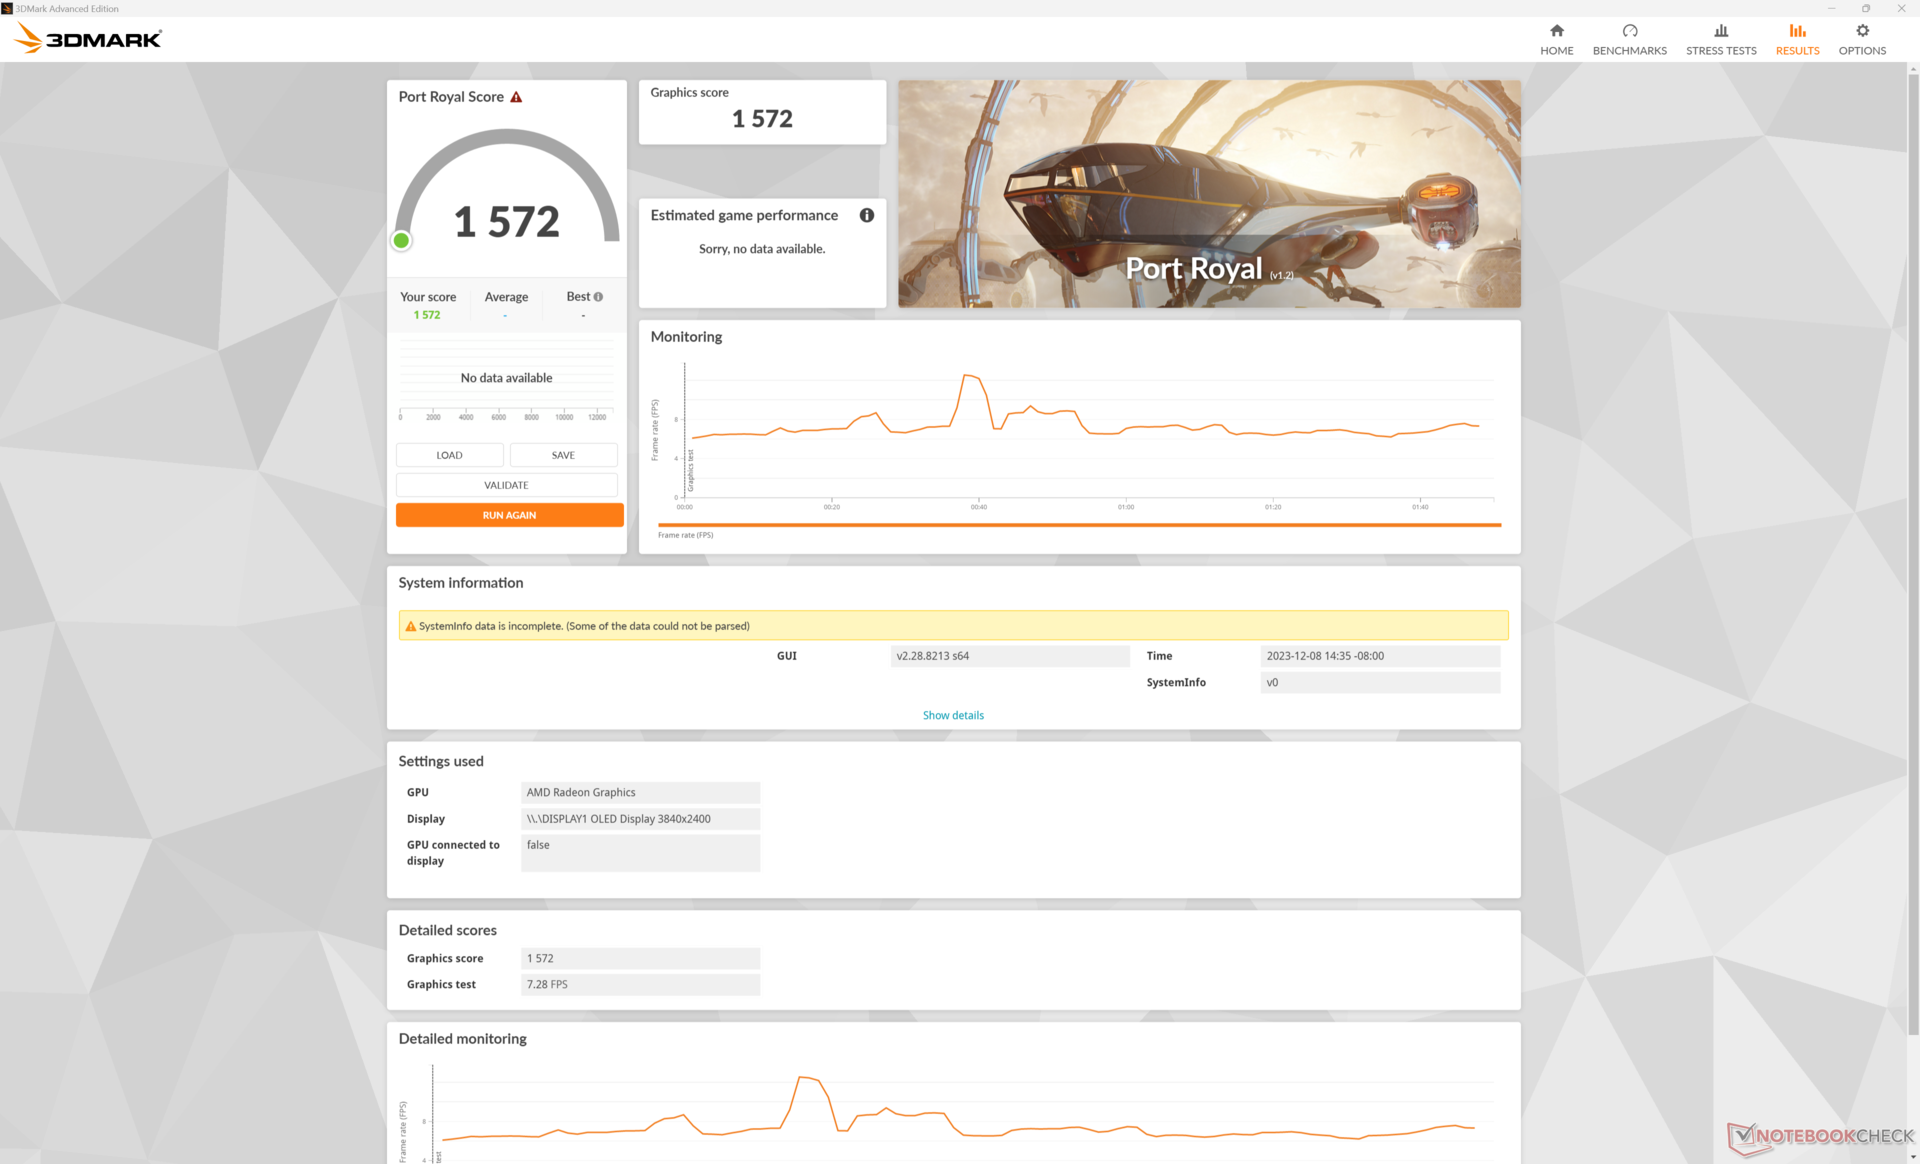
Der Betrieb im Balanced-Modus anstelle des Performance-Modus wirkt sich nur geringfügig auf die Leistung aus, wie unsere Fire-Strike-Ergebnisse in der Tabelle unten zeigen. Der Betrieb im Battery Power würde die Grafikleistung deutlich stärker reduzieren als die Prozessorleistung.
| Energieprofile | CPU-Leistung | Grafikleistung | Gesamtwert |
| Performance-Modus | 26753 | 14696 | 4923 |
| Balanced-Modus | 26333 (-2%) | 13975 (-5%) | 4776 (-3%) |
| Battery Power | 25622 (-4%) | 9649 (-34%) | 3114 (-37%) |
Beachten Sie, dass die RDNA2-basierte Radeon RX 6550M direkt nach der Einführung der High-End RDNA3-basierten Radeon RX 7900M kommt. Das bedeutet, dass bald weitere RDNA3-GPUs für die Mittelklasse erhältlich sein werden. RDNA3 stellt eine deutliche Verbesserung gegenüber RDNA2 in Bezug auf Leistung, Stromverbrauch, Unterstützung für AI-Upscaling und insbesondere Raytracing-Fähigkeiten dar.

| 3DMark Performance Rating - Percent | |
| Asus Zephyrus Duo 16 GX650PY-NM006W | |
| Alienware m16 R1 AMD | |
| Lenovo ThinkPad P1 G6 21FV001KUS | |
| MSI Raider GE68 HX 13VG, i7-13700HX | |
| MSI Raider GE68HX 13VF | |
| HP Victus 16-r0076TX -1! | |
| MSI Creator Z16P B12UHST -1! | |
| Lenovo ThinkPad Z16 G1 21D5S00T00 -1! | |
| Asus VivoBook Pro 16 -1! | |
| Lenovo ThinkPad Z16 Gen 2 | |
| Durchschnittliche AMD Radeon RX 6550M | |
| HP Victus 15 fa0020nr | |
| Asus VivoBook Pro 16X OLED N7600PC-L2026X -1! | |
| LG Gram 2in1 16 16T90R - G.AA78G -1! | |
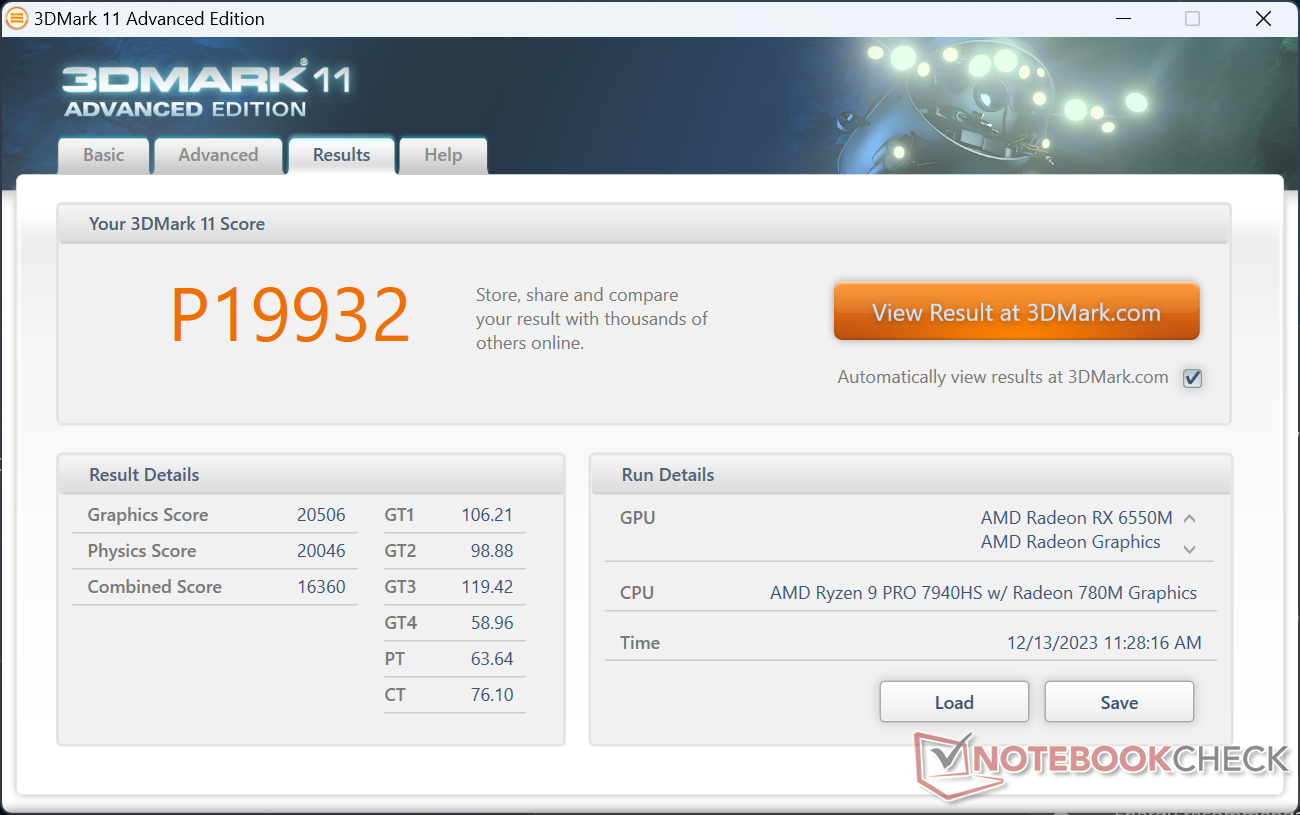
| 3DMark 11 Performance | 19932 Punkte | |
| 3DMark Fire Strike Score | 12994 Punkte | |
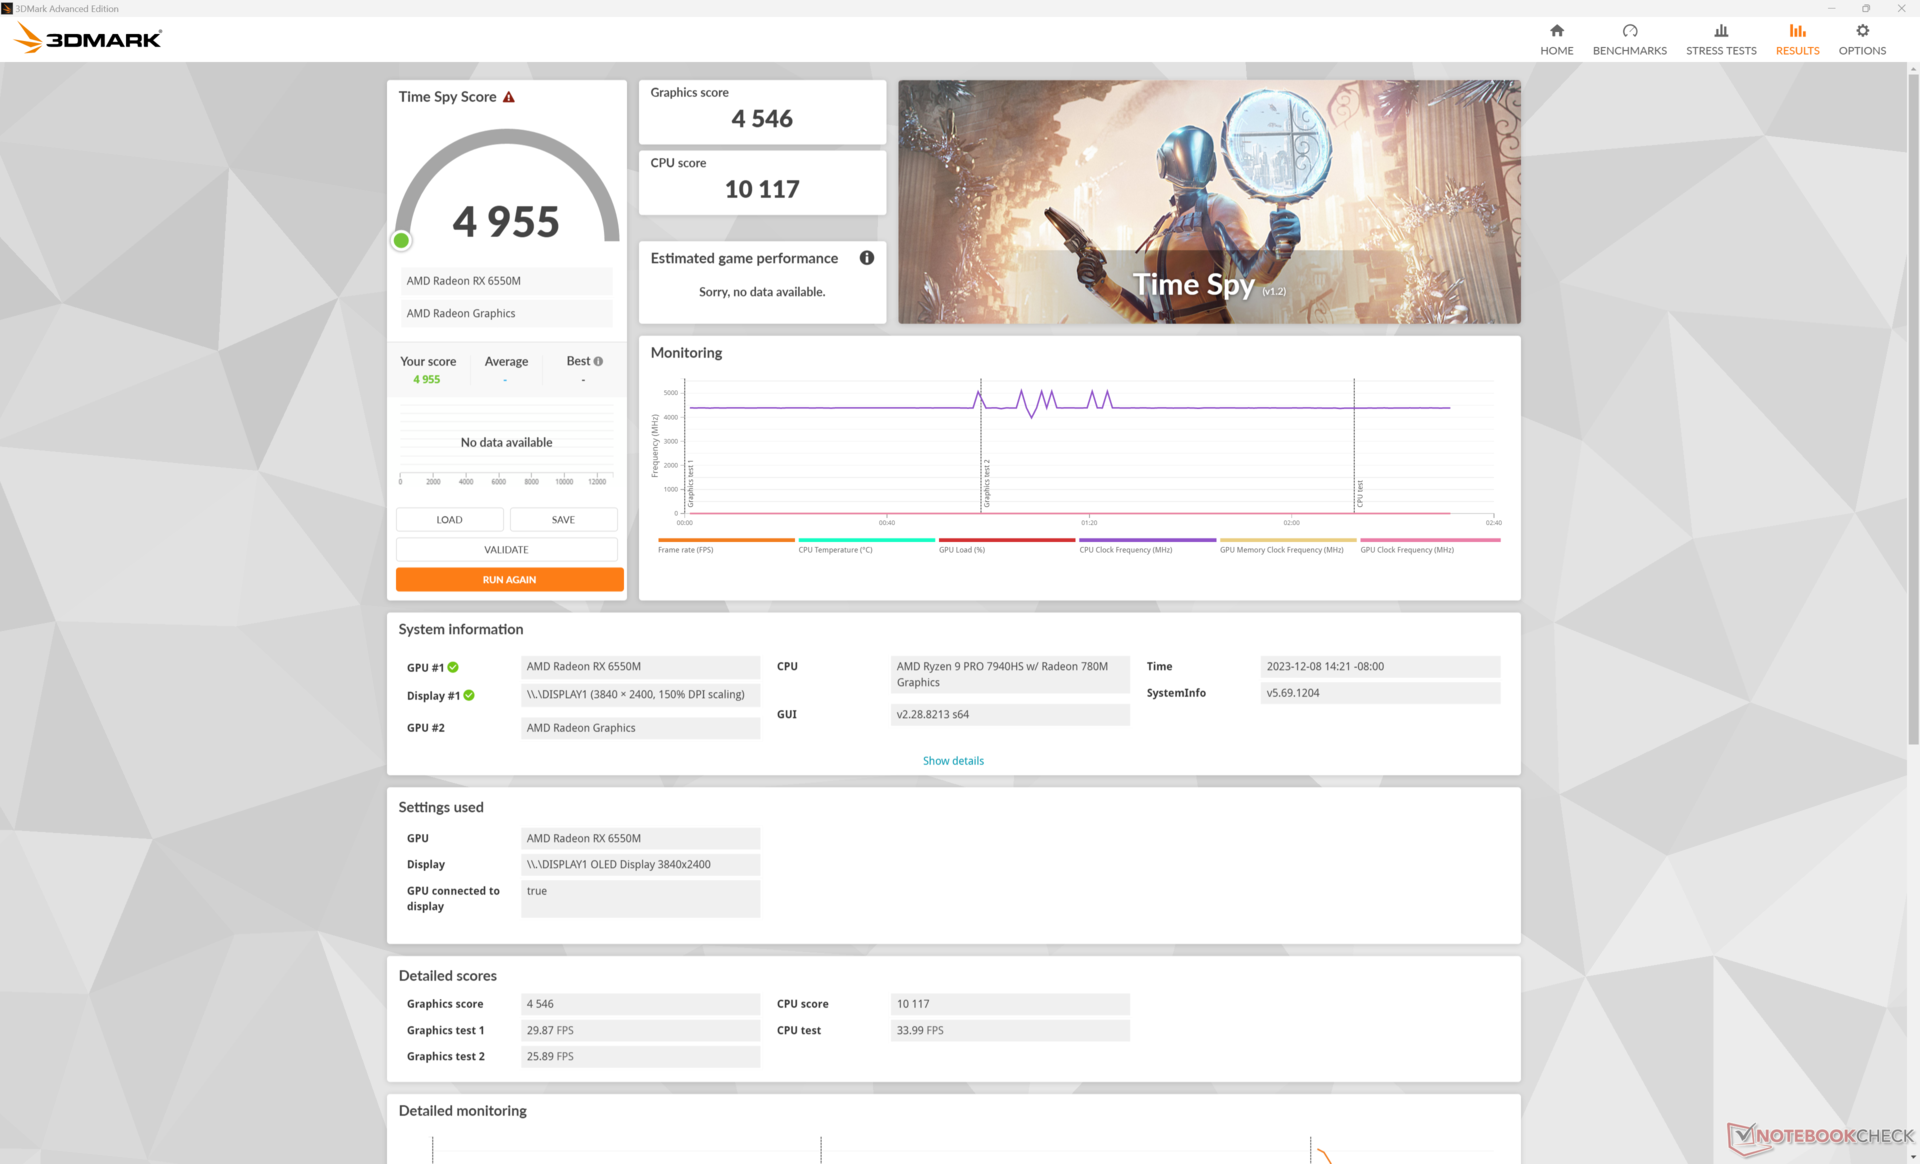
| 3DMark Time Spy Score | 4955 Punkte | |
Hilfe | ||
| Blender | |
| v3.3 Classroom METAL | |
| Apple MacBook Pro 16 2023 M3 Pro | |
| v3.3 Classroom HIP/AMD | |
| Lenovo ThinkPad Z16 G1 21D5S00T00 | |
| v3.3 Classroom OPTIX/RTX | |
| Asus VivoBook Pro 16 | |
| HP Victus 16-r0076TX | |
| MSI Raider GE68HX 13VF | |
| MSI Raider GE68 HX 13VG, i7-13700HX | |
| Alienware m16 R1 AMD | |
| Lenovo ThinkPad P1 G6 21FV001KUS | |
| Asus Zephyrus Duo 16 GX650PY-NM006W | |
| v3.3 Classroom CUDA | |
| Asus VivoBook Pro 16 | |
| HP Victus 16-r0076TX | |
| MSI Raider GE68HX 13VF | |
| MSI Raider GE68 HX 13VG, i7-13700HX | |
| Lenovo ThinkPad P1 G6 21FV001KUS | |
| Alienware m16 R1 AMD | |
| Asus Zephyrus Duo 16 GX650PY-NM006W | |
| v3.3 Classroom CPU | |
| LG Gram 2in1 16 16T90R - G.AA78G | |
| Lenovo ThinkPad Z16 G1 21D5S00T00 | |
| Asus VivoBook Pro 16 | |
| HP Victus 16-r0076TX | |
| Lenovo ThinkPad P1 G6 21FV001KUS | |
| Apple MacBook Pro 16 2023 M3 Pro | |
| Lenovo ThinkPad Z16 Gen 2 | |
| Durchschnittliche AMD Radeon RX 6550M (n=1) | |
| MSI Raider GE68 HX 13VG, i7-13700HX | |
| MSI Raider GE68HX 13VF | |
| Alienware m16 R1 AMD | |
| Asus Zephyrus Duo 16 GX650PY-NM006W | |
* ... kleinere Werte sind besser
Gaming Performance
Die Leistung beim Spielen kann von nahezu identisch zur Radeon RX 6500M bis hin zu bis zu 30 Prozent schneller reichen, je nach Titel und Einstellungen. Final Fantasy XV beispielsweise ist zwischen unseren Radeon RX 6550M- und 6500M-Modellen nahezu identisch, während andere Titel wie Far Cry 5 oder F1 22 bis zu 15 bis 30 Prozent schneller laufen können. Währenddessen kann Tiny Tina's Wonderlands nur bei höheren Grafikeinstellungen bis zu 30 Prozent schneller laufen. Die Ergebnisse hängen also stark von der jeweiligen Anwendung ab, aber die Leistungsvorteile sind im Allgemeinen höher als die 3DMark-Ergebnisse vermuten lassen, was für Gamer eine gute Nachricht ist.
Interessanterweise liegt die Gesamtleistung beim Testen neuerer Spiele wie Cyberpunk 2077 und Baldur's Gate 3 Kopf an Kopf mit dem MacBook Pro 16 M3 Pro. Wenn man bedenkt, dass unsere Radeon eine größere diskrete GPU ist, spricht dies Bände über die Effizienz der integrierten Apple SoC-Lösung.
| Performance Rating - Percent | |
| Asus Zephyrus Duo 16 GX650PY-NM006W | |
| Alienware m16 R1 AMD -1! | |
| Lenovo ThinkPad P1 G6 21FV001KUS -1! | |
| MSI Raider GE68 HX 13VG, i7-13700HX | |
| MSI Raider GE68HX 13VF -1! | |
| MSI Creator Z16P B12UHST | |
| HP Victus 16-r0076TX -1! | |
| Lenovo ThinkPad Z16 Gen 2 -1! | |
| Apple MacBook Pro 16 2023 M3 Pro -4! | |
| Lenovo ThinkPad Z16 G1 21D5S00T00 | |
| LG Gram 2in1 16 16T90R - G.AA78G | |
| The Witcher 3 - 1920x1080 Ultra Graphics & Postprocessing (HBAO+) | |
| Asus Zephyrus Duo 16 GX650PY-NM006W | |
| Alienware m16 R1 AMD | |
| Lenovo ThinkPad P1 G6 21FV001KUS | |
| MSI Raider GE68 HX 13VG, i7-13700HX | |
| MSI Raider GE68HX 13VF | |
| HP Victus 16-r0076TX | |
| MSI Creator Z16P B12UHST | |
| Lenovo ThinkPad Z16 Gen 2 | |
| Apple MacBook Pro 16 2023 M3 Pro | |
| Lenovo ThinkPad Z16 G1 21D5S00T00 | |
| LG Gram 2in1 16 16T90R - G.AA78G | |
| GTA V - 1920x1080 Highest AA:4xMSAA + FX AF:16x | |
| Asus Zephyrus Duo 16 GX650PY-NM006W | |
| Lenovo ThinkPad P1 G6 21FV001KUS | |
| MSI Raider GE68 HX 13VG, i7-13700HX | |
| MSI Creator Z16P B12UHST | |
| Apple MacBook Pro 16 2023 M3 Pro | |
| Lenovo ThinkPad Z16 G1 21D5S00T00 | |
| LG Gram 2in1 16 16T90R - G.AA78G | |
| Final Fantasy XV Benchmark - 1920x1080 High Quality | |
| Asus Zephyrus Duo 16 GX650PY-NM006W | |
| Alienware m16 R1 AMD | |
| Lenovo ThinkPad P1 G6 21FV001KUS | |
| MSI Raider GE68 HX 13VG, i7-13700HX | |
| MSI Raider GE68HX 13VF | |
| MSI Creator Z16P B12UHST | |
| HP Victus 16-r0076TX | |
| Lenovo ThinkPad Z16 Gen 2 | |
| Lenovo ThinkPad Z16 G1 21D5S00T00 | |
| LG Gram 2in1 16 16T90R - G.AA78G | |
| Strange Brigade - 1920x1080 ultra AA:ultra AF:16 | |
| Alienware m16 R1 AMD | |
| Asus Zephyrus Duo 16 GX650PY-NM006W | |
| MSI Raider GE68 HX 13VG, i7-13700HX | |
| MSI Raider GE68HX 13VF | |
| MSI Creator Z16P B12UHST | |
| HP Victus 16-r0076TX | |
| Lenovo ThinkPad Z16 Gen 2 | |
| Lenovo ThinkPad Z16 G1 21D5S00T00 | |
| LG Gram 2in1 16 16T90R - G.AA78G | |
| Dota 2 Reborn - 1920x1080 ultra (3/3) best looking | |
| MSI Raider GE68HX 13VF | |
| Asus Zephyrus Duo 16 GX650PY-NM006W | |
| MSI Raider GE68 HX 13VG, i7-13700HX | |
| Alienware m16 R1 AMD | |
| MSI Creator Z16P B12UHST | |
| Lenovo ThinkPad P1 G6 21FV001KUS | |
| HP Victus 16-r0076TX | |
| Lenovo ThinkPad Z16 Gen 2 | |
| Lenovo ThinkPad Z16 G1 21D5S00T00 | |
| LG Gram 2in1 16 16T90R - G.AA78G | |
| X-Plane 11.11 - 1920x1080 high (fps_test=3) | |
| MSI Raider GE68HX 13VF | |
| MSI Raider GE68 HX 13VG, i7-13700HX | |
| Lenovo ThinkPad P1 G6 21FV001KUS | |
| Asus Zephyrus Duo 16 GX650PY-NM006W | |
| Alienware m16 R1 AMD | |
| HP Victus 16-r0076TX | |
| MSI Creator Z16P B12UHST | |
| LG Gram 2in1 16 16T90R - G.AA78G | |
| Lenovo ThinkPad Z16 G1 21D5S00T00 | |
| Lenovo ThinkPad Z16 Gen 2 | |
| Cyberpunk 2077 | |
| 1280x720 Low Preset (FSR off) | |
| Lenovo ThinkPad Z16 Gen 2 | |
| Durchschnittliche AMD Radeon RX 6550M (n=1) | |
| LG Gram 2in1 16 16T90R - G.AA78G | |
| 1920x1080 Low Preset (FSR off) | |
| Lenovo ThinkPad Z16 Gen 2 | |
| Durchschnittliche AMD Radeon RX 6550M (n=1) | |
| Apple MacBook Pro 16 2023 M3 Pro | |
| LG Gram 2in1 16 16T90R - G.AA78G | |
| 1920x1080 Medium Preset (FSR off) | |
| Lenovo ThinkPad Z16 Gen 2 | |
| Durchschnittliche AMD Radeon RX 6550M (n=1) | |
| Apple MacBook Pro 16 2023 M3 Pro | |
| LG Gram 2in1 16 16T90R - G.AA78G | |
| 1920x1080 High Preset (FSR off) | |
| Lenovo ThinkPad P1 G6 21FV001KUS | |
| Apple MacBook Pro 16 2023 M3 Pro | |
| Lenovo ThinkPad Z16 Gen 2 | |
| Durchschnittliche AMD Radeon RX 6550M (n=1) | |
| LG Gram 2in1 16 16T90R - G.AA78G | |
| 1920x1080 Ultra Preset (FSR off) | |
| Lenovo ThinkPad P1 G6 21FV001KUS | |
| Apple MacBook Pro 16 2023 M3 Pro | |
| Lenovo ThinkPad Z16 Gen 2 | |
| Durchschnittliche AMD Radeon RX 6550M (n=1) | |
| LG Gram 2in1 16 16T90R - G.AA78G | |
| 2560x1440 Ultra Preset (FSR off) | |
| Lenovo ThinkPad P1 G6 21FV001KUS | |
| Lenovo ThinkPad Z16 Gen 2 | |
| Durchschnittliche AMD Radeon RX 6550M (n=1) | |
| Baldur's Gate 3 | |
| 1920x1080 Low Preset AA:SM | |
| Lenovo ThinkPad Z16 Gen 2 | |
| Durchschnittliche AMD Radeon RX 6550M (n=1) | |
| 1920x1080 Medium Preset AA:T | |
| Lenovo ThinkPad Z16 Gen 2 | |
| Durchschnittliche AMD Radeon RX 6550M (n=1) | |
| 1920x1080 High Preset AA:T | |
| Apple MacBook Pro 16 2023 M3 Pro | |
| Lenovo ThinkPad Z16 Gen 2 | |
| Durchschnittliche AMD Radeon RX 6550M (n=1) | |
| 1920x1080 Ultra Preset AA:T | |
| Lenovo ThinkPad P1 G6 21FV001KUS | |
| Apple MacBook Pro 16 2023 M3 Pro | |
| Lenovo ThinkPad Z16 Gen 2 | |
| Durchschnittliche AMD Radeon RX 6550M (n=1) | |
| 2560x1440 Ultra Preset AA:T | |
| Lenovo ThinkPad P1 G6 21FV001KUS | |
| Lenovo ThinkPad Z16 Gen 2 | |
| Durchschnittliche AMD Radeon RX 6550M (n=1) | |
Witcher 3 FPS-Diagramm
| min. | mittel | hoch | max. | QHD | |
|---|---|---|---|---|---|
| The Witcher 3 (2015) | 277.2 | 171.5 | 83.2 | 49.4 | |
| Dota 2 Reborn (2015) | 137.1 | 127.3 | 112.3 | 103 | |
| Final Fantasy XV Benchmark (2018) | 129.3 | 67.4 | 47.8 | 31.2 | |
| X-Plane 11.11 (2018) | 53.7 | 41.2 | 33 | ||
| Far Cry 5 (2018) | 115 | 91 | 84 | 79 | |
| Strange Brigade (2018) | 319 | 122.5 | 101.1 | 88.4 | |
| Tiny Tina's Wonderlands (2022) | 124.1 | 95.5 | 59.7 | 30.3 | 27.2 |
| F1 22 (2022) | 132.5 | 120.8 | 87.5 | 19.3 | 11.3 |
| Baldur's Gate 3 (2023) | 61.6 | 52.9 | 44.7 | 43 | 29 |
| Cyberpunk 2077 (2023) | 62.8 | 45.9 | 34.7 | 28.6 | 17.3 |
Emissionen
Geräuschemissionen
Das Geräuschverhalten der Lüfter hängt stark vom gewählten Energieprofil ab. Zum Beispiel sind die Lüfter nur im Energiesparprofil wirklich leise, da sie ansonsten immer mit fast 30 dB(A) aktiv sind, egal wie hoch die Bildschirmlast ist. In ähnlicher Weise liegt das Lüftergeräusch beim Spielen im Balanced-Modus bei 41 bis 45 dB(A) im Vergleich zu 52 dB(A) im Performance-Modus, was trotz der oben erwähnten geringen Leistungsunterschiede zwischen den beiden Profilen ein erheblicher Unterschied ist. Insbesondere der Performance-Modus ist merklich lauter als viele andere 16-Zoll-Notebooks wie das MSI Creator Z16P oder das MacBook Pro 16.
Das Pulsieren des Lüfters wird ansonsten auf ein Minimum reduziert. Beim 3DMark 06 lag das Lüftergeräusch beispielsweise während der gesamten ersten Benchmark-Szene bei konstanten 29,5 dB(A), ohne plötzliche Aussetzer.
Lautstärkediagramm
| Idle |
| 22.9 / 29.4 / 29.4 dB(A) |
| Last |
| 29.5 / 52 dB(A) |
 | ||
30 dB leise 40 dB(A) deutlich hörbar 50 dB(A) störend |
||
min: | ||
| Lenovo ThinkPad Z16 Gen 2 Radeon RX 6550M, R9 PRO 7940HS, Kioxia XG8 KXG8AZNV1T02 | Lenovo ThinkPad Z16 G1 21D5S00T00 Radeon RX 6500M, R7 PRO 6850H, Samsung PM9A1 MZVL21T0HCLR | Lenovo ThinkBook 16 G6 ABP Vega 7, R5 7530U, SK hynix HFS512GEJ9X125N | MSI Creator Z16P B12UHST GeForce RTX 3080 Ti Laptop GPU, i9-12900H, Samsung PM9A1 MZVL22T0HBLB | Apple MacBook Pro 16 2023 M3 Pro M3 Pro 18-Core GPU, Apple M3 Pro 12-Core, Apple SSD AP0512Z | Asus Vivobook Pro 16X K6604JV-MX016W GeForce RTX 4060 Laptop GPU, i9-13980HX, Solidigm P41 Plus SSDPFKNU010TZ | |
|---|---|---|---|---|---|---|
| Geräuschentwicklung | 9% | 11% | -8% | 12% | -18% | |
| aus / Umgebung * (dB) | 22.6 | 23.7 -5% | 24.3 -8% | 26 -15% | 24.4 -8% | 25.2 -12% |
| Idle min * (dB) | 22.9 | 23.7 -3% | 24.3 -6% | 27 -18% | 24.4 -7% | 26.6 -16% |
| Idle avg * (dB) | 29.4 | 23.7 19% | 24.3 17% | 29 1% | 24.4 17% | 26.6 10% |
| Idle max * (dB) | 29.4 | 23.7 19% | 24.3 17% | 31 -5% | 24.4 17% | 29.2 1% |
| Last avg * (dB) | 29.5 | 25.9 12% | 29.7 -1% | 43 -46% | 26.9 9% | 53.4 -81% |
| Witcher 3 ultra * (dB) | 52 | 46.9 10% | 32.1 38% | 43 17% | 25.1 52% | |
| Last max * (dB) | 52 | 46.9 10% | 41.4 20% | 46 12% | 50.4 3% | 56.9 -9% |
* ... kleinere Werte sind besser
Temperatur
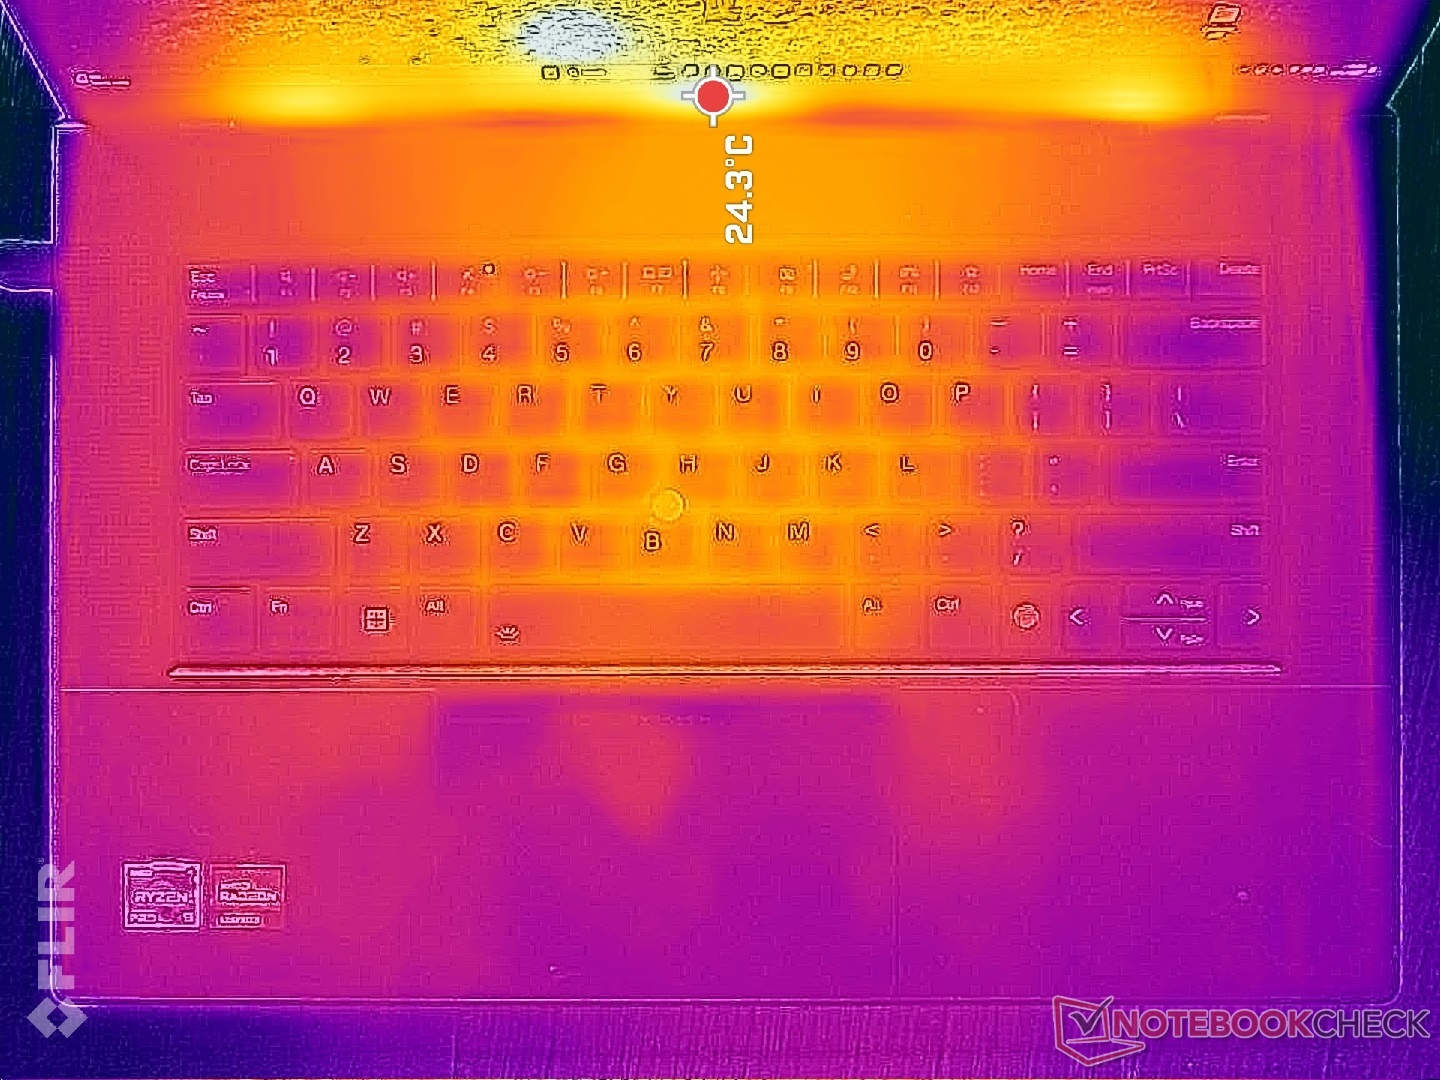
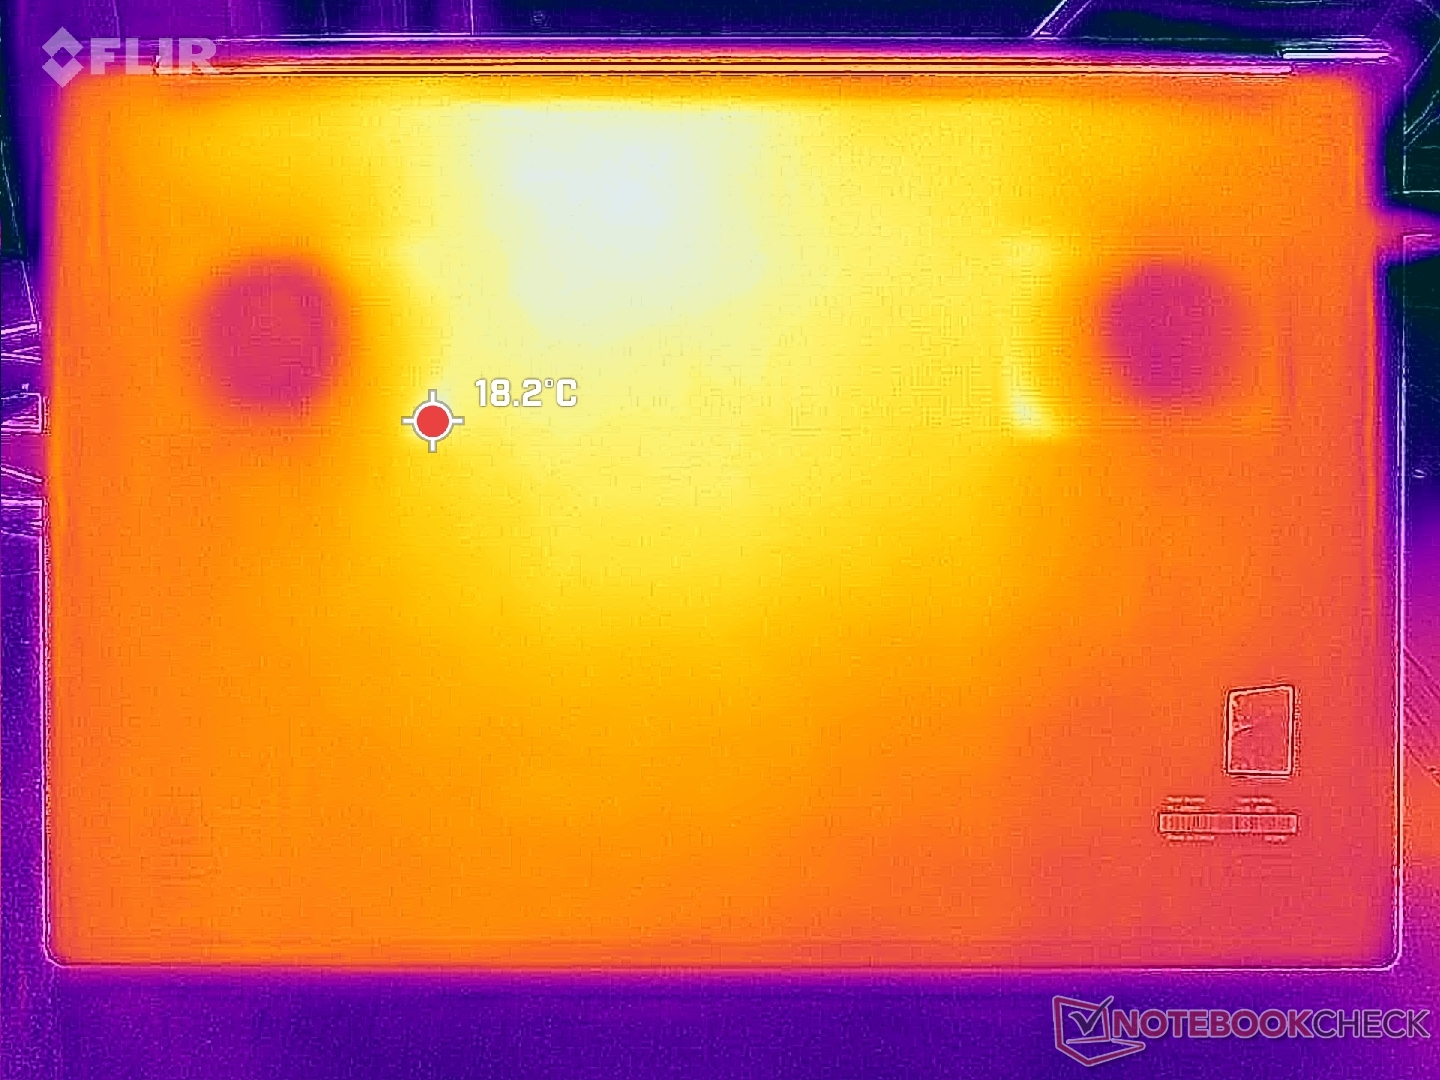
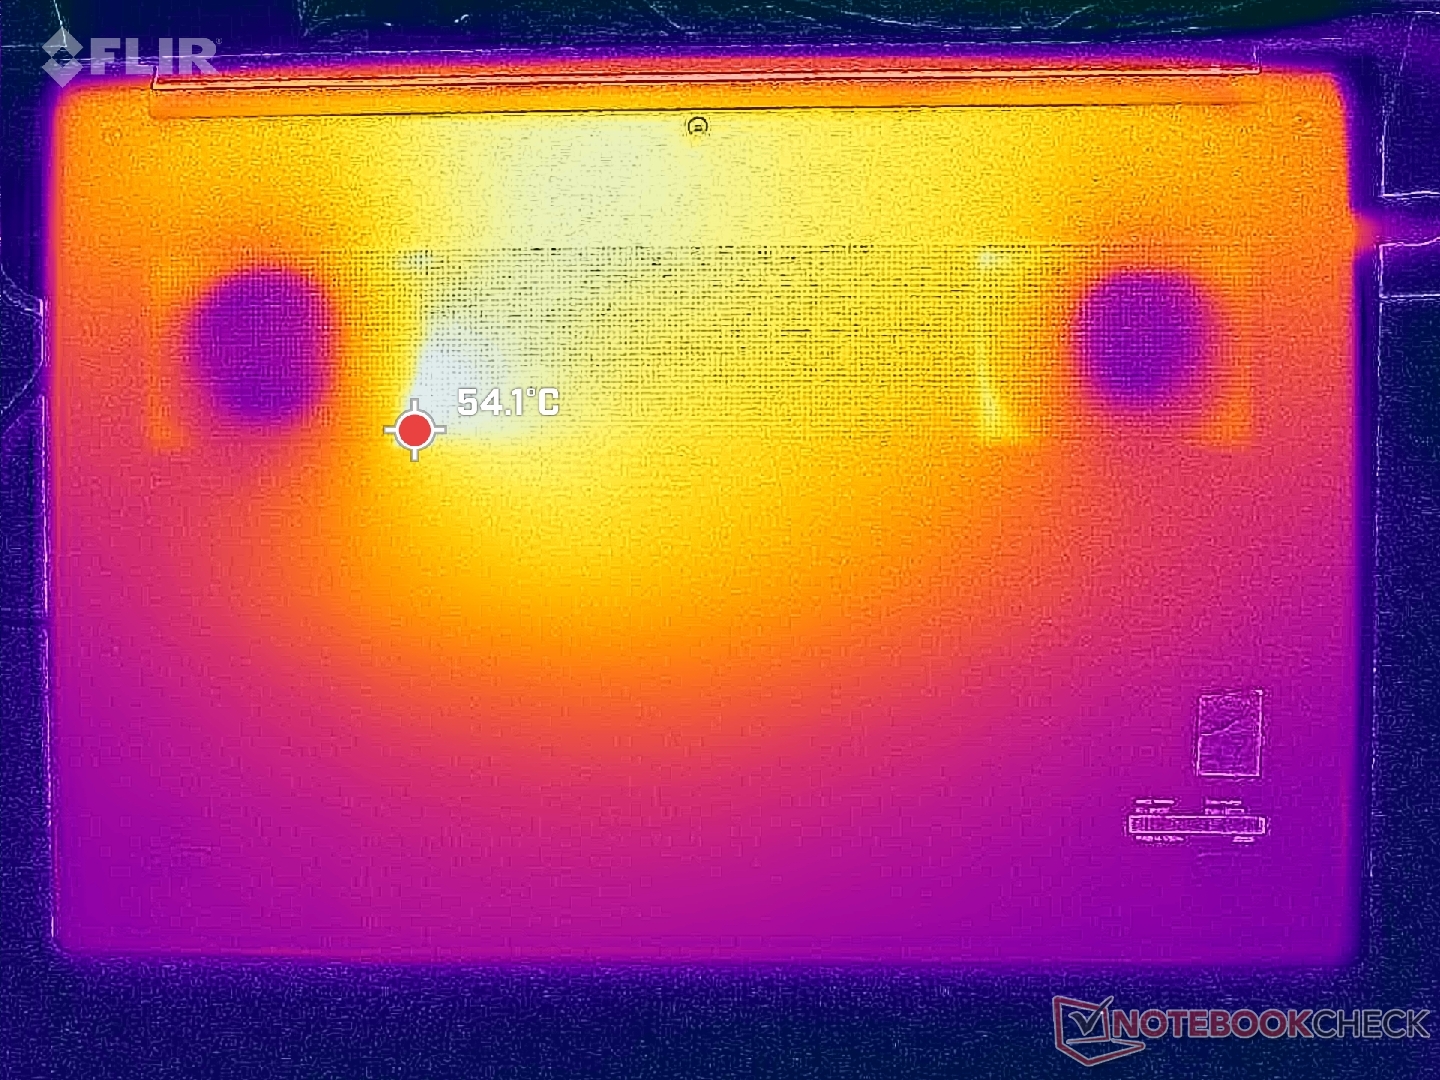
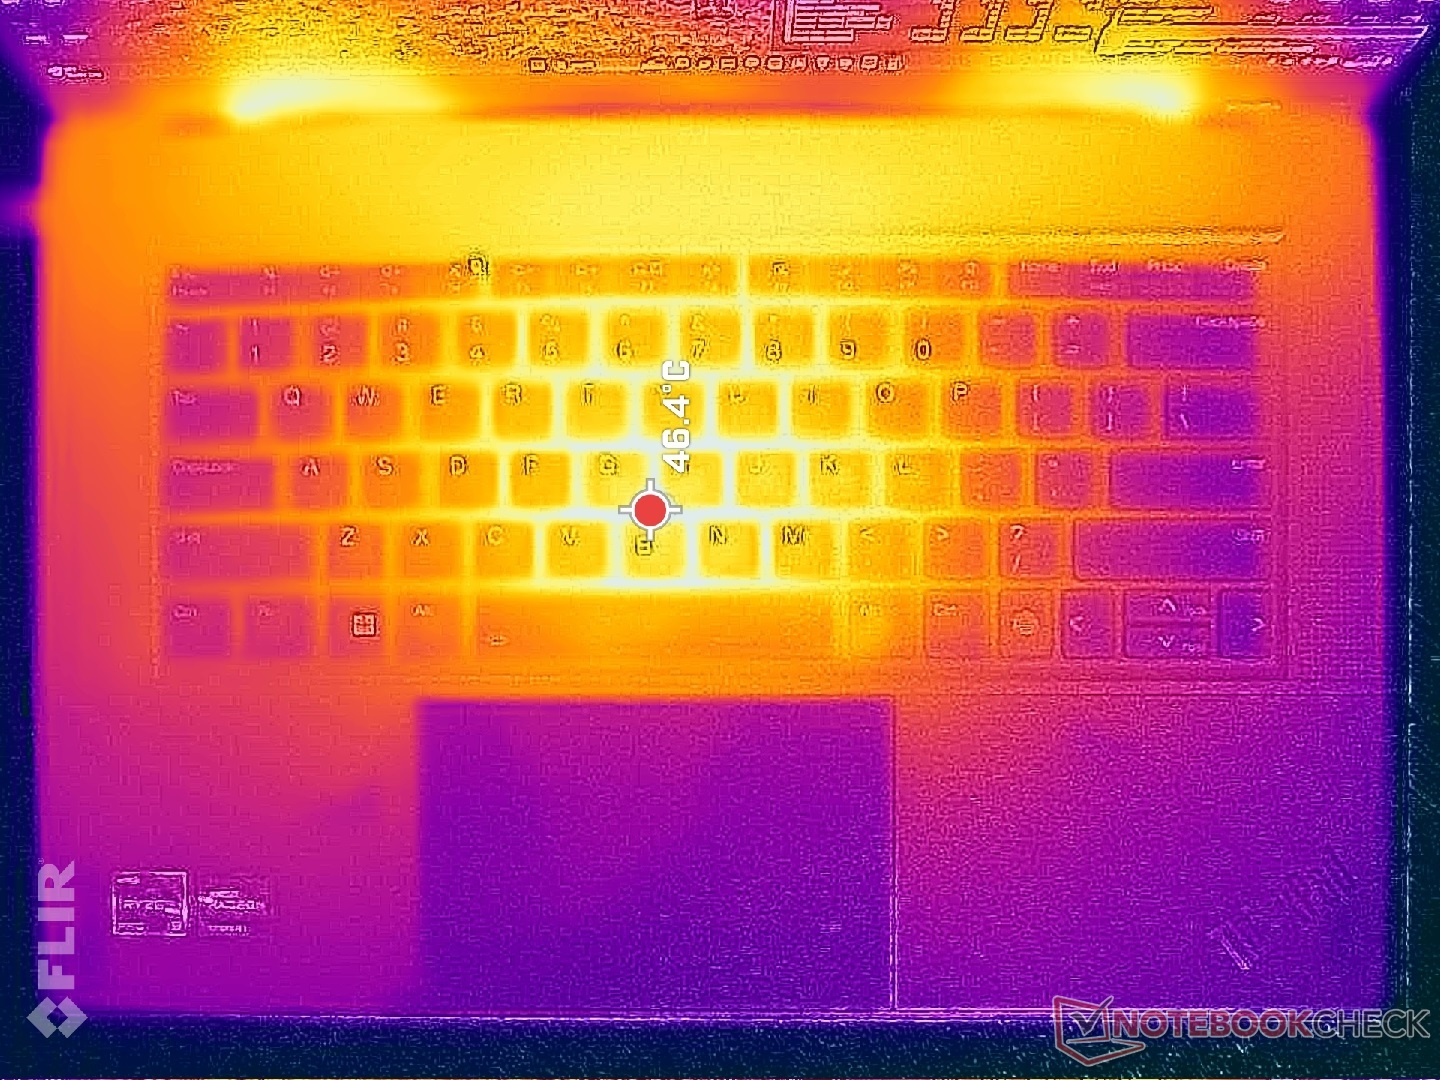
Die Oberflächentemperaturen steigen und fallen ziemlich schnell und in größeren Abständen, da der Großteil des Gehäuses aus Metall besteht. Bei anspruchsvoller Last wie Spielen können die Hotspots in der Mitte der Tastatur und an der Unterseite bis zu 47 °C bzw. 43 °C warm werden. Je nach Umgebungstemperatur kann es sogar über 50 °C warm werden, ähnlich wie wir es beim ThinkPad Z16 Gen 1 beobachtet haben. Die Ergebnisse sind dennoch viel kühler als die des MSI Creator Z16P, das für seine Verhältnisse viel zu heiß wurde.
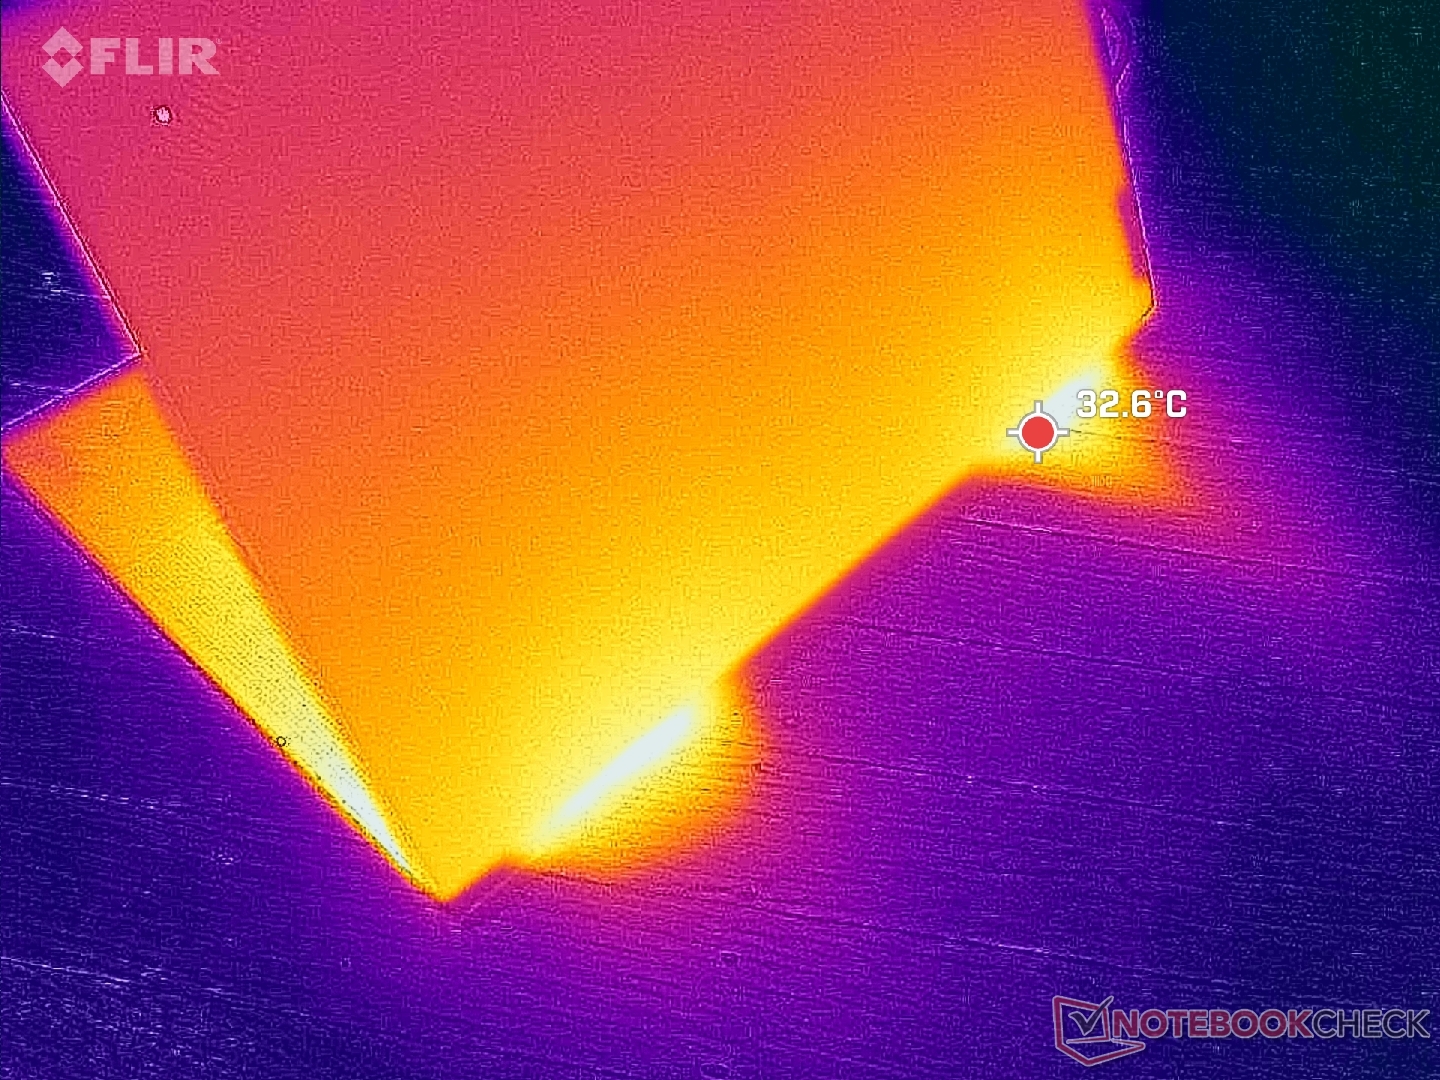
(±) Die maximale Temperatur auf der Oberseite ist 43 °C. Im Vergleich liegt der Klassendurchschnitt bei 36.8 °C (von 21 bis 71 °C für die Klasse Multimedia).
(±) Auf der Unterseite messen wir eine maximalen Wert von 41.6 °C (im Vergleich zum Durchschnitt von 39.1 °C).
(+) Ohne Last messen wir eine durchschnittliche Temperatur von 20.3 °C auf der Oberseite. Der Klassendurchschnitt erreicht 31.3 °C.
(-) Beim längeren Spielen von The Witcher 3 erhitzt sich das Gerät durchschnittlich auf 38.1 °C. Der Durchschnitt der Klasse ist derzeit 31.3 °C.
(+) Die Handballen und der Touchpad-Bereich sind mit gemessenen 30 °C kühler als die typische Hauttemperatur und fühlen sich dadurch kühl an.
(±) Die durchschnittliche Handballen-Temperatur anderer getesteter Geräte war 28.7 °C (-1.3 °C).


| Lenovo ThinkPad Z16 Gen 2 AMD Ryzen 9 PRO 7940HS, AMD Radeon RX 6550M | Lenovo ThinkPad Z16 G1 21D5S00T00 AMD Ryzen 7 PRO 6850H, AMD Radeon RX 6500M | Lenovo ThinkBook 16 G6 ABP AMD Ryzen 5 7530U, AMD Radeon RX Vega 7 | MSI Creator Z16P B12UHST Intel Core i9-12900H, NVIDIA GeForce RTX 3080 Ti Laptop GPU | Apple MacBook Pro 16 2023 M3 Pro Apple M3 Pro 12-Core, Apple M3 Pro 18-Core GPU | Asus Vivobook Pro 16X K6604JV-MX016W Intel Core i9-13980HX, NVIDIA GeForce RTX 4060 Laptop GPU | |
|---|---|---|---|---|---|---|
| Hitze | -33% | -30% | -49% | -2% | -36% | |
| Last oben max * (°C) | 43 | 56.8 -32% | 40.8 5% | 67 -56% | 38.1 11% | 39.7 8% |
| Last unten max * (°C) | 41.6 | 53.3 -28% | 50.5 -21% | 69 -66% | 37 11% | 60 -44% |
| Idle oben max * (°C) | 21.2 | 28.2 -33% | 29.3 -38% | 29 -37% | 24.2 -14% | 30.9 -46% |
| Idle unten max * (°C) | 21.4 | 29.4 -37% | 35.2 -64% | 29 -36% | 24.6 -15% | 34.7 -62% |
* ... kleinere Werte sind besser
Stresstest
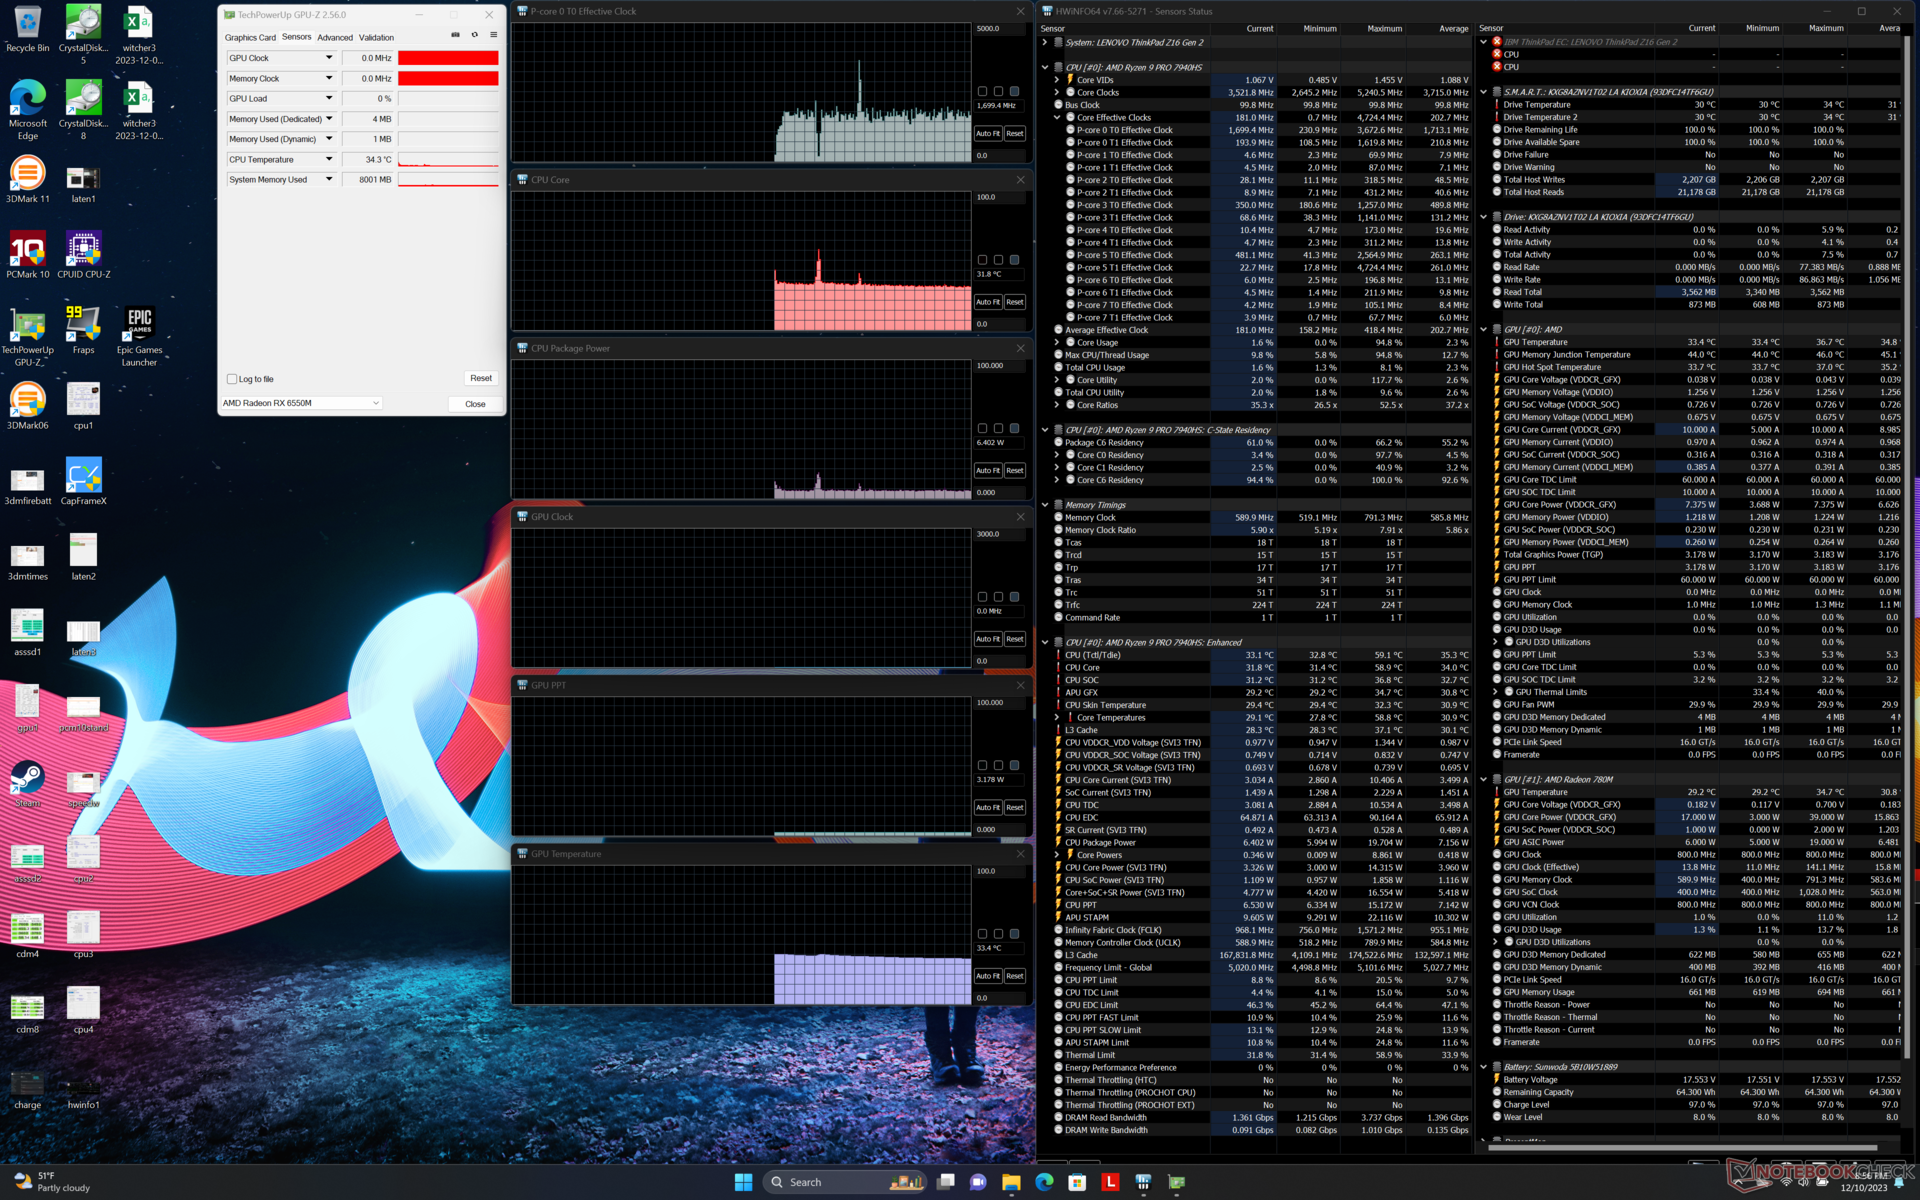
Beim Ausführen des Prime95-Stresstests stieg die CPU für einige Sekunden auf 4,6 GHz und 82 W, bevor sie auf 4,4 GHz, 69 W und angenehme 100 °C fiel und sich stabilisierte.
Die GPU-Taktraten und die Leistungsaufnahme des Boards im Performance-Modus stabilisierten sich bei 2630 MHz bzw. 59 W, verglichen mit 2133 MHz und 39 W im Balanced-Modus. Besonders bemerkenswert ist, dass der Leistungsunterschied zwischen den beiden Modi bei der Ausführung von Witcher 3 mit nur wenigen Frames minimal ist, obwohl die Unterschiede im Lüftergeräusch erheblich sind. Daher sollten Nutzer den Balanced-Modus in Betracht ziehen, da die Lüfter viel leiser sind und die Kerntemperaturen etwas niedriger ausfallen.
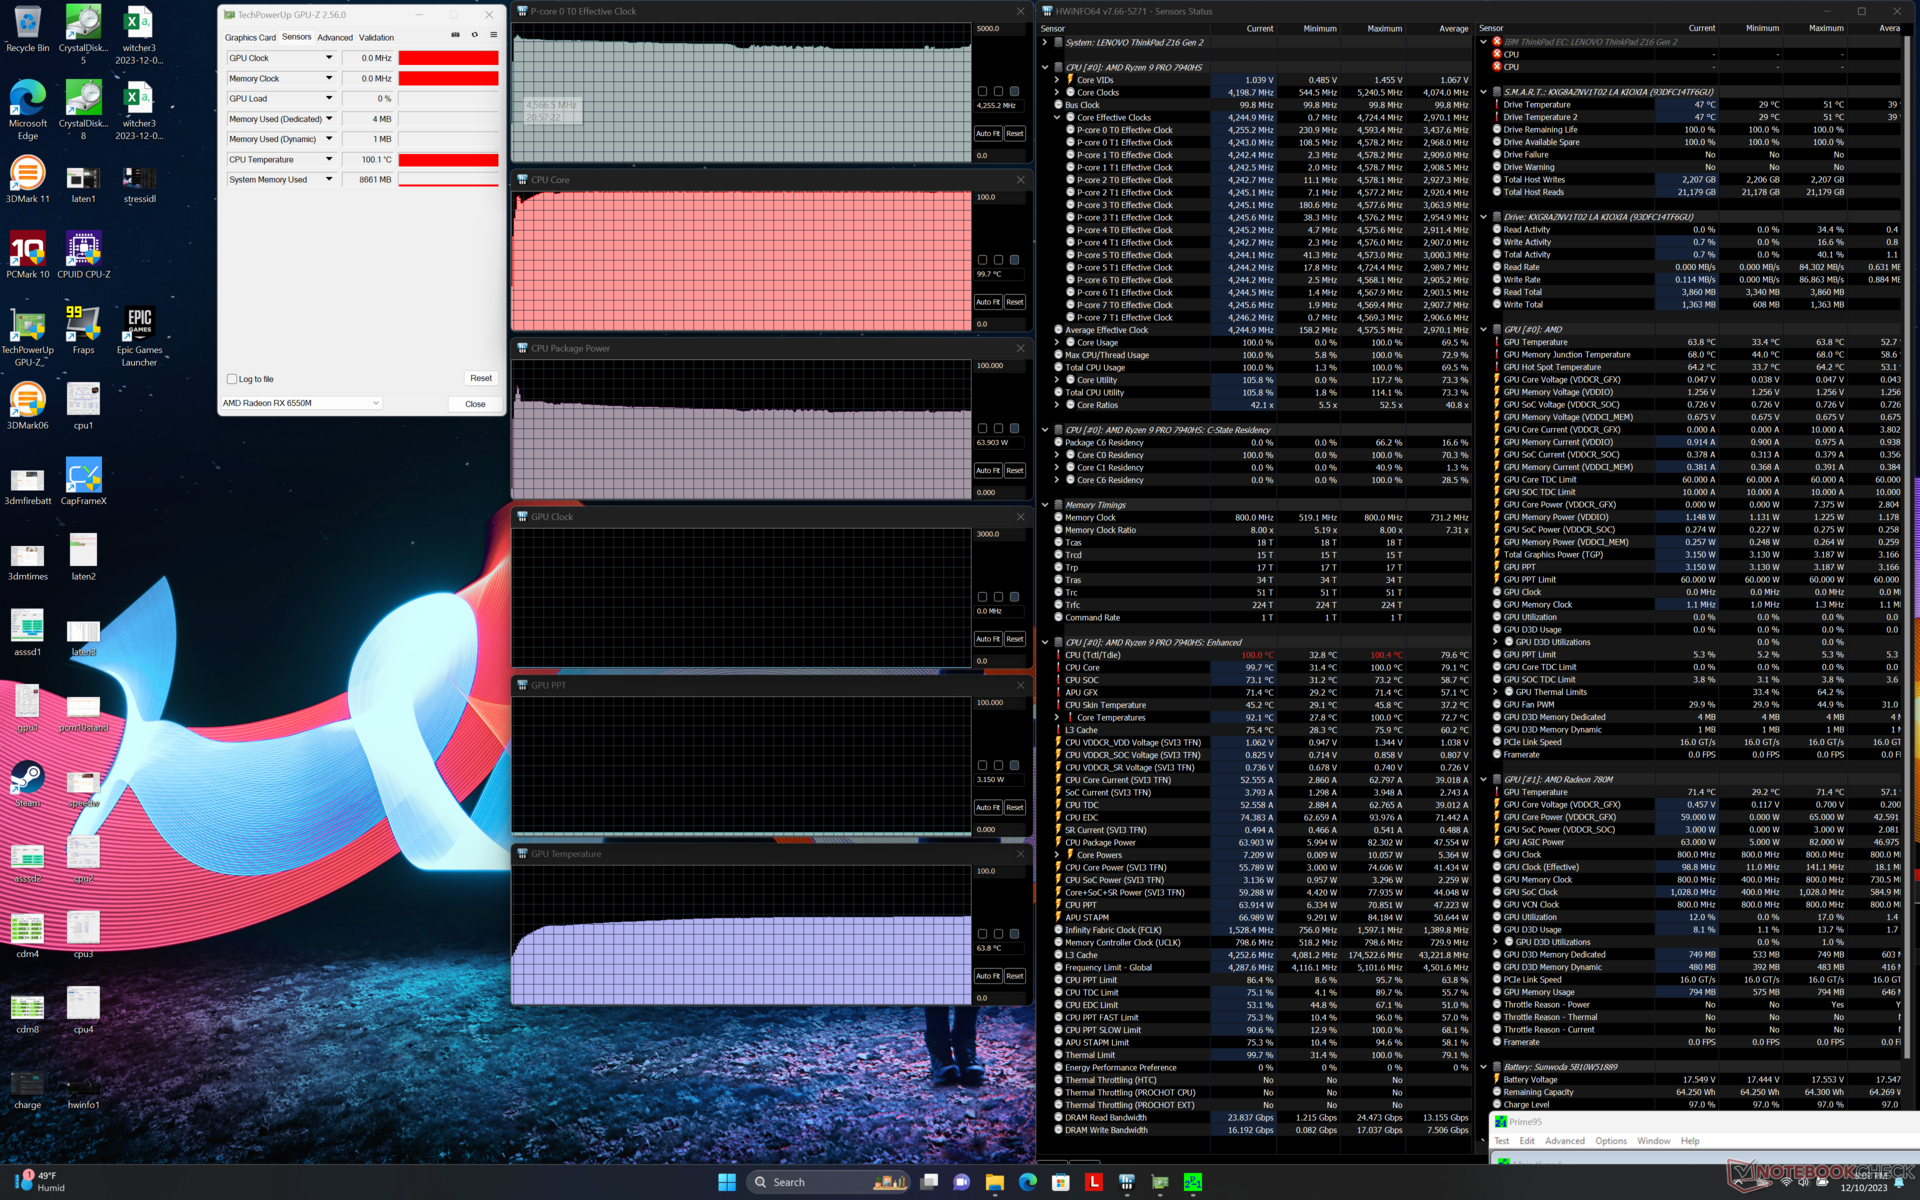
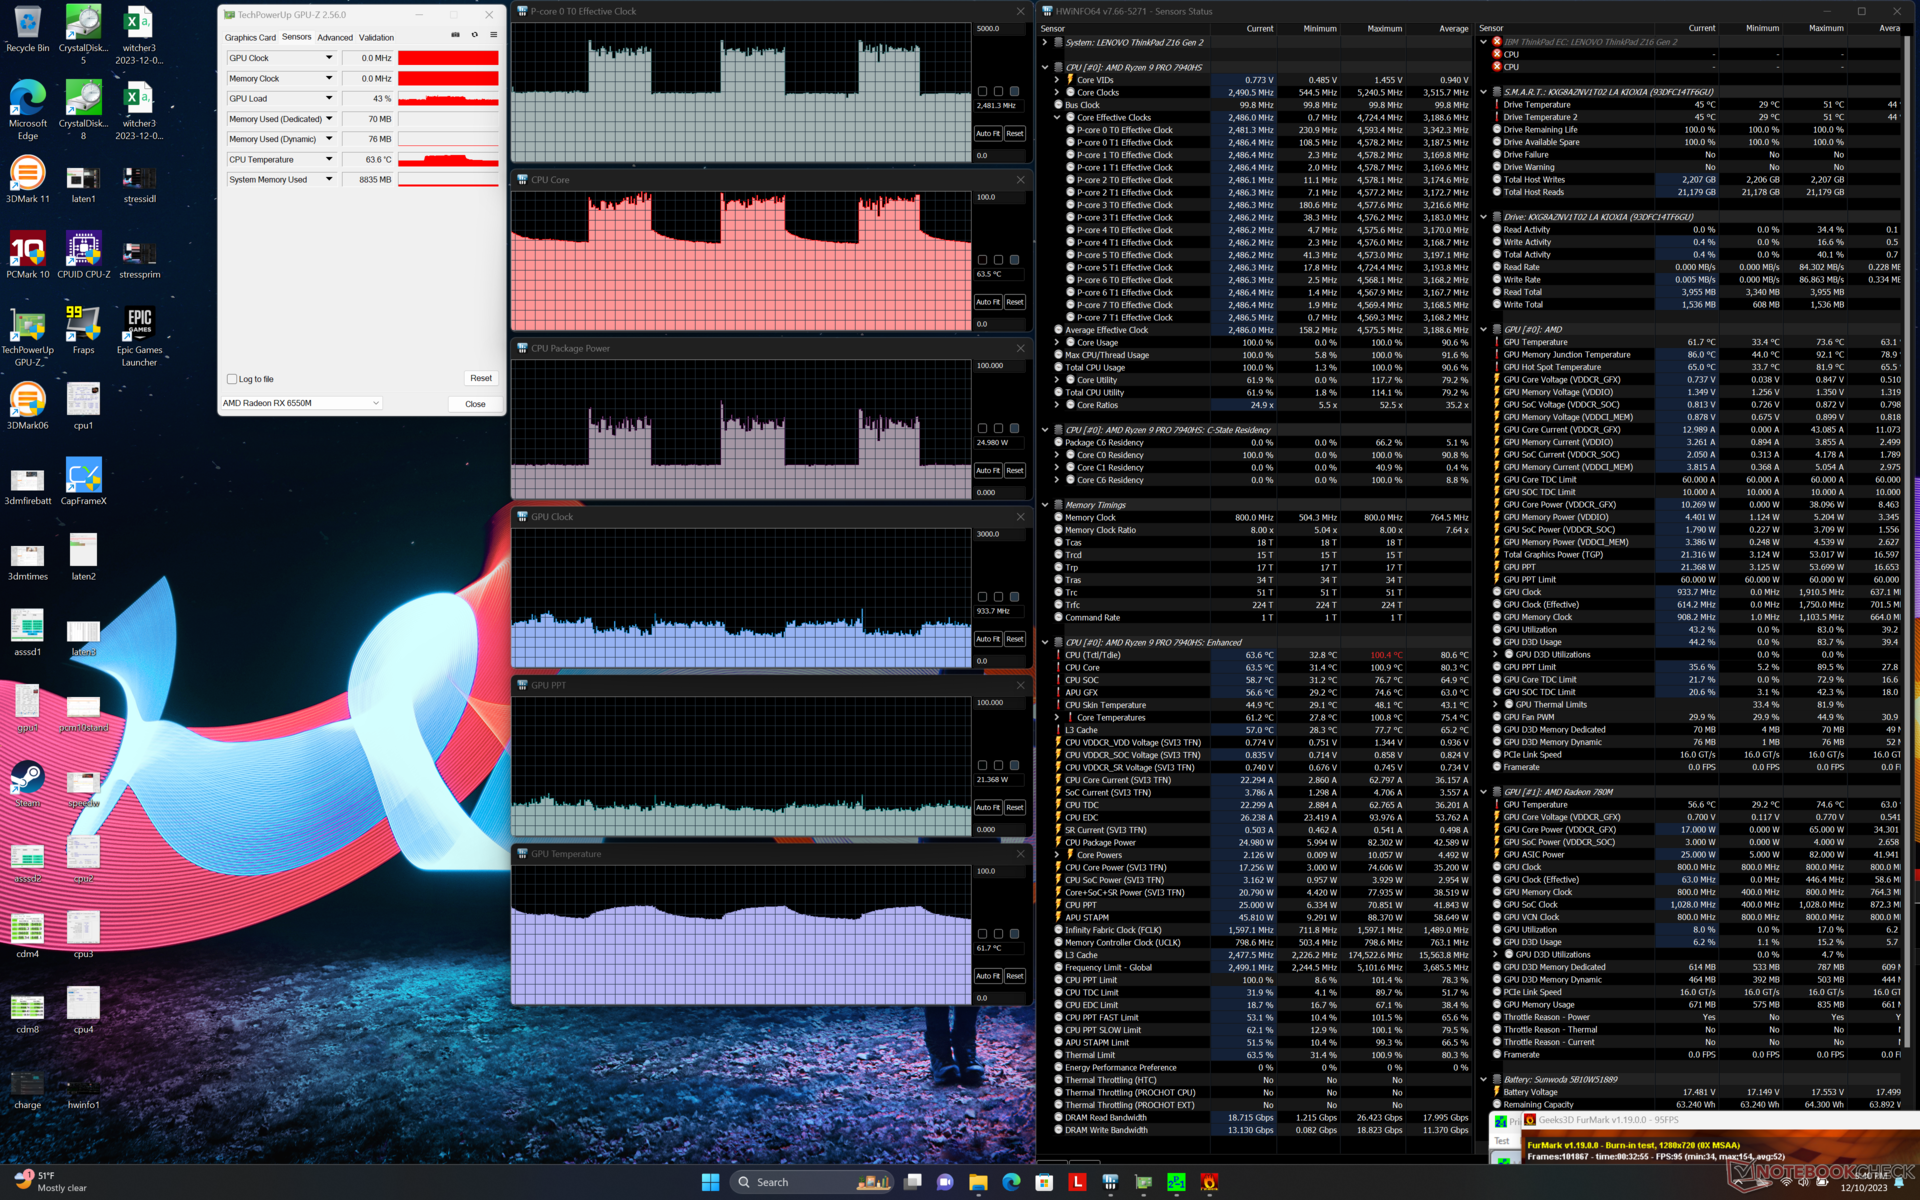
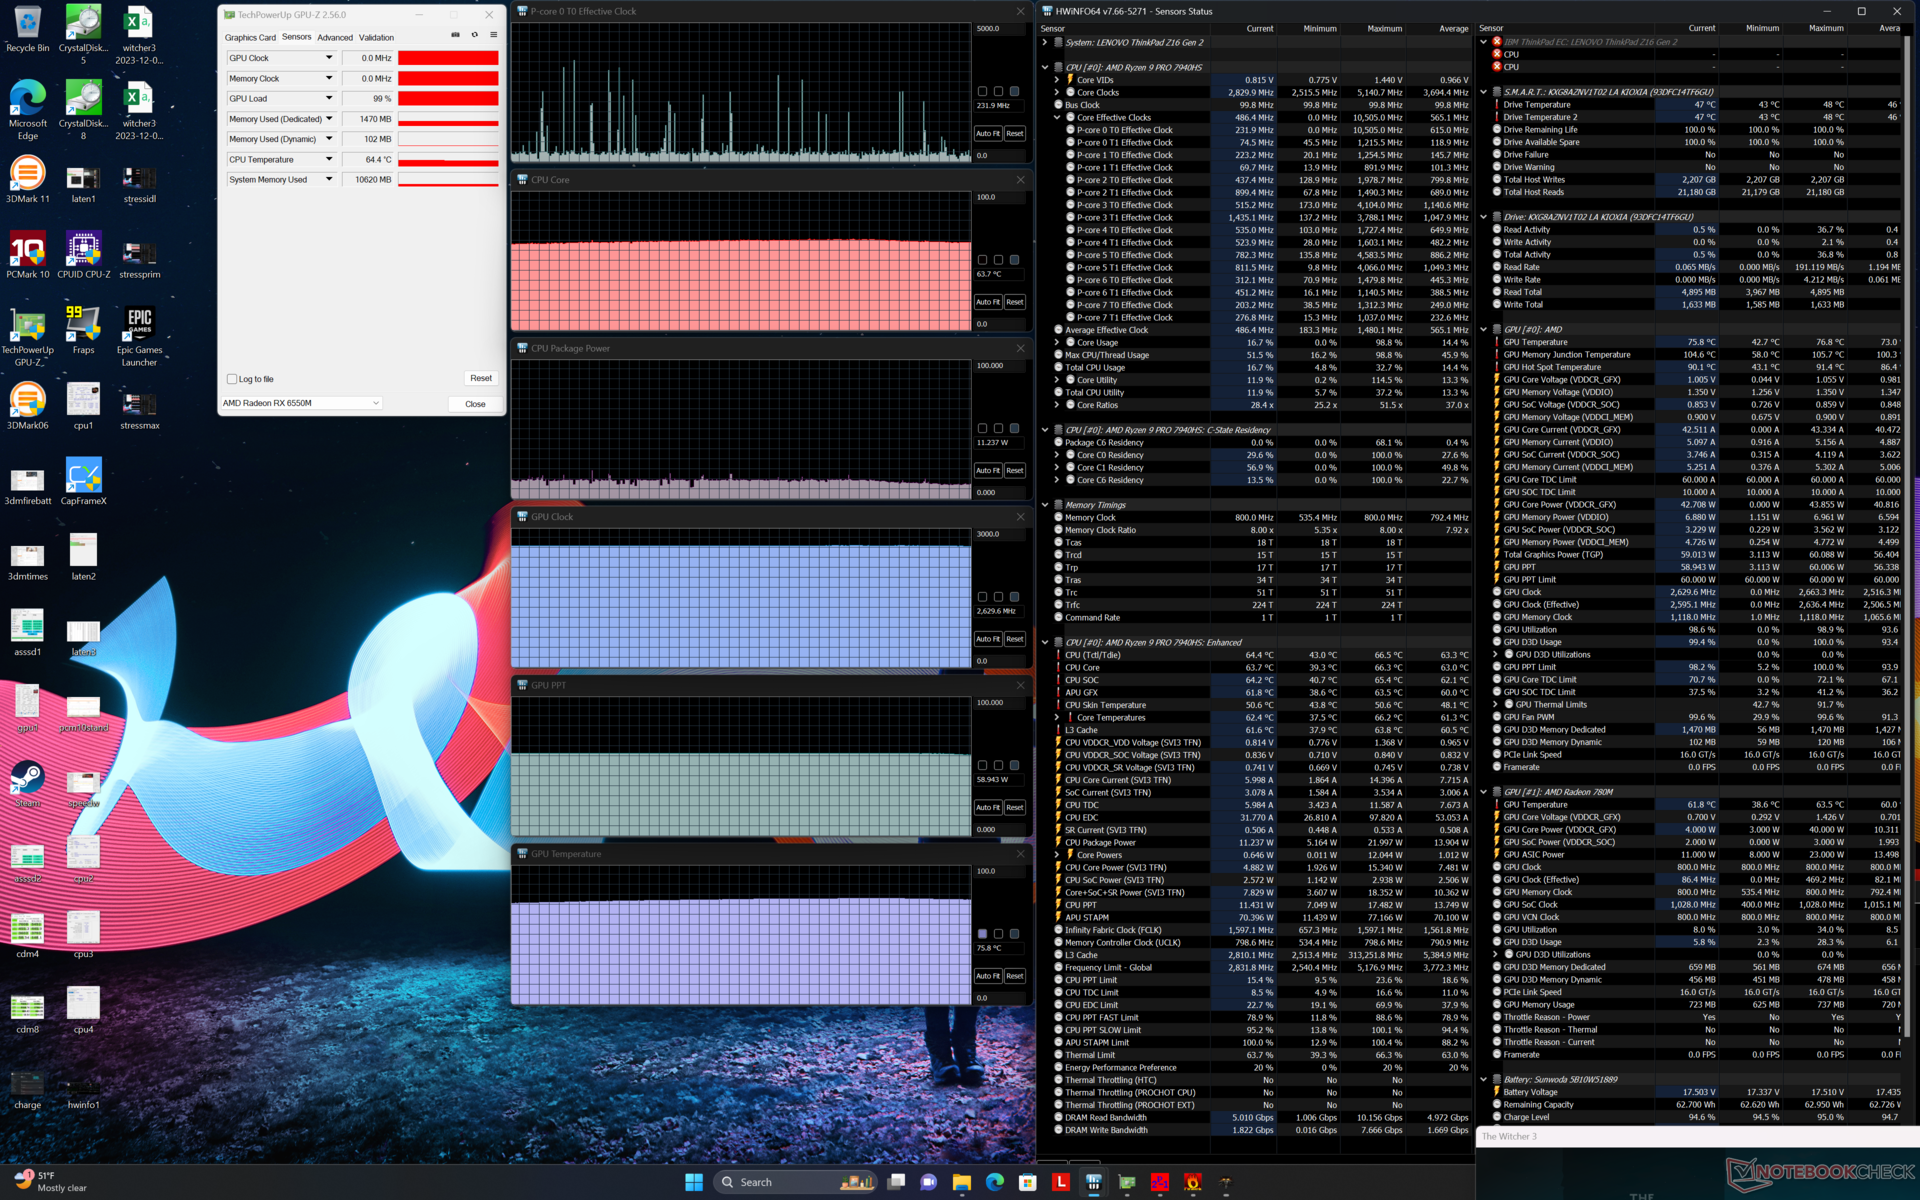

| CPU-Takt (GHz) | GPU-Takt (MHz) | Durchschnittliche CPU-Temperatur (°C) | Durchschnittliche GPU-Temperatur (°C) | |
| System im Leerlauf | -- | -- | 32 | 33 |
| Prime95 Stresstest | 4.2 | -- | 100 | 64 |
| Prime95 + FurMark Stresstest | 2.5 - 4.0 | 750 - 1000 | 64 - 100 | 62 - 72 |
| Witcher 3 Stresstest (Balanced-Modus) | ~0.2 | 2133 | 62 | 71 |
| Witcher 3 Stresstest (Performance-Modus) | ~0.2 | 2630 | 64 | 76 |
Lautsprecher

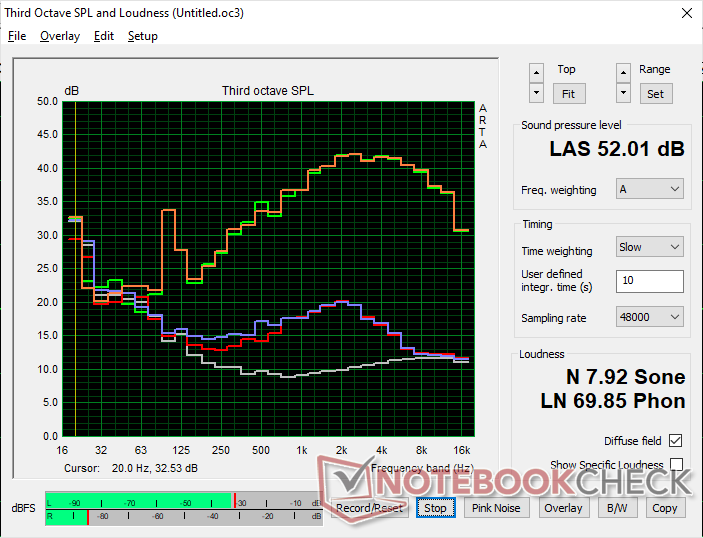
Lenovo ThinkPad Z16 Gen 2 Audio Analyse
(+) | Die Lautsprecher können relativ laut spielen (84.8 dB)
Bass 100 - 315 Hz
(±) | abgesenkter Bass - 13% geringer als der Median
(±) | durchschnittlich lineare Bass-Wiedergabe (11.1% Delta zum Vorgänger)
Mitteltöne 400 - 2000 Hz
(±) | zu hohe Mitten, vom Median 5.5% abweichend
(+) | lineare Mitten (4.9% Delta zum Vorgänger)
Hochtöne 2 - 16 kHz
(+) | ausgeglichene Hochtöne, vom Median nur 4.7% abweichend
(+) | sehr lineare Hochtöne (5.2% Delta zum Vorgänger)
Gesamt im hörbaren Bereich 100 - 16.000 Hz
(+) | hörbarer Bereich ist sehr linear (14.8% Abstand zum Median
Im Vergleich zu allen Geräten derselben Klasse
» 35% aller getesteten Geräte dieser Klasse waren besser, 4% vergleichbar, 61% schlechter
» Das beste Gerät hat einen Delta-Wert von 5%, durchschnittlich ist 17%, das schlechteste Gerät hat 45%
Im Vergleich zu allen Geräten im Test
» 20% aller getesteten Geräte waren besser, 4% vergleichbar, 76% schlechter
» Das beste Gerät hat einen Delta-Wert von 4%, durchschnittlich ist 23%, das schlechteste Gerät hat 134%
Apple MacBook Pro 16 2021 M1 Pro Audio Analyse
(+) | Die Lautsprecher können relativ laut spielen (84.7 dB)
Bass 100 - 315 Hz
(+) | guter Bass - nur 3.8% Abweichung vom Median
(+) | lineare Bass-Wiedergabe (5.2% Delta zum Vorgänger)
Mitteltöne 400 - 2000 Hz
(+) | ausgeglichene Mitten, vom Median nur 1.3% abweichend
(+) | lineare Mitten (2.1% Delta zum Vorgänger)
Hochtöne 2 - 16 kHz
(+) | ausgeglichene Hochtöne, vom Median nur 1.9% abweichend
(+) | sehr lineare Hochtöne (2.7% Delta zum Vorgänger)
Gesamt im hörbaren Bereich 100 - 16.000 Hz
(+) | hörbarer Bereich ist sehr linear (4.6% Abstand zum Median
Im Vergleich zu allen Geräten derselben Klasse
» 0% aller getesteten Geräte dieser Klasse waren besser, 0% vergleichbar, 100% schlechter
» Das beste Gerät hat einen Delta-Wert von 5%, durchschnittlich ist 17%, das schlechteste Gerät hat 45%
Im Vergleich zu allen Geräten im Test
» 0% aller getesteten Geräte waren besser, 0% vergleichbar, 100% schlechter
» Das beste Gerät hat einen Delta-Wert von 4%, durchschnittlich ist 23%, das schlechteste Gerät hat 134%
Energieverwaltung
Energieaufnahme
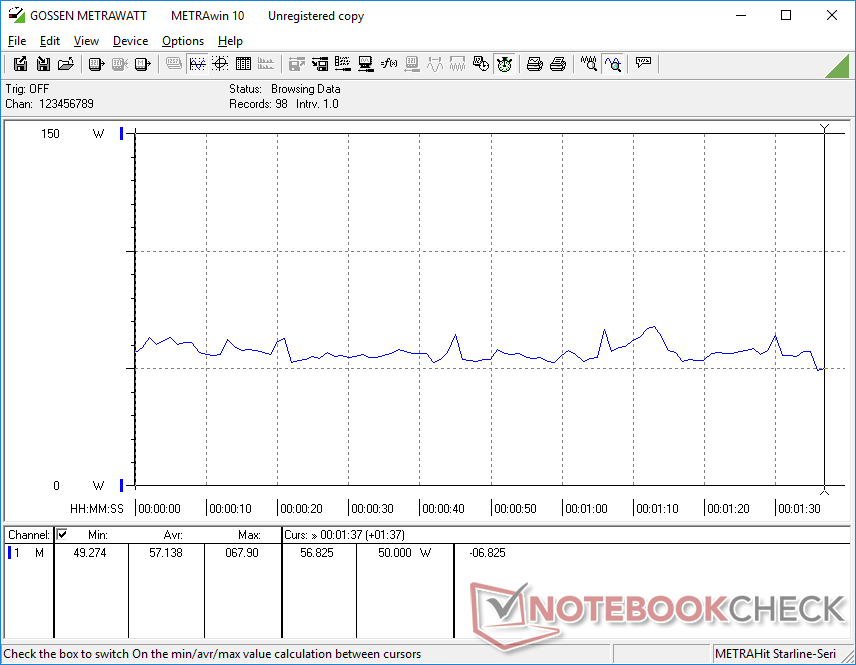
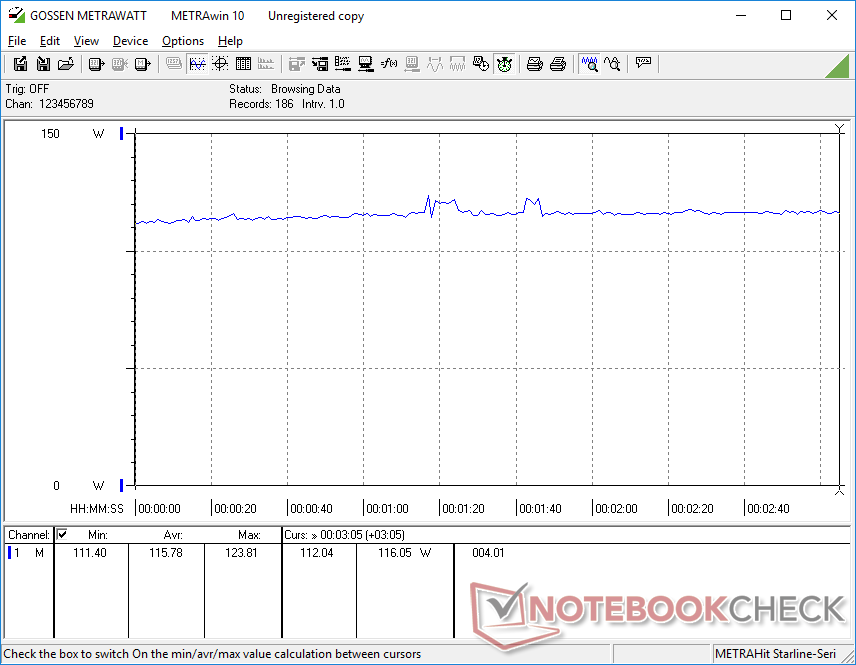
Das 4K-OLED-Panel hat einen erheblichen Einfluss auf den Energieverbrauch. Der Verbrauch im Leerlauf bei einem komplett schwarzen Bildschirm beträgt nur 7 W, während ein komplett weißer Bildschirm bei maximaler Helligkeit fast 19 W verbrauchen kann, verglichen mit nur 10 W bei der IPS-Konfiguration. Die Unterschiede im Stromverbrauch zwischen IPS- und OLED-Bildschirmen werden hier näher erläutert.
Der Verbrauch bei CPU- oder GPU-intensiven Aufgaben ist etwas höher als beim ThinkPad Z16 Gen 1, selbst wenn man das anspruchsvollere OLED-Panel berücksichtigt. Die Unterschiede sind jedoch gering im Vergleich zu den großen Leistungssteigerungen, die die Zen 4 Ryzen 9 CPU bietet.
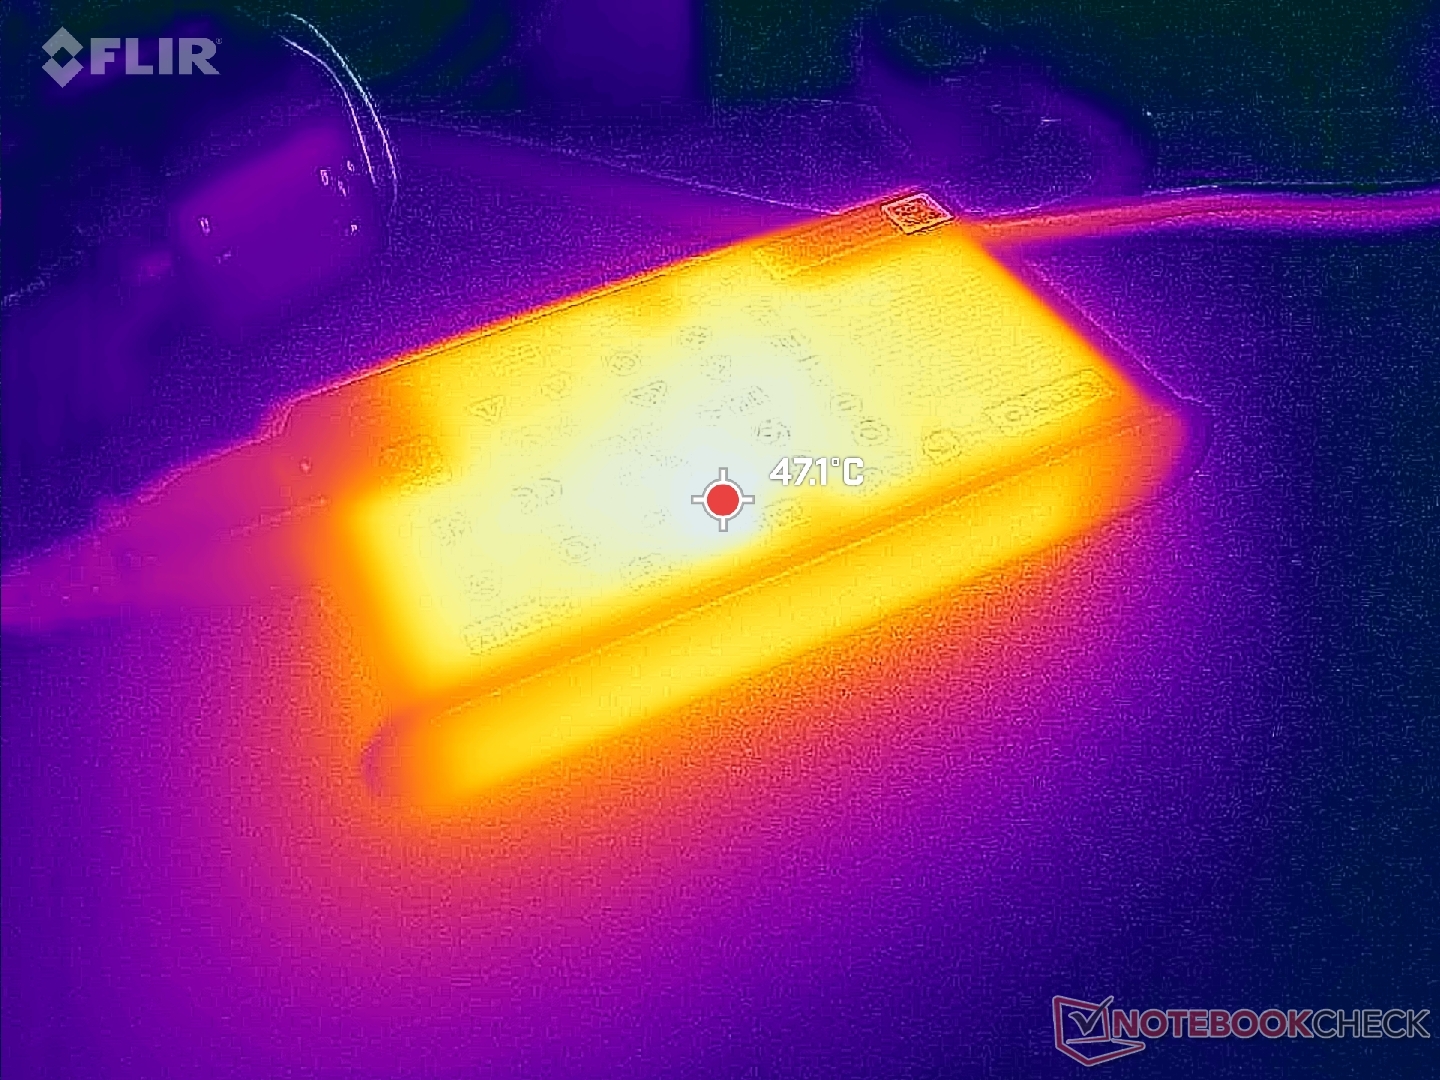
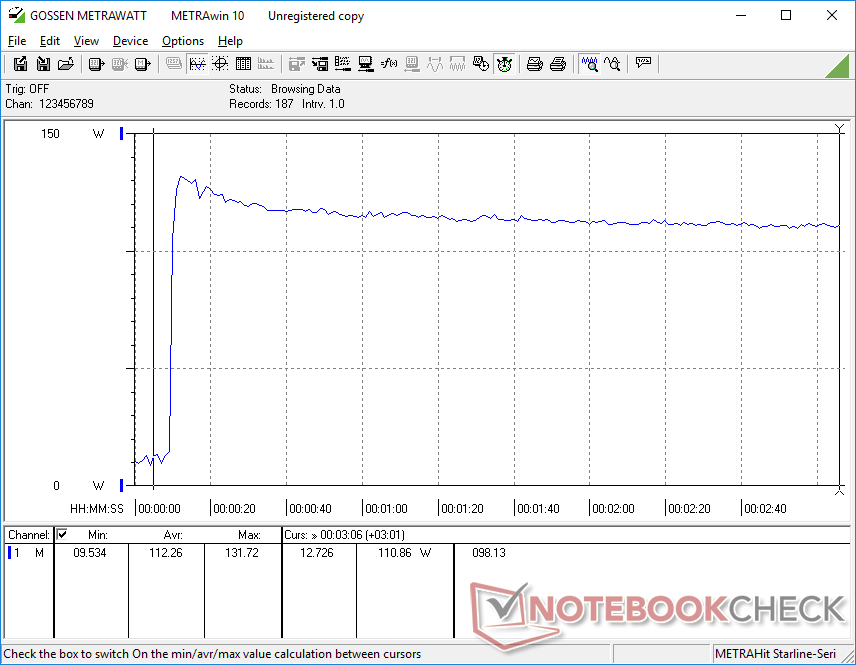
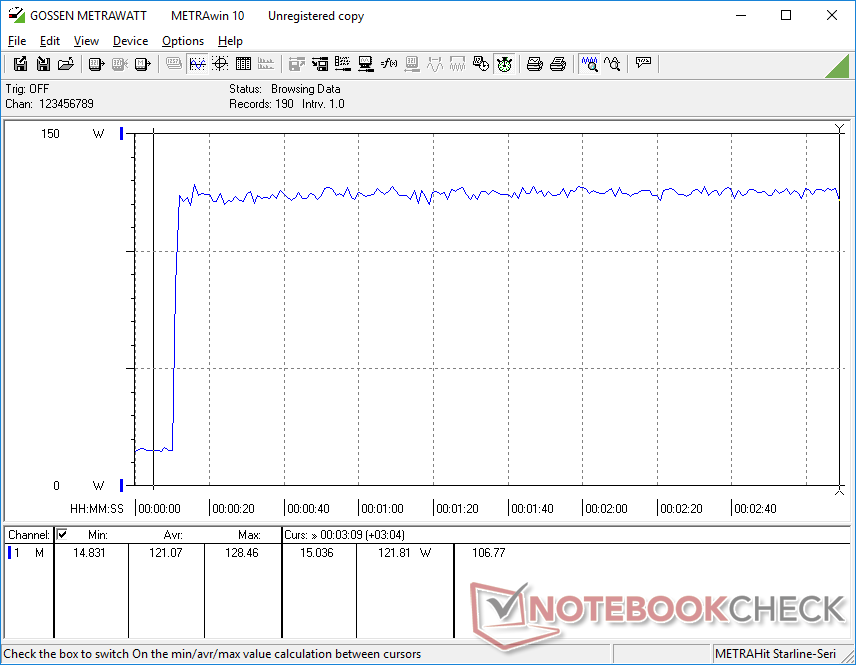
Mit dem mittelgroßen (~14,6 x 7,7 x 2,3 cm) 135-W-USB-C-Netzteil können wir einen maximalen Verbrauch von 132 W messen. Gaming erfordert bereits fast 120 W, was bedeutet, dass die Ladegeschwindigkeit bei gleichzeitigem Betrieb anspruchsvoller Lasten zum Stillstand kommen wird.
| Aus / Standby | |
| Idle | |
| Last |
|
Legende:
min: | |
| Lenovo ThinkPad Z16 Gen 2 R9 PRO 7940HS, Radeon RX 6550M, Kioxia XG8 KXG8AZNV1T02, OLED, 3840x2400, 16" | Lenovo ThinkPad Z16 G1 21D5S00T00 R7 PRO 6850H, Radeon RX 6500M, Samsung PM9A1 MZVL21T0HCLR, IPS LED, 1920x1200, 16" | Lenovo ThinkBook 16 G6 ABP R5 7530U, Vega 7, SK hynix HFS512GEJ9X125N, IPS, 1920x1200, 16" | MSI Creator Z16P B12UHST i9-12900H, GeForce RTX 3080 Ti Laptop GPU, Samsung PM9A1 MZVL22T0HBLB, IPS True Pixel (~100% DCI-P3), 2560x1600, 16" | Asus Vivobook Pro 16X K6604JV-MX016W i9-13980HX, GeForce RTX 4060 Laptop GPU, Solidigm P41 Plus SSDPFKNU010TZ, OLED, 3200x2000, 16" | Apple MacBook Pro 16 2023 M3 Max Apple M3 Max 16-Core, M3 Max 40-Core GPU, Apple SSD AP8192Z, Mini-LED, 3456x2234, 16" | |
|---|---|---|---|---|---|---|
| Stromverbrauch | 15% | 45% | -60% | -71% | -17% | |
| Idle min * (Watt) | 7.5 | 5.3 29% | 3.7 51% | 11 -47% | 13.8 -84% | 5.2 31% |
| Idle avg * (Watt) | 9.6 | 8.6 10% | 7.1 26% | 17 -77% | 16 -67% | 16.9 -76% |
| Idle max * (Watt) | 18.5 | 9.5 49% | 7.7 58% | 26 -41% | 19 -3% | 17.2 7% |
| Last avg * (Watt) | 57.1 | 65.2 -14% | 43.9 23% | 124 -117% | 147 -157% | 90.5 -58% |
| Witcher 3 ultra * (Watt) | 115.8 | 93.6 19% | 40.8 65% | 133.5 -15% | 147.8 -28% | 109 6% |
| Last max * (Watt) | 131.7 | 133.81 -2% | 66.6 49% | 212 -61% | 244 -85% | 145.2 -10% |
* ... kleinere Werte sind besser
Energieverbrauch Witcher 3 / Stresstest
Energieverbrauch externer Monitor
Akkulaufzeit
Die Laufzeiten sind im Allgemeinen kürzer als beim Vorjahresmodell, was hauptsächlich auf unser anspruchsvolleres OLED-Panel zurückzuführen ist. Da die meisten Webseiten überwiegend weiß sind, kann der Stromverbrauch um 10 W höher sein, selbst wenn die aktiven Anwendungen anspruchslos sind, wie im Abschnitt 'Energieaufnahme' oben erwähnt. Wir konnten nur eine WLAN-Laufzeit von 6 Stunden aufzeichnen, verglichen mit 10 Stunden bei der ThinkPad Z16 IPS-Konfiguration oder über 16 Stunden beim MacBook Pro 16.
Das Aufladen von der leeren zur vollen Kapazität dauert mit etwa 2,5 Stunden länger als üblich, verglichen mit 1,5 bis 2 Stunden bei den meisten Ultrabooks. Dies ist eines der wenigen Notebooks mit Ryzen 9 und diskreter Grafik, das über USB-C mit Strom versorgt wird.
| Lenovo ThinkPad Z16 Gen 2 R9 PRO 7940HS, Radeon RX 6550M, 72 Wh | Lenovo ThinkPad Z16 G1 21D5S00T00 R7 PRO 6850H, Radeon RX 6500M, 72 Wh | Lenovo ThinkBook 16 G6 ABP R5 7530U, Vega 7, 45 Wh | MSI Creator Z16P B12UHST i9-12900H, GeForce RTX 3080 Ti Laptop GPU, 90 Wh | Asus Vivobook Pro 16X K6604JV-MX016W i9-13980HX, GeForce RTX 4060 Laptop GPU, 90 Wh | Apple MacBook Pro 16 2023 M3 Max Apple M3 Max 16-Core, M3 Max 40-Core GPU, 99.6 Wh | |
|---|---|---|---|---|---|---|
| Akkulaufzeit | 45% | 68% | -27% | -2% | 75% | |
| Idle (h) | 10.2 | |||||
| WLAN (h) | 6 | 9.9 65% | 10.1 68% | 5.2 -13% | 6.5 8% | 16.7 178% |
| Last (h) | 1.7 | 2.1 24% | 1 -41% | 1.5 -12% | 1.2 -29% | |
| H.264 (h) | 11.9 | 11.6 | 5.8 | 5.3 | 20.4 |
Pro
Contra
Fazit — Beeindruckendes Design wird durch eine durchschnittliche GPU ausgebremst
In unserem Test des ursprünglichen Gen 1-Modells lobten wir das ThinkPad Z16 für seine robuste und attraktive Bauweise sowie die komfortable Tastatur und das Trackpad. Das Gen 2 Modell behält all diese Vorteile bei, fügt aber eine viel schnellere Ryzen Pro CPU und einen hochwertigen OLED-Touchscreen für spürbar bessere Leistung bzw. Farben hinzu. Diese beiden Neuerungen sind die Hauptgründe für die Wahl der Gen 2-Version gegenüber der Gen 1.
Das ThinkPad Z16 Gen 2 ist definitiv schlank und sexy, und die neue Zen 4 Pro-CPU ist nicht zu unterschätzen. Allerdings enttäuscht die Radeon RX 6550M, sowohl in Bezug auf ihre Leistung als auch im Vergleich zu anderen Grafikoptionen in ähnlichen Preisklassen.
Der hohe Preis von über 2.000 Euro macht die Entscheidung noch schwerwiegender. Laptops mit der GeForce RTX 3050 Ti bieten vergleichbare Leistung zu einem günstigeren Preis. Die Radeon GPU ist zweifellos einer der schwächsten Aspekte der ThinkPad Z16 Serie.
Falls Ryzen Pro nicht entscheidend für Sie ist, könnten das Asus Vivobook Pro 16X oder sogar die HP Spectre x360 16-Serie als hervorragende Alternativen zum ThinkPad Z16 Gen 2 dienen. Beide bieten ähnliche OLED- und diskrete Grafikoptionen in schlanken Gehäusen. Es bleibt zu hoffen, dass zukünftige Revisionen von Lenovo entweder GeForce RTX oder neuere RDNA3-Optionen integrieren werden.
Preis und Verfügbarkeit
Lenovo bietet das ThinkPad Z16 Gen 2 ab 2.000 Euro an, mit der Ryzen 5 CPU, integrierter GPU und 1200p IPS-Konfiguration. Die von uns getestete High-End-Konfiguration, mit Ryzen 9 Pro, Radeon RX 6550M und OLED-Touchscreen, kostet über 2.700 Euro.
Lenovo ThinkPad Z16 Gen 2
- 16.12.2023 v7 (old)
Allen Ngo
Transparenz
Die Auswahl der zu testenden Geräte erfolgt innerhalb der Redaktion. Das vorliegende Testmuster wurde dem Autor vom Hersteller oder einem Shop zu Testzwecken leihweise zur Verfügung gestellt. Eine Einflussnahme des Leihstellers auf den Testbericht gab es nicht, der Hersteller erhielt keine Version des Reviews vor der Veröffentlichung. Es bestand keine Verpflichtung zur Publikation. Als eigenständiges, unabhängiges Unternehmen unterliegt Notebookcheck keiner Diktion von Herstellern, Shops und Verlagen.
So testet Notebookcheck
Pro Jahr werden von Notebookcheck hunderte Laptops und Smartphones unabhängig in von uns standardisierten technischen Verfahren getestet, um eine Vergleichbarkeit aller Testergebnisse zu gewährleisten. Seit rund 20 Jahren entwickeln wir diese Testmethoden kontinuierlich weiter und setzen damit Branchenstandards. In unseren Testlaboren kommt ausschließlich hochwertiges Messequipment in die Hände erfahrener Techniker und Redakteure. Die Tests unterliegen einer mehrstufigen Kontrolle. Unsere komplexe Gesamtbewertung basiert auf hunderten fundierten Messergebnissen und Benchmarks, womit Ihnen Objektivität garantiert ist. Weitere Informationen zu unseren Testmethoden gibt es hier.
Preisvergleich

