MSI Cubi NUC M1 Mini-PC im Test: Solide, aber kostspieliger als die Wettbewerber
Das Preis-Leistungs-Verhältnis könnte besser sein.
Der Cubi NUC M1 zeigt keine gravierenden Schwächen, bleibt jedoch auch in keiner entscheidenden Kategorie herausragend. Mit einem Preis von über 765 Euro für die Core-i7-Konfiguration fällt er auf, besonders im Vergleich zu günstigeren und leistungsfähigeren Alternativen, bei denen das Preis-Leistungs-Verhältnis deutlich besser ist.Allen Ngo, 👁 Allen Ngo (übersetzt von Carmen Pol) Veröffentlicht am 🇺🇸 🇫🇷 ...
Fazit — Zuverlässig, aber kostspielig
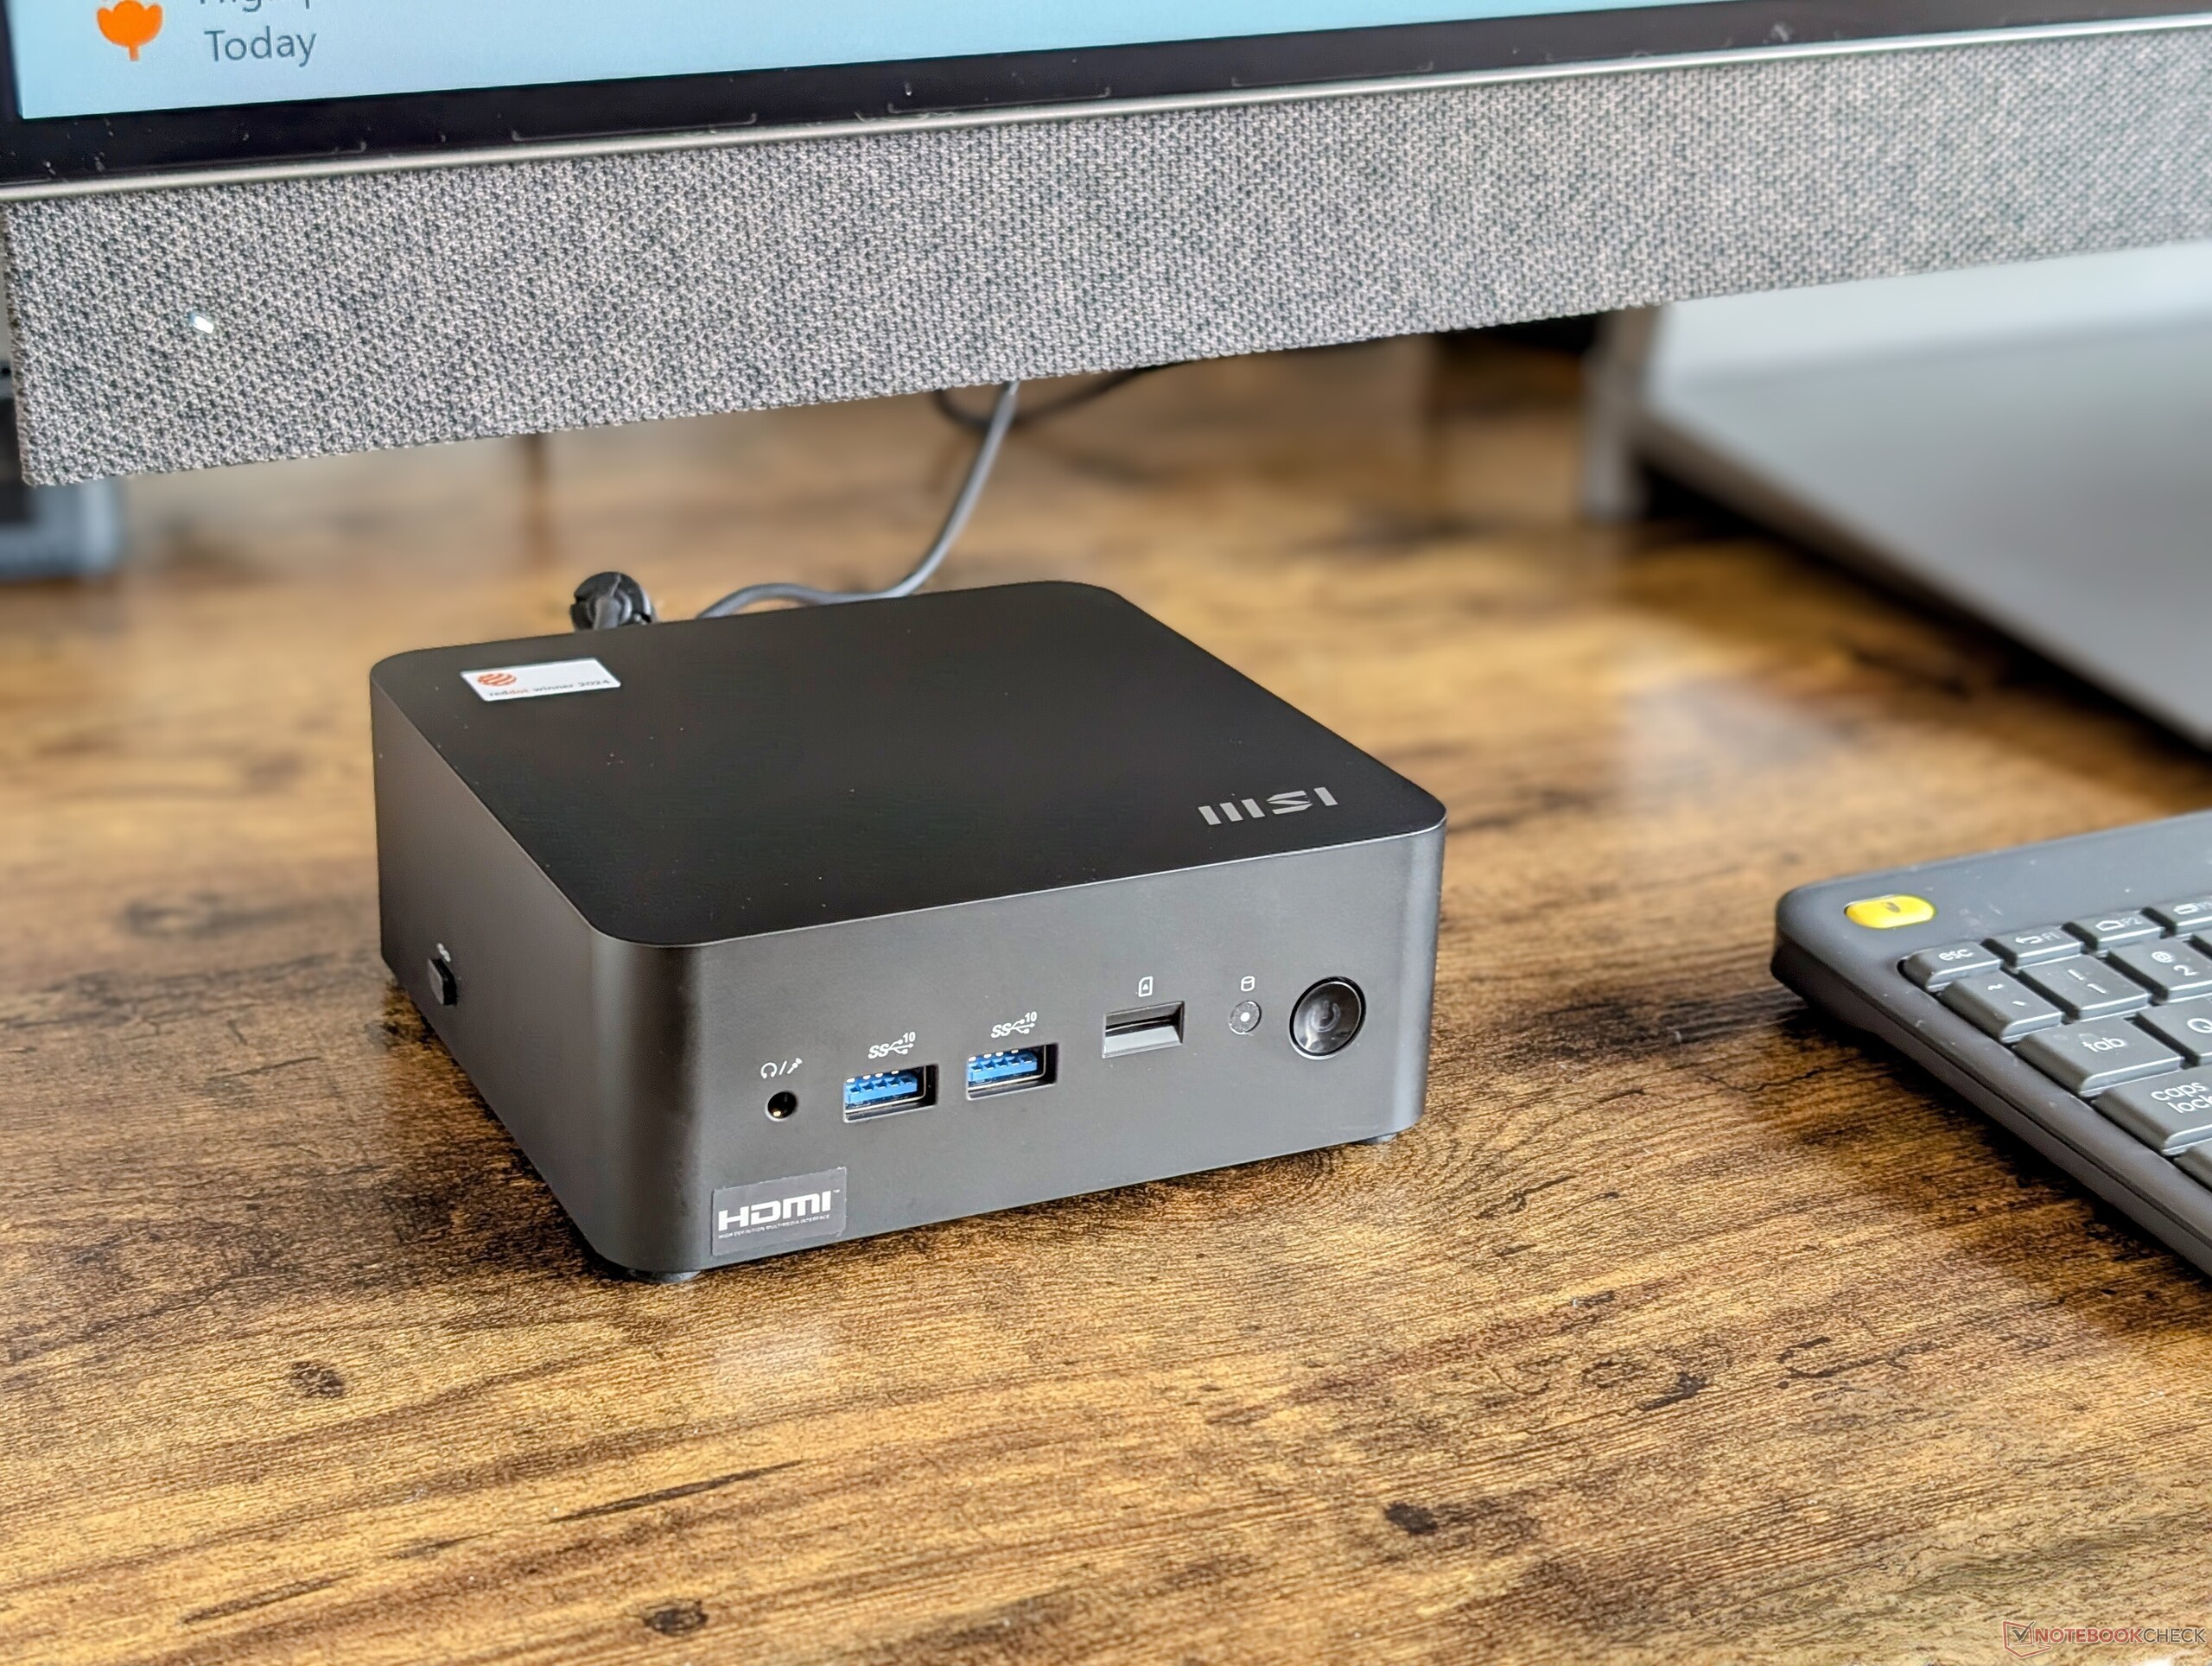
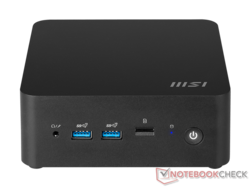
Der Cubi NUC M1 ist ein gut gebauter Mini-PC für Büro- oder Konferenzraumanwendungen. Er verfügt über zwei Thunderbolt-4-Anschlüsse und einen MicroSD-Leser, während die meisten anderen Mini-PCs nur einen Thunderbolt-Anschluss und keinen SD-Leser haben. Wenn Ihre Arbeitslasten diese speziellen Funktionen täglich nutzen können, ist der MSI-Mini-PC eine lohnende Option.
Allerdings ist der Cubi NUC M1 ein grundlegender Büro-Mini-PC mit einem nicht ganz so günstigen UVP. Es gibt billigere und schnellere Alternativen, wenn Ihnen der Verzicht auf den integrierten MicroSD-Leser nichts ausmacht.
Pro
Contra
Das Hauptproblem des Cubi NUC M1 ist sein hoher Preis, der sich auf 600 Euro für die Core i5-120U-Konfiguration und nahezu 800 Euro für die getestete Core i7-Version beläuft. Im Vergleich dazu sind Alternativen von Beelink oder GMK einige Hundert Euro günstiger und bieten sowohl schnellere CPU-Optionen als auch ähnliche Gehäusegrößen. Daher ist das Preis-Leistungs-Verhältnis des Cubi NUC M1 im Vergleich zur Konkurrenz nicht so gut, wie man erwarten könnte.
Preis und Verfügbarkeit
Der Cubi NUC M1 wird ab sofort auf Amazon für 600 Euro in der Core i5-Konfiguration und für 845 Euro in der Core i7-Option angeboten.
Mögliche Konkurrenten im Vergleich
Bild | Modell / Test | Geizhals | Gewicht | Dicke | Display |
|---|---|---|---|---|---|
| MSI Cubi NUC 1M Intel Core 7 150U ⎘ Intel Iris Xe Graphics G7 96EUs ⎘ 16 GB RAM, 1024 GB SSD | Listenpreis 950 USD Geizhals Suche | 660 g | 50.1 mm | x | |
| GMK NucBox K9 Intel Core Ultra 5 125H ⎘ Intel Arc 7-Core iGPU ⎘ 32 GB RAM, 1024 GB SSD | Listenpreis 560 USD Geizhals Suche | 528 g | 47 mm | x | |
| Asus NUC 14 Pro Intel Core Ultra 5 125H ⎘ Intel Arc 7-Core iGPU ⎘ , 2048 GB SSD | 525 g | 37 mm | x | ||
| Beelink SEi11 Pro Intel Core i5-11320H ⎘ Intel Iris Xe Graphics G7 96EUs ⎘ 16 GB RAM, 500 GB SSD | Listenpreis 430 USD | 440 g | 40 mm | x | |
| Beelink SER8 AMD Ryzen 7 8845HS ⎘ AMD Radeon 780M ⎘ 32 GB RAM, 1024 GB SSD | Listenpreis 650 USD | 776 g | 44.7 mm | x | |
| BOSGAME M1 AMD Ryzen 7 7840HS ⎘ AMD Radeon 780M ⎘ 32 GB RAM, 1024 GB SSD | Listenpreis 690 USD | 766 g | 51 mm | x |
Die MSI Cubi-Serie füllt die Lücke, die Intel mit der Einstellung der Produktion der eigenen NUC-Serie hinterlassen hat. Sie zielt auf Core-Business-Anwender und Büros ab, wo flache PCs gegenüber leistungsstarken Alternativen bevorzugt werden.
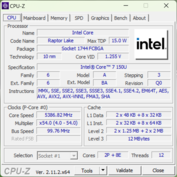
Bei unserem Testgerät handelt es sich um die höchste Konfiguration mit der Raptor Lake-U Refresh Core 7 150U CPU, während kleinere Optionen mit dem Core 5 120U oder Core 3 100U erhältlich sind.
Alternativen zum Cubi NUC M1 sind andere kompakte Mini-PCs der U-Serie, wie die GMK NucBox M5 oder der Beelink Mini S12 Pro.
Weitere MSI Bewertungen:
Spezifikationen
Gehäuse
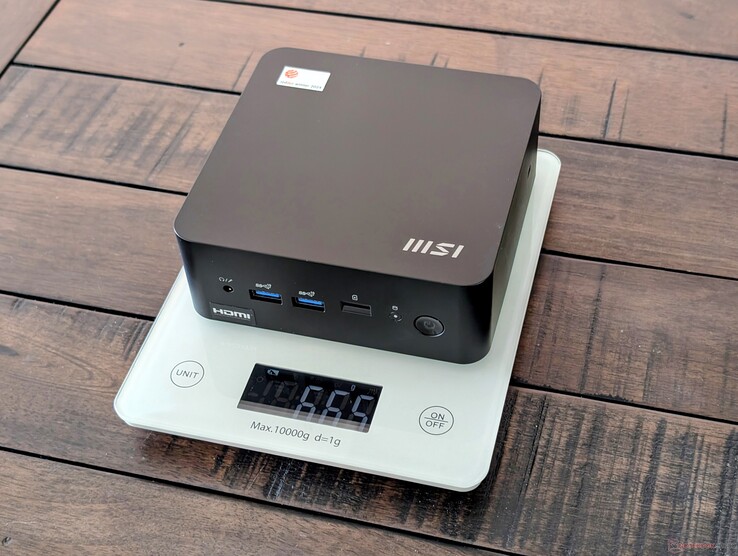
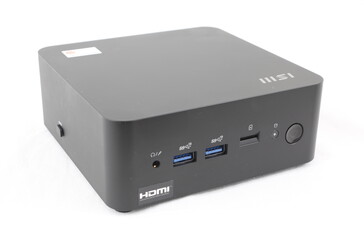
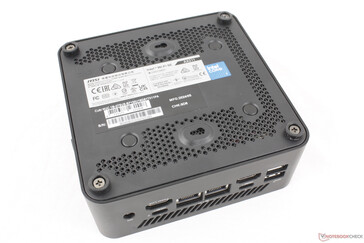
Das Gehäuse besteht größtenteils aus Kunststoff, mit einer Metallverstärkung an der Innenverkleidung der Seiten. Diese Konstruktion verleiht dem Gerät zwar ein gewisses Gewicht, vermittelt jedoch insgesamt ein höheres Gefühl von Qualität, insbesondere im Vergleich zu vielen Alternativen von Beelink oder GMK, die deutlich weniger Metall verwenden, um Kosten zu sparen.
Leider ist die glatte, mattschwarze Oberfläche ein großer Magnet für Fingerabdrücke. Eine weiße oder silberne Farboption, ähnlich wie bei der geschäftsorientierten MSI Prestige-Serie, hätte dieses Problem möglicherweise entschärfen können.
Ausstattung
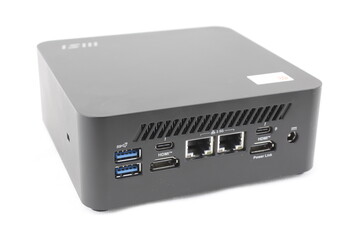
Im Gegensatz zu den meisten anderen Mini-PCs bietet das System einen recht schnellen integrierten MicroSD-Kartenleser, der für Kameranutzer und Content-Ersteller von Interesse sein könnte. Darüber hinaus sind wir erfreut darüber, dass das Gerät im Vergleich zu den meisten Beelink-Mini-PCs über zwei USB-C-Anschlüsse verfügt.
Es ist erwähnenswert, dass das System über USB-C-Netzteile von Drittanbietern mit Strom versorgt werden kann, falls das mitgelieferte Barrel-Netzteil einmal verloren gehen sollte.
SD Card Reader
| SD Card Reader | |
| average JPG Copy Test (av. of 3 runs) | |
| MSI Cubi NUC 1M (Angelbird AV Pro V60) | |
| maximum AS SSD Seq Read Test (1GB) | |
| MSI Cubi NUC 1M (Angelbird AV Pro V60) | |
Kommunikation
Wi-Fi 6E und Bluetooth 5.3 werden standardmäßig unterstützt. Wi-Fi 7 wäre in dieser Preisklasse wünschenswert gewesen.
| Networking | |
| iperf3 transmit AXE11000 | |
| BOSGAME M1 | |
| Asus NUC 14 Pro | |
| GMK NucBox K9 | |
| Beelink SER8 | |
| MSI Cubi NUC 1M | |
| iperf3 receive AXE11000 | |
| BOSGAME M1 | |
| Asus NUC 14 Pro | |
| Beelink SER8 | |
| GMK NucBox K9 | |
| MSI Cubi NUC 1M | |
| iperf3 transmit AXE11000 6GHz | |
| MSI Cubi NUC 1M | |
| Asus NUC 14 Pro | |
| BOSGAME M1 | |
| Beelink SEi11 Pro | |
| iperf3 receive AXE11000 6GHz | |
| Asus NUC 14 Pro | |
| MSI Cubi NUC 1M | |
| BOSGAME M1 | |
| Beelink SEi11 Pro | |
Wartung
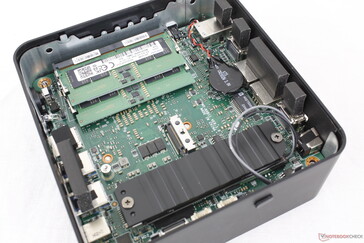
Die untere Metallplatte des Cubi NUC M1 kann leicht mit einem Kreuzschlitzschraubendreher entfernt werden, um aufrüstbare Komponenten freizulegen. Es ist jedoch zu beachten, dass die verwendeten Schrauben keine Rändelschrauben sind, wie sie bei vielen Intel NUC-Modellen zu finden sind.
Nachhaltigkeit
MSI setzt 42,9 Prozent recycelte Kunststoffe ein und verwendet für die Verpackung nachhaltig gewonnenen Holzstoff. Allerdings wird für das Netzteil und das Zubehör weiterhin Kunststoffverpackung verwendet.
Zubehör und Garantie
Ein abnehmbares SATA-III-Kabel wird mitgeliefert, damit Benutzer ein externes 2,5-Zoll-SATA-III-Laufwerk an einen speziellen Anschluss an der rechten Seite des Geräts anschließen können. Es ist keine sehr elegante Lösung, aber zumindest ist die Option vorhanden, während die meisten anderen Mini-PCs ganz auf 2,5-Zoll-SATA-Unterstützung verzichten.
Es gilt die standardmäßige einjährige Herstellergarantie, mit der Option, diese auf bis zu drei Jahre zu verlängern.
Performance
Testbedingungen
Wir haben Windows und das MSI Center auf den Performance-Modus eingestellt, bevor wir die folgenden Benchmarks durchgeführt haben.
Prozessor
Der Core 7 150U ist zwar relativ neu, basiert jedoch auf der älteren Raptor Lake-U-Plattform und bietet daher eine sehr ähnliche Leistung wie der bisherige Core i7-1365U. Ihm fehlen die integrierten KI-Funktionen sowie die verbesserte integrierte Arc-Grafik, die mit der Meteor Lake-Plattform eingeführt wurden.
Es ist unwahrscheinlich, dass der Wechsel zur Core 5 120U-Konfiguration die Prozessorleistung signifikant beeinflusst, da beide CPUs die gleiche Anzahl an Kernen und Threads aufweisen. Wenn Sie versuchen, Geld zu sparen, könnte die Core i5 SKU eine Überlegung wert sein.
Cinebench R15 Multi Dauertest
Cinebench R23: Multi Core | Single Core
Cinebench R20: CPU (Multi Core) | CPU (Single Core)
Cinebench R15: CPU Multi 64Bit | CPU Single 64Bit
Blender: v2.79 BMW27 CPU
7-Zip 18.03: 7z b 4 | 7z b 4 -mmt1
Geekbench 6.5: Multi-Core | Single-Core
Geekbench 5.5: Multi-Core | Single-Core
HWBOT x265 Benchmark v2.2: 4k Preset
LibreOffice : 20 Documents To PDF
R Benchmark 2.5: Overall mean
| CPU Performance Rating | |
| Lenovo ThinkStation P3 Tiny-30H0006AGE | |
| Beelink SER8 | |
| GMK NucBox K6 | |
| Geekom AX8 Pro | |
| HP Elite Mini 800 G9-5M9X6EA | |
| Geekom XT13 Pro | |
| GMK NucBox K9 -1! | |
| Khadas Mind 2 | |
| Asus NUC 14 Pro | |
| Beelink SER6 Pro Ryzen 7 7735HS -2! | |
| Durchschnittliche Intel Core 7 150U | |
| Lenovo IdeaPad Slim 3i 15IRU9 | |
| Beelink SER6 Pro -2! | |
| MSI Cubi NUC 1M | |
| GMK NucBox M6 | |
| GMK NucBox M5 | |
| Beelink SEi11 Pro -2! | |
| Cinebench R23 / Multi Core | |
| Lenovo ThinkStation P3 Tiny-30H0006AGE | |
| Beelink SER8 | |
| GMK NucBox K6 | |
| Geekom AX8 Pro | |
| HP Elite Mini 800 G9-5M9X6EA | |
| Asus NUC 14 Pro | |
| Khadas Mind 2 | |
| GMK NucBox K9 | |
| Geekom XT13 Pro | |
| Beelink SER6 Pro Ryzen 7 7735HS | |
| Beelink SER6 Pro | |
| GMK NucBox M6 | |
| Durchschnittliche Intel Core 7 150U (7226 - 9895, n=4) | |
| Lenovo IdeaPad Slim 3i 15IRU9 | |
| MSI Cubi NUC 1M | |
| GMK NucBox M5 | |
| Beelink SEi11 Pro | |
| Cinebench R23 / Single Core | |
| Lenovo ThinkStation P3 Tiny-30H0006AGE | |
| HP Elite Mini 800 G9-5M9X6EA | |
| MSI Cubi NUC 1M | |
| Durchschnittliche Intel Core 7 150U (1698 - 2032, n=4) | |
| Lenovo IdeaPad Slim 3i 15IRU9 | |
| Geekom AX8 Pro | |
| Beelink SER8 | |
| GMK NucBox K6 | |
| GMK NucBox K9 | |
| Asus NUC 14 Pro | |
| Geekom XT13 Pro | |
| Khadas Mind 2 | |
| Beelink SER6 Pro Ryzen 7 7735HS | |
| Beelink SER6 Pro | |
| GMK NucBox M6 | |
| Beelink SEi11 Pro | |
| GMK NucBox M5 | |
| Cinebench R20 / CPU (Multi Core) | |
| Lenovo ThinkStation P3 Tiny-30H0006AGE | |
| Beelink SER8 | |
| GMK NucBox K6 | |
| Geekom AX8 Pro | |
| HP Elite Mini 800 G9-5M9X6EA | |
| Asus NUC 14 Pro | |
| Khadas Mind 2 | |
| GMK NucBox K9 | |
| Geekom XT13 Pro | |
| Beelink SER6 Pro Ryzen 7 7735HS | |
| Beelink SER6 Pro | |
| GMK NucBox M6 | |
| Durchschnittliche Intel Core 7 150U (2821 - 3790, n=4) | |
| Lenovo IdeaPad Slim 3i 15IRU9 | |
| MSI Cubi NUC 1M | |
| GMK NucBox M5 | |
| Beelink SEi11 Pro | |
| Cinebench R20 / CPU (Single Core) | |
| Lenovo ThinkStation P3 Tiny-30H0006AGE | |
| HP Elite Mini 800 G9-5M9X6EA | |
| MSI Cubi NUC 1M | |
| Lenovo IdeaPad Slim 3i 15IRU9 | |
| Durchschnittliche Intel Core 7 150U (652 - 782, n=4) | |
| Geekom AX8 Pro | |
| Beelink SER8 | |
| GMK NucBox K6 | |
| GMK NucBox K9 | |
| Geekom XT13 Pro | |
| Asus NUC 14 Pro | |
| Khadas Mind 2 | |
| Beelink SER6 Pro Ryzen 7 7735HS | |
| Beelink SER6 Pro | |
| GMK NucBox M6 | |
| Beelink SEi11 Pro | |
| GMK NucBox M5 | |
| Cinebench R15 / CPU Multi 64Bit | |
| Lenovo ThinkStation P3 Tiny-30H0006AGE | |
| Beelink SER8 | |
| GMK NucBox K6 | |
| Geekom AX8 Pro | |
| Geekom XT13 Pro | |
| HP Elite Mini 800 G9-5M9X6EA | |
| Khadas Mind 2 | |
| Asus NUC 14 Pro | |
| GMK NucBox K9 | |
| Beelink SER6 Pro Ryzen 7 7735HS | |
| Beelink SER6 Pro | |
| GMK NucBox M6 | |
| Lenovo IdeaPad Slim 3i 15IRU9 | |
| Durchschnittliche Intel Core 7 150U (1040 - 1609, n=4) | |
| GMK NucBox M5 | |
| MSI Cubi NUC 1M | |
| Beelink SEi11 Pro | |
| Cinebench R15 / CPU Single 64Bit | |
| Lenovo ThinkStation P3 Tiny-30H0006AGE | |
| Geekom AX8 Pro | |
| Beelink SER8 | |
| GMK NucBox K6 | |
| HP Elite Mini 800 G9-5M9X6EA | |
| Durchschnittliche Intel Core 7 150U (243 - 290, n=4) | |
| MSI Cubi NUC 1M | |
| Lenovo IdeaPad Slim 3i 15IRU9 | |
| GMK NucBox K9 | |
| Asus NUC 14 Pro | |
| Beelink SER6 Pro Ryzen 7 7735HS | |
| Geekom XT13 Pro | |
| GMK NucBox M6 | |
| Beelink SER6 Pro | |
| Khadas Mind 2 | |
| Beelink SEi11 Pro | |
| GMK NucBox M5 | |
| Blender / v2.79 BMW27 CPU | |
| Beelink SEi11 Pro | |
| MSI Cubi NUC 1M | |
| Lenovo IdeaPad Slim 3i 15IRU9 | |
| GMK NucBox M5 | |
| Durchschnittliche Intel Core 7 150U (344 - 451, n=4) | |
| GMK NucBox M6 | |
| Beelink SER6 Pro | |
| Beelink SER6 Pro Ryzen 7 7735HS | |
| Geekom XT13 Pro | |
| GMK NucBox K9 | |
| Khadas Mind 2 | |
| Asus NUC 14 Pro | |
| HP Elite Mini 800 G9-5M9X6EA | |
| Geekom AX8 Pro | |
| GMK NucBox K6 | |
| Beelink SER8 | |
| Lenovo ThinkStation P3 Tiny-30H0006AGE | |
| 7-Zip 18.03 / 7z b 4 | |
| Lenovo ThinkStation P3 Tiny-30H0006AGE | |
| Beelink SER8 | |
| GMK NucBox K6 | |
| Geekom AX8 Pro | |
| Beelink SER6 Pro Ryzen 7 7735HS | |
| Geekom XT13 Pro | |
| Beelink SER6 Pro | |
| Khadas Mind 2 | |
| HP Elite Mini 800 G9-5M9X6EA | |
| GMK NucBox M6 | |
| Durchschnittliche Intel Core 7 150U (31447 - 39286, n=4) | |
| GMK NucBox M5 | |
| Lenovo IdeaPad Slim 3i 15IRU9 | |
| MSI Cubi NUC 1M | |
| Beelink SEi11 Pro | |
| Asus NUC 14 Pro | |
| 7-Zip 18.03 / 7z b 4 -mmt1 | |
| Lenovo ThinkStation P3 Tiny-30H0006AGE | |
| Beelink SER8 | |
| Geekom AX8 Pro | |
| GMK NucBox K6 | |
| HP Elite Mini 800 G9-5M9X6EA | |
| MSI Cubi NUC 1M | |
| Lenovo IdeaPad Slim 3i 15IRU9 | |
| Geekom XT13 Pro | |
| Durchschnittliche Intel Core 7 150U (5407 - 6261, n=4) | |
| Beelink SER6 Pro Ryzen 7 7735HS | |
| Beelink SER6 Pro | |
| GMK NucBox M6 | |
| Asus NUC 14 Pro | |
| Beelink SEi11 Pro | |
| GMK NucBox K9 | |
| Khadas Mind 2 | |
| GMK NucBox M5 | |
| Geekbench 6.5 / Multi-Core | |
| Lenovo ThinkStation P3 Tiny-30H0006AGE | |
| Beelink SER8 | |
| GMK NucBox K6 | |
| Geekom AX8 Pro | |
| Khadas Mind 2 | |
| Asus NUC 14 Pro | |
| Geekom XT13 Pro | |
| GMK NucBox K9 | |
| HP Elite Mini 800 G9-5M9X6EA | |
| Lenovo IdeaPad Slim 3i 15IRU9 | |
| GMK NucBox M6 | |
| Durchschnittliche Intel Core 7 150U (7737 - 10160, n=4) | |
| MSI Cubi NUC 1M | |
| GMK NucBox M5 | |
| Geekbench 6.5 / Single-Core | |
| Lenovo ThinkStation P3 Tiny-30H0006AGE | |
| Beelink SER8 | |
| GMK NucBox K6 | |
| Geekom AX8 Pro | |
| MSI Cubi NUC 1M | |
| Durchschnittliche Intel Core 7 150U (2253 - 2781, n=4) | |
| HP Elite Mini 800 G9-5M9X6EA | |
| Lenovo IdeaPad Slim 3i 15IRU9 | |
| Geekom XT13 Pro | |
| Asus NUC 14 Pro | |
| GMK NucBox K9 | |
| Khadas Mind 2 | |
| GMK NucBox M6 | |
| GMK NucBox M5 | |
| Geekbench 5.5 / Multi-Core | |
| Lenovo ThinkStation P3 Tiny-30H0006AGE | |
| Beelink SER8 | |
| Geekom AX8 Pro | |
| GMK NucBox K6 | |
| Geekom XT13 Pro | |
| Khadas Mind 2 | |
| Asus NUC 14 Pro | |
| HP Elite Mini 800 G9-5M9X6EA | |
| GMK NucBox K9 | |
| Beelink SER6 Pro Ryzen 7 7735HS | |
| Beelink SER6 Pro | |
| Lenovo IdeaPad Slim 3i 15IRU9 | |
| GMK NucBox M6 | |
| Durchschnittliche Intel Core 7 150U (7178 - 8354, n=4) | |
| MSI Cubi NUC 1M | |
| GMK NucBox M5 | |
| Beelink SEi11 Pro | |
| Geekbench 5.5 / Single-Core | |
| Lenovo ThinkStation P3 Tiny-30H0006AGE | |
| Beelink SER8 | |
| Geekom AX8 Pro | |
| GMK NucBox K6 | |
| MSI Cubi NUC 1M | |
| HP Elite Mini 800 G9-5M9X6EA | |
| Lenovo IdeaPad Slim 3i 15IRU9 | |
| Durchschnittliche Intel Core 7 150U (1631 - 1969, n=4) | |
| Geekom XT13 Pro | |
| Asus NUC 14 Pro | |
| GMK NucBox K9 | |
| Beelink SER6 Pro Ryzen 7 7735HS | |
| Khadas Mind 2 | |
| Beelink SER6 Pro | |
| Beelink SEi11 Pro | |
| GMK NucBox M6 | |
| GMK NucBox M5 | |
| HWBOT x265 Benchmark v2.2 / 4k Preset | |
| Lenovo ThinkStation P3 Tiny-30H0006AGE | |
| Beelink SER8 | |
| Geekom AX8 Pro | |
| GMK NucBox K6 | |
| HP Elite Mini 800 G9-5M9X6EA | |
| Asus NUC 14 Pro | |
| Khadas Mind 2 | |
| Beelink SER6 Pro Ryzen 7 7735HS | |
| Beelink SER6 Pro | |
| Geekom XT13 Pro | |
| GMK NucBox M6 | |
| GMK NucBox K9 | |
| Durchschnittliche Intel Core 7 150U (8.57 - 11.1, n=4) | |
| Lenovo IdeaPad Slim 3i 15IRU9 | |
| MSI Cubi NUC 1M | |
| GMK NucBox M5 | |
| Beelink SEi11 Pro | |
| LibreOffice / 20 Documents To PDF | |
| Khadas Mind 2 | |
| GMK NucBox M5 | |
| Asus NUC 14 Pro | |
| GMK NucBox M6 | |
| Geekom AX8 Pro | |
| Beelink SEi11 Pro | |
| Beelink SER6 Pro | |
| Geekom XT13 Pro | |
| Beelink SER8 | |
| HP Elite Mini 800 G9-5M9X6EA | |
| Beelink SER6 Pro Ryzen 7 7735HS | |
| GMK NucBox K6 | |
| GMK NucBox K9 | |
| Durchschnittliche Intel Core 7 150U (29 - 69.2, n=4) | |
| Lenovo IdeaPad Slim 3i 15IRU9 | |
| Lenovo ThinkStation P3 Tiny-30H0006AGE | |
| MSI Cubi NUC 1M | |
| R Benchmark 2.5 / Overall mean | |
| GMK NucBox M5 | |
| Beelink SEi11 Pro | |
| Khadas Mind 2 | |
| Beelink SER6 Pro Ryzen 7 7735HS | |
| GMK NucBox M6 | |
| Beelink SER6 Pro | |
| Asus NUC 14 Pro | |
| GMK NucBox K9 | |
| Geekom XT13 Pro | |
| Lenovo IdeaPad Slim 3i 15IRU9 | |
| Geekom AX8 Pro | |
| Durchschnittliche Intel Core 7 150U (0.4386 - 0.502, n=4) | |
| MSI Cubi NUC 1M | |
| HP Elite Mini 800 G9-5M9X6EA | |
| GMK NucBox K6 | |
| Beelink SER8 | |
| Lenovo ThinkStation P3 Tiny-30H0006AGE | |
Cinebench R23: Multi Core | Single Core
Cinebench R20: CPU (Multi Core) | CPU (Single Core)
Cinebench R15: CPU Multi 64Bit | CPU Single 64Bit
Blender: v2.79 BMW27 CPU
7-Zip 18.03: 7z b 4 | 7z b 4 -mmt1
Geekbench 6.5: Multi-Core | Single-Core
Geekbench 5.5: Multi-Core | Single-Core
HWBOT x265 Benchmark v2.2: 4k Preset
LibreOffice : 20 Documents To PDF
R Benchmark 2.5: Overall mean
* ... kleinere Werte sind besser
AIDA64: FP32 Ray-Trace | FPU Julia | CPU SHA3 | CPU Queen | FPU SinJulia | FPU Mandel | CPU AES | CPU ZLib | FP64 Ray-Trace | CPU PhotoWorxx
| Performance Rating | |
| Beelink SER8 | |
| BOSGAME M1 | |
| Asus NUC 14 Pro | |
| GMK NucBox K9 | |
| Durchschnittliche Intel Core 7 150U | |
| MSI Cubi NUC 1M | |
| Beelink SEi11 Pro | |
| AIDA64 / FP32 Ray-Trace | |
| Beelink SER8 | |
| BOSGAME M1 | |
| Asus NUC 14 Pro | |
| GMK NucBox K9 | |
| Durchschnittliche Intel Core 7 150U (6306 - 7909, n=4) | |
| Beelink SEi11 Pro | |
| MSI Cubi NUC 1M | |
| AIDA64 / FPU Julia | |
| Beelink SER8 | |
| BOSGAME M1 | |
| Asus NUC 14 Pro | |
| GMK NucBox K9 | |
| Durchschnittliche Intel Core 7 150U (32582 - 41382, n=4) | |
| MSI Cubi NUC 1M | |
| Beelink SEi11 Pro | |
| AIDA64 / CPU SHA3 | |
| Beelink SER8 | |
| BOSGAME M1 | |
| Asus NUC 14 Pro | |
| GMK NucBox K9 | |
| Beelink SEi11 Pro | |
| Durchschnittliche Intel Core 7 150U (1656 - 2165, n=4) | |
| MSI Cubi NUC 1M | |
| AIDA64 / CPU Queen | |
| BOSGAME M1 | |
| Beelink SER8 | |
| Asus NUC 14 Pro | |
| GMK NucBox K9 | |
| Durchschnittliche Intel Core 7 150U (58025 - 70820, n=4) | |
| MSI Cubi NUC 1M | |
| Beelink SEi11 Pro | |
| AIDA64 / FPU SinJulia | |
| Beelink SER8 | |
| BOSGAME M1 | |
| Asus NUC 14 Pro | |
| GMK NucBox K9 | |
| Durchschnittliche Intel Core 7 150U (4387 - 5293, n=4) | |
| Beelink SEi11 Pro | |
| MSI Cubi NUC 1M | |
| AIDA64 / FPU Mandel | |
| Beelink SER8 | |
| BOSGAME M1 | |
| Asus NUC 14 Pro | |
| GMK NucBox K9 | |
| Durchschnittliche Intel Core 7 150U (16042 - 20259, n=4) | |
| Beelink SEi11 Pro | |
| MSI Cubi NUC 1M | |
| AIDA64 / CPU AES | |
| Beelink SER8 | |
| BOSGAME M1 | |
| GMK NucBox K9 | |
| Beelink SEi11 Pro | |
| Asus NUC 14 Pro | |
| Durchschnittliche Intel Core 7 150U (33007 - 41731, n=4) | |
| MSI Cubi NUC 1M | |
| AIDA64 / CPU ZLib | |
| Beelink SER8 | |
| BOSGAME M1 | |
| Asus NUC 14 Pro | |
| GMK NucBox K9 | |
| Durchschnittliche Intel Core 7 150U (491 - 695, n=4) | |
| MSI Cubi NUC 1M | |
| Beelink SEi11 Pro | |
| AIDA64 / FP64 Ray-Trace | |
| Beelink SER8 | |
| BOSGAME M1 | |
| Asus NUC 14 Pro | |
| GMK NucBox K9 | |
| Durchschnittliche Intel Core 7 150U (3417 - 4243, n=4) | |
| Beelink SEi11 Pro | |
| MSI Cubi NUC 1M | |
| AIDA64 / CPU PhotoWorxx | |
| Asus NUC 14 Pro | |
| GMK NucBox K9 | |
| BOSGAME M1 | |
| Beelink SER8 | |
| MSI Cubi NUC 1M | |
| Durchschnittliche Intel Core 7 150U (21802 - 38866, n=4) | |
| Beelink SEi11 Pro | |
Stresstest
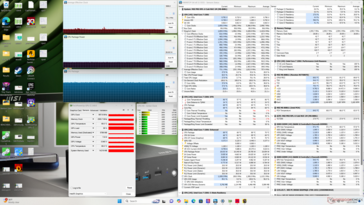
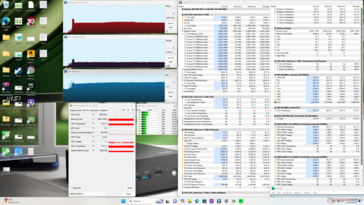
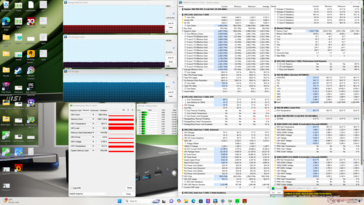
Beim Starten des Prime95-Stresstests stieg die CPU für einige Sekunden auf 2,6 GHz und 31 W, bevor sie auf 1,9 GHz und 20 W fiel und sich stabilisierte, wie die Screenshots unten zeigen. Der maximale Turbo Boost ist nicht nachhaltig, wie man es von einem PC der U-Serie erwarten würde.
Die Kerntemperatur stabilisierte sich bei 69 °C, während Cyberpunk 2077 lief, was im Vergleich zu 72 °C bei der schnelleren NucBox K9 etwas niedriger ist.
| CPU-Takt (GHz) | GPU-Takt (MHz) | Durchschnittliche CPU-Temperatur (°C) | |
| System im Leerlauf | -- | -- | 50 |
| Prime95 Stresstest | 1.9 | -- | 72 |
| Prime95 + FurMark Stresstest | 1.4 | 599 | 70 |
| Cyberpunk 2077 Stresstest | 0.7 | 998 | 69 |
System Performance
CrossMark: Overall | Productivity | Creativity | Responsiveness
WebXPRT 3: Overall
WebXPRT 4: Overall
Mozilla Kraken 1.1: Total
| PCMark 10 / Score | |
| Beelink SER8 | |
| BOSGAME M1 | |
| GMK NucBox K9 | |
| Asus NUC 14 Pro | |
| Durchschnittliche Intel Core 7 150U, Intel Iris Xe Graphics G7 96EUs (6080 - 6173, n=2) | |
| MSI Cubi NUC 1M | |
| Beelink SEi11 Pro | |
| PCMark 10 / Essentials | |
| Beelink SER8 | |
| BOSGAME M1 | |
| Durchschnittliche Intel Core 7 150U, Intel Iris Xe Graphics G7 96EUs (10856 - 11219, n=2) | |
| MSI Cubi NUC 1M | |
| GMK NucBox K9 | |
| Beelink SEi11 Pro | |
| Asus NUC 14 Pro | |
| PCMark 10 / Productivity | |
| Beelink SER8 | |
| BOSGAME M1 | |
| Durchschnittliche Intel Core 7 150U, Intel Iris Xe Graphics G7 96EUs (8387 - 8399, n=2) | |
| MSI Cubi NUC 1M | |
| GMK NucBox K9 | |
| Asus NUC 14 Pro | |
| Beelink SEi11 Pro | |
| PCMark 10 / Digital Content Creation | |
| Beelink SER8 | |
| BOSGAME M1 | |
| Asus NUC 14 Pro | |
| GMK NucBox K9 | |
| Durchschnittliche Intel Core 7 150U, Intel Iris Xe Graphics G7 96EUs (6701 - 6775, n=2) | |
| MSI Cubi NUC 1M | |
| Beelink SEi11 Pro | |
| CrossMark / Overall | |
| BOSGAME M1 | |
| Beelink SER8 | |
| MSI Cubi NUC 1M | |
| Durchschnittliche Intel Core 7 150U, Intel Iris Xe Graphics G7 96EUs (1660 - 1734, n=2) | |
| GMK NucBox K9 | |
| Asus NUC 14 Pro | |
| Beelink SEi11 Pro | |
| CrossMark / Productivity | |
| BOSGAME M1 | |
| Beelink SER8 | |
| MSI Cubi NUC 1M | |
| Durchschnittliche Intel Core 7 150U, Intel Iris Xe Graphics G7 96EUs (1649 - 1778, n=2) | |
| GMK NucBox K9 | |
| Asus NUC 14 Pro | |
| Beelink SEi11 Pro | |
| CrossMark / Creativity | |
| BOSGAME M1 | |
| Beelink SER8 | |
| Asus NUC 14 Pro | |
| Durchschnittliche Intel Core 7 150U, Intel Iris Xe Graphics G7 96EUs (1708 - 1730, n=2) | |
| GMK NucBox K9 | |
| MSI Cubi NUC 1M | |
| Beelink SEi11 Pro | |
| CrossMark / Responsiveness | |
| BOSGAME M1 | |
| Beelink SER8 | |
| MSI Cubi NUC 1M | |
| Durchschnittliche Intel Core 7 150U, Intel Iris Xe Graphics G7 96EUs (1493 - 1685, n=2) | |
| GMK NucBox K9 | |
| Beelink SEi11 Pro | |
| Asus NUC 14 Pro | |
| WebXPRT 3 / Overall | |
| Beelink SER8 | |
| BOSGAME M1 | |
| MSI Cubi NUC 1M | |
| Durchschnittliche Intel Core 7 150U, Intel Iris Xe Graphics G7 96EUs (307 - 311, n=2) | |
| Beelink SEi11 Pro | |
| GMK NucBox K9 | |
| Asus NUC 14 Pro | |
| WebXPRT 4 / Overall | |
| Durchschnittliche Intel Core 7 150U, Intel Iris Xe Graphics G7 96EUs (271 - 276, n=2) | |
| MSI Cubi NUC 1M | |
| Beelink SER8 | |
| BOSGAME M1 | |
| Asus NUC 14 Pro | |
| GMK NucBox K9 | |
| Beelink SEi11 Pro | |
| Mozilla Kraken 1.1 / Total | |
| Beelink SEi11 Pro | |
| Asus NUC 14 Pro | |
| GMK NucBox K9 | |
| BOSGAME M1 | |
| Beelink SER8 | |
| Durchschnittliche Intel Core 7 150U, Intel Iris Xe Graphics G7 96EUs (489 - 502, n=2) | |
| MSI Cubi NUC 1M | |
* ... kleinere Werte sind besser
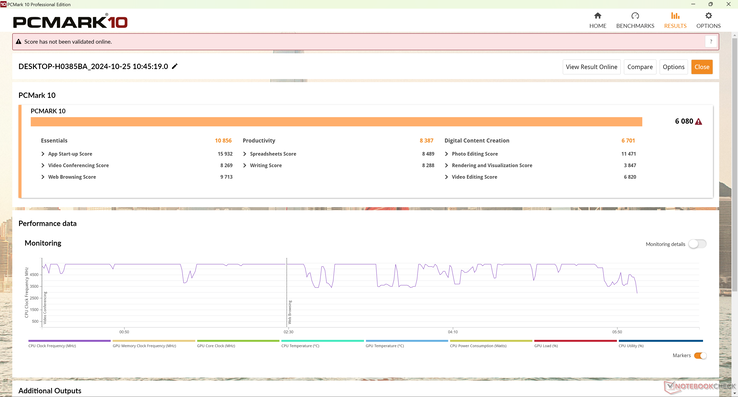
| PCMark 10 Score | 6080 Punkte | |
Hilfe | ||
| AIDA64 / Memory Copy | |
| BOSGAME M1 | |
| Asus NUC 14 Pro | |
| Beelink SER8 | |
| GMK NucBox K9 | |
| MSI Cubi NUC 1M | |
| Durchschnittliche Intel Core 7 150U (36579 - 61190, n=4) | |
| Beelink SEi11 Pro | |
| AIDA64 / Memory Read | |
| Asus NUC 14 Pro | |
| GMK NucBox K9 | |
| MSI Cubi NUC 1M | |
| Beelink SER8 | |
| BOSGAME M1 | |
| Durchschnittliche Intel Core 7 150U (39827 - 68780, n=4) | |
| Beelink SEi11 Pro | |
| AIDA64 / Memory Write | |
| BOSGAME M1 | |
| Beelink SER8 | |
| Asus NUC 14 Pro | |
| GMK NucBox K9 | |
| Durchschnittliche Intel Core 7 150U (44925 - 78327, n=4) | |
| MSI Cubi NUC 1M | |
| Beelink SEi11 Pro | |
| AIDA64 / Memory Latency | |
| GMK NucBox K9 | |
| Asus NUC 14 Pro | |
| BOSGAME M1 | |
| Beelink SER8 | |
| Durchschnittliche Intel Core 7 150U (74.5 - 100, n=4) | |
| Beelink SEi11 Pro | |
| MSI Cubi NUC 1M | |
* ... kleinere Werte sind besser
DPC-Latenzen
| DPC Latencies / LatencyMon - interrupt to process latency (max), Web, Youtube, Prime95 | |
| GMK NucBox K9 | |
| MSI Cubi NUC 1M | |
| Asus NUC 14 Pro | |
| BOSGAME M1 | |
| Beelink SER8 | |
| Beelink SEi11 Pro | |
* ... kleinere Werte sind besser
Massenspeicher
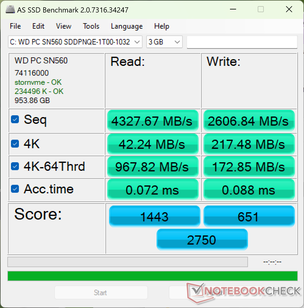
Unser Gerät wird mit der Mittelklasse-SSD WD PC SN560 SDDPNQE-1T00 M.2 PCIe4 x4 NVMe ausgeliefert, die stabile Übertragungsraten von bis zu 5000 MB/s bietet. Wir schätzen, dass der Hitzeschutz der SSD standardmäßig und vorinstalliert ist.
| Drive Performance Rating - Percent | |
| GMK NucBox K9 | |
| Beelink SER8 | |
| Asus NUC 14 Pro | |
| BOSGAME M1 | |
| MSI Cubi NUC 1M | |
| Beelink SEi11 Pro | |
* ... kleinere Werte sind besser
Dauerleistung Lesen: DiskSpd Read Loop, Queue Depth 8
GPU Performance
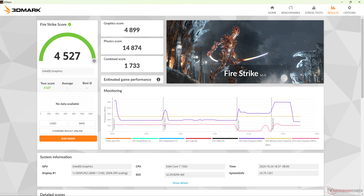
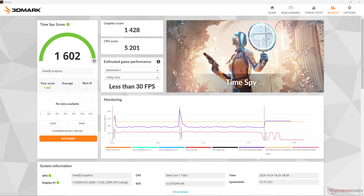
Der Iris Xe G7 mit 96 Execution Units (EUs) ist inzwischen einige Jahre alt und kann daher nicht mit den meisten neueren Mini-PCs mithalten, die auf Plattformen wie Meteor Lake oder Zen 4 basieren. Aus diesem Grund eignet sich der Cubi NUC M1 eher für Streaming und leichte 2D-Spiele.
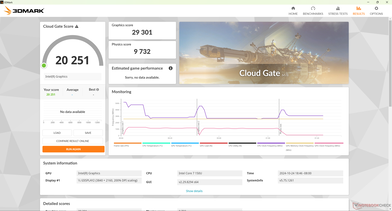
Die Verwendung des Balanced-Modus anstelle des Performance-Modus scheint keinen Einfluss auf die Leistung zu haben, da die 3DMark-Ergebnisse in unseren Tests nahezu identisch sind.
Ein Wechsel zur Core 5 120U-Konfiguration könnte die Grafikleistung um etwa 10 bis 20 Prozent verringern, da die Core 5-CPU mit den langsameren integrierten Iris Xe 80 EUs gepaart ist.
X-Plane ließ sich auf unserem Cubi M1 nicht starten, weshalb die entsprechenden Ergebnisse nicht verfügbar sind.
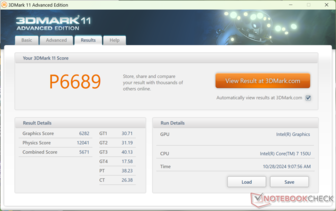
| 3DMark 11 Performance | 6689 Punkte | |
| 3DMark Cloud Gate Standard Score | 20251 Punkte | |
| 3DMark Fire Strike Score | 4527 Punkte | |
| 3DMark Time Spy Score | 1602 Punkte | |
Hilfe | ||
| Blender | |
| v3.3 Classroom HIP/AMD | |
| Beelink SER6 Pro | |
| Beelink SER6 Pro Ryzen 7 7735HS | |
| v3.3 Classroom OPTIX/RTX | |
| Lenovo ThinkStation P3 Tiny-30H0006AGE | |
| v3.3 Classroom CUDA | |
| Lenovo ThinkStation P3 Tiny-30H0006AGE | |
| v3.3 Classroom CPU | |
| Beelink SEi11 Pro | |
| MSI Cubi NUC 1M | |
| GMK NucBox M5 | |
| Durchschnittliche Intel Iris Xe Graphics G7 96EUs (336 - 1259, n=109) | |
| GMK NucBox M6 | |
| Geekom XT13 Pro | |
| Beelink SER6 Pro | |
| Khadas Mind 2 | |
| Beelink SER6 Pro Ryzen 7 7735HS | |
| GMK NucBox K9 | |
| Asus NUC 14 Pro | |
| HP Elite Mini 800 G9-5M9X6EA | |
| GMK NucBox K6 | |
| Geekom AX8 Pro | |
| Beelink SER8 | |
| Lenovo ThinkStation P3 Tiny-30H0006AGE | |
| v3.3 Classroom oneAPI/Intel | |
| GMK NucBox K9 | |
| Khadas Mind 2 | |
* ... kleinere Werte sind besser
| Performance Rating - Percent | |
| BOSGAME M1 -1! | |
| Beelink SER8 -1! | |
| Asus NUC 14 Pro -2! | |
| GMK NucBox K9 | |
| Beelink SEi11 Pro -3! | |
| MSI Cubi NUC 1M -2! | |
| Baldur's Gate 3 - 1920x1080 Ultra Preset AA:T | |
| BOSGAME M1 | |
| Beelink SER8 | |
| GMK NucBox K9 | |
| Asus NUC 14 Pro | |
| GTA V - 1920x1080 Highest AA:4xMSAA + FX AF:16x | |
| Asus NUC 14 Pro | |
| GMK NucBox K9 | |
| MSI Cubi NUC 1M | |
| Final Fantasy XV Benchmark - 1920x1080 High Quality | |
| BOSGAME M1 | |
| Beelink SER8 | |
| Asus NUC 14 Pro | |
| GMK NucBox K9 | |
| MSI Cubi NUC 1M | |
| Beelink SEi11 Pro | |
| Strange Brigade - 1920x1080 ultra AA:ultra AF:16 | |
| BOSGAME M1 | |
| Beelink SER8 | |
| GMK NucBox K9 | |
| MSI Cubi NUC 1M | |
| Beelink SEi11 Pro | |
| Dota 2 Reborn - 1920x1080 ultra (3/3) best looking | |
| Beelink SER8 | |
| BOSGAME M1 | |
| GMK NucBox K9 | |
| Asus NUC 14 Pro | |
| MSI Cubi NUC 1M | |
| Beelink SEi11 Pro | |
| X-Plane 11.11 - 1920x1080 high (fps_test=3) | |
| Beelink SER8 | |
| BOSGAME M1 | |
| Beelink SEi11 Pro | |
| GMK NucBox K9 | |
| Asus NUC 14 Pro | |
| Far Cry 5 - 1920x1080 Ultra Preset AA:T | |
| BOSGAME M1 | |
| Beelink SER8 | |
| GMK NucBox K9 | |
| MSI Cubi NUC 1M | |
Cyberpunk 2077 ultra FPS-Diagramm
| min. | mittel | hoch | max. | |
|---|---|---|---|---|
| GTA V (2015) | 100.3 | 86.1 | 23.6 | 9.98 |
| Dota 2 Reborn (2015) | 97.7 | 61.9 | 62.5 | 57.8 |
| Final Fantasy XV Benchmark (2018) | 40.9 | 23 | 16.6 | |
| Far Cry 5 (2018) | 49 | 28 | 26 | 24 |
| Strange Brigade (2018) | 88.2 | 38.9 | 31.1 | 25.2 |
| Tiny Tina's Wonderlands (2022) | 27.5 | 20.3 | 14 | 10.9 |
| F1 22 (2022) | 42.3 | 38.2 | 28.3 | 21.4 |
| Baldur's Gate 3 (2023) | 15.3 | |||
| Cyberpunk 2077 (2023) | 15.4 | 12.4 | 10.8 | 9.46 |
Emissionen
Geräuschemissionen
Der interne Lüfter des Cubi NUC M1 ist ständig aktiv und erzeugt im Normalbetrieb etwa 30 dB(A). Dies ist in typischen Büro- oder Konferenzraumumgebungen nahezu unhörbar. Positiv zu erwähnen ist, dass der Lüfter relativ träge reagiert, was bedeutet, dass es selbst bei mittlerer bis hoher Belastung nicht zu abrupten oder hohen Drehzahlerhöhungen kommt.
Lautstärkediagramm
| Idle |
| 29.9 / 29.9 / 32 dB(A) |
| Last |
| 33.5 / 40.5 dB(A) |
 | ||
30 dB leise 40 dB(A) deutlich hörbar 50 dB(A) störend |
||
min: | ||
| MSI Cubi NUC 1M Iris Xe G7 96EUs, Core 7 150U, WD PC SN560 SDDPNQE-1T00 | GMK NucBox K9 Arc 7-Core, Ultra 5 125H, MasonSemi 1TB MC7000 | Asus NUC 14 Pro Arc 7-Core, Ultra 5 125H, Kingston KC3000 2048G SKC3000D2048G | Beelink SEi11 Pro Iris Xe G7 96EUs, i5-11320H, Kingston NV1 SNVS/500GCN | Beelink SER8 Radeon 780M, R7 8845HS, Crucial P3 Plus CT1000P3PSSD8 | BOSGAME M1 Radeon 780M, R7 7840HS, Kingston OM8PGP41024N-A0 | |
|---|---|---|---|---|---|---|
| Geräuschentwicklung | -11% | -4% | 11% | 5% | -6% | |
| aus / Umgebung * (dB) | 23.5 | 23 2% | 24 -2% | 22.8 3% | 23.6 -0% | 23.2 1% |
| Idle min * (dB) | 29.9 | 29.8 -0% | 26 13% | 24.7 17% | 28.8 4% | 32 -7% |
| Idle avg * (dB) | 29.9 | 35.7 -19% | 26.2 12% | 24.7 17% | 28.8 4% | 32 -7% |
| Idle max * (dB) | 32 | 35.7 -12% | 26.2 18% | 25.3 21% | 30.5 5% | 32 -0% |
| Last avg * (dB) | 33.5 | 41.9 -25% | 42.4 -27% | 33.2 1% | 34.6 -3% | 38.7 -16% |
| Cyberpunk 2077 ultra * (dB) | 39.1 | 43.8 -12% | 47.7 -22% | 34.1 13% | ||
| Last max * (dB) | 40.5 | 44 -9% | 47.8 -18% | 37.8 7% | 34.5 15% | 42 -4% |
| Witcher 3 ultra * (dB) | 34.5 | 41.7 |
* ... kleinere Werte sind besser
Temperatur
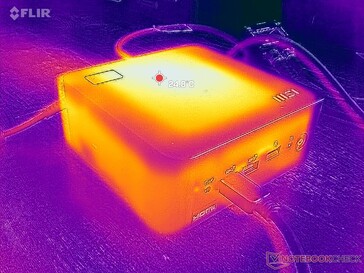
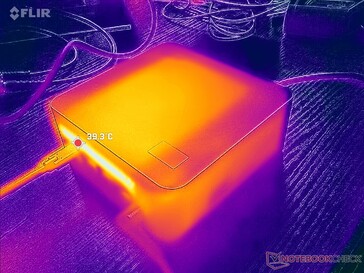
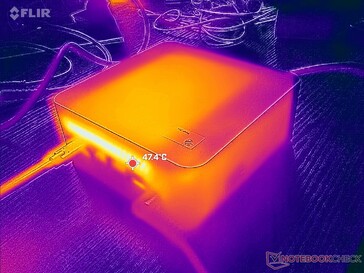
Im Gegensatz zu vielen anderen Mini-PCs hat der Cubi NUC M1 nur an der Unterseite und der Rückseite Lüftungsgitter. Dank der energieeffizienten U-Serien-CPU sind jedoch die Oberflächentemperaturen in der Regel unproblematisch. Selbst bei längeren Belastungen bleibt der Hotspot auf der Oberseite unter 30 °C.
Energieverwaltung
Energieaufnahme
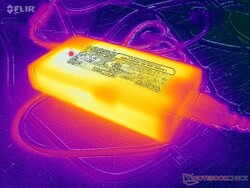
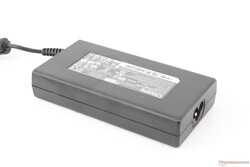
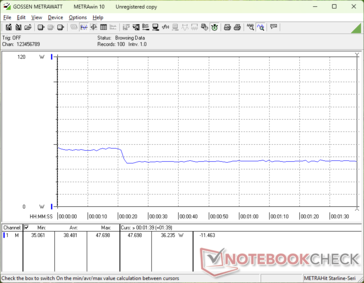
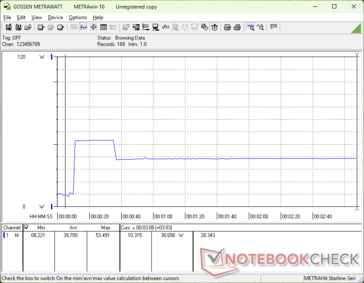
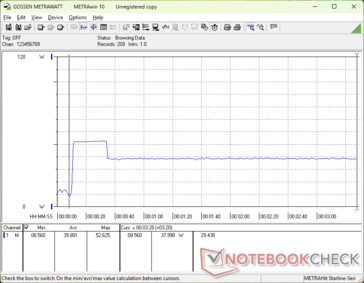
Der Verbrauch ist im Allgemeinen niedriger als bei den meisten Mini-PCs mit H-Power, insbesondere unter anspruchsvoller Last. Besonders bemerkenswert ist, dass das System mit einem beträchtlichen 120-W-Netzteil geliefert wird, obwohl der Mini-PC bei 100 Prozent CPU-Auslastung kaum die Hälfte davon verbraucht. Der hohe Overhead kann für die Stromversorgung von Thunderbolt-Zubehör oder anderen externen Geräten genutzt werden.
Wir würden uns wünschen, dass in Zukunft auf universelle USB-C-Netzteile umgestellt wird, ähnlich wie bei modernen Laptops der U-Serie.
| Aus / Standby | |
| Idle | |
| Last |
|
Legende:
min: | |
| MSI Cubi NUC 1M Core 7 150U, Iris Xe G7 96EUs, WD PC SN560 SDDPNQE-1T00, , x, | GMK NucBox K9 Ultra 5 125H, Arc 7-Core, MasonSemi 1TB MC7000, , x, | Asus NUC 14 Pro Ultra 5 125H, Arc 7-Core, Kingston KC3000 2048G SKC3000D2048G, , x, | Beelink SEi11 Pro i5-11320H, Iris Xe G7 96EUs, Kingston NV1 SNVS/500GCN, , x, | Beelink SER8 R7 8845HS, Radeon 780M, Crucial P3 Plus CT1000P3PSSD8, , x, | BOSGAME M1 R7 7840HS, Radeon 780M, Kingston OM8PGP41024N-A0, , x, | |
|---|---|---|---|---|---|---|
| Stromverbrauch | -41% | -34% | -26% | -24% | -32% | |
| Idle min * (Watt) | 6.4 | 10.9 -70% | 5.1 20% | 9.8 -53% | 7.3 -14% | 7.3 -14% |
| Idle avg * (Watt) | 8.3 | 11 -33% | 6.4 23% | 10.3 -24% | 7.3 12% | 7.3 12% |
| Idle max * (Watt) | 10.4 | 11.4 -10% | 14.7 -41% | 10.5 -1% | 8.4 19% | 8.4 19% |
| Last avg * (Watt) | 38.5 | 52.8 -37% | 55.5 -44% | 54.2 -41% | 68.2 -77% | 72.7 -89% |
| Cyberpunk 2077 ultra external monitor * (Watt) | 36.1 | 57.1 -58% | 59.1 -64% | |||
| Last max * (Watt) | 52.5 | 72.2 -38% | 103.3 -97% | 59 -12% | 84.3 -61% | 99.1 -89% |
| Witcher 3 ultra * (Watt) | 53.1 | 75.1 | 80.5 |
* ... kleinere Werte sind besser
Energieaufnahme Cyberpunk / Stresstest
Energieaufnahme externer Monitor
Notebookcheck Bewertung
MSI Cubi NUC 1M
- 30.10.2024 v8
Allen Ngo
Transparenz
Die Auswahl der zu testenden Geräte erfolgt innerhalb der Redaktion. Das vorliegende Testmuster wurde dem Autor vom Hersteller oder einem Shop zu Testzwecken leihweise zur Verfügung gestellt. Eine Einflussnahme des Leihstellers auf den Testbericht gab es nicht, der Hersteller erhielt keine Version des Reviews vor der Veröffentlichung. Es bestand keine Verpflichtung zur Publikation. Als eigenständiges, unabhängiges Unternehmen unterliegt Notebookcheck keiner Diktion von Herstellern, Shops und Verlagen.
So testet Notebookcheck
Pro Jahr werden von Notebookcheck hunderte Laptops und Smartphones unabhängig in von uns standardisierten technischen Verfahren getestet, um eine Vergleichbarkeit aller Testergebnisse zu gewährleisten. Seit rund 20 Jahren entwickeln wir diese Testmethoden kontinuierlich weiter und setzen damit Branchenstandards. In unseren Testlaboren kommt ausschließlich hochwertiges Messequipment in die Hände erfahrener Techniker und Redakteure. Die Tests unterliegen einer mehrstufigen Kontrolle. Unsere komplexe Gesamtbewertung basiert auf hunderten fundierten Messergebnissen und Benchmarks, womit Ihnen Objektivität garantiert ist. Weitere Informationen zu unseren Testmethoden gibt es hier.












 Total Sustainability Score: