GMK NucBox K6 Mini-PC im Test: So leistungsfähig wie die neuesten Intel Core Ultra-Notebooks

Die GMK NucBox K6 ist einer der neuesten Mini-PCs des Unternehmens, der speziell für Multimedia- und Streaming-Anwendungen zu Hause entwickelt wurde. Er konkurriert direkt mit den Intel NUC und Beelink Mini-PCs in der 500-Euro-Preisklasse.
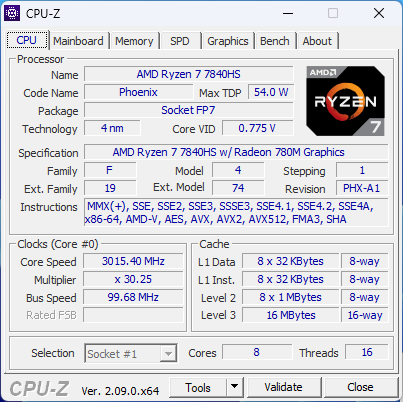
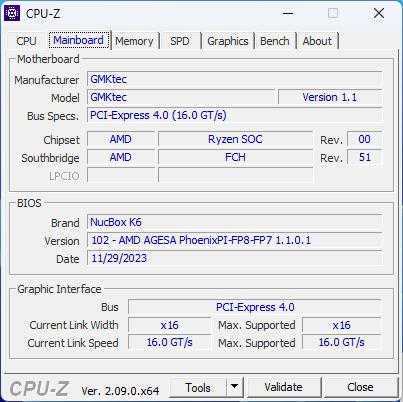
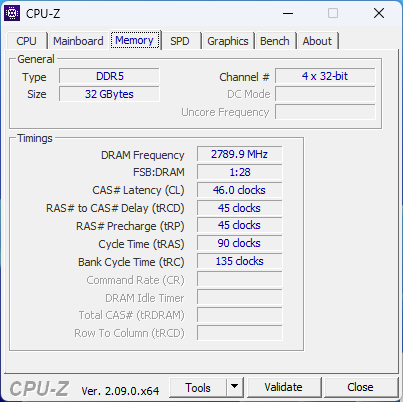
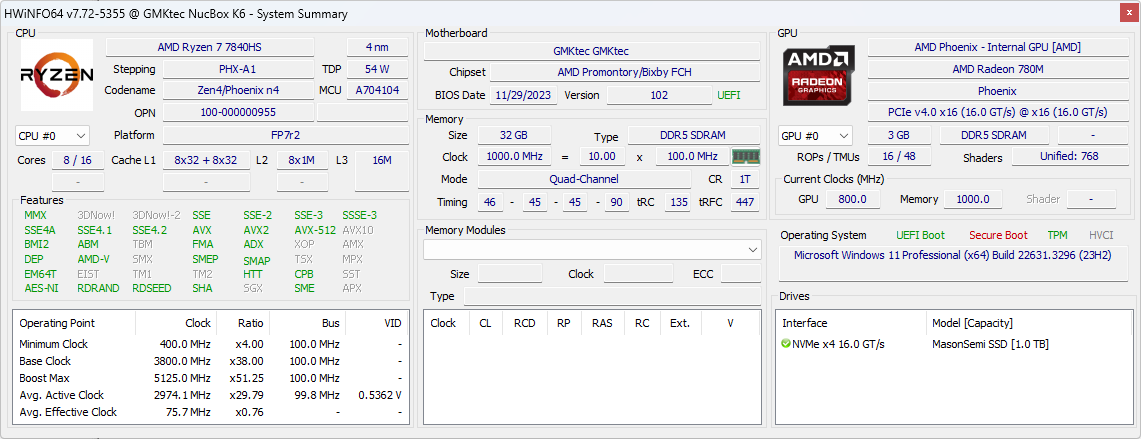
Alle aktuellen Konfigurationen sind mit der AMD Ryzen 7 7840HS Zen 4 CPU mit integrierter Radeon 780M Grafik ausgestattet. Barebone-SKUs sind ab 369 Euro bis zu 673 Euro erhältlich, wenn sie mit 32 GB RAM, 1 TB Speicher und vorinstalliertem Windows 11 Pro konfiguriert sind. Alternativen zur NucBox K6 sind das Intel NUC 13 Pro, das Beelink SER5 oder das Geekom A7.
Weitere GMKtec Bewertungen:
Mögliche Konkurrenten im Vergleich
Bew. | Datum | Modell | Gewicht | Dicke | Größe | Auflösung | Preis ab |
|---|---|---|---|---|---|---|---|
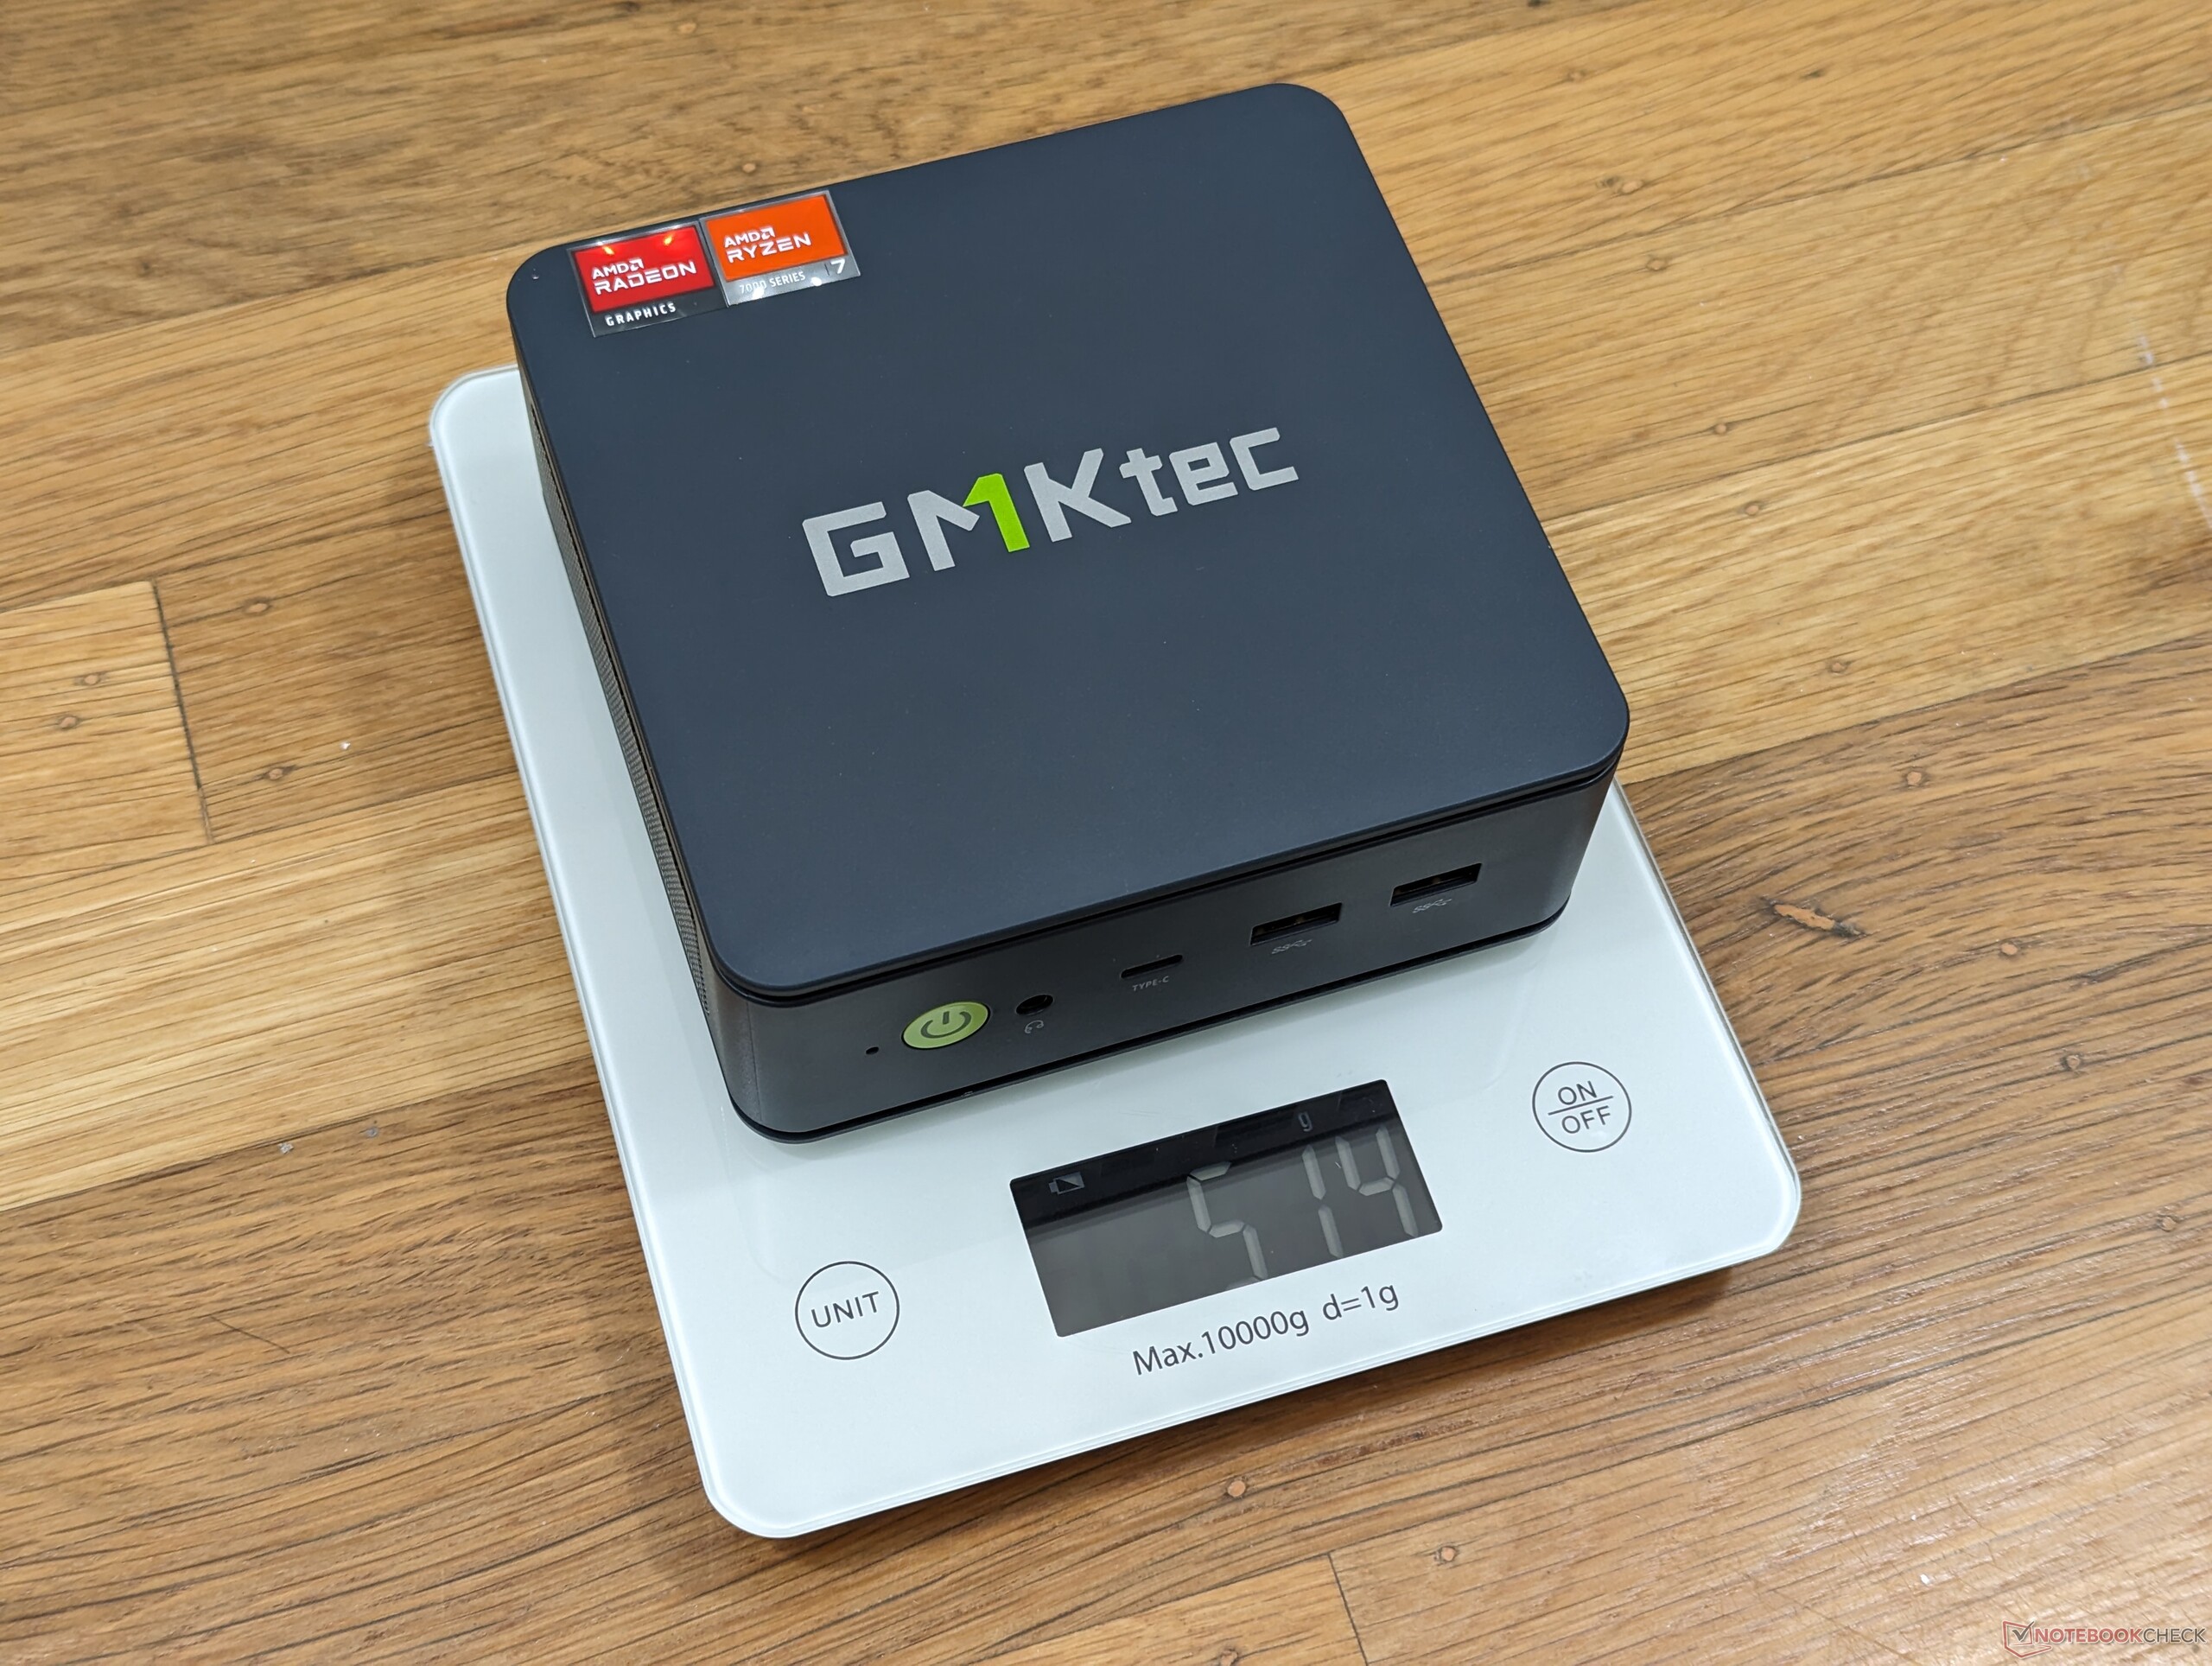
| 83.6 % v7 (old) | 04 / 2024 | GMK NucBox K6 R7 7840HS, Radeon 780M | 514 g | 47 mm | x | ||
| 82.8 % v7 (old) | 10 / 2023 | GMK NucBox K3 Pro i7-12650H, UHD Graphics 64EUs | 396 g | 43.2 mm | x | ||
| 83.1 % v7 (old) | 08 / 2023 | Intel NUC 13 Pro Desk Edition Kit i7-1360P, Iris Xe G7 96EUs | 558 g | 37 mm | x | ||
| 82.1 % v7 (old) | 11 / 2023 | Beelink SER5 R5 5560U, Vega 6 | 439 g | 42 mm | x | ||
| 85.2 % v7 (old) | AcePC Wizbox AI Ultra 7 155H, Arc 8-Core | 840 g | 55.55 mm | x | |||
| 82.6 % v7 (old) | 02 / 2024 | Geekom A7 R9 7940HS, Radeon 780M | 417 g | 38 mm | x |
Gehäuse
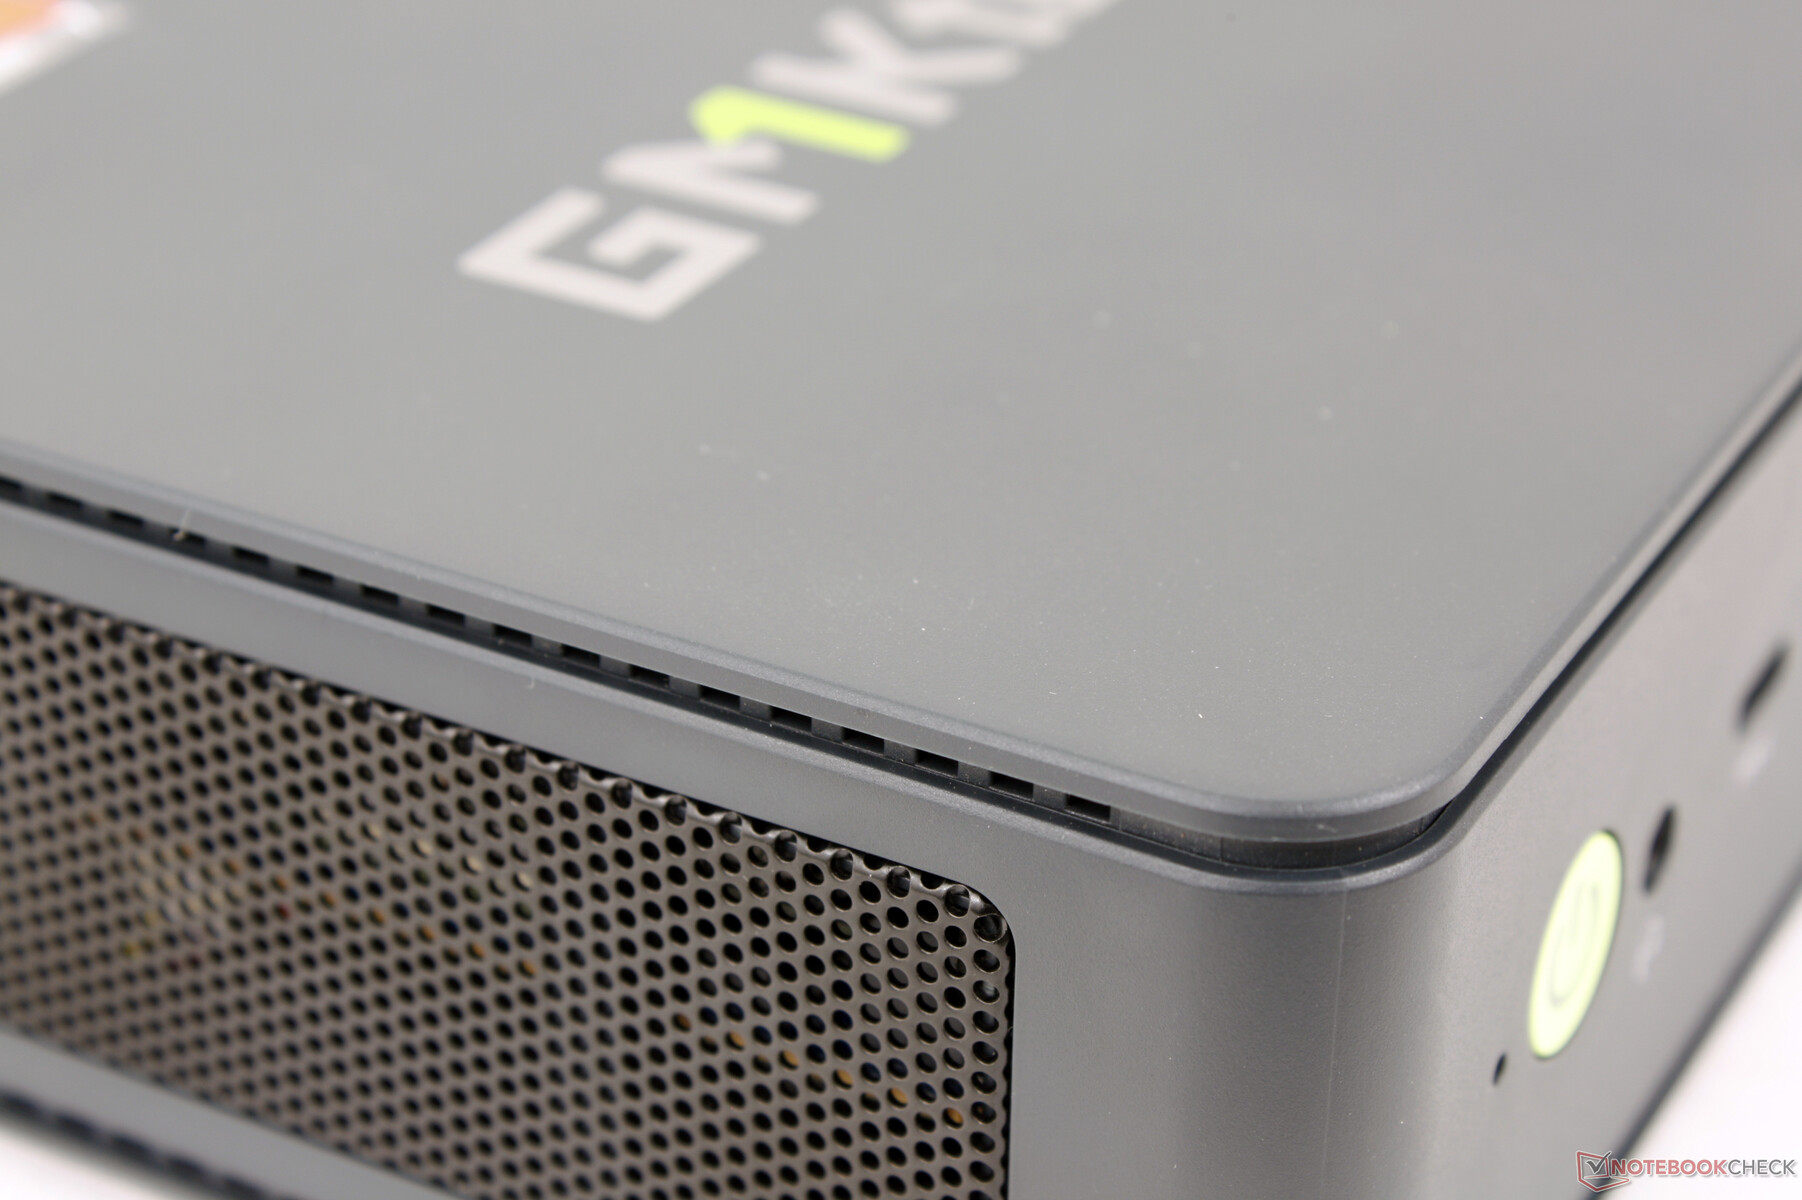
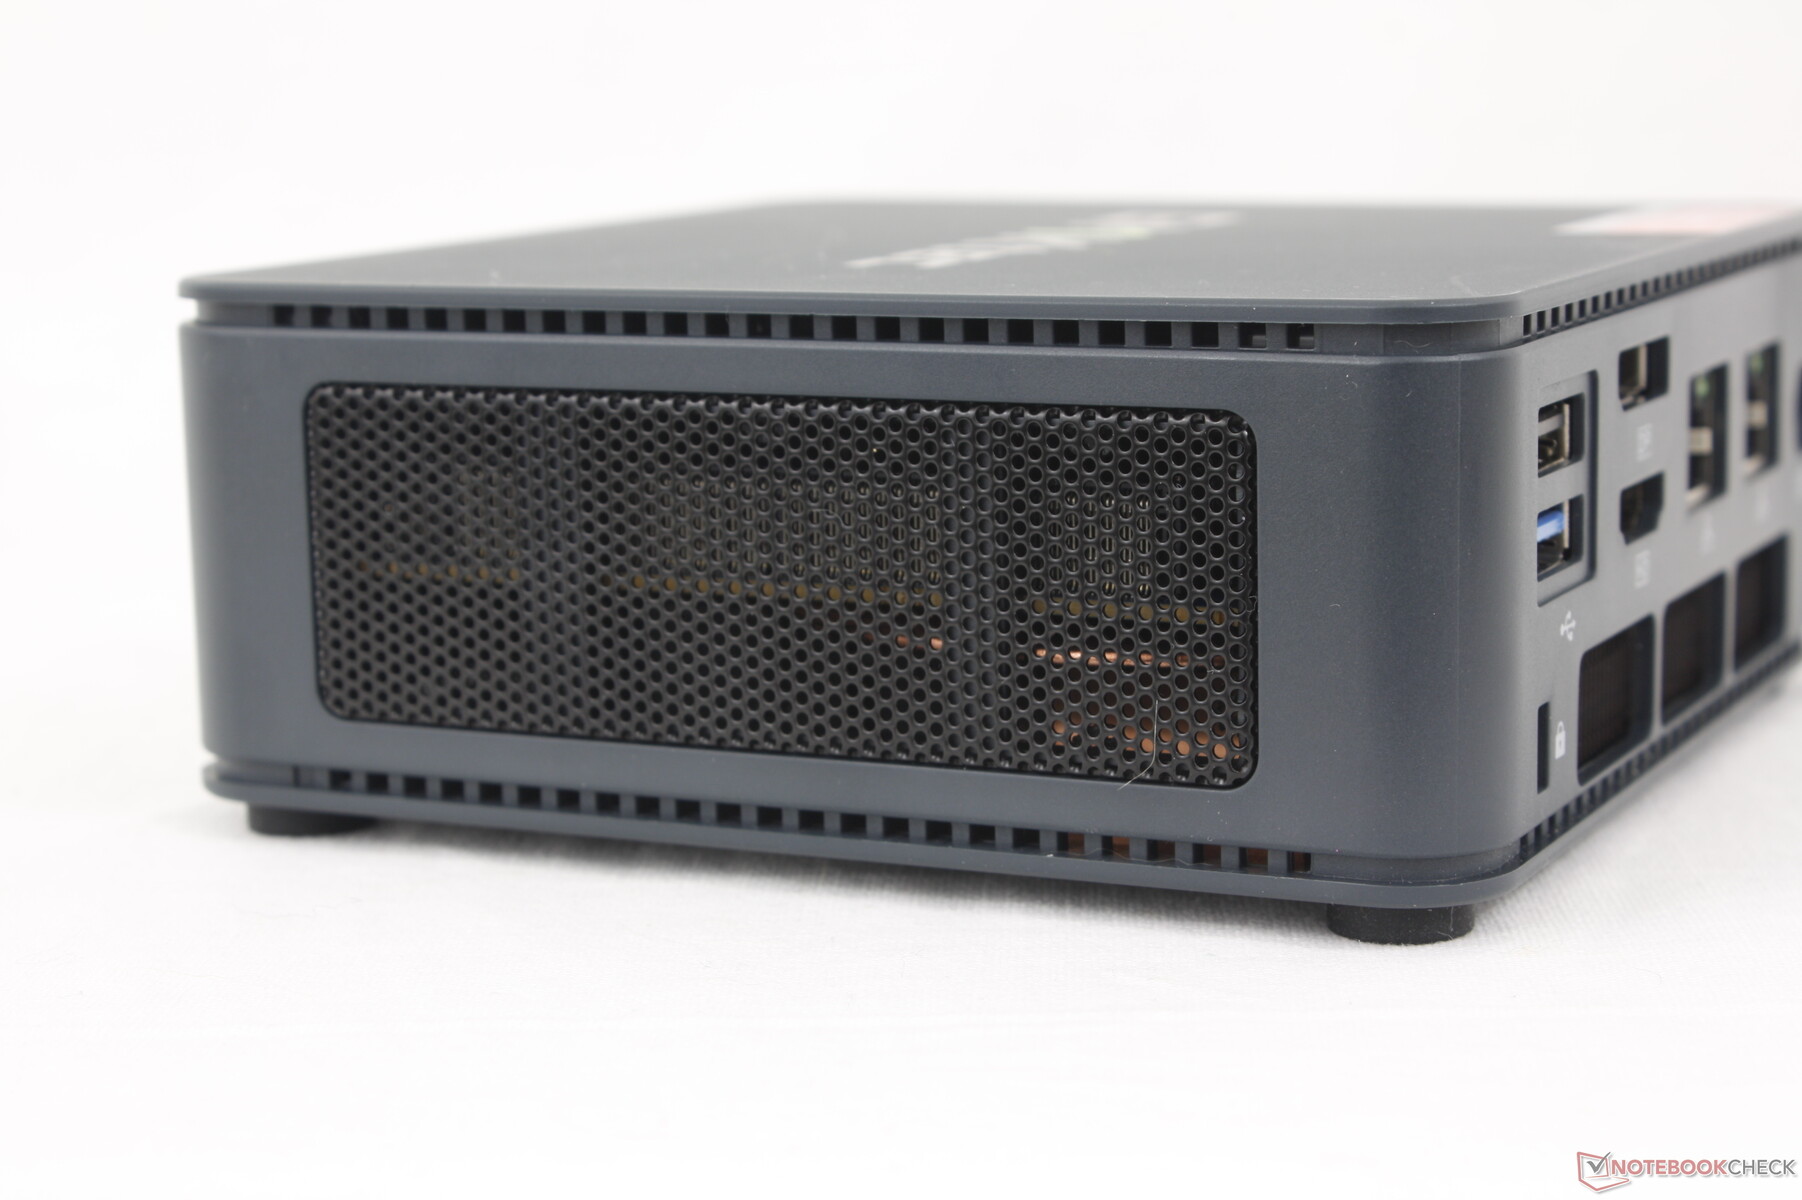
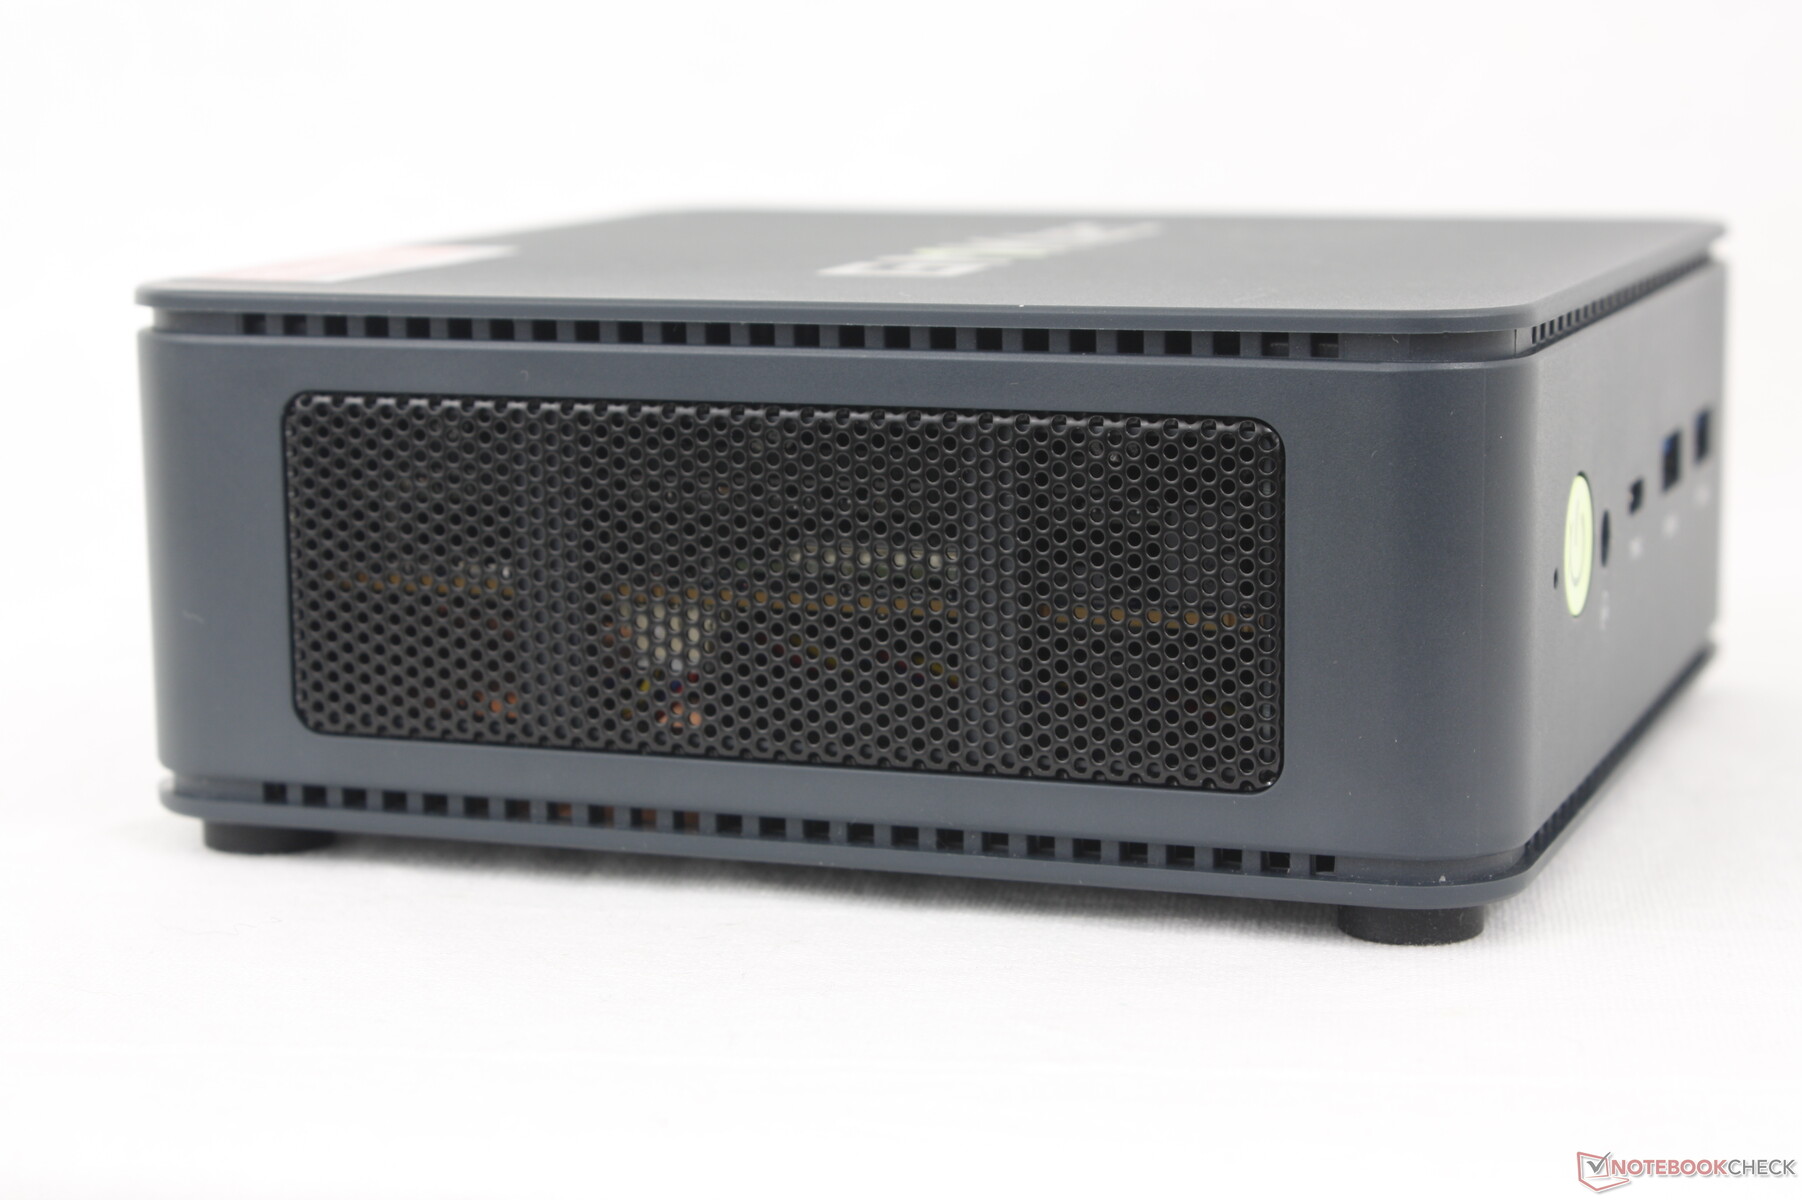
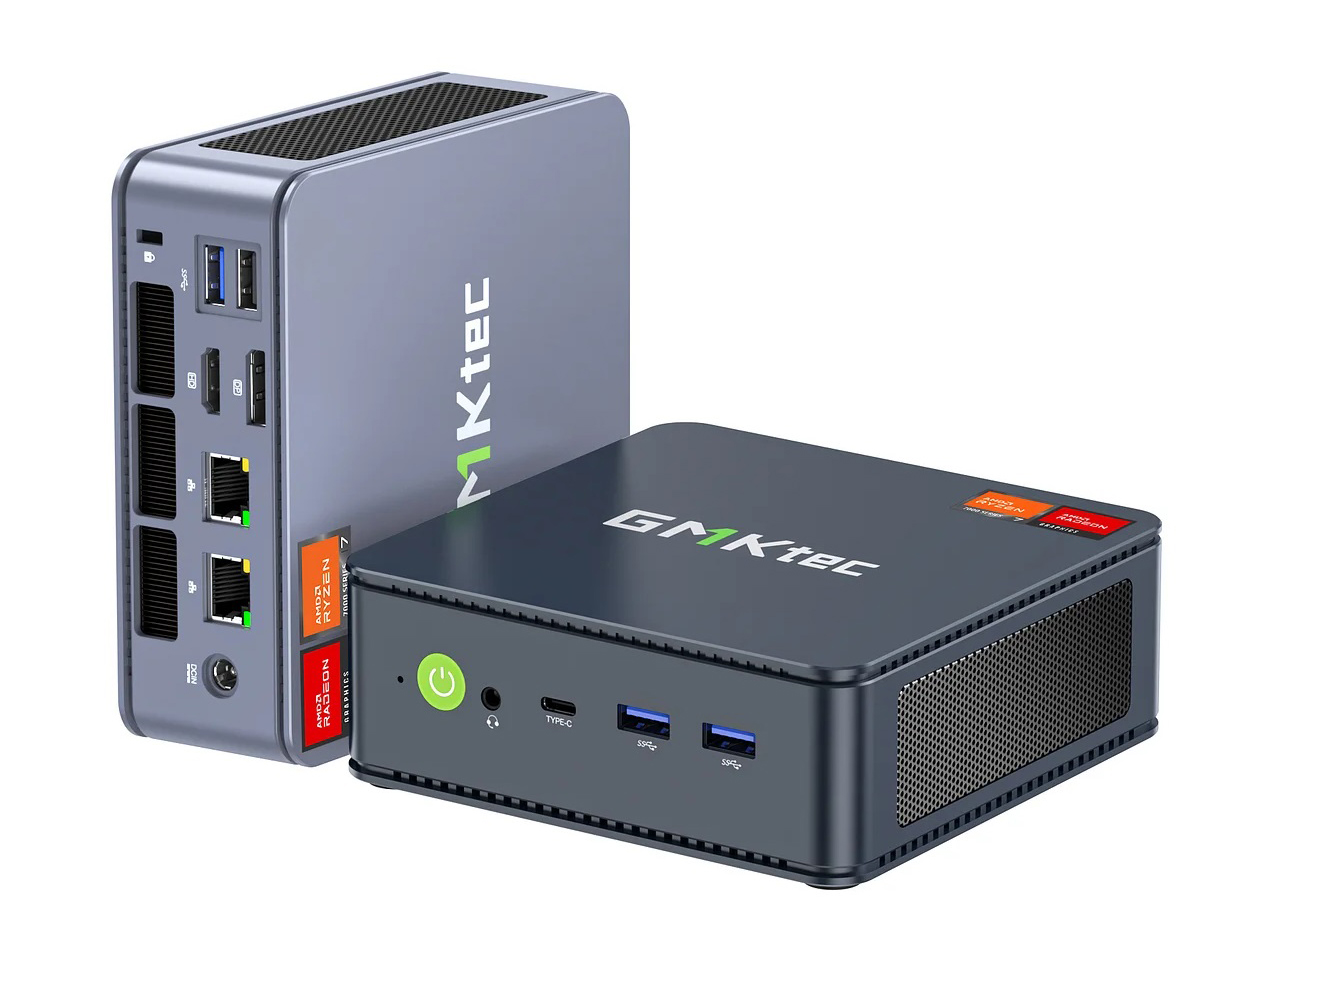
Das Gehäuse besteht aus Kunststoff für die Ober- und Unterseite sowie aus Metall für die Seiten oder Flächen, ähnlich wie bei den Modellen der vorherigen Generation. Neu in diesem Jahr sind jedoch die Lüftungsschlitze an den Seiten, wie auf dem Bild unten zu sehen ist. Dadurch ist die Oberseite lochfrei und optisch ansprechender, ohne den Luftstrom oder die Kühlung zu beeinträchtigen.
Die Gesamtgröße und das Gewicht sind etwas größer bzw. leichter als beim Intel NUC 13 Pro. Das dünnere Gehäuse verwendet weniger Metall als ein Intel NUC, wodurch die NucBox K6 etwas anfälliger für Beschädigungen ist. Dies ist jedoch kein wirkliches Problem, da wir nicht viele Käufer sehen, die den Mini-PC wie einen Reiselaptop behandeln.
Ausstattung
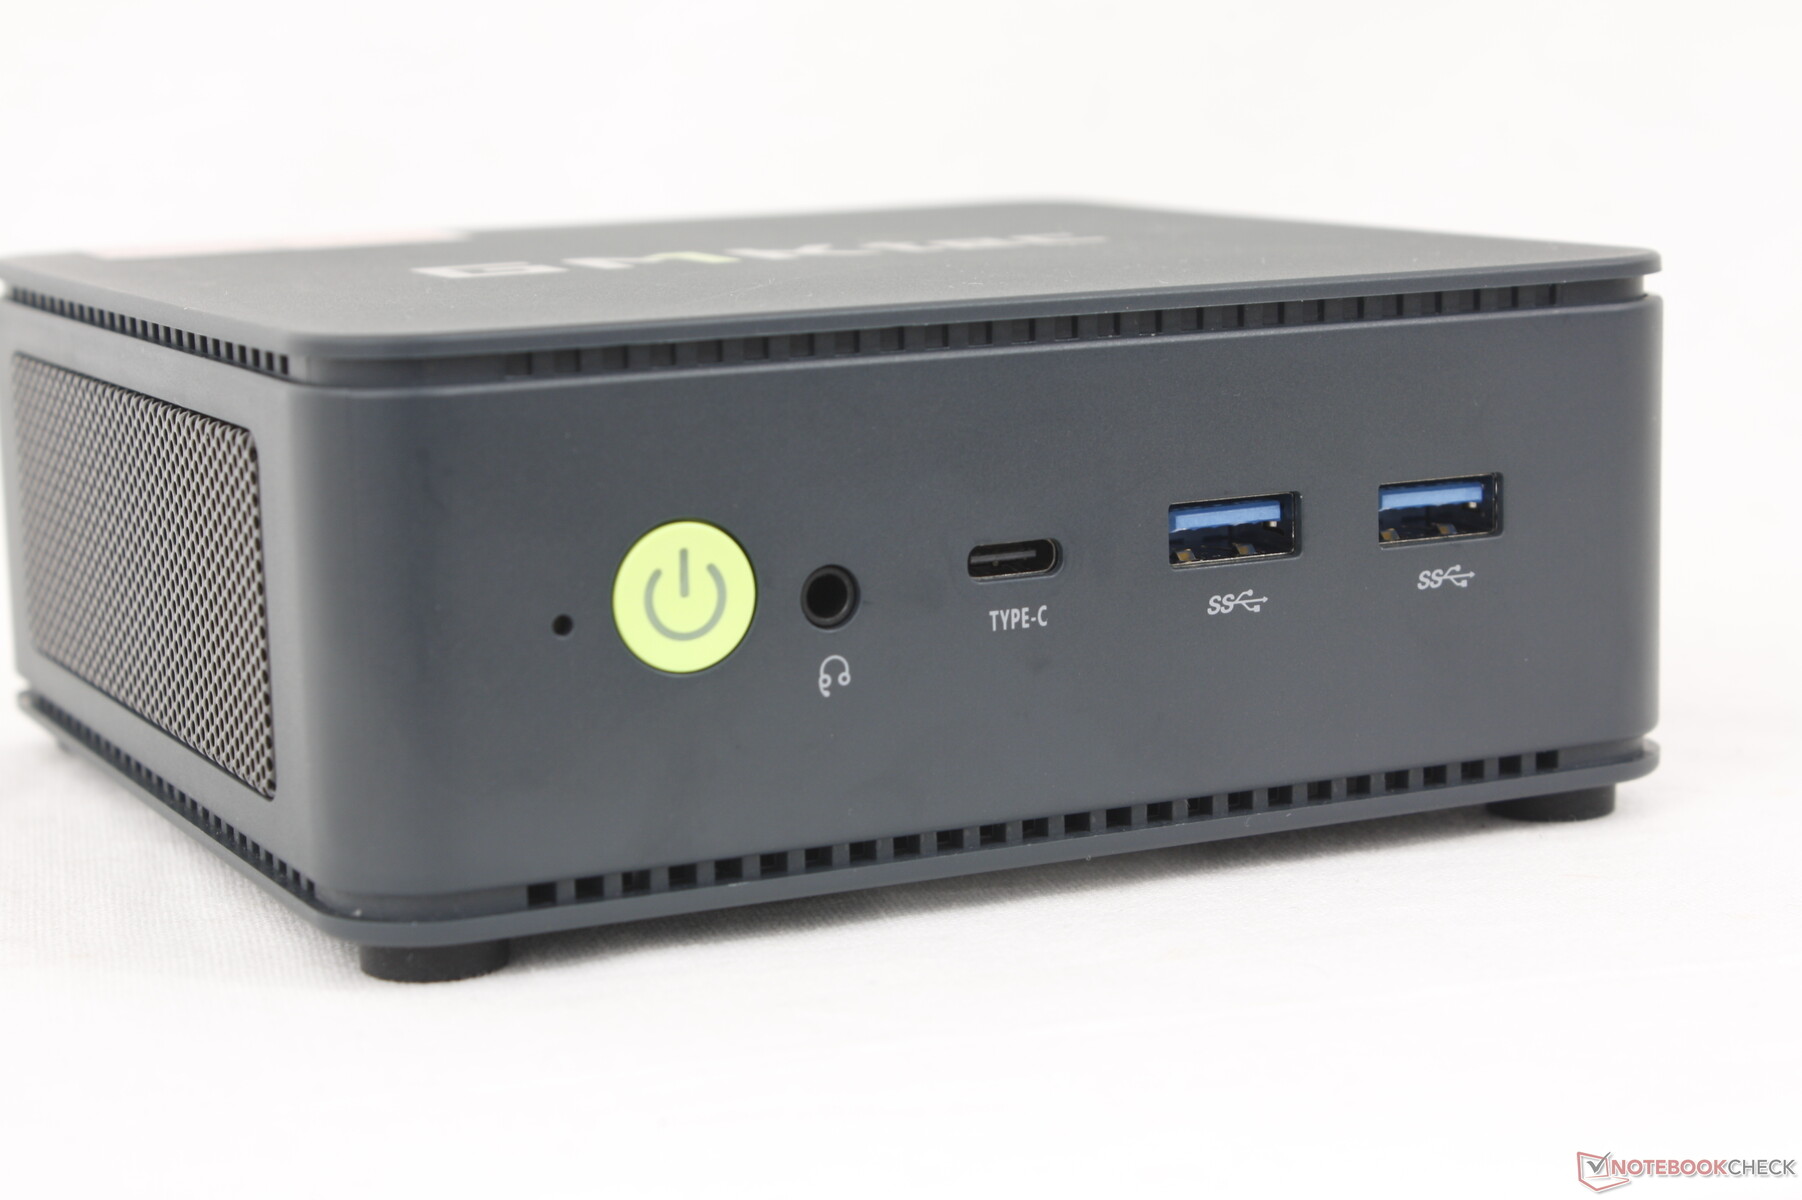
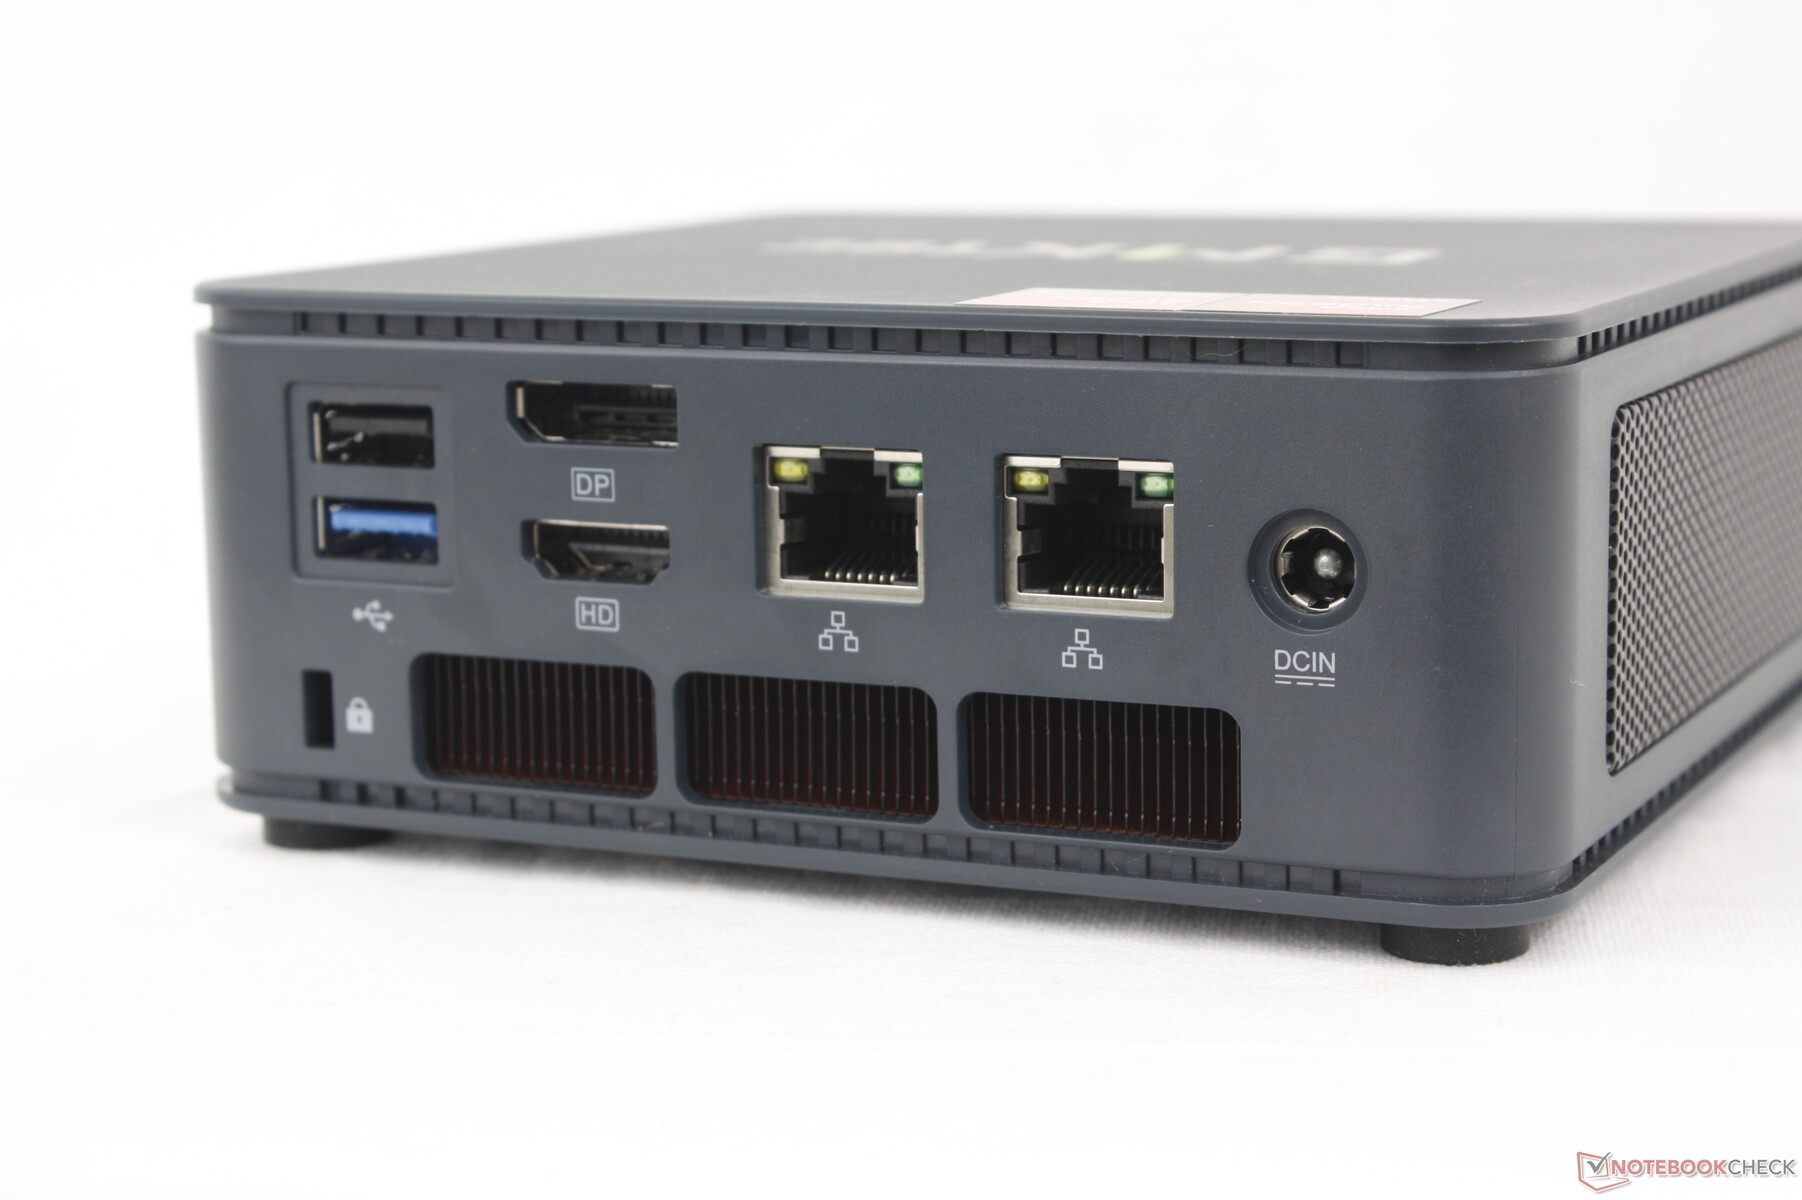
Die Anschlussoptionen sind je nach Vorliebe entweder ein Pluspunkt oder nicht. Im Vergleich zum Intel NUC 13 Pro verfügt die GMK NucBox K6 beispielsweise über mehr RJ-45-Anschlüsse und einen vollwertigen DisplayPort. Auf der anderen Seite hat sie nur einen einzigen USB-C-Anschluss, während das Intel-Modell zwei hat.
Thunderbolt-Geräte werden über den USB-C-4-Anschluss unterstützt. Es ist auch möglich, den Mini-PC mit USB-C-Netzteilen von Drittanbietern zu betreiben, anstatt sich auf den proprietären Barrel-Adapter zu verlassen; unser 135-W-USB-C-Netzteil von Lenovo würde ohne Probleme funktionieren.
Kommunikation
Das AMD-exklusive Gerät wird mit dem MediaTek RZ616 statt der üblichen Intel AX-Lösung für Wi-Fi 6E und Bluetooth 5.3-Konnektivität ausgeliefert. Die Leistung ist gleichmäßig und zuverlässig, wenn auch mit langsameren Übertragungsraten.
| Networking | |
| iperf3 transmit AXE11000 | |
| Intel NUC 13 Pro Desk Edition Kit | |
| Beelink SER5 | |
| GMK NucBox K3 Pro | |
| AcePC Wizbox AI | |
| Geekom A7 | |
| GMK NucBox K6 | |
| iperf3 receive AXE11000 | |
| Beelink SER5 | |
| GMK NucBox K3 Pro | |
| GMK NucBox K6 | |
| Intel NUC 13 Pro Desk Edition Kit | |
| AcePC Wizbox AI | |
| Geekom A7 | |
| iperf3 transmit AXE11000 6GHz | |
| AcePC Wizbox AI | |
| Intel NUC 13 Pro Desk Edition Kit | |
| Geekom A7 | |
| GMK NucBox K6 | |
| iperf3 receive AXE11000 6GHz | |
| AcePC Wizbox AI | |
| Intel NUC 13 Pro Desk Edition Kit | |
| Geekom A7 | |
| GMK NucBox K6 | |
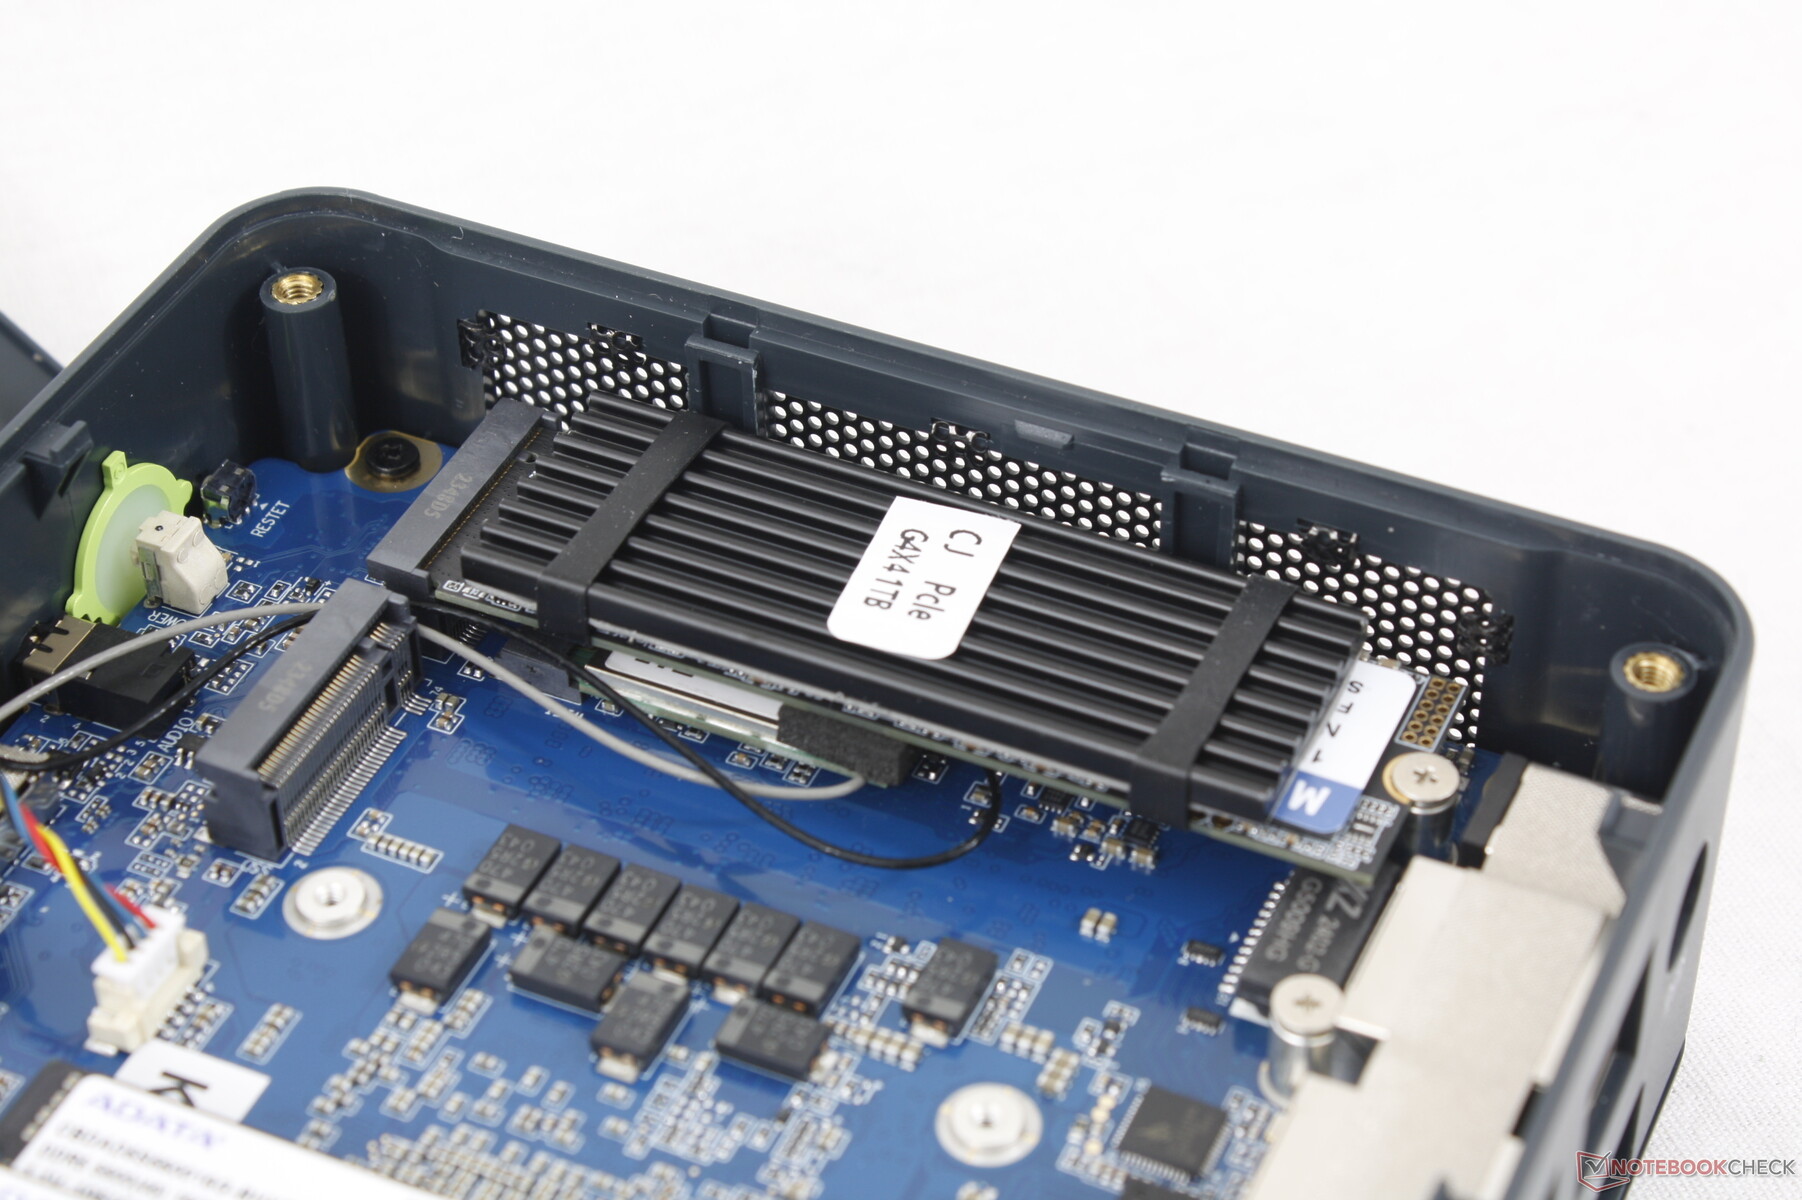
Wartung
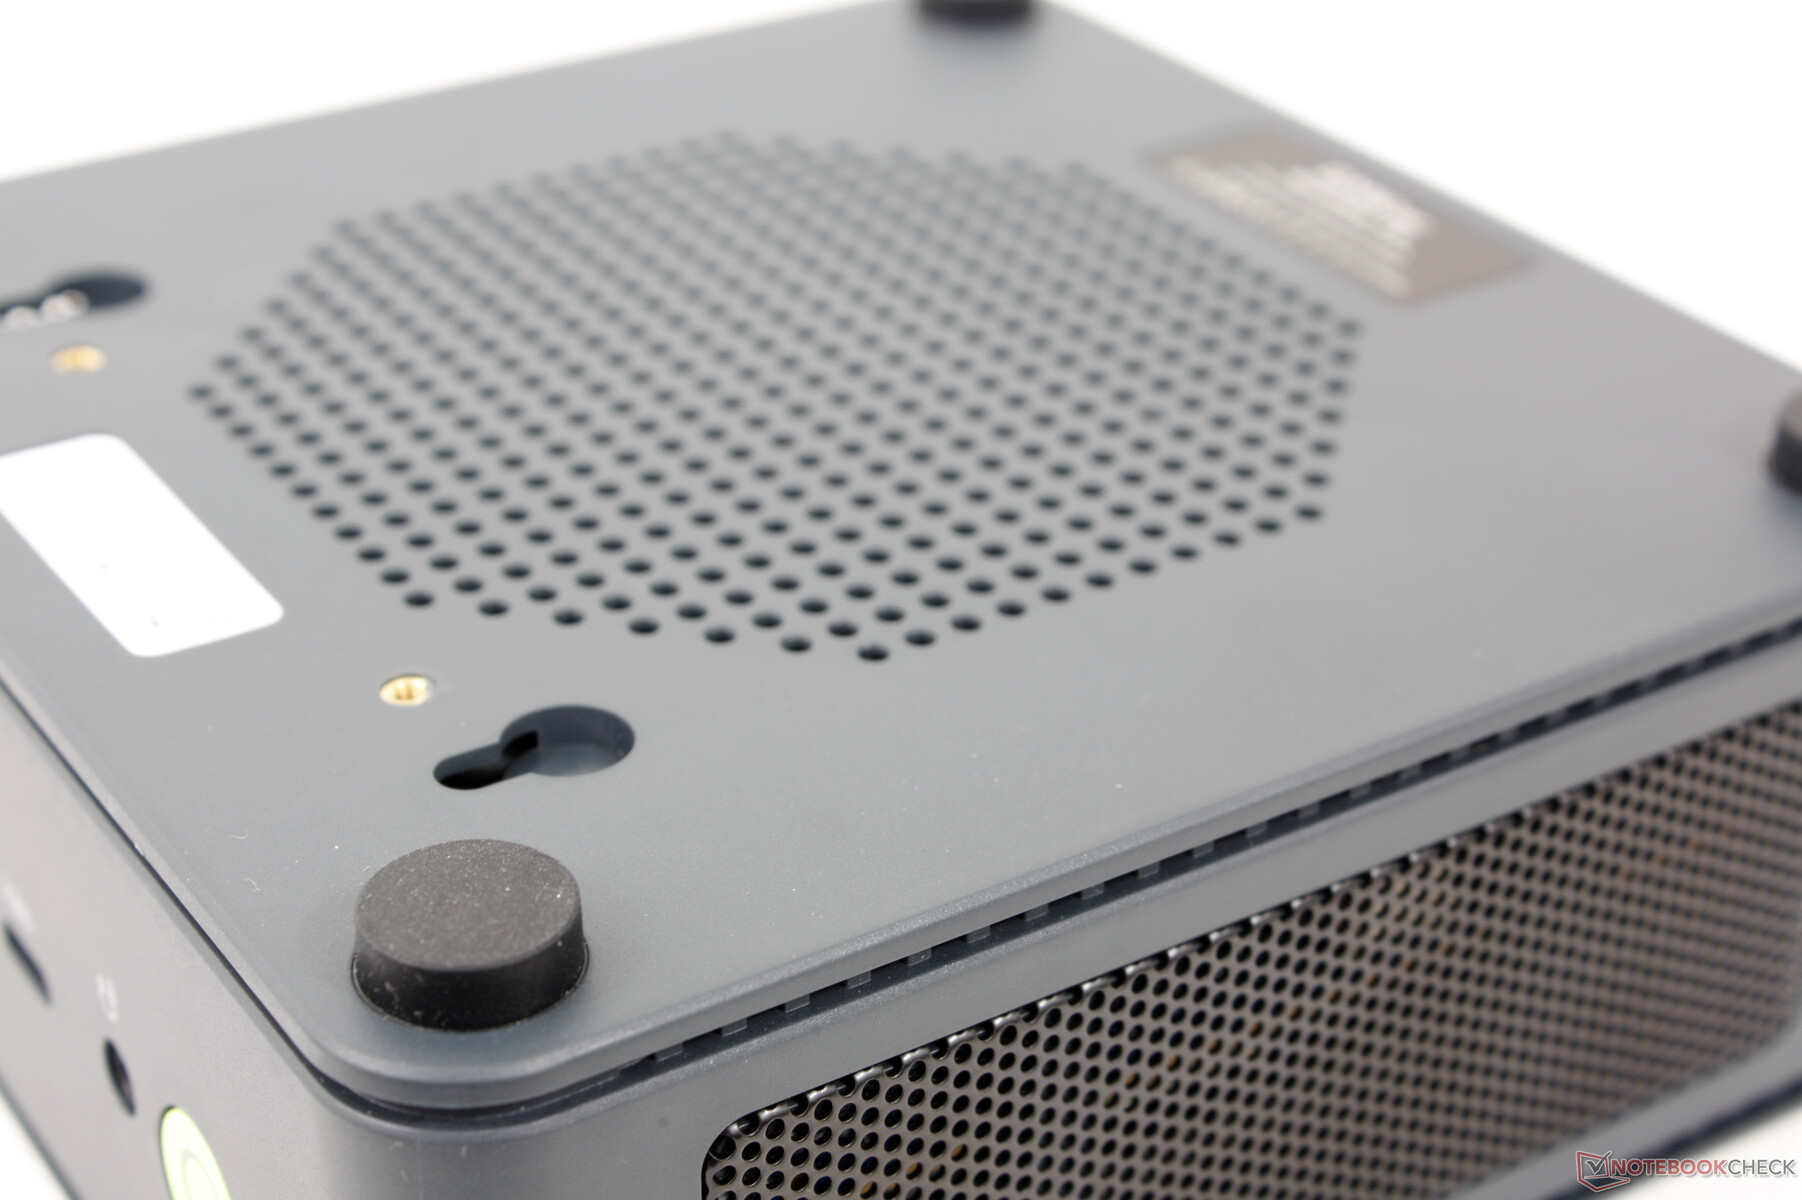
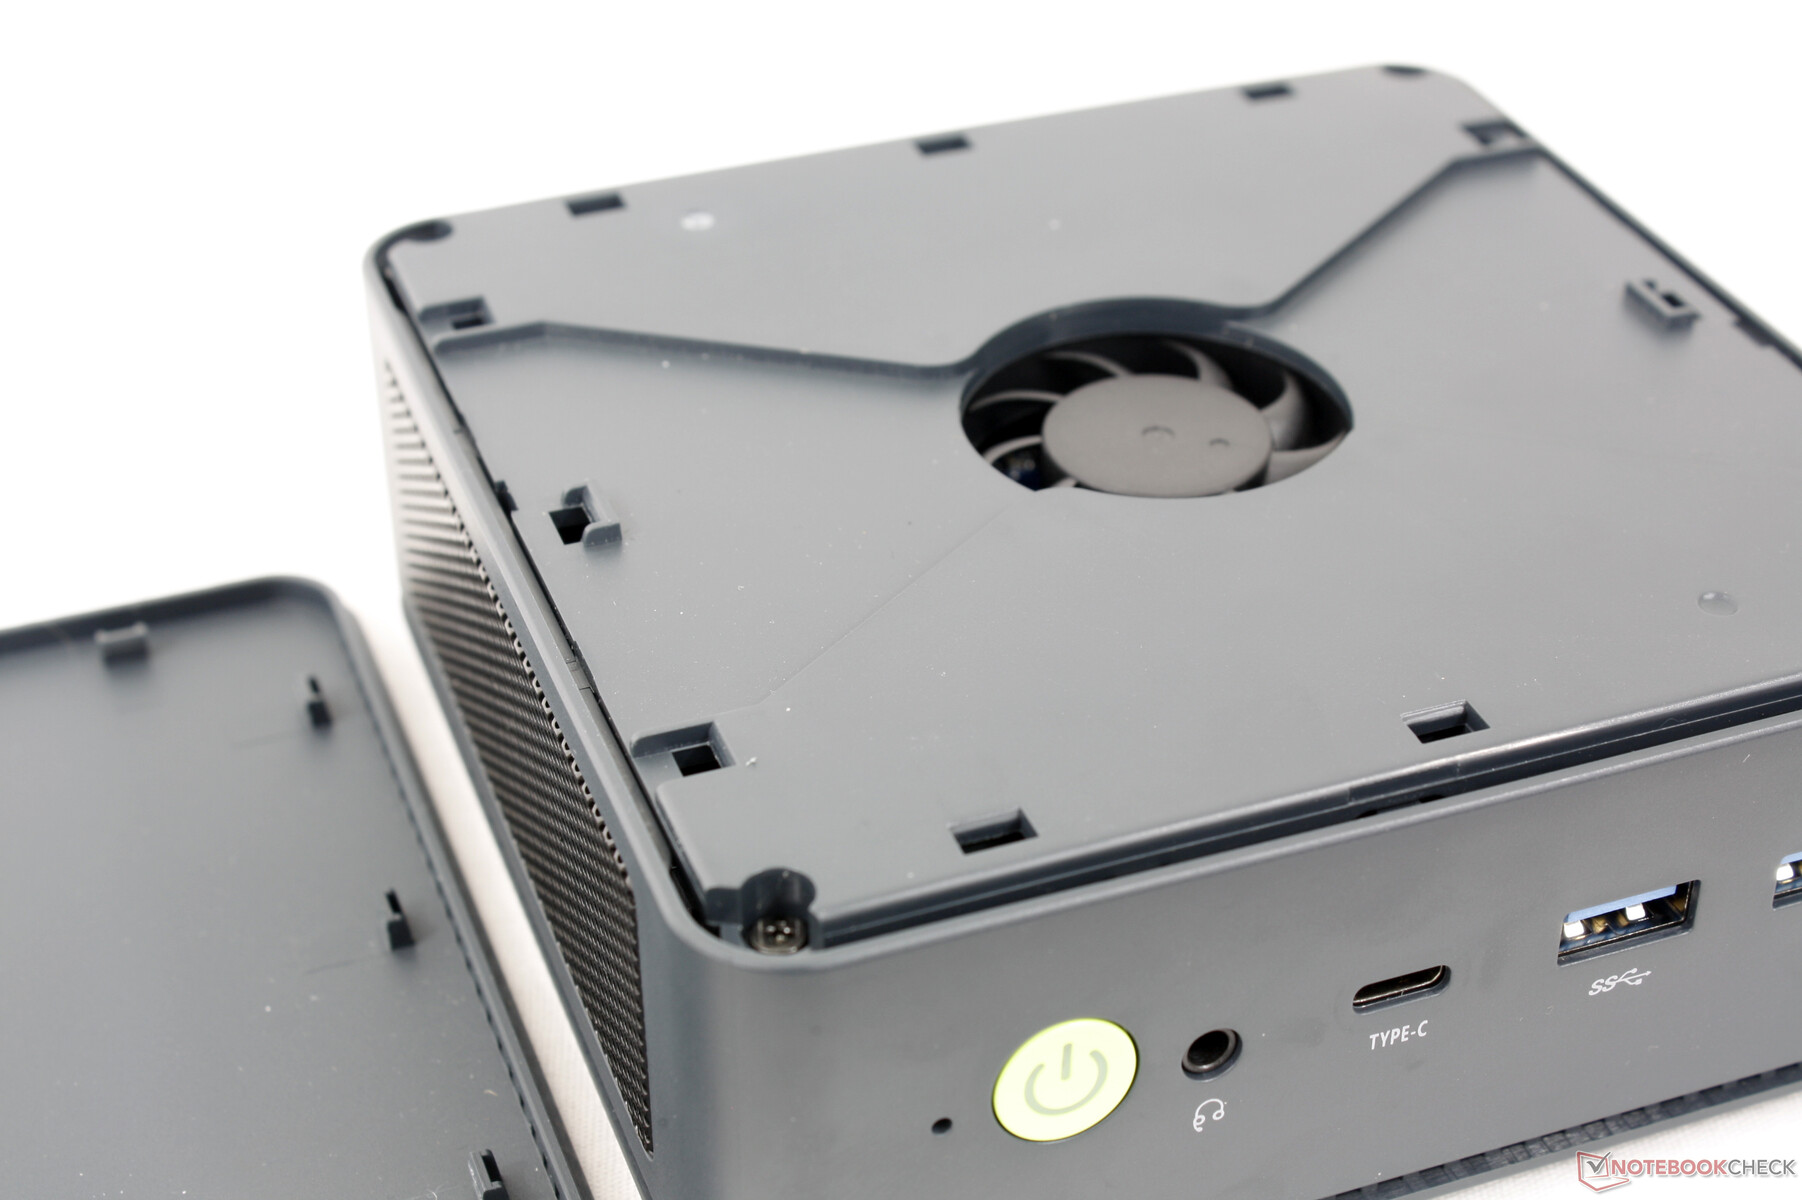
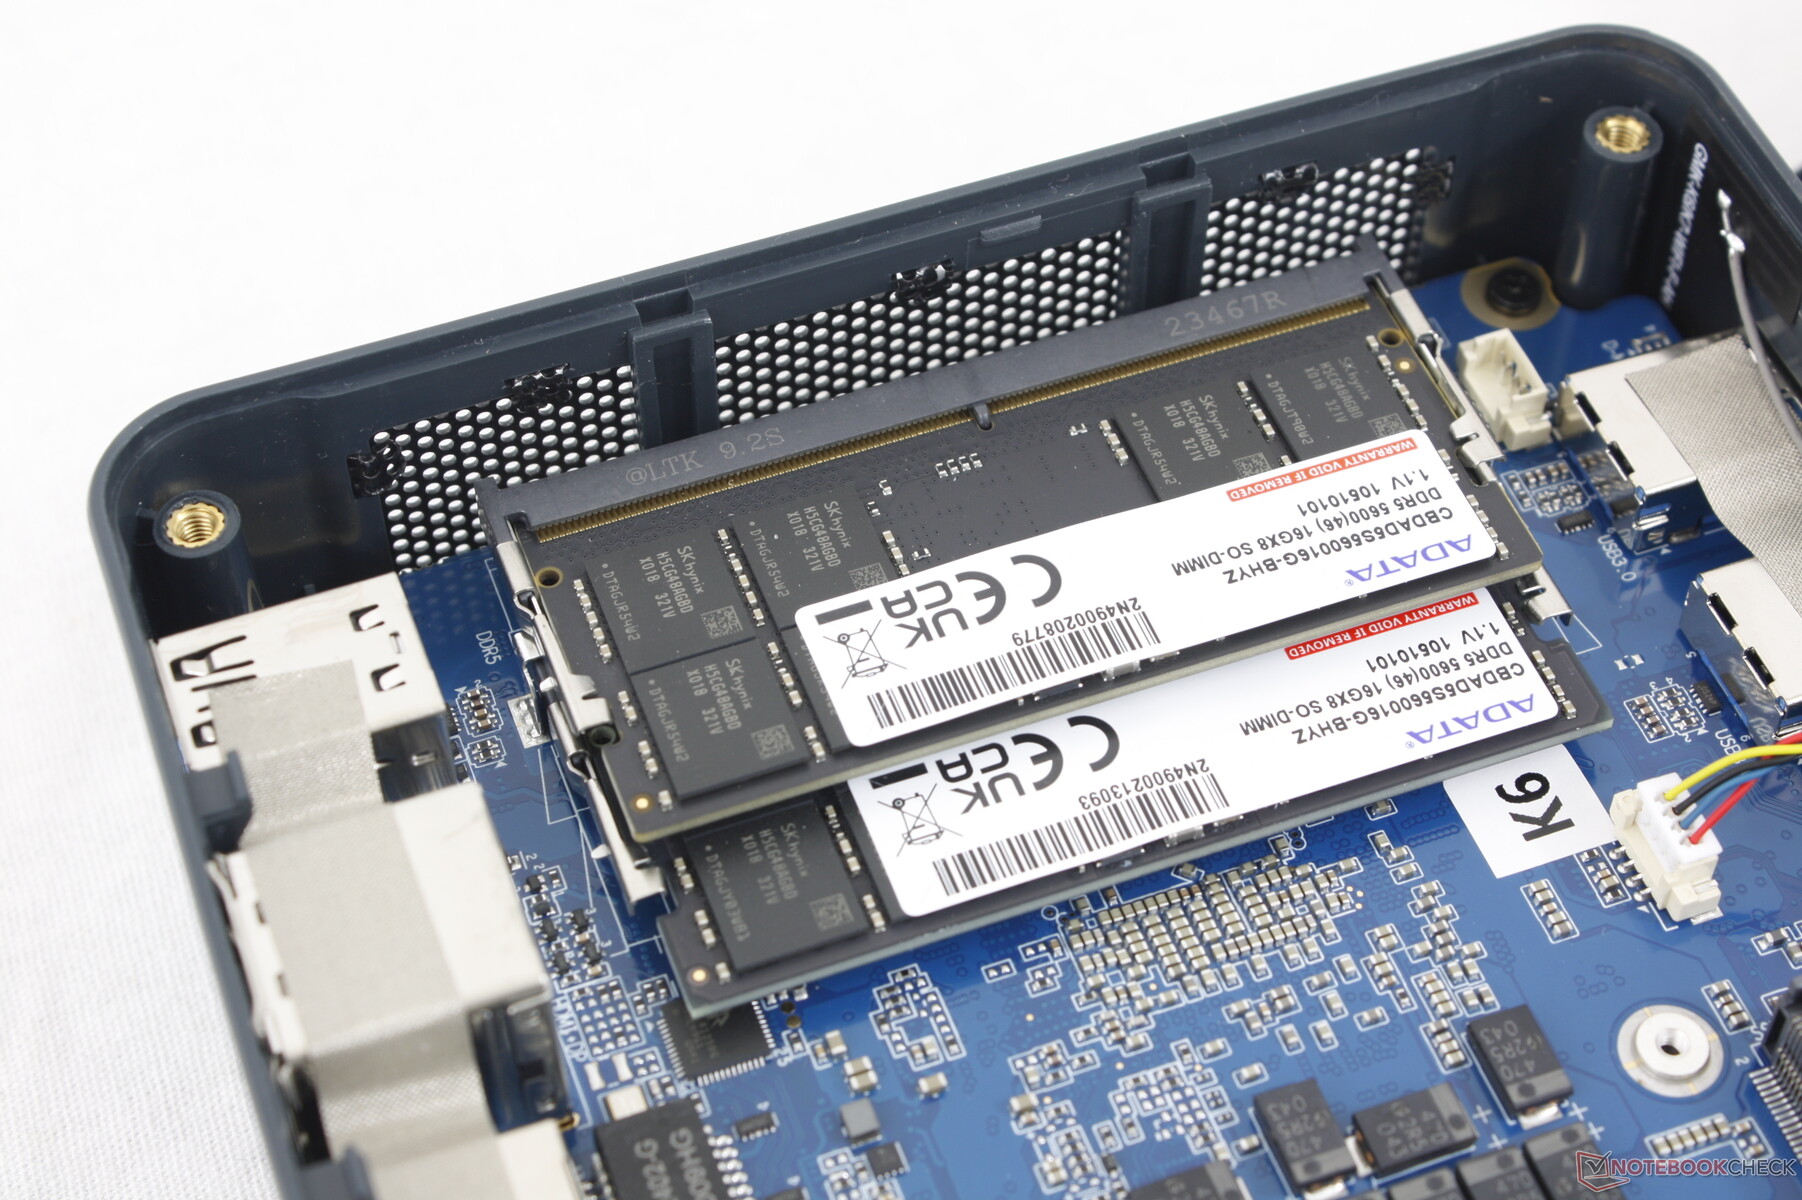
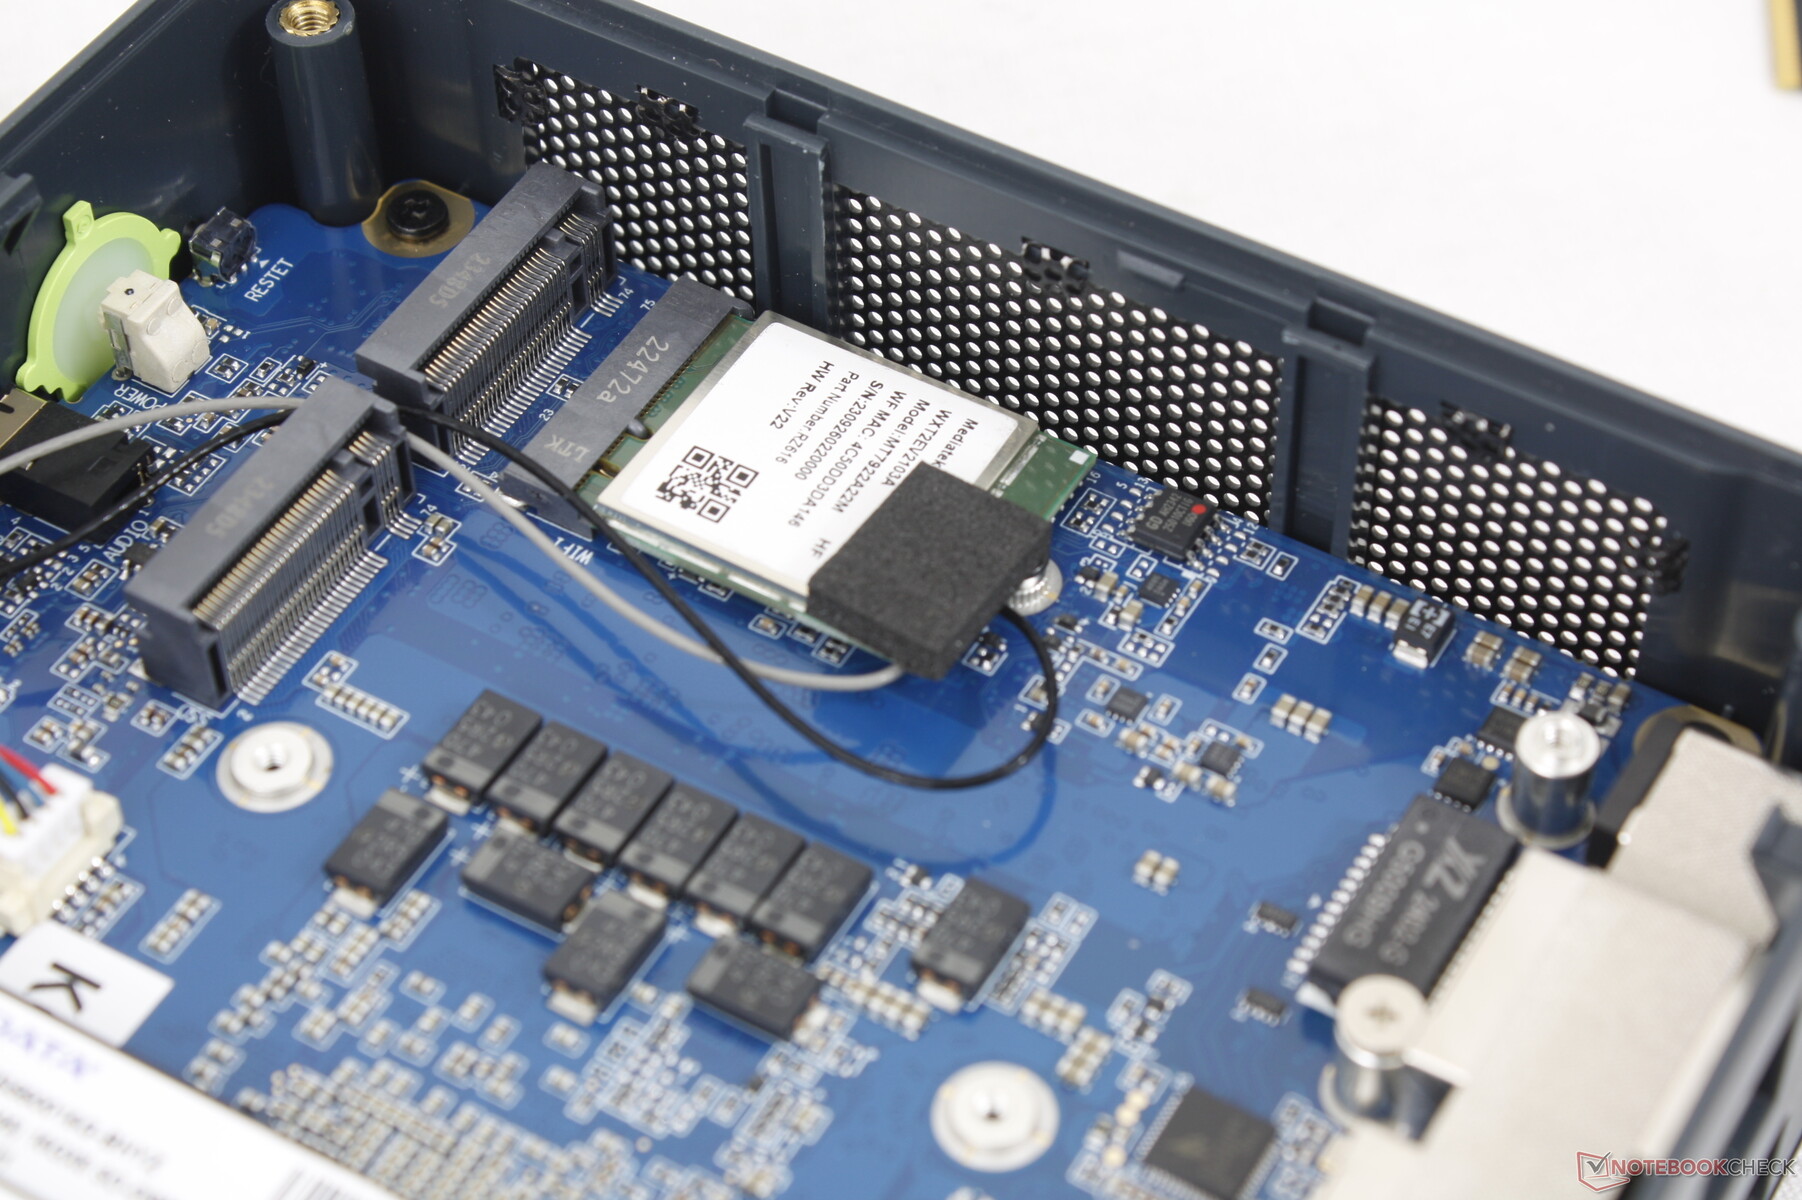
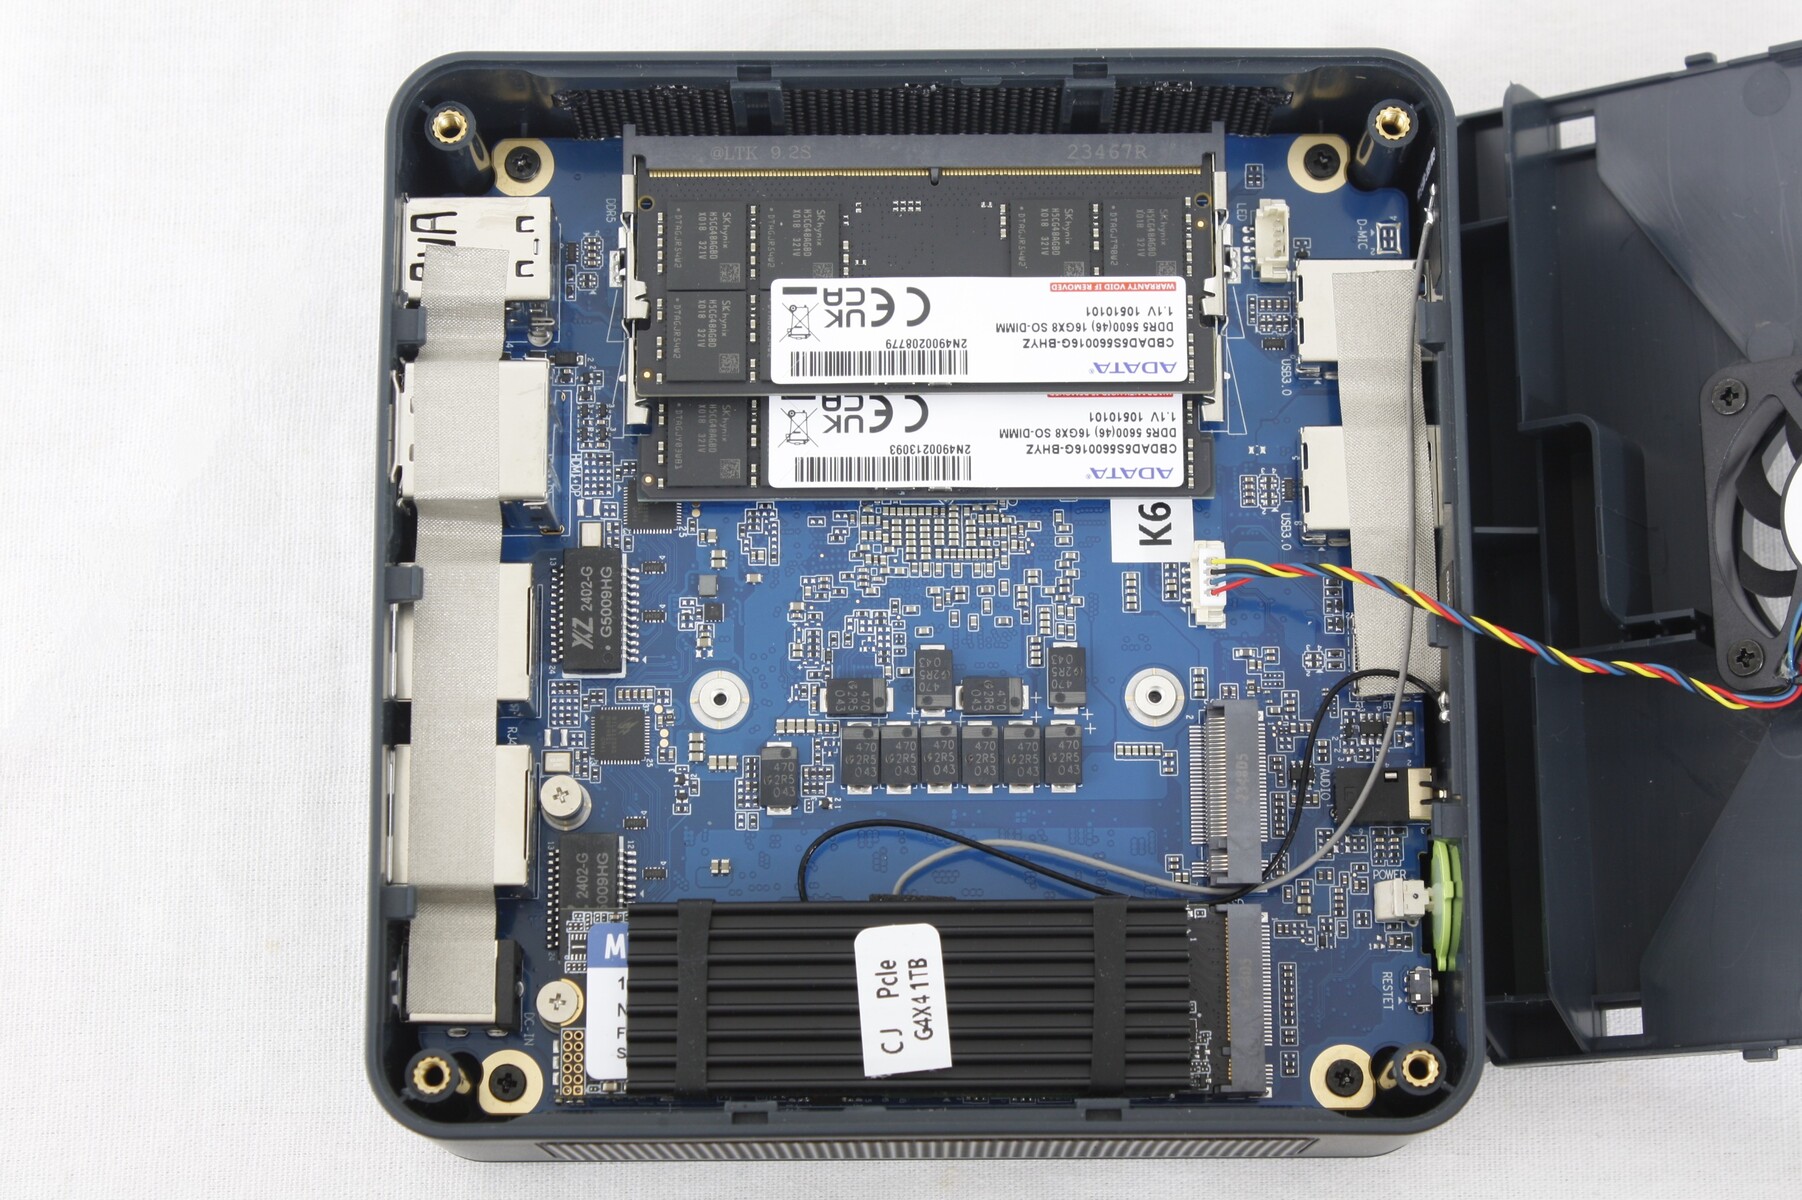
Aufrüstbare Komponenten sind im Gegensatz zu den meisten anderen Mini-PCs von oben, aber nicht von unten zugänglich. Während der äußere Deckel ohne Werkzeug abnehmbar ist, benötigt man für die Lüfterabdeckung darunter einen Schraubendreher.
Der Benutzer hat direkten Zugriff auf zwei SODIMM-RAM-Slots, das WLAN-Modul und zwei M.2 PCIe4 x4 2280 SSD-Slots, wie auf dem Bild unten zu sehen ist. Es gibt keine Unterstützung für 2,5-Zoll-SATA-III-Laufwerke. Um auf die Kühllösung, den Prozessor und den Sekundärlüfter zuzugreifen, muss das Motherboard umgedreht werden.
Zubehör und Garantie
Die Lieferung umfasst ein HDMI-Kabel und eine abnehmbare VESA-Halterung mit Schrauben. Eine einjährige Standard-Herstellergarantie gilt beim Kauf in Deutschland.
Performance — AMD Zen 4 ist immer noch sehr leistungsfähig
Testbedingungen
Wir haben Windows auf den Performance-Modus eingestellt, bevor wir die folgenden Benchmarks durchgeführt haben. Es sind keine Anwendungen vorinstalliert, um eine saubere Windows-Benutzererfahrung zu gewährleisten.
Prozessor
Der Ryzen 7 7840HS läuft auch im Stresstest ohne größere Drosselungsprobleme. Er bleibt eine der schnellsten CPUs für Mini-PCs im NUC-Format. Die Gesamtleistung ist vergleichbar mit dem teureren Ryzen 9 7940HS und dem konkurrierenden Core i7-13700H im Lenovo IdeaCentre Mini.
Cinebench R15 Multi Dauertest
Cinebench R20: CPU (Multi Core) | CPU (Single Core)
Cinebench R15: CPU Multi 64Bit | CPU Single 64Bit
Blender: v2.79 BMW27 CPU
7-Zip 18.03: 7z b 4 | 7z b 4 -mmt1
Geekbench 6.7: Multi-Core | Single-Core
Geekbench 5.5: Multi-Core | Single-Core
HWBOT x265 Benchmark v2.2: 4k Preset
LibreOffice : 20 Documents To PDF
R Benchmark 2.5: Overall mean
| Cinebench R23 / Multi Core | |
| AcePC Wizbox AI | |
| Durchschnittliche AMD Ryzen 7 7840HS (14784 - 17214, n=19) | |
| GMK NucBox K6 | |
| Geekom A7 | |
| Lenovo IdeaCentre Mini 01IRH8 | |
| Geekom Mini IT13 | |
| Geekom Mini IT13 | |
| Geekom Mini IT13 | |
| Aoostar GOD77 | |
| Intel NUC 13 Pro Desk Edition Kit | |
| Beelink GTR6 | |
| Beelink SER6 Pro | |
| GMK NucBox M4 | |
| GMK NucBox K3 Pro | |
| Beelink SER5 | |
| GMK NucBox M3 | |
| Acemagic Tank03 | |
| Cinebench R23 / Single Core | |
| Lenovo IdeaCentre Mini 01IRH8 | |
| Intel NUC 13 Pro Desk Edition Kit | |
| AcePC Wizbox AI | |
| GMK NucBox K3 Pro | |
| GMK NucBox K6 | |
| Durchschnittliche AMD Ryzen 7 7840HS (1718 - 1812, n=19) | |
| Geekom A7 | |
| Geekom Mini IT13 | |
| GMK NucBox M3 | |
| Acemagic Tank03 | |
| Beelink GTR6 | |
| GMK NucBox M4 | |
| Aoostar GOD77 | |
| Beelink SER6 Pro | |
| Beelink SER5 | |
| Cinebench R20 / CPU (Multi Core) | |
| Durchschnittliche AMD Ryzen 7 7840HS (5761 - 6744, n=19) | |
| Geekom A7 | |
| GMK NucBox K6 | |
| AcePC Wizbox AI | |
| Lenovo IdeaCentre Mini 01IRH8 | |
| Geekom Mini IT13 | |
| Aoostar GOD77 | |
| Intel NUC 13 Pro Desk Edition Kit | |
| Beelink GTR6 | |
| Beelink SER6 Pro | |
| GMK NucBox M4 | |
| GMK NucBox K3 Pro | |
| Beelink SER5 | |
| GMK NucBox M3 | |
| Acemagic Tank03 | |
| Cinebench R20 / CPU (Single Core) | |
| Intel NUC 13 Pro Desk Edition Kit | |
| Lenovo IdeaCentre Mini 01IRH8 | |
| Geekom A7 | |
| GMK NucBox K3 Pro | |
| GMK NucBox K6 | |
| Durchschnittliche AMD Ryzen 7 7840HS (661 - 705, n=19) | |
| AcePC Wizbox AI | |
| Geekom Mini IT13 | |
| GMK NucBox M3 | |
| Beelink GTR6 | |
| Acemagic Tank03 | |
| GMK NucBox M4 | |
| Aoostar GOD77 | |
| Beelink SER6 Pro | |
| Beelink SER5 | |
| Cinebench R15 / CPU Multi 64Bit | |
| AcePC Wizbox AI | |
| Durchschnittliche AMD Ryzen 7 7840HS (2300 - 2729, n=19) | |
| GMK NucBox K6 | |
| Geekom Mini IT13 | |
| Geekom Mini IT13 | |
| Geekom A7 | |
| Lenovo IdeaCentre Mini 01IRH8 | |
| Aoostar GOD77 | |
| Intel NUC 13 Pro Desk Edition Kit | |
| Beelink GTR6 | |
| Beelink SER6 Pro | |
| GMK NucBox M4 | |
| GMK NucBox K3 Pro | |
| Acemagic Tank03 | |
| Beelink SER5 | |
| GMK NucBox M3 | |
| Cinebench R15 / CPU Single 64Bit | |
| GMK NucBox K6 | |
| Geekom A7 | |
| Durchschnittliche AMD Ryzen 7 7840HS (270 - 286, n=19) | |
| Intel NUC 13 Pro Desk Edition Kit | |
| Beelink GTR6 | |
| Lenovo IdeaCentre Mini 01IRH8 | |
| GMK NucBox K3 Pro | |
| AcePC Wizbox AI | |
| Geekom Mini IT13 | |
| Geekom Mini IT13 | |
| Aoostar GOD77 | |
| GMK NucBox M4 | |
| Beelink SER6 Pro | |
| GMK NucBox M3 | |
| Acemagic Tank03 | |
| Beelink SER5 | |
| Blender / v2.79 BMW27 CPU | |
| Acemagic Tank03 | |
| GMK NucBox M3 | |
| Beelink SER5 | |
| GMK NucBox K3 Pro | |
| GMK NucBox M4 | |
| Beelink SER6 Pro | |
| Intel NUC 13 Pro Desk Edition Kit | |
| Geekom Mini IT13 | |
| Beelink GTR6 | |
| Aoostar GOD77 | |
| Lenovo IdeaCentre Mini 01IRH8 | |
| AcePC Wizbox AI | |
| Geekom A7 | |
| Durchschnittliche AMD Ryzen 7 7840HS (185 - 231, n=20) | |
| GMK NucBox K6 | |
| 7-Zip 18.03 / 7z b 4 | |
| GMK NucBox K6 | |
| Geekom A7 | |
| Durchschnittliche AMD Ryzen 7 7840HS (59538 - 73035, n=20) | |
| AcePC Wizbox AI | |
| Aoostar GOD77 | |
| Beelink GTR6 | |
| Beelink SER6 Pro | |
| Lenovo IdeaCentre Mini 01IRH8 | |
| Intel NUC 13 Pro Desk Edition Kit | |
| GMK NucBox M4 | |
| Geekom Mini IT13 | |
| GMK NucBox K3 Pro | |
| Beelink SER5 | |
| Acemagic Tank03 | |
| GMK NucBox M3 | |
| 7-Zip 18.03 / 7z b 4 -mmt1 | |
| Geekom A7 | |
| GMK NucBox K6 | |
| Durchschnittliche AMD Ryzen 7 7840HS (6049 - 6754, n=20) | |
| GMK NucBox M4 | |
| Lenovo IdeaCentre Mini 01IRH8 | |
| Beelink GTR6 | |
| Aoostar GOD77 | |
| Intel NUC 13 Pro Desk Edition Kit | |
| GMK NucBox K3 Pro | |
| Beelink SER6 Pro | |
| Acemagic Tank03 | |
| GMK NucBox M3 | |
| Geekom Mini IT13 | |
| AcePC Wizbox AI | |
| Beelink SER5 | |
| Geekbench 6.7 / Multi-Core | |
| Geekom A7 | |
| GMK NucBox K6 | |
| Durchschnittliche AMD Ryzen 7 7840HS (11804 - 13538, n=21) | |
| AcePC Wizbox AI | |
| GMK NucBox K3 Pro | |
| Intel NUC 13 Pro Desk Edition Kit | |
| Lenovo IdeaCentre Mini 01IRH8 | |
| Aoostar GOD77 | |
| GMK NucBox M4 | |
| Acemagic Tank03 | |
| GMK NucBox M3 | |
| Beelink SER5 | |
| Geekbench 6.7 / Single-Core | |
| Geekom A7 | |
| GMK NucBox K6 | |
| Durchschnittliche AMD Ryzen 7 7840HS (2585 - 2721, n=21) | |
| Lenovo IdeaCentre Mini 01IRH8 | |
| Intel NUC 13 Pro Desk Edition Kit | |
| GMK NucBox K3 Pro | |
| AcePC Wizbox AI | |
| GMK NucBox M4 | |
| GMK NucBox M3 | |
| Acemagic Tank03 | |
| Aoostar GOD77 | |
| Beelink SER5 | |
| Geekbench 5.5 / Multi-Core | |
| Geekom A7 | |
| AcePC Wizbox AI | |
| GMK NucBox K6 | |
| Durchschnittliche AMD Ryzen 7 7840HS (8446 - 12339, n=23) | |
| Lenovo IdeaCentre Mini 01IRH8 | |
| Intel NUC 13 Pro Desk Edition Kit | |
| GMK NucBox K3 Pro | |
| Aoostar GOD77 | |
| Beelink GTR6 | |
| Beelink SER6 Pro | |
| Geekom Mini IT13 | |
| GMK NucBox M4 | |
| Acemagic Tank03 | |
| GMK NucBox M3 | |
| Beelink SER5 | |
| Geekbench 5.5 / Single-Core | |
| Geekom A7 | |
| GMK NucBox K6 | |
| Durchschnittliche AMD Ryzen 7 7840HS (1837 - 2017, n=23) | |
| Geekom Mini IT13 | |
| Lenovo IdeaCentre Mini 01IRH8 | |
| Intel NUC 13 Pro Desk Edition Kit | |
| GMK NucBox K3 Pro | |
| AcePC Wizbox AI | |
| GMK NucBox M4 | |
| Acemagic Tank03 | |
| Beelink GTR6 | |
| GMK NucBox M3 | |
| Aoostar GOD77 | |
| Beelink SER6 Pro | |
| Beelink SER5 | |
| HWBOT x265 Benchmark v2.2 / 4k Preset | |
| Geekom A7 | |
| GMK NucBox K6 | |
| Durchschnittliche AMD Ryzen 7 7840HS (11.7 - 21.8, n=20) | |
| AcePC Wizbox AI | |
| Lenovo IdeaCentre Mini 01IRH8 | |
| Aoostar GOD77 | |
| Beelink GTR6 | |
| Beelink SER6 Pro | |
| Geekom Mini IT13 | |
| Intel NUC 13 Pro Desk Edition Kit | |
| GMK NucBox M4 | |
| GMK NucBox K3 Pro | |
| Beelink SER5 | |
| GMK NucBox M3 | |
| Acemagic Tank03 | |
| LibreOffice / 20 Documents To PDF | |
| Beelink SER5 | |
| Geekom A7 | |
| AcePC Wizbox AI | |
| Aoostar GOD77 | |
| Beelink SER6 Pro | |
| Durchschnittliche AMD Ryzen 7 7840HS (38.3 - 68.3, n=20) | |
| Intel NUC 13 Pro Desk Edition Kit | |
| Beelink GTR6 | |
| GMK NucBox K6 | |
| GMK NucBox M4 | |
| GMK NucBox M3 | |
| GMK NucBox K3 Pro | |
| Acemagic Tank03 | |
| Lenovo IdeaCentre Mini 01IRH8 | |
| Geekom Mini IT13 | |
| R Benchmark 2.5 / Overall mean | |
| Beelink SER5 | |
| GMK NucBox M4 | |
| Aoostar GOD77 | |
| Beelink SER6 Pro | |
| GMK NucBox M3 | |
| Acemagic Tank03 | |
| AcePC Wizbox AI | |
| Geekom Mini IT13 | |
| GMK NucBox K3 Pro | |
| Beelink GTR6 | |
| Lenovo IdeaCentre Mini 01IRH8 | |
| Intel NUC 13 Pro Desk Edition Kit | |
| Durchschnittliche AMD Ryzen 7 7840HS (0.4184 - 0.4739, n=20) | |
| Geekom A7 | |
| GMK NucBox K6 | |
Cinebench R20: CPU (Multi Core) | CPU (Single Core)
Cinebench R15: CPU Multi 64Bit | CPU Single 64Bit
Blender: v2.79 BMW27 CPU
7-Zip 18.03: 7z b 4 | 7z b 4 -mmt1
Geekbench 6.7: Multi-Core | Single-Core
Geekbench 5.5: Multi-Core | Single-Core
HWBOT x265 Benchmark v2.2: 4k Preset
LibreOffice : 20 Documents To PDF
R Benchmark 2.5: Overall mean
* ... kleinere Werte sind besser
AIDA64: FP32 Ray-Trace | FPU Julia | CPU SHA3 | CPU Queen | FPU SinJulia | FPU Mandel | CPU AES | CPU ZLib | FP64 Ray-Trace | CPU PhotoWorxx
| Performance Rating | |
| Geekom A7 | |
| GMK NucBox K6 | |
| Durchschnittliche AMD Ryzen 7 7840HS | |
| AcePC Wizbox AI | |
| Intel NUC 13 Pro Desk Edition Kit | |
| GMK NucBox K3 Pro | |
| Beelink SER5 | |
| AIDA64 / FP32 Ray-Trace | |
| Durchschnittliche AMD Ryzen 7 7840HS (22845 - 28921, n=21) | |
| GMK NucBox K6 | |
| Geekom A7 | |
| AcePC Wizbox AI | |
| Intel NUC 13 Pro Desk Edition Kit | |
| GMK NucBox K3 Pro | |
| Beelink SER5 | |
| AIDA64 / FPU Julia | |
| Durchschnittliche AMD Ryzen 7 7840HS (97164 - 123167, n=21) | |
| GMK NucBox K6 | |
| Geekom A7 | |
| AcePC Wizbox AI | |
| Intel NUC 13 Pro Desk Edition Kit | |
| Beelink SER5 | |
| GMK NucBox K3 Pro | |
| AIDA64 / CPU SHA3 | |
| Durchschnittliche AMD Ryzen 7 7840HS (4293 - 5155, n=21) | |
| GMK NucBox K6 | |
| Geekom A7 | |
| AcePC Wizbox AI | |
| Intel NUC 13 Pro Desk Edition Kit | |
| GMK NucBox K3 Pro | |
| Beelink SER5 | |
| AIDA64 / CPU Queen | |
| Geekom A7 | |
| Durchschnittliche AMD Ryzen 7 7840HS (102271 - 125820, n=21) | |
| GMK NucBox K6 | |
| AcePC Wizbox AI | |
| Intel NUC 13 Pro Desk Edition Kit | |
| GMK NucBox K3 Pro | |
| Beelink SER5 | |
| AIDA64 / FPU SinJulia | |
| Durchschnittliche AMD Ryzen 7 7840HS (13767 - 15525, n=21) | |
| GMK NucBox K6 | |
| Geekom A7 | |
| AcePC Wizbox AI | |
| Beelink SER5 | |
| Intel NUC 13 Pro Desk Edition Kit | |
| GMK NucBox K3 Pro | |
| AIDA64 / FPU Mandel | |
| Durchschnittliche AMD Ryzen 7 7840HS (52084 - 65812, n=21) | |
| GMK NucBox K6 | |
| Geekom A7 | |
| AcePC Wizbox AI | |
| Beelink SER5 | |
| Intel NUC 13 Pro Desk Edition Kit | |
| GMK NucBox K3 Pro | |
| AIDA64 / CPU AES | |
| Geekom A7 | |
| GMK NucBox K6 | |
| AcePC Wizbox AI | |
| Durchschnittliche AMD Ryzen 7 7840HS (67389 - 177158, n=21) | |
| GMK NucBox K3 Pro | |
| Beelink SER5 | |
| Intel NUC 13 Pro Desk Edition Kit | |
| AIDA64 / CPU ZLib | |
| AcePC Wizbox AI | |
| Durchschnittliche AMD Ryzen 7 7840HS (944 - 1123, n=21) | |
| GMK NucBox K6 | |
| Geekom A7 | |
| Intel NUC 13 Pro Desk Edition Kit | |
| GMK NucBox K3 Pro | |
| Beelink SER5 | |
| AIDA64 / FP64 Ray-Trace | |
| Durchschnittliche AMD Ryzen 7 7840HS (12248 - 15599, n=21) | |
| GMK NucBox K6 | |
| Geekom A7 | |
| AcePC Wizbox AI | |
| Intel NUC 13 Pro Desk Edition Kit | |
| GMK NucBox K3 Pro | |
| Beelink SER5 | |
| AIDA64 / CPU PhotoWorxx | |
| GMK NucBox K3 Pro | |
| GMK NucBox K6 | |
| Geekom A7 | |
| Durchschnittliche AMD Ryzen 7 7840HS (17615 - 41516, n=21) | |
| AcePC Wizbox AI | |
| Intel NUC 13 Pro Desk Edition Kit | |
| Beelink SER5 | |
Stresstest
Unter Prime95-Stress stieg die CPU für ein paar Sekunden auf 4 GHz und 54 W, bevor sie leicht auf 3,8 GHz und 52 W sank. Die Kerntemperatur bei anspruchsvoller Last wie Spielen stabilisierte sich im mittleren 70-C-Bereich, verglichen mit 65 C beim älteren, aber schwächeren Beelink SER5.
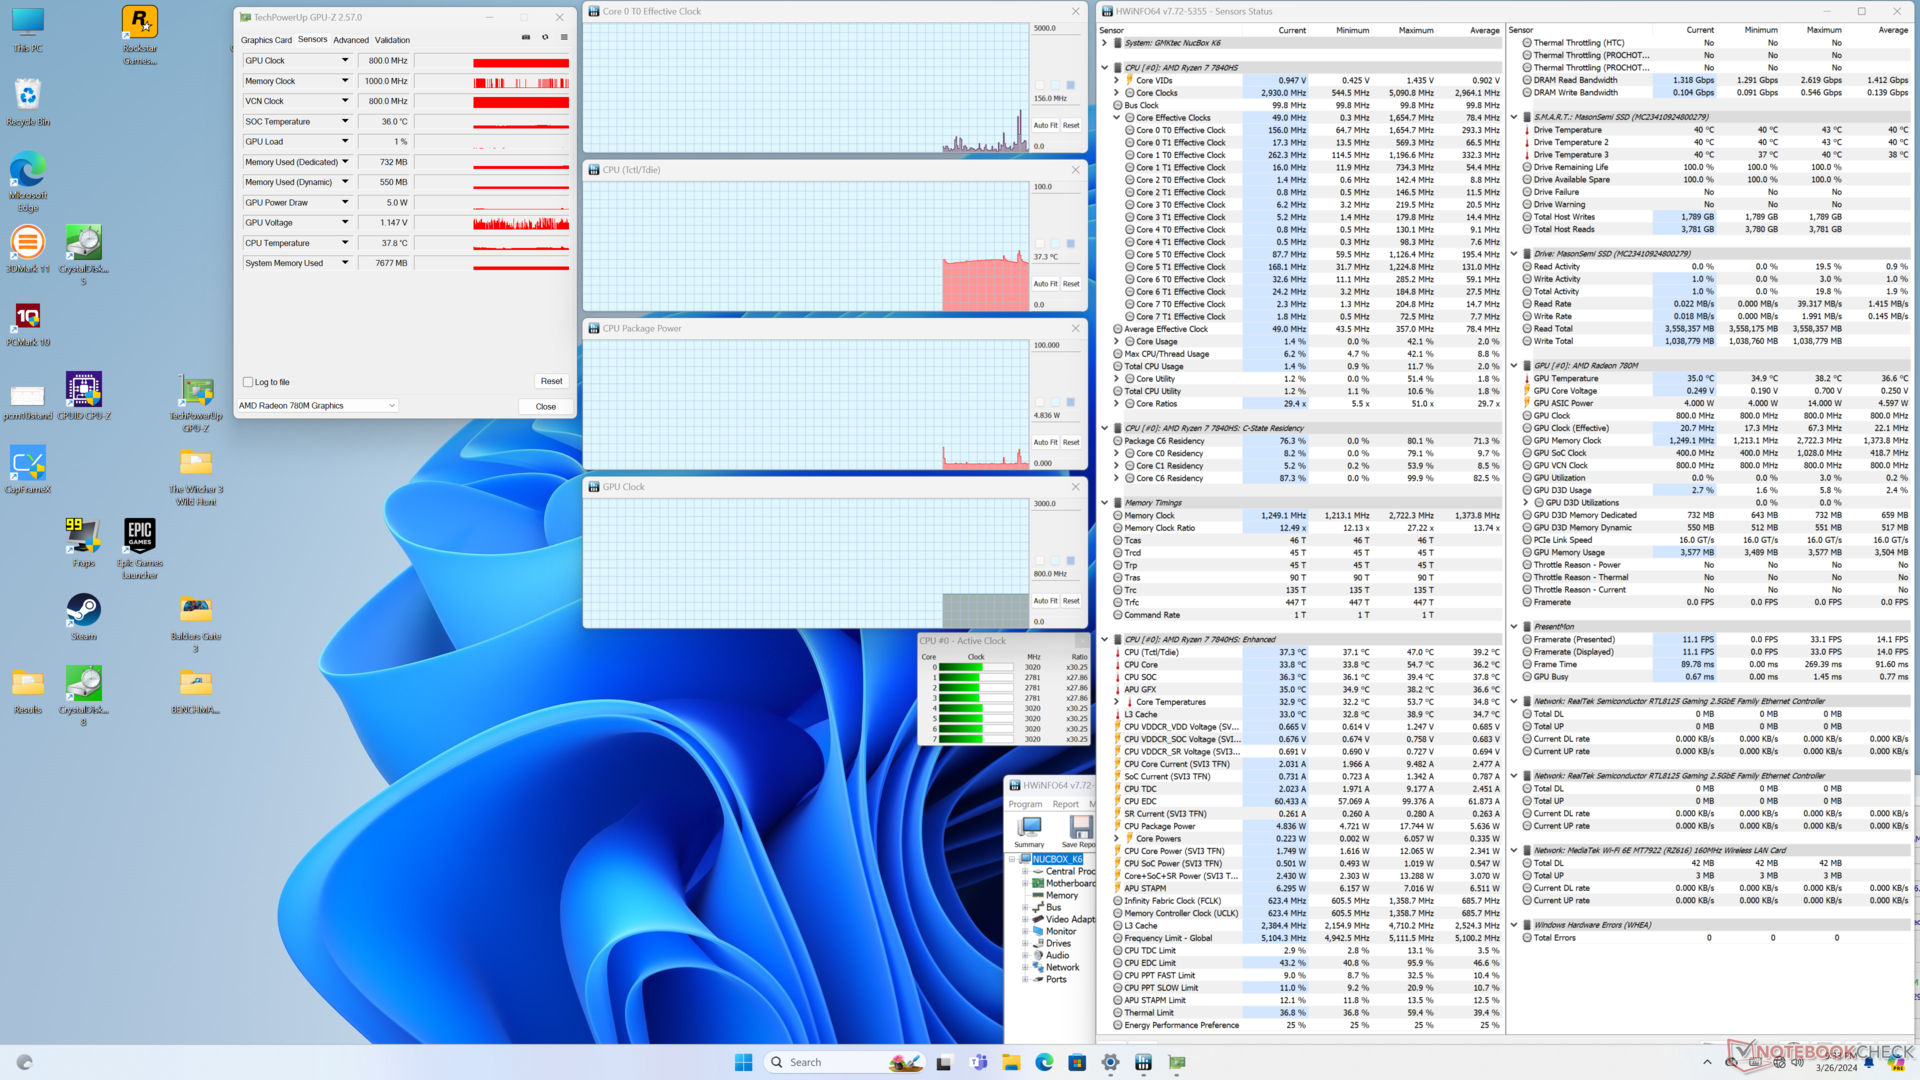
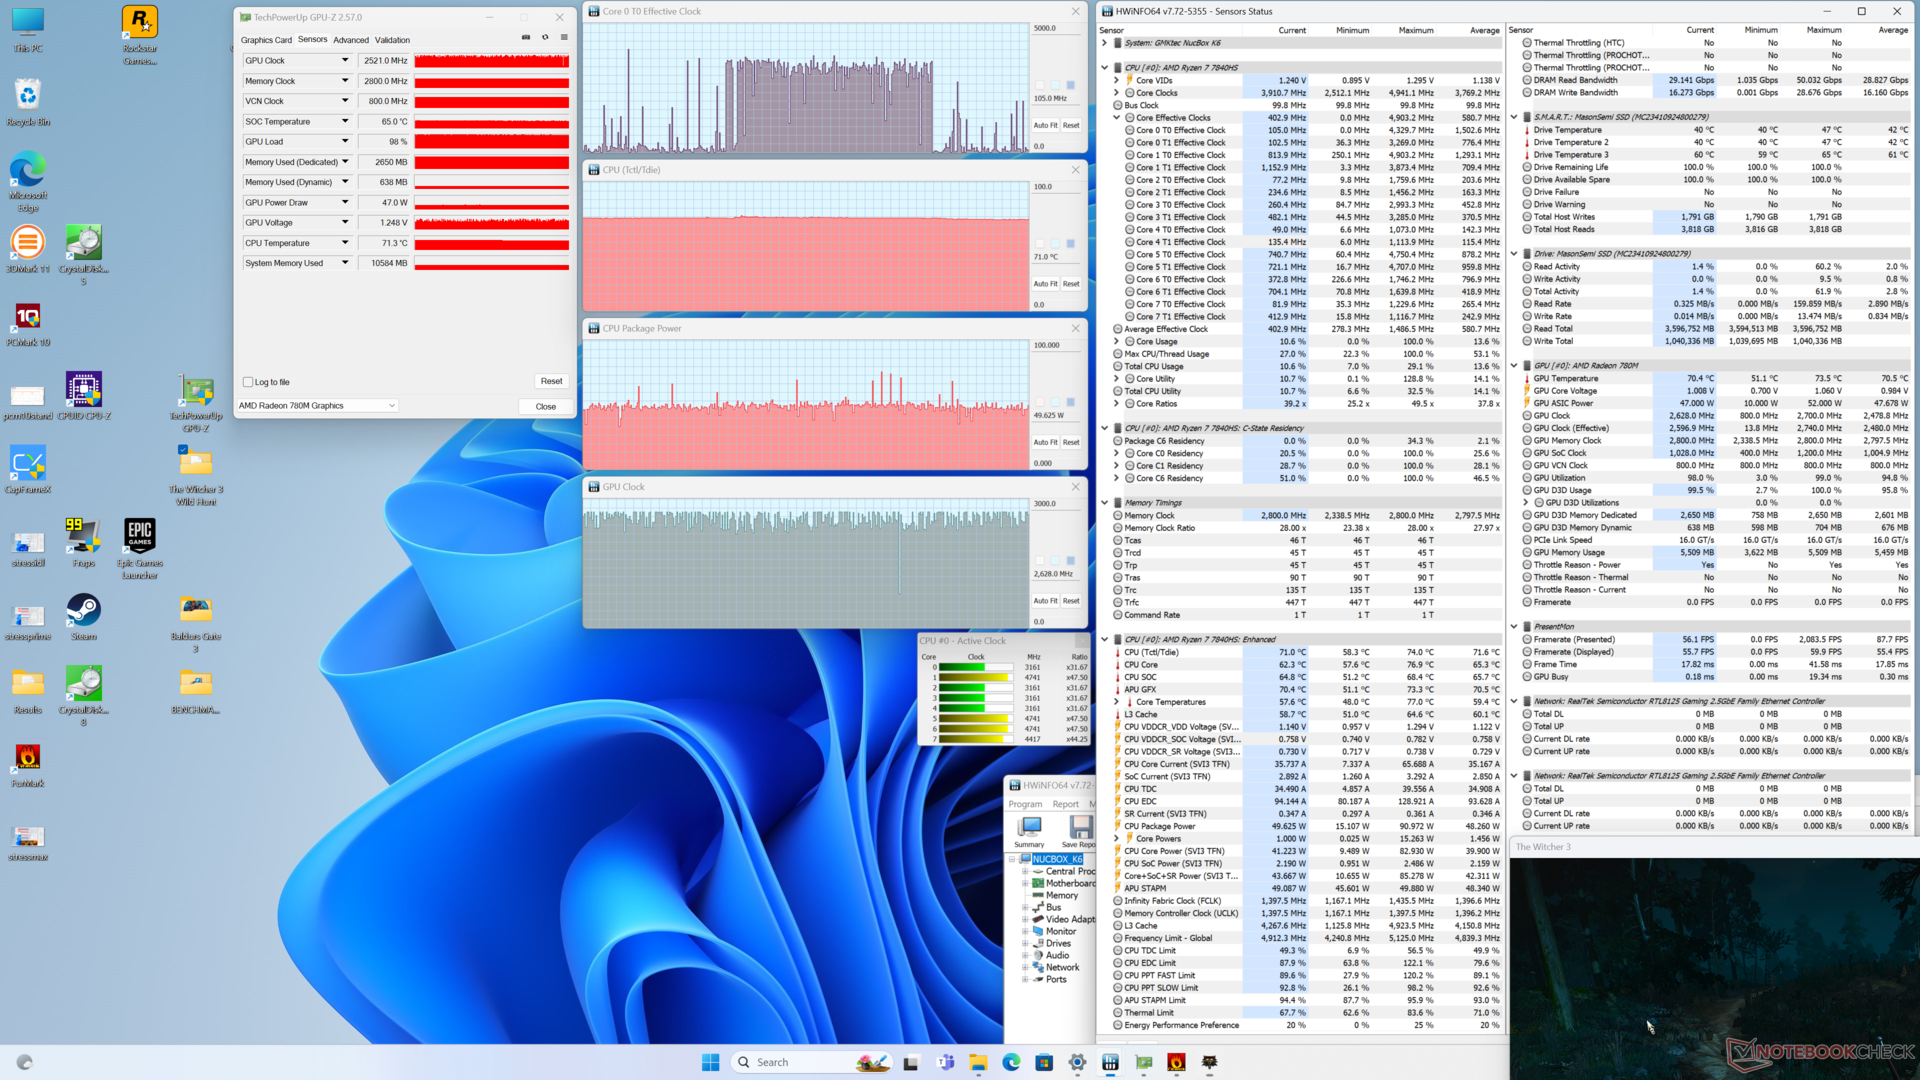
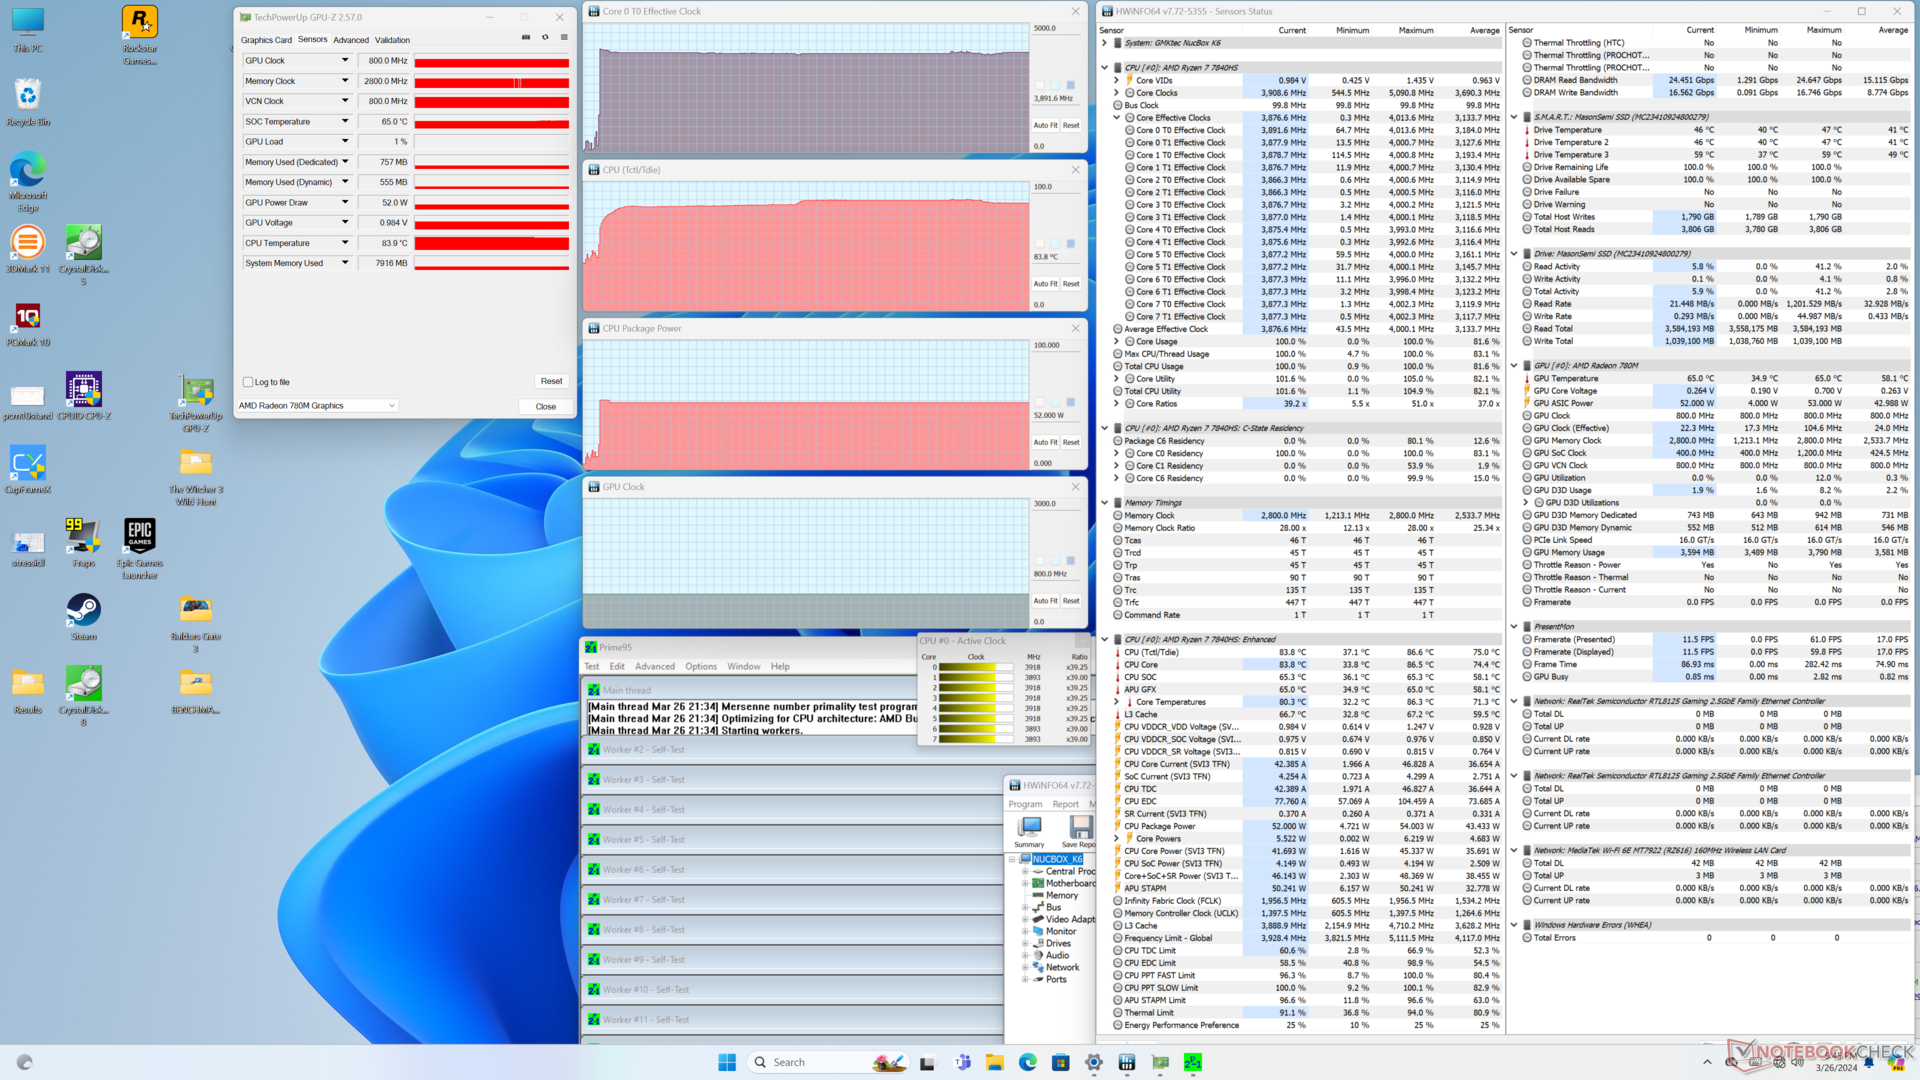
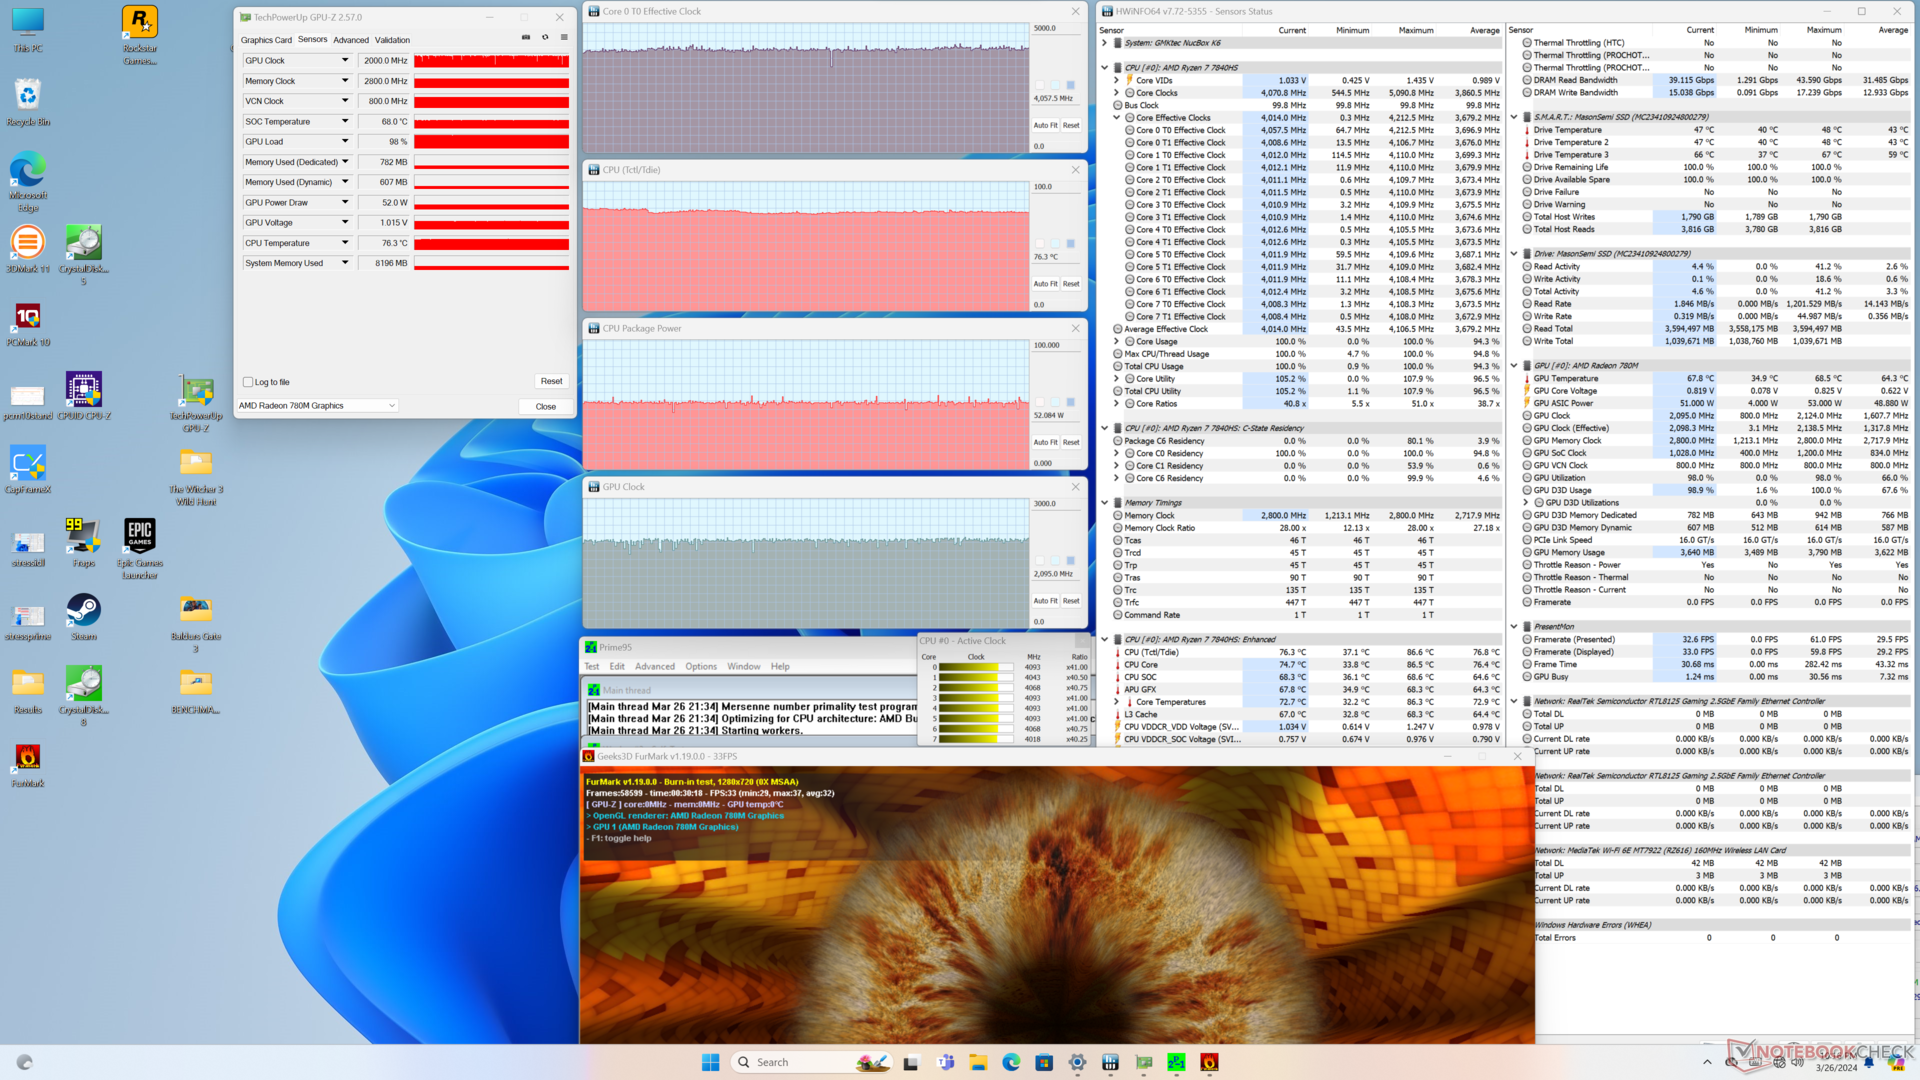
| CPU-Takt (GHz) | GPU-Takt (MHz) | Durchschnittliche CPU-Temperatur (°C) | |
| System im Leerlauf | -- | -- | 37 |
| Prime95 Stresstest | 3.9 | 800 | 84 |
| Prime95 + FurMark Stresstest | 4.1 | 2000 | 76 |
| Witcher 3 Stresstest | ~0.4 | 2200 - 2700 | 71 |
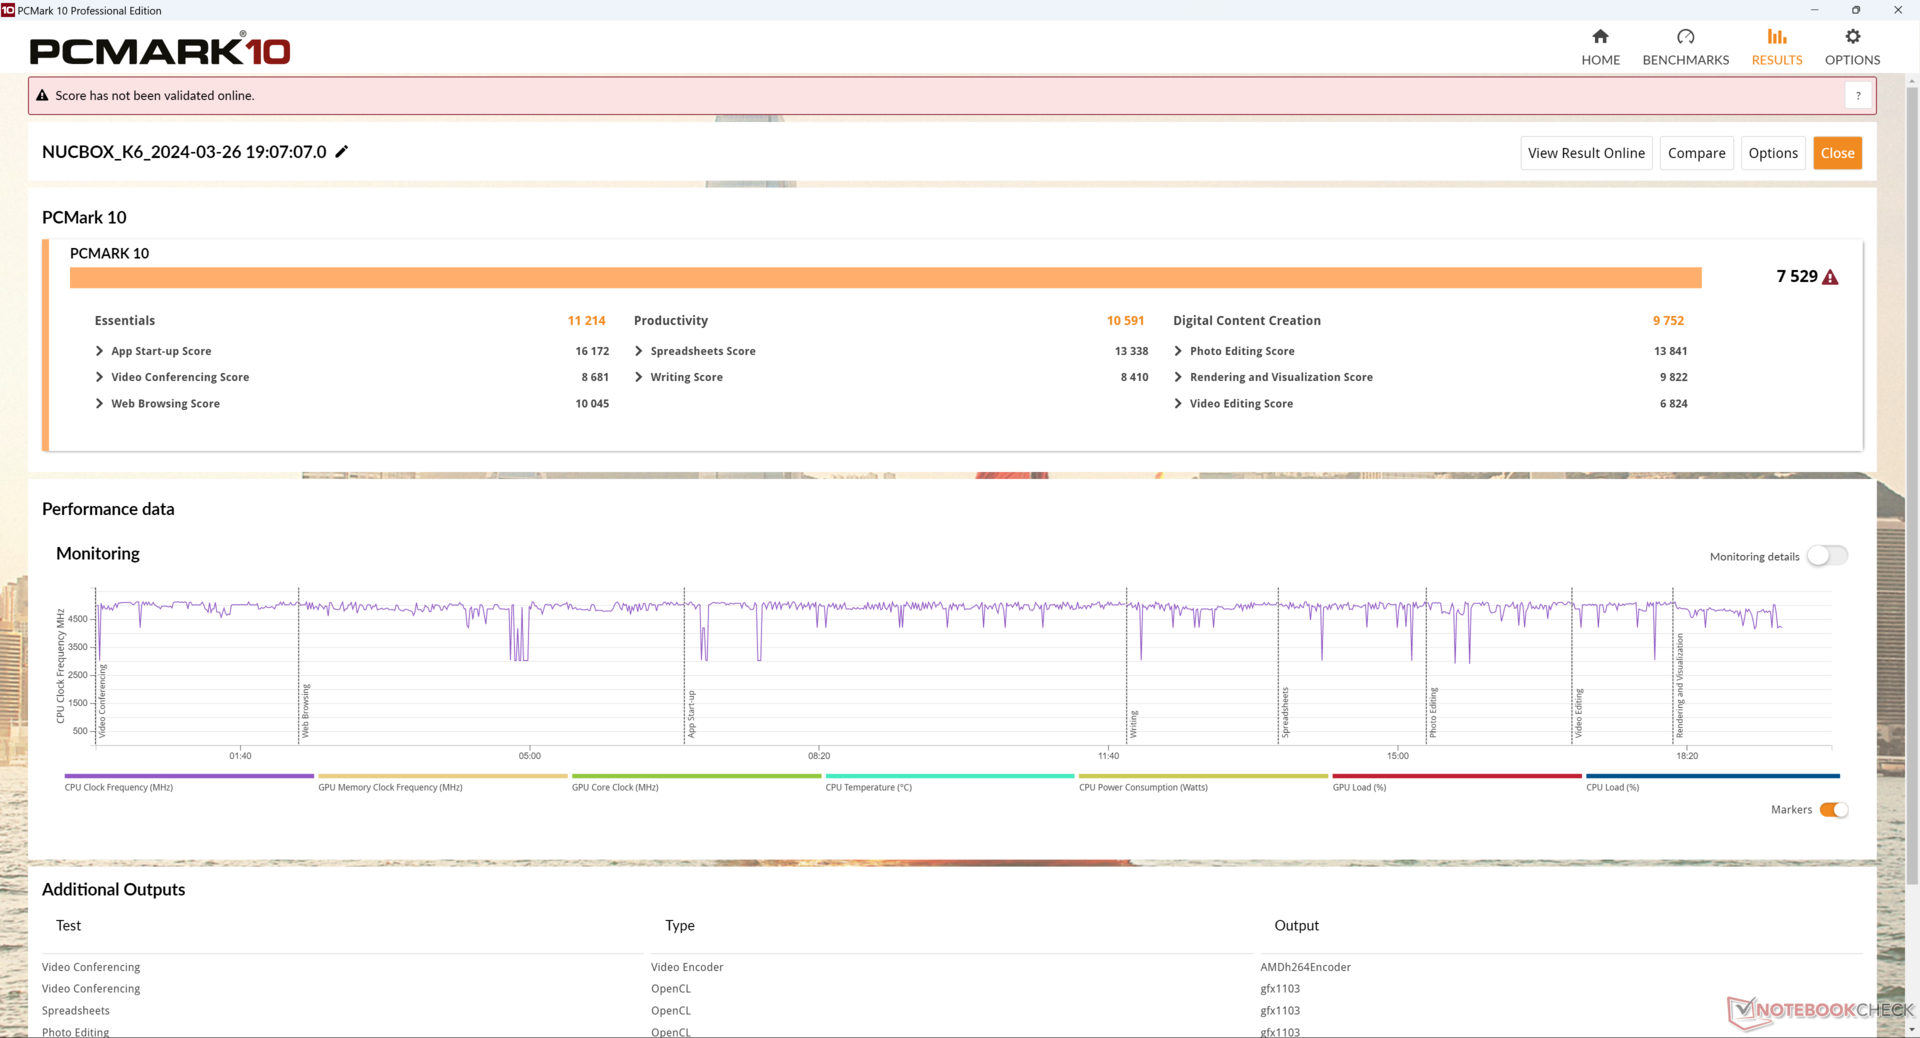
System Performance
Die PCMark-Ergebnisse sind mit denen des Geekom A7 vergleichbar, obwohl der Geekom mit dem teureren Ryzen 9 7940HS ausgestattet ist. Was Intel betrifft, so sind Mini-PCs mit Meteor Lake-H-CPUs wie der AcePC am ehesten mit unserem GMK vergleichbar.
CrossMark: Overall | Productivity | Creativity | Responsiveness
WebXPRT 3: Overall
WebXPRT 4: Overall
Mozilla Kraken 1.1: Total
| PCMark 10 / Score | |
| GMK NucBox K6 | |
| Geekom A7 | |
| Durchschnittliche AMD Ryzen 7 7840HS, AMD Radeon 780M (6914 - 7651, n=10) | |
| AcePC Wizbox AI | |
| Intel NUC 13 Pro Desk Edition Kit | |
| GMK NucBox K3 Pro | |
| Beelink SER5 | |
| PCMark 10 / Essentials | |
| GMK NucBox K6 | |
| Geekom A7 | |
| Intel NUC 13 Pro Desk Edition Kit | |
| Durchschnittliche AMD Ryzen 7 7840HS, AMD Radeon 780M (10519 - 11214, n=10) | |
| AcePC Wizbox AI | |
| GMK NucBox K3 Pro | |
| Beelink SER5 | |
| PCMark 10 / Productivity | |
| GMK NucBox K6 | |
| Geekom A7 | |
| Durchschnittliche AMD Ryzen 7 7840HS, AMD Radeon 780M (9075 - 10970, n=10) | |
| AcePC Wizbox AI | |
| Beelink SER5 | |
| GMK NucBox K3 Pro | |
| Intel NUC 13 Pro Desk Edition Kit | |
| PCMark 10 / Digital Content Creation | |
| AcePC Wizbox AI | |
| Geekom A7 | |
| GMK NucBox K6 | |
| Durchschnittliche AMD Ryzen 7 7840HS, AMD Radeon 780M (9052 - 9987, n=10) | |
| Intel NUC 13 Pro Desk Edition Kit | |
| GMK NucBox K3 Pro | |
| Beelink SER5 | |
| CrossMark / Overall | |
| GMK NucBox K6 | |
| Geekom A7 | |
| Durchschnittliche AMD Ryzen 7 7840HS, AMD Radeon 780M (1566 - 1891, n=10) | |
| AcePC Wizbox AI | |
| Intel NUC 13 Pro Desk Edition Kit | |
| GMK NucBox K3 Pro | |
| Beelink SER5 | |
| CrossMark / Productivity | |
| GMK NucBox K6 | |
| Geekom A7 | |
| Durchschnittliche AMD Ryzen 7 7840HS, AMD Radeon 780M (1535 - 1823, n=10) | |
| AcePC Wizbox AI | |
| Intel NUC 13 Pro Desk Edition Kit | |
| GMK NucBox K3 Pro | |
| Beelink SER5 | |
| CrossMark / Creativity | |
| Geekom A7 | |
| GMK NucBox K6 | |
| Durchschnittliche AMD Ryzen 7 7840HS, AMD Radeon 780M (1556 - 2040, n=10) | |
| AcePC Wizbox AI | |
| Intel NUC 13 Pro Desk Edition Kit | |
| GMK NucBox K3 Pro | |
| Beelink SER5 | |
| CrossMark / Responsiveness | |
| GMK NucBox K6 | |
| Durchschnittliche AMD Ryzen 7 7840HS, AMD Radeon 780M (1293 - 1749, n=10) | |
| Geekom A7 | |
| AcePC Wizbox AI | |
| Intel NUC 13 Pro Desk Edition Kit | |
| GMK NucBox K3 Pro | |
| Beelink SER5 | |
| WebXPRT 3 / Overall | |
| Geekom A7 | |
| GMK NucBox K6 | |
| Durchschnittliche AMD Ryzen 7 7840HS, AMD Radeon 780M (297 - 339, n=10) | |
| Intel NUC 13 Pro Desk Edition Kit | |
| GMK NucBox K3 Pro | |
| AcePC Wizbox AI | |
| Beelink SER5 | |
| WebXPRT 4 / Overall | |
| Geekom A7 | |
| GMK NucBox K6 | |
| Intel NUC 13 Pro Desk Edition Kit | |
| Durchschnittliche AMD Ryzen 7 7840HS, AMD Radeon 780M (245 - 319, n=9) | |
| Beelink SER5 | |
| Mozilla Kraken 1.1 / Total | |
| Beelink SER5 | |
| AcePC Wizbox AI | |
| GMK NucBox K6 | |
| GMK NucBox K3 Pro | |
| Durchschnittliche AMD Ryzen 7 7840HS, AMD Radeon 780M (485 - 544, n=10) | |
| Geekom A7 | |
| Intel NUC 13 Pro Desk Edition Kit | |
* ... kleinere Werte sind besser
| PCMark 10 Score | 7529 Punkte | |
Hilfe | ||
| AIDA64 / Memory Copy | |
| GMK NucBox K3 Pro | |
| GMK NucBox K6 | |
| Geekom A7 | |
| Durchschnittliche AMD Ryzen 7 7840HS (30937 - 72158, n=21) | |
| AcePC Wizbox AI | |
| Intel NUC 13 Pro Desk Edition Kit | |
| Beelink SER5 | |
| AIDA64 / Memory Read | |
| GMK NucBox K3 Pro | |
| GMK NucBox K6 | |
| Geekom A7 | |
| AcePC Wizbox AI | |
| Durchschnittliche AMD Ryzen 7 7840HS (30497 - 62147, n=21) | |
| Intel NUC 13 Pro Desk Edition Kit | |
| Beelink SER5 | |
| AIDA64 / Memory Write | |
| Geekom A7 | |
| GMK NucBox K6 | |
| Durchschnittliche AMD Ryzen 7 7840HS (34590 - 93323, n=21) | |
| AcePC Wizbox AI | |
| GMK NucBox K3 Pro | |
| Intel NUC 13 Pro Desk Edition Kit | |
| Beelink SER5 | |
| AIDA64 / Memory Latency | |
| AcePC Wizbox AI | |
| GMK NucBox K3 Pro | |
| Intel NUC 13 Pro Desk Edition Kit | |
| Beelink SER5 | |
| Durchschnittliche AMD Ryzen 7 7840HS (85.1 - 112, n=21) | |
| Geekom A7 | |
| GMK NucBox K6 | |
* ... kleinere Werte sind besser
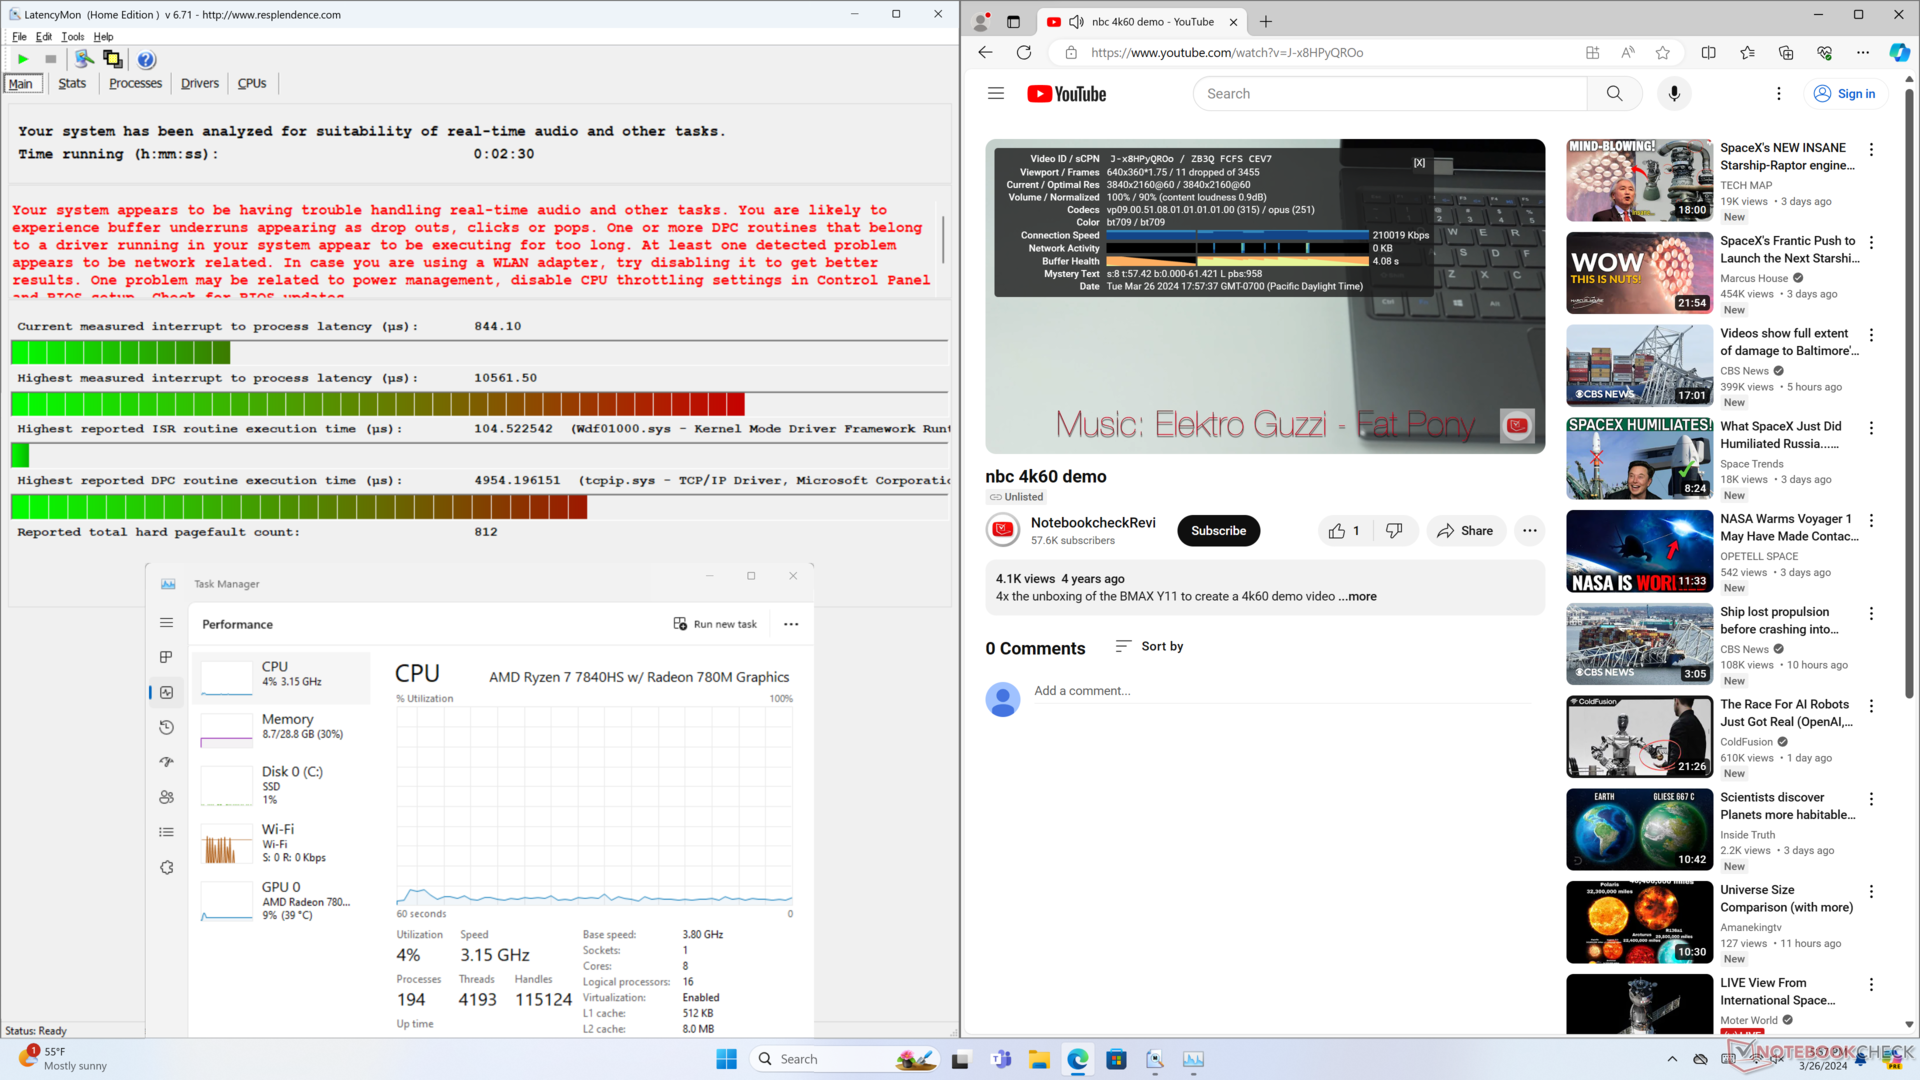
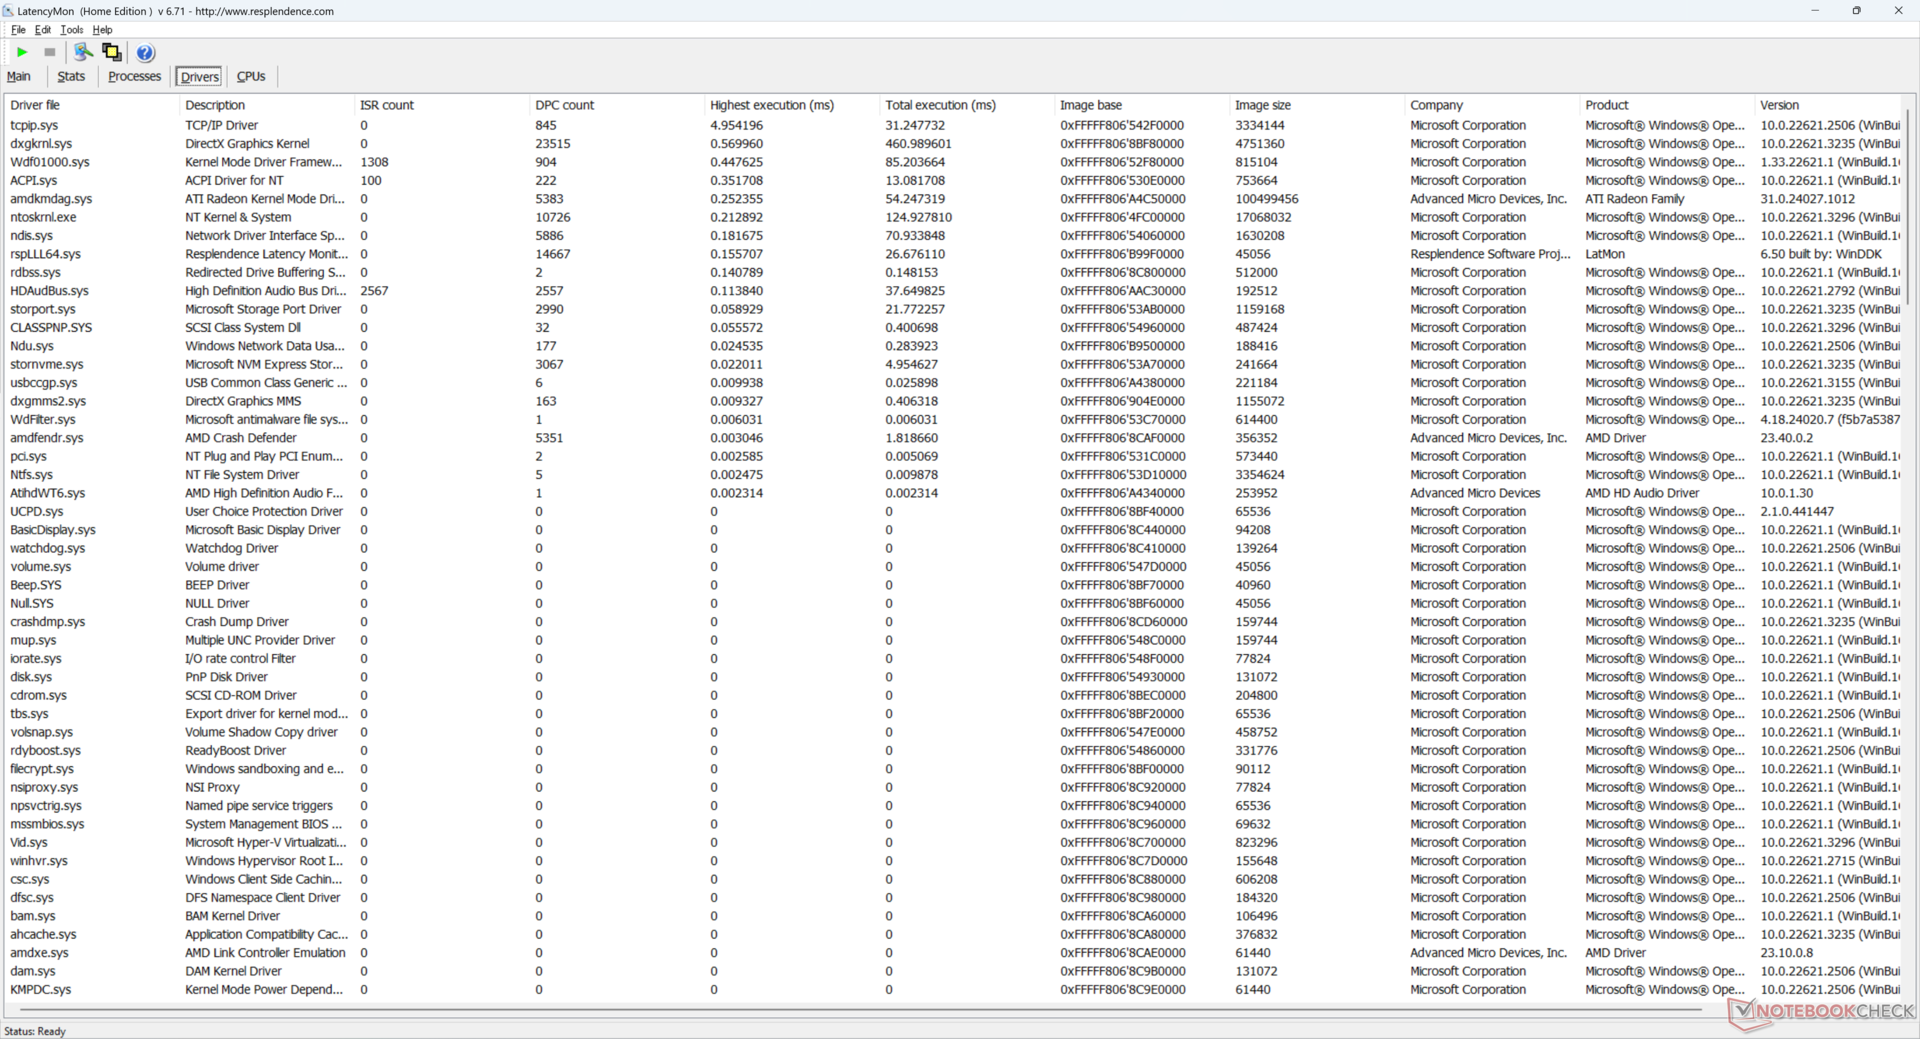
DPC-Latenzen
Leider leidet das System unter DPC-Latenzproblemen, die die Videowiedergabe beeinträchtigen. Unser einminütiges 4K60-Video zeigte 11 unterbrochene Frames an, während es eigentlich Null sein sollten. Beim Streaming von Videos ist daher mit leichtem Stottern zu rechnen.
| DPC Latencies / LatencyMon - interrupt to process latency (max), Web, Youtube, Prime95 | |
| GMK NucBox K6 | |
| Geekom A7 | |
| GMK NucBox K3 Pro | |
| Intel NUC 13 Pro Desk Edition Kit | |
| AcePC Wizbox AI | |
| Beelink SER5 | |
* ... kleinere Werte sind besser
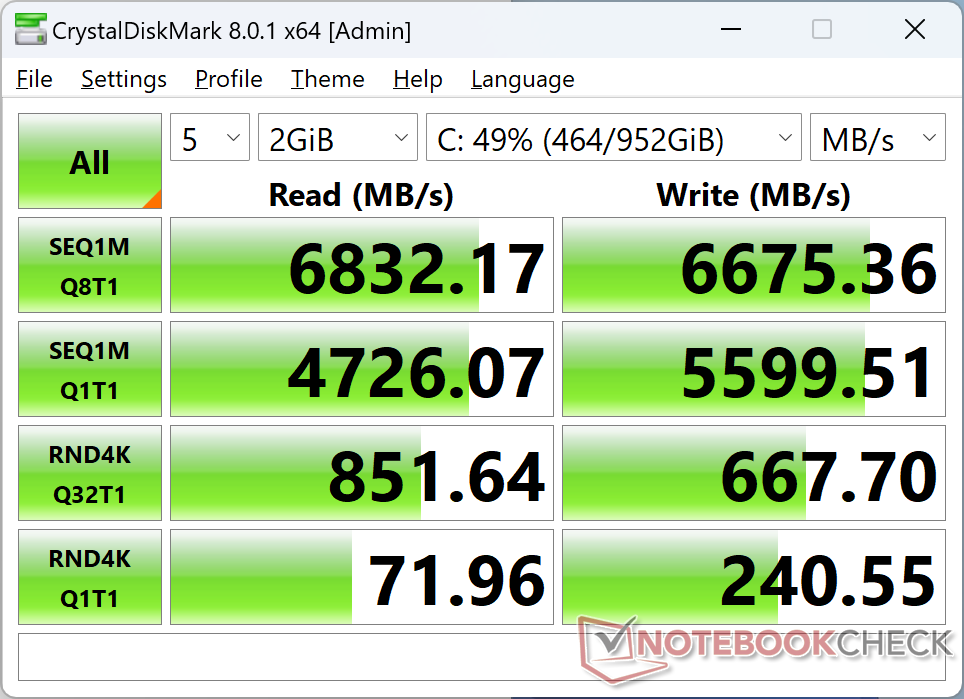
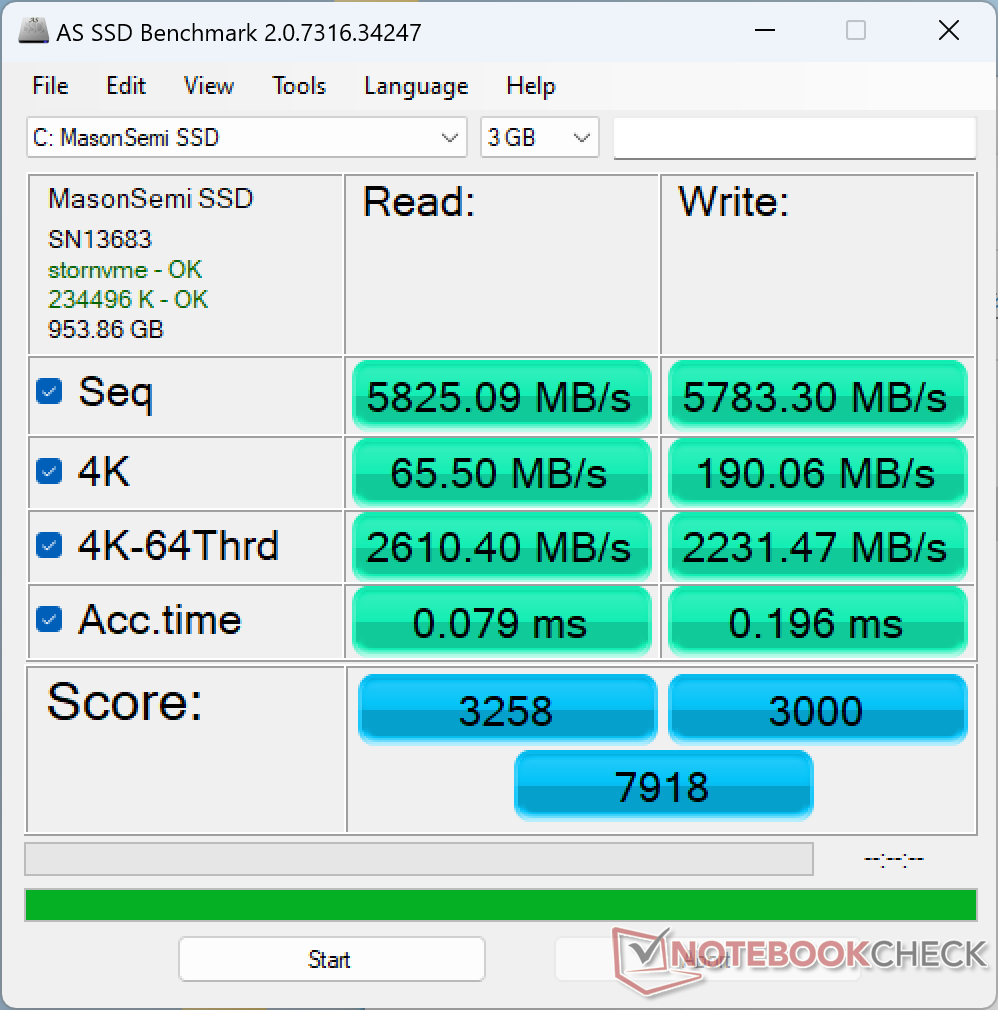
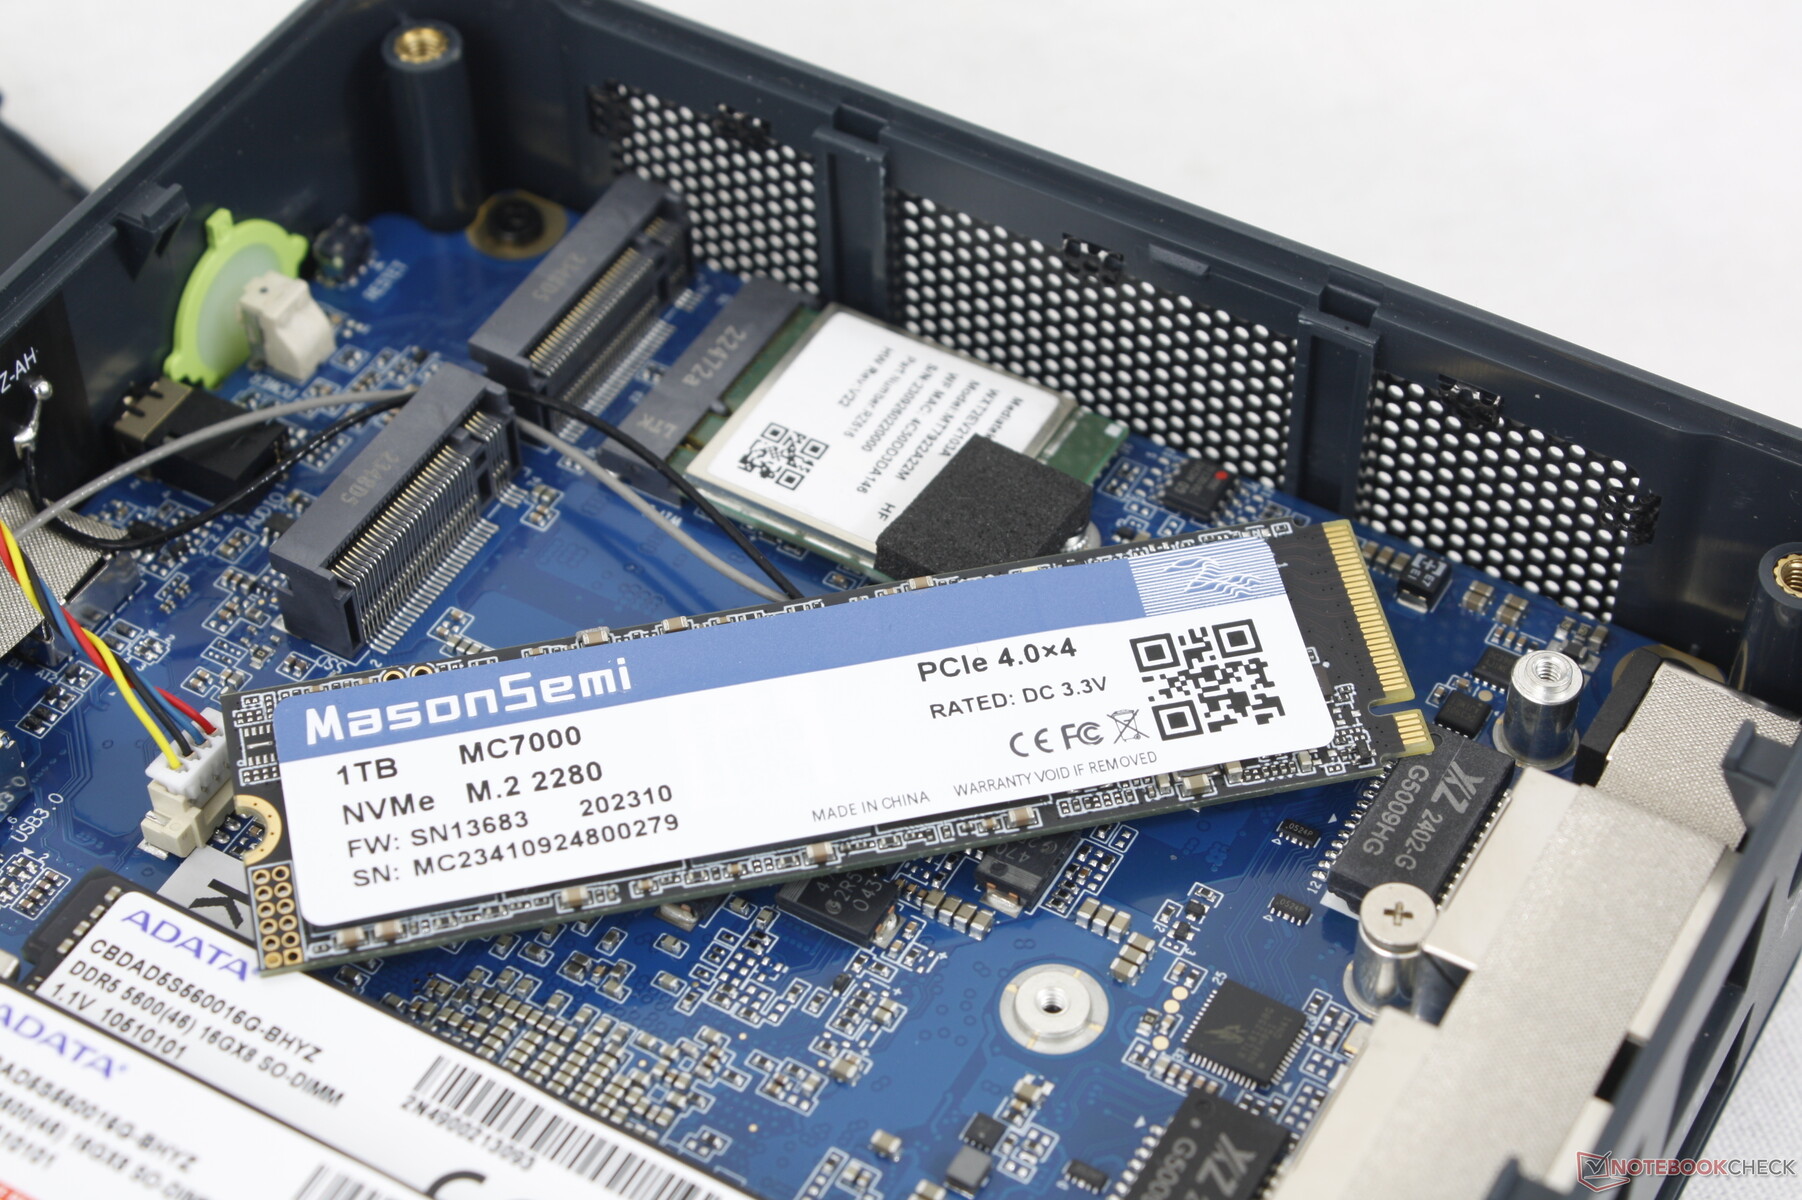
Massenspeicher
GMK-Mini-PCs werden normalerweise mit weniger bekannten SSD-Marken ausgeliefert, um die Kosten niedrig zu halten. Die MasonSemi MC7000 ist vielleicht kein bekannter Name, aber die Leistung ist dennoch hervorragend, und die Ergebnisse sind vergleichbar mit denen der beliebten Samsung PM9A1-Serie. Die Leseraten liegen konstant bei etwa 7000 MB/s, was nahe der Obergrenze für PCIe4 x4-Laufwerke liegt.
Beachten Sie, dass nur ein Heatspreader enthalten ist, obwohl das System bis zu zwei Laufwerke unterstützen kann.

| Drive Performance Rating - Percent | |
| GMK NucBox K6 | |
| Intel NUC 13 Pro Desk Edition Kit | |
| Geekom A7 | |
| Beelink SER5 | |
| AcePC Wizbox AI | |
| GMK NucBox K3 Pro | |
| DiskSpd | |
| seq read | |
| Geekom A7 | |
| GMK NucBox K6 | |
| Intel NUC 13 Pro Desk Edition Kit | |
| Beelink SER5 | |
| AcePC Wizbox AI | |
| GMK NucBox K3 Pro | |
| seq write | |
| GMK NucBox K6 | |
| Geekom A7 | |
| Intel NUC 13 Pro Desk Edition Kit | |
| Beelink SER5 | |
| AcePC Wizbox AI | |
| GMK NucBox K3 Pro | |
| seq q8 t1 read | |
| GMK NucBox K6 | |
| Intel NUC 13 Pro Desk Edition Kit | |
| Geekom A7 | |
| AcePC Wizbox AI | |
| Beelink SER5 | |
| GMK NucBox K3 Pro | |
| seq q8 t1 write | |
| GMK NucBox K6 | |
| Intel NUC 13 Pro Desk Edition Kit | |
| Geekom A7 | |
| Beelink SER5 | |
| AcePC Wizbox AI | |
| GMK NucBox K3 Pro | |
| 4k q1 t1 read | |
| Intel NUC 13 Pro Desk Edition Kit | |
| GMK NucBox K6 | |
| AcePC Wizbox AI | |
| Beelink SER5 | |
| Geekom A7 | |
| GMK NucBox K3 Pro | |
| 4k q1 t1 write | |
| GMK NucBox K6 | |
| Beelink SER5 | |
| Geekom A7 | |
| GMK NucBox K3 Pro | |
| AcePC Wizbox AI | |
| Intel NUC 13 Pro Desk Edition Kit | |
| 4k q32 t16 read | |
| Beelink SER5 | |
| GMK NucBox K6 | |
| Geekom A7 | |
| GMK NucBox K3 Pro | |
| AcePC Wizbox AI | |
| Intel NUC 13 Pro Desk Edition Kit | |
| 4k q32 t16 write | |
| GMK NucBox K6 | |
| Beelink SER5 | |
| AcePC Wizbox AI | |
| Geekom A7 | |
| GMK NucBox K3 Pro | |
| Intel NUC 13 Pro Desk Edition Kit | |
* ... kleinere Werte sind besser
Dauerleistung Lesen: DiskSpd Read Loop, Queue Depth 8
GPU Performance — Leistungsstark genug für die meisten Spiele
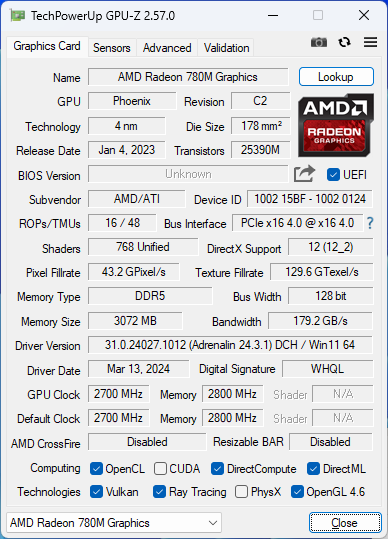
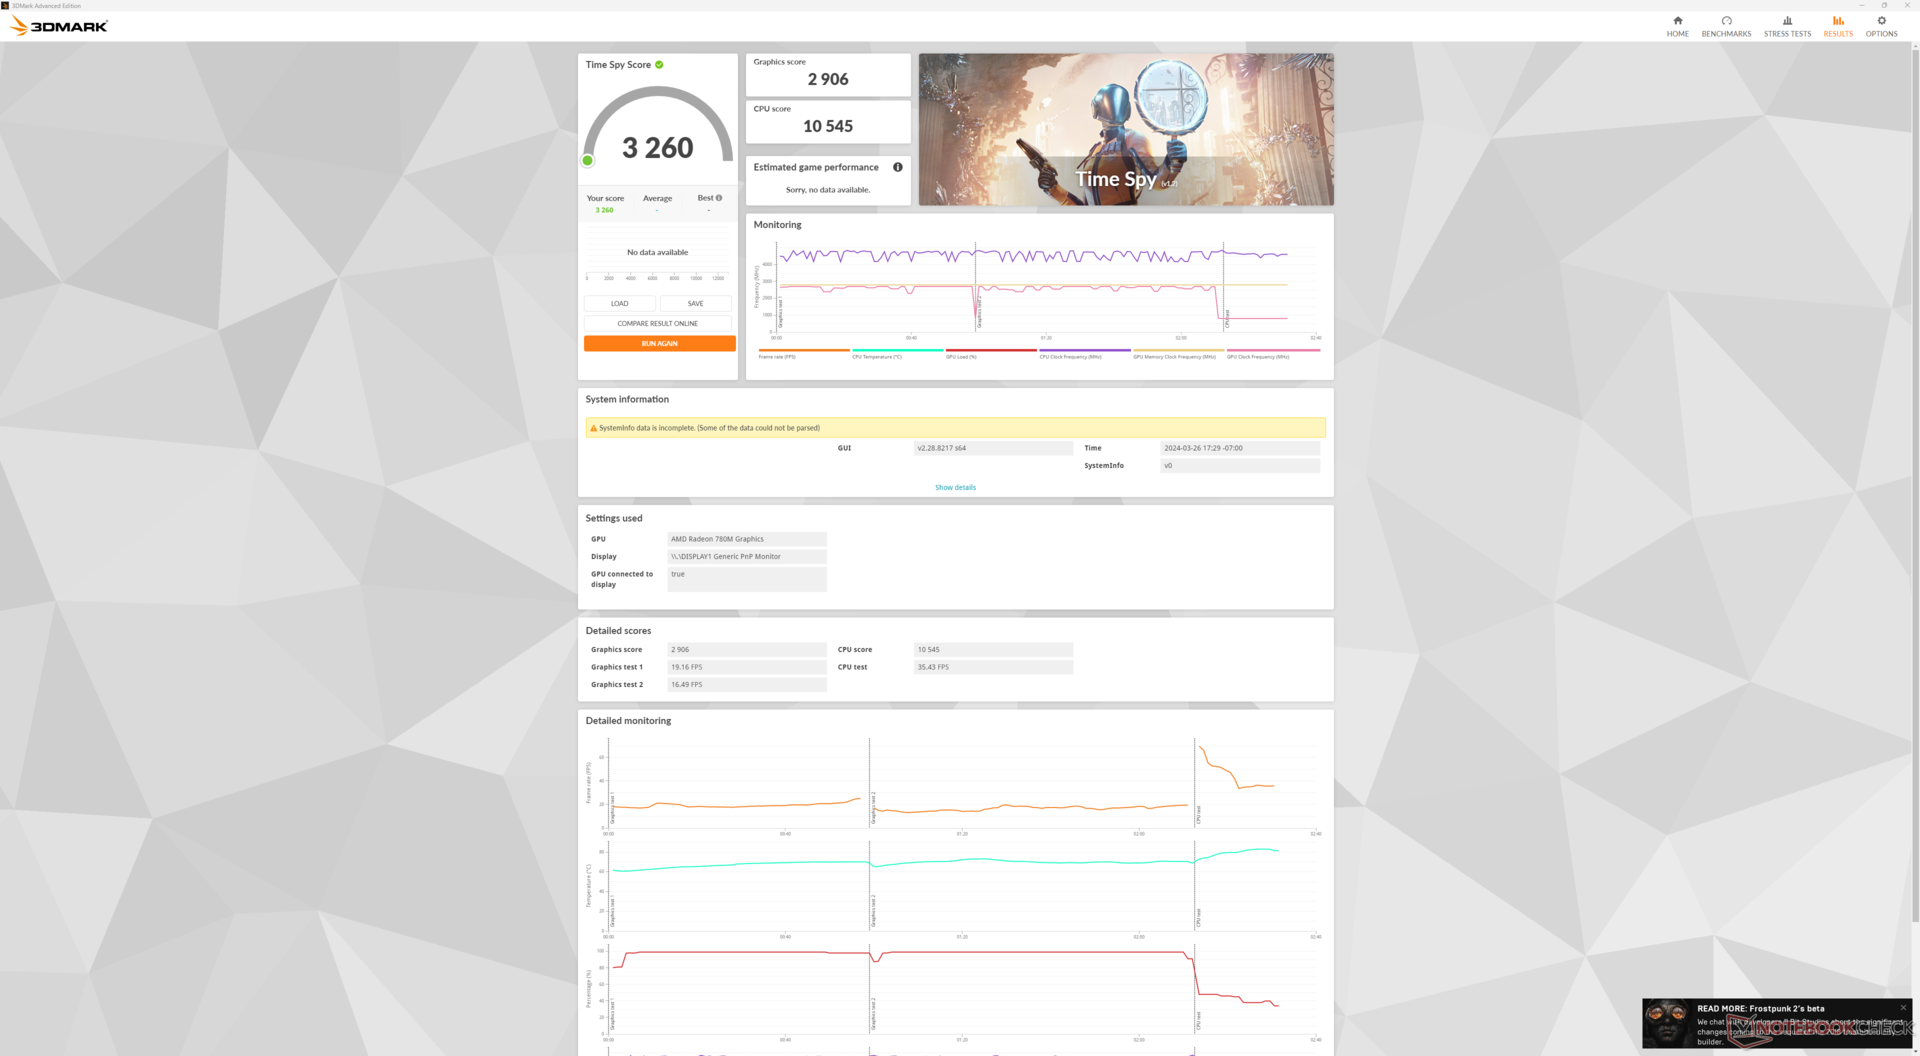
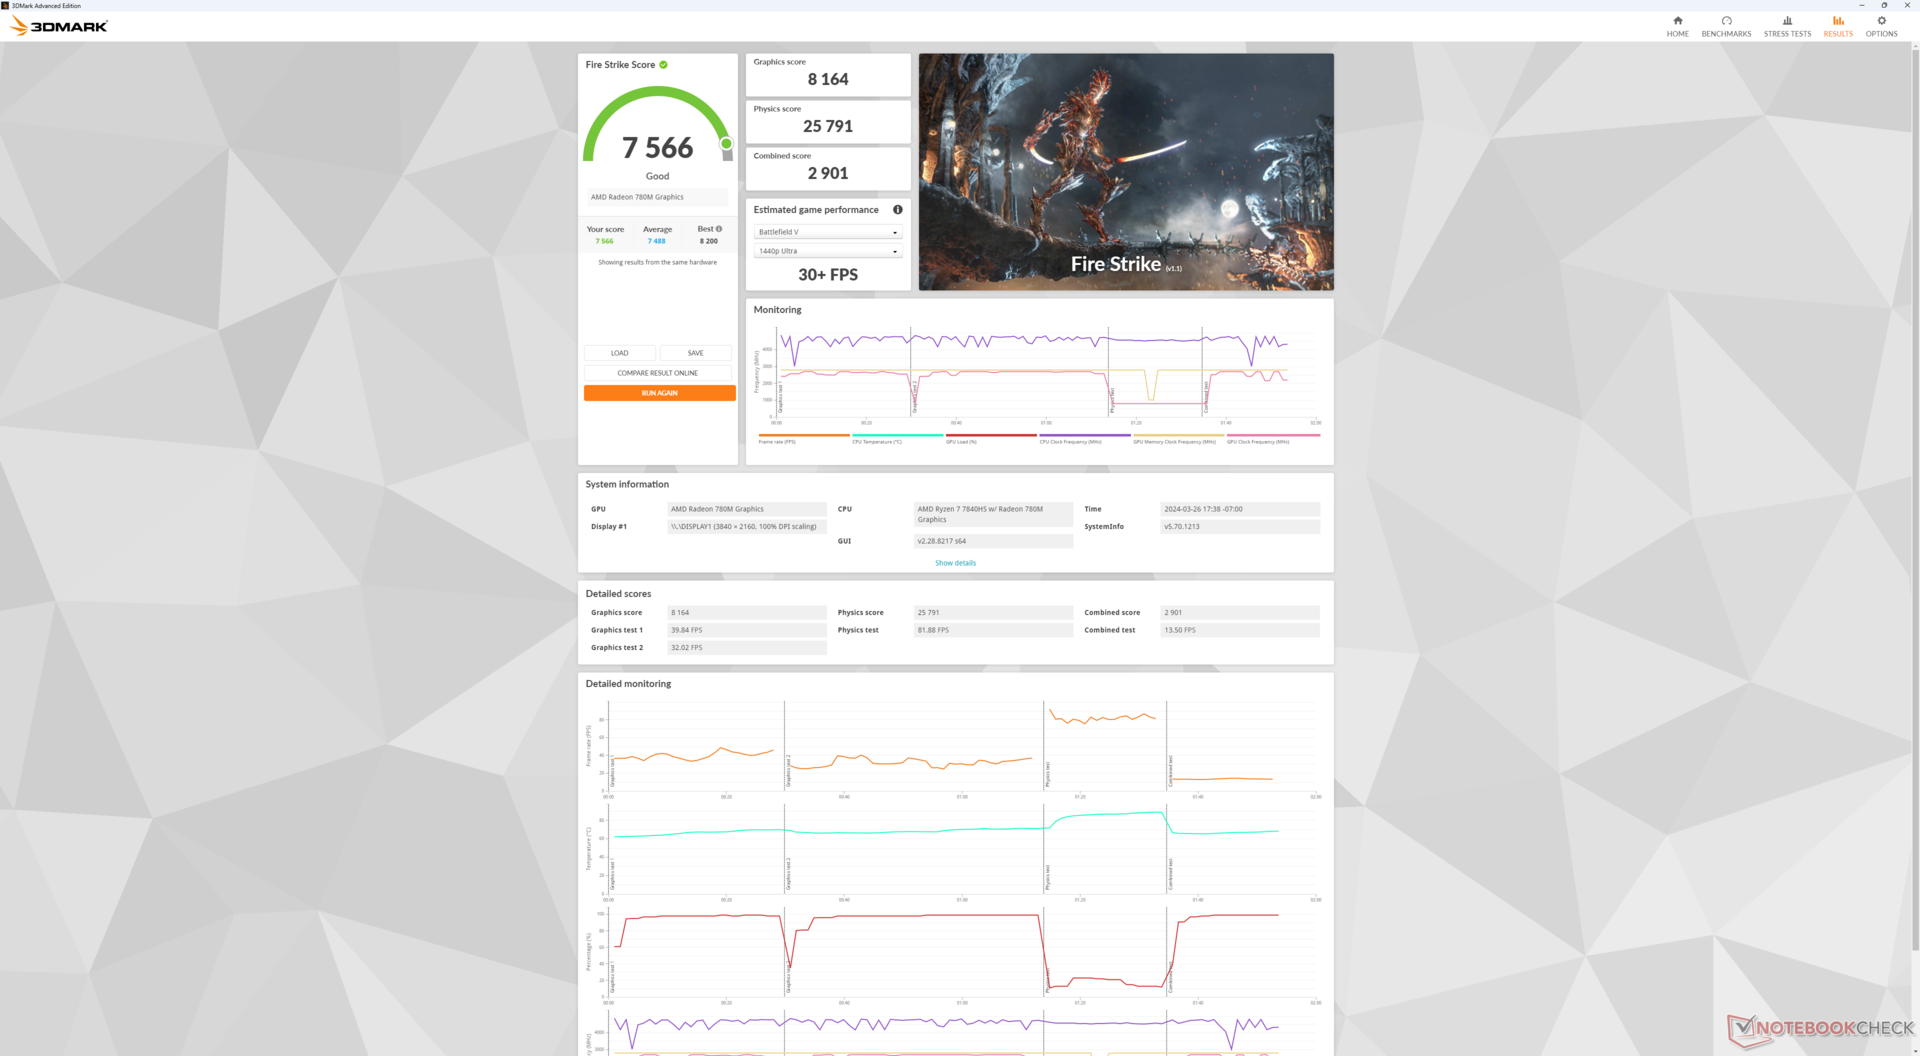
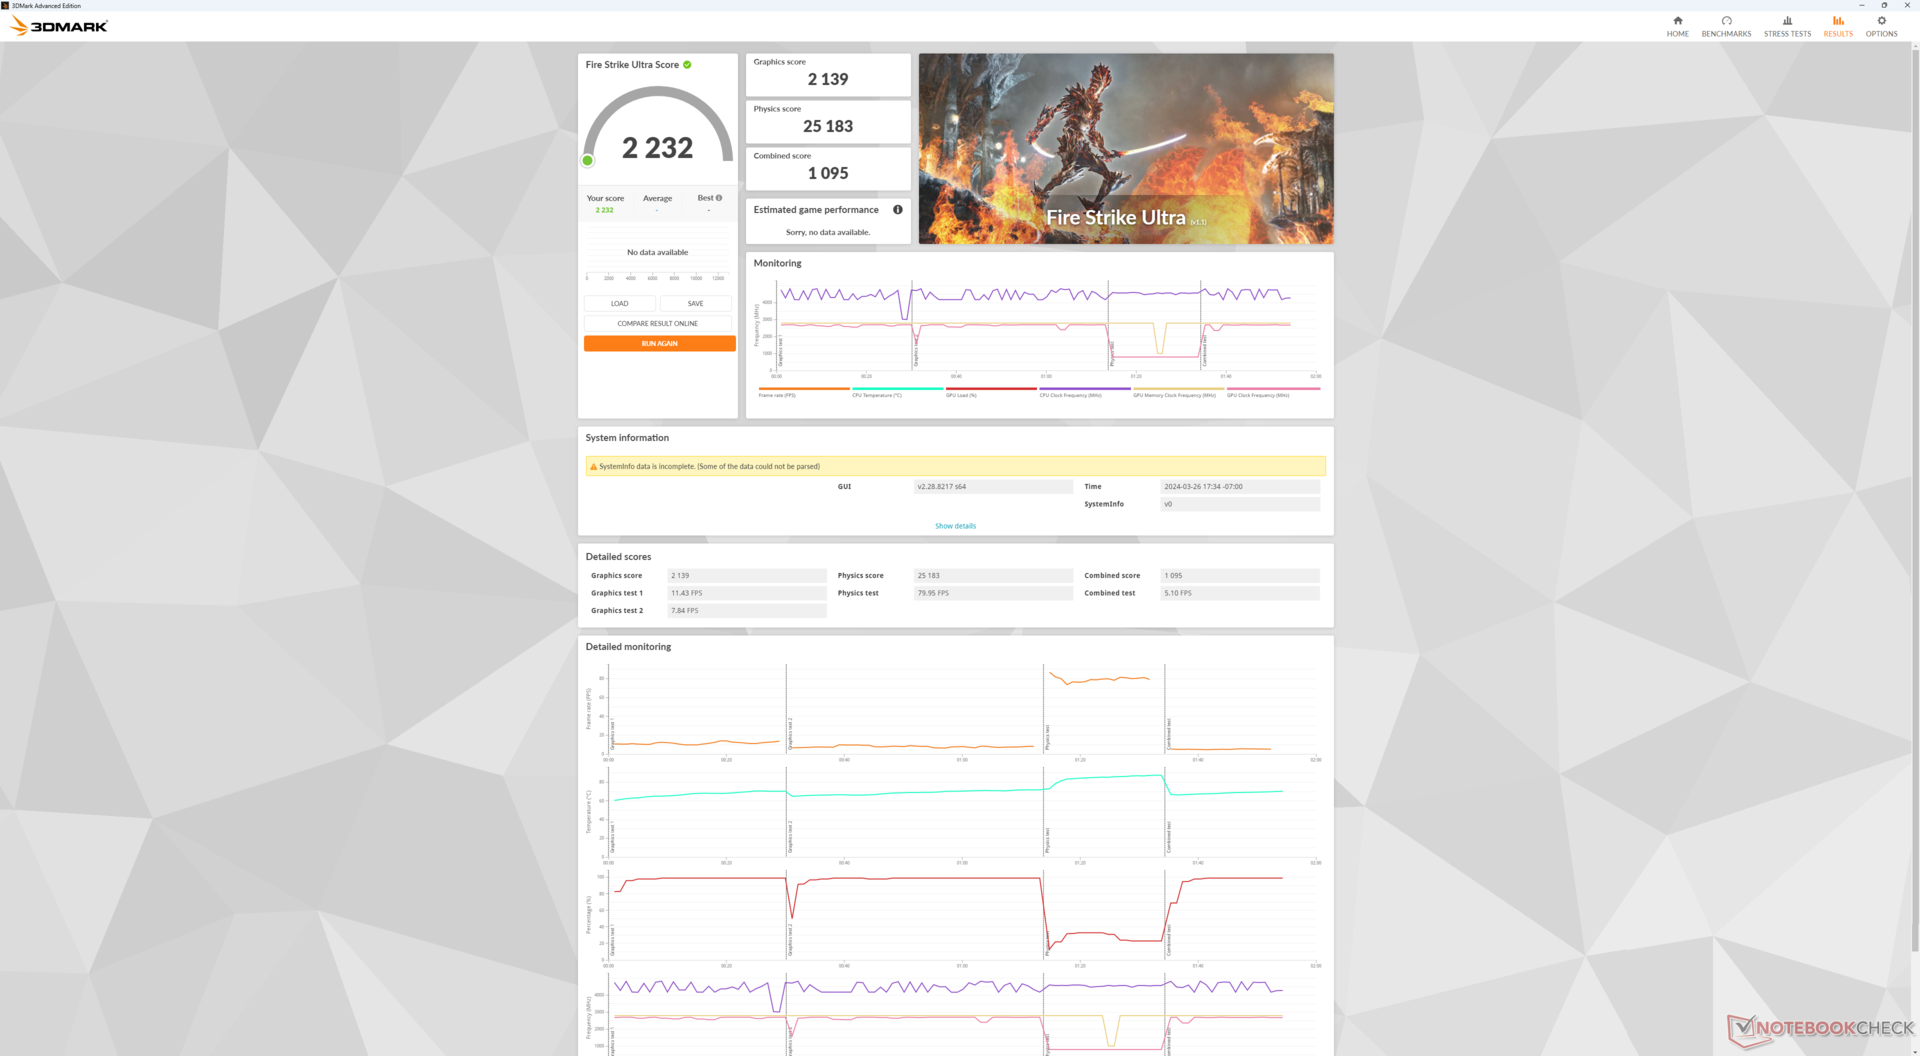
Die Radeon 780M hat sich als leistungsstarker integrierter Grafikprozessor erwiesen und kann in Mini-PCs sogar schneller laufen als in Laptops, da der breitere Formfaktor im Allgemeinen eine höhere Leistungsaufnahme ermöglicht. In diesem Fall läuft die iGPU in unserer NucBox K6 etwa 10 Prozent schneller als der durchschnittliche Laptop in unserer Datenbank, der mit der gleichen Grafikoption ausgestattet ist. Der Leistungsvorteil kann bei Spielen wie Tiny Tina's Wonderlands oder F1 22 noch größer sein, wo wir ein Delta von bis zu 20 Prozent beobachten können. Nutzer, die von einer UHD Graphics oder Iris Xe aufrüsten, sollten einen signifikanten Leistungsschub erleben.
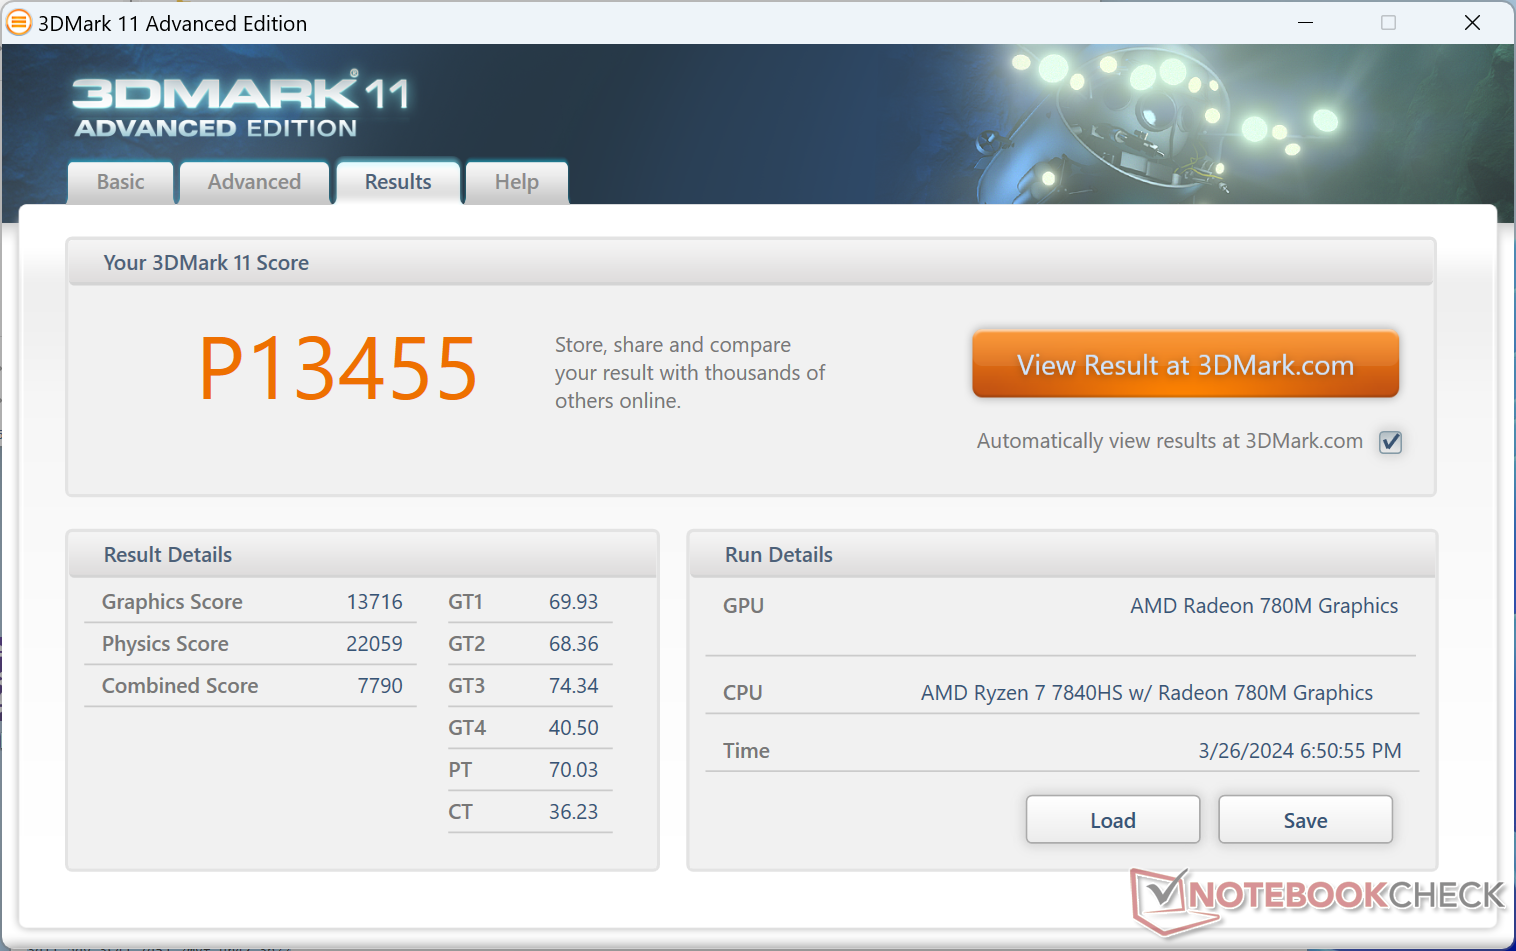
| 3DMark 11 Performance | 13455 Punkte | |
| 3DMark Fire Strike Score | 7566 Punkte | |
| 3DMark Time Spy Score | 3260 Punkte | |
Hilfe | ||
| Blender | |
| v3.3 Classroom HIP/AMD | |
| Beelink SER5 | |
| Beelink GTR6 | |
| Aoostar GOD77 | |
| Beelink SER6 Pro | |
| v3.3 Classroom CPU | |
| GMK NucBox M3 | |
| Beelink SER5 | |
| GMK NucBox K3 Pro | |
| GMK NucBox M4 | |
| Intel NUC 13 Pro Desk Edition Kit | |
| Beelink SER6 Pro | |
| Lenovo IdeaCentre Mini 01IRH8 | |
| Beelink GTR6 | |
| Aoostar GOD77 | |
| Durchschnittliche AMD Radeon 780M (300 - 664, n=76) | |
| AcePC Wizbox AI | |
| Geekom A7 | |
| GMK NucBox K6 | |
| v3.3 Classroom oneAPI/Intel | |
| AcePC Wizbox AI | |
* ... kleinere Werte sind besser
| Performance Rating - Percent | |
| GMK NucBox K6 | |
| AcePC Wizbox AI | |
| Intel NUC 13 Pro Desk Edition Kit | |
| Beelink SER5 | |
| The Witcher 3 - 1920x1080 Ultra Graphics & Postprocessing (HBAO+) | |
| GMK NucBox K6 | |
| AcePC Wizbox AI | |
| Intel NUC 13 Pro Desk Edition Kit | |
| Beelink SER5 | |
| GTA V - 1920x1080 Highest AA:4xMSAA + FX AF:16x | |
| GMK NucBox K6 | |
| AcePC Wizbox AI | |
| Beelink SER5 | |
| Intel NUC 13 Pro Desk Edition Kit | |
| Final Fantasy XV Benchmark - 1920x1080 High Quality | |
| GMK NucBox K6 | |
| AcePC Wizbox AI | |
| Intel NUC 13 Pro Desk Edition Kit | |
| Beelink SER5 | |
| Strange Brigade - 1920x1080 ultra AA:ultra AF:16 | |
| GMK NucBox K6 | |
| AcePC Wizbox AI | |
| Intel NUC 13 Pro Desk Edition Kit | |
| Beelink SER5 | |
| Dota 2 Reborn - 1920x1080 ultra (3/3) best looking | |
| GMK NucBox K6 | |
| AcePC Wizbox AI | |
| Intel NUC 13 Pro Desk Edition Kit | |
| Beelink SER5 | |
| X-Plane 11.11 - 1920x1080 high (fps_test=3) | |
| GMK NucBox K6 | |
| AcePC Wizbox AI | |
| Intel NUC 13 Pro Desk Edition Kit | |
| Beelink SER5 | |
| X-Plane 11.11 | |
| 1280x720 low (fps_test=1) | |
| Geekom A7 | |
| Beelink SER6 Pro | |
| GMK NucBox K6 | |
| Beelink GTR6 | |
| Aoostar GOD77 | |
| AcePC Wizbox AI | |
| AcePC Wizbox AI | |
| Intel NUC 13 Pro Desk Edition Kit | |
| Durchschnittliche AMD Radeon 780M (39 - 69.6, n=81) | |
| Geekom Mini IT13 | |
| Lenovo IdeaCentre Mini 01IRH8 | |
| GMK NucBox K3 Pro | |
| GMK NucBox M4 | |
| Beelink SER5 | |
| GMK NucBox M3 | |
| 1920x1080 med (fps_test=2) | |
| Beelink SER6 Pro | |
| Beelink GTR6 | |
| Aoostar GOD77 | |
| Geekom A7 | |
| GMK NucBox K6 | |
| AcePC Wizbox AI | |
| AcePC Wizbox AI | |
| Intel NUC 13 Pro Desk Edition Kit | |
| Durchschnittliche AMD Radeon 780M (26.2 - 49.1, n=81) | |
| Geekom Mini IT13 | |
| GMK NucBox K3 Pro | |
| Lenovo IdeaCentre Mini 01IRH8 | |
| Beelink SER5 | |
| GMK NucBox M4 | |
| GMK NucBox M3 | |
| 1920x1080 high (fps_test=3) | |
| Beelink SER6 Pro | |
| Beelink GTR6 | |
| Aoostar GOD77 | |
| Geekom A7 | |
| GMK NucBox K6 | |
| AcePC Wizbox AI | |
| Intel NUC 13 Pro Desk Edition Kit | |
| Durchschnittliche AMD Radeon 780M (24.5 - 41.5, n=80) | |
| Geekom Mini IT13 | |
| Lenovo IdeaCentre Mini 01IRH8 | |
| GMK NucBox K3 Pro | |
| Beelink SER5 | |
| GMK NucBox M4 | |
| GMK NucBox M3 | |
| Baldur's Gate 3 | |
| 1920x1080 Low Preset AA:SM | |
| GMK NucBox K6 | |
| Durchschnittliche AMD Radeon 780M (20.2 - 44.1, n=47) | |
| 1920x1080 Medium Preset AA:T | |
| GMK NucBox K6 | |
| Durchschnittliche AMD Radeon 780M (15.7 - 36.8, n=50) | |
| 1920x1080 High Preset AA:T | |
| GMK NucBox K6 | |
| Durchschnittliche AMD Radeon 780M (13.3 - 30.6, n=50) | |
| 1920x1080 Ultra Preset AA:T | |
| GMK NucBox K6 | |
| Durchschnittliche AMD Radeon 780M (12.8 - 29.6, n=49) | |
| Cyberpunk 2077 | |
| 1280x720 Low Preset (FSR off) | |
| GMK NucBox K6 | |
| Durchschnittliche AMD Radeon 780M (41.8 - 80.6, n=38) | |
| 1920x1080 Low Preset (FSR off) | |
| GMK NucBox K6 | |
| Durchschnittliche AMD Radeon 780M (23.9 - 52.1, n=63) | |
| 1920x1080 Medium Preset (FSR off) | |
| GMK NucBox K6 | |
| Durchschnittliche AMD Radeon 780M (16.3 - 37.5, n=59) | |
| AcePC Wizbox AI | |
| 1920x1080 High Preset (FSR off) | |
| GMK NucBox K6 | |
| Durchschnittliche AMD Radeon 780M (13.8 - 29.6, n=59) | |
| AcePC Wizbox AI | |
| 1920x1080 Ultra Preset (FSR off) | |
| GMK NucBox K6 | |
| Durchschnittliche AMD Radeon 780M (11.5 - 26.3, n=54) | |
| Final Fantasy XV Benchmark | |
| 1280x720 Lite Quality | |
| GMK NucBox K6 | |
| Geekom A7 | |
| Durchschnittliche AMD Radeon 780M (41.1 - 84.9, n=75) | |
| Beelink GTR6 | |
| Beelink SER6 Pro | |
| Aoostar GOD77 | |
| AcePC Wizbox AI | |
| Geekom Mini IT13 | |
| Intel NUC 13 Pro Desk Edition Kit | |
| GMK NucBox K3 Pro | |
| Lenovo IdeaCentre Mini 01IRH8 | |
| Beelink SER5 | |
| GMK NucBox M3 | |
| GMK NucBox M4 | |
| 1920x1080 Standard Quality | |
| GMK NucBox K6 | |
| Beelink GTR6 | |
| Beelink SER6 Pro | |
| Durchschnittliche AMD Radeon 780M (20.5 - 42.3, n=77) | |
| AcePC Wizbox AI | |
| Geekom A7 | |
| Aoostar GOD77 | |
| Geekom Mini IT13 | |
| Intel NUC 13 Pro Desk Edition Kit | |
| GMK NucBox K3 Pro | |
| Lenovo IdeaCentre Mini 01IRH8 | |
| Beelink SER5 | |
| GMK NucBox M3 | |
| 1920x1080 High Quality | |
| GMK NucBox K6 | |
| Durchschnittliche AMD Radeon 780M (14.6 - 30.8, n=78) | |
| Geekom A7 | |
| Beelink SER6 Pro | |
| Beelink GTR6 | |
| Aoostar GOD77 | |
| AcePC Wizbox AI | |
| Geekom Mini IT13 | |
| Intel NUC 13 Pro Desk Edition Kit | |
| GMK NucBox K3 Pro | |
| Lenovo IdeaCentre Mini 01IRH8 | |
| Beelink SER5 | |
| GMK NucBox M3 | |
Witcher 3 FPS-Diagramm
| min. | mittel | hoch | max. | |
|---|---|---|---|---|
| GTA V (2015) | 163.4 | 153.8 | 65.7 | 26 |
| The Witcher 3 (2015) | 155.1 | 99 | 50.9 | 30.8 |
| Dota 2 Reborn (2015) | 161.2 | 124.8 | 96.8 | 87.4 |
| Final Fantasy XV Benchmark (2018) | 80.8 | 39.3 | 29.3 | |
| X-Plane 11.11 (2018) | 65.9 | 47.3 | 39.7 | |
| Far Cry 5 (2018) | 86 | 49 | 45 | 43 |
| Strange Brigade (2018) | 167.7 | 67.9 | 57.9 | 48.8 |
| Tiny Tina's Wonderlands (2022) | 74.6 | 52.2 | 36.6 | 29.5 |
| F1 22 (2022) | 99.8 | 85.9 | 66.7 | 18.4 |
| Baldur's Gate 3 (2023) | 40.5 | 33.7 | 28.1 | 27 |
| Cyberpunk 2077 (2023) | 46.3 | 35.2 | 27.7 | 24.5 |
Emissionen — Keine Angst vorm Lautwerden
Geräuschemissionen
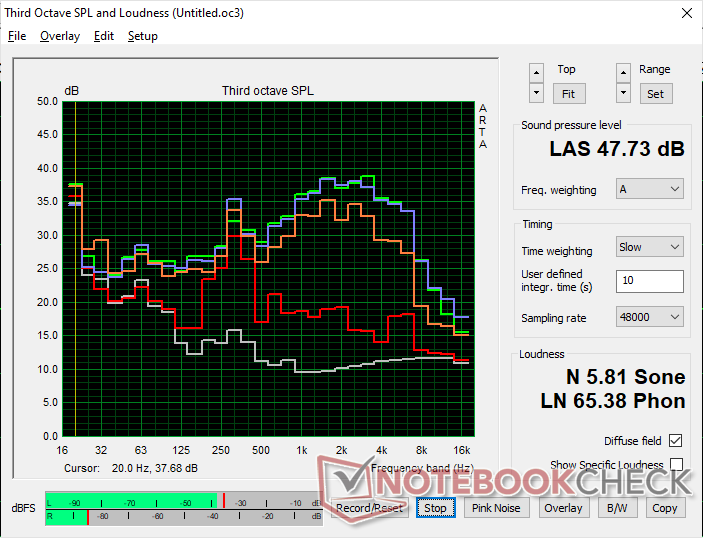
Das Lüftergeräusch liegt immer bei 31,3 dB(A) vor einem leisen Hintergrund von 23,2 dB(A), wodurch die NucBox K6 automatisch lauter ist als die meisten Laptops mit CPUs der U-Serie. Bedenken Sie jedoch, dass die Benutzer normalerweise weiter von den Mini-PCs entfernt sitzen als von den Laptops, so dass der Geräuschpegel insgesamt weniger auffällig sein kann. Beim Videostreaming oder Webbrowsing wird das System mit 33,4 dB(A) etwas lauter, aber die Drehzahländerungen sind zum Glück gleichmäßig und ohne plötzliche Spitzen.
Bei anspruchsvolleren Aufgaben wie Spielen ist das Lüftergeräusch mit 44 bis 48 dB(A) deutlich wahrnehmbarer und fast so laut wie bei einigen Gaming-Laptops wie dem MSI Stealth GS66. Interessanterweise entspricht die Geräuschkulisse und das Verhalten des Lüfters fast dem, was wir beim Geekom A7 beobachtet haben.
Lautstärkediagramm
| Idle |
| 31.3 / 31.3 / 33.4 dB(A) |
| Last |
| 47.5 / 47.7 dB(A) |
 | ||
30 dB leise 40 dB(A) deutlich hörbar 50 dB(A) störend |
||
min: | ||
| GMK NucBox K6 Radeon 780M, R7 7840HS, MasonSemi 1TB MC7000 | GMK NucBox K3 Pro UHD Graphics 64EUs, i7-12650H, Lexar NM610 Pro NM610P001T-HNNNG | Intel NUC 13 Pro Desk Edition Kit Iris Xe G7 96EUs, i7-1360P, Samsung PM9A1 MZVL2512HCJQ | Beelink SER5 Vega 6, R5 5560U, Crucial P3 Plus CT1000P3PSSD8 | AcePC Wizbox AI Arc 8-Core, Ultra 7 155H, Rayson RS512GSSD710 512 GB PCIe 4.0 NVMe | Geekom A7 Radeon 780M, R9 7940HS, Acer N5000 | |
|---|---|---|---|---|---|---|
| Geräuschentwicklung | 15% | 8% | 26% | 19% | -1% | |
| aus / Umgebung * (dB) | 23.2 | 23.1 -0% | 25.2 -9% | 23.7 -2% | 23.54 -1% | 25.4 -9% |
| Idle min * (dB) | 31.3 | 25 20% | 28.1 10% | 23.9 24% | 23.54 25% | 33.3 -6% |
| Idle avg * (dB) | 31.3 | 25.5 19% | 28.2 10% | 23.9 24% | 24.9 20% | 33.6 -7% |
| Idle max * (dB) | 33.4 | 25.5 24% | 28.3 15% | 23.9 28% | 24.9 25% | 33.7 -1% |
| Last avg * (dB) | 47.5 | 39.9 16% | 42 12% | 28 41% | 35.78 25% | 43.3 9% |
| Witcher 3 ultra * (dB) | 43.6 | 39.9 8% | 27.6 37% | 43.2 1% | ||
| Last max * (dB) | 47.7 | 39.9 16% | 42.1 12% | 32.8 31% | 37.57 21% | 43.3 9% |
* ... kleinere Werte sind besser
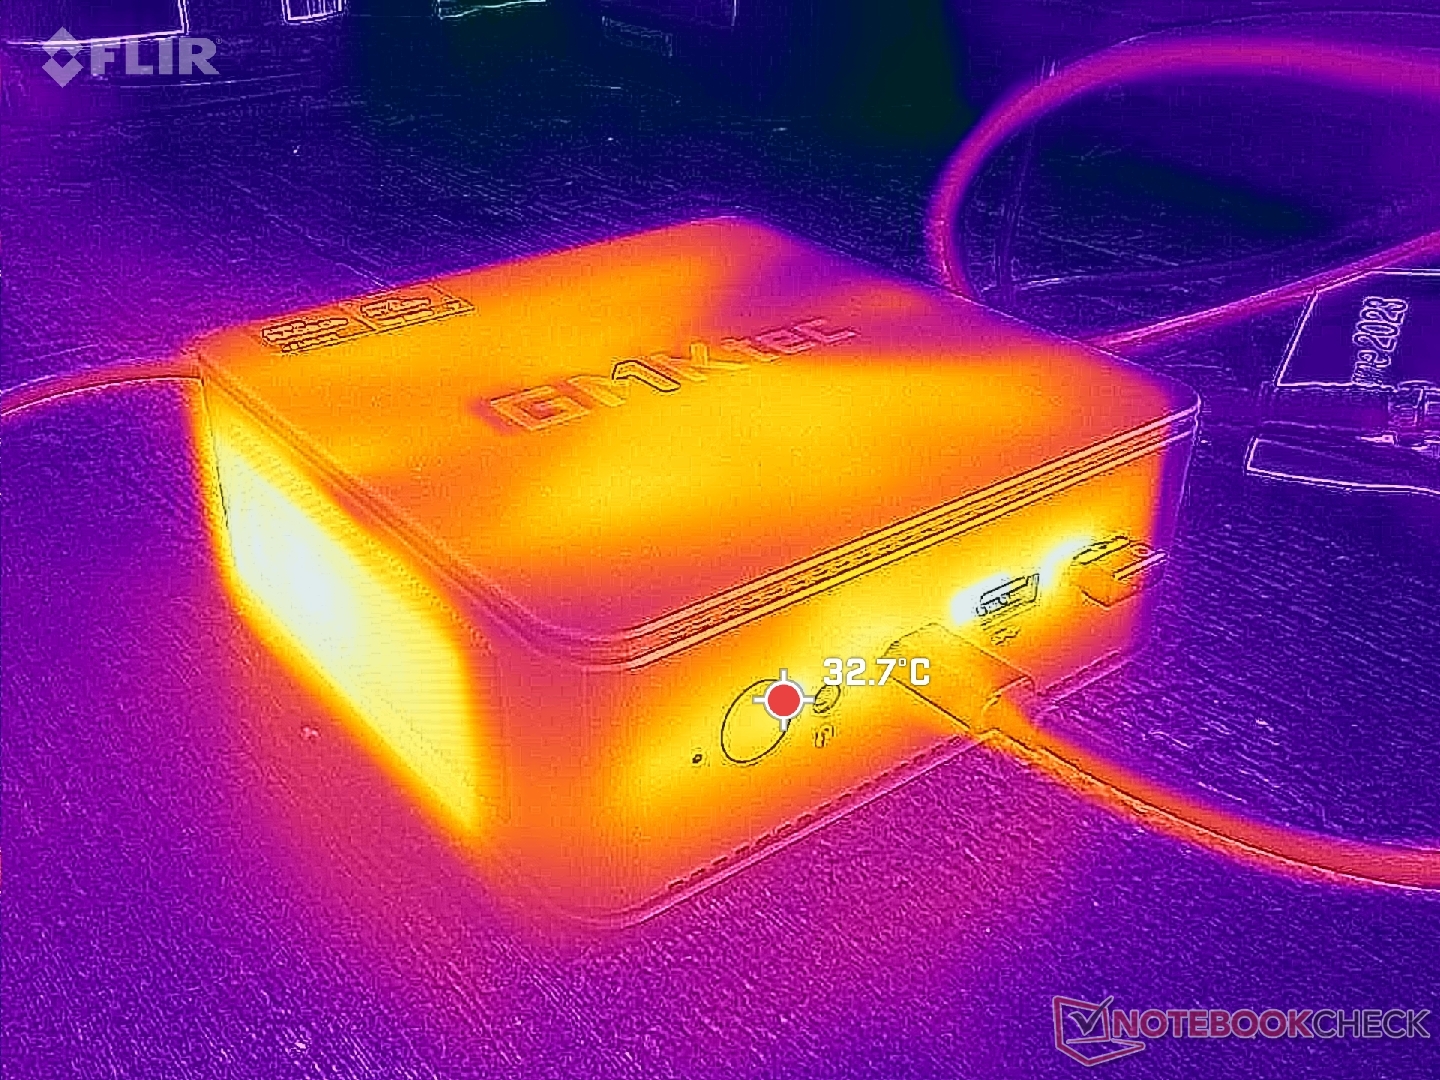
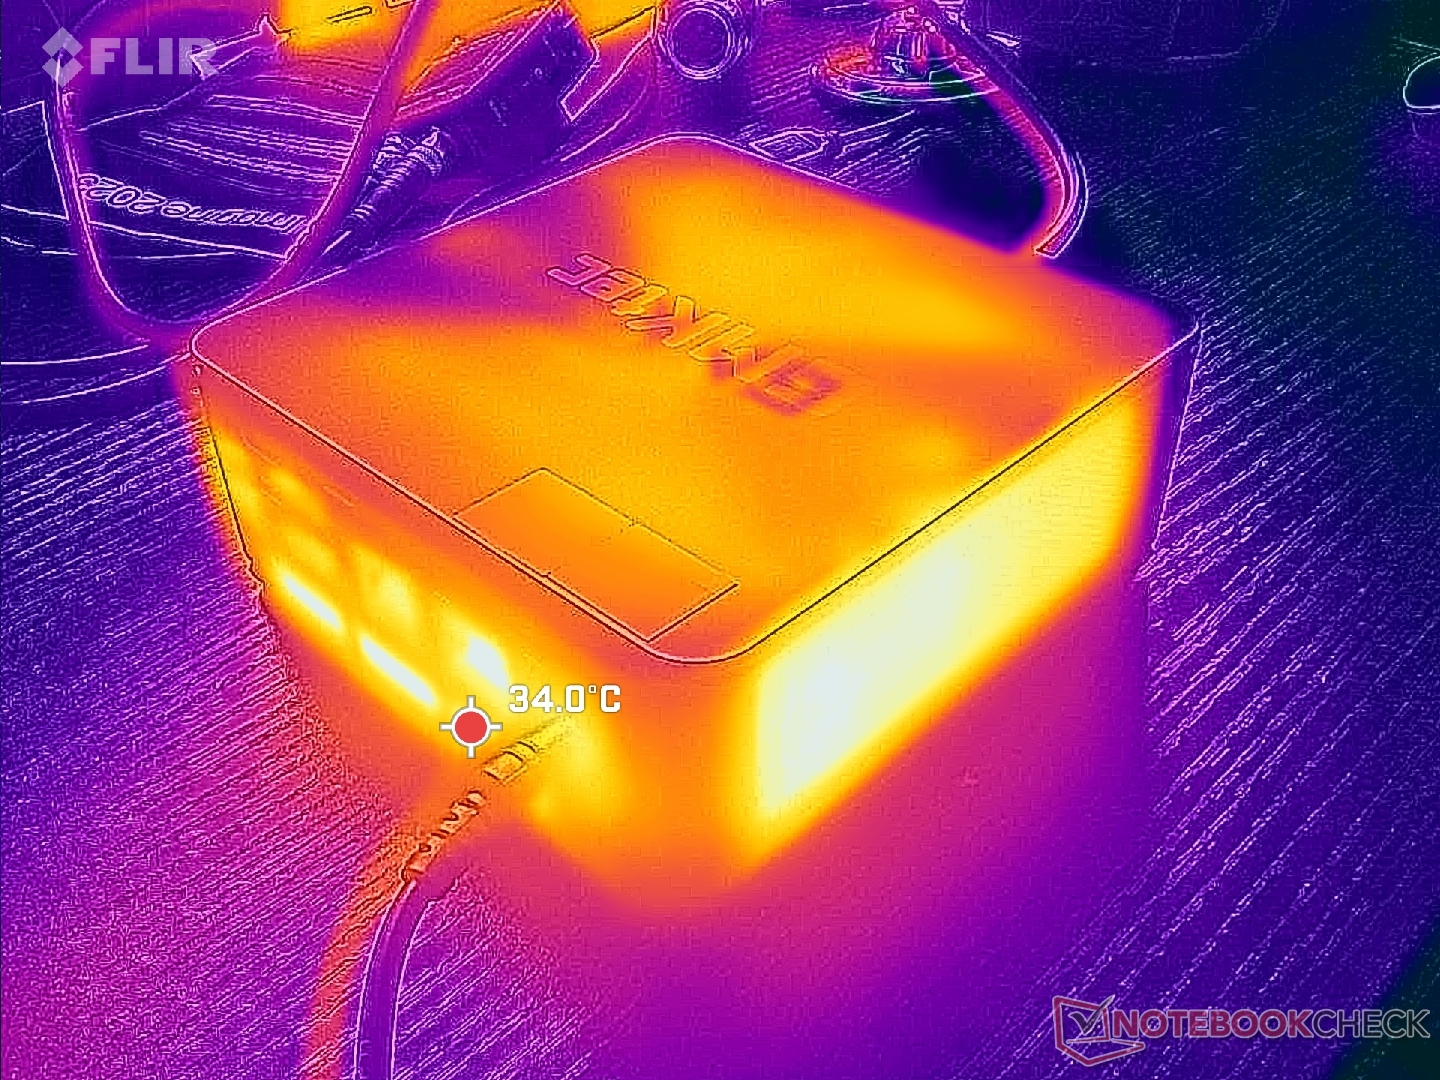
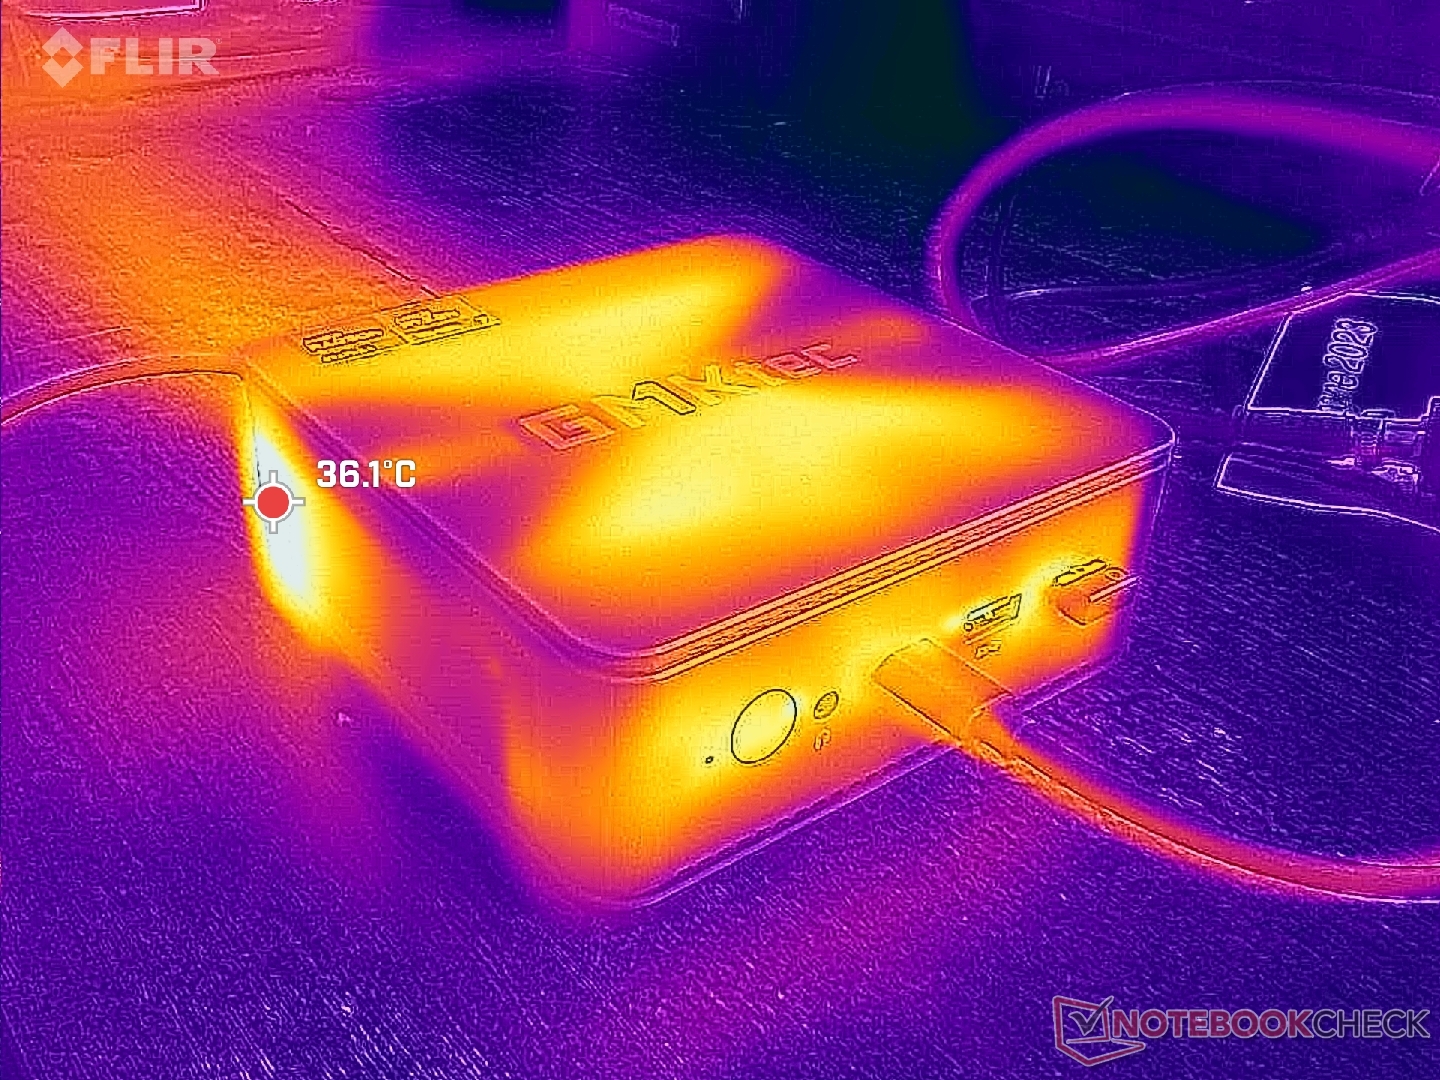
Temperatur
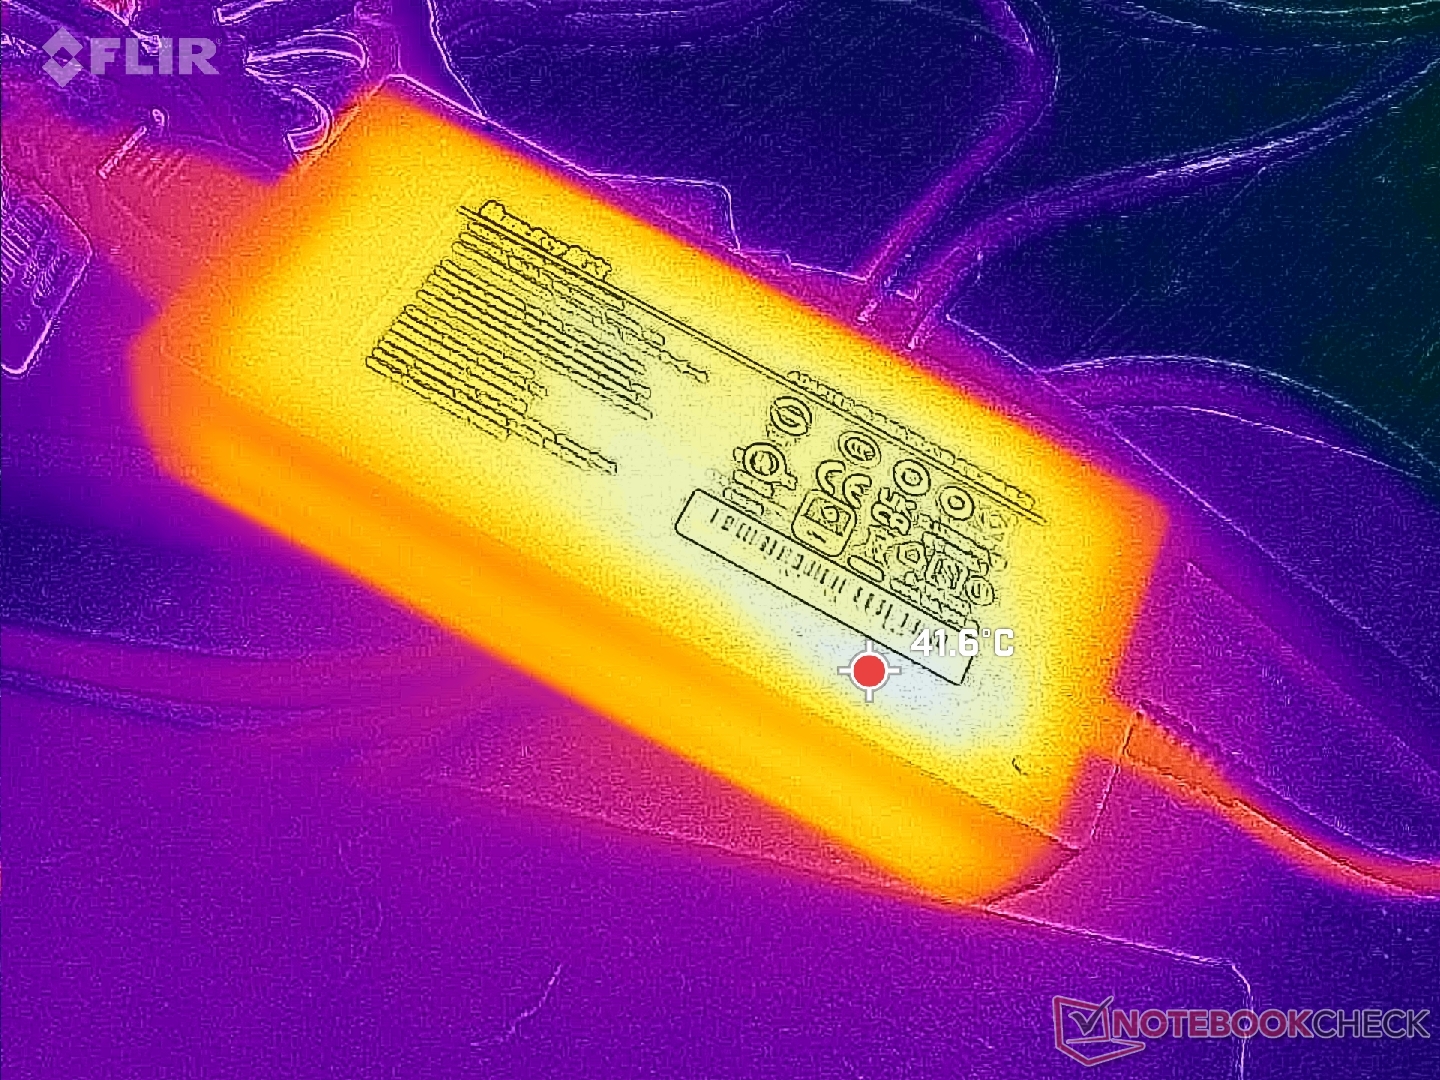
Die Frischluft strömt von unten und entlang des oberen Randes ein, während die Abluft an der Rückseite austritt. Durch dieses Design kann das Gerät sowohl horizontal als auch vertikal aufgestellt werden, ohne dass der Luftstrom behindert wird.
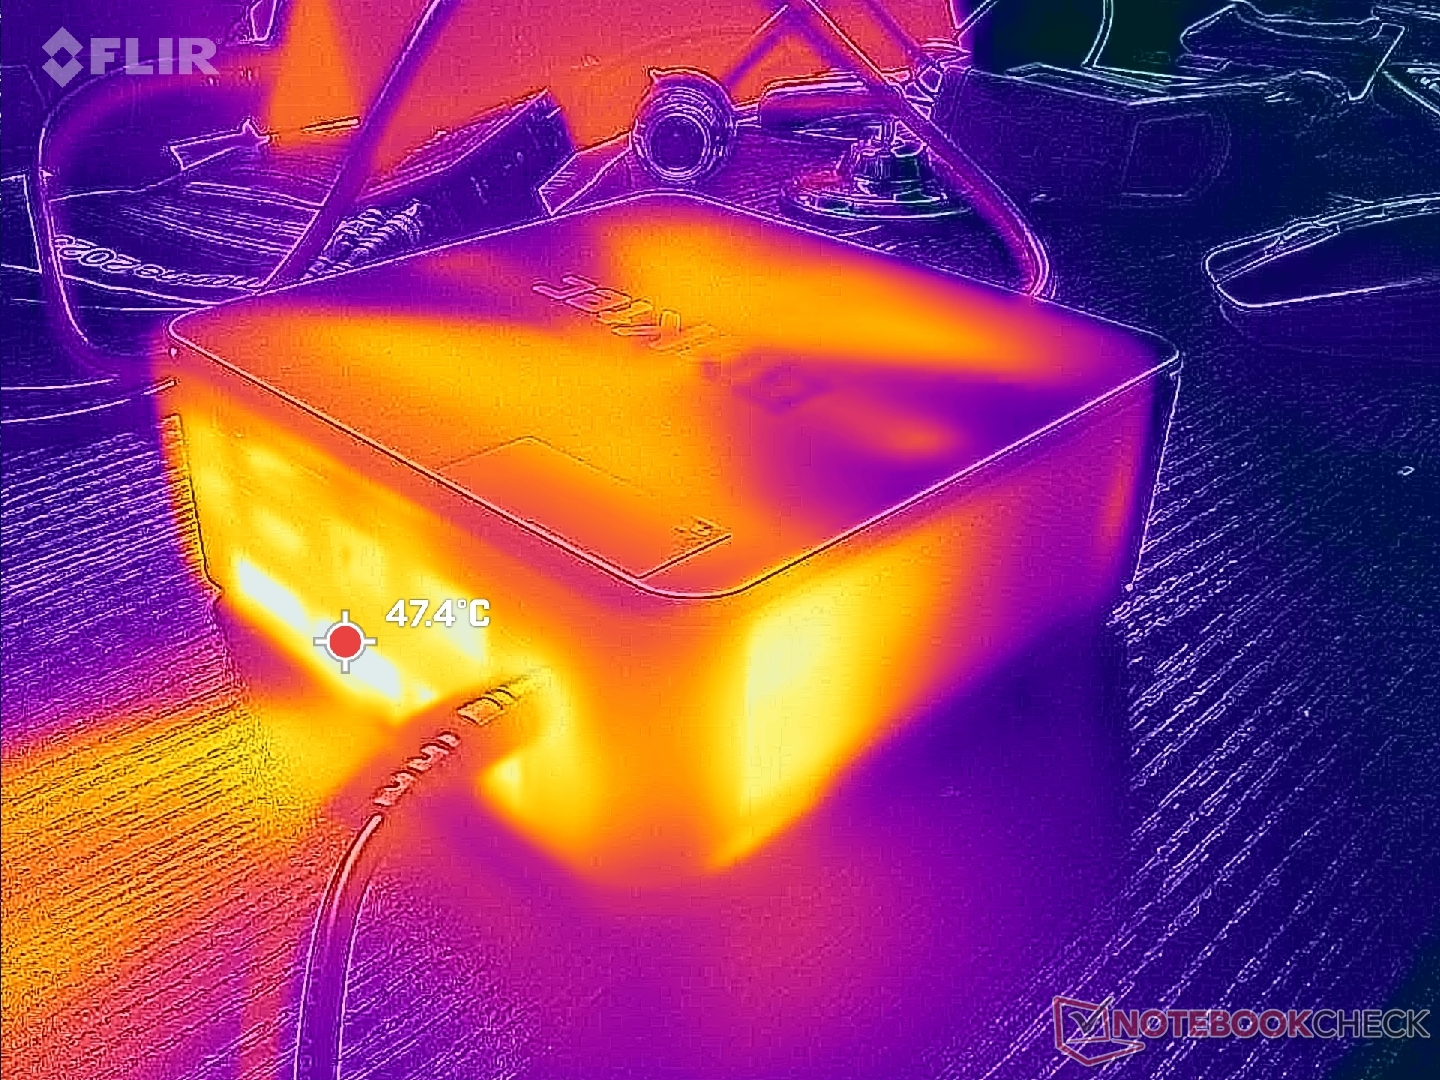
Das Netzteil kann über 42 °C erreichen, wenn anspruchsvolle Lasten über längere Zeit laufen.
Energieverwaltung
Energieaufnahme
Beim Spielen zieht das System etwa 73 W, was für einen Mini-PC mit nur integrierter Grafik relativ viel ist. Der langsamere NUC 13 Pro zum Beispiel benötigt unter ähnlichen Bedingungen nur 45 W. Der hohe Verbrauch steht im Einklang mit unseren obigen Erkenntnissen über die höhere Leistungsaufnahme der NucBox K6.
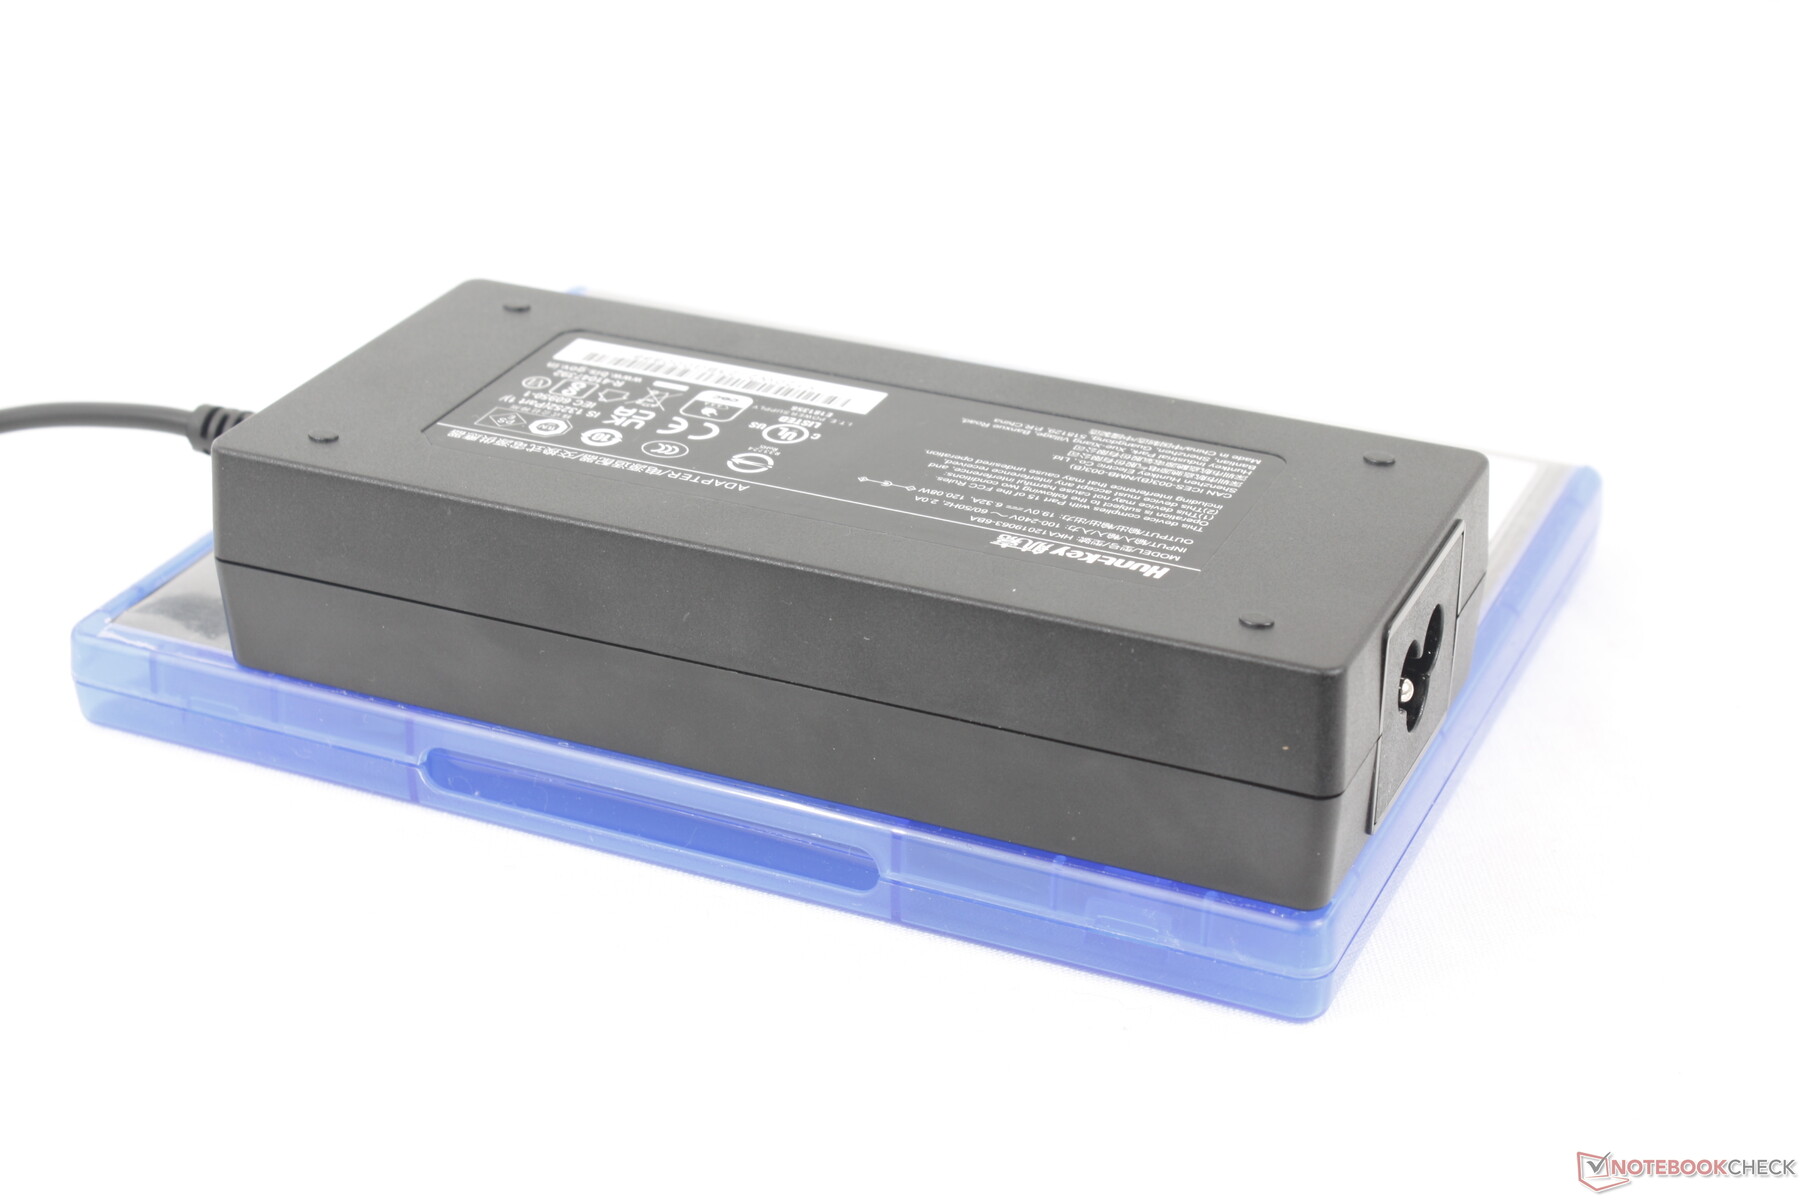
Mit dem mittelgroßen (~14,9 x 6,3 x 3 cm) 130-Watt-Netzteil können wir eine maximale Leistungsaufnahme von etwa 88 W verzeichnen, wenn die CPU zu 100 Prozent ausgelastet ist. Der Strom-Overhead kann für externe USB-C-Geräte wie SSDs genutzt werden.
(Anmerkung der Redaktion: Dieser Abschnitt wird aktualisiert, sobald die Reparaturen an unserem Metrahit Energy-Multimeter abgeschlossen sind. Wir entschuldigen uns für die Unannehmlichkeiten).
| Aus / Standby | |
| Idle | |
| Last |
|
Legende:
min: | |
| GMK NucBox K6 R7 7840HS, Radeon 780M, MasonSemi 1TB MC7000, , x, | GMK NucBox K3 Pro i7-12650H, UHD Graphics 64EUs, Lexar NM610 Pro NM610P001T-HNNNG, , x, | Intel NUC 13 Pro Desk Edition Kit i7-1360P, Iris Xe G7 96EUs, Samsung PM9A1 MZVL2512HCJQ, , x, | Beelink SER5 R5 5560U, Vega 6, Crucial P3 Plus CT1000P3PSSD8, , x, | AcePC Wizbox AI Ultra 7 155H, Arc 8-Core, Rayson RS512GSSD710 512 GB PCIe 4.0 NVMe, , x, | Geekom A7 R9 7940HS, Radeon 780M, Acer N5000, , x, | |
|---|---|---|---|---|---|---|
| Stromverbrauch | -15% | -13% | 45% | -115% | 16% | |
| Idle min * (Watt) | 6.7 | 7.1 -6% | 7 -4% | 4.4 34% | 7.23 -8% | 3.8 43% |
| Idle avg * (Watt) | 7 | 10.1 -44% | 9.2 -31% | 5 29% | 10 -43% | 4.8 31% |
| Idle max * (Watt) | 7.6 | 18.6 -145% | 11.8 -55% | 5.3 30% | 49 -545% | 6.5 14% |
| Last avg * (Watt) | 74.3 | 45.3 39% | 45 39% | 29.8 60% | 53 29% | 71.9 3% |
| Witcher 3 ultra * (Watt) | 75 | 55.2 26% | 28.8 62% | |||
| Last max * (Watt) | 85.7 | 52.9 38% | 97.2 -13% | 40.4 53% | 91 -6% | 94.7 -11% |
* ... kleinere Werte sind besser
Energieverbrauch Witcher 3 / Stresstest
Energieverbrauch externer Monitor
Pro
Contra
Fazit — Leistungsstark und relativ preisgünstig
Die NucBox K6 ist einer der überzeugendsten Mini-PCs, die wir bisher von GMK getestet haben. Er erfüllt mehrere Schlüsselfaktoren, darunter eine erschwingliche Preisspanne von 500 Euro, eine starke CPU- und iGPU-Leistung, aufrüstbaren RAM und Massenspeicher sowie einen kleinen Formfaktor im NUC-Format. Vor allem seine Leistung ist in dieser Kategorie besonders beeindruckend, denn Alternativen wie der Intel NUC 13 Pro oder der Geekom A7 sind langsamer, teurer oder sogar beides.
Die starke Leistung und der attraktive Preis überschatten die kurze Liste der Nachteile und machen die GMK NucBox K6 zu einer einfachen Empfehlung für HTPC- und gelegentliche 1080p-Gaming-Zwecke.
Es gibt nur ein paar kleinere Nachteile. Der einzelne USB-C-Anschluss kann sich zum Beispiel einschränkend anfühlen, wenn Sie eine Menge Zubehör oder Monitore anschließen möchten. Wir würden uns auch eine werkzeuglose Wartung ähnlich wie beim Lenovo IdeaCentre Mini oder bestimmten Intel NUCs wünschen. Die DPC-Latenzprobleme sollten ebenfalls behoben werden, um eine flüssigere Videowiedergabe zu ermöglichen. Und schließlich würde ein Wechsel zu USB-C-Netzteilen den Mini-PC reisefreundlicher machen und die Kompatibilität mit bestehenden USB-C-Netzteilen erhöhen.
Preis und Verfügbarkeit
GMK NucBox K6
- 03.04.2024 v7 (old)
Allen Ngo
Transparenz
Die Auswahl der zu testenden Geräte erfolgt innerhalb der Redaktion. Das vorliegende Testmuster wurde dem Autor vom Hersteller oder einem Shop zu Testzwecken leihweise zur Verfügung gestellt. Eine Einflussnahme des Leihstellers auf den Testbericht gab es nicht, der Hersteller erhielt keine Version des Reviews vor der Veröffentlichung. Es bestand keine Verpflichtung zur Publikation. Als eigenständiges, unabhängiges Unternehmen unterliegt Notebookcheck keiner Diktion von Herstellern, Shops und Verlagen.
So testet Notebookcheck
Pro Jahr werden von Notebookcheck hunderte Laptops und Smartphones unabhängig in von uns standardisierten technischen Verfahren getestet, um eine Vergleichbarkeit aller Testergebnisse zu gewährleisten. Seit rund 20 Jahren entwickeln wir diese Testmethoden kontinuierlich weiter und setzen damit Branchenstandards. In unseren Testlaboren kommt ausschließlich hochwertiges Messequipment in die Hände erfahrener Techniker und Redakteure. Die Tests unterliegen einer mehrstufigen Kontrolle. Unsere komplexe Gesamtbewertung basiert auf hunderten fundierten Messergebnissen und Benchmarks, womit Ihnen Objektivität garantiert ist. Weitere Informationen zu unseren Testmethoden gibt es hier.
Preisvergleich

