GMKtec NucBox M3 mini PC im Test: Core i5-12450H ist einfach zu leistungshungrig

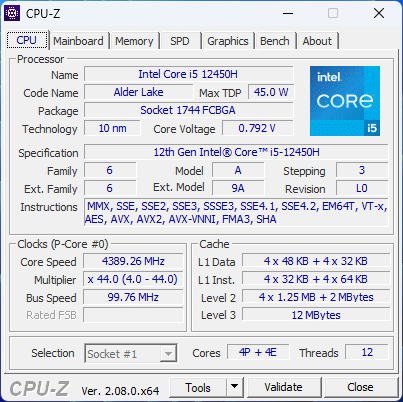
Die NucBox M3 stellt die Weiterentwicklung der NucBox M2 vom letzten Jahr dar und tauscht die Intel Core H CPU der 11. Generation gegen die Alder Lake Optionen der 12. Generation aus. Unser Testgerät ist mit dem Core i5-12450H, 32 GB RAM und einer 1 TB SSD für etwa ~450 Euro ausgestattet, während Barebone-Optionen bereits ab ~350 Euro erhältlich sind.
Als Alternativen zur NucBox M3 kommen andere kostengünstige Mini-PCs wie der Beelink SER5, Geekom A5 oder BMAX B7 in Betracht.
Weitere GMK Bewertungen:
Potential Competitors in Comparison
Bew. | Datum | Modell | Gewicht | Dicke | Größe | Auflösung | Preis ab |
|---|---|---|---|---|---|---|---|
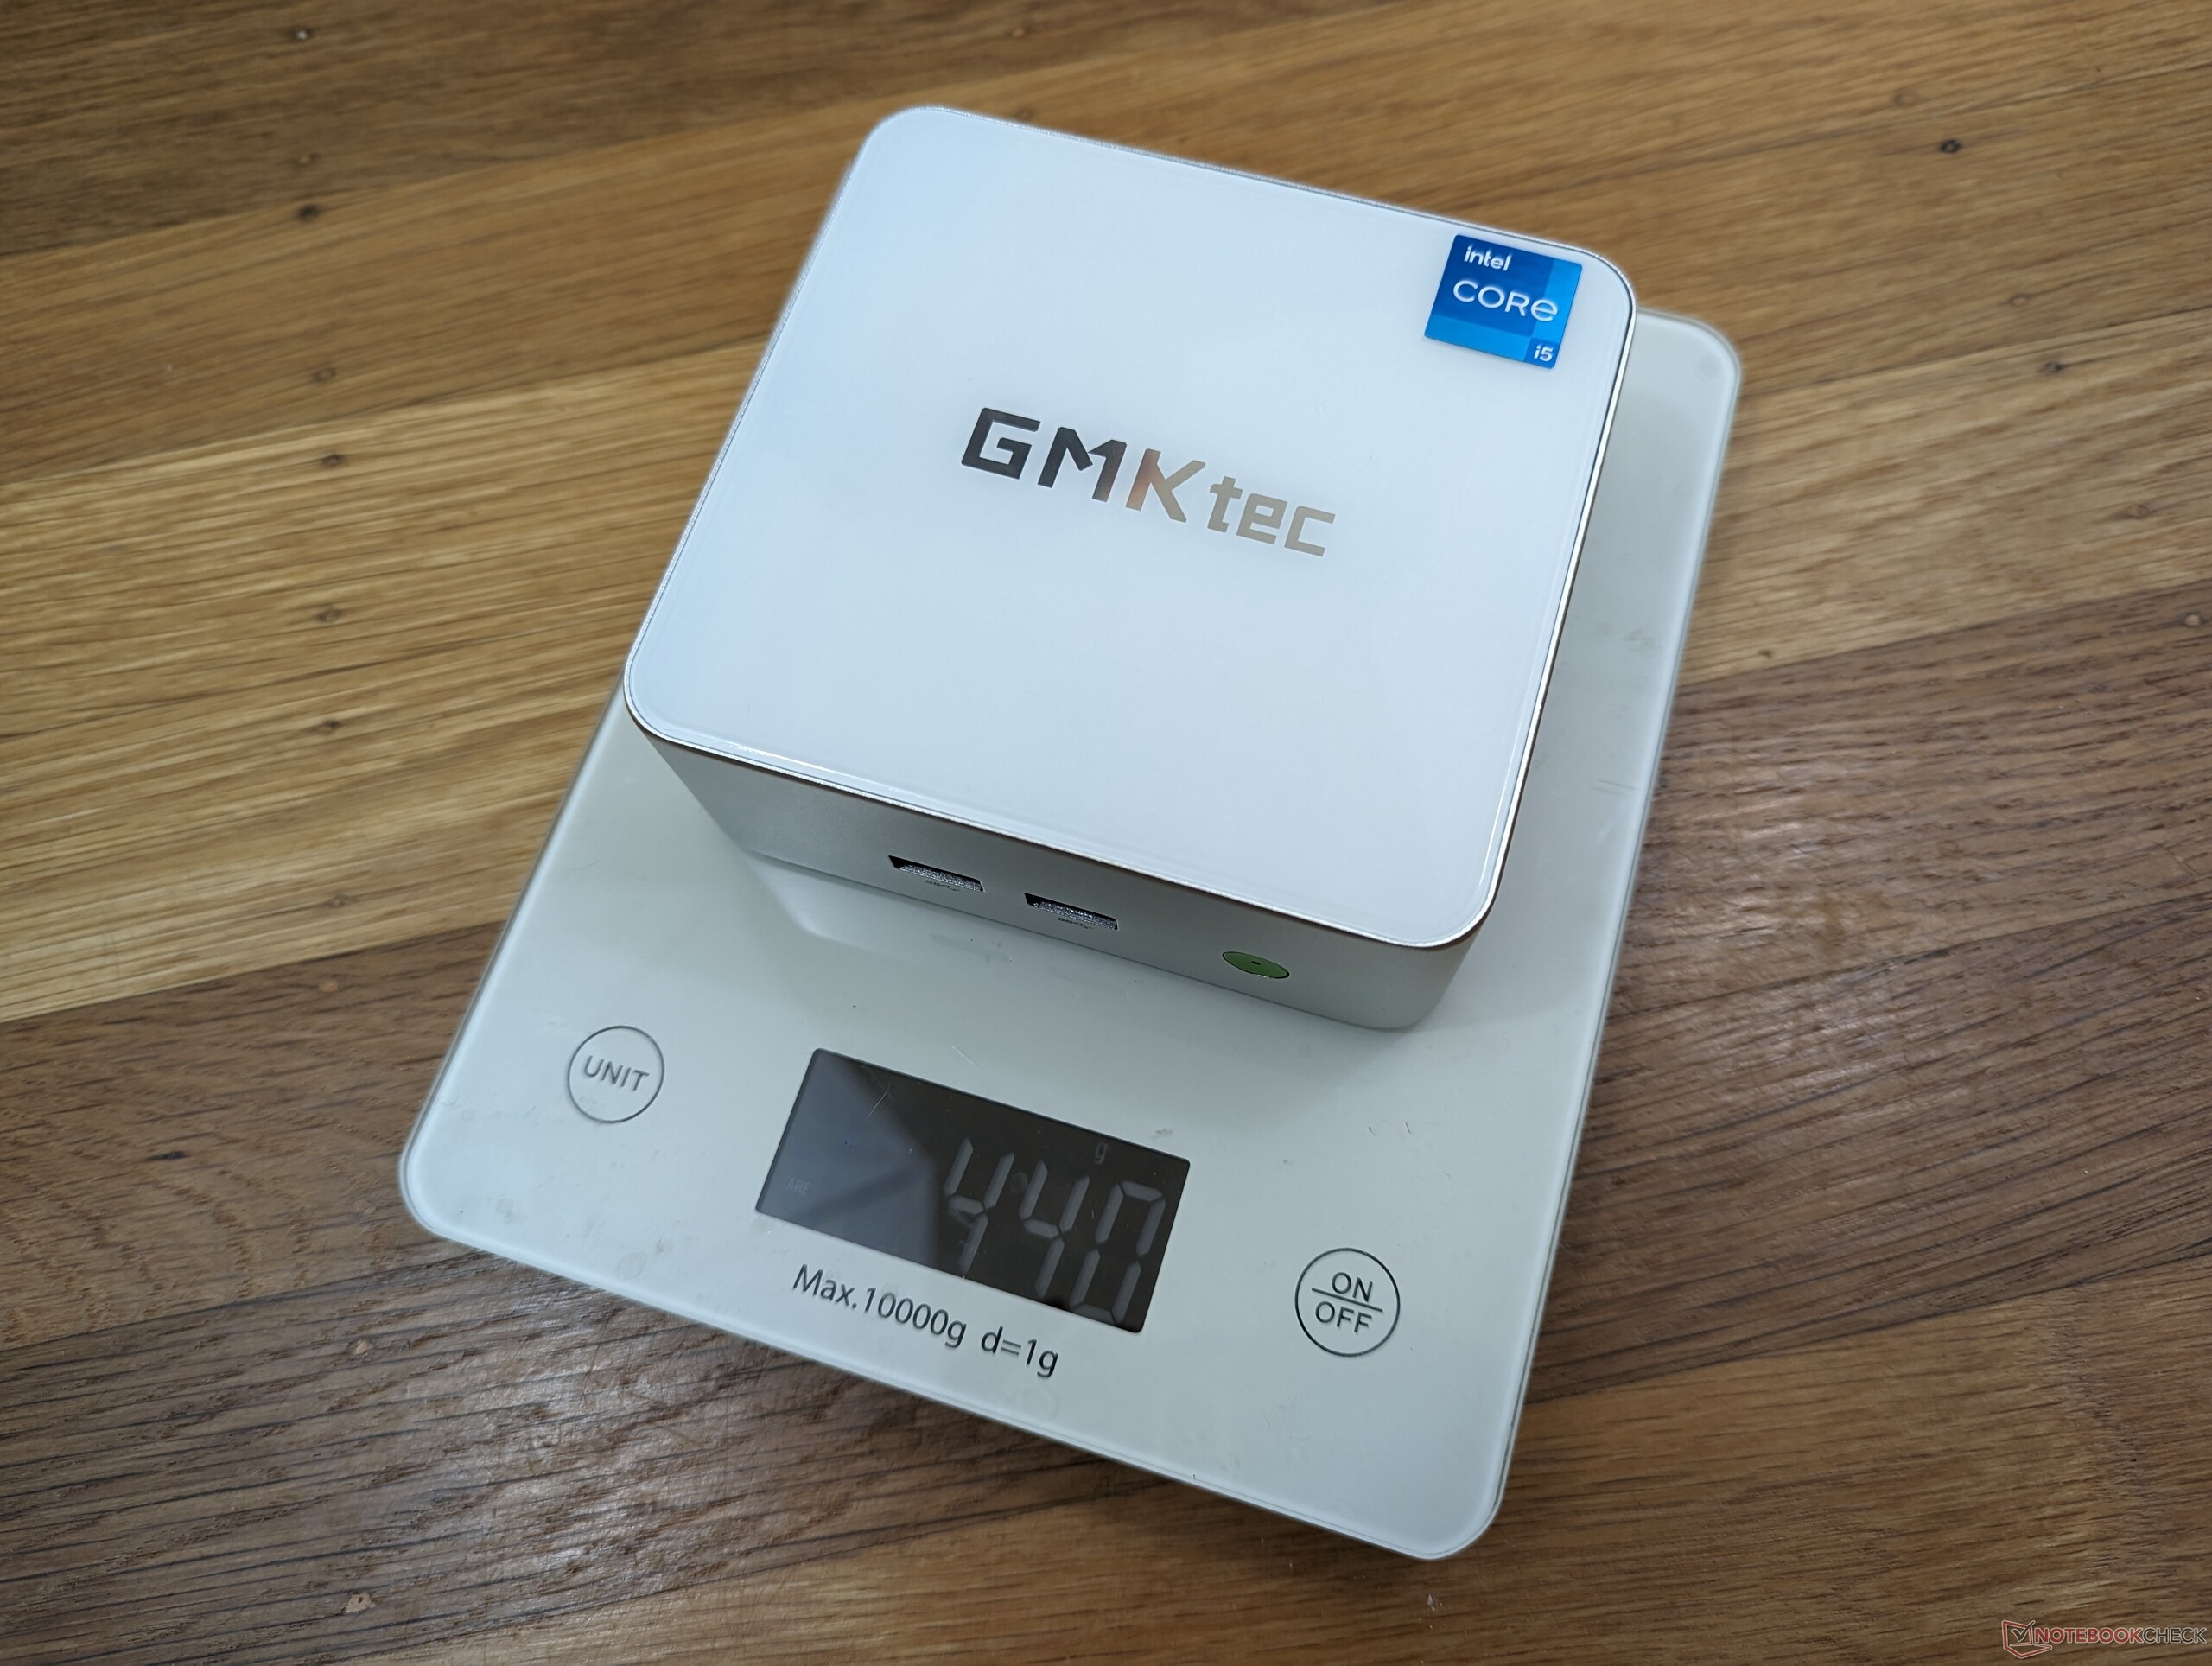
| 78.7 % v7 (old) | 11 / 2023 | GMK NucBox M3 i5-12450H, UHD Graphics Xe G4 48EUs | 440 g | 42.4 mm | x | ||
| 82.8 % v7 (old) | 10 / 2023 | GMK NucBox K3 Pro i7-12650H, UHD Graphics 64EUs | 396 g | 43.2 mm | x | ||
| 82.1 % v7 (old) | 11 / 2023 | Beelink SER5 R5 5560U, Vega 6 | 439 g | 42 mm | x | ||
| 73.1 % v7 (old) | 10 / 2023 | Beelink Mini S12 Pro N100, UHD Graphics 24EUs (Alder Lake-N) | 335 g | 39.1 mm | x | ||
| 81.2 % v7 (old) | 10 / 2023 | Geekom A5 R7 5800H, Vega 8 | 555 g | 49.2 mm | x | ||
| 80.8 % v7 (old) | 04 / 2023 | Intel NUC 13 Pro Kit NUC13ANK i7-1360P, Iris Xe G7 96EUs | 538 g | 37 mm | x |
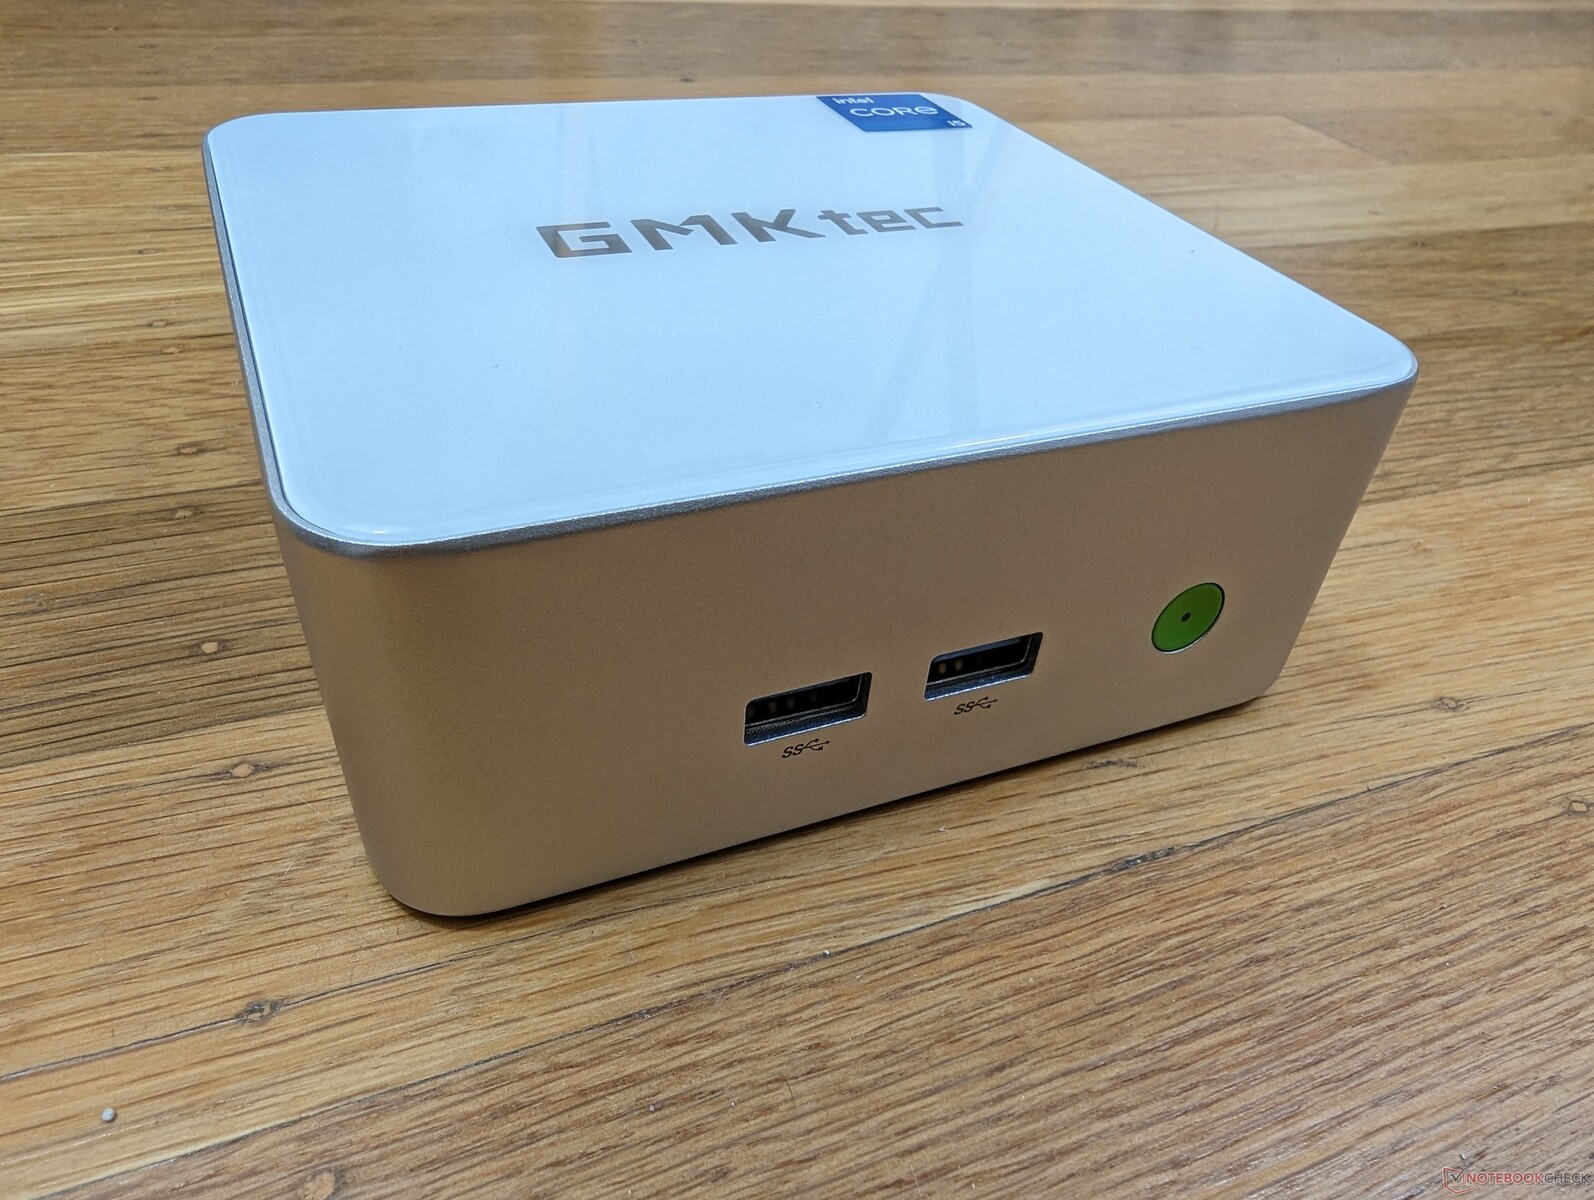
Gehäuse
Die NucBox M3 ist kompakter als die NucBox K3 Pro, weist jedoch ein höheres Gewicht auf und fühlt sich dichter an. Das Gehäuse besteht aus Metall an den Seiten und Kunststoff oben und unten. Obwohl die Verarbeitungsqualität unseres Geräts solide ist und keine offensichtlichen Mängel aufweist, erscheint das System im Vergleich zur Intel NUC-Serie aufgrund der Kunststoff-Ober- und Unterseite möglicherweise weniger hochwertig.

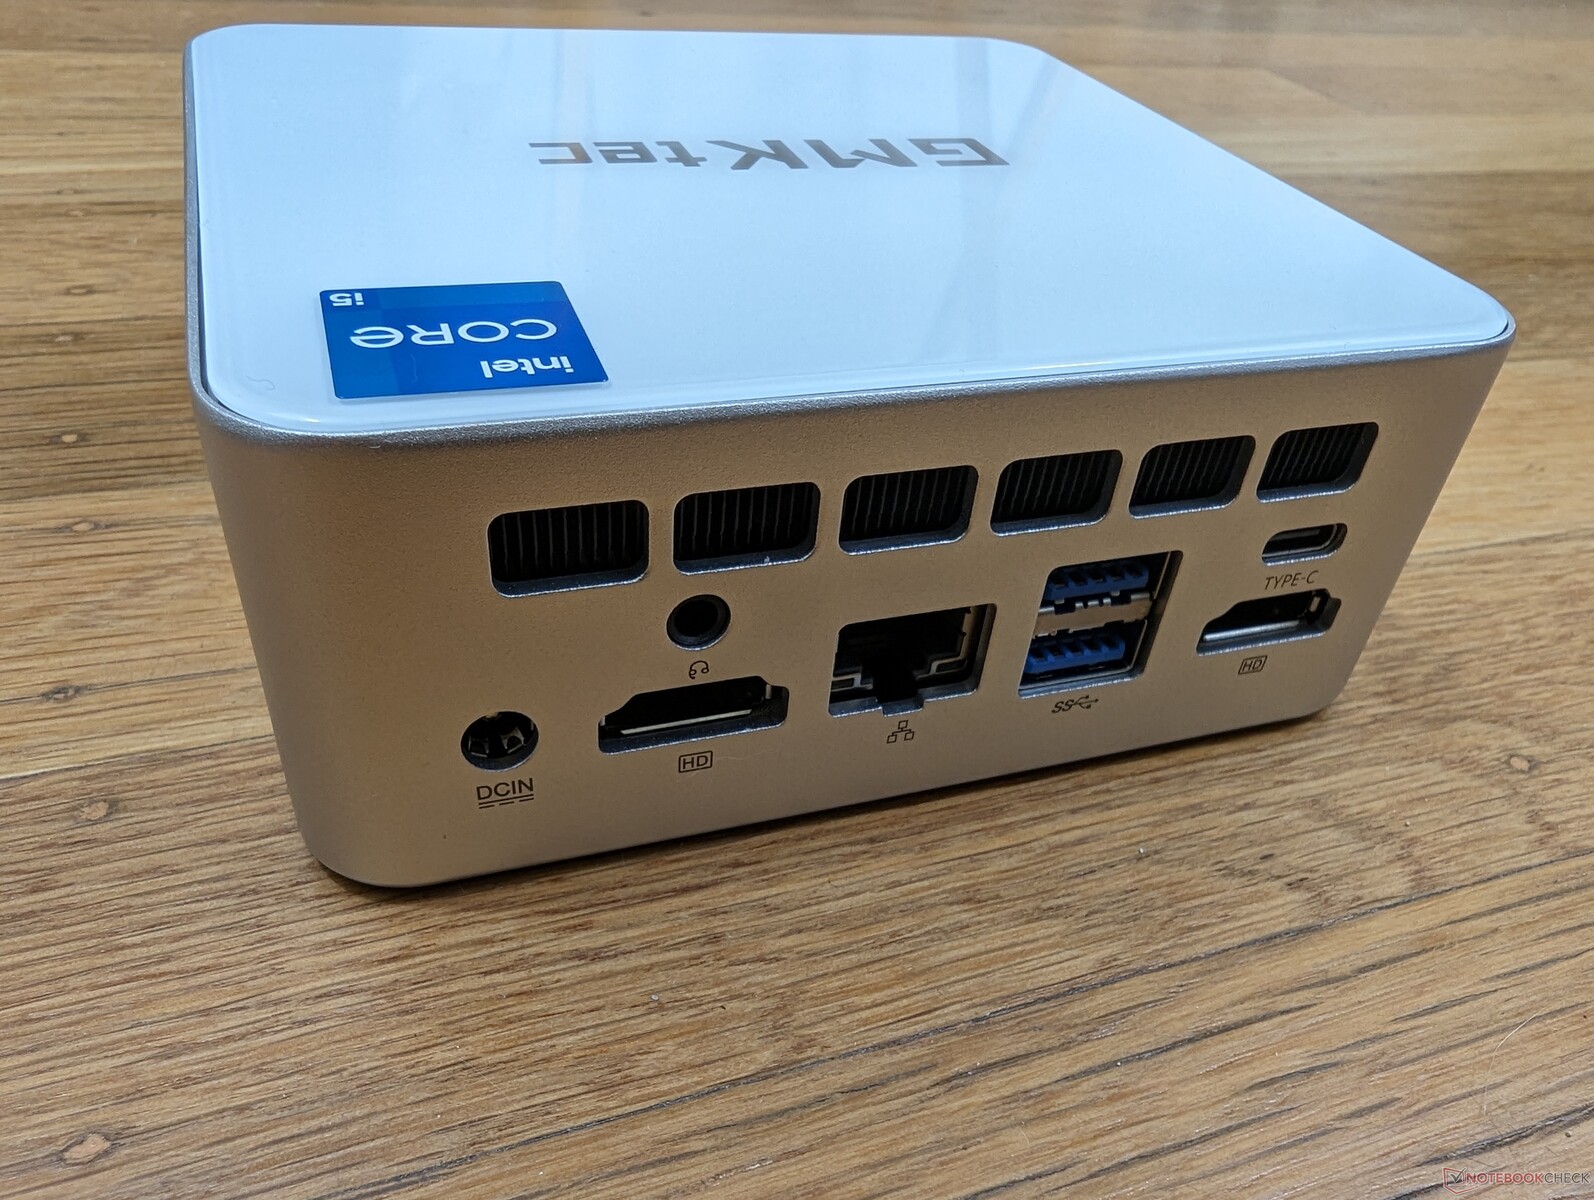
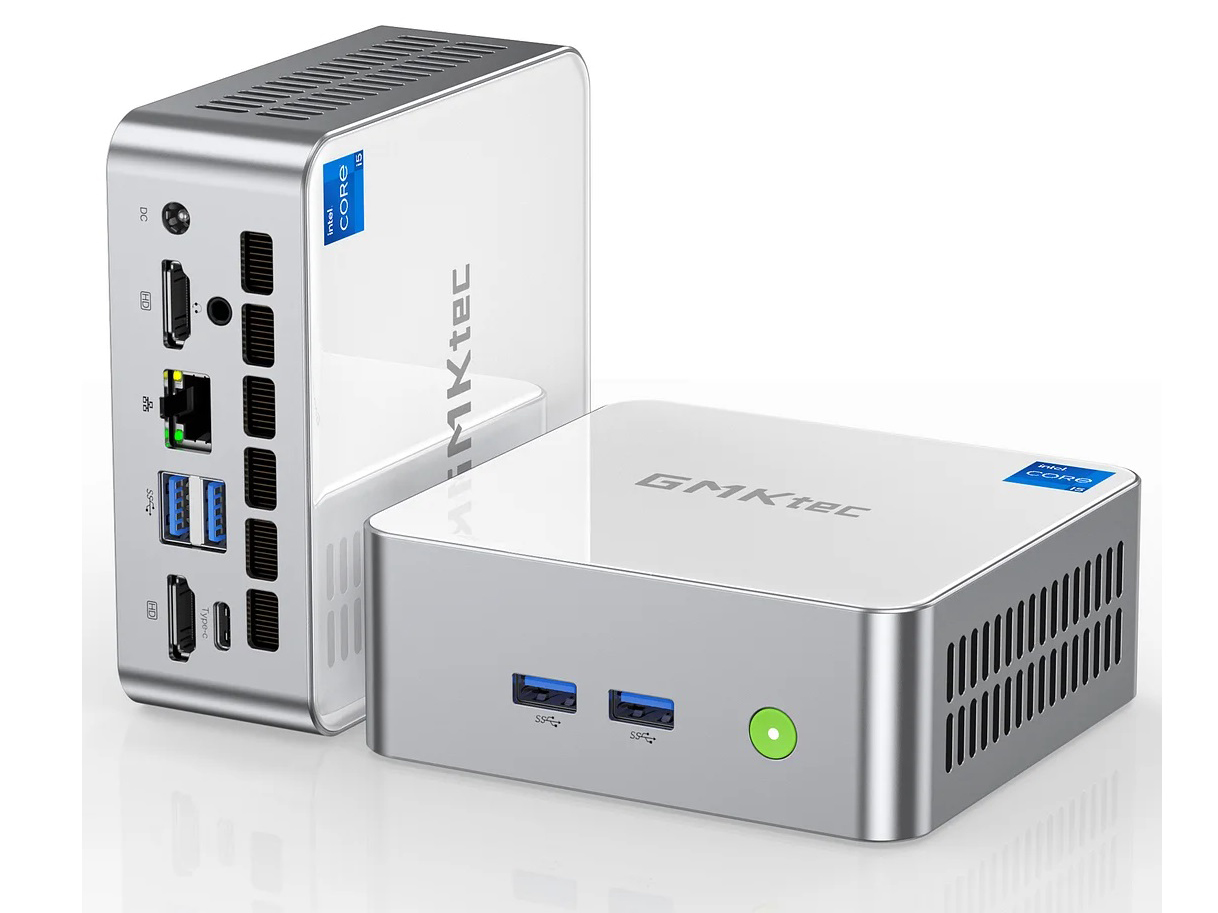
Ausstattung
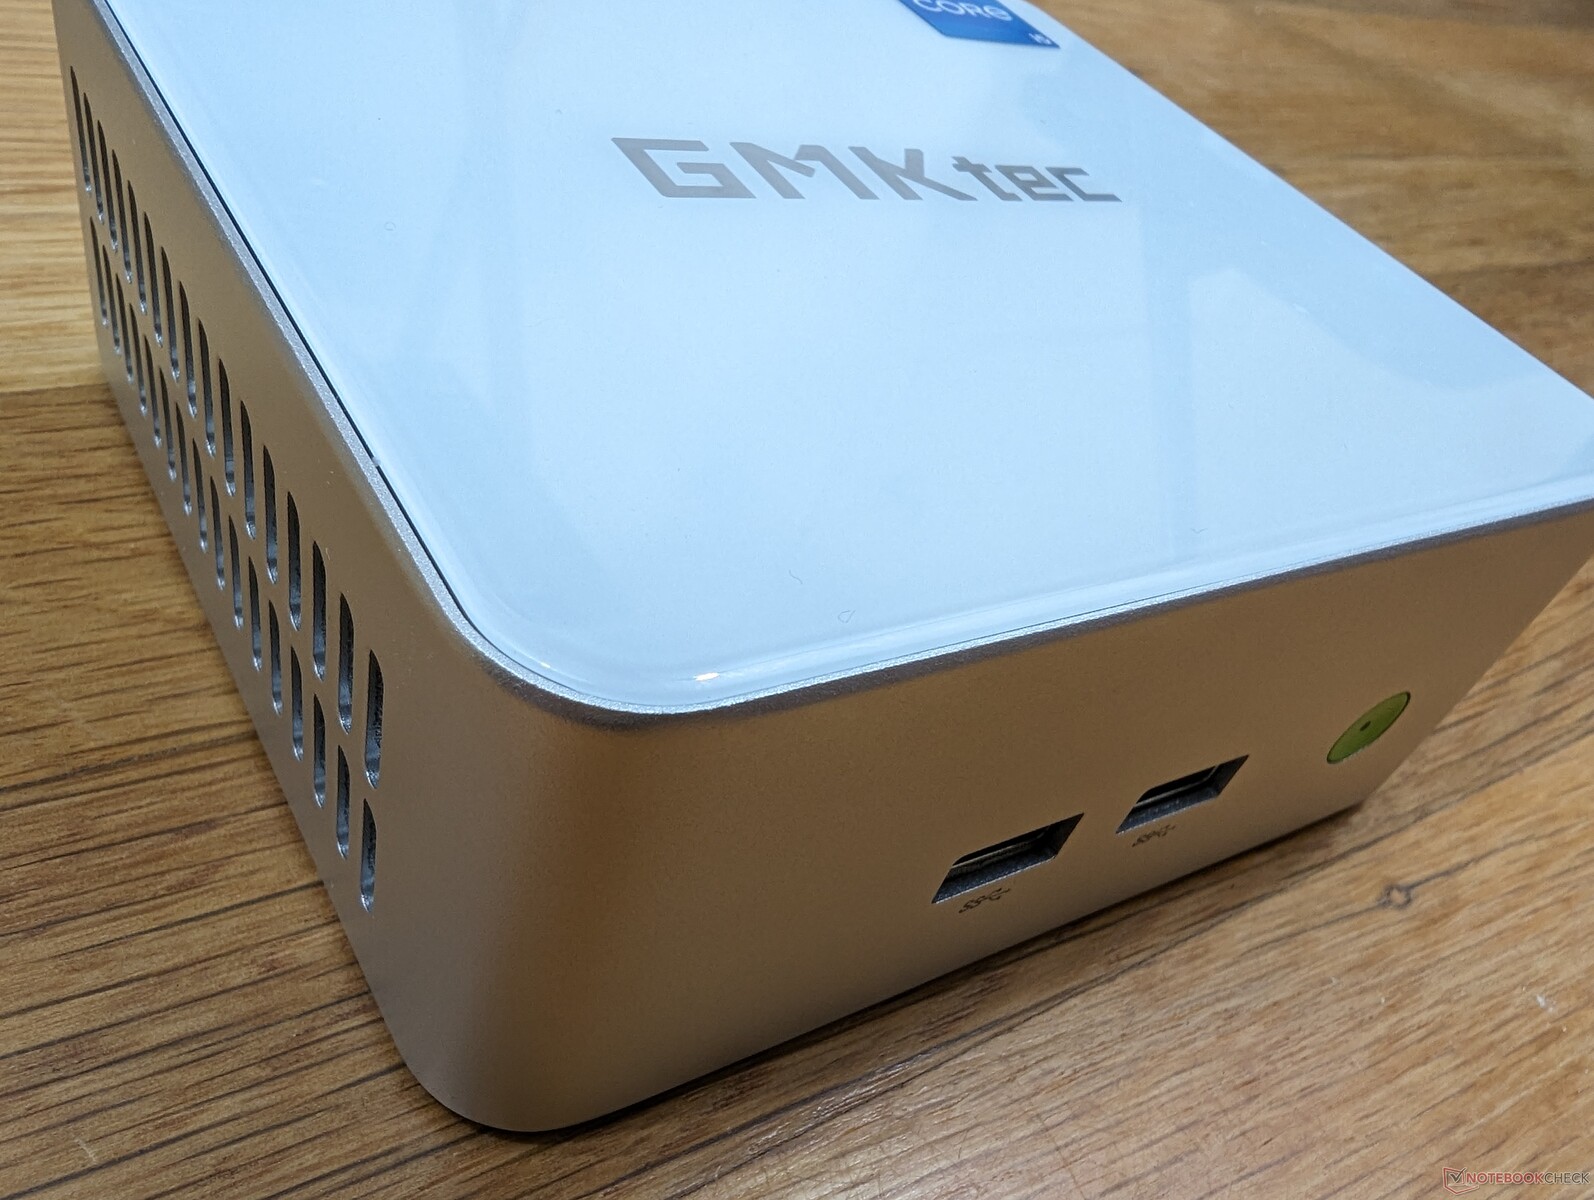
Die Anschlussoptionen sind zwar vielfältig, jedoch scheint es Probleme mit dem einzigen USB-C-Anschluss in Bezug auf die Videoausgabe zu geben. Obwohl der Hersteller mit USB-C-DisplayPort-Kompatibilität wirbt, konnten wir feststellen, dass keiner unserer externen USB-C-Monitore funktioniert. Zudem wird Thunderbolt offenbar nicht unterstützt, vermutlich aus Kostengründen.
Kommunikation
Das Modell wird ohne Wi-Fi 6E-Unterstützung ausgeliefert, wahrscheinlich um Kosten zu sparen. Die Wi-Fi 6-Konnektivität ist ansonsten stabil und zuverlässig.
| Networking | |
| iperf3 transmit AXE11000 | |
| Beelink SER5 | |
| GMK NucBox K3 Pro | |
| GMK NucBox M3 | |
| Geekom A5 | |
| Intel NUC 13 Pro Kit NUC13ANK | |
| Beelink Mini S12 Pro | |
| iperf3 receive AXE11000 | |
| Beelink SER5 | |
| GMK NucBox K3 Pro | |
| Geekom A5 | |
| Intel NUC 13 Pro Kit NUC13ANK | |
| GMK NucBox M3 | |
| Beelink Mini S12 Pro | |
| iperf3 transmit AXE11000 6GHz | |
| Intel NUC 13 Pro Kit NUC13ANK | |
| iperf3 receive AXE11000 6GHz | |
| Intel NUC 13 Pro Kit NUC13ANK | |
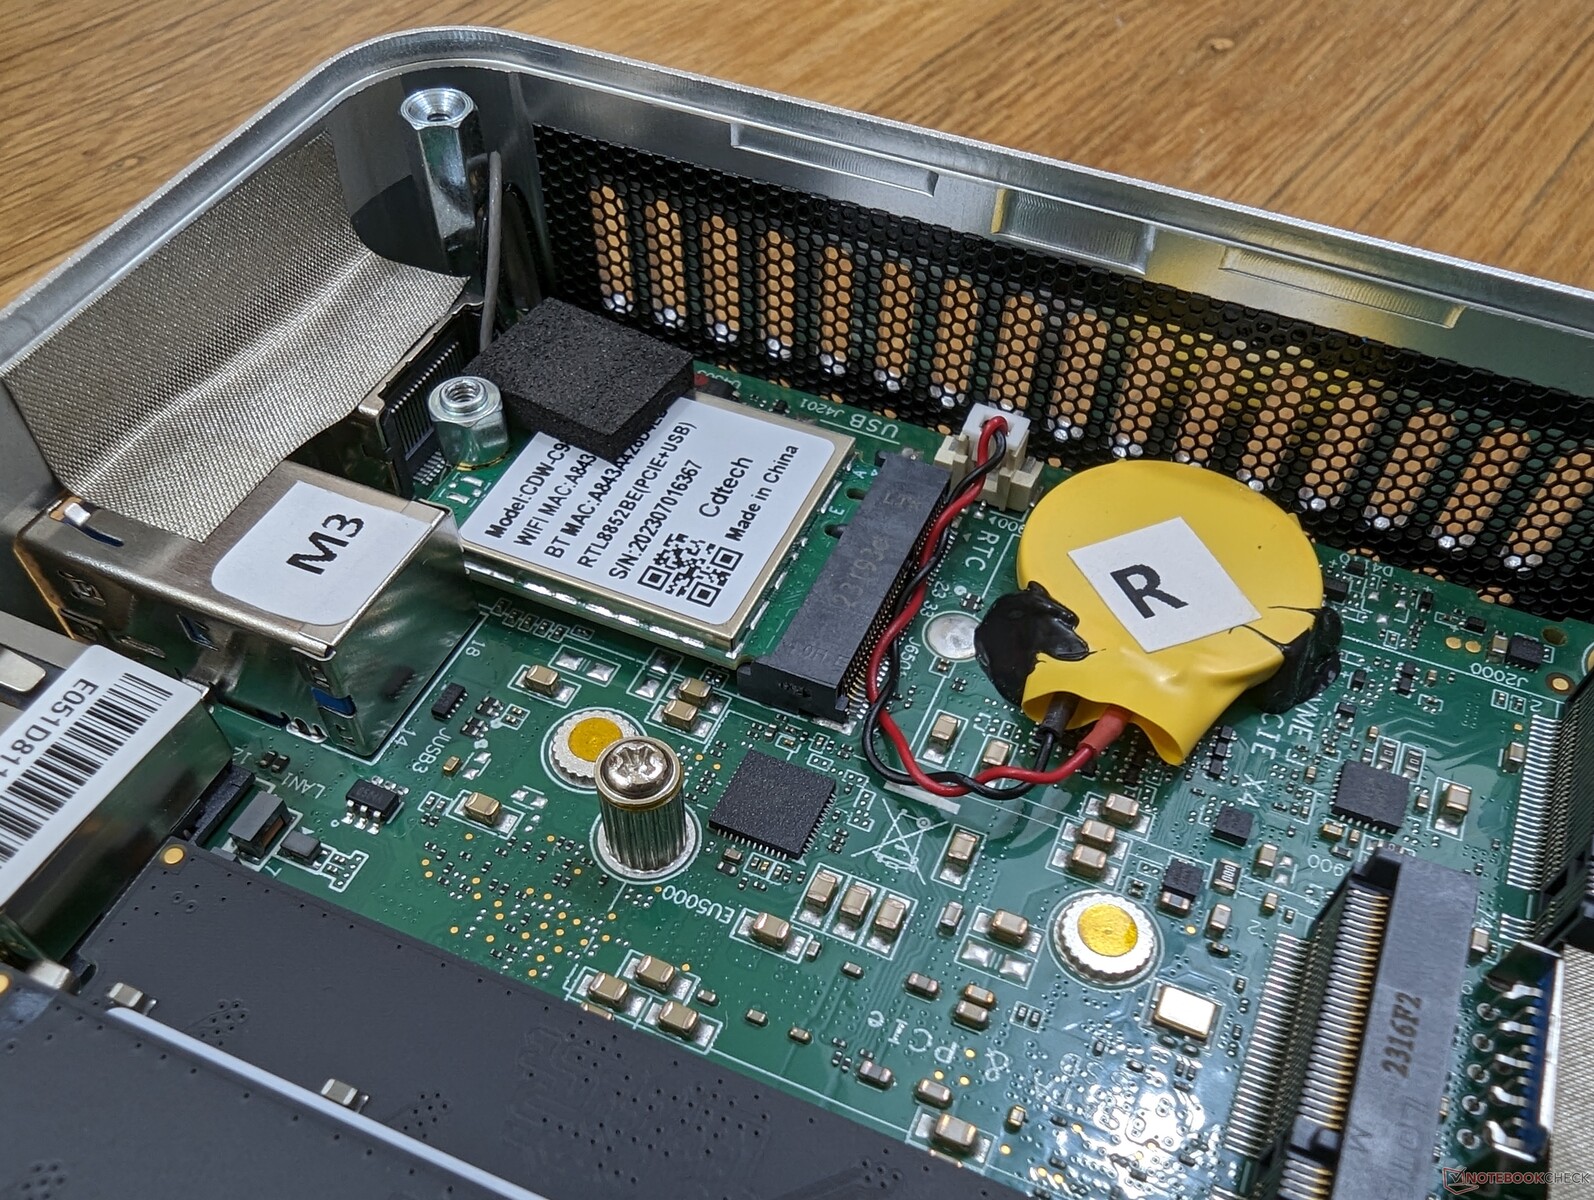
Wartung
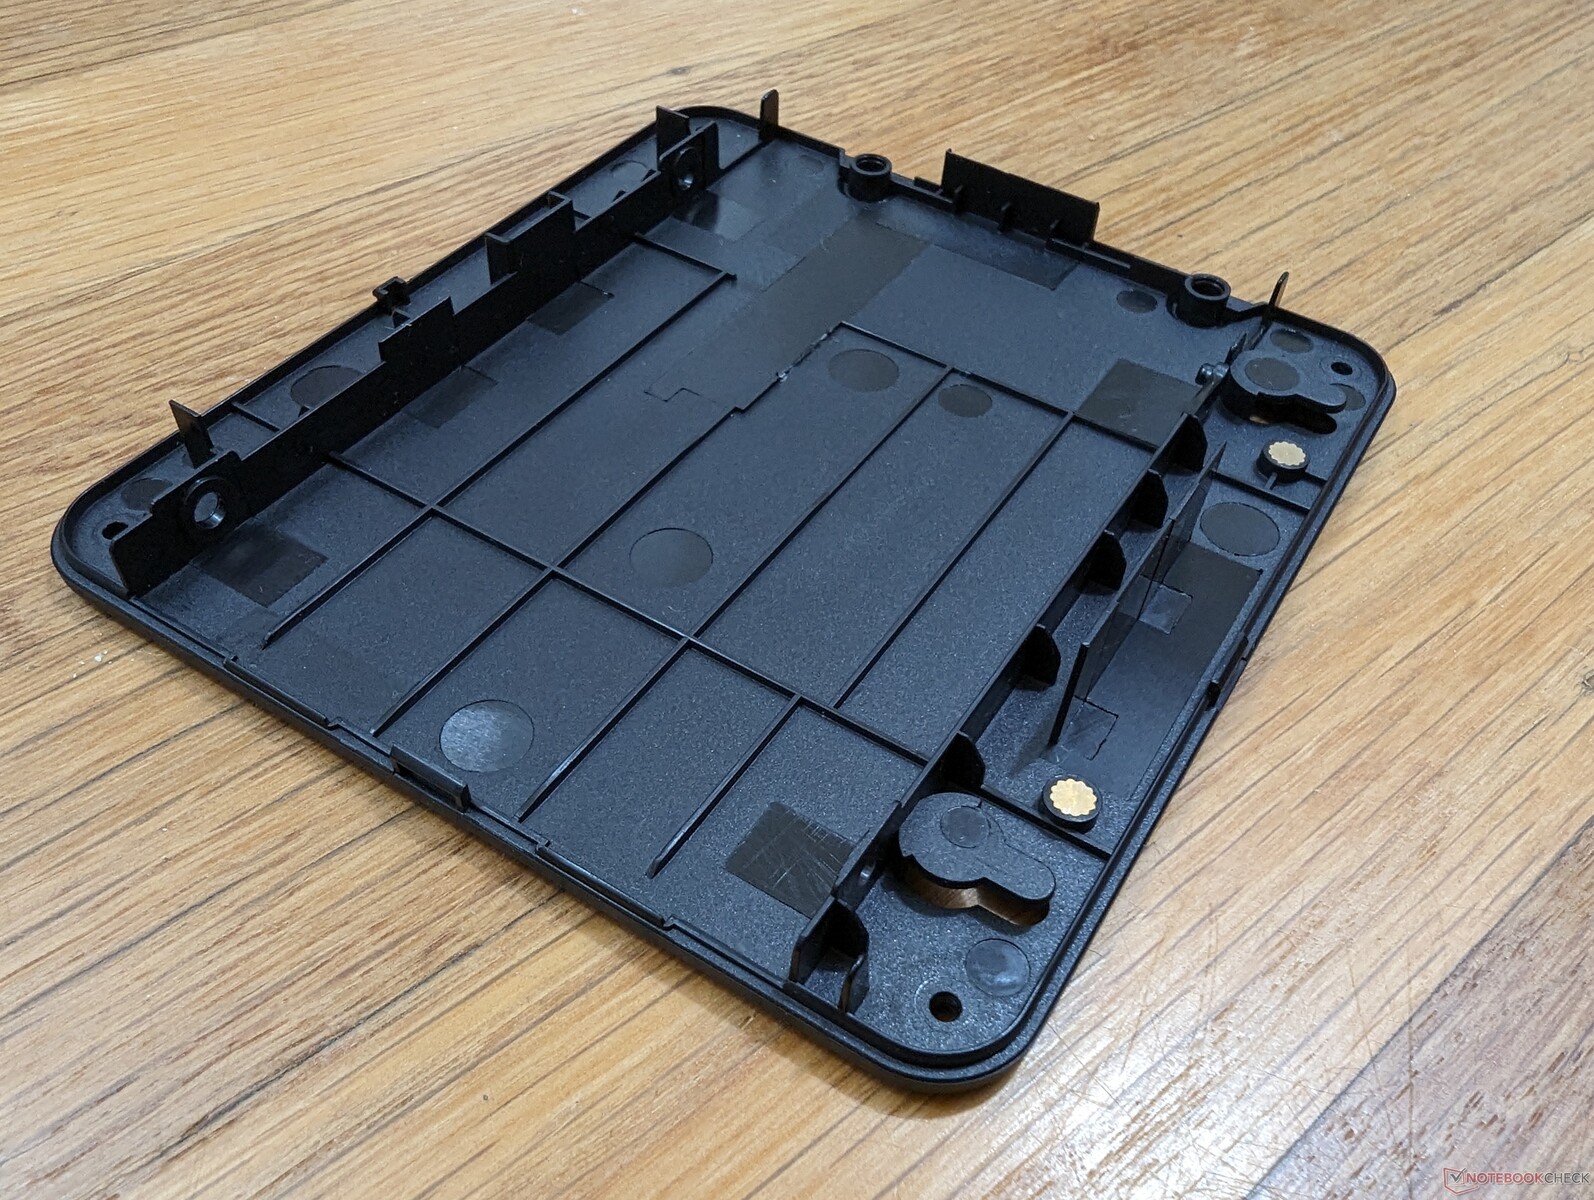
Die Bodenplatte ist mit vier Kreuzschlitzschrauben befestigt, um die Wartung zu erleichtern.
Zubehör & Garantie
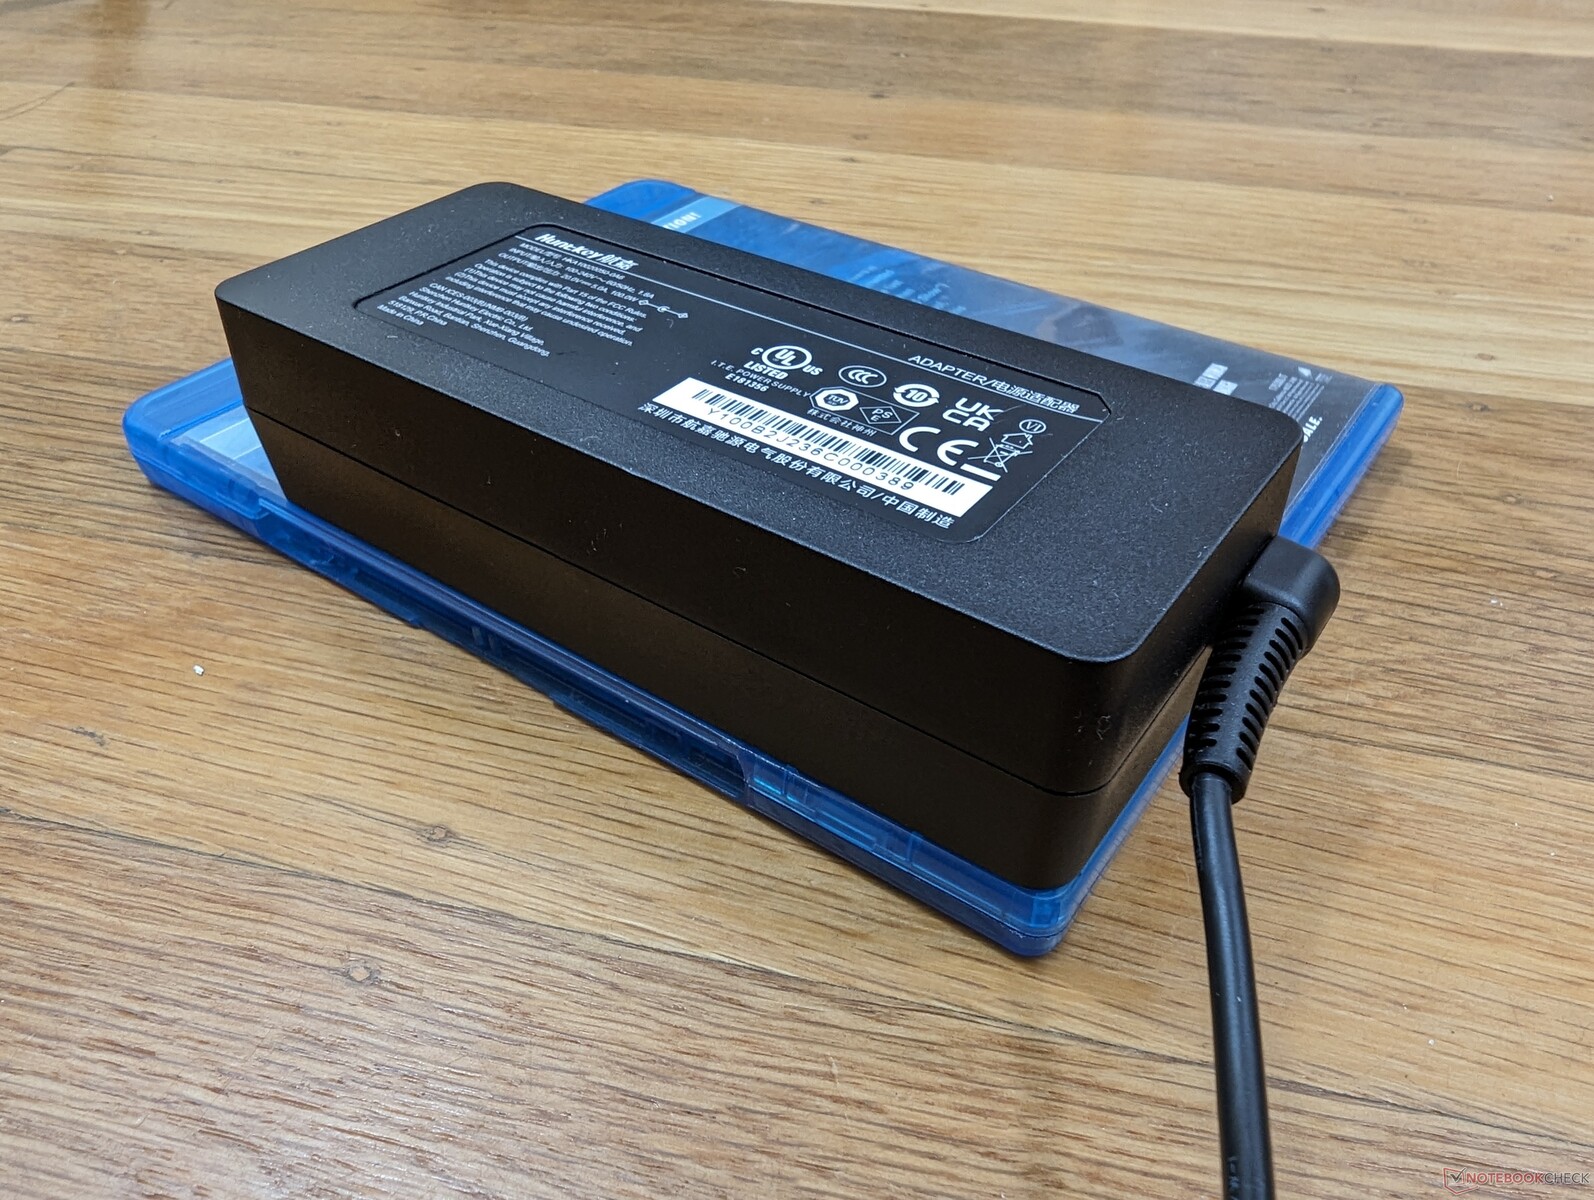
Im Lieferumfang befinden sich ein HDMI-Kabel, das Netzteil, Papierkram und eine VESA-Halterung mit Schrauben. Beim Kauf gilt die übliche einjährige eingeschränkte Herstellergarantie.
Leistung
Testbedingungen
Wir haben Windows in den Performance-Modus versetzt, bevor wir die folgenden Benchmarks durchgeführt haben. Der Hersteller installiert keine eigene Software zum Umschalten von modellabhängigen Funktionen.
Prozessor
Die Multi-Thread-Leistung unseres Core i5-12450H ist etwa 25 bis 30 Prozent langsamer im Vergleich zum Core i7-12650H, der in der NucBox K3 Pro zum Einsatz kommt. Das Defizit reicht aus, um unsere CPU mit dem Ryzen 5 5560U zu vergleichen, der als kostengünstigere und energieeffizientere Alternative gilt. Hingegen zeigt der Core i5-12450H seine Stärke in der Single-Thread-Leistung, wo er in unmittelbarer Nähe des Core i7-13700H liegt.
Cinebench R15 Multi Dauertest
Cinebench R23: Multi Core | Single Core
Cinebench R20: CPU (Multi Core) | CPU (Single Core)
Cinebench R15: CPU Multi 64Bit | CPU Single 64Bit
Blender: v2.79 BMW27 CPU
7-Zip 18.03: 7z b 4 | 7z b 4 -mmt1
Geekbench 5.5: Multi-Core | Single-Core
HWBOT x265 Benchmark v2.2: 4k Preset
LibreOffice : 20 Documents To PDF
R Benchmark 2.5: Overall mean
| Cinebench R23 / Single Core | |
| Dell OptiPlex Micro | |
| Intel NUC 13 Pro Kit NUC13ANK | |
| Lenovo IdeaCentre Mini 01IRH8 | |
| GMK NucBox K3 Pro | |
| Beelink SER7 | |
| GMK NucBox M3 | |
| Durchschnittliche Intel Core i5-12450H (1601 - 1688, n=6) | |
| Minisforum Neptune Series HX77G | |
| Geekom AS 6, R9 6900HX | |
| LG Gram 15Z90Q | |
| Geekom AS 5 | |
| BMAX B7 Power G7A2 | |
| Geekom A5 | |
| Beelink SER5 | |
| Beelink Mini S12 Pro | |
| Cinebench R20 / CPU (Multi Core) | |
| Dell OptiPlex Micro | |
| Beelink SER7 | |
| Lenovo IdeaCentre Mini 01IRH8 | |
| Minisforum Neptune Series HX77G | |
| Intel NUC 13 Pro Kit NUC13ANK | |
| Geekom AS 6, R9 6900HX | |
| Geekom AS 5 | |
| Geekom A5 | |
| GMK NucBox K3 Pro | |
| Durchschnittliche Intel Core i5-12450H (2952 - 4105, n=6) | |
| LG Gram 15Z90Q | |
| Beelink SER5 | |
| GMK NucBox M3 | |
| BMAX B7 Power G7A2 | |
| Beelink Mini S12 Pro | |
| Cinebench R20 / CPU (Single Core) | |
| Intel NUC 13 Pro Kit NUC13ANK | |
| Lenovo IdeaCentre Mini 01IRH8 | |
| Dell OptiPlex Micro | |
| Beelink SER7 | |
| GMK NucBox K3 Pro | |
| GMK NucBox M3 | |
| Durchschnittliche Intel Core i5-12450H (622 - 646, n=6) | |
| Minisforum Neptune Series HX77G | |
| Geekom AS 6, R9 6900HX | |
| Geekom AS 5 | |
| LG Gram 15Z90Q | |
| Geekom A5 | |
| BMAX B7 Power G7A2 | |
| Beelink SER5 | |
| Beelink Mini S12 Pro | |
| Cinebench R15 / CPU Multi 64Bit | |
| Dell OptiPlex Micro | |
| Beelink SER7 | |
| Minisforum Neptune Series HX77G | |
| Lenovo IdeaCentre Mini 01IRH8 | |
| Intel NUC 13 Pro Kit NUC13ANK | |
| Geekom AS 6, R9 6900HX | |
| Geekom AS 5 | |
| Geekom A5 | |
| GMK NucBox K3 Pro | |
| LG Gram 15Z90Q | |
| Durchschnittliche Intel Core i5-12450H (1150 - 1591, n=6) | |
| Beelink SER5 | |
| GMK NucBox M3 | |
| BMAX B7 Power G7A2 | |
| Beelink Mini S12 Pro | |
| Cinebench R15 / CPU Single 64Bit | |
| Beelink SER7 | |
| Dell OptiPlex Micro | |
| Intel NUC 13 Pro Kit NUC13ANK | |
| Lenovo IdeaCentre Mini 01IRH8 | |
| GMK NucBox K3 Pro | |
| Minisforum Neptune Series HX77G | |
| Geekom AS 6, R9 6900HX | |
| Geekom AS 5 | |
| GMK NucBox M3 | |
| Durchschnittliche Intel Core i5-12450H (225 - 239, n=6) | |
| Geekom A5 | |
| LG Gram 15Z90Q | |
| BMAX B7 Power G7A2 | |
| Beelink SER5 | |
| Beelink Mini S12 Pro | |
| 7-Zip 18.03 / 7z b 4 -mmt1 | |
| Beelink SER7 | |
| Dell OptiPlex Micro | |
| Lenovo IdeaCentre Mini 01IRH8 | |
| Intel NUC 13 Pro Kit NUC13ANK | |
| Minisforum Neptune Series HX77G | |
| GMK NucBox K3 Pro | |
| Geekom AS 6, R9 6900HX | |
| Geekom AS 5 | |
| BMAX B7 Power G7A2 | |
| Geekom A5 | |
| GMK NucBox M3 | |
| Durchschnittliche Intel Core i5-12450H (4824 - 5386, n=7) | |
| LG Gram 15Z90Q | |
| Beelink SER5 | |
| Beelink Mini S12 Pro | |
| Geekbench 5.5 / Multi-Core | |
| Dell OptiPlex Micro | |
| Beelink SER7 | |
| Intel NUC 13 Pro Kit NUC13ANK | |
| Lenovo IdeaCentre Mini 01IRH8 | |
| Minisforum Neptune Series HX77G | |
| GMK NucBox K3 Pro | |
| Geekom AS 6, R9 6900HX | |
| Geekom AS 5 | |
| Geekom A5 | |
| LG Gram 15Z90Q | |
| Durchschnittliche Intel Core i5-12450H (6777 - 8330, n=7) | |
| GMK NucBox M3 | |
| Beelink SER5 | |
| BMAX B7 Power G7A2 | |
| Beelink Mini S12 Pro | |
| Geekbench 5.5 / Single-Core | |
| Beelink SER7 | |
| Dell OptiPlex Micro | |
| Intel NUC 13 Pro Kit NUC13ANK | |
| Lenovo IdeaCentre Mini 01IRH8 | |
| GMK NucBox K3 Pro | |
| GMK NucBox M3 | |
| Minisforum Neptune Series HX77G | |
| Durchschnittliche Intel Core i5-12450H (1527 - 1665, n=7) | |
| LG Gram 15Z90Q | |
| Geekom AS 6, R9 6900HX | |
| Geekom AS 5 | |
| Geekom A5 | |
| BMAX B7 Power G7A2 | |
| Beelink SER5 | |
| Beelink Mini S12 Pro | |
| HWBOT x265 Benchmark v2.2 / 4k Preset | |
| Dell OptiPlex Micro | |
| Beelink SER7 | |
| Minisforum Neptune Series HX77G | |
| Lenovo IdeaCentre Mini 01IRH8 | |
| Geekom AS 6, R9 6900HX | |
| Geekom AS 5 | |
| Intel NUC 13 Pro Kit NUC13ANK | |
| Geekom A5 | |
| GMK NucBox K3 Pro | |
| Durchschnittliche Intel Core i5-12450H (8.78 - 12.3, n=6) | |
| Beelink SER5 | |
| GMK NucBox M3 | |
| LG Gram 15Z90Q | |
| BMAX B7 Power G7A2 | |
| Beelink Mini S12 Pro | |
| LibreOffice / 20 Documents To PDF | |
| Beelink Mini S12 Pro | |
| Beelink SER5 | |
| Geekom A5 | |
| LG Gram 15Z90Q | |
| BMAX B7 Power G7A2 | |
| Geekom AS 5 | |
| Minisforum Neptune Series HX77G | |
| Durchschnittliche Intel Core i5-12450H (41.1 - 60.3, n=7) | |
| Geekom AS 6, R9 6900HX | |
| Intel NUC 13 Pro Kit NUC13ANK | |
| GMK NucBox M3 | |
| GMK NucBox K3 Pro | |
| Beelink SER7 | |
| Lenovo IdeaCentre Mini 01IRH8 | |
| Dell OptiPlex Micro | |
| R Benchmark 2.5 / Overall mean | |
| Beelink Mini S12 Pro | |
| Beelink SER5 | |
| BMAX B7 Power G7A2 | |
| LG Gram 15Z90Q | |
| Geekom A5 | |
| Durchschnittliche Intel Core i5-12450H (0.4949 - 0.54, n=7) | |
| Geekom AS 5 | |
| GMK NucBox M3 | |
| Geekom AS 6, R9 6900HX | |
| Minisforum Neptune Series HX77G | |
| GMK NucBox K3 Pro | |
| Lenovo IdeaCentre Mini 01IRH8 | |
| Intel NUC 13 Pro Kit NUC13ANK | |
| Beelink SER7 | |
| Dell OptiPlex Micro | |
Cinebench R23: Multi Core | Single Core
Cinebench R20: CPU (Multi Core) | CPU (Single Core)
Cinebench R15: CPU Multi 64Bit | CPU Single 64Bit
Blender: v2.79 BMW27 CPU
7-Zip 18.03: 7z b 4 | 7z b 4 -mmt1
Geekbench 5.5: Multi-Core | Single-Core
HWBOT x265 Benchmark v2.2: 4k Preset
LibreOffice : 20 Documents To PDF
R Benchmark 2.5: Overall mean
* ... kleinere Werte sind besser
AIDA64: FP32 Ray-Trace | FPU Julia | CPU SHA3 | CPU Queen | FPU SinJulia | FPU Mandel | CPU AES | CPU ZLib | FP64 Ray-Trace | CPU PhotoWorxx
| Performance Rating | |
| Geekom A5 | |
| Intel NUC 13 Pro Kit NUC13ANK | |
| GMK NucBox K3 Pro | |
| Beelink SER5 | |
| Durchschnittliche Intel Core i5-12450H | |
| GMK NucBox M3 | |
| Beelink Mini S12 Pro | |
| AIDA64 / FP32 Ray-Trace | |
| Geekom A5 | |
| Intel NUC 13 Pro Kit NUC13ANK | |
| GMK NucBox K3 Pro | |
| Beelink SER5 | |
| Durchschnittliche Intel Core i5-12450H (7229 - 10474, n=6) | |
| GMK NucBox M3 | |
| Beelink Mini S12 Pro | |
| AIDA64 / FPU Julia | |
| Geekom A5 | |
| Beelink SER5 | |
| Intel NUC 13 Pro Kit NUC13ANK | |
| GMK NucBox K3 Pro | |
| Durchschnittliche Intel Core i5-12450H (37583 - 51636, n=6) | |
| GMK NucBox M3 | |
| Beelink Mini S12 Pro | |
| AIDA64 / CPU SHA3 | |
| Intel NUC 13 Pro Kit NUC13ANK | |
| Geekom A5 | |
| GMK NucBox K3 Pro | |
| Durchschnittliche Intel Core i5-12450H (1724 - 2359, n=6) | |
| Beelink SER5 | |
| GMK NucBox M3 | |
| Beelink Mini S12 Pro | |
| AIDA64 / CPU Queen | |
| Geekom A5 | |
| Intel NUC 13 Pro Kit NUC13ANK | |
| GMK NucBox K3 Pro | |
| Beelink SER5 | |
| Durchschnittliche Intel Core i5-12450H (59539 - 68897, n=6) | |
| GMK NucBox M3 | |
| Beelink Mini S12 Pro | |
| AIDA64 / FPU SinJulia | |
| Geekom A5 | |
| Beelink SER5 | |
| Intel NUC 13 Pro Kit NUC13ANK | |
| GMK NucBox K3 Pro | |
| Durchschnittliche Intel Core i5-12450H (5007 - 6147, n=6) | |
| GMK NucBox M3 | |
| Beelink Mini S12 Pro | |
| AIDA64 / FPU Mandel | |
| Geekom A5 | |
| Beelink SER5 | |
| Intel NUC 13 Pro Kit NUC13ANK | |
| GMK NucBox K3 Pro | |
| Durchschnittliche Intel Core i5-12450H (18516 - 25115, n=6) | |
| GMK NucBox M3 | |
| Beelink Mini S12 Pro | |
| AIDA64 / CPU AES | |
| Geekom A5 | |
| Intel NUC 13 Pro Kit NUC13ANK | |
| GMK NucBox K3 Pro | |
| Beelink SER5 | |
| GMK NucBox M3 | |
| Durchschnittliche Intel Core i5-12450H (46835 - 78537, n=6) | |
| Beelink Mini S12 Pro | |
| AIDA64 / CPU ZLib | |
| Intel NUC 13 Pro Kit NUC13ANK | |
| Geekom A5 | |
| GMK NucBox K3 Pro | |
| Durchschnittliche Intel Core i5-12450H (490 - 708, n=6) | |
| Beelink SER5 | |
| GMK NucBox M3 | |
| Beelink Mini S12 Pro | |
| AIDA64 / FP64 Ray-Trace | |
| Geekom A5 | |
| Intel NUC 13 Pro Kit NUC13ANK | |
| GMK NucBox K3 Pro | |
| Durchschnittliche Intel Core i5-12450H (4025 - 5614, n=6) | |
| Beelink SER5 | |
| GMK NucBox M3 | |
| Beelink Mini S12 Pro | |
| AIDA64 / CPU PhotoWorxx | |
| GMK NucBox K3 Pro | |
| Intel NUC 13 Pro Kit NUC13ANK | |
| GMK NucBox M3 | |
| Geekom A5 | |
| Durchschnittliche Intel Core i5-12450H (12271 - 28682, n=6) | |
| Beelink SER5 | |
| Beelink Mini S12 Pro | |
System Performance
CrossMark: Overall | Productivity | Creativity | Responsiveness
| PCMark 10 / Score | |
| Intel NUC 13 Pro Kit NUC13ANK | |
| Geekom A5 | |
| GMK NucBox K3 Pro | |
| Beelink SER5 | |
| GMK NucBox M3 | |
| Durchschnittliche Intel Core i5-12450H, Intel UHD Graphics Xe G4 48EUs (n=1) | |
| Beelink Mini S12 Pro | |
| PCMark 10 / Essentials | |
| Intel NUC 13 Pro Kit NUC13ANK | |
| GMK NucBox K3 Pro | |
| GMK NucBox M3 | |
| Durchschnittliche Intel Core i5-12450H, Intel UHD Graphics Xe G4 48EUs (n=1) | |
| Geekom A5 | |
| Beelink SER5 | |
| Beelink Mini S12 Pro | |
| PCMark 10 / Productivity | |
| Geekom A5 | |
| Beelink SER5 | |
| Intel NUC 13 Pro Kit NUC13ANK | |
| GMK NucBox K3 Pro | |
| GMK NucBox M3 | |
| Durchschnittliche Intel Core i5-12450H, Intel UHD Graphics Xe G4 48EUs (n=1) | |
| Beelink Mini S12 Pro | |
| PCMark 10 / Digital Content Creation | |
| Intel NUC 13 Pro Kit NUC13ANK | |
| Geekom A5 | |
| GMK NucBox K3 Pro | |
| Beelink SER5 | |
| GMK NucBox M3 | |
| Durchschnittliche Intel Core i5-12450H, Intel UHD Graphics Xe G4 48EUs (n=1) | |
| Beelink Mini S12 Pro | |
| CrossMark / Overall | |
| Intel NUC 13 Pro Kit NUC13ANK | |
| GMK NucBox K3 Pro | |
| GMK NucBox M3 | |
| Durchschnittliche Intel Core i5-12450H, Intel UHD Graphics Xe G4 48EUs (n=1) | |
| Geekom A5 | |
| Beelink SER5 | |
| Beelink Mini S12 Pro | |
| CrossMark / Productivity | |
| Intel NUC 13 Pro Kit NUC13ANK | |
| GMK NucBox M3 | |
| Durchschnittliche Intel Core i5-12450H, Intel UHD Graphics Xe G4 48EUs (n=1) | |
| GMK NucBox K3 Pro | |
| Geekom A5 | |
| Beelink SER5 | |
| Beelink Mini S12 Pro | |
| CrossMark / Creativity | |
| Intel NUC 13 Pro Kit NUC13ANK | |
| GMK NucBox K3 Pro | |
| Geekom A5 | |
| GMK NucBox M3 | |
| Durchschnittliche Intel Core i5-12450H, Intel UHD Graphics Xe G4 48EUs (n=1) | |
| Beelink SER5 | |
| Beelink Mini S12 Pro | |
| CrossMark / Responsiveness | |
| Intel NUC 13 Pro Kit NUC13ANK | |
| GMK NucBox M3 | |
| Durchschnittliche Intel Core i5-12450H, Intel UHD Graphics Xe G4 48EUs (n=1) | |
| GMK NucBox K3 Pro | |
| Geekom A5 | |
| Beelink SER5 | |
| Beelink Mini S12 Pro | |
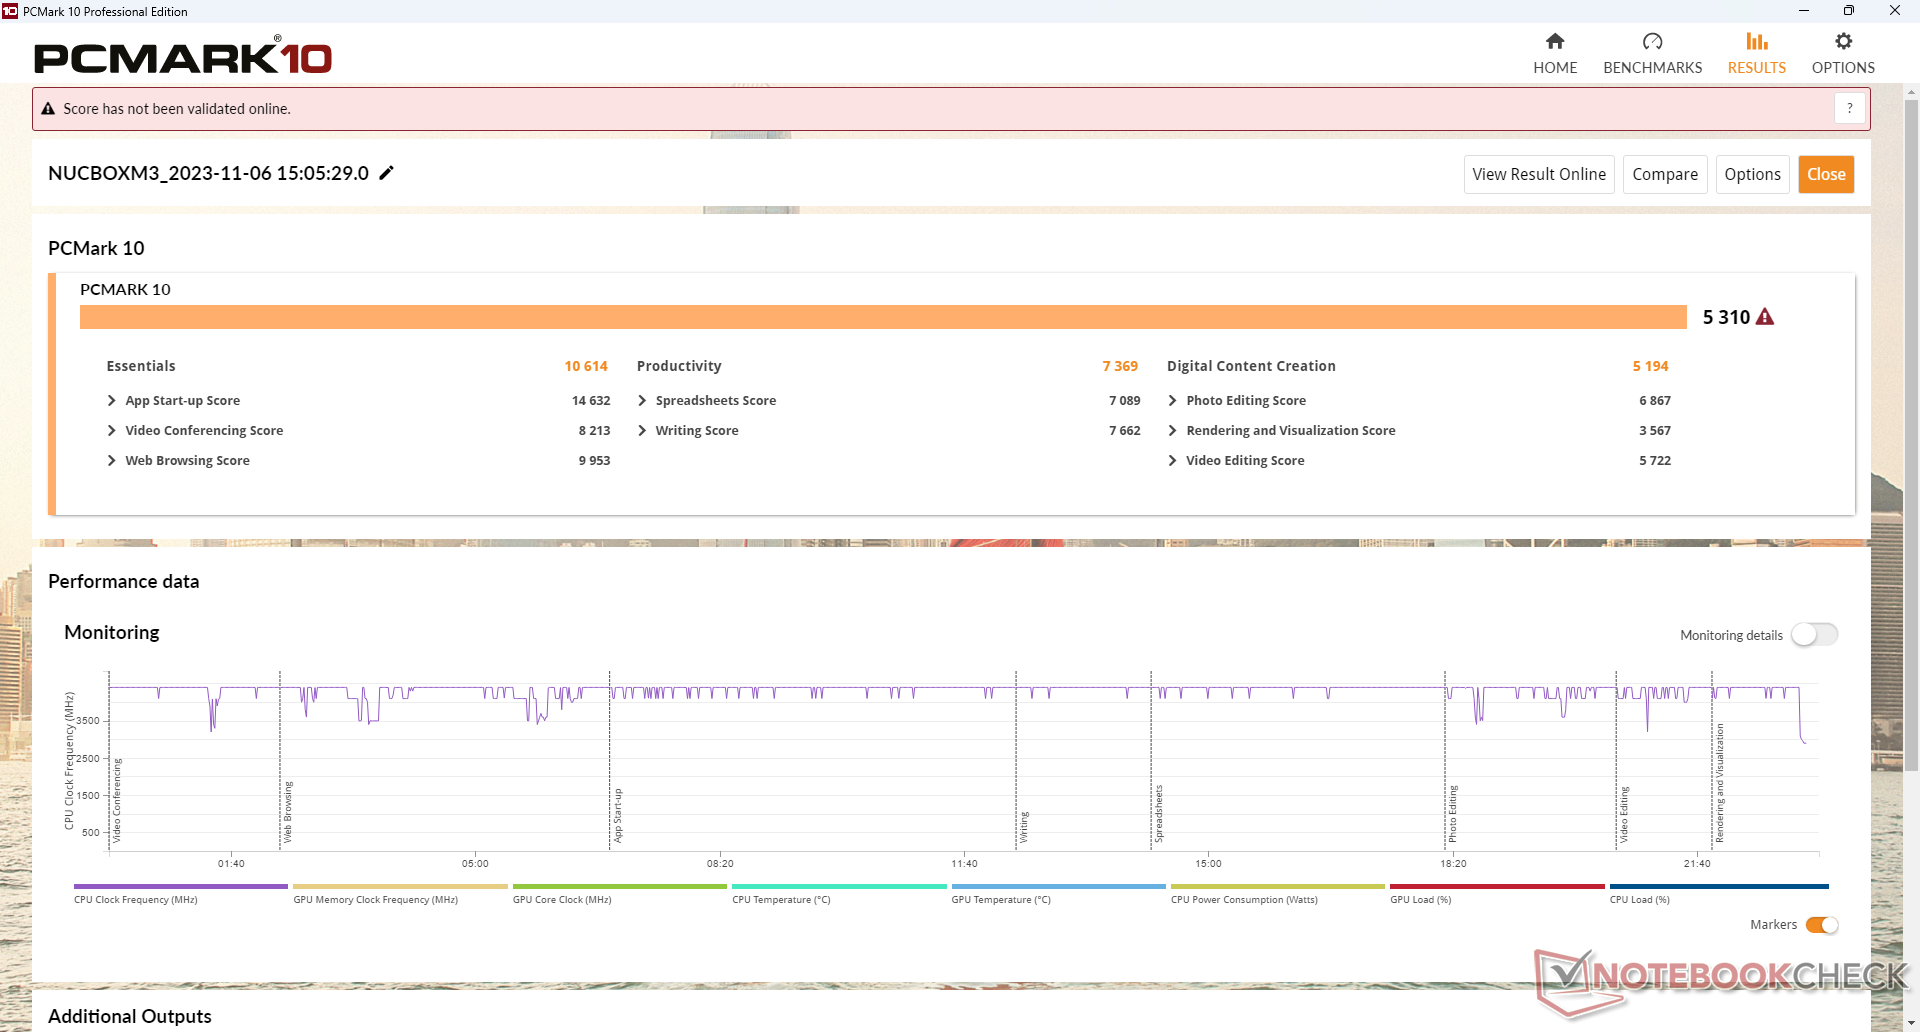
| PCMark 10 Score | 5310 Punkte | |
Hilfe | ||
| AIDA64 / Memory Copy | |
| GMK NucBox K3 Pro | |
| Intel NUC 13 Pro Kit NUC13ANK | |
| Geekom A5 | |
| GMK NucBox M3 | |
| Durchschnittliche Intel Core i5-12450H (21750 - 43918, n=6) | |
| Beelink SER5 | |
| Beelink Mini S12 Pro | |
| AIDA64 / Memory Read | |
| GMK NucBox K3 Pro | |
| Geekom A5 | |
| Intel NUC 13 Pro Kit NUC13ANK | |
| GMK NucBox M3 | |
| Durchschnittliche Intel Core i5-12450H (22956 - 47555, n=6) | |
| Beelink SER5 | |
| Beelink Mini S12 Pro | |
| AIDA64 / Memory Write | |
| GMK NucBox K3 Pro | |
| GMK NucBox M3 | |
| Geekom A5 | |
| Intel NUC 13 Pro Kit NUC13ANK | |
| Durchschnittliche Intel Core i5-12450H (22297 - 46963, n=6) | |
| Beelink SER5 | |
| Beelink Mini S12 Pro | |
| AIDA64 / Memory Latency | |
| Beelink Mini S12 Pro | |
| GMK NucBox K3 Pro | |
| Intel NUC 13 Pro Kit NUC13ANK | |
| Beelink SER5 | |
| Durchschnittliche Intel Core i5-12450H (76.5 - 100.9, n=6) | |
| Geekom A5 | |
| GMK NucBox M3 | |
* ... kleinere Werte sind besser
DPC-Latenzen
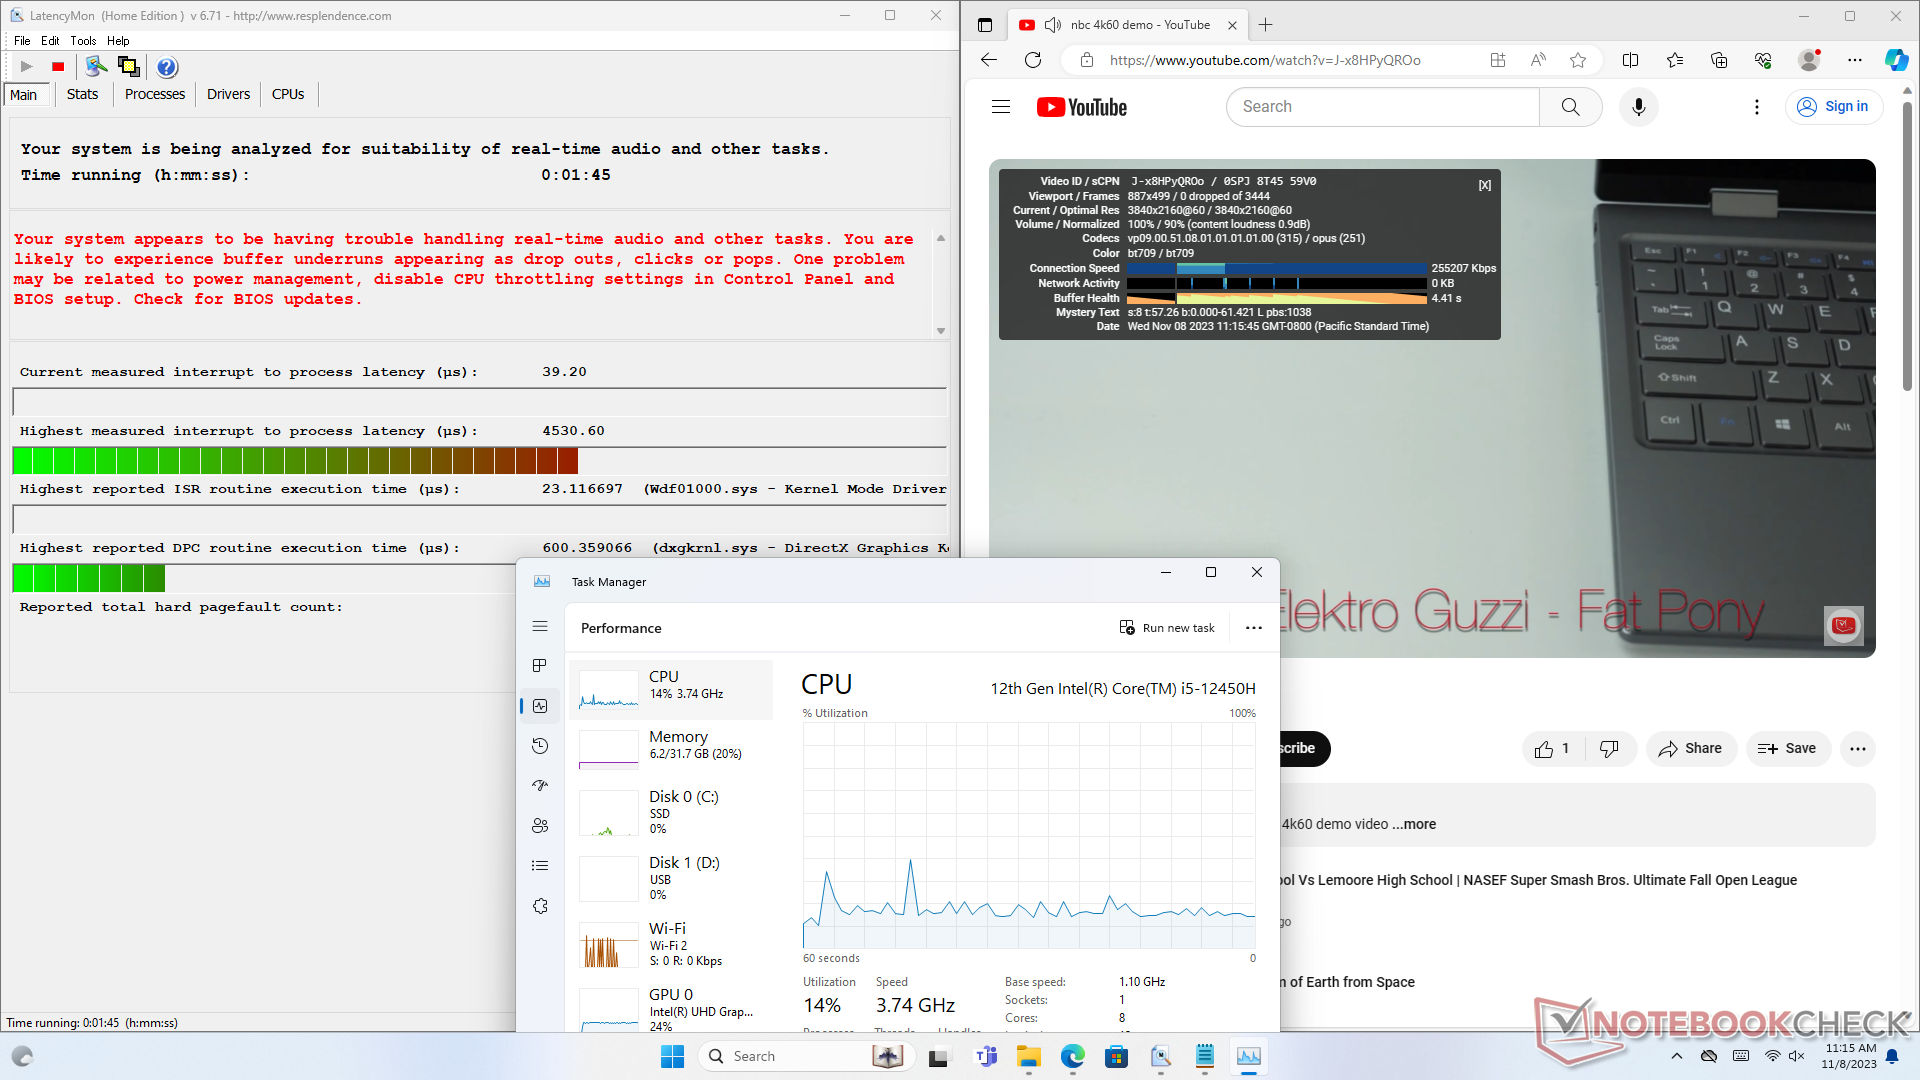
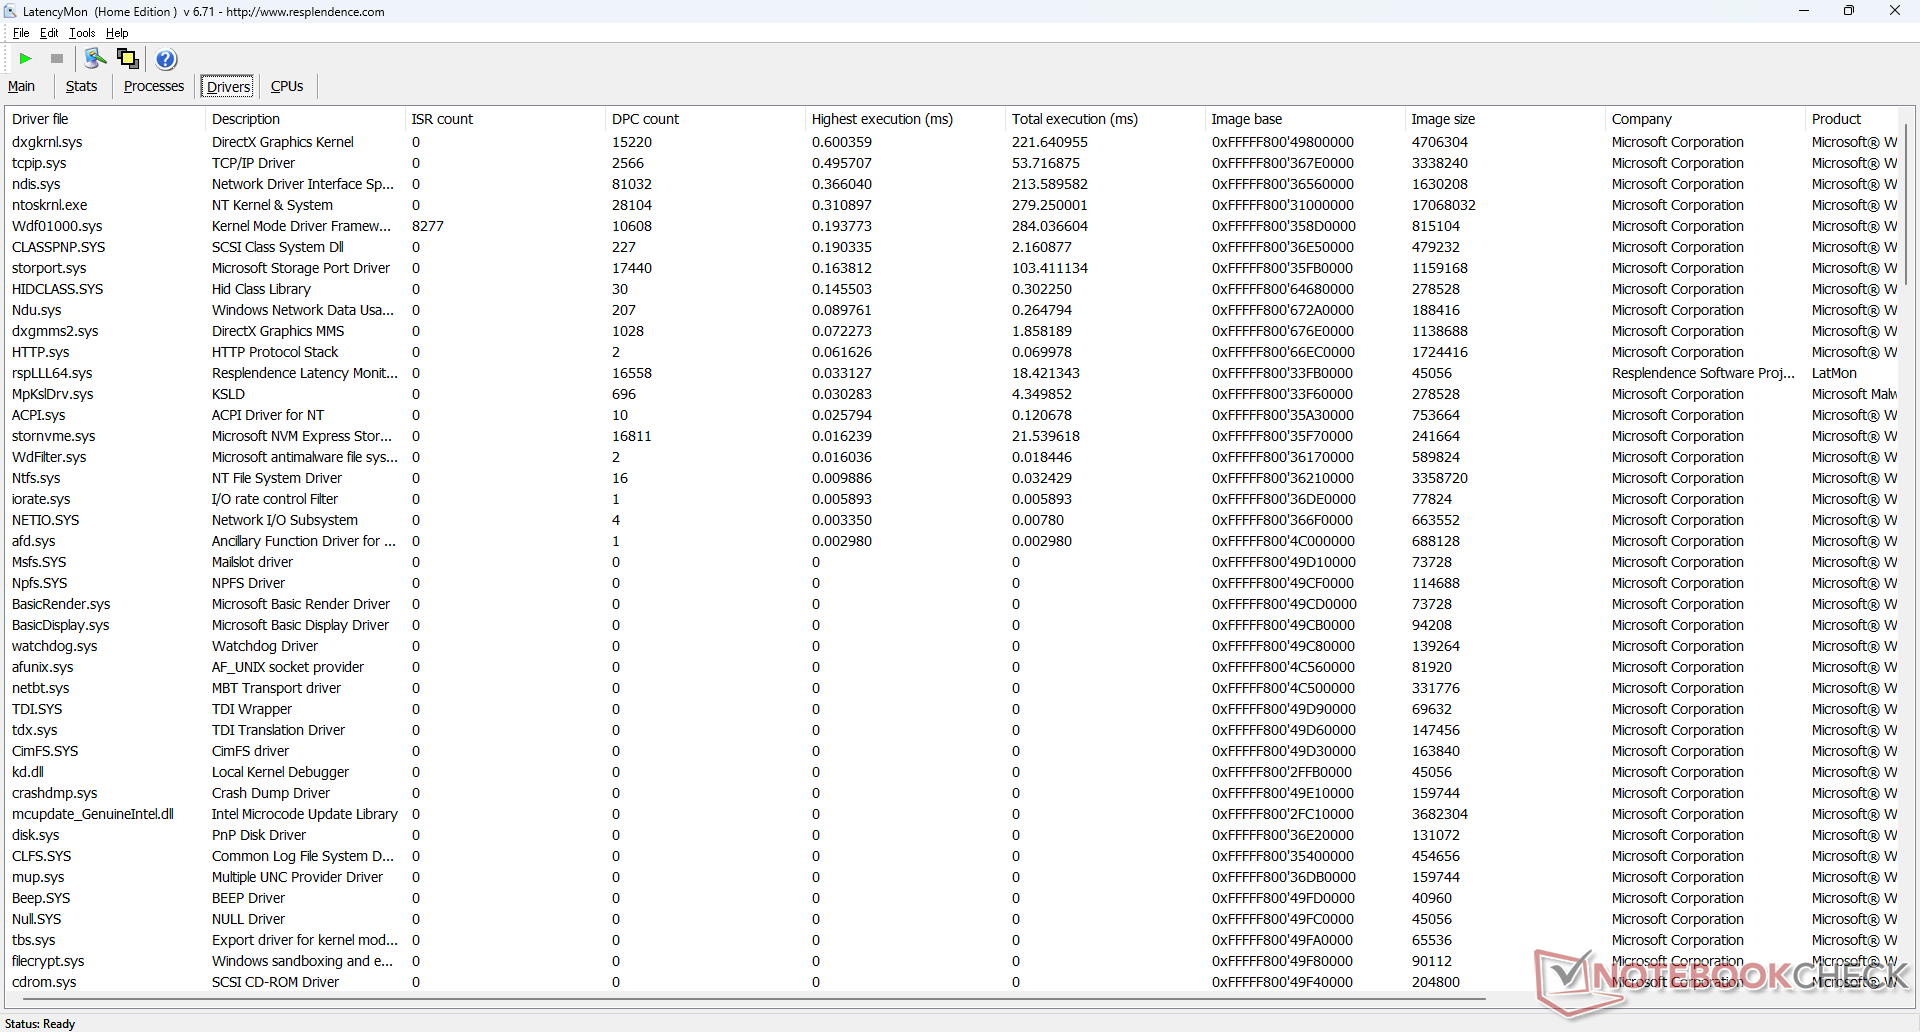
LatencyMon zeigt DPC-Probleme beim Öffnen mehrerer Browser-Tabs unserer Homepage. Die 4K-Videowiedergabe bei 60 FPS funktioniert ansonsten einwandfrei, und es werden keine abgebrochenen Bildsequenzen aufgezeichnet.
| DPC Latencies / LatencyMon - interrupt to process latency (max), Web, Youtube, Prime95 | |
| Beelink Mini S12 Pro | |
| GMK NucBox M3 | |
| GMK NucBox K3 Pro | |
| Geekom A5 | |
| Intel NUC 13 Pro Kit NUC13ANK | |
| Beelink SER5 | |
* ... kleinere Werte sind besser
Massenspeicher
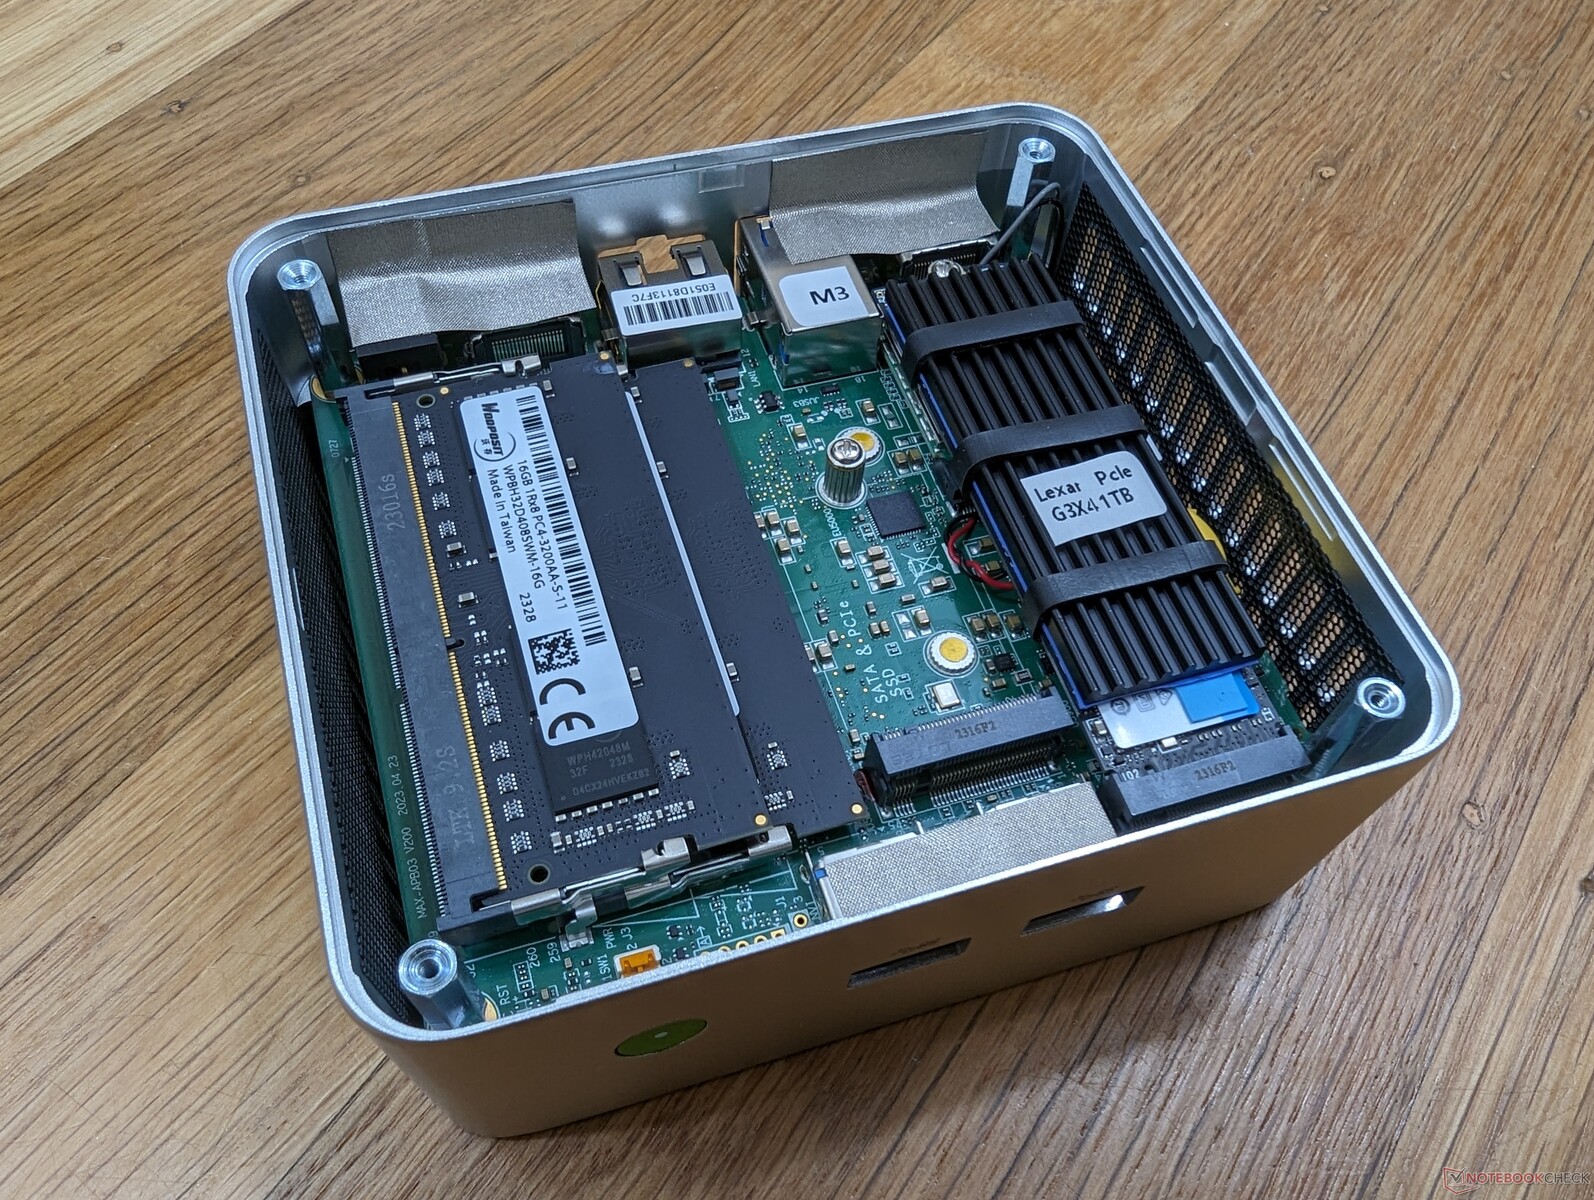
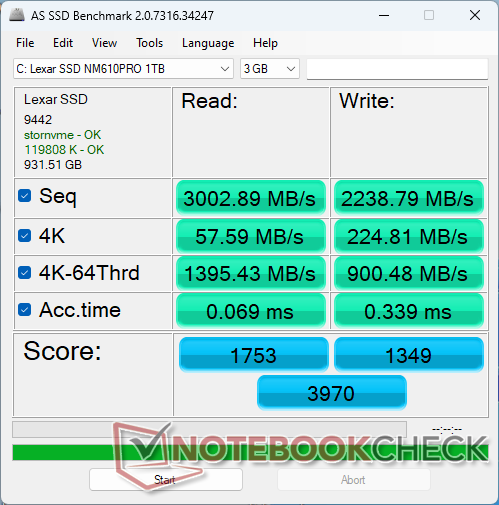
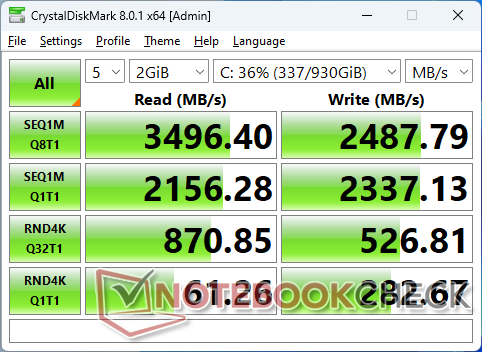
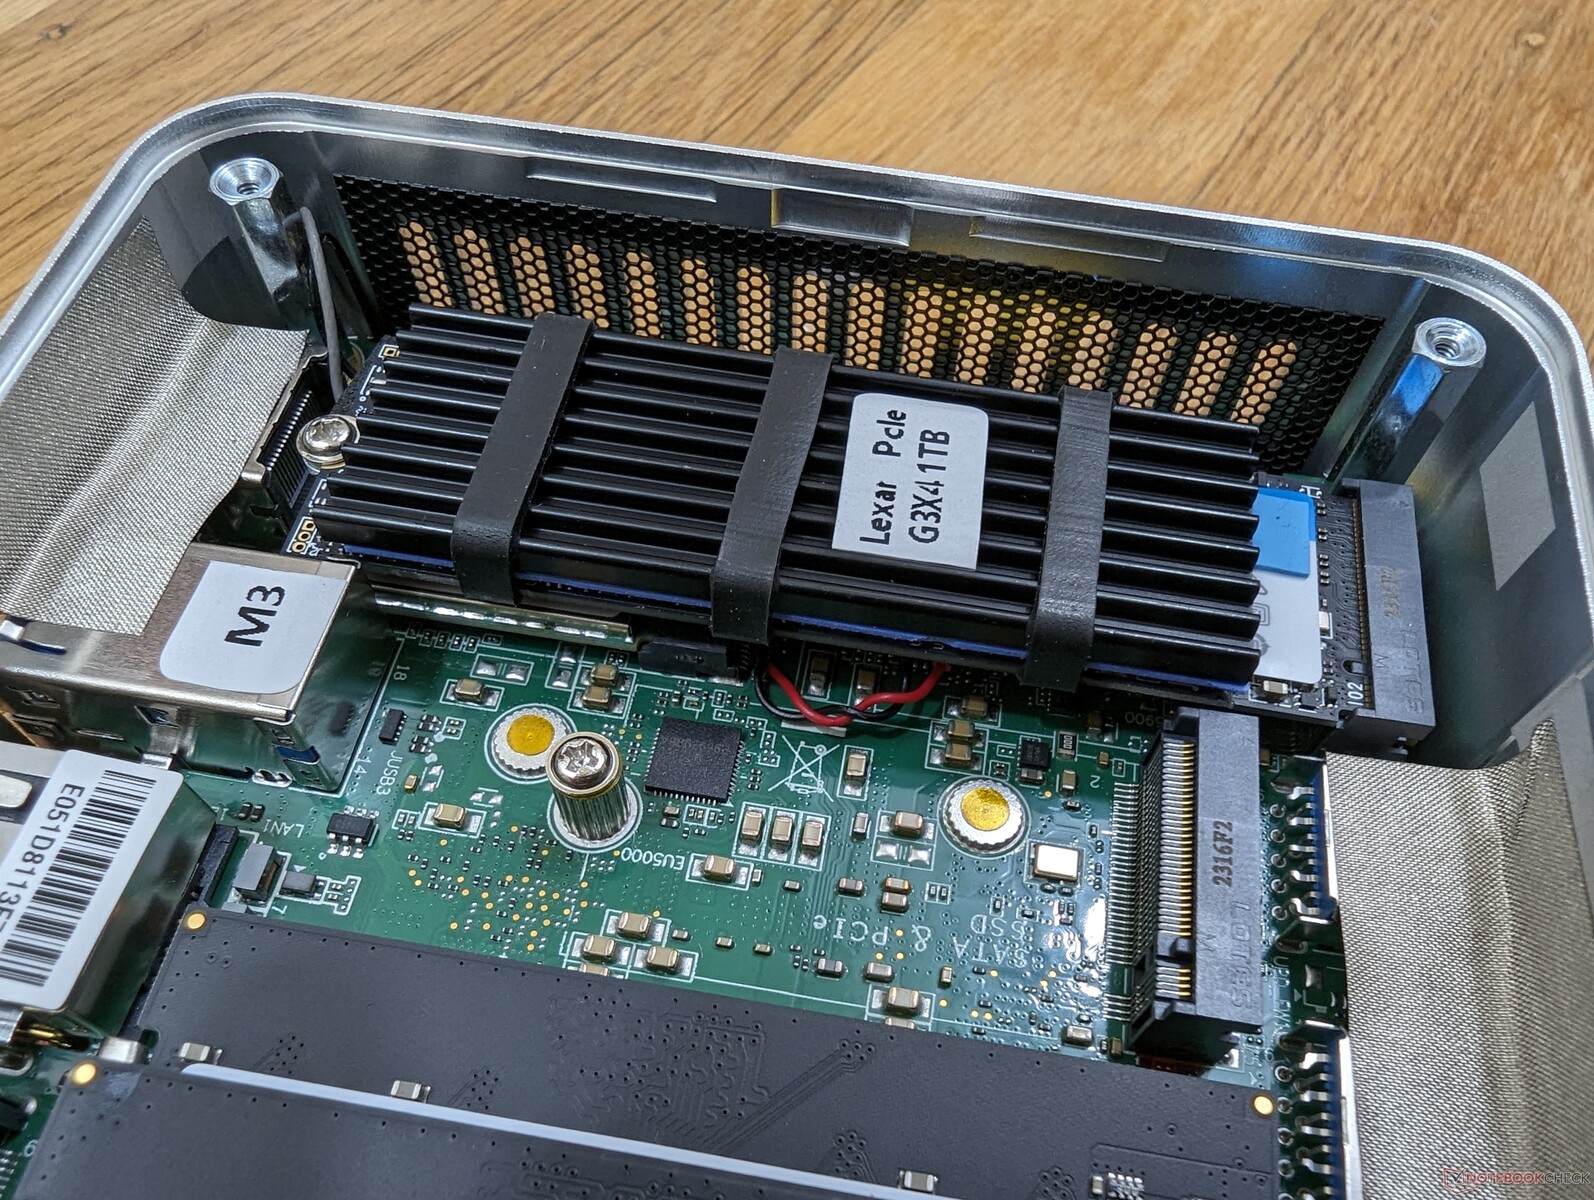
GMK verwendet dieselbe Lexar NM610 Pro PCIe3 x4 NVMe SSD für seine beiden Modelle NucBox M3 und NucBox K3 Pro. Das System wird nicht mit einer PCIe4-SSD geliefert, vermutlich um Kosten zu sparen.
Es besteht die Möglichkeit, eine zweite SSD zu installieren, jedoch darf diese nur 42 mm lang sein oder kürzer.

| Drive Performance Rating - Percent | |
| Intel NUC 13 Pro Kit NUC13ANK | |
| Beelink SER5 | |
| Geekom A5 | |
| GMK NucBox M3 | |
| GMK NucBox K3 Pro | |
| Beelink Mini S12 Pro | |
* ... kleinere Werte sind besser
Disk Throttling: DiskSpd Read Loop, Queue Depth 8
GPU Performance
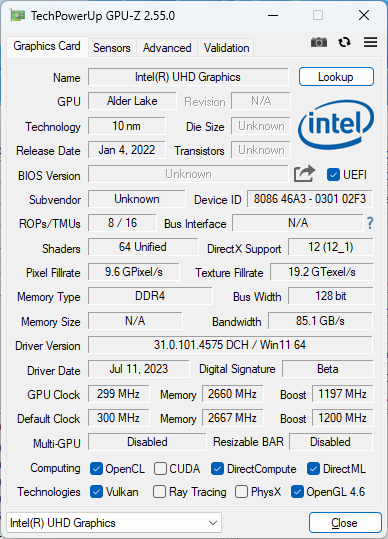
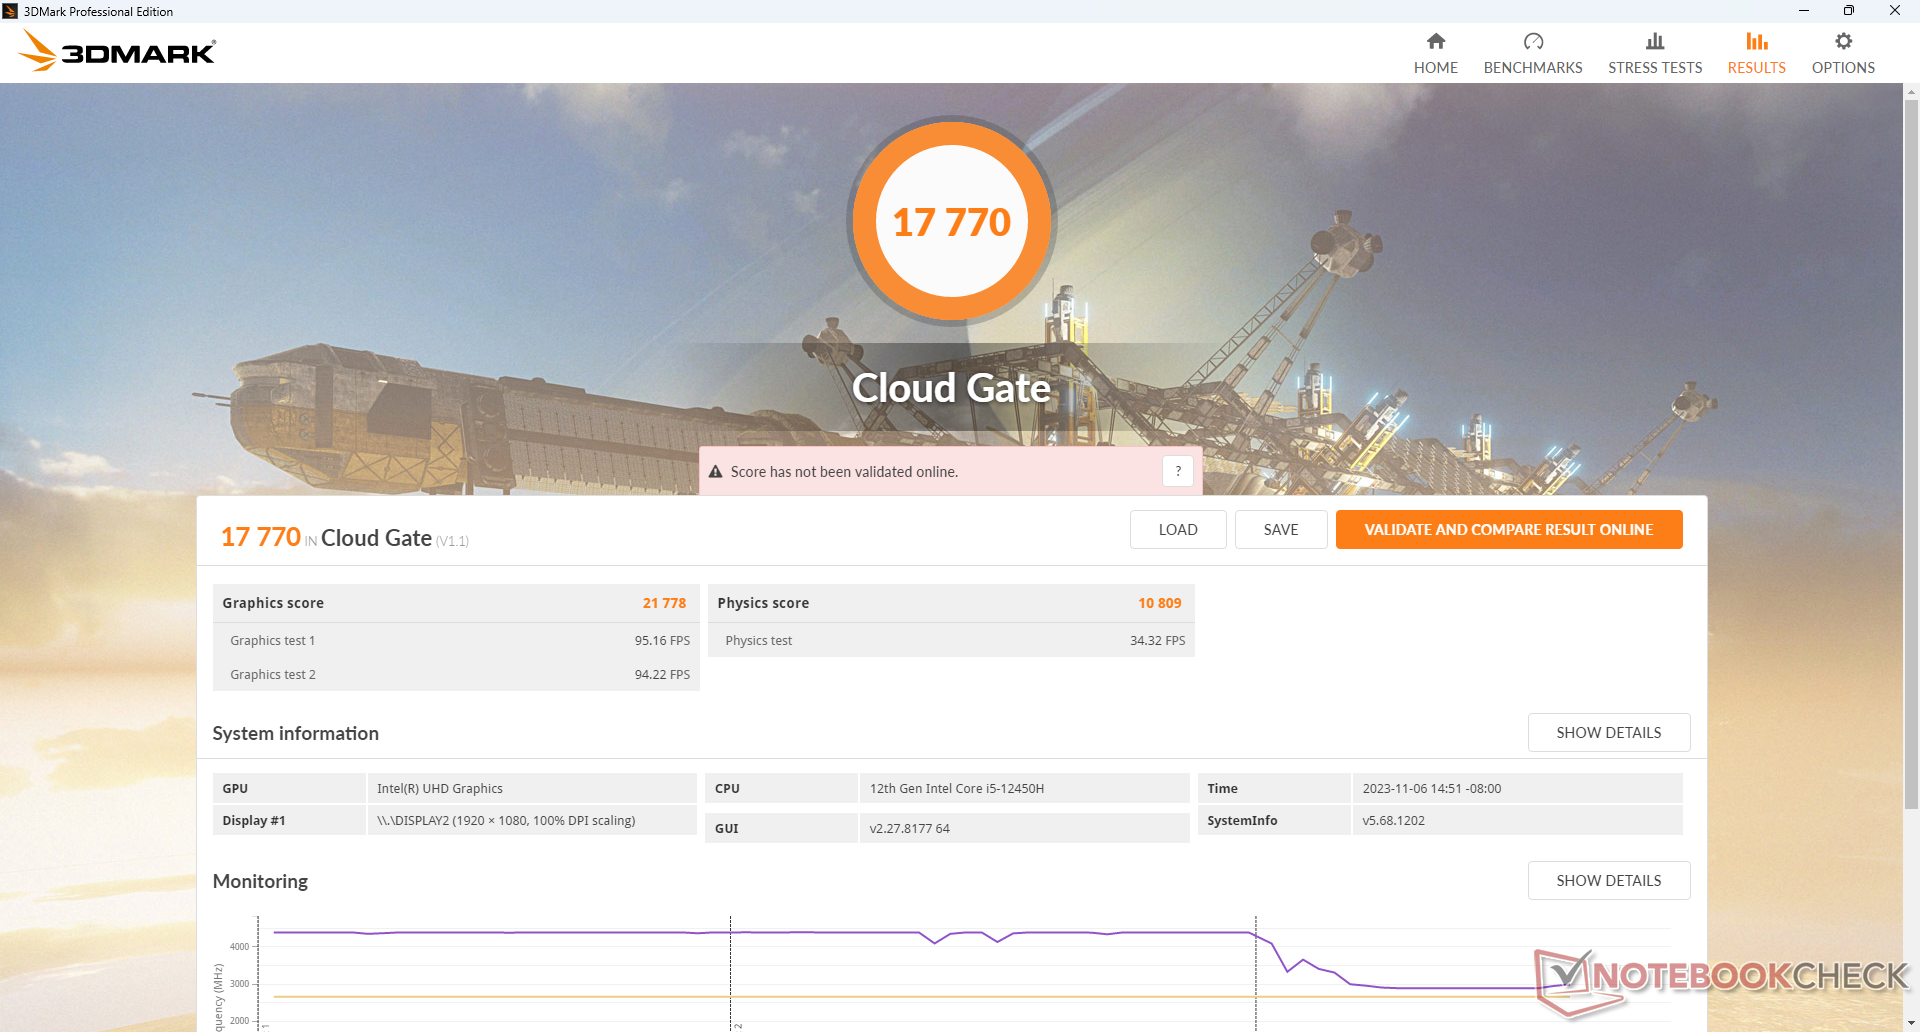
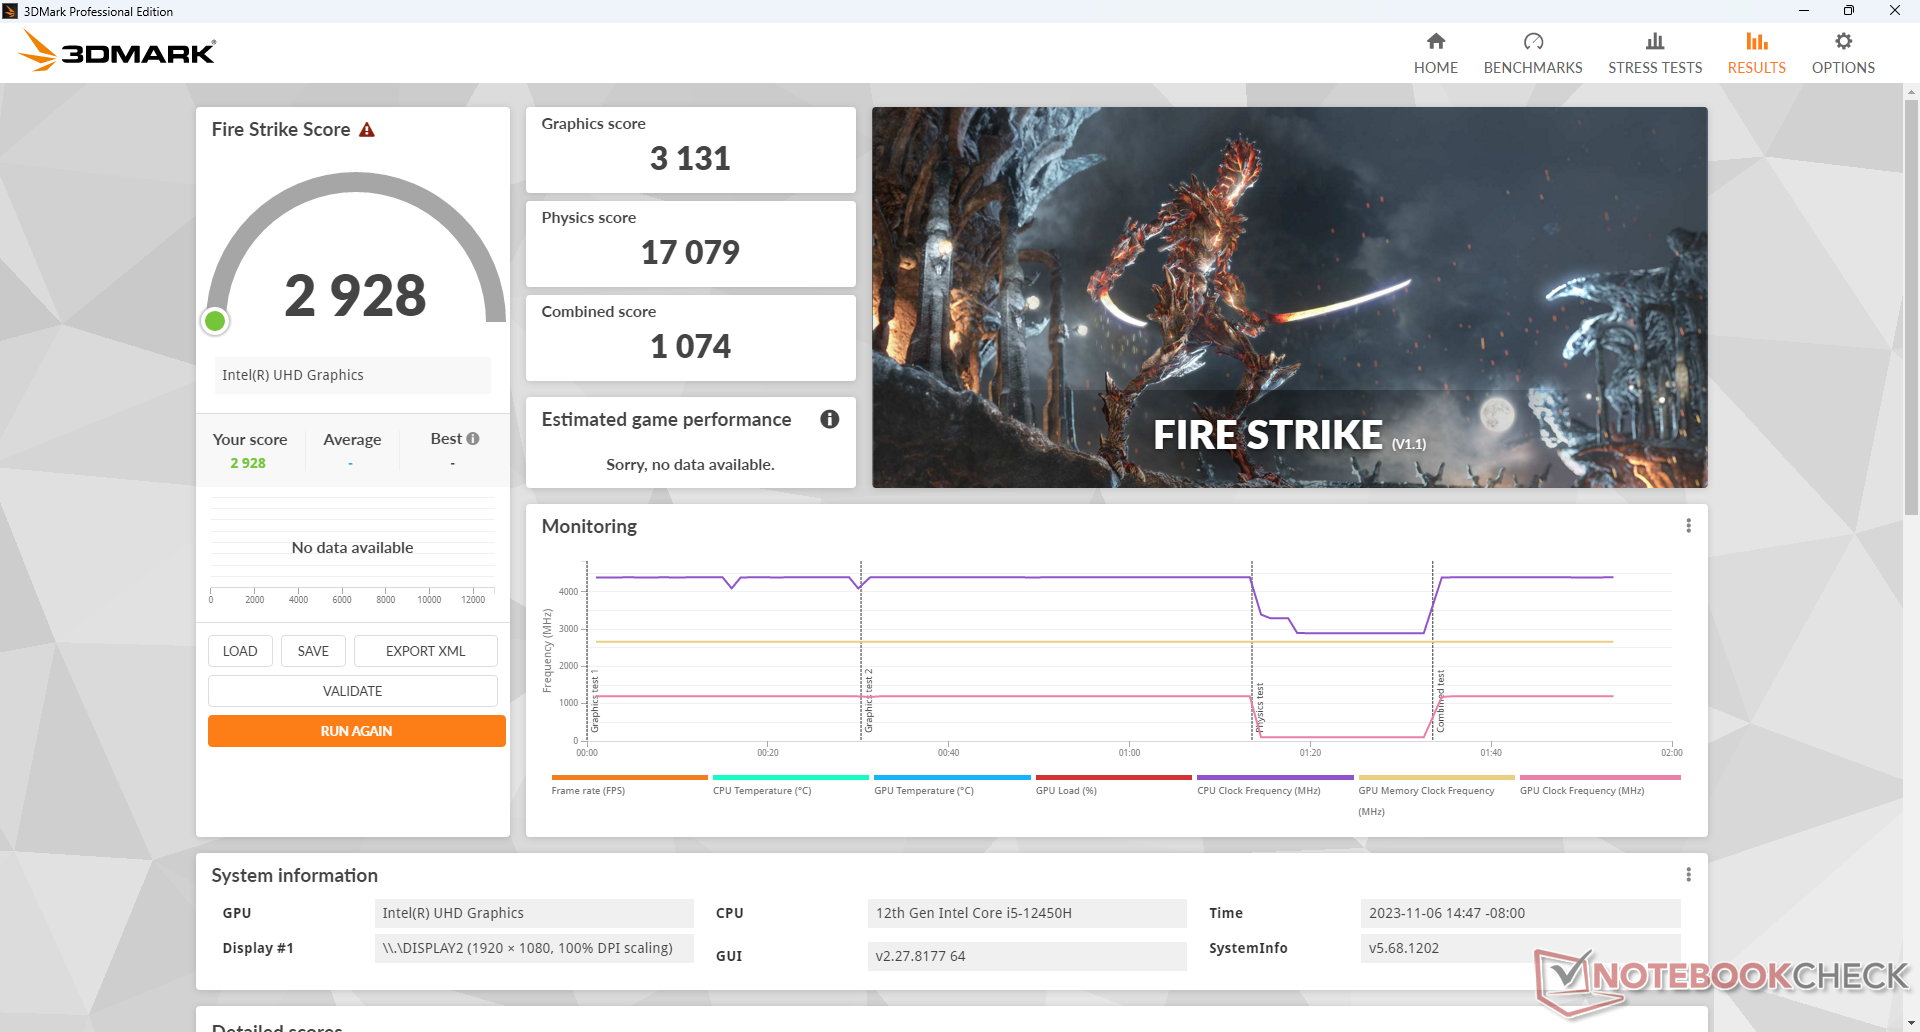
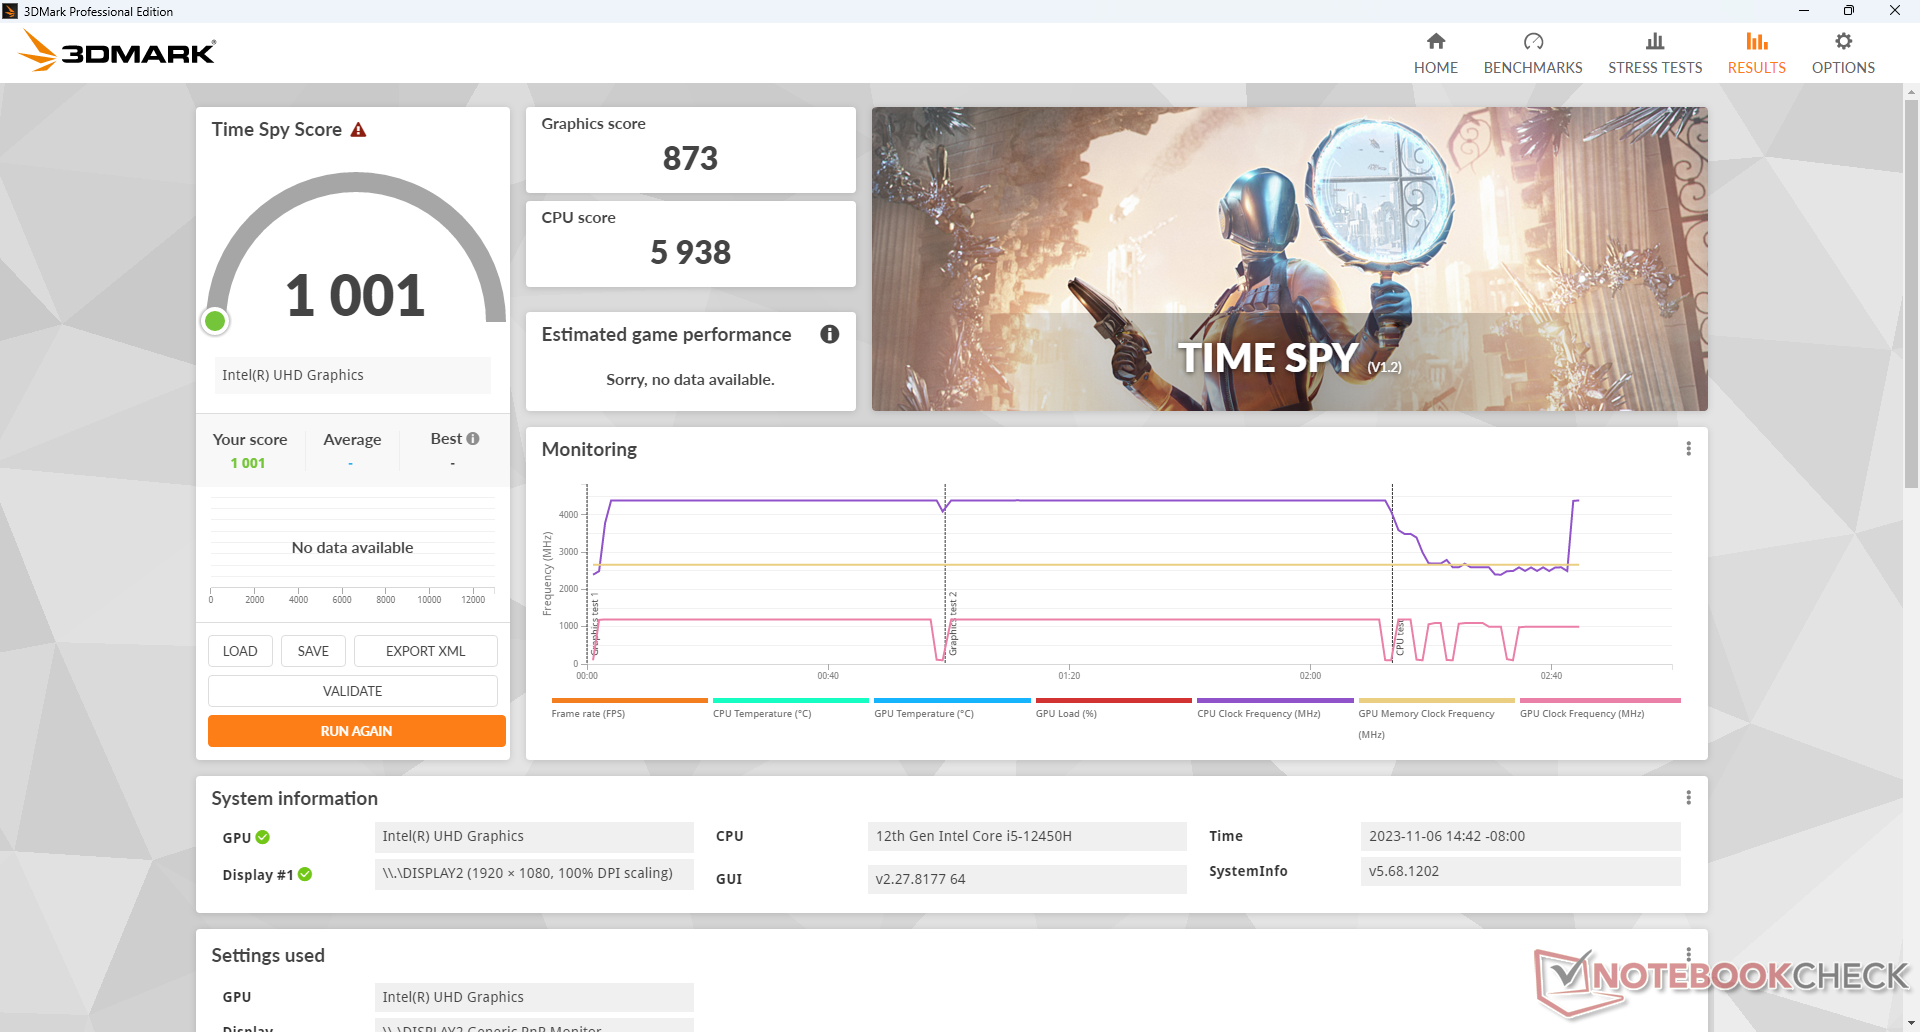
Die Grafikleistung ist schneller als bei einem durchschnittlichen PC mit der gleichen Iris Xe 48 EU, da dieser integrierte Grafikprozessor normalerweise mit langsameren CPUs der Core U-Serie kombiniert wird. In diesem Fall trägt die schnellere Core H-CPU in unserer NucBox M3 dazu bei, die Gesamtleistung der GPU zu steigern. Nichtsdestotrotz ist das System bei weitem nicht schnell genug, um die meisten Spiele nativ auszuführen.
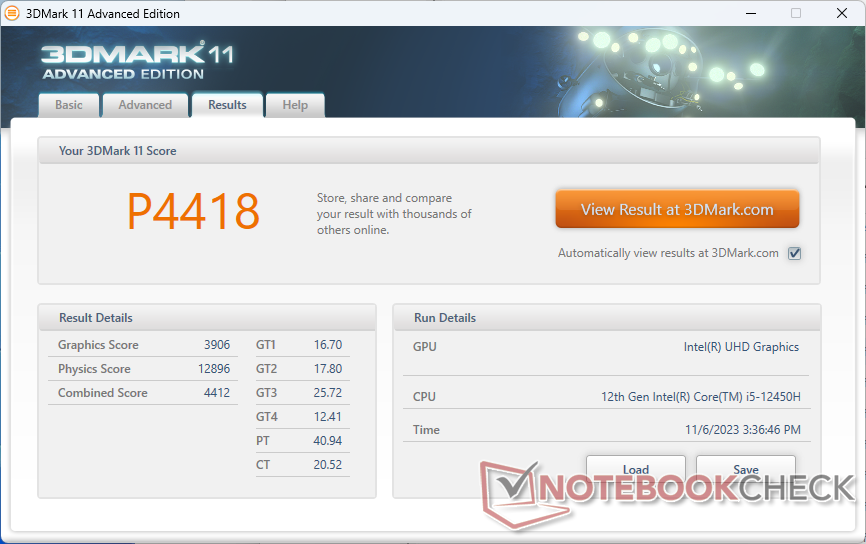
| 3DMark 11 Performance | 4418 Punkte | |
| 3DMark Cloud Gate Standard Score | 17770 Punkte | |
| 3DMark Fire Strike Score | 2928 Punkte | |
| 3DMark Time Spy Score | 1001 Punkte | |
Hilfe | ||
* ... kleinere Werte sind besser
Witcher 3 FPS-Diagramm
| min. | mittel | hoch | max. | |
|---|---|---|---|---|
| GTA V (2015) | 106.7 | 90.7 | 15 | 6.32 |
| The Witcher 3 (2015) | 61.1 | 38.6 | 20.1 | 9.5 |
| Dota 2 Reborn (2015) | 37 | 36.2 | 35.4 | 34.7 |
| Final Fantasy XV Benchmark (2018) | 28.5 | 14.8 | 10.6 | |
| X-Plane 11.11 (2018) | 36.3 | 23.8 | 22 | |
| Far Cry 5 (2018) | 34 | 17 | 16 | 15 |
| Strange Brigade (2018) | 64.4 | 25.6 | 20 | 17.7 |
| Cyberpunk 2077 1.6 (2022) | 10.8 | |||
| Tiny Tina's Wonderlands (2022) | 17.1 | 13.3 | ||
| F1 22 (2022) | 27.9 | 24.8 | 17.5 | 13.5 |
Emissionen
Geräuschemissionen
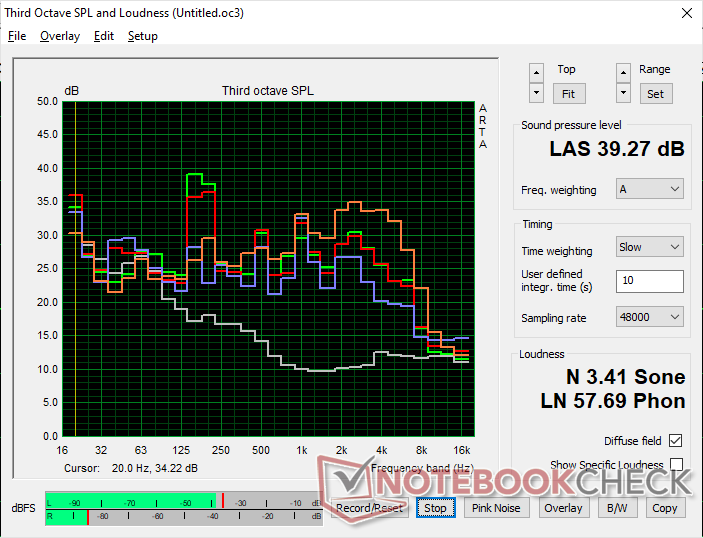
Das Geräuschverhalten des Lüfters ist wahrscheinlich der größte Nachteil der NucBox M3. Dieser pulsiert deutlich häufiger als bei den meisten anderen Mini-PCs. Beim Starten von Anwendungen oder sogar beim Surfen im Internet stieg der Lüfter kurzzeitig auf 39 dB(A) an, bevor er sich wieder normalisierte. Ein Wechsel zu einer CPU der U-Serie anstelle der H-Serie hätte dieses lästige Verhalten wahrscheinlich behoben.
Lautstärkediagramm
| Idle |
| 25.7 / 25.7 / 39.1 dB(A) |
| Last |
| 37 / 43.5 dB(A) |
 | ||
30 dB leise 40 dB(A) deutlich hörbar 50 dB(A) störend |
||
min: | ||
| GMK NucBox M3 UHD Graphics Xe G4 48EUs, i5-12450H, Lexar NM610 Pro NM610P001T-HNNNG | GMK NucBox K3 Pro UHD Graphics 64EUs, i7-12650H, Lexar NM610 Pro NM610P001T-HNNNG | Beelink SER5 Vega 6, R5 5560U, Crucial P3 Plus CT1000P3PSSD8 | Beelink Mini S12 Pro UHD Graphics 24EUs (Alder Lake-N), N100 | Geekom A5 Vega 8, R7 5800H, Lexar NM620 512GB | Intel NUC 13 Pro Kit NUC13ANK Iris Xe G7 96EUs, i7-1360P, Samsung PM9A1 MZVL2512HCJQ | |
|---|---|---|---|---|---|---|
| Geräuschentwicklung | 7% | 20% | 12% | -6% | -8% | |
| aus / Umgebung * (dB) | 23.9 | 23.1 3% | 23.7 1% | 23.3 3% | 25 -5% | 29.8 -25% |
| Idle min * (dB) | 25.7 | 25 3% | 23.9 7% | 26.3 -2% | 28.2 -10% | 30.2 -18% |
| Idle avg * (dB) | 25.7 | 25.5 1% | 23.9 7% | 26.3 -2% | 28.2 -10% | 31.1 -21% |
| Idle max * (dB) | 39.1 | 25.5 35% | 23.9 39% | 26.3 33% | 28.2 28% | 31.9 18% |
| Last avg * (dB) | 37 | 39.9 -8% | 28 24% | 31.9 14% | 47.8 -29% | 40 -8% |
| Witcher 3 ultra * (dB) | 43.5 | 39.9 8% | 27.6 37% | 33 24% | ||
| Last max * (dB) | 43.5 | 39.9 8% | 32.8 25% | 36.7 16% | 47.4 -9% | 40.5 7% |
* ... kleinere Werte sind besser
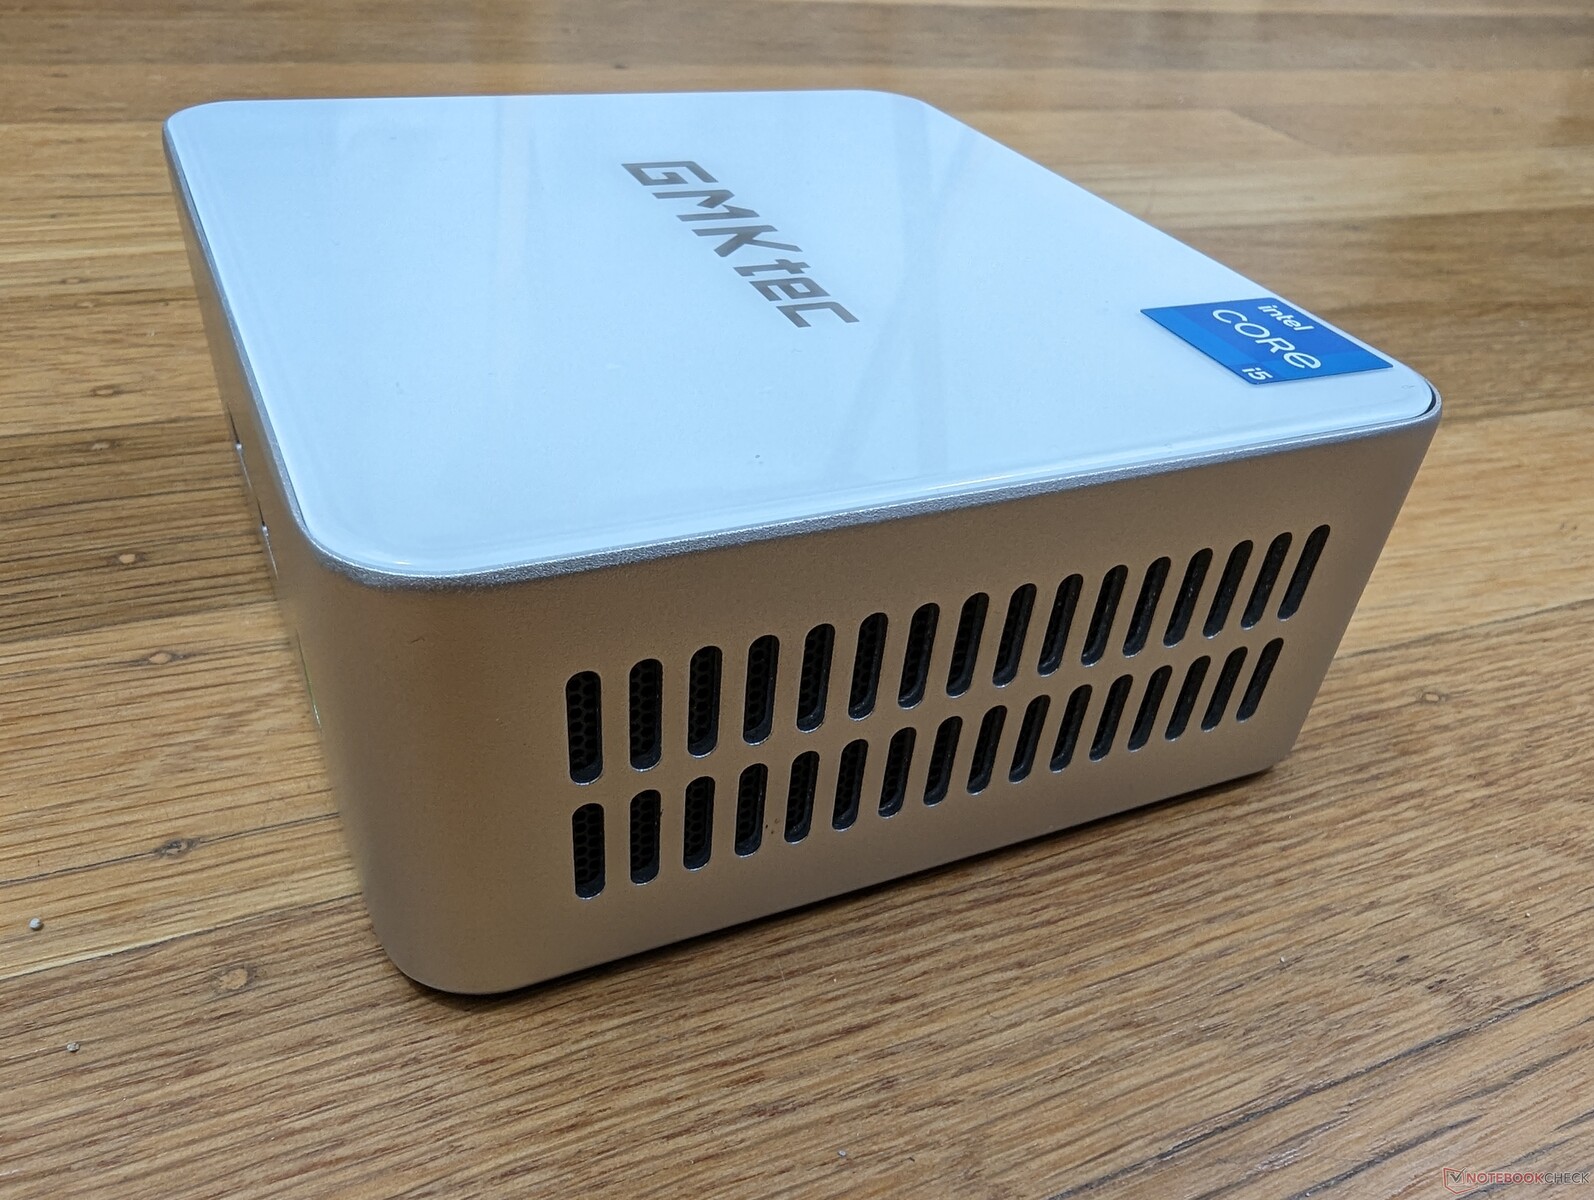
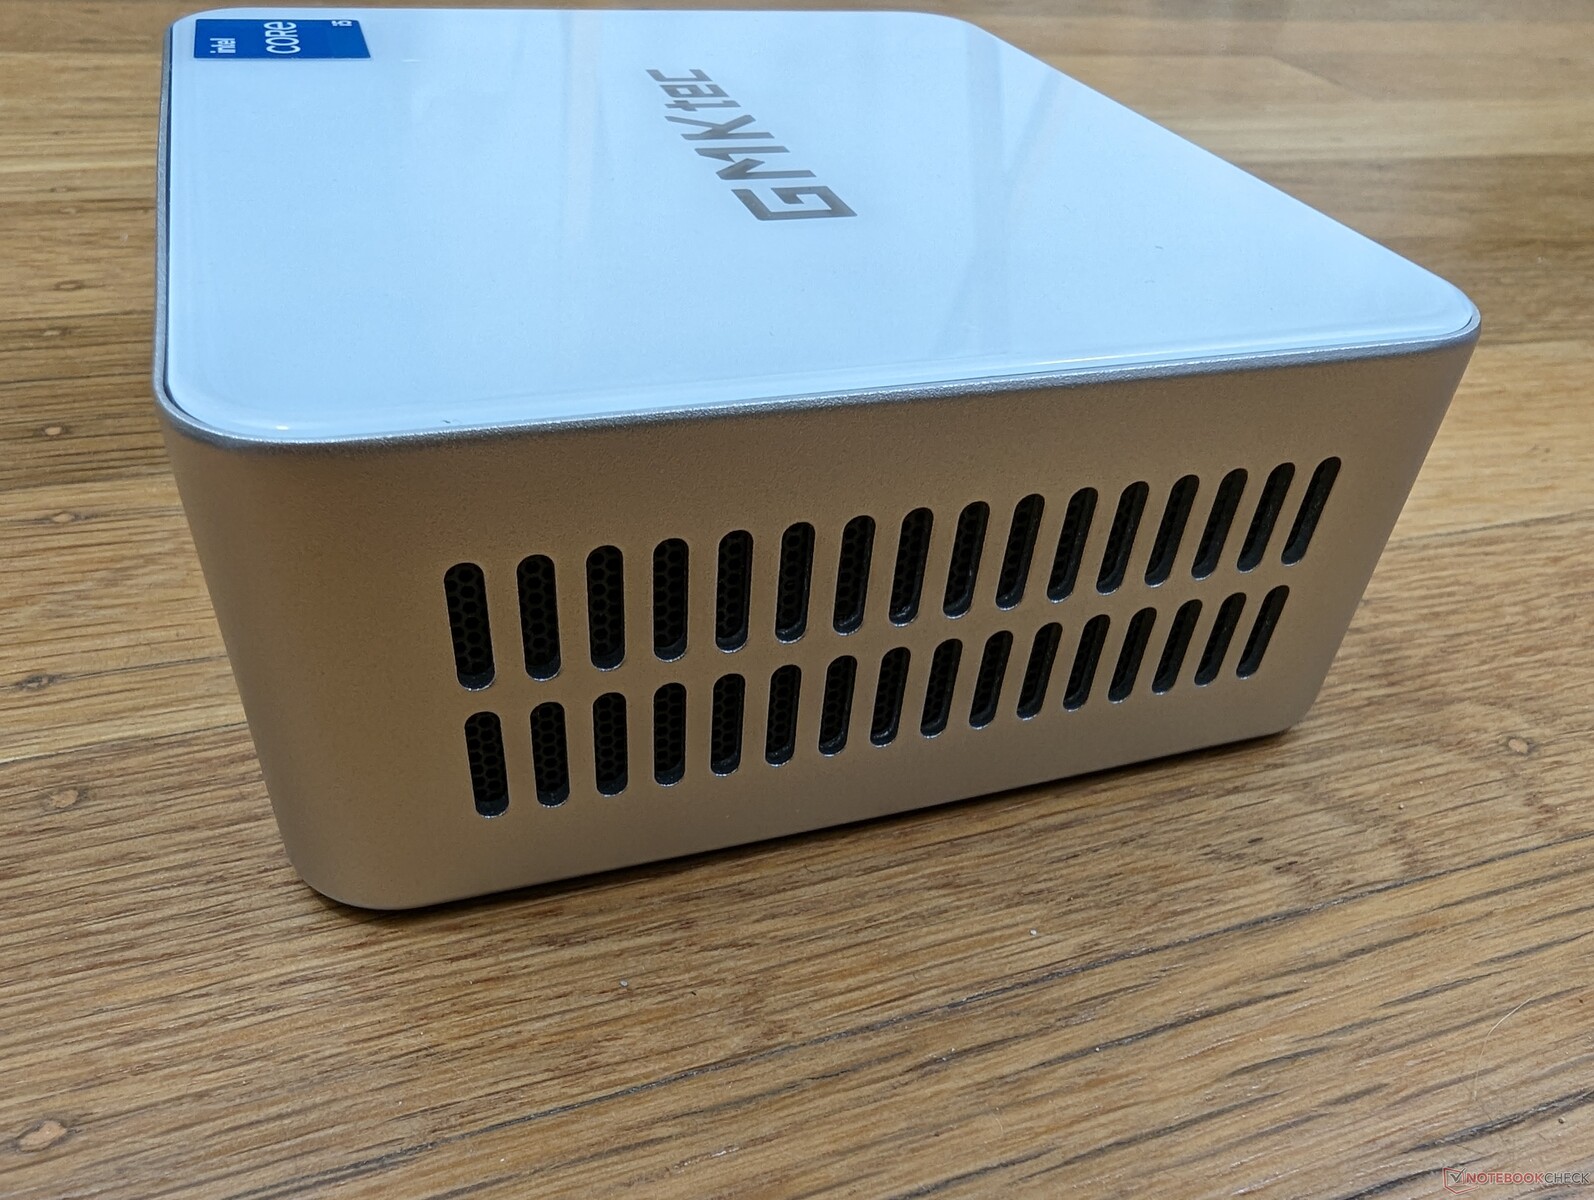
Temperatur
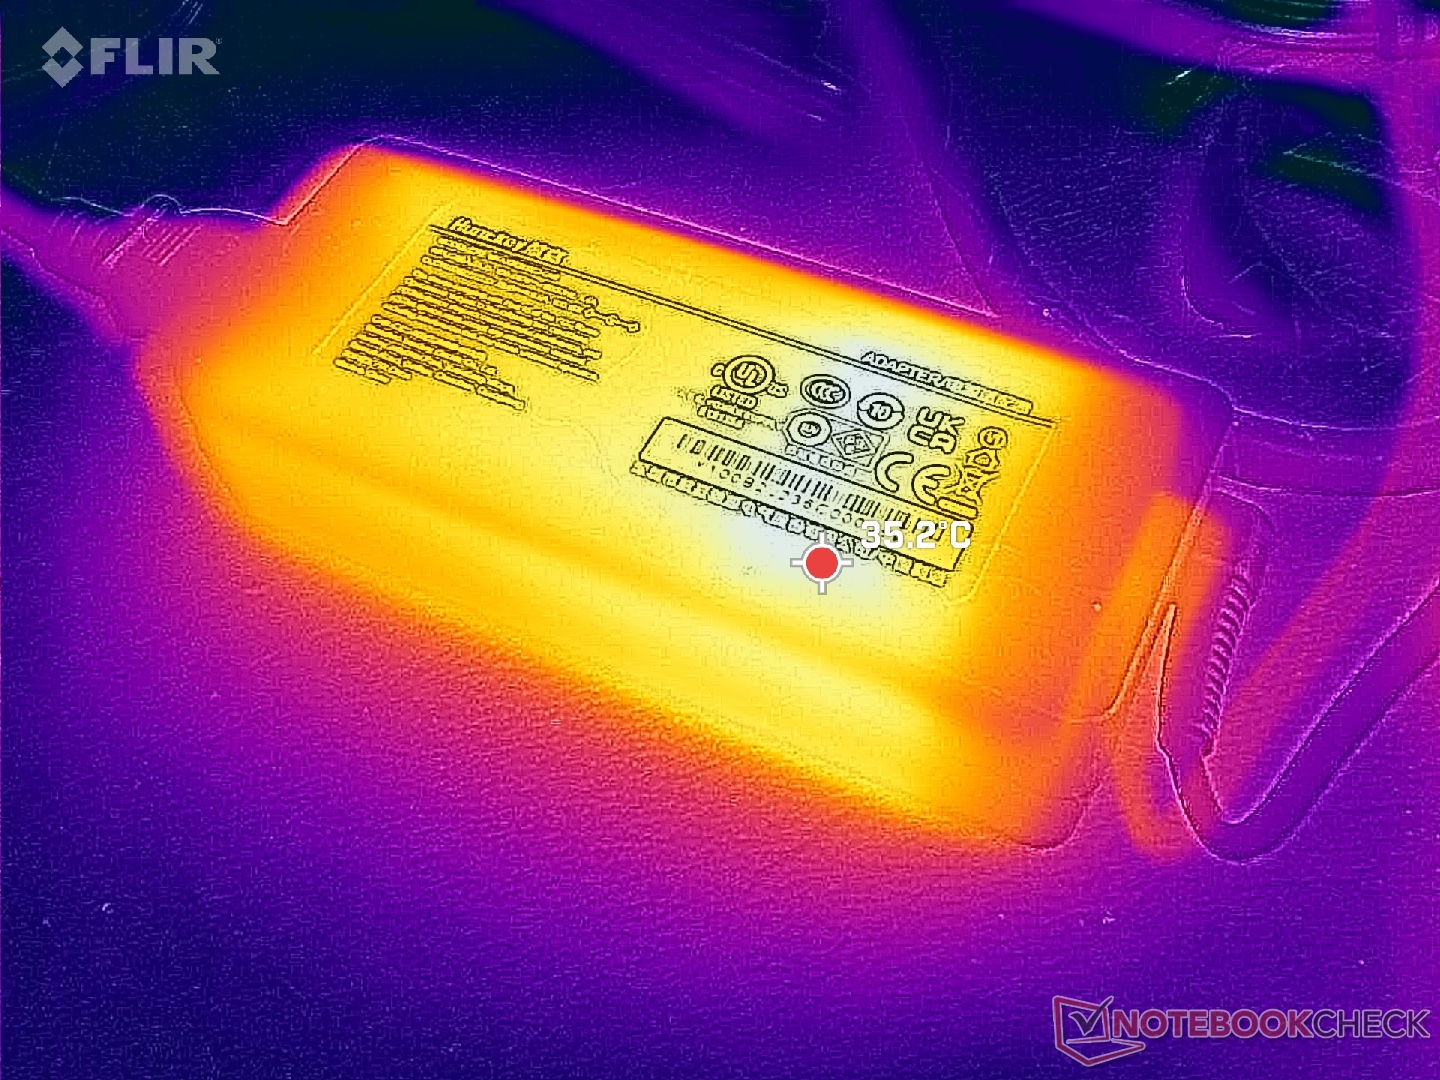
Im Gegensatz zum aktuellen Beelink SER5 wird die Frischluft nicht von oben, sondern von den Seiten des Geräts zugeführt. Daher können Sie bedenkenlos Gegenstände auf dem Gerät ablegen, solange die Seiten und die Rückseite ausreichend Platz für den Luftstrom bieten.
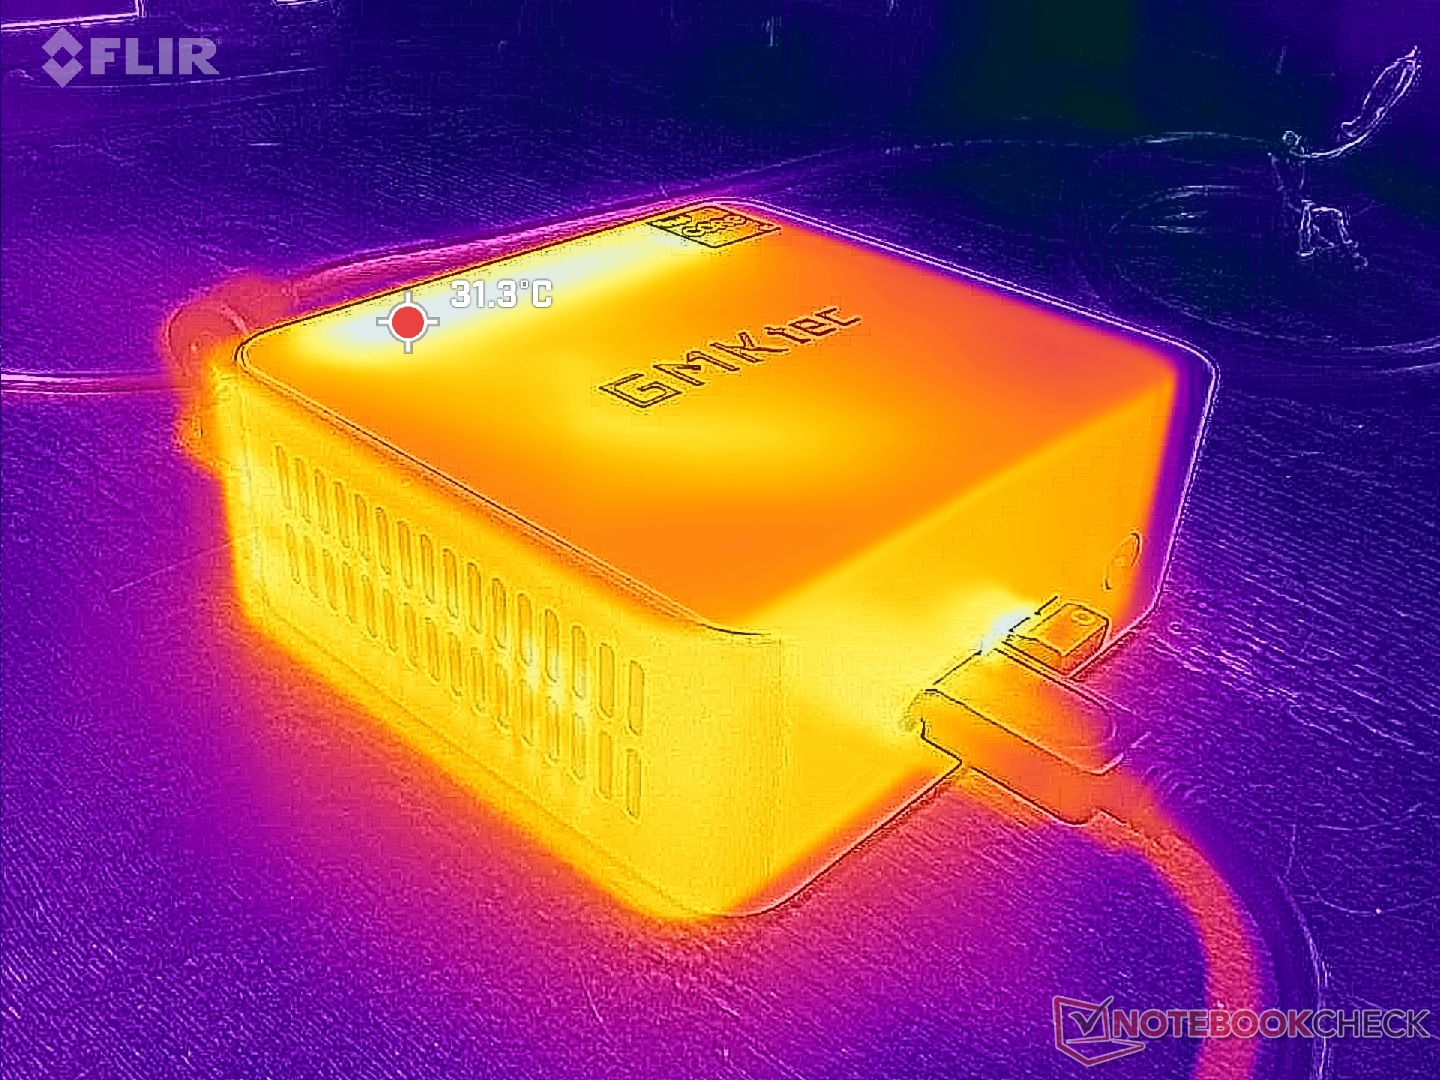
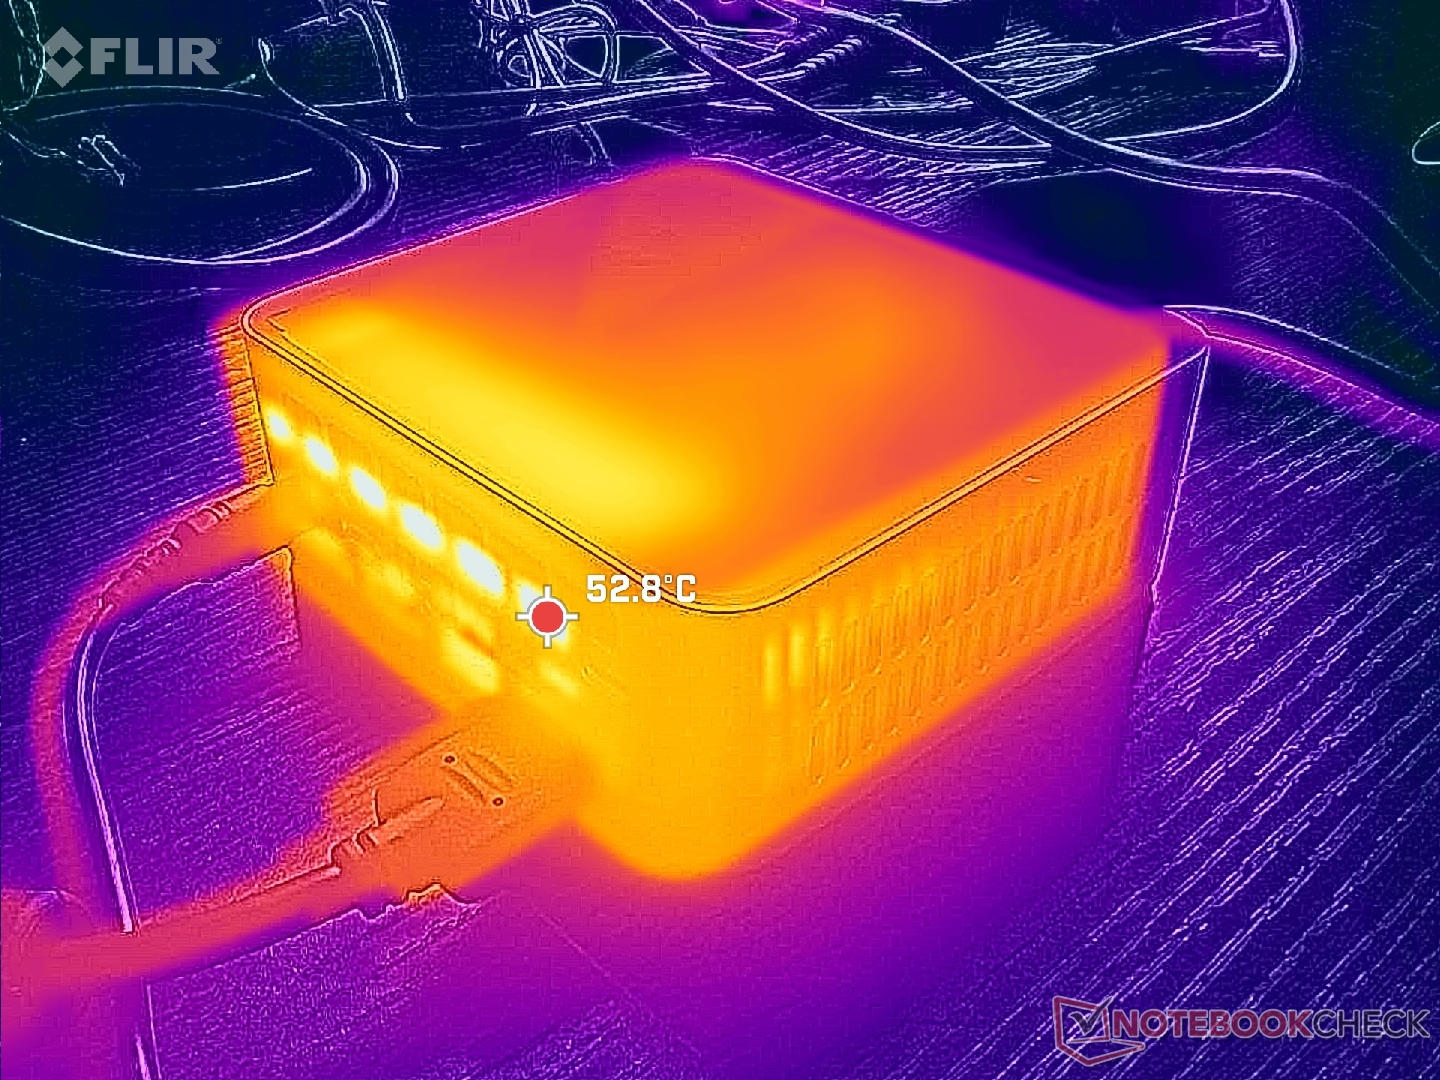
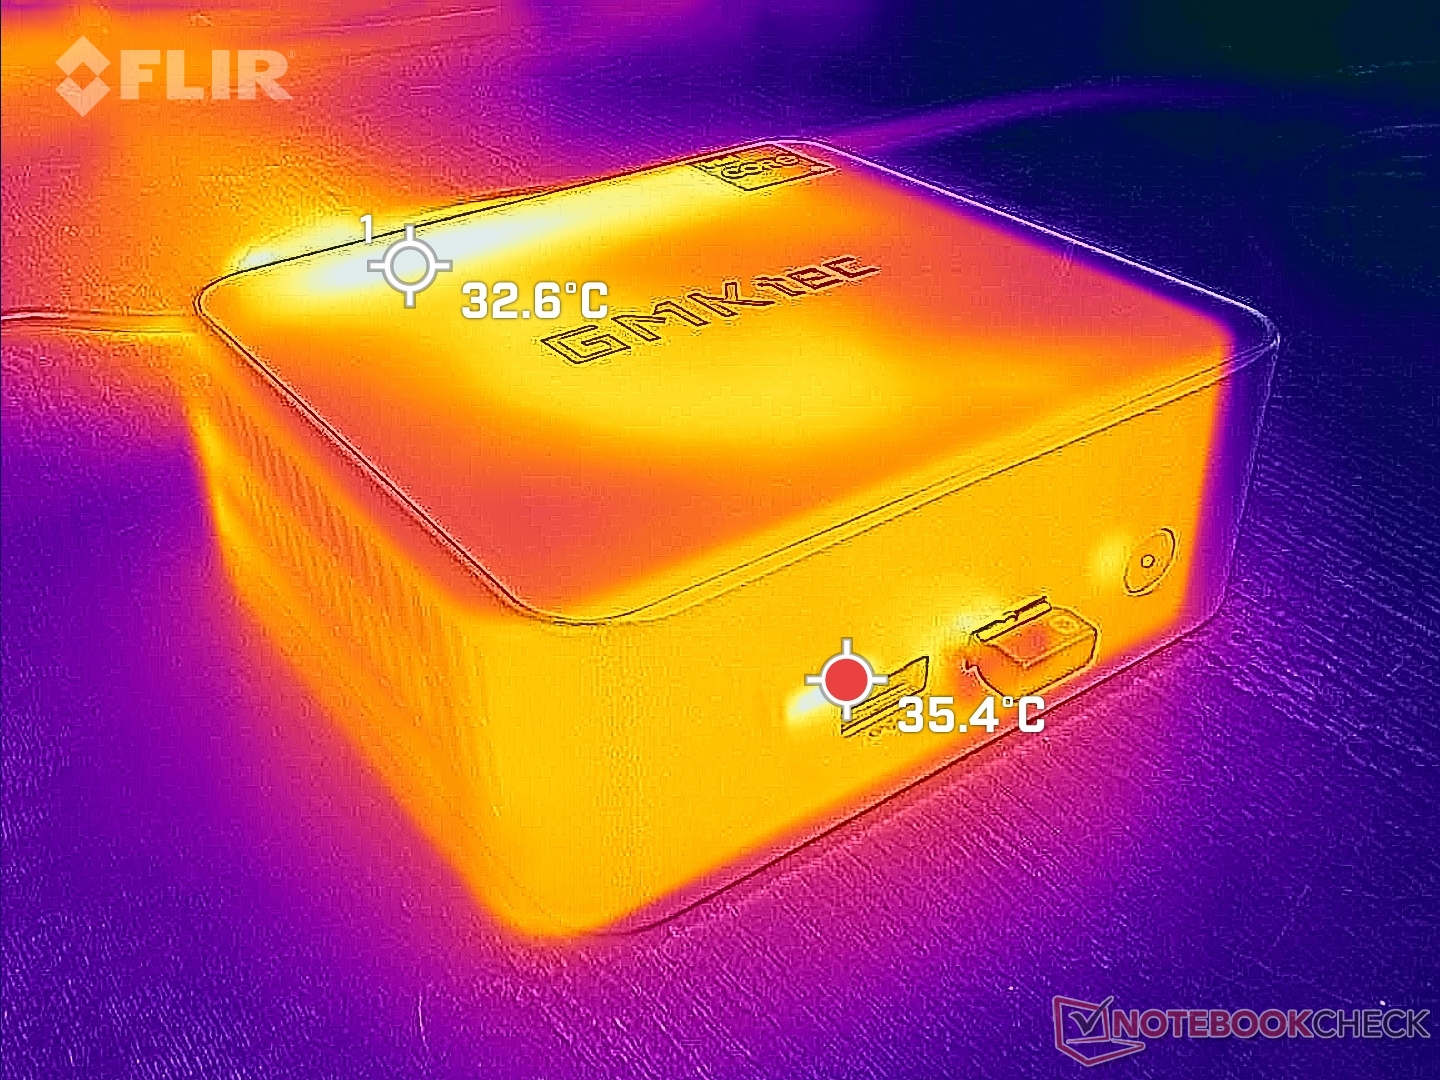
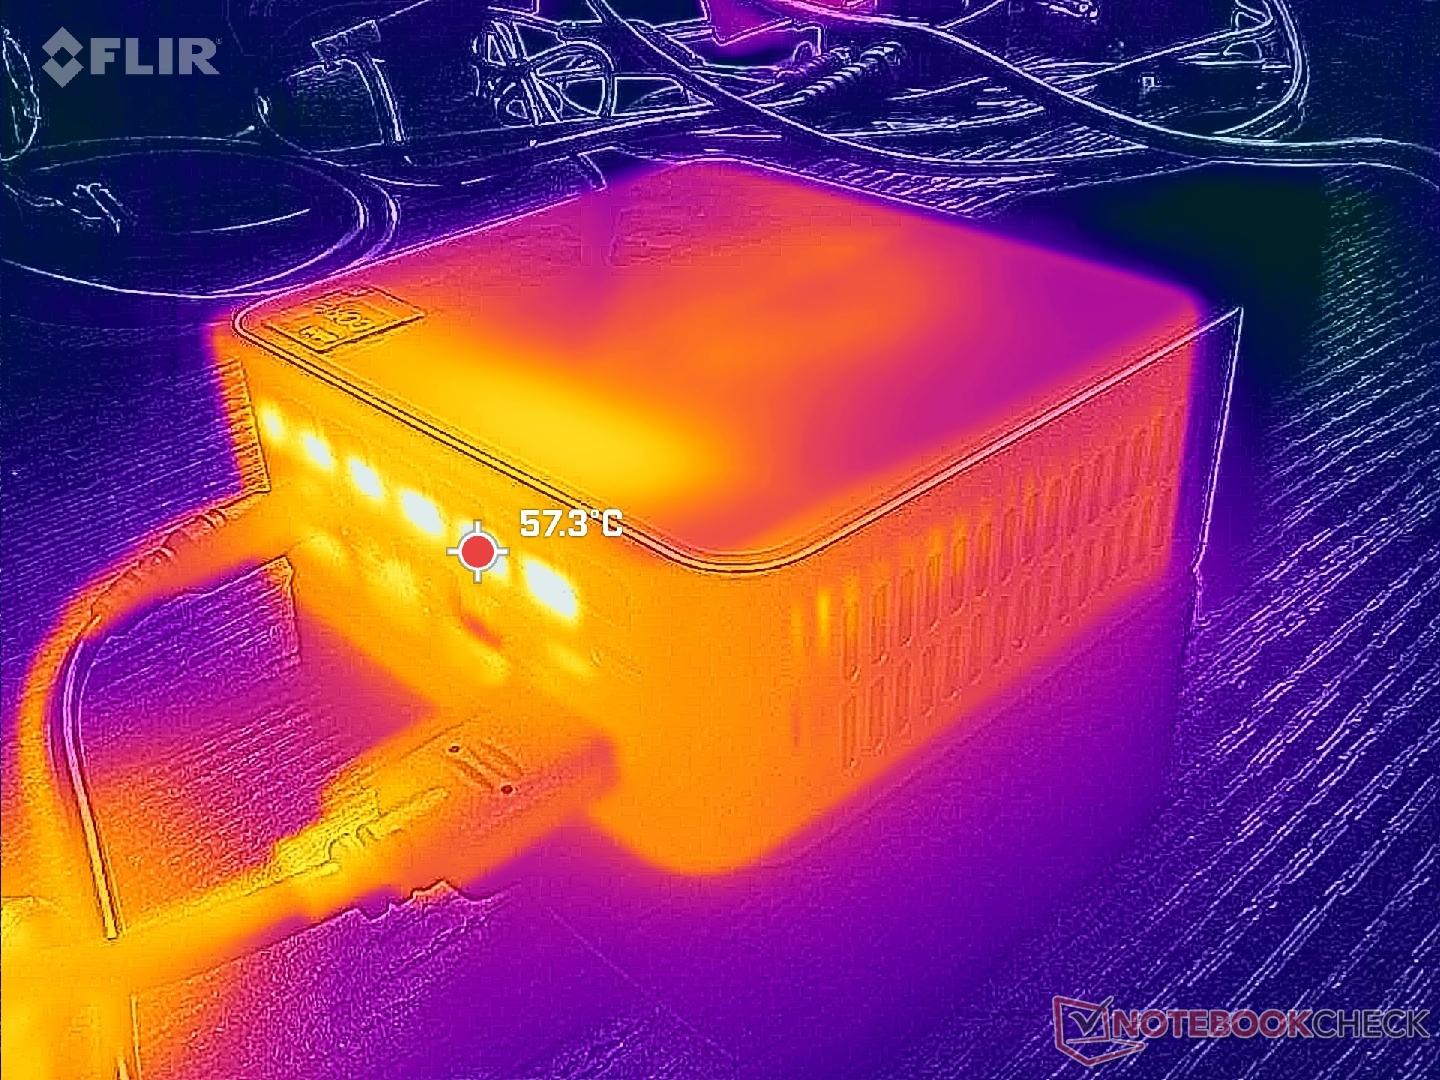
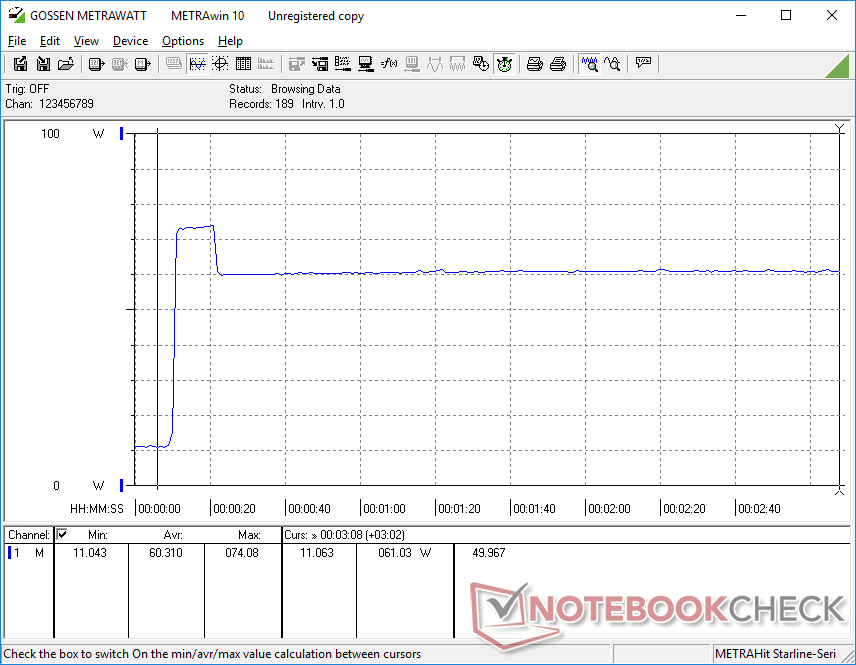
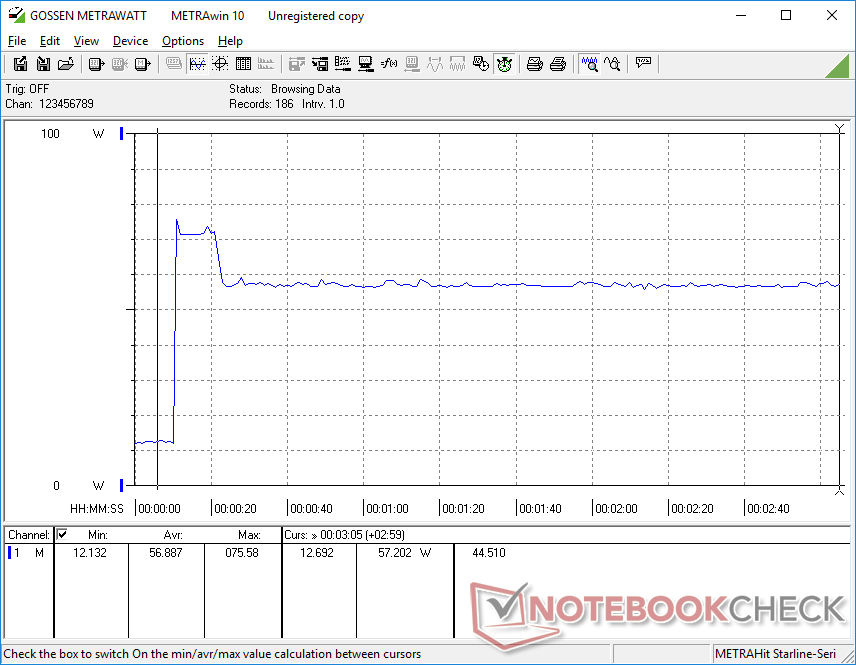
Stresstest
Bei der Ausführung von Prime95 taktet die CPU nur etwa 10 Sekunden lang auf 2,6 GHz und 45 W hoch, bevor sie auf 1,8 GHz und 35 W fällt und sich stabilisiert, um eine angemessene Kerntemperatur von 75 °C aufrechtzuerhalten. Das maximale Turbo-Boost-Potenzial ist bei der NucBox M3 also nur von kurzer Dauer. Eine Wiederholung desselben Tests auf der NucBox K3 Pro mit dem schnelleren Core i7-12650H würde zu sowohl höheren Taktraten als auch wärmeren Kerntemperaturen von annähernd 84 °C führen.
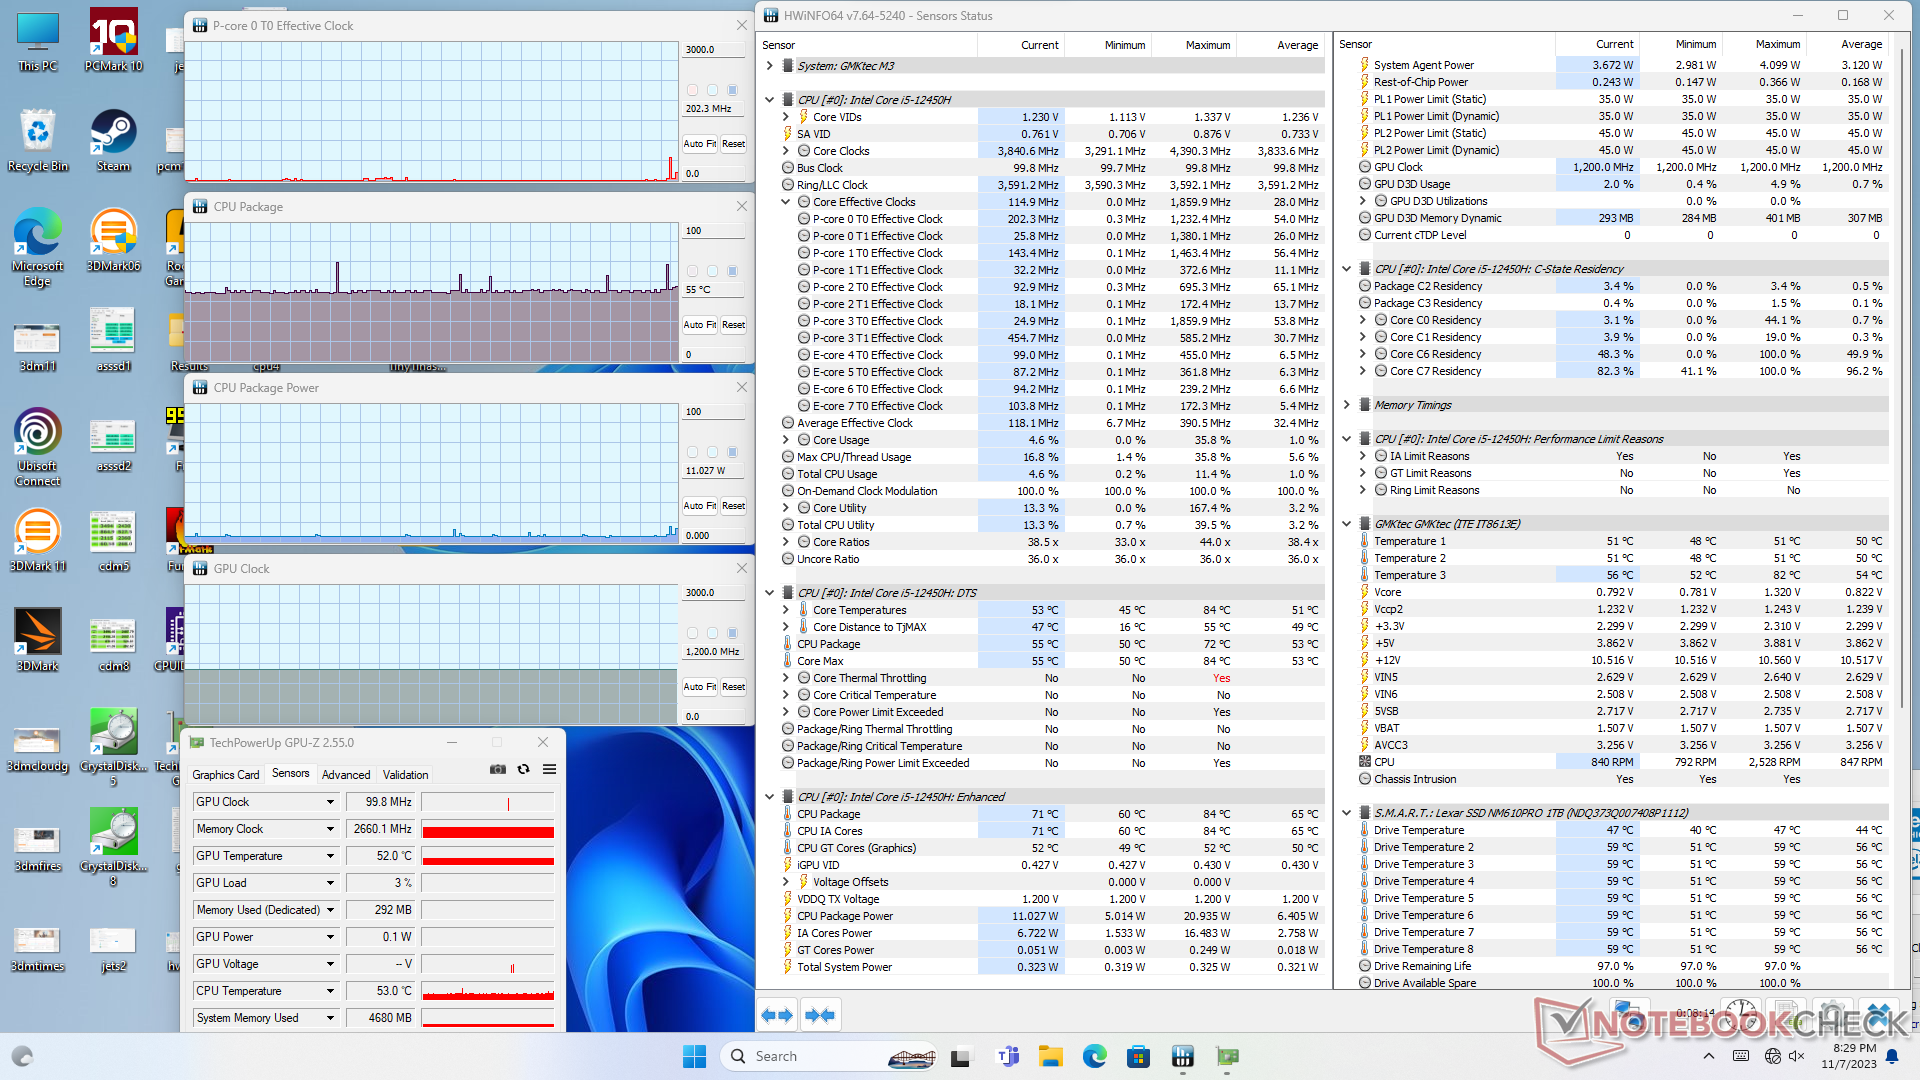
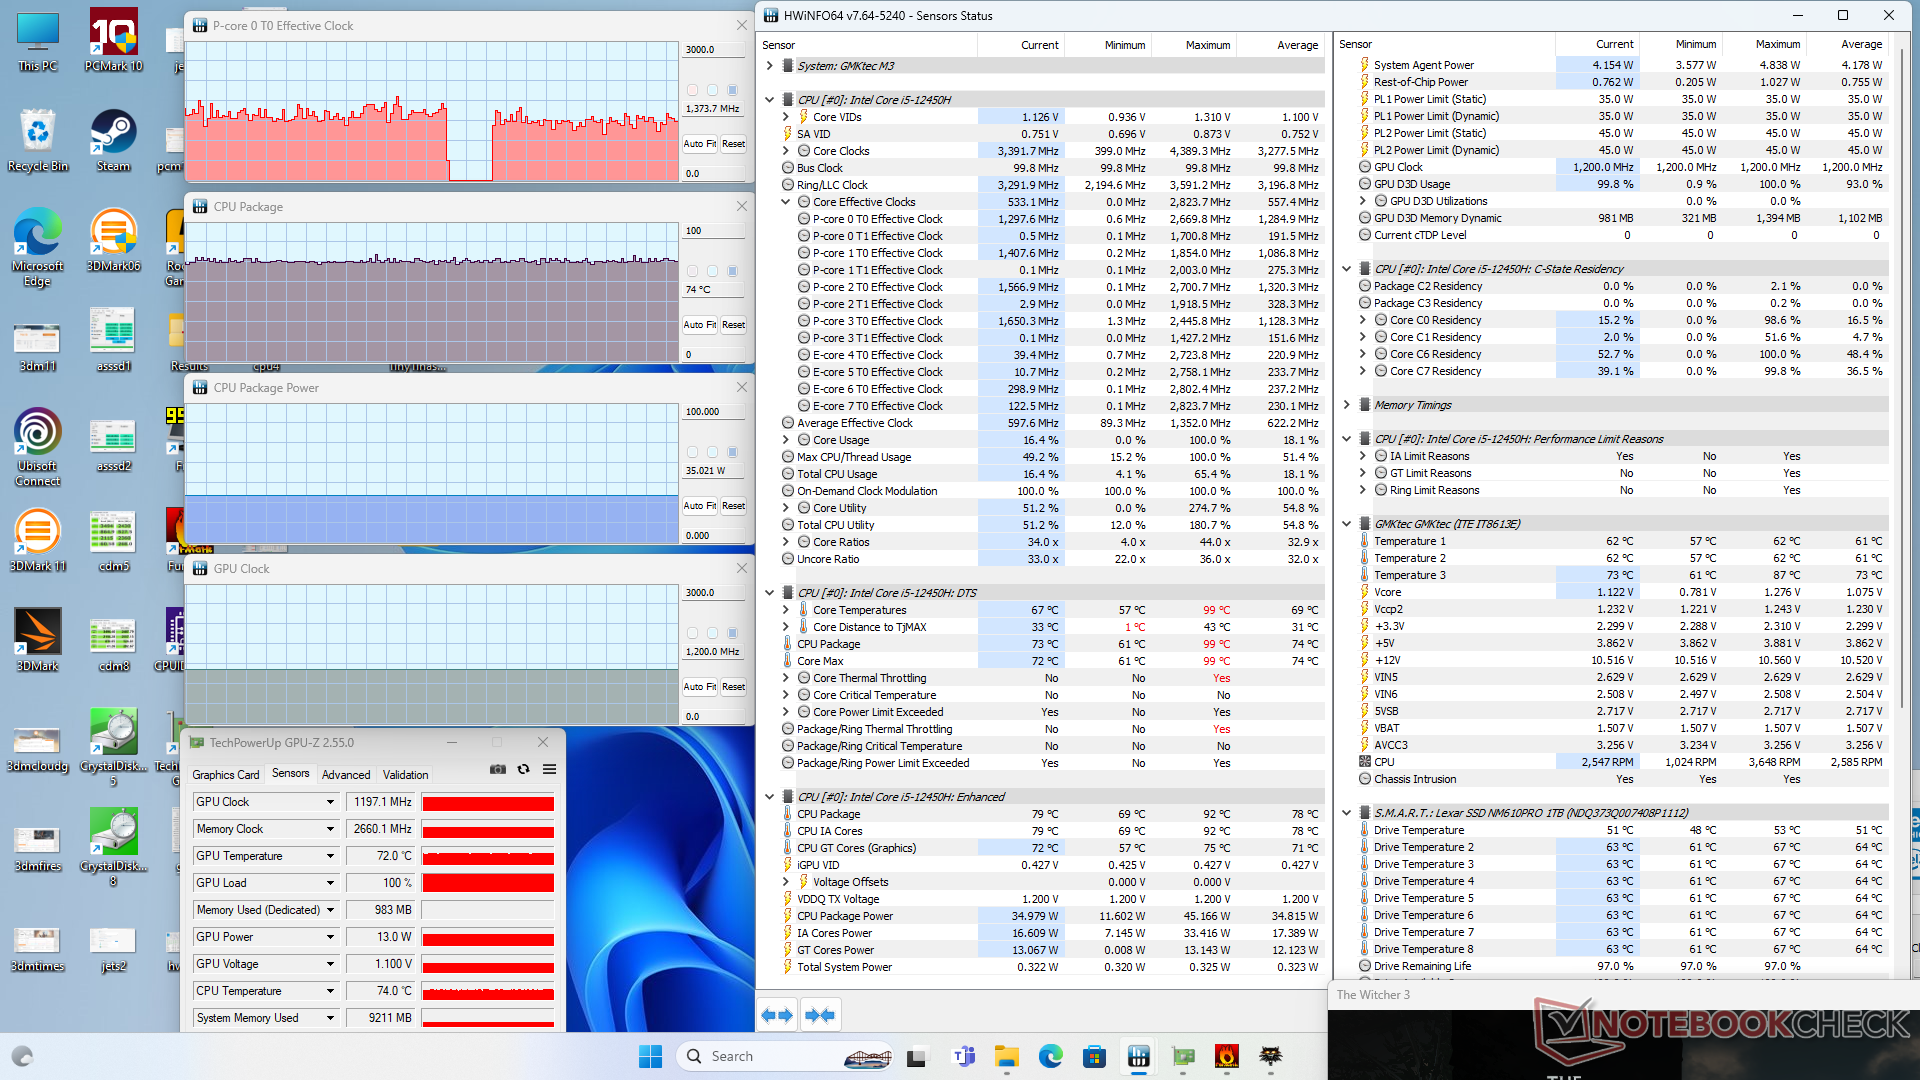
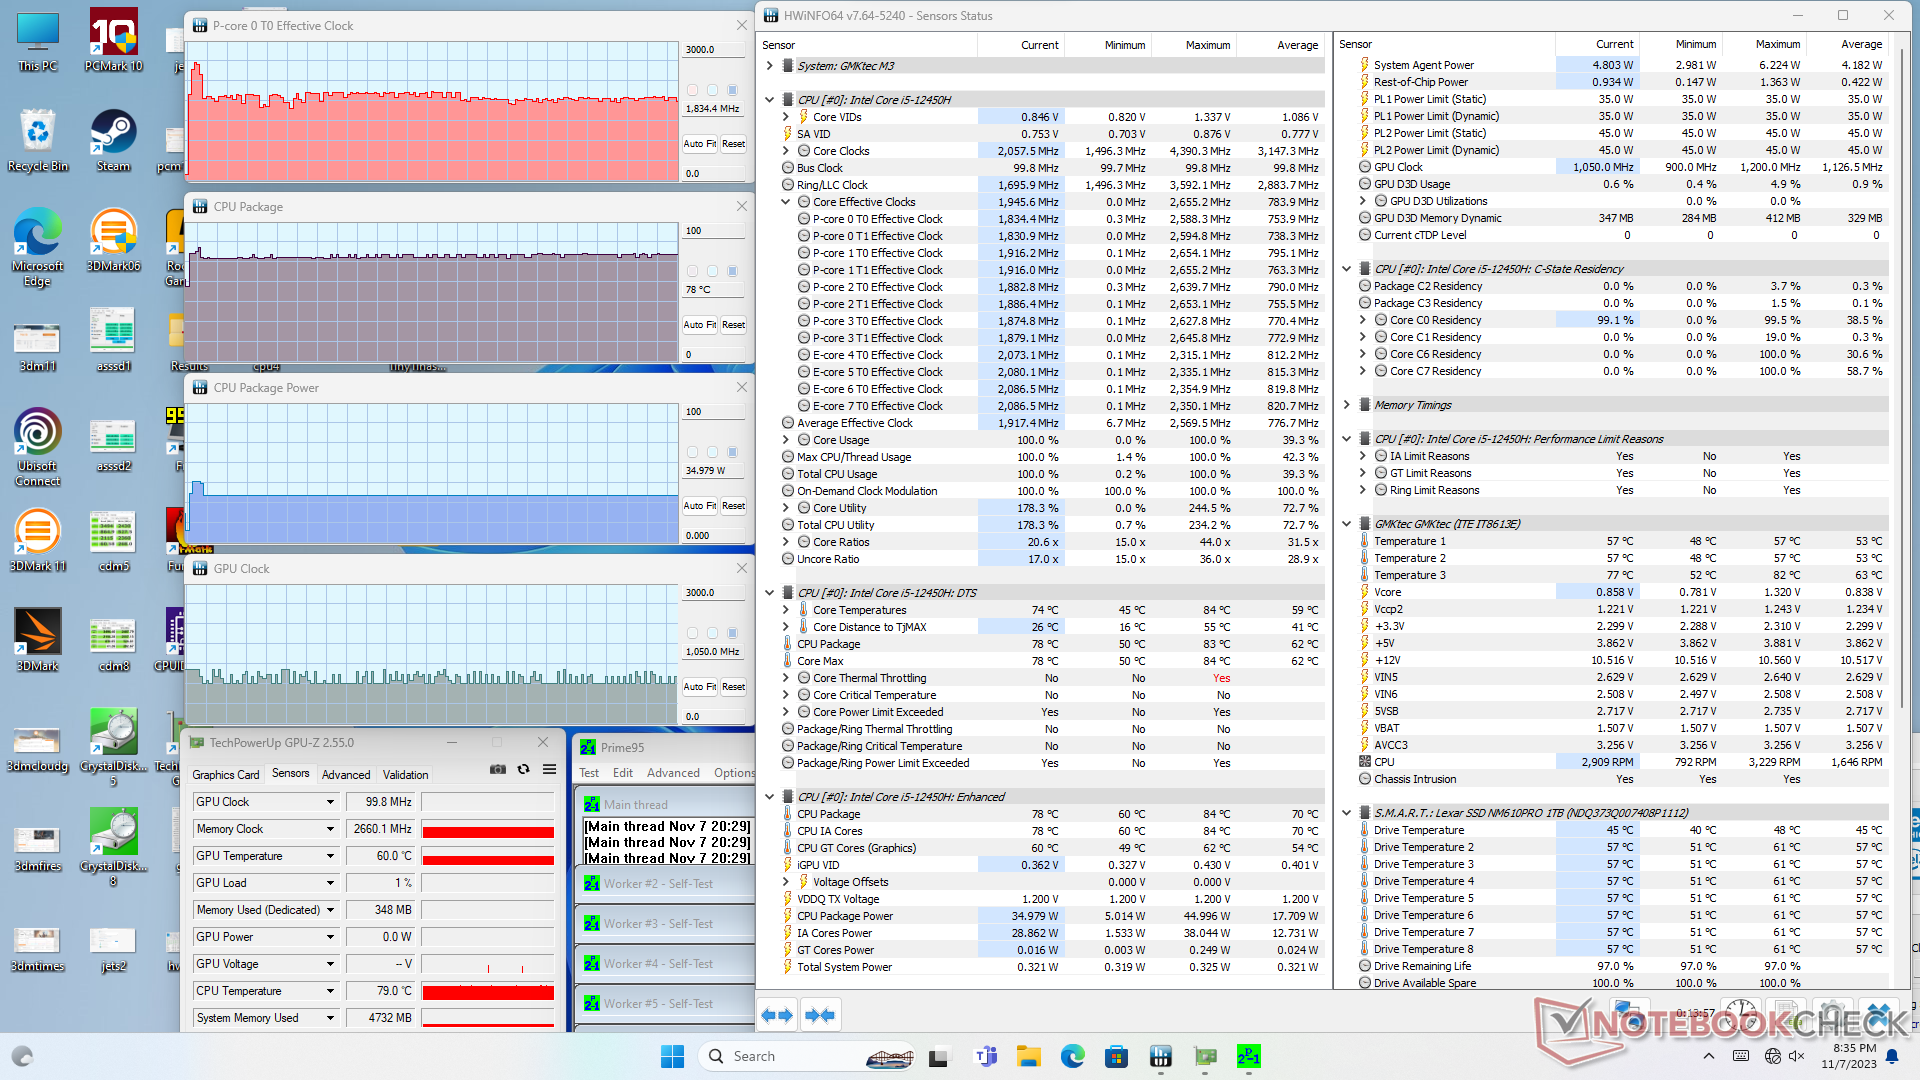
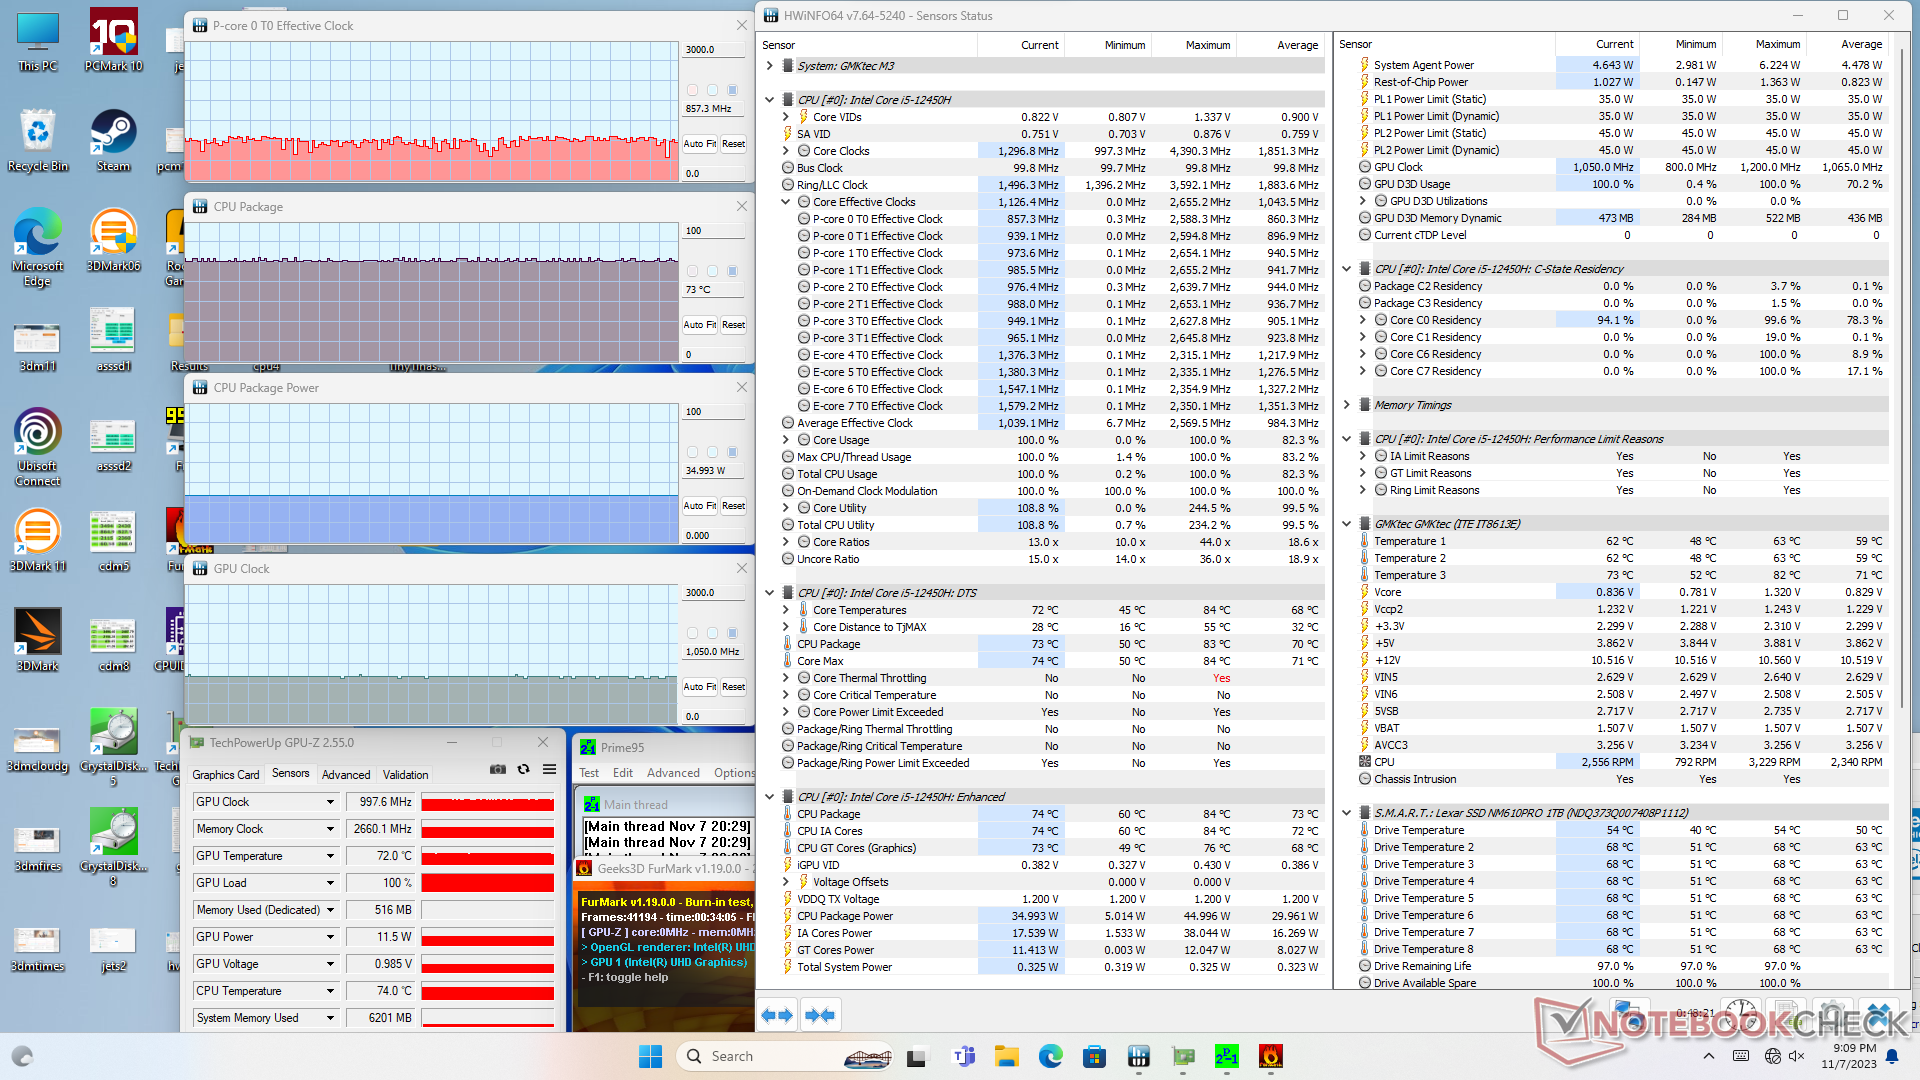
| CPU-Takt (GHz) | GPU-Takt (MHz) | Durchschnittliche CPU-Temperatur (°C) | |
| System im Leerlauf | -- | -- | 54 |
| Prime95 Stresstest | 1.8 | -- | 78 |
| Prime95 + FurMark Stresstest | 0.9 | 998 | 73 |
| Witcher 3 Stresstest | 1.4 | 1197 | 74 |
Energieverwaltung
Energieaufnahme
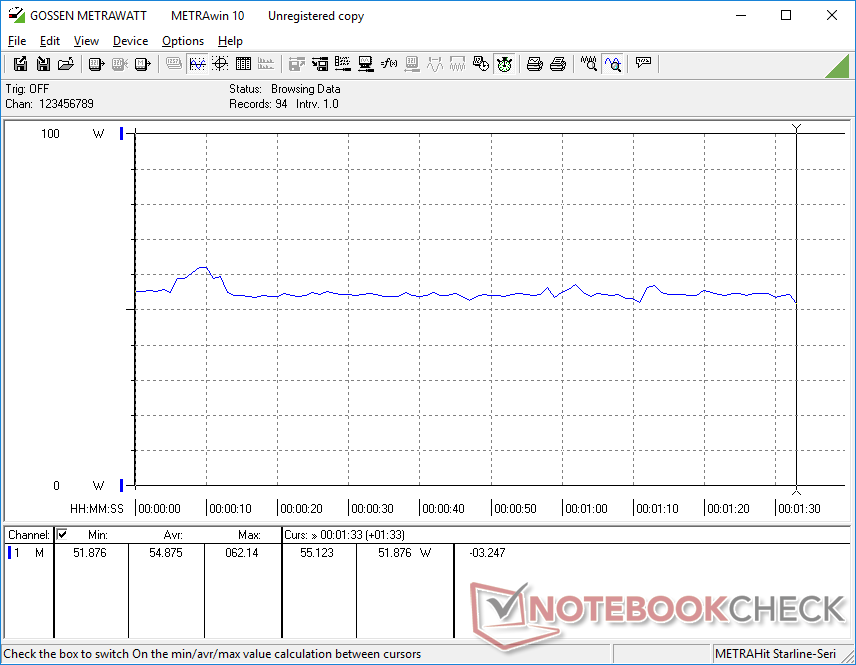
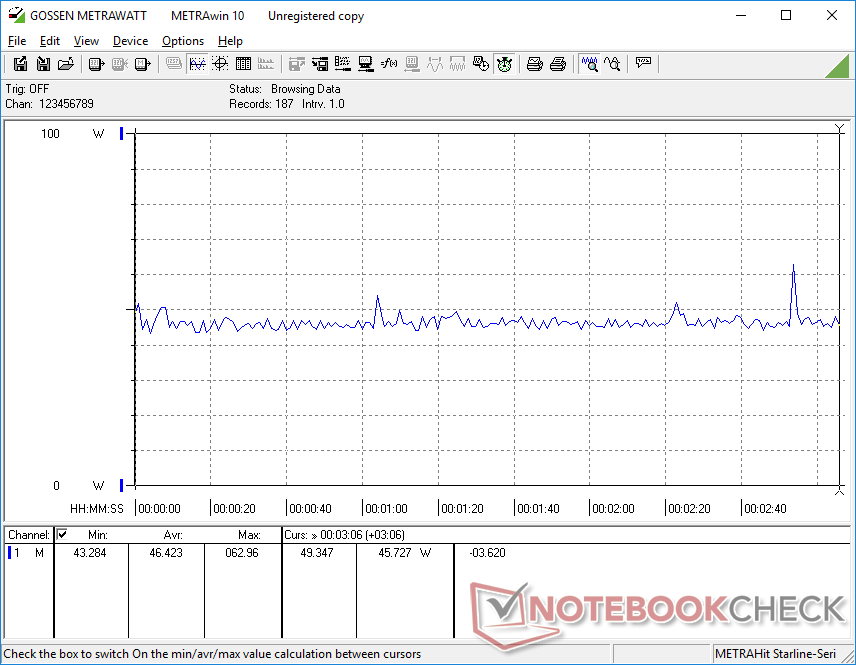
Es ist kein Geheimnis, dass die Intel-CPUs der 12. Generation, insbesondere die der Core-H-Familie, sehr leistungshungrig sein können. Der Core i5-12450H ist keine Ausnahme, da er nahezu so anspruchsvoll ist wie der Ryzen 7 5800H im Geekom A5, obwohl die AMD-CPU eine schnellere Multi-Thread-Leistung bietet. Noch problematischer ist, dass unser System den CineBench R15 xT in etwa der gleichen Zeit wie der Ryzen 5 5560U im Beelink SER5 abschließt, dabei jedoch fast 80 Prozent mehr Strom verbraucht.
Der Energieverbrauch bei der Ausführung von GPU-lastigen Anwendungen wie Spielen lässt unser GMK-System ebenfalls in keinem guten Licht dastehen. Die Ausführung von Witcher 3 würde fast 60 Prozent mehr Strom verbrauchen als auf dem Beelink SER5, obwohl die Grafikleistung beider Modelle ähnlich ist.
| Aus / Standby | |
| Idle | |
| Last |
|
Legende:
min: | |
| GMK NucBox M3 i5-12450H, UHD Graphics Xe G4 48EUs, Lexar NM610 Pro NM610P001T-HNNNG, , x, | GMK NucBox K3 Pro i7-12650H, UHD Graphics 64EUs, Lexar NM610 Pro NM610P001T-HNNNG, , x, | Beelink SER5 R5 5560U, Vega 6, Crucial P3 Plus CT1000P3PSSD8, , x, | Beelink Mini S12 Pro N100, UHD Graphics 24EUs (Alder Lake-N), , , x, | Geekom A5 R7 5800H, Vega 8, Lexar NM620 512GB, , x, | Intel NUC 13 Pro Kit NUC13ANK i7-1360P, Iris Xe G7 96EUs, Samsung PM9A1 MZVL2512HCJQ, , x, | |
|---|---|---|---|---|---|---|
| Stromverbrauch | 5% | 51% | 42% | 14% | 11% | |
| Idle min * (Watt) | 10.6 | 7.1 33% | 4.4 58% | 8.3 22% | 6.9 35% | 5.1 52% |
| Idle avg * (Watt) | 11.9 | 10.1 15% | 5 58% | 8.8 26% | 7.9 34% | 5.8 51% |
| Idle max * (Watt) | 12.5 | 18.6 -49% | 5.3 58% | 8.9 29% | 8.9 29% | 10.2 18% |
| Last avg * (Watt) | 54.9 | 45.3 17% | 29.8 46% | 20.1 63% | 60.8 -11% | 68.1 -24% |
| Witcher 3 ultra * (Watt) | 46.4 | 55.2 -19% | 28.8 38% | 21.5 54% | ||
| Last max * (Watt) | 75.6 | 52.9 30% | 40.4 47% | 32.2 57% | 89.7 -19% | 108.3 -43% |
* ... kleinere Werte sind besser
Energieverbrauch Witcher 3 / Stresstest
Energieverbrauch externer Monitor
Pro
Contra
Fazit
Ein Hauptgrund für die Verwendung eines Core H-basierten Mini-PCs anstelle von Core U oder Ryzen U ist die schnellere Leistung. Leider bietet der Core i5-12450H im Vergleich zu den CPUs der U-Serie nicht genug, um den höheren Energieverbrauch und das lautere Lüftergeräusch zu rechtfertigen. Die NucBox M3 ist deutlich lauter als die Alternativen der U-Serie, wie die Beelink SER5, ohne nennenswerte Vorteile in Bezug auf die Multi-Thread-Leistung oder die Grafikleistung zu bieten. Wenn man dann noch bedenkt, dass die meisten Mini-PCs der U-Serie billiger sind als die NucBox M3, wird es noch schwieriger, dieses Modell zu empfehlen.
Die NucBox M3 ist lauter und wird heißer als die meisten anderen Mini-PCs mit U-Serien-CPUs, ohne dass dies durch eine wesentlich bessere Leistung ausgeglichen wird.
Zu den Highlights der NucBox M3 gehören die leicht zugänglichen Komponenten und die zahlreichen Anschlussmöglichkeiten. Diese Highlights sind jedoch bei den meisten Mini-PCs zu finden und können daher nicht als große Vorteile angesehen werden. Das Modell müsste mehr bieten, um sich besser von der Masse der Alternativen abzuheben, wie werkzeuglose Wartung, Thunderbolt-Unterstützung, mehrere USB-C-Anschlüsse, integriertes Netzteil oder leisere Lüftergeräusche.
Preis und Verfügbarkeit
Amazon bietet die NucBox M3 derzeit noch nicht an. Stattdessen können Nutzer sie direkt beim Hersteller für ~350 Euro kaufen, wenn sie mit 32 GB RAM und 1 TB SSD konfiguriert ist.
GMK NucBox M3
- 09.11.2023 v7 (old)
Allen Ngo
Transparenz
Die Auswahl der zu testenden Geräte erfolgt innerhalb der Redaktion. Das vorliegende Testmuster wurde dem Autor vom Hersteller oder einem Shop zu Testzwecken leihweise zur Verfügung gestellt. Eine Einflussnahme des Leihstellers auf den Testbericht gab es nicht, der Hersteller erhielt keine Version des Reviews vor der Veröffentlichung. Es bestand keine Verpflichtung zur Publikation. Als eigenständiges, unabhängiges Unternehmen unterliegt Notebookcheck keiner Diktion von Herstellern, Shops und Verlagen.
So testet Notebookcheck
Pro Jahr werden von Notebookcheck hunderte Laptops und Smartphones unabhängig in von uns standardisierten technischen Verfahren getestet, um eine Vergleichbarkeit aller Testergebnisse zu gewährleisten. Seit rund 20 Jahren entwickeln wir diese Testmethoden kontinuierlich weiter und setzen damit Branchenstandards. In unseren Testlaboren kommt ausschließlich hochwertiges Messequipment in die Hände erfahrener Techniker und Redakteure. Die Tests unterliegen einer mehrstufigen Kontrolle. Unsere komplexe Gesamtbewertung basiert auf hunderten fundierten Messergebnissen und Benchmarks, womit Ihnen Objektivität garantiert ist. Weitere Informationen zu unseren Testmethoden gibt es hier.
Preisvergleich

