GMK NucBox M5 Mini-PC Test: AMD Zen 2 ist in die Jahre gekommen

Die NucBox M5 ist der neueste Einstiegs-Mini-PC von GMK im Gegensatz zur teureren NucBox-K-Serie. Er verwendet ältere Prozessoroptionen, um die Kosten niedrig zu halten.
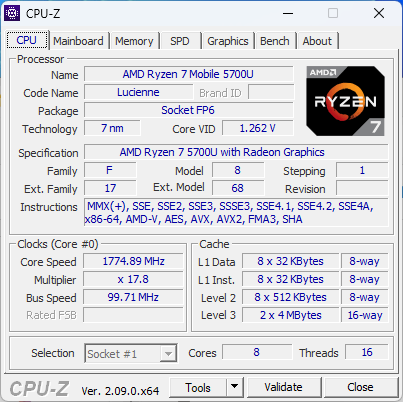
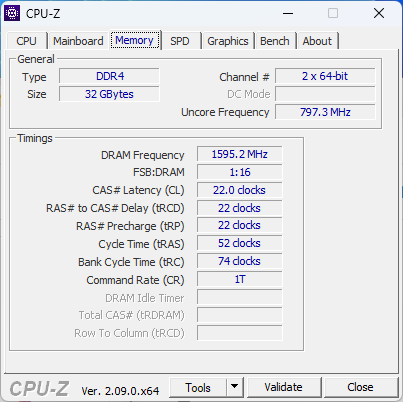
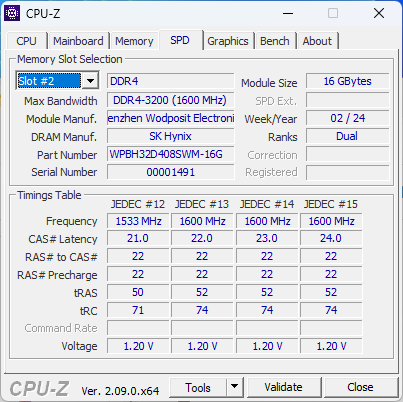
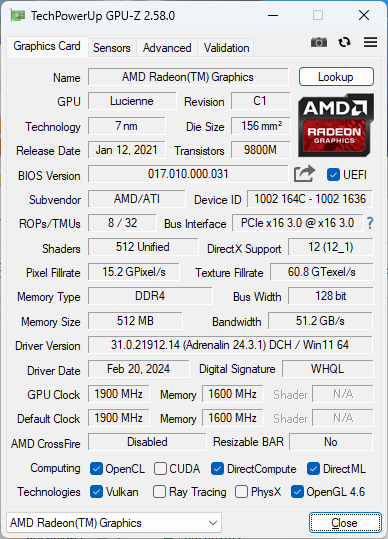
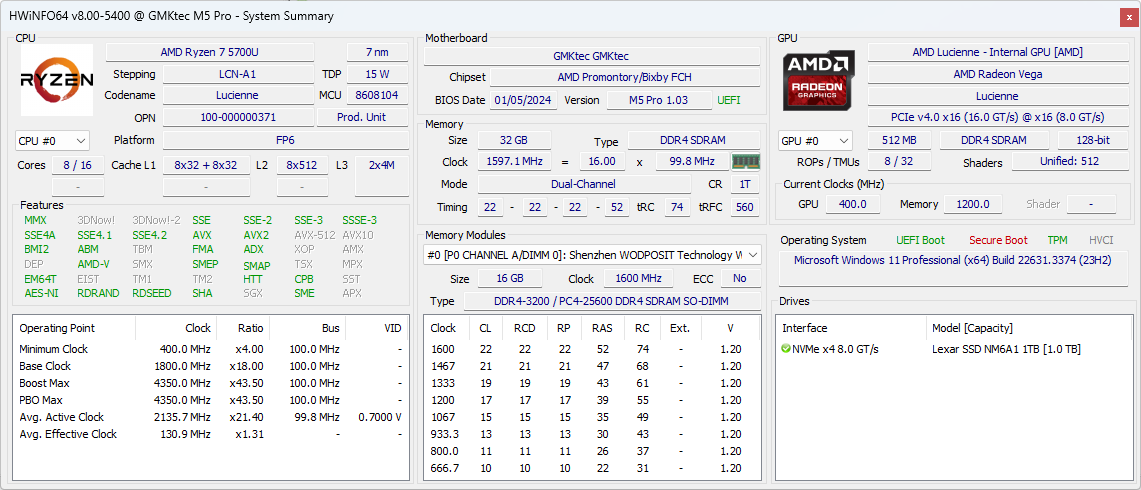
Unser Testgerät ist mit der Zen 2 Ryzen 7 5700U CPU, 32 GB DDR4-3200-RAM und 1 TB Speicher für ca. 470 US-Dollar konfiguriert. Barebone-SKUs sind auch ohne RAM oder Speicher ab 320 US-Dollar erhältlich, aber ansonsten bieten alle Optionen die gleichen Prozessoren.
Zu den Alternativen zur NucBox M4 gehören andere preiswerte Mini-PCs wie der Beelink SER5, BMax B7 Power oder Maxtang MTN-FP750.
Weitere GMKtec Bewertungen:
Mögliche Konkurrenten im Vergleich
Bew. | Datum | Modell | Gewicht | Dicke | Größe | Auflösung | Preis ab |
|---|---|---|---|---|---|---|---|
| 78.9 % v7 (old) | 04 / 2024 | GMK NucBox M5 R7 5700U, Vega 8 | 505 g | 48 mm | x | ||
| 81.1 % v7 (old) | 12 / 2023 | GMK NucBox M4 i9-11900H, UHD Graphics Xe 32EUs (Tiger Lake-H) | 951 g | 37 mm | x | ||
| 83.6 % v7 (old) | 04 / 2024 | GMK NucBox K6 R7 7840HS, Radeon 780M | 514 g | 47 mm | x | ||
| 83.4 % v7 (old) | 04 / 2024 | Acemagic F2A Ultra 7 155H, Arc 8-Core | 768 g | 57 mm | x | ||
| 82.6 % v7 (old) | 02 / 2024 | Geekom A7 R9 7940HS, Radeon 780M | 417 g | 38 mm | x | ||
| 83.1 % v7 (old) | 08 / 2023 | Intel NUC 13 Pro Desk Edition Kit i7-1360P, Iris Xe G7 96EUs | 558 g | 37 mm | x |
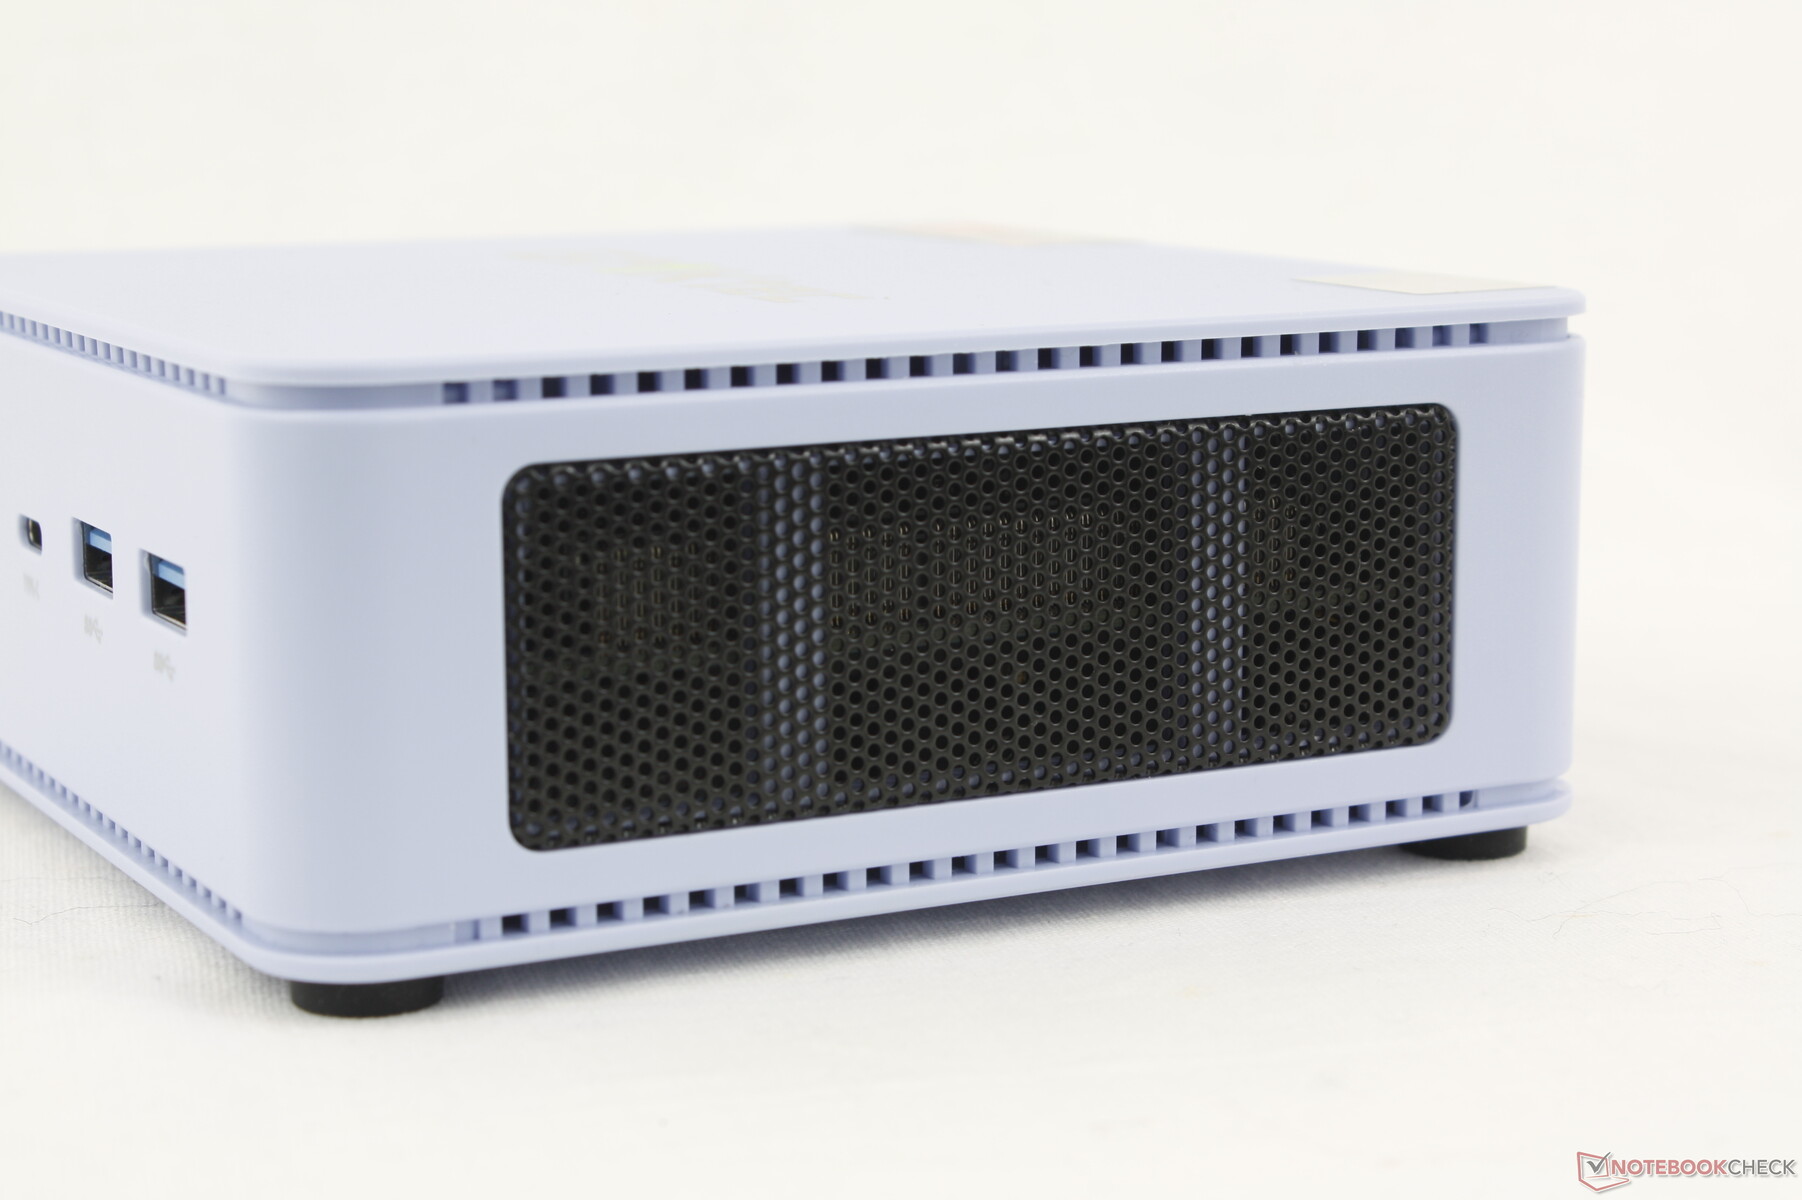
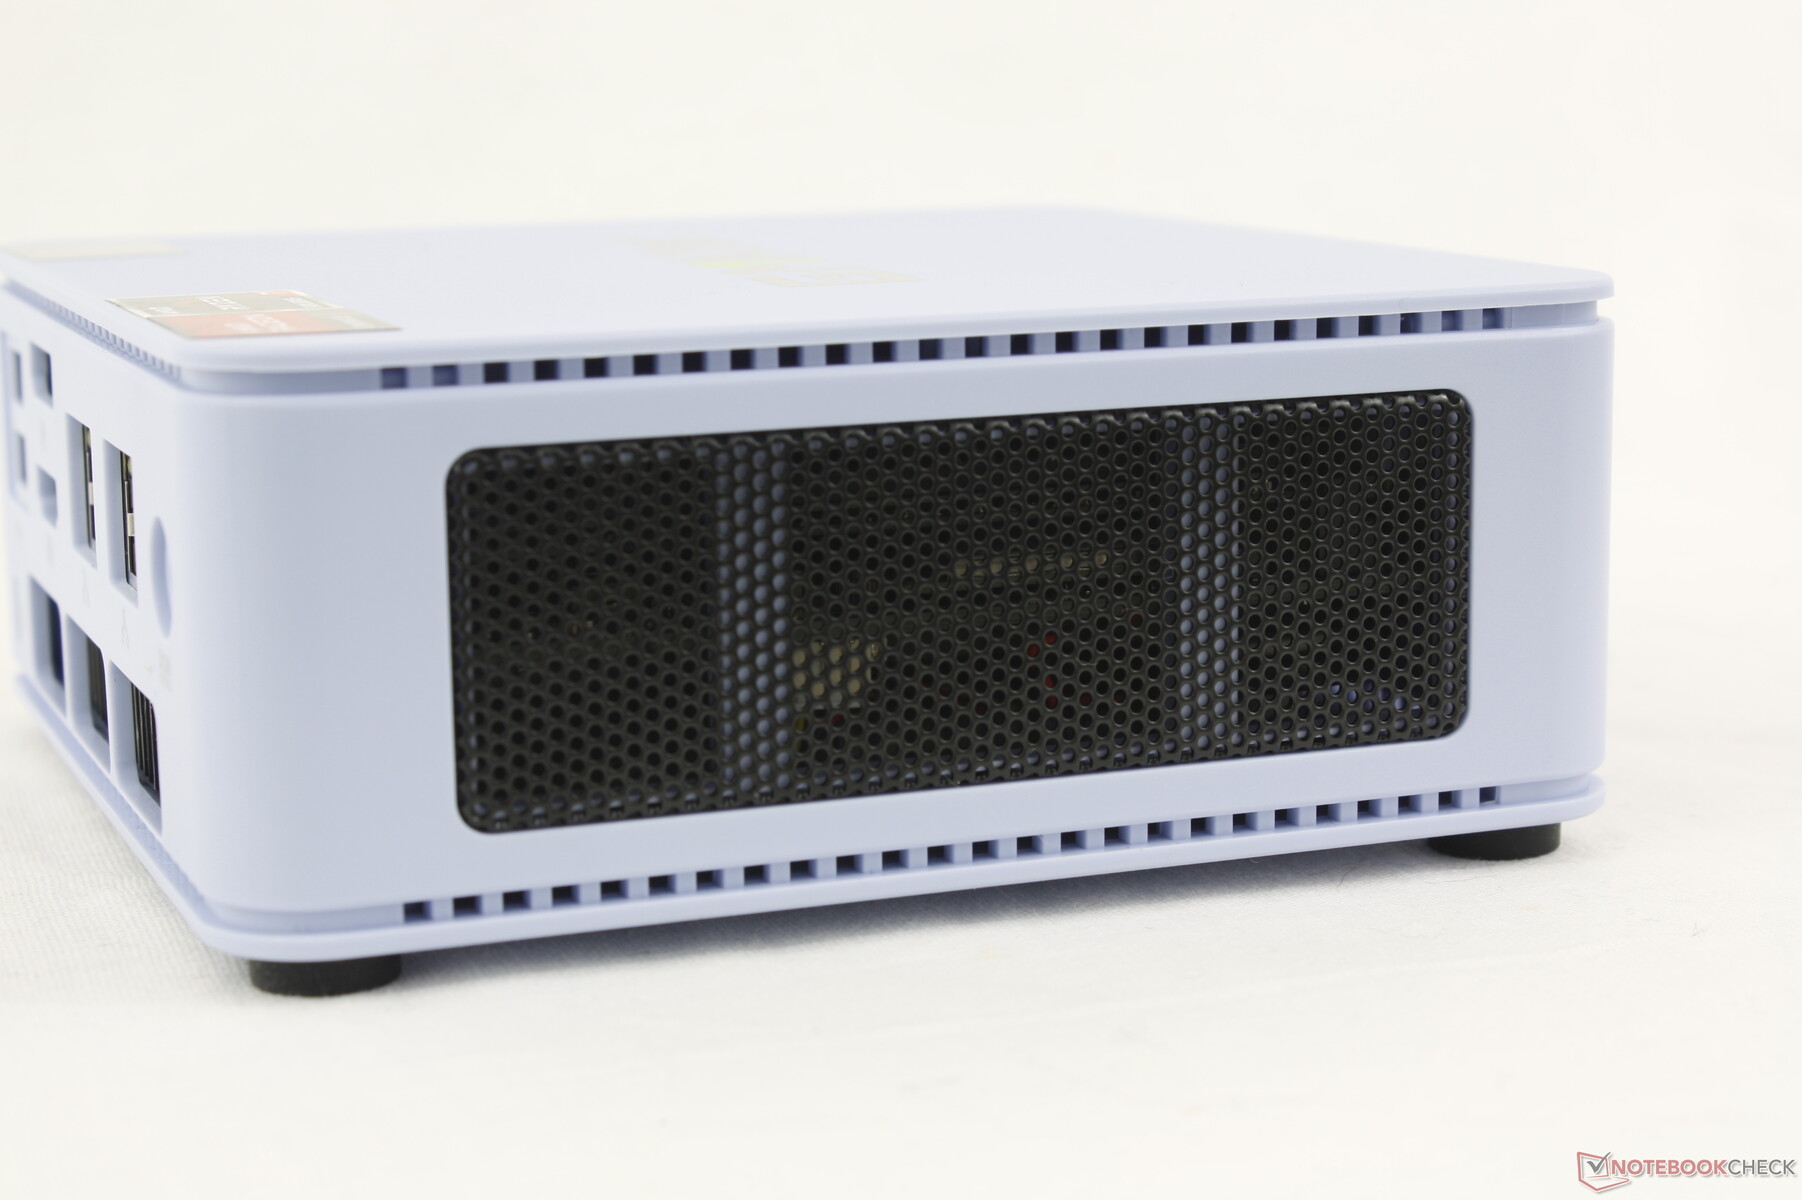
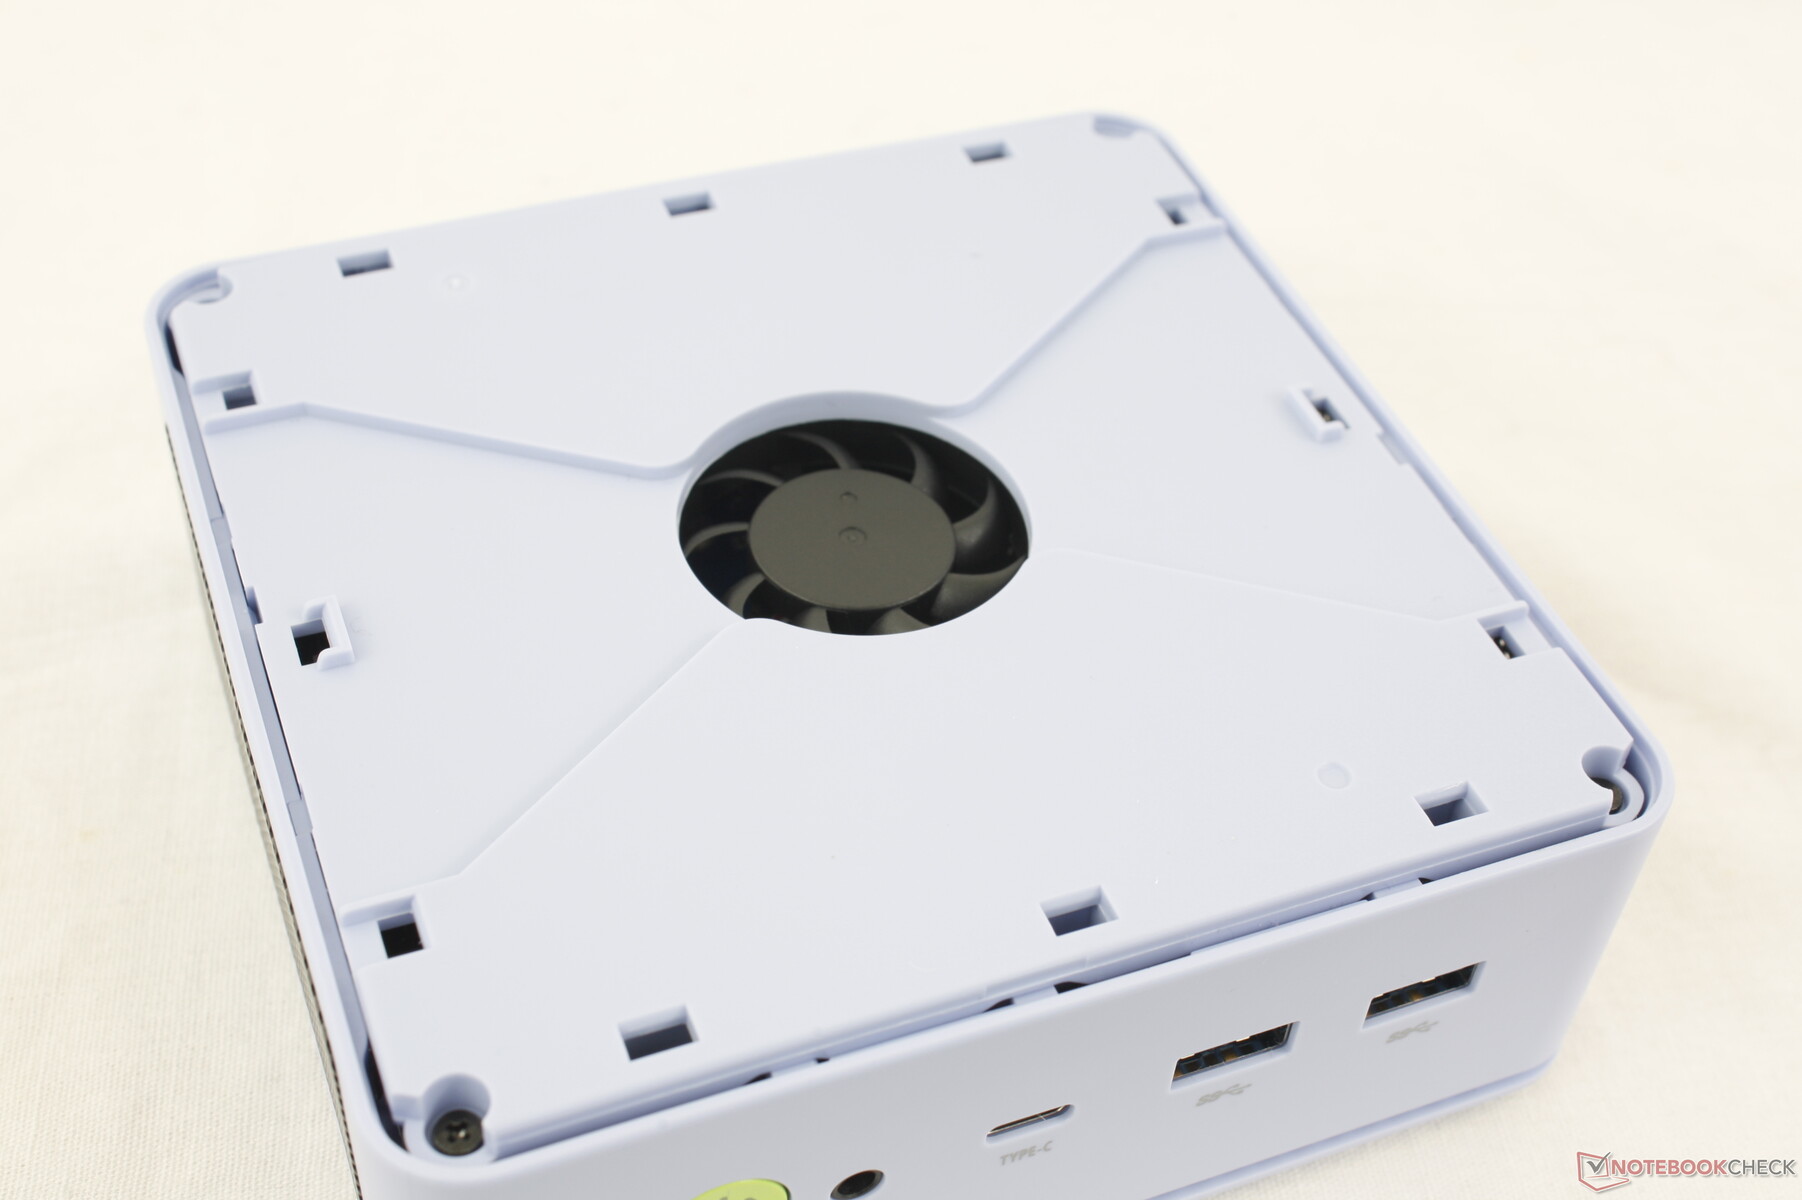
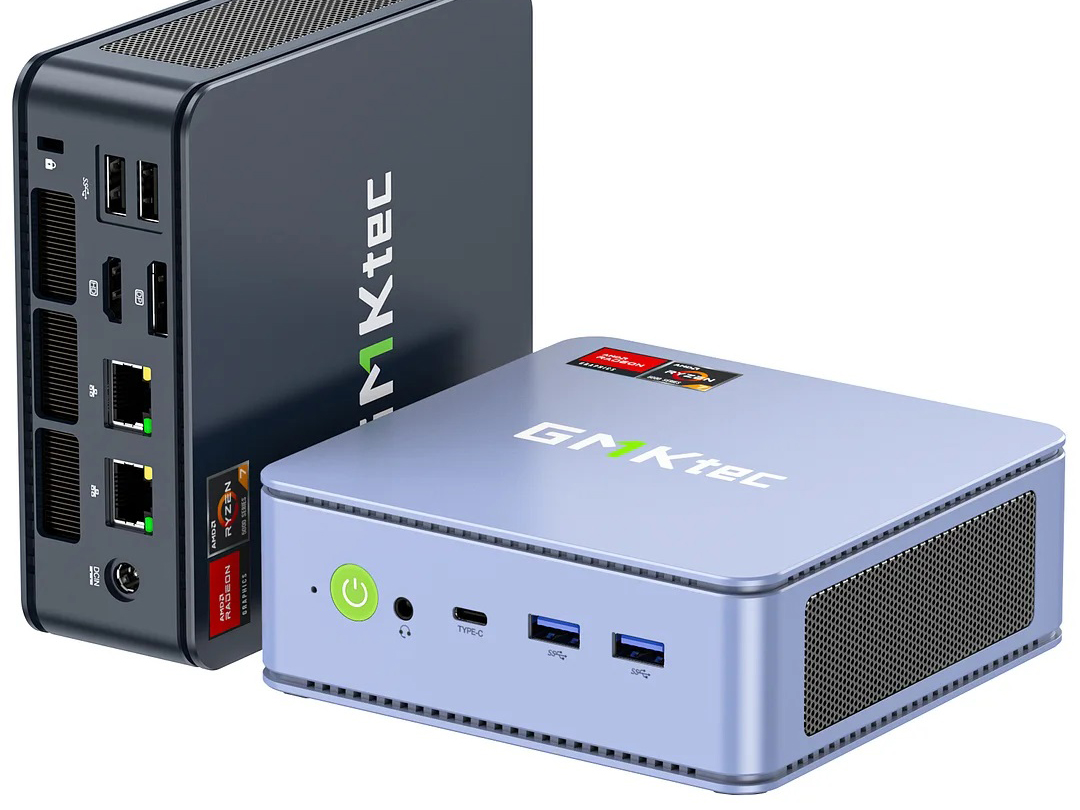
Gehäuse - Aufgefrischtes Design mit verbesserter Belüftung
Das Gehäuse ist optisch identisch mit der NucBox K6. Bei der NucBox M5 sind die Seiten des Gehäuses jedoch aus Kunststoff und nicht aus Metall, wahrscheinlich um die Kosten niedrig zu halten.
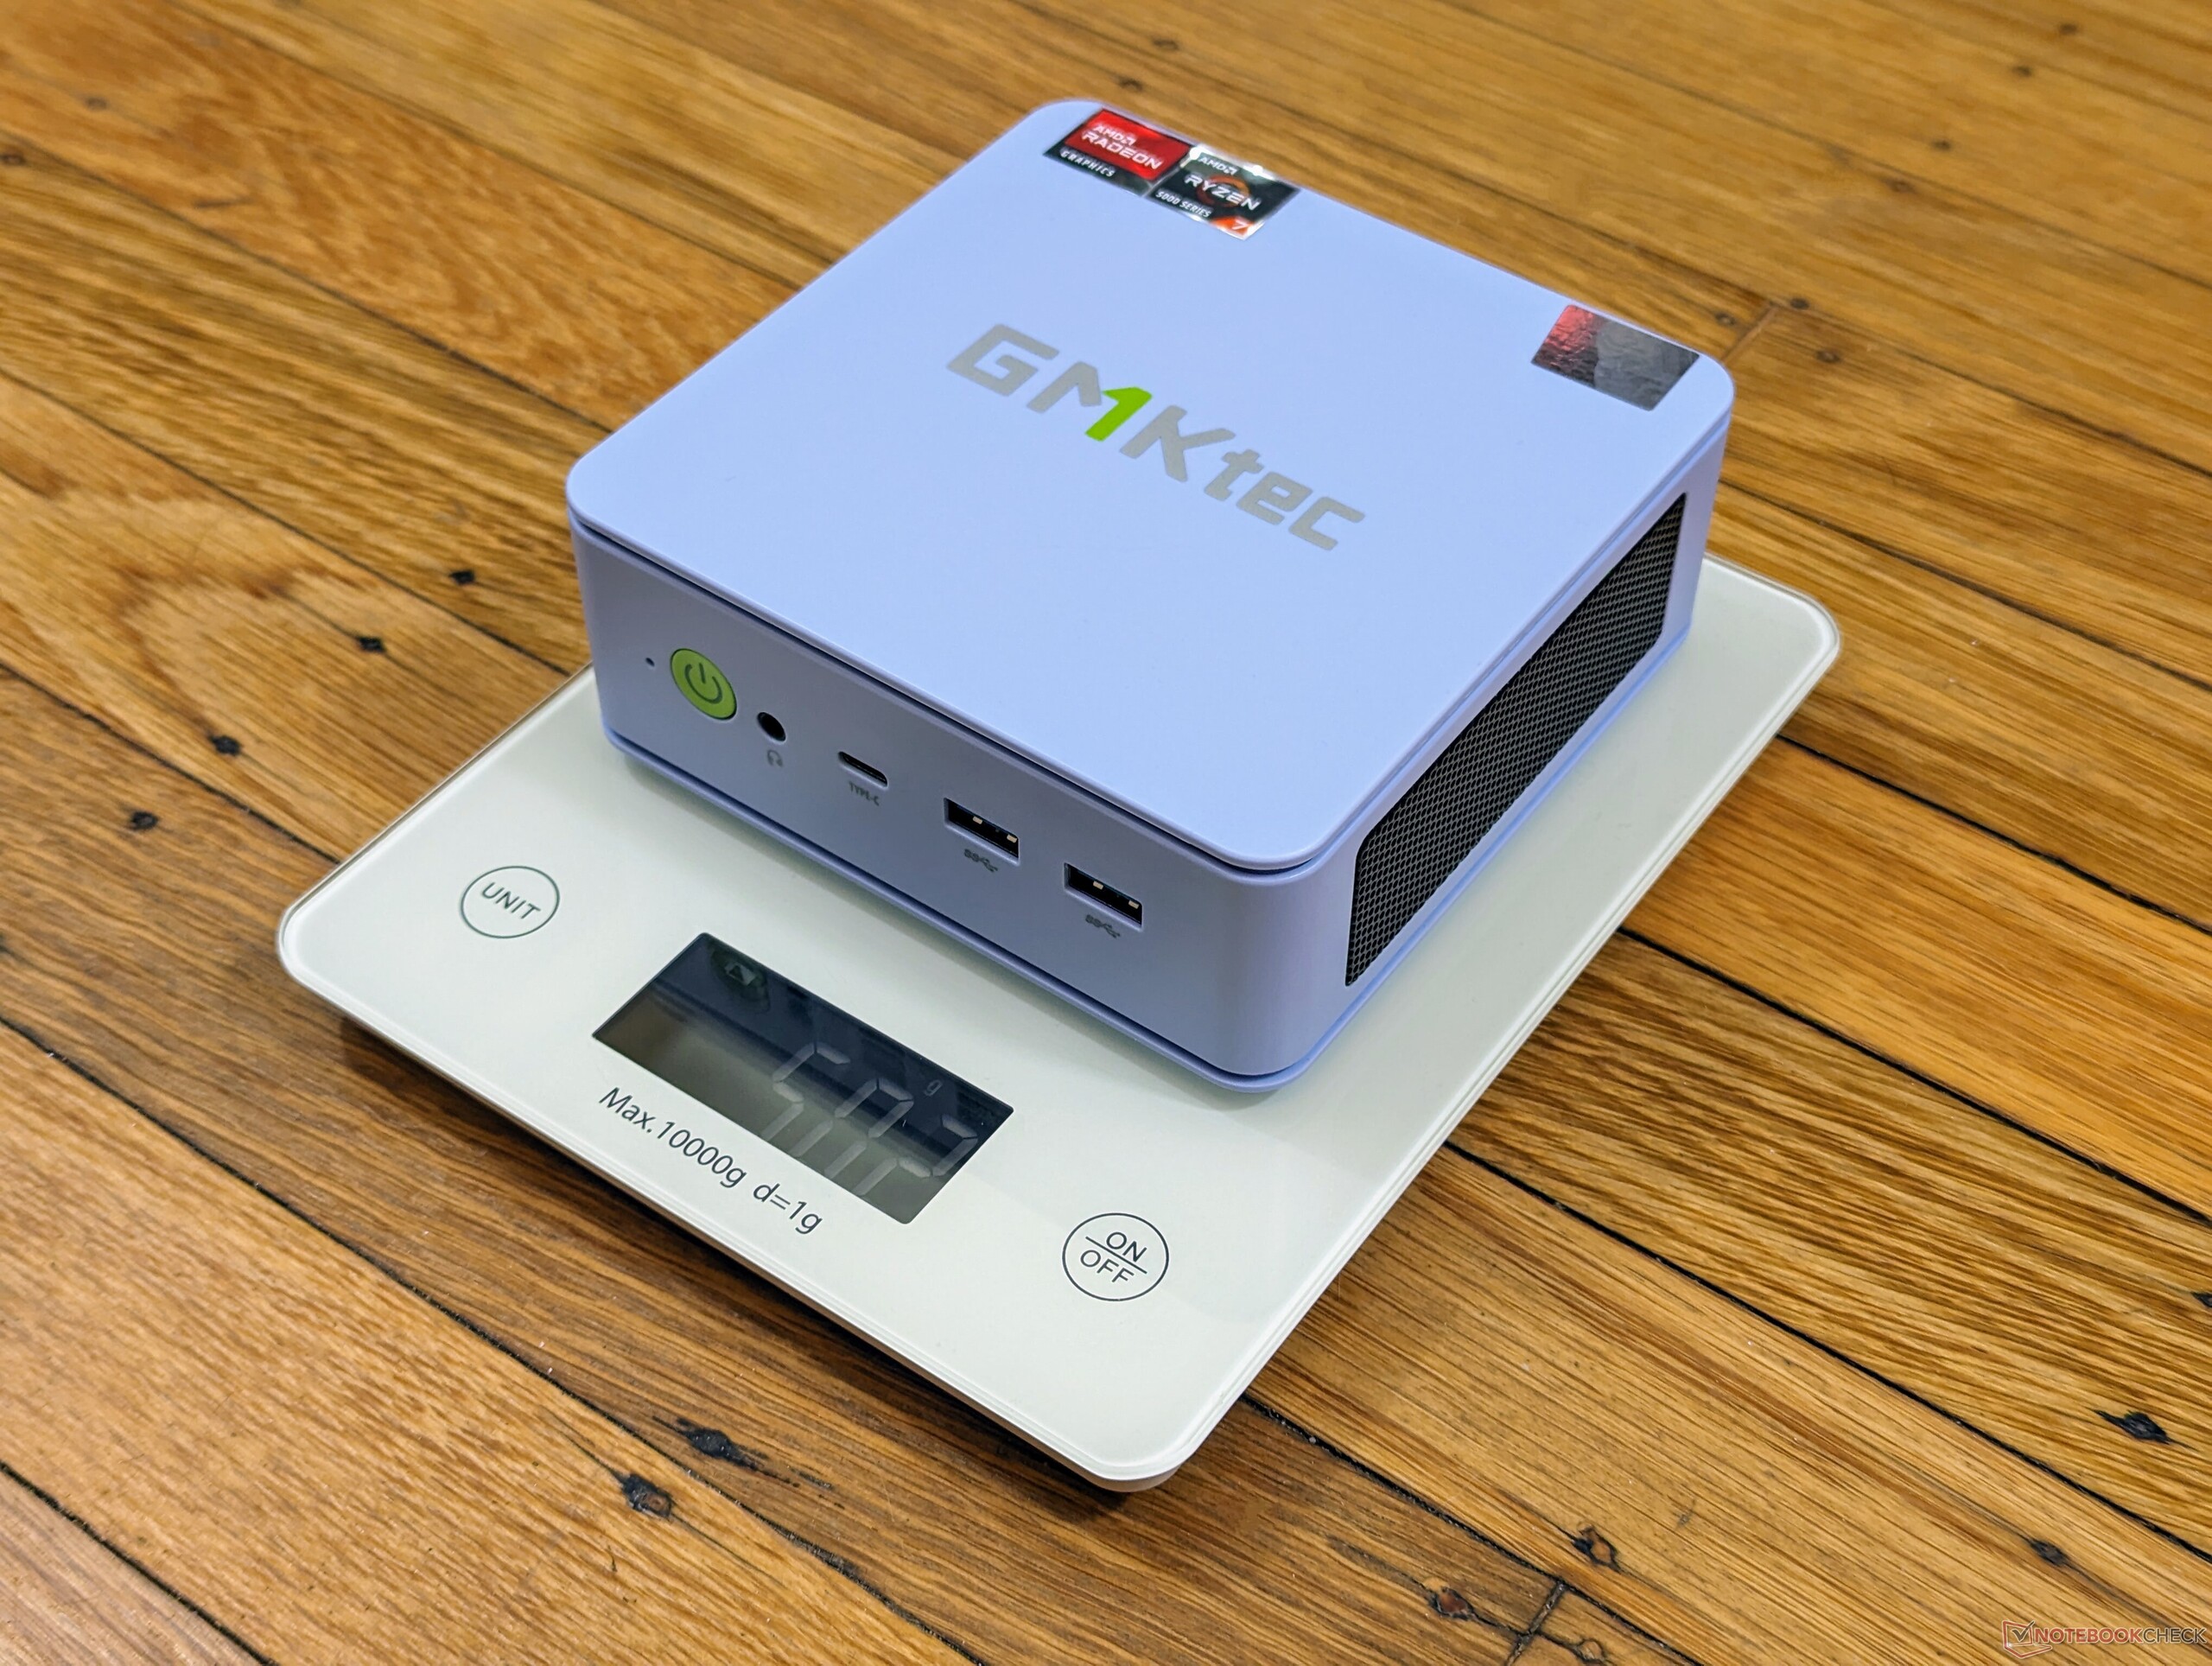
Im Vergleich zu der älteren und überwiegend aus Metall bestehenden NucBox M4 ist die M5 deutlich kleiner und fast halb so schwer.

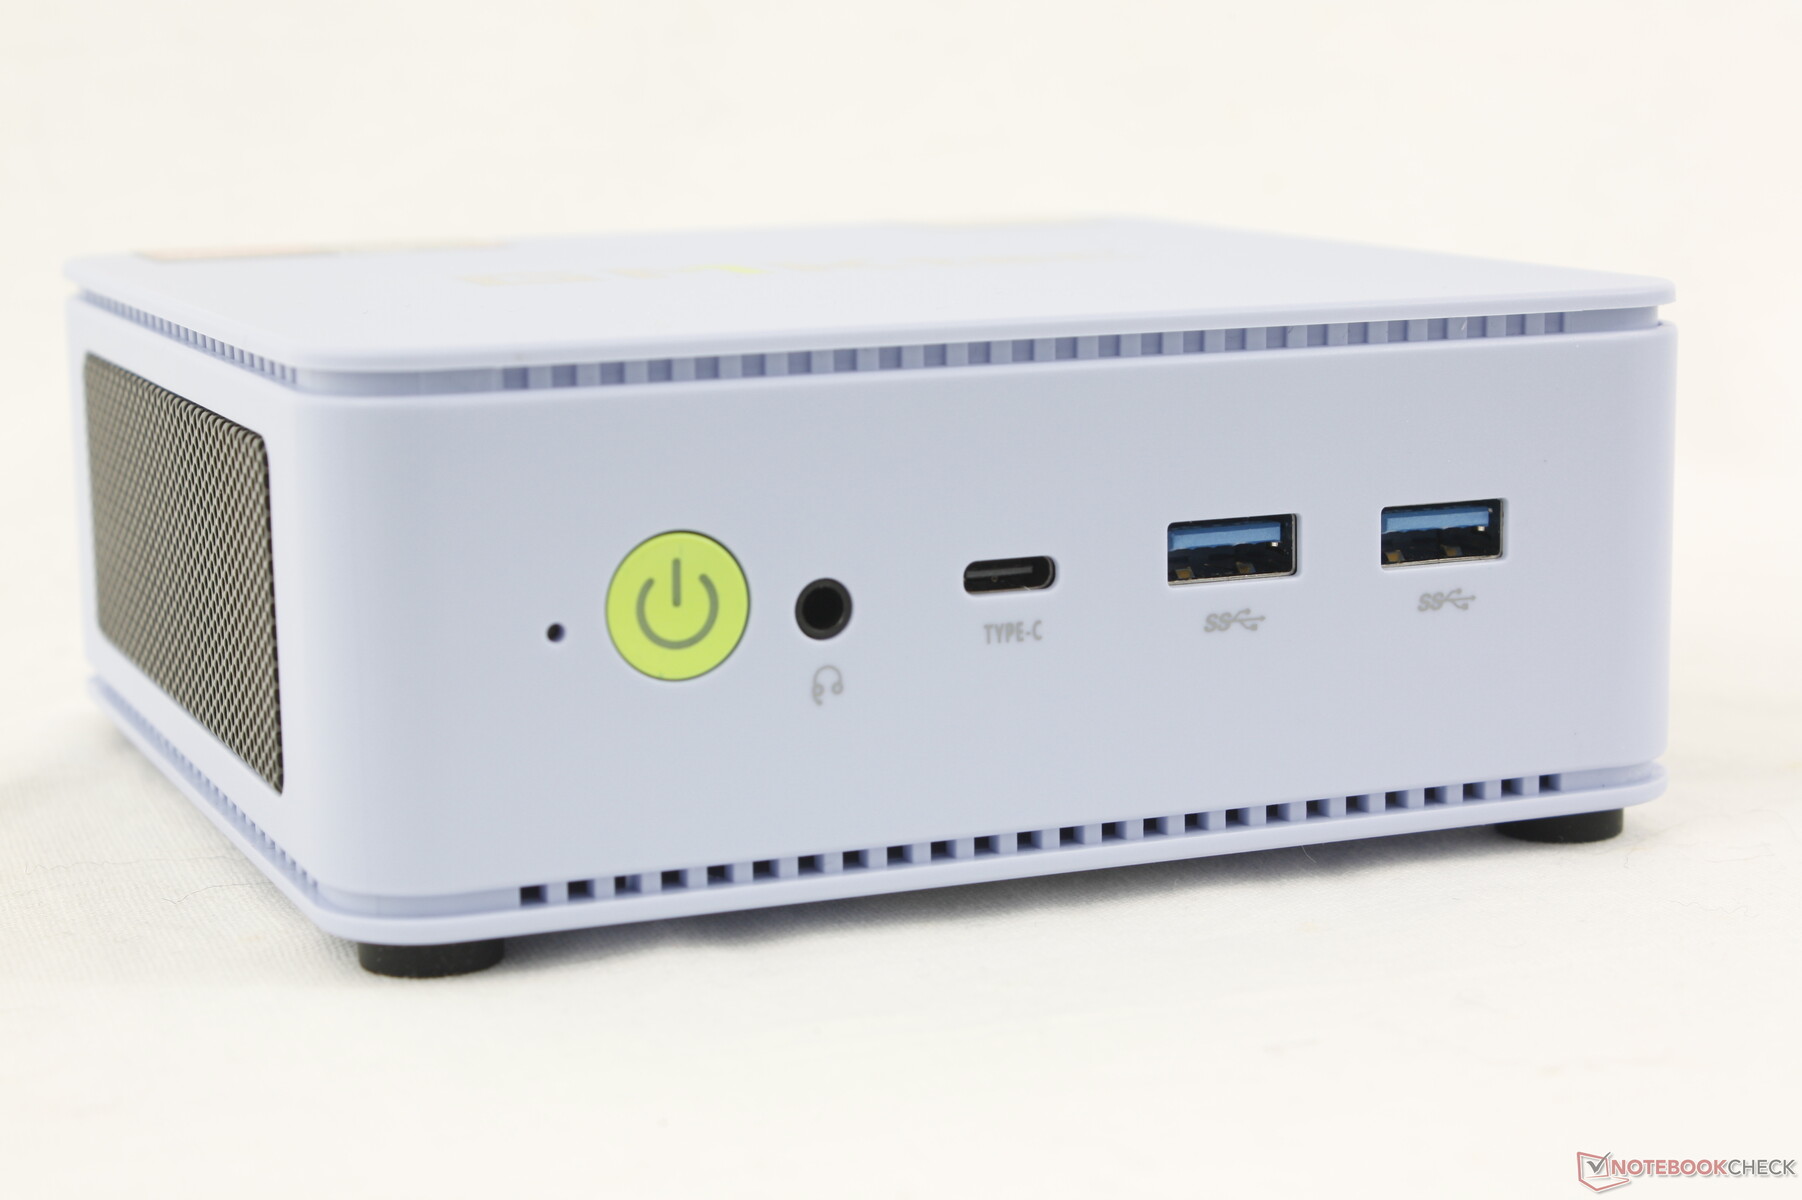
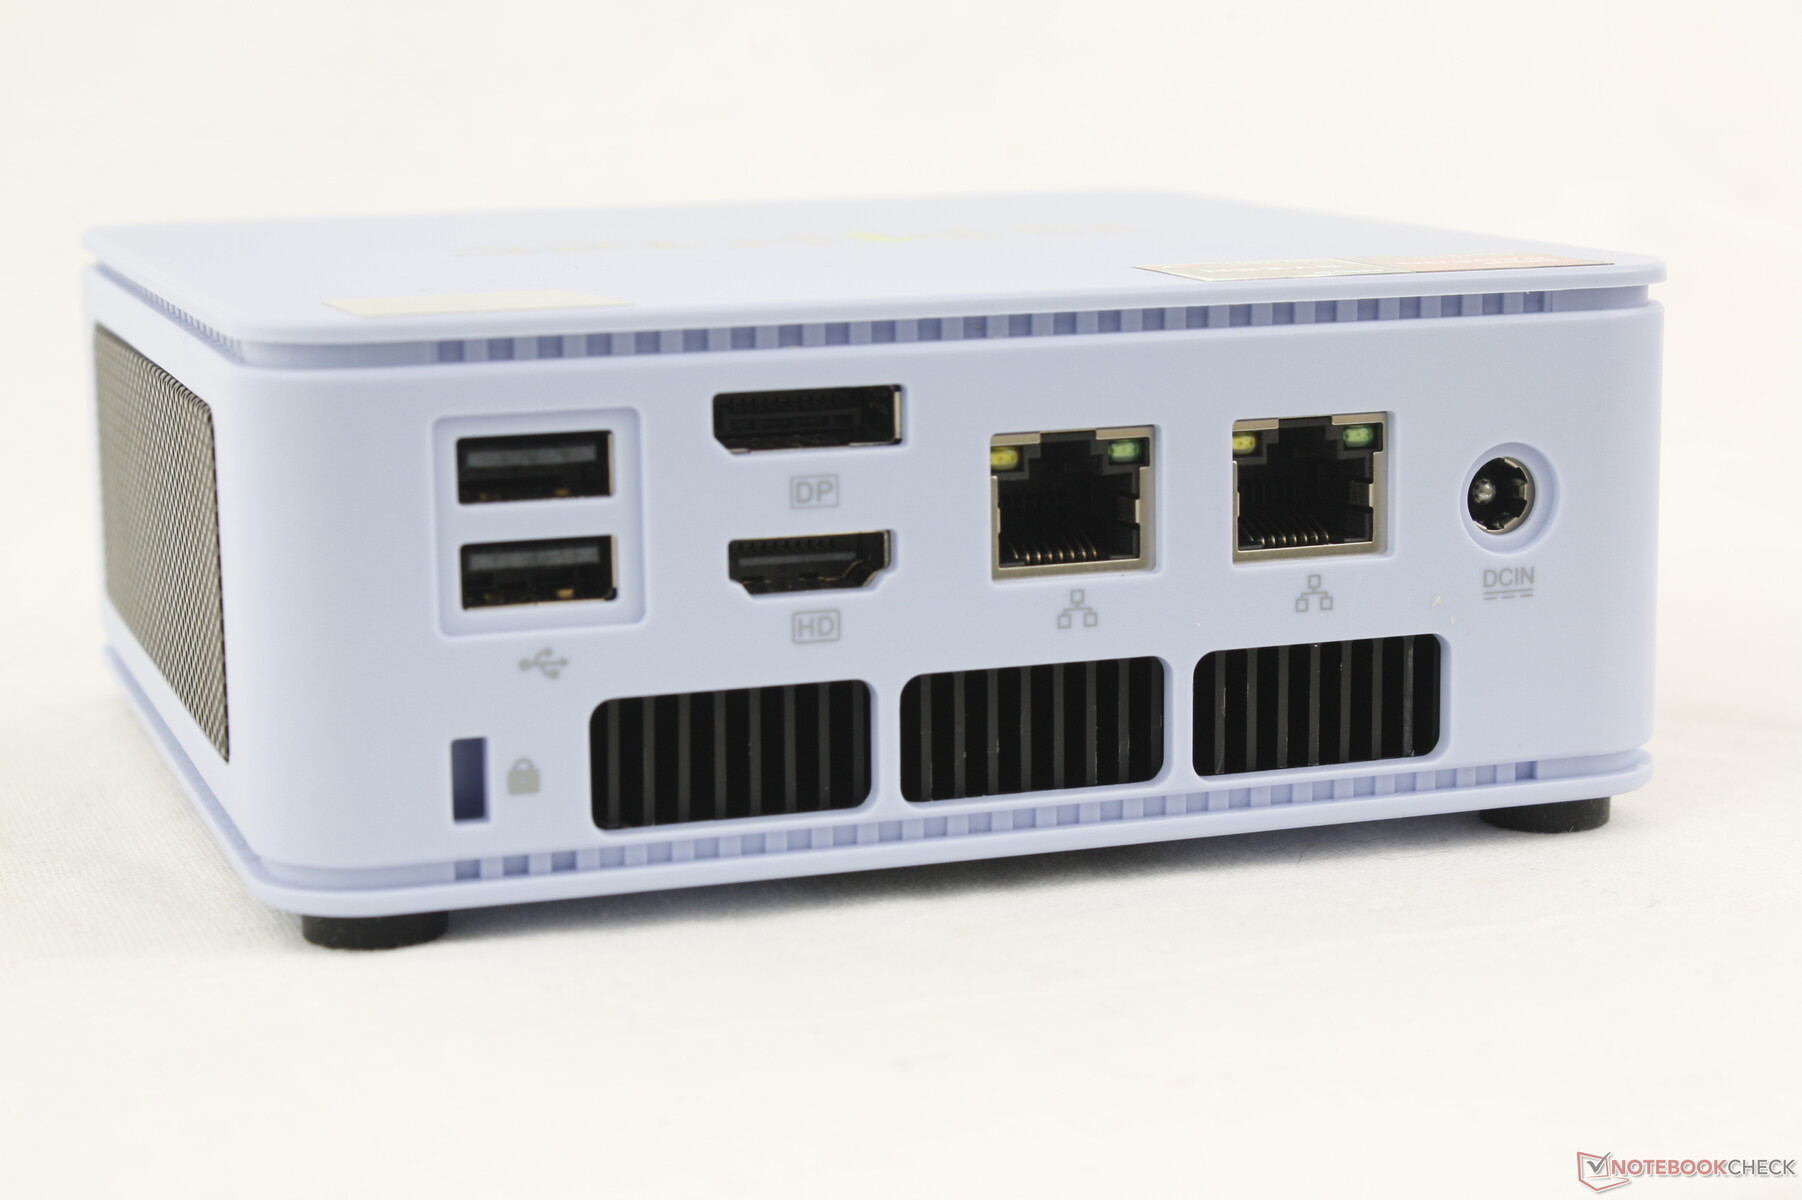
Anschlussausstattung
Die Anschlussoptionen sind die gleichen wie bei der NucBox K6, allerdings mit zwei wesentlichen Verschlechterungen: Dem einzigen USB-C-Anschluss fehlt jetzt die Unterstützung von USB4 und Thunderbolt, während einer der hinteren USB-A-Ports nun auf 2.0 statt auf 3.2 läuft.
Kommunikation
| Networking | |
| iperf3 transmit AXE11000 | |
| GMK NucBox M5 | |
| Intel NUC 13 Pro Desk Edition Kit | |
| Geekom A7 | |
| GMK NucBox M4 | |
| Acemagic F2A | |
| GMK NucBox K6 | |
| iperf3 receive AXE11000 | |
| GMK NucBox M5 | |
| GMK NucBox K6 | |
| Intel NUC 13 Pro Desk Edition Kit | |
| Geekom A7 | |
| Acemagic F2A | |
| GMK NucBox M4 | |
| iperf3 transmit AXE11000 6GHz | |
| Acemagic F2A | |
| Intel NUC 13 Pro Desk Edition Kit | |
| GMK NucBox M5 | |
| Geekom A7 | |
| GMK NucBox K6 | |
| iperf3 receive AXE11000 6GHz | |
| Acemagic F2A | |
| Intel NUC 13 Pro Desk Edition Kit | |
| Geekom A7 | |
| GMK NucBox M5 | |
| GMK NucBox K6 | |
Wartung
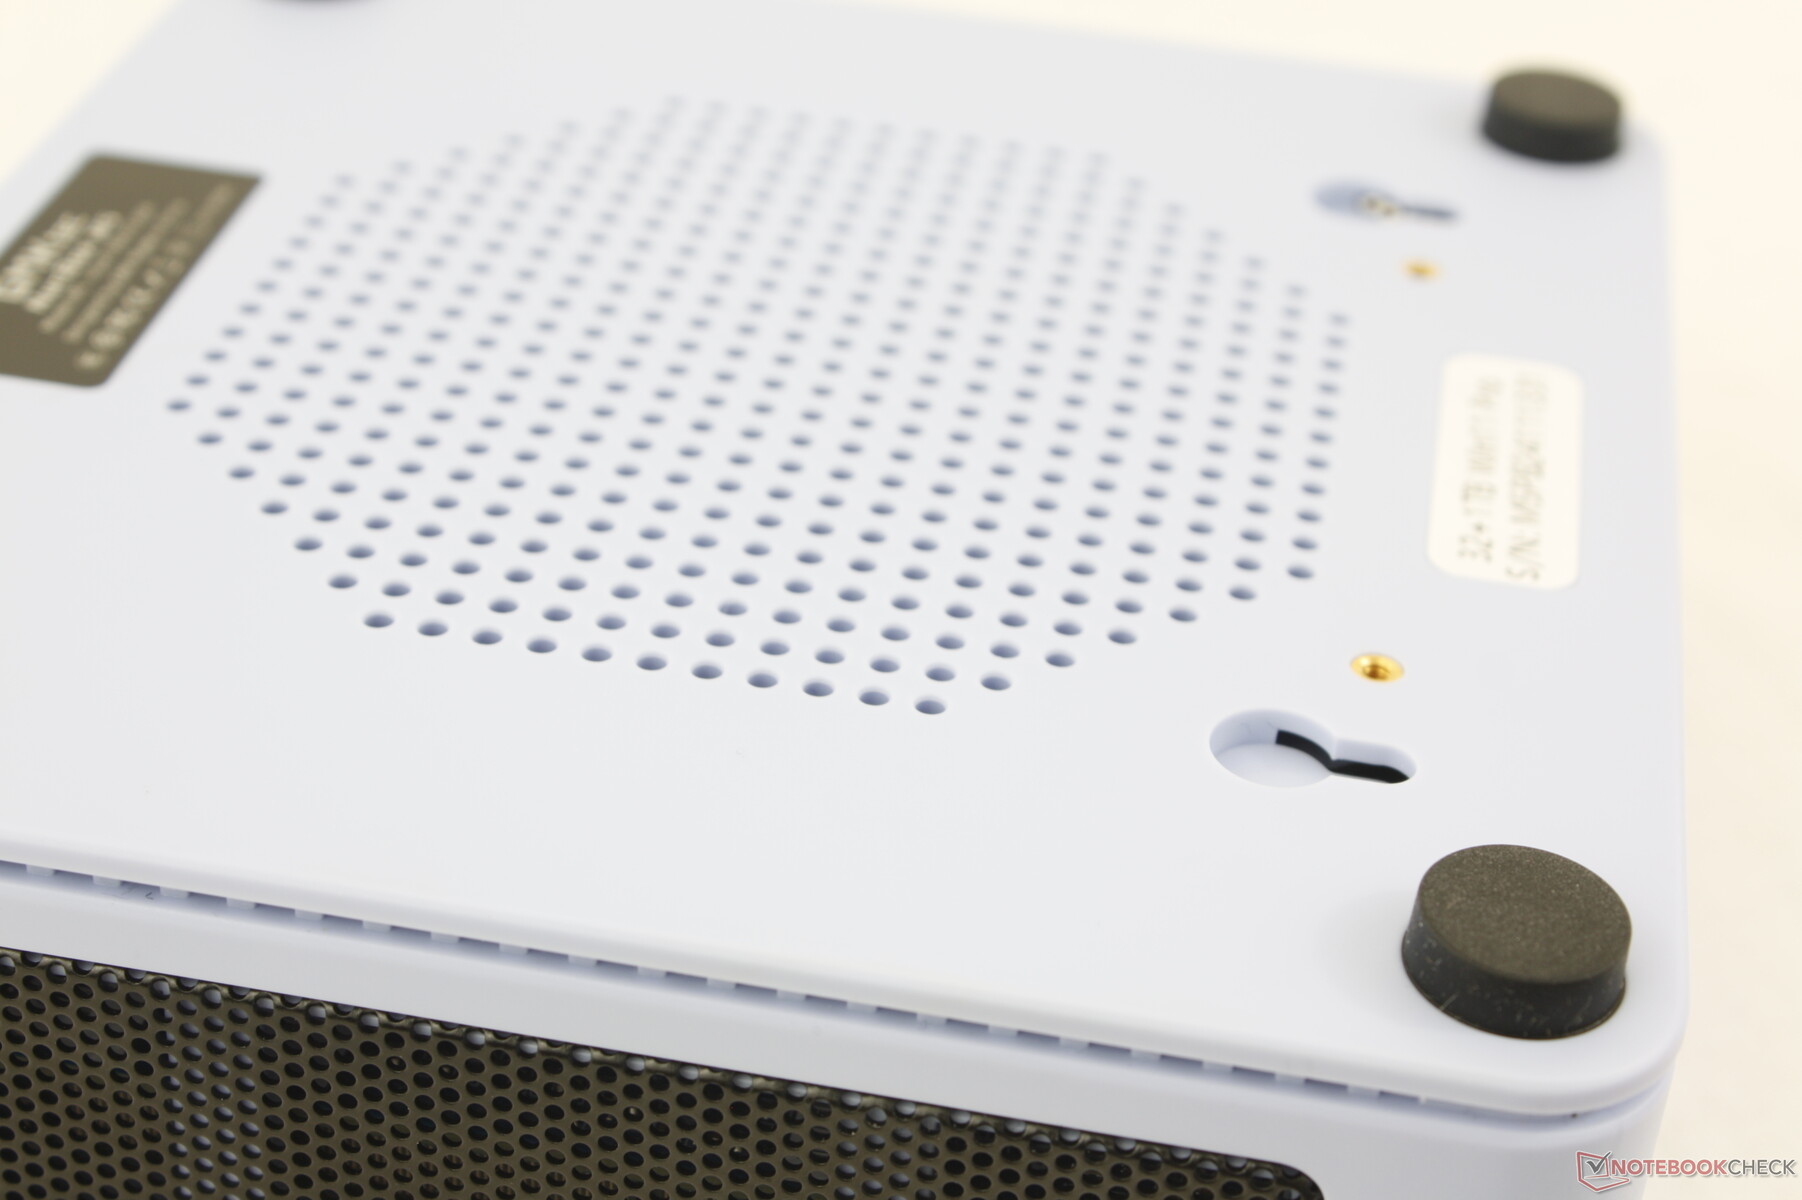
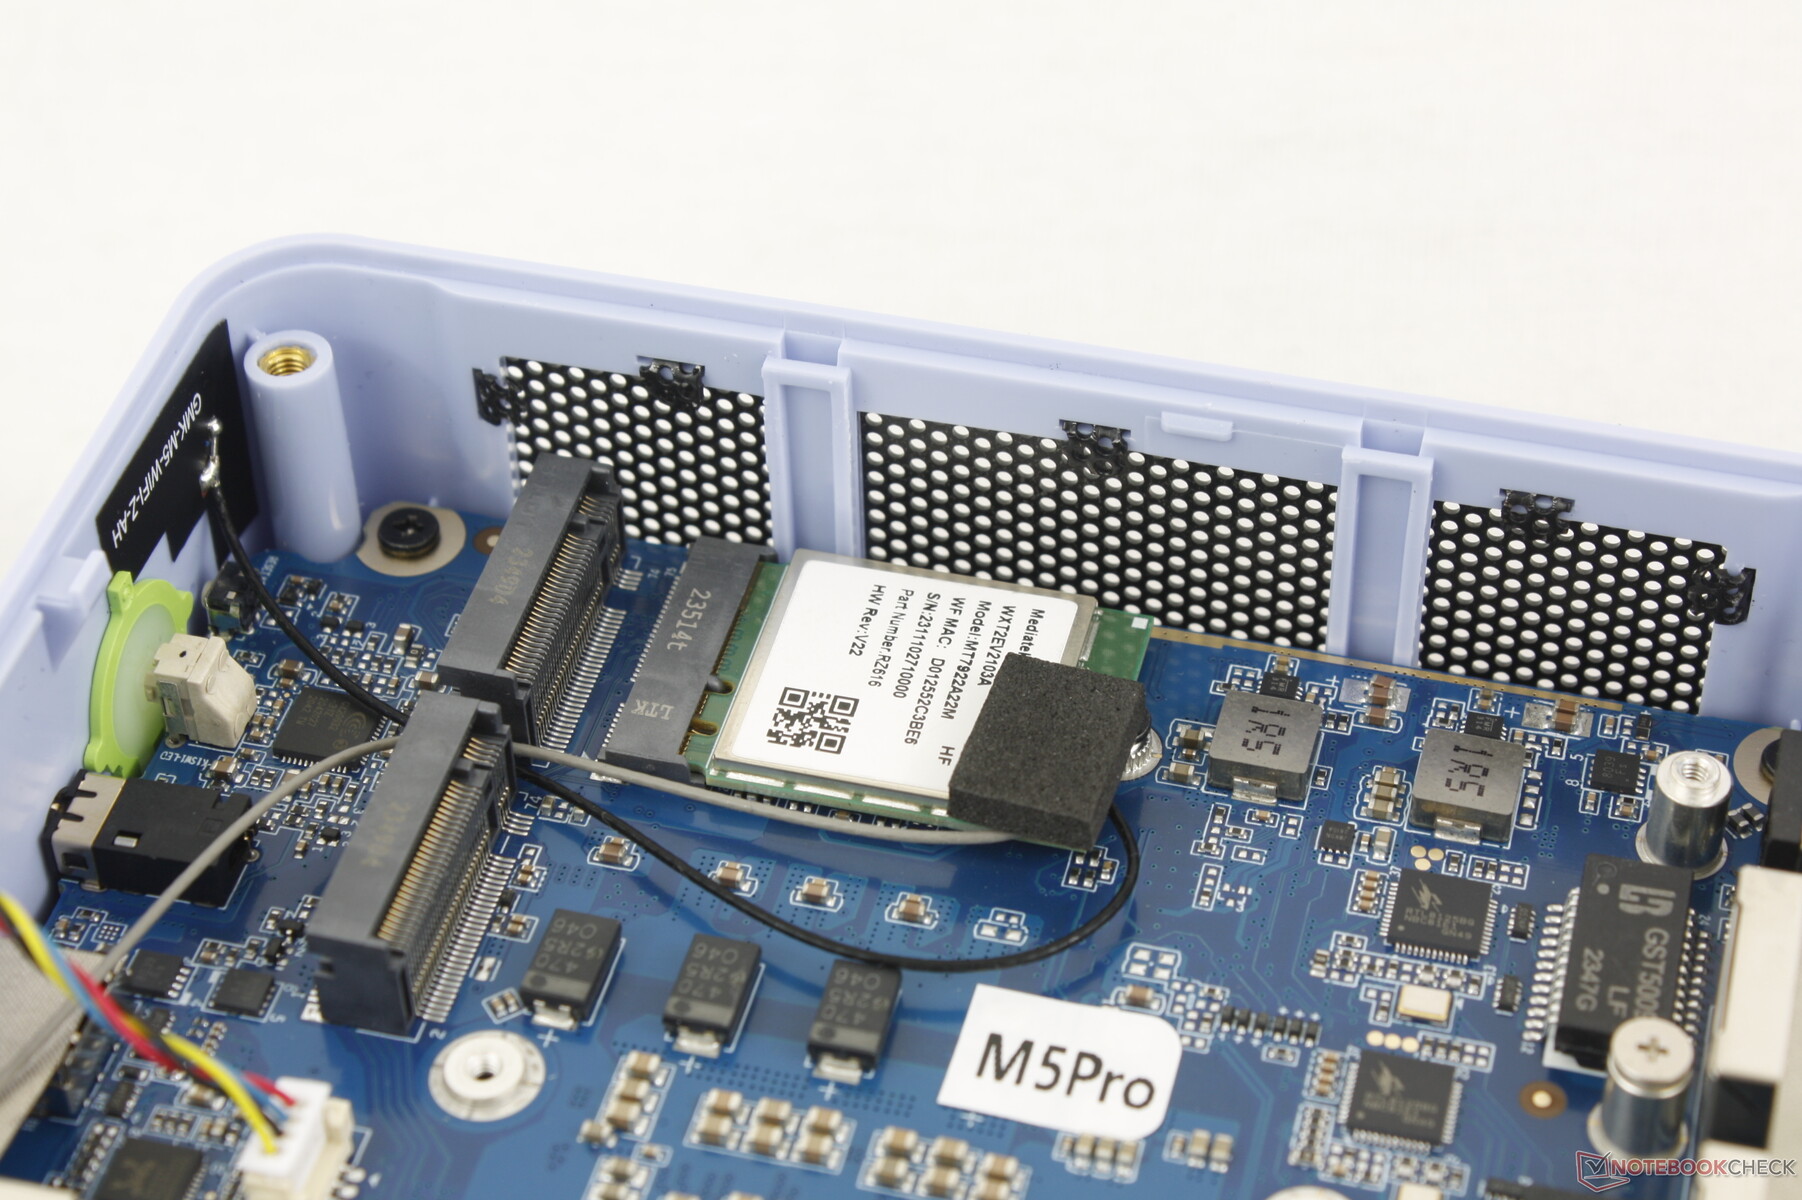
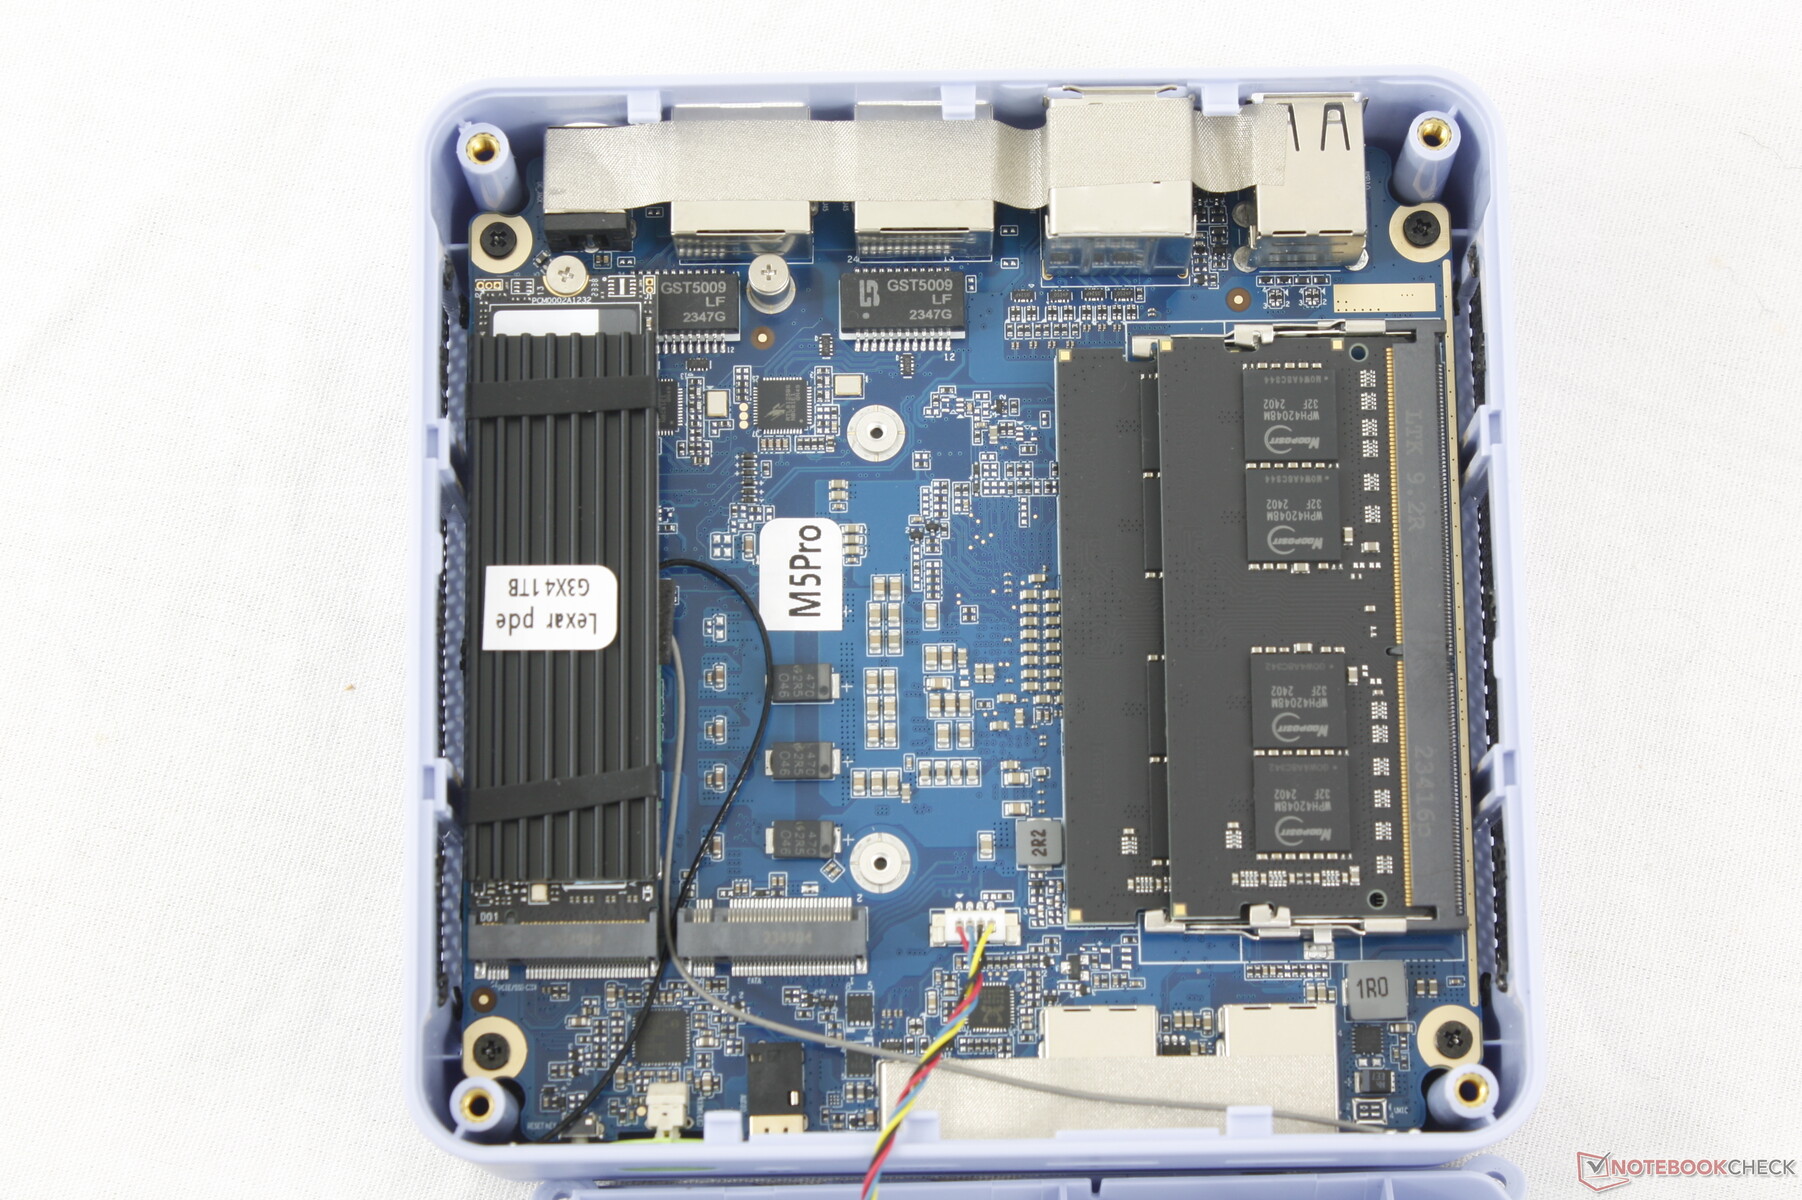
Die obere Abdeckung lässt sich abnehmen, um die darunter liegende Lüfterabdeckung und vier Kreuzschlitzschrauben für den einfachen Zugang zu den zwei DDR4-SODIMM-Steckplätzen, den 2x M.2-2280-SSD-Steckplätzen und dem WLAN-Modul freizulegen. Die untere Abdeckung ist dagegen nicht abnehmbar, so dass die andere Seite des Motherboards schwerer zugänglich ist.
Zubehör und Garantie
Die Verkaufsverpackung enthält neben dem Netzteil und den Unterlagen ein HDMI-Kabel und eine abnehmbare VESA-Halterung. Die einjährige Herstellergarantie gilt bei Kauf in den USA.
Performance - Zen 2 ist es 2024 nicht wert
Testbedingungen
Wir haben Windows in den Modus Performance versetzt, bevor wir die folgenden Benchmarks durchgeführt haben. Das System wird ohne Bloatware oder herstellerspezifische Anwendungen ausgeliefert, um eine saubere Windows Erfahrung zu gewährleisten.
Prozessor
Die CPU-Leistung ist langsamer als erwartet. Unser Ryzen 7 5700U würde 20 bis 25 Prozent langsamer laufen als der durchschnittliche Laptop in unserer Datenbank, der mit genau demselben Prozessor ausgestattet ist. Er läuft immer noch mit jeder mobilen Celeron-, Pentium- oder Atom-Lösung um die Wette, aber die rohe Leistung ist weiterhin ein wenig enttäuschend, da wir wissen, dass der Ryzen 7 5700U zu viel mehr fähig ist.
Die Gesamtleistung liegt Kopf an Kopf mit dem Intel Core i7-1165G7 der 11. Generation, wie er in der älteren 2021-NUC11-Serie zu finden ist.
Cinebench R15 Multi Loop
Cinebench R23: Multi Core | Single Core
Cinebench R20: CPU (Multi Core) | CPU (Single Core)
Cinebench R15: CPU Multi 64Bit | CPU Single 64Bit
Blender: v2.79 BMW27 CPU
7-Zip 18.03: 7z b 4 | 7z b 4 -mmt1
Geekbench 6.7: Multi-Core | Single-Core
Geekbench 5.5: Multi-Core | Single-Core
HWBOT x265 Benchmark v2.2: 4k Preset
LibreOffice : 20 Documents To PDF
R Benchmark 2.5: Overall mean
| CPU Performance Rating | |
| GMK NucBox K6 | |
| Geekom A7 | |
| Acemagic F2A | |
| Intel NUC X15 LAPAC71H | |
| Intel NUC 13 Pro Desk Edition Kit | |
| GMK NucBox K2 | |
| GMK NucBox M4 | |
| Acer TravelMate P4 TMP416-51-55KN -2! | |
| Durchschnittliche AMD Ryzen 7 5700U | |
| GMK NucBox M5 | |
| Intel NUC11ATKPE, N6005 -2! | |
| Intel NUC11ATKC2, N4505 -2! | |
| GMK NucBox 3 -2! | |
| Cinebench R23 / Multi Core | |
| Acemagic F2A | |
| Intel NUC X15 LAPAC71H | |
| GMK NucBox K6 | |
| Geekom A7 | |
| Intel NUC 13 Pro Desk Edition Kit | |
| GMK NucBox K2 | |
| GMK NucBox M4 | |
| Acer TravelMate P4 TMP416-51-55KN | |
| Durchschnittliche AMD Ryzen 7 5700U (4861 - 10139, n=20) | |
| GMK NucBox M5 | |
| Intel NUC11ATKPE, N6005 | |
| GMK NucBox 3 | |
| Intel NUC11ATKC2, N4505 | |
| Cinebench R23 / Single Core | |
| Intel NUC 13 Pro Desk Edition Kit | |
| Intel NUC X15 LAPAC71H | |
| Acemagic F2A | |
| GMK NucBox K6 | |
| Geekom A7 | |
| Acer TravelMate P4 TMP416-51-55KN | |
| GMK NucBox M4 | |
| GMK NucBox K2 | |
| GMK NucBox M5 | |
| Durchschnittliche AMD Ryzen 7 5700U (1177 - 1268, n=20) | |
| Intel NUC11ATKPE, N6005 | |
| Intel NUC11ATKC2, N4505 | |
| GMK NucBox 3 | |
| Cinebench R20 / CPU (Multi Core) | |
| Acemagic F2A | |
| Intel NUC X15 LAPAC71H | |
| Geekom A7 | |
| GMK NucBox K6 | |
| Intel NUC 13 Pro Desk Edition Kit | |
| GMK NucBox K2 | |
| GMK NucBox M4 | |
| Acer TravelMate P4 TMP416-51-55KN | |
| Durchschnittliche AMD Ryzen 7 5700U (1887 - 3877, n=21) | |
| GMK NucBox M5 | |
| Intel NUC11ATKPE, N6005 | |
| Intel NUC11ATKC2, N4505 | |
| GMK NucBox 3 | |
| Cinebench R20 / CPU (Single Core) | |
| Intel NUC 13 Pro Desk Edition Kit | |
| Geekom A7 | |
| GMK NucBox K6 | |
| Intel NUC X15 LAPAC71H | |
| Acemagic F2A | |
| Acer TravelMate P4 TMP416-51-55KN | |
| GMK NucBox M4 | |
| GMK NucBox K2 | |
| GMK NucBox M5 | |
| Durchschnittliche AMD Ryzen 7 5700U (471 - 495, n=21) | |
| Intel NUC11ATKPE, N6005 | |
| Intel NUC11ATKC2, N4505 | |
| GMK NucBox 3 | |
| Cinebench R15 / CPU Multi 64Bit | |
| Acemagic F2A | |
| GMK NucBox K6 | |
| Intel NUC X15 LAPAC71H | |
| Geekom A7 | |
| Intel NUC 13 Pro Desk Edition Kit | |
| GMK NucBox K2 | |
| Acer TravelMate P4 TMP416-51-55KN | |
| GMK NucBox M4 | |
| Durchschnittliche AMD Ryzen 7 5700U (856 - 1691, n=20) | |
| GMK NucBox M5 | |
| Intel NUC11ATKPE, N6005 | |
| GMK NucBox 3 | |
| Intel NUC11ATKC2, N4505 | |
| Cinebench R15 / CPU Single 64Bit | |
| GMK NucBox K6 | |
| Geekom A7 | |
| Intel NUC 13 Pro Desk Edition Kit | |
| Acemagic F2A | |
| Intel NUC X15 LAPAC71H | |
| GMK NucBox K2 | |
| GMK NucBox M4 | |
| Acer TravelMate P4 TMP416-51-55KN | |
| GMK NucBox M5 | |
| Durchschnittliche AMD Ryzen 7 5700U (181 - 190, n=19) | |
| Intel NUC11ATKPE, N6005 | |
| Intel NUC11ATKC2, N4505 | |
| GMK NucBox 3 | |
| Blender / v2.79 BMW27 CPU | |
| GMK NucBox 3 | |
| Intel NUC11ATKC2, N4505 | |
| Intel NUC11ATKPE, N6005 | |
| GMK NucBox M5 | |
| Durchschnittliche AMD Ryzen 7 5700U (292 - 557, n=20) | |
| Acer TravelMate P4 TMP416-51-55KN | |
| GMK NucBox M4 | |
| Intel NUC 13 Pro Desk Edition Kit | |
| GMK NucBox K2 | |
| Intel NUC X15 LAPAC71H | |
| Geekom A7 | |
| GMK NucBox K6 | |
| Acemagic F2A | |
| 7-Zip 18.03 / 7z b 4 | |
| GMK NucBox K6 | |
| Geekom A7 | |
| Acemagic F2A | |
| Intel NUC X15 LAPAC71H | |
| GMK NucBox K2 | |
| Intel NUC 13 Pro Desk Edition Kit | |
| GMK NucBox M4 | |
| Acer TravelMate P4 TMP416-51-55KN | |
| Durchschnittliche AMD Ryzen 7 5700U (29095 - 47501, n=20) | |
| GMK NucBox M5 | |
| Intel NUC11ATKPE, N6005 | |
| Intel NUC11ATKC2, N4505 | |
| GMK NucBox 3 | |
| 7-Zip 18.03 / 7z b 4 -mmt1 | |
| Geekom A7 | |
| GMK NucBox K6 | |
| GMK NucBox M4 | |
| Intel NUC X15 LAPAC71H | |
| Intel NUC 13 Pro Desk Edition Kit | |
| GMK NucBox K2 | |
| Acemagic F2A | |
| Acer TravelMate P4 TMP416-51-55KN | |
| GMK NucBox M5 | |
| Durchschnittliche AMD Ryzen 7 5700U (4402 - 4620, n=20) | |
| Intel NUC11ATKPE, N6005 | |
| Intel NUC11ATKC2, N4505 | |
| GMK NucBox 3 | |
| Geekbench 6.7 / Multi-Core | |
| Geekom A7 | |
| GMK NucBox K6 | |
| Intel NUC X15 LAPAC71H | |
| Acemagic F2A | |
| Intel NUC 13 Pro Desk Edition Kit | |
| GMK NucBox K2 | |
| GMK NucBox M4 | |
| GMK NucBox M5 | |
| Durchschnittliche AMD Ryzen 7 5700U (4983 - 6260, n=5) | |
| Geekbench 6.7 / Single-Core | |
| Geekom A7 | |
| GMK NucBox K6 | |
| Intel NUC 13 Pro Desk Edition Kit | |
| Intel NUC X15 LAPAC71H | |
| Acemagic F2A | |
| GMK NucBox M4 | |
| GMK NucBox K2 | |
| GMK NucBox M5 | |
| Durchschnittliche AMD Ryzen 7 5700U (1550 - 1625, n=5) | |
| Geekbench 5.5 / Multi-Core | |
| Intel NUC X15 LAPAC71H | |
| Acemagic F2A | |
| Geekom A7 | |
| GMK NucBox K6 | |
| Intel NUC 13 Pro Desk Edition Kit | |
| GMK NucBox K2 | |
| Acer TravelMate P4 TMP416-51-55KN | |
| GMK NucBox M4 | |
| Durchschnittliche AMD Ryzen 7 5700U (4254 - 7635, n=19) | |
| GMK NucBox M5 | |
| Intel NUC11ATKPE, N6005 | |
| Intel NUC11ATKC2, N4505 | |
| GMK NucBox 3 | |
| Geekbench 5.5 / Single-Core | |
| Geekom A7 | |
| GMK NucBox K6 | |
| Intel NUC 13 Pro Desk Edition Kit | |
| Intel NUC X15 LAPAC71H | |
| Acemagic F2A | |
| GMK NucBox M4 | |
| Acer TravelMate P4 TMP416-51-55KN | |
| GMK NucBox K2 | |
| GMK NucBox M5 | |
| Durchschnittliche AMD Ryzen 7 5700U (1105 - 1205, n=19) | |
| Intel NUC11ATKPE, N6005 | |
| Intel NUC11ATKC2, N4505 | |
| GMK NucBox 3 | |
| HWBOT x265 Benchmark v2.2 / 4k Preset | |
| Geekom A7 | |
| GMK NucBox K6 | |
| Acemagic F2A | |
| Intel NUC X15 LAPAC71H | |
| GMK NucBox K2 | |
| Intel NUC 13 Pro Desk Edition Kit | |
| GMK NucBox M4 | |
| Acer TravelMate P4 TMP416-51-55KN | |
| Durchschnittliche AMD Ryzen 7 5700U (6.08 - 12.1, n=20) | |
| GMK NucBox M5 | |
| Intel NUC11ATKPE, N6005 | |
| GMK NucBox 3 | |
| Intel NUC11ATKC2, N4505 | |
| LibreOffice / 20 Documents To PDF | |
| GMK NucBox 3 | |
| Intel NUC11ATKPE, N6005 | |
| Intel NUC11ATKC2, N4505 | |
| Durchschnittliche AMD Ryzen 7 5700U (52.4 - 75.5, n=20) | |
| GMK NucBox M5 | |
| Geekom A7 | |
| Acer TravelMate P4 TMP416-51-55KN | |
| Intel NUC 13 Pro Desk Edition Kit | |
| GMK NucBox K2 | |
| Acemagic F2A | |
| GMK NucBox K6 | |
| GMK NucBox M4 | |
| Intel NUC X15 LAPAC71H | |
| R Benchmark 2.5 / Overall mean | |
| GMK NucBox 3 | |
| Intel NUC11ATKC2, N4505 | |
| Intel NUC11ATKPE, N6005 | |
| Durchschnittliche AMD Ryzen 7 5700U (0.567 - 0.641, n=20) | |
| GMK NucBox M5 | |
| Acer TravelMate P4 TMP416-51-55KN | |
| GMK NucBox M4 | |
| GMK NucBox K2 | |
| Acemagic F2A | |
| Intel NUC X15 LAPAC71H | |
| Intel NUC 13 Pro Desk Edition Kit | |
| Geekom A7 | |
| GMK NucBox K6 | |
Cinebench R23: Multi Core | Single Core
Cinebench R20: CPU (Multi Core) | CPU (Single Core)
Cinebench R15: CPU Multi 64Bit | CPU Single 64Bit
Blender: v2.79 BMW27 CPU
7-Zip 18.03: 7z b 4 | 7z b 4 -mmt1
Geekbench 6.7: Multi-Core | Single-Core
Geekbench 5.5: Multi-Core | Single-Core
HWBOT x265 Benchmark v2.2: 4k Preset
LibreOffice : 20 Documents To PDF
R Benchmark 2.5: Overall mean
* ... kleinere Werte sind besser
AIDA64: FP32 Ray-Trace | FPU Julia | CPU SHA3 | CPU Queen | FPU SinJulia | FPU Mandel | CPU AES | CPU ZLib | FP64 Ray-Trace | CPU PhotoWorxx
| Performance Rating | |
| Geekom A7 | |
| GMK NucBox K6 | |
| Acemagic F2A | |
| GMK NucBox M4 | |
| Intel NUC 13 Pro Desk Edition Kit | |
| Durchschnittliche AMD Ryzen 7 5700U | |
| GMK NucBox M5 | |
| AIDA64 / FP32 Ray-Trace | |
| GMK NucBox K6 | |
| Geekom A7 | |
| Acemagic F2A | |
| GMK NucBox M4 | |
| Intel NUC 13 Pro Desk Edition Kit | |
| Durchschnittliche AMD Ryzen 7 5700U (5679 - 12346, n=20) | |
| GMK NucBox M5 | |
| AIDA64 / FPU Julia | |
| GMK NucBox K6 | |
| Geekom A7 | |
| Acemagic F2A | |
| Durchschnittliche AMD Ryzen 7 5700U (39042 - 69580, n=20) | |
| Intel NUC 13 Pro Desk Edition Kit | |
| GMK NucBox M4 | |
| GMK NucBox M5 | |
| AIDA64 / CPU SHA3 | |
| GMK NucBox K6 | |
| Geekom A7 | |
| Acemagic F2A | |
| GMK NucBox M4 | |
| Intel NUC 13 Pro Desk Edition Kit | |
| Durchschnittliche AMD Ryzen 7 5700U (1103 - 2231, n=20) | |
| GMK NucBox M5 | |
| AIDA64 / CPU Queen | |
| Geekom A7 | |
| GMK NucBox K6 | |
| Acemagic F2A | |
| GMK NucBox M4 | |
| Durchschnittliche AMD Ryzen 7 5700U (57016 - 99178, n=20) | |
| Intel NUC 13 Pro Desk Edition Kit | |
| GMK NucBox M5 | |
| AIDA64 / FPU SinJulia | |
| GMK NucBox K6 | |
| Geekom A7 | |
| Durchschnittliche AMD Ryzen 7 5700U (6837 - 14169, n=20) | |
| Acemagic F2A | |
| GMK NucBox M5 | |
| GMK NucBox M4 | |
| Intel NUC 13 Pro Desk Edition Kit | |
| AIDA64 / FPU Mandel | |
| GMK NucBox K6 | |
| Geekom A7 | |
| Acemagic F2A | |
| GMK NucBox M4 | |
| Durchschnittliche AMD Ryzen 7 5700U (20179 - 36523, n=20) | |
| Intel NUC 13 Pro Desk Edition Kit | |
| GMK NucBox M5 | |
| AIDA64 / CPU AES | |
| Geekom A7 | |
| GMK NucBox K6 | |
| Acemagic F2A | |
| GMK NucBox M4 | |
| Intel NUC 13 Pro Desk Edition Kit | |
| Durchschnittliche AMD Ryzen 7 5700U (26066 - 64646, n=20) | |
| GMK NucBox M5 | |
| AIDA64 / CPU ZLib | |
| Acemagic F2A | |
| GMK NucBox K6 | |
| Geekom A7 | |
| Intel NUC 13 Pro Desk Edition Kit | |
| GMK NucBox M4 | |
| Durchschnittliche AMD Ryzen 7 5700U (440 - 776, n=20) | |
| GMK NucBox M5 | |
| AIDA64 / FP64 Ray-Trace | |
| GMK NucBox K6 | |
| Geekom A7 | |
| Acemagic F2A | |
| GMK NucBox M4 | |
| Intel NUC 13 Pro Desk Edition Kit | |
| Durchschnittliche AMD Ryzen 7 5700U (2985 - 6784, n=20) | |
| GMK NucBox M5 | |
| AIDA64 / CPU PhotoWorxx | |
| GMK NucBox K6 | |
| Geekom A7 | |
| Acemagic F2A | |
| Intel NUC 13 Pro Desk Edition Kit | |
| GMK NucBox M5 | |
| GMK NucBox M4 | |
| Durchschnittliche AMD Ryzen 7 5700U (6903 - 25066, n=20) | |
Stresstest
Wenn man Prime95 laufen lässt, um Stress auf die CPU auszuüben, steigen die Taktraten und die Leistungsaufnahme des Boards auf 1,9 GHz bzw. 15 W an. Wir glauben, dass der Prozessor zu einer höheren Leistungsaufnahme von bis zu 28 W fähig ist, insbesondere da die Kerntemperatur nur 55 °C unter Stress beträgt. Doch die Leistung des Gehäuses ist bei der NucBox M5 anscheinend auf 15 W begrenzt, auch wenn wir alle BIOS-Einstellungen oder Windows Energieprofile überprüft haben. Die niedrige Obergrenze von 15 W erklärt auch die langsamere als erwartete Leistung, wie im Abschnitt Prozessor oben erwähnt.
Die Kerntemperatur stabilisierte sich bei nur 55 °C beim Betrieb von Witcher 3 im Vergleich zu 70 °C bei dem viel schnelleren Beelink SER6 Pro.
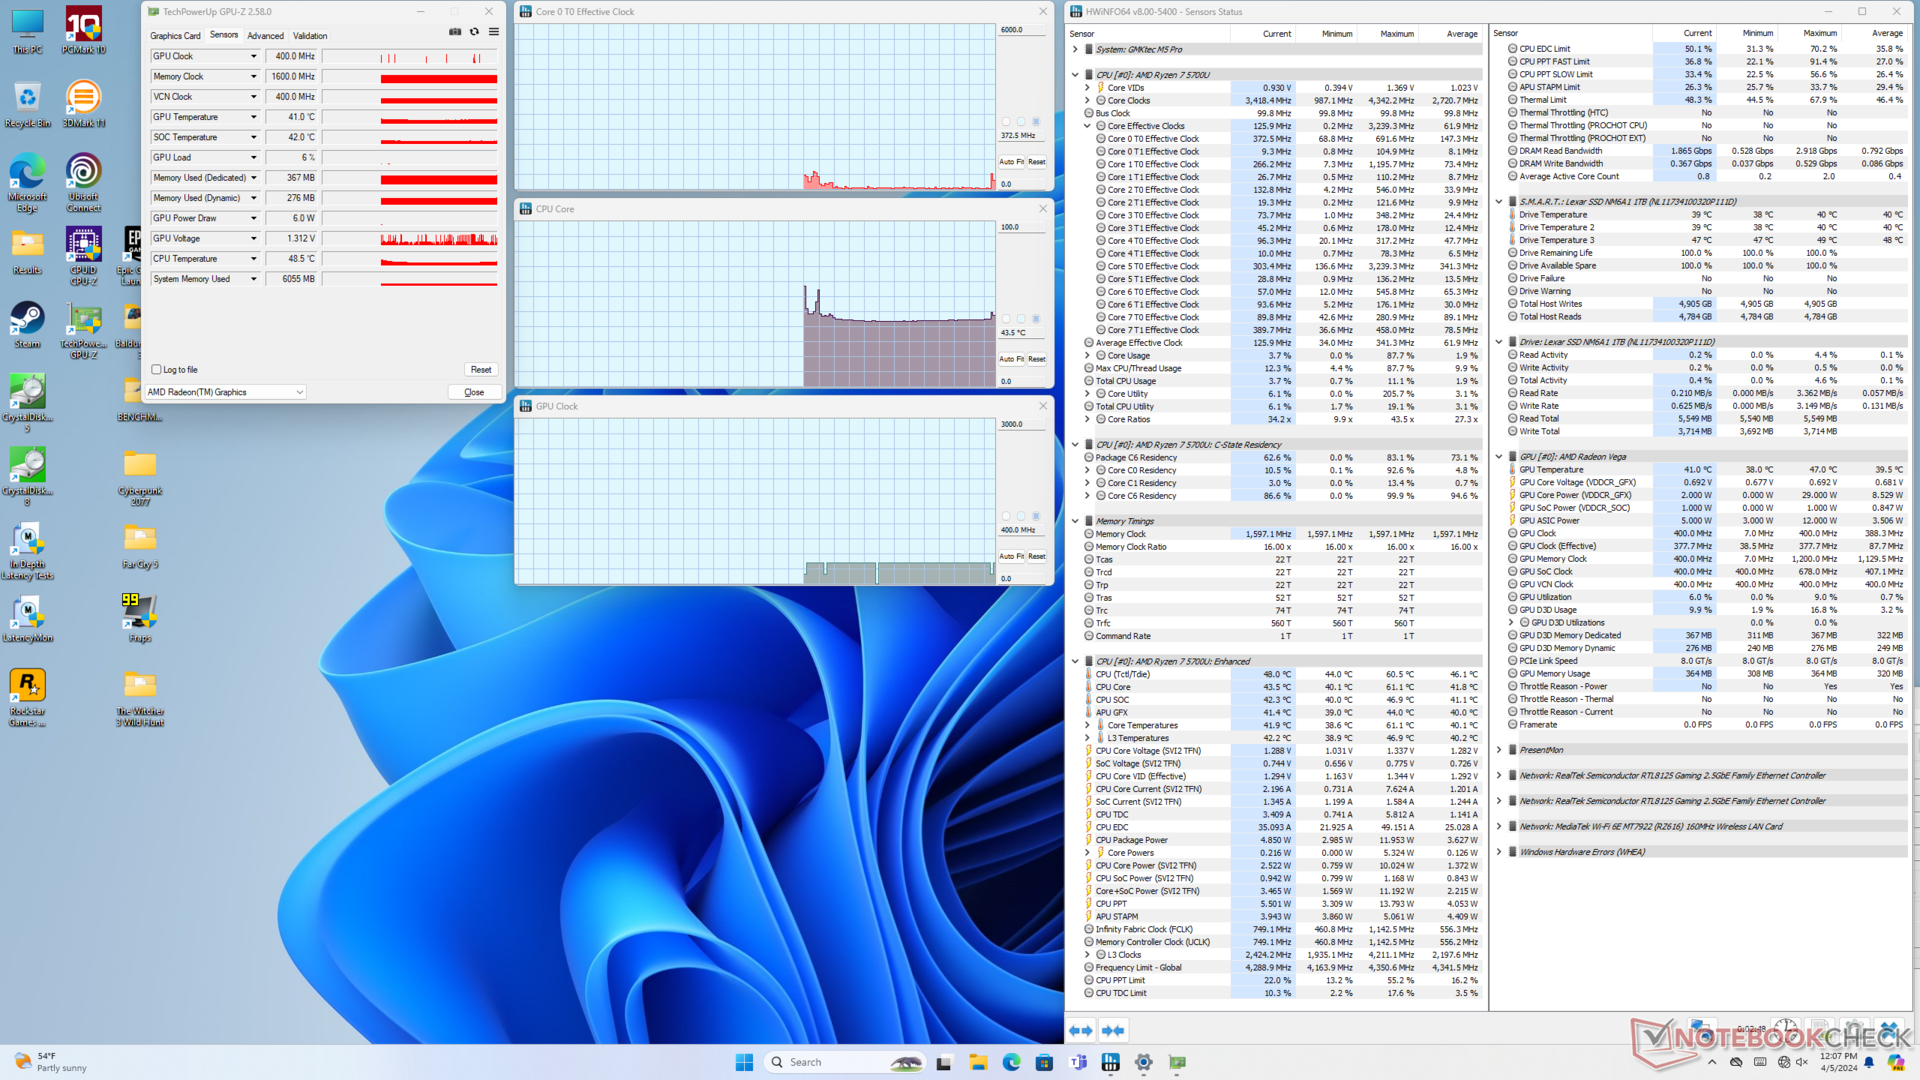
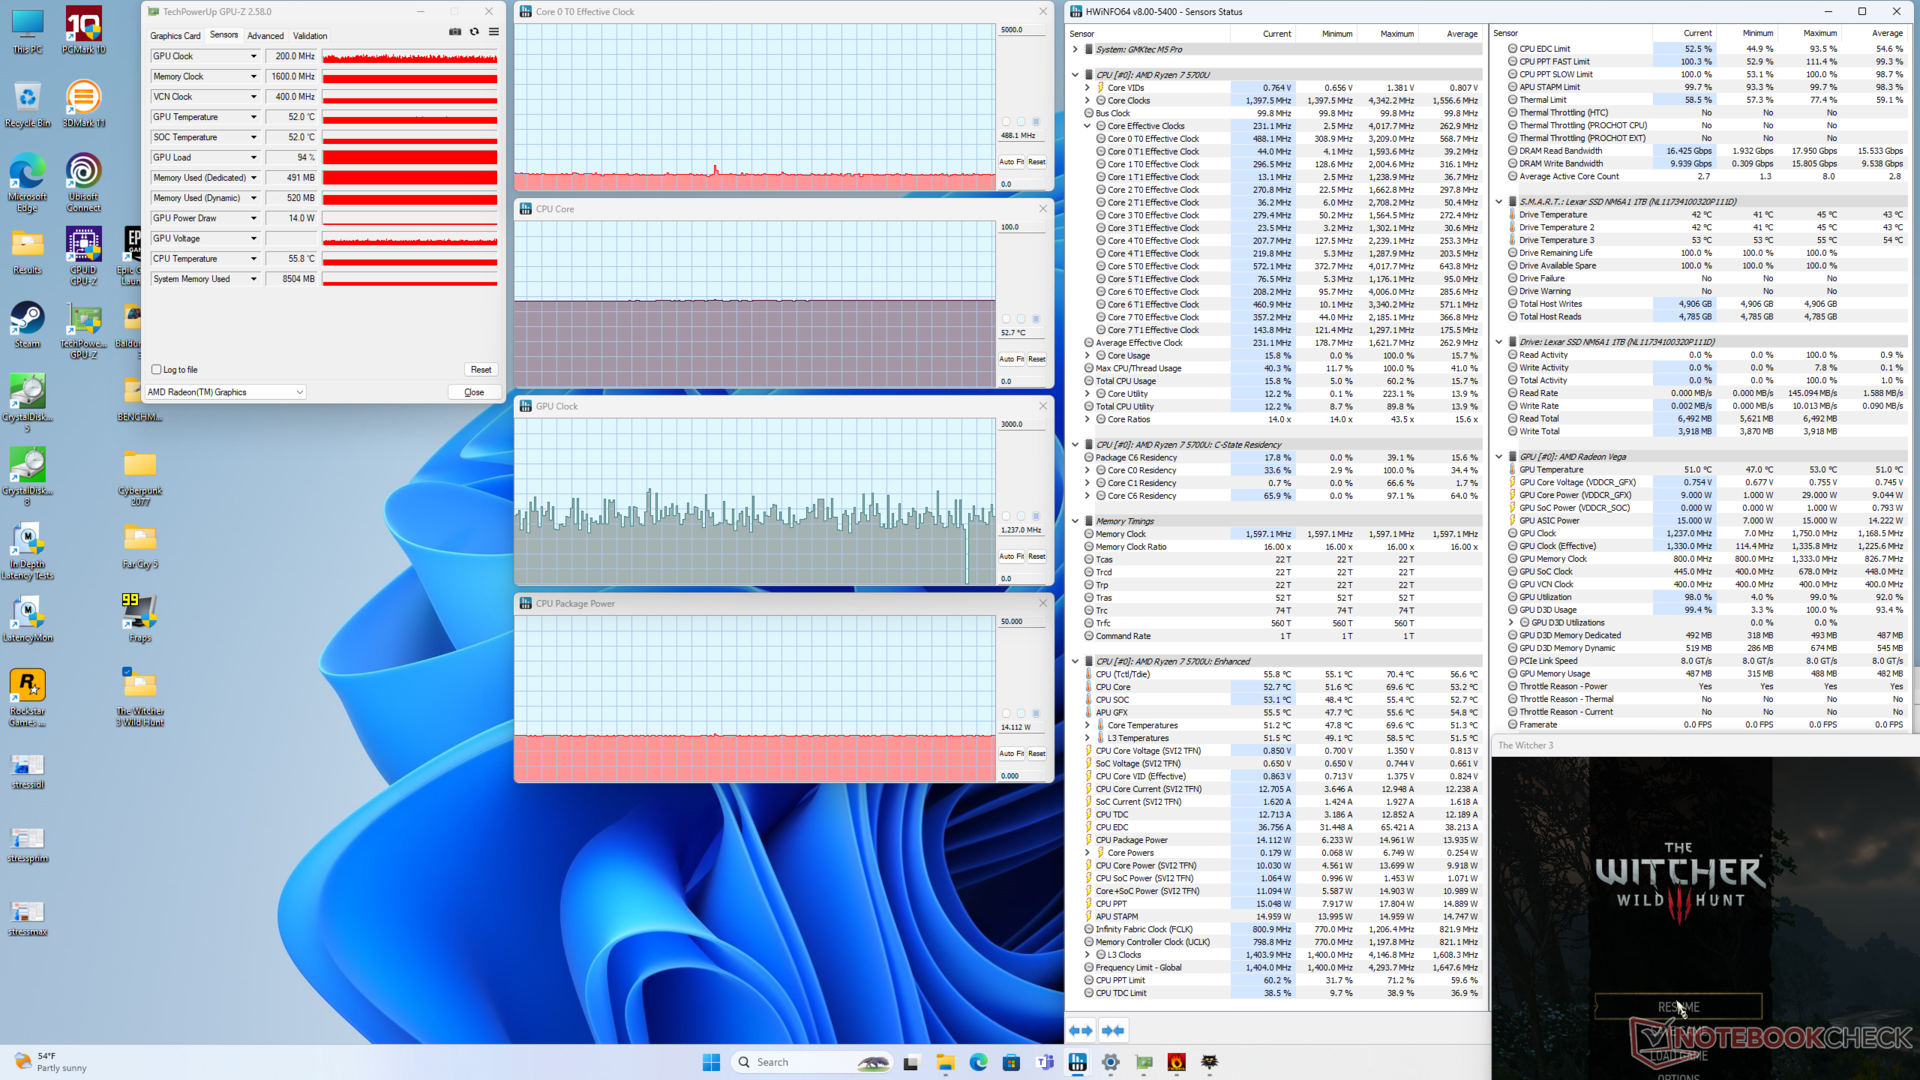
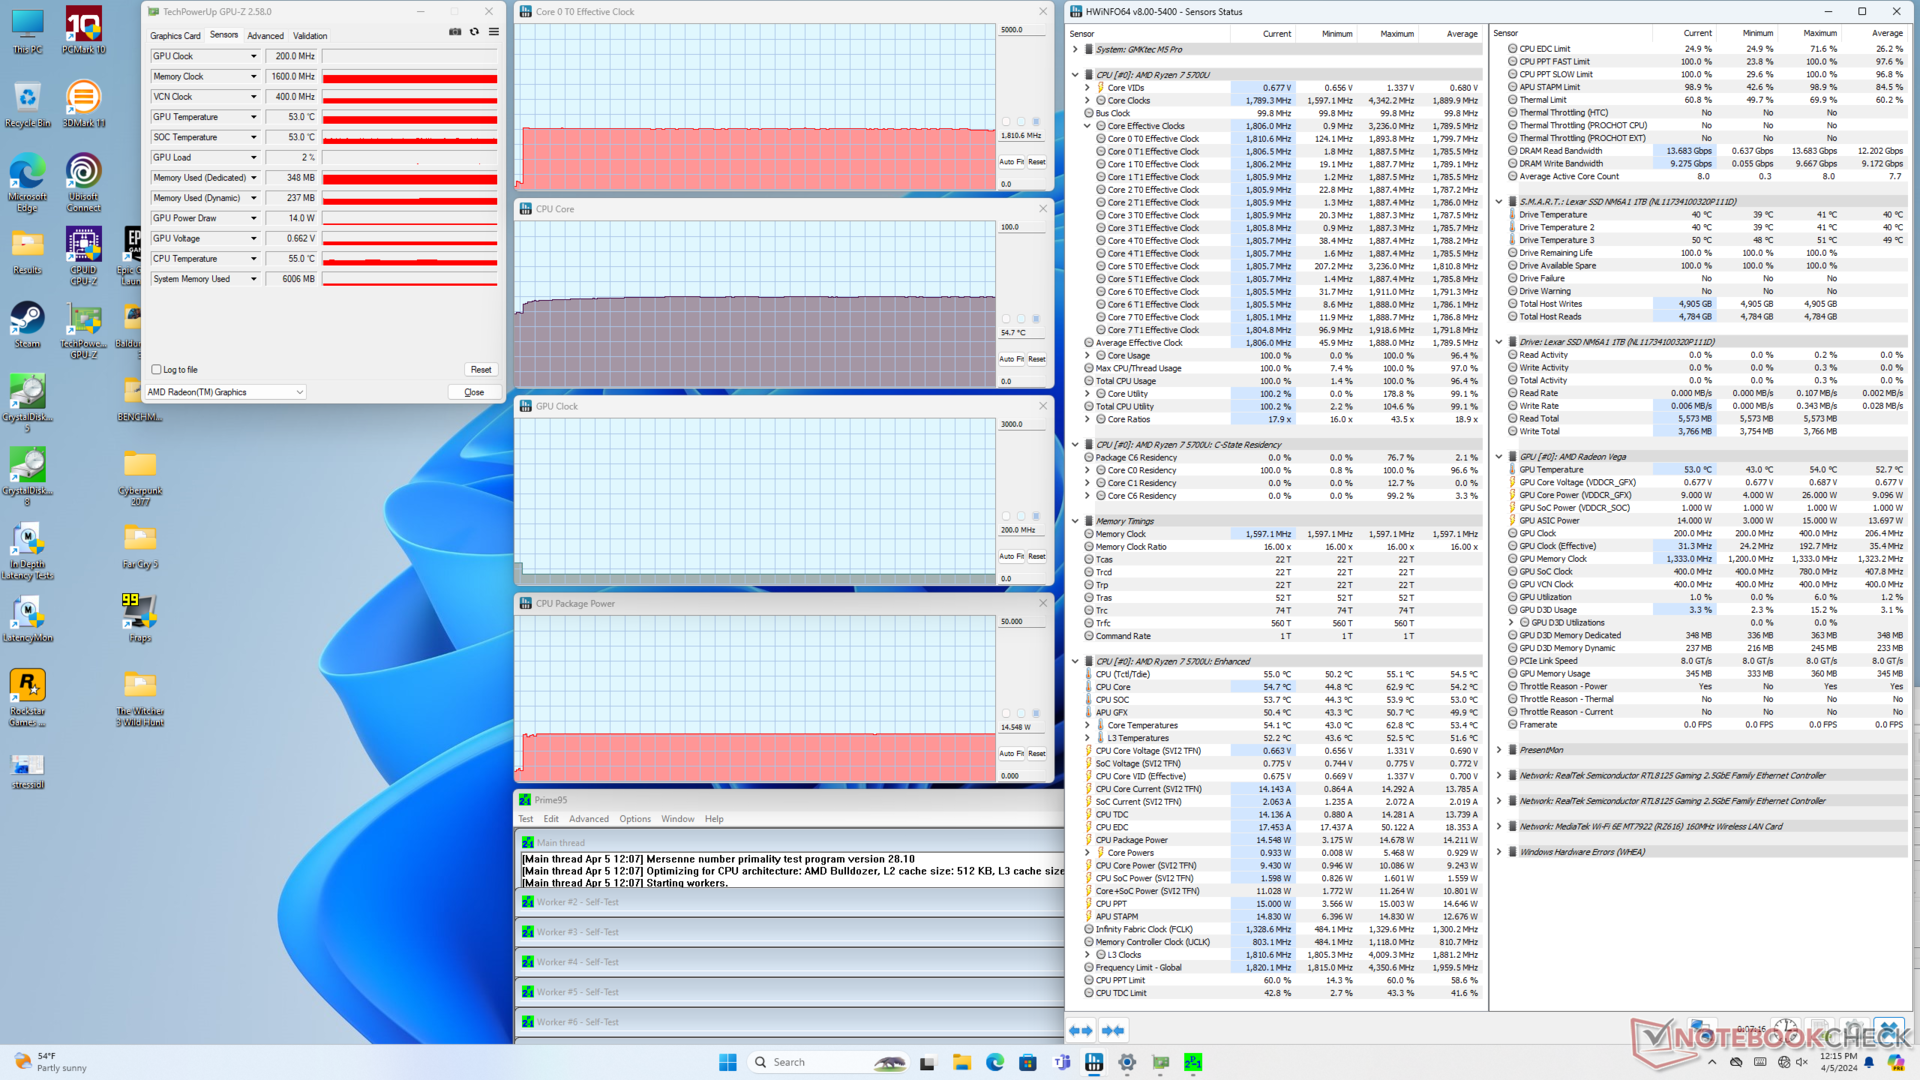
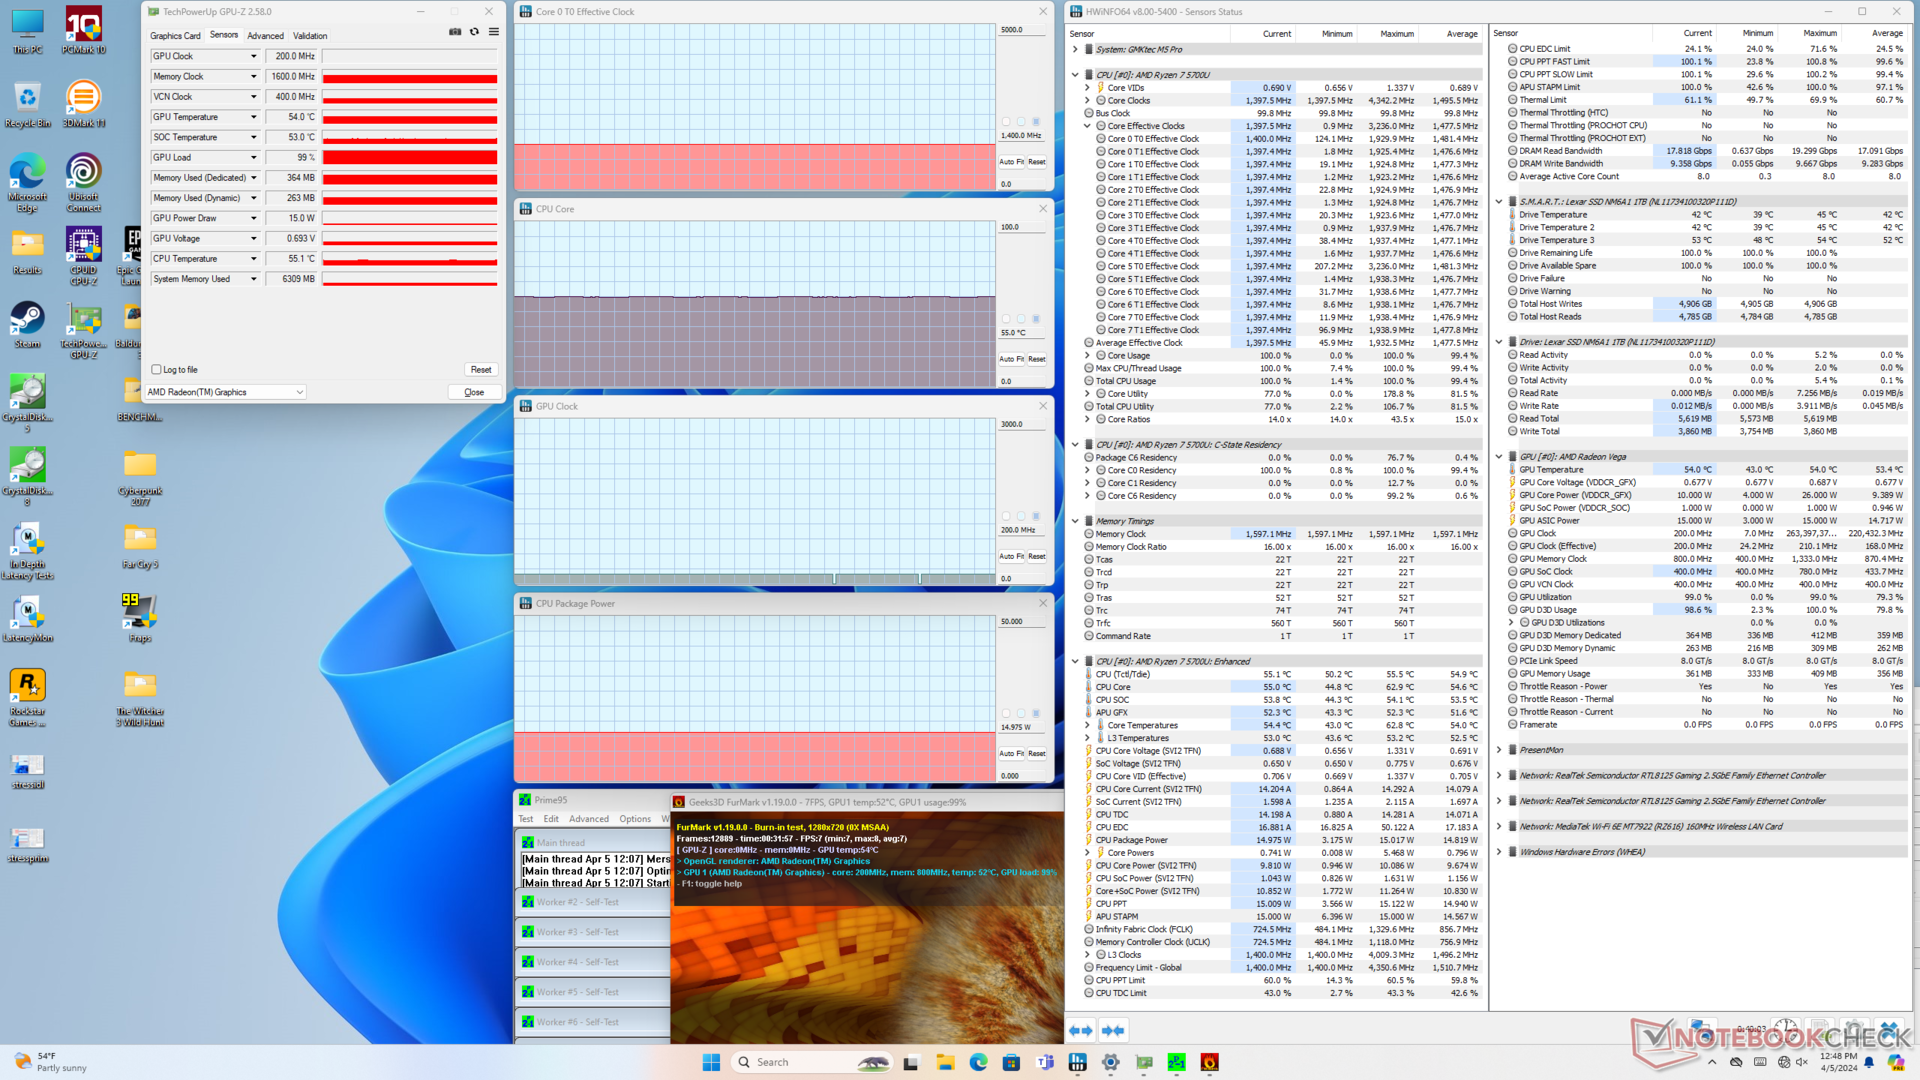
| CPU-Takt (GHz) | GPU-Takt (MHz) | durchschnittliche CPU-Temperatur (°C) | |
| System Leerlauf | -- | -- | 43 |
| Prime95, Stress | 1,8 | -- | 55 |
| Prime95 + FurMark, Stress | 1,4 | 200 | 55 |
| Witcher 3, Stress | ~0,5 | ~1.237 | 53 |
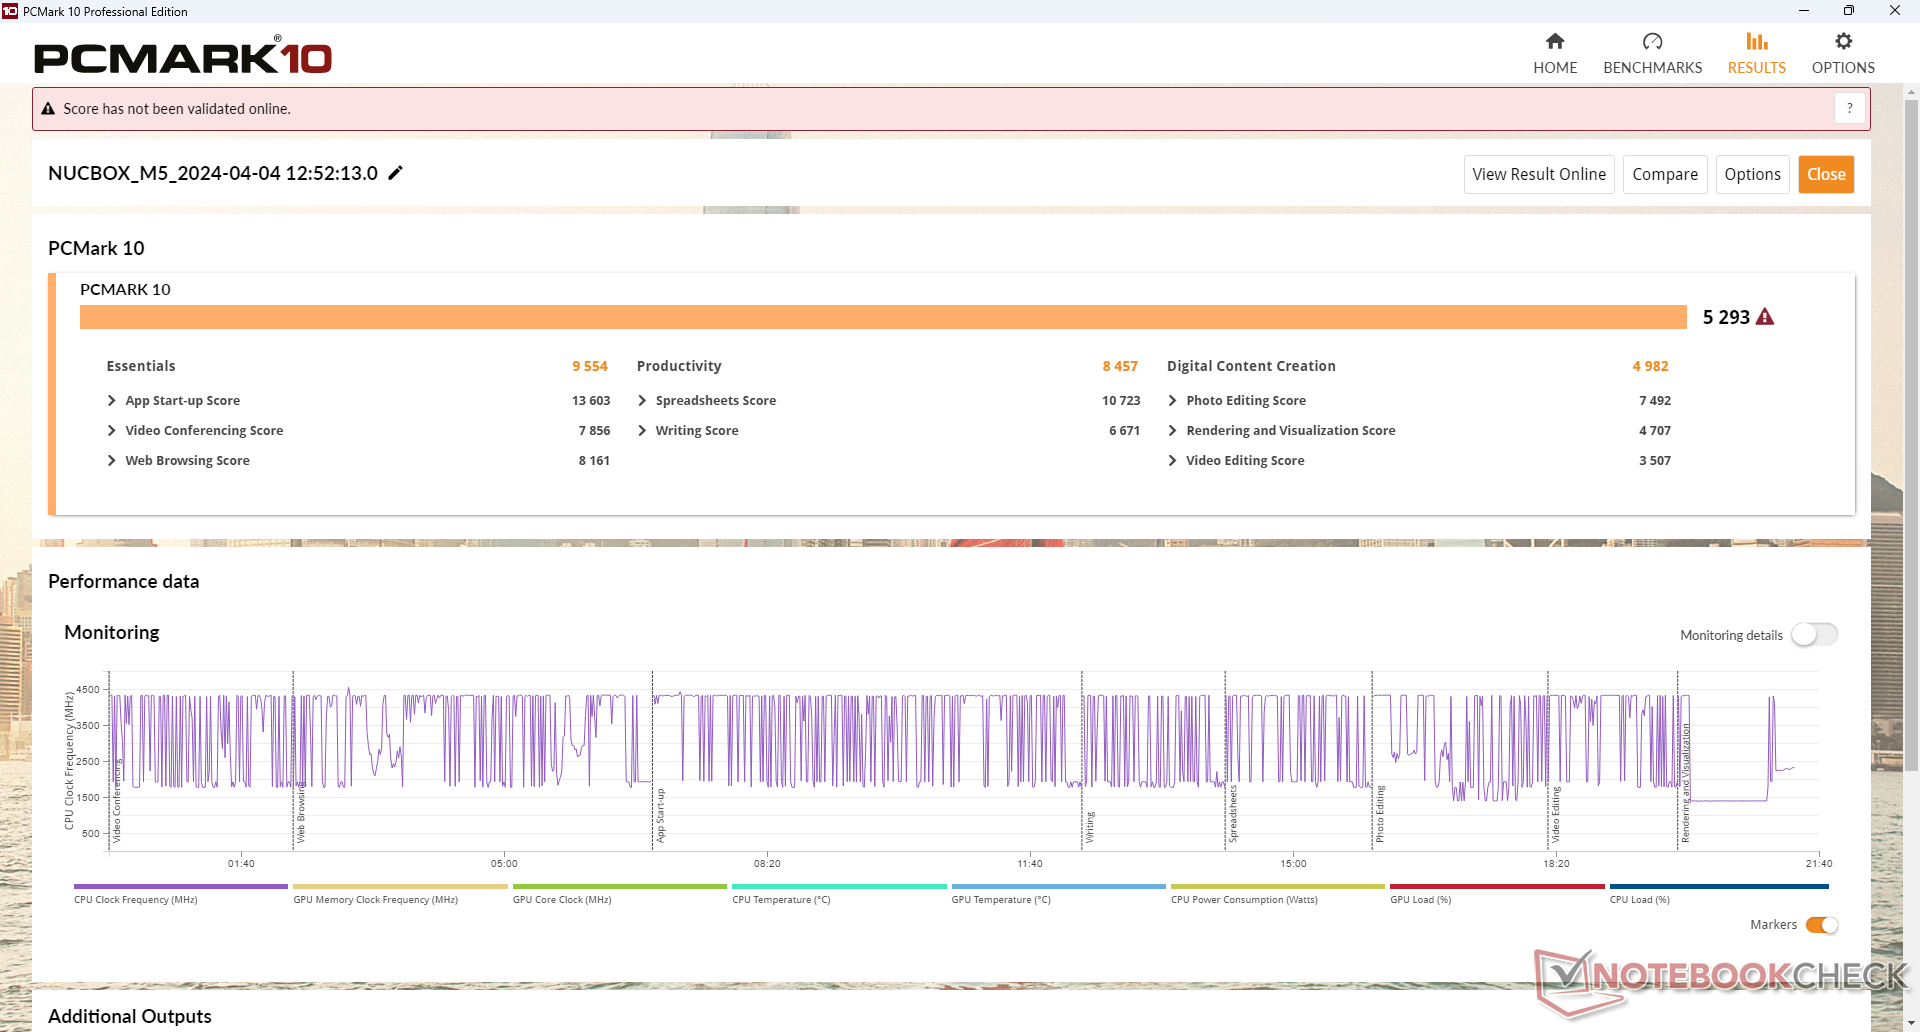
System Performance
Die PCMark-Ergebnisse liegen hinter denen vieler aktueller Mini-PCs, die mit Prozessoren der neuesten Generation laufen, wie dem GMK NucBox K6 oder dem Intel NUC 13 Pro. Der Subtest zur Erstellung digitaler Inhalte ist aufgrund der langsamen integrierten GPU besonders schlecht.
CrossMark: Overall | Productivity | Creativity | Responsiveness
WebXPRT 3: Overall
WebXPRT 4: Overall
Mozilla Kraken 1.1: Total
| PCMark 10 / Score | |
| GMK NucBox K6 | |
| Geekom A7 | |
| Acemagic F2A | |
| Intel NUC 13 Pro Desk Edition Kit | |
| GMK NucBox M4 | |
| GMK NucBox M5 | |
| Durchschnittliche AMD Ryzen 7 5700U, AMD Radeon RX Vega 8 (Ryzen 4000/5000) (4325 - 5518, n=15) | |
| PCMark 10 / Essentials | |
| GMK NucBox K6 | |
| Acemagic F2A | |
| Geekom A7 | |
| Intel NUC 13 Pro Desk Edition Kit | |
| GMK NucBox M4 | |
| GMK NucBox M5 | |
| Durchschnittliche AMD Ryzen 7 5700U, AMD Radeon RX Vega 8 (Ryzen 4000/5000) (8025 - 10091, n=15) | |
| PCMark 10 / Productivity | |
| GMK NucBox K6 | |
| Geekom A7 | |
| Acemagic F2A | |
| GMK NucBox M5 | |
| Durchschnittliche AMD Ryzen 7 5700U, AMD Radeon RX Vega 8 (Ryzen 4000/5000) (7001 - 8457, n=15) | |
| GMK NucBox M4 | |
| Intel NUC 13 Pro Desk Edition Kit | |
| PCMark 10 / Digital Content Creation | |
| Acemagic F2A | |
| Geekom A7 | |
| GMK NucBox K6 | |
| Intel NUC 13 Pro Desk Edition Kit | |
| GMK NucBox M4 | |
| Durchschnittliche AMD Ryzen 7 5700U, AMD Radeon RX Vega 8 (Ryzen 4000/5000) (3738 - 5964, n=15) | |
| GMK NucBox M5 | |
| CrossMark / Overall | |
| GMK NucBox K6 | |
| Geekom A7 | |
| Acemagic F2A | |
| GMK NucBox M4 | |
| Intel NUC 13 Pro Desk Edition Kit | |
| GMK NucBox M5 | |
| Durchschnittliche AMD Ryzen 7 5700U, AMD Radeon RX Vega 8 (Ryzen 4000/5000) (866 - 1183, n=8) | |
| CrossMark / Productivity | |
| GMK NucBox K6 | |
| Geekom A7 | |
| Acemagic F2A | |
| GMK NucBox M4 | |
| Intel NUC 13 Pro Desk Edition Kit | |
| GMK NucBox M5 | |
| Durchschnittliche AMD Ryzen 7 5700U, AMD Radeon RX Vega 8 (Ryzen 4000/5000) (931 - 1191, n=8) | |
| CrossMark / Creativity | |
| Geekom A7 | |
| GMK NucBox K6 | |
| Acemagic F2A | |
| Intel NUC 13 Pro Desk Edition Kit | |
| GMK NucBox M4 | |
| GMK NucBox M5 | |
| Durchschnittliche AMD Ryzen 7 5700U, AMD Radeon RX Vega 8 (Ryzen 4000/5000) (907 - 1197, n=8) | |
| CrossMark / Responsiveness | |
| GMK NucBox K6 | |
| Acemagic F2A | |
| Geekom A7 | |
| GMK NucBox M4 | |
| Intel NUC 13 Pro Desk Edition Kit | |
| GMK NucBox M5 | |
| Durchschnittliche AMD Ryzen 7 5700U, AMD Radeon RX Vega 8 (Ryzen 4000/5000) (605 - 1159, n=8) | |
| WebXPRT 3 / Overall | |
| Geekom A7 | |
| GMK NucBox K6 | |
| Intel NUC 13 Pro Desk Edition Kit | |
| GMK NucBox M4 | |
| Acemagic F2A | |
| GMK NucBox M5 | |
| Durchschnittliche AMD Ryzen 7 5700U, AMD Radeon RX Vega 8 (Ryzen 4000/5000) (197.4 - 222, n=14) | |
| WebXPRT 4 / Overall | |
| Geekom A7 | |
| GMK NucBox K6 | |
| Intel NUC 13 Pro Desk Edition Kit | |
| Acemagic F2A | |
| GMK NucBox M4 | |
| Durchschnittliche AMD Ryzen 7 5700U, AMD Radeon RX Vega 8 (Ryzen 4000/5000) (158.5 - 225, n=5) | |
| GMK NucBox M5 | |
| Mozilla Kraken 1.1 / Total | |
| Durchschnittliche AMD Ryzen 7 5700U, AMD Radeon RX Vega 8 (Ryzen 4000/5000) (791 - 835, n=15) | |
| GMK NucBox M5 | |
| GMK NucBox M4 | |
| Acemagic F2A | |
| GMK NucBox K6 | |
| Geekom A7 | |
| Intel NUC 13 Pro Desk Edition Kit | |
* ... kleinere Werte sind besser
| PCMark 10 Score | 5293 Punkte | |
Hilfe | ||
| AIDA64 / Memory Copy | |
| GMK NucBox K6 | |
| Geekom A7 | |
| Acemagic F2A | |
| Intel NUC 13 Pro Desk Edition Kit | |
| GMK NucBox M4 | |
| GMK NucBox M5 | |
| Durchschnittliche AMD Ryzen 7 5700U (15867 - 39326, n=20) | |
| AIDA64 / Memory Read | |
| Acemagic F2A | |
| GMK NucBox K6 | |
| Geekom A7 | |
| GMK NucBox M4 | |
| GMK NucBox M5 | |
| Intel NUC 13 Pro Desk Edition Kit | |
| Durchschnittliche AMD Ryzen 7 5700U (17632 - 47190, n=20) | |
| AIDA64 / Memory Write | |
| Geekom A7 | |
| GMK NucBox K6 | |
| Acemagic F2A | |
| GMK NucBox M5 | |
| GMK NucBox M4 | |
| Intel NUC 13 Pro Desk Edition Kit | |
| Durchschnittliche AMD Ryzen 7 5700U (11554 - 47048, n=20) | |
| AIDA64 / Memory Latency | |
| Acemagic F2A | |
| GMK NucBox M5 | |
| Durchschnittliche AMD Ryzen 7 5700U (84.9 - 113, n=20) | |
| Intel NUC 13 Pro Desk Edition Kit | |
| Geekom A7 | |
| GMK NucBox K6 | |
| GMK NucBox M4 | |
* ... kleinere Werte sind besser
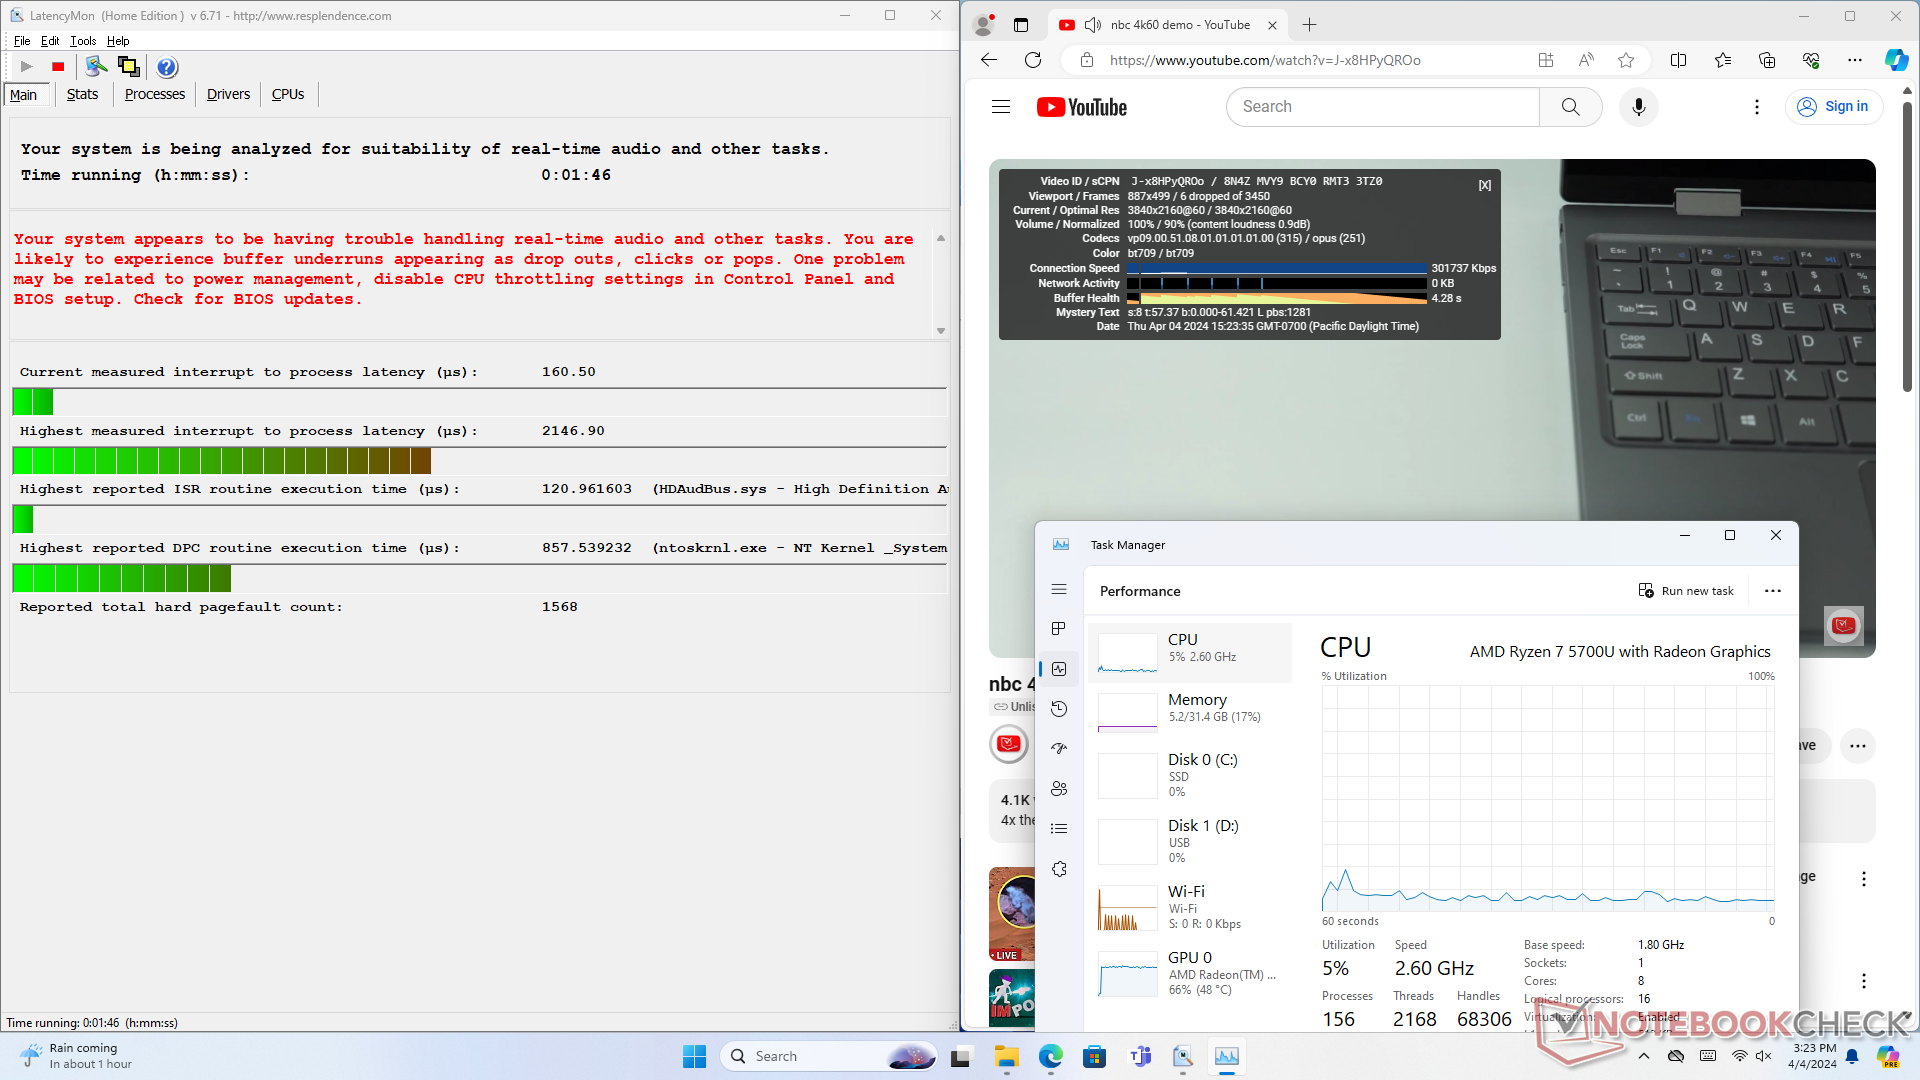
DPC-Latenzzeit
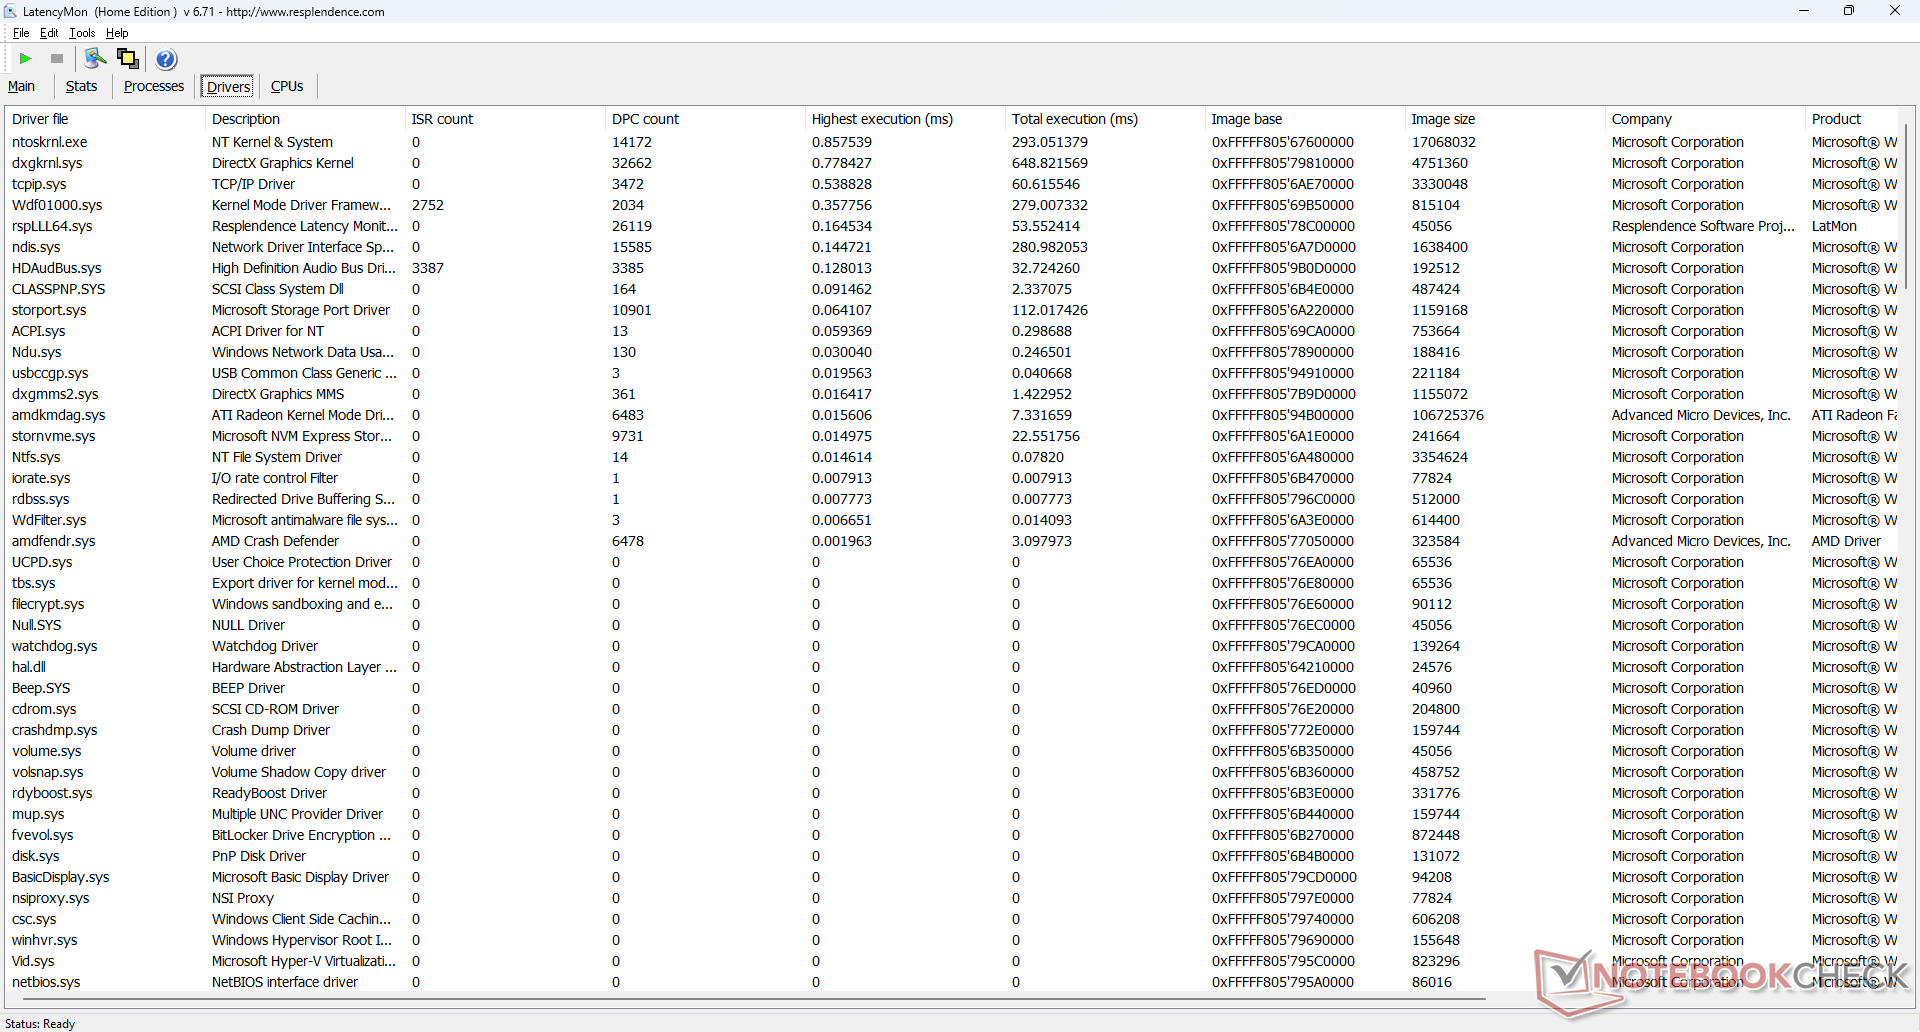
LatencyMon zeigt kleinere DPC-Probleme beim Öffnen mehrerer Browser Tabs unserer Homepage. Die 4K-Videowiedergabe bei 60 fps ist ebenfalls nicht perfekt. In einem Zeitraum von einer Minute wurden 6 Dropped Frames aufgezeichnet.
| DPC Latencies / LatencyMon - interrupt to process latency (max), Web, Youtube, Prime95 | |
| GMK NucBox K6 | |
| Acemagic F2A | |
| GMK NucBox M5 | |
| Geekom A7 | |
| Intel NUC 13 Pro Desk Edition Kit | |
| GMK NucBox M4 | |
* ... kleinere Werte sind besser
Speichergeräte
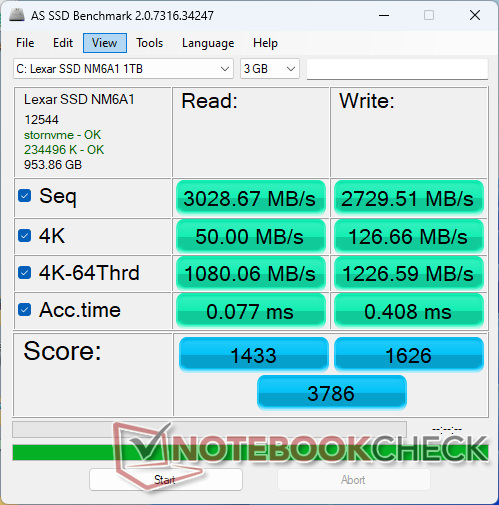
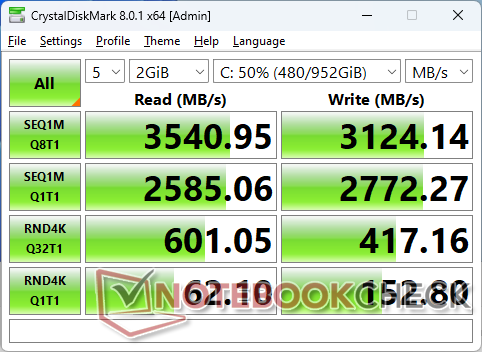
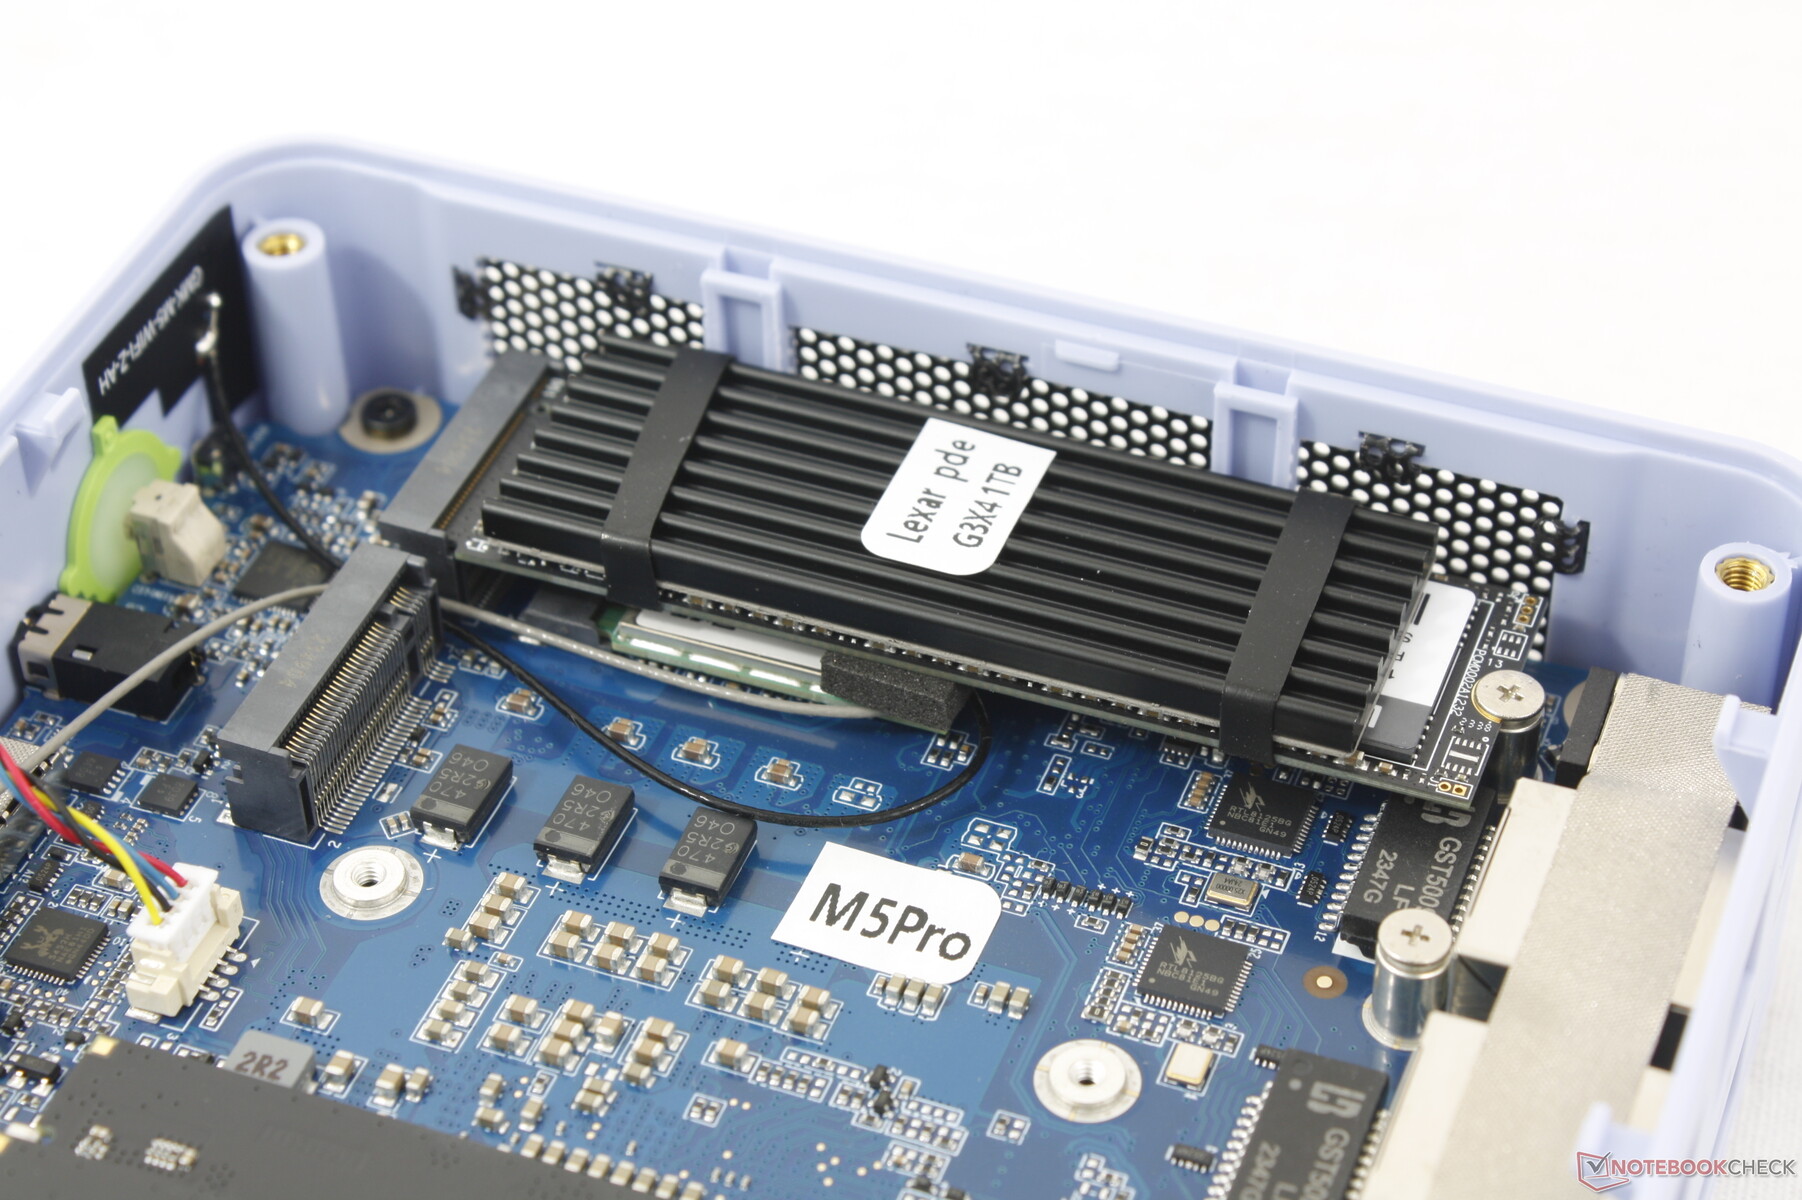
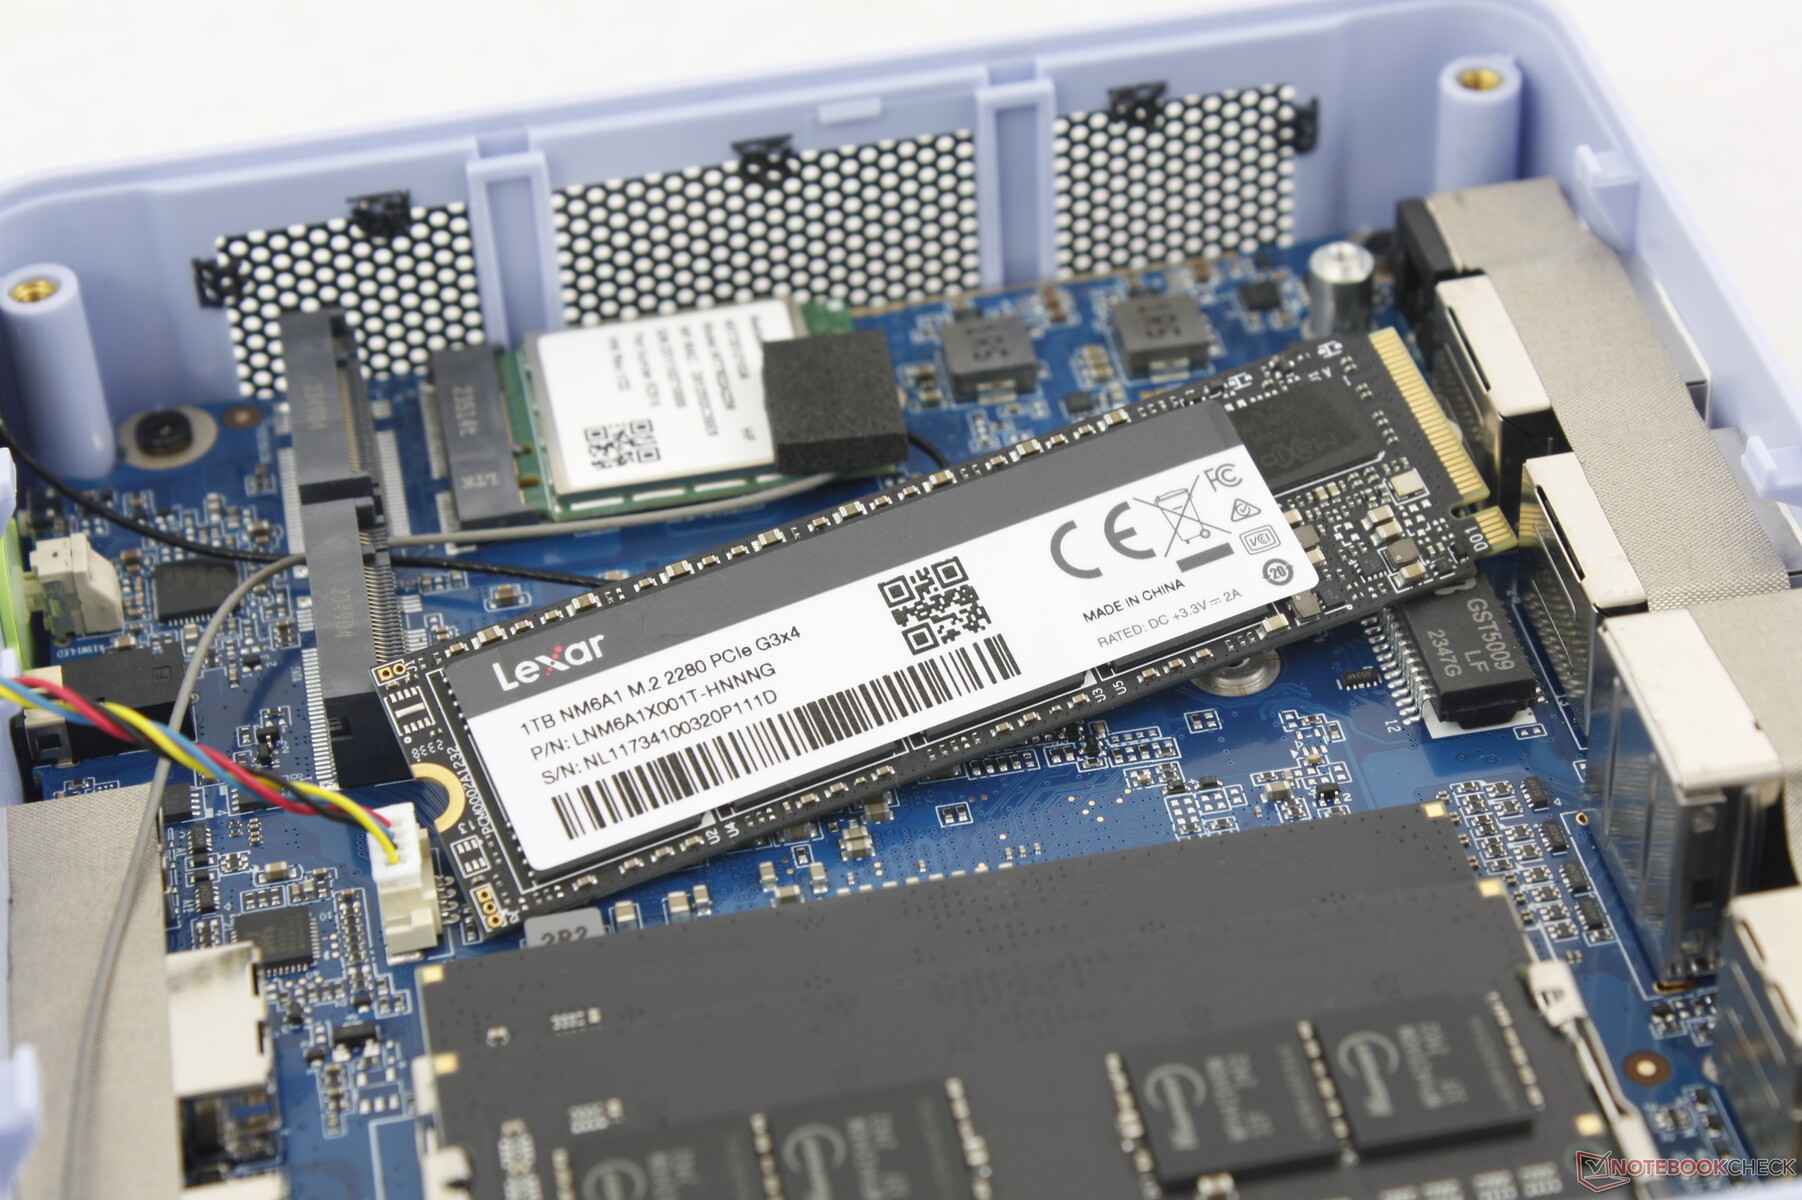
Ähnlich wie bei der NucBox M4 wird auch die M5 mit einer Lexar PCIe4 x4 NVMe SSD für konstante Übertragungsraten von bis zu 3.600 MB/s ausgeliefert. Auch die sequenziellen Schreibgeschwindigkeiten sind mit 3100 MB/s recht gut und gehören damit zu den besseren PCIe4-SSDs der Mittelklasse.

| Drive Performance Rating - Percent | |
| GMK NucBox K6 | |
| Intel NUC 13 Pro Desk Edition Kit | |
| Geekom A7 | |
| Acemagic F2A | |
| GMK NucBox M5 | |
| GMK NucBox M4 | |
* ... kleinere Werte sind besser
Disk Throttling: DiskSpd Read Loop, Queue Depth 8
GPU Performance - Veraltete Radeon RX Vega 8
Die integrierte Radeon RX Vega 8 ist älter als die Radeon 680M und 780M, die heute die Mini-PCs und Laptops der Mittelklasse oder höher dominieren. Sie ist deutlich langsamer als die Radeon 680M, und zwar um etwa 50 bis 60 Prozent, um mit der Iris Xe Grafik G7 96EUs auf Intel CPUs der 11. Generation mitzuziehen. Die Radeon RX Vega 8 kann die meisten Spiele lokal nicht mit vernünftigen Bildraten ausführen.
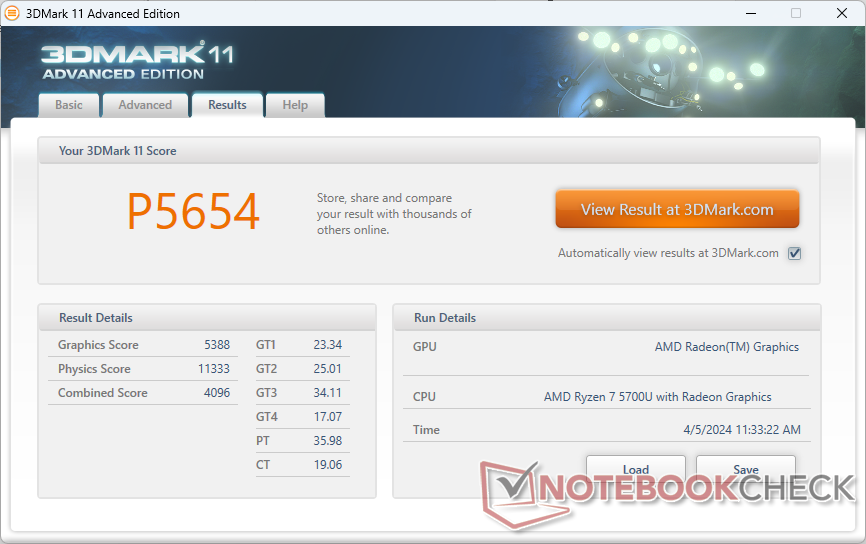
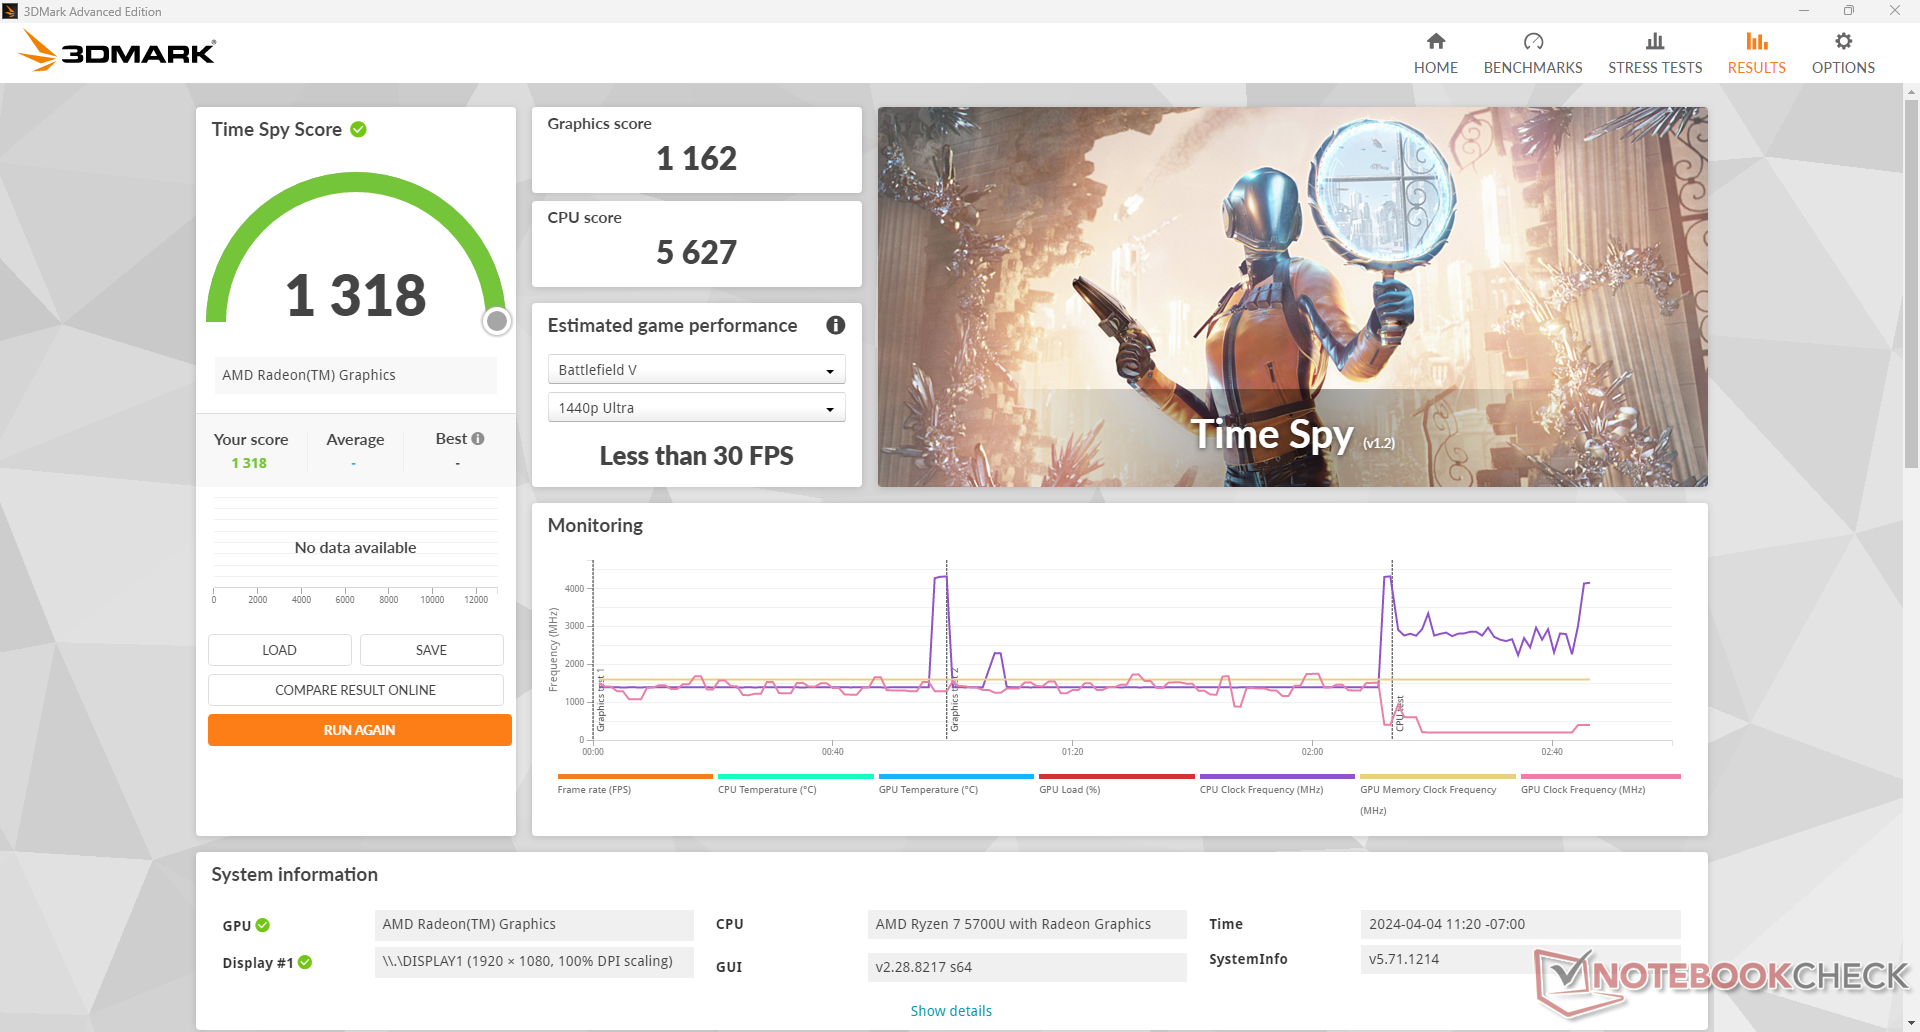
| 3DMark 11 Performance | 5654 Punkte | |
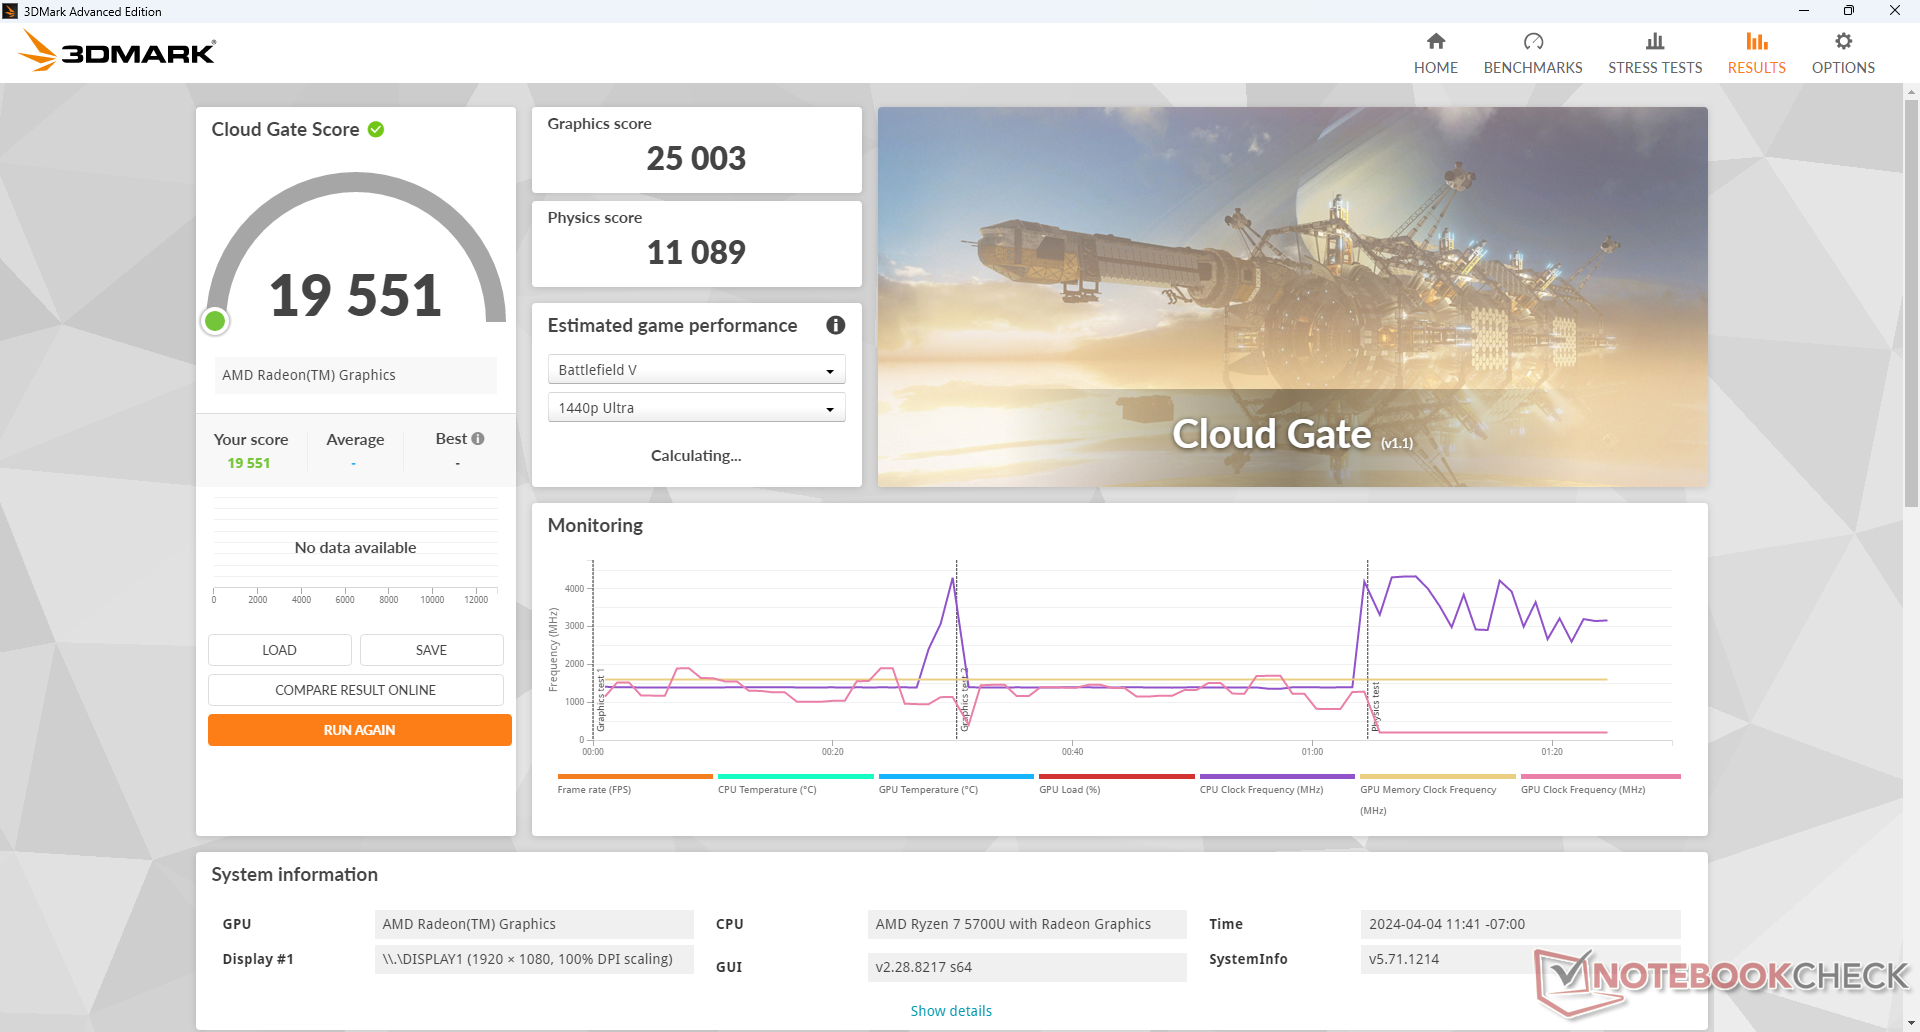
| 3DMark Cloud Gate Standard Score | 19551 Punkte | |
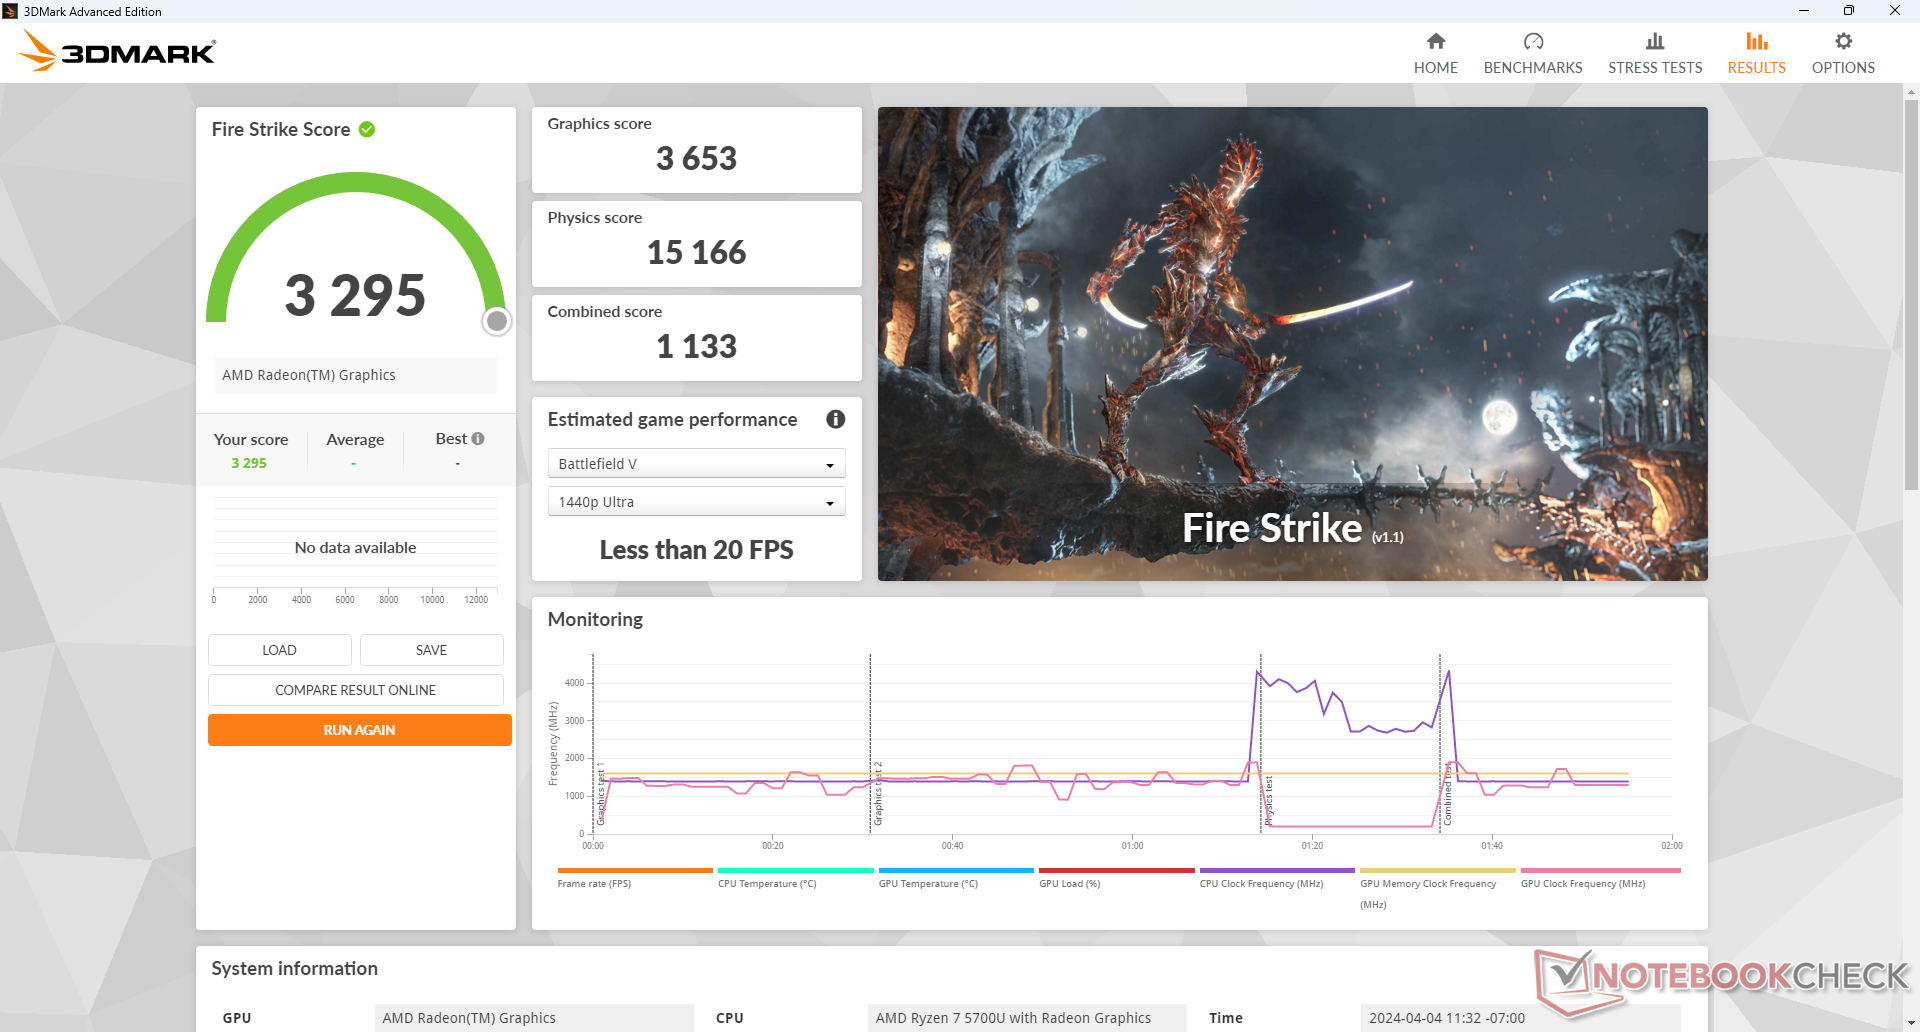
| 3DMark Fire Strike Score | 3295 Punkte | |
| 3DMark Time Spy Score | 1318 Punkte | |
Hilfe | ||
* ... kleinere Werte sind besser
| Performance Rating - Percent | |
| GMK NucBox K6 | |
| Geekom A7 -1! | |
| Acemagic F2A | |
| Intel NUC 13 Pro Desk Edition Kit | |
| GMK NucBox M5 | |
| GMK NucBox M4 -1! | |
| The Witcher 3 - 1920x1080 Ultra Graphics & Postprocessing (HBAO+) | |
| Geekom A7 | |
| GMK NucBox K6 | |
| Acemagic F2A | |
| Intel NUC 13 Pro Desk Edition Kit | |
| GMK NucBox M5 | |
| GMK NucBox M4 | |
| Final Fantasy XV Benchmark - 1920x1080 High Quality | |
| GMK NucBox K6 | |
| Geekom A7 | |
| Acemagic F2A | |
| Intel NUC 13 Pro Desk Edition Kit | |
| GMK NucBox M5 | |
| Strange Brigade - 1920x1080 ultra AA:ultra AF:16 | |
| GMK NucBox K6 | |
| Acemagic F2A | |
| Intel NUC 13 Pro Desk Edition Kit | |
| GMK NucBox M5 | |
| GMK NucBox M4 | |
| Dota 2 Reborn - 1920x1080 ultra (3/3) best looking | |
| GMK NucBox K6 | |
| Geekom A7 | |
| Acemagic F2A | |
| Intel NUC 13 Pro Desk Edition Kit | |
| GMK NucBox M5 | |
| GMK NucBox M4 | |
| X-Plane 11.11 - 1920x1080 high (fps_test=3) | |
| Geekom A7 | |
| GMK NucBox K6 | |
| Intel NUC 13 Pro Desk Edition Kit | |
| Acemagic F2A | |
| GMK NucBox M5 | |
| GMK NucBox M4 | |
| Cyberpunk 2077 | |
| 1280x720 Low Preset (FSR off) | |
| Intel NUC X15 LAPAC71H | |
| GMK NucBox K6 | |
| Acemagic F2A | |
| Durchschnittliche AMD Radeon RX Vega 8 (Ryzen 4000/5000) (16.6 - 35.2, n=4) | |
| GMK NucBox M5 | |
| 1920x1080 Low Preset (FSR off) | |
| Intel NUC X15 LAPAC71H | |
| GMK NucBox K6 | |
| Acemagic F2A | |
| Durchschnittliche AMD Radeon RX Vega 8 (Ryzen 4000/5000) (9.9 - 19.9, n=5) | |
| GMK NucBox M5 | |
| 1920x1080 Medium Preset (FSR off) | |
| Intel NUC X15 LAPAC71H | |
| GMK NucBox K6 | |
| Acemagic F2A | |
| Durchschnittliche AMD Radeon RX Vega 8 (Ryzen 4000/5000) (7.7 - 14.8, n=4) | |
| GMK NucBox M5 | |
| 1920x1080 High Preset (FSR off) | |
| Intel NUC X15 LAPAC71H | |
| GMK NucBox K6 | |
| Acemagic F2A | |
| GMK NucBox M5 | |
| Durchschnittliche AMD Radeon RX Vega 8 (Ryzen 4000/5000) (5.71 - 12.3, n=5) | |
| 1920x1080 Ultra Preset (FSR off) | |
| Intel NUC X15 LAPAC71H | |
| GMK NucBox K6 | |
| Acemagic F2A | |
| Durchschnittliche AMD Radeon RX Vega 8 (Ryzen 4000/5000) (8.23 - 10.5, n=2) | |
| Baldur's Gate 3 | |
| 1920x1080 Low Preset AA:SM | |
| Intel NUC X15 LAPAC71H | |
| GMK NucBox K6 | |
| GMK NucBox M5 | |
| Durchschnittliche AMD Radeon RX Vega 8 (Ryzen 4000/5000) (9.78 - 17.6, n=4) | |
| 1920x1080 Medium Preset AA:T | |
| Intel NUC X15 LAPAC71H | |
| GMK NucBox K6 | |
| Durchschnittliche AMD Radeon RX Vega 8 (Ryzen 4000/5000) (7.5 - 14.4, n=3) | |
| 1920x1080 High Preset AA:T | |
| Intel NUC X15 LAPAC71H | |
| GMK NucBox K6 | |
| Durchschnittliche AMD Radeon RX Vega 8 (Ryzen 4000/5000) (6.11 - 11.7, n=3) | |
Witcher 3 FPS Chart
| min. | mittel | hoch | max. | |
|---|---|---|---|---|
| The Witcher 3 (2015) | 67.6 | 43.3 | 22 | 13.7 |
| Dota 2 Reborn (2015) | 99.7 | 80.6 | 50.5 | 47.6 |
| Final Fantasy XV Benchmark (2018) | 35.2 | 18 | 13.1 | |
| X-Plane 11.11 (2018) | 40.4 | 27.3 | 25.1 | |
| Far Cry 5 (2018) | 42 | 20 | 19 | 17 |
| Strange Brigade (2018) | 79.8 | 32.4 | 26.8 | 22.7 |
| Tiny Tina's Wonderlands (2022) | 27.3 | 21.5 | 13.8 | 10.3 |
| F1 22 (2022) | 35.7 | 32.3 | 23.8 | 16.8 |
| Baldur's Gate 3 (2023) | 14.2 | |||
| Cyberpunk 2077 (2023) | 13.8 | 10.9 | 9.17 |
Emissionen
Systemrauschen
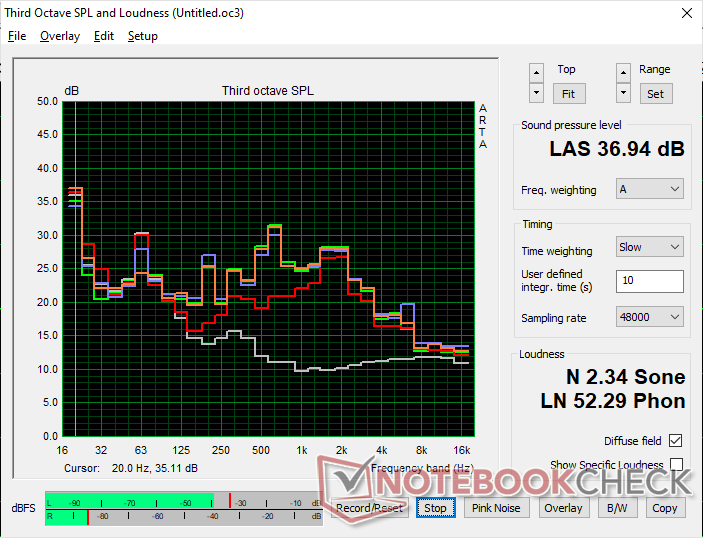
Das Lüftergeräusch ist immer vorhanden und liegt bei 33,8 dB(A), unabhängig von der Bildschirmlast oder der Profileinstellung. Das leise Surren ist in einer HTPC-Umgebung wie dem Wohnzimmer zwar hörbar, aber nicht laut genug, um zu stören.
Der Drehzahlbereich des Lüfters ist glücklicherweise recht schmal, so dass der Unterschied zwischen maximalem und minimalem Lüftergeräusch relativ gering ist. Wir konnten zum Beispiel ein Maximum von nur 37 dB(A) aufzeichnen, verglichen mit über 48 dB(A) bei der NucBox K6 oder der Acemagic F2A.
Lautstärkediagramm
| Idle |
| 33.8 / 33.8 / 33.8 dB(A) |
| Last |
| 36.5 / 36.9 dB(A) |
 | ||
30 dB leise 40 dB(A) deutlich hörbar 50 dB(A) störend |
||
min: | ||
| GMK NucBox M5 Vega 8, R7 5700U, Lexar 1024GB LNM6A1X001T-HNNNG | GMK NucBox M4 UHD Graphics Xe 32EUs (Tiger Lake-H), i9-11900H, Lexar NM620 512GB | GMK NucBox K6 Radeon 780M, R7 7840HS, MasonSemi 1TB MC7000 | Acemagic F2A Arc 8-Core, Ultra 7 155H, Kingston OM8SEP1024Q-A0 | Geekom A7 Radeon 780M, R9 7940HS, Acer N5000 | Intel NUC 13 Pro Desk Edition Kit Iris Xe G7 96EUs, i7-1360P, Samsung PM9A1 MZVL2512HCJQ | |
|---|---|---|---|---|---|---|
| Geräuschentwicklung | 12% | -9% | -3% | -9% | 2% | |
| aus / Umgebung * (dB) | 23.4 | 22.7 3% | 23.2 1% | 24.9 -6% | 25.4 -9% | 25.2 -8% |
| Idle min * (dB) | 33.8 | 24.4 28% | 31.3 7% | 25.4 25% | 33.3 1% | 28.1 17% |
| Idle avg * (dB) | 33.8 | 24.4 28% | 31.3 7% | 25.7 24% | 33.6 1% | 28.2 17% |
| Idle max * (dB) | 33.8 | 28 17% | 33.4 1% | 25.7 24% | 33.7 -0% | 28.3 16% |
| Last avg * (dB) | 36.5 | 28 23% | 47.5 -30% | 47.8 -31% | 43.3 -19% | 42 -15% |
| Witcher 3 ultra * (dB) | 36.8 | 33.7 8% | 43.6 -18% | 45.23 -23% | 43.2 -17% | |
| Last max * (dB) | 36.9 | 44.6 -21% | 47.7 -29% | 49 -33% | 43.3 -17% | 42.1 -14% |
* ... kleinere Werte sind besser
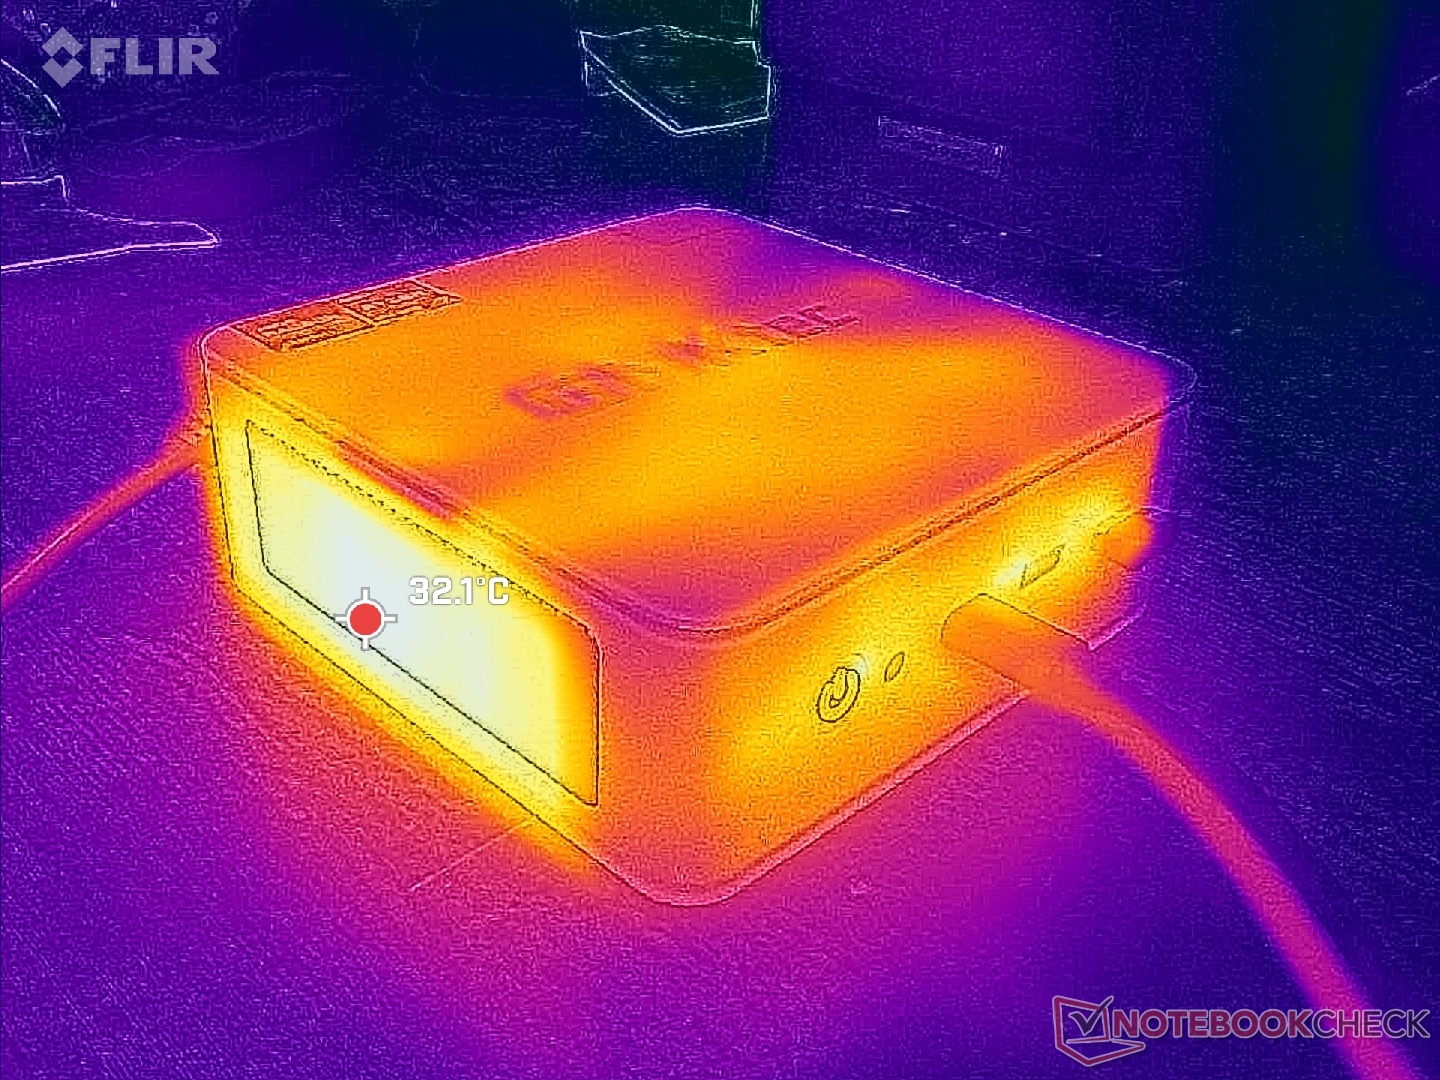
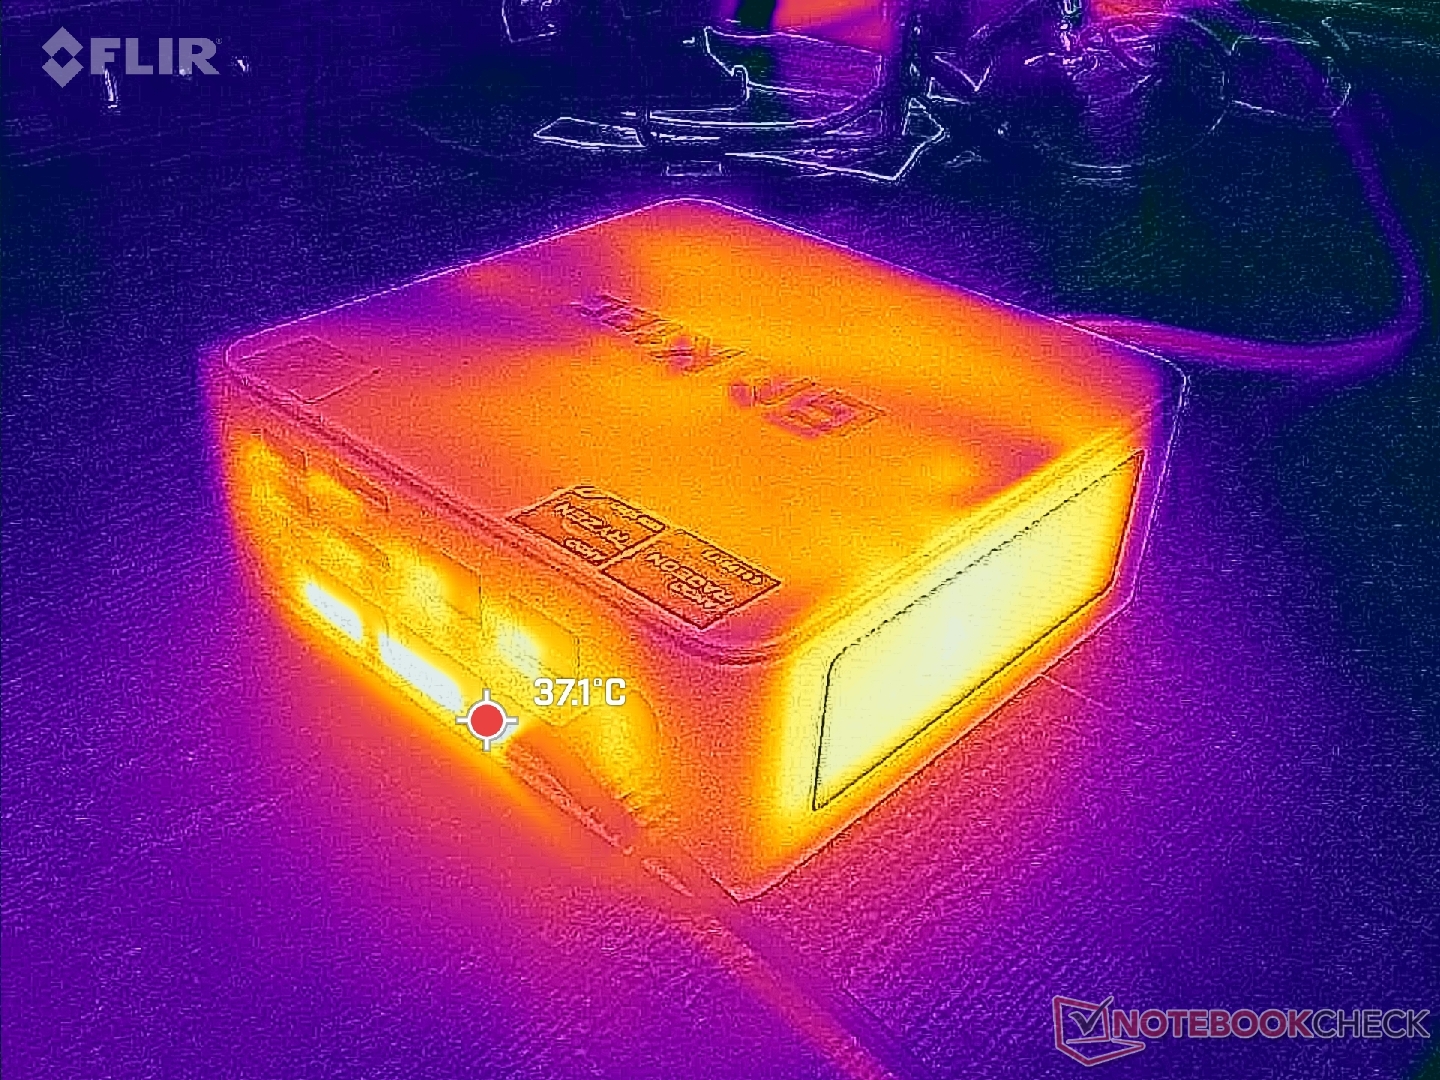
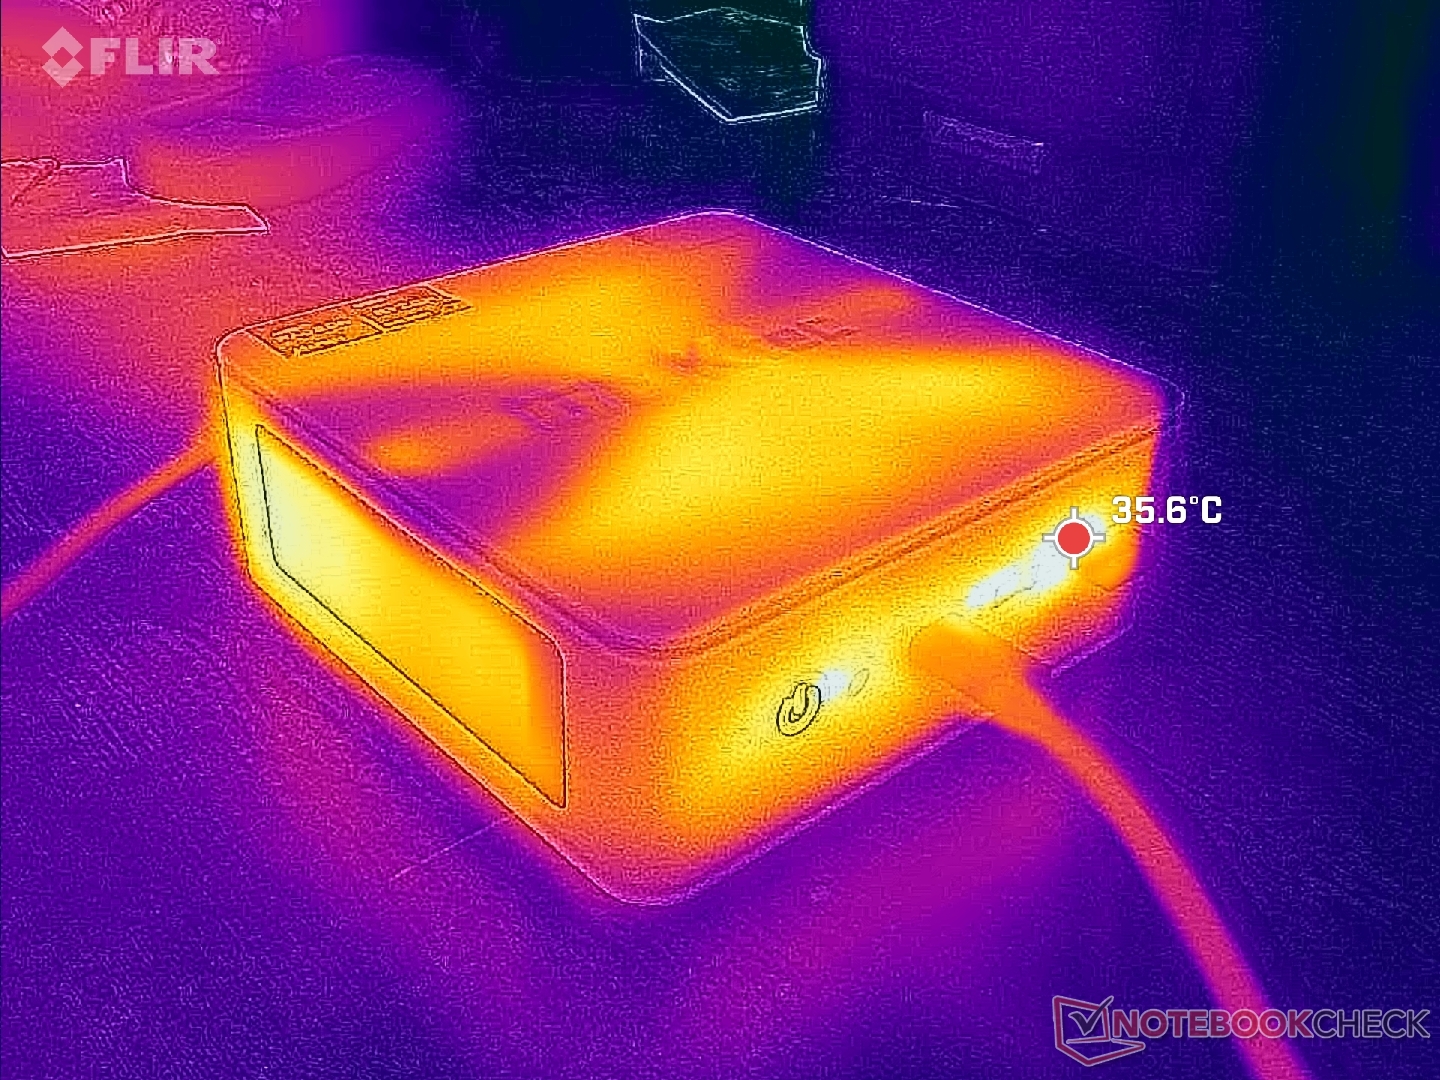
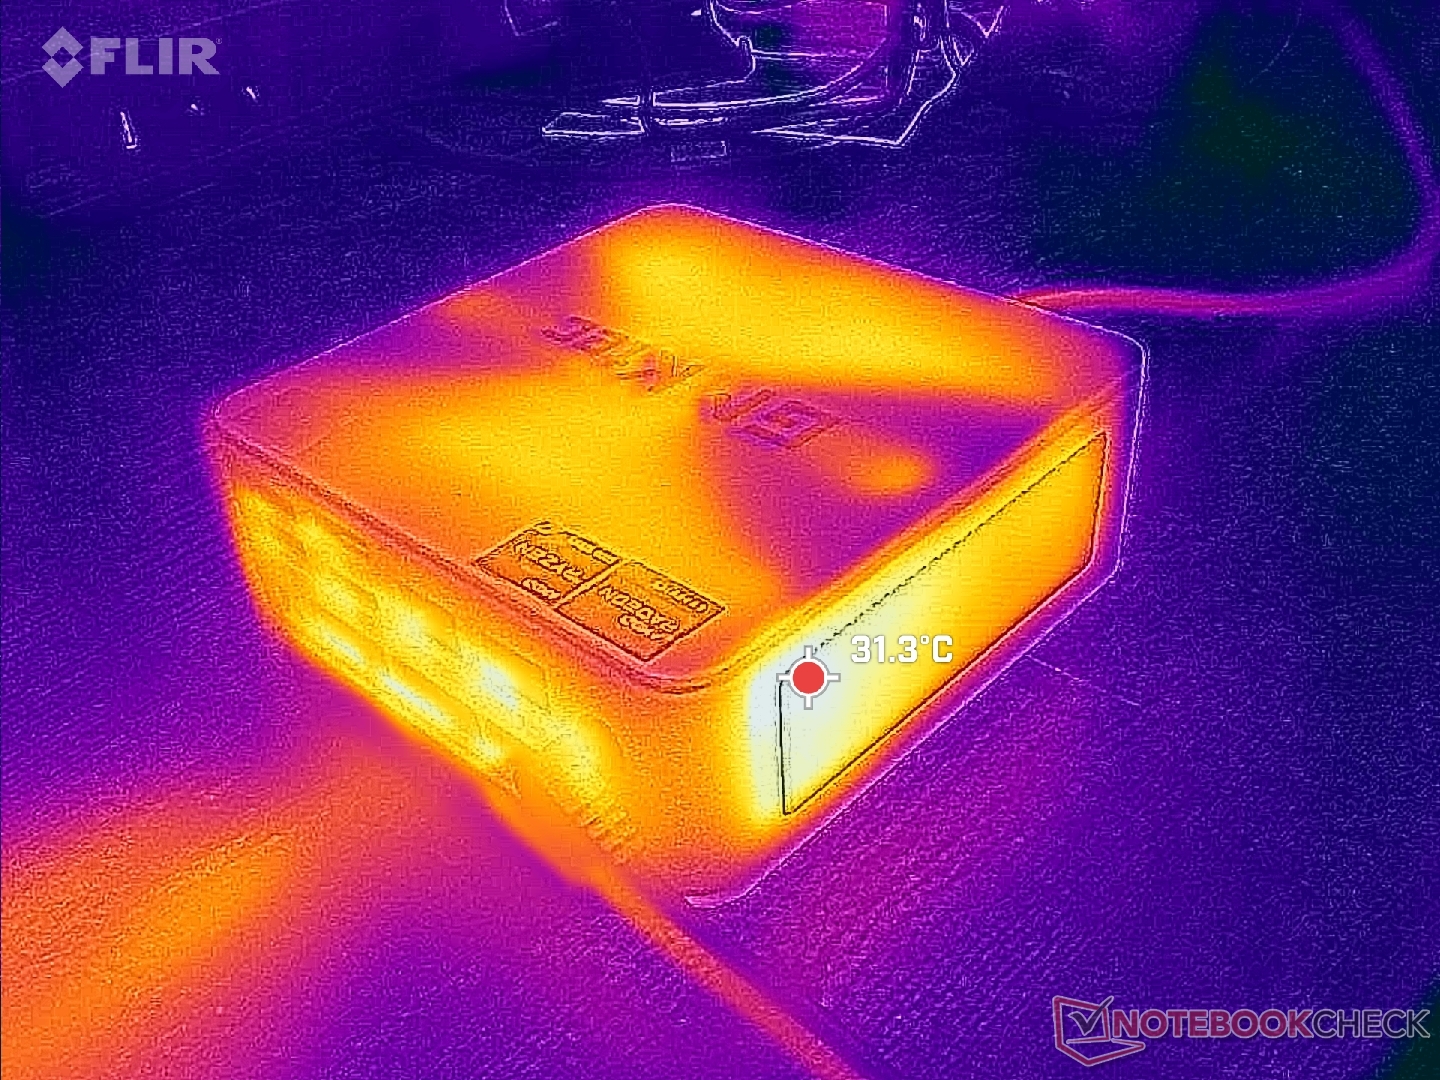
Temperatur
Die Oberflächentemperaturen sind dank der überflüssigen Belüftung rund um das Gehäuse kein Problem. Das System verwendet zwei Lüfter, ähnlich wie bei der NucBox K6, obwohl ein Lüfter angesichts der stromsparenden Core-U-Serien-CPU wahrscheinlich ausreichend gewesen wäre.
Energieverwaltung
Stromverbrauch
Der Betrieb von Witcher 3 zur Darstellung von typisch hohen Lasten verbraucht etwa 35 W, also knapp die Hälfte dessen, was die NucBox K6 benötigt. Die Energieeinsparungen reichen aus, um die NucBox M5 effizienter als die meisten anderen Mini-PCs zu machen, was auch mit dem niedrigen maximalen Lüftergeräusch und der TDP-Obergrenze zusammenhängt. Darunter leiden jedoch die CPU- und GPU-Leistung.
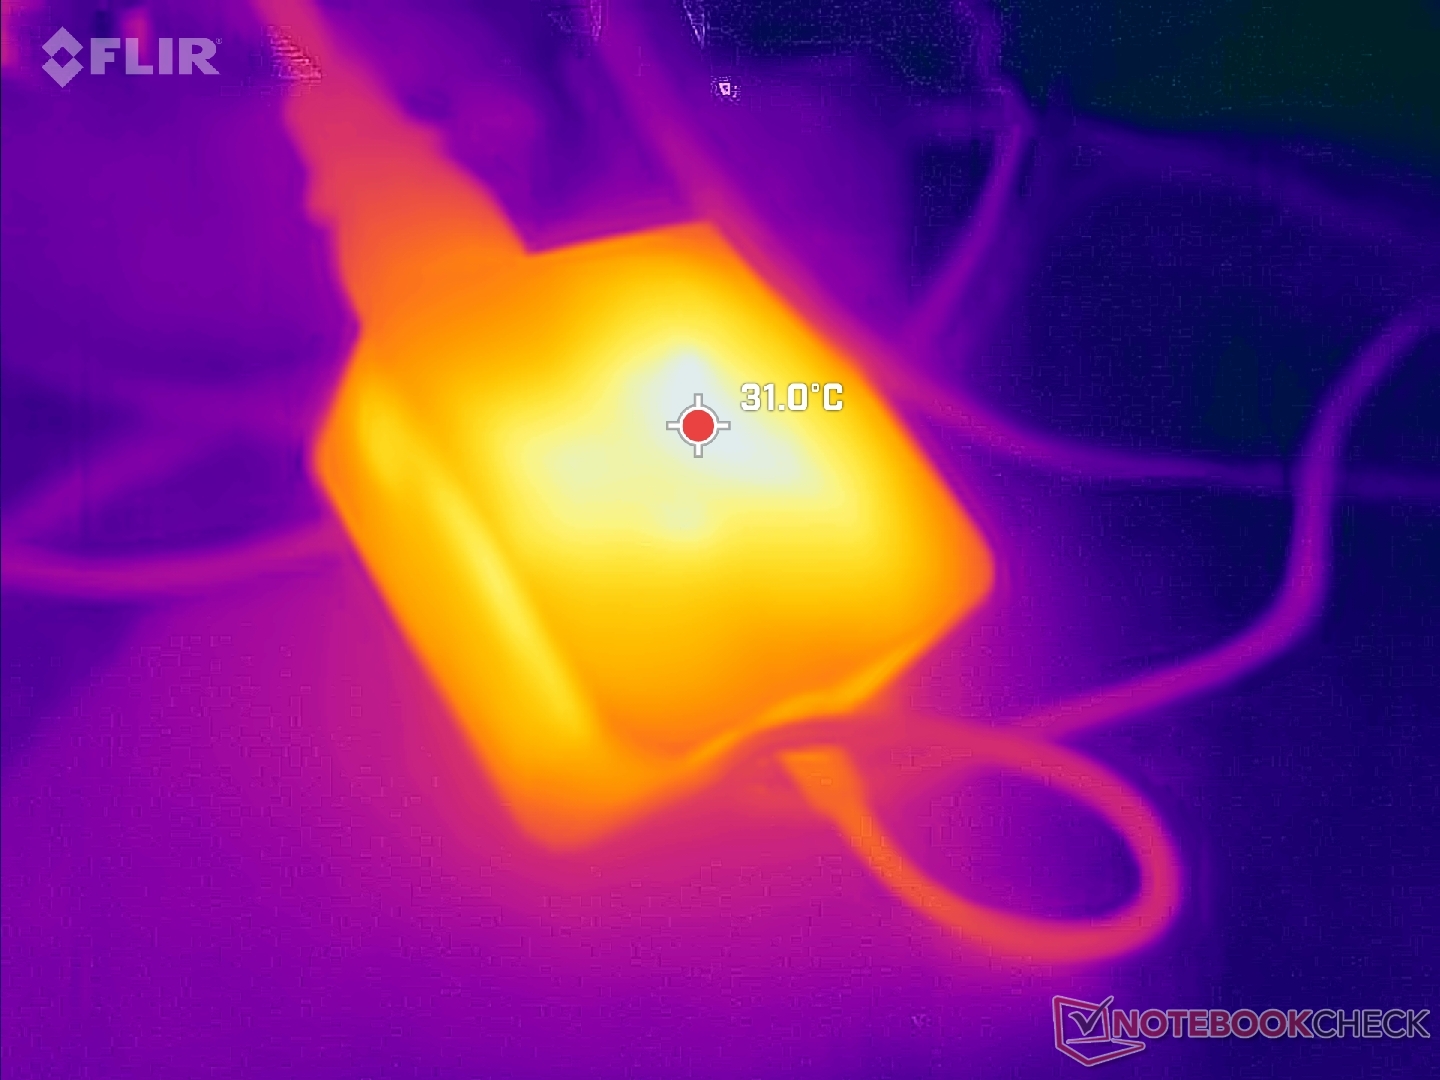
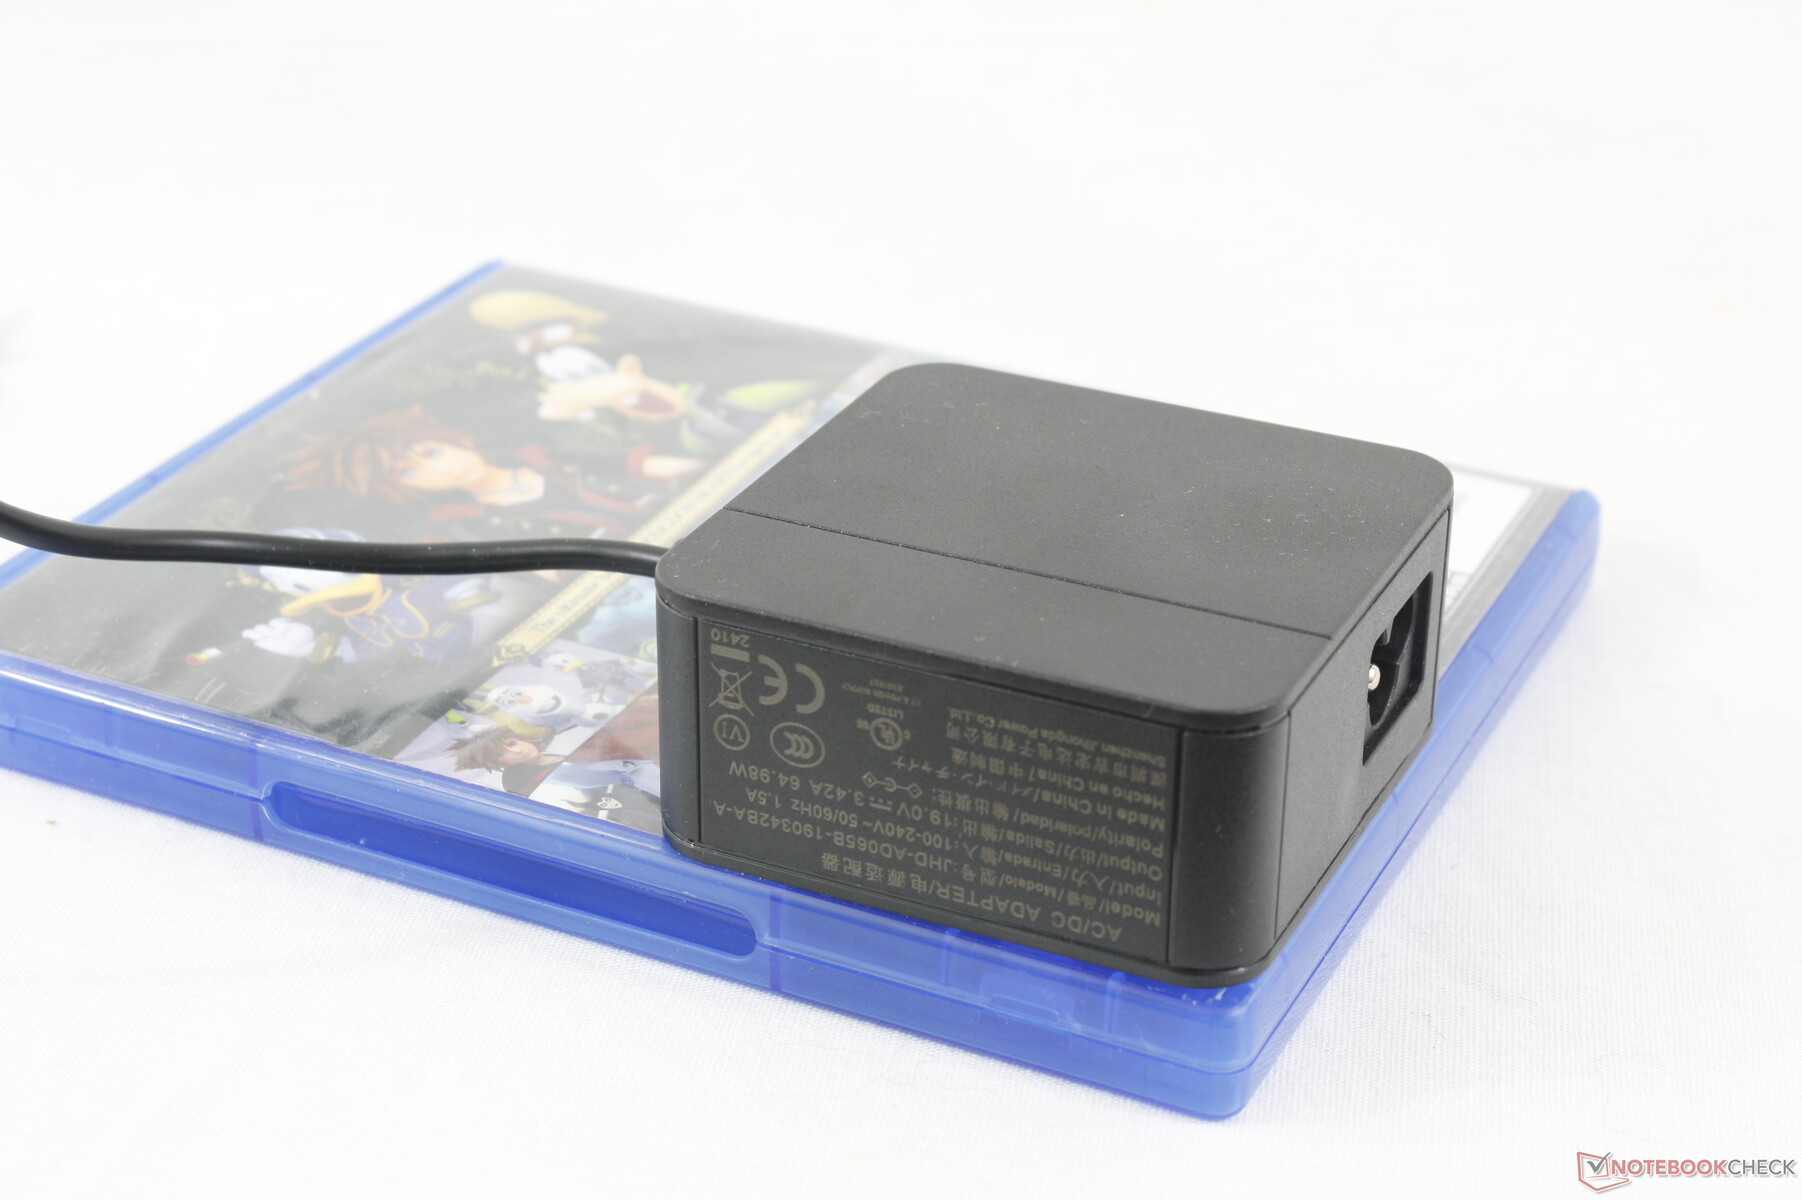
Das Modell wird mit einem viel kleineren (~6,8 x 6,8 x 3,2 cm) 65-Watt-Netzteil geliefert, verglichen mit dem 130-Watt-Netzteil, das mit der NucBox K6 geliefert wird. USB-C-Netzadapter von Drittanbietern werden unterstützt.
(Anmerkung der Redaktion: Dieser Abschnitt wird aktualisiert, sobald die Reparaturen an unserem Metrahit Energy Multimeter im Laufe des Monats abgeschlossen sind. Wir entschuldigen uns für die Unannehmlichkeiten.)
| Aus / Standby | |
| Idle | |
| Last |
|
Legende:
min: | |
| GMK NucBox M5 R7 5700U, Vega 8, Lexar 1024GB LNM6A1X001T-HNNNG, , x, | GMK NucBox M4 i9-11900H, UHD Graphics Xe 32EUs (Tiger Lake-H), Lexar NM620 512GB, , x, | GMK NucBox K6 R7 7840HS, Radeon 780M, MasonSemi 1TB MC7000, , x, | Acemagic F2A Ultra 7 155H, Arc 8-Core, Kingston OM8SEP1024Q-A0, , x, | Geekom A7 R9 7940HS, Radeon 780M, Acer N5000, , x, | Intel NUC 13 Pro Desk Edition Kit i7-1360P, Iris Xe G7 96EUs, Samsung PM9A1 MZVL2512HCJQ, , x, | |
|---|---|---|---|---|---|---|
| Stromverbrauch | -153% | -96% | -123% | -64% | -88% | |
| Idle min * (Watt) | 5.9 | 15.2 -158% | 6.7 -14% | 9.1 -54% | 3.8 36% | 7 -19% |
| Idle avg * (Watt) | 6.2 | 17.2 -177% | 7 -13% | 10.3 -66% | 4.8 23% | 9.2 -48% |
| Idle max * (Watt) | 6.4 | 17.4 -172% | 7.6 -19% | 14.4 -125% | 6.5 -2% | 11.8 -84% |
| Last avg * (Watt) | 28.2 | 40 -42% | 74.3 -163% | 54.9 -95% | 71.9 -155% | 45 -60% |
| Witcher 3 ultra * (Watt) | 27.5 | 50.6 -84% | 75 -173% | |||
| Last max * (Watt) | 29.5 | 112.8 -282% | 85.7 -191% | 110.4 -274% | 94.7 -221% | 97.2 -229% |
* ... kleinere Werte sind besser
Power Consumption Witcher 3 / Stresstest
Power Consumption external Monitor
Pro
Contra
Fazit - Bessere Optionen sind verfügbar
Die NucBox M5 wird derzeit für 300 bis 380 US-Dollar mit RAM und Speicherplatz verkauft. Inzwischen ist die NucBox K6 für 500 Dollar zu haben und bietet die 2- bis 2,5-fache CPU- und GPU-Leistung, ohne größer oder schwerer zu sein. Es ist natürlich schwer, die NucBox M5 zu empfehlen, wenn GMKtec bereits eine objektiv bessere Alternative für nicht viel mehr anbietet. Auch außerhalb von GMK ist die Beelink SER6 für weniger als 500 Dollar zu finden, die eine viel schnellere Leistung als die NucBox M5 bietet.
Die NucBox M5 ist nicht unbedingt ein schlechtes System, jedoch gibt es eine Handvoll viel schnellerer Mini-PCs in derselben Preisklasse unter 500 US-Dollar.
Die NucBox M5 zeichnet sich durch einige herausragende Merkmale aus, darunter die dualen 2,5-Gbps-RJ-45-Ports, zwei Lüfter und ein SSD-Kühlkörper, die bei preisgünstigen Mini-PCs relativ ungewöhnlich sind. Nichtsdestotrotz überschattet das schlechte Preis-Leistungs-Verhältnis alle Vorteile, die dieses Modell haben könnte.
Preis und Verfügbarkeit
GMK NucBox M5
- 10.04.2024 v7 (old)
Allen Ngo
Transparenz
Die Auswahl der zu testenden Geräte erfolgt innerhalb der Redaktion. Das vorliegende Testmuster wurde dem Autor vom Hersteller oder einem Shop zu Testzwecken leihweise zur Verfügung gestellt. Eine Einflussnahme des Leihstellers auf den Testbericht gab es nicht, der Hersteller erhielt keine Version des Reviews vor der Veröffentlichung. Es bestand keine Verpflichtung zur Publikation. Als eigenständiges, unabhängiges Unternehmen unterliegt Notebookcheck keiner Diktion von Herstellern, Shops und Verlagen.
So testet Notebookcheck
Pro Jahr werden von Notebookcheck hunderte Laptops und Smartphones unabhängig in von uns standardisierten technischen Verfahren getestet, um eine Vergleichbarkeit aller Testergebnisse zu gewährleisten. Seit rund 20 Jahren entwickeln wir diese Testmethoden kontinuierlich weiter und setzen damit Branchenstandards. In unseren Testlaboren kommt ausschließlich hochwertiges Messequipment in die Hände erfahrener Techniker und Redakteure. Die Tests unterliegen einer mehrstufigen Kontrolle. Unsere komplexe Gesamtbewertung basiert auf hunderten fundierten Messergebnissen und Benchmarks, womit Ihnen Objektivität garantiert ist. Weitere Informationen zu unseren Testmethoden gibt es hier.
Preisvergleich

