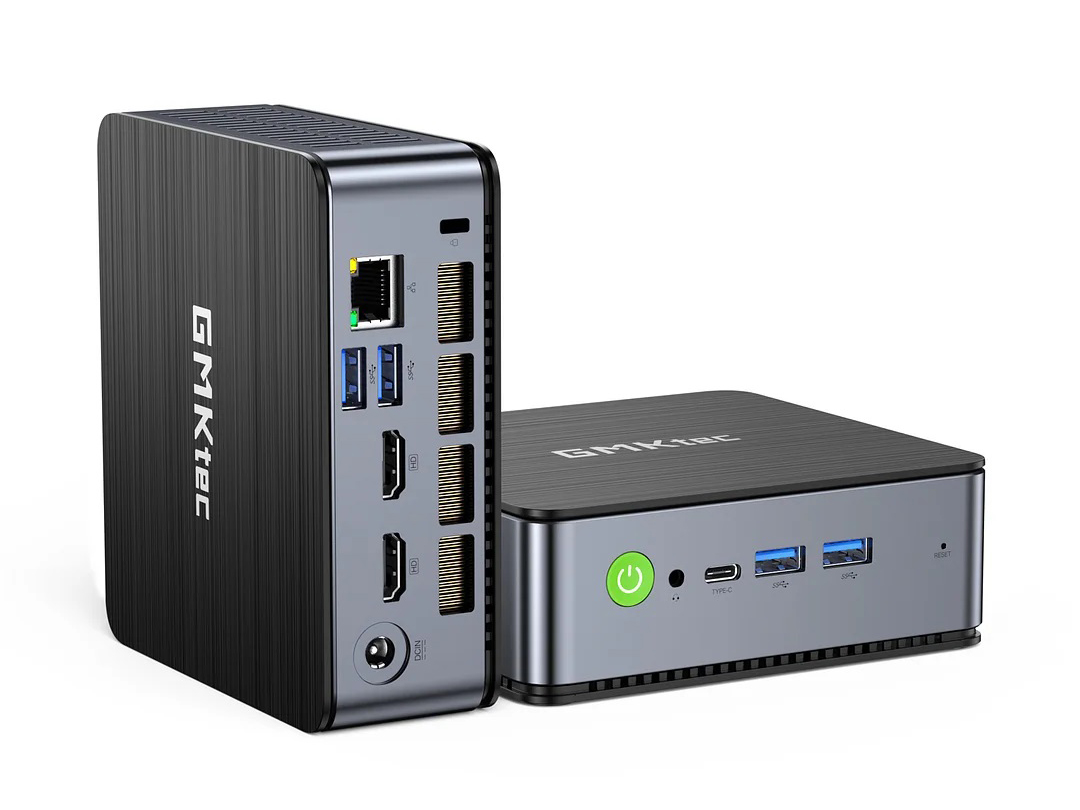
GMK NucBox K3 Pro Mini-PC-Test: Die NucBox K2 ist besser

Der Mini-PC NucBox K3 Pro ist die Intel Version der AMD basierten NucBox K2. Während Letztere mit einer Ryzen-7-Zen-3+-HS-Serien-CPU ausgeliefert wird, kommt unsere NucBox K3 Pro stattdessen mit dem Core i7-12650U der 12. Gen. Beide Modelle sind ansonsten optisch identisch, jedoch mit ein paar internen Unterschieden, die wir im Test erwähnen. Wir empfehlen, unseren Test der NucBox K2 zu lesen, da alle unsere Kommentare zu den Anschlüssen und den physischen Eigenschaften auch für die NucBox K3 Pro gelten.
Alternativen zur NucBox K3 Pro sind andere Mini-PCs mit integrierter Grafik wie der Lenovo IdeaCentre Mini 01IRH8, Intel NUC 13 oder der Beelink SEi12.
Weitere GMKtec Bewertungen:
Mögliche Konkurrenten im Vergleich
Bew. | Datum | Modell | Gewicht | Dicke | Größe | Auflösung | Preis ab |
|---|---|---|---|---|---|---|---|
| 82.8 % v7 (old) | 10 / 2023 | GMK NucBox K3 Pro i7-12650H, UHD Graphics 64EUs | 396 g | 43.2 mm | x | ||
| 83 % v7 (old) | 09 / 2023 | GMK NucBox K2 R7 7735HS, Radeon 680M | 440 g | 43.2 mm | x | ||
v (old) | Beelink SEi12 Core i5-1235U i5-1235U, Iris Xe G7 80EUs | 465 g | 42 mm | x | |||
| 86.3 % v7 (old) | 07 / 2023 | Beelink GTR7 7840HS R7 7840HS, Radeon 780M | 890 g | 48.8 mm | x | ||
| 83.1 % v7 (old) | 08 / 2023 | Intel NUC 13 Pro Desk Edition Kit i7-1360P, Iris Xe G7 96EUs | 558 g | 37 mm | x | ||
| 81 % v7 (old) | 09 / 2023 | Lenovo IdeaCentre Mini 01IRH8 i7-13700H, Iris Xe G7 96EUs | 1.8 kg | 39 mm | x |
Gehäuse
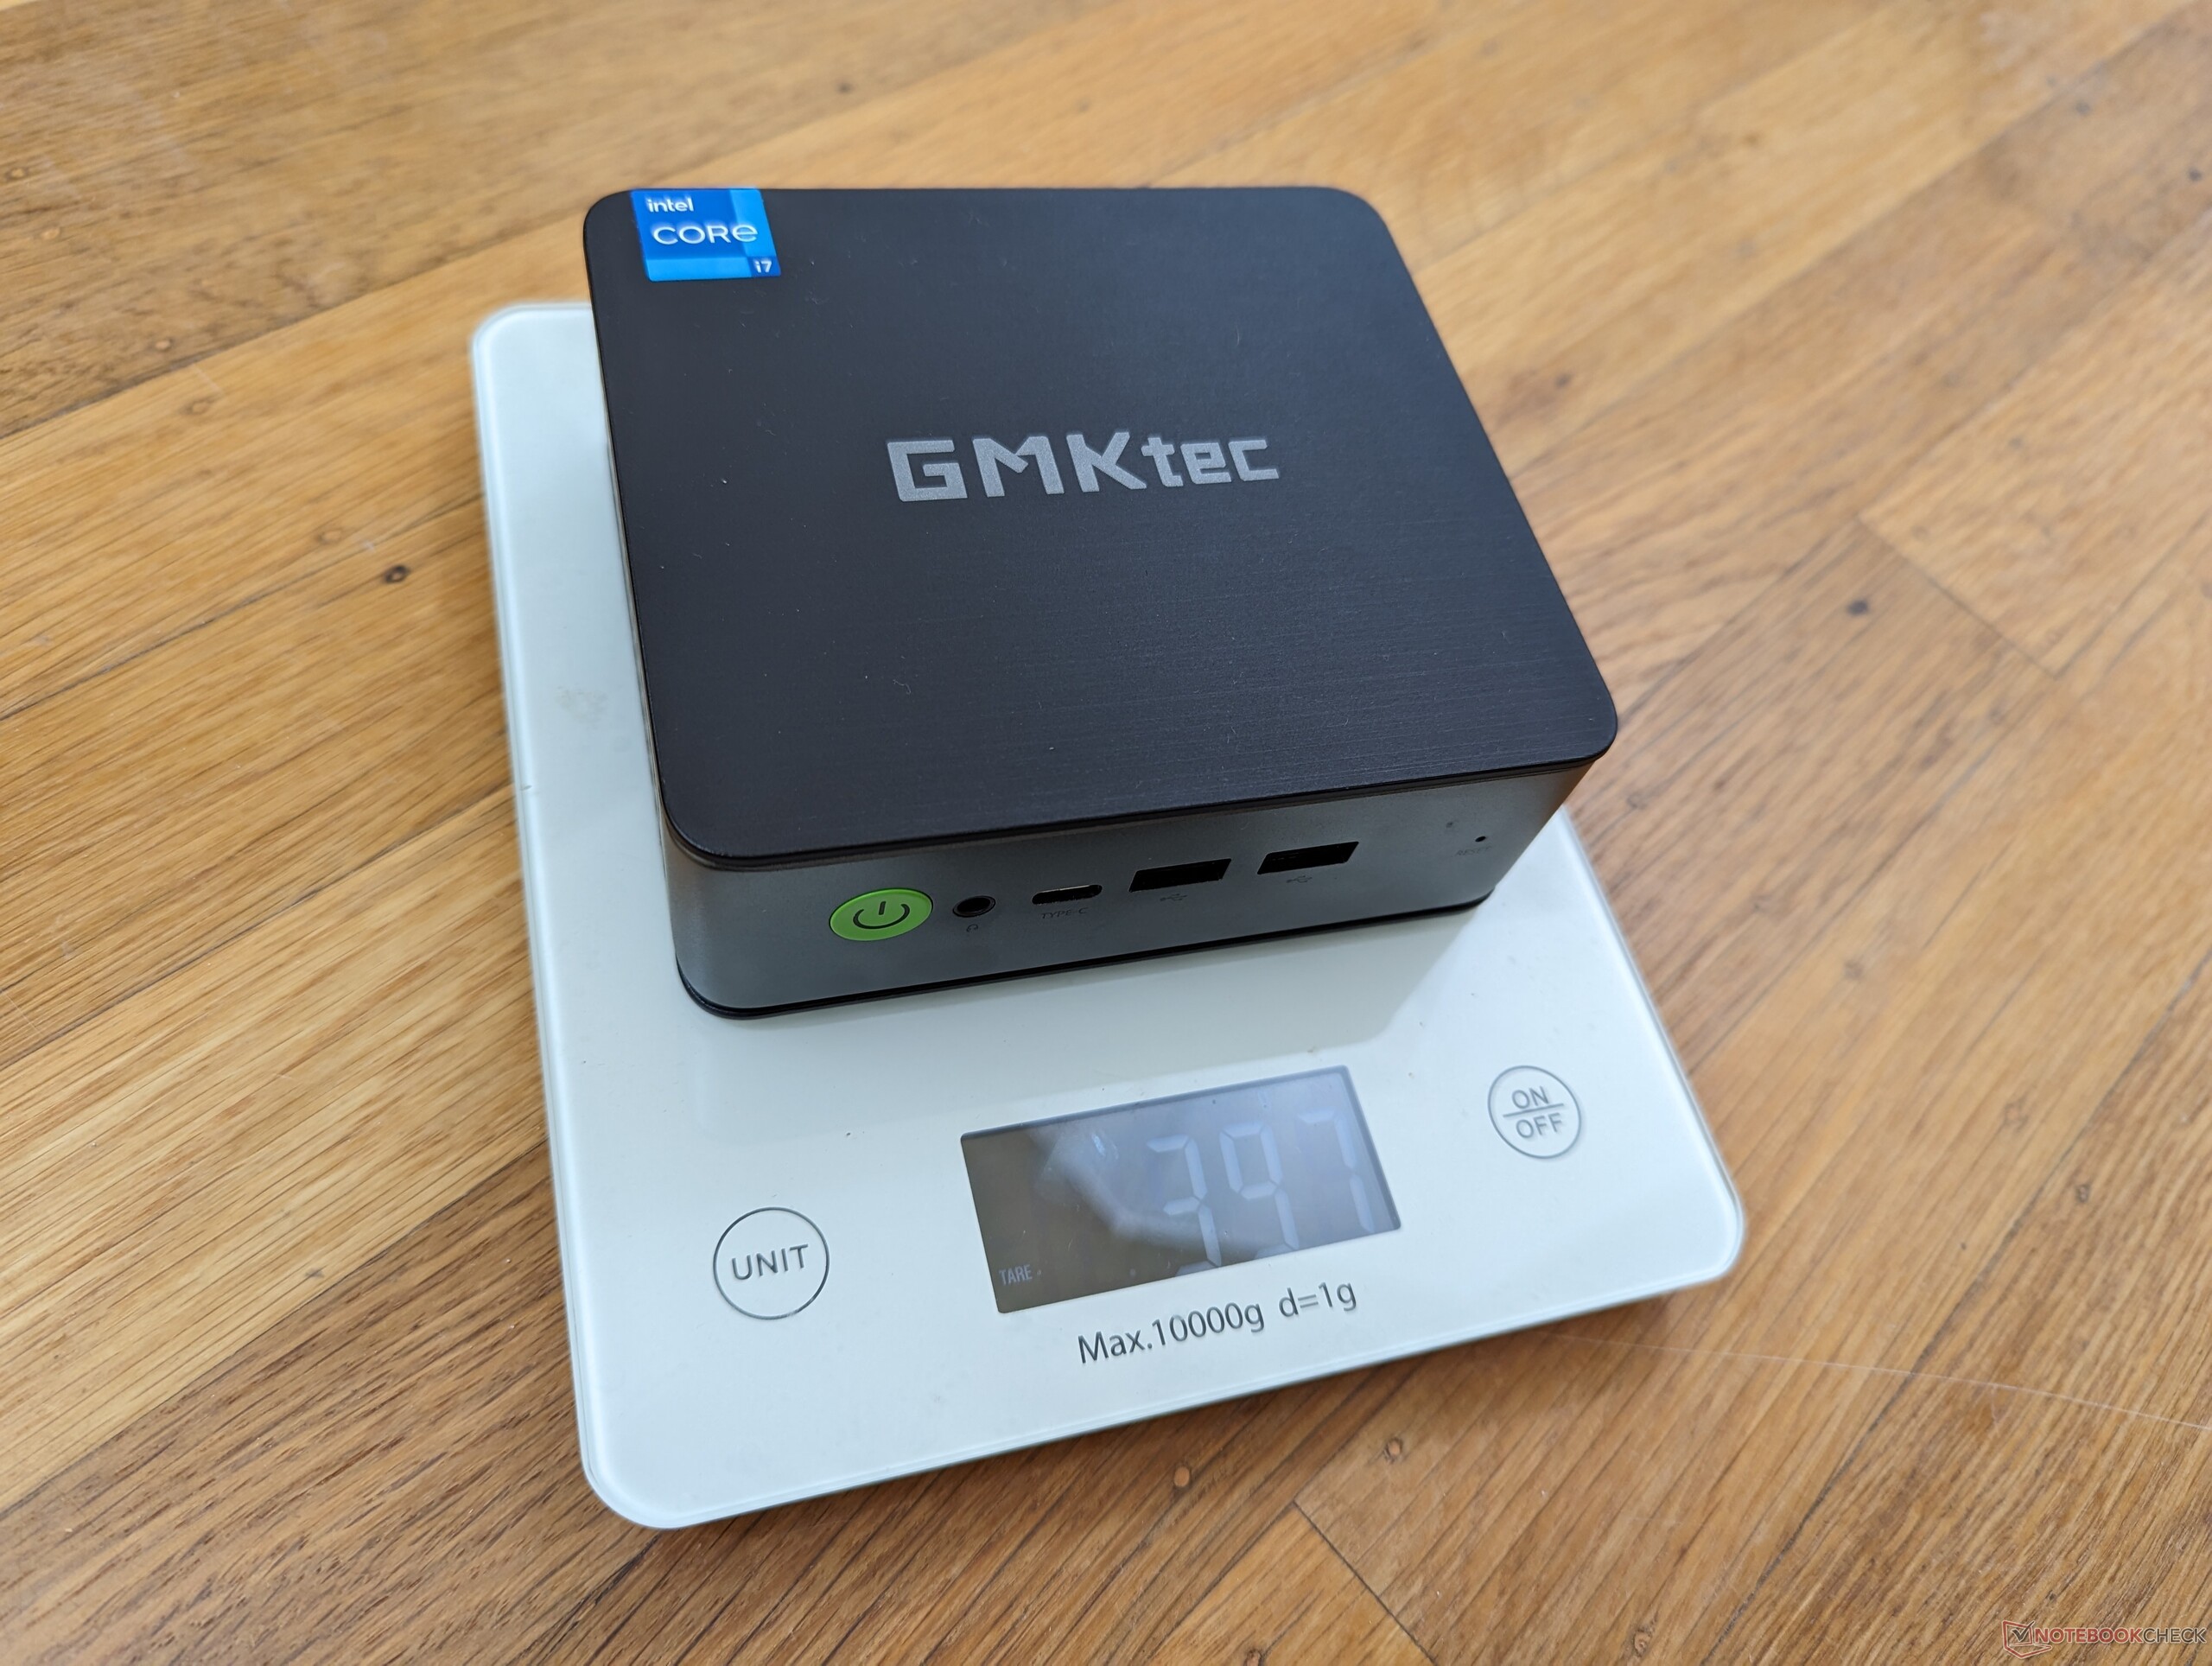
Die NucBox K3 Pro ist aufgrund der verlöteten RAM- und WLAN-Module etwas leichter als die K2.
Kommunikation
Das System wird mit einem Intel AX201 für Wi-Fi 6-Unterstützung ausgeliefert. Es enthält kein Wi-Fi 6E, wahrscheinlich um Kosten zu sparen.
| Networking | |
| iperf3 transmit AXE11000 | |
| Beelink SEi12 Core i5-1235U | |
| Intel NUC 13 Pro Desk Edition Kit | |
| GMK NucBox K3 Pro | |
| Beelink GTR7 7840HS | |
| GMK NucBox K2 | |
| Lenovo IdeaCentre Mini 01IRH8 | |
| iperf3 receive AXE11000 | |
| Beelink SEi12 Core i5-1235U | |
| GMK NucBox K3 Pro | |
| Beelink GTR7 7840HS | |
| Intel NUC 13 Pro Desk Edition Kit | |
| GMK NucBox K2 | |
| Lenovo IdeaCentre Mini 01IRH8 | |
| iperf3 transmit AXE11000 6GHz | |
| Intel NUC 13 Pro Desk Edition Kit | |
| GMK NucBox K2 | |
| iperf3 receive AXE11000 6GHz | |
| Intel NUC 13 Pro Desk Edition Kit | |
| GMK NucBox K2 | |
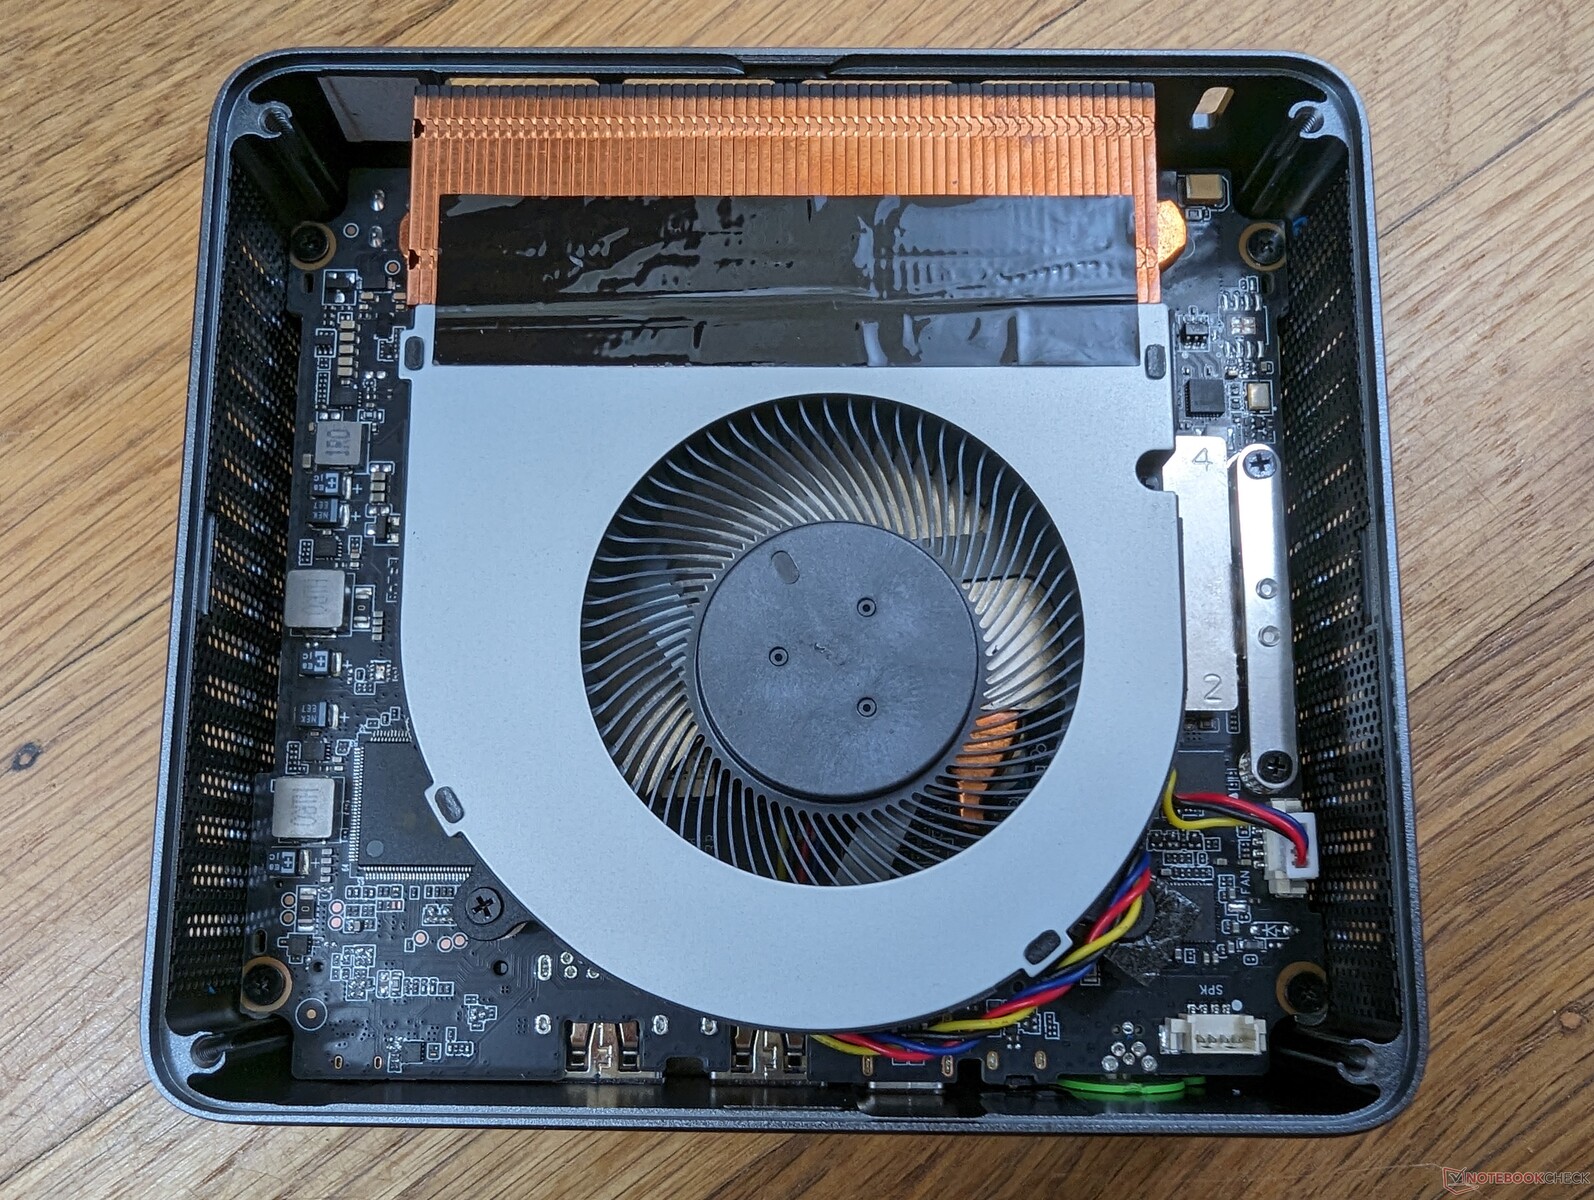
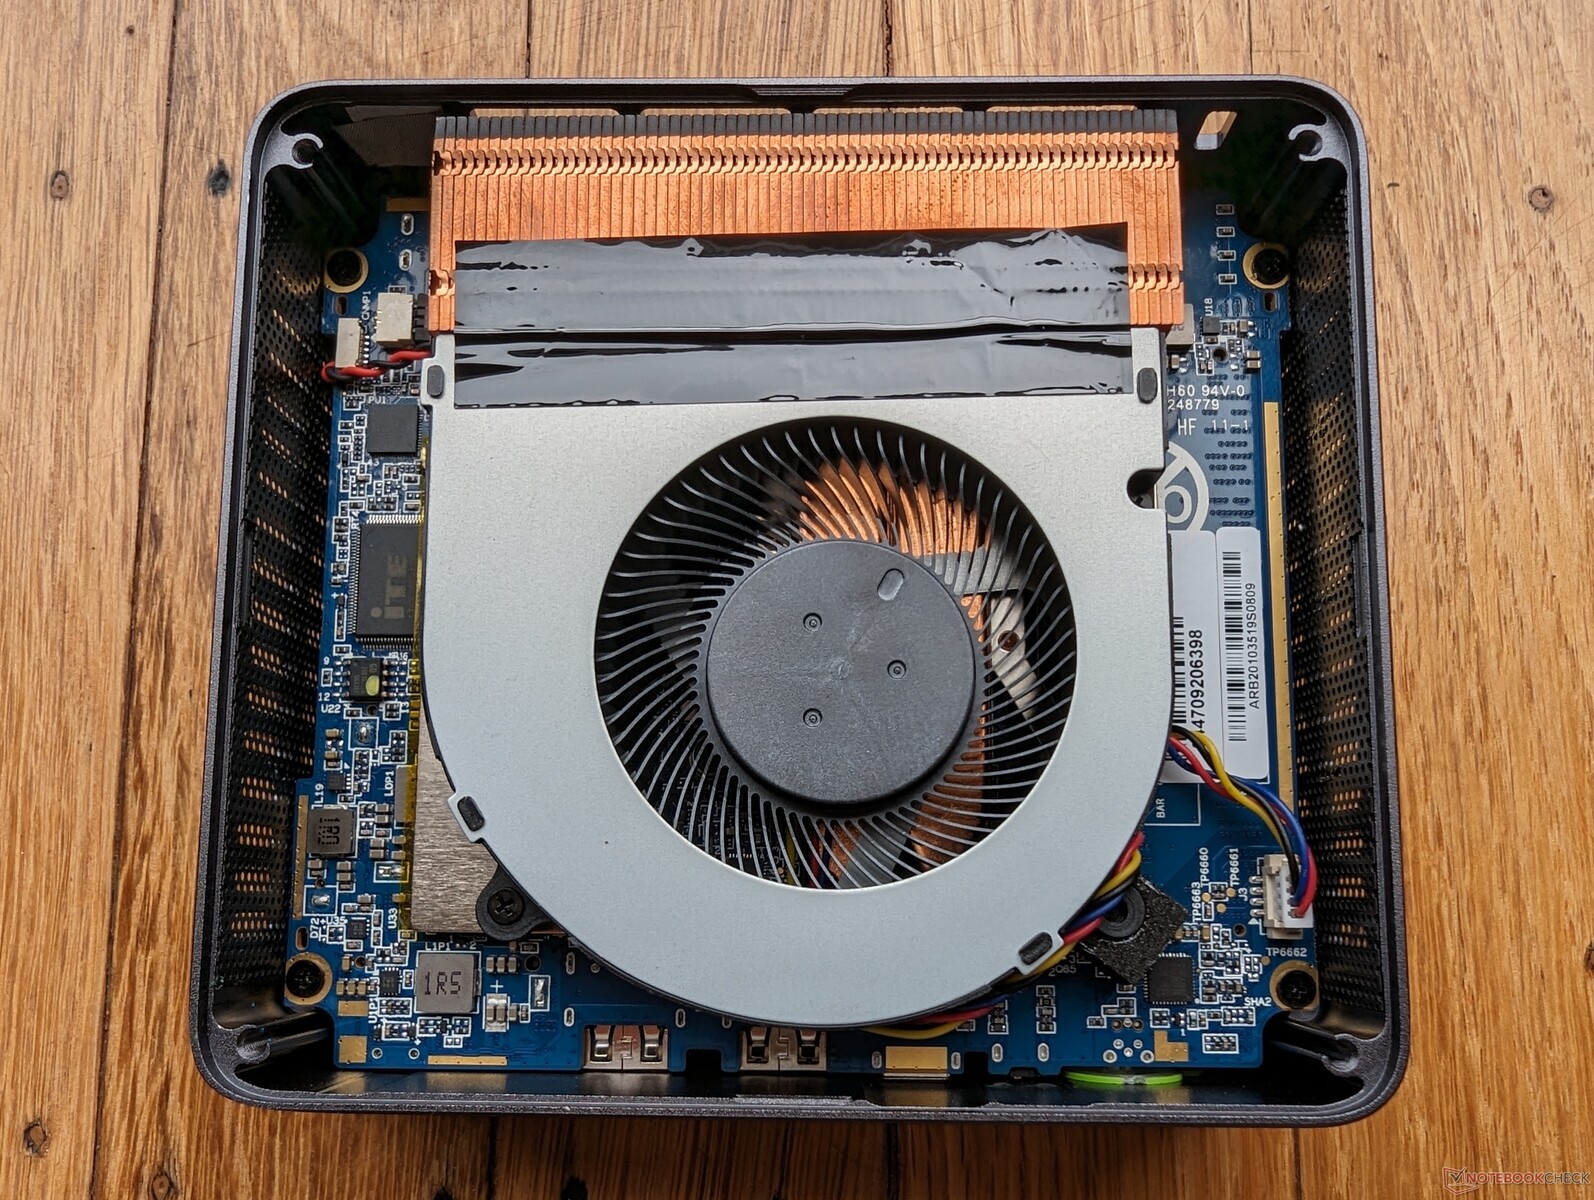
Wartung
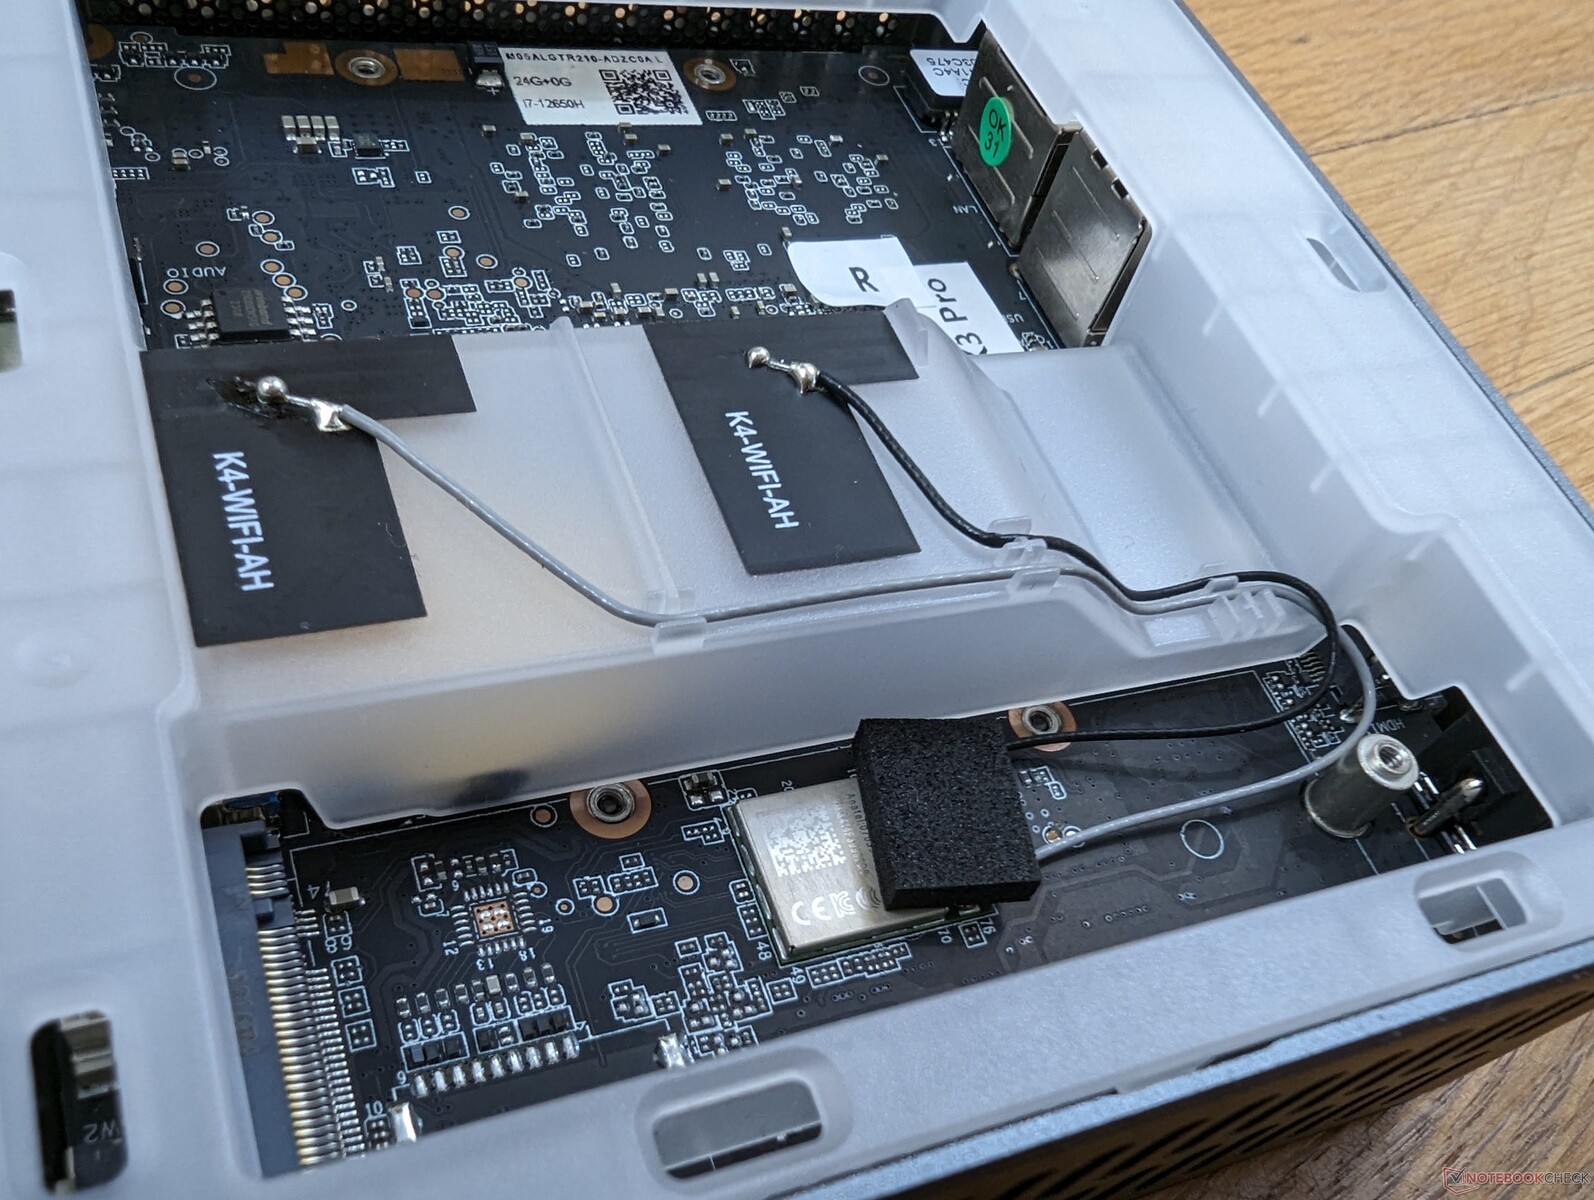
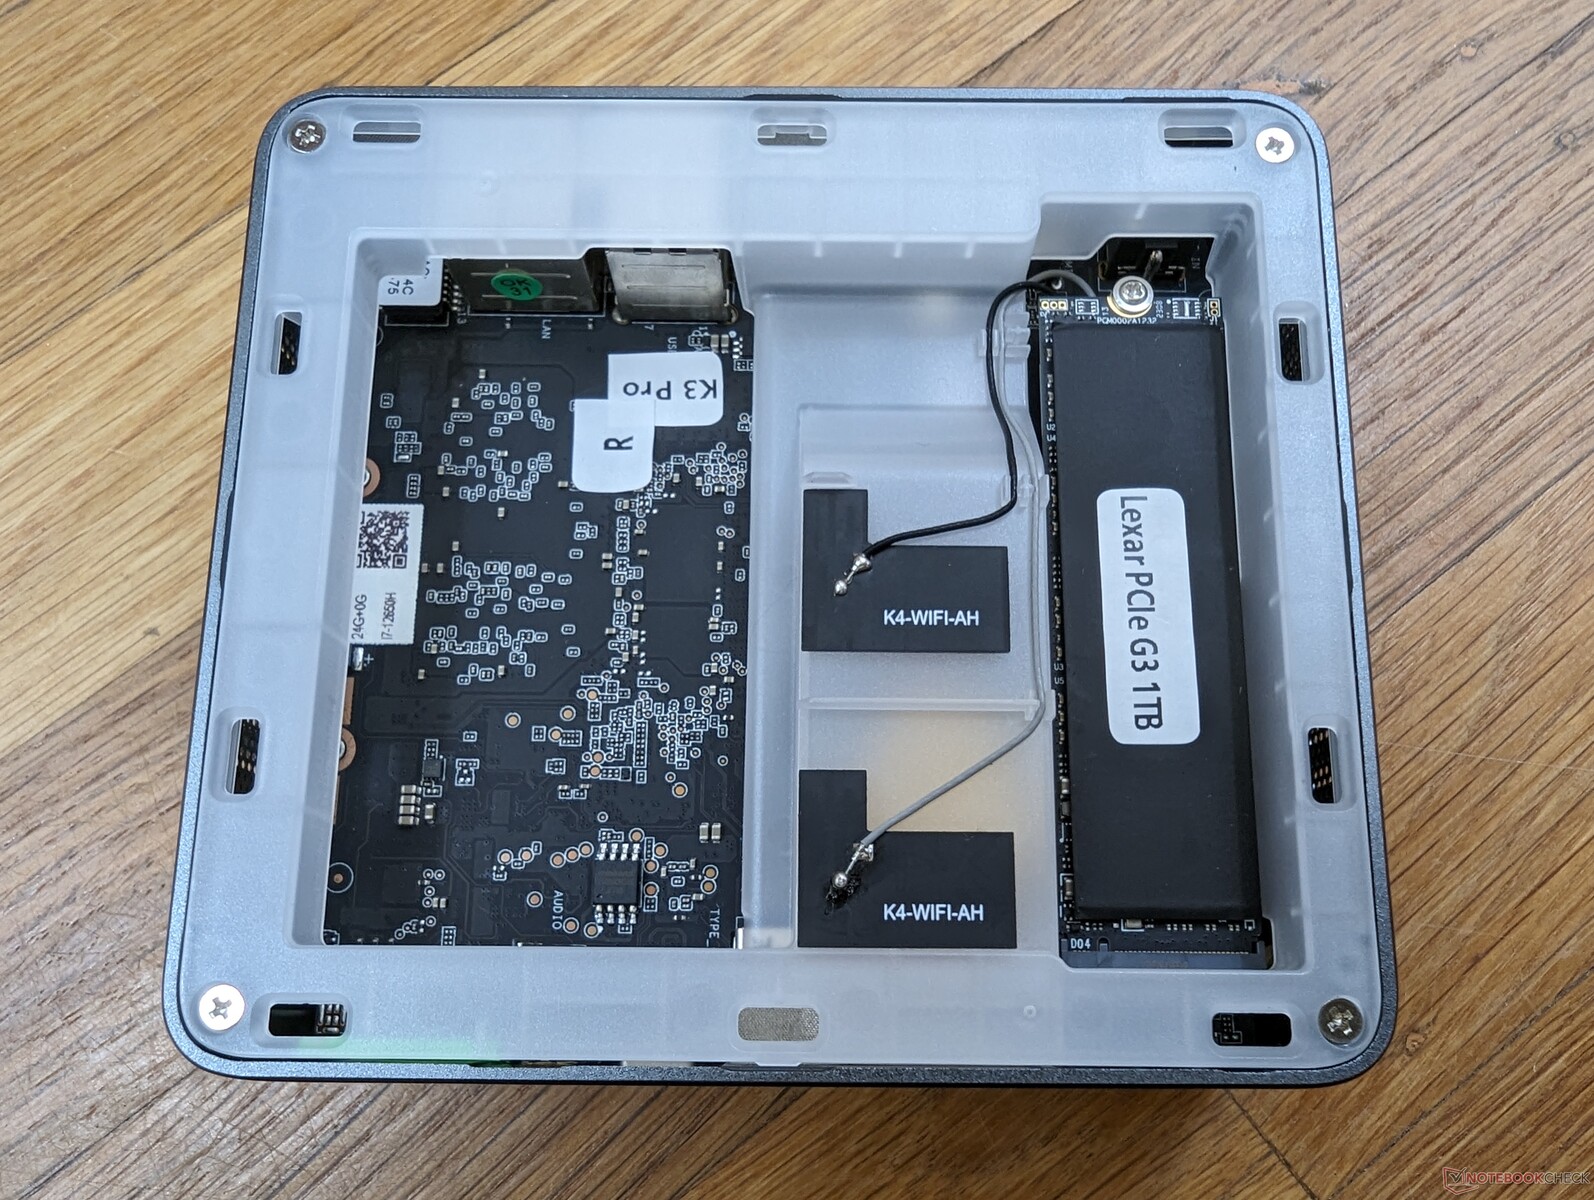
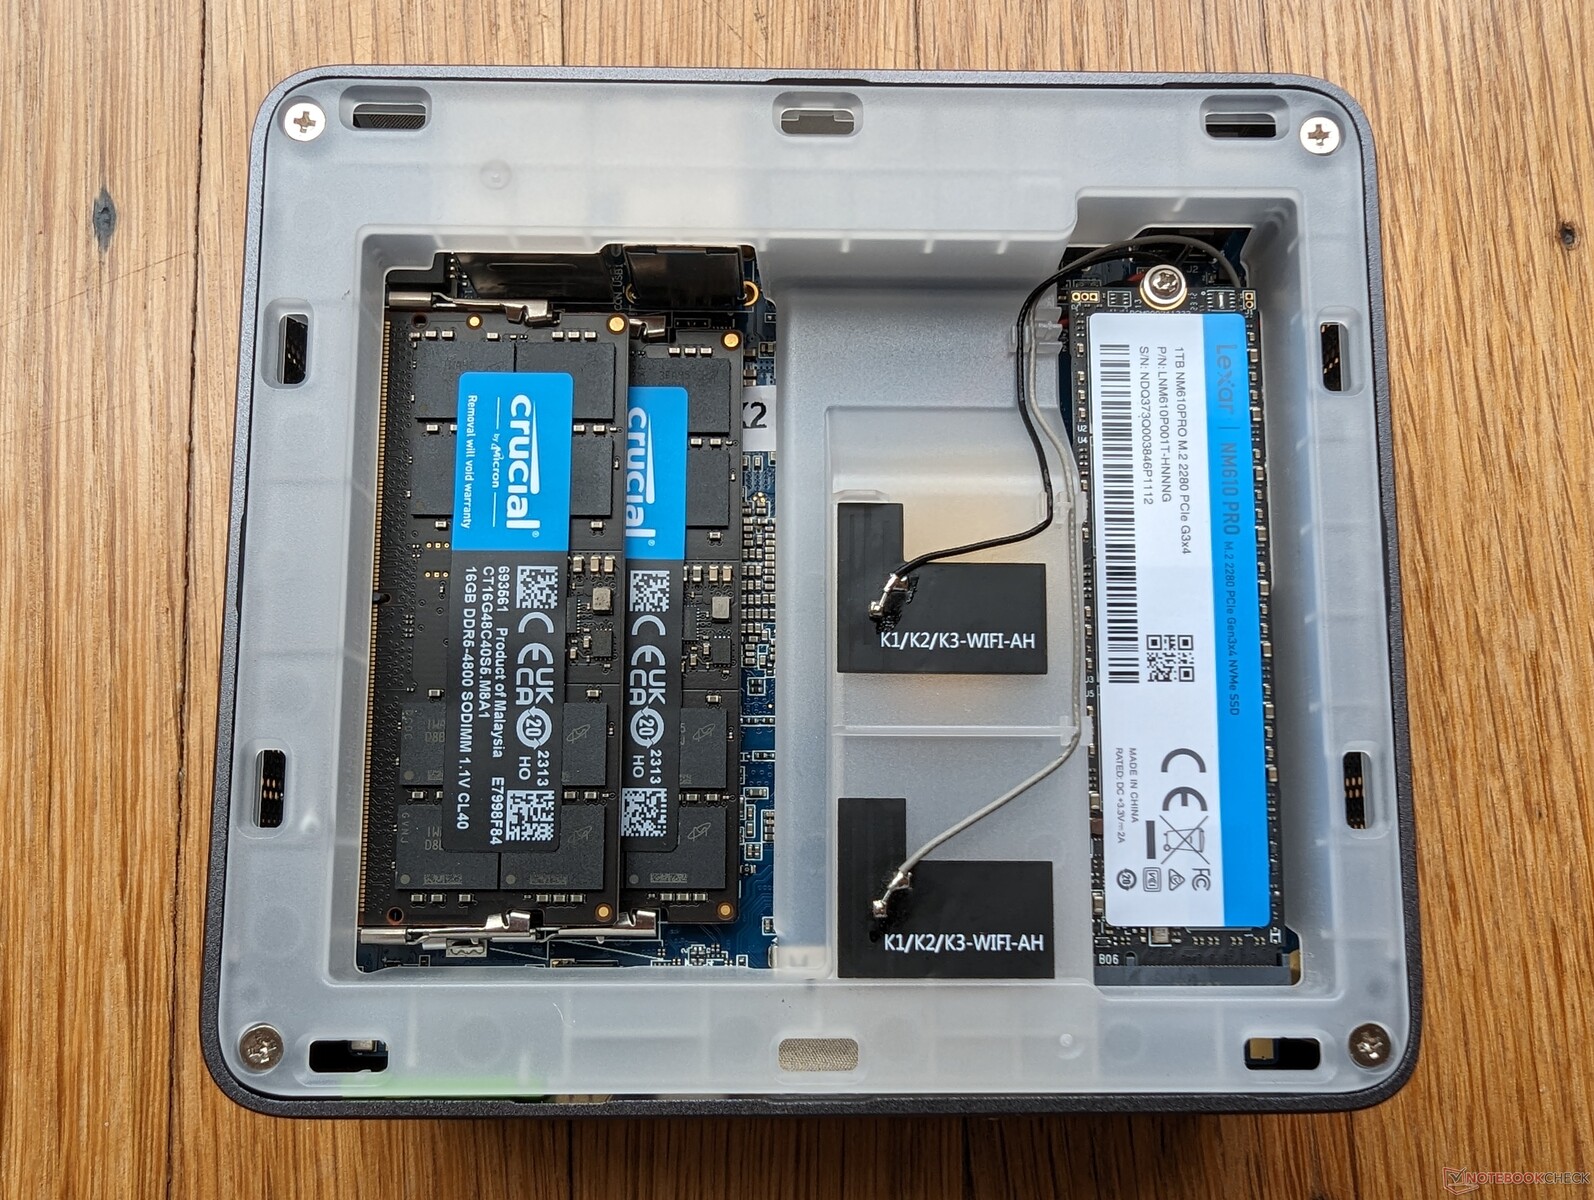
Die obere Abdeckung lässt sich aufklappen, um den einzigen M.2-PCIe-SSD-Steckplatz freizulegen. Beachten Sie die fehlenden SODIMM-Steckplätze im Vergleich zur NucBox K2, wie auf den Bildern unten zu sehen ist.
Zubehör und Garantie
Im Lieferumfang enthalten sind die abnehmbare VESA-Halterung, ein Netzteil, ein HDMI-Kabel, Unterlagen und sogar eine rote Kunststoffabdeckung für Benutzer, denen die graue Standardabdeckung nicht gefällt.
Beim Kauf in den USA gilt eine einjährige eingeschränkte Herstellergarantie.
Performance
Testbedingungen
Wir haben Windows in den Modus Performance versetzt, bevor wir die folgenden Benchmarks durchgeführt haben.
Prozessor
Der Core i7-12650H ist nicht so verbreitet wie der Core i7-12700H. Die Multi-Thread-Leistung ist aufgrund der geringeren Anzahl von Kernen und der geringeren Leistung des i7-12700H um etwa 35 % langsamer als beim i7-12650H. Dieser deutliche Rückstand reicht aus, um den i7-12650H bis auf wenige Prozentpunkte an den konkurrierenden Ryzen 7 7735HS in der NucBox K2 heranzuführen.
Die CPU-Leistung sinkt bei unserem CineBench-R15-xT-Loop-Test ebenfalls um etwa 17 Prozent, während die AMD CPU in der NucBox K2 in Bezug auf die Taktraten stabiler arbeitet.
Cinebench R15 Multi Loop
Cinebench R23: Multi Core | Single Core
Cinebench R20: CPU (Multi Core) | CPU (Single Core)
Cinebench R15: CPU Multi 64Bit | CPU Single 64Bit
Blender: v2.79 BMW27 CPU
7-Zip 18.03: 7z b 4 | 7z b 4 -mmt1
Geekbench 5.5: Multi-Core | Single-Core
HWBOT x265 Benchmark v2.2: 4k Preset
LibreOffice : 20 Documents To PDF
R Benchmark 2.5: Overall mean
| CPU Performance Rating | |
| Beelink GTR7 7840HS | |
| Intel NUC X15 LAPAC71H | |
| Lenovo IdeaCentre Mini 01IRH8 | |
| Intel NUC 13 Pro Kit NUC13ANK | |
| Minisforum Venus Series NPB5 | |
| Intel NUC 13 Pro Desk Edition Kit | |
| Durchschnittliche Intel Core i7-12650H | |
| GMK NucBox K2 | |
| GMK NucBox K3 Pro | |
| Acemagic AM20 | |
| Acemagic AD15 | |
| Beelink SEi12 Core i5-1235U | |
| BMAX B7 Power G7A2 | |
| Cinebench R23 / Multi Core | |
| Beelink GTR7 7840HS | |
| Intel NUC X15 LAPAC71H | |
| Lenovo IdeaCentre Mini 01IRH8 | |
| Minisforum Venus Series NPB5 | |
| Intel NUC 13 Pro Kit NUC13ANK | |
| Intel NUC 13 Pro Desk Edition Kit | |
| GMK NucBox K2 | |
| Durchschnittliche Intel Core i7-12650H (5362 - 15537, n=14) | |
| Acemagic AM20 | |
| GMK NucBox K3 Pro | |
| Acemagic AD15 | |
| Beelink SEi12 Core i5-1235U | |
| BMAX B7 Power G7A2 | |
| Cinebench R23 / Single Core | |
| Intel NUC 13 Pro Kit NUC13ANK | |
| Lenovo IdeaCentre Mini 01IRH8 | |
| Intel NUC 13 Pro Desk Edition Kit | |
| Beelink GTR7 7840HS | |
| GMK NucBox K3 Pro | |
| Intel NUC X15 LAPAC71H | |
| Minisforum Venus Series NPB5 | |
| Durchschnittliche Intel Core i7-12650H (1428 - 1808, n=14) | |
| Beelink SEi12 Core i5-1235U | |
| Acemagic AM20 | |
| GMK NucBox K2 | |
| Acemagic AD15 | |
| BMAX B7 Power G7A2 | |
| Cinebench R20 / CPU (Multi Core) | |
| Beelink GTR7 7840HS | |
| Intel NUC X15 LAPAC71H | |
| Lenovo IdeaCentre Mini 01IRH8 | |
| Minisforum Venus Series NPB5 | |
| Intel NUC 13 Pro Kit NUC13ANK | |
| Intel NUC 13 Pro Desk Edition Kit | |
| GMK NucBox K2 | |
| Durchschnittliche Intel Core i7-12650H (2106 - 6009, n=14) | |
| Acemagic AM20 | |
| GMK NucBox K3 Pro | |
| Acemagic AD15 | |
| Beelink SEi12 Core i5-1235U | |
| BMAX B7 Power G7A2 | |
| Cinebench R20 / CPU (Single Core) | |
| Intel NUC 13 Pro Kit NUC13ANK | |
| Intel NUC 13 Pro Desk Edition Kit | |
| Lenovo IdeaCentre Mini 01IRH8 | |
| Beelink GTR7 7840HS | |
| GMK NucBox K3 Pro | |
| Minisforum Venus Series NPB5 | |
| Intel NUC X15 LAPAC71H | |
| Durchschnittliche Intel Core i7-12650H (552 - 696, n=14) | |
| Beelink SEi12 Core i5-1235U | |
| Acemagic AM20 | |
| GMK NucBox K2 | |
| Acemagic AD15 | |
| BMAX B7 Power G7A2 | |
| Cinebench R15 / CPU Multi 64Bit | |
| Beelink GTR7 7840HS | |
| Intel NUC X15 LAPAC71H | |
| Minisforum Venus Series NPB5 | |
| Lenovo IdeaCentre Mini 01IRH8 | |
| Intel NUC 13 Pro Kit NUC13ANK | |
| Intel NUC 13 Pro Desk Edition Kit | |
| GMK NucBox K2 | |
| Acemagic AM20 | |
| Durchschnittliche Intel Core i7-12650H (753 - 2253, n=14) | |
| GMK NucBox K3 Pro | |
| Acemagic AD15 | |
| Beelink SEi12 Core i5-1235U | |
| BMAX B7 Power G7A2 | |
| Cinebench R15 / CPU Single 64Bit | |
| Beelink GTR7 7840HS | |
| Intel NUC 13 Pro Kit NUC13ANK | |
| Intel NUC 13 Pro Desk Edition Kit | |
| Lenovo IdeaCentre Mini 01IRH8 | |
| Intel NUC X15 LAPAC71H | |
| GMK NucBox K3 Pro | |
| Minisforum Venus Series NPB5 | |
| Acemagic AM20 | |
| Durchschnittliche Intel Core i7-12650H (206 - 261, n=14) | |
| GMK NucBox K2 | |
| Beelink SEi12 Core i5-1235U | |
| Acemagic AD15 | |
| BMAX B7 Power G7A2 | |
| Blender / v2.79 BMW27 CPU | |
| BMAX B7 Power G7A2 | |
| Beelink SEi12 Core i5-1235U | |
| GMK NucBox K3 Pro | |
| Acemagic AD15 | |
| Durchschnittliche Intel Core i7-12650H (222 - 553, n=15) | |
| Acemagic AM20 | |
| Intel NUC 13 Pro Kit NUC13ANK | |
| Intel NUC 13 Pro Desk Edition Kit | |
| Minisforum Venus Series NPB5 | |
| GMK NucBox K2 | |
| Intel NUC X15 LAPAC71H | |
| Beelink GTR7 7840HS | |
| Lenovo IdeaCentre Mini 01IRH8 | |
| 7-Zip 18.03 / 7z b 4 | |
| Beelink GTR7 7840HS | |
| Intel NUC X15 LAPAC71H | |
| GMK NucBox K2 | |
| Lenovo IdeaCentre Mini 01IRH8 | |
| Intel NUC 13 Pro Kit NUC13ANK | |
| Minisforum Venus Series NPB5 | |
| Acemagic AM20 | |
| Intel NUC 13 Pro Desk Edition Kit | |
| Durchschnittliche Intel Core i7-12650H (27053 - 59034, n=14) | |
| Acemagic AD15 | |
| GMK NucBox K3 Pro | |
| Beelink SEi12 Core i5-1235U | |
| BMAX B7 Power G7A2 | |
| 7-Zip 18.03 / 7z b 4 -mmt1 | |
| Beelink GTR7 7840HS | |
| Lenovo IdeaCentre Mini 01IRH8 | |
| Intel NUC 13 Pro Kit NUC13ANK | |
| Intel NUC X15 LAPAC71H | |
| Intel NUC 13 Pro Desk Edition Kit | |
| GMK NucBox K2 | |
| GMK NucBox K3 Pro | |
| Acemagic AD15 | |
| Minisforum Venus Series NPB5 | |
| Durchschnittliche Intel Core i7-12650H (5265 - 6116, n=14) | |
| Acemagic AM20 | |
| BMAX B7 Power G7A2 | |
| Beelink SEi12 Core i5-1235U | |
| Geekbench 5.5 / Multi-Core | |
| Intel NUC X15 LAPAC71H | |
| Minisforum Venus Series NPB5 | |
| Beelink GTR7 7840HS | |
| Intel NUC 13 Pro Kit NUC13ANK | |
| Lenovo IdeaCentre Mini 01IRH8 | |
| Intel NUC 13 Pro Desk Edition Kit | |
| GMK NucBox K3 Pro | |
| Durchschnittliche Intel Core i7-12650H (6478 - 11284, n=16) | |
| GMK NucBox K2 | |
| Acemagic AM20 | |
| Acemagic AD15 | |
| Beelink SEi12 Core i5-1235U | |
| BMAX B7 Power G7A2 | |
| Geekbench 5.5 / Single-Core | |
| Beelink GTR7 7840HS | |
| Intel NUC 13 Pro Kit NUC13ANK | |
| Lenovo IdeaCentre Mini 01IRH8 | |
| Intel NUC 13 Pro Desk Edition Kit | |
| GMK NucBox K3 Pro | |
| Minisforum Venus Series NPB5 | |
| Intel NUC X15 LAPAC71H | |
| Durchschnittliche Intel Core i7-12650H (1590 - 1797, n=16) | |
| Beelink SEi12 Core i5-1235U | |
| Acemagic AD15 | |
| GMK NucBox K2 | |
| Acemagic AM20 | |
| BMAX B7 Power G7A2 | |
| HWBOT x265 Benchmark v2.2 / 4k Preset | |
| Lenovo IdeaCentre Mini 01IRH8 | |
| Intel NUC X15 LAPAC71H | |
| GMK NucBox K2 | |
| Minisforum Venus Series NPB5 | |
| Intel NUC 13 Pro Kit NUC13ANK | |
| Acemagic AM20 | |
| Intel NUC 13 Pro Desk Edition Kit | |
| Durchschnittliche Intel Core i7-12650H (6.62 - 17.4, n=16) | |
| GMK NucBox K3 Pro | |
| Acemagic AD15 | |
| Beelink GTR7 7840HS | |
| Beelink SEi12 Core i5-1235U | |
| BMAX B7 Power G7A2 | |
| LibreOffice / 20 Documents To PDF | |
| BMAX B7 Power G7A2 | |
| Beelink SEi12 Core i5-1235U | |
| Intel NUC 13 Pro Desk Edition Kit | |
| Acemagic AD15 | |
| Acemagic AM20 | |
| GMK NucBox K2 | |
| Minisforum Venus Series NPB5 | |
| Intel NUC 13 Pro Kit NUC13ANK | |
| Durchschnittliche Intel Core i7-12650H (35.1 - 58.5, n=14) | |
| GMK NucBox K3 Pro | |
| Beelink GTR7 7840HS | |
| Lenovo IdeaCentre Mini 01IRH8 | |
| Intel NUC X15 LAPAC71H | |
| R Benchmark 2.5 / Overall mean | |
| BMAX B7 Power G7A2 | |
| Acemagic AD15 | |
| Acemagic AM20 | |
| Beelink SEi12 Core i5-1235U | |
| GMK NucBox K2 | |
| Durchschnittliche Intel Core i7-12650H (0.4584 - 0.515, n=14) | |
| Minisforum Venus Series NPB5 | |
| GMK NucBox K3 Pro | |
| Intel NUC X15 LAPAC71H | |
| Lenovo IdeaCentre Mini 01IRH8 | |
| Intel NUC 13 Pro Desk Edition Kit | |
| Intel NUC 13 Pro Kit NUC13ANK | |
| Beelink GTR7 7840HS | |
Cinebench R23: Multi Core | Single Core
Cinebench R20: CPU (Multi Core) | CPU (Single Core)
Cinebench R15: CPU Multi 64Bit | CPU Single 64Bit
Blender: v2.79 BMW27 CPU
7-Zip 18.03: 7z b 4 | 7z b 4 -mmt1
Geekbench 5.5: Multi-Core | Single-Core
HWBOT x265 Benchmark v2.2: 4k Preset
LibreOffice : 20 Documents To PDF
R Benchmark 2.5: Overall mean
* ... kleinere Werte sind besser
AIDA64: FP32 Ray-Trace | FPU Julia | CPU SHA3 | CPU Queen | FPU SinJulia | FPU Mandel | CPU AES | CPU ZLib | FP64 Ray-Trace | CPU PhotoWorxx
| Performance Rating | |
| Beelink GTR7 7840HS | |
| GMK NucBox K2 | |
| Lenovo IdeaCentre Mini 01IRH8 | |
| Intel NUC 13 Pro Desk Edition Kit | |
| GMK NucBox K3 Pro | |
| Durchschnittliche Intel Core i7-12650H | |
| Beelink SEi12 Core i5-1235U | |
| AIDA64 / FP32 Ray-Trace | |
| Beelink GTR7 7840HS | |
| GMK NucBox K2 | |
| Lenovo IdeaCentre Mini 01IRH8 | |
| Intel NUC 13 Pro Desk Edition Kit | |
| Durchschnittliche Intel Core i7-12650H (5422 - 15620, n=14) | |
| GMK NucBox K3 Pro | |
| Beelink SEi12 Core i5-1235U | |
| AIDA64 / FPU Julia | |
| Beelink GTR7 7840HS | |
| GMK NucBox K2 | |
| Lenovo IdeaCentre Mini 01IRH8 | |
| Intel NUC 13 Pro Desk Edition Kit | |
| Durchschnittliche Intel Core i7-12650H (26386 - 76434, n=14) | |
| GMK NucBox K3 Pro | |
| Beelink SEi12 Core i5-1235U | |
| AIDA64 / CPU SHA3 | |
| Beelink GTR7 7840HS | |
| Lenovo IdeaCentre Mini 01IRH8 | |
| GMK NucBox K2 | |
| Intel NUC 13 Pro Desk Edition Kit | |
| Durchschnittliche Intel Core i7-12650H (1479 - 3244, n=14) | |
| GMK NucBox K3 Pro | |
| Beelink SEi12 Core i5-1235U | |
| AIDA64 / CPU Queen | |
| Beelink GTR7 7840HS | |
| Lenovo IdeaCentre Mini 01IRH8 | |
| GMK NucBox K2 | |
| Intel NUC 13 Pro Desk Edition Kit | |
| GMK NucBox K3 Pro | |
| Durchschnittliche Intel Core i7-12650H (59278 - 89537, n=14) | |
| Beelink SEi12 Core i5-1235U | |
| AIDA64 / FPU SinJulia | |
| Beelink GTR7 7840HS | |
| GMK NucBox K2 | |
| Lenovo IdeaCentre Mini 01IRH8 | |
| Durchschnittliche Intel Core i7-12650H (4690 - 8726, n=14) | |
| Intel NUC 13 Pro Desk Edition Kit | |
| GMK NucBox K3 Pro | |
| Beelink SEi12 Core i5-1235U | |
| AIDA64 / FPU Mandel | |
| Beelink GTR7 7840HS | |
| GMK NucBox K2 | |
| Lenovo IdeaCentre Mini 01IRH8 | |
| Intel NUC 13 Pro Desk Edition Kit | |
| Durchschnittliche Intel Core i7-12650H (15001 - 37738, n=14) | |
| GMK NucBox K3 Pro | |
| Beelink SEi12 Core i5-1235U | |
| AIDA64 / CPU AES | |
| Beelink GTR7 7840HS | |
| GMK NucBox K2 | |
| GMK NucBox K3 Pro | |
| Beelink SEi12 Core i5-1235U | |
| Lenovo IdeaCentre Mini 01IRH8 | |
| Durchschnittliche Intel Core i7-12650H (32702 - 92530, n=14) | |
| Intel NUC 13 Pro Desk Edition Kit | |
| AIDA64 / CPU ZLib | |
| Beelink GTR7 7840HS | |
| Lenovo IdeaCentre Mini 01IRH8 | |
| Intel NUC 13 Pro Desk Edition Kit | |
| GMK NucBox K2 | |
| Durchschnittliche Intel Core i7-12650H (443 - 891, n=14) | |
| Beelink SEi12 Core i5-1235U | |
| GMK NucBox K3 Pro | |
| AIDA64 / FP64 Ray-Trace | |
| Beelink GTR7 7840HS | |
| GMK NucBox K2 | |
| Lenovo IdeaCentre Mini 01IRH8 | |
| Intel NUC 13 Pro Desk Edition Kit | |
| Durchschnittliche Intel Core i7-12650H (3096 - 8448, n=14) | |
| GMK NucBox K3 Pro | |
| Beelink SEi12 Core i5-1235U | |
| AIDA64 / CPU PhotoWorxx | |
| GMK NucBox K3 Pro | |
| Beelink GTR7 7840HS | |
| Durchschnittliche Intel Core i7-12650H (22046 - 44164, n=14) | |
| GMK NucBox K2 | |
| Beelink SEi12 Core i5-1235U | |
| Intel NUC 13 Pro Desk Edition Kit | |
| Lenovo IdeaCentre Mini 01IRH8 | |
System Performance
CrossMark: Overall | Productivity | Creativity | Responsiveness
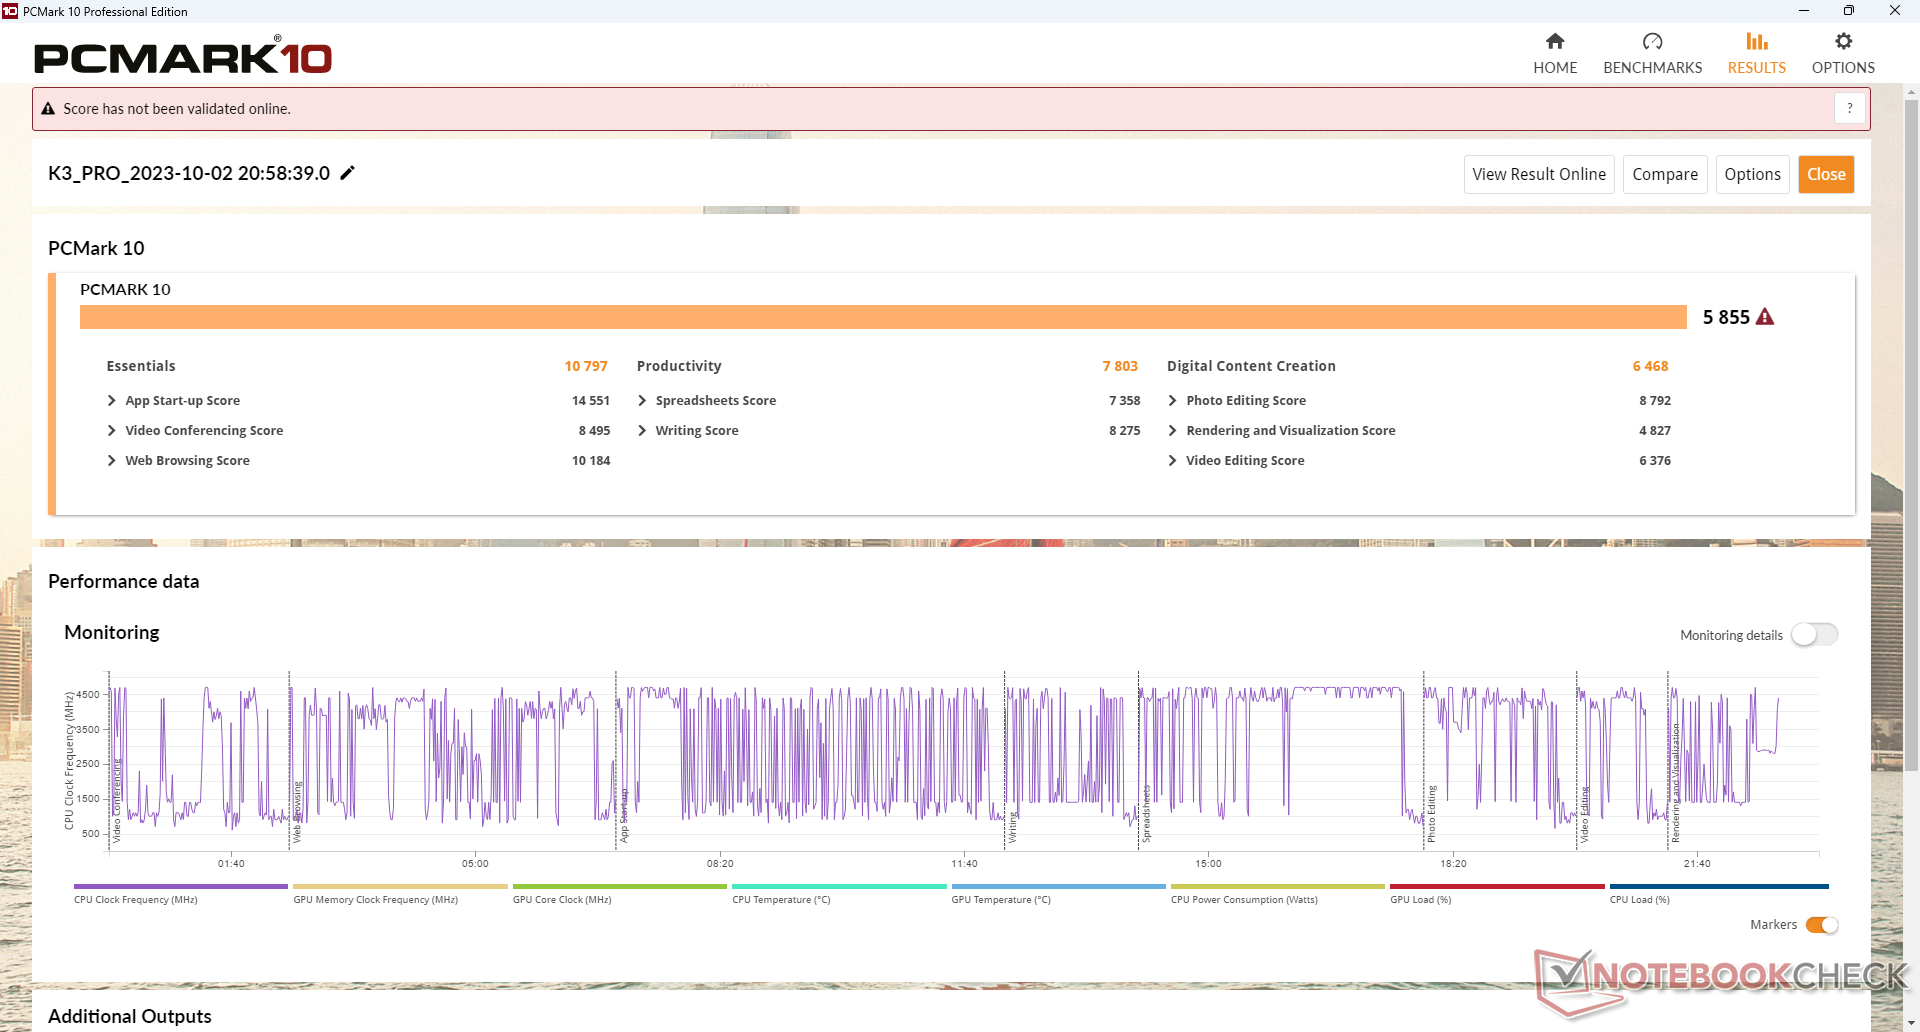
| PCMark 10 / Score | |
| Beelink GTR7 7840HS | |
| GMK NucBox K2 | |
| Lenovo IdeaCentre Mini 01IRH8 | |
| Intel NUC 13 Pro Desk Edition Kit | |
| GMK NucBox K3 Pro | |
| Durchschnittliche Intel Core i7-12650H, Intel UHD Graphics 64EUs (Alder Lake 12th Gen) (5156 - 6057, n=5) | |
| Beelink SEi12 Core i5-1235U | |
| PCMark 10 / Essentials | |
| Lenovo IdeaCentre Mini 01IRH8 | |
| Beelink GTR7 7840HS | |
| GMK NucBox K2 | |
| Intel NUC 13 Pro Desk Edition Kit | |
| Beelink SEi12 Core i5-1235U | |
| GMK NucBox K3 Pro | |
| Durchschnittliche Intel Core i7-12650H, Intel UHD Graphics 64EUs (Alder Lake 12th Gen) (9905 - 11395, n=5) | |
| PCMark 10 / Productivity | |
| Beelink GTR7 7840HS | |
| GMK NucBox K2 | |
| GMK NucBox K3 Pro | |
| Durchschnittliche Intel Core i7-12650H, Intel UHD Graphics 64EUs (Alder Lake 12th Gen) (7167 - 8164, n=5) | |
| Lenovo IdeaCentre Mini 01IRH8 | |
| Beelink SEi12 Core i5-1235U | |
| Intel NUC 13 Pro Desk Edition Kit | |
| PCMark 10 / Digital Content Creation | |
| Beelink GTR7 7840HS | |
| GMK NucBox K2 | |
| Intel NUC 13 Pro Desk Edition Kit | |
| Lenovo IdeaCentre Mini 01IRH8 | |
| GMK NucBox K3 Pro | |
| Durchschnittliche Intel Core i7-12650H, Intel UHD Graphics 64EUs (Alder Lake 12th Gen) (5242 - 6482, n=5) | |
| Beelink SEi12 Core i5-1235U | |
| CrossMark / Overall | |
| Lenovo IdeaCentre Mini 01IRH8 | |
| GMK NucBox K2 | |
| Beelink SEi12 Core i5-1235U | |
| Durchschnittliche Intel Core i7-12650H, Intel UHD Graphics 64EUs (Alder Lake 12th Gen) (1532 - 1875, n=5) | |
| Intel NUC 13 Pro Desk Edition Kit | |
| GMK NucBox K3 Pro | |
| Beelink GTR7 7840HS | |
| CrossMark / Productivity | |
| Lenovo IdeaCentre Mini 01IRH8 | |
| Beelink SEi12 Core i5-1235U | |
| GMK NucBox K2 | |
| Durchschnittliche Intel Core i7-12650H, Intel UHD Graphics 64EUs (Alder Lake 12th Gen) (1503 - 1876, n=5) | |
| Beelink GTR7 7840HS | |
| Intel NUC 13 Pro Desk Edition Kit | |
| GMK NucBox K3 Pro | |
| CrossMark / Creativity | |
| Lenovo IdeaCentre Mini 01IRH8 | |
| Intel NUC 13 Pro Desk Edition Kit | |
| GMK NucBox K3 Pro | |
| GMK NucBox K2 | |
| Durchschnittliche Intel Core i7-12650H, Intel UHD Graphics 64EUs (Alder Lake 12th Gen) (1554 - 1811, n=5) | |
| Beelink GTR7 7840HS | |
| Beelink SEi12 Core i5-1235U | |
| CrossMark / Responsiveness | |
| Beelink SEi12 Core i5-1235U | |
| Beelink GTR7 7840HS | |
| Durchschnittliche Intel Core i7-12650H, Intel UHD Graphics 64EUs (Alder Lake 12th Gen) (1301 - 2077, n=5) | |
| GMK NucBox K2 | |
| Lenovo IdeaCentre Mini 01IRH8 | |
| Intel NUC 13 Pro Desk Edition Kit | |
| GMK NucBox K3 Pro | |
| PCMark 10 Score | 5855 Punkte | |
Hilfe | ||
| AIDA64 / Memory Copy | |
| GMK NucBox K3 Pro | |
| Beelink GTR7 7840HS | |
| GMK NucBox K2 | |
| Durchschnittliche Intel Core i7-12650H (43261 - 69735, n=14) | |
| Intel NUC 13 Pro Desk Edition Kit | |
| Beelink SEi12 Core i5-1235U | |
| Lenovo IdeaCentre Mini 01IRH8 | |
| AIDA64 / Memory Read | |
| GMK NucBox K3 Pro | |
| Beelink GTR7 7840HS | |
| Durchschnittliche Intel Core i7-12650H (47313 - 67412, n=14) | |
| GMK NucBox K2 | |
| Beelink SEi12 Core i5-1235U | |
| Intel NUC 13 Pro Desk Edition Kit | |
| Lenovo IdeaCentre Mini 01IRH8 | |
| AIDA64 / Memory Write | |
| Beelink GTR7 7840HS | |
| GMK NucBox K3 Pro | |
| GMK NucBox K2 | |
| Durchschnittliche Intel Core i7-12650H (45617 - 59361, n=14) | |
| Beelink SEi12 Core i5-1235U | |
| Intel NUC 13 Pro Desk Edition Kit | |
| Lenovo IdeaCentre Mini 01IRH8 | |
| AIDA64 / Memory Latency | |
| GMK NucBox K3 Pro | |
| Intel NUC 13 Pro Desk Edition Kit | |
| Beelink SEi12 Core i5-1235U | |
| Beelink GTR7 7840HS | |
| Durchschnittliche Intel Core i7-12650H (71.6 - 103.9, n=14) | |
| Lenovo IdeaCentre Mini 01IRH8 | |
| GMK NucBox K2 | |
* ... kleinere Werte sind besser
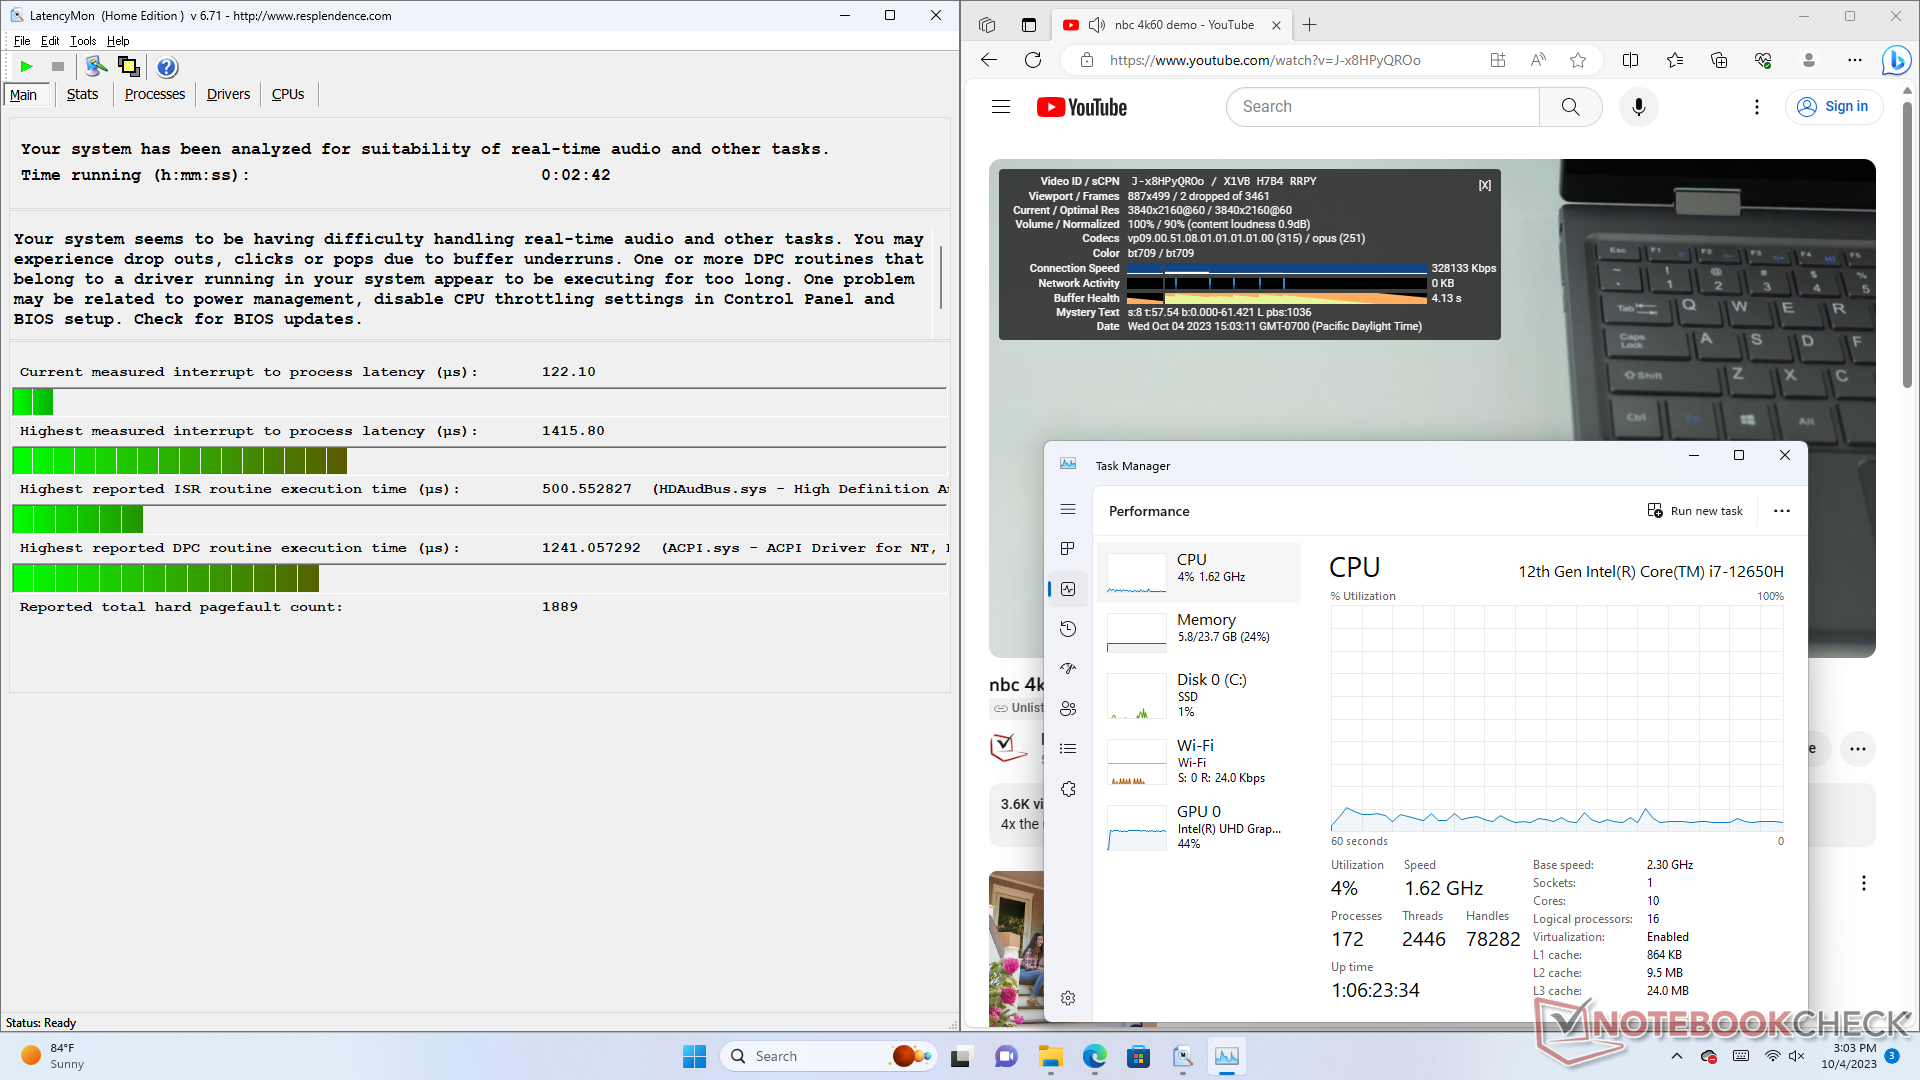
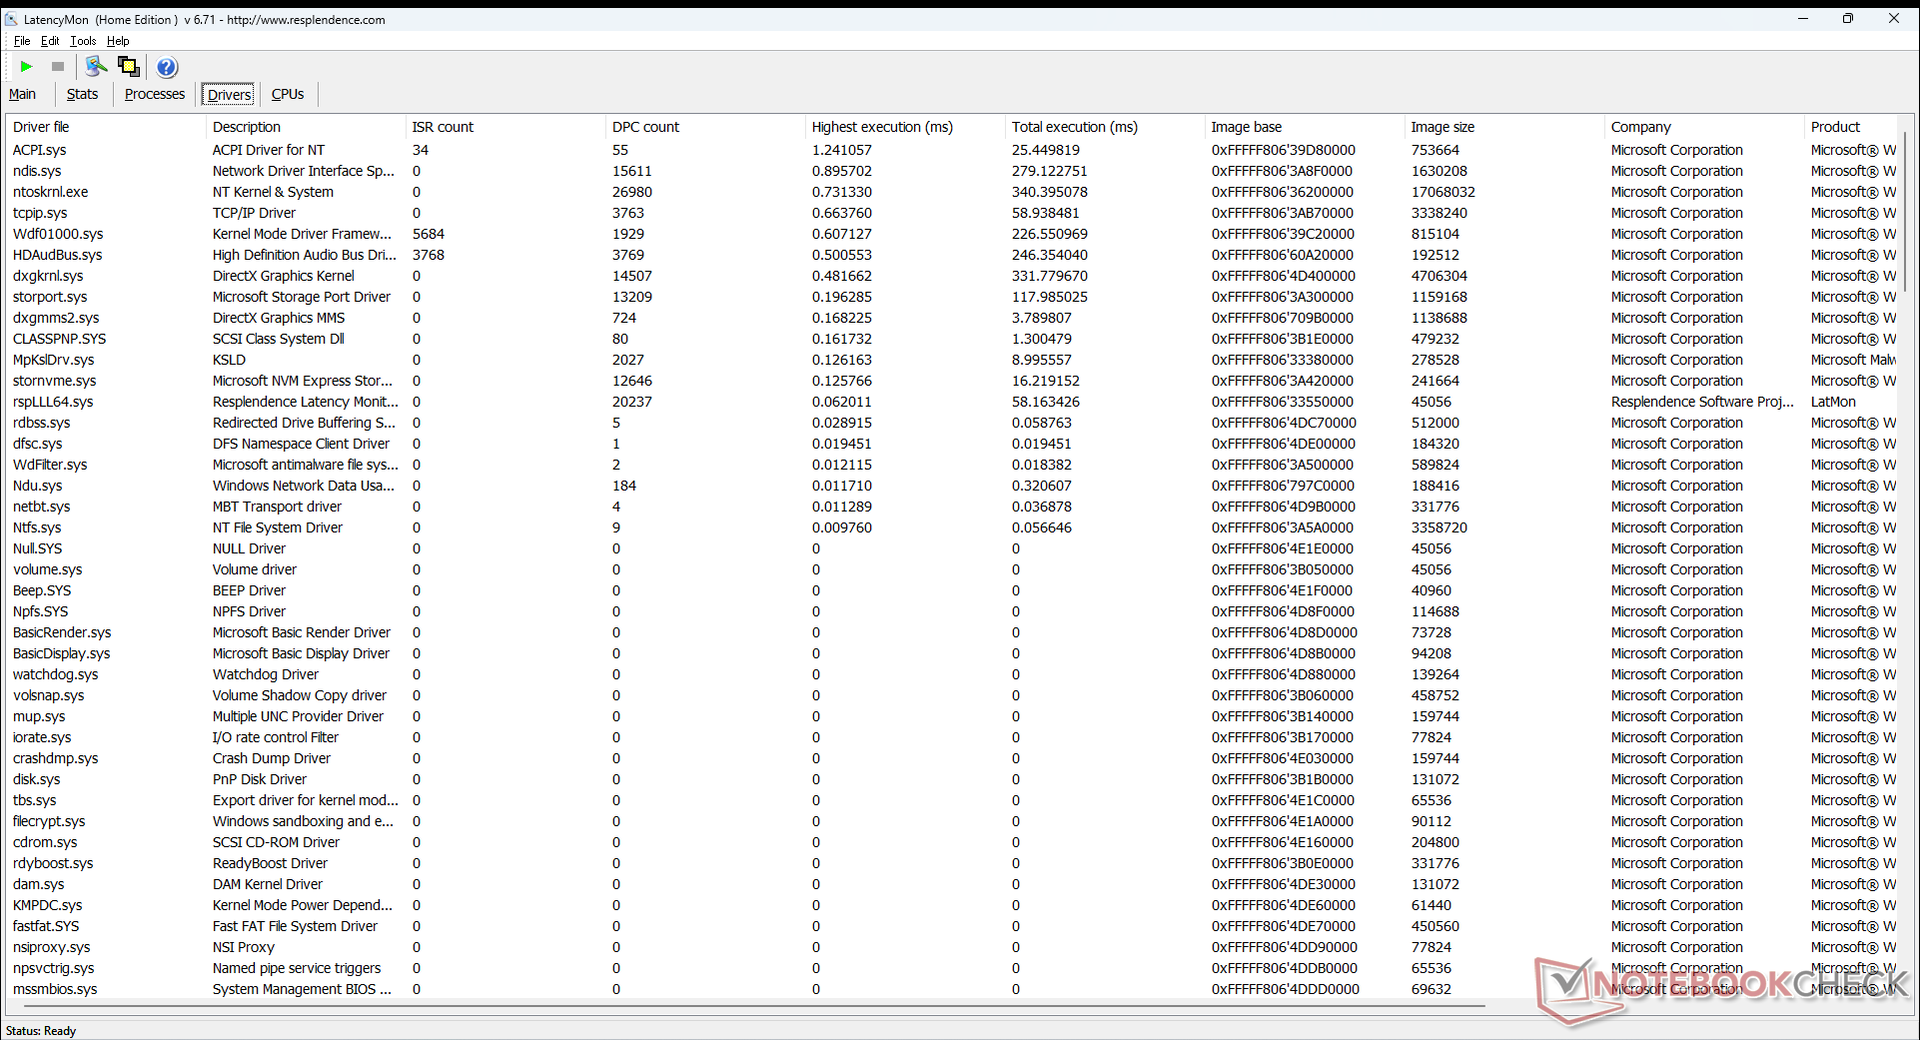
DPC-Latenzzeit
LatencyMon zeigt kleinere DPC-Probleme beim Öffnen mehrerer Browser Tabs unserer Homepage. Die 4K-Videowiedergabe bei 60 fps ist ebenfalls unvollkommen. Während eines 60-sekündigen Testvideos wurden 2 Dropped Frames aufgezeichnet.
| DPC Latencies / LatencyMon - interrupt to process latency (max), Web, Youtube, Prime95 | |
| Lenovo IdeaCentre Mini 01IRH8 | |
| GMK NucBox K3 Pro | |
| GMK NucBox K2 | |
| Intel NUC 13 Pro Desk Edition Kit | |
| Beelink SEi12 Core i5-1235U | |
| Beelink GTR7 7840HS | |
* ... kleinere Werte sind besser
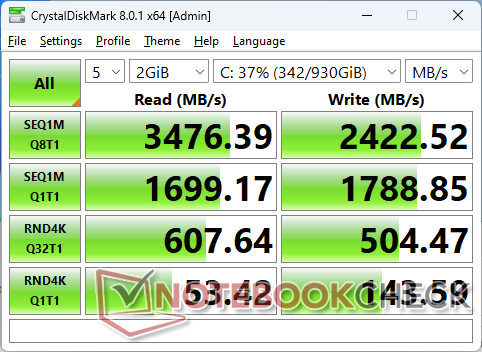
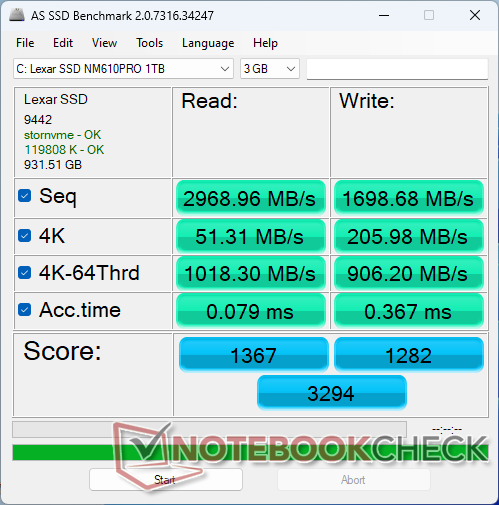
Speichergeräte
GMK verwendet die gleichen Lexar-NM610-Pro-SSDs in unseren K2- und K3-Pro-Testgeräten.

| Drive Performance Rating - Percent | |
| Beelink GTR7 7840HS | |
| Intel NUC 13 Pro Desk Edition Kit | |
| Beelink SEi12 Core i5-1235U | |
| GMK NucBox K2 | |
| Lenovo IdeaCentre Mini 01IRH8 | |
| GMK NucBox K3 Pro | |
* ... kleinere Werte sind besser
Disk Throttling: DiskSpd Read Loop, Queue Depth 8
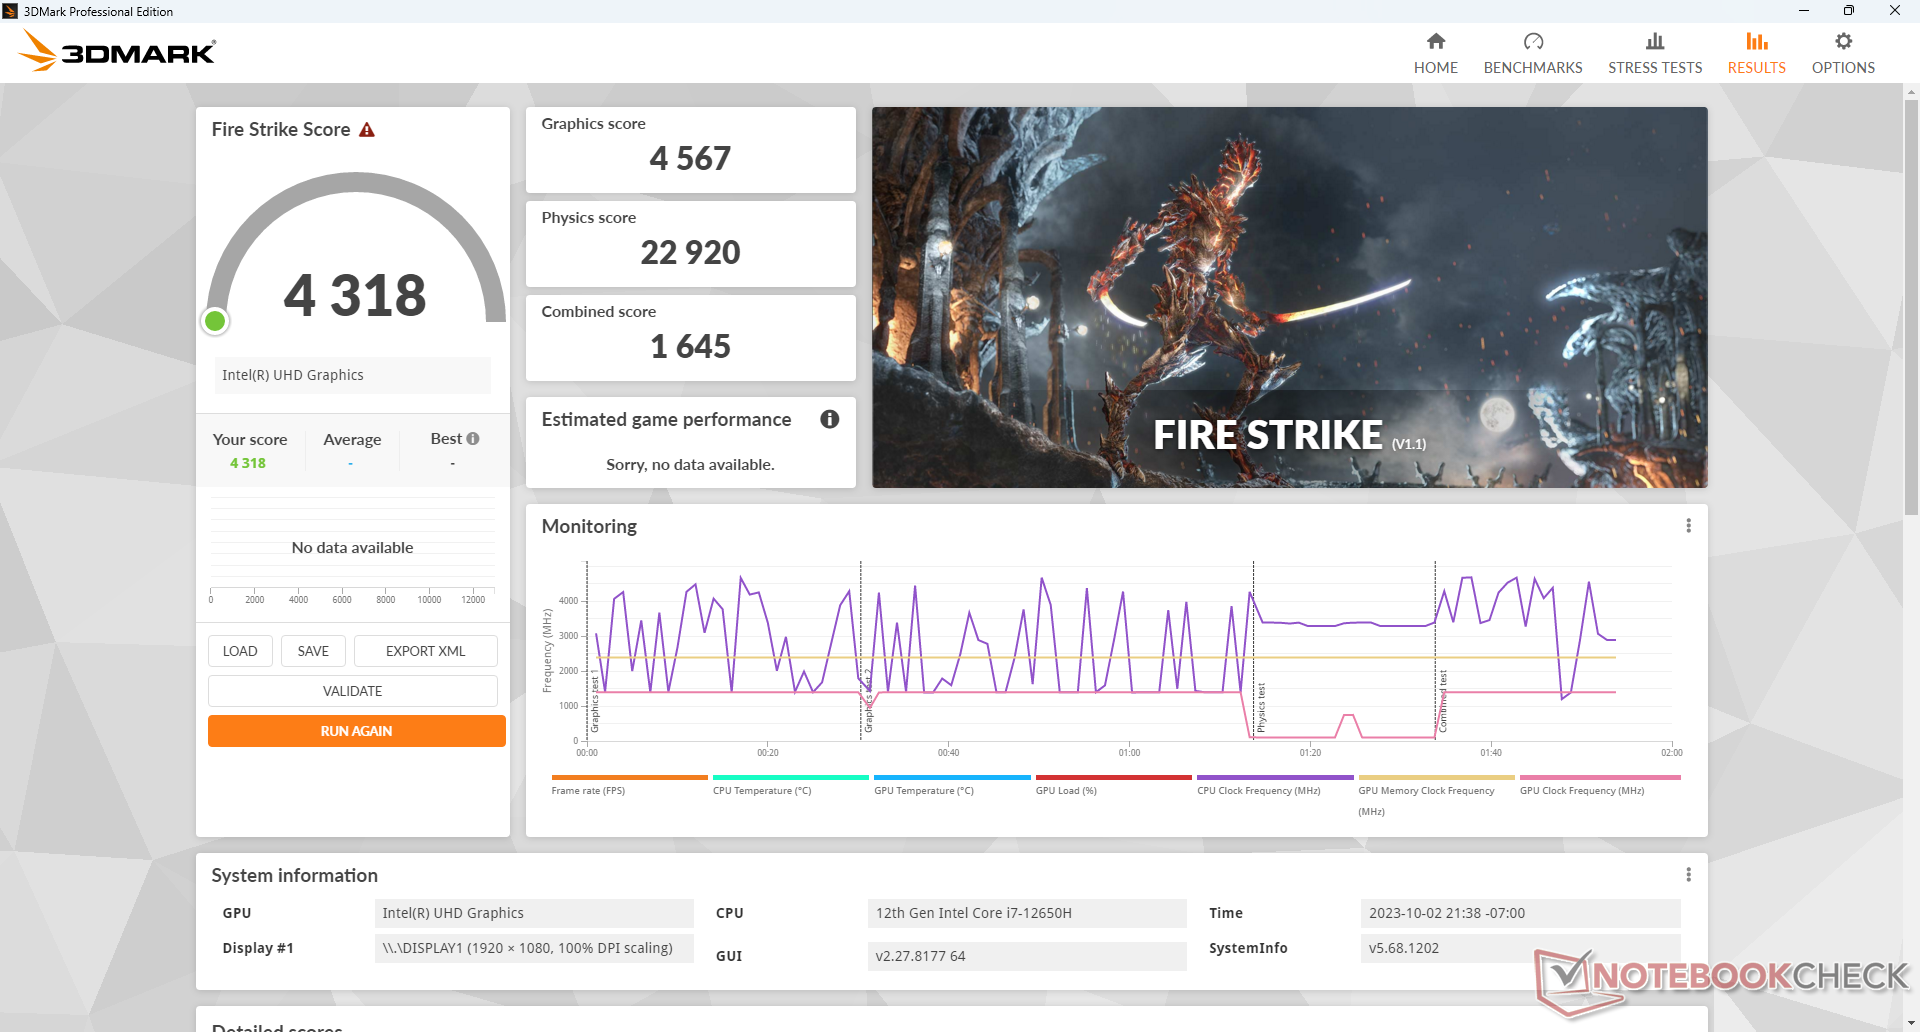
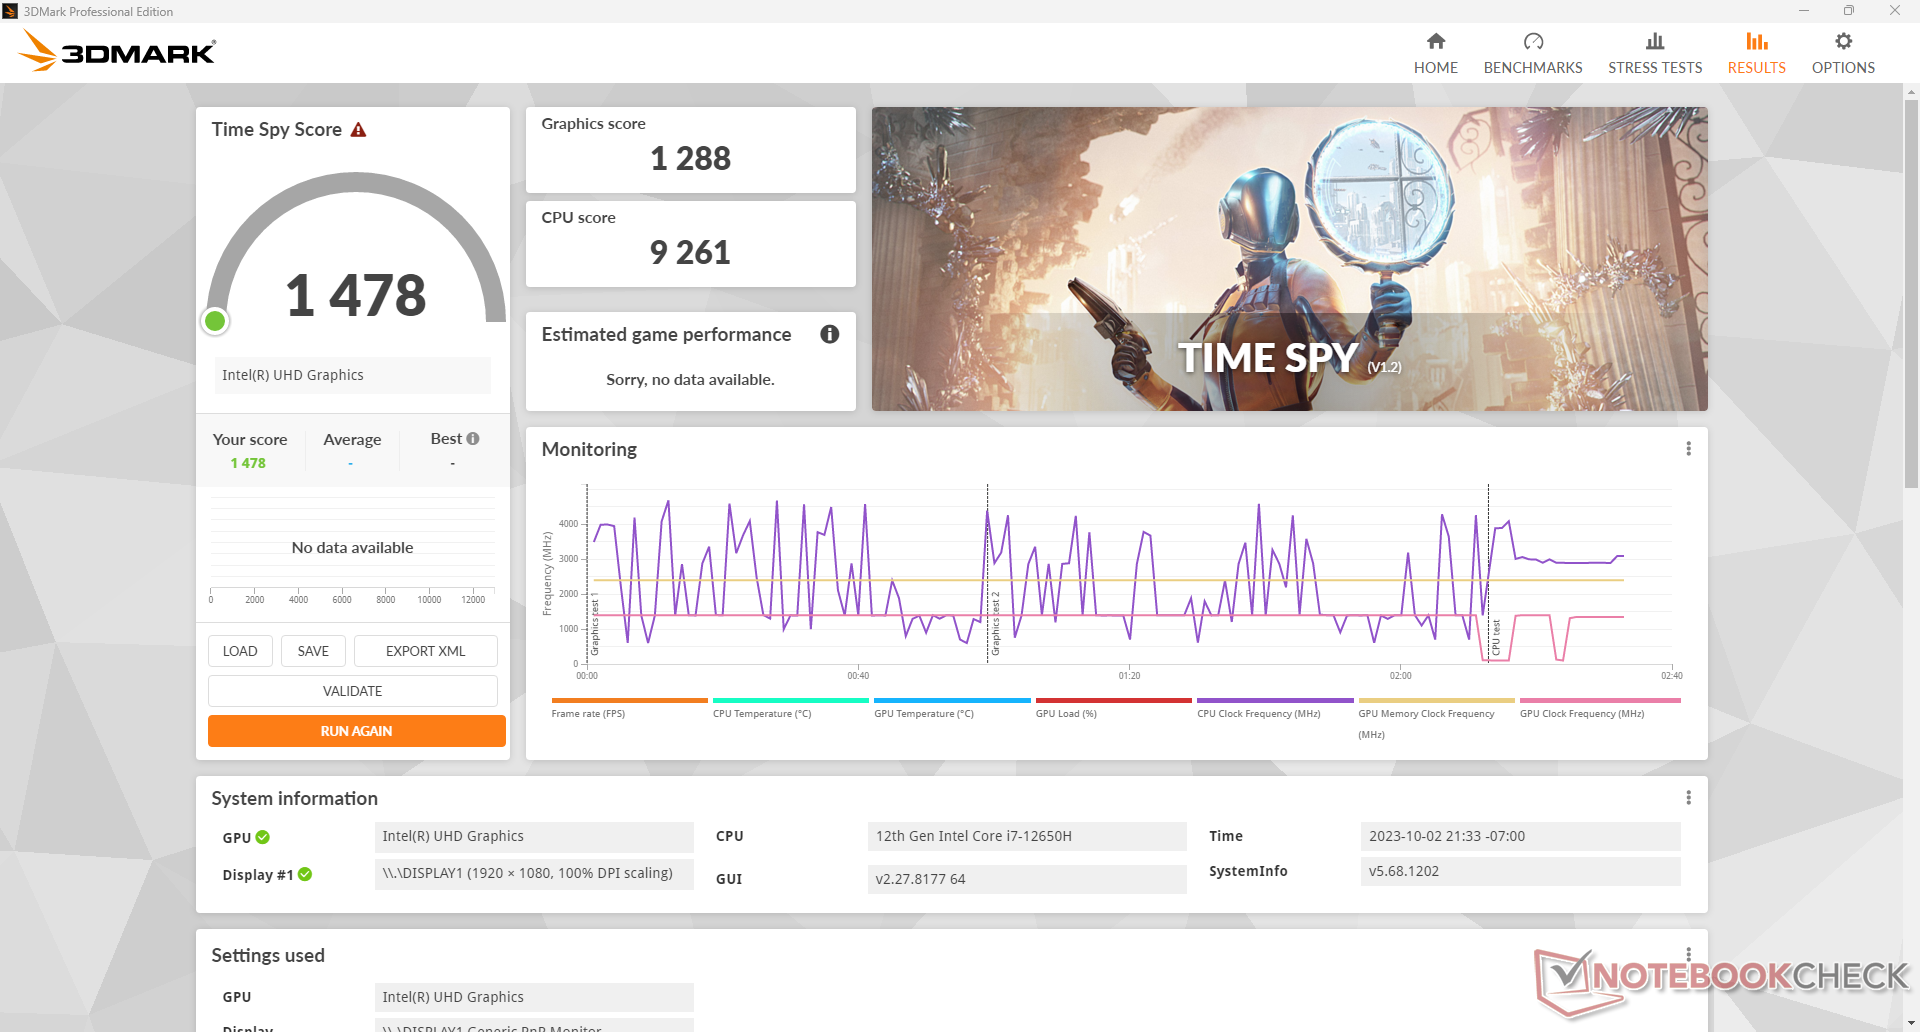
GPU-Performance
Die Grafikleistung ist die größte Schwäche der NucBox K3 Pro im Vergleich zur NucBox K2. Die integrierte UHD Graphics 64 EUs ist langsamer als die ohnehin schon langsame Iris Xe 96 EUs, die im Vergleich zur konkurrierenden Radeon 680M verblasst. Das Modell eignet sich daher besser für Spiele-Streaming und 4K-Videowiedergabe als für natives Grafik-Rendering.
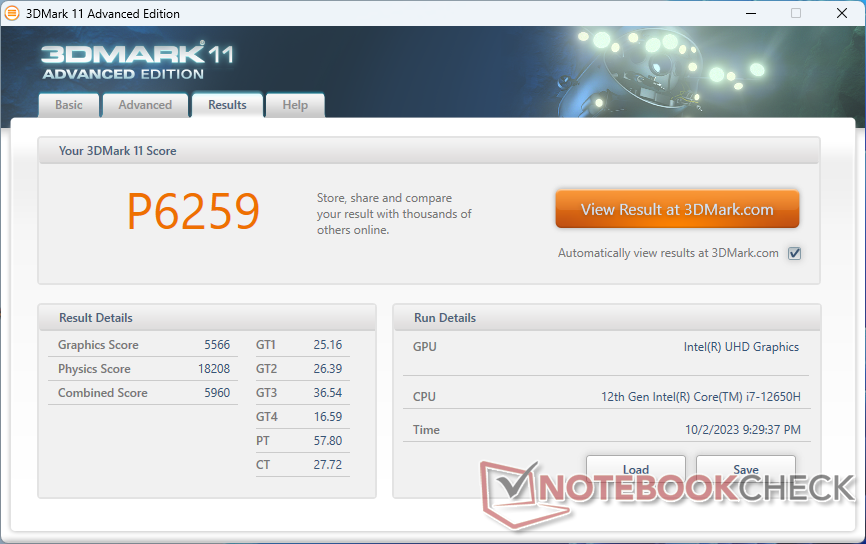
| 3DMark 11 Performance | 6259 Punkte | |
| 3DMark Fire Strike Score | 4318 Punkte | |
| 3DMark Time Spy Score | 1478 Punkte | |
Hilfe | ||
| Blender | |
| v3.3 Classroom HIP/AMD | |
| GMK NucBox K2 | |
| v3.3 Classroom CPU | |
| BMAX B7 Power G7A2 | |
| Durchschnittliche Intel UHD Graphics 64EUs (Alder Lake 12th Gen) (494 - 1458, n=12) | |
| Beelink SEi12 Core i5-1235U | |
| GMK NucBox K3 Pro | |
| Acemagic AD15 | |
| Intel NUC 13 Pro Desk Edition Kit | |
| Intel NUC 13 Pro Kit NUC13ANK | |
| Beelink GTR7 7840HS | |
| Minisforum Venus Series NPB5 | |
| Lenovo IdeaCentre Mini 01IRH8 | |
| GMK NucBox K2 | |
* ... kleinere Werte sind besser
Witcher 3 FPS Chart
| min. | mittel | hoch | max. | |
|---|---|---|---|---|
| The Witcher 3 (2015) | 85.3 | 56 | 30.1 | 13.8 |
| Dota 2 Reborn (2015) | 119.5 | 93.4 | 62.7 | 57.5 |
| Final Fantasy XV Benchmark (2018) | 39.6 | 21.9 | 15.2 | |
| X-Plane 11.11 (2018) | 41.3 | 33.1 | 26 |
Emissionen
System-Rauschen
Der interne Lüfter pulsiert bei geringerer Last nicht so oft wie bei der K2, wodurch die NucBox K3 Pro etwas leiser ist als die K2. Ansonsten erreichen beide einen ähnlichen maximalen Geräuschpegel von ca. 40 dB(A), wenn anspruchsvolle Lasten wie Spiele laufen.
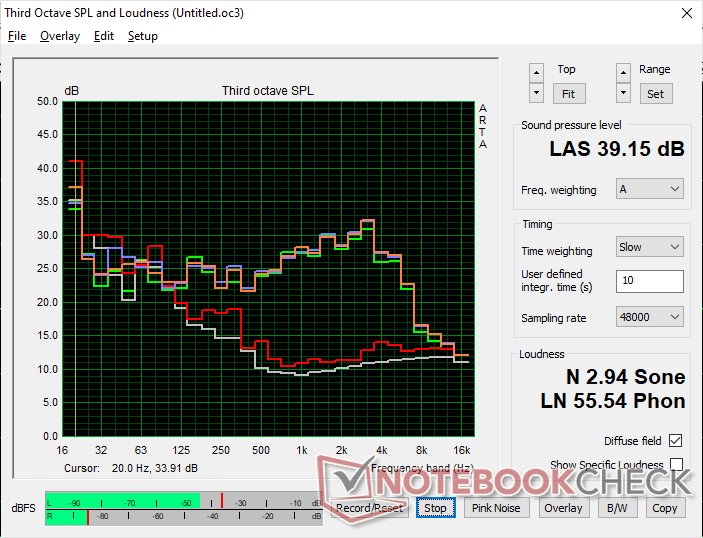
Lautstärkediagramm
| Idle |
| 25 / 25.5 / 25.5 dB(A) |
| Last |
| 39.9 / 39.9 dB(A) |
 | ||
30 dB leise 40 dB(A) deutlich hörbar 50 dB(A) störend |
||
min: | ||
| GMK NucBox K3 Pro UHD Graphics 64EUs, i7-12650H, Lexar NM610 Pro NM610P001T-HNNNG | GMK NucBox K2 Radeon 680M, R7 7735HS, Lexar NM610 Pro NM610P001T-HNNNG | Beelink SEi12 Core i5-1235U Iris Xe G7 80EUs, i5-1235U, Kingston NV1 SNVS/500GCN | Beelink GTR7 7840HS Radeon 780M, R7 7840HS, Crucial P3 Plus CT1000P3PSSD8 | Intel NUC 13 Pro Desk Edition Kit Iris Xe G7 96EUs, i7-1360P, Samsung PM9A1 MZVL2512HCJQ | Lenovo IdeaCentre Mini 01IRH8 Iris Xe G7 96EUs, i7-13700H, Samsung PM9B1 512GB MZVL4512HBLU | |
|---|---|---|---|---|---|---|
| Geräuschentwicklung | -8% | 1% | -4% | -9% | -4% | |
| aus / Umgebung * (dB) | 23.1 | 24.1 -4% | 23.3 -1% | 25.6 -11% | 25.2 -9% | 23.4 -1% |
| Idle min * (dB) | 25 | 24.4 2% | 27.8 -11% | 28.1 -12% | 28.1 -12% | 30.4 -22% |
| Idle avg * (dB) | 25.5 | 24.4 4% | 27.8 -9% | 28.1 -10% | 28.2 -11% | 30.4 -19% |
| Idle max * (dB) | 25.5 | 36.8 -44% | 27.8 -9% | 28.1 -10% | 28.3 -11% | 30.4 -19% |
| Last avg * (dB) | 39.9 | 41.6 -4% | 32 20% | 34.9 13% | 42 -5% | 30.7 23% |
| Witcher 3 ultra * (dB) | 39.9 | 41.7 -5% | 34.1 15% | 36.4 9% | 33.9 15% | |
| Last max * (dB) | 39.9 | 41.6 -4% | 39.2 2% | 42.4 -6% | 42.1 -6% | 41 -3% |
* ... kleinere Werte sind besser
Temperatur
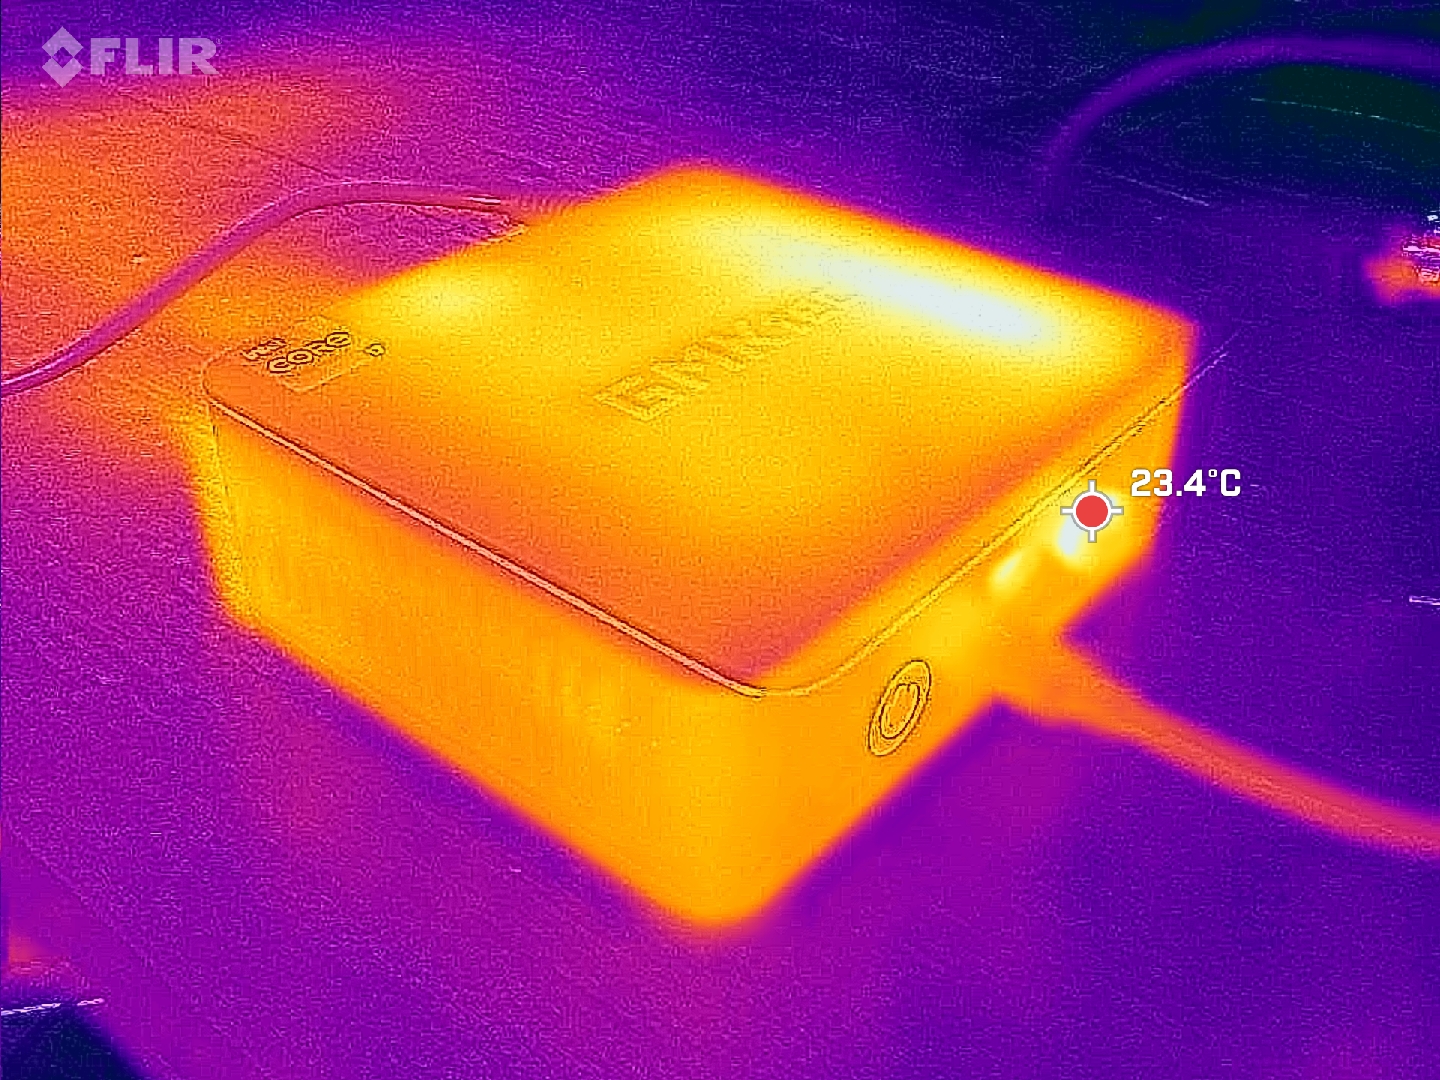
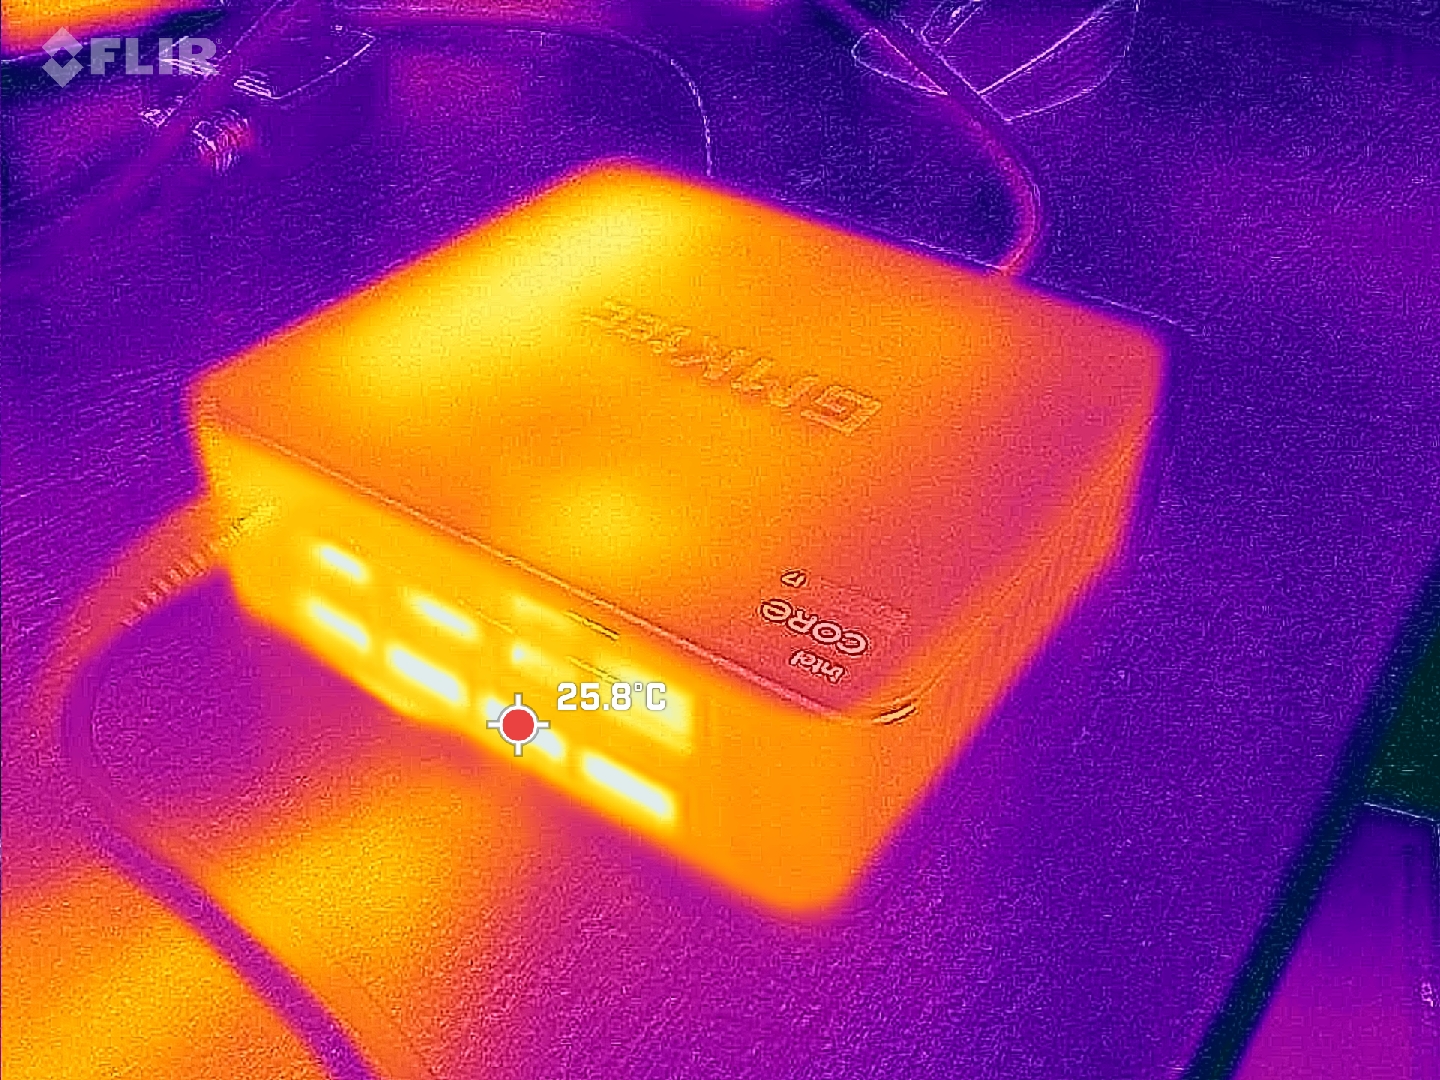
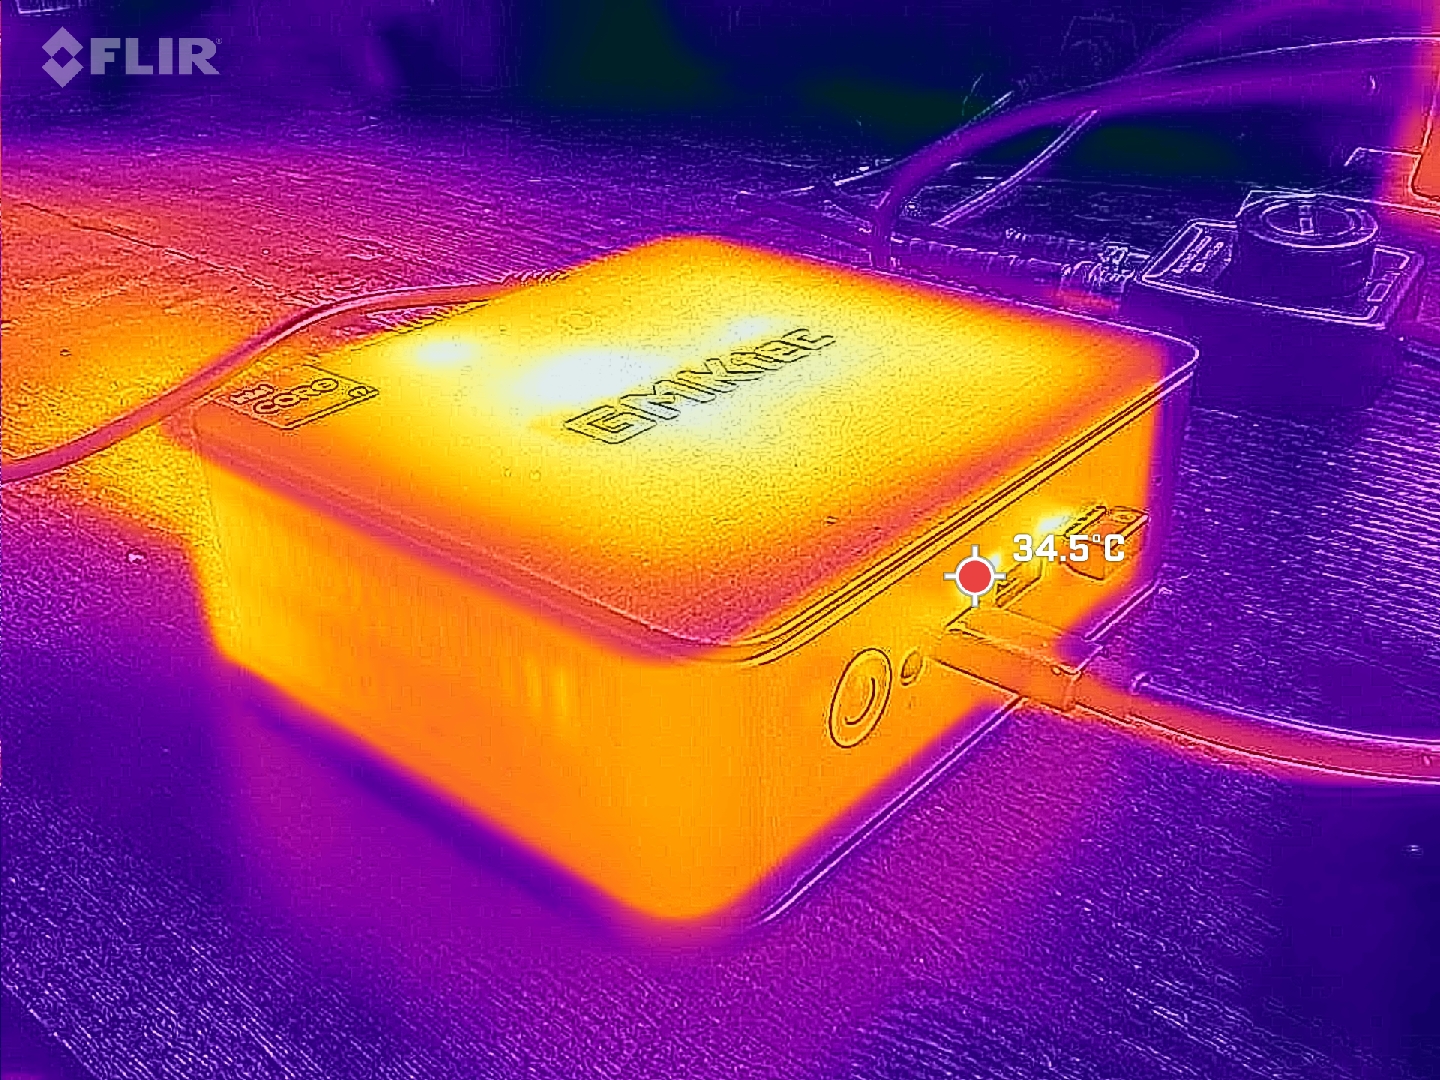
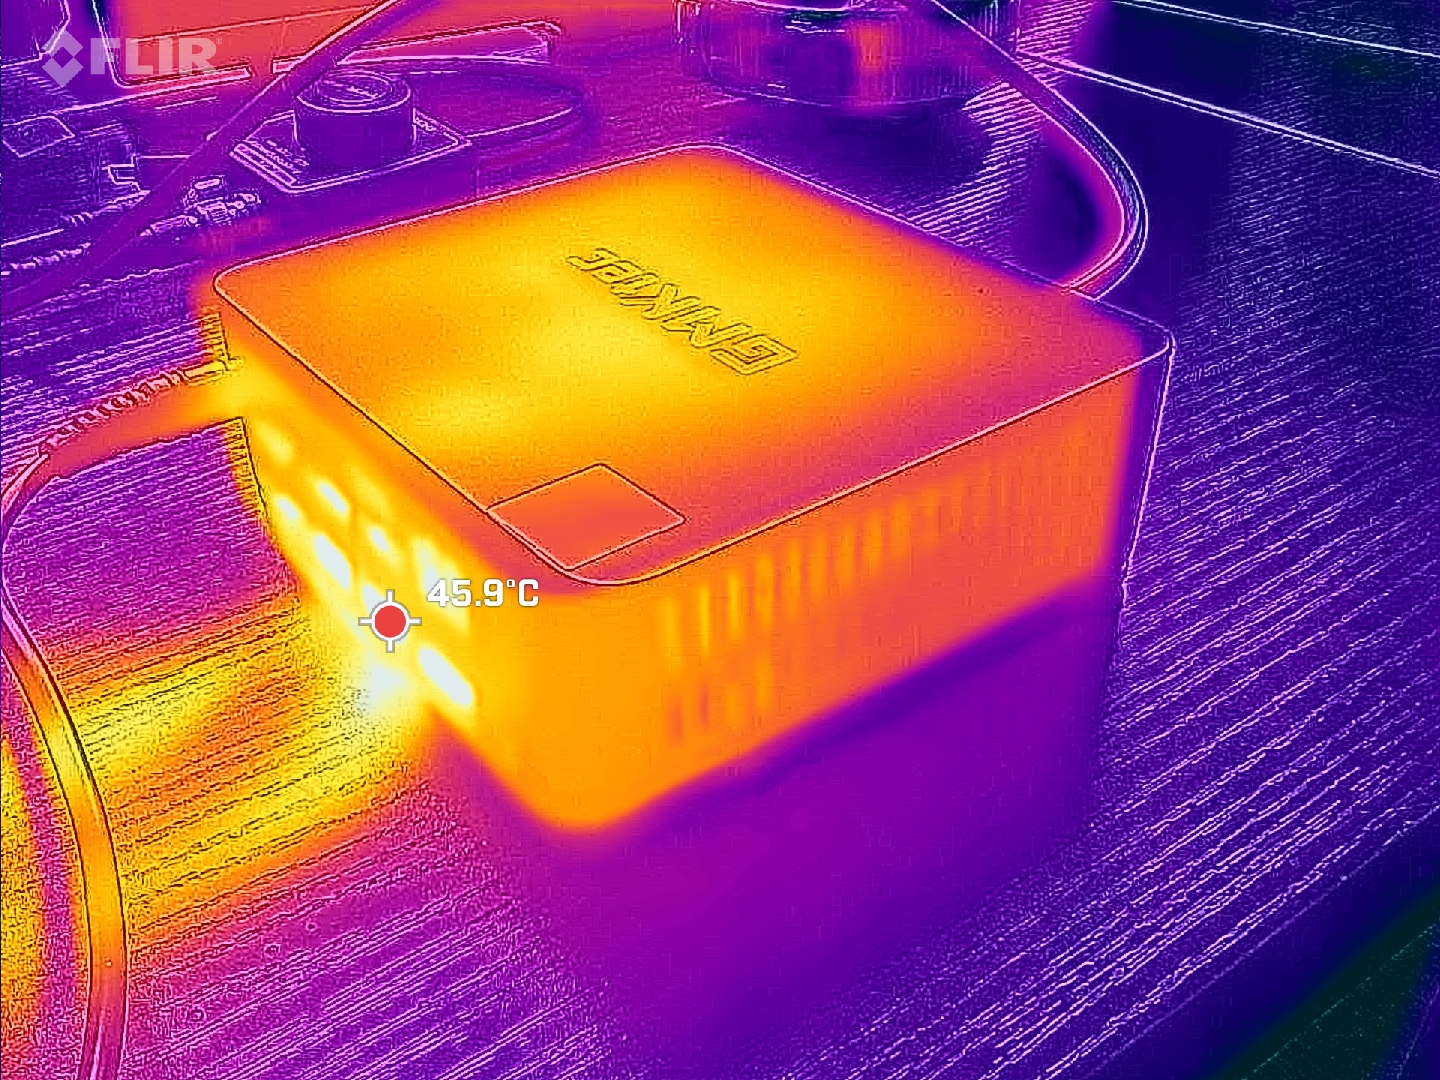
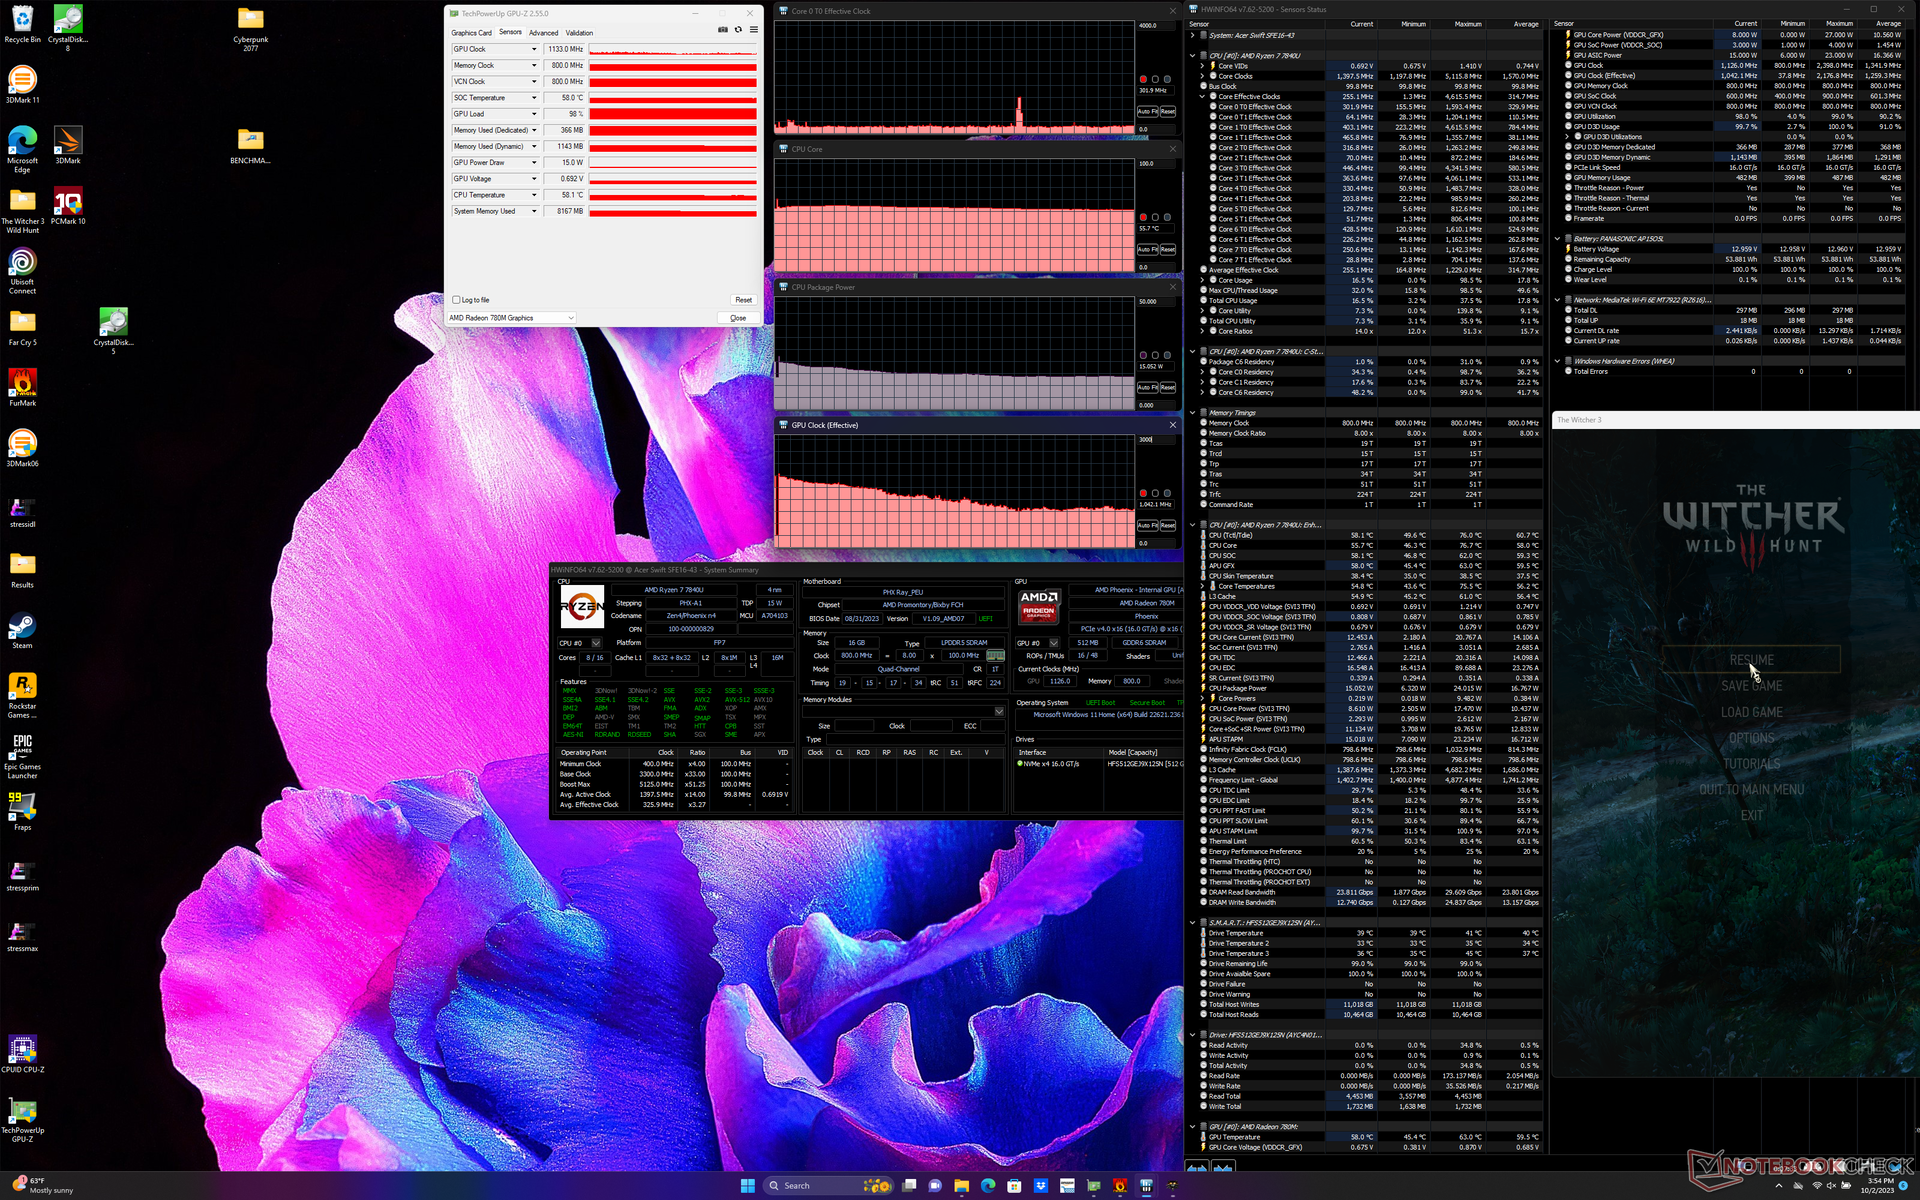
Stresstest
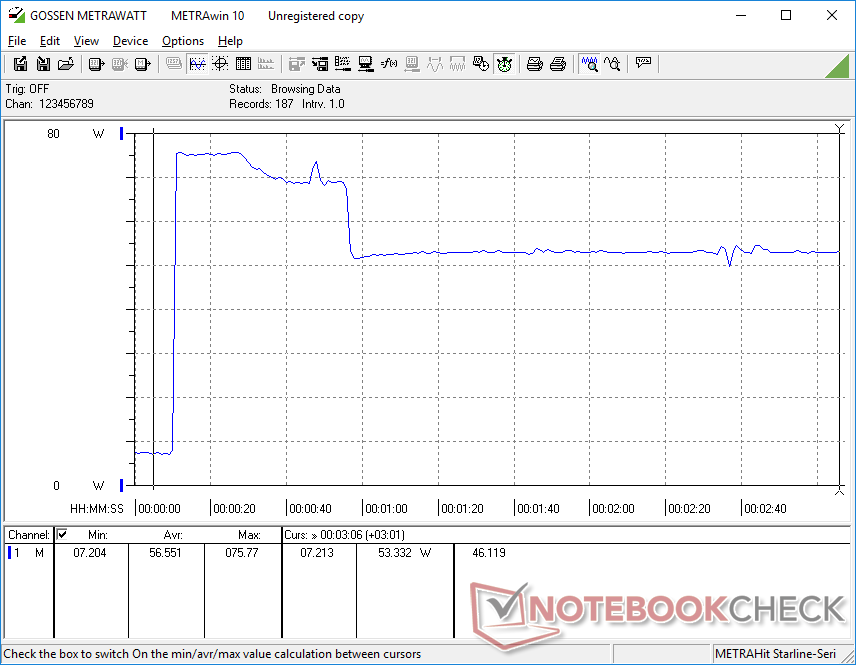
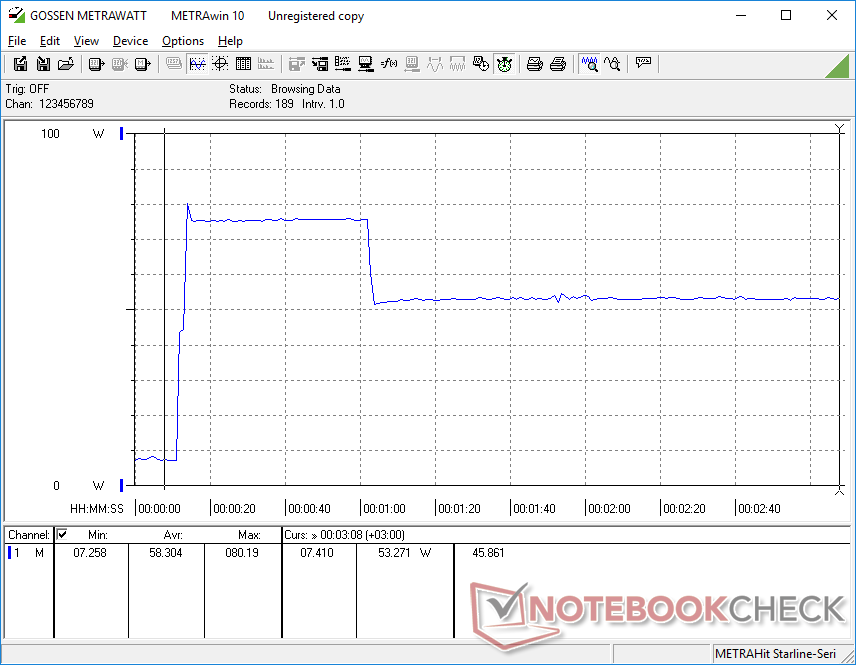
Unsere NucBox K3 Pro stabilisiert sich bei wärmeren Kerntemperaturen als das bei der NucBox K2 der Fall ist. Die CPU-Temperatur bei der Ausführung von anspruchsvollen Lasten wie Witcher 3 oder Prime95 stabilisiert sich bei 80 °C bzw. 83 °C, verglichen mit nur 67 °C bzw. 79 °C bei der AMD betriebenen K2.
Hohe Turbo-Core-Taktraten sind nicht nachhaltig. Bei der Ausführung von Prime95 zum Beispiel stiegen die Taktraten und die Leistungsaufnahme des Boards auf 2,3 GHz bzw. 52 W, bevor sie nach etwa 45 Sekunden auf 2,0 GHz und 35 W sanken.

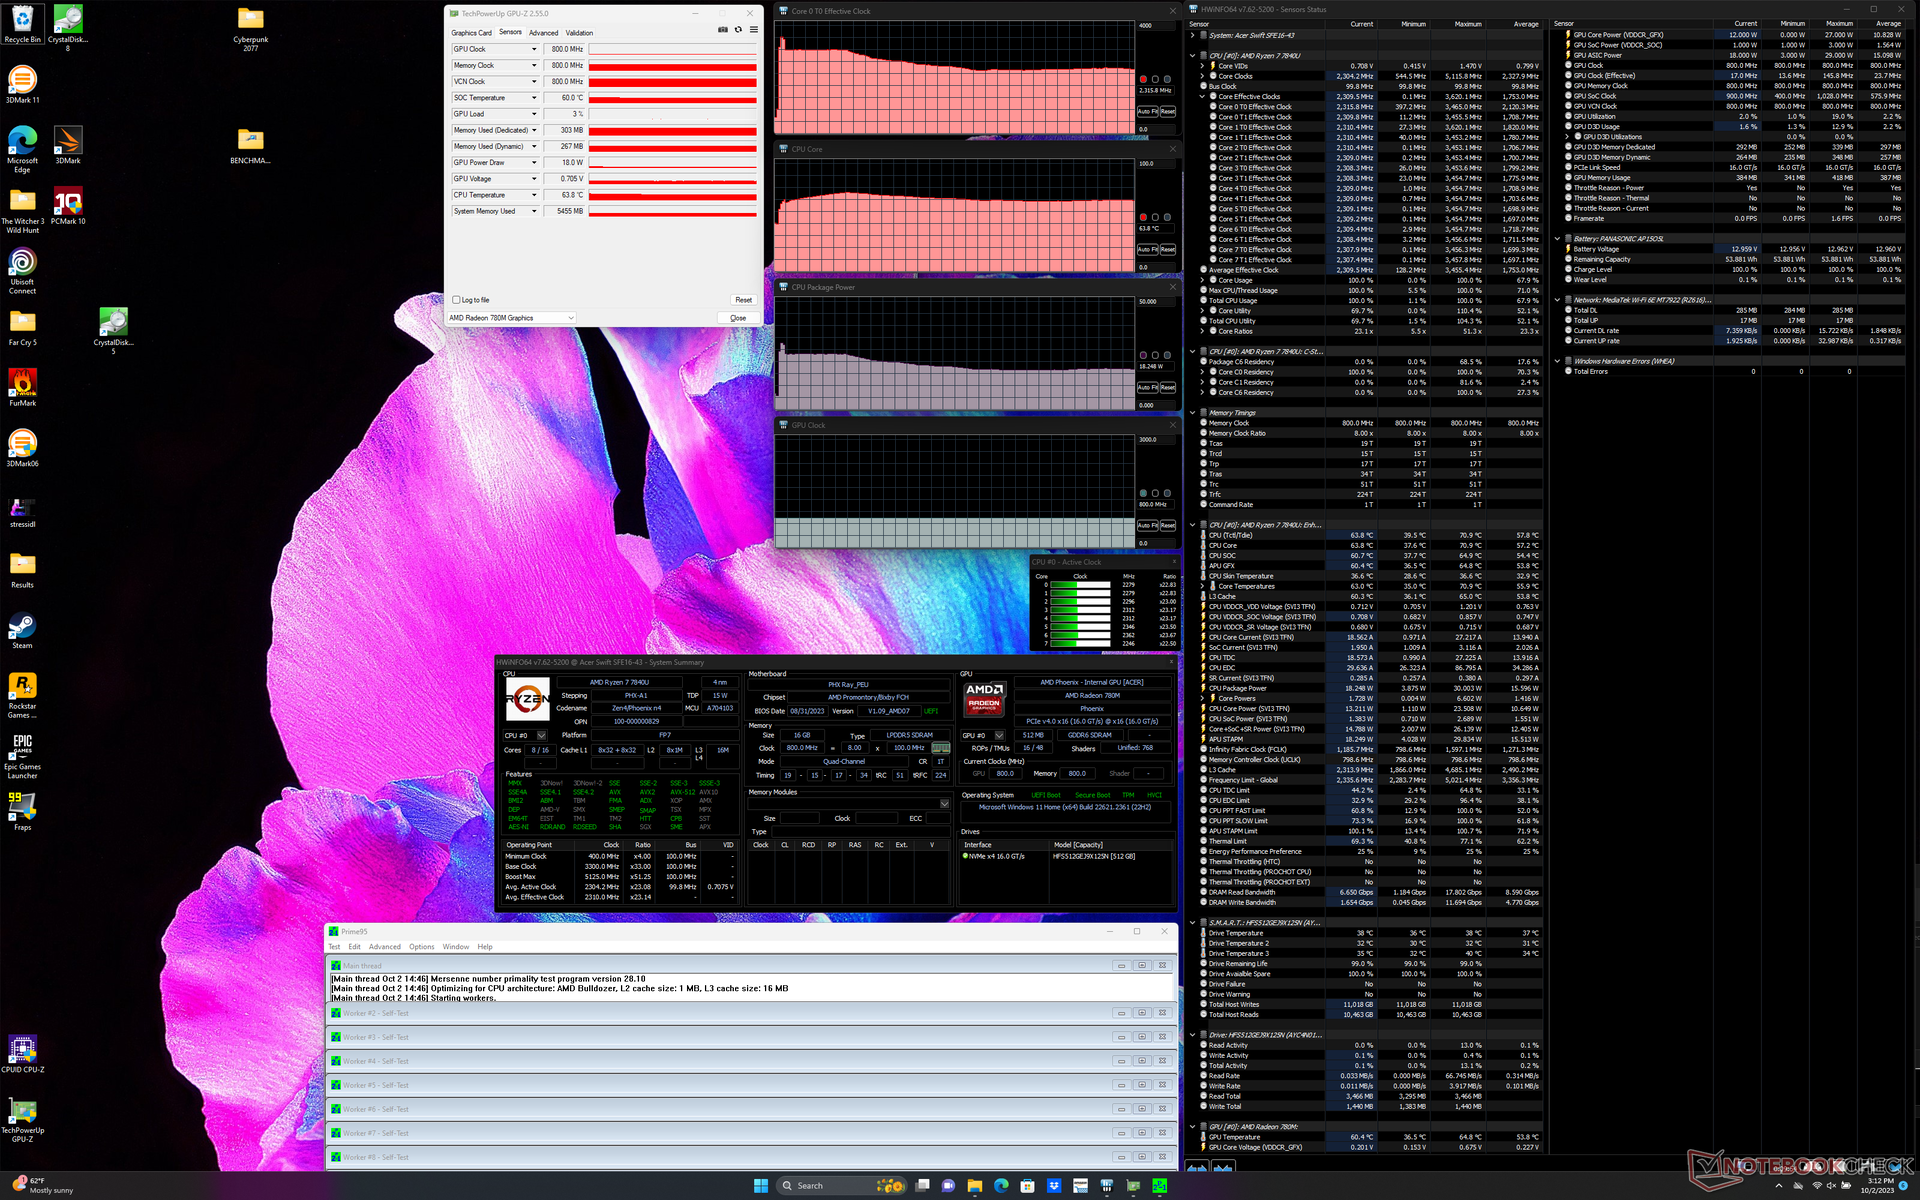
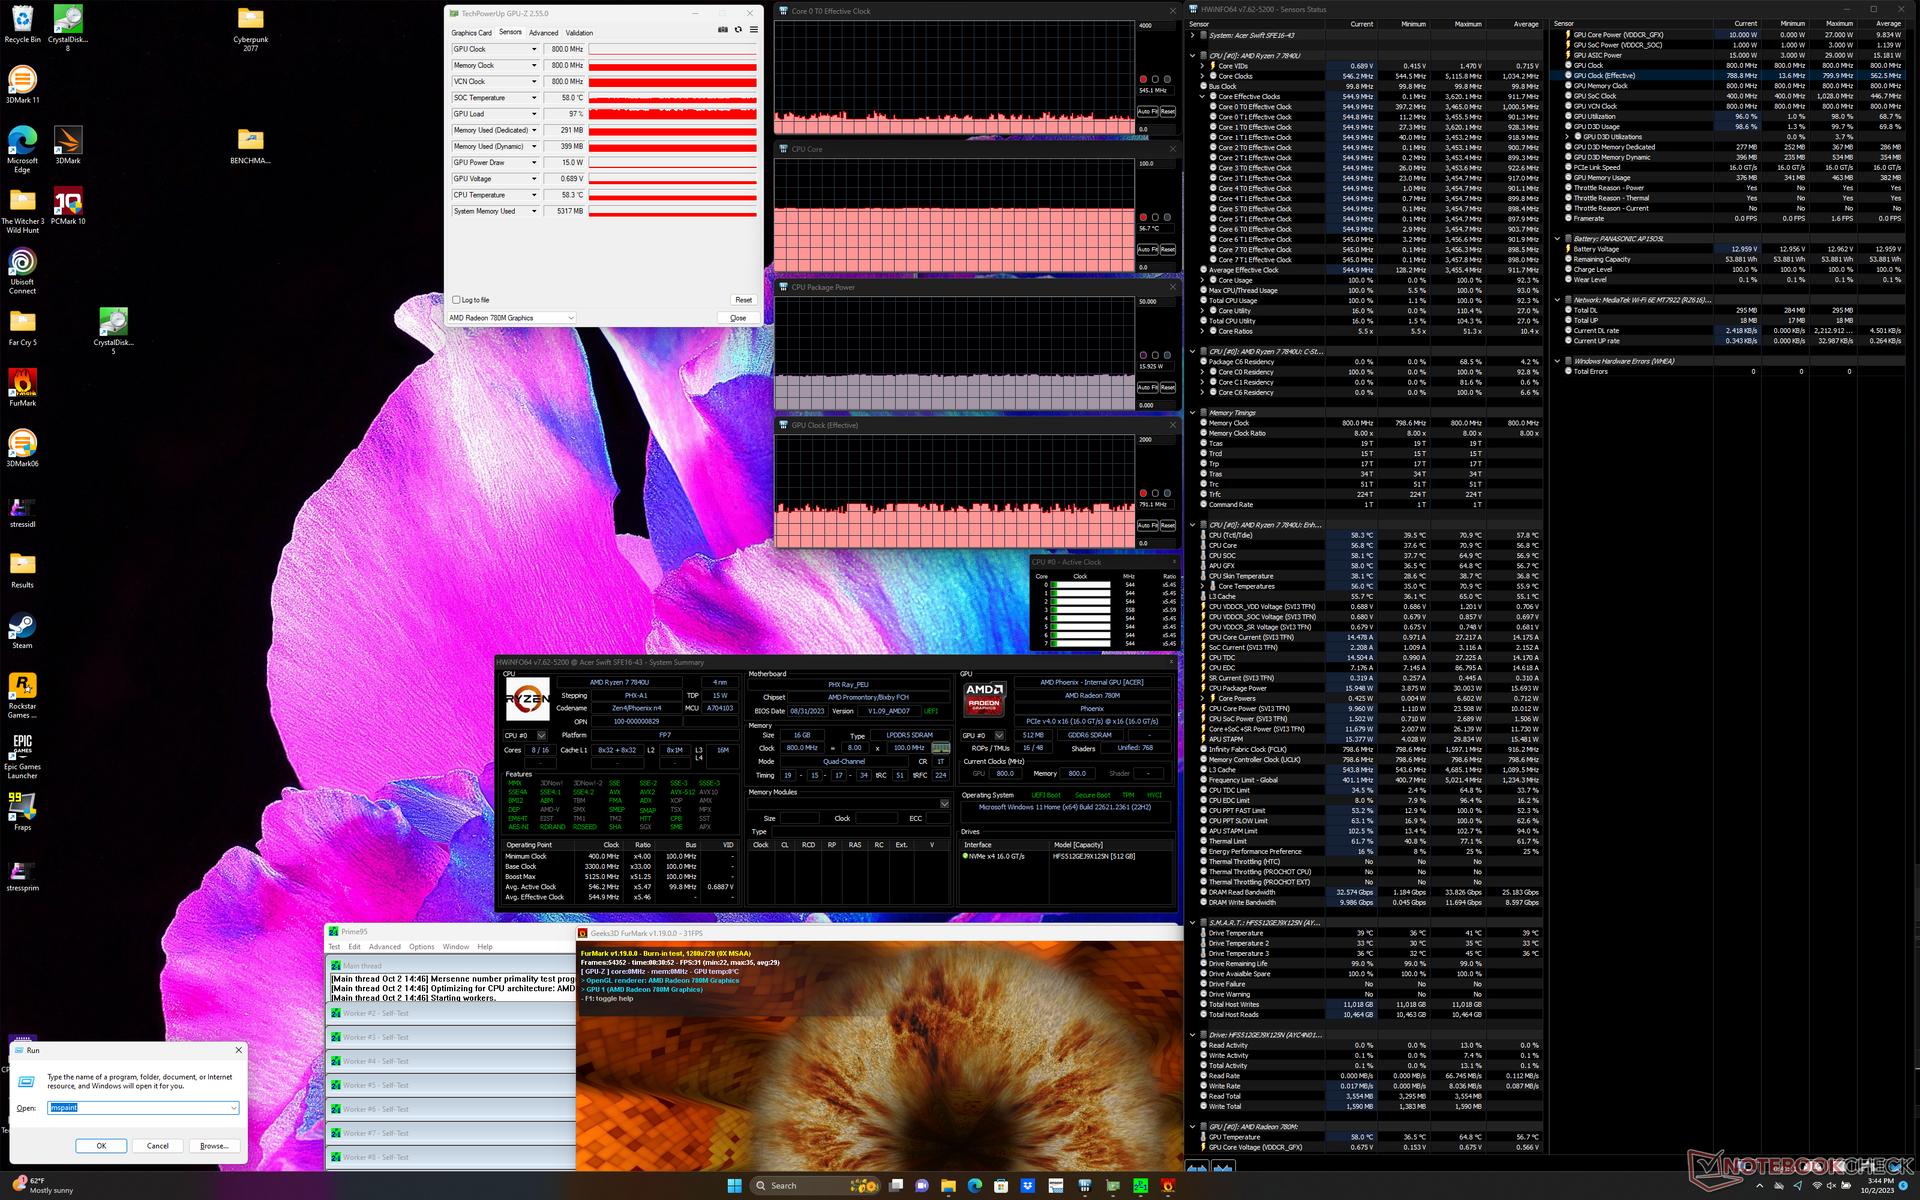
| CPU-Takt (GHz) | GPU-Takt (MHz) | durchschnittliche CPU-Temperatur (°C) | |
| System Leerlauf | -- | -- | 43 |
| Prime95, Stress | 2.0 | -- | 83 |
| Prime95 + FurMark, Stress | ~1,3 | 948 | 78 |
| Witcher 3, Stress | ~0,8 | 1.397 | 80 |
Energieverwaltung
Stromverbrauch
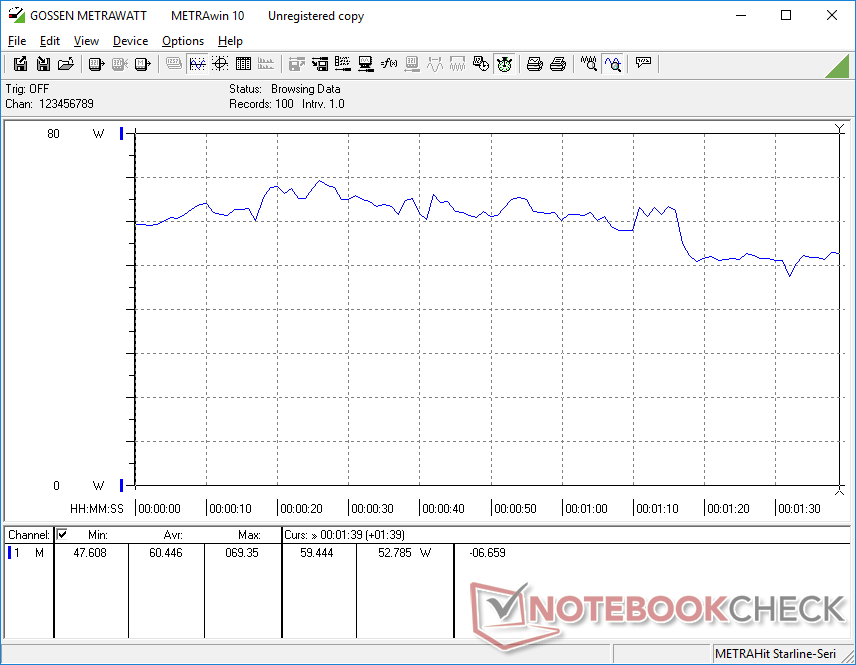
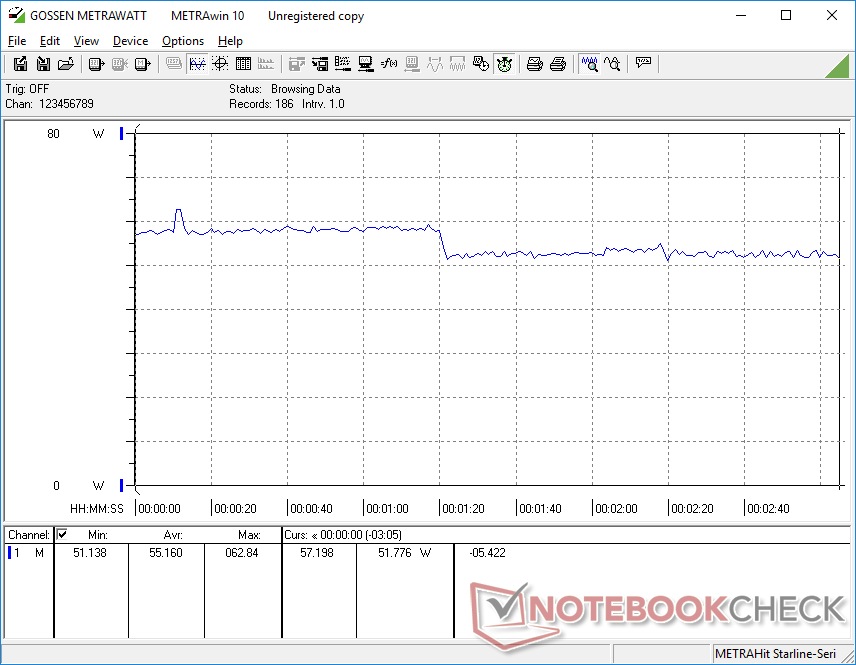
Die NucBox K2 ist etwas anspruchsvoller als unsere K3 Pro, was teilweise den aktiveren internen Lüfter der K2 erklären könnte. Nichtsdestotrotz liegt die Leistung pro Watt immer noch deutlich zu Gunsten von AMD. Die Ausführung von Witcher 3 auf der K2 benötigt zum Beispiel nur 13 Prozent mehr Strom für eine große Steigerung der Grafikleistung um 70 bis 90 Prozent.
| Aus / Standby | |
| Idle | |
| Last |
|
Legende:
min: | |
| GMK NucBox K3 Pro i7-12650H, UHD Graphics 64EUs, Lexar NM610 Pro NM610P001T-HNNNG, , x, | GMK NucBox K2 R7 7735HS, Radeon 680M, Lexar NM610 Pro NM610P001T-HNNNG, , x, | Beelink SEi12 Core i5-1235U i5-1235U, Iris Xe G7 80EUs, Kingston NV1 SNVS/500GCN, , x, | Beelink GTR7 7840HS R7 7840HS, Radeon 780M, Crucial P3 Plus CT1000P3PSSD8, , x, | Intel NUC 13 Pro Desk Edition Kit i7-1360P, Iris Xe G7 96EUs, Samsung PM9A1 MZVL2512HCJQ, , x, | Lenovo IdeaCentre Mini 01IRH8 i7-13700H, Iris Xe G7 96EUs, Samsung PM9B1 512GB MZVL4512HBLU, , x, | |
|---|---|---|---|---|---|---|
| Stromverbrauch | -7% | -53% | -15% | -7% | -9% | |
| Idle min * (Watt) | 7.1 | 7.3 -3% | 15.8 -123% | 5.5 23% | 7 1% | 6.7 6% |
| Idle avg * (Watt) | 10.1 | 9.8 3% | 16.8 -66% | 5.8 43% | 9.2 9% | 6.7 34% |
| Idle max * (Watt) | 18.6 | 10.5 44% | 17 9% | 7.7 59% | 11.8 37% | 7.1 62% |
| Last avg * (Watt) | 45.3 | 61.3 -35% | 54.4 -20% | 70.6 -56% | 45 1% | 68.5 -51% |
| Witcher 3 ultra * (Watt) | 55.2 | 62.2 -13% | 50.7 8% | 79.8 -45% | 58.3 -6% | |
| Last max * (Watt) | 52.9 | 72.8 -38% | 119.1 -125% | 111.8 -111% | 97.2 -84% | 104.3 -97% |
* ... kleinere Werte sind besser
Stromverbrauch Witcher 3 / Stresstest
Stromverbrauch externer Monitor
Pro
Contra
Fazit - AMD FTW
Wenn Sie sich zwischen der NucBox K3 Pro und der NucBox K2 entscheiden müssen, sollten Sie sich nicht nur für den Namen "Pro" entscheiden, denn die K2 ist zweifellos die bessere Option. Die AMD betriebene K2 bietet eine ähnliche (Prozessor-)Leistung, eine viel schnellere Grafikleistung, sowohl abnehmbares WLAN als auch Arbeitsspeicher, und sie kostet sogar ungefähr den gleichen Preis, wenn man alle Gutscheine berücksichtigt. In dieser Hinsicht gibt es kaum einen Grund, sich für die Intel betriebene NucBox K3 Pro zu entscheiden, es sei denn, Sie wollen 50 US-Dollar bei dem ohnehin schon günstigen Preis von <500 US-Dollar sparen.
Die NucBox K3 Pro ist keineswegs schlecht, aber sie steht definitiv im Schatten der optisch identischen NucBox K2, sowohl in Bezug auf die Leistung pro Dollar als auch auf die Leistung pro Watt.
Das Lüftergeräusch ist bei der K3 Pro im Vergleich zur K2 etwas weniger auffällig, aber nicht so stark, dass es in einer typischen Büro- oder HTPC-Umgebung störend wäre.
Preis und Verfügbarkeit
Die GNKtec NucBox K3 Pro ist derzeit nicht auf dem deutschsprachigen Markt erhältlich, kann aber online direkt beim Hersteller während des aktuellen Flashsales ab 439 US-Dollar erworben werden (regulär ab 639 US-Dollar).
GMK NucBox K3 Pro
- 11.10.2023 v7 (old)
Allen Ngo
Transparenz
Die Auswahl der zu testenden Geräte erfolgt innerhalb der Redaktion. Das vorliegende Testmuster wurde dem Autor vom Hersteller oder einem Shop zu Testzwecken leihweise zur Verfügung gestellt. Eine Einflussnahme des Leihstellers auf den Testbericht gab es nicht, der Hersteller erhielt keine Version des Reviews vor der Veröffentlichung. Es bestand keine Verpflichtung zur Publikation. Als eigenständiges, unabhängiges Unternehmen unterliegt Notebookcheck keiner Diktion von Herstellern, Shops und Verlagen.
So testet Notebookcheck
Pro Jahr werden von Notebookcheck hunderte Laptops und Smartphones unabhängig in von uns standardisierten technischen Verfahren getestet, um eine Vergleichbarkeit aller Testergebnisse zu gewährleisten. Seit rund 20 Jahren entwickeln wir diese Testmethoden kontinuierlich weiter und setzen damit Branchenstandards. In unseren Testlaboren kommt ausschließlich hochwertiges Messequipment in die Hände erfahrener Techniker und Redakteure. Die Tests unterliegen einer mehrstufigen Kontrolle. Unsere komplexe Gesamtbewertung basiert auf hunderten fundierten Messergebnissen und Benchmarks, womit Ihnen Objektivität garantiert ist. Weitere Informationen zu unseren Testmethoden gibt es hier.
Preisvergleich

