
Fazit - Klein, geradlinig und professionell
Die NucBox K16 wird durch ihren Prozessor definiert. Während sie das gleiche hervorragende Gehäuse wie der hochgelobte EVO-X1 bietet, bedeutet die ältere Zen‑3‑Plus‑CPU im NucBox K16, dass das System für Nutzer mit einem knapperen Budget gedacht ist, die die physischen Eigenschaften oder Anschlüsse des Gehäuses schätzen, aber nicht unbedingt die hohe Leistung einer Zen‑5‑CPU benötigen. Für einfachere Büro-, Remote- oder Serveraufgaben ist die NucBox K16 nicht übermäßig mit Funktionen ausgestattet und bietet somit ein schlankes Benutzererlebnis.
Derselbe Zen-3+-Prozessor ist auch für eine Reihe von Nachteilen des Systems verantwortlich. Die in die Jahre gekommene CPU zeigt ihre Grenzen bei der Analyse des Stromverbrauchs, da die Leistung pro Watt bei weitem nicht so hoch ist wie bei einigen der neuesten Alternativen von Intel, einschließlich der GMKs eigenen NucBox K13. Die Grafikleistung ist auch langsamer als der Durchschnitt, selbst für eine integrierte Lösung.
Wenn der Oculink Port für Ihre Arbeitslasten nicht von Bedeutung ist, dann kann die ähnlich teure NucBox K13 aufgrund ihres neueren Prozessors und ihres schlankeren Aussehens eine viel effizientere Option sein als die K16. Die MSI Cubi NUC ist ebenfalls mit einem ähnlichen Leistungsniveau erhältlich, verfügt aber über einen integrierten Thunderbolt-4-Anschluss anstelle von Oculink.
Pro
Contra
Preis und Verfügbarkeit
Die NucBox K16 ist direkt beim Hersteller für 630 Euro zu beziehen. Bei Amazon ist der Mini-PC mit 32 GB RAM und 512-GB-SSD gelistet, aktuell allerdings nicht verfügbar.
- 533,80 €GMKtec K16 Metallgehäuse Gaming Mini PC AMD Ryzen 7 7735HS (8C/12T bis 4,75 GHz), 32 GB LPDDR5 6400MT/s RAM + 512 GB SSD Festplatte Desktop Computer, Dual NIC LAN 2.5GbE/Oculink/USB4/HDMI/USB-C
- 669,96 €GMKtec K17 Mini PC Ultra 5 226V mit 16GB LPDDR5X 8533, 512GB PCIe 4.0 SSD, 97 TOPS AI, Mini Computer Lunar Lake mit Intel Arc 130V/USB 4/WiFi 6E/2.5G LAN/Triple Display für KI-Workflows & Multitasking
- 799,96 €GMKtec K15 AI Mini PC Oculink mit Intel Core Ultra 5 125U Prozessor, 48 GB DDR5 RAM, 1 TB SSD, Mini Computer AI Boost, 3X M.2 2280 Speichererweiterung, Dual NIC 2,5 GbE, HDMI 2.1, USB4
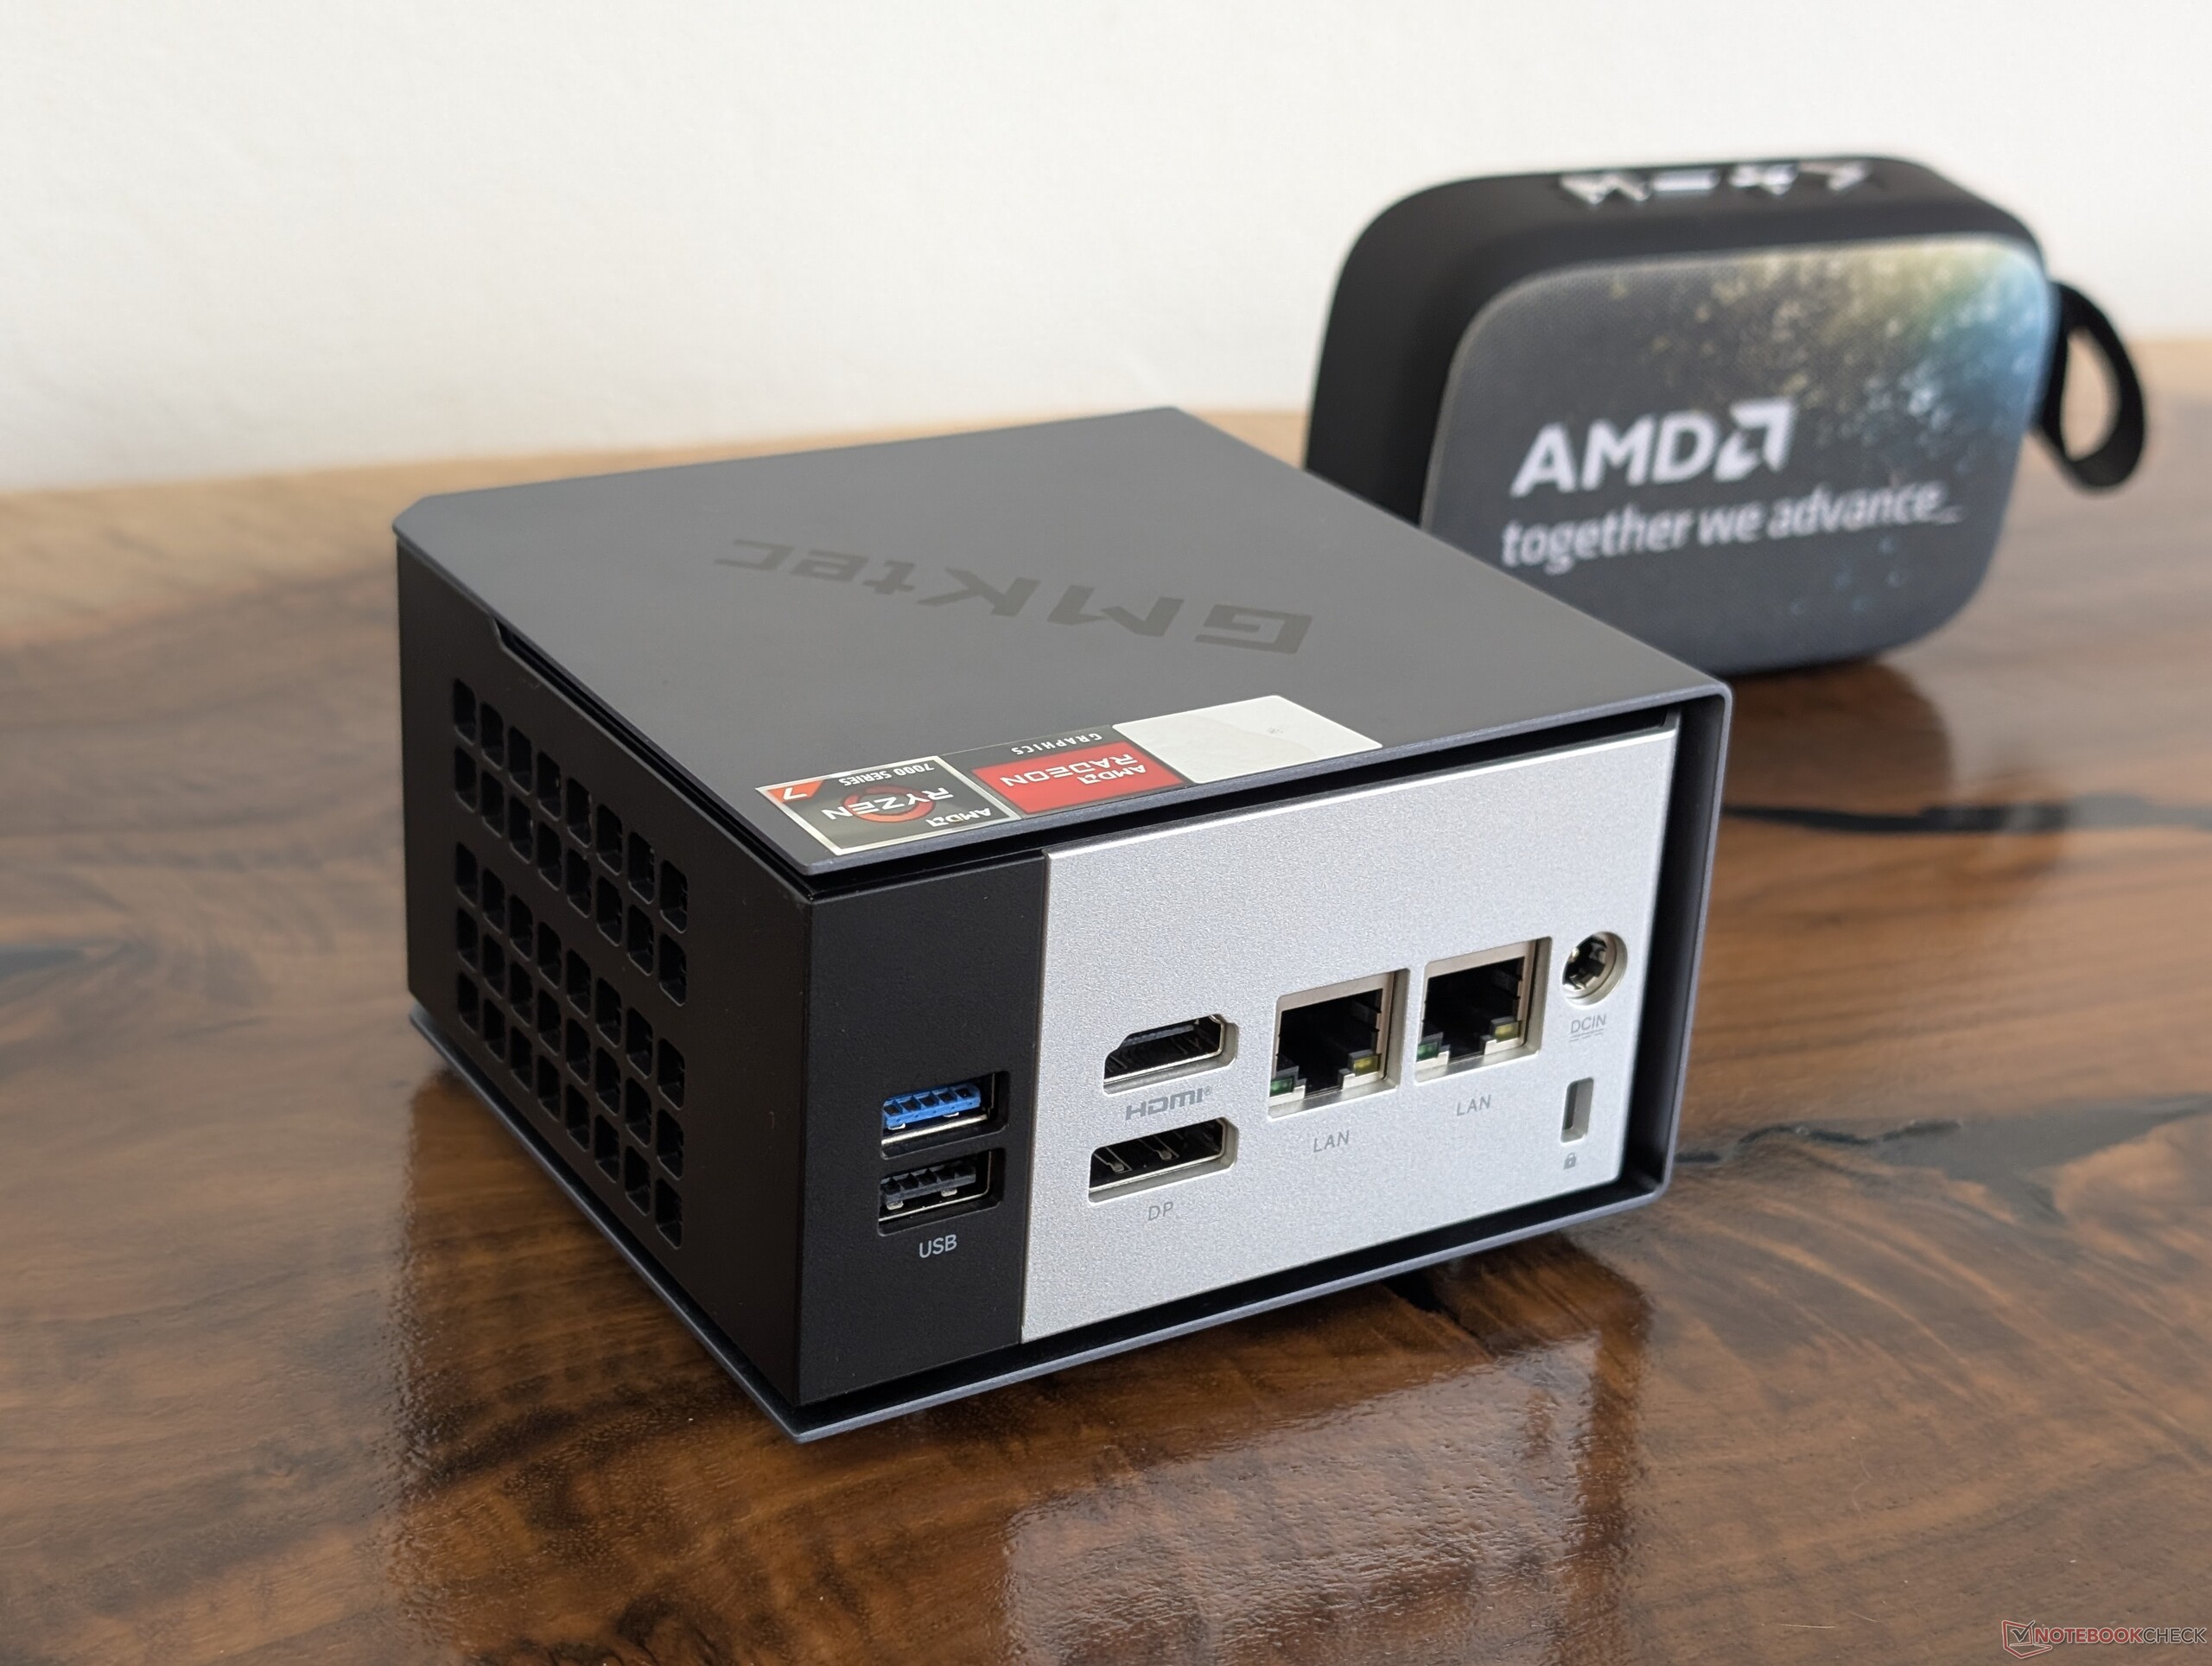
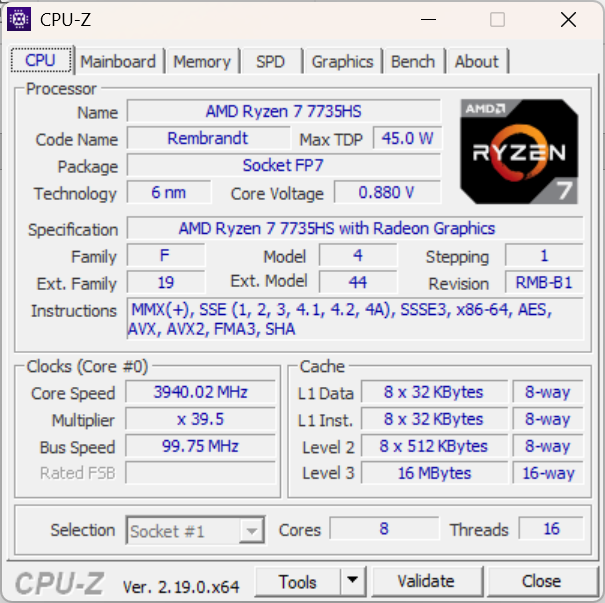
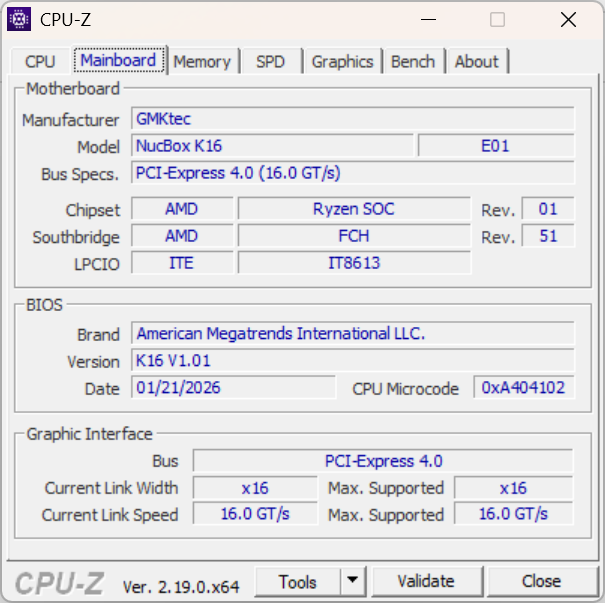
Die NucBox K16 ist der neueste Mini-PC von GMktec, der sich aufgrund des integrierten Oculink Anschlusses eher an Profis als an HTPC-Benutzer richtet. Zu beachten ist, dass der K16 zwar technisch gesehen eines der neueren Modelle von GMK ist, aber nicht unbedingt besser oder schneller als der K15 oder frühere Modelle, da der Name "K" keinen Einfluss auf den Prozessortyp hat.
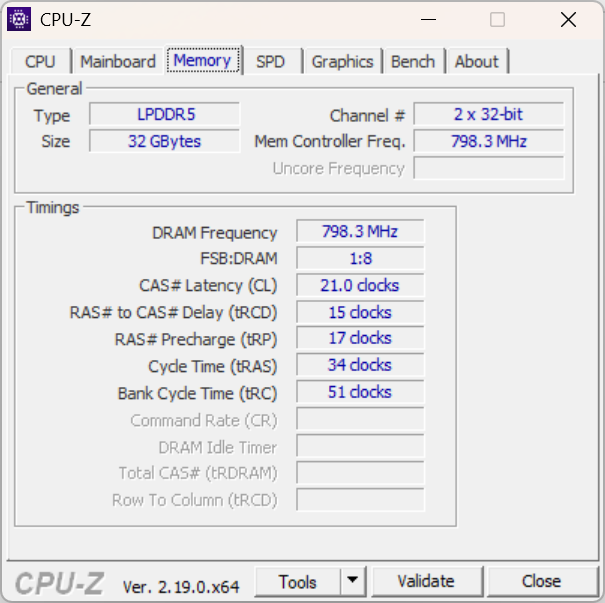
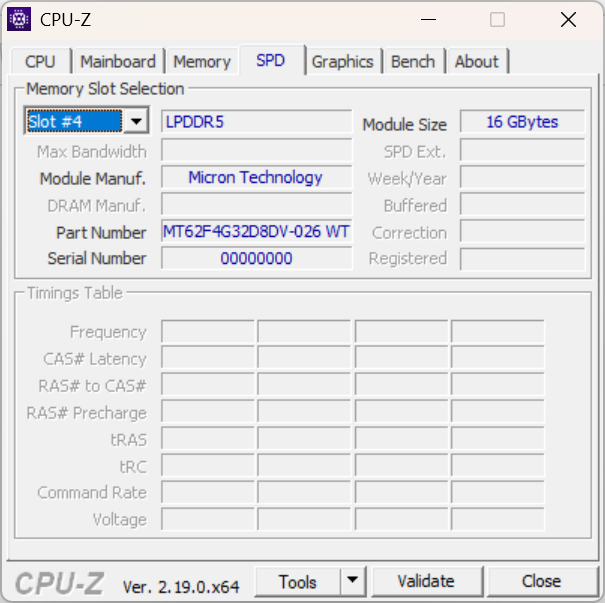
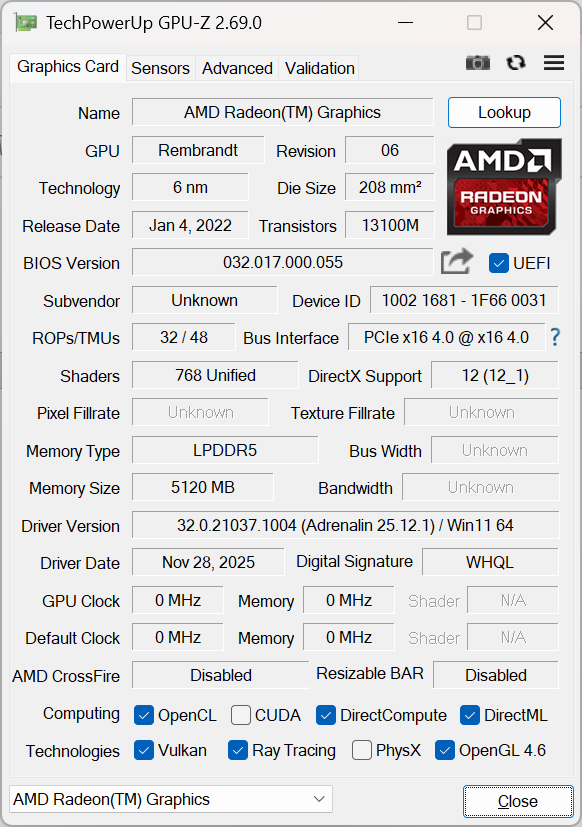
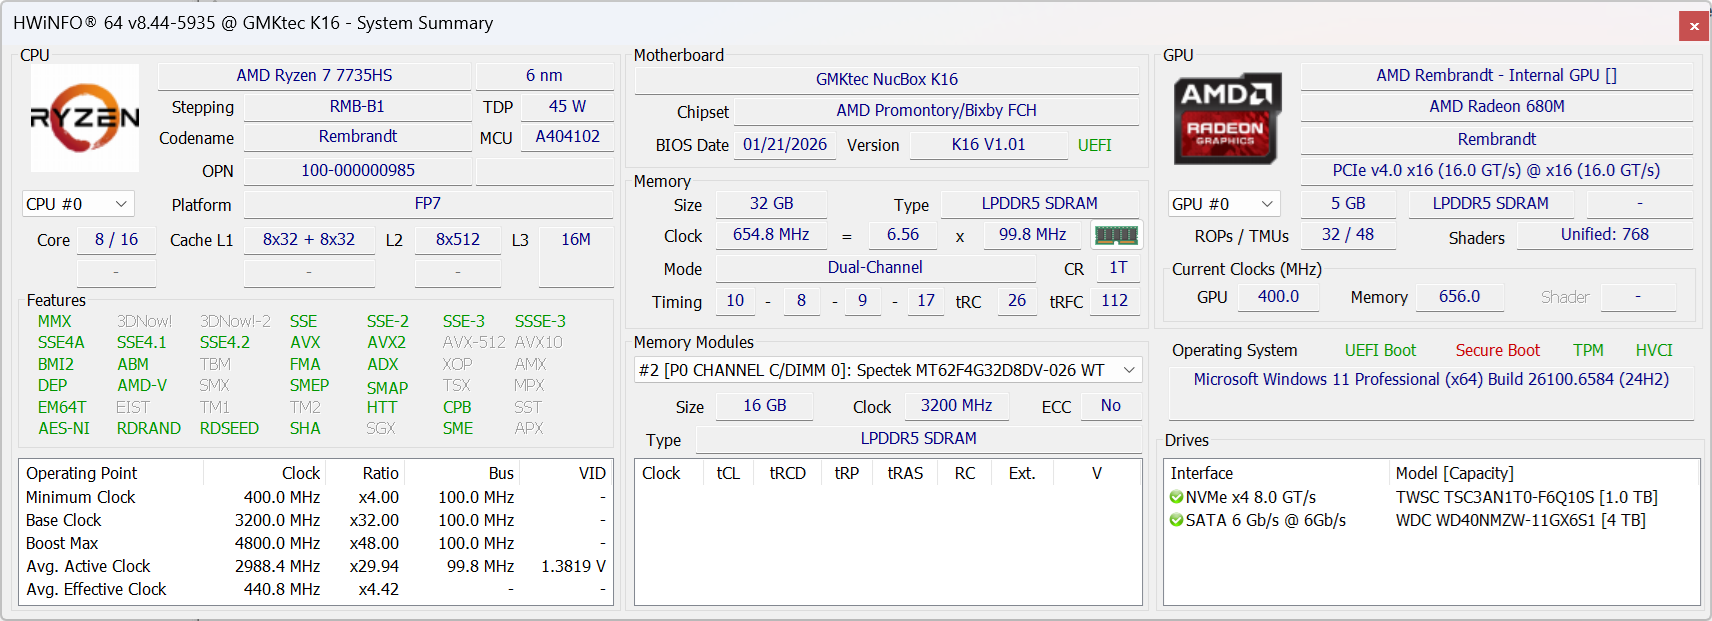
Im Moment ist nur eine Hauptkonfiguration mit der Ryzen 7 7735HS CPU, 32 GB RAM und 512-GB-SSD verfügbar. Andere Konfigurationen können den Speicher verdoppeln, aber der verlötete 32-GB-Speicher und die ältere Zen-3+-CPU bleiben gleich.
Weitere GMKtec Testberichte:
Spezifikationen
Gehäuse
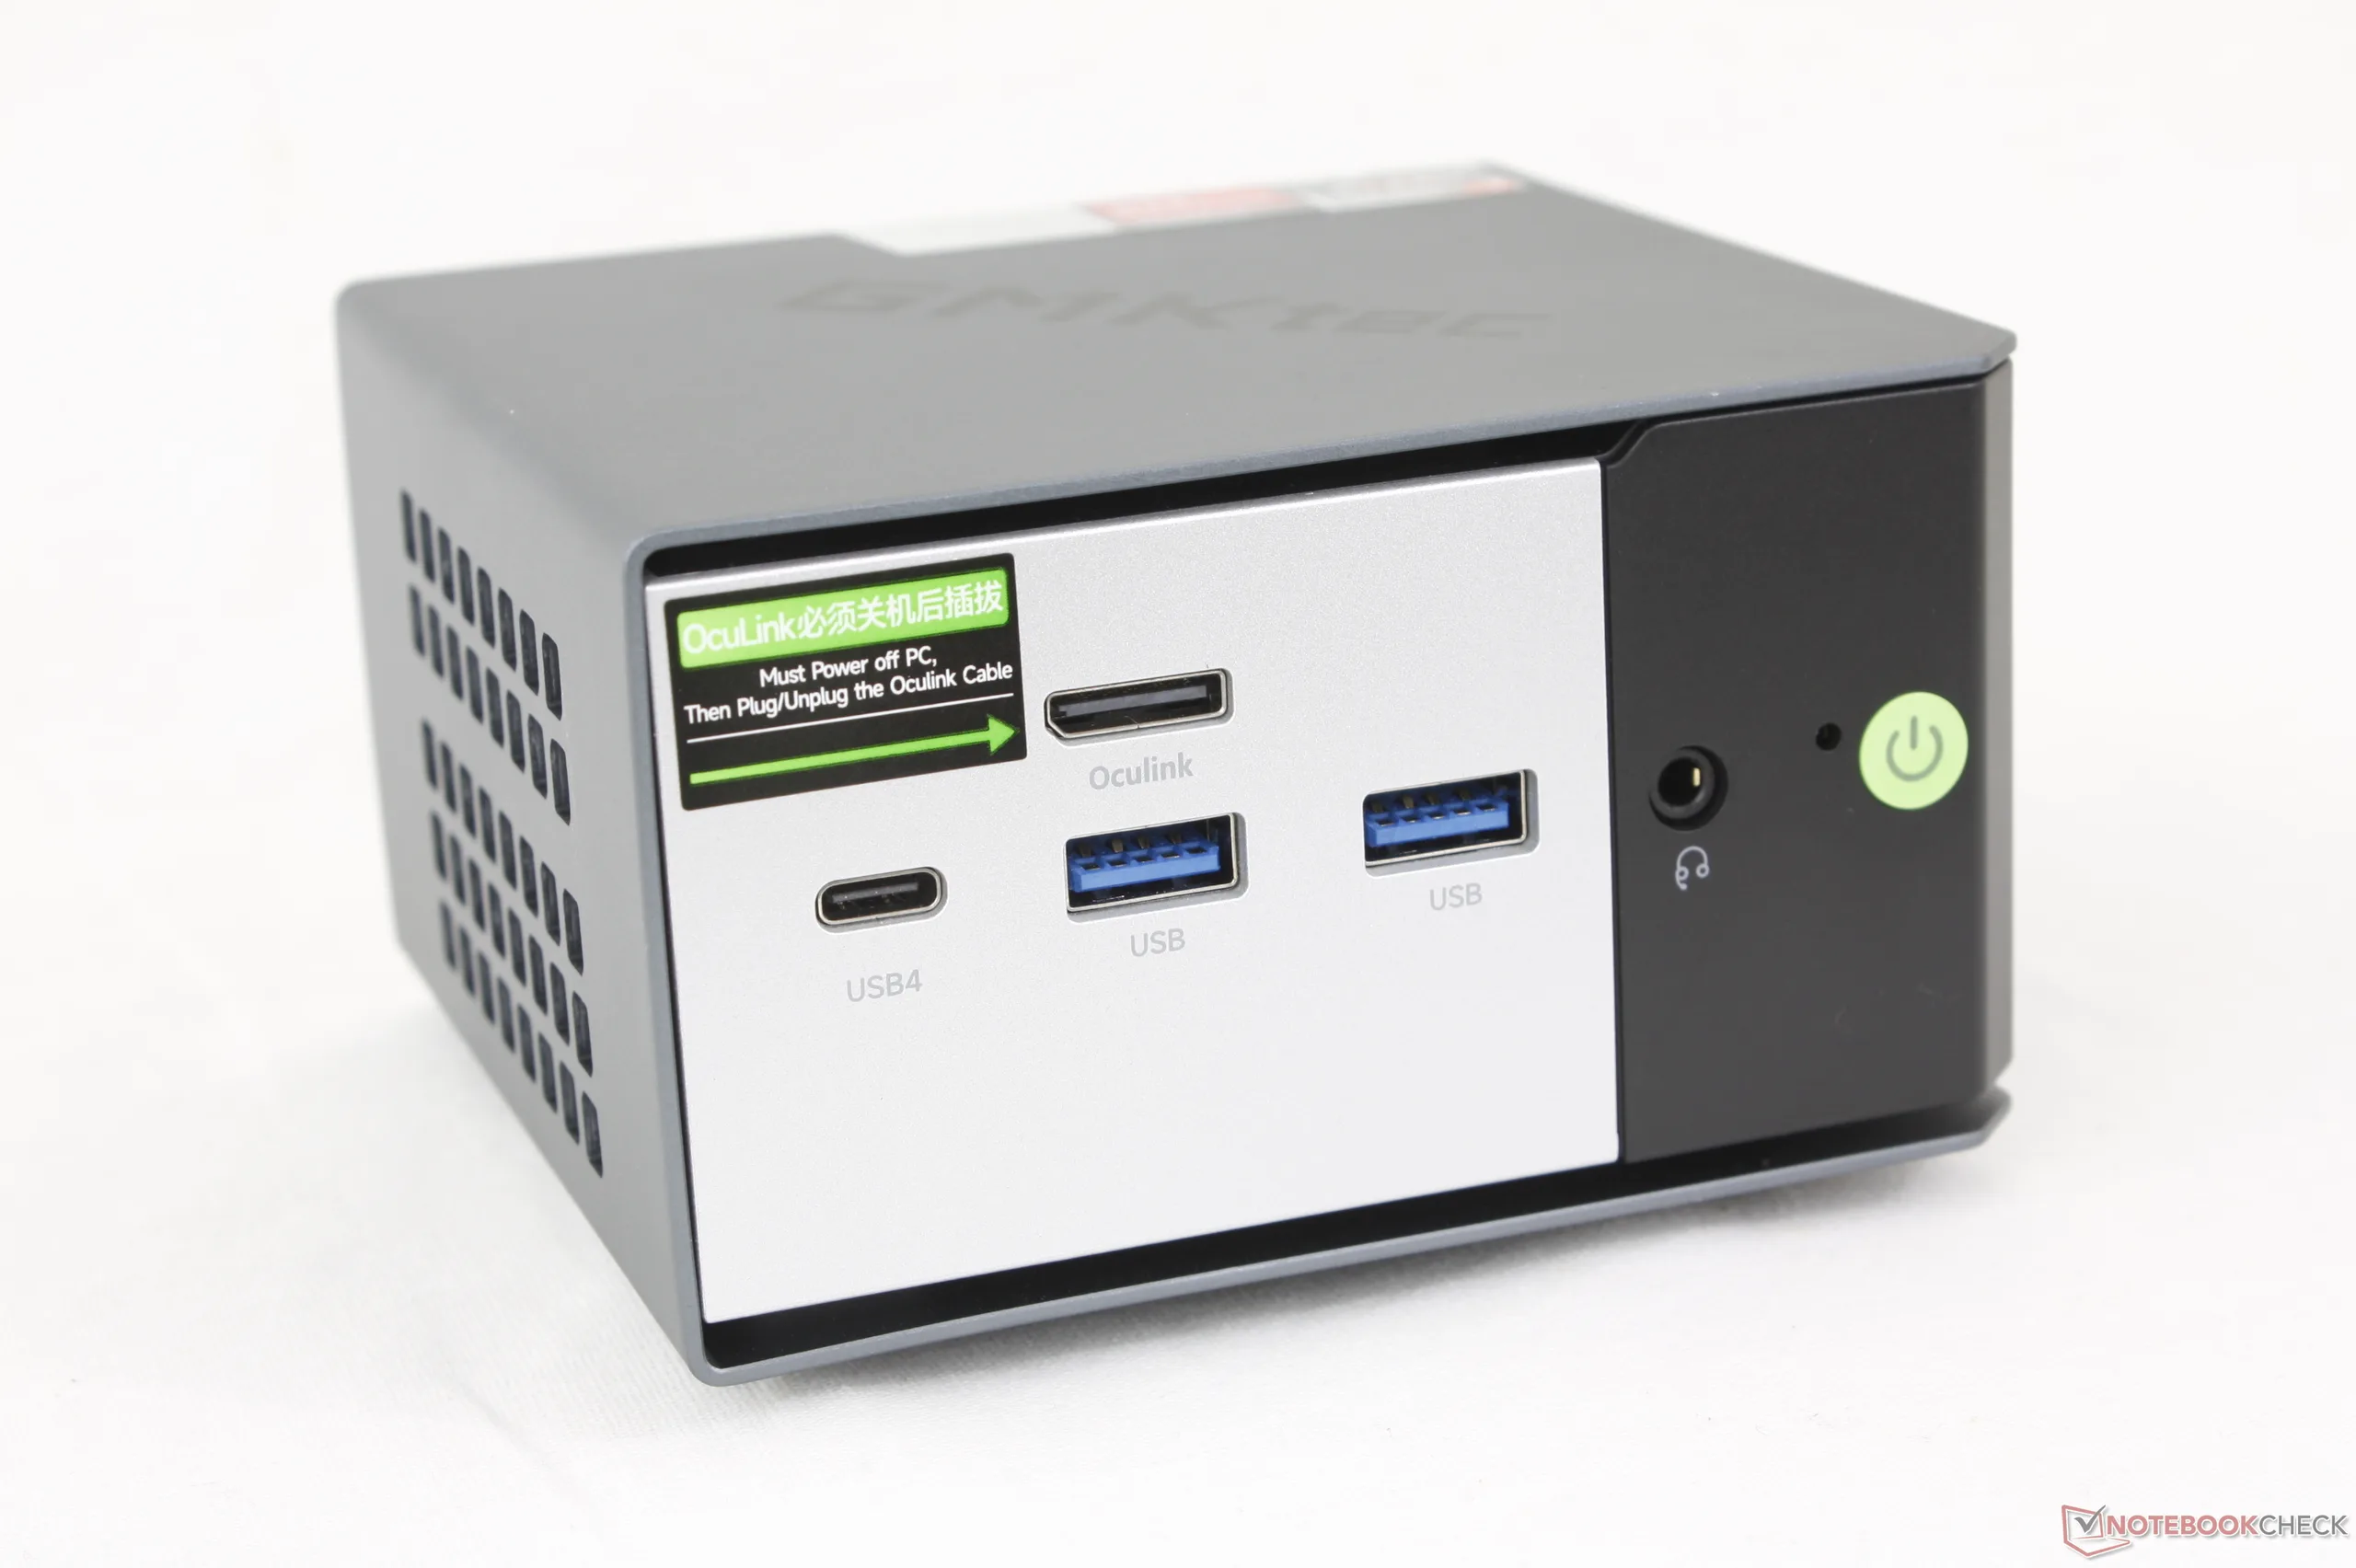
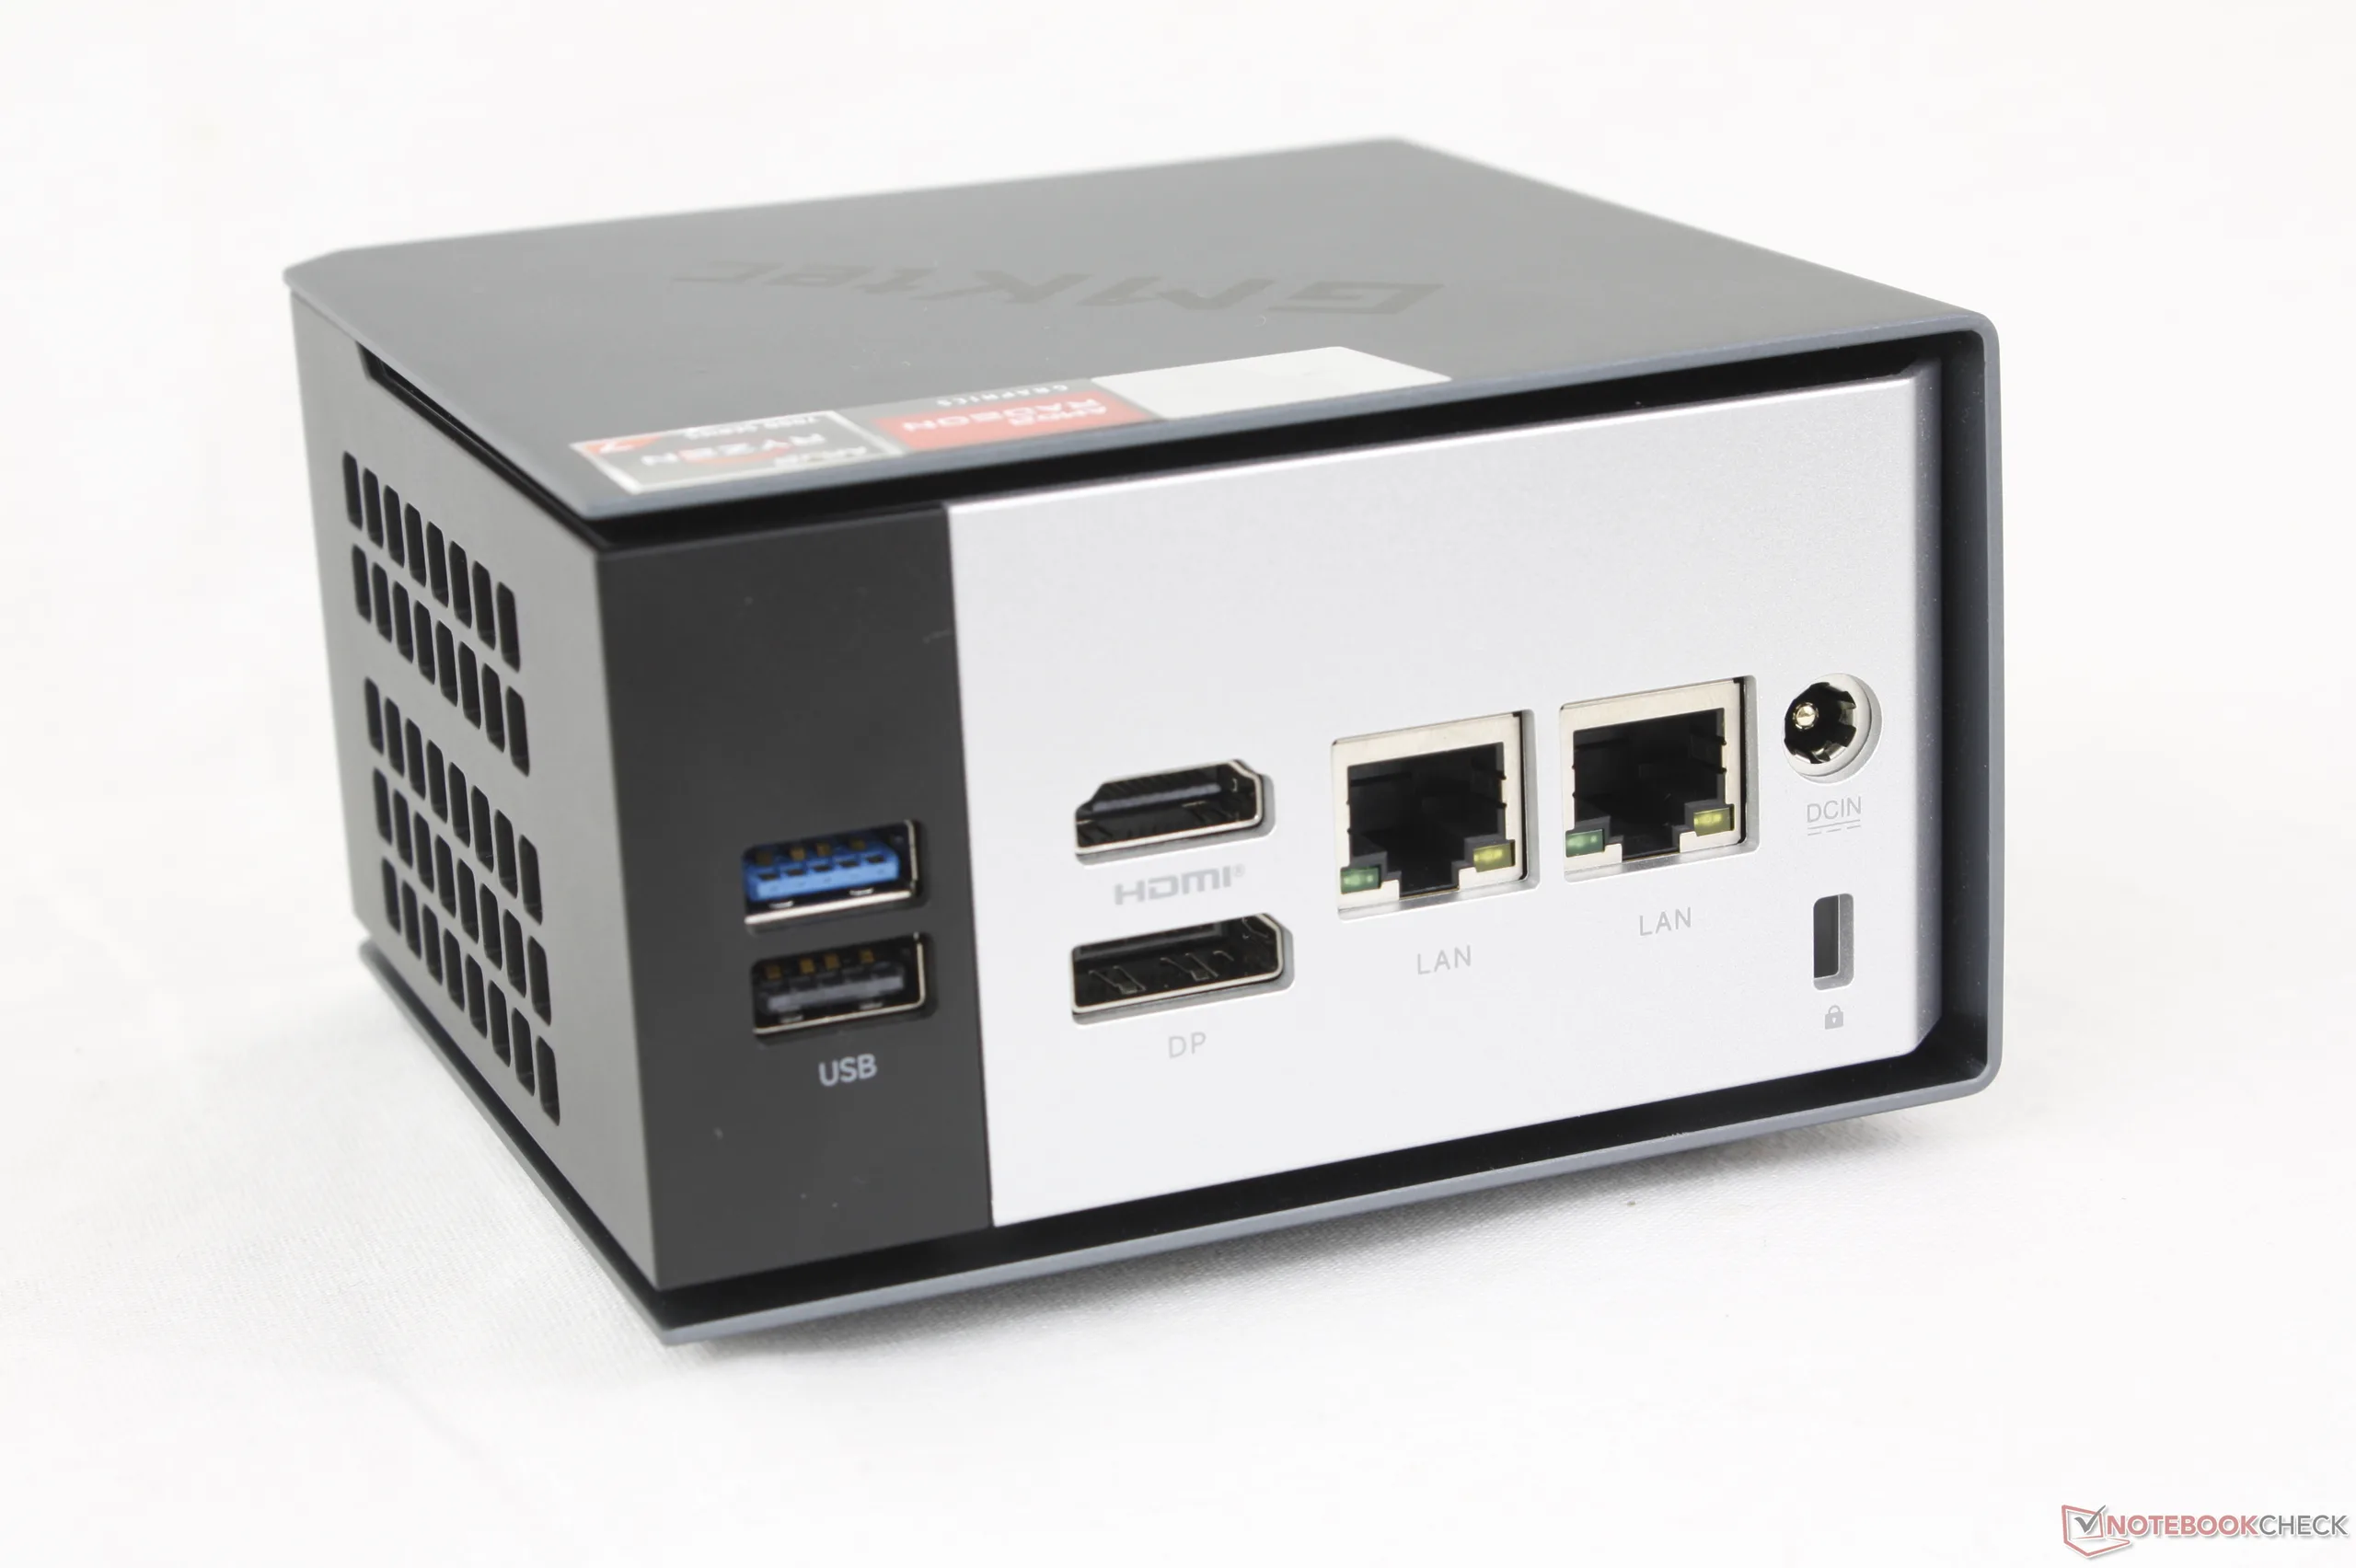
Das Gehäuse ist identisch mit dem EVO-X1 aus dem letzten Jahr, der nach wie vor einer der kleinsten Mini-PCs in GMKtecs Produktpalette ist. Die Anschlussoptionen haben sich nicht geändert, einschließlich des wichtigen Oculink Anschlusses, der das Modell von den meisten konkurrierenden Mini-PCs unterscheidet.
Anschlussausstattung
Kommunikation
| Networking | |
| iperf3 transmit AXE11000 | |
| Asus NUC 15 Pro+ | |
| Geekom A7 Max, R9 7940HS | |
| MSI Cubi NUC AI+ 2MG | |
| GMK NucBox K16 | |
| GMK NucBox K13 | |
| Beelink SER9 Pro | |
| iperf3 receive AXE11000 | |
| Asus NUC 15 Pro+ | |
| MSI Cubi NUC AI+ 2MG | |
| Geekom A7 Max, R9 7940HS | |
| Beelink SER9 Pro | |
| GMK NucBox K13 | |
| GMK NucBox K16 | |
| iperf3 transmit AXE11000 6GHz | |
| GMK NucBox K16 | |
| Asus NUC 15 Pro+ | |
| MSI Cubi NUC AI+ 2MG | |
| GMK NucBox K13 | |
| Geekom A7 Max, R9 7940HS | |
| iperf3 receive AXE11000 6GHz | |
| GMK NucBox K16 | |
| GMK NucBox K13 | |
| MSI Cubi NUC AI+ 2MG | |
| Asus NUC 15 Pro+ | |
| Geekom A7 Max, R9 7940HS | |
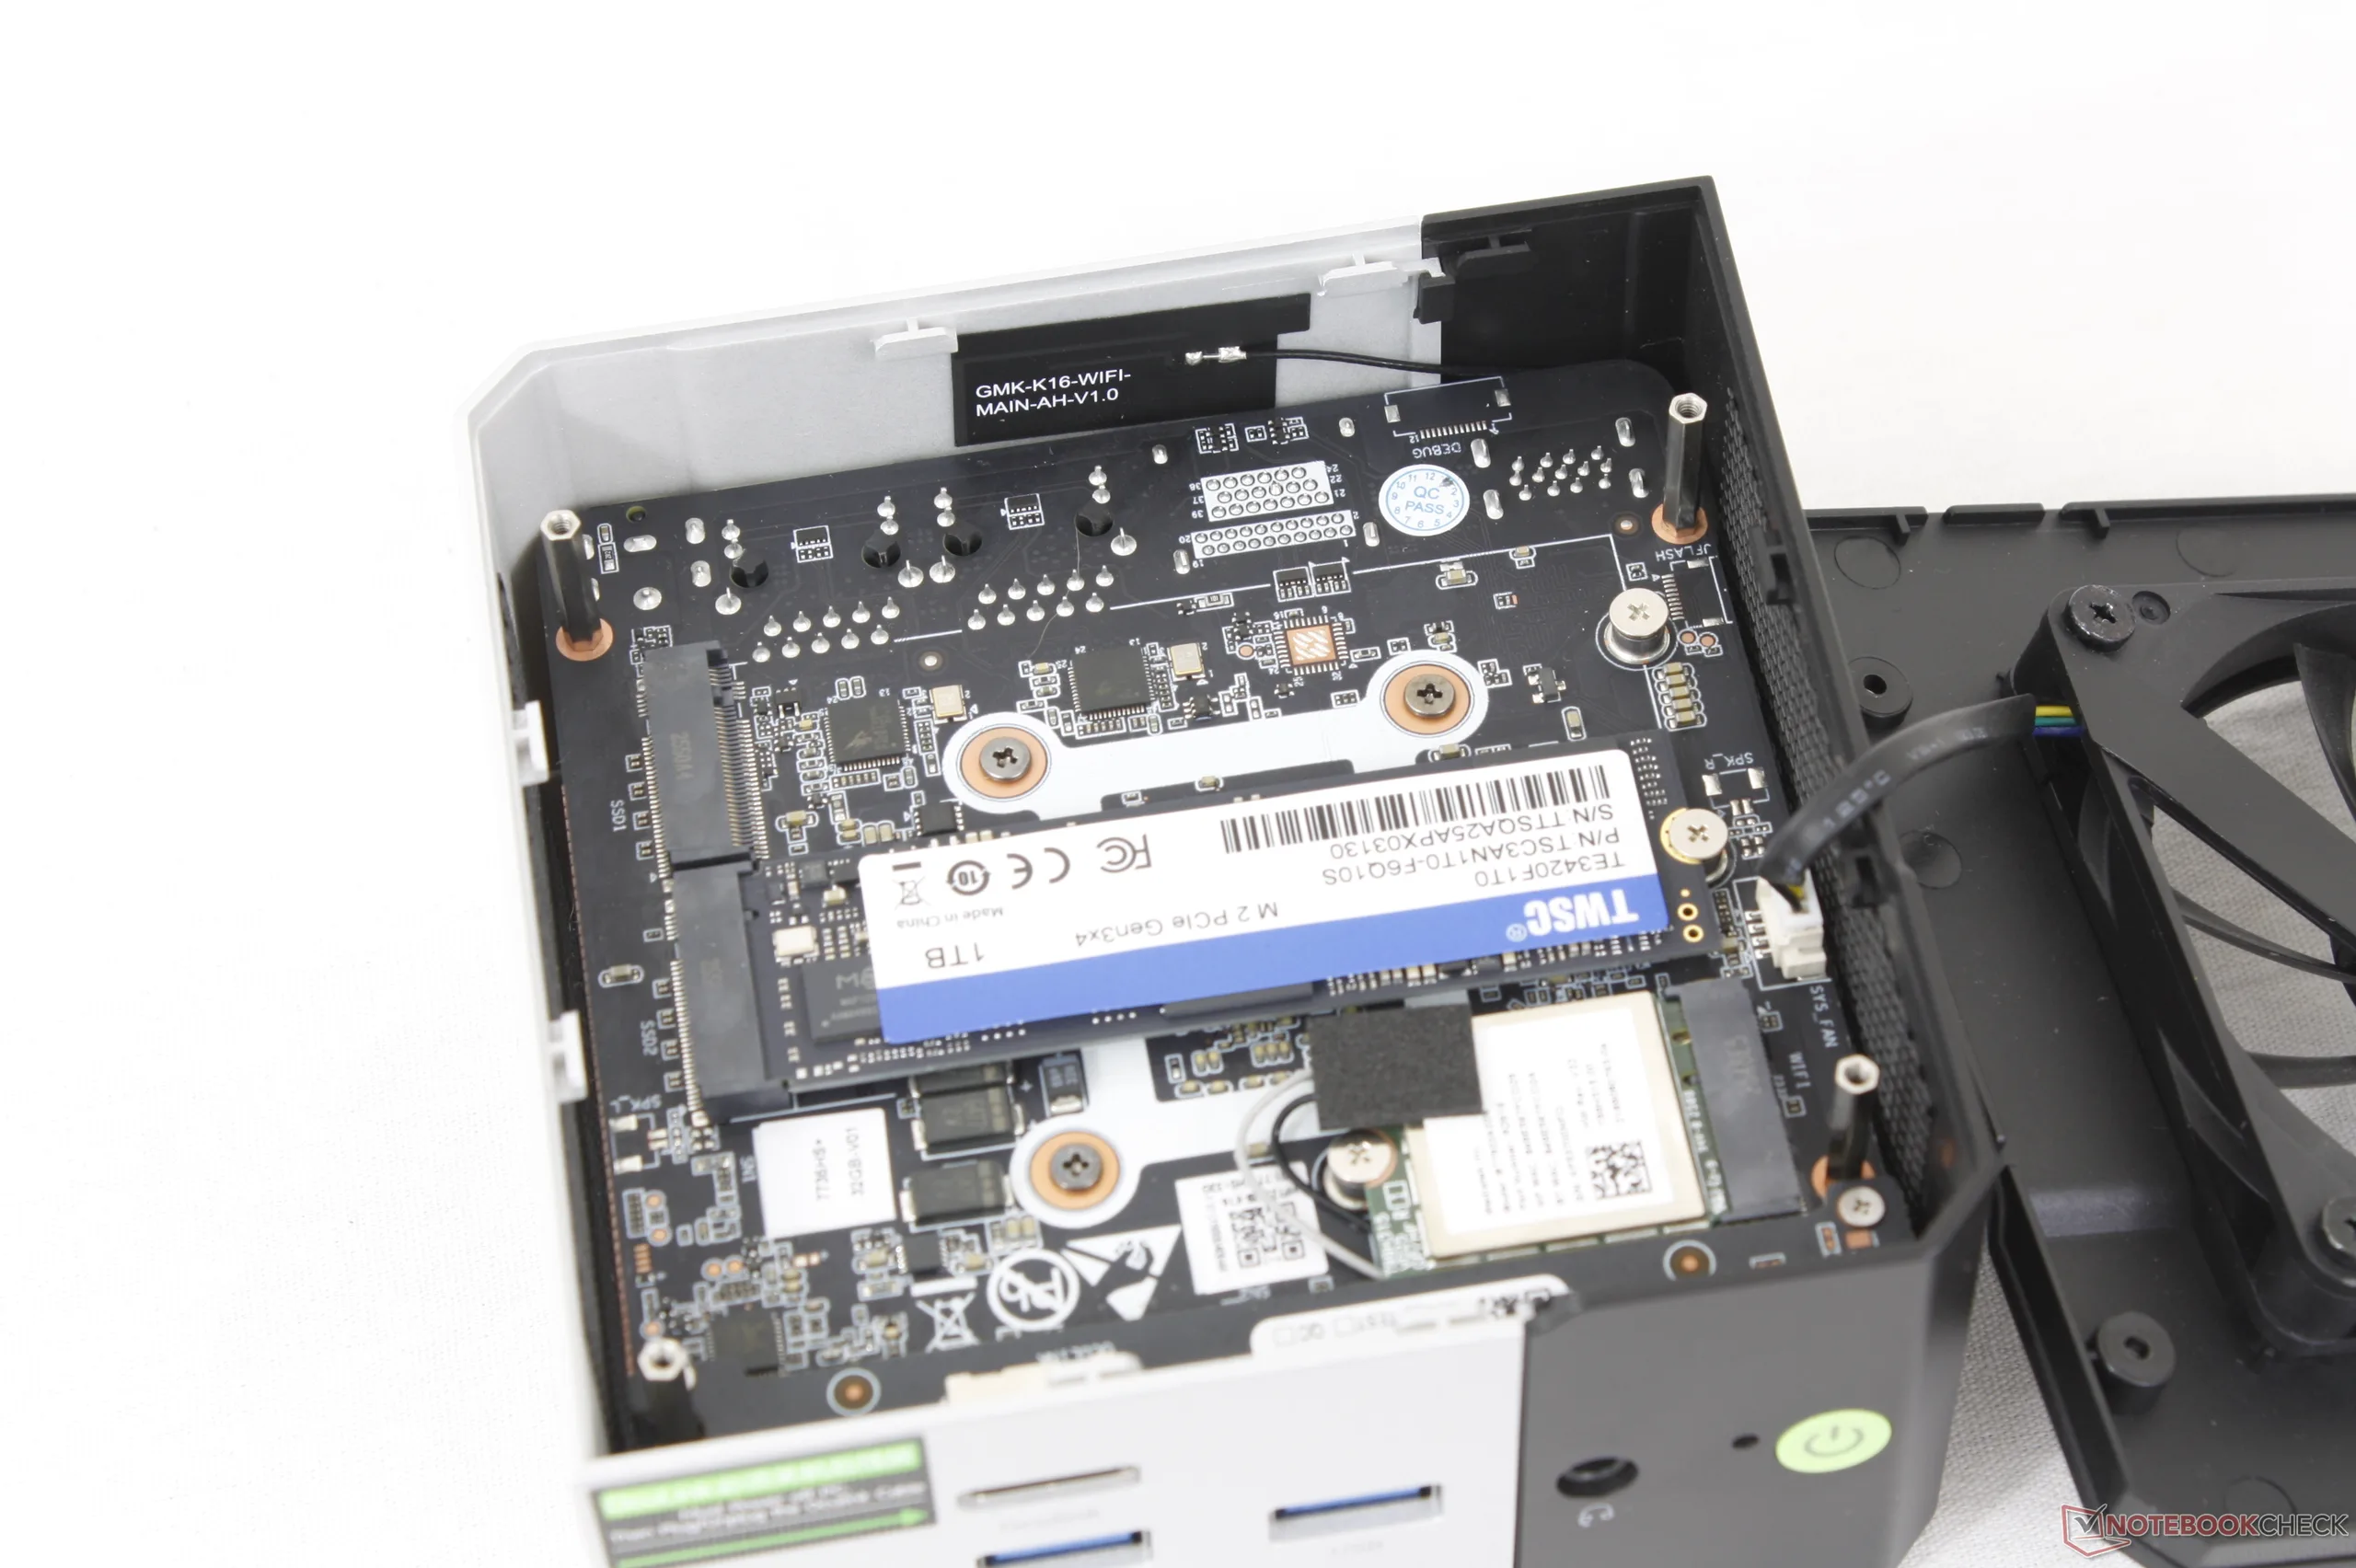
Wartung
Nachhaltigkeit
Der Hersteller gibt nicht ausdrücklich an, welche recycelten Materialien bei der Herstellung verwendet wurden. Ansonsten besteht die Verpackung bis auf die äußere Plastikhülle aus Papier und Kunststoff.
Zubehör und Garantie
Die Verkaufsverpackung enthält neben dem üblichen Netzteil und den Unterlagen auch ein HDMI-Kabel.
Beim Kauf in den USA gilt standardmäßig die einjährige Herstellergarantie.
Performance
Testbedingungen
Wir haben das System über das BIOS auf den Modus Performance eingestellt, bevor wir die folgenden Benchmarks durchgeführt haben. Hinweis: Das System wird standardmäßig im Balanced-Modus ausgeliefert.
Prozessor
Der Ryzen 7 7735HS mag in die Jahre gekommen sein, aber die rohe Prozessorleistung ist immer noch anständig, und die Ergebnisse sind vergleichbar mit denen der neueren Core Ultra 5 125H oder etwa 20 bis 25 Prozent schneller als der effizientere Core Ultra 7 256V. Beachtet werden sollte, dass im Gegensatz zu vielen neueren CPUs, der Ryzen 7 7735HS nicht über eine integrierte NPU verfügt, die für lokale KI-Funktionen wie Co-Pilot+ erforderlich ist.
Cinebench R15 Mehrfachschleife
Cinebench R23: Multi Core | Single Core
Cinebench R20: CPU (Multi Core) | CPU (Single Core)
Cinebench R15: CPU Multi 64Bit | CPU Single 64Bit
Blender: v2.79 BMW27 CPU
7-Zip 18.03: 7z b 4 | 7z b 4 -mmt1
Geekbench 6.7: Multi-Core | Single-Core
Geekbench 5.5: Multi-Core | Single-Core
HWBOT x265 Benchmark v2.2: 4k Preset
LibreOffice : 20 Documents To PDF
R Benchmark 2.5: Overall mean
| CPU Performance Rating | |
| Asus NUC 15 Pro+ | |
| Khadas Mind Pro | |
| Beelink SER9 Pro | |
| Geekom A7 Max, R9 7940HS | |
| GMK NucBox K13 | |
| MSI Cubi NUC AI+ 2MG | |
| Durchschnittliche AMD Ryzen 7 7735HS | |
| GMK NucBox M7 Ultra | |
| GMK NucBox M3 Ultra | |
| GMK NucBox K16 | |
| MSI Cubi NUC 1M | |
| Minix Elite EU512-AI -2! | |
| BMAX B4 Turbo | |
| Cinebench R23 / Multi Core | |
| Asus NUC 15 Pro+ | |
| Khadas Mind Pro | |
| Beelink SER9 Pro | |
| Geekom A7 Max, R9 7940HS | |
| Minix Elite EU512-AI | |
| GMK NucBox K16 | |
| GMK NucBox M7 Ultra | |
| Durchschnittliche AMD Ryzen 7 7735HS (10283 - 14131, n=15) | |
| GMK NucBox K13 | |
| MSI Cubi NUC AI+ 2MG | |
| GMK NucBox M3 Ultra | |
| MSI Cubi NUC 1M | |
| BMAX B4 Turbo | |
| Cinebench R23 / Single Core | |
| Asus NUC 15 Pro+ | |
| Khadas Mind Pro | |
| MSI Cubi NUC AI+ 2MG | |
| GMK NucBox K13 | |
| MSI Cubi NUC 1M | |
| Geekom A7 Max, R9 7940HS | |
| GMK NucBox M3 Ultra | |
| Beelink SER9 Pro | |
| Minix Elite EU512-AI | |
| GMK NucBox K16 | |
| GMK NucBox M7 Ultra | |
| Durchschnittliche AMD Ryzen 7 7735HS (1288 - 1570, n=15) | |
| BMAX B4 Turbo | |
| Cinebench R20 / CPU (Multi Core) | |
| Asus NUC 15 Pro+ | |
| Khadas Mind Pro | |
| Geekom A7 Max, R9 7940HS | |
| Beelink SER9 Pro | |
| Minix Elite EU512-AI | |
| GMK NucBox M7 Ultra | |
| GMK NucBox K16 | |
| Durchschnittliche AMD Ryzen 7 7735HS (3968 - 5502, n=15) | |
| GMK NucBox K13 | |
| MSI Cubi NUC AI+ 2MG | |
| GMK NucBox M3 Ultra | |
| MSI Cubi NUC 1M | |
| BMAX B4 Turbo | |
| Cinebench R20 / CPU (Single Core) | |
| Asus NUC 15 Pro+ | |
| Khadas Mind Pro | |
| MSI Cubi NUC AI+ 2MG | |
| GMK NucBox K13 | |
| MSI Cubi NUC 1M | |
| GMK NucBox M3 Ultra | |
| Geekom A7 Max, R9 7940HS | |
| Beelink SER9 Pro | |
| Minix Elite EU512-AI | |
| Durchschnittliche AMD Ryzen 7 7735HS (502 - 613, n=15) | |
| GMK NucBox K16 | |
| GMK NucBox M7 Ultra | |
| BMAX B4 Turbo | |
| Cinebench R15 / CPU Multi 64Bit | |
| Asus NUC 15 Pro+ | |
| Khadas Mind Pro | |
| Geekom A7 Max, R9 7940HS | |
| Beelink SER9 Pro | |
| Durchschnittliche AMD Ryzen 7 7735HS (1758 - 2355, n=17) | |
| GMK NucBox M7 Ultra | |
| Minix Elite EU512-AI | |
| GMK NucBox K16 | |
| GMK NucBox K13 | |
| GMK NucBox M3 Ultra | |
| MSI Cubi NUC AI+ 2MG | |
| MSI Cubi NUC 1M | |
| BMAX B4 Turbo | |
| Cinebench R15 / CPU Single 64Bit | |
| Asus NUC 15 Pro+ | |
| Khadas Mind Pro | |
| MSI Cubi NUC AI+ 2MG | |
| GMK NucBox K13 | |
| Geekom A7 Max, R9 7940HS | |
| Beelink SER9 Pro | |
| MSI Cubi NUC 1M | |
| GMK NucBox M3 Ultra | |
| Durchschnittliche AMD Ryzen 7 7735HS (206 - 255, n=16) | |
| GMK NucBox M7 Ultra | |
| GMK NucBox K16 | |
| Minix Elite EU512-AI | |
| BMAX B4 Turbo | |
| Blender / v2.79 BMW27 CPU | |
| BMAX B4 Turbo | |
| MSI Cubi NUC 1M | |
| MSI Cubi NUC AI+ 2MG | |
| GMK NucBox K13 | |
| GMK NucBox M3 Ultra | |
| Durchschnittliche AMD Ryzen 7 7735HS (214 - 351, n=15) | |
| GMK NucBox K16 | |
| GMK NucBox M7 Ultra | |
| Minix Elite EU512-AI | |
| Geekom A7 Max, R9 7940HS | |
| Beelink SER9 Pro | |
| Khadas Mind Pro | |
| Asus NUC 15 Pro+ | |
| 7-Zip 18.03 / 7z b 4 | |
| Beelink SER9 Pro | |
| Asus NUC 15 Pro+ | |
| Khadas Mind Pro | |
| Geekom A7 Max, R9 7940HS | |
| GMK NucBox M7 Ultra | |
| Durchschnittliche AMD Ryzen 7 7735HS (43455 - 63698, n=15) | |
| GMK NucBox K16 | |
| GMK NucBox M3 Ultra | |
| GMK NucBox K13 | |
| MSI Cubi NUC AI+ 2MG | |
| MSI Cubi NUC 1M | |
| BMAX B4 Turbo | |
| Minix Elite EU512-AI | |
| 7-Zip 18.03 / 7z b 4 -mmt1 | |
| Geekom A7 Max, R9 7940HS | |
| Beelink SER9 Pro | |
| Khadas Mind Pro | |
| Asus NUC 15 Pro+ | |
| MSI Cubi NUC 1M | |
| GMK NucBox M3 Ultra | |
| MSI Cubi NUC AI+ 2MG | |
| GMK NucBox K13 | |
| GMK NucBox M7 Ultra | |
| Durchschnittliche AMD Ryzen 7 7735HS (4779 - 5849, n=15) | |
| GMK NucBox K16 | |
| Minix Elite EU512-AI | |
| BMAX B4 Turbo | |
| Geekbench 6.7 / Multi-Core | |
| Asus NUC 15 Pro+ | |
| Khadas Mind Pro | |
| Beelink SER9 Pro | |
| GMK NucBox K13 | |
| Geekom A7 Max, R9 7940HS | |
| GMK NucBox M7 Ultra | |
| Durchschnittliche AMD Ryzen 7 7735HS (7046 - 11035, n=9) | |
| MSI Cubi NUC AI+ 2MG | |
| MSI Cubi NUC 1M | |
| GMK NucBox M3 Ultra | |
| GMK NucBox K16 | |
| BMAX B4 Turbo | |
| Geekbench 6.7 / Single-Core | |
| Khadas Mind Pro | |
| GMK NucBox K13 | |
| MSI Cubi NUC AI+ 2MG | |
| Asus NUC 15 Pro+ | |
| MSI Cubi NUC 1M | |
| Geekom A7 Max, R9 7940HS | |
| Beelink SER9 Pro | |
| GMK NucBox M3 Ultra | |
| Durchschnittliche AMD Ryzen 7 7735HS (1949 - 2153, n=9) | |
| GMK NucBox M7 Ultra | |
| GMK NucBox K16 | |
| BMAX B4 Turbo | |
| Geekbench 5.5 / Multi-Core | |
| Khadas Mind Pro | |
| Asus NUC 15 Pro+ | |
| Beelink SER9 Pro | |
| Geekom A7 Max, R9 7940HS | |
| GMK NucBox M7 Ultra | |
| Durchschnittliche AMD Ryzen 7 7735HS (7151 - 10258, n=15) | |
| Minix Elite EU512-AI | |
| GMK NucBox K13 | |
| GMK NucBox M3 Ultra | |
| MSI Cubi NUC 1M | |
| MSI Cubi NUC AI+ 2MG | |
| GMK NucBox K16 | |
| BMAX B4 Turbo | |
| Geekbench 5.5 / Single-Core | |
| Khadas Mind Pro | |
| MSI Cubi NUC AI+ 2MG | |
| GMK NucBox K13 | |
| Geekom A7 Max, R9 7940HS | |
| MSI Cubi NUC 1M | |
| Beelink SER9 Pro | |
| GMK NucBox M3 Ultra | |
| Asus NUC 15 Pro+ | |
| Minix Elite EU512-AI | |
| Durchschnittliche AMD Ryzen 7 7735HS (1327 - 1615, n=15) | |
| GMK NucBox M7 Ultra | |
| GMK NucBox K16 | |
| BMAX B4 Turbo | |
| HWBOT x265 Benchmark v2.2 / 4k Preset | |
| Asus NUC 15 Pro+ | |
| Khadas Mind Pro | |
| Beelink SER9 Pro | |
| Geekom A7 Max, R9 7940HS | |
| GMK NucBox M7 Ultra | |
| Durchschnittliche AMD Ryzen 7 7735HS (10.8 - 17.9, n=15) | |
| Minix Elite EU512-AI | |
| GMK NucBox K13 | |
| MSI Cubi NUC AI+ 2MG | |
| GMK NucBox K16 | |
| GMK NucBox M3 Ultra | |
| MSI Cubi NUC 1M | |
| BMAX B4 Turbo | |
| LibreOffice / 20 Documents To PDF | |
| BMAX B4 Turbo | |
| GMK NucBox M7 Ultra | |
| Minix Elite EU512-AI | |
| GMK NucBox M3 Ultra | |
| GMK NucBox K16 | |
| Asus NUC 15 Pro+ | |
| Durchschnittliche AMD Ryzen 7 7735HS (44.3 - 63.9, n=15) | |
| Geekom A7 Max, R9 7940HS | |
| Beelink SER9 Pro | |
| GMK NucBox K13 | |
| Khadas Mind Pro | |
| MSI Cubi NUC AI+ 2MG | |
| MSI Cubi NUC 1M | |
| R Benchmark 2.5 / Overall mean | |
| BMAX B4 Turbo | |
| Minix Elite EU512-AI | |
| GMK NucBox K16 | |
| Durchschnittliche AMD Ryzen 7 7735HS (0.4822 - 0.585, n=15) | |
| Beelink SER9 Pro | |
| GMK NucBox M7 Ultra | |
| GMK NucBox M3 Ultra | |
| MSI Cubi NUC AI+ 2MG | |
| GMK NucBox K13 | |
| MSI Cubi NUC 1M | |
| Geekom A7 Max, R9 7940HS | |
| Asus NUC 15 Pro+ | |
| Khadas Mind Pro | |
| Khadas Mind Pro | |
Cinebench R23: Multi Core | Single Core
Cinebench R20: CPU (Multi Core) | CPU (Single Core)
Cinebench R15: CPU Multi 64Bit | CPU Single 64Bit
Blender: v2.79 BMW27 CPU
7-Zip 18.03: 7z b 4 | 7z b 4 -mmt1
Geekbench 6.7: Multi-Core | Single-Core
Geekbench 5.5: Multi-Core | Single-Core
HWBOT x265 Benchmark v2.2: 4k Preset
LibreOffice : 20 Documents To PDF
R Benchmark 2.5: Overall mean
* ... kleinere Werte sind besser
AIDA64: FP32 Ray-Trace | FPU Julia | CPU SHA3 | CPU Queen | FPU SinJulia | FPU Mandel | CPU AES | CPU ZLib | FP64 Ray-Trace | CPU PhotoWorxx | CPU CheckMate
| Performance Rating | |
| Beelink SER9 Pro -1! | |
| Geekom A7 Max, R9 7940HS -1! | |
| Asus NUC 15 Pro+ -1! | |
| Durchschnittliche AMD Ryzen 7 7735HS | |
| GMK NucBox K16 -1! | |
| GMK NucBox K13 -1! | |
| MSI Cubi NUC AI+ 2MG -1! | |
| AIDA64 / FP32 Ray-Trace | |
| Beelink SER9 Pro (v6.92.6600) | |
| Geekom A7 Max, R9 7940HS (v6.92.6600) | |
| Asus NUC 15 Pro+ (v6.92.6600) | |
| GMK NucBox K16 (v8.20.8100) | |
| Durchschnittliche AMD Ryzen 7 7735HS (11831 - 17161, n=16) | |
| GMK NucBox K13 (v8.20.8100) | |
| MSI Cubi NUC AI+ 2MG (v6.92.6600) | |
| AIDA64 / FPU Julia | |
| Asus NUC 15 Pro+ (v6.92.6600) | |
| Geekom A7 Max, R9 7940HS (v6.92.6600) | |
| Beelink SER9 Pro (v6.92.6600) | |
| GMK NucBox K16 (v8.20.8100) | |
| Durchschnittliche AMD Ryzen 7 7735HS (75370 - 105483, n=16) | |
| GMK NucBox K13 (v8.20.8100) | |
| MSI Cubi NUC AI+ 2MG (v6.92.6600) | |
| AIDA64 / CPU SHA3 | |
| Asus NUC 15 Pro+ (v6.92.6600) | |
| Geekom A7 Max, R9 7940HS (v6.92.6600) | |
| Beelink SER9 Pro (v6.92.6600) | |
| GMK NucBox K16 (v8.20.8100) | |
| Durchschnittliche AMD Ryzen 7 7735HS (2499 - 3494, n=16) | |
| GMK NucBox K13 (v8.20.8100) | |
| MSI Cubi NUC AI+ 2MG (v6.92.6600) | |
| AIDA64 / CPU Queen | |
| Geekom A7 Max, R9 7940HS (v6.92.6600) | |
| Beelink SER9 Pro (v6.92.6600) | |
| Durchschnittliche AMD Ryzen 7 7735HS (87486 - 108729, n=15) | |
| Asus NUC 15 Pro+ (v6.92.6600) | |
| MSI Cubi NUC AI+ 2MG (v6.92.6600) | |
| AIDA64 / FPU SinJulia | |
| Beelink SER9 Pro (v6.92.6600) | |
| Geekom A7 Max, R9 7940HS (v6.92.6600) | |
| GMK NucBox K16 (v8.20.8100) | |
| Durchschnittliche AMD Ryzen 7 7735HS (11233 - 13097, n=16) | |
| Asus NUC 15 Pro+ (v6.92.6600) | |
| GMK NucBox K13 (v8.20.8100) | |
| MSI Cubi NUC AI+ 2MG (v6.92.6600) | |
| AIDA64 / FPU Mandel | |
| Asus NUC 15 Pro+ (v6.92.6600) | |
| Geekom A7 Max, R9 7940HS (v6.92.6600) | |
| Beelink SER9 Pro (v6.92.6600) | |
| GMK NucBox K16 (v8.20.8100) | |
| Durchschnittliche AMD Ryzen 7 7735HS (41400 - 58232, n=16) | |
| GMK NucBox K13 (v8.20.8100) | |
| MSI Cubi NUC AI+ 2MG (v6.92.6600) | |
| AIDA64 / CPU AES | |
| Geekom A7 Max, R9 7940HS (v6.92.6600) | |
| Beelink SER9 Pro (v6.92.6600) | |
| Asus NUC 15 Pro+ (v6.92.6600) | |
| Durchschnittliche AMD Ryzen 7 7735HS (44013 - 137629, n=16) | |
| GMK NucBox K13 (v8.20.8100) | |
| GMK NucBox K16 (v8.20.8100) | |
| MSI Cubi NUC AI+ 2MG (v6.92.6600) | |
| AIDA64 / CPU ZLib | |
| Asus NUC 15 Pro+ (v6.92.6600) | |
| Geekom A7 Max, R9 7940HS (v6.92.6600) | |
| Beelink SER9 Pro (v6.92.6600) | |
| GMK NucBox K16 (v8.20.8100) | |
| Durchschnittliche AMD Ryzen 7 7735HS (651 - 906, n=16) | |
| GMK NucBox K13 (v8.20.8100) | |
| MSI Cubi NUC AI+ 2MG (v6.92.6600) | |
| AIDA64 / FP64 Ray-Trace | |
| Beelink SER9 Pro (v6.92.6600) | |
| Geekom A7 Max, R9 7940HS (v6.92.6600) | |
| Asus NUC 15 Pro+ (v6.92.6600) | |
| GMK NucBox K16 (v8.20.8100) | |
| Durchschnittliche AMD Ryzen 7 7735HS (1459 - 9094, n=16) | |
| GMK NucBox K13 (v8.20.8100) | |
| MSI Cubi NUC AI+ 2MG (v6.92.6600) | |
| AIDA64 / CPU PhotoWorxx | |
| GMK NucBox K13 (v8.20.8100) | |
| Asus NUC 15 Pro+ (v6.92.6600) | |
| MSI Cubi NUC AI+ 2MG (v6.92.6600) | |
| Beelink SER9 Pro (v6.92.6600) | |
| Durchschnittliche AMD Ryzen 7 7735HS (17524 - 30542, n=16) | |
| Geekom A7 Max, R9 7940HS (v6.92.6600) | |
| GMK NucBox K16 (v8.20.8100) | |
| AIDA64 / CPU CheckMate | |
| GMK NucBox K16 (v8.20.8100) | |
| Durchschnittliche AMD Ryzen 7 7735HS (n=1) | |
| GMK NucBox K13 (v8.20.8100) | |
Systemleistung
PCMark 10: Score | Essentials | Productivity | Digital Content Creation
CrossMark: Overall | Productivity | Creativity | Responsiveness
WebXPRT 3: Overall
WebXPRT 4: Overall
Mozilla Kraken 1.1: Total
| Performance Rating | |
| GMK NucBox K13 | |
| Beelink SER9 Pro | |
| Asus NUC 15 Pro+ | |
| MSI Cubi NUC AI+ 2MG | |
| Geekom A7 Max, R9 7940HS | |
| Durchschnittliche AMD Ryzen 7 7735HS, AMD Radeon 680M | |
| GMK NucBox K16 | |
| PCMark 10 / Score | |
| GMK NucBox K13 | |
| Asus NUC 15 Pro+ | |
| Beelink SER9 Pro | |
| MSI Cubi NUC AI+ 2MG | |
| GMK NucBox K16 | |
| Geekom A7 Max, R9 7940HS | |
| Durchschnittliche AMD Ryzen 7 7735HS, AMD Radeon 680M (5722 - 7000, n=8) | |
| PCMark 10 / Essentials | |
| Beelink SER9 Pro | |
| Durchschnittliche AMD Ryzen 7 7735HS, AMD Radeon 680M (8648 - 11124, n=8) | |
| MSI Cubi NUC AI+ 2MG | |
| Geekom A7 Max, R9 7940HS | |
| GMK NucBox K13 | |
| Asus NUC 15 Pro+ | |
| GMK NucBox K16 | |
| PCMark 10 / Productivity | |
| GMK NucBox K13 | |
| GMK NucBox K16 | |
| Durchschnittliche AMD Ryzen 7 7735HS, AMD Radeon 680M (8428 - 12153, n=8) | |
| Geekom A7 Max, R9 7940HS | |
| Beelink SER9 Pro | |
| MSI Cubi NUC AI+ 2MG | |
| Asus NUC 15 Pro+ | |
| PCMark 10 / Digital Content Creation | |
| Asus NUC 15 Pro+ | |
| GMK NucBox K13 | |
| MSI Cubi NUC AI+ 2MG | |
| Beelink SER9 Pro | |
| Geekom A7 Max, R9 7940HS | |
| GMK NucBox K16 | |
| Durchschnittliche AMD Ryzen 7 7735HS, AMD Radeon 680M (5798 - 8726, n=8) | |
| CrossMark / Overall | |
| Beelink SER9 Pro | |
| Asus NUC 15 Pro+ | |
| GMK NucBox K13 | |
| Geekom A7 Max, R9 7940HS | |
| MSI Cubi NUC AI+ 2MG | |
| Durchschnittliche AMD Ryzen 7 7735HS, AMD Radeon 680M (1280 - 1736, n=8) | |
| GMK NucBox K16 | |
| CrossMark / Productivity | |
| Beelink SER9 Pro | |
| Geekom A7 Max, R9 7940HS | |
| GMK NucBox K13 | |
| Asus NUC 15 Pro+ | |
| Durchschnittliche AMD Ryzen 7 7735HS, AMD Radeon 680M (1336 - 1725, n=8) | |
| MSI Cubi NUC AI+ 2MG | |
| GMK NucBox K16 | |
| CrossMark / Creativity | |
| Asus NUC 15 Pro+ | |
| GMK NucBox K13 | |
| Beelink SER9 Pro | |
| MSI Cubi NUC AI+ 2MG | |
| Geekom A7 Max, R9 7940HS | |
| Durchschnittliche AMD Ryzen 7 7735HS, AMD Radeon 680M (1273 - 1785, n=8) | |
| GMK NucBox K16 | |
| CrossMark / Responsiveness | |
| Beelink SER9 Pro | |
| Geekom A7 Max, R9 7940HS | |
| Durchschnittliche AMD Ryzen 7 7735HS, AMD Radeon 680M (1144 - 1653, n=8) | |
| GMK NucBox K13 | |
| Asus NUC 15 Pro+ | |
| MSI Cubi NUC AI+ 2MG | |
| GMK NucBox K16 | |
| WebXPRT 3 / Overall | |
| MSI Cubi NUC AI+ 2MG | |
| Beelink SER9 Pro | |
| GMK NucBox K13 | |
| Geekom A7 Max, R9 7940HS | |
| Durchschnittliche AMD Ryzen 7 7735HS, AMD Radeon 680M (228 - 307, n=7) | |
| Asus NUC 15 Pro+ | |
| GMK NucBox K16 | |
| WebXPRT 4 / Overall | |
| GMK NucBox K13 | |
| MSI Cubi NUC AI+ 2MG | |
| Beelink SER9 Pro | |
| Geekom A7 Max, R9 7940HS | |
| Asus NUC 15 Pro+ | |
| Durchschnittliche AMD Ryzen 7 7735HS, AMD Radeon 680M (176 - 231, n=8) | |
| GMK NucBox K16 | |
| Mozilla Kraken 1.1 / Total | |
| GMK NucBox K16 | |
| Durchschnittliche AMD Ryzen 7 7735HS, AMD Radeon 680M (580 - 655, n=8) | |
| Beelink SER9 Pro | |
| Geekom A7 Max, R9 7940HS | |
| MSI Cubi NUC AI+ 2MG | |
| Asus NUC 15 Pro+ | |
| GMK NucBox K13 | |
* ... kleinere Werte sind besser
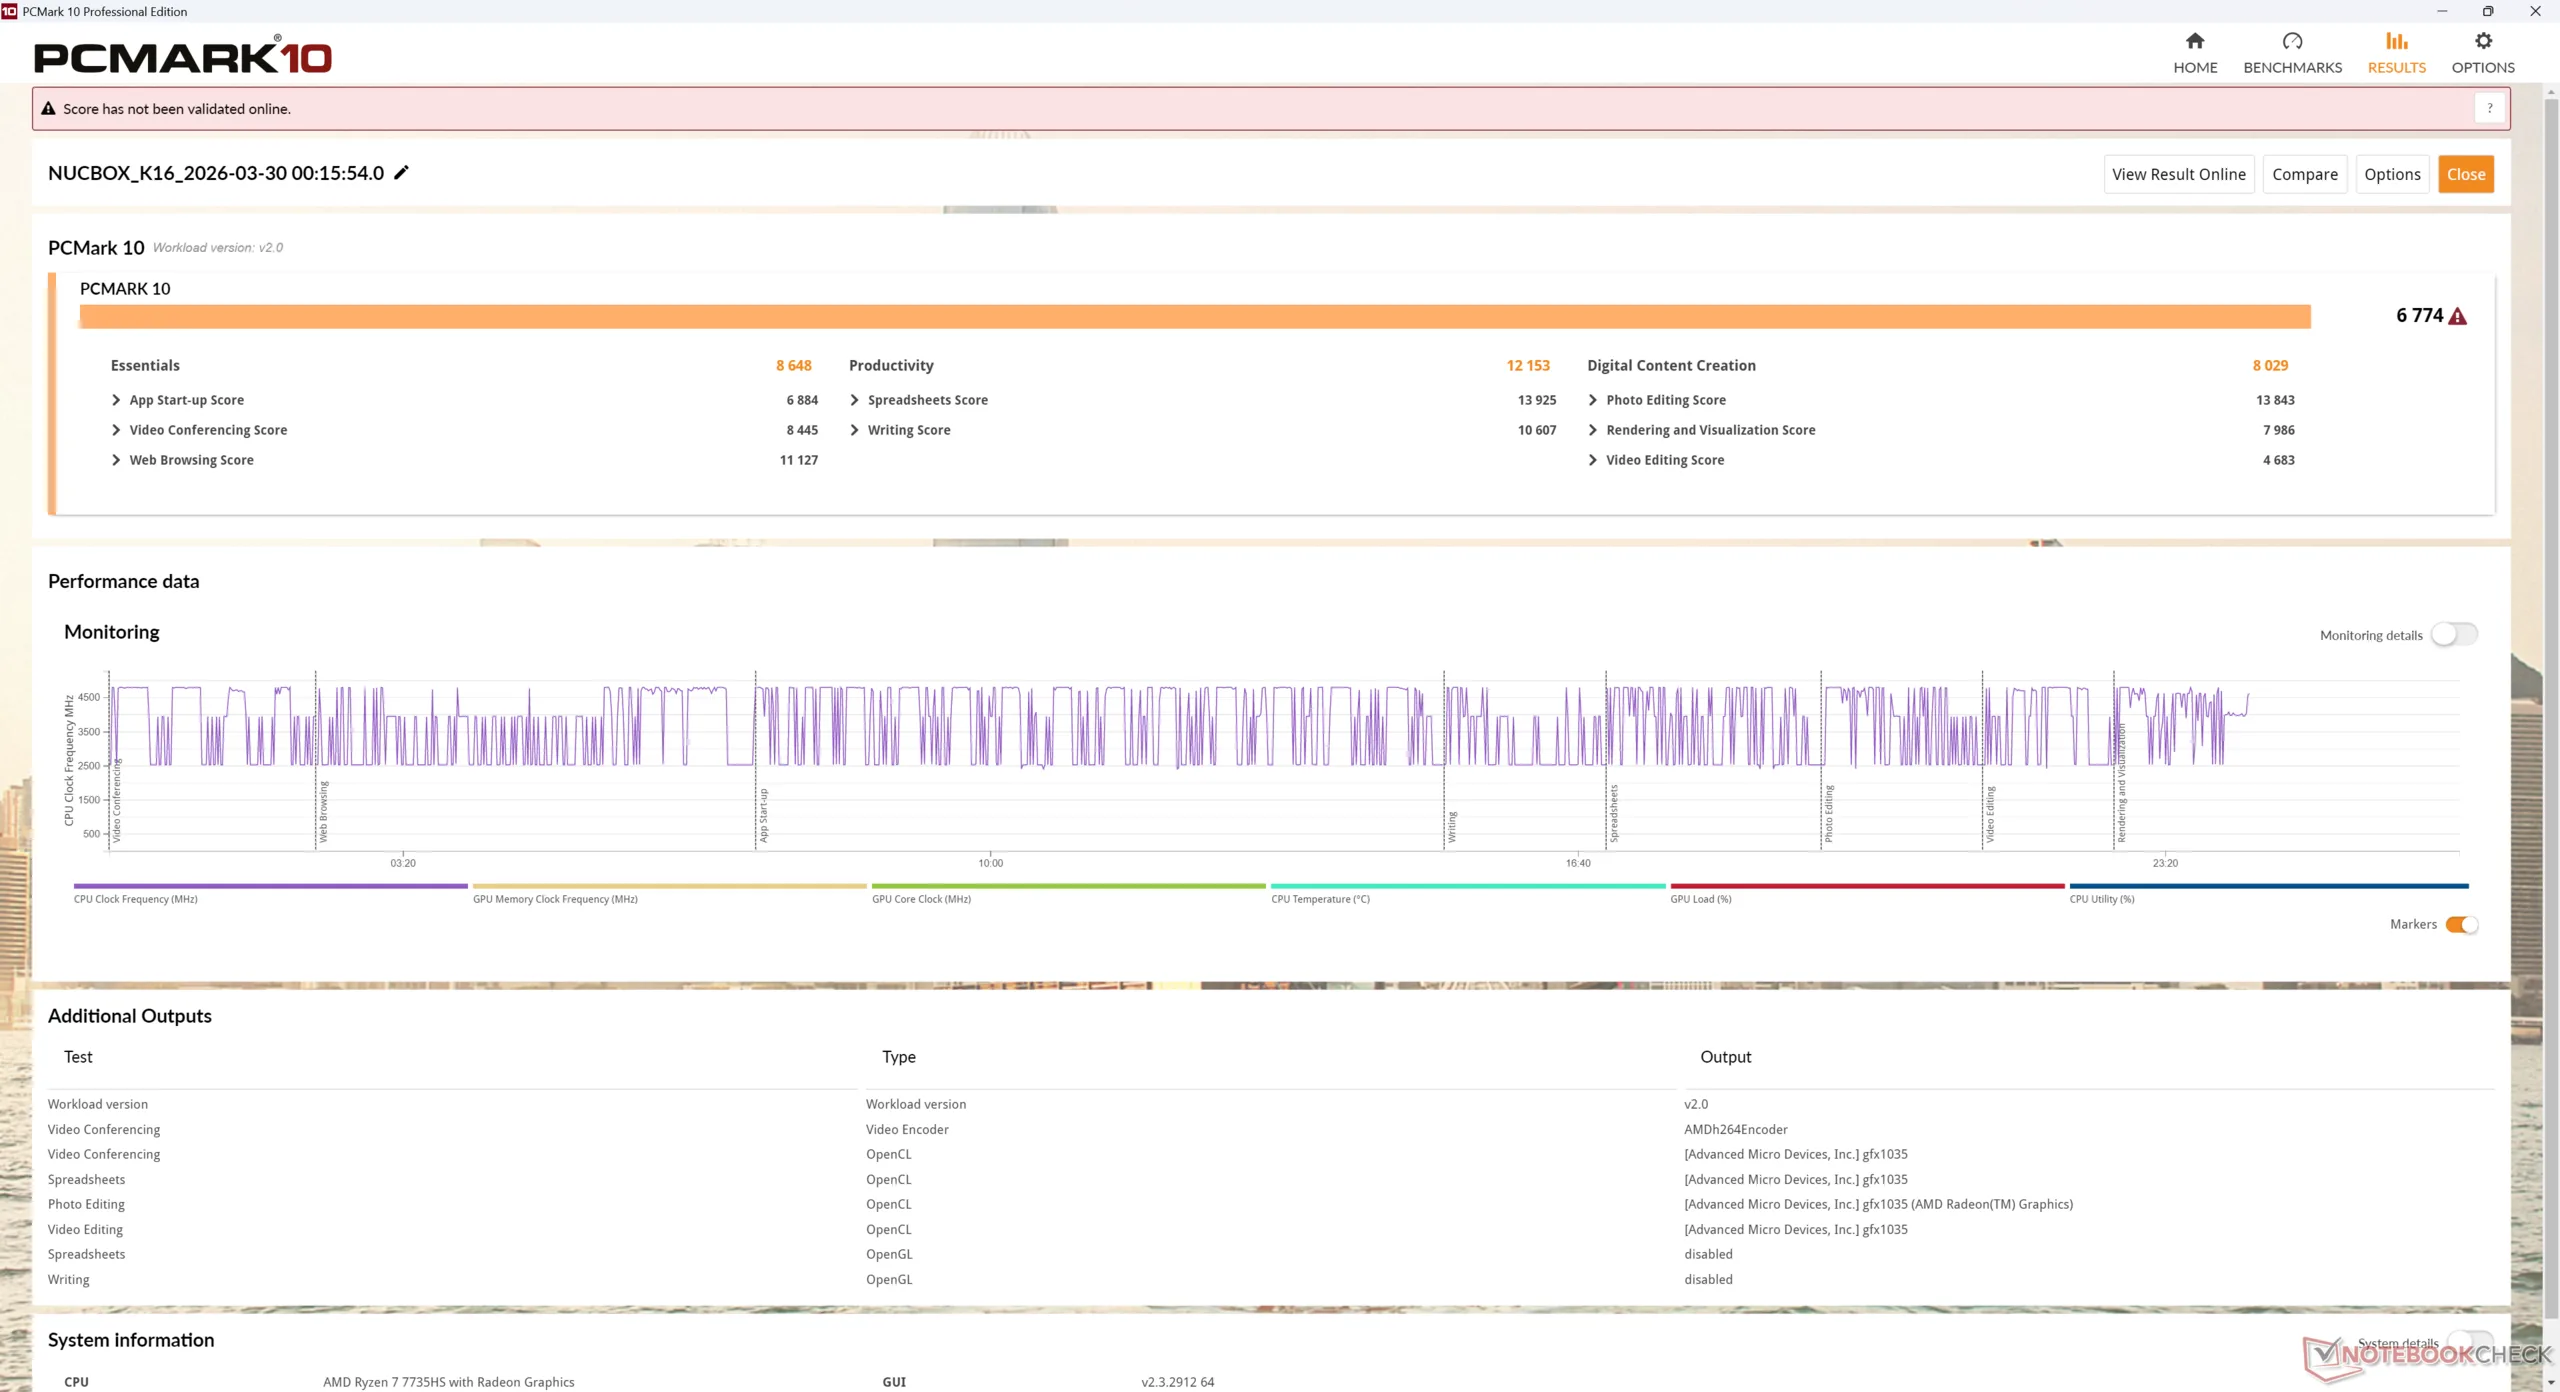
| PCMark 10 Score | 6774 Punkte | |
Hilfe | ||
| AIDA64 / Memory Copy | |
| MSI Cubi NUC AI+ 2MG | |
| GMK NucBox K13 | |
| Asus NUC 15 Pro+ | |
| Beelink SER9 Pro | |
| Durchschnittliche AMD Ryzen 7 7735HS (30324 - 52012, n=16) | |
| GMK NucBox K16 | |
| Geekom A7 Max, R9 7940HS | |
| AIDA64 / Memory Read | |
| GMK NucBox K13 | |
| Asus NUC 15 Pro+ | |
| MSI Cubi NUC AI+ 2MG | |
| Beelink SER9 Pro | |
| Durchschnittliche AMD Ryzen 7 7735HS (33938 - 51856, n=16) | |
| GMK NucBox K16 | |
| Geekom A7 Max, R9 7940HS | |
| AIDA64 / Memory Write | |
| MSI Cubi NUC AI+ 2MG | |
| GMK NucBox K13 | |
| Beelink SER9 Pro | |
| Asus NUC 15 Pro+ | |
| Durchschnittliche AMD Ryzen 7 7735HS (33175 - 55284, n=16) | |
| GMK NucBox K16 | |
| Geekom A7 Max, R9 7940HS | |
| AIDA64 / Memory Latency | |
| GMK NucBox K16 | |
| Asus NUC 15 Pro+ | |
| Beelink SER9 Pro | |
| GMK NucBox K13 | |
| MSI Cubi NUC AI+ 2MG | |
| Geekom A7 Max, R9 7940HS | |
| Durchschnittliche AMD Ryzen 7 7735HS (78.2 - 109.8, n=16) | |
* ... kleinere Werte sind besser
DPC-Latenzzeit
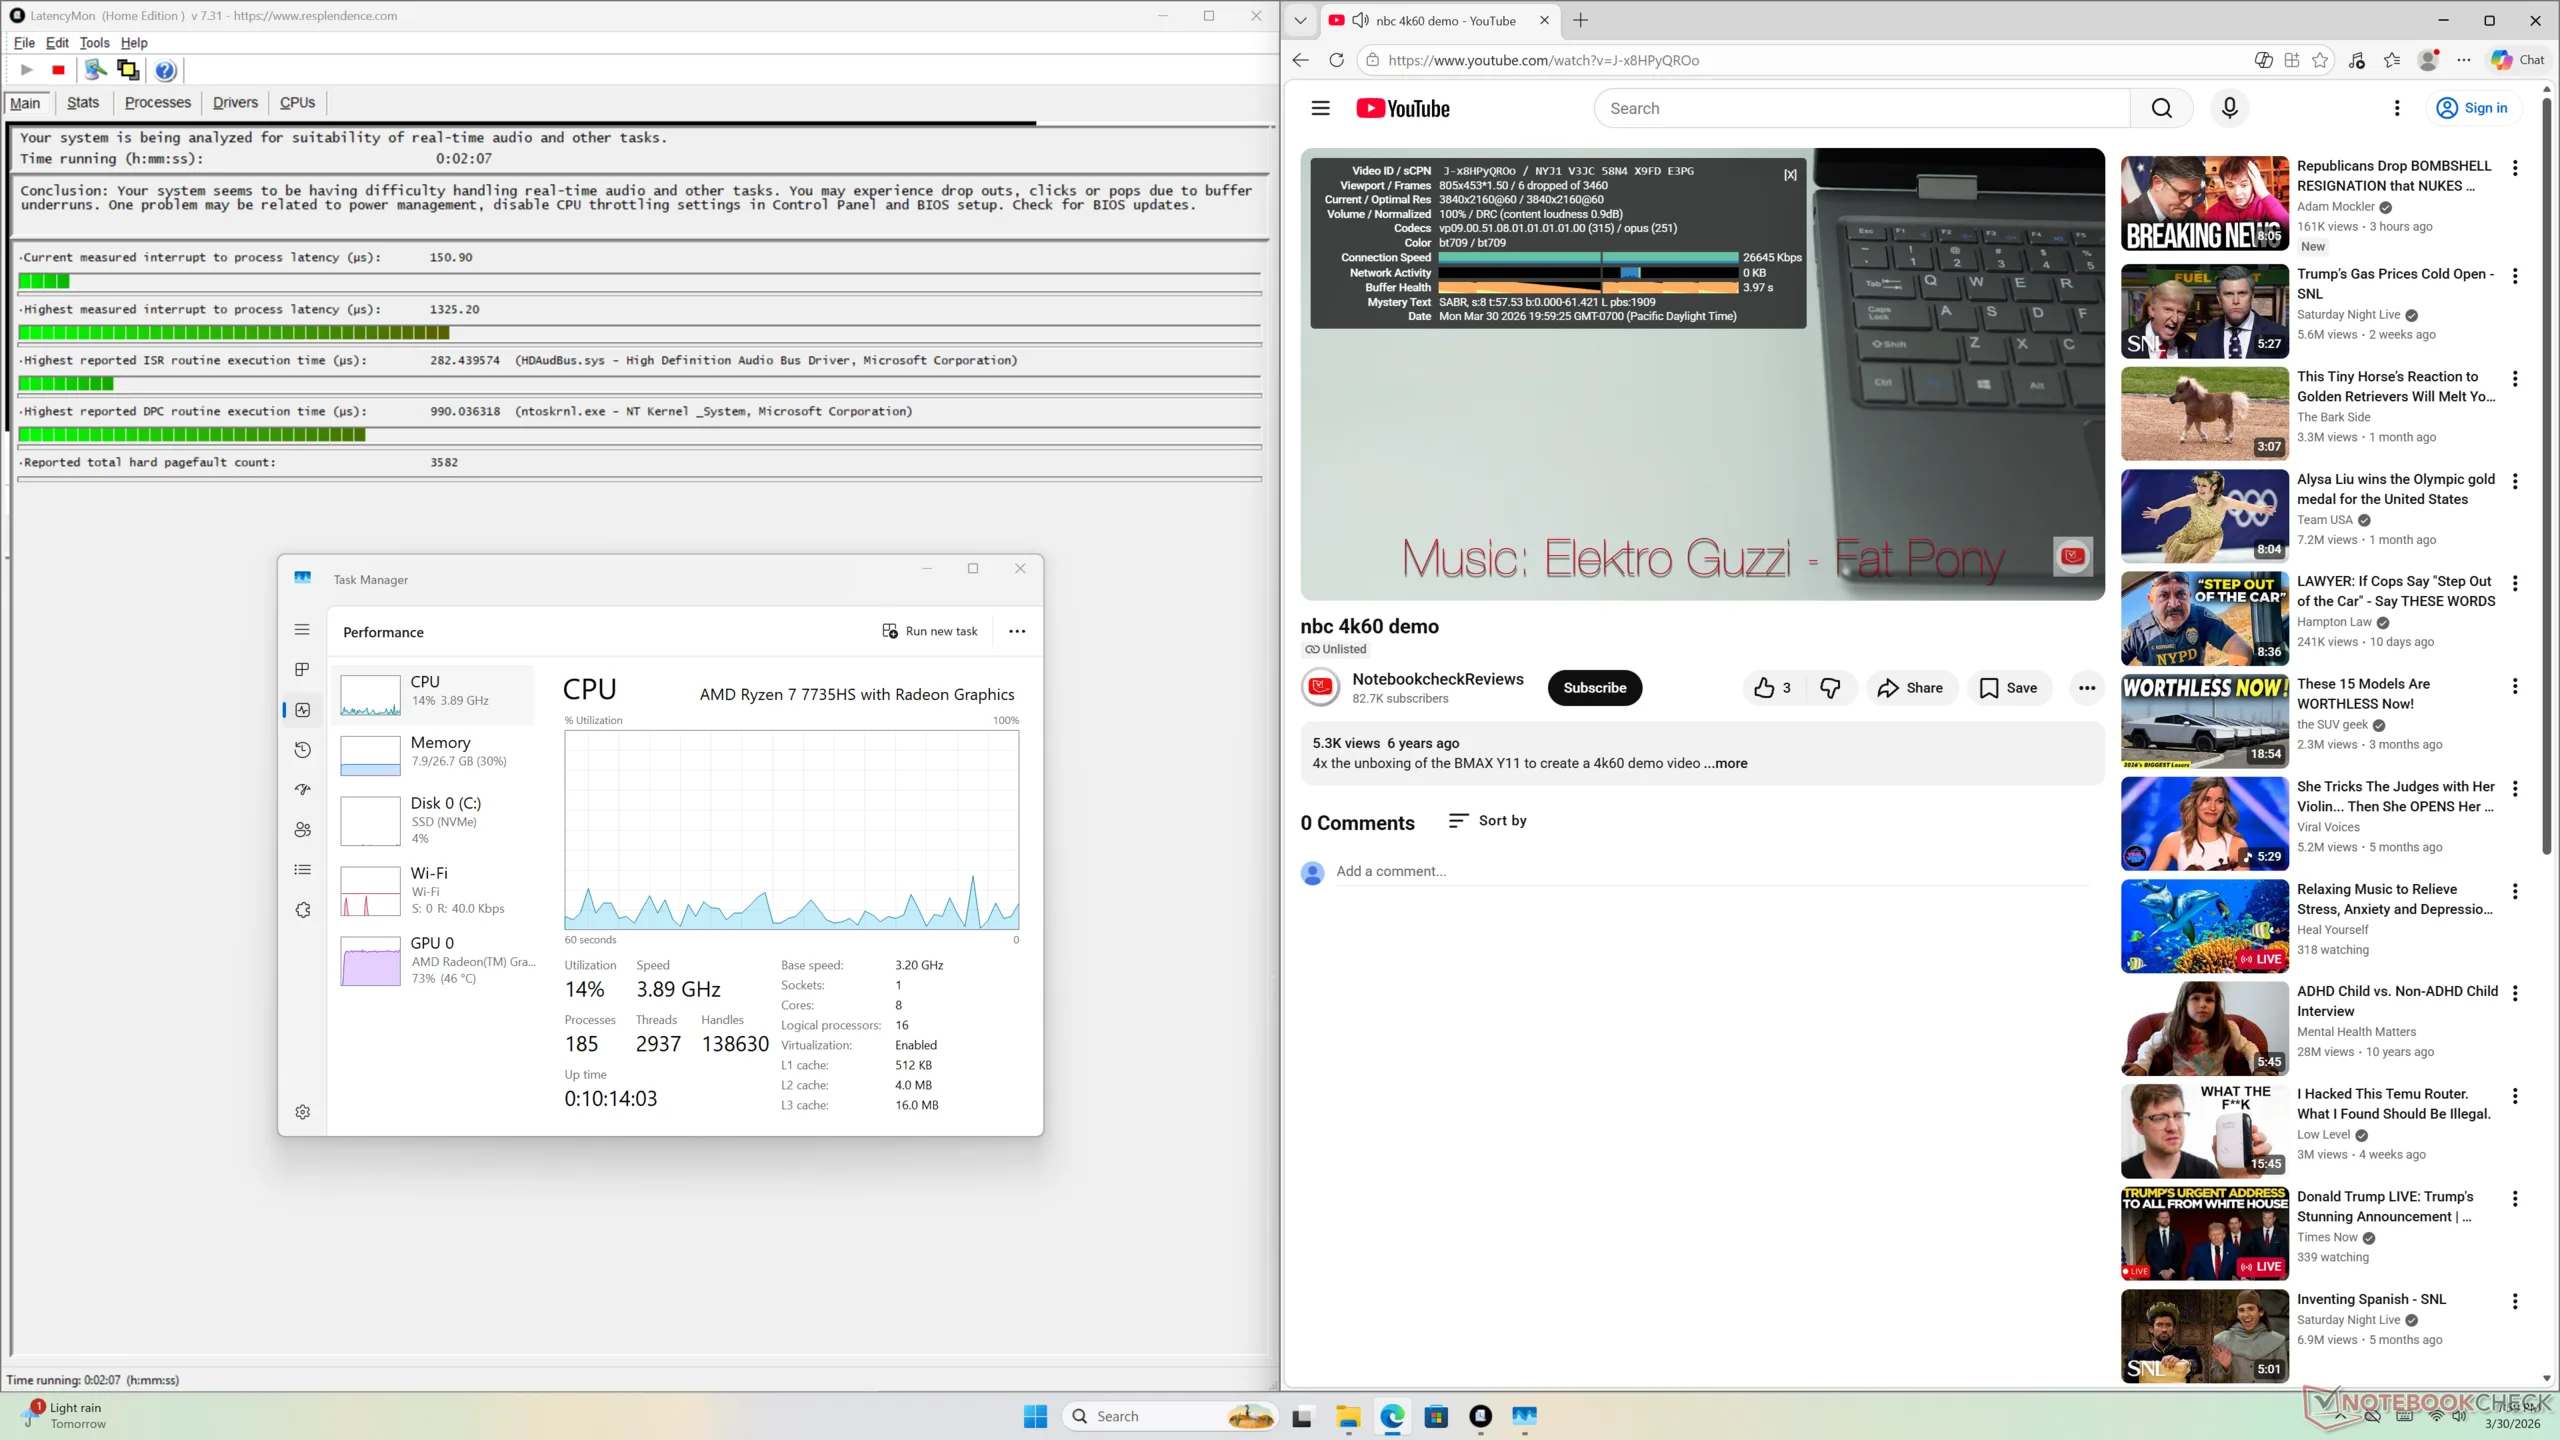
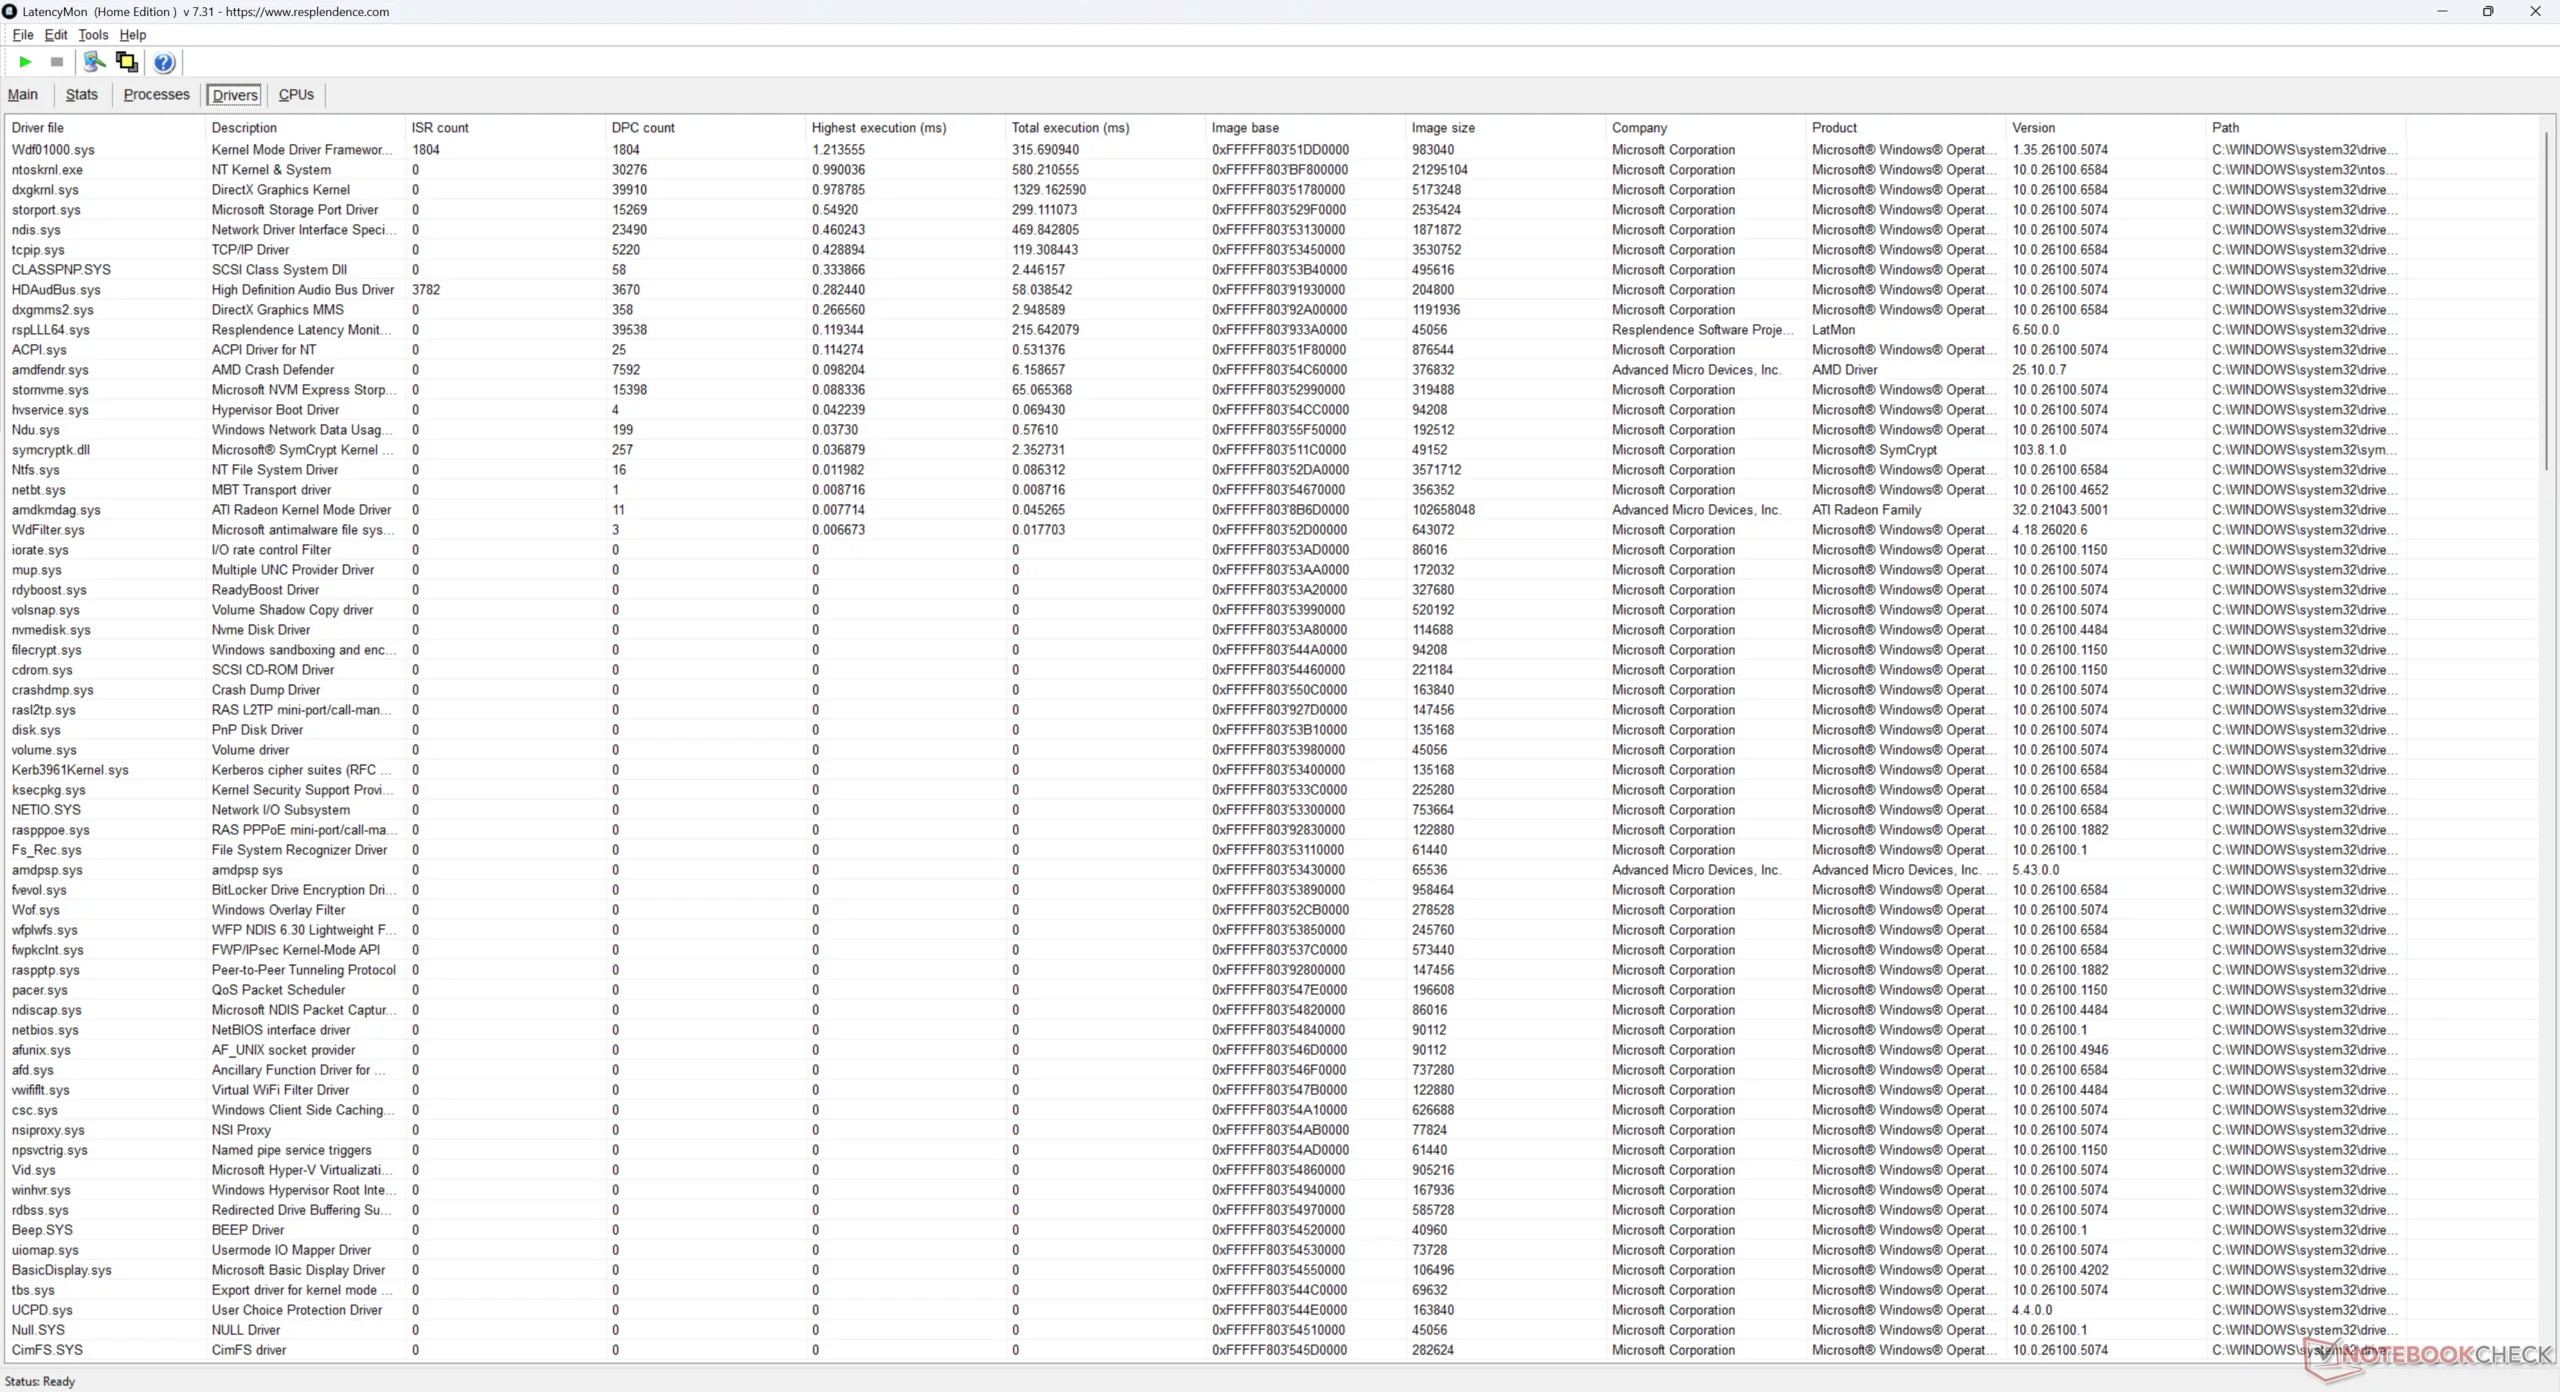
| DPC Latencies / LatencyMon - interrupt to process latency (max), Web, Youtube, Prime95 | |
| Geekom A7 Max, R9 7940HS | |
| GMK NucBox K13 | |
| GMK NucBox K16 | |
| Asus NUC 15 Pro+ | |
| MSI Cubi NUC AI+ 2MG | |
| Beelink SER9 Pro | |
* ... kleinere Werte sind besser
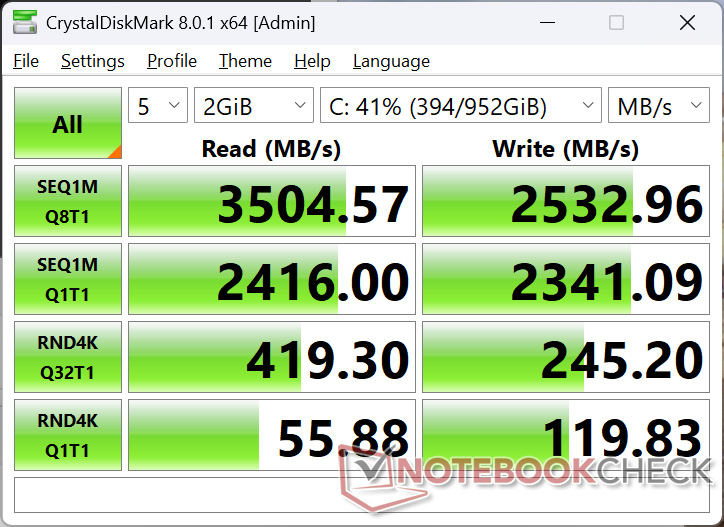
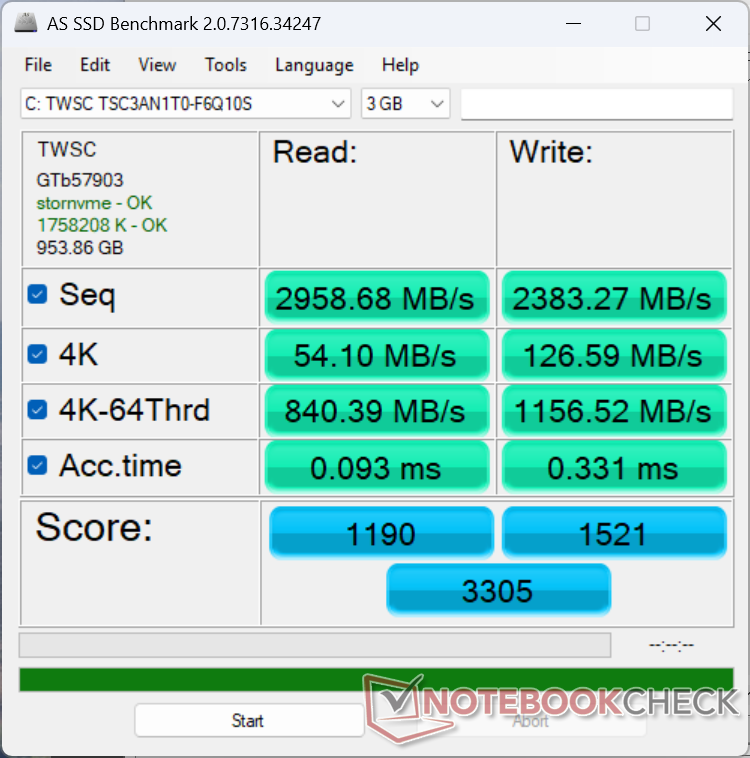
Speichergeräte
Unser Testgerät wird mit einem TWSC TSC3AN1T0-F6Q10S anstelle des Crucial P3 Plus, wie er in dem teureren EVO-X1 vom letzten Jahr zu finden ist, ausgeliefert, wahrscheinlich um Kosten zu sparen. Die Leistung ist etwas langsamer mit Übertragungsraten von bis zu 3.500 MB/s, wie unser Stresstest unten zeigt.

| Drive Performance Rating - Percent | |
| Geekom A7 Max, R9 7940HS | |
| Asus NUC 15 Pro+ | |
| Beelink SER9 Pro | |
| MSI Cubi NUC AI+ 2MG | |
| GMK NucBox K13 | |
| GMK NucBox K16 | |
| DiskSpd | |
| seq read | |
| GMK NucBox K13 | |
| Geekom A7 Max, R9 7940HS | |
| MSI Cubi NUC AI+ 2MG | |
| GMK NucBox K16 | |
| Beelink SER9 Pro | |
| Asus NUC 15 Pro+ | |
| seq write | |
| Geekom A7 Max, R9 7940HS | |
| GMK NucBox K13 | |
| Asus NUC 15 Pro+ | |
| MSI Cubi NUC AI+ 2MG | |
| GMK NucBox K16 | |
| Beelink SER9 Pro | |
| seq q8 t1 read | |
| Asus NUC 15 Pro+ | |
| GMK NucBox K13 | |
| Geekom A7 Max, R9 7940HS | |
| MSI Cubi NUC AI+ 2MG | |
| Beelink SER9 Pro | |
| GMK NucBox K16 | |
| seq q8 t1 write | |
| Asus NUC 15 Pro+ | |
| MSI Cubi NUC AI+ 2MG | |
| GMK NucBox K13 | |
| Geekom A7 Max, R9 7940HS | |
| GMK NucBox K16 | |
| Beelink SER9 Pro | |
| 4k q1 t1 read | |
| Geekom A7 Max, R9 7940HS | |
| Asus NUC 15 Pro+ | |
| GMK NucBox K13 | |
| MSI Cubi NUC AI+ 2MG | |
| GMK NucBox K16 | |
| Beelink SER9 Pro | |
| 4k q1 t1 write | |
| Beelink SER9 Pro | |
| Geekom A7 Max, R9 7940HS | |
| MSI Cubi NUC AI+ 2MG | |
| Asus NUC 15 Pro+ | |
| GMK NucBox K13 | |
| GMK NucBox K16 | |
| 4k q32 t16 read | |
| Geekom A7 Max, R9 7940HS | |
| GMK NucBox K13 | |
| GMK NucBox K16 | |
| Asus NUC 15 Pro+ | |
| MSI Cubi NUC AI+ 2MG | |
| Beelink SER9 Pro | |
| 4k q32 t16 write | |
| Beelink SER9 Pro | |
| GMK NucBox K16 | |
| Geekom A7 Max, R9 7940HS | |
| GMK NucBox K13 | |
| Asus NUC 15 Pro+ | |
| MSI Cubi NUC AI+ 2MG | |
* ... kleinere Werte sind besser
Disk Throttling: DiskSpd Read Loop, Queue Depth 8
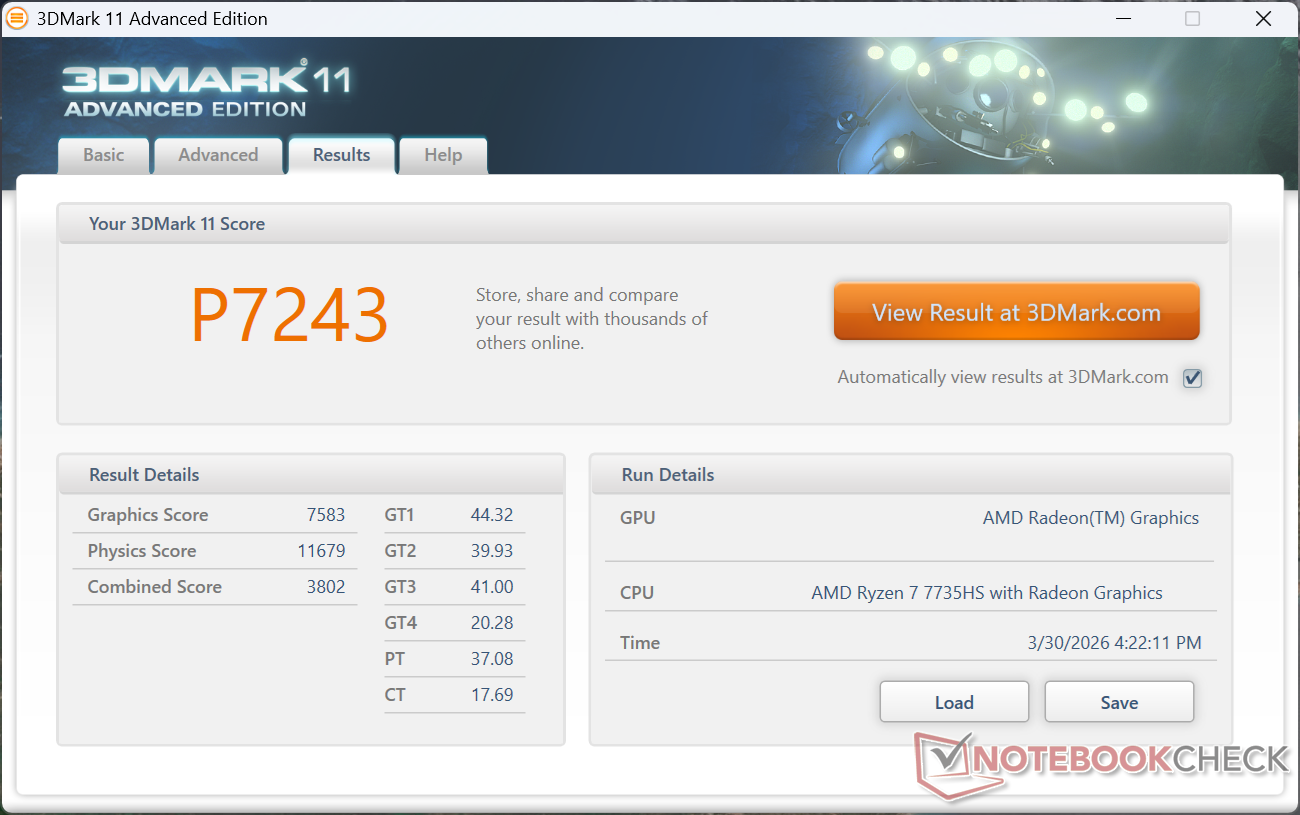
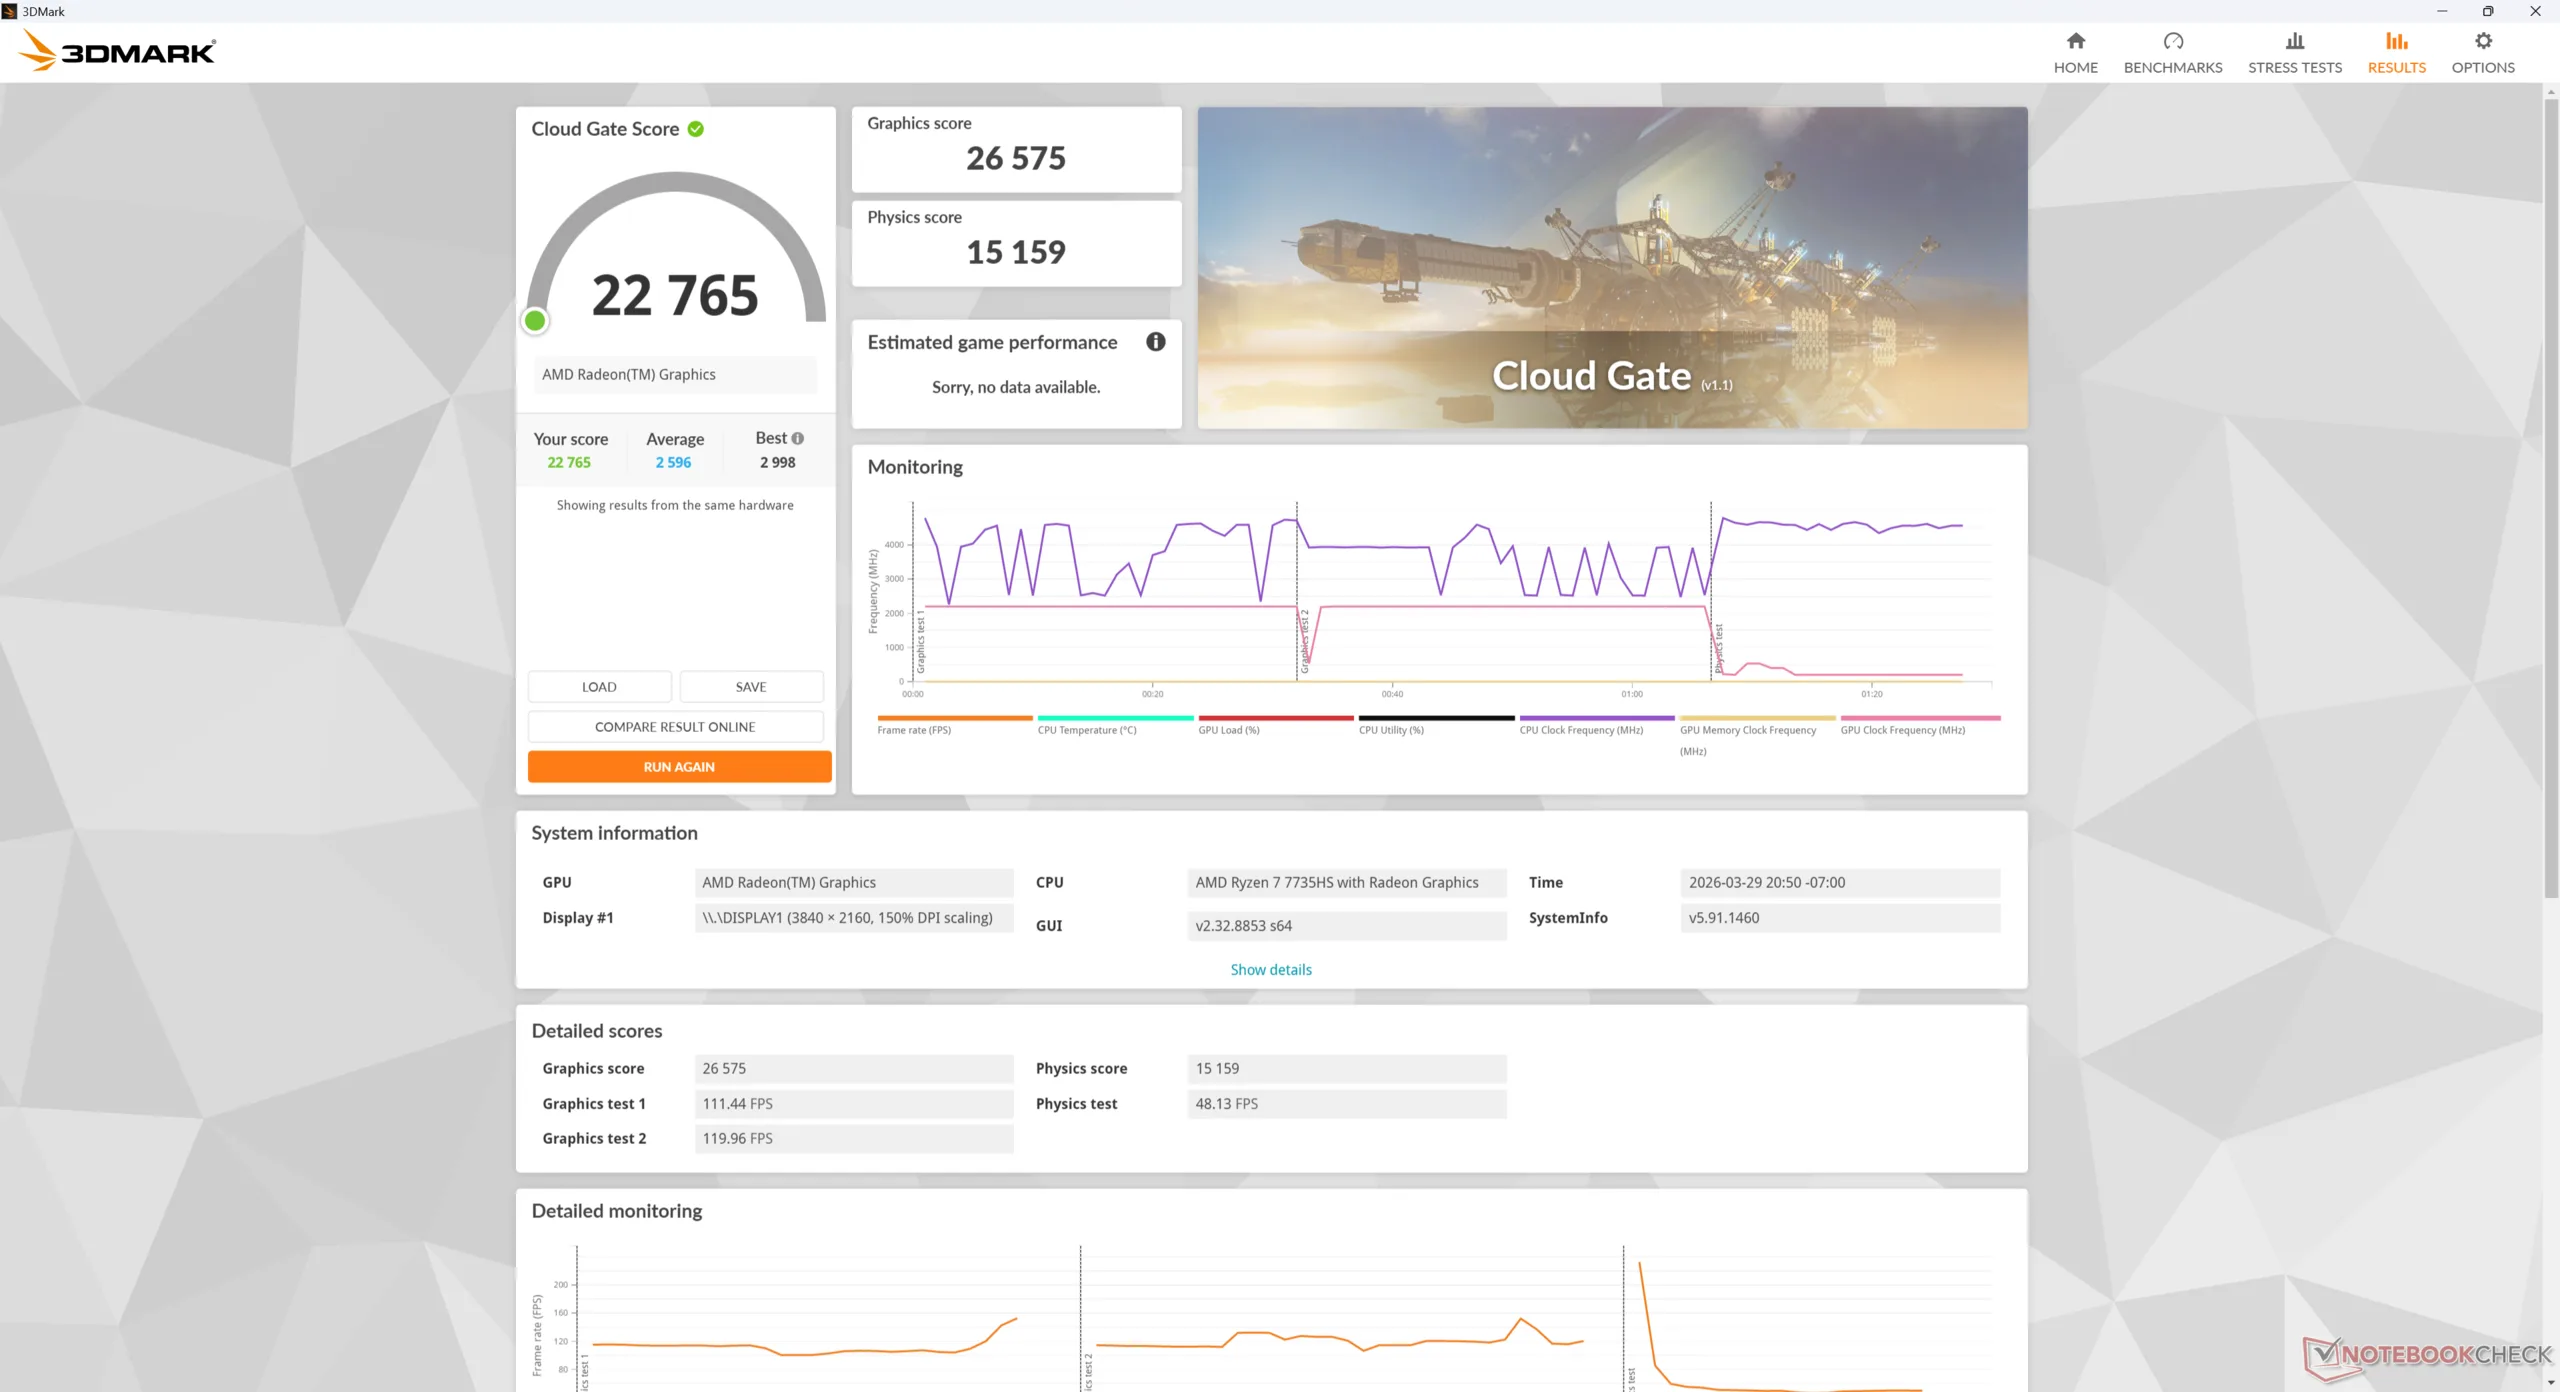
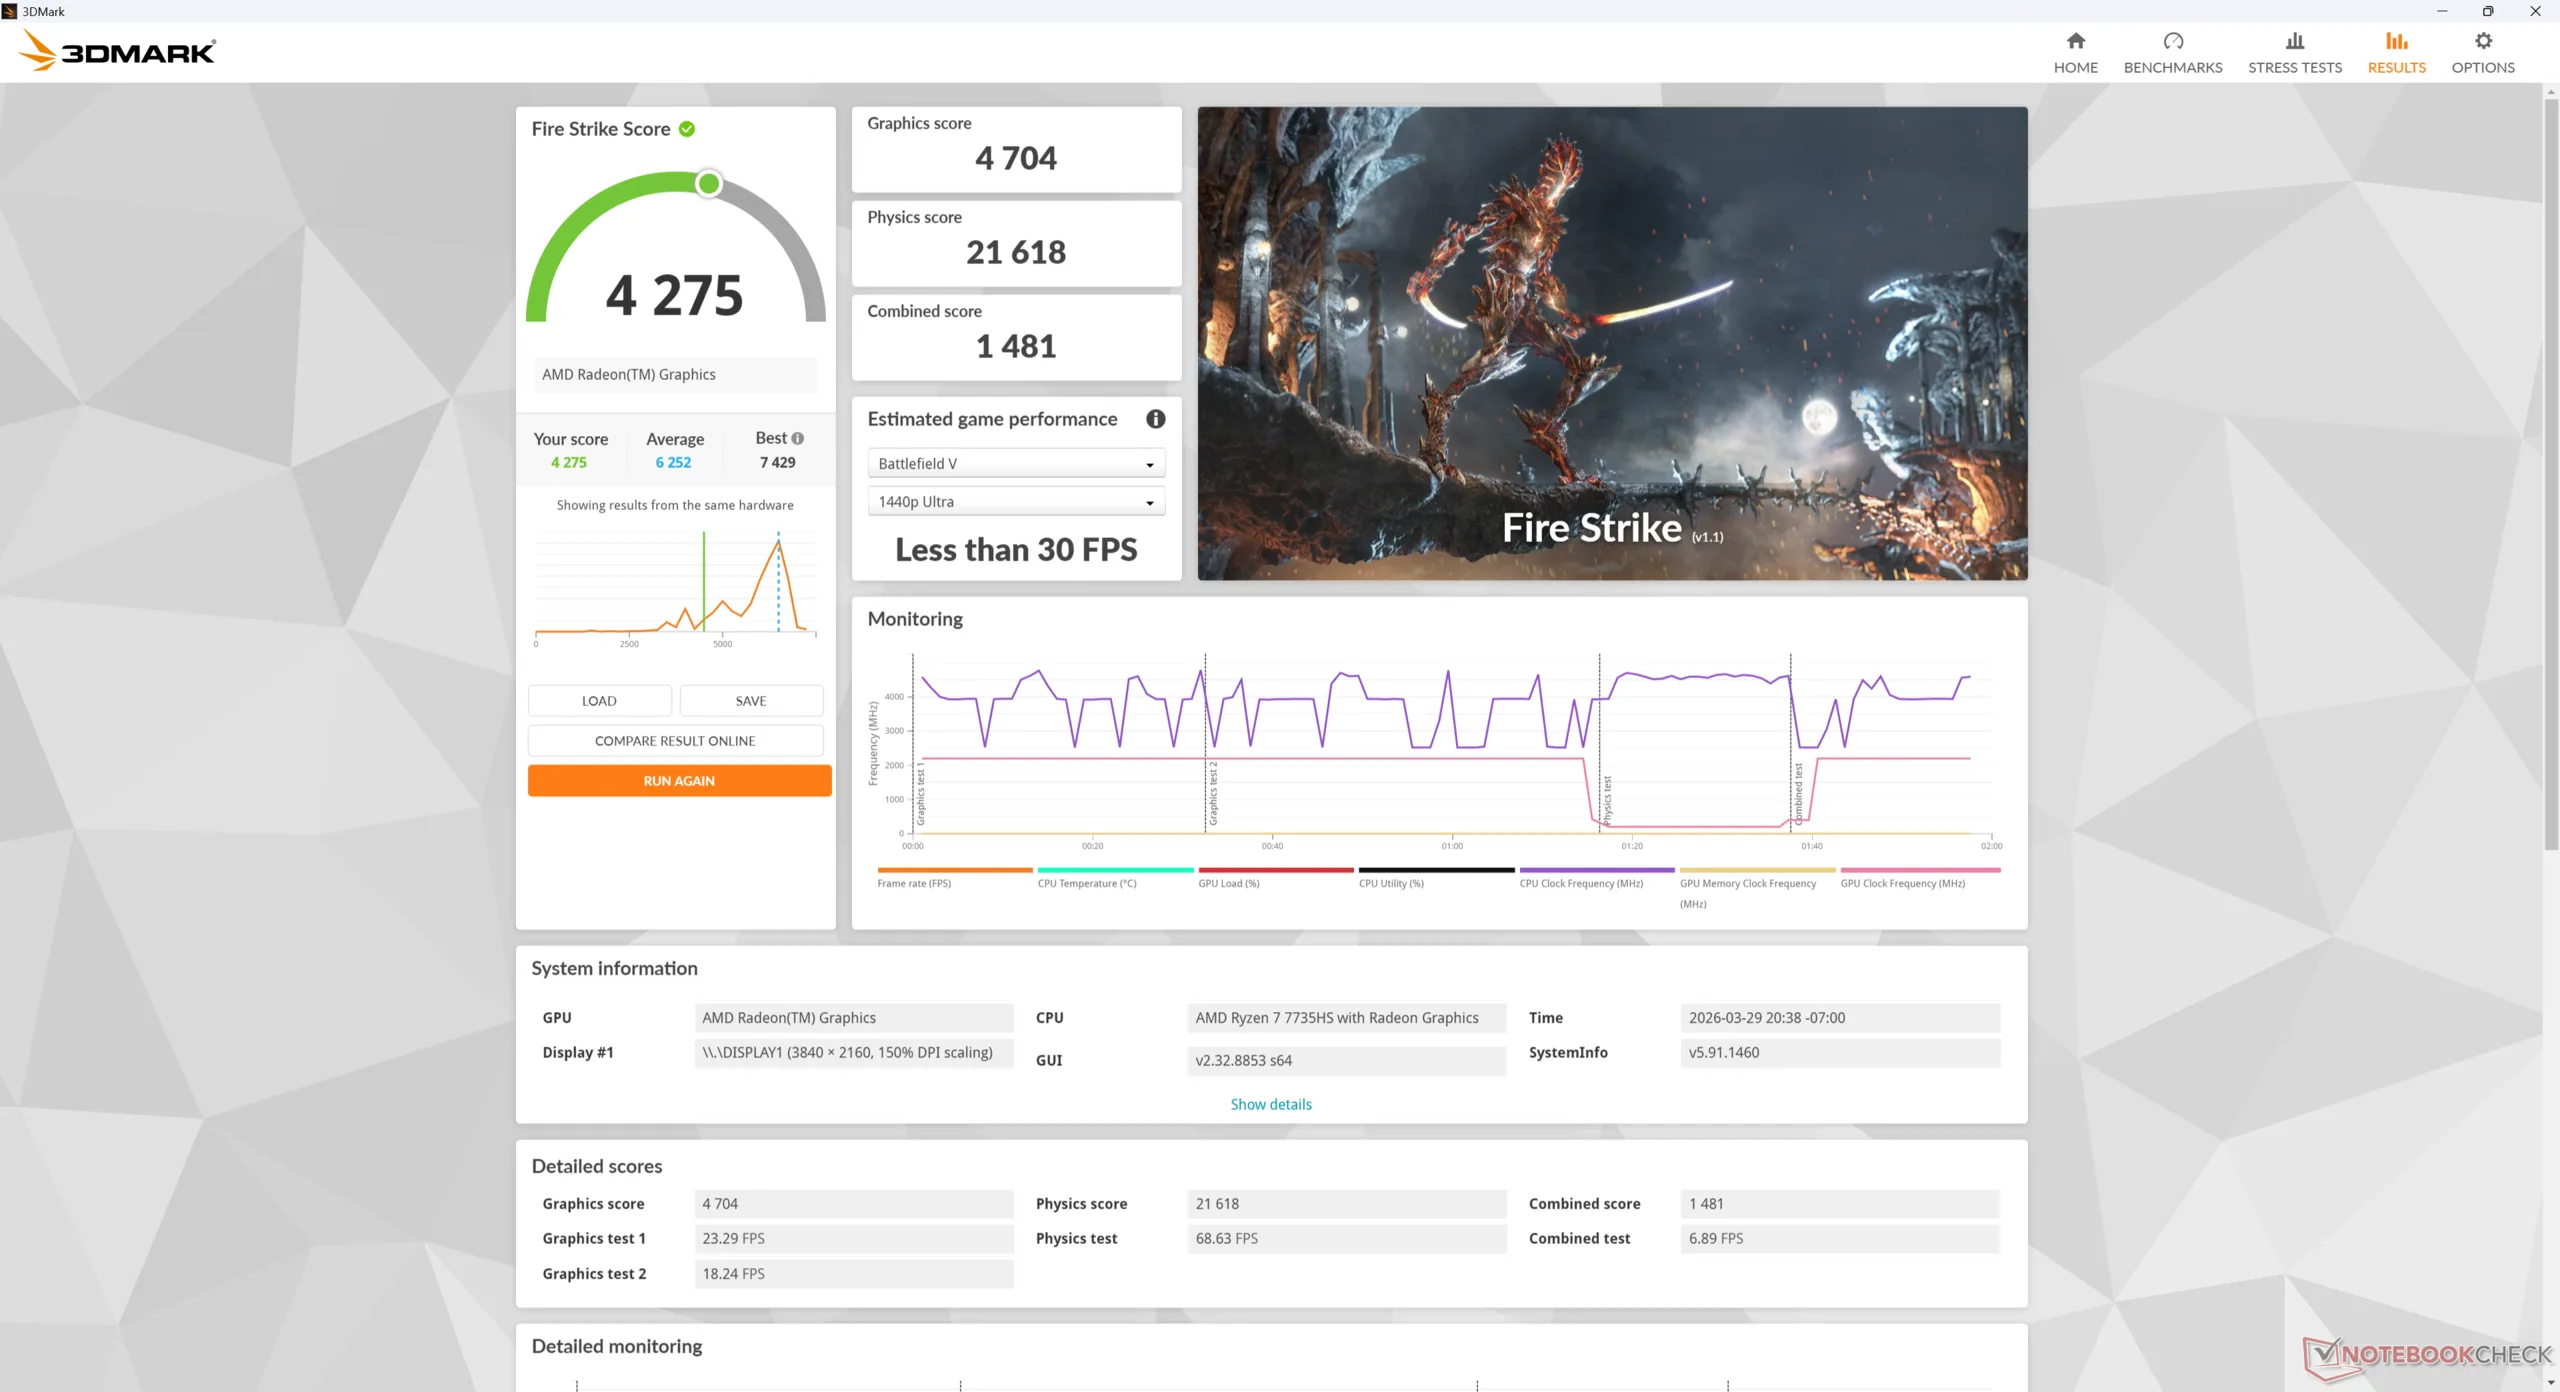
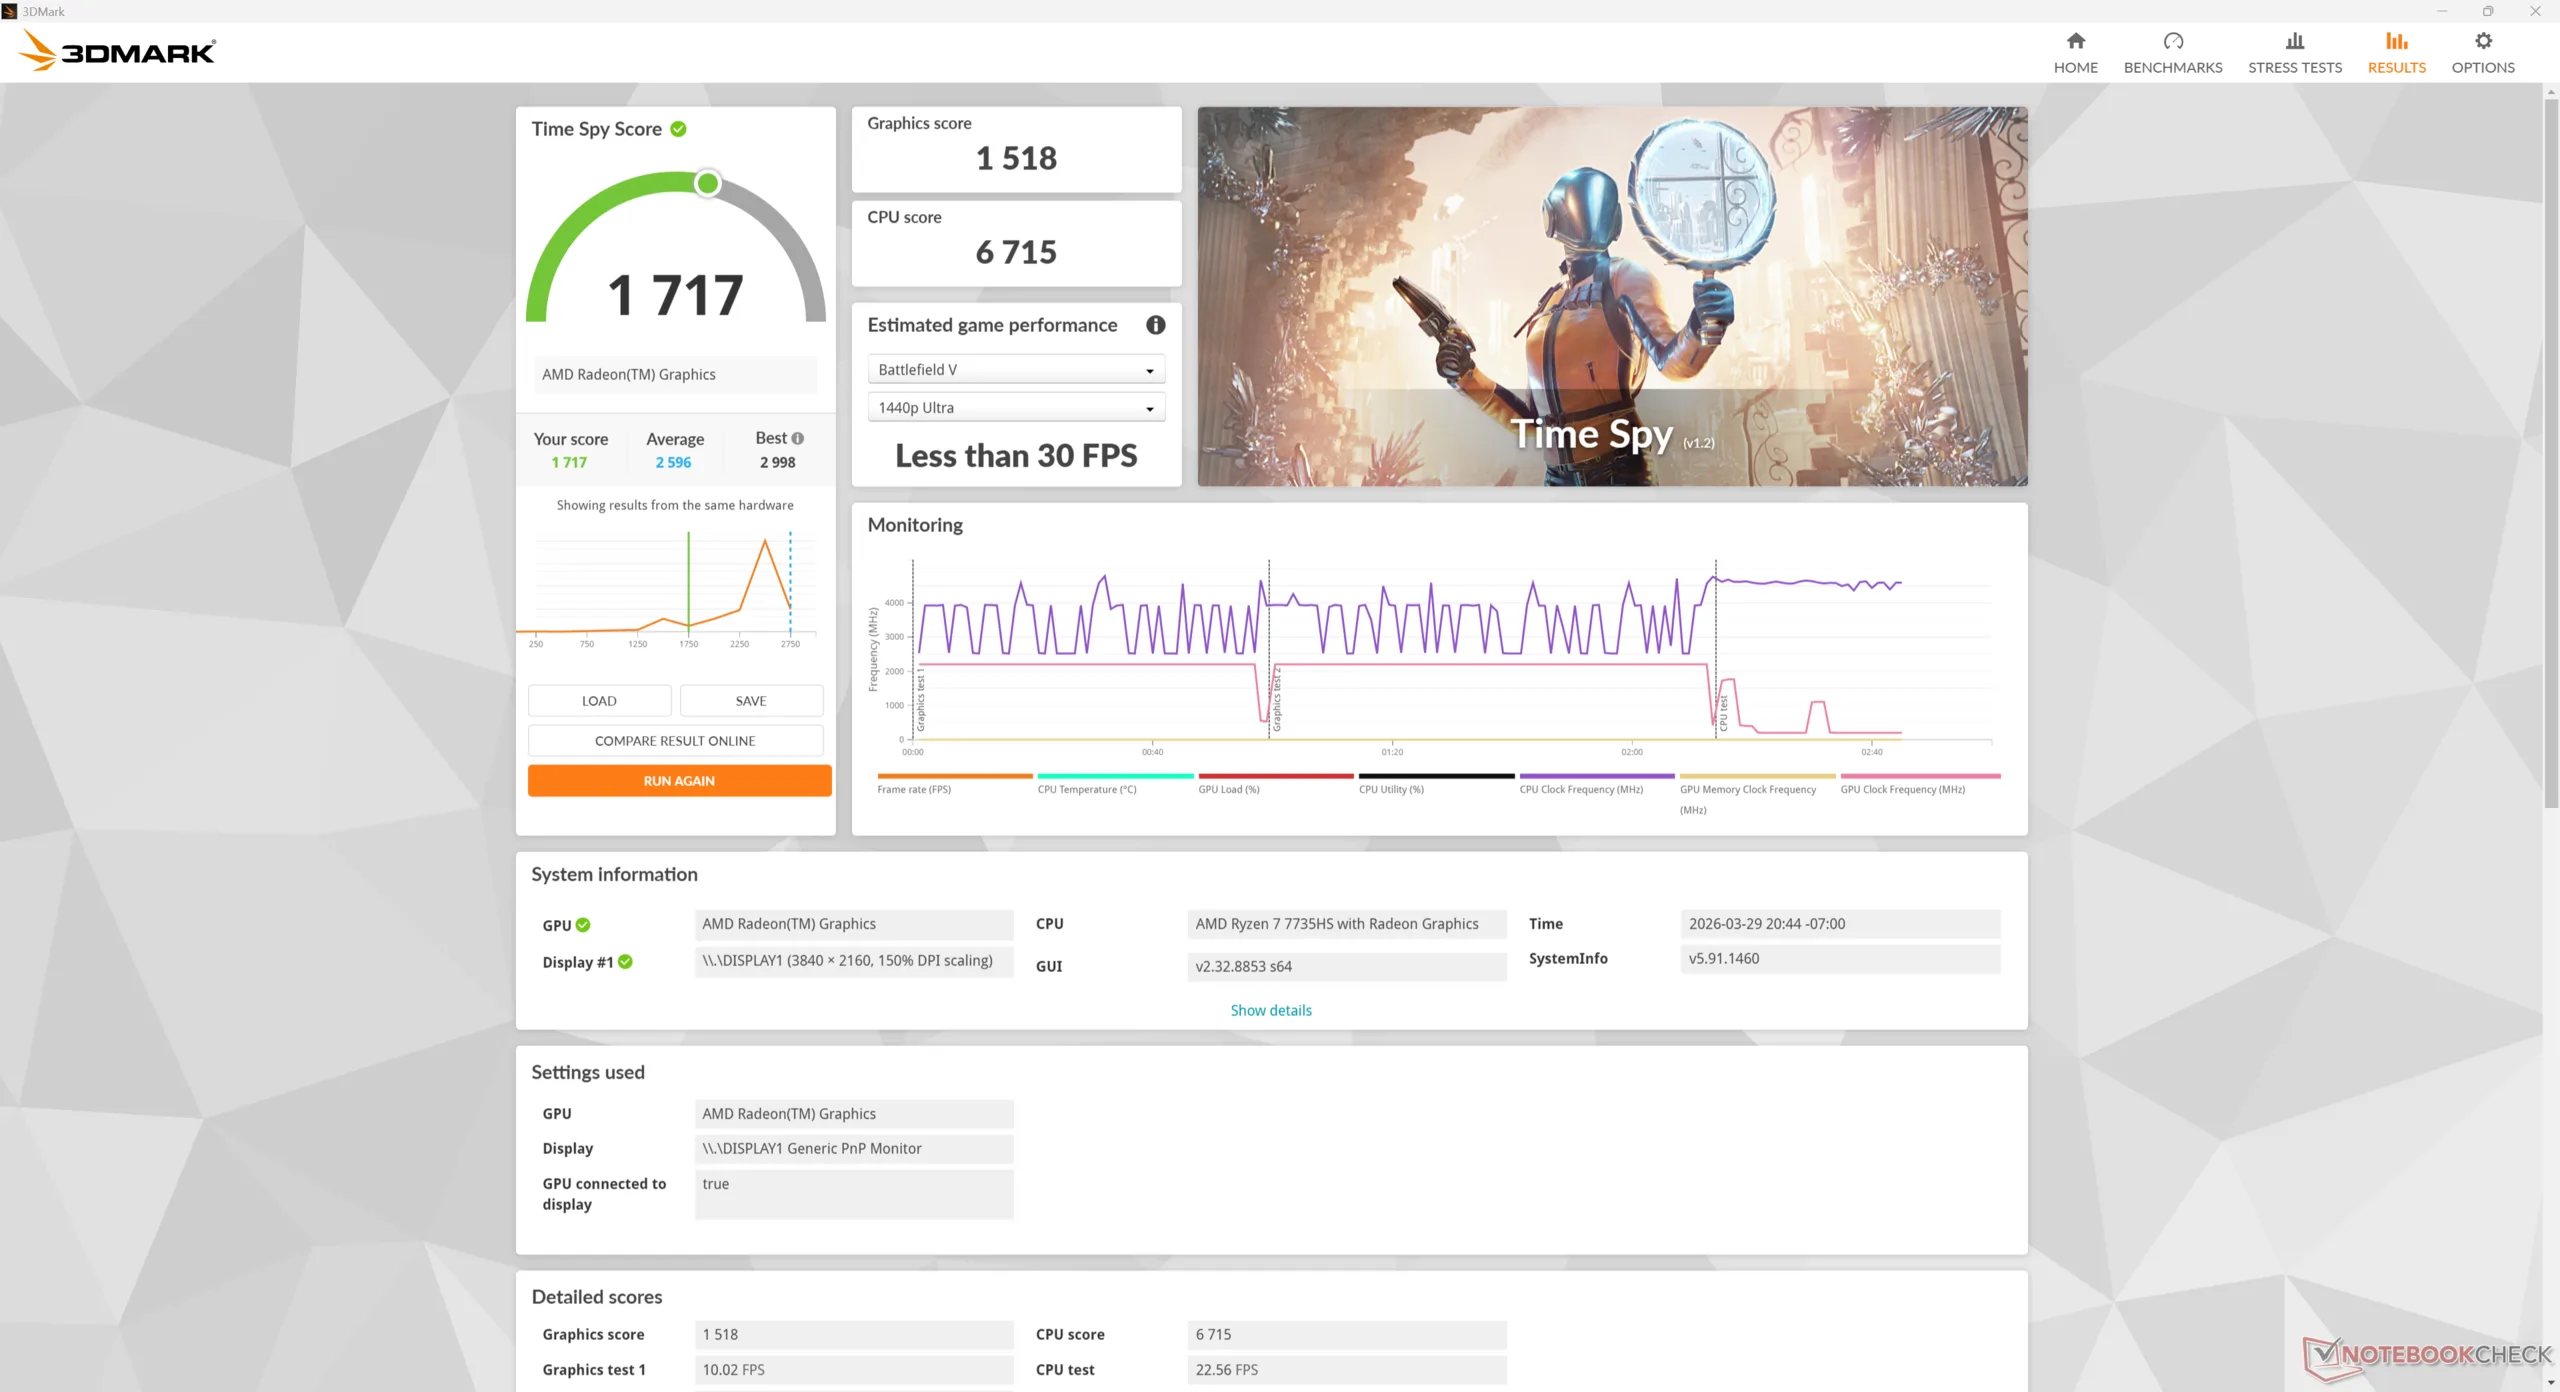
GPU-Leistung
Die Grafikleistung ist langsamer als erwartet, selbst nach der Aktualisierung auf die neuesten Treiber zum Zeitpunkt der Veröffentlichung. Die 3DMark-Ergebnisse sind etwa 30 Prozent langsamer als der durchschnittliche PC in unserer Datenbank, der mit der gleichen integrierten Radeon 680M GPU ausgestattet ist. Die enttäuschende Leistung kann auf die langsamen RAM-Lese-, Schreib- und Kopierergebnisse zurückgeführt werden, wie unsere AIDA64-Benchmark-Ergebnisse oben zeigen.
| 3DMark Performance Rating - Percent | |
| Khadas Mind Pro | |
| Asus NUC 15 Pro+ | |
| Beelink SER9 Pro | |
| GMK NucBox K13 | |
| MSI Cubi NUC AI+ 2MG | |
| GMK NucBox M7 Ultra | |
| Durchschnittliche AMD Radeon 680M | |
| GMK NucBox M3 Ultra -1! | |
| Geekom A7 Max, R9 7940HS | |
| GMK NucBox K16 | |
| Minix Elite EU512-AI | |
| MSI Cubi NUC 1M | |
| BMAX B4 Turbo | |
| 3DMark 11 - 1280x720 Performance GPU | |
| Khadas Mind Pro | |
| Beelink SER9 Pro | |
| Asus NUC 15 Pro+ | |
| Durchschnittliche AMD Radeon 680M (6858 - 11755, n=39) | |
| GMK NucBox K13 | |
| GMK NucBox M7 Ultra | |
| Geekom A7 Max, R9 7940HS | |
| GMK NucBox K16 | |
| MSI Cubi NUC AI+ 2MG | |
| GMK NucBox M3 Ultra | |
| MSI Cubi NUC 1M | |
| Minix Elite EU512-AI | |
| BMAX B4 Turbo | |
| 3DMark | |
| 1280x720 Cloud Gate Standard Graphics | |
| Khadas Mind Pro | |
| Asus NUC 15 Pro+ | |
| Beelink SER9 Pro | |
| MSI Cubi NUC AI+ 2MG | |
| GMK NucBox M7 Ultra | |
| Durchschnittliche AMD Radeon 680M (24634 - 50120, n=31) | |
| GMK NucBox K13 | |
| GMK NucBox M3 Ultra | |
| MSI Cubi NUC 1M | |
| Geekom A7 Max, R9 7940HS | |
| Minix Elite EU512-AI | |
| GMK NucBox K16 | |
| BMAX B4 Turbo | |
| 1920x1080 Fire Strike Graphics | |
| Khadas Mind Pro | |
| Beelink SER9 Pro | |
| Asus NUC 15 Pro+ | |
| GMK NucBox K13 | |
| GMK NucBox M7 Ultra | |
| Durchschnittliche AMD Radeon 680M (3791 - 7706, n=41) | |
| MSI Cubi NUC AI+ 2MG | |
| GMK NucBox M3 Ultra | |
| MSI Cubi NUC 1M | |
| Geekom A7 Max, R9 7940HS | |
| GMK NucBox K16 | |
| Minix Elite EU512-AI | |
| BMAX B4 Turbo | |
| 2560x1440 Time Spy Graphics | |
| Khadas Mind Pro | |
| Asus NUC 15 Pro+ | |
| Beelink SER9 Pro | |
| GMK NucBox K13 | |
| MSI Cubi NUC AI+ 2MG | |
| GMK NucBox M7 Ultra | |
| Durchschnittliche AMD Radeon 680M (1359 - 2607, n=41) | |
| Minix Elite EU512-AI | |
| Geekom A7 Max, R9 7940HS | |
| GMK NucBox K16 | |
| MSI Cubi NUC 1M | |
| BMAX B4 Turbo | |
| 3DMark 11 Performance | 7243 Punkte | |
| 3DMark Cloud Gate Standard Score | 22765 Punkte | |
| 3DMark Fire Strike Score | 4275 Punkte | |
| 3DMark Time Spy Score | 1717 Punkte | |
Hilfe | ||
| Blender | |
| v3.3 Classroom CPU | |
| BMAX B4 Turbo | |
| MSI Cubi NUC 1M | |
| GMK NucBox M3 Ultra | |
| GMK NucBox K13 | |
| Durchschnittliche AMD Radeon 680M (389 - 980, n=37) | |
| Minix Elite EU512-AI | |
| GMK NucBox K16 | |
| GMK NucBox M7 Ultra | |
| Geekom A7 Max, R9 7940HS | |
| Beelink SER9 Pro | |
| Khadas Mind Pro | |
| Asus NUC 15 Pro+ | |
| v3.3 Classroom oneAPI/Intel | |
| MSI Cubi NUC AI+ 2MG | |
| GMK NucBox K13 | |
| v4.3 Barbershop CPU | |
| BMAX B4 Turbo | |
| MSI Cubi NUC AI+ 2MG | |
| GMK NucBox K13 | |
| GMK NucBox M3 Ultra | |
| GMK NucBox K16 | |
| Durchschnittliche AMD Radeon 680M (2038 - 2257, n=4) | |
| GMK NucBox M7 Ultra | |
| Geekom A7 Max, R9 7940HS | |
| Beelink SER9 Pro | |
| Khadas Mind Pro | |
| Asus NUC 15 Pro+ | |
| v4.3 Barbershop oneAPI | |
| GMK NucBox K13 | |
| MSI Cubi NUC AI+ 2MG | |
* ... kleinere Werte sind besser
| Performance Rating - Percent | |
| Asus NUC 15 Pro+ | |
| Beelink SER9 Pro | |
| MSI Cubi NUC AI+ 2MG | |
| GMK NucBox K13 | |
| Geekom A7 Max, R9 7940HS -1! | |
| GMK NucBox K16 | |
| Cyberpunk 2077 - 1920x1080 Ultra Preset (FSR off) | |
| Asus NUC 15 Pro+ | |
| Beelink SER9 Pro | |
| GMK NucBox K13 | |
| MSI Cubi NUC AI+ 2MG | |
| Geekom A7 Max, R9 7940HS | |
| GMK NucBox K16 | |
| Baldur's Gate 3 - 1920x1080 Ultra Preset AA:T | |
| Beelink SER9 Pro | |
| MSI Cubi NUC AI+ 2MG | |
| Asus NUC 15 Pro+ | |
| GMK NucBox K13 | |
| GMK NucBox K16 | |
| Geekom A7 Max, R9 7940HS | |
| GTA V - 1920x1080 Highest AA:4xMSAA + FX AF:16x | |
| Beelink SER9 Pro | |
| MSI Cubi NUC AI+ 2MG | |
| GMK NucBox K13 | |
| Asus NUC 15 Pro+ | |
| Geekom A7 Max, R9 7940HS | |
| GMK NucBox K16 | |
| Final Fantasy XV Benchmark - 1920x1080 High Quality | |
| Asus NUC 15 Pro+ | |
| Beelink SER9 Pro | |
| MSI Cubi NUC AI+ 2MG | |
| GMK NucBox K13 | |
| Geekom A7 Max, R9 7940HS | |
| GMK NucBox K16 | |
| Strange Brigade - 1920x1080 ultra AA:ultra AF:16 | |
| MSI Cubi NUC AI+ 2MG | |
| Asus NUC 15 Pro+ | |
| GMK NucBox K13 | |
| Beelink SER9 Pro | |
| GMK NucBox K16 | |
| Dota 2 Reborn - 1920x1080 ultra (3/3) best looking | |
| Asus NUC 15 Pro+ | |
| GMK NucBox K13 | |
| Beelink SER9 Pro | |
| MSI Cubi NUC AI+ 2MG | |
| Geekom A7 Max, R9 7940HS | |
| GMK NucBox K16 | |
| X-Plane 11.11 - 1920x1080 high (fps_test=3) | |
| Asus NUC 15 Pro+ | |
| Beelink SER9 Pro | |
| MSI Cubi NUC AI+ 2MG | |
| Geekom A7 Max, R9 7940HS | |
| GMK NucBox K16 | |
| GMK NucBox K13 | |
| Final Fantasy XV Benchmark | |
| 1280x720 Lite Quality | |
| Beelink SER9 Pro | |
| GMK NucBox K13 | |
| Asus NUC 15 Pro+ | |
| MSI Cubi NUC AI+ 2MG | |
| GMK NucBox M7 Ultra | |
| Durchschnittliche AMD Radeon 680M (34.4 - 74.7, n=39) | |
| Geekom A7 Max, R9 7940HS | |
| GMK NucBox K16 | |
| MSI Cubi NUC 1M | |
| Minix Elite EU512-AI | |
| BMAX B4 Turbo | |
| 1920x1080 Standard Quality | |
| Asus NUC 15 Pro+ | |
| GMK NucBox K13 | |
| Beelink SER9 Pro | |
| MSI Cubi NUC AI+ 2MG | |
| Durchschnittliche AMD Radeon 680M (18.3 - 36.9, n=40) | |
| GMK NucBox M7 Ultra | |
| MSI Cubi NUC 1M | |
| Geekom A7 Max, R9 7940HS | |
| GMK NucBox K16 | |
| Minix Elite EU512-AI | |
| BMAX B4 Turbo | |
| 1920x1080 High Quality | |
| Asus NUC 15 Pro+ | |
| Beelink SER9 Pro | |
| MSI Cubi NUC AI+ 2MG | |
| GMK NucBox K13 | |
| Durchschnittliche AMD Radeon 680M (12.9 - 26.2, n=40) | |
| GMK NucBox M7 Ultra | |
| MSI Cubi NUC 1M | |
| Geekom A7 Max, R9 7940HS | |
| Minix Elite EU512-AI | |
| GMK NucBox K16 | |
| BMAX B4 Turbo | |
| X-Plane 11.11 | |
| 1280x720 low (fps_test=1) | |
| Asus NUC 15 Pro+ | |
| GMK NucBox M7 Ultra | |
| Khadas Mind Pro | |
| Beelink SER9 Pro | |
| Geekom A7 Max, R9 7940HS | |
| Durchschnittliche AMD Radeon 680M (26.8 - 66.7, n=41) | |
| MSI Cubi NUC AI+ 2MG | |
| GMK NucBox K16 | |
| Minix Elite EU512-AI | |
| GMK NucBox K13 | |
| 1920x1080 med (fps_test=2) | |
| Asus NUC 15 Pro+ | |
| GMK NucBox M7 Ultra | |
| Khadas Mind Pro | |
| Beelink SER9 Pro | |
| Durchschnittliche AMD Radeon 680M (21.1 - 53.1, n=41) | |
| MSI Cubi NUC AI+ 2MG | |
| Geekom A7 Max, R9 7940HS | |
| GMK NucBox K16 | |
| Minix Elite EU512-AI | |
| GMK NucBox K13 | |
| 1920x1080 high (fps_test=3) | |
| Asus NUC 15 Pro+ | |
| GMK NucBox M7 Ultra | |
| Khadas Mind Pro | |
| Beelink SER9 Pro | |
| MSI Cubi NUC AI+ 2MG | |
| Durchschnittliche AMD Radeon 680M (16.6 - 44.5, n=41) | |
| Geekom A7 Max, R9 7940HS | |
| GMK NucBox K16 | |
| Minix Elite EU512-AI | |
| GMK NucBox K13 | |
| F1 24 | |
| 1920x1080 Low Preset AA:T AF:16x | |
| Khadas Mind Pro | |
| Beelink SER9 Pro | |
| Asus NUC 15 Pro+ | |
| GMK NucBox K13 | |
| MSI Cubi NUC AI+ 2MG | |
| GMK NucBox M7 Ultra | |
| Durchschnittliche AMD Radeon 680M (42.8 - 72.2, n=5) | |
| Geekom A7 Max, R9 7940HS | |
| GMK NucBox K16 | |
| 1920x1080 Medium Preset AA:T AF:16x | |
| Khadas Mind Pro | |
| GMK NucBox K13 | |
| Beelink SER9 Pro | |
| Asus NUC 15 Pro+ | |
| GMK NucBox M7 Ultra | |
| Durchschnittliche AMD Radeon 680M (35.8 - 64.3, n=5) | |
| Geekom A7 Max, R9 7940HS | |
| GMK NucBox K16 | |
| 1920x1080 High Preset AA:T AF:16x | |
| Khadas Mind Pro | |
| GMK NucBox K13 | |
| Asus NUC 15 Pro+ | |
| Beelink SER9 Pro | |
| MSI Cubi NUC AI+ 2MG | |
| GMK NucBox M7 Ultra | |
| Durchschnittliche AMD Radeon 680M (23.7 - 46, n=5) | |
| Geekom A7 Max, R9 7940HS | |
| GMK NucBox K16 | |
| 1920x1080 Ultra High Preset AA:T AF:16x | |
| Khadas Mind Pro | |
| Asus NUC 15 Pro+ | |
| GMK NucBox K13 | |
| MSI Cubi NUC AI+ 2MG | |
| Beelink SER9 Pro | |
| Durchschnittliche AMD Radeon 680M (7.41 - 9.53, n=4) | |
| GMK NucBox K16 | |
| 1280x720 Ultra Low Preset AA:T | |
| MSI Cubi NUC AI+ 2MG | |
| Strange Brigade | |
| 1280x720 lowest AF:1 | |
| Khadas Mind Pro | |
| MSI Cubi NUC AI+ 2MG | |
| GMK NucBox K13 | |
| Asus NUC 15 Pro+ | |
| Beelink SER9 Pro | |
| Durchschnittliche AMD Radeon 680M (72.9 - 167.5, n=38) | |
| GMK NucBox M3 Ultra | |
| MSI Cubi NUC 1M | |
| GMK NucBox K16 | |
| BMAX B4 Turbo | |
| 1920x1080 medium AA:medium AF:4 | |
| Khadas Mind Pro | |
| GMK NucBox K13 | |
| Asus NUC 15 Pro+ | |
| Beelink SER9 Pro | |
| MSI Cubi NUC AI+ 2MG | |
| Durchschnittliche AMD Radeon 680M (30 - 63, n=38) | |
| GMK NucBox M3 Ultra | |
| MSI Cubi NUC 1M | |
| GMK NucBox K16 | |
| 1920x1080 high AA:high AF:8 | |
| Khadas Mind Pro | |
| Asus NUC 15 Pro+ | |
| GMK NucBox K13 | |
| Beelink SER9 Pro | |
| MSI Cubi NUC AI+ 2MG | |
| Durchschnittliche AMD Radeon 680M (25.3 - 53.1, n=38) | |
| GMK NucBox M3 Ultra | |
| MSI Cubi NUC 1M | |
| GMK NucBox K16 | |
| 1920x1080 ultra AA:ultra AF:16 | |
| Khadas Mind Pro | |
| MSI Cubi NUC AI+ 2MG | |
| Asus NUC 15 Pro+ | |
| GMK NucBox K13 | |
| Beelink SER9 Pro | |
| Durchschnittliche AMD Radeon 680M (22 - 46, n=38) | |
| GMK NucBox M3 Ultra | |
| GMK NucBox K16 | |
| MSI Cubi NUC 1M | |
Cyberpunk 2077 ultra FPS Grafik
| min. | mittel | hoch | max. | |
|---|---|---|---|---|
| GTA V (2015) | 88.3 | 82.2 | 29.4 | 13.1 |
| Dota 2 Reborn (2015) | 101.2 | 82.8 | 59.8 | 52.2 |
| Final Fantasy XV Benchmark (2018) | 41.2 | 22.1 | 15.8 | |
| X-Plane 11.11 (2018) | 42.3 | 34.2 | 30 | |
| Strange Brigade (2018) | 85.7 | 35.5 | 30.4 | 25.3 |
| Baldur's Gate 3 (2023) | 24.8 | 20.7 | 16.6 | 16.5 |
| Cyberpunk 2077 (2023) | 23.3 | 18.6 | 14.3 | 12.6 |
| F1 24 (2024) | 42.8 | 35.8 | 23.7 | 7.62 |
Emissionen
Systemgeräusche
Die Lüfter sind immer aktiv, unabhängig von der Bildschirmauslastung. Sie sind zwar nicht sehr laut, aber selbst bei geringer Last wie Webbrowsing oder Videostreaming ist ein konstantes Surren zu hören. Bei höherer Belastung wie Spielen kann das Lüftergeräusch auf bis zu 50 dB(A) ansteigen und ist damit lauter als bei den meisten ultradünnen Laptops.
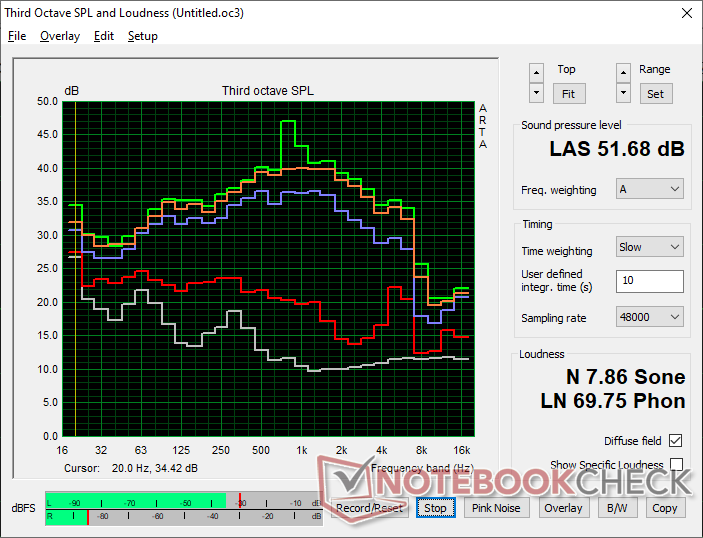
Lautstärkediagramm
| Idle |
| 30.9 / 31.6 / 31.6 dB(A) |
| Last |
| 45.3 / 51.7 dB(A) |
 | ||
30 dB leise 40 dB(A) deutlich hörbar 50 dB(A) störend |
||
min: | ||
| GMK NucBox K16 R7 7735HS, Radeon 680M | GMK NucBox K13 Core Ultra 7 256V, Arc 140V | Beelink SER9 Pro Ryzen 7 H 255, Radeon 780M | Geekom A7 Max, R9 7940HS R9 7940HS, Radeon 780M | Asus NUC 15 Pro+ Ultra 9 285H, Arc 140T | MSI Cubi NUC AI+ 2MG Core Ultra 7 258V, Arc 140V | |
|---|---|---|---|---|---|---|
| Geräuschentwicklung | 14% | 15% | 11% | 3% | 3% | |
| aus / Umgebung * (dB) | 23.6 | 23.3 1% | 23 3% | 24.7 -5% | 25.3 -7% | 24.8 -5% |
| Idle min * (dB) | 30.9 | 24.5 21% | 29.1 6% | 25.5 17% | 25.4 18% | 28 9% |
| Idle avg * (dB) | 31.6 | 25 21% | 30.1 5% | 25.6 19% | 25.5 19% | 36.1 -14% |
| Idle max * (dB) | 31.6 | 25.1 21% | 31.7 -0% | 25.7 19% | 37.3 -18% | 36.1 -14% |
| Last avg * (dB) | 45.3 | 40.1 11% | 33.7 26% | 43 5% | 44.4 2% | 38.9 14% |
| Cyberpunk 2077 ultra * (dB) | 49.2 | 44.2 10% | 33.8 31% | 44.9 9% | 46.2 6% | 37 25% |
| Last max * (dB) | 51.7 | 45.1 13% | 35.2 32% | 45 13% | 52.7 -2% | 49.2 5% |
| Witcher 3 ultra * (dB) | 44.9 | 47.7 |
* ... kleinere Werte sind besser
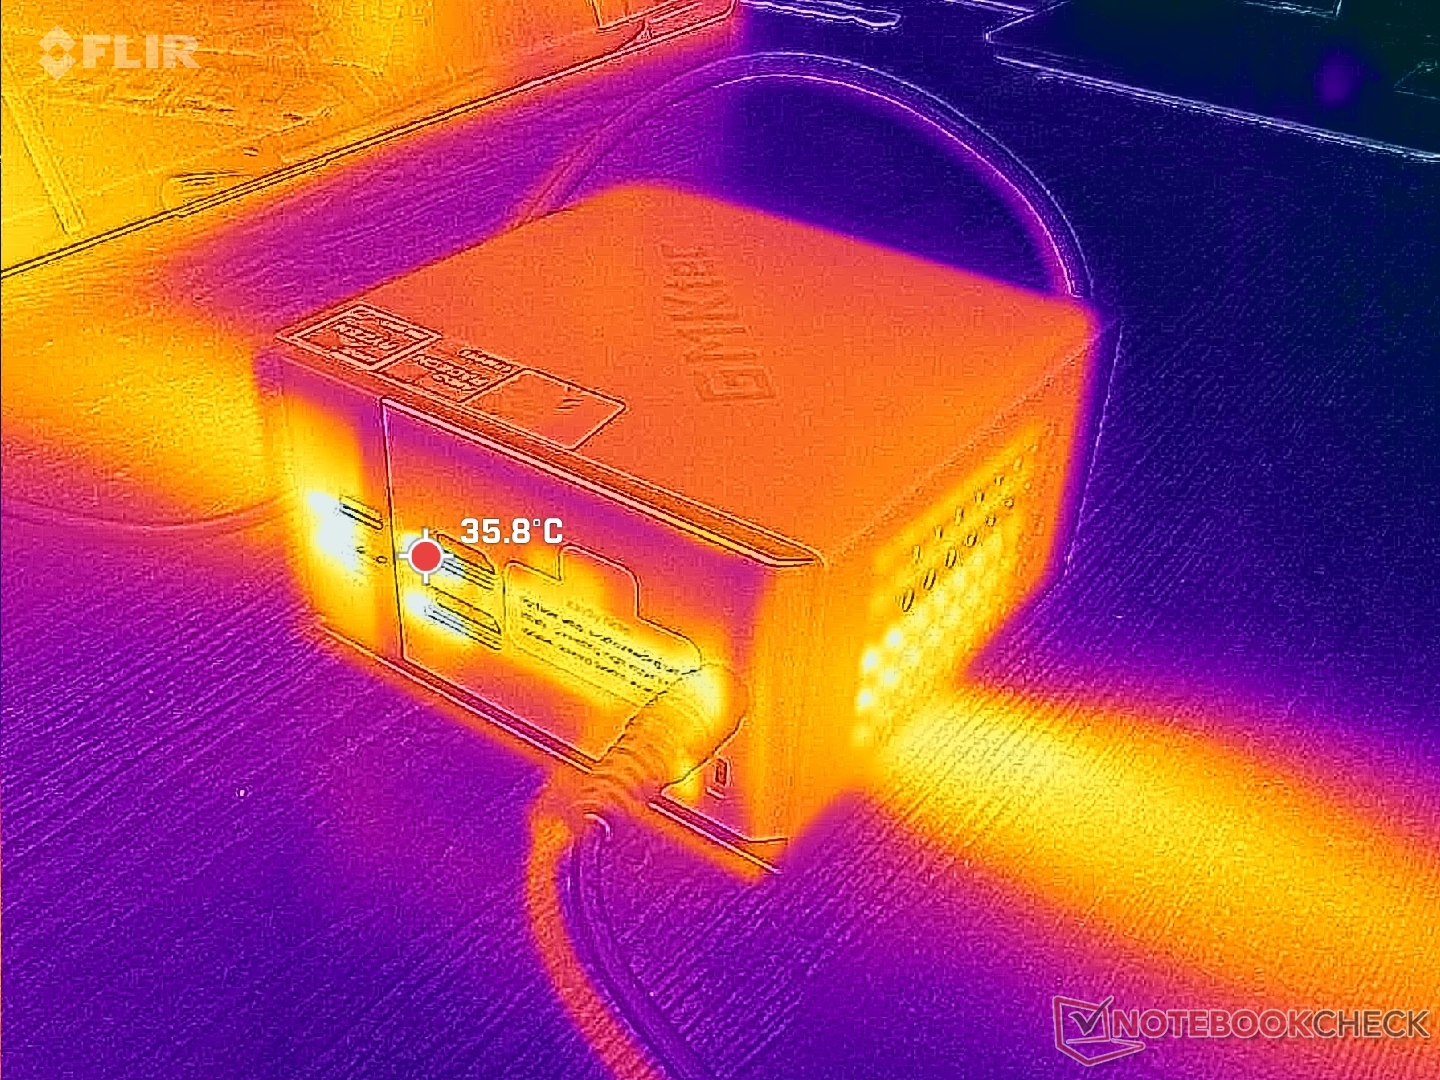
Temperatur
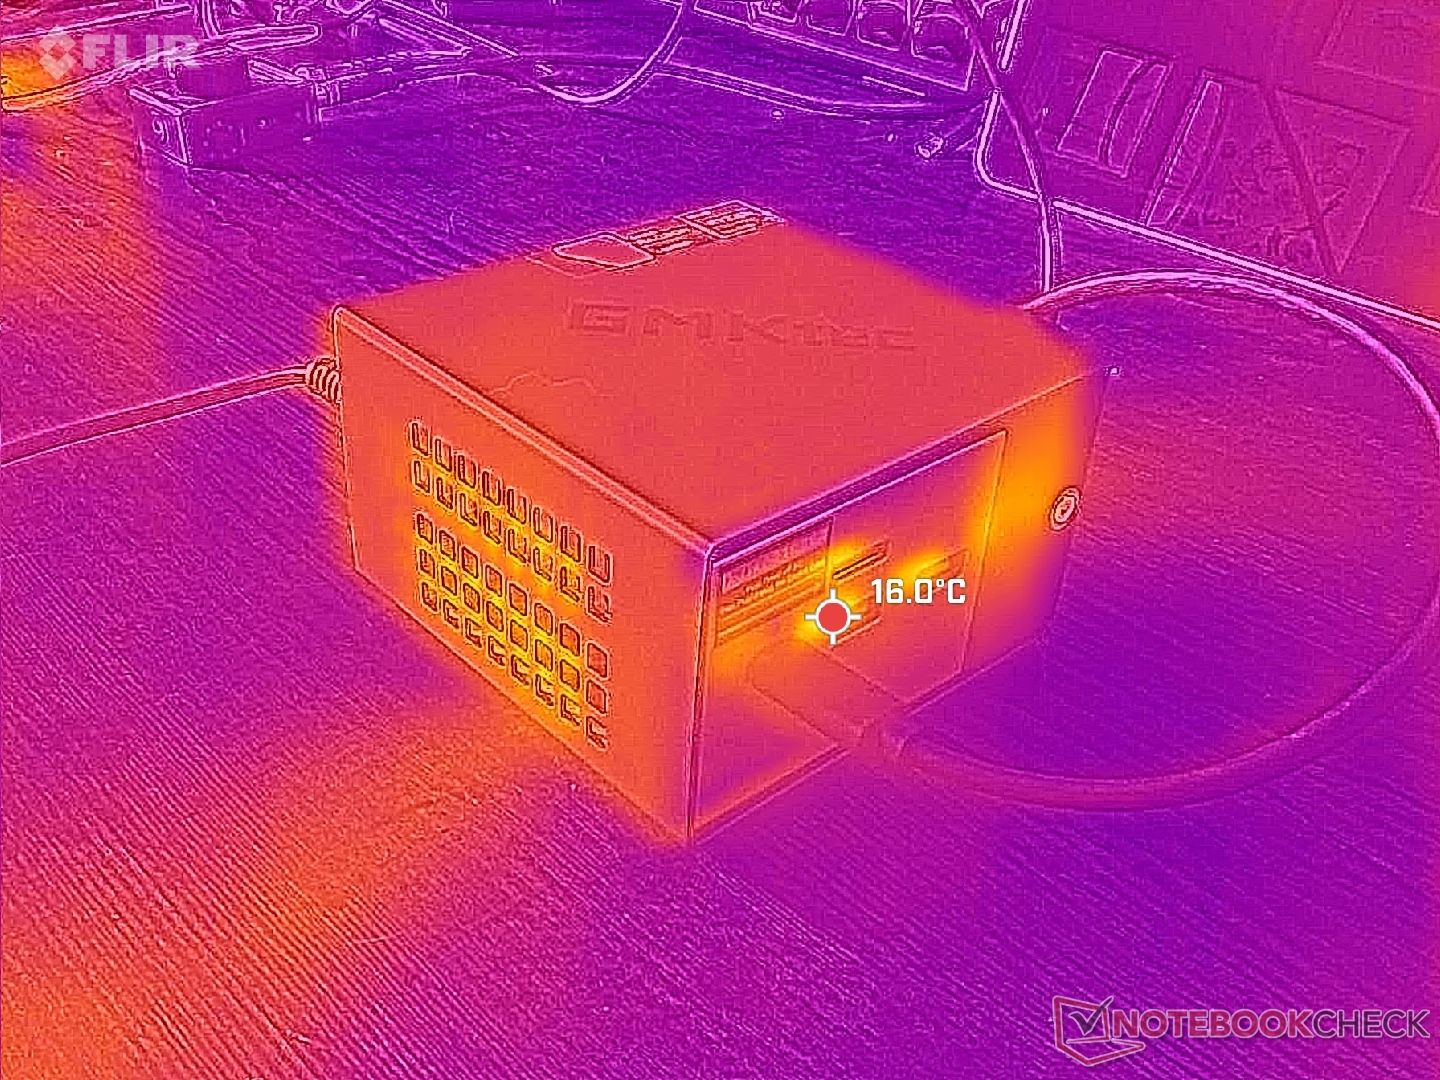
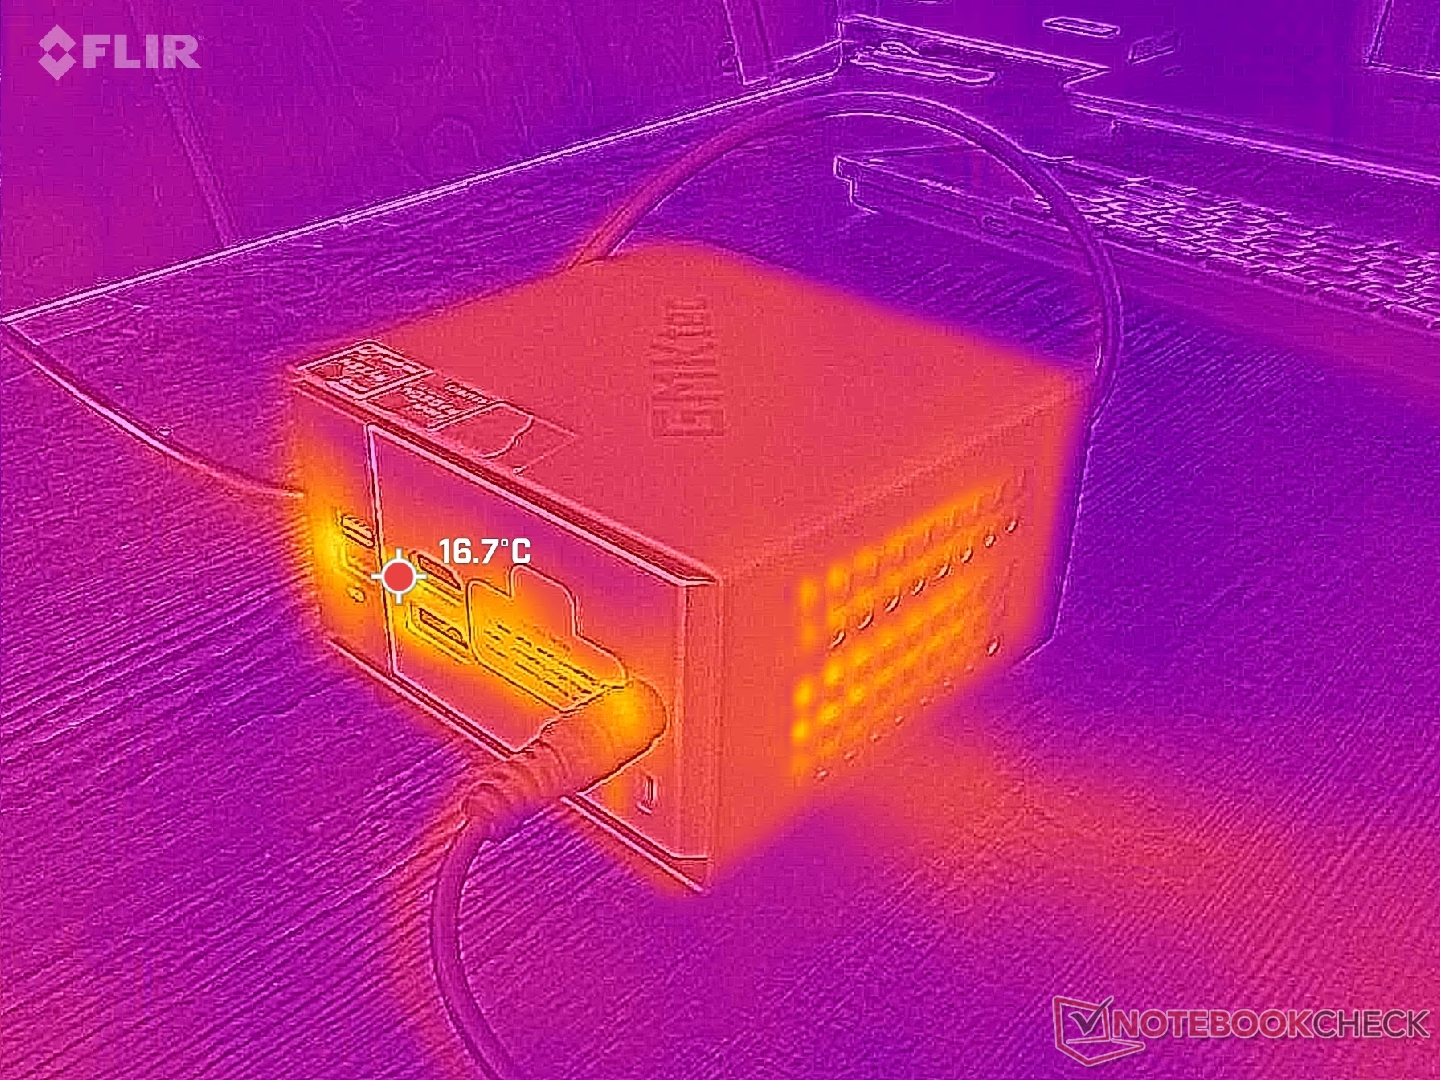
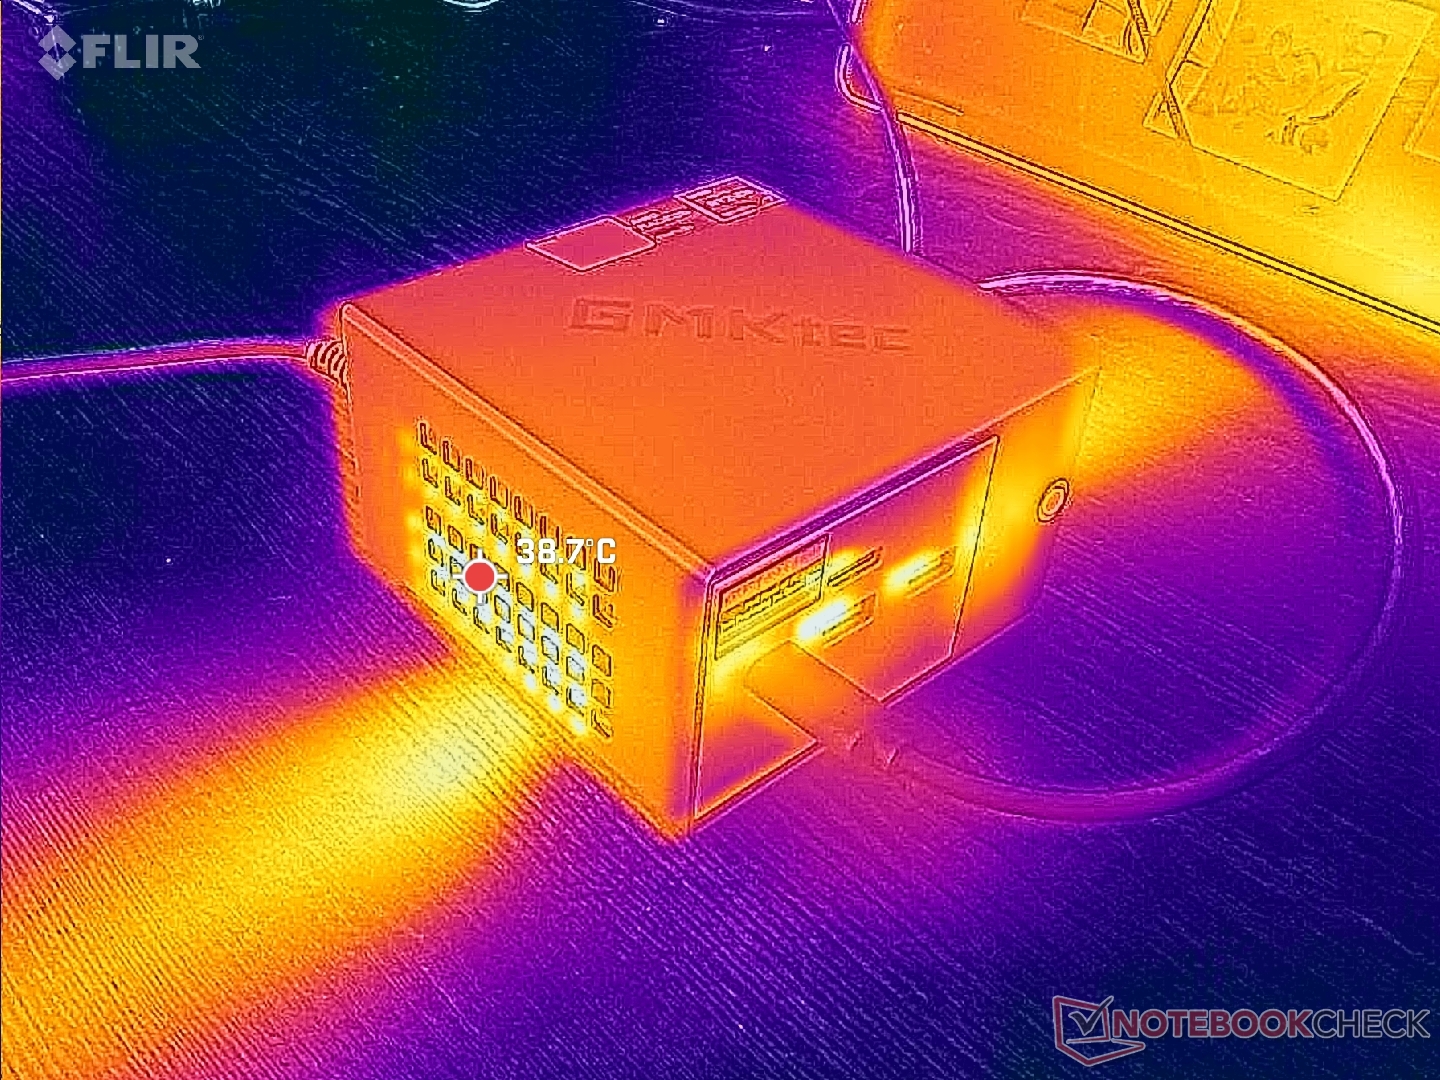
Frische Luft strömt durch Schlitze an der Oberkante des Gerätes ein, bevor sie an den beiden Seiten des Geräts austritt. Im Gegensatz dazu wird die Abwärme bei den meisten anderen Mini-PCs über die Rückseite abgeleitet. Würde man die NucBox K16 auf die Seite legen, wären die Abluftgitter verdeckt, was sich möglicherweise auf die Temperatur und die Leistung auswirken könnte.
(+) Die maximale Temperatur auf der Oberseite ist 28.4 °C. Im Vergleich liegt der Klassendurchschnitt bei 35.4 °C (von 20.6 bis 69.5 °C für die Klasse Mini PC).
(+) Auf der Unterseite messen wir eine maximalen Wert von 29.4 °C (im Vergleich zum Durchschnitt von 36.1 °C).
(+) Ohne Last messen wir eine durchschnittliche Temperatur von 23.2 °C auf der Oberseite. Der Klassendurchschnitt erreicht 32.1 °C.
Stresstest
Die CPU stabilisiert sich bei 4,1 GHz, 50 W und 81 °C, wenn Prime95 Stress läuft, was tatsächlich wärmer ist als die Werte, die wir auf der EVO-X1 mit der neueren und schnelleren Zen-5-CPU messen. Auch bei der Ausführung von Spielen ist die Kerntemperatur weiterhin um einige Grad Celsius wärmer. Die NucBox K13 mit dem effizienteren Core Ultra 7 256V bietet sowohl eine schnellere Gaming-Leistung als auch eine kühlere Betriebstemperatur.
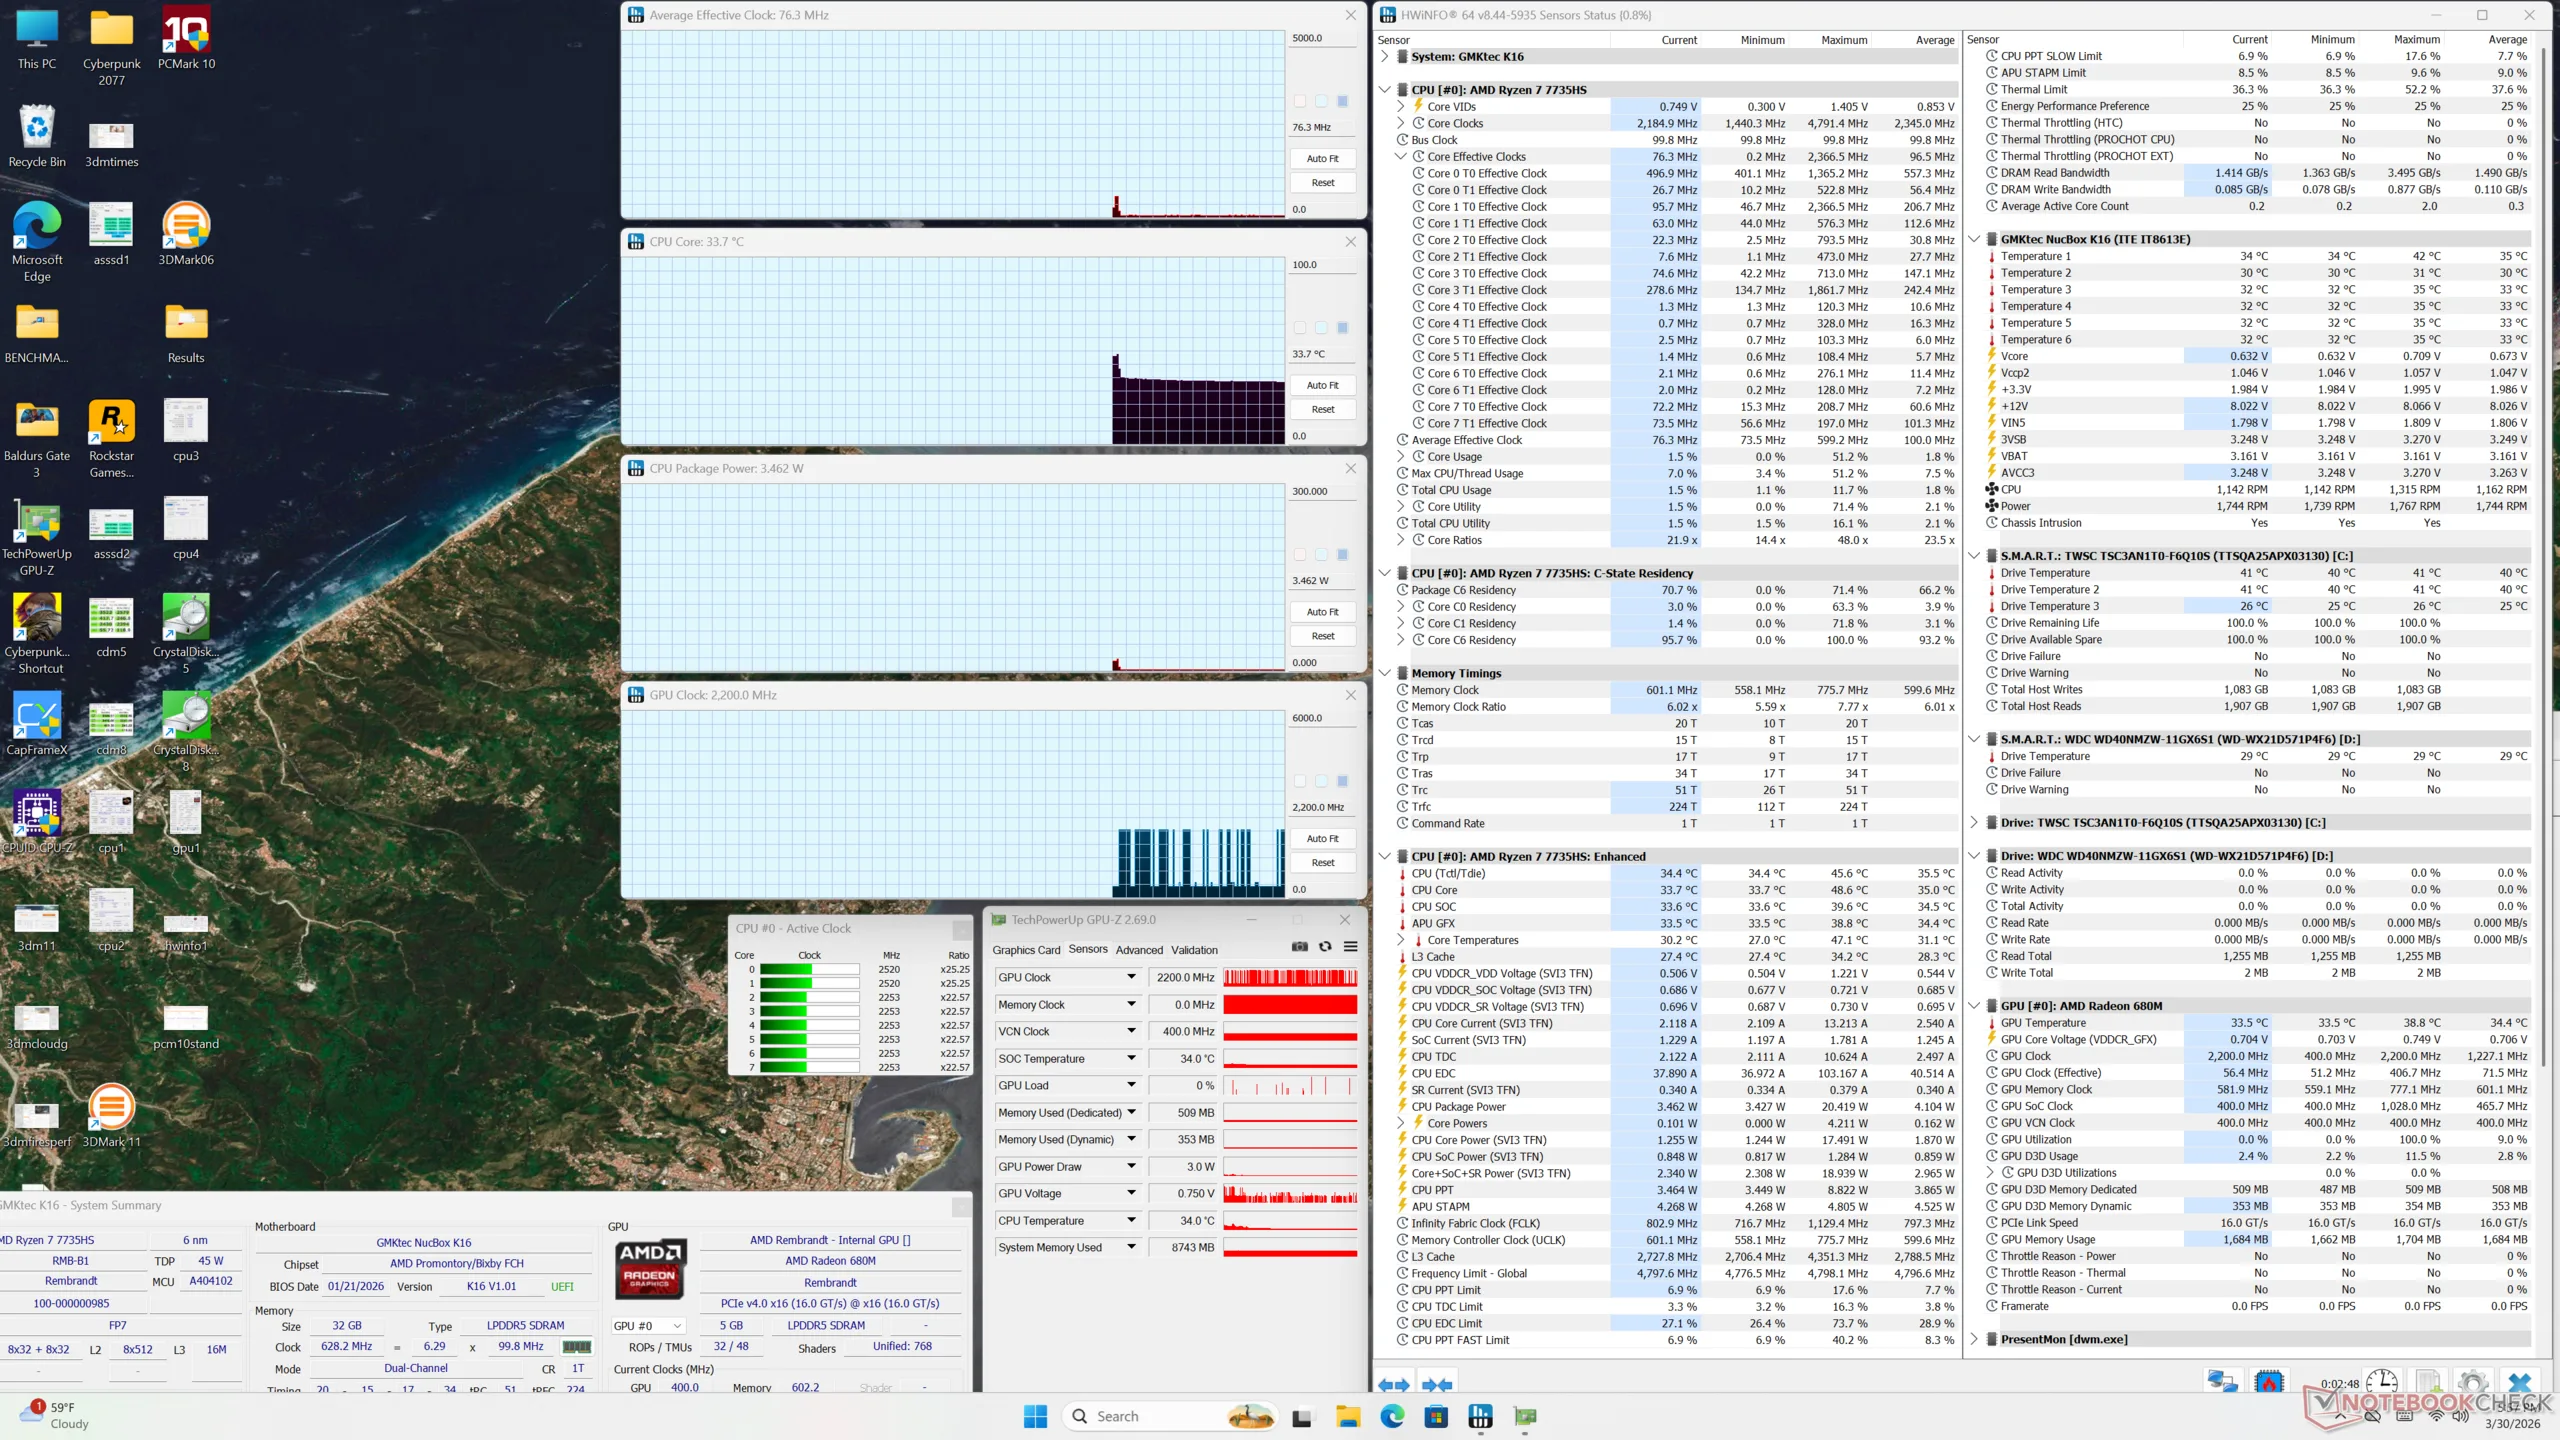
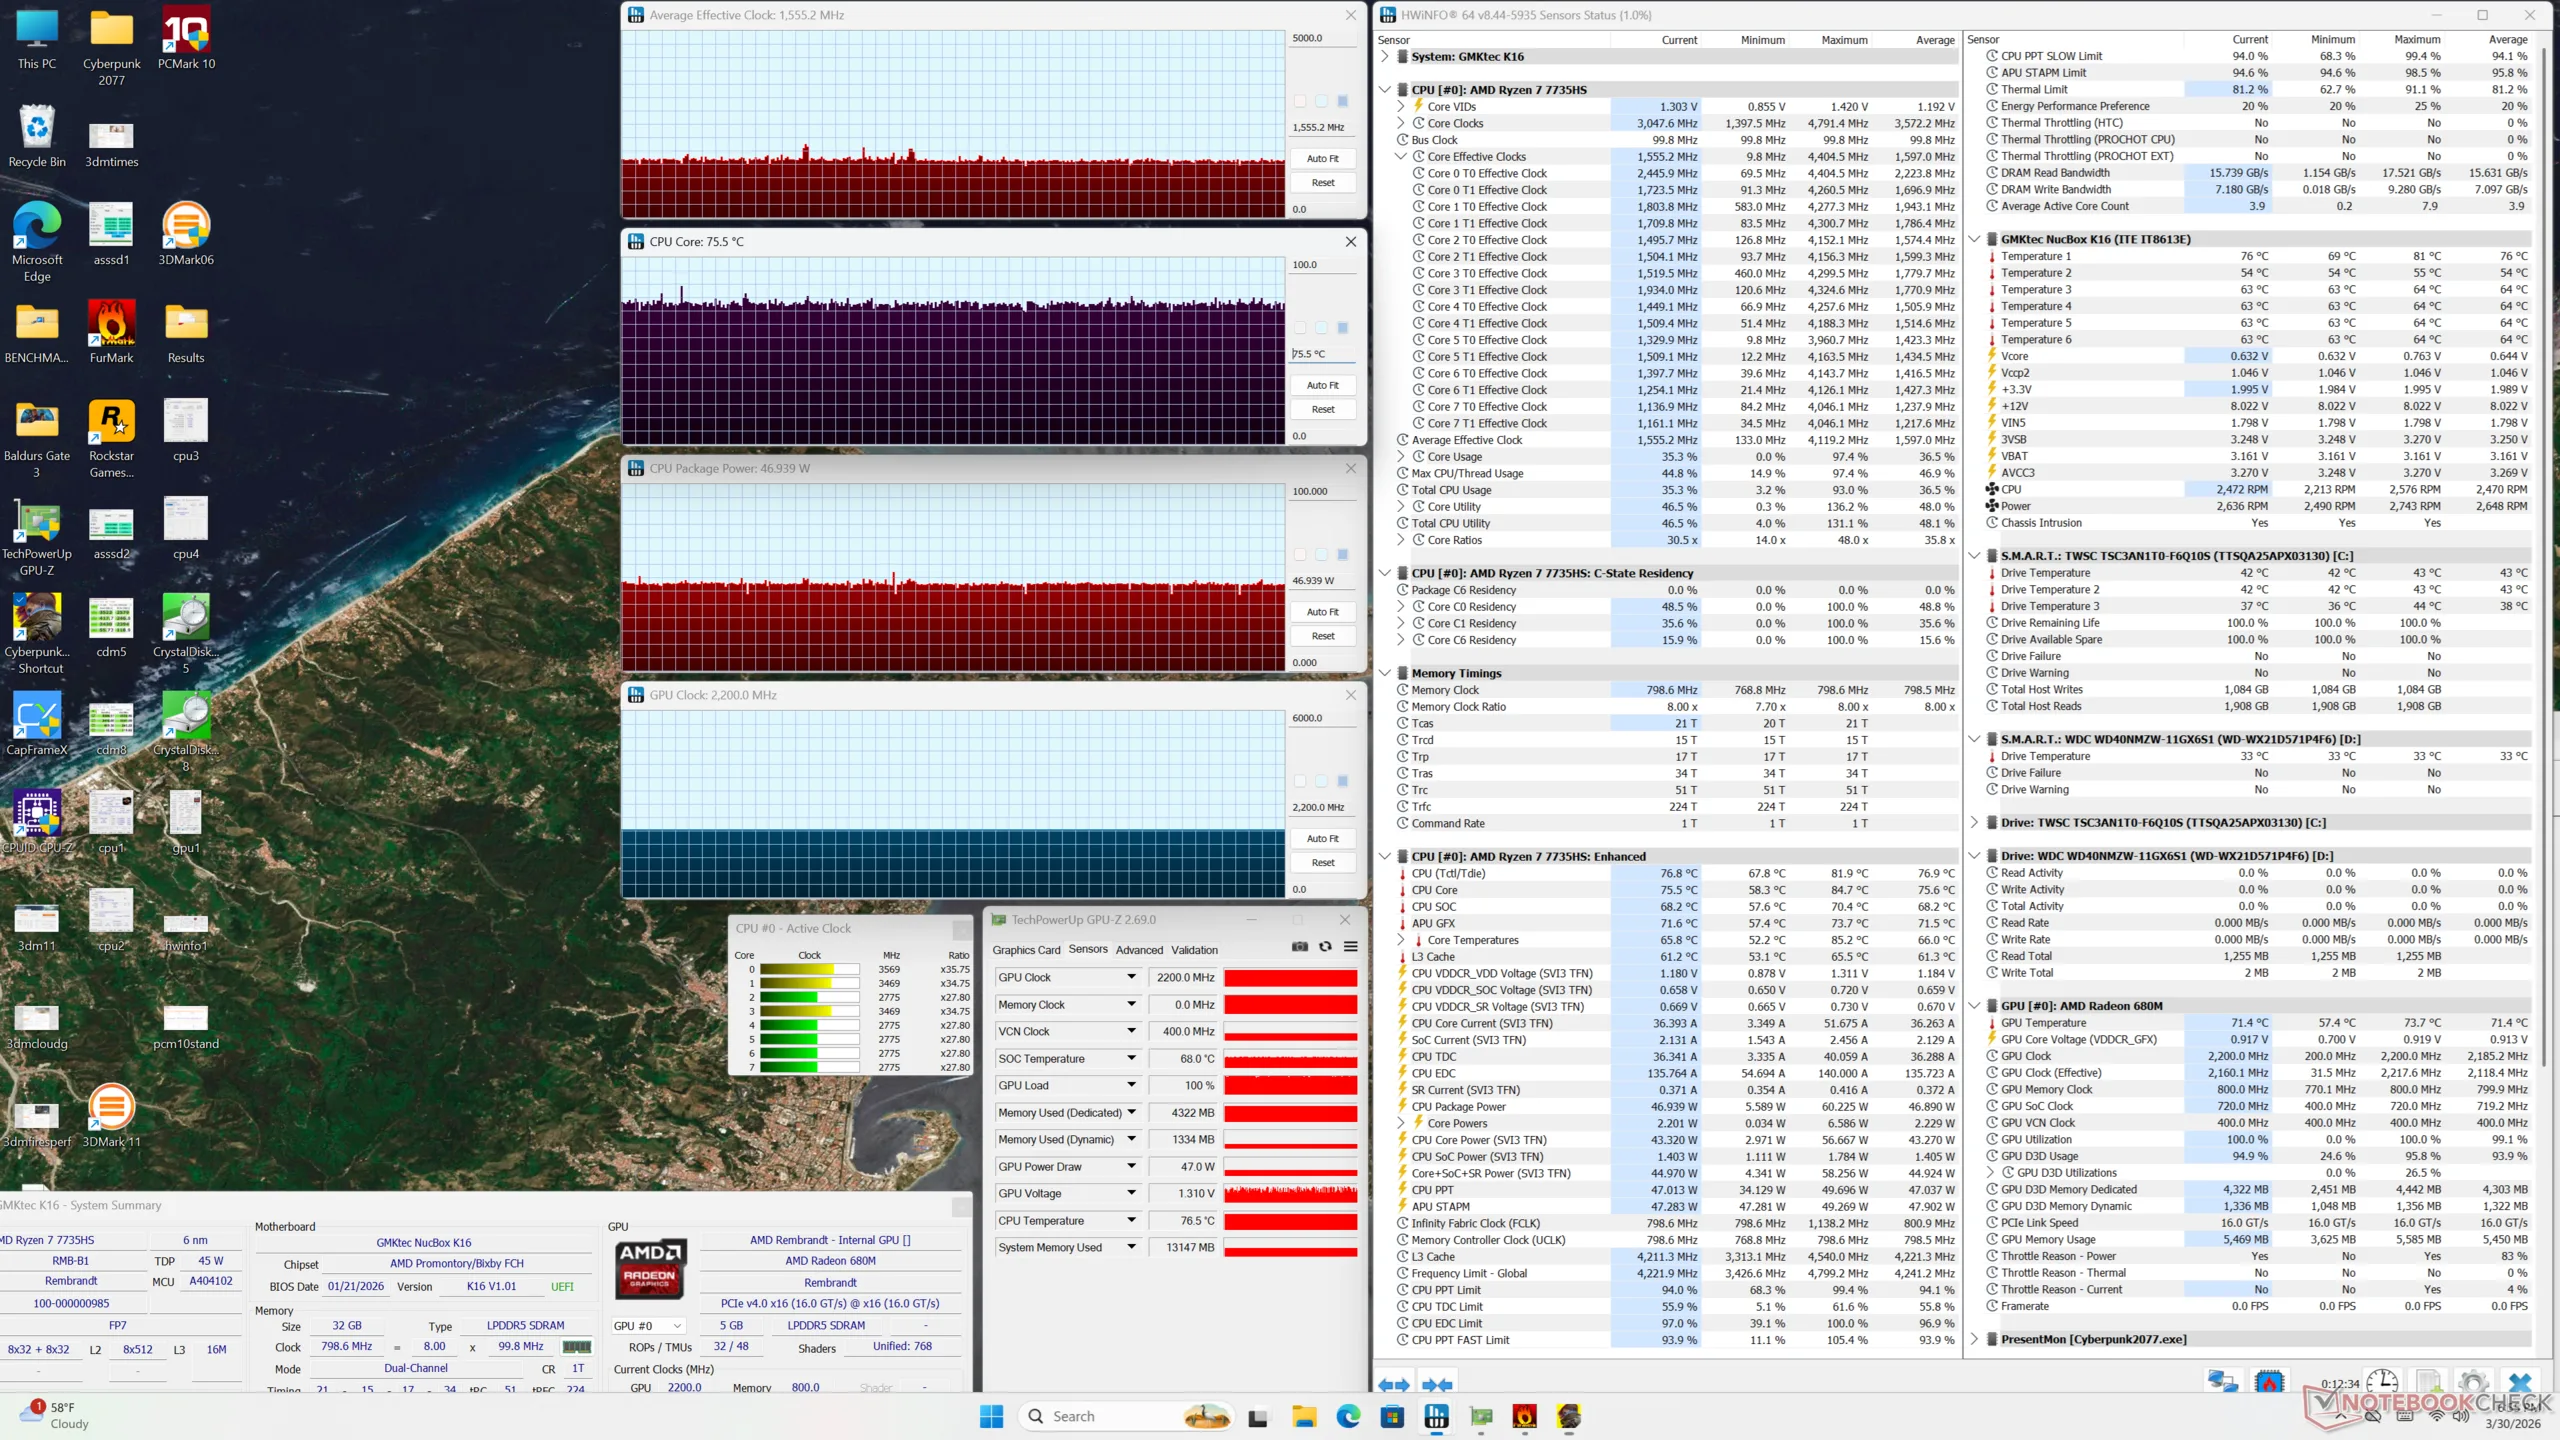
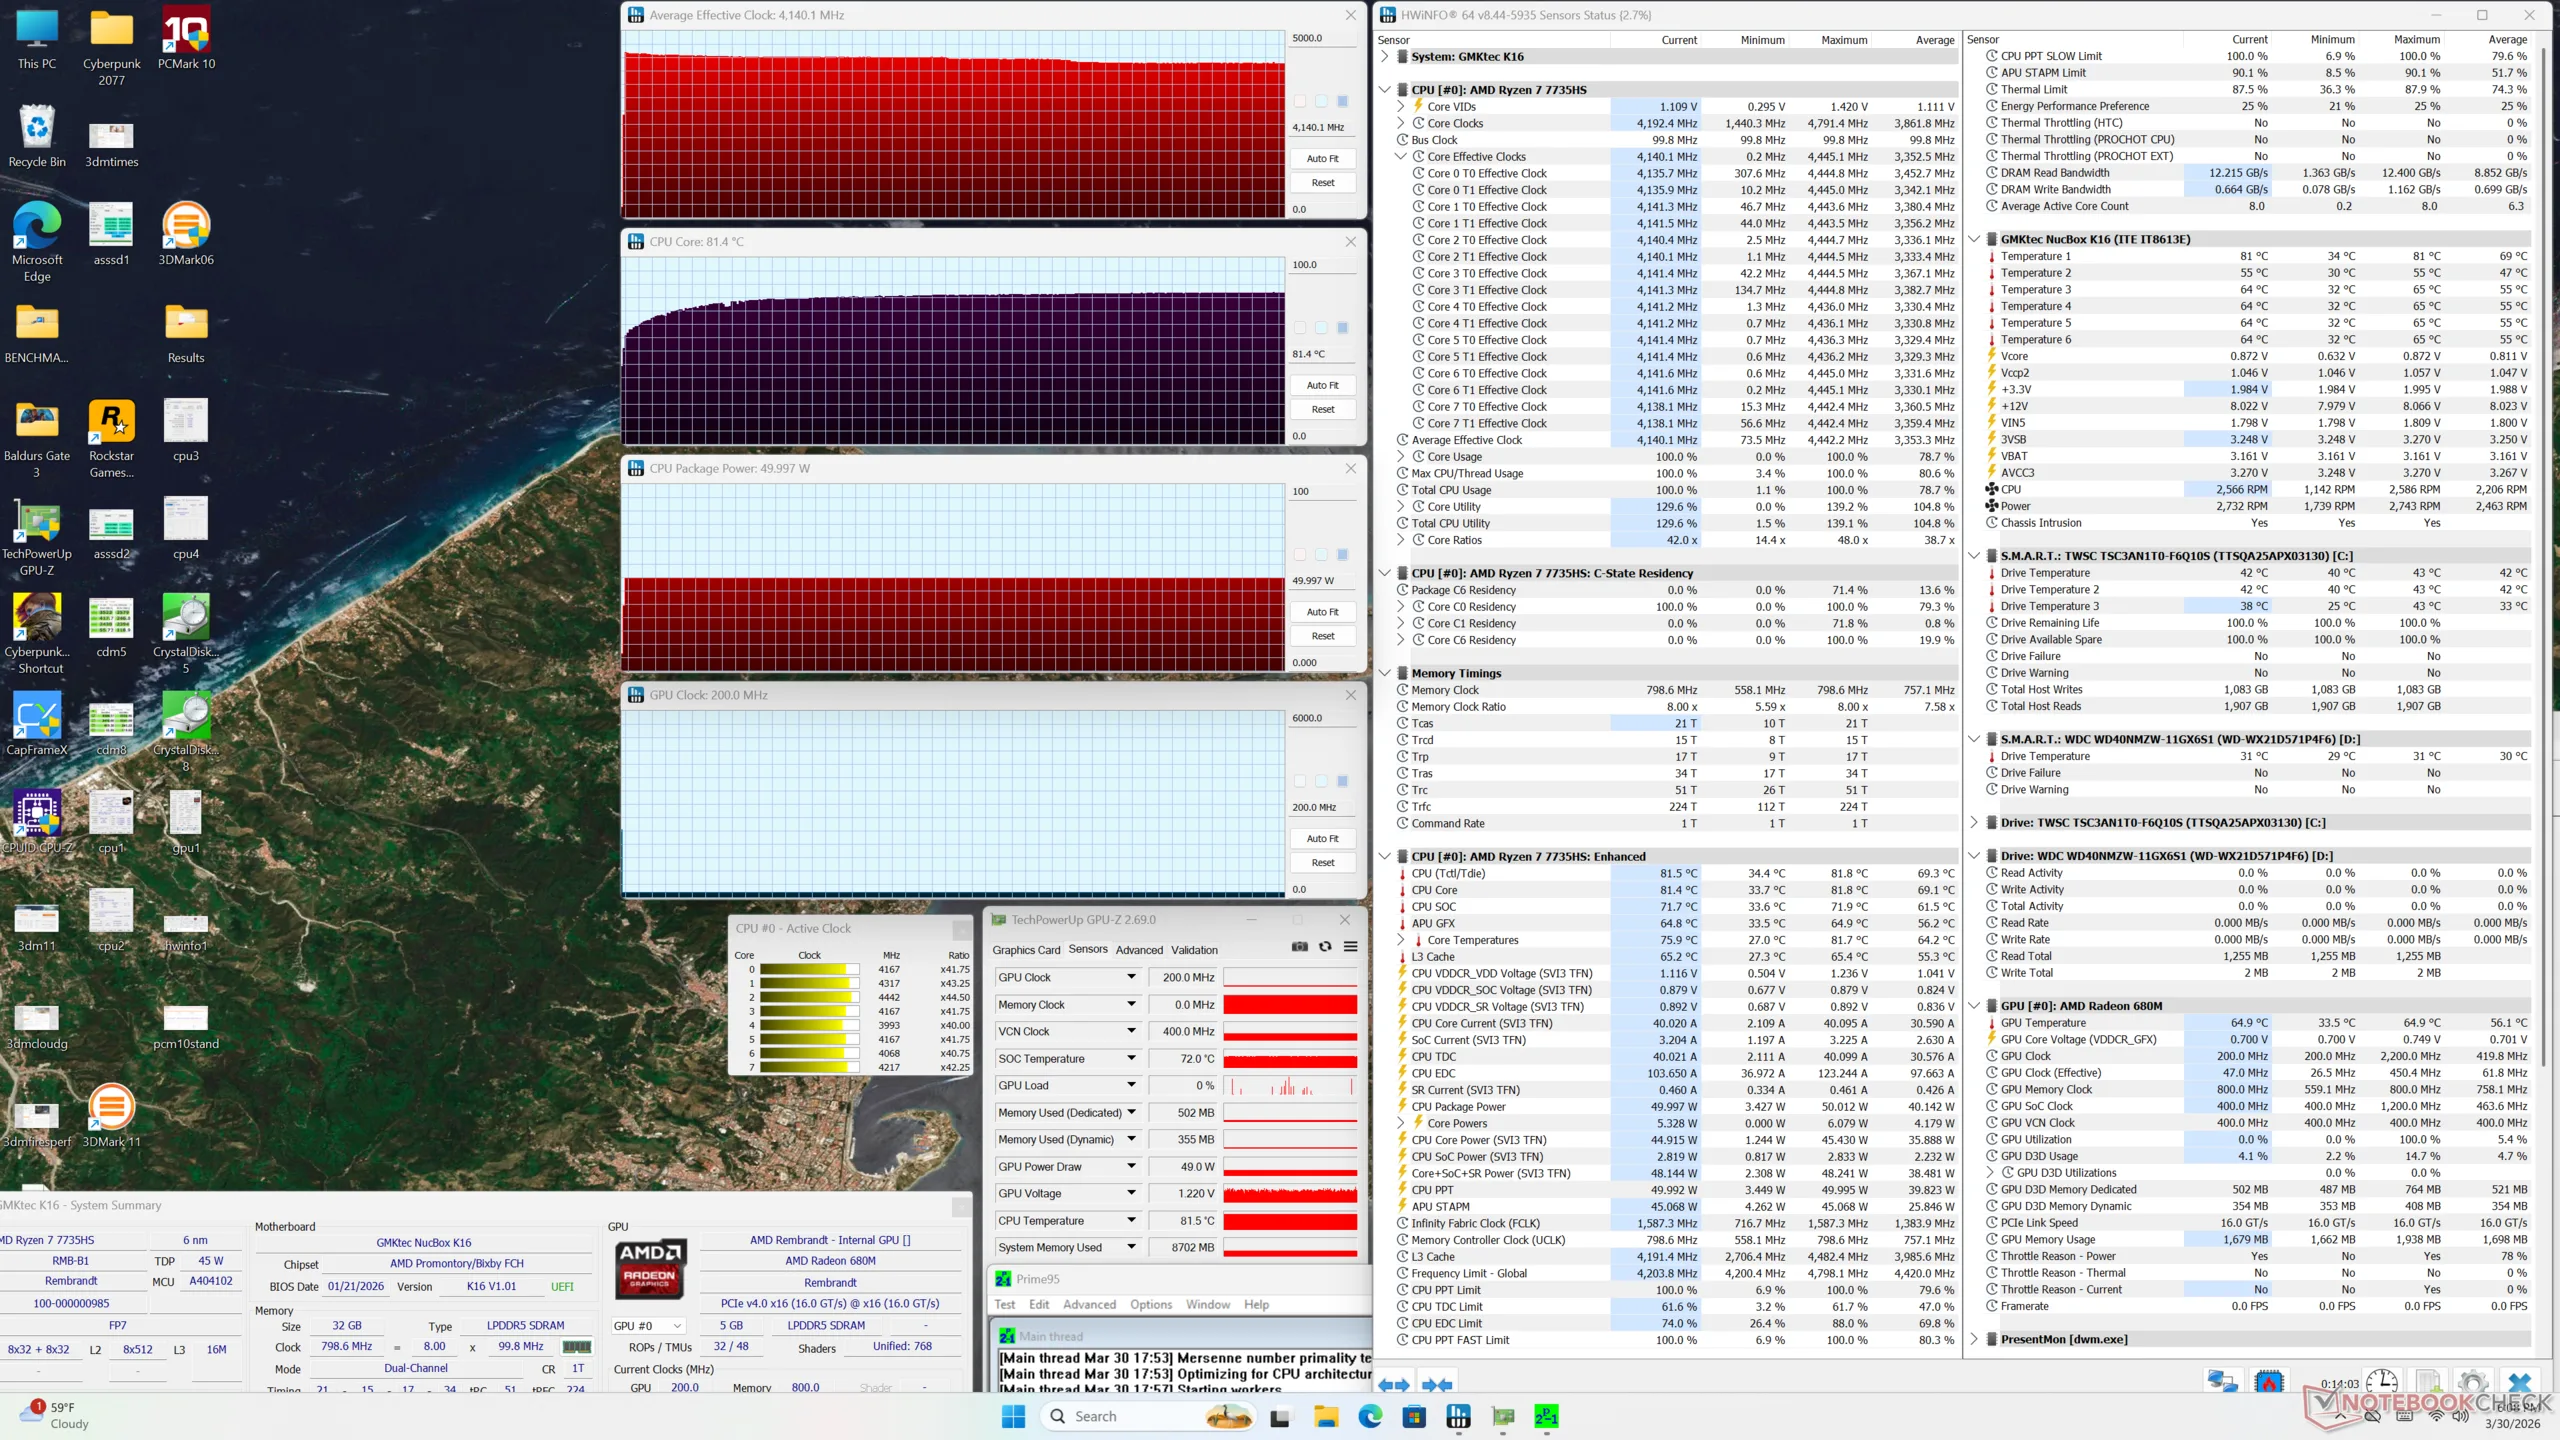
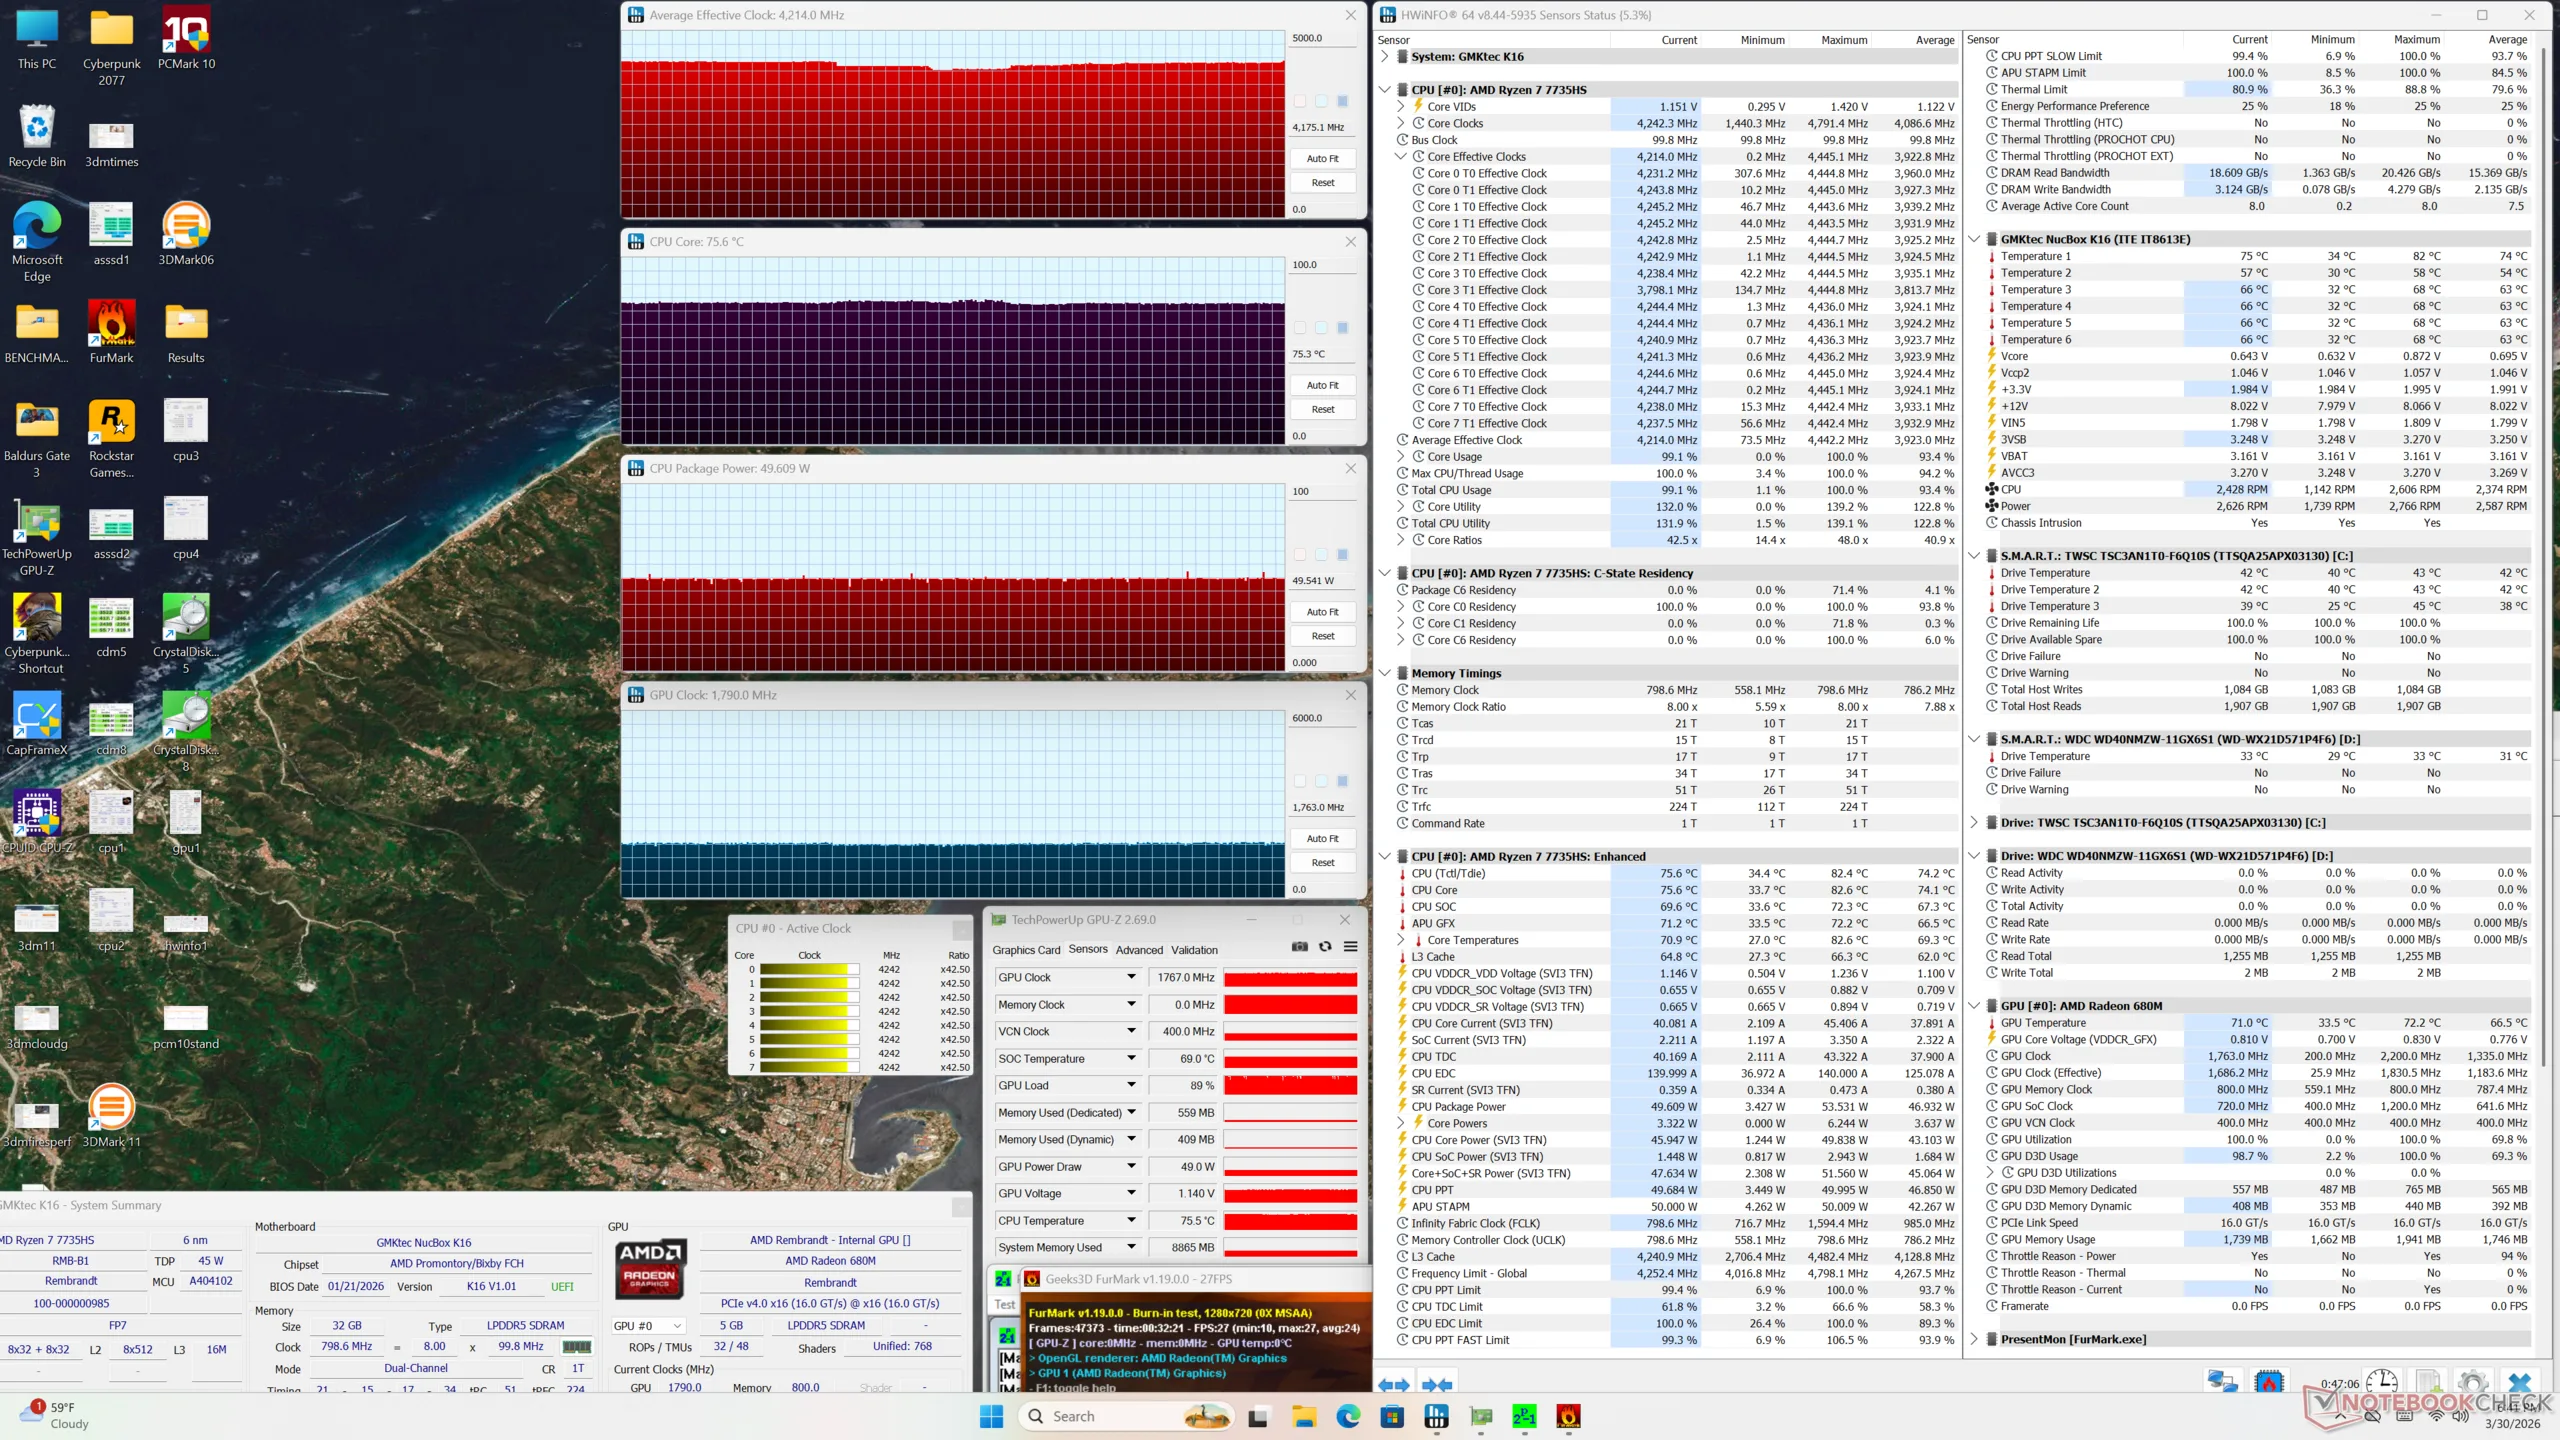
| durchschnittlicher CPU-Takt (GHz) | GPU-Takt (MHz) | durchschnittliche CPU-Temperatur (°C) | |
| System Leerlauf | -- | 400 | 34 |
| Prime95 Stress | 4,1 | -- | 81 |
| Prime95 + FurMark Stress | 4,2 | 1.763 | 75 |
| Cyberpunk 2077 Stress | 1,6 | 2.200 | 76 |
Energieverwaltung
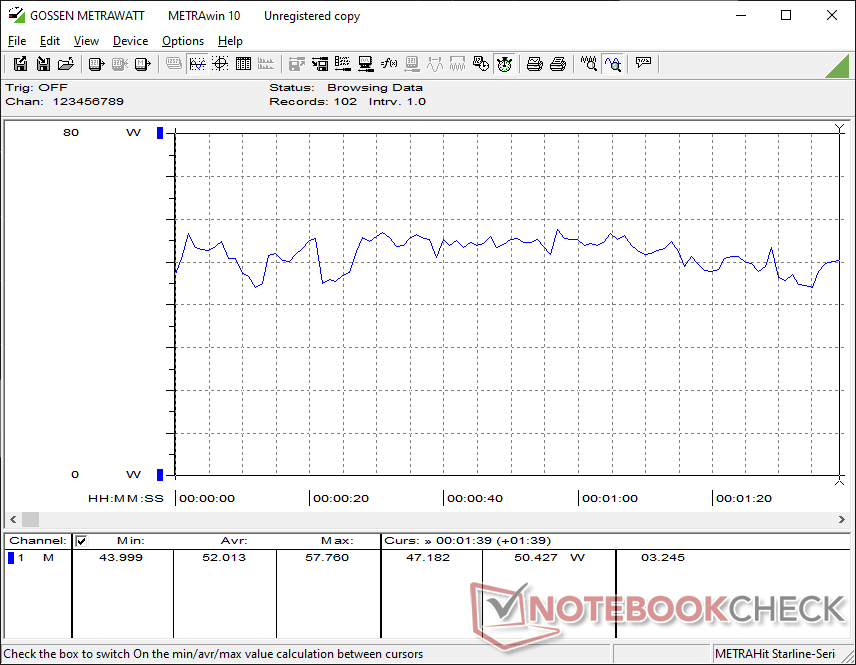
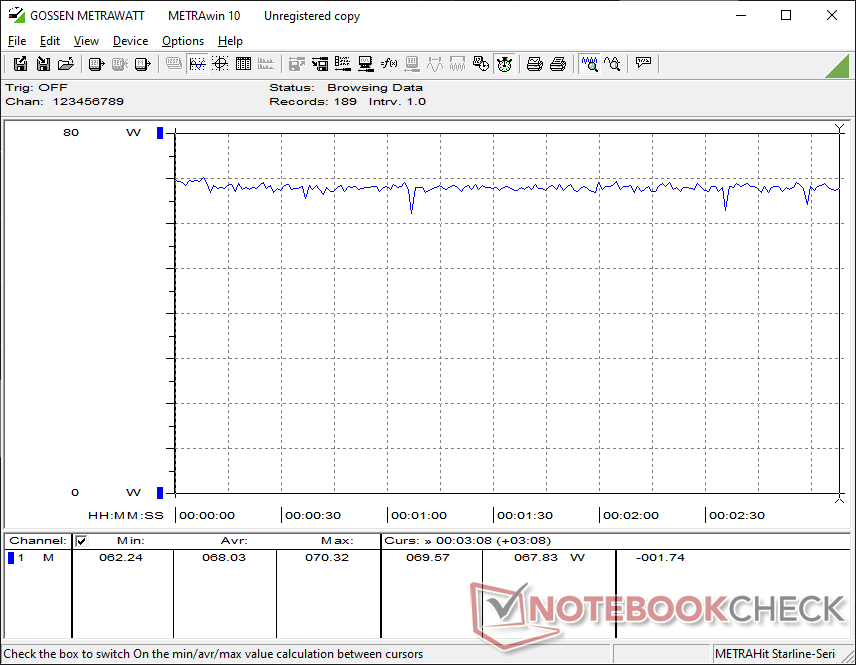
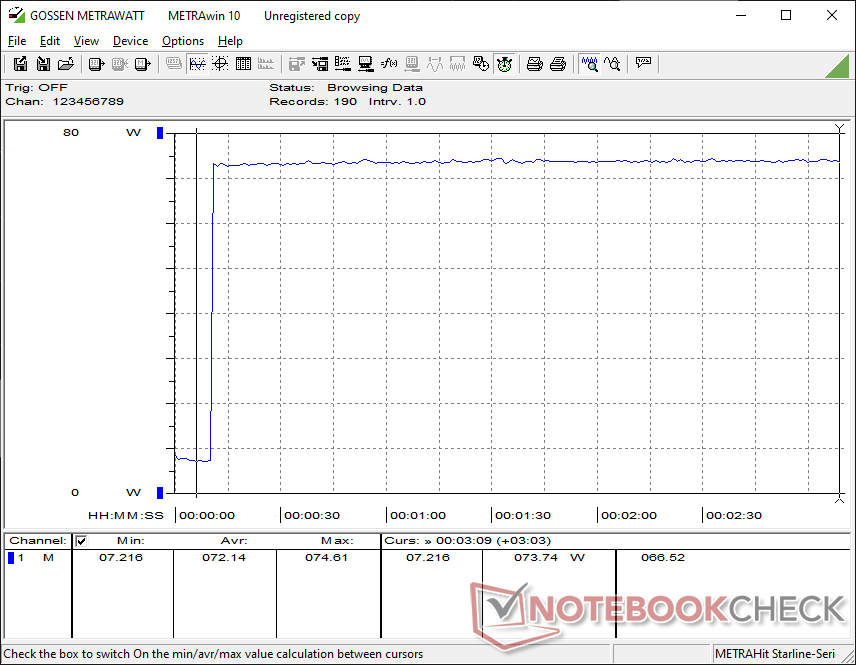
Stromverbrauch
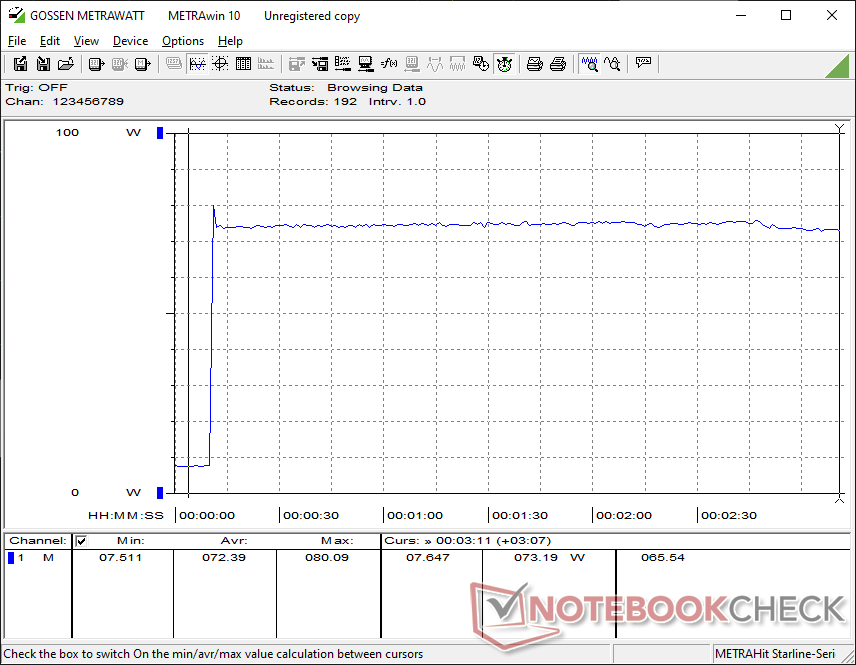
Der Stromverbrauch ist der Punkt, an dem das Zen-3+-System beginnt, sein Alter zu zeigen. Beim Spielen verbraucht das System fast 70 W oder doppelt so viel wie die Lunar Lake betriebene NucBox K13, obwohl Letztere eine 60 bis 90 Prozent bessere Grafikleistung bietet. Auch bei der Ausführung von Prime95 benötigt die NucBox K16 mehr als doppelt so viel Strom für eine nur mittelmäßige 20-prozentige Leistungssteigerung des Prozessors.
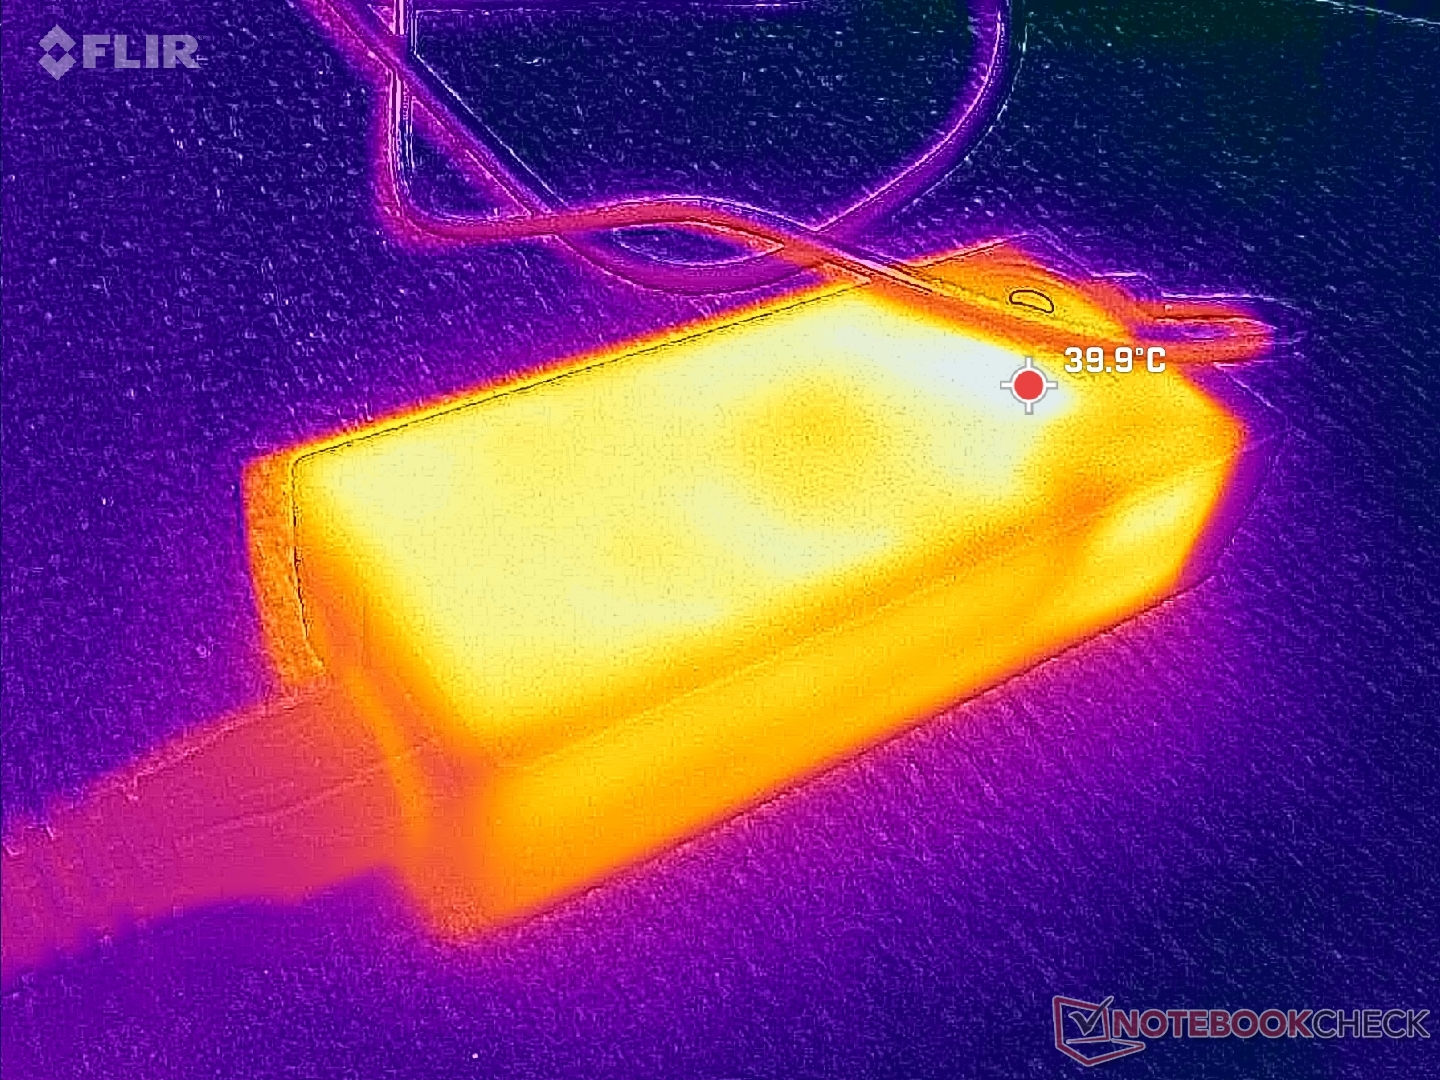
Wir konnten eine maximale Leistungsaufnahme von 80 W aus dem mittelgroßen (~13,3 x 5,8 x 3,2 cm) 120-W-Netzteil messen.
| Aus / Standby | |
| Idle | |
| Last |
|
Legende:
min: | |
| GMK NucBox K16 R7 7735HS, Radeon 680M, TWSC TSC3AN1T0-F6Q10S, , x, | GMK NucBox K13 Core Ultra 7 256V, Arc 140V, Huawei eKitStor Xtreme 200e 1 TB, , x, | Beelink SER9 Pro Ryzen 7 H 255, Radeon 780M, Crucial P3 Plus CT1000P3PSSD8, , x, | Geekom A7 Max, R9 7940HS R9 7940HS, Radeon 780M, Wodposit WPBSN4M8-1TGP, , x, | Asus NUC 15 Pro+ Ultra 9 285H, Arc 140T, Micron 3500 1TB MTFDKBA1T0TGD, , x, | MSI Cubi NUC AI+ 2MG Core Ultra 7 258V, Arc 140V, Phison 1 TB ESR01TBTCCZ-27J, , x, | |
|---|---|---|---|---|---|---|
| Stromverbrauch | 50% | -4% | -1% | -7% | 24% | |
| Idle min * (Watt) | 7.4 | 2.3 69% | 7 5% | 5.6 24% | 3.9 47% | 2.9 61% |
| Idle avg * (Watt) | 7.7 | 3.6 53% | 7.1 8% | 7.1 8% | 6.1 21% | 5.7 26% |
| Idle max * (Watt) | 7.7 | 5.8 25% | 7.5 3% | 8.4 -9% | 8.2 -6% | 10.2 -32% |
| Last avg * (Watt) | 52 | 27.3 47% | 62.3 -20% | 57.5 -11% | 56.1 -8% | 38.7 26% |
| Cyberpunk 2077 ultra external monitor * (Watt) | 68 | 31.6 54% | 80.1 -18% | 67.4 1% | 63.9 6% | 41.1 40% |
| Last max * (Watt) | 80.1 | 39.6 51% | 82.9 -3% | 92.9 -16% | 160.6 -100% | 60 25% |
* ... kleinere Werte sind besser
Stromverbrauch Cyberpunk/Stresstest
Stromverbrauch externer Monitor
Notebookcheck Bewertung
Die NucBox K16 vereint eine ältere AMD-Zen-3+-CPU mit einem neueren Gehäuse-Design, komplett mit Oculink und zwei RJ-45-Ports, die Profis zu schätzen wissen.
GMK NucBox K16
- 01.04.2026 v8
Allen Ngo
 Total Sustainability Score:
 Potenzielle Wettbewerber im Vergleich
Bild | Modell / Test | Preis ab | Gewicht | Dicke | Display |
|---|---|---|---|---|---|
1. 64.8% 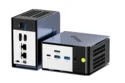 | GMK NucBox K16 AMD Ryzen 7 7735HS ⎘ AMD Radeon 680M ⎘ 32 GB RAM, 1024 GB SSD | Amazon: 1. 533,80 € GMKtec K16 Metallgehäuse Ga... 2. 669,96 € GMKtec K17 Mini PC Ultra 5 2... 3. 799,96 € GMKtec K15 AI Mini PC Oculin... Geizhals Suche | 567 g | 63 mm | x |
2. 77.4% 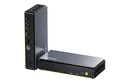 | GMK NucBox K13 Intel Core Ultra 7 256V ⎘ Intel Arc Graphics 140V ⎘ 16 GB RAM, 1024 GB SSD | Amazon: 1. 769,96 € GMKtec K13 Mini PC Intel Ult... 2. 629,96 € GMKtec M3 Pro Mini-PC mit In... Geizhals Suche | 506 g | 36.6 mm | x |
3. 80.2%  | Beelink SER9 Pro AMD Ryzen 7 H 255 ⎘ AMD Radeon 780M ⎘ 32 GB RAM, 1024 GB SSD | Amazon: 931,78 € Geizhals Suche | 812 g | 44.7 mm | x |
4. 78.2%  | Geekom A7 Max, R9 7940HS AMD Ryzen 9 7940HS ⎘ AMD Radeon 780M ⎘ 16 GB RAM, 1024 GB SSD | Amazon: Listenpreis: 749€ | 681 g | 46.9 mm | x |
5. 77.5% 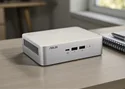 | Asus NUC 15 Pro+ Intel Core Ultra 9 285H ⎘ Intel Arc Graphics 140T ⎘ 32 GB RAM, 1024 GB SSD | Amazon: 728,90 € Bestpreis 728.9€ galaxus 2. 728.9€ office-partner.de 3. 735.03€ office-partner (AT) | 690 g | 42 mm | x |
6. 75.2% 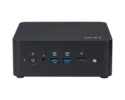 | MSI Cubi NUC AI+ 2MG Intel Core Ultra 7 258V ⎘ Intel Arc Graphics 140V ⎘ 32 GB RAM, 1000 GB SSD | Amazon: Bestpreis 1899€ galaxus 2. 1919€ galaxus.at | 669 g | 50.1 mm | x |
Transparenz
Die Auswahl der zu testenden Geräte erfolgt innerhalb der Redaktion. Das vorliegende Testmuster wurde dem Autor vom Hersteller oder einem Shop zu Testzwecken leihweise zur Verfügung gestellt. Eine Einflussnahme des Leihstellers auf den Testbericht gab es nicht, der Hersteller erhielt keine Version des Reviews vor der Veröffentlichung. Es bestand keine Verpflichtung zur Publikation. Als eigenständiges, unabhängiges Unternehmen unterliegt Notebookcheck keiner Diktion von Herstellern, Shops und Verlagen.
So testet Notebookcheck
Pro Jahr werden von Notebookcheck hunderte Laptops und Smartphones unabhängig in von uns standardisierten technischen Verfahren getestet, um eine Vergleichbarkeit aller Testergebnisse zu gewährleisten. Seit rund 20 Jahren entwickeln wir diese Testmethoden kontinuierlich weiter und setzen damit Branchenstandards. In unseren Testlaboren kommt ausschließlich hochwertiges Messequipment in die Hände erfahrener Techniker und Redakteure. Die Tests unterliegen einer mehrstufigen Kontrolle. Unsere komplexe Gesamtbewertung basiert auf hunderten fundierten Messergebnissen und Benchmarks, womit Ihnen Objektivität garantiert ist. Weitere Informationen zu unseren Testmethoden gibt es hier.

