GMK NucBox M4 Mini-PC im Test: Core i9 der 11. Generation für unter 500 Euro

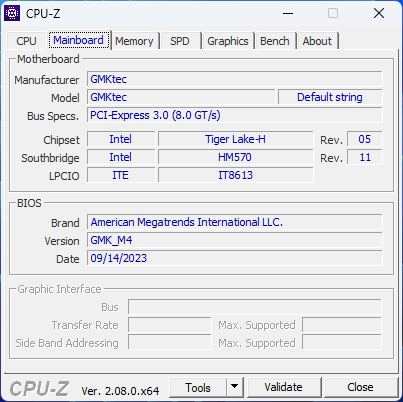
Die NucBox M4 ist der neueste Mini-PC von GMK mit einer Core i9 Tiger Lake-H CPU der 11. Generation. Er zeichnet sich dadurch aus, dass er einer der günstigsten Mini-PCs mit einer solchen Prozessoroption ist.
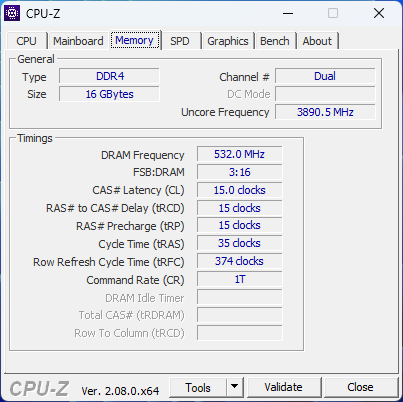
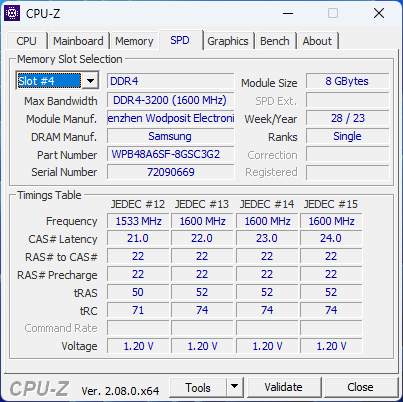
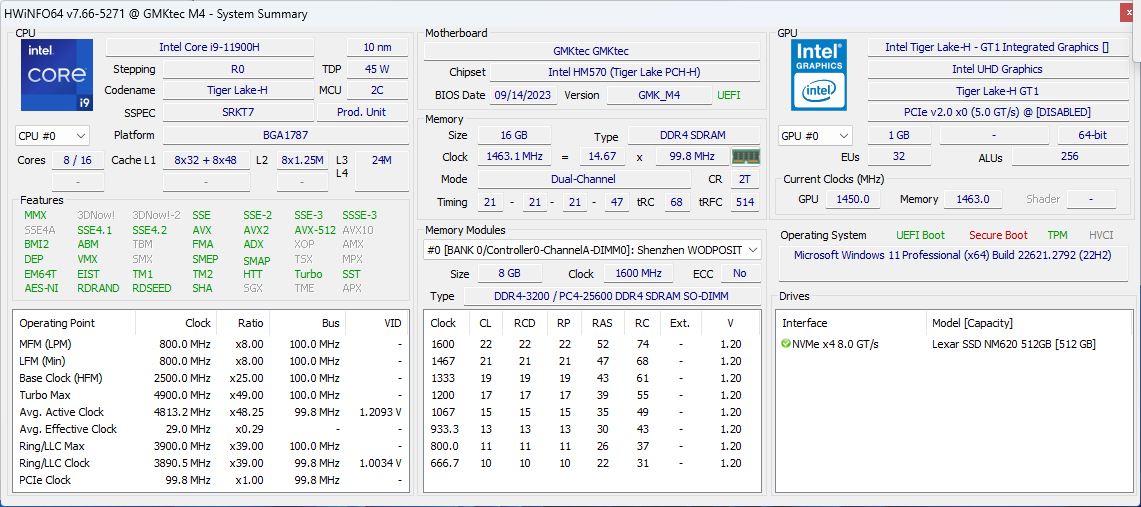
Unsere Testkonfiguration ist online für 450 bis 500 Euro mit dem Core i9-11900H, 16 GB DDR4 RAM, 512 TB M.2 SSD und vorinstalliertem Windows 11 Pro erhältlich. Zu den Konkurrenten der NucBox M4 gehören andere preiswerte Mini-PCs wie der Beelink SER6 Pro, Lenovo IdeaCentre Mini oder Minisforum Neptune Series HX77G.
Weitere GMKtec-Bewertungen:
Mögliche Konkurrenten im Vergleich
Bew. | Datum | Modell | Gewicht | Dicke | Größe | Auflösung | Preis ab |
|---|---|---|---|---|---|---|---|
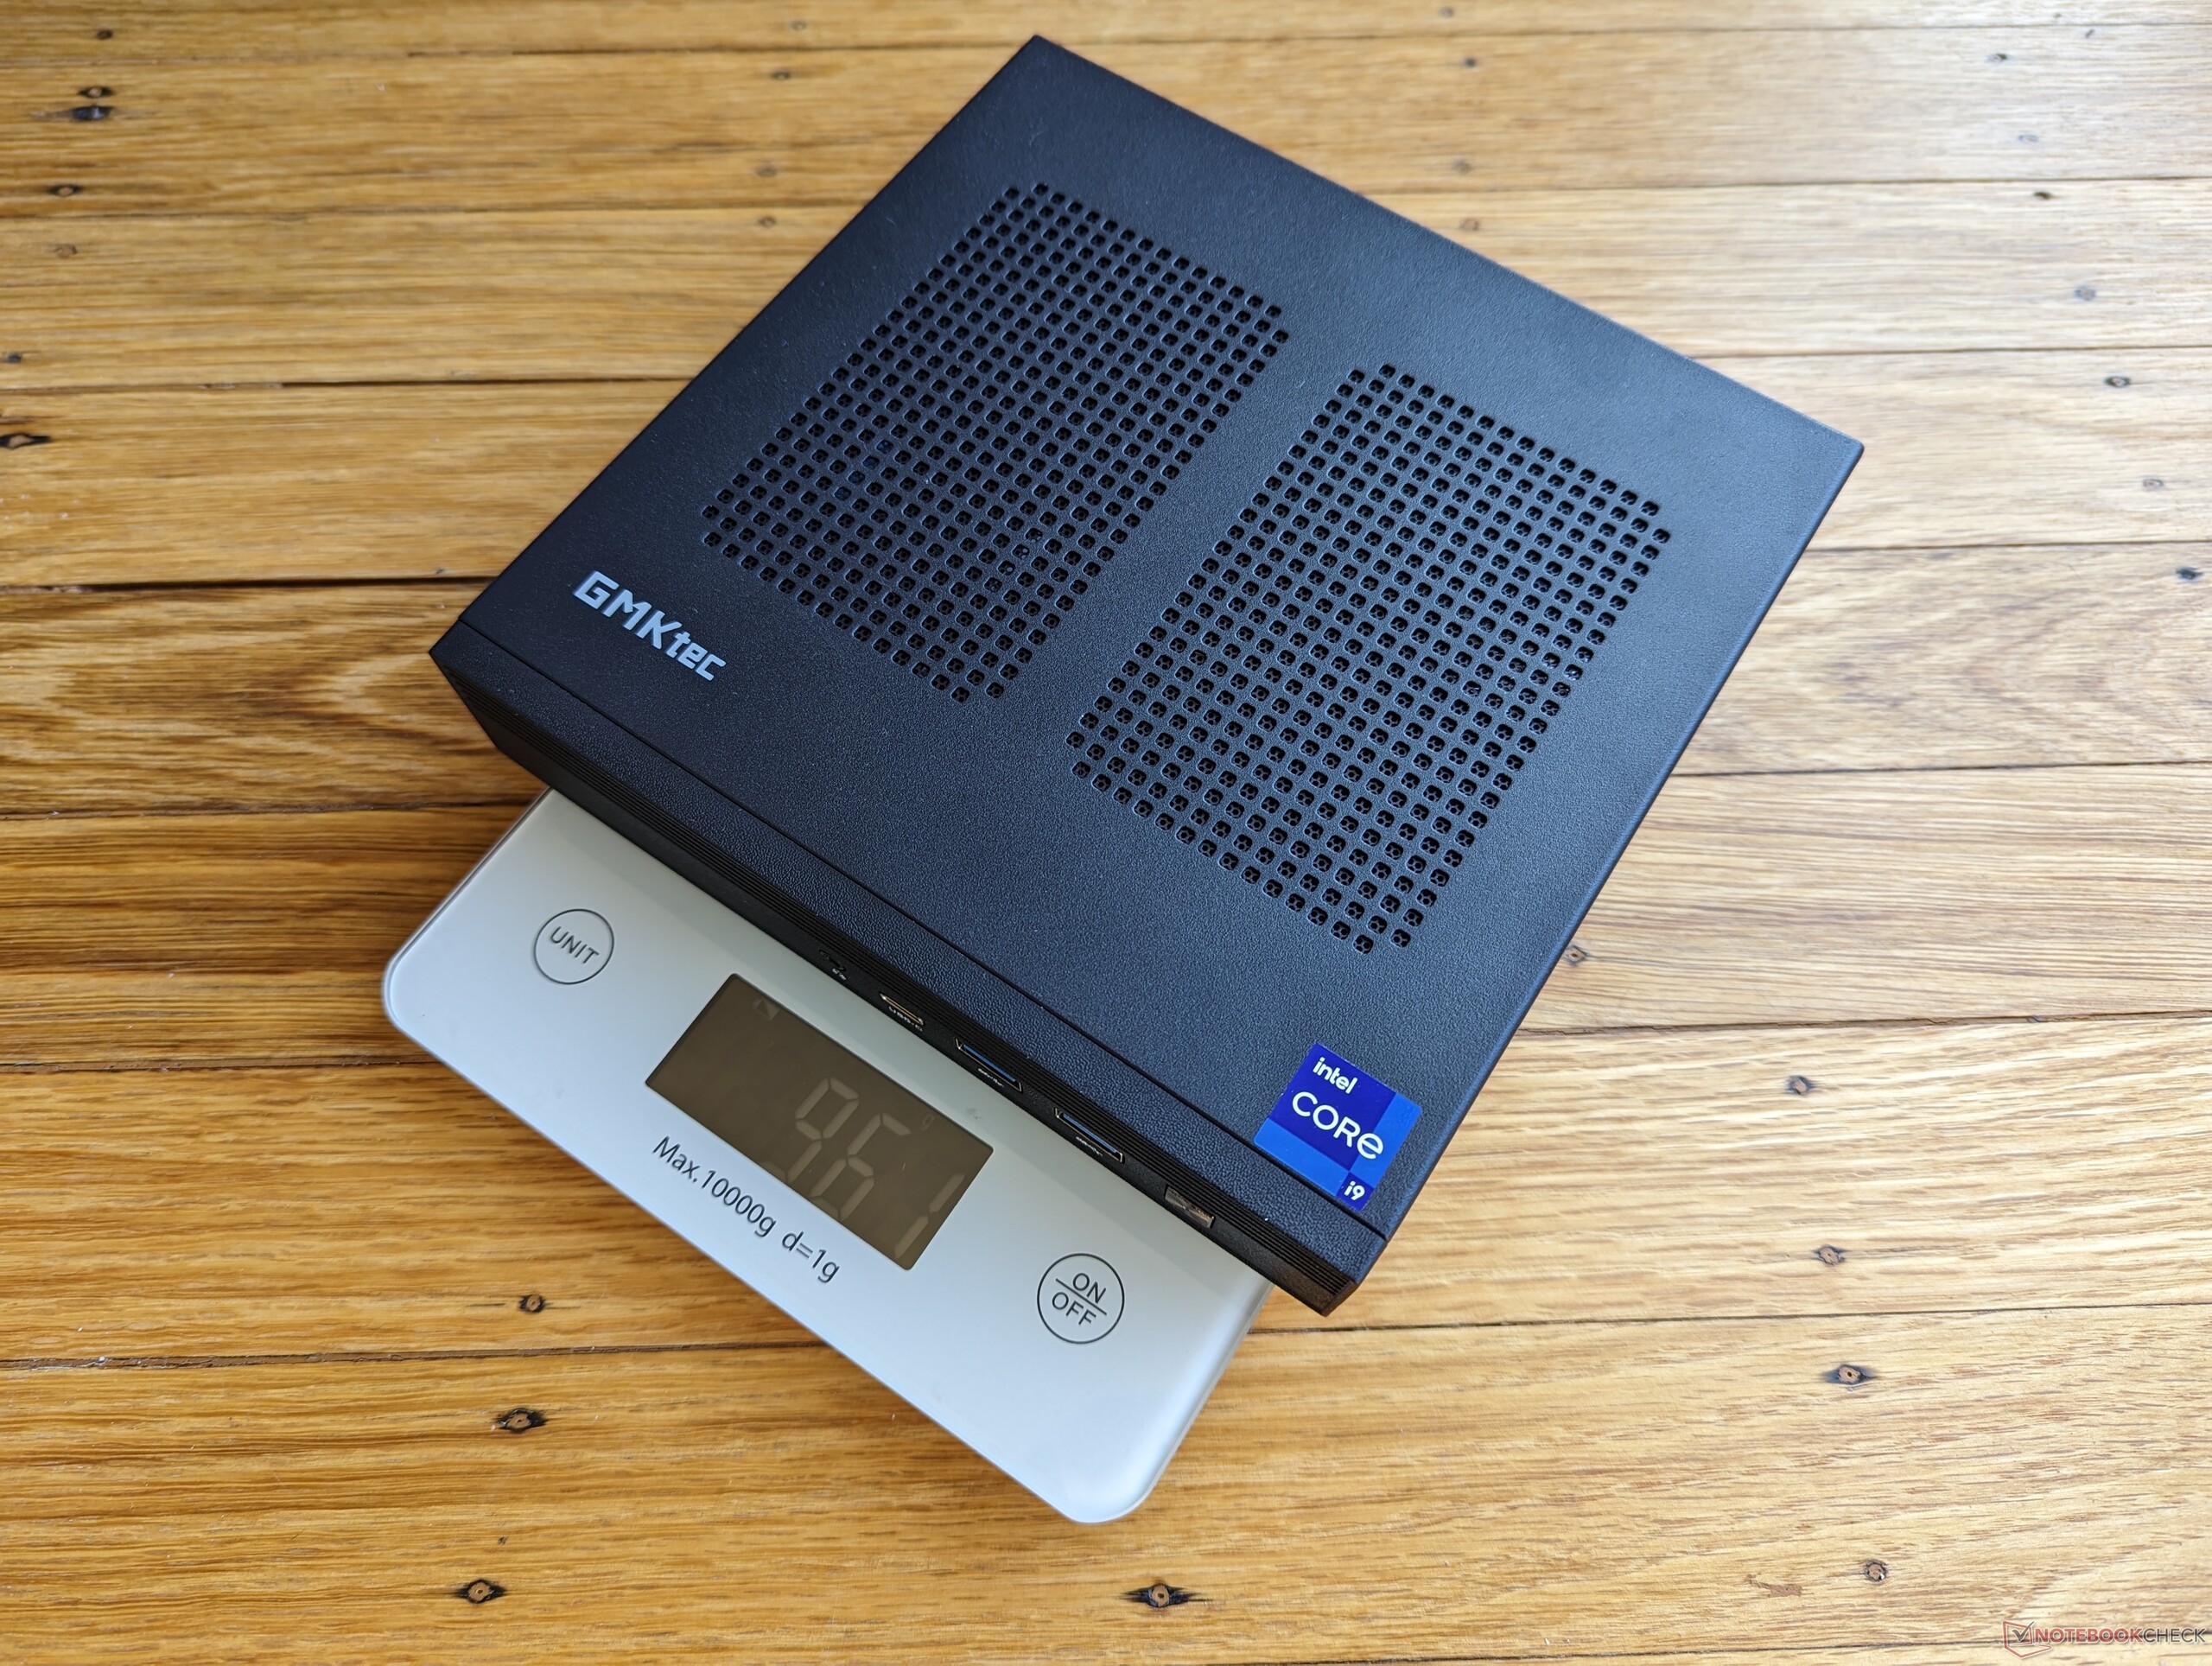
| 81.1 % v7 (old) | 12 / 2023 | GMK NucBox M4 i9-11900H, UHD Graphics Xe 32EUs (Tiger Lake-H) | 951 g | 37 mm | x | ||
| 78.7 % v7 (old) | 11 / 2023 | GMK NucBox M3 i5-12450H, UHD Graphics Xe G4 48EUs | 440 g | 42.4 mm | x | ||
| 82.8 % v7 (old) | 10 / 2023 | GMK NucBox K3 Pro i7-12650H, UHD Graphics 64EUs | 396 g | 43.2 mm | x | ||
| 81 % v7 (old) | 09 / 2023 | Lenovo IdeaCentre Mini 01IRH8 i7-13700H, Iris Xe G7 96EUs | 1.8 kg | 39 mm | x | ||
v (old) | 01 / 2023 | Beelink SER6 Pro R7 6800H, Radeon 680M | 511 g | 42 mm | x | ||
| 80.8 % v7 (old) | 04 / 2023 | Intel NUC 13 Pro Kit NUC13ANK i7-1360P, Iris Xe G7 96EUs | 538 g | 37 mm | x |
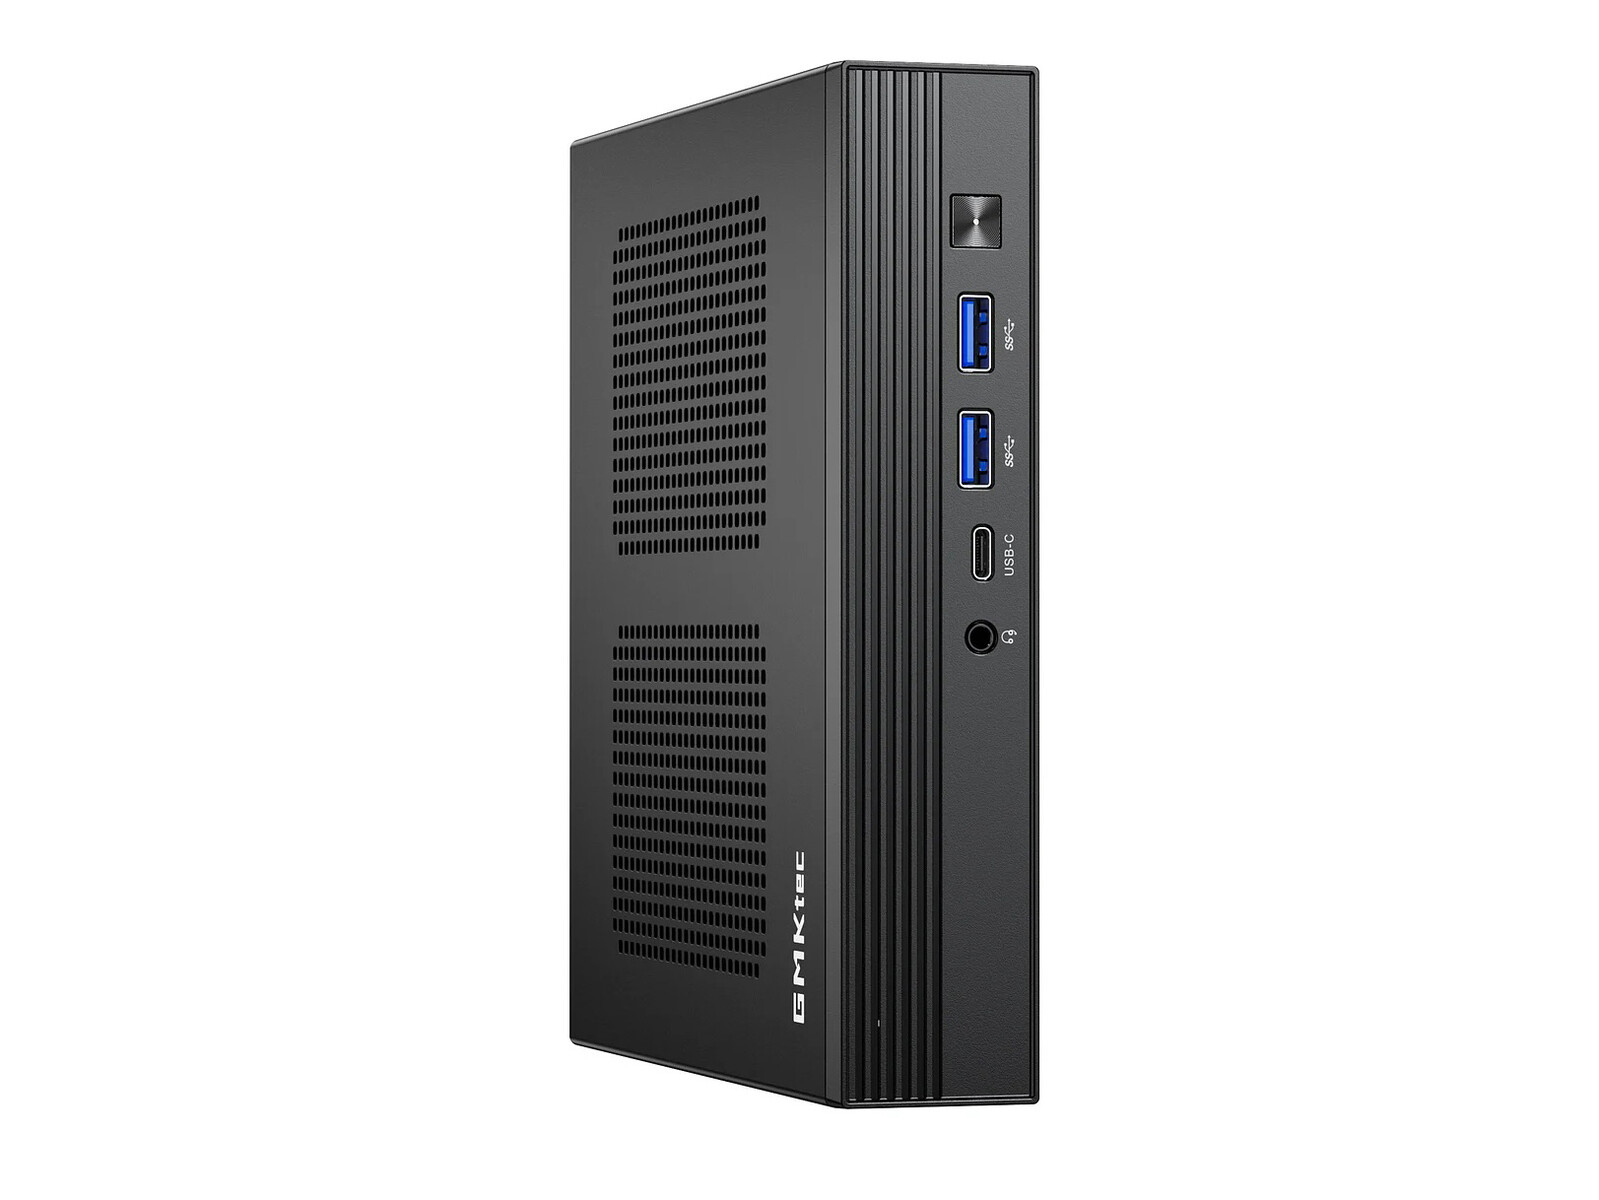
Gehäuse
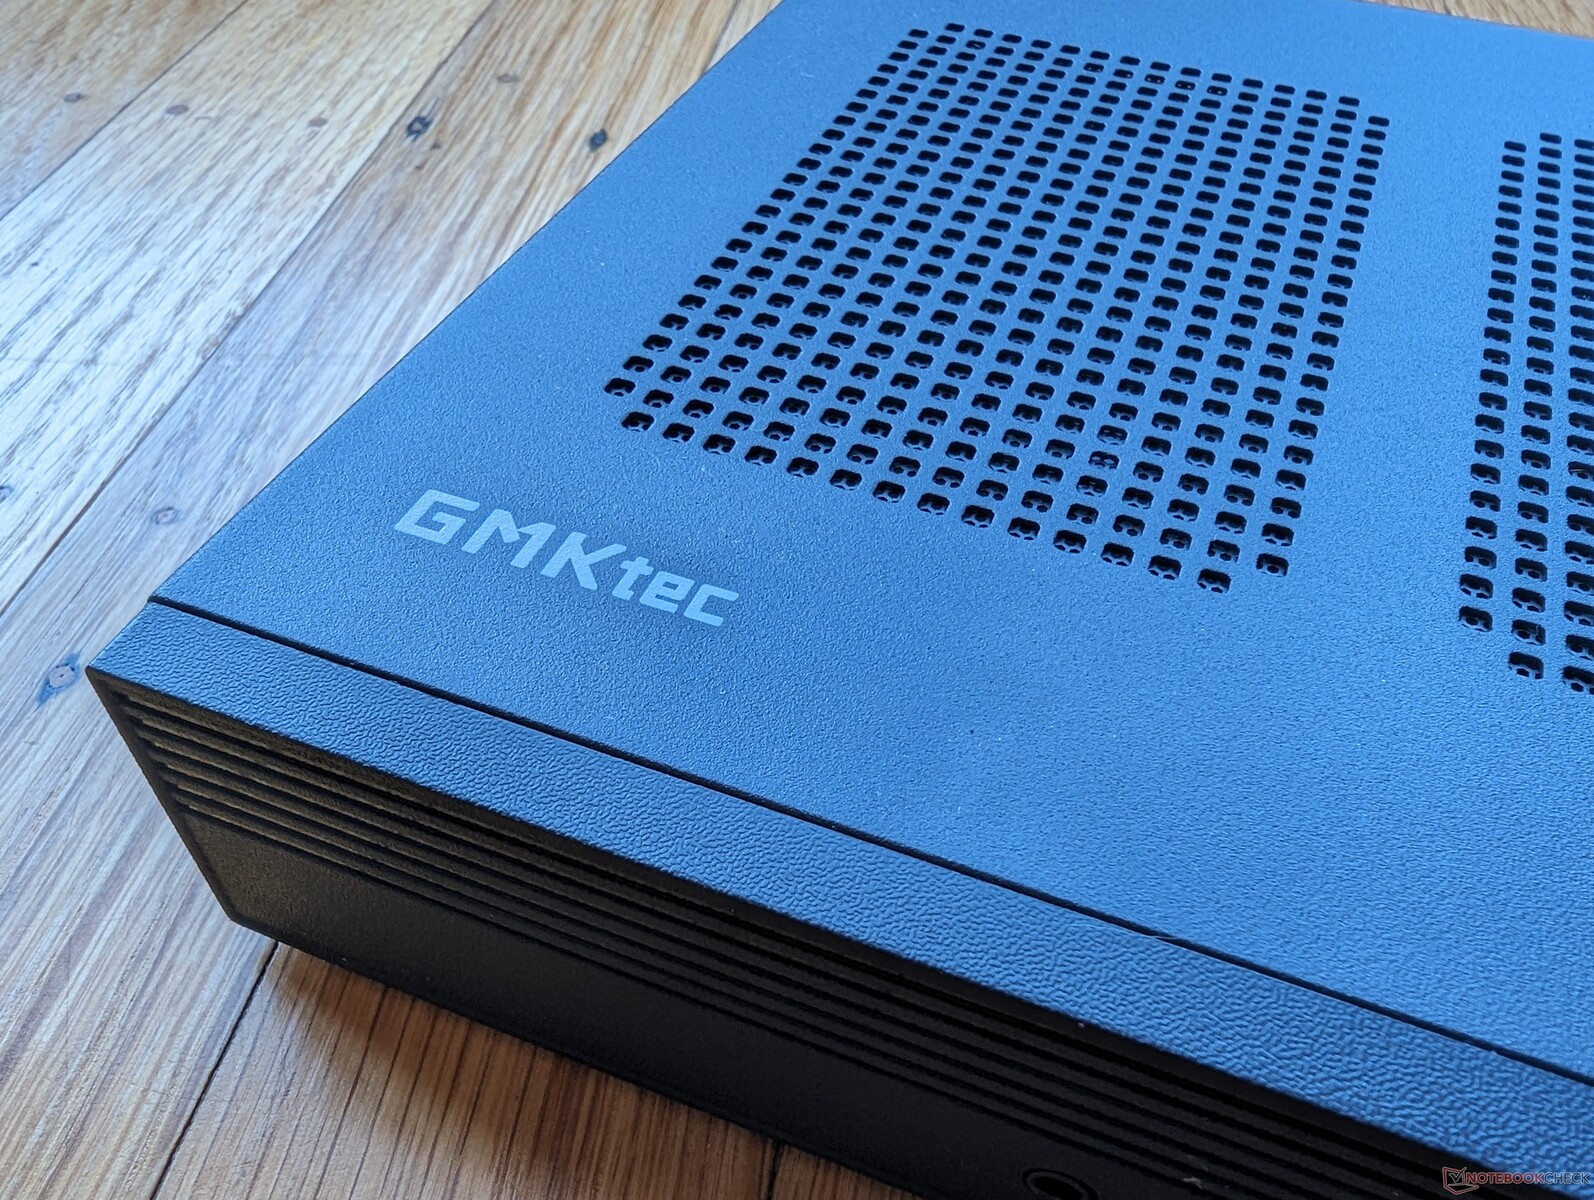
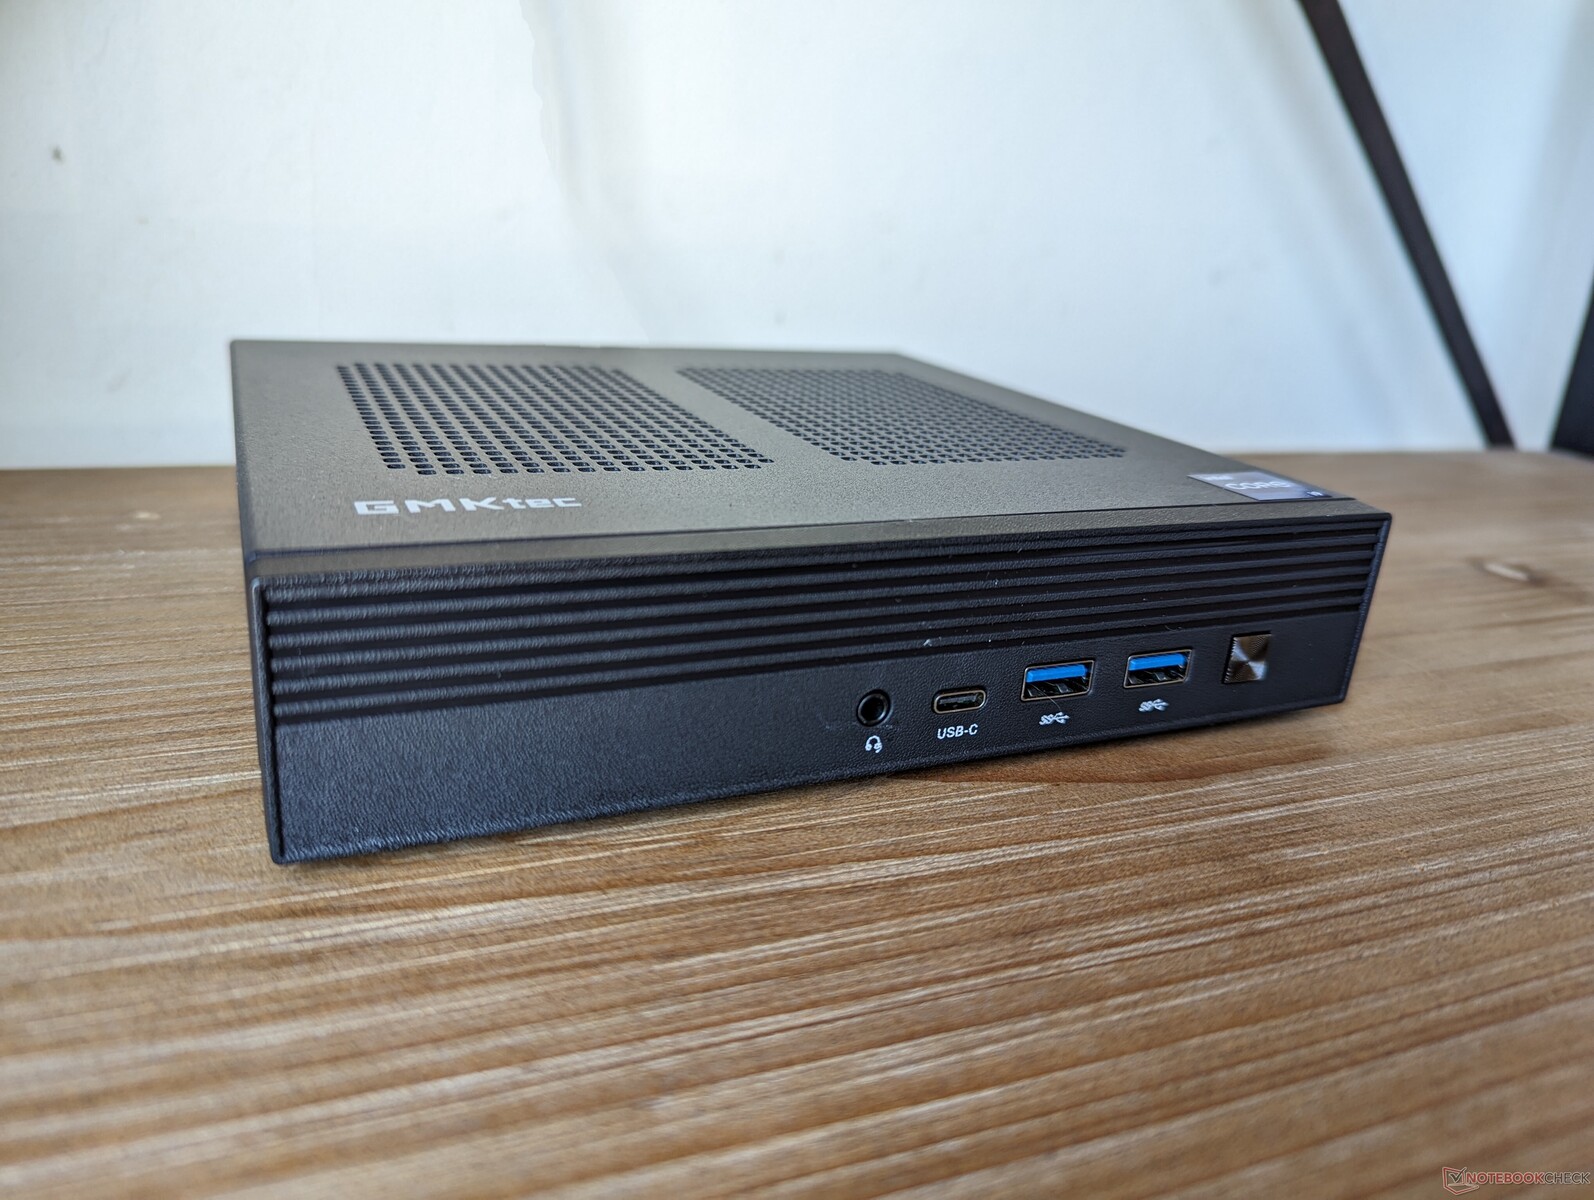
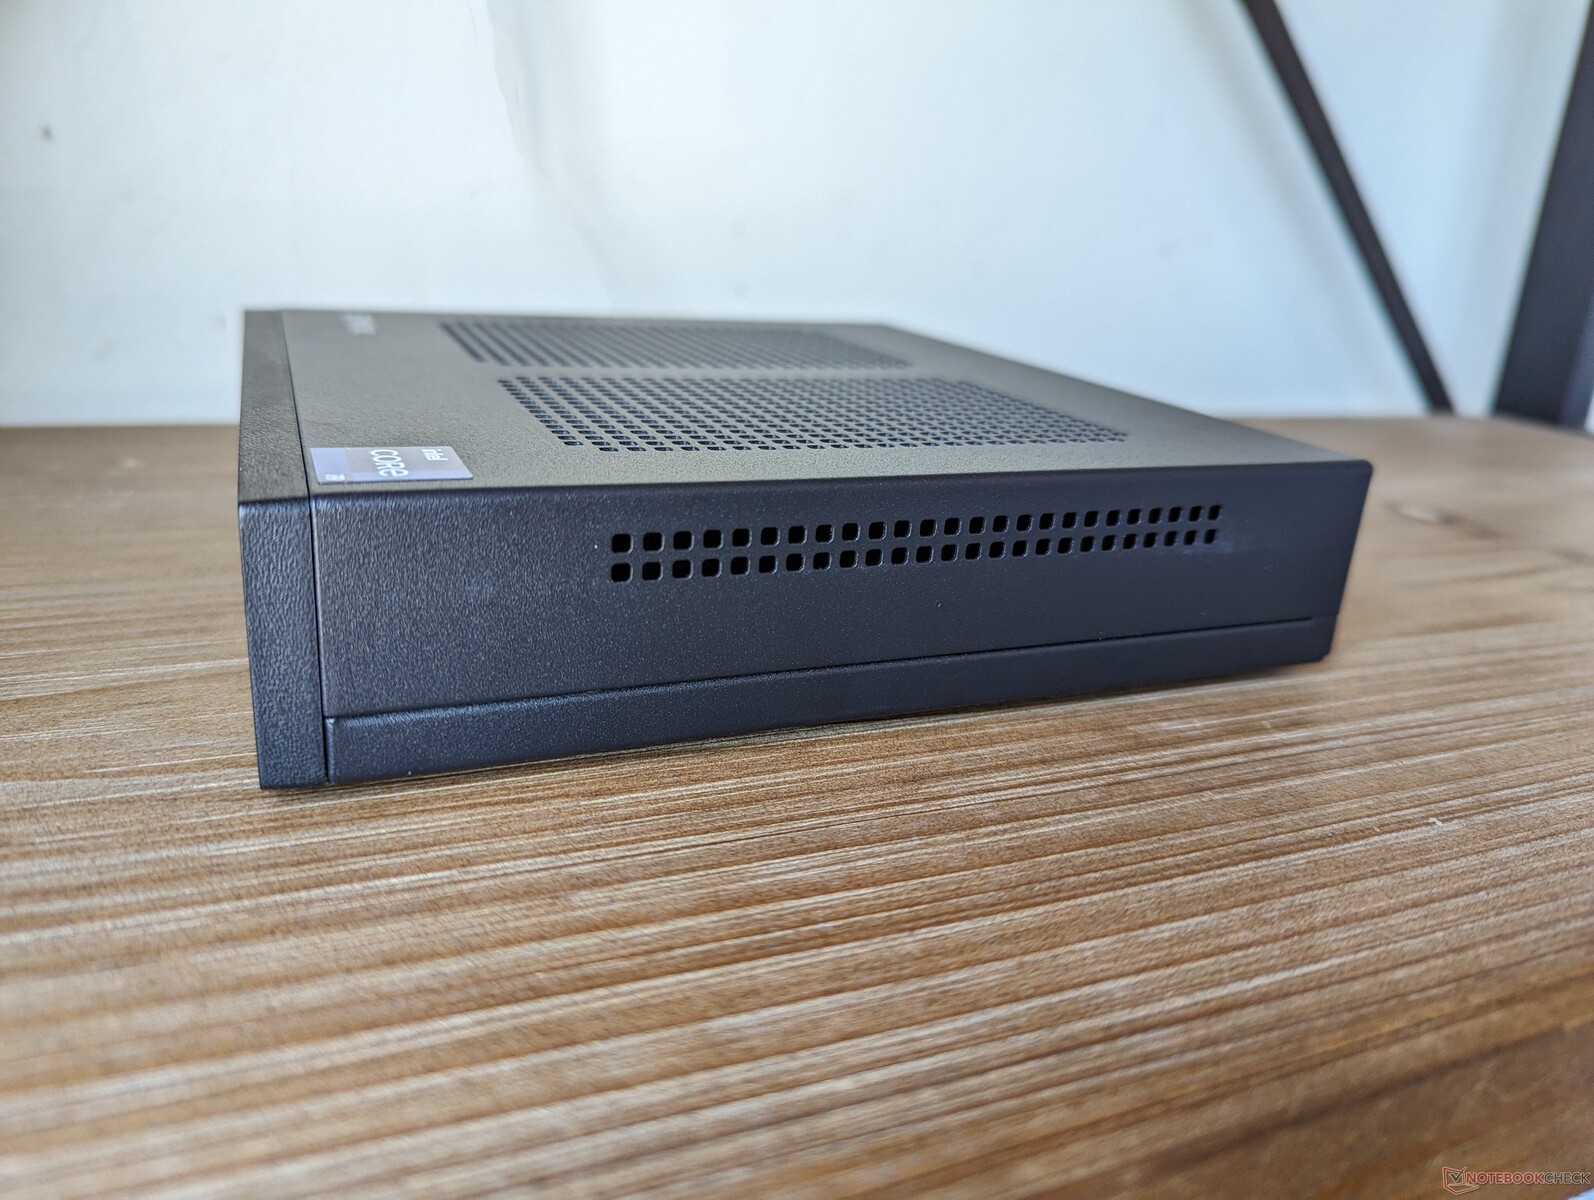
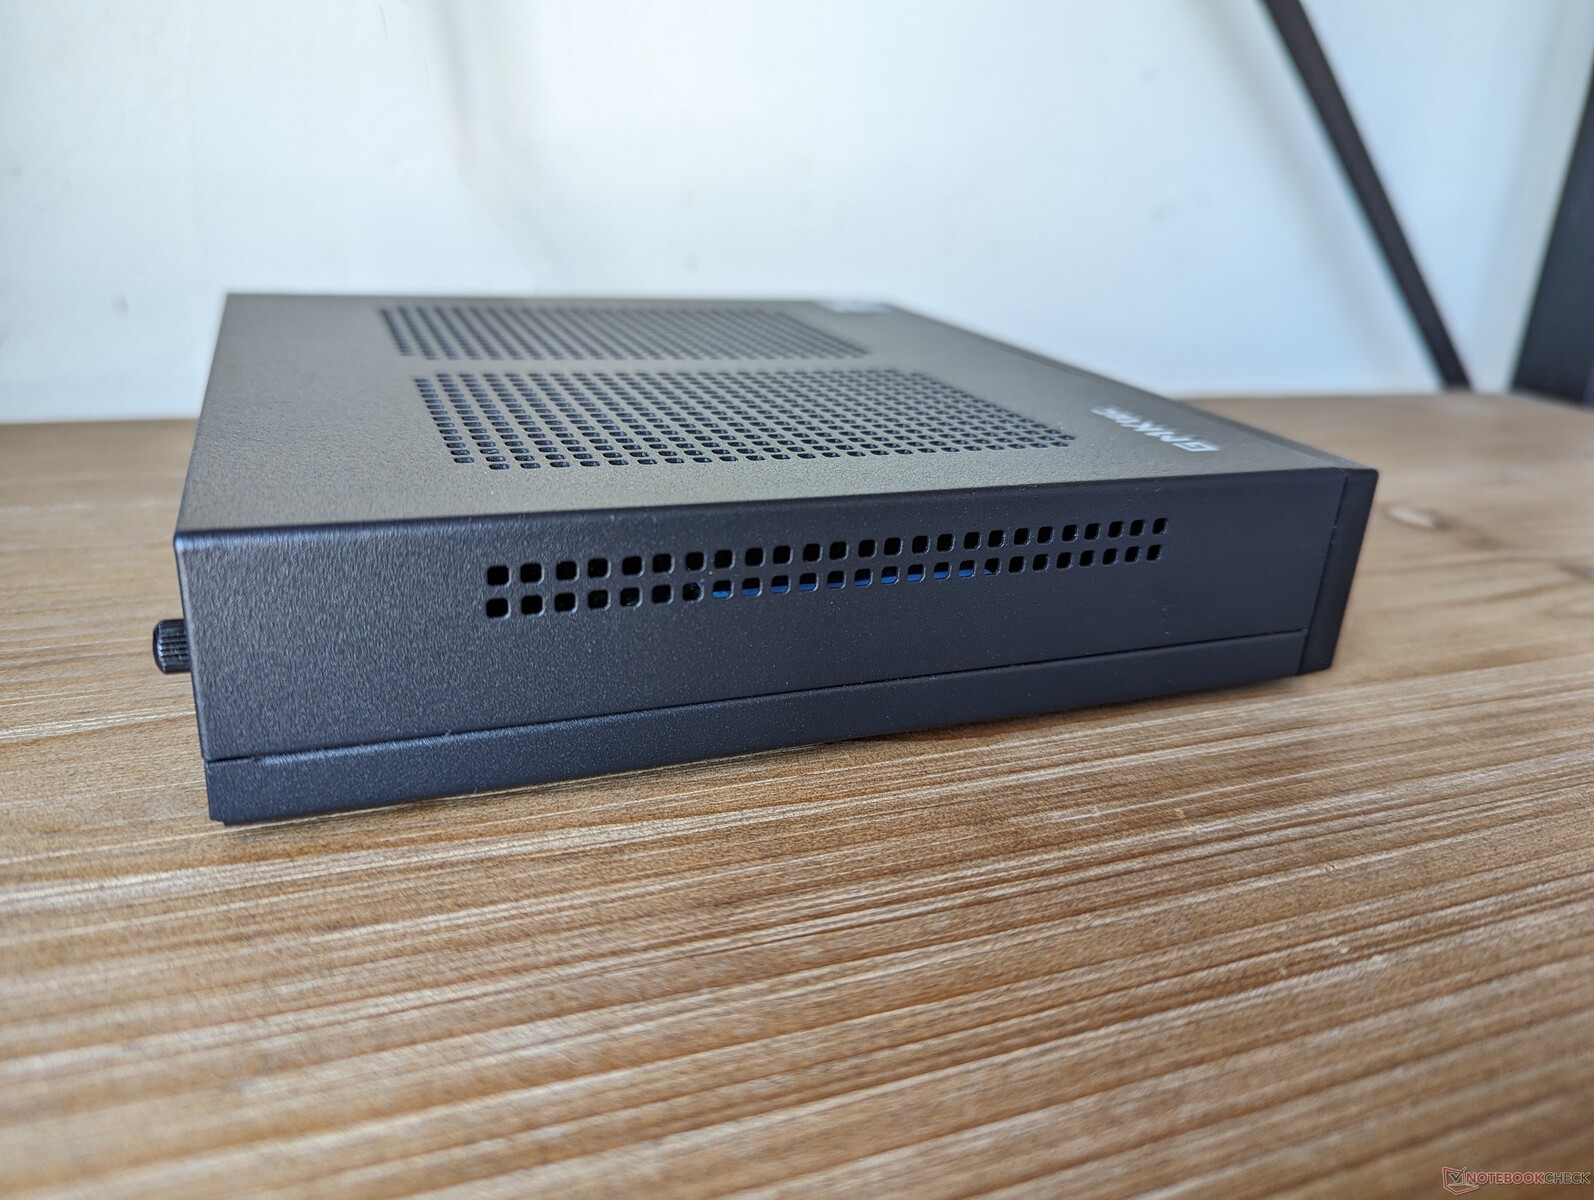
Im Gegensatz zu den meisten anderen Mini-PCs in dieser Preisklasse ist die NucBox M4 fast vollständig aus Metall gefertigt, was ihr ein industrielles oder professionelles Aussehen verleiht. Allerdings ist sie auch deutlich größer und schwerer als ein typischer Intel NUC.
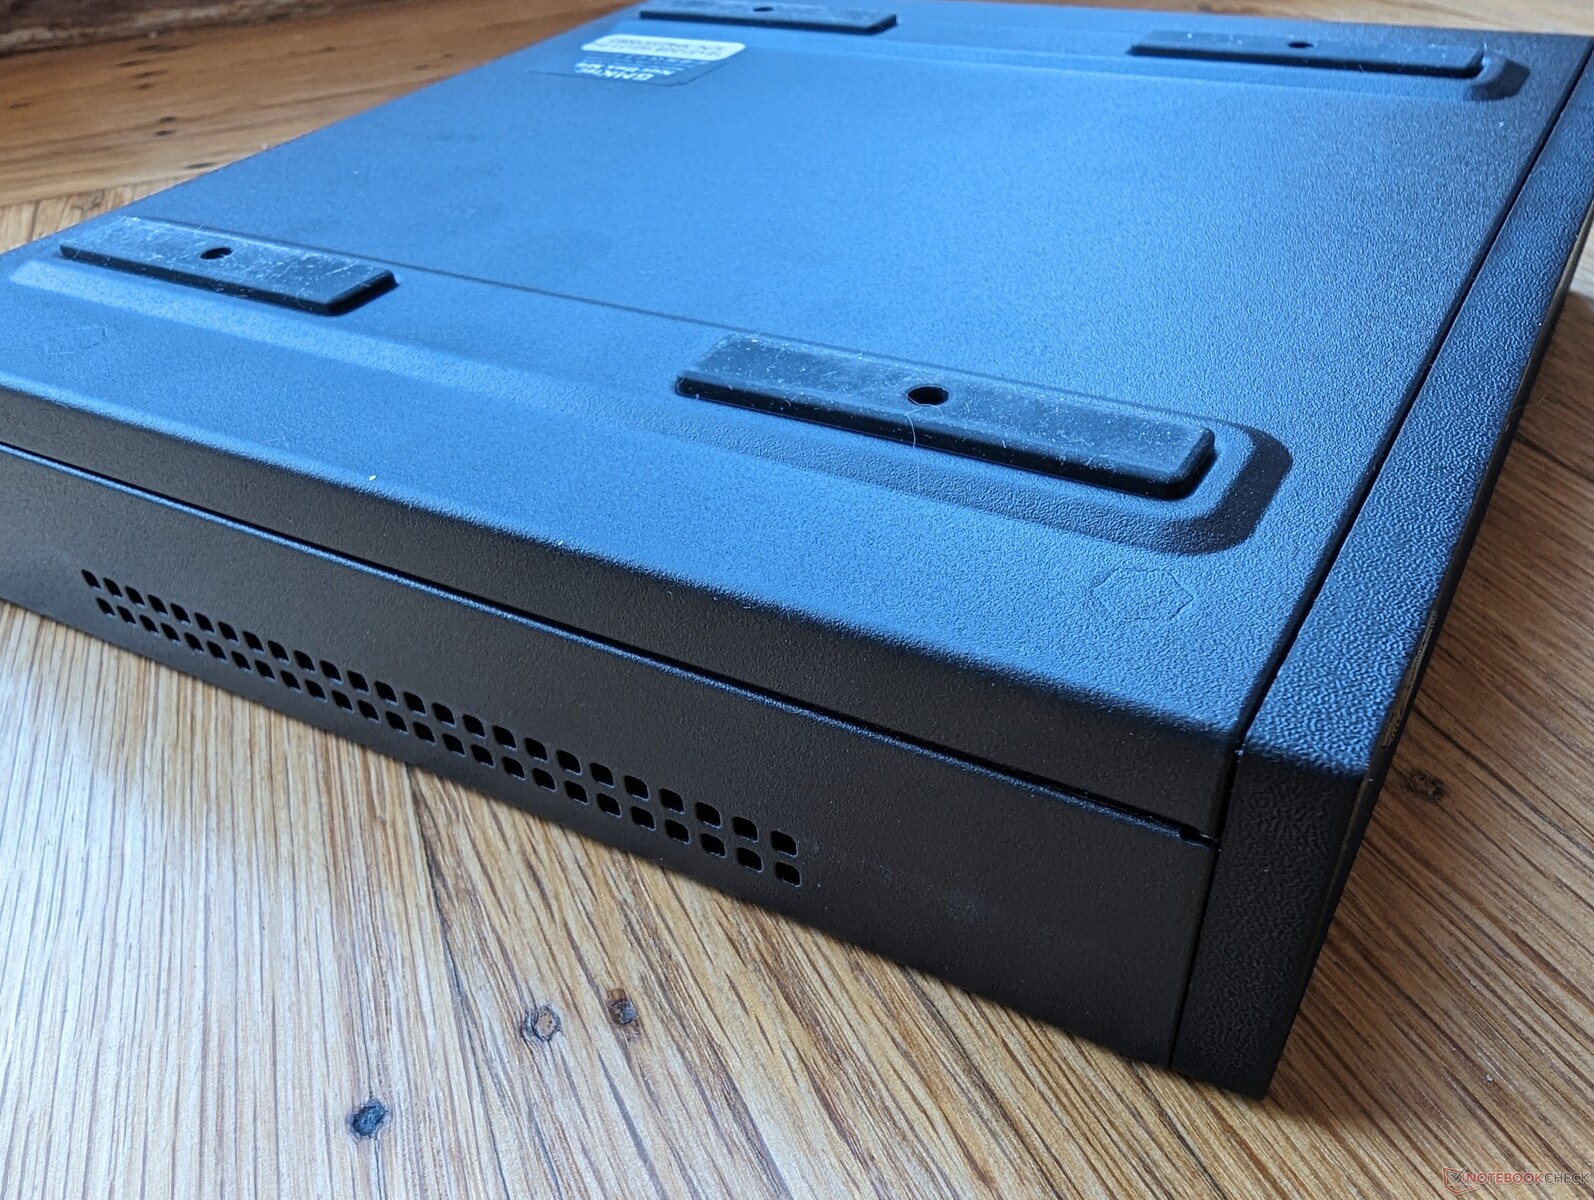
Obwohl GMK die NucBox M4 sowohl in horizontaler als auch in vertikaler Ausrichtung bewirbt, ist das Modell kippgefährdet, wenn es vertikal aufgestellt wird. Es gibt keinen speziellen Ständer, um das Gerät in der vertikalen Position zu sichern.
Ausstattung
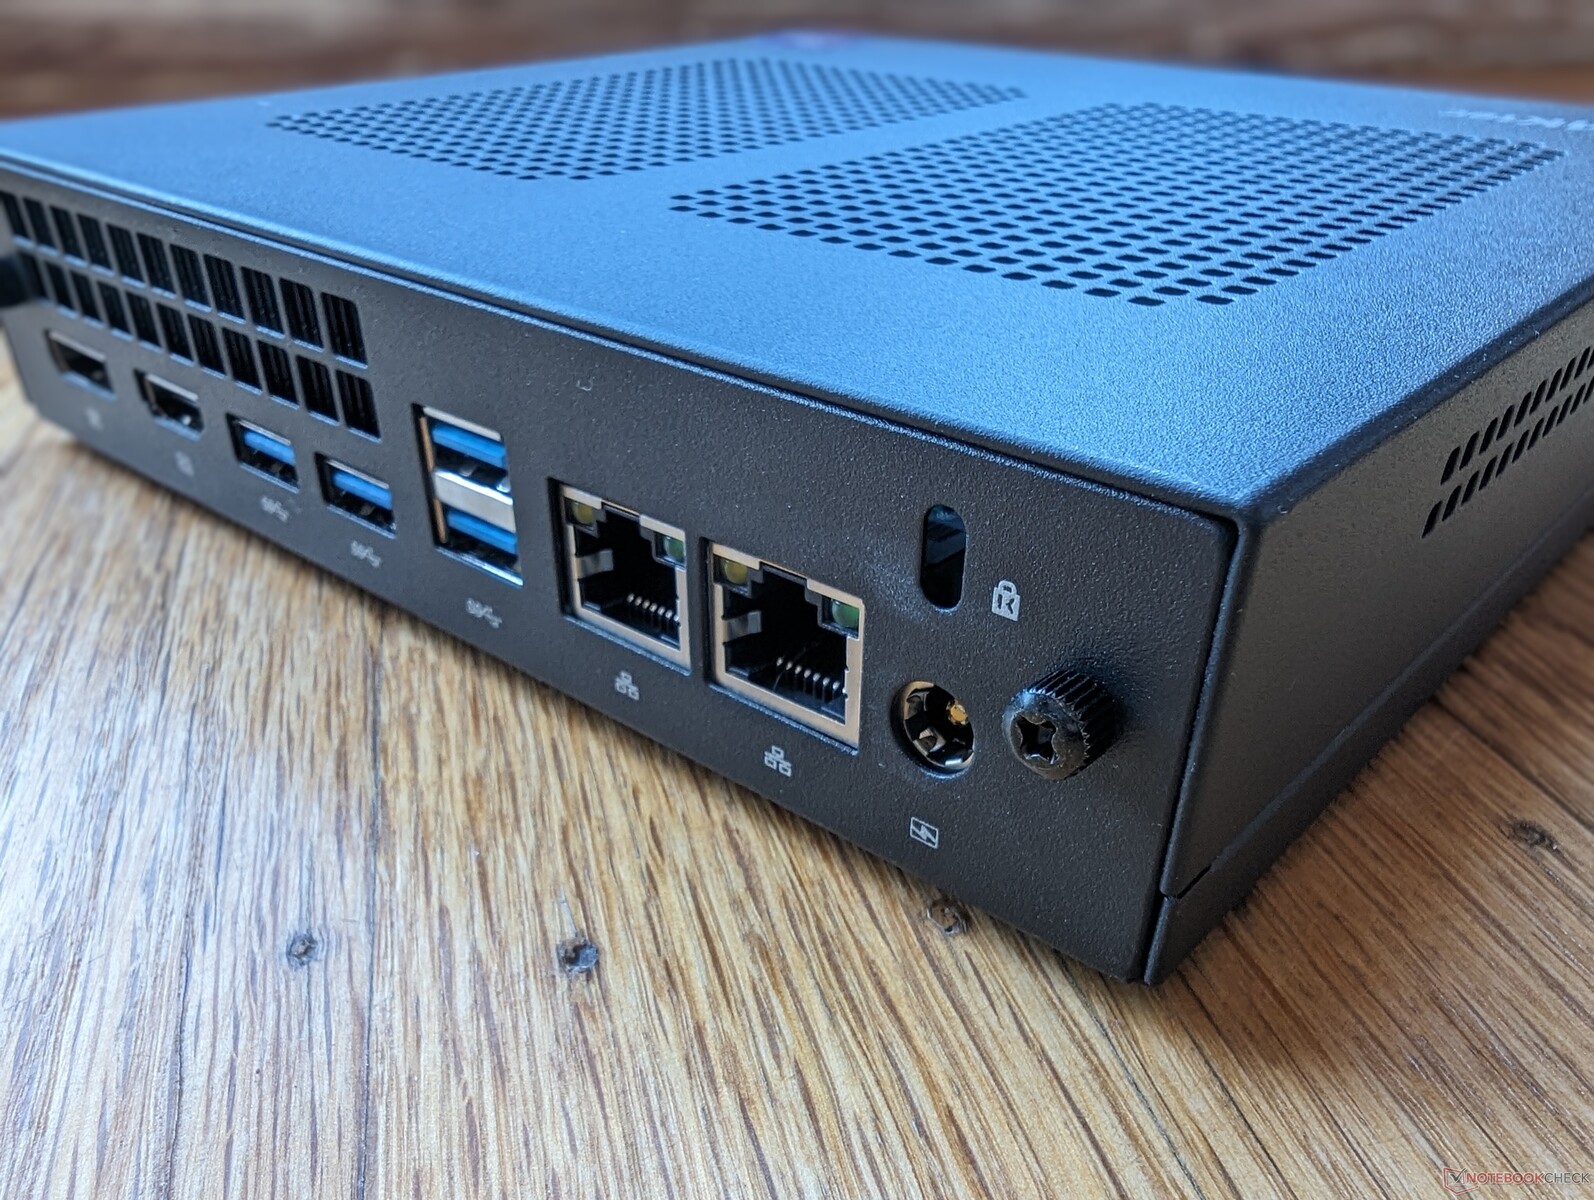
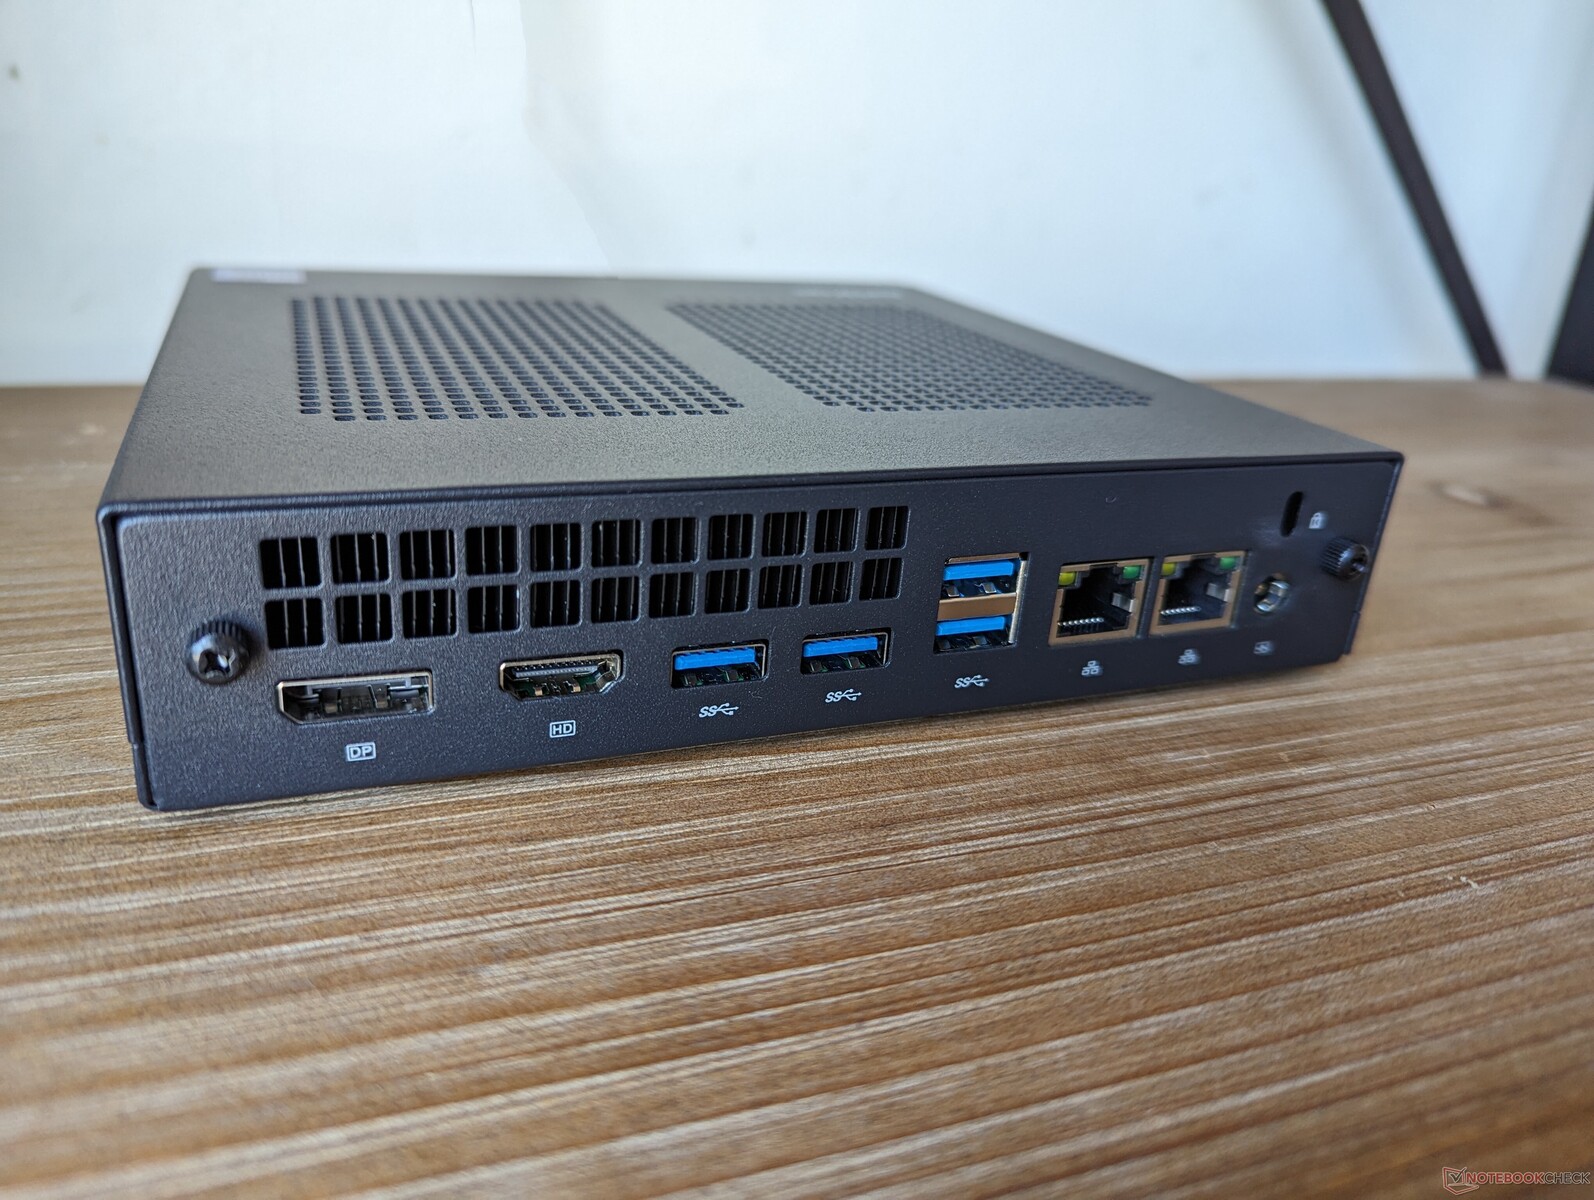
An Anschlüssen mangelt es nicht, denn die Nutzer erhalten insgesamt sieben USB-Anschlüsse, drei Videoausgänge und zwei 2,5-Gbit-Ethernet-Anschlüsse. Allerdings gibt es keine Thunderbolt- oder eGPU-Unterstützung, was die Vielseitigkeit des Modells erhöht hätte.
Kommunikation
Wi-Fi 6E gehört nicht zur Standardausstattung, um die Kosten niedrig zu halten. Die Übertragungsraten sind jedoch stabil und zuverlässig, wenn sie mit unserem Wi-Fi 6-Netzwerk verbunden sind.
| Networking | |
| iperf3 transmit AXE11000 | |
| Beelink SER6 Pro | |
| GMK NucBox K3 Pro | |
| GMK NucBox M3 | |
| Intel NUC 13 Pro Kit NUC13ANK | |
| Lenovo IdeaCentre Mini 01IRH8 | |
| GMK NucBox M4 | |
| iperf3 receive AXE11000 | |
| GMK NucBox K3 Pro | |
| Beelink SER6 Pro | |
| Intel NUC 13 Pro Kit NUC13ANK | |
| GMK NucBox M3 | |
| Lenovo IdeaCentre Mini 01IRH8 | |
| GMK NucBox M4 | |
| iperf3 transmit AXE11000 6GHz | |
| Intel NUC 13 Pro Kit NUC13ANK | |
| iperf3 receive AXE11000 6GHz | |
| Intel NUC 13 Pro Kit NUC13ANK | |
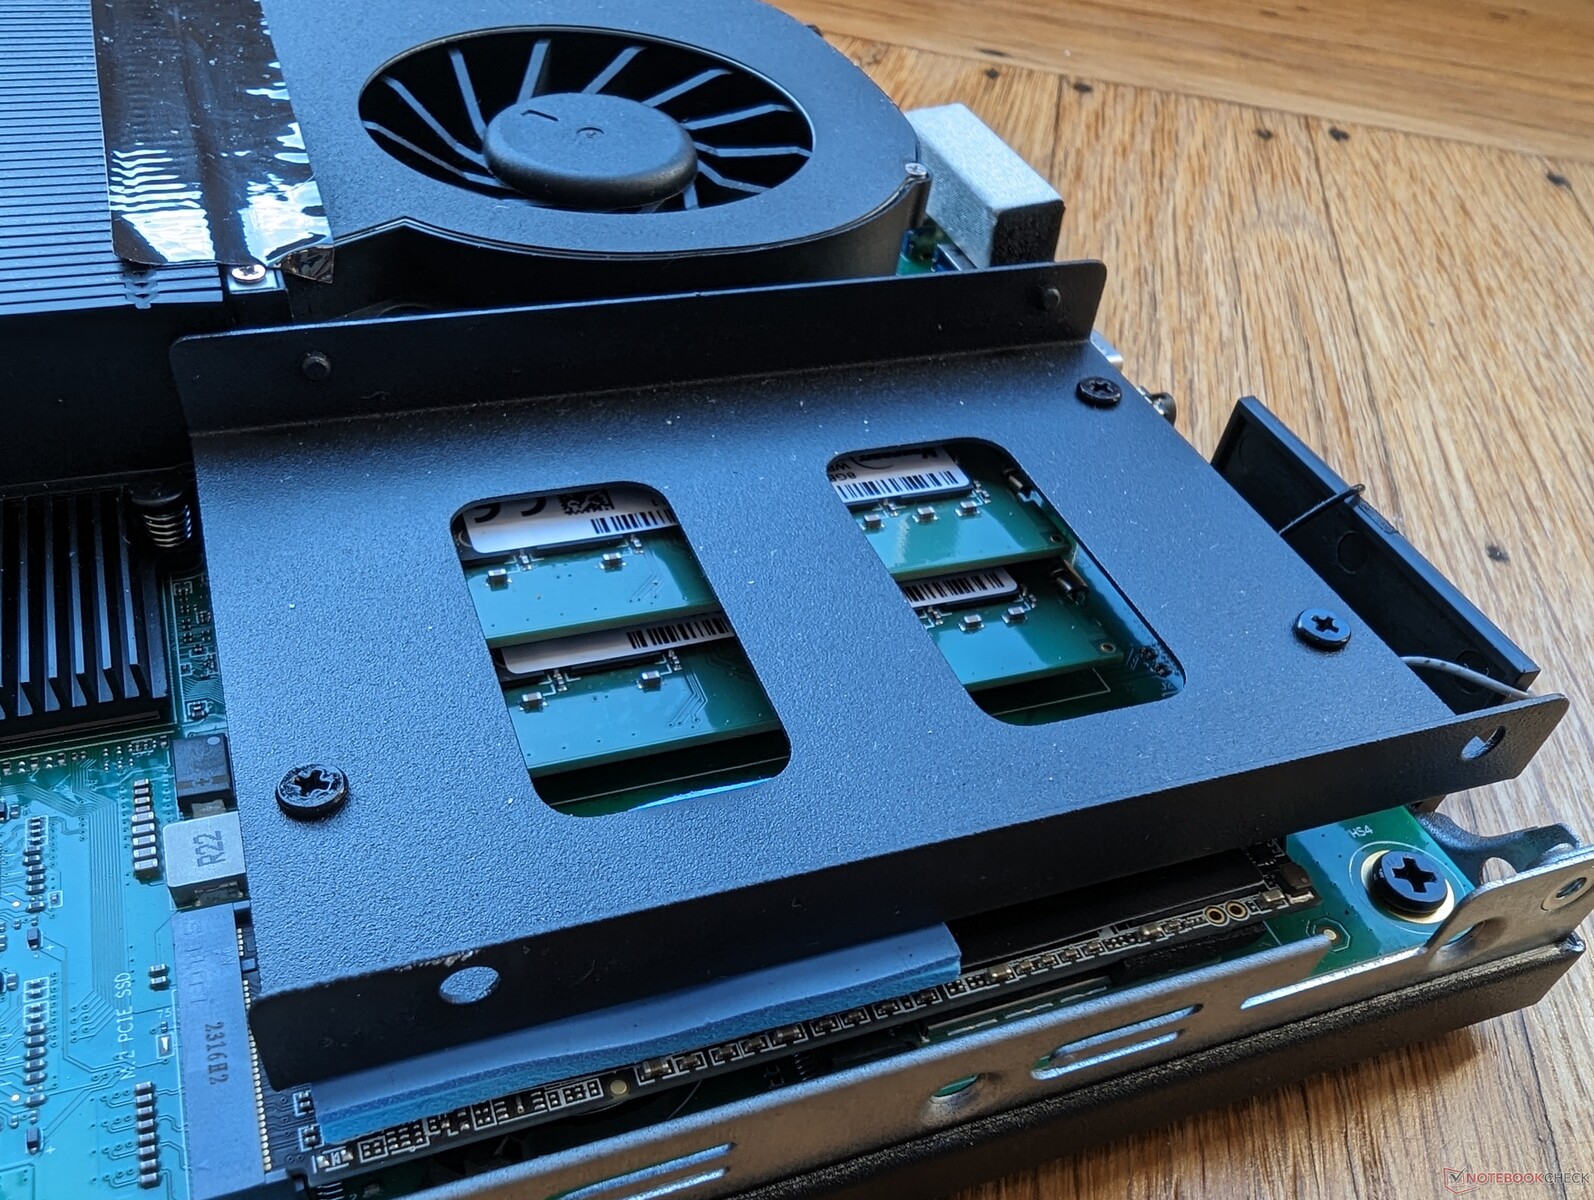
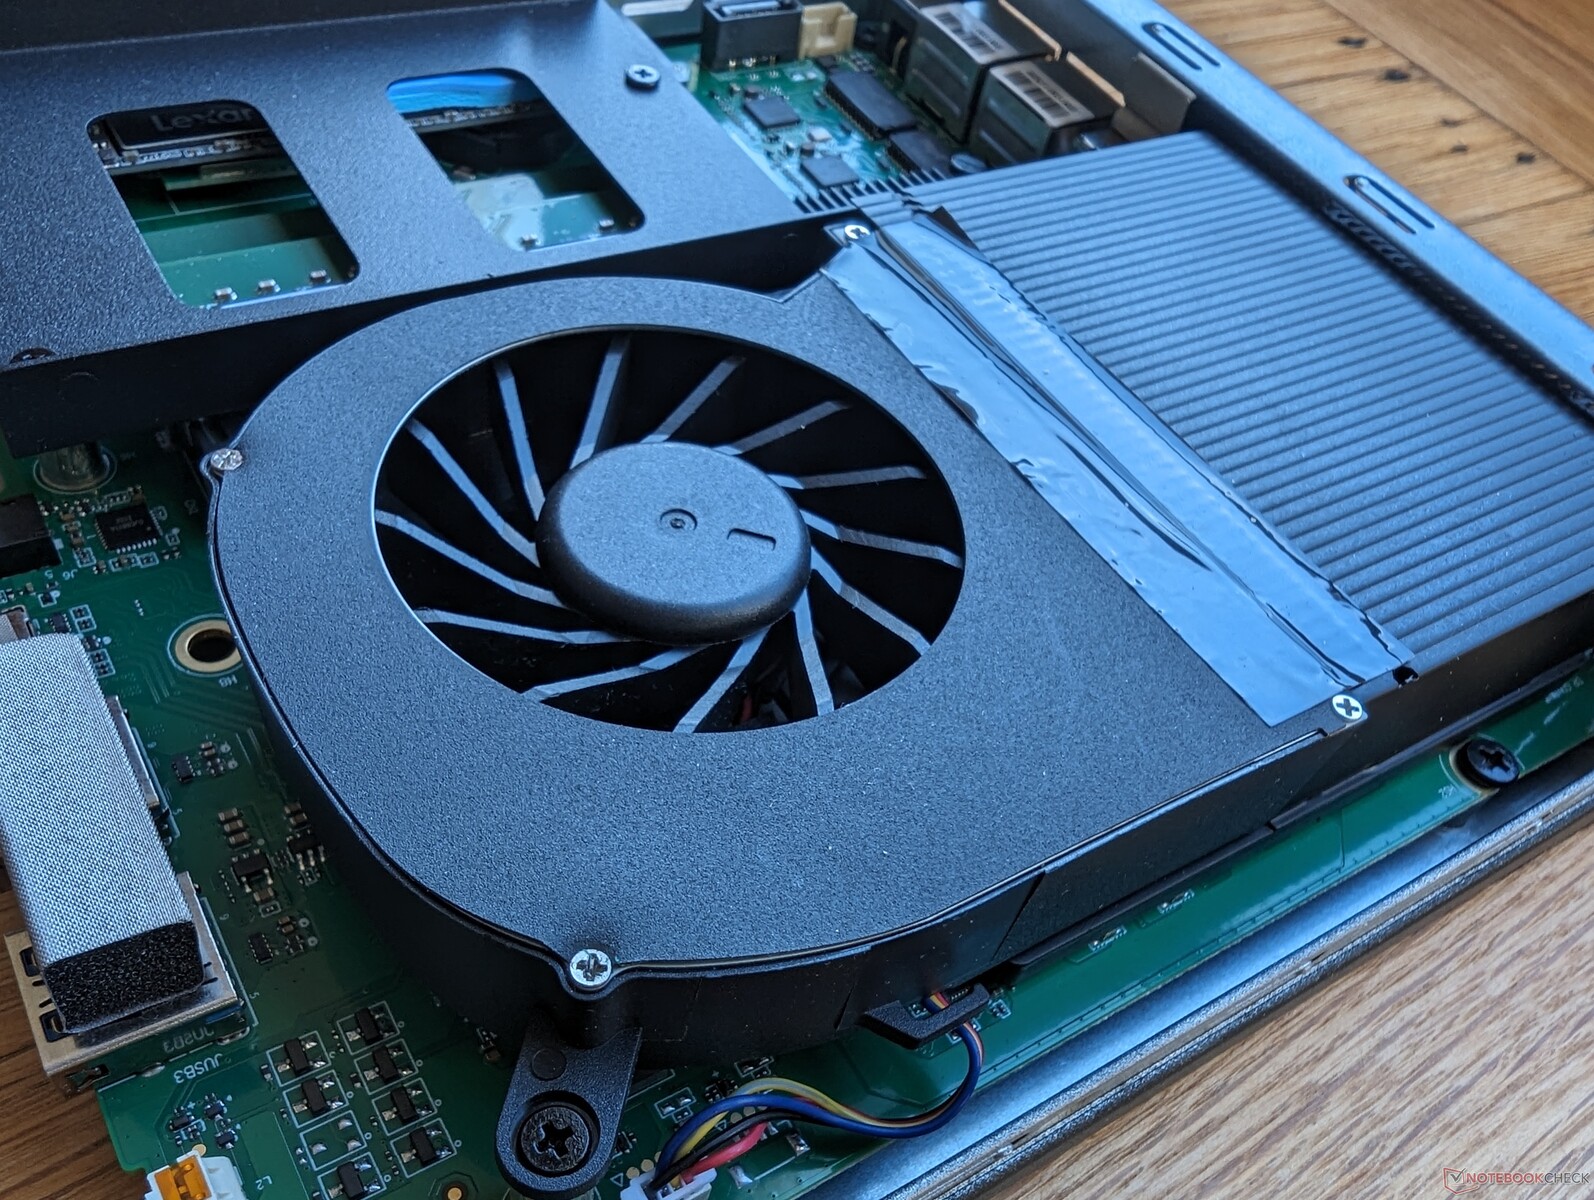
Wartung
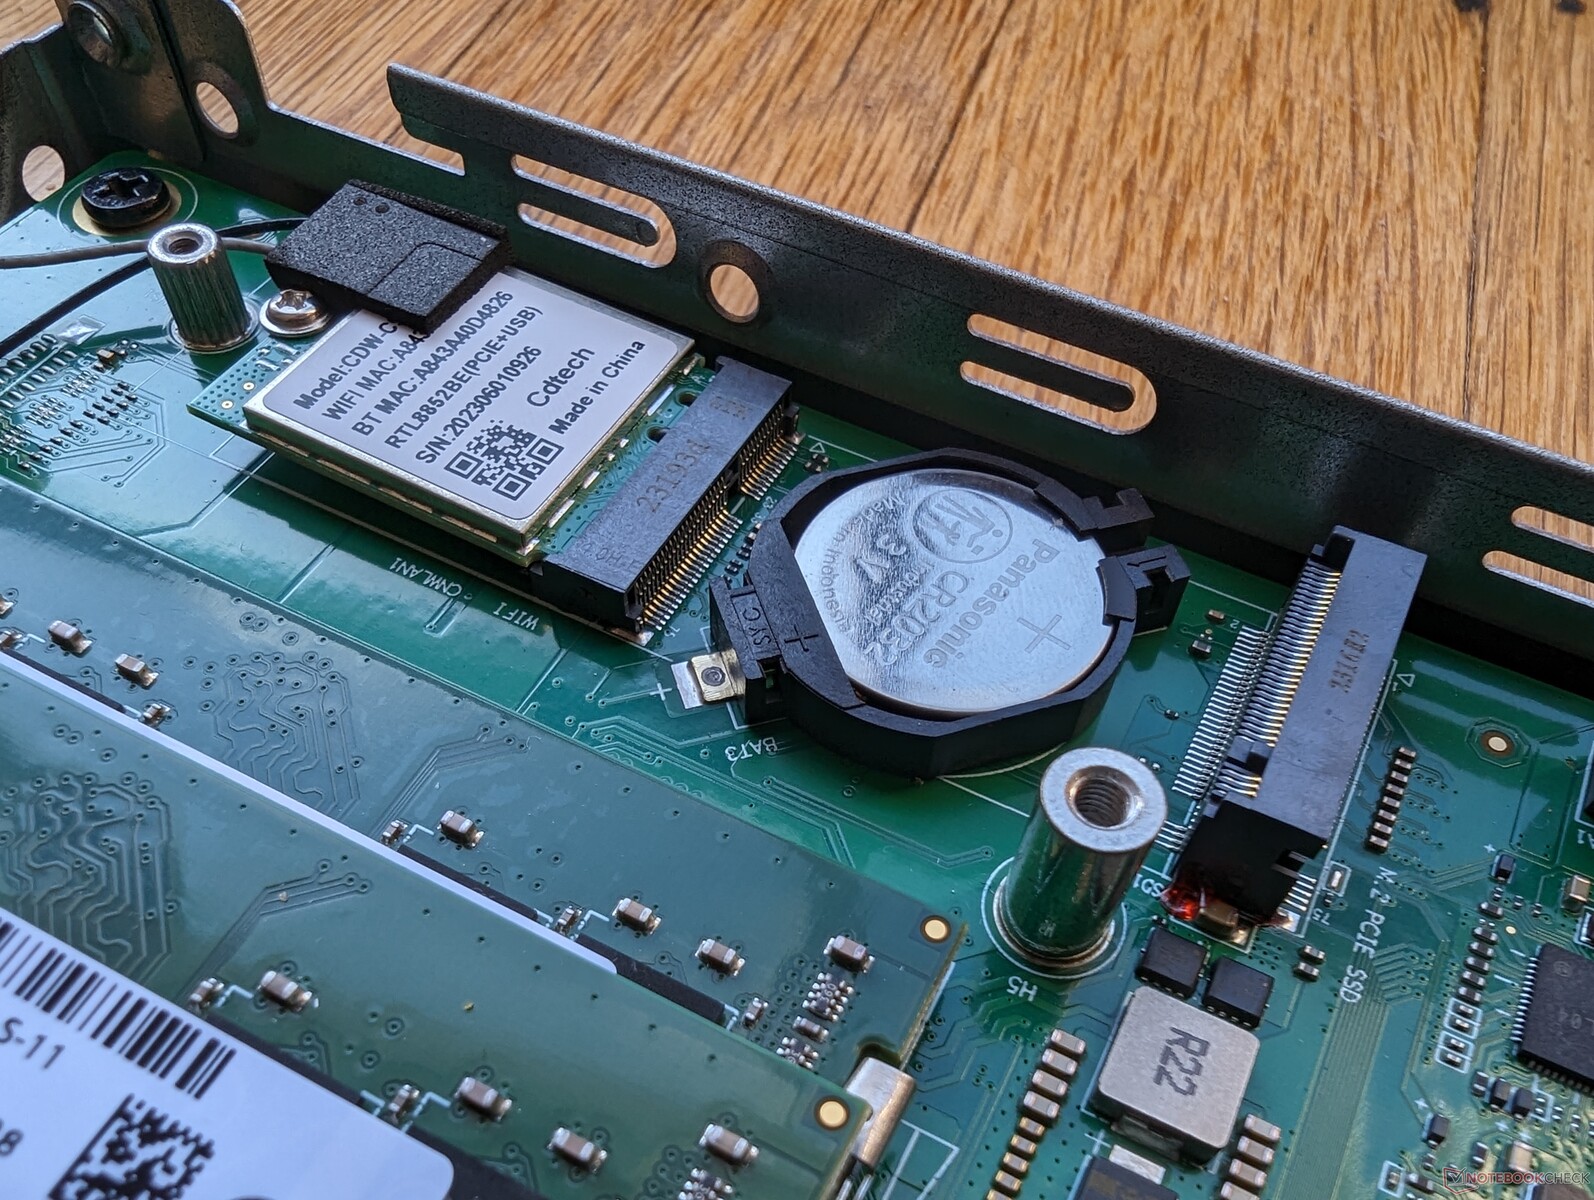
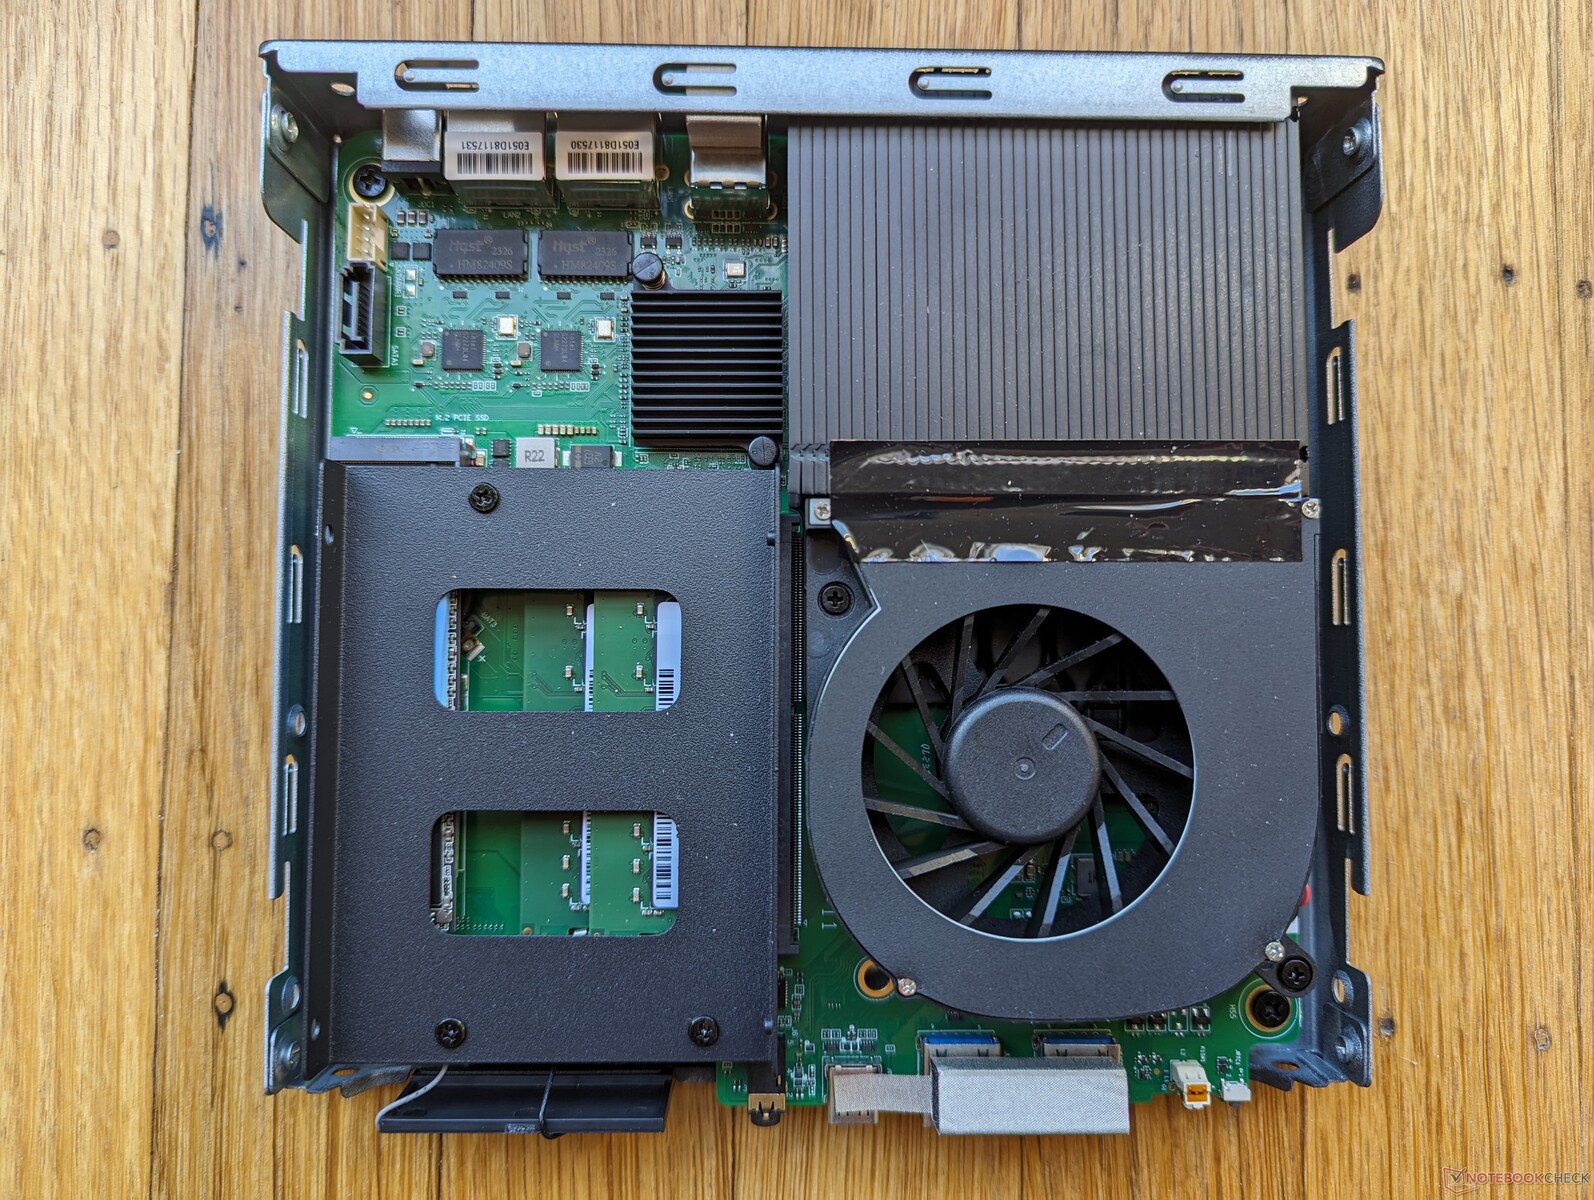
Die obere Abdeckung kann entfernt werden, nachdem zwei Schrauben auf der Rückseite gelöst wurden. Dahinter offenbaren sich zwei Speicherschächte (2,5-Zoll-SATA III + M.2 2280) sowie zwei SODIMM-Slots. Upgrades gestalten sich relativ unkompliziert und erfordern lediglich einen Schraubenzieher.
Zubehör & Garantie
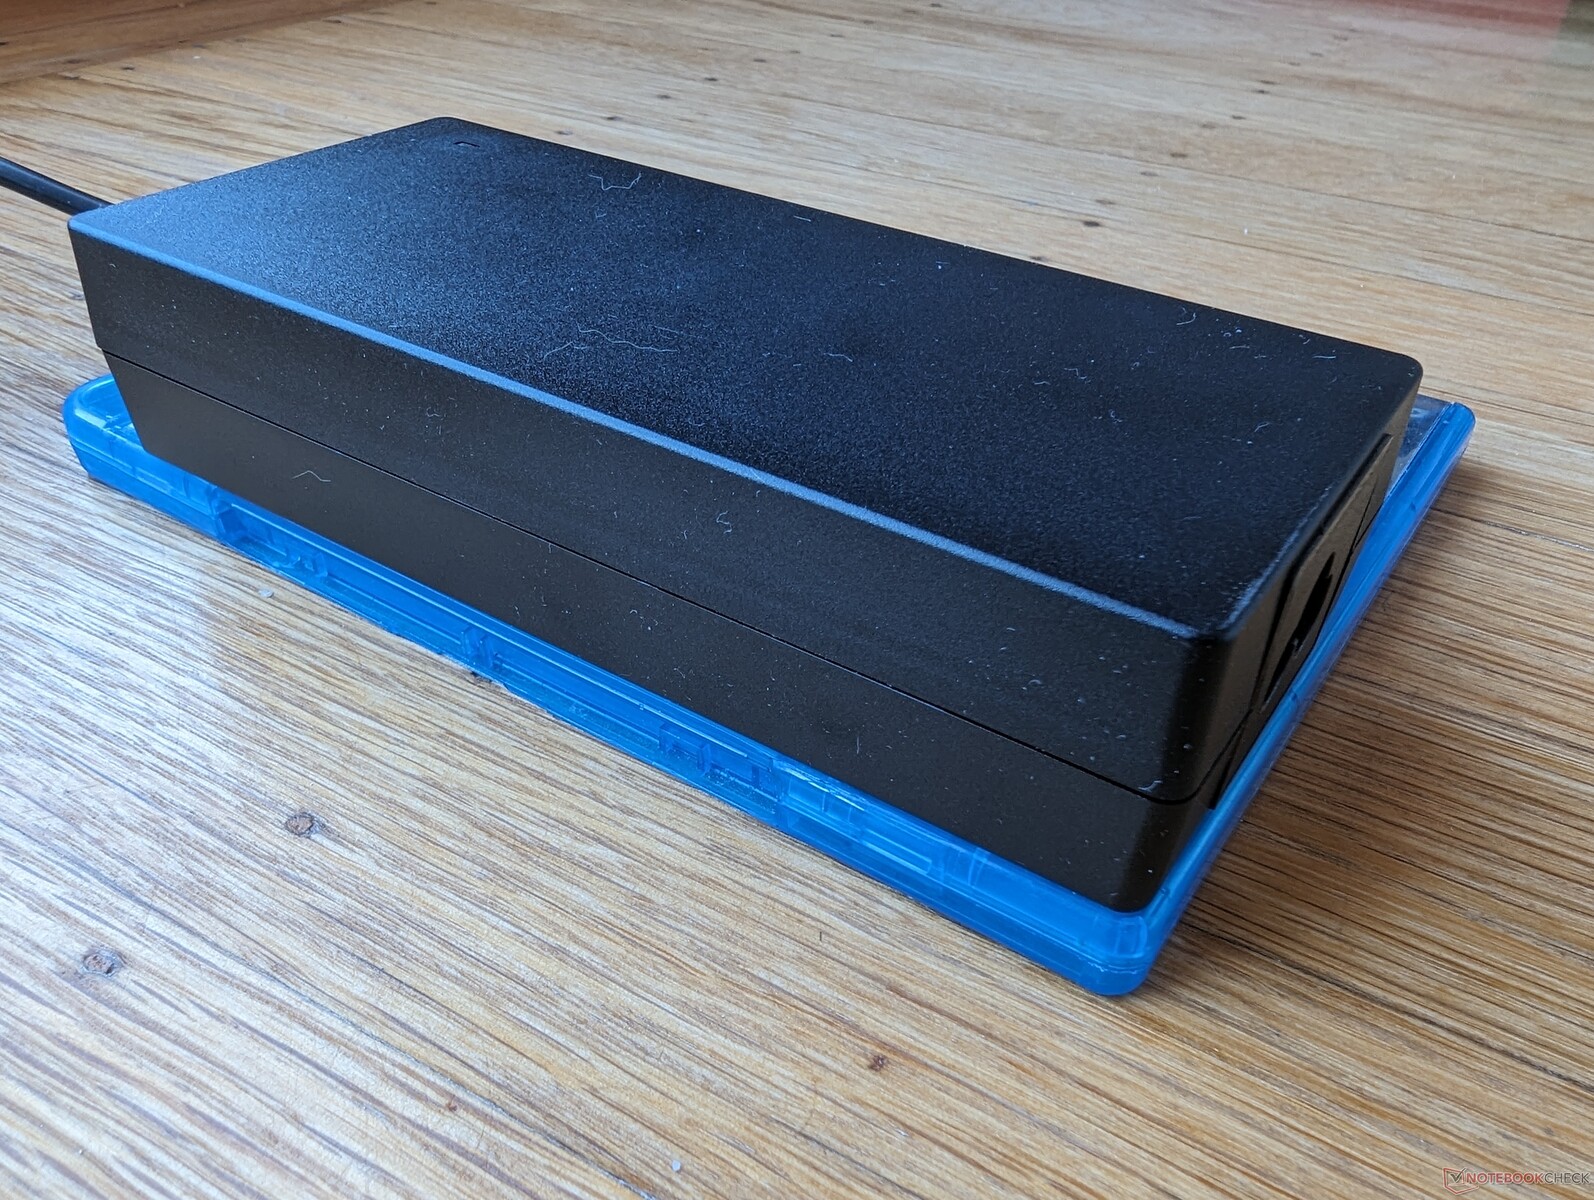
Im Lieferumfang sind neben dem Netzteil und dem Handbuch auch ein HDMI-Kabel und VESA-Montageschrauben enthalten. Beim Kauf in Europa gilt eine einjährige eingeschränkte Herstellergarantie.
Leistung
Testbedingungen
Wir haben Windows auf den Performance-Modus eingestellt, bevor wir die folgenden Benchmarks durchgeführt haben.
Prozessor
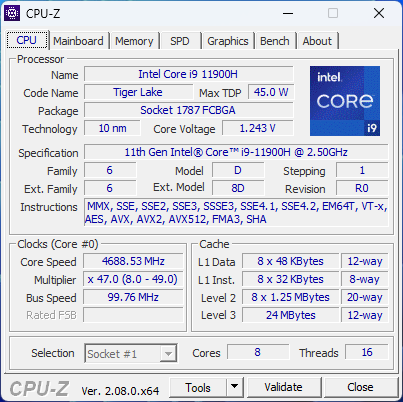
Als drei Jahre alte Core i9-CPU hat der i9-11900H Schwierigkeiten, mit neueren Core i7- und Ryzen 7-Angeboten wie dem Core i7-13700H, Core i7-1360P oder Ryzen 7 7735HS mitzuhalten. Nichtsdestotrotz ist er schneller als der Core i5-12450H in der NucBox M3 und den meisten Core-U-CPUs, einschließlich des Core i7-1365U der 13. Generation.
Cinebench R15 Multi Dauertest
Cinebench R23: Multi Core | Single Core
Cinebench R20: CPU (Multi Core) | CPU (Single Core)
Cinebench R15: CPU Multi 64Bit | CPU Single 64Bit
Blender: v2.79 BMW27 CPU
7-Zip 18.03: 7z b 4 | 7z b 4 -mmt1
Geekbench 5.5: Multi-Core | Single-Core
HWBOT x265 Benchmark v2.2: 4k Preset
LibreOffice : 20 Documents To PDF
R Benchmark 2.5: Overall mean
| CPU Performance Rating | |
| Minisforum EliteMini UM780 XTX | |
| Lenovo IdeaCentre Mini 01IRH8 | |
| Intel NUC 13 Pro Kit NUC13ANK | |
| Minisforum Neptune Series HX77G | |
| Durchschnittliche Intel Core i9-11900H | |
| GMK NucBox K2 | |
| GMK NucBox K3 Pro | |
| Beelink SER6 Pro | |
| GMK NucBox M4 | |
| Geekom A5 | |
| GMK NucBox M3 | |
| Beelink SER5 | |
| Cinebench R23 / Multi Core | |
| Minisforum EliteMini UM780 XTX | |
| Lenovo IdeaCentre Mini 01IRH8 | |
| Minisforum Neptune Series HX77G | |
| Intel NUC 13 Pro Kit NUC13ANK | |
| Durchschnittliche Intel Core i9-11900H (11135 - 13012, n=4) | |
| GMK NucBox K2 | |
| Beelink SER6 Pro | |
| GMK NucBox M4 | |
| Geekom A5 | |
| GMK NucBox K3 Pro | |
| Beelink SER5 | |
| GMK NucBox M3 | |
| Cinebench R23 / Single Core | |
| Intel NUC 13 Pro Kit NUC13ANK | |
| Lenovo IdeaCentre Mini 01IRH8 | |
| GMK NucBox K3 Pro | |
| Minisforum EliteMini UM780 XTX | |
| GMK NucBox M3 | |
| GMK NucBox M4 | |
| Durchschnittliche Intel Core i9-11900H (1574 - 1605, n=4) | |
| Minisforum Neptune Series HX77G | |
| Beelink SER6 Pro | |
| GMK NucBox K2 | |
| Geekom A5 | |
| Beelink SER5 | |
| Cinebench R20 / CPU (Multi Core) | |
| Minisforum EliteMini UM780 XTX | |
| Lenovo IdeaCentre Mini 01IRH8 | |
| Minisforum Neptune Series HX77G | |
| Intel NUC 13 Pro Kit NUC13ANK | |
| Durchschnittliche Intel Core i9-11900H (4324 - 5160, n=5) | |
| GMK NucBox K2 | |
| Beelink SER6 Pro | |
| GMK NucBox M4 | |
| Geekom A5 | |
| GMK NucBox K3 Pro | |
| Beelink SER5 | |
| GMK NucBox M3 | |
| Cinebench R20 / CPU (Single Core) | |
| Intel NUC 13 Pro Kit NUC13ANK | |
| Lenovo IdeaCentre Mini 01IRH8 | |
| GMK NucBox K3 Pro | |
| Minisforum EliteMini UM780 XTX | |
| GMK NucBox M3 | |
| GMK NucBox M4 | |
| Minisforum Neptune Series HX77G | |
| Durchschnittliche Intel Core i9-11900H (600 - 615, n=5) | |
| GMK NucBox K2 | |
| Beelink SER6 Pro | |
| Geekom A5 | |
| Beelink SER5 | |
| Cinebench R15 / CPU Multi 64Bit | |
| Minisforum EliteMini UM780 XTX | |
| Minisforum Neptune Series HX77G | |
| Lenovo IdeaCentre Mini 01IRH8 | |
| Durchschnittliche Intel Core i9-11900H (1770 - 2211, n=5) | |
| Intel NUC 13 Pro Kit NUC13ANK | |
| GMK NucBox K2 | |
| Beelink SER6 Pro | |
| Geekom A5 | |
| GMK NucBox M4 | |
| GMK NucBox K3 Pro | |
| Beelink SER5 | |
| GMK NucBox M3 | |
| Cinebench R15 / CPU Single 64Bit | |
| Minisforum EliteMini UM780 XTX | |
| Intel NUC 13 Pro Kit NUC13ANK | |
| Lenovo IdeaCentre Mini 01IRH8 | |
| GMK NucBox K3 Pro | |
| Minisforum Neptune Series HX77G | |
| GMK NucBox K2 | |
| GMK NucBox M4 | |
| Beelink SER6 Pro | |
| Durchschnittliche Intel Core i9-11900H (236 - 243, n=5) | |
| GMK NucBox M3 | |
| Geekom A5 | |
| Beelink SER5 | |
| Blender / v2.79 BMW27 CPU | |
| GMK NucBox M3 | |
| Beelink SER5 | |
| GMK NucBox K3 Pro | |
| Geekom A5 | |
| Intel NUC 13 Pro Kit NUC13ANK | |
| GMK NucBox M4 | |
| Beelink SER6 Pro | |
| GMK NucBox K2 | |
| Durchschnittliche Intel Core i9-11900H (231 - 270, n=5) | |
| Minisforum Neptune Series HX77G | |
| Lenovo IdeaCentre Mini 01IRH8 | |
| Minisforum EliteMini UM780 XTX | |
| 7-Zip 18.03 / 7z b 4 | |
| Minisforum EliteMini UM780 XTX | |
| Minisforum Neptune Series HX77G | |
| GMK NucBox K2 | |
| Beelink SER6 Pro | |
| Lenovo IdeaCentre Mini 01IRH8 | |
| Geekom A5 | |
| Intel NUC 13 Pro Kit NUC13ANK | |
| Durchschnittliche Intel Core i9-11900H (49486 - 57263, n=5) | |
| GMK NucBox M4 | |
| GMK NucBox K3 Pro | |
| Beelink SER5 | |
| GMK NucBox M3 | |
| 7-Zip 18.03 / 7z b 4 -mmt1 | |
| Minisforum EliteMini UM780 XTX | |
| GMK NucBox M4 | |
| Lenovo IdeaCentre Mini 01IRH8 | |
| Intel NUC 13 Pro Kit NUC13ANK | |
| Minisforum Neptune Series HX77G | |
| GMK NucBox K2 | |
| Durchschnittliche Intel Core i9-11900H (5582 - 6018, n=5) | |
| GMK NucBox K3 Pro | |
| Beelink SER6 Pro | |
| Geekom A5 | |
| GMK NucBox M3 | |
| Beelink SER5 | |
| Geekbench 5.5 / Multi-Core | |
| Minisforum EliteMini UM780 XTX | |
| Intel NUC 13 Pro Kit NUC13ANK | |
| Lenovo IdeaCentre Mini 01IRH8 | |
| Minisforum Neptune Series HX77G | |
| GMK NucBox K3 Pro | |
| GMK NucBox K2 | |
| Beelink SER6 Pro | |
| Durchschnittliche Intel Core i9-11900H (7725 - 9856, n=5) | |
| GMK NucBox M4 | |
| Geekom A5 | |
| GMK NucBox M3 | |
| Beelink SER5 | |
| Geekbench 5.5 / Single-Core | |
| Minisforum EliteMini UM780 XTX | |
| Intel NUC 13 Pro Kit NUC13ANK | |
| Lenovo IdeaCentre Mini 01IRH8 | |
| GMK NucBox K3 Pro | |
| GMK NucBox M4 | |
| GMK NucBox M3 | |
| Durchschnittliche Intel Core i9-11900H (1576 - 1692, n=5) | |
| Minisforum Neptune Series HX77G | |
| GMK NucBox K2 | |
| Beelink SER6 Pro | |
| Geekom A5 | |
| Beelink SER5 | |
| HWBOT x265 Benchmark v2.2 / 4k Preset | |
| Minisforum EliteMini UM780 XTX | |
| Minisforum Neptune Series HX77G | |
| Lenovo IdeaCentre Mini 01IRH8 | |
| GMK NucBox K2 | |
| Beelink SER6 Pro | |
| Durchschnittliche Intel Core i9-11900H (13.6 - 16.7, n=5) | |
| Intel NUC 13 Pro Kit NUC13ANK | |
| GMK NucBox M4 | |
| Geekom A5 | |
| GMK NucBox K3 Pro | |
| Beelink SER5 | |
| GMK NucBox M3 | |
| LibreOffice / 20 Documents To PDF | |
| Beelink SER5 | |
| Geekom A5 | |
| Minisforum EliteMini UM780 XTX | |
| Minisforum Neptune Series HX77G | |
| Beelink SER6 Pro | |
| GMK NucBox K2 | |
| Durchschnittliche Intel Core i9-11900H (40.5 - 49.3, n=5) | |
| Intel NUC 13 Pro Kit NUC13ANK | |
| GMK NucBox M4 | |
| GMK NucBox M3 | |
| GMK NucBox K3 Pro | |
| Lenovo IdeaCentre Mini 01IRH8 | |
| R Benchmark 2.5 / Overall mean | |
| Beelink SER5 | |
| Durchschnittliche Intel Core i9-11900H (0.52 - 0.544, n=5) | |
| Geekom A5 | |
| GMK NucBox M4 | |
| Beelink SER6 Pro | |
| GMK NucBox M3 | |
| GMK NucBox K2 | |
| Minisforum Neptune Series HX77G | |
| GMK NucBox K3 Pro | |
| Lenovo IdeaCentre Mini 01IRH8 | |
| Intel NUC 13 Pro Kit NUC13ANK | |
| Minisforum EliteMini UM780 XTX | |
* ... kleinere Werte sind besser
AIDA64: FP32 Ray-Trace | FPU Julia | CPU SHA3 | CPU Queen | FPU SinJulia | FPU Mandel | CPU AES | CPU ZLib | FP64 Ray-Trace | CPU PhotoWorxx
| Performance Rating | |
| Beelink SER6 Pro | |
| GMK NucBox M4 | |
| Lenovo IdeaCentre Mini 01IRH8 | |
| Durchschnittliche Intel Core i9-11900H | |
| Intel NUC 13 Pro Kit NUC13ANK | |
| GMK NucBox K3 Pro | |
| GMK NucBox M3 | |
| AIDA64 / FP32 Ray-Trace | |
| GMK NucBox M4 | |
| Durchschnittliche Intel Core i9-11900H (n=1) | |
| Lenovo IdeaCentre Mini 01IRH8 | |
| Beelink SER6 Pro | |
| Intel NUC 13 Pro Kit NUC13ANK | |
| GMK NucBox K3 Pro | |
| GMK NucBox M3 | |
| AIDA64 / FPU Julia | |
| Beelink SER6 Pro | |
| Lenovo IdeaCentre Mini 01IRH8 | |
| GMK NucBox M4 | |
| Durchschnittliche Intel Core i9-11900H (n=1) | |
| Intel NUC 13 Pro Kit NUC13ANK | |
| GMK NucBox K3 Pro | |
| GMK NucBox M3 | |
| AIDA64 / CPU SHA3 | |
| GMK NucBox M4 | |
| Durchschnittliche Intel Core i9-11900H (n=1) | |
| Lenovo IdeaCentre Mini 01IRH8 | |
| Beelink SER6 Pro | |
| Intel NUC 13 Pro Kit NUC13ANK | |
| GMK NucBox K3 Pro | |
| GMK NucBox M3 | |
| AIDA64 / CPU Queen | |
| Lenovo IdeaCentre Mini 01IRH8 | |
| Beelink SER6 Pro | |
| GMK NucBox M4 | |
| Durchschnittliche Intel Core i9-11900H (n=1) | |
| Intel NUC 13 Pro Kit NUC13ANK | |
| GMK NucBox K3 Pro | |
| GMK NucBox M3 | |
| AIDA64 / FPU SinJulia | |
| Beelink SER6 Pro | |
| GMK NucBox M4 | |
| Durchschnittliche Intel Core i9-11900H (n=1) | |
| Lenovo IdeaCentre Mini 01IRH8 | |
| Intel NUC 13 Pro Kit NUC13ANK | |
| GMK NucBox K3 Pro | |
| GMK NucBox M3 | |
| AIDA64 / FPU Mandel | |
| Beelink SER6 Pro | |
| GMK NucBox M4 | |
| Durchschnittliche Intel Core i9-11900H (n=1) | |
| Lenovo IdeaCentre Mini 01IRH8 | |
| Intel NUC 13 Pro Kit NUC13ANK | |
| GMK NucBox K3 Pro | |
| GMK NucBox M3 | |
| AIDA64 / CPU AES | |
| GMK NucBox M4 | |
| Durchschnittliche Intel Core i9-11900H (n=1) | |
| Beelink SER6 Pro | |
| Intel NUC 13 Pro Kit NUC13ANK | |
| GMK NucBox K3 Pro | |
| Lenovo IdeaCentre Mini 01IRH8 | |
| GMK NucBox M3 | |
| AIDA64 / CPU ZLib | |
| Lenovo IdeaCentre Mini 01IRH8 | |
| Intel NUC 13 Pro Kit NUC13ANK | |
| GMK NucBox M4 | |
| Beelink SER6 Pro | |
| GMK NucBox K3 Pro | |
| GMK NucBox M3 | |
| Durchschnittliche Intel Core i9-11900H (738 - 738, n=4) | |
| AIDA64 / FP64 Ray-Trace | |
| GMK NucBox M4 | |
| Durchschnittliche Intel Core i9-11900H (n=1) | |
| Lenovo IdeaCentre Mini 01IRH8 | |
| Beelink SER6 Pro | |
| Intel NUC 13 Pro Kit NUC13ANK | |
| GMK NucBox K3 Pro | |
| GMK NucBox M3 | |
| AIDA64 / CPU PhotoWorxx | |
| GMK NucBox K3 Pro | |
| Beelink SER6 Pro | |
| Intel NUC 13 Pro Kit NUC13ANK | |
| GMK NucBox M3 | |
| GMK NucBox M4 | |
| Durchschnittliche Intel Core i9-11900H (n=1) | |
| Lenovo IdeaCentre Mini 01IRH8 | |
System Performance
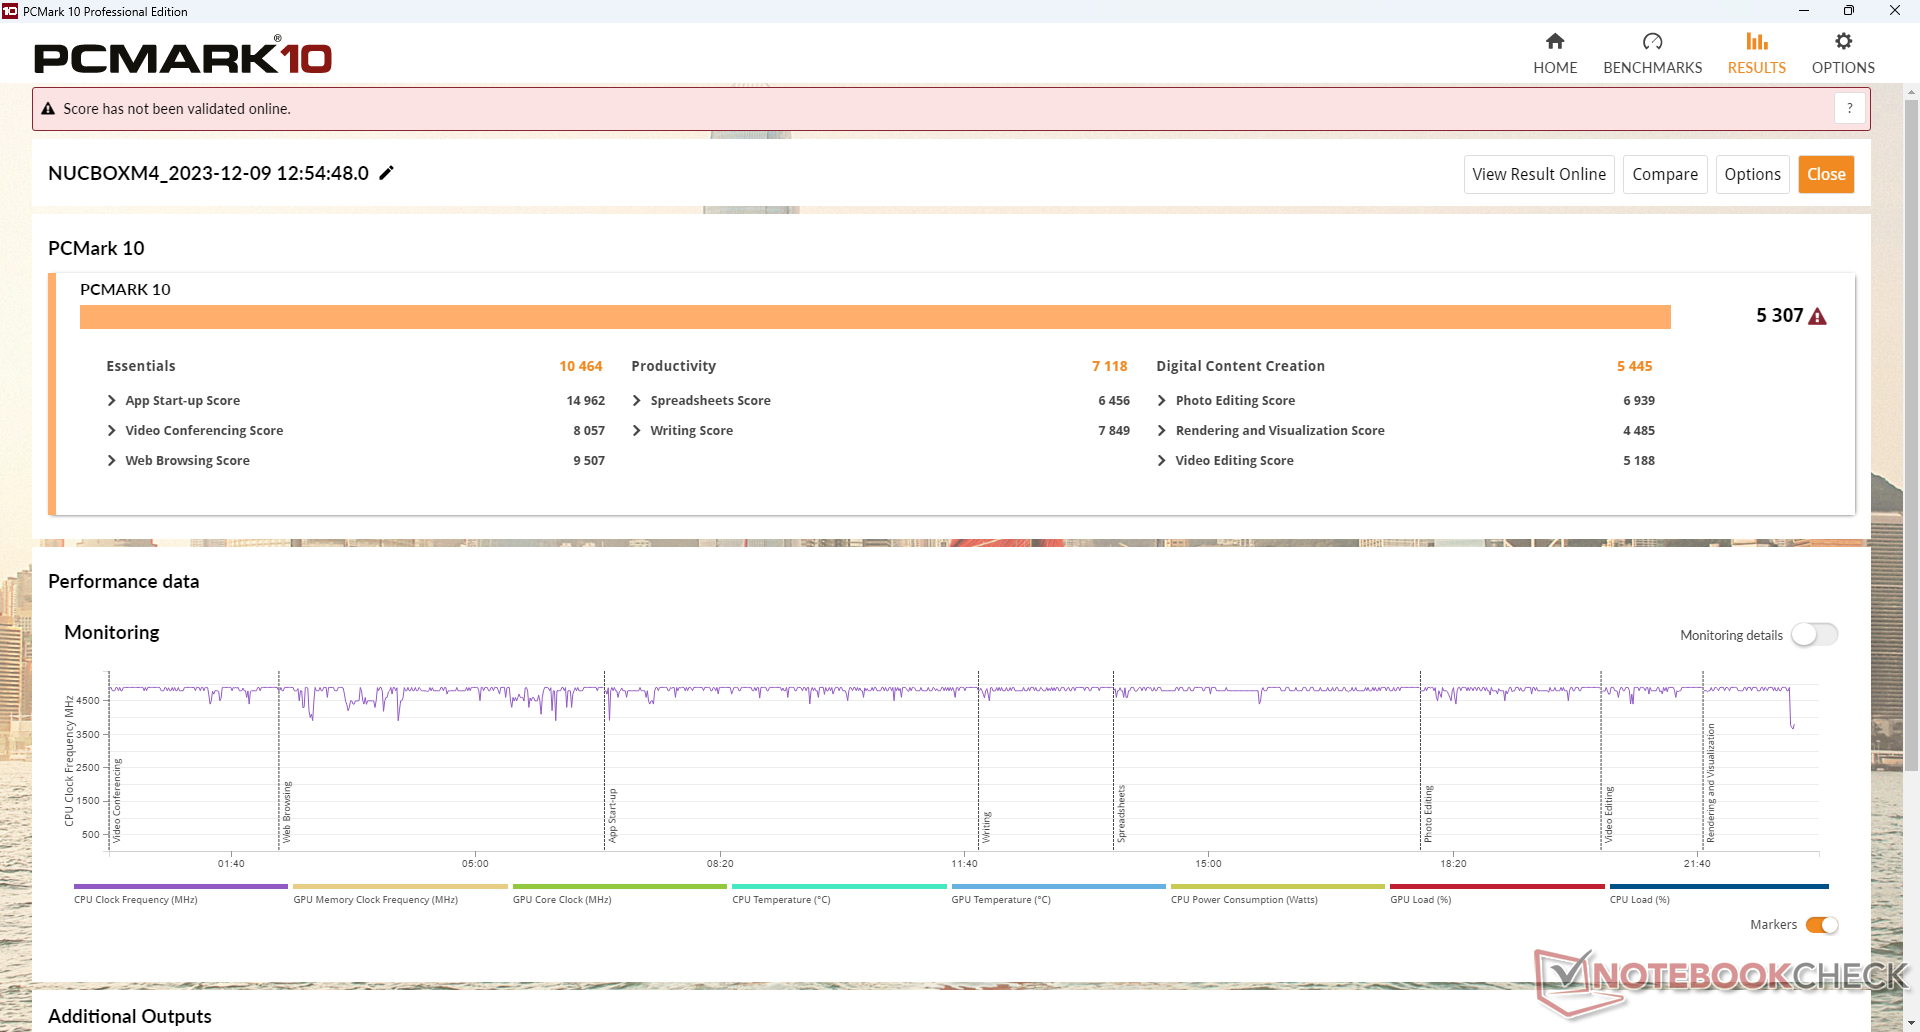
Die PCMark-Ergebnisse sind niedriger als bei vielen Mini-PCs mit neueren CPUs der 12. oder 13. Generation oder Zen 3+, was vor allem an der langsamen integrierten GPU in unserer NucBox M4 liegt.
CrossMark: Overall | Productivity | Creativity | Responsiveness
WebXPRT 3: Overall
WebXPRT 4: Overall
Mozilla Kraken 1.1: Total
| PCMark 10 / Score | |
| Beelink SER6 Pro | |
| Intel NUC 13 Pro Kit NUC13ANK | |
| Lenovo IdeaCentre Mini 01IRH8 | |
| GMK NucBox K3 Pro | |
| GMK NucBox M3 | |
| GMK NucBox M4 | |
| Durchschnittliche Intel Core i9-11900H, Intel UHD Graphics Xe 32EUs (Tiger Lake-H) (n=1) | |
| PCMark 10 / Essentials | |
| Intel NUC 13 Pro Kit NUC13ANK | |
| Lenovo IdeaCentre Mini 01IRH8 | |
| Beelink SER6 Pro | |
| GMK NucBox K3 Pro | |
| GMK NucBox M3 | |
| GMK NucBox M4 | |
| Durchschnittliche Intel Core i9-11900H, Intel UHD Graphics Xe 32EUs (Tiger Lake-H) (n=1) | |
| PCMark 10 / Productivity | |
| Beelink SER6 Pro | |
| Intel NUC 13 Pro Kit NUC13ANK | |
| GMK NucBox K3 Pro | |
| Lenovo IdeaCentre Mini 01IRH8 | |
| GMK NucBox M3 | |
| GMK NucBox M4 | |
| Durchschnittliche Intel Core i9-11900H, Intel UHD Graphics Xe 32EUs (Tiger Lake-H) (n=1) | |
| PCMark 10 / Digital Content Creation | |
| Beelink SER6 Pro | |
| Lenovo IdeaCentre Mini 01IRH8 | |
| Intel NUC 13 Pro Kit NUC13ANK | |
| GMK NucBox K3 Pro | |
| GMK NucBox M4 | |
| Durchschnittliche Intel Core i9-11900H, Intel UHD Graphics Xe 32EUs (Tiger Lake-H) (n=1) | |
| GMK NucBox M3 | |
| CrossMark / Overall | |
| Intel NUC 13 Pro Kit NUC13ANK | |
| Lenovo IdeaCentre Mini 01IRH8 | |
| Beelink SER6 Pro | |
| GMK NucBox M4 | |
| Durchschnittliche Intel Core i9-11900H, Intel UHD Graphics Xe 32EUs (Tiger Lake-H) (n=1) | |
| GMK NucBox K3 Pro | |
| GMK NucBox M3 | |
| CrossMark / Productivity | |
| Intel NUC 13 Pro Kit NUC13ANK | |
| Lenovo IdeaCentre Mini 01IRH8 | |
| Beelink SER6 Pro | |
| GMK NucBox M4 | |
| Durchschnittliche Intel Core i9-11900H, Intel UHD Graphics Xe 32EUs (Tiger Lake-H) (n=1) | |
| GMK NucBox M3 | |
| GMK NucBox K3 Pro | |
| CrossMark / Creativity | |
| Intel NUC 13 Pro Kit NUC13ANK | |
| Lenovo IdeaCentre Mini 01IRH8 | |
| Beelink SER6 Pro | |
| GMK NucBox K3 Pro | |
| GMK NucBox M4 | |
| Durchschnittliche Intel Core i9-11900H, Intel UHD Graphics Xe 32EUs (Tiger Lake-H) (n=1) | |
| GMK NucBox M3 | |
| CrossMark / Responsiveness | |
| Beelink SER6 Pro | |
| Intel NUC 13 Pro Kit NUC13ANK | |
| GMK NucBox M3 | |
| GMK NucBox M4 | |
| Durchschnittliche Intel Core i9-11900H, Intel UHD Graphics Xe 32EUs (Tiger Lake-H) (n=1) | |
| Lenovo IdeaCentre Mini 01IRH8 | |
| GMK NucBox K3 Pro | |
| WebXPRT 3 / Overall | |
| Intel NUC 13 Pro Kit NUC13ANK | |
| GMK NucBox K3 Pro | |
| Beelink SER6 Pro | |
| GMK NucBox M3 | |
| GMK NucBox M4 | |
| Durchschnittliche Intel Core i9-11900H, Intel UHD Graphics Xe 32EUs (Tiger Lake-H) (n=1) | |
| WebXPRT 4 / Overall | |
| Intel NUC 13 Pro Kit NUC13ANK | |
| GMK NucBox M3 | |
| GMK NucBox M4 | |
| Durchschnittliche Intel Core i9-11900H, Intel UHD Graphics Xe 32EUs (Tiger Lake-H) (n=1) | |
| Beelink SER6 Pro | |
| Mozilla Kraken 1.1 / Total | |
| GMK NucBox M4 | |
| Durchschnittliche Intel Core i9-11900H, Intel UHD Graphics Xe 32EUs (Tiger Lake-H) (n=1) | |
| Beelink SER6 Pro | |
| GMK NucBox M3 | |
| GMK NucBox K3 Pro | |
| Lenovo IdeaCentre Mini 01IRH8 | |
| Intel NUC 13 Pro Kit NUC13ANK | |
* ... kleinere Werte sind besser
| PCMark 10 Score | 5307 Punkte | |
Hilfe | ||
| AIDA64 / Memory Copy | |
| GMK NucBox K3 Pro | |
| Beelink SER6 Pro | |
| Intel NUC 13 Pro Kit NUC13ANK | |
| GMK NucBox M4 | |
| Durchschnittliche Intel Core i9-11900H (n=1) | |
| GMK NucBox M3 | |
| Lenovo IdeaCentre Mini 01IRH8 | |
| AIDA64 / Memory Read | |
| GMK NucBox K3 Pro | |
| Beelink SER6 Pro | |
| GMK NucBox M4 | |
| Durchschnittliche Intel Core i9-11900H (n=1) | |
| Intel NUC 13 Pro Kit NUC13ANK | |
| Lenovo IdeaCentre Mini 01IRH8 | |
| GMK NucBox M3 | |
| AIDA64 / Memory Write | |
| GMK NucBox K3 Pro | |
| Beelink SER6 Pro | |
| GMK NucBox M4 | |
| Durchschnittliche Intel Core i9-11900H (n=1) | |
| GMK NucBox M3 | |
| Intel NUC 13 Pro Kit NUC13ANK | |
| Lenovo IdeaCentre Mini 01IRH8 | |
| AIDA64 / Memory Latency | |
| GMK NucBox K3 Pro | |
| Intel NUC 13 Pro Kit NUC13ANK | |
| Beelink SER6 Pro | |
| Lenovo IdeaCentre Mini 01IRH8 | |
| GMK NucBox M3 | |
| GMK NucBox M4 | |
| Durchschnittliche Intel Core i9-11900H (71.2 - 71.2, n=4) | |
* ... kleinere Werte sind besser
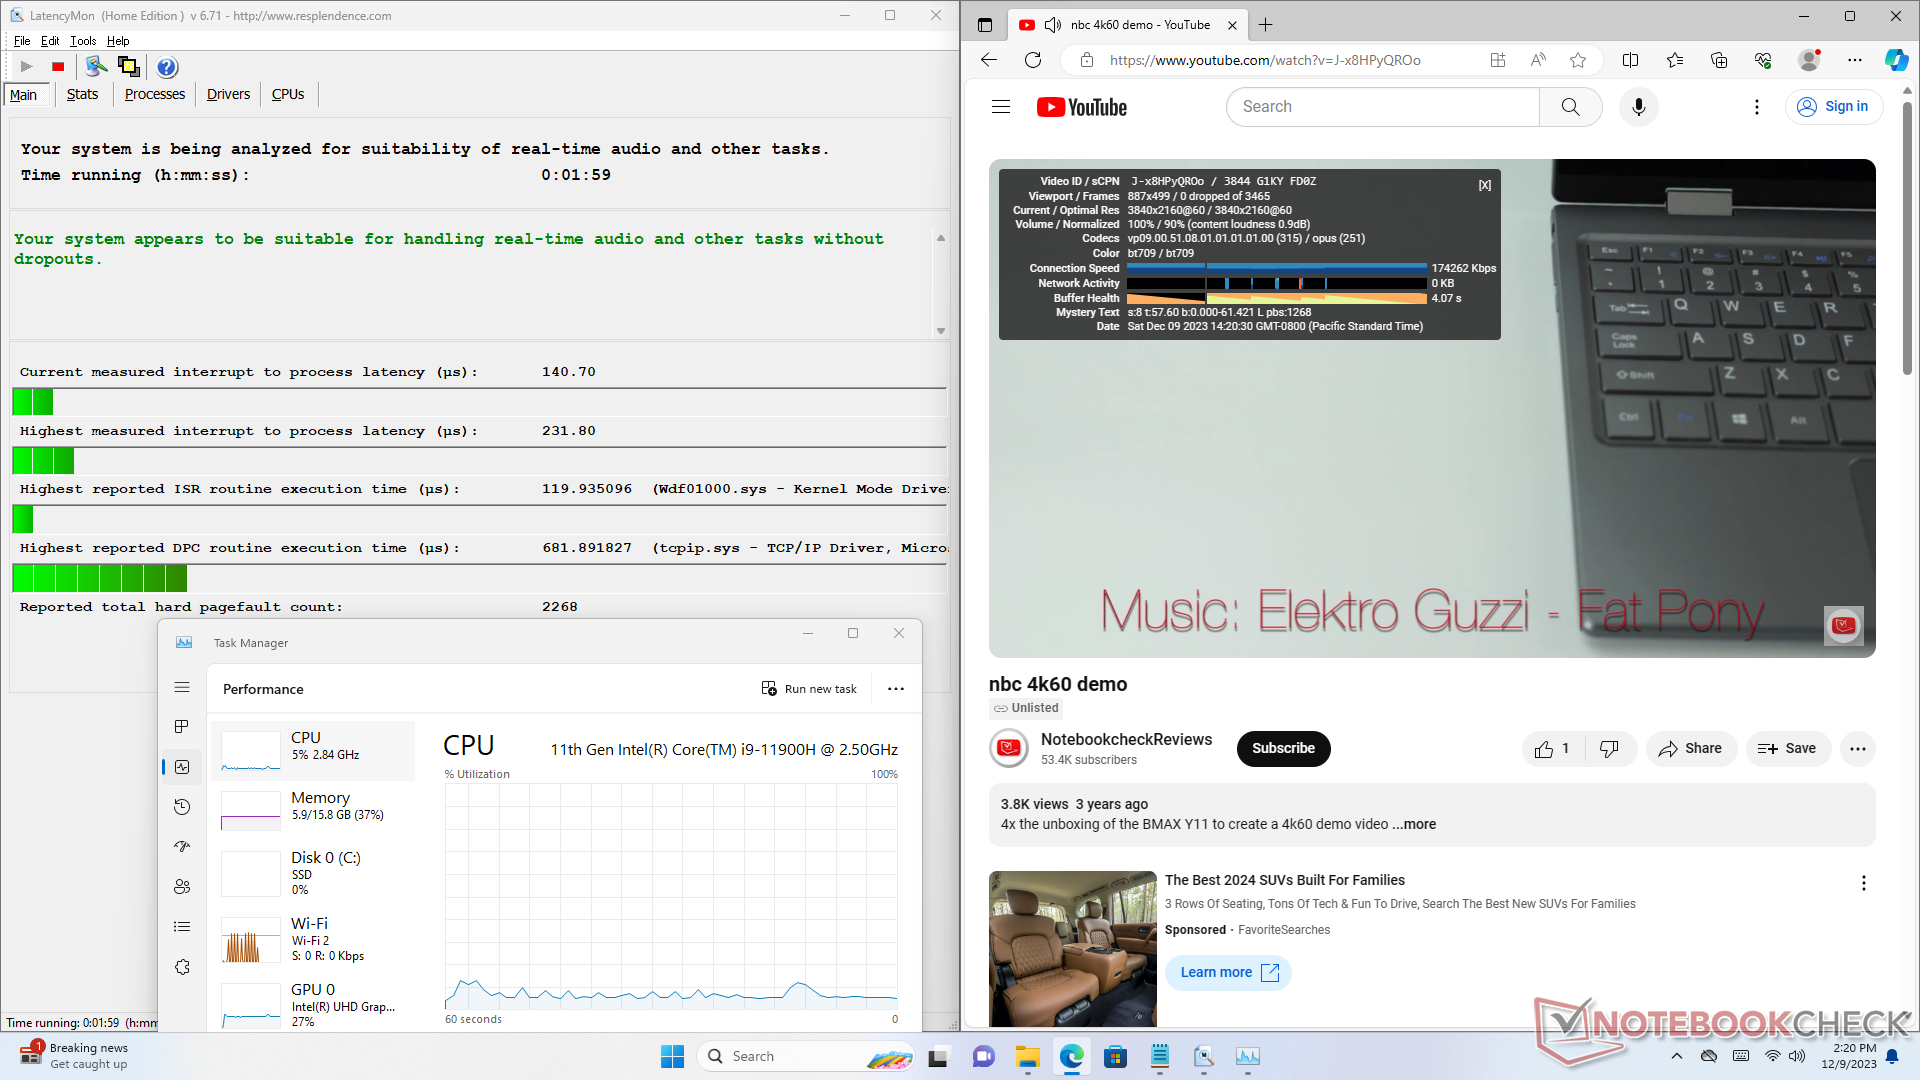
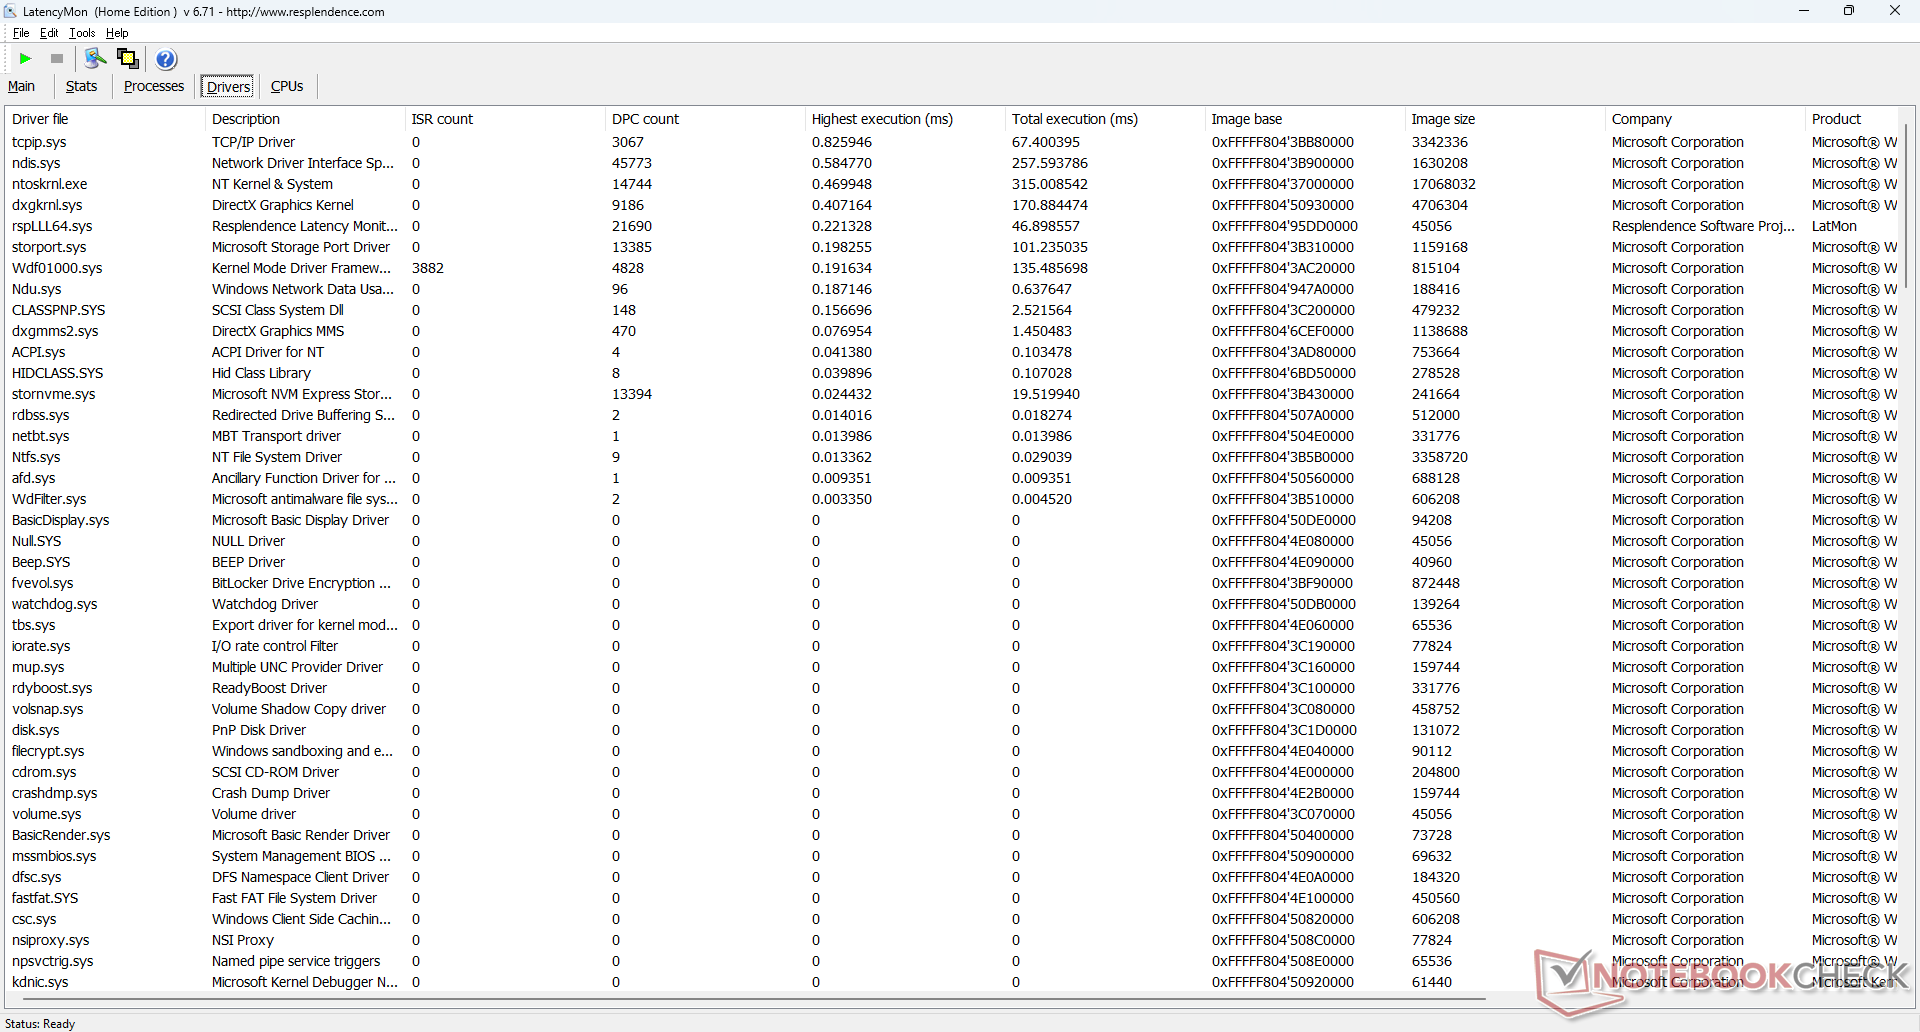
DPC-Latenzen
LatencyMon zeigt keine DPC-Probleme beim Öffnen mehrerer Browser-Tabs unserer Homepage. Die 4K-Videowiedergabe bei 60 FPS ist ebenfalls perfekt und ohne Bildaussetzer, was dieses Gerät zu einem hervorragenden Mini-PC für Streaming-Zwecke macht.
| DPC Latencies / LatencyMon - interrupt to process latency (max), Web, Youtube, Prime95 | |
| GMK NucBox M3 | |
| Lenovo IdeaCentre Mini 01IRH8 | |
| GMK NucBox K3 Pro | |
| Beelink SER6 Pro | |
| Intel NUC 13 Pro Kit NUC13ANK | |
| GMK NucBox M4 | |
* ... kleinere Werte sind besser
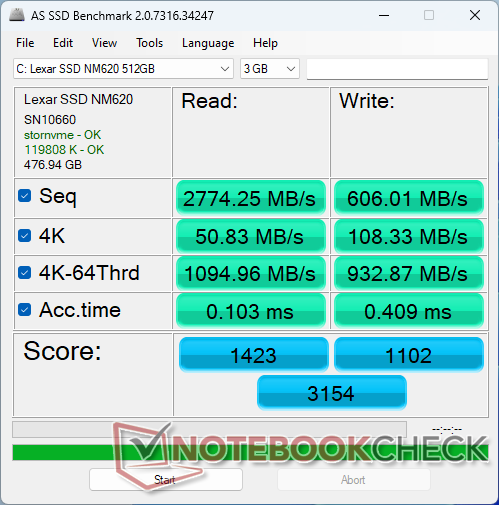
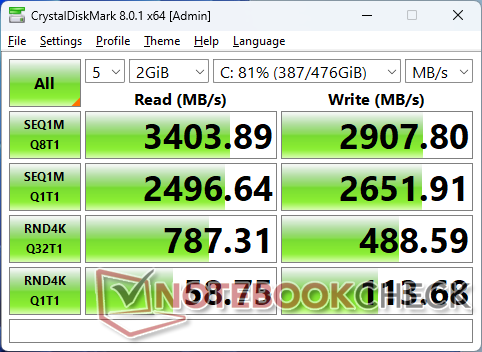
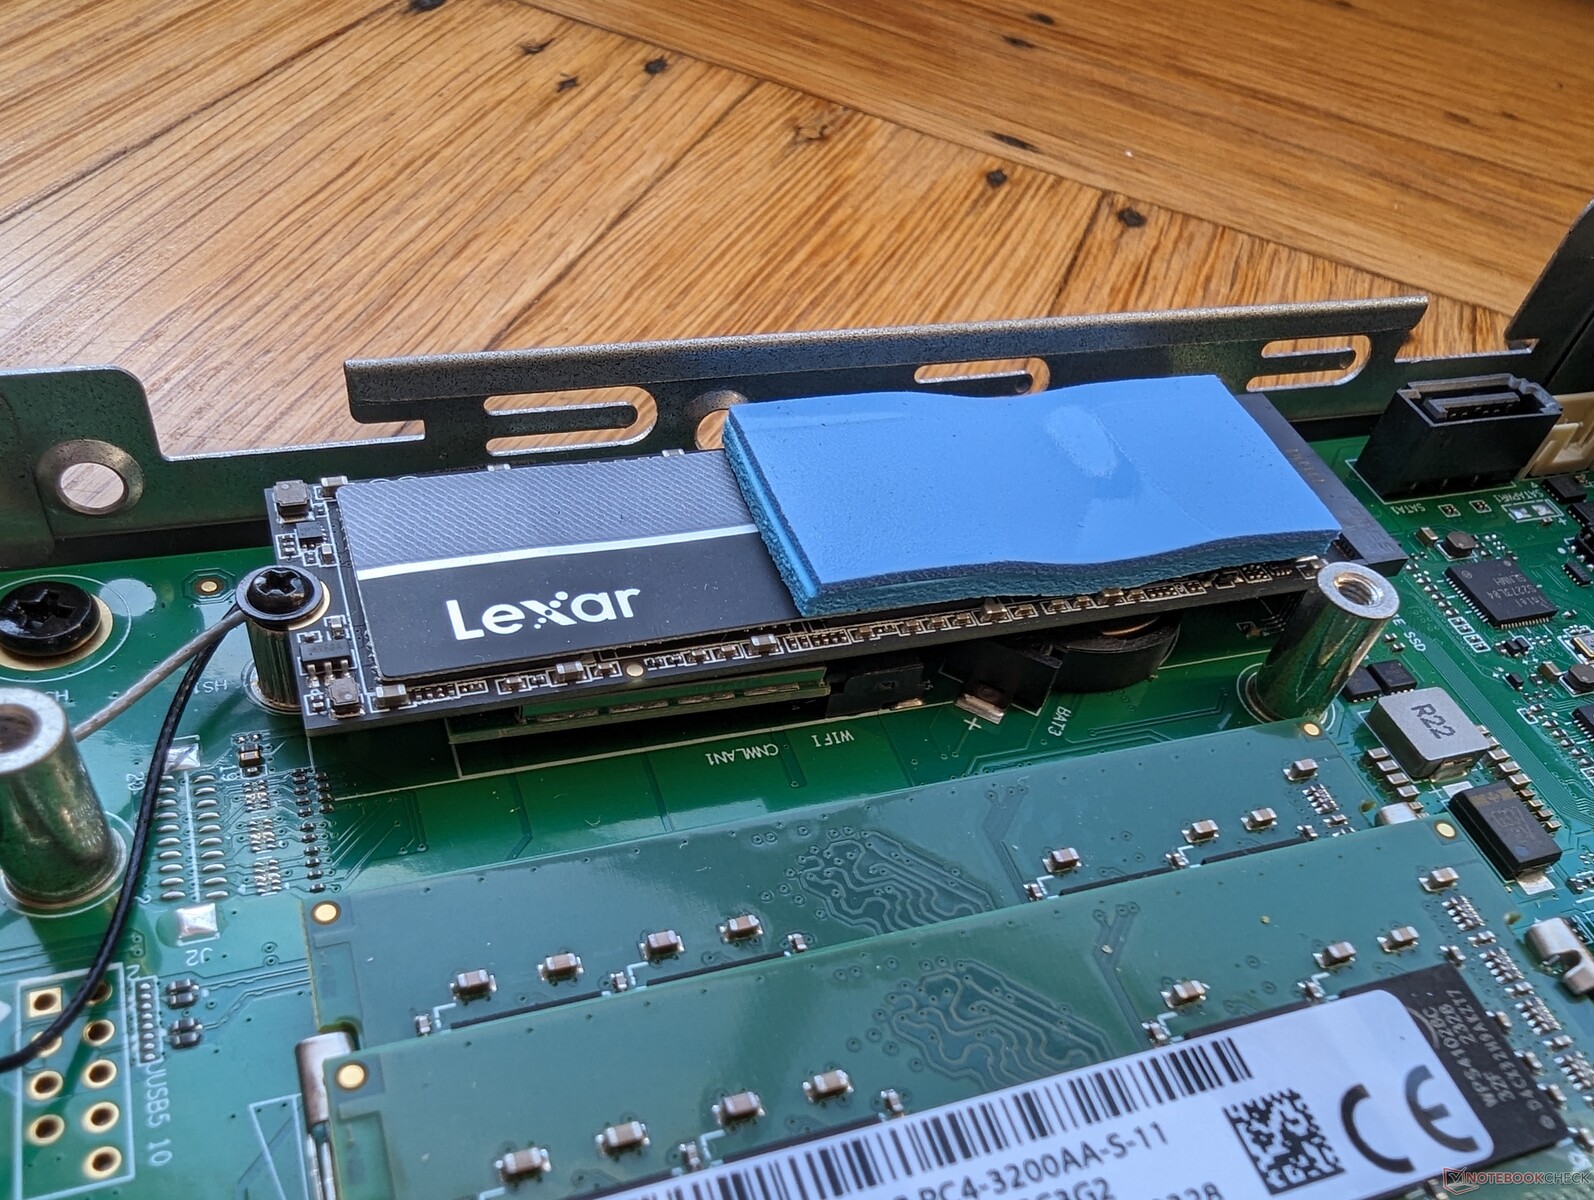
Massenspeicher
Unser Gerät wird mit einer 512 GB Lexar NM620 PCIe3 x4 NVMe SSD ausgeliefert, die sequenzielle Lese- und Schreibraten von bis zu 3500 MB/s bzw. 2400 MB/s bietet. Das Laufwerk zeigt keine Drosselungsprobleme und hält seine maximalen Leistungsraten über lange Zeiträume aufrecht.

| Drive Performance Rating - Percent | |
| Intel NUC 13 Pro Kit NUC13ANK | |
| GMK NucBox M3 | |
| Beelink SER6 Pro | |
| Lenovo IdeaCentre Mini 01IRH8 | |
| GMK NucBox K3 Pro | |
| GMK NucBox M4 | |
* ... kleinere Werte sind besser
Disk-Throttling: DiskSpd Read Loop, 8 Runden
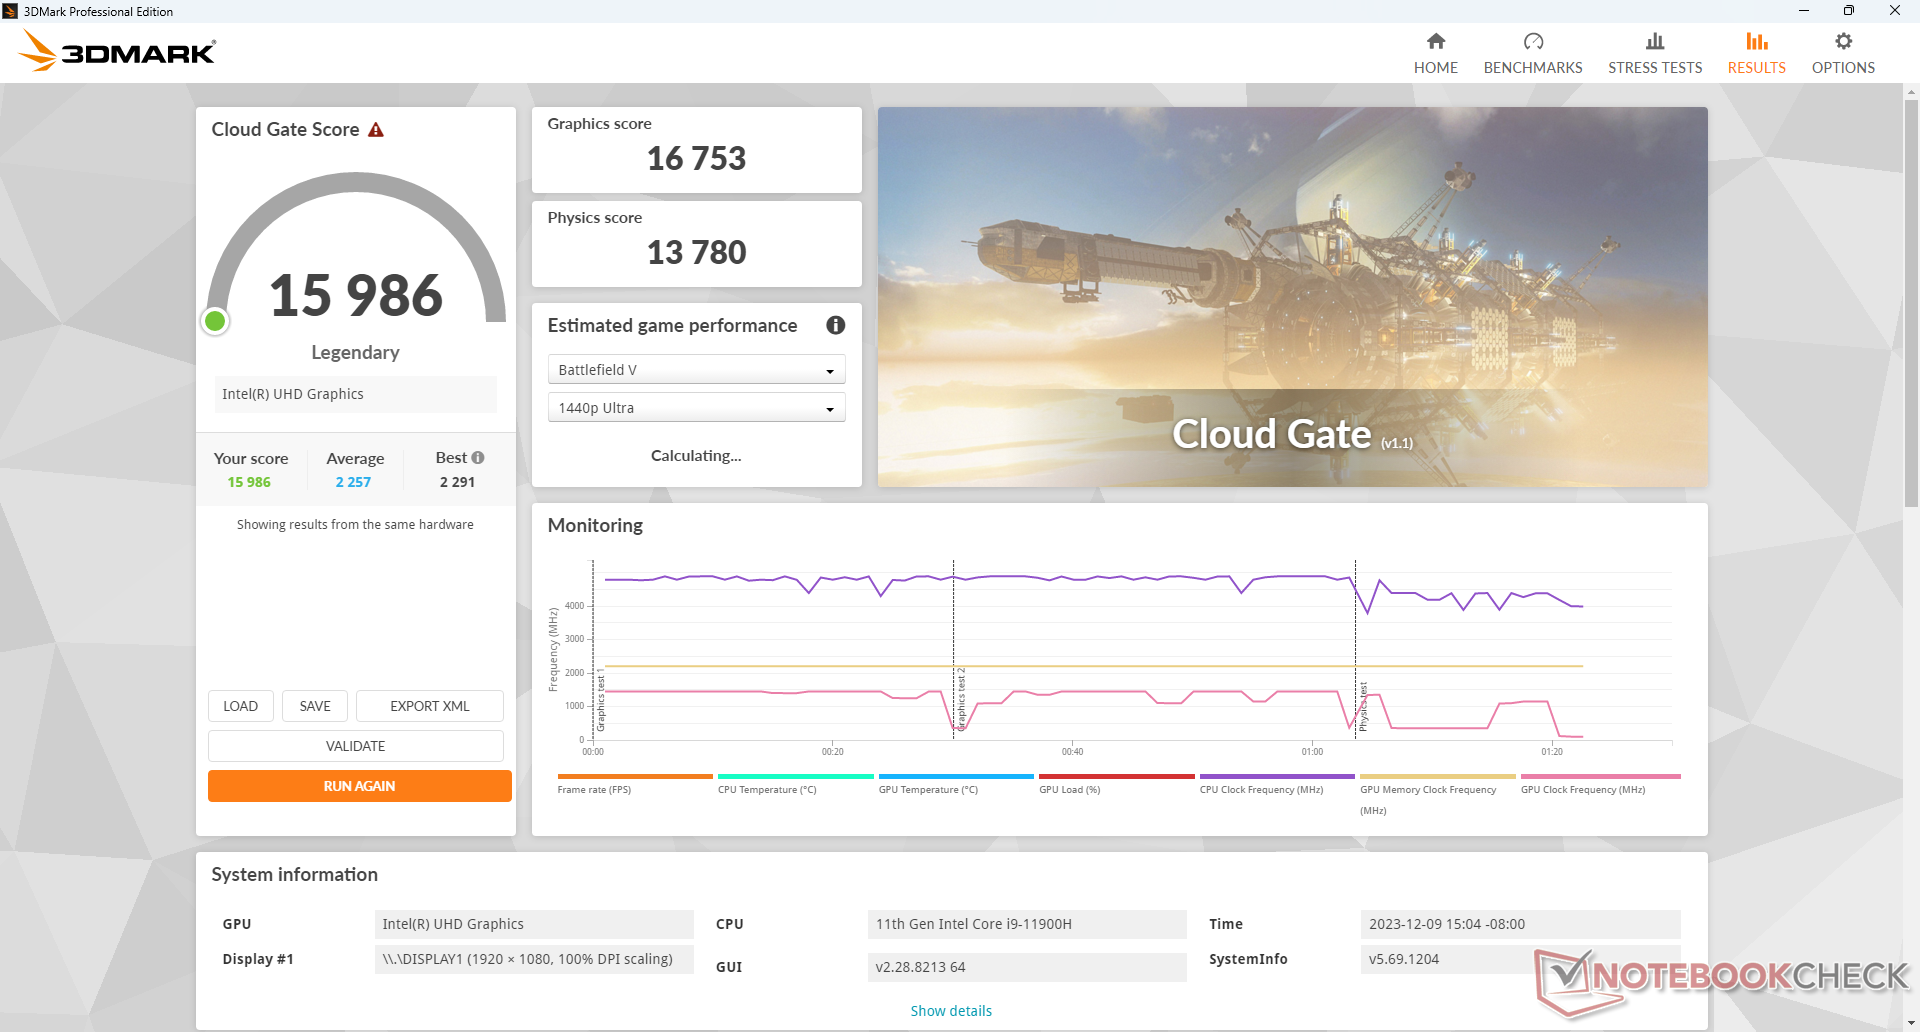
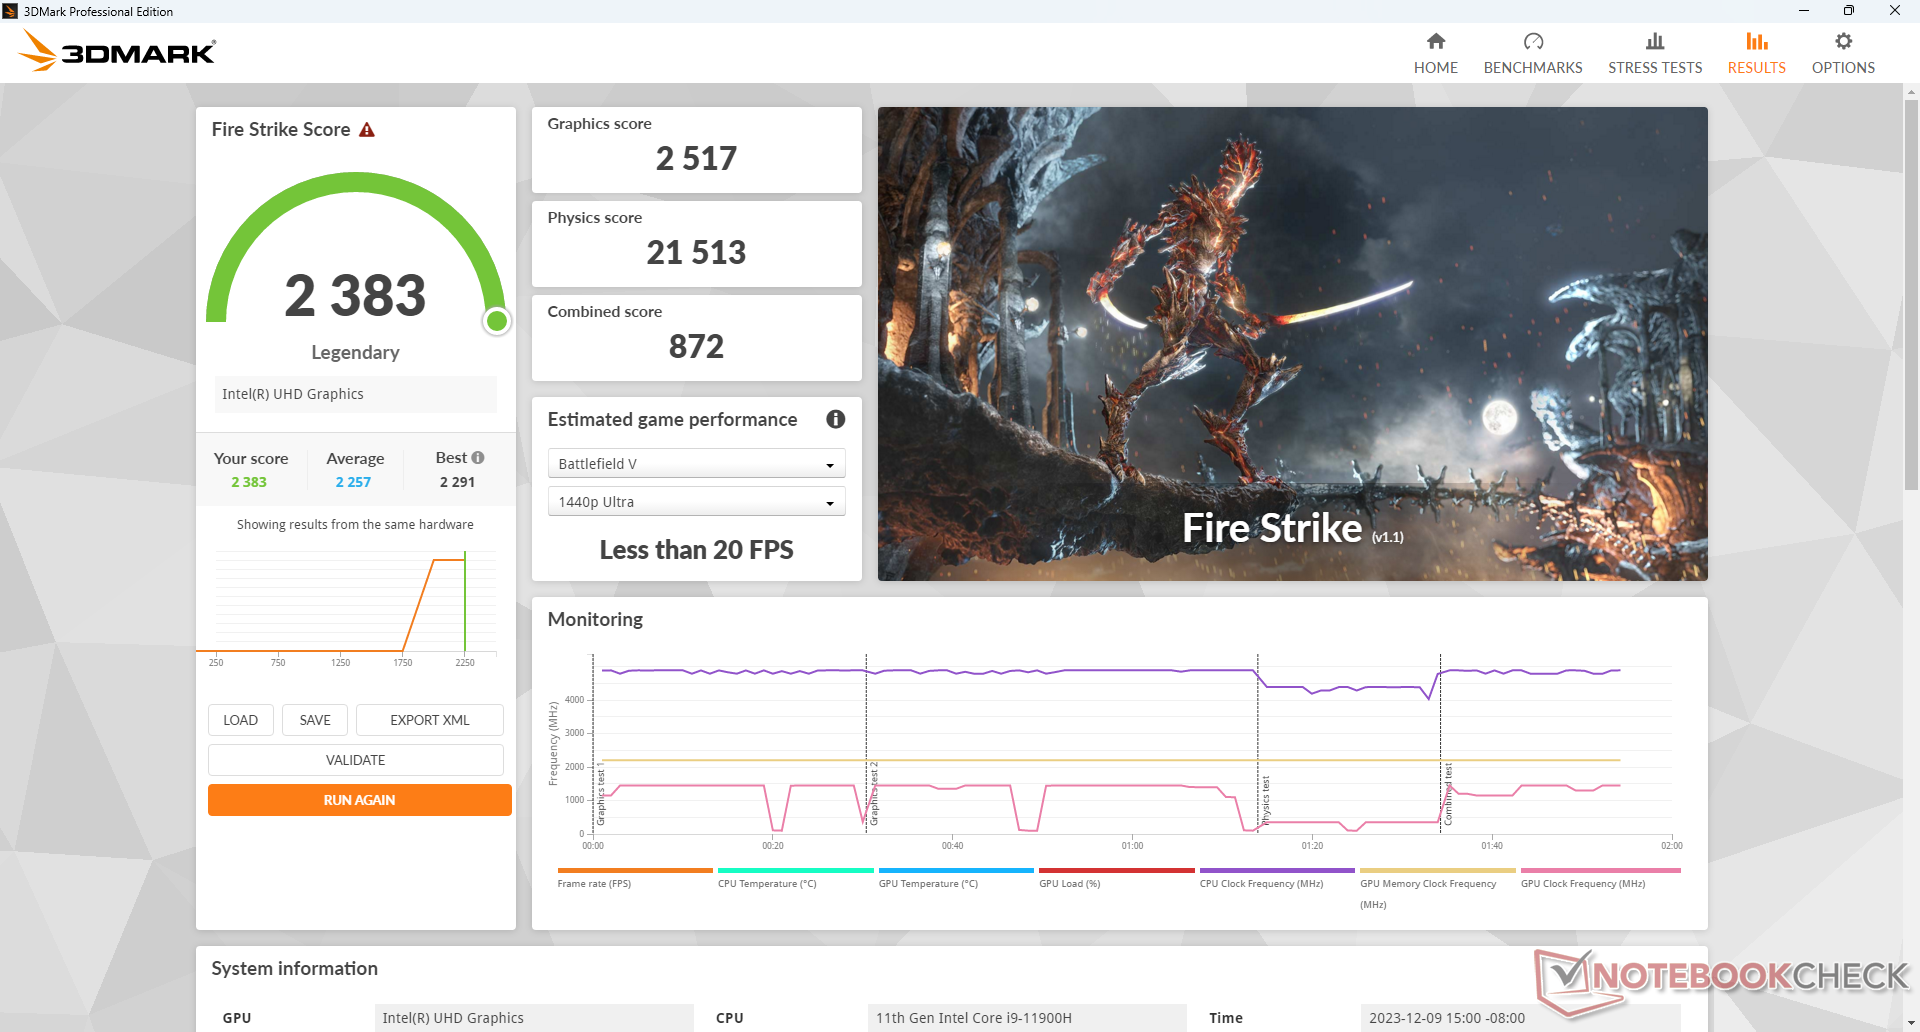
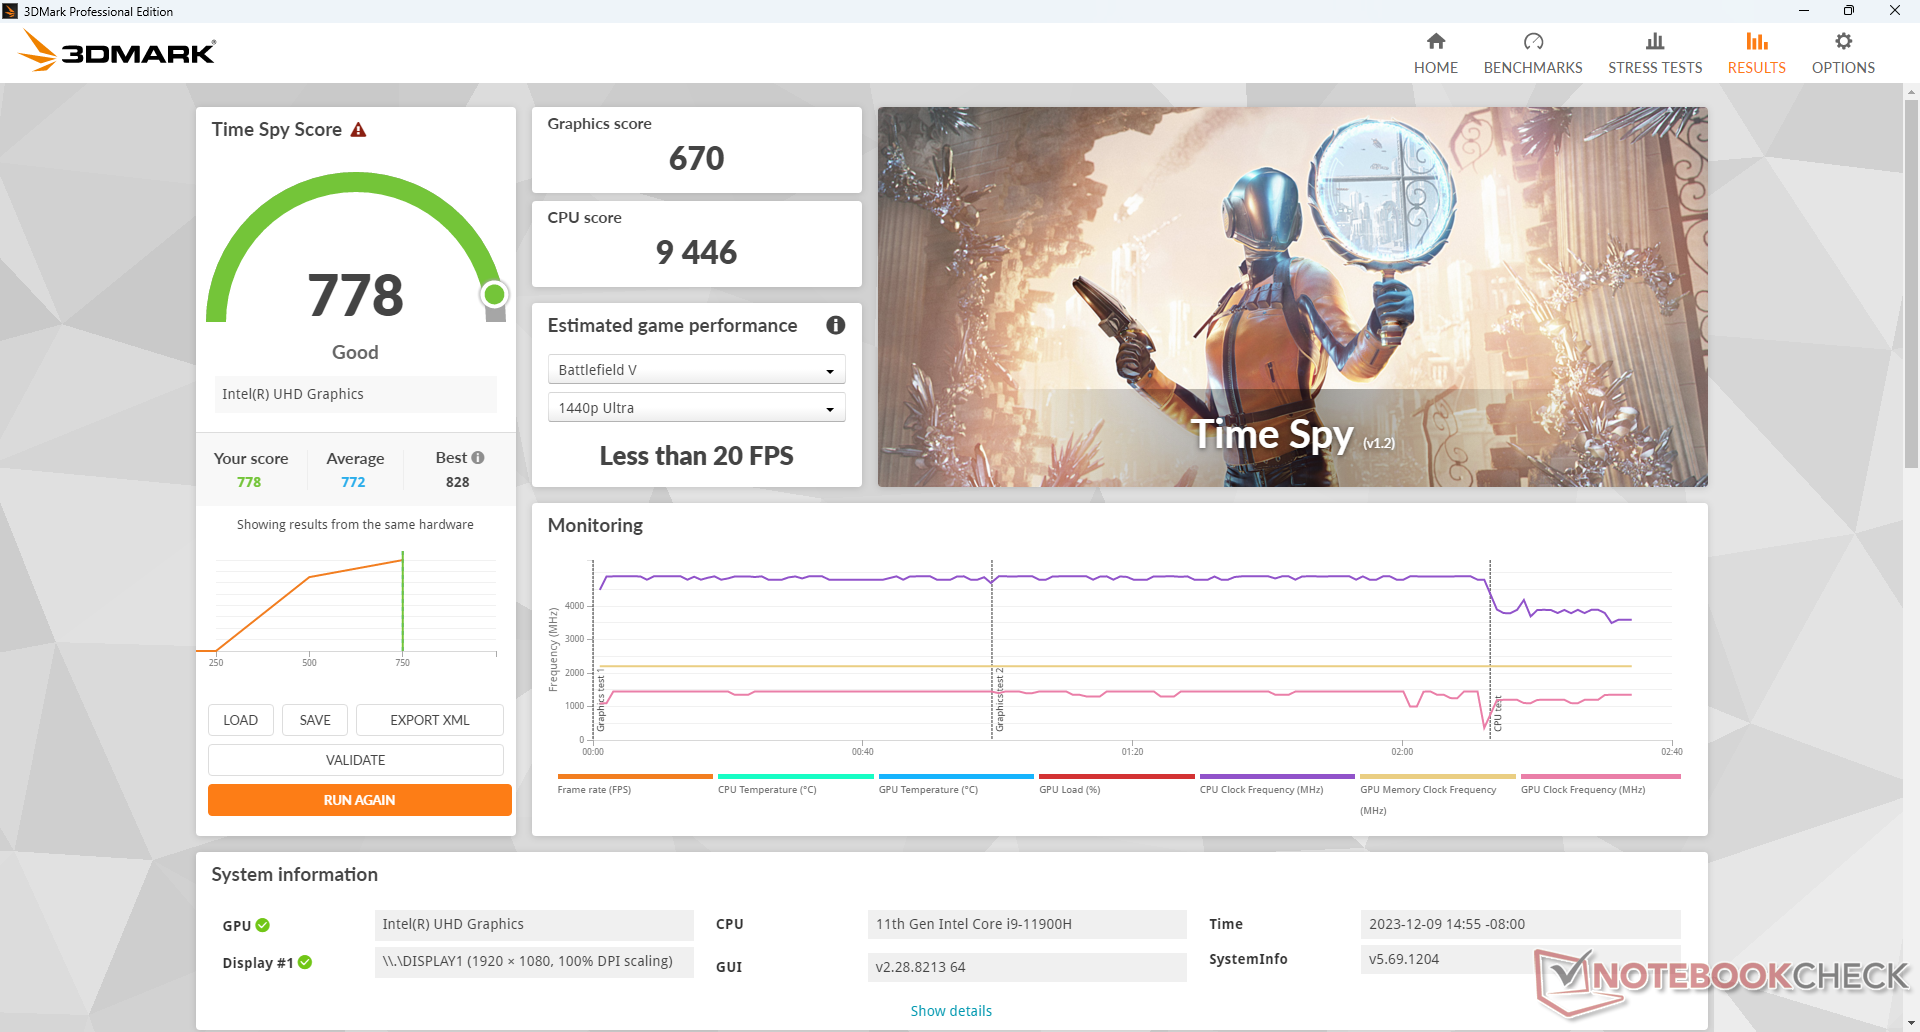
GPU Performance
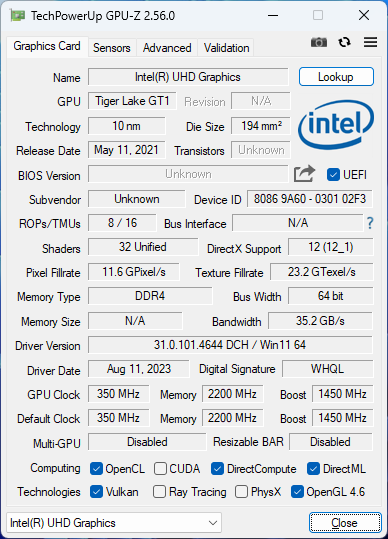
Die integrierte UHD Graphics Xe mit 32 Execution Units ist eine der langsameren GPUs in der Intel Xe-Familie. Daher ist die NucBox M4 für natives Gaming nicht geeignet. Spiele-Streaming läuft jedoch hervorragend auf dem Gerät.
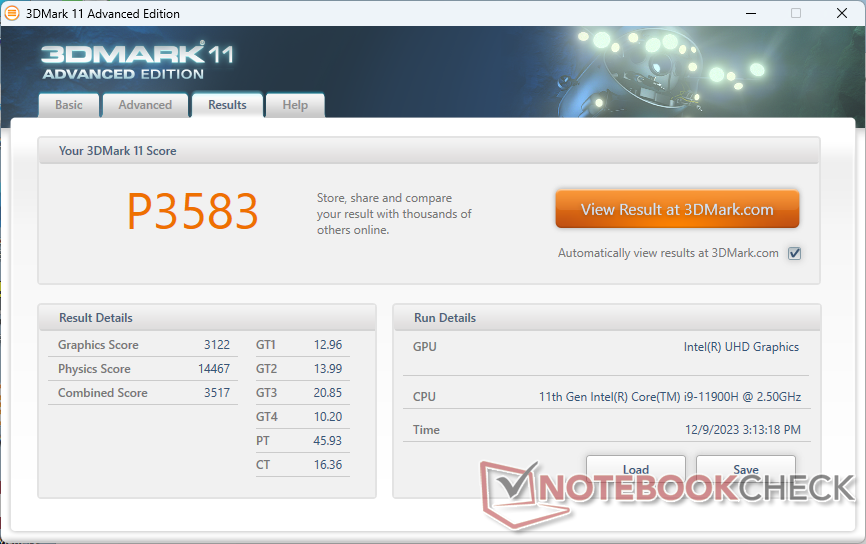
| 3DMark 11 Performance | 3583 Punkte | |
| 3DMark Cloud Gate Standard Score | 15986 Punkte | |
| 3DMark Fire Strike Score | 2383 Punkte | |
Hilfe | ||
* ... kleinere Werte sind besser
Witcher 3 FPS-Diagramm
| min. | mittel | hoch | max. | |
|---|---|---|---|---|
| The Witcher 3 (2015) | 49.7 | 29.8 | 16.7 | 8.2 |
| Dota 2 Reborn (2015) | 112.3 | 70.1 | 36.1 | 32.8 |
| Final Fantasy XV Benchmark (2018) | 23 | |||
| X-Plane 11.11 (2018) | 38.8 | 26.3 | 23.3 | |
| Strange Brigade (2018) | 56.5 | 22.4 | 17.2 | 16.4 |
Emissionen
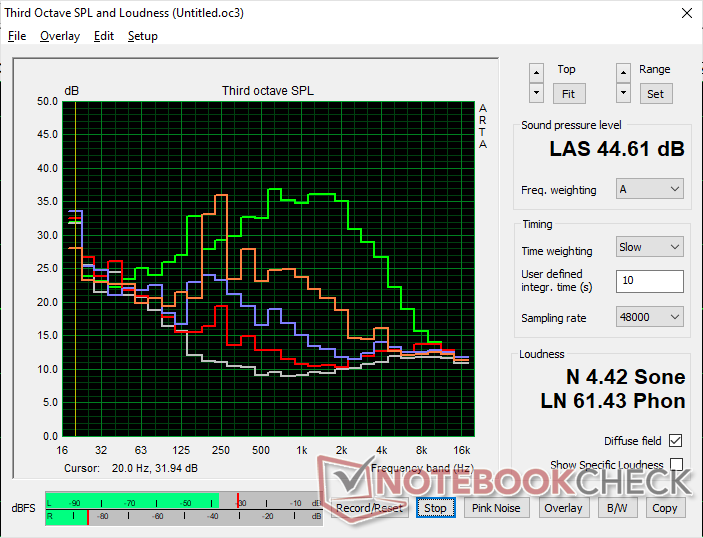
Geräuschemissionen
Das Lüftergeräusch ist bei geringer Last, wie beim Surfen im Internet oder beim Streaming von Videos, leiser als bei den meisten anderen kleineren Mini-PCs. Beispielsweise liegt das Lüftergeräusch beim 3DMark 06, der eine durchschnittliche Belastung darstellt, nur bei 28 dB(A) im Vergleich zu 37 dB(A) bei der NucBox M3. Auch das Pulsieren des Lüfters ist auf ein Minimum reduziert.
Bei extrem anspruchsvollen Aufgaben wie Prime95 kann der interne Lüfter jedoch bis zu 45 dB(A) laut werden, was lauter ist als bei den meisten anderen Mini-PCs. Die NucBox M4 ist also nur dann laut, wenn die Arbeitslast es erfordert; ansonsten bleibt sie relativ leise.
Lautstärkediagramm
| Idle |
| 24.4 / 24.4 / 28 dB(A) |
| Last |
| 28 / 44.6 dB(A) |
 | ||
30 dB leise 40 dB(A) deutlich hörbar 50 dB(A) störend |
||
min: | ||
| GMK NucBox M4 UHD Graphics Xe 32EUs (Tiger Lake-H), i9-11900H, Lexar NM620 512GB | GMK NucBox M3 UHD Graphics Xe G4 48EUs, i5-12450H, Lexar NM610 Pro NM610P001T-HNNNG | GMK NucBox K3 Pro UHD Graphics 64EUs, i7-12650H, Lexar NM610 Pro NM610P001T-HNNNG | Lenovo IdeaCentre Mini 01IRH8 Iris Xe G7 96EUs, i7-13700H, Samsung PM9B1 512GB MZVL4512HBLU | Beelink SER6 Pro Radeon 680M, R7 6800H, Kingston NV2 500GB SNV2S/500G | Intel NUC 13 Pro Kit NUC13ANK Iris Xe G7 96EUs, i7-1360P, Samsung PM9A1 MZVL2512HCJQ | |
|---|---|---|---|---|---|---|
| Geräuschentwicklung | -16% | -7% | -9% | -10% | -22% | |
| aus / Umgebung * (dB) | 22.7 | 23.9 -5% | 23.1 -2% | 23.4 -3% | 22.8 -0% | 29.8 -31% |
| Idle min * (dB) | 24.4 | 25.7 -5% | 25 -2% | 30.4 -25% | 24.1 1% | 30.2 -24% |
| Idle avg * (dB) | 24.4 | 25.7 -5% | 25.5 -5% | 30.4 -25% | 24.1 1% | 31.1 -27% |
| Idle max * (dB) | 28 | 39.1 -40% | 25.5 9% | 30.4 -9% | 33.8 -21% | 31.9 -14% |
| Last avg * (dB) | 28 | 37 -32% | 39.9 -43% | 30.7 -10% | 40.1 -43% | 40 -43% |
| Witcher 3 ultra * (dB) | 33.7 | 43.5 -29% | 39.9 -18% | 33.9 -1% | 38.7 -15% | |
| Last max * (dB) | 44.6 | 43.5 2% | 39.9 11% | 41 8% | 40.1 10% | 40.5 9% |
* ... kleinere Werte sind besser
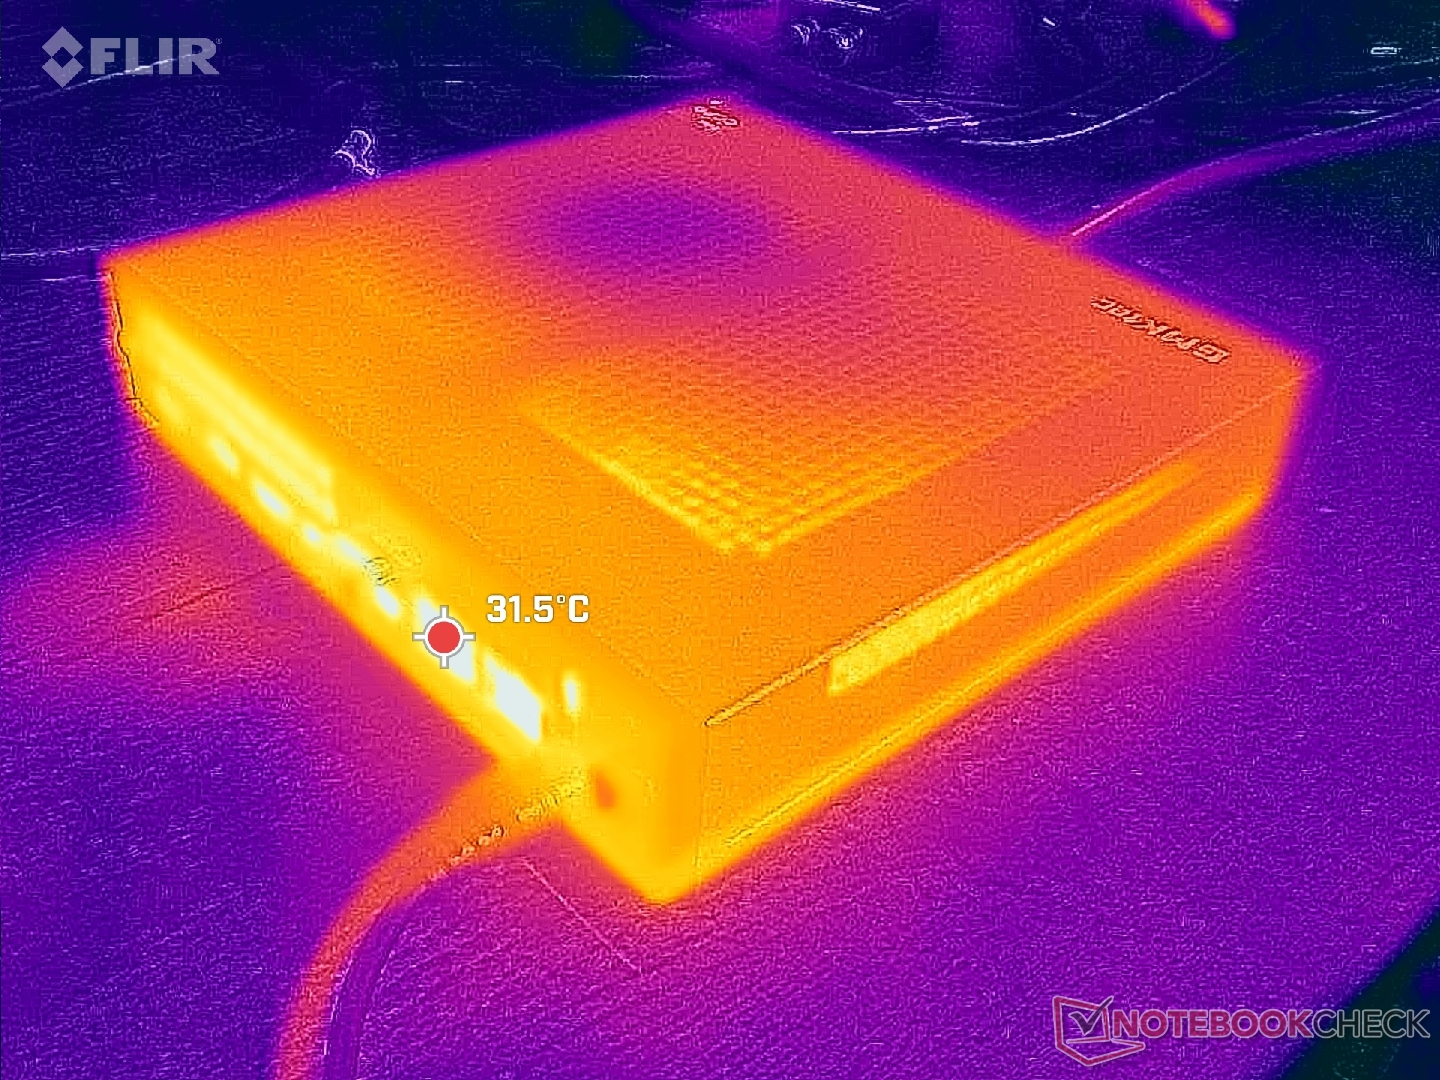
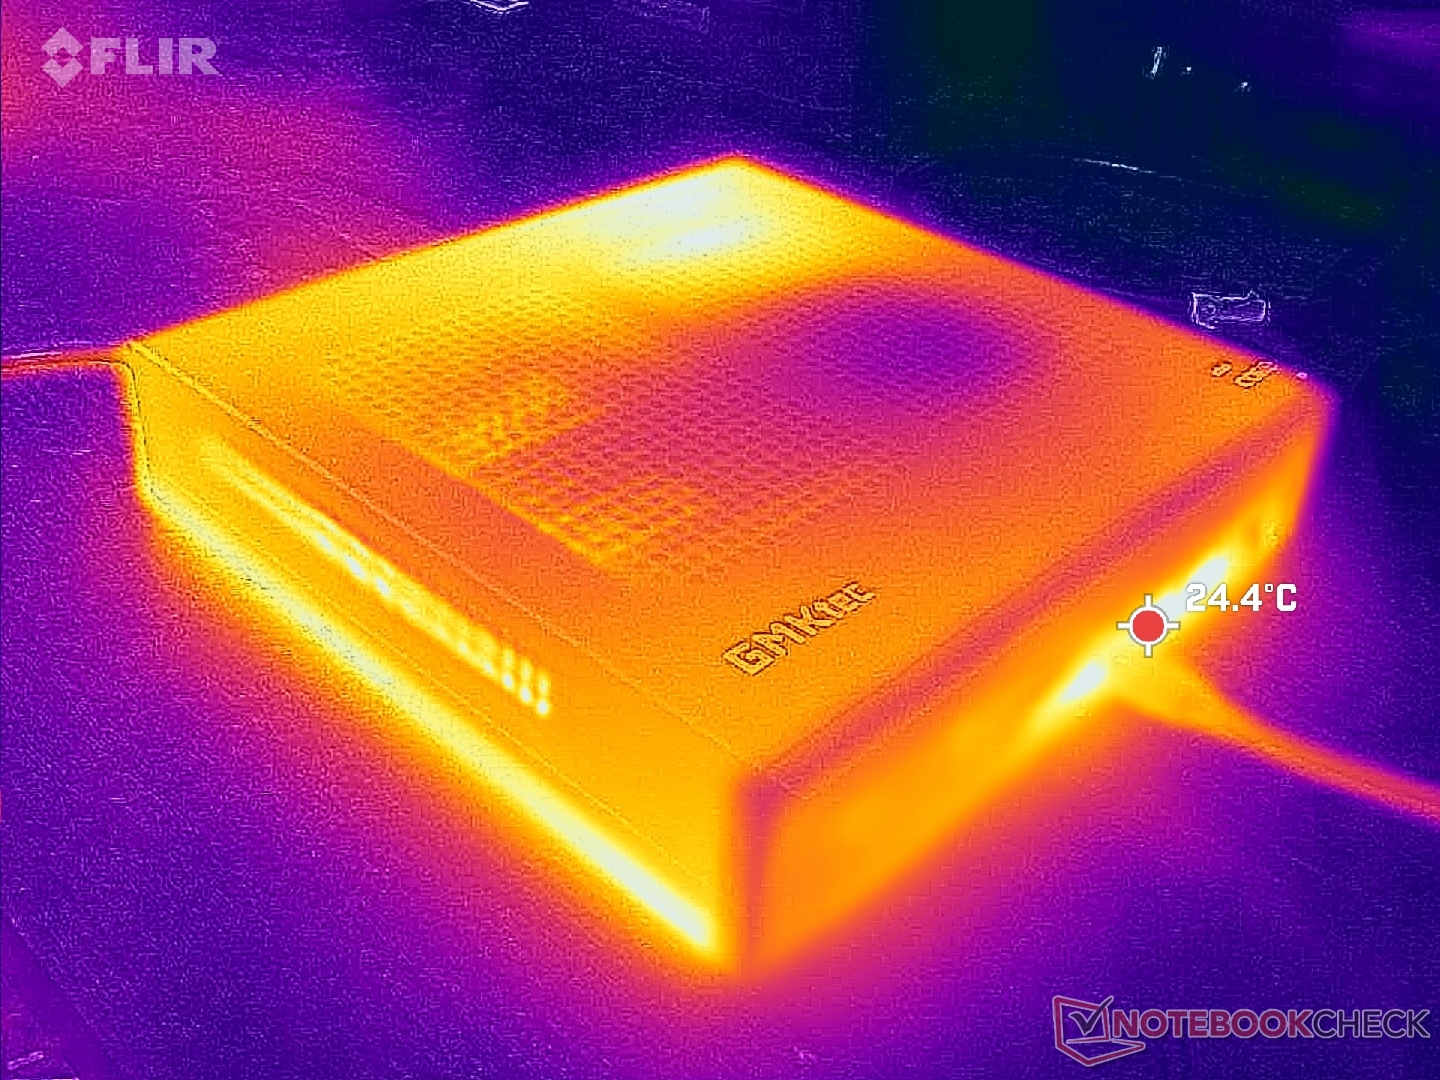
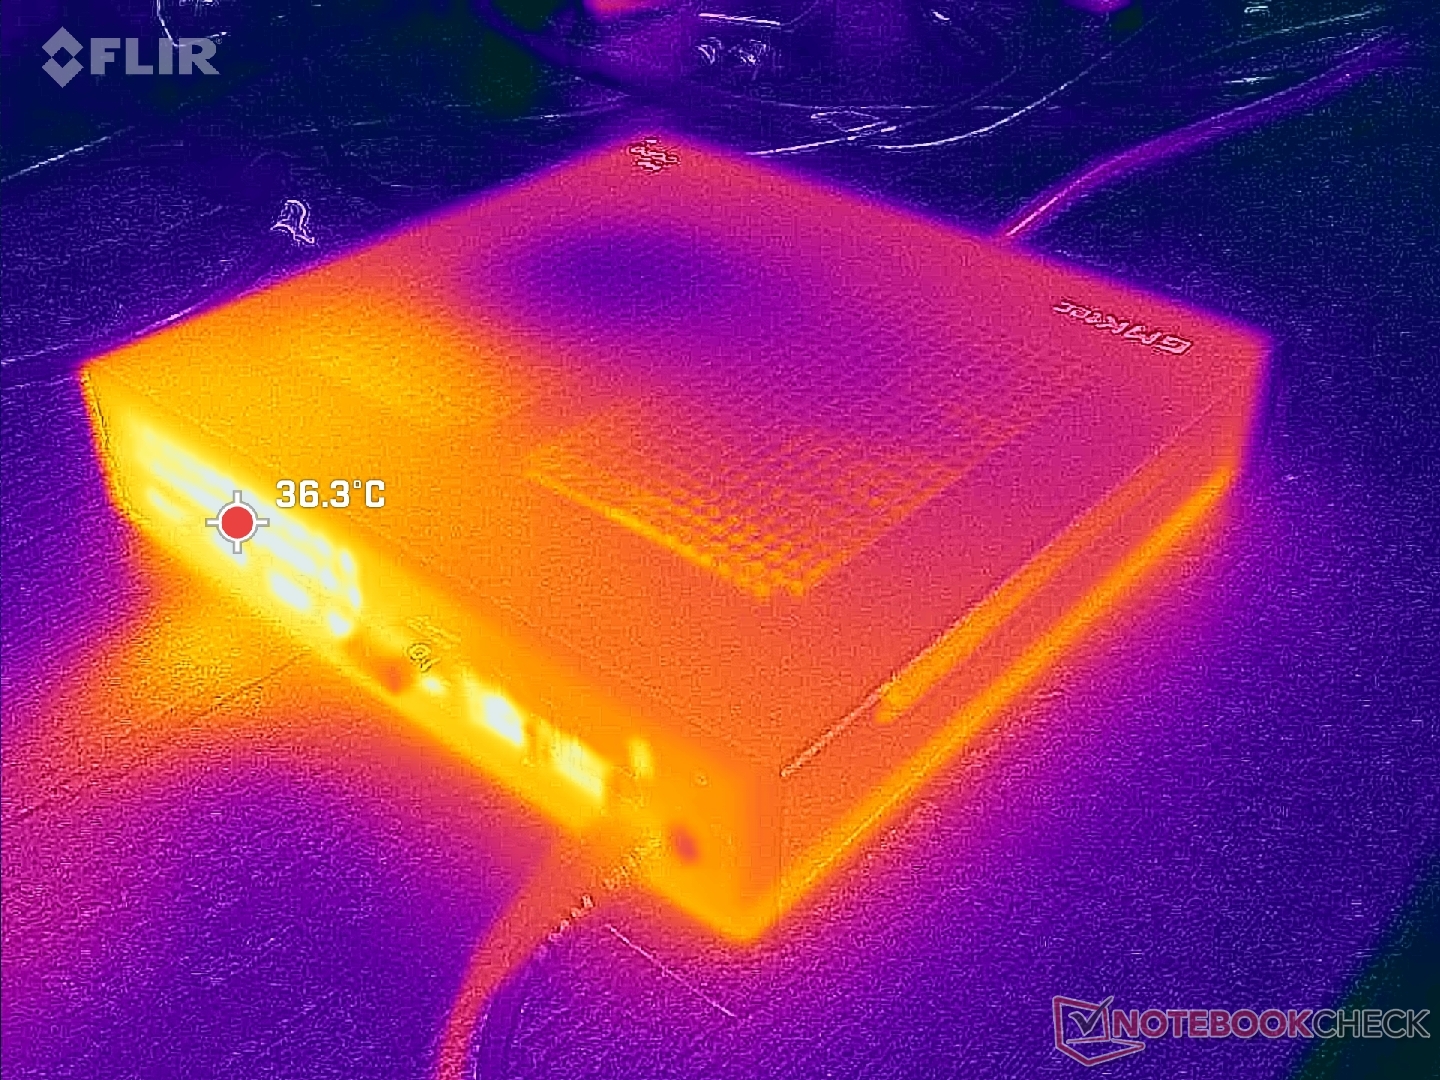
Temperatur
Die Oberflächentemperaturen sind aufgrund der relativ großen Stellfläche und des Metallgehäuses nie unangenehm warm. Die Frischluft strömt von oben ein, während die Abwärme von der Rückseite abgegeben wird. Daher wird nicht empfohlen, Gegenstände wie Bücher oder Papier auf das Gerät zu legen.
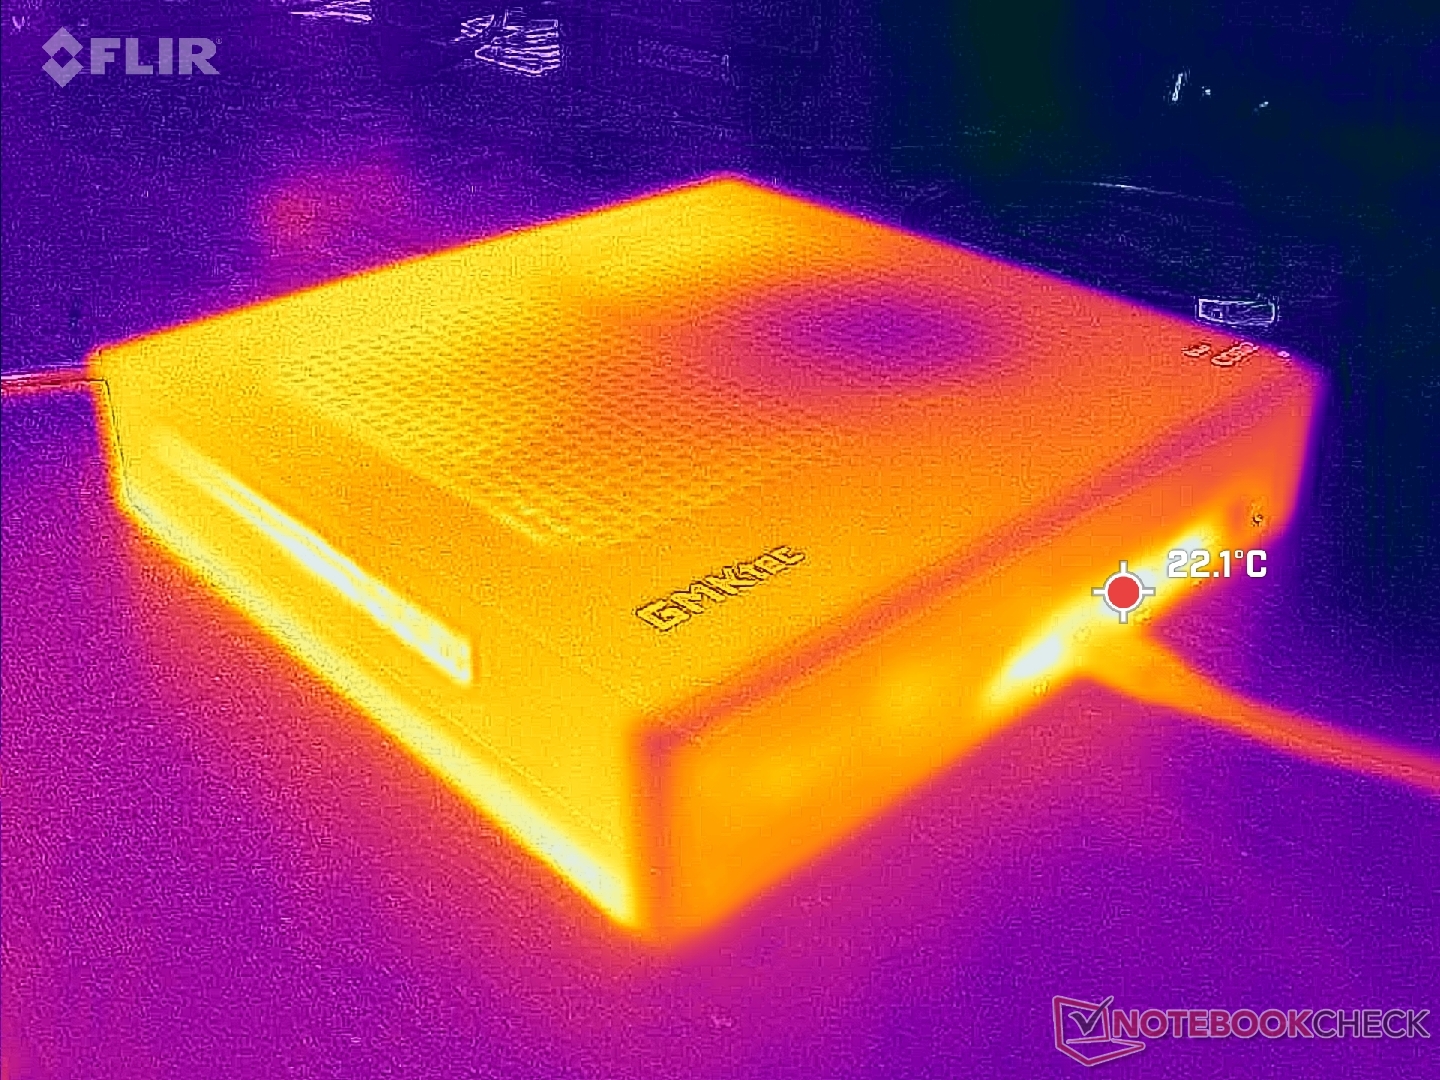
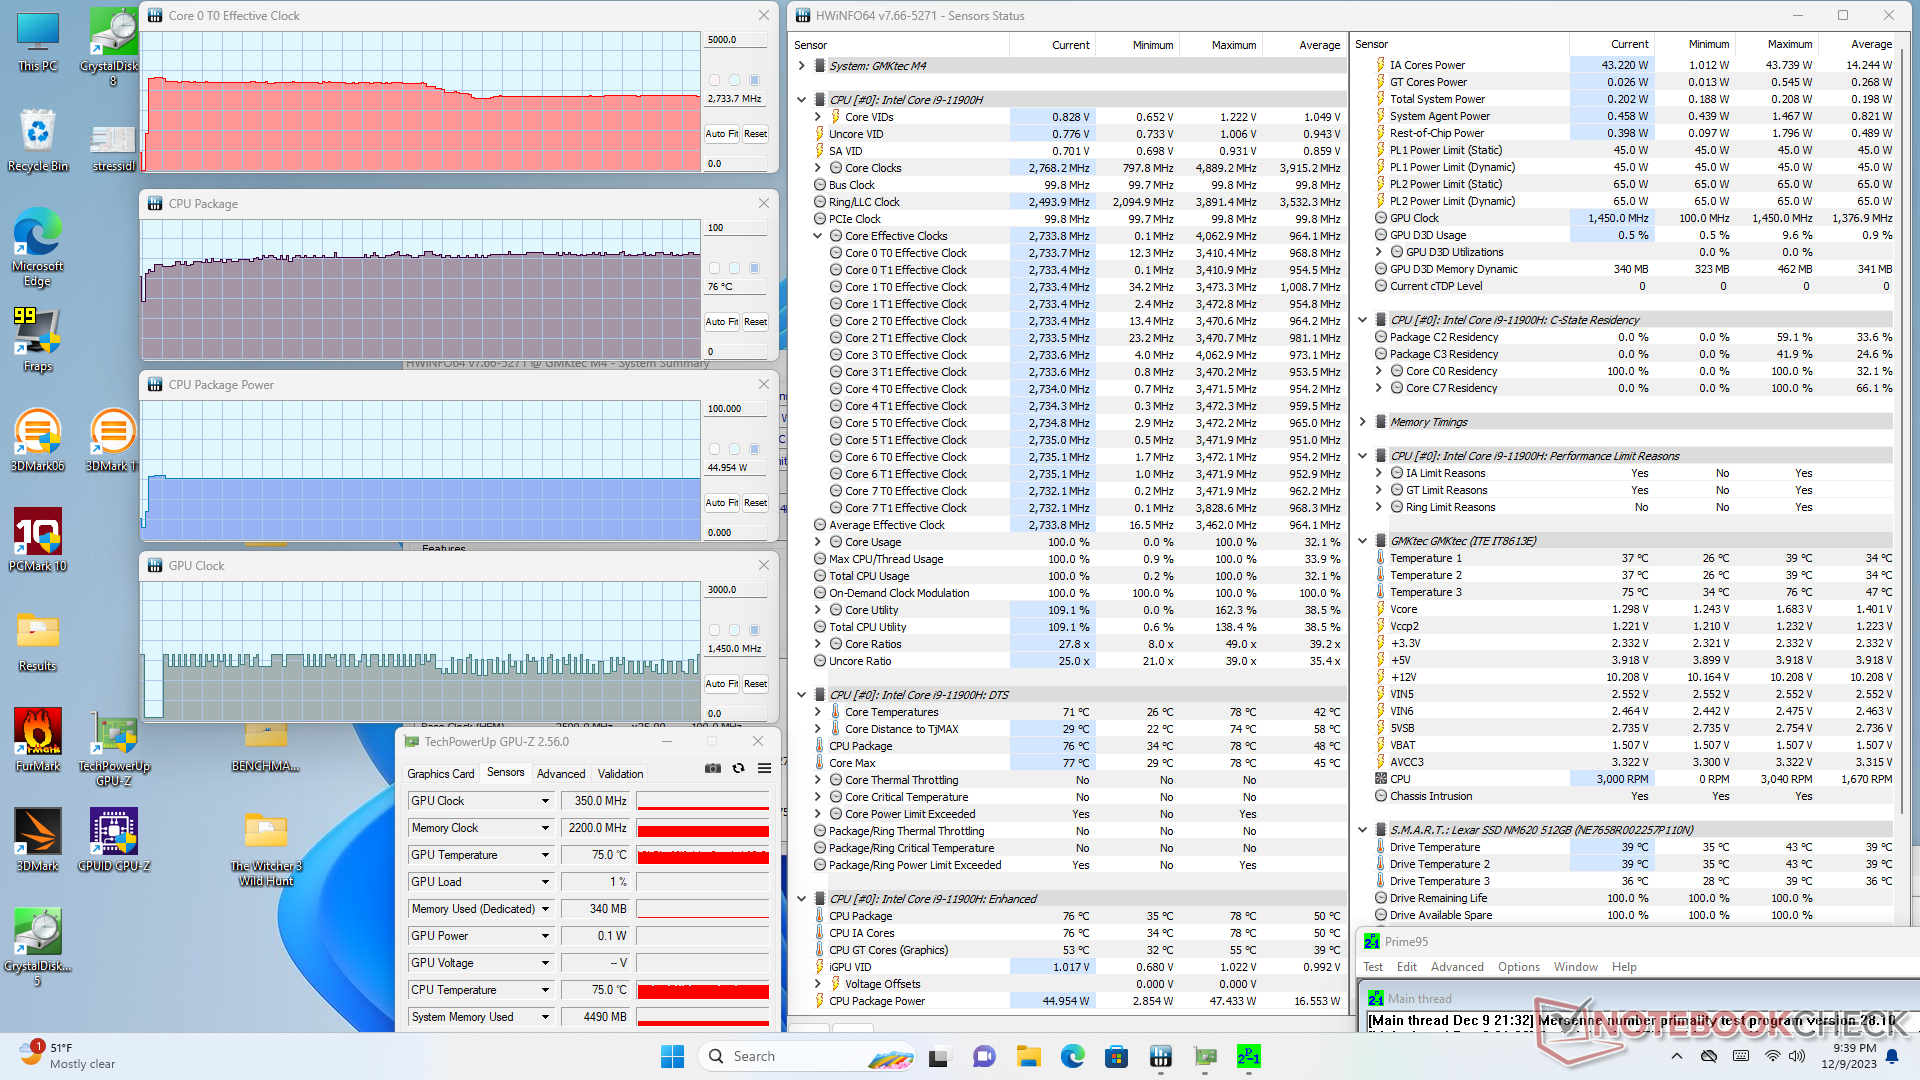
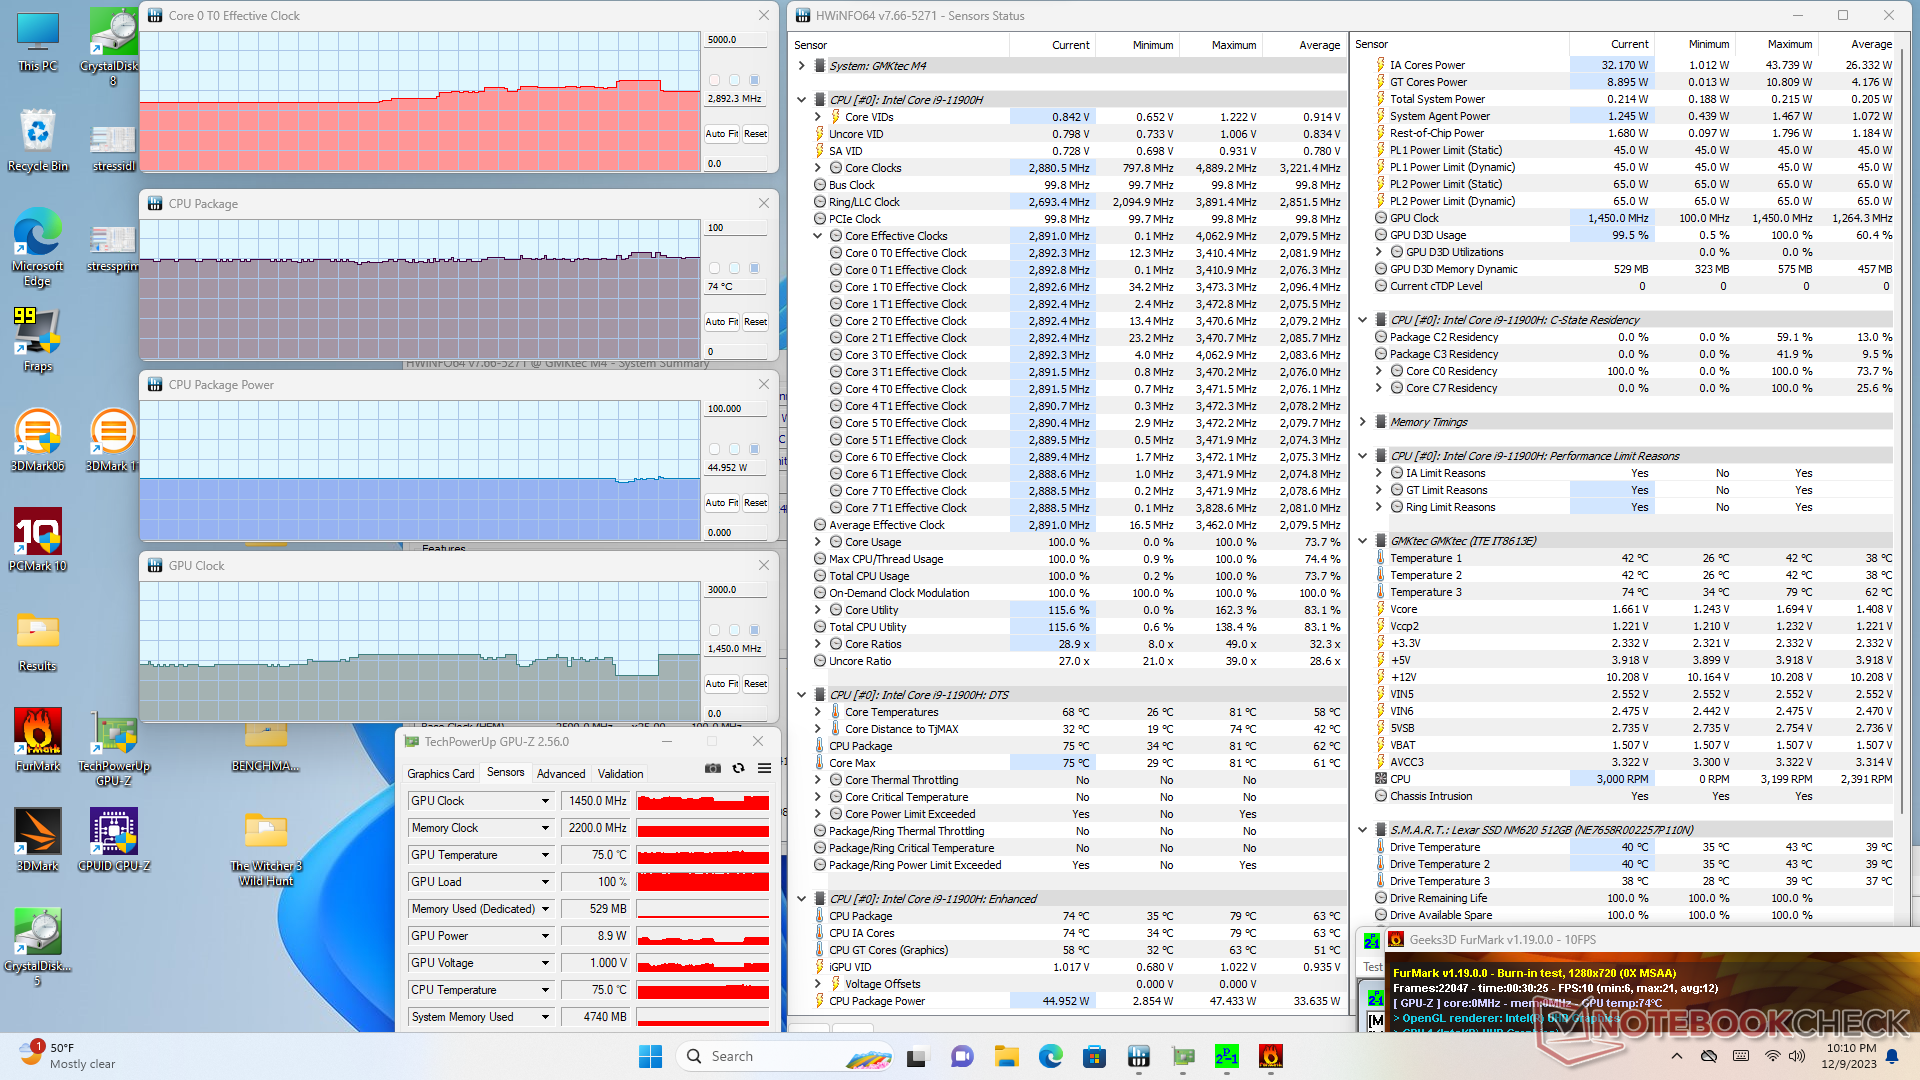
Stresstest
Nur in den ersten Sekunden der Prime95-Belastung stieg die CPU auf 3,4 GHz und 47 W, bevor sie schließlich auf 2,7 GHz, 45 W und 76 °C sank und sich stabilisierte. Die Kerntemperatur blieb mit nur 57 °C relativ niedrig, wenn realistischere Lasten wie Spiele ausgeführt wurden, was wahrscheinlich auf die große Gehäusegröße zurückzuführen wird. Würde man den gleichen Test mit der kleineren NucBox K3 Pro wiederholen, würde die Kerntemperatur mit 80 °C deutlich höher ausfallen.
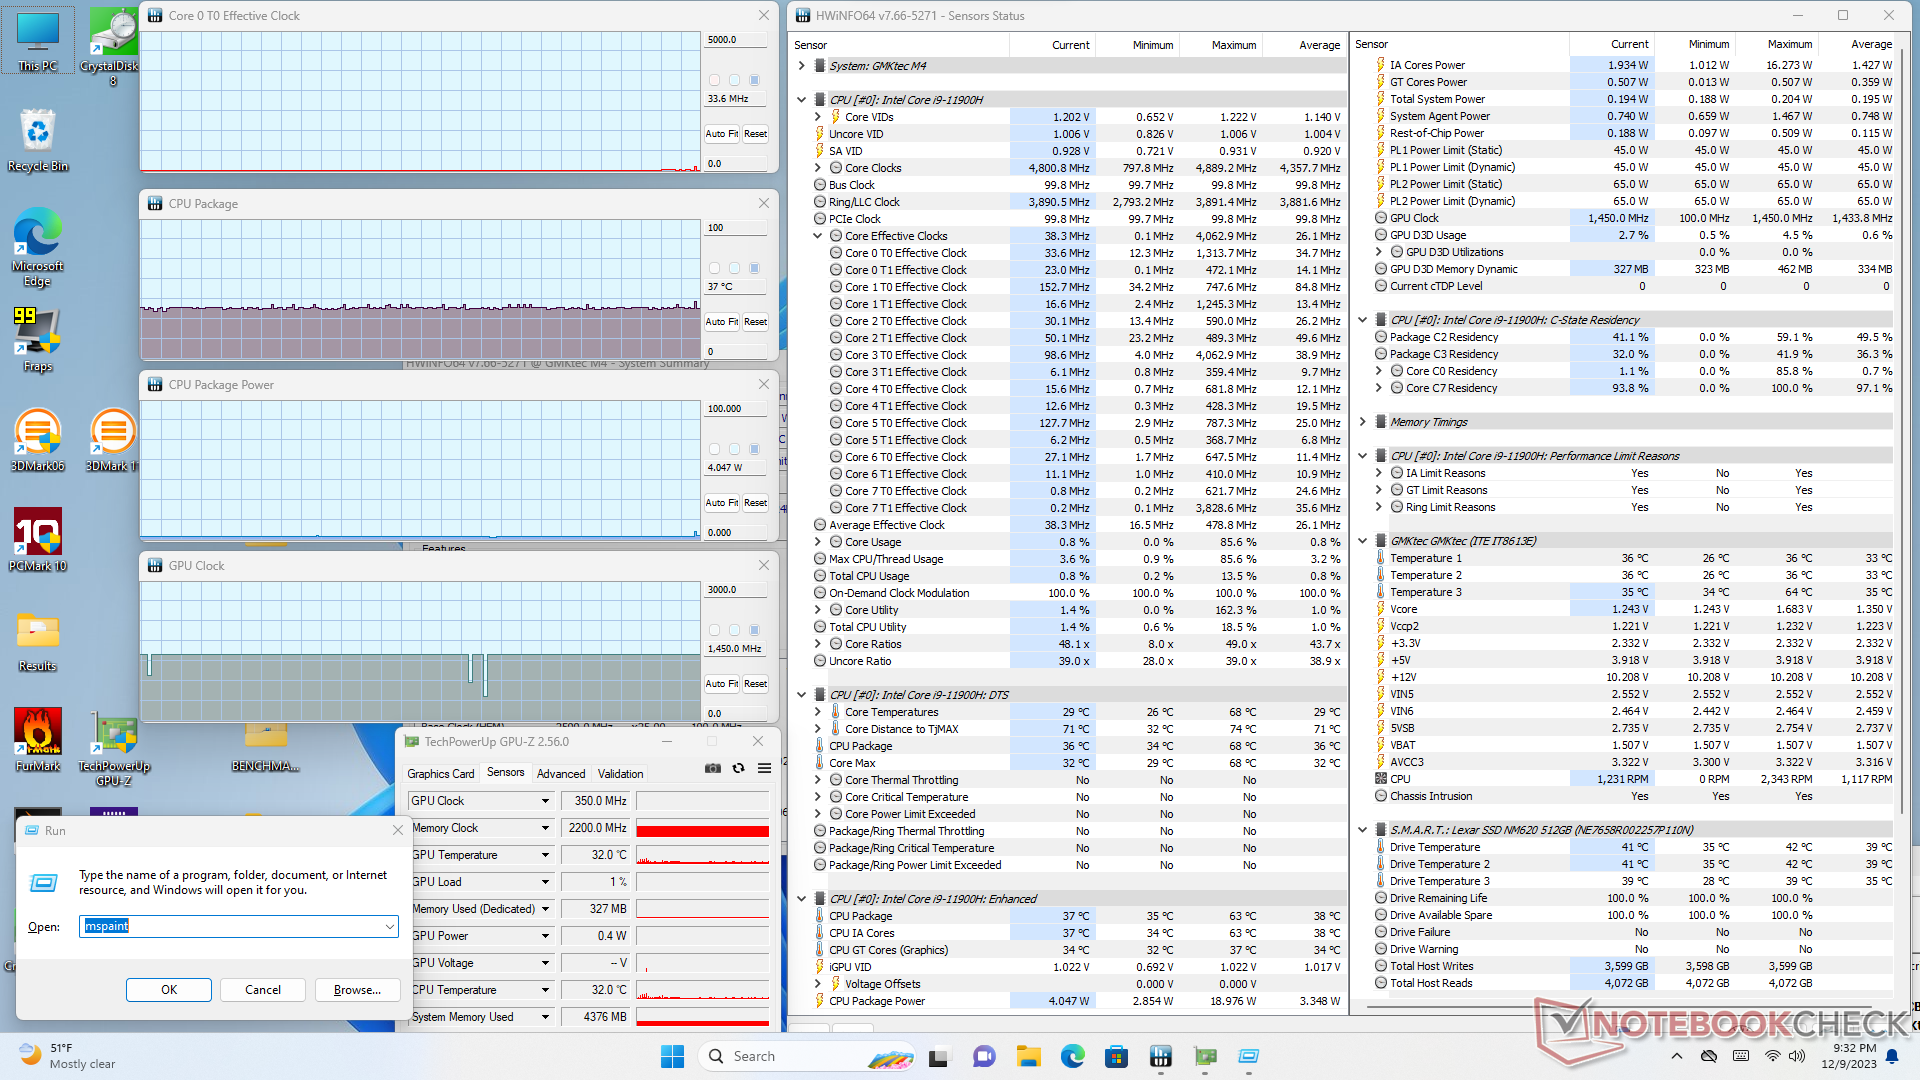
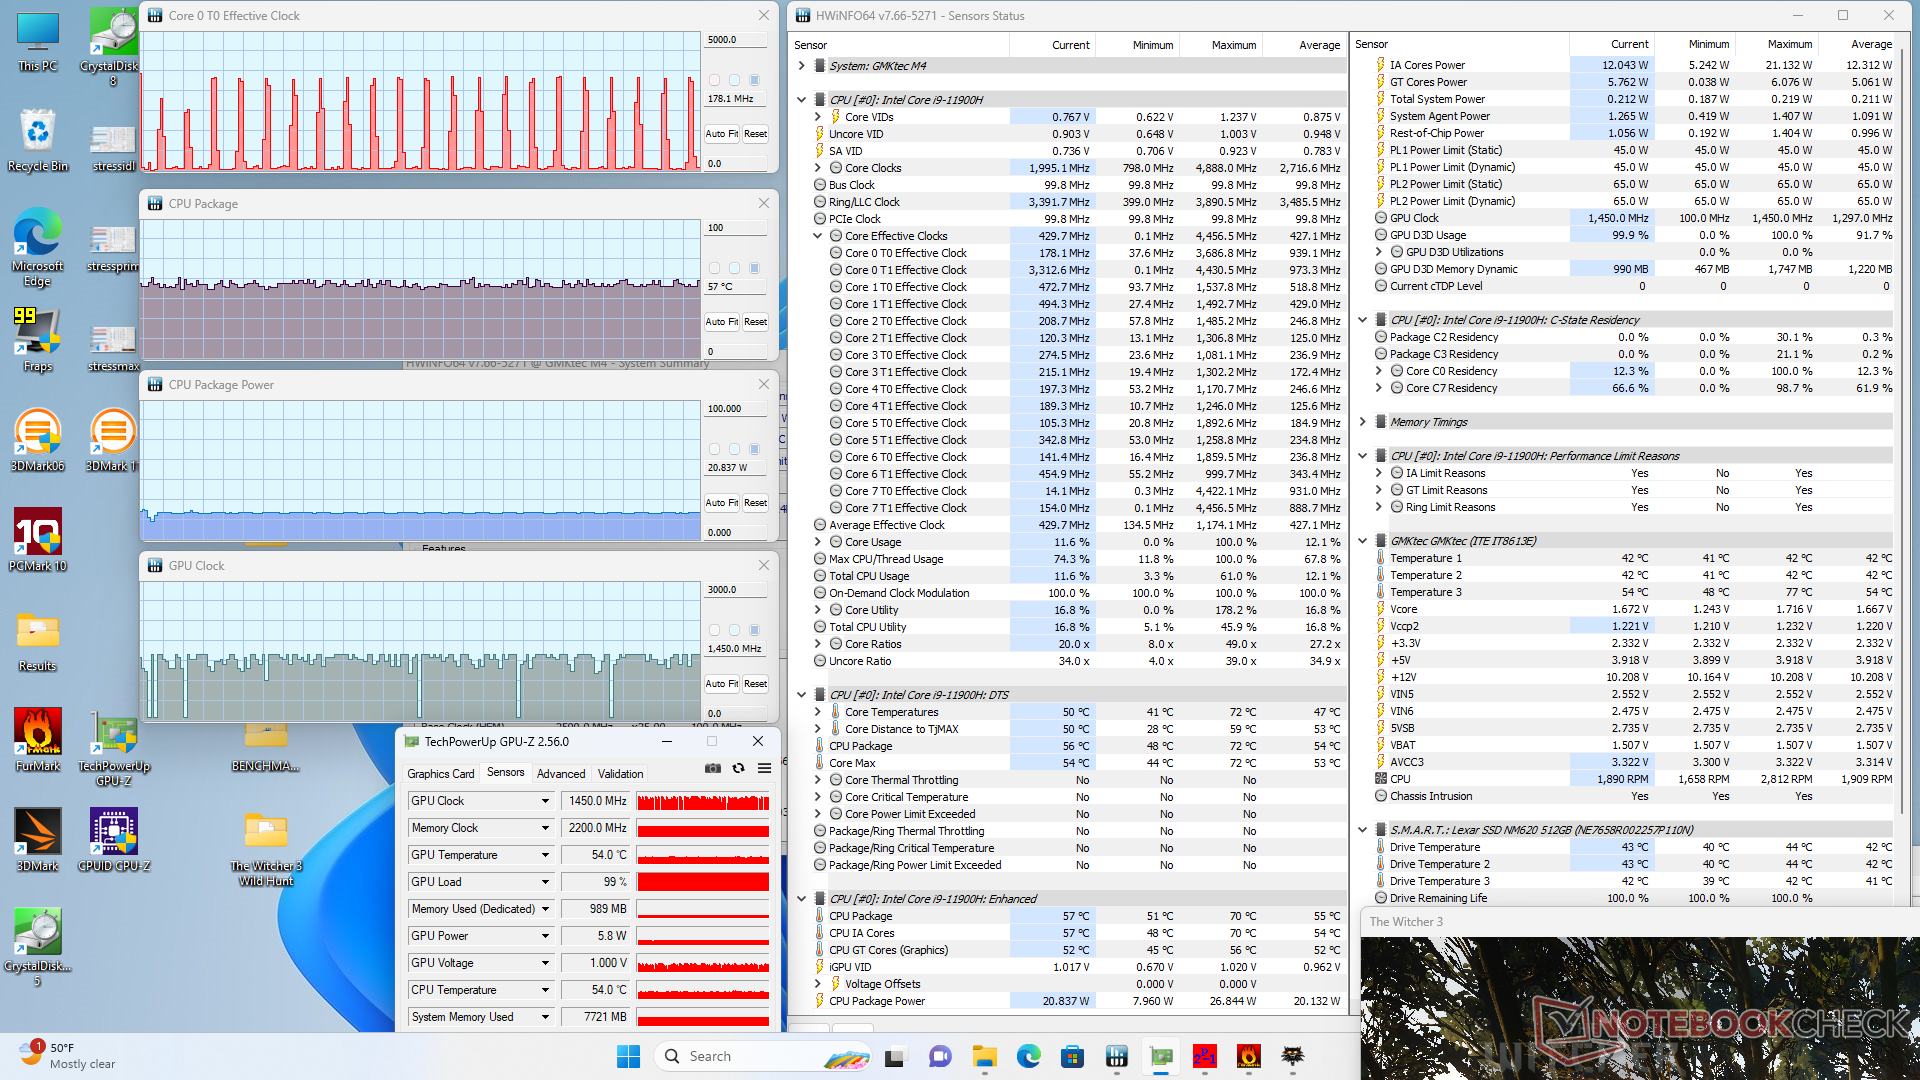
| CPU-Takt (GHz) | GPU-Takt (MHz) | Durchschnittliche CPU-Temperatur (°C) | |
| System im Leerlauf | -- | -- | 37 |
| Prime95 Stresstest | 2.7 | -- | 76 |
| Prime95 + FurMark Stresstest | 2.5 - 3.0 | 1000 - 1450 | 74 |
| Witcher 3 Stresstest | ~3.3 | 1450 | 57 |
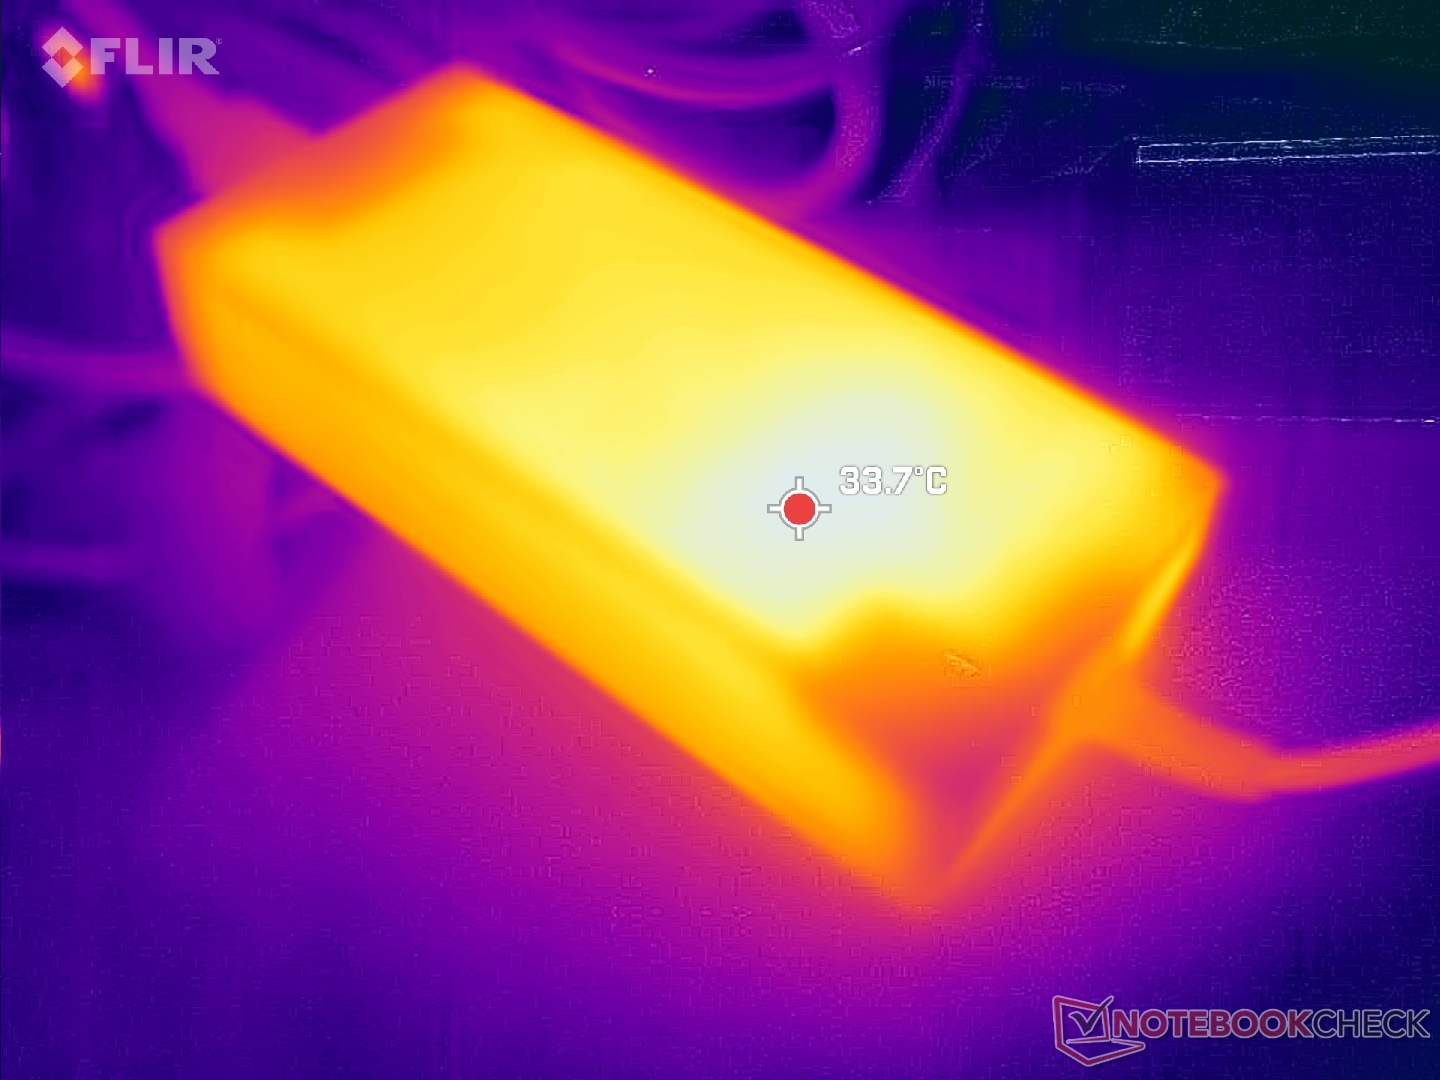
Energieverwaltung
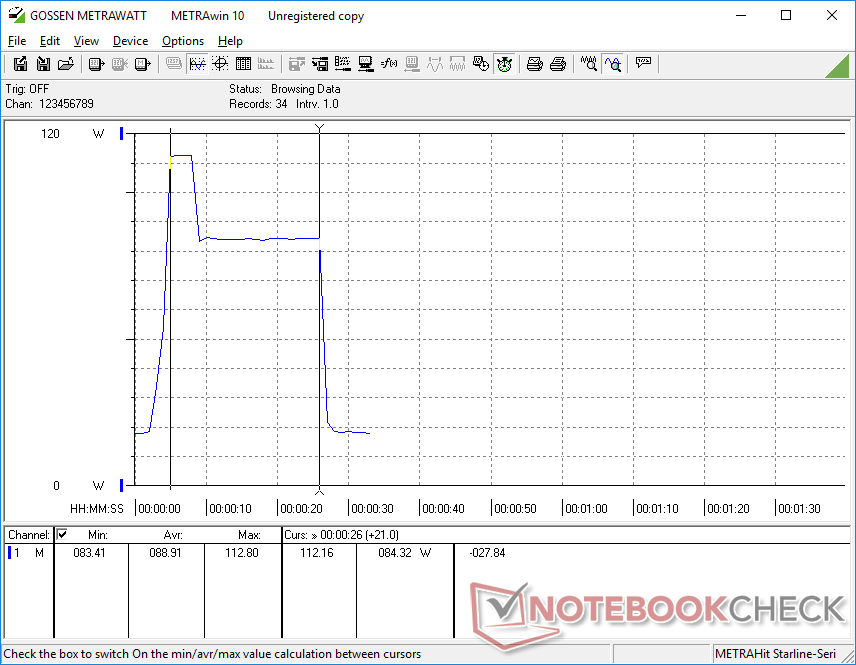
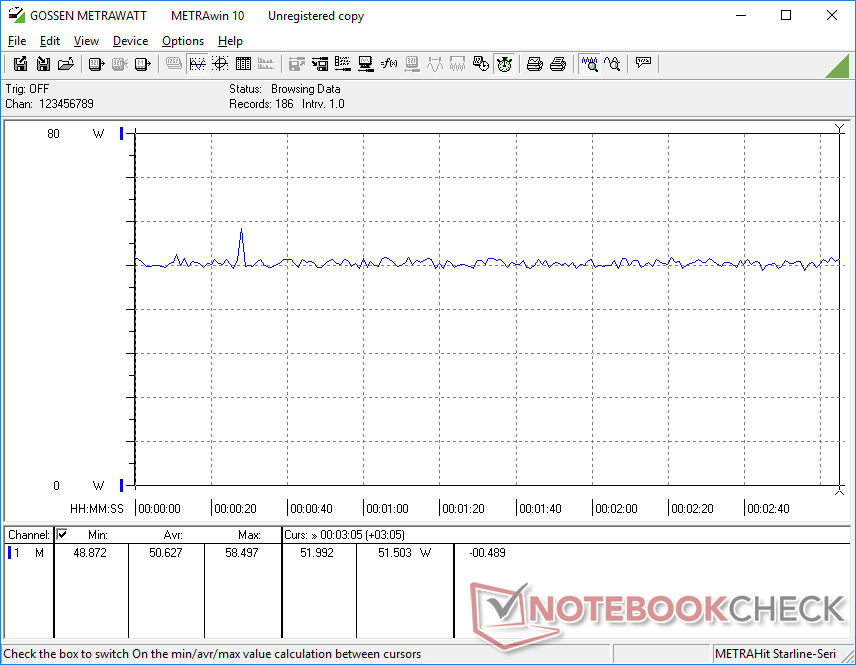
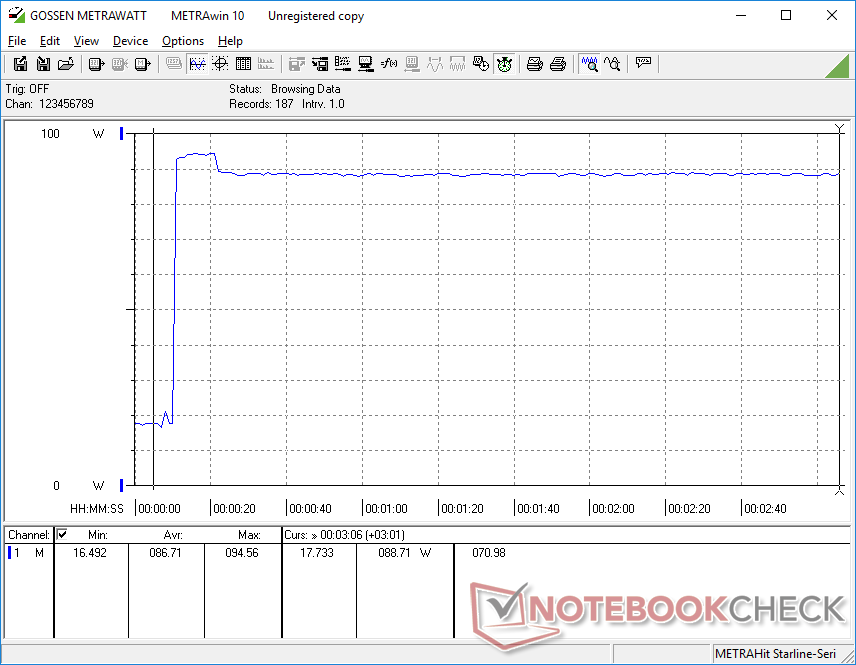
Energieaufnahme
Der Gesamtverbrauch ist im Leerlauf auf dem Desktop relativ hoch, während er bei anspruchsvoller Last relativ niedrig bleibt. Dies ist zu erwarten, da die älteren Intel-CPUs der 11. Generation im Allgemeinen weniger effizient sind. Beachten Sie, dass das AMD-betriebene Beelink SER6 Pro sowohl eine schnellere Leistung als auch einen geringeren Verbrauch anbietet, und somit ein besseres Leistungsverhältnis pro Watt aufweist.
Der USB-C-Anschluss unterstützt keine Stromzufuhr, daher muss das eigene Netzteil verwendet werden.
| Aus / Standby | |
| Idle | |
| Last |
|
Legende:
min: | |
| GMK NucBox M4 i9-11900H, UHD Graphics Xe 32EUs (Tiger Lake-H), Lexar NM620 512GB, , x, | GMK NucBox M3 i5-12450H, UHD Graphics Xe G4 48EUs, Lexar NM610 Pro NM610P001T-HNNNG, , x, | GMK NucBox K3 Pro i7-12650H, UHD Graphics 64EUs, Lexar NM610 Pro NM610P001T-HNNNG, , x, | Lenovo IdeaCentre Mini 01IRH8 i7-13700H, Iris Xe G7 96EUs, Samsung PM9B1 512GB MZVL4512HBLU, , x, | Beelink SER6 Pro R7 6800H, Radeon 680M, Kingston NV2 500GB SNV2S/500G, , x, | Intel NUC 13 Pro Kit NUC13ANK i7-1360P, Iris Xe G7 96EUs, Samsung PM9A1 MZVL2512HCJQ, , x, | |
|---|---|---|---|---|---|---|
| Stromverbrauch | 16% | 20% | 16% | 18% | 21% | |
| Idle min * (Watt) | 15.2 | 10.6 30% | 7.1 53% | 6.7 56% | 8.3 45% | 5.1 66% |
| Idle avg * (Watt) | 17.2 | 11.9 31% | 10.1 41% | 6.7 61% | 8.4 51% | 5.8 66% |
| Idle max * (Watt) | 17.4 | 12.5 28% | 18.6 -7% | 7.1 59% | 8.7 50% | 10.2 41% |
| Last avg * (Watt) | 40 | 54.9 -37% | 45.3 -13% | 68.5 -71% | 60.8 -52% | 68.1 -70% |
| Witcher 3 ultra * (Watt) | 50.6 | 46.4 8% | 55.2 -9% | 58.3 -15% | 61.4 -21% | |
| Last max * (Watt) | 112.8 | 75.6 33% | 52.9 53% | 104.3 8% | 72 36% | 108.3 4% |
* ... kleinere Werte sind besser
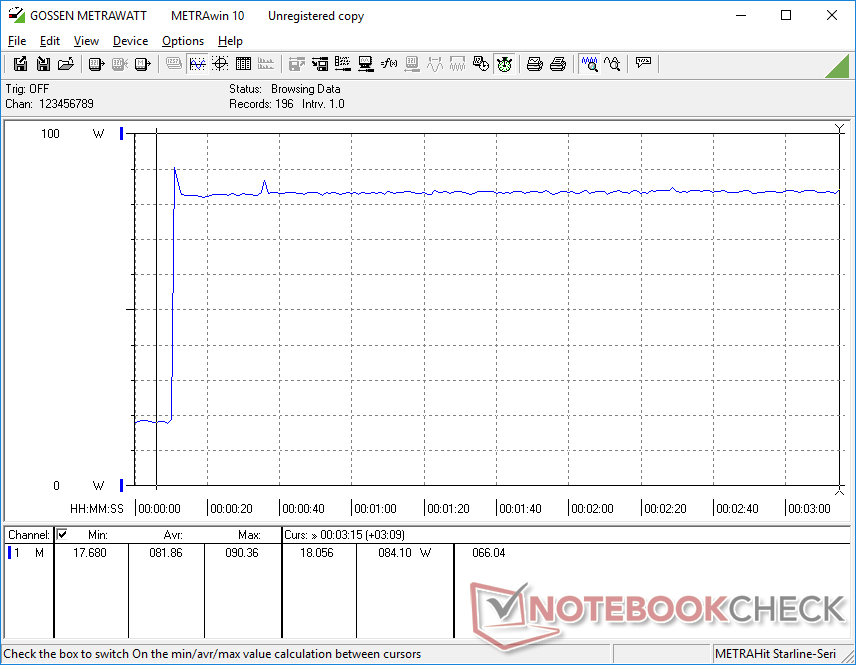
PEnergieverbrauch Witcher 3 / Stresstest
Energieverbrauch externer Monitor
Pro
Contra
Fazit — Der ältere Core i9 wird vom Ryzen 7 6800H übertroffen und ist zudem überteuert
Die NucBox M4 ist zwar gerade erst auf den Markt gekommen, aber ihre Core i9-CPU aus dem Jahr 2021 ist nicht besonders gut gealtert. Vor allem Mini-PCs mit Ryzen 7 6800H oder Ryzen 7 7735HS wie der Beelink SER6 Pro oder die NucBox K2 bieten eine ähnliche Prozessorleistung und eine deutlich schnellere Grafikleistung zum etwa gleichen Preis. Die wichtigsten Gründe für die Wahl der NucBox M4 sind daher das allgemein leisere Lüftergeräusch und das Core i9-Abzeichen.
Die NucBox M4 ist schnell, leise und preiswert. Allerdings wird ihre veraltete CPU von ähnlich teuren modernen Alternativen wie dem Ryzen 7 6800H übertroffen.
Der Rest des Modells ist ansonsten ausgezeichnet, angefangen bei dem robusten Metallgehäuse, der einfachen Wartbarkeit und der Vielzahl an integrierten Anschlüssen. Die relativ große Bauform begünstigt sowohl kühlere Betriebstemperaturen als auch einen leiseren Lüfter. Dennoch machen die schwache GPU und die fehlende Thunderbolt-Unterstützung die NucBox M4 nicht gerade zu einem Langläufer.
Preis und Verfügbarkeit
Die NucBox M4 ist derzeit bei Amazon erhältlich or direkt beim Hersteller.
GMK NucBox M4
- 12.12.2023 v7 (old)
Allen Ngo
Transparenz
Die Auswahl der zu testenden Geräte erfolgt innerhalb der Redaktion. Das vorliegende Testmuster wurde dem Autor vom Hersteller oder einem Shop zu Testzwecken leihweise zur Verfügung gestellt. Eine Einflussnahme des Leihstellers auf den Testbericht gab es nicht, der Hersteller erhielt keine Version des Reviews vor der Veröffentlichung. Es bestand keine Verpflichtung zur Publikation. Als eigenständiges, unabhängiges Unternehmen unterliegt Notebookcheck keiner Diktion von Herstellern, Shops und Verlagen.
So testet Notebookcheck
Pro Jahr werden von Notebookcheck hunderte Laptops und Smartphones unabhängig in von uns standardisierten technischen Verfahren getestet, um eine Vergleichbarkeit aller Testergebnisse zu gewährleisten. Seit rund 20 Jahren entwickeln wir diese Testmethoden kontinuierlich weiter und setzen damit Branchenstandards. In unseren Testlaboren kommt ausschließlich hochwertiges Messequipment in die Hände erfahrener Techniker und Redakteure. Die Tests unterliegen einer mehrstufigen Kontrolle. Unsere komplexe Gesamtbewertung basiert auf hunderten fundierten Messergebnissen und Benchmarks, womit Ihnen Objektivität garantiert ist. Weitere Informationen zu unseren Testmethoden gibt es hier.
Preisvergleich

