Beelink SER6 Pro Test: Die AMD Radeon 680M beeindruckt in einem Mini-PC
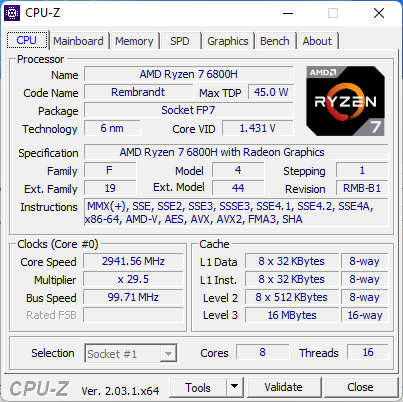
Der Beelink SER6 Pro ist der Nachfolger der älteren Generation Beelink SER5 Pro. Er führt neue äußere Veränderungen und eine verbesserte Zen 3+ Ryzen 7 6800H CPU ein, die den Zen 3 Ryzen 7 5800H des Vorgängermodells ersetzt. Andere CPU-Optionen sind für den SER6 Pro derzeit nicht verfügbar.
Das SER6 Pro konkurriert direkt mit vielen Intel-NUC-Lösungen sowie der Zotac ZBox oder der MSI-Cubi-Serie. Unsere spezielle Konfiguration von Beelink kostet zwischen 600 und 700 US-Dollar.
Mehr Beelink Bewertungen:
Potenzielle Wettbewerber im Vergleich
Bew. | Datum | Modell | Gewicht | Dicke | Größe | Auflösung | Preis ab |
|---|---|---|---|---|---|---|---|
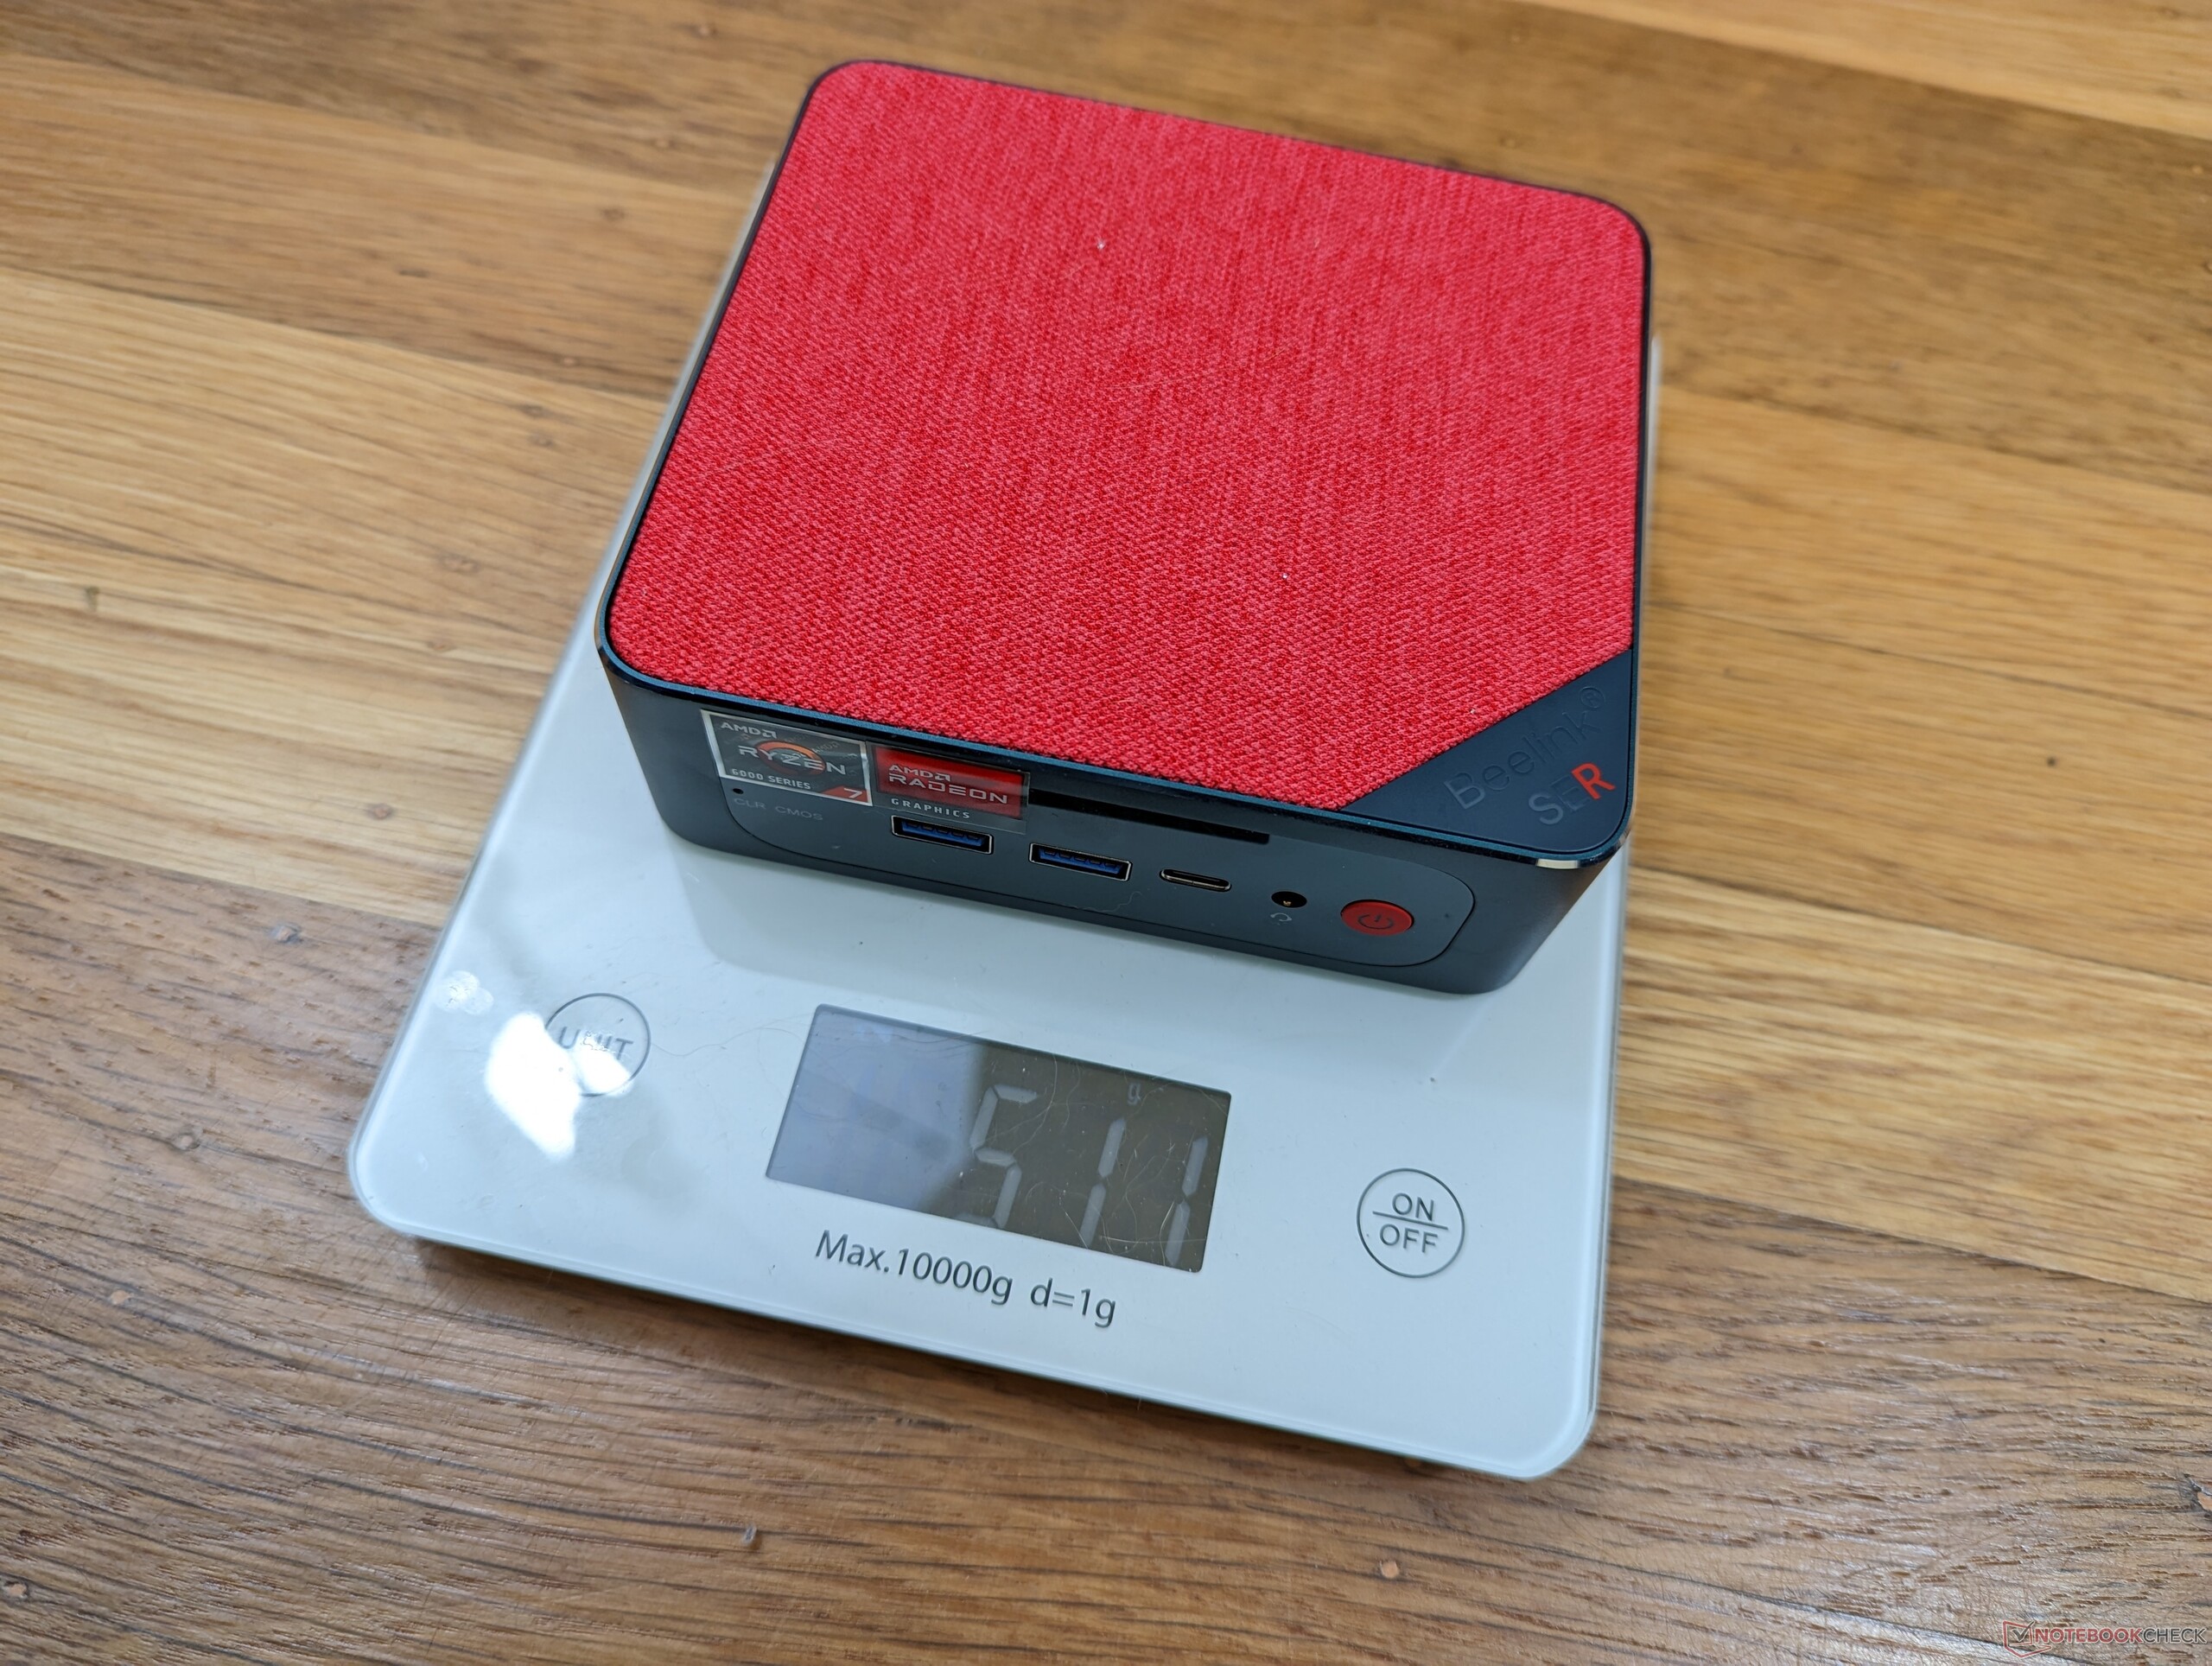
v (old) | 01 / 2023 | Beelink SER6 Pro R7 6800H, Radeon 680M | 511 g | 42 mm | x | ||
v (old) | Beelink GTR6 R9 6900HX, Radeon 680M | 815 g | 43 mm | x | |||
v (old) | 09 / 2022 | Beelink SEi11 Pro i5-11320H, Iris Xe G7 96EUs | 440 g | 40 mm | x | ||
| 78.9 % v7 (old) | 11 / 2022 | Intel NUC 12 Pro Kit NUC12WSKi7 i7-1260P, Iris Xe G7 96EUs | 511 g | 37 mm | x | ||
v (old) | 04 / 2021 | Intel NUC11PHKi7C i7-1165G7, GeForce RTX 2060 Mobile | 1.4 kg | 42 mm | x | ||
v (old) | 03 / 2018 | Intel Hades Canyon NUC8i7HVK i7-8809G, Vega M GH | 1.3 kg | 39 mm | x |
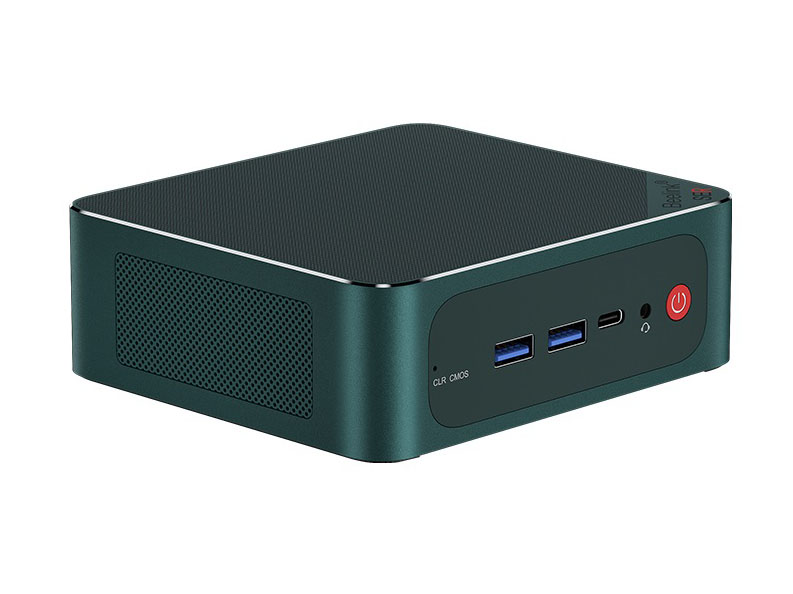
Gehäuse
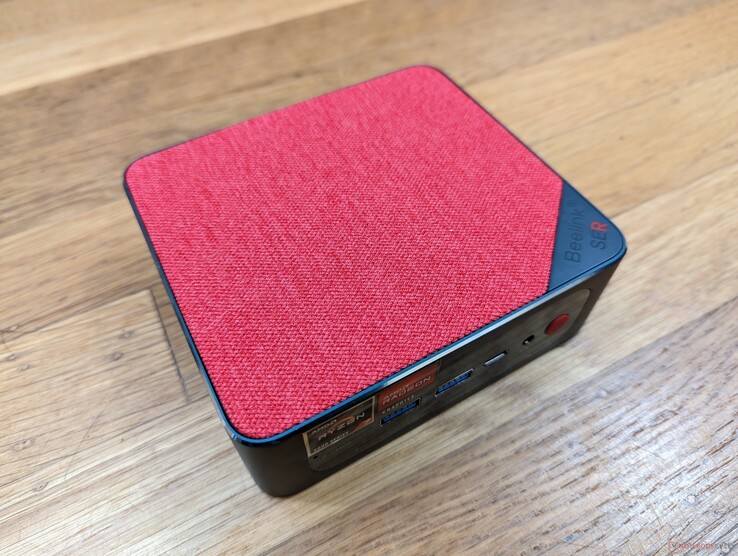
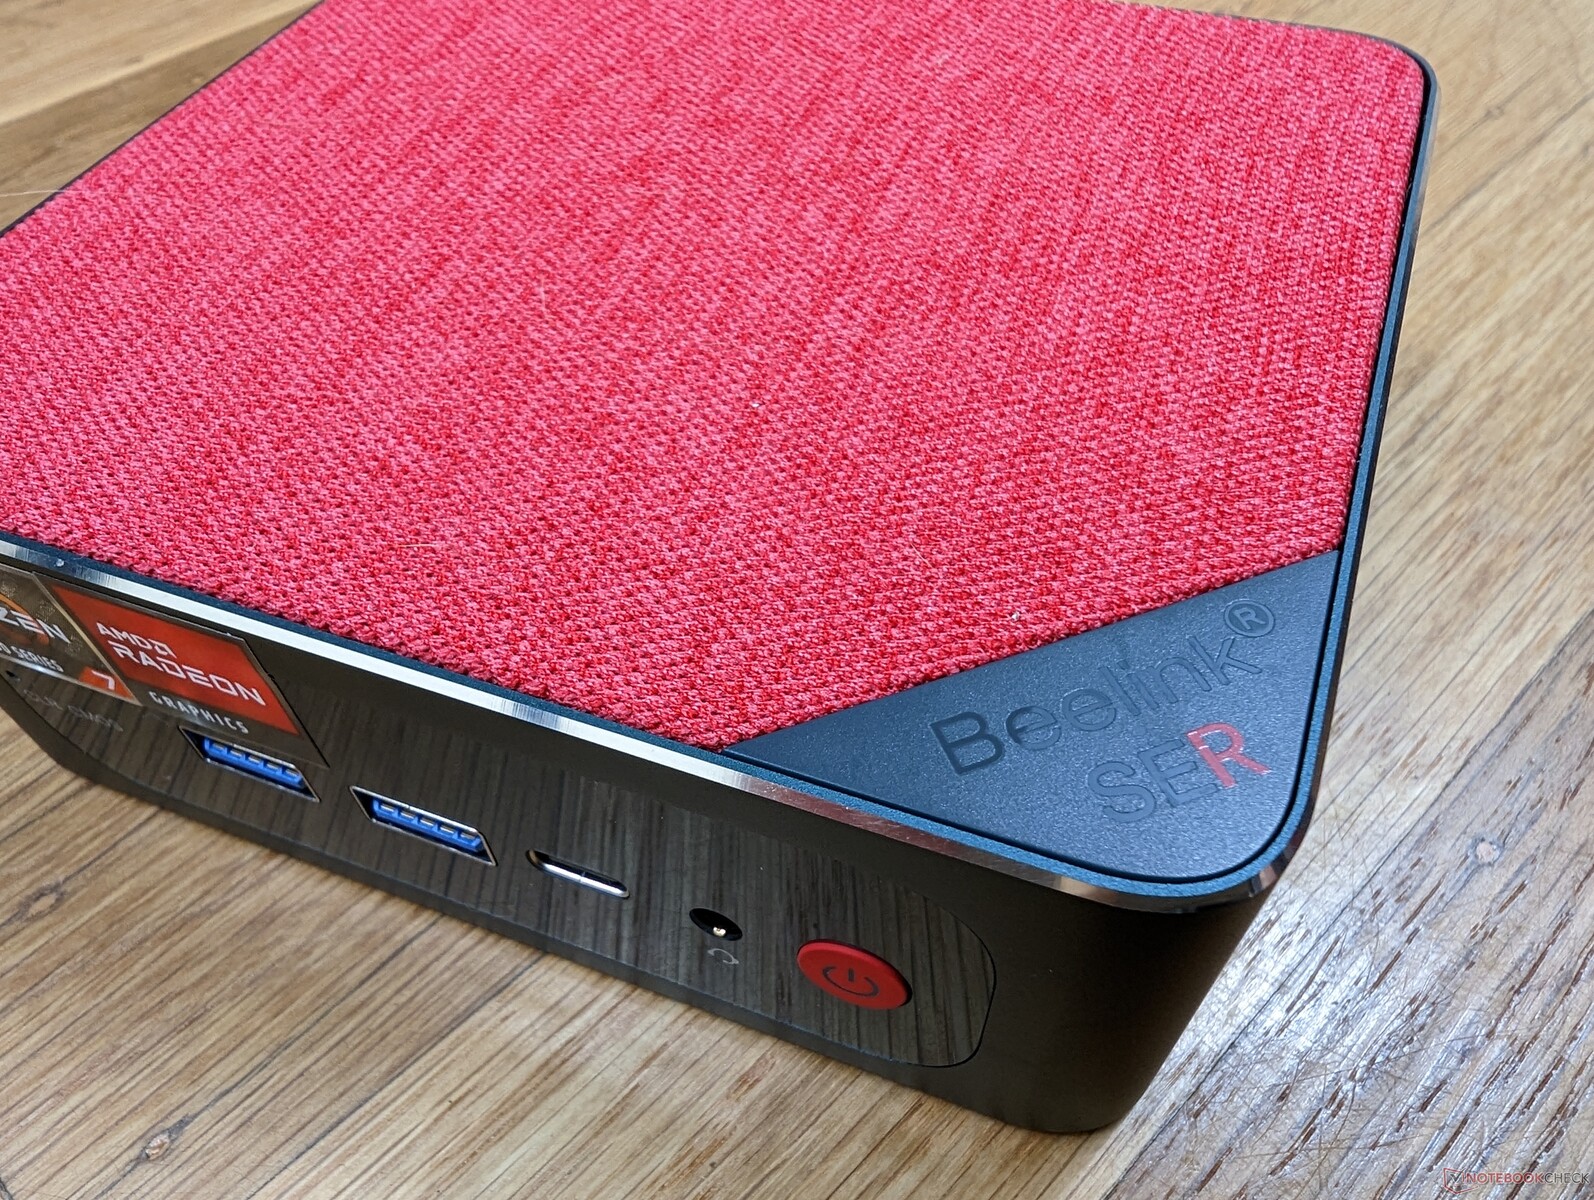
Das Gehäuse besteht - abgesehen von der abnehmbaren Stoffabdeckung - an allen Seiten aus Metall. Seine Gesamtabmessungen sind sehr ähnlich wie die des SEi11 Pro, wenn auch aufgrund der überarbeiteten Innereien etwas schwerer. Überraschenderweise wiegt der SER6 Pro genauso viel wie der NUC 12 Pro, auch wenn der NUC kleiner ist.
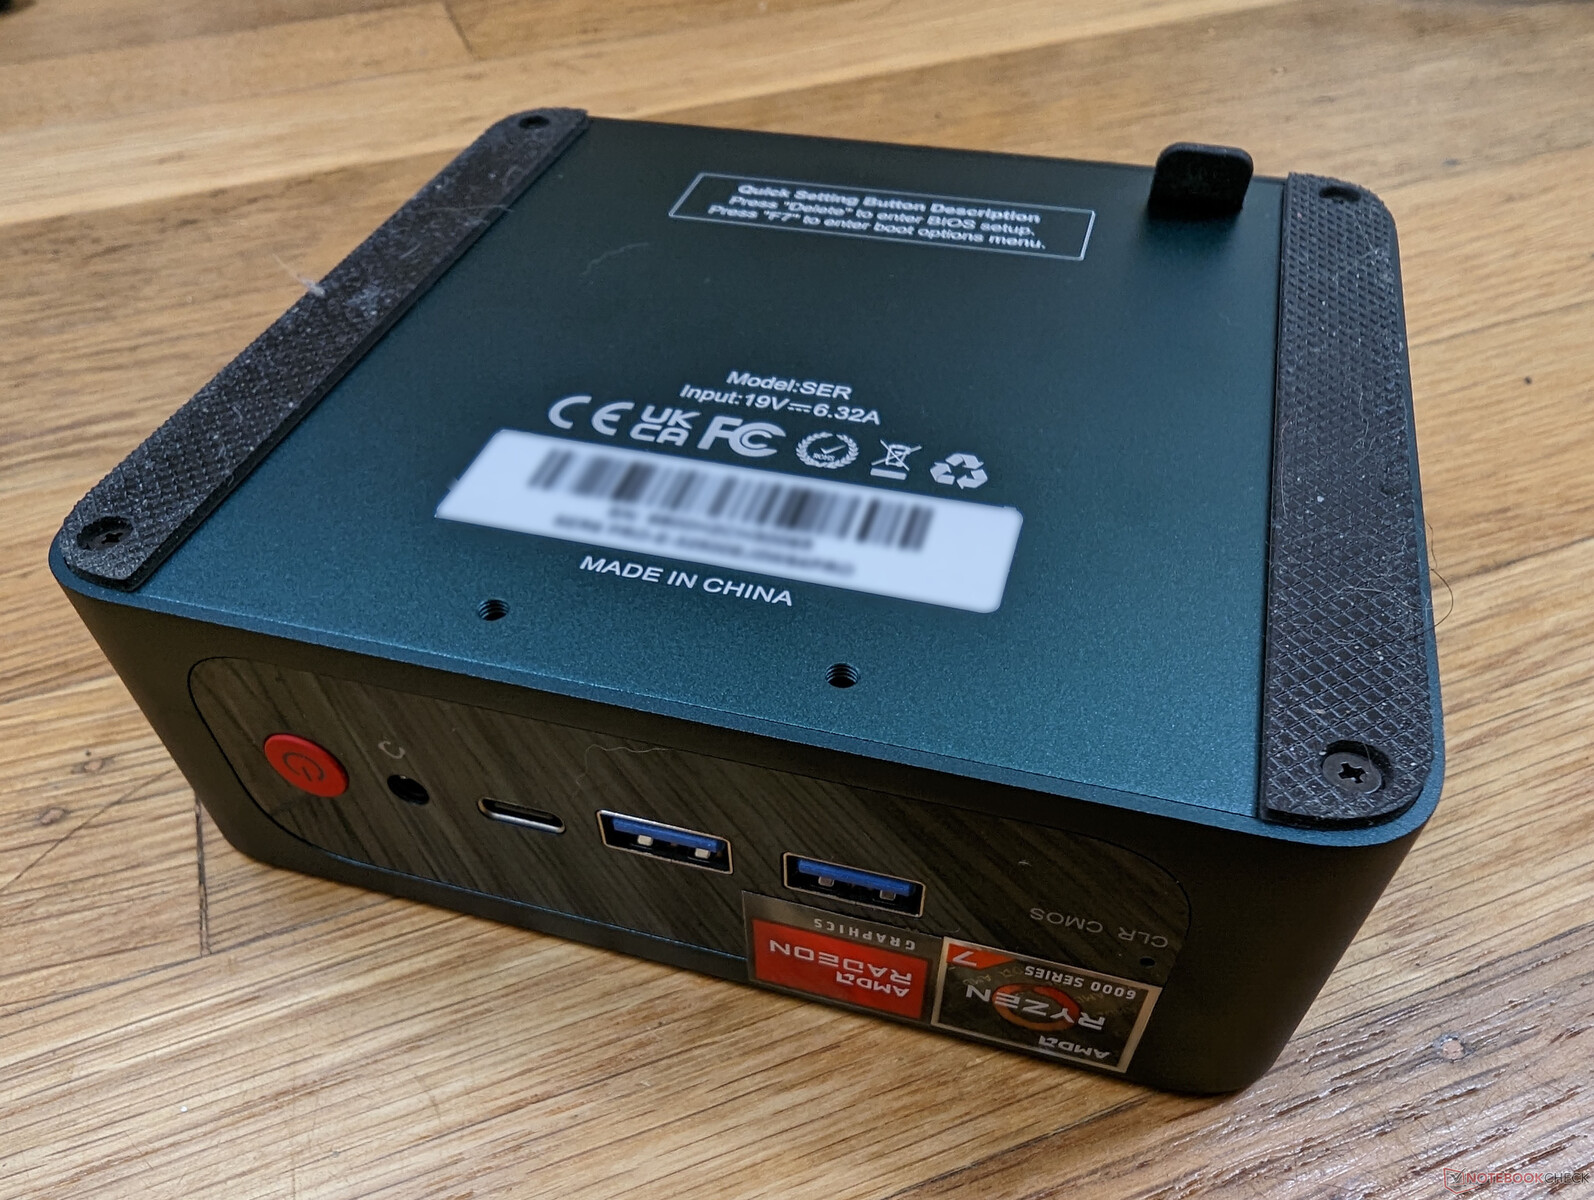
Anschlussausstattung
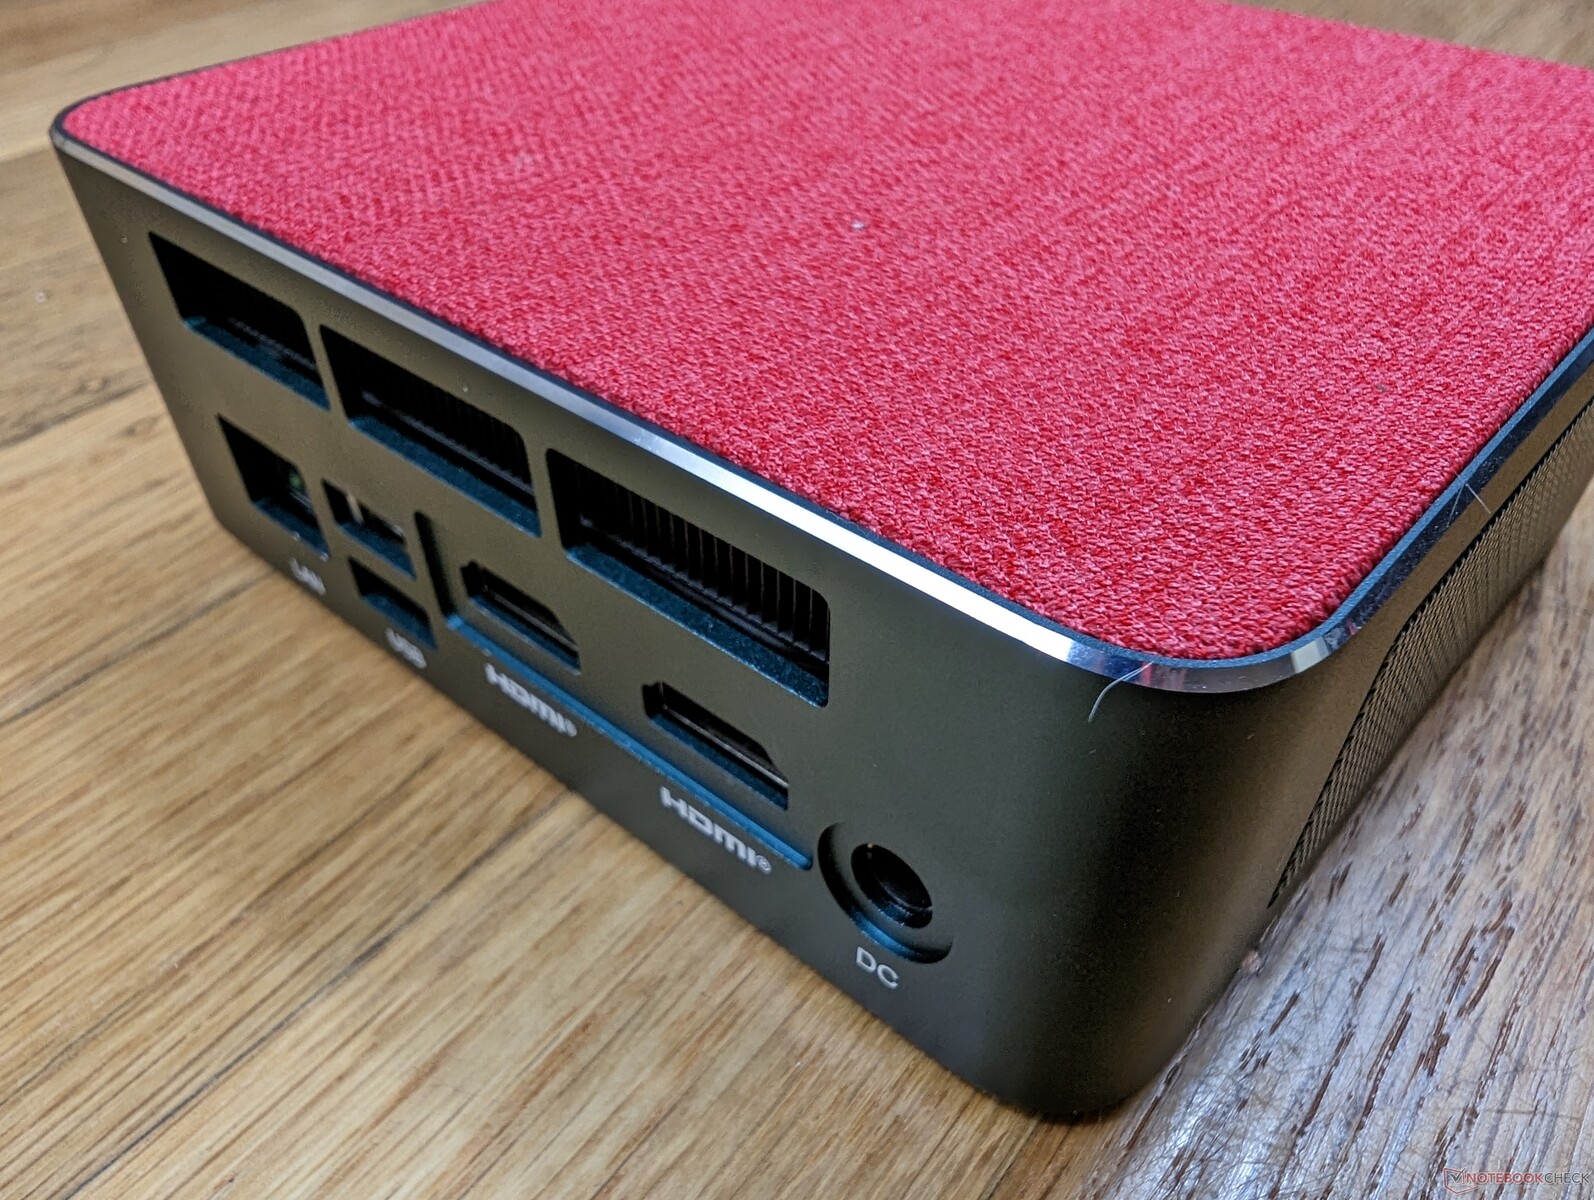
Die Anschlussoptionen und die Positionierung sind identisch mit denen des SER5 Pro, allerdings mit einem bemerkenswerten Upgrade: Der RJ-45-Anschluss unterstützt jetzt 2,5 Gbit/s statt nur 1 Gbit/s. Das System kann auch über USB-C-Netzteile von Drittanbietern mit Strom versorgt werden, falls Sie das proprietäre Netzteil, das im Lieferumfang enthalten ist, verlieren sollten. Unser 130-W-Netzteil, das mit dem Dell XPS 17 mitgeliefert wird, würde zum Beispiel unser SER6 Pro ohne Probleme mit Strom versorgen.
(Update vom 25. Januar 2023: USB 4.0 wird für theoretische Übertragungsraten von 40 Gbit/s unterstützt. Bestimmte Thunderbolt-fähige eGPU-Docks sind daher kompatibel.)
Kommunikation
Beelink hat das MediaTek RZ608 im SER5 Pro gegen das gängigere Intel-AX200-Modul ausgetauscht. Dieses spezielle Intel Modul verfügt nicht über Wi-Fi-6E-Fähigkeiten, aber die Übertragungsraten sind mit durchschnittlich 1.200 Mbit/s in Verbindung mit unserem Testrouter Asus AXE11000 dennoch schnell.

| Networking | |
| iperf3 transmit AX12 | |
| Intel NUC11PHKi7C | |
| Intel Hades Canyon NUC8i7HVK | |
| iperf3 receive AX12 | |
| Intel NUC11PHKi7C | |
| Intel Hades Canyon NUC8i7HVK | |
| iperf3 receive AXE11000 6GHz | |
| Intel NUC 12 Pro Kit NUC12WSKi7 | |
| Beelink GTR6 | |
| Beelink SEi11 Pro | |
| iperf3 receive AXE11000 | |
| Beelink SER6 Pro | |
| Beelink GTR6 | |
| iperf3 transmit AXE11000 | |
| Beelink SER6 Pro | |
| Beelink GTR6 | |
| iperf3 transmit AXE11000 6GHz | |
| Beelink GTR6 | |
| Intel NUC 12 Pro Kit NUC12WSKi7 | |
| Beelink SEi11 Pro | |
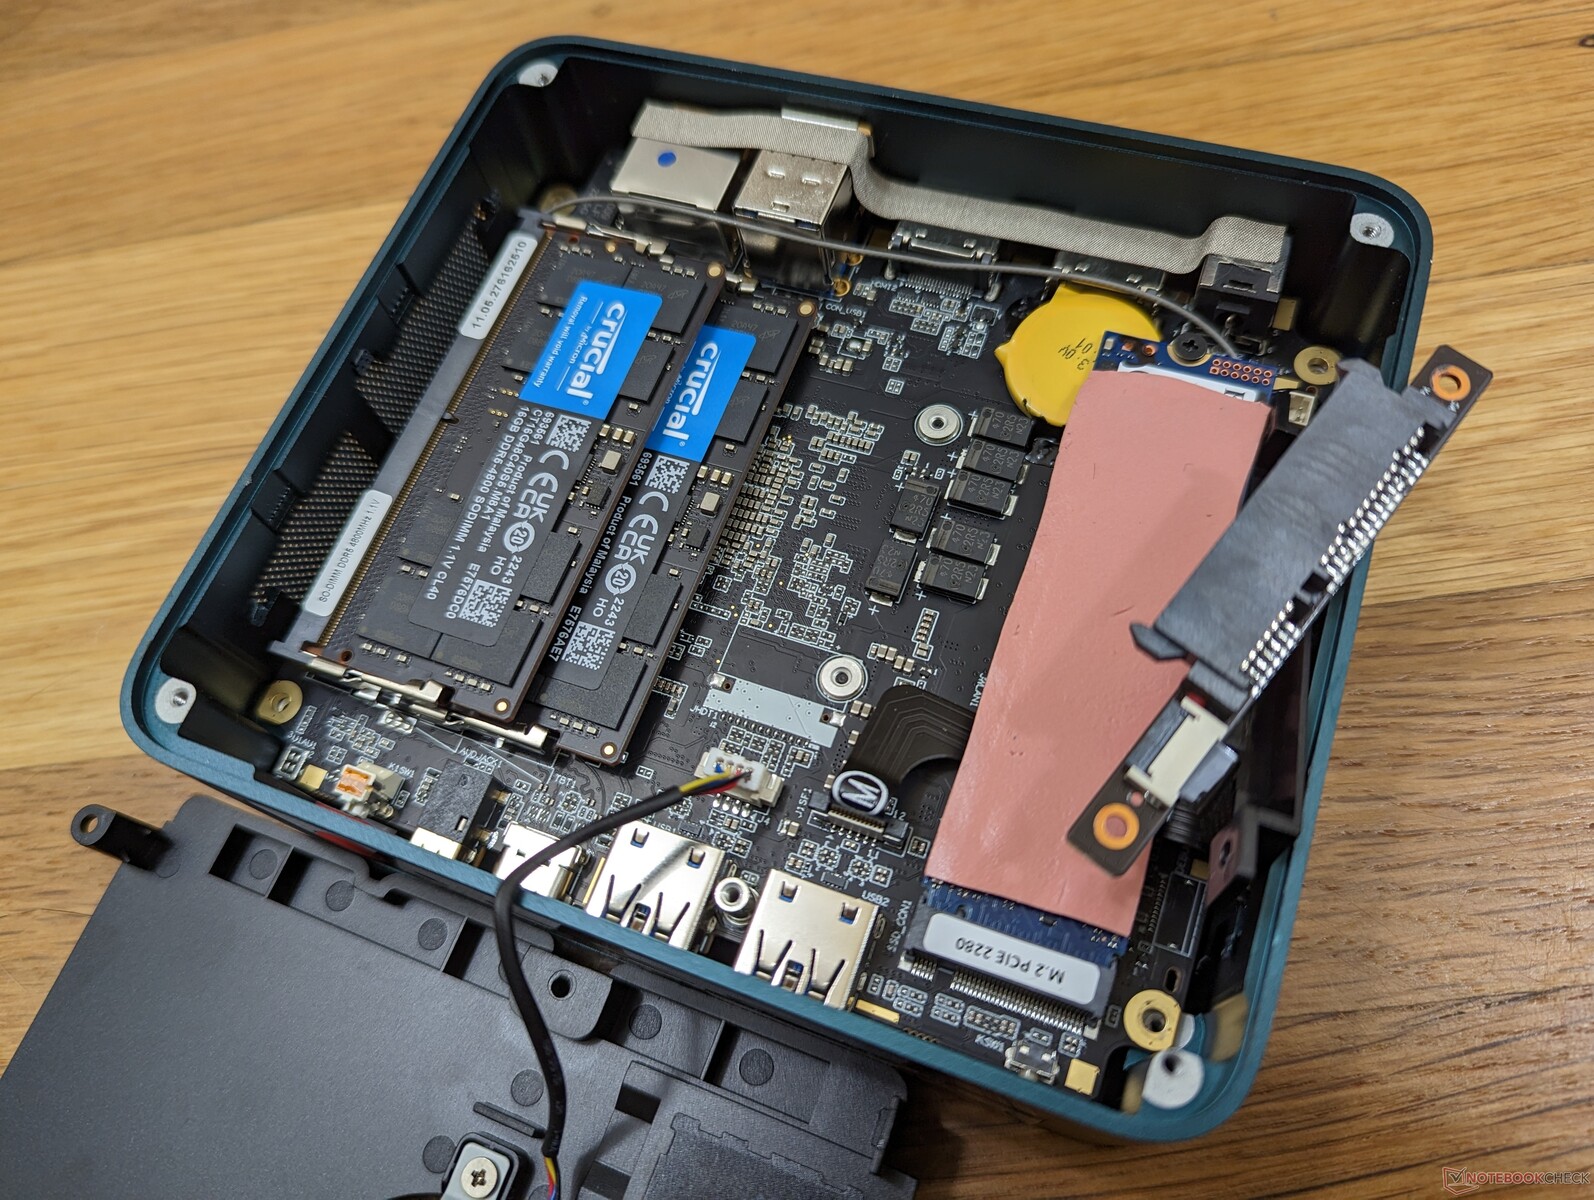
Wartung
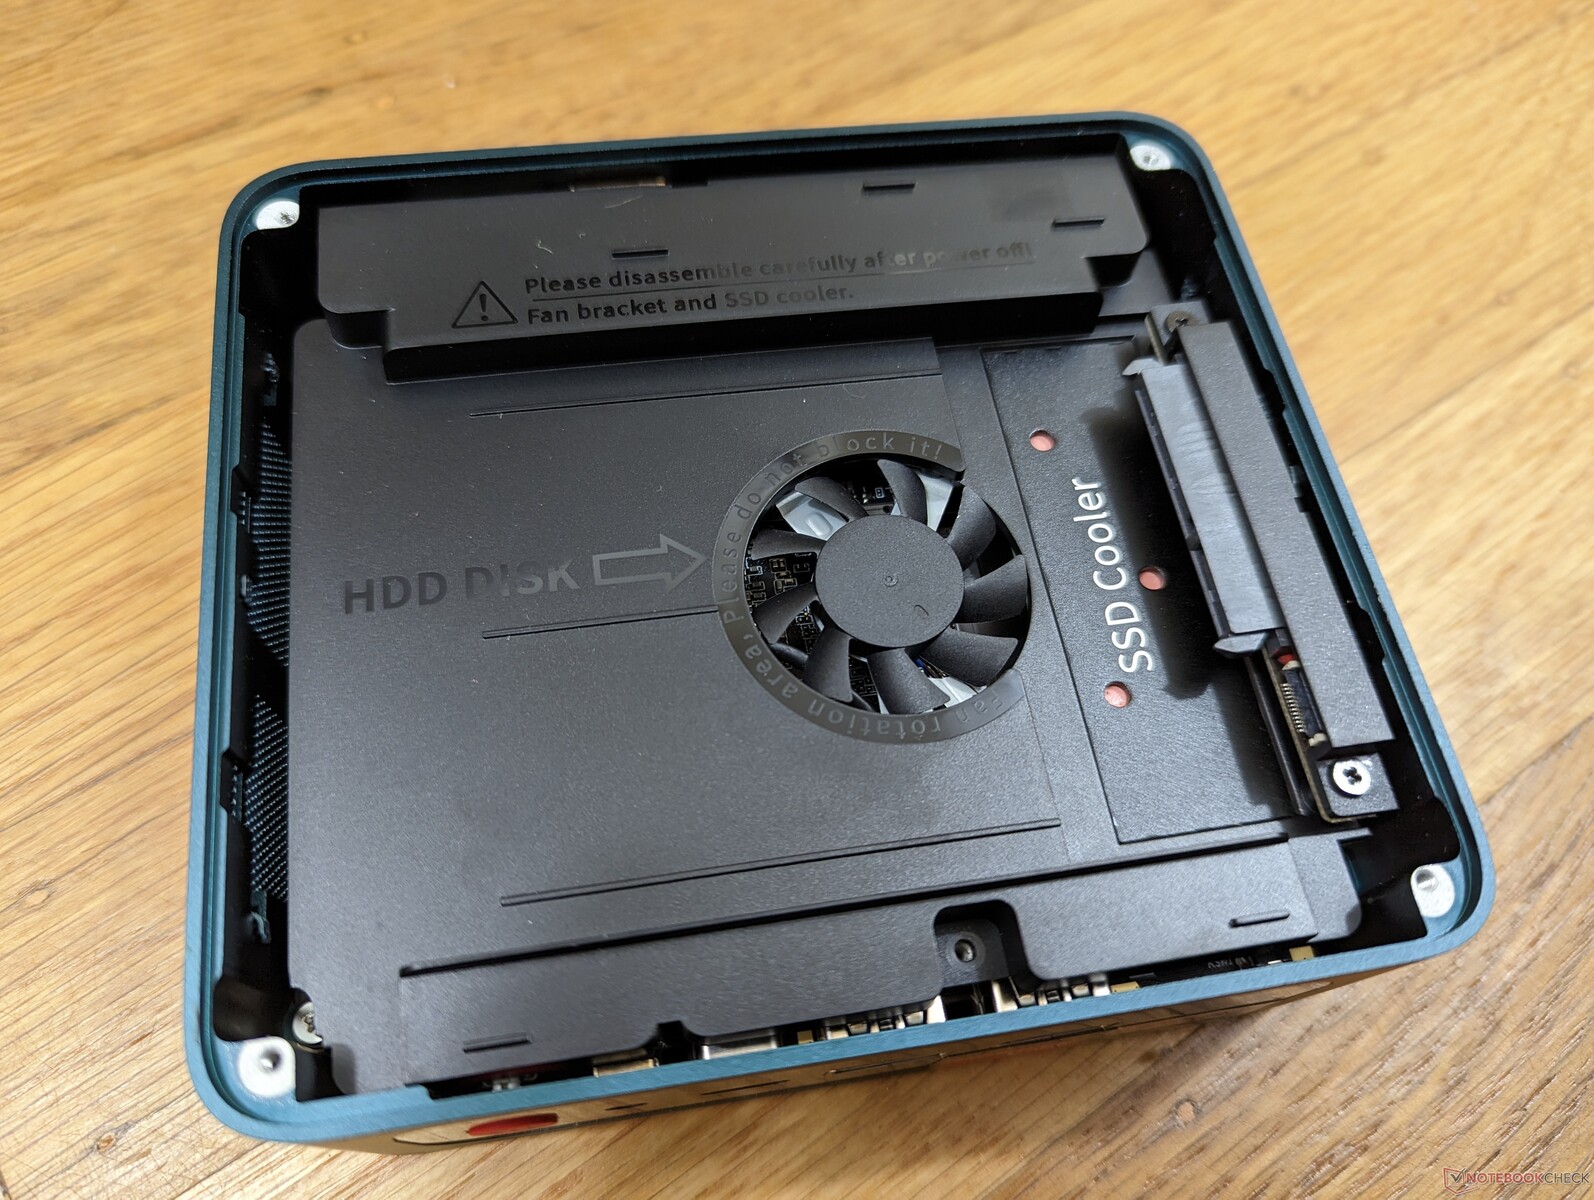
RAM- und Speicher-Upgrades sind einfach und erfordern nur einen Kreuzschlitzschraubendreher. Benutzer können bis zu zwei SODIMM-RAM-Module und zwei Laufwerke (1x M.2 PCIe4 x4 + 1x 2,5-Zoll-SATA-III) installieren.
Zubehör und Garantie
Im Lieferumfang enthalten sind zwei HDMI-Kabel, eine abnehmbare VESA-Halterung, eine schwarze und eine rote Stoffabdeckung, ein Netzgerät und Unterlagen. Beim Kauf in den USA gilt die übliche einjährige eingeschränkte Herstellergarantie.
Performance
Testbedingungen
Wir haben unser Gerät in den Performance-Modus versetzt, bevor wir die folgenden Benchmarks durchgeführt haben. Es gibt keine vorinstallierten Anwendungen vom Typ Control Center.
Prozessor
Die Rohleistung des Prozessors ist nahezu identisch mit der Rohleistung der vorherigen Generation Ryzen 7 5800H. Die Single-Thread-Leistung kann bis zu 5 % schneller sein, aber die Unterschiede sind bestenfalls marginal. Stattdessen beziehen sich die größten Verbesserungen zwischen den beiden CPUs auf ihre integrierten GPUs, wie unser GPU-Abschnitt unten zeigen wird.
Cinebench R15 Multi Loop
Cinebench R23: Multi Core | Single Core
Cinebench R15: CPU Multi 64Bit | CPU Single 64Bit
Blender: v2.79 BMW27 CPU
7-Zip 18.03: 7z b 4 | 7z b 4 -mmt1
Geekbench 5.5: Multi-Core | Single-Core
HWBOT x265 Benchmark v2.2: 4k Preset
LibreOffice : 20 Documents To PDF
R Benchmark 2.5: Overall mean
| Cinebench R20 / CPU (Multi Core) | |
| Minisforum Neptune Series HX90G | |
| Durchschnittliche AMD Ryzen 7 6800H (4460 - 5661, n=9) | |
| Beelink GTR6 | |
| Dell G15 5515 | |
| Intel NUC 12 Pro Kit NUC12WSKi7 | |
| Beelink SER6 Pro | |
| Beelink SEi12 Core i5-1235U | |
| Beelink SER Pro Ryzen 5 5600H | |
| Minipc Union Ace Magician AMR5 | |
| Beelink SEi11 Pro | |
| Intel Hades Canyon NUC8i7HVK | |
| Intel NUC11PHKi7C | |
| Minipc Union NiPoGi CK10 - 10810U | |
| BMAX B5 Pro G7H8 | |
| Trigkey S3 | |
| Cinebench R20 / CPU (Single Core) | |
| Intel NUC 12 Pro Kit NUC12WSKi7 | |
| Beelink GTR6 | |
| Beelink SEi12 Core i5-1235U | |
| Durchschnittliche AMD Ryzen 7 6800H (580 - 605, n=9) | |
| Beelink SER6 Pro | |
| Intel NUC11PHKi7C | |
| Minisforum Neptune Series HX90G | |
| Beelink SEi11 Pro | |
| Dell G15 5515 | |
| Minipc Union Ace Magician AMR5 | |
| Beelink SER Pro Ryzen 5 5600H | |
| Minipc Union NiPoGi CK10 - 10810U | |
| Intel Hades Canyon NUC8i7HVK | |
| BMAX B5 Pro G7H8 | |
| Trigkey S3 | |
| Cinebench R23 / Multi Core | |
| Minisforum Neptune Series HX90G | |
| Durchschnittliche AMD Ryzen 7 6800H (11481 - 14660, n=11) | |
| Dell G15 5515 | |
| Beelink GTR6 | |
| Intel NUC 12 Pro Kit NUC12WSKi7 | |
| Beelink SER6 Pro | |
| Beelink SEi12 Core i5-1235U | |
| Beelink SER Pro Ryzen 5 5600H | |
| Minipc Union Ace Magician AMR5 | |
| Intel NUC11PHKi7C | |
| Beelink SEi11 Pro | |
| Minipc Union NiPoGi CK10 - 10810U | |
| Trigkey S3 | |
| BMAX B5 Pro G7H8 | |
| Cinebench R23 / Single Core | |
| Intel NUC 12 Pro Kit NUC12WSKi7 | |
| Beelink SEi12 Core i5-1235U | |
| Beelink GTR6 | |
| Intel NUC11PHKi7C | |
| Durchschnittliche AMD Ryzen 7 6800H (1500 - 1552, n=9) | |
| Beelink SER6 Pro | |
| Minisforum Neptune Series HX90G | |
| Beelink SEi11 Pro | |
| Dell G15 5515 | |
| Minipc Union Ace Magician AMR5 | |
| Beelink SER Pro Ryzen 5 5600H | |
| Minipc Union NiPoGi CK10 - 10810U | |
| Trigkey S3 | |
| BMAX B5 Pro G7H8 | |
| Cinebench R15 / CPU Multi 64Bit | |
| Minisforum Neptune Series HX90G | |
| Durchschnittliche AMD Ryzen 7 6800H (1585 - 2366, n=10) | |
| Beelink GTR6 | |
| Dell G15 5515 | |
| Beelink SER6 Pro | |
| Intel NUC 12 Pro Kit NUC12WSKi7 | |
| Beelink SEi12 Core i5-1235U | |
| Beelink SER Pro Ryzen 5 5600H | |
| Minipc Union Ace Magician AMR5 | |
| Intel NUC11PHKi7C | |
| Intel Hades Canyon NUC8i7HVK | |
| Beelink SEi11 Pro | |
| Trigkey S3 | |
| BMAX B5 Pro G7H8 | |
| Minipc Union NiPoGi CK10 - 10810U | |
| Cinebench R15 / CPU Single 64Bit | |
| Intel NUC 12 Pro Kit NUC12WSKi7 | |
| Beelink GTR6 | |
| Minisforum Neptune Series HX90G | |
| Beelink SER6 Pro | |
| Durchschnittliche AMD Ryzen 7 6800H (182.7 - 250, n=10) | |
| Beelink SEi12 Core i5-1235U | |
| Intel NUC11PHKi7C | |
| Dell G15 5515 | |
| Minipc Union Ace Magician AMR5 | |
| Beelink SER Pro Ryzen 5 5600H | |
| Beelink SEi11 Pro | |
| Intel Hades Canyon NUC8i7HVK | |
| Minipc Union NiPoGi CK10 - 10810U | |
| BMAX B5 Pro G7H8 | |
| Trigkey S3 | |
| Blender / v2.79 BMW27 CPU | |
| BMAX B5 Pro G7H8 | |
| Trigkey S3 | |
| Minipc Union NiPoGi CK10 - 10810U | |
| Intel NUC11PHKi7C | |
| Beelink SEi11 Pro | |
| Intel Hades Canyon NUC8i7HVK | |
| Minipc Union Ace Magician AMR5 | |
| Beelink SEi12 Core i5-1235U | |
| Beelink SER Pro Ryzen 5 5600H | |
| Intel NUC 12 Pro Kit NUC12WSKi7 | |
| Beelink SER6 Pro | |
| Dell G15 5515 | |
| Beelink GTR6 | |
| Durchschnittliche AMD Ryzen 7 6800H (213 - 268, n=8) | |
| Minisforum Neptune Series HX90G | |
| 7-Zip 18.03 / 7z b 4 | |
| Minisforum Neptune Series HX90G | |
| Durchschnittliche AMD Ryzen 7 6800H (55067 - 64817, n=8) | |
| Beelink GTR6 | |
| Beelink SER6 Pro | |
| Dell G15 5515 | |
| Intel NUC 12 Pro Kit NUC12WSKi7 | |
| Beelink SER Pro Ryzen 5 5600H | |
| Minipc Union Ace Magician AMR5 | |
| Beelink SEi12 Core i5-1235U | |
| Beelink SEi11 Pro | |
| Intel NUC11PHKi7C | |
| Minipc Union NiPoGi CK10 - 10810U | |
| Intel Hades Canyon NUC8i7HVK | |
| BMAX B5 Pro G7H8 | |
| Trigkey S3 | |
| 7-Zip 18.03 / 7z b 4 -mmt1 | |
| Beelink GTR6 | |
| Minisforum Neptune Series HX90G | |
| Beelink SER6 Pro | |
| Intel NUC 12 Pro Kit NUC12WSKi7 | |
| Durchschnittliche AMD Ryzen 7 6800H (5521 - 5803, n=8) | |
| Dell G15 5515 | |
| Beelink SER Pro Ryzen 5 5600H | |
| Intel NUC11PHKi7C | |
| Minipc Union Ace Magician AMR5 | |
| Beelink SEi12 Core i5-1235U | |
| Beelink SEi11 Pro | |
| Minipc Union NiPoGi CK10 - 10810U | |
| Intel Hades Canyon NUC8i7HVK | |
| BMAX B5 Pro G7H8 | |
| Trigkey S3 | |
| Geekbench 5.5 / Multi-Core | |
| Intel NUC 12 Pro Kit NUC12WSKi7 | |
| Durchschnittliche AMD Ryzen 7 6800H (8898 - 10355, n=10) | |
| Beelink GTR6 | |
| Beelink SER6 Pro | |
| Minisforum Neptune Series HX90G | |
| Beelink SEi12 Core i5-1235U | |
| Dell G15 5515 | |
| Minipc Union Ace Magician AMR5 | |
| Beelink SER Pro Ryzen 5 5600H | |
| Intel NUC11PHKi7C | |
| Beelink SEi11 Pro | |
| Minipc Union NiPoGi CK10 - 10810U | |
| Trigkey S3 | |
| BMAX B5 Pro G7H8 | |
| Geekbench 5.5 / Single-Core | |
| Intel NUC 12 Pro Kit NUC12WSKi7 | |
| Beelink GTR6 | |
| Beelink SEi12 Core i5-1235U | |
| Minisforum Neptune Series HX90G | |
| Beelink SER6 Pro | |
| Durchschnittliche AMD Ryzen 7 6800H (1518 - 1568, n=10) | |
| Intel NUC11PHKi7C | |
| Beelink SEi11 Pro | |
| Dell G15 5515 | |
| Beelink SER Pro Ryzen 5 5600H | |
| Minipc Union Ace Magician AMR5 | |
| Minipc Union NiPoGi CK10 - 10810U | |
| Trigkey S3 | |
| BMAX B5 Pro G7H8 | |
| HWBOT x265 Benchmark v2.2 / 4k Preset | |
| Durchschnittliche AMD Ryzen 7 6800H (14.9 - 18.5, n=9) | |
| Minisforum Neptune Series HX90G | |
| Beelink GTR6 | |
| Beelink SER6 Pro | |
| Dell G15 5515 | |
| Intel NUC 12 Pro Kit NUC12WSKi7 | |
| Beelink SER Pro Ryzen 5 5600H | |
| Minipc Union Ace Magician AMR5 | |
| Beelink SEi12 Core i5-1235U | |
| Beelink SEi11 Pro | |
| Intel NUC11PHKi7C | |
| Intel Hades Canyon NUC8i7HVK | |
| Minipc Union NiPoGi CK10 - 10810U | |
| Trigkey S3 | |
| BMAX B5 Pro G7H8 | |
| LibreOffice / 20 Documents To PDF | |
| BMAX B5 Pro G7H8 | |
| Dell G15 5515 | |
| Trigkey S3 | |
| Minipc Union NiPoGi CK10 - 10810U | |
| Minisforum Neptune Series HX90G | |
| Durchschnittliche AMD Ryzen 7 6800H (48.7 - 79.5, n=8) | |
| Beelink SER Pro Ryzen 5 5600H | |
| Minipc Union Ace Magician AMR5 | |
| Beelink SEi11 Pro | |
| Beelink SER6 Pro | |
| Beelink SEi12 Core i5-1235U | |
| Intel NUC11PHKi7C | |
| Beelink GTR6 | |
| Intel NUC 12 Pro Kit NUC12WSKi7 | |
| R Benchmark 2.5 / Overall mean | |
| BMAX B5 Pro G7H8 | |
| Trigkey S3 | |
| Minipc Union NiPoGi CK10 - 10810U | |
| Beelink SEi11 Pro | |
| Intel NUC11PHKi7C | |
| Minipc Union Ace Magician AMR5 | |
| Beelink SER Pro Ryzen 5 5600H | |
| Dell G15 5515 | |
| Beelink SEi12 Core i5-1235U | |
| Beelink SER6 Pro | |
| Durchschnittliche AMD Ryzen 7 6800H (0.4783 - 0.515, n=8) | |
| Minisforum Neptune Series HX90G | |
| Intel NUC 12 Pro Kit NUC12WSKi7 | |
| Beelink GTR6 | |
Cinebench R23: Multi Core | Single Core
Cinebench R15: CPU Multi 64Bit | CPU Single 64Bit
Blender: v2.79 BMW27 CPU
7-Zip 18.03: 7z b 4 | 7z b 4 -mmt1
Geekbench 5.5: Multi-Core | Single-Core
HWBOT x265 Benchmark v2.2: 4k Preset
LibreOffice : 20 Documents To PDF
R Benchmark 2.5: Overall mean
* ... kleinere Werte sind besser
AIDA64: FP32 Ray-Trace | FPU Julia | CPU SHA3 | CPU Queen | FPU SinJulia | FPU Mandel | CPU AES | CPU ZLib | FP64 Ray-Trace | CPU PhotoWorxx
| Performance Rating | |
| Durchschnittliche AMD Ryzen 7 6800H | |
| Beelink GTR6 | |
| Beelink SER6 Pro | |
| Intel NUC 12 Pro Kit NUC12WSKi7 | |
| Intel NUC11PHKi7C | |
| Beelink SEi11 Pro | |
| AIDA64 / FP32 Ray-Trace | |
| Durchschnittliche AMD Ryzen 7 6800H (12876 - 17031, n=8) | |
| Beelink GTR6 | |
| Beelink SER6 Pro | |
| Intel NUC 12 Pro Kit NUC12WSKi7 | |
| Intel NUC11PHKi7C | |
| Beelink SEi11 Pro | |
| AIDA64 / FPU Julia | |
| Durchschnittliche AMD Ryzen 7 6800H (82673 - 105987, n=8) | |
| Beelink GTR6 | |
| Beelink SER6 Pro | |
| Intel NUC 12 Pro Kit NUC12WSKi7 | |
| Intel NUC11PHKi7C | |
| Beelink SEi11 Pro | |
| AIDA64 / CPU SHA3 | |
| Durchschnittliche AMD Ryzen 7 6800H (2886 - 3634, n=8) | |
| Beelink GTR6 | |
| Beelink SER6 Pro | |
| Intel NUC 12 Pro Kit NUC12WSKi7 | |
| Intel NUC11PHKi7C | |
| Beelink SEi11 Pro | |
| AIDA64 / CPU Queen | |
| Durchschnittliche AMD Ryzen 7 6800H (75117 - 106322, n=8) | |
| Beelink GTR6 | |
| Beelink SER6 Pro | |
| Intel NUC 12 Pro Kit NUC12WSKi7 | |
| Intel NUC11PHKi7C | |
| Beelink SEi11 Pro | |
| AIDA64 / FPU SinJulia | |
| Durchschnittliche AMD Ryzen 7 6800H (11771 - 13120, n=8) | |
| Beelink GTR6 | |
| Beelink SER6 Pro | |
| Intel NUC 12 Pro Kit NUC12WSKi7 | |
| Intel NUC11PHKi7C | |
| Beelink SEi11 Pro | |
| AIDA64 / FPU Mandel | |
| Durchschnittliche AMD Ryzen 7 6800H (45287 - 58327, n=8) | |
| Beelink GTR6 | |
| Beelink SER6 Pro | |
| Intel NUC 12 Pro Kit NUC12WSKi7 | |
| Intel NUC11PHKi7C | |
| Beelink SEi11 Pro | |
| AIDA64 / CPU AES | |
| Beelink GTR6 | |
| Durchschnittliche AMD Ryzen 7 6800H (67816 - 137383, n=8) | |
| Beelink SER6 Pro | |
| Intel NUC 12 Pro Kit NUC12WSKi7 | |
| Intel NUC11PHKi7C | |
| Beelink SEi11 Pro | |
| AIDA64 / CPU ZLib | |
| Durchschnittliche AMD Ryzen 7 6800H (732 - 901, n=8) | |
| Beelink GTR6 | |
| Beelink SER6 Pro | |
| Intel NUC 12 Pro Kit NUC12WSKi7 | |
| Intel NUC11PHKi7C | |
| Beelink SEi11 Pro | |
| AIDA64 / FP64 Ray-Trace | |
| Durchschnittliche AMD Ryzen 7 6800H (6917 - 8980, n=8) | |
| Beelink GTR6 | |
| Beelink SER6 Pro | |
| Intel NUC 12 Pro Kit NUC12WSKi7 | |
| Intel NUC11PHKi7C | |
| Beelink SEi11 Pro | |
| AIDA64 / CPU PhotoWorxx | |
| Beelink GTR6 | |
| Beelink SER6 Pro | |
| Durchschnittliche AMD Ryzen 7 6800H (26496 - 30360, n=8) | |
| Intel NUC 12 Pro Kit NUC12WSKi7 | |
| Intel NUC11PHKi7C | |
| Beelink SEi11 Pro | |
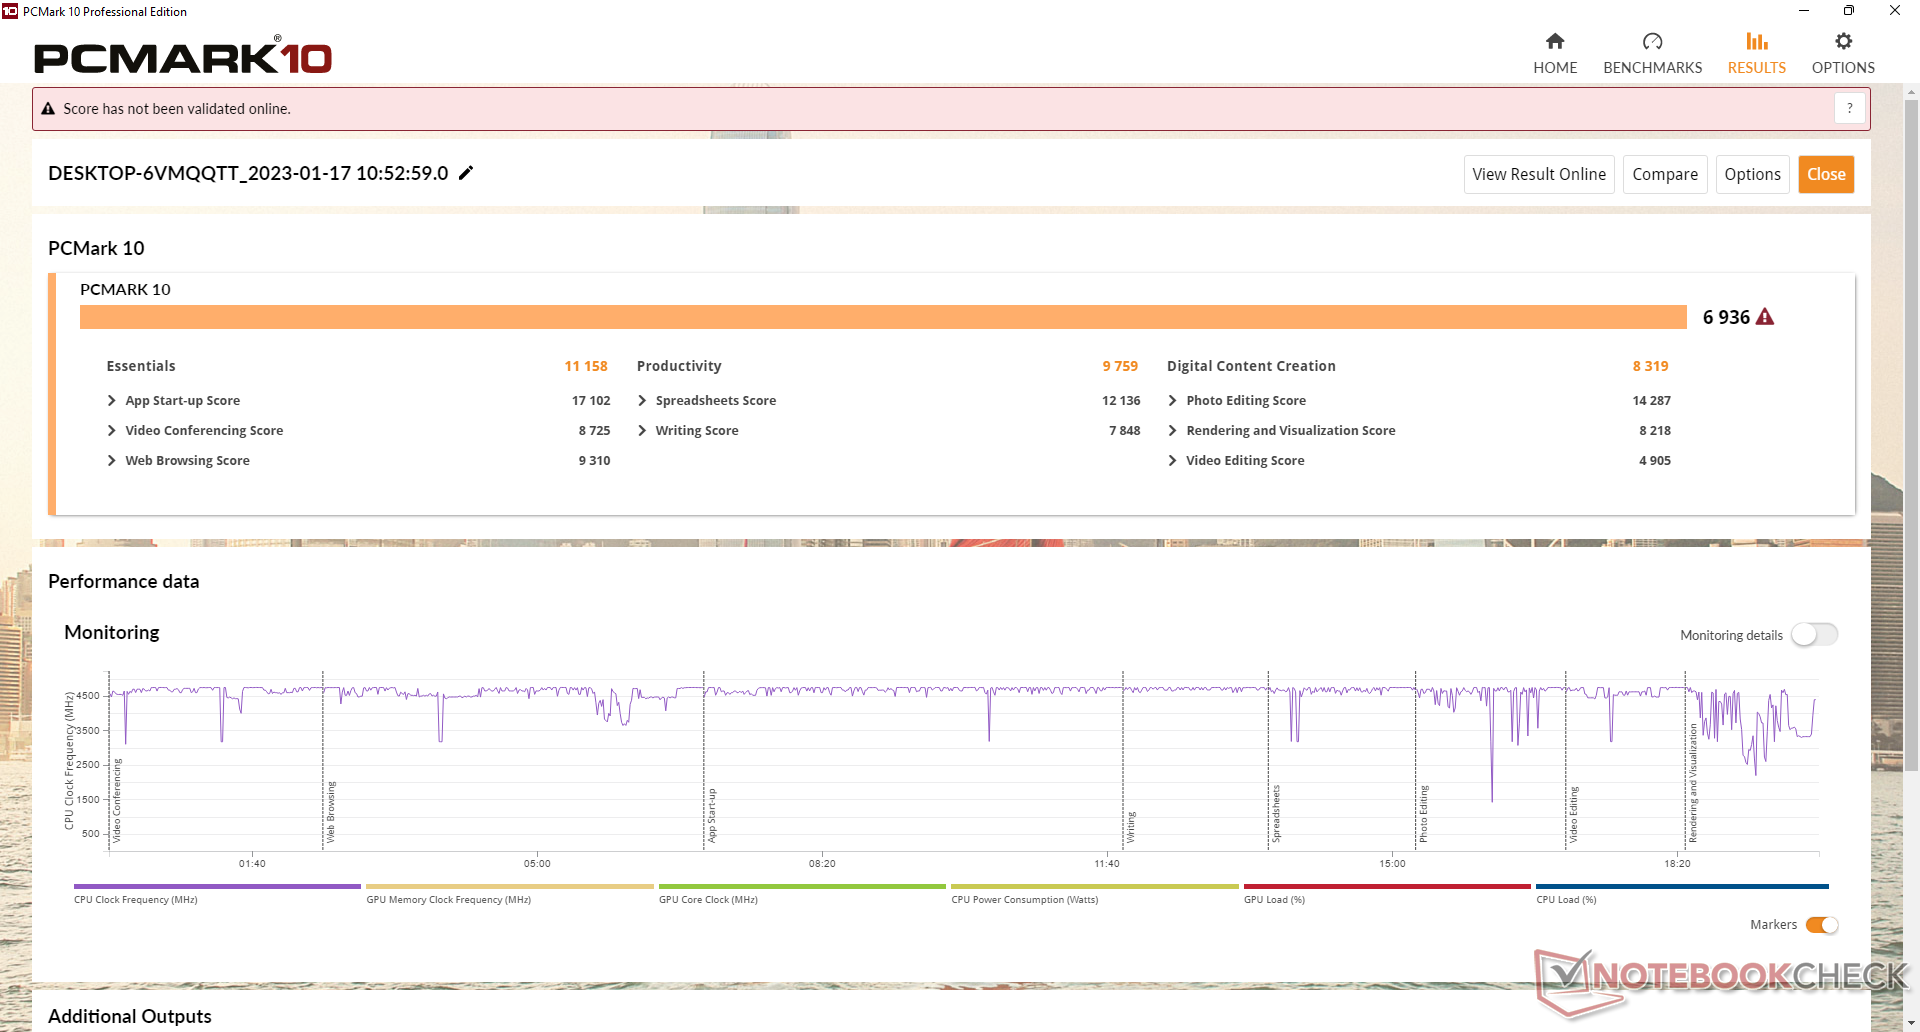
System Performance
Die PCMark Ergebnisse gehören zu den besten für einen Mini-PC ohne dedizierte Grafik. Die hohe Punktzahl ist der neuen Radeon 680M zuzuschreiben, die einen erheblichen Sprung macht gegenüber der älteren integrierten Radeon-RX-Vega-Serie oder Iris-Xe-Serie.
CrossMark: Overall | Productivity | Creativity | Responsiveness
| PCMark 10 / Score | |
| Beelink GTR6 | |
| Beelink SER6 Pro | |
| Durchschnittliche AMD Ryzen 7 6800H, AMD Radeon 680M (6591 - 6936, n=4) | |
| Intel NUC11PHKi7C | |
| Intel NUC 12 Pro Kit NUC12WSKi7 | |
| Beelink SER Pro Ryzen 5 5600H | |
| Intel Hades Canyon NUC8i7HVK | |
| Beelink SEi11 Pro | |
| PCMark 10 / Essentials | |
| Beelink GTR6 | |
| Beelink SER6 Pro | |
| Intel NUC 12 Pro Kit NUC12WSKi7 | |
| Durchschnittliche AMD Ryzen 7 6800H, AMD Radeon 680M (10381 - 11158, n=4) | |
| Beelink SER Pro Ryzen 5 5600H | |
| Beelink SEi11 Pro | |
| Intel NUC11PHKi7C | |
| Intel Hades Canyon NUC8i7HVK | |
| PCMark 10 / Productivity | |
| Beelink GTR6 | |
| Beelink SER6 Pro | |
| Durchschnittliche AMD Ryzen 7 6800H, AMD Radeon 680M (9140 - 9759, n=4) | |
| Beelink SER Pro Ryzen 5 5600H | |
| Intel NUC11PHKi7C | |
| Intel Hades Canyon NUC8i7HVK | |
| Intel NUC 12 Pro Kit NUC12WSKi7 | |
| Beelink SEi11 Pro | |
| PCMark 10 / Digital Content Creation | |
| Beelink GTR6 | |
| Durchschnittliche AMD Ryzen 7 6800H, AMD Radeon 680M (8092 - 8485, n=4) | |
| Beelink SER6 Pro | |
| Intel NUC11PHKi7C | |
| Intel NUC 12 Pro Kit NUC12WSKi7 | |
| Beelink SER Pro Ryzen 5 5600H | |
| Intel Hades Canyon NUC8i7HVK | |
| Beelink SEi11 Pro | |
| CrossMark / Overall | |
| Beelink SER6 Pro | |
| Beelink GTR6 | |
| Intel NUC 12 Pro Kit NUC12WSKi7 | |
| Durchschnittliche AMD Ryzen 7 6800H, AMD Radeon 680M (1590 - 1704, n=3) | |
| Beelink SEi11 Pro | |
| Beelink SER Pro Ryzen 5 5600H | |
| CrossMark / Productivity | |
| Beelink GTR6 | |
| Beelink SER6 Pro | |
| Intel NUC 12 Pro Kit NUC12WSKi7 | |
| Durchschnittliche AMD Ryzen 7 6800H, AMD Radeon 680M (1566 - 1674, n=3) | |
| Beelink SEi11 Pro | |
| Beelink SER Pro Ryzen 5 5600H | |
| CrossMark / Creativity | |
| Intel NUC 12 Pro Kit NUC12WSKi7 | |
| Beelink SER6 Pro | |
| Durchschnittliche AMD Ryzen 7 6800H, AMD Radeon 680M (1696 - 1763, n=3) | |
| Beelink GTR6 | |
| Beelink SER Pro Ryzen 5 5600H | |
| Beelink SEi11 Pro | |
| CrossMark / Responsiveness | |
| Beelink GTR6 | |
| Beelink SER6 Pro | |
| Durchschnittliche AMD Ryzen 7 6800H, AMD Radeon 680M (1340 - 1625, n=3) | |
| Intel NUC 12 Pro Kit NUC12WSKi7 | |
| Beelink SEi11 Pro | |
| Beelink SER Pro Ryzen 5 5600H | |
| PCMark 10 Score | 6936 Punkte | |
Hilfe | ||
| AIDA64 / Memory Copy | |
| Beelink SER6 Pro | |
| Beelink GTR6 | |
| Durchschnittliche AMD Ryzen 7 6800H (48209 - 51186, n=8) | |
| Intel NUC 12 Pro Kit NUC12WSKi7 | |
| Beelink SEi11 Pro | |
| Intel NUC11PHKi7C | |
| AIDA64 / Memory Read | |
| Beelink GTR6 | |
| Beelink SER6 Pro | |
| Durchschnittliche AMD Ryzen 7 6800H (43828 - 51778, n=8) | |
| Intel NUC 12 Pro Kit NUC12WSKi7 | |
| Beelink SEi11 Pro | |
| Intel NUC11PHKi7C | |
| AIDA64 / Memory Write | |
| Beelink GTR6 | |
| Beelink SER6 Pro | |
| Durchschnittliche AMD Ryzen 7 6800H (51116 - 55307, n=8) | |
| Beelink SEi11 Pro | |
| Intel NUC 12 Pro Kit NUC12WSKi7 | |
| Intel NUC11PHKi7C | |
| AIDA64 / Memory Latency | |
| Intel NUC 12 Pro Kit NUC12WSKi7 | |
| Intel NUC11PHKi7C | |
| Durchschnittliche AMD Ryzen 7 6800H (83.1 - 104.1, n=8) | |
| Beelink SER6 Pro | |
| Beelink GTR6 | |
| Beelink SEi11 Pro | |
* ... kleinere Werte sind besser
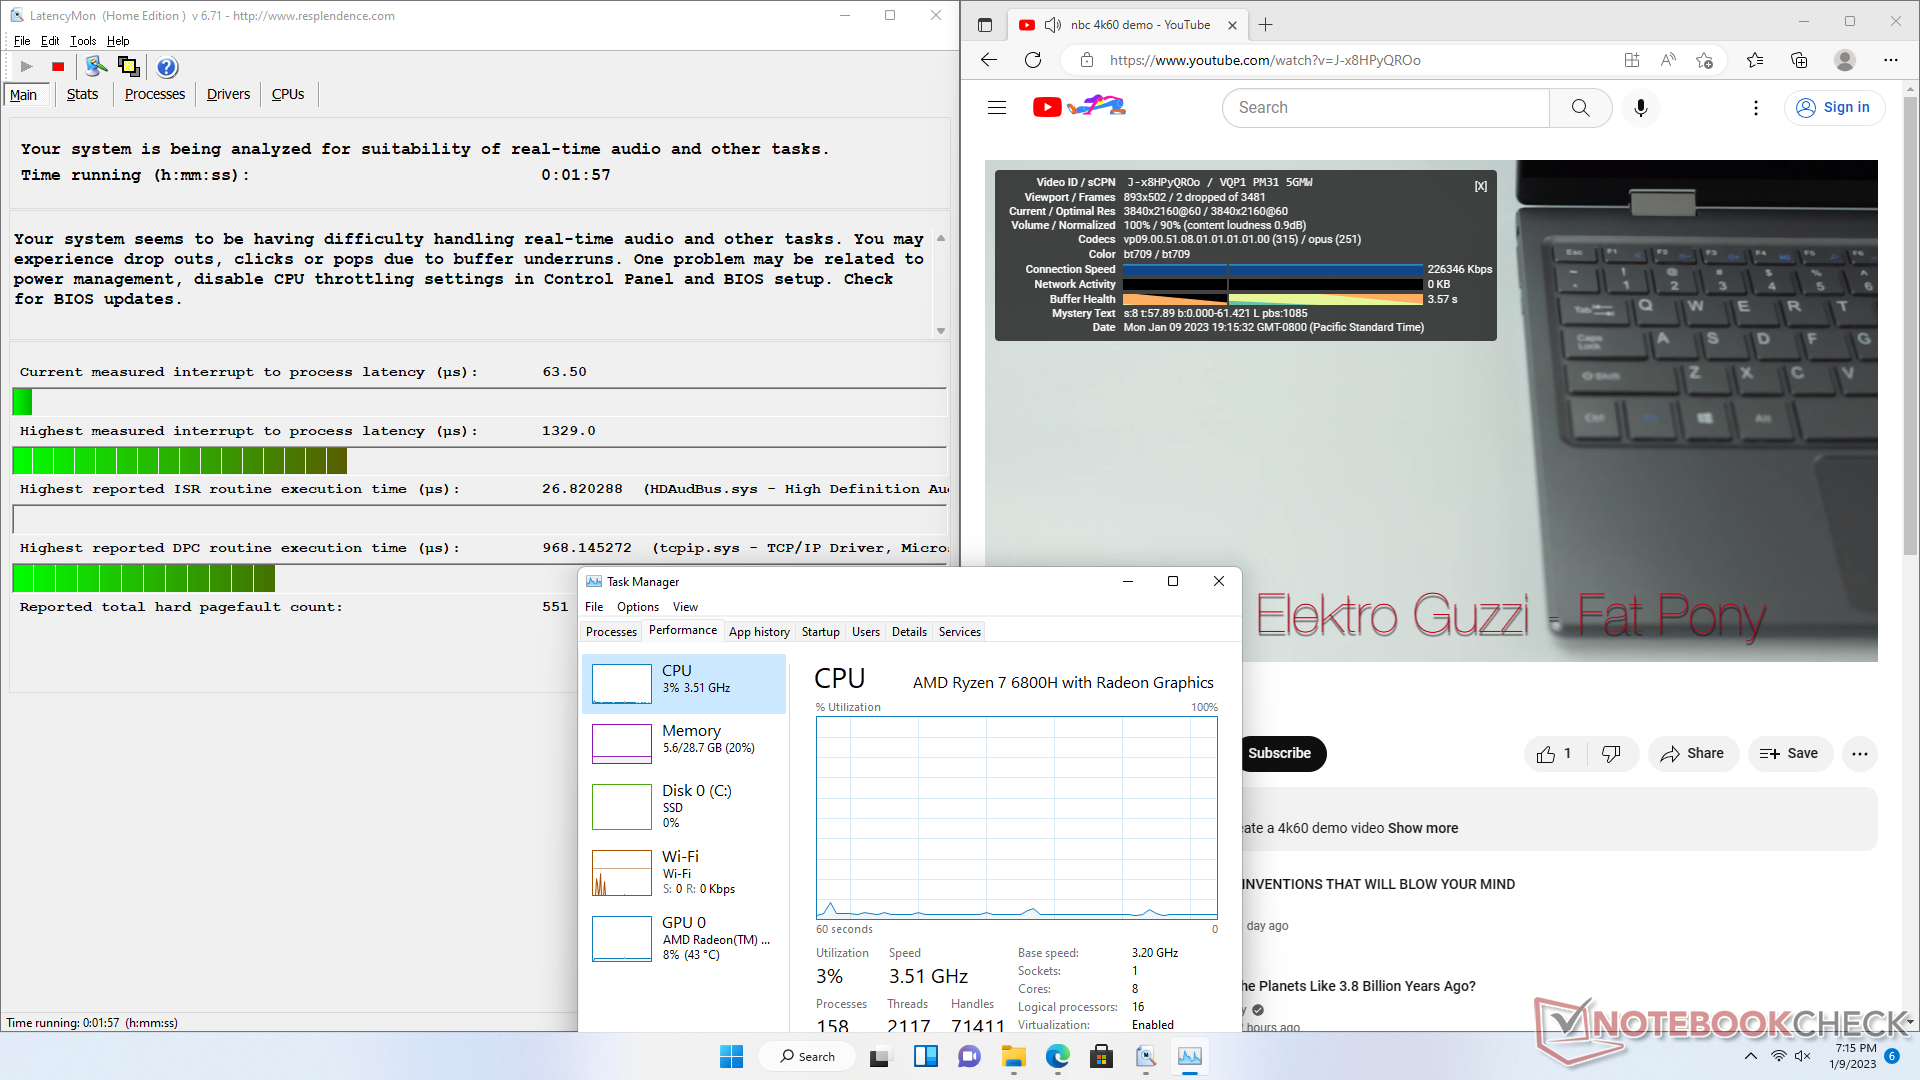
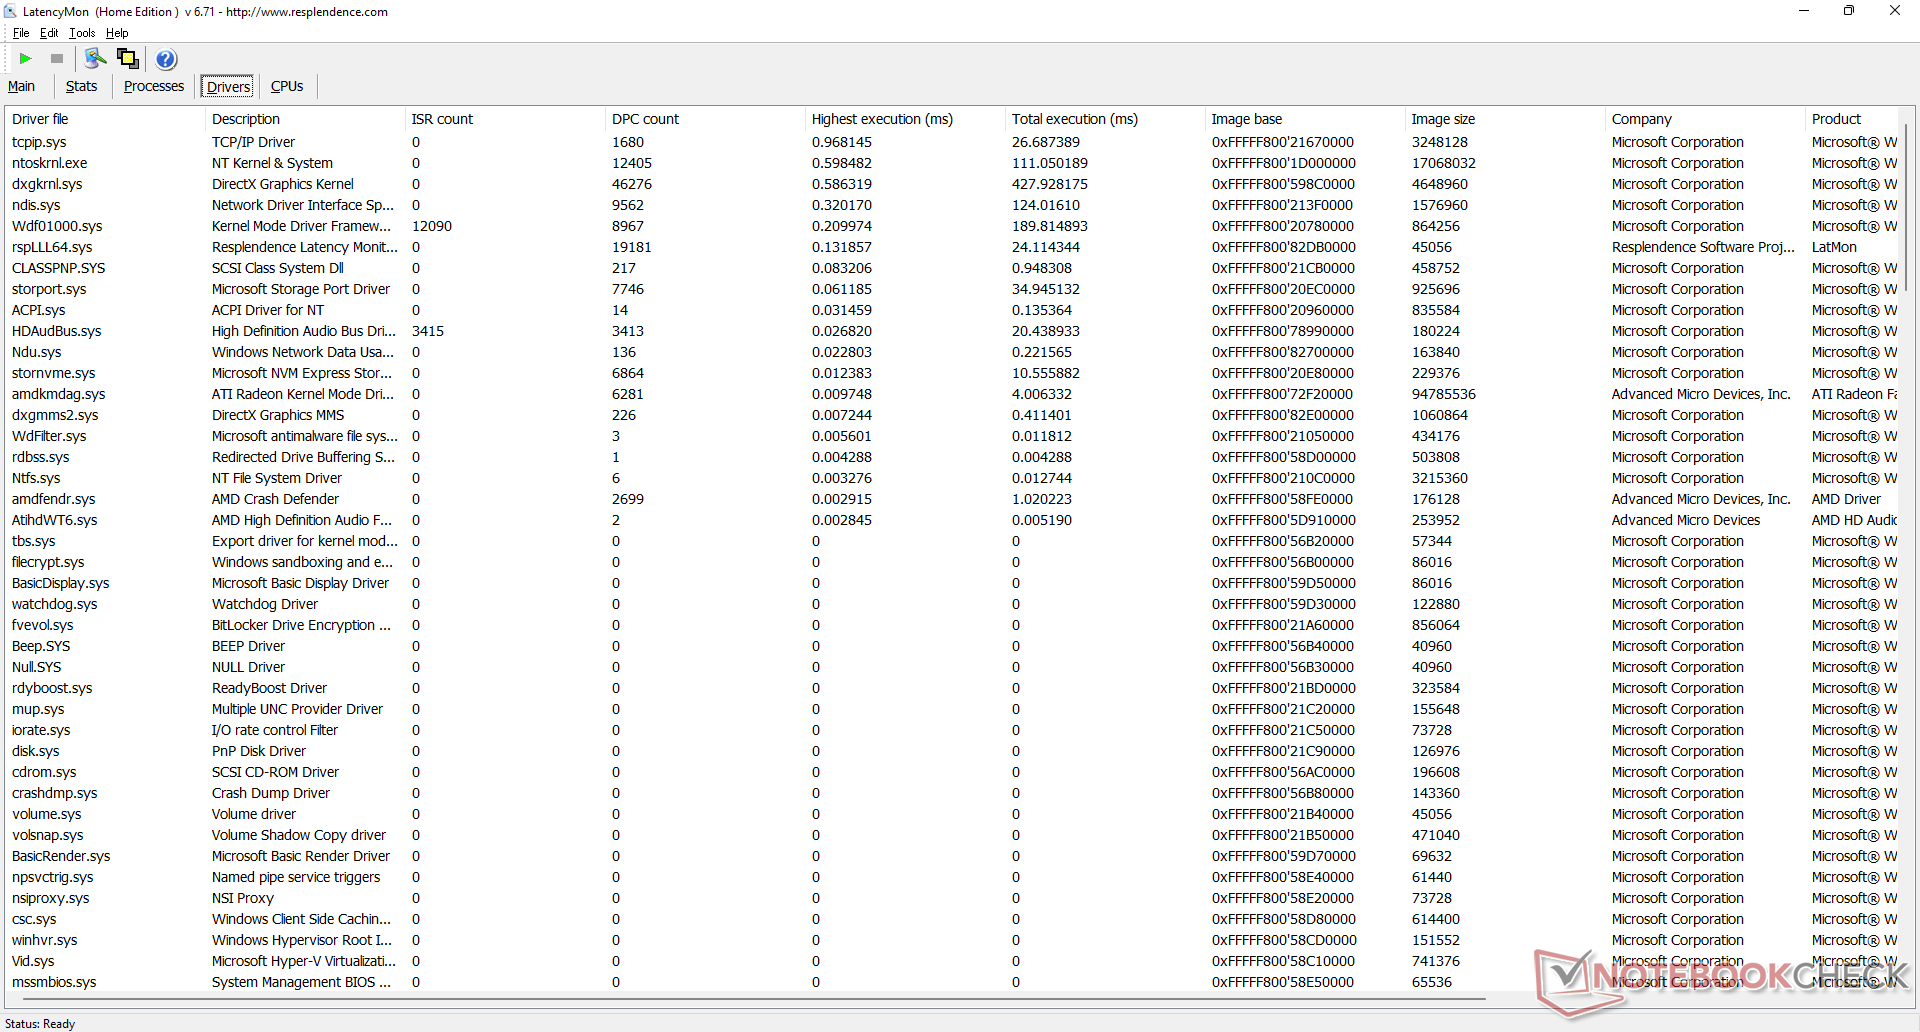
DPC-Latenzzeit
LatencyMon zeigt DPC-Probleme beim Öffnen mehrerer Browser Tabs unserer Homepage. die 4K-Videowiedergabe bei 60 fps läuft ansonsten flüssig, mit nur zwei Bildaussetzern während unseres einminütigen Testvideos.
| DPC Latencies / LatencyMon - interrupt to process latency (max), Web, Youtube, Prime95 | |
| Beelink SER6 Pro | |
| Intel NUC11PHKi7C | |
| Intel NUC 12 Pro Kit NUC12WSKi7 | |
| Beelink GTR6 | |
| Beelink SEi11 Pro | |
* ... kleinere Werte sind besser
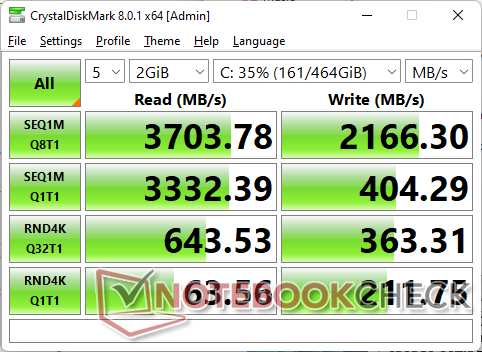
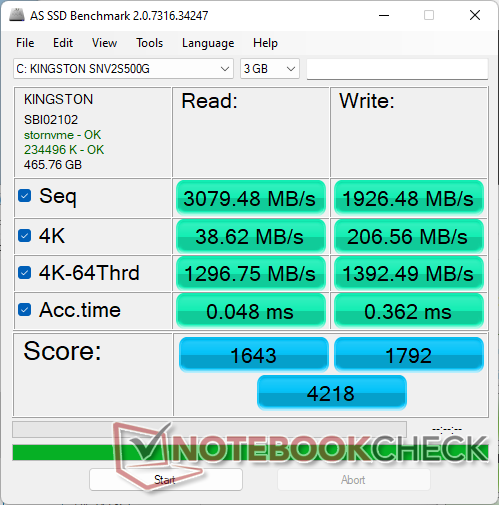
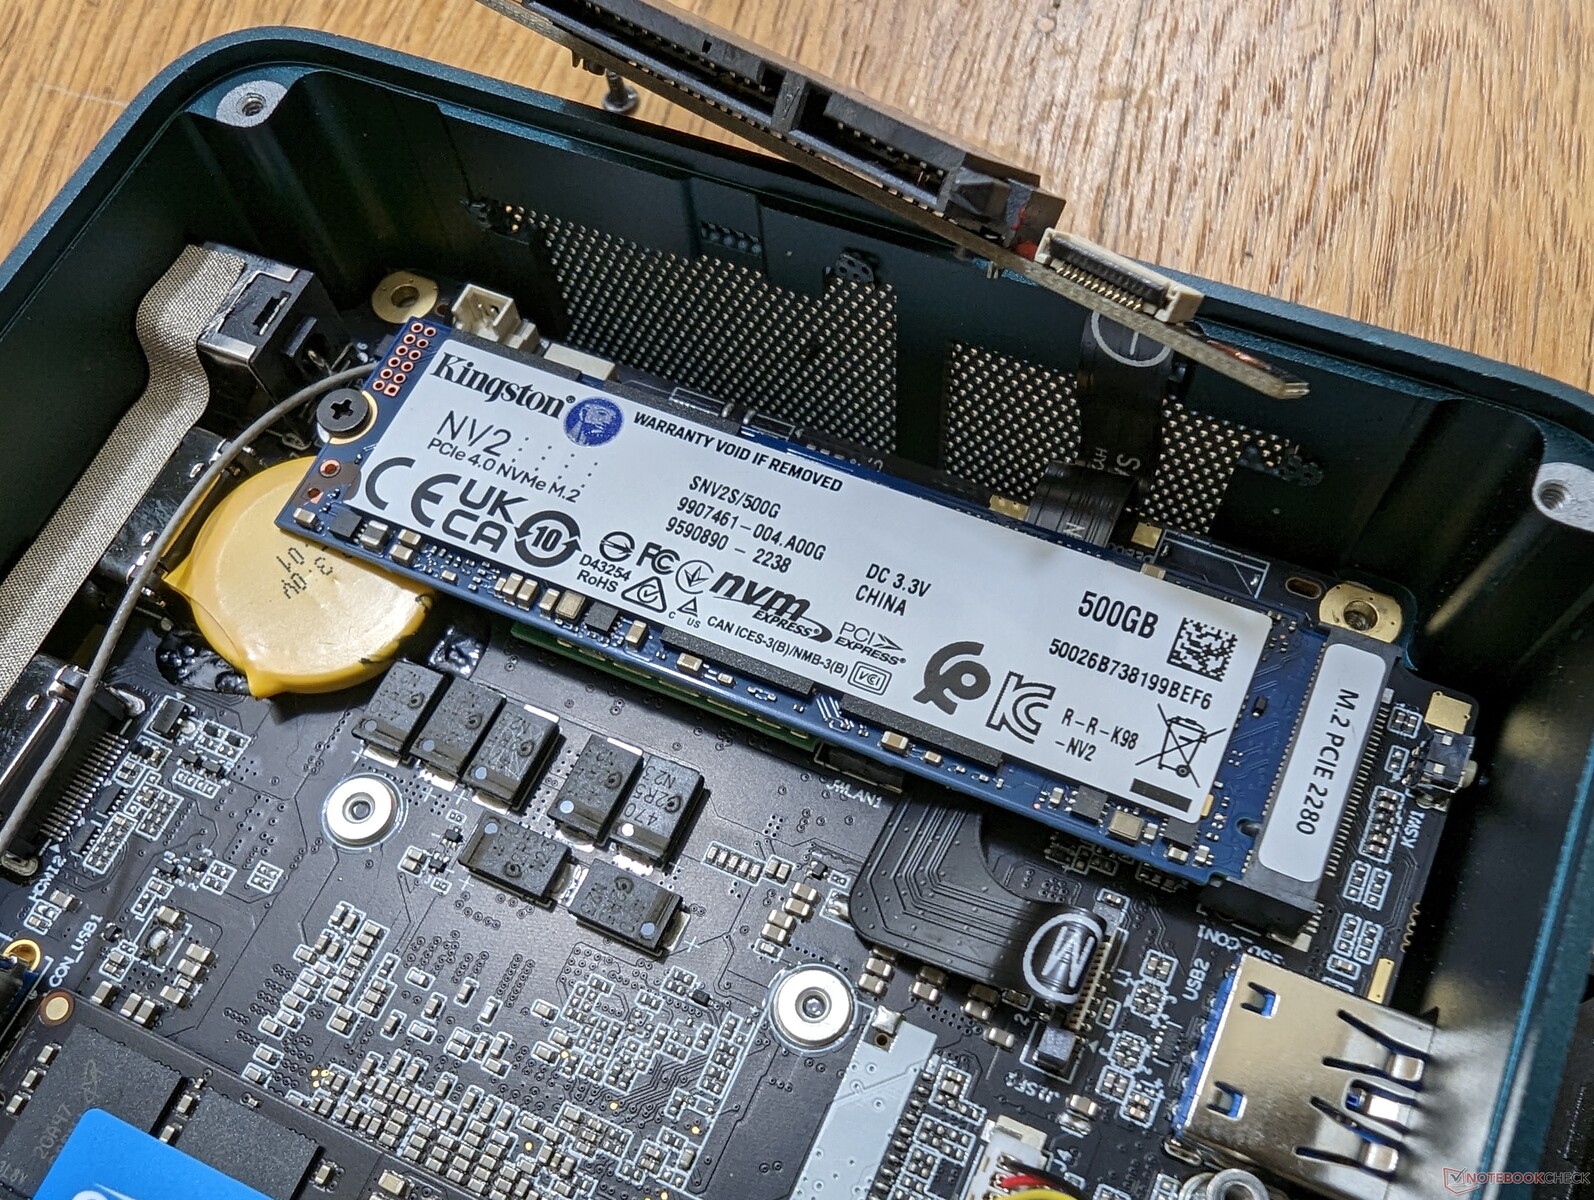
Speichergeräte
Die Kingston SNV2S PCIe4 x4 SSD in unserem Gerät ist ein NVMe-Laufwerk der Mittelklasse mit sequenziellen Lese- und Übertragungsraten von etwa 3.700 bzw. 2.200 MB/s, verglichen mit 5.000 MB/s oder mehr bei Alternativen wie der Samsung PM9A1. Das Laufwerk kommt mit einer inneren Metallplatte unterhalb des 2,5-Zoll-SATA-III-Steckplatzes in Berührung, die der Wärmeableitung dient.

| Drive Performance Rating - Percent | |
| Beelink GTR6 | |
| Beelink SER6 Pro | |
| Intel Hades Canyon NUC8i7HVK -8! | |
| Intel NUC11PHKi7C | |
| Beelink SEi11 Pro | |
| Intel NUC 12 Pro Kit NUC12WSKi7 | |
| DiskSpd | |
| seq read | |
| Beelink GTR6 | |
| Beelink SER6 Pro | |
| Intel NUC11PHKi7C | |
| Intel NUC 12 Pro Kit NUC12WSKi7 | |
| Beelink SEi11 Pro | |
| seq write | |
| Beelink GTR6 | |
| Beelink SER6 Pro | |
| Intel NUC11PHKi7C | |
| Beelink SEi11 Pro | |
| Intel NUC 12 Pro Kit NUC12WSKi7 | |
| seq q8 t1 read | |
| Beelink GTR6 | |
| Beelink SER6 Pro | |
| Intel NUC11PHKi7C | |
| Beelink SEi11 Pro | |
| Intel NUC 12 Pro Kit NUC12WSKi7 | |
| seq q8 t1 write | |
| Beelink GTR6 | |
| Intel NUC11PHKi7C | |
| Beelink SER6 Pro | |
| Intel NUC 12 Pro Kit NUC12WSKi7 | |
| Beelink SEi11 Pro | |
| 4k q1 t1 read | |
| Beelink GTR6 | |
| Intel NUC 12 Pro Kit NUC12WSKi7 | |
| Beelink SEi11 Pro | |
| Beelink SER6 Pro | |
| Intel NUC11PHKi7C | |
| 4k q1 t1 write | |
| Beelink GTR6 | |
| Beelink SER6 Pro | |
| Intel NUC 12 Pro Kit NUC12WSKi7 | |
| Beelink SEi11 Pro | |
| Intel NUC11PHKi7C | |
| 4k q32 t16 read | |
| Beelink GTR6 | |
| Beelink SER6 Pro | |
| Intel NUC11PHKi7C | |
| Beelink SEi11 Pro | |
| Intel NUC 12 Pro Kit NUC12WSKi7 | |
| 4k q32 t16 write | |
| Beelink GTR6 | |
| Beelink SER6 Pro | |
| Beelink SEi11 Pro | |
| Intel NUC 12 Pro Kit NUC12WSKi7 | |
| Intel NUC11PHKi7C | |
* ... kleinere Werte sind besser
Disk Throttling: DiskSpd Read Loop, Queue Depth 8
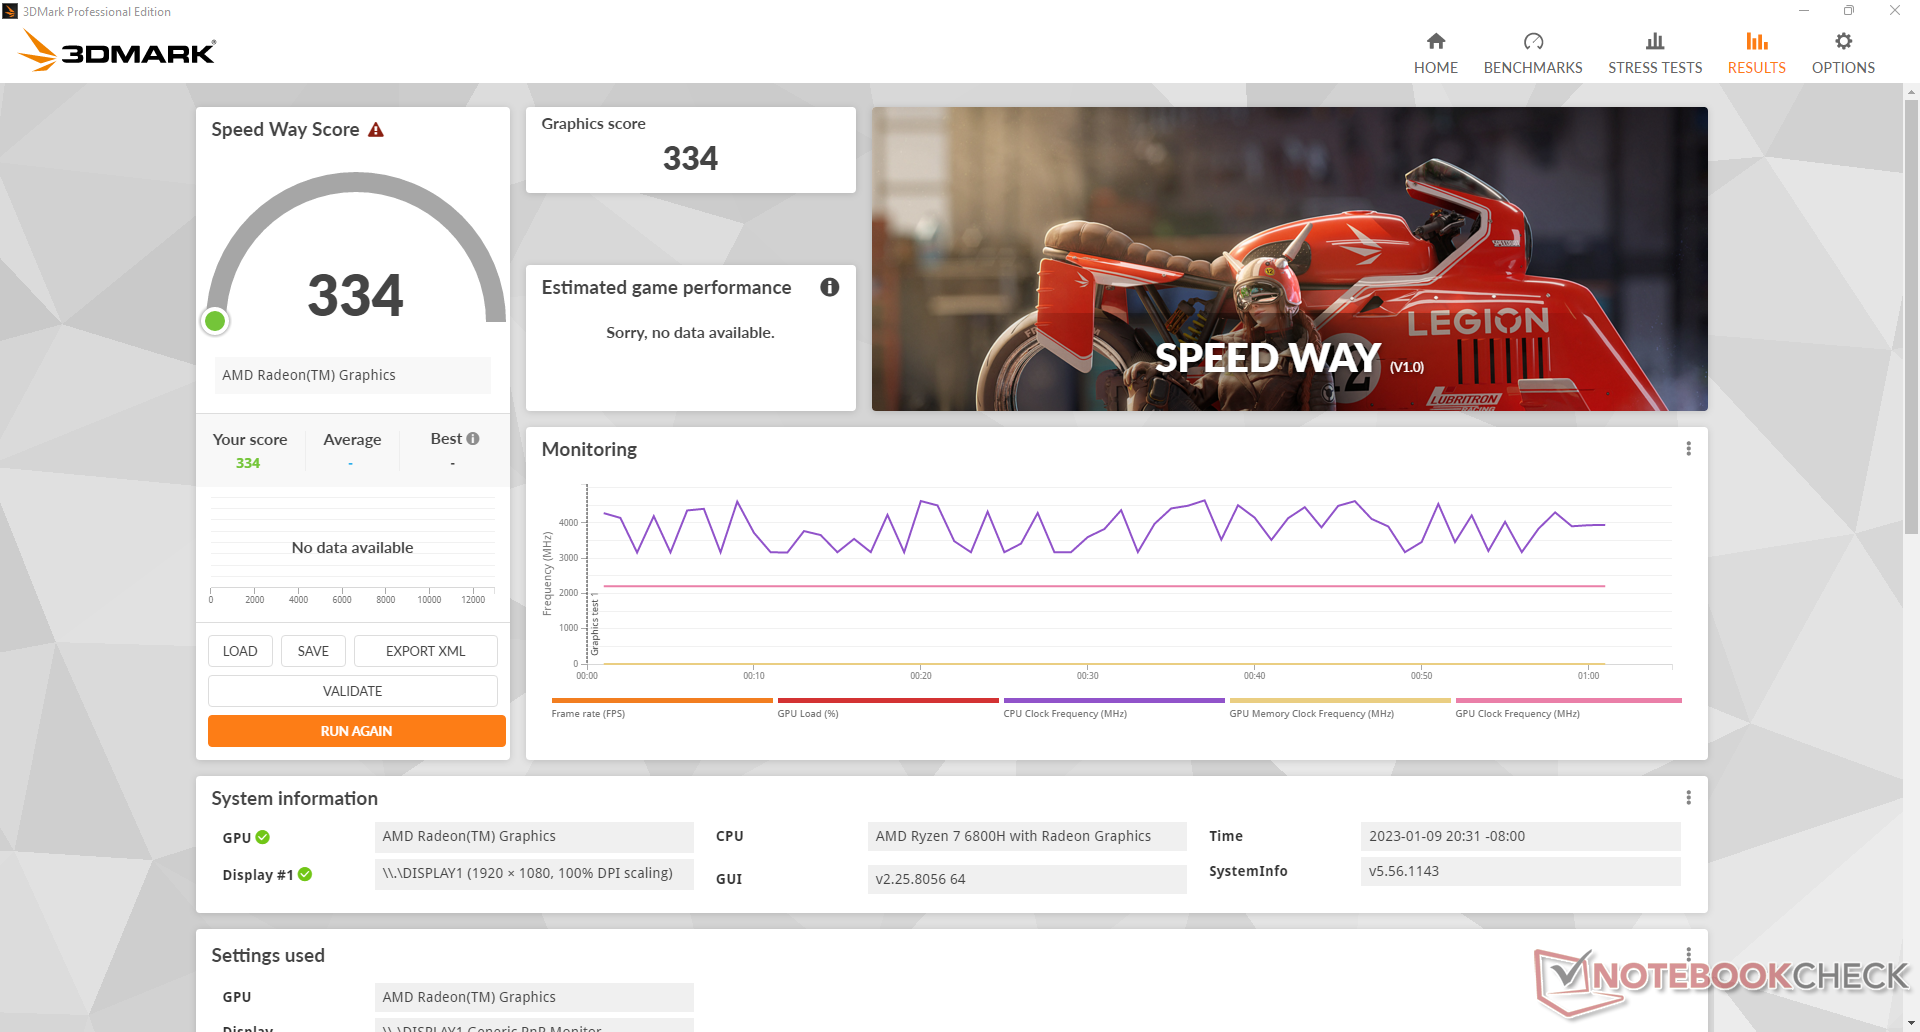
GPU-Performance
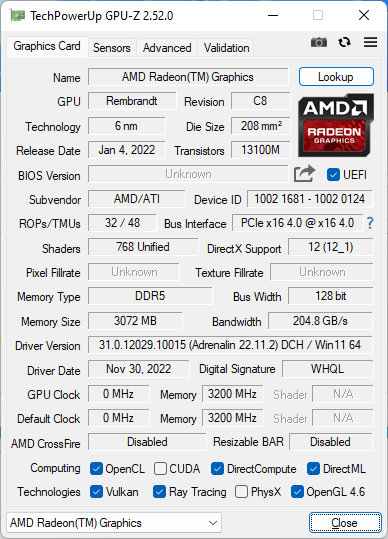
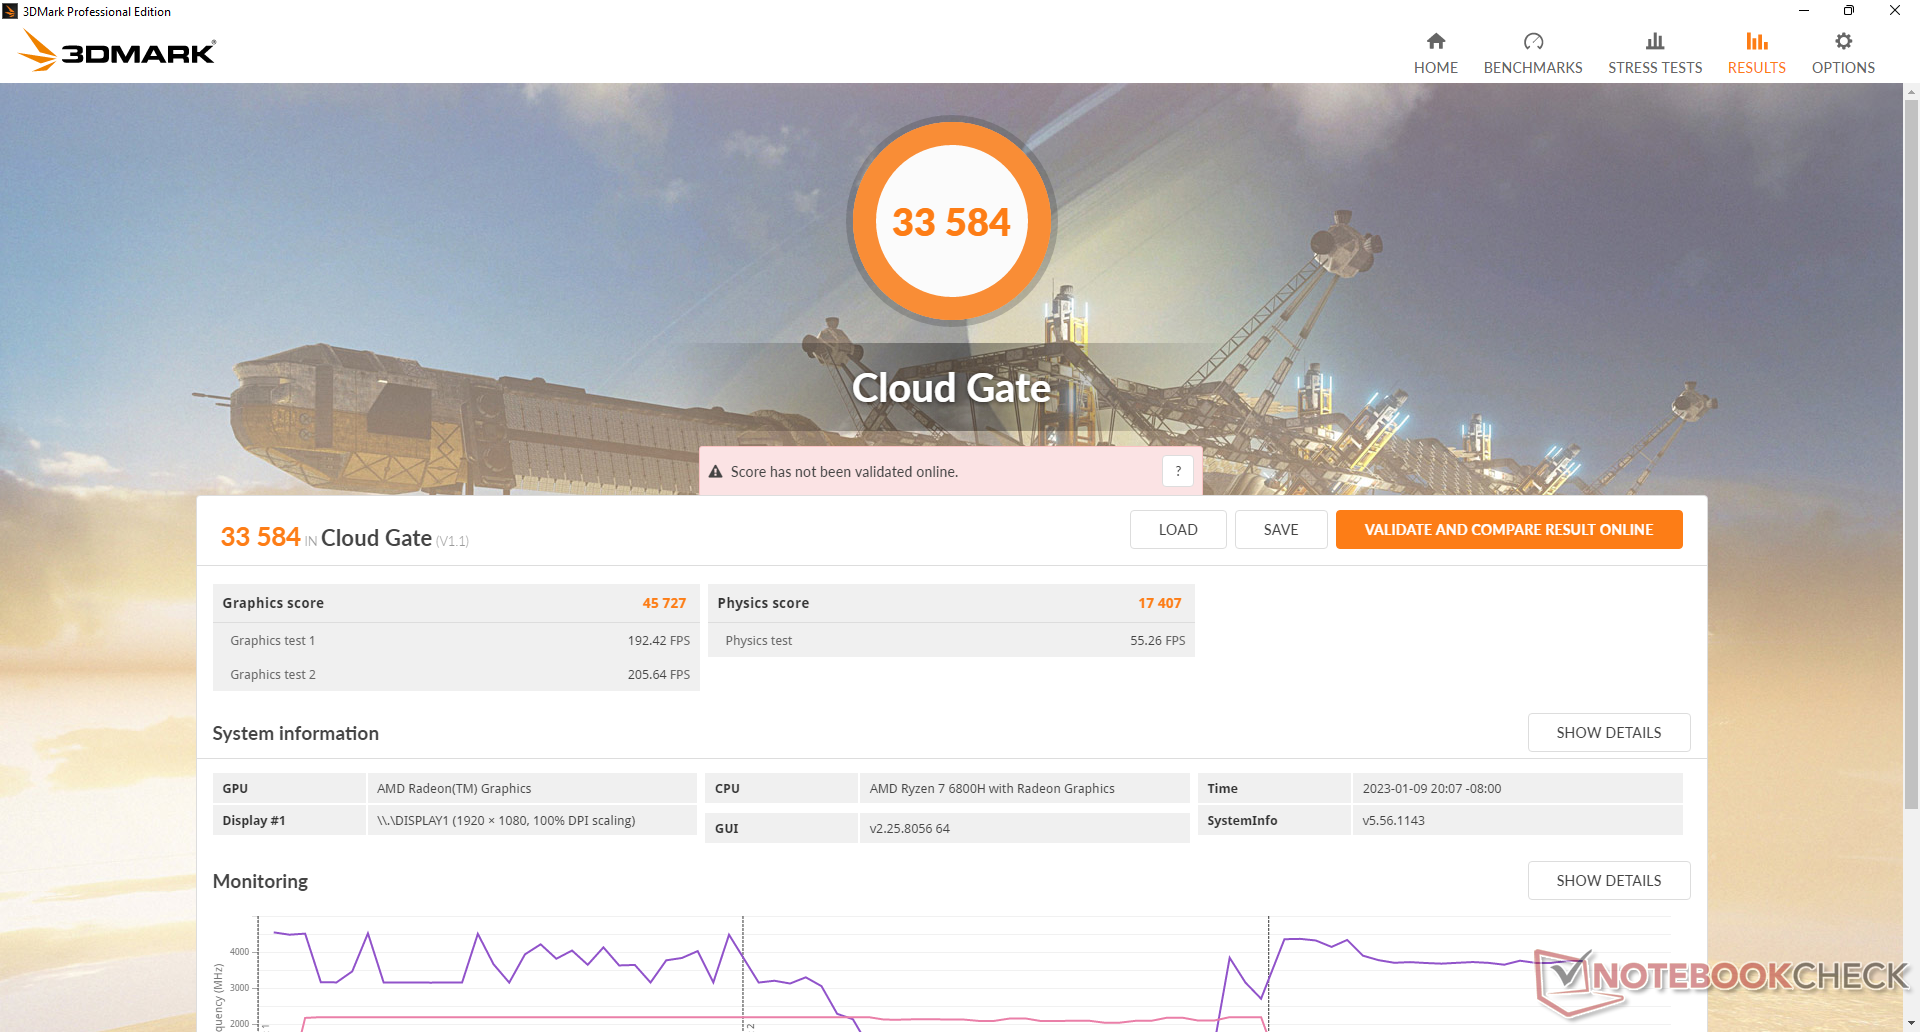
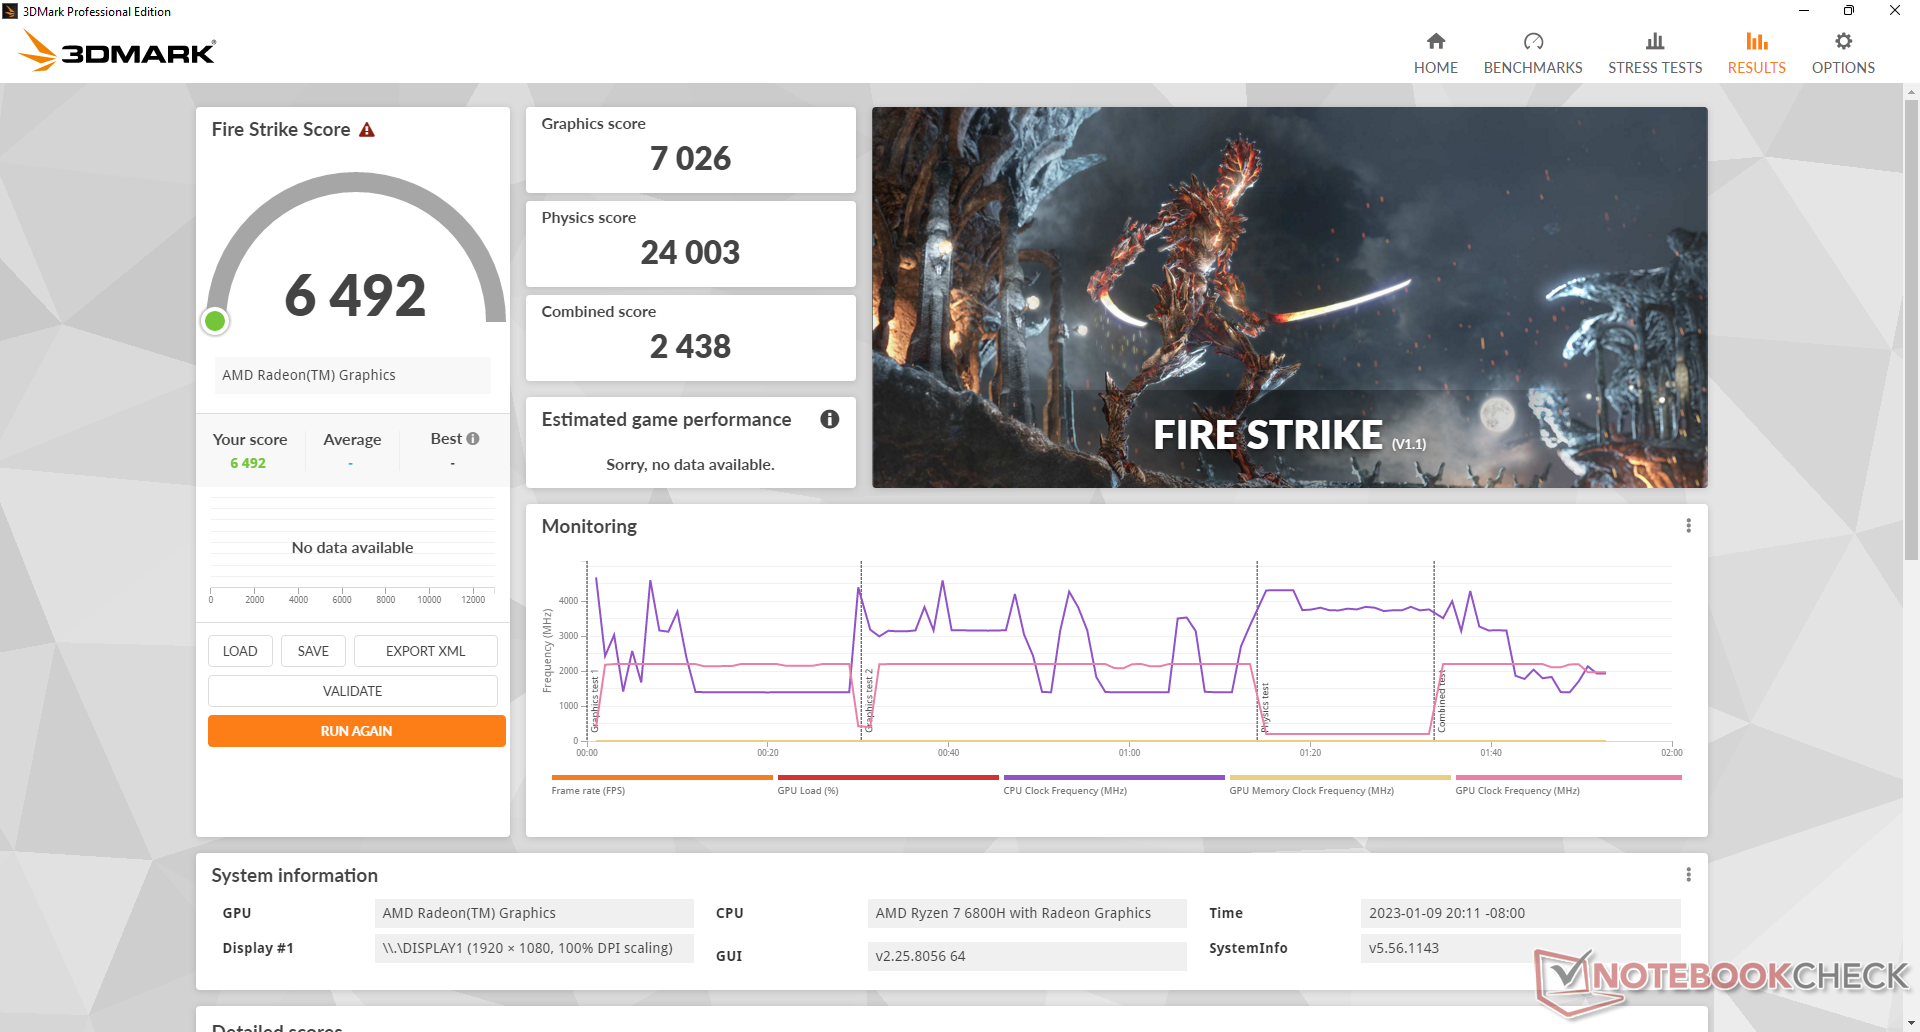
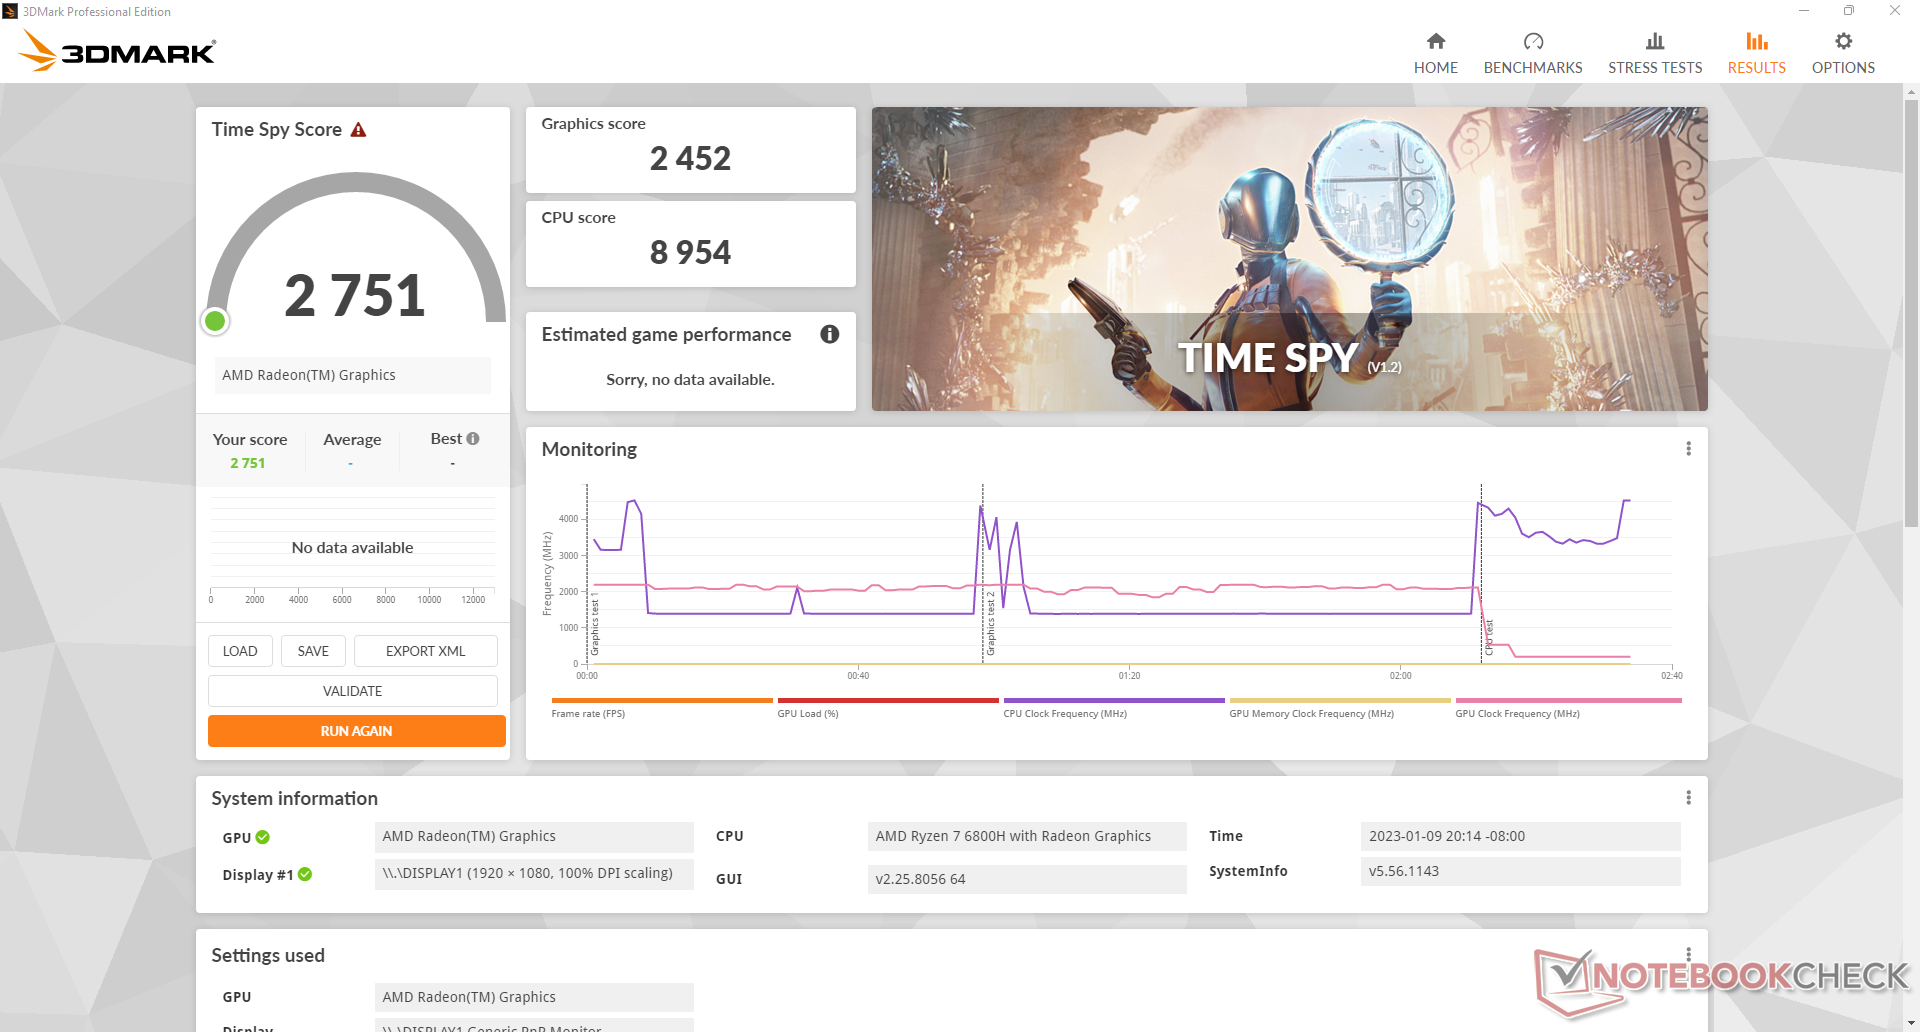
Die integrierte Radeon 680M ist ein bedeutendes Upgrade gegenüber der vorherigen Generation der Radeon RX Vega 7 oder Vega 8, die im Ryzen 5 5600H bzw. Ryzen 7 5800H zu finden ist. Die Rohleistung ist 70 bis 100 Prozent schneller, was zu einem deutlich besseren Spielerlebnis führt. Das soll nicht heißen, dass das SER6 Pro eine Gaming-Maschine ist, denn es ist immer noch über 2x langsamer als ein GeForce RTX 2060-betriebener Laptop, aber es hat genügend Leistung, um die meisten Spiele bequem mit 1.080p auf niedrigen bis mittleren Einstellungen zu spielen.
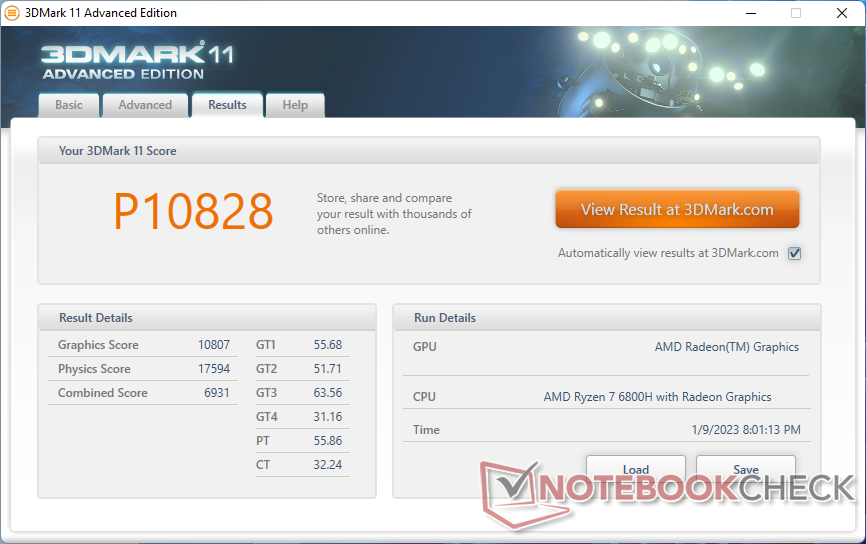
| 3DMark 11 - 1280x720 Performance GPU | |
| Minisforum Neptune Series HX90G | |
| Intel NUC11PHKi7C | |
| Intel Hades Canyon NUC8i7HVK | |
| Beelink SER6 Pro | |
| Beelink GTR6 | |
| Durchschnittliche AMD Radeon 680M (6858 - 11755, n=39) | |
| Intel NUC 12 Pro Kit NUC12WSKi7 | |
| Beelink SEi11 Pro | |
| Beelink SER Pro Ryzen 5 5600H | |
| Asus ZenBook Flip 14 UN5401QA-KN085W | |
| Minipc Union Ace Magician AMR5 | |
| Beelink SEi12 Core i5-1235U | |
| Trigkey S3 | |
| BMAX B5 Pro G7H8 | |
| Minipc Union NiPoGi CK10 - 10810U | |
| 3DMark 11 Performance | 10825 Punkte | |
| 3DMark Cloud Gate Standard Score | 33584 Punkte | |
| 3DMark Fire Strike Score | 6492 Punkte | |
| 3DMark Time Spy Score | 2751 Punkte | |
Hilfe | ||
| Blender | |
| v3.3 Classroom HIP/AMD | |
| Trigkey S3 | |
| Beelink GTR6 | |
| Durchschnittliche AMD Radeon 680M (270 - 555, n=34) | |
| Beelink SER6 Pro | |
| Minisforum Neptune Series HX90G | |
| v3.3 Classroom CPU | |
| BMAX B5 Pro G7H8 | |
| Minipc Union NiPoGi CK10 - 10810U | |
| Trigkey S3 | |
| Beelink SEi11 Pro | |
| Beelink SEi12 Core i5-1235U | |
| Beelink SER Pro Ryzen 5 5600H | |
| Intel NUC 12 Pro Kit NUC12WSKi7 | |
| Durchschnittliche AMD Radeon 680M (389 - 980, n=37) | |
| Beelink SER6 Pro | |
| Beelink GTR6 | |
| Minisforum Neptune Series HX90G | |
* ... kleinere Werte sind besser
Unser Gerät hatte Probleme, die Bildrate aufrechtzuerhalten. Im Leerlauf bei Witcher 3 fielen die Frame-Raten regelmäßig von ~80 auf ~70 fps ab, scheinbar ohne Grund. Wir erlebten sogar einen Einbruch auf bis zu 18 fps, wie die Grafik unten zeigt. Die Instabilität deutet auf eine Unterbrechung von Hintergrundaktivitäten oder eine schlechte Verwaltung von Hintergrundanwendungen hin.
Witcher 3 FPS Chart
| min. | mittel | hoch | max. | |
|---|---|---|---|---|
| GTA V (2015) | 152.3 | 139.7 | 51.9 | 23.7 |
| The Witcher 3 (2015) | 138.1 | 85.1 | 43.3 | 27 |
| Dota 2 Reborn (2015) | 143.3 | 113.4 | 83.9 | 73.1 |
| Final Fantasy XV Benchmark (2018) | 68.1 | 34.7 | 24.6 | |
| X-Plane 11.11 (2018) | 66.4 | 52.9 | 43 | |
| Strange Brigade (2018) | 141.9 | 57.8 | 48.6 | 41.9 |
| Cyberpunk 2077 1.6 (2022) | 43.3 | 33.1 | 21.3 | 17.2 |
Emissionen
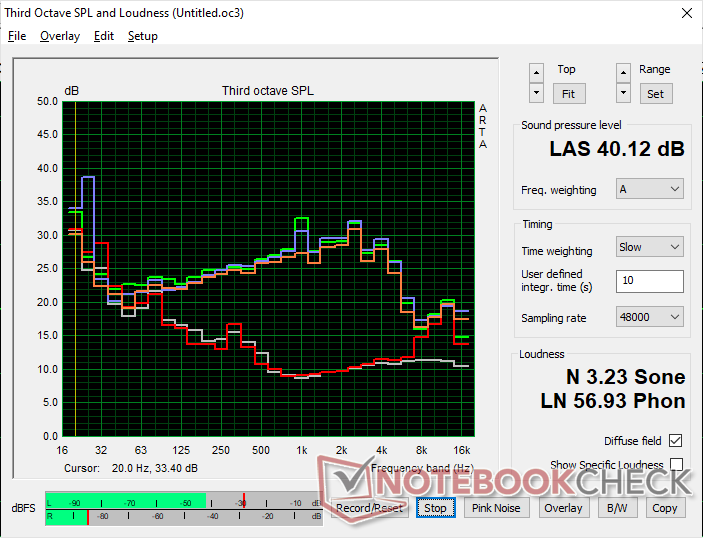
System-Rauschen
Die internen Lüfter reagieren empfindlich auf die Belastung des Bildschirms. Beim Surfen im Internet oder beim Videostreaming beispielsweise kann das Lüftergeräusch gelegentlich kurzzeitig auf 33 dB(A) ansteigen. Das Lüftergeräusch erreicht auch schneller als bei den meisten anderen Mini-PCs sein Maximum von etwa 40 dB(A).
Wir haben bei unserem Testgerät leichte elektronische Geräusche oder Spulenfiepen wahrgenommen. So konnten wir ein Geräusch von 24,1 dB(A) gegen einen leisen Hintergrund von 22,8 dB(A) aufzeichnen, selbst wenn der Lüfter im Leerlauf war.
Lautstärkediagramm
| Idle |
| 24.1 / 24.1 / 33.8 dB(A) |
| Last |
| 40.1 / 40.1 dB(A) |
 | ||
30 dB leise 40 dB(A) deutlich hörbar 50 dB(A) störend |
||
min: | ||
| Beelink SER6 Pro Radeon 680M, R7 6800H, Kingston NV2 500GB SNV2S/500G | Beelink GTR6 Radeon 680M, R9 6900HX, Kingston KC3000 512G SKC3000S512G | Beelink SEi11 Pro Iris Xe G7 96EUs, i5-11320H, Kingston NV1 SNVS/500GCN | Intel NUC 12 Pro Kit NUC12WSKi7 Iris Xe G7 96EUs, i7-1260P, Transcend M.2 SSD 2200S TS512GMTE220S | Intel NUC11PHKi7C GeForce RTX 2060 Mobile, i7-1165G7, Samsung SSD 980 Pro 500GB MZ-V8P500BW | Intel Hades Canyon NUC8i7HVK Vega M GH, i7-8809G, Intel Optane 120 GB SSDPEK1W120GA | |
|---|---|---|---|---|---|---|
| Geräuschentwicklung | -3% | 8% | -18% | -1% | -11% | |
| aus / Umgebung * (dB) | 22.8 | 23.2 -2% | 22.8 -0% | 30.4 -33% | 24.5 -7% | 28.7 -26% |
| Idle min * (dB) | 24.1 | 23.6 2% | 24.7 -2% | 33.1 -37% | 25.3 -5% | 29 -20% |
| Idle avg * (dB) | 24.1 | 23.8 1% | 24.7 -2% | 33.1 -37% | 25.3 -5% | 29 -20% |
| Idle max * (dB) | 33.8 | 36.2 -7% | 25.3 25% | 33.1 2% | 25.3 25% | 29 14% |
| Last avg * (dB) | 40.1 | 39.7 1% | 33.2 17% | 38.1 5% | 36.4 9% | 36 10% |
| Witcher 3 ultra * (dB) | 38.7 | 41 -6% | 34.5 11% | 39.7 -3% | 42 -9% | |
| Last max * (dB) | 40.1 | 43 -7% | 37.8 6% | 43.6 -9% | 47.9 -19% | 49.4 -23% |
* ... kleinere Werte sind besser
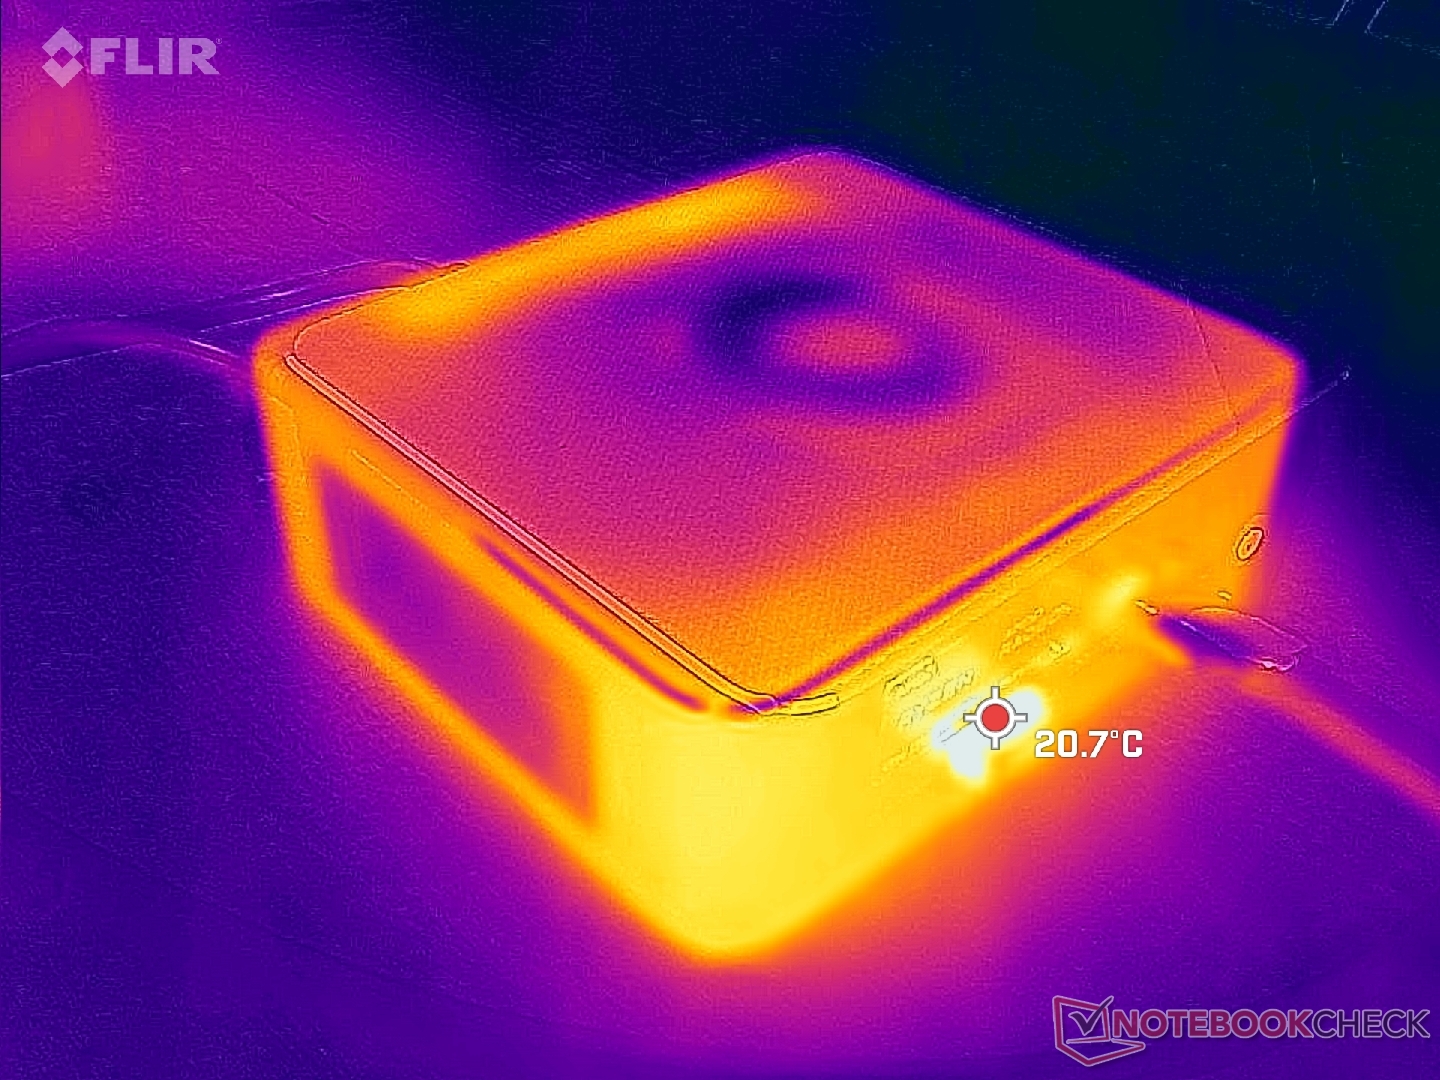
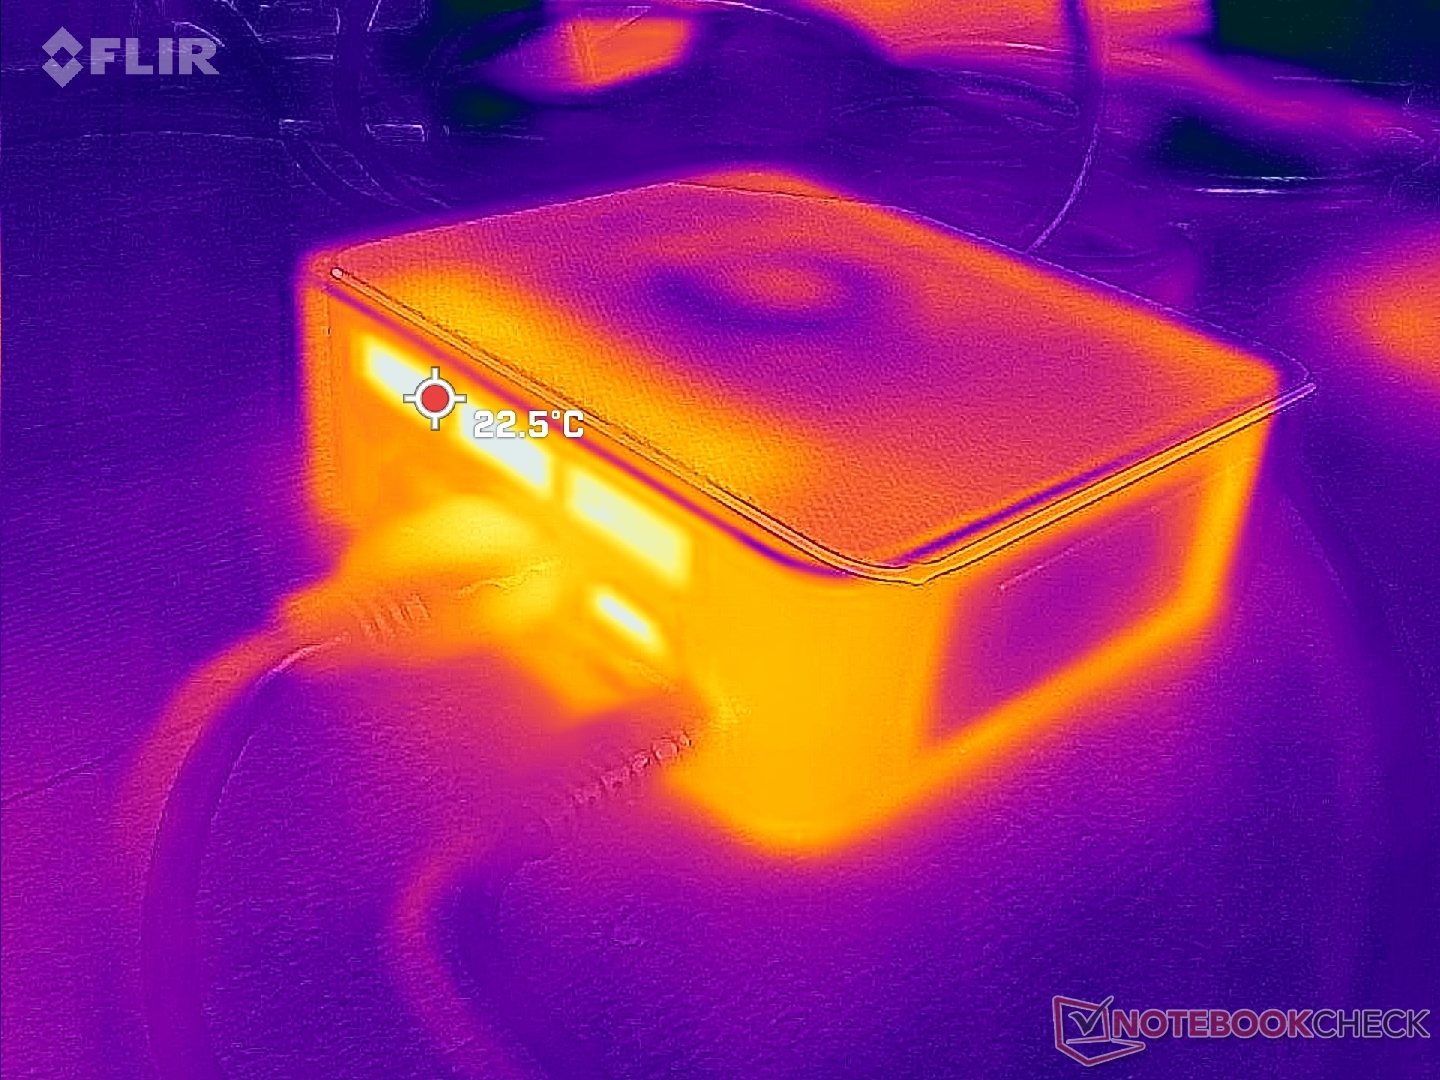
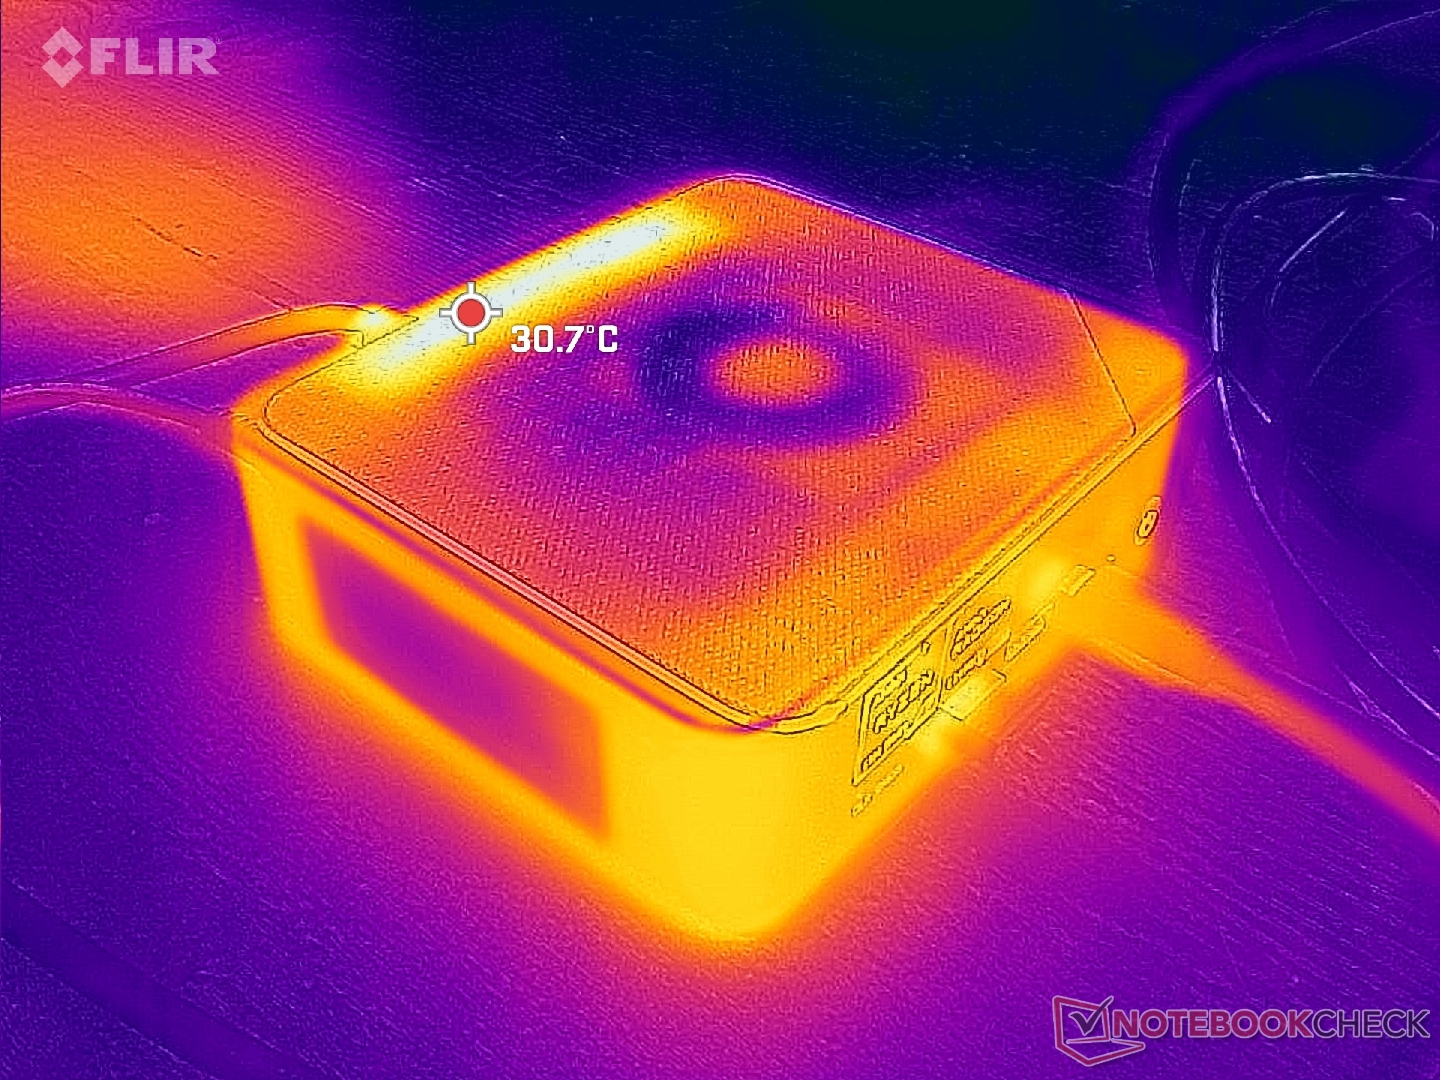
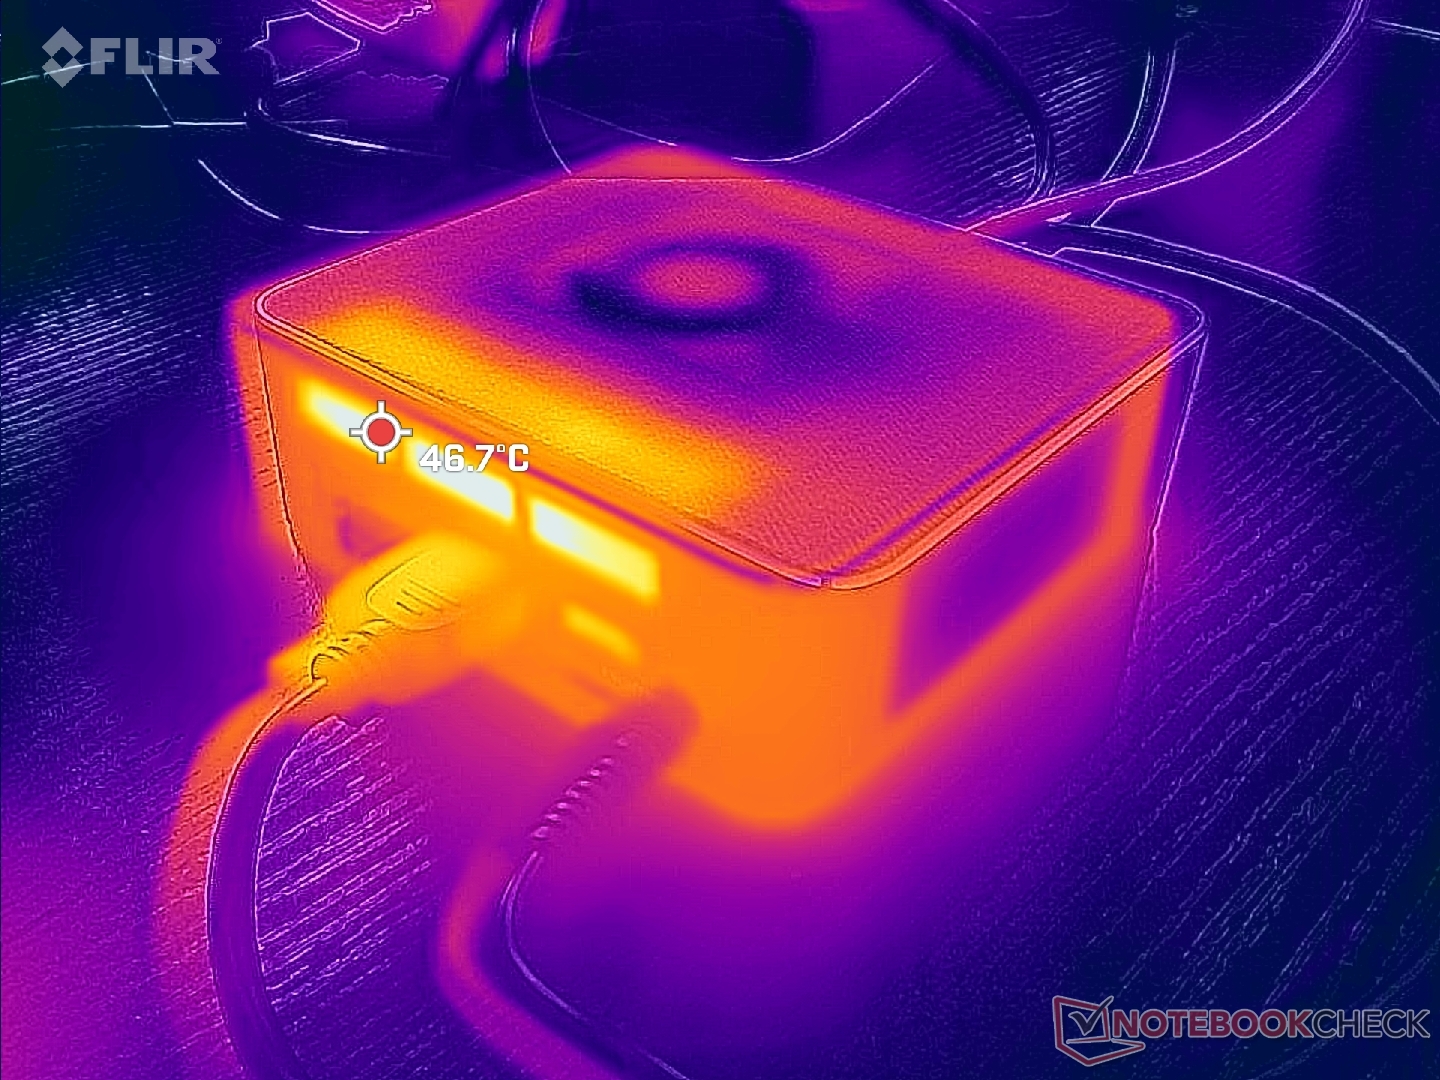
Temperatur
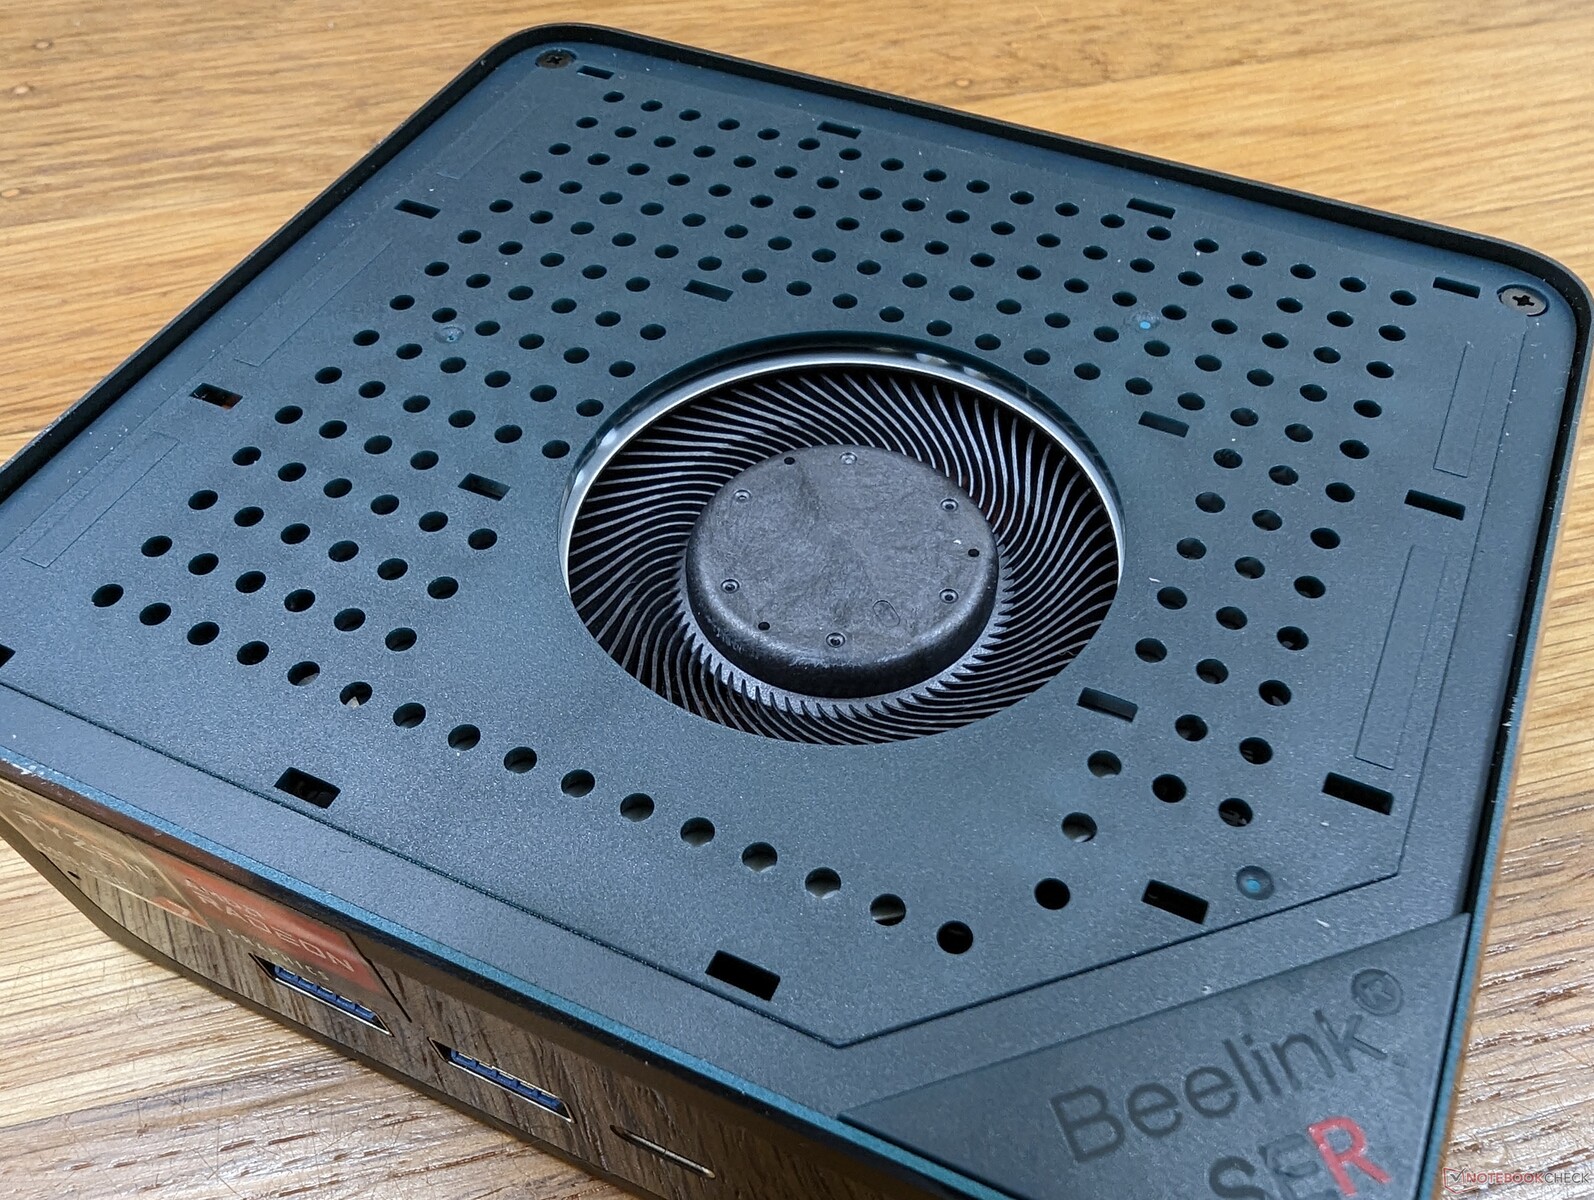
Oberflächentemperaturen sind kein Thema. Im Gegensatz zu vielen anderen Mini-PCs ist das SER6 Pro mit zwei Lüftern ausgestattet, um die Kühlung zu verbessern. Kühle Luft strömt an den Seiten und oben ein, während heiße Luft an der Rückseite austritt. Wenn Sie Gegenstände auf dem Mini-PC platzieren oder ihn vertikal aufstellen, wird der Luftstrom daher etwas behindert.
Stresstest
Bei der Ausführung von Prime95 bei Stress auf der CPU, stiegen die Taktraten und die Leistungsaufnahme des Boards auf 3,3 GHz bzw. 45 W an, was nur wenige Sekunden lang anhielt. Danach stabilisierte sich die CPU schnell bei 3 GHz, 38 W und 82 °C. Die Wiederholung desselben Tests auf dem Beelink SEi11, der mit dem langsameren Core i5-11320H betrieben wird, ergibt eine wärmere Kerntemperatur von 89 °C.
Bei der Ausführung von Witcher 3, um typische Spiellasten darzustellen, stabilisieren sich die GPU-Taktrate und die Temperatur bei 1.956 MHz bzw. 70 °C, verglichen mit 83 °C beim SEi11. Die SER6 Pro ist nicht nur schneller, sondern läuft auch kühler.
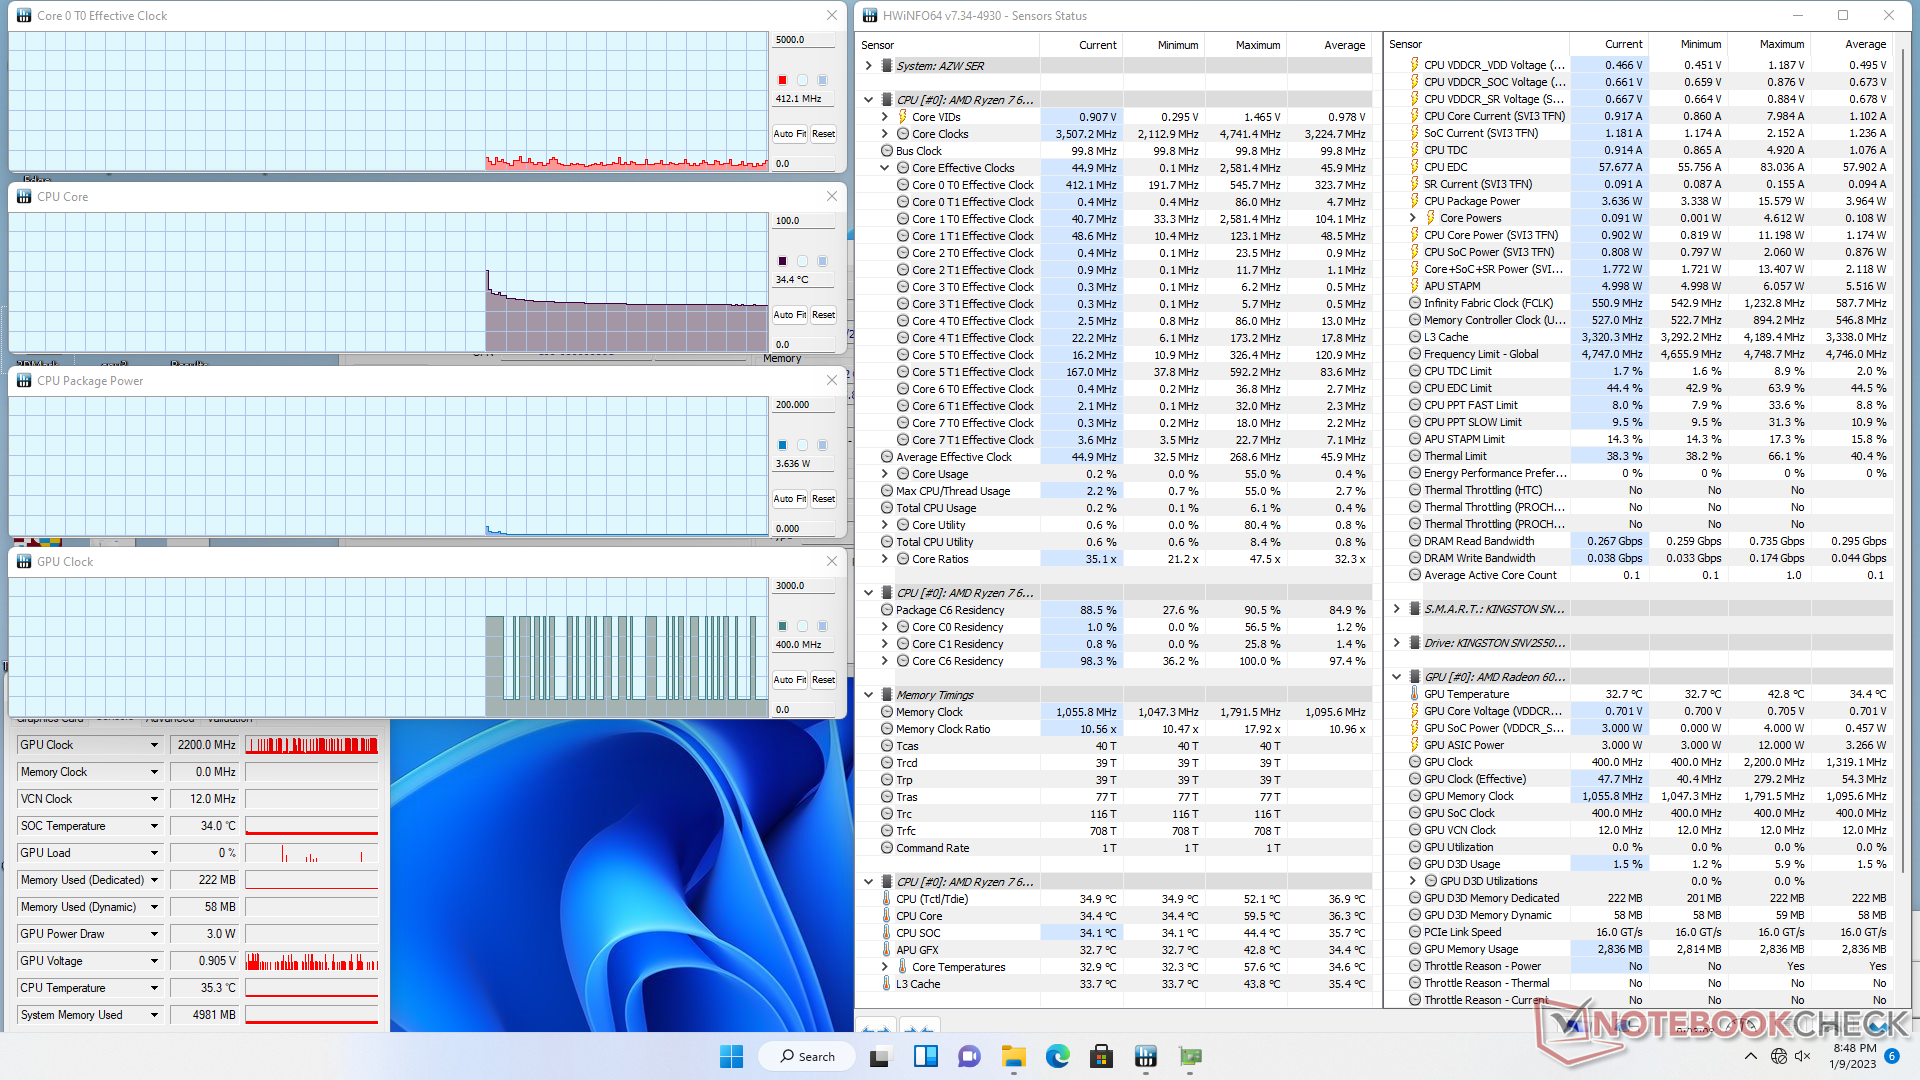
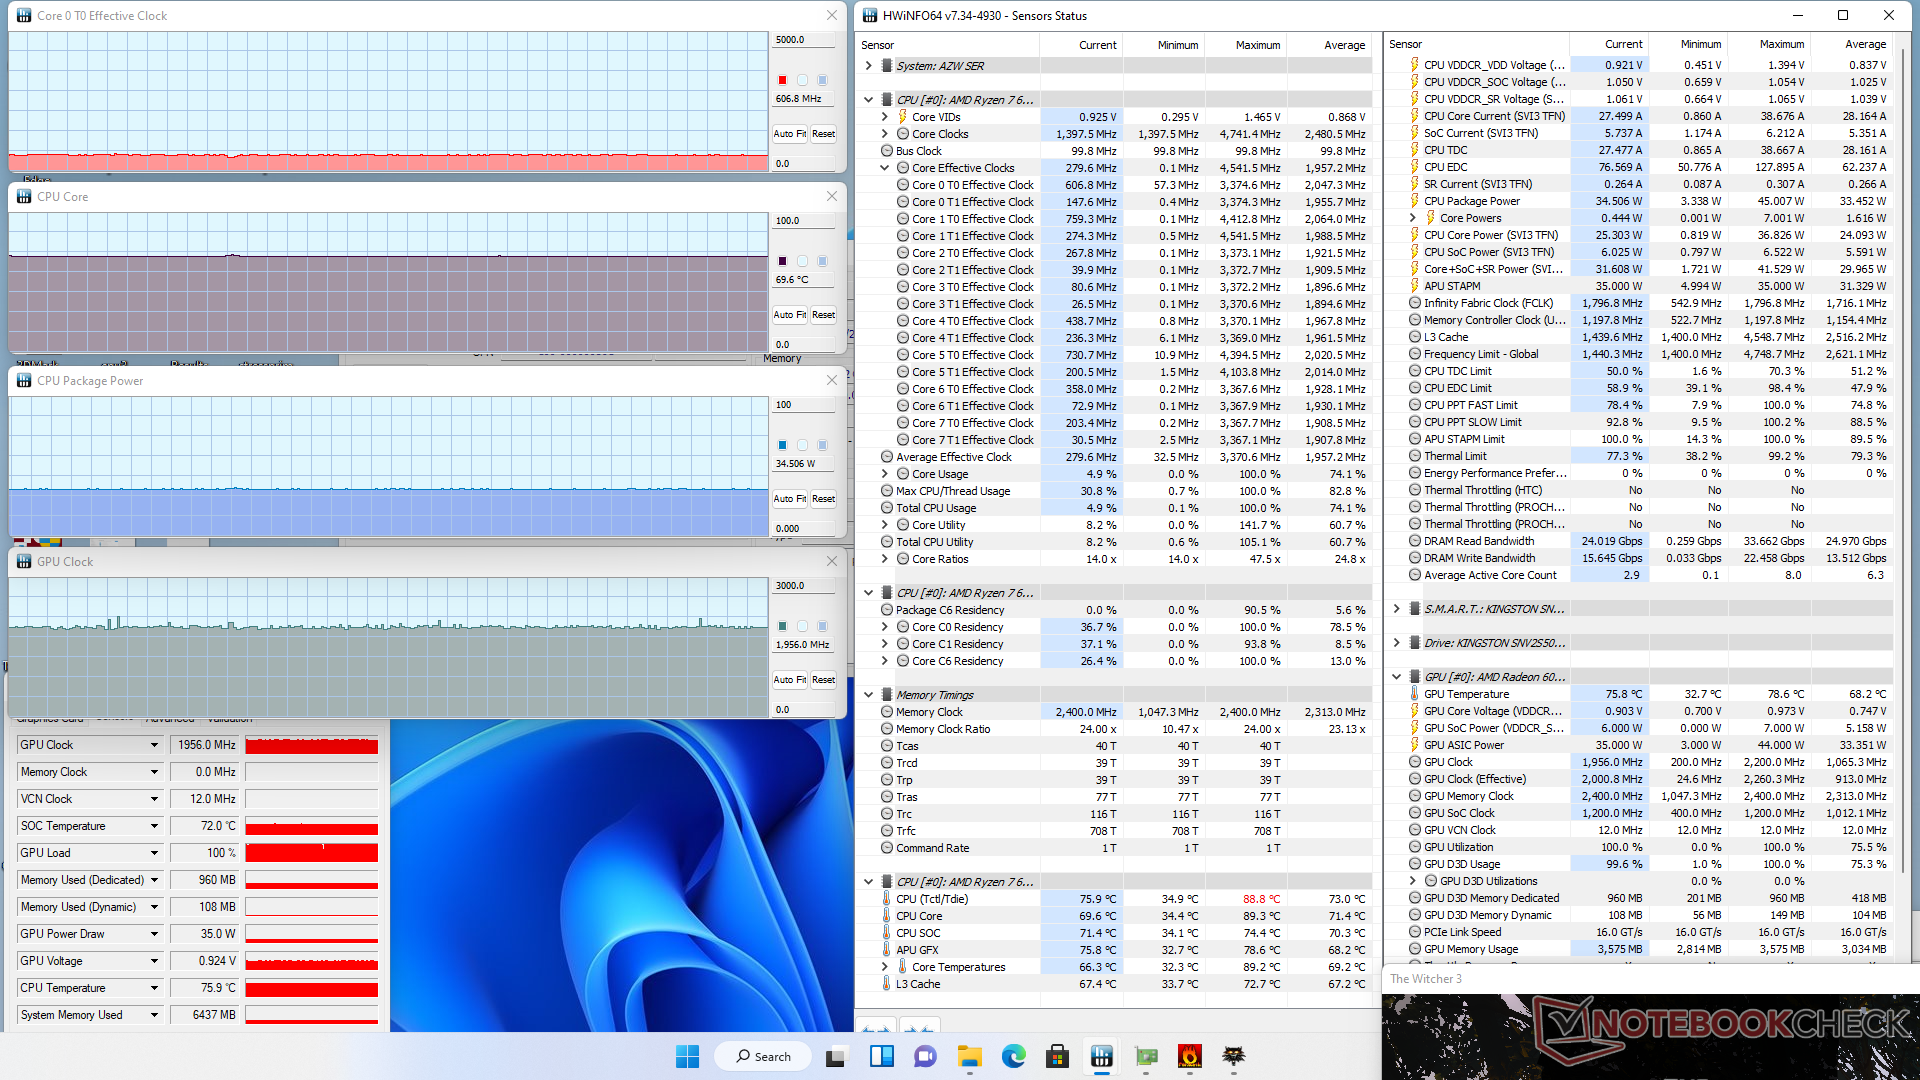
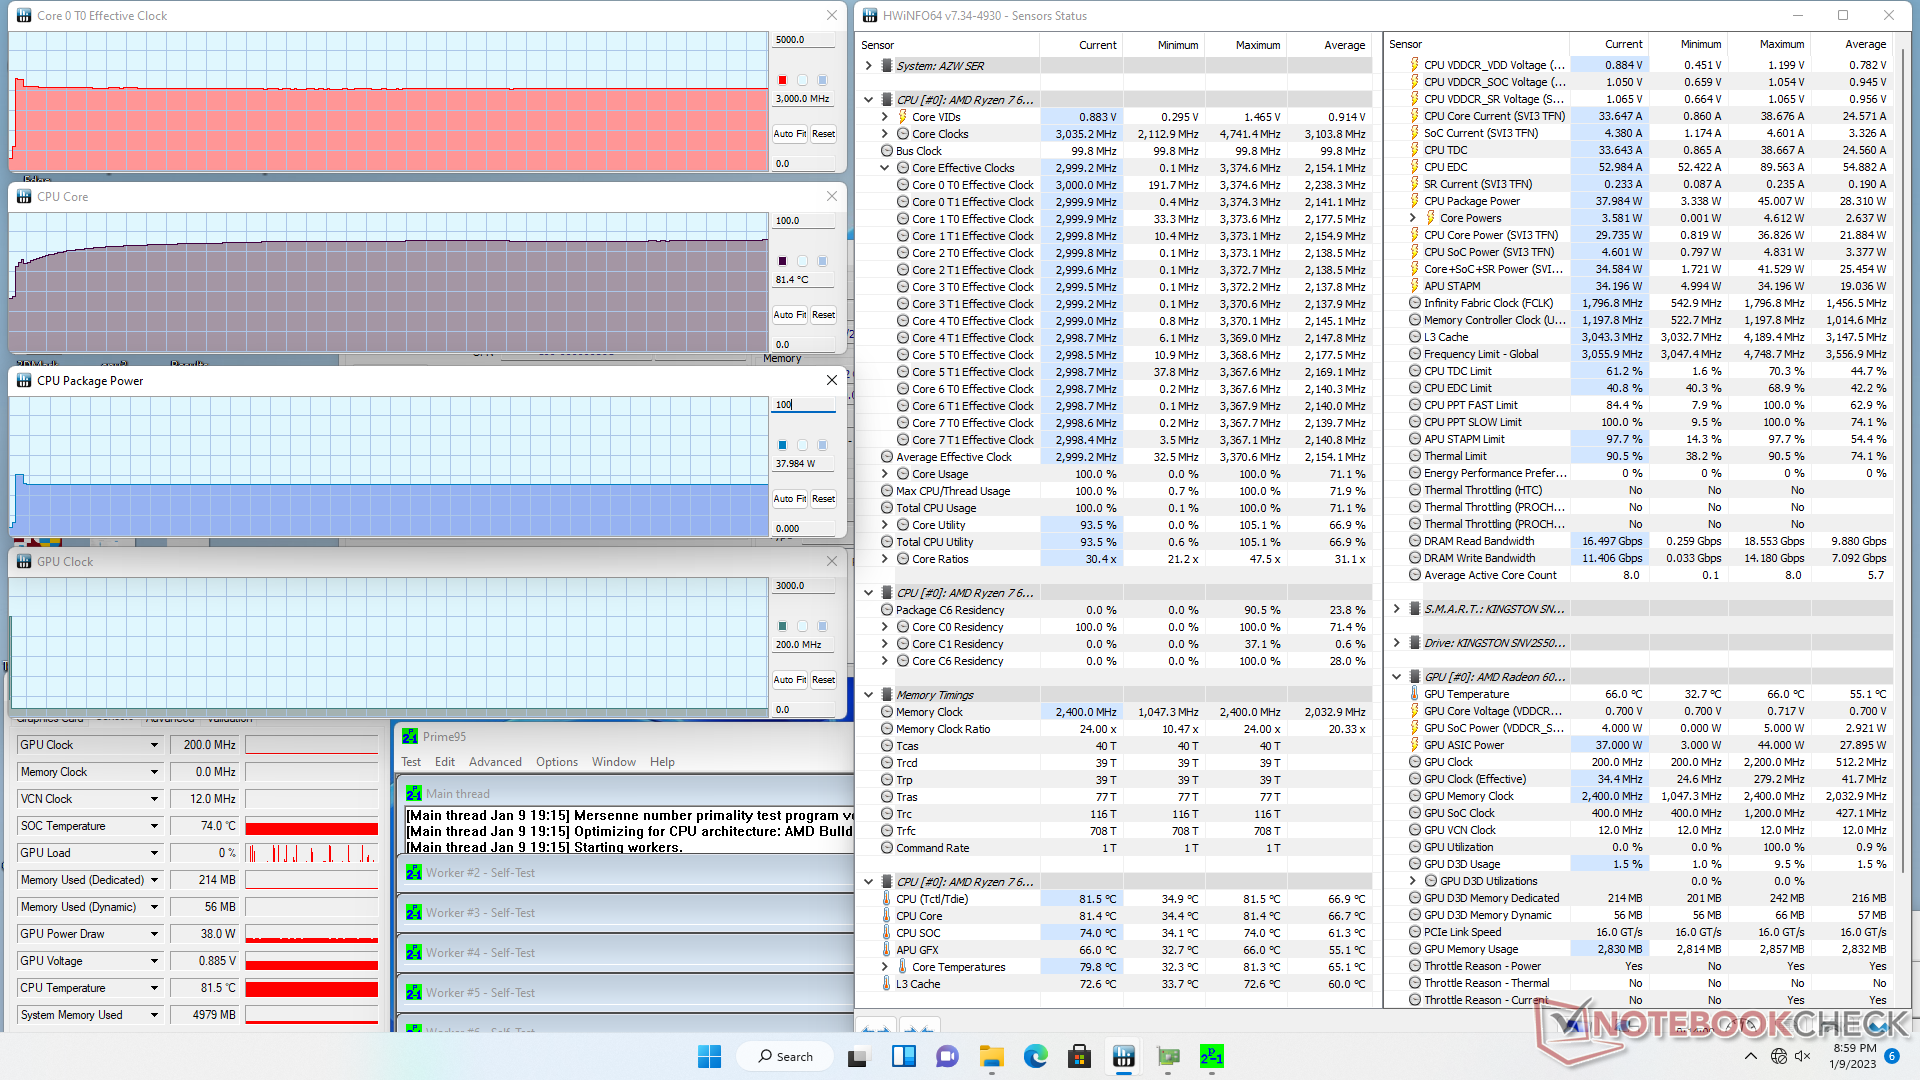
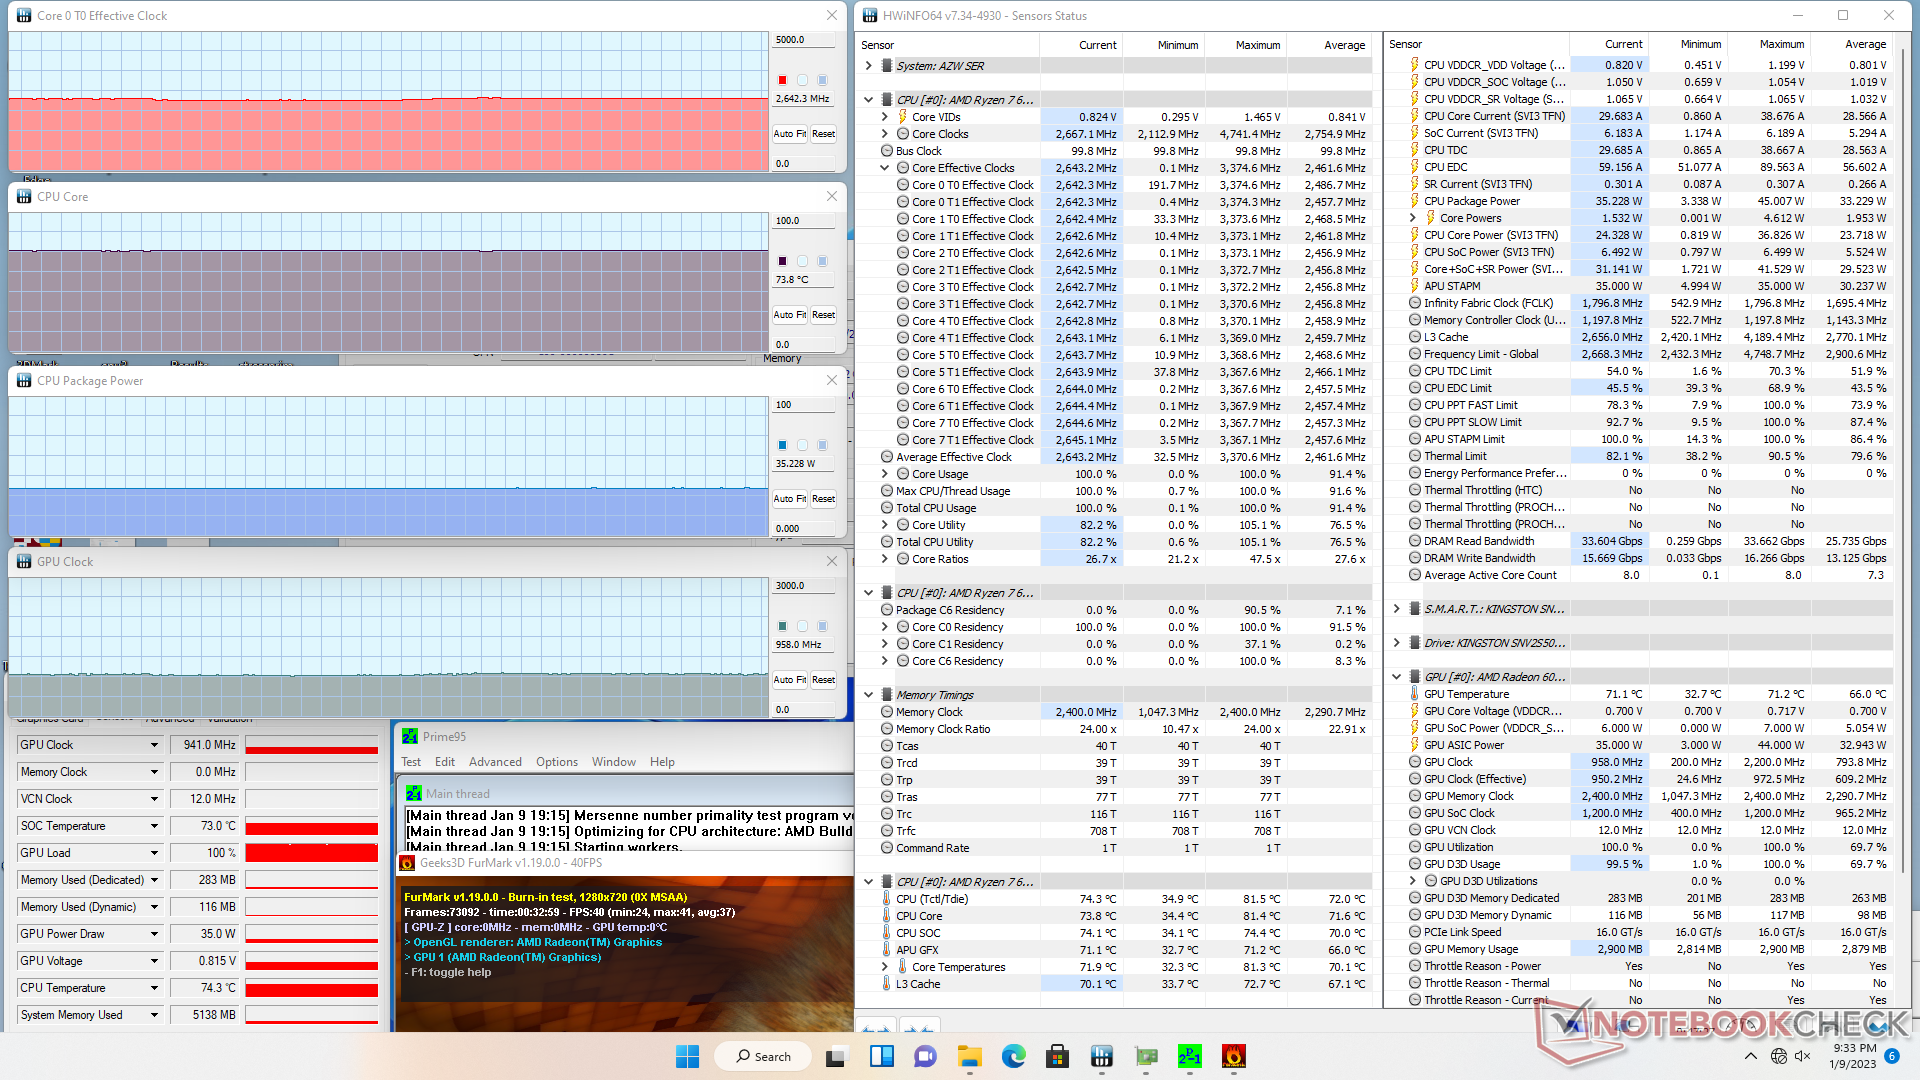
| CPU-Takt (GHz) | GPU-Takt (MHz) | durchschnittliche CPU-Temperatur (°C) | |
| System Leerlauf | -- | -- | 34 |
| Prime95, Stress | 3,0 | -- | 82 |
| Prime95 + FurMark, Stress | 2,7 | 941 | 74 |
| Witcher 3, Stress | ~0,6 | 1.956 | 70 |
Energieverwaltung
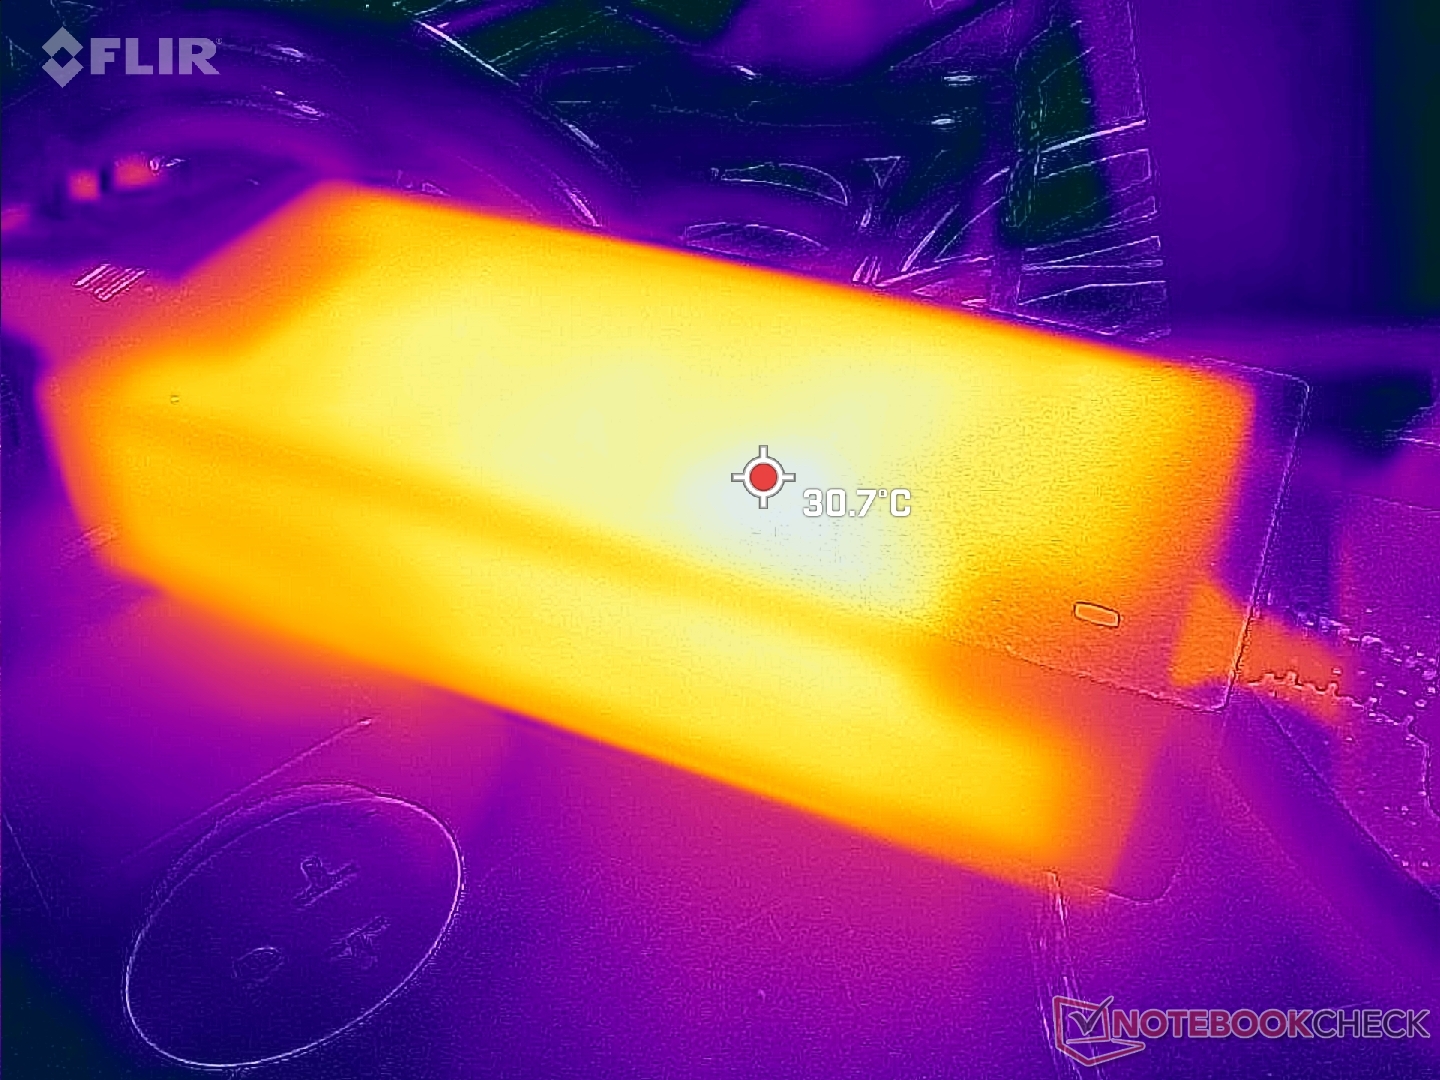
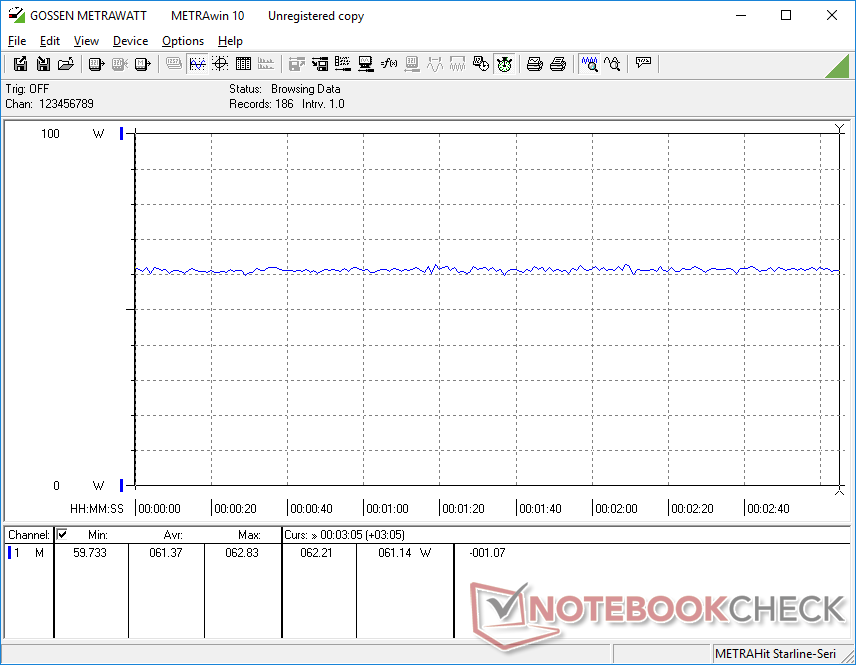
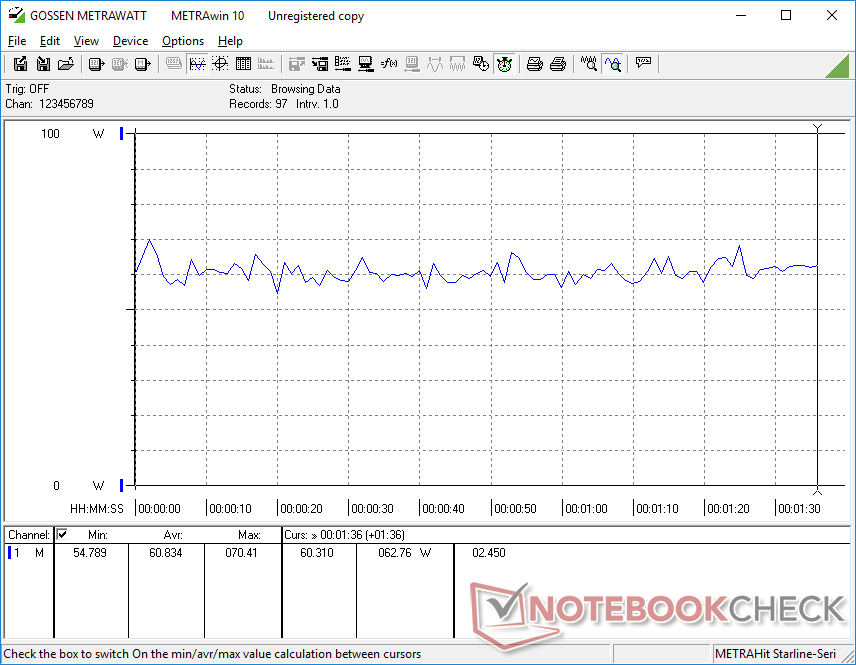
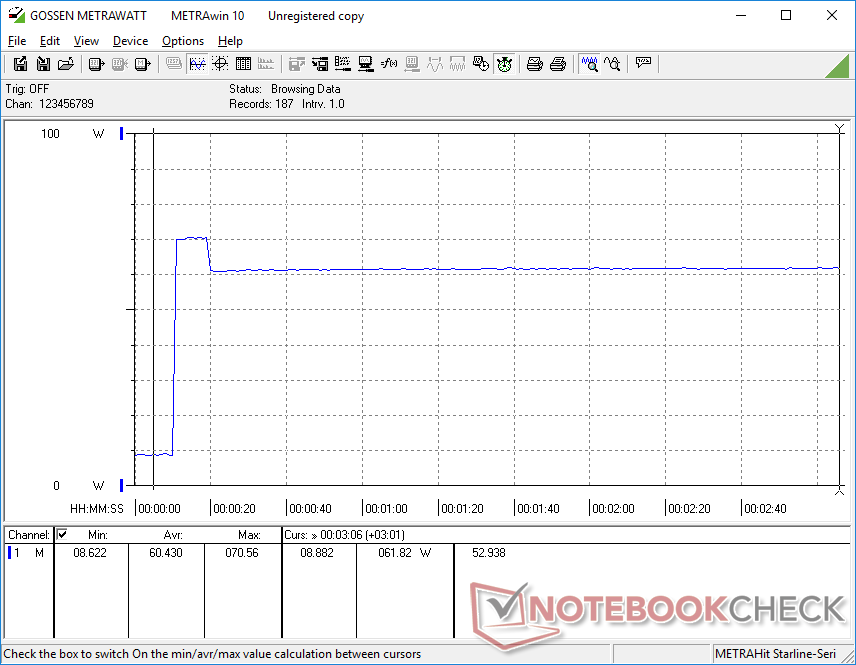
Stromverbrauch
Der Stromverbrauch beim Spielen ist etwa 33 Prozent höher als beim SER5 Pro, das mit der letzten Generation Ryzen 5 5600H betrieben wird, und auch etwas höher als beim SEi11 Pro, der mit einer Intel-Core-H-Series-CPU der 12. Generation ausgestattet ist. Wenn man bedenkt, dass unsere Radeon 680M bis zu zweimal mehr Leistung als die Radeon RX Vega 7 bieten kann, ist der höhere Stromverbrauch jedoch sicherlich lohnenswert. Der Leerlauf auf dem Desktop verbraucht trotz der verbesserten Grafik immer noch genauso viel Strom wie das letztjährige Modell.
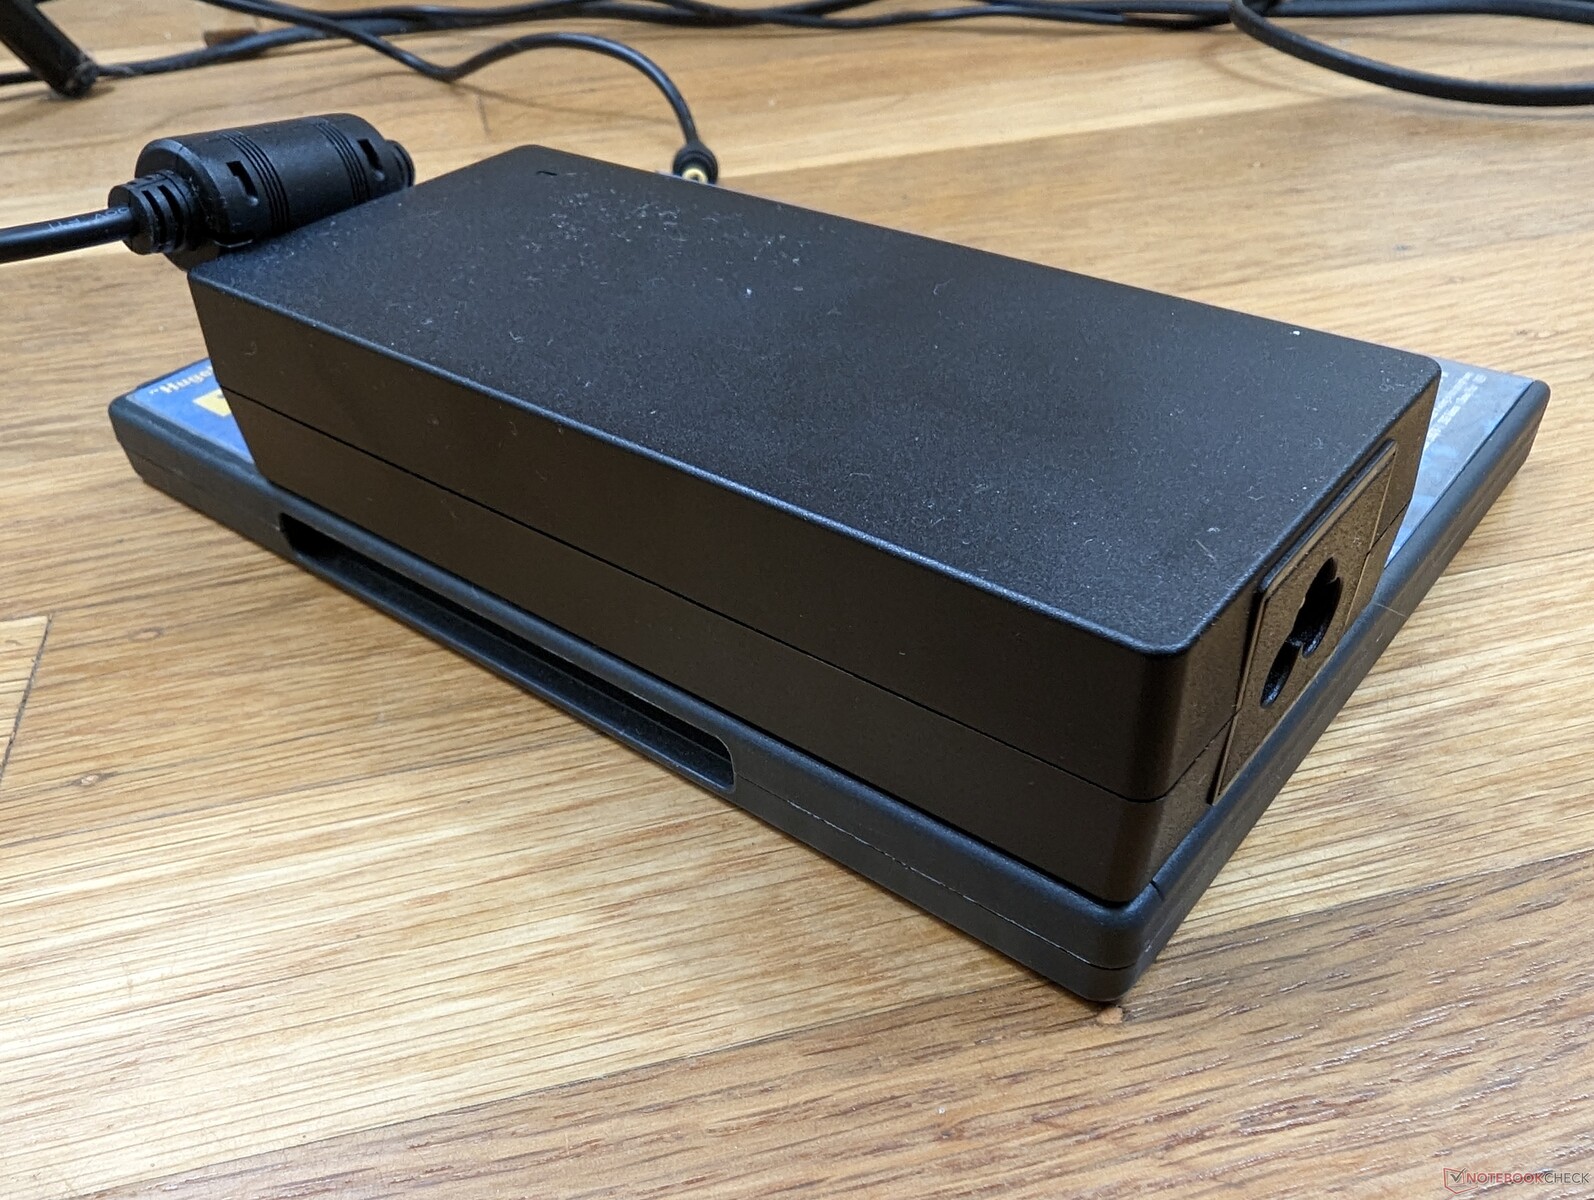
Bei einer 100-prozentigen Auslastung der CPU können wir eine maximale Leistungsaufnahme von 72 W aus dem 120-Watt-Netzteil verzeichnen. Der hohe Overhead ermöglicht es dem Mini-PC, bestimmte USB-C-Geräte auf Kosten eines sperrigen Netzteils mit Strom zu versorgen oder zu laden.

| Aus / Standby | |
| Idle | |
| Last |
|
Legende:
min: | |
| Beelink SER6 Pro R7 6800H, Radeon 680M, Kingston NV2 500GB SNV2S/500G, , x, | Beelink SER Pro Ryzen 5 5600H R5 5600H, Vega 7, Kingston NV1 SNVS/500GCN, , x, | Beelink SEi11 Pro i5-11320H, Iris Xe G7 96EUs, Kingston NV1 SNVS/500GCN, , x, | Intel NUC 12 Pro Kit NUC12WSKi7 i7-1260P, Iris Xe G7 96EUs, Transcend M.2 SSD 2200S TS512GMTE220S, , x, | Intel NUC11PHKi7C i7-1165G7, GeForce RTX 2060 Mobile, Samsung SSD 980 Pro 500GB MZ-V8P500BW, , x, | Intel Hades Canyon NUC8i7HVK i7-8809G, Vega M GH, Intel Optane 120 GB SSDPEK1W120GA, , x, | |
|---|---|---|---|---|---|---|
| Stromverbrauch | 19% | -3% | -35% | -93% | -91% | |
| Idle min * (Watt) | 8.3 | 5.4 35% | 9.8 -18% | 12.1 -46% | 5.8 30% | 15.5 -87% |
| Idle avg * (Watt) | 8.4 | 8.2 2% | 10.3 -23% | 12.2 -45% | 5.9 30% | 16.2 -93% |
| Idle max * (Watt) | 8.7 | 8.3 5% | 10.5 -21% | 12.3 -41% | 20.7 -138% | 16.5 -90% |
| Last avg * (Watt) | 60.8 | 49.3 19% | 54.2 11% | 64 -5% | 130.8 -115% | 83.4 -37% |
| Witcher 3 ultra * (Watt) | 61.4 | 46.1 25% | 53.1 14% | 154.4 -151% | 121.7 -98% | |
| Last max * (Watt) | 72 | 50.2 30% | 59 18% | 98.8 -37% | 225.2 -213% | 173.5 -141% |
* ... kleinere Werte sind besser
Power Consumption Witcher 3 / Stresstest
Power Consumption external Monitor
Pro
Contra
Fazit - Ein starker Hit
Der SER6 Pro hat viele der gleichen Vor- und Nachteile wie der aktuelle GTR6. Insbesondere ist die Leistung im Vergleich zu anderen Mini-PCs mit integrierter Grafik besonders stark, doch sowohl das Lüftergeräusch als auch der Stromverbrauch sind lauter bzw. etwas höher. Die beiden Hauptnachteile schmälern jedoch nicht den unglaublichen Wert, den Käufer erhalten: 32 GB RAM, 500-GB-NVMe-SSD, Windows 11 Pro und einen der schnellsten Mini-PCs mit integrierter Grafik - und das alles für nur 650 US-Dollar.
Der Beelink SER6 Pro schlägt einen gleichwertigen Intel-Core-NUC der U-Serie sowohl in Bezug auf die Leistung als auch auf das Preis-Leistungs-Verhältnis bei Weitem.
Für zukünftige Überarbeitungen wünschen wir uns ein kleineres Netzteil und nur einen großen internen Lüfter anstelle von zwei kleineren. Das aktuelle Netzteil ist schwerer als der Mini-PC selbst, und ein größerer Lüfter würde zu einem leiseren und weniger auffälligen Lüftergeräusch führen. Benutzer sollten auch auf mögliche Probleme mit der Stabilität der Bildrate bei Spielen achten. Abgesehen davon hat Beelink mit seinen Mini-PCs der SEi- und SER-Serien sowohl in Bezug auf die Leistung als auch als auch beim Preis-Leistungs-Verhältnis einen Volltreffer gelandet.
Preis und Verfügbarkeit
Im Beelink Store bei Amazon ist unsere exakte SER6-Pro-Konfiguration derzeit für 699 Euro erhältlich.
Transparenz
Die Auswahl der zu testenden Geräte erfolgt innerhalb der Redaktion. Das vorliegende Testmuster wurde dem Autor vom Hersteller oder einem Shop zu Testzwecken leihweise zur Verfügung gestellt. Eine Einflussnahme des Leihstellers auf den Testbericht gab es nicht, der Hersteller erhielt keine Version des Reviews vor der Veröffentlichung. Es bestand keine Verpflichtung zur Publikation. Als eigenständiges, unabhängiges Unternehmen unterliegt Notebookcheck keiner Diktion von Herstellern, Shops und Verlagen.
So testet Notebookcheck
Pro Jahr werden von Notebookcheck hunderte Laptops und Smartphones unabhängig in von uns standardisierten technischen Verfahren getestet, um eine Vergleichbarkeit aller Testergebnisse zu gewährleisten. Seit rund 20 Jahren entwickeln wir diese Testmethoden kontinuierlich weiter und setzen damit Branchenstandards. In unseren Testlaboren kommt ausschließlich hochwertiges Messequipment in die Hände erfahrener Techniker und Redakteure. Die Tests unterliegen einer mehrstufigen Kontrolle. Unsere komplexe Gesamtbewertung basiert auf hunderten fundierten Messergebnissen und Benchmarks, womit Ihnen Objektivität garantiert ist. Weitere Informationen zu unseren Testmethoden gibt es hier.
Preisvergleich

