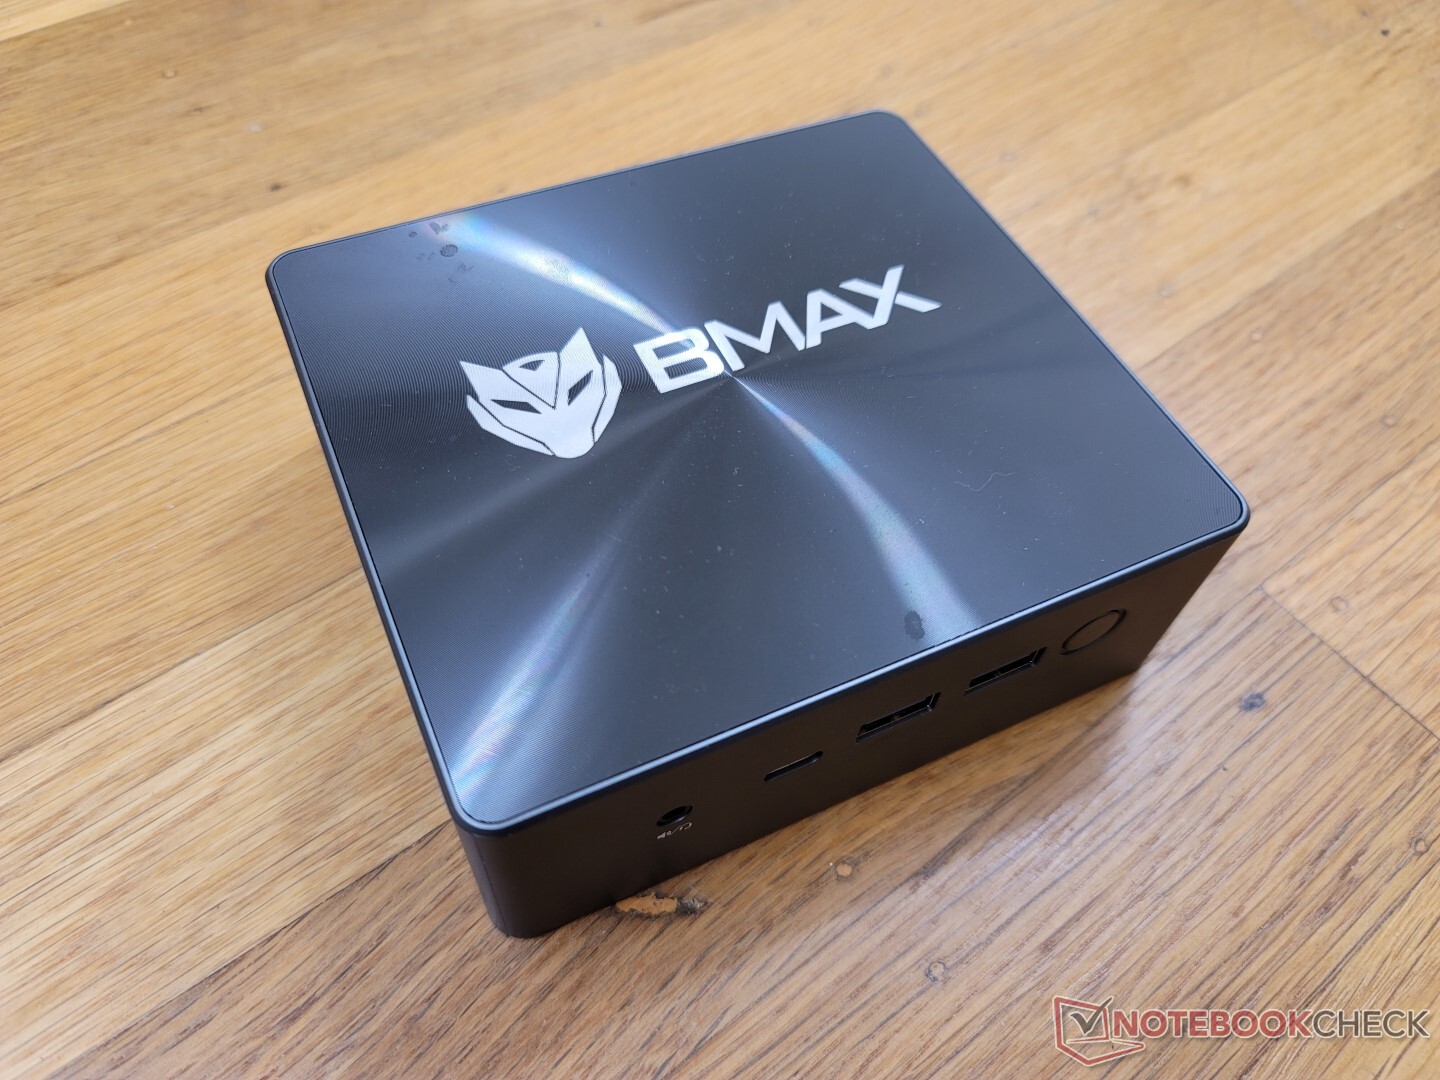
BMax B5 Pro G7H8 Mini-PC im Test: Debüt des Intel Core i5-8260U

BMax ist ähnlich wie Chuwi auf preiswerte Laptops, Monitore und Mini PCs spezialisiert, für meist mehrere hundert Euro günstiger als die Basismodelle von größeren und bekannteren Herstellern. Ihr Geheimnis ist der Einsatz von älteren CPU-Generationen, welche die Kosten der Geräte drastisch reduzieren können.
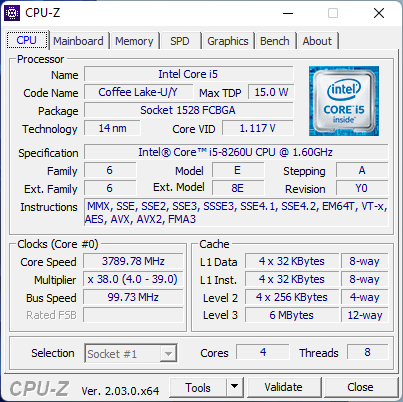
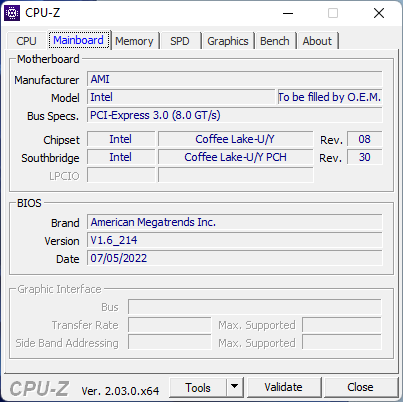
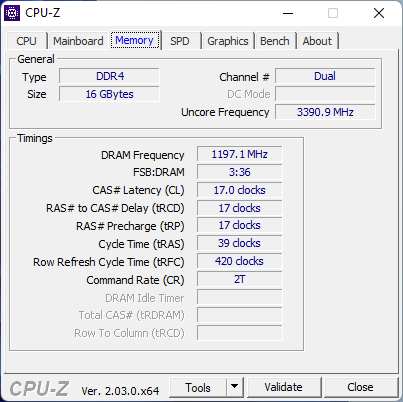
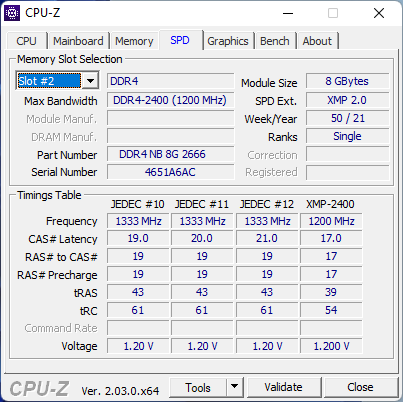
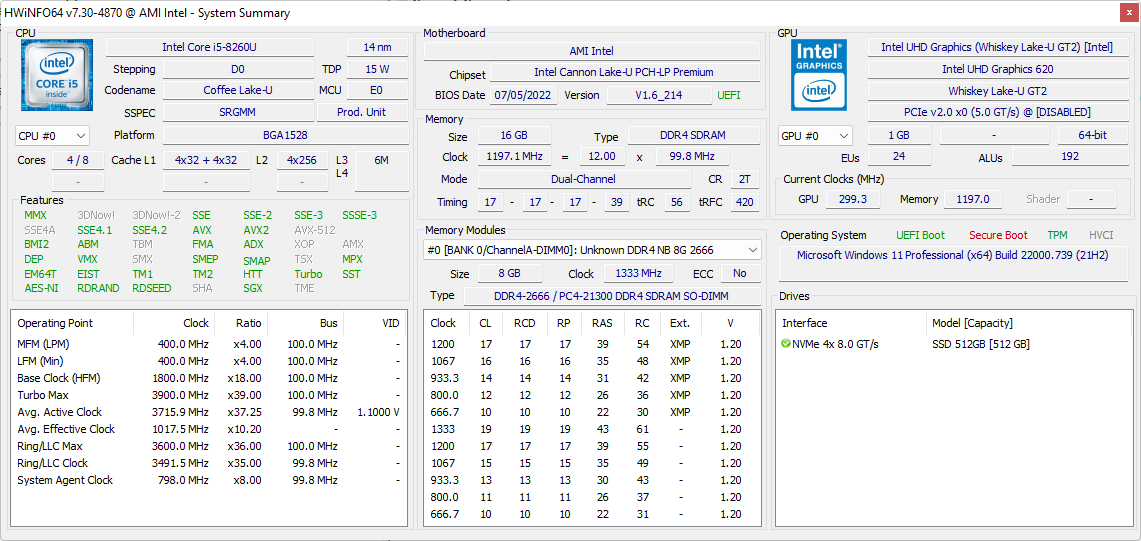
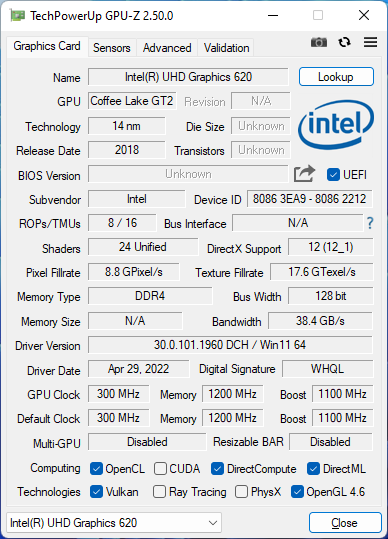
Das BMax B5 Pro ist der neuste Mini-PC des Herstellers und für HTPC-User mit einem schmalen Budget gedacht. Es zeichnet sich durch den Einsatz eine älteren Intel 8.-Gen-U-Series-CPU aus, während die aktuellen Mini-PCs 12.-Gen-CPUs verwenden. Unsere Testkonfiguration wird vom selteneren Coffee Lake Core i5-8260U befeuert, zusammen mit 16 GB RAM, einer 512-GB-NVMe-SSD und vorinstalliertem Windows 11, für nur 390 Euro zum Zeitpunkt der Veröffentlichung dieses Testberichtes. Das B5 Pro ist ein direkter Konkurrent zu anderen günstigen Mini-PCs wie das Beelink SEi8 oder die GMK NucBox 2.
Weitere BMax Testberichte:
mögliche Konkurrenten im Vergleich
Bew. | Datum | Modell | Gewicht | Dicke | Größe | Auflösung | Preis ab |
|---|---|---|---|---|---|---|---|
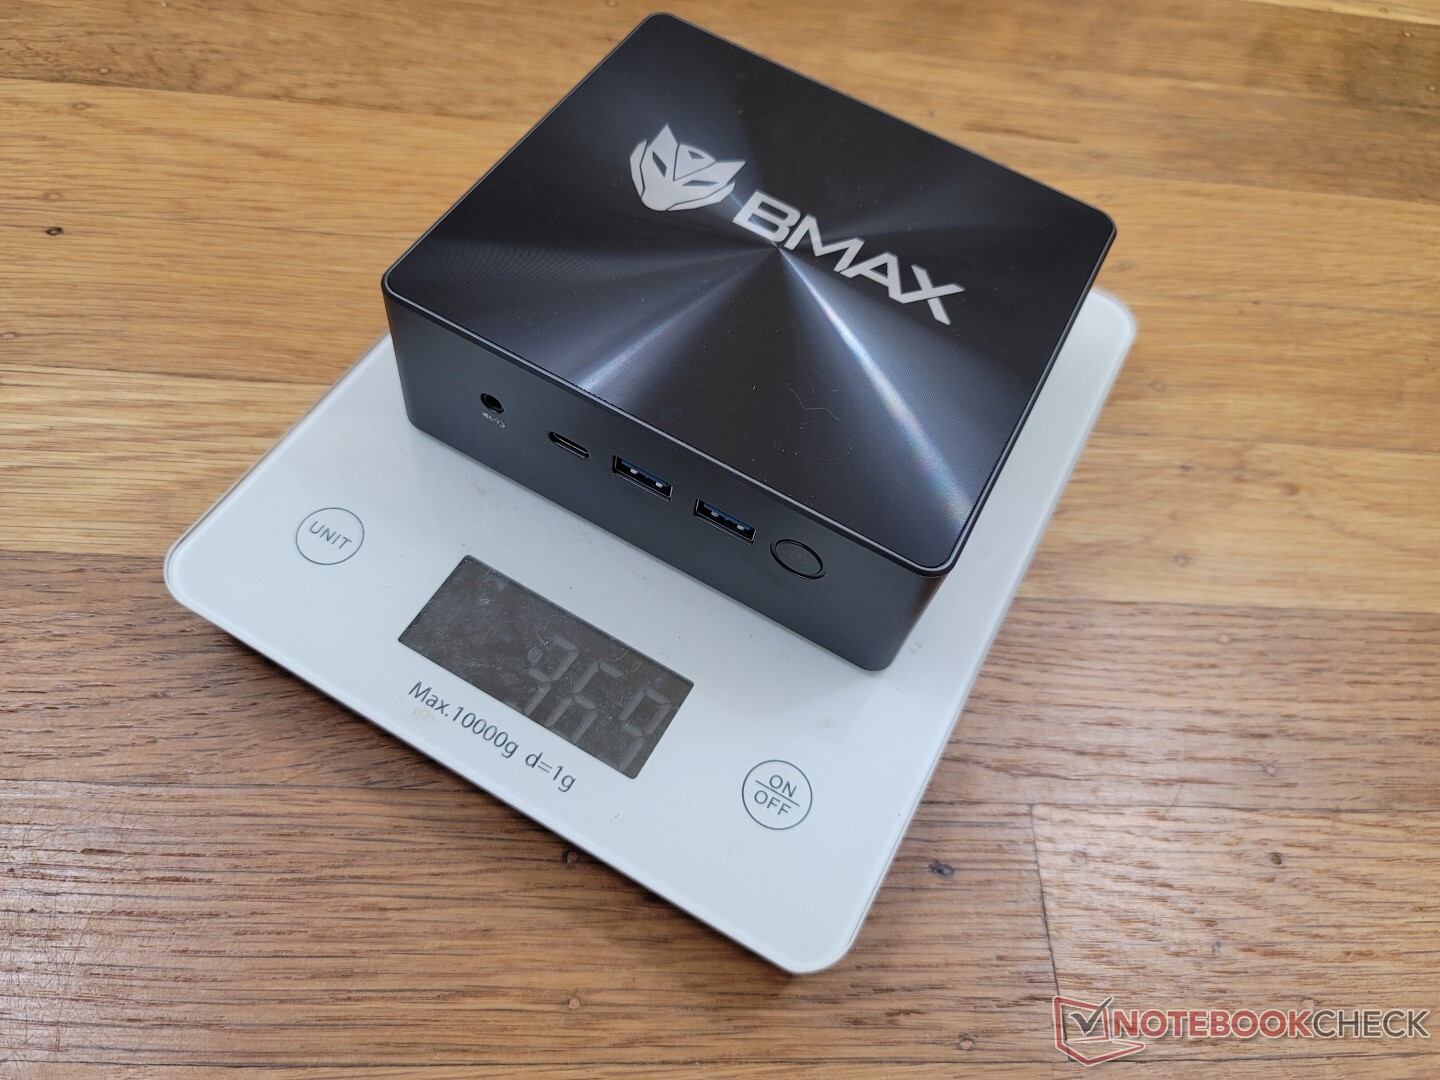
v (old) | 11 / 2022 | BMAX B5 Pro G7H8 i5-8260U, UHD Graphics 620 | 369 g | 43.2 mm | x | ||
v (old) | 09 / 2022 | Beelink SEi11 Pro i5-11320H, Iris Xe G7 96EUs | 440 g | 40 mm | x | ||
v (old) | 09 / 2022 | Beelink U59 N5105 Celeron N5105, UHD Graphics (Jasper Lake 24 EU) | 320 g | 42 mm | x | ||
v (old) | Beelink SEi8 i3-8109U, Iris Plus Graphics 655 | 346 g | 41 mm | x | |||
v (old) | 10 / 2022 | Beelink SER Pro Ryzen 5 5600H R5 5600H, Vega 7 | 498 g | 42 mm | x | ||
v (old) | 04 / 2021 | Intel NUC11TNKi5 i5-1135G7, Iris Xe G7 80EUs | 504 g | 37 mm | x |
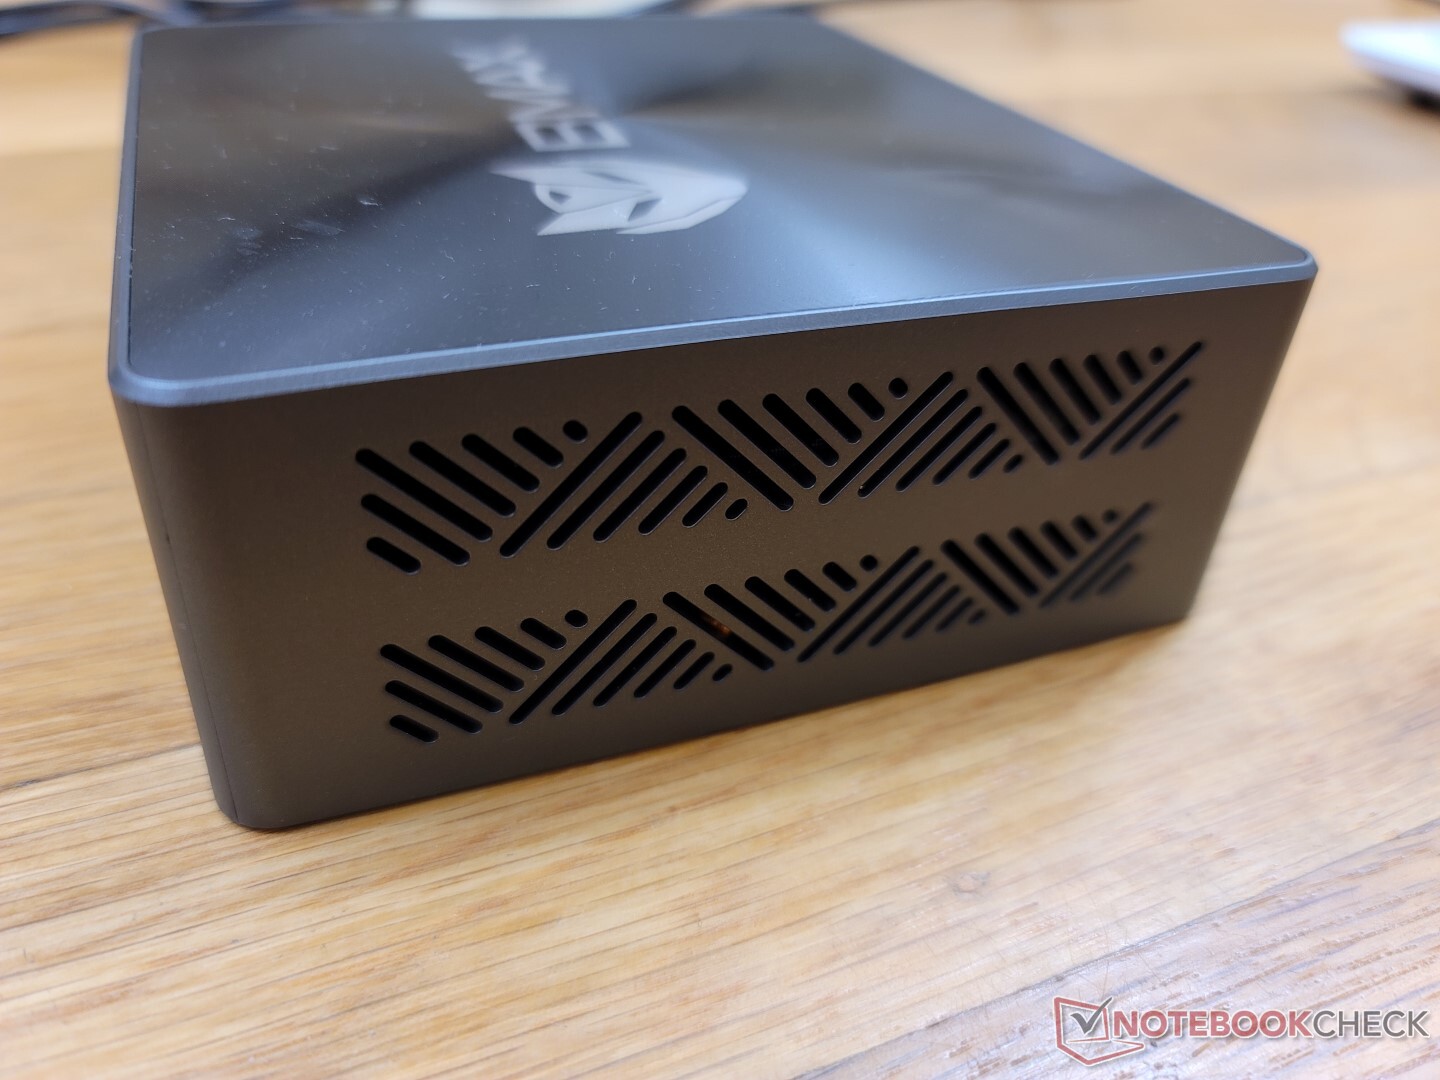
Gehäuse — nichts Ungewöhnliches
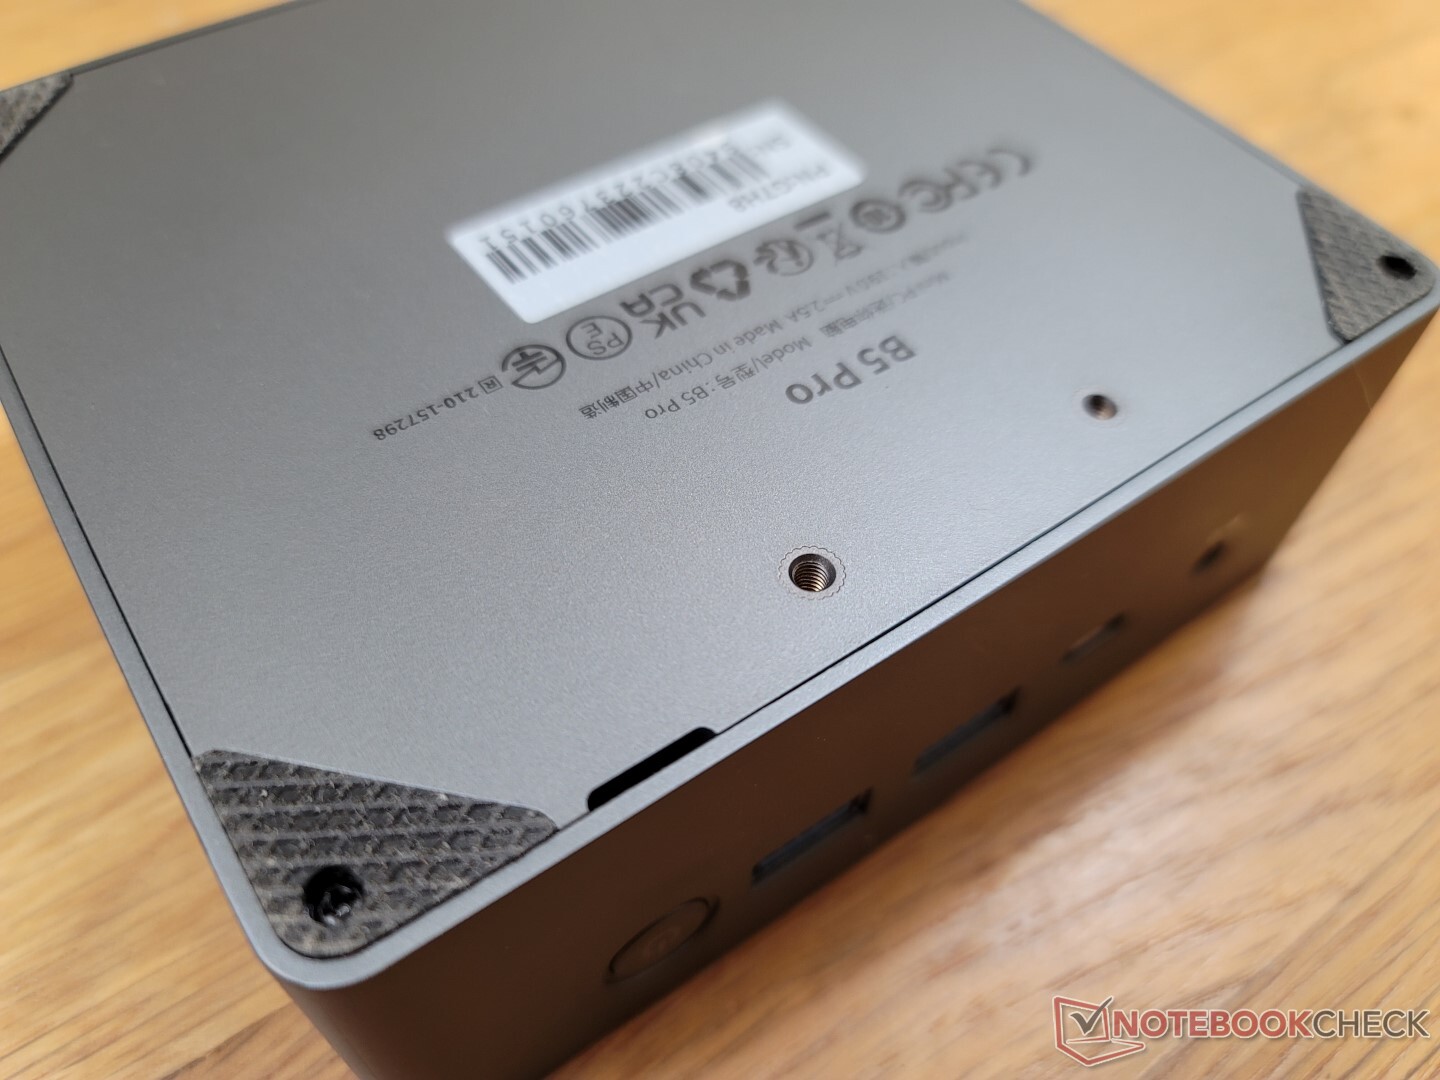
Das Gehäuse ist etwas dicker als das Intel NUC11TNKi5 und nahezu identisch zum Beelink SEi8. Die Unterseite sowie die Ecken sind sehr robust, da sie aus Metall gefertigt sind, während die Oberseite aus günstigem Plastik besteht und daher anfälliger für Verwindungen ist. Dennoch handelt es sich um ein starkes Design, ohne ins Auge springende Mängel, trotz des geringeren Gewichts gegenüber eines Intel NUC.
Konnektivität — kein Thunderbolt
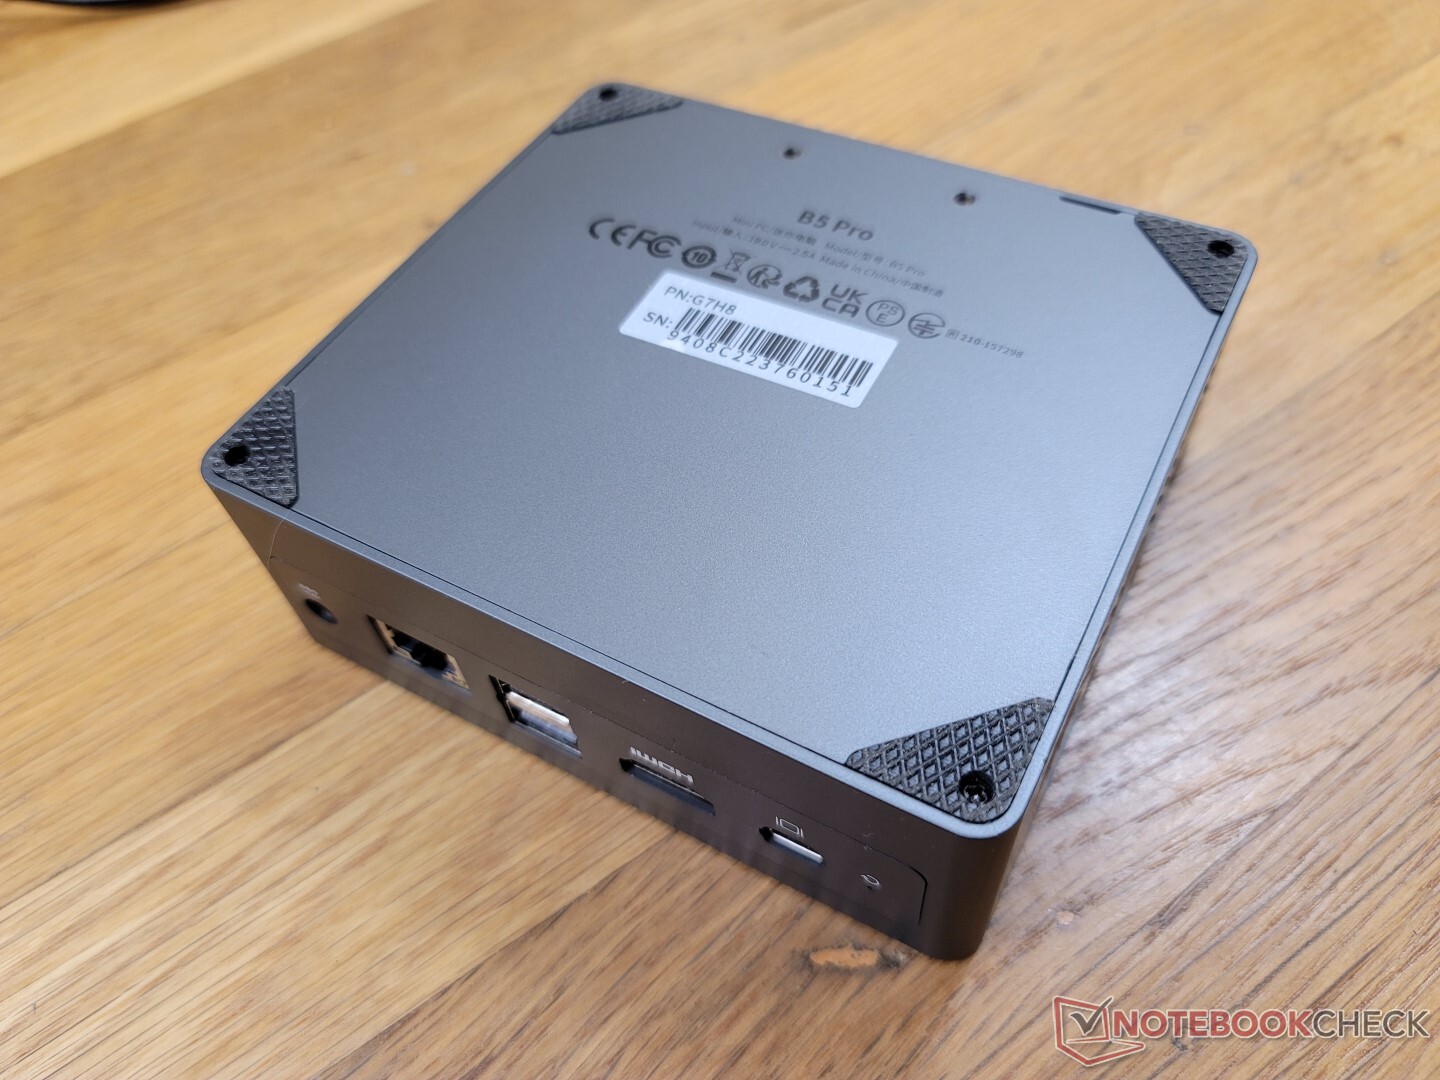
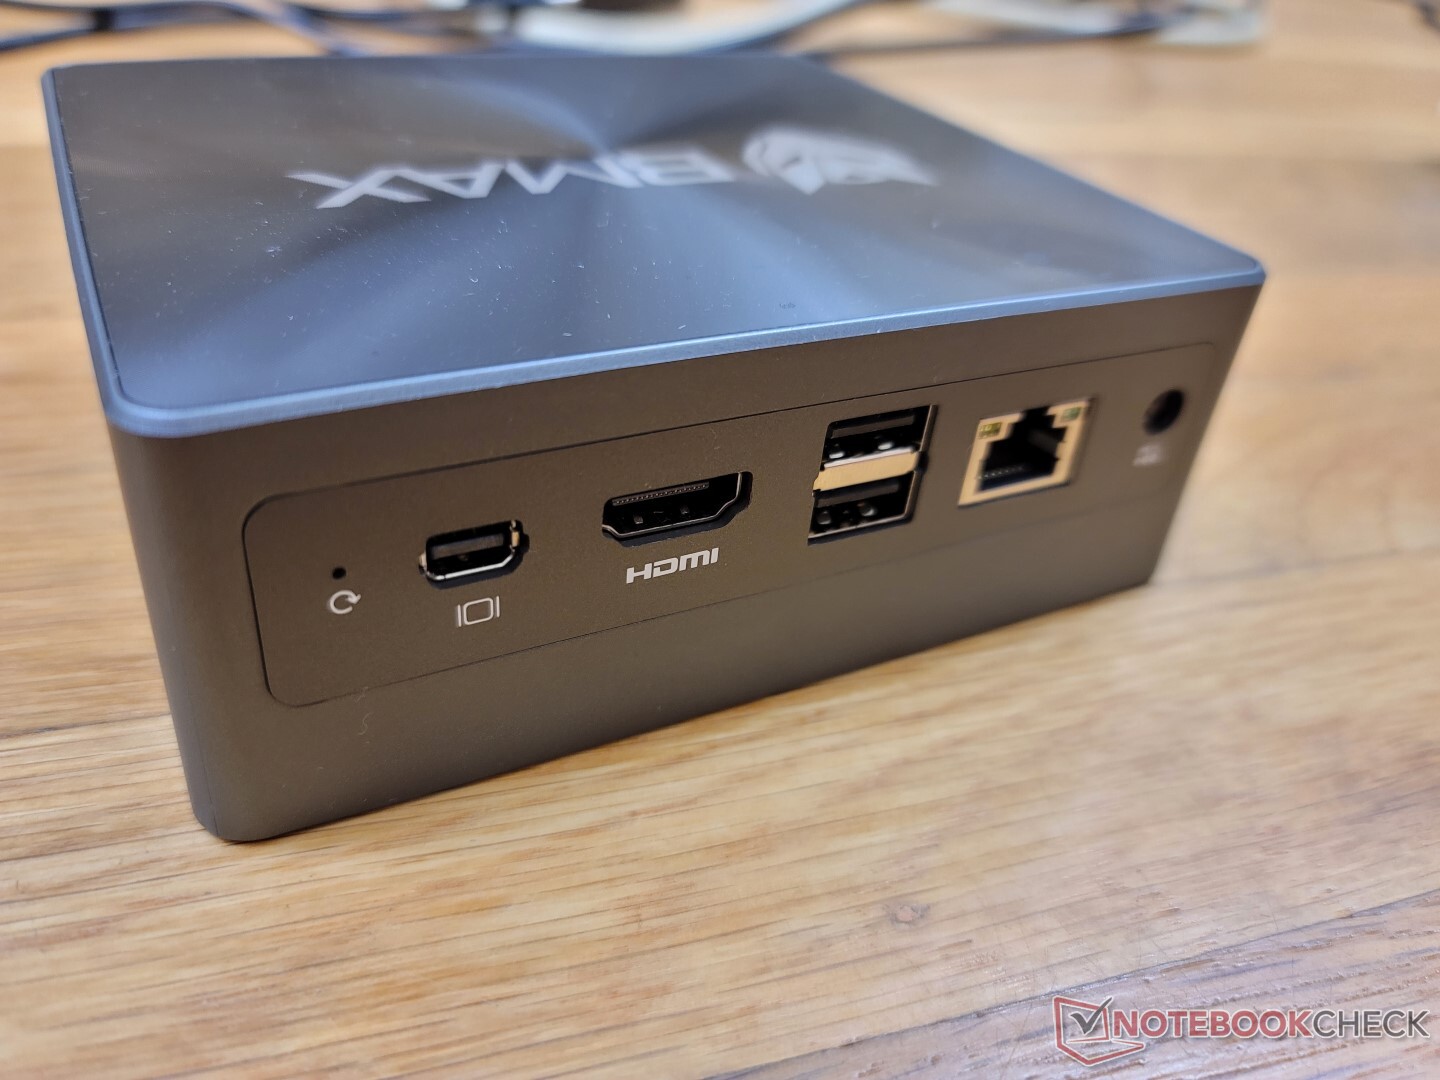
Der auffälligste Anschluss am B5 Pro ist der Mini DisplayPort. Denn die meisten anderen Mini-PCs dieser Preiskategorie besitzen schlicht keinen. 4K-Monitore laufen am HDMI-1.4-Anschluss nur mit 30 Hz.
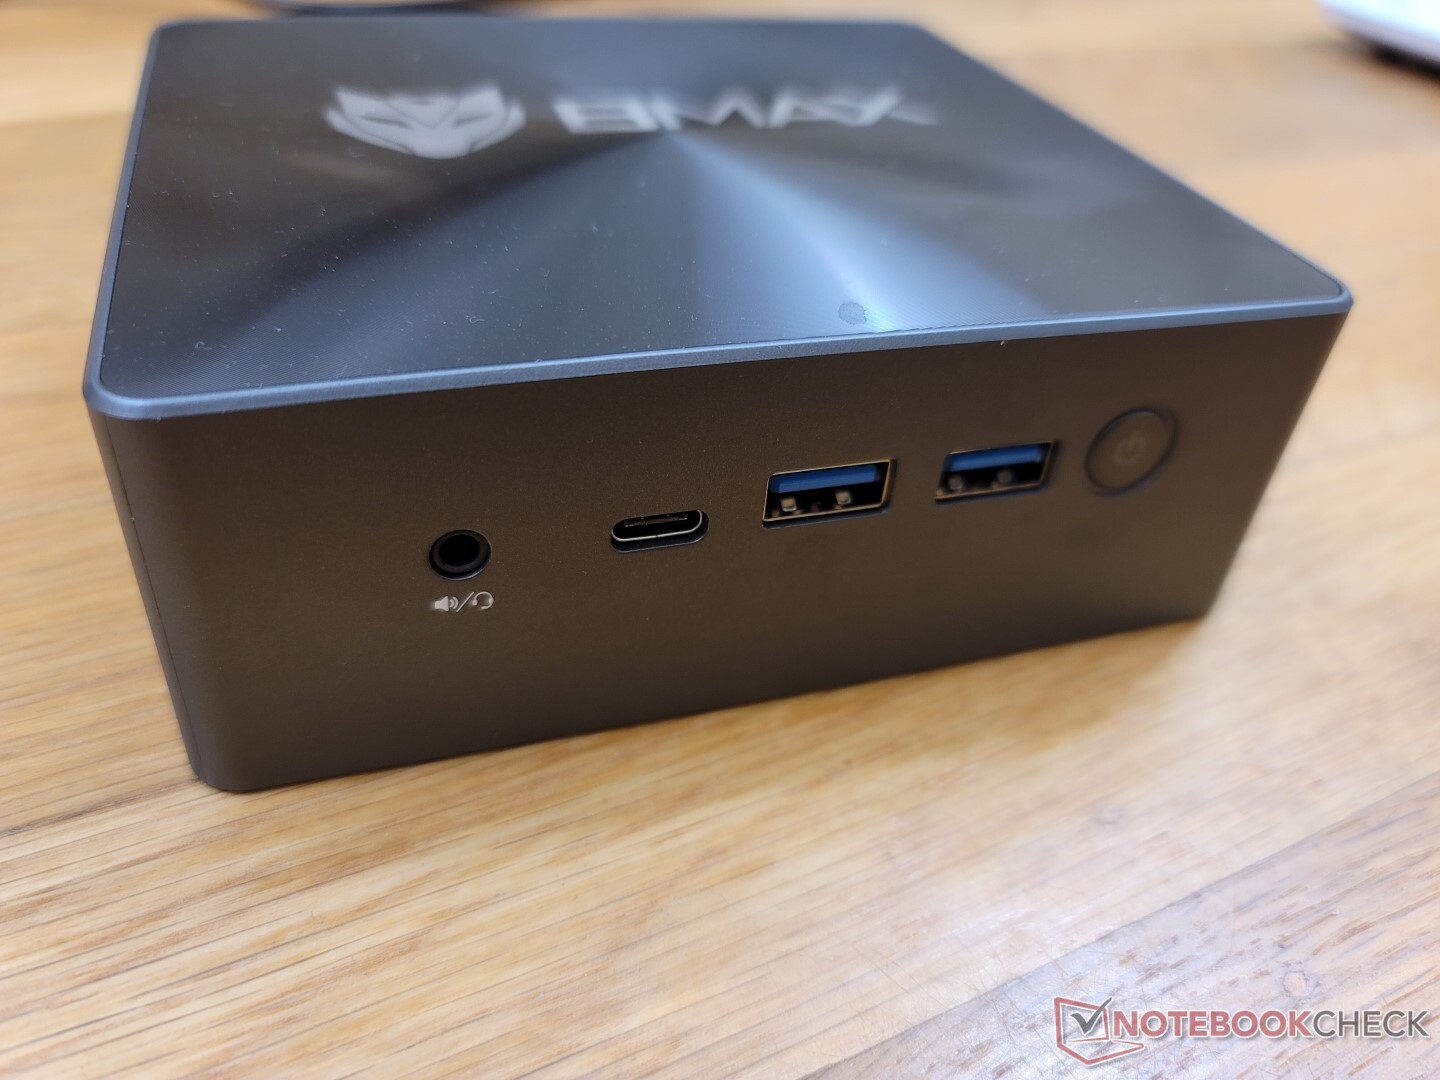
Der vorne angebrachte USB-C-Anschluss unterstützt externe Monitore, aber kein PowerDelivery oder Thunderbolt.
Kommunikation
Standardmäßig wird die RealTek RTL8852BE mit Wi-Fi 6 und Bluetooth 5.2 verbaut. Wi-Fi 6E gibt es nicht, wohl um Kosten einzusparen. Die Transfer-Geschwindigkeiten sind immerhin beständig und weisen auf keine Probleme hin, auch wenn sie nicht mal ansatzweise so hoch ausfallen wie die herkömmlicheren Intel-AX200/201-WLAN-Chips.
| Networking | |
| BMAX B5 Pro G7H8 | |
| iperf3 receive AXE11000 | |
| iperf3 transmit AXE11000 | |
| Beelink SEi11 Pro | |
| iperf3 receive AXE11000 6GHz | |
| iperf3 transmit AXE11000 6GHz | |
| Beelink U59 N5105 | |
| iperf3 receive AXE11000 | |
| iperf3 transmit AXE11000 | |
| Beelink SEi8 | |
| iperf3 transmit AX12 | |
| iperf3 receive AX12 | |
| Beelink SER Pro Ryzen 5 5600H | |
| iperf3 receive AXE11000 6GHz | |
| iperf3 transmit AXE11000 6GHz | |
| Intel NUC11TNKi5 | |
| iperf3 transmit AX12 | |
| iperf3 receive AX12 | |
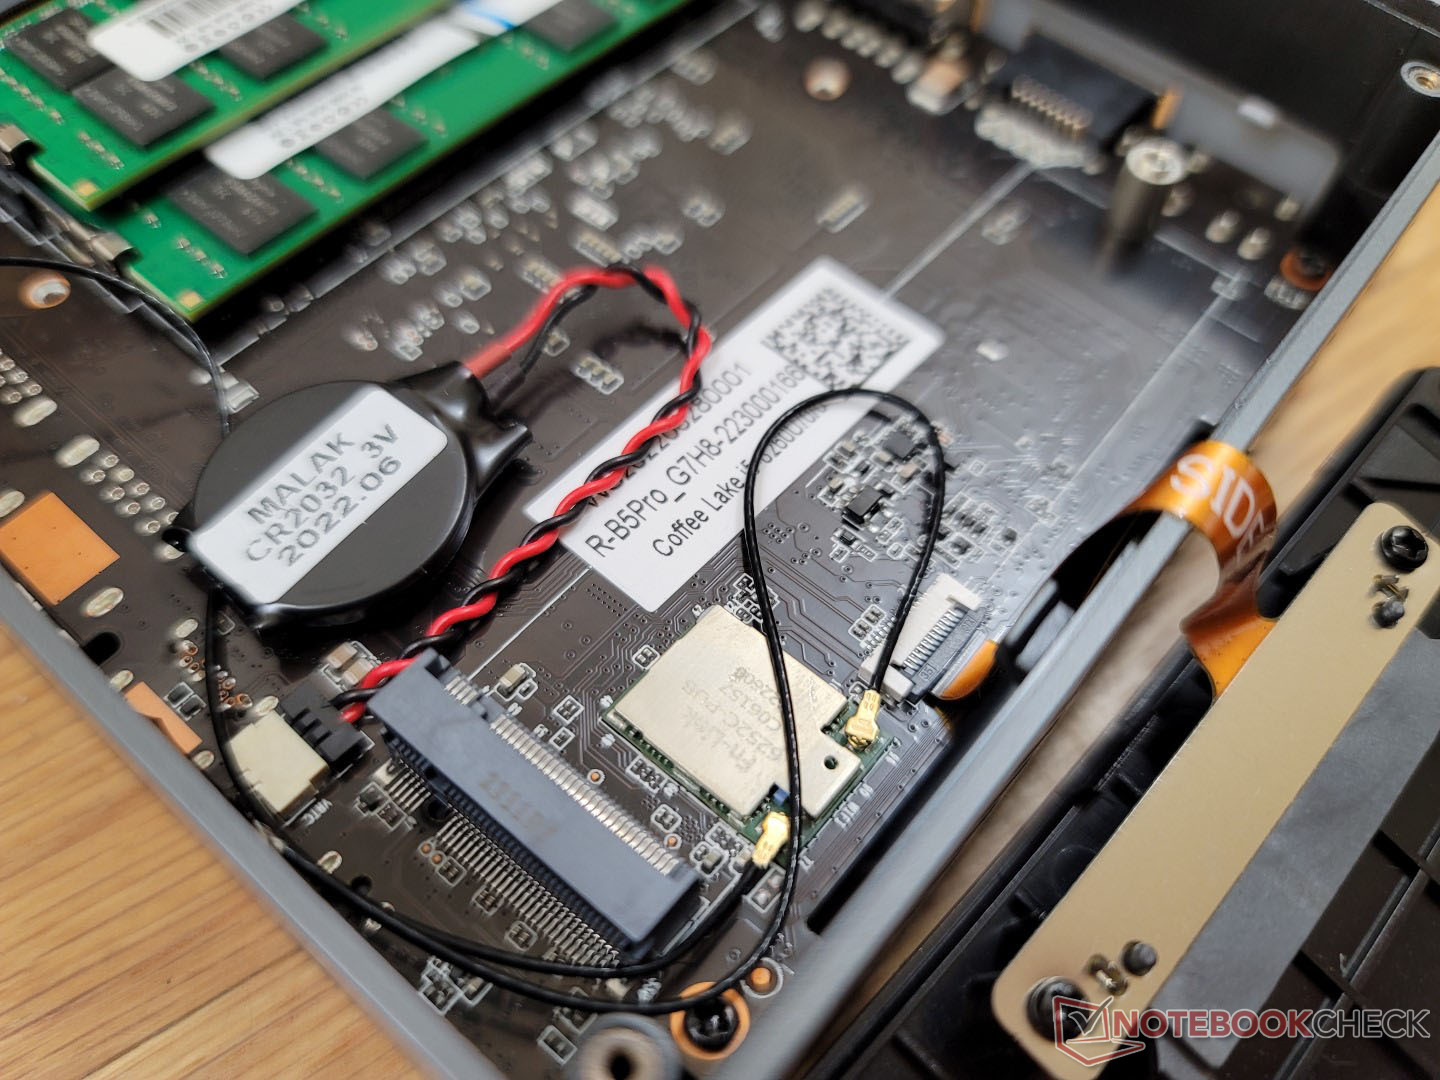
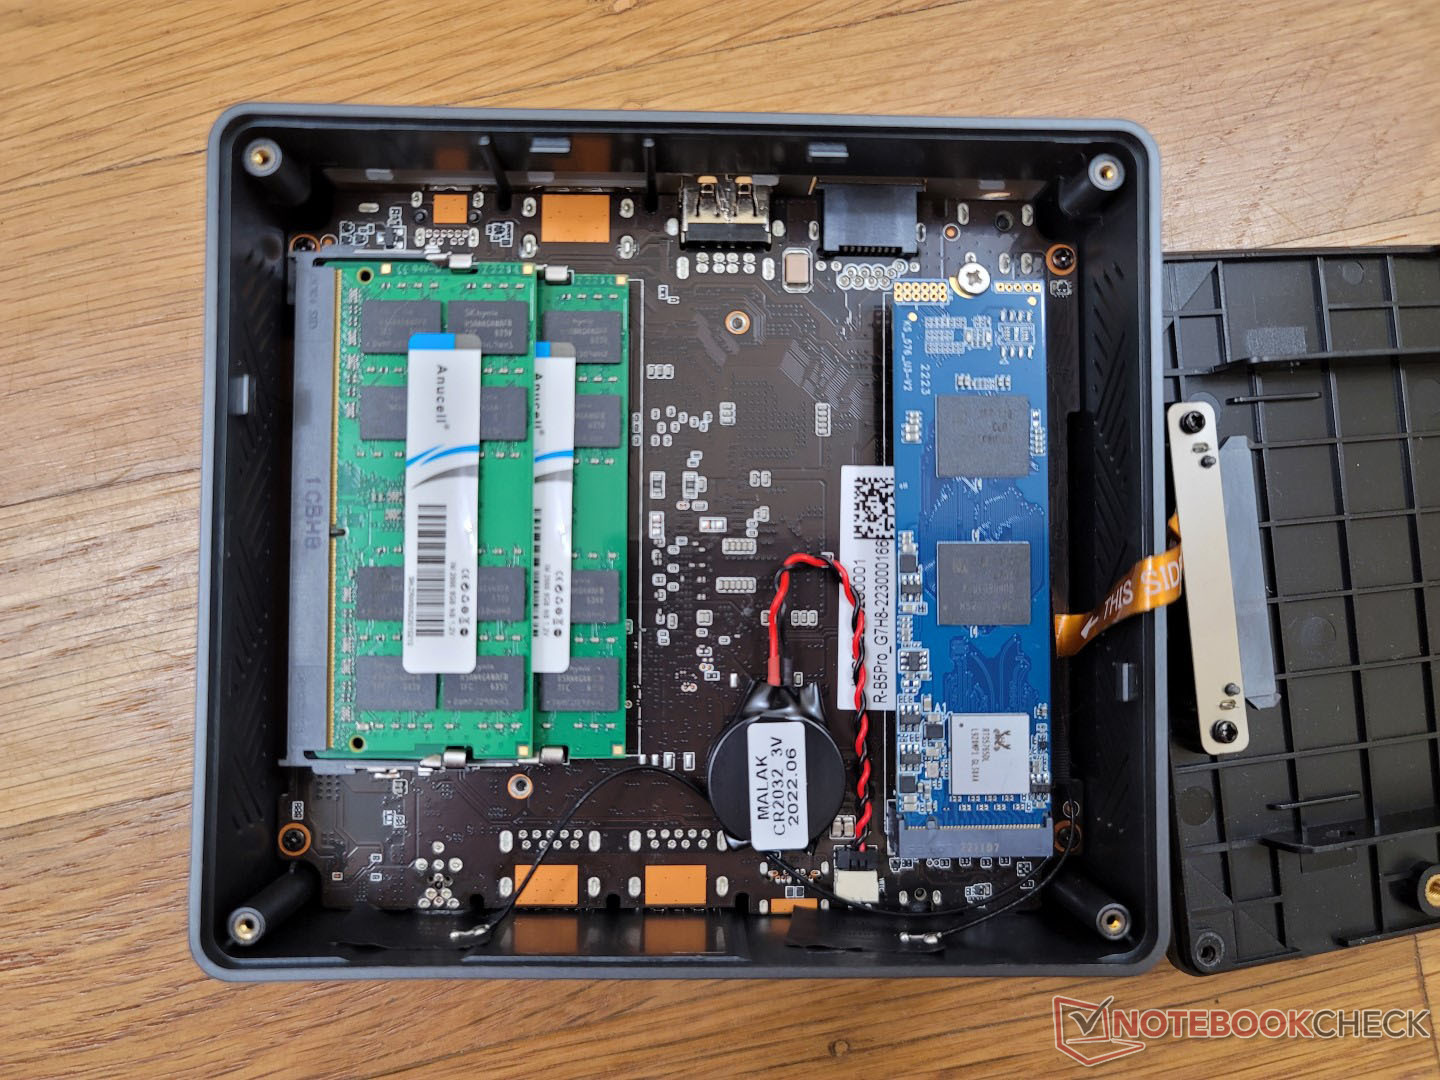
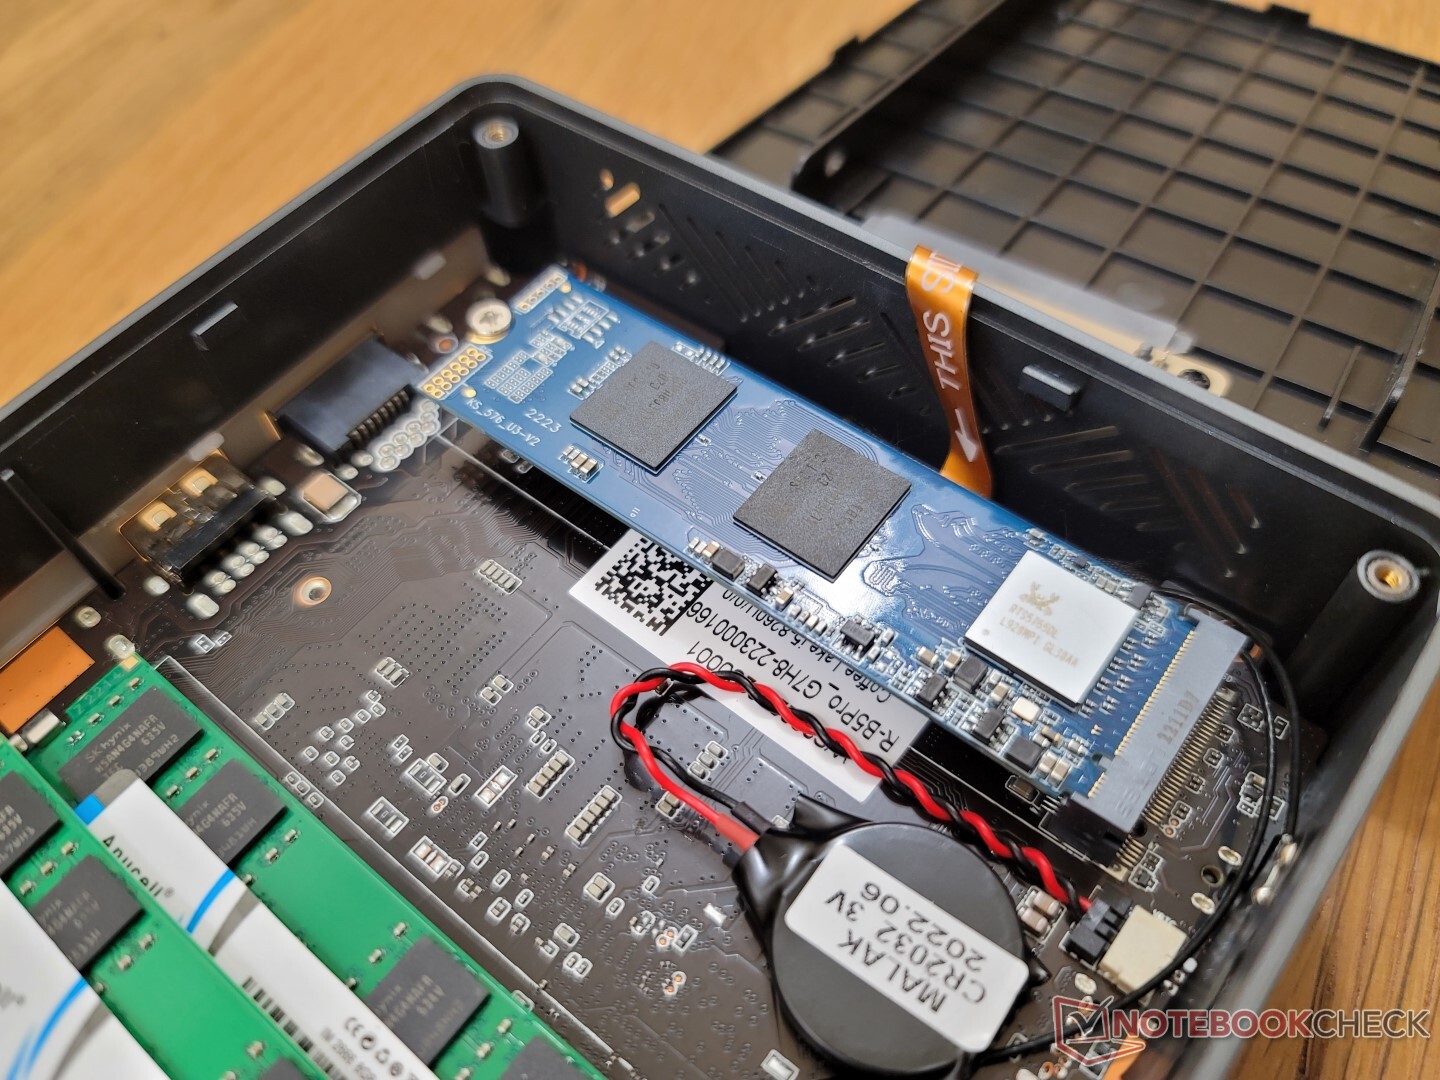
Wartung
Die Bodenplatte ist durch vier Kreuzschlitzschrauben gesichert, um eine einfache Wartung zu gewährleisten. Anders als beim Beelink SEi8 besitzt die Bodenplatte des BMax einen kleinen Schlitz entlang der Ecke, um beim Entfernen einen besseren Griff zu ermöglichen.
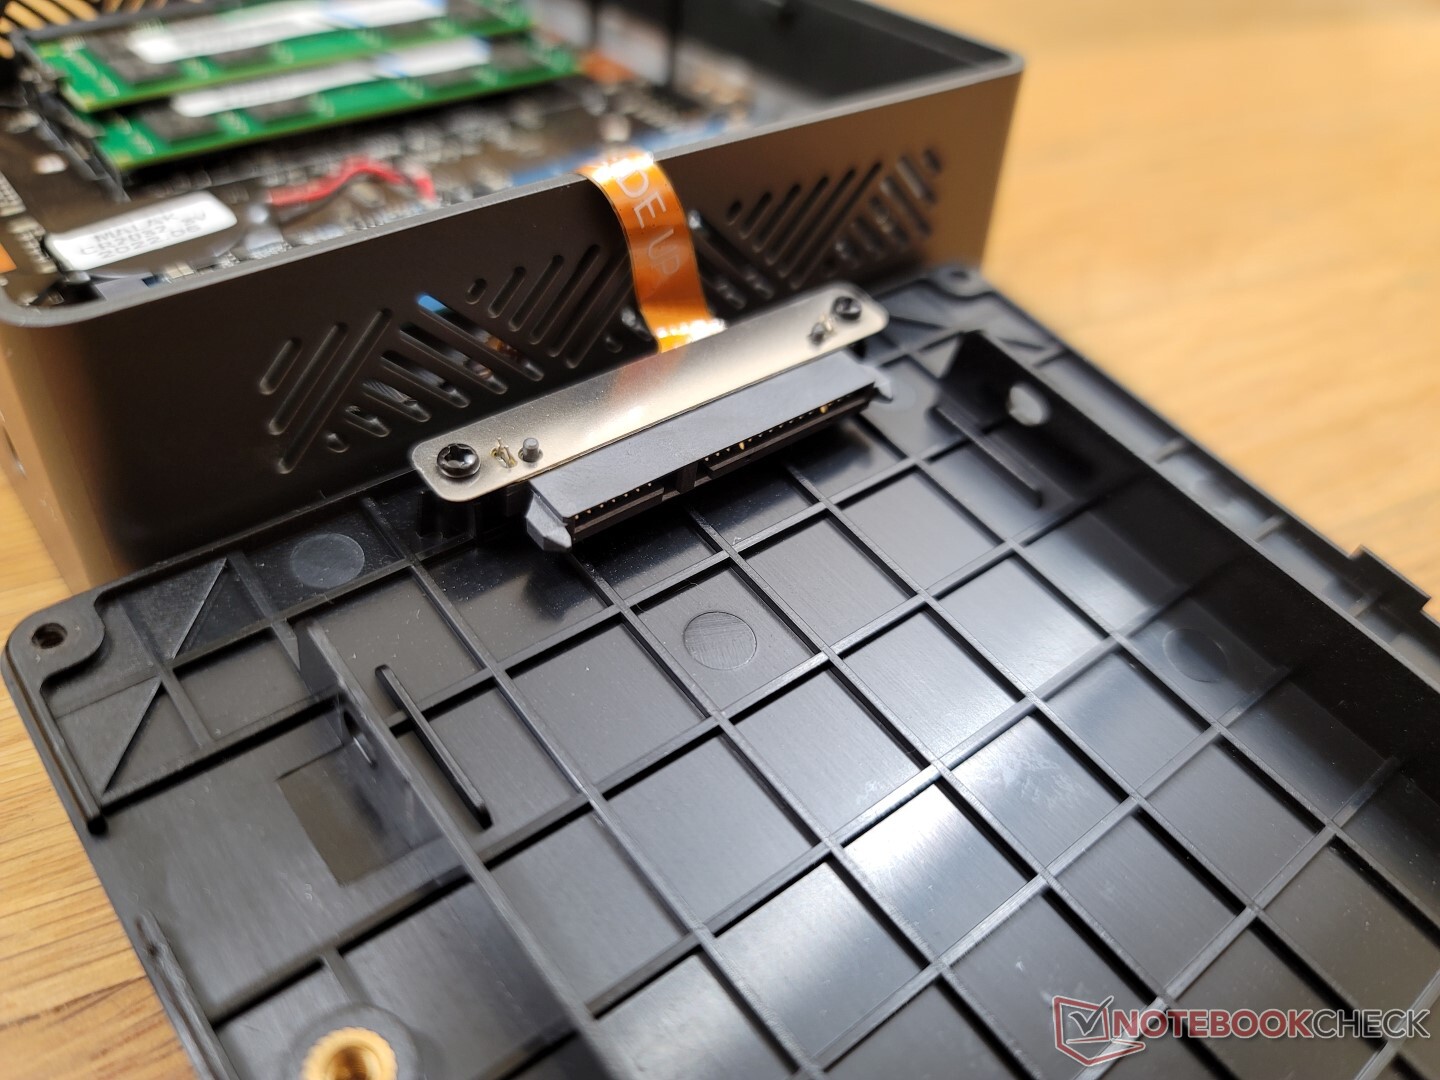
Nachdem man ins Innere gelangt ist, kann man bis zu zwei DDR4-SODIMM-Module und maximal zwei Massenspeicher installieren.
Zubehör und Garantie
In der Verpackung findet man neben dem Netzteil ein HDMI-Kabel und eine entfernbare VESA-Halterung samt Schrauben. In Deutschland gewährt der Hersteller eine 12-monatige Garantie.
Leistung — 8th Gen vs. 12th Gen
Testbedingungen
Um höchste Punktzahlen zu erreichen, haben wir haben unser Testgerät in den Windows eigenen Leistungsmodus versetzt, bevor wir die unten aufgeführten Benchmarks laufen ließen. Der Hersteller installiert keine Zusatz-Software, sodass man ein cleanes Windows 11 vorfindet.
Prozessor
Die reine Prozessorleistung ist in etwa vergleichbar mit der eines Core i7-1065G7 (10. Gen) oder Core i5-8259U. Obwohl die CPU um ganze 50 Prozent langsamer werkelt als der 11.-Gen-Core i5-1135G7, so ist sie trotzdem schnell genug für normale Multimedia-Anwendungen wie Web-Browsing, Video-Streaming und moderates Multitasking.
Der 12.-Gen-Core-i5-1235U, der mehrere Generationen neuer ist als der Core i5-8260U im B5 Pro, bietet eine um 60 Prozent höhere Single-Core-Performance, während sich die Multi-Core-Leistung um 80 Prozent abhebt.
Die dauerhaft aufrechterhaltene Leistung geht in Ordnung. Bei unserer CineBench-R15-Schleife nimmt die Leistung um 11 Prozent ab.
Cinebench R15 Multi Dauertest
Cinebench R23: Multi Core | Single Core
Cinebench R15: CPU Multi 64Bit | CPU Single 64Bit
Blender: v2.79 BMW27 CPU
7-Zip 18.03: 7z b 4 | 7z b 4 -mmt1
Geekbench 5.5: Multi-Core | Single-Core
HWBOT x265 Benchmark v2.2: 4k Preset
LibreOffice : 20 Documents To PDF
R Benchmark 2.5: Overall mean
| Cinebench R20 / CPU (Multi Core) | |
| Beelink SER Pro Ryzen 5 5600H | |
| Beelink SEi11 Pro | |
| Asus Vivobook 15 K513EQ | |
| Intel NUC11TNKi5 | |
| BMAX B5 Pro G7H8 | |
| Geekom Mini IT8-GM08i5T | |
| Infinix INBook X2 | |
| Fujitsu Lifebook U939 i5 | |
| Beelink U59 N5105 | |
| Beelink SEi8 | |
| Cinebench R20 / CPU (Single Core) | |
| Asus Vivobook 15 K513EQ | |
| Beelink SEi11 Pro | |
| Beelink SER Pro Ryzen 5 5600H | |
| Intel NUC11TNKi5 | |
| Infinix INBook X2 | |
| BMAX B5 Pro G7H8 | |
| Fujitsu Lifebook U939 i5 | |
| Geekom Mini IT8-GM08i5T | |
| Beelink SEi8 | |
| Beelink U59 N5105 | |
| Cinebench R23 / Multi Core | |
| Beelink SER Pro Ryzen 5 5600H | |
| Beelink SEi11 Pro | |
| Asus Vivobook 15 K513EQ | |
| Intel NUC11TNKi5 | |
| Geekom Mini IT8-GM08i5T | |
| Infinix INBook X2 | |
| BMAX B5 Pro G7H8 | |
| Beelink U59 N5105 | |
| Beelink SEi8 | |
| Cinebench R23 / Single Core | |
| Asus Vivobook 15 K513EQ | |
| Beelink SEi11 Pro | |
| Intel NUC11TNKi5 | |
| Beelink SER Pro Ryzen 5 5600H | |
| Infinix INBook X2 | |
| Beelink SEi8 | |
| BMAX B5 Pro G7H8 | |
| Beelink U59 N5105 | |
| Cinebench R15 / CPU Multi 64Bit | |
| Beelink SER Pro Ryzen 5 5600H | |
| Asus Vivobook 15 K513EQ | |
| Beelink SEi11 Pro | |
| Intel NUC11TNKi5 | |
| BMAX B5 Pro G7H8 | |
| Geekom Mini IT8-GM08i5T | |
| Infinix INBook X2 | |
| Fujitsu Lifebook U939 i5 | |
| Beelink U59 N5105 | |
| Beelink SEi8 | |
| Cinebench R15 / CPU Single 64Bit | |
| Asus Vivobook 15 K513EQ | |
| Beelink SER Pro Ryzen 5 5600H | |
| Beelink SEi11 Pro | |
| Intel NUC11TNKi5 | |
| Fujitsu Lifebook U939 i5 | |
| BMAX B5 Pro G7H8 | |
| Infinix INBook X2 | |
| Geekom Mini IT8-GM08i5T | |
| Beelink SEi8 | |
| Beelink U59 N5105 | |
| Blender / v2.79 BMW27 CPU | |
| Beelink U59 N5105 | |
| Beelink SEi8 | |
| Fujitsu Lifebook U939 i5 | |
| Infinix INBook X2 | |
| BMAX B5 Pro G7H8 | |
| Geekom Mini IT8-GM08i5T | |
| Intel NUC11TNKi5 | |
| Asus Vivobook 15 K513EQ | |
| Beelink SEi11 Pro | |
| Beelink SER Pro Ryzen 5 5600H | |
| 7-Zip 18.03 / 7z b 4 | |
| Beelink SER Pro Ryzen 5 5600H | |
| Geekom Mini IT8-GM08i5T | |
| Asus Vivobook 15 K513EQ | |
| Beelink SEi11 Pro | |
| Intel NUC11TNKi5 | |
| BMAX B5 Pro G7H8 | |
| Infinix INBook X2 | |
| Fujitsu Lifebook U939 i5 | |
| Beelink U59 N5105 | |
| Beelink SEi8 | |
| 7-Zip 18.03 / 7z b 4 -mmt1 | |
| Beelink SER Pro Ryzen 5 5600H | |
| Asus Vivobook 15 K513EQ | |
| Beelink SEi11 Pro | |
| Intel NUC11TNKi5 | |
| BMAX B5 Pro G7H8 | |
| Fujitsu Lifebook U939 i5 | |
| Geekom Mini IT8-GM08i5T | |
| Beelink SEi8 | |
| Infinix INBook X2 | |
| Beelink U59 N5105 | |
| Geekbench 5.5 / Multi-Core | |
| Beelink SER Pro Ryzen 5 5600H | |
| Beelink SEi11 Pro | |
| Intel NUC11TNKi5 | |
| Geekom Mini IT8-GM08i5T | |
| Fujitsu Lifebook U939 i5 | |
| Infinix INBook X2 | |
| Beelink U59 N5105 | |
| Beelink SEi8 | |
| BMAX B5 Pro G7H8 | |
| Geekbench 5.5 / Single-Core | |
| Beelink SEi11 Pro | |
| Beelink SER Pro Ryzen 5 5600H | |
| Intel NUC11TNKi5 | |
| Infinix INBook X2 | |
| Fujitsu Lifebook U939 i5 | |
| Geekom Mini IT8-GM08i5T | |
| Beelink SEi8 | |
| Beelink U59 N5105 | |
| BMAX B5 Pro G7H8 | |
| HWBOT x265 Benchmark v2.2 / 4k Preset | |
| Beelink SER Pro Ryzen 5 5600H | |
| Beelink SEi11 Pro | |
| Asus Vivobook 15 K513EQ | |
| Intel NUC11TNKi5 | |
| Geekom Mini IT8-GM08i5T | |
| Infinix INBook X2 | |
| Fujitsu Lifebook U939 i5 | |
| Beelink SEi8 | |
| Beelink U59 N5105 | |
| BMAX B5 Pro G7H8 | |
| LibreOffice / 20 Documents To PDF | |
| BMAX B5 Pro G7H8 | |
| Beelink U59 N5105 | |
| Beelink SEi8 | |
| Geekom Mini IT8-GM08i5T | |
| Infinix INBook X2 | |
| Fujitsu Lifebook U939 i5 | |
| Beelink SER Pro Ryzen 5 5600H | |
| Intel NUC11TNKi5 | |
| Beelink SEi11 Pro | |
| Asus Vivobook 15 K513EQ | |
| R Benchmark 2.5 / Overall mean | |
| BMAX B5 Pro G7H8 | |
| Beelink U59 N5105 | |
| Beelink SEi8 | |
| Geekom Mini IT8-GM08i5T | |
| Infinix INBook X2 | |
| Fujitsu Lifebook U939 i5 | |
| Intel NUC11TNKi5 | |
| Beelink SEi11 Pro | |
| Asus Vivobook 15 K513EQ | |
| Beelink SER Pro Ryzen 5 5600H | |
* ... kleinere Werte sind besser
AIDA64: FP32 Ray-Trace | FPU Julia | CPU SHA3 | CPU Queen | FPU SinJulia | FPU Mandel | CPU AES | CPU ZLib | FP64 Ray-Trace | CPU PhotoWorxx
| Performance Rating | |
| Beelink SER Pro Ryzen 5 5600H | |
| Beelink SEi11 Pro | |
| Intel NUC11TNKi5 | |
| BMAX B5 Pro G7H8 | |
| Beelink SEi8 | |
| Beelink U59 N5105 | |
| AIDA64 / FP32 Ray-Trace | |
| Beelink SER Pro Ryzen 5 5600H | |
| Beelink SEi11 Pro | |
| Intel NUC11TNKi5 | |
| BMAX B5 Pro G7H8 | |
| Beelink SEi8 | |
| Beelink U59 N5105 | |
| AIDA64 / FPU Julia | |
| Beelink SER Pro Ryzen 5 5600H | |
| Beelink SEi11 Pro | |
| Intel NUC11TNKi5 | |
| BMAX B5 Pro G7H8 | |
| Beelink SEi8 | |
| Beelink U59 N5105 | |
| AIDA64 / CPU SHA3 | |
| Beelink SER Pro Ryzen 5 5600H | |
| Beelink SEi11 Pro | |
| Intel NUC11TNKi5 | |
| BMAX B5 Pro G7H8 | |
| Beelink SEi8 | |
| Beelink U59 N5105 | |
| AIDA64 / CPU Queen | |
| Beelink SER Pro Ryzen 5 5600H | |
| Beelink SEi11 Pro | |
| Intel NUC11TNKi5 | |
| BMAX B5 Pro G7H8 | |
| Beelink SEi8 | |
| Beelink U59 N5105 | |
| AIDA64 / FPU SinJulia | |
| Beelink SER Pro Ryzen 5 5600H | |
| Beelink SEi11 Pro | |
| Intel NUC11TNKi5 | |
| BMAX B5 Pro G7H8 | |
| Beelink SEi8 | |
| Beelink U59 N5105 | |
| AIDA64 / FPU Mandel | |
| Beelink SER Pro Ryzen 5 5600H | |
| Beelink SEi11 Pro | |
| Intel NUC11TNKi5 | |
| BMAX B5 Pro G7H8 | |
| Beelink SEi8 | |
| Beelink U59 N5105 | |
| AIDA64 / CPU AES | |
| Beelink SER Pro Ryzen 5 5600H | |
| Beelink SEi11 Pro | |
| Intel NUC11TNKi5 | |
| Beelink U59 N5105 | |
| BMAX B5 Pro G7H8 | |
| Beelink SEi8 | |
| AIDA64 / CPU ZLib | |
| Beelink SER Pro Ryzen 5 5600H | |
| Intel NUC11TNKi5 | |
| Beelink SEi11 Pro | |
| BMAX B5 Pro G7H8 | |
| Beelink U59 N5105 | |
| Beelink SEi8 | |
| AIDA64 / FP64 Ray-Trace | |
| Beelink SER Pro Ryzen 5 5600H | |
| Beelink SEi11 Pro | |
| Intel NUC11TNKi5 | |
| BMAX B5 Pro G7H8 | |
| Beelink SEi8 | |
| Beelink U59 N5105 | |
| AIDA64 / CPU PhotoWorxx | |
| Beelink SEi11 Pro | |
| Beelink SER Pro Ryzen 5 5600H | |
| BMAX B5 Pro G7H8 | |
| Intel NUC11TNKi5 | |
| Beelink SEi8 | |
| Beelink U59 N5105 | |
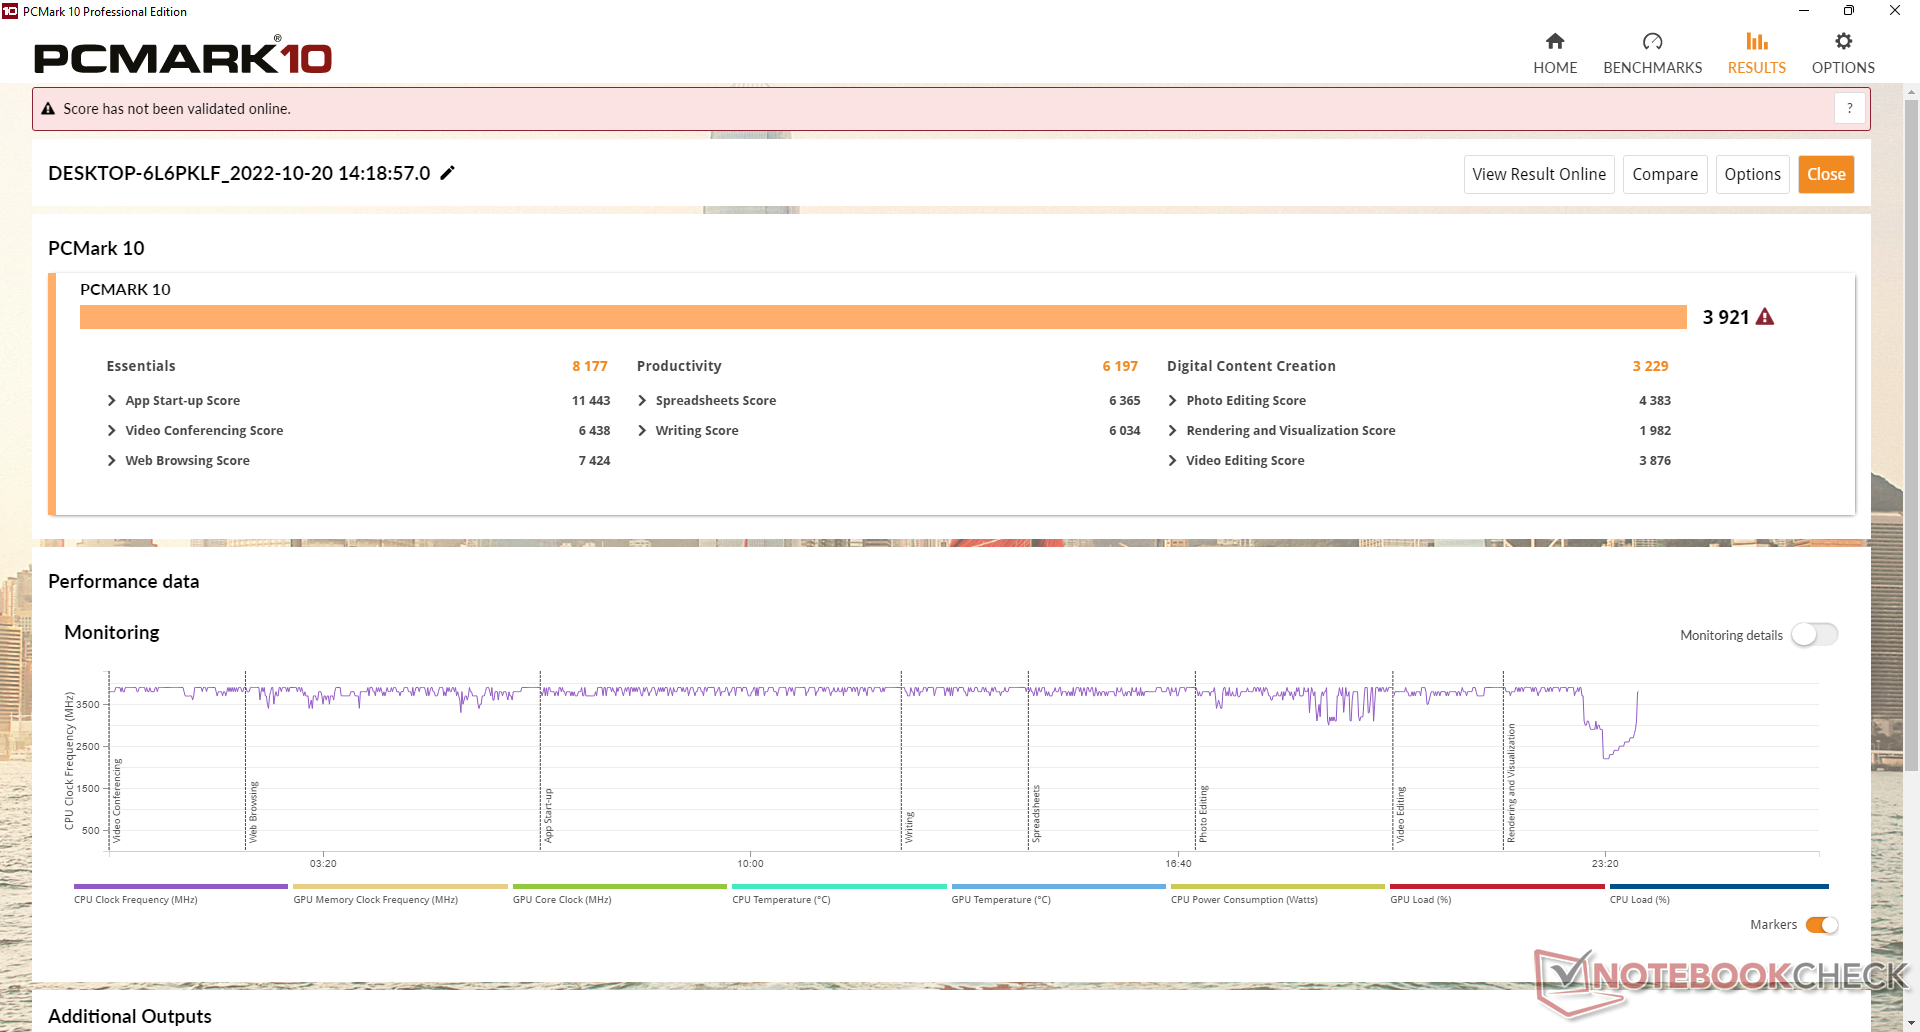
System Performance
Die PCMark-10-Ergebnisse sind ähnlich wie beim Beelink SEi8, das auch eine ältere 8.-Gen-CPU verwendet. Mini-PCs mit neueren 11.-Gen-CPUs wie das Intel NUC11TNKi5 erzielen im Bereich Content Creation deutlich höhere Punktzahlen aufgrund der stärkeren integrierten Grafikeinheit.
CrossMark: Overall | Productivity | Creativity | Responsiveness
| PCMark 10 / Score | |
| Beelink SER Pro Ryzen 5 5600H | |
| Beelink SEi11 Pro | |
| Intel NUC11TNKi5 | |
| BMAX B5 Pro G7H8 | |
| Beelink SEi8 | |
| Beelink U59 N5105 | |
| PCMark 10 / Essentials | |
| Beelink SER Pro Ryzen 5 5600H | |
| Beelink SEi11 Pro | |
| Intel NUC11TNKi5 | |
| BMAX B5 Pro G7H8 | |
| Beelink SEi8 | |
| Beelink U59 N5105 | |
| PCMark 10 / Productivity | |
| Beelink SER Pro Ryzen 5 5600H | |
| Beelink SEi11 Pro | |
| BMAX B5 Pro G7H8 | |
| Intel NUC11TNKi5 | |
| Beelink SEi8 | |
| Beelink U59 N5105 | |
| PCMark 10 / Digital Content Creation | |
| Beelink SER Pro Ryzen 5 5600H | |
| Beelink SEi11 Pro | |
| Intel NUC11TNKi5 | |
| BMAX B5 Pro G7H8 | |
| Beelink SEi8 | |
| Beelink U59 N5105 | |
| CrossMark / Overall | |
| Beelink SEi11 Pro | |
| Beelink SER Pro Ryzen 5 5600H | |
| BMAX B5 Pro G7H8 | |
| Beelink U59 N5105 | |
| CrossMark / Productivity | |
| Beelink SEi11 Pro | |
| Beelink SER Pro Ryzen 5 5600H | |
| BMAX B5 Pro G7H8 | |
| Beelink U59 N5105 | |
| CrossMark / Creativity | |
| Beelink SER Pro Ryzen 5 5600H | |
| Beelink SEi11 Pro | |
| BMAX B5 Pro G7H8 | |
| Beelink U59 N5105 | |
| CrossMark / Responsiveness | |
| Beelink SEi11 Pro | |
| Beelink SER Pro Ryzen 5 5600H | |
| BMAX B5 Pro G7H8 | |
| Beelink U59 N5105 | |
| PCMark 10 Score | 3921 Punkte | |
Hilfe | ||
| AIDA64 / Memory Copy | |
| Beelink SER Pro Ryzen 5 5600H | |
| Beelink SEi11 Pro | |
| Beelink SEi8 | |
| BMAX B5 Pro G7H8 | |
| Beelink U59 N5105 | |
| Intel NUC11TNKi5 | |
| AIDA64 / Memory Read | |
| Beelink SER Pro Ryzen 5 5600H | |
| Beelink SEi11 Pro | |
| BMAX B5 Pro G7H8 | |
| Beelink SEi8 | |
| Intel NUC11TNKi5 | |
| Beelink U59 N5105 | |
| AIDA64 / Memory Write | |
| Beelink SEi11 Pro | |
| Beelink SER Pro Ryzen 5 5600H | |
| BMAX B5 Pro G7H8 | |
| Beelink U59 N5105 | |
| Intel NUC11TNKi5 | |
| Beelink SEi8 | |
| AIDA64 / Memory Latency | |
| BMAX B5 Pro G7H8 | |
| Intel NUC11TNKi5 | |
| Beelink SEi11 Pro | |
| Beelink SER Pro Ryzen 5 5600H | |
| Beelink U59 N5105 | |
| Beelink SEi8 | |
* ... kleinere Werte sind besser
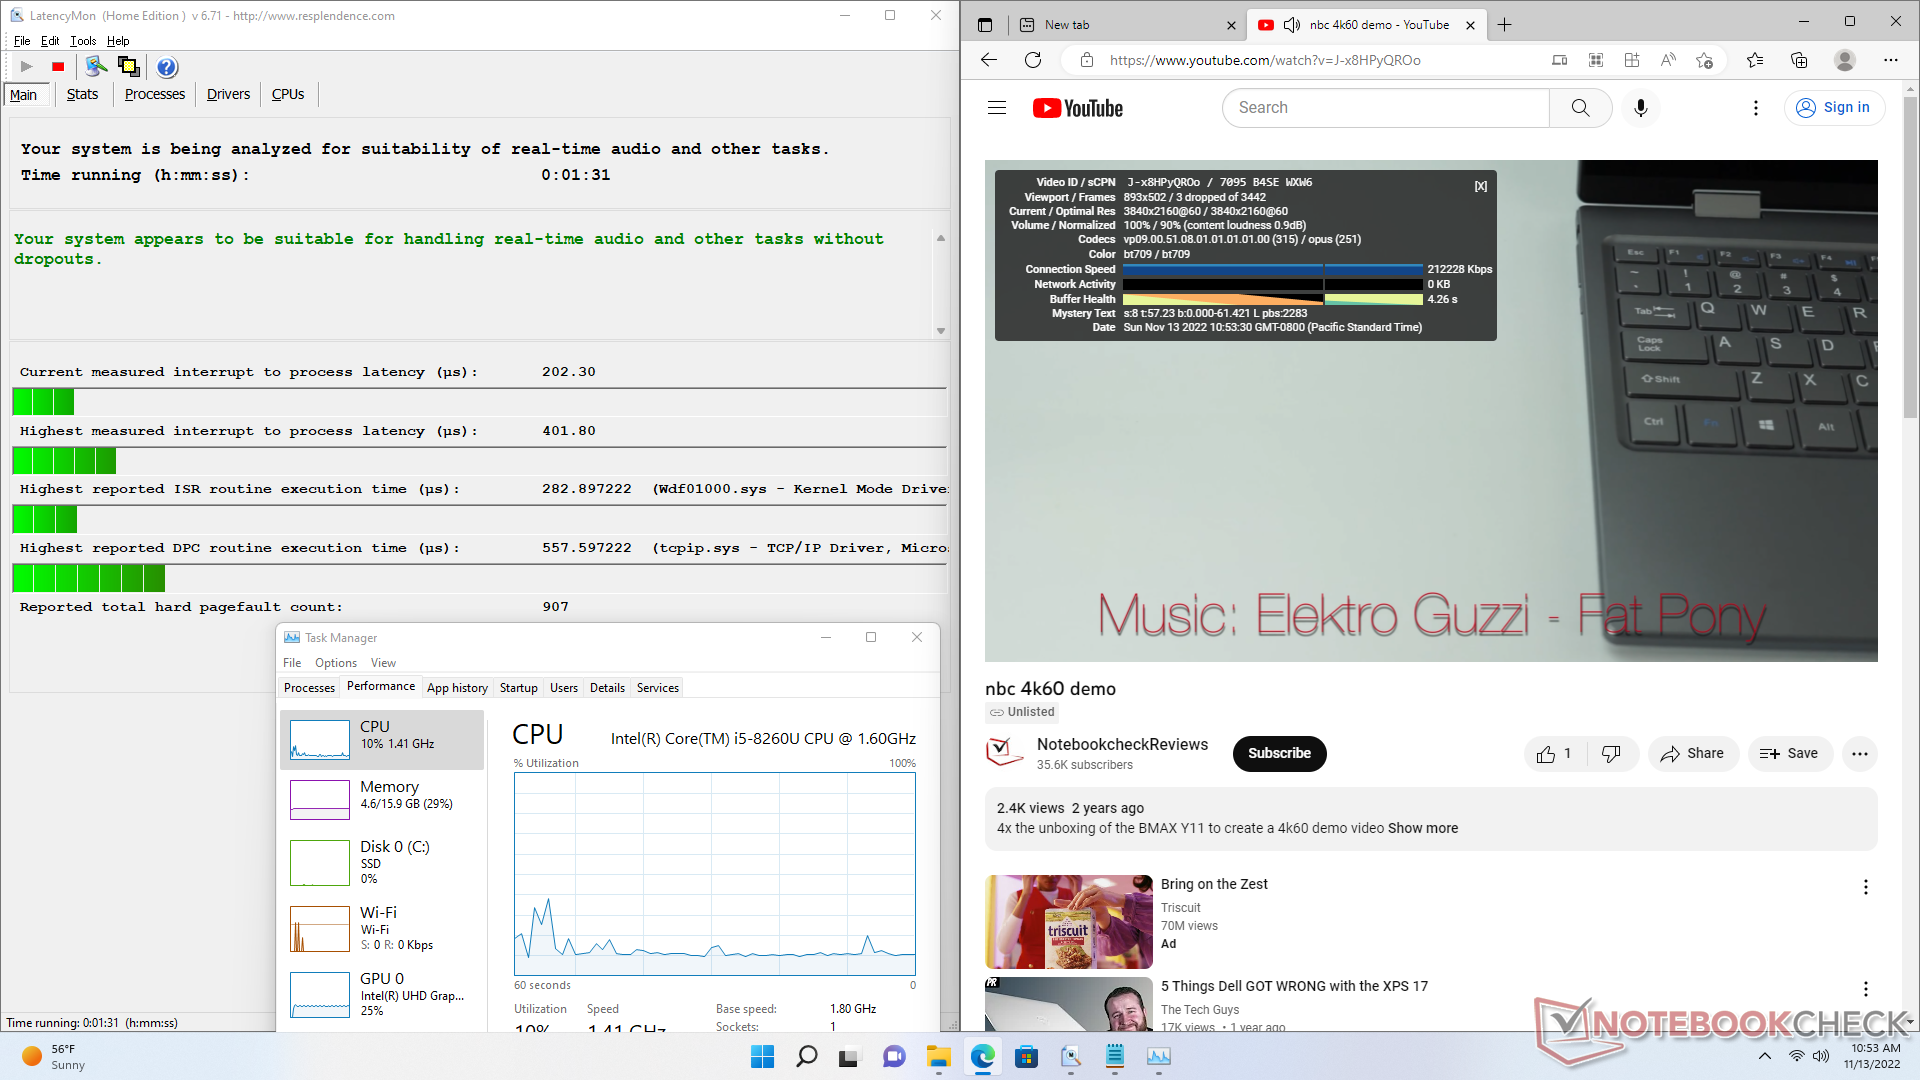
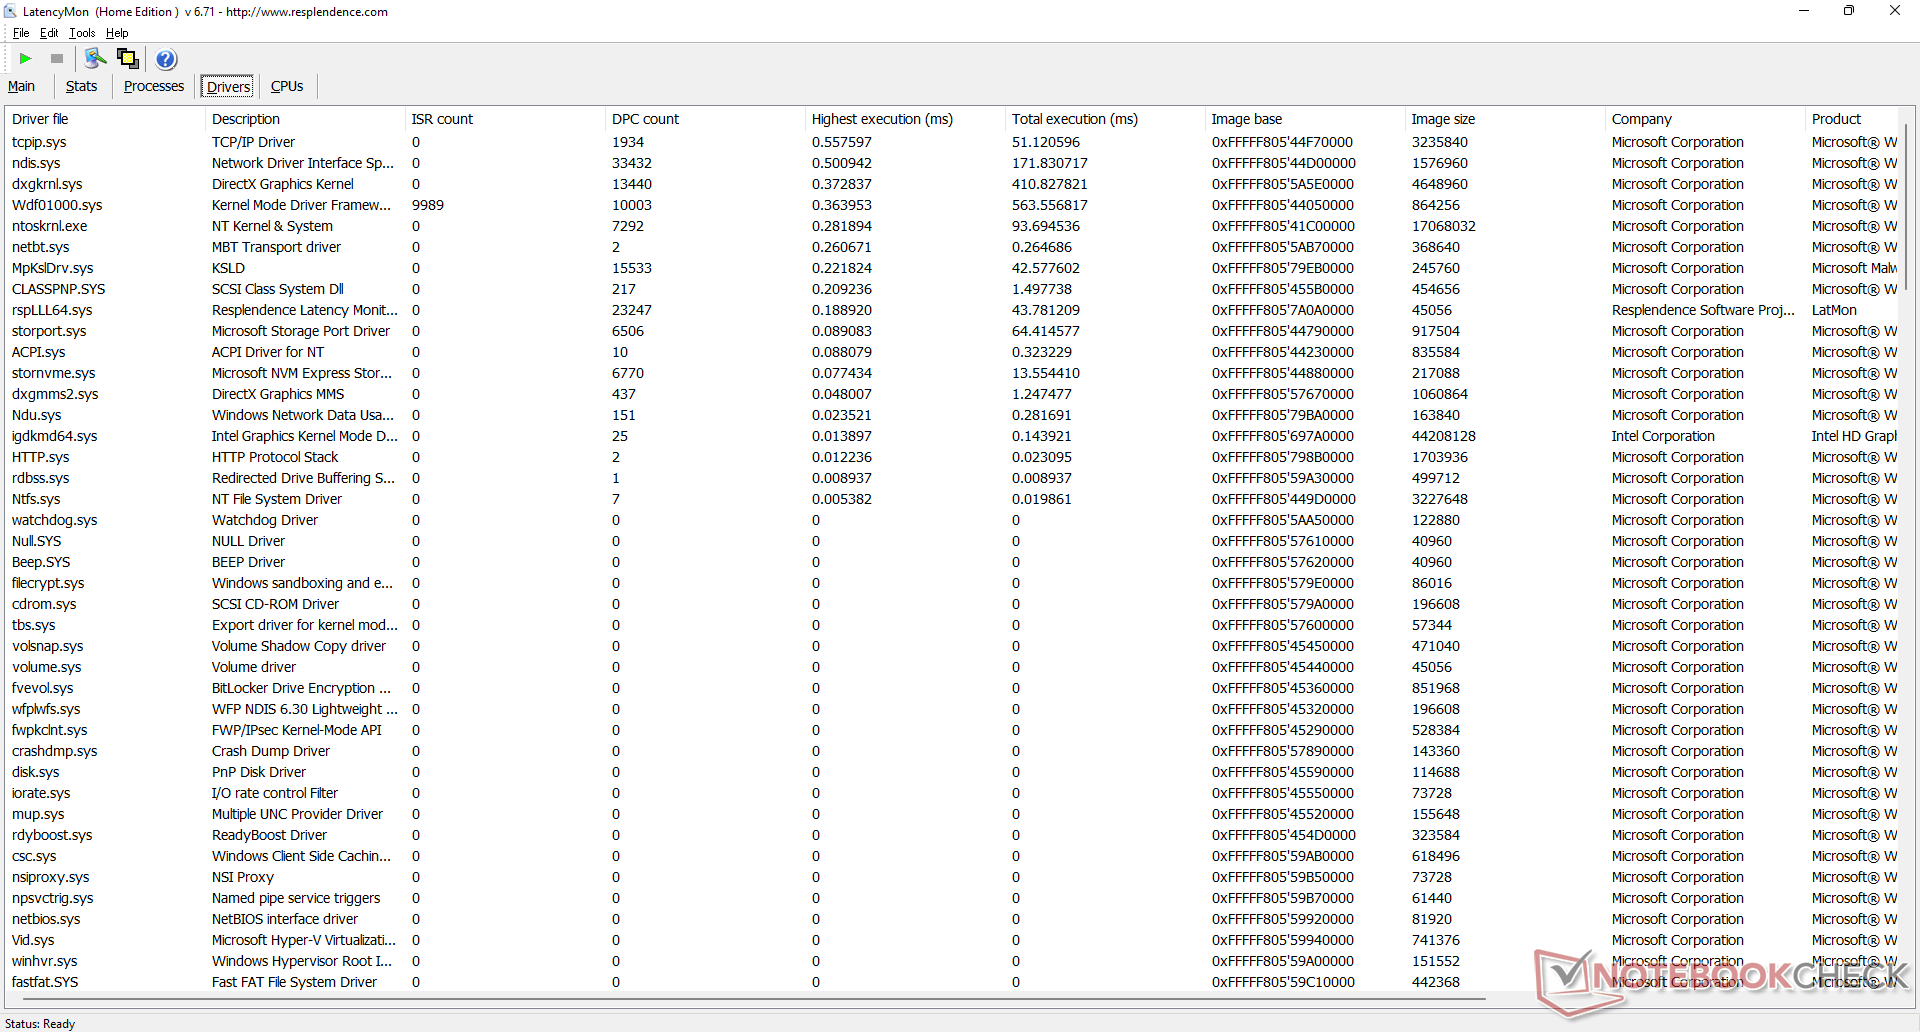
DPC-Latenzen
LatencyMon meldet keine größeren DPC-Probleme beim Web-Browsing, und die 4K-Vdeo-Wiedergabe bei 60 fps geschieht problemlos, mit nur drei ausgelassenen Bildern während des Abspielens unseres einminütigen Testvideos.
| DPC Latencies / LatencyMon - interrupt to process latency (max), Web, Youtube, Prime95 | |
| Beelink SEi8 | |
| Beelink U59 N5105 | |
| Beelink SER Pro Ryzen 5 5600H | |
| Intel NUC11TNKi5 | |
| BMAX B5 Pro G7H8 | |
| Beelink SEi11 Pro | |
* ... kleinere Werte sind besser
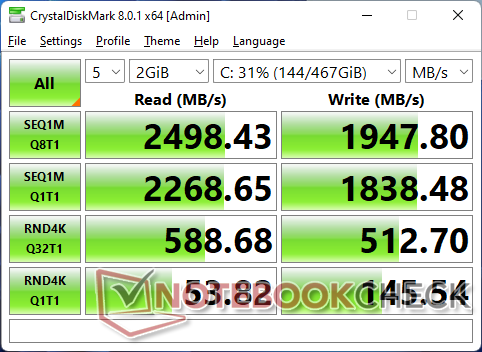
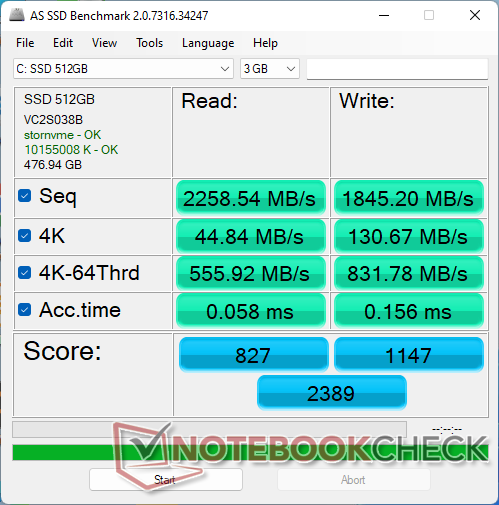
Massenspeicher — bis zu zwei möglich
Das B5 Pro verfügt über eine typische M.2-PCIe3-x4-SSD an einem RealTek-RTS5763DL-Controller, um Kosten einzusparen. Die Performance ist nicht gerade optimal, da die Lese-Geschwindigkeit von anfänglichen ~2.400 MB/s auf lediglich ~1.700 MB/s fällt, wenn man mit größeren Datenmengen hantiert.

| Drive Performance Rating - Percent | |
| Beelink SER Pro Ryzen 5 5600H -11! | |
| BMAX B5 Pro G7H8 | |
| Beelink SEi11 Pro | |
| Beelink SEi8 | |
| Beelink U59 N5105 | |
| Intel NUC11TNKi5 | |
| DiskSpd | |
| seq read | |
| BMAX B5 Pro G7H8 | |
| Beelink SER Pro Ryzen 5 5600H | |
| Beelink SEi11 Pro | |
| Beelink SEi8 | |
| Intel NUC11TNKi5 | |
| Beelink U59 N5105 | |
| seq write | |
| Beelink SER Pro Ryzen 5 5600H | |
| Beelink SEi11 Pro | |
| BMAX B5 Pro G7H8 | |
| Beelink SEi8 | |
| Intel NUC11TNKi5 | |
| Beelink U59 N5105 | |
| seq q8 t1 read | |
| Beelink SER Pro Ryzen 5 5600H | |
| BMAX B5 Pro G7H8 | |
| Beelink SEi11 Pro | |
| Beelink SEi8 | |
| Intel NUC11TNKi5 | |
| Beelink U59 N5105 | |
| seq q8 t1 write | |
| BMAX B5 Pro G7H8 | |
| Beelink SER Pro Ryzen 5 5600H | |
| Beelink SEi11 Pro | |
| Beelink SEi8 | |
| Intel NUC11TNKi5 | |
| Beelink U59 N5105 | |
| 4k q1 t1 read | |
| Beelink SEi8 | |
| Beelink SEi11 Pro | |
| BMAX B5 Pro G7H8 | |
| Beelink SER Pro Ryzen 5 5600H | |
| Beelink U59 N5105 | |
| Intel NUC11TNKi5 | |
| 4k q1 t1 write | |
| Beelink SEi11 Pro | |
| Beelink SER Pro Ryzen 5 5600H | |
| Beelink SEi8 | |
| BMAX B5 Pro G7H8 | |
| Beelink U59 N5105 | |
| Intel NUC11TNKi5 | |
| 4k q32 t16 read | |
| BMAX B5 Pro G7H8 | |
| Beelink SER Pro Ryzen 5 5600H | |
| Beelink SEi11 Pro | |
| Beelink SEi8 | |
| Intel NUC11TNKi5 | |
| Beelink U59 N5105 | |
| 4k q32 t16 write | |
| BMAX B5 Pro G7H8 | |
| Beelink SER Pro Ryzen 5 5600H | |
| Beelink SEi11 Pro | |
| Beelink SEi8 | |
| Intel NUC11TNKi5 | |
| Beelink U59 N5105 | |
| AS SSD | |
| Score Total | |
| Beelink SEi11 Pro | |
| BMAX B5 Pro G7H8 | |
| Beelink SEi8 | |
| Intel NUC11TNKi5 | |
| Beelink U59 N5105 | |
| Score Read | |
| Beelink SEi11 Pro | |
| BMAX B5 Pro G7H8 | |
| Beelink SEi8 | |
| Intel NUC11TNKi5 | |
| Beelink U59 N5105 | |
| Score Write | |
| Beelink SEi11 Pro | |
| BMAX B5 Pro G7H8 | |
| Beelink SEi8 | |
| Intel NUC11TNKi5 | |
| Beelink U59 N5105 | |
| Seq Read | |
| BMAX B5 Pro G7H8 | |
| Beelink SEi11 Pro | |
| Beelink SEi8 | |
| Intel NUC11TNKi5 | |
| Beelink U59 N5105 | |
| Seq Write | |
| BMAX B5 Pro G7H8 | |
| Beelink SEi11 Pro | |
| Beelink SEi8 | |
| Intel NUC11TNKi5 | |
| Beelink U59 N5105 | |
| 4K Read | |
| Beelink SEi8 | |
| BMAX B5 Pro G7H8 | |
| Beelink SEi11 Pro | |
| Intel NUC11TNKi5 | |
| Beelink U59 N5105 | |
| 4K Write | |
| Beelink SEi11 Pro | |
| BMAX B5 Pro G7H8 | |
| Beelink SEi8 | |
| Beelink U59 N5105 | |
| Intel NUC11TNKi5 | |
| 4K-64 Read | |
| Beelink SEi11 Pro | |
| BMAX B5 Pro G7H8 | |
| Beelink SEi8 | |
| Intel NUC11TNKi5 | |
| Beelink U59 N5105 | |
| 4K-64 Write | |
| Beelink SEi11 Pro | |
| BMAX B5 Pro G7H8 | |
| Beelink SEi8 | |
| Intel NUC11TNKi5 | |
| Beelink U59 N5105 | |
| Access Time Read | |
| Intel NUC11TNKi5 | |
| Beelink SEi8 | |
| Beelink U59 N5105 | |
| BMAX B5 Pro G7H8 | |
| Beelink SEi11 Pro | |
| Access Time Write | |
| Beelink SEi11 Pro | |
| Intel NUC11TNKi5 | |
| Beelink U59 N5105 | |
| BMAX B5 Pro G7H8 | |
| Beelink SEi8 | |
* ... kleinere Werte sind besser
Dauerleistung Lesen: DiskSpd Read Loop, Queue Depth 8
Grafikleistung
Die Grafikleistung ist schlecht, wenn man aktuelle Standards anlegt. Die Iris Xe 80 EUs etwa vieler moderner Core-i5-U-Series-CPUs erreicht eine 2 bis 2,5 mal höhere Leistung als die alte UHD Graphics 620 im B5 Pro. Bei den Games sind die meisten unspielbar, während einige nicht mal starten, so auch X-Plane.
| 3DMark | |
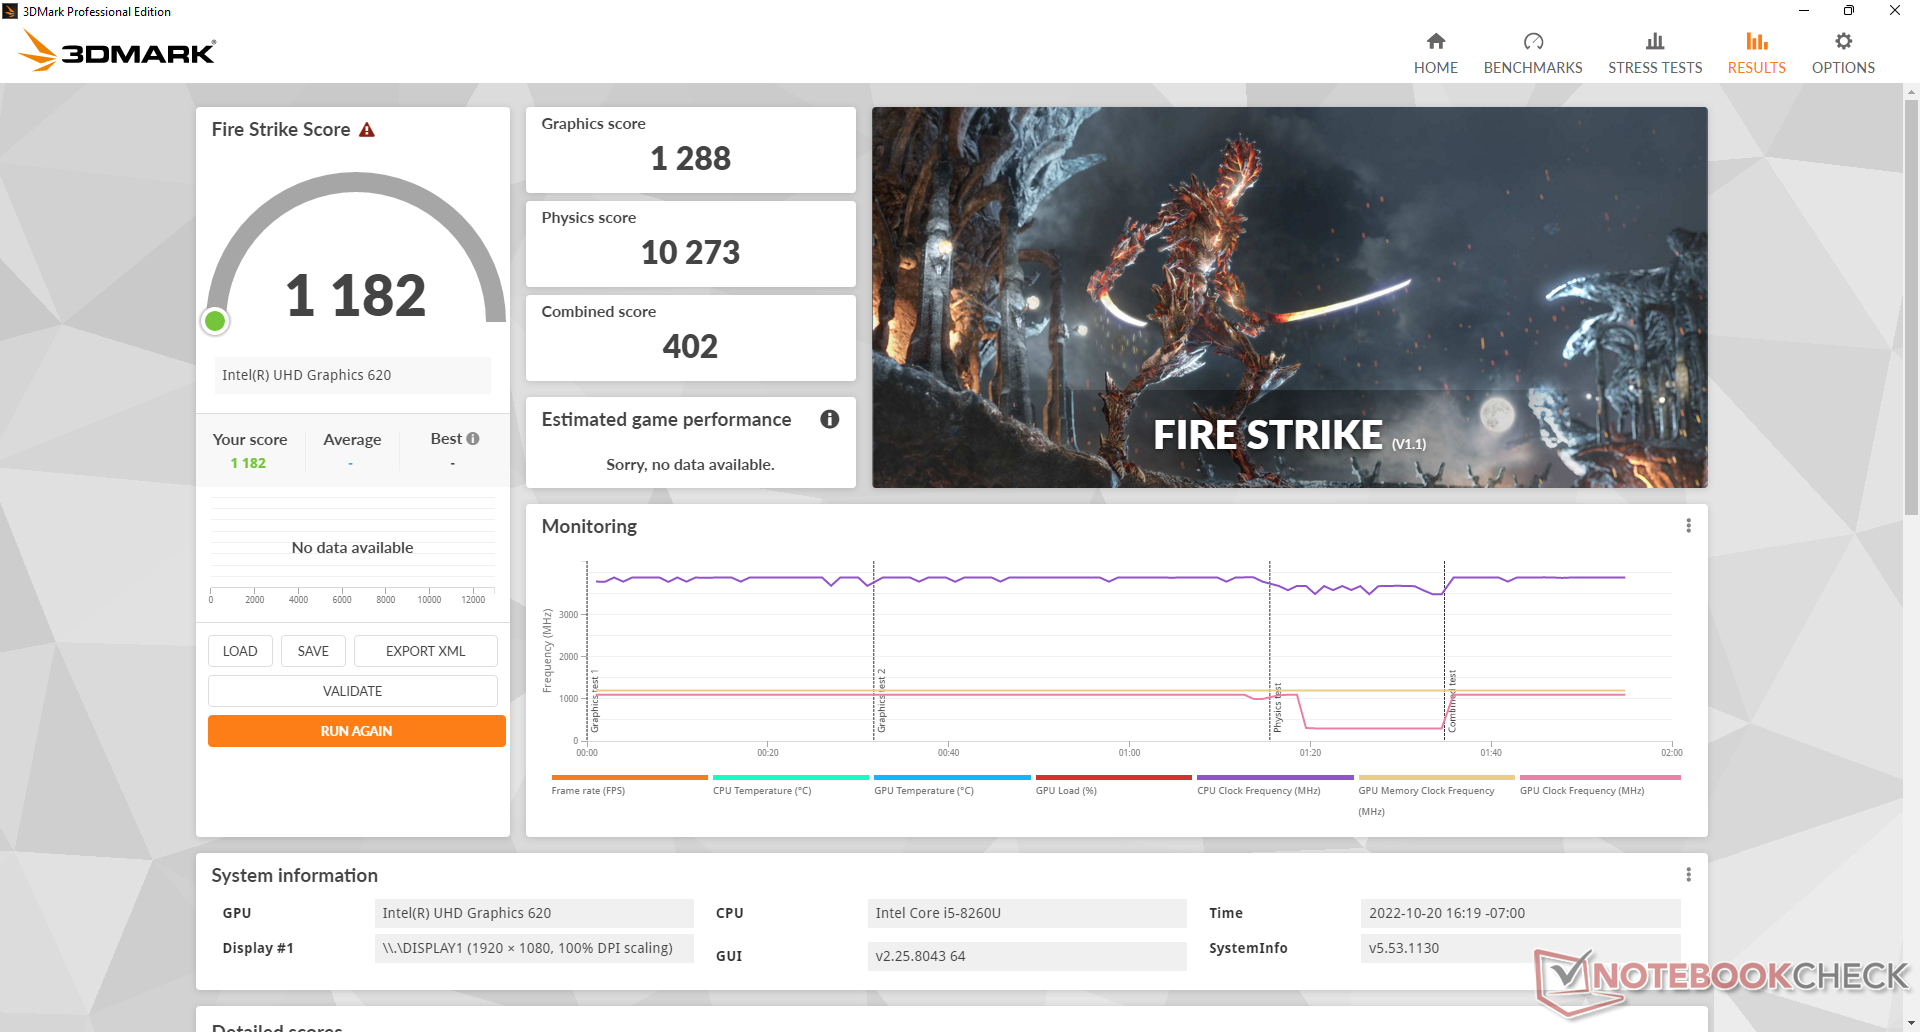
| 1920x1080 Fire Strike Graphics | |
| Beelink SEi11 Pro | |
| Asus Vivobook 15 K513EQ | |
| Beelink SER Pro Ryzen 5 5600H | |
| Intel NUC11TNKi5 | |
| Infinix INBook X2 | |
| Geekom Mini IT8-GM08i5T | |
| Beelink SEi8 | |
| BMAX B5 Pro G7H8 | |
| Beelink U59 N5105 | |
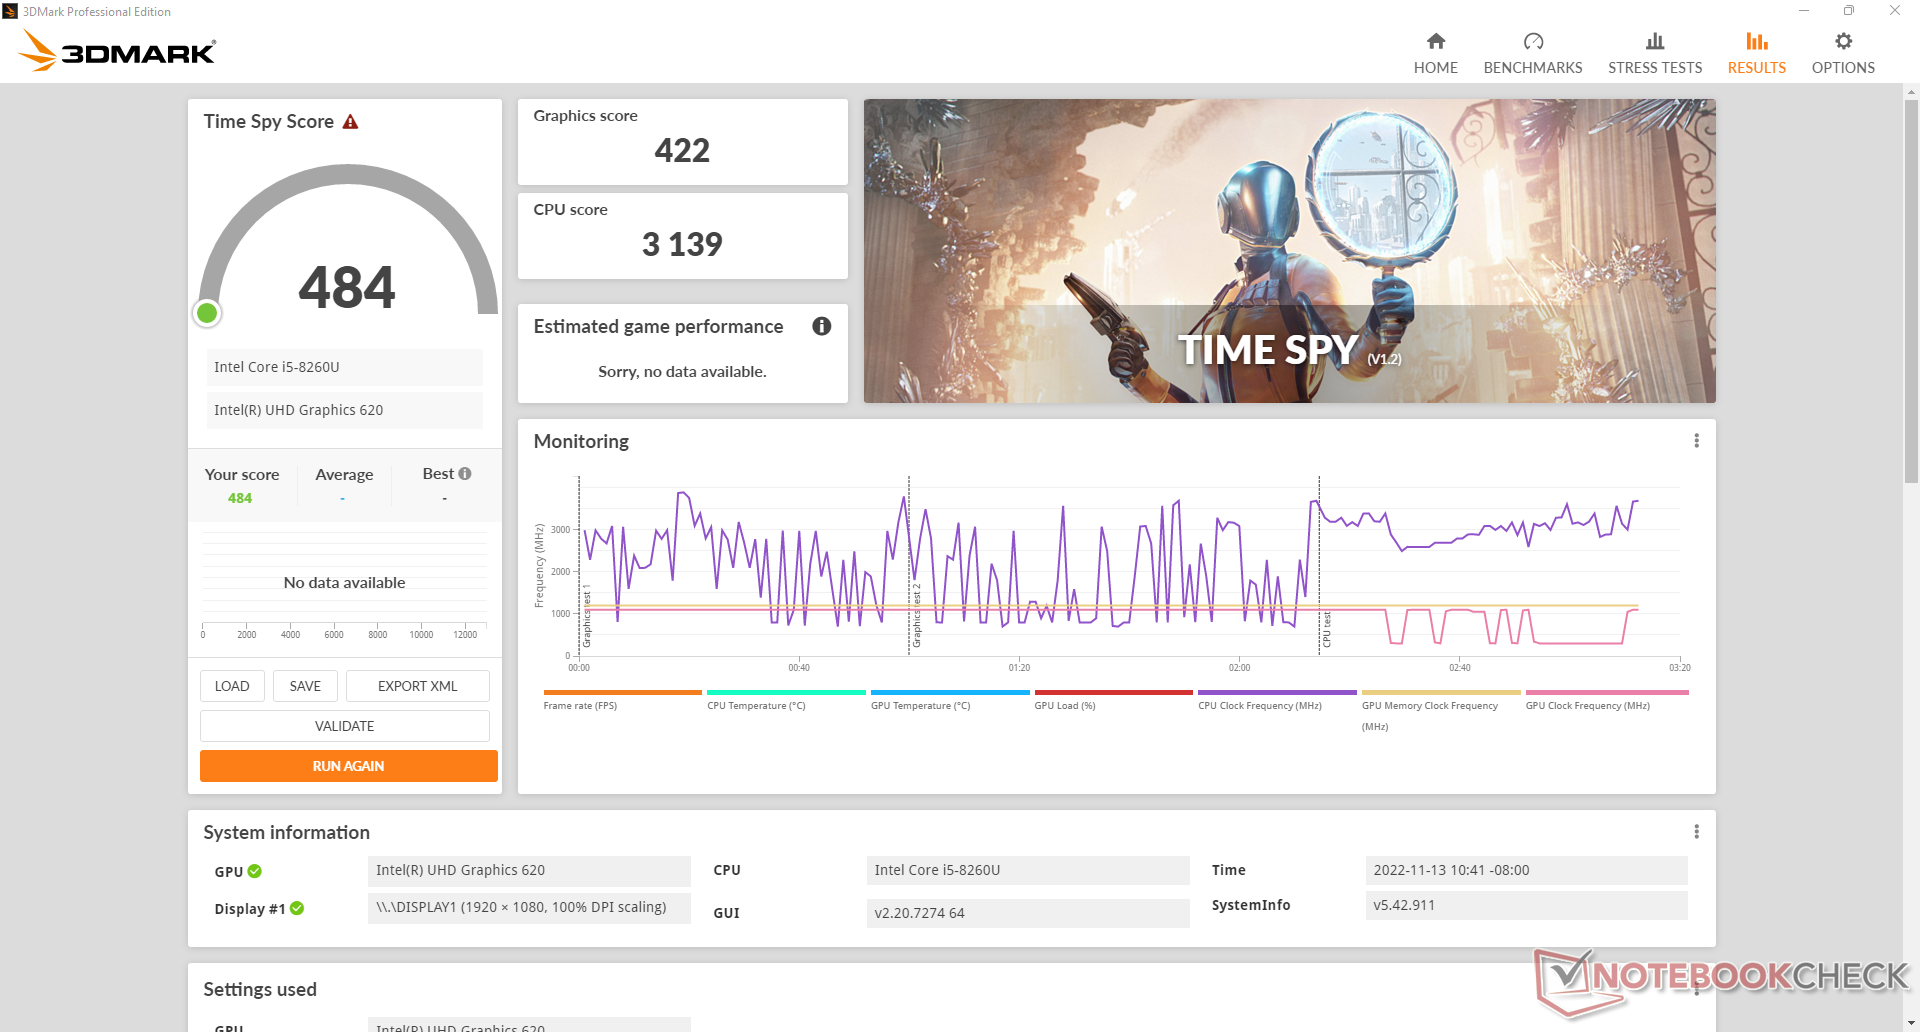
| 2560x1440 Time Spy Graphics | |
| Beelink SEi11 Pro | |
| Asus Vivobook 15 K513EQ | |
| Beelink SER Pro Ryzen 5 5600H | |
| Intel NUC11TNKi5 | |
| Infinix INBook X2 | |
| Geekom Mini IT8-GM08i5T | |
| Beelink SEi8 | |
| BMAX B5 Pro G7H8 | |
| Beelink U59 N5105 | |
| 2560x1440 Time Spy Score | |
| Beelink SEi11 Pro | |
| Asus Vivobook 15 K513EQ | |
| Beelink SER Pro Ryzen 5 5600H | |
| Intel NUC11TNKi5 | |
| Infinix INBook X2 | |
| Geekom Mini IT8-GM08i5T | |
| Beelink SEi8 | |
| BMAX B5 Pro G7H8 | |
| Beelink U59 N5105 | |
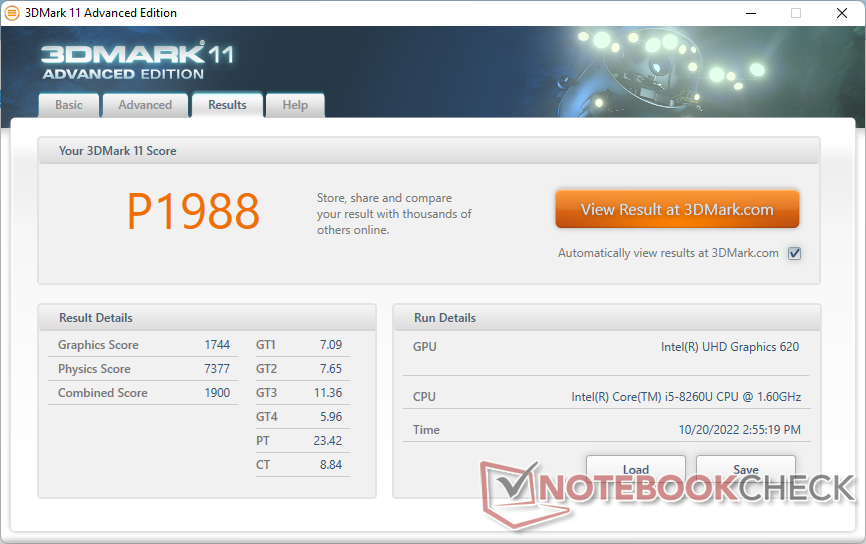
| 3DMark 11 - 1280x720 Performance GPU | |
| Beelink SEi11 Pro | |
| Asus Vivobook 15 K513EQ | |
| Beelink SER Pro Ryzen 5 5600H | |
| Intel NUC11TNKi5 | |
| Infinix INBook X2 | |
| Geekom Mini IT8-GM08i5T | |
| Beelink SEi8 | |
| BMAX B5 Pro G7H8 | |
| Fujitsu Lifebook U939 i5 | |
| Beelink U59 N5105 | |
| 3DMark 11 Performance | 1988 Punkte | |
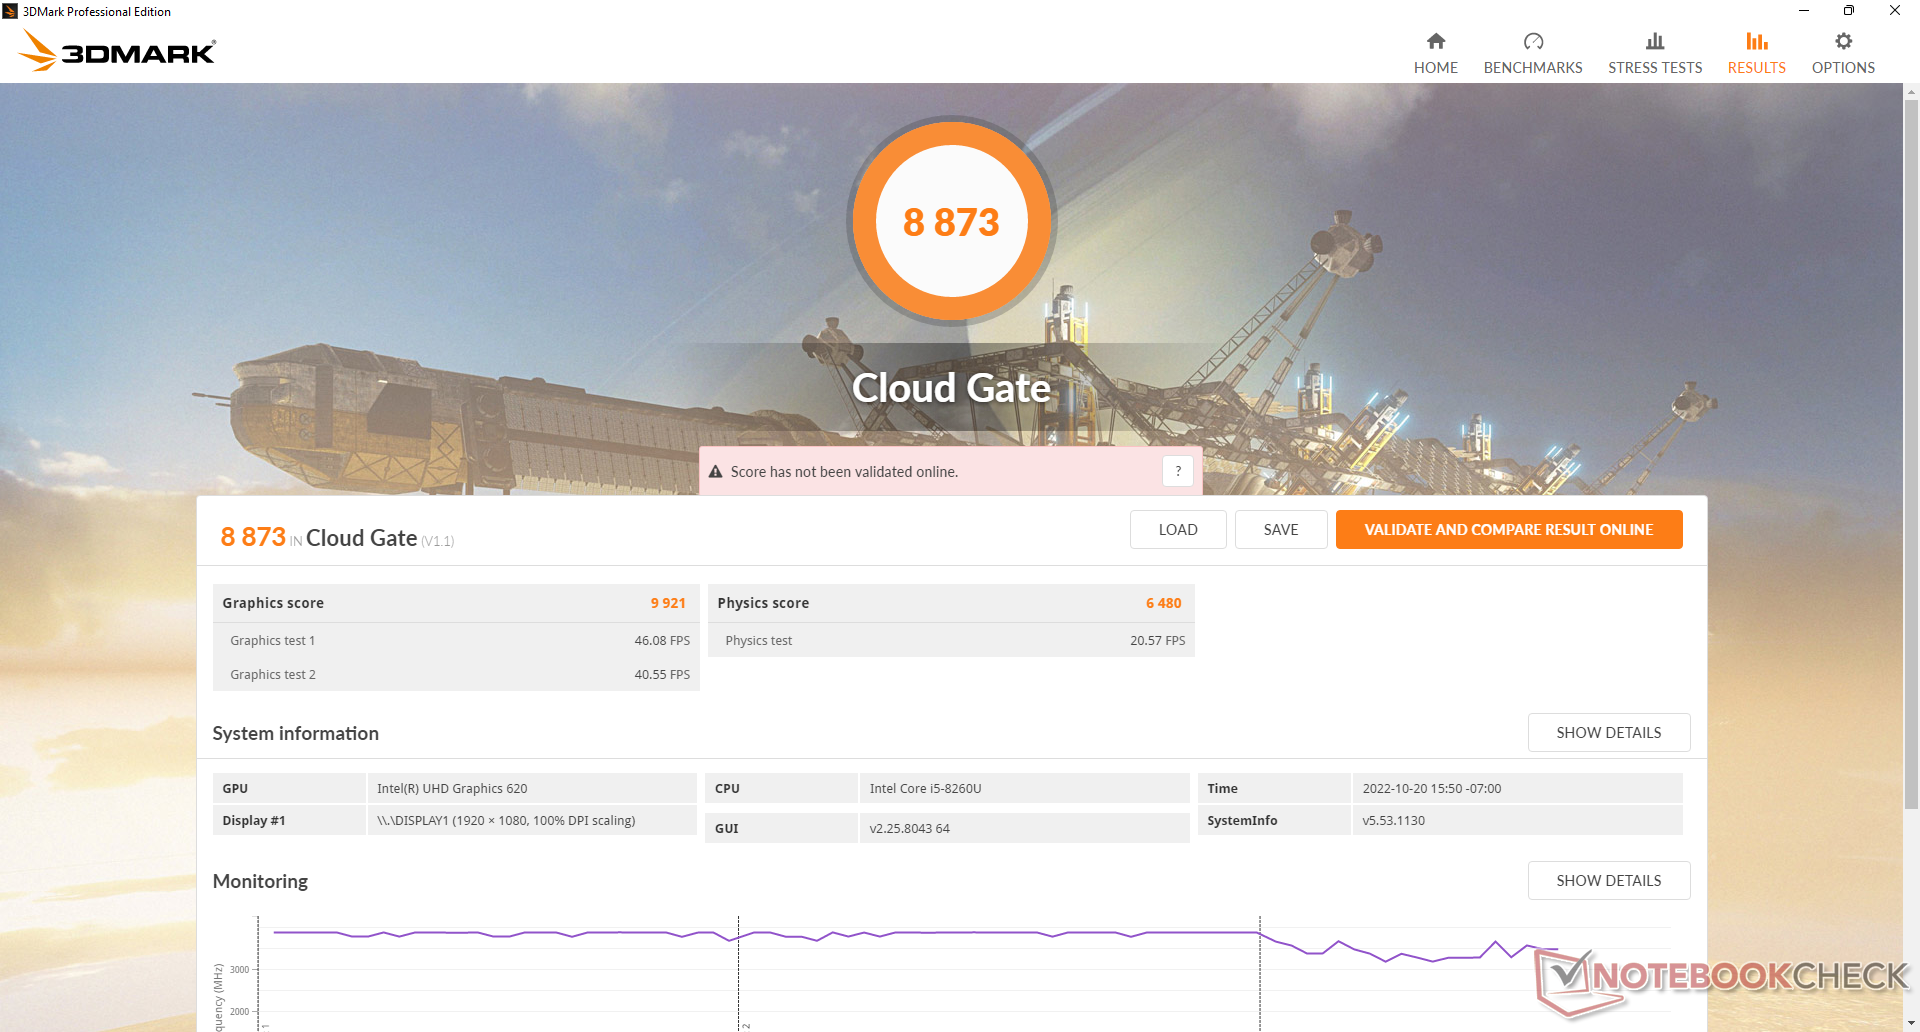
| 3DMark Cloud Gate Standard Score | 8873 Punkte | |
| 3DMark Fire Strike Score | 1182 Punkte | |
| 3DMark Time Spy Score | 484 Punkte | |
Hilfe | ||
| Blender - v3.3 Classroom CPU (nach Ergebnis sortieren) | |
| BMAX B5 Pro G7H8 | |
| Beelink SEi11 Pro | |
| Beelink U59 N5105 | |
| Beelink SER Pro Ryzen 5 5600H | |
* ... kleinere Werte sind besser
| Performance Rating - Percent | |
| Asus Vivobook 15 K513EQ | |
| Beelink SER Pro Ryzen 5 5600H | |
| Beelink SEi11 Pro -1! | |
| Intel NUC11TNKi5 -3! | |
| Infinix INBook X2 -2! | |
| Beelink SEi8 -3! | |
| Fujitsu Lifebook U939 i5 -4! | |
| Beelink U59 N5105 -3! | |
| BMAX B5 Pro G7H8 -5! | |
| The Witcher 3 - 1920x1080 Ultra Graphics & Postprocessing (HBAO+) | |
| Asus Vivobook 15 K513EQ | |
| Beelink SER Pro Ryzen 5 5600H | |
| Beelink SEi11 Pro | |
| Infinix INBook X2 | |
| Beelink U59 N5105 | |
| GTA V - 1920x1080 Highest AA:4xMSAA + FX AF:16x | |
| Asus Vivobook 15 K513EQ | |
| Beelink SER Pro Ryzen 5 5600H | |
| Final Fantasy XV Benchmark - 1920x1080 High Quality | |
| Beelink SEi11 Pro | |
| Asus Vivobook 15 K513EQ | |
| Beelink SER Pro Ryzen 5 5600H | |
| Intel NUC11TNKi5 | |
| Infinix INBook X2 | |
| Beelink SEi8 | |
| Strange Brigade - 1920x1080 ultra AA:ultra AF:16 | |
| Beelink SER Pro Ryzen 5 5600H | |
| Beelink SEi11 Pro | |
| Asus Vivobook 15 K513EQ | |
| Dota 2 Reborn - 1920x1080 ultra (3/3) best looking | |
| Asus Vivobook 15 K513EQ | |
| Beelink SER Pro Ryzen 5 5600H | |
| Beelink SEi11 Pro | |
| Intel NUC11TNKi5 | |
| Infinix INBook X2 | |
| Beelink SEi8 | |
| Fujitsu Lifebook U939 i5 | |
| Beelink U59 N5105 | |
| BMAX B5 Pro G7H8 | |
| X-Plane 11.11 - 1920x1080 high (fps_test=3) | |
| Asus Vivobook 15 K513EQ | |
| Beelink SEi11 Pro | |
| Beelink SER Pro Ryzen 5 5600H | |
| Intel NUC11TNKi5 | |
| Infinix INBook X2 | |
| Fujitsu Lifebook U939 i5 | |
| Beelink SEi8 | |
| Beelink U59 N5105 | |
| The Witcher 3 | |
| 1024x768 Low Graphics & Postprocessing | |
| Beelink SEi11 Pro | |
| Asus Vivobook 15 K513EQ | |
| Beelink SER Pro Ryzen 5 5600H | |
| Intel NUC11TNKi5 | |
| Infinix INBook X2 | |
| BMAX B5 Pro G7H8 | |
| Beelink U59 N5105 | |
| Fujitsu Lifebook U939 i5 | |
| 1366x768 Medium Graphics & Postprocessing | |
| Beelink SEi11 Pro | |
| Beelink SER Pro Ryzen 5 5600H | |
| Asus Vivobook 15 K513EQ | |
| Infinix INBook X2 | |
| Beelink U59 N5105 | |
| BMAX B5 Pro G7H8 | |
| 1920x1080 High Graphics & Postprocessing (Nvidia HairWorks Off) | |
| Asus Vivobook 15 K513EQ | |
| Beelink SEi11 Pro | |
| Beelink SER Pro Ryzen 5 5600H | |
| Infinix INBook X2 | |
| Beelink U59 N5105 | |
| BMAX B5 Pro G7H8 | |
| Final Fantasy XV Benchmark - 1280x720 Lite Quality | |
| Asus Vivobook 15 K513EQ | |
| Beelink SER Pro Ryzen 5 5600H | |
| Beelink SEi11 Pro | |
| Intel NUC11TNKi5 | |
| Infinix INBook X2 | |
| Geekom Mini IT8-GM08i5T | |
| Beelink SEi8 | |
| Beelink U59 N5105 | |
| BMAX B5 Pro G7H8 | |
| Dota 2 Reborn | |
| 1280x720 min (0/3) fastest | |
| Beelink SER Pro Ryzen 5 5600H | |
| Asus Vivobook 15 K513EQ | |
| Beelink SEi11 Pro | |
| Beelink SEi8 | |
| Infinix INBook X2 | |
| Intel NUC11TNKi5 | |
| Beelink U59 N5105 | |
| Fujitsu Lifebook U939 i5 | |
| BMAX B5 Pro G7H8 | |
| 1366x768 med (1/3) | |
| Asus Vivobook 15 K513EQ | |
| Beelink SER Pro Ryzen 5 5600H | |
| Beelink SEi11 Pro | |
| Infinix INBook X2 | |
| Intel NUC11TNKi5 | |
| Fujitsu Lifebook U939 i5 | |
| Beelink SEi8 | |
| Beelink U59 N5105 | |
| BMAX B5 Pro G7H8 | |
| 1920x1080 high (2/3) | |
| Asus Vivobook 15 K513EQ | |
| Beelink SER Pro Ryzen 5 5600H | |
| Beelink SEi11 Pro | |
| Intel NUC11TNKi5 | |
| Infinix INBook X2 | |
| Beelink SEi8 | |
| Fujitsu Lifebook U939 i5 | |
| Beelink U59 N5105 | |
| BMAX B5 Pro G7H8 | |
| 1920x1080 ultra (3/3) best looking | |
| Asus Vivobook 15 K513EQ | |
| Beelink SER Pro Ryzen 5 5600H | |
| Beelink SEi11 Pro | |
| Intel NUC11TNKi5 | |
| Infinix INBook X2 | |
| Beelink SEi8 | |
| Fujitsu Lifebook U939 i5 | |
| Beelink U59 N5105 | |
| BMAX B5 Pro G7H8 | |
Witcher-3-fps-Diagramm
| min. | mittel | hoch | max. | |
|---|---|---|---|---|
| The Witcher 3 (2015) | 23.8 | 13.5 | 7.3 | |
| Dota 2 Reborn (2015) | 42.4 | 8.6 | 5.6 | 5.6 |
| Final Fantasy XV Benchmark (2018) | 5.61 |
Emissionen
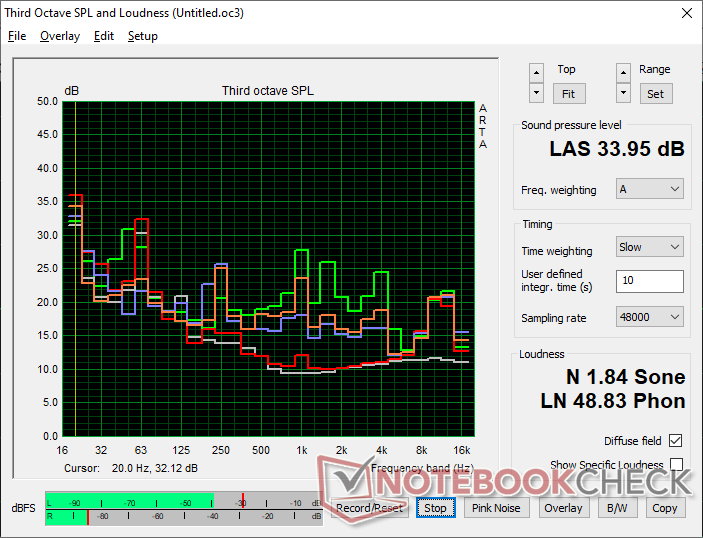
Geräuschemissionen — nicht mal ansatzweise laut
Der interne Lüfter ist selbst im Leerlauf fast immer aktiv, mit einem Schallpegel von 25 dB(A), bei einer Umgebung, die 23 dB(A) misst. Efreulicherweise ist das so leise, dass man das B5 Pro in den meisten Fällen nicht wahrnimmt. Bei höheren Lasten, etwa beim Spielen, bewegt sich die Lüfterlautstärke im Bereich von 30 bis 34 dB(A), was immer noch sehr leise ist, besonders für HTPC-Umgebungen.
Lautstärkediagramm
| Idle |
| 25.1 / 25.1 / 25.1 dB(A) |
| Last |
| 28.6 / 34 dB(A) |
 | ||
30 dB leise 40 dB(A) deutlich hörbar 50 dB(A) störend |
||
min: | ||
| BMAX B5 Pro G7H8 UHD Graphics 620, i5-8260U | Beelink SEi11 Pro Iris Xe G7 96EUs, i5-11320H, Kingston NV1 SNVS/500GCN | Beelink U59 N5105 UHD Graphics (Jasper Lake 24 EU), Celeron N5105, Silicon Motion AZW 512G NV428 | Beelink SEi8 Iris Plus Graphics 655, i3-8109U, Intel SSD 660p SSDPEKNW512G8 | Beelink SER Pro Ryzen 5 5600H Vega 7, R5 5600H, Kingston NV1 SNVS/500GCN | Intel NUC11TNKi5 Iris Xe G7 80EUs, i5-1135G7, Transcend M.2 SSD 430S TS512GMTS430S | |
|---|---|---|---|---|---|---|
| Geräuschentwicklung | -5% | 14% | -14% | -7% | -32% | |
| aus / Umgebung * (dB) | 23 | 22.8 1% | 21.5 7% | 24.5 -7% | 22.8 1% | 24.8 -8% |
| Idle min * (dB) | 25.1 | 24.7 2% | 22.1 12% | 26.5 -6% | 26.1 -4% | 35.6 -42% |
| Idle avg * (dB) | 25.1 | 24.7 2% | 22.1 12% | 26.5 -6% | 26.1 -4% | 35.6 -42% |
| Idle max * (dB) | 25.1 | 25.3 -1% | 22.1 12% | 31.1 -24% | 28.7 -14% | 35.6 -42% |
| Last avg * (dB) | 28.6 | 33.2 -16% | 23.9 16% | 37.7 -32% | 32.3 -13% | 36.2 -27% |
| Witcher 3 ultra * (dB) | 30.1 | 34.5 -15% | 24.4 19% | 32.8 -9% | 38 -26% | |
| Last max * (dB) | 34 | 37.8 -11% | 26.8 21% | 37.5 -10% | 36.4 -7% | 47.6 -40% |
* ... kleinere Werte sind besser
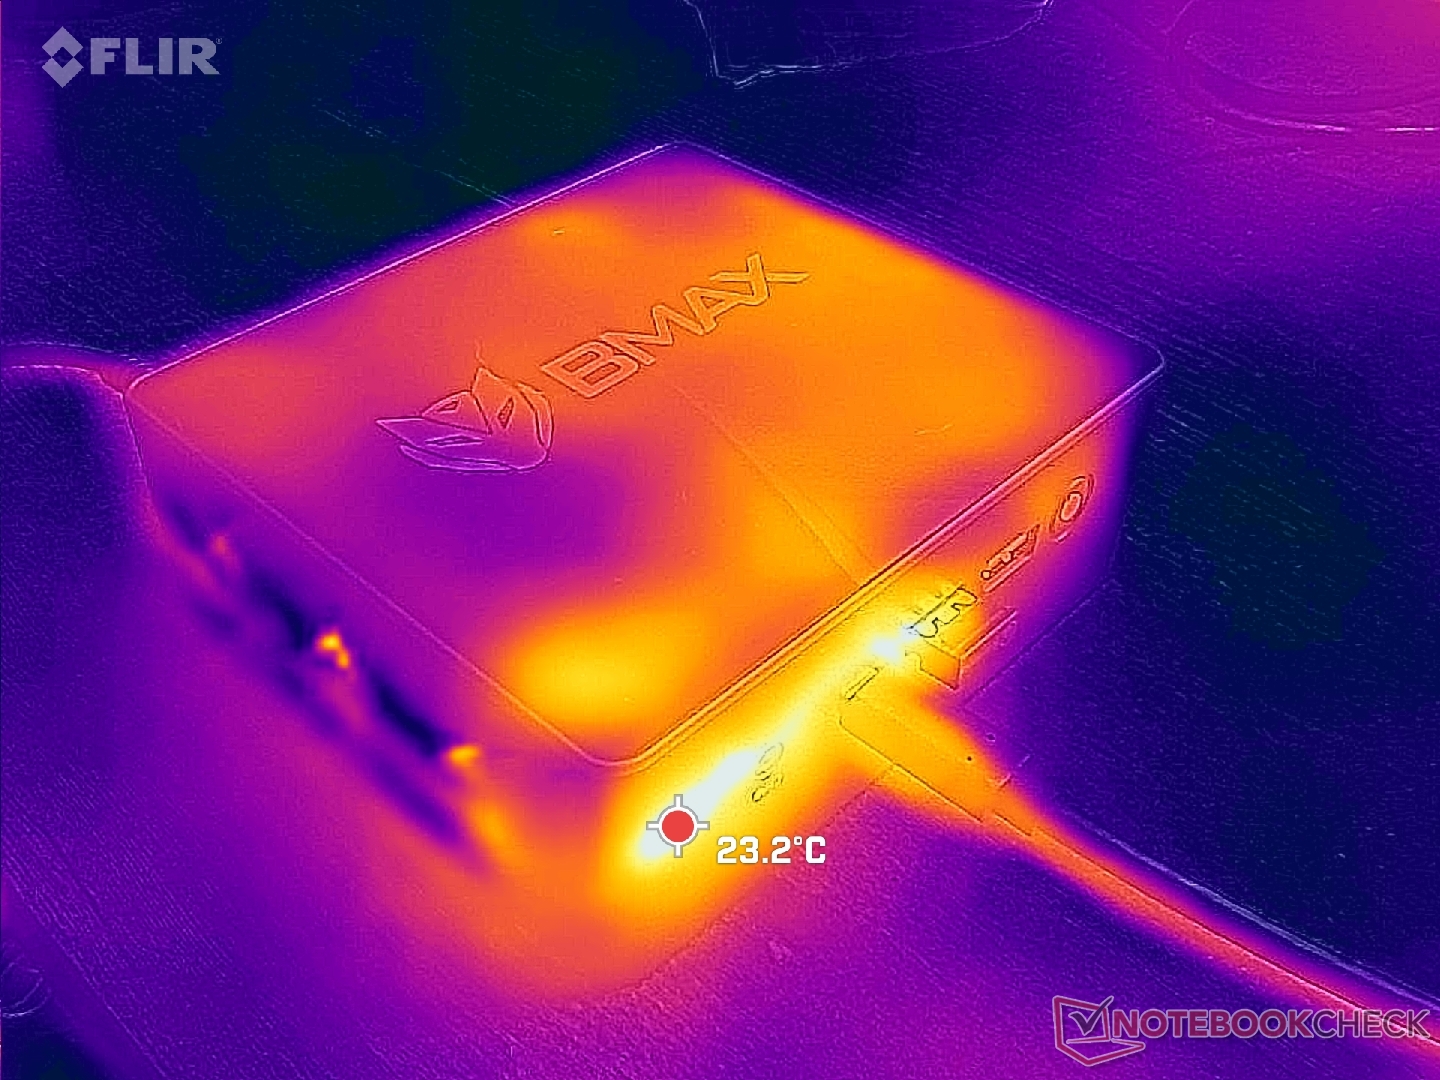
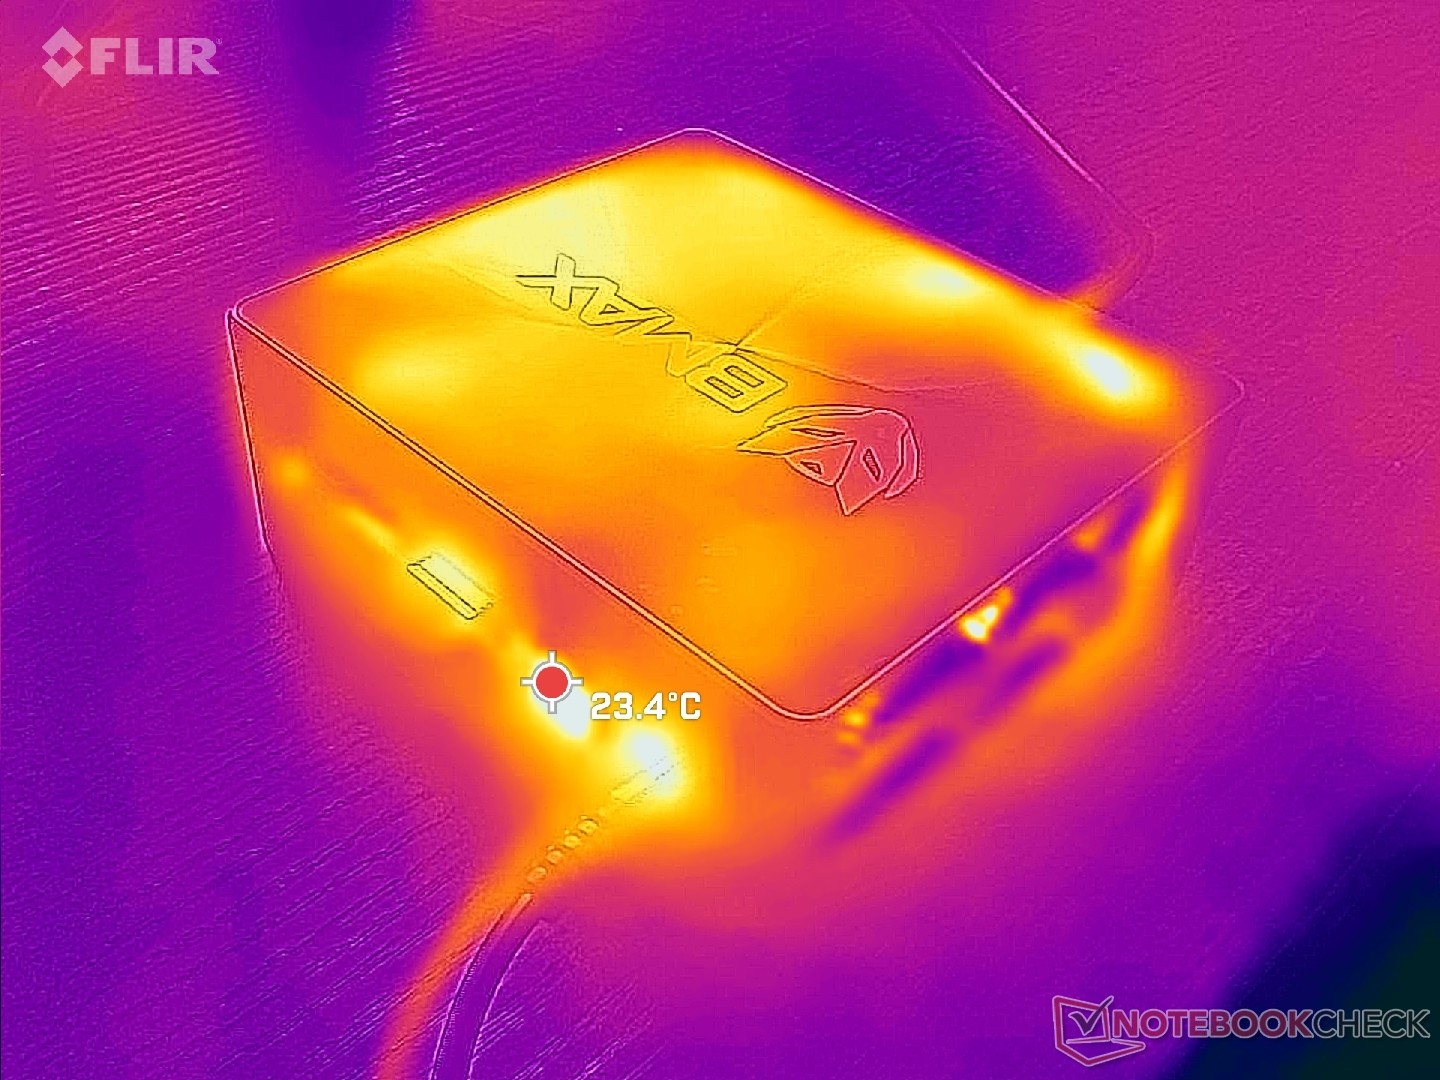
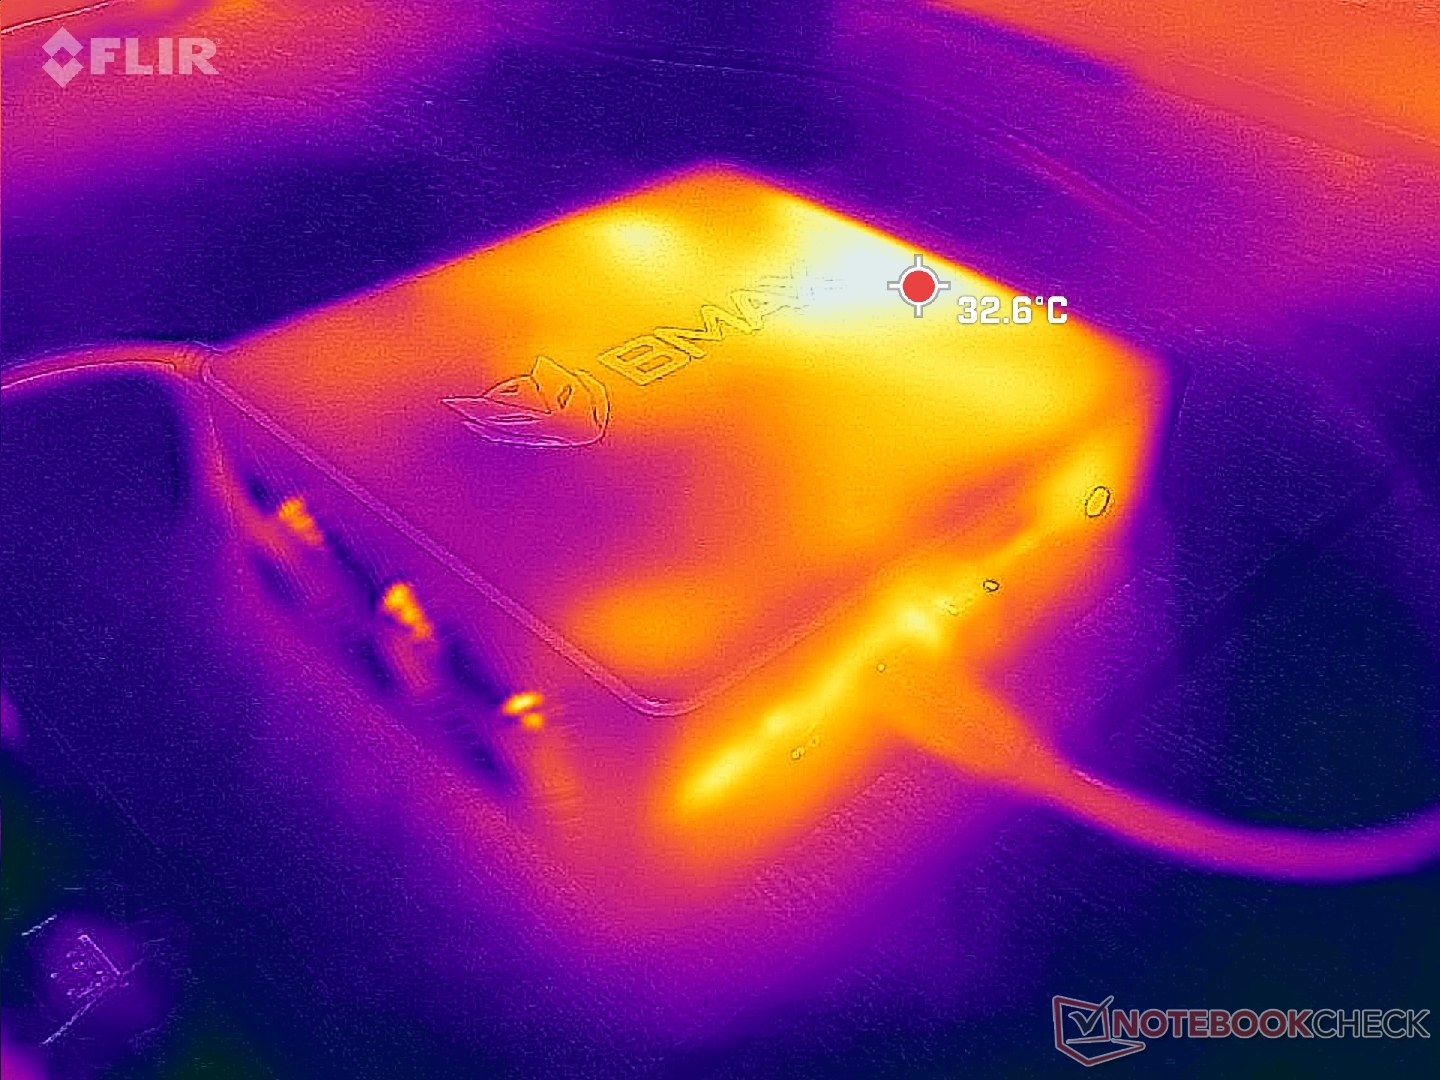
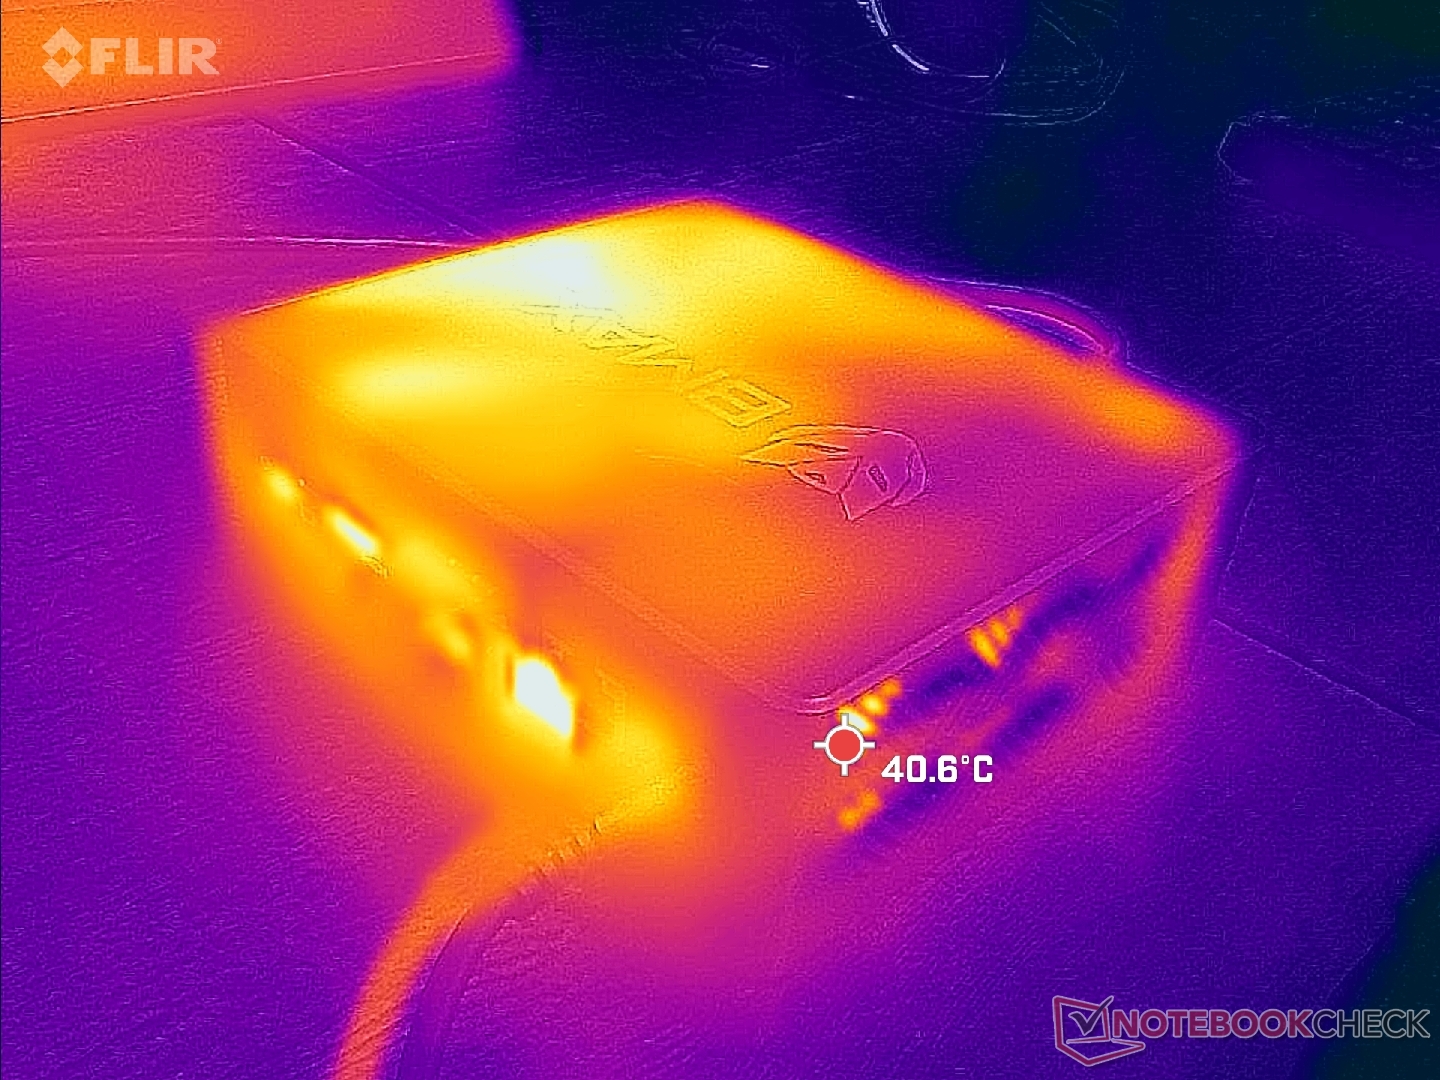
Temperatur
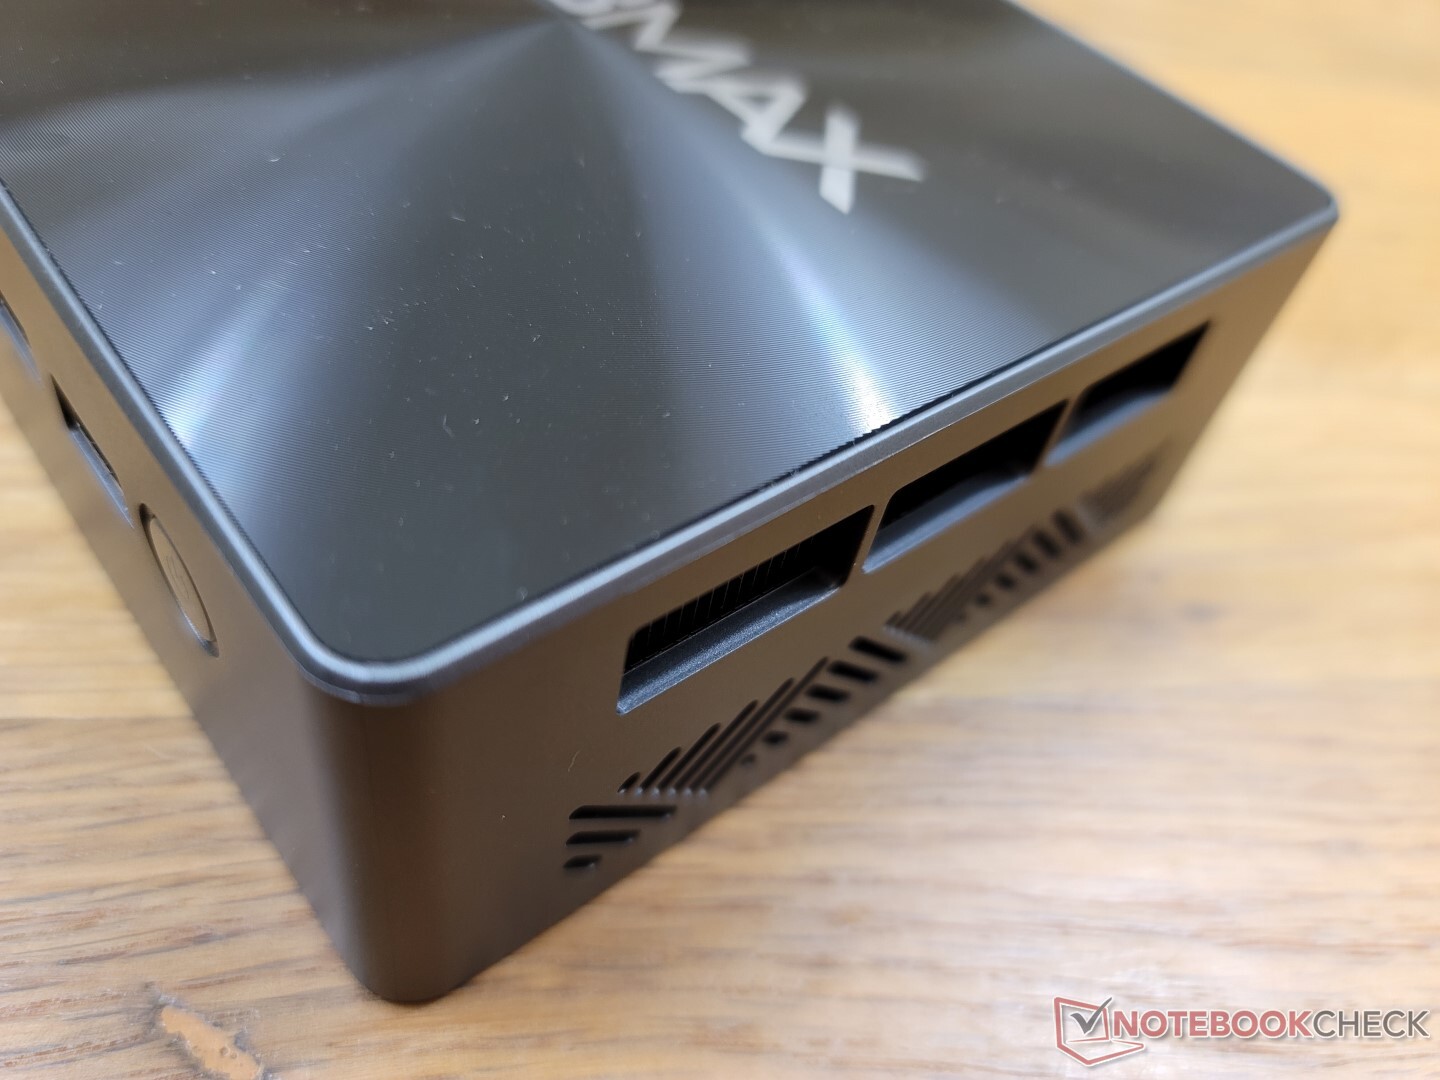
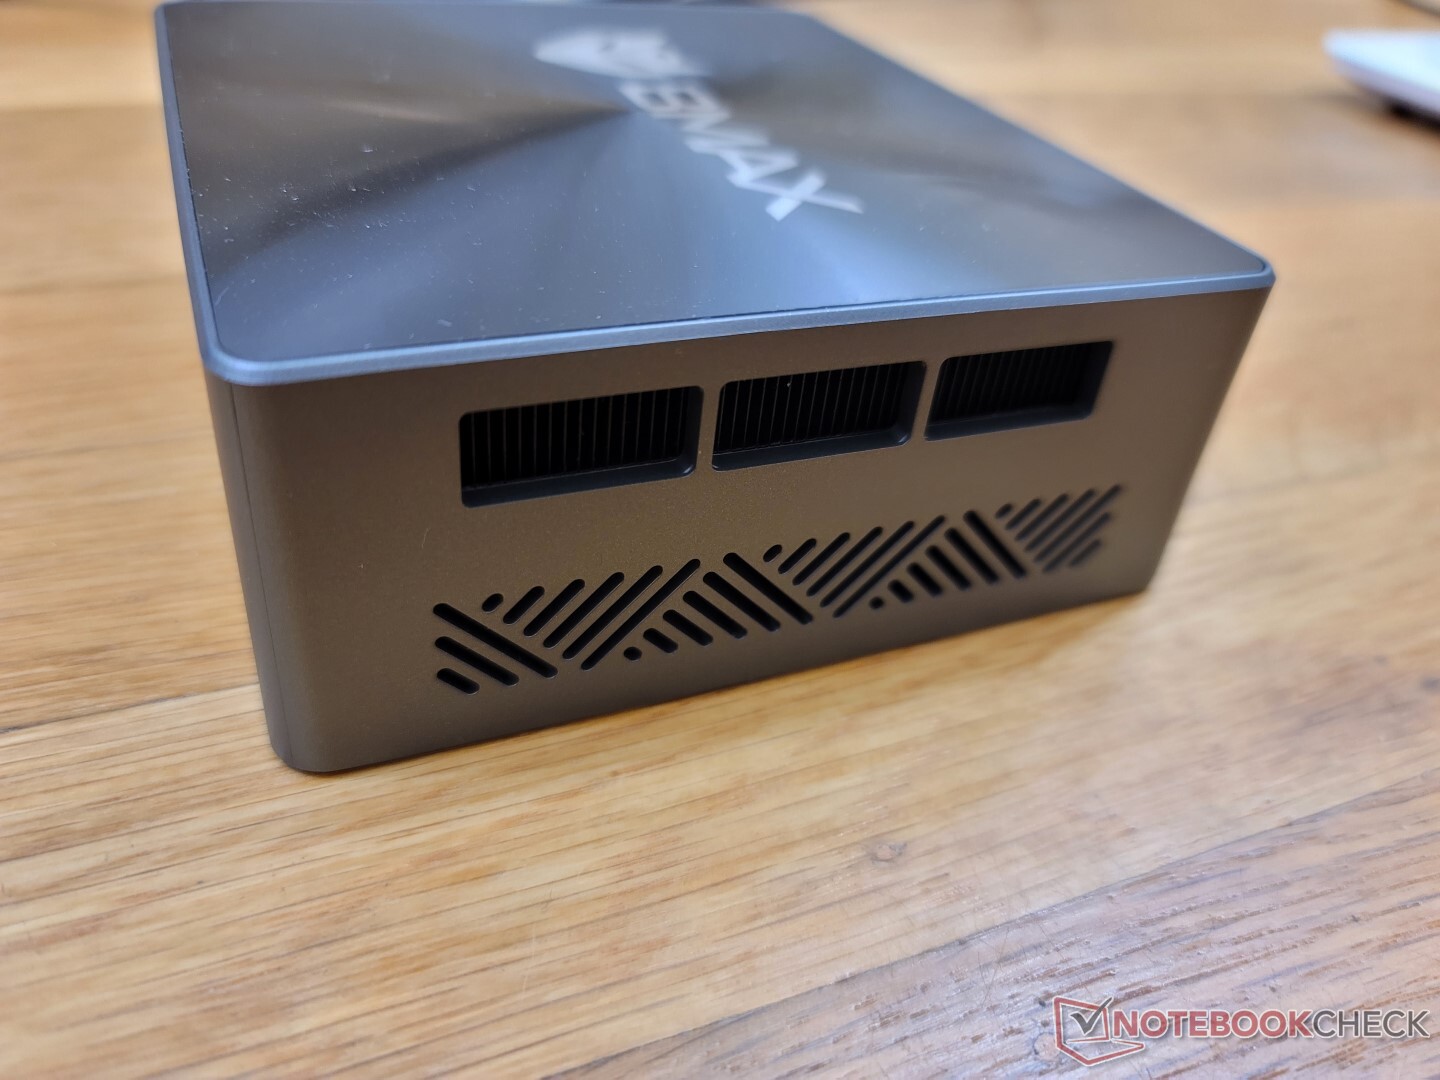
Die Oberflächen werden zu keinem Zeitpunkt unangenehm warm. Die wärmste Stelle auf der Oberseite beträgt bei hoher CPU-Auslastung beispielsweise lediglich um die 33 °C. Die Hitze wird aus der rechten Seite des Gehäuses hinaustransportiert, anders als beim Intel NUC, bei dem die Hitze hinten entflieht.
Da es auf der Oberseite keine Lüftungsgitter gibt, können dort problemlos Gegenstände platziert werden.
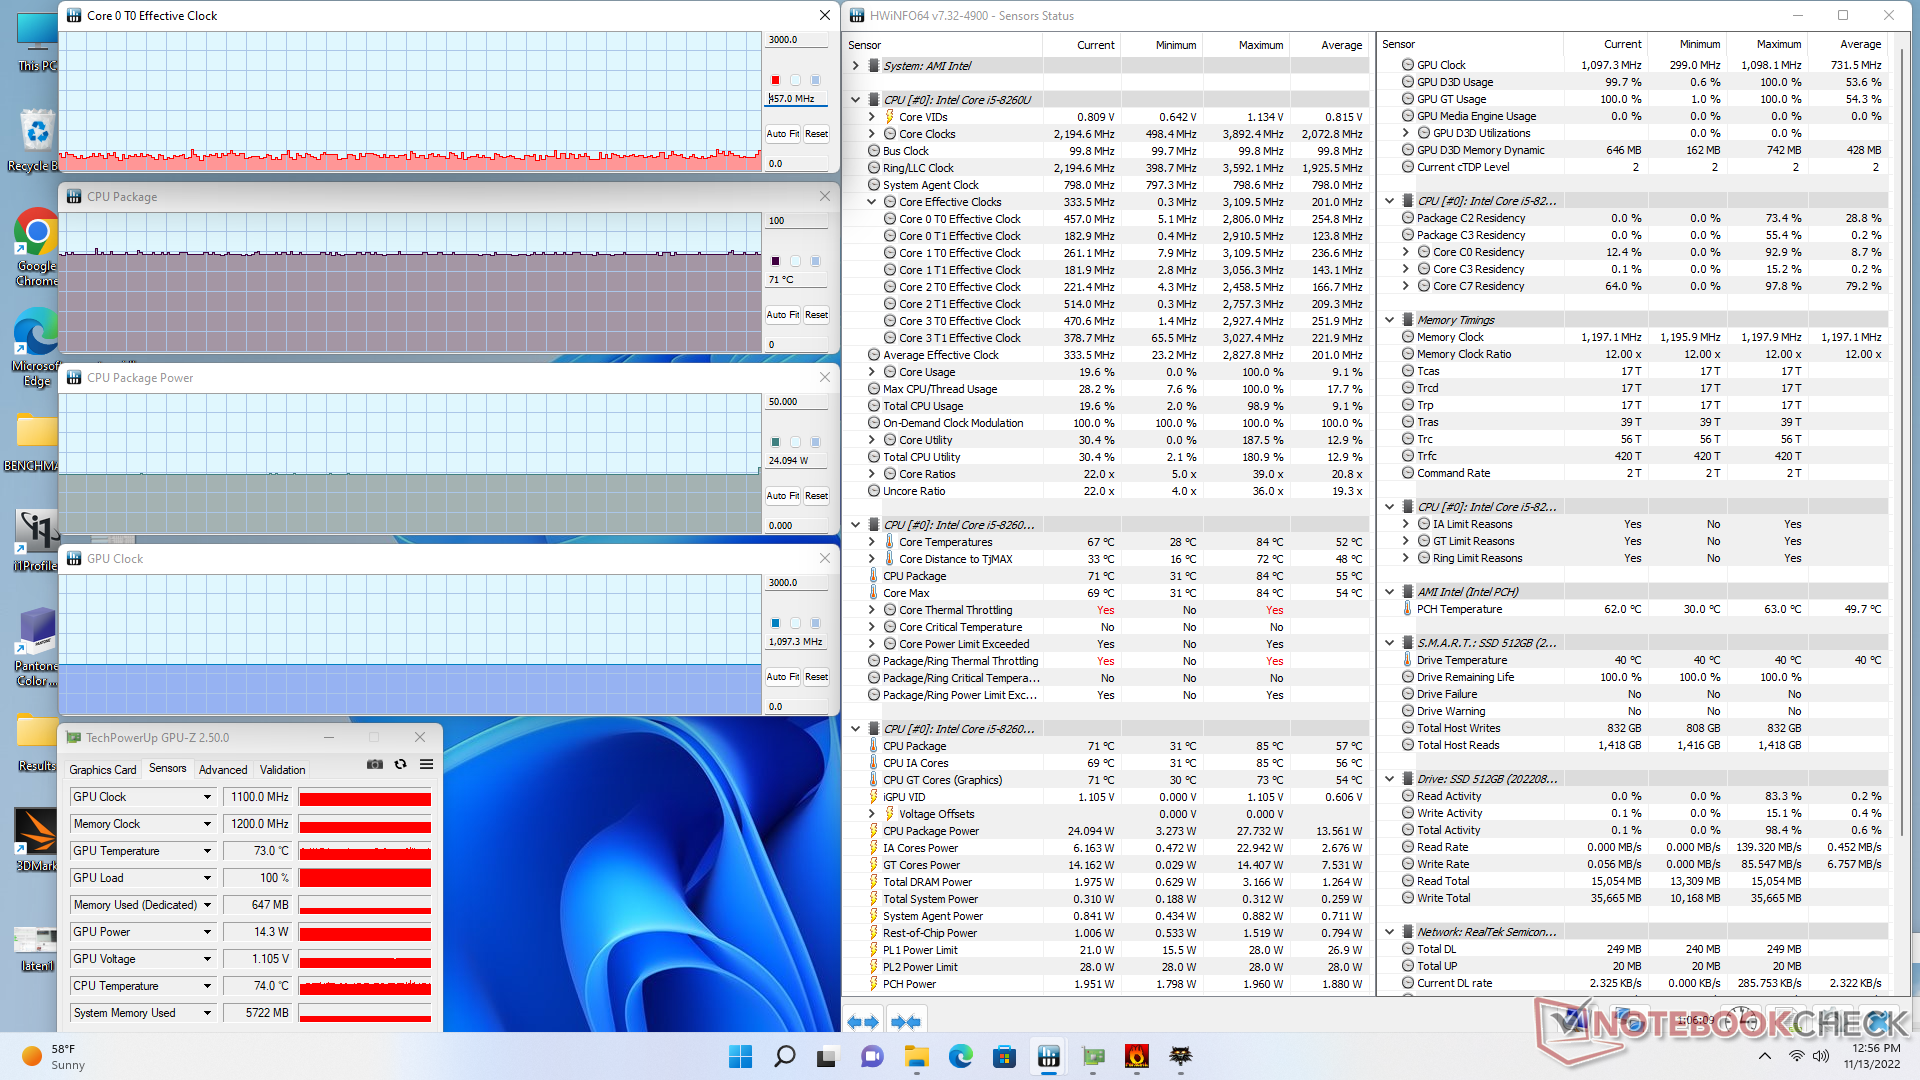
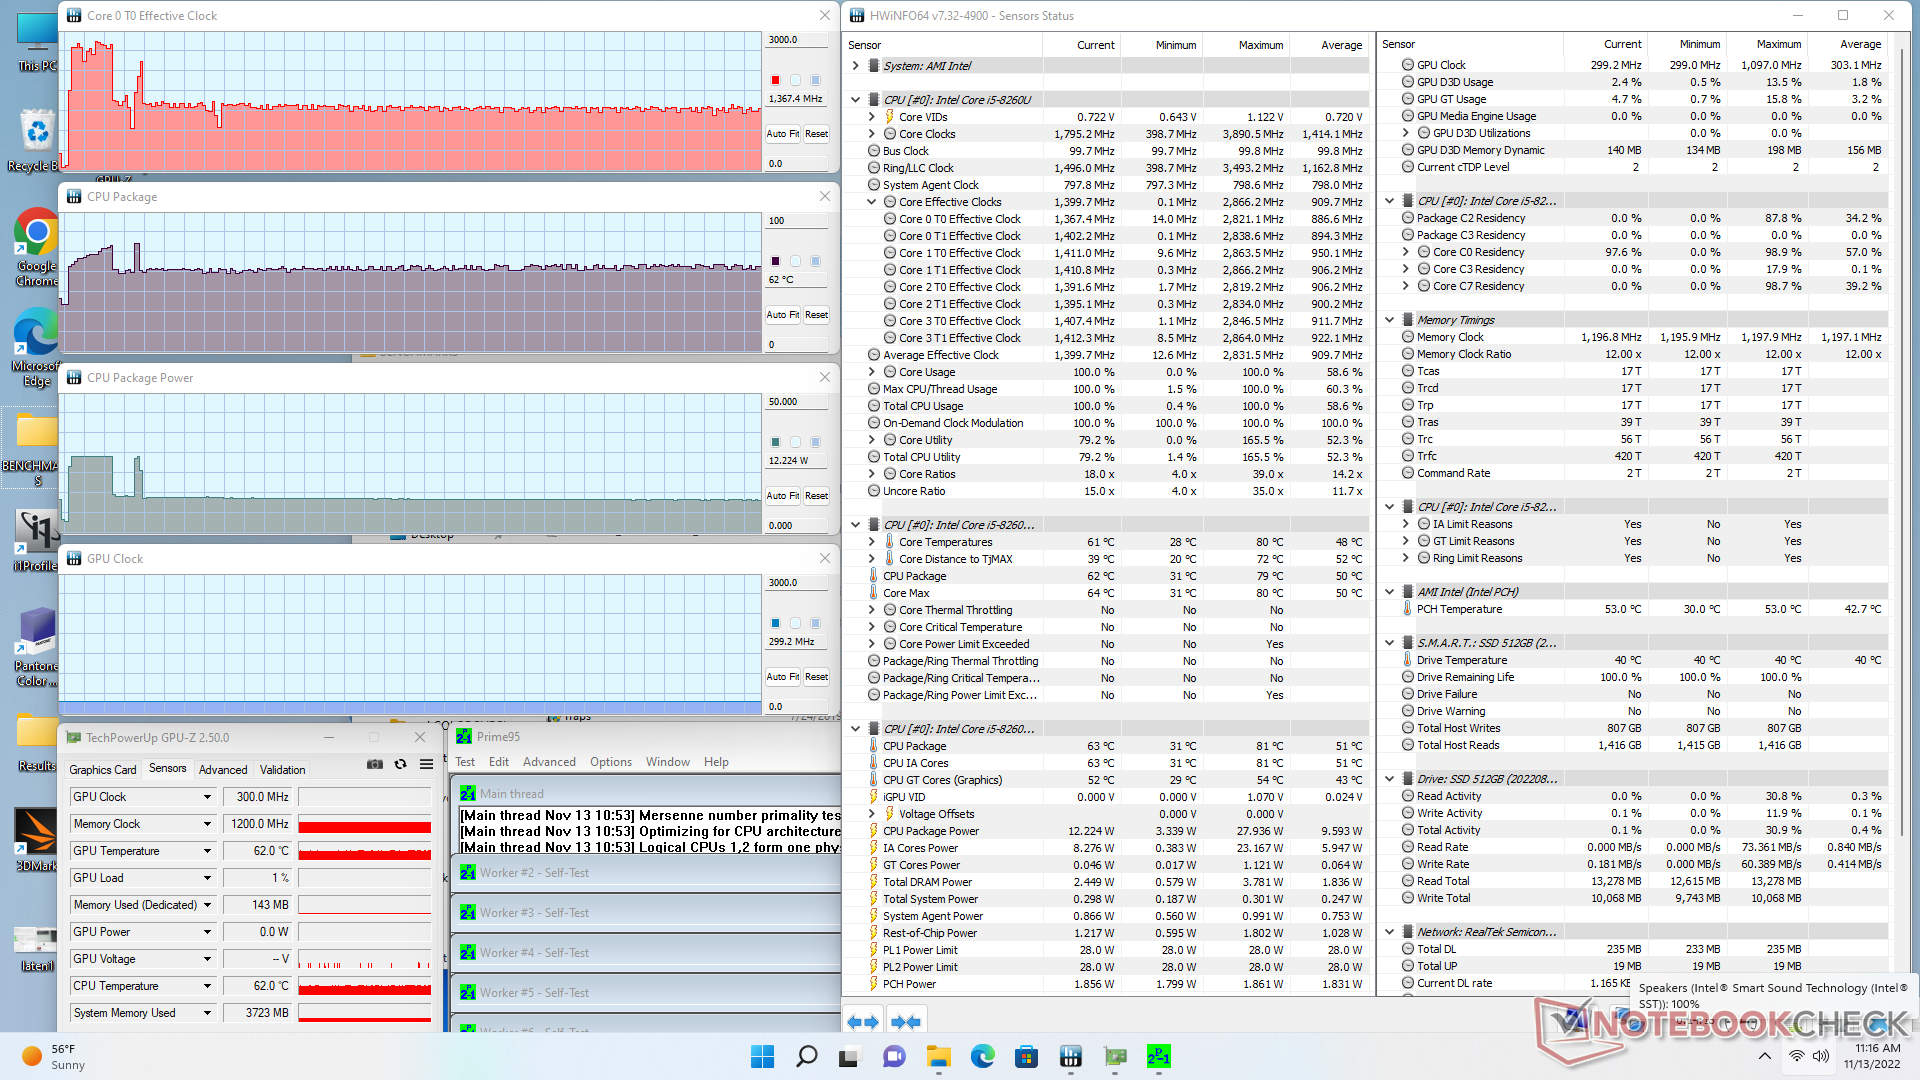
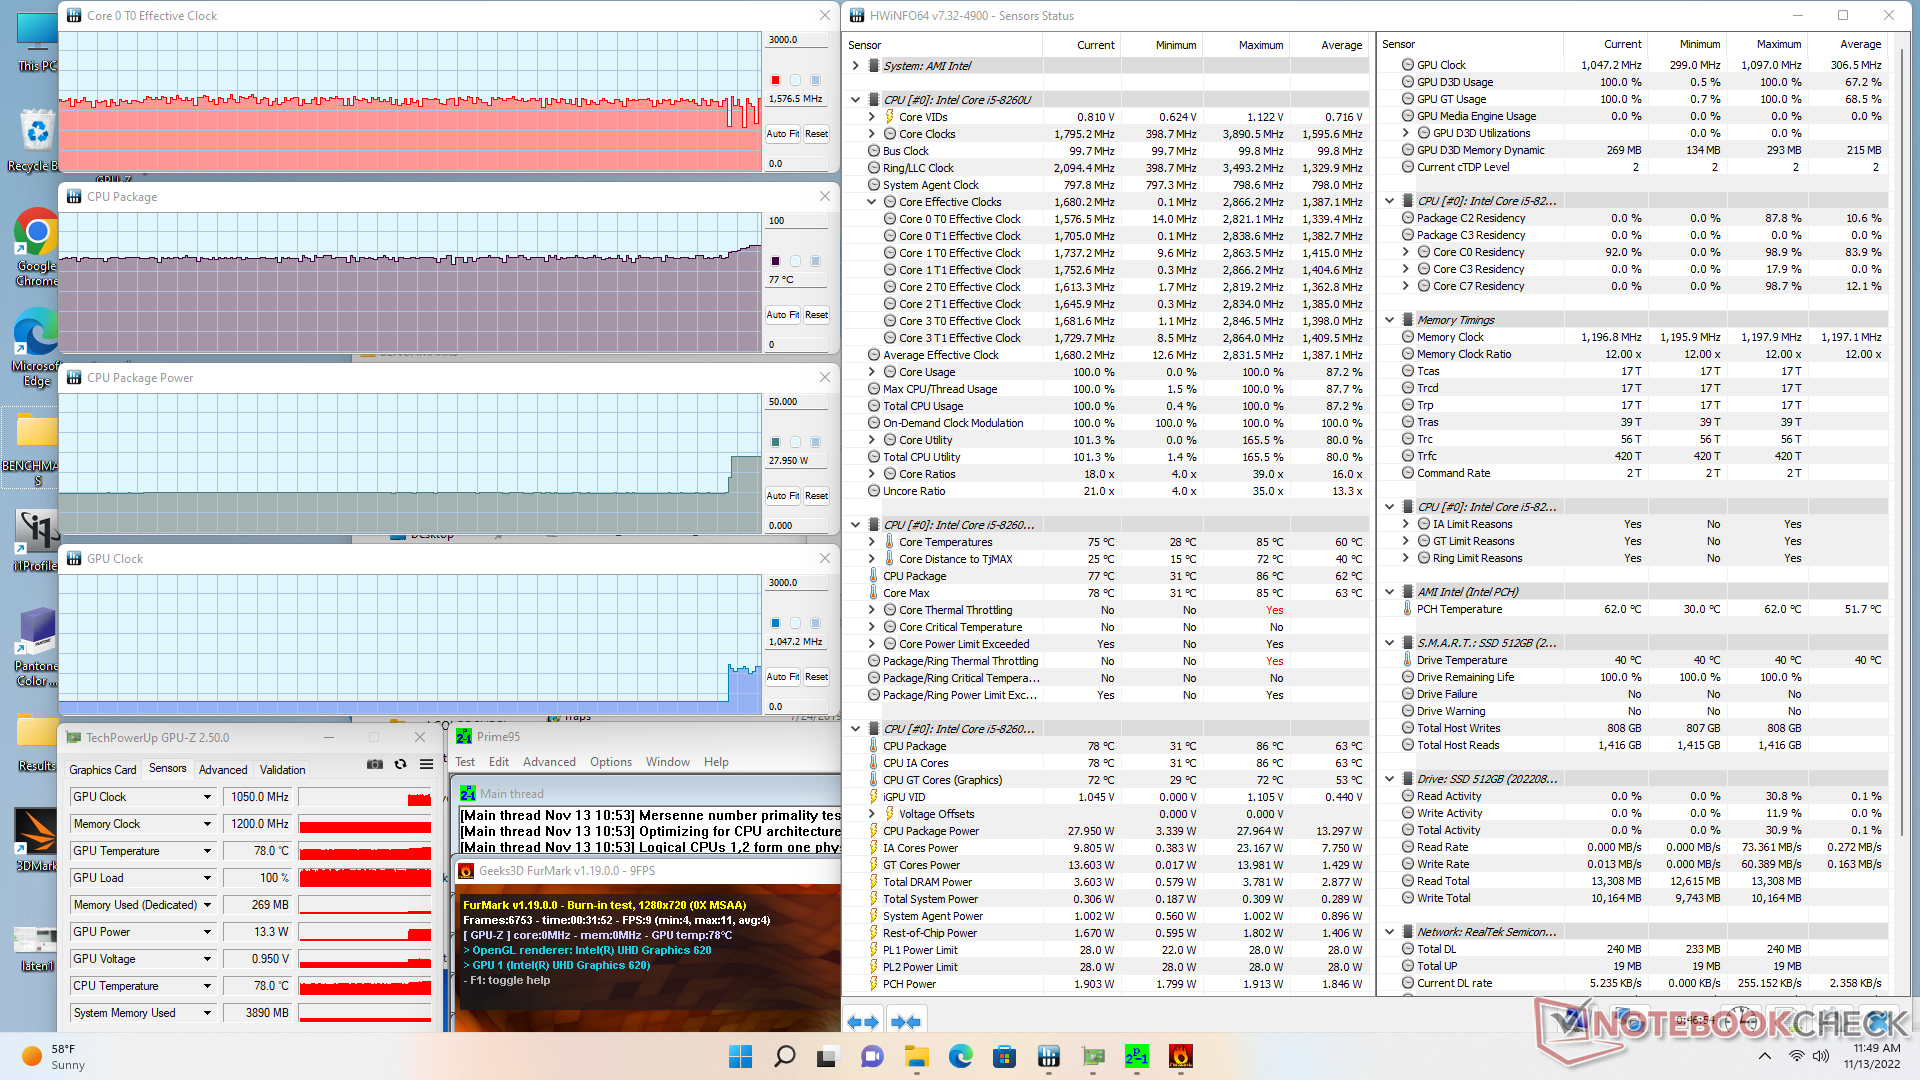
Stresstest
Beim Stresstets mit Prime95 taktet die CPU circa 20 Sekunden lang bis auf 2,8 GHz und zieht dabei 28 W. Die Kerntemperaturen erreichen 76 °C. Danach pendelt sich der Takt auf 1,5 GHz ein und die Energieaufnahme auf 12 W, um kühlere Kerntemperaturen von 60 °C zu erreichen. Das Beelink SEi8 kann den initialen Takt von 2,8 GHz hingegen aufrechterhalten, bei einer Temperatur von 80 °C. Der Turbo des B5 Pro ist demnach begrenzt, was sich mit unserer Beobachtung bei der weiter oben beschriebenen CineBench-R15-Schleife deckt.

| CPU Clock (GHz) | GPU Clock (MHz) | Average CPU Temperature (°C) | |
| System Idle | -- | -- | 33 |
| Prime95, Stress | 1,3 | -- | 62 |
| Prime95 + FurMark, Stress | 1,6 | 300 | 67 |
| Witcher 3, Stress | ~400 | 1.100 | 71 |
Energieverwaltung
Energieaufnahme — sehr genügsam
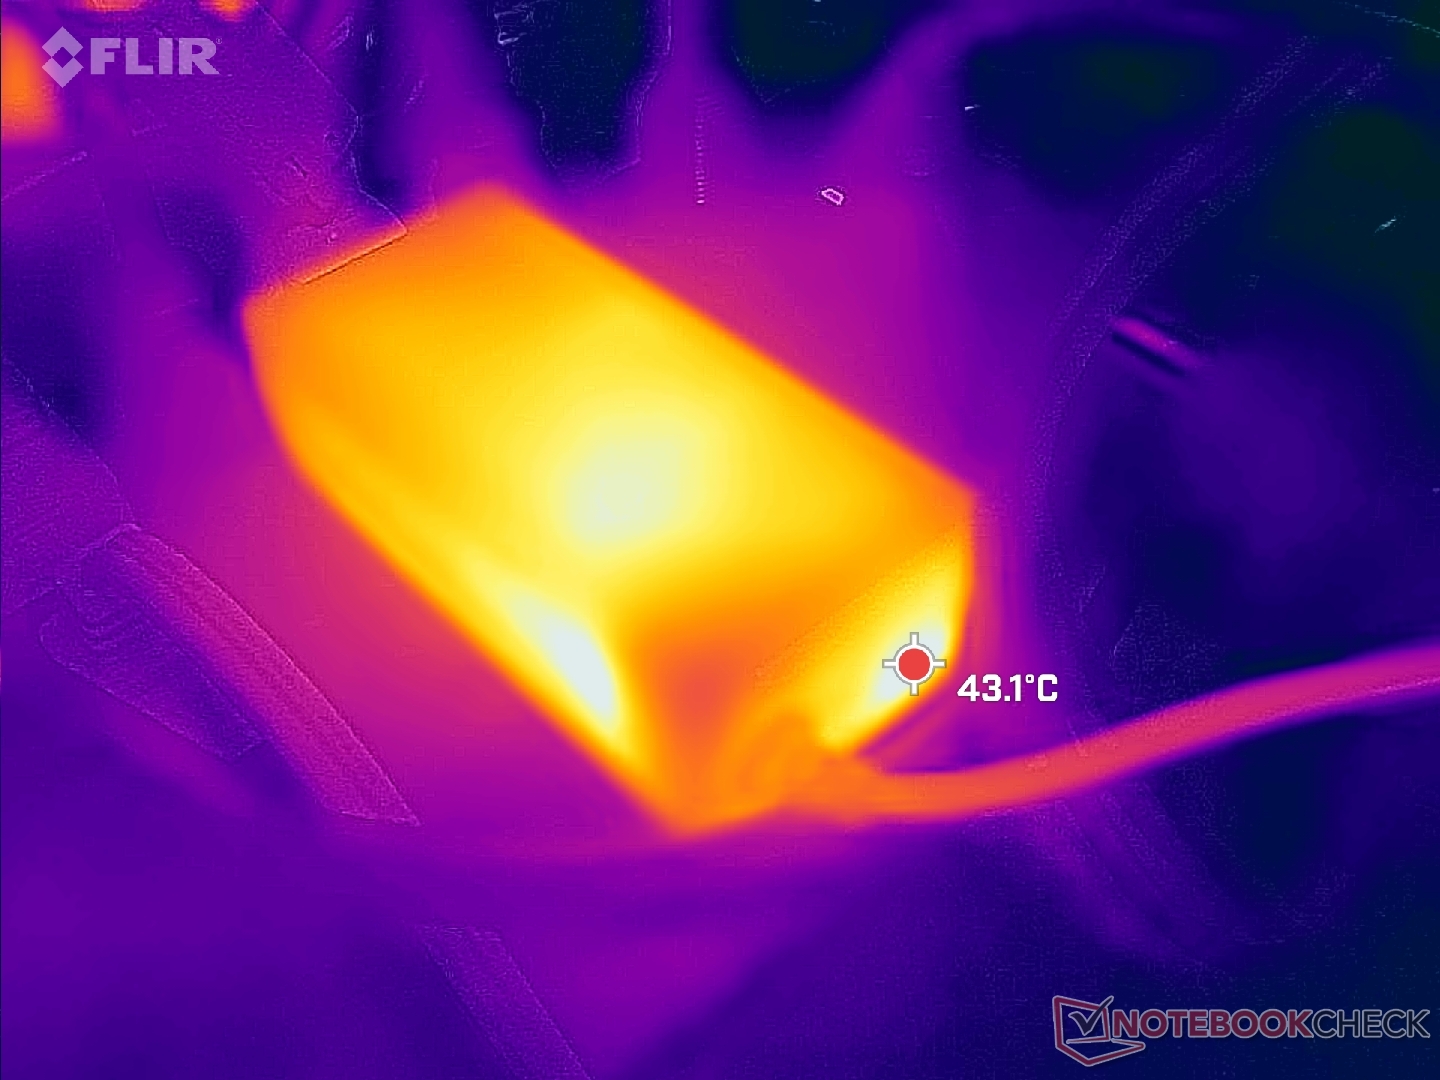
Generell ist die Energieaufnahme geringer als bei vielen Mini-PCs mit neueren CPUs, wie das Intel NUC11TNKi5 mit 11th-Gen-Core-i5-1135G7. Wenn man von Leistung pro Watt spricht, schneidet Intels NUC deutlich besser ab. Dennoch können Nutzer des BMax einige Watt einsparen, während Mini-PCs mit neueren CPU-Generationen wie das gerade erwähnte NUC mehr als die doppelte Grafikleistung sowie um eine 50 Prozent höhere Prozessorleistung bieten.
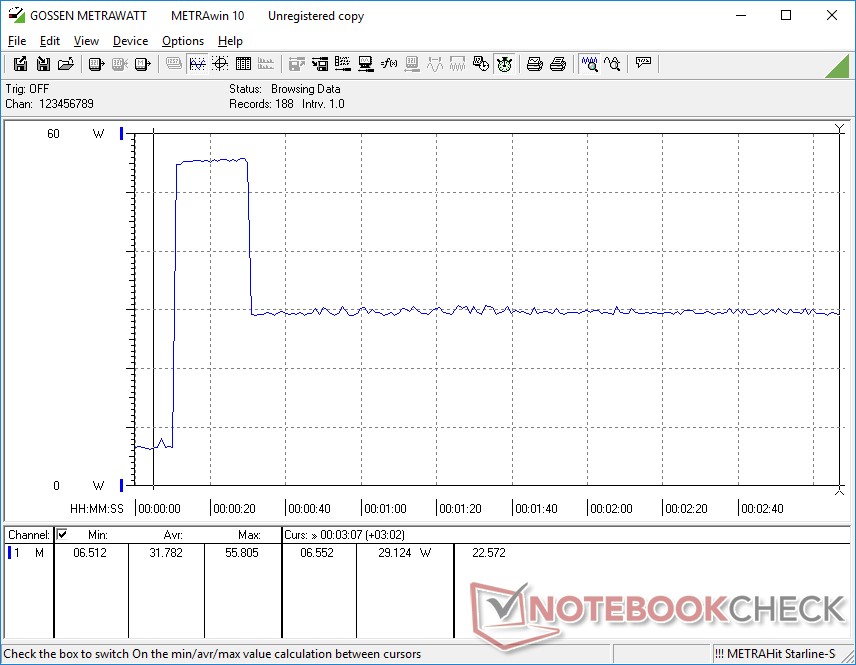
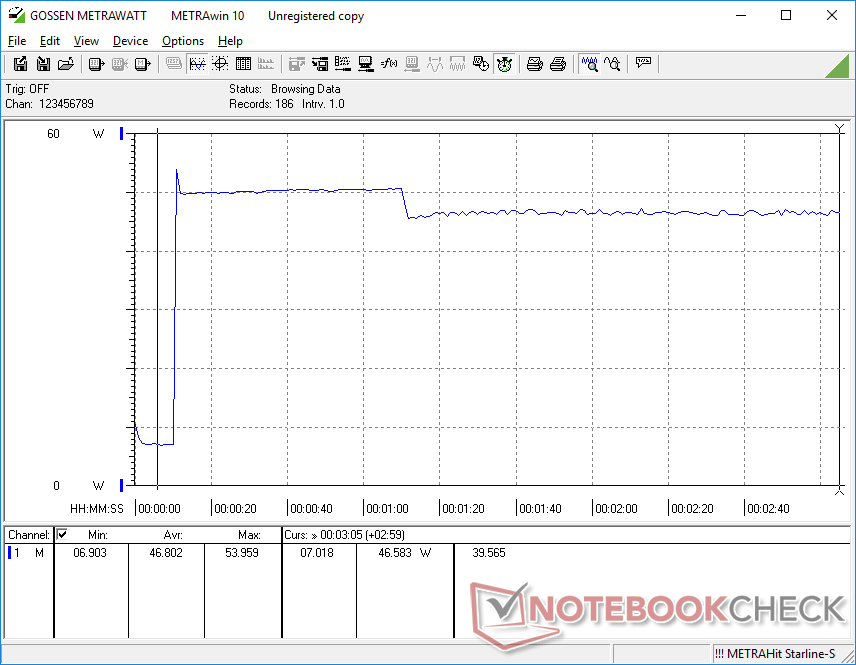
Wir messen eine maximale Energieaufnahme von 55,9 W beim kleinen, 9,8x4,3x3,7 cm messenden 48-W-Netzteil, während die CPU zu 100 Prozent ausgelastet wird. Es handelt sich dabei um ein kurzzeitges Verhalten, wie die folgenden Graphen zeigen.
| Aus / Standby | |
| Idle | |
| Last |
|
Legende:
min: | |
| BMAX B5 Pro G7H8 i5-8260U, UHD Graphics 620, , , x, | Beelink SEi11 Pro i5-11320H, Iris Xe G7 96EUs, Kingston NV1 SNVS/500GCN, , x, | Beelink U59 N5105 Celeron N5105, UHD Graphics (Jasper Lake 24 EU), Silicon Motion AZW 512G NV428, , x, | Beelink SEi8 i3-8109U, Iris Plus Graphics 655, Intel SSD 660p SSDPEKNW512G8, , x, | Beelink SER Pro Ryzen 5 5600H R5 5600H, Vega 7, Kingston NV1 SNVS/500GCN, , x, | Intel NUC11TNKi5 i5-1135G7, Iris Xe G7 80EUs, Transcend M.2 SSD 430S TS512GMTS430S, , x, | |
|---|---|---|---|---|---|---|
| Stromverbrauch | -47% | 2% | -13% | -15% | -58% | |
| Idle min * (Watt) | 6 | 9.8 -63% | 6.7 -12% | 7.5 -25% | 5.4 10% | 11.5 -92% |
| Idle avg * (Watt) | 6.2 | 10.3 -66% | 8.1 -31% | 7.6 -23% | 8.2 -32% | 12.4 -100% |
| Idle max * (Watt) | 6.3 | 10.5 -67% | 11.6 -84% | 9.2 -46% | 8.3 -32% | 12.9 -105% |
| Last avg * (Watt) | 42.8 | 54.2 -27% | 23.9 44% | 41.1 4% | 49.3 -15% | 40.7 5% |
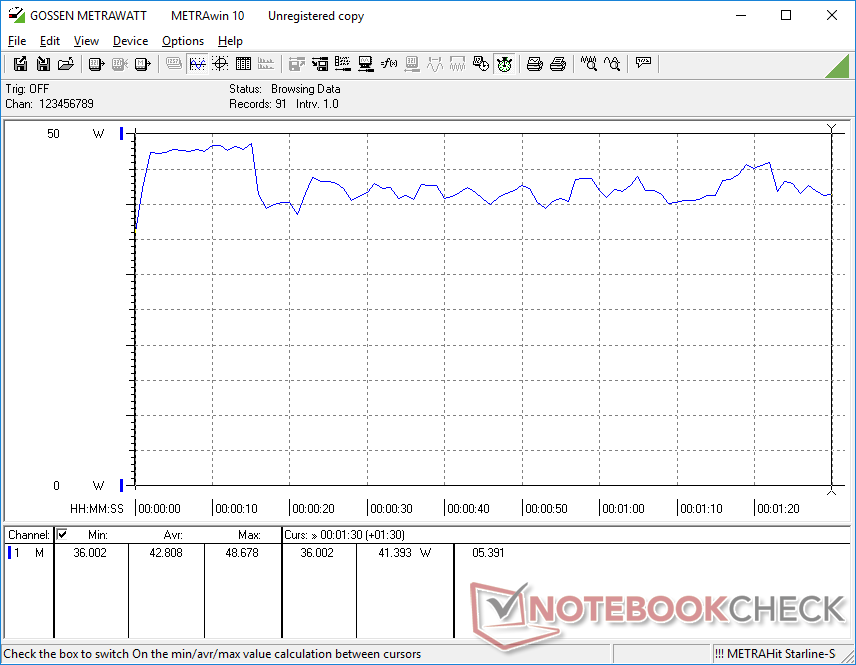
| Witcher 3 ultra * (Watt) | 35 | 53.1 -52% | 19.1 45% | 46.1 -32% | 43.9 -25% | |
| Last max * (Watt) | 55.8 | 59 -6% | 28.8 48% | 41.4 26% | 50.2 10% | 73.5 -32% |
* ... kleinere Werte sind besser
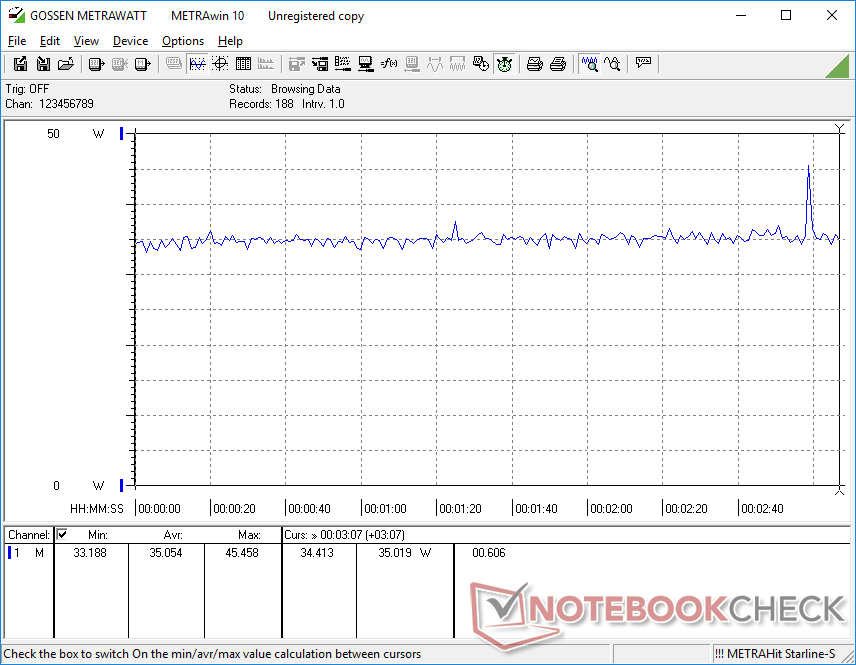
Energieaufnahme Witcher 3 / Stresstest
Energieaufnahme mit externem Monitor
Pro
Contra
Fazit — günstige Option für grundlegende HTPC-Anwendung
Falls man das beste Preis-Leistungs-Verhältnis herausschlagen möchte, ist der BMax B5 Pro eine der besten Optionen. Der Festspeicher fällt mit 512 GB großzügig aus, während man eine zweite SSD (2,5 Zoll) nachrüsten kann, und auch die 16 GB RAM sind aufrüstbar, ein lizenziertes Windows 11 Pro ist vorinstalliert, der Lüfter arbeitet leise und die Prozessorleistung ist vergleichbar mit einem Core i7-1265G7 der 10. Generation. Das alles bekommt man für unter 390 Euro. Der Core i5-8260U überrundet jede aktuelle Alternative mit Core i3, Celeron, Atom oder Ryzen 3, welche in dieser Preisregion sehr häufig anzutreffen sind.
Der BMax B5 Pro stellt ein komplettes Paket dar, fast zum halben Preis eines Intel-NUC-Barebones, ohne auf Low-End-Celeron- oder Atom-Prozessoren zurückgreifen zu müssen.
Der Hauptnachteil dieses Modells ist die schwache Grafikleistung, was jedoch kein Problem sein sollte, da wohl niemand das B5 Pro zum Zocken kauft. Für eine problemlose Wiedergabe von 4K-Material ist die Grafikleistung immerhin ausreichend.
Für künftige Modelle würden wir gerne mehr USB-C-Anschlüsse sehen, mit Power Delivery und einen HDMI-Anschluss in der Version 2.0 oder neuer.
Prieis und Verfügbarkeit
Amazon bietet exakt das von uns getestete Modell des BMax B5 Pro für aktuell 389 Euro an.
Preisvergleich

