Der neue Celeron N5105 Jasper Lake: Beelink U59 (Pro) Mini-PC im Test
Beelink hat einem seiner preiswertesten Mini-PCs ein Update verpasst. Dabei ersetzt der schnellere Jasper Lake Intel Celeron N5105 den Celeron N5095 aus dem Vorgängermodell, welches ebenfalls mit U59 betitelt war. Obwohl das Gehäuse quasi gleich bleibt, gibt es doch einige wichtige Unterschiede, auf die wir im Test eingehen werden.
Natürlich steht der Beelink U59 in Konkurrenz zu anderen preiswerten Mini-PCs wie dem Zotac Nano, der GMK NucBox oder der Chuwi GBox.
Weitere Beelink-Tests:
Potentielle Konkurrenten im Vergleich
Bew. | Datum | Modell | Gewicht | Dicke | Größe | Auflösung | Preis ab |
|---|---|---|---|---|---|---|---|
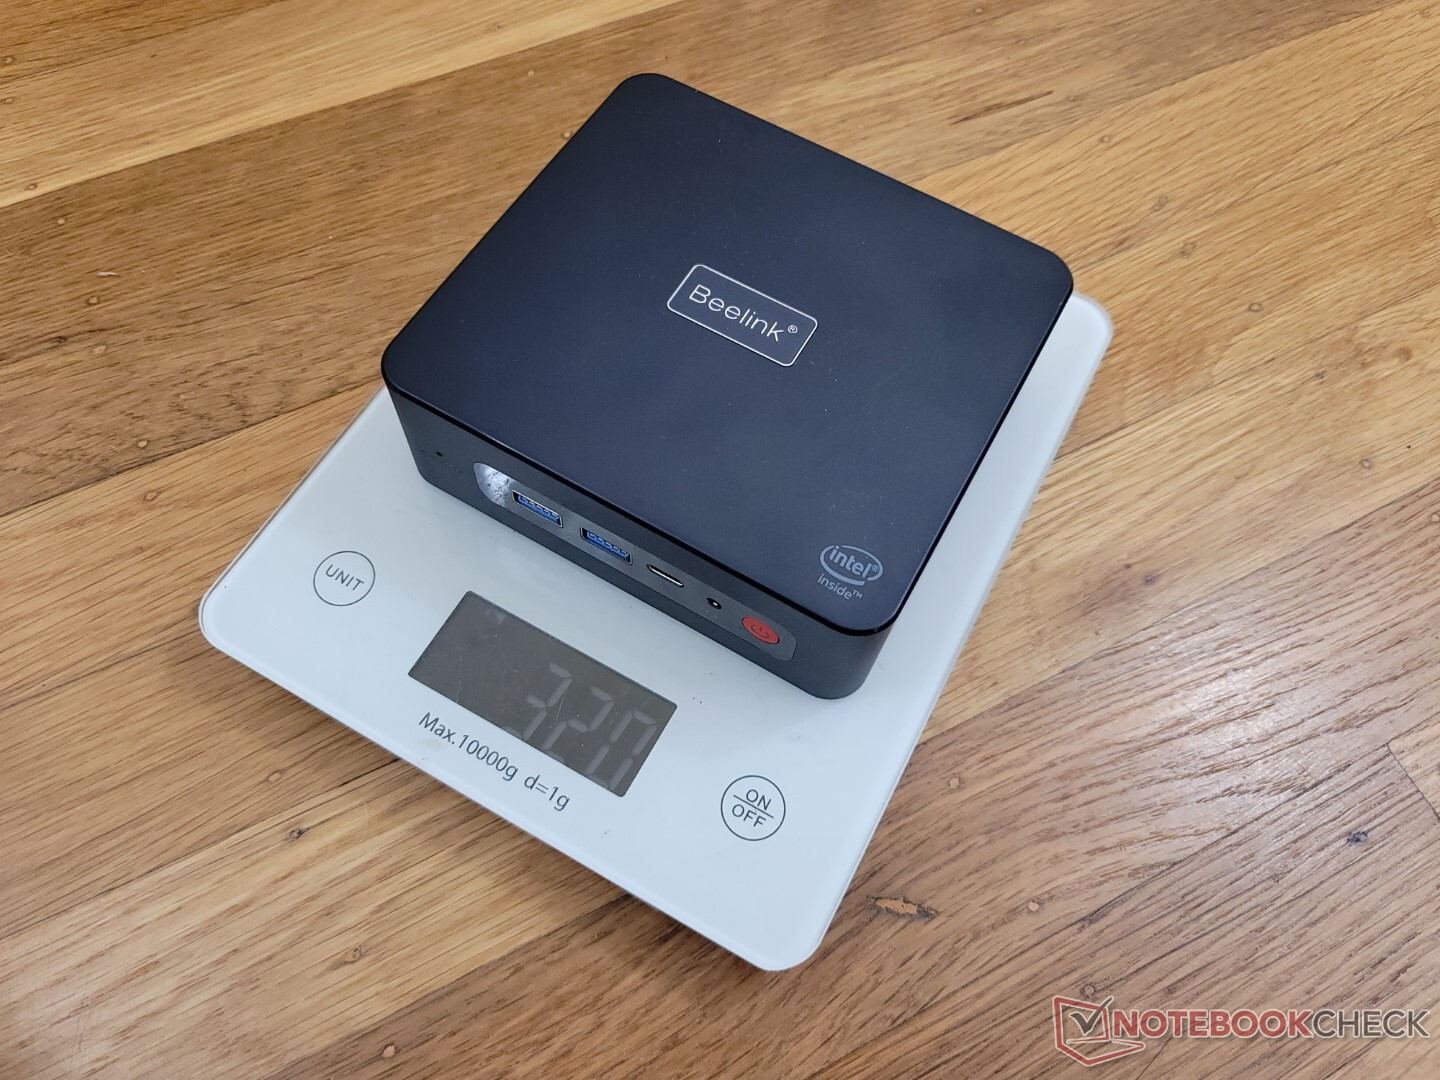
v (old) | 09 / 2022 | Beelink U59 N5105 Celeron N5105, UHD Graphics (Jasper Lake 24 EU) | 320 g | 42 mm | x | ||
v (old) | 06 / 2022 | Beelink U59 Mini-S Celeron N5095, UHD Graphics (Jasper Lake 16 EU) | 279 g | 41 mm | x | ||
v (old) | Beelink SER4 R7 4800U, Vega 8 | 494 g | 40 mm | x | |||
v (old) | Beelink SER3 R7 3750H, Vega 10 | 492 g | 40 mm | x | |||
v (old) | 04 / 2021 | Intel NUC11TNKi5 i5-1135G7, Iris Xe G7 80EUs | 504 g | 37 mm | x | ||
v (old) | 07 / 2022 | Zotac ZBOX PI336 pico Celeron N6211, UHD Graphics (Elkhart Lake 16 EU) | 293 g | 20.7 mm | x |
Gehäuse
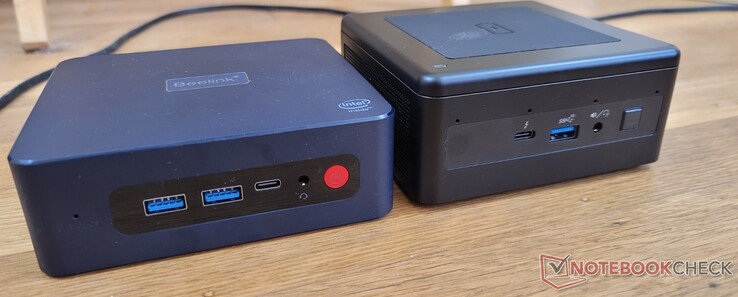
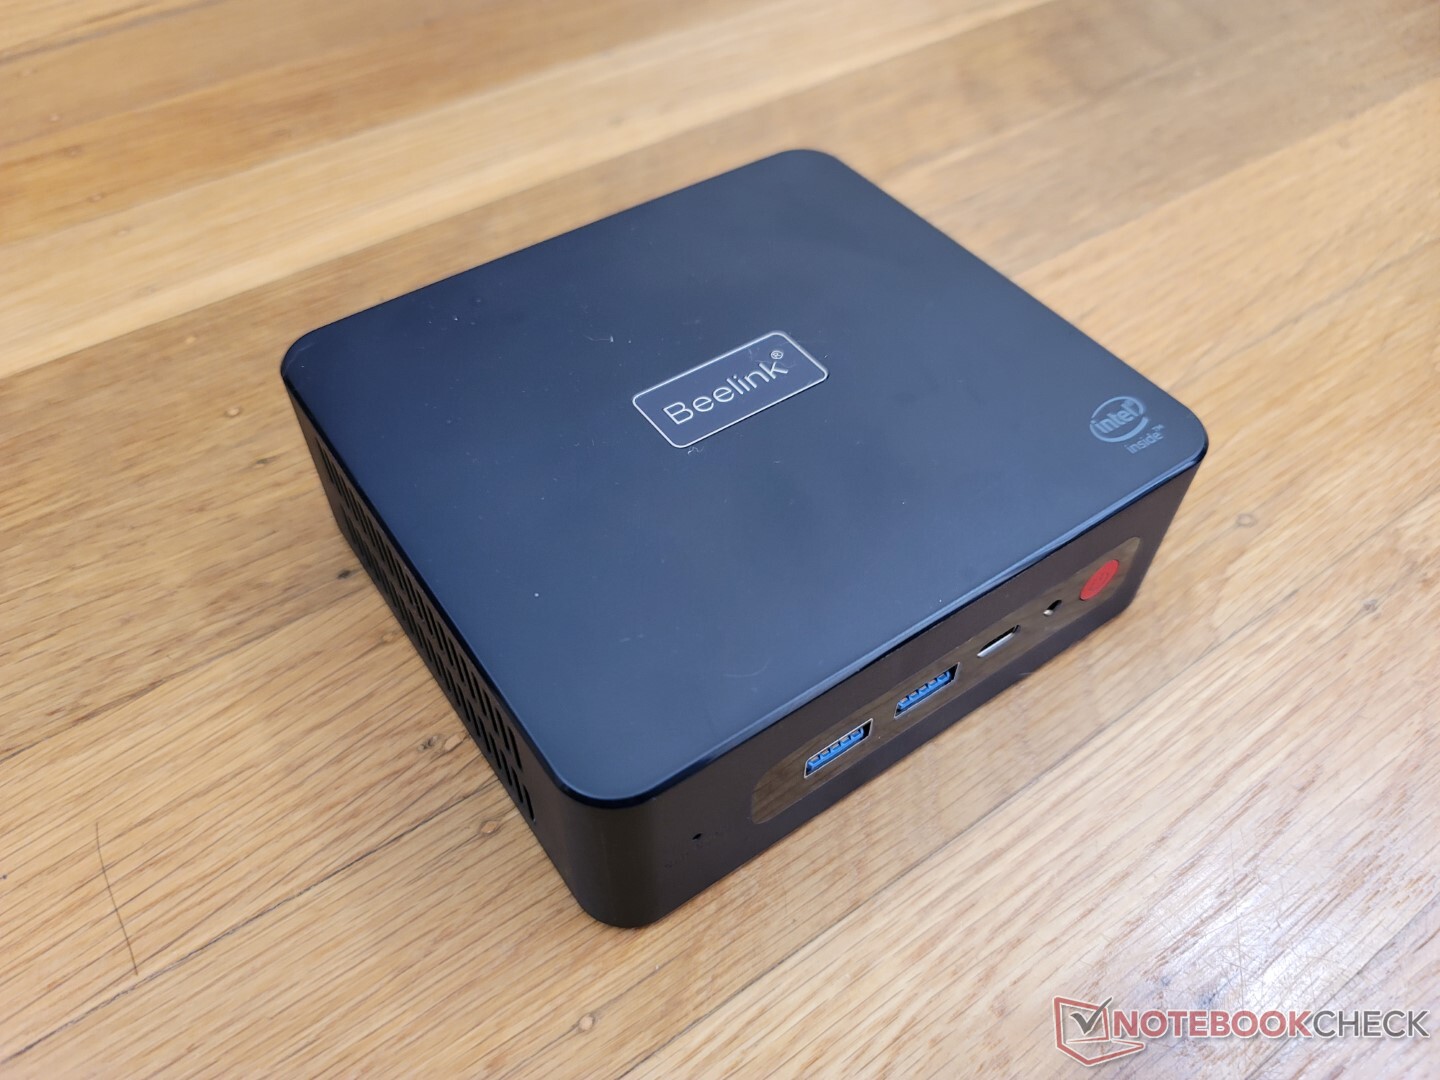
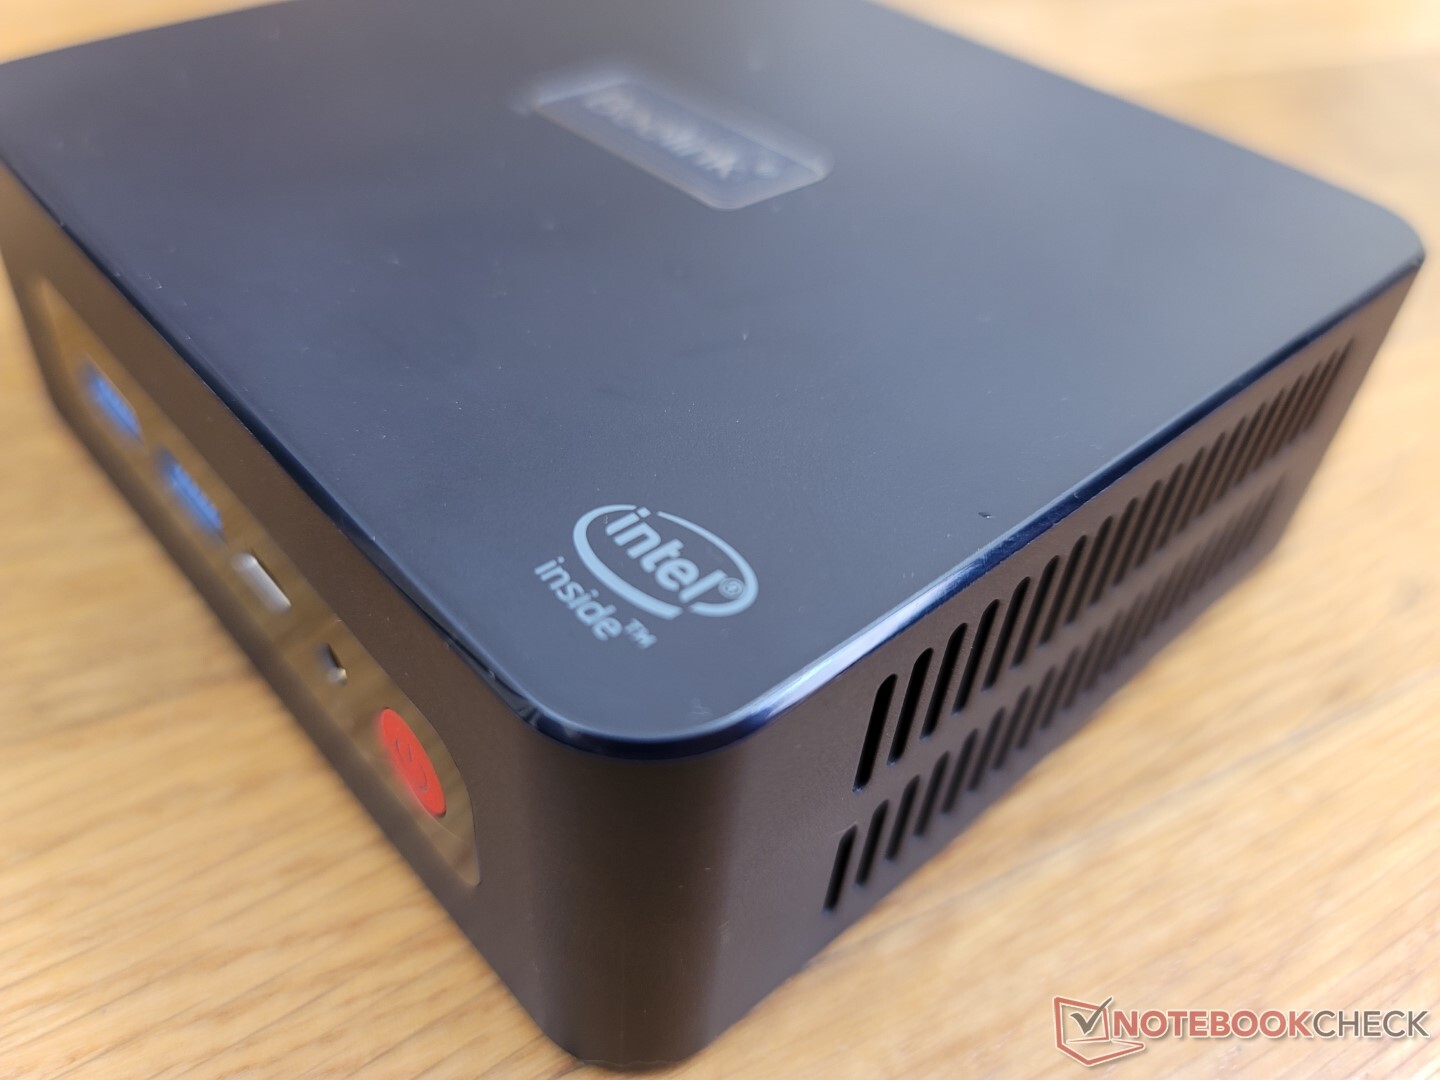
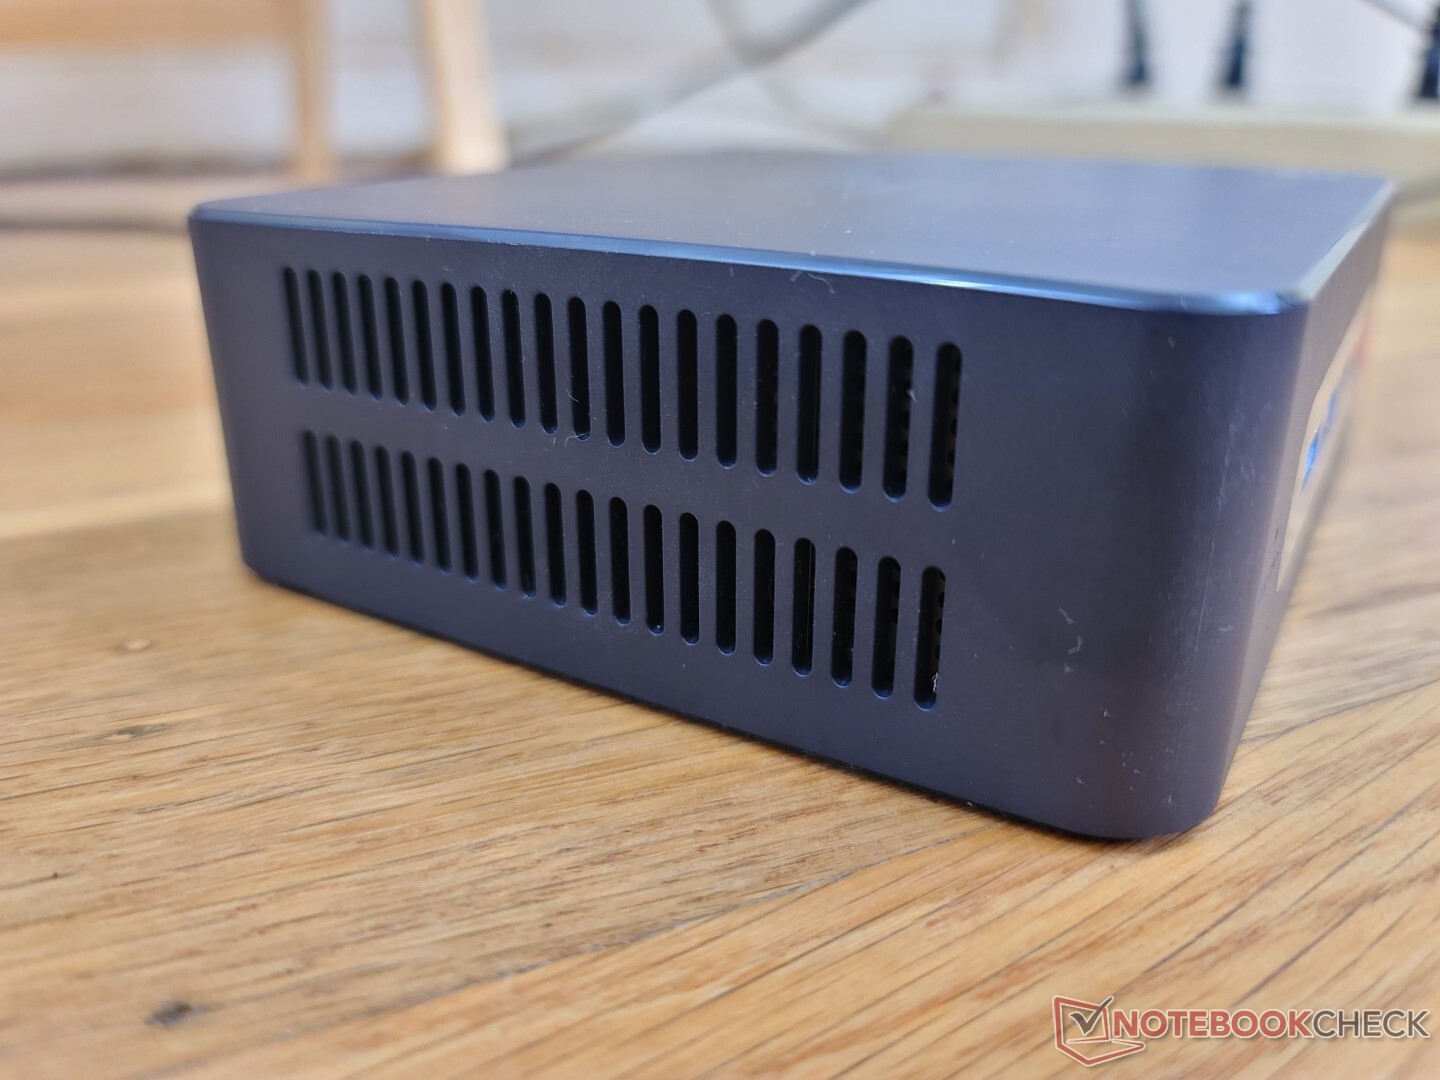
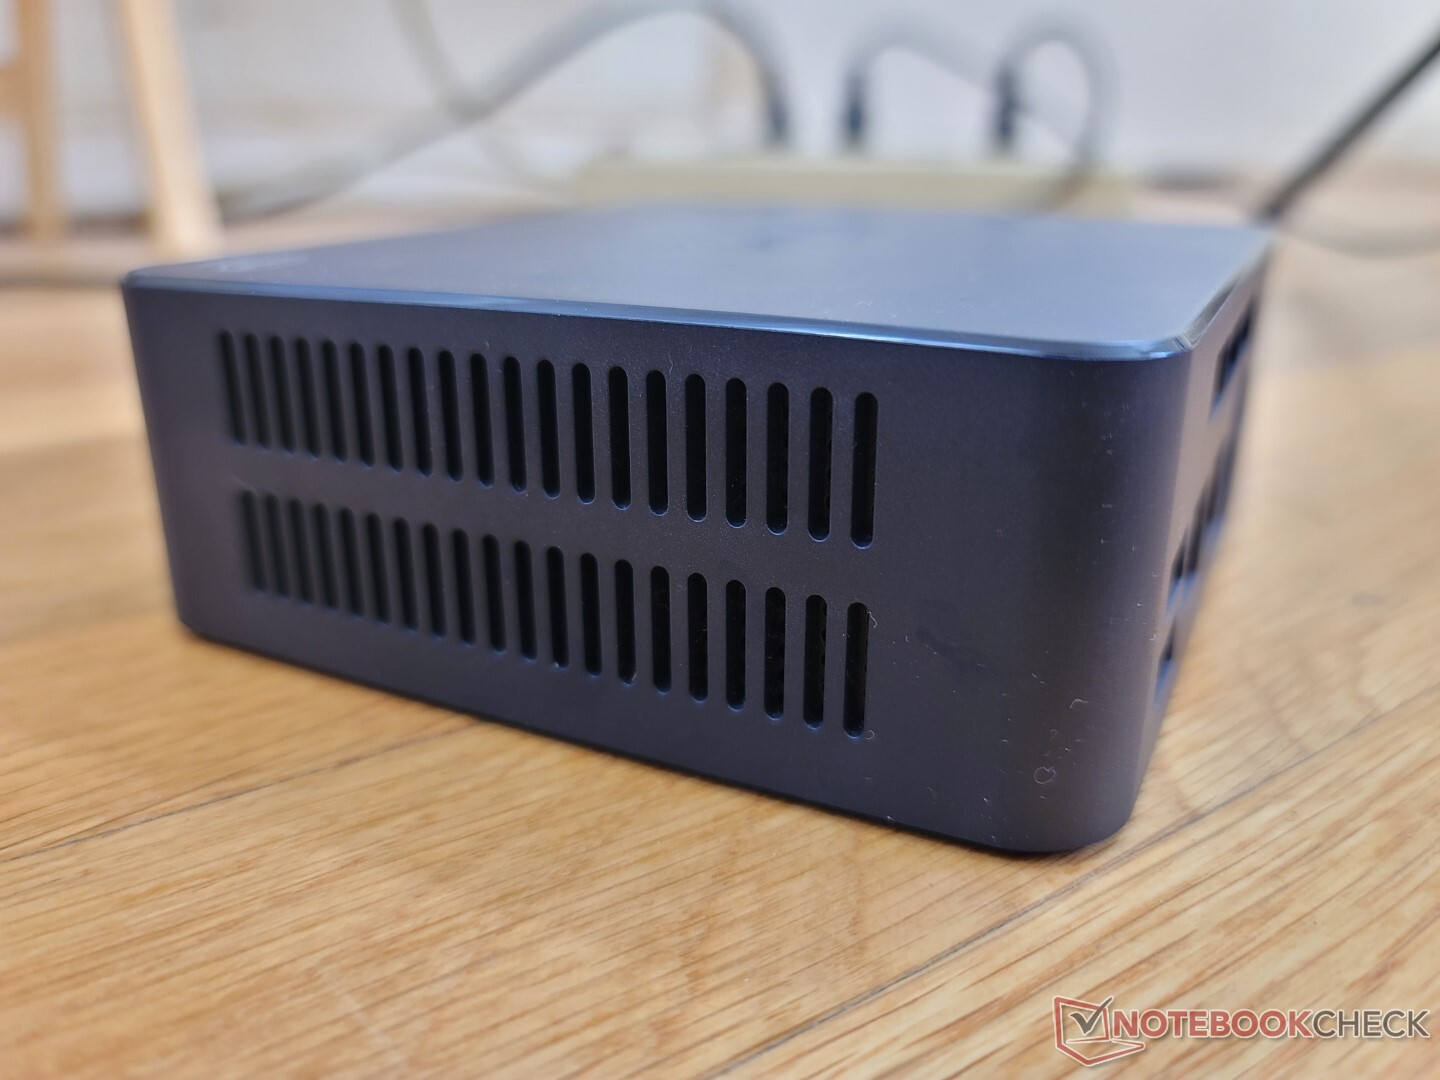
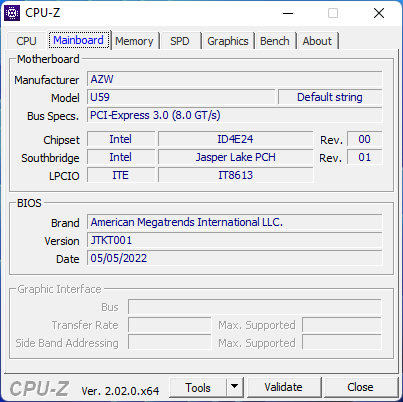
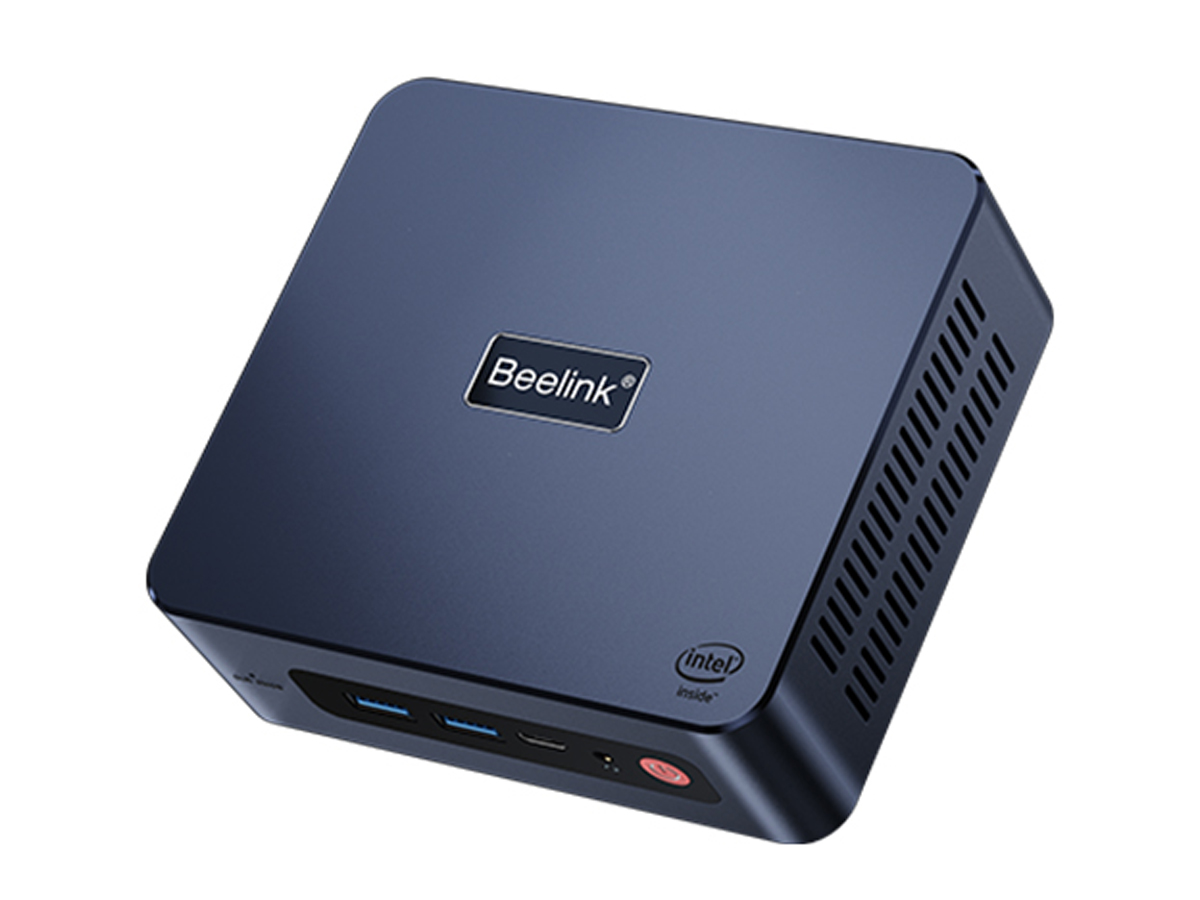
Ärgerlicherweise bietet Beelink gleich drei verschiedene U59-Designs im Handel an, welche sich alle minimal bei den Anschlussmöglichkeiten, dem Design und der internen Hardware. Ihre Ausmaße und das Gewicht sind hingegen nahezu identisch. Unser Testmodell verfügt über größere Lüftergitter und eine komplett matte Oberseite mit dem Logo darauf, während ältere Modelle über kleinere Lüftergitter und eine spiegelnde Oberseite verfügen.
Anschlüsse
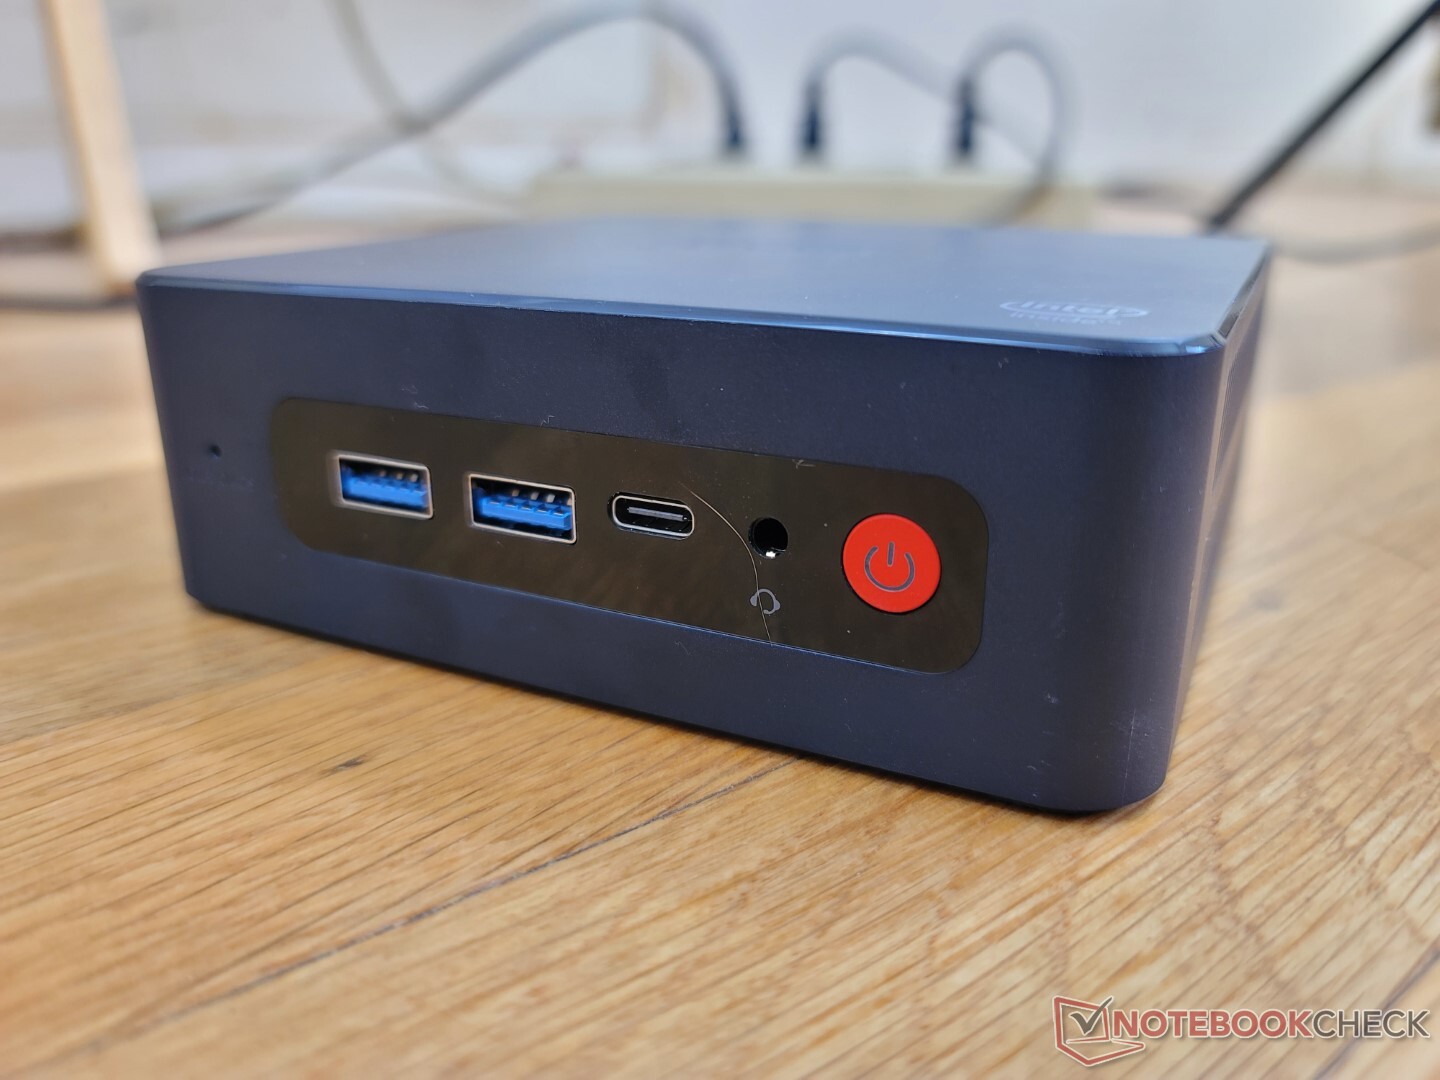
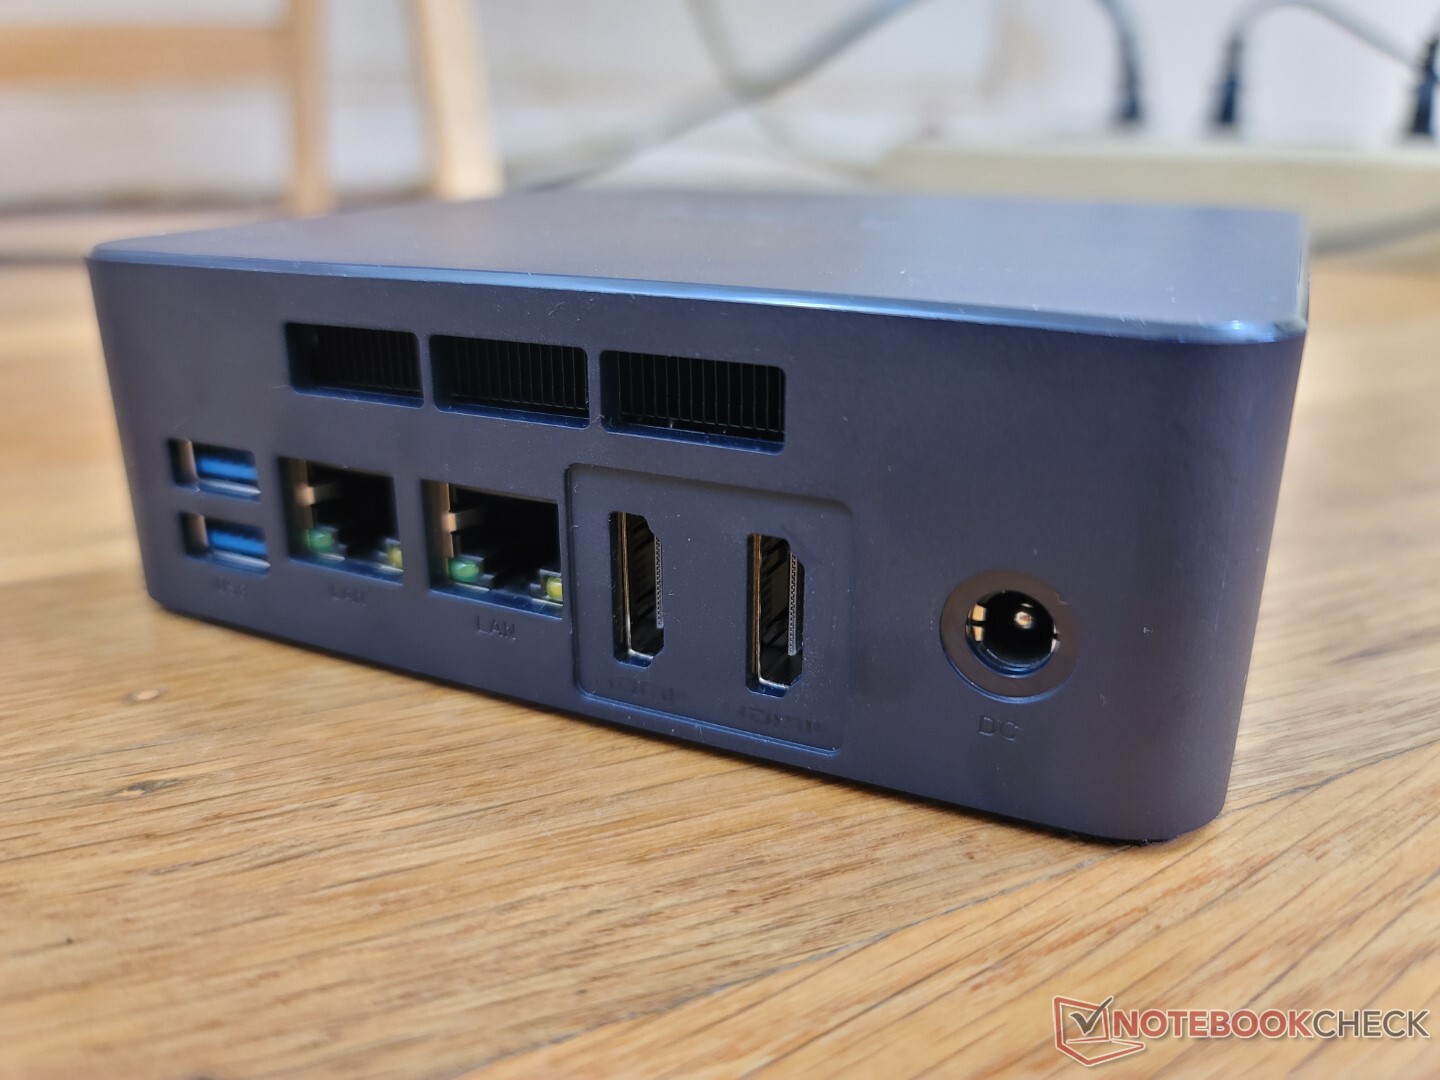
Die Anschlüsse sind beinahe identisch zu denen des Original-U59, inklusive USB-C-Port und dem Fehlen eines Kensington-Anschlusses. Allerdings hat spendiert Hersteller dem neuen Modell einen zweiten RJ45-LAN-Port. Zu beachten ist, dass der USB-C-Port zwar DisplayPort unterstützt, jedoch kein Power Delivery, sodass man vom mitgelieferten Netzteil abhängig ist.
Kommunikation
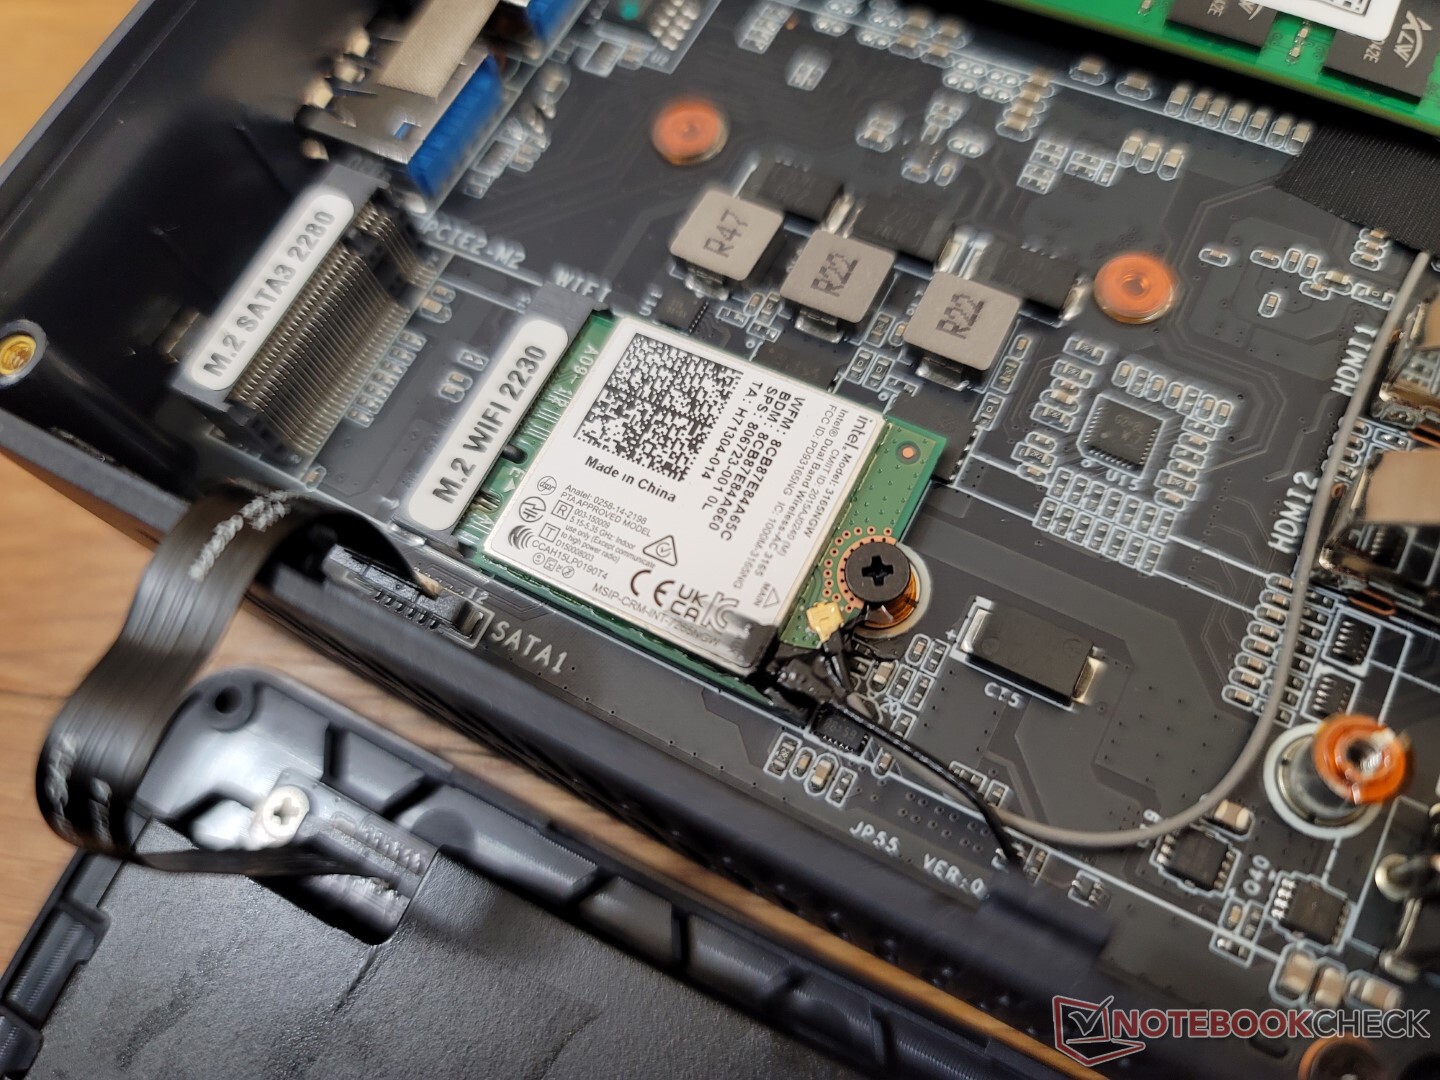
Anders als bei der Mini-S-Version des U59 ist das WLAN-Modul Intel 3165 austauschbar. Leider sind die Transferraten eher langsam, aber immerhin gab es keine Verbindungsprobleme beim Streaming von 4K-Inhalten.
| Networking | |
| iperf3 transmit AX12 | |
| Intel NUC11TNKi5 | |
| Beelink SER4 | |
| Beelink SER3 | |
| iperf3 receive AX12 | |
| Intel NUC11TNKi5 | |
| Beelink SER4 | |
| Beelink SER3 | |
| iperf3 receive AXE11000 | |
| Beelink U59 N5105 | |
| Beelink U59 Mini-S | |
| iperf3 transmit AXE11000 | |
| Beelink U59 N5105 | |
| Beelink U59 Mini-S | |
Wartung
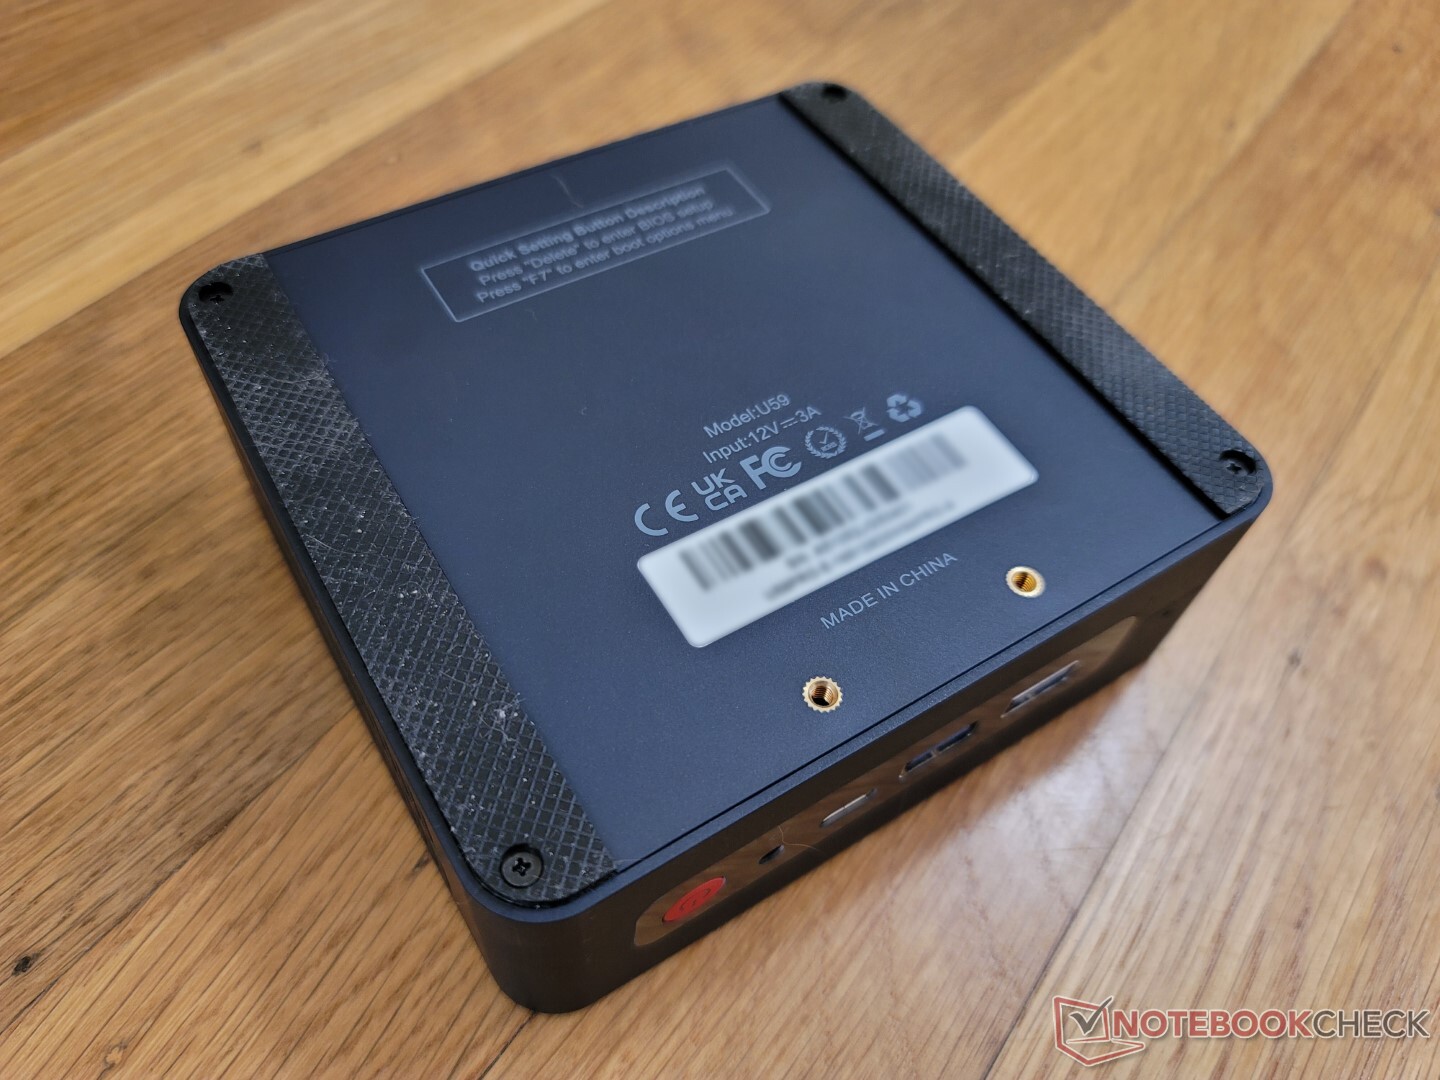
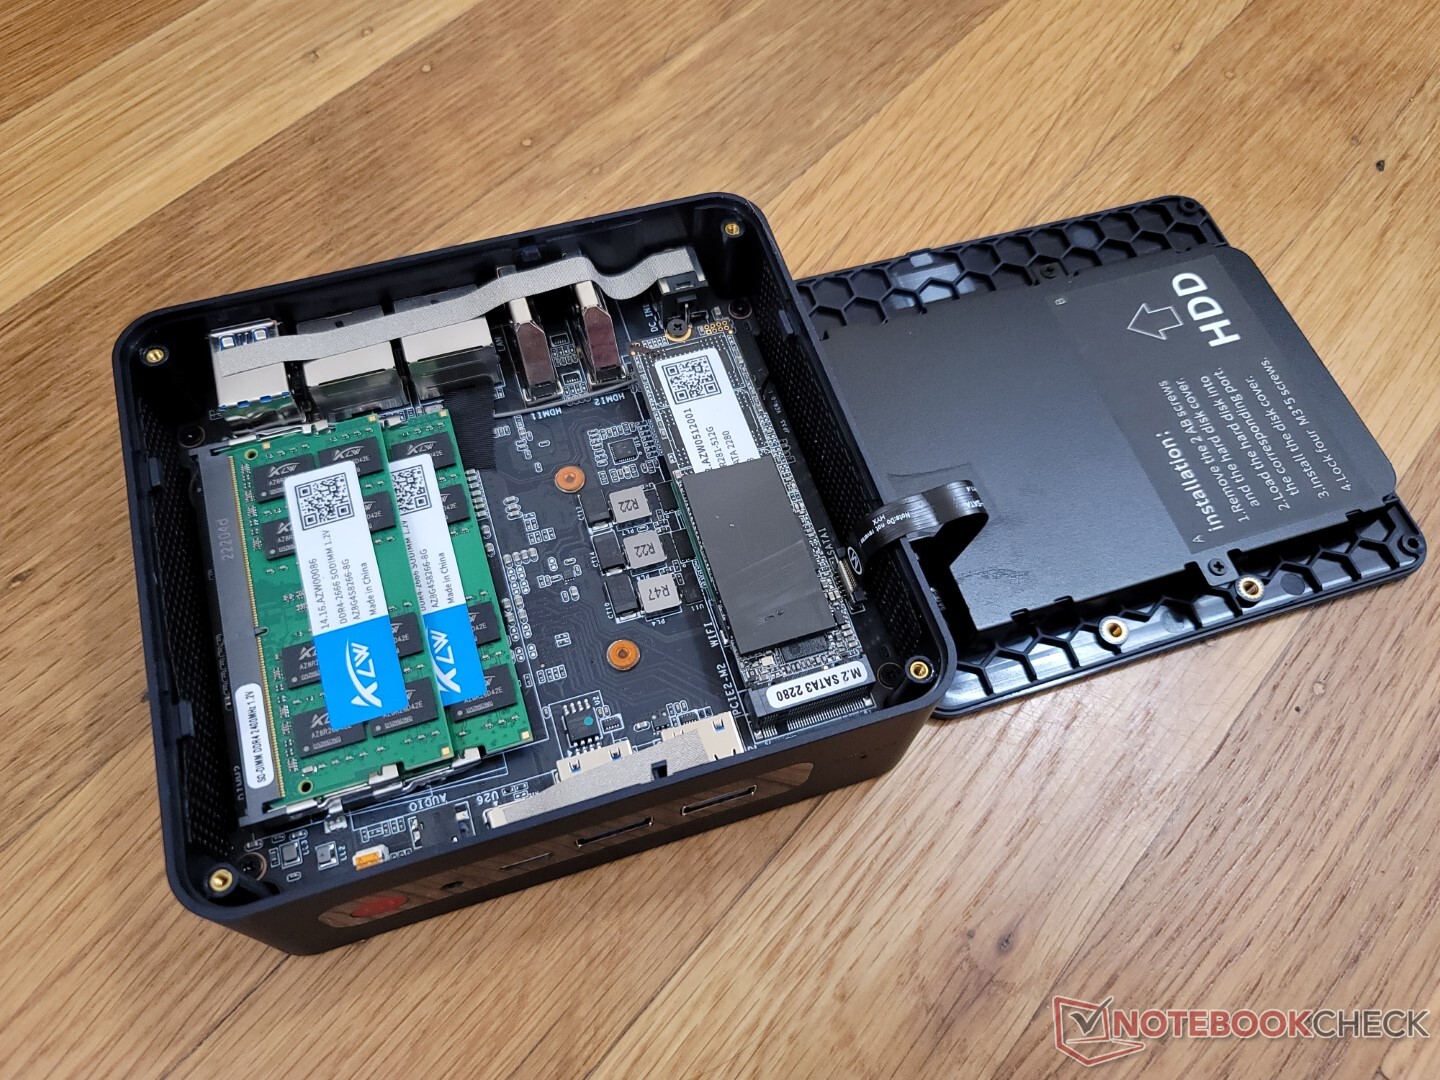
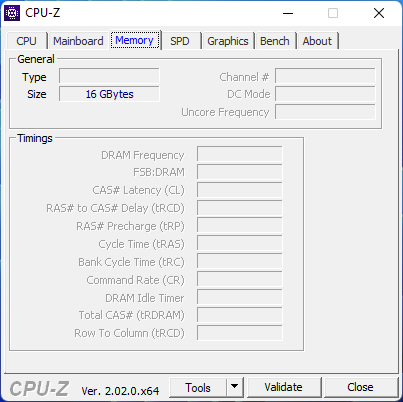
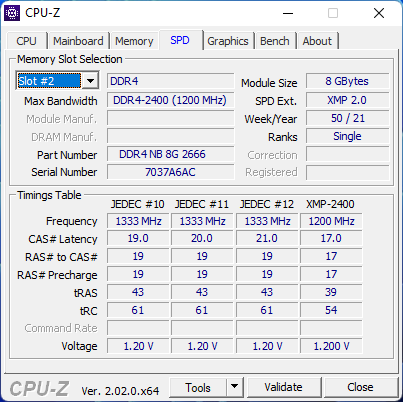
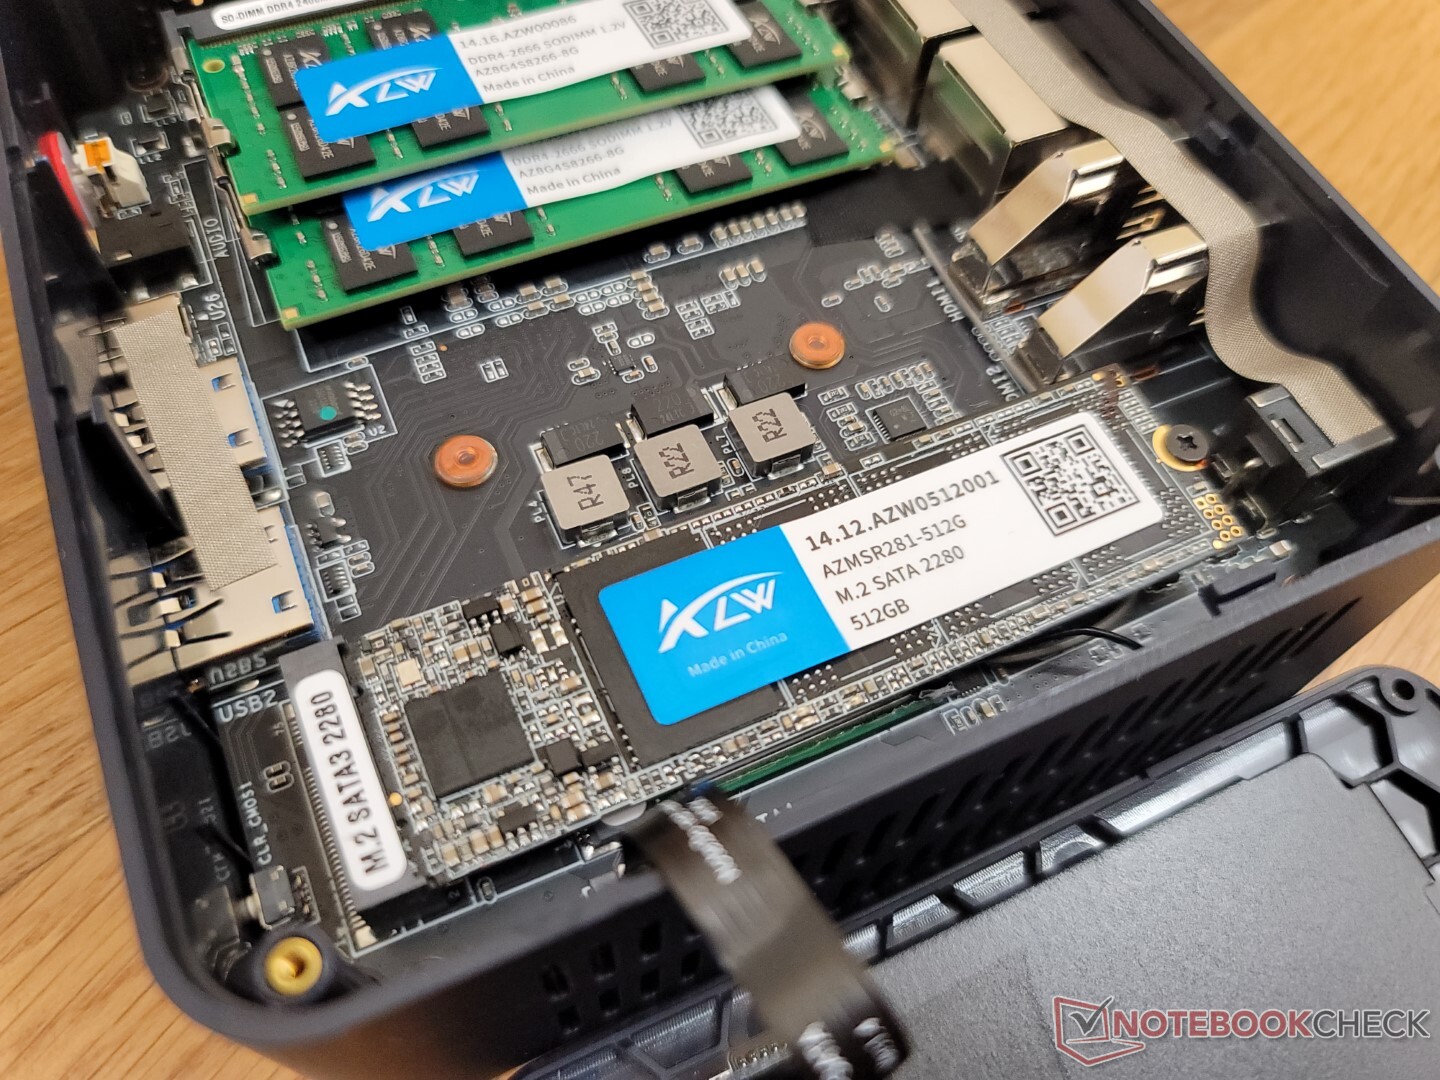
Man benötigt lediglich einen Kreuzschraubendreher, um die Unterseite zu entfernen. Darunter befinden sich zwei Speicherslots (M.2 SATA 2280 + 2,5 Zoll SATA III), zwei RAM-Slots und das austauschbare M.2-WLAN-Modul. Das U59 Mini-S war auf einen einzigen RAM-Slot begrenzt.
Zubehör und Garantie
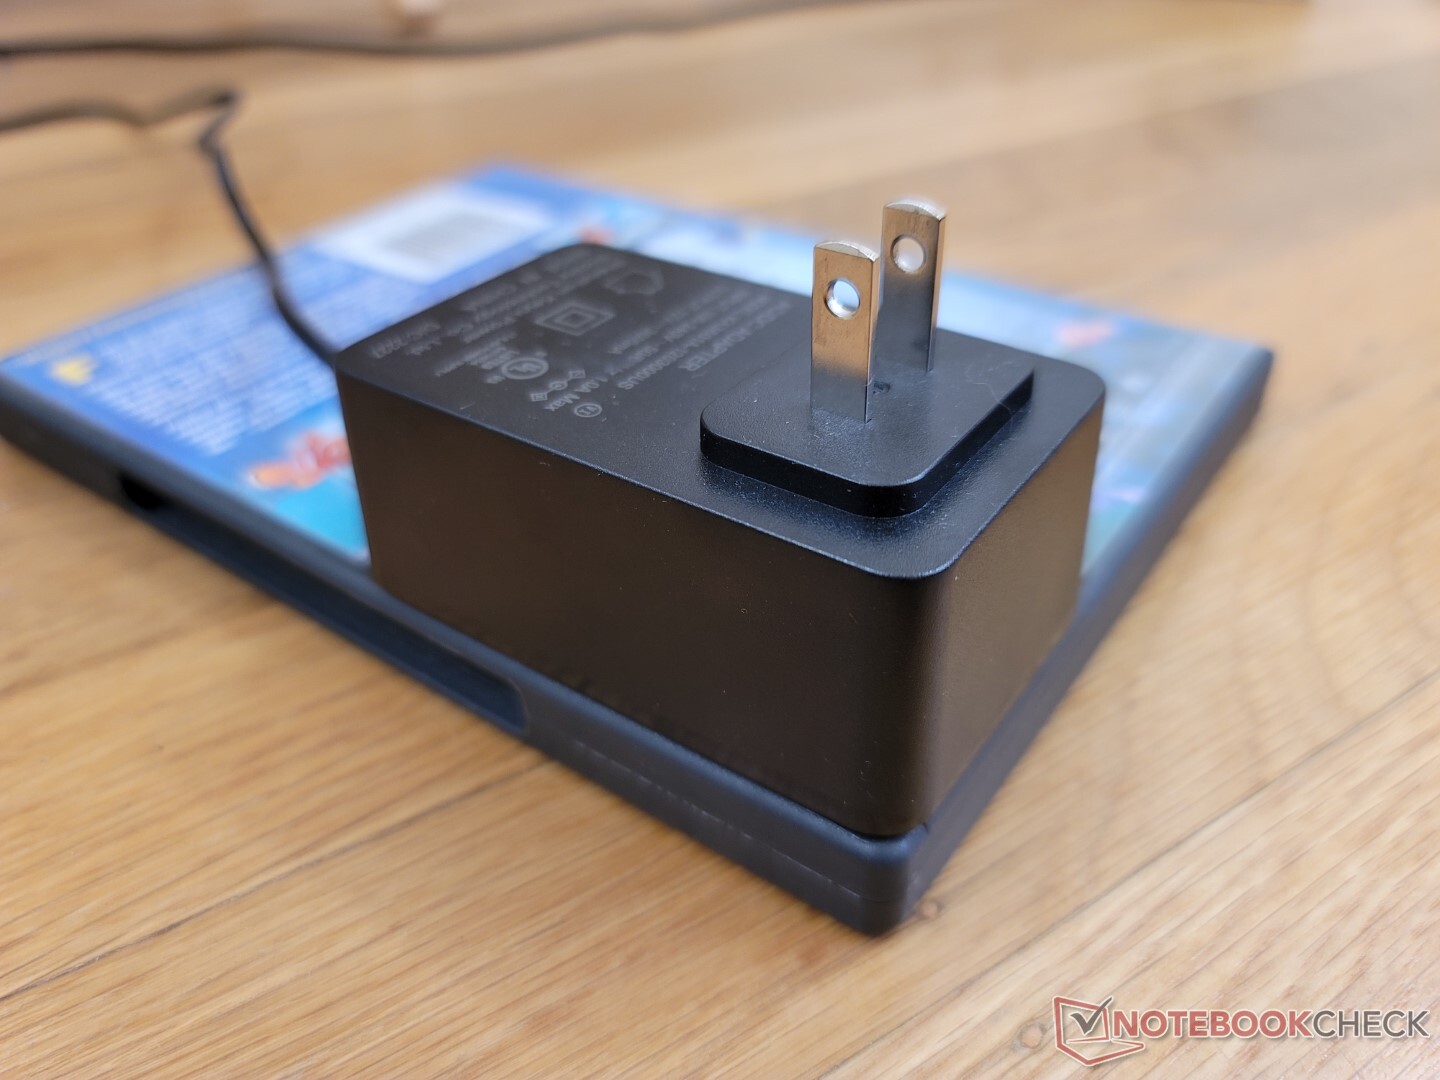
In der Verpackung befinden sich ein HDMI-Kabel, das Netzteil, Papierkram sowie eine Adapterhalterung für die VESA-Montage.
Es greift auch in Deutschland nur eine Standard-1-Jahres-Garantie.
Leistung
Testbedingungen
Unter Windows stellen wir vor der Durchführung unserer Benchmarks den Leistungsmodus ein. Auf dem Mini-PC gibt es keine Hersteller-Programme oder speziellen BIOS-Optionen, welche die Systemleistung regulieren.
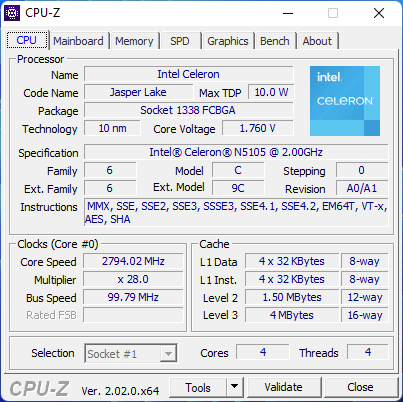
Prozessor
Die reine CPU-Leistung ist leider nur um Haaresbreite besser als die des "alten" N5095, sowohl in den Single- als auch Multi-Thread-Tests. Der Leistungsunterschied ist dermaßen gering, dass es sich auch um den gleichen Prozessor handeln könnte.
Cinebench R15 Multi Loop
Cinebench R23: Multi Core | Single Core
Cinebench R15: CPU Multi 64Bit | CPU Single 64Bit
Blender: v2.79 BMW27 CPU
7-Zip 18.03: 7z b 4 | 7z b 4 -mmt1
Geekbench 5.5: Multi-Core | Single-Core
HWBOT x265 Benchmark v2.2: 4k Preset
LibreOffice : 20 Documents To PDF
R Benchmark 2.5: Overall mean
| Cinebench R20 / CPU (Multi Core) | |
| Beelink SER4 | |
| Intel NUC11TNKi5 | |
| Beelink SER3 | |
| Lenovo IdeaPad 3 15ITL05 81X80074GE | |
| Beelink U59 N5105 | |
| Durchschnittliche Intel Celeron N5105 (n=1) | |
| Teclast TBOLT F15 Pro | |
| Beelink U59 Mini-S | |
| Beelink SEi8 | |
| HP 17-by2437ng | |
| Zotac ZBOX PI336 pico | |
| Cinebench R20 / CPU (Single Core) | |
| Lenovo IdeaPad 3 15ITL05 81X80074GE | |
| Intel NUC11TNKi5 | |
| Beelink SER4 | |
| Teclast TBOLT F15 Pro | |
| HP 17-by2437ng | |
| Beelink SER3 | |
| Beelink SEi8 | |
| Beelink U59 N5105 | |
| Durchschnittliche Intel Celeron N5105 (n=1) | |
| Beelink U59 Mini-S | |
| Zotac ZBOX PI336 pico | |
| Cinebench R23 / Multi Core | |
| Beelink SER4 | |
| Intel NUC11TNKi5 | |
| Beelink SER3 | |
| Lenovo IdeaPad 3 15ITL05 81X80074GE | |
| Beelink U59 N5105 | |
| Durchschnittliche Intel Celeron N5105 (n=1) | |
| Beelink U59 Mini-S | |
| Teclast TBOLT F15 Pro | |
| Beelink SEi8 | |
| Zotac ZBOX PI336 pico | |
| Cinebench R23 / Single Core | |
| Intel NUC11TNKi5 | |
| Lenovo IdeaPad 3 15ITL05 81X80074GE | |
| Beelink SER4 | |
| Teclast TBOLT F15 Pro | |
| Beelink SER3 | |
| Beelink SEi8 | |
| Beelink U59 N5105 | |
| Durchschnittliche Intel Celeron N5105 (n=1) | |
| Beelink U59 Mini-S | |
| Zotac ZBOX PI336 pico | |
| Cinebench R15 / CPU Multi 64Bit | |
| Beelink SER4 | |
| Intel NUC11TNKi5 | |
| Beelink SER3 | |
| Lenovo IdeaPad 3 15ITL05 81X80074GE | |
| Beelink U59 N5105 | |
| Durchschnittliche Intel Celeron N5105 (n=1) | |
| Beelink U59 Mini-S | |
| Teclast TBOLT F15 Pro | |
| Beelink SEi8 | |
| HP 17-by2437ng | |
| Zotac ZBOX PI336 pico | |
| Cinebench R15 / CPU Single 64Bit | |
| Intel NUC11TNKi5 | |
| Beelink SER4 | |
| HP 17-by2437ng | |
| Teclast TBOLT F15 Pro | |
| Beelink SER3 | |
| Lenovo IdeaPad 3 15ITL05 81X80074GE | |
| Beelink SEi8 | |
| Beelink U59 N5105 | |
| Durchschnittliche Intel Celeron N5105 (n=1) | |
| Beelink U59 Mini-S | |
| Zotac ZBOX PI336 pico | |
| Blender / v2.79 BMW27 CPU | |
| Zotac ZBOX PI336 pico | |
| Beelink U59 Mini-S | |
| Beelink U59 N5105 | |
| Durchschnittliche Intel Celeron N5105 (n=1) | |
| Teclast TBOLT F15 Pro | |
| HP 17-by2437ng | |
| Beelink SEi8 | |
| Lenovo IdeaPad 3 15ITL05 81X80074GE | |
| Beelink SER3 | |
| Intel NUC11TNKi5 | |
| Beelink SER4 | |
| 7-Zip 18.03 / 7z b 4 | |
| Beelink SER4 | |
| Intel NUC11TNKi5 | |
| Beelink SER3 | |
| Lenovo IdeaPad 3 15ITL05 81X80074GE | |
| Beelink U59 N5105 | |
| Durchschnittliche Intel Celeron N5105 (n=1) | |
| Beelink U59 Mini-S | |
| HP 17-by2437ng | |
| Teclast TBOLT F15 Pro | |
| Beelink SEi8 | |
| Zotac ZBOX PI336 pico | |
| 7-Zip 18.03 / 7z b 4 -mmt1 | |
| Intel NUC11TNKi5 | |
| Lenovo IdeaPad 3 15ITL05 81X80074GE | |
| Beelink SER4 | |
| HP 17-by2437ng | |
| Teclast TBOLT F15 Pro | |
| Beelink SER3 | |
| Beelink SEi8 | |
| Beelink U59 Mini-S | |
| Beelink U59 N5105 | |
| Durchschnittliche Intel Celeron N5105 (n=1) | |
| Zotac ZBOX PI336 pico | |
| Geekbench 5.5 / Multi-Core | |
| Beelink SER4 | |
| Intel NUC11TNKi5 | |
| Lenovo IdeaPad 3 15ITL05 81X80074GE | |
| Teclast TBOLT F15 Pro | |
| Beelink U59 N5105 | |
| Durchschnittliche Intel Celeron N5105 (n=1) | |
| HP 17-by2437ng | |
| Beelink U59 Mini-S | |
| Beelink SEi8 | |
| Zotac ZBOX PI336 pico | |
| Geekbench 5.5 / Single-Core | |
| Intel NUC11TNKi5 | |
| Lenovo IdeaPad 3 15ITL05 81X80074GE | |
| Beelink SER4 | |
| Teclast TBOLT F15 Pro | |
| HP 17-by2437ng | |
| Beelink SEi8 | |
| Beelink U59 N5105 | |
| Durchschnittliche Intel Celeron N5105 (n=1) | |
| Beelink U59 Mini-S | |
| Zotac ZBOX PI336 pico | |
| HWBOT x265 Benchmark v2.2 / 4k Preset | |
| Beelink SER4 | |
| Intel NUC11TNKi5 | |
| Beelink SER3 | |
| Lenovo IdeaPad 3 15ITL05 81X80074GE | |
| Beelink SEi8 | |
| HP 17-by2437ng | |
| Teclast TBOLT F15 Pro | |
| Beelink U59 N5105 | |
| Durchschnittliche Intel Celeron N5105 (n=1) | |
| Beelink U59 Mini-S | |
| Zotac ZBOX PI336 pico | |
| LibreOffice / 20 Documents To PDF | |
| Zotac ZBOX PI336 pico | |
| Beelink U59 Mini-S | |
| Beelink U59 N5105 | |
| Durchschnittliche Intel Celeron N5105 (n=1) | |
| Beelink SER3 | |
| Teclast TBOLT F15 Pro | |
| Beelink SEi8 | |
| HP 17-by2437ng | |
| Beelink SER4 | |
| Intel NUC11TNKi5 | |
| Lenovo IdeaPad 3 15ITL05 81X80074GE | |
| R Benchmark 2.5 / Overall mean | |
| Zotac ZBOX PI336 pico | |
| Beelink U59 Mini-S | |
| Beelink U59 N5105 | |
| Durchschnittliche Intel Celeron N5105 (n=1) | |
| Beelink SEi8 | |
| Teclast TBOLT F15 Pro | |
| HP 17-by2437ng | |
| Beelink SER3 | |
| Lenovo IdeaPad 3 15ITL05 81X80074GE | |
| Intel NUC11TNKi5 | |
| Beelink SER4 | |
* ... kleinere Werte sind besser
AIDA64: FP32 Ray-Trace | FPU Julia | CPU SHA3 | CPU Queen | FPU SinJulia | FPU Mandel | CPU AES | CPU ZLib | FP64 Ray-Trace | CPU PhotoWorxx
| Performance Rating | |
| Beelink SER4 | |
| Intel NUC11TNKi5 | |
| Beelink SER3 | |
| Beelink U59 N5105 | |
| Beelink U59 Mini-S | |
| Zotac ZBOX PI336 pico | |
| AIDA64 / FP32 Ray-Trace | |
| Beelink SER4 | |
| Intel NUC11TNKi5 | |
| Beelink SER3 | |
| Beelink U59 Mini-S | |
| Beelink U59 N5105 | |
| Zotac ZBOX PI336 pico | |
| AIDA64 / FPU Julia | |
| Beelink SER4 | |
| Intel NUC11TNKi5 | |
| Beelink SER3 | |
| Beelink U59 N5105 | |
| Beelink U59 Mini-S | |
| Zotac ZBOX PI336 pico | |
| AIDA64 / CPU SHA3 | |
| Intel NUC11TNKi5 | |
| Beelink SER4 | |
| Beelink SER3 | |
| Beelink U59 N5105 | |
| Beelink U59 Mini-S | |
| Zotac ZBOX PI336 pico | |
| AIDA64 / CPU Queen | |
| Beelink SER4 | |
| Intel NUC11TNKi5 | |
| Beelink SER3 | |
| Beelink U59 N5105 | |
| Beelink U59 Mini-S | |
| Zotac ZBOX PI336 pico | |
| AIDA64 / FPU SinJulia | |
| Beelink SER4 | |
| Beelink SER3 | |
| Intel NUC11TNKi5 | |
| Beelink U59 Mini-S | |
| Beelink U59 N5105 | |
| Zotac ZBOX PI336 pico | |
| AIDA64 / FPU Mandel | |
| Beelink SER4 | |
| Intel NUC11TNKi5 | |
| Beelink SER3 | |
| Beelink U59 N5105 | |
| Beelink U59 Mini-S | |
| Zotac ZBOX PI336 pico | |
| AIDA64 / CPU AES | |
| Intel NUC11TNKi5 | |
| Beelink SER4 | |
| Beelink SER3 | |
| Beelink U59 N5105 | |
| Beelink U59 Mini-S | |
| Zotac ZBOX PI336 pico | |
| AIDA64 / CPU ZLib | |
| Beelink SER4 | |
| Intel NUC11TNKi5 | |
| Beelink SER3 | |
| Beelink U59 N5105 | |
| Beelink U59 Mini-S | |
| Zotac ZBOX PI336 pico | |
| AIDA64 / FP64 Ray-Trace | |
| Beelink SER4 | |
| Intel NUC11TNKi5 | |
| Beelink SER3 | |
| Beelink U59 N5105 | |
| Beelink U59 Mini-S | |
| Zotac ZBOX PI336 pico | |
| AIDA64 / CPU PhotoWorxx | |
| Beelink SER4 | |
| Intel NUC11TNKi5 | |
| Beelink U59 N5105 | |
| Beelink SER3 | |
| Beelink U59 Mini-S | |
| Zotac ZBOX PI336 pico | |
Systemleistung
CrossMark: Overall | Productivity | Creativity | Responsiveness
| PCMark 10 / Score | |
| Beelink SER4 | |
| Intel NUC11TNKi5 | |
| Beelink SER3 | |
| Beelink U59 N5105 | |
| Durchschnittliche Intel Celeron N5105, Intel UHD Graphics (Jasper Lake 24 EU) (n=1) | |
| Beelink U59 Mini-S | |
| PCMark 10 / Essentials | |
| Beelink SER4 | |
| Intel NUC11TNKi5 | |
| Beelink SER3 | |
| Beelink U59 N5105 | |
| Durchschnittliche Intel Celeron N5105, Intel UHD Graphics (Jasper Lake 24 EU) (n=1) | |
| Beelink U59 Mini-S | |
| PCMark 10 / Productivity | |
| Beelink SER4 | |
| Intel NUC11TNKi5 | |
| Beelink SER3 | |
| Beelink U59 N5105 | |
| Durchschnittliche Intel Celeron N5105, Intel UHD Graphics (Jasper Lake 24 EU) (n=1) | |
| Beelink U59 Mini-S | |
| PCMark 10 / Digital Content Creation | |
| Beelink SER4 | |
| Intel NUC11TNKi5 | |
| Beelink SER3 | |
| Beelink U59 N5105 | |
| Durchschnittliche Intel Celeron N5105, Intel UHD Graphics (Jasper Lake 24 EU) (n=1) | |
| Beelink U59 Mini-S | |
| CrossMark / Overall | |
| Beelink U59 N5105 | |
| Durchschnittliche Intel Celeron N5105, Intel UHD Graphics (Jasper Lake 24 EU) (n=1) | |
| Beelink U59 Mini-S | |
| CrossMark / Productivity | |
| Beelink U59 N5105 | |
| Durchschnittliche Intel Celeron N5105, Intel UHD Graphics (Jasper Lake 24 EU) (n=1) | |
| Beelink U59 Mini-S | |
| CrossMark / Creativity | |
| Beelink U59 N5105 | |
| Durchschnittliche Intel Celeron N5105, Intel UHD Graphics (Jasper Lake 24 EU) (n=1) | |
| Beelink U59 Mini-S | |
| CrossMark / Responsiveness | |
| Beelink U59 N5105 | |
| Durchschnittliche Intel Celeron N5105, Intel UHD Graphics (Jasper Lake 24 EU) (n=1) | |
| Beelink U59 Mini-S | |
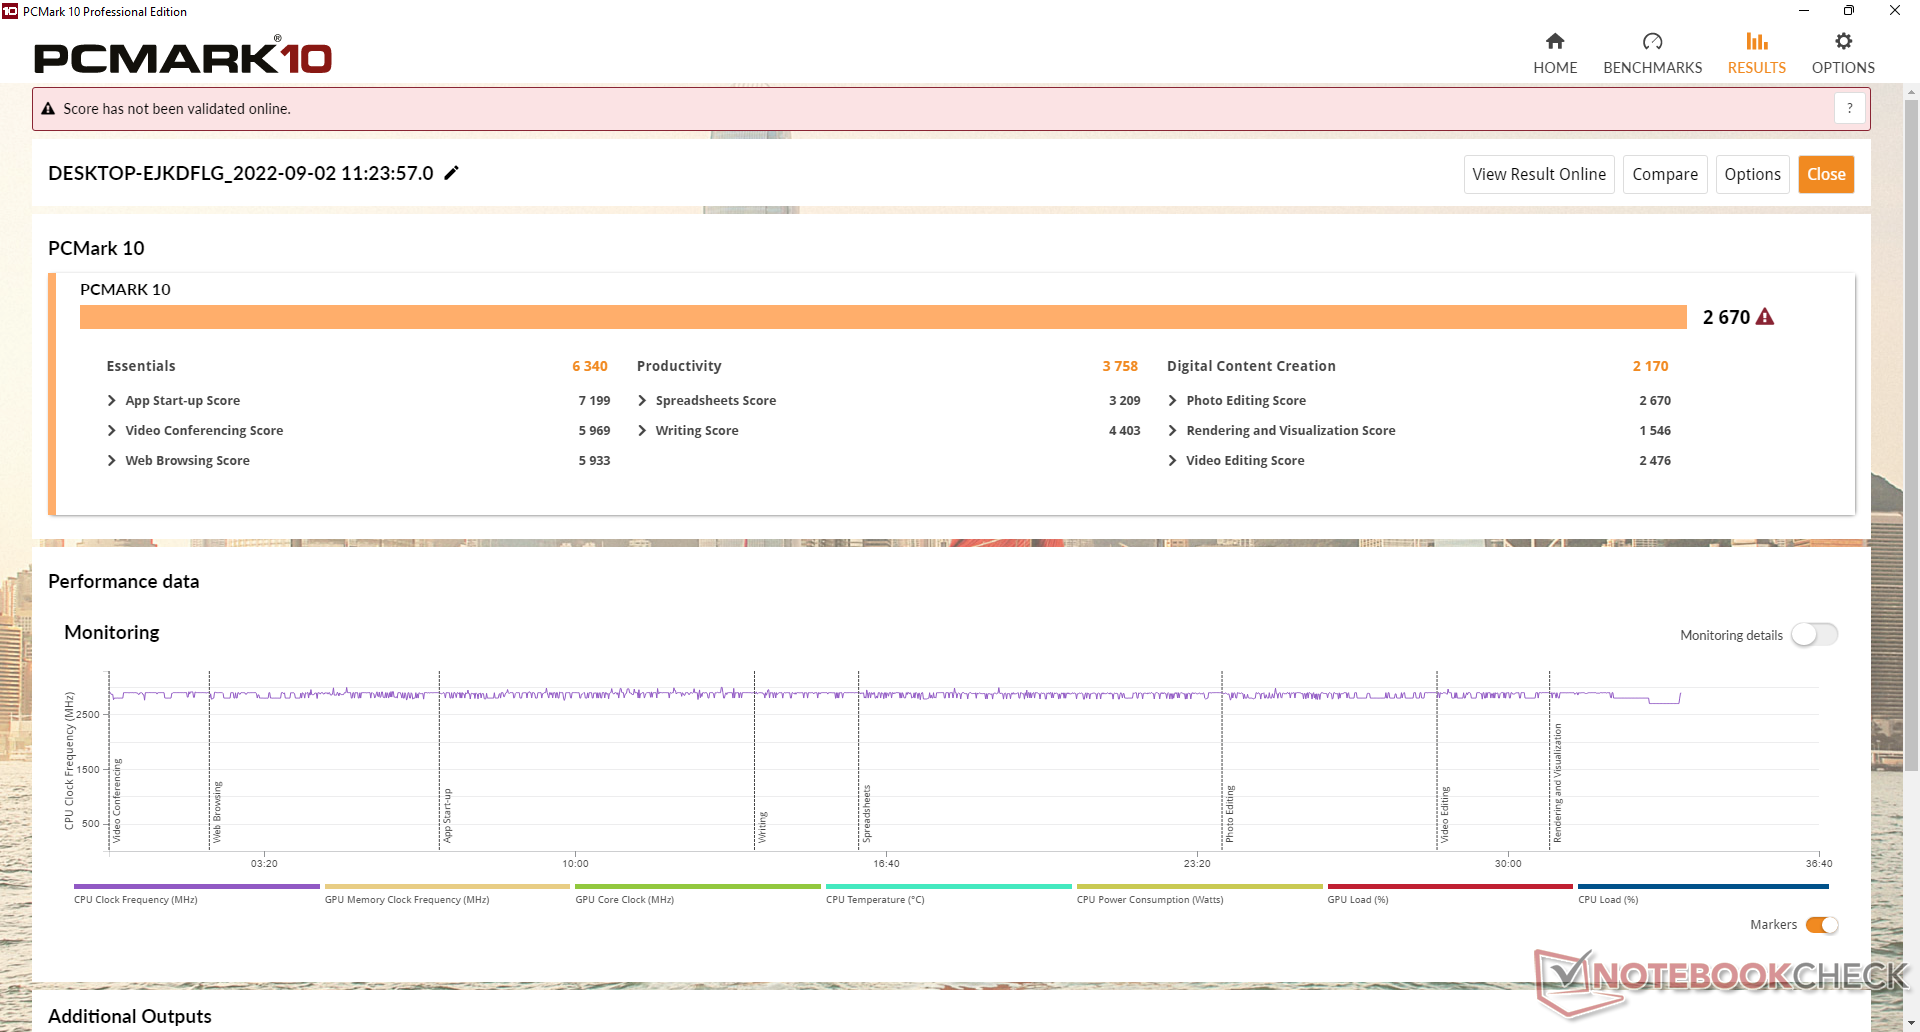
| PCMark 10 Score | 2670 Punkte | |
Hilfe | ||
| AIDA64 / Memory Copy | |
| Beelink SER4 | |
| Beelink U59 N5105 | |
| Intel NUC11TNKi5 | |
| Beelink U59 Mini-S | |
| Beelink SER3 | |
| Zotac ZBOX PI336 pico | |
| AIDA64 / Memory Read | |
| Beelink SER4 | |
| Intel NUC11TNKi5 | |
| Beelink SER3 | |
| Beelink U59 N5105 | |
| Beelink U59 Mini-S | |
| Zotac ZBOX PI336 pico | |
| AIDA64 / Memory Write | |
| Beelink SER4 | |
| Beelink U59 N5105 | |
| Intel NUC11TNKi5 | |
| Beelink U59 Mini-S | |
| Beelink SER3 | |
| Zotac ZBOX PI336 pico | |
| AIDA64 / Memory Latency | |
| Beelink SER3 | |
| Beelink SER4 | |
| Intel NUC11TNKi5 | |
| Zotac ZBOX PI336 pico | |
| Beelink U59 N5105 | |
| Beelink U59 Mini-S | |
* ... kleinere Werte sind besser
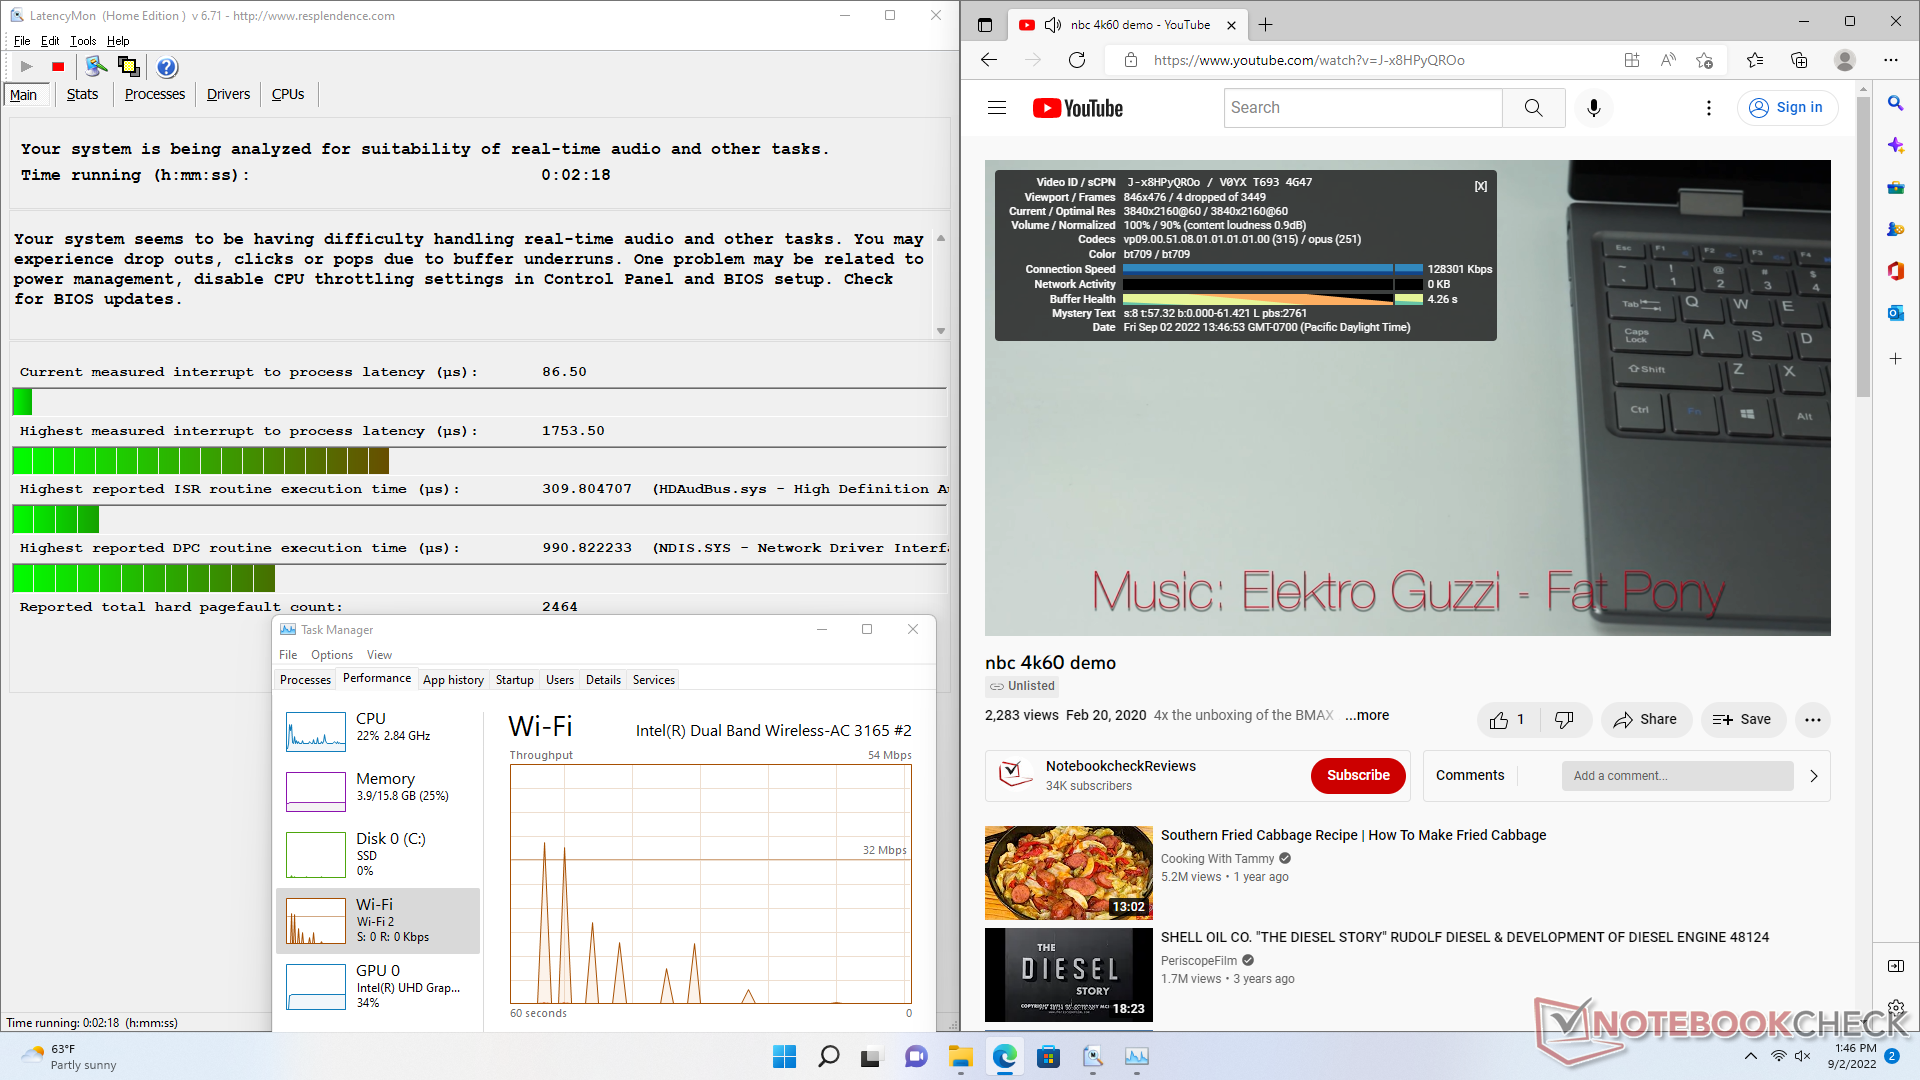
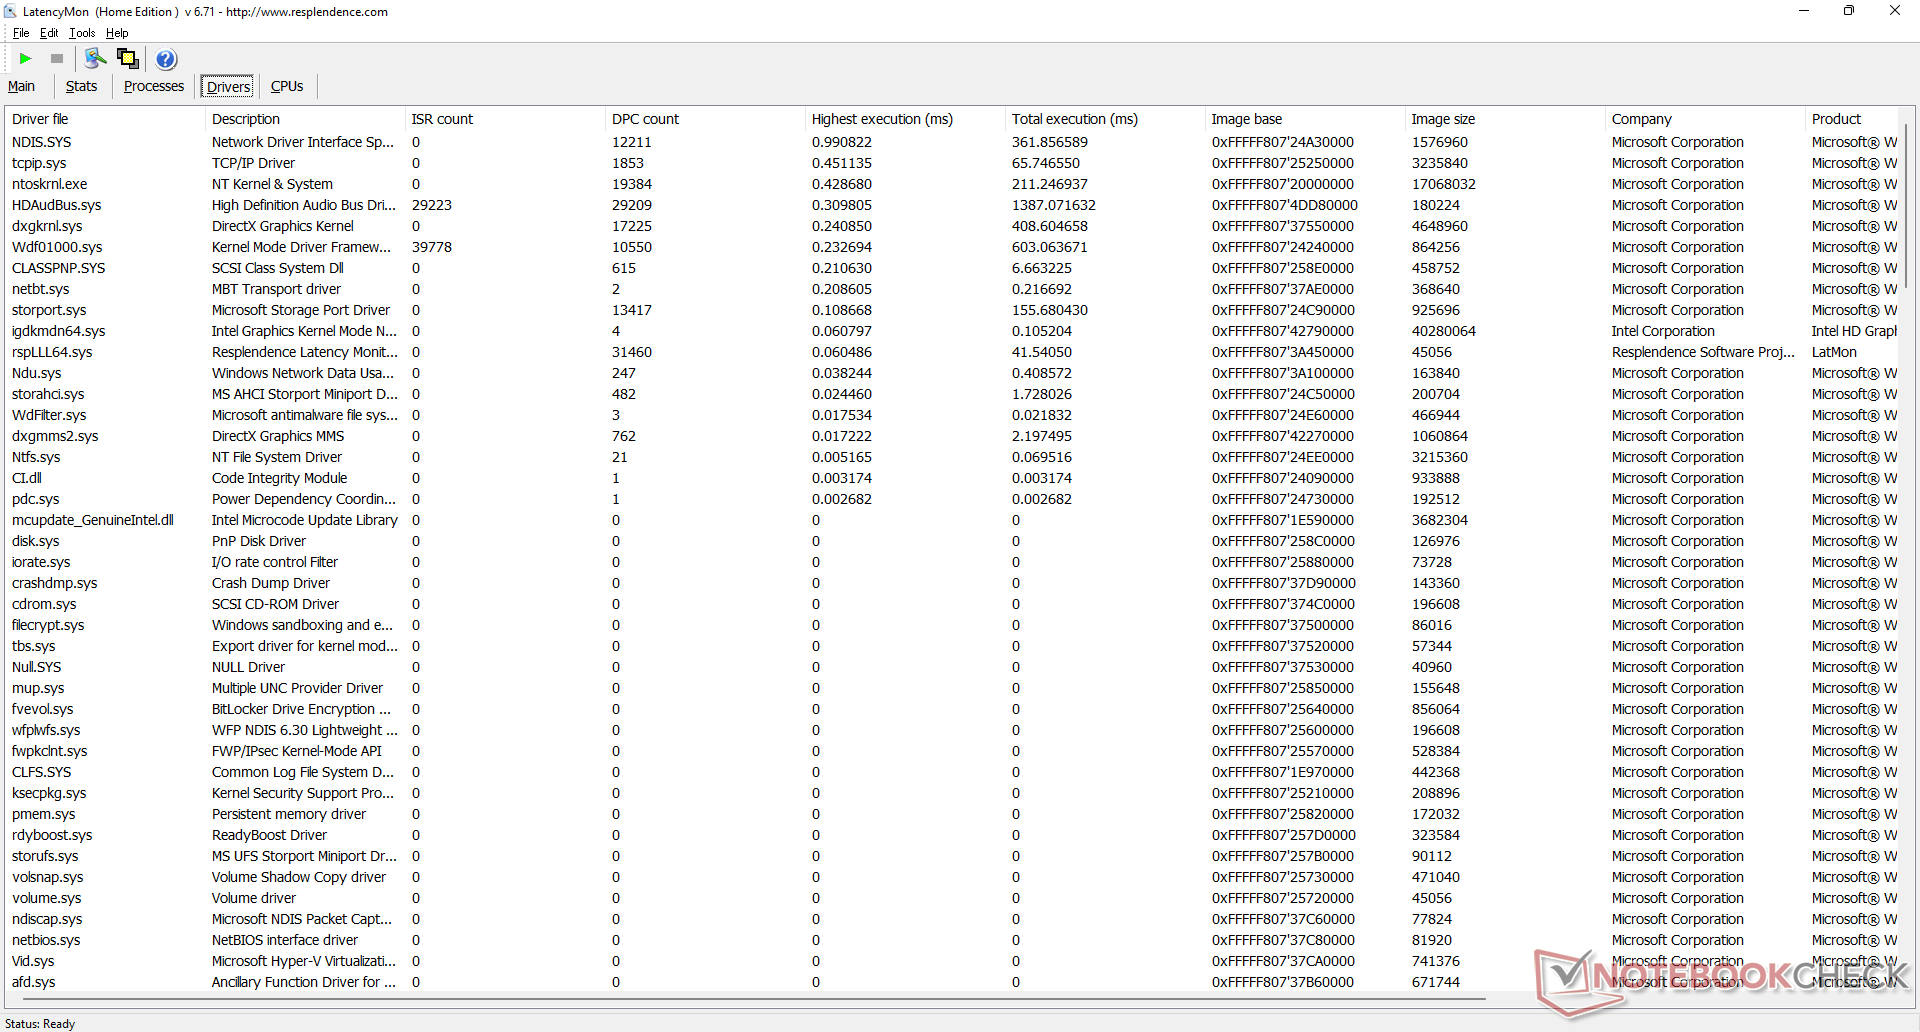
DPC Latency
LatencyMon deckt DPC-Probleme beim Öffnen mehrerer Browsertabs auf. Die Videowiedergabe unseres 4K/60-fps-YouTube-Testvideos läuft hingegen beinahe perfekt ab, es gibt nur 4 Dropped Frames zu beklagen.
| DPC Latencies / LatencyMon - interrupt to process latency (max), Web, Youtube, Prime95 | |
| Beelink U59 N5105 | |
| Beelink U59 Mini-S | |
| Zotac ZBOX PI336 pico | |
| Beelink SER3 | |
| Intel NUC11TNKi5 | |
| Beelink SER4 | |
* ... kleinere Werte sind besser
Massenspeicher
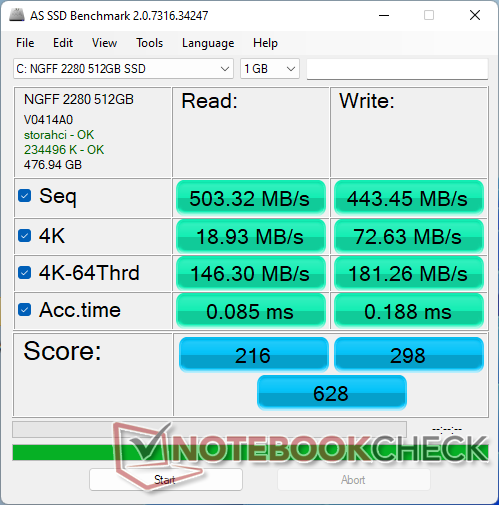
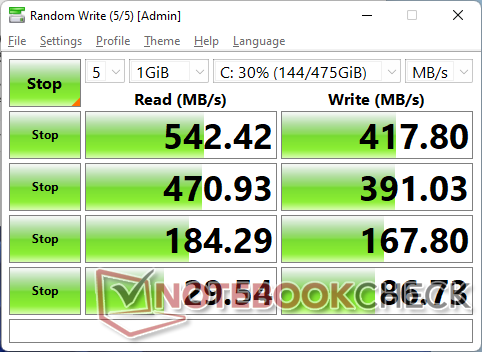
Unser Testmodell wird mit einem M.2-SATA-III-Speicherlaufwerk anstelle einer NVMe-SSD ausgeliefert, vermutlich um Kosten zu sparen. Angesichts der CPU ist die SATA-III-SSD jedoch akzeptabel. Die Silicon Motion AZW kommt im Test auf für derartige SSDs hervorragende Transferraten mit Werten im sequentiellen Lesen und Schreiben oberhalb von 400 MB/s.
Für die SSD gibt es ein kleines Kühlpad, was in dieser Preisklasse positiv überrascht, es sitzt zwischen der SSD und dem Metallrahmen des 2,5-Zoll-SATA-III-Schachtes, welcher an der Oberseite befestigt ist.

| Drive Performance Rating - Percent | |
| Beelink SER3 | |
| Beelink SER4 | |
| Intel NUC11TNKi5 | |
| Beelink U59 N5105 | |
| Beelink U59 Mini-S | |
| Zotac ZBOX PI336 pico | |
| DiskSpd | |
| seq read | |
| Beelink SER4 | |
| Beelink SER3 | |
| Intel NUC11TNKi5 | |
| Beelink U59 N5105 | |
| Beelink U59 Mini-S | |
| Zotac ZBOX PI336 pico | |
| seq write | |
| Beelink SER3 | |
| Beelink SER4 | |
| Intel NUC11TNKi5 | |
| Beelink U59 N5105 | |
| Beelink U59 Mini-S | |
| Zotac ZBOX PI336 pico | |
| seq q8 t1 read | |
| Beelink SER3 | |
| Beelink SER4 | |
| Intel NUC11TNKi5 | |
| Beelink U59 N5105 | |
| Beelink U59 Mini-S | |
| Zotac ZBOX PI336 pico | |
| seq q8 t1 write | |
| Beelink SER3 | |
| Beelink SER4 | |
| Intel NUC11TNKi5 | |
| Beelink U59 Mini-S | |
| Beelink U59 N5105 | |
| Zotac ZBOX PI336 pico | |
| 4k q1 t1 read | |
| Beelink SER4 | |
| Beelink SER3 | |
| Beelink U59 N5105 | |
| Intel NUC11TNKi5 | |
| Beelink U59 Mini-S | |
| Zotac ZBOX PI336 pico | |
| 4k q1 t1 write | |
| Beelink SER4 | |
| Beelink SER3 | |
| Beelink U59 N5105 | |
| Beelink U59 Mini-S | |
| Intel NUC11TNKi5 | |
| Zotac ZBOX PI336 pico | |
| 4k q32 t16 read | |
| Beelink SER3 | |
| Beelink SER4 | |
| Intel NUC11TNKi5 | |
| Beelink U59 N5105 | |
| Beelink U59 Mini-S | |
| Zotac ZBOX PI336 pico | |
| 4k q32 t16 write | |
| Beelink SER4 | |
| Beelink SER3 | |
| Intel NUC11TNKi5 | |
| Beelink U59 N5105 | |
| Beelink U59 Mini-S | |
| Zotac ZBOX PI336 pico | |
* ... kleinere Werte sind besser
Disk Throttling: DiskSpd Read Loop, Queue Depth 8
Grafikleistung
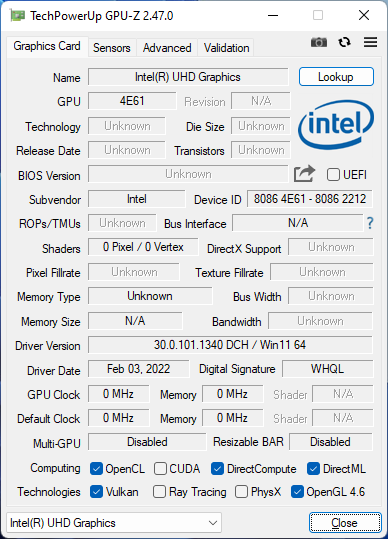
Die integrierte GPU erhält ein Upgrade: Letztes Jahr gab es eine Jasper-Lake-GPU mit 16 EUs, jetzt kommt die Jasper-Lake-GPU auf 24 EUs. Dadurch steigen die 3DMark-Ergebnisse um ganze 80 Prozent, was einen signifikanten Leistungsgewinn im Jahresvergleich darstellt. Allerdings gilt es zu beachten, dass unser U59-N5095-Testmodell im letzten Jahr nur mit 8 GB Single-Channel-RAM bestückt war, während im aktuellen U59-N5105-Testmodell 16 GB Dual-Channel-RAM stecken. Der Dual-Channel-RAM dürfte alleine schon für 30 bis 50 Prozent der Leistungssteigerung verantwortlich sein. Insgesamt handelt es sich trotz der Leistungssteigerung um eine der langsameren, integrierten Grafikeinheiten die es gibt und sie eignet sich folglich wenig für die meisten aktuellen oder auch älteren Spiele.
| 3DMark | |
| 1920x1080 Fire Strike Graphics | |
| Beelink SER4 | |
| Intel NUC11TNKi5 | |
| Lenovo IdeaPad 3 15ITL05 81X80074GE | |
| Beelink SER3 | |
| Beelink SEi8 | |
| Teclast TBOLT F15 Pro | |
| Beelink U59 N5105 | |
| Durchschnittliche Intel UHD Graphics (Jasper Lake 24 EU) (n=1) | |
| HP 17-by2437ng | |
| Beelink U59 Mini-S | |
| Zotac ZBOX PI336 pico | |
| 2560x1440 Time Spy Graphics | |
| Beelink SER4 | |
| Intel NUC11TNKi5 | |
| Lenovo IdeaPad 3 15ITL05 81X80074GE | |
| Beelink SER3 | |
| Beelink SEi8 | |
| Teclast TBOLT F15 Pro | |
| HP 17-by2437ng | |
| Beelink U59 N5105 | |
| Durchschnittliche Intel UHD Graphics (Jasper Lake 24 EU) (n=1) | |
| Beelink U59 Mini-S | |
| 2560x1440 Time Spy Score | |
| Beelink SER4 | |
| Intel NUC11TNKi5 | |
| Lenovo IdeaPad 3 15ITL05 81X80074GE | |
| Beelink SER3 | |
| Beelink SEi8 | |
| Teclast TBOLT F15 Pro | |
| HP 17-by2437ng | |
| Beelink U59 N5105 | |
| Durchschnittliche Intel UHD Graphics (Jasper Lake 24 EU) (n=1) | |
| Beelink U59 Mini-S | |
| 3DMark 11 - 1280x720 Performance GPU | |
| Beelink SER4 | |
| Intel NUC11TNKi5 | |
| Lenovo IdeaPad 3 15ITL05 81X80074GE | |
| Beelink SER3 | |
| Beelink SEi8 | |
| Teclast TBOLT F15 Pro | |
| HP 17-by2437ng | |
| Beelink U59 N5105 | |
| Durchschnittliche Intel UHD Graphics (Jasper Lake 24 EU) (n=1) | |
| Beelink U59 Mini-S | |
| Zotac ZBOX PI336 pico | |
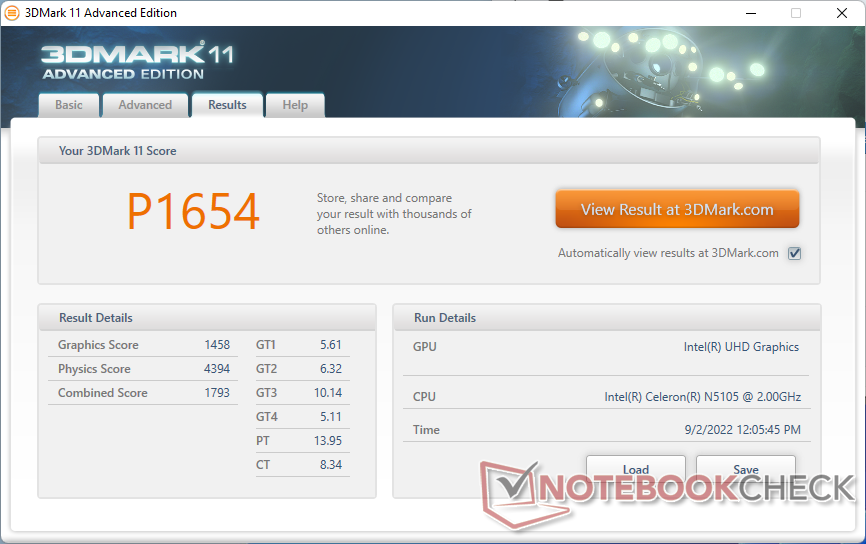
| 3DMark 11 Performance | 1654 Punkte | |
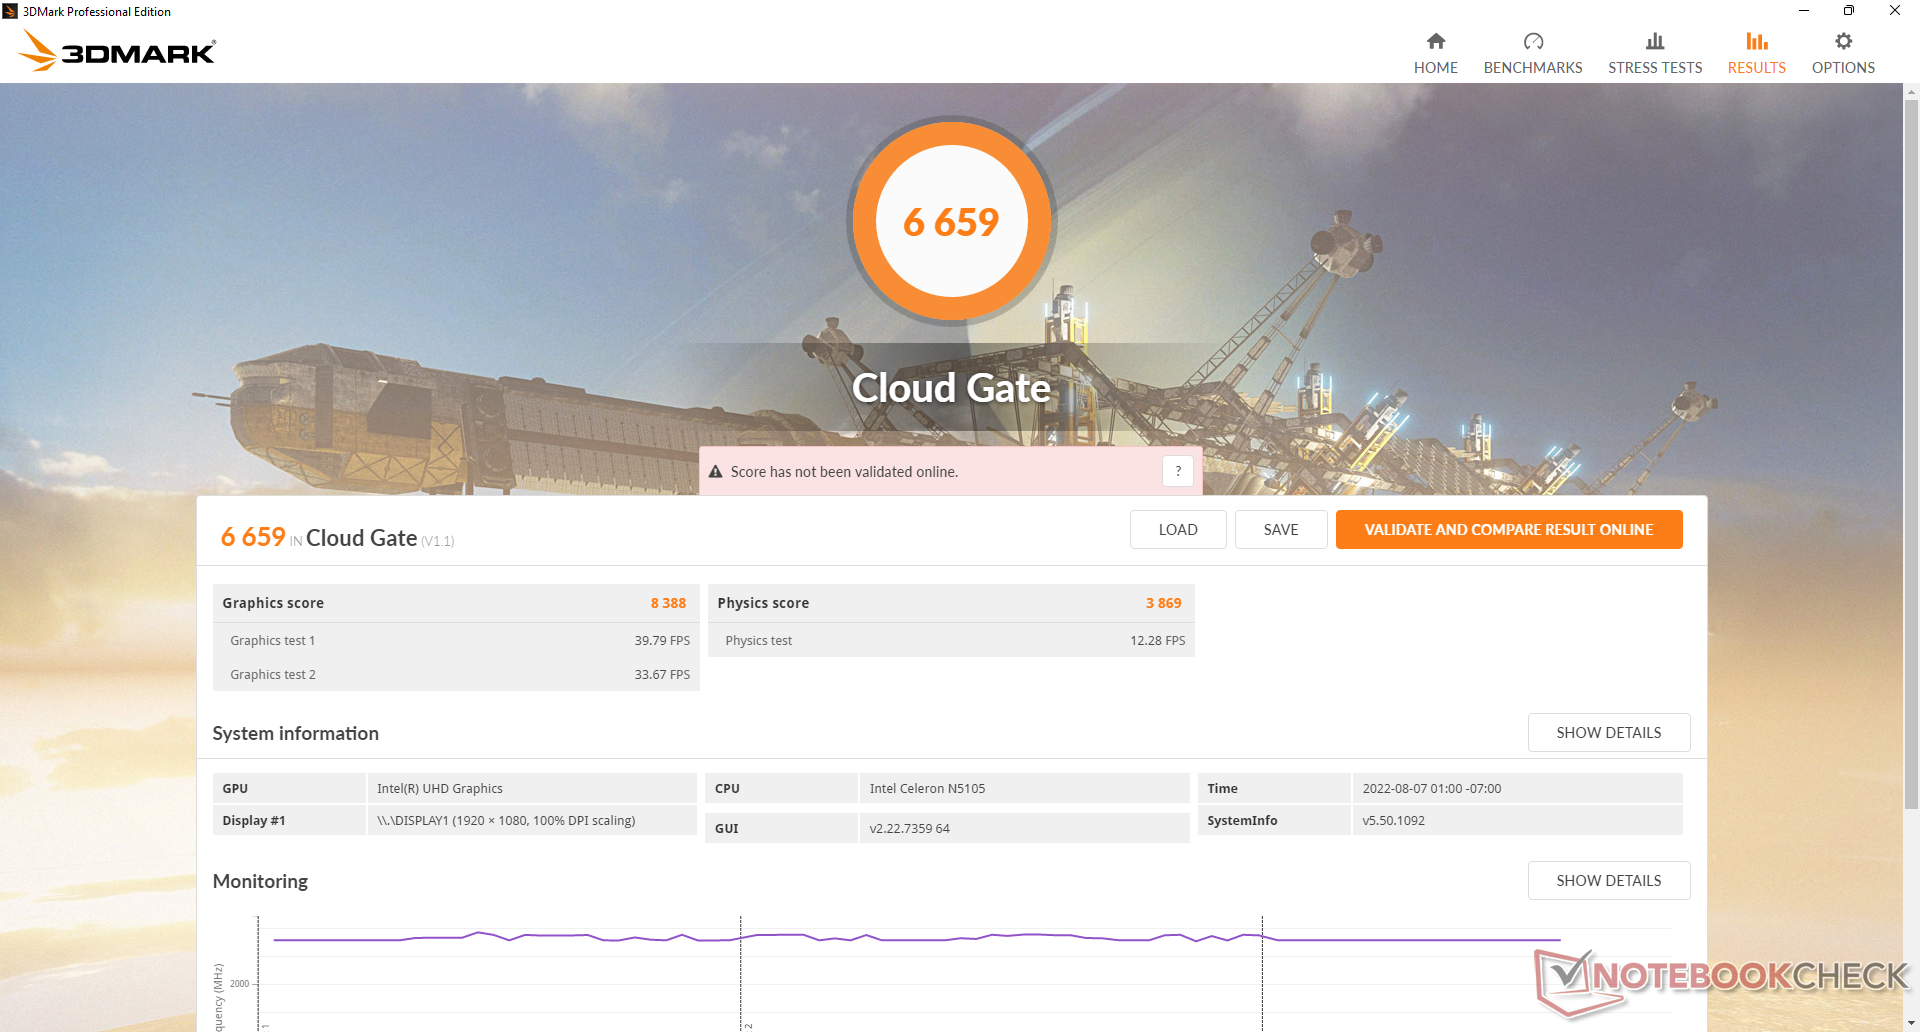
| 3DMark Cloud Gate Standard Score | 6659 Punkte | |
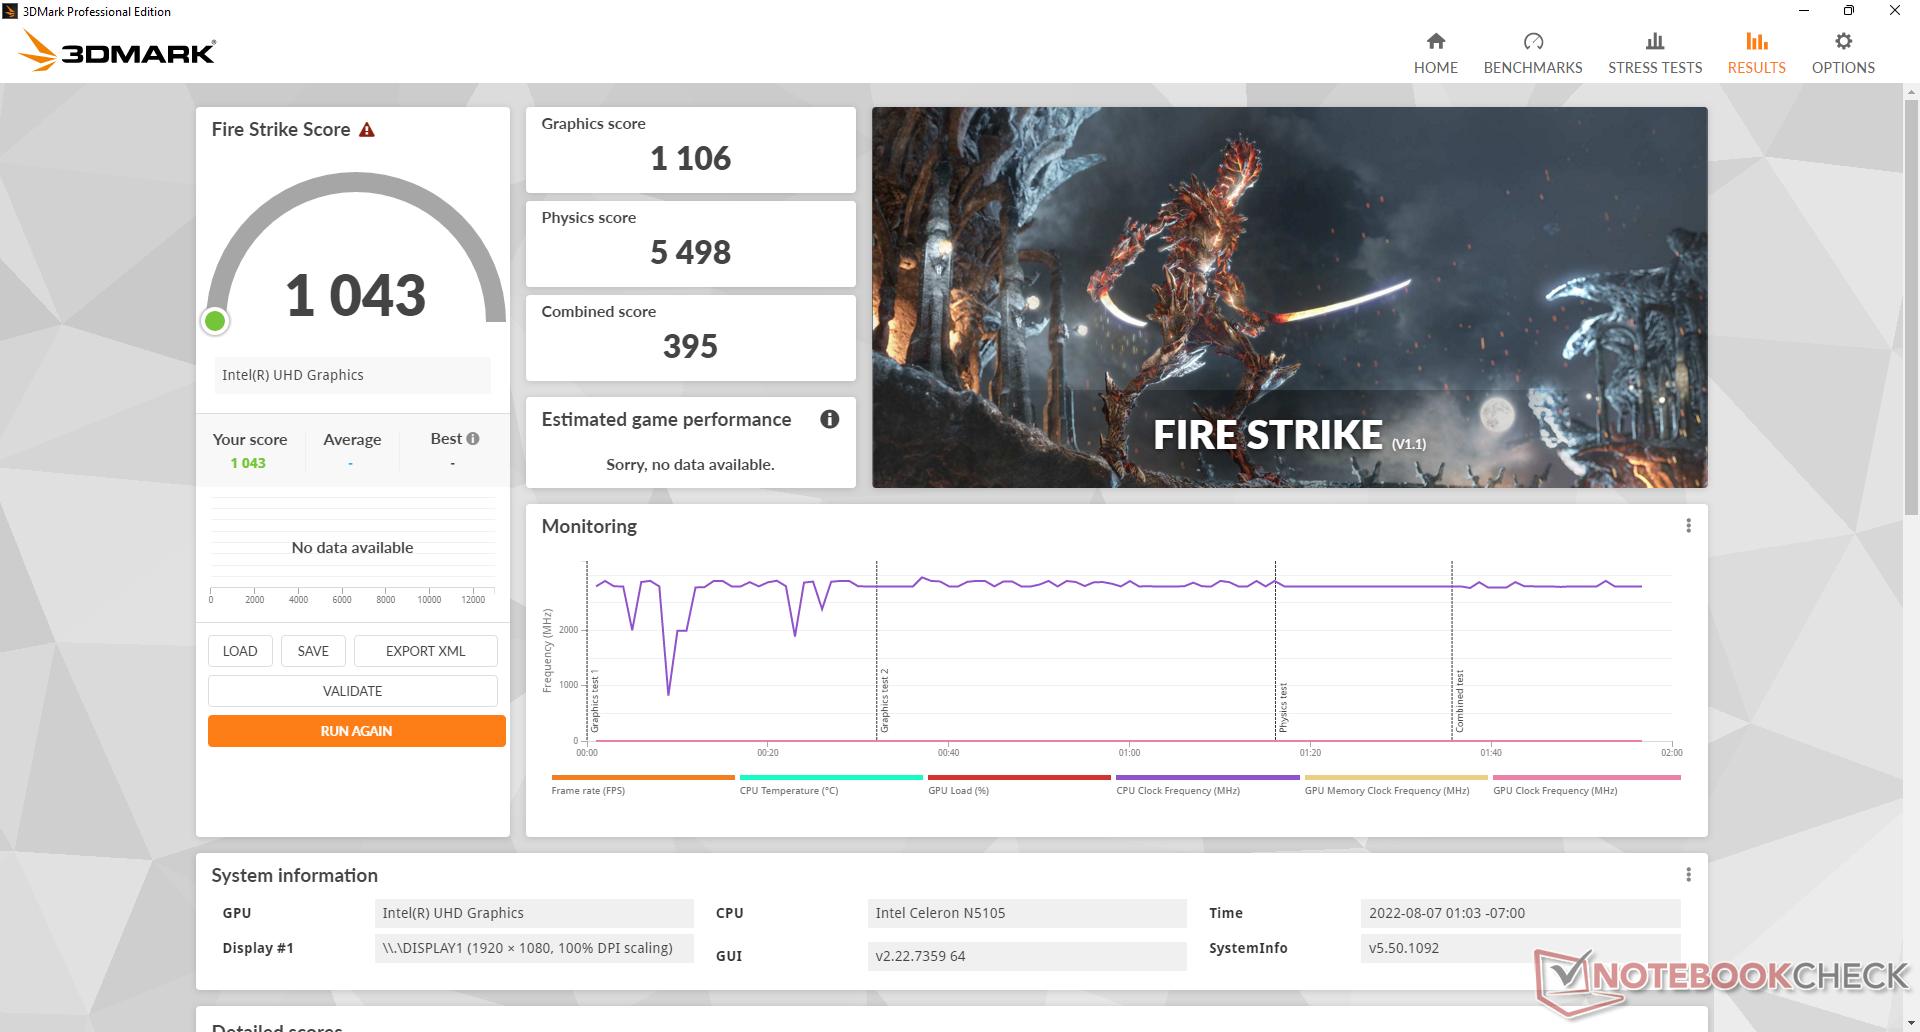
| 3DMark Fire Strike Score | 1043 Punkte | |
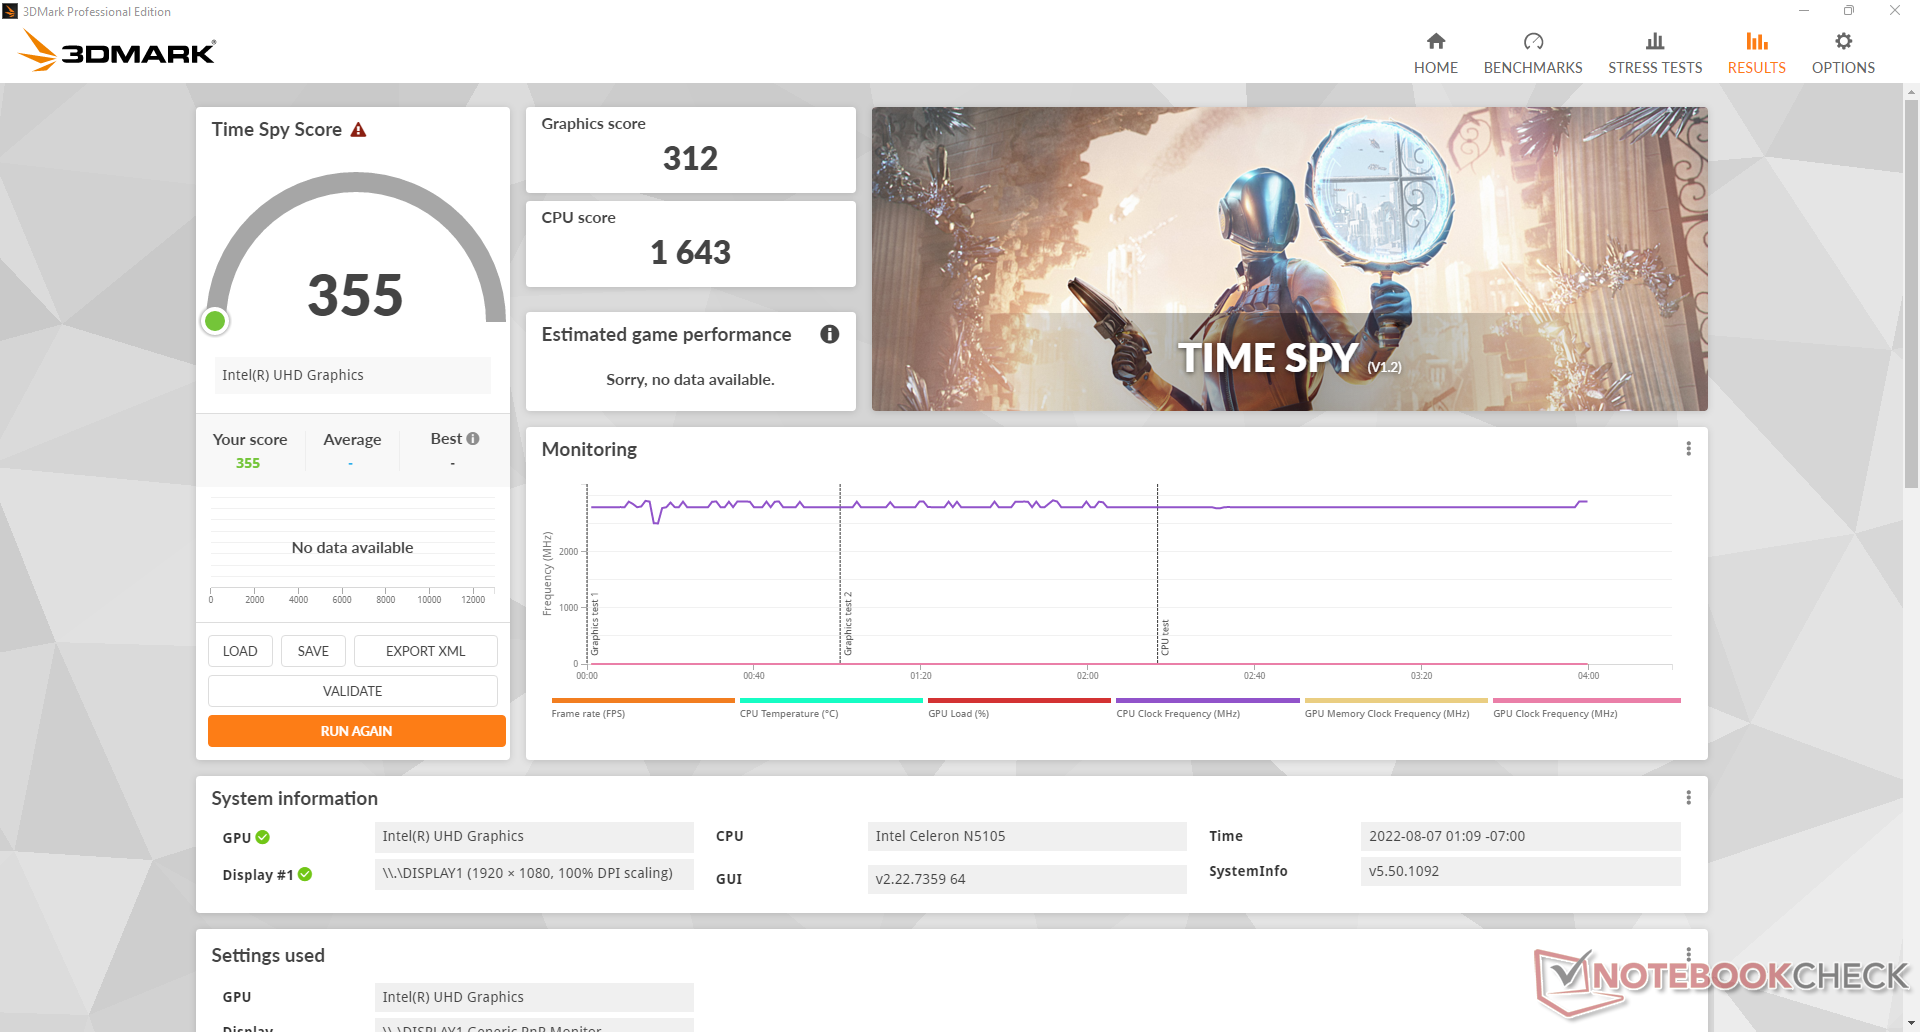
| 3DMark Time Spy Score | 355 Punkte | |
Hilfe | ||
| The Witcher 3 | |
| 1024x768 Low Graphics & Postprocessing | |
| Beelink SER4 | |
| Intel NUC11TNKi5 | |
| Lenovo IdeaPad 3 15ITL05 81X80074GE | |
| Beelink SER3 | |
| Teclast TBOLT F15 Pro | |
| Beelink U59 N5105 | |
| Durchschnittliche Intel UHD Graphics (Jasper Lake 24 EU) (n=1) | |
| 1366x768 Medium Graphics & Postprocessing | |
| Beelink SER4 | |
| Lenovo IdeaPad 3 15ITL05 81X80074GE | |
| Beelink SER3 | |
| Teclast TBOLT F15 Pro | |
| Beelink U59 N5105 | |
| Durchschnittliche Intel UHD Graphics (Jasper Lake 24 EU) (n=1) | |
| 1920x1080 High Graphics & Postprocessing (Nvidia HairWorks Off) | |
| Beelink SER4 | |
| Lenovo IdeaPad 3 15ITL05 81X80074GE | |
| Beelink SER3 | |
| Teclast TBOLT F15 Pro | |
| Beelink U59 N5105 | |
| Durchschnittliche Intel UHD Graphics (Jasper Lake 24 EU) (n=1) | |
| 1920x1080 Ultra Graphics & Postprocessing (HBAO+) | |
| Beelink SER4 | |
| Lenovo IdeaPad 3 15ITL05 81X80074GE | |
| Beelink SER3 | |
| Beelink U59 N5105 | |
| Durchschnittliche Intel UHD Graphics (Jasper Lake 24 EU) (n=1) | |
| X-Plane 11.11 | |
| 1280x720 low (fps_test=1) | |
| Beelink SER4 | |
| Lenovo IdeaPad 3 15ITL05 81X80074GE | |
| Intel NUC11TNKi5 | |
| Teclast TBOLT F15 Pro | |
| Beelink SER3 | |
| Beelink SEi8 | |
| Beelink U59 N5105 | |
| Durchschnittliche Intel UHD Graphics (Jasper Lake 24 EU) (n=1) | |
| Beelink U59 Mini-S | |
| Zotac ZBOX PI336 pico | |
| 1920x1080 med (fps_test=2) | |
| Beelink SER4 | |
| Intel NUC11TNKi5 | |
| Lenovo IdeaPad 3 15ITL05 81X80074GE | |
| Beelink SER3 | |
| Beelink SEi8 | |
| Teclast TBOLT F15 Pro | |
| Beelink U59 N5105 | |
| Durchschnittliche Intel UHD Graphics (Jasper Lake 24 EU) (n=1) | |
| Beelink U59 Mini-S | |
| Zotac ZBOX PI336 pico | |
| 1920x1080 high (fps_test=3) | |
| Beelink SER4 | |
| Intel NUC11TNKi5 | |
| Lenovo IdeaPad 3 15ITL05 81X80074GE | |
| Beelink SER3 | |
| Teclast TBOLT F15 Pro | |
| Beelink SEi8 | |
| Beelink U59 N5105 | |
| Durchschnittliche Intel UHD Graphics (Jasper Lake 24 EU) (n=1) | |
| Beelink U59 Mini-S | |
| Zotac ZBOX PI336 pico | |
| Final Fantasy XV Benchmark - 1280x720 Lite Quality | |
| Beelink SER4 | |
| Intel NUC11TNKi5 | |
| Lenovo IdeaPad 3 15ITL05 81X80074GE | |
| Beelink SER3 | |
| Beelink SEi8 | |
| Teclast TBOLT F15 Pro | |
| Beelink U59 N5105 | |
| Durchschnittliche Intel UHD Graphics (Jasper Lake 24 EU) (n=1) | |
| Beelink U59 Mini-S | |
| Zotac ZBOX PI336 pico | |
| min. | mittel | hoch | max. | |
|---|---|---|---|---|
| The Witcher 3 (2015) | 21.6 | 14.4 | 7.8 | 3.9 |
| Dota 2 Reborn (2015) | 73.8 | 24.1 | 16.8 | 15.5 |
| Final Fantasy XV Benchmark (2018) | 13.7 | |||
| X-Plane 11.11 (2018) | 20.8 | 13.3 | 12.3 |
Emissionen
Systemlautstärke
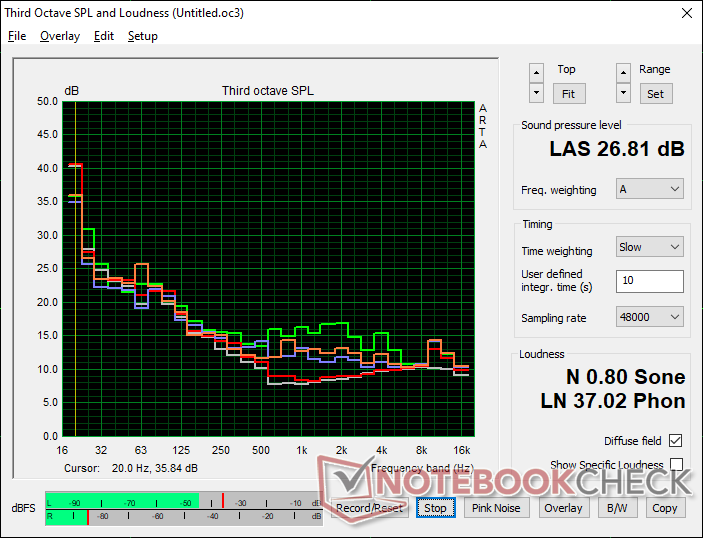
Unabhängig von der angelegten Last agiert das Kühlsystem sehr leise, selbst im Leistungsmodus. Wir messen ein Lautstärkemaximum von nur 27 dB(A) bei einer Hintergrundlautstärke von 21,5 dB(A), im letzten Jahr waren es noch lautere 34 dB(A). Abgesehen von lüfterlosen Modellen wie der Zotac ZBOX PI336 handelt es sich hier um einen der leisesten Mini-PCs.
Unser Testmodell produziert leise, elektronische Störgeräusche oder Spulenfiepen, was die Lautstärke im Leerlauf von 22,1 dB(A) erklärt.
Lautstärkediagramm
| Idle |
| 22.1 / 22.1 / 22.1 dB(A) |
| Last |
| 23.9 / 26.8 dB(A) |
 | ||
30 dB leise 40 dB(A) deutlich hörbar 50 dB(A) störend |
||
min: | ||
| Beelink U59 N5105 UHD Graphics (Jasper Lake 24 EU), Celeron N5105, Silicon Motion AZW 512G NV428 | Beelink U59 Mini-S UHD Graphics (Jasper Lake 16 EU), Celeron N5095, Silicon Motion AZW 256G M.228 220426 C SATA 3 | Beelink SER4 Vega 8, R7 4800U, Intel SSD 660p SSDPEKNW512G8 | Beelink SER3 Vega 10, R7 3750H, GSemi AZW GSDFN512TS3F1OGCX | Intel NUC11TNKi5 Iris Xe G7 80EUs, i5-1135G7, Transcend M.2 SSD 430S TS512GMTS430S | Zotac ZBOX PI336 pico UHD Graphics (Elkhart Lake 16 EU), Celeron N6211, SanDisk DF4128 | |
|---|---|---|---|---|---|---|
| Geräuschentwicklung | -12% | -48% | -31% | -55% | ||
| aus / Umgebung * (dB) | 21.5 | 23.3 -8% | 23.4 -9% | 23.4 -9% | 24.8 -15% | |
| Idle min * (dB) | 22.1 | 24.2 -10% | 33.2 -50% | 23.4 -6% | 35.6 -61% | |
| Idle avg * (dB) | 22.1 | 24.2 -10% | 33.2 -50% | 23.4 -6% | 35.6 -61% | |
| Idle max * (dB) | 22.1 | 24.2 -10% | 33.2 -50% | 29.4 -33% | 35.6 -61% | |
| Last avg * (dB) | 23.9 | 25.1 -5% | 38.6 -62% | 35.2 -47% | 36.2 -51% | |
| Witcher 3 ultra * (dB) | 24.4 | 39.2 -61% | 37.2 -52% | 38 -56% | ||
| Last max * (dB) | 26.8 | 33.9 -26% | 40.8 -52% | 43.3 -62% | 47.6 -78% |
* ... kleinere Werte sind besser
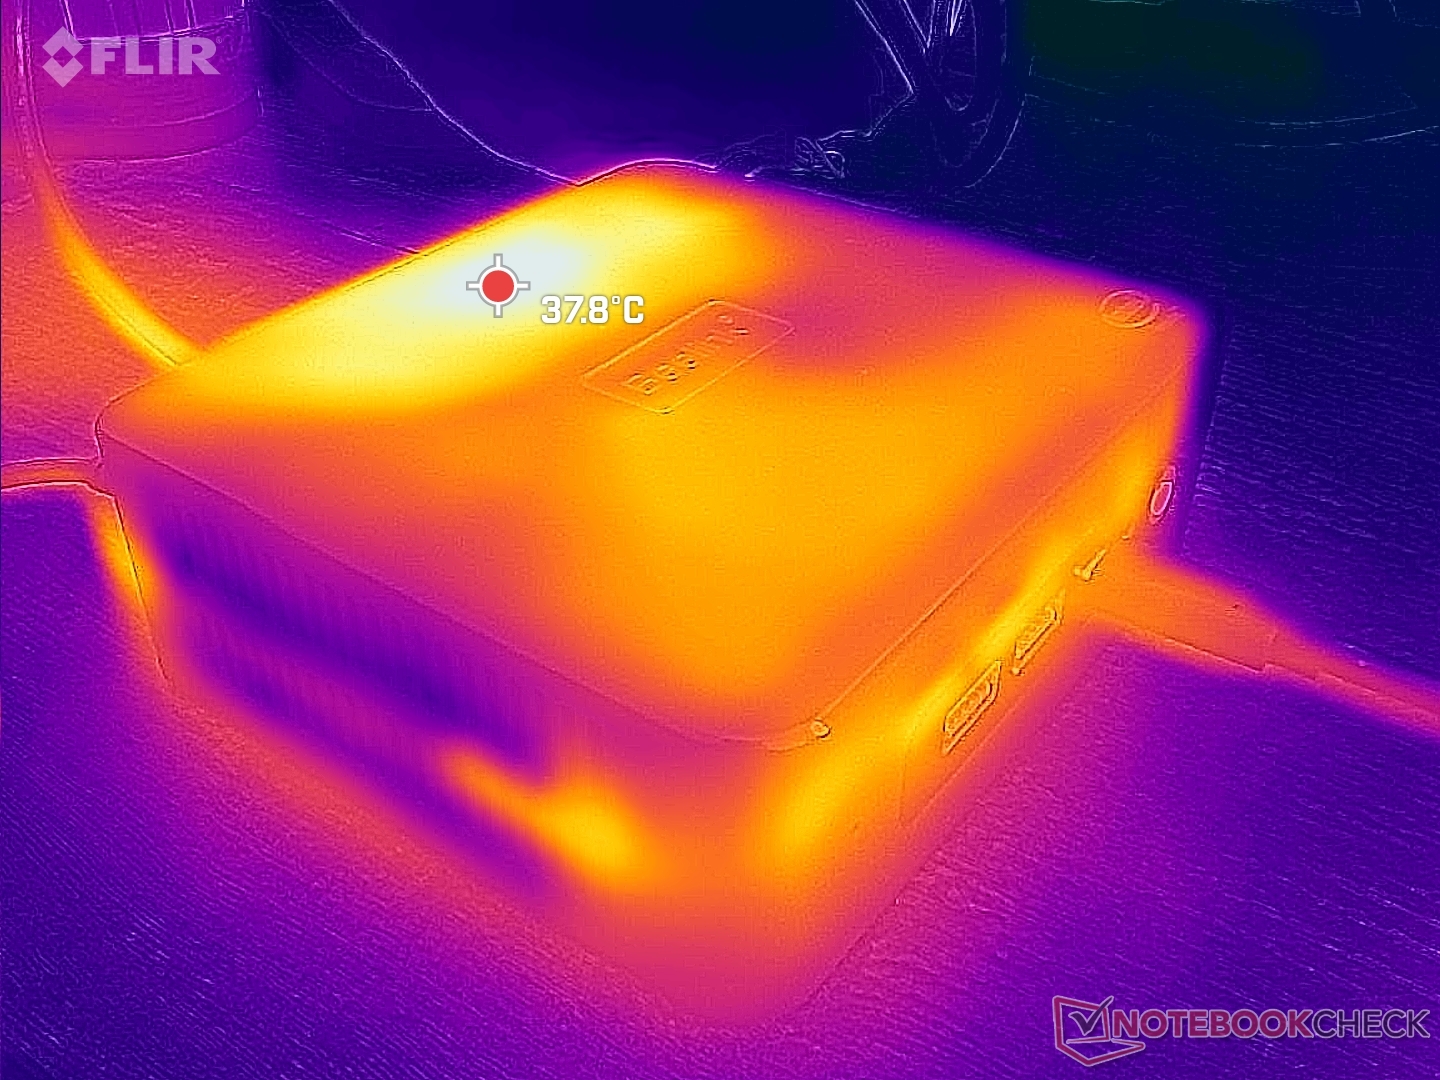
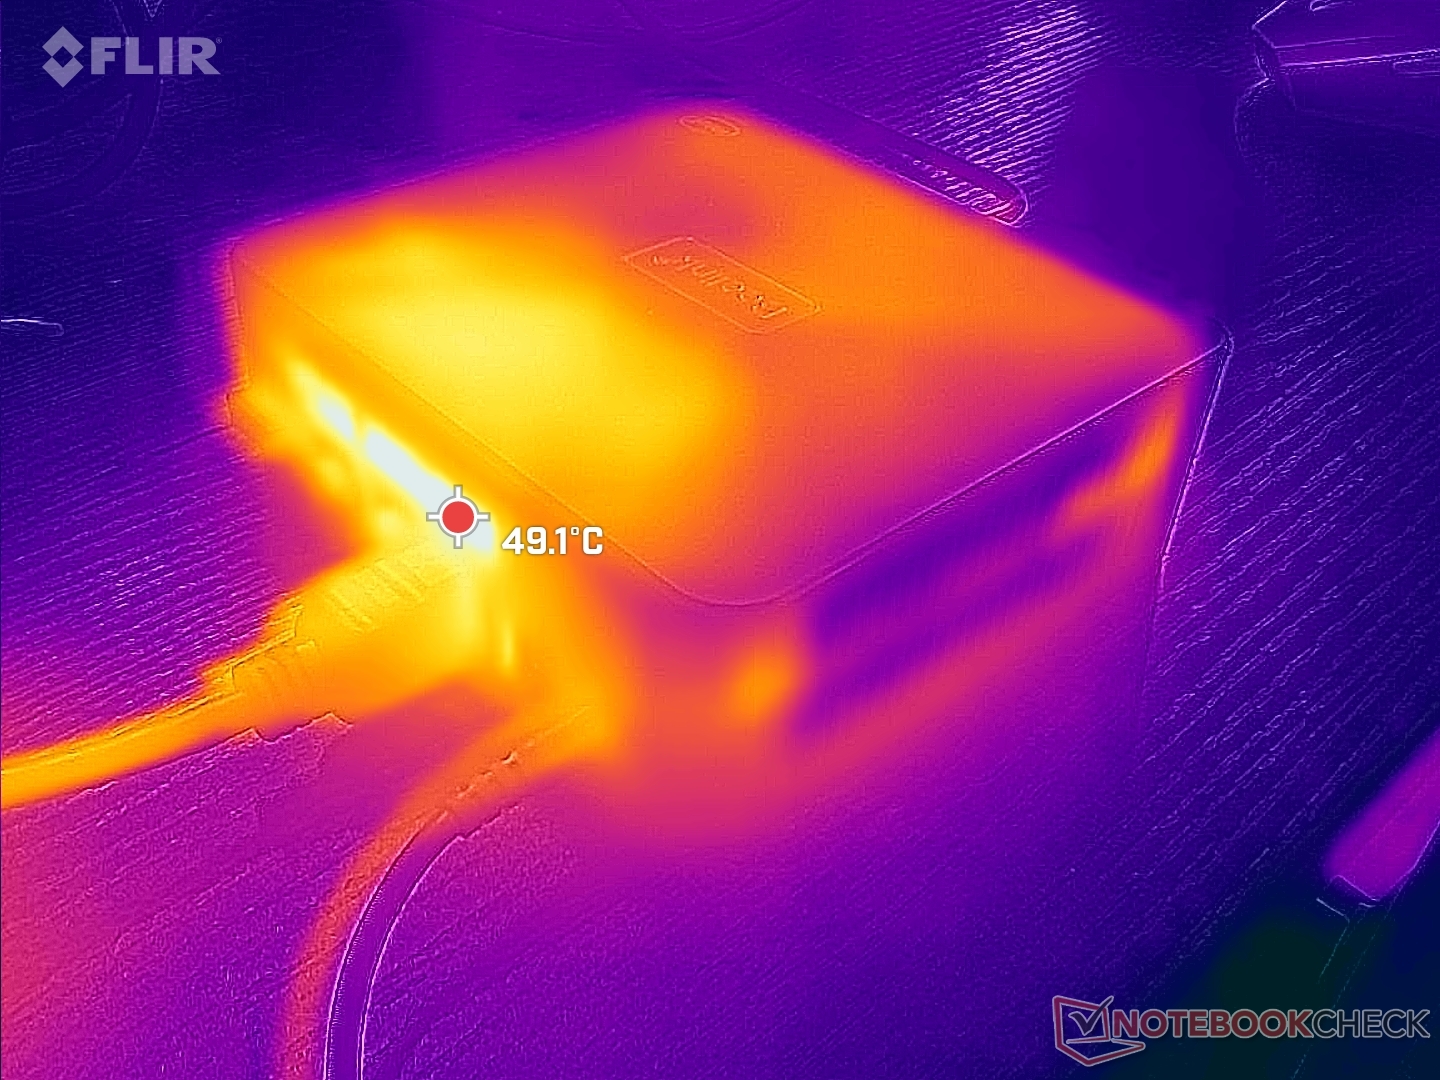
Temperatur
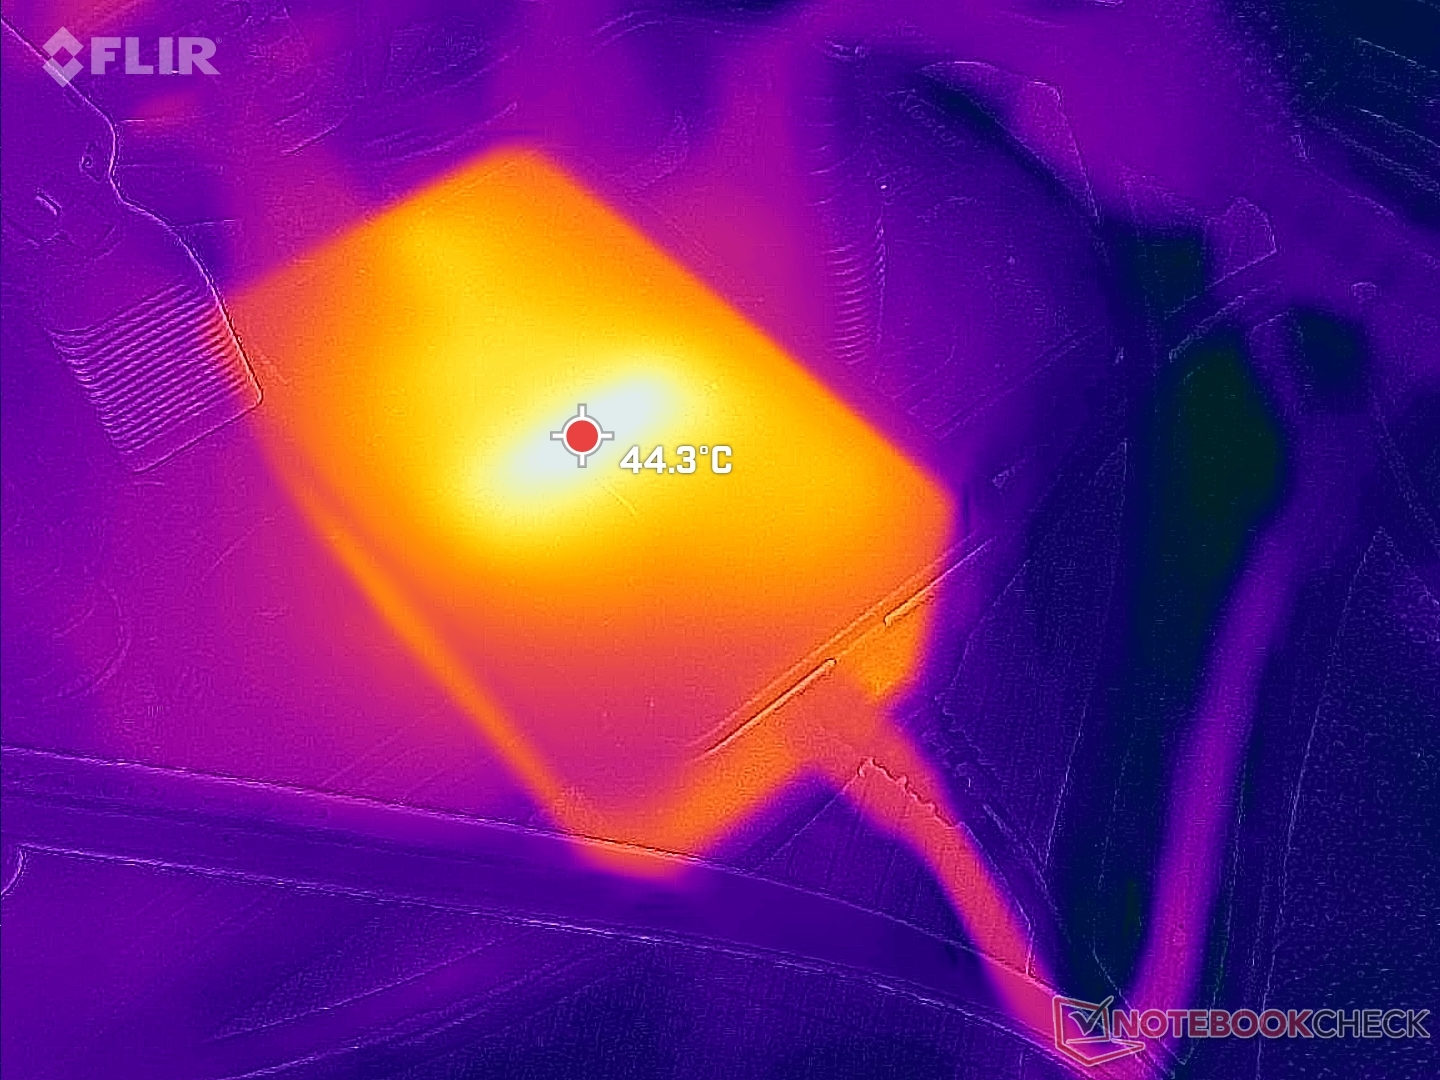
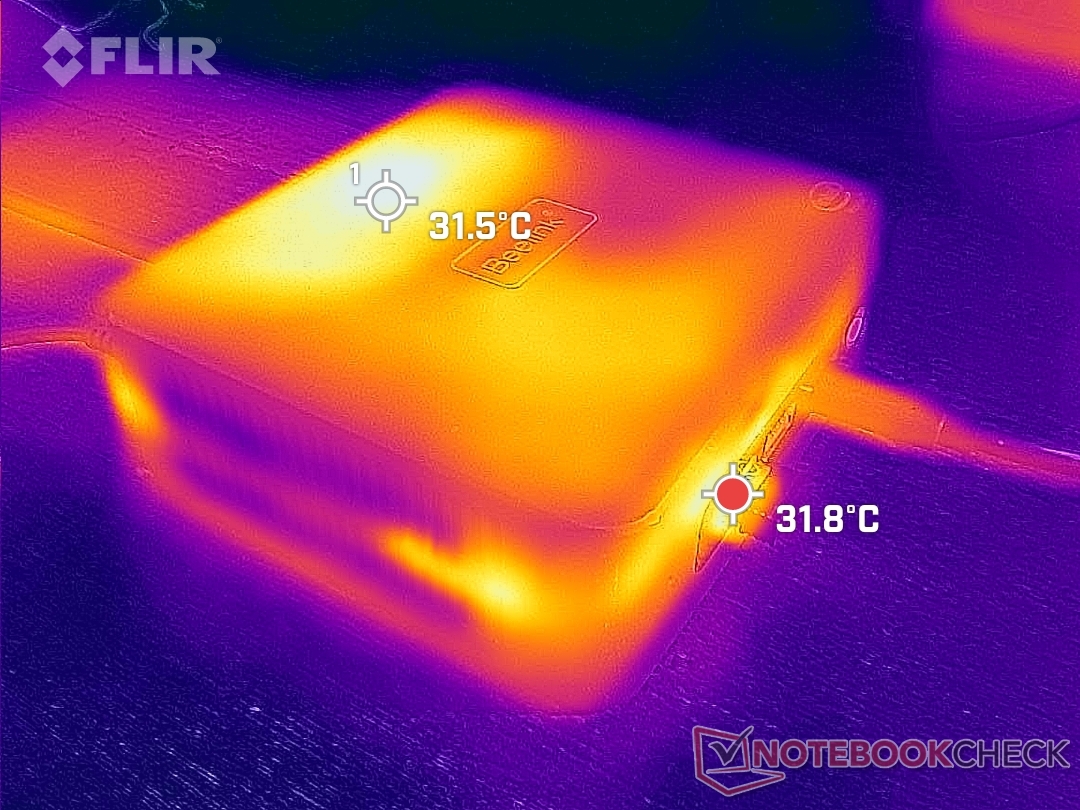
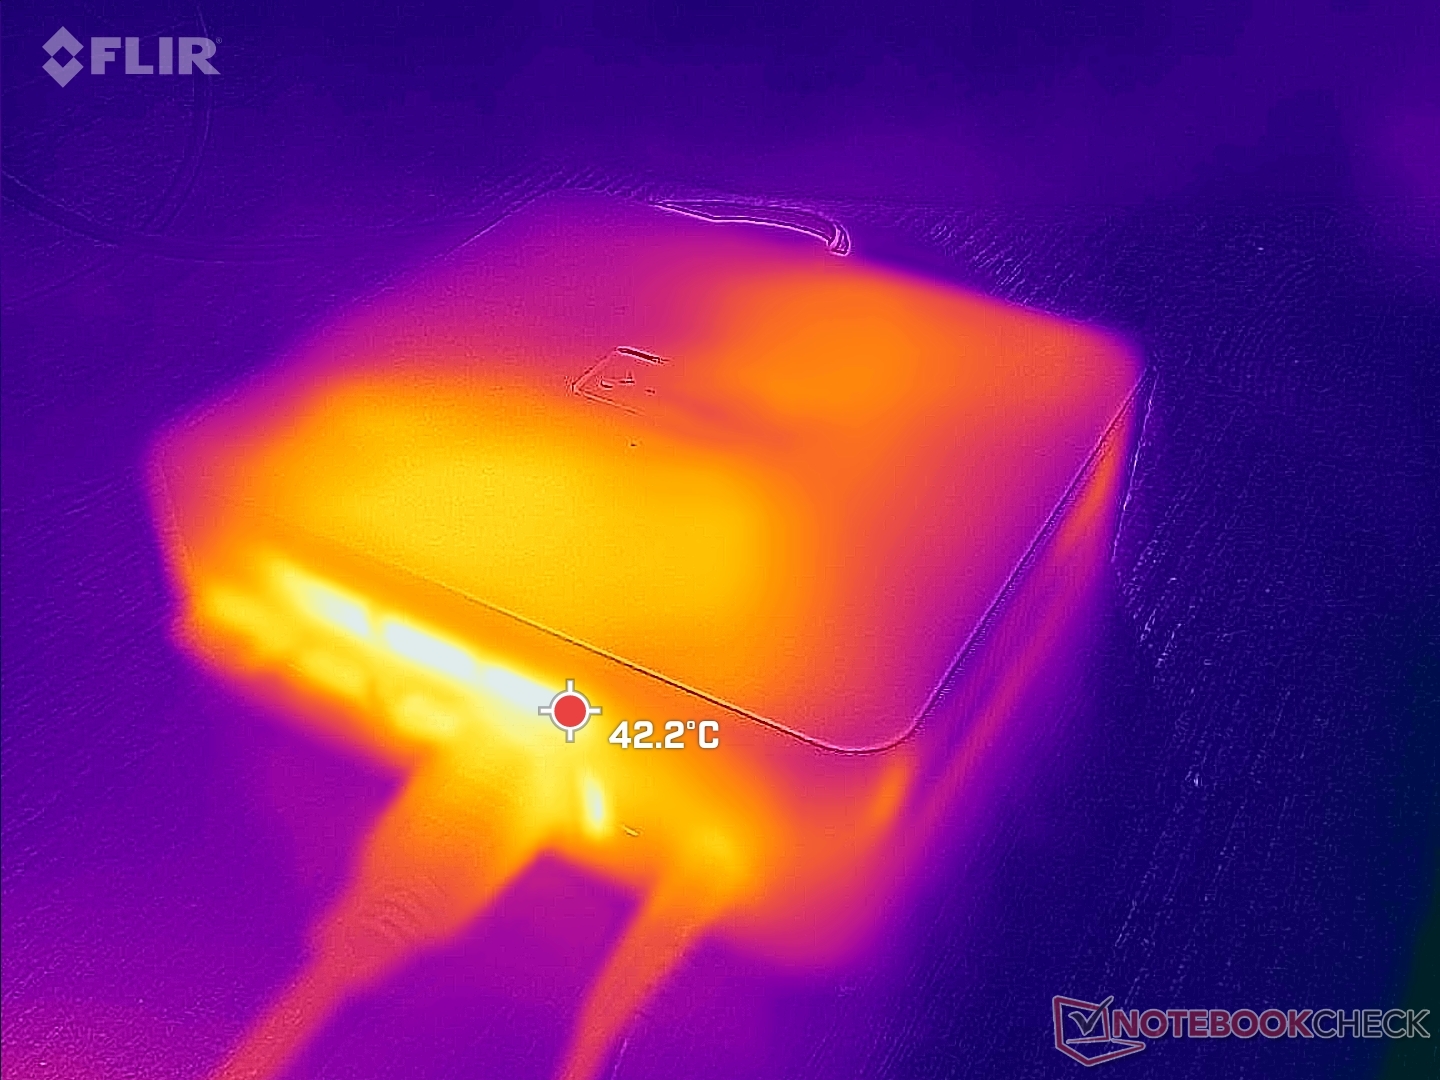
Durch den lethargisch agierenden Lüfter wird der U59 bereits im Leerlauf warm. Die Oberseite wird bereits 32 °C warm, auch ohne dass irgendwelche Anwendungen laufen. Bis zu 38 °C erreichen die Oberflächen wenn länger anhaltende Stresslasten anliegen. Die Hot Spots befinden sich an der Rückseite des Gehäuses nahe den rückseitigen Lüftergittern.
Stresstest
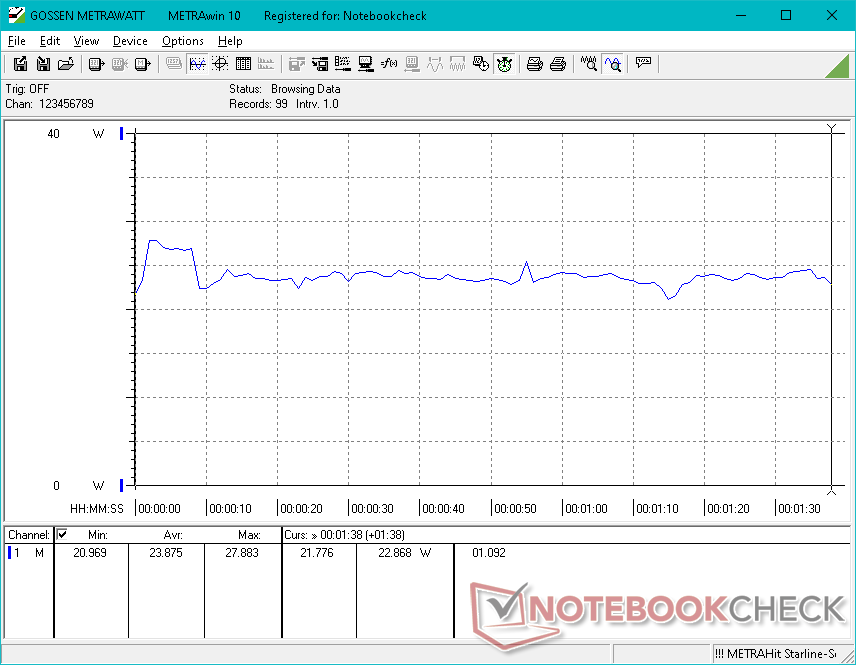
Beim Starten von Prime95 gehen die CPU-Taktraten, Temperaturen und Leistungsaufnahme kurz auf 2,8 GHz, 86 °C und 20 W hoch. Nach etwa 20 Sekunden sinkt die Taktrate auf 2,4 GHz und der Verbrauch auf 15 W, was in kühleren CPU-Temperaturen von 76 °C resultiert, wie der unten stehende Screenshot verdeutlicht. Das ist leider 200 MHz langsamer, aber auch 9 °C kühler als beim U59 mit N5095 aus dem letzten Jahr.
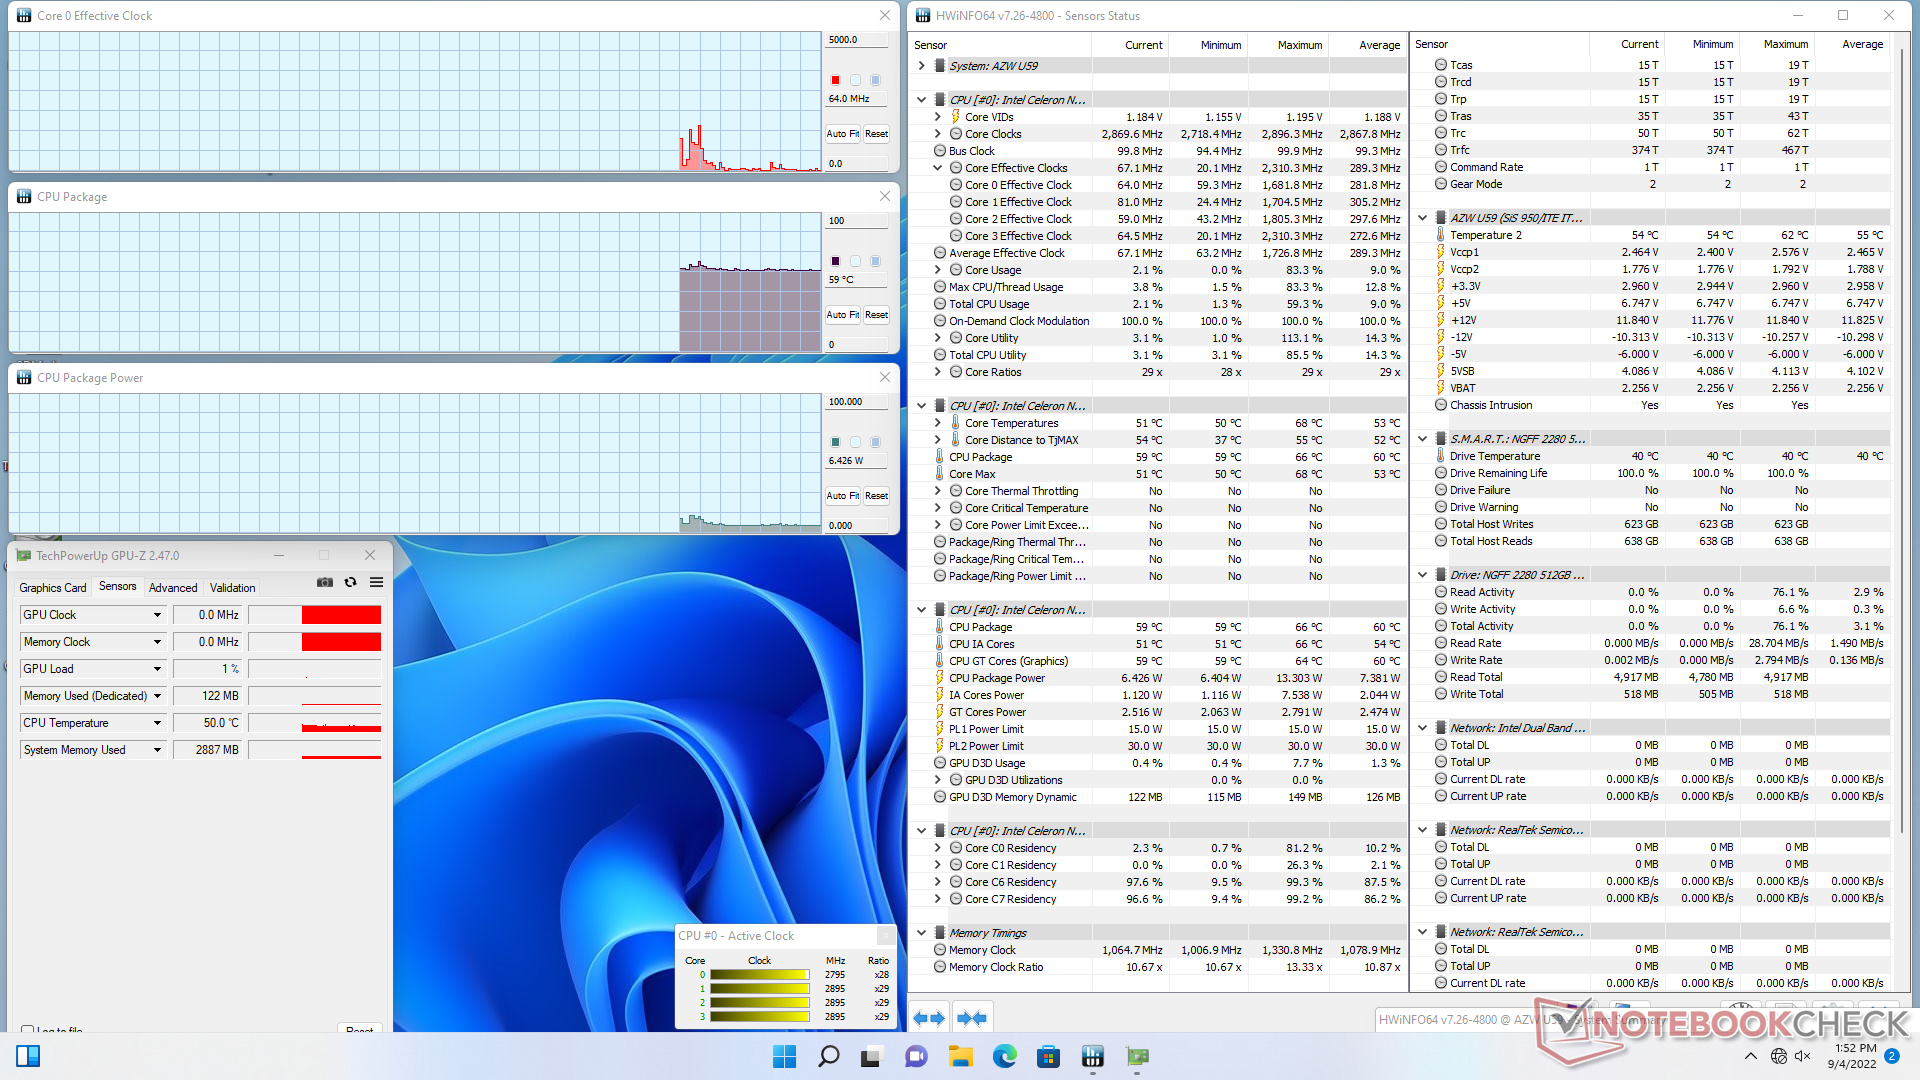
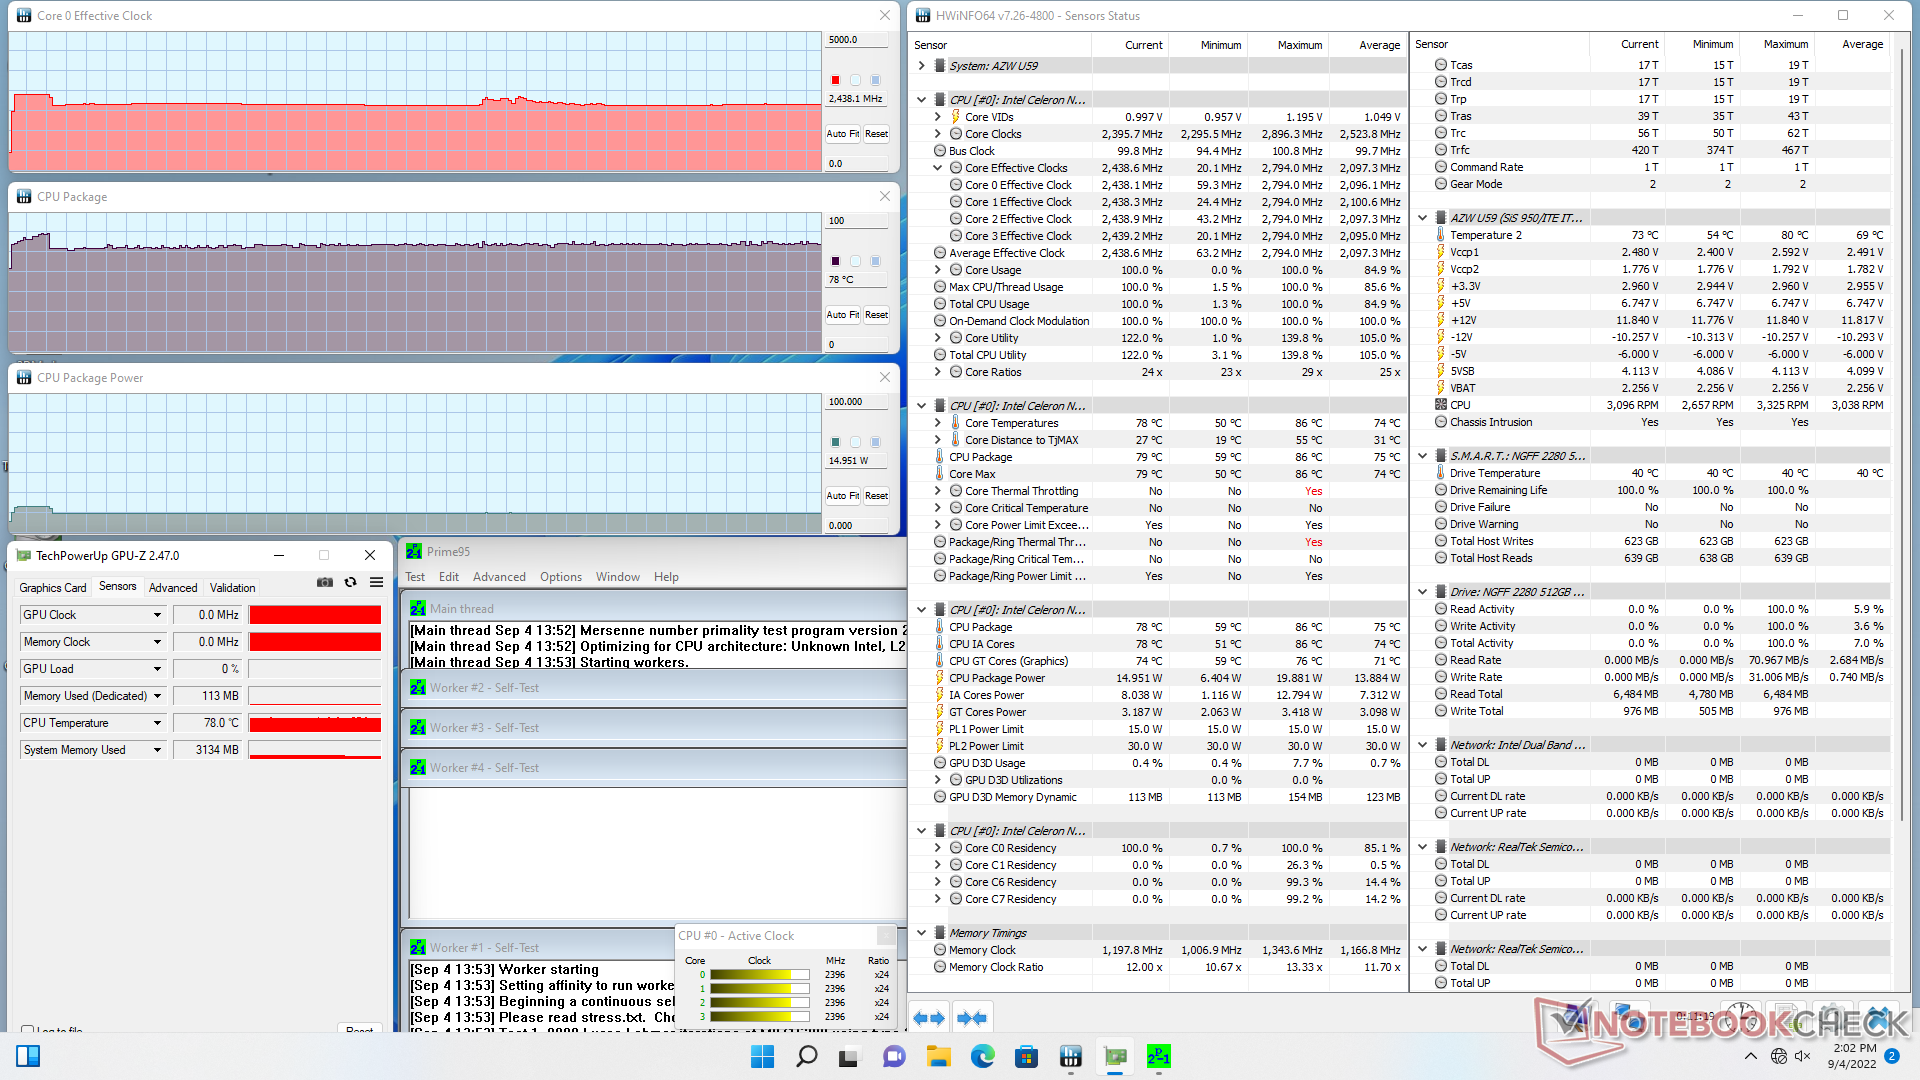
| CPU Clock (GHz) | GPU Clock (MHz) | Average CPU Temperature (°C) | |
| System Idle | -- | -- | 59 |
| Prime95 Stress | 2.4 | -- | 78 |
Energiemanagement
Energieverbrauch
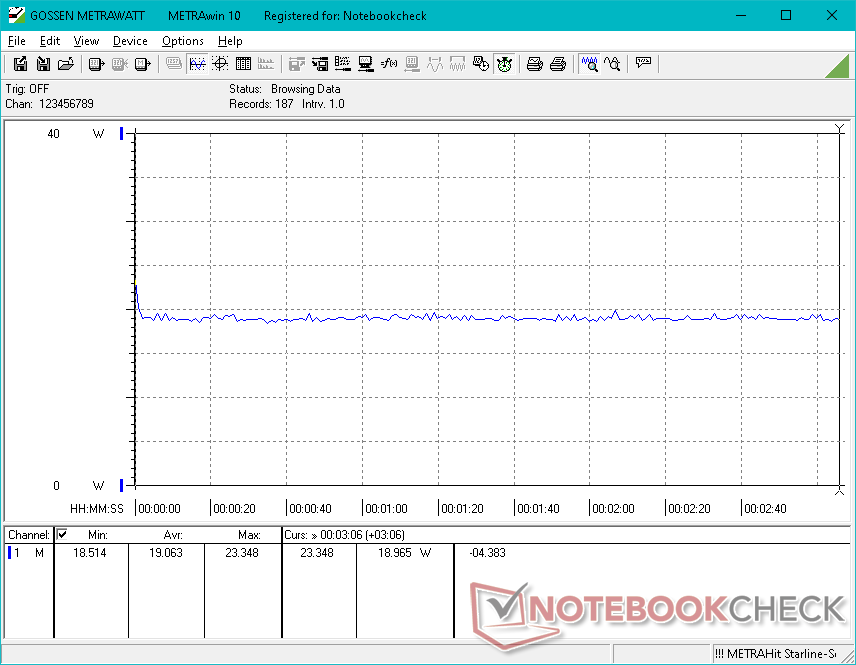
Das System präsentiert sich nur minimal fordernder als der U59 mit dem älteren Celeron N5095 aus dem letzten Jahr. Die Zugewinne bei der Grafikleistung sind die paar Extrawatt jedoch wert. Insgesamt ist der Verbrauch dennoch deutlich niedriger als bei Mini-PCs, welche von einer Core-U- oder Ryzen-U-CPU angetrieben werde, beispielsweise der Intel NUC11 oder Beelink SER4.
Wir messen einen temporären Maximalverbrauch von 29 W aus dem kleinen (~7,8 x 4,6 x 3,2 cm) 36-W-Netzteil während des Prime95-Stresstests.
| Aus / Standby | |
| Idle | |
| Last |
|
Legende:
min: | |
| Beelink U59 N5105 Celeron N5105, UHD Graphics (Jasper Lake 24 EU), Silicon Motion AZW 512G NV428, , x, | Beelink U59 Mini-S Celeron N5095, UHD Graphics (Jasper Lake 16 EU), Silicon Motion AZW 256G M.228 220426 C SATA 3, , x, | Beelink SER4 R7 4800U, Vega 8, Intel SSD 660p SSDPEKNW512G8, , x, | Beelink SER3 R7 3750H, Vega 10, GSemi AZW GSDFN512TS3F1OGCX, , x, | Intel NUC11TNKi5 i5-1135G7, Iris Xe G7 80EUs, Transcend M.2 SSD 430S TS512GMTS430S, , x, | Zotac ZBOX PI336 pico Celeron N6211, UHD Graphics (Elkhart Lake 16 EU), SanDisk DF4128, , x, | |
|---|---|---|---|---|---|---|
| Stromverbrauch | 15% | -4% | -27% | -82% | 42% | |
| Idle min * (Watt) | 6.7 | 7 -4% | 4.1 39% | 7 -4% | 11.5 -72% | 5.4 19% |
| Idle avg * (Watt) | 8.1 | 7 14% | 4.1 49% | 9.1 -12% | 12.4 -53% | 5.5 32% |
| Idle max * (Watt) | 11.6 | 7.6 34% | 4.6 60% | 9.7 16% | 12.9 -11% | 6.2 47% |
| Last avg * (Watt) | 23.9 | 18.3 23% | 35.6 -49% | 29.5 -23% | 40.7 -70% | 11.3 53% |
| Witcher 3 ultra * (Watt) | 19.1 | 35.6 -86% | 32.5 -70% | 43.9 -130% | ||
| Last max * (Watt) | 28.8 | 27.1 6% | 39.9 -39% | 48.7 -69% | 73.5 -155% | 11.8 59% |
* ... kleinere Werte sind besser
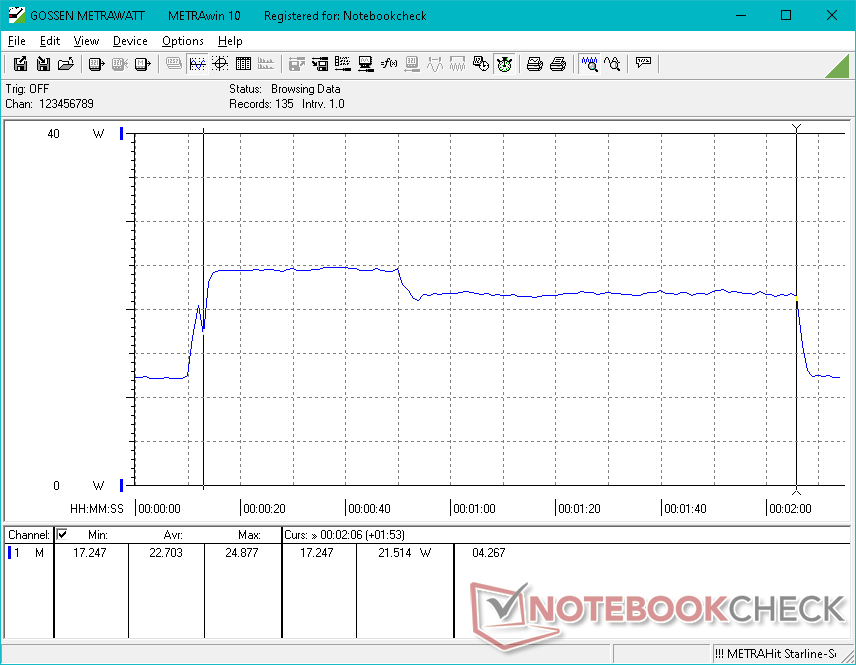
Power Consumption Witcher 3 / Stresstest
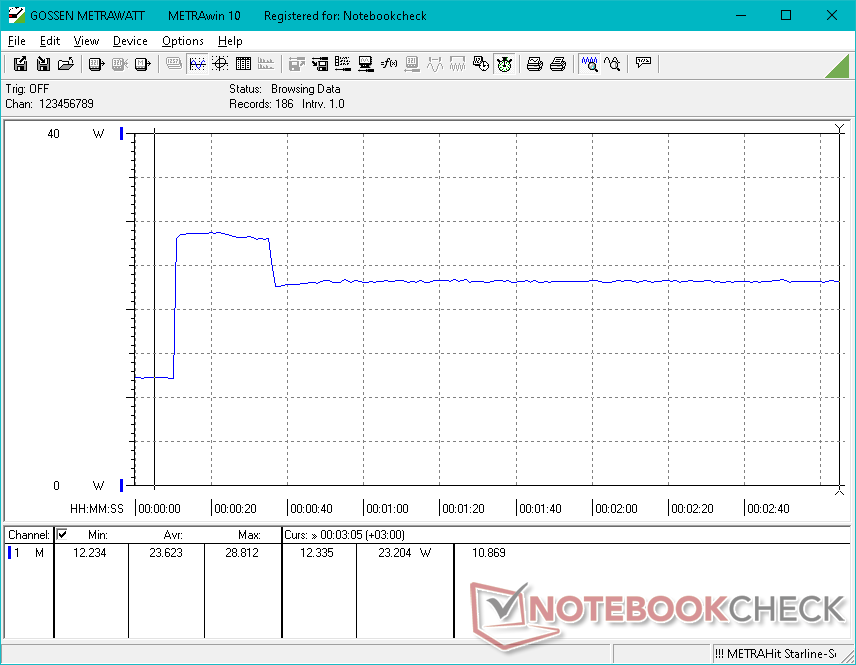
Energieverbrauch mit externem Monitor
Pro
Contra
Fazit — Gleiche CPU, schnellere GPU
Wer auf eine höhere Prozessorleistung abzielt, hat eigentlich keinen Grund den neuen Celeron N5105 dem älteren N5095 vorzuziehen. Der N5105 rechnet vielleicht etwas kühler, das wird jedoch nicht in nennbaren Leistungsgewinnen umgewandelt, sei es in Single- oder Multi-Thread-Anwendungen. Die Vorteile der neuen CPU liegen stattdessen in der integrierten GPU, welche nun deutlich schneller ist als die integrierte Grafikeinheit im N5095.
Leider ist die GPU im N5105 aber insgesamt dennoch langsam, sodass sich der Umgang mit der Windows-Oberfläche noch immer unrund anfühlt, zumindest wenn zwei oder mehr Anwendungen laufen. In diesem Fall sind die Streaming-Fähigkeiten des U59 N5105 quasi die gleichen wie im U59 N5095. Es empfiehlt sich außerdem unbedingt auf Konfigurationen mit Dual-Channel-RAM zu setzen, um die maximale Leistung der integrierten GPU abrufen zu können.
Als Mini-PC hat der U59 ein paar überzeugende Funktionen, wenn man den recht niedrigen Preis bedenkt, welcher in Deutschland allerdings leider deutlich höher angesetzt ist als in den USA. Sämtliche Konfigurationen werden mit einem vorinstallierten Windows 11 und einer großzügigen 512-GB-SSD und 16 GB RAM ausgeliefert. In den USA werden dafür nur $200 USD fällig, während ein Intel NUC mal locker das Doppelte kosten kann, und zwar ohne RAM und Massenspeicher. Wer nur ein Gerät zum Surfen oder Streaming von 1080p-Material sucht, wird im U59 einen fähigen Rechner finden. Für anspruchsvolleres Multi-Tasking oder mehr Leistungsspielraum sollte man in einen Mini-PC mit schnellerer Core- oder Ryzen-CPU investieren, beispielsweise den Bellink SEI oder SER.
Preise und Verfügbarkeit
Während der Beelink U59 N5105 in den USA für etwa $200 USD gekauft werden kann, kostet er hierzulande beispielsweise bei Amazon deutlich teurere 349 Euro. Scheinbar um Verwirrungen um den gleich gebliebenen Namen vorzubeugen, wird er in Deutschland oft auch als U59 Pro bezeichnet.
Preisvergleich

