Beelink U59 Mini-S Mini-PC Test: Die supergünstige Alternative zu Intels NUC HTPC
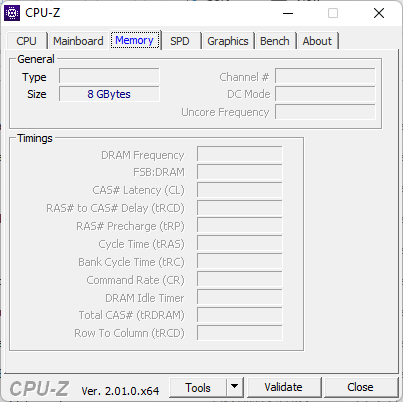
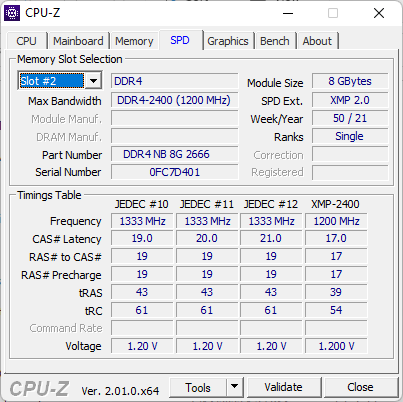
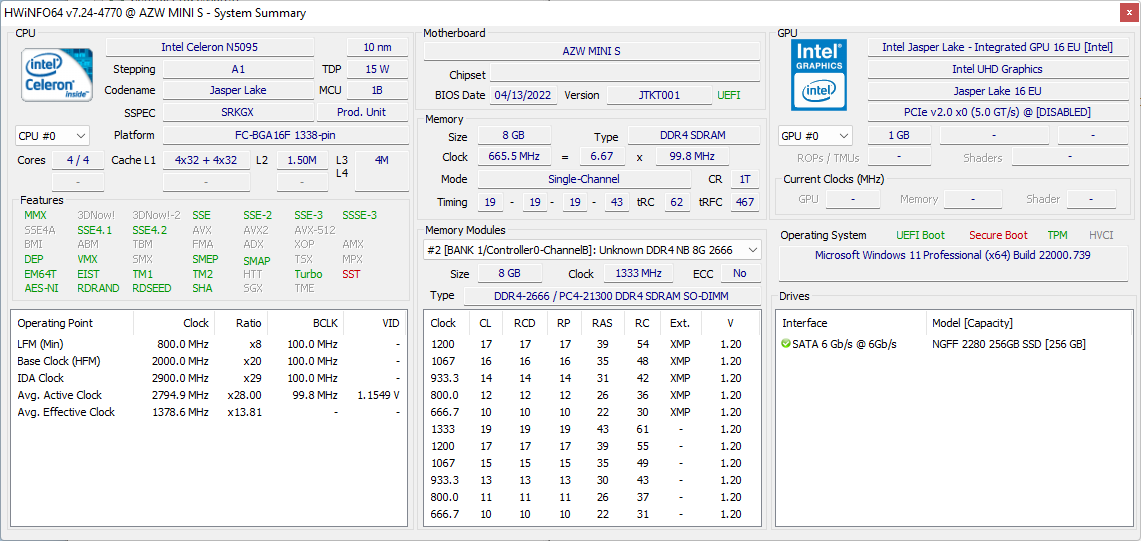
Beelink bietet eine umfangreiche Familie von Mini-PCs an, die vom sehr preiswerten U59 mit Celeron Prozessor bis hin zum wahnsinnig schnellen GTR5 mit Ryzen-9-5900HX-Prozessor reicht. Unser heutiges Modell U59 Mini-S liegt am unteren Ende des Spektrums und verfügt über eine Celeron-N5095-CPU, nur 8 GB Single-Channel-Speicher sowie eine 256-GB-SSD und kostet ca. 220 USD im Einzelhandel.
Zu den Alternativen zum U59 Mini-S gehören Mini-PCs mit Atom- oder Celeron Prozessor, wie zum Beispiel die Chuwi HeroBox, GMK NucBox K1, NucBox 3 oder der Intel NUC 11 Essential. Das U59 Mini-S im Test ist nicht zu verwechseln mit dem etwas teureren ursprünglichen U59.
Mehr Beelink Bewertungen:
Mögliche Konkurrenten im Vergleich
Bew. | Datum | Modell | Gewicht | Dicke | Größe | Auflösung | Preis ab |
|---|---|---|---|---|---|---|---|
v (old) | 06 / 2022 | Beelink U59 Mini-S Celeron N5095, UHD Graphics (Jasper Lake 16 EU) | 279 g | 41 mm | x | ||
v (old) | Beelink SEi8 i3-8109U, Iris Plus Graphics 655 | 346 g | 41 mm | x | |||
v (old) | 04 / 2021 | Intel NUC11TNKi5 i5-1135G7, Iris Xe G7 80EUs | 504 g | 37 mm | x | ||
v (old) | 12 / 2021 | Beelink U59 Celeron N5095, UHD Graphics (Jasper Lake 16 EU) | 329 g | 42 mm | x | ||
v (old) | GMK NucBox 3 Celeron J4125, UHD Graphics 600 | 410 g | 32.5 mm | x | |||
v (old) | 10 / 2020 | Zotac ZBOX MI642 Nano i5-10210U, UHD Graphics 620 | 472 g | 51 mm | x |
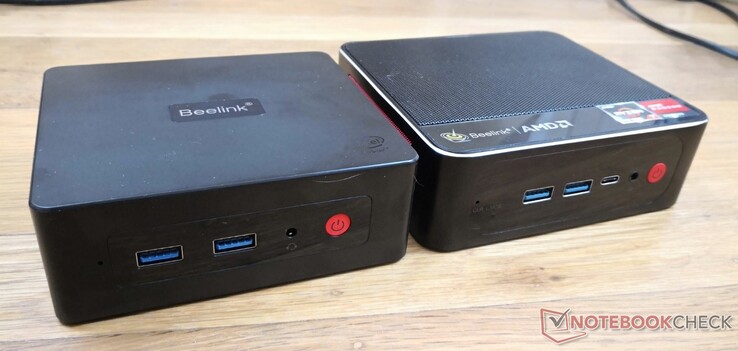
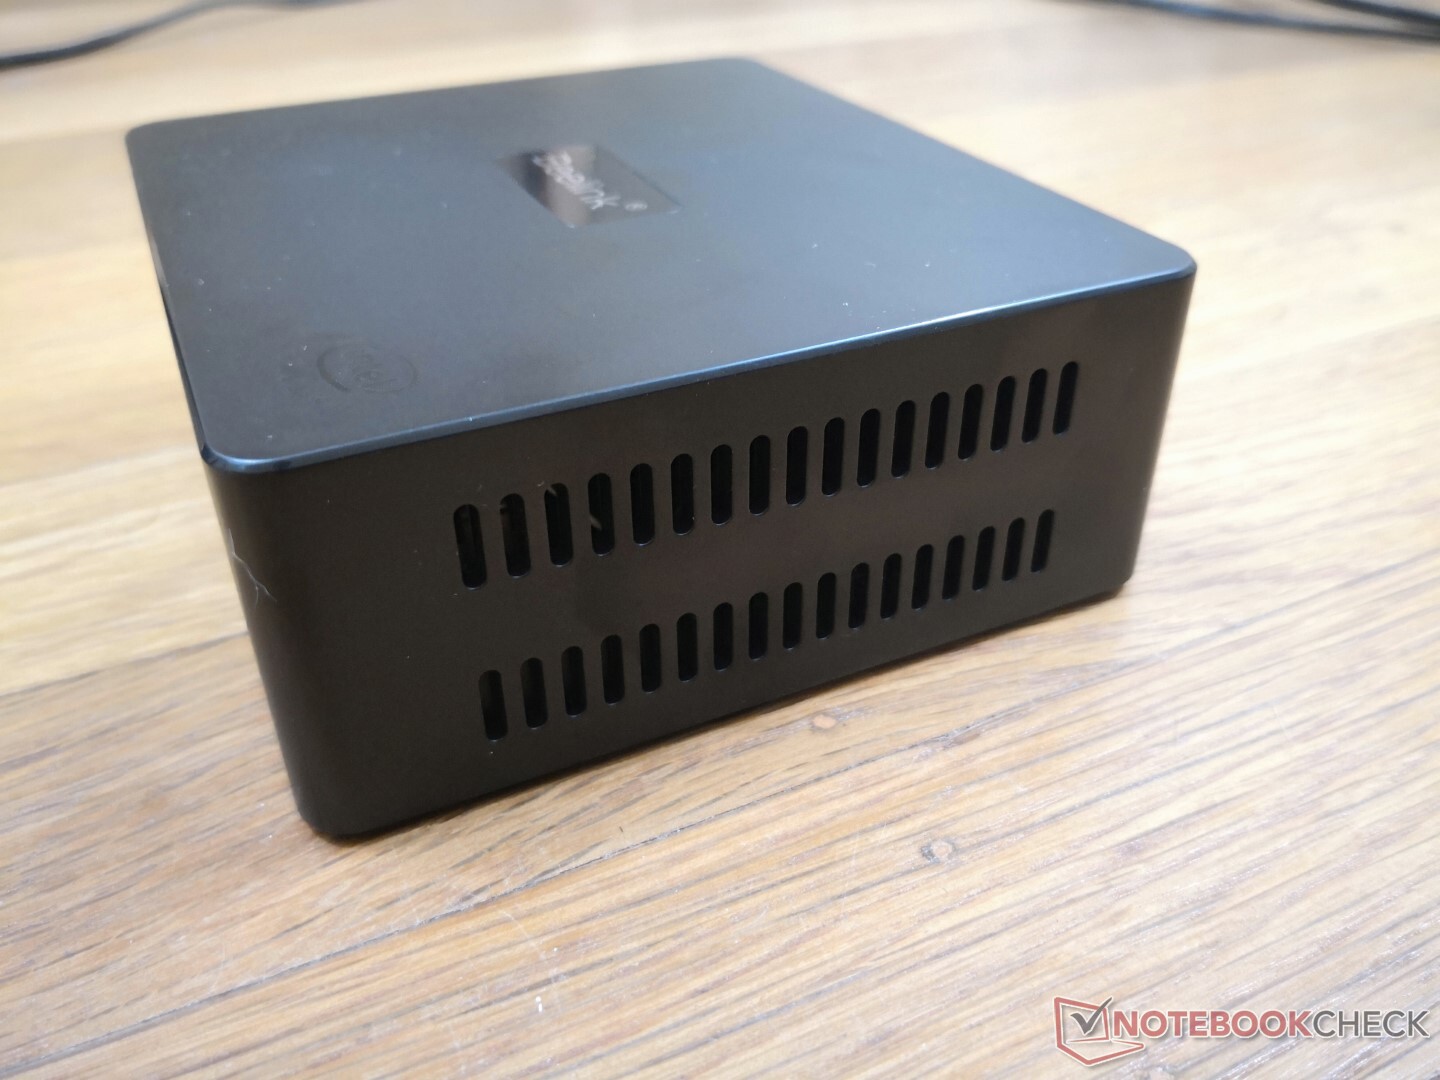
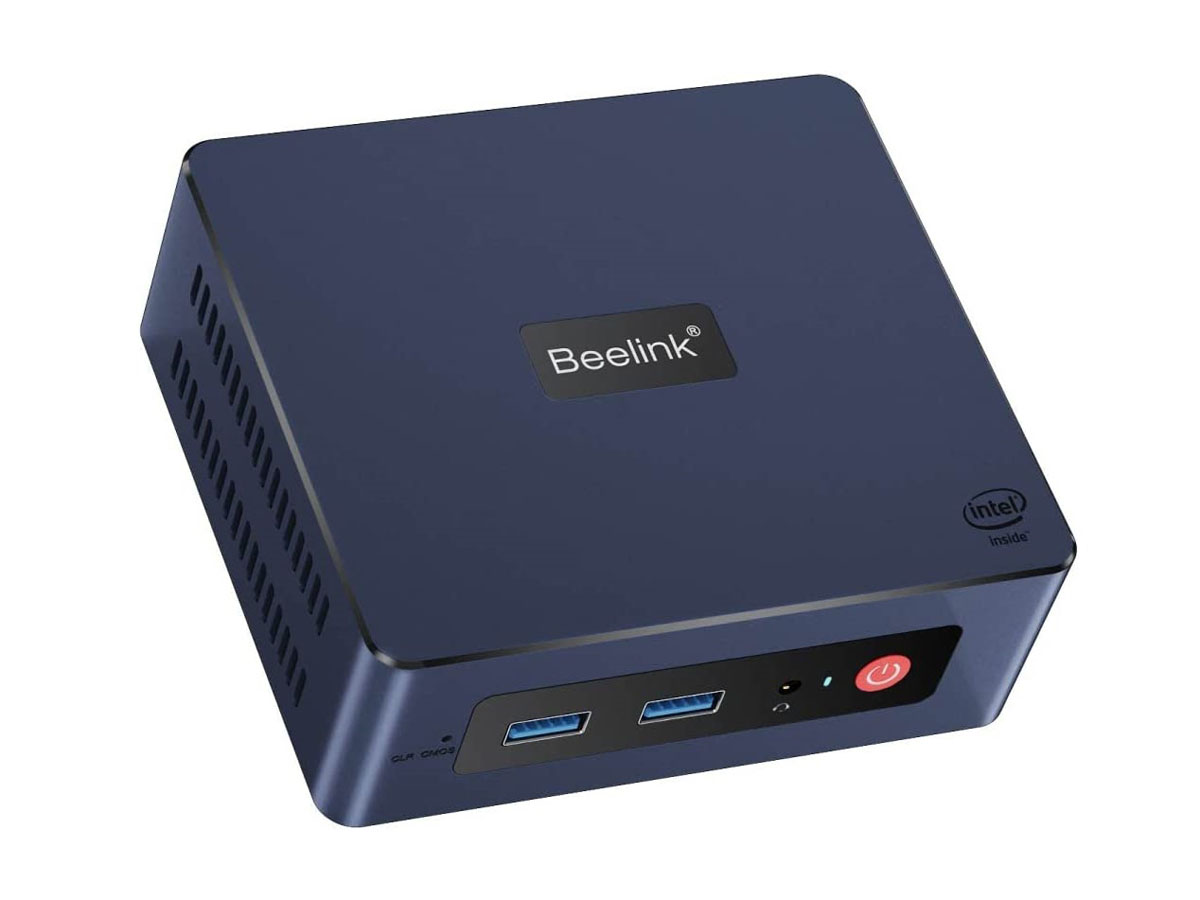
Gehäuse - Leichter als es aussieht
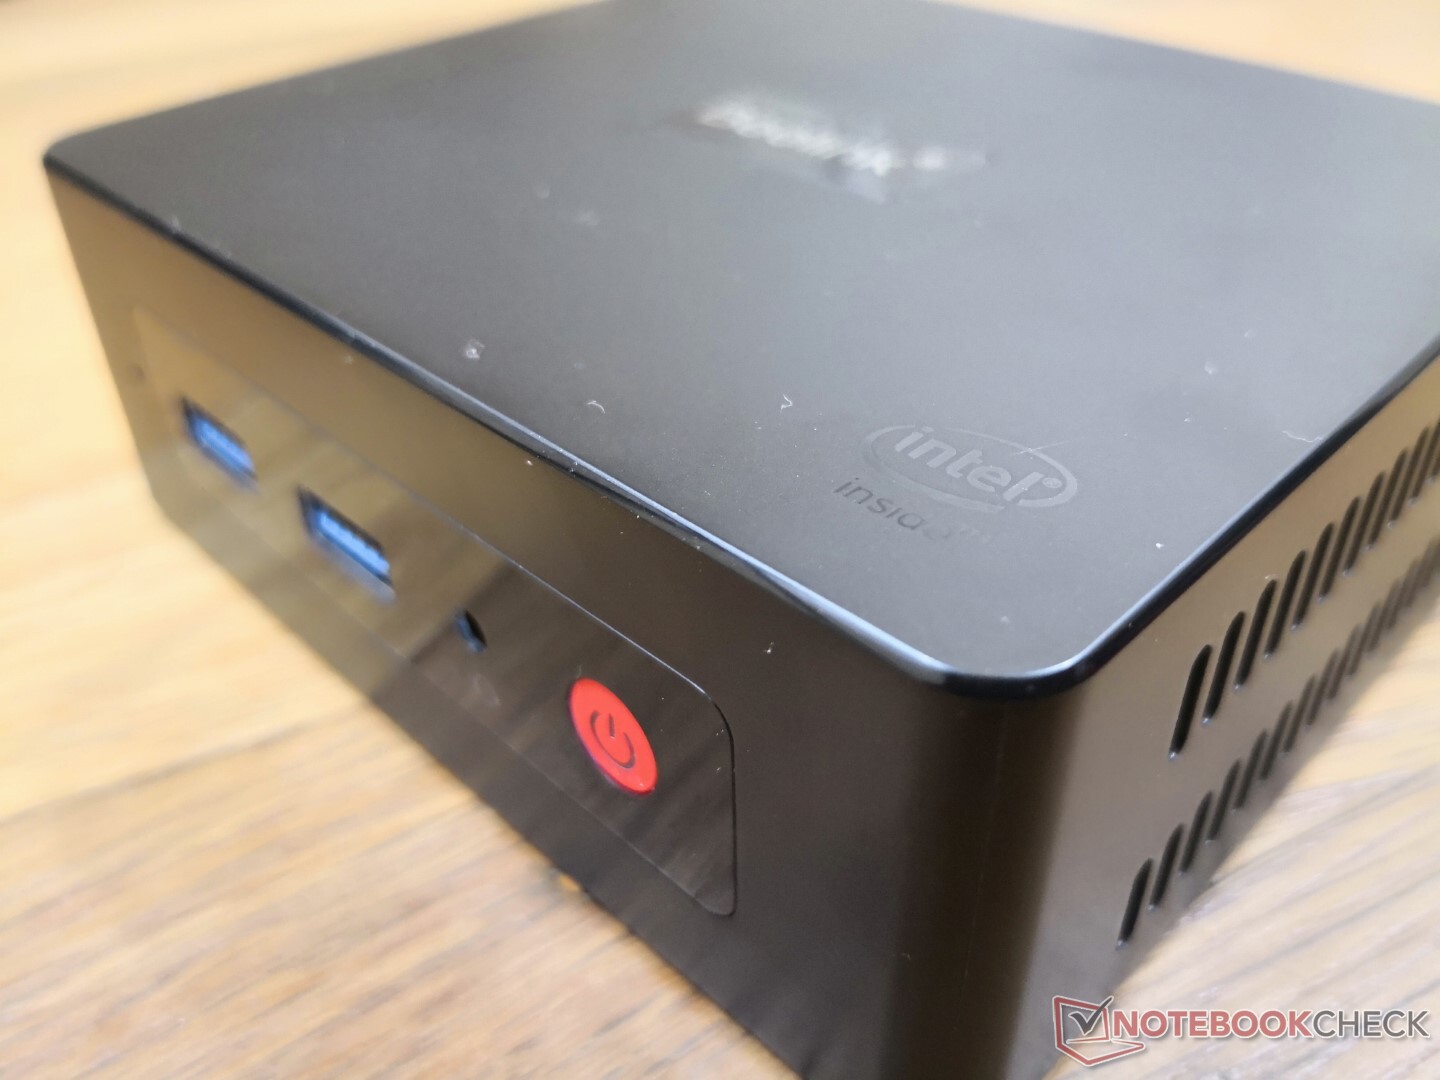
Das Gehäuse ist fast identisch mit dem ursprünglichen U59, wenn auch mit ein paar oberflächlichen Unterschieden: Die Oberseite zum Beispiel ist jetzt matt statt glänzend, was wir für eine kluge Änderung halten, da die matte Oberfläche resistenter gegen Fingerabdrücke und Kratzer ist. Die Seiten und die Unterseite des Gehäuse sind aus Metall und vermitteln einen starken ersten Eindruck.
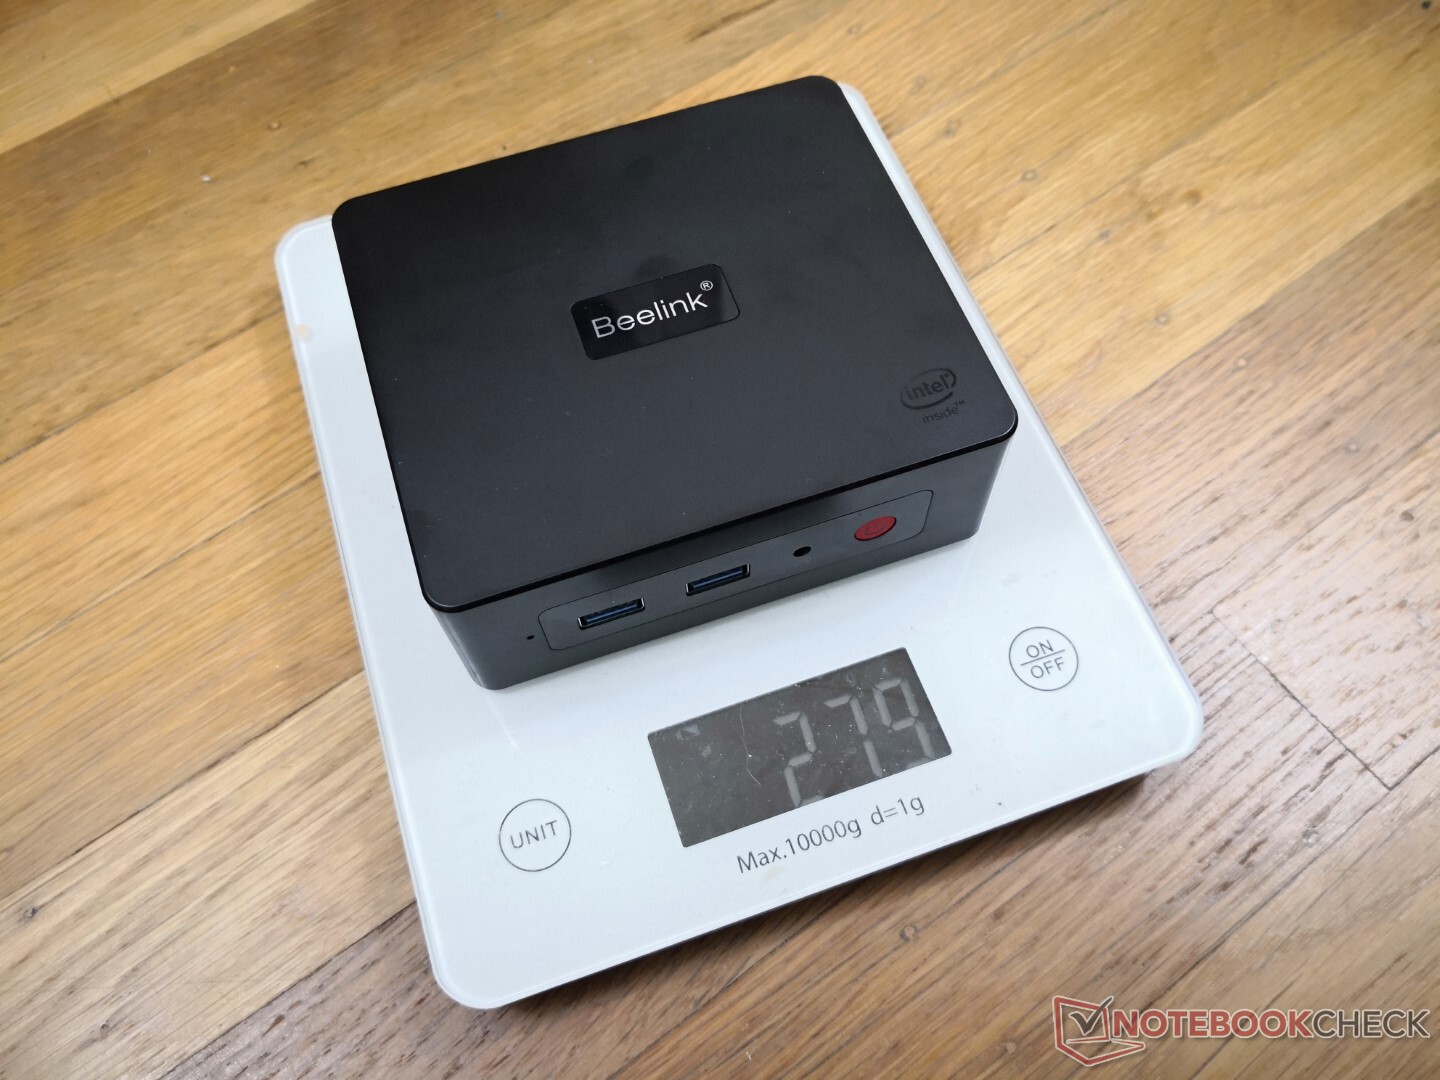
Ein bemerkenswerter Aspekt des Beelink ist sein sehr geringes Gewicht von nur 279 g im Vergleich zu über 500 g bei dem ähnlich großen Intel NUC 11. Die dünneren Gehäusematerialien des Beelink und das Fehlen eines internen Metallkäfigs zur zusätzlichen Verstärkung tragen zu den erheblichen Gewichtsunterschieden zwischen den beiden Modellen bei.

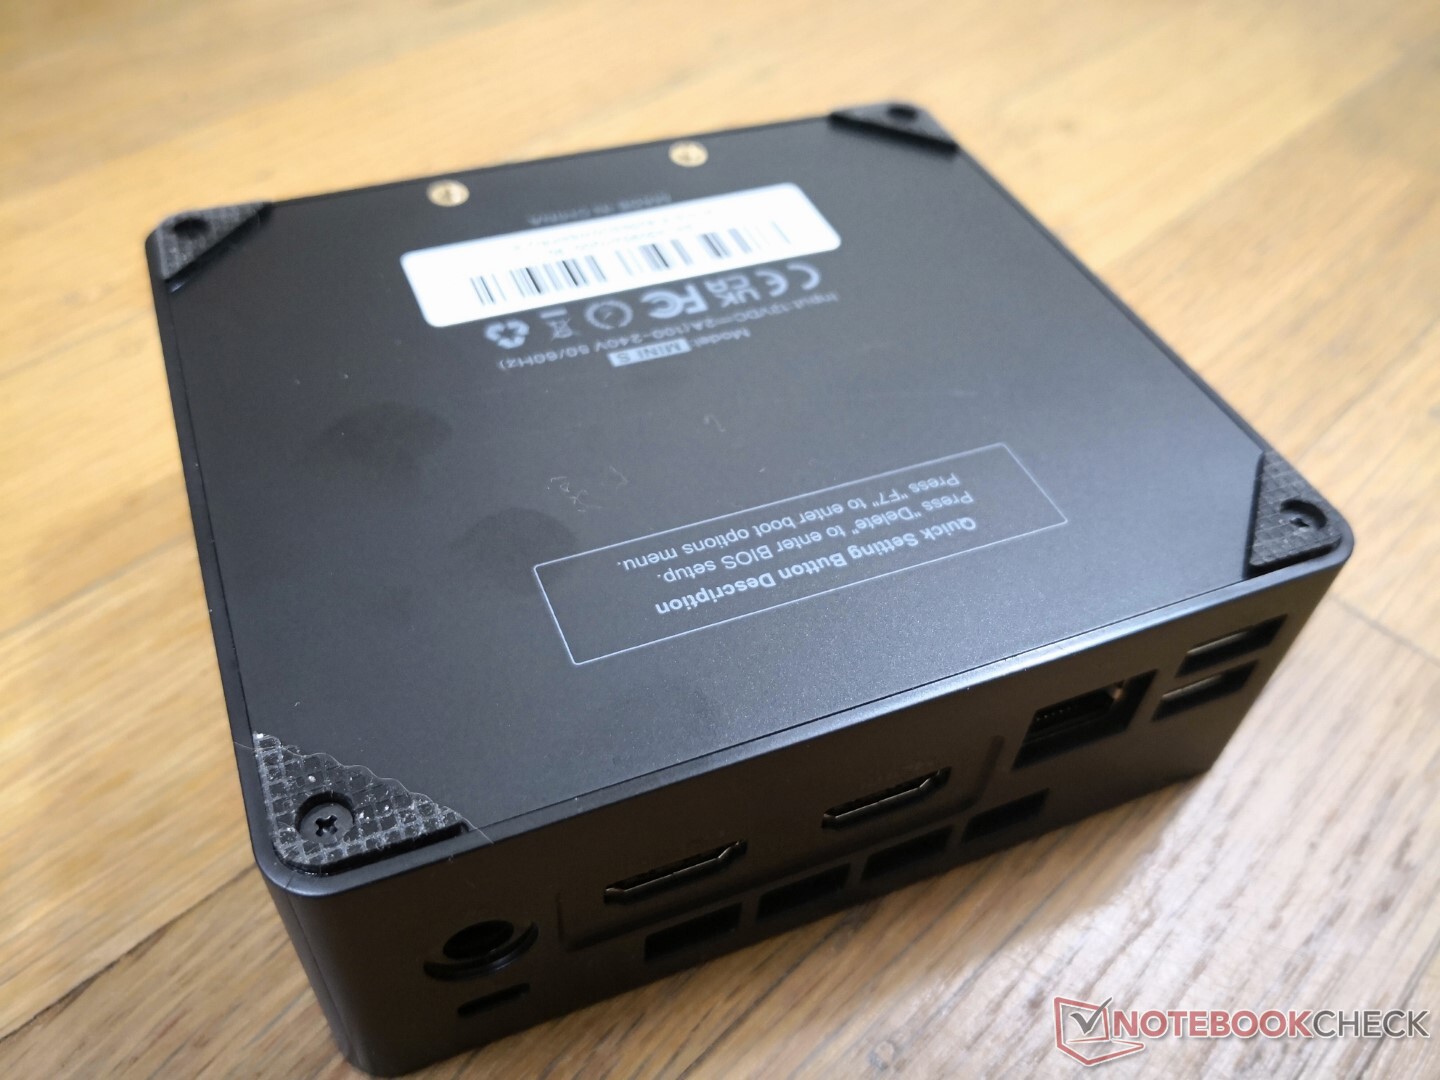
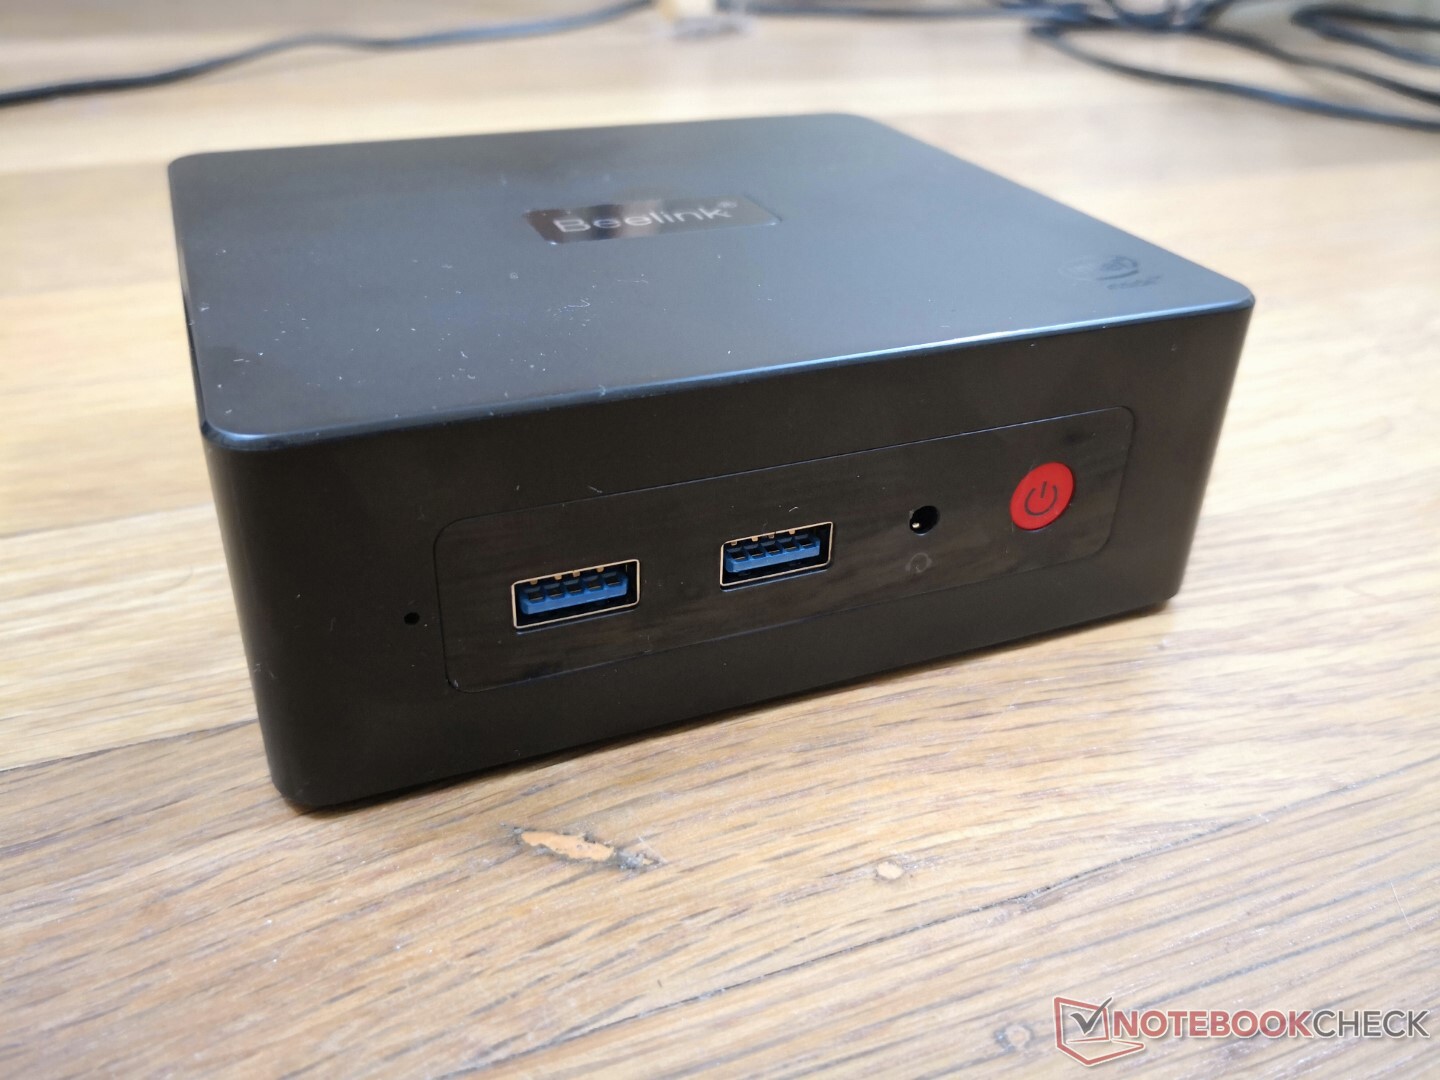
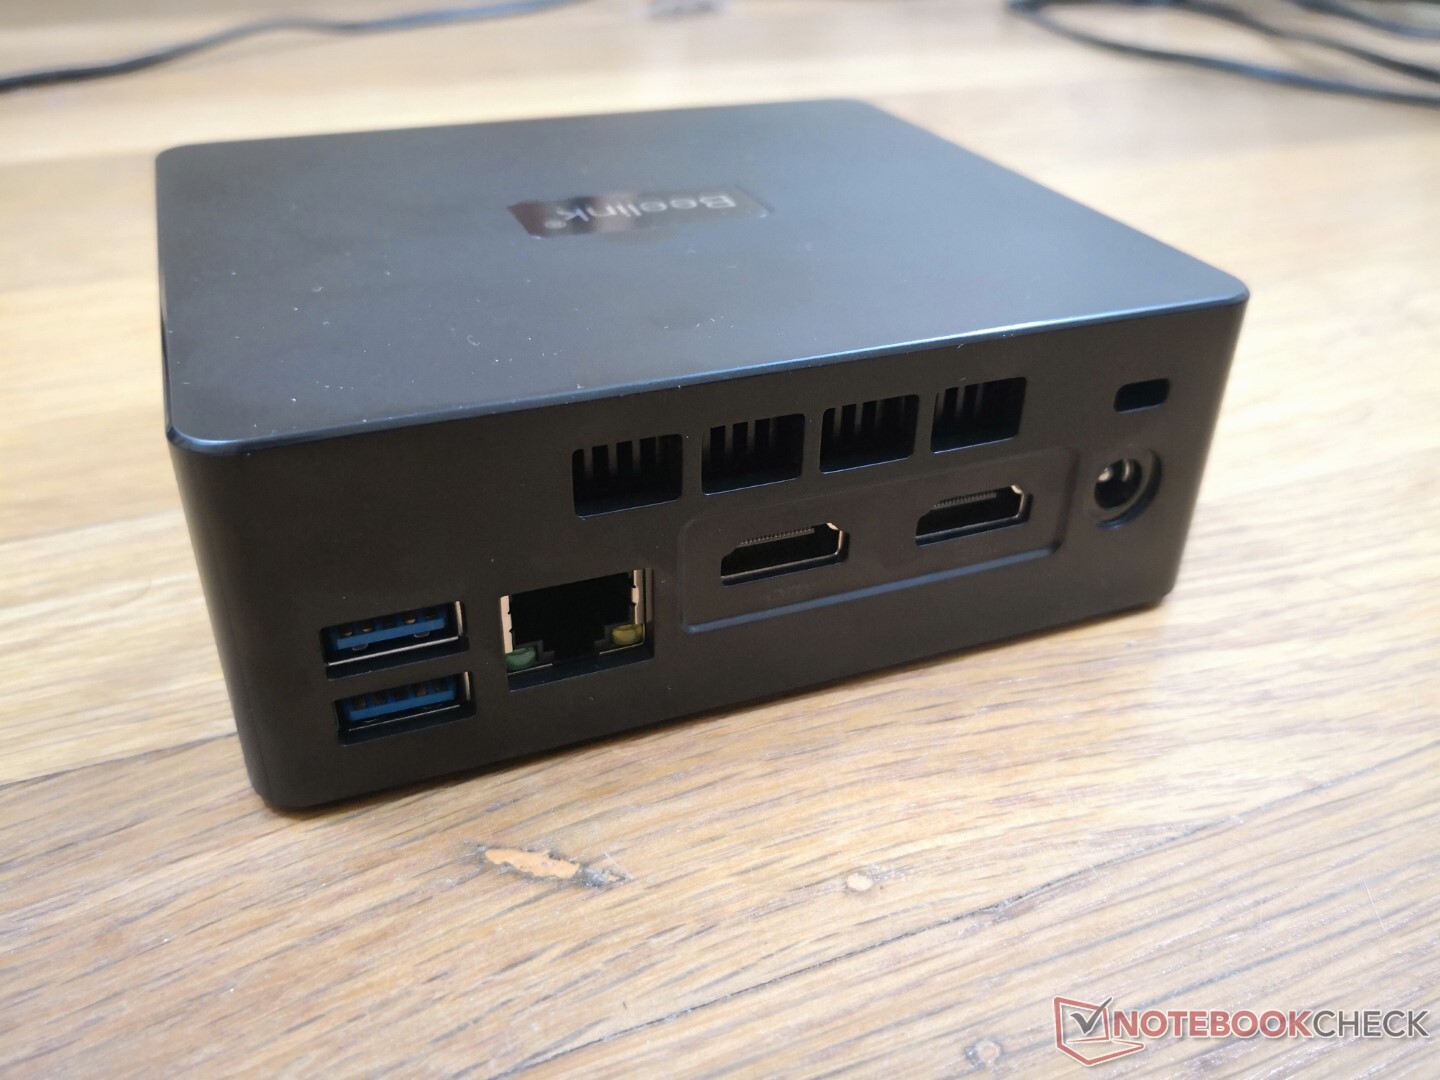
Anschlussausstattung - Kein USB-C
Die Anschlussoptionen sind identisch mit denen des U59, allerdings mit einer wichtigen Ausnahme: Der USB-C-Anschluss wurde gestrichen. Wir vermuten, dass dies eine Maßnahme ist, um die Kosten zu senken.
Kommunikation
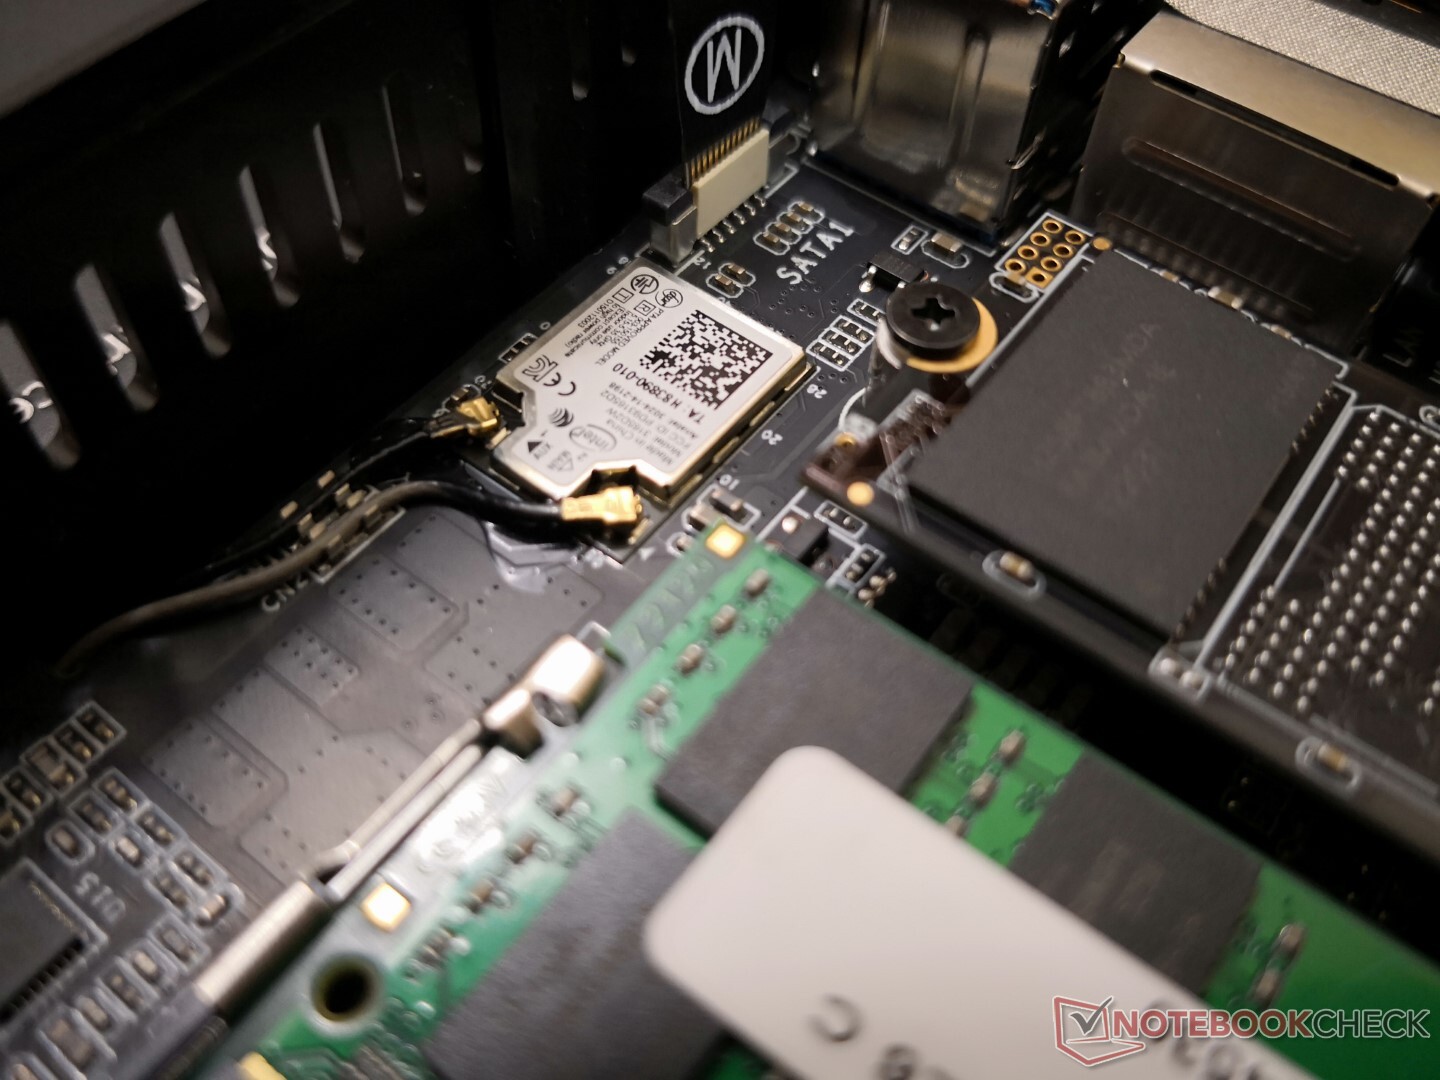
Ein Intel 3165 kommt standardmäßig wieder für eine 1x1-Wi-Fi-5- und Bluetooth-4.2-Anbindung. Obwohl er nach heutigen Maßstäben langsam ist, ist er immer noch schnell genug für 4K-Videostreaming.
| Networking | |
| iperf3 transmit AX12 | |
| Intel NUC11TNKi5 | |
| Beelink SEi8 | |
| Beelink U59 | |
| GMK NucBox 3 | |
| iperf3 receive AX12 | |
| Intel NUC11TNKi5 | |
| GMK NucBox 3 | |
| Beelink U59 | |
| Beelink SEi8 | |
| iperf3 transmit AXE11000 | |
| Beelink U59 Mini-S | |
| iperf3 receive AXE11000 | |
| Beelink U59 Mini-S | |
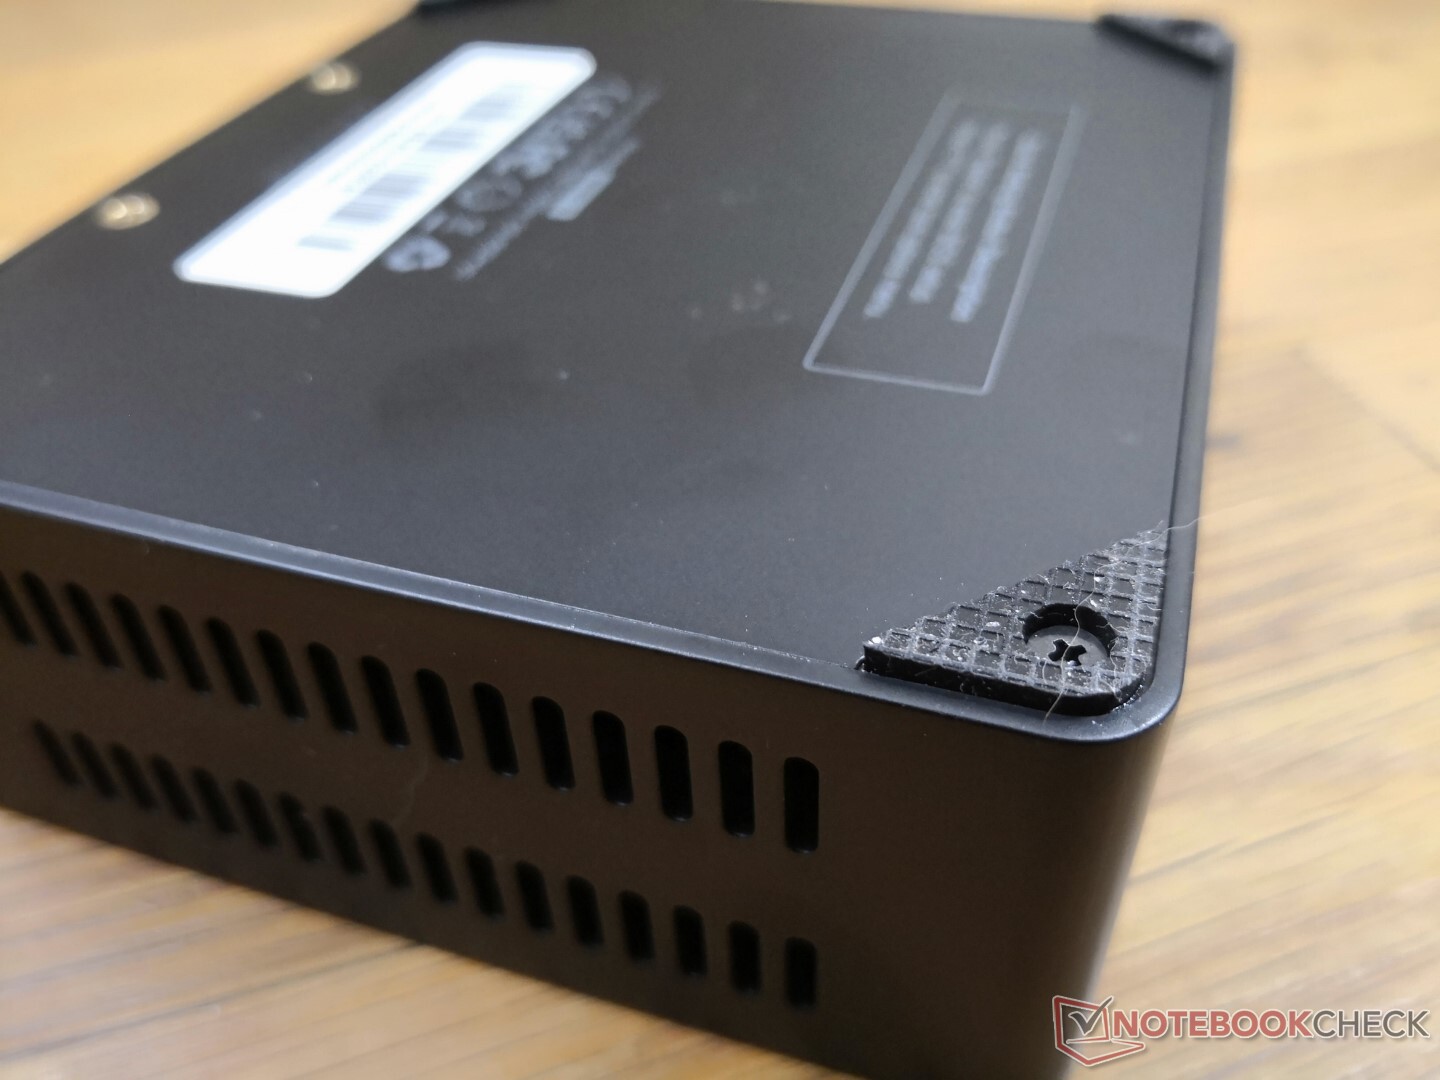
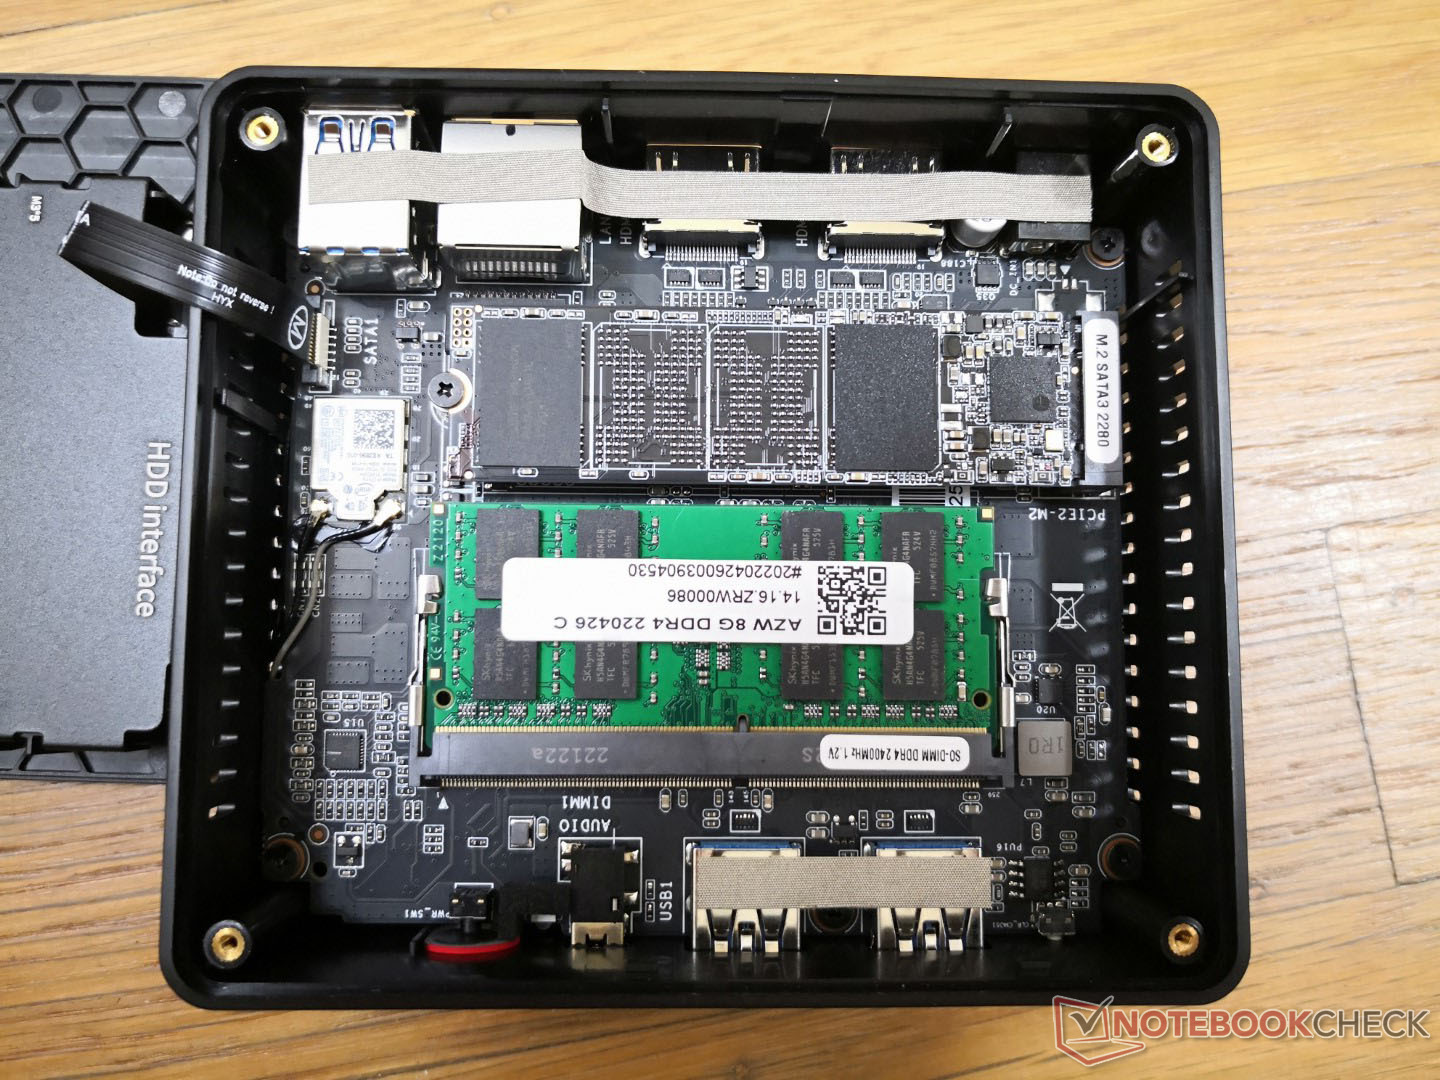
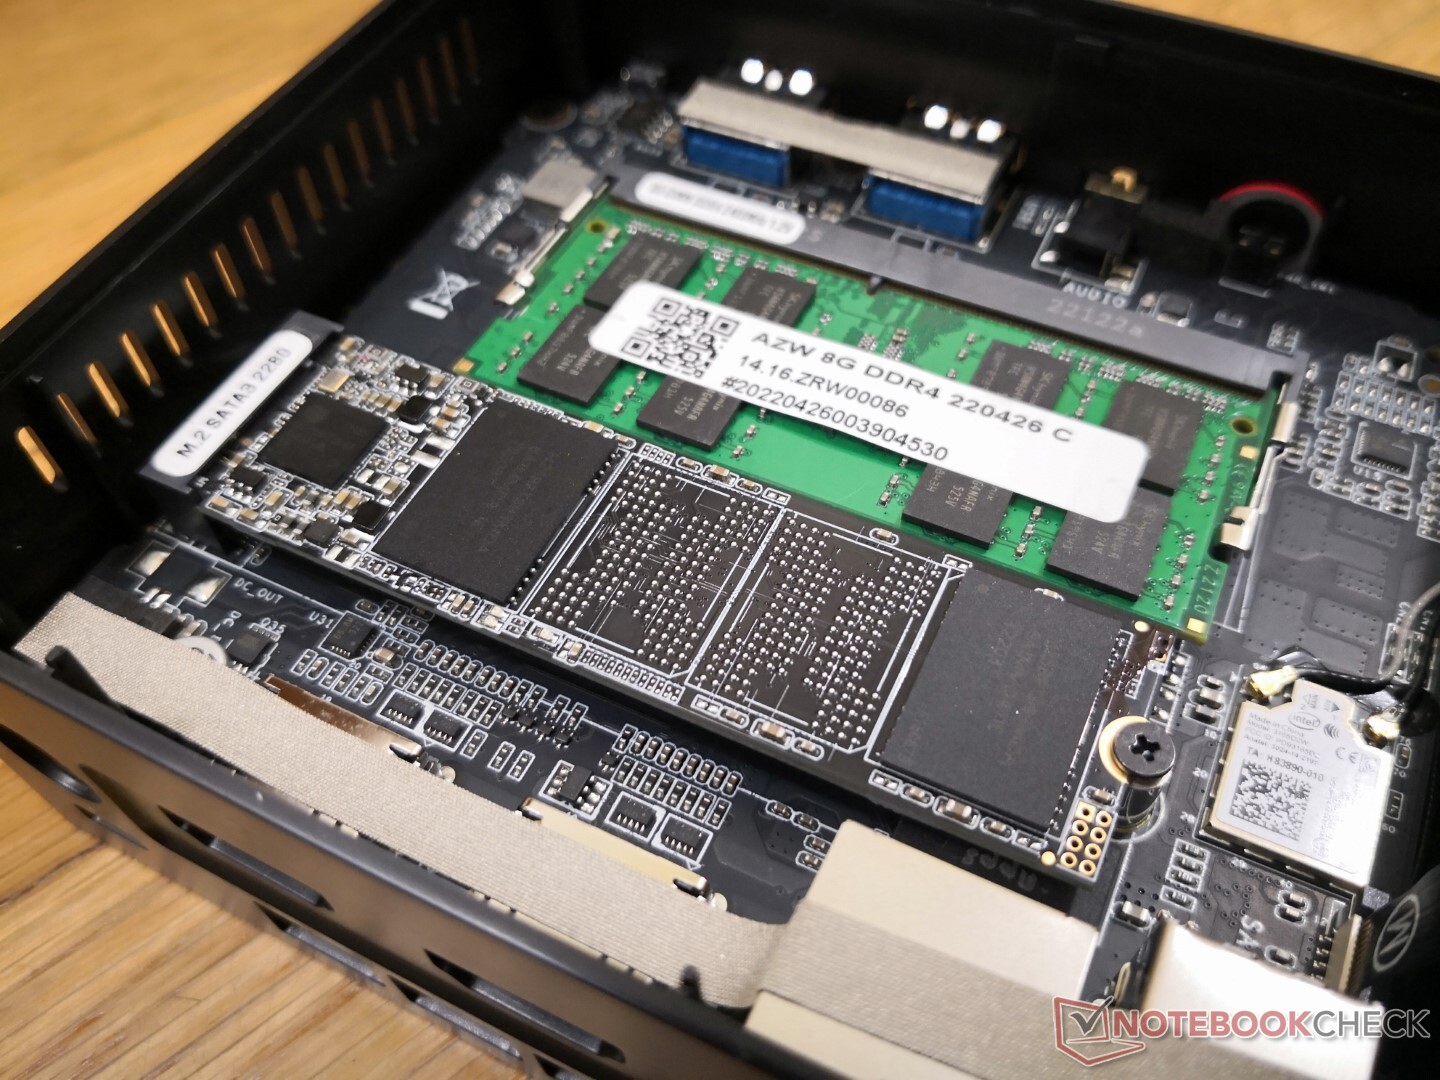
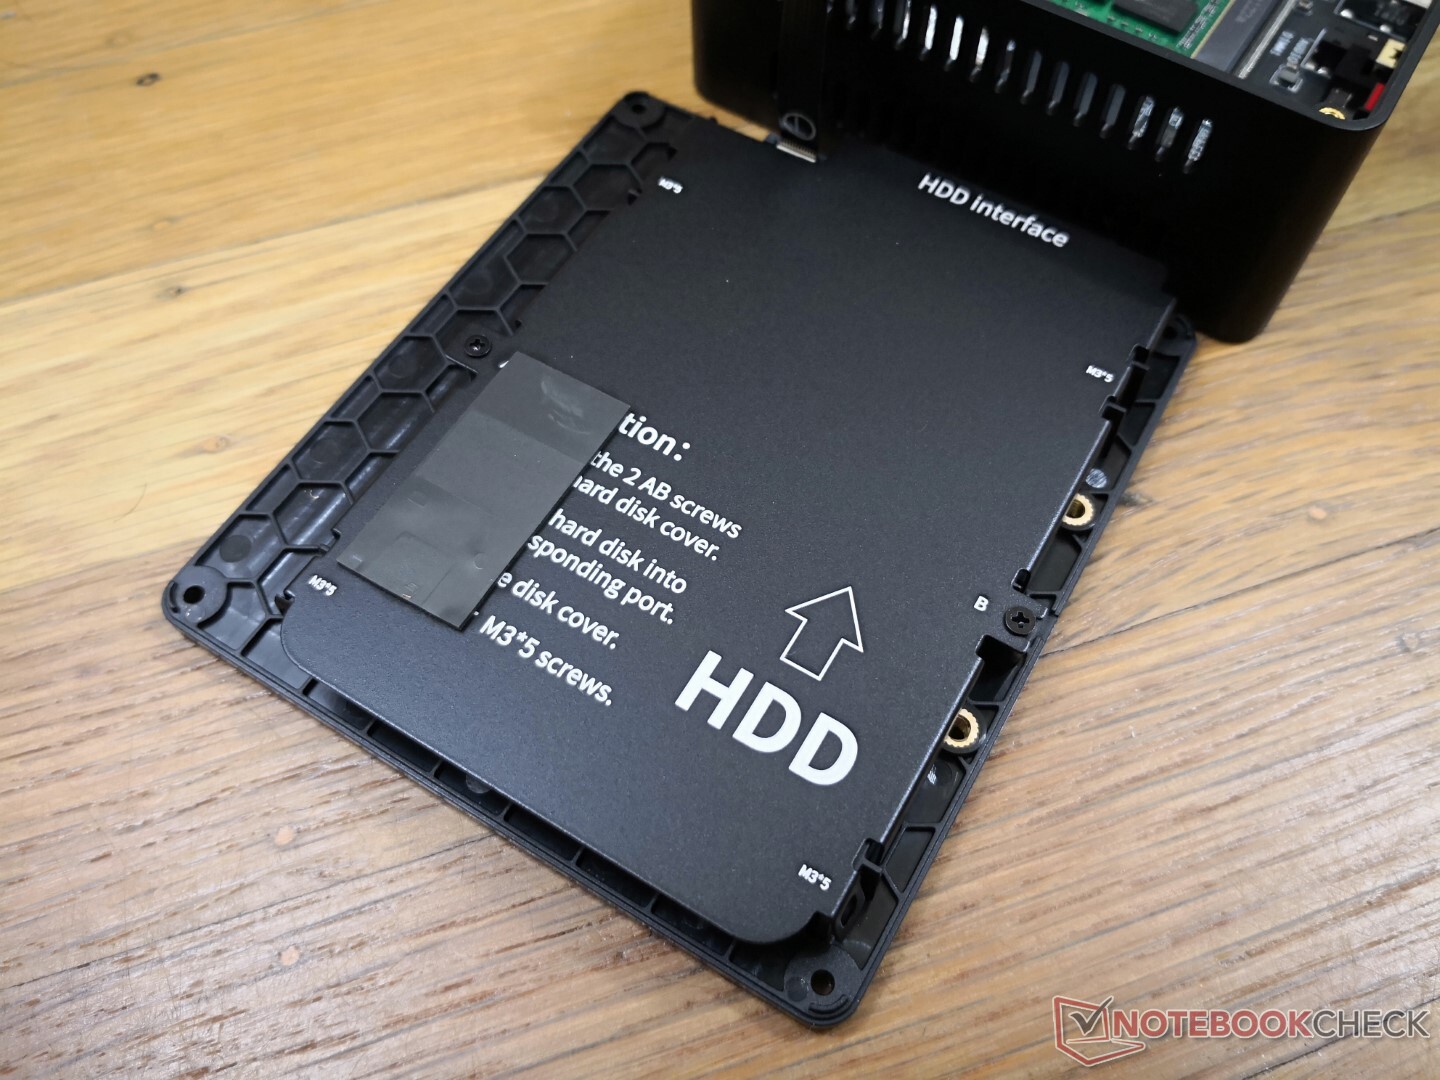
Wartung
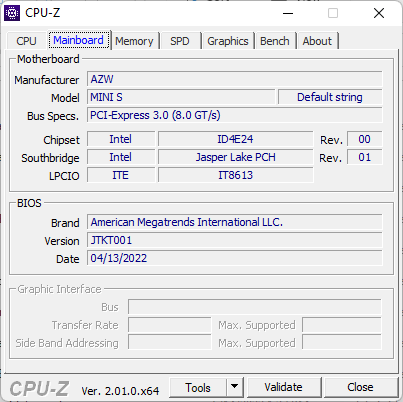
Die Bodenplatte lässt sich nach dem Entfernen der vier Kreuzschlitzschrauben an den Ecken leicht abnehmen. Nutzer haben direkten Zugriff auf zwei Speicherschächte (1x M.2 2280 SATA III + 1x 2,5-Zoll-SATA-III) und einen einzelnen SODIMM-DDR4-Steckplatz, der bis zu 16 GB Single-Channel-Speicher unterstützt.
Zubehör und Garantie
Im Lieferumfang ist eine abnehmbare VESA-Halterung mit Schrauben enthalten, die an der Bodenplatte des Gerätes befestigt wird. Zwei HDMI-Kabel sind ebenfalls enthalten.
Performance
Testbedingungen
Unser Testgerät wurde auf den Windows-Performance-Modus eingestellt, bevor wir die folgenden Benchmark-Tests durchführten, um die bestmöglichen Ergebnisse zu erzielen. Abgesehen von den üblichen BIOS-Einstellungen gibt es keine speziellen Anwendungen zur Steuerung bestimmter Funktionen oder Verhaltensweisen des U59 Mini-S.
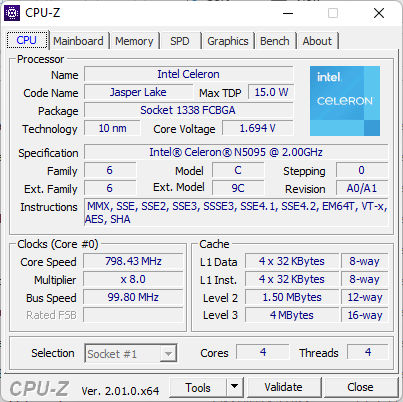
Prozessor - Schneller als der Atom, langsamer als der Core i3
Die Multi-Thread-Leistung ist vergleichbar mit der des Dual-Core Quad-Thread Core i3-8109U, während er bei der Single-Thread-Leistung etwa 20 bis 45 Prozent langsamer ist. Der Celeron N5095 ist dennoch schneller als Celeron Lösungen der vorherigen Generation, einschließlich des J4125 oder N4100, und zwar bis zu 2x schneller bei Multi-Thread-Anwendungen.
Die Leistungsstabilität ist gut, ohne größere Einbrüche bei der Ausführung von CineBench R15 xT in einer Schleife.
Cinebench R15 Multi Loop
Cinebench R23: Multi Core | Single Core
Cinebench R15: CPU Multi 64Bit | CPU Single 64Bit
Blender: v2.79 BMW27 CPU
7-Zip 18.03: 7z b 4 | 7z b 4 -mmt1
Geekbench 5.5: Multi-Core | Single-Core
HWBOT x265 Benchmark v2.2: 4k Preset
LibreOffice : 20 Documents To PDF
R Benchmark 2.5: Overall mean
| Cinebench R20 / CPU (Multi Core) | |
| Lenovo Yoga Slim 7 14ARE05 82A20008GE | |
| Intel NUC11TNKi5 | |
| Acer Swift 3 SF314-42-R27B | |
| Zotac ZBOX MI642 Nano | |
| Durchschnittliche Intel Celeron N5095 (804 - 844, n=5) | |
| Beelink U59 Mini-S | |
| Beelink SEi8 | |
| GMK NucBox 3 | |
| Chuwi UBook CWI509 | |
| Blackview AceBook 1 | |
| Chuwi LapBook Plus | |
| Cinebench R20 / CPU (Single Core) | |
| Intel NUC11TNKi5 | |
| Lenovo Yoga Slim 7 14ARE05 82A20008GE | |
| Acer Swift 3 SF314-42-R27B | |
| Zotac ZBOX MI642 Nano | |
| Beelink SEi8 | |
| Durchschnittliche Intel Celeron N5095 (228 - 239, n=5) | |
| Beelink U59 Mini-S | |
| GMK NucBox 3 | |
| Blackview AceBook 1 | |
| Chuwi UBook CWI509 | |
| Chuwi LapBook Plus | |
| Cinebench R23 / Multi Core | |
| Lenovo Yoga Slim 7 14ARE05 82A20008GE | |
| Intel NUC11TNKi5 | |
| Durchschnittliche Intel Celeron N5095 (2150 - 2219, n=5) | |
| Beelink U59 Mini-S | |
| Beelink SEi8 | |
| GMK NucBox 3 | |
| Blackview AceBook 1 | |
| Cinebench R23 / Single Core | |
| Intel NUC11TNKi5 | |
| Lenovo Yoga Slim 7 14ARE05 82A20008GE | |
| Beelink SEi8 | |
| Beelink U59 Mini-S | |
| Durchschnittliche Intel Celeron N5095 (587 - 621, n=5) | |
| GMK NucBox 3 | |
| Blackview AceBook 1 | |
| Cinebench R15 / CPU Multi 64Bit | |
| Lenovo Yoga Slim 7 14ARE05 82A20008GE | |
| Intel NUC11TNKi5 | |
| Acer Swift 3 SF314-42-R27B | |
| Zotac ZBOX MI642 Nano | |
| Beelink U59 Mini-S | |
| Durchschnittliche Intel Celeron N5095 (221 - 379, n=6) | |
| Beelink SEi8 | |
| Blackview AceBook 1 | |
| GMK NucBox 3 | |
| Chuwi UBook CWI509 | |
| Chuwi LapBook Plus | |
| Cinebench R15 / CPU Single 64Bit | |
| Intel NUC11TNKi5 | |
| Lenovo Yoga Slim 7 14ARE05 82A20008GE | |
| Zotac ZBOX MI642 Nano | |
| Acer Swift 3 SF314-42-R27B | |
| Beelink SEi8 | |
| Durchschnittliche Intel Celeron N5095 (95.4 - 109, n=5) | |
| Beelink U59 Mini-S | |
| Blackview AceBook 1 | |
| Chuwi UBook CWI509 | |
| GMK NucBox 3 | |
| Chuwi LapBook Plus | |
| Blender / v2.79 BMW27 CPU | |
| Chuwi LapBook Plus | |
| GMK NucBox 3 | |
| Blackview AceBook 1 | |
| Beelink U59 Mini-S | |
| Durchschnittliche Intel Celeron N5095 (1502 - 1624, n=5) | |
| Beelink SEi8 | |
| Acer Swift 3 SF314-42-R27B | |
| Zotac ZBOX MI642 Nano | |
| Intel NUC11TNKi5 | |
| Lenovo Yoga Slim 7 14ARE05 82A20008GE | |
| 7-Zip 18.03 / 7z b 4 | |
| Lenovo Yoga Slim 7 14ARE05 82A20008GE | |
| Intel NUC11TNKi5 | |
| Zotac ZBOX MI642 Nano | |
| Acer Swift 3 SF314-42-R27B | |
| Durchschnittliche Intel Celeron N5095 (10924 - 11168, n=5) | |
| Beelink U59 Mini-S | |
| Beelink SEi8 | |
| Blackview AceBook 1 | |
| GMK NucBox 3 | |
| Chuwi LapBook Plus | |
| 7-Zip 18.03 / 7z b 4 -mmt1 | |
| Intel NUC11TNKi5 | |
| Lenovo Yoga Slim 7 14ARE05 82A20008GE | |
| Zotac ZBOX MI642 Nano | |
| Acer Swift 3 SF314-42-R27B | |
| Beelink SEi8 | |
| Beelink U59 Mini-S | |
| Durchschnittliche Intel Celeron N5095 (2935 - 3124, n=5) | |
| Blackview AceBook 1 | |
| GMK NucBox 3 | |
| Chuwi LapBook Plus | |
| Geekbench 5.5 / Multi-Core | |
| Lenovo Yoga Slim 7 14ARE05 82A20008GE | |
| Intel NUC11TNKi5 | |
| Zotac ZBOX MI642 Nano | |
| Acer Swift 3 SF314-42-R27B | |
| Durchschnittliche Intel Celeron N5095 (1933 - 2052, n=4) | |
| Beelink U59 Mini-S | |
| Beelink SEi8 | |
| GMK NucBox 3 | |
| Geekbench 5.5 / Single-Core | |
| Intel NUC11TNKi5 | |
| Lenovo Yoga Slim 7 14ARE05 82A20008GE | |
| Zotac ZBOX MI642 Nano | |
| Acer Swift 3 SF314-42-R27B | |
| Beelink SEi8 | |
| Durchschnittliche Intel Celeron N5095 (637 - 659, n=4) | |
| Beelink U59 Mini-S | |
| GMK NucBox 3 | |
| HWBOT x265 Benchmark v2.2 / 4k Preset | |
| Lenovo Yoga Slim 7 14ARE05 82A20008GE | |
| Intel NUC11TNKi5 | |
| Acer Swift 3 SF314-42-R27B | |
| Zotac ZBOX MI642 Nano | |
| Beelink SEi8 | |
| Beelink U59 Mini-S | |
| Durchschnittliche Intel Celeron N5095 (1.9 - 2.05, n=5) | |
| GMK NucBox 3 | |
| Blackview AceBook 1 | |
| Chuwi LapBook Plus | |
| LibreOffice / 20 Documents To PDF | |
| GMK NucBox 3 | |
| Blackview AceBook 1 | |
| Beelink U59 Mini-S | |
| Durchschnittliche Intel Celeron N5095 (97 - 107.9, n=5) | |
| Beelink SEi8 | |
| Zotac ZBOX MI642 Nano | |
| Lenovo Yoga Slim 7 14ARE05 82A20008GE | |
| Acer Swift 3 SF314-42-R27B | |
| Intel NUC11TNKi5 | |
| R Benchmark 2.5 / Overall mean | |
| Blackview AceBook 1 | |
| GMK NucBox 3 | |
| Beelink U59 Mini-S | |
| Durchschnittliche Intel Celeron N5095 (1.16 - 1.2, n=5) | |
| Beelink SEi8 | |
| Zotac ZBOX MI642 Nano | |
| Acer Swift 3 SF314-42-R27B | |
| Intel NUC11TNKi5 | |
| Lenovo Yoga Slim 7 14ARE05 82A20008GE | |
* ... kleinere Werte sind besser
AIDA64: FP32 Ray-Trace | FPU Julia | CPU SHA3 | CPU Queen | FPU SinJulia | FPU Mandel | CPU AES | CPU ZLib | FP64 Ray-Trace | CPU PhotoWorxx
| Performance Rating | |
| Intel NUC11TNKi5 | |
| Zotac ZBOX MI642 Nano | |
| Beelink SEi8 | |
| Beelink U59 | |
| Durchschnittliche Intel Celeron N5095 | |
| Beelink U59 Mini-S | |
| GMK NucBox 3 | |
| AIDA64 / FP32 Ray-Trace | |
| Intel NUC11TNKi5 | |
| Zotac ZBOX MI642 Nano | |
| Beelink SEi8 | |
| Beelink U59 | |
| Beelink U59 Mini-S | |
| Durchschnittliche Intel Celeron N5095 (1241 - 1245, n=5) | |
| GMK NucBox 3 | |
| AIDA64 / FPU Julia | |
| Intel NUC11TNKi5 | |
| Zotac ZBOX MI642 Nano | |
| Beelink SEi8 | |
| Beelink U59 | |
| Durchschnittliche Intel Celeron N5095 (7264 - 7466, n=5) | |
| Beelink U59 Mini-S | |
| GMK NucBox 3 | |
| AIDA64 / CPU SHA3 | |
| Intel NUC11TNKi5 | |
| Zotac ZBOX MI642 Nano | |
| Beelink SEi8 | |
| Beelink U59 | |
| Durchschnittliche Intel Celeron N5095 (508 - 515, n=5) | |
| Beelink U59 Mini-S | |
| GMK NucBox 3 | |
| AIDA64 / CPU Queen | |
| Zotac ZBOX MI642 Nano | |
| Intel NUC11TNKi5 | |
| Beelink SEi8 | |
| Beelink U59 | |
| Durchschnittliche Intel Celeron N5095 (21458 - 22326, n=5) | |
| Beelink U59 Mini-S | |
| GMK NucBox 3 | |
| AIDA64 / FPU SinJulia | |
| Intel NUC11TNKi5 | |
| Zotac ZBOX MI642 Nano | |
| Beelink SEi8 | |
| GMK NucBox 3 | |
| Beelink U59 | |
| Beelink U59 Mini-S | |
| Durchschnittliche Intel Celeron N5095 (1000 - 1003, n=5) | |
| AIDA64 / FPU Mandel | |
| Intel NUC11TNKi5 | |
| Zotac ZBOX MI642 Nano | |
| Beelink SEi8 | |
| Beelink U59 | |
| Durchschnittliche Intel Celeron N5095 (3802 - 3967, n=5) | |
| Beelink U59 Mini-S | |
| GMK NucBox 3 | |
| AIDA64 / CPU AES | |
| Intel NUC11TNKi5 | |
| Durchschnittliche Intel Celeron N5095 (19076 - 19354, n=5) | |
| Beelink U59 | |
| Beelink U59 Mini-S | |
| Zotac ZBOX MI642 Nano | |
| GMK NucBox 3 | |
| Beelink SEi8 | |
| AIDA64 / CPU ZLib | |
| Intel NUC11TNKi5 | |
| Zotac ZBOX MI642 Nano | |
| Beelink U59 | |
| Durchschnittliche Intel Celeron N5095 (187.7 - 190, n=5) | |
| Beelink U59 Mini-S | |
| Beelink SEi8 | |
| GMK NucBox 3 | |
| AIDA64 / FP64 Ray-Trace | |
| Intel NUC11TNKi5 | |
| Zotac ZBOX MI642 Nano | |
| Beelink SEi8 | |
| Beelink U59 | |
| Durchschnittliche Intel Celeron N5095 (673 - 676, n=5) | |
| Beelink U59 Mini-S | |
| GMK NucBox 3 | |
| AIDA64 / CPU PhotoWorxx | |
| Intel NUC11TNKi5 | |
| Zotac ZBOX MI642 Nano | |
| Beelink SEi8 | |
| Beelink U59 | |
| Durchschnittliche Intel Celeron N5095 (7386 - 9899, n=5) | |
| Beelink U59 Mini-S | |
| GMK NucBox 3 | |
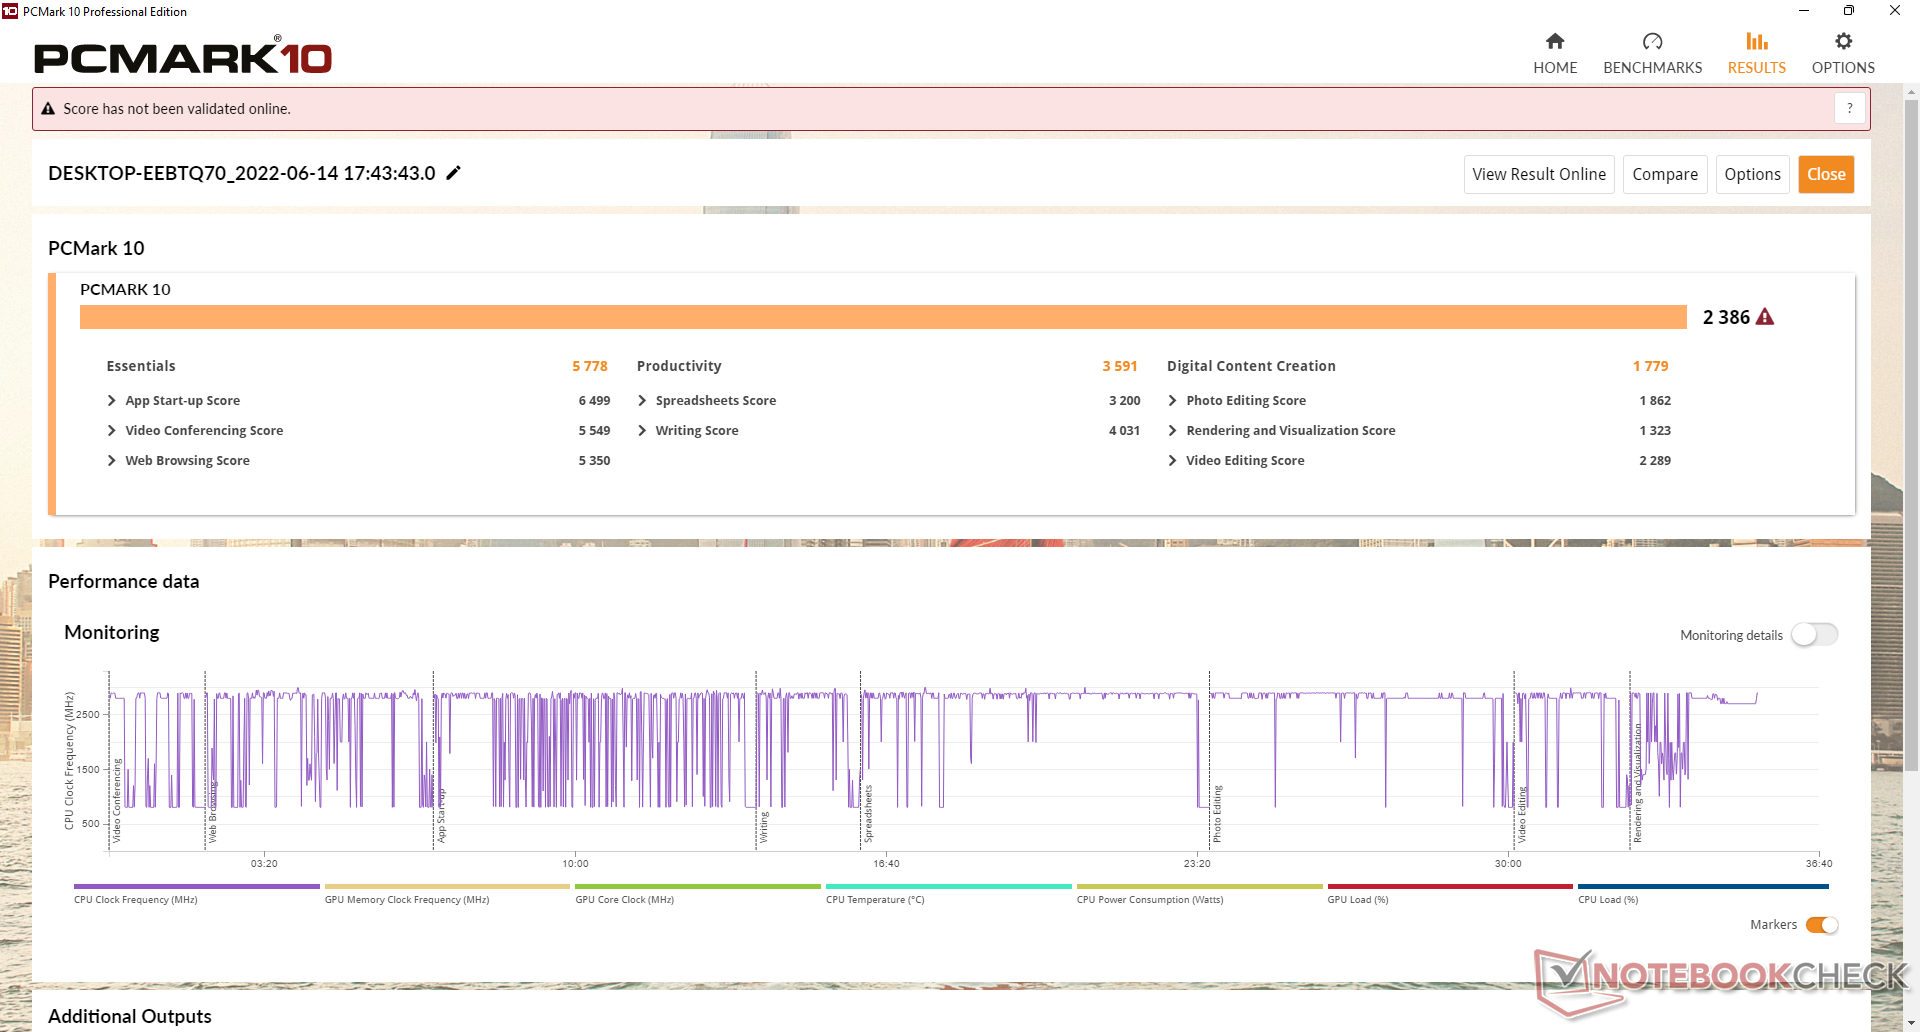
System Performance
Die PCMark Ergebnisse liegen entspannt zwischen Mini-PCs mit dem älteren Celeron J4125 wie der GMK NucBox 3 und Mini-PCs mit Core-i3-CPUs wie dem Beelink SEi8.
CrossMark: Overall | Productivity | Creativity | Responsiveness
| PCMark 10 / Score | |
| Intel NUC11TNKi5 | |
| Zotac ZBOX MI642 Nano | |
| Beelink SEi8 | |
| Beelink U59 | |
| Beelink U59 Mini-S | |
| Durchschnittliche Intel Celeron N5095, Intel UHD Graphics (Jasper Lake 16 EU) (2317 - 2417, n=5) | |
| GMK NucBox 3 | |
| PCMark 10 / Essentials | |
| Intel NUC11TNKi5 | |
| Beelink SEi8 | |
| Zotac ZBOX MI642 Nano | |
| Beelink U59 | |
| Beelink U59 Mini-S | |
| Durchschnittliche Intel Celeron N5095, Intel UHD Graphics (Jasper Lake 16 EU) (5516 - 5874, n=5) | |
| GMK NucBox 3 | |
| PCMark 10 / Productivity | |
| Zotac ZBOX MI642 Nano | |
| Intel NUC11TNKi5 | |
| Beelink SEi8 | |
| Beelink U59 | |
| Beelink U59 Mini-S | |
| Durchschnittliche Intel Celeron N5095, Intel UHD Graphics (Jasper Lake 16 EU) (3454 - 3666, n=5) | |
| GMK NucBox 3 | |
| PCMark 10 / Digital Content Creation | |
| Intel NUC11TNKi5 | |
| Zotac ZBOX MI642 Nano | |
| Beelink SEi8 | |
| Beelink U59 | |
| Beelink U59 Mini-S | |
| Durchschnittliche Intel Celeron N5095, Intel UHD Graphics (Jasper Lake 16 EU) (1752 - 1787, n=5) | |
| GMK NucBox 3 | |
| CrossMark / Overall | |
| Beelink U59 Mini-S | |
| Durchschnittliche Intel Celeron N5095, Intel UHD Graphics (Jasper Lake 16 EU) (473 - 495, n=3) | |
| CrossMark / Productivity | |
| Beelink U59 Mini-S | |
| Durchschnittliche Intel Celeron N5095, Intel UHD Graphics (Jasper Lake 16 EU) (535 - 561, n=3) | |
| CrossMark / Creativity | |
| Durchschnittliche Intel Celeron N5095, Intel UHD Graphics (Jasper Lake 16 EU) (434 - 440, n=3) | |
| Beelink U59 Mini-S | |
| CrossMark / Responsiveness | |
| Beelink U59 Mini-S | |
| Durchschnittliche Intel Celeron N5095, Intel UHD Graphics (Jasper Lake 16 EU) (403 - 497, n=3) | |
| PCMark 10 Score | 2386 Punkte | |
Hilfe | ||
| AIDA64 / Memory Copy | |
| Beelink SEi8 | |
| Zotac ZBOX MI642 Nano | |
| Beelink U59 | |
| Intel NUC11TNKi5 | |
| Durchschnittliche Intel Celeron N5095 (16422 - 23009, n=5) | |
| Beelink U59 Mini-S | |
| GMK NucBox 3 | |
| AIDA64 / Memory Read | |
| Zotac ZBOX MI642 Nano | |
| Beelink SEi8 | |
| Intel NUC11TNKi5 | |
| Beelink U59 Mini-S | |
| Durchschnittliche Intel Celeron N5095 (15464 - 16959, n=5) | |
| Beelink U59 | |
| GMK NucBox 3 | |
| AIDA64 / Memory Write | |
| Zotac ZBOX MI642 Nano | |
| Beelink U59 | |
| Durchschnittliche Intel Celeron N5095 (18612 - 30843, n=5) | |
| Intel NUC11TNKi5 | |
| Beelink U59 Mini-S | |
| Beelink SEi8 | |
| GMK NucBox 3 | |
| AIDA64 / Memory Latency | |
| Zotac ZBOX MI642 Nano | |
| Intel NUC11TNKi5 | |
| GMK NucBox 3 | |
| Durchschnittliche Intel Celeron N5095 (58 - 74.1, n=5) | |
| Beelink U59 | |
| Beelink U59 Mini-S | |
| Beelink SEi8 | |
* ... kleinere Werte sind besser
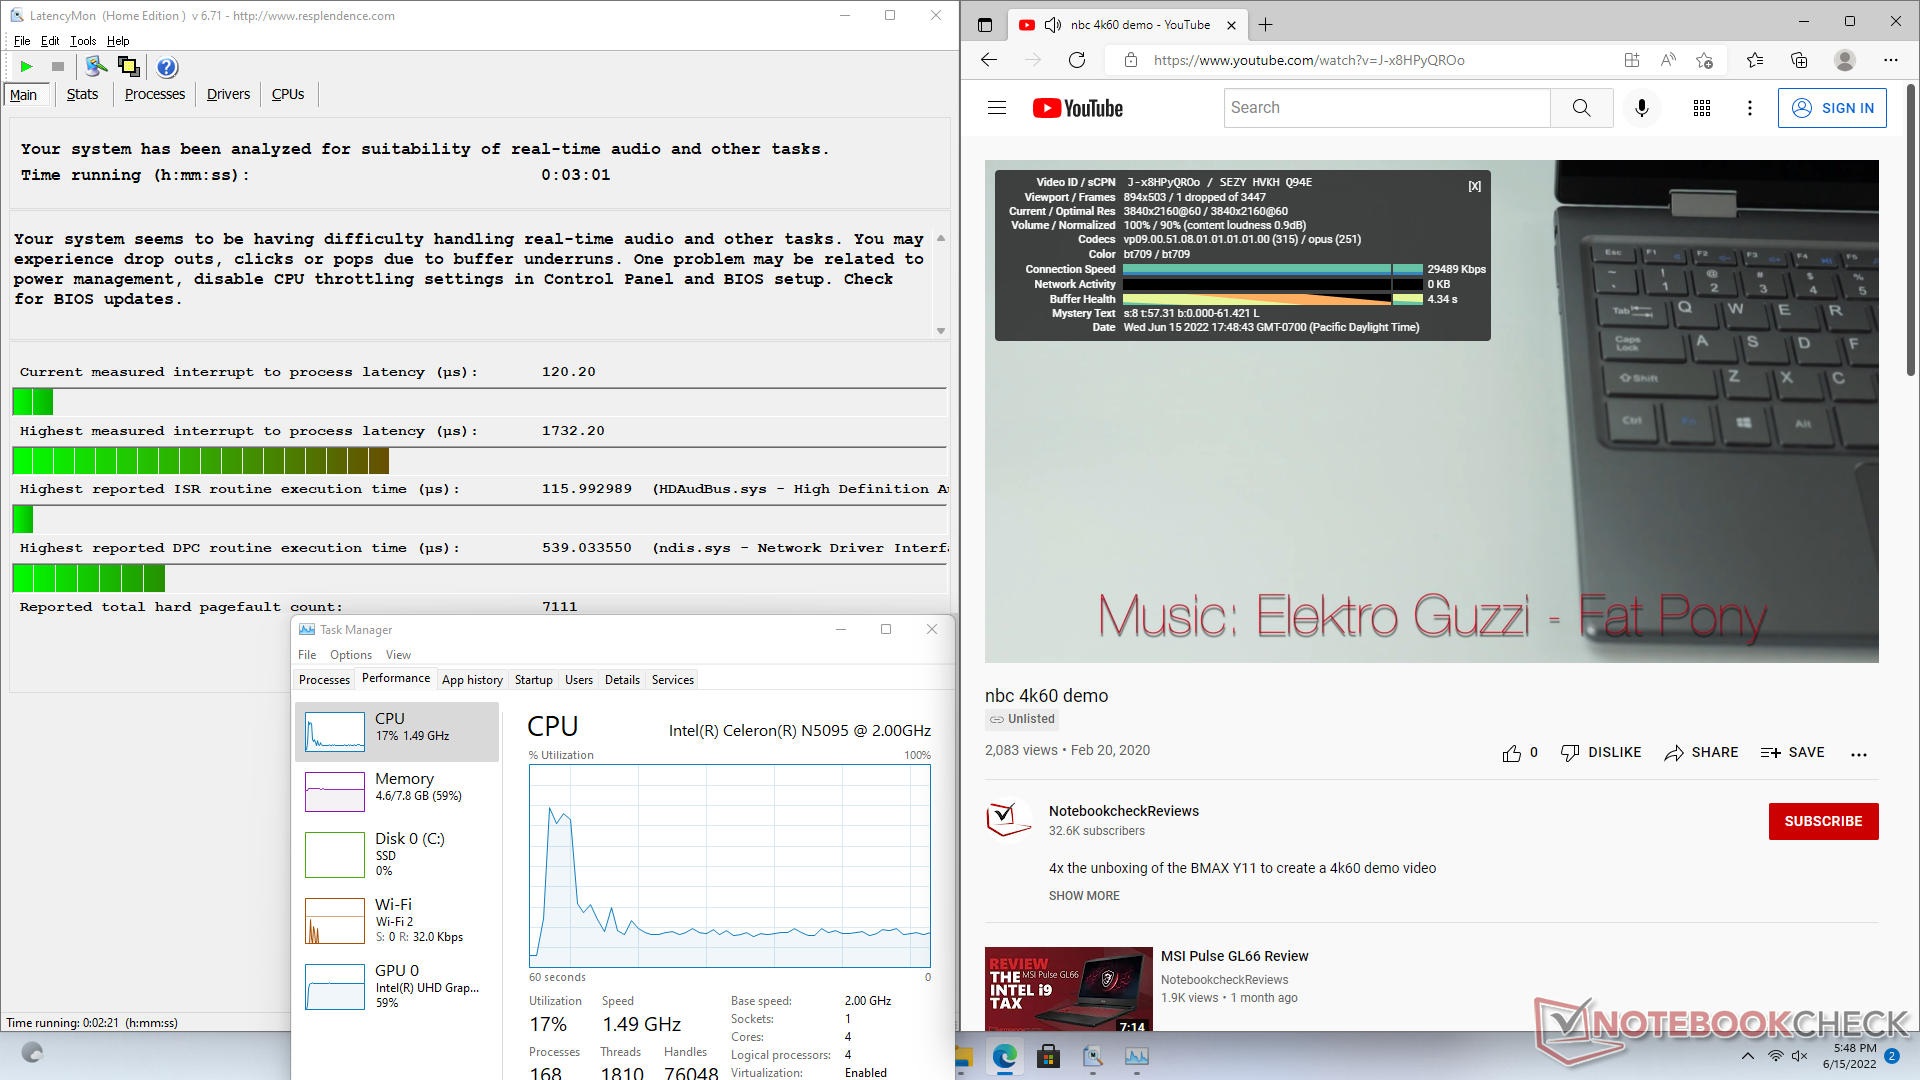
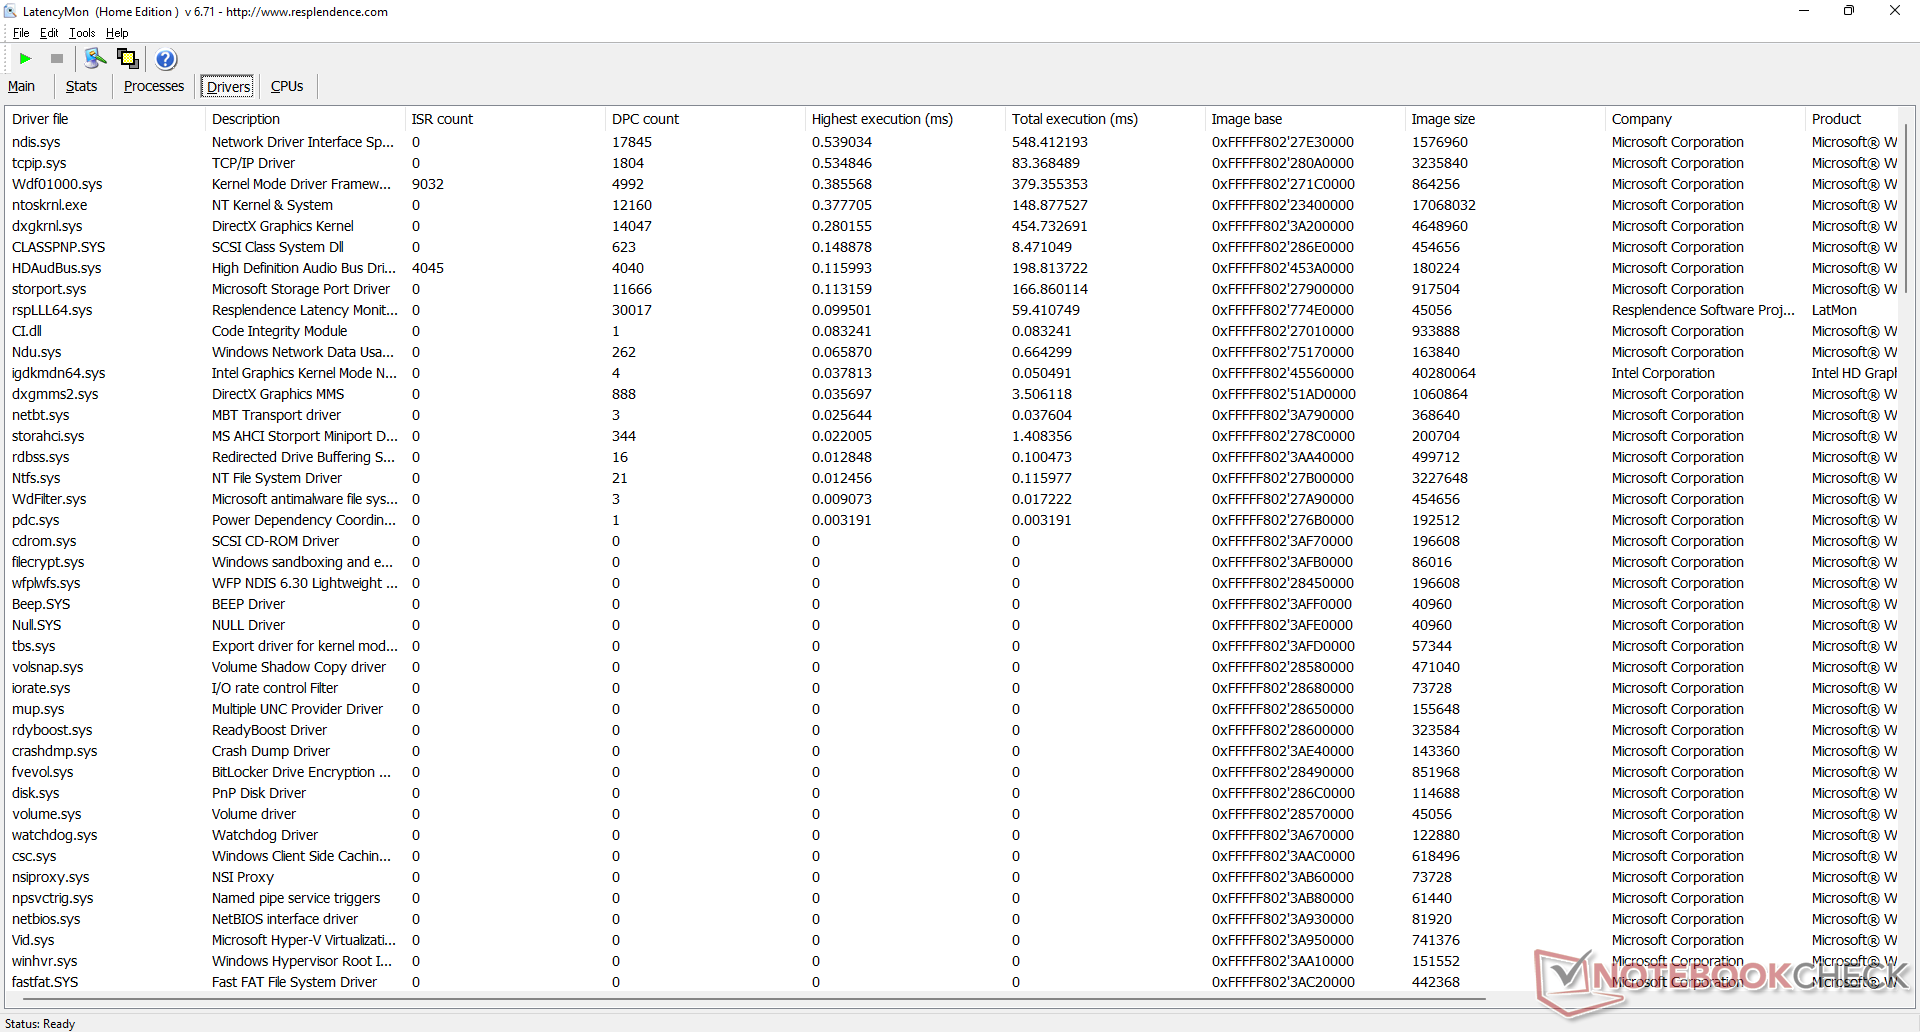
DPC-Latenzzeit
LatencyMon zeigt DPC-Probleme beim Öffnen mehrerer Browser Tabs unserer Homepage. Die 4K-Videowiedergabe bei 60 fps läuft ansonsten flüssig und bei einer recht niedrigen CPU-Auslastung von 17 Prozent mit nur einem Frame-Verlust während unserer Tests.
| DPC Latencies / LatencyMon - interrupt to process latency (max), Web, Youtube, Prime95 | |
| Beelink SEi8 | |
| GMK NucBox 3 | |
| Beelink U59 Mini-S | |
| Beelink U59 | |
| Intel NUC11TNKi5 | |
* ... kleinere Werte sind besser
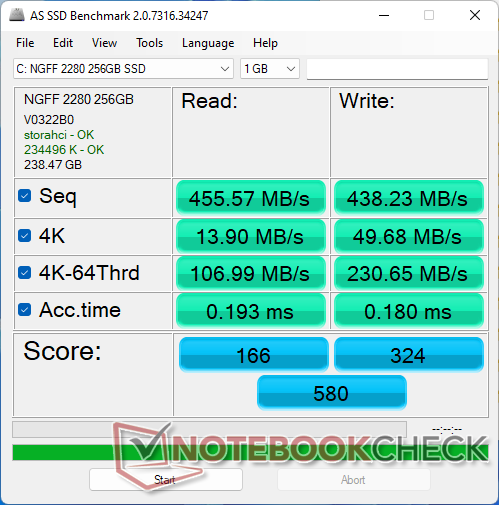
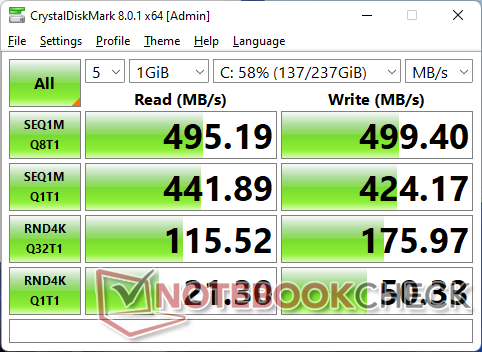
Speichergeräte - Bis zu zwei interne Laufwerke
Unser Gerät ist mit einer ungewöhnlichen Silicon Motion AZW 256G M.228 220426 SATA III M.2 SSD bestückt für sequenzielle Übertragungsraten von maximal 500 MB/s. Das ist zwar nicht annähernd so schnell wie eine NVMe-Lösung, aber in Anbetracht der Zielgruppe und der Celeron CPU ist das dennoch ausreichend.

| Drive Performance Rating - Percent | |
| Beelink SEi8 | |
| Zotac ZBOX MI642 Nano | |
| Intel NUC11TNKi5 | |
| Beelink U59 Mini-S | |
| Beelink U59 | |
| GMK NucBox 3 | |
| DiskSpd | |
| seq read | |
| Beelink SEi8 | |
| Intel NUC11TNKi5 | |
| Zotac ZBOX MI642 Nano | |
| Beelink U59 Mini-S | |
| Beelink U59 | |
| GMK NucBox 3 | |
| seq write | |
| Beelink SEi8 | |
| Zotac ZBOX MI642 Nano | |
| Intel NUC11TNKi5 | |
| Beelink U59 Mini-S | |
| Beelink U59 | |
| GMK NucBox 3 | |
| seq q8 t1 read | |
| Beelink SEi8 | |
| Intel NUC11TNKi5 | |
| Zotac ZBOX MI642 Nano | |
| Beelink U59 Mini-S | |
| GMK NucBox 3 | |
| Beelink U59 | |
| seq q8 t1 write | |
| Beelink SEi8 | |
| Zotac ZBOX MI642 Nano | |
| Intel NUC11TNKi5 | |
| Beelink U59 Mini-S | |
| Beelink U59 | |
| GMK NucBox 3 | |
| 4k q1 t1 read | |
| Beelink SEi8 | |
| Zotac ZBOX MI642 Nano | |
| Intel NUC11TNKi5 | |
| Beelink U59 Mini-S | |
| Beelink U59 | |
| GMK NucBox 3 | |
| 4k q1 t1 write | |
| Beelink SEi8 | |
| Zotac ZBOX MI642 Nano | |
| GMK NucBox 3 | |
| Beelink U59 Mini-S | |
| Intel NUC11TNKi5 | |
| Beelink U59 | |
| 4k q32 t16 read | |
| Zotac ZBOX MI642 Nano | |
| Beelink SEi8 | |
| Intel NUC11TNKi5 | |
| Beelink U59 Mini-S | |
| Beelink U59 | |
| GMK NucBox 3 | |
| 4k q32 t16 write | |
| Beelink SEi8 | |
| Intel NUC11TNKi5 | |
| Zotac ZBOX MI642 Nano | |
| Beelink U59 Mini-S | |
| GMK NucBox 3 | |
| Beelink U59 | |
* ... kleinere Werte sind besser
Disk Throttling: DiskSpd Read Loop, Queue Depth 8
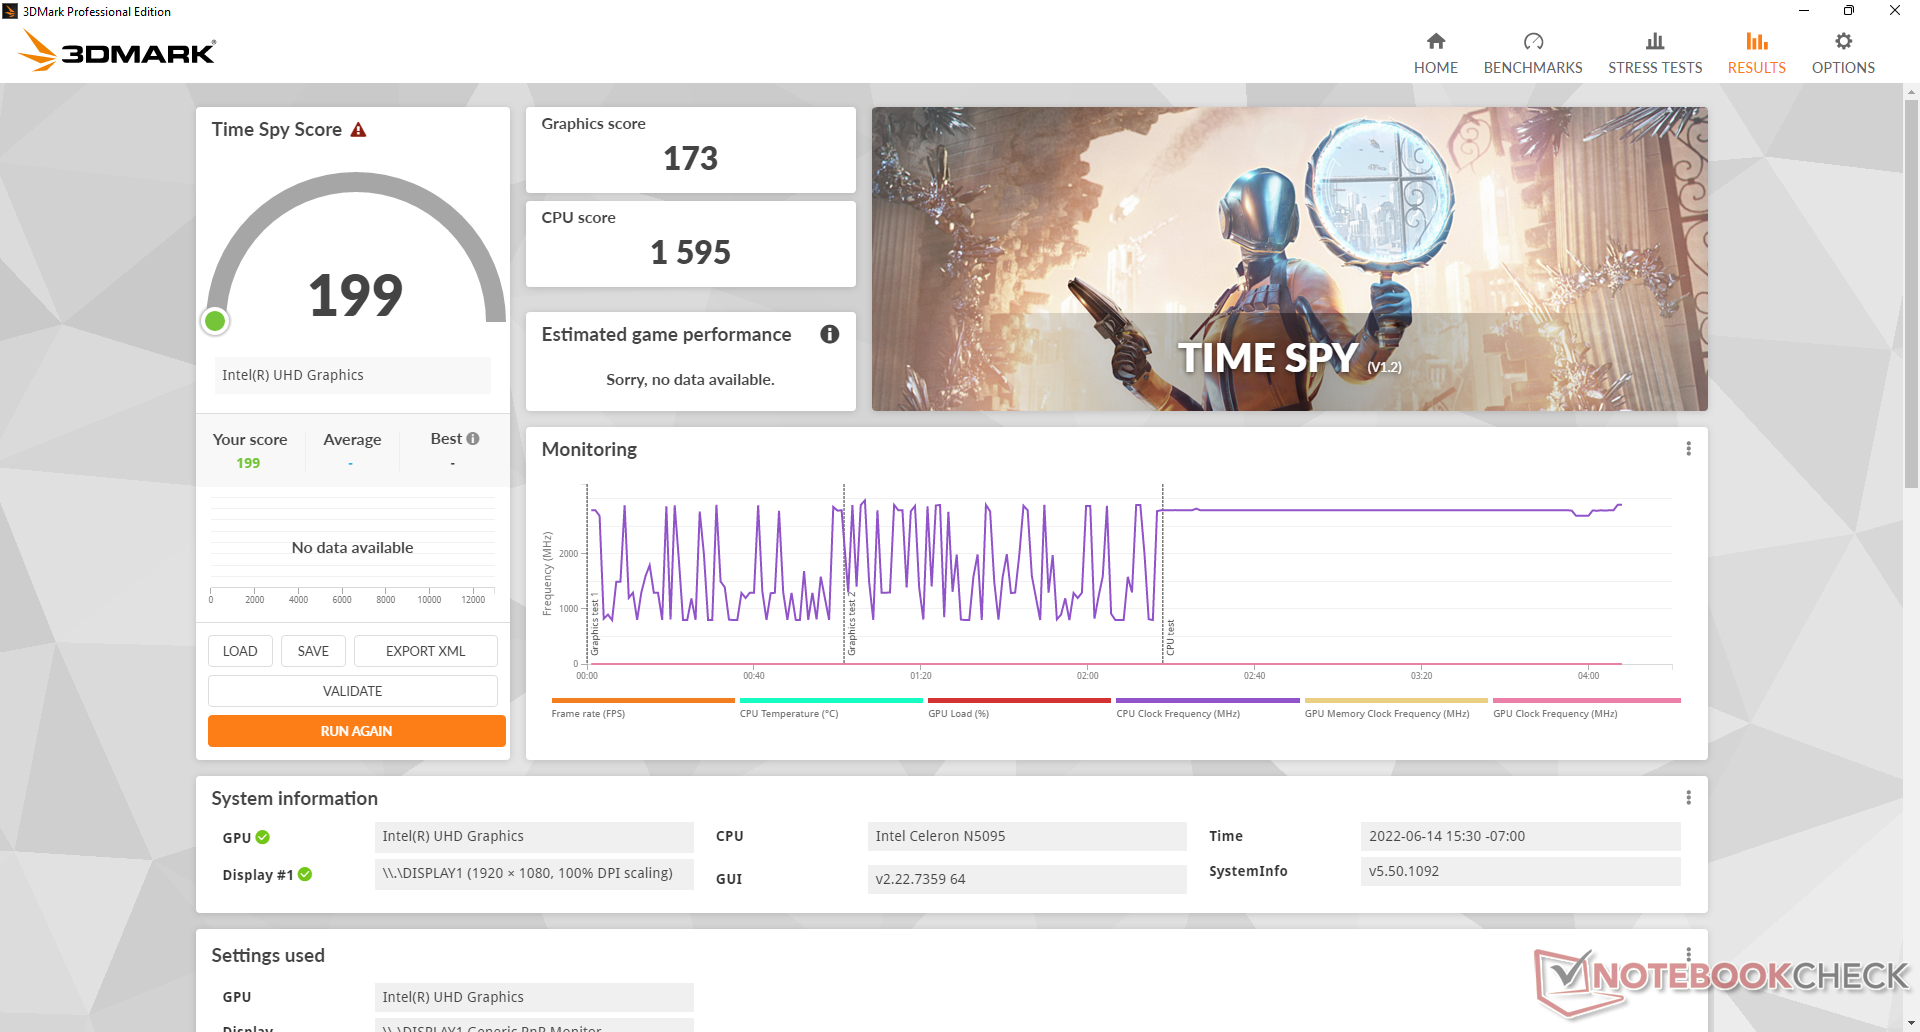
GPU Performance - Zu langsam für Spiele
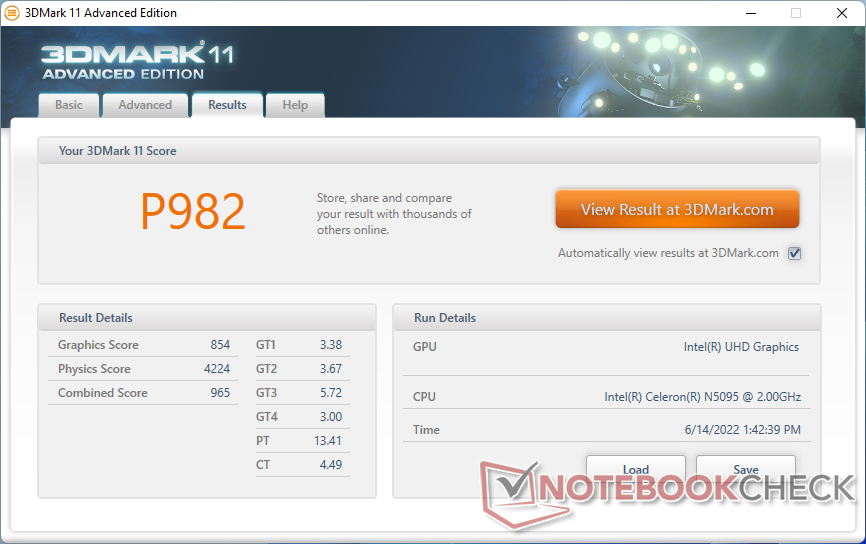
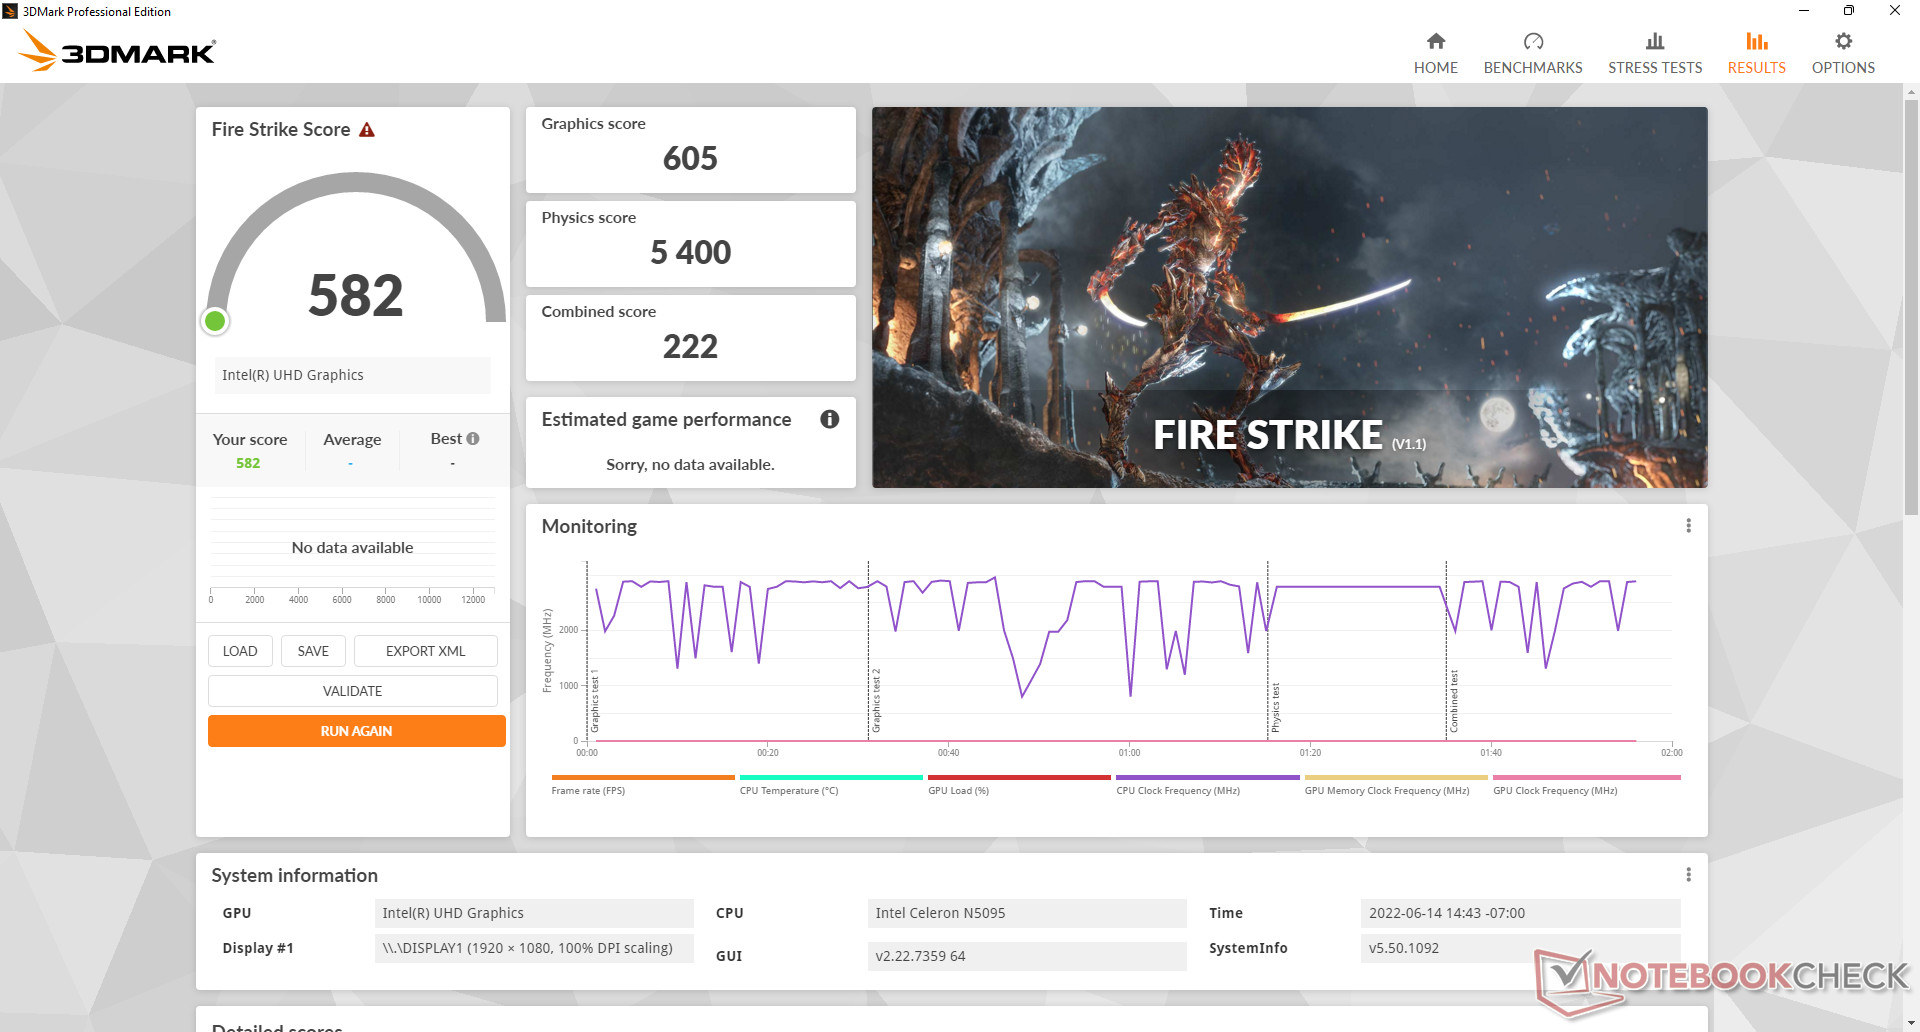
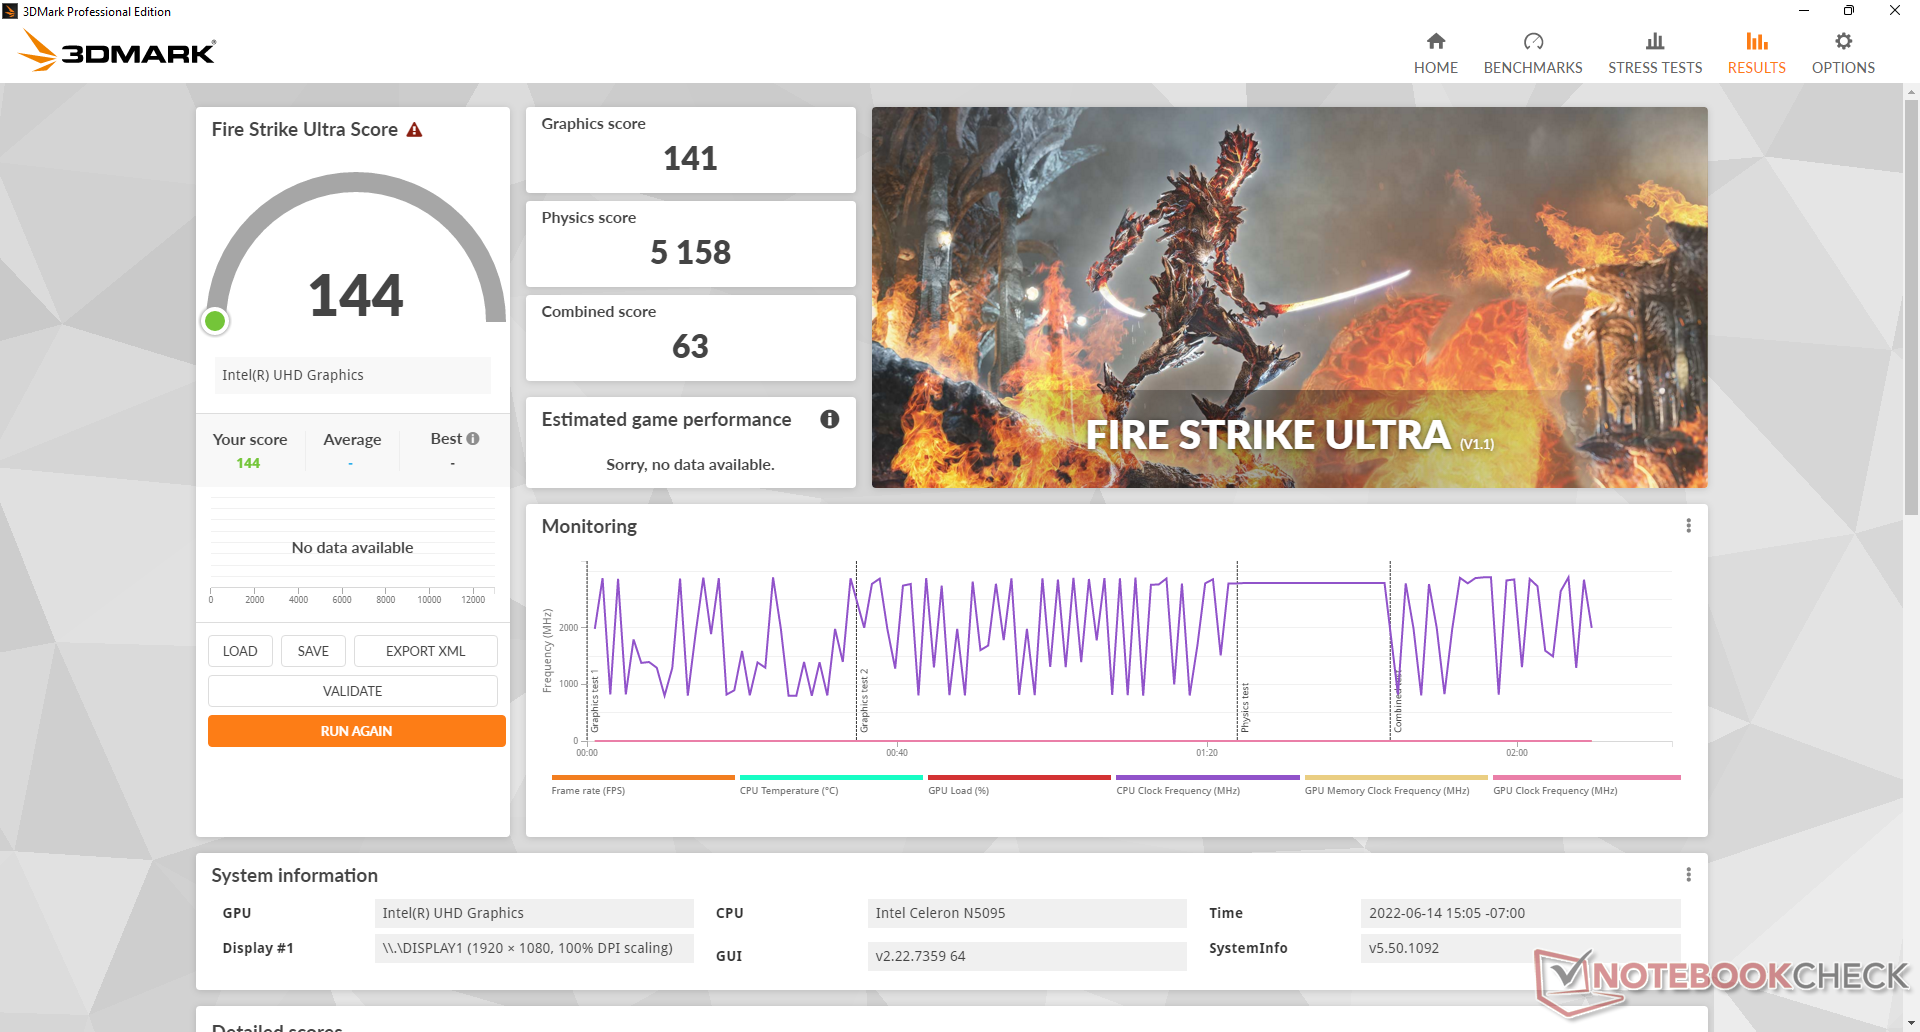
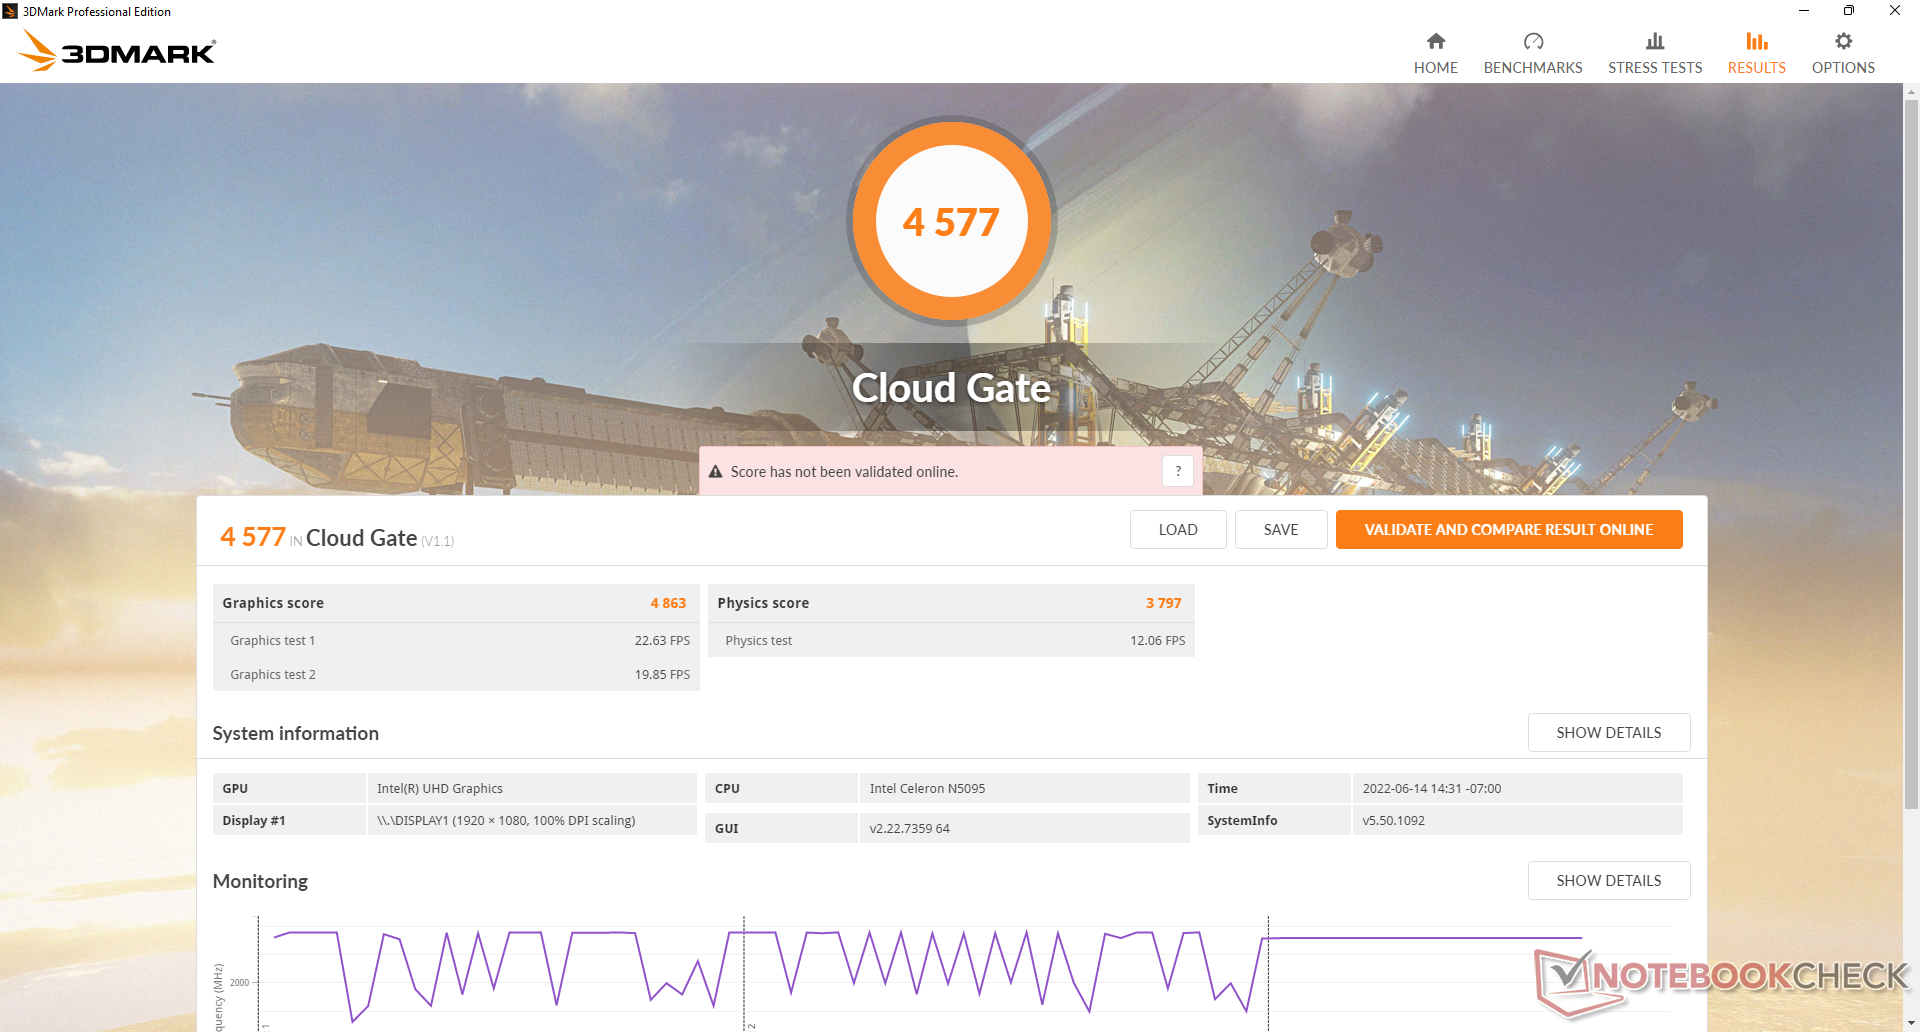
Die Grafikleistung ist schlecht, die Ergebnisse liegen sogar unter denen der alten UHD Graphics 620 um mehr als 50 Prozent. Selbst die anspruchslosesten 3D-Spiele sind nicht ausführbar, da dieser spezielle Mini-PC eher für FHD- oder 4K-Videostreaming konzipiert wurde.
| 3DMark 11 - 1280x720 Performance GPU | |
| Lenovo Yoga Slim 7 14ARE05 82A20008GE | |
| Intel NUC11TNKi5 | |
| Acer Swift 3 SF314-42-R27B | |
| Beelink SEi8 | |
| Zotac ZBox MI643 | |
| Beelink U59 Mini-S | |
| Durchschnittliche Intel UHD Graphics (Jasper Lake 16 EU) (554 - 894, n=8) | |
| Chuwi LapBook Plus | |
| Blackview AceBook 1 | |
| GMK NucBox 3 | |
| Chuwi UBook CWI509 | |
| 3DMark 11 Performance | 982 Punkte | |
| 3DMark Cloud Gate Standard Score | 4577 Punkte | |
| 3DMark Fire Strike Score | 582 Punkte | |
| 3DMark Time Spy Score | 199 Punkte | |
Hilfe | ||
| min. | mittel | hoch | max. | |
|---|---|---|---|---|
| Dota 2 Reborn (2015) | 58.3 | 20.7 | 11.6 | 10.8 |
| Final Fantasy XV Benchmark (2018) | 6.86 | |||
| X-Plane 11.11 (2018) | 13.3 | 7.54 | 7.07 |
Emissionen
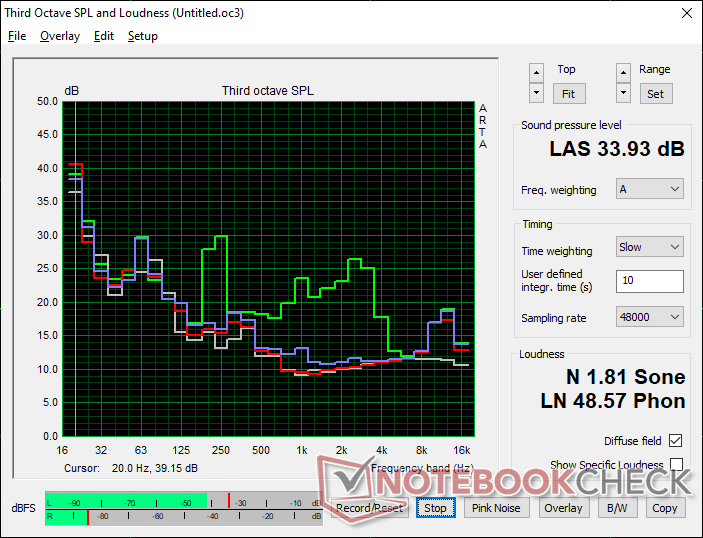
Systemgeräusch - Leise unter den meisten Bedingungen
Obwohl das Modell nicht passiv gekühlt wird, kann es in der Praxis genauso gut gekühlt werden, da der Lüfter im Leerlauf oder bei den meisten Belastungen kaum hörbar ist. Beim Ausführen der ersten Benchmark-Szene des 3DMark 06 beträgt das Lüftergeräusch beispielsweise nur etwa 25 dB(A) vor einem leisen Hintergrund von 23 dB(A). Die Ergebnisse sind viel leiser als die, die wir bei dem Beelink SEi8 oder dem Intel NUC11 beobachten konnten, die beide über leistungsfähigere Hardware verfügen.
Wir können bis zu 34 dB(A) aufzeichnen, wenn die CPU unter Prime95 belastet wird. Bei längerem Surfen oder Videostreaming sollte man mit Lüftergeräuschen im Bereich von 31 dB(A) rechnen.
Lautstärkediagramm
| Idle |
| 24.2 / 24.2 / 24.2 dB(A) |
| Last |
| 25.1 / 33.9 dB(A) |
 | ||
30 dB leise 40 dB(A) deutlich hörbar 50 dB(A) störend |
||
min: | ||
| Beelink U59 Mini-S UHD Graphics (Jasper Lake 16 EU), Celeron N5095, Silicon Motion AZW 256G M.228 220426 C SATA 3 | Beelink SEi8 Iris Plus Graphics 655, i3-8109U, Intel SSD 660p SSDPEKNW512G8 | Intel NUC11TNKi5 Iris Xe G7 80EUs, i5-1135G7, Transcend M.2 SSD 430S TS512GMTS430S | Beelink U59 UHD Graphics (Jasper Lake 16 EU), Celeron N5095, Silicon Motion AZW 512G NV428 | Zotac ZBOX MI642 Nano UHD Graphics 620, i5-10210U, Western Digital WD Blue 3D WDBNCE5000PNC | |
|---|---|---|---|---|---|
| Geräuschentwicklung | -19% | -39% | -9% | -36% | |
| aus / Umgebung * (dB) | 23.3 | 24.5 -5% | 24.8 -6% | 24.5 -5% | 27.8 -19% |
| Idle min * (dB) | 24.2 | 26.5 -10% | 35.6 -47% | 24.5 -1% | 27.8 -15% |
| Idle avg * (dB) | 24.2 | 26.5 -10% | 35.6 -47% | 24.5 -1% | 33.9 -40% |
| Idle max * (dB) | 24.2 | 31.1 -29% | 35.6 -47% | 28.6 -18% | 33.9 -40% |
| Last avg * (dB) | 25.1 | 37.7 -50% | 36.2 -44% | 29.7 -18% | 43.7 -74% |
| Last max * (dB) | 33.9 | 37.5 -11% | 47.6 -40% | 37.6 -11% | 43.7 -29% |
| Witcher 3 ultra * (dB) | 38 | 30.4 |
* ... kleinere Werte sind besser
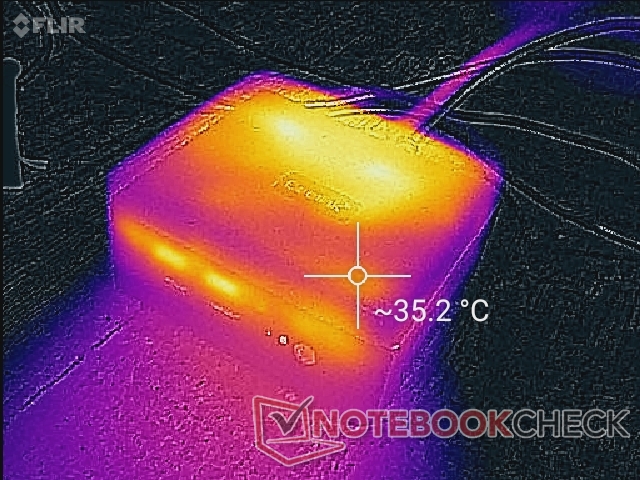
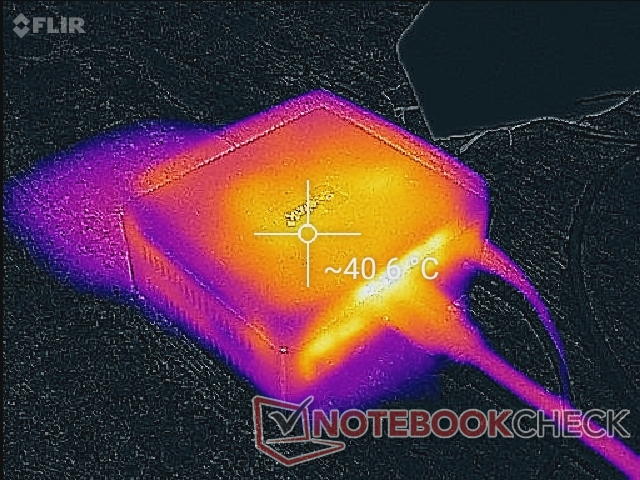
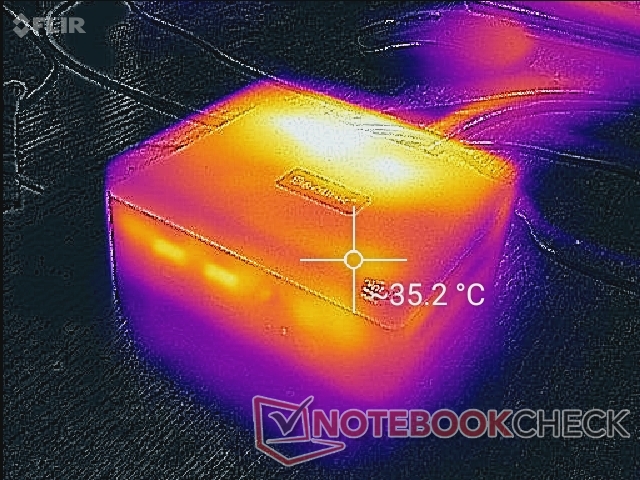
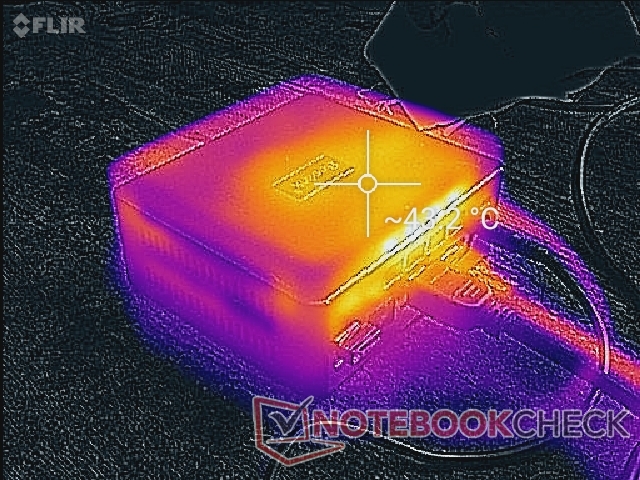
Temperatur
Die Oberflächentemperaturen sind mit bis zu 40 °C an der Oberseite auch im Leerlauf auf dem Desktop wärmer als erwartet. Bei anspruchsvoller Last steigt die Temperatur an der Oberseite nur geringfügig auf 43 °C an. Die hohe Oberflächentemperatur im Leerlauf kann auf den im Leerlauf laufenden Lüfter zurückgeführt werden, um das System so leise wie möglich zu halten, bis der Lüfter benötigt wird.
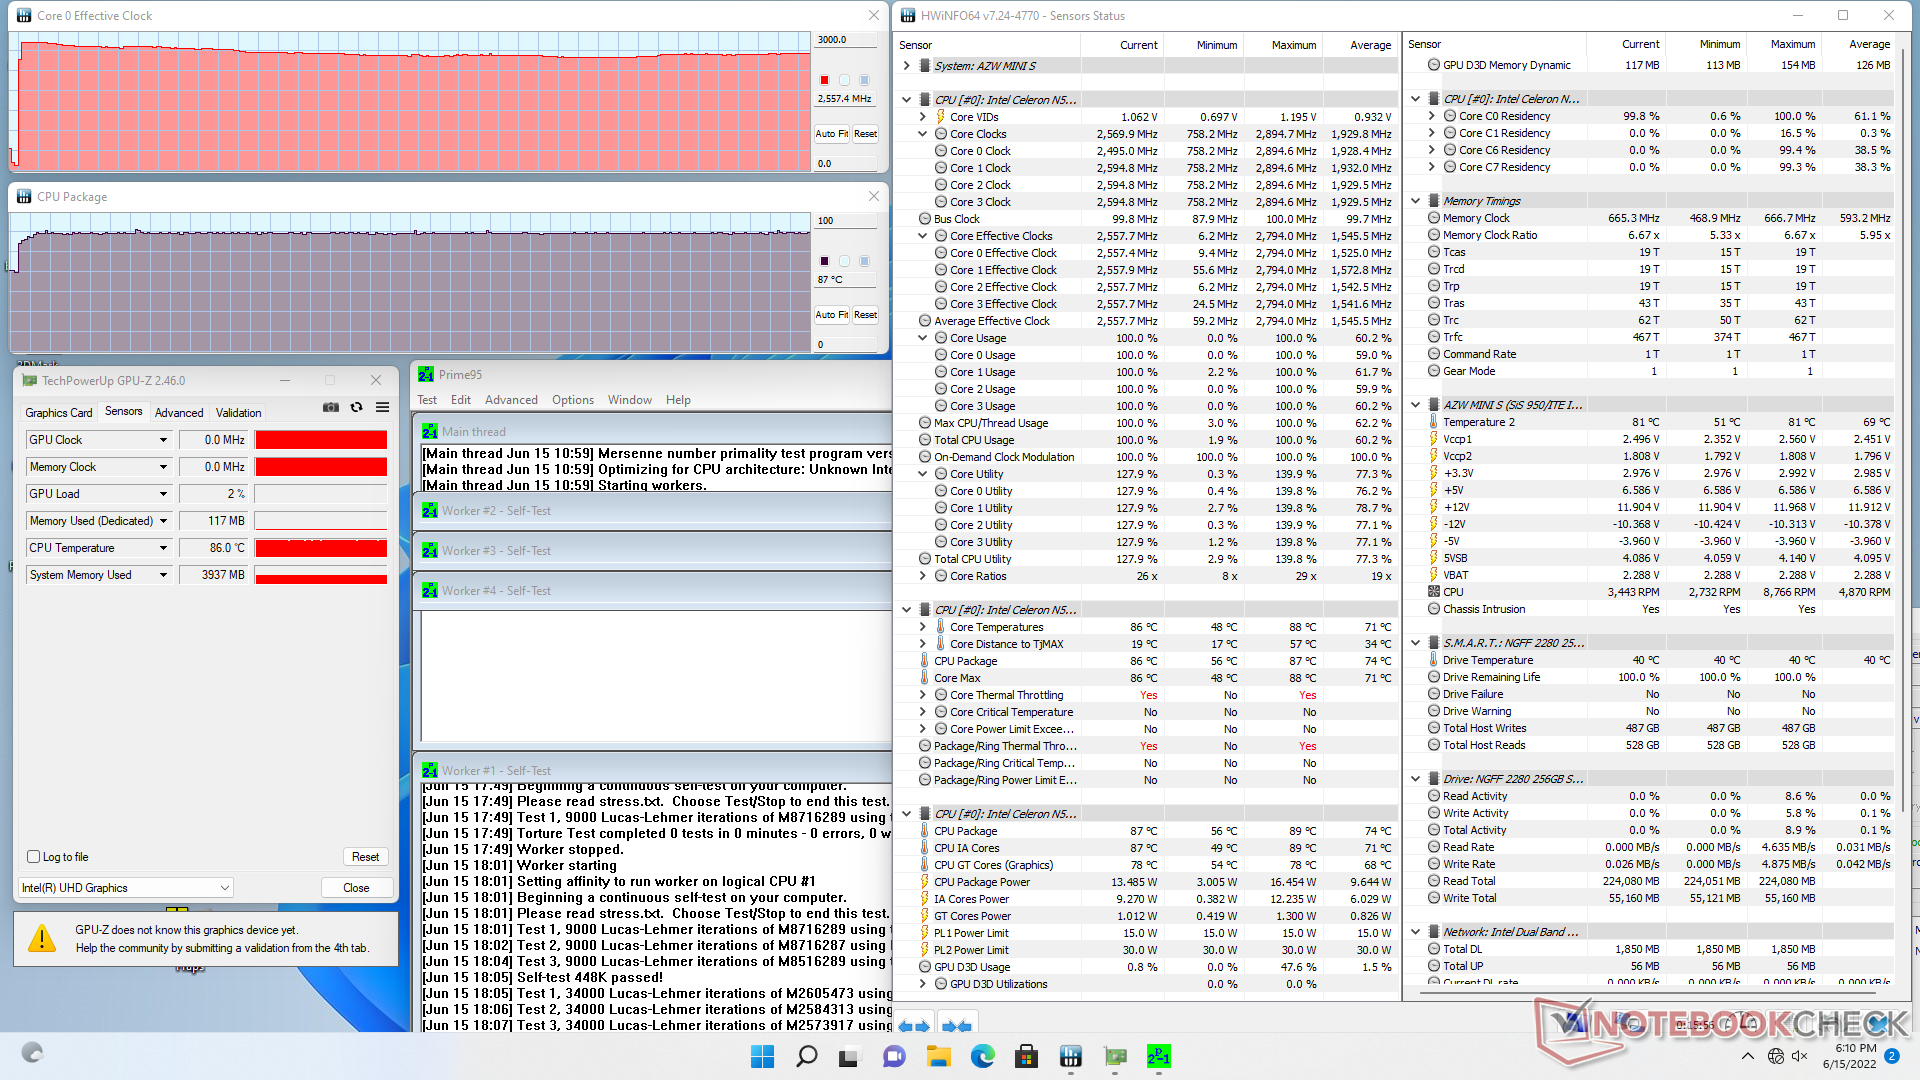
Stresstest
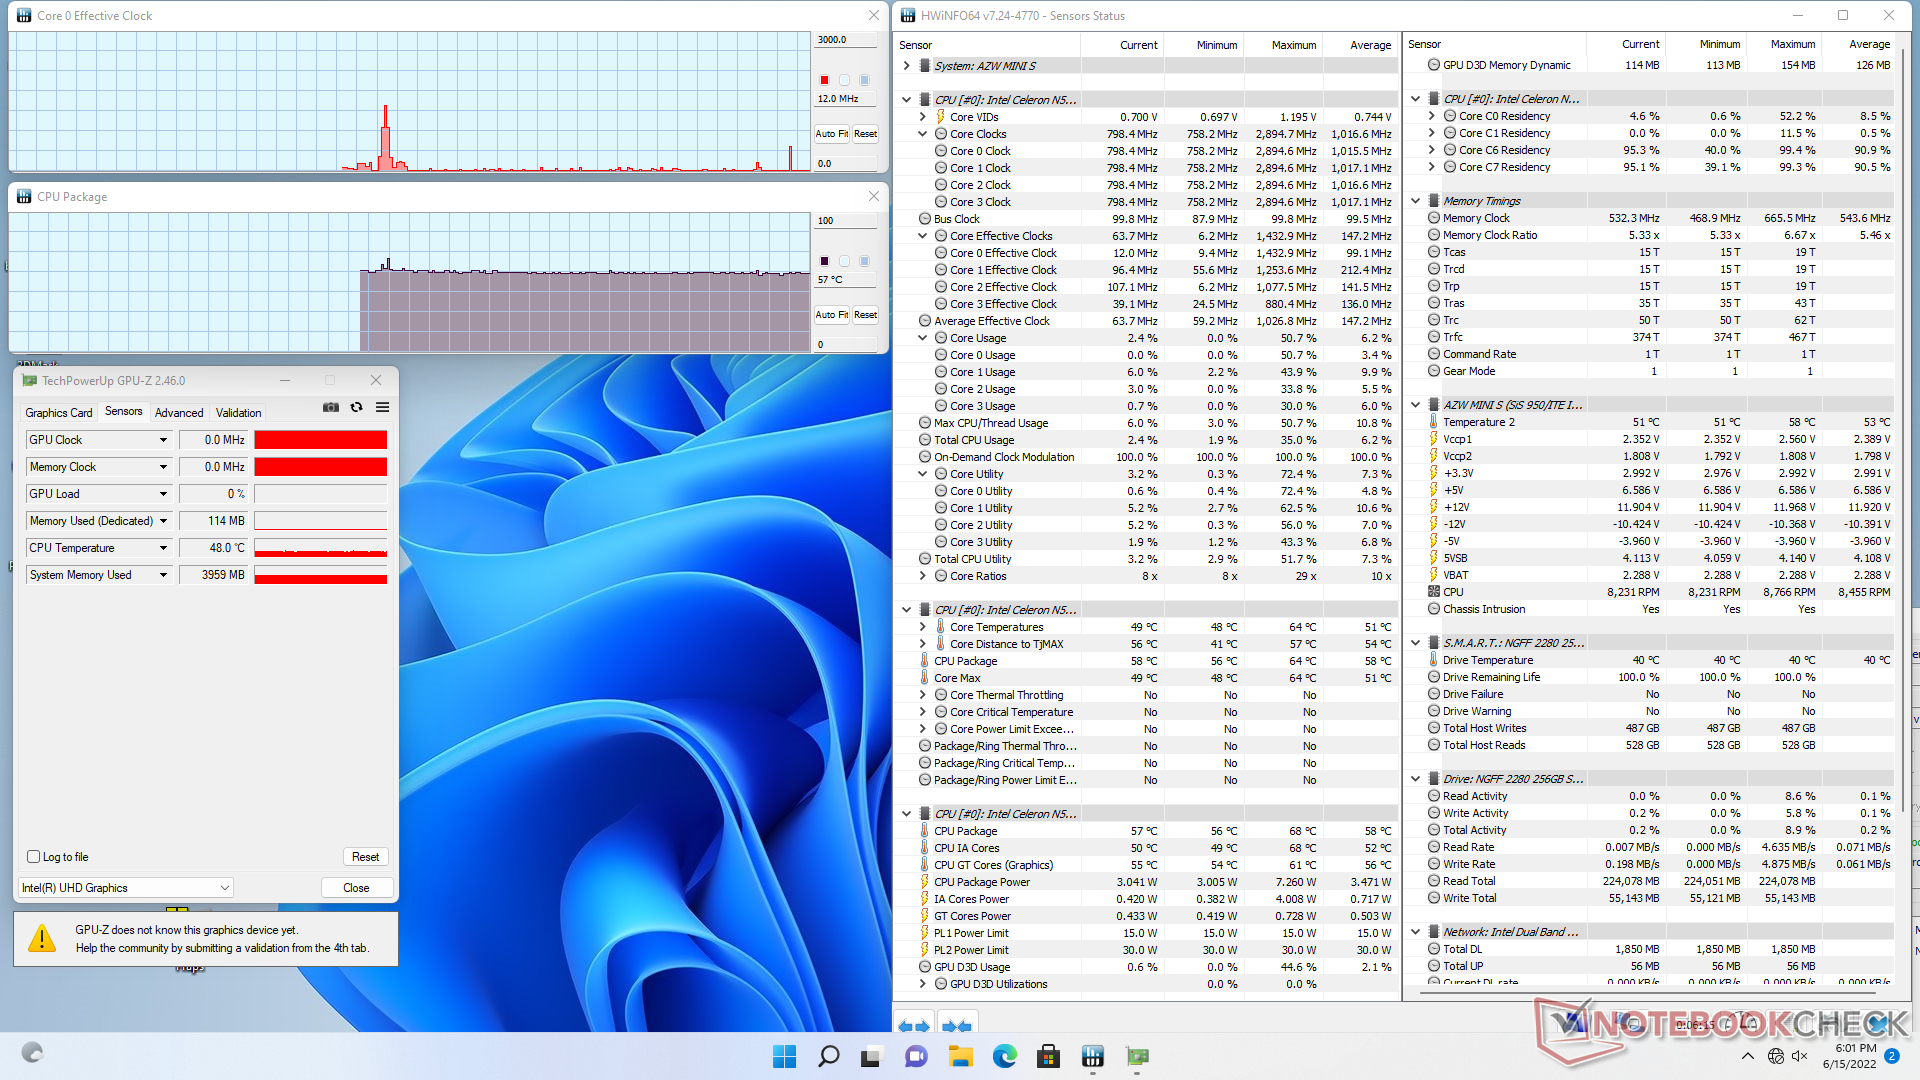
Wenn Prime95 ausgeführt wird, steigen die CPU-Taktraten und die Temperatur auf 2,8 GHz bzw. 87 °C. Die Taktraten fielen nach kurzer Zeit auf 2,5 bis 2,6 GHz, um die Kerntemperatur von 87 °C zu halten. Die Leistungsaufnahme der CPU lag zu Beginn des Tests bei bis zu 16 W, bevor sie sich aufgrund der thermischen Beschränkungen bei 13 W stabilisierte.
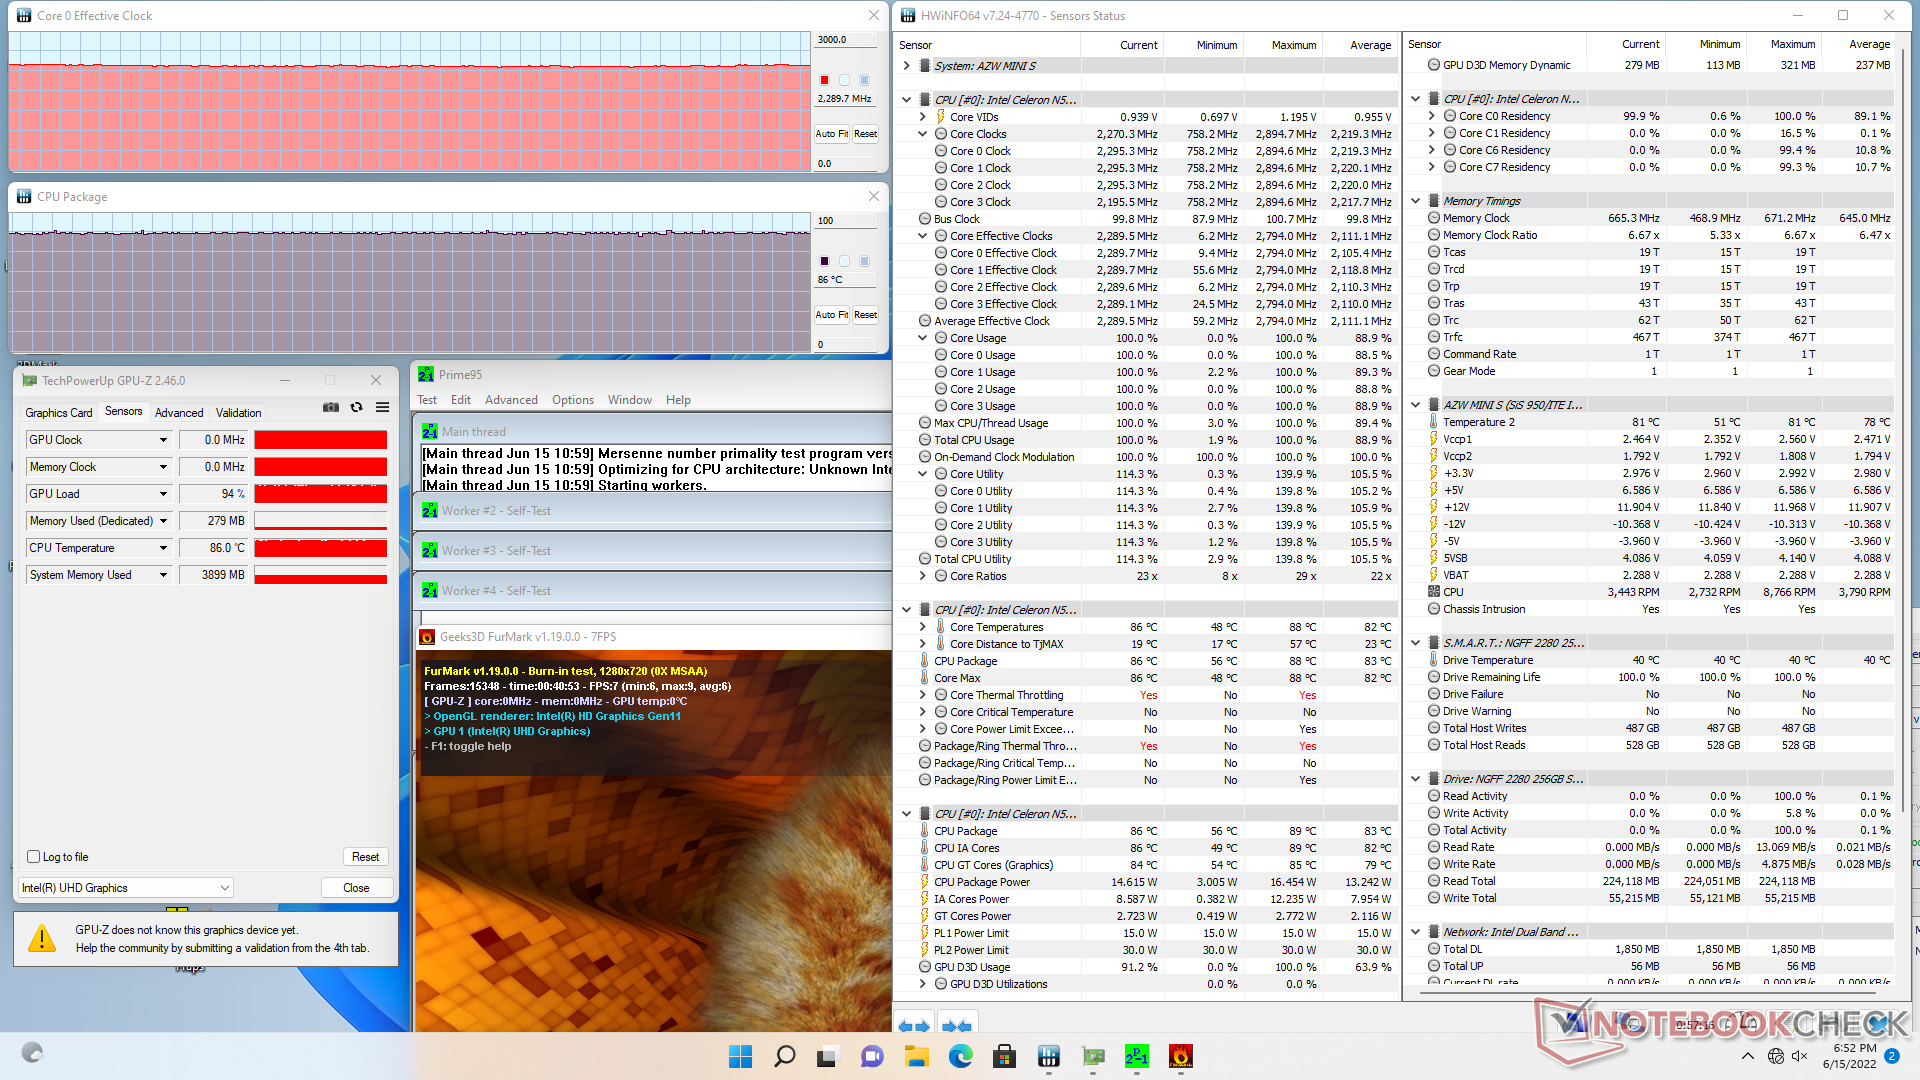
| CPU-Takt (GHz) | GPU-Takt (MHz) | durchschnittliche CPU-Temperatur (°C) | |
| System Leerlauf | -- | -- | 57 |
| Prime95 Stress | 2,6 | -- | 87 |
| Prime95 + FurMark Stress | 2,3 | -- | 86 |
Energieverwaltung - Sehr Effizient
Stromverbrauch
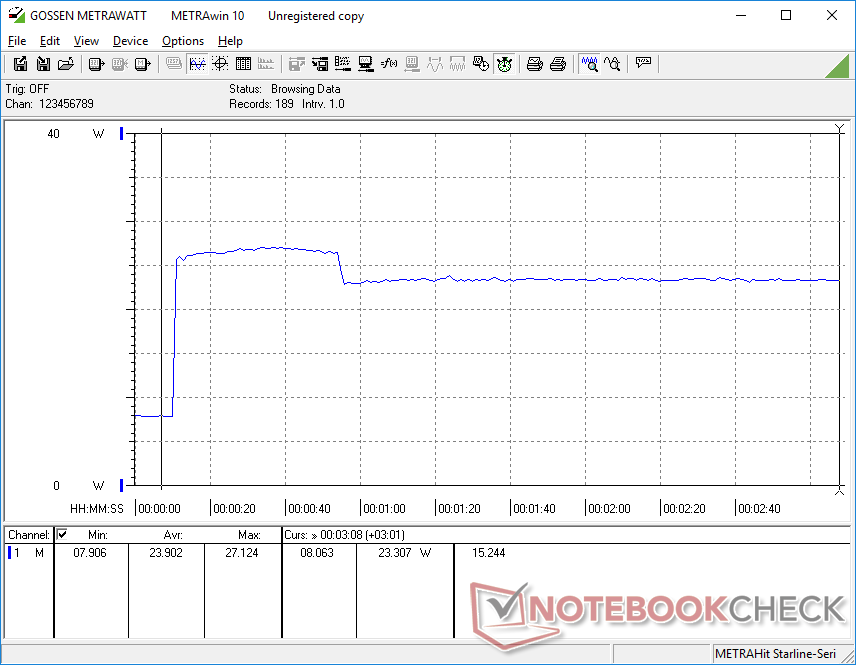
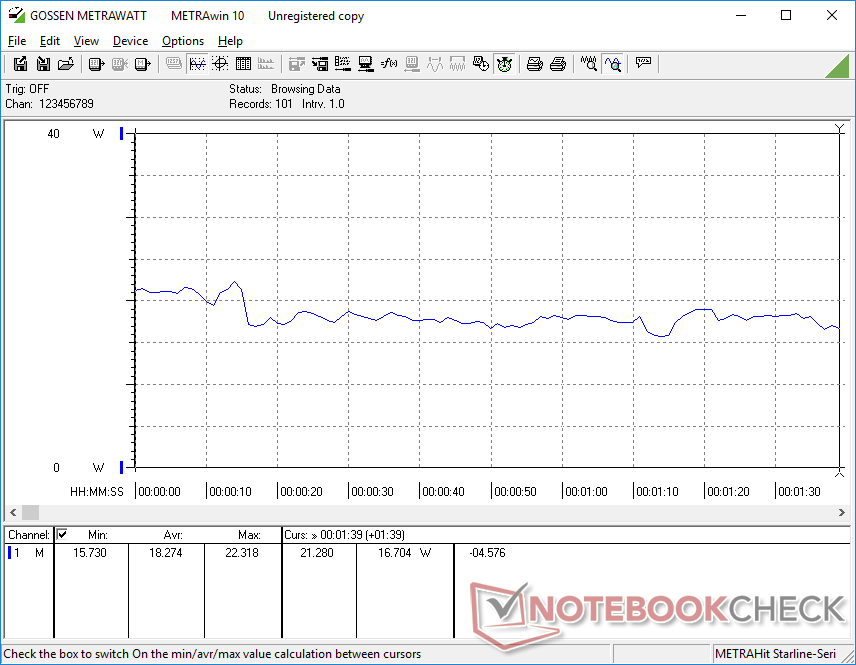
Das Gerät verbraucht im Leerlauf auf dem Desktop ohne laufende Anwendungen etwa 7 bis 8 W. Das ist effizienter als der Intel NUC11 mit Core i5 der 11. Generation oder der mit einem 10.-Gen.-Core-i5 bestückte Zotac ZBox Nano. Bei anspruchsvolleren Anwendungen wie Spielen verbraucht das System im Durchschnitt nur 18 W im Vergleich zu 41 W bzw. 33 W bei den oben genannten Modellen von Intel und Zotac. Natürlich ist die GPU-Leistung beim Beelink Mini-S deutlich langsamer, weshalb der geringere Stromverbrauch zu erwarten ist.
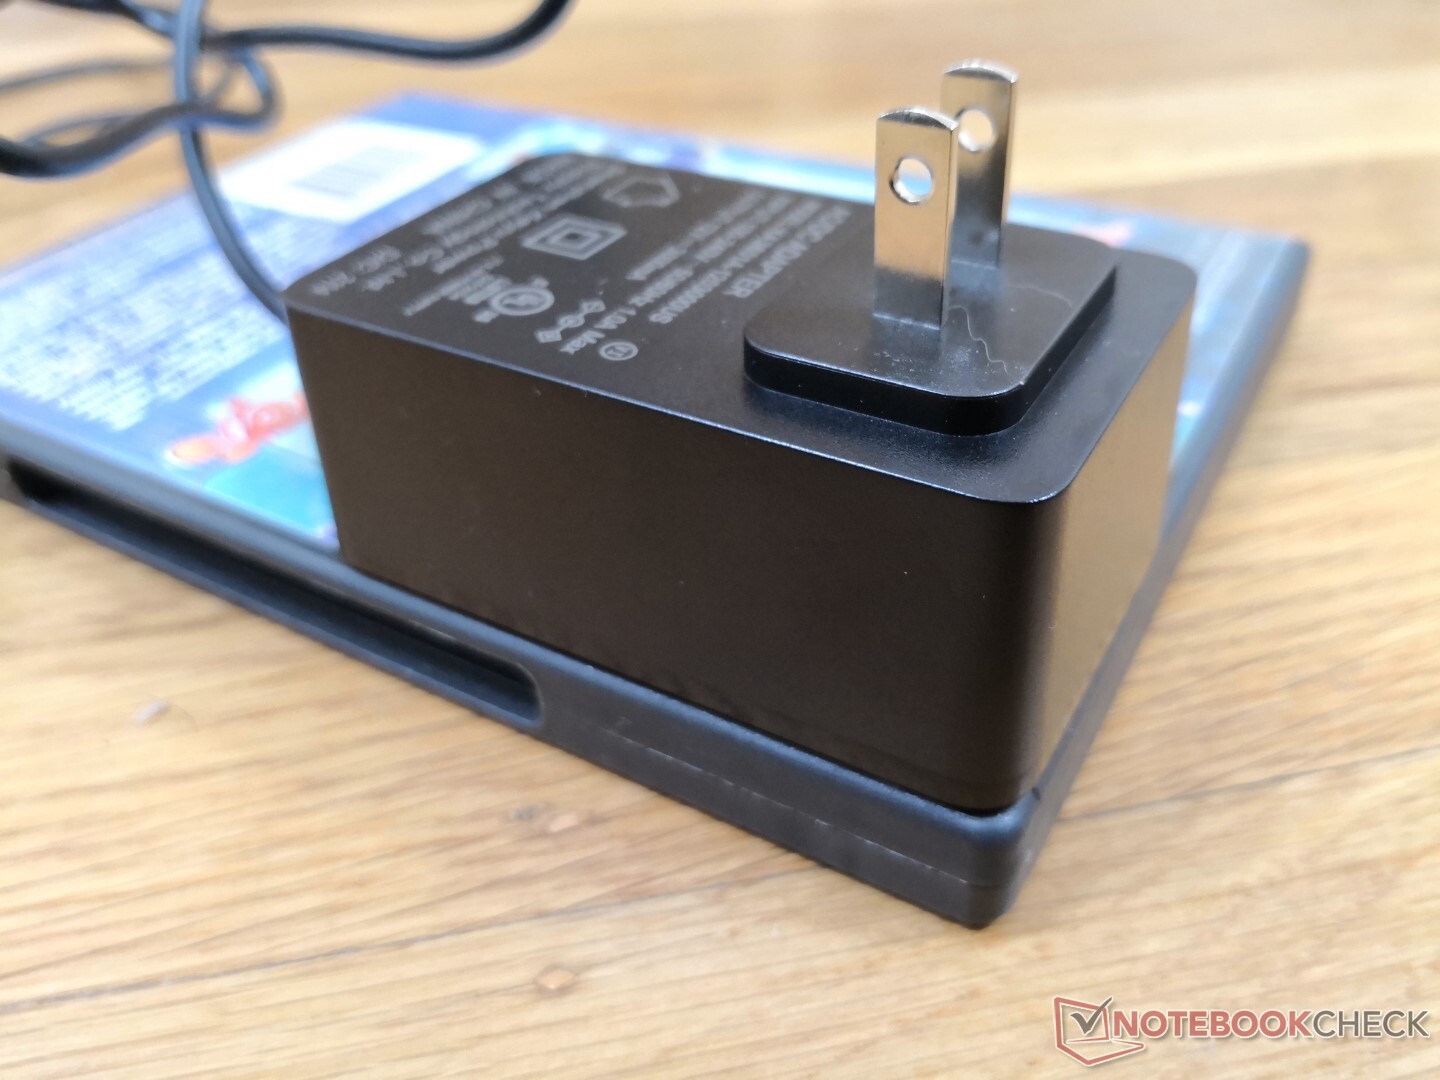
Mit dem kleinen (~7,9 x 4,8 x 3,4 cm) 36-W-Netzteil konnten wir eine maximale Leistungsaufnahme von 27 W messen. Es handelt sich dabei um das gleiche Netzteil, das auch im Lieferumfang des originalen U59 enthalten ist.
| Aus / Standby | |
| Idle | |
| Last |
|
Legende:
min: | |
| Beelink U59 Mini-S Celeron N5095, UHD Graphics (Jasper Lake 16 EU), Silicon Motion AZW 256G M.228 220426 C SATA 3, , x, | Beelink SEi8 i3-8109U, Iris Plus Graphics 655, Intel SSD 660p SSDPEKNW512G8, , x, | Intel NUC11TNKi5 i5-1135G7, Iris Xe G7 80EUs, Transcend M.2 SSD 430S TS512GMTS430S, , x, | Beelink U59 Celeron N5095, UHD Graphics (Jasper Lake 16 EU), Silicon Motion AZW 512G NV428, , x, | GMK NucBox 3 Celeron J4125, UHD Graphics 600, Netac S535N8/256GYN, , x, | Zotac ZBOX MI642 Nano i5-10210U, UHD Graphics 620, Western Digital WD Blue 3D WDBNCE5000PNC, , x, | |
|---|---|---|---|---|---|---|
| Stromverbrauch | -43% | -101% | 6% | 42% | -56% | |
| Idle min * (Watt) | 7 | 7.5 -7% | 11.5 -64% | 6.7 4% | 3 57% | 8.9 -27% |
| Idle avg * (Watt) | 7 | 7.6 -9% | 12.4 -77% | 6.7 4% | 3.1 56% | 9 -29% |
| Idle max * (Watt) | 7.6 | 9.2 -21% | 12.9 -70% | 7.4 3% | 3.6 53% | 9.9 -30% |
| Last avg * (Watt) | 18.3 | 41.1 -125% | 40.7 -122% | 16 13% | 11.1 39% | 33 -80% |
| Last max * (Watt) | 27.1 | 41.4 -53% | 73.5 -171% | 25.6 6% | 25.4 6% | 58 -114% |
| Witcher 3 ultra * (Watt) | 43.9 | 13.1 |
* ... kleinere Werte sind besser
Power Consumption Witcher 3 / Stresstest
Power Consumption external Monitor
Pro
Contra
Fazit - Für preiswerte HTPC-Konfigurationen
Mit einem Preis von knapp über 200 US-Dollar ist der Beelink U59 Mini-S einer der günstigsten Mini-PCs, die man finden kann und die voll ausgestattet sind mit RAM, Speicher und Windows 11. Bei diesem niedrigen Preis kann der Mini-S eine gute Option für Benutzer sein, die nicht bereit sind, Hunderte von Euro für einen schnelleren Core-ix-Mini-PC auszugeben und die sich nicht mit digitalen Medien-Dongles wie Chromecast, Roku oder Amazon Fire TV zufriedengeben wollen. Der Celeron N5905 ist zwar nicht besonders schnell, aber immer noch schneller als jede Atom Option auf dem Markt und sorgt für einen relativ reibungslosen Betrieb sowie exzellentes 4K-Videostreaming mit 60 fps.
Zu den bemerkenswerten Highlights des Mini-S gehören neben dem günstigen Preis auch die interne Dual-Storage-Option und das sehr leise Lüftergeräusch.
Es sind eine Menge Abstriche zu machen, die sich hauptsächlich auf die fehlenden Funktionen des Modells beziehen. Es gibt keinen SD-Kartenleser, kein USB-C, Wi-Fi 6 oder Dual-Channel-RAM. Das Kabel des Netzteils ist mit nur etwa einem Meter auch etwas kurz. Glücklicherweise beeinträchtigen diese Defizite das HTPC-Kernerlebnis nicht allzu sehr.
Preis und Verfügbarkeit
Das Beelink U59 Mini-S ist auf Amazon erhältlich für 256 Euro oder 302 Euro über die offizielle Beelink-Websitehttps://www.bee-link.com/catalog/product/buy?id=298.
Preisvergleich

