Intel Celeron N5095 Jasper Lake im Benchmarking-Test: Beelink U59 Mini-PC Test

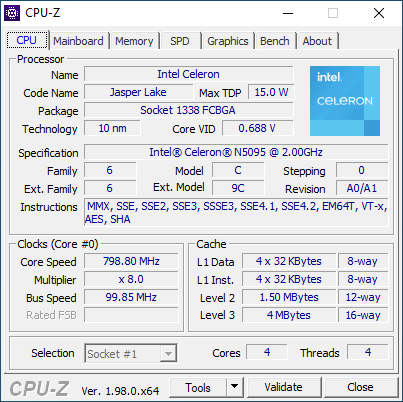
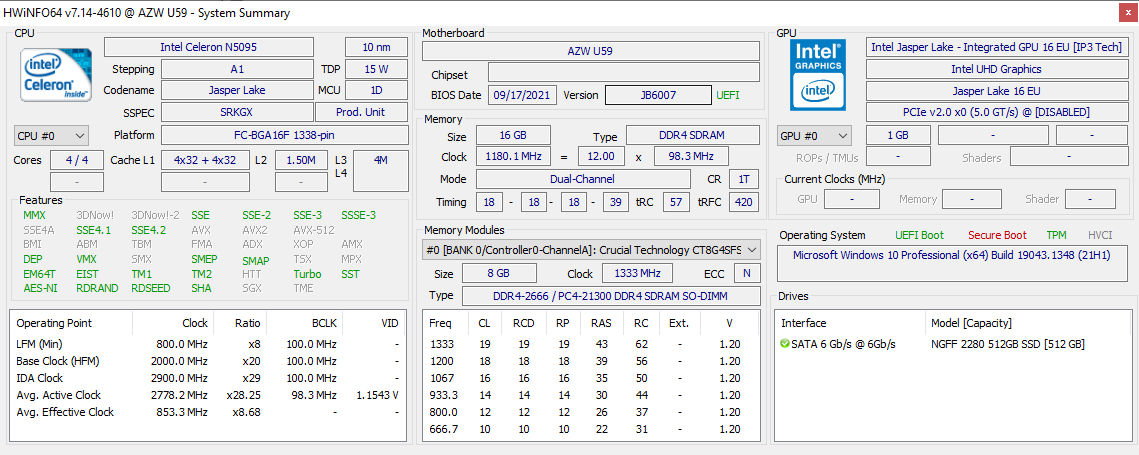
Beelink hat vor Kurzem seinen Mini-PC U59 als Nachfolger des U55 der letzten Generation vorgestellt. Das System ist mit Intels neuem Quad-Core Celeron N5095 ausgestattet, der die älteren Celeron N4500, J4125 oder N4120 ersetzt, welche in anderen Mini-PCs in dieser Preisklasse (300 USD) zu finden sind.
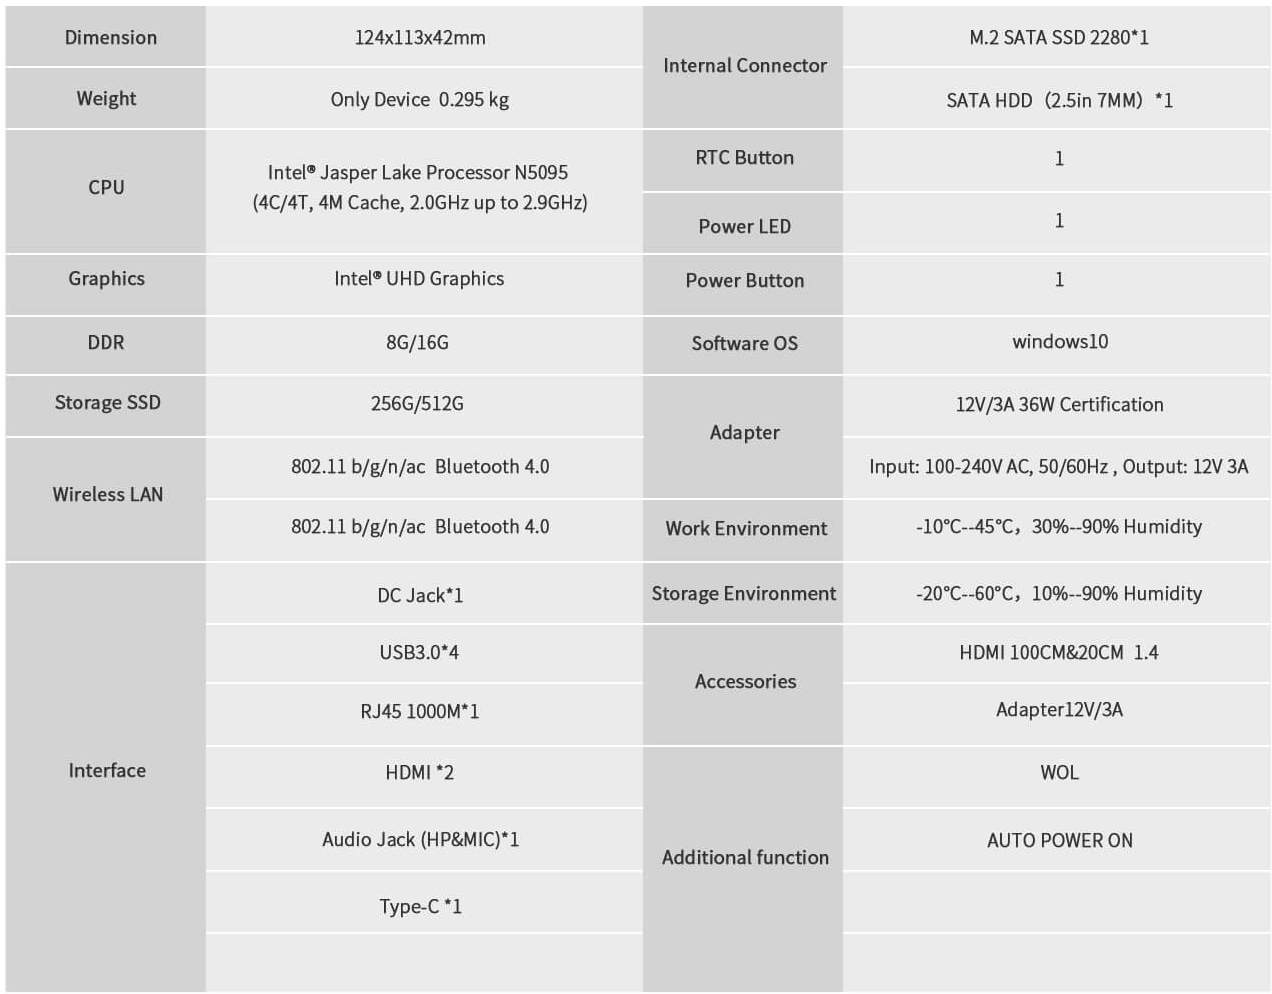
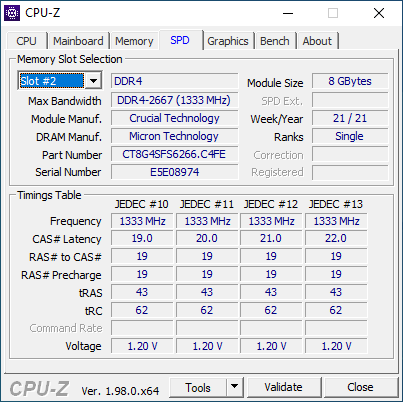
Unsere spezielle Testkonfiguration mit 16 GB Dual-Channel-RAM und 512-GB-M.2-SSD ist online für 349 US-Dollar erhältlich, während eine geringere Konfiguration mit der Hälfte des RAM und des Speichers für nur 279 US-Dollar zu haben ist. Weitere Spezifikationen zum U59 finden Sie auf der offiziellen Produktseite hier.
Mehr Beelink Bewertungen:
Mögliche Konkurrenten im Vergleich
Bew. | Datum | Modell | Gewicht | Dicke | Größe | Auflösung | Preis ab |
|---|---|---|---|---|---|---|---|
v (old) | 12 / 2021 | Beelink U59 Celeron N5095, UHD Graphics (Jasper Lake 16 EU) | 329 g | 42 mm | x | ||
v (old) | 04 / 2021 | Intel NUC11TNKi5 i5-1135G7, Iris Xe G7 80EUs | 504 g | 37 mm | x | ||
v (old) | 11 / 2018 | Intel NUC8i7BE i7-8559U, Iris Plus Graphics 655 | 683 g | 51 mm | x | ||
v (old) | 12 / 2020 | Beelink SEi10 i3-1005G1, UHD Graphics G1 (Ice Lake 32 EU) | 350 g | 41 mm | x | ||
v (old) | 10 / 2020 | Zotac ZBOX MI642 Nano i5-10210U, UHD Graphics 620 | 472 g | 51 mm | x | ||
v (old) | 10 / 2020 | GMK NucBox K1 Celeron J4125, UHD Graphics 600 | 130 g | 42 mm | x |
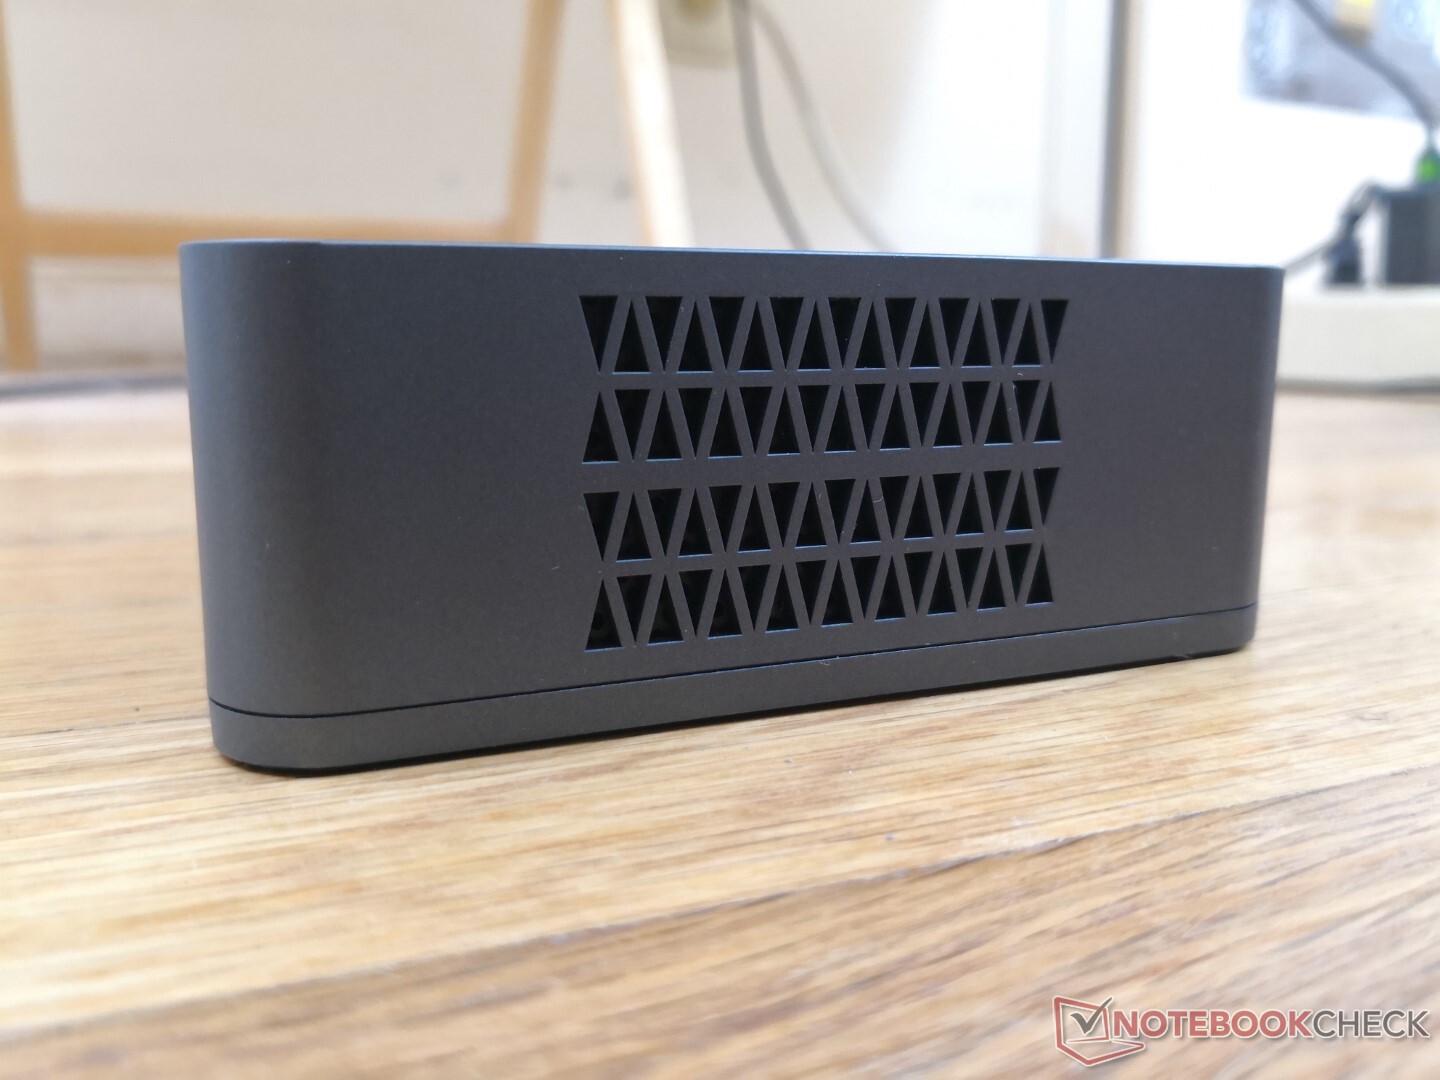
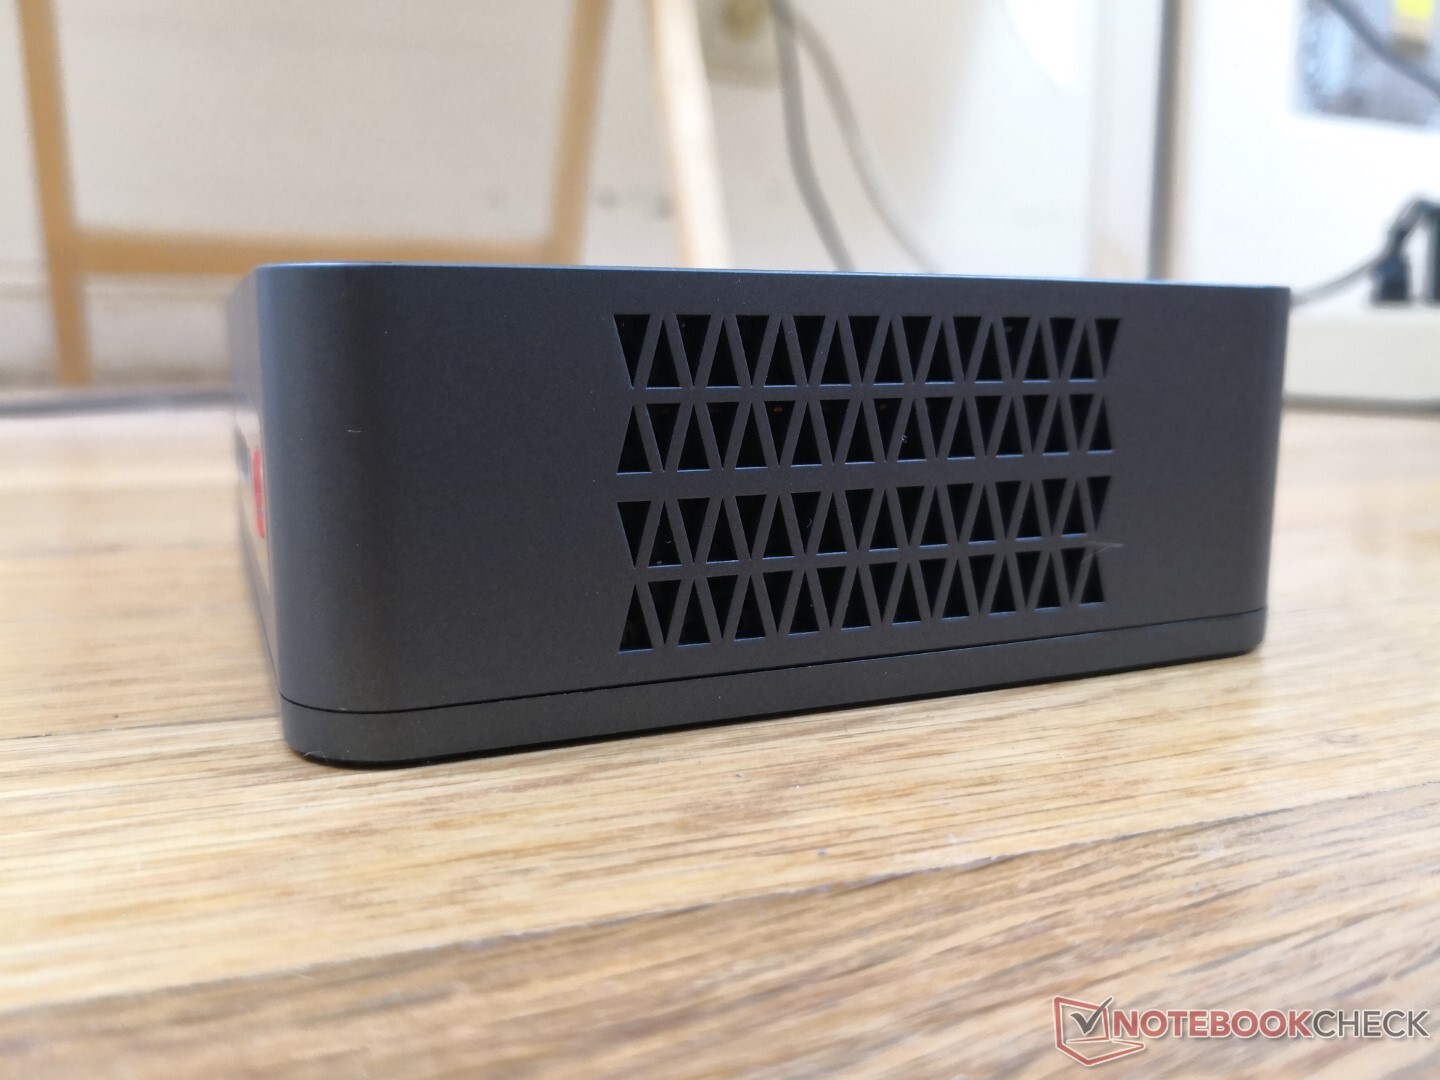
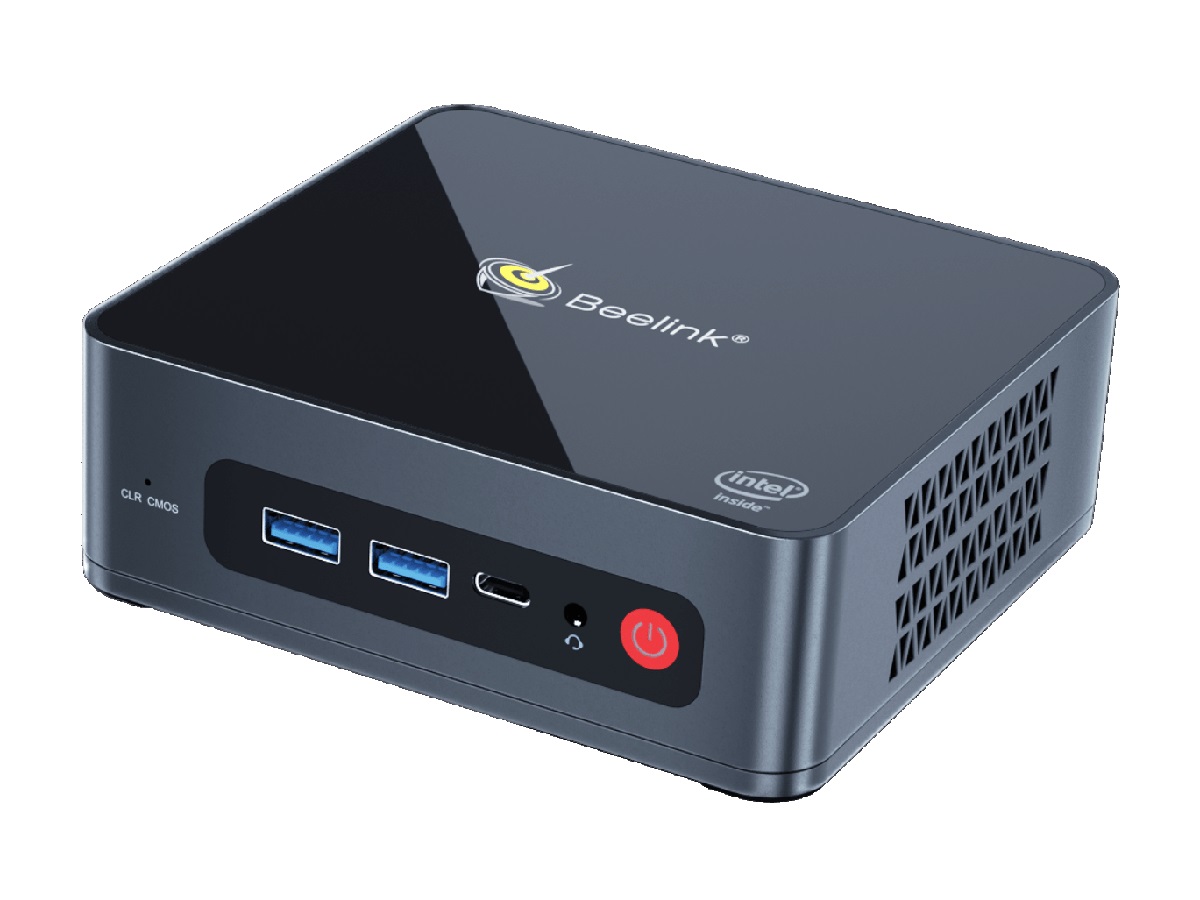
Gehäuse
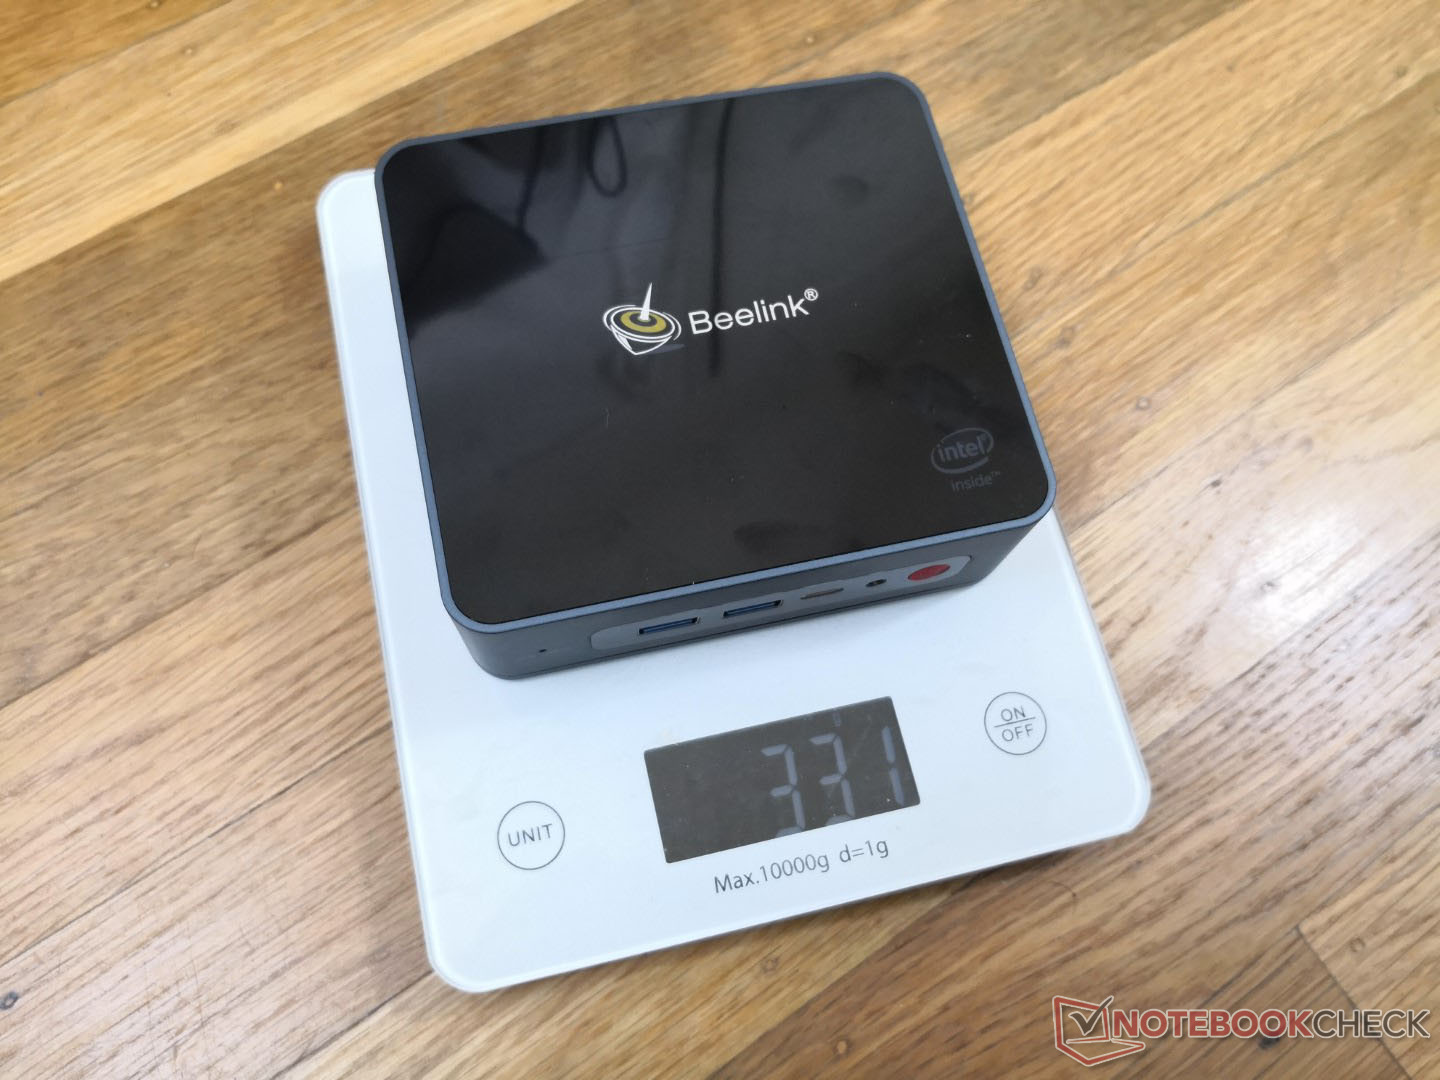
Beelink verwendet ein ähnliches Gehäuse-Design zwischen seiner U59 und AMD-basierten SER3-Mini-PC-Serie. Beim U59 besteht die Oberseite jedoch einfach aus glänzendem Kunststoff ohne die Metallgitter oder den verchromten Rand wie beim SER3, was für einen gedämpften Look sorgt. Die Kunststoffoberfläche sieht auf den ersten Blick gut aus, aber selbst die kleinsten Kratzer oder Fingerabdrücke lassen sich nur schwer verbergen. Außerdem lässt sie sich in der Mitte leichter biegen als andere, dickere Mini-PCs wie die GMK NucBox 2 oder Intel-NUC-Serie.
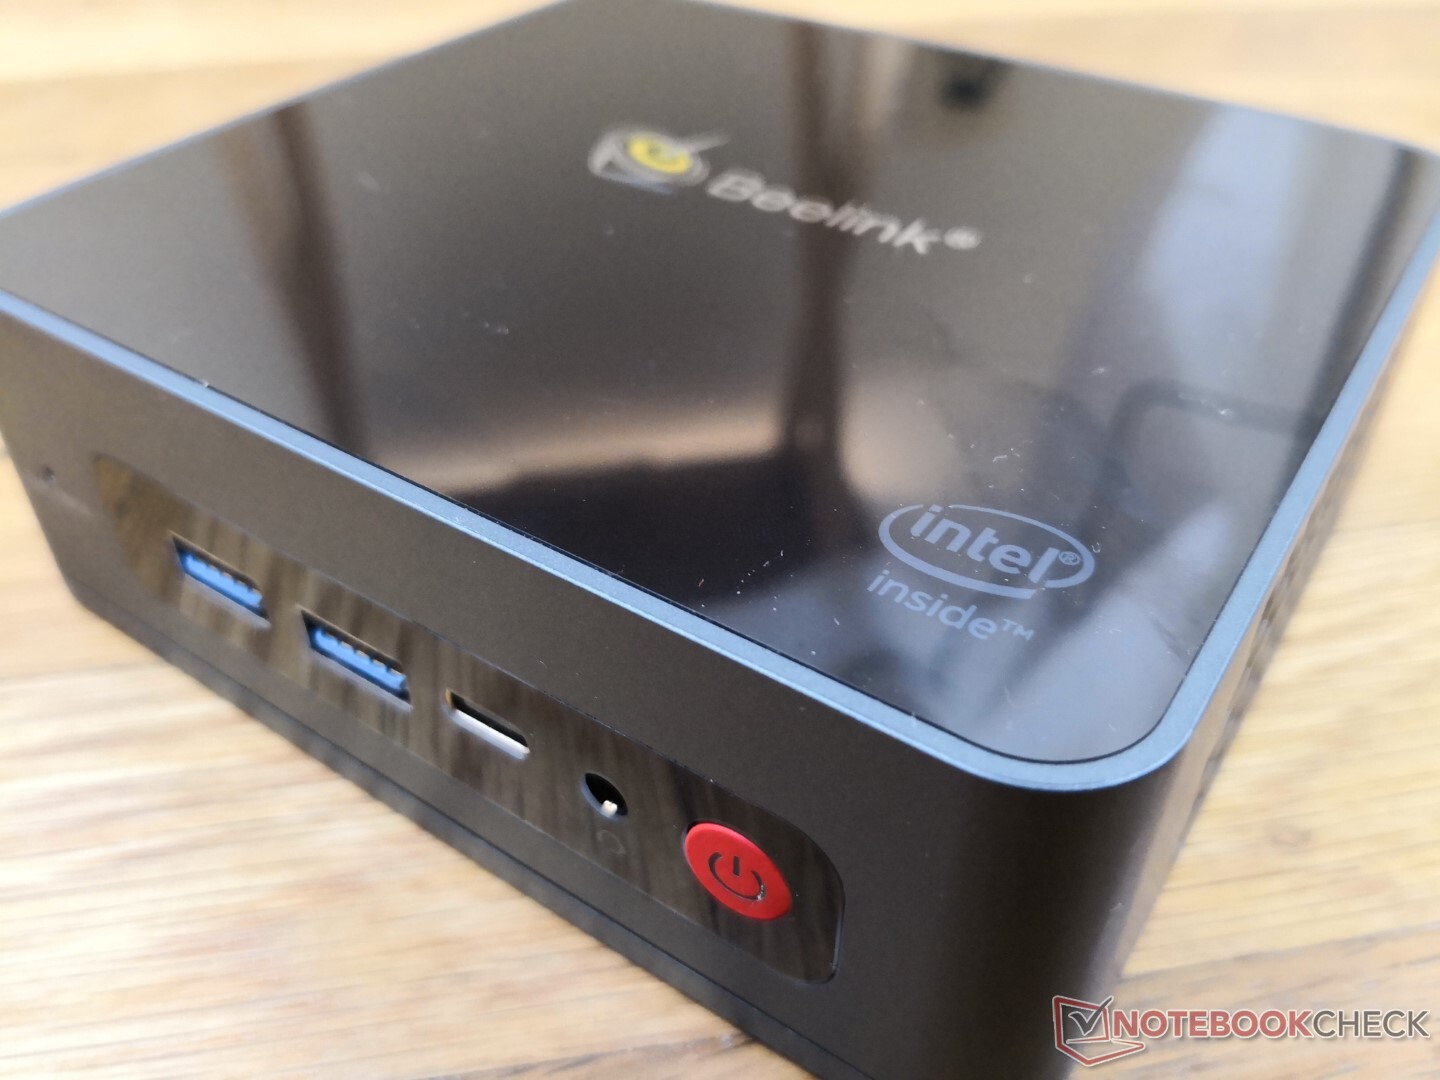

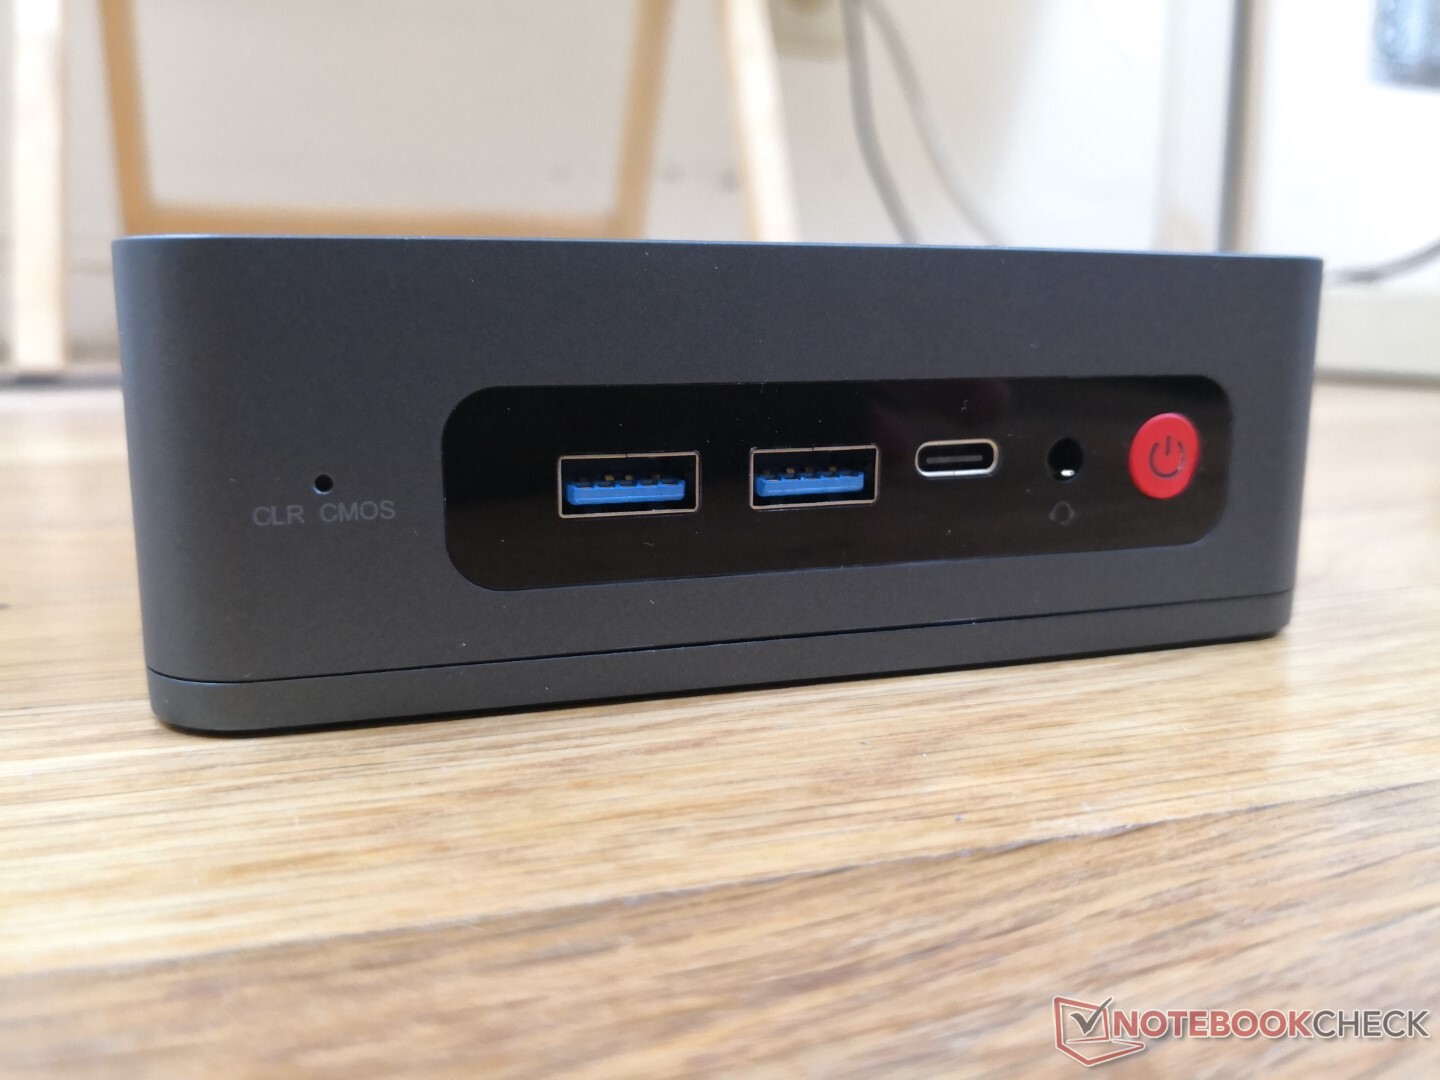
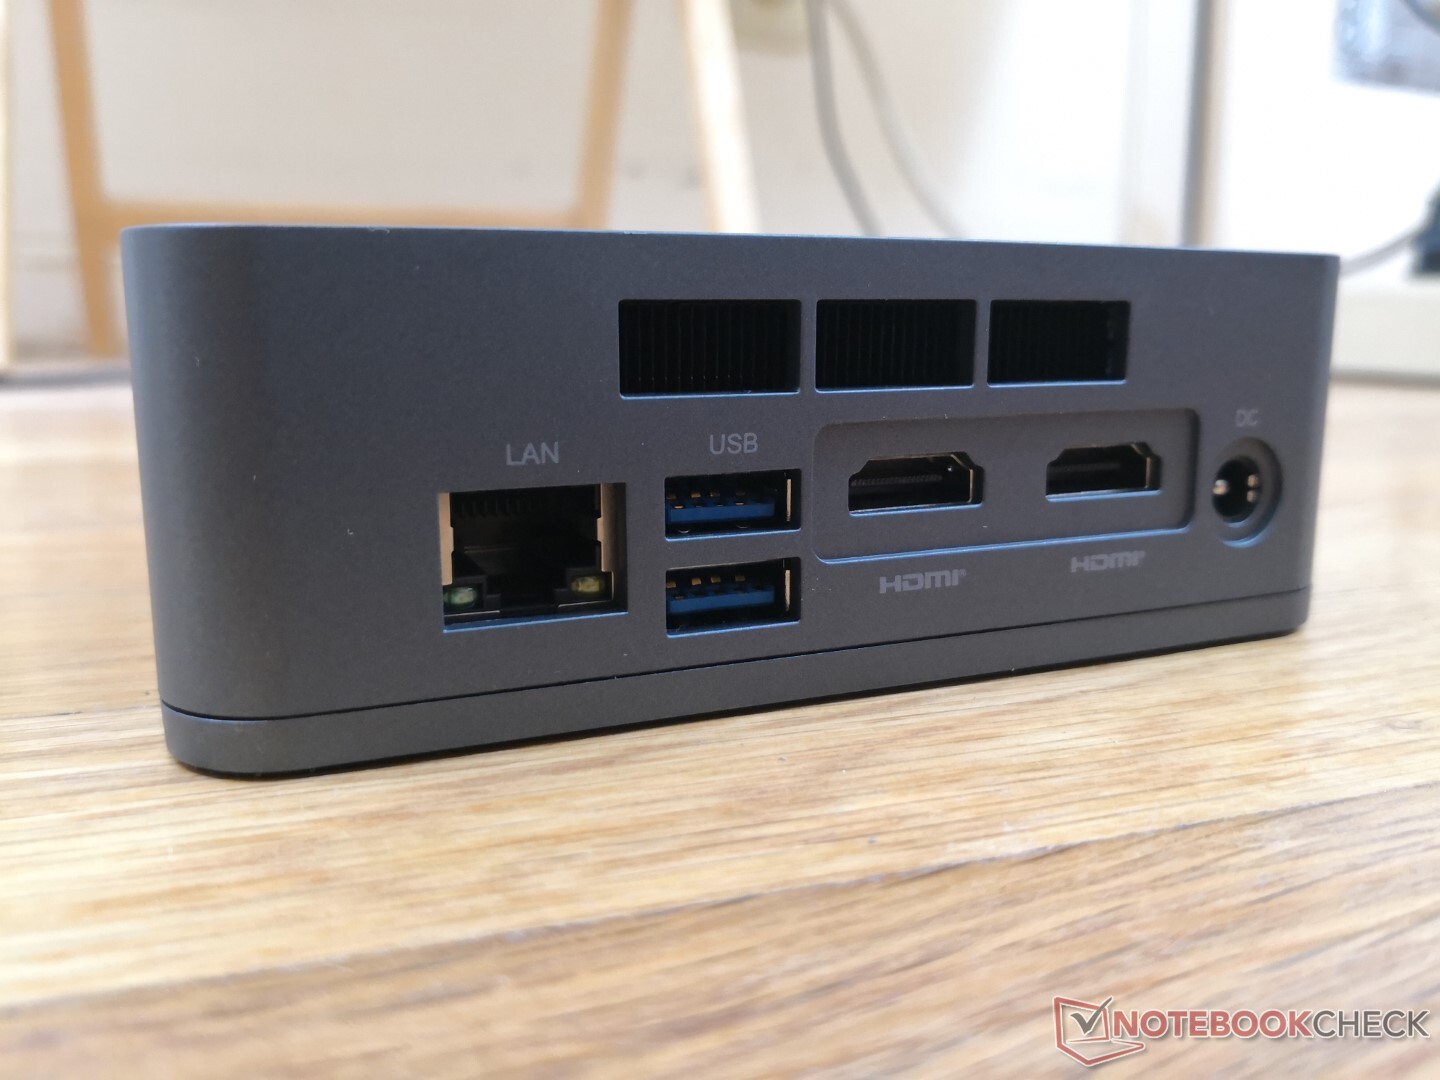
Anschlussausstattung
Die physischen Anschlussoptionen sind identisch mit denen des Beelink SEi10 jedoch mit Ausnahme der Thunderbolt-Unterstützung. Sowohl DisplayPort-over-USB-C als auch eine 4K60-Ausgabe werden unterstützt.
Kommunikation
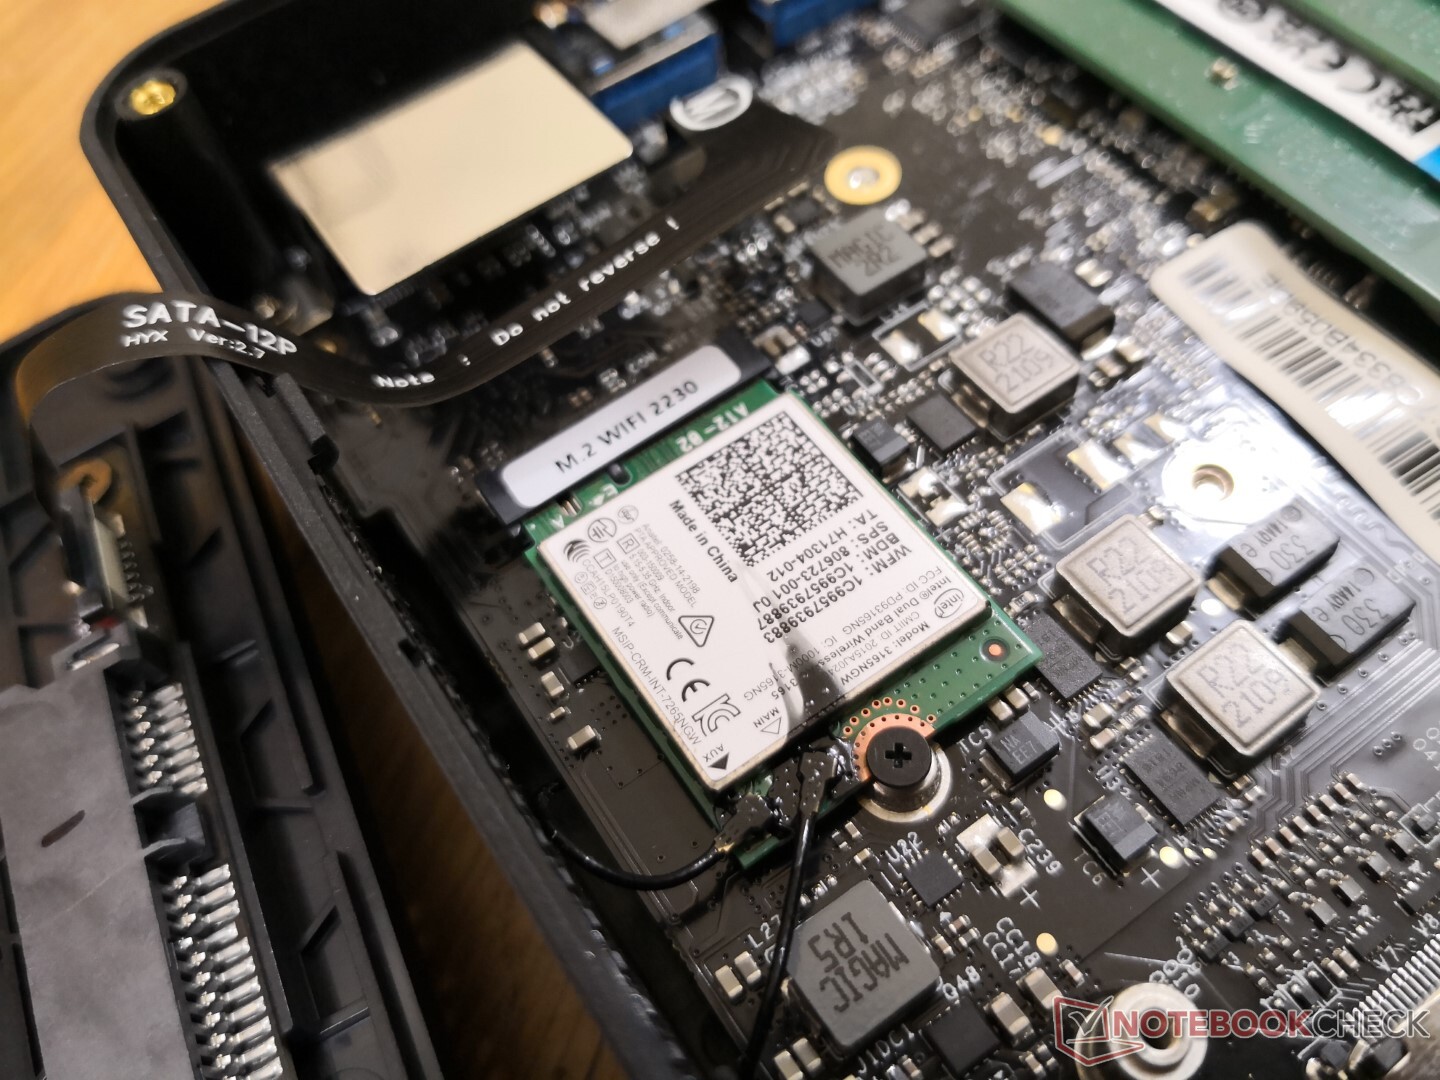
Der sieben Jahre alte Intel 3165 kommt standardmäßig für Wi-Fi-5-Anschlüsse mit bis zu theoretischen 433 Mbps. Die Performance ist stabil, wenn auch um über ein Gigabit langsamer als moderne Wi-Fi-6-Module.
| Networking | |
| iperf3 transmit AX12 | |
| Intel NUC11TNKi5 | |
| Beelink SEi10 | |
| Intel NUC8i7BE | |
| Beelink U59 | |
| GMK NucBox K1 | |
| iperf3 receive AX12 | |
| Intel NUC11TNKi5 | |
| Beelink SEi10 | |
| Intel NUC8i7BE | |
| GMK NucBox K1 | |
| Beelink U59 | |
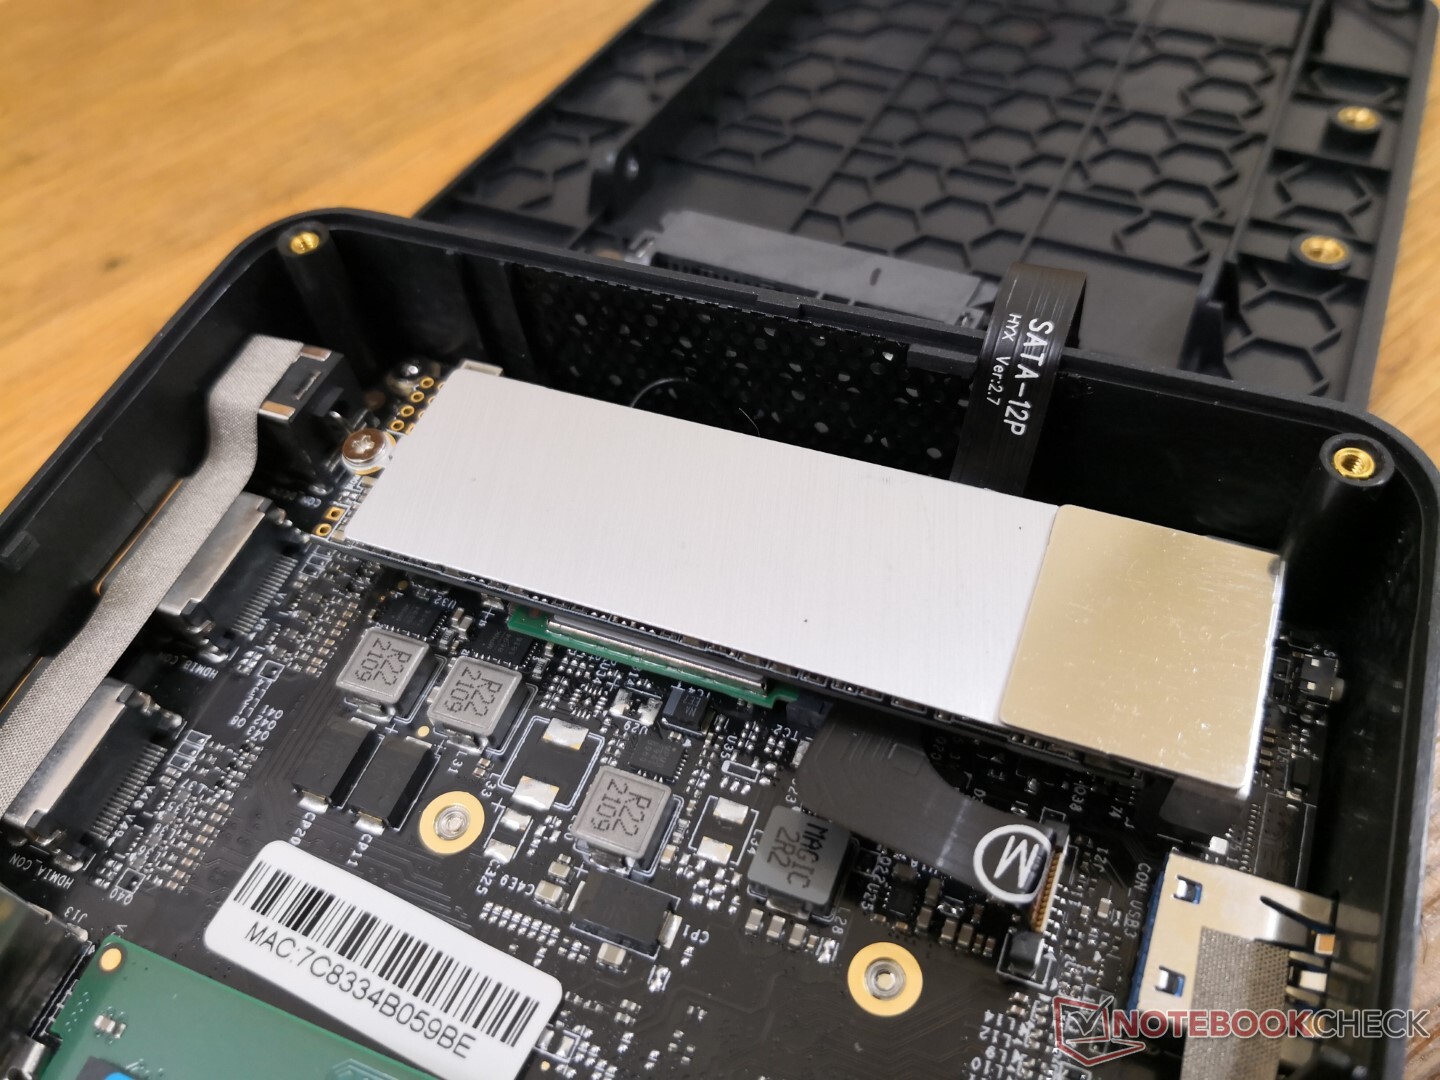
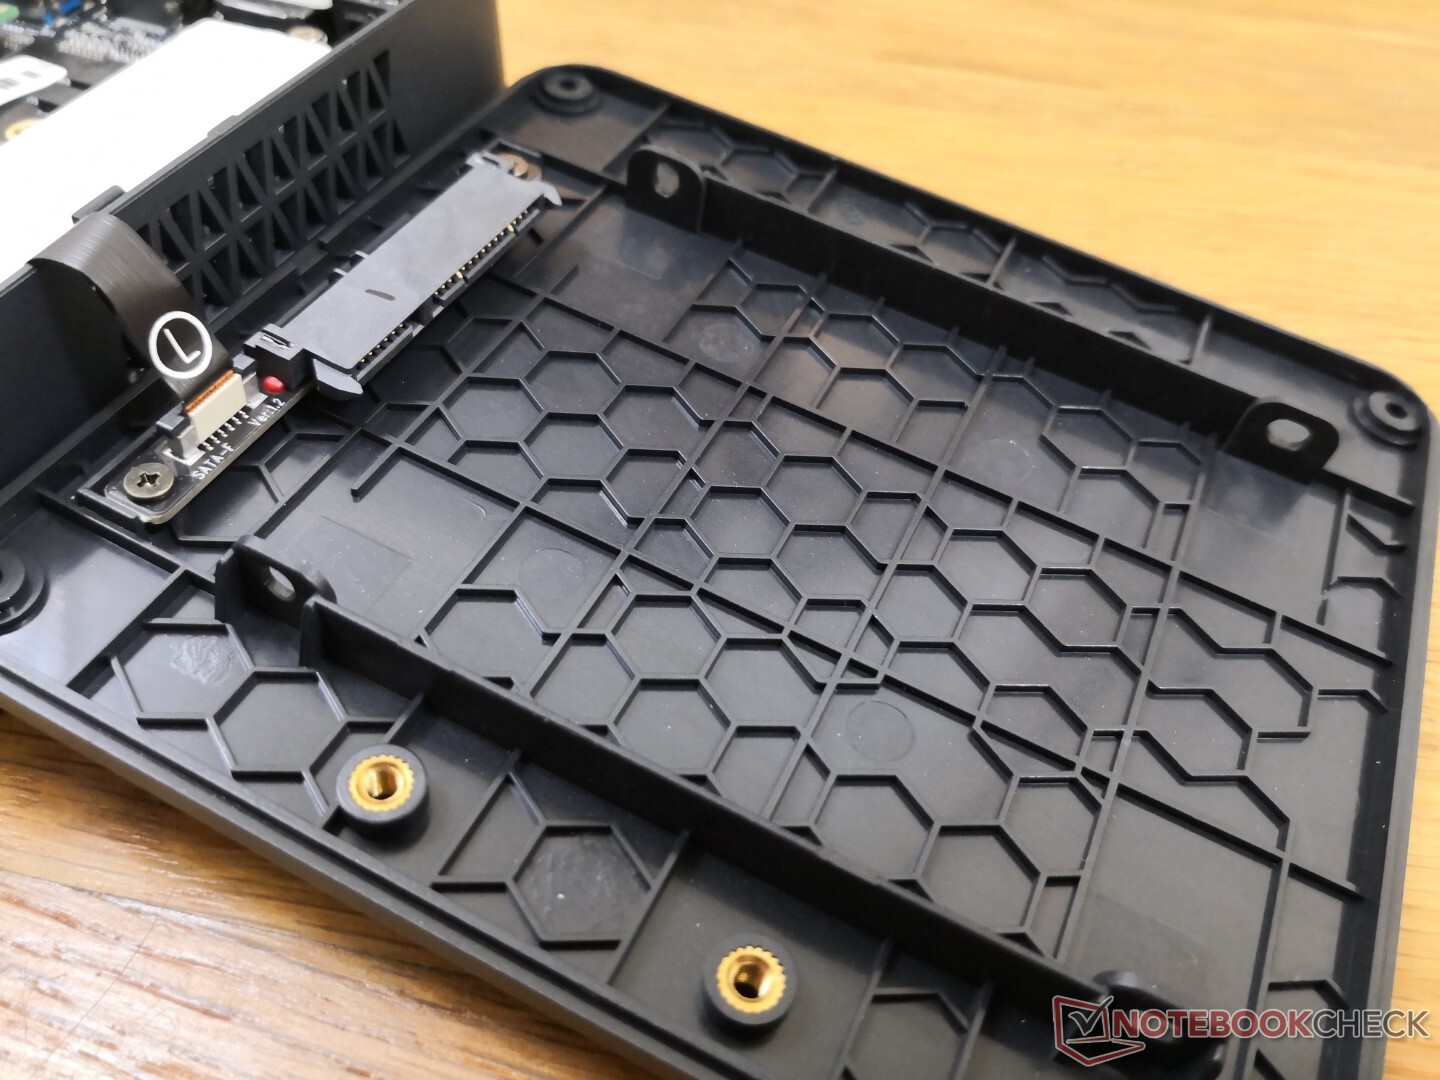
Wartung
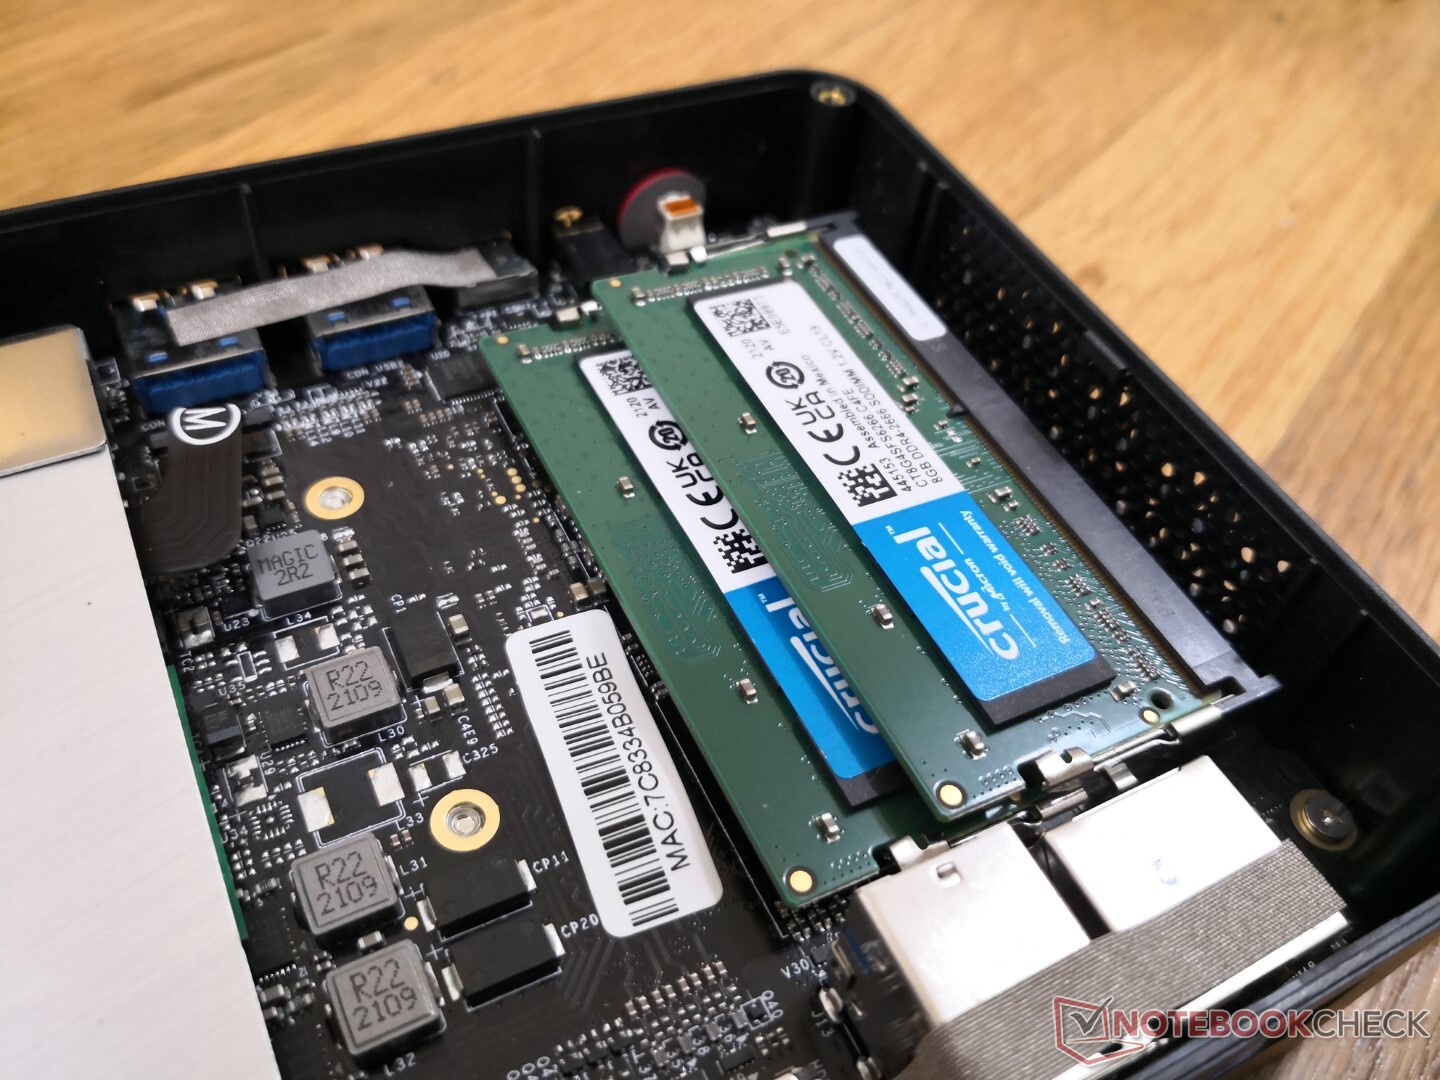
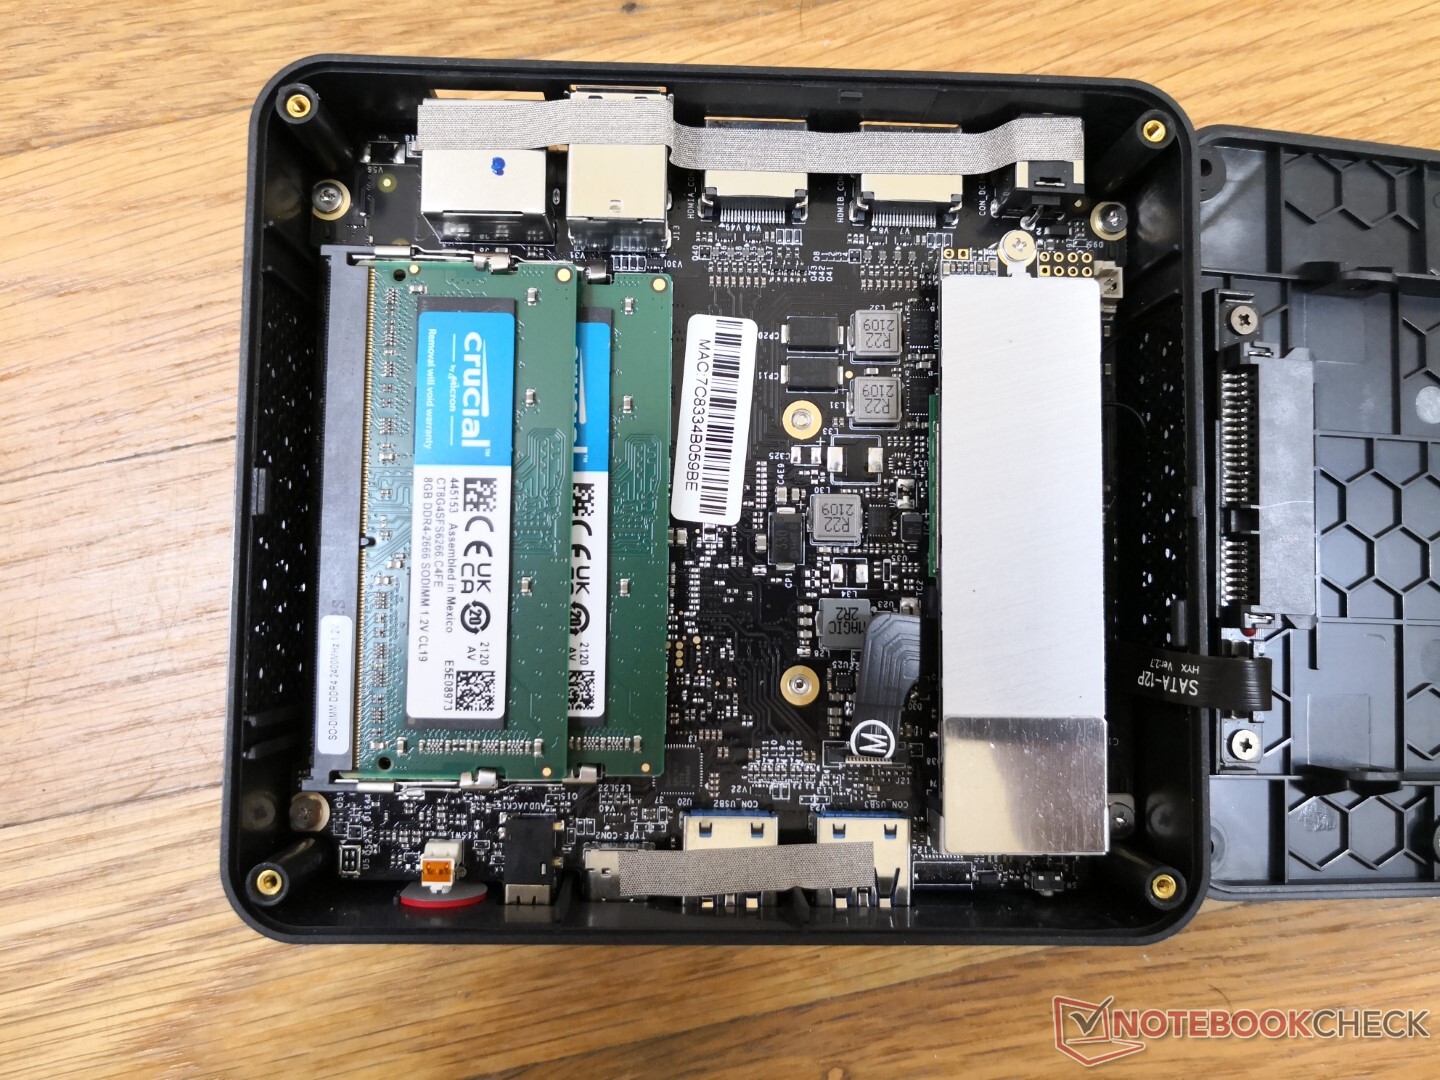
Die Unterseite ist mit nur vier Kreuzschlitzschrauben gesichert und lässt sich leicht entfernen. Nutzer haben direkten Zugriff auf zwei SODIMM-Steckplätze, das herausnehmbare M.2-WLAN-Modul und zwei Speicherschächte (M.2 2280 SATA III + 2,5-Zoll-SATA III). Leider müssen der Prozessor und der Lüfter zusätzlich demontiert werden, da sich beide auf der anderen Seite des Motherboards befinden.
Zubehör und Garantie
Im Lieferumfang sind zwei HDMI-Kabel, ein Netzadapter, Unterlagen und eine abnehmbare VESA-Halterung enthalten. Es gilt die einjährige beschränkte Standardgarantie.
Performance


Prozessor
Die Multi-Thread-CPU-Leistung ist überraschenderweise ziemlich nah an der Ice Lake Core i3-1005G1. Dagegen ist die Single-Thread-Leistung um etwa 30 bis 40 Prozent langsamer. Der Celeron N5095 hat vier physische Kerne ohne Hyper-Threading, während der i3-1005G1 zwei physische Kerne mit Hyper-Threading hat. Daher ist es nicht überraschend, dass die Single-Thread-Leistung auf dem Prozessor mit weniger Kernen schneller ist. Die Performance-Nachhaltigkeit über die Zeit ist ansonsten ausgezeichnet, wenn CineBench R15 xT in einer Schleife läuft.
Cinebench R15 Multi Loop
Cinebench R23: Multi Core | Single Core
Cinebench R20: CPU (Multi Core) | CPU (Single Core)
Cinebench R15: CPU Multi 64Bit | CPU Single 64Bit
Blender: v2.79 BMW27 CPU
7-Zip 18.03: 7z b 4 | 7z b 4 -mmt1
Geekbench 5.5: Multi-Core | Single-Core
HWBOT x265 Benchmark v2.2: 4k Preset
LibreOffice : 20 Documents To PDF
R Benchmark 2.5: Overall mean
| CPU Performance Rating | |
| Intel NUC11TNKi5 | |
| Intel NUC8i7BE -3! | |
| Zotac ZBOX MI642 Nano -2! | |
| Beelink SEi10 -2! | |
| Beelink U59 -2! | |
| Durchschnittliche Intel Celeron N5095 | |
| GMK NucBox K1 -2! | |
| Blackview AceBook 1 -2! | |
| Jumper Tech Ez Book X3 Air -2! | |
| Asus BR1100FKA-BP0109RA | |
| Chuwi LapBook Plus -6! | |
| Cinebench R23 / Multi Core | |
| Intel NUC11TNKi5 | |
| Beelink U59 | |
| Durchschnittliche Intel Celeron N5095 (2150 - 2219, n=5) | |
| Blackview AceBook 1 | |
| Asus BR1100FKA-BP0109RA | |
| Cinebench R23 / Single Core | |
| Intel NUC11TNKi5 | |
| Beelink U59 | |
| Durchschnittliche Intel Celeron N5095 (587 - 621, n=5) | |
| Asus BR1100FKA-BP0109RA | |
| Blackview AceBook 1 | |
| Cinebench R20 / CPU (Multi Core) | |
| Intel NUC11TNKi5 | |
| Intel NUC8i7BE | |
| Zotac ZBOX MI642 Nano | |
| Beelink SEi10 | |
| Beelink U59 | |
| Durchschnittliche Intel Celeron N5095 (804 - 844, n=5) | |
| Jumper Tech Ez Book X3 Air | |
| Blackview AceBook 1 | |
| Asus BR1100FKA-BP0109RA | |
| GMK NucBox K1 | |
| Chuwi LapBook Plus | |
| Cinebench R20 / CPU (Single Core) | |
| Intel NUC11TNKi5 | |
| Intel NUC8i7BE | |
| Zotac ZBOX MI642 Nano | |
| Beelink SEi10 | |
| Beelink U59 | |
| Durchschnittliche Intel Celeron N5095 (228 - 239, n=5) | |
| Asus BR1100FKA-BP0109RA | |
| GMK NucBox K1 | |
| Blackview AceBook 1 | |
| Jumper Tech Ez Book X3 Air | |
| Chuwi LapBook Plus | |
| Cinebench R15 / CPU Multi 64Bit | |
| Intel NUC8i7BE | |
| Intel NUC11TNKi5 | |
| Zotac ZBOX MI642 Nano | |
| Beelink SEi10 | |
| Beelink U59 | |
| Durchschnittliche Intel Celeron N5095 (221 - 379, n=6) | |
| GMK NucBox K1 | |
| Blackview AceBook 1 | |
| Jumper Tech Ez Book X3 Air | |
| Asus BR1100FKA-BP0109RA | |
| Chuwi LapBook Plus | |
| Cinebench R15 / CPU Single 64Bit | |
| Intel NUC11TNKi5 | |
| Intel NUC8i7BE | |
| Zotac ZBOX MI642 Nano | |
| Beelink SEi10 | |
| Beelink U59 | |
| Durchschnittliche Intel Celeron N5095 (95.4 - 109, n=5) | |
| Asus BR1100FKA-BP0109RA | |
| GMK NucBox K1 | |
| Blackview AceBook 1 | |
| Jumper Tech Ez Book X3 Air | |
| Chuwi LapBook Plus | |
| Blender / v2.79 BMW27 CPU | |
| Chuwi LapBook Plus | |
| Asus BR1100FKA-BP0109RA | |
| Jumper Tech Ez Book X3 Air | |
| Blackview AceBook 1 | |
| GMK NucBox K1 | |
| Durchschnittliche Intel Celeron N5095 (1502 - 1624, n=5) | |
| Beelink U59 | |
| Beelink SEi10 | |
| Zotac ZBOX MI642 Nano | |
| Intel NUC8i7BE | |
| Intel NUC8i7BE | |
| Intel NUC11TNKi5 | |
| 7-Zip 18.03 / 7z b 4 | |
| Intel NUC8i7BE | |
| Intel NUC8i7BE | |
| Intel NUC11TNKi5 | |
| Zotac ZBOX MI642 Nano | |
| Beelink U59 | |
| Durchschnittliche Intel Celeron N5095 (10924 - 11168, n=5) | |
| Beelink SEi10 | |
| GMK NucBox K1 | |
| Blackview AceBook 1 | |
| Jumper Tech Ez Book X3 Air | |
| Asus BR1100FKA-BP0109RA | |
| Chuwi LapBook Plus | |
| 7-Zip 18.03 / 7z b 4 -mmt1 | |
| Intel NUC8i7BE | |
| Intel NUC8i7BE | |
| Intel NUC11TNKi5 | |
| Zotac ZBOX MI642 Nano | |
| Beelink SEi10 | |
| Beelink U59 | |
| Durchschnittliche Intel Celeron N5095 (2935 - 3124, n=5) | |
| Asus BR1100FKA-BP0109RA | |
| Blackview AceBook 1 | |
| GMK NucBox K1 | |
| Jumper Tech Ez Book X3 Air | |
| Chuwi LapBook Plus | |
| Geekbench 5.5 / Multi-Core | |
| Intel NUC11TNKi5 | |
| Zotac ZBOX MI642 Nano | |
| Intel NUC8i7BE | |
| Beelink SEi10 | |
| Durchschnittliche Intel Celeron N5095 (1933 - 2052, n=4) | |
| Jumper Tech Ez Book X3 Air | |
| GMK NucBox K1 | |
| Asus BR1100FKA-BP0109RA | |
| Geekbench 5.5 / Single-Core | |
| Intel NUC11TNKi5 | |
| Beelink SEi10 | |
| Zotac ZBOX MI642 Nano | |
| Intel NUC8i7BE | |
| Durchschnittliche Intel Celeron N5095 (637 - 659, n=4) | |
| GMK NucBox K1 | |
| Jumper Tech Ez Book X3 Air | |
| Asus BR1100FKA-BP0109RA | |
| HWBOT x265 Benchmark v2.2 / 4k Preset | |
| Intel NUC11TNKi5 | |
| Intel NUC8i7BE | |
| Intel NUC8i7BE | |
| Zotac ZBOX MI642 Nano | |
| Beelink SEi10 | |
| Beelink U59 | |
| Durchschnittliche Intel Celeron N5095 (1.9 - 2.05, n=5) | |
| GMK NucBox K1 | |
| Jumper Tech Ez Book X3 Air | |
| Blackview AceBook 1 | |
| Chuwi LapBook Plus | |
| Asus BR1100FKA-BP0109RA | |
| LibreOffice / 20 Documents To PDF | |
| Asus BR1100FKA-BP0109RA | |
| Blackview AceBook 1 | |
| Jumper Tech Ez Book X3 Air | |
| GMK NucBox K1 | |
| Durchschnittliche Intel Celeron N5095 (97 - 107.9, n=5) | |
| Beelink U59 | |
| Zotac ZBOX MI642 Nano | |
| Beelink SEi10 | |
| Intel NUC11TNKi5 | |
| R Benchmark 2.5 / Overall mean | |
| Asus BR1100FKA-BP0109RA | |
| Jumper Tech Ez Book X3 Air | |
| Blackview AceBook 1 | |
| GMK NucBox K1 | |
| Durchschnittliche Intel Celeron N5095 (1.16 - 1.2, n=5) | |
| Beelink U59 | |
| Beelink SEi10 | |
| Zotac ZBOX MI642 Nano | |
| Intel NUC8i7BE | |
| Intel NUC11TNKi5 | |
* ... kleinere Werte sind besser
AIDA64: FP32 Ray-Trace | FPU Julia | CPU SHA3 | CPU Queen | FPU SinJulia | FPU Mandel | CPU AES | CPU ZLib | FP64 Ray-Trace | CPU PhotoWorxx
| Performance Rating | |
| Intel NUC11TNKi5 | |
| Intel NUC8i7BE -1! | |
| Zotac ZBOX MI642 Nano | |
| Beelink U59 | |
| AIDA64 / FP32 Ray-Trace | |
| Intel NUC11TNKi5 | |
| Intel NUC8i7BE | |
| Zotac ZBOX MI642 Nano | |
| Beelink U59 | |
| AIDA64 / FPU Julia | |
| Intel NUC11TNKi5 | |
| Intel NUC8i7BE | |
| Zotac ZBOX MI642 Nano | |
| Beelink U59 | |
| AIDA64 / CPU SHA3 | |
| Intel NUC11TNKi5 | |
| Zotac ZBOX MI642 Nano | |
| Beelink U59 | |
| AIDA64 / CPU Queen | |
| Intel NUC8i7BE | |
| Zotac ZBOX MI642 Nano | |
| Intel NUC11TNKi5 | |
| Beelink U59 | |
| AIDA64 / FPU SinJulia | |
| Intel NUC8i7BE | |
| Intel NUC11TNKi5 | |
| Zotac ZBOX MI642 Nano | |
| Beelink U59 | |
| AIDA64 / FPU Mandel | |
| Intel NUC11TNKi5 | |
| Intel NUC8i7BE | |
| Zotac ZBOX MI642 Nano | |
| Beelink U59 | |
| AIDA64 / CPU AES | |
| Intel NUC11TNKi5 | |
| Beelink U59 | |
| Intel NUC8i7BE | |
| Zotac ZBOX MI642 Nano | |
| AIDA64 / CPU ZLib | |
| Intel NUC11TNKi5 | |
| Intel NUC8i7BE | |
| Zotac ZBOX MI642 Nano | |
| Beelink U59 | |
| AIDA64 / FP64 Ray-Trace | |
| Intel NUC11TNKi5 | |
| Intel NUC8i7BE | |
| Zotac ZBOX MI642 Nano | |
| Beelink U59 | |
| AIDA64 / CPU PhotoWorxx | |
| Intel NUC8i7BE | |
| Intel NUC11TNKi5 | |
| Zotac ZBOX MI642 Nano | |
| Beelink U59 | |
System Performance
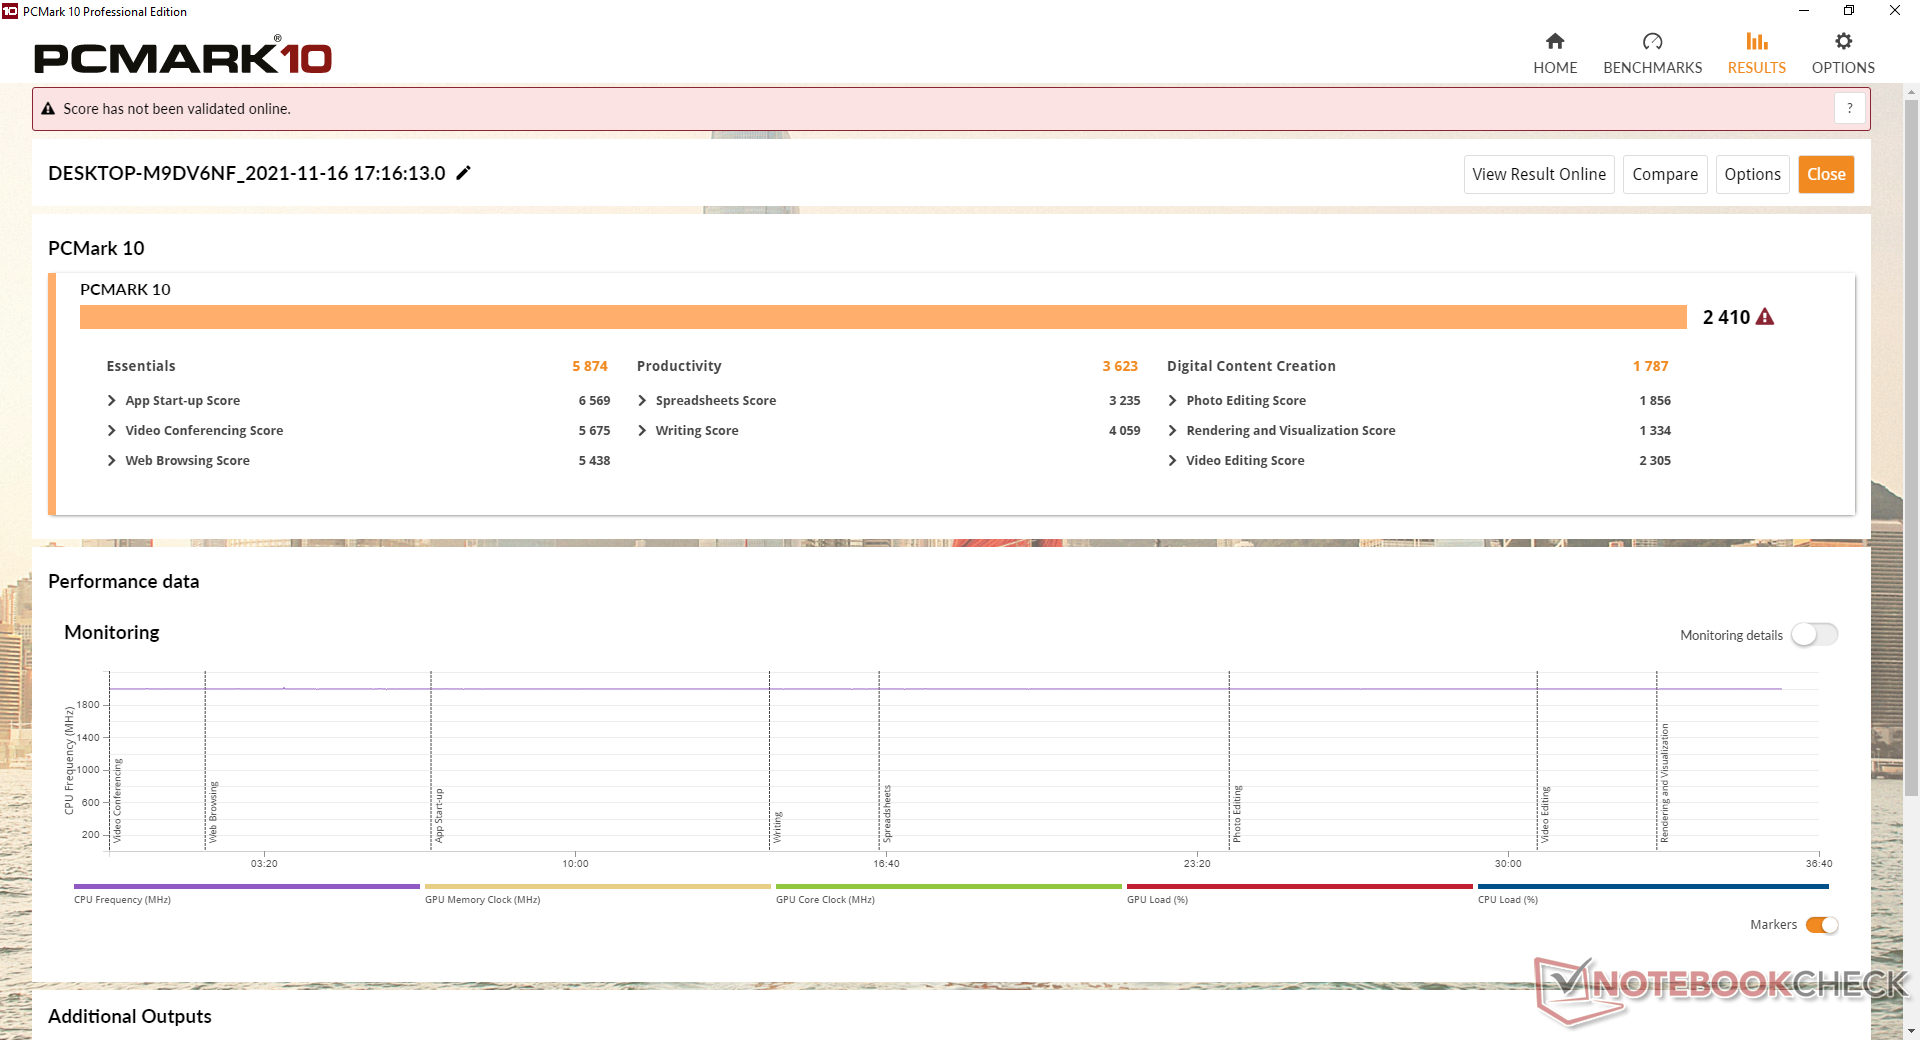
Die PCMark-10-Ergebnisse sind durchweg höher als die der GMK NucBox K1 während sie langsamer sind als beim Core-i3-betriebenen Beelink SEi10.
| PCMark 10 / Score | |
| Intel NUC8i7BE | |
| Intel NUC11TNKi5 | |
| Zotac ZBOX MI642 Nano | |
| Beelink SEi10 | |
| Beelink U59 | |
| Durchschnittliche Intel Celeron N5095, Intel UHD Graphics (Jasper Lake 16 EU) (2317 - 2417, n=5) | |
| GMK NucBox K1 | |
| PCMark 10 / Essentials | |
| Intel NUC11TNKi5 | |
| Intel NUC8i7BE | |
| Zotac ZBOX MI642 Nano | |
| Beelink SEi10 | |
| Beelink U59 | |
| Durchschnittliche Intel Celeron N5095, Intel UHD Graphics (Jasper Lake 16 EU) (5516 - 5874, n=5) | |
| GMK NucBox K1 | |
| PCMark 10 / Productivity | |
| Intel NUC8i7BE | |
| Zotac ZBOX MI642 Nano | |
| Intel NUC11TNKi5 | |
| Beelink SEi10 | |
| Beelink U59 | |
| Durchschnittliche Intel Celeron N5095, Intel UHD Graphics (Jasper Lake 16 EU) (3454 - 3666, n=5) | |
| GMK NucBox K1 | |
| PCMark 10 / Digital Content Creation | |
| Intel NUC11TNKi5 | |
| Intel NUC8i7BE | |
| Zotac ZBOX MI642 Nano | |
| Beelink SEi10 | |
| Beelink U59 | |
| Durchschnittliche Intel Celeron N5095, Intel UHD Graphics (Jasper Lake 16 EU) (1752 - 1787, n=5) | |
| GMK NucBox K1 | |
| PCMark 10 Score | 2410 Punkte | |
Hilfe | ||
| AIDA64 / Memory Copy | |
| Intel NUC8i7BE | |
| Zotac ZBOX MI642 Nano | |
| Beelink U59 | |
| Intel NUC11TNKi5 | |
| AIDA64 / Memory Read | |
| Intel NUC8i7BE | |
| Zotac ZBOX MI642 Nano | |
| Intel NUC11TNKi5 | |
| Beelink U59 | |
| AIDA64 / Memory Write | |
| Intel NUC8i7BE | |
| Zotac ZBOX MI642 Nano | |
| Beelink U59 | |
| Intel NUC11TNKi5 | |
| AIDA64 / Memory Latency | |
| Zotac ZBOX MI642 Nano | |
| Intel NUC11TNKi5 | |
| Beelink U59 | |
| Intel NUC8i7BE | |
* ... kleinere Werte sind besser
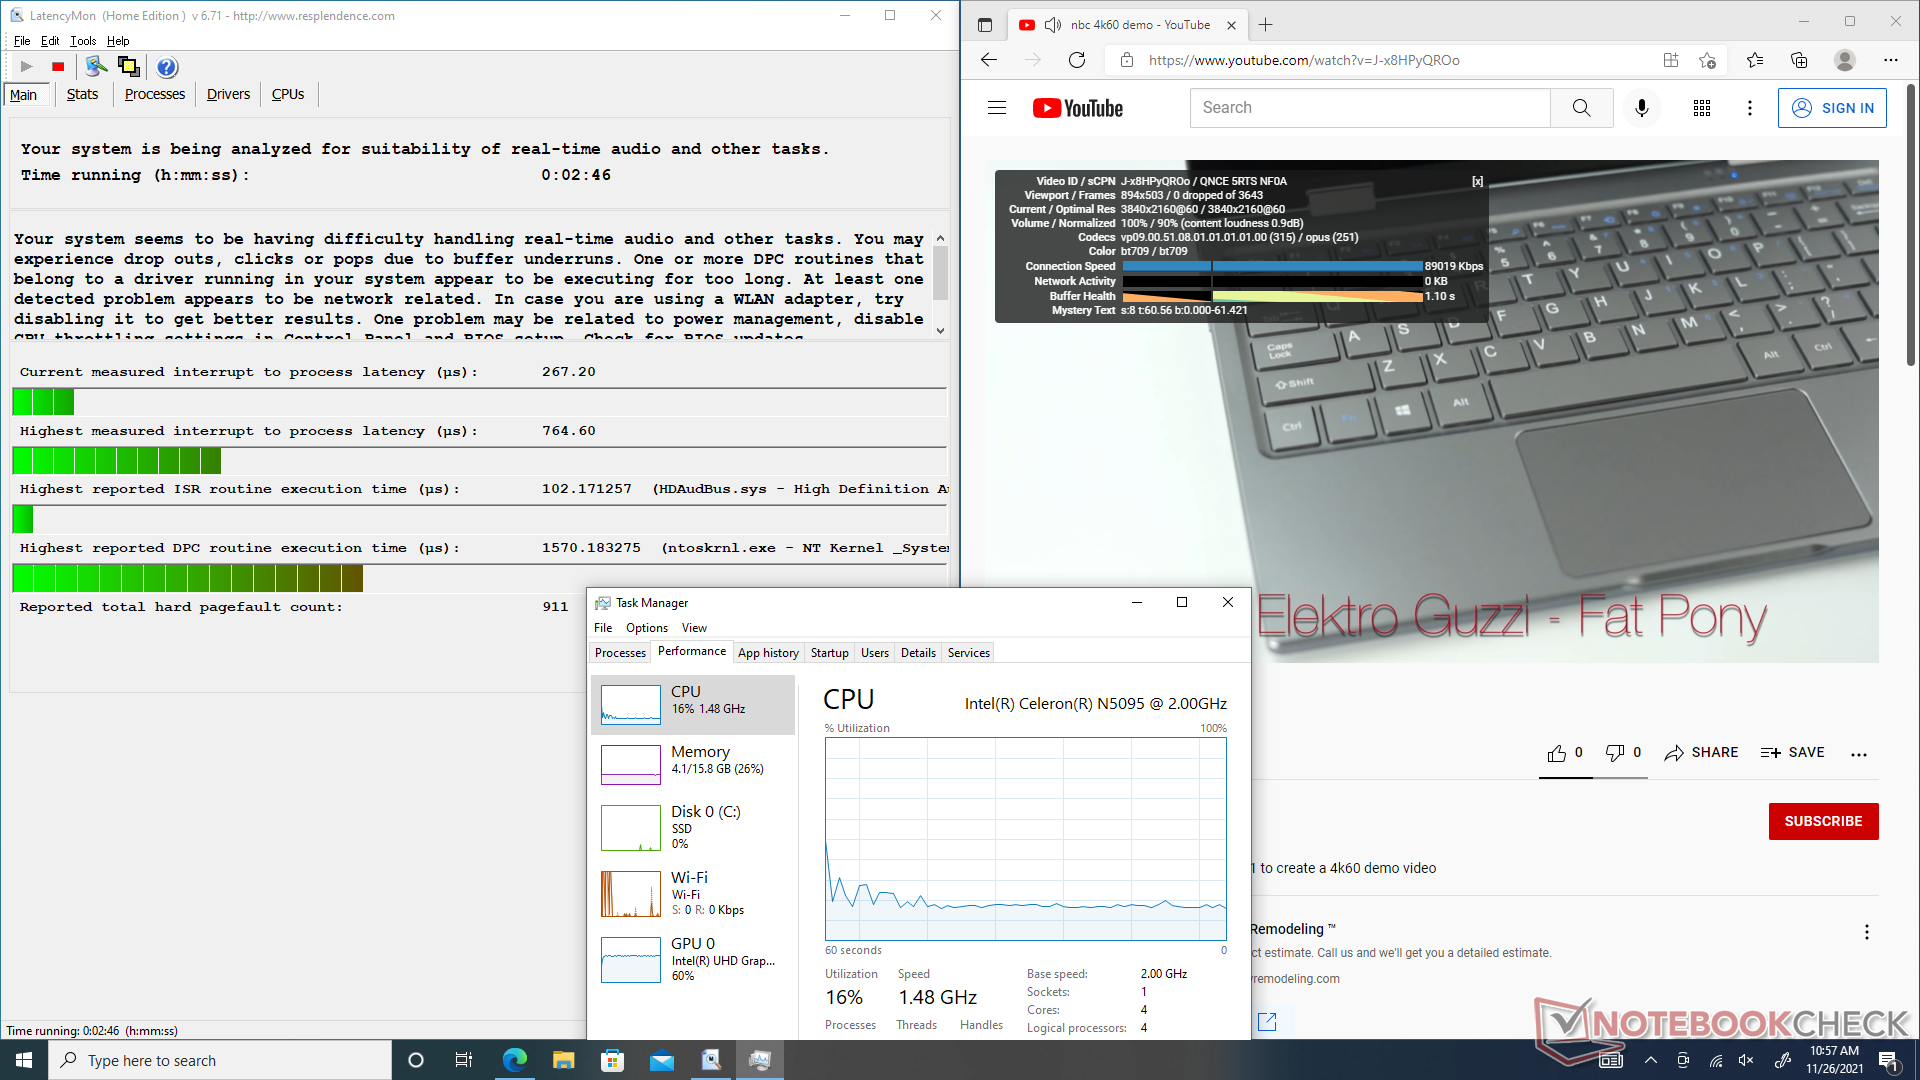
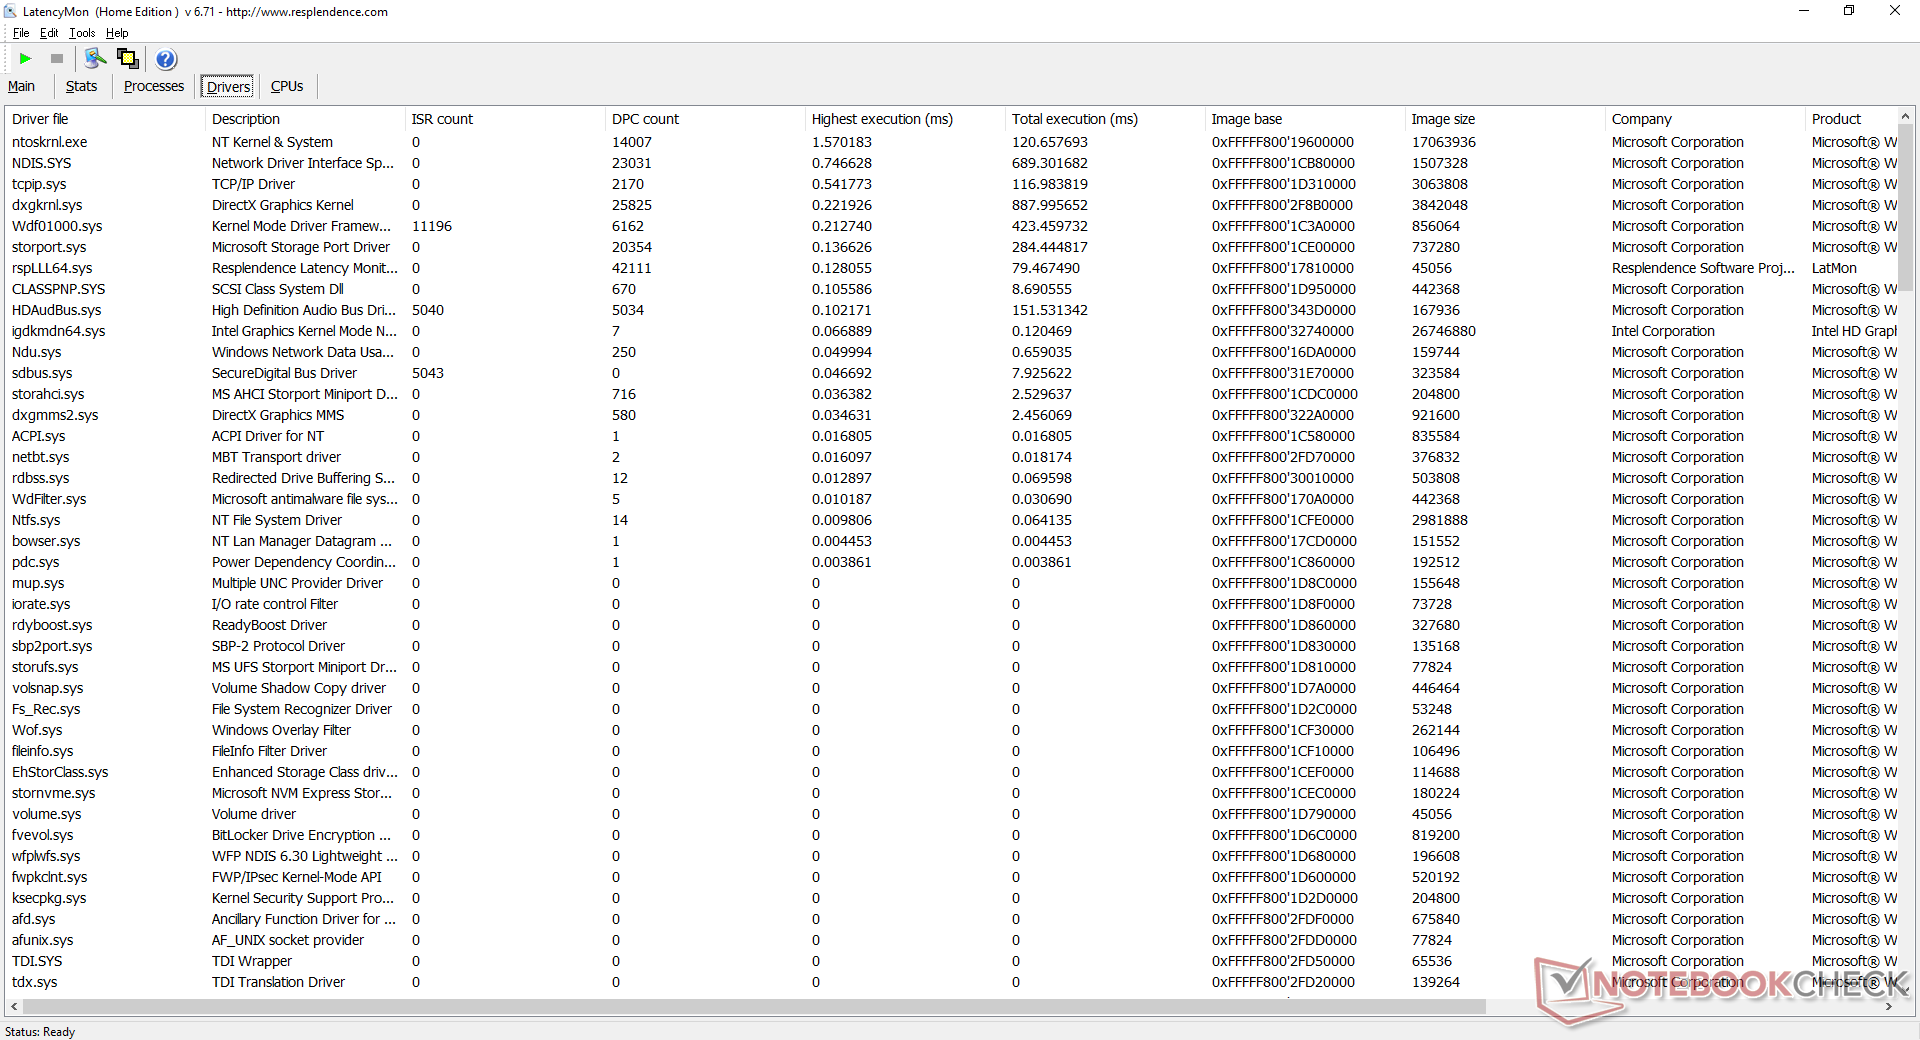
DPC-Latenzzeit
LatencyMon zeigt kleinere DPC-Latenzprobleme beim Öffnen mehrerer Browser-Tabs auf unserer Homepage. Die 4K-Videowiedergabe ist ansonsten exzellent, während unseres einminütigen Tests gab es keine Bildaussetzer. Die GPU-Auslastung ist mit 60 Prozent relativ hoch.
| DPC Latencies / LatencyMon - interrupt to process latency (max), Web, Youtube, Prime95 | |
| GMK NucBox K1 | |
| Beelink SEi10 | |
| Beelink U59 | |
| Intel NUC11TNKi5 | |
* ... kleinere Werte sind besser
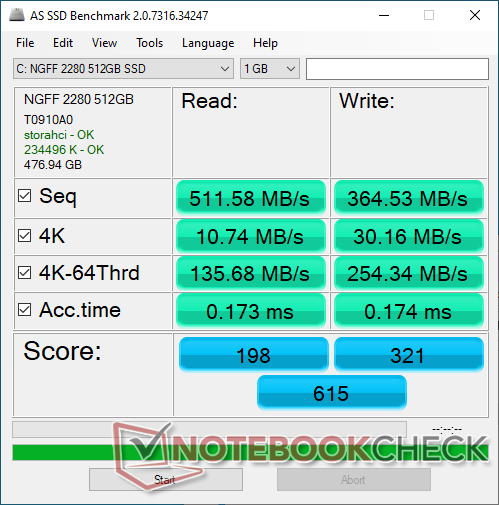
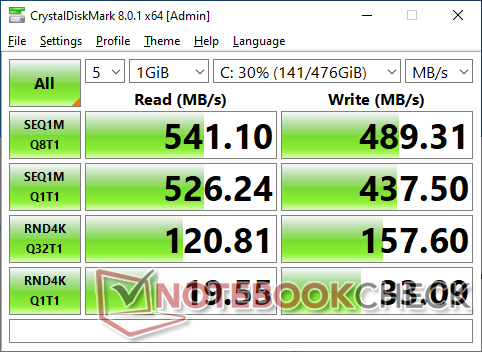
Speichergeräte
Unser Testgerät ist mit einer 512 GB AZW M.2 2280 SATA III SSD ausgestattet, einer relativ unbekannten Marke, die wahrscheinlich Kosten spart. Die meisten anderen PCs verwenden bekanntere SSD-Marken wie Samsung, Intel, Kingston oder andere. Die Übertragungsraten sind für ein SATA-III-Laufwerk mit sequentiellen Lese- und Schreibgeschwindigkeiten von jeweils etwa 500 MB/s dennoch hervorragend.

| Drive Performance Rating - Percent | |
| Beelink SEi10 | |
| Zotac ZBOX MI642 Nano | |
| Intel NUC11TNKi5 | |
| Beelink U59 | |
| GMK NucBox K1 | |
* ... kleinere Werte sind besser
Dauerleistung Lesen: DiskSpd Read Loop, Queue Depth 8
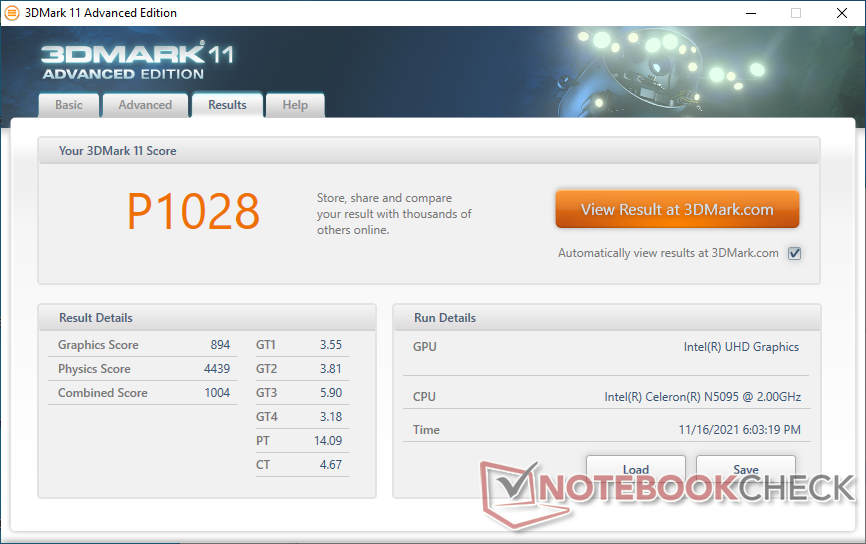
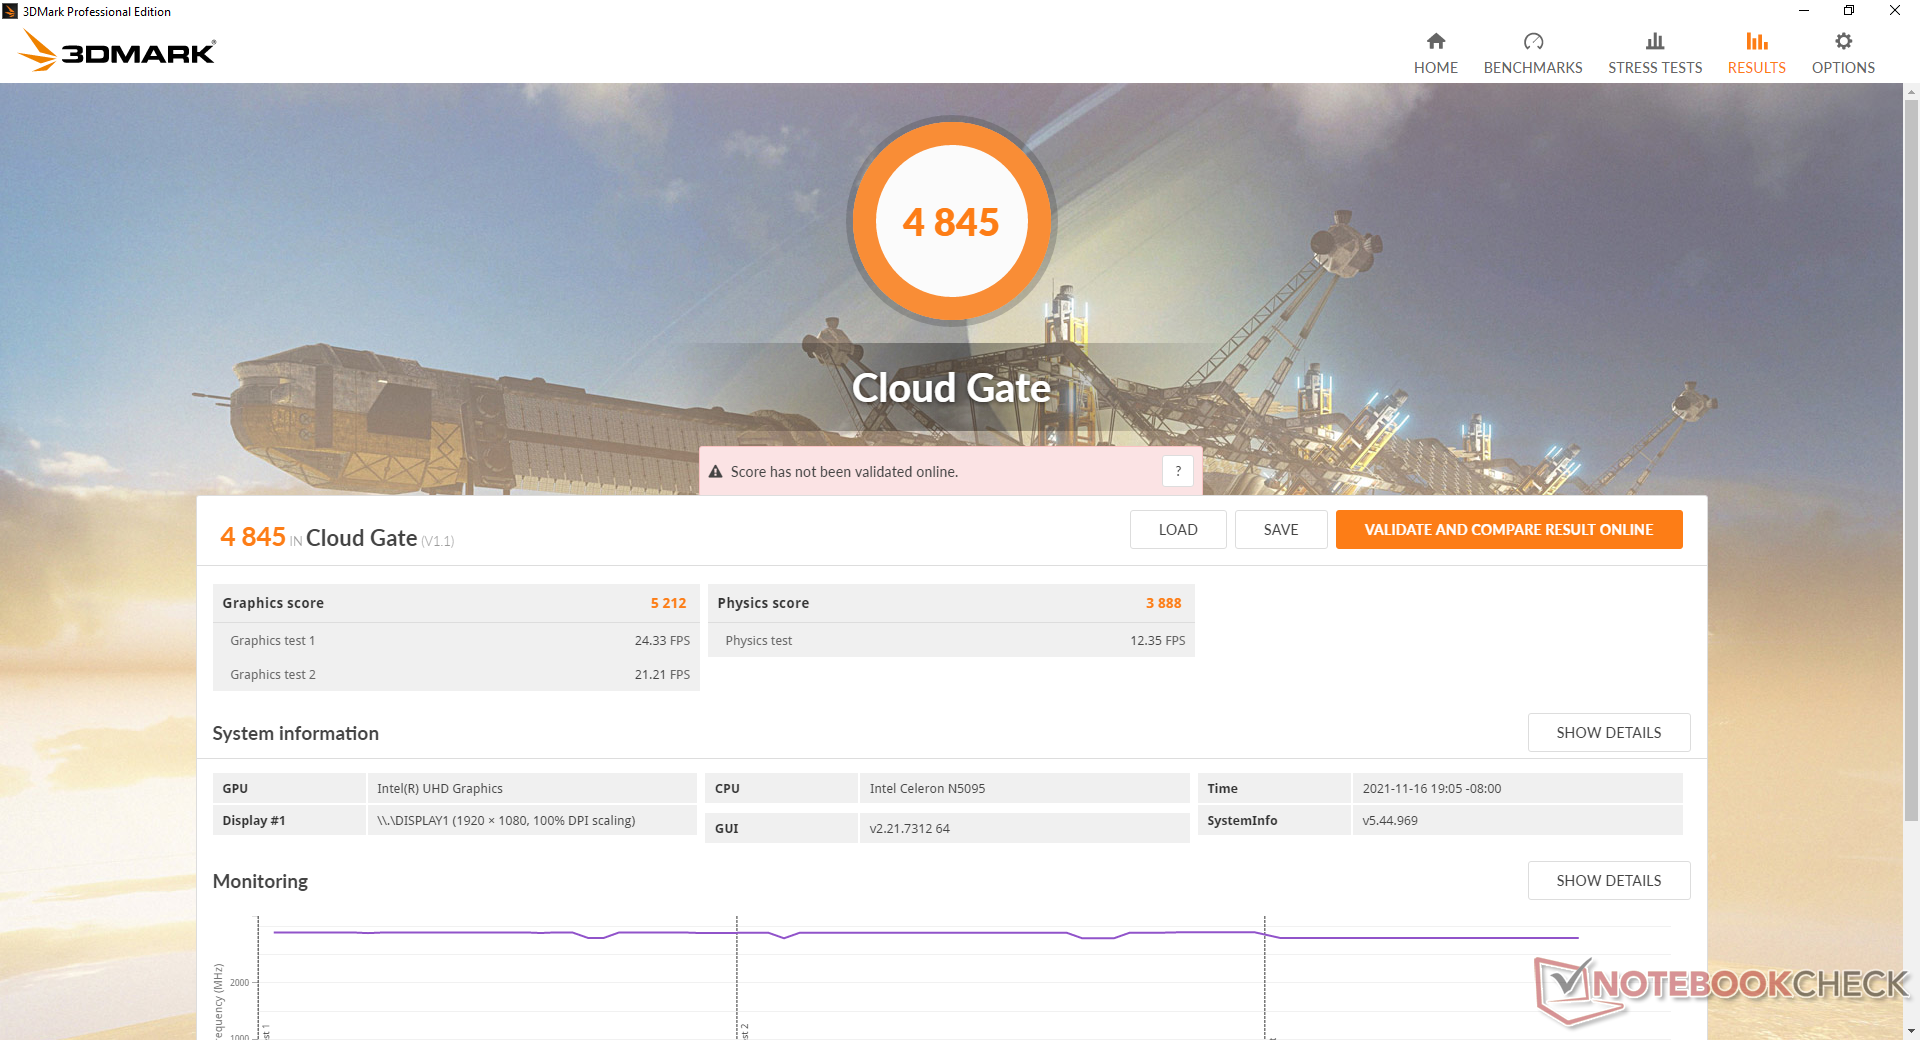
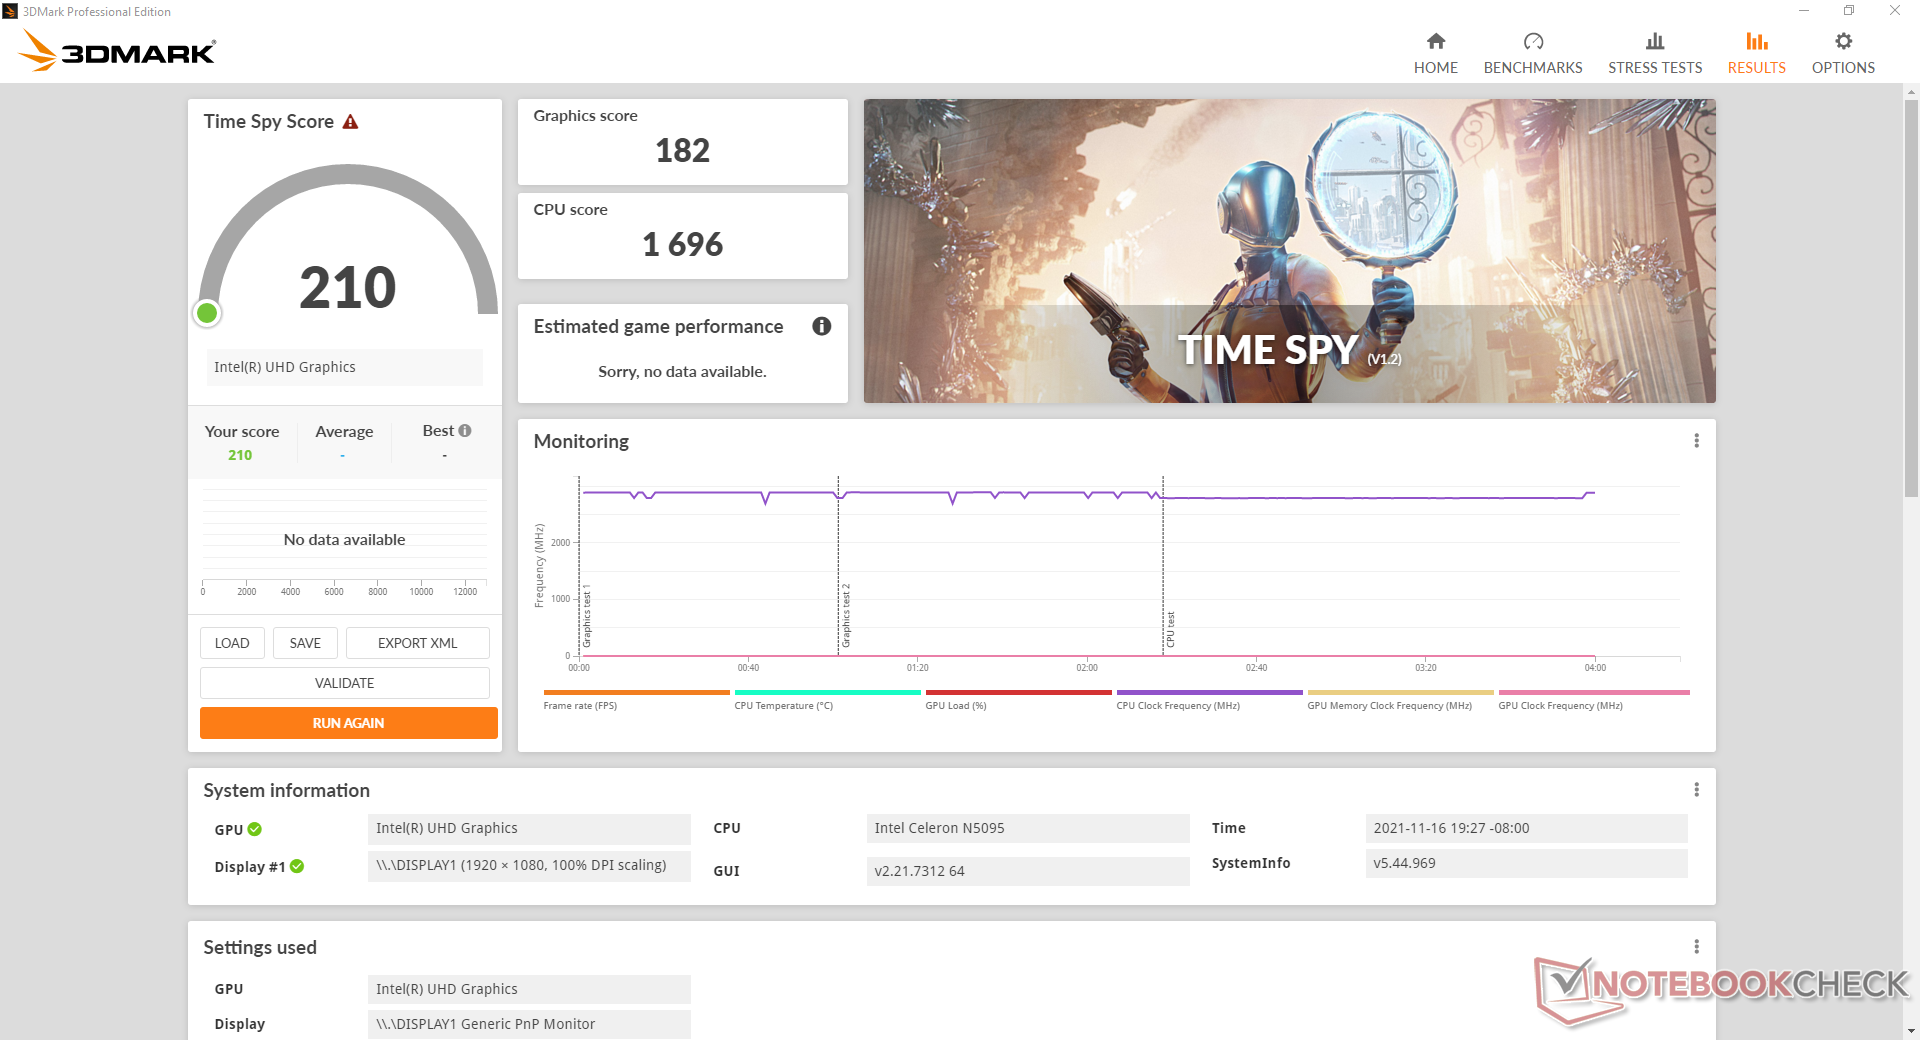
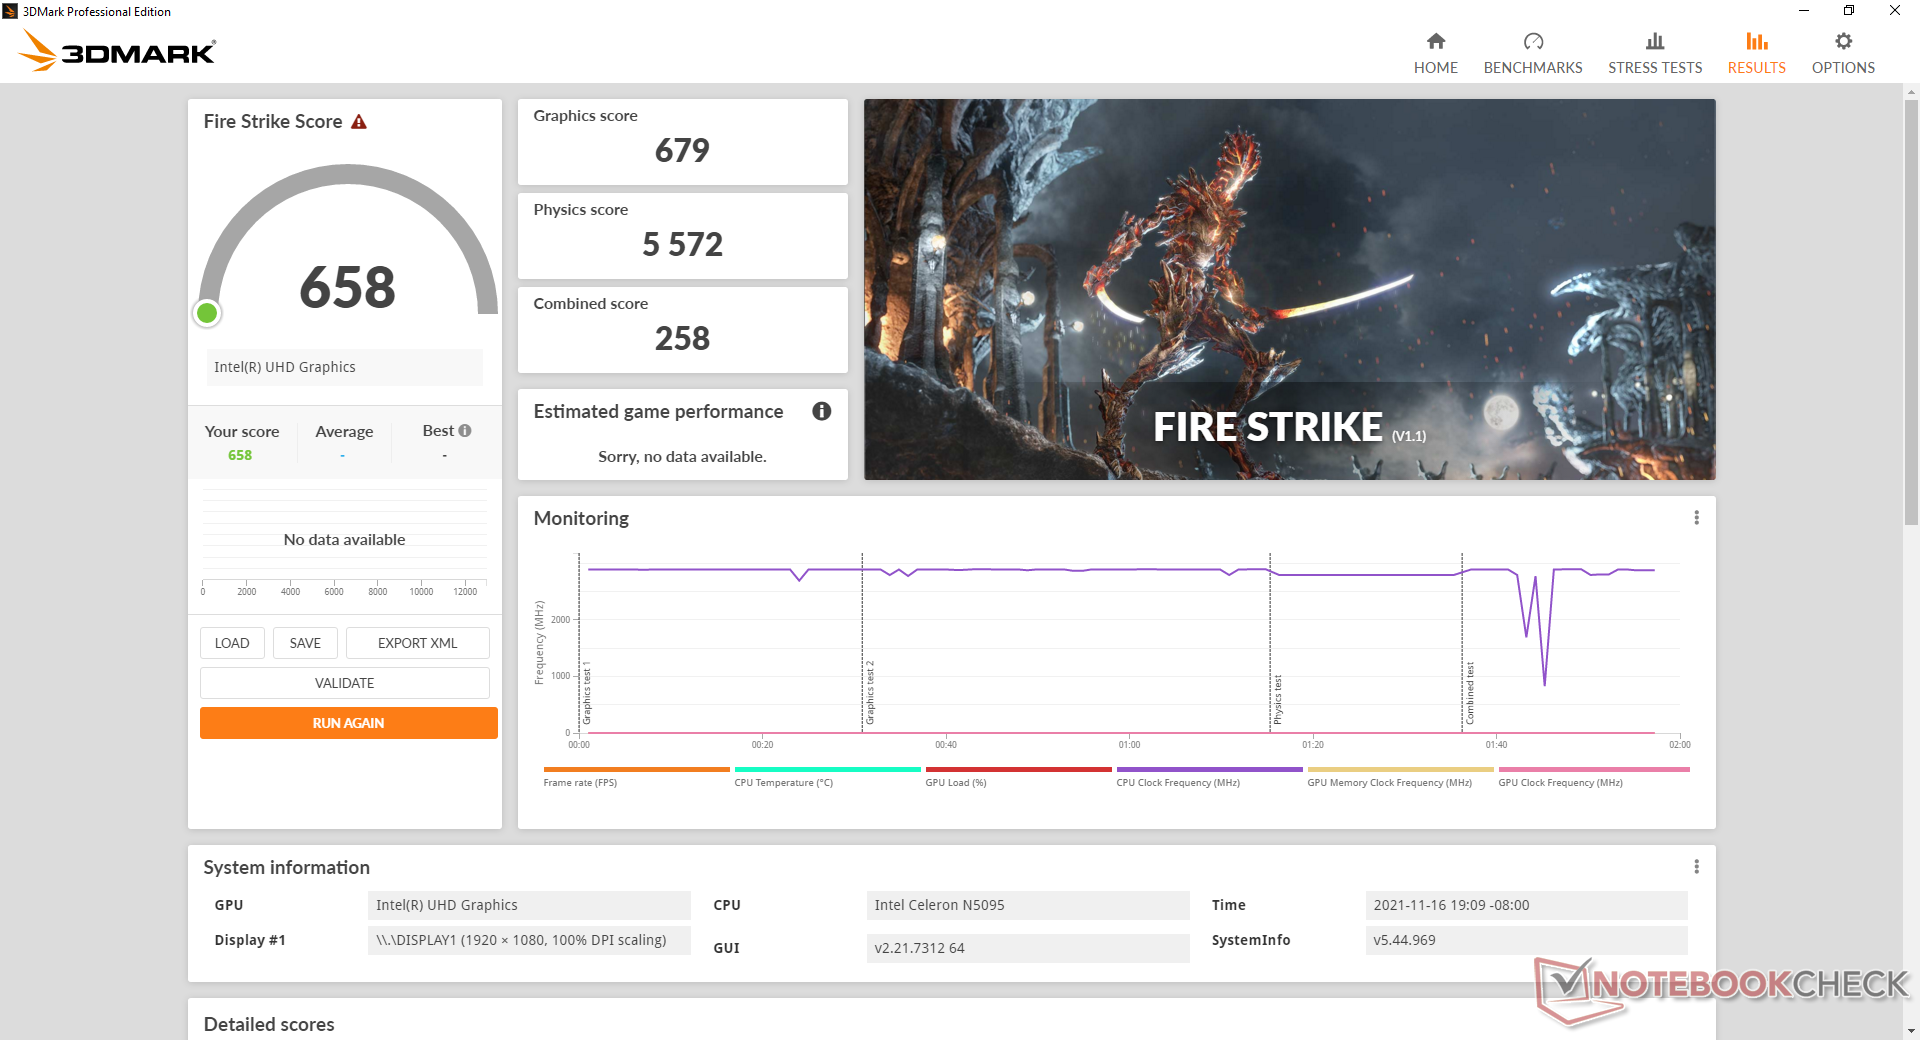
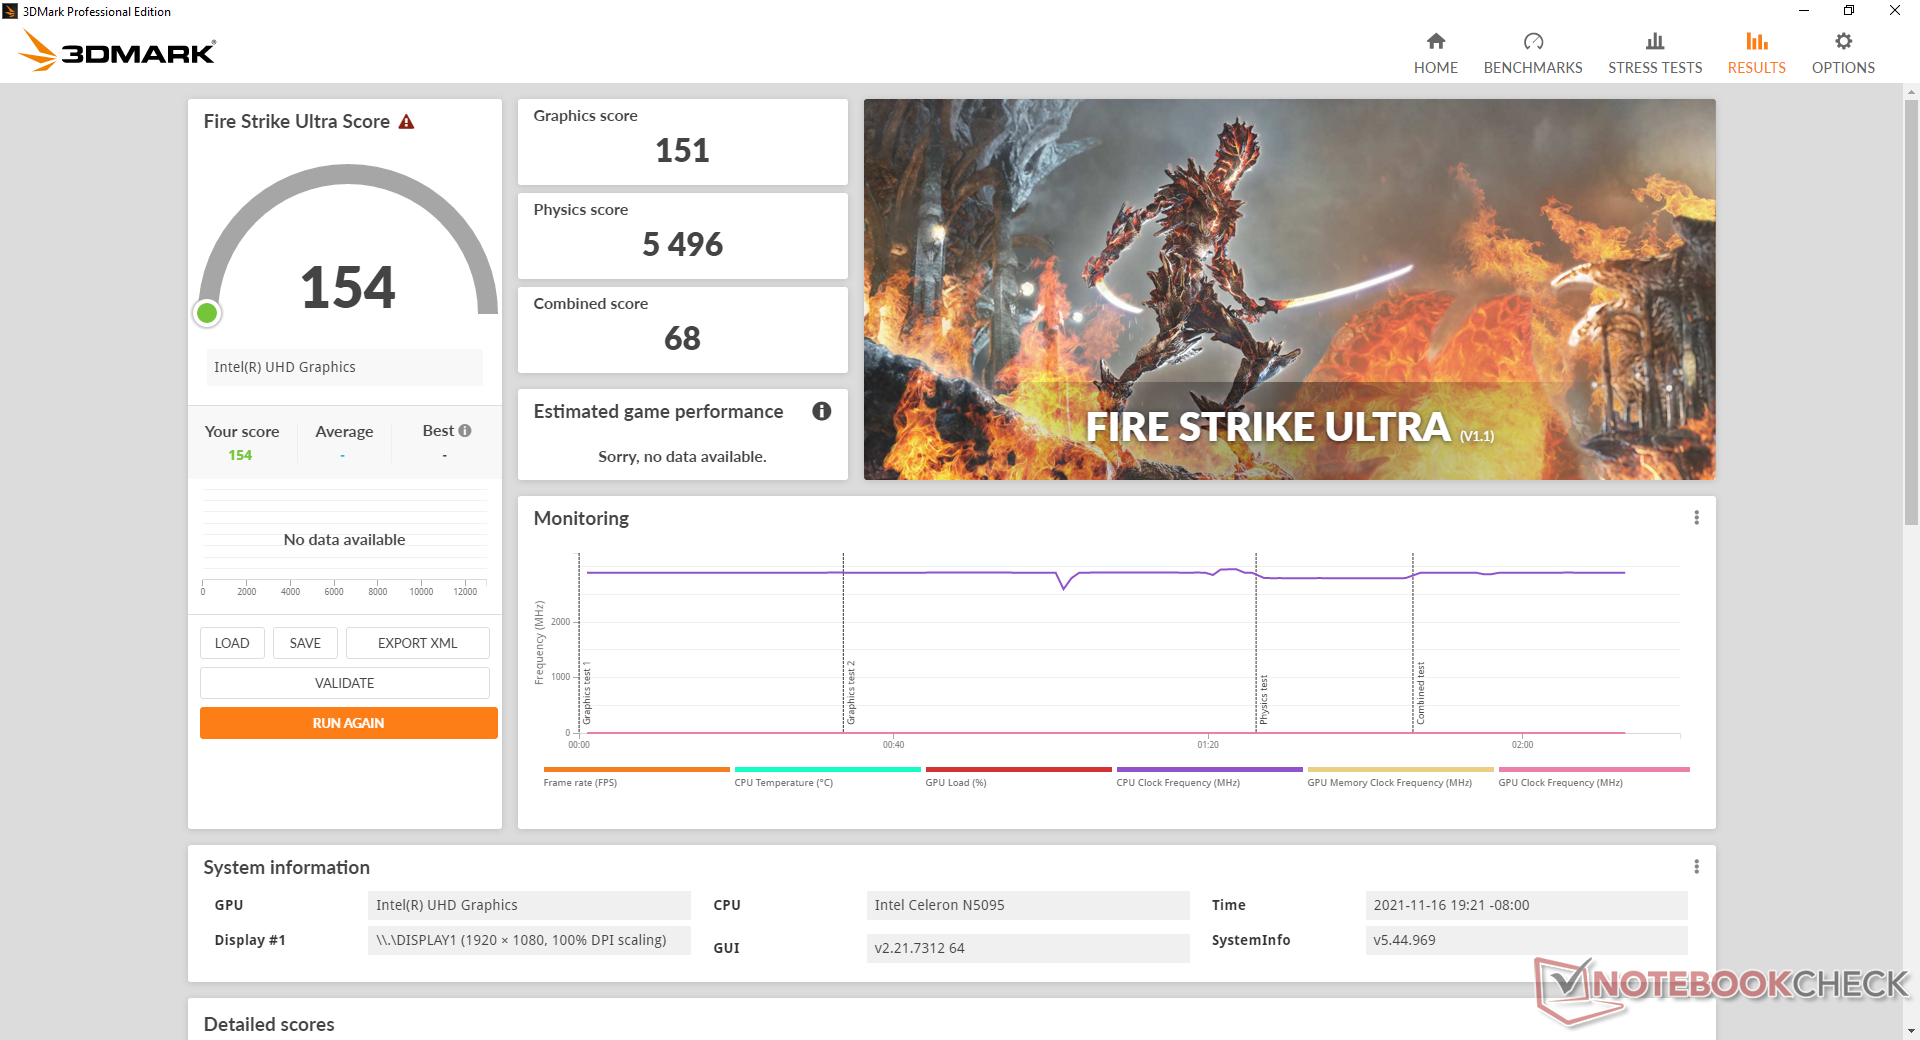
GPU Performance
Die Grafikleistung ist etwa 40 bis 50 Prozent langsamer als bei den üblichen UHD Graphics 620 bei älteren Laptops und Mini-PCs vor der Einführung von Iris Xe. Obwohl die Grafikkarte streamen kann, sollte man nicht erwarten, dass die meisten nativen Spiele gut laufen.
| 3DMark Performance Rating - Percent | |
| Intel NUC11TNKi5 | |
| Intel NUC8i7BE | |
| Zotac ZBOX MI642 Nano -3! | |
| Prime Computer PrimeMini 5 i7 NUC8v7PNB | |
| Beelink SEi10 | |
| Beelink U59 | |
| Durchschnittliche Intel UHD Graphics (Jasper Lake 16 EU) | |
| Chuwi LapBook Plus -1! | |
| Blackview AceBook 1 -2! | |
| Asus BR1100FKA-BP0109RA | |
| GMK NucBox K1 | |
| Jumper Tech Ez Book X3 Air -1! | |
| 3DMark 11 Performance | 1028 Punkte | |
| 3DMark Cloud Gate Standard Score | 4845 Punkte | |
| 3DMark Fire Strike Score | 658 Punkte | |
| 3DMark Time Spy Score | 210 Punkte | |
Hilfe | ||
Witcher 3 FPS Chart
| min. | mittel | hoch | max. | |
|---|---|---|---|---|
| The Witcher 3 (2015) | 14 | |||
| Dota 2 Reborn (2015) | 57.3 | 26.6 | 12 | 11.2 |
| Final Fantasy XV Benchmark (2018) | 7.17 | |||
| X-Plane 11.11 (2018) | 10.8 | 9.18 | 8.62 |
Emissionen
System-Rauschen
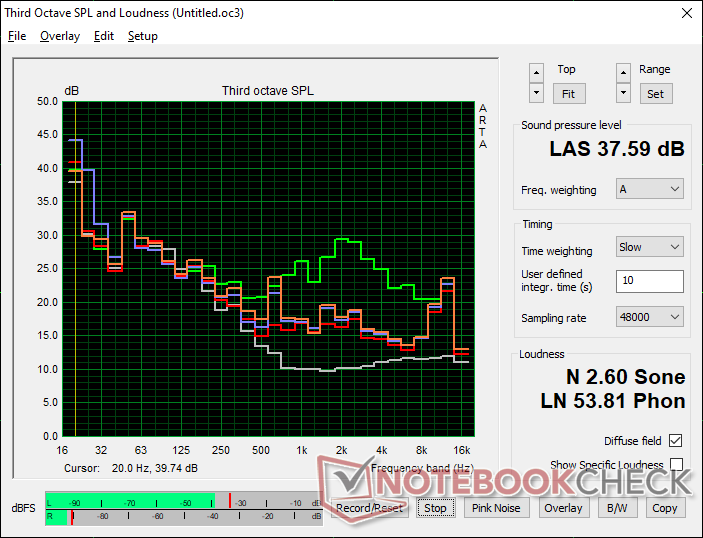
Der interne Lüfter ist mit 24,5 dB(A) leise, wenn das System keine Anwendungen ausführt. In den meisten Fällen werden die Benutzer jedoch wahrscheinlich Videostreaming oder Webbrowsing betreiben, und so wird der Lüfter gelegentlich auf 28,6 oder 30,4 dB(A) ansteigen. Andere Mini-PCs sind viel lauter, darunter auch der SEi10 von Beelink.
Der Betrieb von Prime95 verursacht ein maximales Lüftergeräusch von 37,6 dB(A), das in einer HTPC-Umgebung zwar wahrnehmbar, aber nicht störend ist.
Lautstärkediagramm
| Idle |
| 24.5 / 24.5 / 28.6 dB(A) |
| Last |
| 29.7 / 37.6 dB(A) |
 | ||
30 dB leise 40 dB(A) deutlich hörbar 50 dB(A) störend |
||
min: | ||
| Beelink U59 UHD Graphics (Jasper Lake 16 EU), Celeron N5095, Silicon Motion AZW 512G NV428 | Intel NUC11TNKi5 Iris Xe G7 80EUs, i5-1135G7, Transcend M.2 SSD 430S TS512GMTS430S | Intel NUC8i7BE Iris Plus Graphics 655, i7-8559U | Beelink SEi10 UHD Graphics G1 (Ice Lake 32 EU), i3-1005G1, Silicon Motion AZW 256G M.2280 NVMe 4X 200725 D | Zotac ZBOX MI642 Nano UHD Graphics 620, i5-10210U, Western Digital WD Blue 3D WDBNCE5000PNC | GMK NucBox K1 UHD Graphics 600, Celeron J4125, HIKVision C100 NGFF SSD 128GB | |
|---|---|---|---|---|---|---|
| Geräuschentwicklung | -27% | -19% | -27% | -24% | -20% | |
| aus / Umgebung * (dB) | 24.5 | 24.8 -1% | 28.7 -17% | 27.5 -12% | 27.8 -13% | 27.8 -13% |
| Idle min * (dB) | 24.5 | 35.6 -45% | 28.7 -17% | 30.9 -26% | 27.8 -13% | 27.8 -13% |
| Idle avg * (dB) | 24.5 | 35.6 -45% | 29.3 -20% | 33.5 -37% | 33.9 -38% | 27.8 -13% |
| Idle max * (dB) | 28.6 | 35.6 -24% | 31.8 -11% | 33.5 -17% | 33.9 -19% | 27.8 3% |
| Last avg * (dB) | 29.7 | 36.2 -22% | 39 -31% | 38.5 -30% | 43.7 -47% | 46.8 -58% |
| Witcher 3 ultra * (dB) | 30.4 | 38 -25% | 39 -28% | |||
| Last max * (dB) | 37.6 | 47.6 -27% | 41.4 -10% | 51.6 -37% | 43.7 -16% | 46.8 -24% |
* ... kleinere Werte sind besser
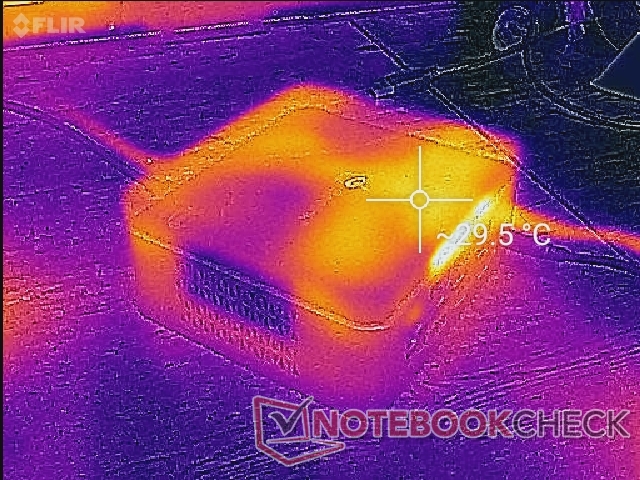
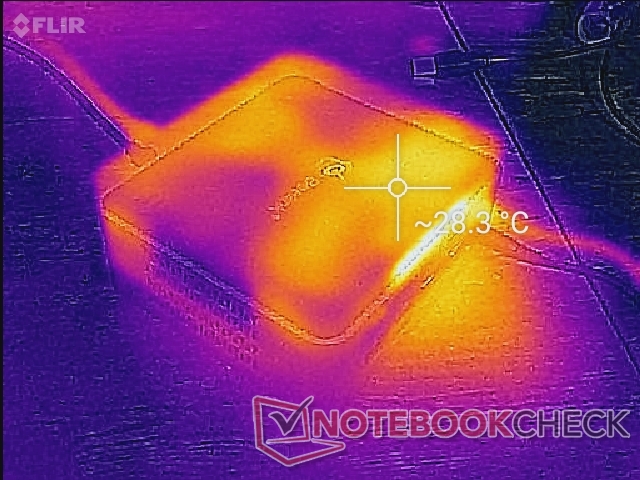
Temperatur
Temperaturen sind bei der U59 kein Thema. Hot Spots werden kaum wärmer, selbst wenn das System voll ausgelastet ist.


Stresstest
Die CPU stabilisiert sich unter Prime95 bei 2,8 GHz und 69 °C Stress. Die Tatsache, dass das System mit einem aktiven Lüfter gekühlt wird, ist wahrscheinlich für die niedriger als erwarteten Temperaturen und die gleichbleibende Leistung über die Zeit verantwortlich. HWiNFO meldet PL1- und PL2-Werte von 15 bzw. 25 W, aber wir sind nur in der Lage, einen stabilen Wert von 15 W zu erreichen, wenn wir solch extreme Lasten ausführen. Derselbe Test mit dem Core-i3-betriebenen Beelink SEi10 würde zu einer deutlich wärmeren Kerntemperatur von 90 °C führen.
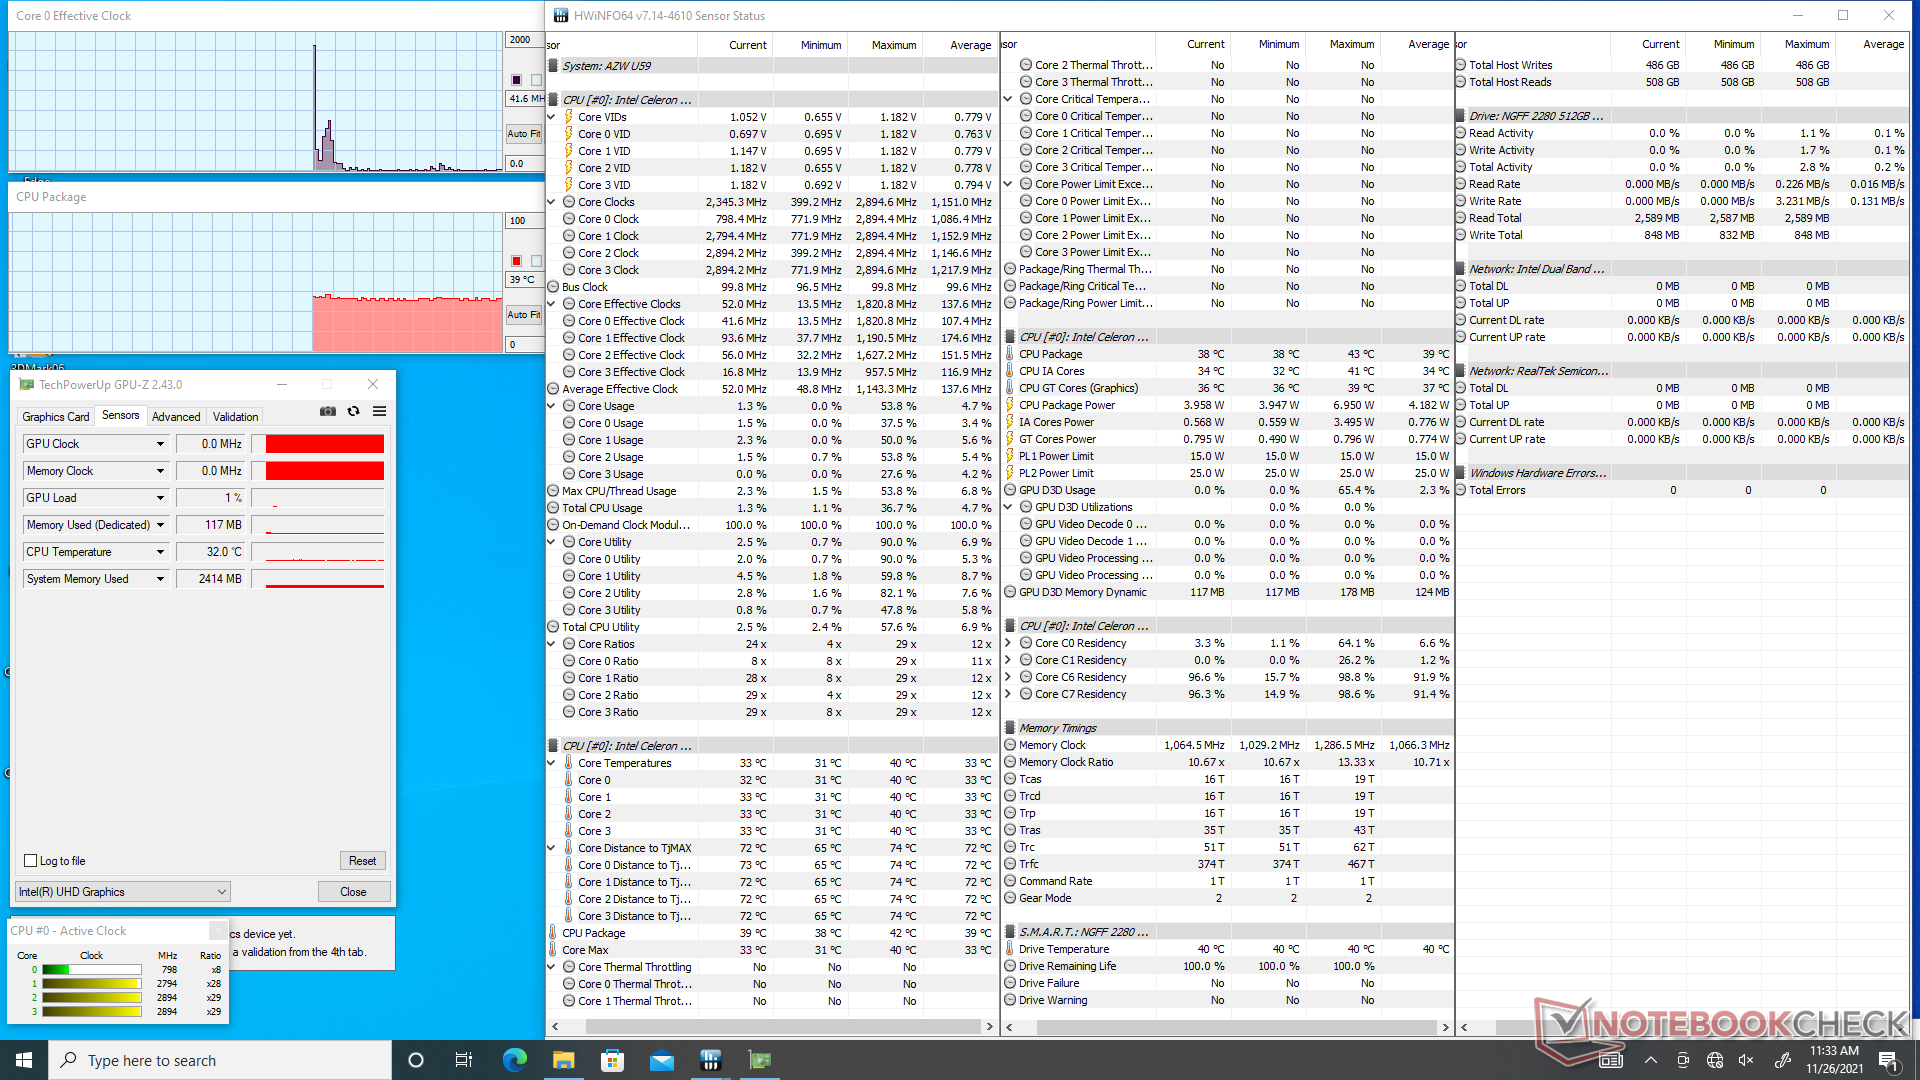
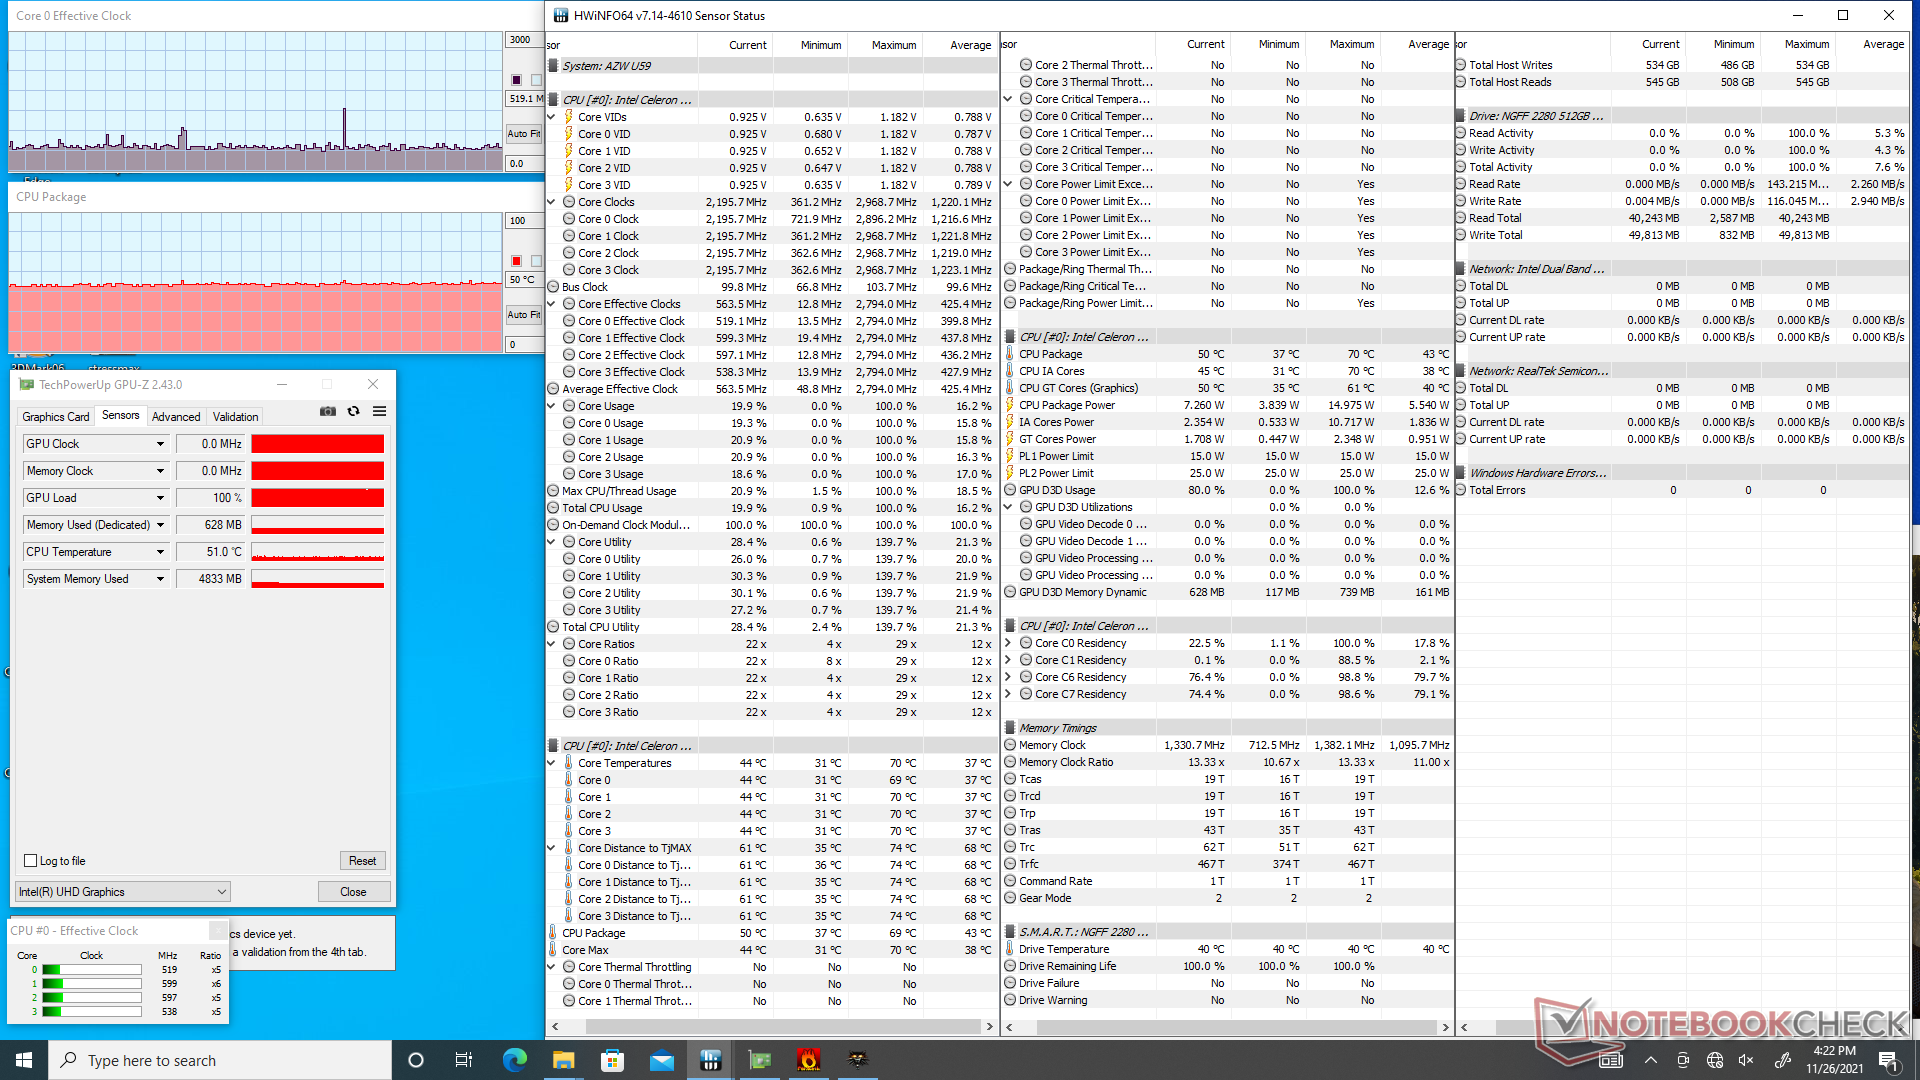
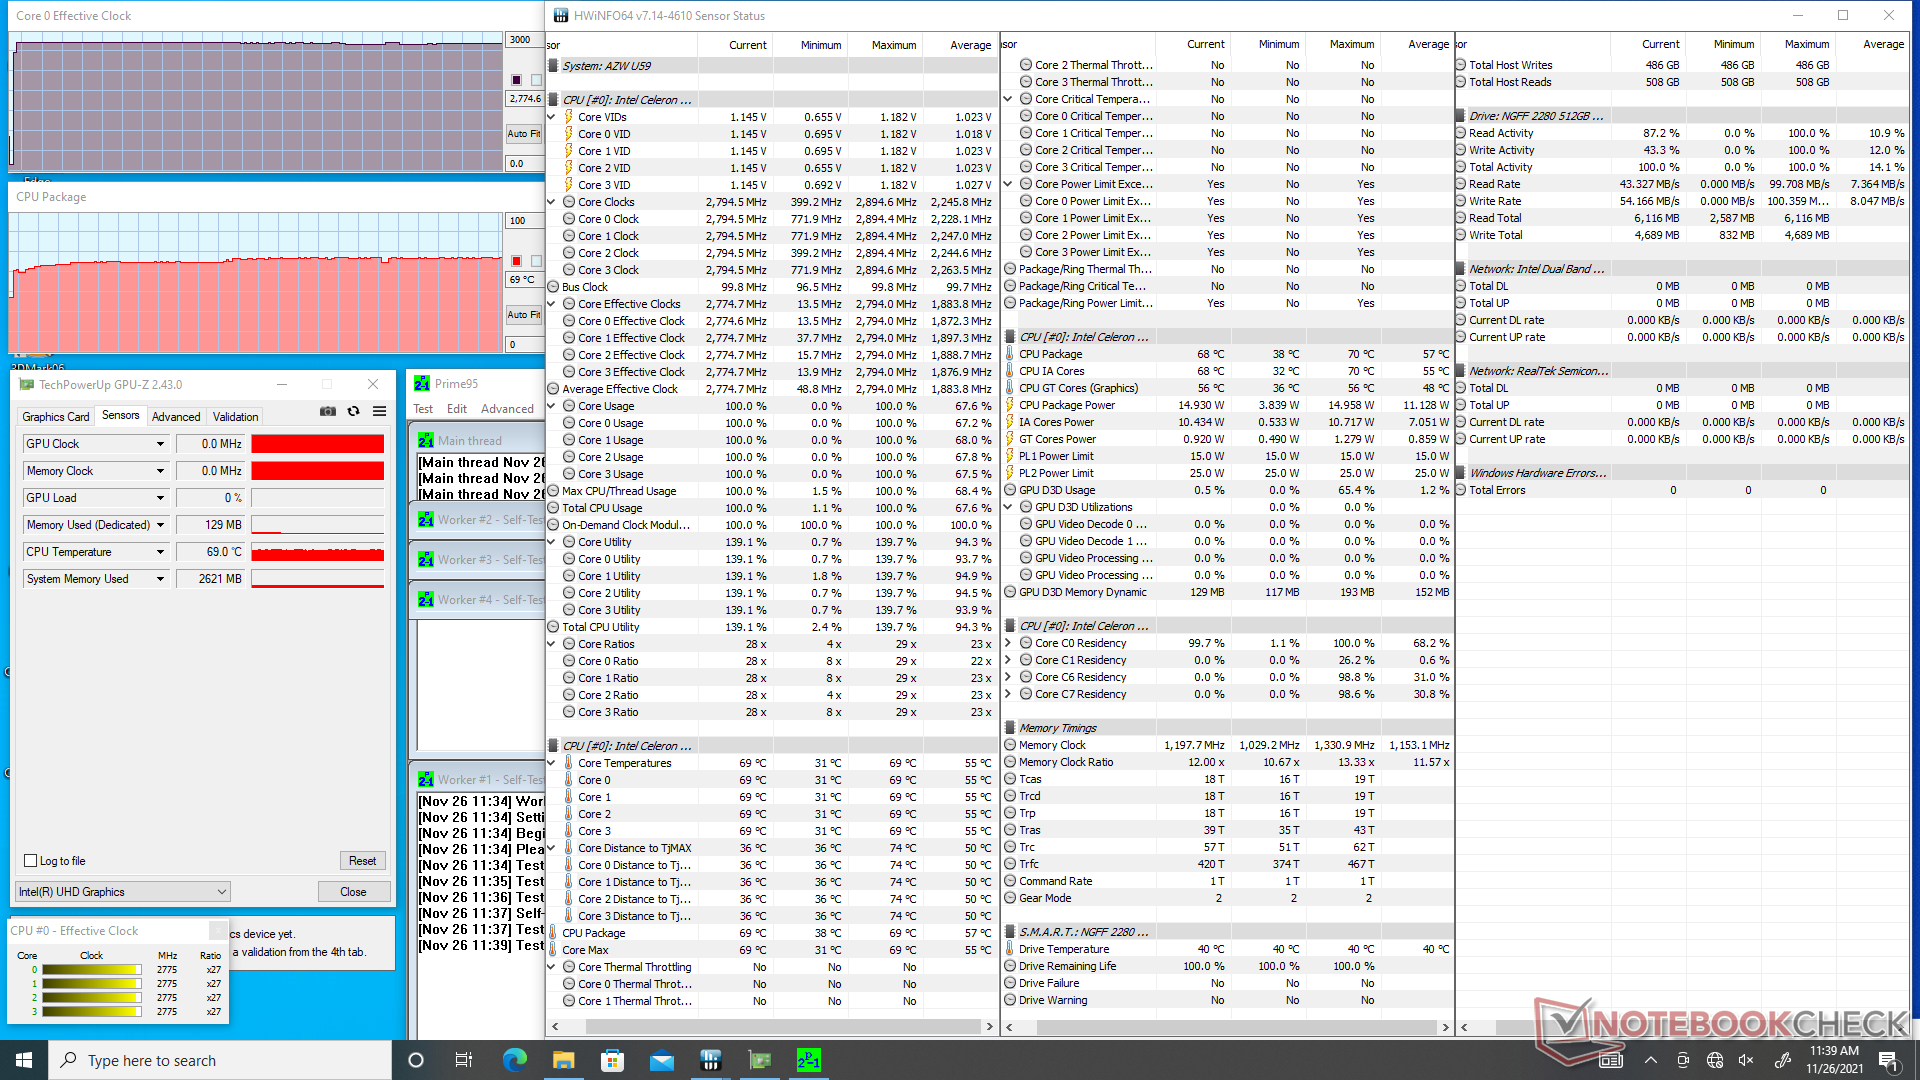
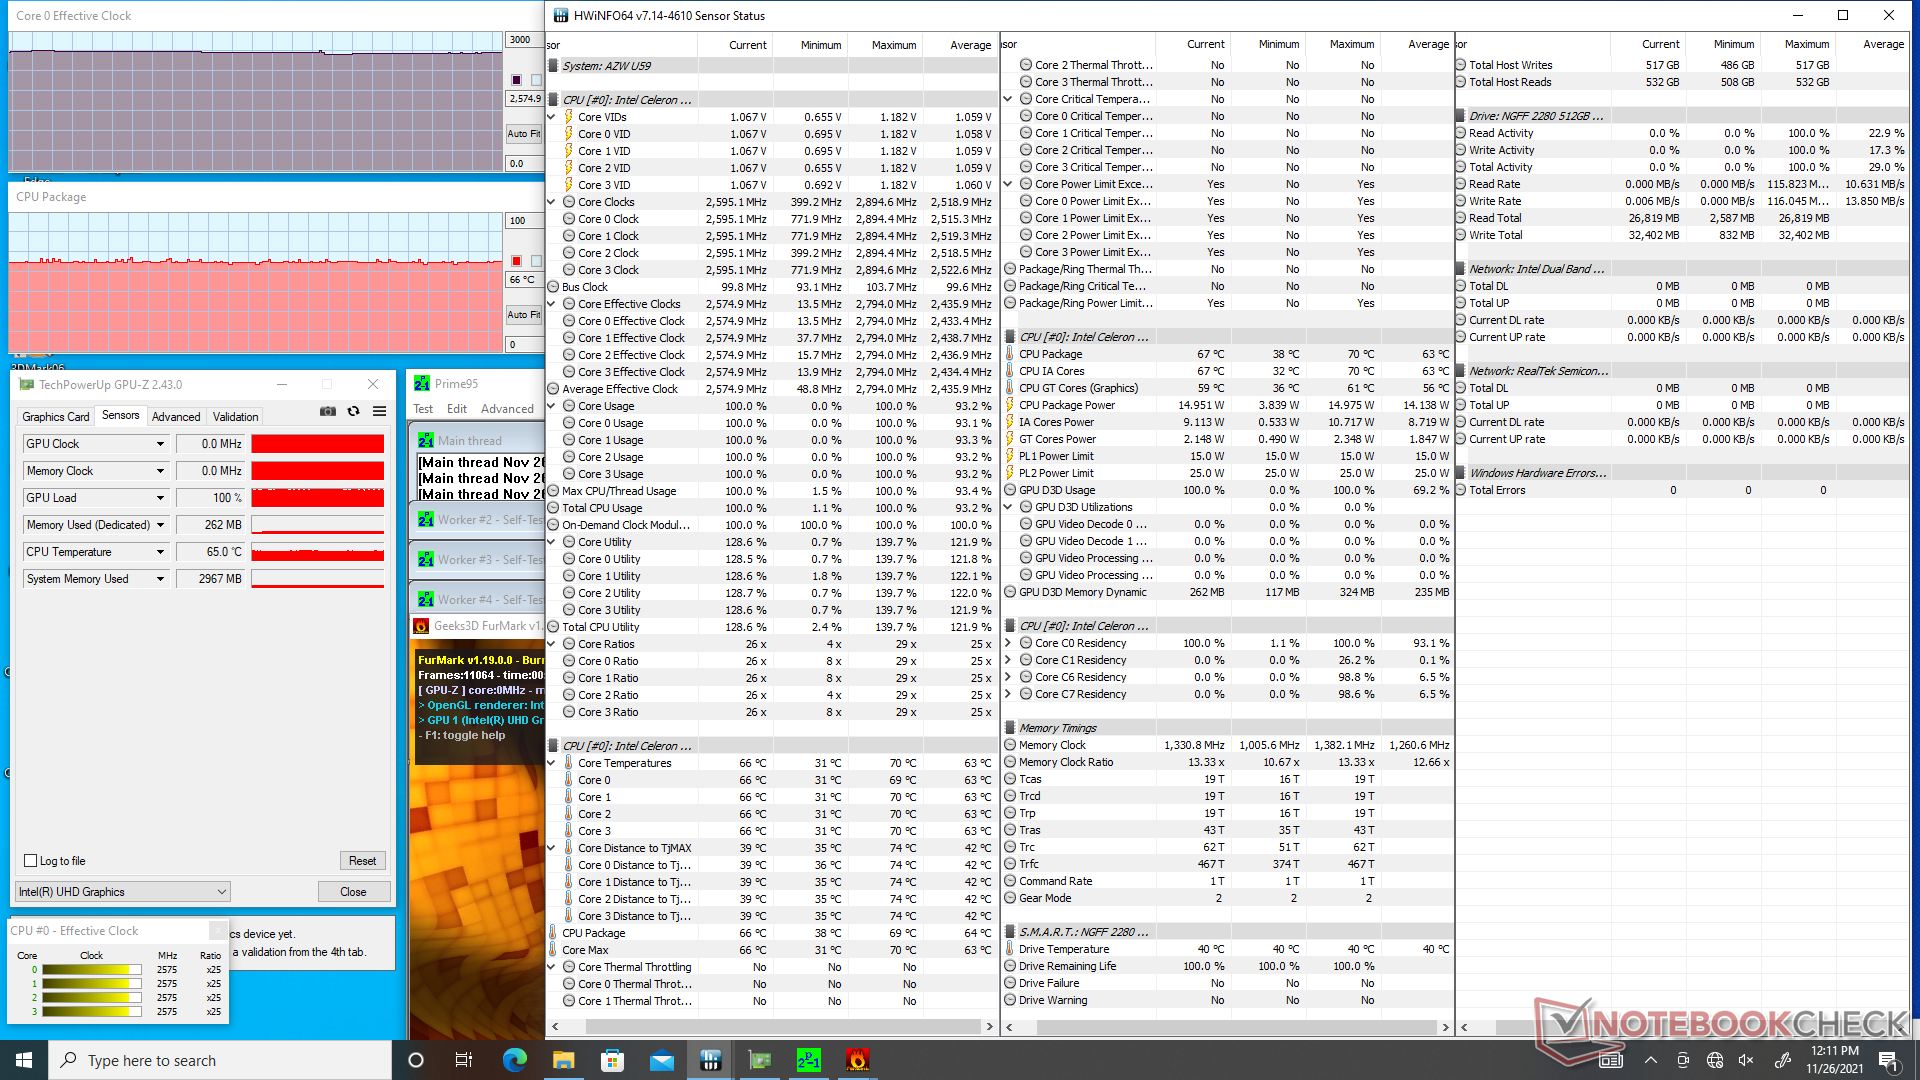
| CPU-Takt (GHz) | GPU-Takt (MHz) | DurchschnittlicheCPU-Temperatur (°C) | |
| System Leerlauf | -- | -- | 39 |
| Prime95 Stress | 2.8 | -- | 69 |
| Prime95 + FurMark Stress | 2.6 | -- | 66 |
| Witcher 3 Stress | 0.5 | -- | 50 |
Energieverwaltung
Stromverbrauch
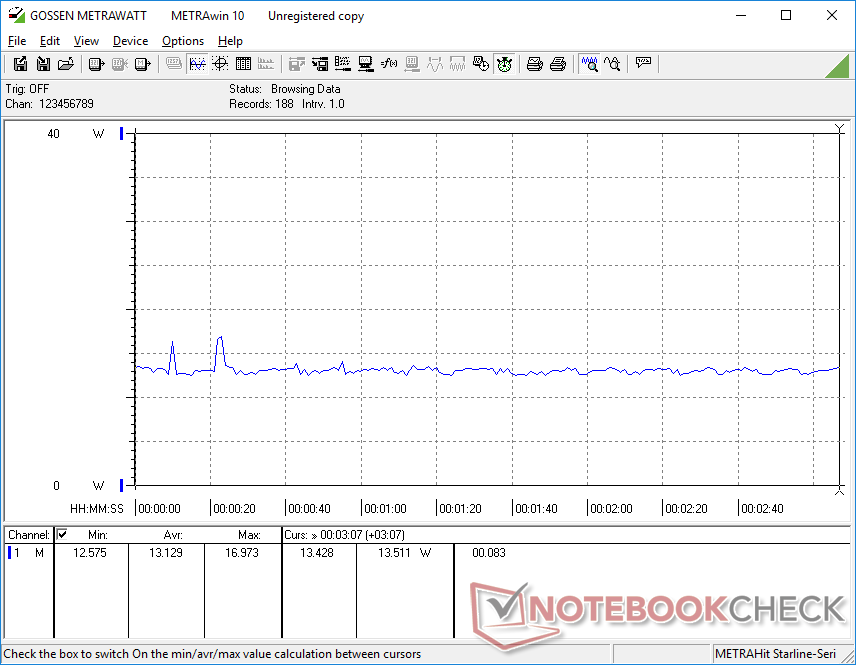
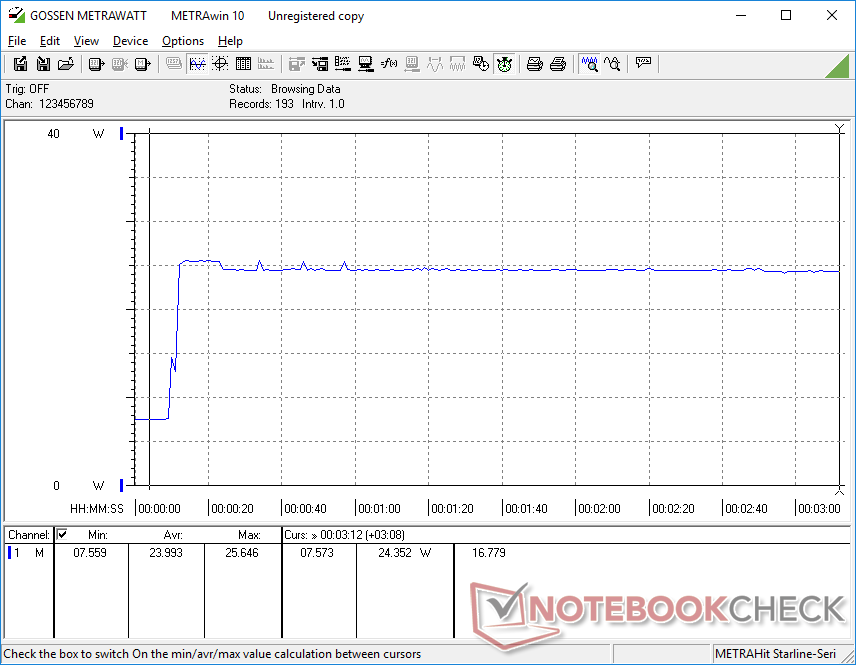
Der Leerlauf auf dem Desktop ohne laufende Anwendungen verbraucht mit etwa 7 W mehr als erwartet, während der Intel NUC8 oder die GMK NucBox K1 jeweils nur 3 W verbrauchen. Höhere Lasten wie Spiele konsumieren auf unserem U59 mit durchschnittlich 13 bis 16 W viel weniger als das Zweifache oder mehr auf Mini-PCs mit schnelleren UHD Graphics 620 oder Iris Xe GPUs.
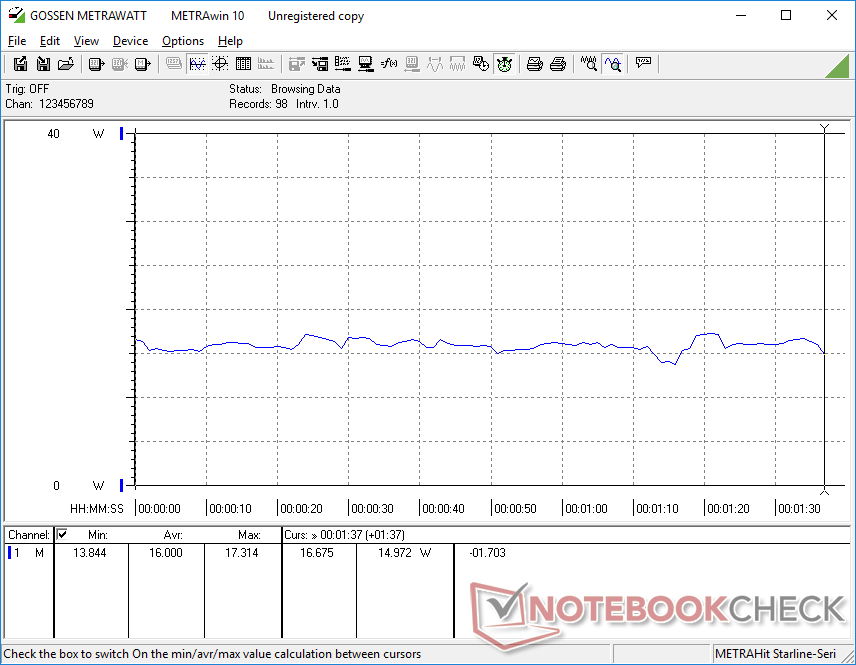

| Aus / Standby | |
| Idle | |
| Last |
|
Legende:
min: | |
| Beelink U59 Celeron N5095, UHD Graphics (Jasper Lake 16 EU), Silicon Motion AZW 512G NV428, , x, | Intel NUC11TNKi5 i5-1135G7, Iris Xe G7 80EUs, Transcend M.2 SSD 430S TS512GMTS430S, , x, | Intel NUC8i7BE i7-8559U, Iris Plus Graphics 655, , , x, | Beelink SEi10 i3-1005G1, UHD Graphics G1 (Ice Lake 32 EU), Silicon Motion AZW 256G M.2280 NVMe 4X 200725 D, , x, | Zotac ZBOX MI642 Nano i5-10210U, UHD Graphics 620, Western Digital WD Blue 3D WDBNCE5000PNC, , x, | GMK NucBox K1 Celeron J4125, UHD Graphics 600, HIKVision C100 NGFF SSD 128GB, , x, | |
|---|---|---|---|---|---|---|
| Stromverbrauch | -135% | -102% | -26% | -67% | 34% | |
| Idle min * (Watt) | 6.7 | 11.5 -72% | 2.7 60% | 6.3 6% | 8.9 -33% | 3.4 49% |
| Idle avg * (Watt) | 6.7 | 12.4 -85% | 3.1 54% | 6.6 1% | 9 -34% | 3.8 43% |
| Idle max * (Watt) | 7.4 | 12.9 -74% | 6.3 15% | 6.7 9% | 9.9 -34% | 3.9 47% |
| Last avg * (Watt) | 16 | 40.7 -154% | 59.7 -273% | 25.9 -62% | 33 -106% | 12.5 22% |
| Witcher 3 ultra * (Watt) | 13.1 | 43.9 -235% | 47.2 -260% | |||
| Last max * (Watt) | 25.6 | 73.5 -187% | 78 -205% | 46.7 -82% | 58 -127% | 22.7 11% |
* ... kleinere Werte sind besser
Energieverwaltung Witcher 3 / Stresstest
Energieverwaltung externer Monitor
Pro
Contra
Fazit
Der niedrige Preis von 279 bis 349 US-Dollar inklusive RAM, Speicher und Windows 11 Pro ist das überzeugendste Verkaufsargument des Beelink U59. Die Performance-pro-Dollar ist spürbar höher als bei den Celeron-Mini-PCs der vorherigen Generation, und zwar um das 2- bis 2,5-fache in Bezug auf die Multi-Thread-Leistung bzw. um 50 Prozent in Bezug auf die Single-Thread-Leistung und Grafik. Wir schätzen es, dass beide Speicherschächte, beide RAM-Steckplätze und das WLAN-Modul leicht zugänglich und aufrüstbar sind, so dass interessierte Käufer nicht für die High-End-Konfiguration zahlen müssen, wenn sie diese Komponenten selbst aufrüsten wollen.
Es ist zwar kein Core i3, aber der Jasper Lake Celeron N5095 ist zumindest viel näher dran als alle anderen mobilen Celeron CPUs vor ihm. Der Beelink U59 bietet eine deutlich bessere Leistung als die meisten anderen Mini-PCs in der Preisklasse zwischen 200 und 350 US-Dollar.
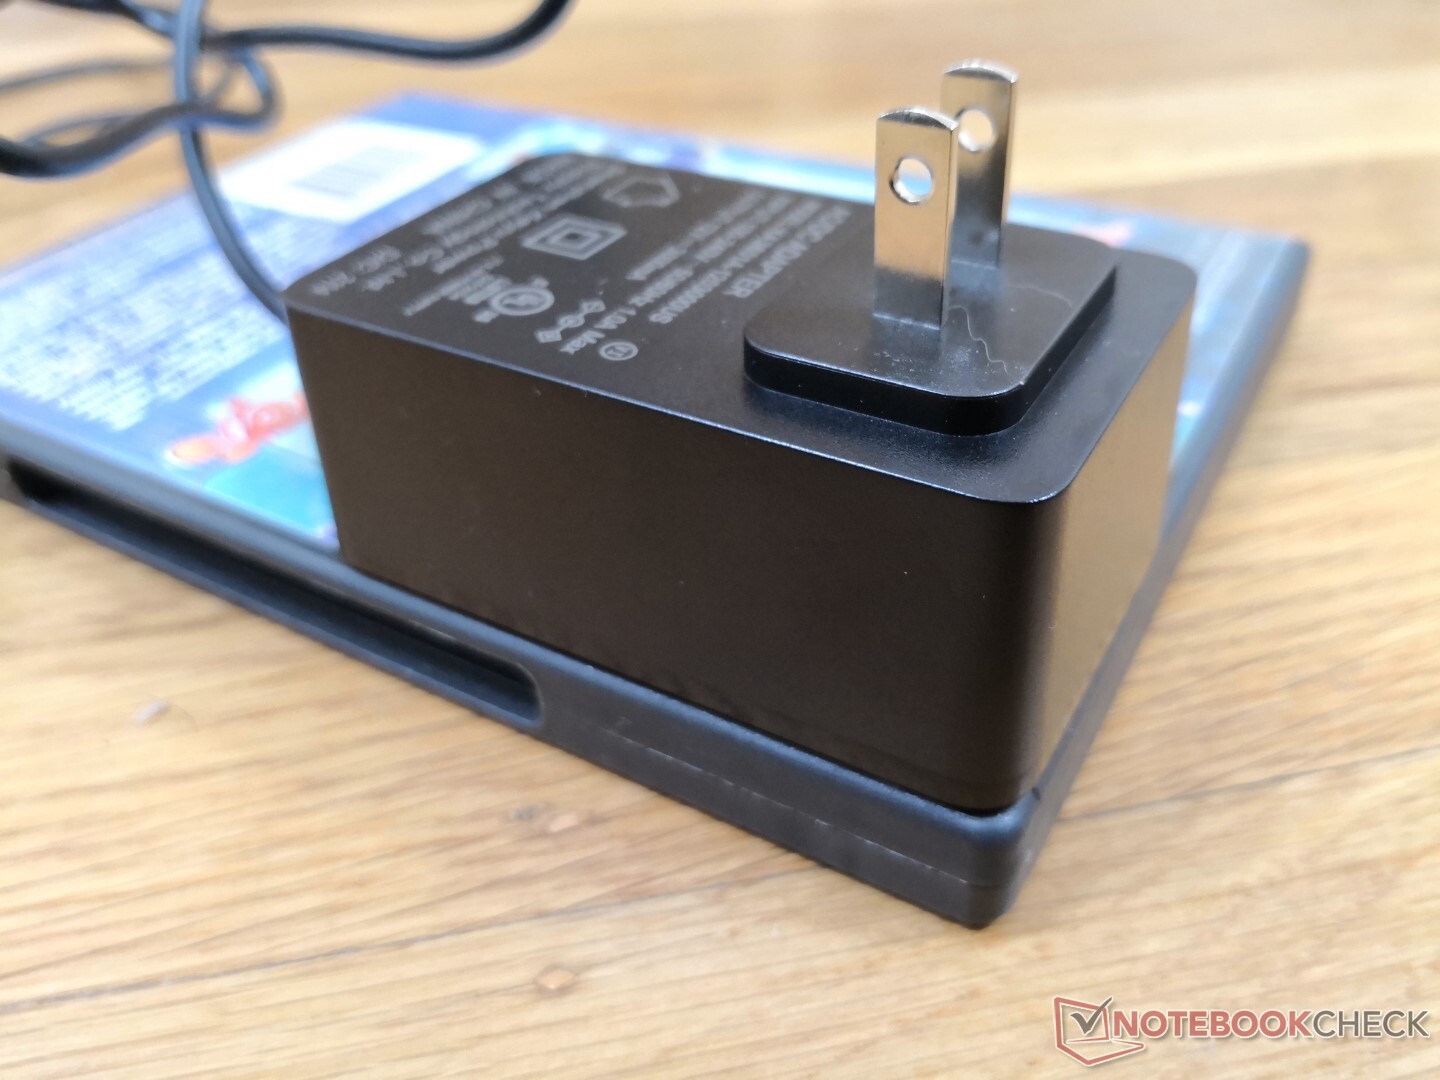
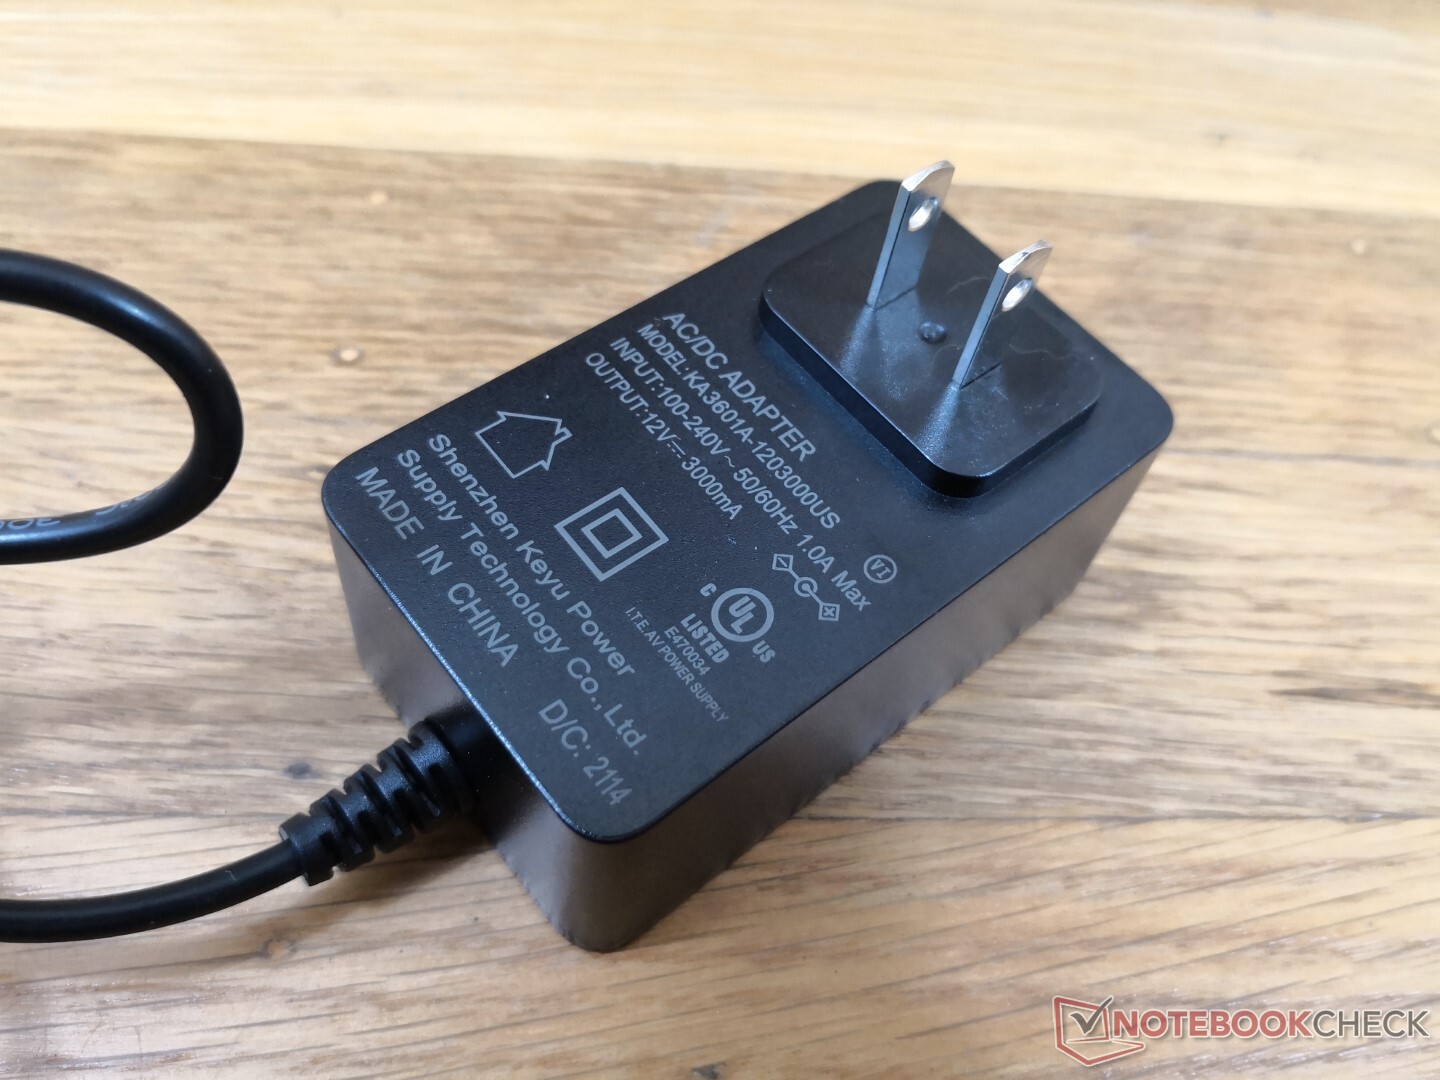
Die Nachteile sind gering, aber sie summieren sich: Die Tatsache, dass das System einen proprietären Wechselstromadapter benötigt, ist ein Ärgernis, wenn es stattdessen auch über den universelleren USB-C-Anschluss mit Strom versorgt werden könnte. Der Lüfter, obwohl er im Allgemeinen leise ist, neigt dazu, als Reaktion auf die Arbeitslast häufig zu pulsieren. Das Fehlen eines SD-Kartenlesers könnte Nutzer verärgern, die darauf angewiesen sind, und die obere Kunststoffplatte fühlt sich billig an und ist anfällig für Kratzer. Wenn Sie sich jedoch einen Celeron-Mini-PC zulegen müssen, dann kann der Beelink U59 mit Jasper Lake eine gute Wahl sein, einfach wegen der bemerkenswerten Leistungsvorteile gegenüber älteren Celeron Chips wie denen im GMK NucBox K1 oder Chuwi GBox.
Preis und Verfügbarkeit
Amazon liefert derzeit den Beelink U59 ab 329 bis zu 429 Euro je nach RAM und Speicheroption.
Preisvergleich

