Kaby Lake-G ist Geschichte: Intel Phantom Canyon NUC11PHKi7C Test
 vs. 2018 Intel Hades Canyon (rechts)")
(Update vom 26. April 2021: Wir haben eine Anfrage an Intel gesendet, ob der NUC11PHK G-Sync unterstützt und ob der blaue, LED-beleuchtete Totenkopf auf andere Farben umgestellt werden kann. Die Seite wird aktualisiert, sobald wir die Informationen haben.)
Im Gegensatz zu den langsameren und günstigeren NUC11TNK oder NUC11PAQ ist der NUC11PHK Phantom Canyon standardmäßig mit einer diskreten GeForce RTX 2060 GPU ausgestattet, die eine deutlich schnellere Grafikleistung und ein höheres Spielepotenzial bietet. Er ist der direkte Nachfolger des NUC8 Hades Canyon und nicht des NUC9 Extreme, da sein Gehäuse eher dem Ersten und nicht dem Zweiten ähnelt.
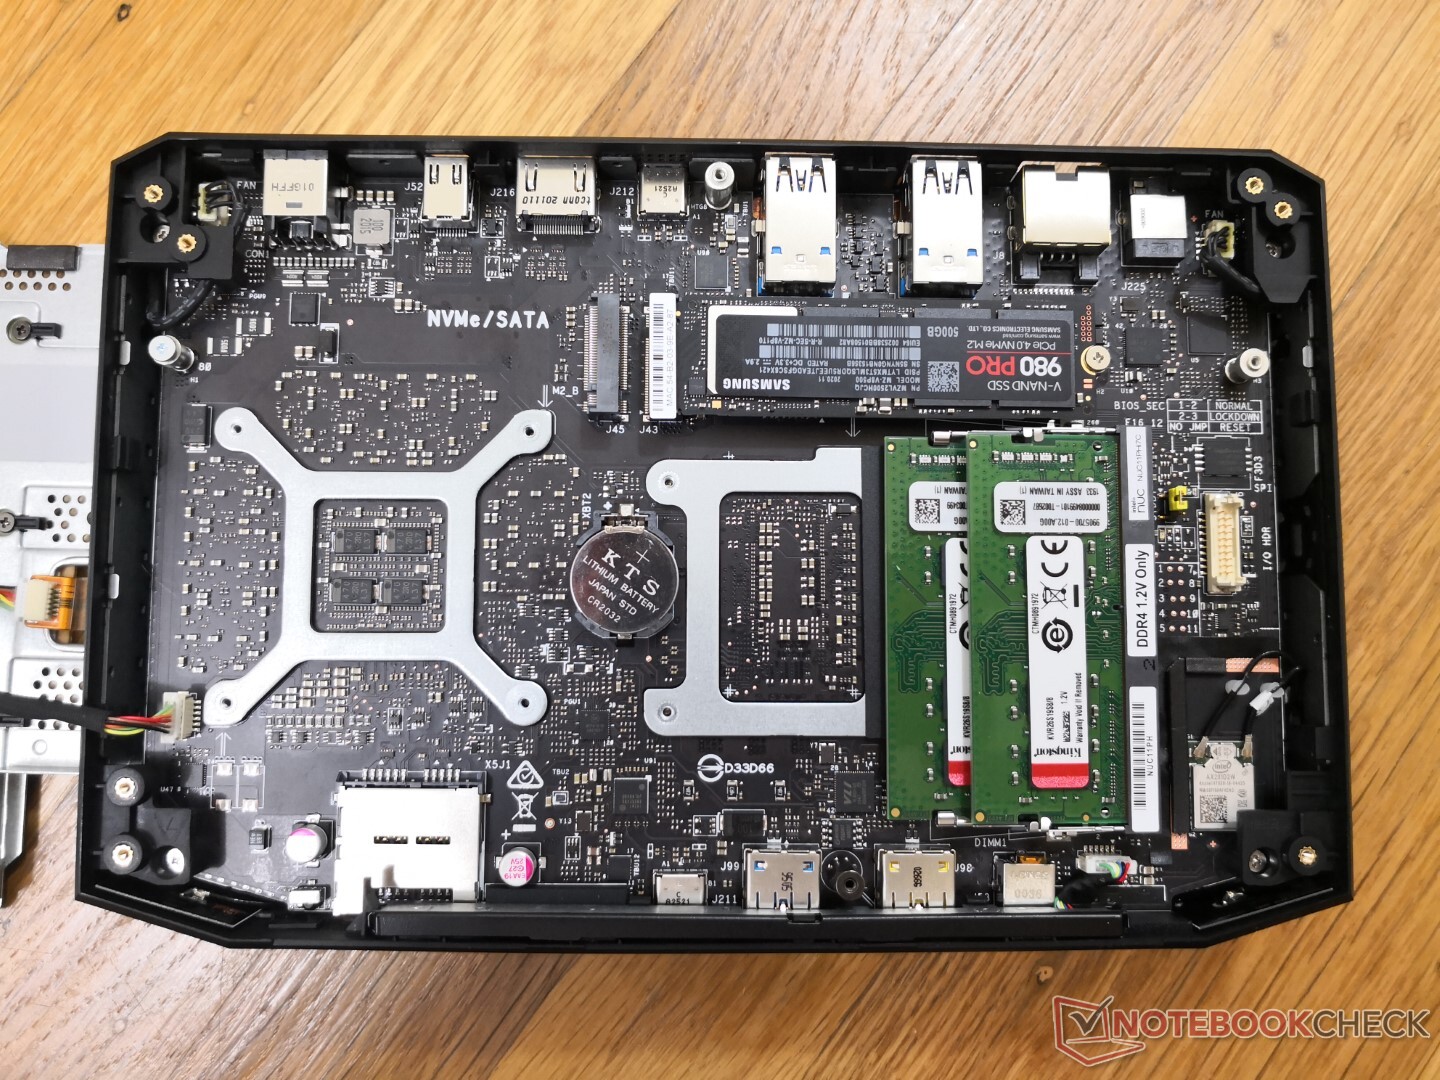
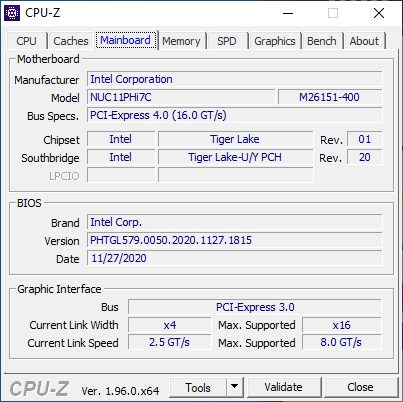
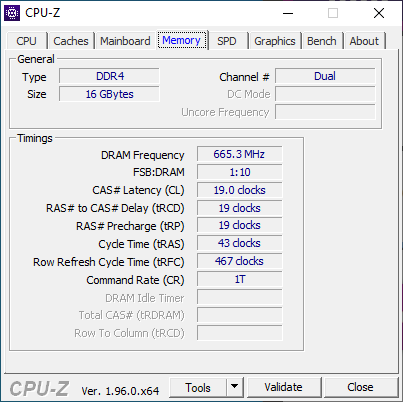
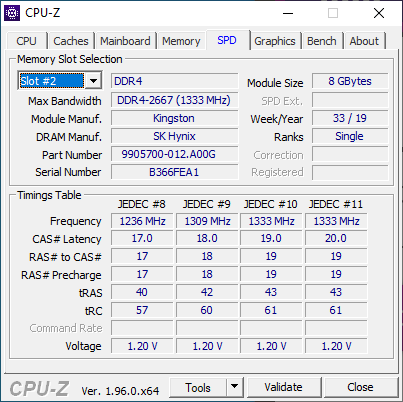
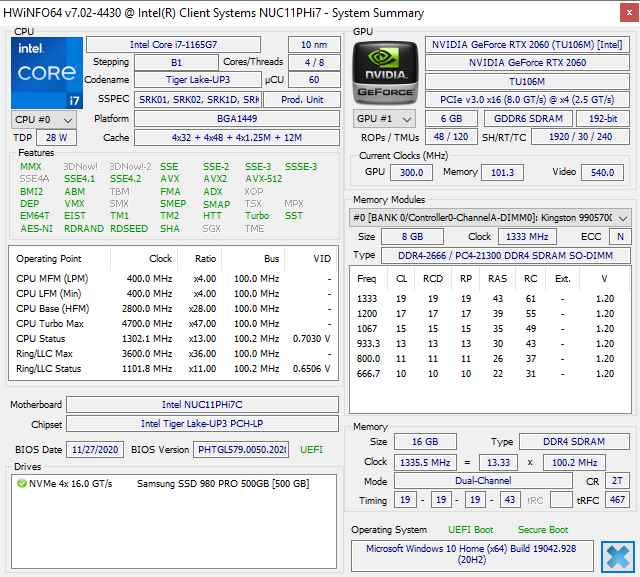
Der Phantom Canyon wird als Barebone-Kit ausgeliefert. Für unseren Test haben wir eine Samsung 980 Pro NVMe-SSD mit 16 GB DDR4-2666-Dual-Channel-RAM eingebaut. Der NUC selbst kann einen schnelleren Arbeitsspeicher mit bis zu 3.200 MHz unterstützen.
Weitere Intel-NUC-Tests:
potential competitors in comparison
Bew. | Datum | Modell | Gewicht | Dicke | Größe | Auflösung | Preis ab |
|---|---|---|---|---|---|---|---|
v (old) | 04 / 2021 | Intel NUC11PHKi7C i7-1165G7, GeForce RTX 2060 Mobile | 1.4 kg | 42 mm | x | ||
v (old) | 03 / 2018 | Intel Hades Canyon NUC8i7HVK i7-8809G, Vega M GH | 1.3 kg | 39 mm | x | ||
v (old) | 02 / 2021 | Intel NUC11PAQi7 i7-1165G7, Iris Xe G7 96EUs | 647 g | 56 mm | x | ||
v (old) | GMK NucBox 2 i5-8259U, Iris Plus Graphics 655 | 430 g | 50 mm | x | |||
v (old) | 03 / 2018 | Zotac ZBOX Magnus EK71080 i7-7700HQ, GeForce GTX 1080 (Desktop) | 3.3 kg | 128 mm | 0.00" | x | |
v (old) | 02 / 2021 | Aorus Gaming Box GeForce RTX 2080 Ti i7-1165G7 | 3.8 kg | 140 mm | x | ||
v (old) | 08 / 2020 | Beelink GTR35 II-G-16512D00W64PRO-1T R5 3550H, Vega 8 | 843 g | 39 mm | x |
Gehäuse
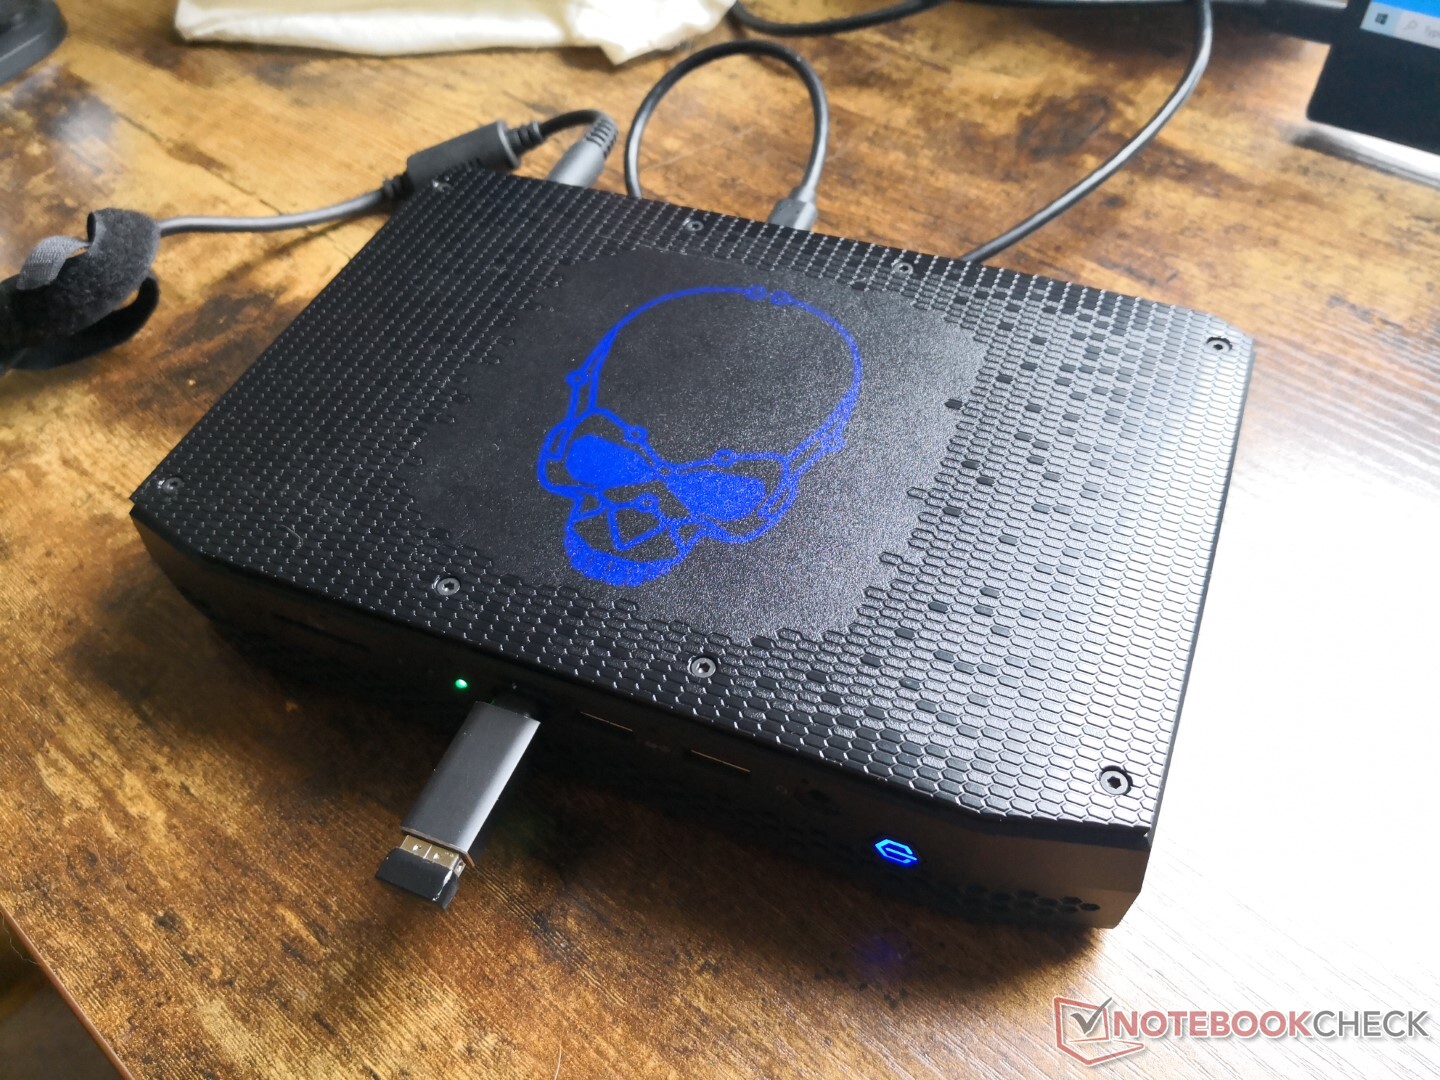
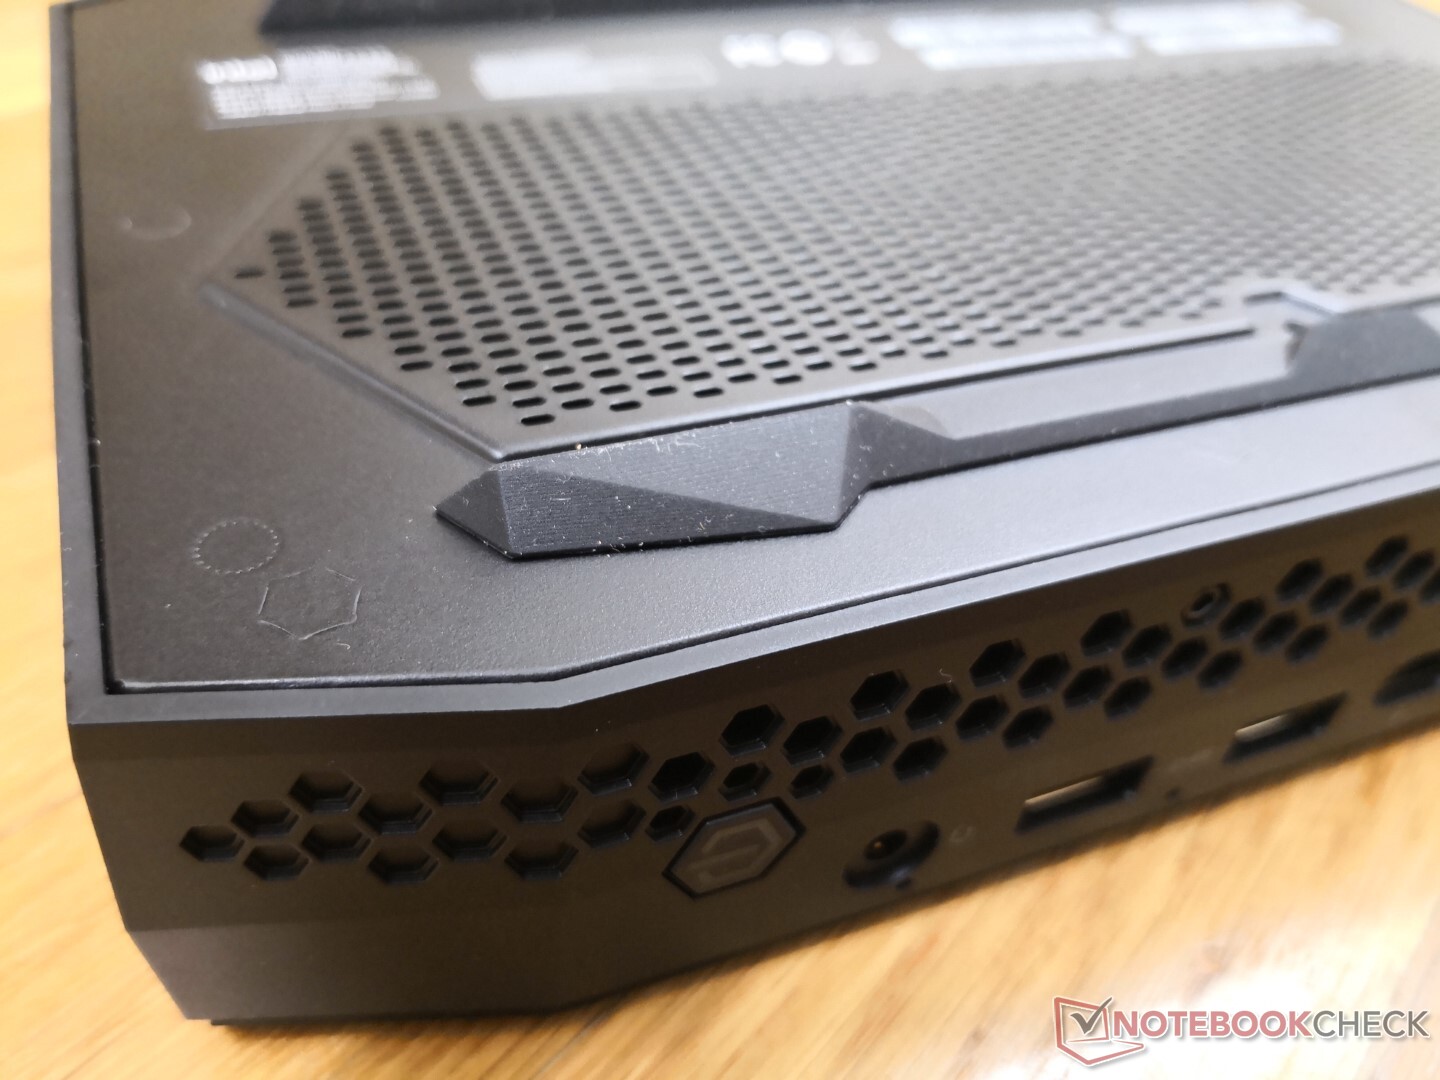
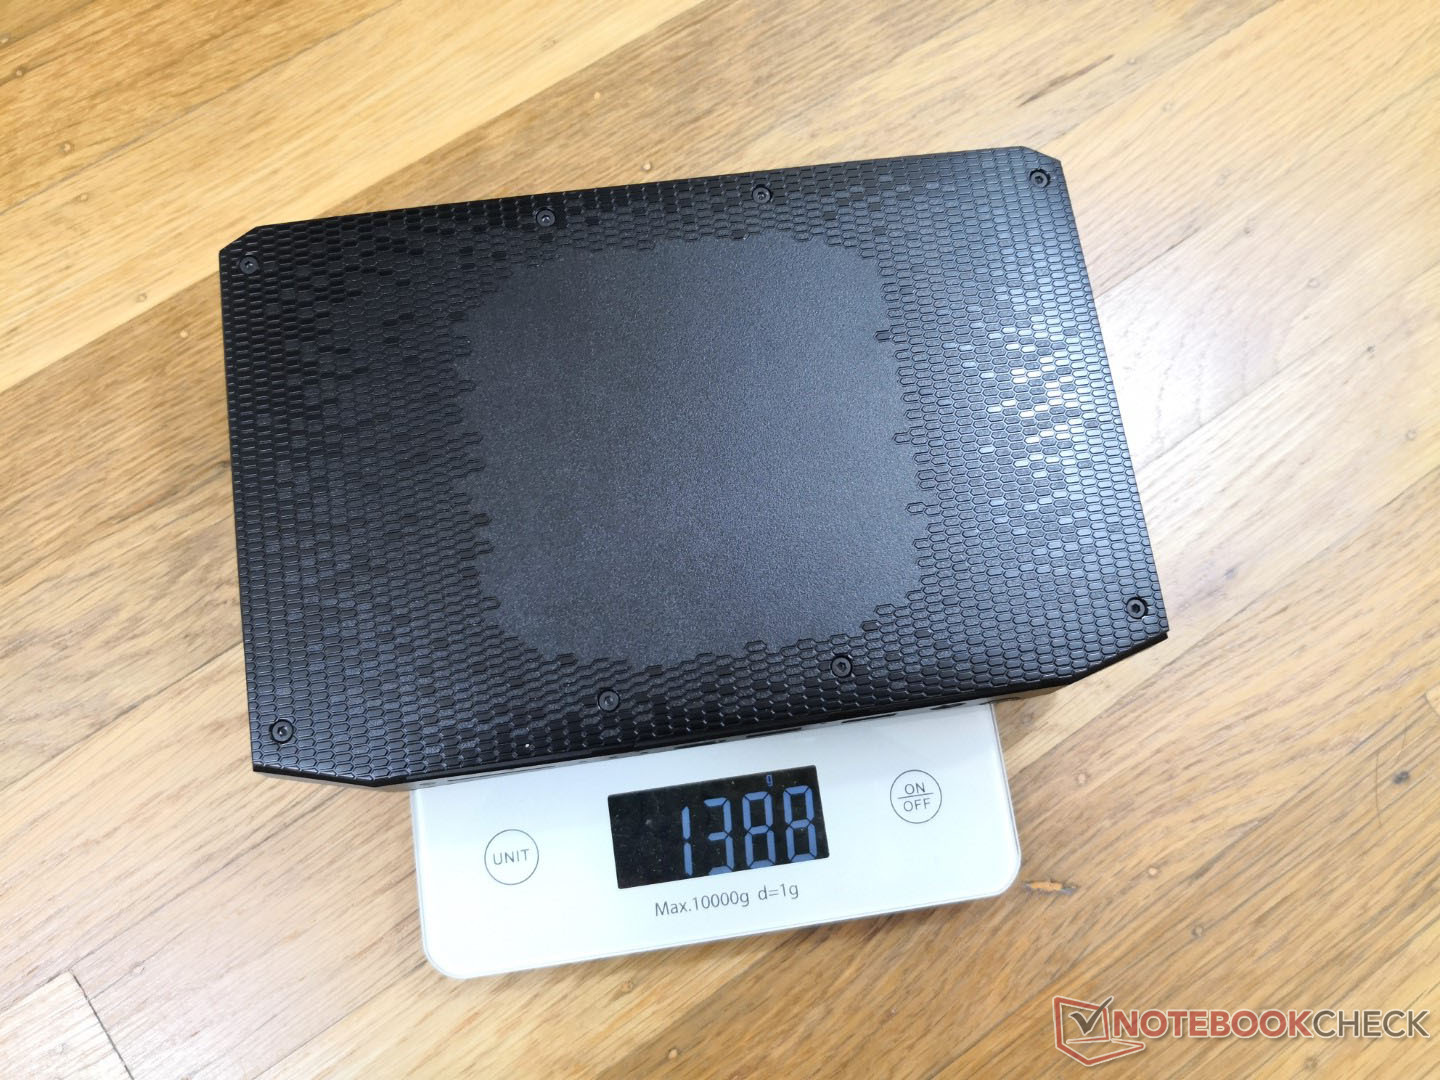
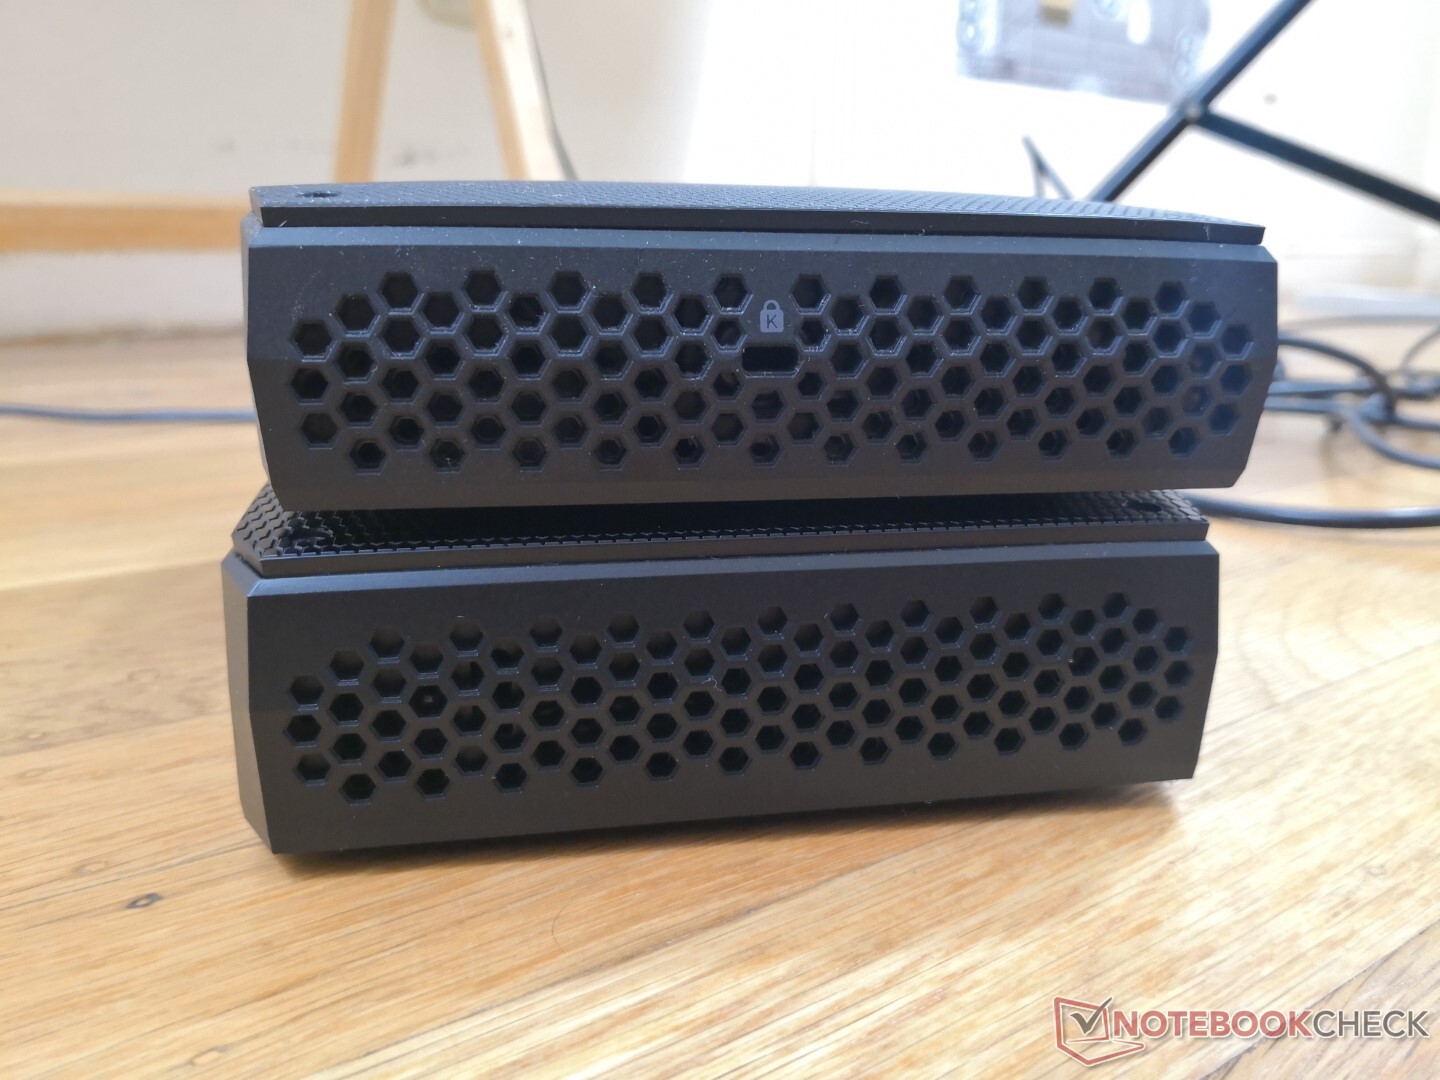
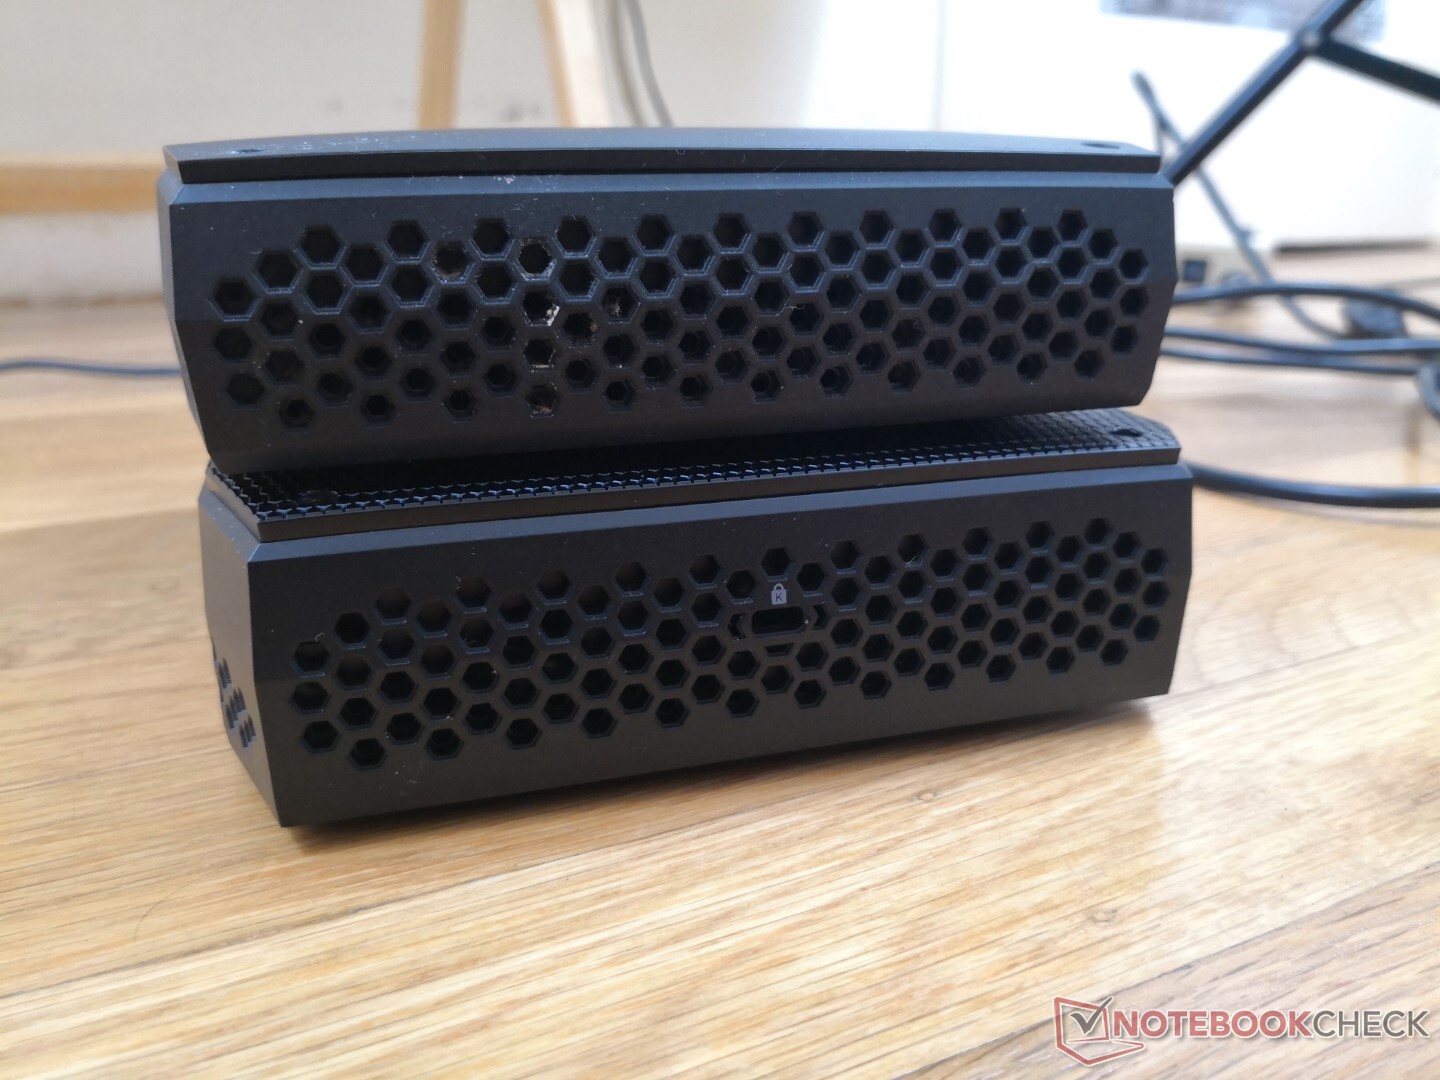
Die Gehäusematerialien und die Größe sind im Wesentlichen die gleichen wie beim Hades Canyon NUC mit nur leichten kosmetischen Änderungen an Texturen und Lüftungsgittern. Allerdings ist das Phantom Canyon etwas dicker (42 mm vs. 39 mm) und schwerer (1,4 kg vs. 1,3 kg) als sein unmittelbarer Vorgänger, um die leistungshungrigeren Prozessoren besser unterzubringen und für die neue, abnehmbare LED-beleuchtete Frontplatte.
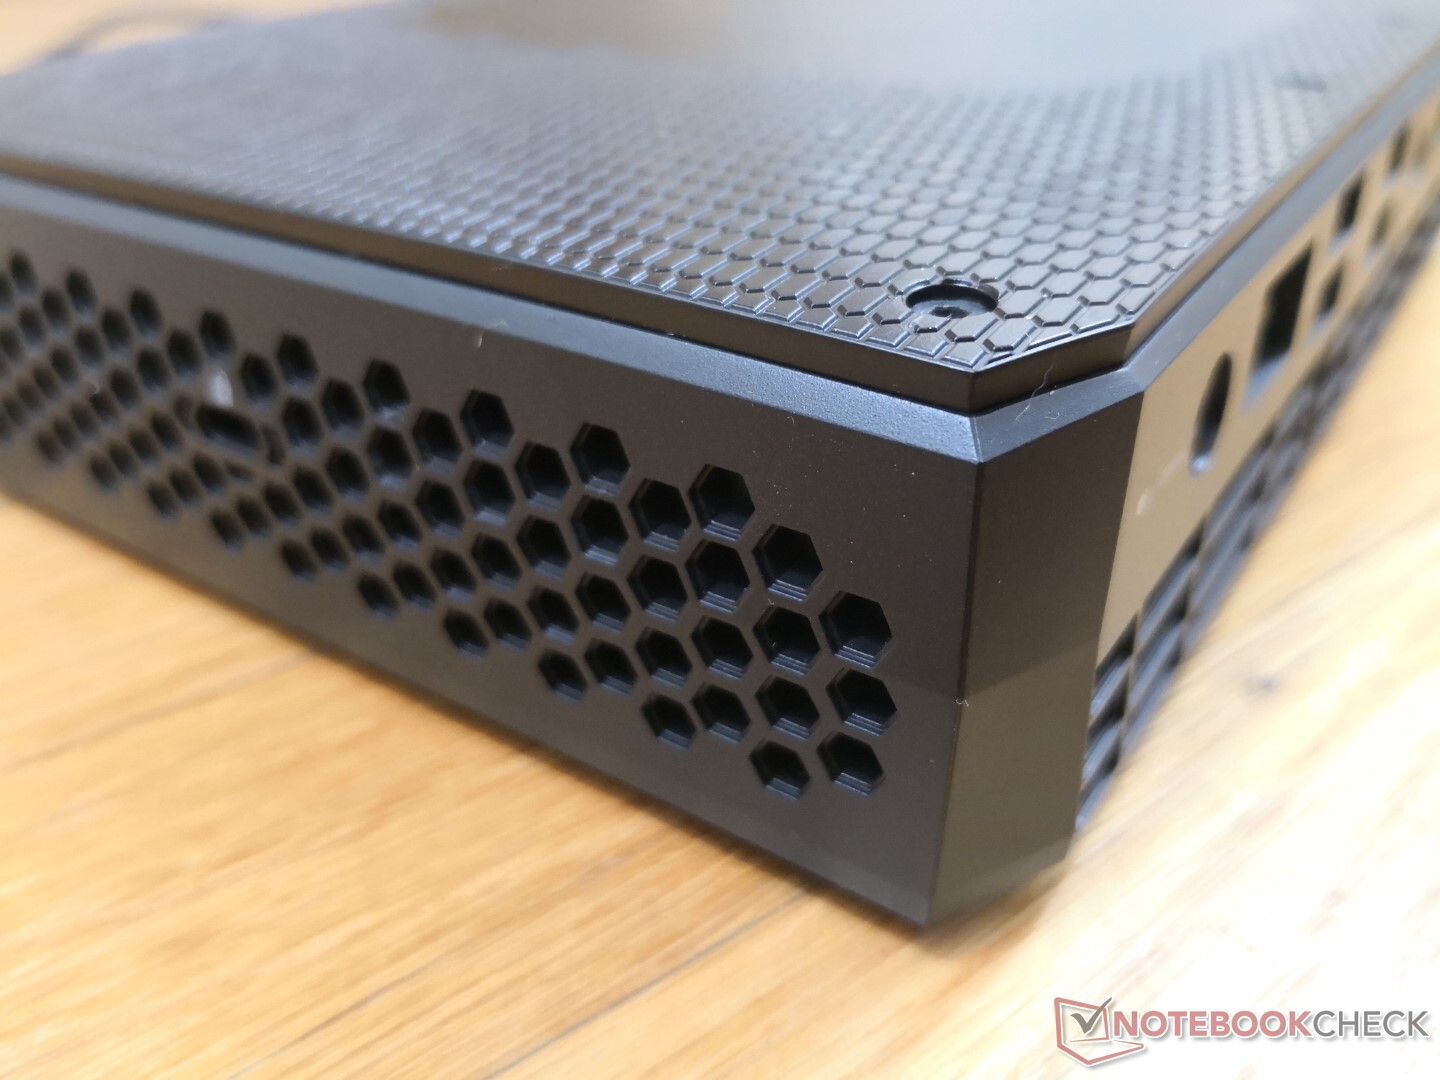
Konnektivität
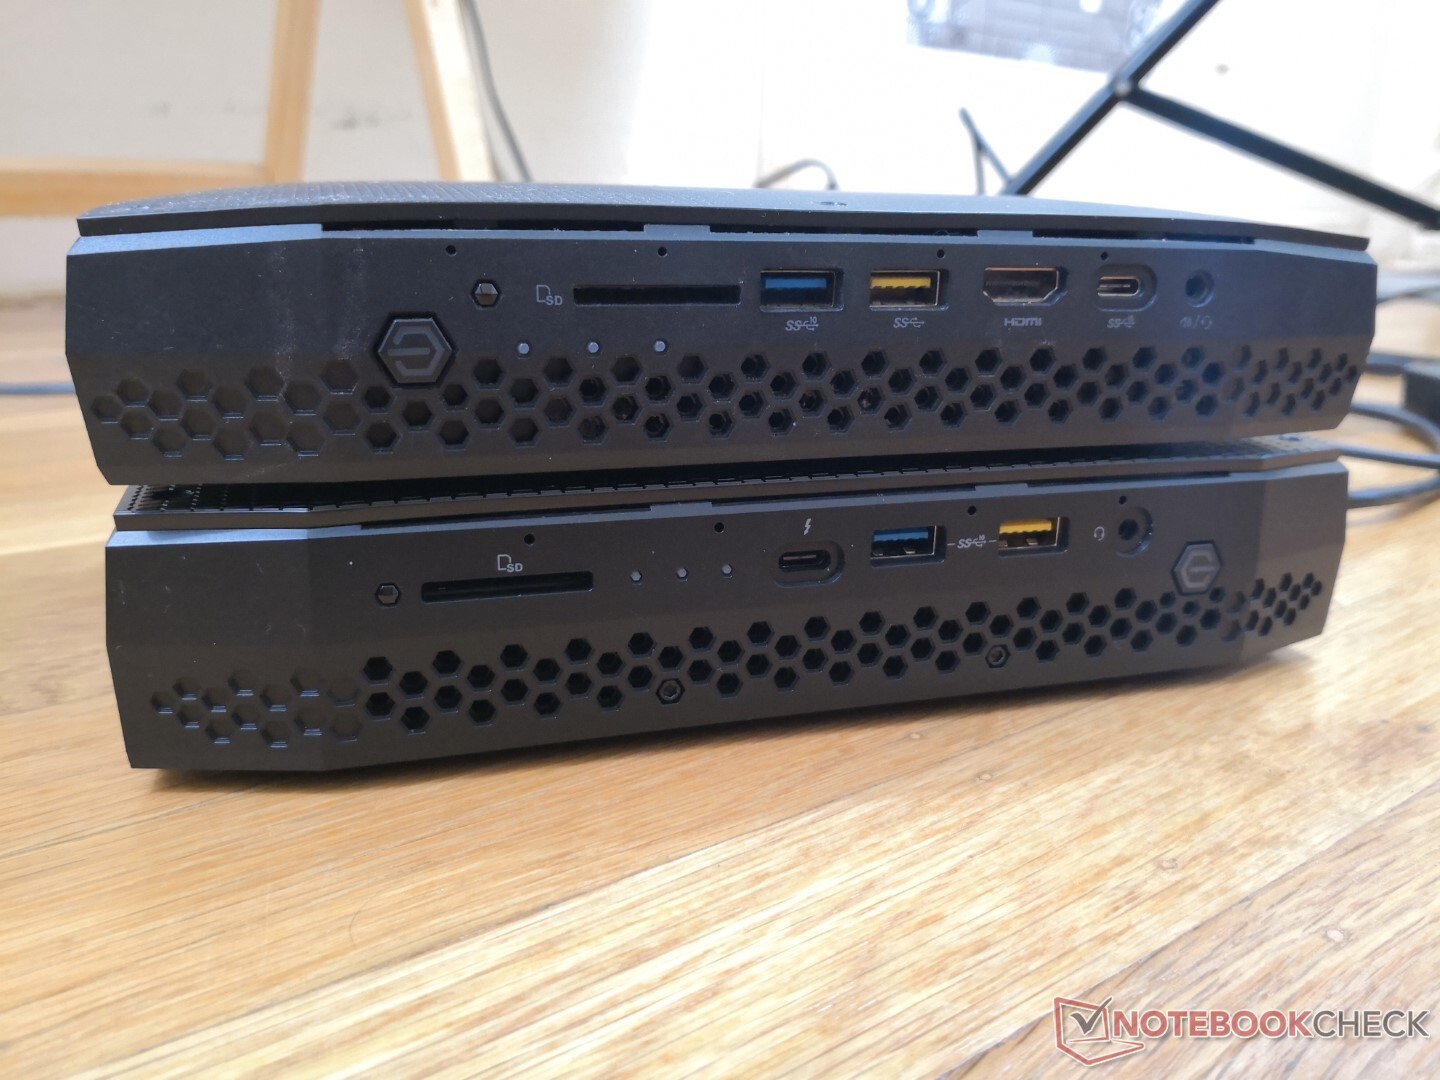
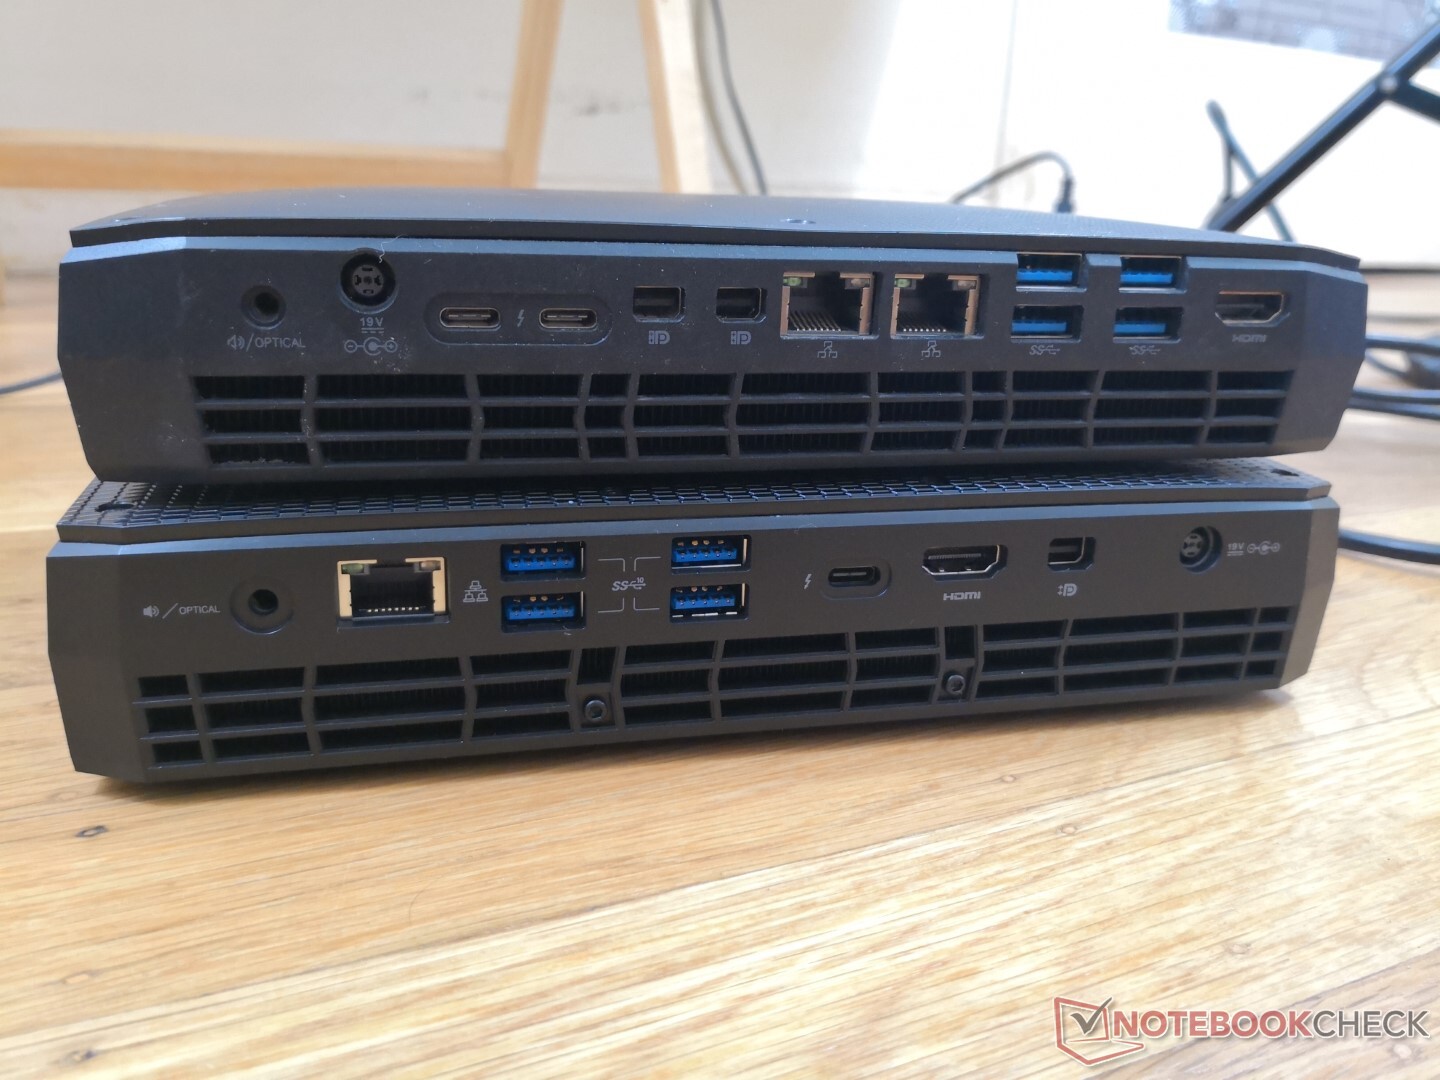
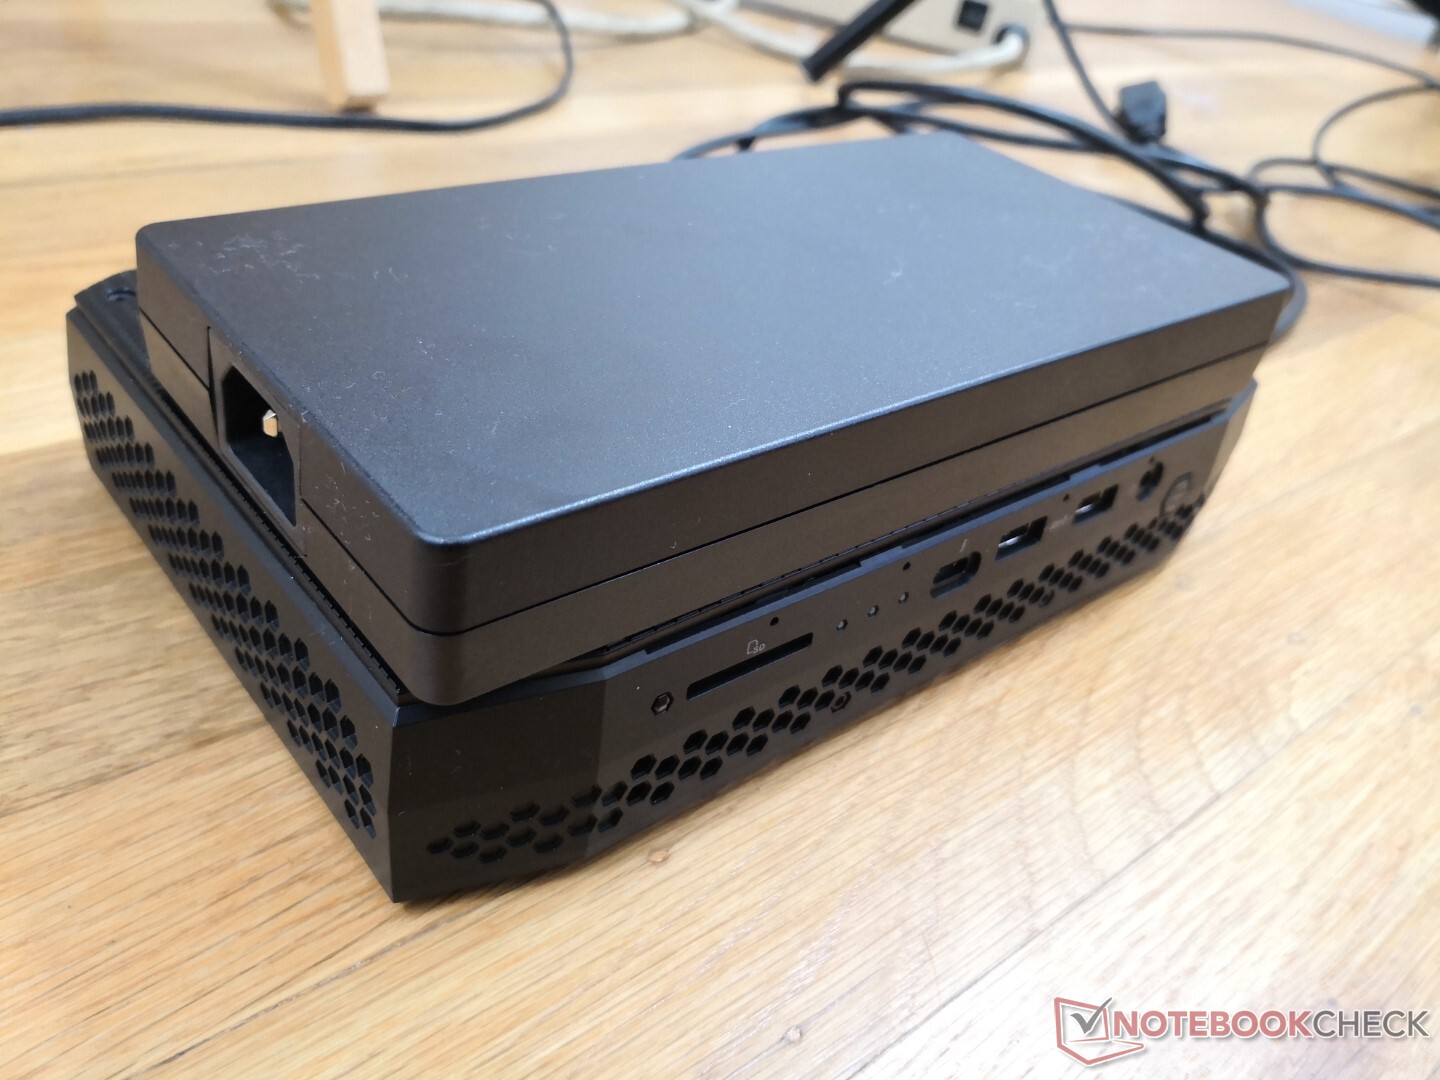
Die Anschlussoptionen haben sich gegenüber dem 2018er Modell Hades Canyon geändert. Es gibt jetzt nur noch einen RJ-45-Anschluss, einen HDMI-Anschluss, einen Mini-DisplayPort und zwei USB-C mit Thunderbolt 4 anstelle von zwei RJ-45, zwei HDMI, zwei Mini-DisplayPorts und drei USB-C beim Vorgängermodell. Alle sechs USB-A-Anschlüsse bleiben erhalten.
Der NUC kann nicht über USB-C mit Strom versorgt werden, und selbst wenn er es könnte, würde er mehr Saft benötigen als die 100-W-USB-C-Grenze.
Die Bilder unten vergleichen den NUC8 Hades Canyon (oben) mit dem NUC11 Phantom Canyon (unten).
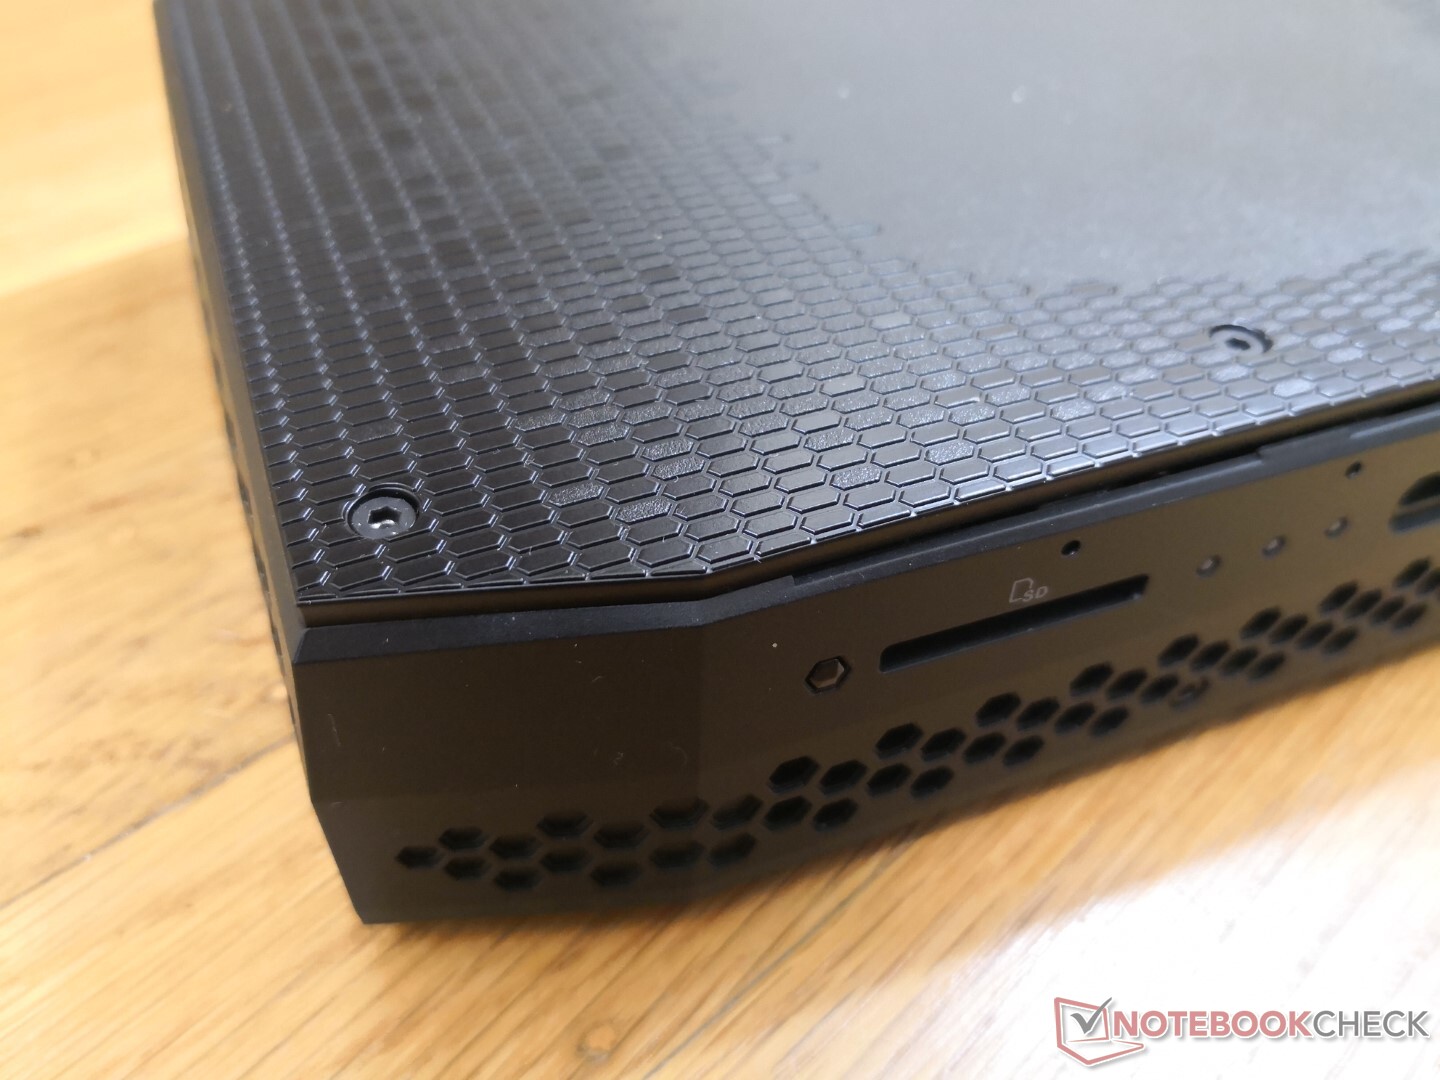
SD-Kartenleser
Der integrierte SD-Leser bietet schnellere Übertragungsraten als der Kartenleser auf Hades Canyon. Er ist nicht federbelastet wie bei den meisten Laptops.
| SD Card Reader | |
| average JPG Copy Test (av. of 3 runs) | |
| Intel NUC11PAQi7 (Toshiba Exceria Pro SDXC 64 GB UHS-II) | |
| Intel NUC11PHKi7C (Toshiba Exceria Pro SDXC 64 GB UHS-II) | |
| Intel Hades Canyon NUC8i7HVK (Toshiba Exceria Pro SDXC 64 GB UHS-II) | |
| Zotac ZBOX Magnus EK71080 (Toshiba Exceria Pro SDXC 64 GB UHS-II) | |
| GMK NucBox 2 (Toshiba Exceria Pro M501 UHS-II) | |
| maximum AS SSD Seq Read Test (1GB) | |
| Intel NUC11PHKi7C (Toshiba Exceria Pro SDXC 64 GB UHS-II) | |
| Intel NUC11PAQi7 (Toshiba Exceria Pro SDXC 64 GB UHS-II) | |
| Intel Hades Canyon NUC8i7HVK (Toshiba Exceria Pro SDXC 64 GB UHS-II) | |
| Zotac ZBOX Magnus EK71080 (Toshiba Exceria Pro SDXC 64 GB UHS-II) | |
| GMK NucBox 2 (Toshiba Exceria Pro M501 UHS-II) | |
Kommunikation
| Networking | |
| iperf3 transmit AX12 | |
| Intel NUC11PHKi7C | |
| Intel NUC11PAQi7 | |
| GMK NucBox 2 | |
| Intel Hades Canyon NUC8i7HVK | |
| Zotac ZBOX Magnus EK71080 | |
| iperf3 receive AX12 | |
| Intel NUC11PHKi7C | |
| Intel NUC11PAQi7 | |
| GMK NucBox 2 | |
| Intel Hades Canyon NUC8i7HVK | |
| Zotac ZBOX Magnus EK71080 | |
Wartung
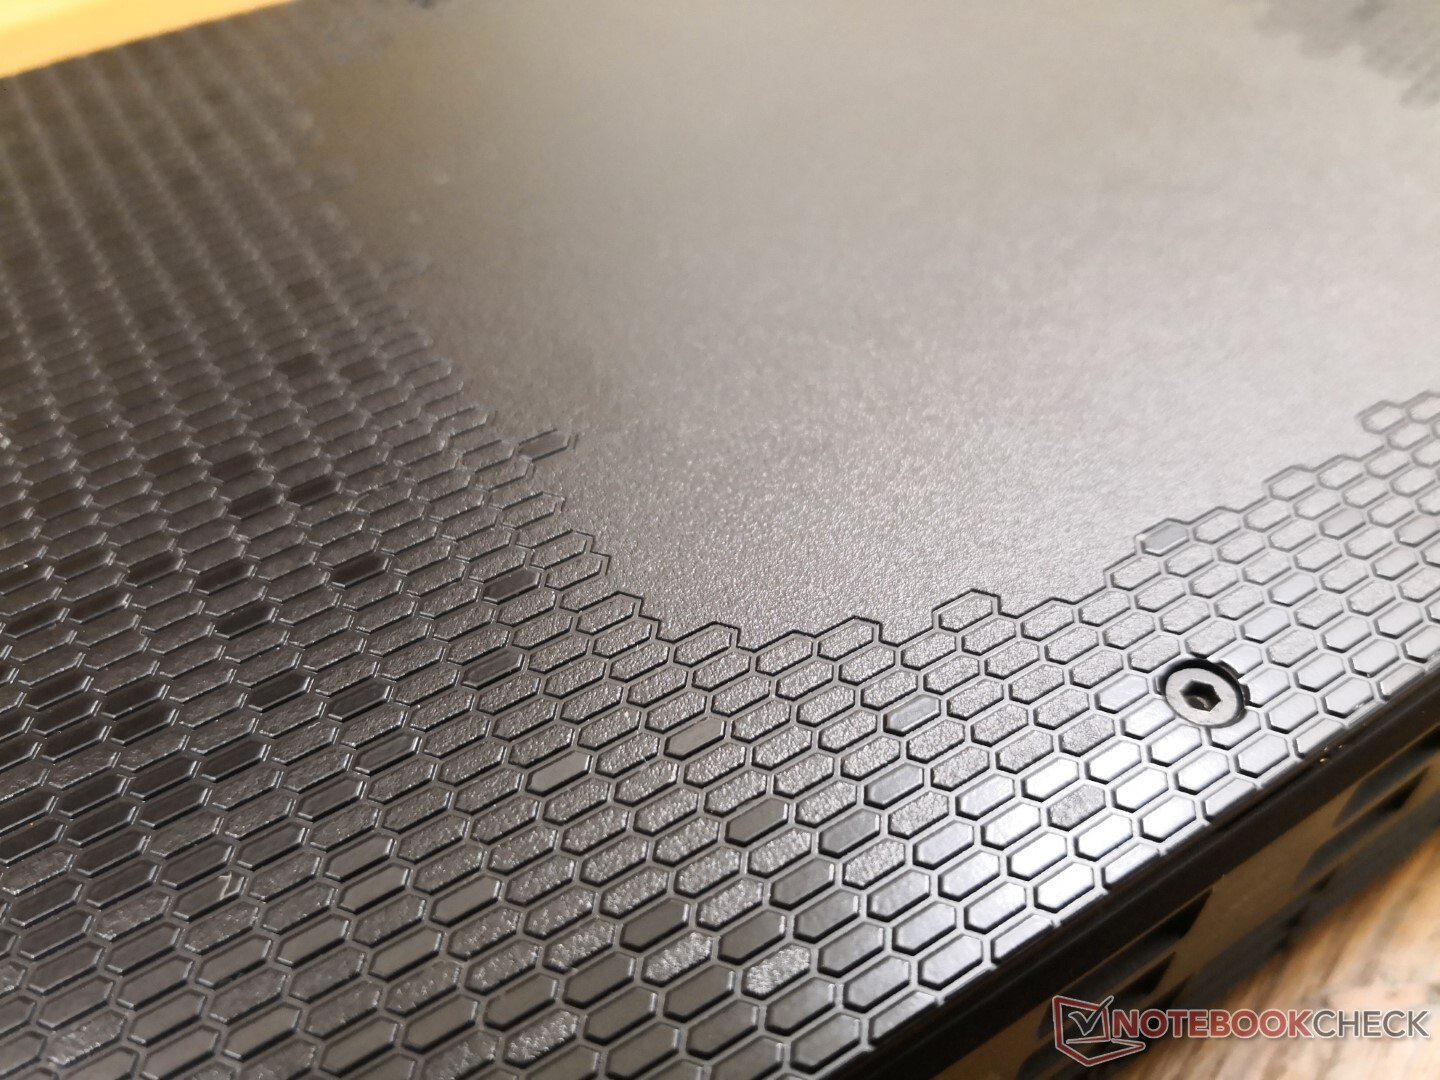
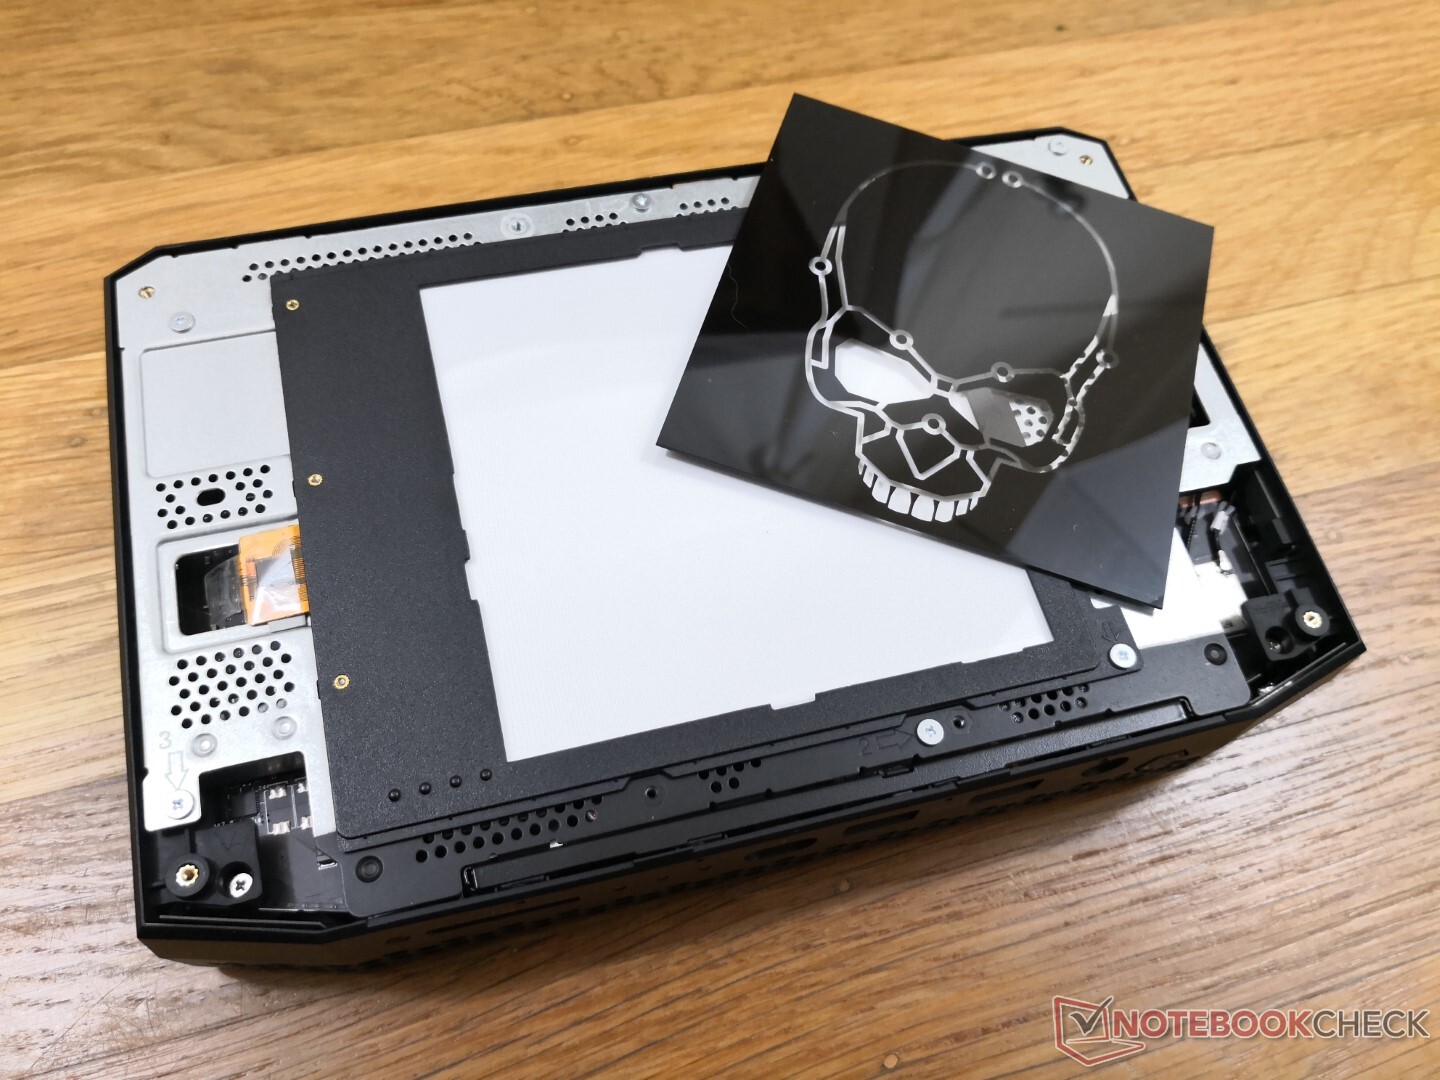
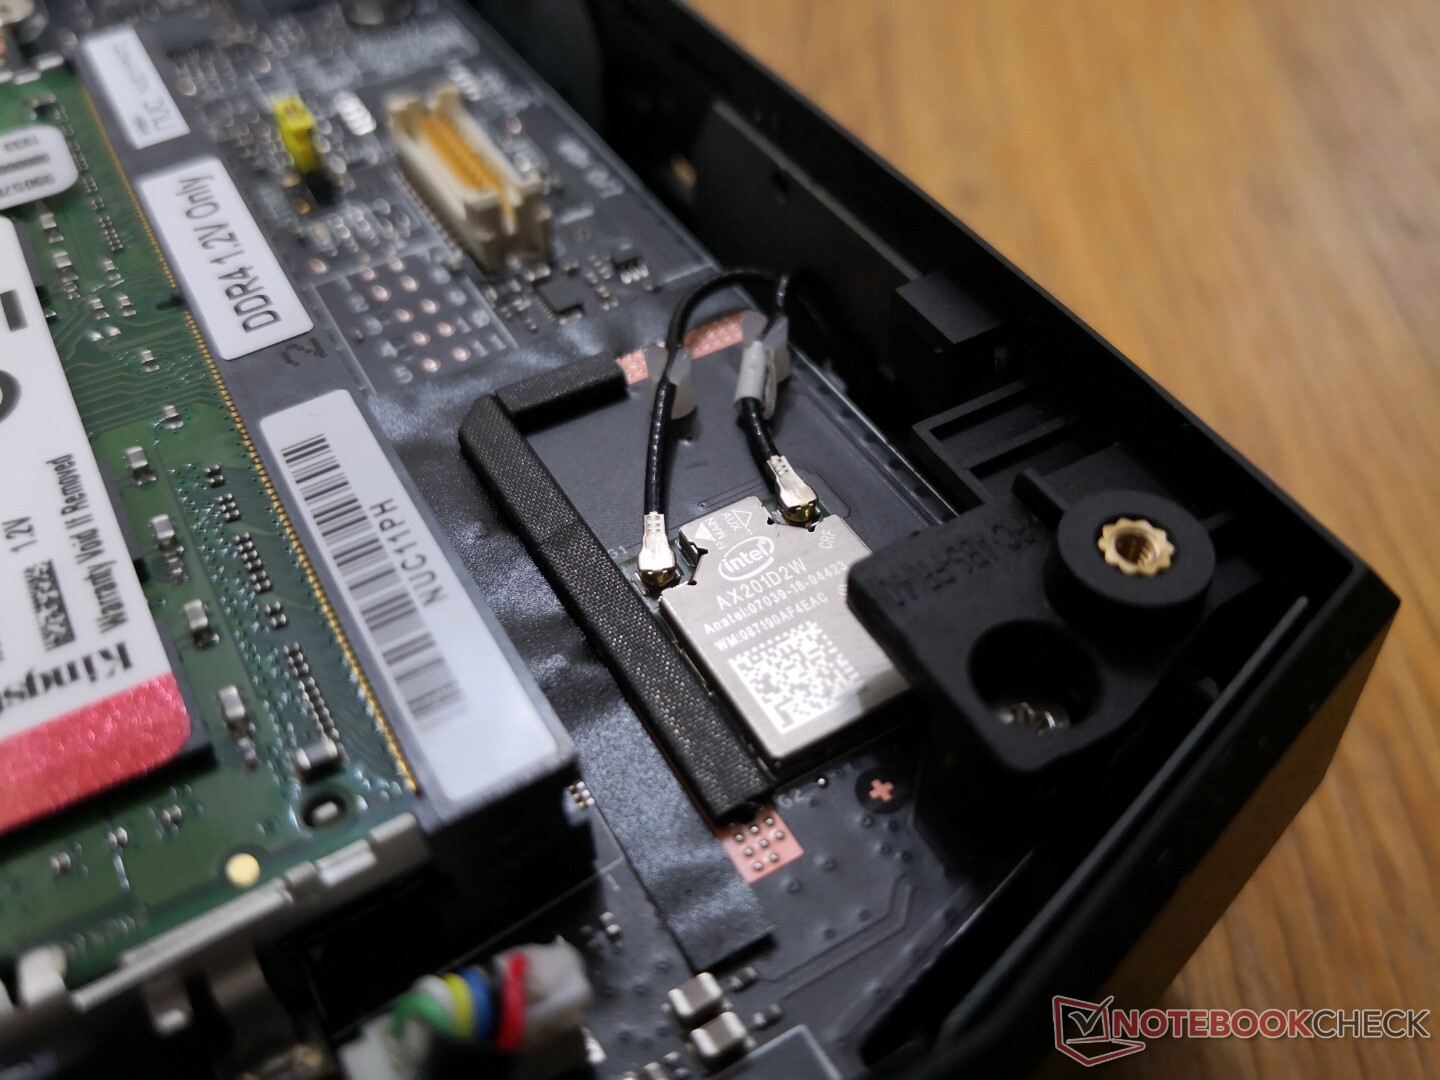
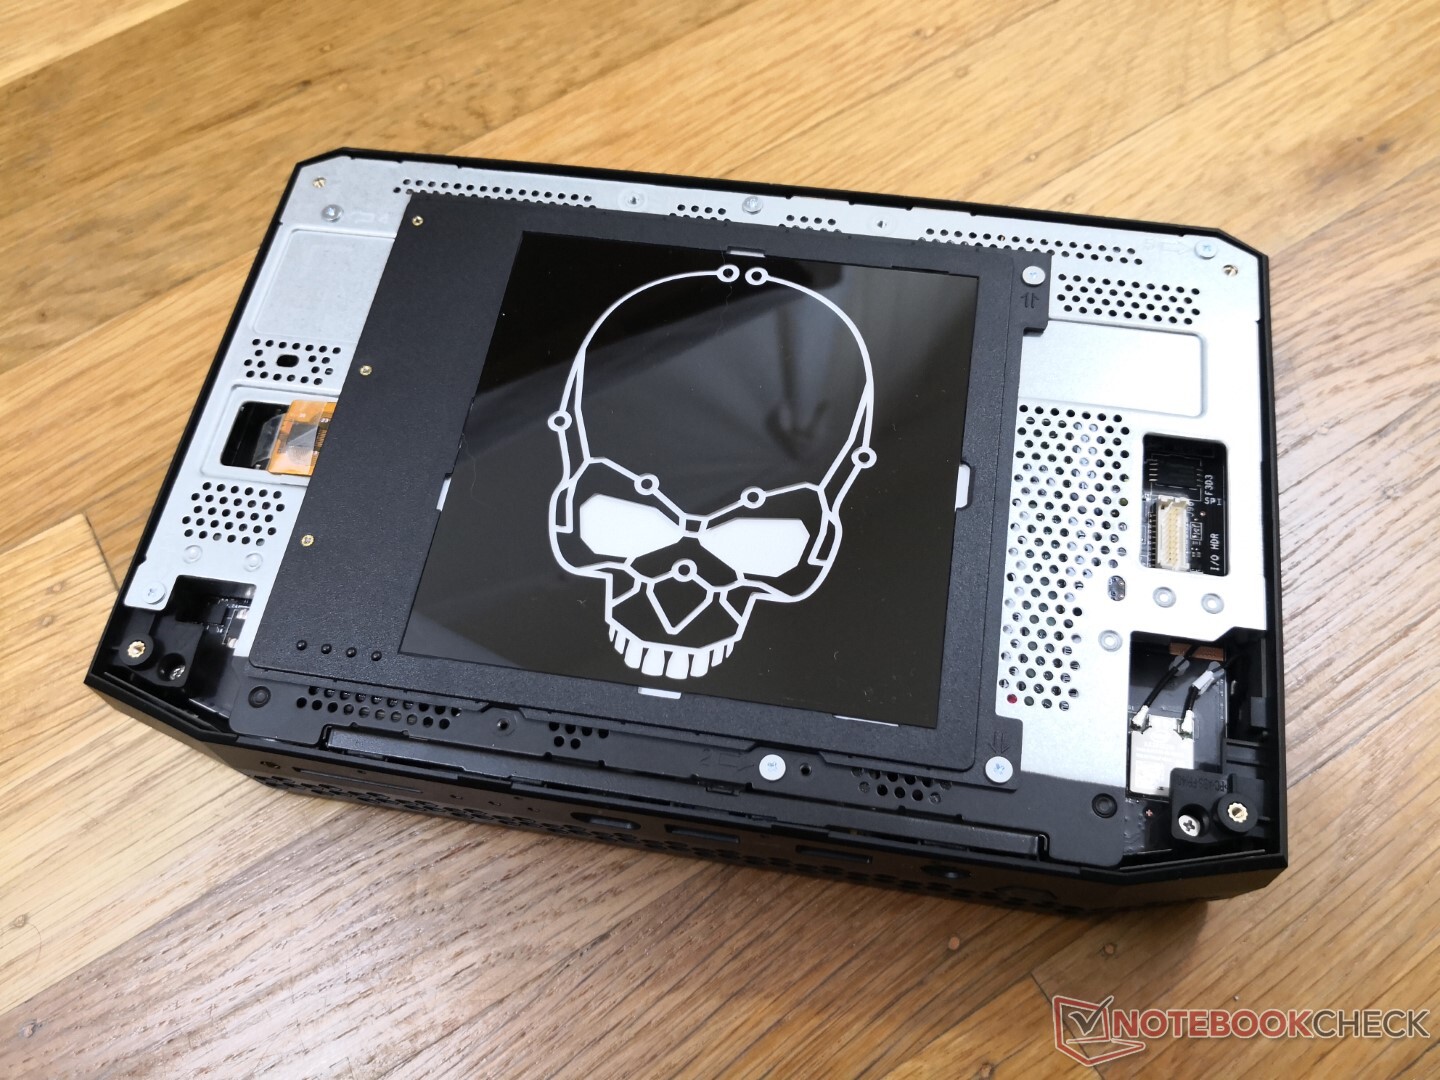
Die Oberseite ist mit acht Sechskantschrauben befestigt, die die anpassbare LED-Frontplatte und den Metallkäfig schützen. Das Entfernen des Metallkäfigs für den Zugriff auf die RAM- und Speichersteckplätze erfordert einen Standard-Kreuzschlitzschraubendreher. Der Zugriff auf die Kühllösung darunter ist leider schwieriger und weniger benutzerfreundlich.
Zubehör und Garantie
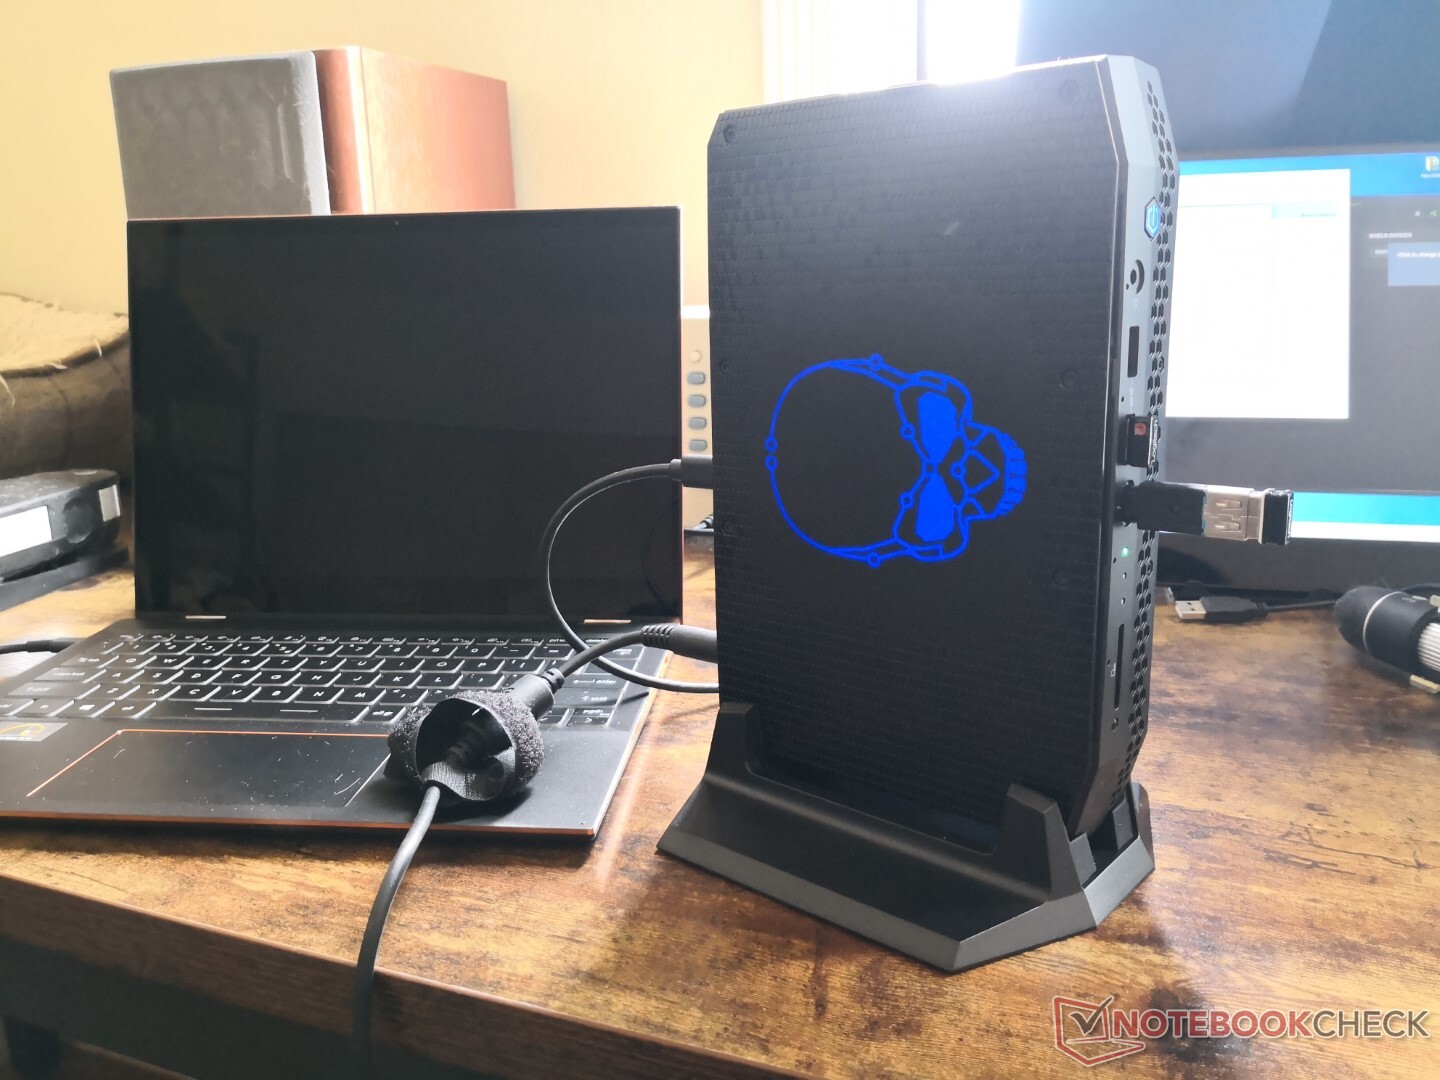
Zu den Extras im Karton gehören eine abnehmbare VESA-Halterung, zusätzliche Schrauben, ein vertikaler Kunststoffständer und fünf durchsichtige Kunststoffblenden, falls der Besitzer den LED-beleuchteten Totenkopf gegen ein anderes Muster austauschen möchte. Der Standfuß ist erfreulicherweise stabil und birgt keine echte Kippgefahr. Die Polster halten den NUC an seinem Platz und lassen an der Unterseite etwas Spielraum für die Luftzirkulation.
Anders als bei den meisten anderen Mini-PCs ist eine dreijährige Garantie Standard.
Performance
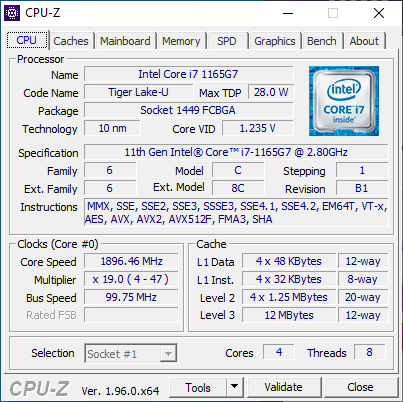
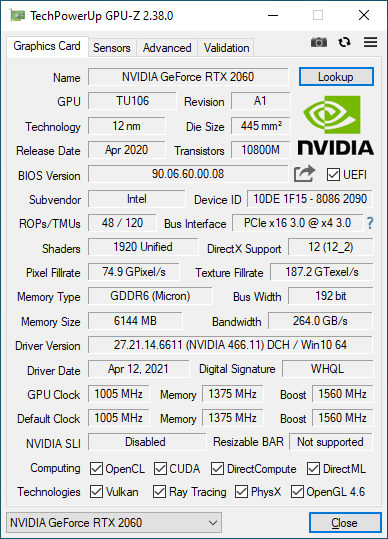
Alle NUC11-Enthusiast-SKUs werden mit der 11. Generation der Core i7-1165G7-CPU und der GeForce RTX 2060-GPU ausgeliefert. Beachten Sie, dass es sich bei der Nvidia GPU hier um die mobile Max-P-Version und nicht um die Desktop-Version handelt.
Optimus wird für die automatische Grafikumschaltung unterstützt. Es gibt keine G-Sync-Unterstützung.
Unser Gerät wurde über das BIOS auf den Modus "Performance" eingestellt, bevor wir die folgenden Leistungs-Benchmarks durchgeführt haben, um die höchstmöglichen Ergebnisse zu erzielen.

Prozessor
Die CPU-Leistung ist ausgezeichnet mit Ergebnissen, die innerhalb von fünf Prozent des NUC11PHKi7C liegen. Das Huawei MateBook X Pro, ausgestattet mit der gleichen Core i7-1165G7 CPU, würde etwa 32 Prozent langsamer laufen als unser Phantom Canyon NUC.
Wenn über das BIOS der Modus Balanced statt Performance eingestellt wird, dann würde die Multi-Thread-Leistung laut CineBench um etwa zehn bis 15 Prozent sinken.
Im Vergleich mit dem älteren Core i7-8809G ist unser Core i7-1165G7 in der Lage, Ersteren sowohl in Single-Thread- als auch in Multi-Thread-Benchmarks um etwa 30 Prozent bzw. 15 Prozent zu übertreffen. Interessanterweise ist unser CineBench R20 xT Score auch nach zwei Wiederholungen niedriger als erwartet.
Cinebench R15: CPU Multi 64Bit | CPU Single 64Bit
Blender: v2.79 BMW27 CPU
7-Zip 18.03: 7z b 4 -mmt1 | 7z b 4
Geekbench 5.5: Single-Core | Multi-Core
HWBOT x265 Benchmark v2.2: 4k Preset
LibreOffice : 20 Documents To PDF
R Benchmark 2.5: Overall mean
| Cinebench R20 / CPU (Multi Core) | |
| Lenovo Legion C7 15IMH05 82EH0030GE | |
| Asus ZenBook 13 UM325S | |
| Zotac ZBOX Magnus EN72070V | |
| Lenovo ThinkBook 15p Gen1 4K | |
| Intel Hades Canyon NUC8i7HVK | |
| Intel NUC11TNKi5 | |
| Durchschnittliche Intel Core i7-1165G7 (1060 - 2657, n=81) | |
| Intel NUC11PHKi7C | |
| Beelink GTR35 II-G-16512D00W64PRO-1T | |
| Asus VivoBook S13 S333JA-DS51 | |
| Asus Zenbook S UX393JA | |
| Beelink SEi10 | |
| Cinebench R20 / CPU (Single Core) | |
| Intel NUC11PHKi7C | |
| Asus ZenBook 13 UM325S | |
| Durchschnittliche Intel Core i7-1165G7 (442 - 589, n=81) | |
| Intel NUC11TNKi5 | |
| Zotac ZBOX Magnus EN72070V | |
| Lenovo Legion C7 15IMH05 82EH0030GE | |
| Lenovo ThinkBook 15p Gen1 4K | |
| Asus Zenbook S UX393JA | |
| Intel Hades Canyon NUC8i7HVK | |
| Beelink SEi10 | |
| Asus VivoBook S13 S333JA-DS51 | |
| Beelink GTR35 II-G-16512D00W64PRO-1T | |
| Cinebench R15 / CPU Multi 64Bit | |
| Lenovo Legion C7 15IMH05 82EH0030GE | |
| Asus ZenBook 13 UM325S | |
| Lenovo ThinkBook 15p Gen1 4K | |
| Zotac ZBOX Magnus EN72070V | |
| Intel NUC11PHKi7C | |
| Intel Hades Canyon NUC8i7HVK | |
| Durchschnittliche Intel Core i7-1165G7 (553 - 1027, n=86) | |
| Intel NUC11TNKi5 | |
| Beelink GTR35 II-G-16512D00W64PRO-1T | |
| Asus VivoBook S13 S333JA-DS51 | |
| Asus Zenbook S UX393JA | |
| Beelink SEi10 | |
| Cinebench R15 / CPU Single 64Bit | |
| Intel NUC11PHKi7C | |
| Asus ZenBook 13 UM325S | |
| Durchschnittliche Intel Core i7-1165G7 (115 - 230, n=78) | |
| Lenovo Legion C7 15IMH05 82EH0030GE | |
| Intel NUC11TNKi5 | |
| Lenovo ThinkBook 15p Gen1 4K | |
| Zotac ZBOX Magnus EN72070V | |
| Asus Zenbook S UX393JA | |
| Intel Hades Canyon NUC8i7HVK | |
| Beelink SEi10 | |
| Beelink GTR35 II-G-16512D00W64PRO-1T | |
| Asus VivoBook S13 S333JA-DS51 | |
| Blender / v2.79 BMW27 CPU | |
| Beelink SEi10 | |
| Asus Zenbook S UX393JA | |
| Asus VivoBook S13 S333JA-DS51 | |
| Beelink GTR35 II-G-16512D00W64PRO-1T | |
| Durchschnittliche Intel Core i7-1165G7 (468 - 1138, n=80) | |
| Intel NUC11TNKi5 | |
| Intel NUC11PHKi7C | |
| Intel Hades Canyon NUC8i7HVK | |
| Lenovo ThinkBook 15p Gen1 4K | |
| Zotac ZBOX Magnus EN72070V | |
| Asus ZenBook 13 UM325S | |
| Lenovo Legion C7 15IMH05 82EH0030GE | |
| 7-Zip 18.03 / 7z b 4 -mmt1 | |
| Lenovo Legion C7 15IMH05 82EH0030GE | |
| Asus ZenBook 13 UM325S | |
| Intel NUC11PHKi7C | |
| Durchschnittliche Intel Core i7-1165G7 (4478 - 5507, n=80) | |
| Lenovo ThinkBook 15p Gen1 4K | |
| Zotac ZBOX Magnus EN72070V | |
| Intel NUC11TNKi5 | |
| Asus Zenbook S UX393JA | |
| Intel Hades Canyon NUC8i7HVK | |
| Beelink SEi10 | |
| Asus VivoBook S13 S333JA-DS51 | |
| Beelink GTR35 II-G-16512D00W64PRO-1T | |
| 7-Zip 18.03 / 7z b 4 | |
| Lenovo Legion C7 15IMH05 82EH0030GE | |
| Asus ZenBook 13 UM325S | |
| Zotac ZBOX Magnus EN72070V | |
| Lenovo ThinkBook 15p Gen1 4K | |
| Intel NUC11PHKi7C | |
| Intel NUC11TNKi5 | |
| Durchschnittliche Intel Core i7-1165G7 (15347 - 27405, n=80) | |
| Intel Hades Canyon NUC8i7HVK | |
| Asus Zenbook S UX393JA | |
| Asus VivoBook S13 S333JA-DS51 | |
| Beelink GTR35 II-G-16512D00W64PRO-1T | |
| Beelink SEi10 | |
| Geekbench 5.5 / Single-Core | |
| Intel NUC11PHKi7C | |
| Durchschnittliche Intel Core i7-1165G7 (1302 - 1595, n=77) | |
| Asus ZenBook 13 UM325S | |
| Intel NUC11TNKi5 | |
| Asus Zenbook S UX393JA | |
| Lenovo Legion C7 15IMH05 82EH0030GE | |
| Lenovo ThinkBook 15p Gen1 4K | |
| Zotac ZBOX Magnus EN72070V | |
| Asus VivoBook S13 S333JA-DS51 | |
| Beelink SEi10 | |
| Beelink GTR35 II-G-16512D00W64PRO-1T | |
| Geekbench 5.5 / Multi-Core | |
| Lenovo Legion C7 15IMH05 82EH0030GE | |
| Asus ZenBook 13 UM325S | |
| Lenovo ThinkBook 15p Gen1 4K | |
| Zotac ZBOX Magnus EN72070V | |
| Intel NUC11PHKi7C | |
| Durchschnittliche Intel Core i7-1165G7 (3078 - 5926, n=77) | |
| Asus Zenbook S UX393JA | |
| Intel NUC11TNKi5 | |
| Asus VivoBook S13 S333JA-DS51 | |
| Beelink GTR35 II-G-16512D00W64PRO-1T | |
| Beelink SEi10 | |
| HWBOT x265 Benchmark v2.2 / 4k Preset | |
| Lenovo Legion C7 15IMH05 82EH0030GE | |
| Asus ZenBook 13 UM325S | |
| Zotac ZBOX Magnus EN72070V | |
| Lenovo ThinkBook 15p Gen1 4K | |
| Intel NUC11PHKi7C | |
| Intel Hades Canyon NUC8i7HVK | |
| Intel NUC11TNKi5 | |
| Durchschnittliche Intel Core i7-1165G7 (1.39 - 8.47, n=80) | |
| Asus VivoBook S13 S333JA-DS51 | |
| Asus Zenbook S UX393JA | |
| Beelink GTR35 II-G-16512D00W64PRO-1T | |
| Beelink SEi10 | |
| LibreOffice / 20 Documents To PDF | |
| Beelink GTR35 II-G-16512D00W64PRO-1T | |
| Asus VivoBook S13 S333JA-DS51 | |
| Zotac ZBOX Magnus EN72070V | |
| Lenovo ThinkBook 15p Gen1 4K | |
| Lenovo Legion C7 15IMH05 82EH0030GE | |
| Beelink SEi10 | |
| Asus ZenBook 13 UM325S | |
| Intel NUC11TNKi5 | |
| Durchschnittliche Intel Core i7-1165G7 (21.5 - 88.1, n=78) | |
| Asus Zenbook S UX393JA | |
| Intel NUC11PHKi7C | |
| R Benchmark 2.5 / Overall mean | |
| Asus VivoBook S13 S333JA-DS51 | |
| Beelink SEi10 | |
| Beelink GTR35 II-G-16512D00W64PRO-1T | |
| Asus Zenbook S UX393JA | |
| Intel NUC11TNKi5 | |
| Lenovo ThinkBook 15p Gen1 4K | |
| Zotac ZBOX Magnus EN72070V | |
| Durchschnittliche Intel Core i7-1165G7 (0.552 - 1.002, n=80) | |
| Lenovo Legion C7 15IMH05 82EH0030GE | |
| Intel NUC11PHKi7C | |
| Asus ZenBook 13 UM325S | |
* ... kleinere Werte sind besser
System Performance
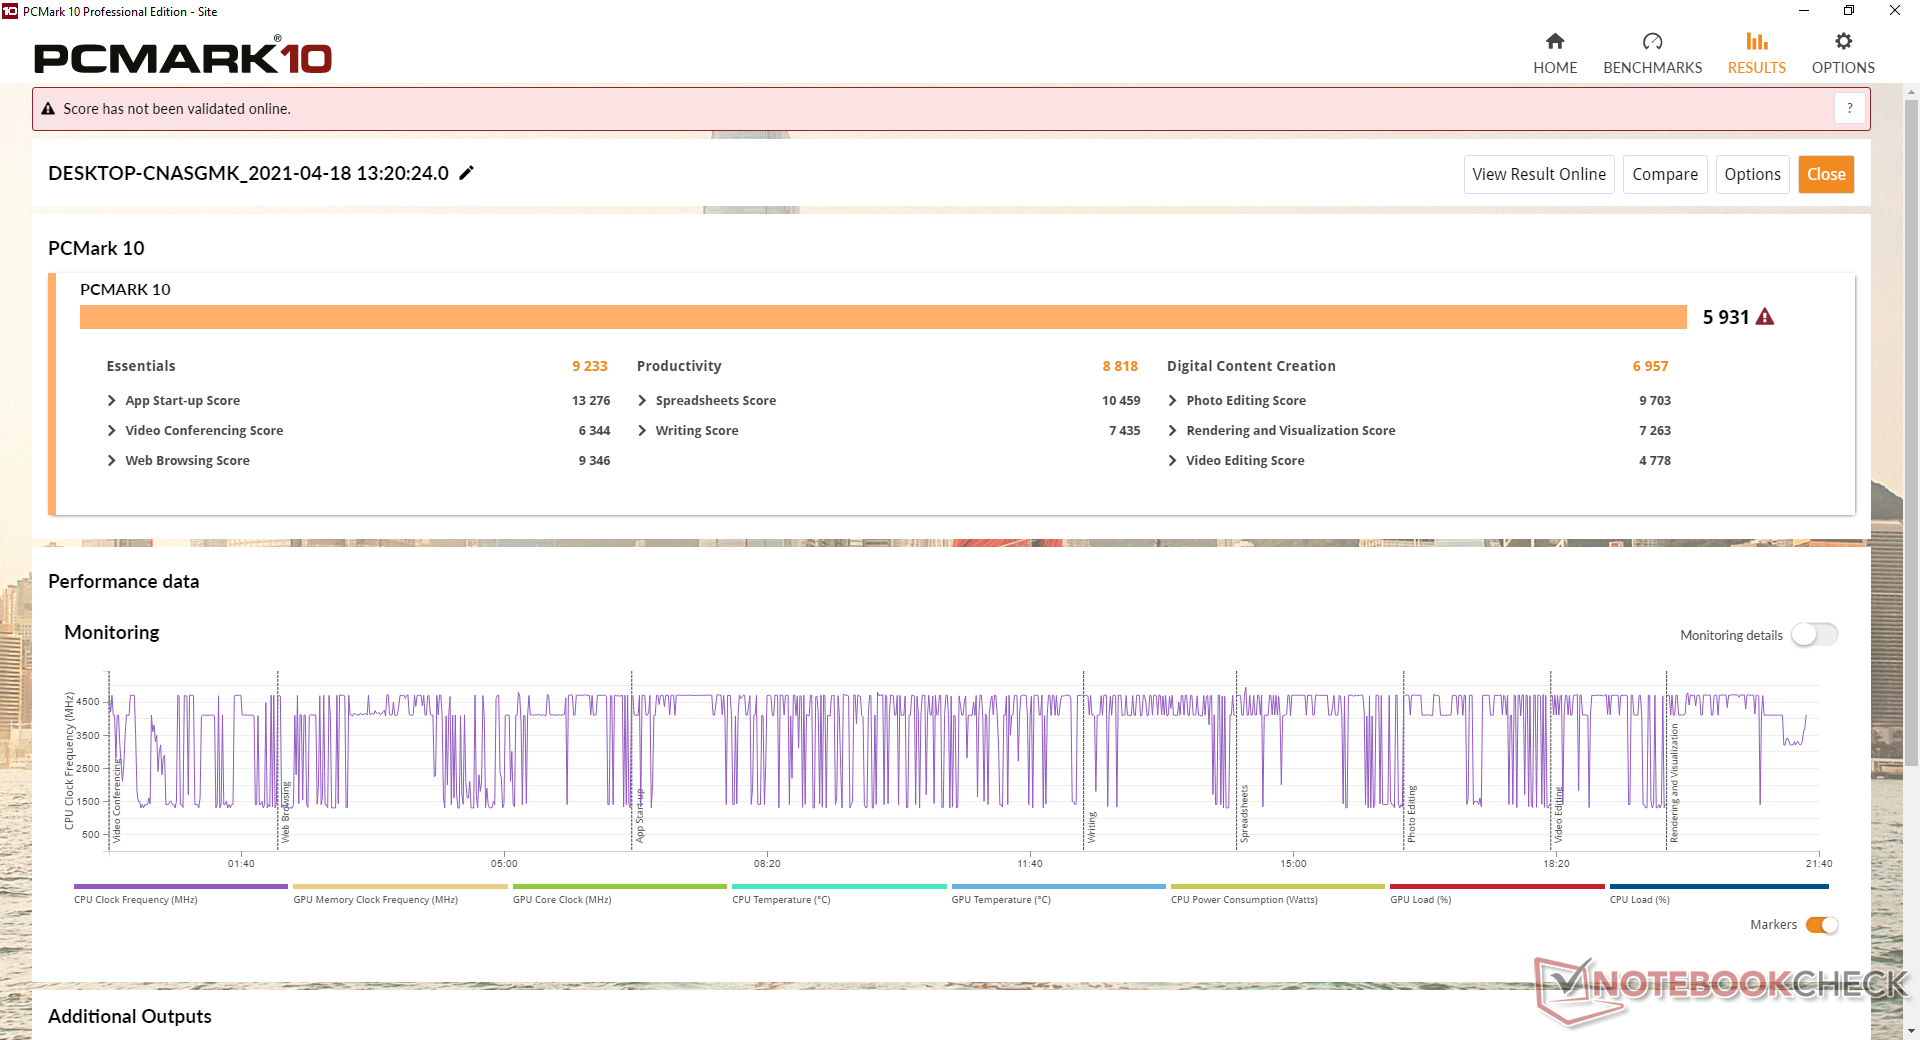
| PCMark 10 Score | 5931 Punkte | |
Hilfe | ||
DPC-Latenzzeit
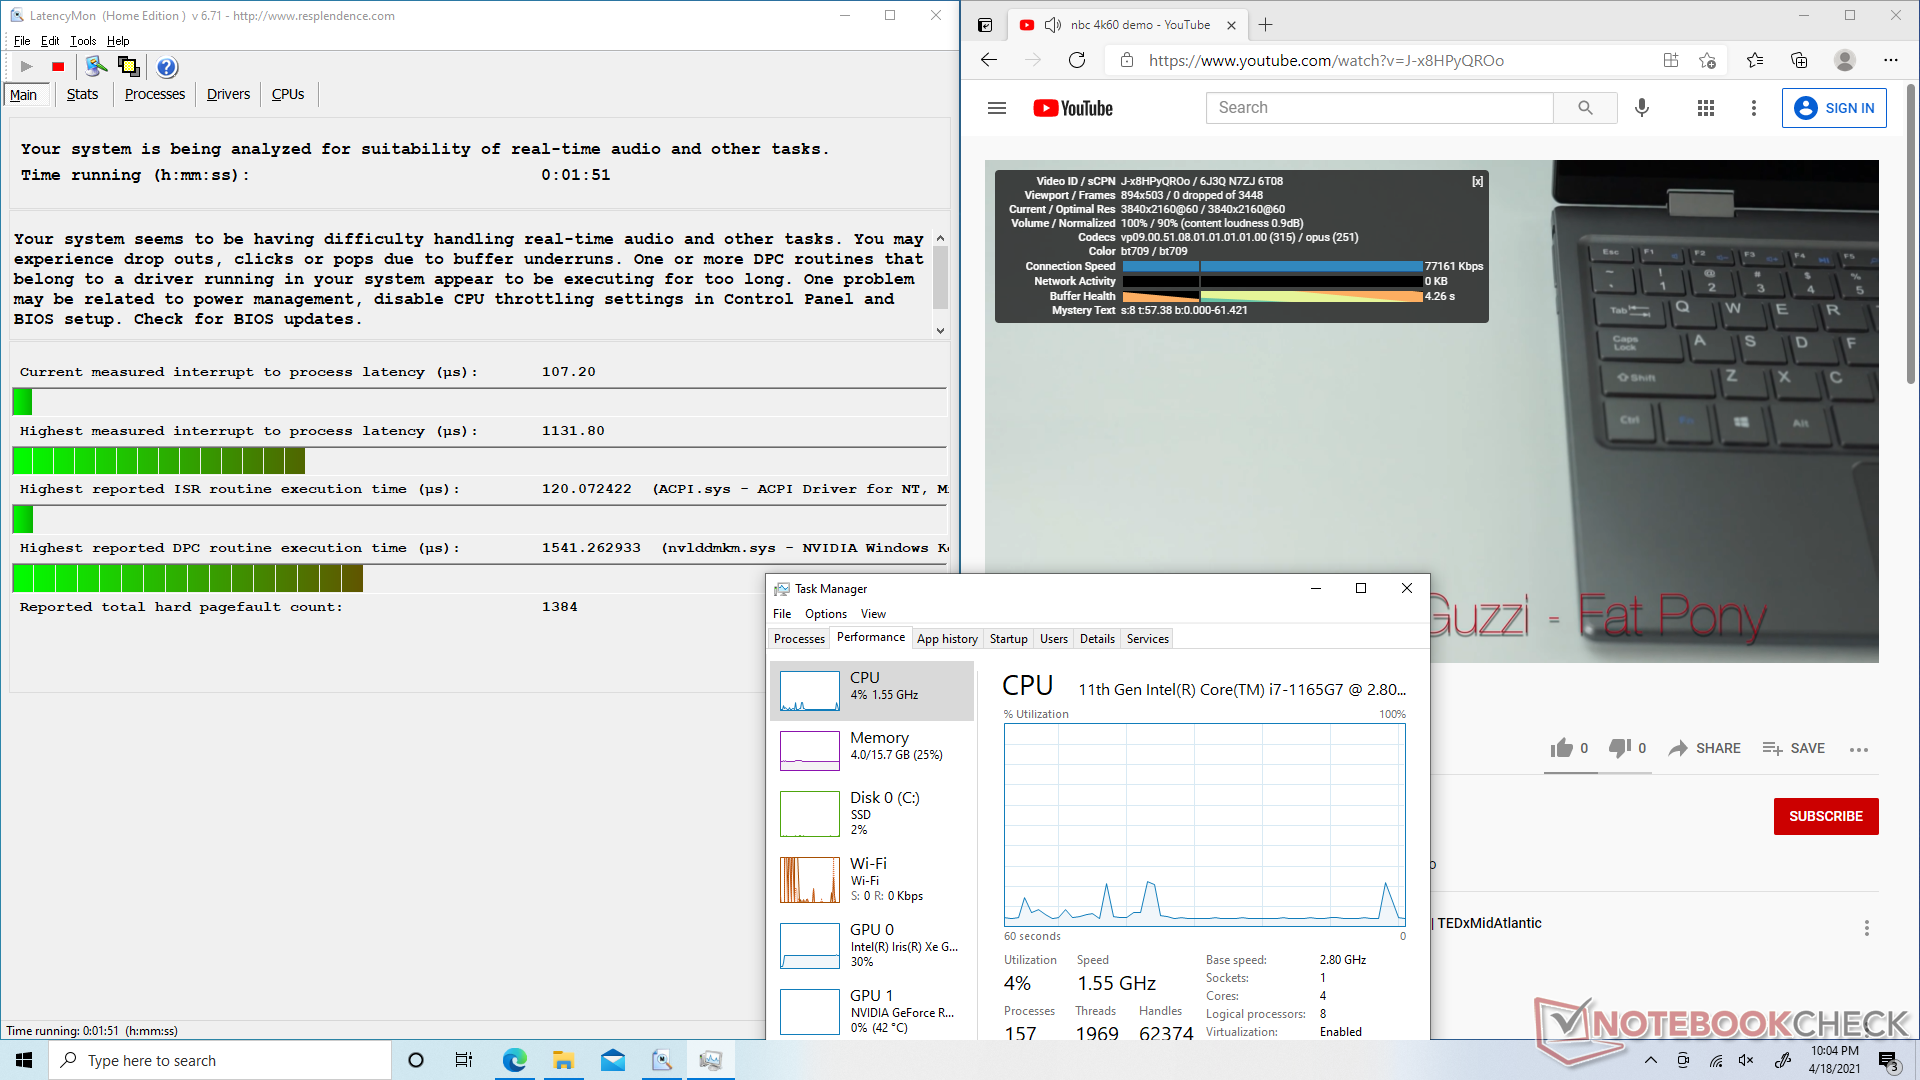

| DPC Latencies / LatencyMon - interrupt to process latency (max), Web, Youtube, Prime95 | |
| Intel NUC11PHKi7C | |
| GMK NucBox 2 | |
| Intel NUC11PAQi7 | |
* ... kleinere Werte sind besser
Speichergeräte
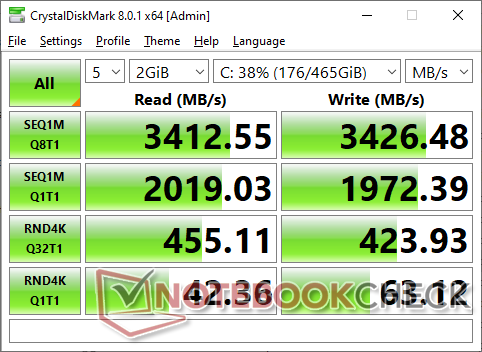
Während das NUC11PAQi7 pCIe-4.0-x4-NVMe-SSD-Geschwindigkeiten unterstützt, ist dies beim NUC11PHKi7C nicht der Fall, da seine beiden M.2-Steckplätze nur auf PCIe-3.0-x4- bzw. SATA-III-Geschwindigkeiten beschränkt sind. Dies ist etwas enttäuschend, wenn man bedenkt, dass das NUC11PHKi7C ein "Enthusiasten"-Produkt sein soll, das sich an Hochleistungsnutzer richtet. Wir haben dieselbe Samsung SSD 980 aus dem NUC11PAQi7 in unserem NUC11PHKi7C installiert, und tatsächlich waren unsere Transferraten nur etwa halb so hoch wie die des NUC11PAQi7.
Es ist erwähnenswert, dass das System längere M.2-22110-SSDs unterstützt, während die meisten anderen Systeme auf 2280 beschränkt sind.
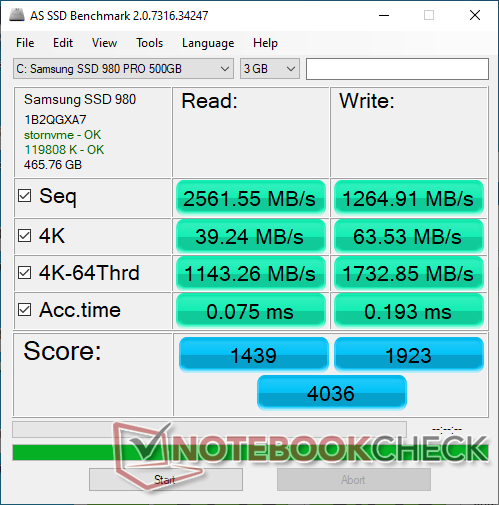
| Intel NUC11PHKi7C Samsung SSD 980 Pro 500GB MZ-V8P500BW | Intel Hades Canyon NUC8i7HVK Intel Optane 120 GB SSDPEK1W120GA | Intel NUC11PAQi7 Samsung SSD 980 Pro 500GB MZ-V8P500BW | GMK NucBox 2 Netac S930E8/256GPN | Zotac ZBOX Magnus EK71080 Samsung PM961 MZVLW256HEHP | |
|---|---|---|---|---|---|
| AS SSD | 3% | 47% | -33% | -8% | |
| Seq Read (MB/s) | 2562 | 1379 -46% | 3257 27% | 2069 -19% | 2119 -17% |
| Seq Write (MB/s) | 1265 | 553 -56% | 3937 211% | 1203 -5% | 1205 -5% |
| 4K Read (MB/s) | 39.24 | 127.9 226% | 51.3 31% | 41.66 6% | 46.69 19% |
| 4K Write (MB/s) | 63.5 | 103.5 63% | 75.7 19% | 136.9 116% | 105.2 66% |
| 4K-64 Read (MB/s) | 1143 | 1258 10% | 2283 100% | 366.3 -68% | 1170 2% |
| 4K-64 Write (MB/s) | 1733 | 556 -68% | 2206 27% | 340.5 -80% | 443.8 -74% |
| Access Time Read * (ms) | 0.075 | 0.025 67% | 0.056 25% | 0.064 15% | 0.06 20% |
| Access Time Write * (ms) | 0.193 | 0.033 83% | 0.154 20% | 0.347 -80% | 0.04 79% |
| Score Read (Points) | 1439 | 1524 6% | 2660 85% | 615 -57% | 1429 -1% |
| Score Write (Points) | 1923 | 714 -63% | 2676 39% | 598 -69% | 669 -65% |
| Score Total (Points) | 4036 | 3023 -25% | 6725 67% | 1497 -63% | 2791 -31% |
| Copy ISO MB/s (MB/s) | 1675 | 1125 -33% | 2030 21% | 1186 -29% | 1649 -2% |
| Copy Program MB/s (MB/s) | 1030 | 342.4 -67% | 883 -14% | 428.6 -58% | 468 -55% |
| Copy Game MB/s (MB/s) | 1810 | 768 -58% | 1817 0% | 435.7 -76% | 1010 -44% |
| CrystalDiskMark 5.2 / 6 | 21% | 111% | 6% | -2% | |
| Write 4K (MB/s) | 67.3 | 133.7 99% | 244.6 263% | 178.4 165% | 132.7 97% |
| Read 4K (MB/s) | 38.32 | 178.6 366% | 80.4 110% | 61 59% | 44.48 16% |
| Write Seq (MB/s) | 1985 | 608 -69% | 4094 106% | 1040 -48% | 1193 -40% |
| Read Seq (MB/s) | 2049 | 1428 -30% | 4099 100% | 1919 -6% | 1371 -33% |
| Write 4K Q32T1 (MB/s) | 432.3 | 323.6 -25% | 715 65% | 417.7 -3% | 398.5 -8% |
| Read 4K Q32T1 (MB/s) | 452.4 | 282.3 -38% | 783 73% | 325.6 -28% | 483.5 7% |
| Write Seq Q32T1 (MB/s) | 3423 | 627 -82% | 5065 48% | 1144 -67% | 1202 -65% |
| Read Seq Q32T1 (MB/s) | 3123 | 1521 -51% | 6884 120% | 2379 -24% | 3388 8% |
| Durchschnitt gesamt (Programm / Settings) | 12% /
10% | 79% /
70% | -14% /
-19% | -5% /
-6% |
* ... kleinere Werte sind besser

Disk Throttling: DiskSpd Read Loop, Queue Depth 8
GPU Performance
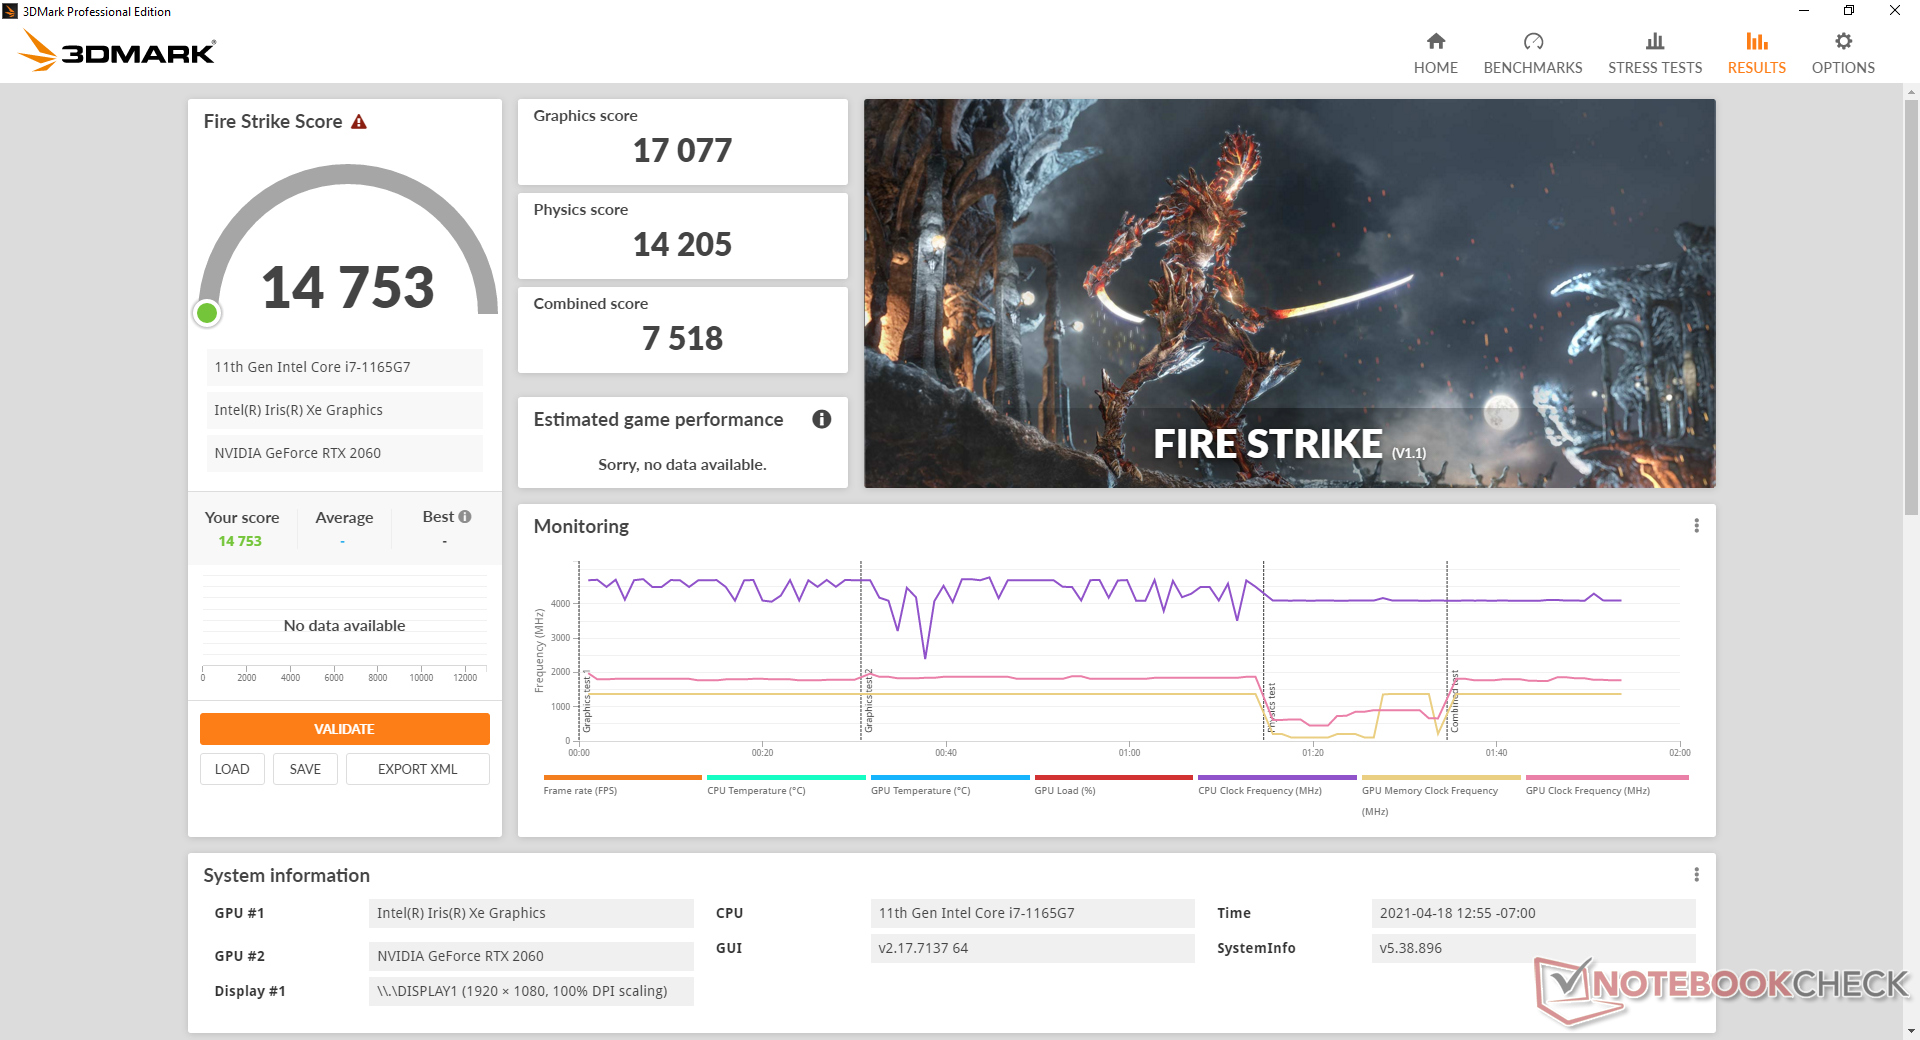
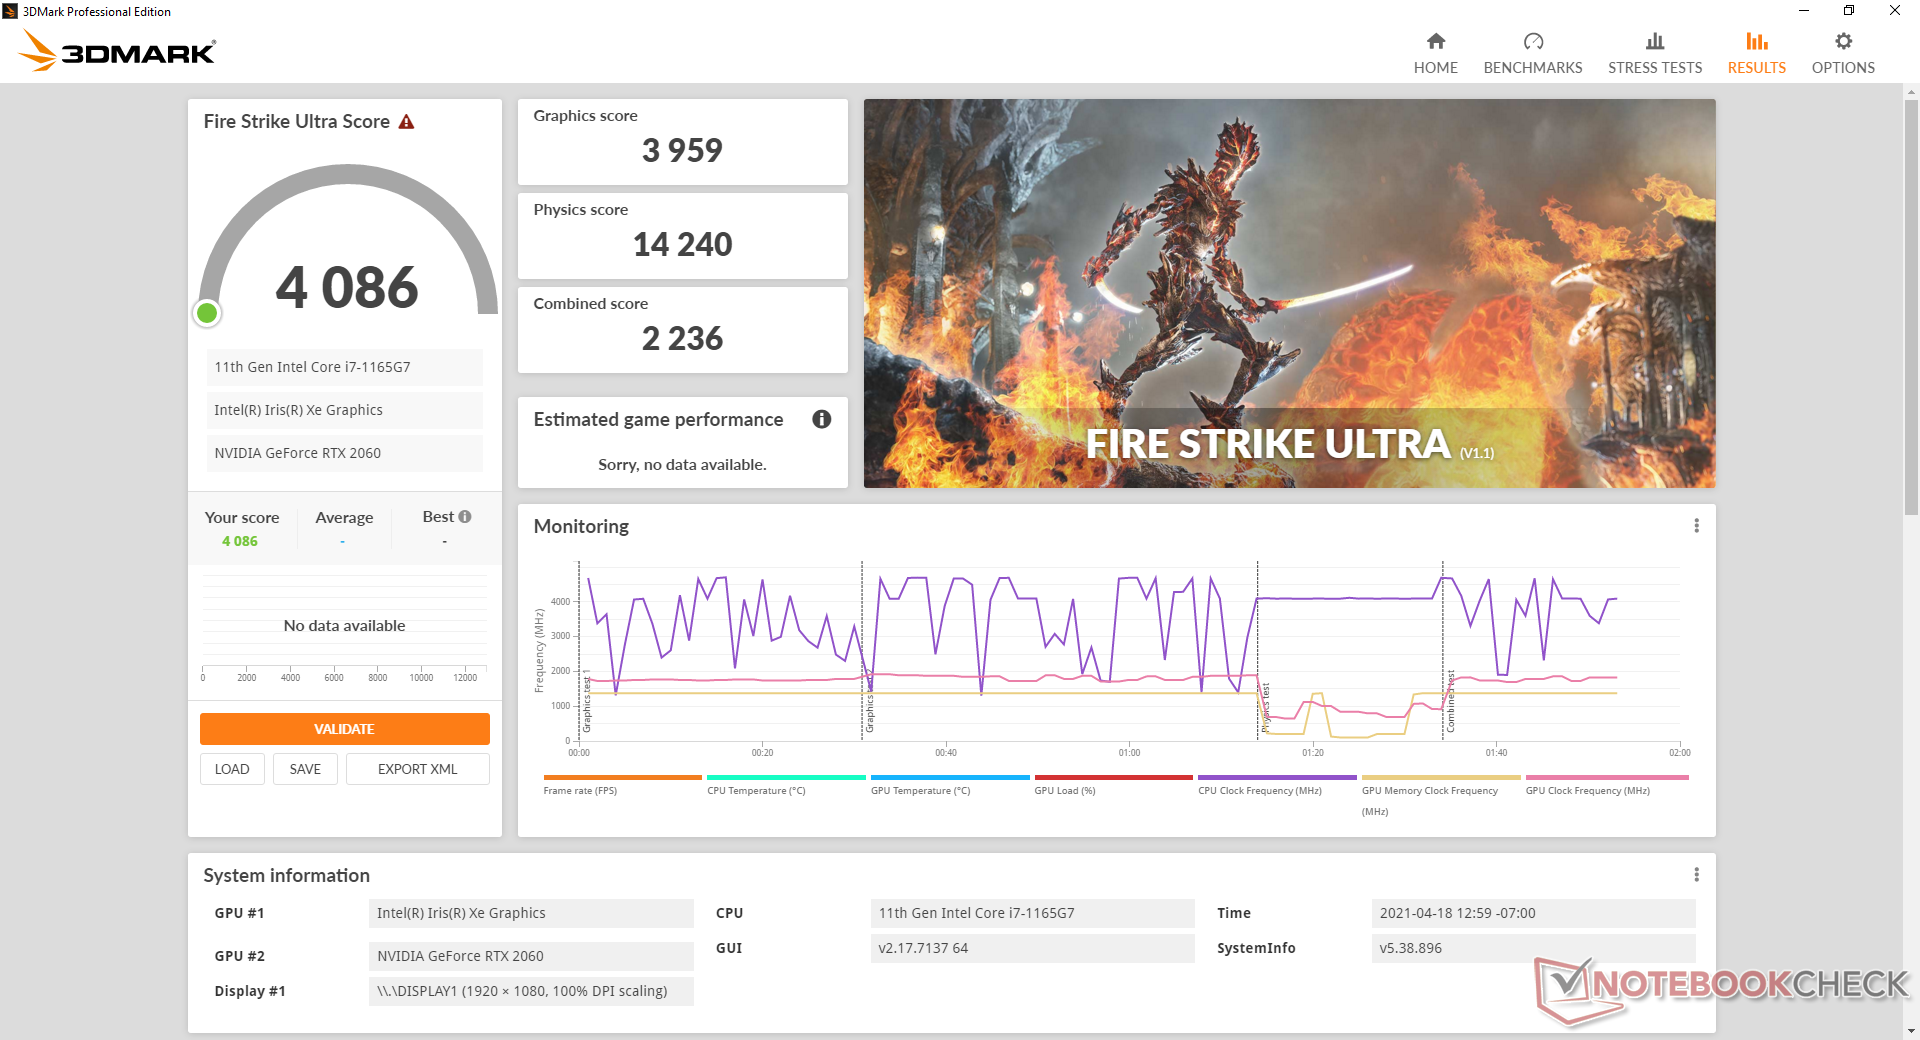
Die Grafikleistung ist dort, wo wir sie im Vergleich zu einem durchschnittlichen Laptop, der mit der gleichen GeForce RTX 2060 GPU ausgestattet ist, erwarten. Vor allem ist die Leistung laut 3DMark Fire Strike fast 70 Prozent schneller als bei der Radeon RX Vega M GH auf der älteren Hades Canyon, während Time Spy einen noch größeren Leistungsschub von knapp über 2x zeigt. Dies deutet darauf hin, dass Spiele, die auf DX12 laufen, die größten Leistungsvorteile von Generation zu Generation sehen werden.
Ein Desktop-PC mit einer "richtigen" GeForce RTX 2060 wird immer noch besser abschneiden als die mobile RTX 2060 in unserem NUC um etwa 15 bis 20 Prozent
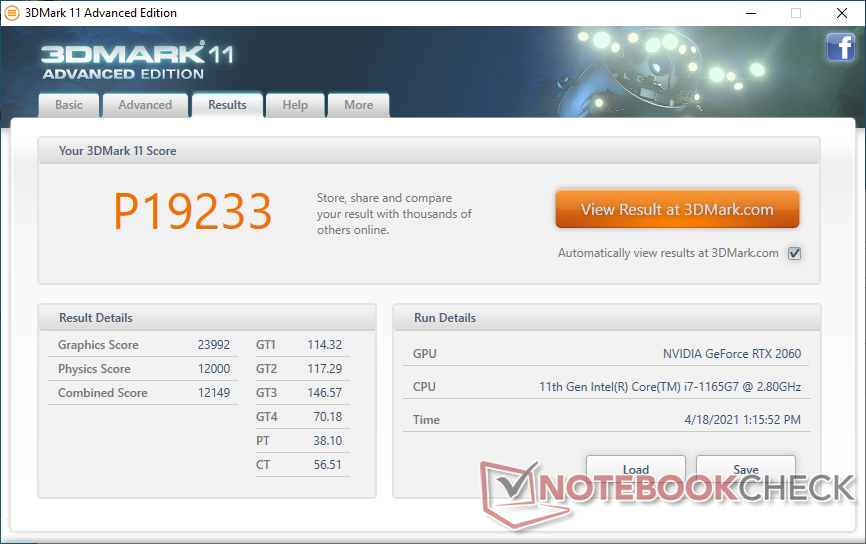

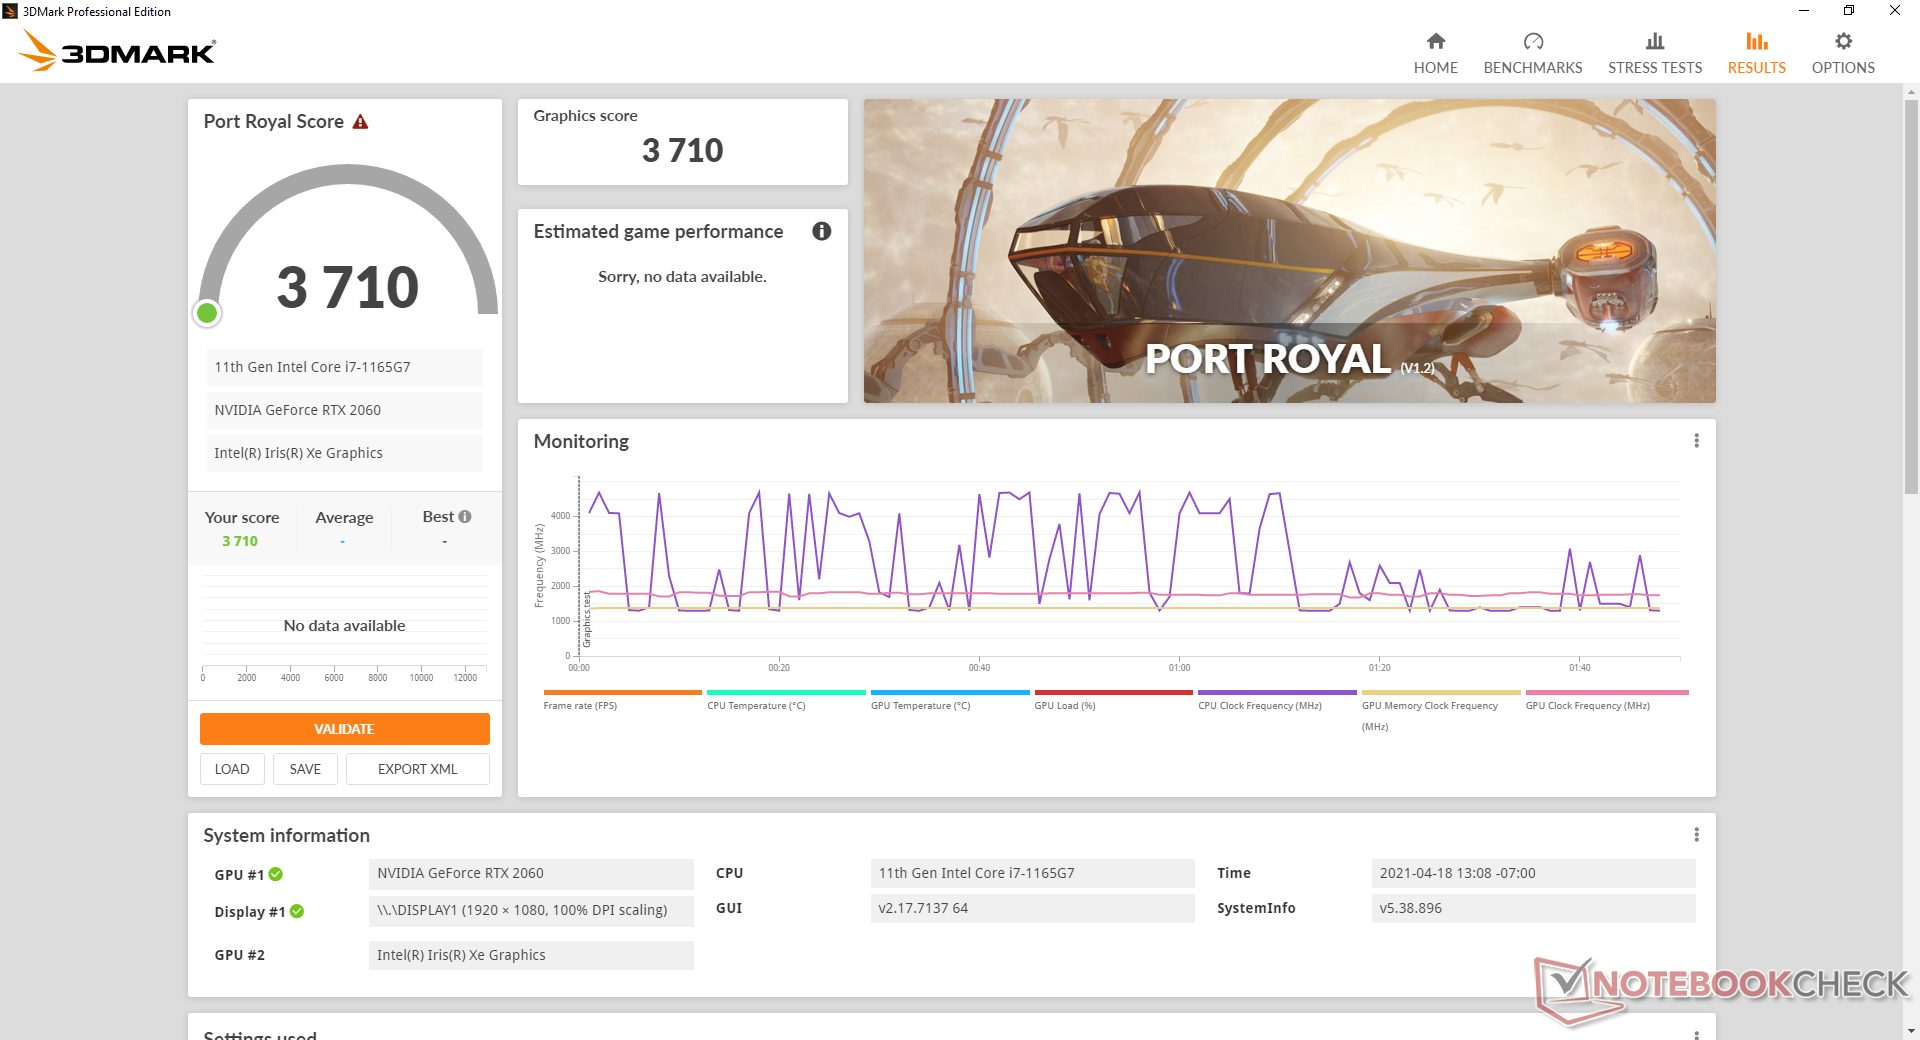
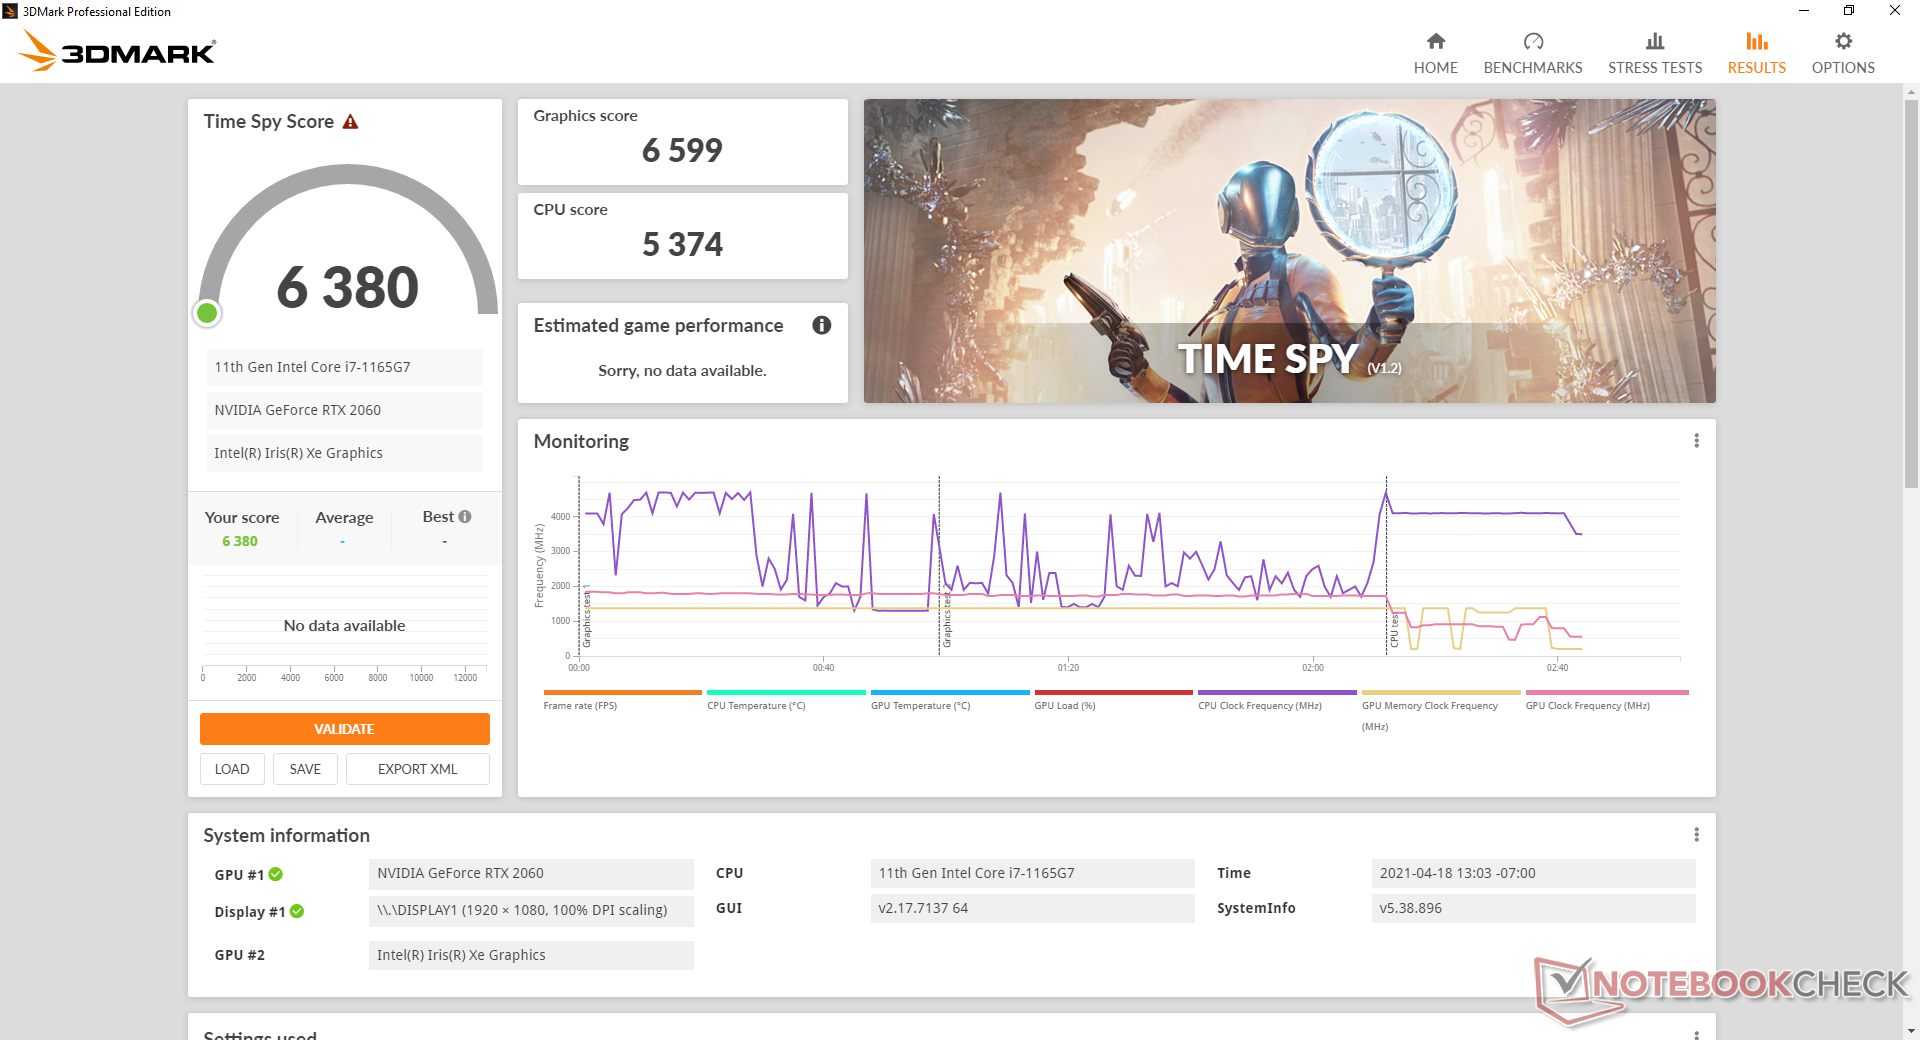
| 3DMark 11 Performance | 19233 Punkte | |
| 3DMark Cloud Gate Standard Score | 30679 Punkte | |
| 3DMark Fire Strike Score | 14753 Punkte | |
| 3DMark Time Spy Score | 6380 Punkte | |
Hilfe | ||
| min. | mittel | hoch | max. | |
|---|---|---|---|---|
| GTA V (2015) | 168 | 158 | 119 | 69.6 |
| The Witcher 3 (2015) | 220.7 | 152.2 | 101.5 | 61.4 |
| Dota 2 Reborn (2015) | 139 | 123 | 116 | 112 |
| Final Fantasy XV Benchmark (2018) | 130 | 89.2 | 67.5 | |
| X-Plane 11.11 (2018) | 94.8 | 81.3 | 69.8 | |
| Strange Brigade (2018) | 287 | 148 | 124 | 109 |
Emissions
Systemrauschen
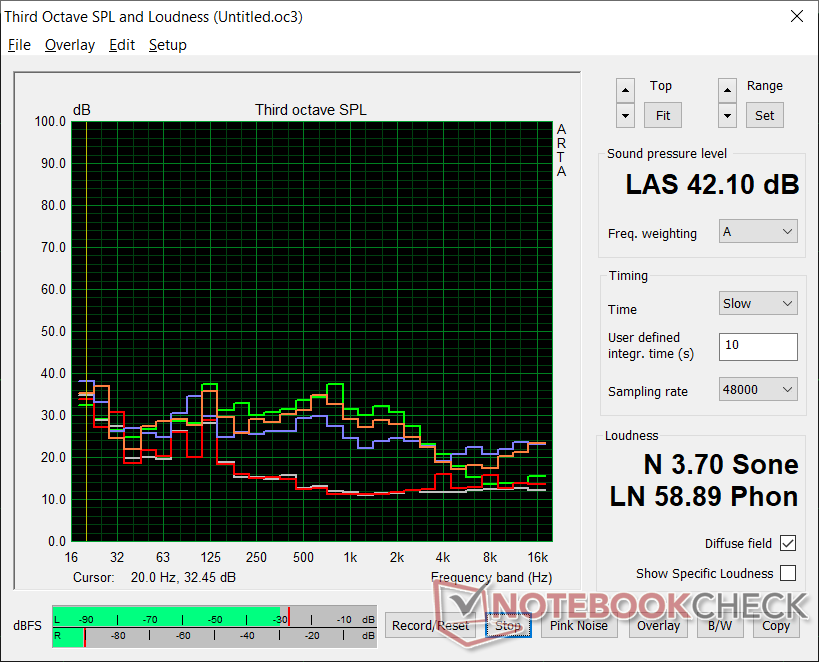
Wir können ein Spulenheulen von 25,3 dB(A) im Leerlauf auf dem Desktop gegen einen leisen Hintergrund von 24,5 dB(A) aufzeichnen. Das Lüftergeräusch liegt ansonsten nahe an dem, was wir beim Hades Canyon NUC aufgezeichnet haben. Im Betrieb Witcher 3 zum Beispiel steigt das Lüftergeräusch langsam an, bis es einen konstanten Wert von 39,7 dB(A) erreicht. Bei extremeren Belastungen wie Prime95 oder FurMark steigt das Lüftergeräusch kurzzeitig auf bis zu 47,9 dB(A) an, bevor es abfällt und sich bei 42,1 dB(A) stabilisiert.
| Intel NUC11PHKi7C GeForce RTX 2060 Mobile, i7-1165G7, Samsung SSD 980 Pro 500GB MZ-V8P500BW | Intel Hades Canyon NUC8i7HVK Vega M GH, i7-8809G, Intel Optane 120 GB SSDPEK1W120GA | Intel NUC11PAQi7 Iris Xe G7 96EUs, i7-1165G7, Samsung SSD 980 Pro 500GB MZ-V8P500BW | GMK NucBox 2 Iris Plus Graphics 655, i5-8259U, Netac S930E8/256GPN | Zotac ZBOX Magnus EK71080 GeForce GTX 1080 (Desktop), i7-7700HQ, Samsung PM961 MZVLW256HEHP | Aorus Gaming Box GeForce RTX 2080 Ti , i7-1165G7 | |
|---|---|---|---|---|---|---|
| Geräuschentwicklung | -10% | 0% | 3% | -28% | -25% | |
| aus / Umgebung * (dB) | 24.5 | 28.7 -17% | 25.6 -4% | 25.6 -4% | 29.9 -22% | 26.5 -8% |
| Idle min * (dB) | 25.3 | 29 -15% | 25.6 -1% | 25.7 -2% | 38.6 -53% | 34.7 -37% |
| Idle avg * (dB) | 25.3 | 29 -15% | 25.6 -1% | 25.7 -2% | 38.6 -53% | 39.1 -55% |
| Idle max * (dB) | 25.3 | 29 -15% | 25.6 -1% | 25.7 -2% | 39 -54% | 39.1 -55% |
| Last avg * (dB) | 36.4 | 36 1% | 33.6 8% | 35.3 3% | 40.6 -12% | 39.5 -9% |
| Witcher 3 ultra * (dB) | 39.7 | 42 -6% | 33.6 15% | 41.7 -5% | 43.7 -10% | |
| Last max * (dB) | 47.9 | 49.4 -3% | 54.5 -14% | 35.1 27% | 47 2% | 48 -0% |
* ... kleinere Werte sind besser
Lautstärkediagramm
| Idle |
| 25.3 / 25.3 / 25.3 dB(A) |
| Last |
| 36.4 / 47.9 dB(A) |
 | ||
30 dB leise 40 dB(A) deutlich hörbar 50 dB(A) störend |
||
min: | ||
Temperatur

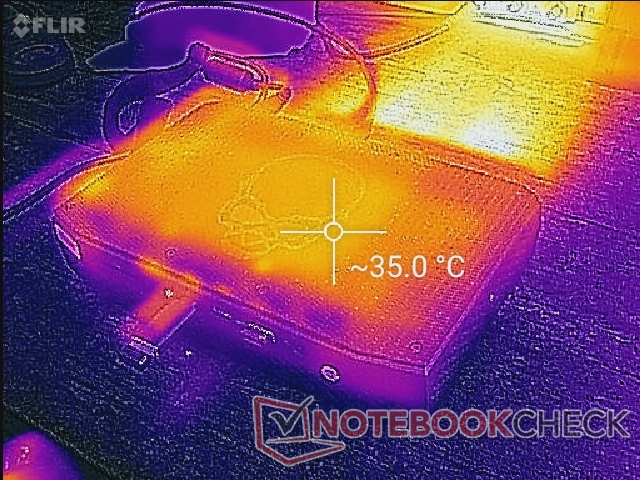
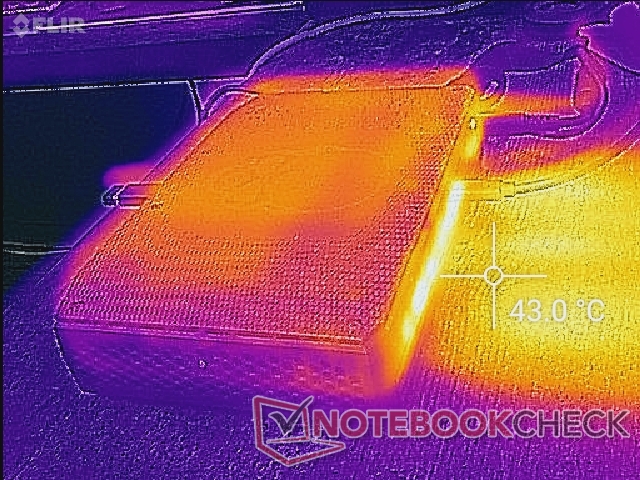
Die Oberflächentemperaturen sind kein Problem, da der Hotspot auf der Oberseite beim Spielen nur etwa 35 °C beträgt. Die gesamte Abluft kommt jedoch von der Rückseite, daher sollte dahinter genügend Platz für eine ausreichende Belüftung reserviert werden.
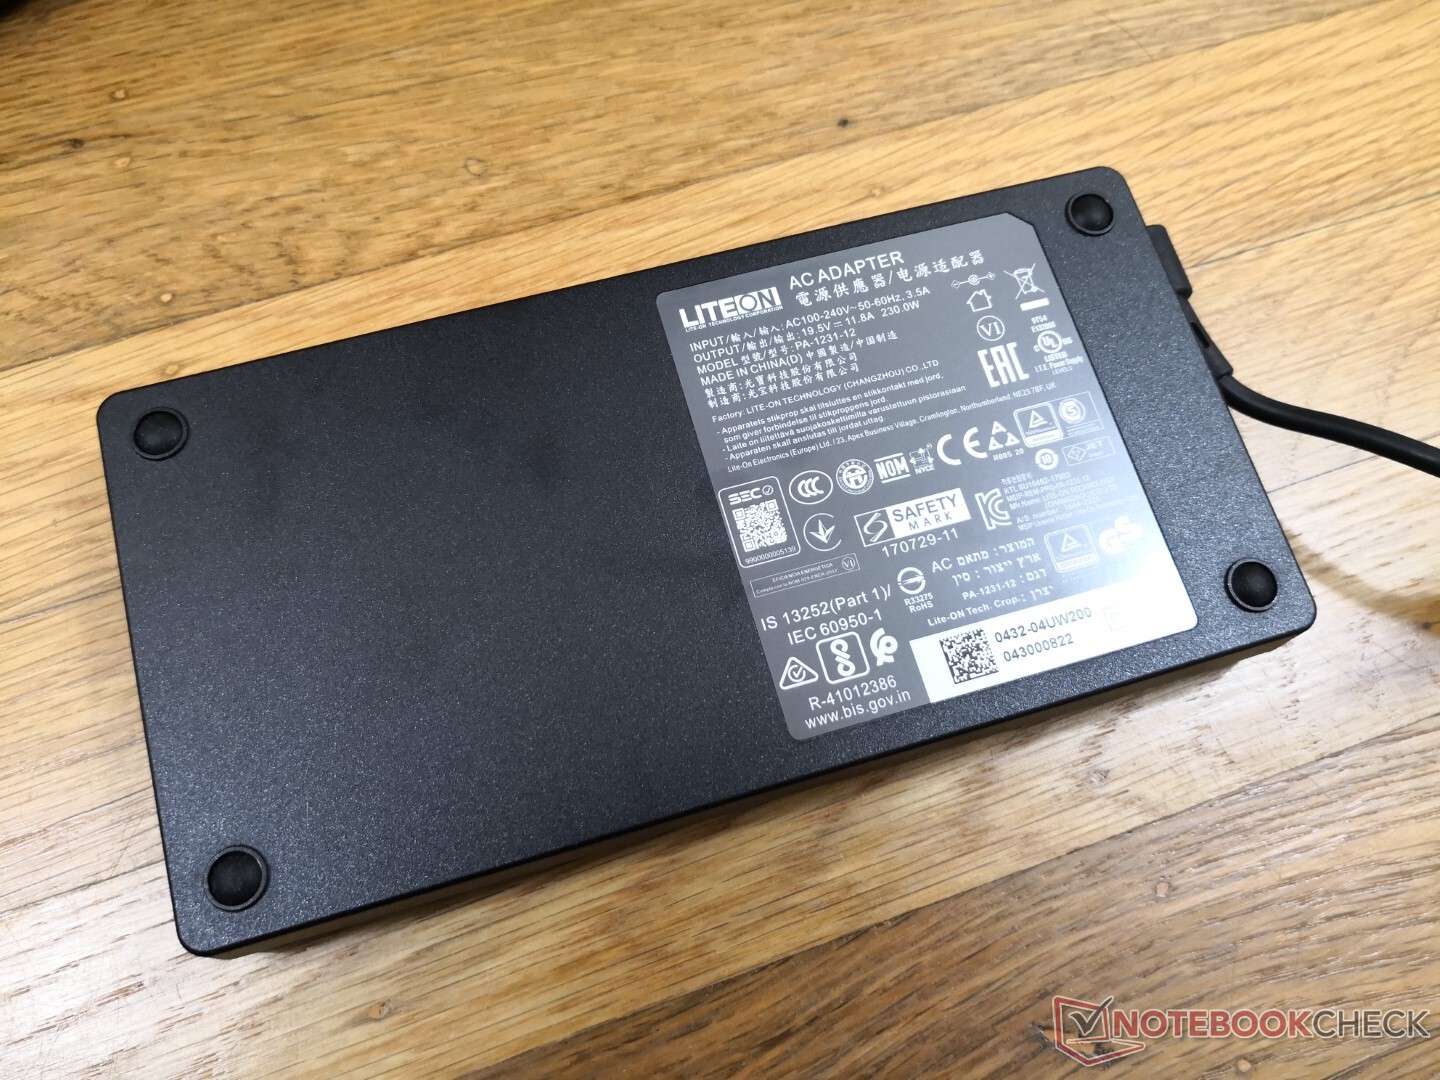
Das Netzteil kann beim Spielen mit 43 °C wärmer werden als der NUC selbst. Intel hätte wahrscheinlich ein kleineres und dichteres Netzteil entwickeln können, aber es wäre sicherlich noch wärmer geworden, ähnlich wie wir es bei der Razer-Blade-Serie kennen.


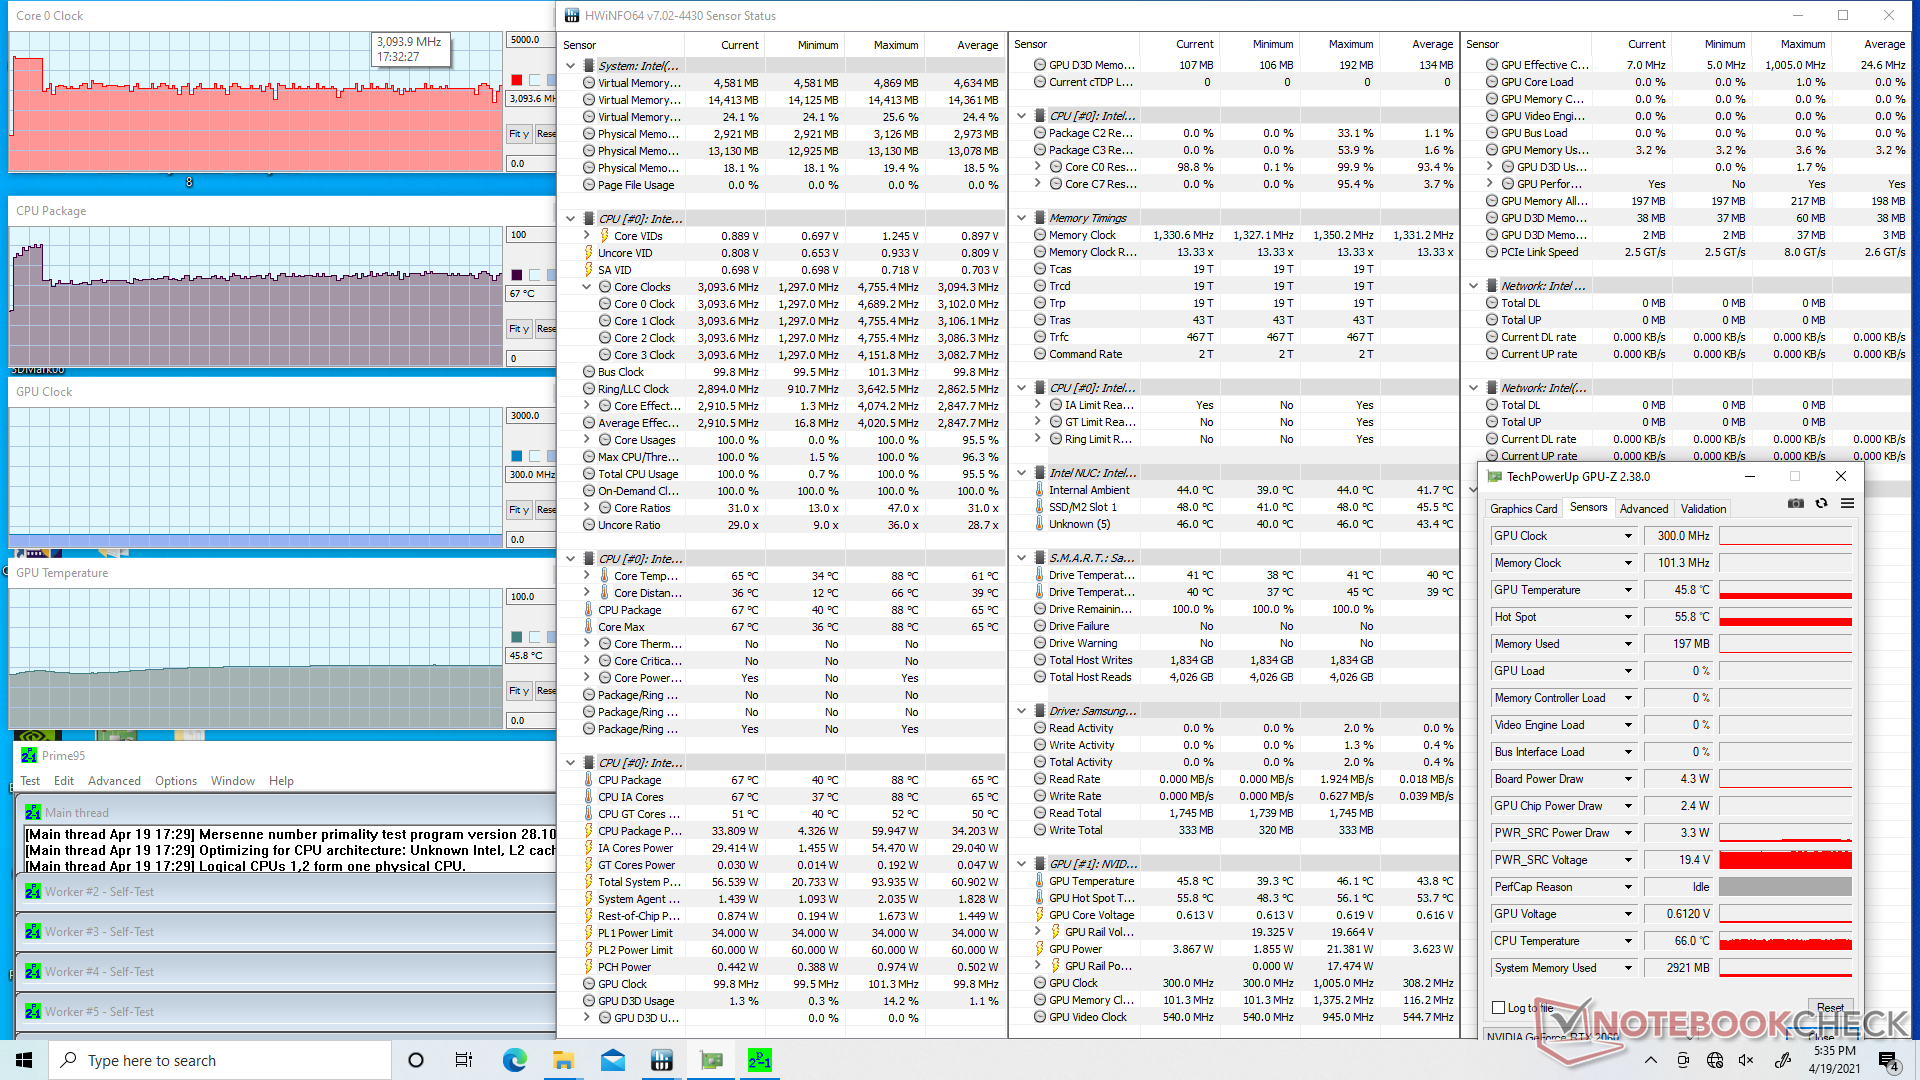
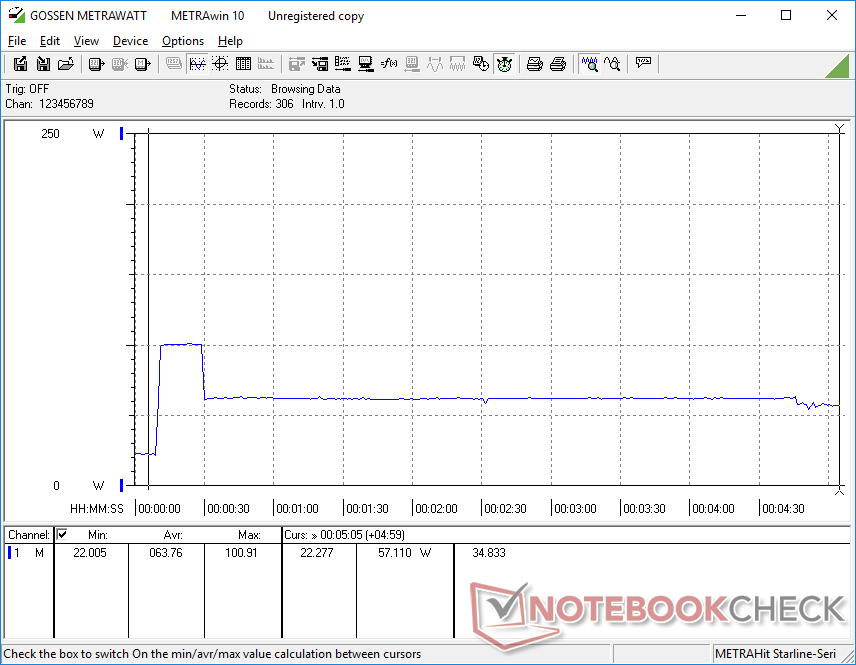
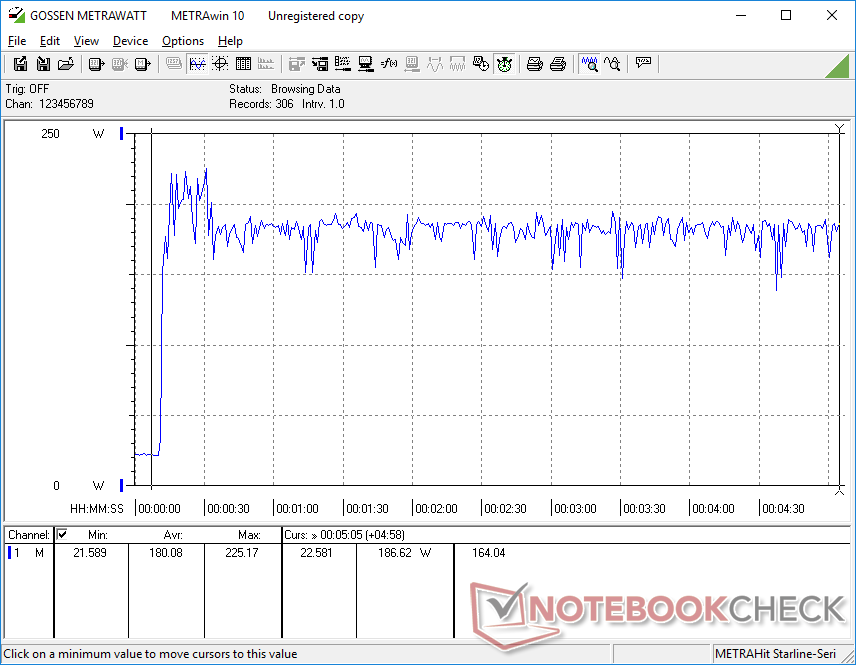
Stresstest
Wenn Prime95 läuft, um die CPU zu belasten, steigen die Taktraten für etwa 20 Sekunden auf 4,1 GHz, bis eine Kerntemperatur von 89 °C erreicht wird. Danach sinken die Taktraten stetig, bis sie sich bei 3,0 bis 3,2 GHz und einer Kerntemperatur von 67 °C stabilisieren. Wenn der NUC auf den Balanced-Modus eingestellt ist, sinken die Taktraten weiter auf 2,8 GHz und eine kühlere Kerntemperatur von 57 °C.
Im Betrieb von Witcher 3, um die reale Spielelast zu repräsentieren, stabilisieren sich die CPU- und GPU-Temperaturen bei 63 °C bzw. 69 °C, mit einer konstanten Leistungsaufnahme der GPU-Platine von etwa 116 W. Die Kaby-Lake-G-CPU im Hades Canyon NUC würde sich bei der Ausführung desselben Spiels in einem ähnlichen Temperaturbereich einpendeln.

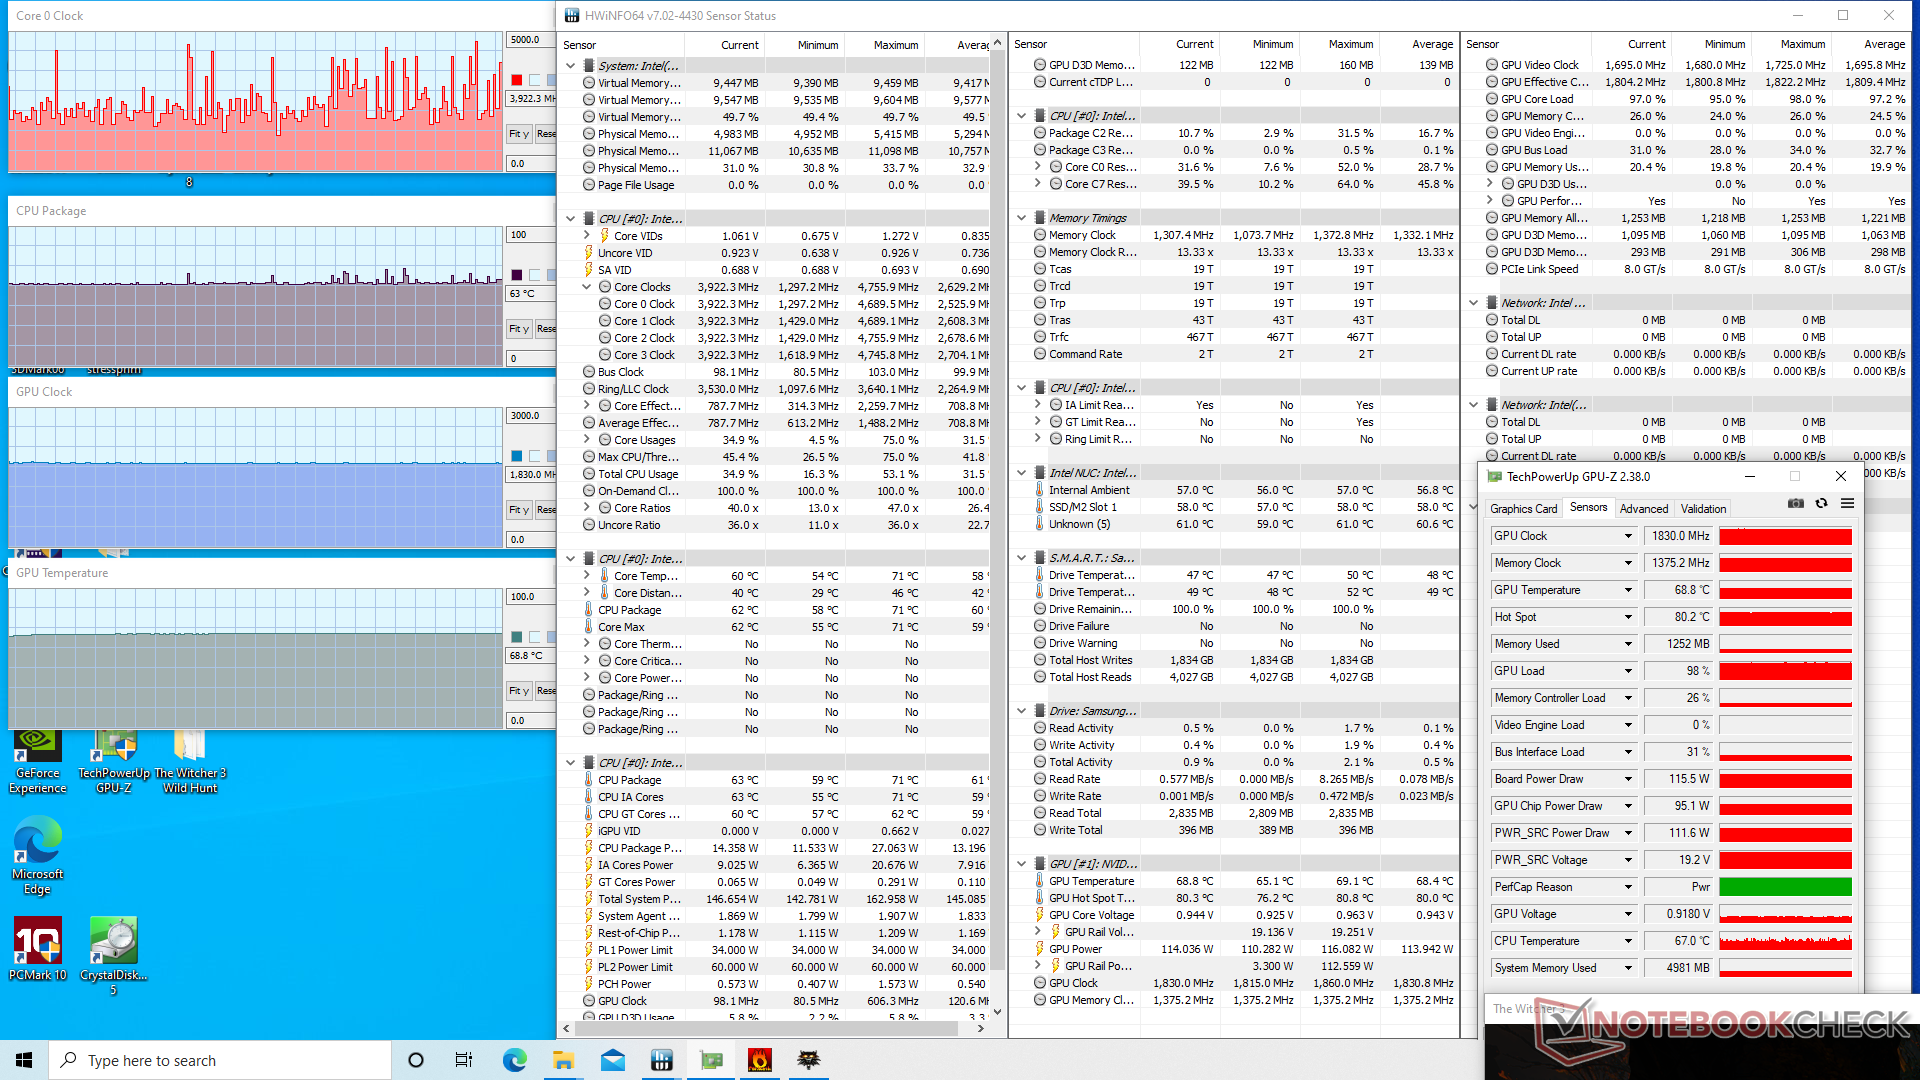
| CPU-Takt (GHz) | GPU-Takt (MHz) | durchschnittlicheCPU-Temperatur (°C) | durchschnittlicheGPU-Temperatur (°C) | |
| System Leerlauf | -- | -- | 44 | 43 |
| Prime95 Stress | 3.0 - 3.2 | -- | 67 | 46 |
| Prime95 + FurMark Stress | 2.9 | 1440 | 84 | 72 |
| Witcher 3 Stress | 1.5 - 4.2 | 1830 | 63 | 69 |
Energie-Management
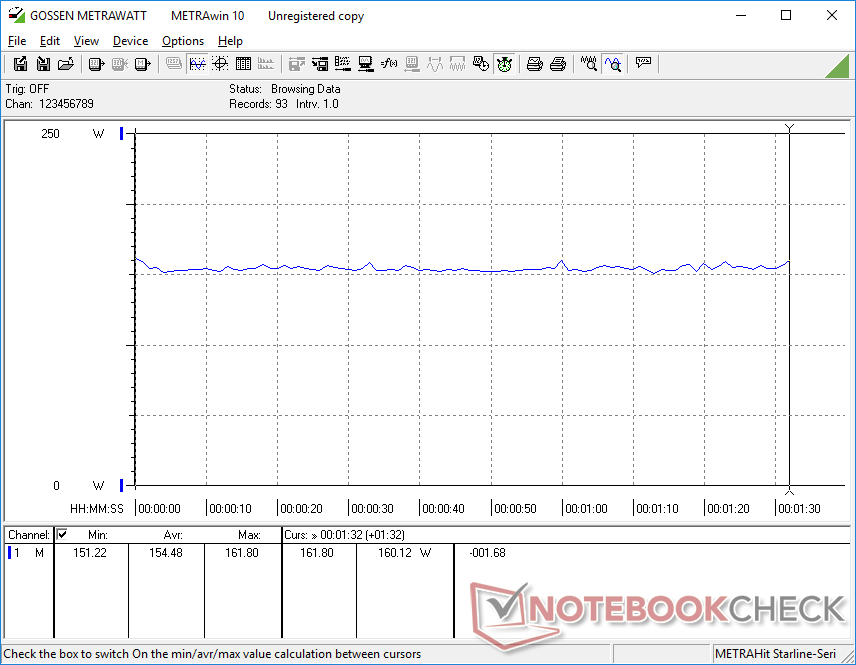
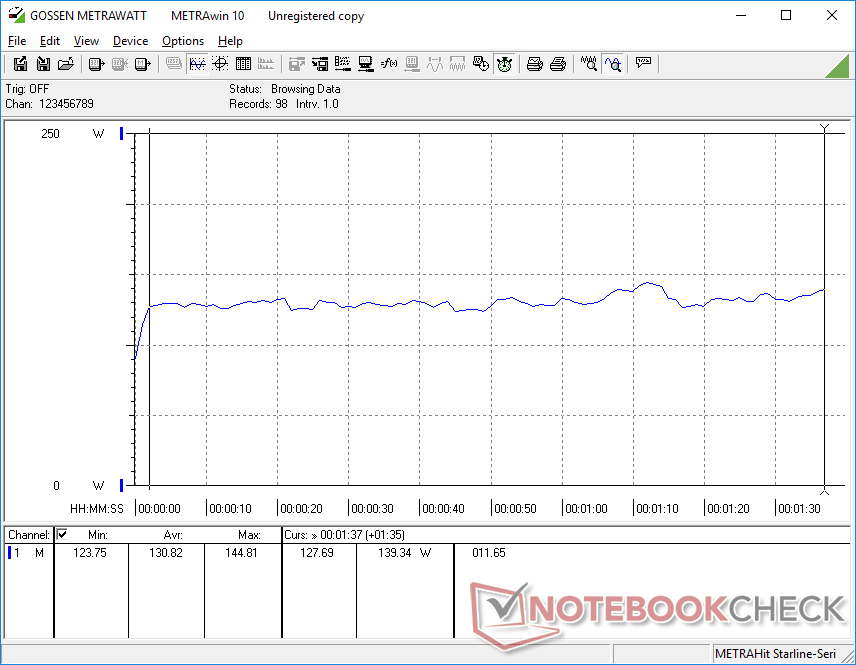
Leistungsaufnahme
Im Leerlauf auf dem Desktop werden nur 5 bis 6 W benötigt, wenn keine Bildschirme oder USB-Geräte angeschlossen sind, bis zu 21 W, wenn Tastaturen, Mäuse und Bildschirme angeschlossen sind und die diskrete GPU aktiv ist. Der Stromverbrauch beim Spielen kann etwa 30 bis 60 Prozent höher sein als beim Hades Canyon NUC, was angesichts der um 70 bis 100 Prozent gesteigerten Grafikleistung fair ist.
Wir können eine maximale temporäre Leistungsaufnahme von 225 W aus dem großen (~20 x 10 x 2 cm) 240-W-Netzteil verzeichnen, wenn Prime95 und FurMark gleichzeitig laufen. Man beachte, dass das NUC11 Phantom Canyon das gleiche Lite-on-Netzteil wie das NUC8 Hades Canyon verwendet und diese somit austauschbar sind.
| Aus / Standby | |
| Idle | |
| Last |
|
Legende:
min: | |
| Intel NUC11PHKi7C i7-1165G7, GeForce RTX 2060 Mobile, Samsung SSD 980 Pro 500GB MZ-V8P500BW, , x, | Intel Hades Canyon NUC8i7HVK i7-8809G, Vega M GH, Intel Optane 120 GB SSDPEK1W120GA, , x, | Intel NUC11PAQi7 i7-1165G7, Iris Xe G7 96EUs, Samsung SSD 980 Pro 500GB MZ-V8P500BW, , x, | Zotac ZBOX Magnus EK71080 i7-7700HQ, GeForce GTX 1080 (Desktop), Samsung PM961 MZVLW256HEHP, , x, 0" | Aorus Gaming Box GeForce RTX 2080 Ti i7-1165G7, , , , x, | |
|---|---|---|---|---|---|
| Stromverbrauch | -40% | 49% | -131% | -154% | |
| Idle min * (Watt) | 5.8 | 15.5 -167% | 5.6 3% | 27.1 -367% | 29.6 -410% |
| Idle avg * (Watt) | 5.9 | 16.2 -175% | 5.6 5% | 27.4 -364% | 29.6 -402% |
| Idle max * (Watt) | 20.7 | 16.5 20% | 6 71% | 28.8 -39% | 29.6 -43% |
| Last avg * (Watt) | 130.8 | 83.4 36% | 31.4 76% | 100.4 23% | 79.9 39% |
| Witcher 3 ultra * (Watt) | 154.4 | 121.7 21% | 39 75% | 243.1 -57% | 252 -63% |
| Last max * (Watt) | 225.2 | 173.5 23% | 80.5 64% | 186.7 17% | 319.8 -42% |
* ... kleinere Werte sind besser
Pro
Contra
Fazit
Phantom Canyon ist der Beweis, dass Intel sich seit Kaby Lake-G weiterentwickelt hat. Vorbei ist die Neuheit eines Intel-AMD-Chipsatzes zugunsten von mehr Standard-Prozessoren und VRAM-Modulen, die üblicherweise in Ultrabooks und Gaming-Notebooks zu finden sind. Dies bedeutet letztendlich eine zuverlässigere Treiberunterstützung und eine reibungslosere Kompatibilität mit Spielen, als es sich Hades Canyon jemals erhoffen konnte.
Hades Canyon fühlt sich vor dem Phantom Canyon fast schon obsolet an. Der neueste NUC mag etwas größer sein, aber er ist deutlich schneller, ohne dass er lauter oder heißer laufen muss, um den Größenzuwachs von Generation zu Generation mehr als auszugleichen.
Die Gesamtleistung ist erwartungsgemäß schneller als Hades Canyon, aber es ist großartig zu sehen, dass dies nicht auf Kosten von merklich lauteren Lüftern oder wärmeren Kerntemperaturen geht, was immer die Befürchtung ist, wenn man auf schnellere PCs aufrüstet.
Zu den Nachteilen gehören die etwas dickere Größe und der höhere Stromverbrauch als bei Hades Canyon, der unansehnliche Power Brick und der hohe Straßenpreis von über 1.000 US-Dollar für ein Barebone-Gerät. Anwender müssen den Formfaktor und die Qualität des NUC Namens wirklich schätzen, da leistungsfähigere Gaming-Laptops - übrigens komplett mit RAM und Speicher - für ungefähr denselben Preis zu haben sind.
Preis und Verfügbarkeit
Der Intel NUC11PHKi7C Phantom Canyon ist zum Zeitpunkt der Erstellung dieses Artikels noch nicht allgemein verfügbar. Simplynuc.com bietet derzeit Vorbestellungen für das System ab 1.339 USD an.
Preisvergleich

