Notebookcheck Logo

Intel NUC 9 Extreme mit Core i9 und RTX 2070 im Test

Der Teufel steckt im Detail! Intel NUC-Systeme sind seit Jahren bekannt und überzeugen mit ihrer Kompaktheit. Der nun veröffentlichte Intel NUC 9 Extreme bietet sogar Platz für eine vollwertige Desktop-GPU. Damit ist das Gerät etwas größer aber gleichwohl trotzdem sehr kompakt. Wieviel Leistung in dem kleinen PC steckt, erfahren Sie in diesem Review mit zahlreichen Messungen und Benchmarks.

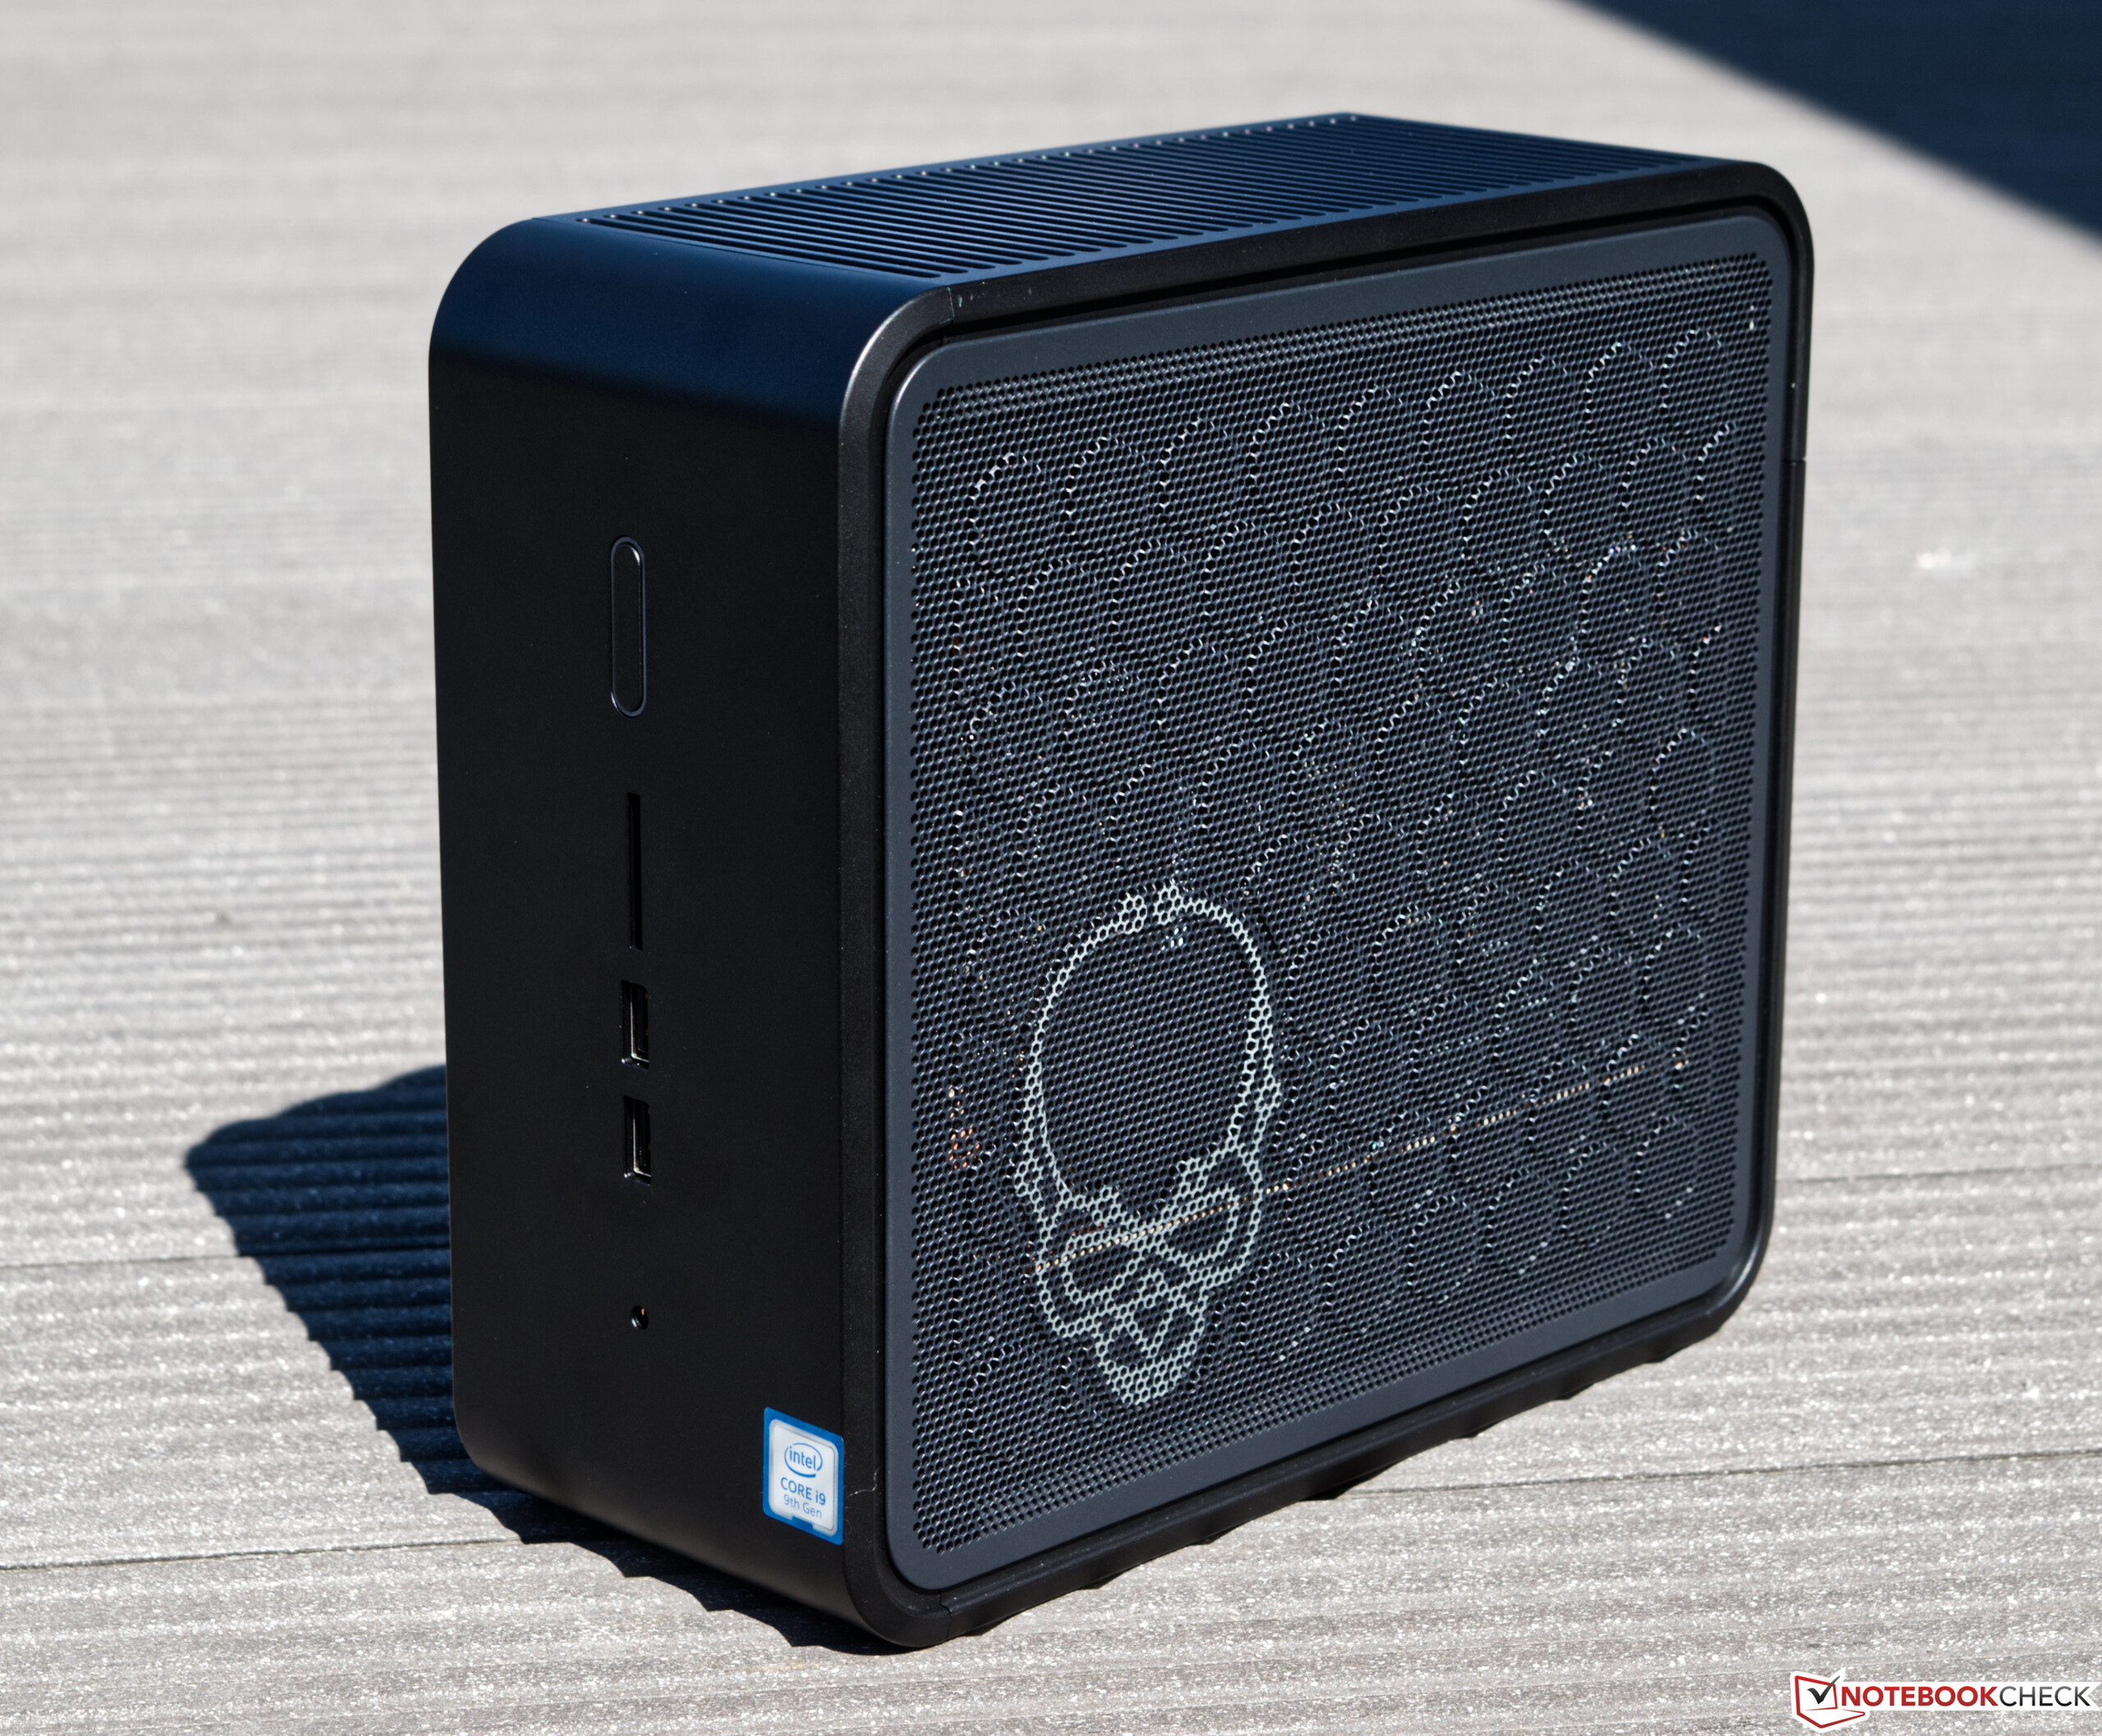
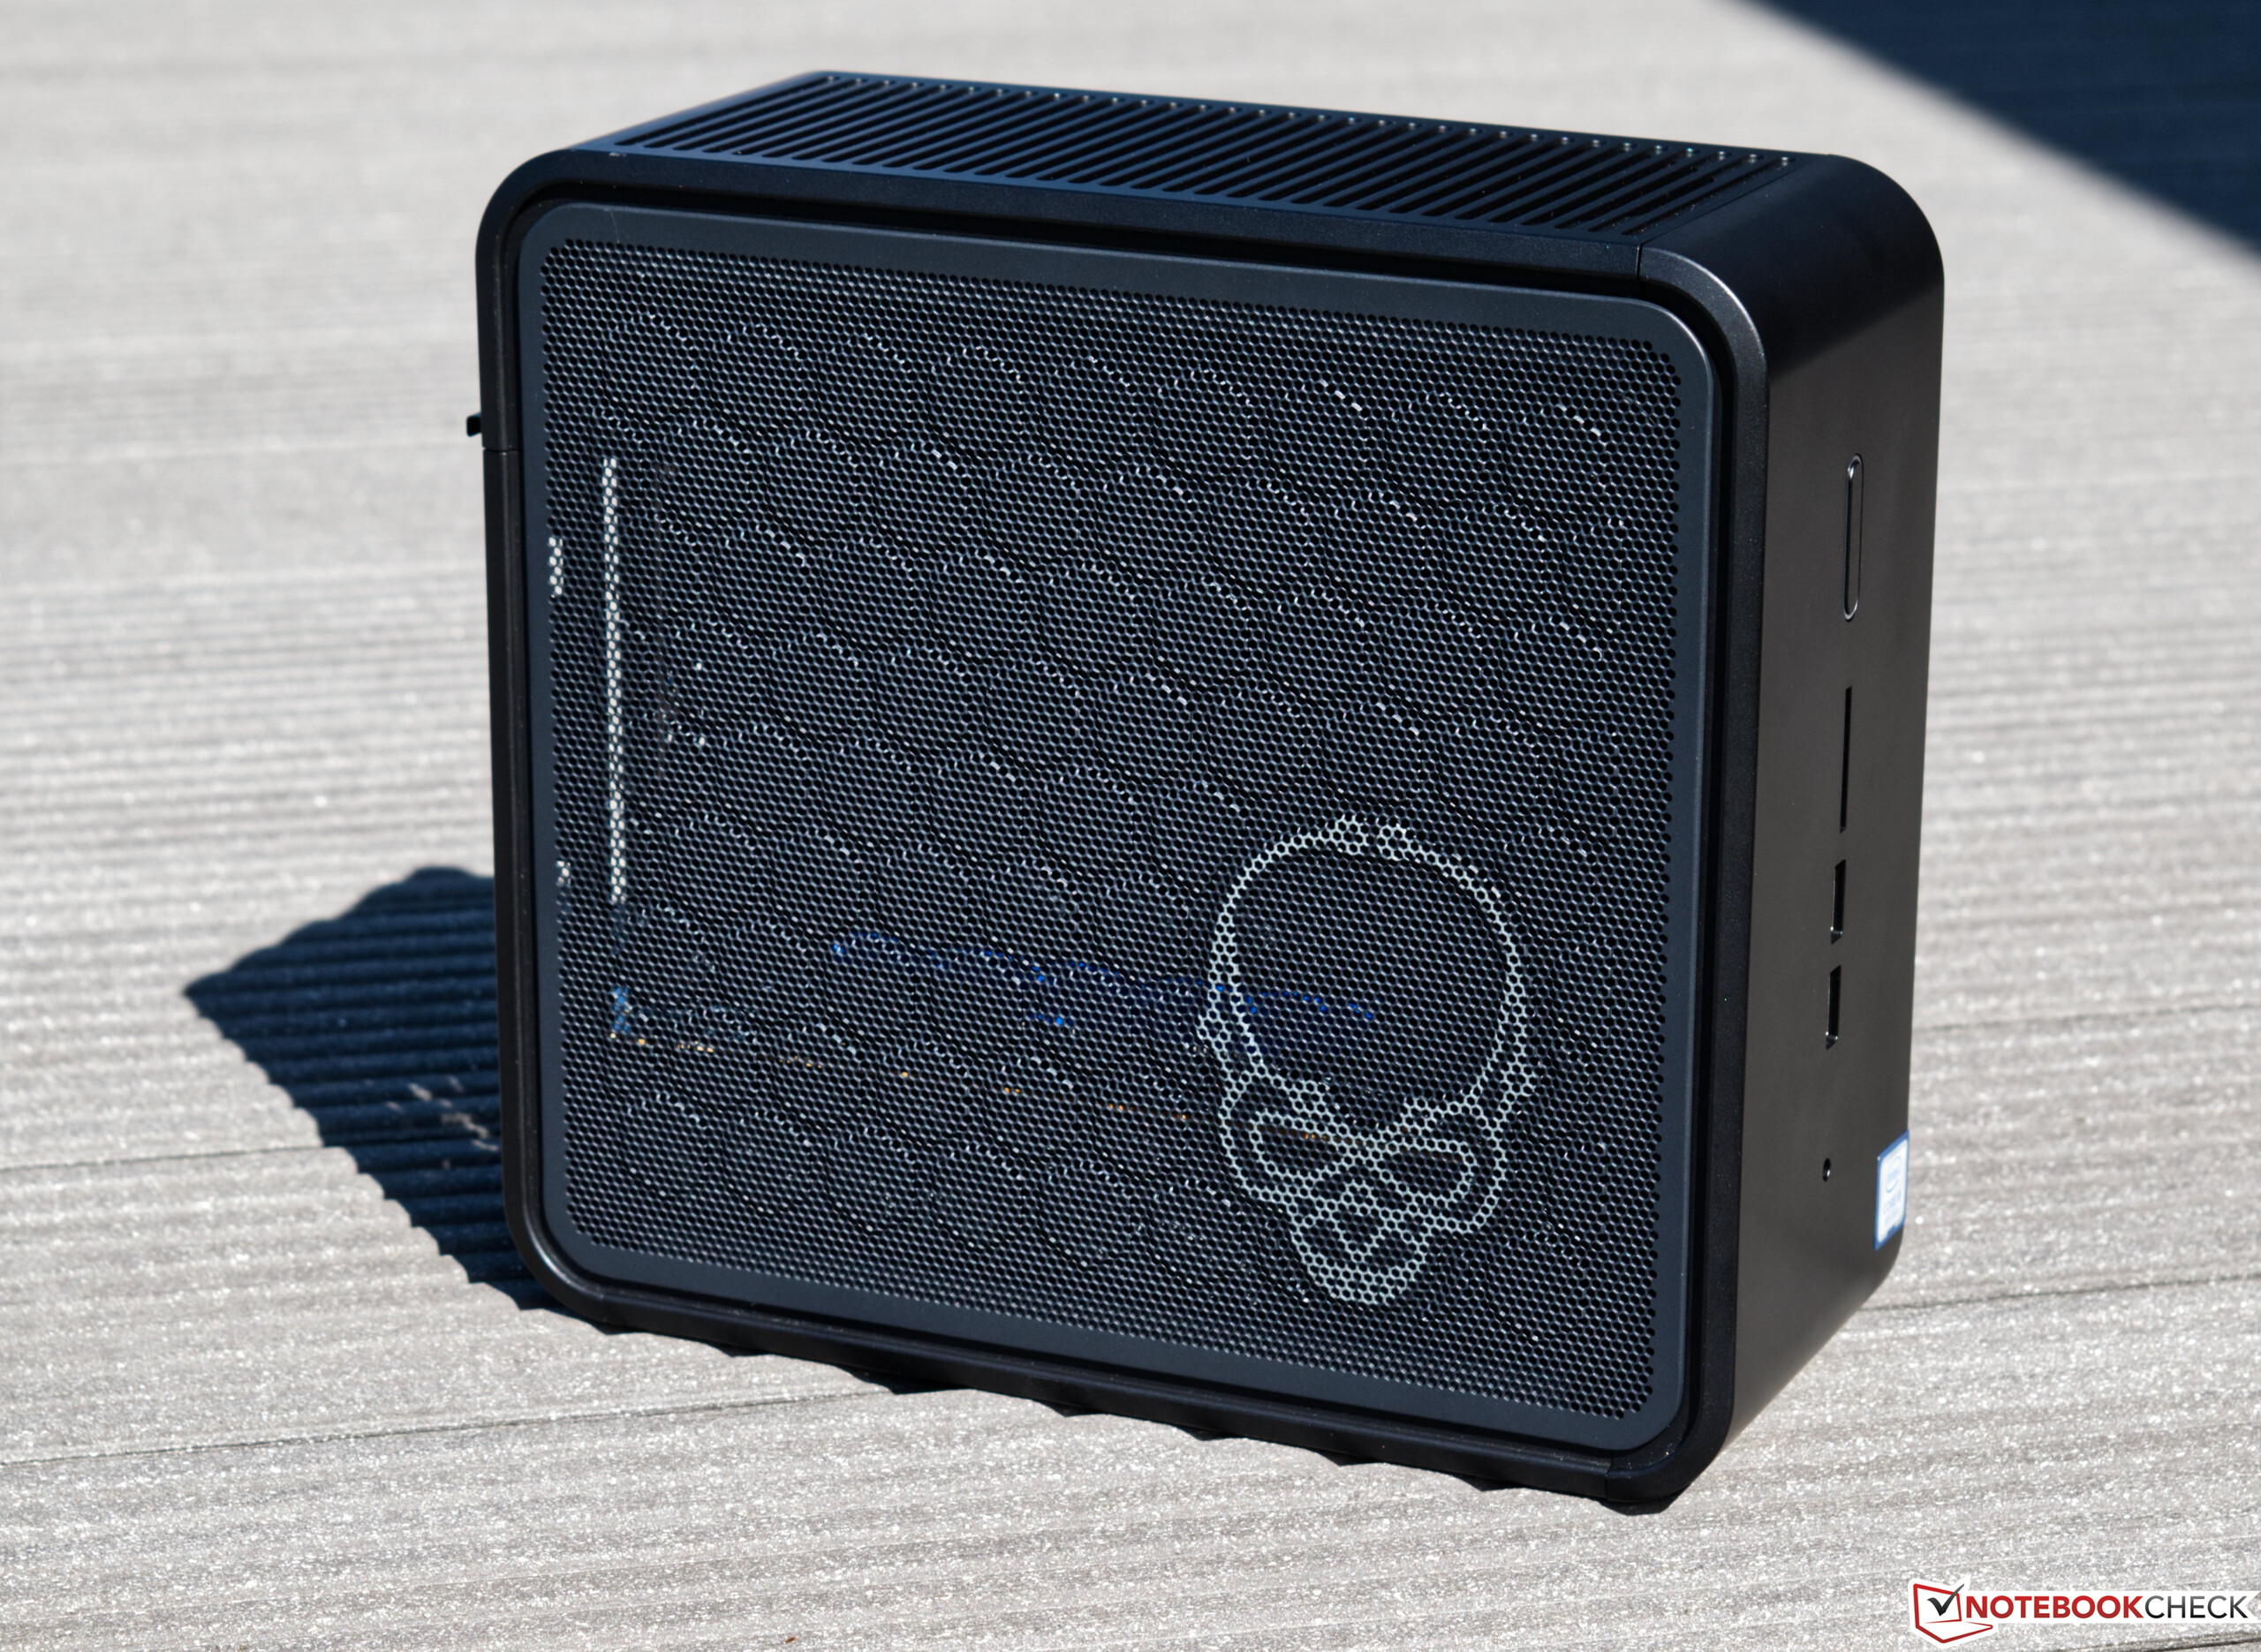
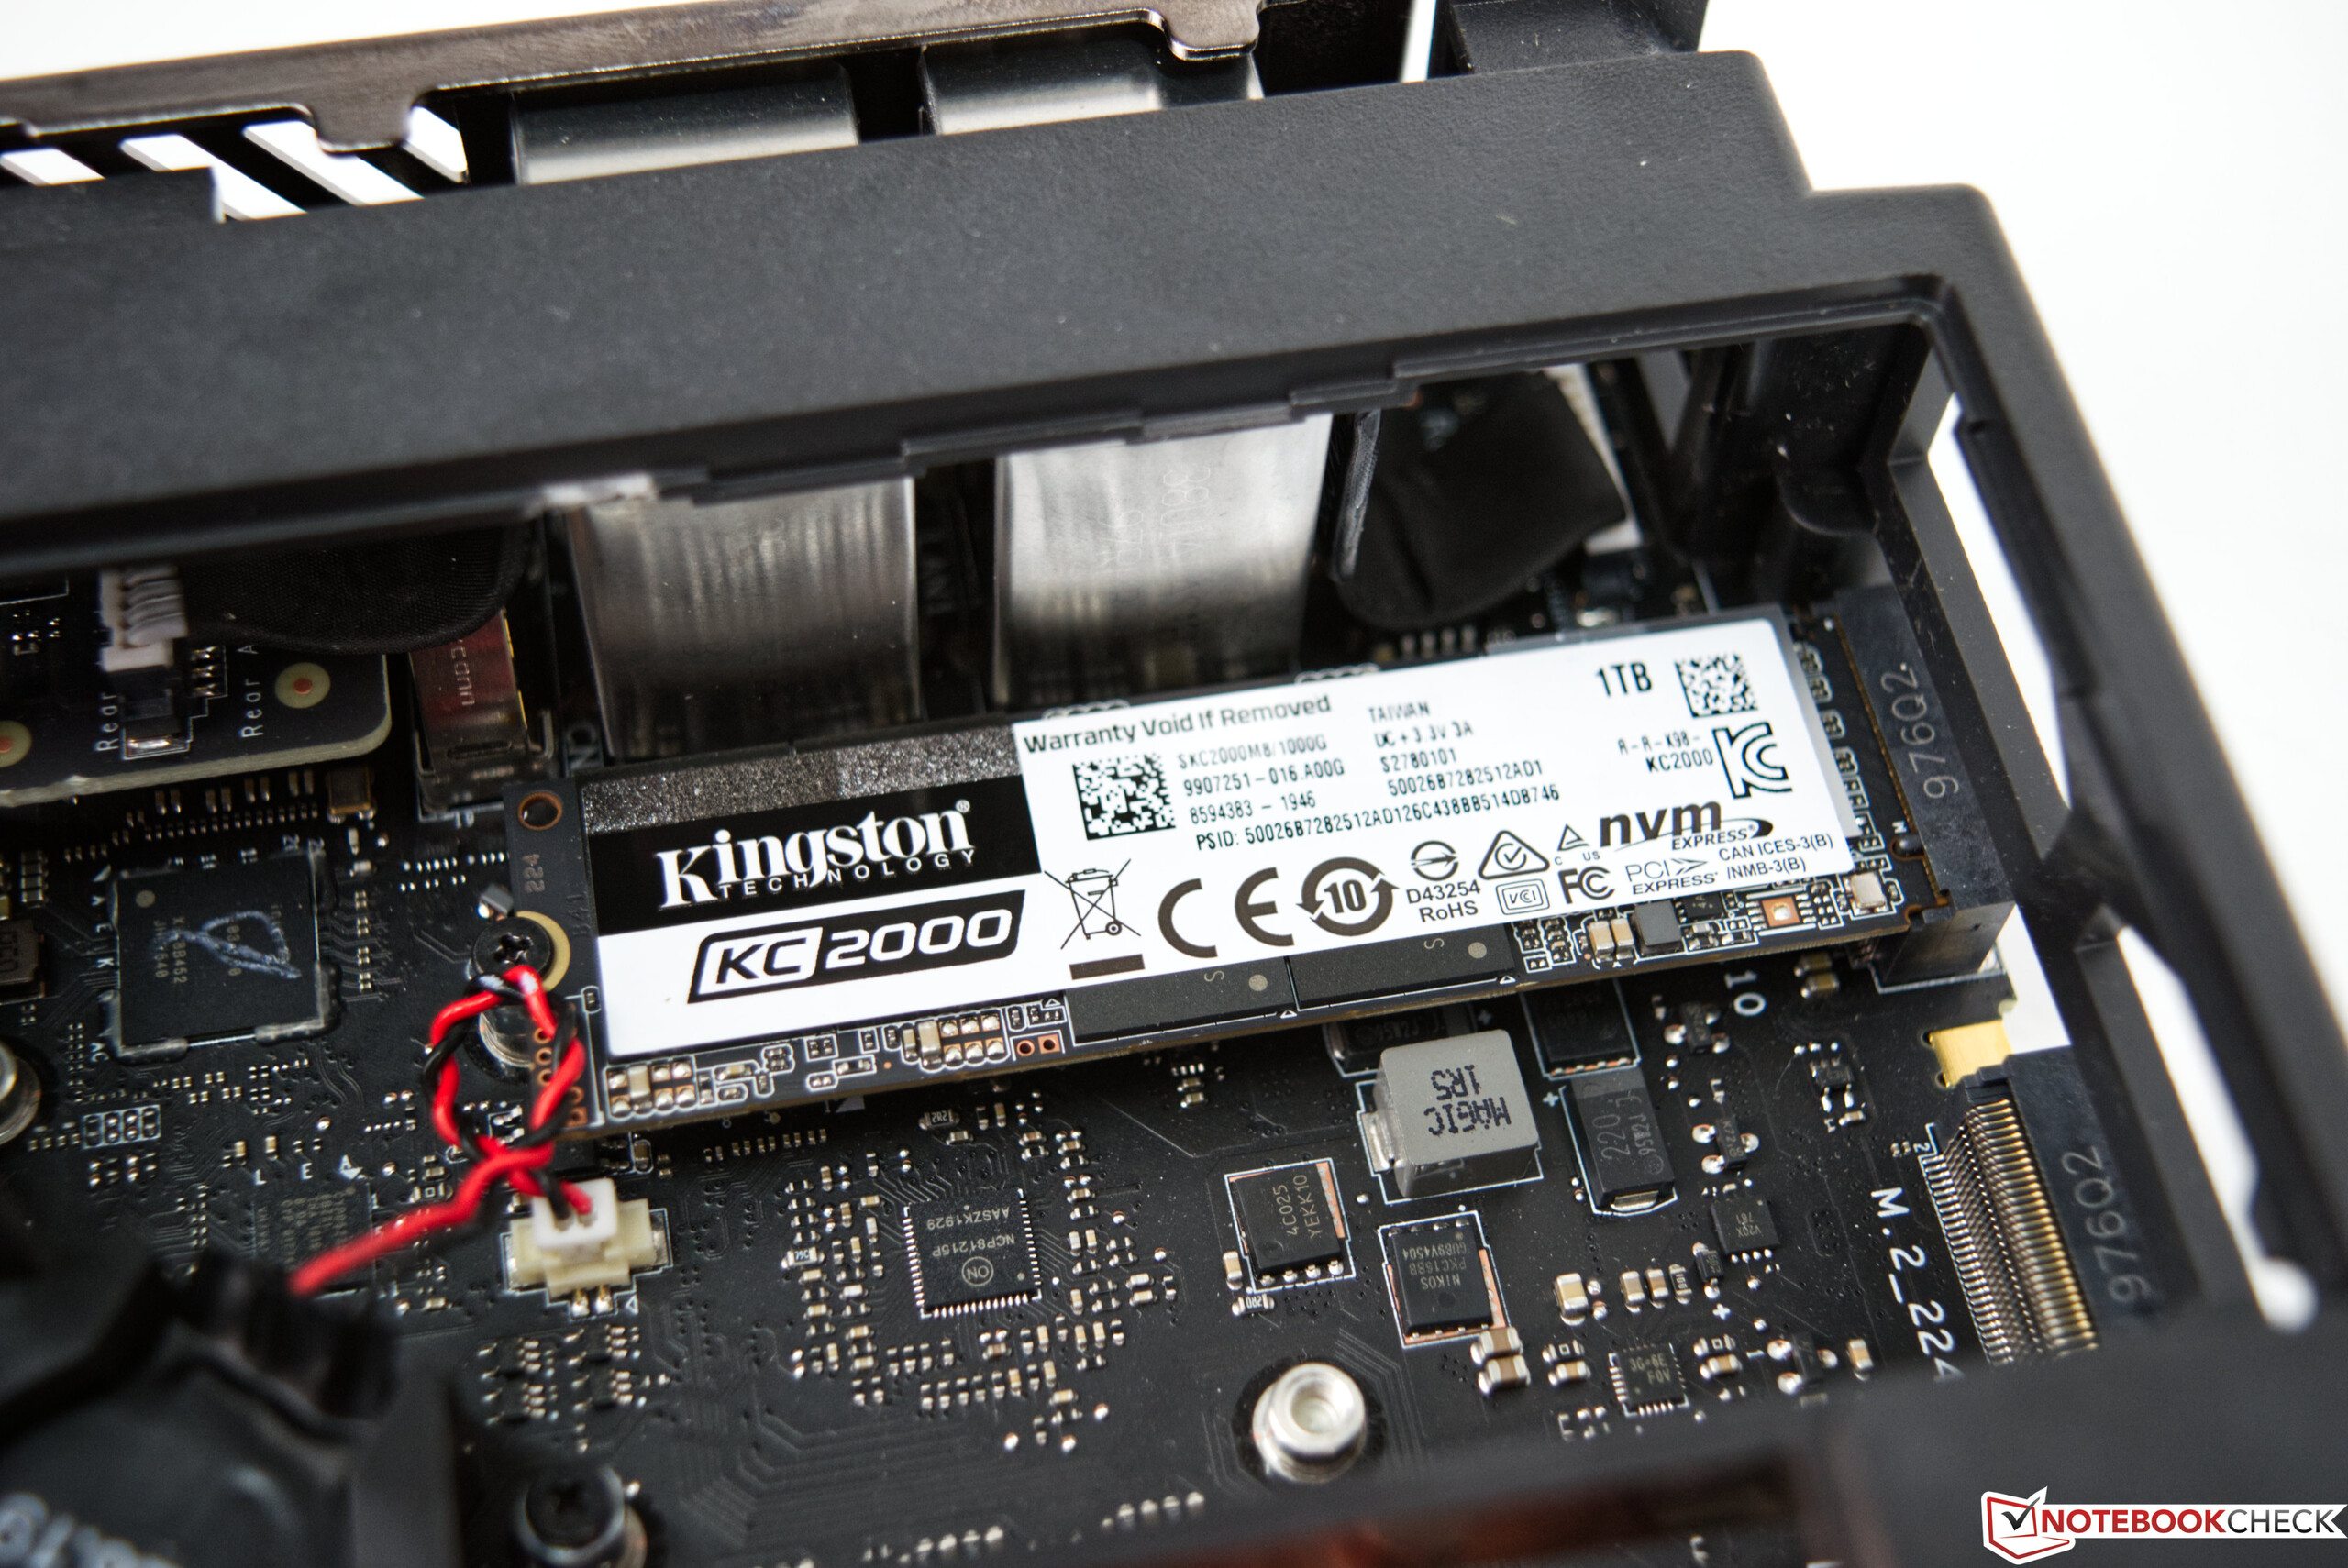
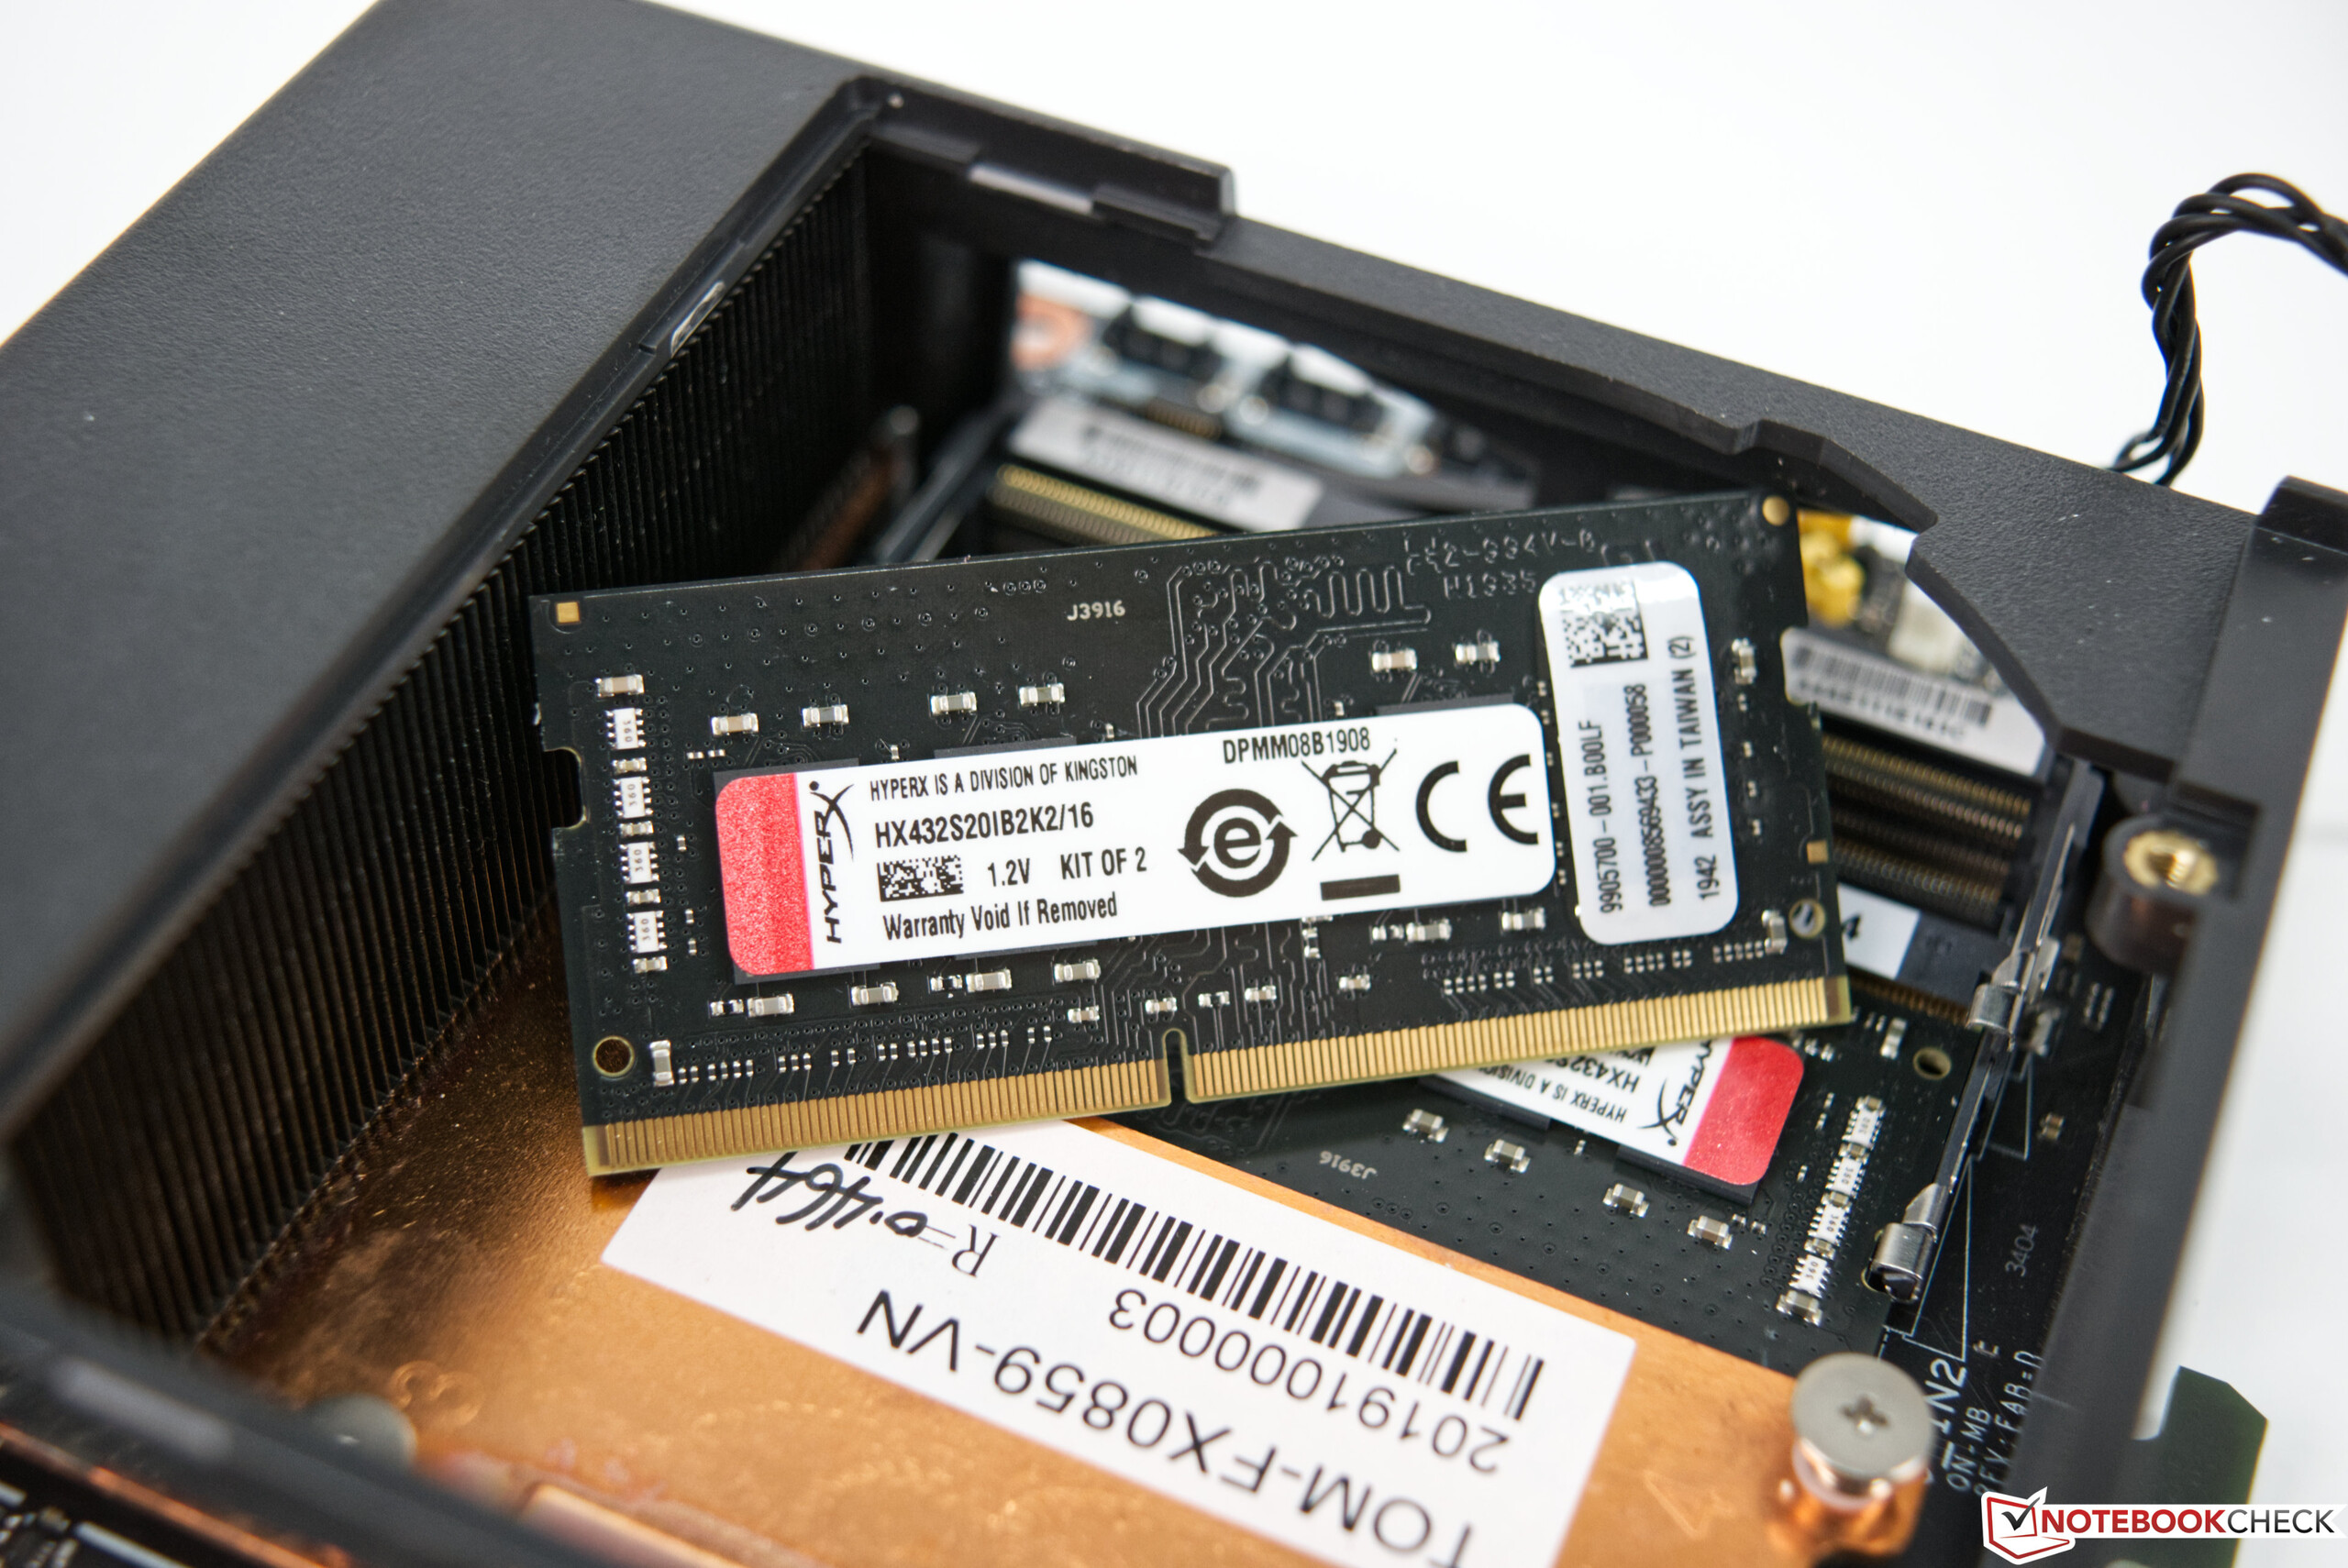
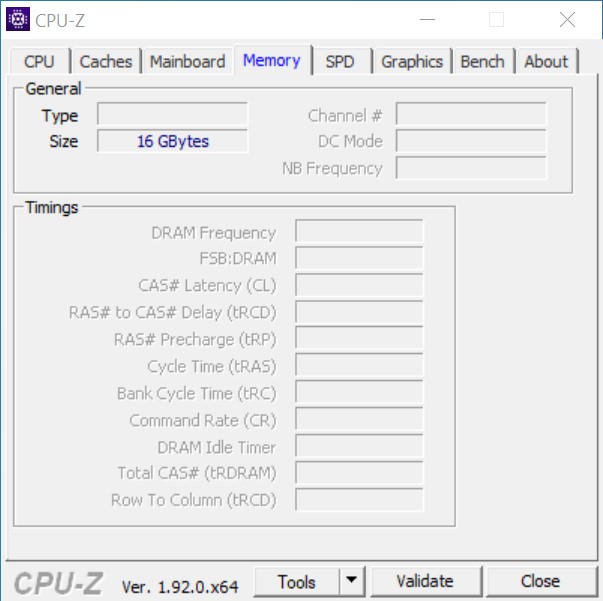
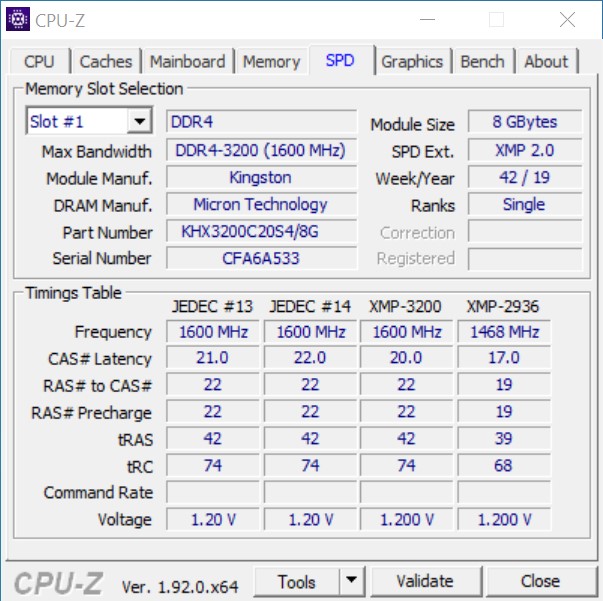
Die NUC-PCs aus dem Hause Intel gibt es schon lange auf dem Markt und sind meistens als sehr kleine Office-Rechner bekannt. In Zusammenarbeit mit AMD schaffte es auch der Intel NUC Hades Canyon auf den Markt und richtete sich damit an Gamer, welche ein sehr kompaktes Gerät bevorzugen. Genau hier setzt Intel mit dem Ghost Canyon an und vereint ein sehr kompaktes Gehäuse mit einem Volumen von unter 5L mit einer ordentlichen Portion an Leistung. In der von uns getesteten Version steckt ein Intel Core i9-9980HK mit 16 GB Arbeitsspeicher und zwei SSDs mit insgesamt 1,38 TB an Speicherplatz. Für die 3D-Beschleunigung dient zusätzlich eine Nvidia GeForce RTX 2070. Damit lassen sich selbst modernste Titel mit dem kleinen Kraftprotz flüssig darstellen.

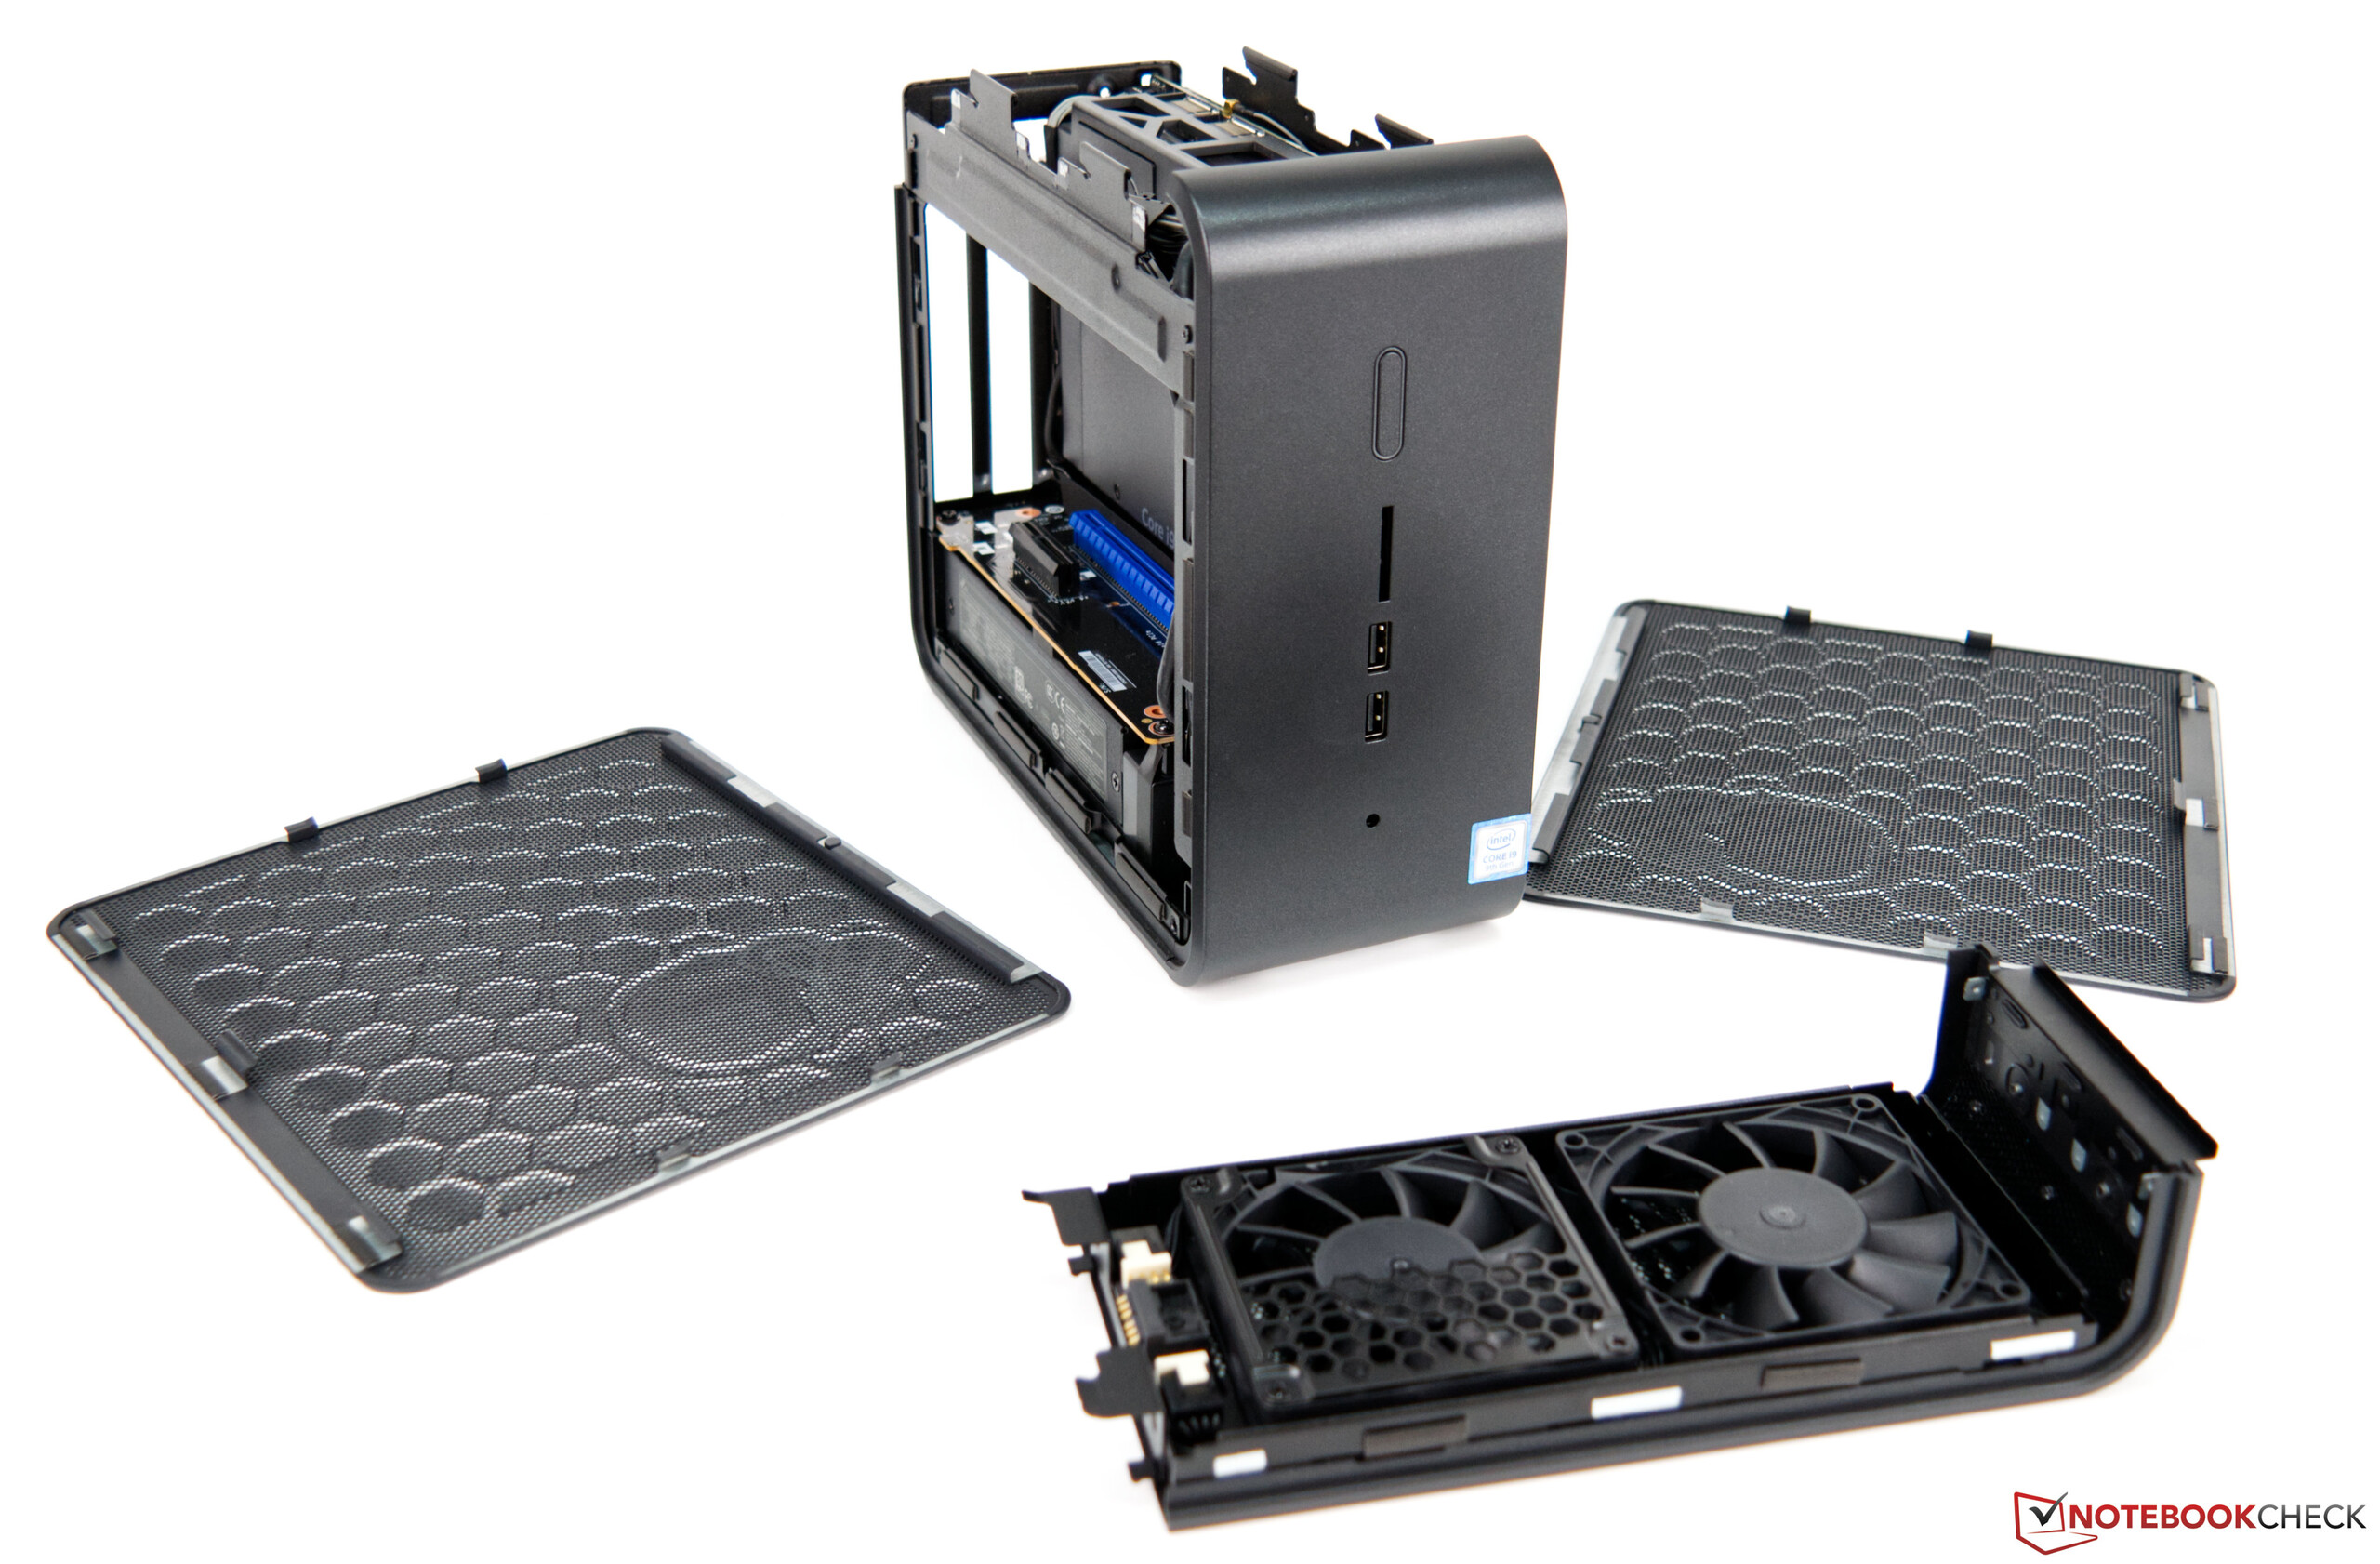
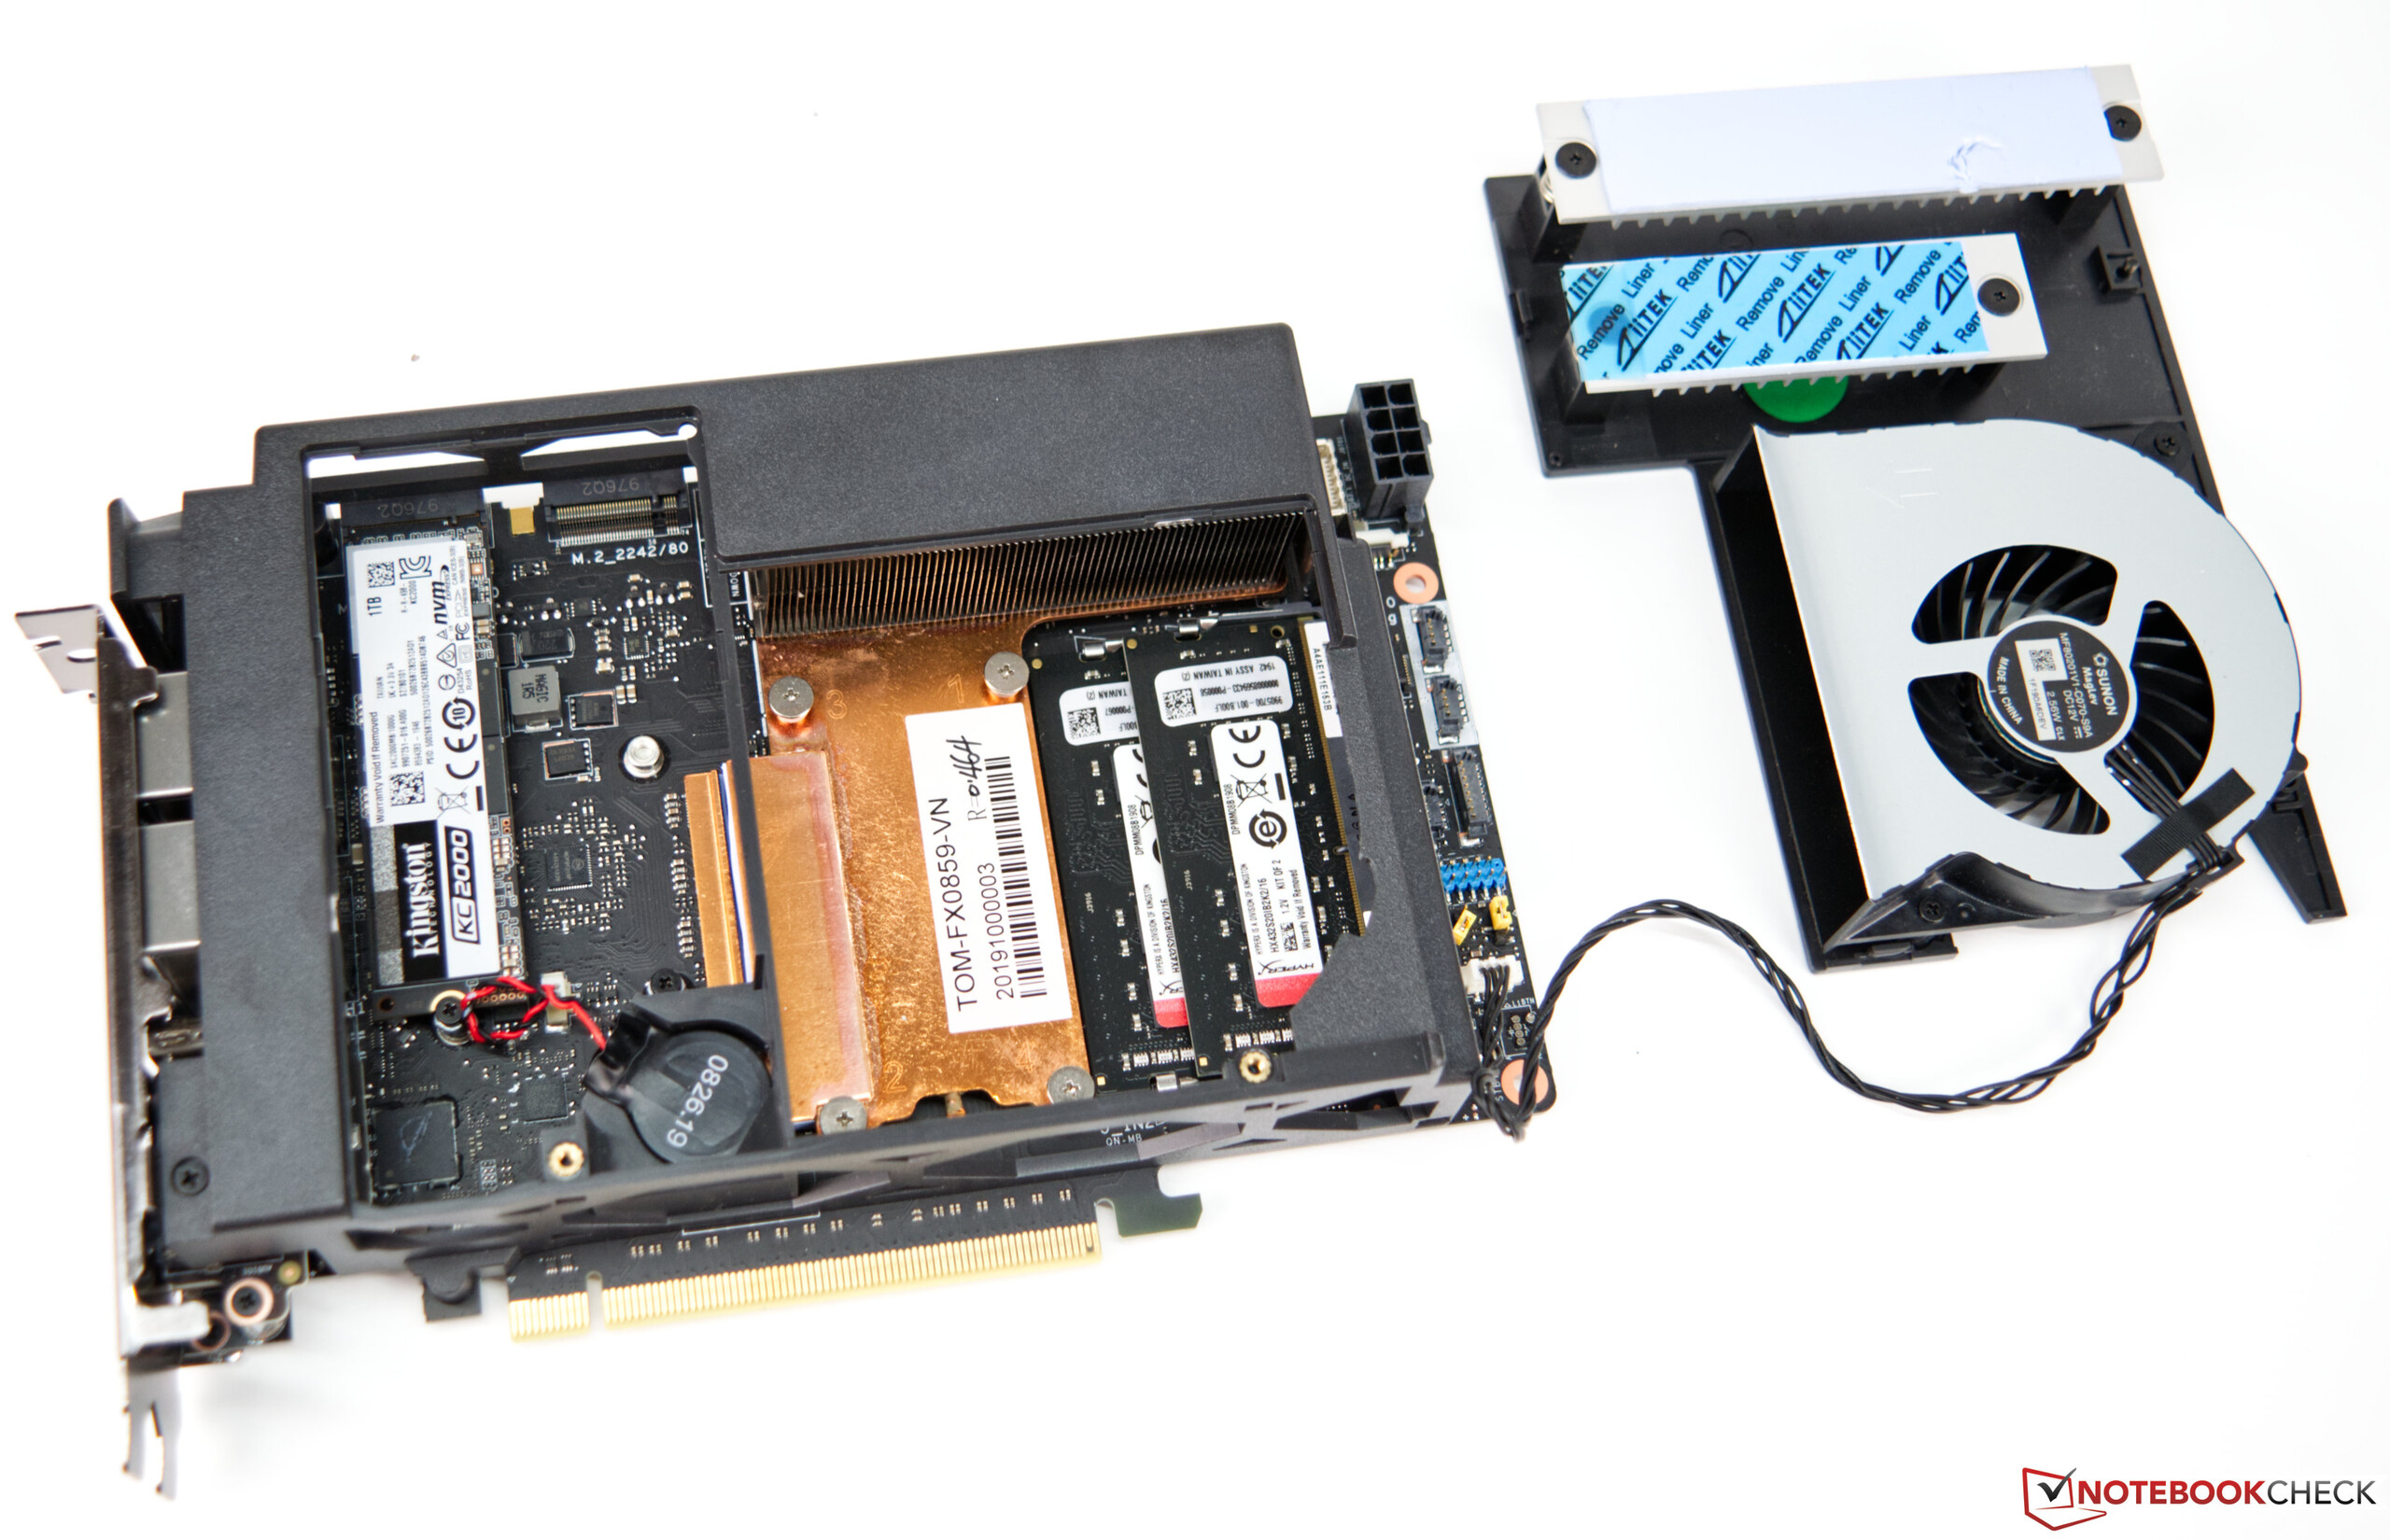
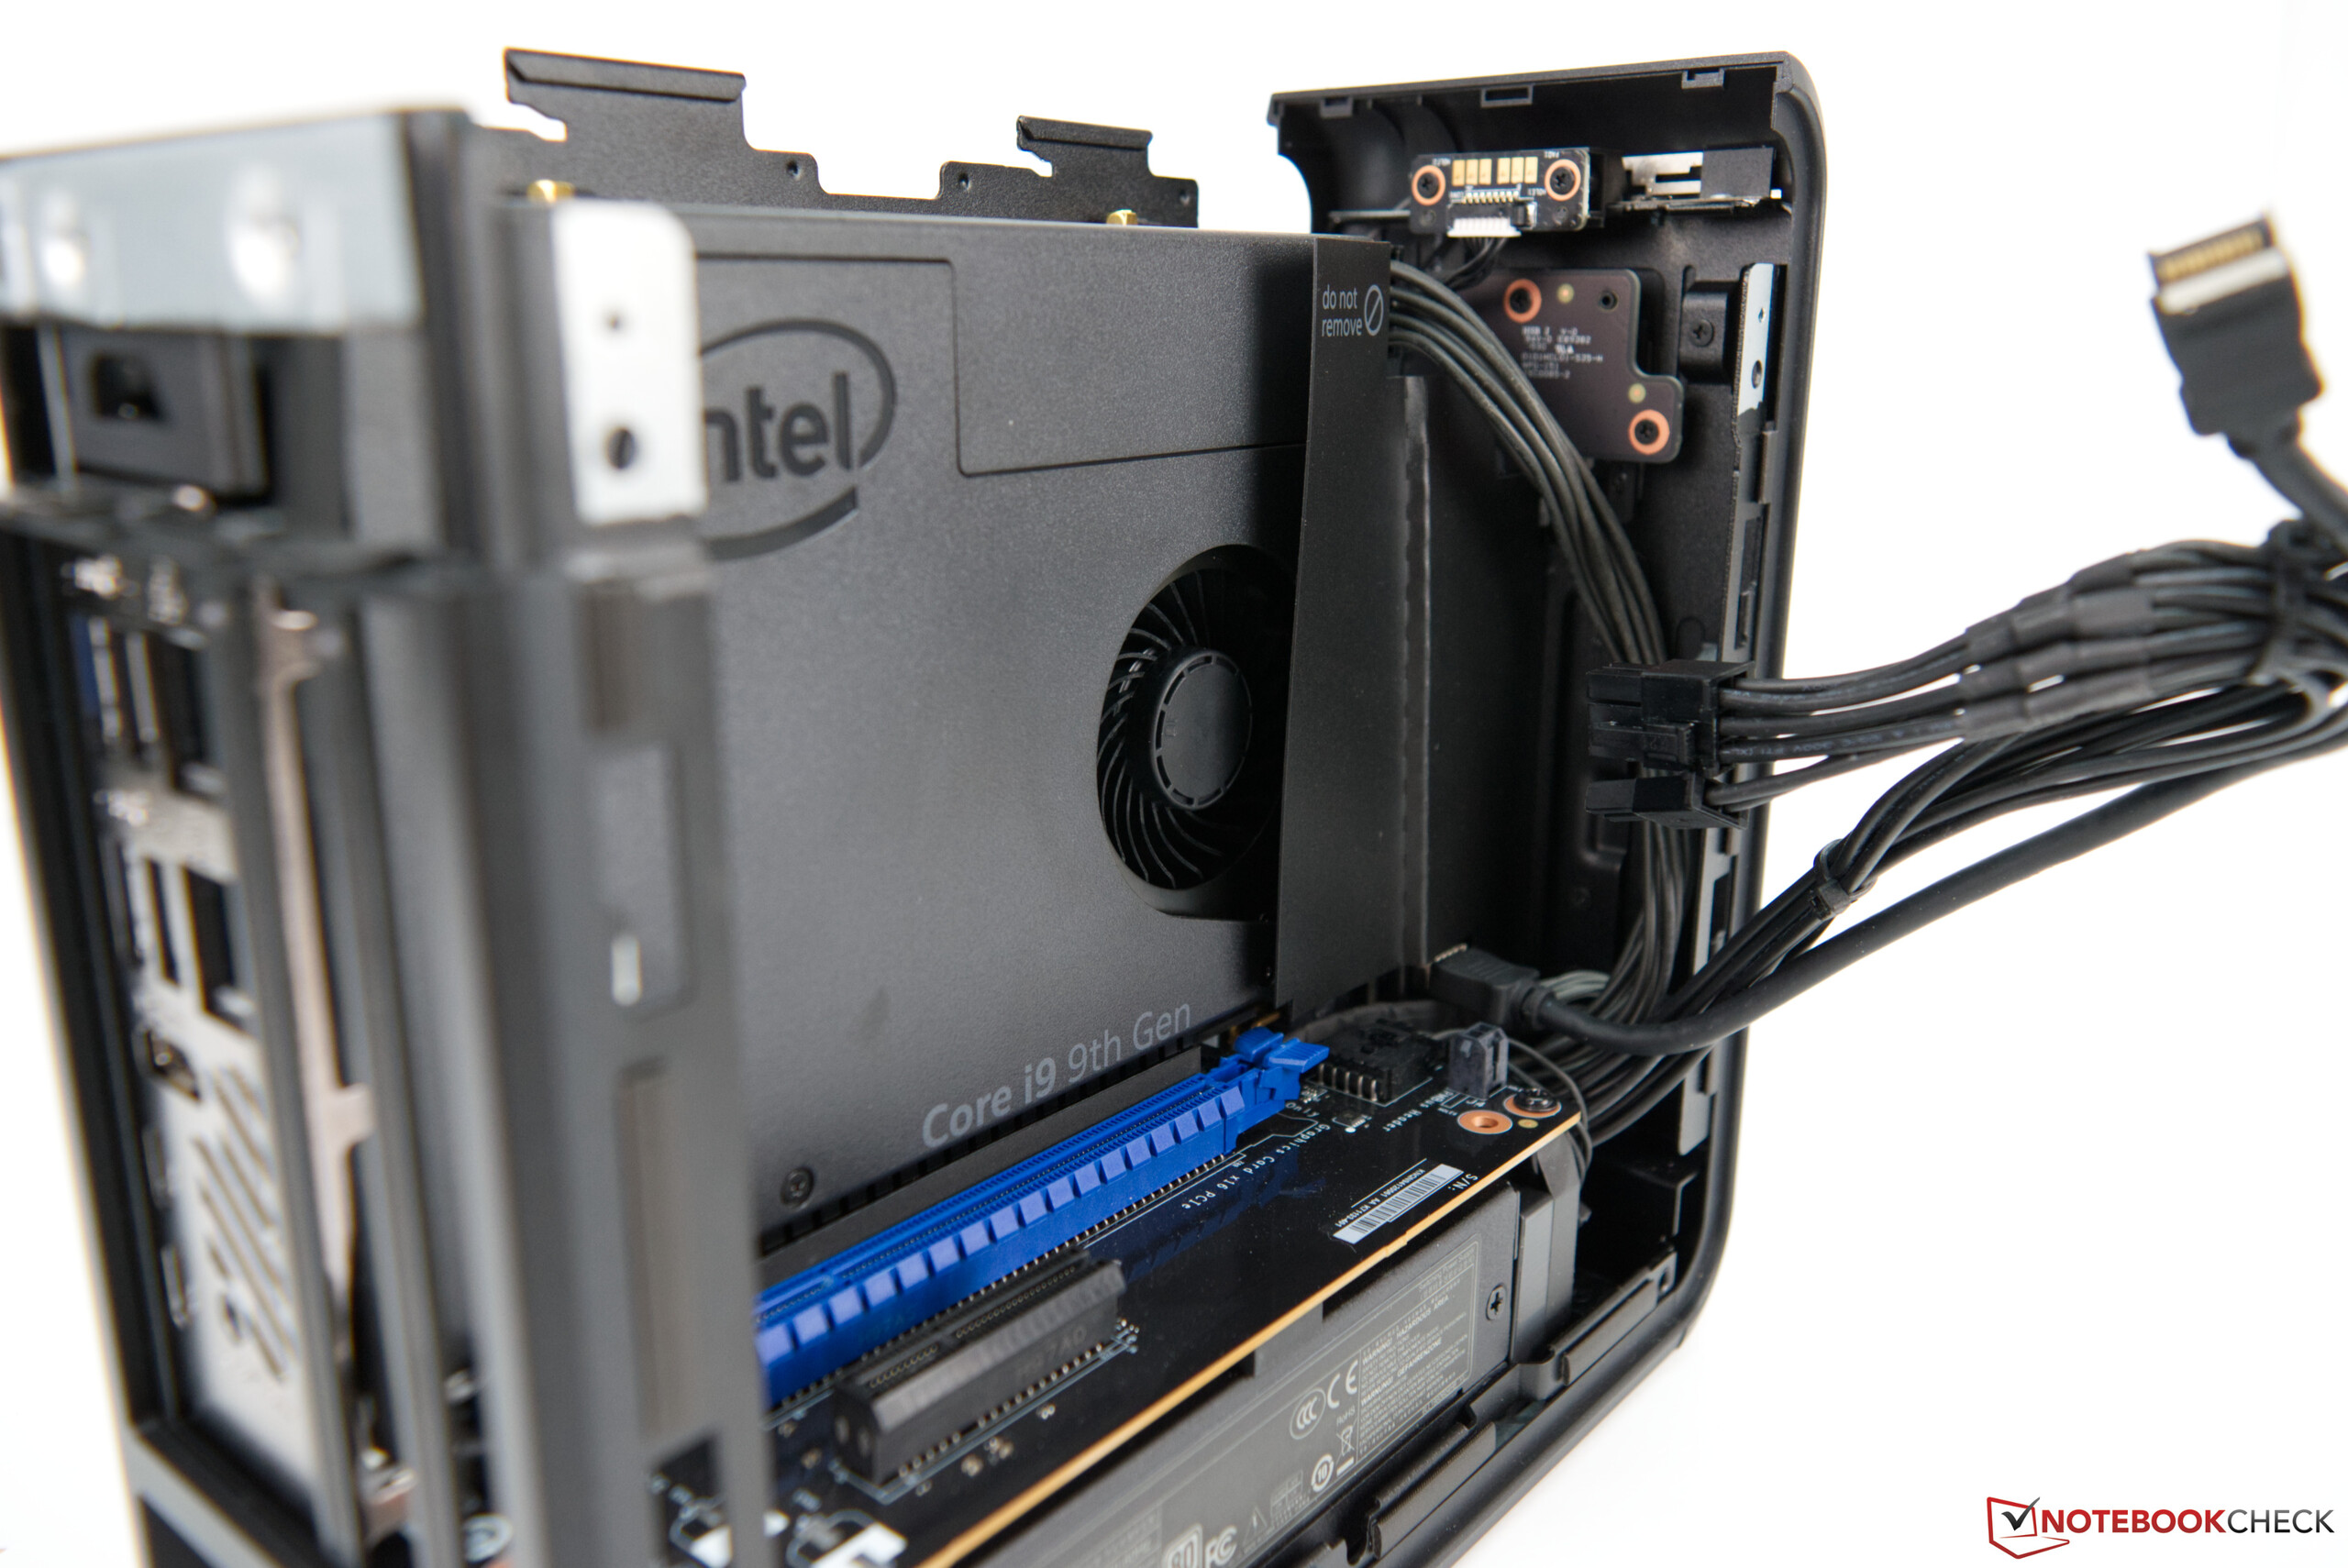
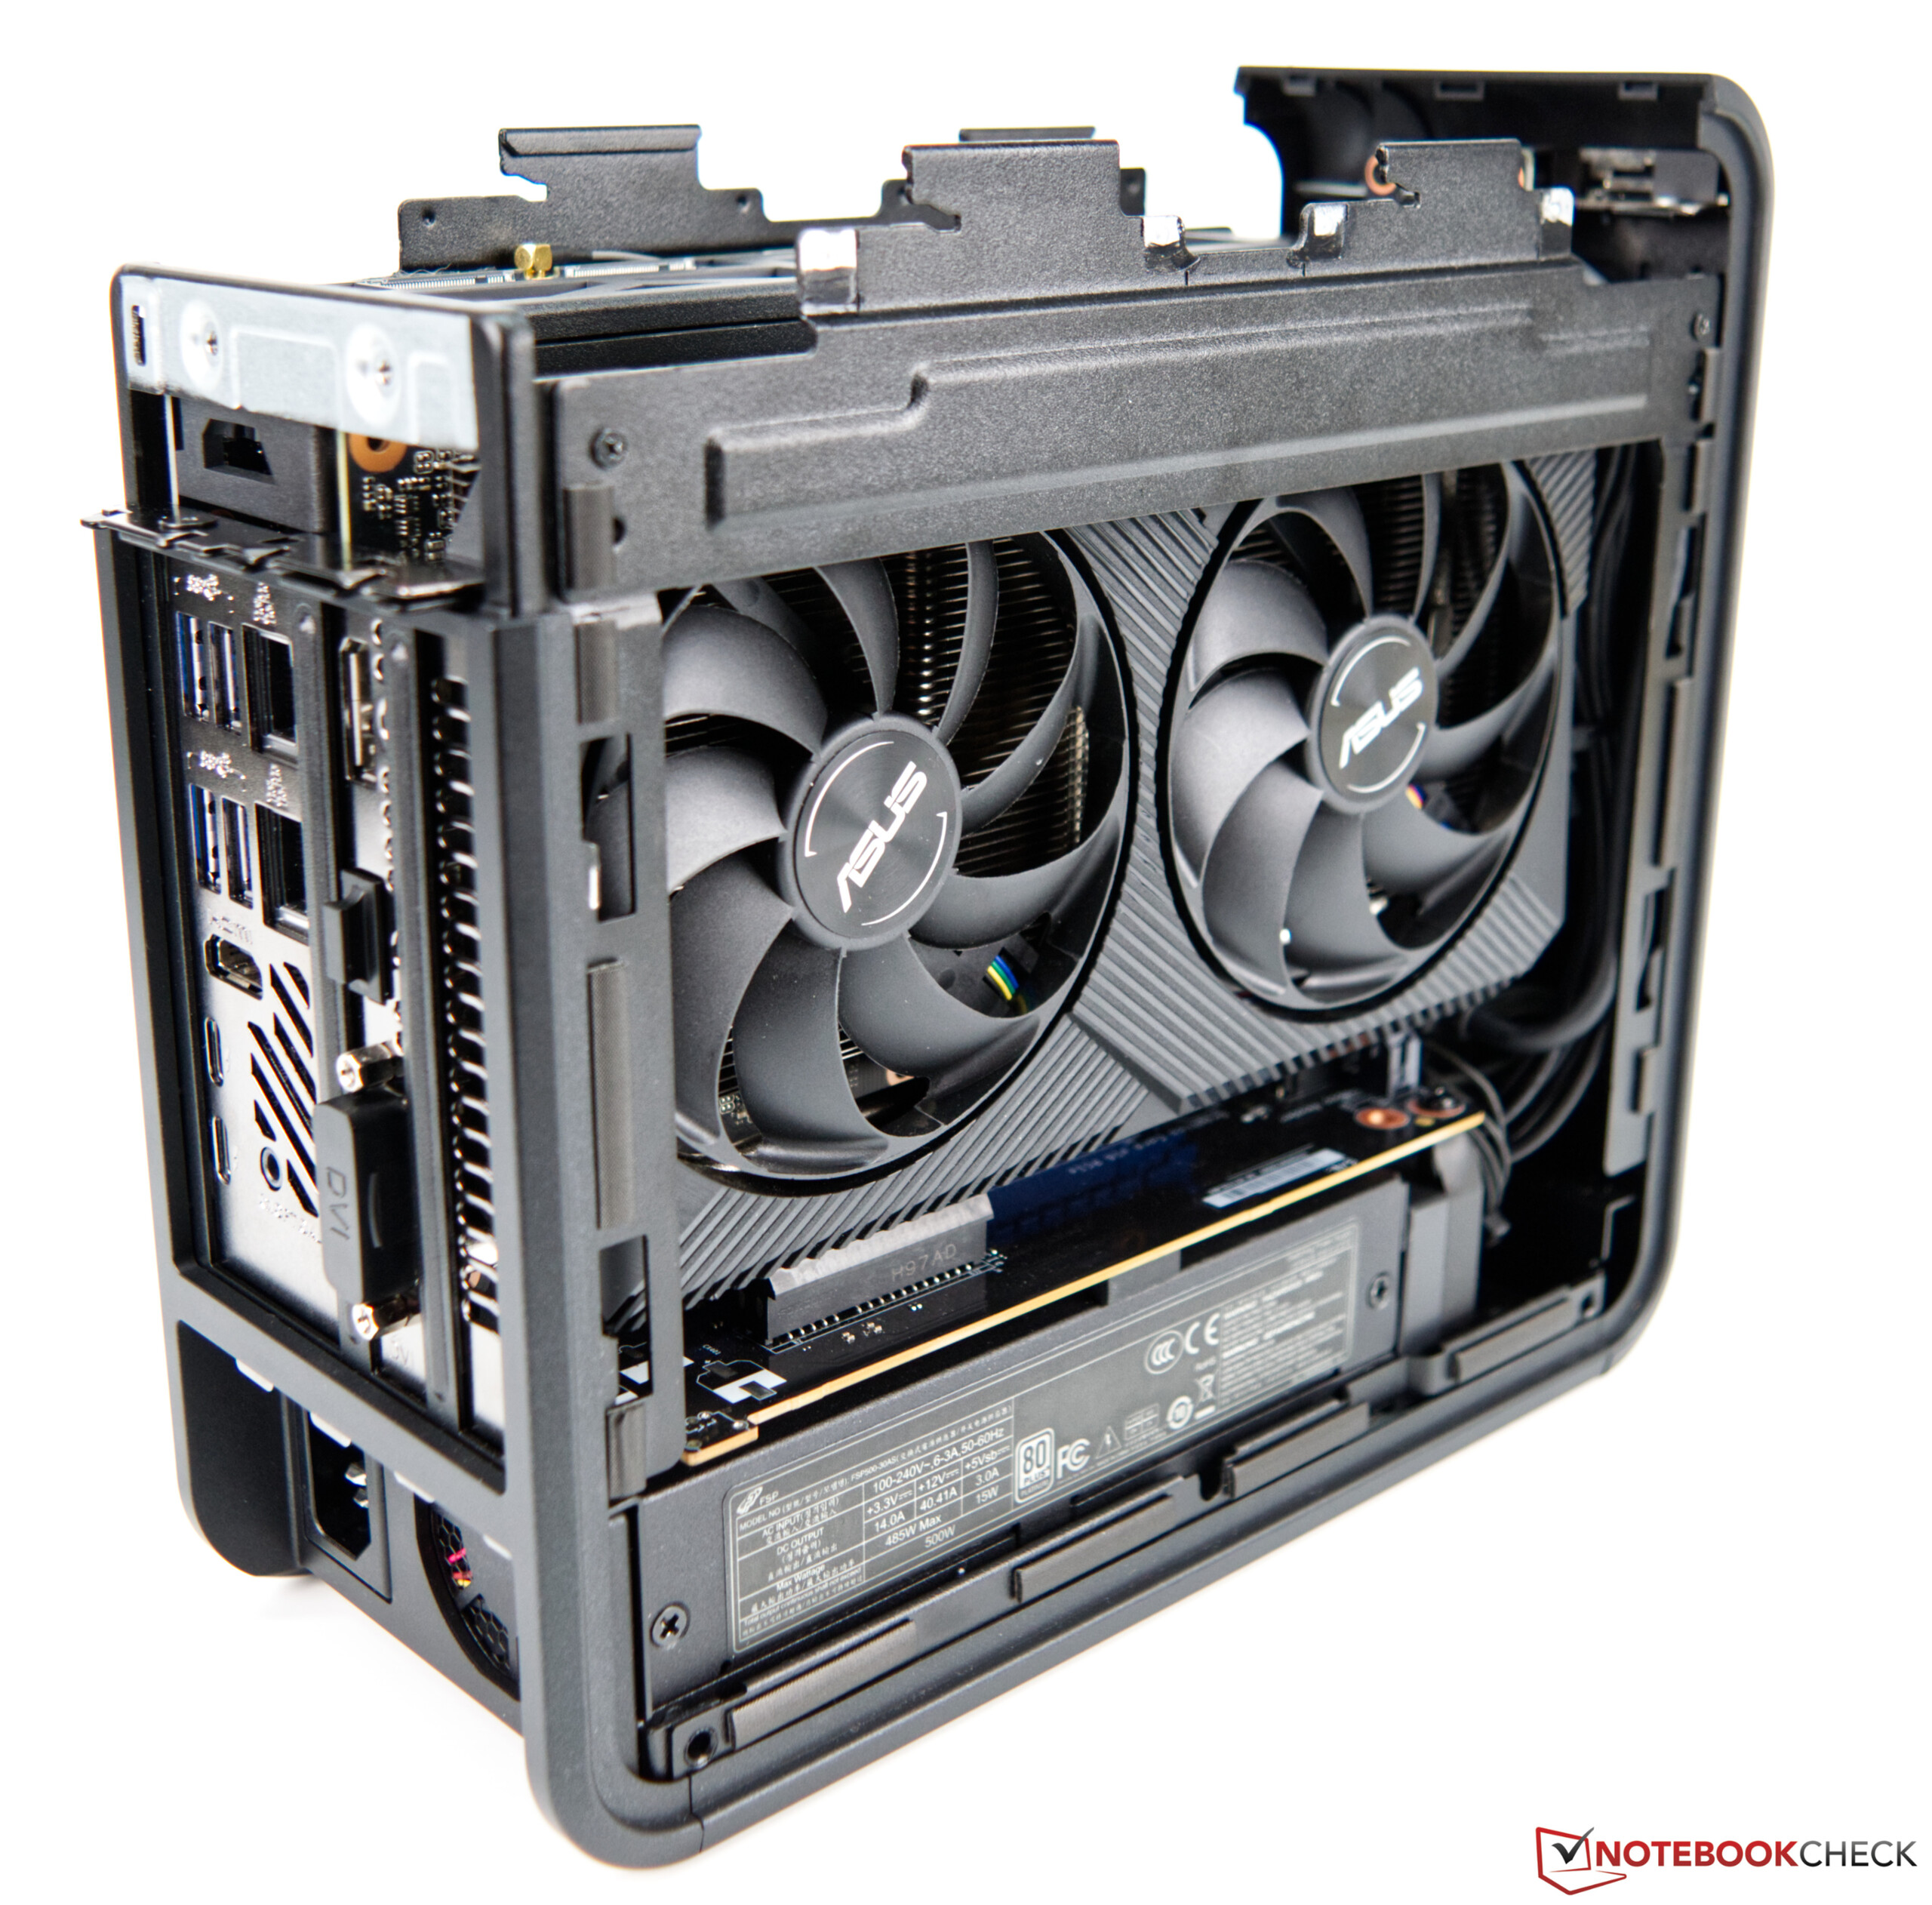
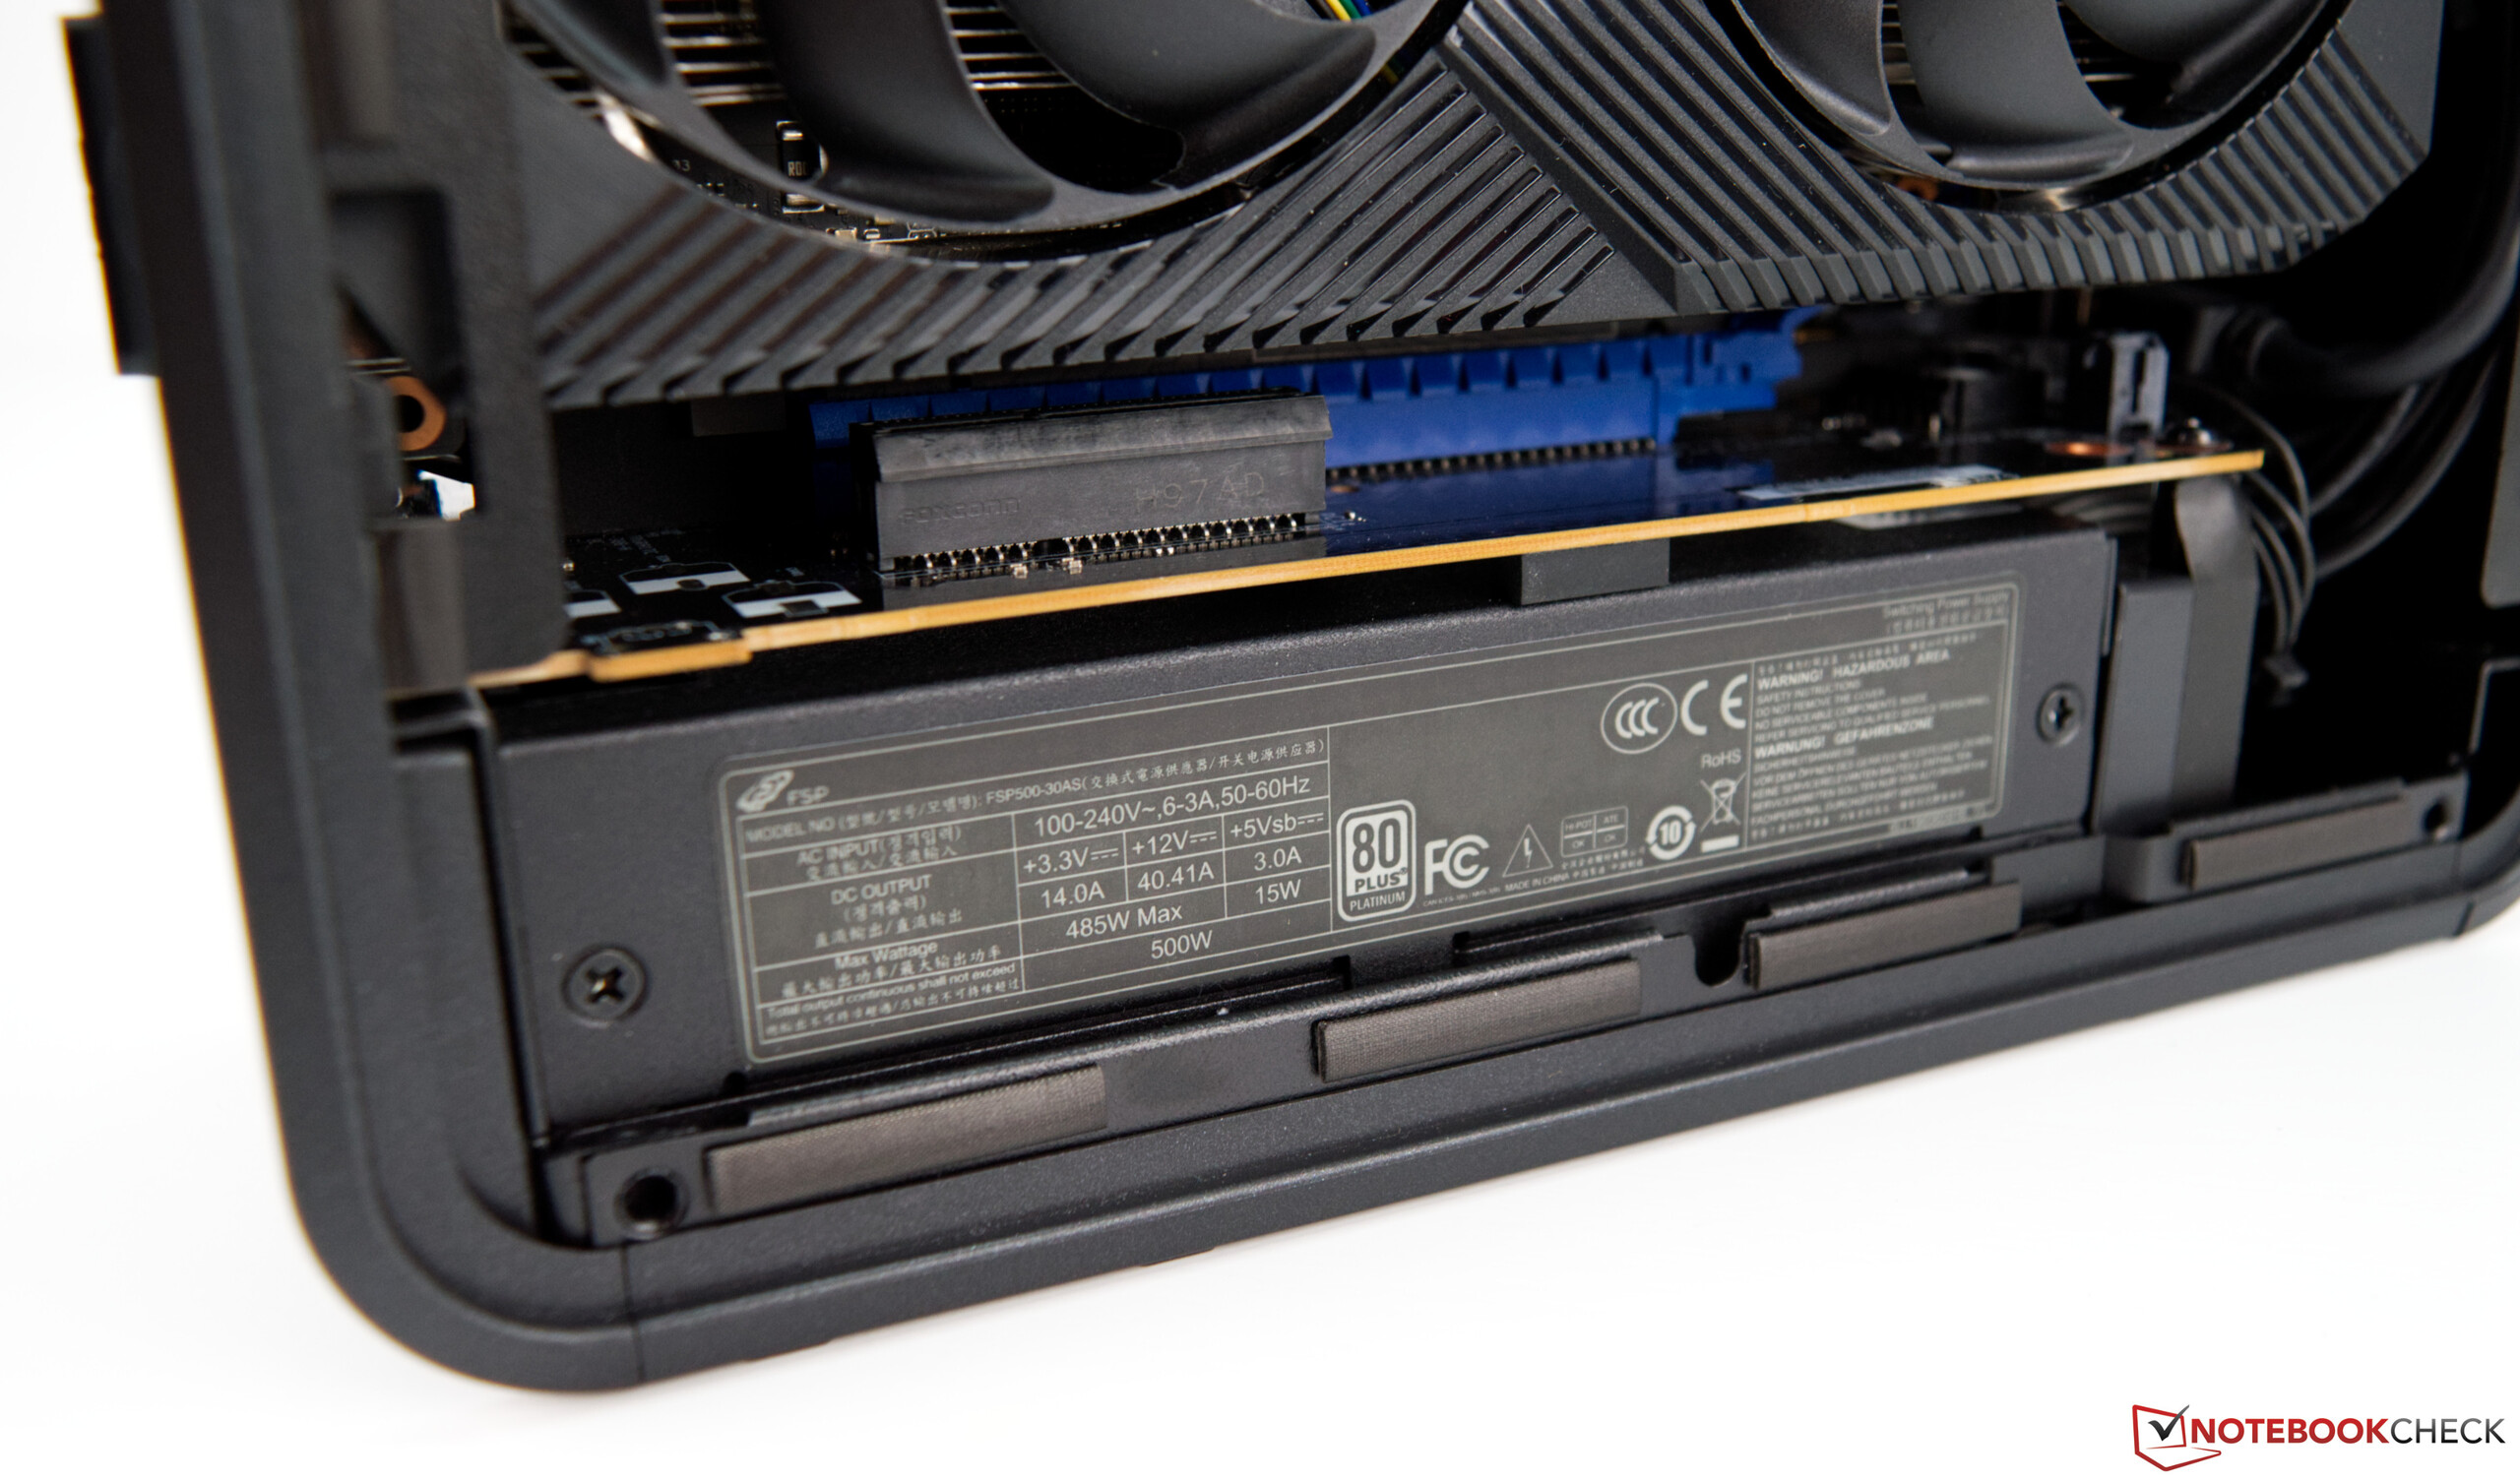
Wer sich nun dieses Gerät zulegen möchte, muss bedenken, dass der Arbeitsspeicher, die Massenspeicher und auch die dedizierte Grafikkarte optional sind und nicht zum Lieferumfang gehören. Trotzdem werden knapp 1.700 Euro für das Modell mit dem Core i9-9980HK fällig. Alternativ gibt es den Ghost Canyon NUC auch mit einem Intel Core i5-9300H (ca. 1.000 Euro) oder einem Intel Core i7-9750H (ca. 1.250 Euro). Für den Erstbetrieb muss aber noch der RAM und mindestens ein Massenspeicher installiert werden. Diese müssen in dem Compute Element verbaut werden, welches sich mit etwas Geschick leicht ausbauen lässt.

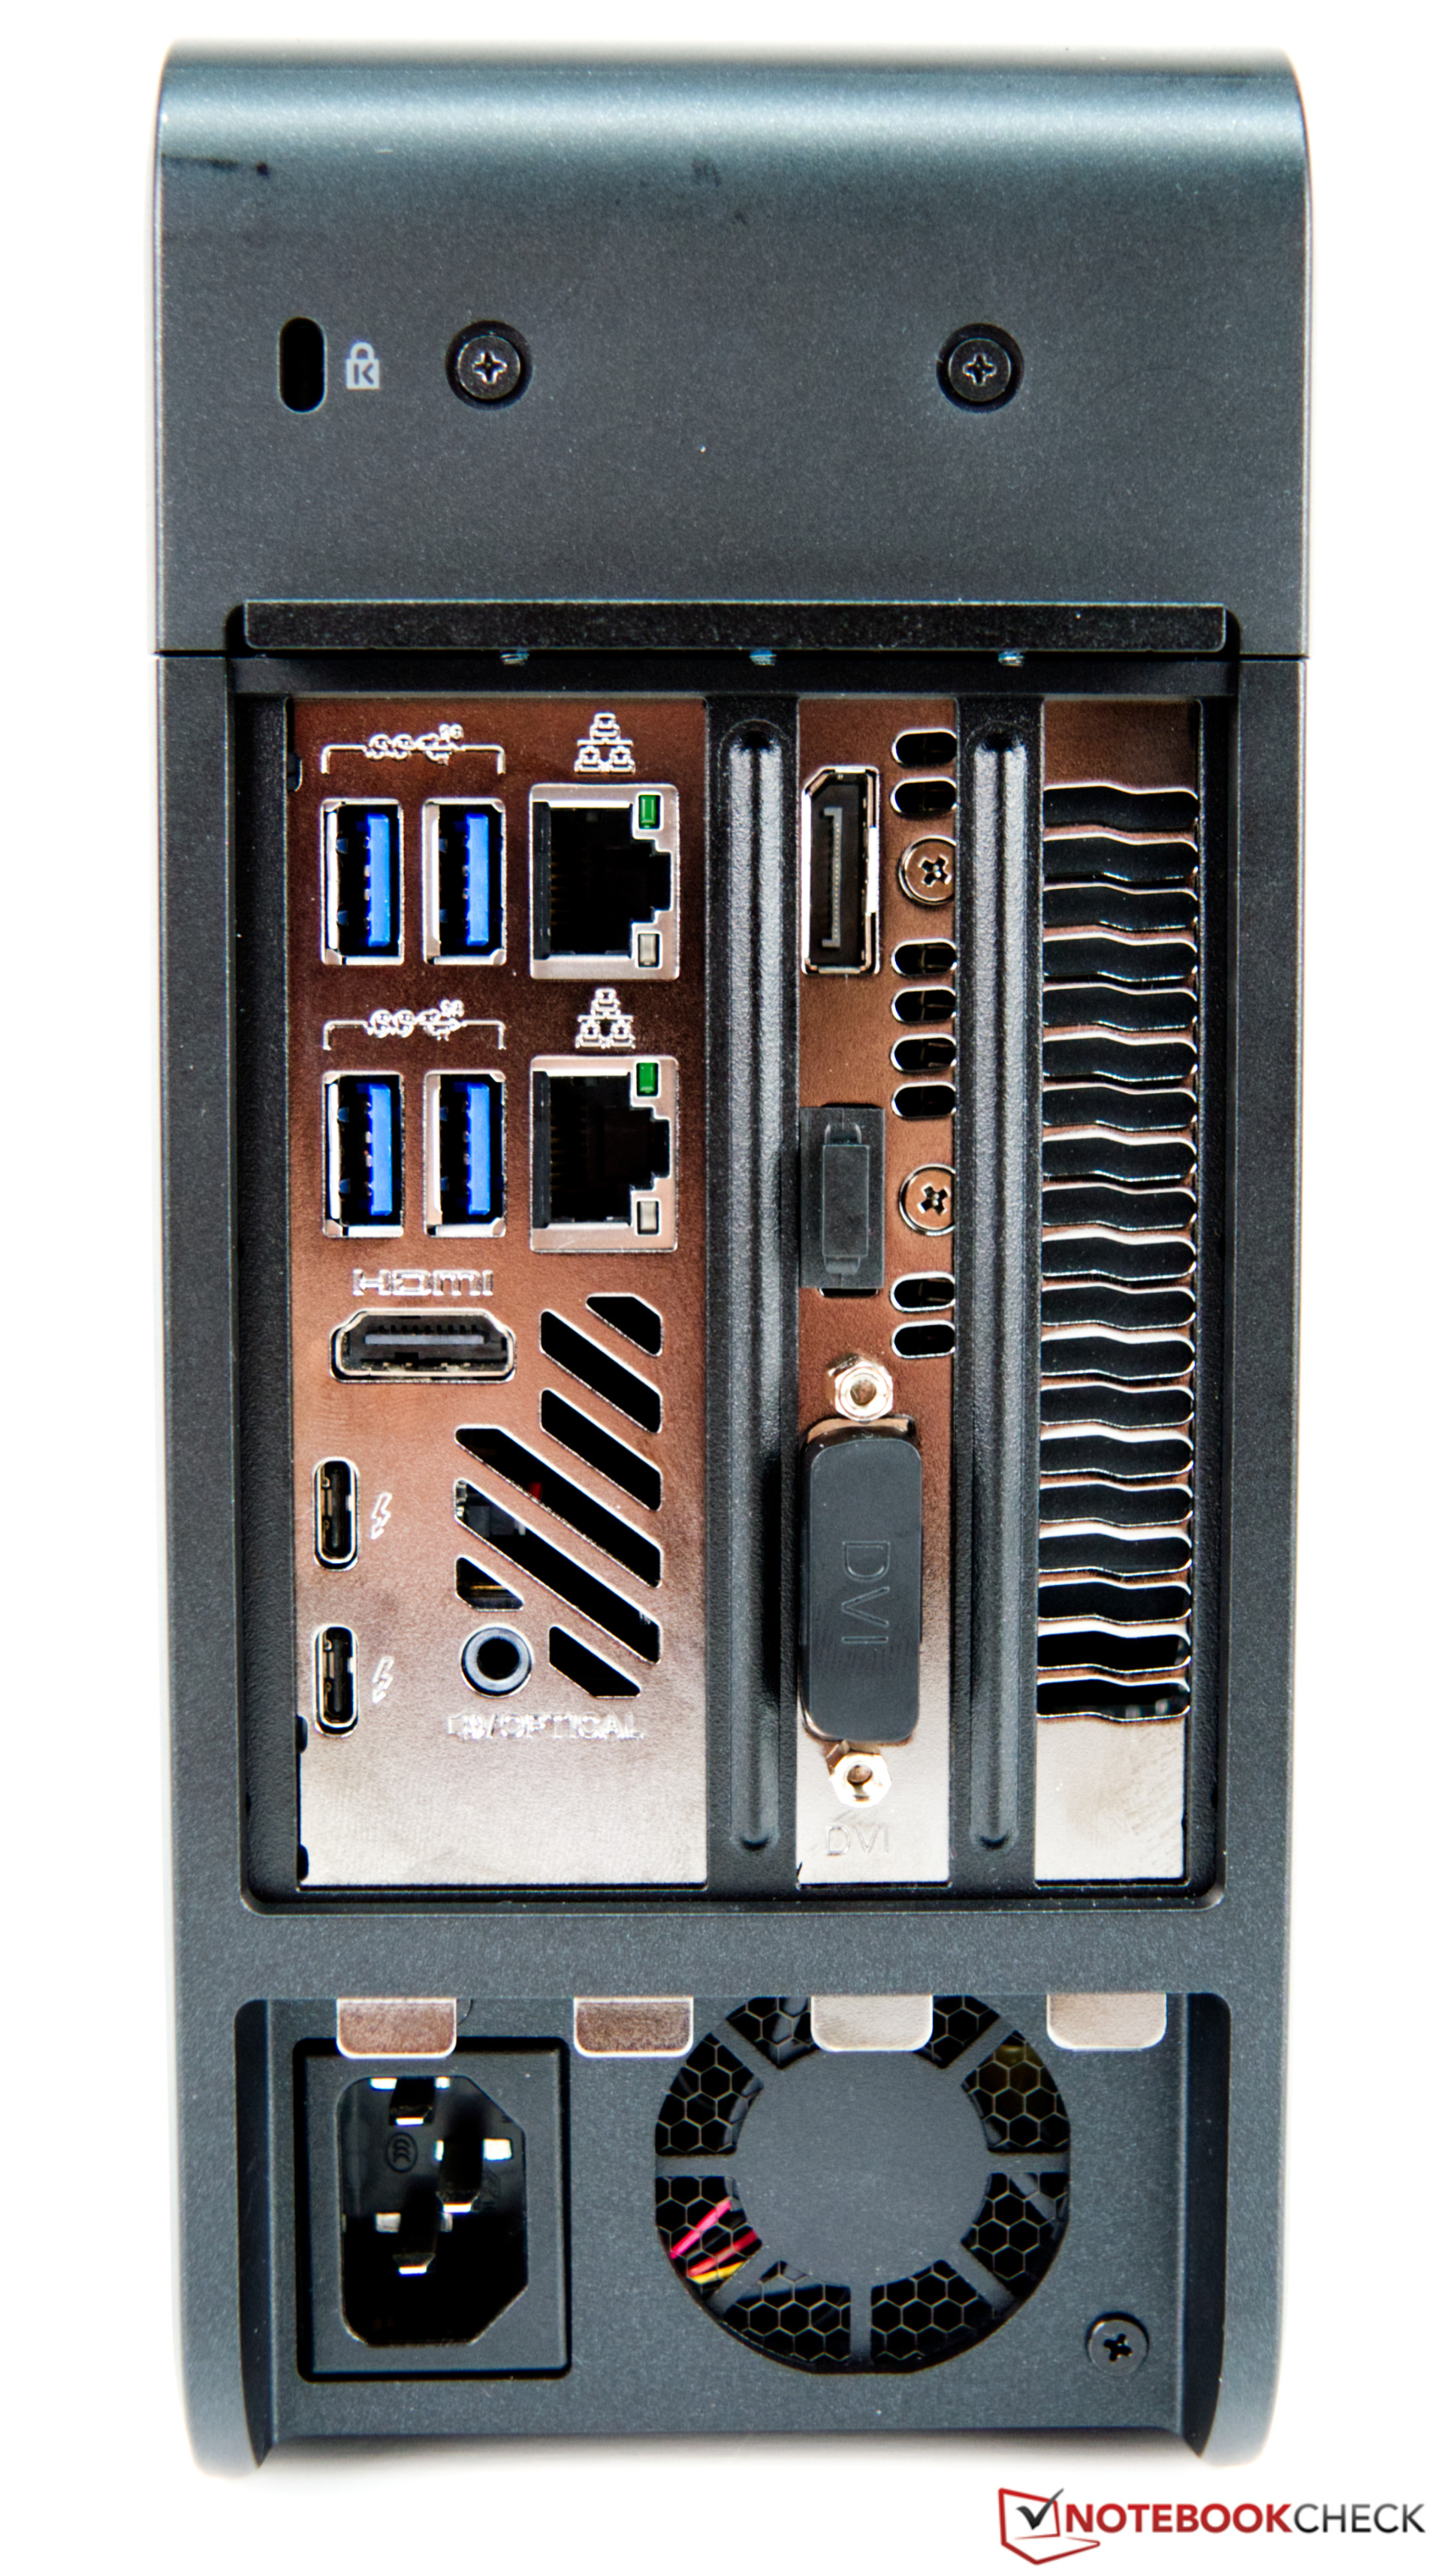
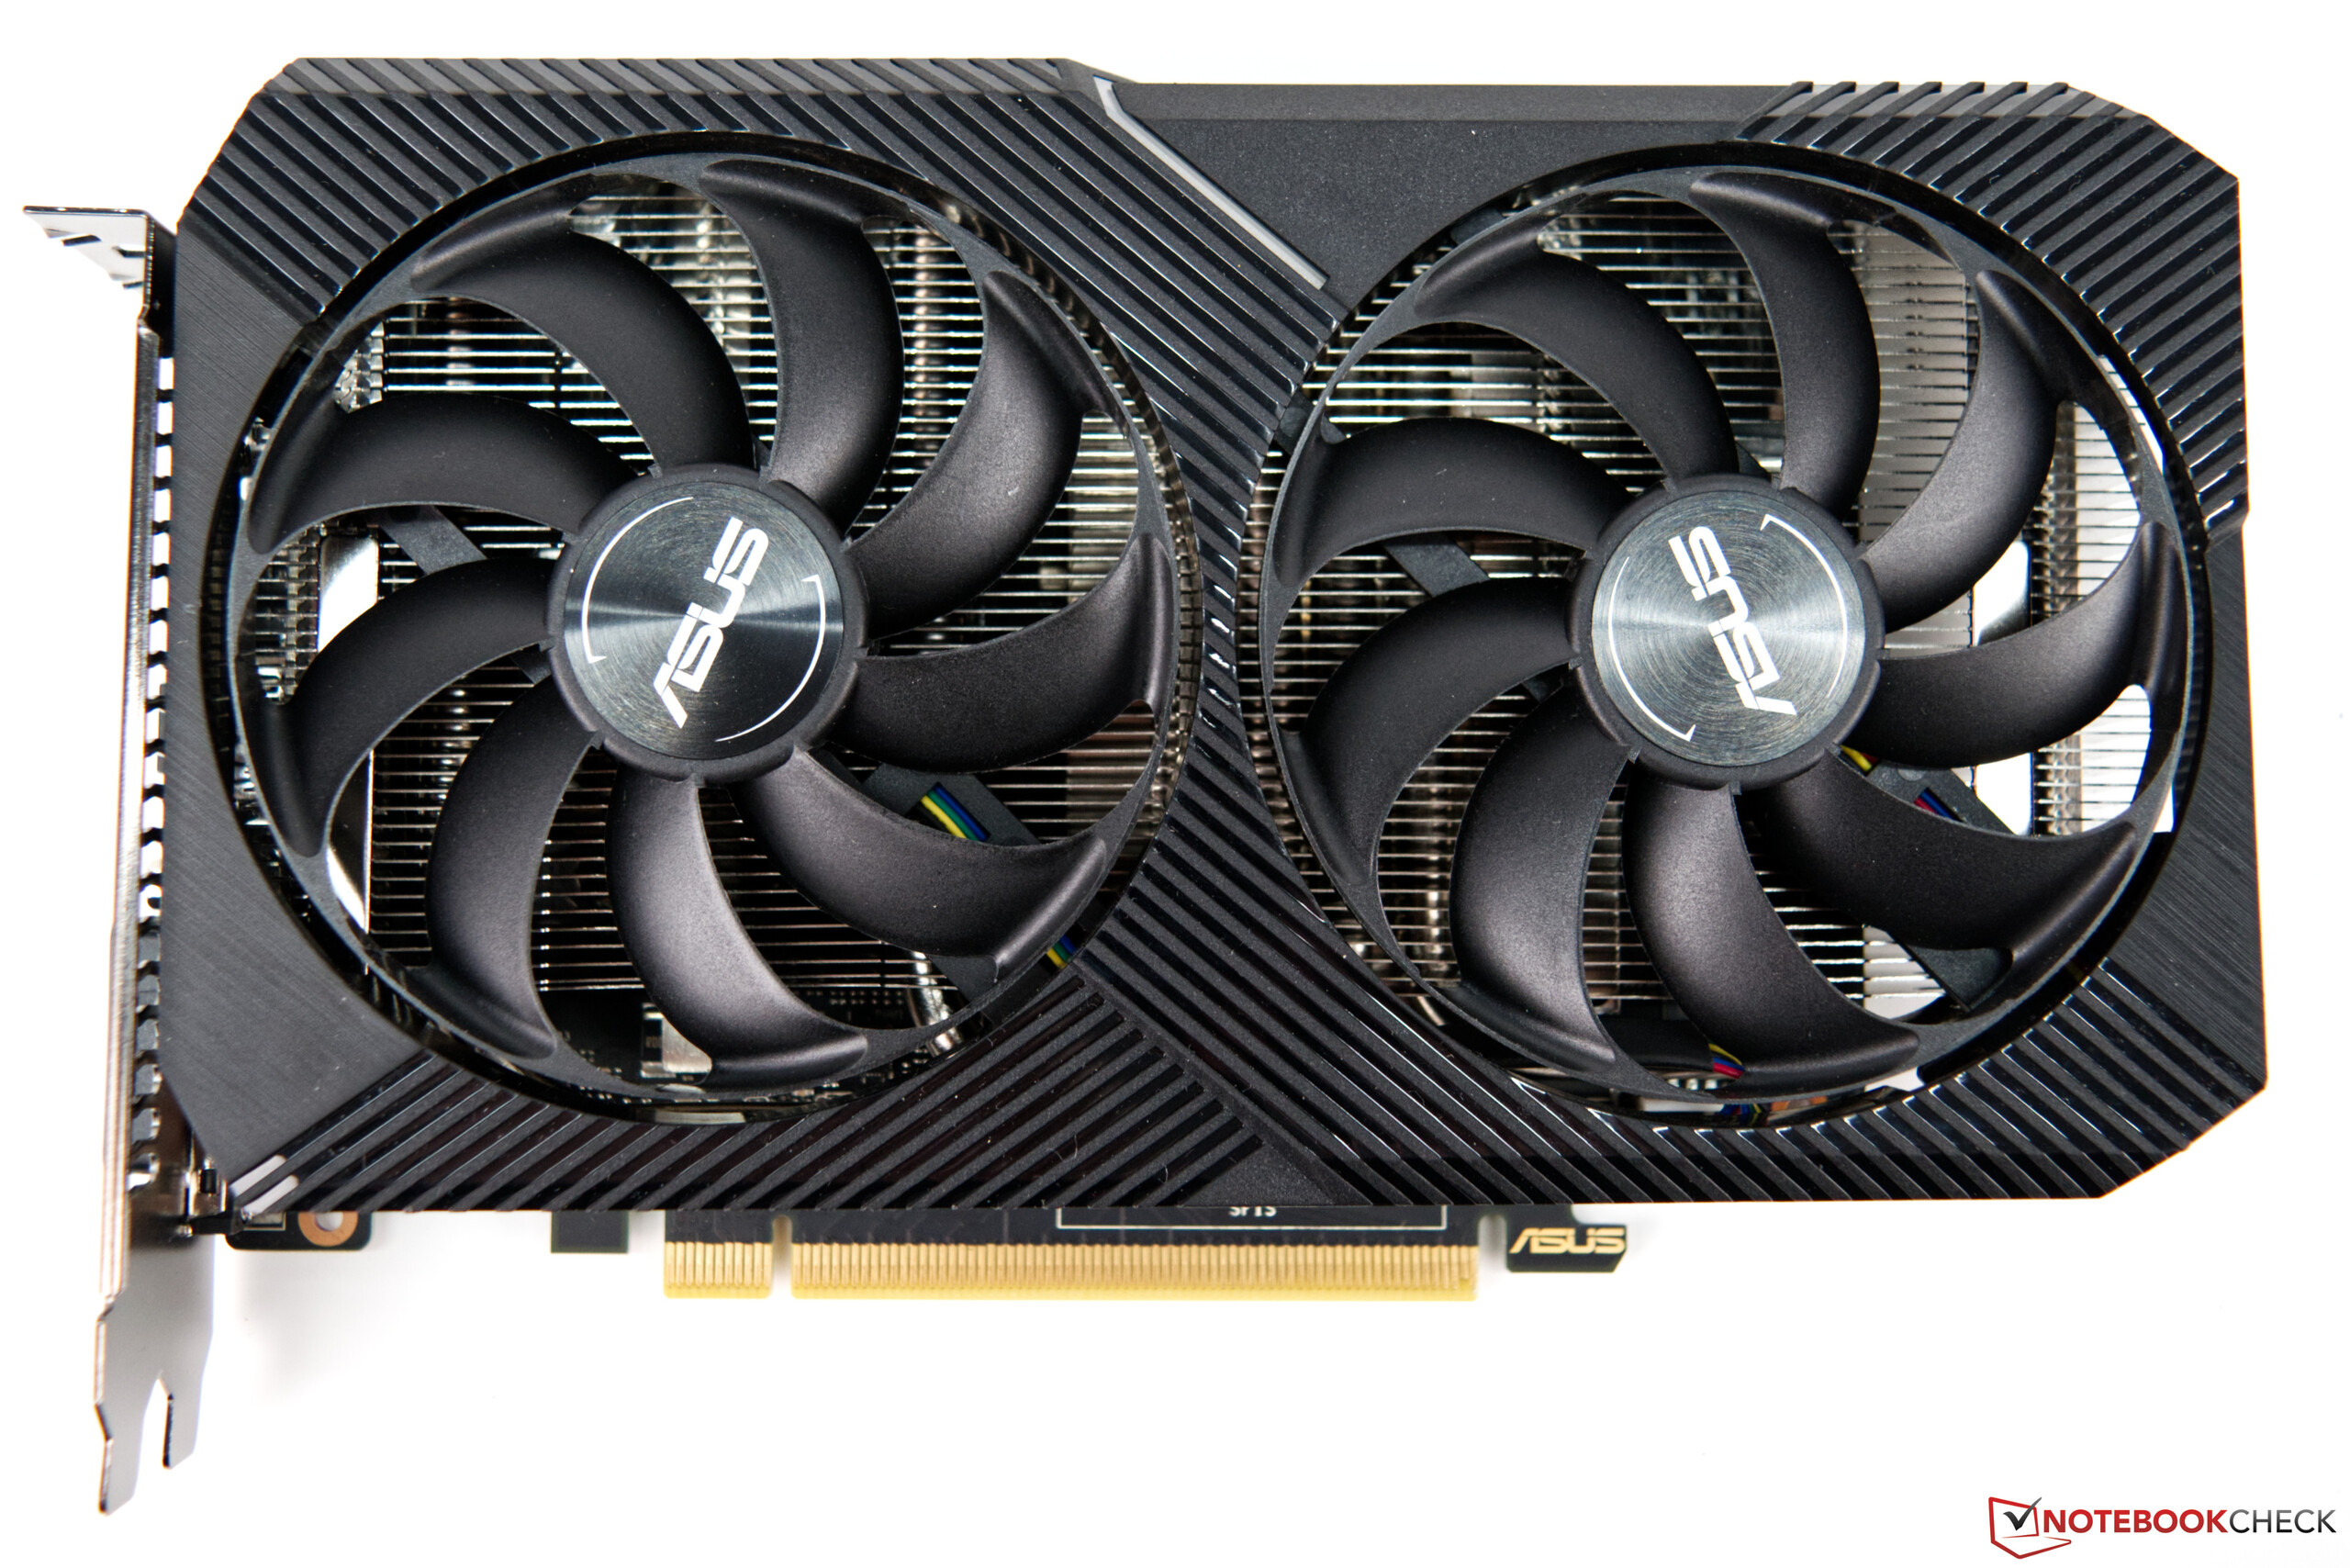
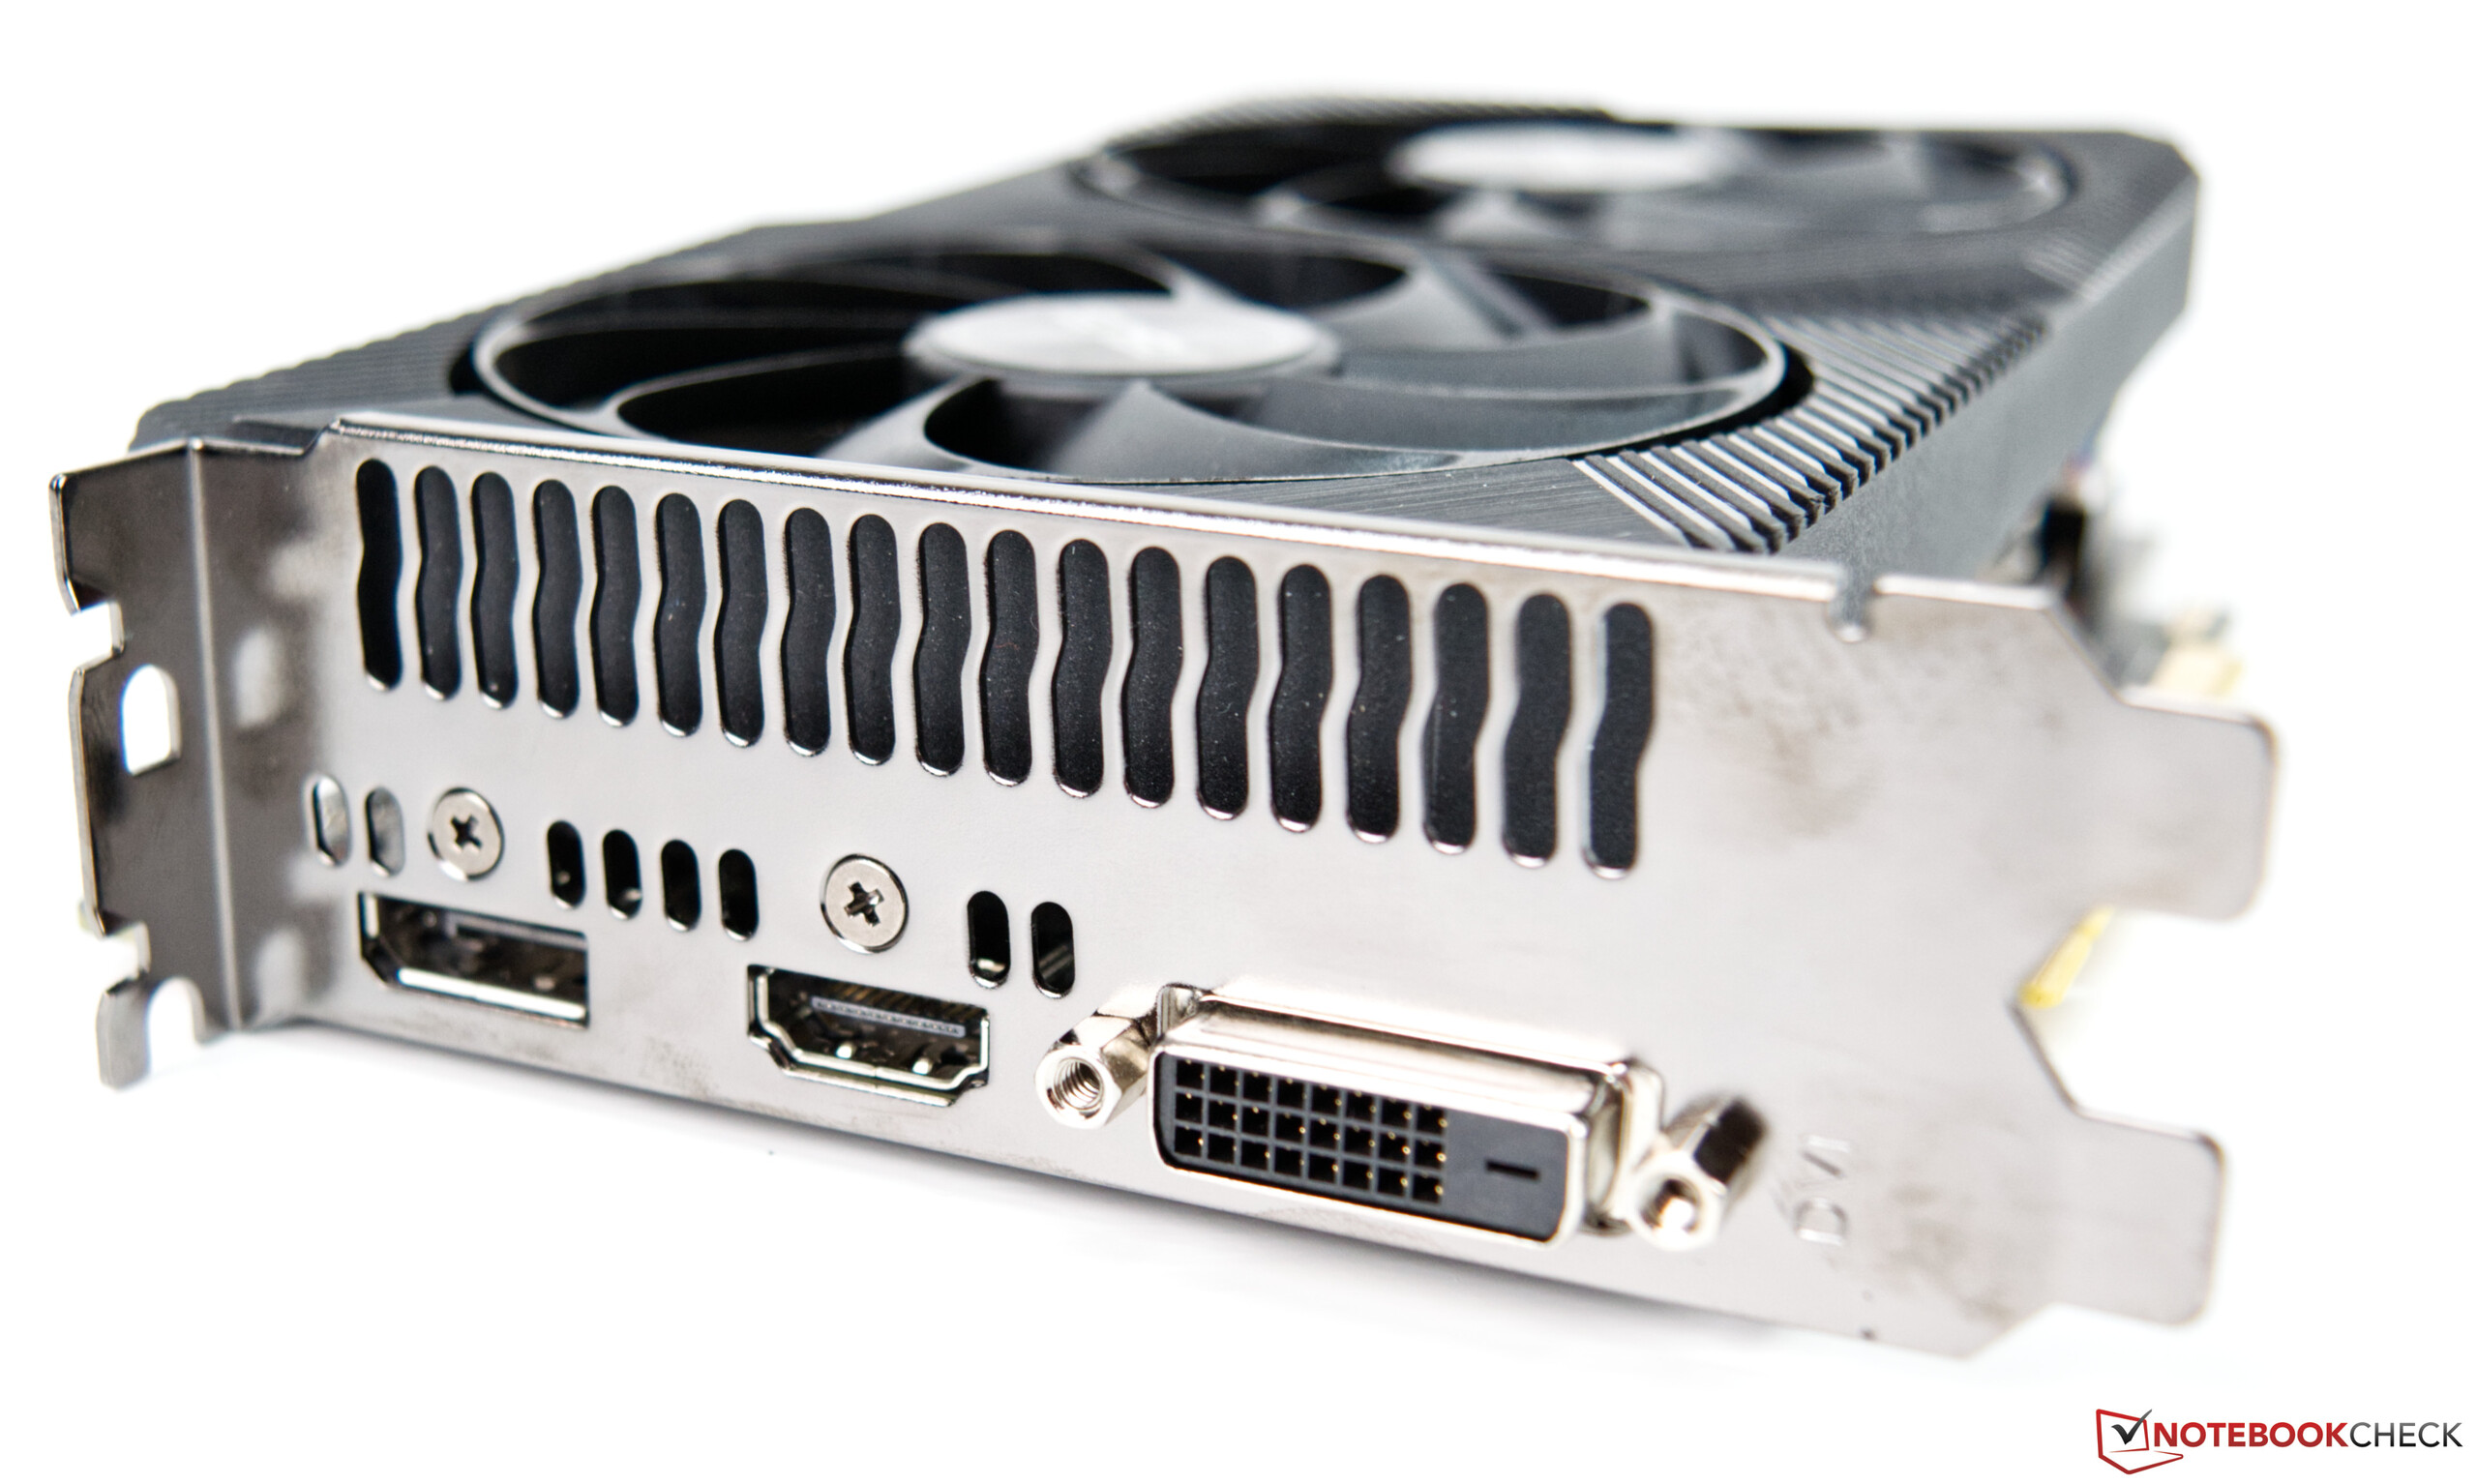
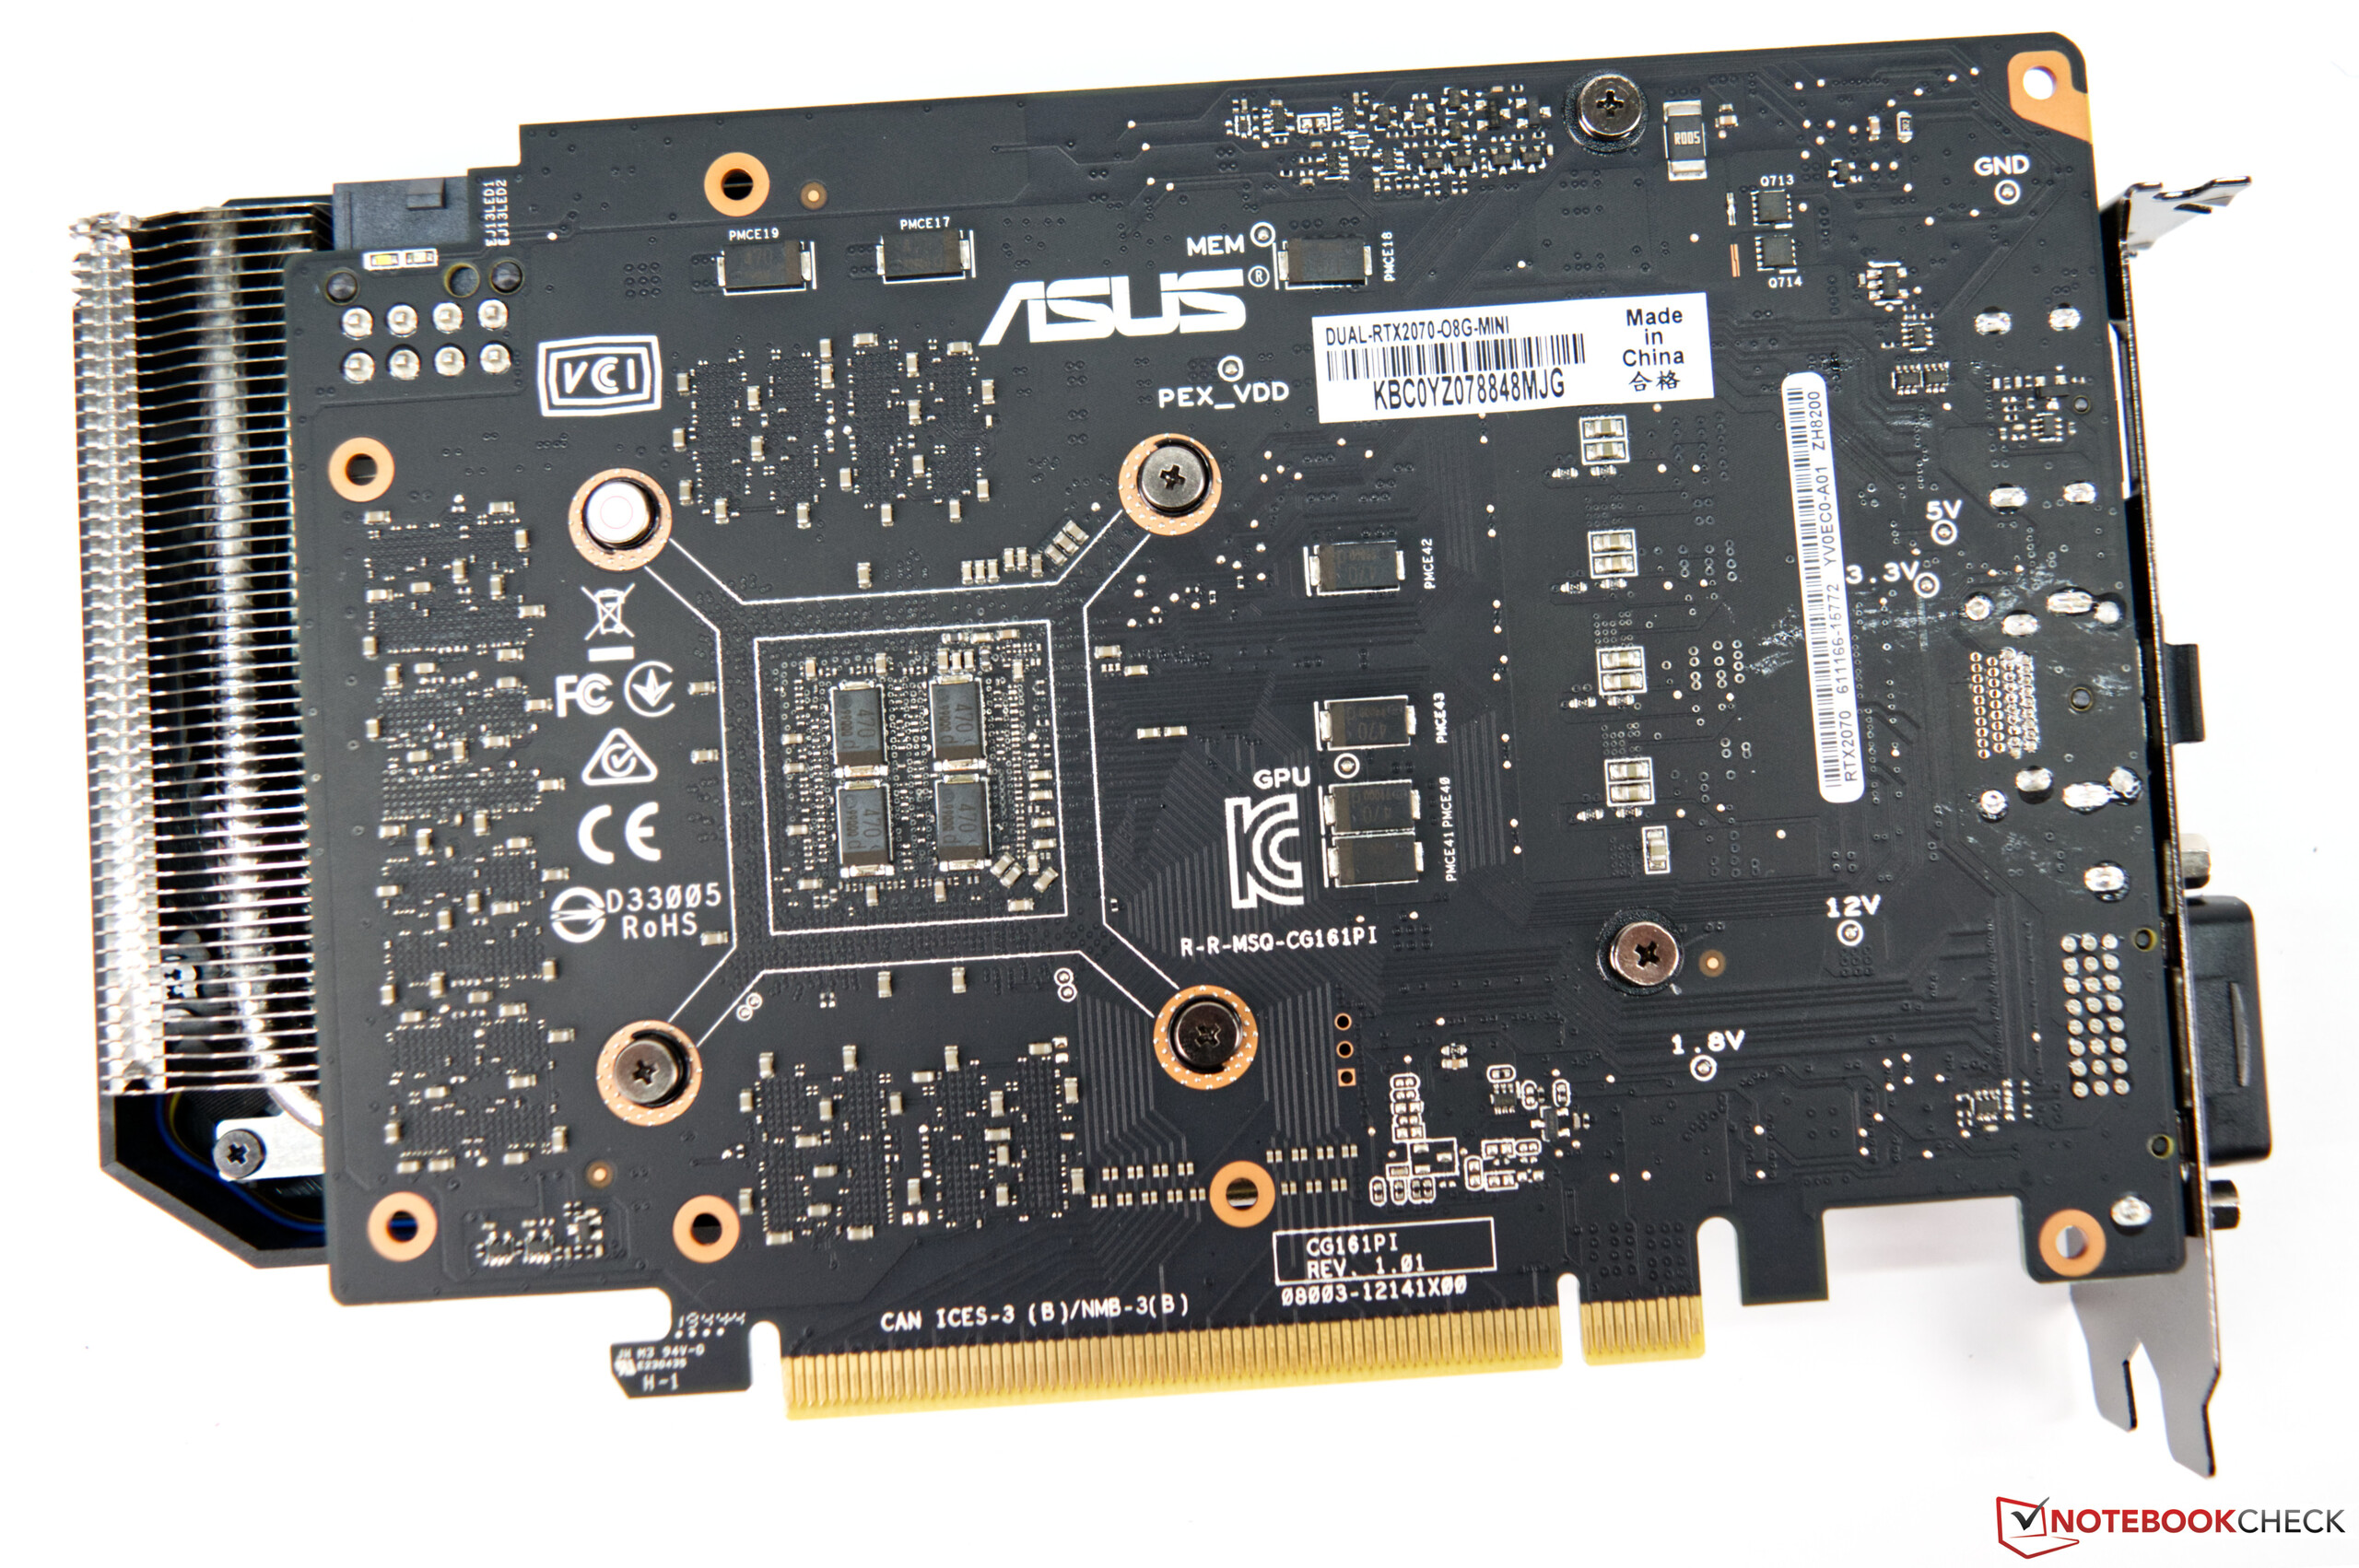
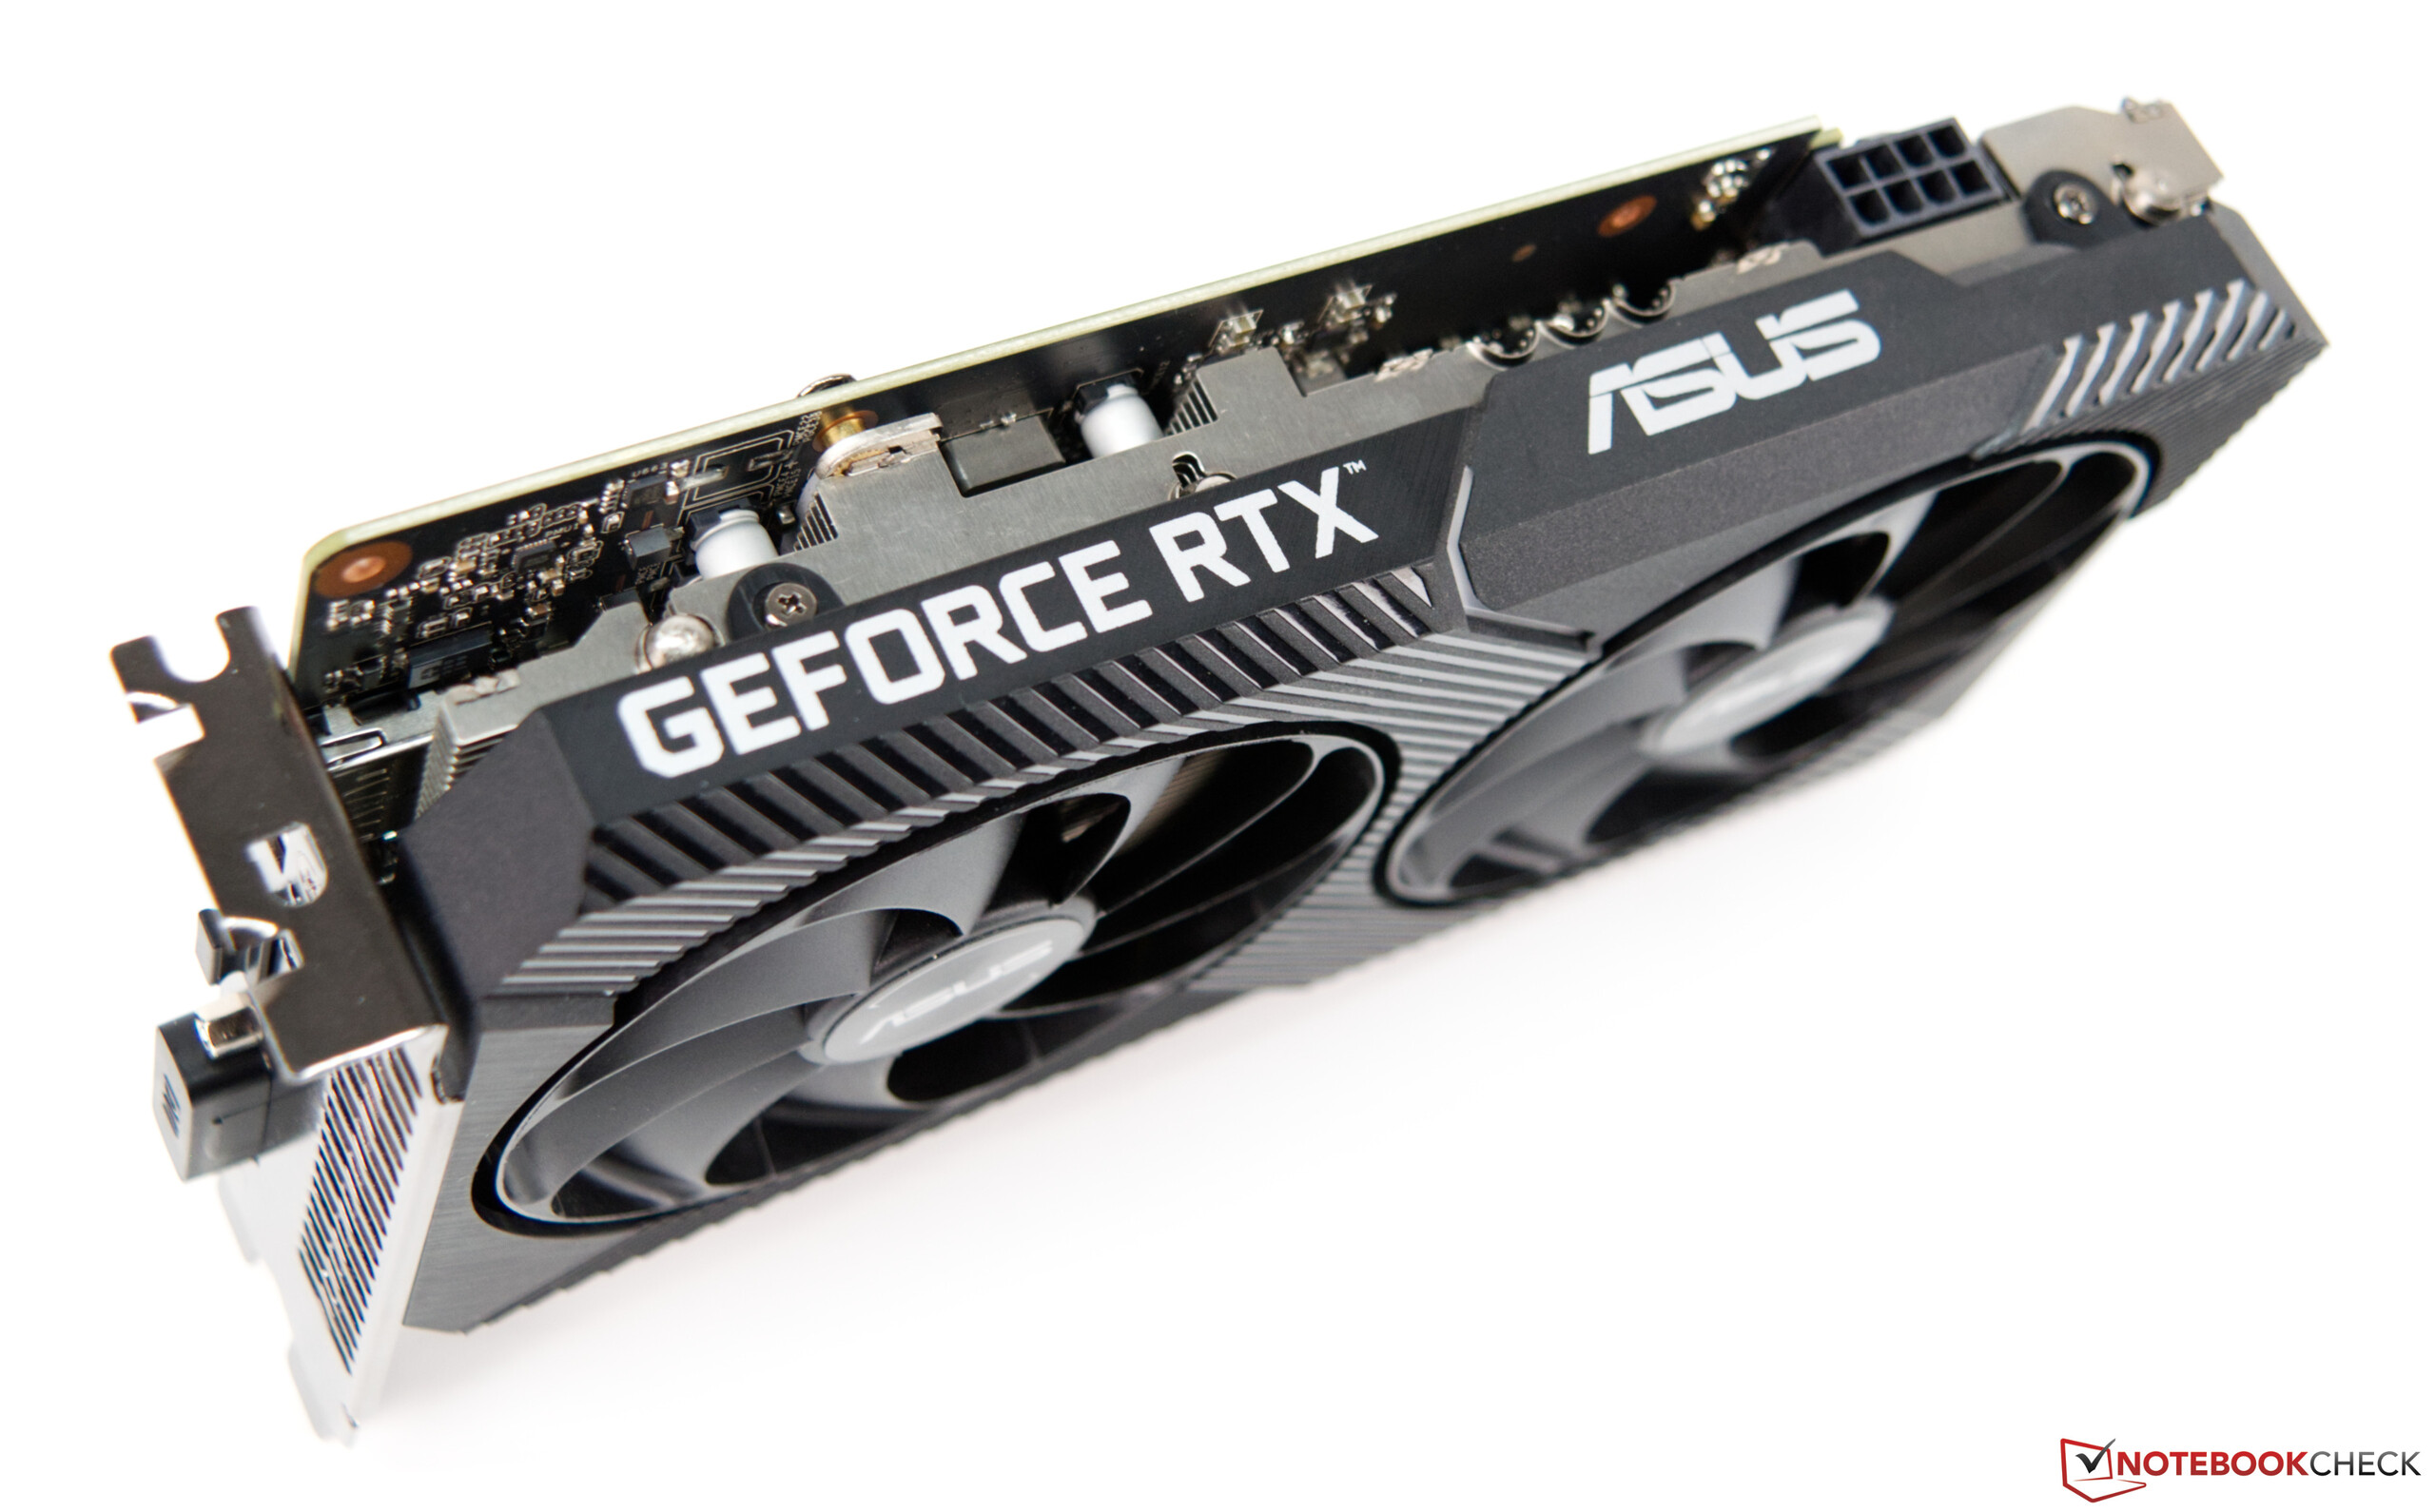
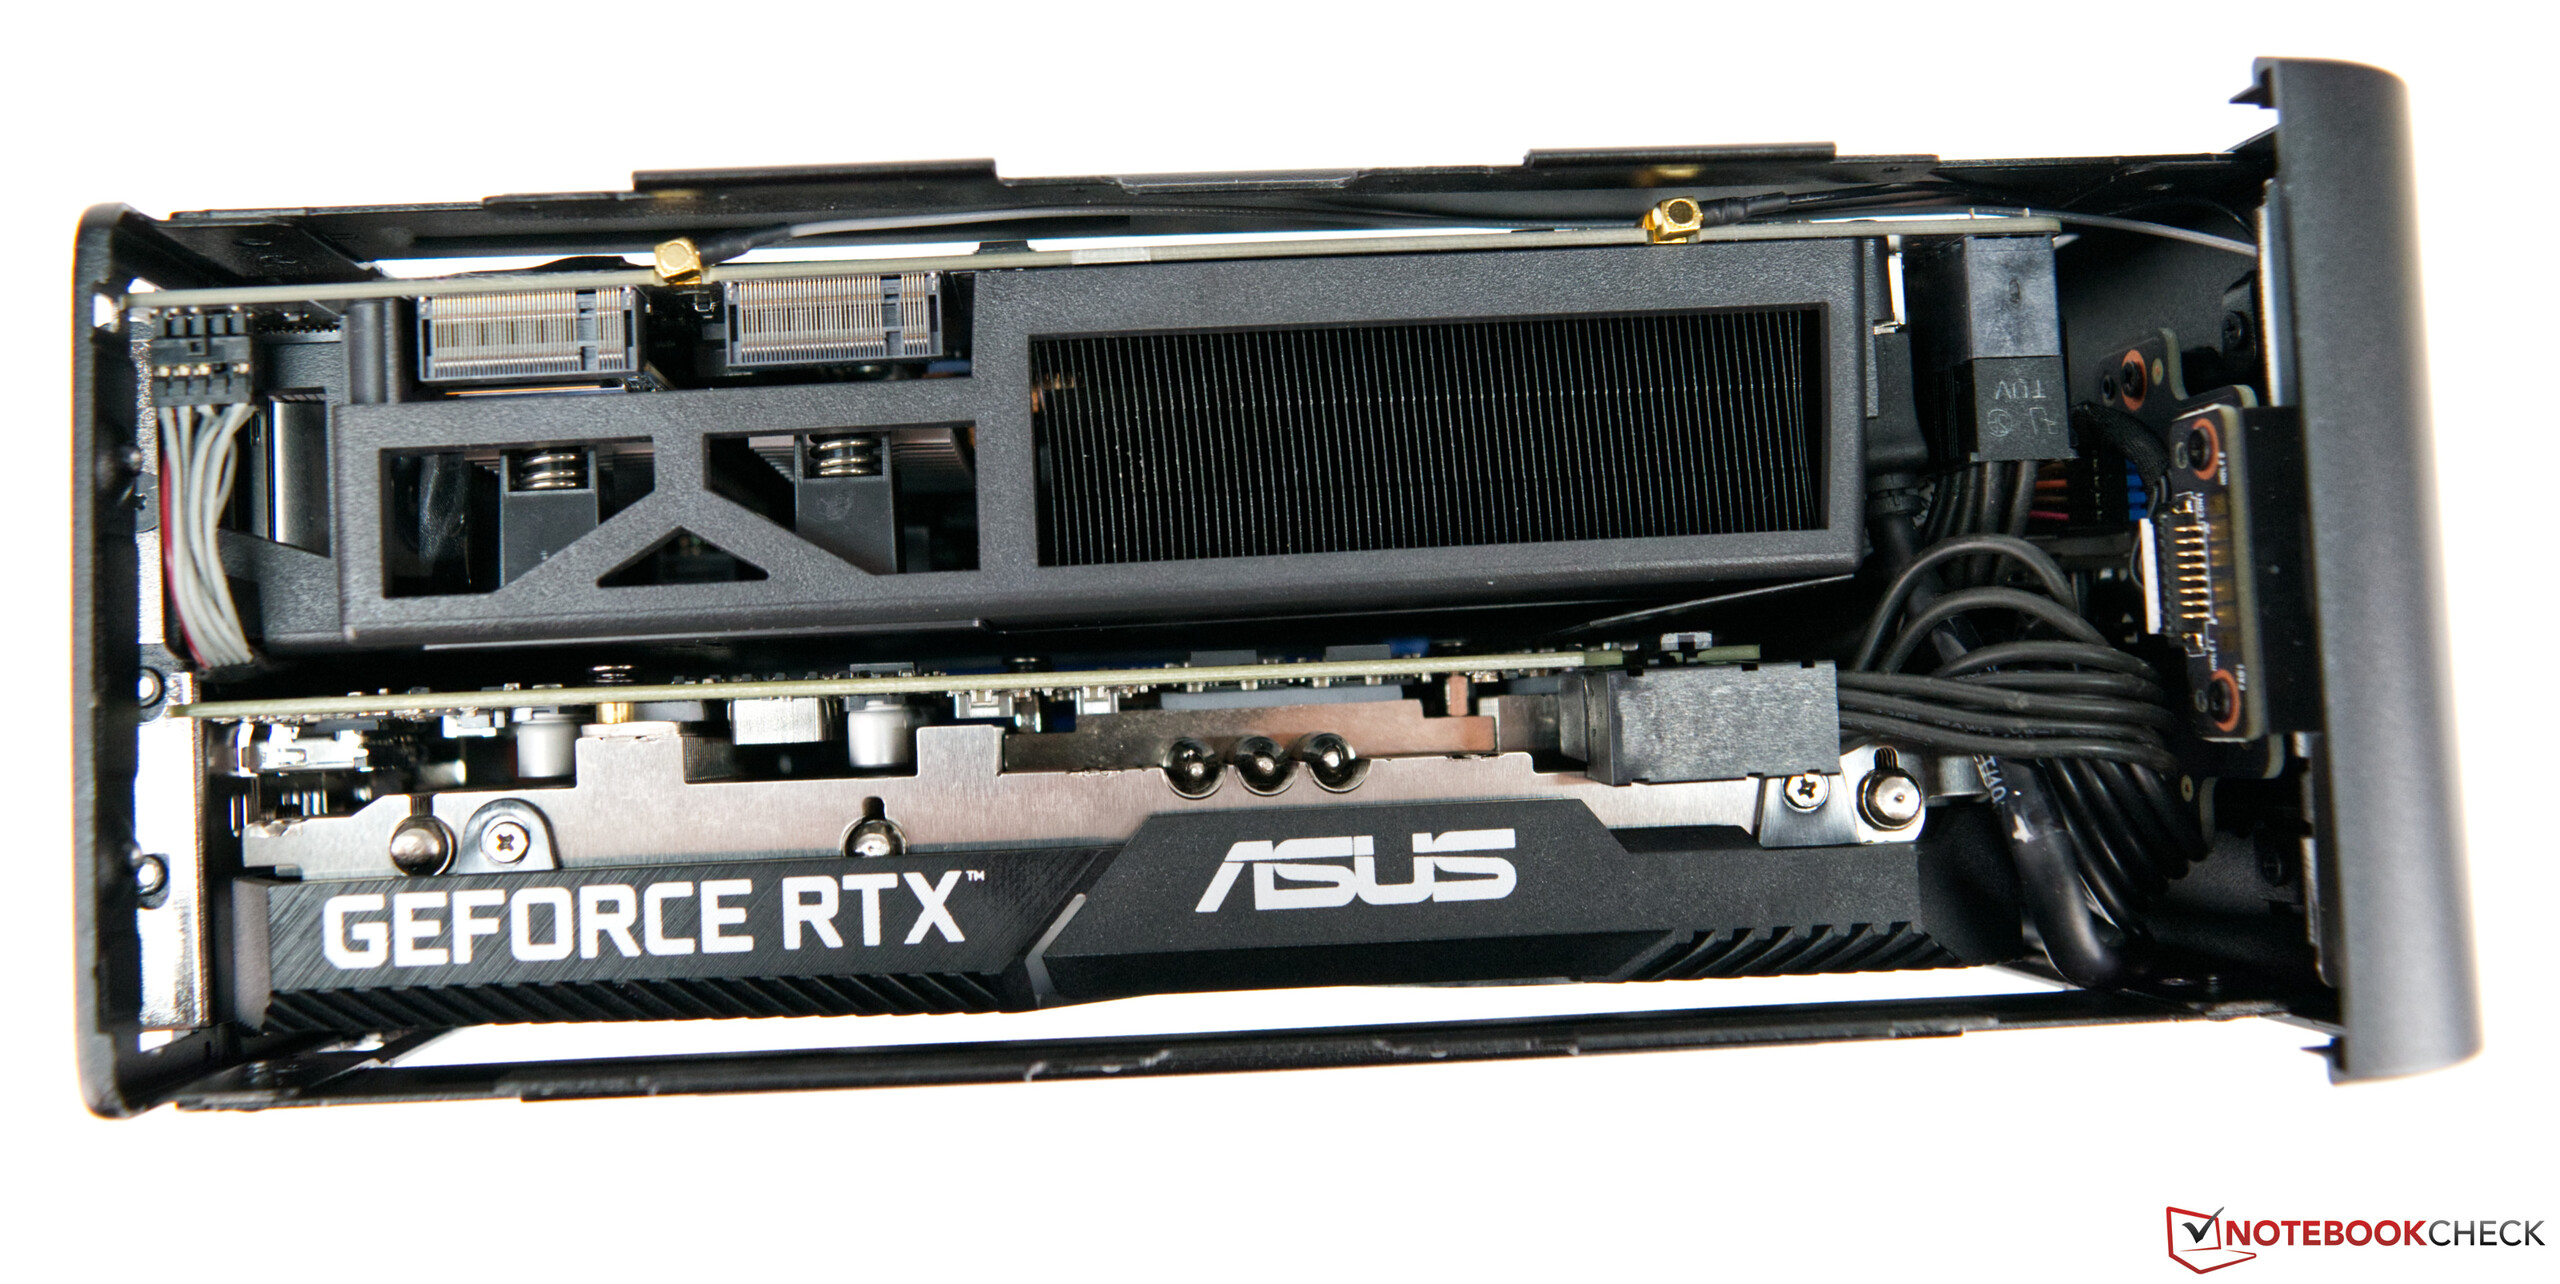
Soll der Mini-PC noch mit einer dedizierten Grafikkarte bestückt werden muss unbedingt auf die Baugröße des Pixelbeschleunigers geachtet werden! In unserem Testsample steckt eine Mini-Version der GeForce RTX 2070 aus dem Hause Asus. Hier finden Sie eine Kompatibilitätsliste für den Ghost Canyon NUC.

Intel NUC 9 Extreme Kit
Intel NUC 9 Extreme Kit mit GeForce RTX 2070
Intel NUC 9 Extreme Kit
Intel NUC 9 Extreme Kit Compute Element
Intel NUC 9 Extreme Kit WLAN-Modul
Intel NUC 9 Extreme Kit Compute Element (Kühleinheit)
Intel NUC 9 Extreme Kit
Asus GeForce RTX 2070 Mini
Intel NUC 9 Extreme Kit

Intel NUC 9 Extreme im Detail

Intel NUC 9 Extreme Kit Compute Element

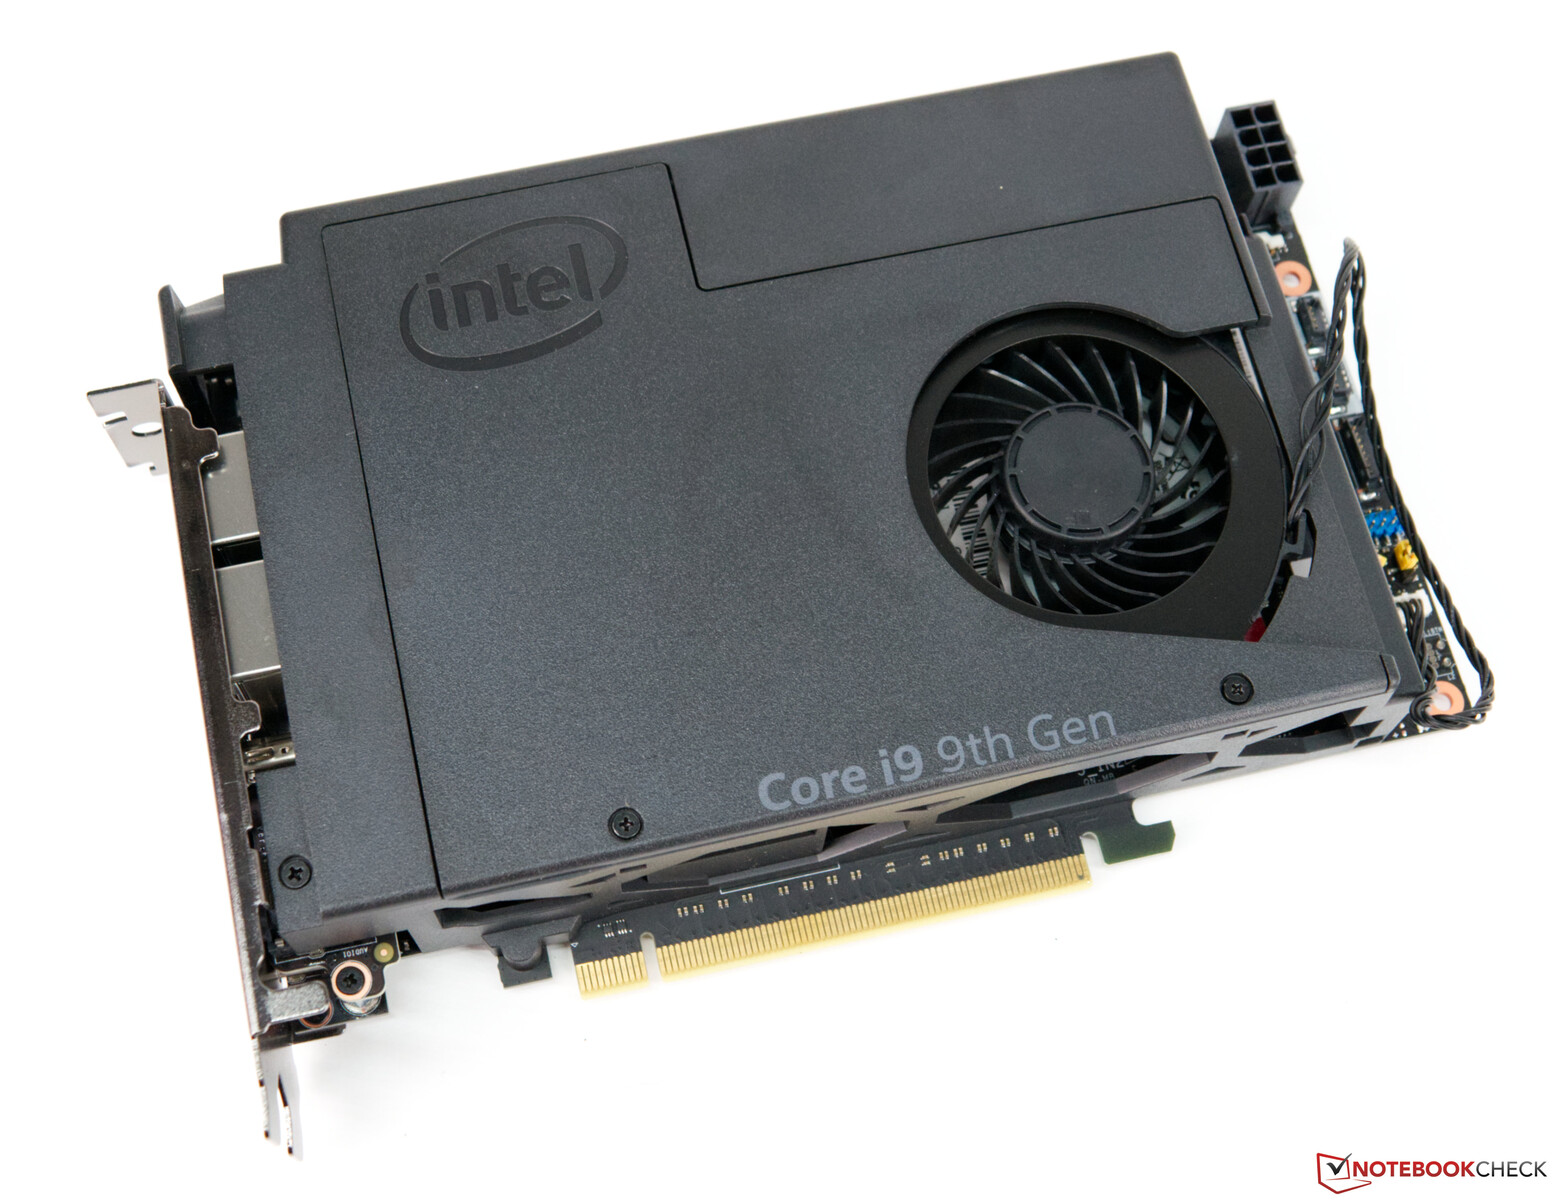
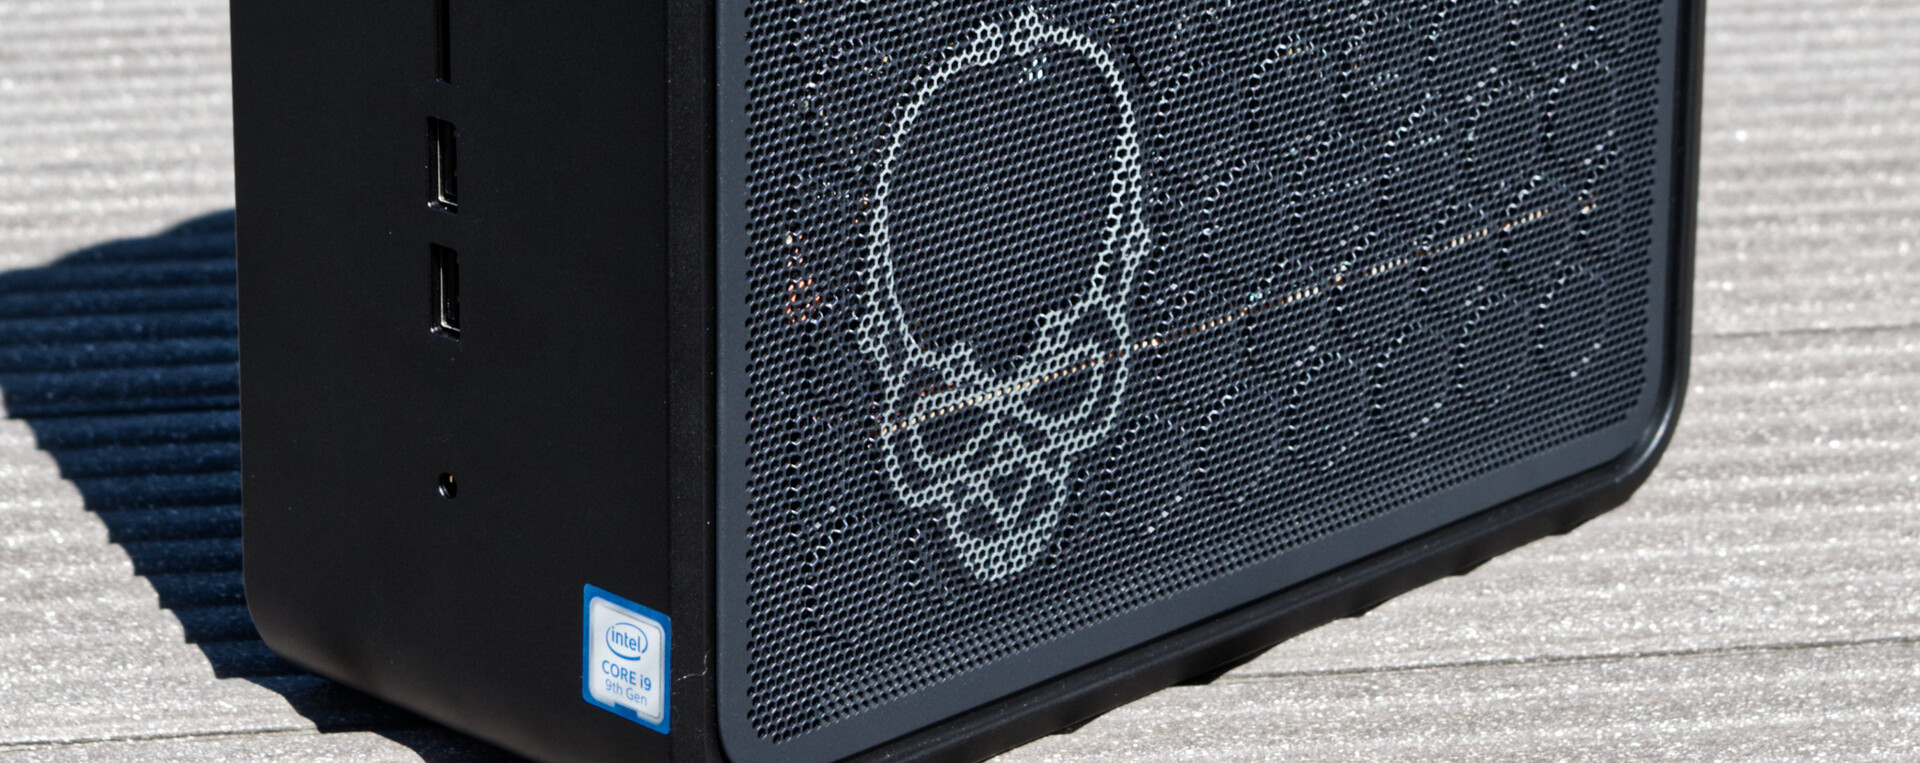
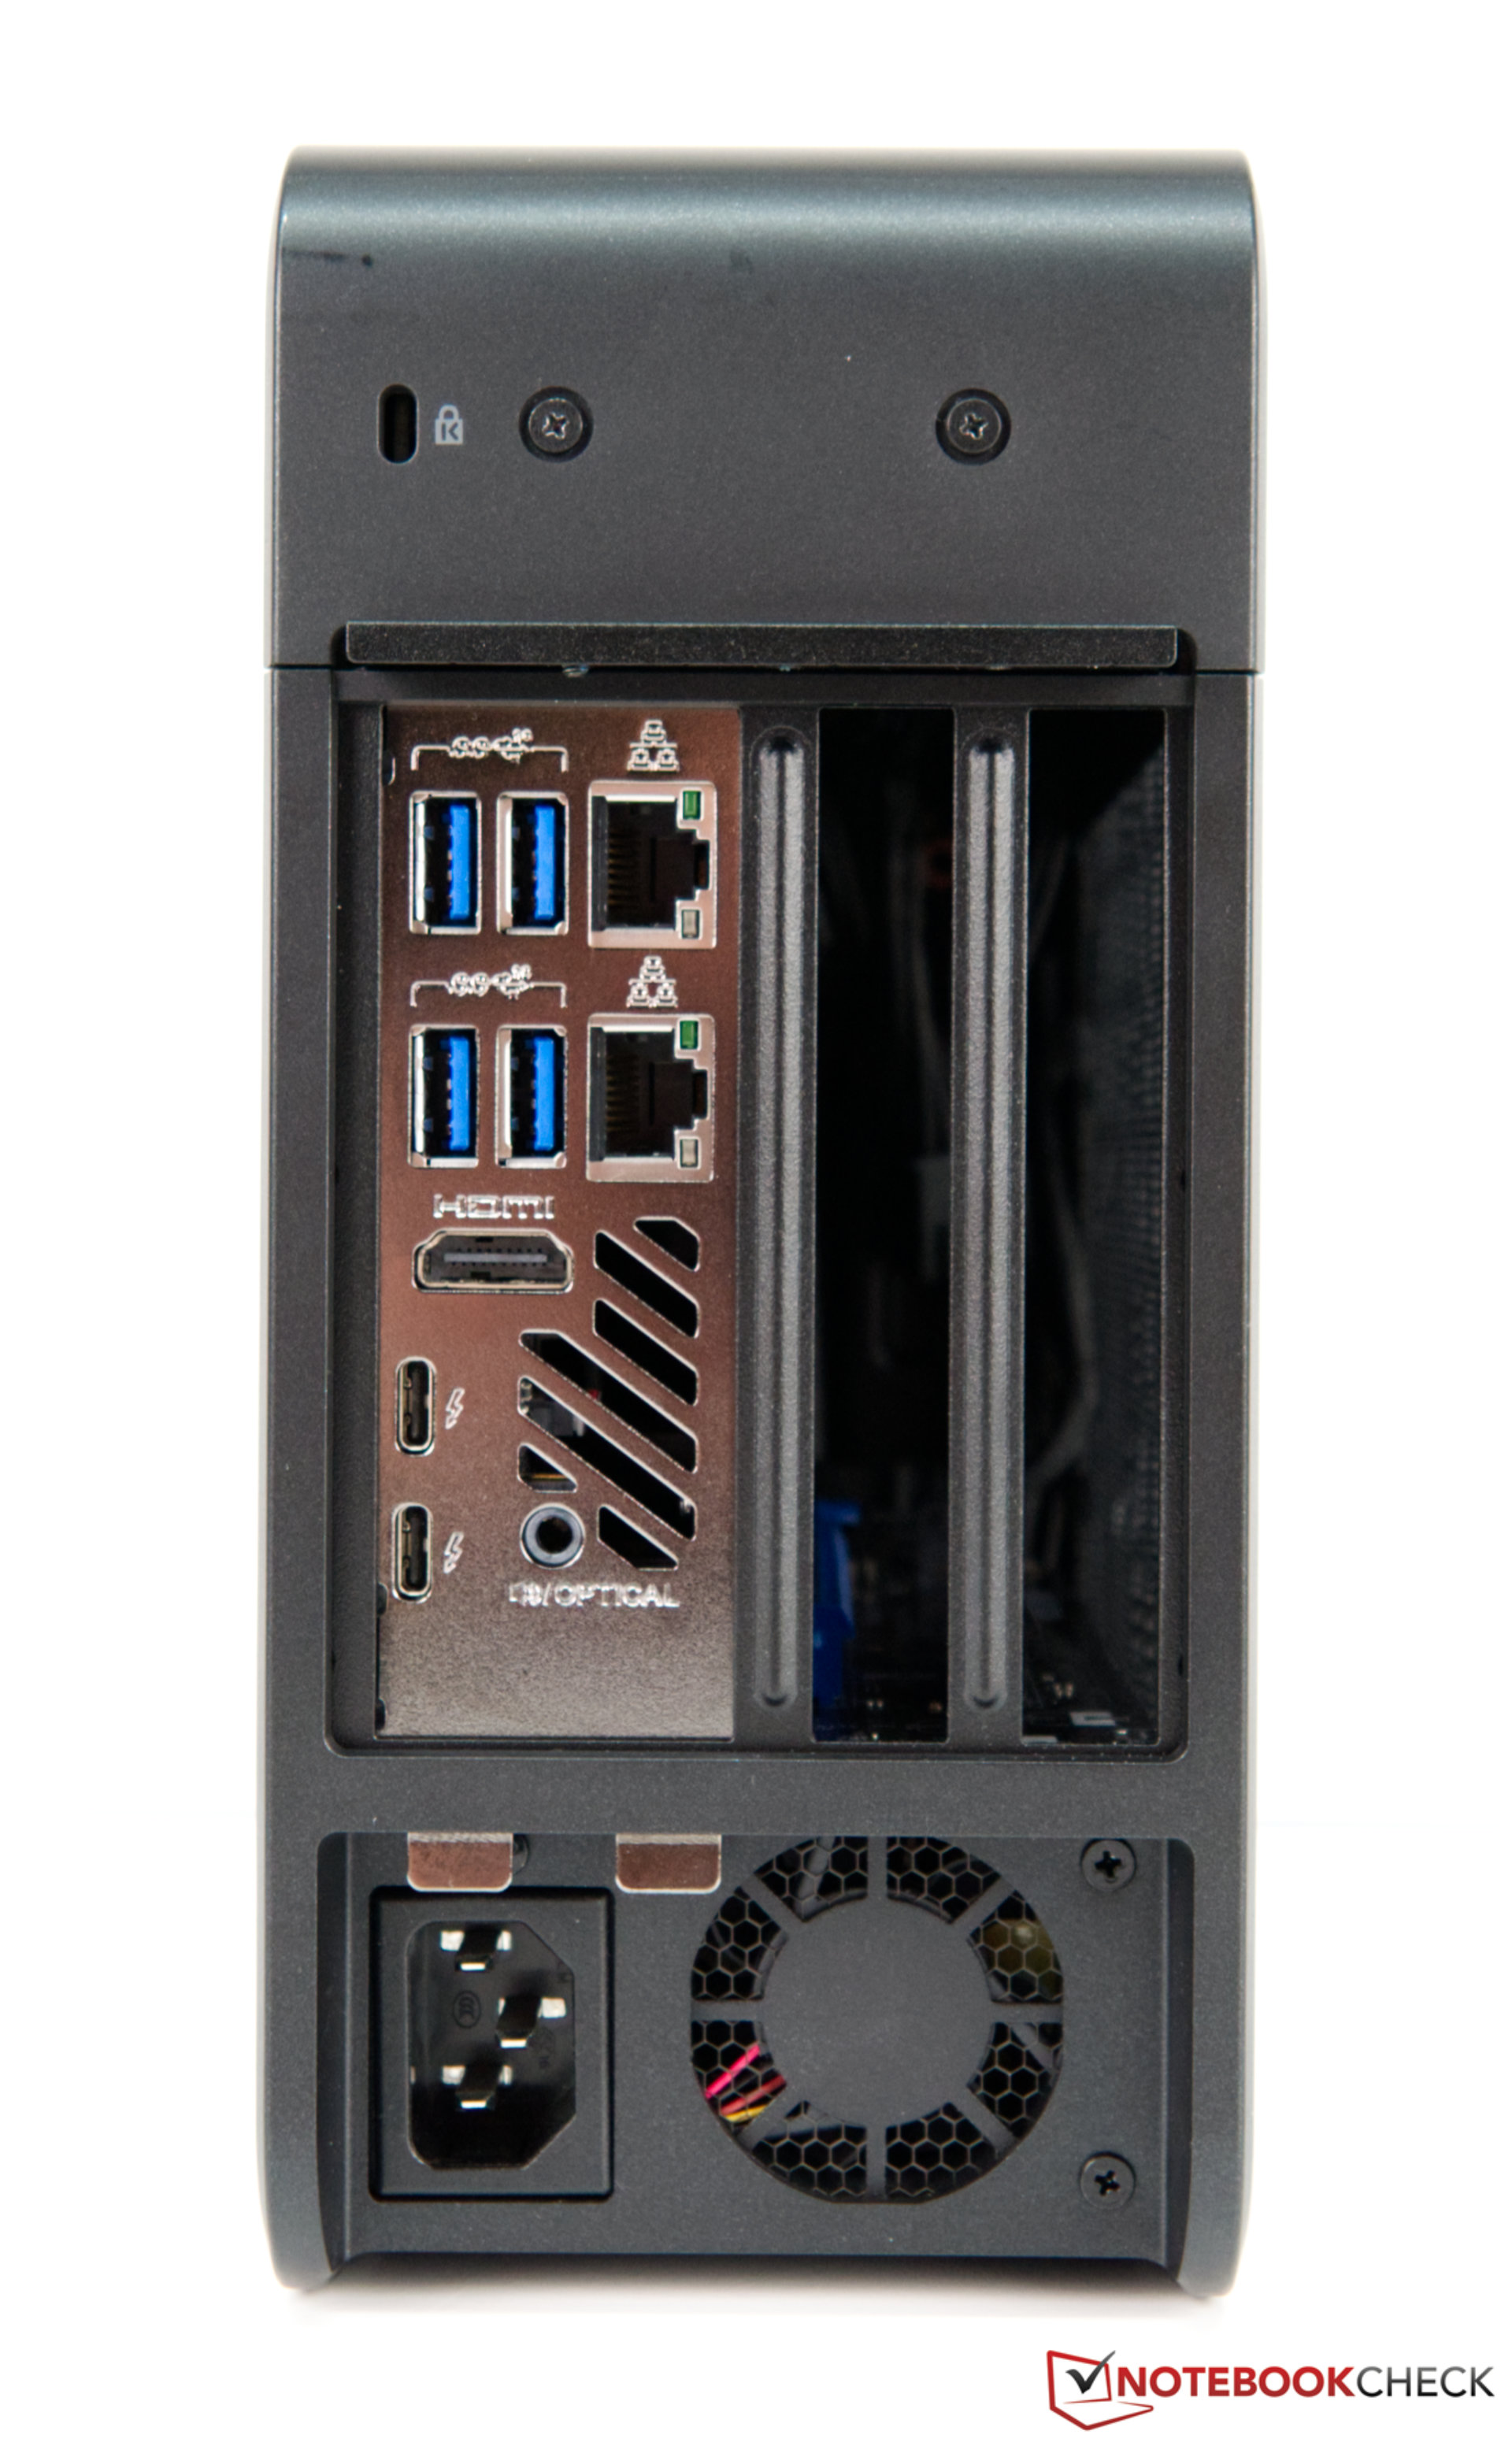
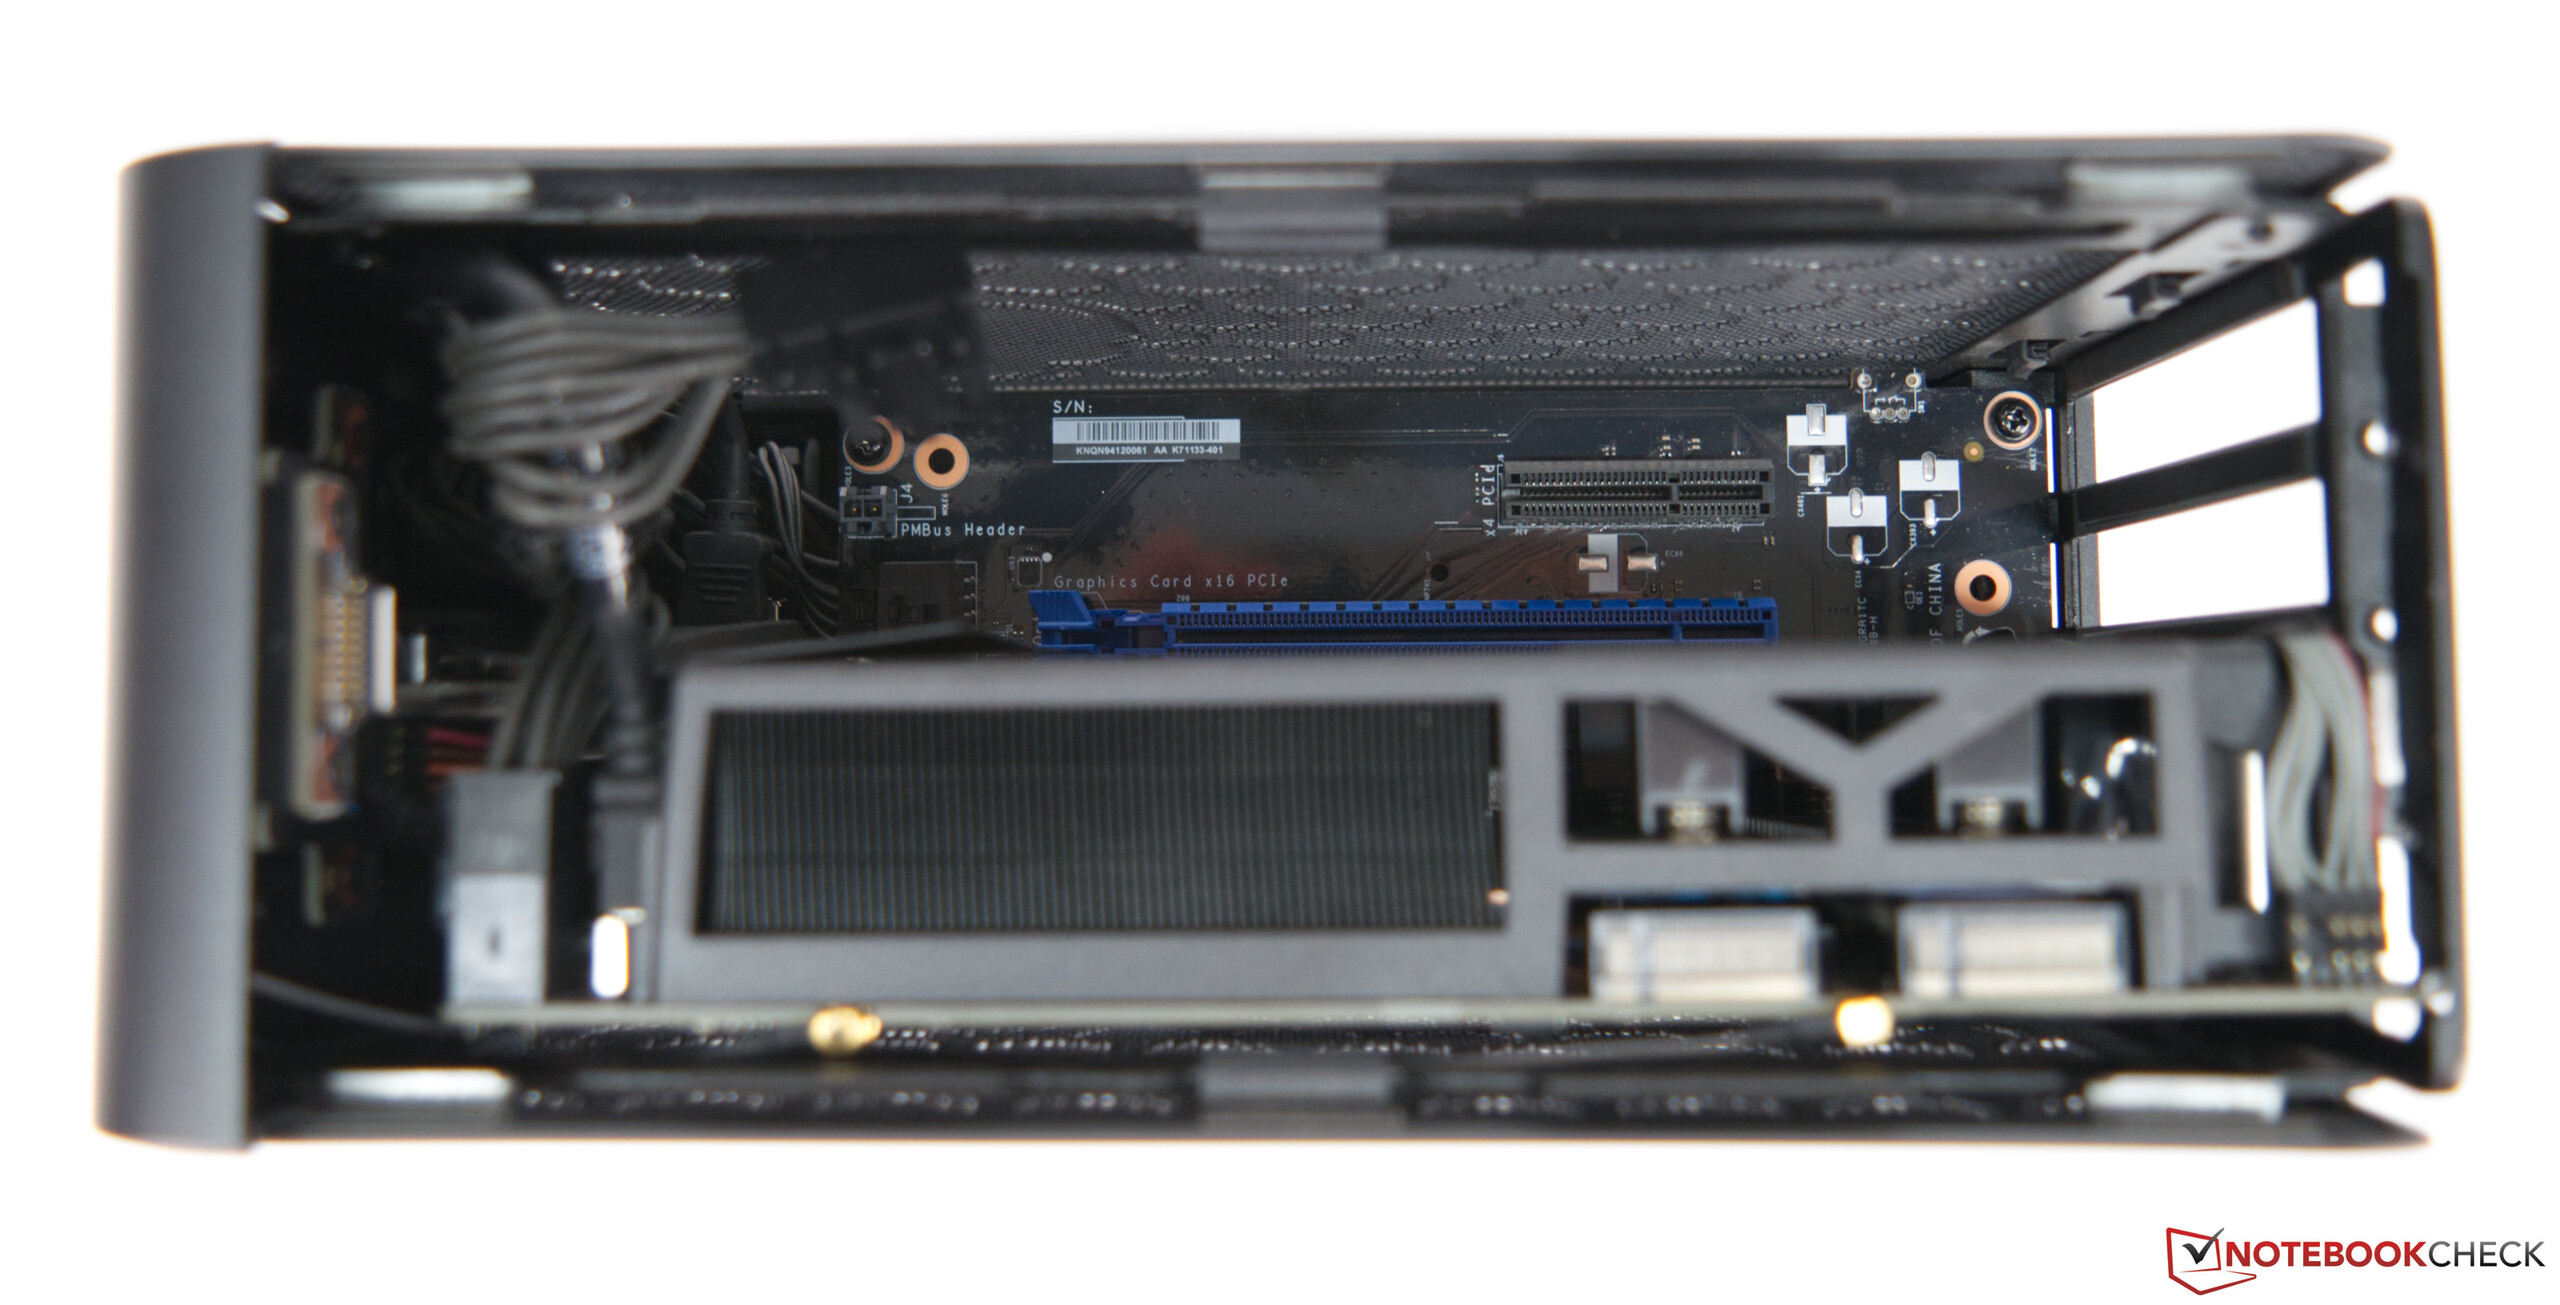
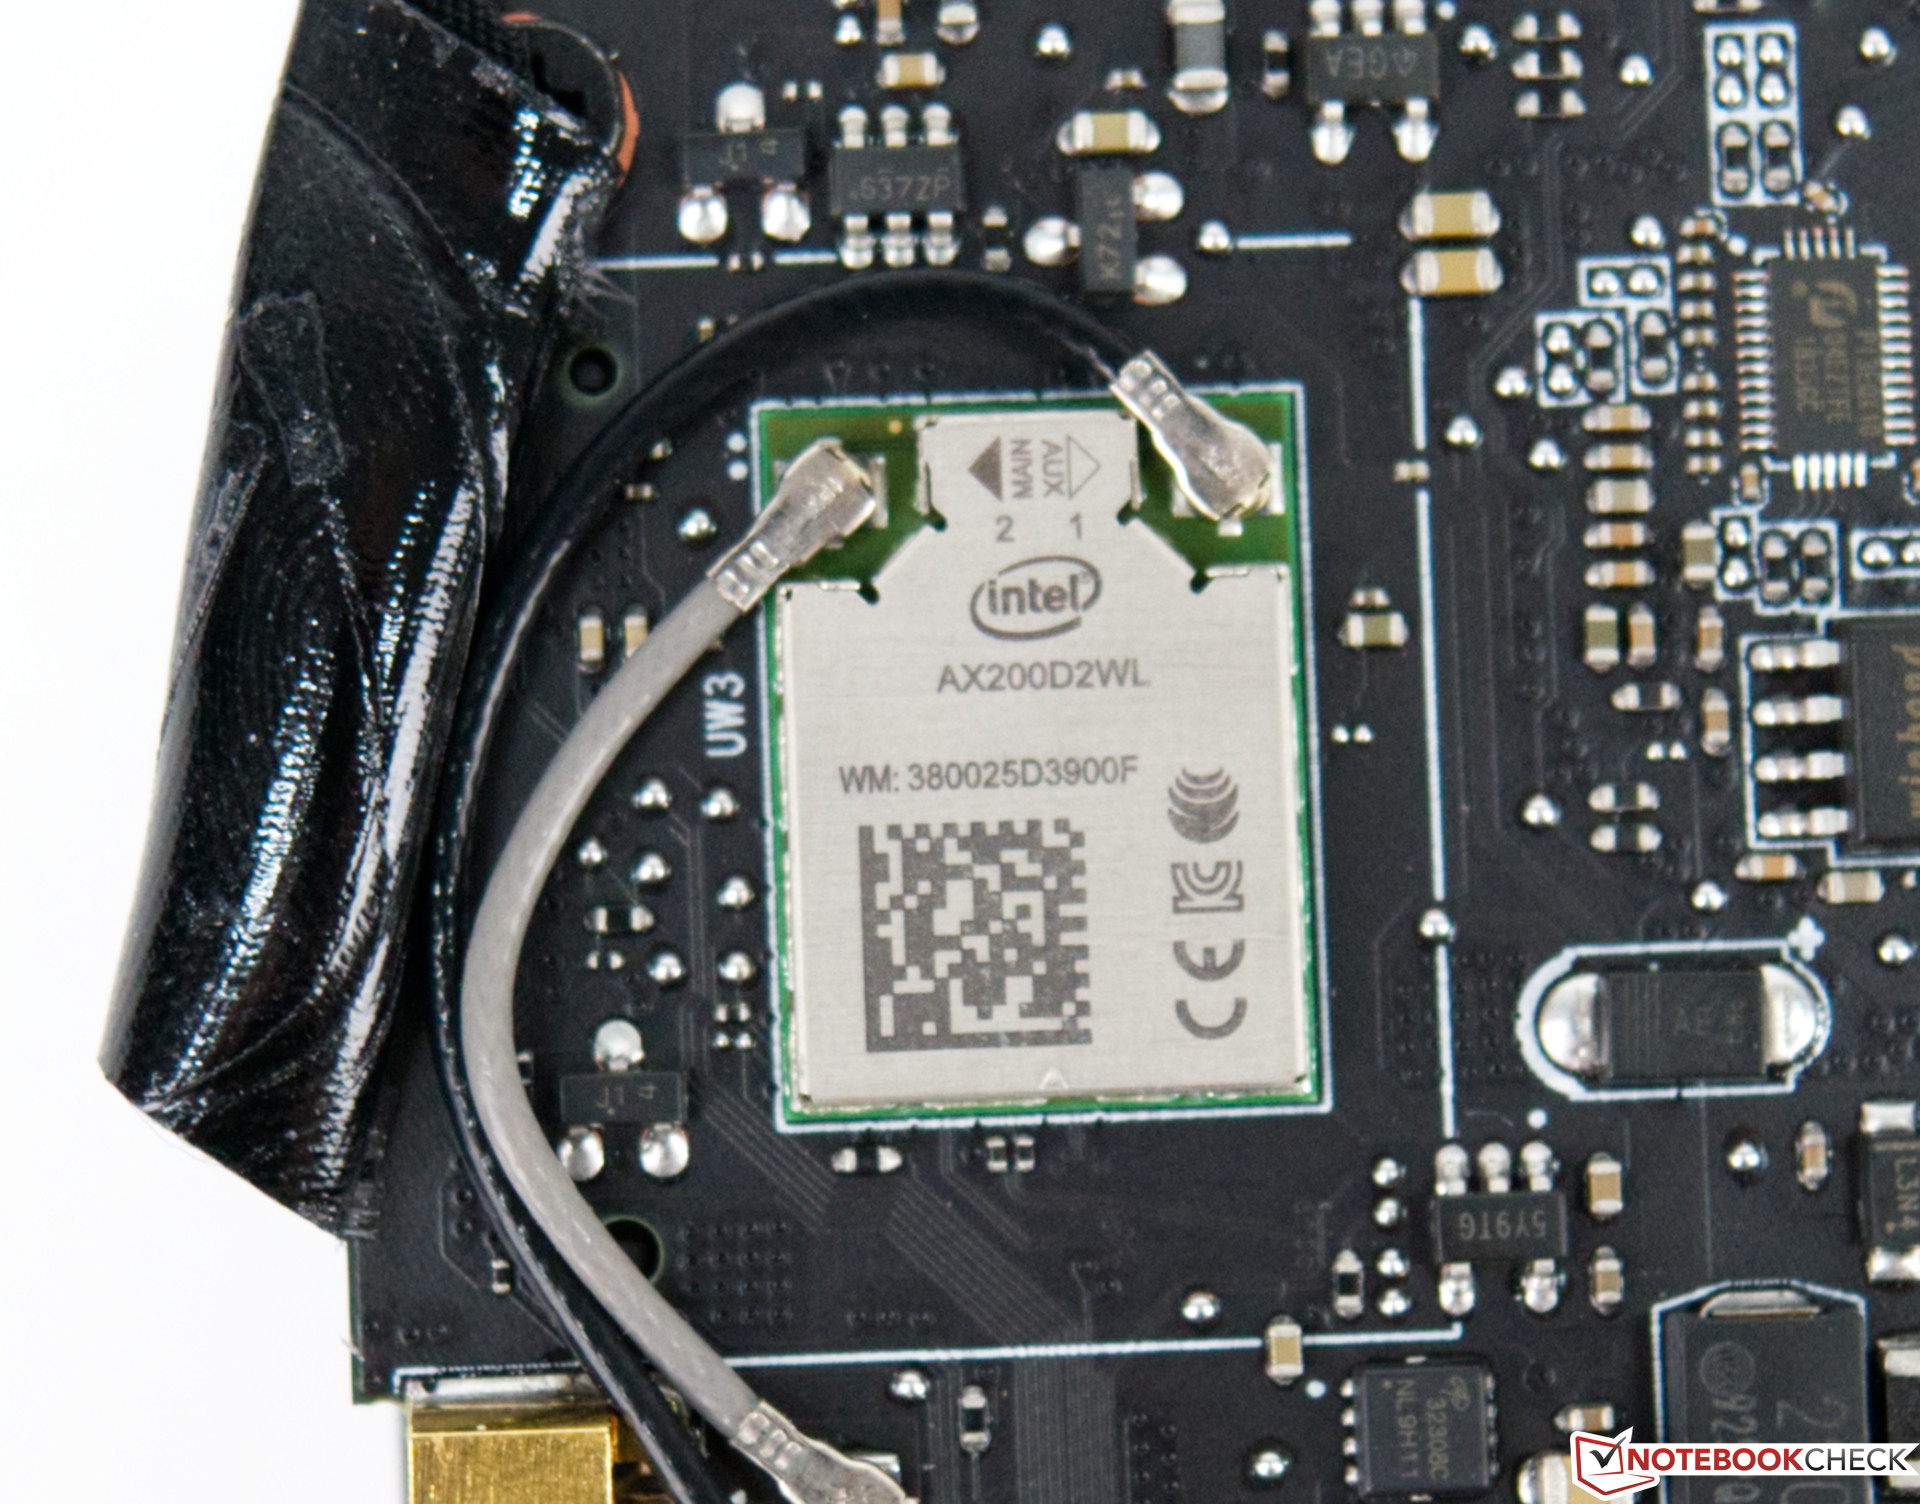
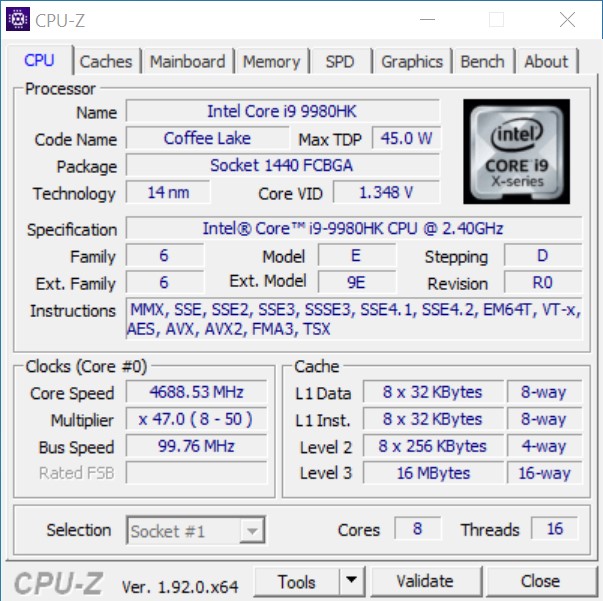
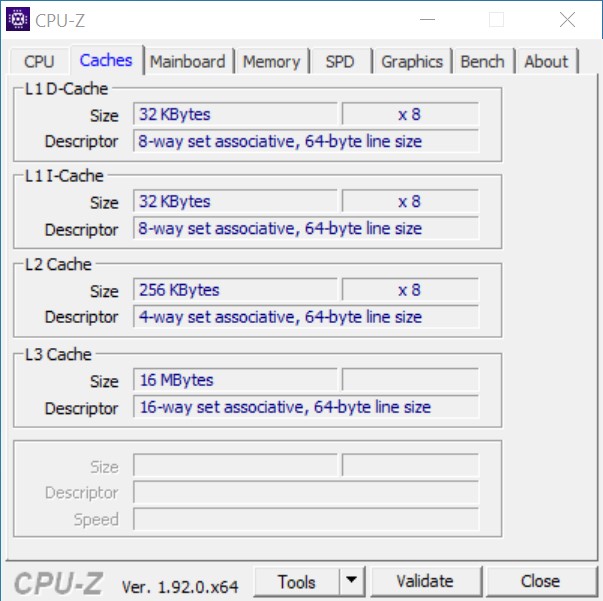
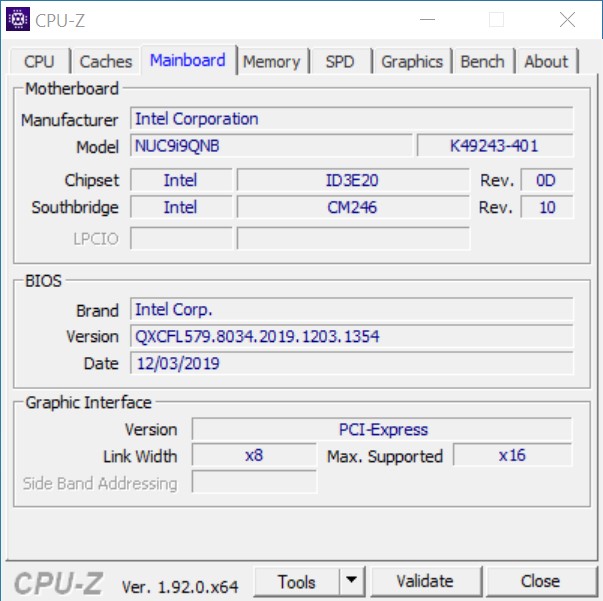
Der Intel NUC 9 Extreme bietet mit dem Intel Core i9-9980HK einen 8-Kern-SoC mit 16 Threads. Dieser stammt aus dem Notebook-Bereich und ist fest auf der Platine des Compute Elements verbaut. Dieses beherbergt auch die externen Schnittstellen, wie USB, LAN und HDMI. Zusammen mit den beiden Front-USB-Ports gibt es also 8x USB. Davon sind zwei als TypC mit Thunderbolt vorhanden über die auch die Bildschirmausgabe möglich ist. Somit lassen sich insgesamt drei Displays über die iGPU des SoC ansteuern, denn neben den beiden TypC-Ports gibt es auch noch einen HDMI 2.0b Ausgang. Im Compute Element selbst lassen sich zwei SO-DIMM-RAM-Module mit jeweils maximal 32 GB verbauen. Außerdem finden hier noch zwei M.2 SSDs Platz. Für die Netzwerkverbindungen bietet das Ghost Canyon NIC zwei Ethernet-Schnittstellen und ein WiFi6-Modul. Eine der beiden Ethernet-Ports bietet indes sogar Geschwindigkeiten bis zu 2,5 GBit/s. 

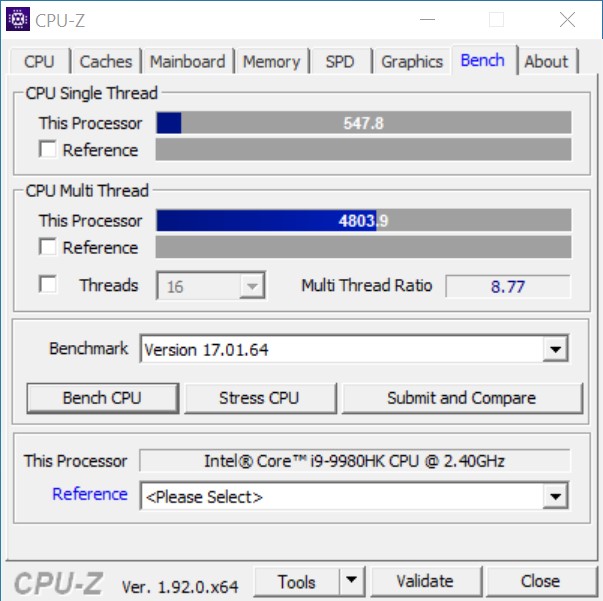
Prozessor Benchmarks

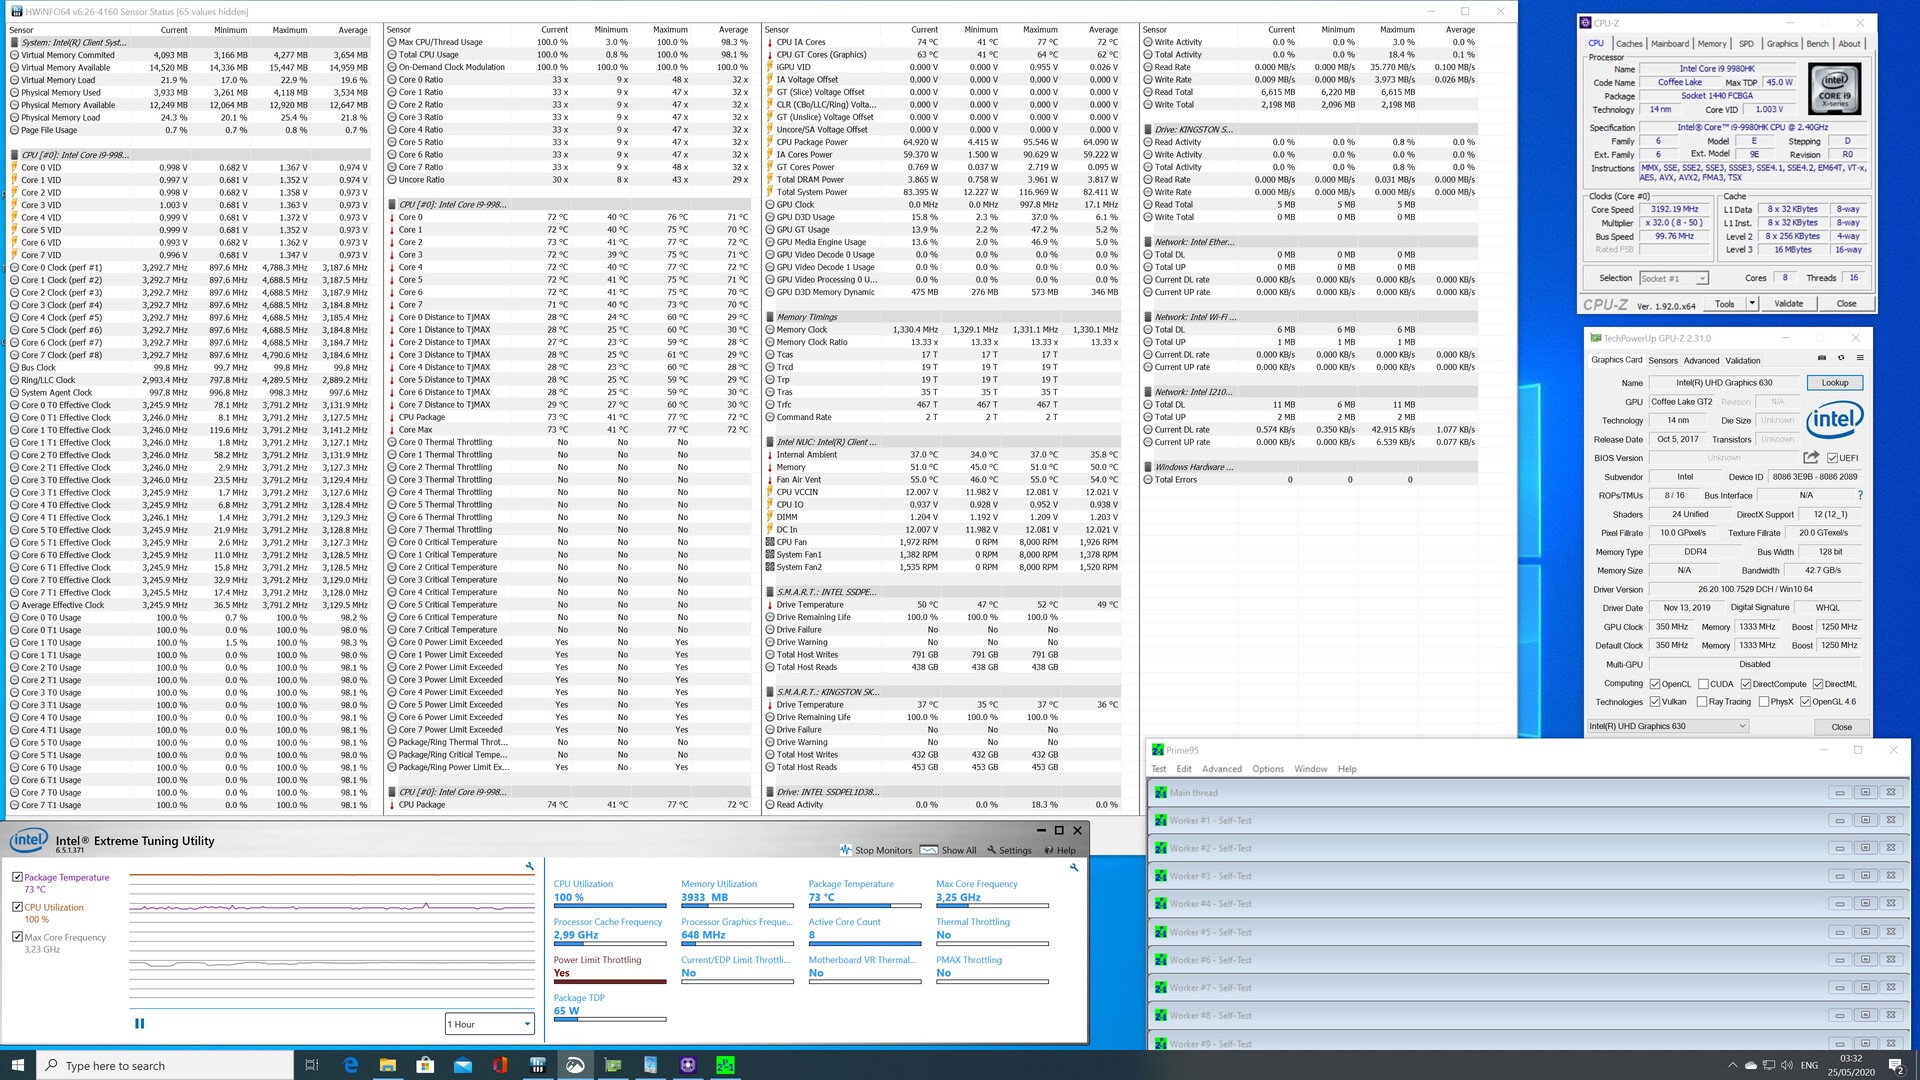
Grundsätzlich kann der Intel Core i9-9980HK eine gute Leistung abliefern. Gleichwohl ist die Leistung in unserem Testsample etwa gleichauf mit den Durchschnittswerten diverser getesteter Notebooks auf gleicher Basis. Der Core i9-9980HK muss sich aber auch den Desktop-Konkurrenten stellen, die wir in Form von Intel Core i5-10600K, Intel Core i9-10900K und AMD Ryzen 9 3950X herausgesucht haben. Hier rangiert der Core i9-9980HK etwa auf dem Level eines Core i5-10600K. Mit den 10- respektive 16-Kernern kann es der 8-Kerner in unserem NUC nur bedingt aufnehmen. Wenn es um die reine Single-Core-Leistung geht, dann ist der Core i9-9980HK zur Stelle und der Abstand zum Core i9-10900K schmilzt auf wenige Prozente. Bei den Multi-Thread-Benchmarks lassen sich die fehlenden Kerne gegenüber den Desktop-CPUs nicht so einfach kompensieren. Da Intel den Ghost Canyon NUC auch mit dem Intel Core i5-9300H und dem Intel Core i7-9750H anbietet, haben wir auch diese beiden Probanden mit in die Vergleichstabelle aufgenommen. Damit haben Sie einen ungefähren Anhaltspunkt welche Leistung mit diesen beiden SoCs erwartet werden kann.

CPU-Z
CPU-Z
CPU-Z
CPU-Z
CPU-Z
CPU-Z
CPU-Z
Cinebench R15
CPU Single 64Bit
Intel Core i9-10900K, NVIDIA Titan RTX
i9-10900K, 3700 MHz
224 Points +4%
Intel Core i9-9980HK, NVIDIA GeForce RTX 2070 (Desktop)
i9-9980HK, 2400 MHz
215 Points
AMD Ryzen 9 3950X, NVIDIA Titan RTX
R9 3950X, 3500 MHz
209 Points -3%
Intel Core i5-10600K, NVIDIA Titan RTX
i5-10600K, 4100 MHz
205 Points -5%
Durchschnittliche Intel Core i9-9980HK
  (181 - 215, n=13)
198.8 Points -8%
Durchschnittliche Intel Core i7-9750H
  (170 - 194, n=82)
183.7 Points -15%
Durchschnittliche Intel Core i5-9300H
  (169 - 176, n=11)
172.6 Points -20%
CPU Multi 64Bit
AMD Ryzen 9 3950X, NVIDIA Titan RTX
R9 3950X, 3500 MHz
4002 Points +149%
Intel Core i9-10900K, NVIDIA Titan RTX
i9-10900K, 3700 MHz
2620 Points +63%
Durchschnittliche Intel Core i9-9980HK
  (1327 - 1930, n=14)
1656 Points +3%
Intel Core i9-9980HK, NVIDIA GeForce RTX 2070 (Desktop)
i9-9980HK, 2400 MHz
1607 Points
Intel Core i5-10600K, NVIDIA Titan RTX
i5-10600K, 4100 MHz
1452 Points -10%
Durchschnittliche Intel Core i7-9750H
  (952 - 1306, n=85)
1182 Points -26%
Durchschnittliche Intel Core i5-9300H
  (717 - 850, n=11)
784 Points -51%
Cinebench R20
CPU (Single Core)
Intel Core i9-10900K, NVIDIA Titan RTX
i9-10900K, 3700 MHz
532 Points +6%
AMD Ryzen 9 3950X, NVIDIA Titan RTX
R9 3950X, 3500 MHz
520 Points +3%
Intel Core i9-9980HK, NVIDIA GeForce RTX 2070 (Desktop)
i9-9980HK, 2400 MHz
504 Points
Durchschnittliche Intel Core i9-9980HK
  (431 - 505, n=10)
471 Points -7%
Intel Core i5-10600K, NVIDIA Titan RTX
i5-10600K, 4100 MHz
464 Points -8%
Durchschnittliche Intel Core i7-9750H
  (416 - 486, n=55)
443 Points -12%
Durchschnittliche Intel Core i5-9300H
  (398 - 427, n=9)
415 Points -18%
CPU (Multi Core)
AMD Ryzen 9 3950X, NVIDIA Titan RTX
R9 3950X, 3500 MHz
9075 Points +170%
Intel Core i9-10900K, NVIDIA Titan RTX
i9-10900K, 3700 MHz
6381 Points +90%
Durchschnittliche Intel Core i9-9980HK
  (2974 - 4150, n=10)
3530 Points +5%
Intel Core i5-10600K, NVIDIA Titan RTX
i5-10600K, 4100 MHz
3443 Points +3%
Intel Core i9-9980HK, NVIDIA GeForce RTX 2070 (Desktop)
i9-9980HK, 2400 MHz
3357 Points
Durchschnittliche Intel Core i7-9750H
  (2017 - 3133, n=55)
2564 Points -24%
Durchschnittliche Intel Core i5-9300H
  (1530 - 1877, n=9)
1727 Points -49%
Cinebench R11.5
CPU Single 64Bit
Intel Core i9-10900K, NVIDIA Titan RTX
i9-10900K, 3700 MHz
2.56 Points +7%
Intel Core i9-9980HK, NVIDIA GeForce RTX 2070 (Desktop)
i9-9980HK, 2400 MHz
2.4 Points
AMD Ryzen 9 3950X, NVIDIA Titan RTX
R9 3950X, 3500 MHz
2.37 Points -1%
Durchschnittliche Intel Core i9-9980HK
  (2.25 - 2.4, n=3)
2.31 Points -4%
Intel Core i5-10600K, NVIDIA Titan RTX
i5-10600K, 4100 MHz
2.19 Points -9%
Durchschnittliche Intel Core i7-9750H
  (1.96 - 2.19, n=10)
2.1 Points -12%
CPU Multi 64Bit
AMD Ryzen 9 3950X, NVIDIA Titan RTX
R9 3950X, 3500 MHz
43.68 Points +142%
Intel Core i9-10900K, NVIDIA Titan RTX
i9-10900K, 3700 MHz
29.03 Points +61%
Intel Core i9-9980HK, NVIDIA GeForce RTX 2070 (Desktop)
i9-9980HK, 2400 MHz
18.04 Points
Durchschnittliche Intel Core i9-9980HK
  (14.8 - 18, n=3)
16.7 Points -7%
Intel Core i5-10600K, NVIDIA Titan RTX
i5-10600K, 4100 MHz
15.76 Points -13%
Durchschnittliche Intel Core i7-9750H
  (11.3 - 14.1, n=10)
13 Points -28%
Cinebench R10
Rendering Single CPUs 64Bit
Intel Core i9-10900K, NVIDIA Titan RTX
i9-10900K, 3700 MHz
10625 Points +3%
AMD Ryzen 9 3950X, NVIDIA Titan RTX
R9 3950X, 3500 MHz
10580 Points +2%
Intel Core i9-9980HK, NVIDIA GeForce RTX 2070 (Desktop)
i9-9980HK, 2400 MHz
10359 Points
Durchschnittliche Intel Core i9-9980HK
  ()
10359 Points 0%
Intel Core i5-10600K, NVIDIA Titan RTX
i5-10600K, 4100 MHz
9594 Points -7%
Durchschnittliche Intel Core i7-9750H
  (9069 - 9346, n=3)
9165 Points -12%
Rendering Multiple CPUs 64Bit
AMD Ryzen 9 3950X, NVIDIA Titan RTX
R9 3950X, 3500 MHz
86232 Points +55%
Intel Core i9-10900K, NVIDIA Titan RTX
i9-10900K, 3700 MHz
80495 Points +44%
Intel Core i9-9980HK, NVIDIA GeForce RTX 2070 (Desktop)
i9-9980HK, 2400 MHz
55742 Points
Durchschnittliche Intel Core i9-9980HK
  ()
55742 Points 0%
Intel Core i5-10600K, NVIDIA Titan RTX
i5-10600K, 4100 MHz
51816 Points -7%
Durchschnittliche Intel Core i7-9750H
  (37188 - 44238, n=3)
40129 Points -28%
Blender - v2.79 BMW27 CPU
Durchschnittliche Intel Core i5-9300H
  (588 - 643, n=3)
611 Seconds * -93%
Durchschnittliche Intel Core i7-9750H
  (342 - 495, n=21)
433 Seconds * -36%
Durchschnittliche Intel Core i9-9980HK
  (317 - 527, n=3)
398 Seconds * -25%
Intel Core i9-9980HK, NVIDIA GeForce RTX 2070 (Desktop)
i9-9980HK, 2400 MHz
317.4 Seconds *
Intel Core i5-10600K, NVIDIA Titan RTX
i5-10600K, 4100 MHz
302.4 Seconds * +5%
Intel Core i9-10900K, NVIDIA Titan RTX
i9-10900K, 3700 MHz
167.3 Seconds * +47%
AMD Ryzen 9 3950X, NVIDIA Titan RTX
R9 3950X, 3500 MHz
125.8 Seconds * +60%
wPrime 2.10
32m
Durchschnittliche Intel Core i7-9750H
  ()
4.93 s * -30%
Intel Core i5-10600K, NVIDIA Titan RTX
i5-10600K, 4100 MHz
4.648 s * -23%
Durchschnittliche Intel Core i9-9980HK
  (3.79 - 4.94, n=2)
4.36 s * -15%
AMD Ryzen 9 3950X, NVIDIA Titan RTX
R9 3950X, 3500 MHz
4.112 s * -9%
Intel Core i9-9980HK, NVIDIA GeForce RTX 2070 (Desktop)
i9-9980HK, 2400 MHz
3.788 s *
Intel Core i9-10900K, NVIDIA Titan RTX
i9-10900K, 3700 MHz
3.582 s * +5%
1024m
Durchschnittliche Intel Core i7-9750H
  ()
154.4 s * -28%
Intel Core i9-9980HK, NVIDIA GeForce RTX 2070 (Desktop)
i9-9980HK, 2400 MHz
120.2 s *
Durchschnittliche Intel Core i9-9980HK
  (110.4 - 120.2, n=2)
115.3 s * +4%
Intel Core i5-10600K, NVIDIA Titan RTX
i5-10600K, 4100 MHz
113.2 s * +6%
Intel Core i9-10900K, NVIDIA Titan RTX
i9-10900K, 3700 MHz
66.3 s * +45%
AMD Ryzen 9 3950X, NVIDIA Titan RTX
R9 3950X, 3500 MHz
44.86 s * +63%
X264 HD Benchmark 4.0
Pass 1
Intel Core i9-10900K, NVIDIA Titan RTX
i9-10900K, 3700 MHz
289.5 (289min - 291max) fps +22%
AMD Ryzen 9 3950X, NVIDIA Titan RTX
R9 3950X, 3500 MHz
265 (265min - 266max) fps +12%
Intel Core i5-10600K, NVIDIA Titan RTX
i5-10600K, 4100 MHz
251.5 (250min - 253max) fps +6%
Durchschnittliche Intel Core i9-9980HK
  (238 - 239, n=2)
238 fps 0%
Intel Core i9-9980HK, NVIDIA GeForce RTX 2070 (Desktop)
i9-9980HK, 2400 MHz
237.5 (236min - 239max) fps
Durchschnittliche Intel Core i7-9750H
  (211 - 219, n=2)
215 fps -9%
Durchschnittliche Intel Core i5-9300H
  ()
193.7 fps -18%
Pass 2
AMD Ryzen 9 3950X, NVIDIA Titan RTX
R9 3950X, 3500 MHz
168 (168min - 169max) fps +81%
Intel Core i9-10900K, NVIDIA Titan RTX
i9-10900K, 3700 MHz
149 (149min - 149max) fps +61%
Durchschnittliche Intel Core i9-9980HK
  (92.8 - 94.8, n=2)
93.8 fps +1%
Intel Core i9-9980HK, NVIDIA GeForce RTX 2070 (Desktop)
i9-9980HK, 2400 MHz
92.8 (89.1min - 100max) fps
Intel Core i5-10600K, NVIDIA Titan RTX
i5-10600K, 4100 MHz
88.2 (88min - 88.2max) fps -5%
Durchschnittliche Intel Core i7-9750H
  (69.6 - 70.9, n=2)
70.3 fps -24%
Durchschnittliche Intel Core i5-9300H
  ()
49.4 fps -47%
WinRAR - Result
Intel Core i9-10900K, NVIDIA Titan RTX
i9-10900K, 3700 MHz
9739 KB/s +34%
AMD Ryzen 9 3950X, NVIDIA Titan RTX
R9 3950X, 3500 MHz
7409 KB/s +2%
Durchschnittliche Intel Core i9-9980HK
  (7266 - 7436, n=2)
7351 KB/s +1%
Intel Core i9-9980HK, NVIDIA GeForce RTX 2070 (Desktop)
i9-9980HK, 2400 MHz
7266 KB/s
Intel Core i5-10600K, NVIDIA Titan RTX
i5-10600K, 4100 MHz
6536 KB/s -10%
Durchschnittliche Intel Core i7-9750H
  (6160 - 6631, n=2)
6396 KB/s -12%
Durchschnittliche Intel Core i5-9300H
  ()
5663 KB/s -22%
TrueCrypt
AES Mean 100MB
Intel Core i9-10900K, NVIDIA Titan RTX
i9-10900K, 3700 MHz
14.6 GB/s +45%
AMD Ryzen 9 3950X, NVIDIA Titan RTX
R9 3950X, 3500 MHz
10.8 GB/s +7%
Durchschnittliche Intel Core i9-9980HK
  (10.1 - 10.3, n=2)
10.2 GB/s +1%
Intel Core i9-9980HK, NVIDIA GeForce RTX 2070 (Desktop)
i9-9980HK, 2400 MHz
10.1 GB/s
Intel Core i5-10600K, NVIDIA Titan RTX
i5-10600K, 4100 MHz
8 GB/s -21%
Durchschnittliche Intel Core i7-9750H
  (7.3 - 7.4, n=2)
7.35 GB/s -27%
Durchschnittliche Intel Core i5-9300H
  ()
4.7 GB/s -53%
Twofish Mean 100MB
AMD Ryzen 9 3950X, NVIDIA Titan RTX
R9 3950X, 3500 MHz
3.6 GB/s +112%
Intel Core i9-10900K, NVIDIA Titan RTX
i9-10900K, 3700 MHz
2.6 GB/s +53%
Intel Core i9-9980HK, NVIDIA GeForce RTX 2070 (Desktop)
i9-9980HK, 2400 MHz
1.7 GB/s
Durchschnittliche Intel Core i9-9980HK
  (1.7 - 1.7, n=2)
1.7 GB/s 0%
Intel Core i5-10600K, NVIDIA Titan RTX
i5-10600K, 4100 MHz
1.4 GB/s -18%
Durchschnittliche Intel Core i7-9750H
  (1.2 - 1.3, n=2)
1.25 GB/s -26%
Durchschnittliche Intel Core i5-9300H
  ()
0.84 GB/s -51%
Serpent Mean 100MB
AMD Ryzen 9 3950X, NVIDIA Titan RTX
R9 3950X, 3500 MHz
2.3 GB/s +130%
Intel Core i9-10900K, NVIDIA Titan RTX
i9-10900K, 3700 MHz
1.5 GB/s +50%
Intel Core i9-9980HK, NVIDIA GeForce RTX 2070 (Desktop)
i9-9980HK, 2400 MHz
1 GB/s
Durchschnittliche Intel Core i9-9980HK
  (1 - 1, n=2)
1 GB/s 0%
Intel Core i5-10600K, NVIDIA Titan RTX
i5-10600K, 4100 MHz
0.82 GB/s -18%
Durchschnittliche Intel Core i7-9750H
  (0.7 - 0.75, n=2)
0.725 GB/s -27%
Durchschnittliche Intel Core i5-9300H
  ()
0.5 GB/s -50%
Geekbench 5.5
Multi-Core
AMD Ryzen 9 3950X, NVIDIA Titan RTX
R9 3950X, 3500 MHz
12363 Points +63%
Intel Core i9-10900K, NVIDIA Titan RTX
i9-10900K, 3700 MHz
11414 Points +51%
Intel Core i9-9980HK, NVIDIA GeForce RTX 2070 (Desktop)
i9-9980HK, 2400 MHz
7568 Points
Durchschnittliche Intel Core i9-9980HK
  (6945 - 7703, n=3)
7405 Points -2%
Intel Core i5-10600K, NVIDIA Titan RTX
i5-10600K, 4100 MHz
7248 Points -4%
Durchschnittliche Intel Core i7-9750H
  (4859 - 6262, n=13)
5597 Points -26%
Single-Core
Intel Core i9-10900K, NVIDIA Titan RTX
i9-10900K, 3700 MHz
1449 Points +5%
Intel Core i9-9980HK, NVIDIA GeForce RTX 2070 (Desktop)
i9-9980HK, 2400 MHz
1378 Points
Durchschnittliche Intel Core i9-9980HK
  (1314 - 1378, n=2)
1346 Points -2%
AMD Ryzen 9 3950X, NVIDIA Titan RTX
R9 3950X, 3500 MHz
1306 Points -5%
Intel Core i5-10600K, NVIDIA Titan RTX
i5-10600K, 4100 MHz
1286 Points -7%
Durchschnittliche Intel Core i7-9750H
  (1117 - 1251, n=13)
1190 Points -14%
Geekbench 5.0
5.0 Multi-Core
AMD Ryzen 9 3950X, NVIDIA Titan RTX
R9 3950X, 3500 MHz
12976 Points +72%
Intel Core i9-10900K, NVIDIA Titan RTX
i9-10900K, 3700 MHz
11407 Points +51%
Intel Core i9-9980HK, NVIDIA GeForce RTX 2070 (Desktop)
i9-9980HK, 2400 MHz
7540 Points
Durchschnittliche Intel Core i9-9980HK
  (7072 - 7805, n=4)
7421 Points -2%
Intel Core i5-10600K, NVIDIA Titan RTX
i5-10600K, 4100 MHz
7237 Points -4%
Durchschnittliche Intel Core i7-9750H
  (4812 - 6230, n=15)
5575 Points -26%
Durchschnittliche Intel Core i5-9300H
  (3697 - 4200, n=3)
4014 Points -47%
5.0 Single-Core
Intel Core i9-10900K, NVIDIA Titan RTX
i9-10900K, 3700 MHz
1440 Points +6%
Intel Core i9-9980HK, NVIDIA GeForce RTX 2070 (Desktop)
i9-9980HK, 2400 MHz
1355 Points
AMD Ryzen 9 3950X, NVIDIA Titan RTX
R9 3950X, 3500 MHz
1315 Points -3%
Intel Core i5-10600K, NVIDIA Titan RTX
i5-10600K, 4100 MHz
1281 Points -5%
Durchschnittliche Intel Core i9-9980HK
  (1171 - 1355, n=4)
1273 Points -6%
Durchschnittliche Intel Core i7-9750H
  (1105 - 1248, n=15)
1179 Points -13%
Durchschnittliche Intel Core i5-9300H
  (1095 - 1137, n=3)
1118 Points -17%
Geekbench 4.4
64 Bit Single-Core Score
Intel Core i9-10900K, NVIDIA Titan RTX
i9-10900K, 3700 MHz
6348 Points +6%
Intel Core i9-9980HK, NVIDIA GeForce RTX 2070 (Desktop)
i9-9980HK, 2400 MHz
5969 Points
Durchschnittliche Intel Core i9-9980HK
  (5617 - 5972, n=3)
5853 Points -2%
Intel Core i5-10600K, NVIDIA Titan RTX
i5-10600K, 4100 MHz
5821 Points -2%
AMD Ryzen 9 3950X, NVIDIA Titan RTX
R9 3950X, 3500 MHz
5749 Points -4%
Durchschnittliche Intel Core i7-9750H
  (4440 - 5511, n=27)
5238 Points -12%
Durchschnittliche Intel Core i5-9300H
  (4704 - 5089, n=7)
4898 Points -18%
64 Bit Multi-Core Score
AMD Ryzen 9 3950X, NVIDIA Titan RTX
R9 3950X, 3500 MHz
48962 Points +67%
Intel Core i9-10900K, NVIDIA Titan RTX
i9-10900K, 3700 MHz
43058 Points +47%
Durchschnittliche Intel Core i9-9980HK
  (28625 - 30849, n=3)
29620 Points +1%
Intel Core i9-9980HK, NVIDIA GeForce RTX 2070 (Desktop)
i9-9980HK, 2400 MHz
29385 Points
Intel Core i5-10600K, NVIDIA Titan RTX
i5-10600K, 4100 MHz
28391 Points -3%
Durchschnittliche Intel Core i7-9750H
  (17054 - 25043, n=27)
22076 Points -25%
Durchschnittliche Intel Core i5-9300H
  (14853 - 17684, n=7)
16246 Points -45%
3DMark 11 - 1280x720 Performance Physics
Intel Core i9-10900K, NVIDIA Titan RTX
i9-10900K, 3700 MHz
22140 Points +35%
AMD Ryzen 9 3950X, NVIDIA Titan RTX
R9 3950X, 3500 MHz
21016 Points +28%
Intel Core i9-9980HK, NVIDIA GeForce RTX 2070 (Desktop)
i9-9980HK, 2400 MHz
16422 Points
Intel Core i5-10600K, NVIDIA Titan RTX
i5-10600K, 4100 MHz
15961 Points -3%
Durchschnittliche Intel Core i9-9980HK
  (9056 - 18260, n=12)
15688 Points -4%
Durchschnittliche Intel Core i7-9750H
  (9704 - 14337, n=80)
12766 Points -22%
Intel Core i9-9980HK, Intel UHD Graphics 630
i9-9980HK, 2400 MHz
9056 Points -45%
Durchschnittliche Intel Core i5-9300H
  (7499 - 10557, n=12)
8987 Points -45%
7-Zip 18.03
7z b 4
AMD Ryzen 9 3950X, NVIDIA Titan RTX
R9 3950X, 3500 MHz
99467 MIPS +126%
Intel Core i9-10900K, NVIDIA Titan RTX
i9-10900K, 3700 MHz
70968 MIPS +61%
Intel Core i9-9980HK, NVIDIA GeForce RTX 2070 (Desktop)
i9-9980HK, 2400 MHz
44081 MIPS
Durchschnittliche Intel Core i9-9980HK
  (39566 - 44081, n=4)
41756 MIPS -5%
Intel Core i5-10600K, NVIDIA Titan RTX
i5-10600K, 4100 MHz
40379 MIPS -8%
Durchschnittliche Intel Core i7-9750H
  (28512 - 35174, n=21)
32357 MIPS -27%
Durchschnittliche Intel Core i5-9300H
  (20736 - 23155, n=3)
22008 MIPS -50%
7z b 4 -mmt1
Intel Core i9-10900K, NVIDIA Titan RTX
i9-10900K, 3700 MHz
5954 MIPS +6%
Intel Core i9-9980HK, NVIDIA GeForce RTX 2070 (Desktop)
i9-9980HK, 2400 MHz
5642 MIPS
Durchschnittliche Intel Core i9-9980HK
  (5283 - 5642, n=4)
5426 MIPS -4%
AMD Ryzen 9 3950X, NVIDIA Titan RTX
R9 3950X, 3500 MHz
5340 MIPS -5%
Intel Core i5-10600K, NVIDIA Titan RTX
i5-10600K, 4100 MHz
5289 MIPS -6%
Durchschnittliche Intel Core i7-9750H
  (4580 - 5090, n=21)
4846 MIPS -14%
Durchschnittliche Intel Core i5-9300H
  (4542 - 4626, n=3)
4592 MIPS -19%
HWBOT x265 Benchmark v2.2 - 4k Preset
Intel Core i9-10900K, NVIDIA Titan RTX
i9-10900K, 3700 MHz
21 fps +84%
AMD Ryzen 9 3950X, NVIDIA Titan RTX
R9 3950X, 3500 MHz
15.8 fps +39%
Intel Core i5-10600K, NVIDIA Titan RTX
i5-10600K, 4100 MHz
12.2 fps +7%
Durchschnittliche Intel Core i9-9980HK
  (10.8 - 12.4, n=3)
11.5 fps +1%
Intel Core i9-9980HK, NVIDIA GeForce RTX 2070 (Desktop)
i9-9980HK, 2400 MHz
11.4 fps
Durchschnittliche Intel Core i7-9750H
  (7.1 - 10.7, n=21)
8.72 fps -24%
Durchschnittliche Intel Core i5-9300H
  (5.7 - 6.5, n=3)
6.07 fps -47%
R Benchmark 2.5 - Overall mean
Durchschnittliche Intel Core i7-9750H
  (0.608 - 0.695, n=14)
0.643 sec * -19%
Intel Core i5-10600K, NVIDIA Titan RTX
i5-10600K, 4100 MHz
0.593 sec * -10%
Intel Core i9-9980HK, NVIDIA GeForce RTX 2070 (Desktop)
i9-9980HK, 2400 MHz
0.541 sec *
Durchschnittliche Intel Core i9-9980HK
  ()
0.541 sec * -0%
Intel Core i9-10900K, NVIDIA Titan RTX
i9-10900K, 3700 MHz
0.528 sec * +2%
AMD Ryzen 9 3950X, NVIDIA Titan RTX
R9 3950X, 3500 MHz
0.524 sec * +3%
LibreOffice - 20 Documents To PDF
Intel Core i9-10900K, NVIDIA Titan RTX
i9-10900K, 3700 MHz
76 s * -68%
Durchschnittliche Intel Core i7-9750H
  (54.5 - 64.7, n=9)
59 s * -30%
AMD Ryzen 9 3950X, NVIDIA Titan RTX
R9 3950X, 3500 MHz
53.6 s * -19%
Durchschnittliche Intel Core i9-9980HK
  (45.2 - 57.5, n=2)
51.4 s * -14%
Intel Core i5-10600K, NVIDIA Titan RTX
i5-10600K, 4100 MHz
46.06 s * -2%
Intel Core i9-9980HK, NVIDIA GeForce RTX 2070 (Desktop)
i9-9980HK, 2400 MHz
45.23 s *
WebXPRT 3 - Overall
Intel Core i9-10900K, NVIDIA Titan RTX
i9-10900K, 3700 MHz
255 Points +9%
AMD Ryzen 9 3950X, NVIDIA Titan RTX
R9 3950X, 3500 MHz
239 Points +3%
Intel Core i5-10600K, NVIDIA Titan RTX
i5-10600K, 4100 MHz
239 Points +3%
Intel Core i9-9980HK, NVIDIA GeForce RTX 2070 (Desktop)
i9-9980HK, 2400 MHz
233 Points
Durchschnittliche Intel Core i9-9980HK
  ()
233 Points 0%
Durchschnittliche Intel Core i5-9300H
  ()
222 Points -5%
Durchschnittliche Intel Core i7-9750H
  (199 - 231, n=10)
211 Points -9%
Mozilla Kraken 1.1 - Total
Durchschnittliche Intel Core i5-9300H
  (1079 - 1349, n=8)
1138 ms * -51%
Durchschnittliche Intel Core i7-9750H
  (845 - 1713, n=54)
1048 ms * -39%
Durchschnittliche Intel Core i9-9980HK
  (705 - 999, n=9)
878 ms * -16%
Intel Core i5-10600K, NVIDIA Titan RTX
i5-10600K, 4100 MHz
760 ms * -1%
Intel Core i9-9980HK, NVIDIA GeForce RTX 2070 (Desktop)
i9-9980HK, 2400 MHz
754 ms *
Intel Core i9-10900K, NVIDIA Titan RTX
i9-10900K, 3700 MHz
709 ms * +6%
AMD Ryzen 9 3950X, NVIDIA Titan RTX
R9 3950X, 3500 MHz
706 ms * +6%
3DMark
3840x2160 Fire Strike Ultra Physics
AMD Ryzen 9 3950X, NVIDIA Titan RTX
R9 3950X, 3500 MHz
31881 Points +46%
Intel Core i9-10900K, NVIDIA Titan RTX
i9-10900K, 3700 MHz
29374 Points +34%
Intel Core i9-9980HK, NVIDIA GeForce RTX 2070 (Desktop)
i9-9980HK, 2400 MHz
21864 Points
Durchschnittliche Intel Core i9-9980HK
  (19832 - 22568, n=8)
21323 Points -2%
Intel Core i5-10600K, NVIDIA Titan RTX
i5-10600K, 4100 MHz
19942 Points -9%
Intel Core i9-9980HK, Intel UHD Graphics 630
i9-9980HK, 2400 MHz
19832 Points -9%
Durchschnittliche Intel Core i7-9750H
  (12628 - 17820, n=51)
16437 Points -25%
Durchschnittliche Intel Core i5-9300H
  (9749 - 12343, n=6)
11357 Points -48%
1920x1080 Fire Strike Physics
AMD Ryzen 9 3950X, NVIDIA Titan RTX
R9 3950X, 3500 MHz
32004 Points +47%
Intel Core i9-10900K, NVIDIA Titan RTX
i9-10900K, 3700 MHz
29805 Points +37%
Intel Core i9-9980HK, NVIDIA GeForce RTX 2070 (Desktop)
i9-9980HK, 2400 MHz
21706 Points
Intel Core i9-9980HK, Intel UHD Graphics 630
i9-9980HK, 2400 MHz
20357 Points -6%
Intel Core i5-10600K, NVIDIA Titan RTX
i5-10600K, 4100 MHz
20040 Points -8%
Durchschnittliche Intel Core i9-9980HK
  (11758 - 22463, n=11)
19893 Points -8%
Durchschnittliche Intel Core i7-9750H
  (12438 - 17788, n=76)
16332 Points -25%
Durchschnittliche Intel Core i5-9300H
  (9387 - 12349, n=12)
11376 Points -48%
2560x1440 Time Spy CPU
Intel Core i9-10900K, NVIDIA Titan RTX
i9-10900K, 3700 MHz
14326 Points +52%
AMD Ryzen 9 3950X, NVIDIA Titan RTX
R9 3950X, 3500 MHz
12404 Points +32%
Intel Core i9-9980HK, NVIDIA GeForce RTX 2070 (Desktop)
i9-9980HK, 2400 MHz
9417 Points
Durchschnittliche Intel Core i9-9980HK
  (5540 - 10162, n=12)
8487 Points -10%
Intel Core i5-10600K, NVIDIA Titan RTX
i5-10600K, 4100 MHz
8290 Points -12%
Intel Core i9-9980HK, Intel UHD Graphics 630
i9-9980HK, 2400 MHz
7243 Points -23%
Durchschnittliche Intel Core i7-9750H
  (4620 - 7171, n=70)
6334 Points -33%
Durchschnittliche Intel Core i5-9300H
  (3165 - 4861, n=10)
4074 Points -57%

* ... kleinere Werte sind besser

Intel NUC 9 Extreme Kit in der Cinebench-R15-Multi-Schleife

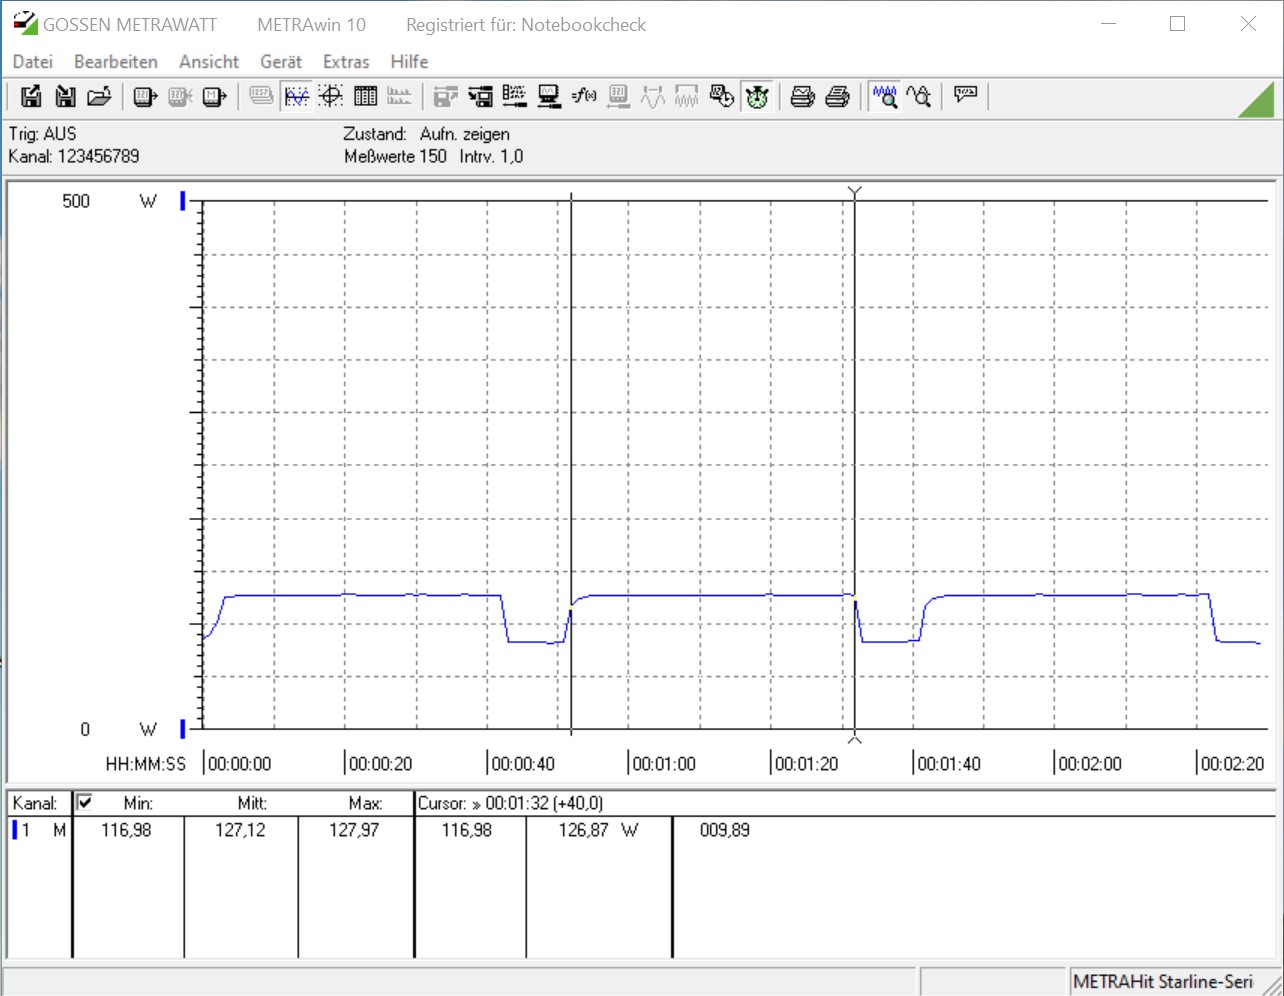
Trotz der sehr kompakten Bauweise arbeitet das Kühlsystem sehr gut, sodass auch bei der Cinebench-R15-Multi-Schleife ein dauerhaft hohes Ergebnis erzielt werden kann. Nach dem ersten Durchlauf den der Intel Core i9-9980HK noch mit dem vollen Turbo absolvieren kann sinkt die Leistung um etwa 150 Punkte und bleibt danach relativ stabil. Im Durchschnitt erreichte unser Testsample 1.463 Punkte. Wir haben diesen Test auch ohne die zusätzlich verbaute GeForce RTX 2070 gemacht, um zu schauen, ob die Grafikkarte durch den schlechteren Luftstrom im Gehäuse die Werte beeinflusst. Das konnten wir nicht feststellen. Auch ohne die dedizierte Grafikkarte war das Ergebnis bis auf geringe Abweichungen identisch.

1410.81460.81510.81560.8Tooltip
Intel Ghost Canyon NUC (RTX 2070) Intel Core i9-9980HK, Intel Core i9-9980HK: Ø1463 (1410.79-1593.44)

Anwendungsleistung

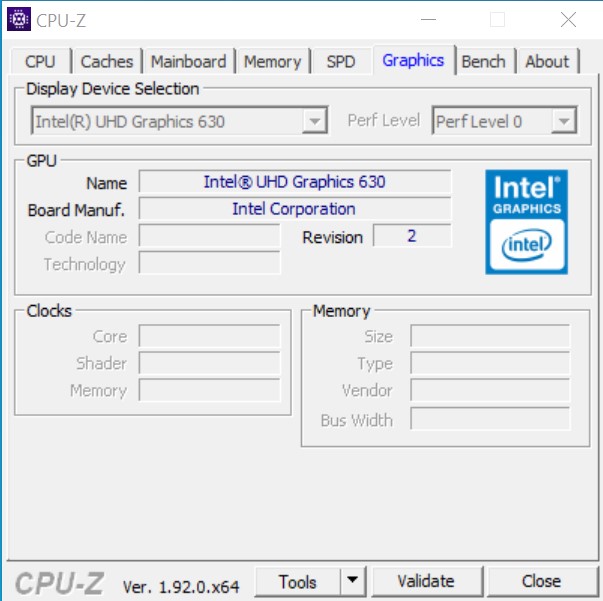
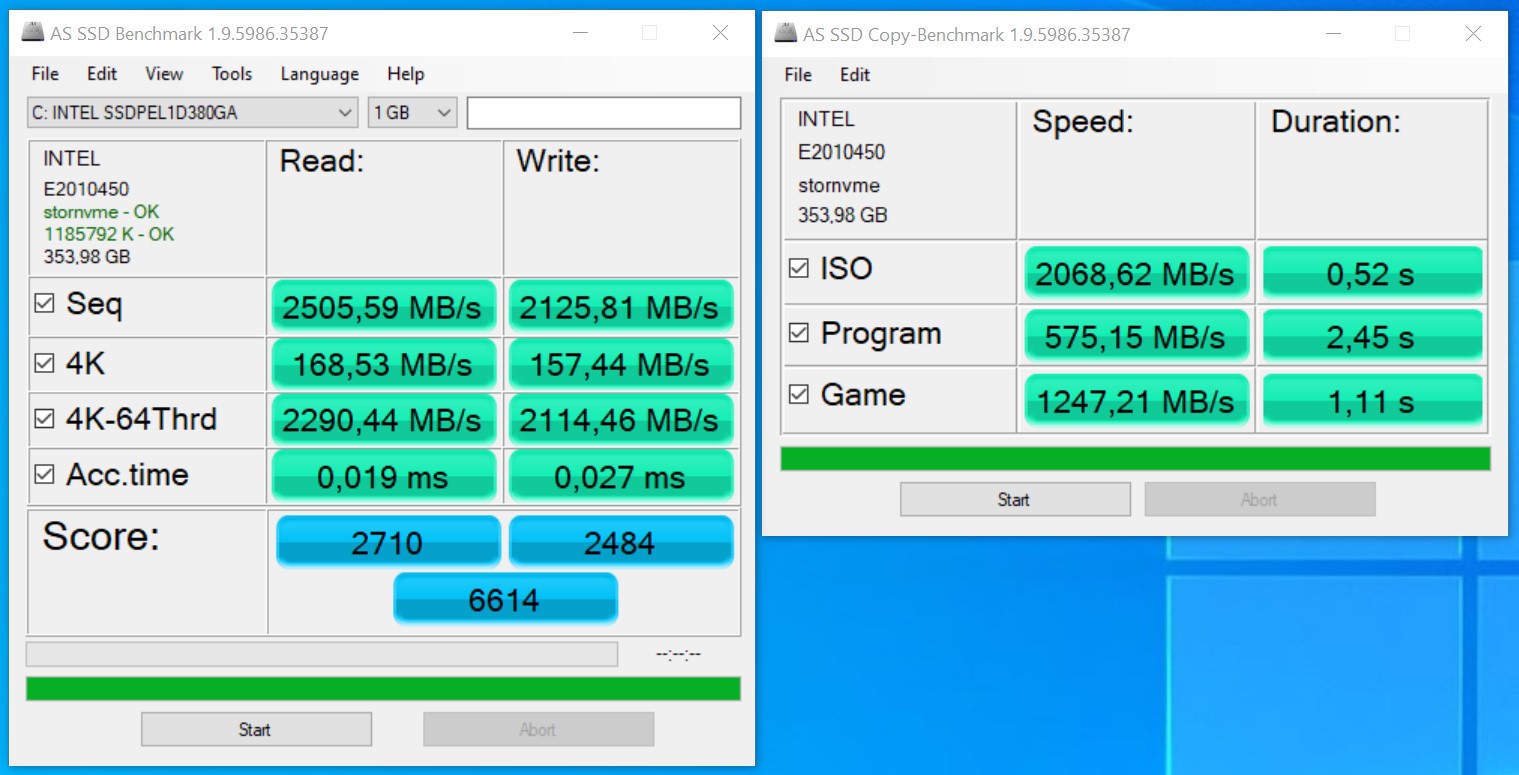
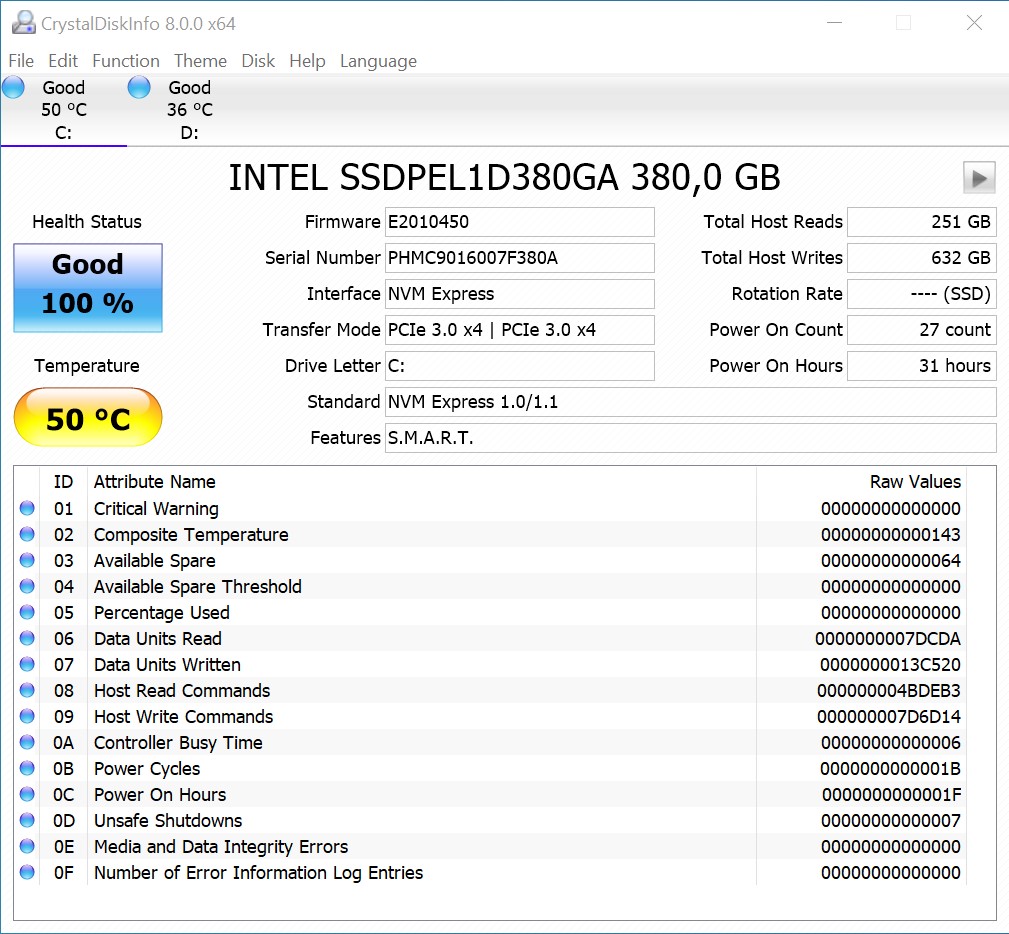
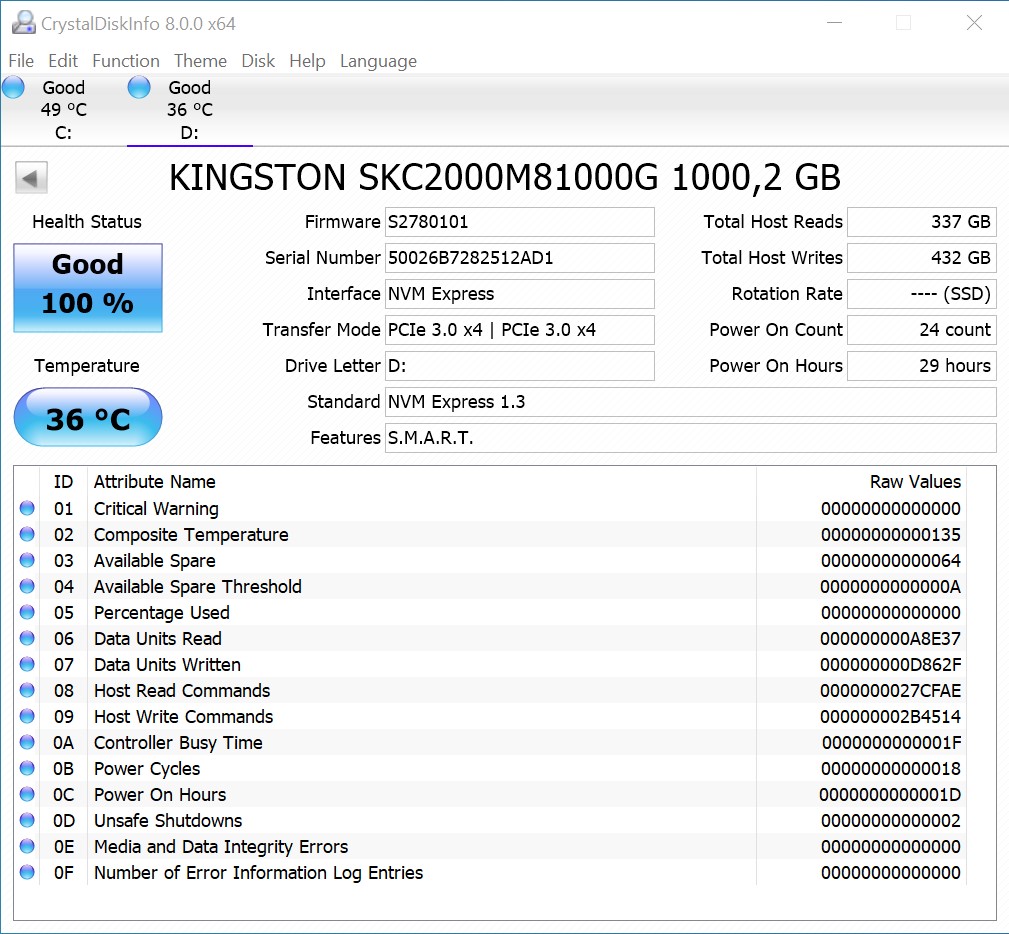
Bei den Anwendungsbenchmarks reiht sich der unser Testsample direkt hinter den drei Desktop-Prozessoren ein. Wir haben diesen Test ebenfalls einmal mit der zusätzlich verbauten GeForce RTX 2070 gemacht und einmal ohne dedizierte Grafikkarte. Somit musste die Intel UHD Graphics 630 die Bildausgabe übernehmen. Einen deutlichen Nachteil gab es bei den Grafiktests, was aber zu erwarten war, da die iGPU im Vergleich zur RTX 2070 einfach zu schwach ist. Im Umkehrschluss lässt sich mit dem Intel NUC 9 Extreme sehr gut arbeiten. Die Performance der verbauten SSDs ist sehr gut. Dadurch lassen sich Wartezeiten auf ein Minimum begrenzen. Auch die nachfolgenden Spieletests stellte das System vor keine große Herausforderung. Wir finden es gut, dass Intel mit diesem NUC ein SSD-only-System auf die Beine gestellt hat. 

Intel Optane SSD 905P (380 GB)
Kingston KC2000 NVMe SSD (1.024 GB)
PCMark 10 - Score
AMD Ryzen 9 3950X, AMD Ryzen 9 3950X
NVIDIA Titan RTX
7869 Points +13%
Intel Core i9-10900K, Intel Core i9-10900K
NVIDIA Titan RTX
7641 Points +10%
Corsair One i160, Intel Core i9-9900K
NVIDIA GeForce RTX 2080 Ti (Desktop)
7329 Points +6%
Intel Core i5-10600K, Intel Core i5-10600K
NVIDIA Titan RTX
7279 Points +5%
Intel Ghost Canyon NUC (RTX 2070), Intel Core i9-9980HK
NVIDIA GeForce RTX 2070 (Desktop)
6939 Points
Intel Ghost Canyon NUC, Intel Core i9-9980HK
Intel UHD Graphics 630
4806 Points -31%
PCMark 8
Work Score Accelerated v2
AMD Ryzen 9 3950X, AMD Ryzen 9 3950X
NVIDIA Titan RTX
5388 Points +6%
Corsair One i160, Intel Core i9-9900K
NVIDIA GeForce RTX 2080 Ti (Desktop)
5296 Points +5%
Intel Core i5-10600K, Intel Core i5-10600K
NVIDIA Titan RTX
5148 Points +2%
Intel Core i9-10900K, Intel Core i9-10900K
NVIDIA Titan RTX
5115 Points +1%
Intel Ghost Canyon NUC (RTX 2070), Intel Core i9-9980HK
NVIDIA GeForce RTX 2070 (Desktop)
5066 Points
Intel Ghost Canyon NUC, Intel Core i9-9980HK
Intel UHD Graphics 630
4814 Points -5%
Creative Score Accelerated v2
Corsair One i160, Intel Core i9-9900K
NVIDIA GeForce RTX 2080 Ti (Desktop)
10550 Points +18%
AMD Ryzen 9 3950X, AMD Ryzen 9 3950X
NVIDIA Titan RTX
10402 Points +16%
Intel Core i5-10600K, Intel Core i5-10600K
NVIDIA Titan RTX
10349 Points +15%
Intel Core i9-10900K, Intel Core i9-10900K
NVIDIA Titan RTX
10245 Points +14%
Intel Ghost Canyon NUC (RTX 2070), Intel Core i9-9980HK
NVIDIA GeForce RTX 2070 (Desktop)
8969 Points
Intel Ghost Canyon NUC, Intel Core i9-9980HK
Intel UHD Graphics 630
5572 Points -38%
Home Score Accelerated v2
Corsair One i160, Intel Core i9-9900K
NVIDIA GeForce RTX 2080 Ti (Desktop)
5418 Points +3%
AMD Ryzen 9 3950X, AMD Ryzen 9 3950X
NVIDIA Titan RTX
5404 Points +3%
Intel Ghost Canyon NUC (RTX 2070), Intel Core i9-9980HK
NVIDIA GeForce RTX 2070 (Desktop)
5247 Points
Intel Core i5-10600K, Intel Core i5-10600K
NVIDIA Titan RTX
5212 Points -1%
Intel Core i9-10900K, Intel Core i9-10900K
NVIDIA Titan RTX
5185 Points -1%
Intel Ghost Canyon NUC, Intel Core i9-9980HK
Intel UHD Graphics 630
4075 Points -22%
SPECviewperf 12
1900x1060 Solidworks (sw-03)
Intel Core i9-10900K, Intel Core i9-10900K
NVIDIA Titan RTX
172.2 fps +191%
Intel Core i5-10600K, Intel Core i5-10600K
NVIDIA Titan RTX
158.2 fps +167%
AMD Ryzen 9 3950X, AMD Ryzen 9 3950X
NVIDIA Titan RTX
157.6 fps +166%
Corsair One i160, Intel Core i9-9900K
NVIDIA GeForce RTX 2080 Ti (Desktop)
83.7 fps +41%
Intel Ghost Canyon NUC (RTX 2070), Intel Core i9-9980HK
NVIDIA GeForce RTX 2070 (Desktop)
59.2 fps
Intel Ghost Canyon NUC, Intel Core i9-9980HK
Intel UHD Graphics 630
29.03 fps -51%
1900x1060 Siemens NX (snx-02)
Intel Core i9-10900K, Intel Core i9-10900K
NVIDIA Titan RTX
263.3 fps +2800%
Intel Core i5-10600K, Intel Core i5-10600K
NVIDIA Titan RTX
259.1 fps +2754%
AMD Ryzen 9 3950X, AMD Ryzen 9 3950X
NVIDIA Titan RTX
254.8 fps +2706%
Corsair One i160, Intel Core i9-9900K
NVIDIA GeForce RTX 2080 Ti (Desktop)
12.72 fps +40%
Intel Ghost Canyon NUC (RTX 2070), Intel Core i9-9980HK
NVIDIA GeForce RTX 2070 (Desktop)
9.08 fps
Intel Ghost Canyon NUC, Intel Core i9-9980HK
Intel UHD Graphics 630
3.37 fps -63%
1900x1060 Showcase (showcase-01)
Intel Core i5-10600K, Intel Core i5-10600K
NVIDIA Titan RTX
196.1 fps +65%
Intel Core i9-10900K, Intel Core i9-10900K
NVIDIA Titan RTX
192.4 fps +62%
AMD Ryzen 9 3950X, AMD Ryzen 9 3950X
NVIDIA Titan RTX
188.3 fps +59%
Corsair One i160, Intel Core i9-9900K
NVIDIA GeForce RTX 2080 Ti (Desktop)
182.3 fps +54%
Intel Ghost Canyon NUC (RTX 2070), Intel Core i9-9980HK
NVIDIA GeForce RTX 2070 (Desktop)
118.5 fps
Intel Ghost Canyon NUC, Intel Core i9-9980HK
Intel UHD Graphics 630
8.38 fps -93%
1900x1060 Medical (medical-01)
Intel Core i5-10600K, Intel Core i5-10600K
NVIDIA Titan RTX
94.6 fps +136%
Intel Core i9-10900K, Intel Core i9-10900K
NVIDIA Titan RTX
94.5 fps +135%
AMD Ryzen 9 3950X, AMD Ryzen 9 3950X
NVIDIA Titan RTX
88.1 fps +119%
Corsair One i160, Intel Core i9-9900K
NVIDIA GeForce RTX 2080 Ti (Desktop)
56.6 fps +41%
Intel Ghost Canyon NUC (RTX 2070), Intel Core i9-9980HK
NVIDIA GeForce RTX 2070 (Desktop)
40.14 fps
Intel Ghost Canyon NUC, Intel Core i9-9980HK
Intel UHD Graphics 630
2.96 fps -93%
1900x1060 Maya (maya-04)
Corsair One i160, Intel Core i9-9900K
NVIDIA GeForce RTX 2080 Ti (Desktop)
190.9 fps +12%
Intel Core i9-10900K, Intel Core i9-10900K
NVIDIA Titan RTX
188.7 fps +10%
AMD Ryzen 9 3950X, AMD Ryzen 9 3950X
NVIDIA Titan RTX
172.2 fps +1%
Intel Ghost Canyon NUC (RTX 2070), Intel Core i9-9980HK
NVIDIA GeForce RTX 2070 (Desktop)
171 fps
Intel Core i5-10600K, Intel Core i5-10600K
NVIDIA Titan RTX
169.4 fps -1%
Intel Ghost Canyon NUC, Intel Core i9-9980HK
Intel UHD Graphics 630
15.67 fps -91%
1900x1060 Energy (energy-01)
Intel Core i5-10600K, Intel Core i5-10600K
NVIDIA Titan RTX
28.77 fps +150%
Intel Core i9-10900K, Intel Core i9-10900K
NVIDIA Titan RTX
28.72 fps +150%
AMD Ryzen 9 3950X, AMD Ryzen 9 3950X
NVIDIA Titan RTX
28.18 fps +145%
Corsair One i160, Intel Core i9-9900K
NVIDIA GeForce RTX 2080 Ti (Desktop)
16.72 fps +46%
Intel Ghost Canyon NUC (RTX 2070), Intel Core i9-9980HK
NVIDIA GeForce RTX 2070 (Desktop)
11.49 fps
Intel Ghost Canyon NUC, Intel Core i9-9980HK
Intel UHD Graphics 630
0.29 fps -97%
1900x1060 Creo (creo-01)
Intel Core i9-10900K, Intel Core i9-10900K
NVIDIA Titan RTX
157.2 fps +201%
Intel Core i5-10600K, Intel Core i5-10600K
NVIDIA Titan RTX
142.7 fps +173%
AMD Ryzen 9 3950X, AMD Ryzen 9 3950X
NVIDIA Titan RTX
134.8 fps +158%
Corsair One i160, Intel Core i9-9900K
NVIDIA GeForce RTX 2080 Ti (Desktop)
72.2 fps +38%
Intel Ghost Canyon NUC (RTX 2070), Intel Core i9-9980HK
NVIDIA GeForce RTX 2070 (Desktop)
52.2 fps
Intel Ghost Canyon NUC, Intel Core i9-9980HK
Intel UHD Graphics 630
14.51 fps -72%
1900x1060 Catia (catia-04)
Intel Core i9-10900K, Intel Core i9-10900K
NVIDIA Titan RTX
225.2 fps +188%
AMD Ryzen 9 3950X, AMD Ryzen 9 3950X
NVIDIA Titan RTX
218.4 fps +179%
Intel Core i5-10600K, Intel Core i5-10600K
NVIDIA Titan RTX
215.5 fps +175%
Corsair One i160, Intel Core i9-9900K
NVIDIA GeForce RTX 2080 Ti (Desktop)
120.8 fps +54%
Intel Ghost Canyon NUC (RTX 2070), Intel Core i9-9980HK
NVIDIA GeForce RTX 2070 (Desktop)
78.3 fps
Intel Ghost Canyon NUC, Intel Core i9-9980HK
Intel UHD Graphics 630
16.61 fps -79%
1900x1060 3ds Max (3dsmax-05)
Intel Core i9-10900K, Intel Core i9-10900K
NVIDIA Titan RTX
297.4 fps +64%
Intel Core i5-10600K, Intel Core i5-10600K
NVIDIA Titan RTX
296.9 fps +64%
AMD Ryzen 9 3950X, AMD Ryzen 9 3950X
NVIDIA Titan RTX
274.5 fps +52%
Corsair One i160, Intel Core i9-9900K
NVIDIA GeForce RTX 2080 Ti (Desktop)
271.8 fps +50%
Intel Ghost Canyon NUC (RTX 2070), Intel Core i9-9980HK
NVIDIA GeForce RTX 2070 (Desktop)
180.8 fps
Intel Ghost Canyon NUC, Intel Core i9-9980HK
Intel UHD Graphics 630
11.27 fps -94%
SPECviewperf 13
Solidworks (sw-04)
Intel Core i9-10900K, Intel Core i9-10900K
NVIDIA Titan RTX
166.2 fps +95%
Intel Core i5-10600K, Intel Core i5-10600K
NVIDIA Titan RTX
153.9 fps +80%
AMD Ryzen 9 3950X, AMD Ryzen 9 3950X
NVIDIA Titan RTX
153.2 fps +79%
Corsair One i160, Intel Core i9-9900K
NVIDIA GeForce RTX 2080 Ti (Desktop)
116.3 fps +36%
Intel Ghost Canyon NUC (RTX 2070), Intel Core i9-9980HK
NVIDIA GeForce RTX 2070 (Desktop)
85.4 fps
Intel Ghost Canyon NUC, Intel Core i9-9980HK
Intel UHD Graphics 630
37.96 fps -56%
Siemens NX (snx-03)
Intel Core i9-10900K, Intel Core i9-10900K
NVIDIA Titan RTX
472.9 fps +2796%
Intel Core i5-10600K, Intel Core i5-10600K
NVIDIA Titan RTX
469.1 fps +2773%
AMD Ryzen 9 3950X, AMD Ryzen 9 3950X
NVIDIA Titan RTX
460 fps +2717%
Corsair One i160, Intel Core i9-9900K
NVIDIA GeForce RTX 2080 Ti (Desktop)
23.03 fps +41%
Intel Ghost Canyon NUC (RTX 2070), Intel Core i9-9980HK
NVIDIA GeForce RTX 2070 (Desktop)
16.33 fps
Intel Ghost Canyon NUC, Intel Core i9-9980HK
Intel UHD Graphics 630
6.07 fps -63%
Showcase (showcase-02)
Intel Core i5-10600K, Intel Core i5-10600K
NVIDIA Titan RTX
195.1 fps +65%
Intel Core i9-10900K, Intel Core i9-10900K
NVIDIA Titan RTX
194.1 fps +64%
AMD Ryzen 9 3950X, AMD Ryzen 9 3950X
NVIDIA Titan RTX
186.8 fps +58%
Corsair One i160, Intel Core i9-9900K
NVIDIA GeForce RTX 2080 Ti (Desktop)
182.6 fps +54%
Intel Ghost Canyon NUC (RTX 2070), Intel Core i9-9980HK
NVIDIA GeForce RTX 2070 (Desktop)
118.5 fps
Intel Ghost Canyon NUC, Intel Core i9-9980HK
Intel UHD Graphics 630
8.34 fps -93%
Medical (medical-02)
AMD Ryzen 9 3950X, AMD Ryzen 9 3950X
NVIDIA Titan RTX
90.3 fps +60%
Intel Core i5-10600K, Intel Core i5-10600K
NVIDIA Titan RTX
89.7 fps +59%
Intel Core i9-10900K, Intel Core i9-10900K
NVIDIA Titan RTX
88.7 fps +57%
Corsair One i160, Intel Core i9-9900K
NVIDIA GeForce RTX 2080 Ti (Desktop)
85 fps +51%
Intel Ghost Canyon NUC (RTX 2070), Intel Core i9-9980HK
NVIDIA GeForce RTX 2070 (Desktop)
56.4 fps
Intel Ghost Canyon NUC, Intel Core i9-9980HK
Intel UHD Graphics 630
2.28 fps -96%
Maya (maya-05)
Intel Core i9-10900K, Intel Core i9-10900K
NVIDIA Titan RTX
405.9 fps +44%
Corsair One i160, Intel Core i9-9900K
NVIDIA GeForce RTX 2080 Ti (Desktop)
402 fps +43%
AMD Ryzen 9 3950X, AMD Ryzen 9 3950X
NVIDIA Titan RTX
394.9 fps +41%
Intel Core i5-10600K, Intel Core i5-10600K
NVIDIA Titan RTX
387.5 fps +38%
Intel Ghost Canyon NUC (RTX 2070), Intel Core i9-9980HK
NVIDIA GeForce RTX 2070 (Desktop)
281 fps
Intel Ghost Canyon NUC, Intel Core i9-9980HK
Intel UHD Graphics 630
23.03 fps -92%
Energy (energy-02)
Intel Core i5-10600K, Intel Core i5-10600K
NVIDIA Titan RTX
53.3 fps +144%
Intel Core i9-10900K, Intel Core i9-10900K
NVIDIA Titan RTX
53.2 fps +144%
AMD Ryzen 9 3950X, AMD Ryzen 9 3950X
NVIDIA Titan RTX
52.4 fps +140%
Corsair One i160, Intel Core i9-9900K
NVIDIA GeForce RTX 2080 Ti (Desktop)
31.93 fps +46%
Intel Ghost Canyon NUC (RTX 2070), Intel Core i9-9980HK
NVIDIA GeForce RTX 2070 (Desktop)
21.83 fps
Intel Ghost Canyon NUC, Intel Core i9-9980HK
Intel UHD Graphics 630
0.77 fps -96%
Creo (creo-02)
Intel Core i9-10900K, Intel Core i9-10900K
NVIDIA Titan RTX
336.3 fps +83%
Intel Core i5-10600K, Intel Core i5-10600K
NVIDIA Titan RTX
331.7 fps +80%
AMD Ryzen 9 3950X, AMD Ryzen 9 3950X
NVIDIA Titan RTX
328.8 fps +79%
Corsair One i160, Intel Core i9-9900K
NVIDIA GeForce RTX 2080 Ti (Desktop)
286.1 fps +56%
Intel Ghost Canyon NUC (RTX 2070), Intel Core i9-9980HK
NVIDIA GeForce RTX 2070 (Desktop)
183.8 fps
Intel Ghost Canyon NUC, Intel Core i9-9980HK
Intel UHD Graphics 630
18.83 fps -90%
Catia (catia-05)
Intel Core i9-10900K, Intel Core i9-10900K
NVIDIA Titan RTX
362.1 fps +218%
AMD Ryzen 9 3950X, AMD Ryzen 9 3950X
NVIDIA Titan RTX
355.2 fps +212%
Intel Core i5-10600K, Intel Core i5-10600K
NVIDIA Titan RTX
341.7 fps +201%
Corsair One i160, Intel Core i9-9900K
NVIDIA GeForce RTX 2080 Ti (Desktop)
177.3 fps +56%
Intel Ghost Canyon NUC (RTX 2070), Intel Core i9-9980HK
NVIDIA GeForce RTX 2070 (Desktop)
113.7 fps
Intel Ghost Canyon NUC, Intel Core i9-9980HK
Intel UHD Graphics 630
23.36 fps -79%
3ds Max (3dsmax-06)
Intel Core i5-10600K, Intel Core i5-10600K
NVIDIA Titan RTX
294.4 fps +65%
Intel Core i9-10900K, Intel Core i9-10900K
NVIDIA Titan RTX
292.5 fps +64%
AMD Ryzen 9 3950X, AMD Ryzen 9 3950X
NVIDIA Titan RTX
274.5 fps +54%
Corsair One i160, Intel Core i9-9900K
NVIDIA GeForce RTX 2080 Ti (Desktop)
265.9 fps +49%
Intel Ghost Canyon NUC (RTX 2070), Intel Core i9-9980HK
NVIDIA GeForce RTX 2070 (Desktop)
178.6 fps
Intel Ghost Canyon NUC, Intel Core i9-9980HK
Intel UHD Graphics 630
14.98 fps -92%

3D-Leistung und Gaming Performance

Bei der 3D-Leistung kommt es vielmehr darauf an, welche Grafikkarte in dem System steckt. Da Intel den Mini-PC ohne zusätzliche Grafikkarte vertreibt haben wir auch dementsprechend einmal die synthetischen Benchmarks mit der iGPU des Core i9-9980HK durchgeführt. Im Vergleich zu unseren durchschnittlichen Leistungen einer Intel UHD Graphics 630 ist die iGPU in unserem Testsample teilweise deutlich schneller. Für aufwendige Spiele eignet sich diese aber dennoch nicht. Hier bedarf es einer dedizierten Grafikkarte, welche uns in Form einer GeForce RTX 2070 Mini von Asus mitgeliefert wurde. Damit lassen sich selbst neueste Spiele problemlos in QHD flüssig auf den Bildschirm bringen. Von einer stärkeren Grafikkarte würden wir aber absehen, da das 500-Watt-Netzteil schon mit einer RTX 2070 sehr gut ausgelastet ist.

Für weitere Vergleiche und Benchmarks verweisen wir hier auf unsere GPU-Vergleichstabelle.

Borderlands 3
1280x720 Very Low Overall Quality (DX11)
Intel Ghost Canyon NUC (RTX 2070)
GeForce RTX 2070 (Desktop), i9-9980HK, Kingston KC2500 1 TB SKC2500M81000G
152 fps
Durchschnittliche NVIDIA GeForce RTX 2070 (Desktop)
  (138 - 152, n=2)
145 fps -5%
Durchschnittliche NVIDIA GeForce RTX 2070 Mobile
  (94 - 125, n=2)
109.5 fps -28%
Durchschnittliche Intel UHD Graphics 630
  ()
17.8 fps -88%
1920x1080 Badass Overall Quality (DX11)
Durchschnittliche NVIDIA GeForce RTX 2070 (Desktop)
  (70.9 - 74.4, n=2)
72.7 fps +3%
Intel Ghost Canyon NUC (RTX 2070)
GeForce RTX 2070 (Desktop), i9-9980HK, Kingston KC2500 1 TB SKC2500M81000G
70.9 fps
Durchschnittliche NVIDIA GeForce RTX 2070 Mobile
  (61 - 64.5, n=3)
62.9 fps -11%
Metro Exodus
1280x720 Low Quality AF:4x
Intel Ghost Canyon NUC (RTX 2070)
GeForce RTX 2070 (Desktop), i9-9980HK, Kingston KC2500 1 TB SKC2500M81000G
181 (100.48min - 268.67max) fps
Durchschnittliche NVIDIA GeForce RTX 2070 (Desktop)
  (82.7 - 181, n=4)
131.1 fps -28%
Durchschnittliche NVIDIA GeForce RTX 2070 Mobile
  (91.1 - 98, n=2)
94.6 fps -48%
Durchschnittliche Intel UHD Graphics 630
  ()
15.4 fps -91%
1920x1080 Ultra Quality AF:16x
Intel Ghost Canyon NUC (RTX 2070)
GeForce RTX 2070 (Desktop), i9-9980HK, Kingston KC2500 1 TB SKC2500M81000G
60.9 (33.61min - 92.62max) fps
Durchschnittliche NVIDIA GeForce RTX 2070 (Desktop)
  (33.4 - 62.8, n=4)
54.4 fps -11%
Durchschnittliche NVIDIA GeForce RTX 2070 Mobile
  (53.3 - 54.6, n=5)
53.9 fps -11%
Far Cry New Dawn
1280x720 Low Preset
Intel Ghost Canyon NUC (RTX 2070)
GeForce RTX 2070 (Desktop), i9-9980HK, Kingston KC2500 1 TB SKC2500M81000G
128 (92min - 190max) fps
Durchschnittliche NVIDIA GeForce RTX 2070 (Desktop)
  (117 - 128, n=3)
121.7 fps -5%
Durchschnittliche Intel UHD Graphics 630
  ()
17 fps -87%
1920x1080 Ultra Preset
Durchschnittliche NVIDIA GeForce RTX 2070 (Desktop)
  (79 - 94, n=3)
87.7 fps +11%
Durchschnittliche NVIDIA GeForce RTX 2070 Mobile
  (82 - 83, n=2)
82.5 fps +4%
Intel Ghost Canyon NUC (RTX 2070)
GeForce RTX 2070 (Desktop), i9-9980HK, Kingston KC2500 1 TB SKC2500M81000G
79 (61min - 99max) fps
Forza Horizon 4
1280x720 Very Low Preset
Intel Ghost Canyon NUC (RTX 2070)
GeForce RTX 2070 (Desktop), i9-9980HK, Kingston KC2500 1 TB SKC2500M81000G
198 fps
Durchschnittliche NVIDIA GeForce RTX 2070 (Desktop)
  (169 - 198, n=4)
183.3 fps -7%
Durchschnittliche NVIDIA GeForce RTX 2070 Mobile
  ()
137 fps -31%
1920x1080 Ultra Preset AA:2xMS
Durchschnittliche NVIDIA GeForce RTX 2070 (Desktop)
  (106 - 118, n=4)
111 fps +5%
Intel Ghost Canyon NUC (RTX 2070)
GeForce RTX 2070 (Desktop), i9-9980HK, Kingston KC2500 1 TB SKC2500M81000G
106 fps
Durchschnittliche NVIDIA GeForce RTX 2070 Mobile
  ()
94 fps -11%
Far Cry 5
1280x720 Low Preset AA:T
Intel Ghost Canyon NUC (RTX 2070)
GeForce RTX 2070 (Desktop), i9-9980HK, Kingston KC2500 1 TB SKC2500M81000G
147 (119min - 193max) fps
Durchschnittliche NVIDIA GeForce RTX 2070 Mobile
  ()
147 fps 0%
Durchschnittliche NVIDIA GeForce RTX 2070 (Desktop)
  (126 - 147, n=4)
132.5 fps -10%
Durchschnittliche Intel UHD Graphics 630
  (13 - 15, n=3)
14 fps -90%
1920x1080 Ultra Preset AA:T
Durchschnittliche NVIDIA GeForce RTX 2070 Mobile
  (103 - 109, n=2)
106 fps +23%
Durchschnittliche NVIDIA GeForce RTX 2070 (Desktop)
  (86 - 105, n=4)
99.8 fps +16%
Intel Ghost Canyon NUC (RTX 2070)
GeForce RTX 2070 (Desktop), i9-9980HK, Kingston KC2500 1 TB SKC2500M81000G
86 (68min - 111max) fps
X-Plane 11.11
1280x720 low (fps_test=1)
Intel Ghost Canyon NUC (RTX 2070)
GeForce RTX 2070 (Desktop), i9-9980HK, Kingston KC2500 1 TB SKC2500M81000G
127 fps
Durchschnittliche NVIDIA GeForce RTX 2070 (Desktop)
  ()
127 fps 0%
Durchschnittliche NVIDIA GeForce RTX 2070 Mobile
  (96.1 - 128.4, n=8)
107.9 fps -15%
Durchschnittliche Intel UHD Graphics 630
  (11.6 - 31.3, n=10)
21 fps -83%
1920x1080 high (fps_test=3)
Intel Ghost Canyon NUC (RTX 2070)
GeForce RTX 2070 (Desktop), i9-9980HK, Kingston KC2500 1 TB SKC2500M81000G
92.7 fps
Durchschnittliche NVIDIA GeForce RTX 2070 (Desktop)
  ()
92.7 fps 0%
Durchschnittliche NVIDIA GeForce RTX 2070 Mobile
  (71.9 - 92.5, n=8)
79.9 fps -14%
Durchschnittliche Intel UHD Graphics 630
  (10.3 - 18.3, n=10)
13.8 fps -85%
Final Fantasy XV Benchmark
1280x720 Lite Quality
Intel Ghost Canyon NUC (RTX 2070)
GeForce RTX 2070 (Desktop), i9-9980HK, Kingston KC2500 1 TB SKC2500M81000G
193 (94min - 237max) fps
Durchschnittliche NVIDIA GeForce RTX 2070 Mobile
  (151 - 158, n=2)
154.5 fps -20%
Durchschnittliche NVIDIA GeForce RTX 2070 (Desktop)
  (106.5 - 193, n=5)
154.4 fps -20%
Durchschnittliche Intel UHD Graphics 630
  (9.5 - 14, n=3)
11.6 fps -94%
1920x1080 High Quality
Intel Ghost Canyon NUC (RTX 2070)
GeForce RTX 2070 (Desktop), i9-9980HK, Kingston KC2500 1 TB SKC2500M81000G
90.6 (56min - 138max) fps
Durchschnittliche NVIDIA GeForce RTX 2070 (Desktop)
  (60.8 - 90.6, n=5)
81.9 fps -10%
Durchschnittliche NVIDIA GeForce RTX 2070 Mobile
  (77 - 80.6, n=3)
78.6 fps -13%
Dota 2 Reborn
1280x720 min (0/3) fastest
Intel Ghost Canyon NUC (RTX 2070)
GeForce RTX 2070 (Desktop), i9-9980HK, Kingston KC2500 1 TB SKC2500M81000G
155.6 (135.2min) fps
Durchschnittliche NVIDIA GeForce RTX 2070 (Desktop)
  ()
155.6 fps 0%
Durchschnittliche NVIDIA GeForce RTX 2070 Mobile
  (129.7 - 153, n=9)
144.4 fps -7%
Durchschnittliche Intel UHD Graphics 630
  (70.4 - 99.1, n=11)
80.6 fps -48%
1920x1080 ultra (3/3) best looking
Intel Ghost Canyon NUC (RTX 2070)
GeForce RTX 2070 (Desktop), i9-9980HK, Kingston KC2500 1 TB SKC2500M81000G
130.3 (114.9min) fps
Durchschnittliche NVIDIA GeForce RTX 2070 (Desktop)
  ()
130.3 fps 0%
Durchschnittliche NVIDIA GeForce RTX 2070 Mobile
  (98.4 - 124, n=9)
115.9 fps -11%
Durchschnittliche Intel UHD Graphics 630
  (6.8 - 21, n=11)
17.8 fps -86%
The Witcher 3
1024x768 Low Graphics & Postprocessing
Durchschnittliche NVIDIA GeForce RTX 2070 Mobile
  (193.9 - 357, n=12)
290 fps +1%
Intel Ghost Canyon NUC (RTX 2070)
GeForce RTX 2070 (Desktop), i9-9980HK, Kingston KC2500 1 TB SKC2500M81000G
286 (243min - 334max) fps
Durchschnittliche NVIDIA GeForce RTX 2070 (Desktop)
  (151.4 - 315, n=5)
271 fps -5%
Durchschnittliche Intel UHD Graphics 630
  (15.2 - 17.3, n=3)
16.2 fps -94%
1920x1080 Ultra Graphics & Postprocessing (HBAO+)
Intel Ghost Canyon NUC (RTX 2070)
GeForce RTX 2070 (Desktop), i9-9980HK, Kingston KC2500 1 TB SKC2500M81000G
83.1 (72min - 93max) fps
Durchschnittliche NVIDIA GeForce RTX 2070 (Desktop)
  (40.9 - 95, n=5)
79.2 fps -5%
Durchschnittliche NVIDIA GeForce RTX 2070 Mobile
  (64 - 82.1, n=21)
74.3 fps -11%
3DMark
Fire Strike Extreme Graphics
Durchschnittliche NVIDIA GeForce RTX 2070 (Desktop)
  (9979 - 11423, n=5)
10987 Points +10%
Intel Ghost Canyon NUC (RTX 2070)
GeForce RTX 2070 (Desktop), i9-9980HK, Kingston KC2500 1 TB SKC2500M81000G
9979 Points
Durchschnittliche NVIDIA GeForce RTX 2070 Mobile
  (9042 - 9335, n=3)
9179 Points -8%
Intel Ghost Canyon NUC
UHD Graphics 630, i9-9980HK, Kingston KC2500 1 TB SKC2500M81000G
657 Points -93%
Durchschnittliche Intel UHD Graphics 630
  (600 - 657, n=2)
629 Points -94%
1920x1080 Fire Strike Graphics
Durchschnittliche NVIDIA GeForce RTX 2070 (Desktop)
  (16770 - 24242, n=6)
21999 Points +6%
Intel Ghost Canyon NUC (RTX 2070)
GeForce RTX 2070 (Desktop), i9-9980HK, Kingston KC2500 1 TB SKC2500M81000G
20775 Points
Durchschnittliche NVIDIA GeForce RTX 2070 Mobile
  (18169 - 21138, n=19)
20123 Points -3%
Intel Ghost Canyon NUC
UHD Graphics 630, i9-9980HK, Kingston KC2500 1 TB SKC2500M81000G
1472 Points -93%
Durchschnittliche Intel UHD Graphics 630
  (722 - 1472, n=11)
1228 Points -94%
2560x1440 Time Spy Graphics
Durchschnittliche NVIDIA GeForce RTX 2070 (Desktop)
  (7445 - 9656, n=6)
8952 Points +4%
Intel Ghost Canyon NUC (RTX 2070)
GeForce RTX 2070 (Desktop), i9-9980HK, Kingston KC2500 1 TB SKC2500M81000G
8631 Points
Durchschnittliche NVIDIA GeForce RTX 2070 Mobile
  (7006 - 8028, n=18)
7651 Points -11%
Intel Ghost Canyon NUC
UHD Graphics 630, i9-9980HK, Kingston KC2500 1 TB SKC2500M81000G
459 Points -95%
Durchschnittliche Intel UHD Graphics 630
  (367 - 459, n=10)
410 Points -95%
3DMark 11
1280x720 Performance GPU
Durchschnittliche NVIDIA GeForce RTX 2070 (Desktop)
  (22174 - 32373, n=7)
29866 Points +4%
Intel Ghost Canyon NUC (RTX 2070)
GeForce RTX 2070 (Desktop), i9-9980HK, Kingston KC2500 1 TB SKC2500M81000G
28828 Points
Durchschnittliche NVIDIA GeForce RTX 2070 Mobile
  (23335 - 27298, n=21)
25775 Points -11%
Intel Ghost Canyon NUC
UHD Graphics 630, i9-9980HK, Kingston KC2500 1 TB SKC2500M81000G
2025 Points -93%
Durchschnittliche Intel UHD Graphics 630
  (642 - 2025, n=12)
1742 Points -94%
1280x720 Performance
Intel Ghost Canyon NUC (RTX 2070)
GeForce RTX 2070 (Desktop), i9-9980HK, Kingston KC2500 1 TB SKC2500M81000G
24131 Points
Durchschnittliche NVIDIA GeForce RTX 2070 (Desktop)
  (15341 - 27206, n=7)
23703 Points -2%
Durchschnittliche NVIDIA GeForce RTX 2070 Mobile
  (17817 - 23447, n=21)
20620 Points -15%
Intel Ghost Canyon NUC
UHD Graphics 630, i9-9980HK, Kingston KC2500 1 TB SKC2500M81000G
2259 Points -91%
Durchschnittliche Intel UHD Graphics 630
  (790 - 2326, n=12)
1990 Points -92%
min. mittel hoch max.QHD4K
The Witcher 3 (2015) 286 216 142 83.1 55.9
Dota 2 Reborn (2015) 155.6 141.8 137.6 130.3 116.1
Final Fantasy XV Benchmark (2018) 193 122 90.6 37.1
X-Plane 11.11 (2018) 127 115 92.7 82.2
Far Cry 5 (2018) 147 106 82 86 71 46
Forza Horizon 4 (2018) 198 141 132 106 88 61
Far Cry New Dawn (2019) 128 92 87 79 63 49
Metro Exodus (2019) 181 104 77 60.9 48.4 30.5
Borderlands 3 (2019) 152 126 91.7 70.9 49.8 26.7

Energieverbrauch und Hitzeentwicklung beim Intel NUC 9 Extreme

Intel NUC 9 Extreme Kit beim Stresstest

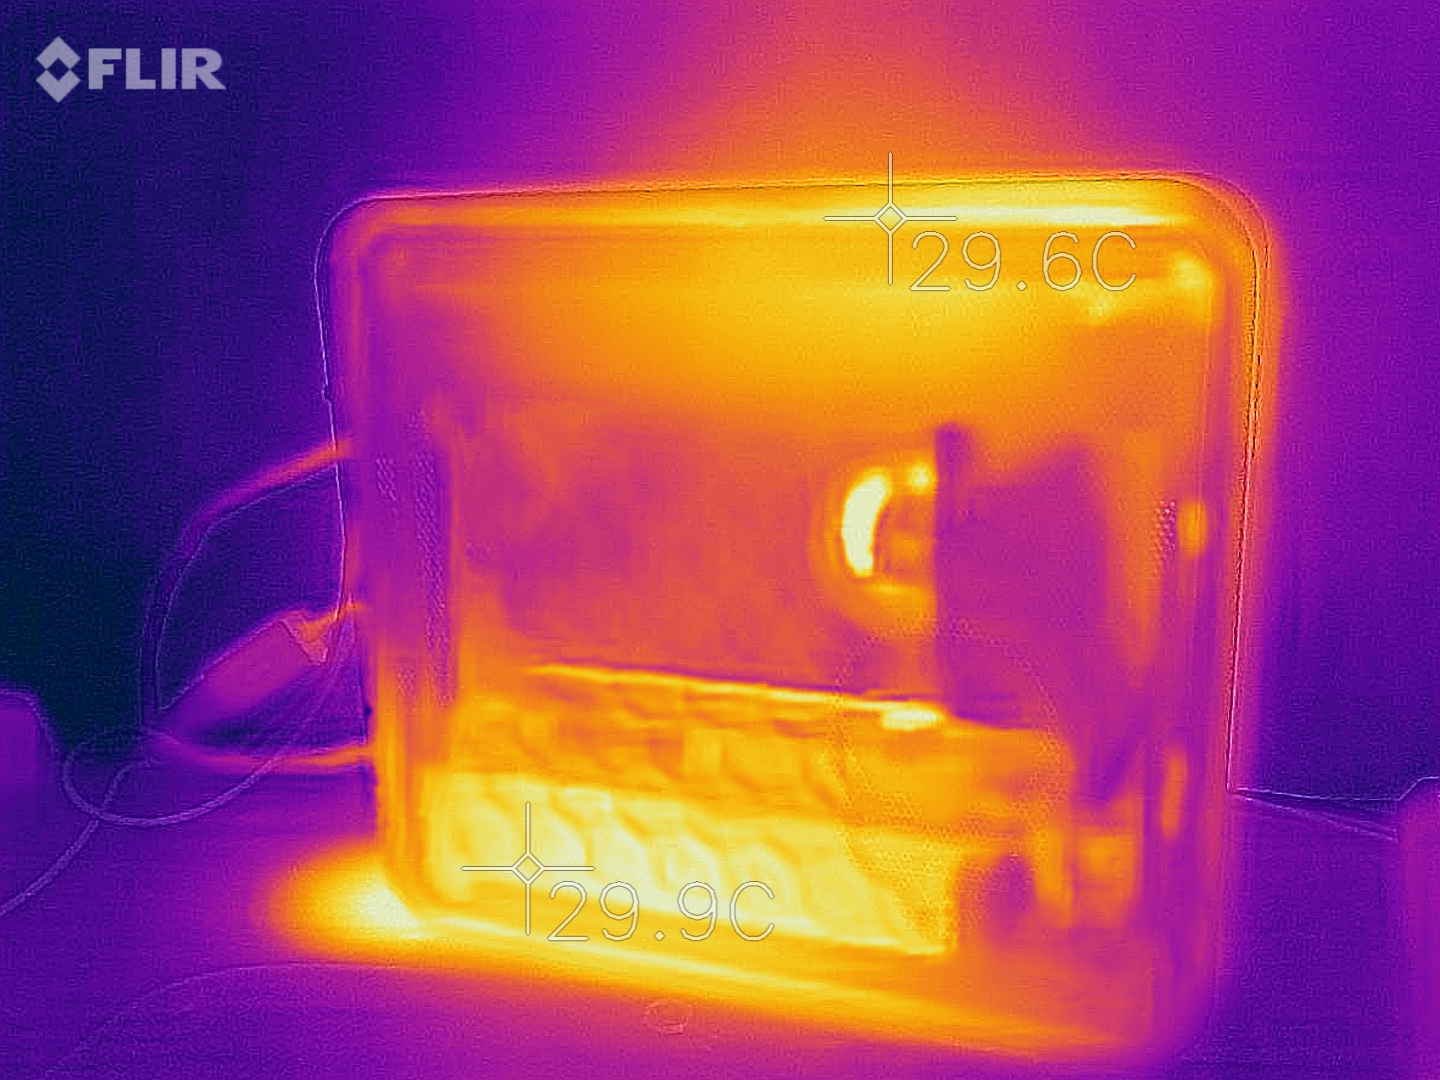
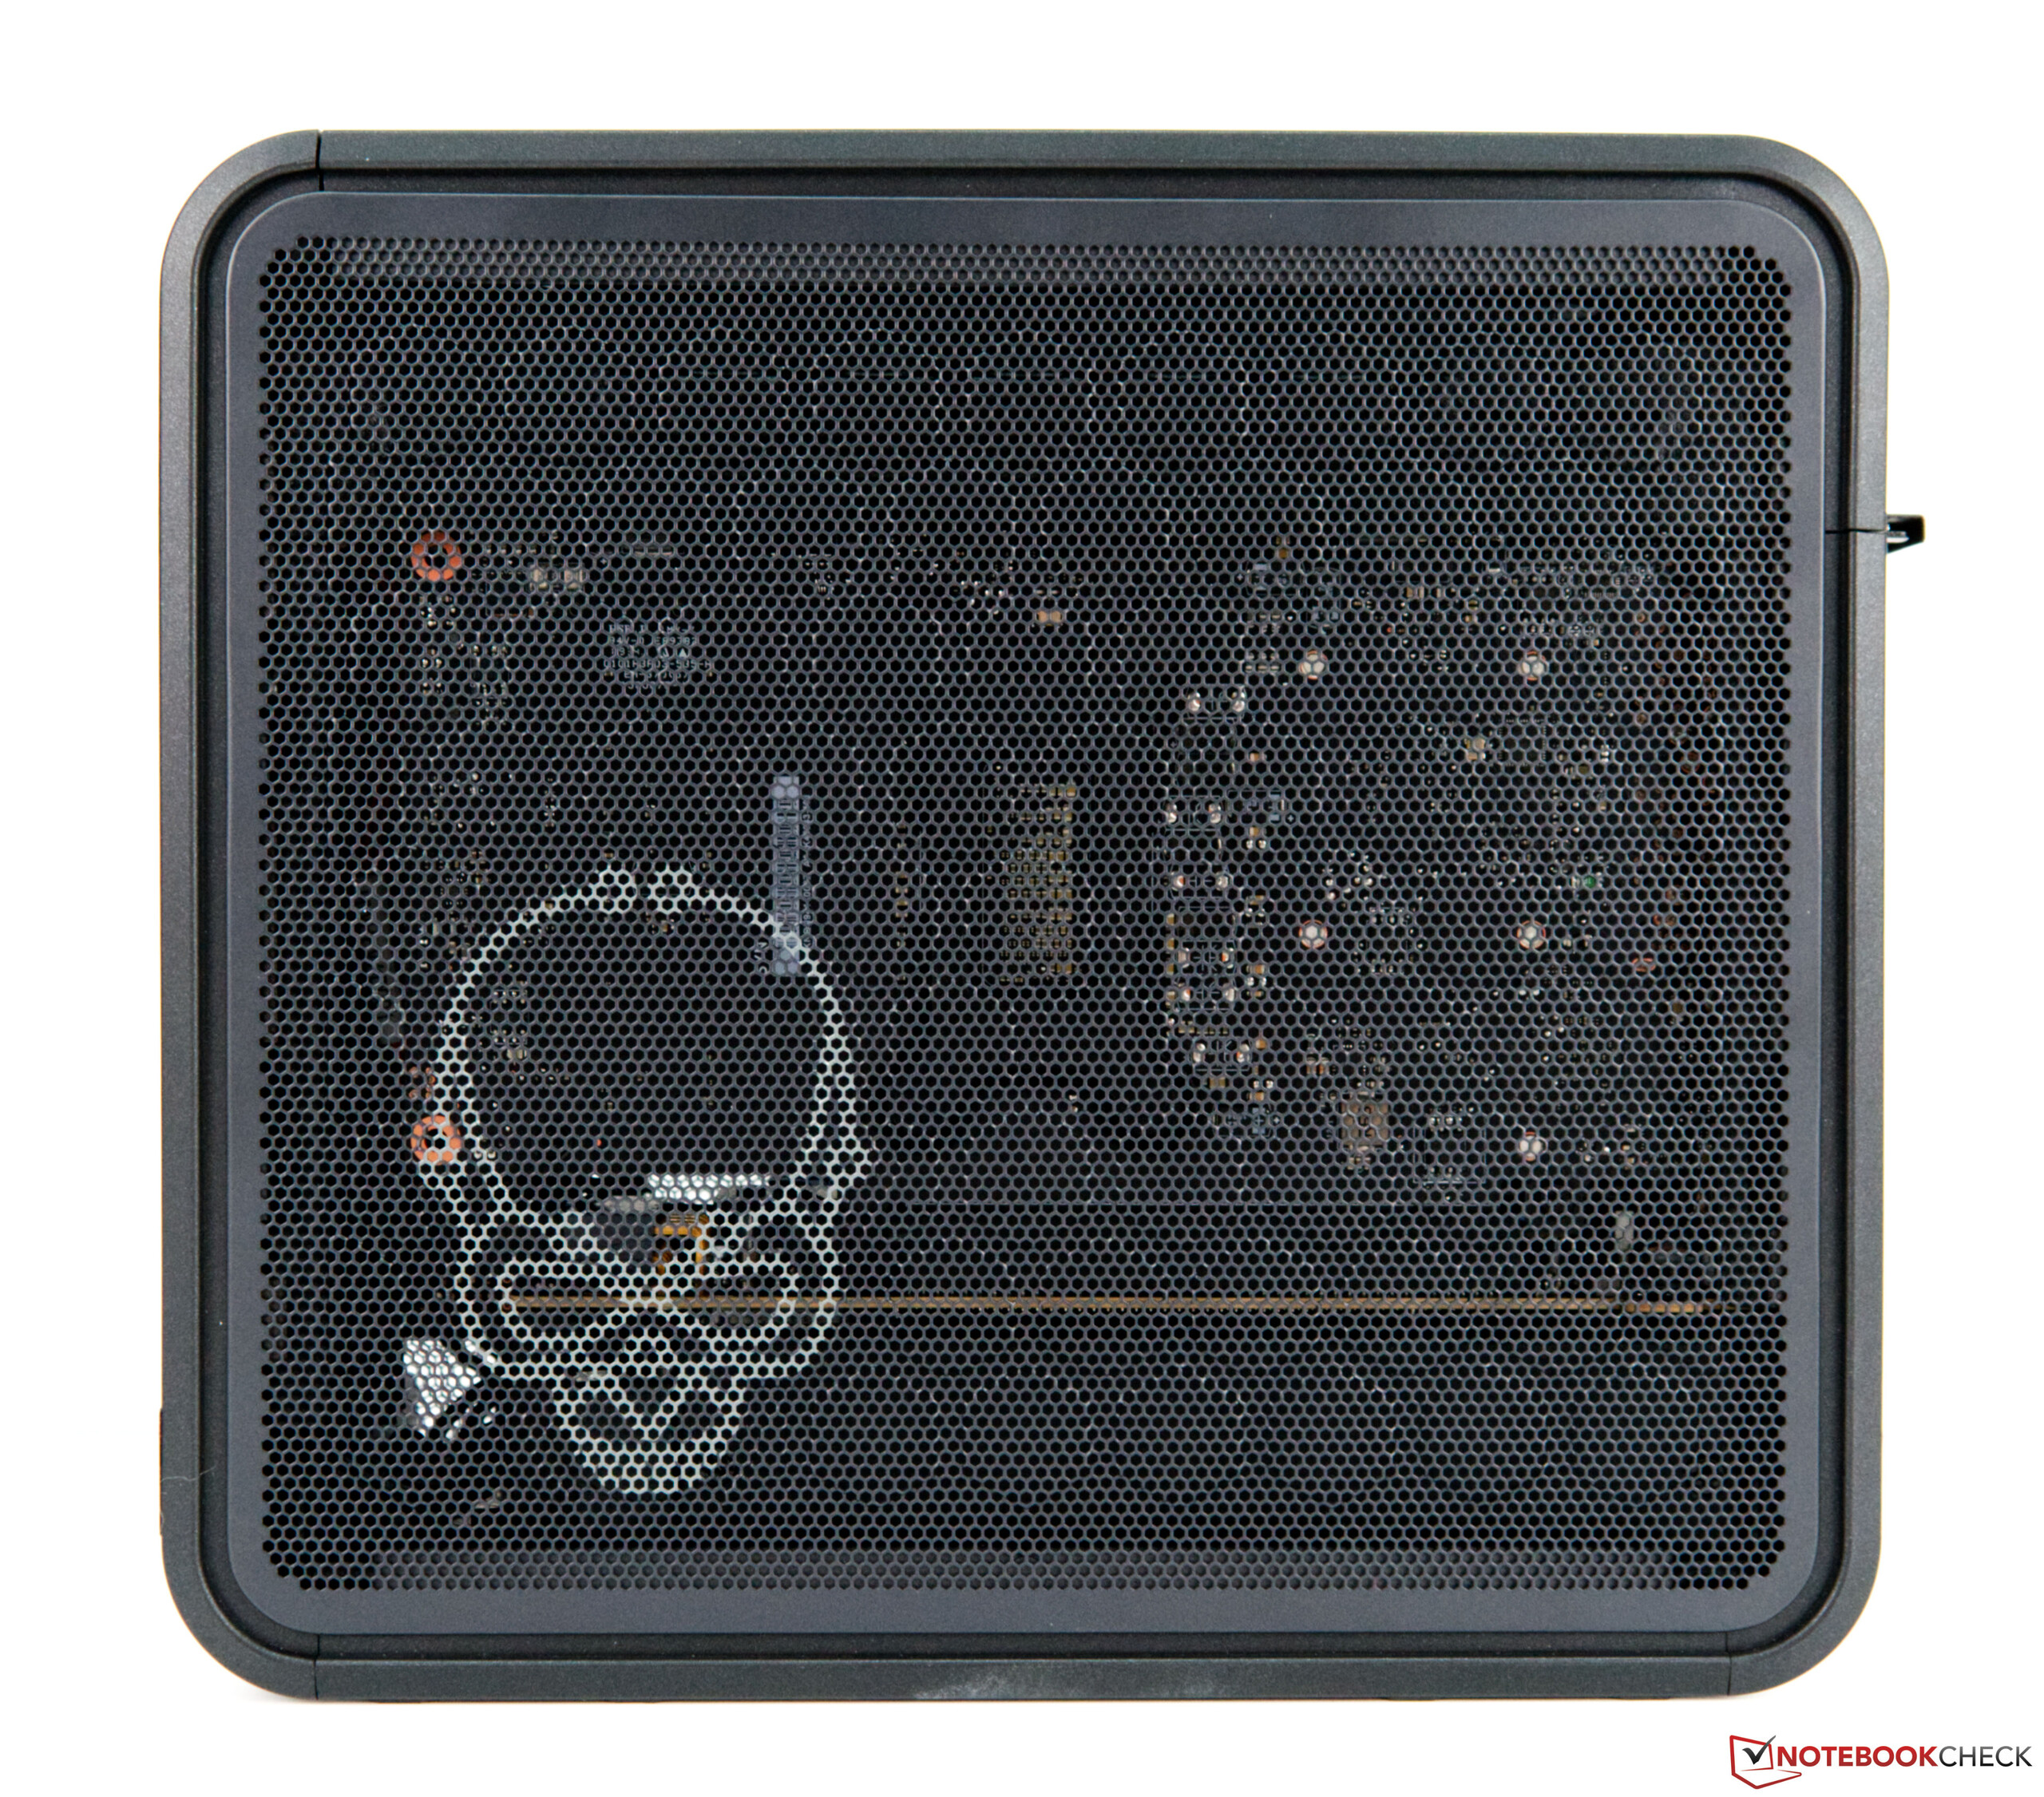
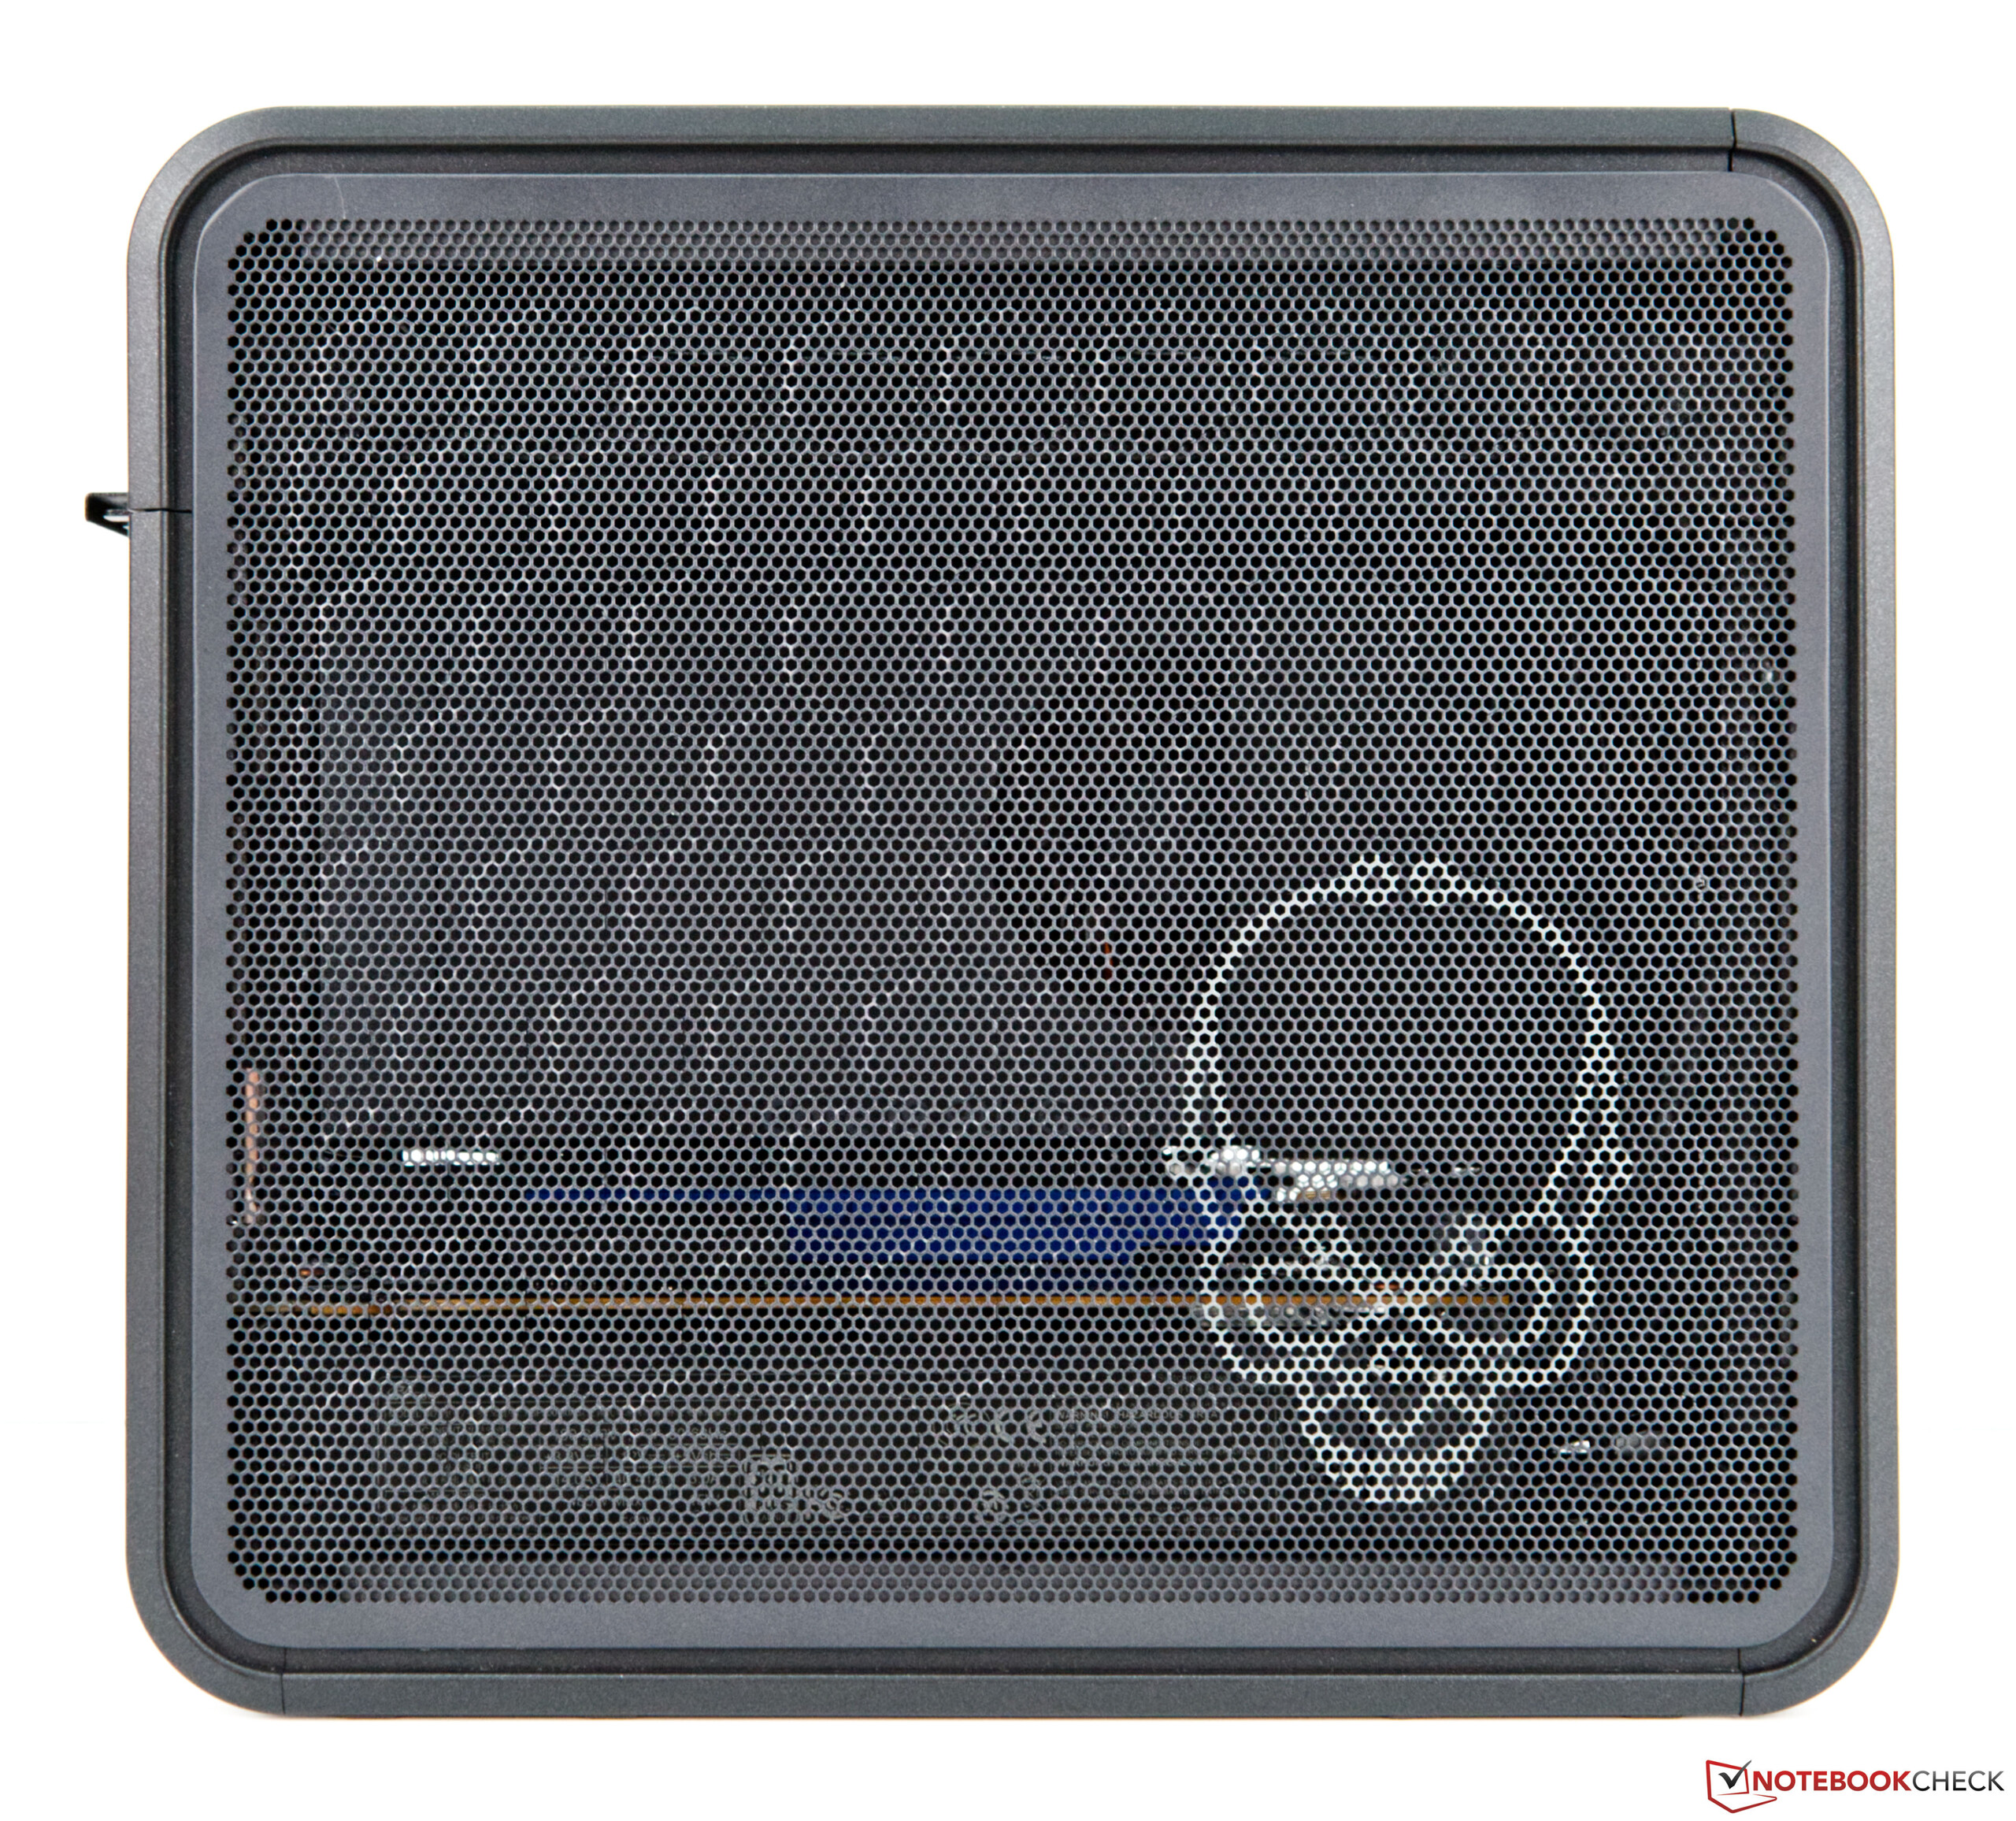
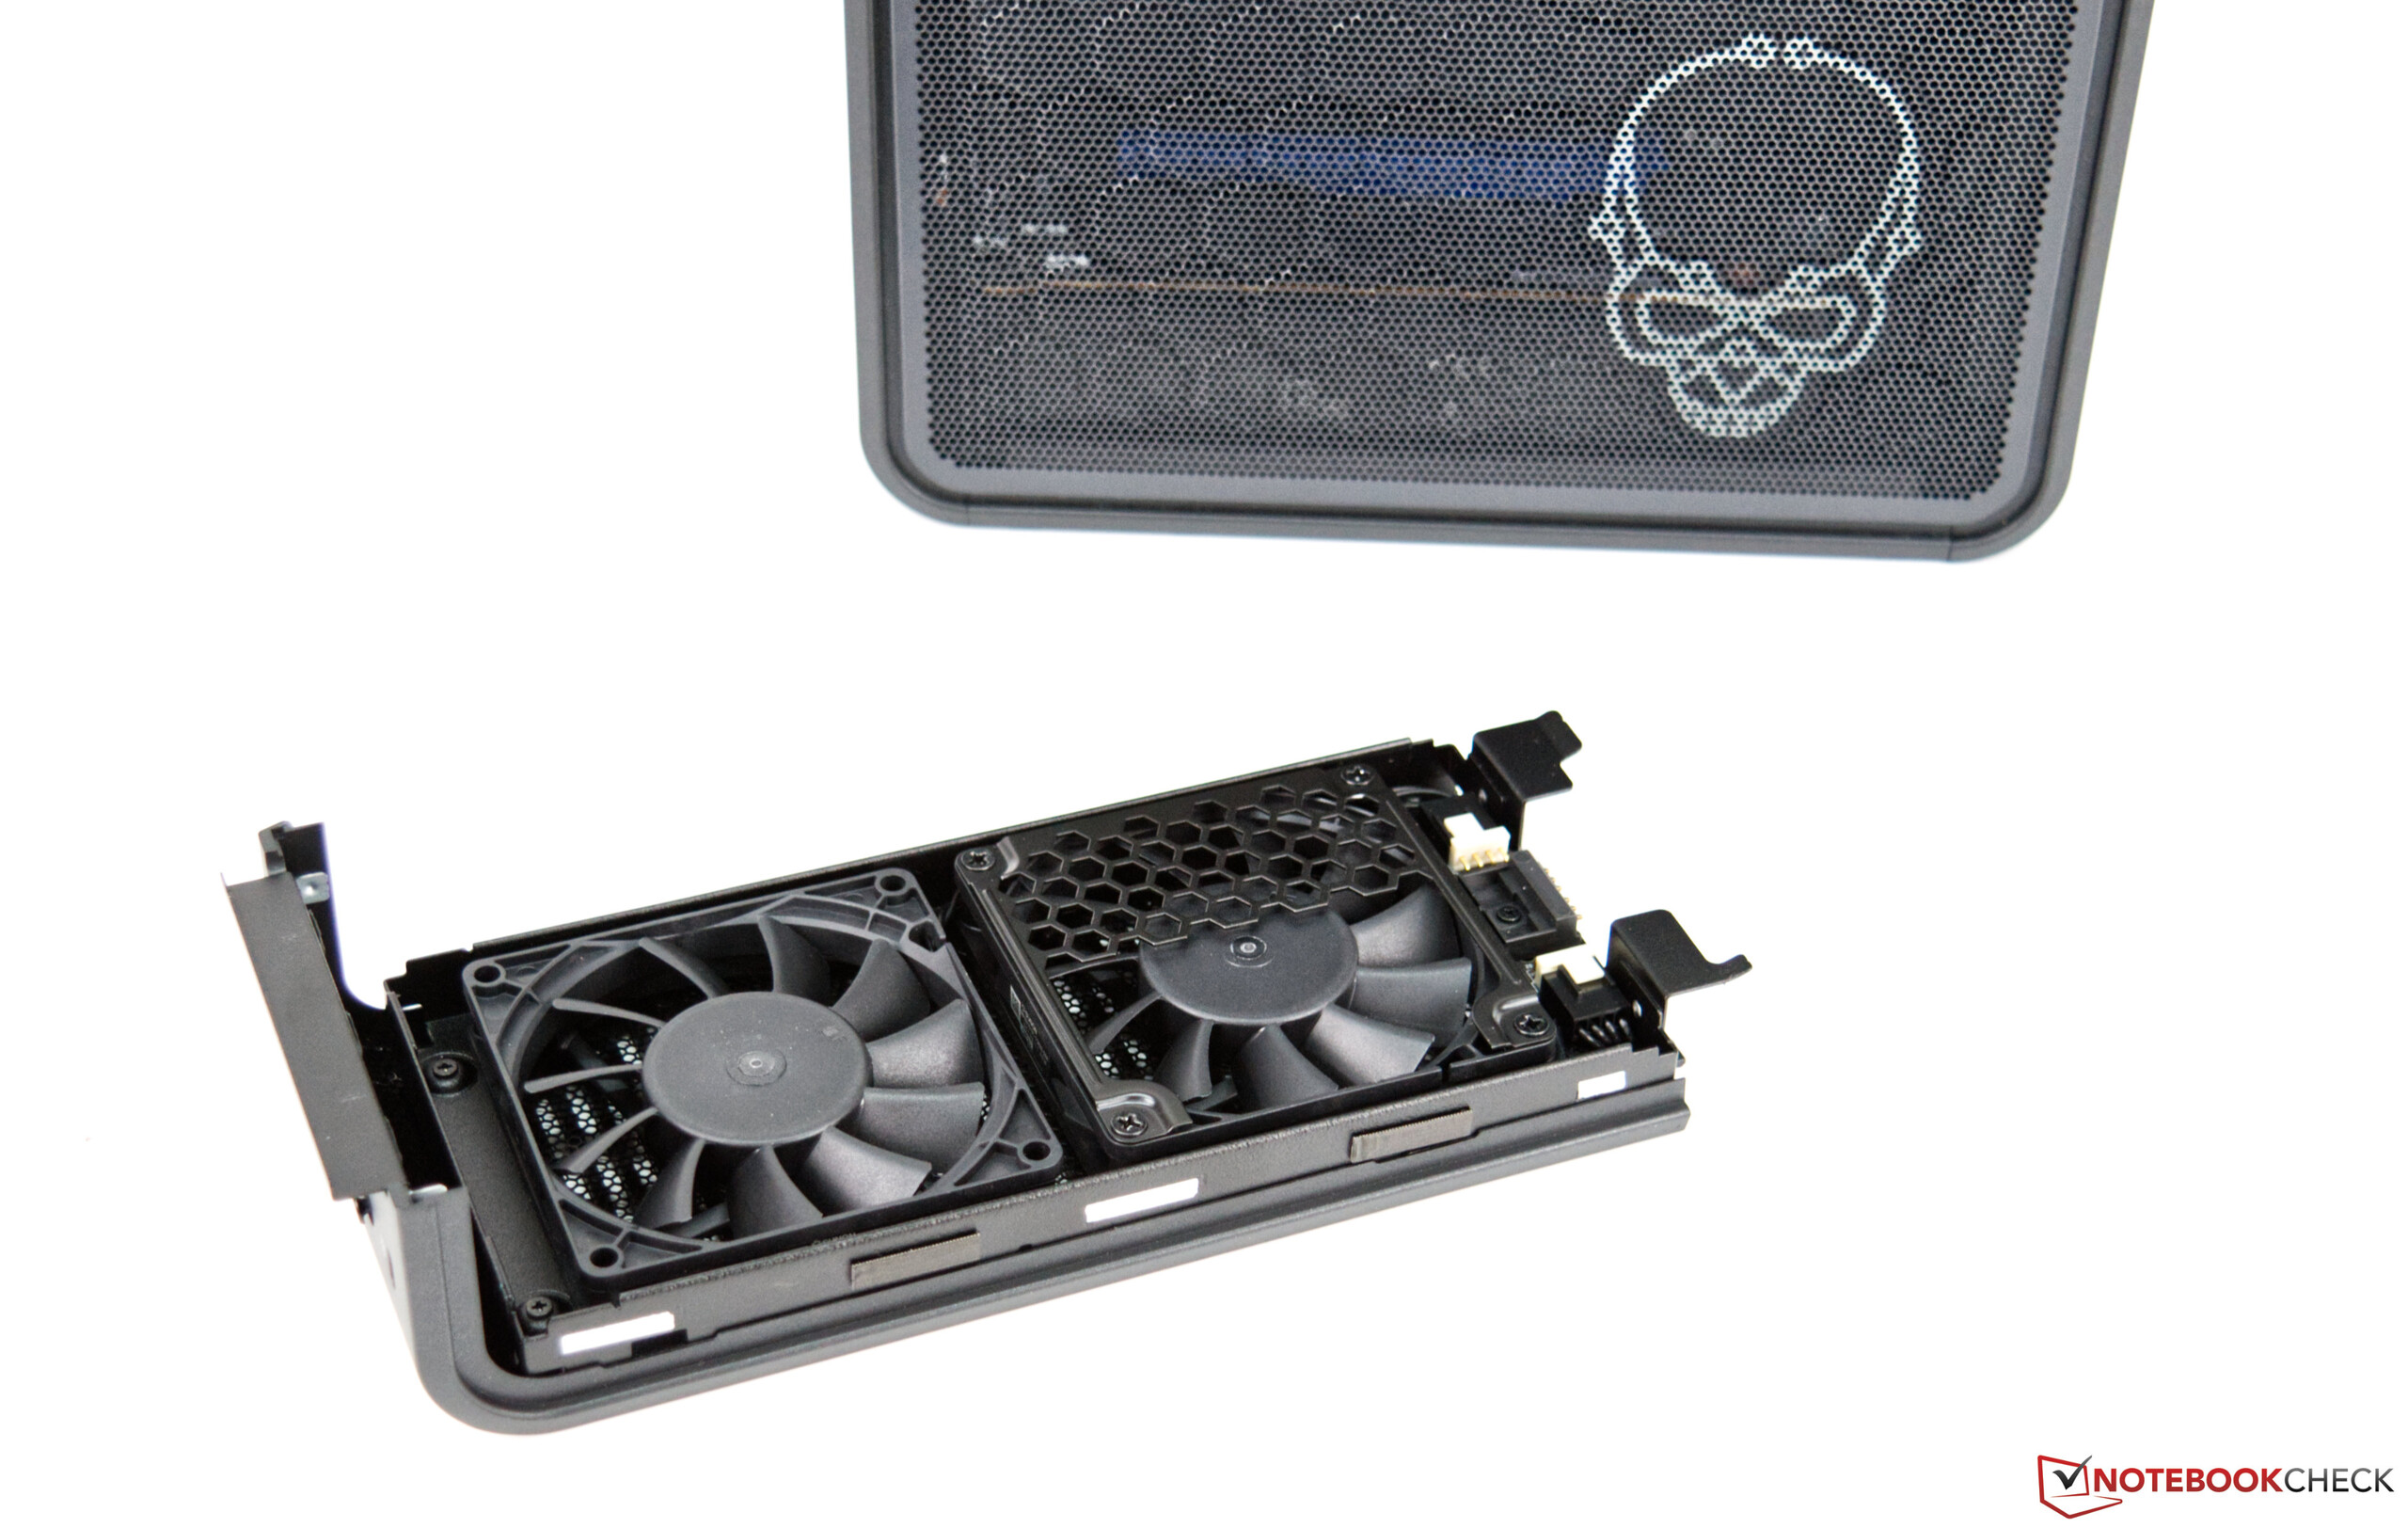
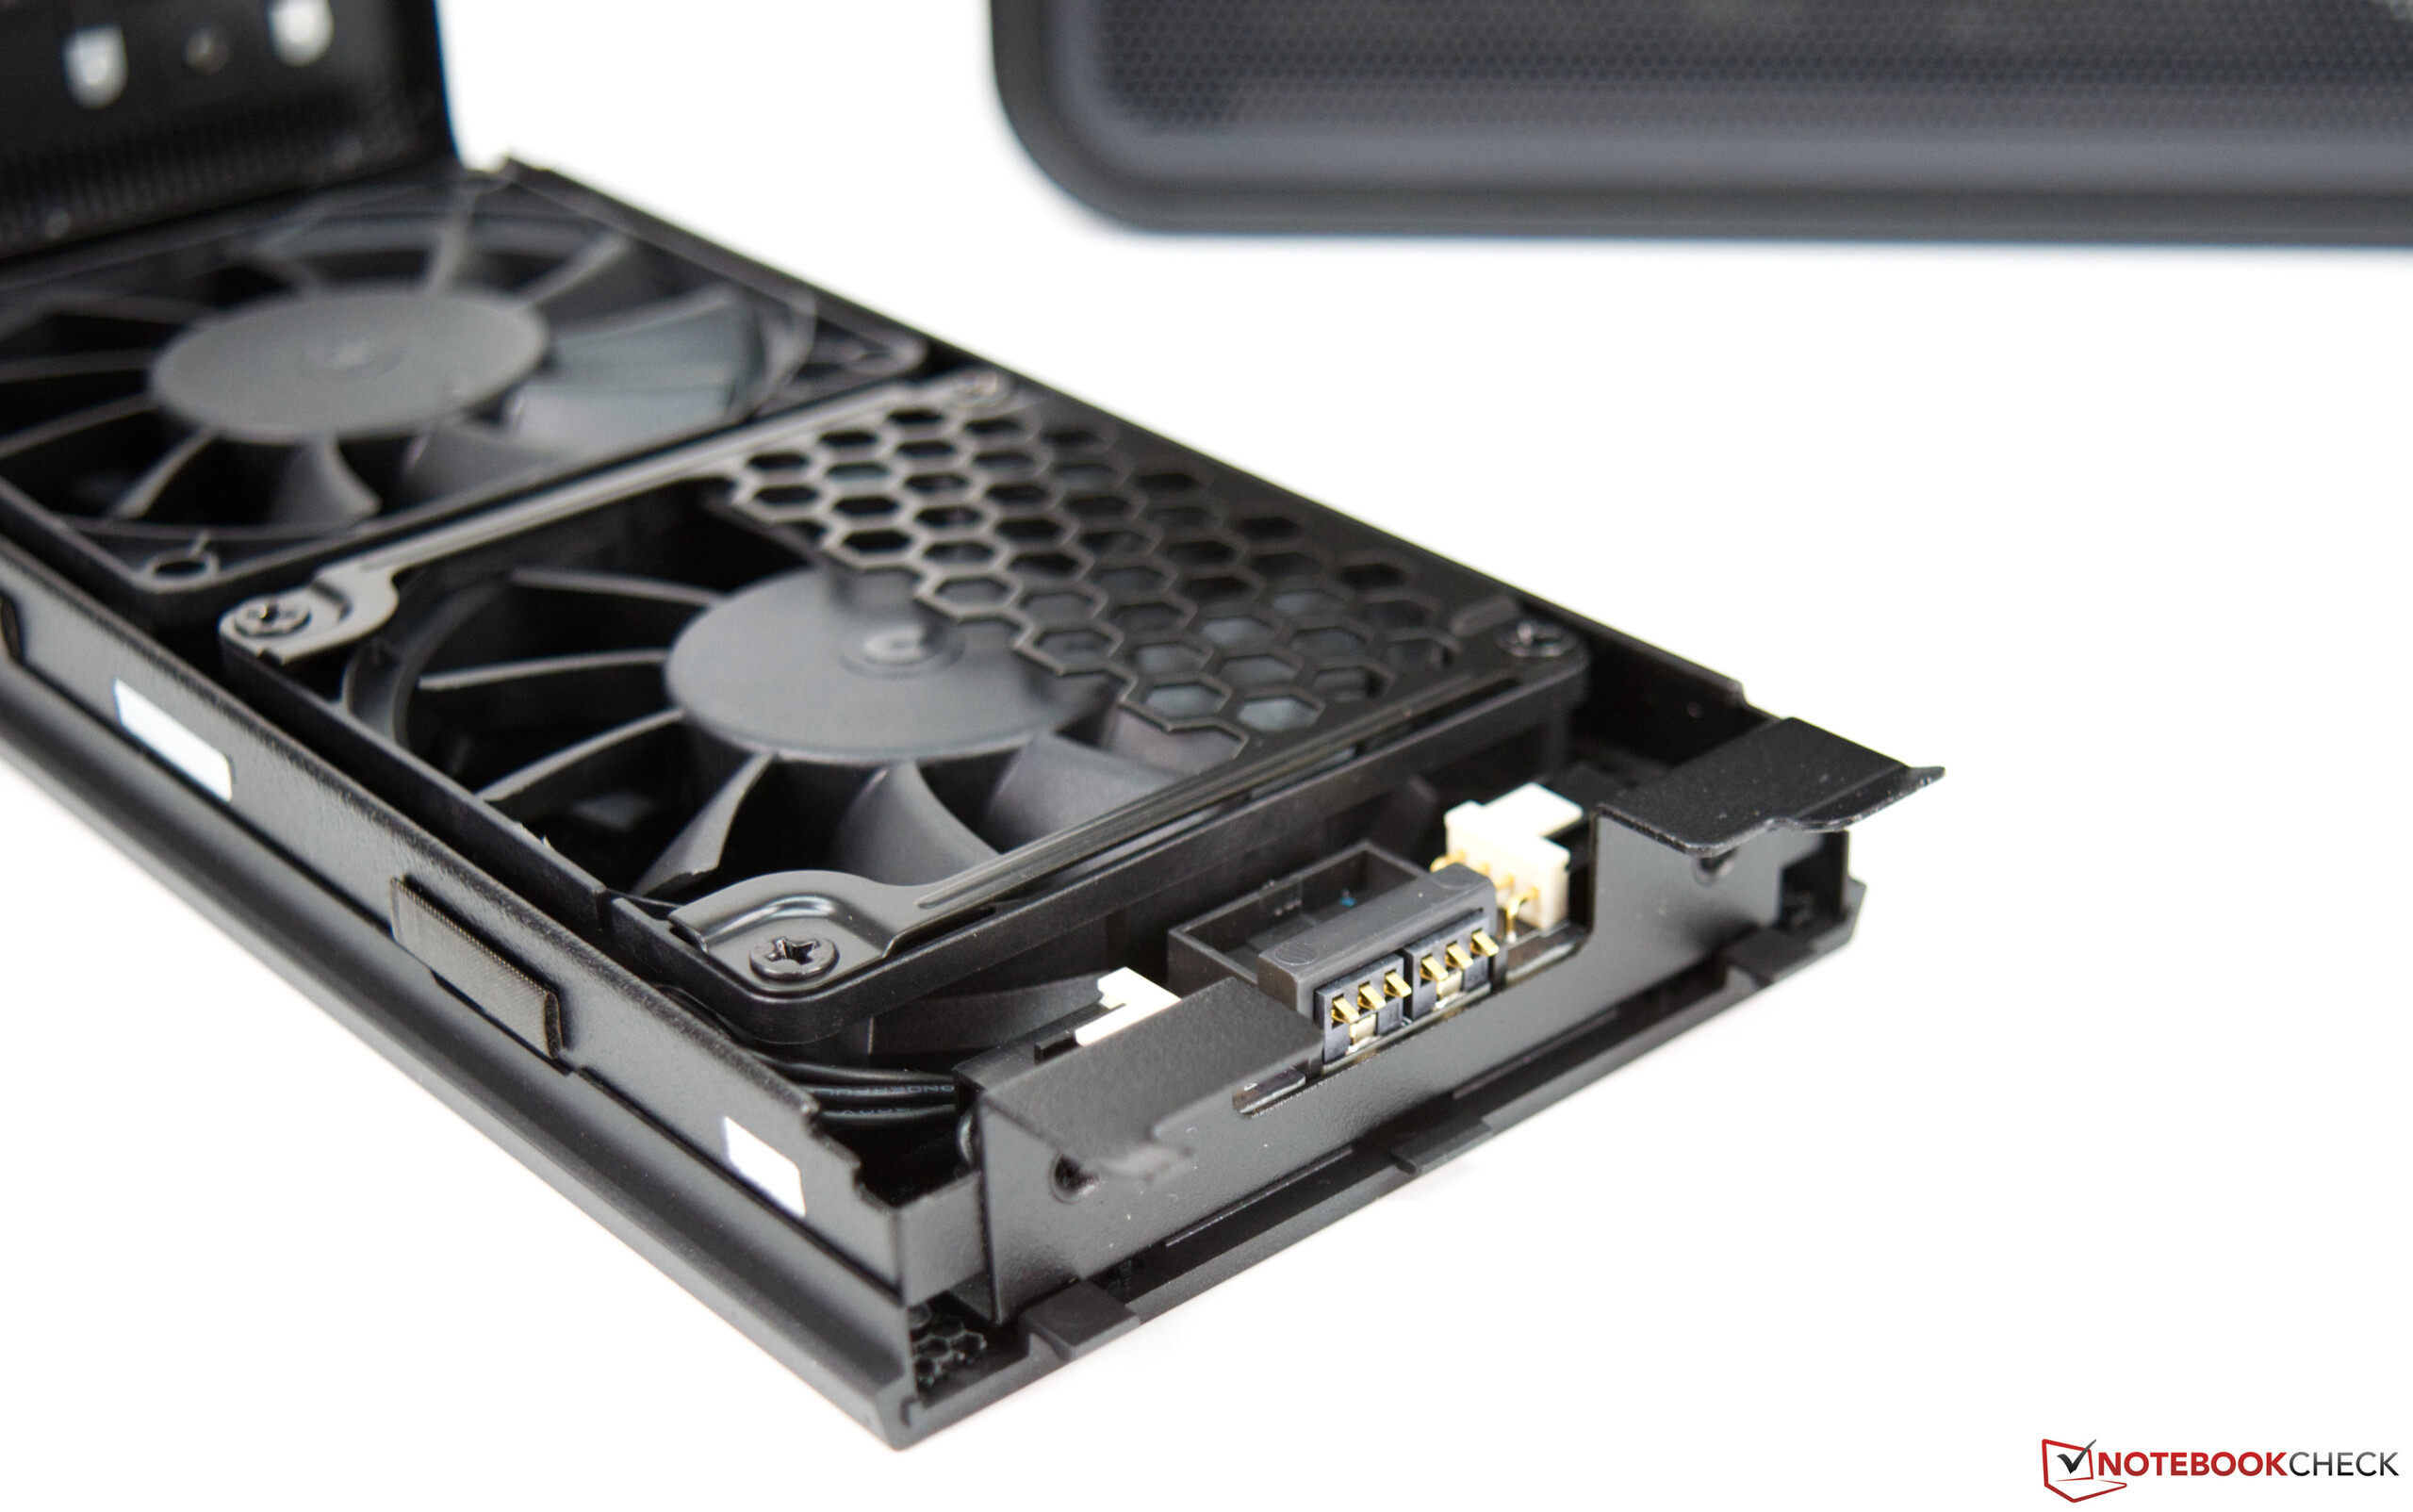
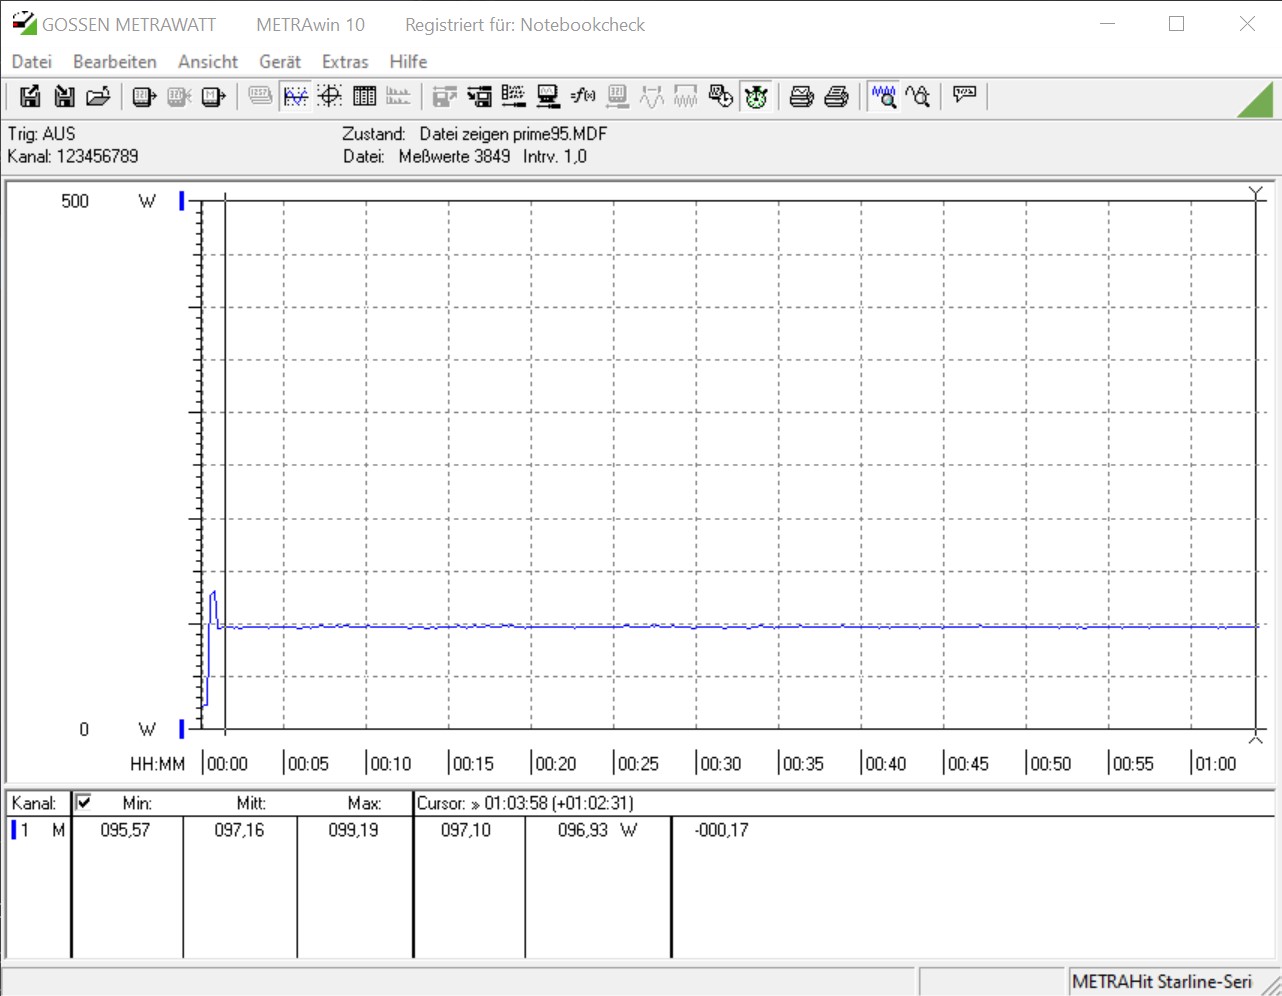
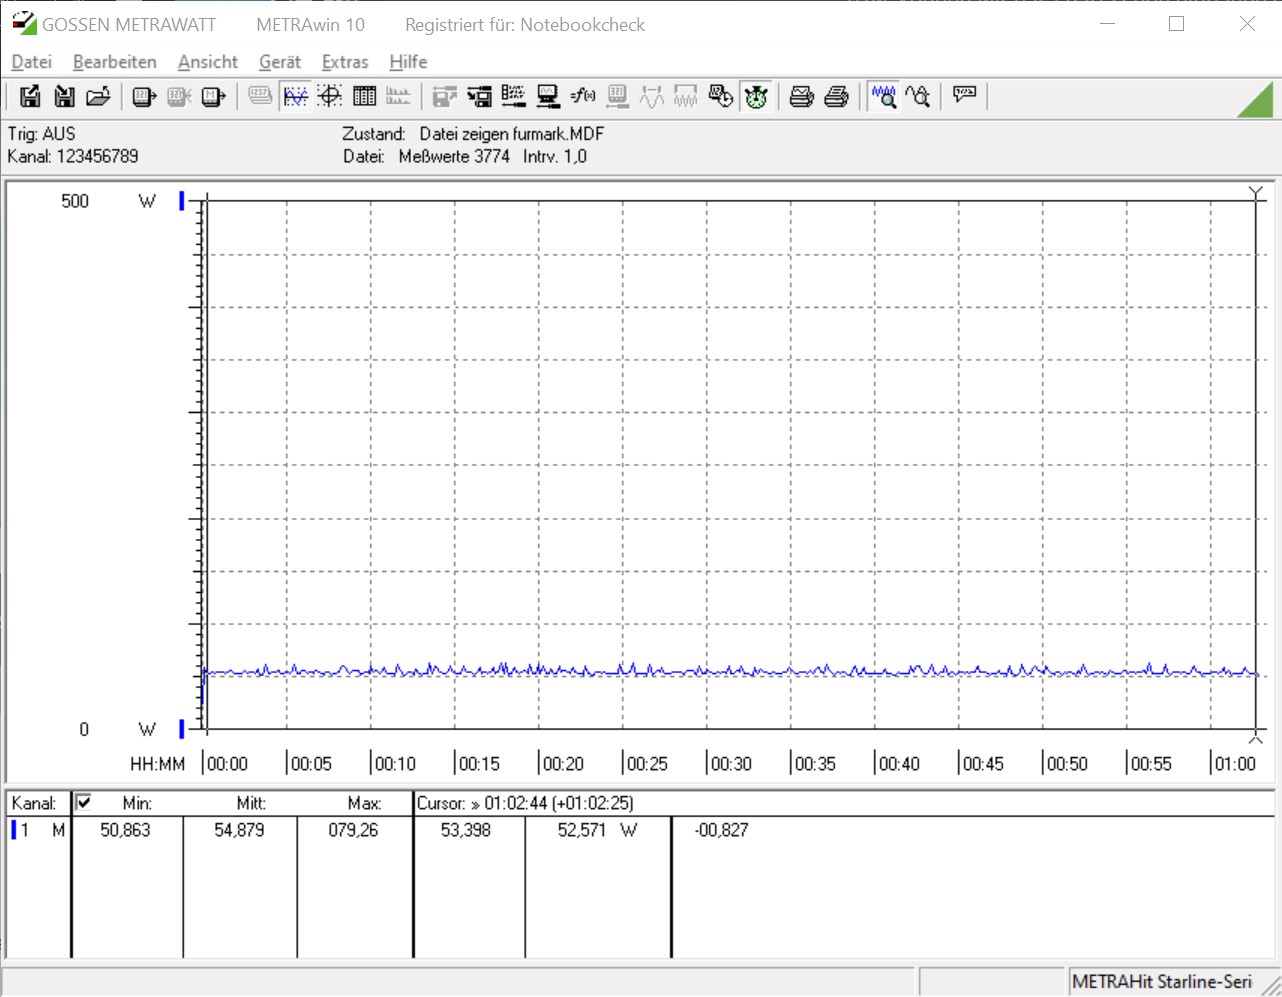
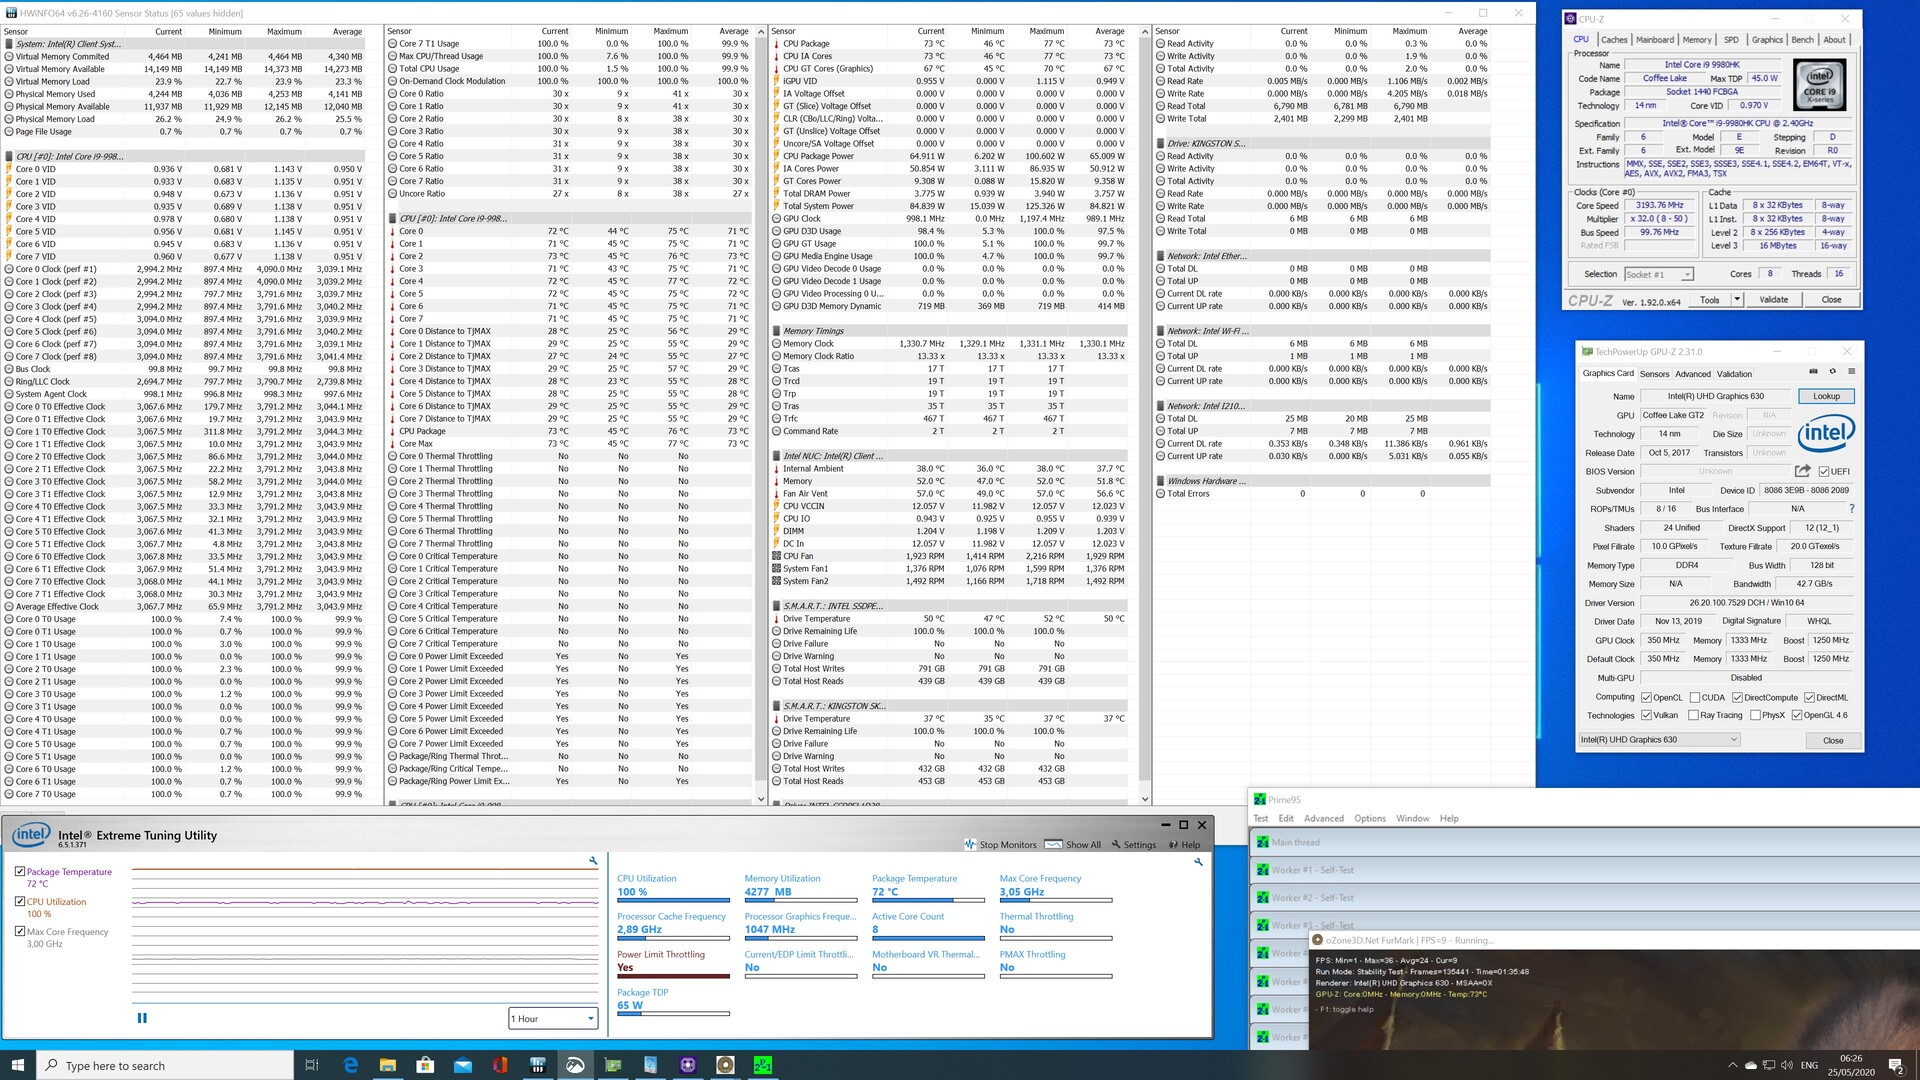
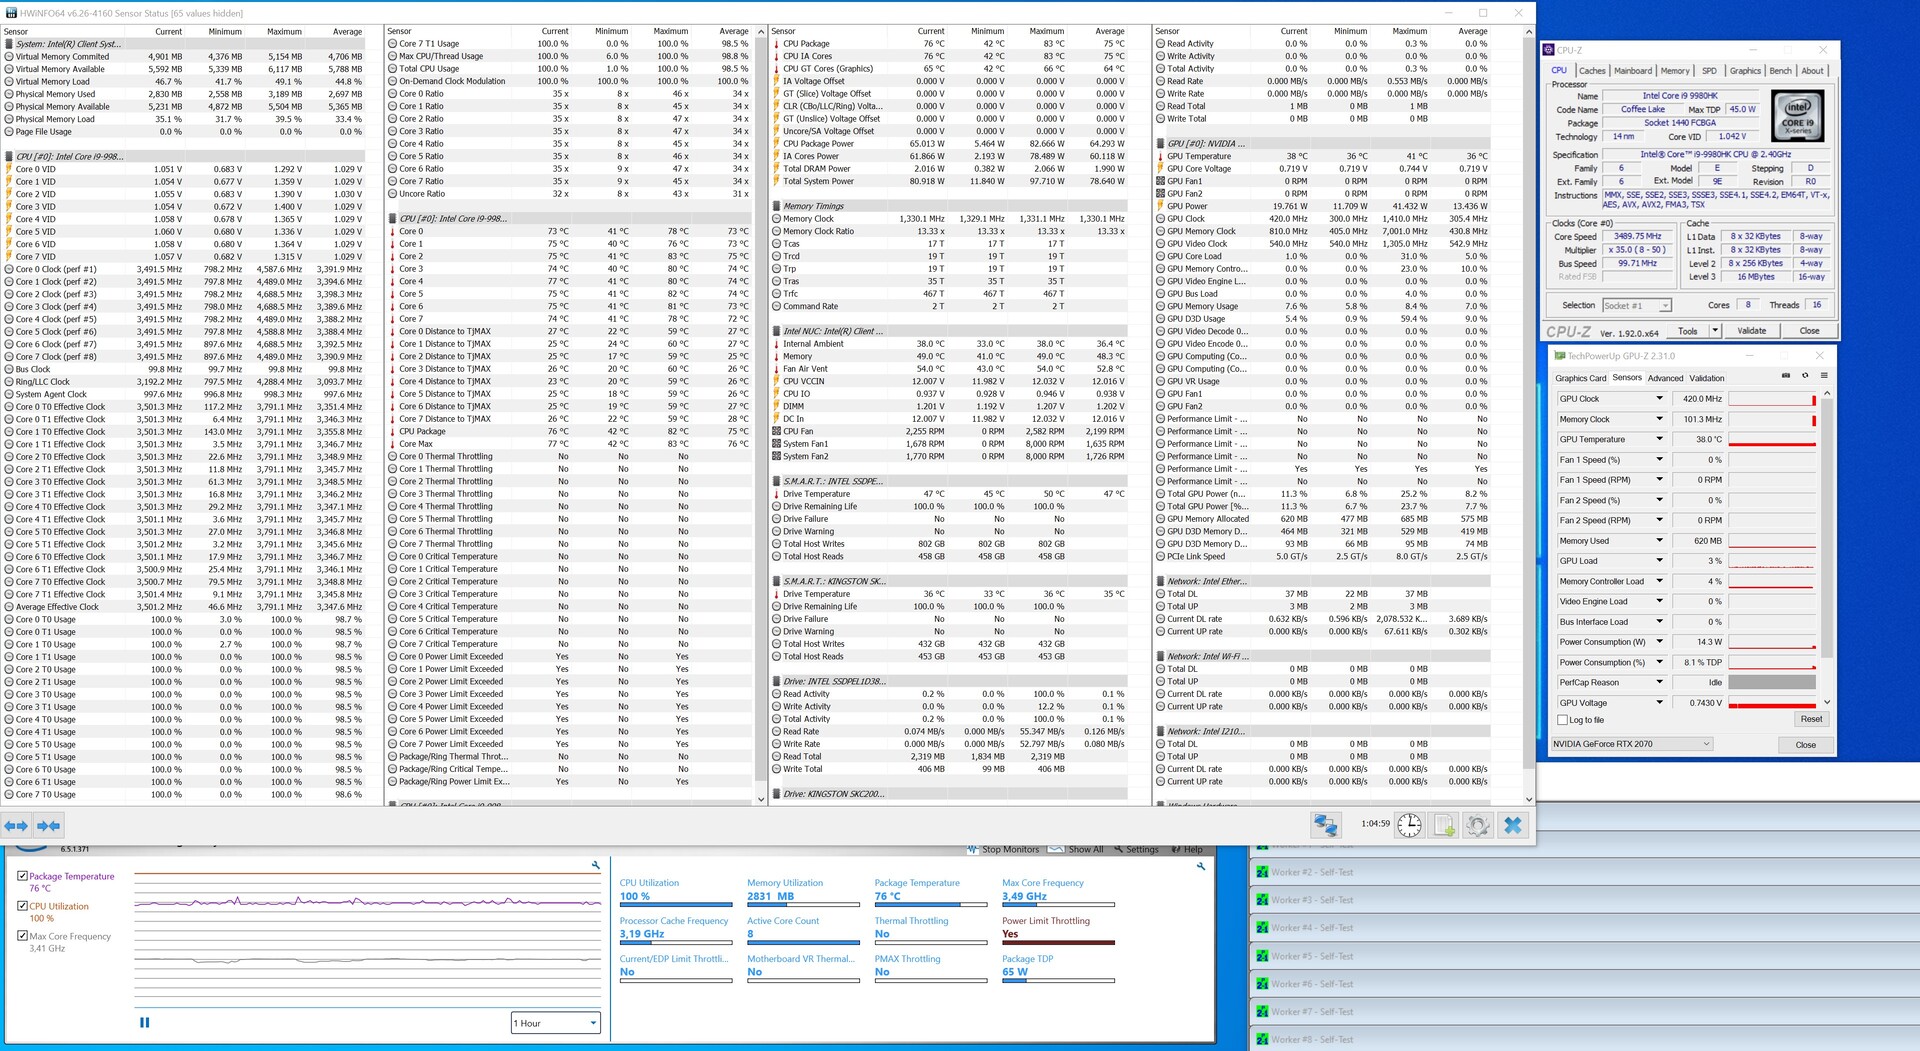
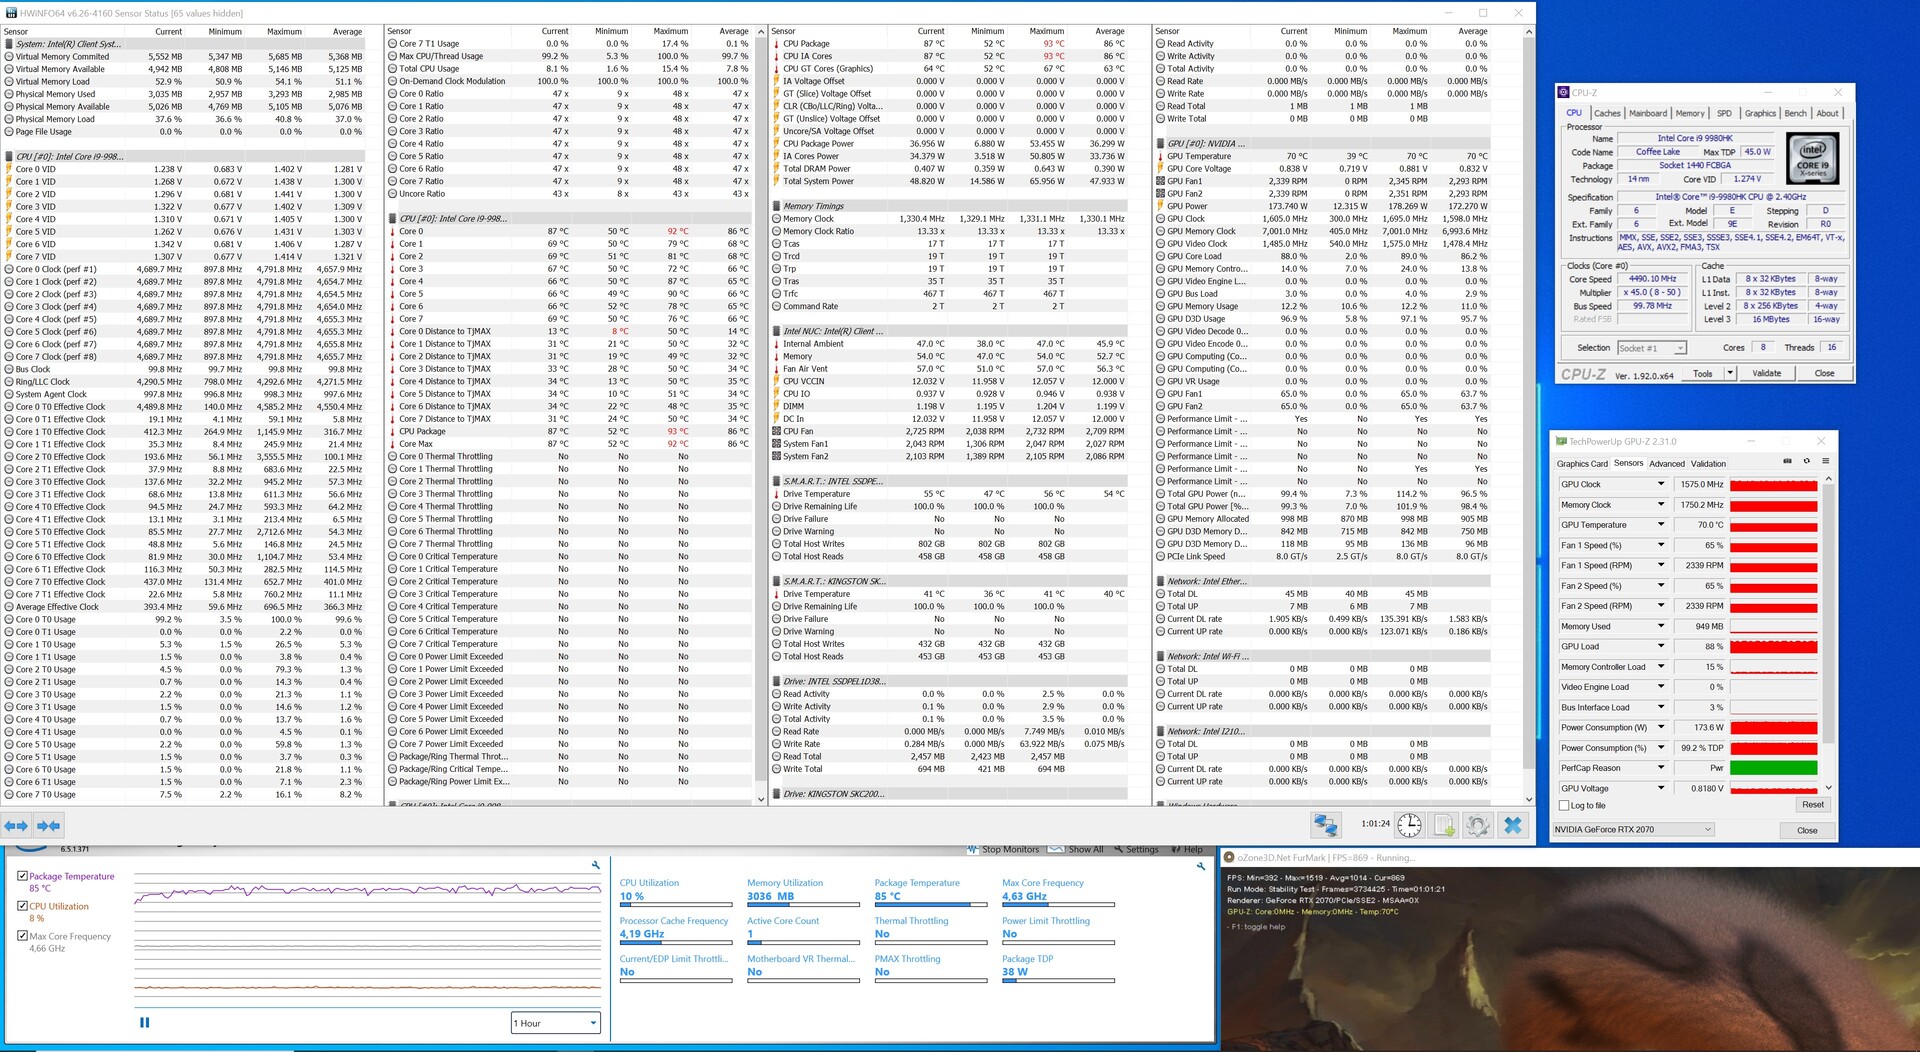
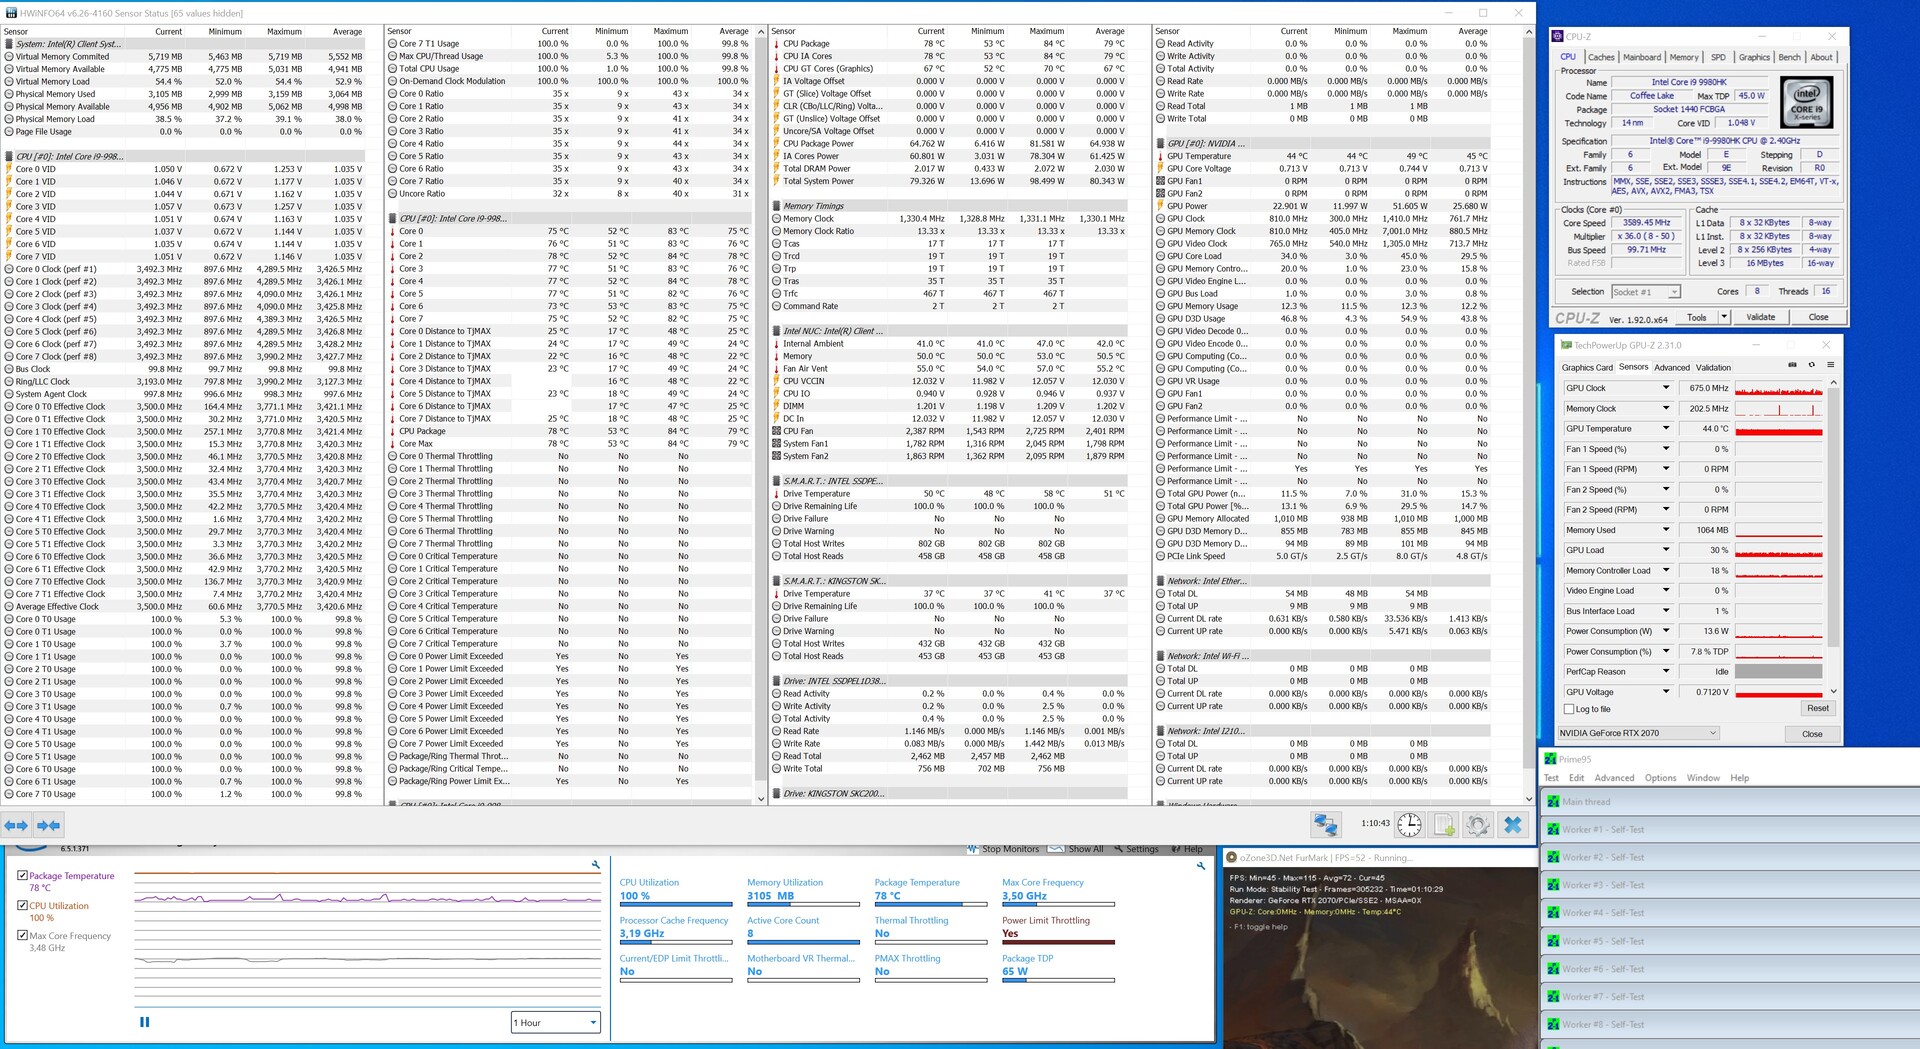
Beim Intel NUC 9 Extreme macht sich der Hersteller den Kamineffekt zur Kühlung der Komponenten zu nutzen. Im Umkehrschluss bedeutet dies, dass an den Seiten kühlere Luft angesaugt wird und nach oben aus dem Gehäuse gefördert wird. Dies funktioniert auch ganz gut, solange keine Grafikkarte den Lüfter der Compute Einheit bedeckt. Bei unserem Stresstes konnten wir glücklicherweise keinen nennenswerten Leistungsverlust aufgrund der schlechteren Kühlung feststellen, aber bei unserer Lautstärkemessung war das System mit eingebauter Grafikkarte deutlich lauter. Beim Prime95-Lasttest kletterte die gemessene Lautstärke von 38,8 dB(A) auf 39,8 dB(A). Warum Intel den Lüfter der Compute Einheit nicht auf der anderen Seite verbaut bleibt uns ein Rätsel. Die Seitenabdeckungen im Mesh-Design würden hier für gute Frischluftversorgung dienen. Beim GPU-Lasttest, für den wir FurMark benutzen, haben wir eine Lautstärke von 48,5 dB(A) gemessen. Dies ist aber auch auf die verbaute RTX 2070 zurückzuführen. Diese erreichte knapp 70 °C und die beiden Lüfter drehten mit 58 Prozent der maximalen Last. Auffällig war hingegen auch deutlich hörbare elektronische Geräusche. Diese hörten sich jedoch nicht wie das typische Spulenfiepen, was man von Grafikkarten her kennt, an. Dies war auch beim Datenzugriff auf die beiden Massenspeicher immer wieder zwischendurch hörbar.

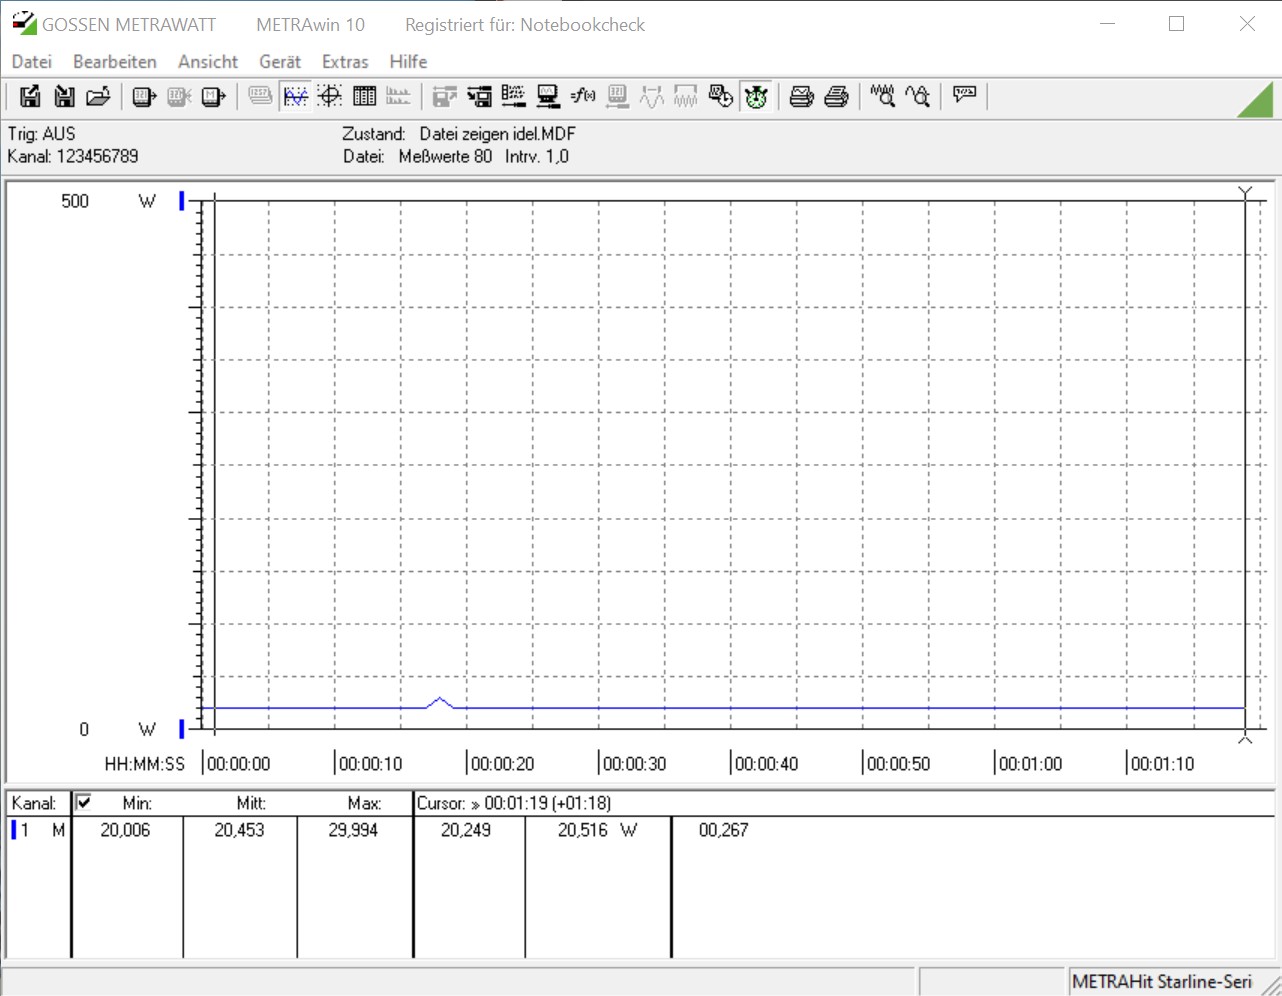
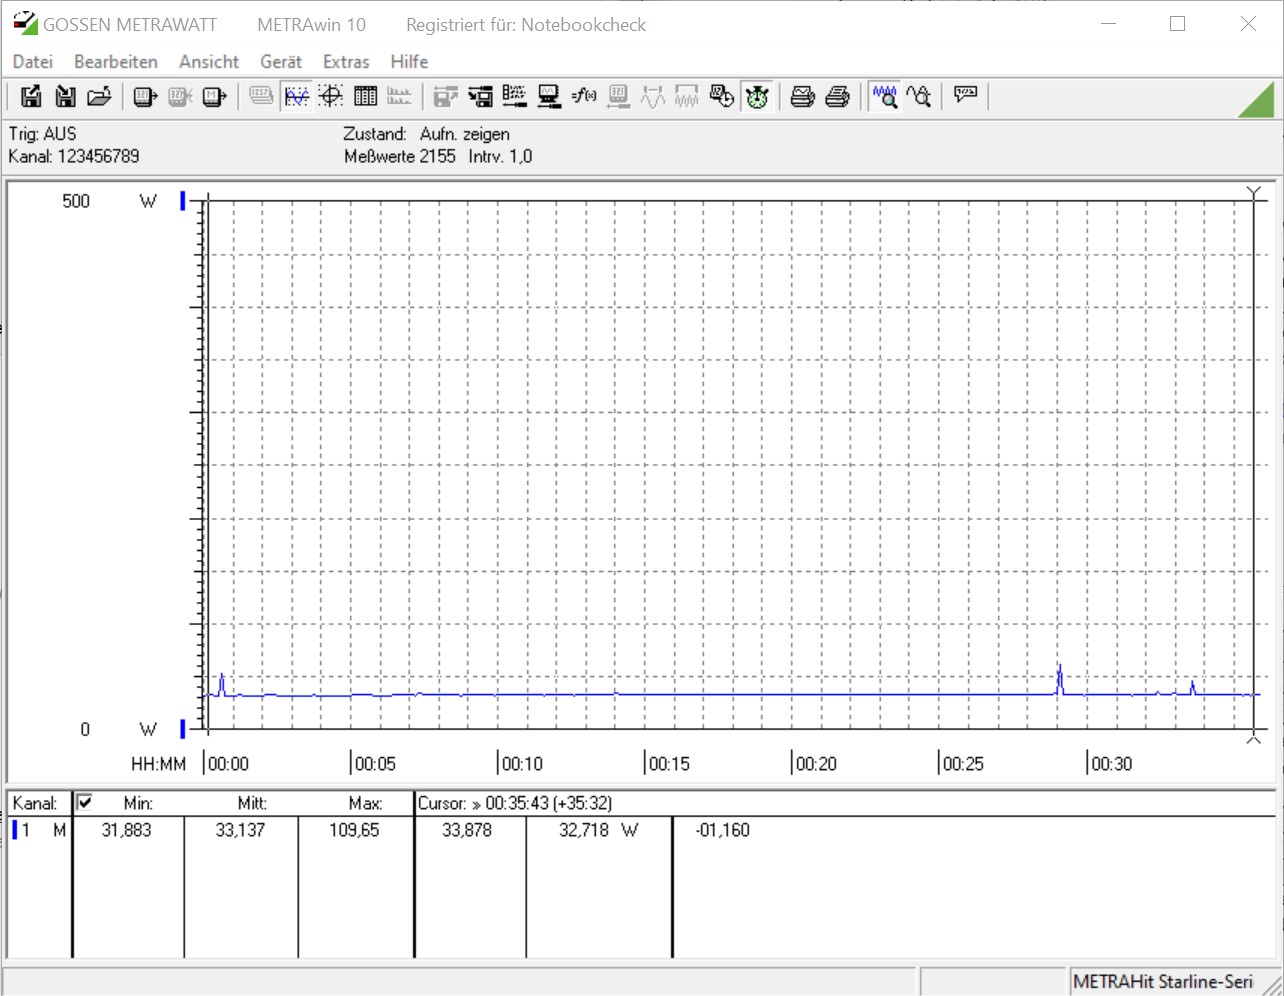
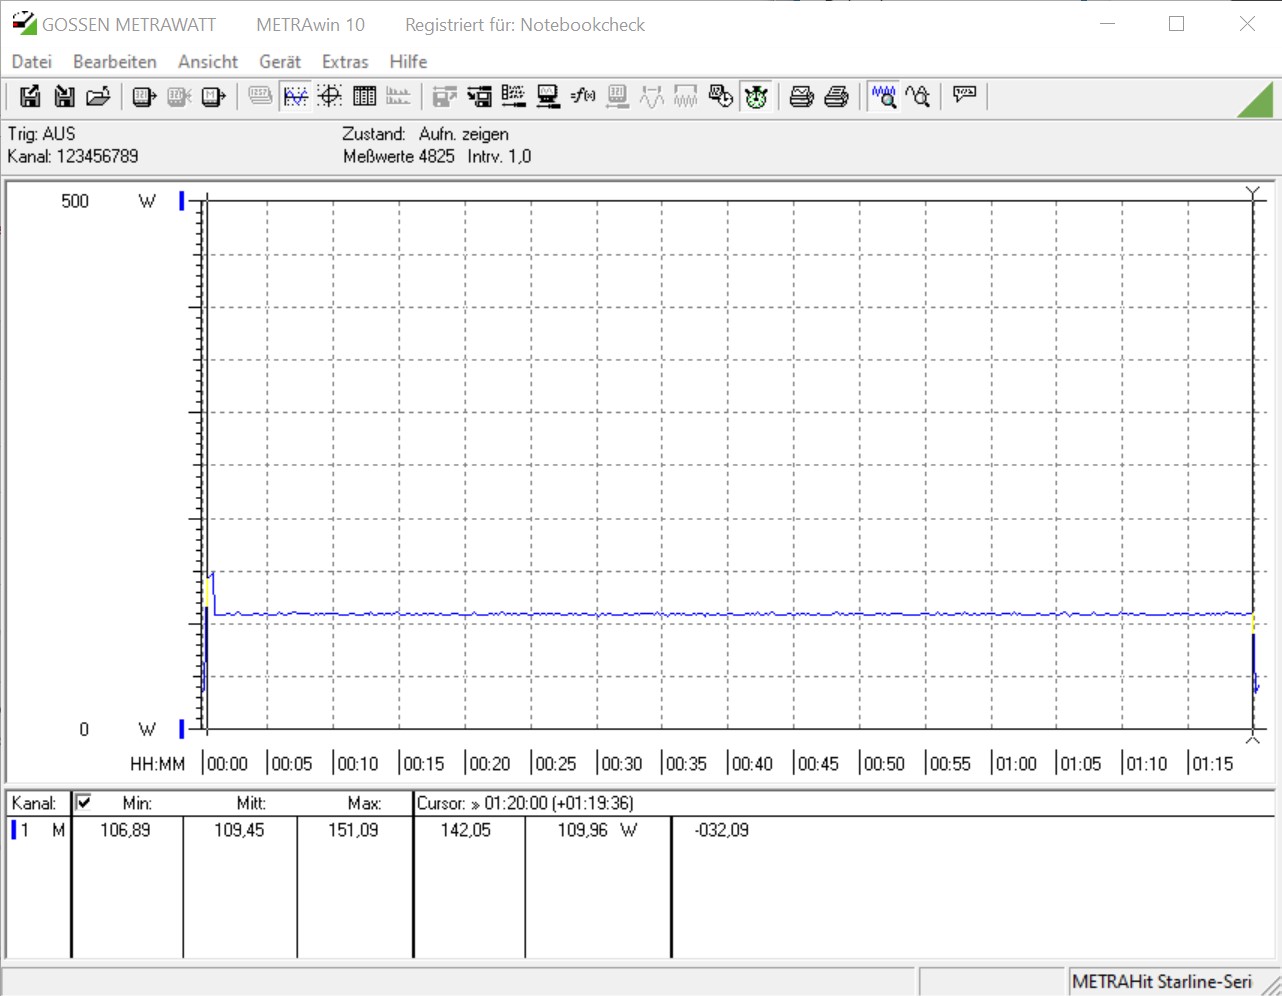
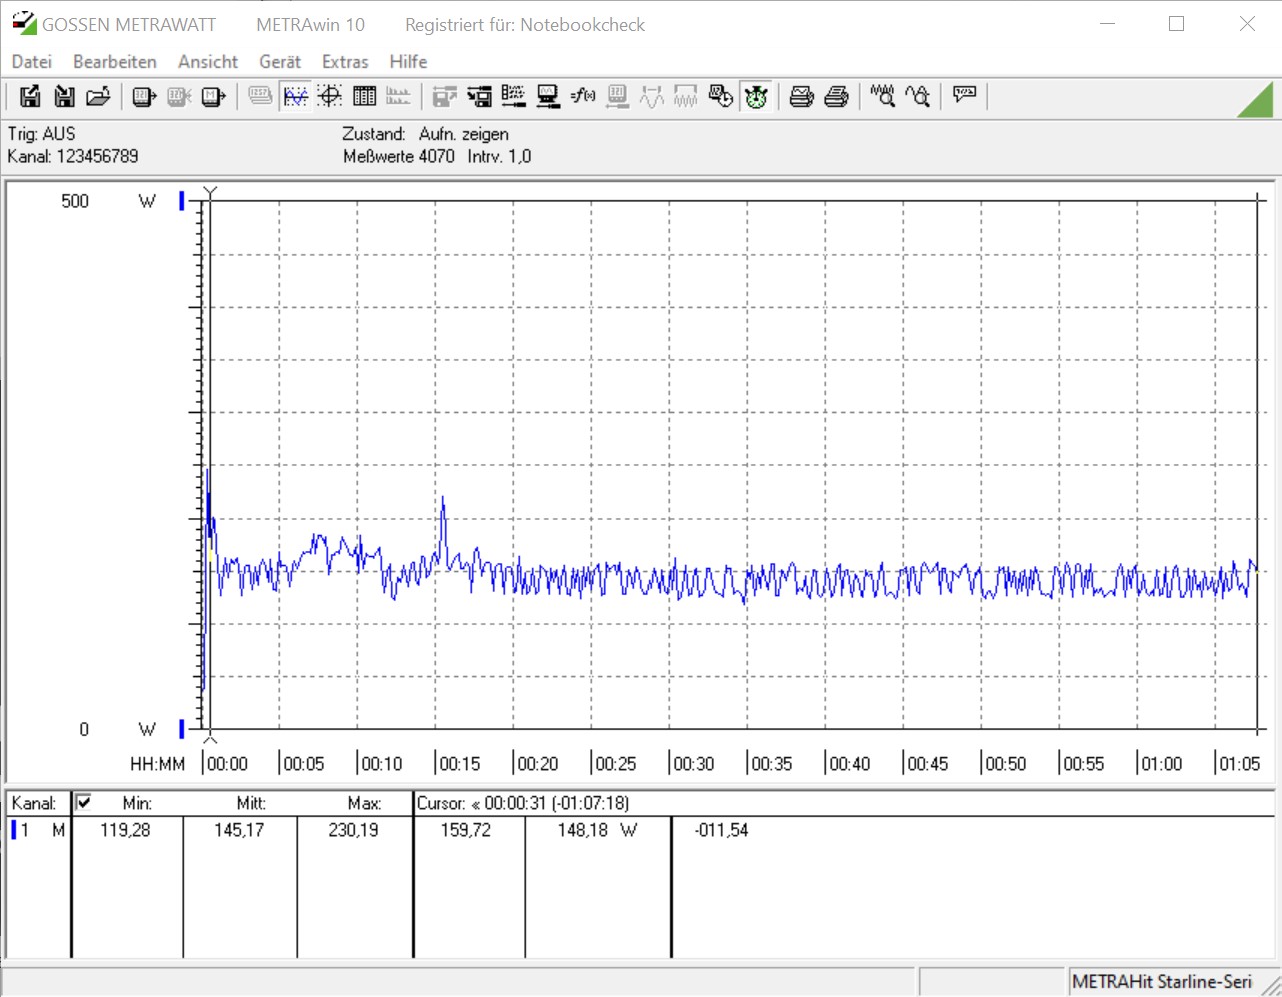
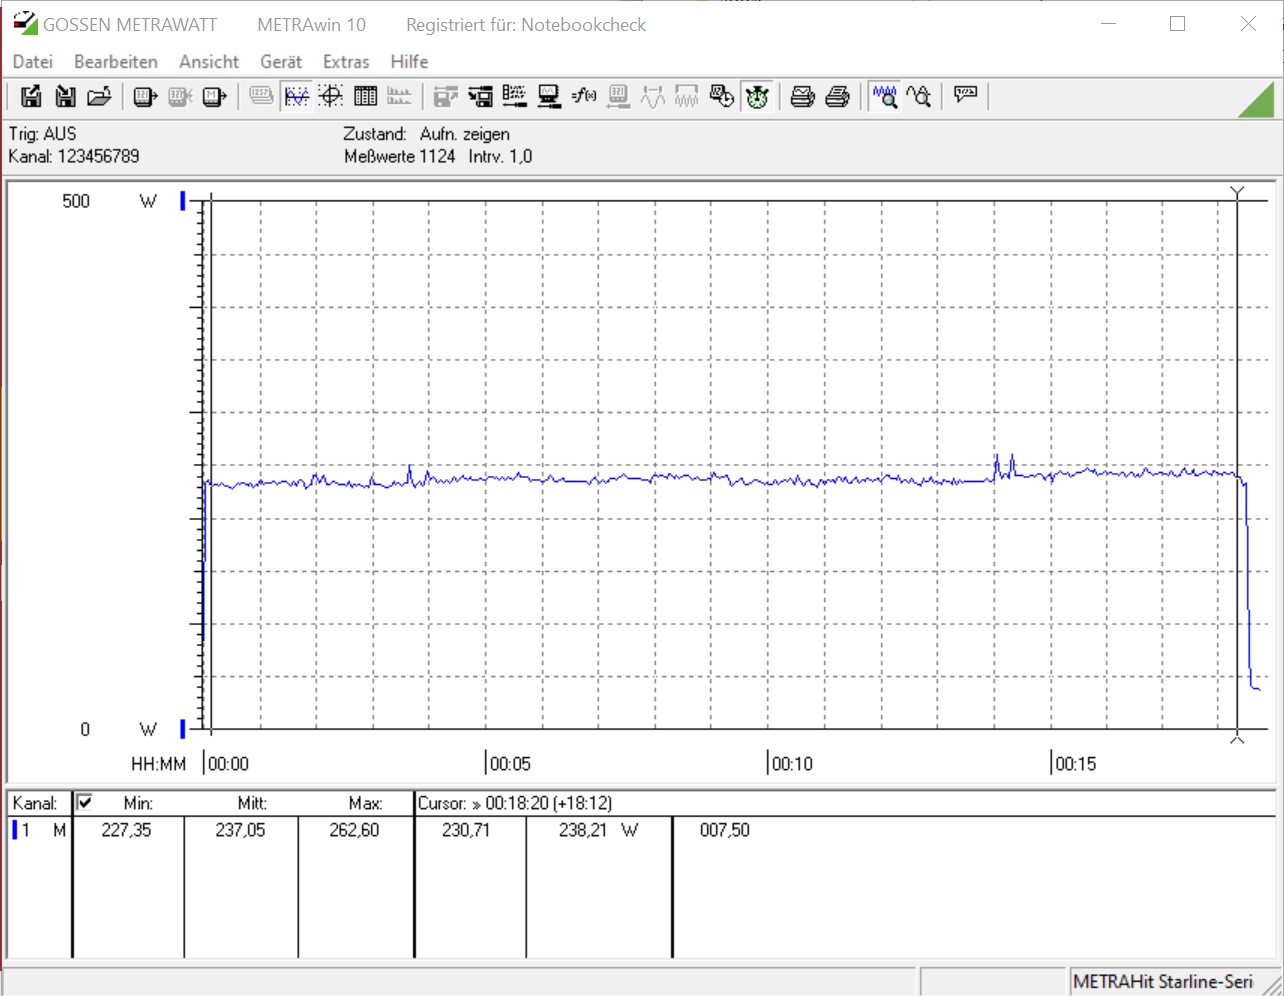
Bei dem Energieverbrauch ist unser Testsample recht sparsam. Im Leerlauf sind es bestenfalls 20 Watt. Den höchsten Verbrauch ohne dedizierte GPU verzeichnen wir beim Cineben-R15-Multi-Test. Hier waren es 127 Watt, die wir an der Steckdose gemessen haben. Bei der Konfiguration mit der GeForce RTX 2070 ist der Energieverbrauch im Leerlauf mit 33 Watt deutlich höher. Beim Stresstest mit FurMark messen wir mit durchschnittlich 251 Watt einen akzeptablen Wert, wenn man bedenkt, dass es sich hierbei um einen Gaming-Rechner handelt. In der Spitze können es auch mal 270 Watt sein, die das 500-Watt-Netzteil bereitstellen muss. Selbst beim Spielen haben wir nicht diesen hohen Energiebedarf gemessen. Gleichwohl fällt der Energiebedarf beim Zocken mit 237 Watt im Schnitt nicht viel geringer aus.

Power Consumption
1920x1080 The Witcher 3 ultra (external Monitor)
AMD Ryzen 9 3950X
NVIDIA Titan RTX, R9 3950X, Intel Optane 905P 480GB 2.5 (Idle: 95 W)
423.6 (400min - 442max) Watt * -79%
Intel Core i9-10900K
NVIDIA Titan RTX, i9-10900K, WDC PC SN720 SDAQNTW-512G (Idle: 52.3 W)
396.2 (380min - 475max) Watt * -67%
Intel Core i5-10600K
NVIDIA Titan RTX, i5-10600K (Idle: 52.2 W)
386.9 (380min - 404max) Watt * -63%
Intel Ghost Canyon NUC (RTX 2070)
GeForce RTX 2070 (Desktop), i9-9980HK, Kingston KC2500 1 TB SKC2500M81000G (Idle: 33.1 W)
237.1 (227min - 263max) Watt *
Prime95 V2810 Stress (external Monitor)
Intel Core i9-10900K
NVIDIA Titan RTX, i9-10900K, WDC PC SN720 SDAQNTW-512G (Idle: 52.3 W)
275.7 (254min - 385max) Watt * -152%
Intel Core i5-10600K
NVIDIA Titan RTX, i5-10600K (Idle: 52.2 W)
204.4 (191min - 261max) Watt * -87%
AMD Ryzen 9 3950X
NVIDIA Titan RTX, R9 3950X, Intel Optane 905P 480GB 2.5 (Idle: 95 W)
198.8 (185min - 240max) Watt * -82%
Intel Ghost Canyon NUC (RTX 2070)
GeForce RTX 2070 (Desktop), i9-9980HK, Kingston KC2500 1 TB SKC2500M81000G (Idle: 33.1 W)
109.4 (107min - 151max) Watt *
Intel Ghost Canyon NUC
UHD Graphics 630, i9-9980HK, Kingston KC2500 1 TB SKC2500M81000G (Idle: 20.45 W)
97.2 (96min - 99max) Watt * +11%
Cinebench R15 Multi (external Monitor)
Intel Core i9-10900K
NVIDIA Titan RTX, i9-10900K, WDC PC SN720 SDAQNTW-512G (Idle: 52.3 W)
268.5 (265min - 270max) Watt *
AMD Ryzen 9 3950X
NVIDIA Titan RTX, R9 3950X, Intel Optane 905P 480GB 2.5 (Idle: 95 W)
219.5 (218min - 225max) Watt *
Intel Core i5-10600K
NVIDIA Titan RTX, i5-10600K (Idle: 52.2 W)
172.5 (170min - 176max) Watt *
Intel Ghost Canyon NUC
UHD Graphics 630, i9-9980HK, Kingston KC2500 1 TB SKC2500M81000G (Idle: 20.45 W)
127.1 (117min - 128max) Watt *
Temperatures - CPU Temperature Prime95
Intel Core i9-10900K
NVIDIA Titan RTX, i9-10900K, WDC PC SN720 SDAQNTW-512G
88 °C
AMD Ryzen 9 3950X
NVIDIA Titan RTX, R9 3950X, Intel Optane 905P 480GB 2.5
83.8 °C
Intel Ghost Canyon NUC
UHD Graphics 630, i9-9980HK, Kingston KC2500 1 TB SKC2500M81000G
77 °C
Intel Core i5-10600K
NVIDIA Titan RTX, i5-10600K
70 °C

* ... kleinere Werte sind besser

Intel NUC 9 Extreme Kit ohne RTX 2070

Intel NUC 9 Extreme Kit - Stromverbrauch Idle
Intel NUC 9 Extreme Kit - Stromverbrauch Prime95
Intel NUC 9 Extreme Kit - Stromverbrauch FurMark
Intel NUC 9 Extreme Kit - Stromverbrauch Prime95 und FurMark
Intel NUC 9 Extreme Kit - Stromverbrauch Cinebench-R15-Multi
Intel NUC 9 Extreme Kit - Stresstest Prime95 solo
Intel NUC 9 Extreme Kit - Stresstest FurMark solo
Intel NUC 9 Extreme Kit - Stresstest Prime95 und FurMark


Intel NUC 9 Extreme Kit mit RTX 2070

Intel NUC 9 Extreme Kit - Stromverbrauch Idle
Intel NUC 9 Extreme Kit - Stromverbrauch Prime95
Intel NUC 9 Extreme Kit - Stromverbrauch FurMark
Intel NUC 9 Extreme Kit - Stromverbrauch Prime95 und FurMark
Intel NUC 9 Extreme Kit - Stromverbrauch The Witcher 3 (Ultra-Preset)
Intel NUC 9 Extreme Kit - Stresstest Prime95 solo
Intel NUC 9 Extreme Kit - Stresstest FurMark solo
Intel NUC 9 Extreme Kit - Stresstest Prime95 und FurMark


Pro

+ sehr klein
+ sauber verarbeitet
+ Core i9 mit 8 Kernen
+ hohe System performance
+ viele Anschlussmöglichkeiten
+ Thunderbolt 3
+ WiFi6
+ drei M.2 Steckplätze
+ 500-Watt-Netzteil

Contra

- hoher Preis
- im Auslieferungszustand nicht Betriebsbereit
- unkluge Kühleinheit
- eingeschränkte Kompatibilität bei Erweiterungskarten
- deutlich hörbar unter Last

Fazit - kleiner Kraftprotz für den großen Geldbeutel

Intel NUC 9 Extreme Kit, zur Verfügung gestellt von Intel Deutschland

Das Intel NUC 9 Extreme Kit ist ein sehr kleines und dennoch sehr leistungsstarkes System. Für die aufgerufenen knapp 1.700 Euro ist das System aber alles andere als ein Schnäppchen, denn man darf nicht vergessen, dass der Arbeitsspeicher, die Massenspeicher und die hier im Test benutzte Grafikkarte nicht zum Lieferumfang gehören. Wer den Kauf dennoch nicht scheut und sich das Gerät mit den nötigen Komponenten bestückt bekommt ein sehr gut ausgestattetes und modernes Gerät. Mit einer performanten Grafikkarte verwandelt sich der Mini-PC in einen vollwertigen Gaming-PC mit dem auch modernsten Titel gespielt werden können.

Wer nicht unbedingt auf die Leistung der 8 Kerne des Intel Core i9-9980HK angewiesen ist, kann den Ghost Canyon NUC auch mit einem schwächeren i7-9750H oder einem i5-9300H bekommen. Beide Prozessoren kommen häufig in Gaming-Laptops zum Einsatz und konnten in den vergangenen Tests ebenfalls mit einer soliden Leistung überzeugen. Das Non-Plus-Ultra bleibt allerdings der Core i9-9980HK.

Die Leistung passt und dennoch wird es der kleine Kraftprotz es schwer haben sich aufgrund des hohen Anschaffungspreises auf die Einkaufsliste zu setzen.

Nichtsdestotrotz gibt es bei dem Ghost Canyon NUC trotzdem einige negative Aspekte, welche die Lautstärke bei Vollbestückung mit einer dedizierten Grafikkarte betreffen. Durch die sehr kompakte Bauweise wird der Lüfter der Compute Einheit fast völlig bedeckt, sodass die Heatpipe des SoC nur noch mit sehr warmer Luft aufgrund der direkt angrenzenden Grafikkarte versorgt wird. Ein Teufelskreis, denn dadurch steigt die Lautstärke unter Last deutlich. Eine Konstruktion, bei der der Lüfter auf der Gehäuseaußenseite platziert wäre, wäre vermutlich die bessere Alternative.

Summa Summarum ist der Intel NUC 9 Extreme der kleinste PC unter 5L welcher mit einer GeForce RTX 2070 bestückt werden kann. Zudem überzeugt das Testgerät mit hochwertigen Komponenten und einer sauberen Verarbeitung. Einen ähnlichen Ansatz einen sehr kompakten PC zu konstruieren verfolgte Corsair mit der One-Serie den wir bereits als One i160 ebenfalls schon hier im Test hatten. Preislich befindet sich auch das Modell von Corsair in ähnlichen Regionen wie ein voll ausgestatteter Intel Ghost Canyon NUC 9 Extreme. Auch Zotac möchte hier mit mischen und ist mit dem MEK Mini am Markt welcher ebenfalls mit einer RTX 2070 ausgestattet ist.

Alle 3 Beträge lesen / Antworten
static version load dynamic
Die Kommentare zum Artikel werden geladen
Diesen Artikel kommentieren / Antworten
Teilen Sie diesen Artikel, um uns zu unterstützen. Jeder Link hilft!
> Notebook Test, Laptop Test und News > Tests > Sonstige Tests > Intel NUC 9 Extreme mit Core i9 und RTX 2070 im Test
Autor: Sebastian Bade,  4.06.2020 (Update: 12.06.2023)