GMK NucBox K2 Mini-PC im Test: Überraschend gutes Preis-Leistungs-Verhältnis
")
Der NucBox K2 ist der neueste Mini-PC aus dem Hause GMKtec, welcher vor allem für Homeoffice-Tätigkeiten und Büroarbeiten entwickelt wurde. Während man beim Namen denken könnte, der K2 ersetze den K1, ist genau das Gegenteil der Fall: Er erweitert das Repertoire des Herstellers und spricht auch genau genommen eine andere Zielgruppe an.
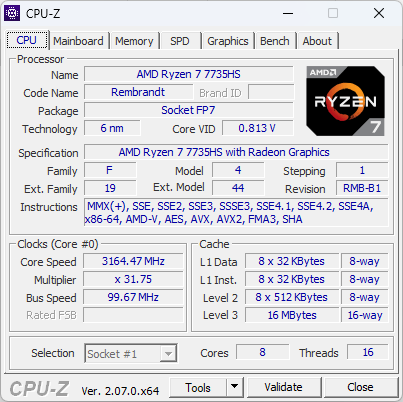
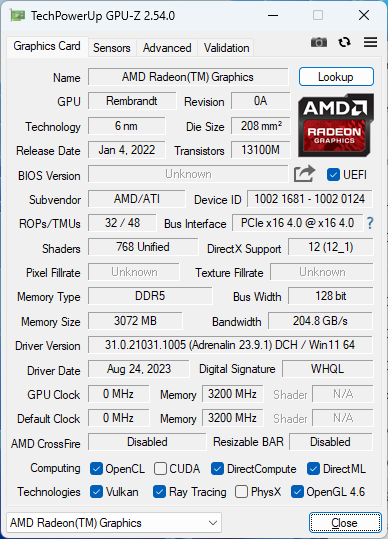
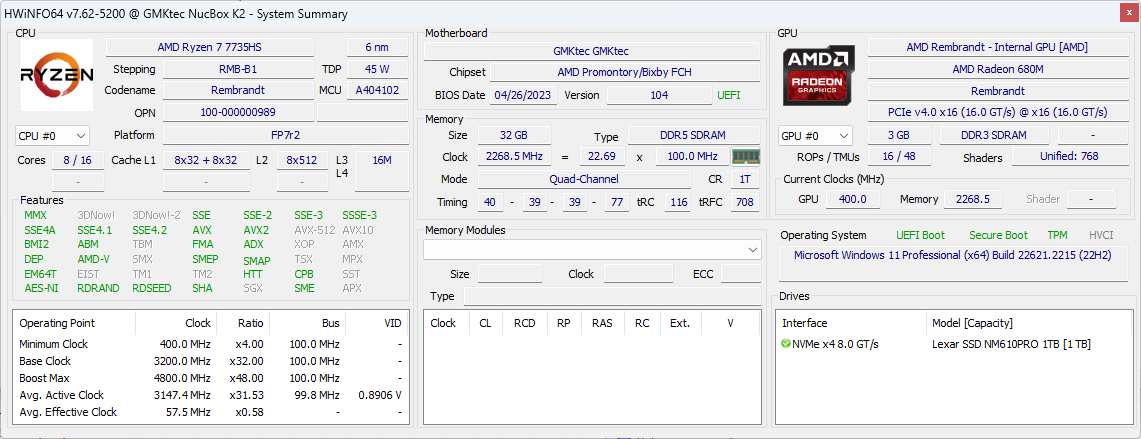
Unser Testgerät im Speziellen besitzt eine AMD-Ryzen-7-7735HS-CPU, eine integrierte Radeon 680M, eine 1-TB-PCIe3-SSD und 32 GB RAM für einen Preis von ca. 540 Euro ($580 USD). Es gibt auch für knapp 750 Euro ($800 USD) weitere Konfigurationen mit weniger RAM und Speicher, welche sogar einen etwas schnelleren Prozessor besitzen.
Alternativen zum NucBox K2 wären andere Mini-PCs mit integrierter GPU, wie beispielsweise der Lenovo IdeaCentre Mini, der Geekom Mini iT13, der Trigkey Speed S oder der Intel NUC 13 Pro.
Weitere GMK-Reviews:
NucBox 3
NucBox 2
NucBox K1
KD2 (Monitor)
Potentielle Mitstreiter im Vergleich
Bew. | Datum | Modell | Gewicht | Dicke | Größe | Auflösung | Preis ab |
|---|---|---|---|---|---|---|---|
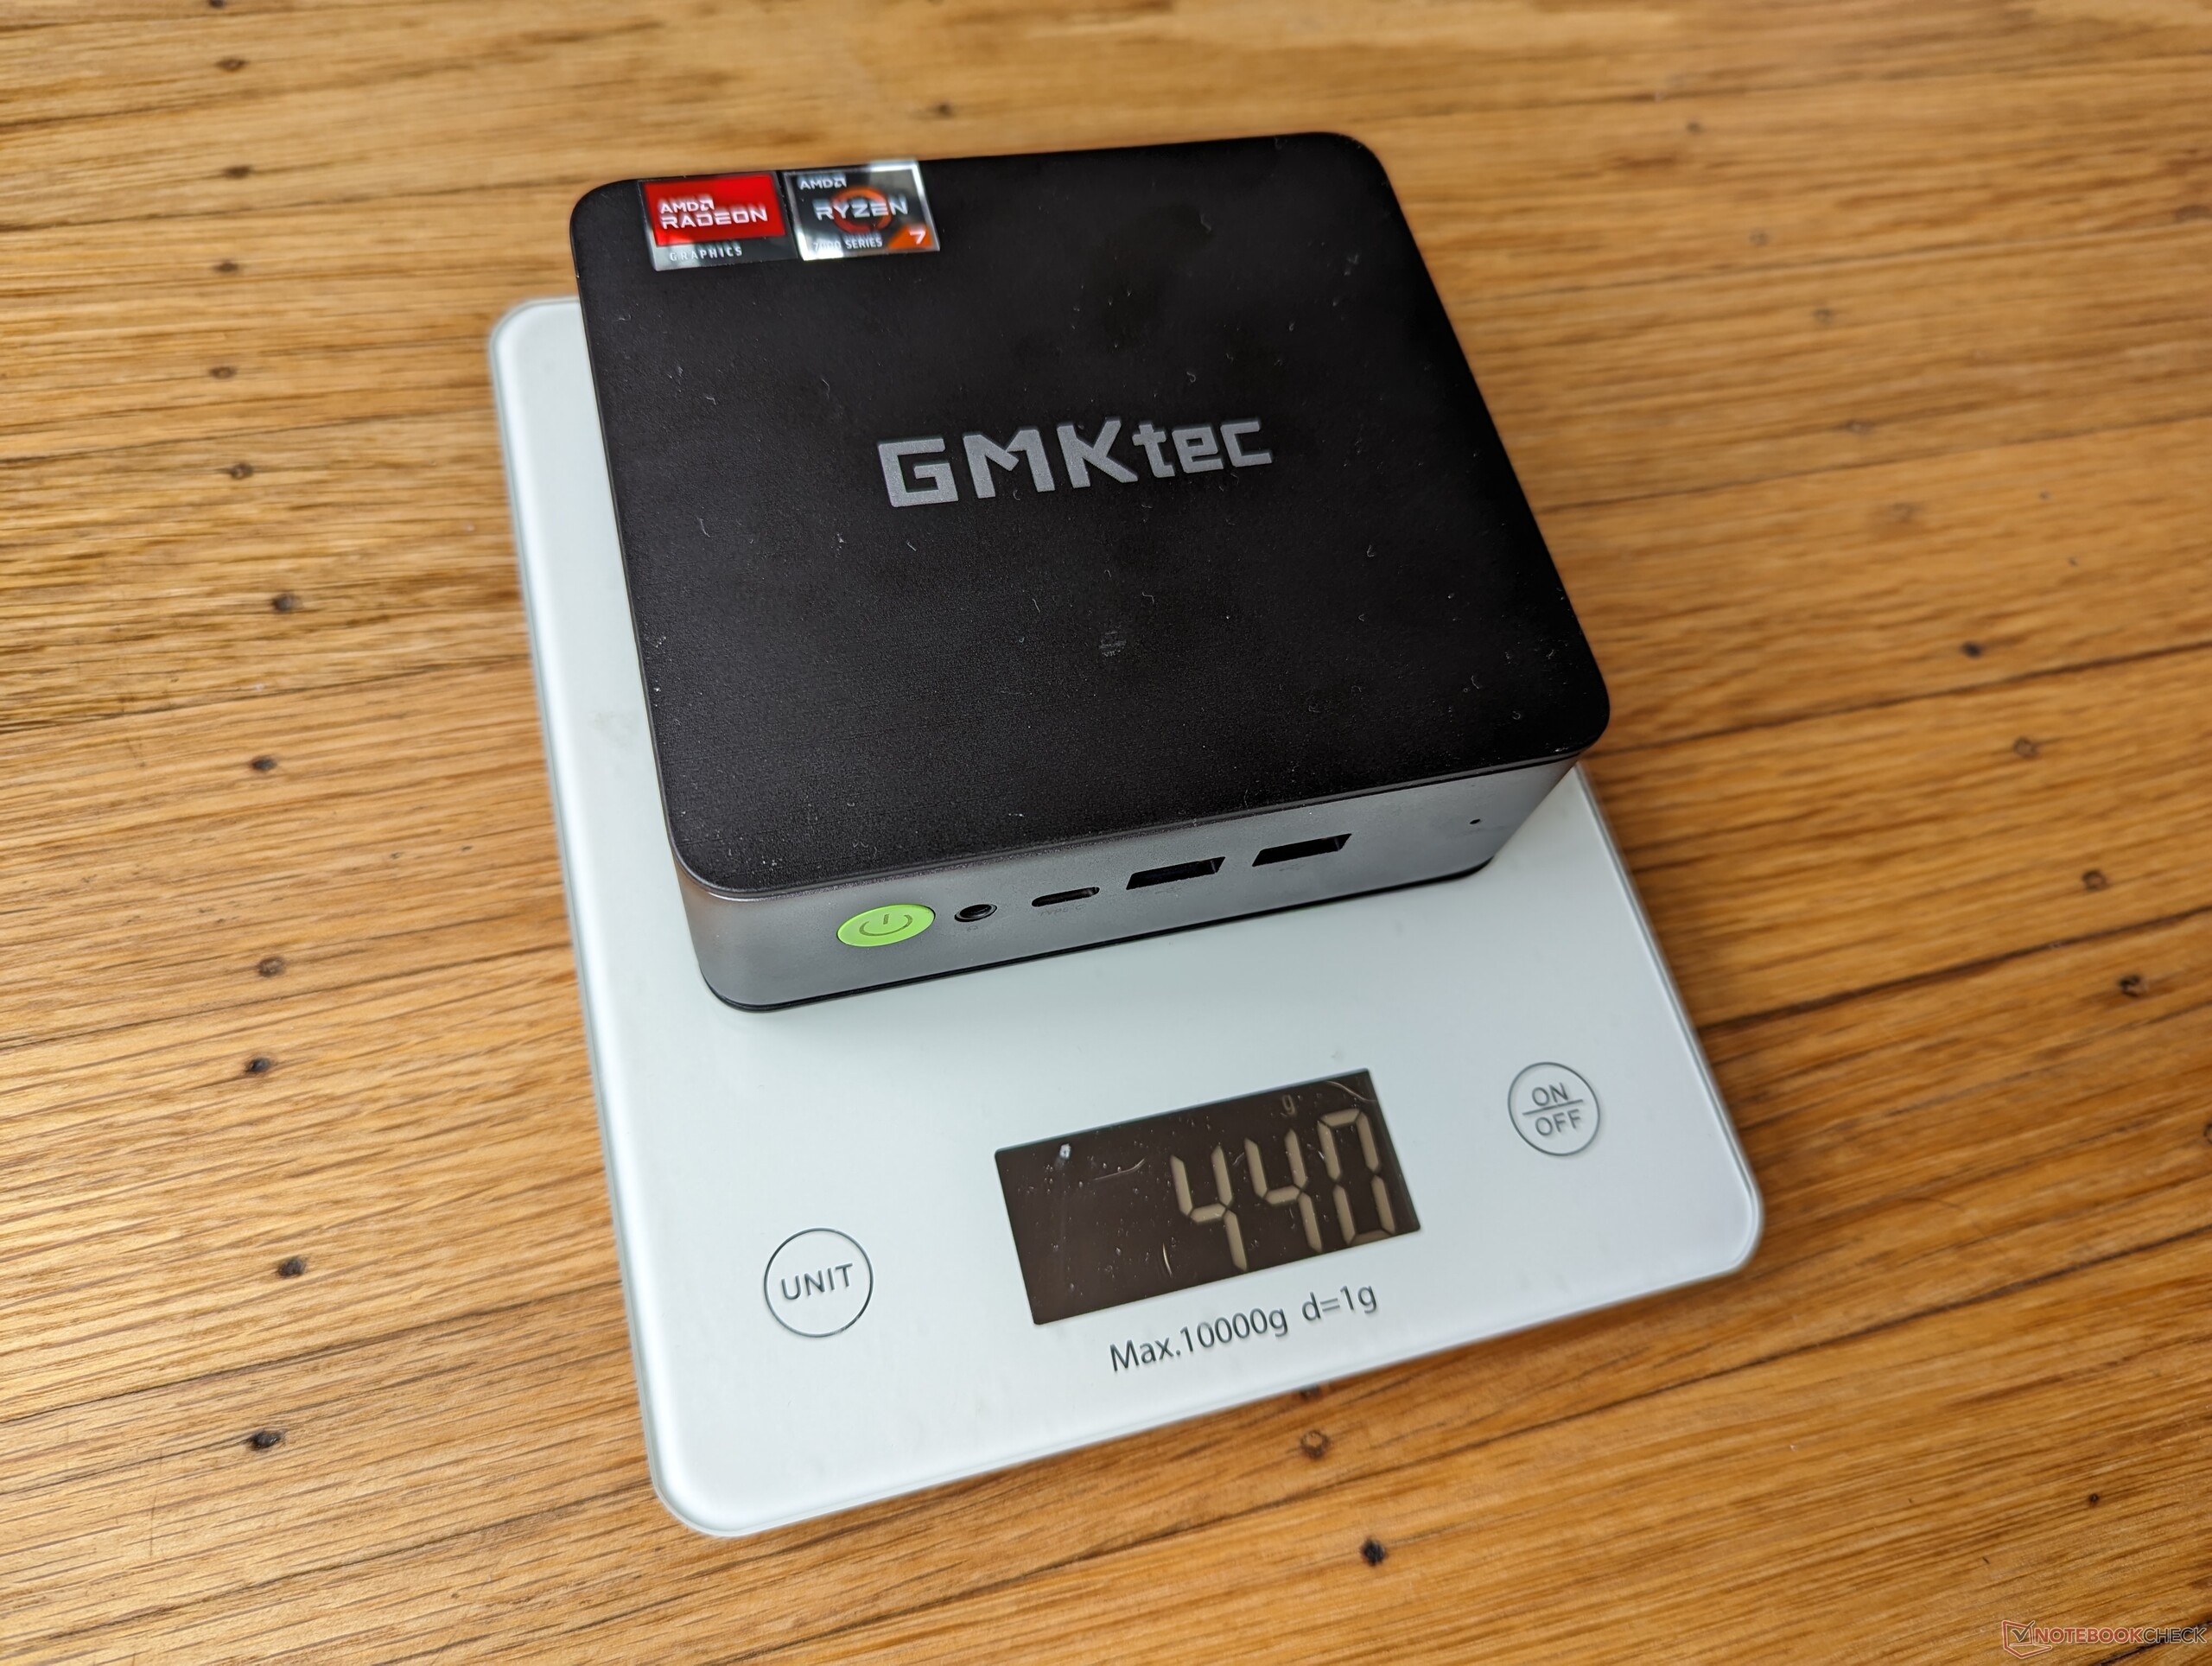
| 83 % v7 (old) | 09 / 2023 | GMK NucBox K2 R7 7735HS, Radeon 680M | 440 g | 43.2 mm | x | ||
| 86.6 % v7 (old) | 09 / 2023 | Beelink SER7 R7 7840HS, Radeon 780M | 640 g | 49 mm | x | ||
| 73.5 % v7 (old) | 09 / 2023 | Blackview MP80 N95, UHD Graphics 24EUs (Alder Lake-N) | 214 g | 37 mm | x | ||
| 83.1 % v7 (old) | 08 / 2023 | Intel NUC 13 Pro Desk Edition Kit i7-1360P, Iris Xe G7 96EUs | 558 g | 37 mm | x | ||
| 80.6 % v7 (old) | 07 / 2023 | Geekom Mini IT11, i7-11390H i7-11390H, Iris Xe G7 96EUs | 536 g | 48 mm | x | ||
v (old) | Trigkey Speed S i5-11320H, Iris Xe G7 96EUs | 415 g | 40.7 mm | x |
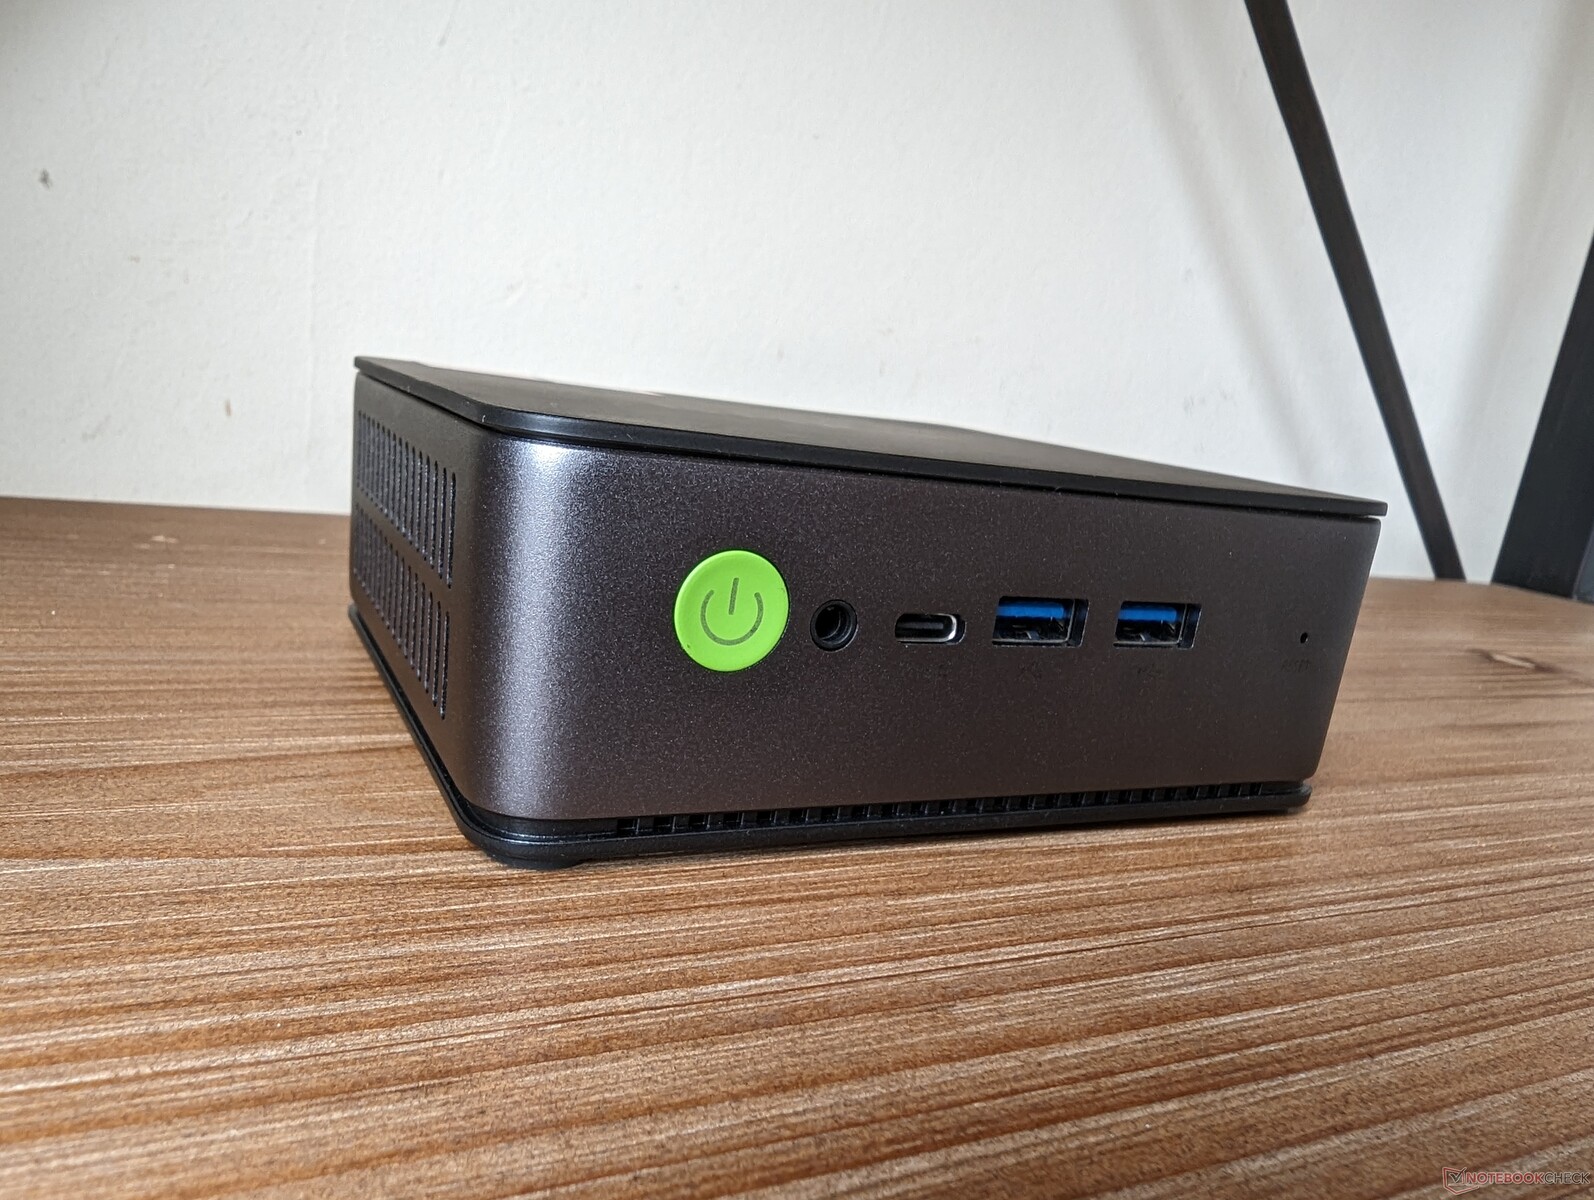
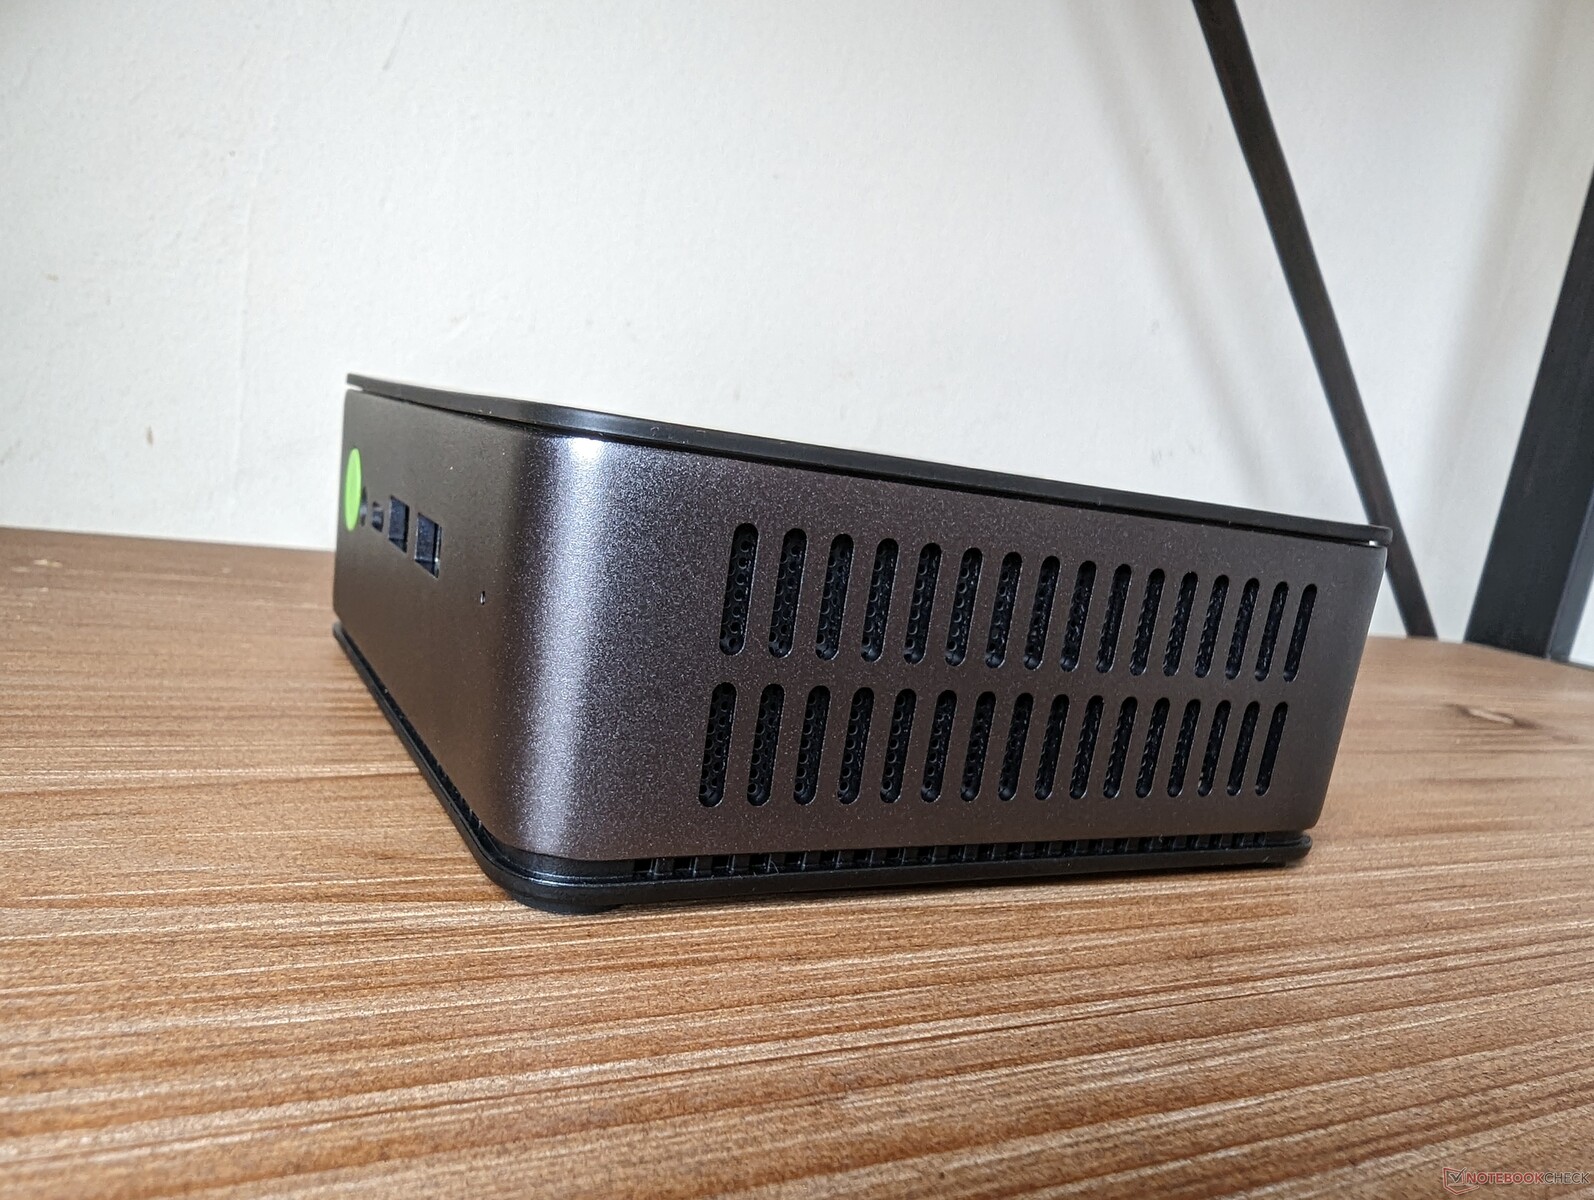
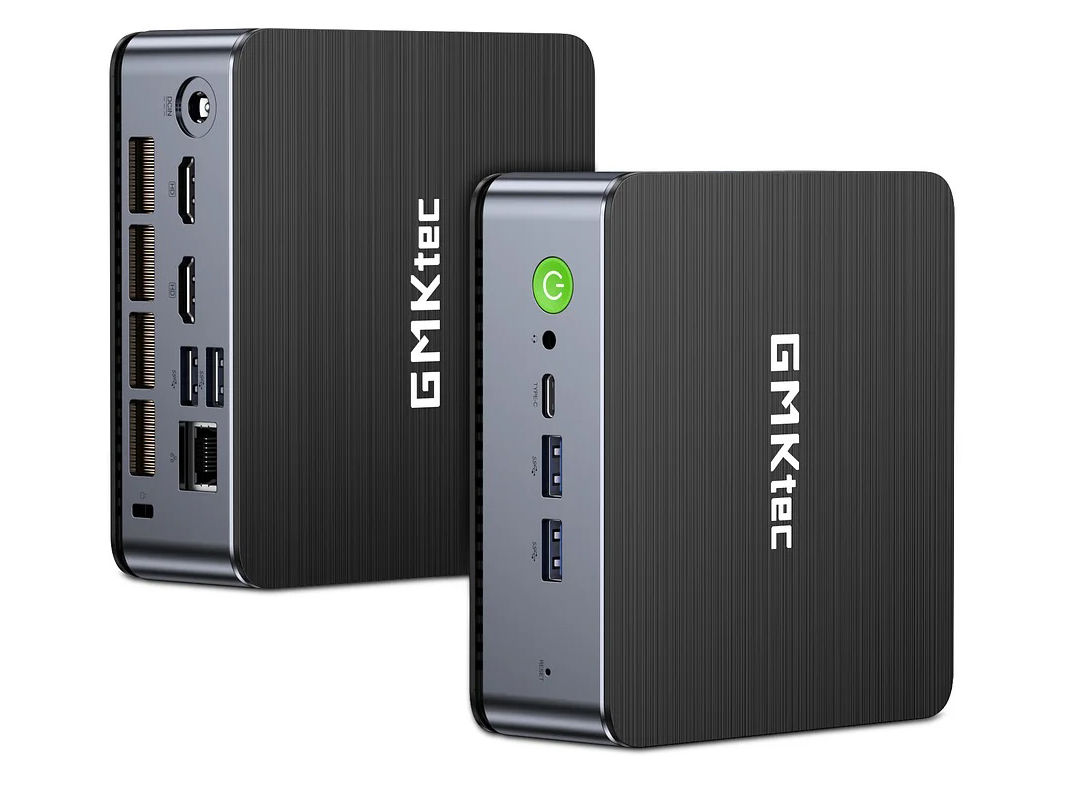
Gehäuse — Schlicht und einfach
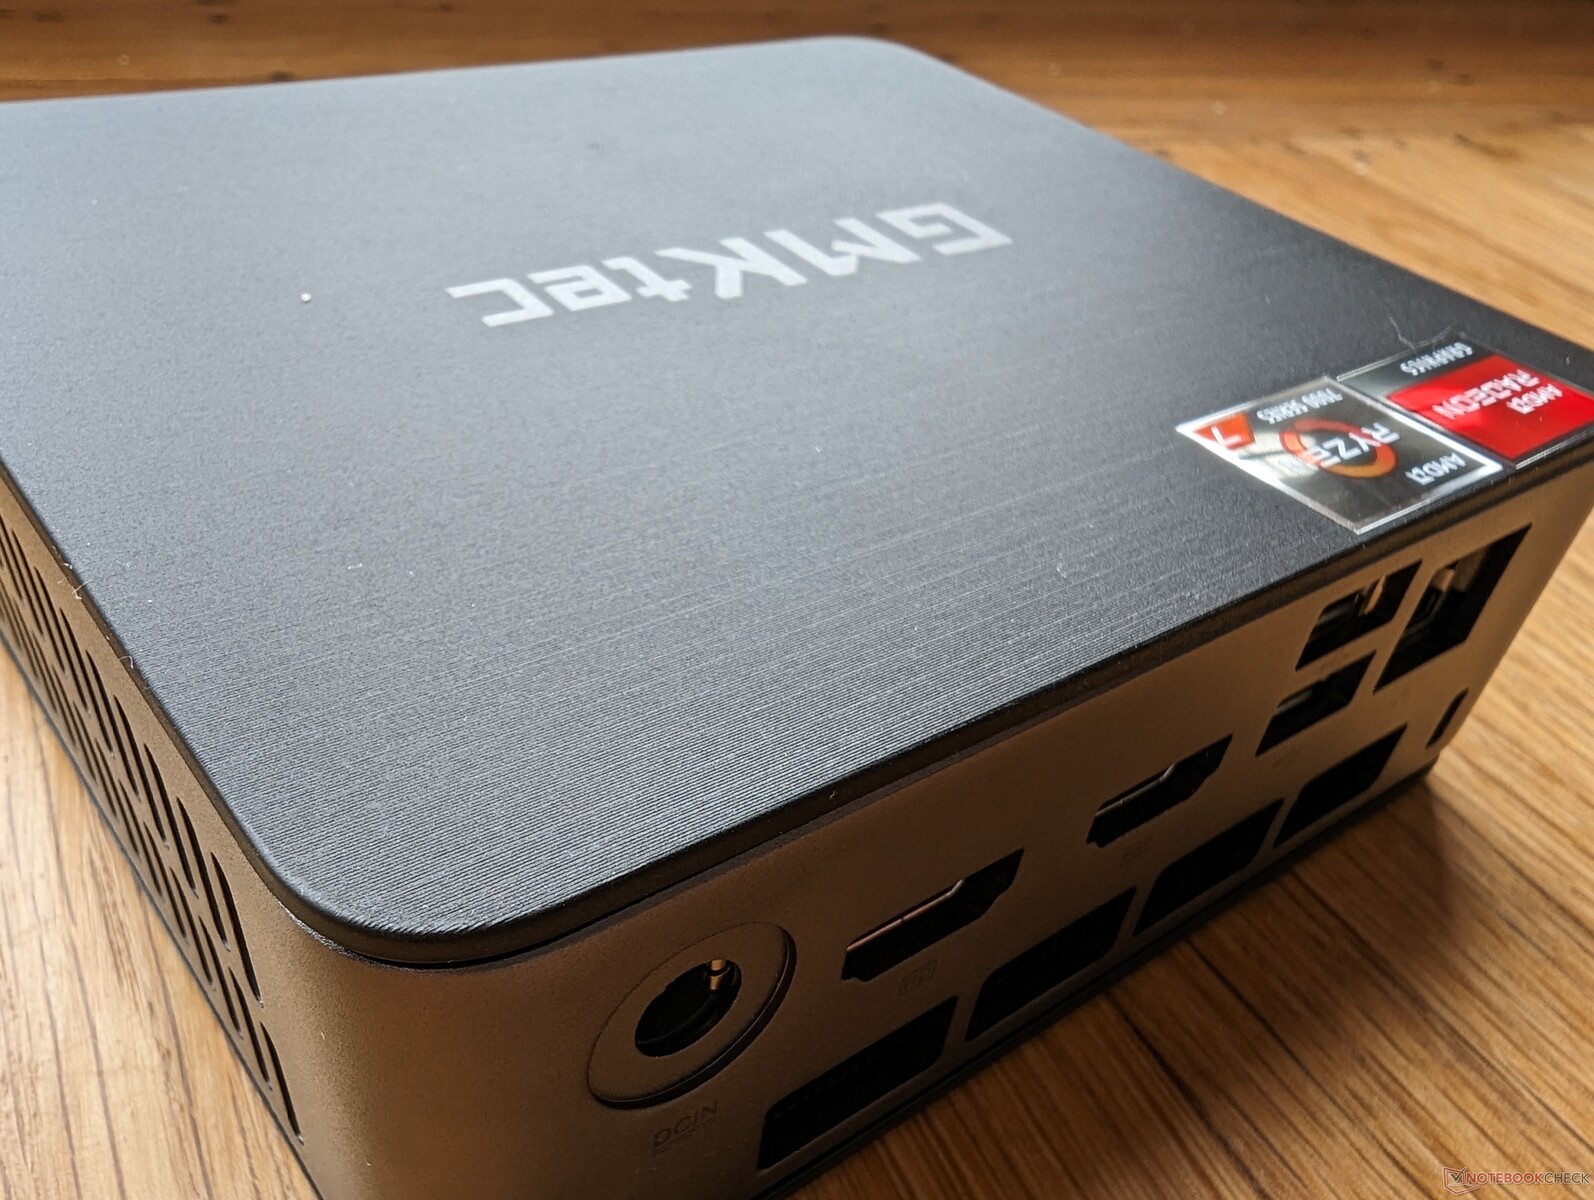
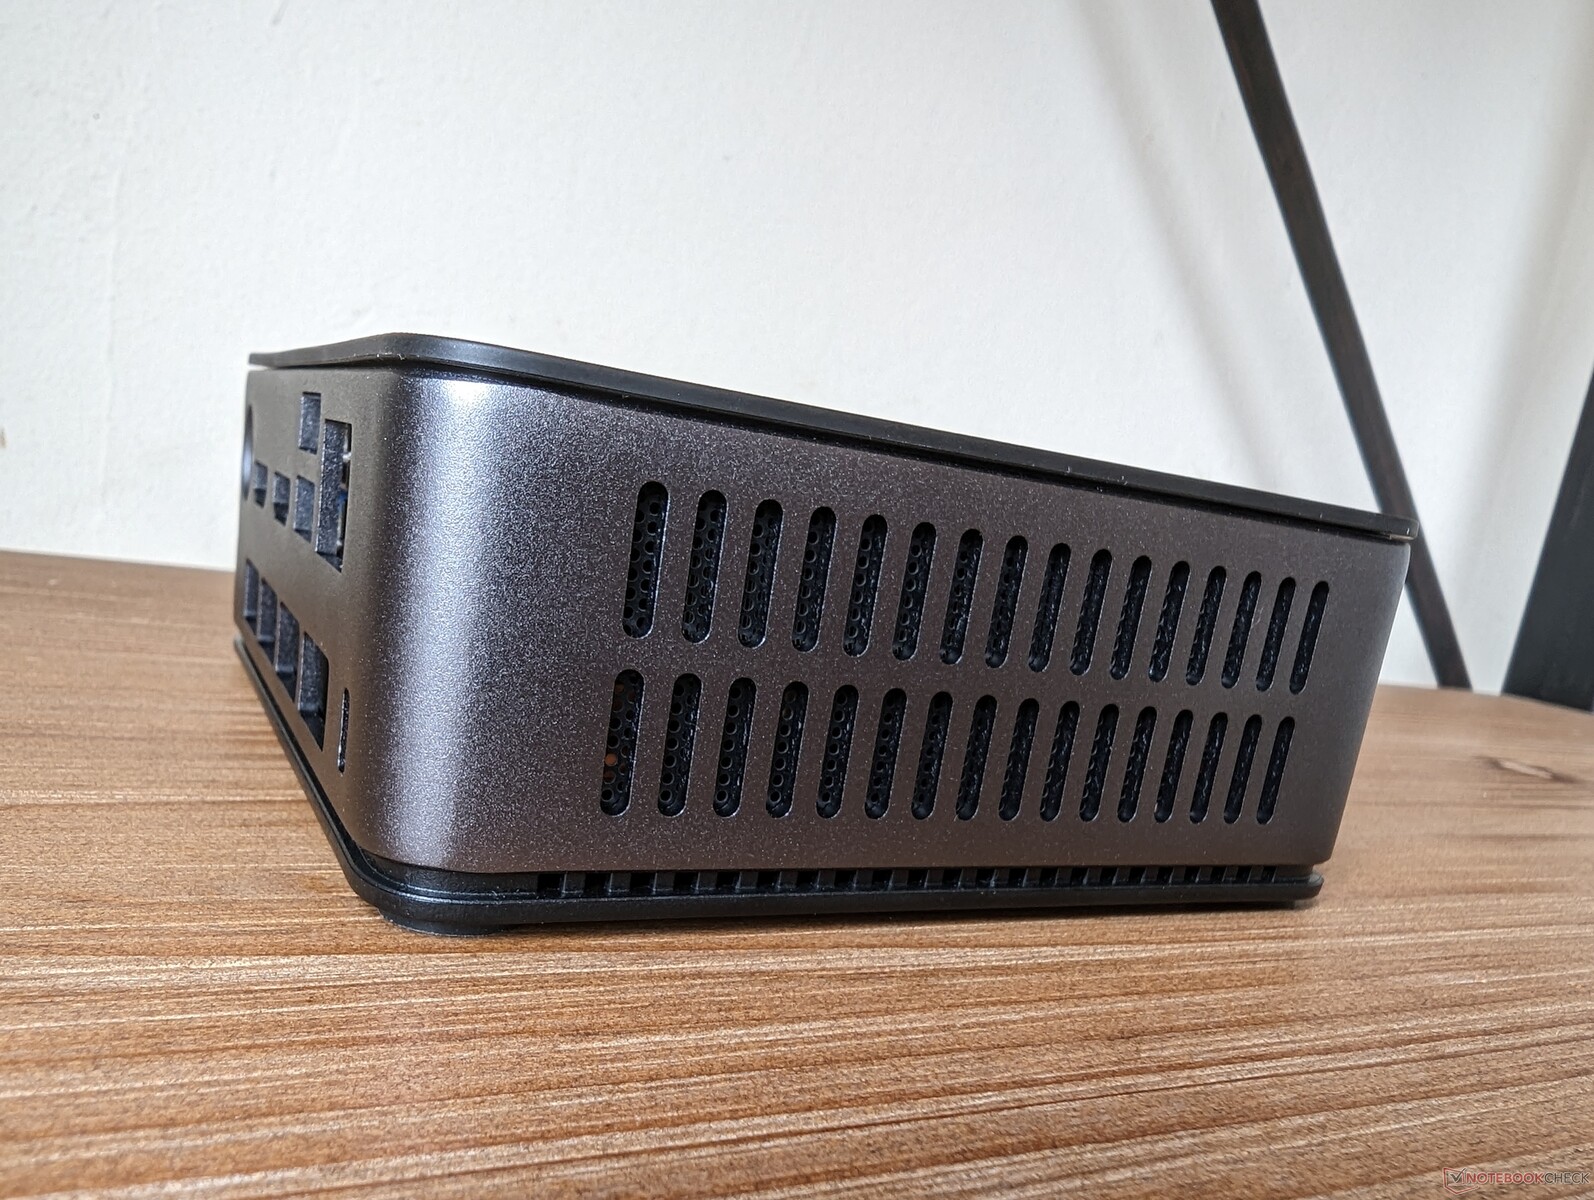
Der NucBox-K2-Mini-PC ist im Vergleich zu anderen Geräten dieser Kategorie, wie dem Intel NUC 13 Pro oder dem Geekom Mini IT11, deutlich leichter. Dies liegt aber unter anderem daran, dass der PC hauptsächlich aus Plastik anstelle von Metall besteht. Lediglich die Seiten wurden hier aus Aluminium gefertigt. Das matte Design sieht auch eher zurückhaltend aus, wenn man es neben anderen Mini-PCs stehen hat. Nichtsdestotrotz ist die gesamte Verarbeitung des Geräts gut und weist keinerlei Mängel auf.
Konnektivität
Der auffallendste Port des Mini-PCs ist ohne Frage der USB4-Anschluss. Dieser kann für diverse eGPUs, externe Displays, Docking-Stationen oder für Stromadapter von Drittherstellern genutzt werden. Leider gibt es hier aber nur einen einzigen USB-C-Port, im Vergleich dazu kommt der Beelink SER7 mit drei Stück daher.
Kommunikation
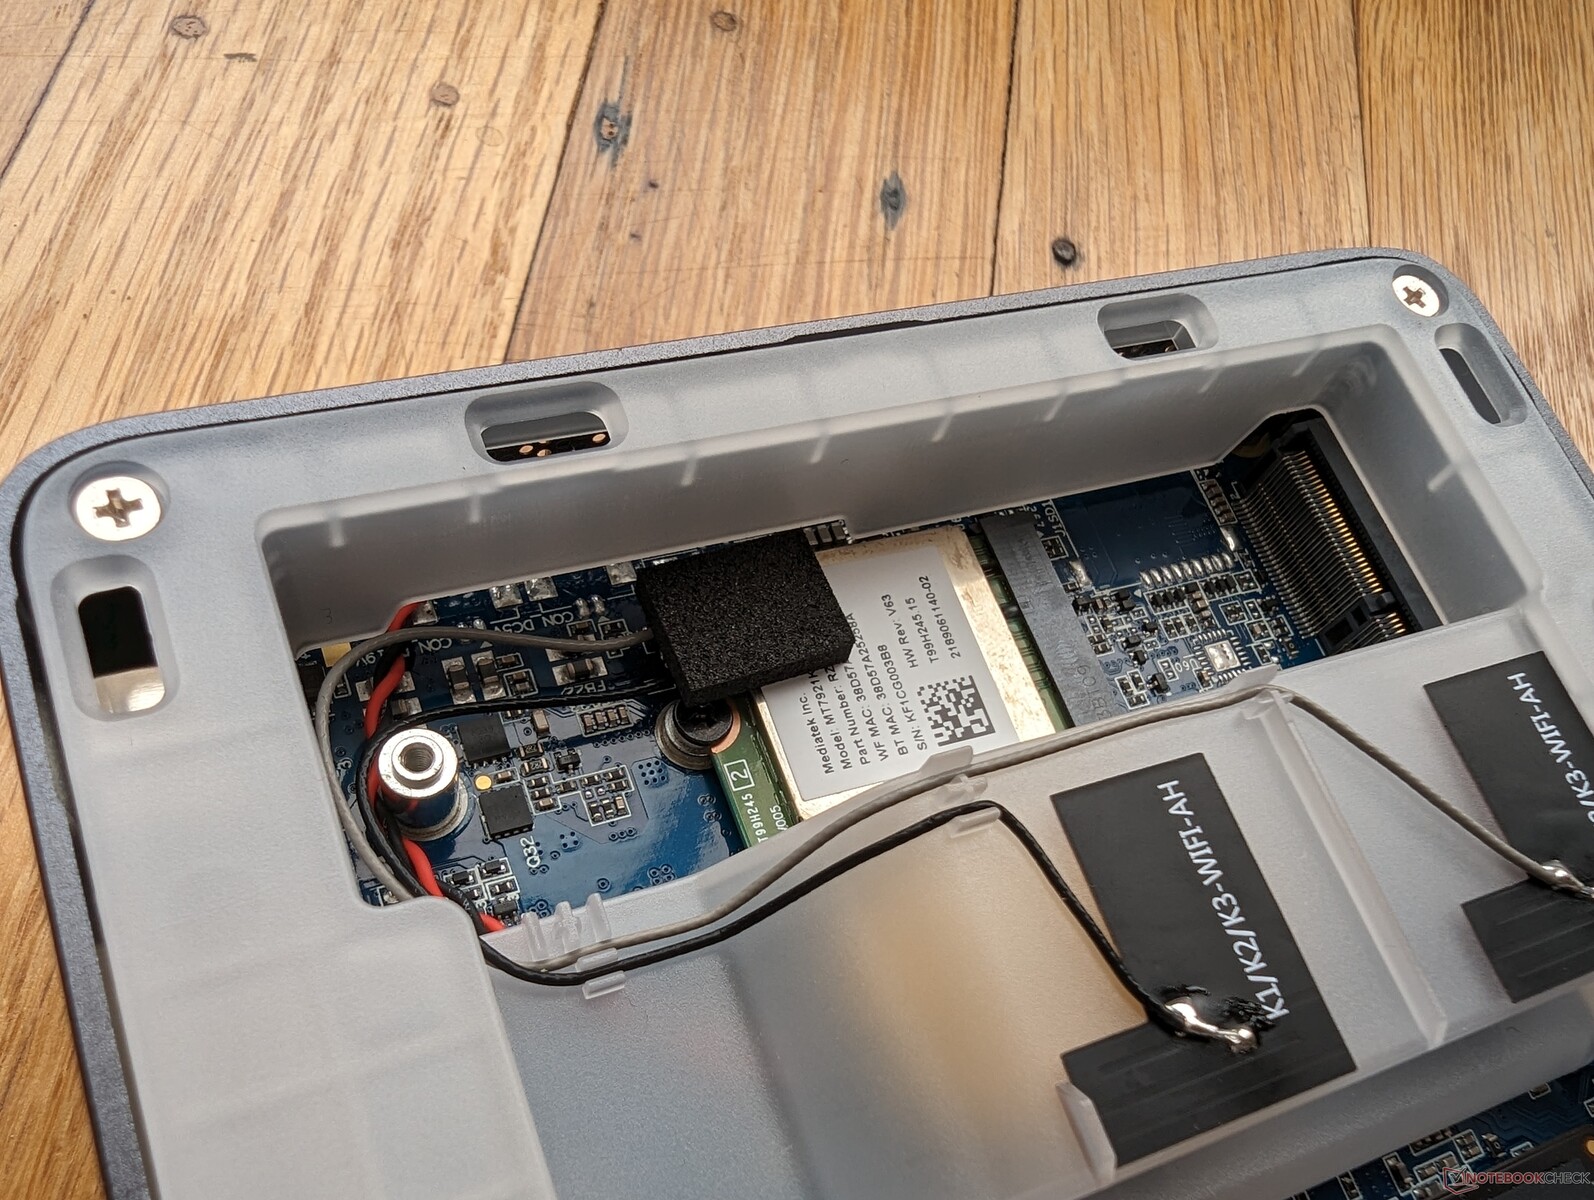
Das MediaTek-RZ608-WLAN-Modul sorgt für einen schnellen WiFi-6- und WiFI-6E-Support. Hierzu ist zu sagen, dass die Verbindung zwar stabil, aber trotzdem etwas langsam ist. Getestet haben wir in diesem Fall mit einem 6-GHz-Netzwerk. Wir vermuten, dass dies an einer etwas schwächeren Antenne des Moduls liegt.
Bluetooth funktionierte auch eher schlecht als recht. Als wir versuchten, eine Maus via Bluetooth zu verbinden, funktionierte dies nicht. Auf anderen Geräten hatte die Maus jedoch keine Probleme.
| Networking | |
| iperf3 transmit AX12 | |
| GMK NucBox 2 | |
| iperf3 receive AX12 | |
| GMK NucBox 2 | |
| iperf3 transmit AXE11000 | |
| Beelink SER7 | |
| Intel NUC 13 Pro Desk Edition Kit | |
| Trigkey Speed S | |
| GMK NucBox K2 | |
| Geekom Mini IT11, i7-11390H | |
| iperf3 receive AXE11000 | |
| Beelink SER7 | |
| Trigkey Speed S | |
| Intel NUC 13 Pro Desk Edition Kit | |
| Geekom Mini IT11, i7-11390H | |
| GMK NucBox K2 | |
| iperf3 transmit AXE11000 6GHz | |
| Intel NUC 13 Pro Desk Edition Kit | |
| GMK NucBox K2 | |
| iperf3 receive AXE11000 6GHz | |
| Intel NUC 13 Pro Desk Edition Kit | |
| GMK NucBox K2 | |
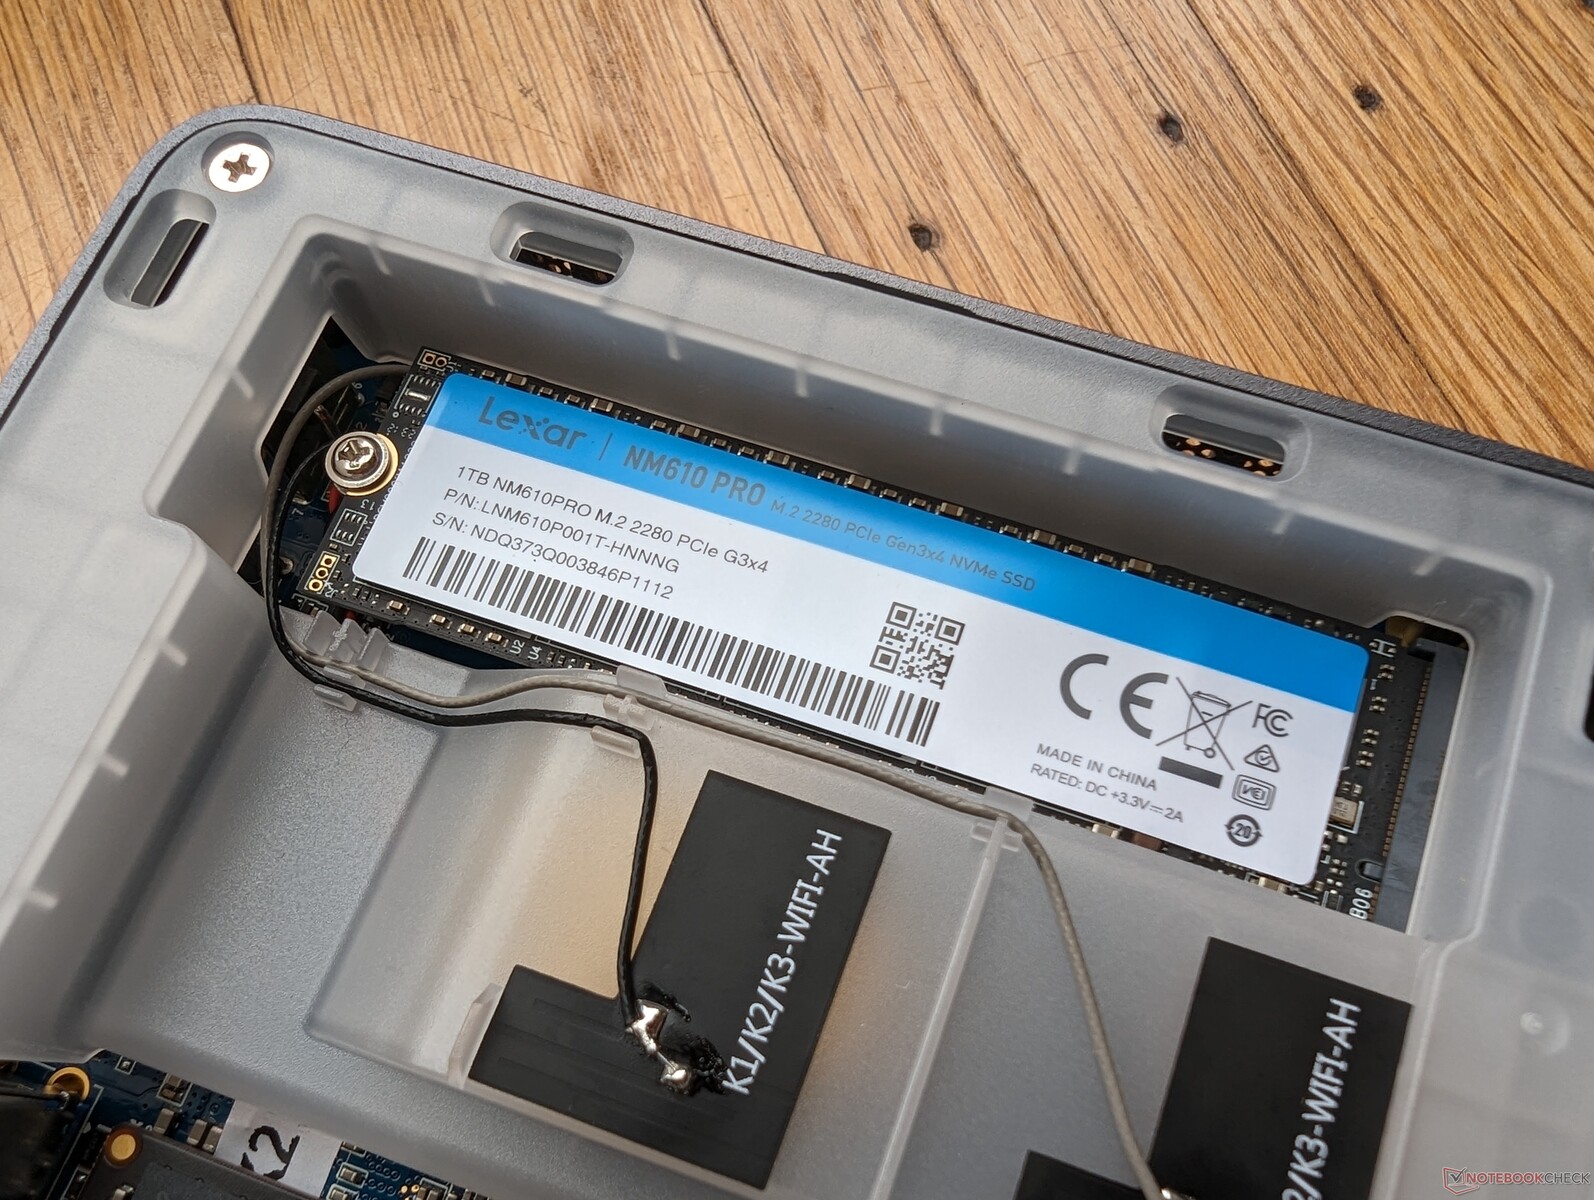
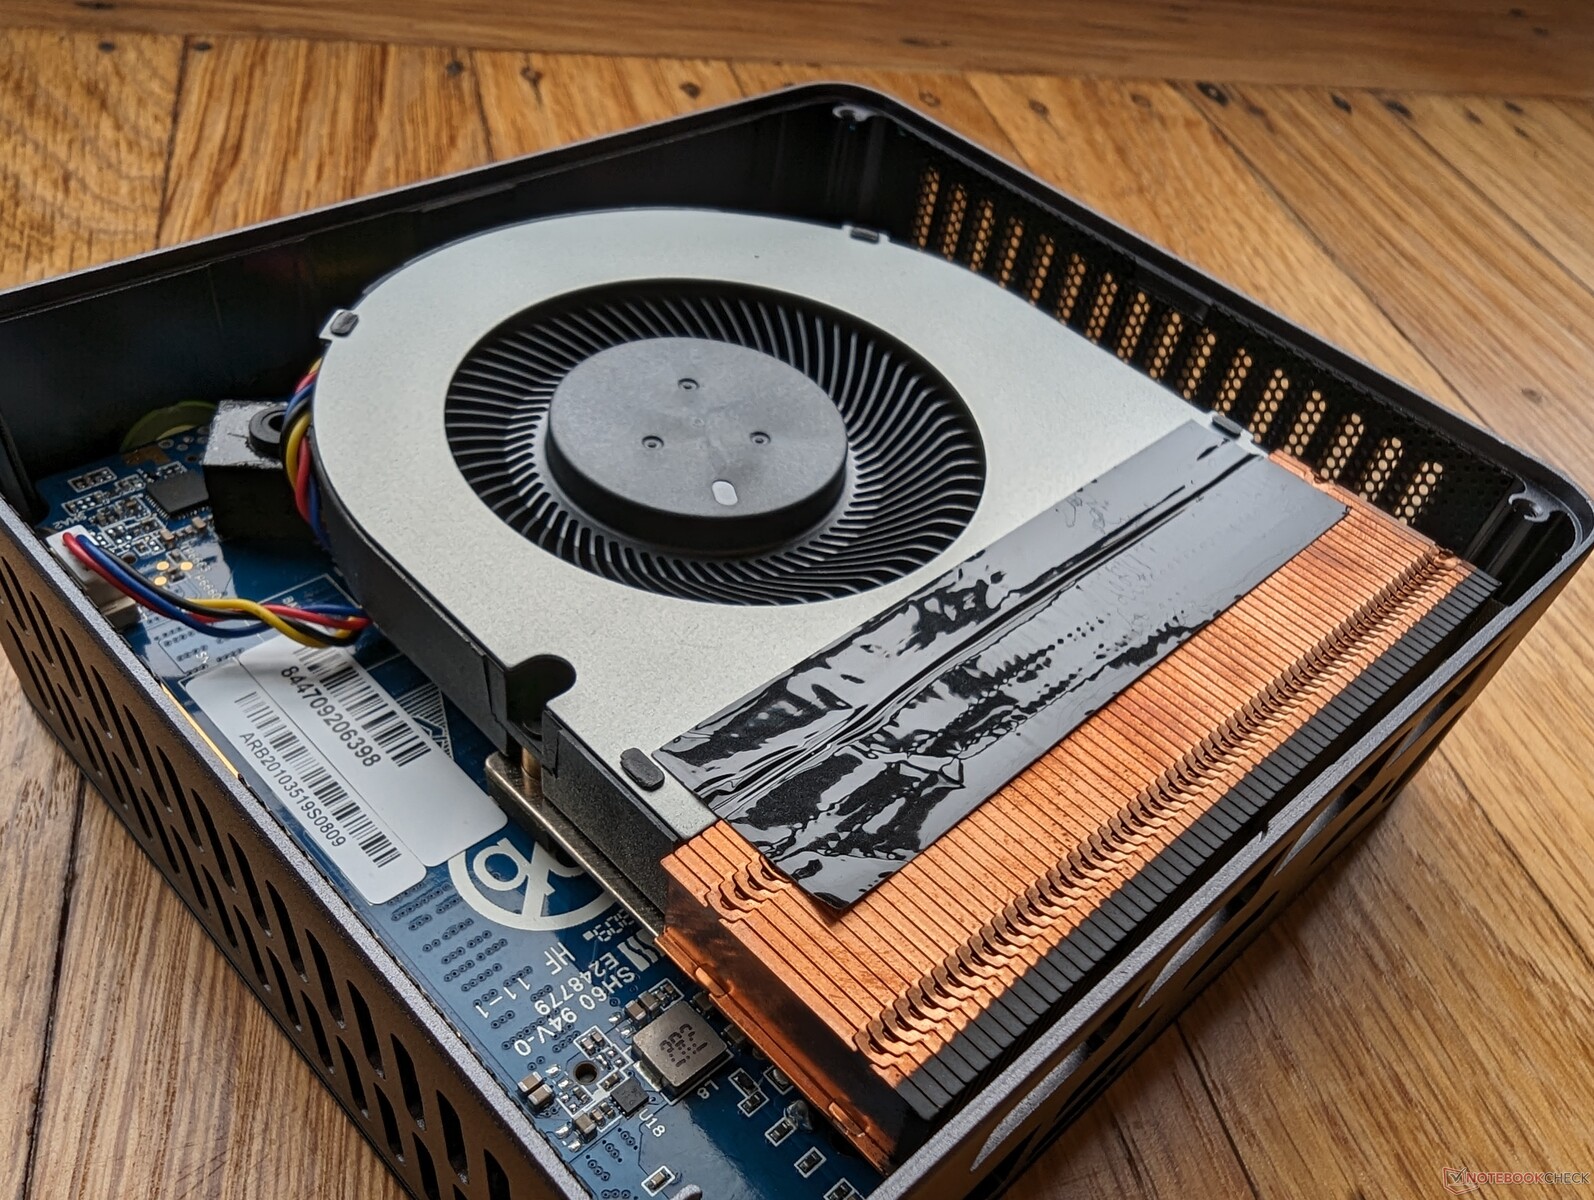
Wartung
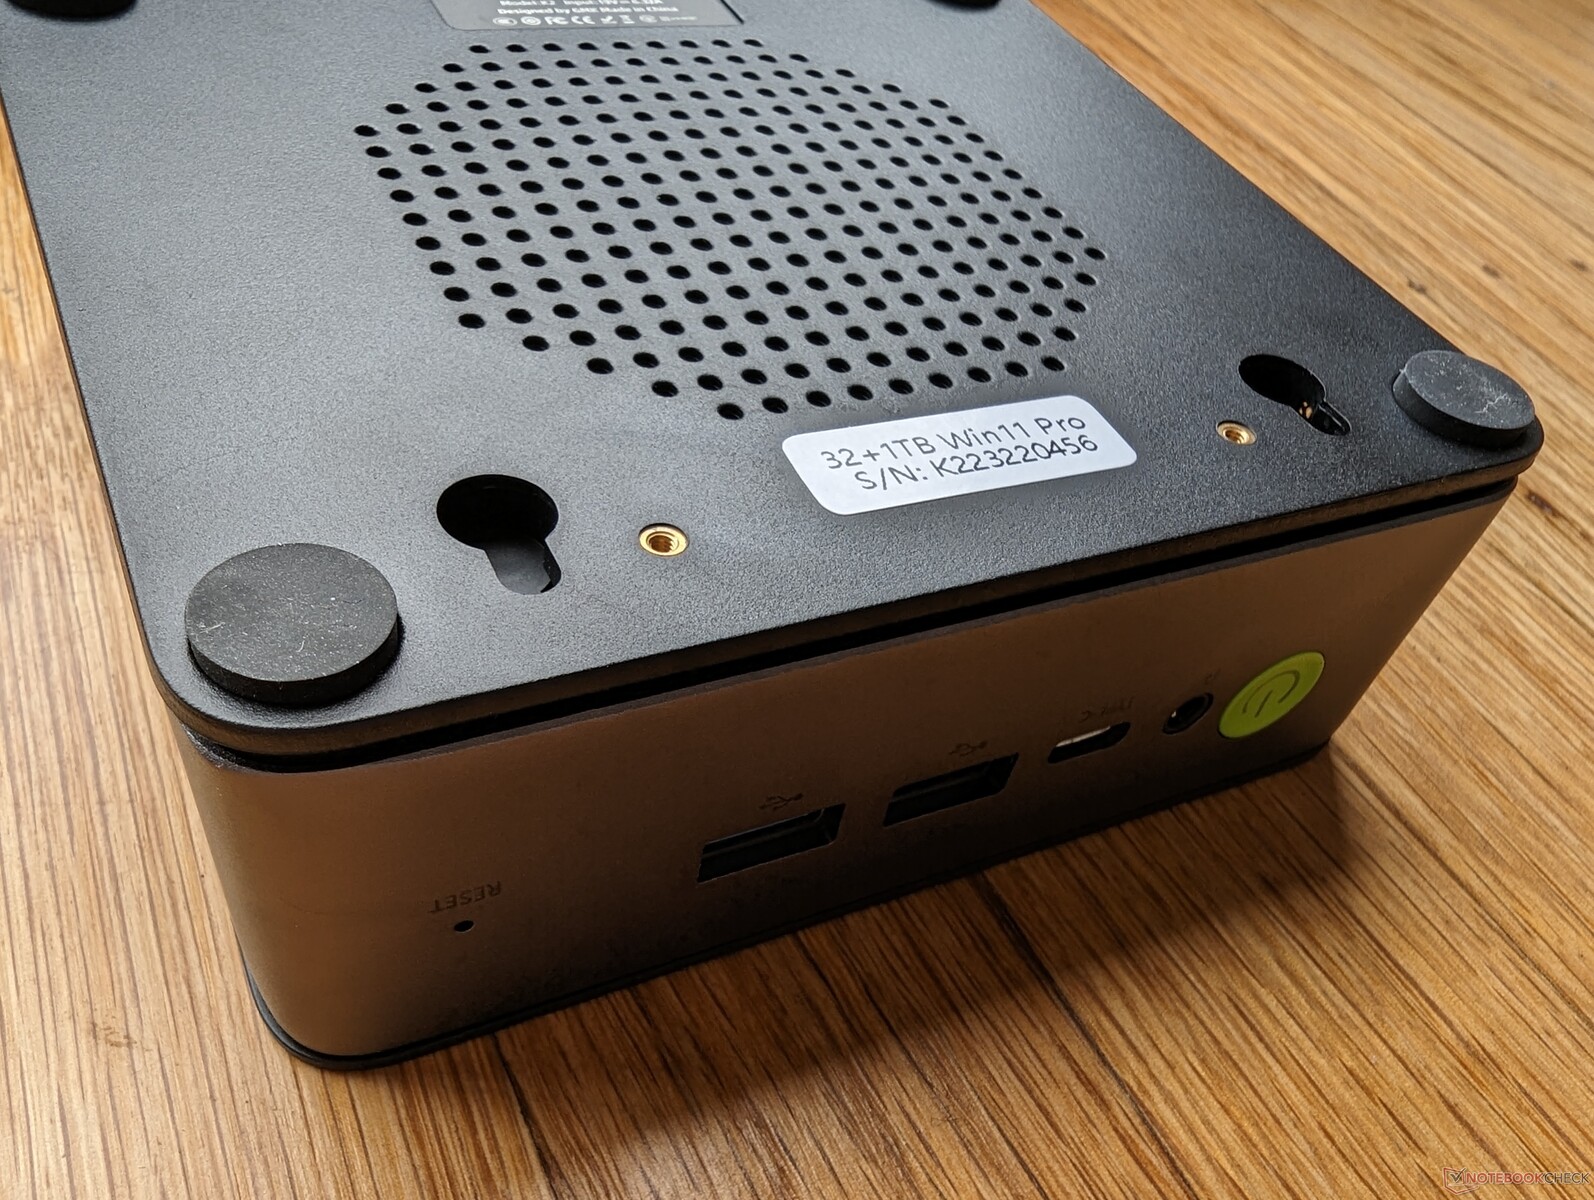
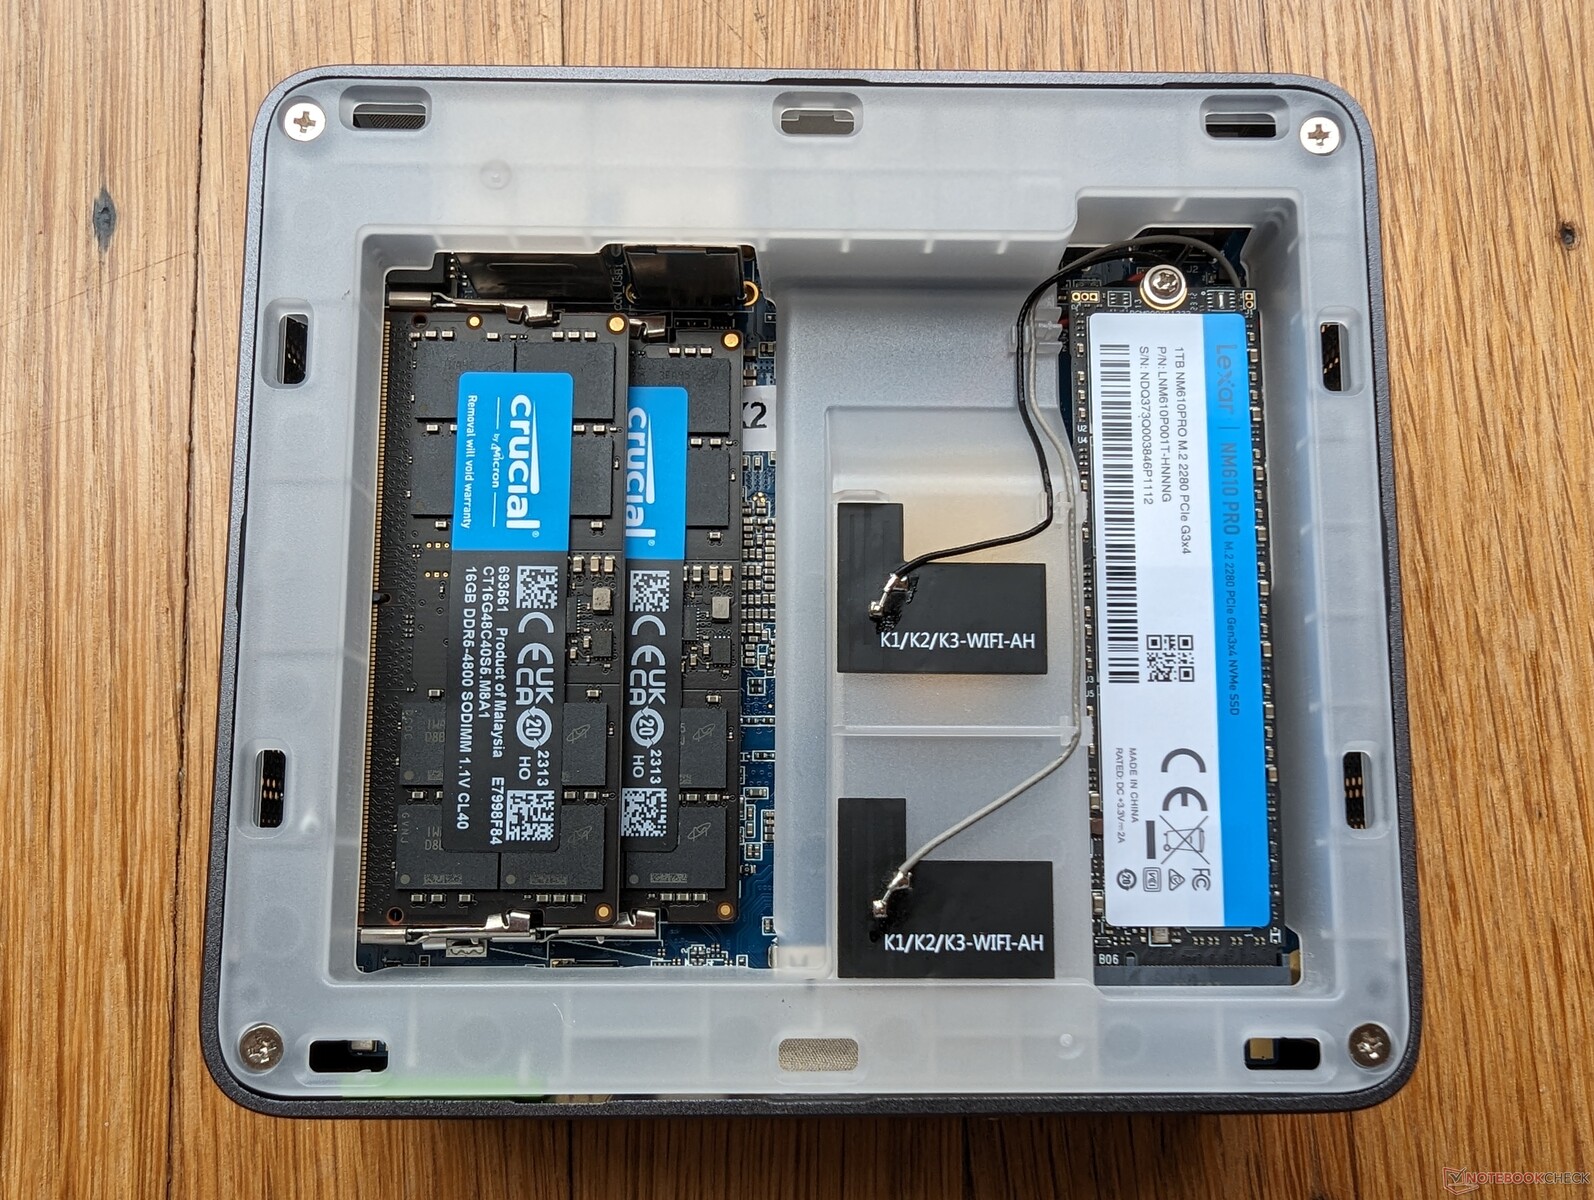
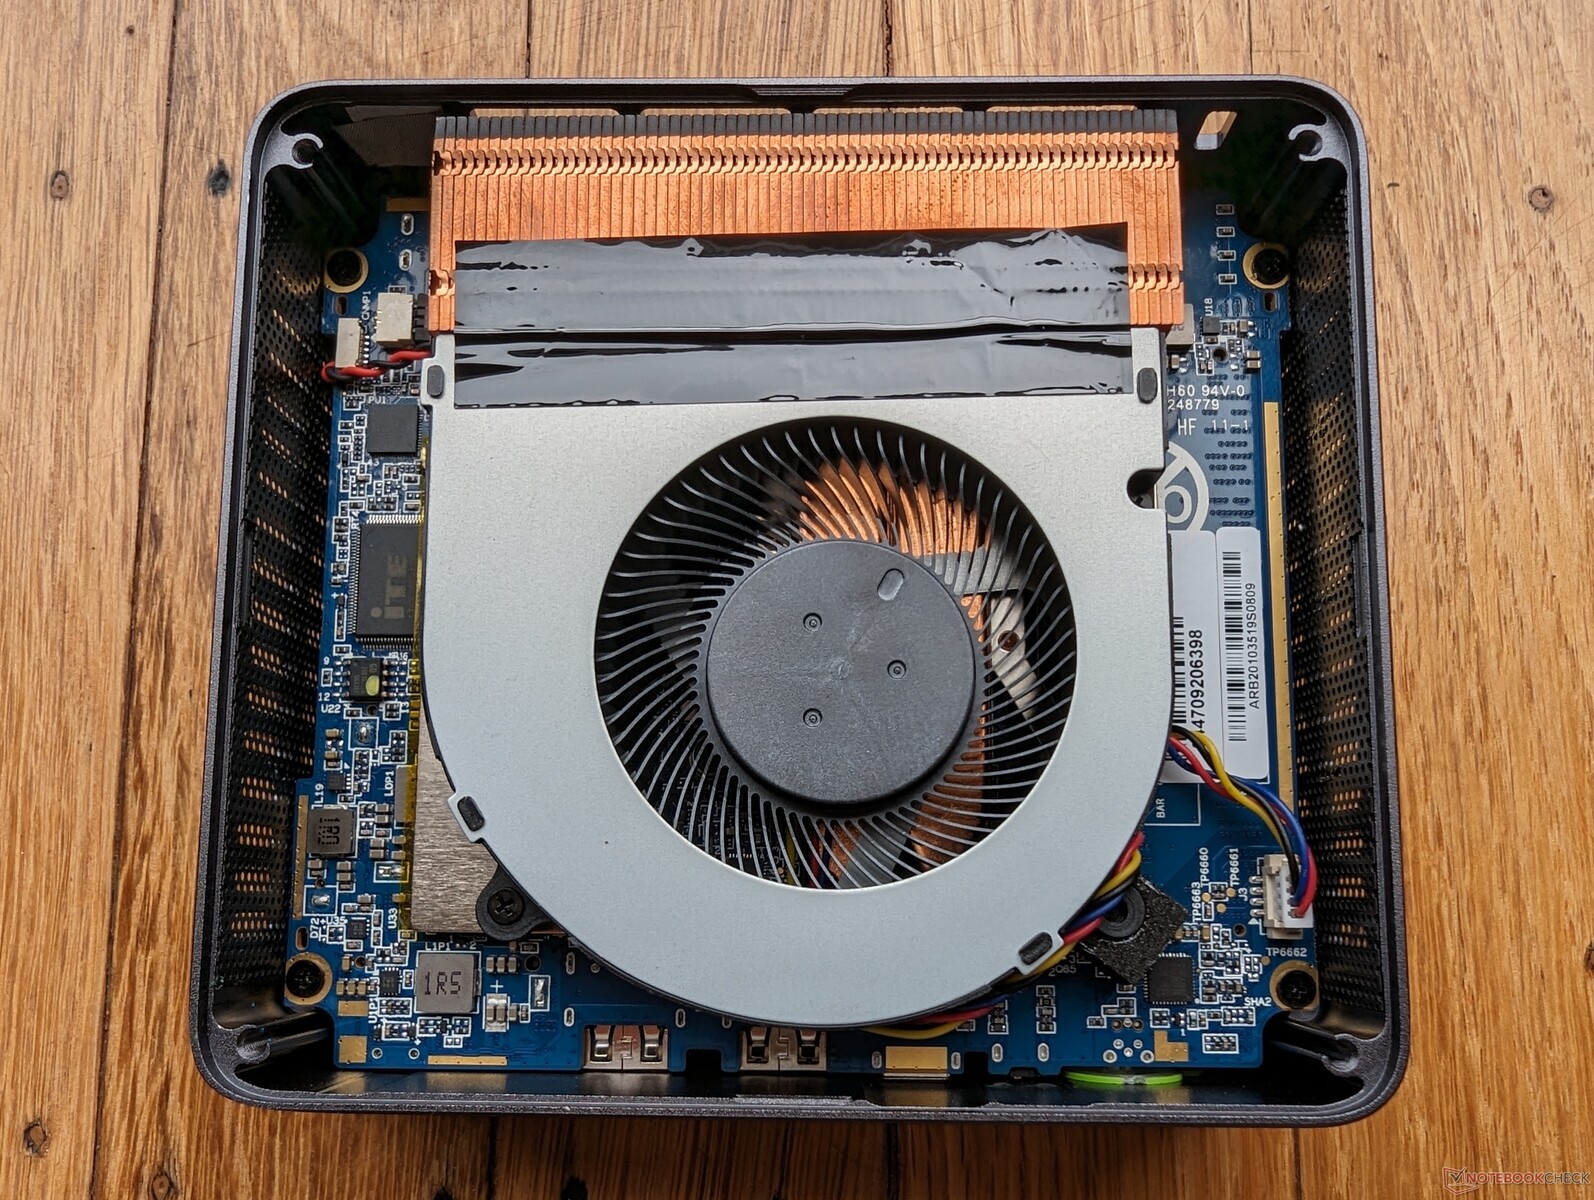
Die Hardware des NucBox K2 kann man im Vergleich zum Beelink SER7 ziemlich einfach herausnehmen beziehungsweise austauschen. Die obere Plastikabdeckung kann ohne Probleme einfach abgenommen werden, ohne eine einzige Schraube zu entfernen. So erhält man Zugriff zu den zwei SODIMM-Slots, zur M.2-SSD und zum WLAN-Modul. Sogar der Lüfter kann relativ einfach herausgenommen werden, indem man die vier Gummi-Füße auf der Unterseite abnimmt und vier Schrauben entfernt.
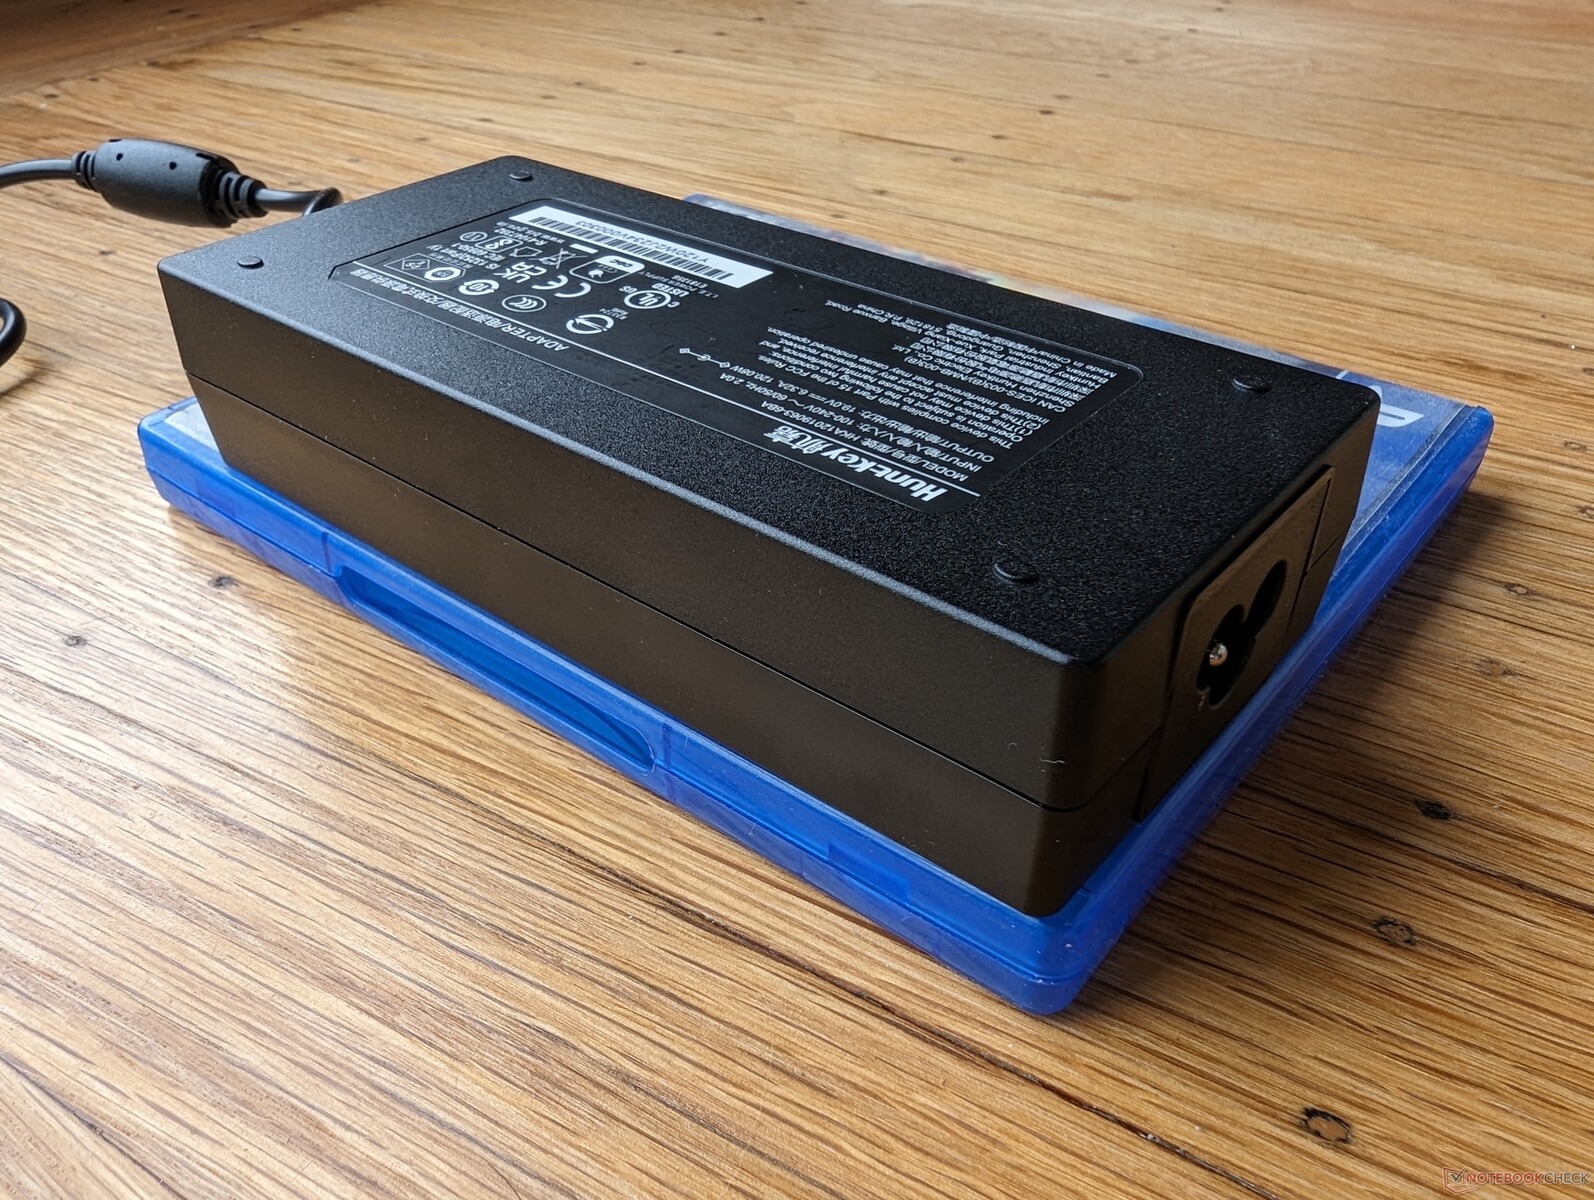
Zubehör und Garantie
Bei Kauf erhält man neben dem Gerät an sich noch eine Betriebsanleitung, einen Stromadapter, ein HDMI-Kabel und eine VESA-Halterung. Die standardmäßige 1-Jahres-Garantie greift auch bei diesem Gerät.
Performance — Der Zen 3+ ist immer noch pfeilschnell
Testszenario
Bevor wir jegliche Benchmarks durchgeführt haben, aktivierten wir den Windows-Performance-Modus. GMK bietet ansonsten leider keine eigene Performance-Software an.
Prozessor
Der Ryzen 7 7735HS ist unter der Haube eigentlich ein Ryzen 7 6800H, da dieser auf der gleichen Zen-3+-Architektur basiert. Dies bedeutet zwar nicht, dass der Prozessor langsam ist, aber Nutzer mit einem Verlangen nach der neusten Technologie sollten eher zu Konfigurationen mit einem Ryzen 9 7940HS greifen. Dieser bietet genauer gesagt eine 45 bis 50 Prozent höhere Multi-Thread-Performance als die CPU in unserer Variante.
Alles in allem ist die Leistung des AMD-Prozessors um ca. 30 Prozent geringer als jene vom i7-12700H, den man in den meisten High-End-Gaming-Laptops oder Mini-PCs findet, so wie auch im Intel NUC 12 Serpent Canyon.
Cinebench R15 Multi Loop
Cinebench R23: Multi Core | Single Core
Cinebench R20: CPU (Multi Core) | CPU (Single Core)
Cinebench R15: CPU Multi 64Bit | CPU Single 64Bit
Blender: v2.79 BMW27 CPU
7-Zip 18.03: 7z b 4 | 7z b 4 -mmt1
Geekbench 5.5: Multi-Core | Single-Core
HWBOT x265 Benchmark v2.2: 4k Preset
LibreOffice : 20 Documents To PDF
R Benchmark 2.5: Overall mean
| CPU Performance Rating | |
| Minisforum Venus Series UM790 Pro | |
| Beelink SER7 | |
| Intel NUC 12, NUC12SNKi72_Serpent Canyon | |
| Minisforum Venus Series NPB5 | |
| Intel NUC 13 Pro Desk Edition Kit | |
| Beelink GTR6 | |
| GMK NucBox K2 | |
| Durchschnittliche AMD Ryzen 7 7735HS | |
| Beelink SER6 Pro | |
| Minisforum Mercury Series EM680 | |
| Beelink SER Pro Ryzen 5 5600H | |
| Geekom Mini IT11, i7-11390H | |
| Trigkey Speed S | |
| GMK NucBox 2 | |
| Cinebench R23 / Multi Core | |
| Minisforum Venus Series UM790 Pro | |
| Intel NUC 12, NUC12SNKi72_Serpent Canyon | |
| Beelink SER7 | |
| Minisforum Venus Series NPB5 | |
| Durchschnittliche AMD Ryzen 7 7735HS (10283 - 14131, n=15) | |
| Intel NUC 13 Pro Desk Edition Kit | |
| Beelink GTR6 | |
| GMK NucBox K2 | |
| Beelink SER6 Pro | |
| Minisforum Mercury Series EM680 | |
| Beelink SER Pro Ryzen 5 5600H | |
| Geekom Mini IT11, i7-11390H | |
| Trigkey Speed S | |
| GMK NucBox 2 | |
| Cinebench R23 / Single Core | |
| Intel NUC 13 Pro Desk Edition Kit | |
| Minisforum Venus Series UM790 Pro | |
| Intel NUC 12, NUC12SNKi72_Serpent Canyon | |
| Minisforum Venus Series NPB5 | |
| Beelink SER7 | |
| Beelink GTR6 | |
| Geekom Mini IT11, i7-11390H | |
| Durchschnittliche AMD Ryzen 7 7735HS (1288 - 1570, n=15) | |
| Beelink SER6 Pro | |
| Minisforum Mercury Series EM680 | |
| GMK NucBox K2 | |
| Trigkey Speed S | |
| Beelink SER Pro Ryzen 5 5600H | |
| GMK NucBox 2 | |
| Cinebench R20 / CPU (Multi Core) | |
| Minisforum Venus Series UM790 Pro | |
| Intel NUC 12, NUC12SNKi72_Serpent Canyon | |
| Beelink SER7 | |
| Minisforum Venus Series NPB5 | |
| Durchschnittliche AMD Ryzen 7 7735HS (3968 - 5502, n=15) | |
| Intel NUC 13 Pro Desk Edition Kit | |
| Beelink GTR6 | |
| GMK NucBox K2 | |
| Beelink SER6 Pro | |
| Minisforum Mercury Series EM680 | |
| Beelink SER Pro Ryzen 5 5600H | |
| Geekom Mini IT11, i7-11390H | |
| Trigkey Speed S | |
| GMK NucBox 2 | |
| Cinebench R20 / CPU (Single Core) | |
| Intel NUC 13 Pro Desk Edition Kit | |
| Minisforum Venus Series UM790 Pro | |
| Beelink SER7 | |
| Intel NUC 12, NUC12SNKi72_Serpent Canyon | |
| Minisforum Venus Series NPB5 | |
| Beelink GTR6 | |
| Geekom Mini IT11, i7-11390H | |
| Durchschnittliche AMD Ryzen 7 7735HS (502 - 613, n=15) | |
| Minisforum Mercury Series EM680 | |
| GMK NucBox K2 | |
| Beelink SER6 Pro | |
| Trigkey Speed S | |
| Beelink SER Pro Ryzen 5 5600H | |
| GMK NucBox 2 | |
| Cinebench R15 / CPU Multi 64Bit | |
| Minisforum Venus Series UM790 Pro | |
| Intel NUC 12, NUC12SNKi72_Serpent Canyon | |
| Beelink SER7 | |
| Minisforum Venus Series NPB5 | |
| Durchschnittliche AMD Ryzen 7 7735HS (1758 - 2355, n=17) | |
| Intel NUC 13 Pro Desk Edition Kit | |
| GMK NucBox K2 | |
| Beelink GTR6 | |
| Beelink SER6 Pro | |
| Minisforum Mercury Series EM680 | |
| Beelink SER Pro Ryzen 5 5600H | |
| Geekom Mini IT11, i7-11390H | |
| Trigkey Speed S | |
| GMK NucBox 2 | |
| Cinebench R15 / CPU Single 64Bit | |
| Minisforum Venus Series UM790 Pro | |
| Beelink SER7 | |
| Intel NUC 13 Pro Desk Edition Kit | |
| Beelink GTR6 | |
| Intel NUC 12, NUC12SNKi72_Serpent Canyon | |
| Minisforum Venus Series NPB5 | |
| Durchschnittliche AMD Ryzen 7 7735HS (206 - 255, n=16) | |
| GMK NucBox K2 | |
| Minisforum Mercury Series EM680 | |
| Beelink SER6 Pro | |
| Geekom Mini IT11, i7-11390H | |
| Beelink SER Pro Ryzen 5 5600H | |
| Trigkey Speed S | |
| GMK NucBox 2 | |
| Blender / v2.79 BMW27 CPU | |
| GMK NucBox 2 | |
| Trigkey Speed S | |
| Geekom Mini IT11, i7-11390H | |
| Beelink SER Pro Ryzen 5 5600H | |
| Minisforum Mercury Series EM680 | |
| Beelink SER6 Pro | |
| Intel NUC 13 Pro Desk Edition Kit | |
| Minisforum Venus Series NPB5 | |
| GMK NucBox K2 | |
| Beelink GTR6 | |
| Durchschnittliche AMD Ryzen 7 7735HS (214 - 351, n=15) | |
| Intel NUC 12, NUC12SNKi72_Serpent Canyon | |
| Beelink SER7 | |
| Minisforum Venus Series UM790 Pro | |
| 7-Zip 18.03 / 7z b 4 | |
| Minisforum Venus Series UM790 Pro | |
| Beelink SER7 | |
| Intel NUC 12, NUC12SNKi72_Serpent Canyon | |
| GMK NucBox K2 | |
| Beelink GTR6 | |
| Durchschnittliche AMD Ryzen 7 7735HS (43455 - 63698, n=15) | |
| Beelink SER6 Pro | |
| Minisforum Venus Series NPB5 | |
| Minisforum Mercury Series EM680 | |
| Intel NUC 13 Pro Desk Edition Kit | |
| Beelink SER Pro Ryzen 5 5600H | |
| Geekom Mini IT11, i7-11390H | |
| Trigkey Speed S | |
| GMK NucBox 2 | |
| 7-Zip 18.03 / 7z b 4 -mmt1 | |
| Beelink SER7 | |
| Minisforum Venus Series UM790 Pro | |
| Beelink GTR6 | |
| Intel NUC 12, NUC12SNKi72_Serpent Canyon | |
| Geekom Mini IT11, i7-11390H | |
| Intel NUC 13 Pro Desk Edition Kit | |
| GMK NucBox K2 | |
| Beelink SER6 Pro | |
| Minisforum Venus Series NPB5 | |
| Durchschnittliche AMD Ryzen 7 7735HS (4779 - 5849, n=15) | |
| Minisforum Mercury Series EM680 | |
| Beelink SER Pro Ryzen 5 5600H | |
| Trigkey Speed S | |
| GMK NucBox 2 | |
| Geekbench 5.5 / Multi-Core | |
| Minisforum Venus Series UM790 Pro | |
| Minisforum Venus Series NPB5 | |
| Beelink SER7 | |
| Intel NUC 13 Pro Desk Edition Kit | |
| Intel NUC 12, NUC12SNKi72_Serpent Canyon | |
| GMK NucBox K2 | |
| Beelink GTR6 | |
| Beelink SER6 Pro | |
| Durchschnittliche AMD Ryzen 7 7735HS (7151 - 10258, n=15) | |
| Minisforum Mercury Series EM680 | |
| Beelink SER Pro Ryzen 5 5600H | |
| Geekom Mini IT11, i7-11390H | |
| Trigkey Speed S | |
| GMK NucBox 2 | |
| Geekbench 5.5 / Single-Core | |
| Beelink SER7 | |
| Minisforum Venus Series UM790 Pro | |
| Intel NUC 13 Pro Desk Edition Kit | |
| Minisforum Venus Series NPB5 | |
| Geekom Mini IT11, i7-11390H | |
| Beelink GTR6 | |
| Intel NUC 12, NUC12SNKi72_Serpent Canyon | |
| GMK NucBox K2 | |
| Beelink SER6 Pro | |
| Durchschnittliche AMD Ryzen 7 7735HS (1327 - 1615, n=15) | |
| Trigkey Speed S | |
| Minisforum Mercury Series EM680 | |
| Beelink SER Pro Ryzen 5 5600H | |
| GMK NucBox 2 | |
| HWBOT x265 Benchmark v2.2 / 4k Preset | |
| Minisforum Venus Series UM790 Pro | |
| Beelink SER7 | |
| Intel NUC 12, NUC12SNKi72_Serpent Canyon | |
| Durchschnittliche AMD Ryzen 7 7735HS (10.8 - 17.9, n=15) | |
| Beelink GTR6 | |
| GMK NucBox K2 | |
| Beelink SER6 Pro | |
| Minisforum Venus Series NPB5 | |
| Intel NUC 13 Pro Desk Edition Kit | |
| Minisforum Mercury Series EM680 | |
| Beelink SER Pro Ryzen 5 5600H | |
| Geekom Mini IT11, i7-11390H | |
| Trigkey Speed S | |
| GMK NucBox 2 | |
| LibreOffice / 20 Documents To PDF | |
| GMK NucBox 2 | |
| Minisforum Mercury Series EM680 | |
| Durchschnittliche AMD Ryzen 7 7735HS (44.3 - 63.9, n=15) | |
| Beelink SER Pro Ryzen 5 5600H | |
| Beelink SER6 Pro | |
| Geekom Mini IT11, i7-11390H | |
| Intel NUC 13 Pro Desk Edition Kit | |
| Minisforum Venus Series UM790 Pro | |
| Beelink GTR6 | |
| GMK NucBox K2 | |
| Intel NUC 12, NUC12SNKi72_Serpent Canyon | |
| Trigkey Speed S | |
| Minisforum Venus Series NPB5 | |
| Beelink SER7 | |
| R Benchmark 2.5 / Overall mean | |
| GMK NucBox 2 | |
| Trigkey Speed S | |
| Geekom Mini IT11, i7-11390H | |
| Beelink SER Pro Ryzen 5 5600H | |
| Minisforum Mercury Series EM680 | |
| Durchschnittliche AMD Ryzen 7 7735HS (0.4822 - 0.585, n=15) | |
| Beelink SER6 Pro | |
| GMK NucBox K2 | |
| Minisforum Venus Series NPB5 | |
| Intel NUC 12, NUC12SNKi72_Serpent Canyon | |
| Beelink GTR6 | |
| Intel NUC 13 Pro Desk Edition Kit | |
| Beelink SER7 | |
| Minisforum Venus Series UM790 Pro | |
Cinebench R23: Multi Core | Single Core
Cinebench R20: CPU (Multi Core) | CPU (Single Core)
Cinebench R15: CPU Multi 64Bit | CPU Single 64Bit
Blender: v2.79 BMW27 CPU
7-Zip 18.03: 7z b 4 | 7z b 4 -mmt1
Geekbench 5.5: Multi-Core | Single-Core
HWBOT x265 Benchmark v2.2: 4k Preset
LibreOffice : 20 Documents To PDF
R Benchmark 2.5: Overall mean
* ... kleinere Werte sind besser
AIDA64: FP32 Ray-Trace | FPU Julia | CPU SHA3 | CPU Queen | FPU SinJulia | FPU Mandel | CPU AES | CPU ZLib | FP64 Ray-Trace | CPU PhotoWorxx
| Performance Rating | |
| Beelink SER7 | |
| Durchschnittliche AMD Ryzen 7 7735HS | |
| GMK NucBox K2 | |
| Intel NUC 13 Pro Desk Edition Kit | |
| Trigkey Speed S | |
| Geekom Mini IT11, i7-11390H | |
| Blackview MP80 | |
| AIDA64 / FP32 Ray-Trace | |
| Beelink SER7 | |
| Durchschnittliche AMD Ryzen 7 7735HS (11831 - 17161, n=16) | |
| GMK NucBox K2 | |
| Intel NUC 13 Pro Desk Edition Kit | |
| Trigkey Speed S | |
| Geekom Mini IT11, i7-11390H | |
| Blackview MP80 | |
| AIDA64 / FPU Julia | |
| Beelink SER7 | |
| Durchschnittliche AMD Ryzen 7 7735HS (75370 - 105483, n=16) | |
| GMK NucBox K2 | |
| Intel NUC 13 Pro Desk Edition Kit | |
| Trigkey Speed S | |
| Geekom Mini IT11, i7-11390H | |
| Blackview MP80 | |
| AIDA64 / CPU SHA3 | |
| Beelink SER7 | |
| Durchschnittliche AMD Ryzen 7 7735HS (2499 - 3494, n=16) | |
| GMK NucBox K2 | |
| Intel NUC 13 Pro Desk Edition Kit | |
| Trigkey Speed S | |
| Geekom Mini IT11, i7-11390H | |
| Blackview MP80 | |
| AIDA64 / CPU Queen | |
| Beelink SER7 | |
| Durchschnittliche AMD Ryzen 7 7735HS (87486 - 108729, n=15) | |
| GMK NucBox K2 | |
| Intel NUC 13 Pro Desk Edition Kit | |
| Geekom Mini IT11, i7-11390H | |
| Trigkey Speed S | |
| Blackview MP80 | |
| AIDA64 / FPU SinJulia | |
| Beelink SER7 | |
| Durchschnittliche AMD Ryzen 7 7735HS (11233 - 13097, n=16) | |
| GMK NucBox K2 | |
| Intel NUC 13 Pro Desk Edition Kit | |
| Trigkey Speed S | |
| Geekom Mini IT11, i7-11390H | |
| Blackview MP80 | |
| AIDA64 / FPU Mandel | |
| Beelink SER7 | |
| Durchschnittliche AMD Ryzen 7 7735HS (41400 - 58232, n=16) | |
| GMK NucBox K2 | |
| Intel NUC 13 Pro Desk Edition Kit | |
| Trigkey Speed S | |
| Geekom Mini IT11, i7-11390H | |
| Blackview MP80 | |
| AIDA64 / CPU AES | |
| Beelink SER7 | |
| GMK NucBox K2 | |
| Durchschnittliche AMD Ryzen 7 7735HS (44013 - 137629, n=16) | |
| Trigkey Speed S | |
| Geekom Mini IT11, i7-11390H | |
| Intel NUC 13 Pro Desk Edition Kit | |
| Blackview MP80 | |
| AIDA64 / CPU ZLib | |
| Beelink SER7 | |
| Durchschnittliche AMD Ryzen 7 7735HS (651 - 906, n=16) | |
| Intel NUC 13 Pro Desk Edition Kit | |
| GMK NucBox K2 | |
| Geekom Mini IT11, i7-11390H | |
| Trigkey Speed S | |
| Blackview MP80 | |
| AIDA64 / FP64 Ray-Trace | |
| Beelink SER7 | |
| Durchschnittliche AMD Ryzen 7 7735HS (1459 - 9094, n=16) | |
| GMK NucBox K2 | |
| Intel NUC 13 Pro Desk Edition Kit | |
| Trigkey Speed S | |
| Geekom Mini IT11, i7-11390H | |
| Blackview MP80 | |
| AIDA64 / CPU PhotoWorxx | |
| Beelink SER7 | |
| GMK NucBox K2 | |
| Intel NUC 13 Pro Desk Edition Kit | |
| Durchschnittliche AMD Ryzen 7 7735HS (17524 - 30542, n=16) | |
| Trigkey Speed S | |
| Geekom Mini IT11, i7-11390H | |
| Blackview MP80 | |
System-Performance
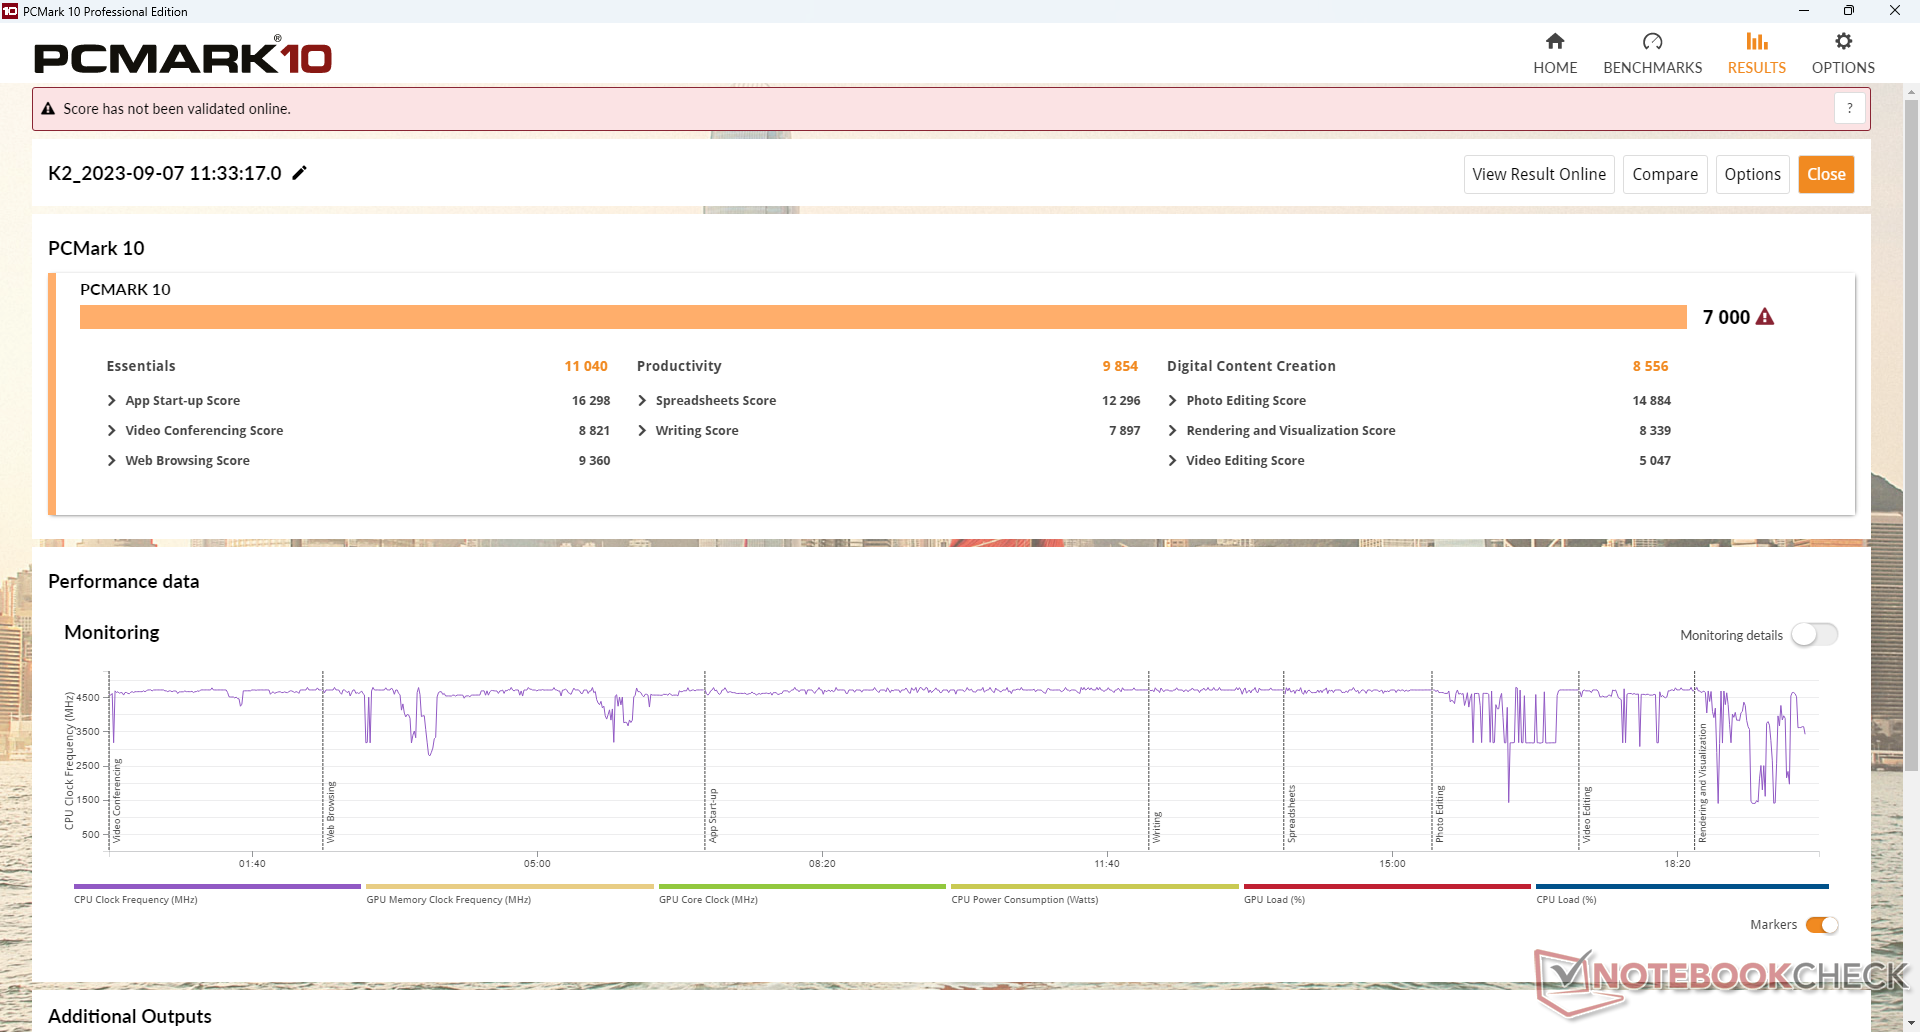
Unsere PCMark-Ergebnisse ergeben, dass unsere CPU schneller als die meisten Vertreter der 12. Generation ist. Vor allem der Digital-Content-Creation-Score ist dank der Radeon 680M mehr als nur ausreichend.
CrossMark: Overall | Productivity | Creativity | Responsiveness
| PCMark 10 / Score | |
| Beelink SER7 | |
| GMK NucBox K2 | |
| Durchschnittliche AMD Ryzen 7 7735HS (5722 - 7916, n=16) | |
| Intel NUC 13 Pro Desk Edition Kit | |
| Trigkey Speed S | |
| Geekom Mini IT11, i7-11390H | |
| GMK NucBox 2 | |
| PCMark 10 / Essentials | |
| GMK NucBox K2 | |
| Intel NUC 13 Pro Desk Edition Kit | |
| Beelink SER7 | |
| Trigkey Speed S | |
| Durchschnittliche AMD Ryzen 7 7735HS (8648 - 11124, n=16) | |
| Geekom Mini IT11, i7-11390H | |
| GMK NucBox 2 | |
| PCMark 10 / Productivity | |
| Beelink SER7 | |
| GMK NucBox K2 | |
| Durchschnittliche AMD Ryzen 7 7735HS (8077 - 12153, n=16) | |
| Trigkey Speed S | |
| Geekom Mini IT11, i7-11390H | |
| Intel NUC 13 Pro Desk Edition Kit | |
| GMK NucBox 2 | |
| PCMark 10 / Digital Content Creation | |
| Durchschnittliche AMD Ryzen 7 7735HS (5798 - 12699, n=16) | |
| Beelink SER7 | |
| GMK NucBox K2 | |
| Intel NUC 13 Pro Desk Edition Kit | |
| Trigkey Speed S | |
| Geekom Mini IT11, i7-11390H | |
| GMK NucBox 2 | |
| CrossMark / Overall | |
| Beelink SER7 | |
| GMK NucBox K2 | |
| Intel NUC 13 Pro Desk Edition Kit | |
| Durchschnittliche AMD Ryzen 7 7735HS (1280 - 1758, n=13) | |
| Geekom Mini IT11, i7-11390H | |
| Trigkey Speed S | |
| CrossMark / Productivity | |
| GMK NucBox K2 | |
| Beelink SER7 | |
| Durchschnittliche AMD Ryzen 7 7735HS (1308 - 1730, n=13) | |
| Intel NUC 13 Pro Desk Edition Kit | |
| Geekom Mini IT11, i7-11390H | |
| Trigkey Speed S | |
| CrossMark / Creativity | |
| Beelink SER7 | |
| Intel NUC 13 Pro Desk Edition Kit | |
| GMK NucBox K2 | |
| Durchschnittliche AMD Ryzen 7 7735HS (1273 - 1986, n=13) | |
| Geekom Mini IT11, i7-11390H | |
| Trigkey Speed S | |
| CrossMark / Responsiveness | |
| GMK NucBox K2 | |
| Trigkey Speed S | |
| Geekom Mini IT11, i7-11390H | |
| Durchschnittliche AMD Ryzen 7 7735HS (1108 - 1704, n=13) | |
| Intel NUC 13 Pro Desk Edition Kit | |
| Beelink SER7 | |
| PCMark 10 Score | 7000 Punkte | |
Hilfe | ||
| AIDA64 / Memory Copy | |
| Beelink SER7 | |
| GMK NucBox K2 | |
| GMK NucBox 2 | |
| Durchschnittliche AMD Ryzen 7 7735HS (30324 - 52012, n=16) | |
| Intel NUC 13 Pro Desk Edition Kit | |
| Geekom Mini IT11, i7-11390H | |
| Trigkey Speed S | |
| AIDA64 / Memory Read | |
| Beelink SER7 | |
| GMK NucBox K2 | |
| Geekom Mini IT11, i7-11390H | |
| Durchschnittliche AMD Ryzen 7 7735HS (33938 - 51856, n=16) | |
| Trigkey Speed S | |
| Intel NUC 13 Pro Desk Edition Kit | |
| GMK NucBox 2 | |
| AIDA64 / Memory Write | |
| Beelink SER7 | |
| GMK NucBox K2 | |
| GMK NucBox 2 | |
| Durchschnittliche AMD Ryzen 7 7735HS (33175 - 55284, n=16) | |
| Geekom Mini IT11, i7-11390H | |
| Trigkey Speed S | |
| Intel NUC 13 Pro Desk Edition Kit | |
| AIDA64 / Memory Latency | |
| Intel NUC 13 Pro Desk Edition Kit | |
| Durchschnittliche AMD Ryzen 7 7735HS (78.2 - 109.8, n=16) | |
| Beelink SER7 | |
| GMK NucBox K2 | |
| Trigkey Speed S | |
| Geekom Mini IT11, i7-11390H | |
| GMK NucBox 2 | |
* ... kleinere Werte sind besser
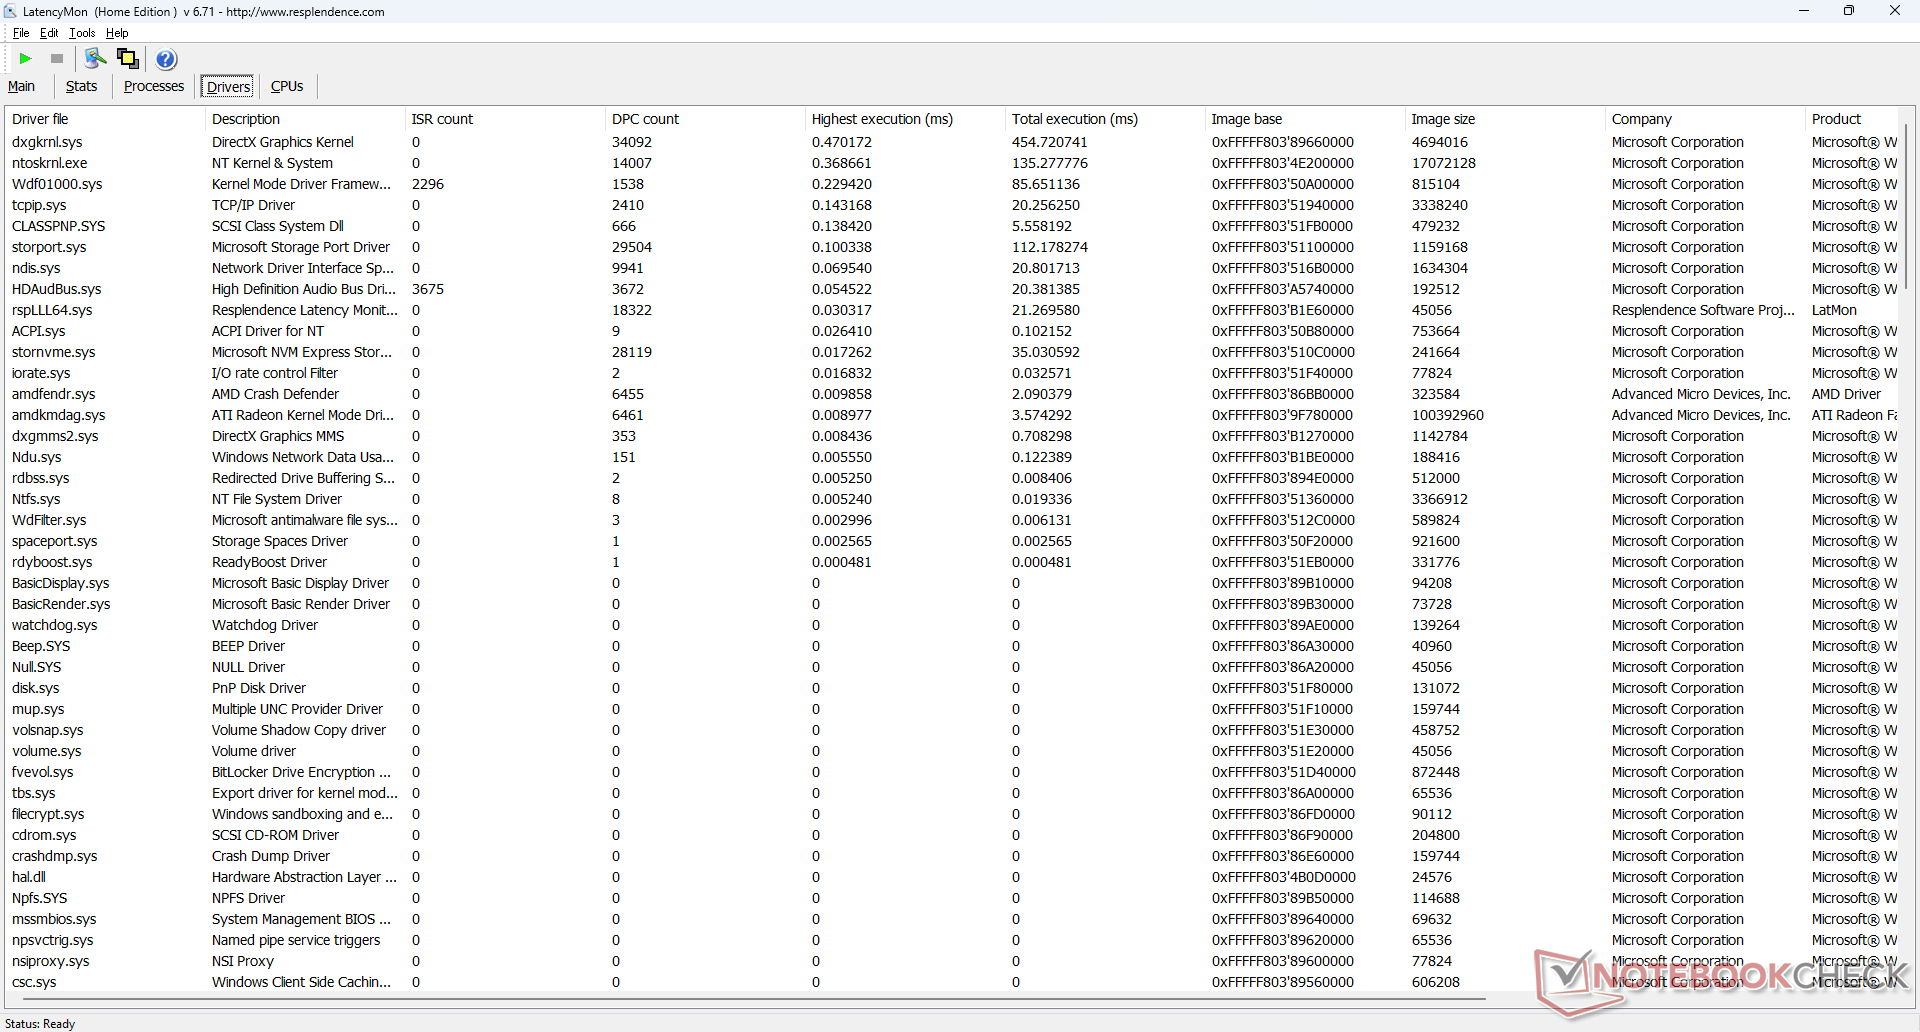
DPC-Latenz
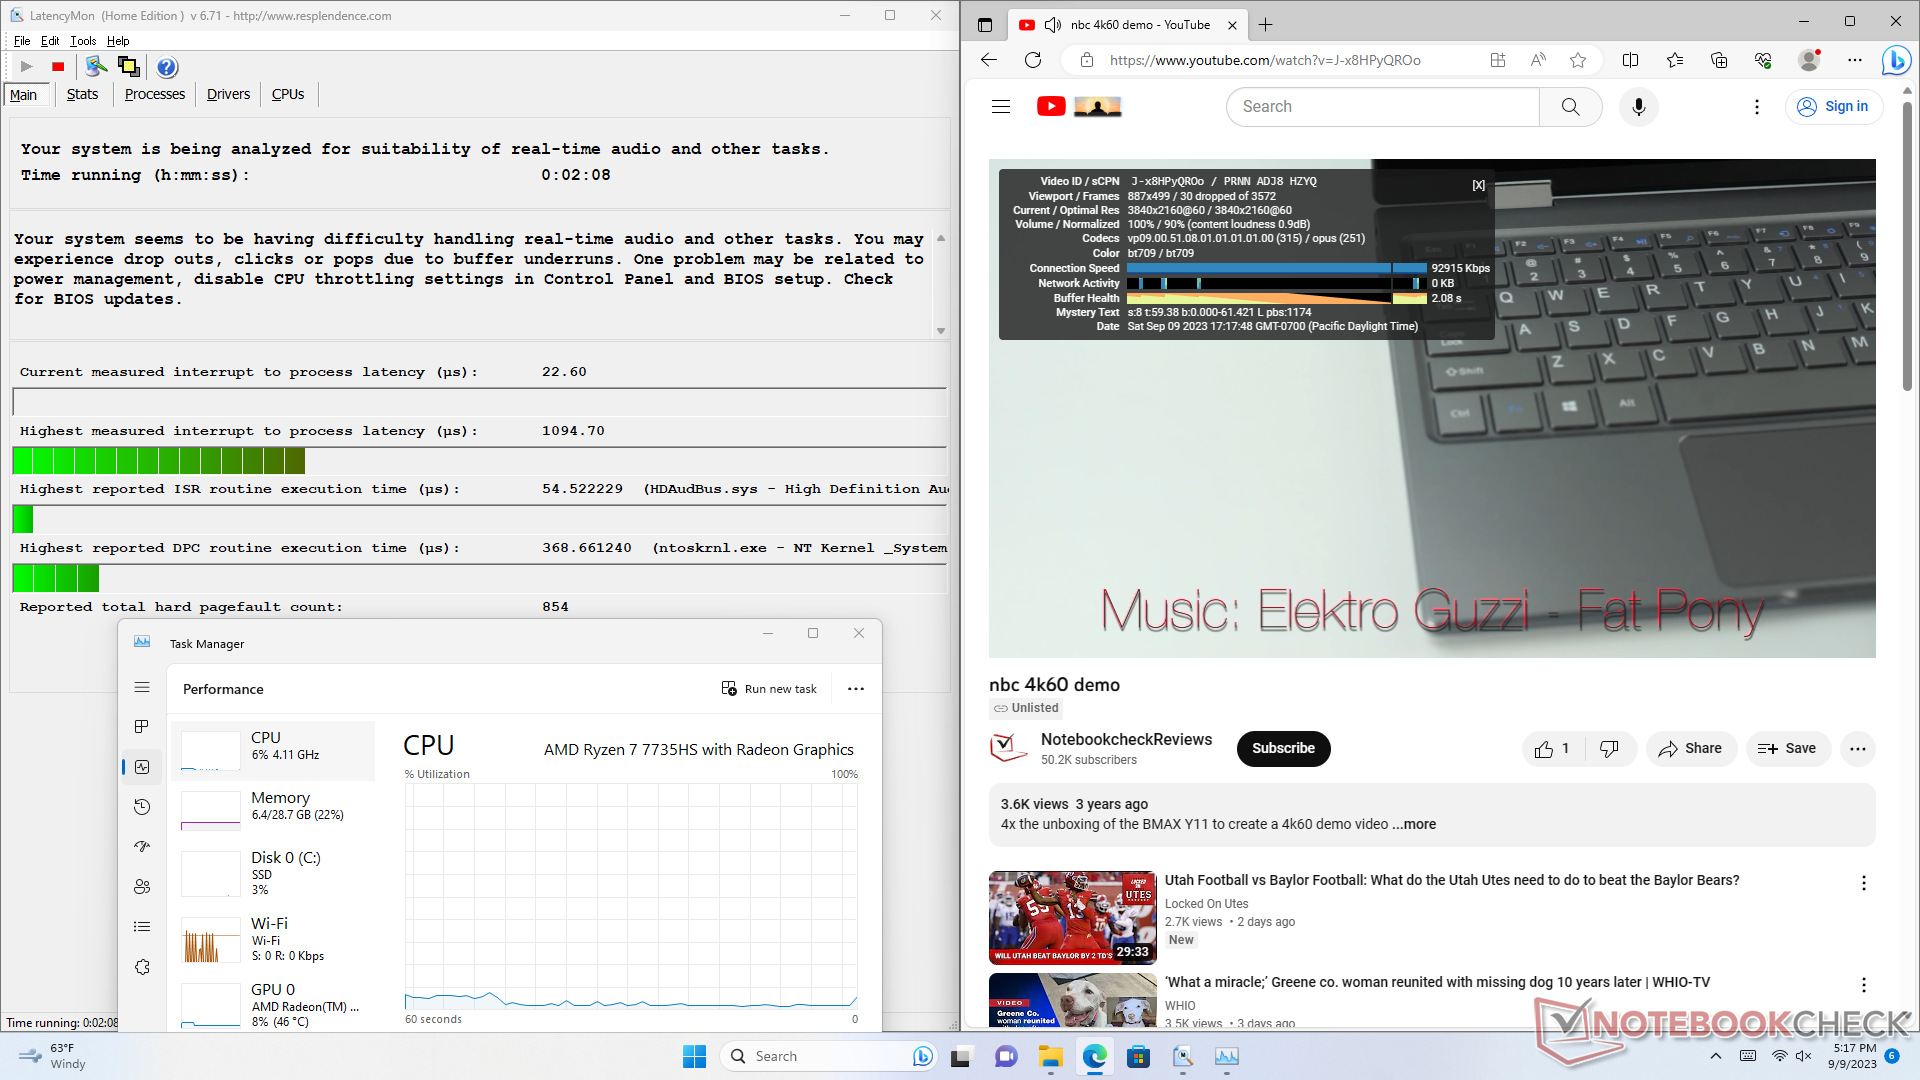
LatencyMon zeigt kleinere DPC-Probleme beim Öffnen mehrerer Tabs unserer Homepage. Bei 4K-60-fps-Videostreaming konnten wir in einer Minute 30 verlorene Frames feststellen. Dies dürfte allerdings ein Treiberproblem sein, das dringend gelöst werden sollte.
| DPC Latencies / LatencyMon - interrupt to process latency (max), Web, Youtube, Prime95 | |
| Trigkey Speed S | |
| GMK NucBox K2 | |
| Intel NUC 13 Pro Desk Edition Kit | |
| GMK NucBox 2 | |
| Beelink SER7 | |
| Geekom Mini IT11, i7-11390H | |
* ... kleinere Werte sind besser
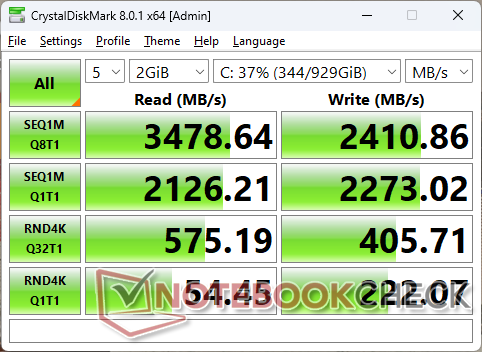
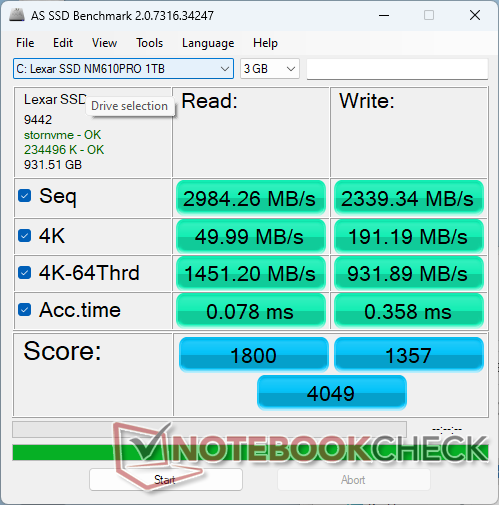
Speicher
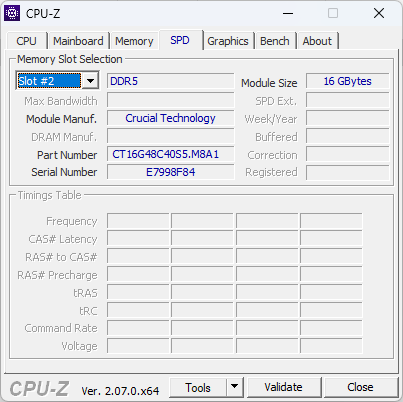
Unser Modell wird mit einer PCIe3 x4 Lexar NM610 Pro ausgeliefert, welche im Vergleich zum Non-Pro-Modell eine höhere maximale Transferrate besitzt (3300 MB/s vs. 2100 MB/s). Teurere PCIe4-Varianten werden aber ebenfalls unterstützt, wie beispielsweise eine Samsung PM9A1, jedoch befürchten wir hier, dass es aufgrund der unzureichenden Kühlung zu Problemen kommen könnte.

| Drive Performance Rating - Percent | |
| Intel NUC 13 Pro Desk Edition Kit | |
| Beelink SER7 | |
| GMK NucBox K2 | |
| Trigkey Speed S | |
| Geekom Mini IT11, i7-11390H | |
| GMK NucBox 2 | |
* ... kleinere Werte sind besser
Disk Throttling: DiskSpd Read Loop, Queue Depth 8
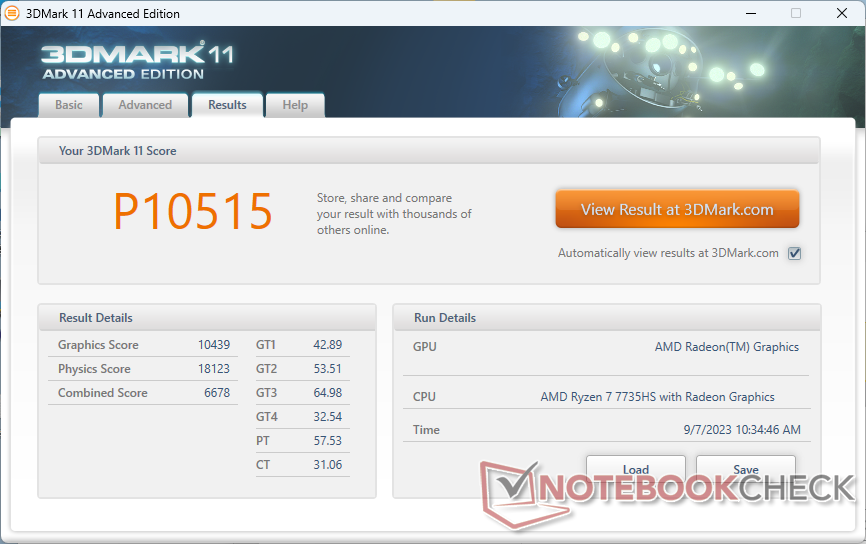
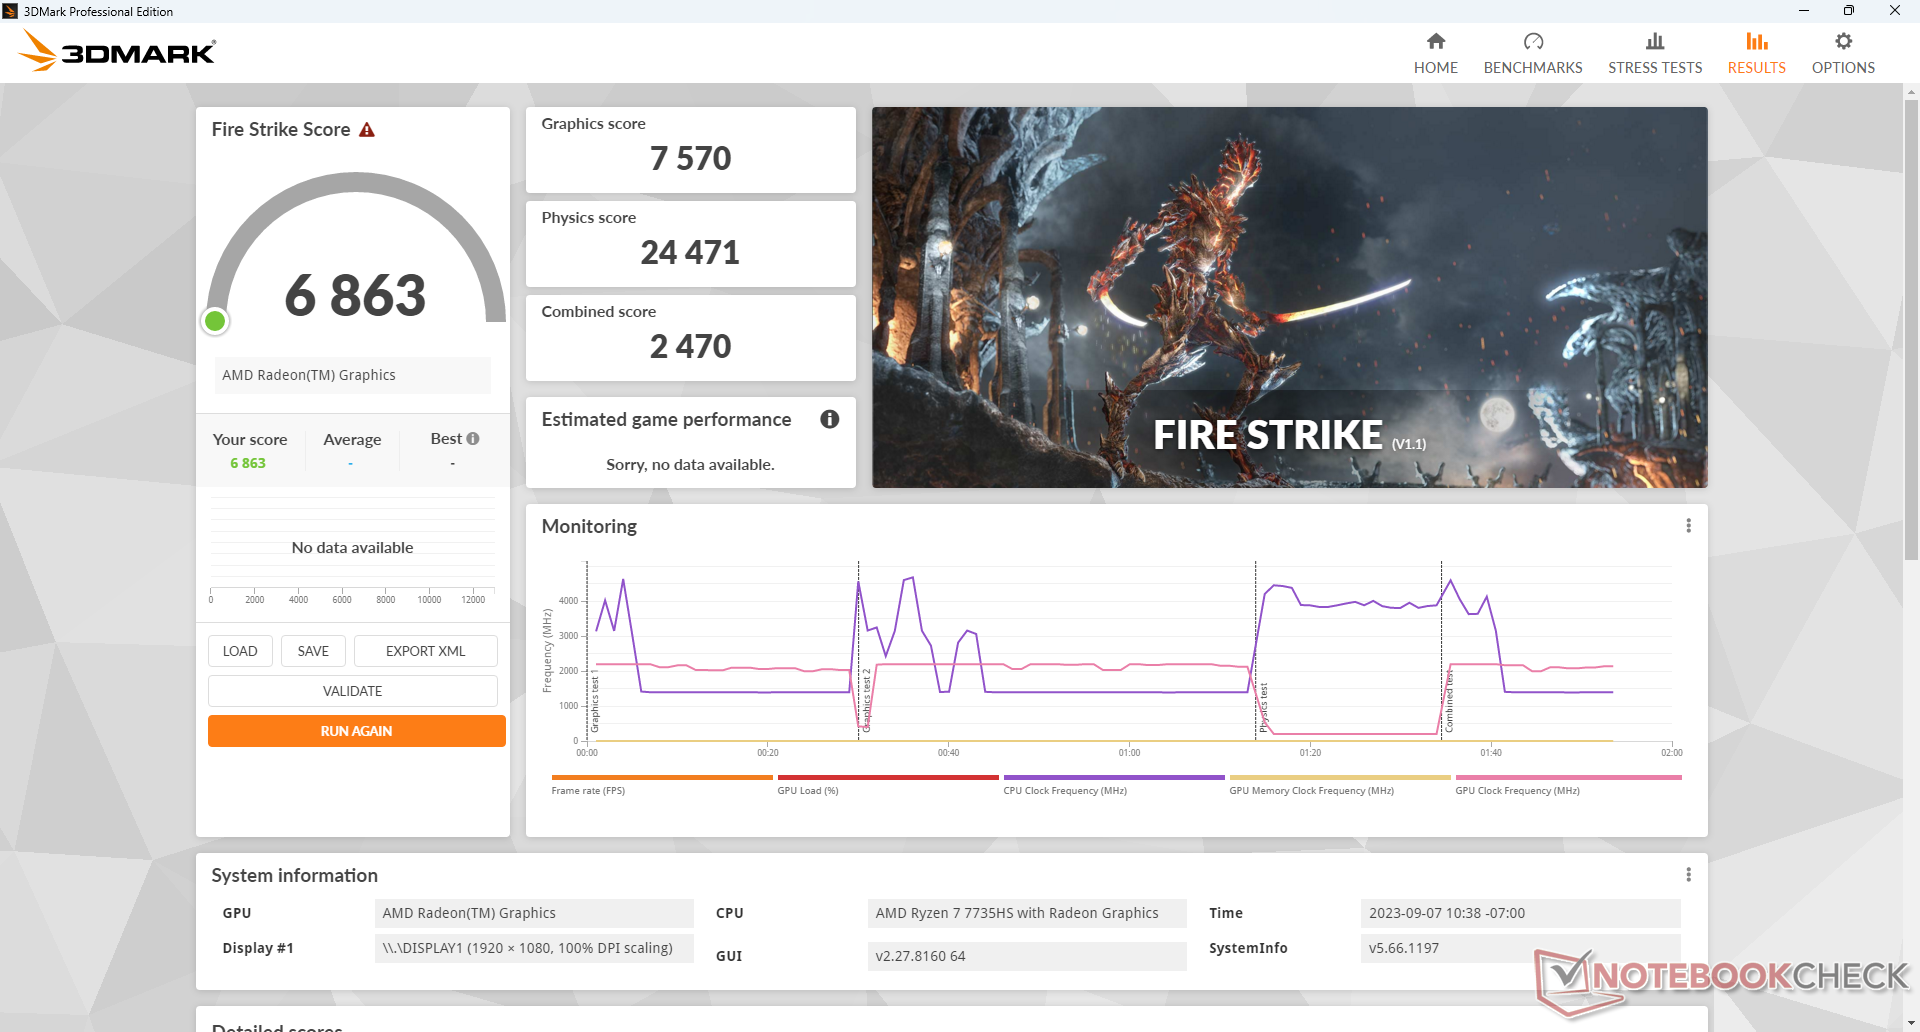
GPU-Performance
Die Radeon 680M ist trotz ihres Alters immer noch eine der schnellsten integrierten GPUs auf dem Markt. Die Grafikkarte ist fähig die meisten neueren Triple-A-Titel ohne Probleme mit einer Auflösung von 1080 p auszuführen, insofern die Grafikdetails etwas zurückgeschraubt werden. Für Nutzer, die viel mit dem Mini-PC spielen, empfehlen wir aber trotzdem, einen Monitor mit FreeSync zu nutzen, da so die durchschnittlichen Bilder pro Sekunde von 45 bis 60 etwas angehoben werden können.
Sollte man sich doch für das Modell mit dem Ryzen 9 7940HS und der Radeon 780M entscheiden, erhält man im Durchschnitt zehn bis 20 Prozent mehr Grafik-Performance.
| 3DMark Performance Rating - Percent | |
| Beelink SER7 | |
| Minisforum Venus Series UM790 Pro | |
| GMK NucBox K2 | |
| Beelink SER6 Pro | |
| Beelink GTR6 | |
| Durchschnittliche AMD Radeon 680M | |
| Minisforum Mercury Series EM680 | |
| Intel NUC 13 Pro Desk Edition Kit | |
| Minisforum Venus Series NPB5 | |
| Trigkey Speed S | |
| Beelink SER Pro Ryzen 5 5600H | |
| Geekom Mini IT11, i7-11390H | |
| GMK NucBox 2 | |
| 3DMark 11 - 1280x720 Performance GPU | |
| Beelink SER7 | |
| Minisforum Venus Series UM790 Pro | |
| Beelink SER6 Pro | |
| Beelink GTR6 | |
| GMK NucBox K2 | |
| Durchschnittliche AMD Radeon 680M (6858 - 11755, n=39) | |
| Minisforum Mercury Series EM680 | |
| Intel NUC 13 Pro Desk Edition Kit | |
| Minisforum Venus Series NPB5 | |
| Trigkey Speed S | |
| Beelink SER Pro Ryzen 5 5600H | |
| Geekom Mini IT11, i7-11390H | |
| GMK NucBox 2 | |
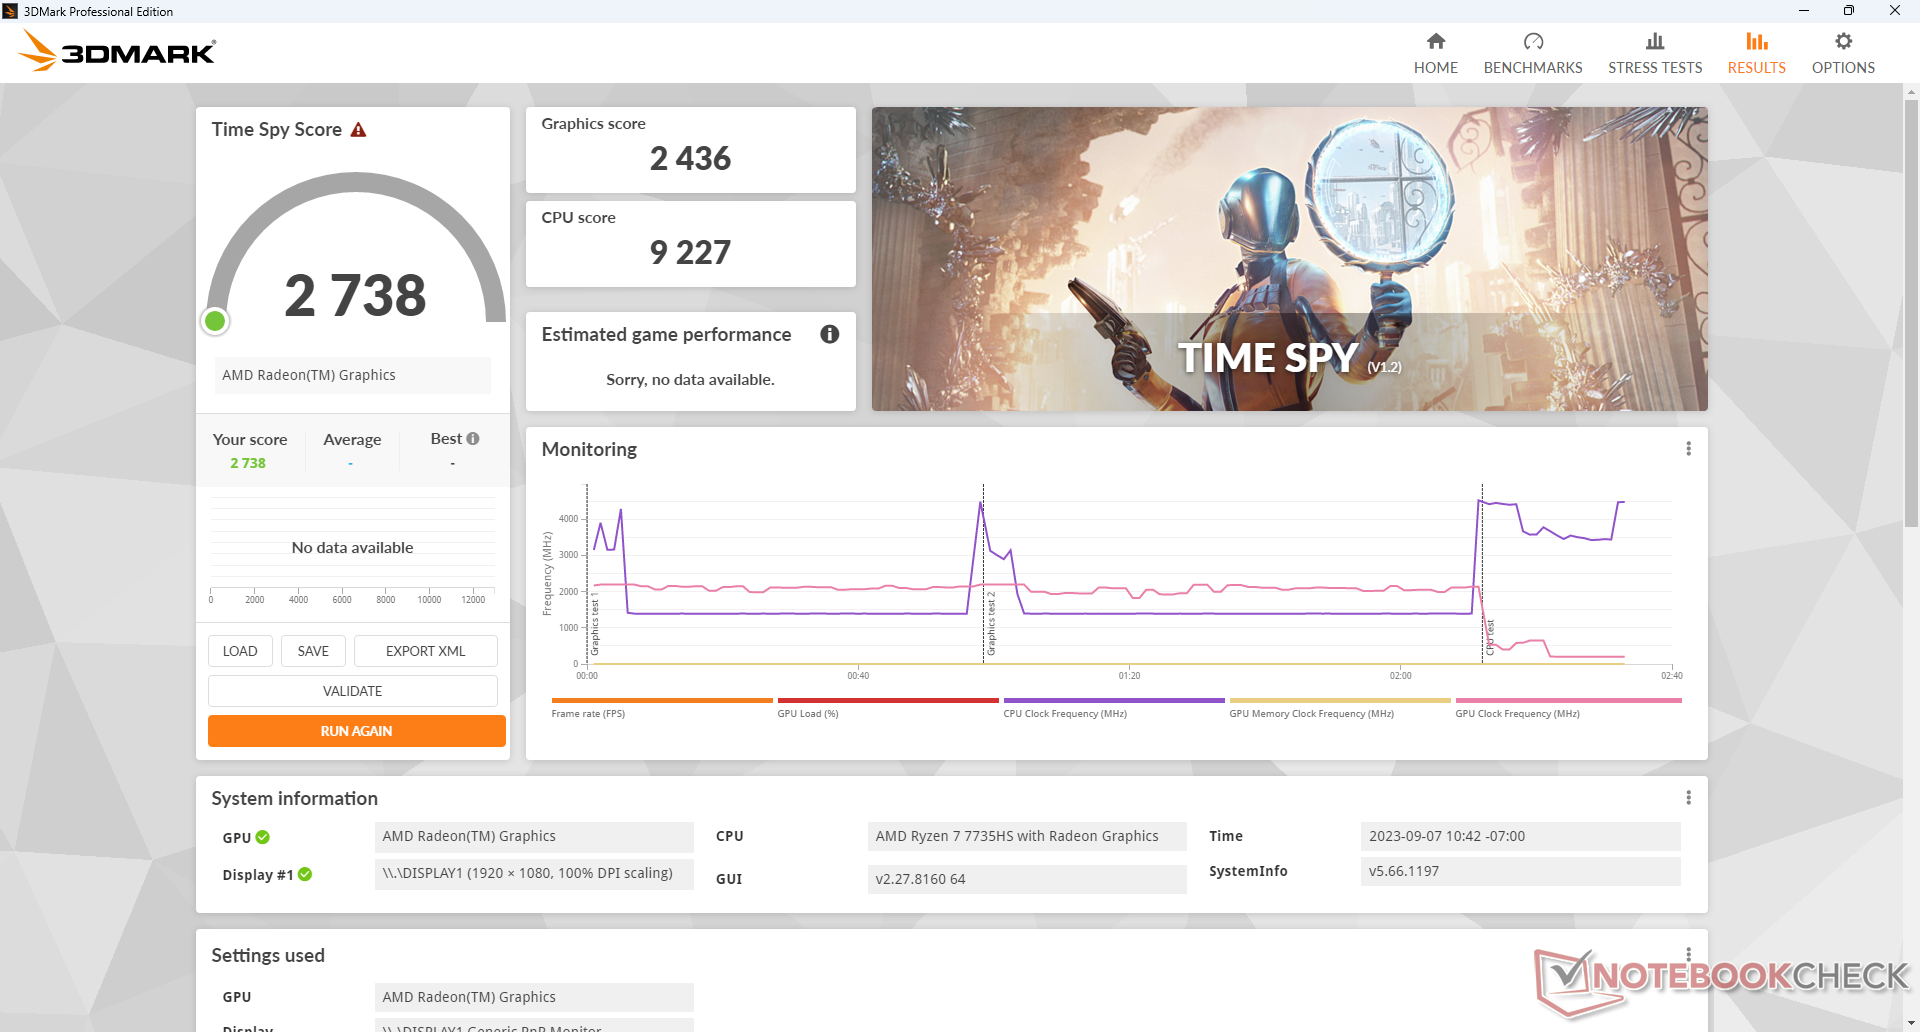
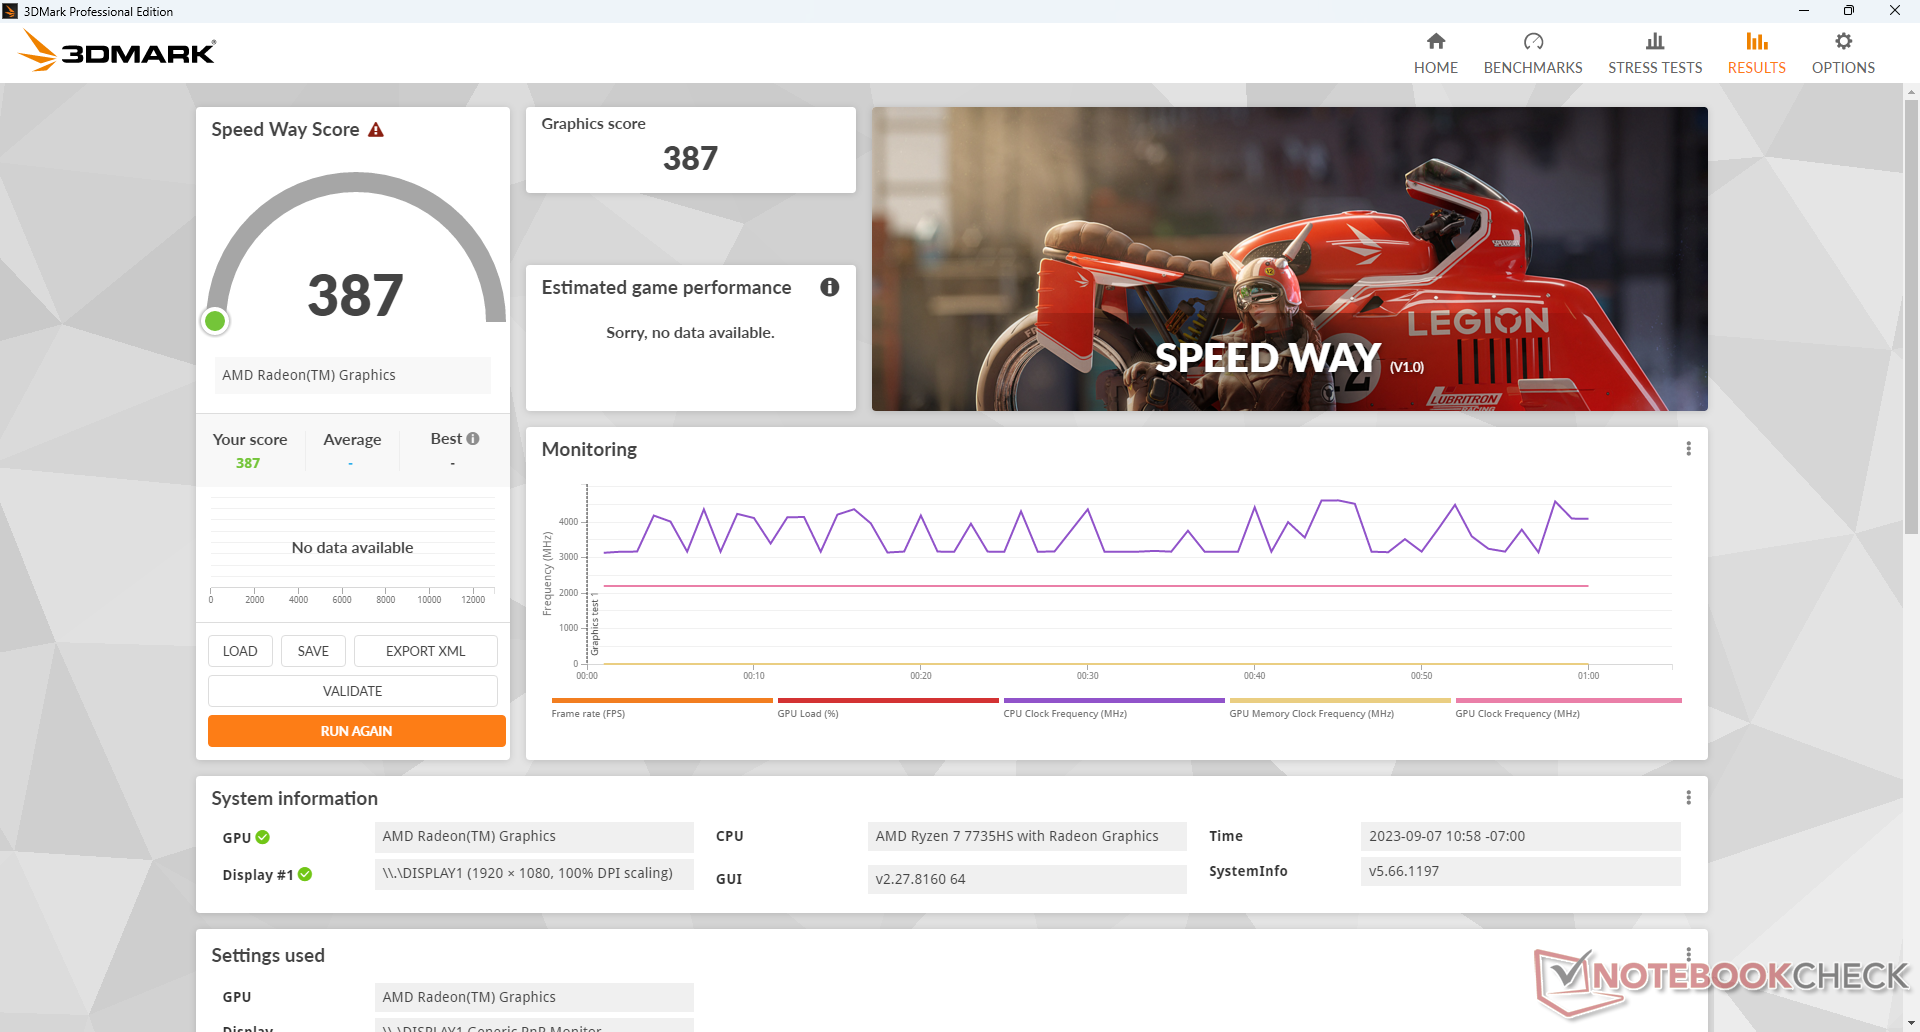
| 3DMark 11 Performance | 10515 Punkte | |
| 3DMark Fire Strike Score | 6863 Punkte | |
| 3DMark Time Spy Score | 2738 Punkte | |
Hilfe | ||
* ... kleinere Werte sind besser
| X-Plane 11.11 | |
| 1280x720 low (fps_test=1) | |
| GMK NucBox K2 | |
| Beelink SER6 Pro | |
| Beelink GTR6 | |
| Minisforum Venus Series UM790 Pro | |
| Beelink SER7 | |
| Durchschnittliche AMD Radeon 680M (26.8 - 66.7, n=41) | |
| Intel NUC 13 Pro Desk Edition Kit | |
| Beelink SER Pro Ryzen 5 5600H | |
| Trigkey Speed S | |
| Minisforum Venus Series NPB5 | |
| Minisforum Mercury Series EM680 | |
| GMK NucBox 2 | |
| 1920x1080 med (fps_test=2) | |
| Beelink SER6 Pro | |
| GMK NucBox K2 | |
| Beelink GTR6 | |
| Trigkey Speed S | |
| Beelink SER7 | |
| Durchschnittliche AMD Radeon 680M (21.1 - 53.1, n=41) | |
| Minisforum Venus Series UM790 Pro | |
| Intel NUC 13 Pro Desk Edition Kit | |
| Beelink SER Pro Ryzen 5 5600H | |
| Minisforum Venus Series NPB5 | |
| Minisforum Mercury Series EM680 | |
| GMK NucBox 2 | |
| 1920x1080 high (fps_test=3) | |
| Beelink SER6 Pro | |
| GMK NucBox K2 | |
| Beelink GTR6 | |
| Trigkey Speed S | |
| Minisforum Venus Series UM790 Pro | |
| Beelink SER7 | |
| Beelink SER Pro Ryzen 5 5600H | |
| Durchschnittliche AMD Radeon 680M (16.6 - 44.5, n=41) | |
| Intel NUC 13 Pro Desk Edition Kit | |
| Minisforum Venus Series NPB5 | |
| Minisforum Mercury Series EM680 | |
| GMK NucBox 2 | |
| Final Fantasy XV Benchmark | |
| 1280x720 Lite Quality | |
| Beelink SER7 | |
| Minisforum Venus Series UM790 Pro | |
| Beelink GTR6 | |
| Beelink SER6 Pro | |
| GMK NucBox K2 | |
| Durchschnittliche AMD Radeon 680M (34.4 - 74.7, n=39) | |
| Minisforum Mercury Series EM680 | |
| Minisforum Venus Series NPB5 | |
| Intel NUC 13 Pro Desk Edition Kit | |
| Beelink SER Pro Ryzen 5 5600H | |
| Trigkey Speed S | |
| GMK NucBox 2 | |
| 1920x1080 Standard Quality | |
| Beelink SER7 | |
| Minisforum Venus Series UM790 Pro | |
| Beelink GTR6 | |
| Beelink SER6 Pro | |
| GMK NucBox K2 | |
| Durchschnittliche AMD Radeon 680M (18.3 - 36.9, n=40) | |
| Minisforum Mercury Series EM680 | |
| Minisforum Venus Series NPB5 | |
| Intel NUC 13 Pro Desk Edition Kit | |
| Trigkey Speed S | |
| Beelink SER Pro Ryzen 5 5600H | |
| GMK NucBox 2 | |
| 1920x1080 High Quality | |
| Beelink SER7 | |
| Minisforum Venus Series UM790 Pro | |
| GMK NucBox K2 | |
| Beelink SER6 Pro | |
| Beelink GTR6 | |
| Durchschnittliche AMD Radeon 680M (12.9 - 26.2, n=40) | |
| Minisforum Mercury Series EM680 | |
| Minisforum Venus Series NPB5 | |
| Intel NUC 13 Pro Desk Edition Kit | |
| Trigkey Speed S | |
| Beelink SER Pro Ryzen 5 5600H | |
| GMK NucBox 2 | |
| Cyberpunk 2077 1.6 | |
| 1280x720 Low Preset | |
| Minisforum Venus Series UM790 Pro | |
| Beelink SER6 Pro | |
| Beelink GTR6 | |
| Beelink SER7 | |
| Durchschnittliche AMD Radeon 680M (46.1 - 77.6, n=14) | |
| GMK NucBox K2 | |
| 1920x1080 Low Preset | |
| Minisforum Venus Series UM790 Pro | |
| Beelink SER7 | |
| Beelink SER6 Pro | |
| Beelink GTR6 | |
| Durchschnittliche AMD Radeon 680M (26 - 50.6, n=15) | |
| GMK NucBox K2 | |
| Beelink SER Pro Ryzen 5 5600H | |
| 1920x1080 Medium Preset | |
| Minisforum Venus Series UM790 Pro | |
| Beelink SER7 | |
| Beelink SER6 Pro | |
| Beelink GTR6 | |
| Durchschnittliche AMD Radeon 680M (20.1 - 41.8, n=15) | |
| GMK NucBox K2 | |
| Beelink SER Pro Ryzen 5 5600H | |
| 1920x1080 High Preset | |
| Minisforum Venus Series UM790 Pro | |
| Beelink SER7 | |
| Beelink GTR6 | |
| Durchschnittliche AMD Radeon 680M (16.3 - 33.6, n=15) | |
| Beelink SER6 Pro | |
| GMK NucBox K2 | |
| Beelink SER Pro Ryzen 5 5600H | |
| 1920x1080 Ultra Preset | |
| Minisforum Venus Series UM790 Pro | |
| Beelink SER7 | |
| GMK NucBox K2 | |
| Beelink GTR6 | |
| Durchschnittliche AMD Radeon 680M (14 - 23.8, n=15) | |
| Beelink SER6 Pro | |
Frame rates when idling on Witcher 3 are generally consistent but not without some highs and lows as shown by our graph below. The fluctuations are thankfully not extreme enough to be on any concern while gaming.
Witcher 3 FPS
| min. | mittel | hoch | max. | |
|---|---|---|---|---|
| GTA V (2015) | 152.3 | 139.1 | 51.9 | 24 |
| The Witcher 3 (2015) | 121.6 | 75.9 | 37.9 | 22.7 |
| Dota 2 Reborn (2015) | 141.2 | 113.5 | 84.2 | 73.7 |
| Final Fantasy XV Benchmark (2018) | 63.4 | 33 | 24.8 | |
| X-Plane 11.11 (2018) | 66.7 | 52.8 | 42.4 | |
| Far Cry 5 (2018) | 69 | 41 | 38 | 36 |
| Strange Brigade (2018) | 147.3 | 56 | 45.9 | 42.5 |
| Cyberpunk 2077 1.6 (2022) | 35.8 | 27.4 | 21 | 19.2 |
| Tiny Tina's Wonderlands (2022) | 61 | 45.1 | 31.2 | 24.4 |
| F1 22 (2022) | 82.6 | 74.1 | 54.7 | 13.9 |
Emissionen
Systemlautstärke
Die Lautstärke des NucBox K2 ist definitiv einer der größten Schwachpunkte. Dieser erreicht auch bei nicht besonders fordernden Aufgaben wie Browsing oder Videostreaming eine Lautstärke von knapp 36 dB(A). Kurz nach Beginn unseres 3DMark-06-Benchmarks erreichen wir eine maximale Lautstärke von deutlich hörbaren 42 dB(A).
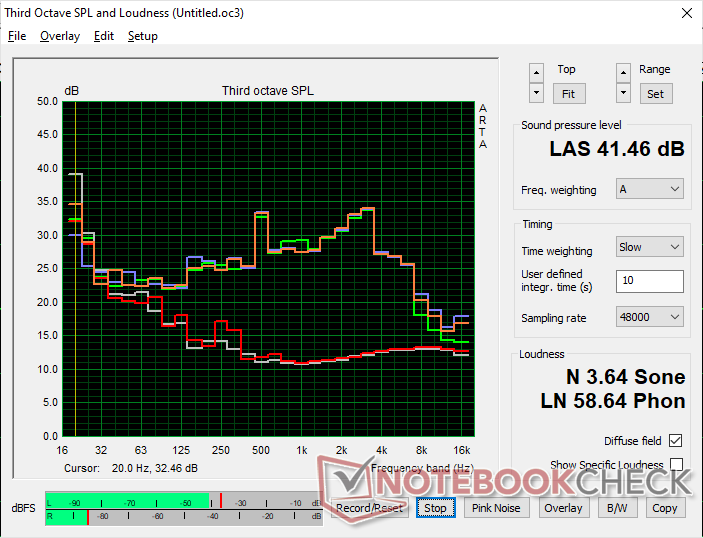
Lautstärkediagramm
| Idle |
| 24.4 / 24.4 / 36.8 dB(A) |
| Last |
| 41.6 / 41.6 dB(A) |
 | ||
30 dB leise 40 dB(A) deutlich hörbar 50 dB(A) störend |
||
min: | ||
| GMK NucBox K2 Radeon 680M, R7 7735HS, Lexar NM610 Pro NM610P001T-HNNNG | GMK NucBox 2 Iris Plus Graphics 655, i5-8259U, Netac S930E8/256GPN | Beelink SER7 Radeon 780M, R7 7840HS, Crucial P3 Plus CT1000P3PSSD8 | Intel NUC 13 Pro Desk Edition Kit Iris Xe G7 96EUs, i7-1360P, Samsung PM9A1 MZVL2512HCJQ | Geekom Mini IT11, i7-11390H Iris Xe G7 96EUs, i7-11390H, Lexar 1024GB LNM6A1X001T-HNNNG | Trigkey Speed S Iris Xe G7 96EUs, i5-11320H, Intel SSD 670p SSDPEKNU512GZ | |
|---|---|---|---|---|---|---|
| Geräuschentwicklung | 8% | 6% | -3% | 2% | 13% | |
| aus / Umgebung * (dB) | 24.1 | 25.6 -6% | 24.5 -2% | 25.2 -5% | 29.7 -23% | 23.5 2% |
| Idle min * (dB) | 24.4 | 25.7 -5% | 25.1 -3% | 28.1 -15% | 30.2 -24% | 24.1 1% |
| Idle avg * (dB) | 24.4 | 25.7 -5% | 25.1 -3% | 28.2 -16% | 30.2 -24% | 24.1 1% |
| Idle max * (dB) | 36.8 | 25.7 30% | 25.1 32% | 28.3 23% | 30.2 18% | 26.6 28% |
| Last avg * (dB) | 41.6 | 35.3 15% | 35.9 14% | 42 -1% | 30.6 26% | 30.4 27% |
| Witcher 3 ultra * (dB) | 41.7 | 35.6 15% | 30.5 27% | 30.4 27% | ||
| Last max * (dB) | 41.6 | 35.1 16% | 45.4 -9% | 42.1 -1% | 36.4 13% | 38.1 8% |
* ... kleinere Werte sind besser
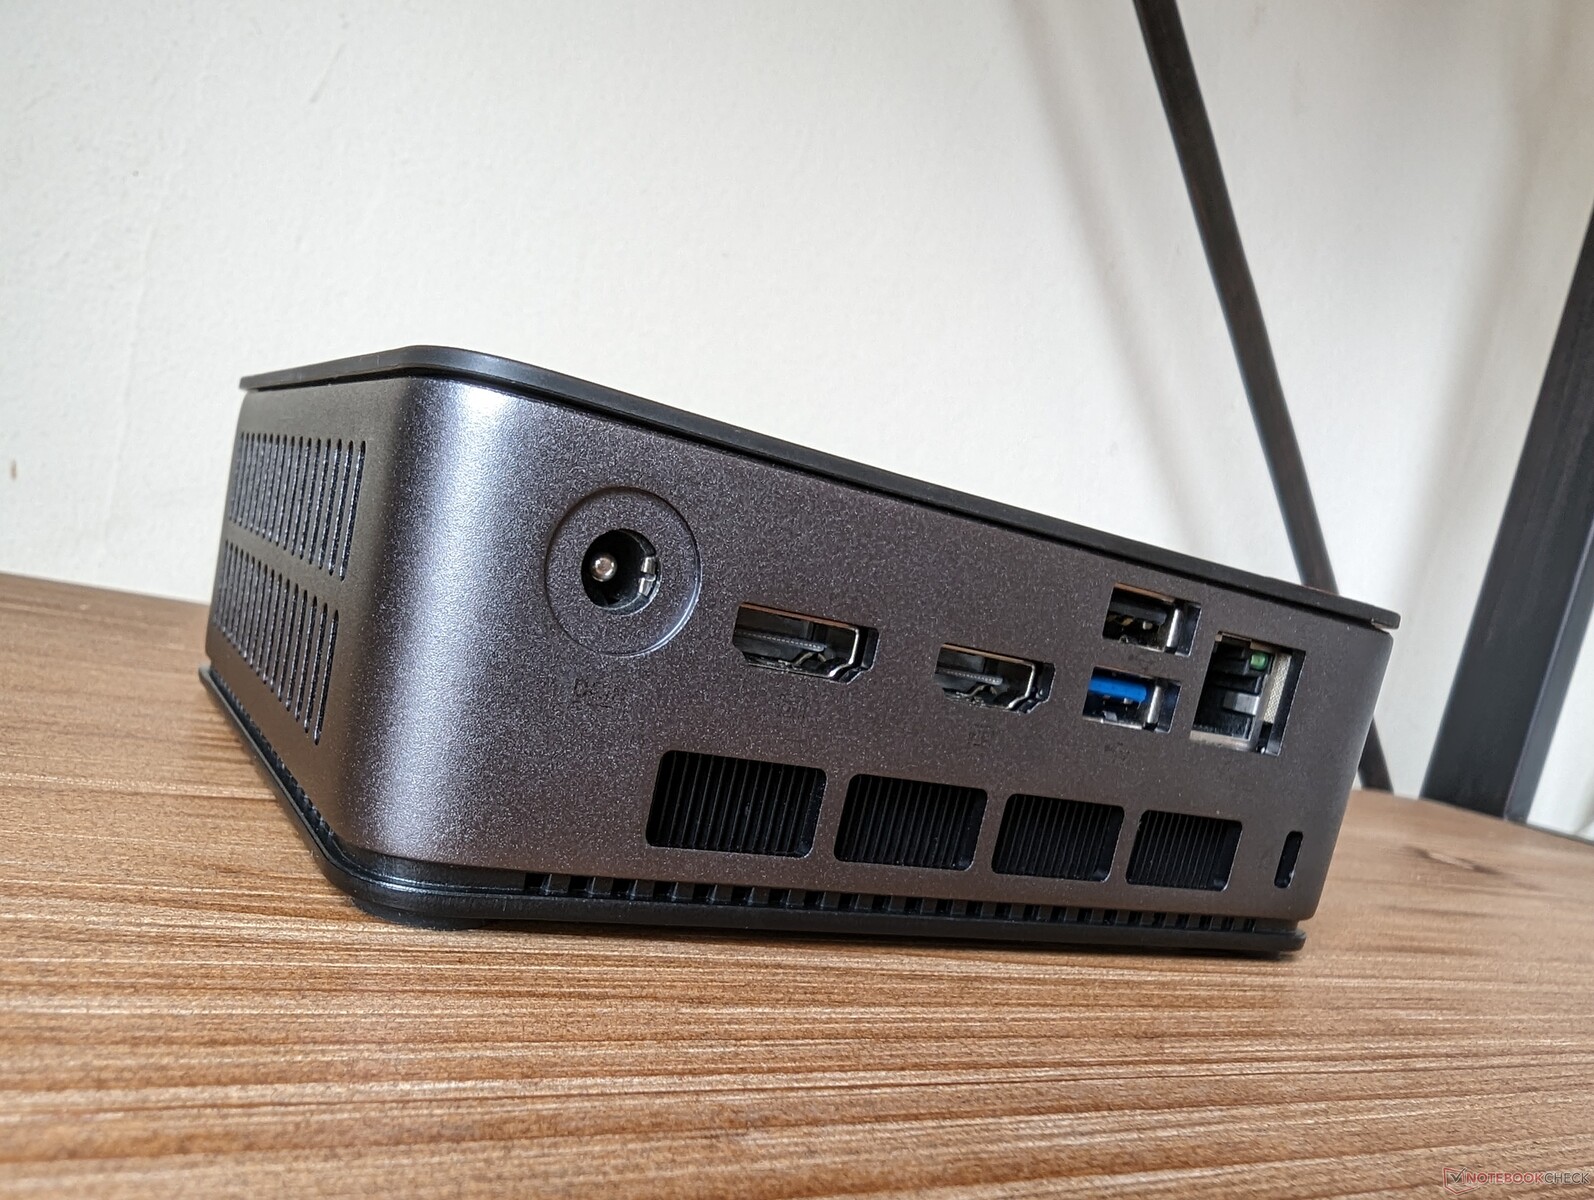
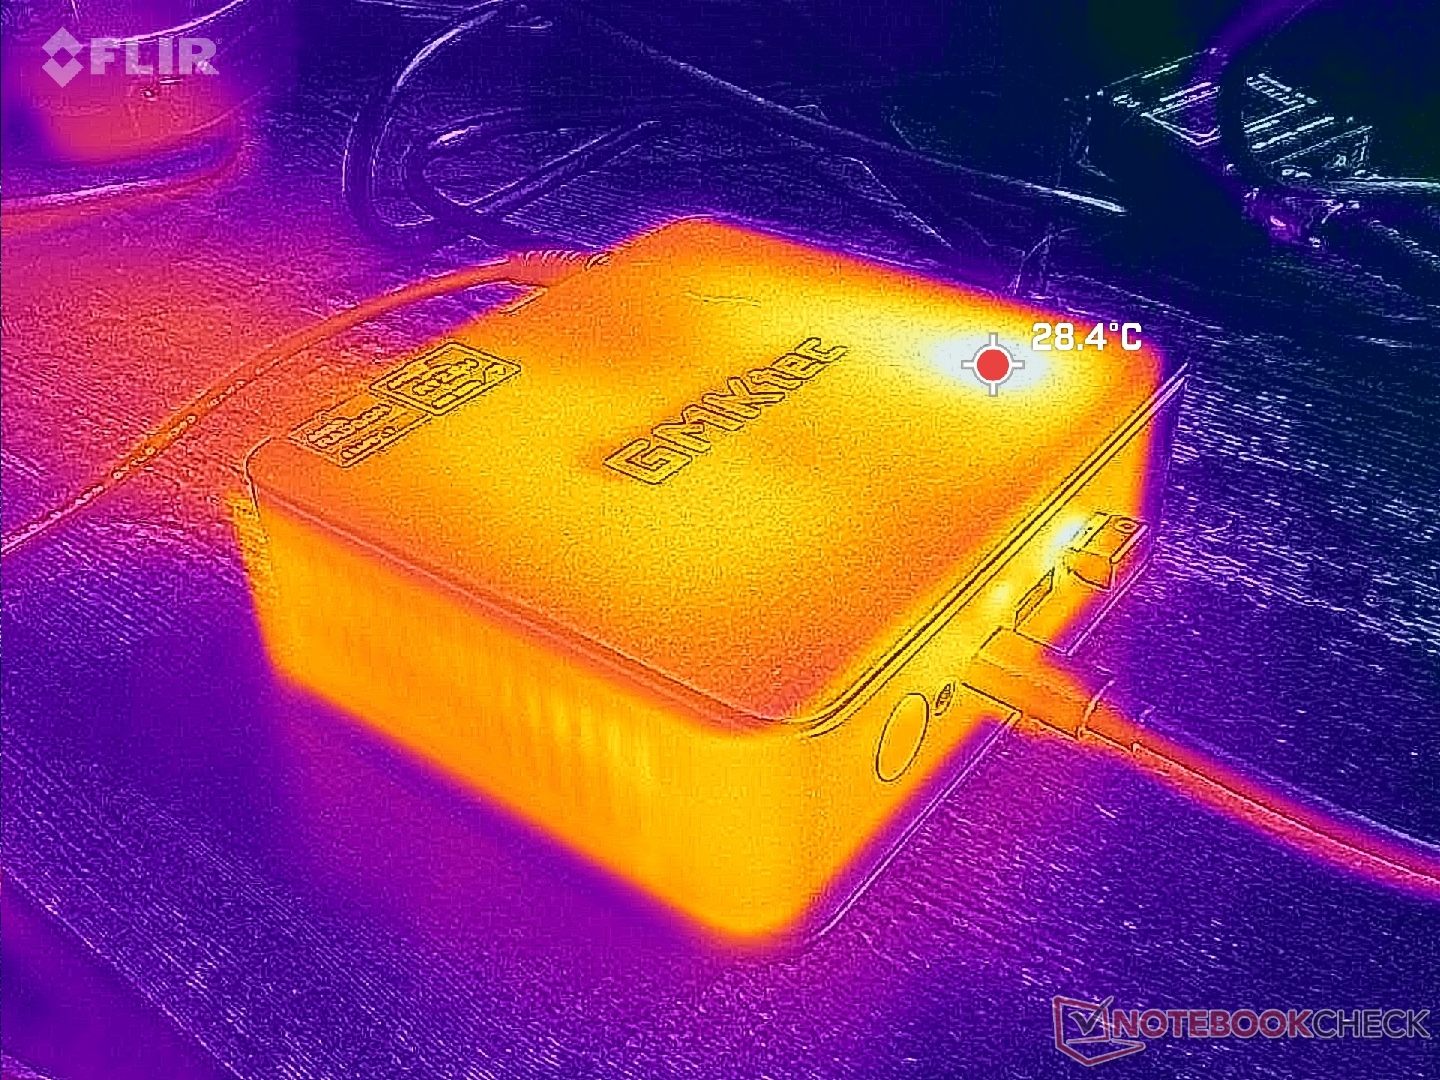
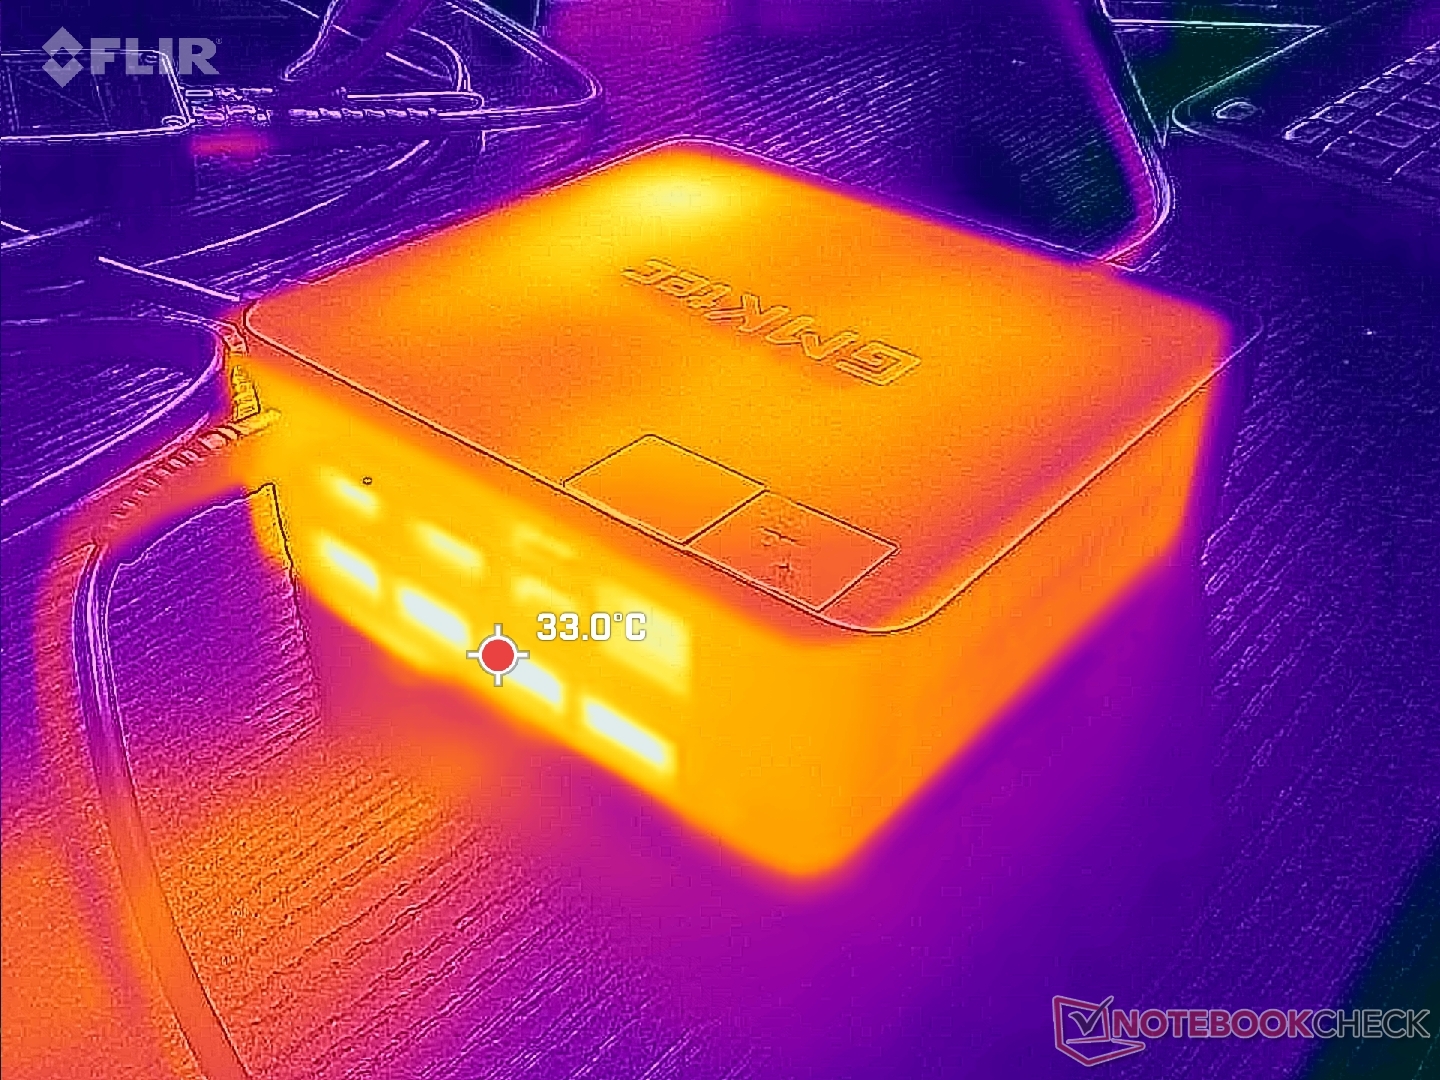
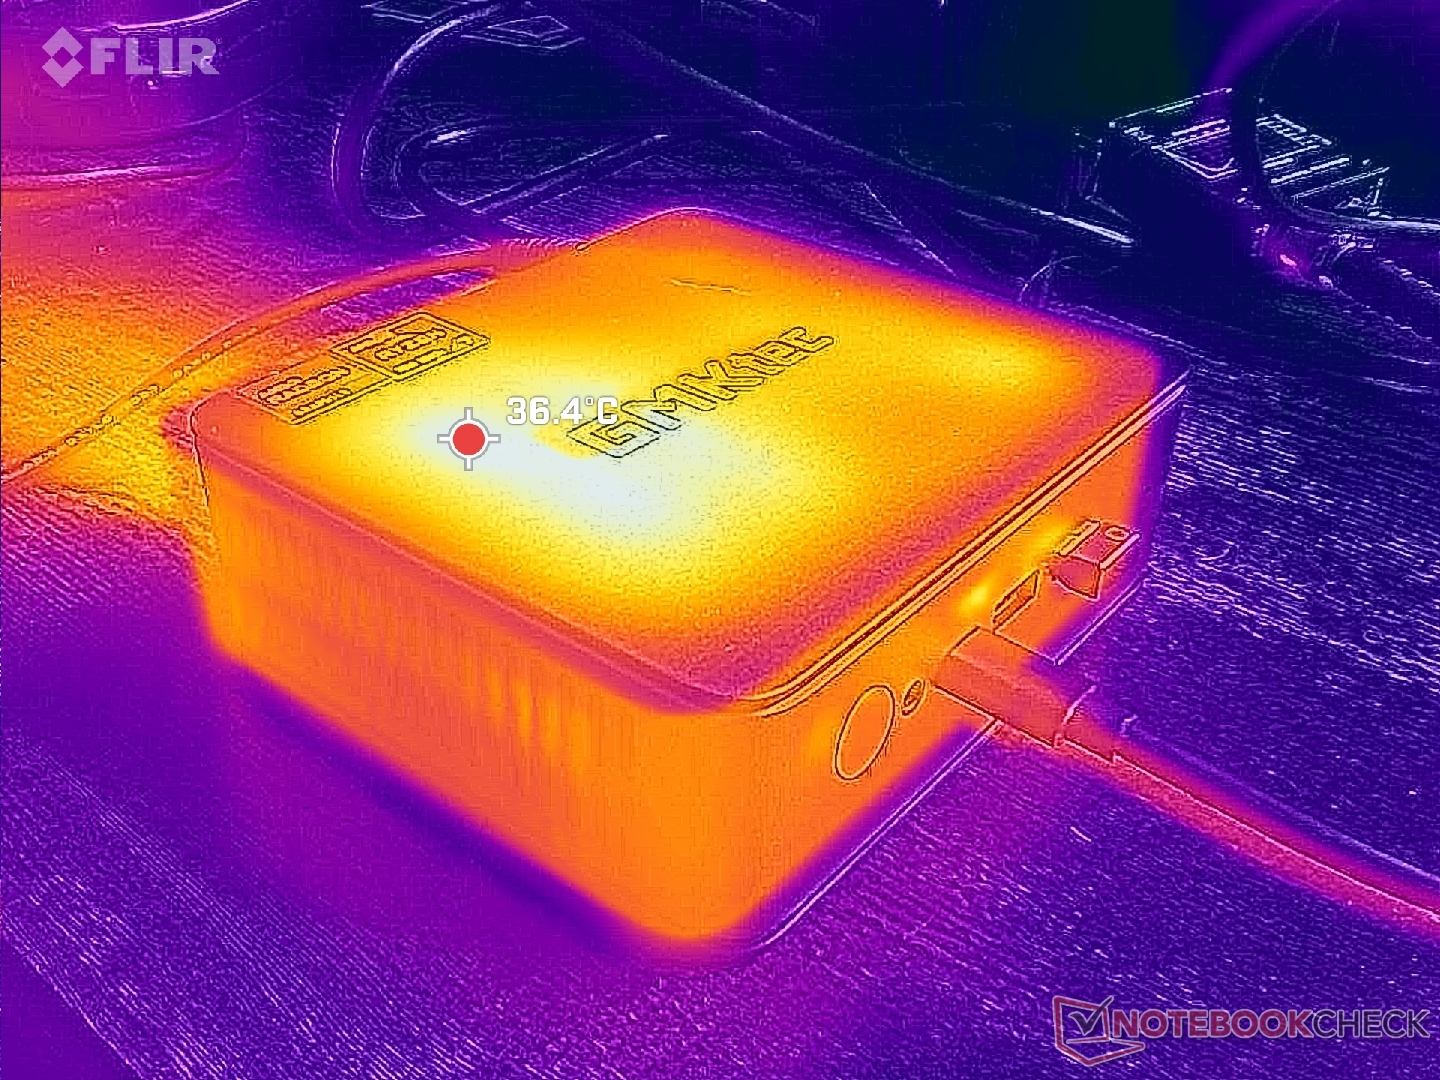
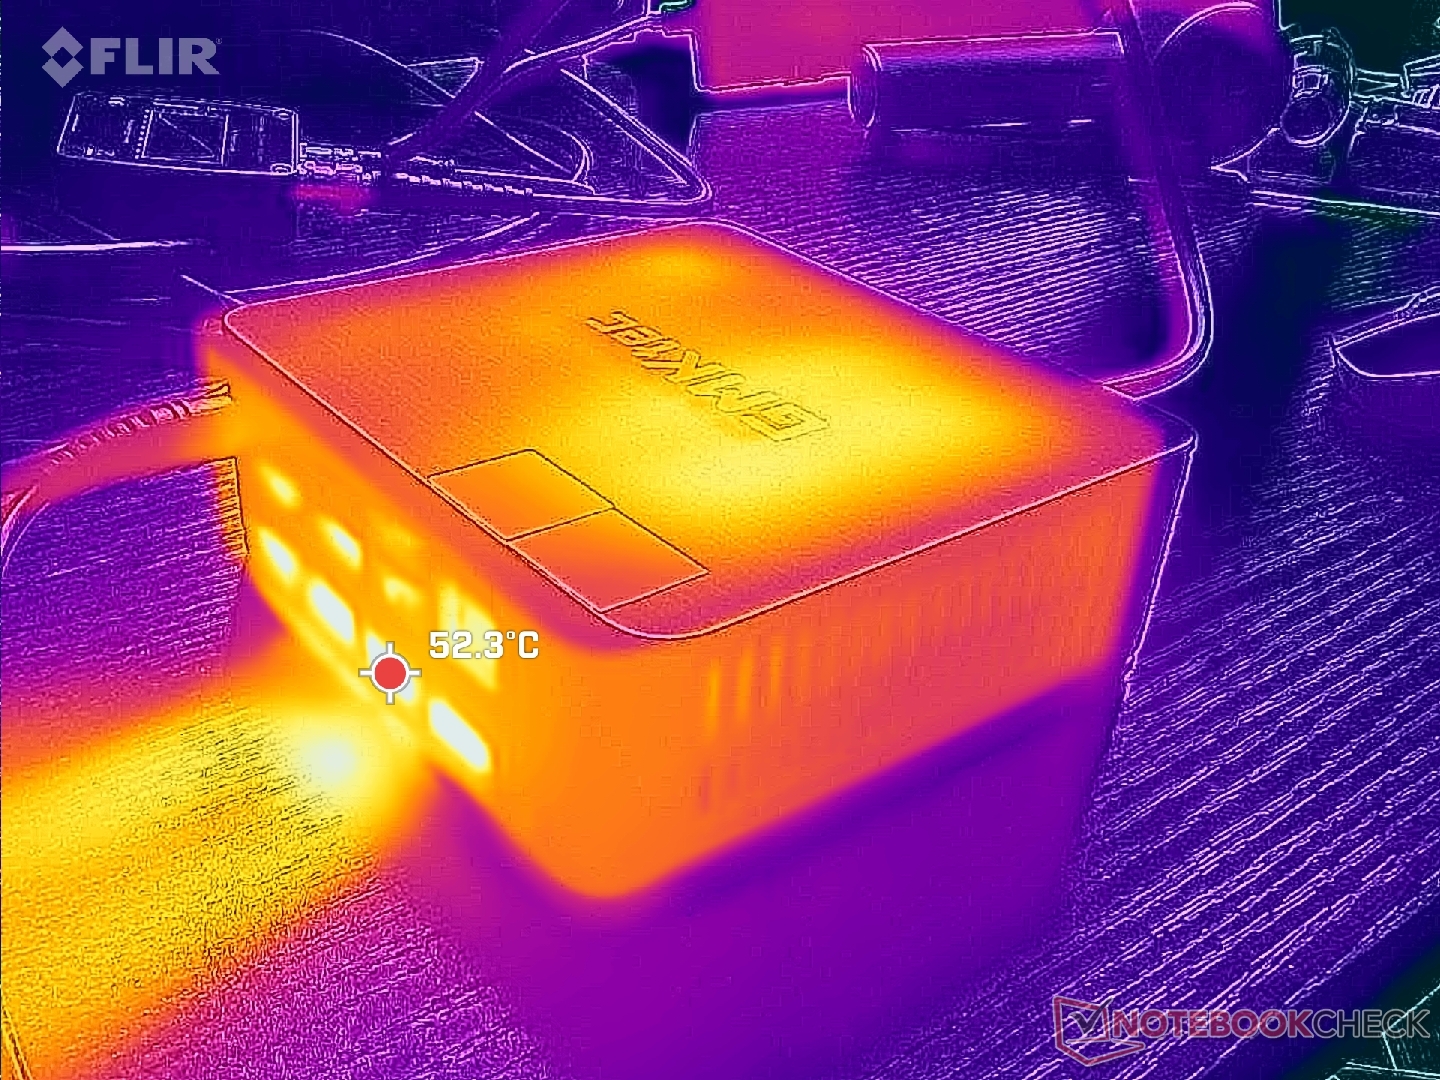
Temperaturen
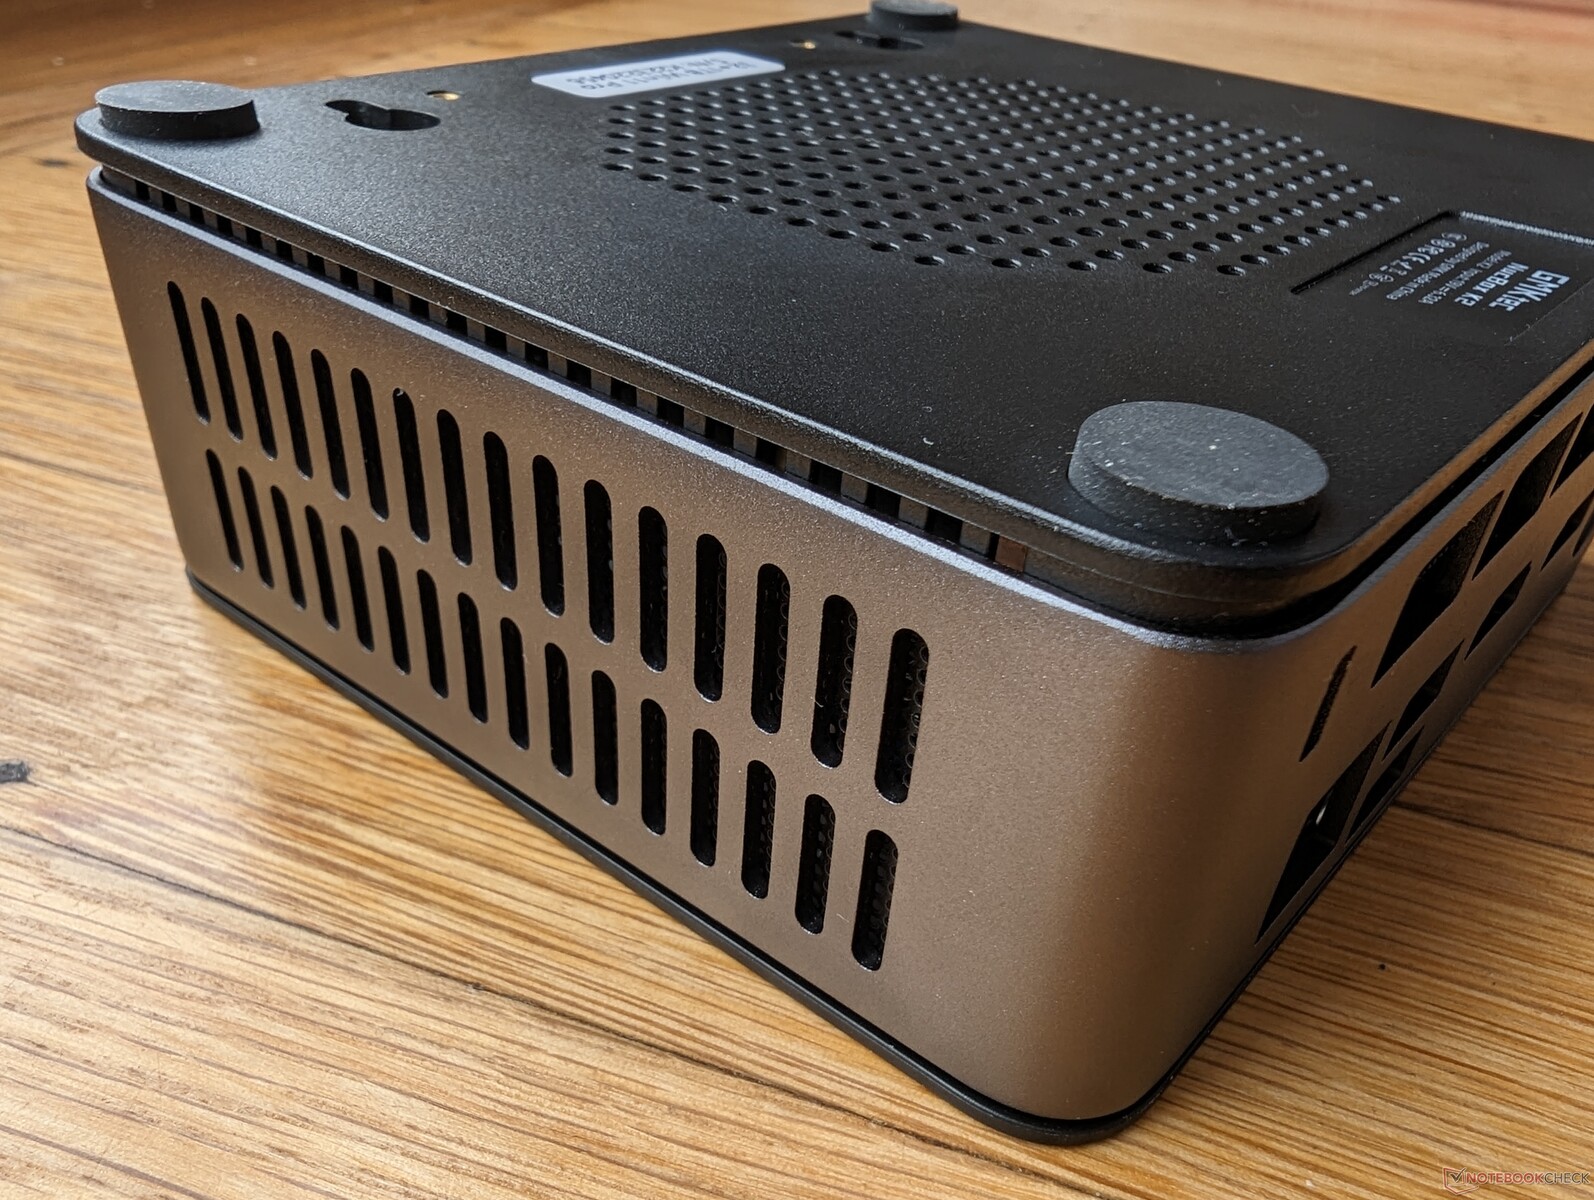
Die Oberflächen des Mini-PCs erreichen unter Volllast eine maximale Temperatur von 36 °C. Ansonsten wird die heiße Luft über die Lüfterauslässe auf der Rückseite abgegeben, wie unten auf der Abbildung zu erkennen ist.
Sollte man das Gerät vertikal anstatt horizontal aufstellen wollen, ist dies kein Problem, da er auch auf der Unterseite Lüfterschlitze besitzt.
Stresstest
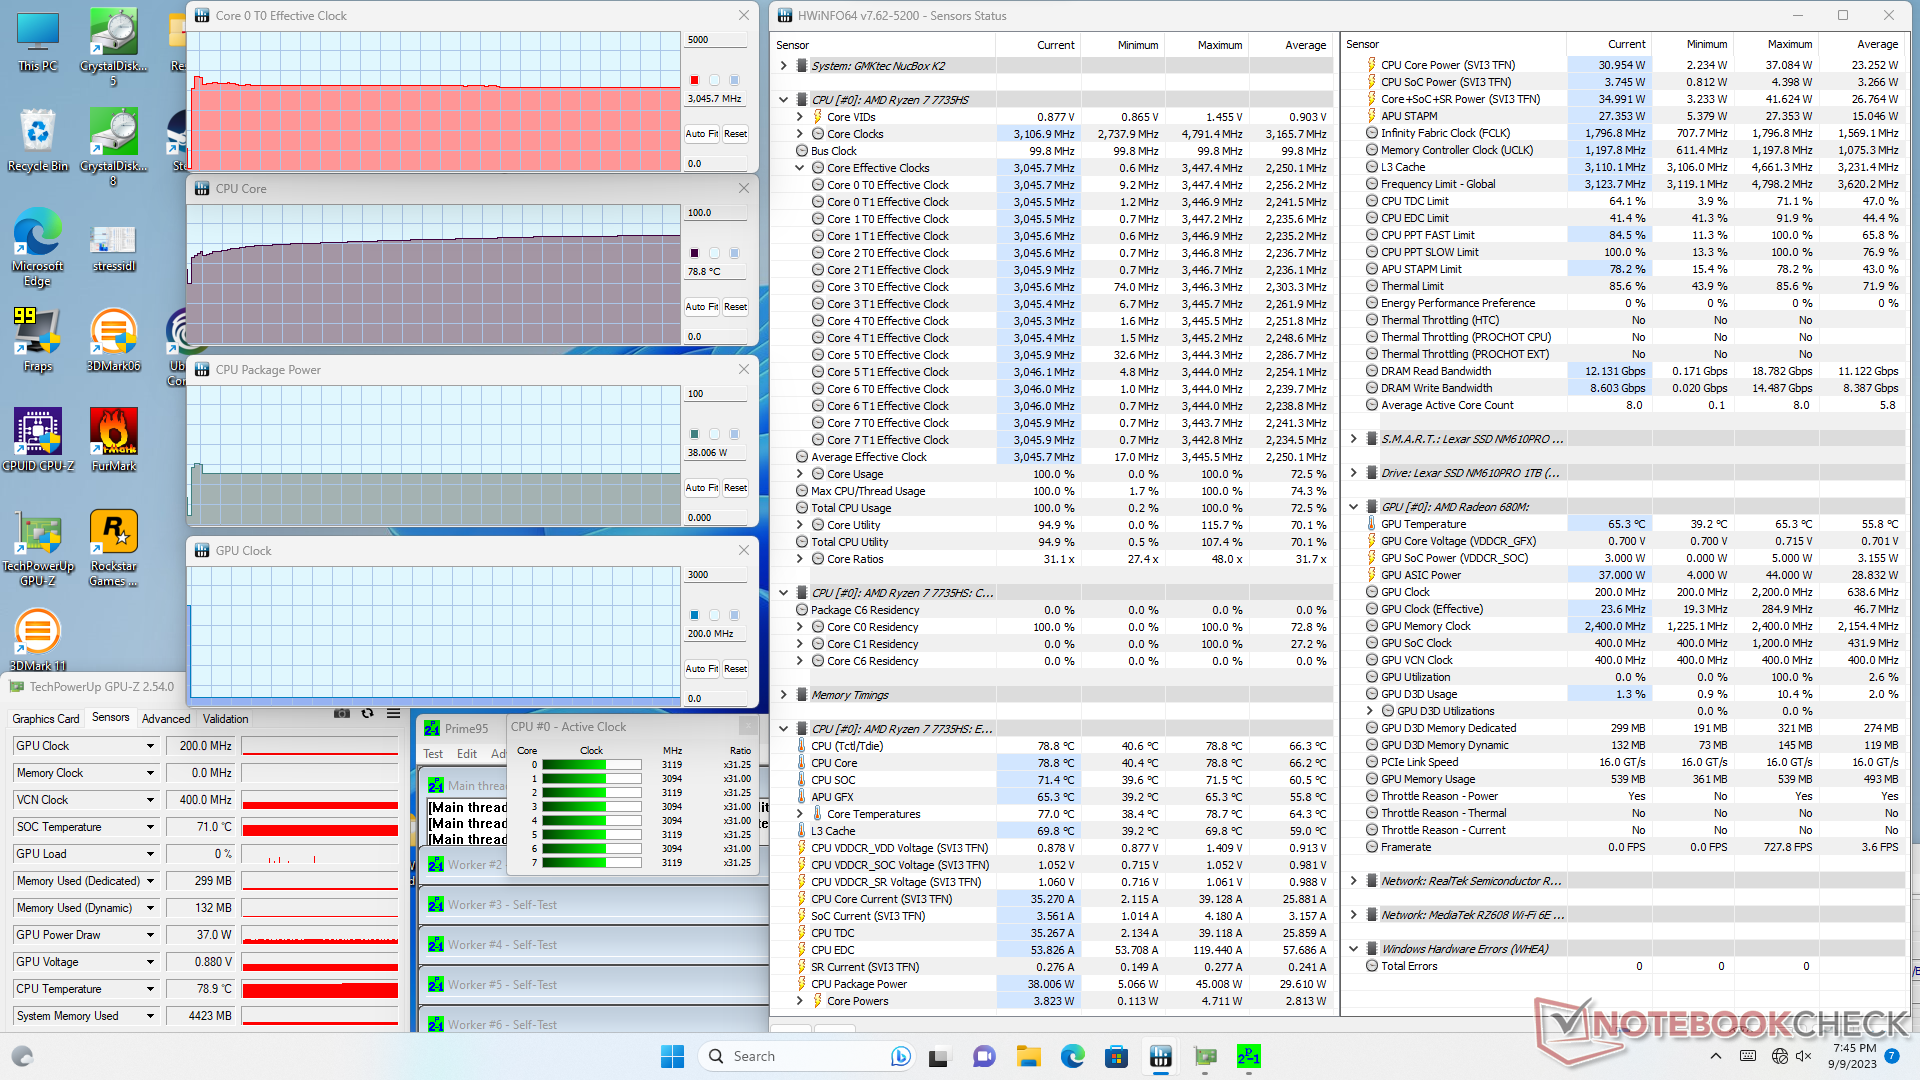
Bei Prime95 erreichten wir eine maximale Taktrate von 3,5 GHz bei einem Verbrauch von 45 W. Nach ein paar Sekunden sinkt dieser Wert aber auf ca. 3,1 GHz (bei 38 W), was vor allem am limitierten Turbo-Boost liegt.
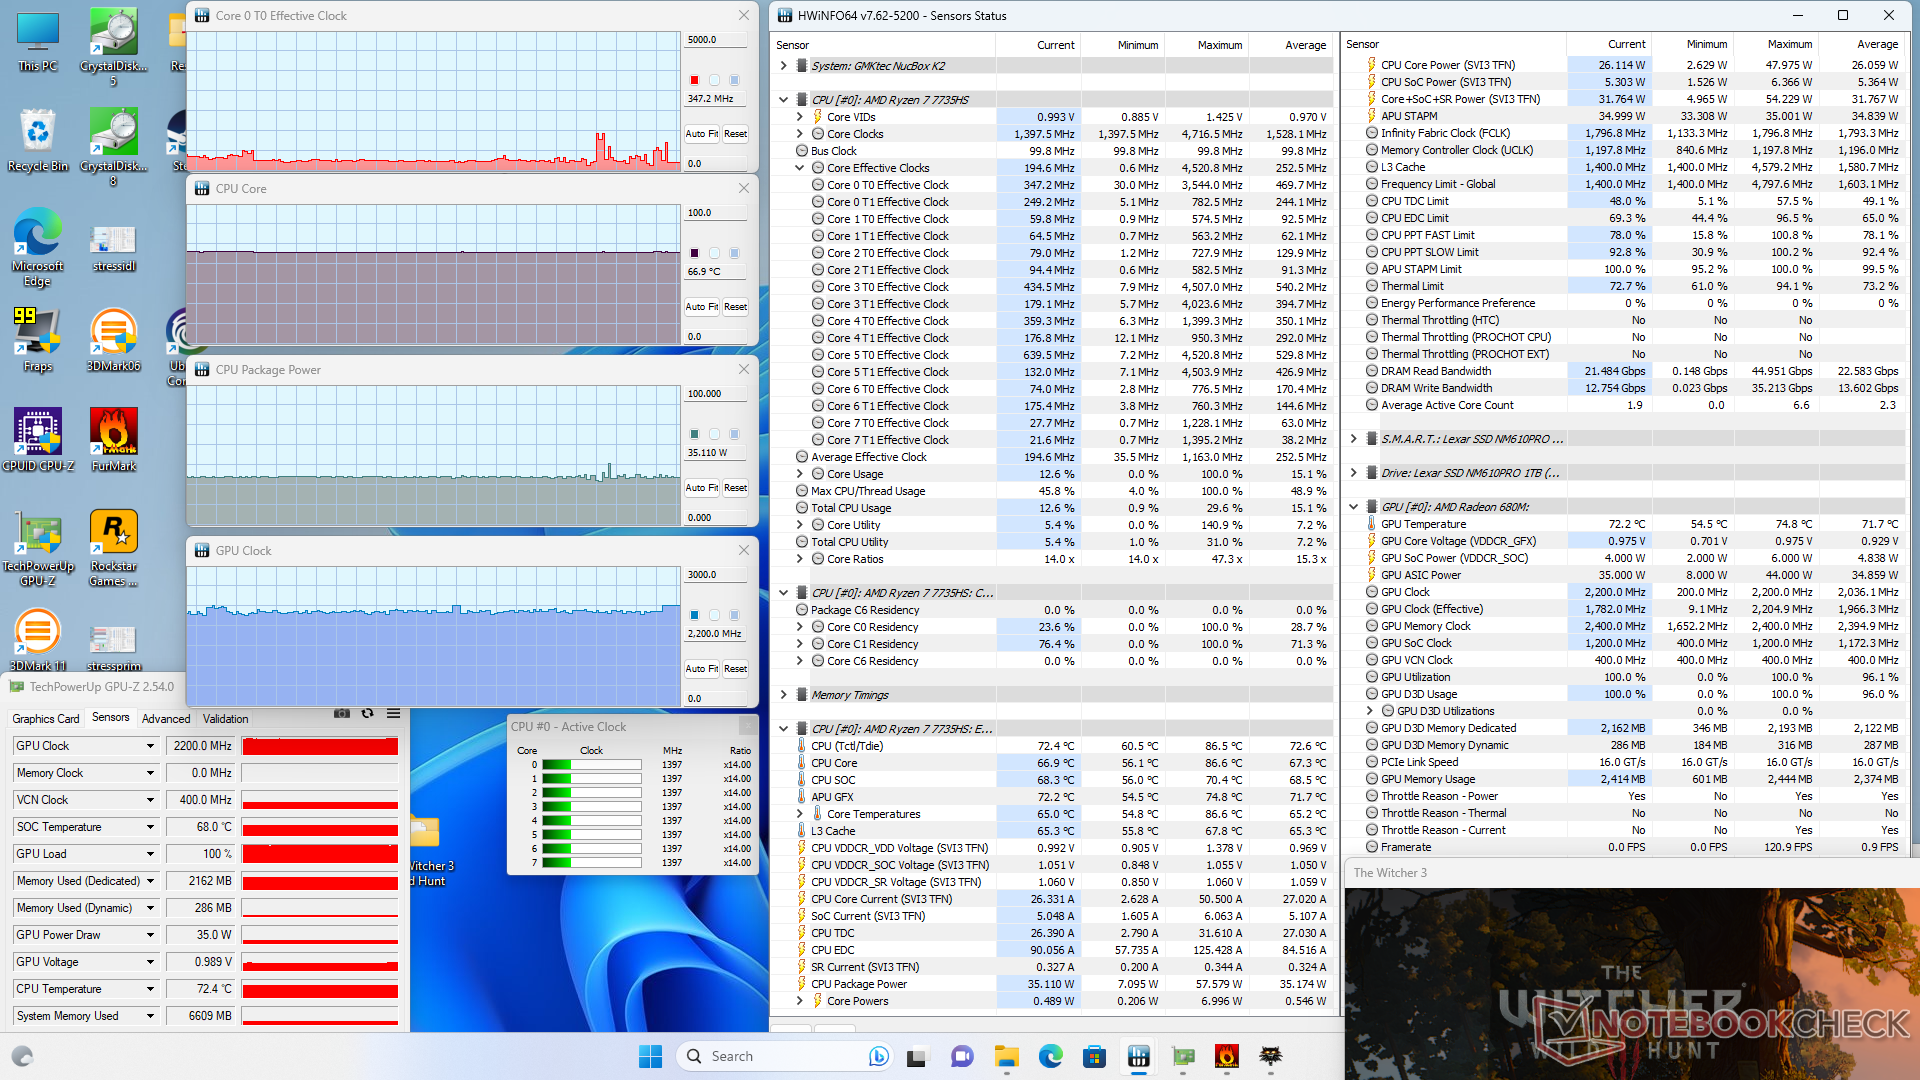
Die Temperaturen der CPU erreichen bei Witcher 3 67 °C, im Vergleich zu 64 °C beim Beelink SER7. Nur bei länger andauernder Volllast wird der Prozessor knapp 70 °C heiß.
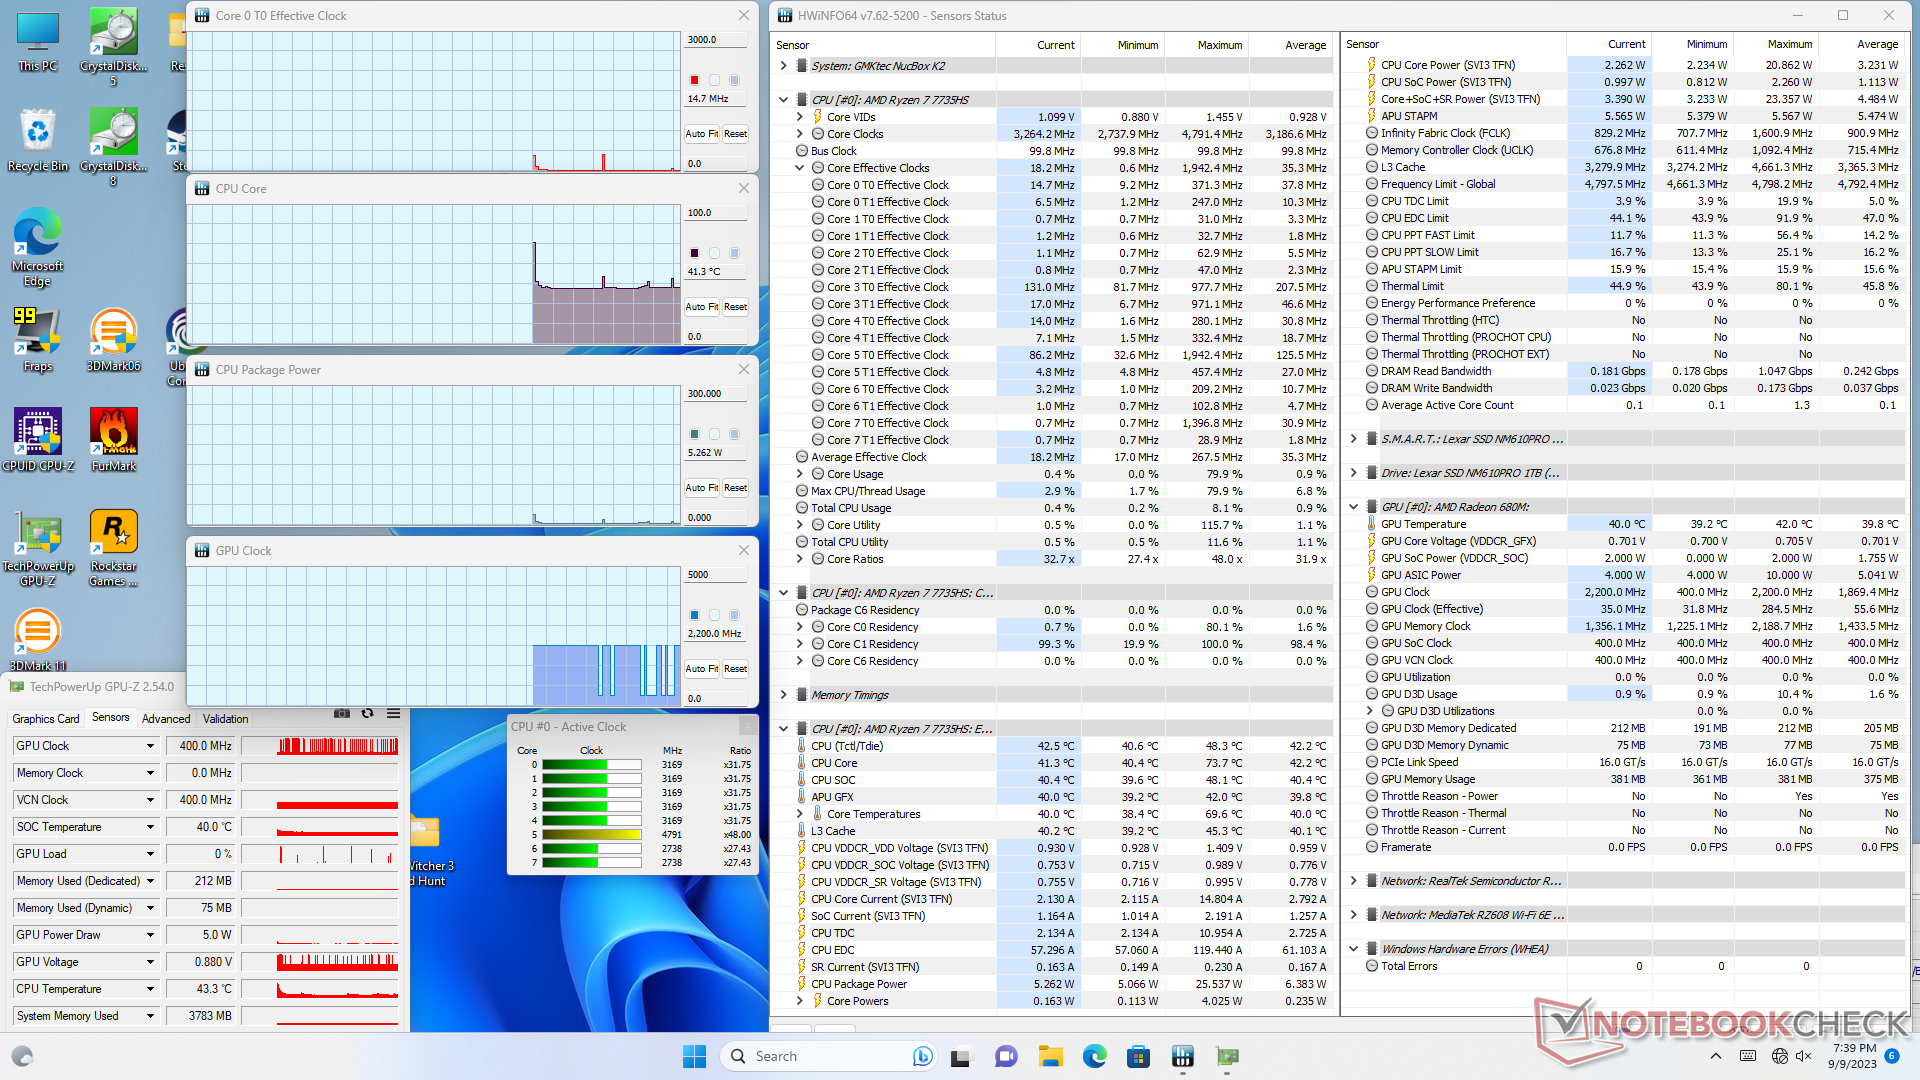
| CPU Clock (GHz) | GPU Clock (MHz) | Average CPU Temperature (°C) | |
| System Idle | -- | -- | 41 |
| Prime95 Stress | 3.0 | -- | 79 |
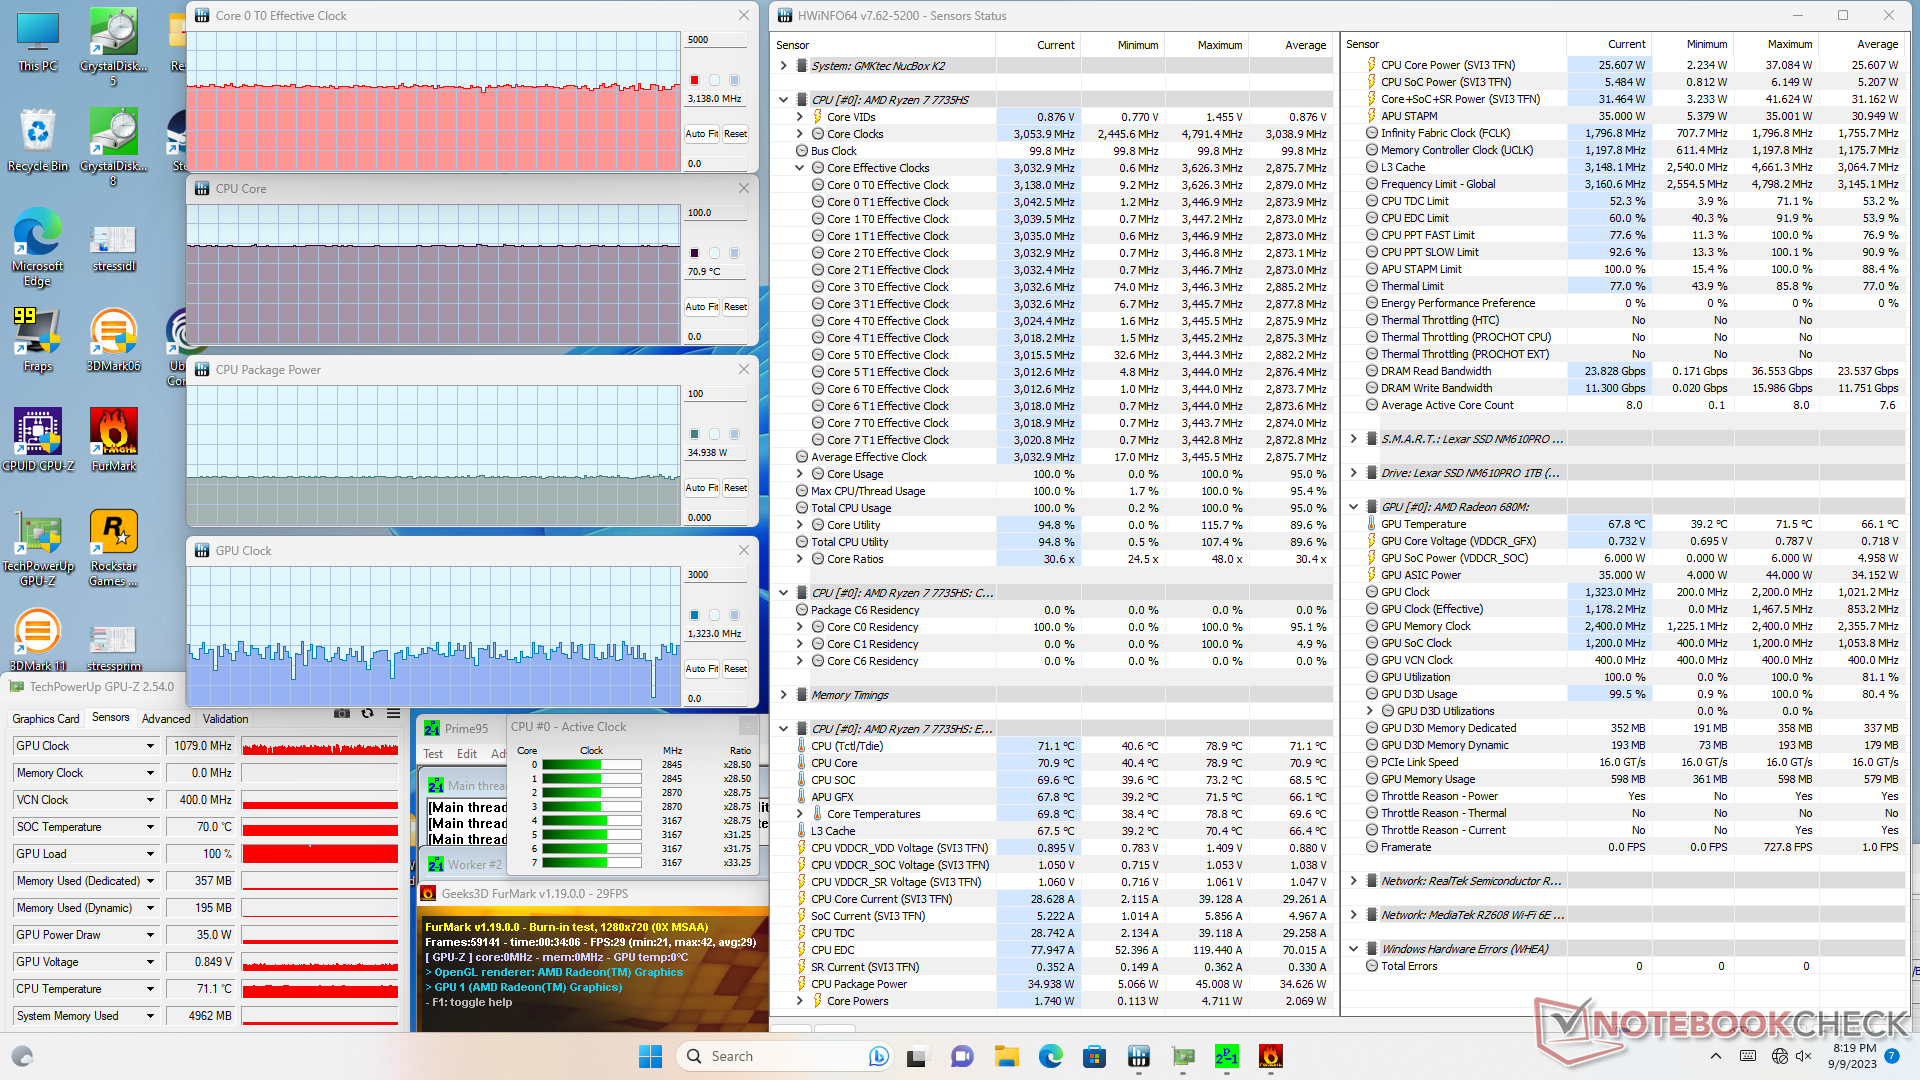
| Prime95 + FurMark Stress | 3.1 | ~1323 | 71 |
| Witcher 3 Stress | 0.4 | 2000 - 2200 | 67 |
Energiemanagement — Nur ein bisschen durstiger
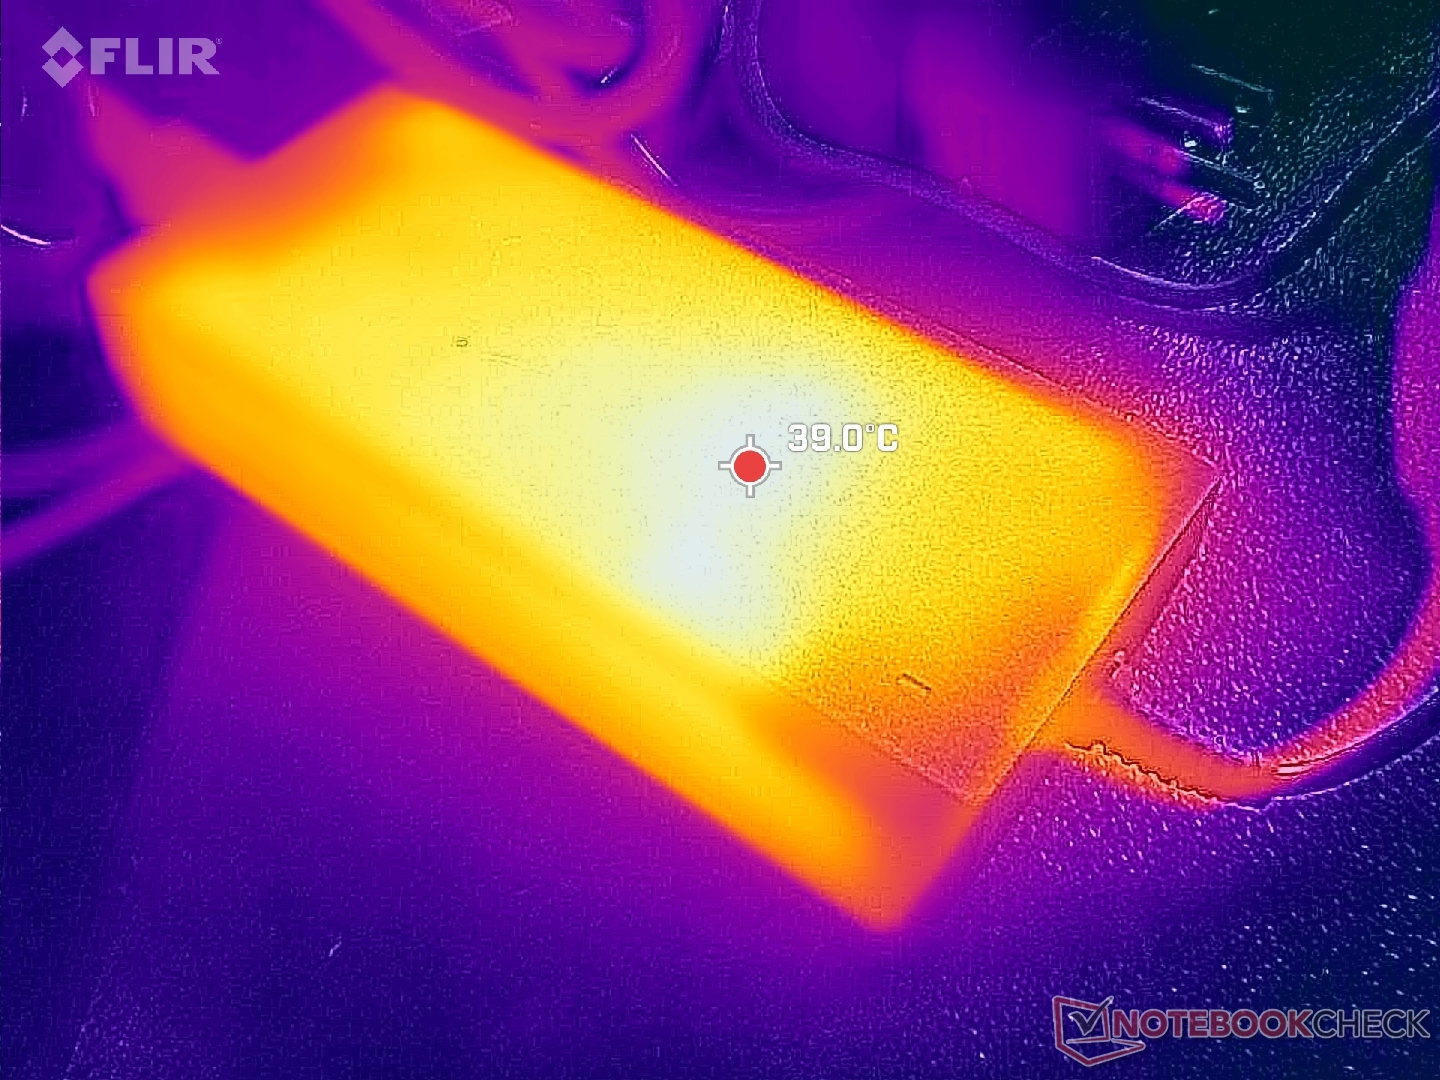
Stromverbrauch
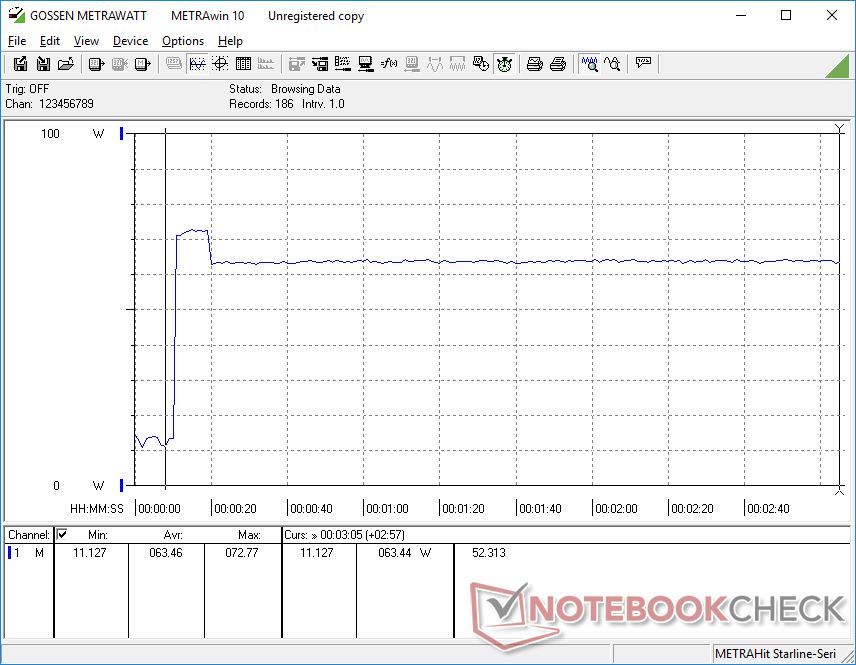
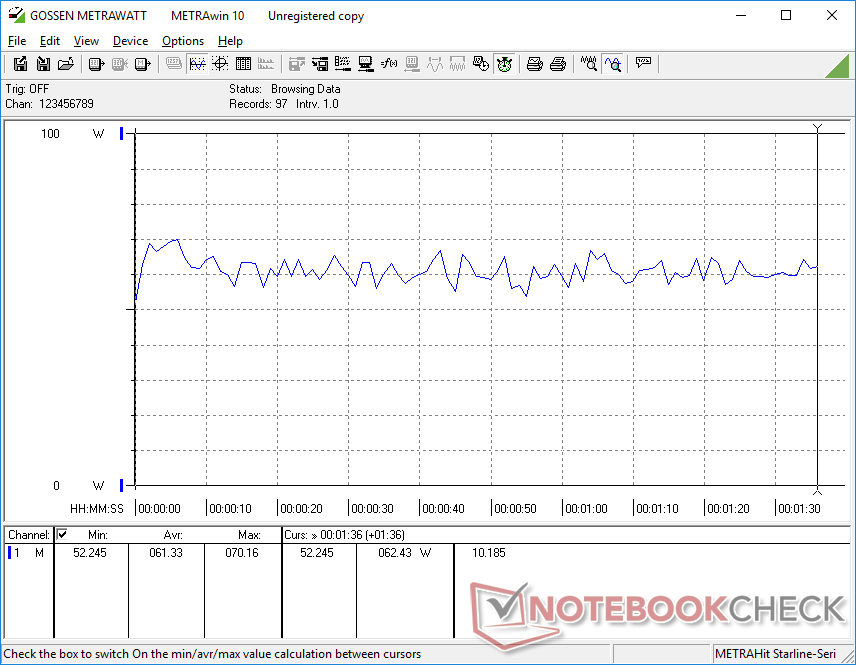
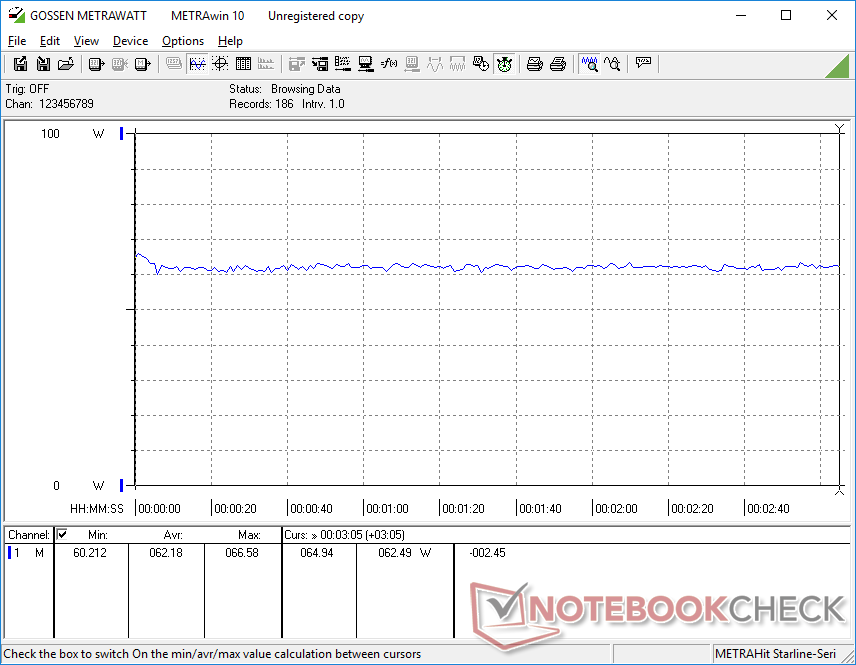
Der NucBox K2 ist etwas Stromhungriger als andere Mini-PCs mit Prozessoren der älteren Generation, wie der NucBox 2 oder der Trigkey Speed S. Trotzdem rechtfertigt der höhere Stromverbrauch die gewonnene Leistung: Unser NucBox K2 braucht zwar beispielsweise 30 Prozent mehr Strom, kann aber auch 60 bis 70 Prozent mehr Leistung liefern.

| Aus / Standby | |
| Idle | |
| Last |
|
Legende:
min: | |
| GMK NucBox K2 R7 7735HS, Radeon 680M, Lexar NM610 Pro NM610P001T-HNNNG, , x, | GMK NucBox 2 i5-8259U, Iris Plus Graphics 655, Netac S930E8/256GPN, , x, | Beelink SER7 R7 7840HS, Radeon 780M, Crucial P3 Plus CT1000P3PSSD8, , x, | Intel NUC 13 Pro Desk Edition Kit i7-1360P, Iris Xe G7 96EUs, Samsung PM9A1 MZVL2512HCJQ, , x, | Geekom Mini IT11, i7-11390H i7-11390H, Iris Xe G7 96EUs, Lexar 1024GB LNM6A1X001T-HNNNG, , x, | Trigkey Speed S i5-11320H, Iris Xe G7 96EUs, Intel SSD 670p SSDPEKNU512GZ, , x, | |
|---|---|---|---|---|---|---|
| Stromverbrauch | 26% | -6% | -2% | 22% | 20% | |
| Idle min * (Watt) | 7.3 | 6.1 16% | 6.7 8% | 7 4% | 7.3 -0% | 6.7 8% |
| Idle avg * (Watt) | 9.8 | 6.8 31% | 7.3 26% | 9.2 6% | 7.8 20% | 8 18% |
| Idle max * (Watt) | 10.5 | 7.3 30% | 11.6 -10% | 11.8 -12% | 8.4 20% | 8.1 23% |
| Last avg * (Watt) | 61.3 | 46.3 24% | 64.1 -5% | 45 27% | 28.7 53% | 47.6 22% |
| Witcher 3 ultra * (Watt) | 62.2 | 75.8 -22% | 47.5 24% | |||
| Last max * (Watt) | 72.8 | 50.7 30% | 94.8 -30% | 97.2 -34% | 61.1 16% | 56.3 23% |
* ... kleinere Werte sind besser
Power Consumption Witcher 3 / Stresstest
Stromverbrauch externer Monitor
Pro
Contra
Fazit — Viel Performance für wenig Geld
Der GMKtec NucBox K2 liefert alle Bedürfnisse eines Homeoffice-Nutzers, aber ohne extravaganten Extras. Die sehr einfache Wartung des Geräts, ein pfeilschneller Zen-3+-Prozessor und der USB4-Port zählen hierbei definitiv zu den Highlights des Geräts. Außerdem macht der Fakt, dass unsere Konfiguration bereits ab knapp 450 Euro ($480 USD) zu haben ist, den PC noch attraktiver, sofern man ein paar Kompromisse eingehen kann.
Wie so oft gibt es aber auch hier ein paar Schattenseiten. Hierzu zählt, dass nur eine interne SSD unterstützt wird, obwohl die meisten anderen Mini-PCs zwei oder mehr supporten. Weiters könnte der einzige USB-C-Anschluss zum Problem werden, wenn man externe Hardware nutzen möchte. Zuletzt empfehlen wir, vorab auf mögliche Bluetooth-Verbindungsprobleme und Frame-Skipping zu achten, da beides bei unserem Test immer wieder vorkam.
Der NucBox-K2-Mini-PC kann mehr, als wir es eigentlich bei diesem Preis gewohnt sind. Trotzdem muss man auch ein paar Kompromisse eingehen.
Wir würden uns auch ein paar Verbesserung in Hinsicht auf die WLAN-Verbindung und den Lüfter wünschen. Unsere WiFi-6E-Verbindung ist hier langsamer als bei anderen Geräten und die RPM-Anzahl des Lüfter springt auch teilweise merkbar herum. Sollte man dieses Modell aber für unter 450 Euro ($500 USD) zum Kauf angeboten bekommen, kann man es trotz seiner kleinen Schwächen kaufen.
Preis und Verfügbarkeit
In Europa ist der GMKtec-NucBox-K2-Mini-PC zwar noch nicht erhältlich, er kann aber über Amazon US oder auf der Website des Herstellers erworben werden. Der UVP beträgt ca. 540 Euro ($580 USD).
GMK NucBox K2
- 12.09.2023 v7 (old)
Allen Ngo
Transparenz
Die Auswahl der zu testenden Geräte erfolgt innerhalb der Redaktion. Das vorliegende Testmuster wurde dem Autor vom Hersteller oder einem Shop zu Testzwecken leihweise zur Verfügung gestellt. Eine Einflussnahme des Leihstellers auf den Testbericht gab es nicht, der Hersteller erhielt keine Version des Reviews vor der Veröffentlichung. Es bestand keine Verpflichtung zur Publikation. Als eigenständiges, unabhängiges Unternehmen unterliegt Notebookcheck keiner Diktion von Herstellern, Shops und Verlagen.
So testet Notebookcheck
Pro Jahr werden von Notebookcheck hunderte Laptops und Smartphones unabhängig in von uns standardisierten technischen Verfahren getestet, um eine Vergleichbarkeit aller Testergebnisse zu gewährleisten. Seit rund 20 Jahren entwickeln wir diese Testmethoden kontinuierlich weiter und setzen damit Branchenstandards. In unseren Testlaboren kommt ausschließlich hochwertiges Messequipment in die Hände erfahrener Techniker und Redakteure. Die Tests unterliegen einer mehrstufigen Kontrolle. Unsere komplexe Gesamtbewertung basiert auf hunderten fundierten Messergebnissen und Benchmarks, womit Ihnen Objektivität garantiert ist. Weitere Informationen zu unseren Testmethoden gibt es hier.
Preisvergleich

