
Fazit - Einfach, aber vielleicht zu einfach
Der Cubi NUC 2MG ist eine einfache, aber zuverlässige Option für Unternehmen, daher auch die dezente Ästhetik. Der integrierte Lautsprecher, die Mikrofone, die Co-Pilot+ Unterstützung und die Power Link Funktion können sehr nützlich sein. Die Lunar Lake-V CPU ist im Allgemeinen kühler und effizienter ist als die aktuellen AMD-Alternativen. Wir schätzen besonders den schnellen integrierten MicroSD-Leser, da viele andere Mini-PCs keinen Kartenleser haben.
Unser Hauptkritikpunkt am Cubi 2MG ist sein relativ hoher Preis von $900 USD, während schnellere AMD-Mini-PCs wie der Beelink SER9 Pro oder GMK NucBox K12 bereits für deutlich weniger erhältlich sind. Diese Alternativen bieten außerdem nützliche Funktionen wie austauschbaren Arbeitsspeicher und Unterstützung für mehrere interne SSDs. Um den Preis zu rechtfertigen will MSI einen besseren Kundensupport und Garantie anbieten.
Auch das Verhalten der Lüfter könnte noch etwas verbessert werden. Sofern Sie nicht den Silent-Modus verwenden, neigt der Lüfter dazu, zu pulsieren und sich auch bei geringer Last bemerkbar zu machen. Die zyklischen GPU-Taktraten sind zwar für die meisten professionellen Einstellungen kein Problem, aber dennoch suboptimal.
Pro
Contra
Preis und Verfügbarkeit
Der MSI Cubi NUC AI+ 2MG ist in der stärkeren Option mit dem Intel Core Ultra 9 bei Amazon um ca. 1.800 Euro erhältlich.
Der Cubi NUC 2MG ist der Nachfolger des letztjährigen Cubi NUC 1M. Er ersetzt die ältere Raptor Lake-U Core Ultra 7 150U CPU durch neuere Lunar Lake-V Optionen und nimmt weitere kleinere Änderungen vor. Die Cubi-Serie ist für Unternehmen konzipiert.
Bei unserem Testgerät handelt es sich um eine Mittelklasse-Konfiguration mit der Core Ultra 7 258V CPU, 32 GB verlötetem RAM und 1 TB SSD für etwa 900 USD. Niedrigere SKUs beginnen mit dem Core Ultra 5 226V, während die stärkste Option mit dem Core Ultra 9 288V ausgeliefert wird. In einigen Regionen ist auch eine weiße Version erhältlich.
Spezifikationen
Preisvergleich
Gehäuse
Das Gehäuse und dessen Abmessungen bleiben gegenüber dem Cubi 1M weitgehend unverändert. Neu am Cubi 2MG ist jedoch die spezielle CoPilot Taste auf der Vorderseite des Geräts. Das Problem bei dieser Funktion ist, dass die physische Taste schwer zu erreichen sein kann, je nachdem, wie Sie das System auf Ihrem Schreibtisch positionieren.
Power Link wird unterstützt, um das Gerät über bestimmte MSI-Monitore einzuschalten. Die Liste der kompatiblen Monitore finden Sie hier. Leider ist für Power Link immer noch ein Netzadapter für den Mini-PC erforderlich, so dass es sich nicht um eine echte "Ein-Kabel-Lösung" handelt.

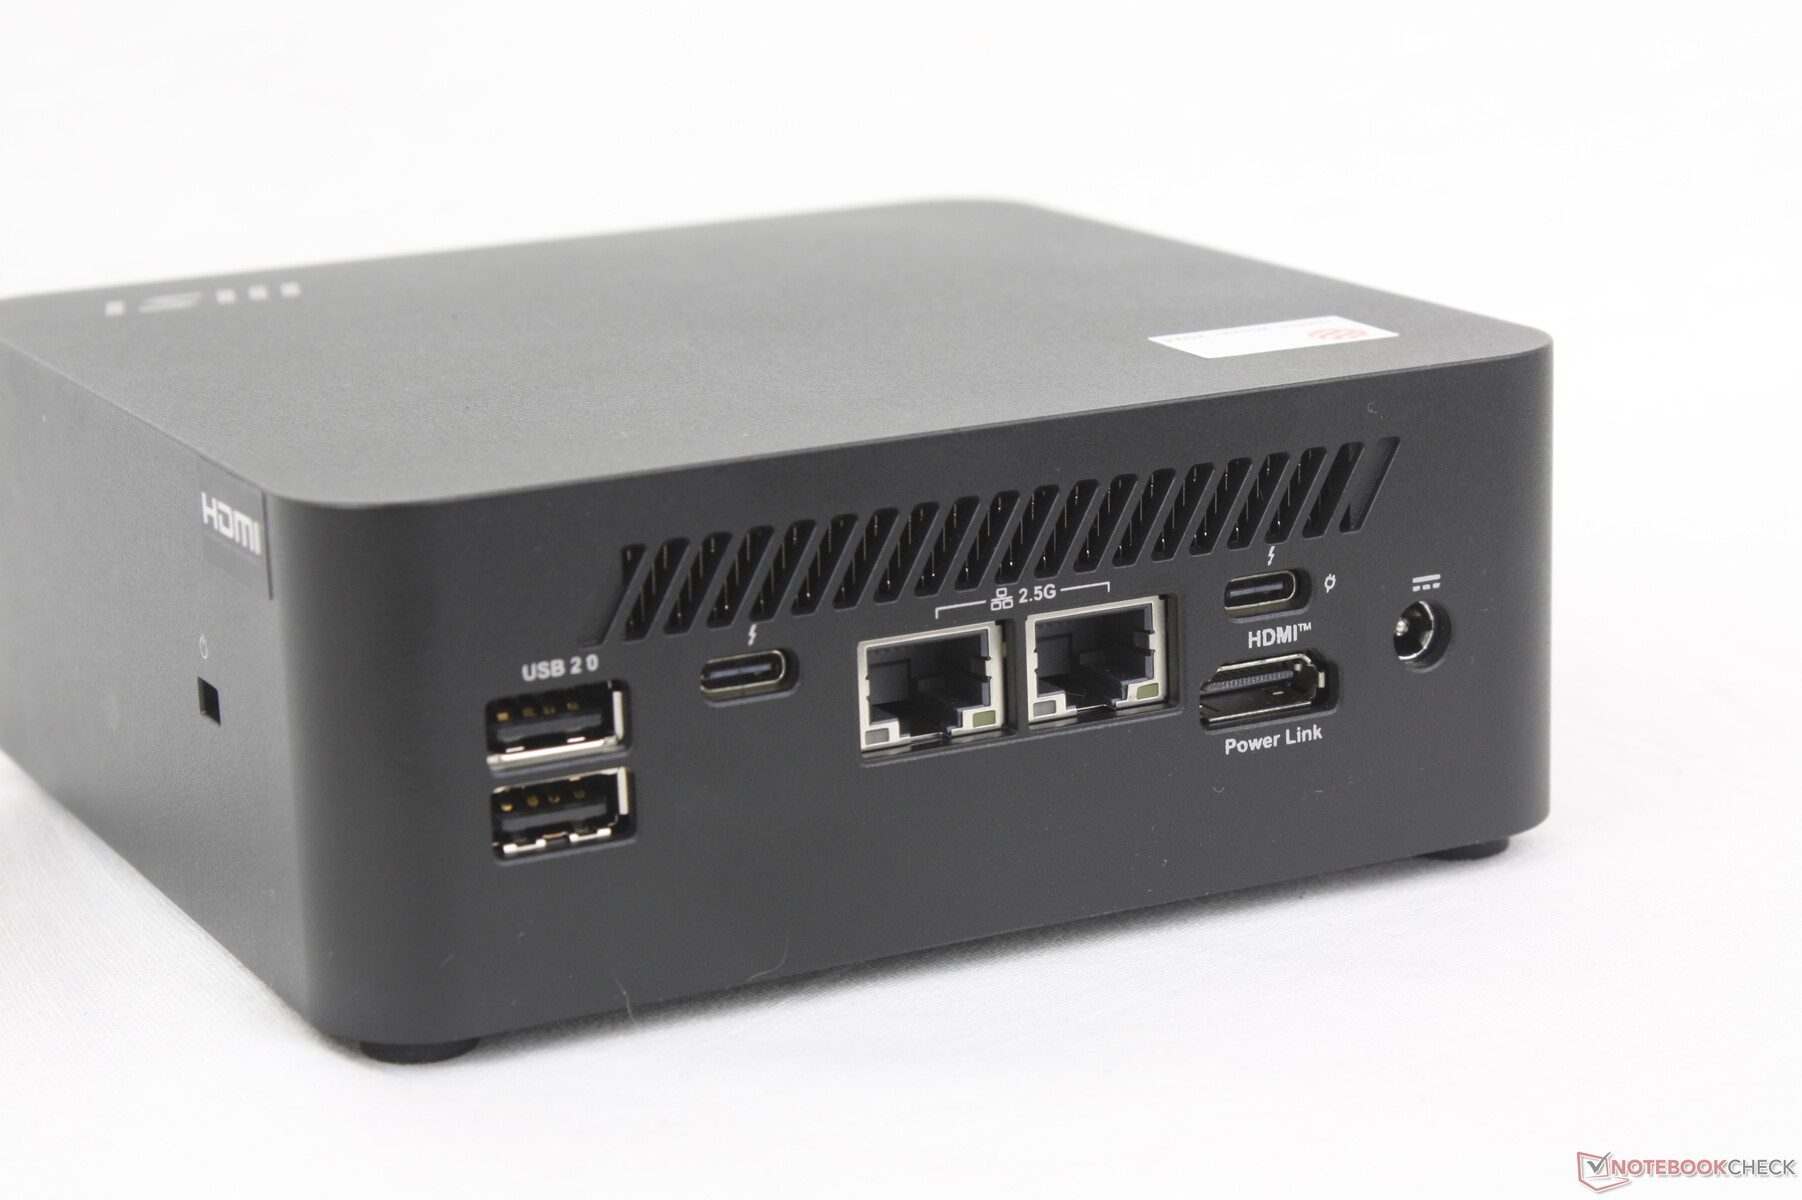
Anschlussausstattung
Die Anschlussmöglichkeiten haben sich gegenüber dem Cubi 1M leicht verändert. Es gibt jetzt nur noch einen HDMI-Anschluss anstelle von zwei und weniger USB 3.0 Ports.
Beachten Sie, dass es zwar zwei USB-C Thunderbolt 4 Ports gibt, aber nur einer unterstützt die Stromversorgung mit bis zu 100 W, falls das Hauptnetzteil nicht verfügbar sein sollte.

SD-Kartenleser
| SD Card Reader | |
| average JPG Copy Test (av. of 3 runs) | |
| MSI Cubi NUC 1M (Angelbird AV Pro V60) | |
| MSI Cubi NUC AI+ 2MG (Angelbird AV Pro V60) | |
| maximum AS SSD Seq Read Test (1GB) | |
| MSI Cubi NUC AI+ 2MG (Angelbird AV Pro V60) | |
| MSI Cubi NUC 1M (Angelbird AV Pro V60) | |
Kommunikation
| Networking | |
| iperf3 transmit AXE11000 | |
| MSI Cubi NUC AI+ 2MG | |
| GMK NucBox K12 | |
| Minisforum MS-A1 | |
| MSI Cubi NUC 1M | |
| Beelink SER9 Pro | |
| iperf3 receive AXE11000 | |
| MSI Cubi NUC AI+ 2MG | |
| Minisforum MS-A1 | |
| Beelink SER9 Pro | |
| GMK NucBox K12 | |
| MSI Cubi NUC 1M | |
| iperf3 transmit AXE11000 6GHz | |
| Minisforum MS-A1 | |
| MSI Cubi NUC 1M | |
| MSI Cubi NUC AI+ 2MG | |
| GMK NucBox K12 | |
| iperf3 receive AXE11000 6GHz | |
| Minisforum MS-A1 | |
| MSI Cubi NUC AI+ 2MG | |
| MSI Cubi NUC 1M | |
| GMK NucBox K12 | |
Wartung
Die Unterseite lässt sich für eine schnelle Wartung einfach mit einem Kreuzschlitzschraubendreher abnehmen. Leider wird nur eine interne PCIe4 x4 M.2 2280 SSD unterstützt und kein herausnehmbarer Arbeitsspeicher. Im Gegensatz dazu ist der NucBox K12 Mini PC mit bis zu drei M.2 SSDs und zwei herausnehmbaren SODIMM RAM-Modulen ausgestattet.


Nachhaltigkeit
Die Gehäuse besteht zu 37,25 Prozent aus recyceltem Kunststoff, während die Innenverpackung aus FSC-zertifizierten Kartons besteht, die aus nachhaltig gewonnenem Holzzellstoff hergestellt werden.
Zubehör und Garantie
Die Verkaufsverpackung enthält eine abnehmbare VESA-Halterung und einen praktischen 19-Zoll-Netzschalter, mit dem Sie den PC einschalten können, wenn er sich in einem schwer zugänglichen Bereich befindet.
Es gilt die in Deutschland übliche Garantie.
Performance


Testbedingungen
Wir haben MSI Center auf den Modus Performance eingestellt, bevor wir die folgenden Benchmarks durchgeführt haben.
Prozessor
Der Core Ultra 7 258V ist fast 50 Prozent schneller als der ältere Core 7 150U im Cubi NUC 1M vom letzten Jahr, wenn es um die reine Multi-Thread-Leistung geht. Außerdem verfügt er über eine integrierte NPU, während der Nuc 1M keine Co-Pilot+ Unterstützung bot.
Das Aufrüsten auf den Core Ultra 9 288V SKU wird die Leistung voraussichtlich nicht nennenswert steigern, während ein Downgrade auf den Core Ultra 5 226V die Leistung nur um ein paar Prozentpunkte reduziert.
Cinebench R15 Mehrfachschleife
Cinebench R23: Multi Core | Single Core
Cinebench R20: CPU (Multi Core) | CPU (Single Core)
Cinebench R15: CPU Multi 64Bit | CPU Single 64Bit
Blender: v2.79 BMW27 CPU
7-Zip 18.03: 7z b 4 | 7z b 4 -mmt1
Geekbench 6.7: Multi-Core | Single-Core
Geekbench 5.5: Multi-Core | Single-Core
HWBOT x265 Benchmark v2.2: 4k Preset
LibreOffice : 20 Documents To PDF
R Benchmark 2.5: Overall mean
| CPU Performance Rating | |
| Minisforum MS-A1 | |
| Asus NUC 14 Pro+ | |
| Beelink SER9 Pro | |
| Intel NUC 13 Pro Kit NUC13ANK -2! | |
| MSI Cubi NUC AI+ 2MG | |
| Durchschnittliche Intel Core Ultra 7 258V | |
| MSI Cubi NUC 1M | |
| Ninkear M7, (16+512) | |
| GMK NucBox M5 | |
| Asus NUC 14 Essential | |
| BMAX B4 Turbo | |
| Cinebench R23 / Multi Core | |
| Asus NUC 14 Pro+ | |
| Minisforum MS-A1 | |
| Beelink SER9 Pro | |
| Intel NUC 13 Pro Kit NUC13ANK | |
| MSI Cubi NUC AI+ 2MG | |
| Durchschnittliche Intel Core Ultra 7 258V (7920 - 11097, n=25) | |
| MSI Cubi NUC 1M | |
| GMK NucBox M5 | |
| Ninkear M7, (16+512) | |
| Asus NUC 14 Essential | |
| BMAX B4 Turbo | |
| Cinebench R23 / Single Core | |
| MSI Cubi NUC AI+ 2MG | |
| Intel NUC 13 Pro Kit NUC13ANK | |
| MSI Cubi NUC 1M | |
| Durchschnittliche Intel Core Ultra 7 258V (1664 - 1957, n=25) | |
| Minisforum MS-A1 | |
| Asus NUC 14 Pro+ | |
| Beelink SER9 Pro | |
| Ninkear M7, (16+512) | |
| GMK NucBox M5 | |
| Asus NUC 14 Essential | |
| BMAX B4 Turbo | |
| Cinebench R20 / CPU (Multi Core) | |
| Asus NUC 14 Pro+ | |
| Minisforum MS-A1 | |
| Beelink SER9 Pro | |
| Intel NUC 13 Pro Kit NUC13ANK | |
| MSI Cubi NUC AI+ 2MG | |
| Durchschnittliche Intel Core Ultra 7 258V (3130 - 4314, n=24) | |
| Ninkear M7, (16+512) | |
| MSI Cubi NUC 1M | |
| GMK NucBox M5 | |
| Asus NUC 14 Essential | |
| BMAX B4 Turbo | |
| Cinebench R20 / CPU (Single Core) | |
| MSI Cubi NUC AI+ 2MG | |
| Intel NUC 13 Pro Kit NUC13ANK | |
| MSI Cubi NUC 1M | |
| Durchschnittliche Intel Core Ultra 7 258V (643 - 749, n=24) | |
| Minisforum MS-A1 | |
| Asus NUC 14 Pro+ | |
| Beelink SER9 Pro | |
| Ninkear M7, (16+512) | |
| GMK NucBox M5 | |
| Asus NUC 14 Essential | |
| BMAX B4 Turbo | |
| Cinebench R15 / CPU Multi 64Bit | |
| Asus NUC 14 Pro+ | |
| Minisforum MS-A1 | |
| Beelink SER9 Pro | |
| Intel NUC 13 Pro Kit NUC13ANK | |
| Durchschnittliche Intel Core Ultra 7 258V (1280 - 1656, n=24) | |
| MSI Cubi NUC AI+ 2MG | |
| Ninkear M7, (16+512) | |
| GMK NucBox M5 | |
| MSI Cubi NUC 1M | |
| Asus NUC 14 Essential | |
| BMAX B4 Turbo | |
| Cinebench R15 / CPU Single 64Bit | |
| MSI Cubi NUC AI+ 2MG | |
| Minisforum MS-A1 | |
| Durchschnittliche Intel Core Ultra 7 258V (258 - 298, n=24) | |
| Beelink SER9 Pro | |
| Intel NUC 13 Pro Kit NUC13ANK | |
| Asus NUC 14 Pro+ | |
| MSI Cubi NUC 1M | |
| Ninkear M7, (16+512) | |
| GMK NucBox M5 | |
| Asus NUC 14 Essential | |
| BMAX B4 Turbo | |
| Blender / v2.79 BMW27 CPU | |
| BMAX B4 Turbo | |
| Asus NUC 14 Essential | |
| MSI Cubi NUC 1M | |
| Ninkear M7, (16+512) | |
| GMK NucBox M5 | |
| Durchschnittliche Intel Core Ultra 7 258V (315 - 484, n=24) | |
| MSI Cubi NUC AI+ 2MG | |
| Intel NUC 13 Pro Kit NUC13ANK | |
| Beelink SER9 Pro | |
| Minisforum MS-A1 | |
| Asus NUC 14 Pro+ | |
| 7-Zip 18.03 / 7z b 4 | |
| Minisforum MS-A1 | |
| Beelink SER9 Pro | |
| Asus NUC 14 Pro+ | |
| Intel NUC 13 Pro Kit NUC13ANK | |
| Ninkear M7, (16+512) | |
| MSI Cubi NUC AI+ 2MG | |
| Durchschnittliche Intel Core Ultra 7 258V (24486 - 36724, n=24) | |
| GMK NucBox M5 | |
| MSI Cubi NUC 1M | |
| Asus NUC 14 Essential | |
| BMAX B4 Turbo | |
| 7-Zip 18.03 / 7z b 4 -mmt1 | |
| Minisforum MS-A1 | |
| Beelink SER9 Pro | |
| Intel NUC 13 Pro Kit NUC13ANK | |
| MSI Cubi NUC 1M | |
| MSI Cubi NUC AI+ 2MG | |
| Asus NUC 14 Pro+ | |
| Durchschnittliche Intel Core Ultra 7 258V (4769 - 5869, n=24) | |
| Ninkear M7, (16+512) | |
| GMK NucBox M5 | |
| Asus NUC 14 Essential | |
| BMAX B4 Turbo | |
| Geekbench 6.7 / Multi-Core | |
| Asus NUC 14 Pro+ | |
| Minisforum MS-A1 | |
| Beelink SER9 Pro | |
| Durchschnittliche Intel Core Ultra 7 258V (8964 - 11334, n=24) | |
| MSI Cubi NUC AI+ 2MG | |
| MSI Cubi NUC 1M | |
| GMK NucBox M5 | |
| Ninkear M7, (16+512) | |
| Asus NUC 14 Essential | |
| BMAX B4 Turbo | |
| Geekbench 6.7 / Single-Core | |
| MSI Cubi NUC AI+ 2MG | |
| Durchschnittliche Intel Core Ultra 7 258V (2593 - 2795, n=24) | |
| Minisforum MS-A1 | |
| MSI Cubi NUC 1M | |
| Beelink SER9 Pro | |
| Asus NUC 14 Pro+ | |
| Ninkear M7, (16+512) | |
| GMK NucBox M5 | |
| Asus NUC 14 Essential | |
| BMAX B4 Turbo | |
| Geekbench 5.5 / Multi-Core | |
| Asus NUC 14 Pro+ | |
| Minisforum MS-A1 | |
| Beelink SER9 Pro | |
| Intel NUC 13 Pro Kit NUC13ANK | |
| Durchschnittliche Intel Core Ultra 7 258V (7574 - 9918, n=24) | |
| MSI Cubi NUC 1M | |
| MSI Cubi NUC AI+ 2MG | |
| GMK NucBox M5 | |
| Ninkear M7, (16+512) | |
| Asus NUC 14 Essential | |
| BMAX B4 Turbo | |
| Geekbench 5.5 / Single-Core | |
| MSI Cubi NUC AI+ 2MG | |
| Minisforum MS-A1 | |
| Durchschnittliche Intel Core Ultra 7 258V (1891 - 2046, n=24) | |
| MSI Cubi NUC 1M | |
| Intel NUC 13 Pro Kit NUC13ANK | |
| Beelink SER9 Pro | |
| Asus NUC 14 Pro+ | |
| Ninkear M7, (16+512) | |
| GMK NucBox M5 | |
| Asus NUC 14 Essential | |
| BMAX B4 Turbo | |
| HWBOT x265 Benchmark v2.2 / 4k Preset | |
| Minisforum MS-A1 | |
| Beelink SER9 Pro | |
| Asus NUC 14 Pro+ | |
| Intel NUC 13 Pro Kit NUC13ANK | |
| MSI Cubi NUC AI+ 2MG | |
| Durchschnittliche Intel Core Ultra 7 258V (7.11 - 14.2, n=24) | |
| MSI Cubi NUC 1M | |
| Ninkear M7, (16+512) | |
| GMK NucBox M5 | |
| Asus NUC 14 Essential | |
| BMAX B4 Turbo | |
| LibreOffice / 20 Documents To PDF | |
| Asus NUC 14 Essential | |
| BMAX B4 Turbo | |
| Ninkear M7, (16+512) | |
| GMK NucBox M5 | |
| Asus NUC 14 Pro+ | |
| Beelink SER9 Pro | |
| Durchschnittliche Intel Core Ultra 7 258V (41.1 - 62.8, n=24) | |
| Minisforum MS-A1 | |
| MSI Cubi NUC AI+ 2MG | |
| Intel NUC 13 Pro Kit NUC13ANK | |
| MSI Cubi NUC 1M | |
| R Benchmark 2.5 / Overall mean | |
| BMAX B4 Turbo | |
| Asus NUC 14 Essential | |
| Ninkear M7, (16+512) | |
| GMK NucBox M5 | |
| Beelink SER9 Pro | |
| Durchschnittliche Intel Core Ultra 7 258V (0.443 - 0.542, n=24) | |
| MSI Cubi NUC AI+ 2MG | |
| Asus NUC 14 Pro+ | |
| Intel NUC 13 Pro Kit NUC13ANK | |
| MSI Cubi NUC 1M | |
| Minisforum MS-A1 | |
* ... kleinere Werte sind besser
AIDA64: FP32 Ray-Trace | FPU Julia | CPU SHA3 | CPU Queen | FPU SinJulia | FPU Mandel | CPU AES | CPU ZLib | FP64 Ray-Trace | CPU PhotoWorxx
| Performance Rating | |
| Minisforum MS-A1 | |
| Beelink SER9 Pro | |
| GMK NucBox K12 | |
| MSI Cubi NUC AI+ 2MG | |
| Durchschnittliche Intel Core Ultra 7 258V | |
| Ninkear M7, (16+512) | |
| MSI Cubi NUC 1M | |
| AIDA64 / FP32 Ray-Trace | |
| Minisforum MS-A1 | |
| Beelink SER9 Pro | |
| GMK NucBox K12 | |
| MSI Cubi NUC AI+ 2MG | |
| Durchschnittliche Intel Core Ultra 7 258V (8454 - 12781, n=26) | |
| Ninkear M7, (16+512) | |
| MSI Cubi NUC 1M | |
| AIDA64 / FPU Julia | |
| Minisforum MS-A1 | |
| Beelink SER9 Pro | |
| GMK NucBox K12 | |
| MSI Cubi NUC AI+ 2MG | |
| Durchschnittliche Intel Core Ultra 7 258V (40875 - 63401, n=26) | |
| Ninkear M7, (16+512) | |
| MSI Cubi NUC 1M | |
| AIDA64 / CPU SHA3 | |
| Minisforum MS-A1 | |
| Beelink SER9 Pro | |
| GMK NucBox K12 | |
| MSI Cubi NUC AI+ 2MG | |
| Durchschnittliche Intel Core Ultra 7 258V (1930 - 2817, n=26) | |
| Ninkear M7, (16+512) | |
| MSI Cubi NUC 1M | |
| AIDA64 / CPU Queen | |
| Minisforum MS-A1 | |
| Beelink SER9 Pro | |
| GMK NucBox K12 | |
| Ninkear M7, (16+512) | |
| MSI Cubi NUC 1M | |
| Durchschnittliche Intel Core Ultra 7 258V (48816 - 49818, n=24) | |
| MSI Cubi NUC AI+ 2MG | |
| AIDA64 / FPU SinJulia | |
| Minisforum MS-A1 | |
| Beelink SER9 Pro | |
| GMK NucBox K12 | |
| Ninkear M7, (16+512) | |
| MSI Cubi NUC AI+ 2MG | |
| MSI Cubi NUC 1M | |
| Durchschnittliche Intel Core Ultra 7 258V (3817 - 4440, n=26) | |
| AIDA64 / FPU Mandel | |
| Minisforum MS-A1 | |
| Beelink SER9 Pro | |
| GMK NucBox K12 | |
| MSI Cubi NUC AI+ 2MG | |
| Durchschnittliche Intel Core Ultra 7 258V (21670 - 33565, n=26) | |
| Ninkear M7, (16+512) | |
| MSI Cubi NUC 1M | |
| AIDA64 / CPU AES | |
| Minisforum MS-A1 | |
| Beelink SER9 Pro | |
| GMK NucBox K12 | |
| MSI Cubi NUC AI+ 2MG | |
| Durchschnittliche Intel Core Ultra 7 258V (30957 - 40753, n=26) | |
| Ninkear M7, (16+512) | |
| MSI Cubi NUC 1M | |
| AIDA64 / CPU ZLib | |
| Minisforum MS-A1 | |
| Beelink SER9 Pro | |
| GMK NucBox K12 | |
| MSI Cubi NUC AI+ 2MG | |
| Durchschnittliche Intel Core Ultra 7 258V (422 - 632, n=26) | |
| MSI Cubi NUC 1M | |
| Ninkear M7, (16+512) | |
| AIDA64 / FP64 Ray-Trace | |
| Minisforum MS-A1 | |
| Beelink SER9 Pro | |
| GMK NucBox K12 | |
| MSI Cubi NUC AI+ 2MG | |
| Durchschnittliche Intel Core Ultra 7 258V (4258 - 6930, n=26) | |
| Ninkear M7, (16+512) | |
| MSI Cubi NUC 1M | |
| AIDA64 / CPU PhotoWorxx | |
| MSI Cubi NUC AI+ 2MG | |
| Durchschnittliche Intel Core Ultra 7 258V (44223 - 59245, n=26) | |
| Beelink SER9 Pro | |
| Minisforum MS-A1 | |
| GMK NucBox K12 | |
| MSI Cubi NUC 1M | |
| Ninkear M7, (16+512) | |
Stress Test
Die CPU stabilisiert sich bei 3,2 GHz, 66 °C und etwa 38 W, wenn Prime95 läuft Stress. Wenn Cyberpunk 2077 läuft, um ein typisches Spiel zu repräsentieren, schwanken die GPU-Taktraten jedoch zwischen 800 MHz und 1950 MHz, was zu instabilen Frame-Zeiten beim Spielen führt, wie unser Abschnitt GPU Performance unten zeigt, selbst wenn die durchschnittliche Frame-Rate normal ist. Dieses stotternde Verhalten trat sowohl im Modus Balanced als auch im Modus Performance auf.

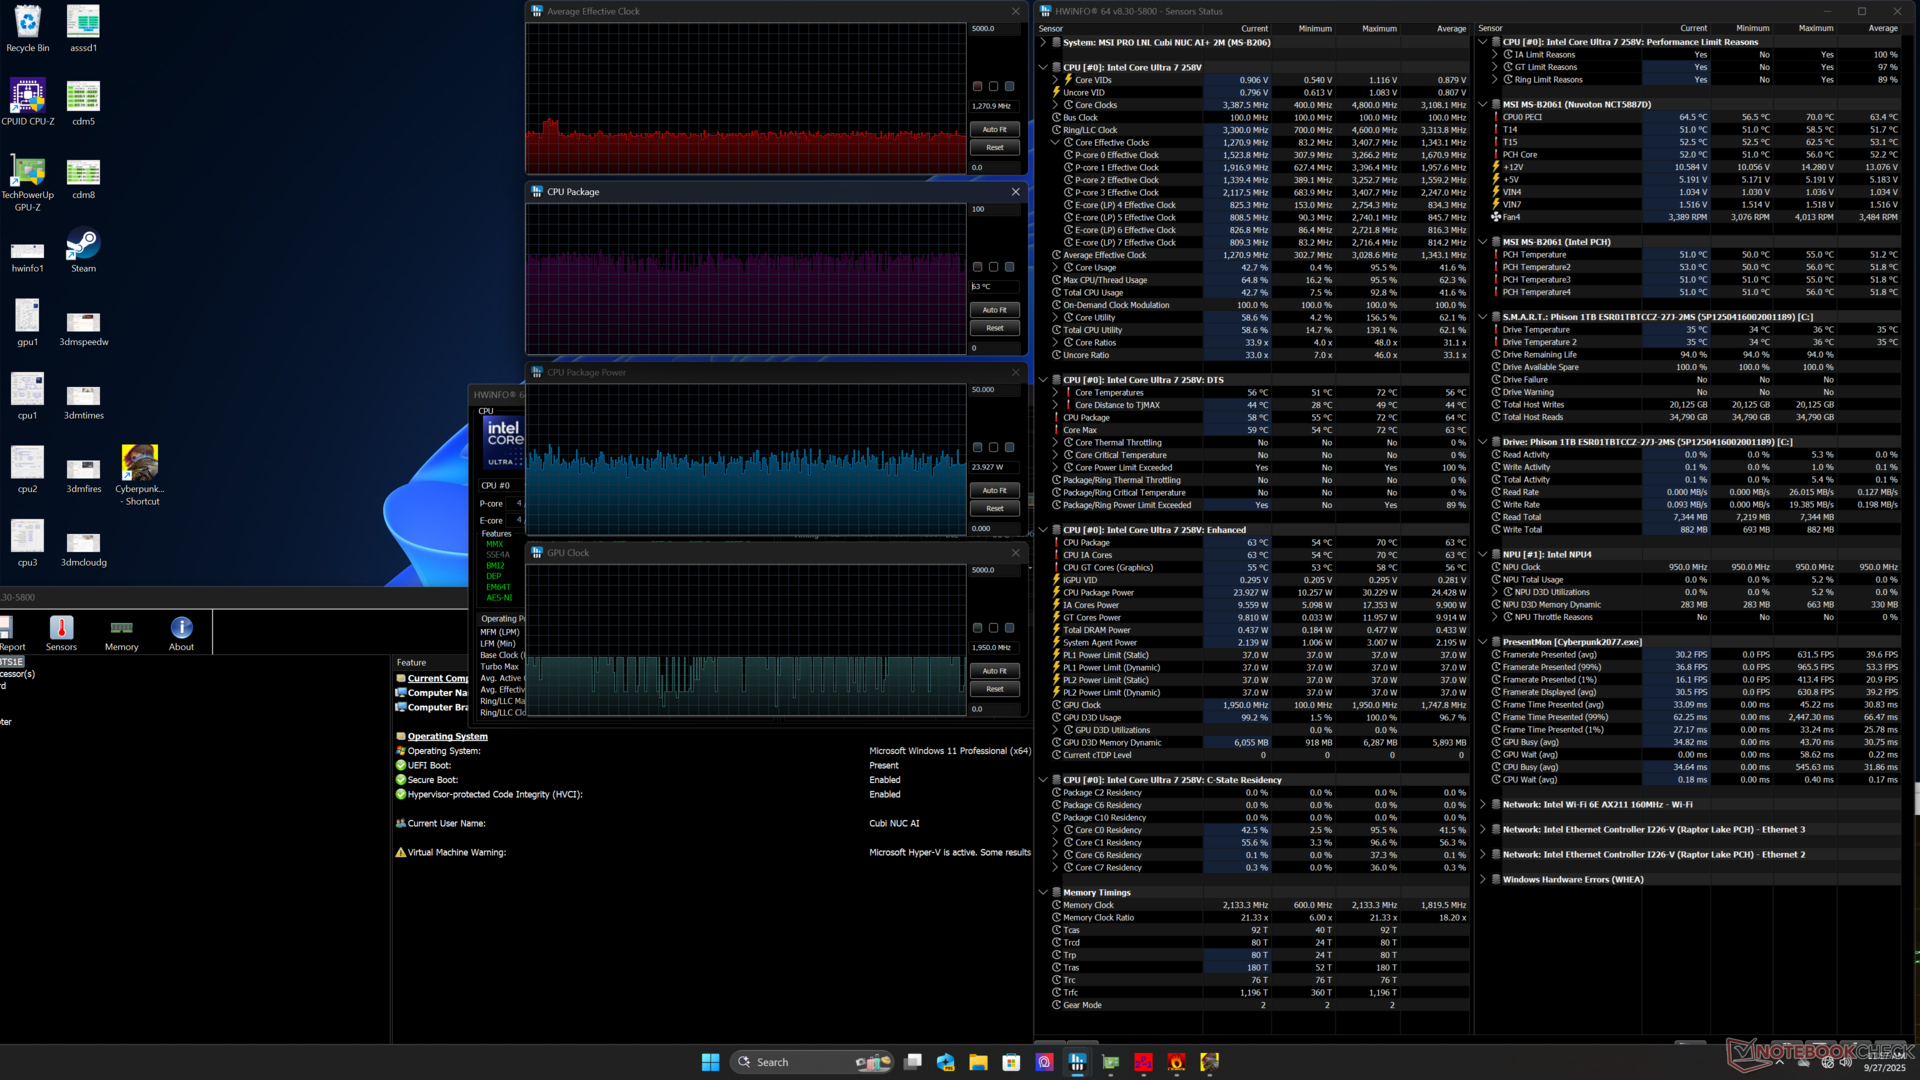


| Durchschnittlicher CPU-Takt (GHz) | GPU-Takt (MHz) | Durchschnittliche CPU-Temperatur (°C) | |
| System Leerlauf | -- | -- | 33 |
| Prime95 Stress | 3.2 | -- | 66 |
| Prime95 + FurMark Stress | 2.9 | 1200 | 71 |
| Cyberpunk 2077 Stress | 1.3 | 800 - 1950 | 63 |
System Performance

PCMark 10: Score | Essentials | Productivity | Digital Content Creation
CrossMark: Overall | Productivity | Creativity | Responsiveness
WebXPRT 3: Overall
WebXPRT 4: Overall
Mozilla Kraken 1.1: Total
| Performance Rating | |
| Minisforum MS-A1 | |
| Beelink SER9 Pro | |
| GMK NucBox K12 | |
| Durchschnittliche Intel Core Ultra 7 258V, Intel Arc Graphics 140V | |
| MSI Cubi NUC 1M | |
| MSI Cubi NUC AI+ 2MG | |
| Ninkear M7, (16+512) | |
| PCMark 10 / Score | |
| Minisforum MS-A1 | |
| GMK NucBox K12 | |
| Durchschnittliche Intel Core Ultra 7 258V, Intel Arc Graphics 140V (6265 - 7420, n=23) | |
| Beelink SER9 Pro | |
| MSI Cubi NUC AI+ 2MG | |
| MSI Cubi NUC 1M | |
| Ninkear M7, (16+512) | |
| PCMark 10 / Essentials | |
| Minisforum MS-A1 | |
| MSI Cubi NUC 1M | |
| GMK NucBox K12 | |
| Beelink SER9 Pro | |
| Durchschnittliche Intel Core Ultra 7 258V, Intel Arc Graphics 140V (9295 - 11467, n=23) | |
| MSI Cubi NUC AI+ 2MG | |
| Ninkear M7, (16+512) | |
| PCMark 10 / Productivity | |
| Minisforum MS-A1 | |
| GMK NucBox K12 | |
| Beelink SER9 Pro | |
| Durchschnittliche Intel Core Ultra 7 258V, Intel Arc Graphics 140V (7357 - 13600, n=23) | |
| MSI Cubi NUC AI+ 2MG | |
| Ninkear M7, (16+512) | |
| MSI Cubi NUC 1M | |
| PCMark 10 / Digital Content Creation | |
| Minisforum MS-A1 | |
| Durchschnittliche Intel Core Ultra 7 258V, Intel Arc Graphics 140V (8160 - 10308, n=23) | |
| MSI Cubi NUC AI+ 2MG | |
| Beelink SER9 Pro | |
| GMK NucBox K12 | |
| MSI Cubi NUC 1M | |
| Ninkear M7, (16+512) | |
| CrossMark / Overall | |
| Minisforum MS-A1 | |
| Beelink SER9 Pro | |
| GMK NucBox K12 | |
| MSI Cubi NUC 1M | |
| Durchschnittliche Intel Core Ultra 7 258V, Intel Arc Graphics 140V (1275 - 1742, n=22) | |
| MSI Cubi NUC AI+ 2MG | |
| Ninkear M7, (16+512) | |
| CrossMark / Productivity | |
| Minisforum MS-A1 | |
| MSI Cubi NUC 1M | |
| Beelink SER9 Pro | |
| GMK NucBox K12 | |
| Durchschnittliche Intel Core Ultra 7 258V, Intel Arc Graphics 140V (1267 - 1684, n=22) | |
| MSI Cubi NUC AI+ 2MG | |
| Ninkear M7, (16+512) | |
| CrossMark / Creativity | |
| Minisforum MS-A1 | |
| Beelink SER9 Pro | |
| GMK NucBox K12 | |
| Durchschnittliche Intel Core Ultra 7 258V, Intel Arc Graphics 140V (1393 - 1977, n=22) | |
| MSI Cubi NUC AI+ 2MG | |
| MSI Cubi NUC 1M | |
| Ninkear M7, (16+512) | |
| CrossMark / Responsiveness | |
| MSI Cubi NUC 1M | |
| Beelink SER9 Pro | |
| Minisforum MS-A1 | |
| GMK NucBox K12 | |
| Durchschnittliche Intel Core Ultra 7 258V, Intel Arc Graphics 140V (999 - 1411, n=22) | |
| MSI Cubi NUC AI+ 2MG | |
| Ninkear M7, (16+512) | |
| WebXPRT 3 / Overall | |
| Minisforum MS-A1 | |
| MSI Cubi NUC AI+ 2MG | |
| MSI Cubi NUC 1M | |
| Beelink SER9 Pro | |
| GMK NucBox K12 | |
| Durchschnittliche Intel Core Ultra 7 258V, Intel Arc Graphics 140V (219 - 317, n=22) | |
| Ninkear M7, (16+512) | |
| WebXPRT 4 / Overall | |
| MSI Cubi NUC AI+ 2MG | |
| Minisforum MS-A1 | |
| MSI Cubi NUC 1M | |
| Durchschnittliche Intel Core Ultra 7 258V, Intel Arc Graphics 140V (199.5 - 291, n=22) | |
| Beelink SER9 Pro | |
| GMK NucBox K12 | |
| Ninkear M7, (16+512) | |
| Mozilla Kraken 1.1 / Total | |
| Ninkear M7, (16+512) | |
| GMK NucBox K12 | |
| Beelink SER9 Pro | |
| MSI Cubi NUC 1M | |
| Durchschnittliche Intel Core Ultra 7 258V, Intel Arc Graphics 140V (468 - 559, n=24) | |
| Minisforum MS-A1 | |
| MSI Cubi NUC AI+ 2MG | |
* ... kleinere Werte sind besser
| PCMark 10 Score | 6864 Punkte | |
Hilfe | ||
| AIDA64 / Memory Copy | |
| Durchschnittliche Intel Core Ultra 7 258V (104408 - 114336, n=24) | |
| MSI Cubi NUC AI+ 2MG | |
| Beelink SER9 Pro | |
| GMK NucBox K12 | |
| Minisforum MS-A1 | |
| MSI Cubi NUC 1M | |
| Ninkear M7, (16+512) | |
| AIDA64 / Memory Read | |
| MSI Cubi NUC AI+ 2MG | |
| Durchschnittliche Intel Core Ultra 7 258V (82846 - 89417, n=24) | |
| MSI Cubi NUC 1M | |
| Minisforum MS-A1 | |
| GMK NucBox K12 | |
| Beelink SER9 Pro | |
| Ninkear M7, (16+512) | |
| AIDA64 / Memory Write | |
| MSI Cubi NUC AI+ 2MG | |
| Durchschnittliche Intel Core Ultra 7 258V (108824 - 117989, n=24) | |
| Beelink SER9 Pro | |
| GMK NucBox K12 | |
| Minisforum MS-A1 | |
| MSI Cubi NUC 1M | |
| Ninkear M7, (16+512) | |
| AIDA64 / Memory Latency | |
| Beelink SER9 Pro | |
| Durchschnittliche Intel Core Ultra 7 258V (95 - 101.7, n=24) | |
| MSI Cubi NUC AI+ 2MG | |
| Ninkear M7, (16+512) | |
| GMK NucBox K12 | |
| Minisforum MS-A1 | |
| MSI Cubi NUC 1M | |
* ... kleinere Werte sind besser
DPC-Latenzzeit

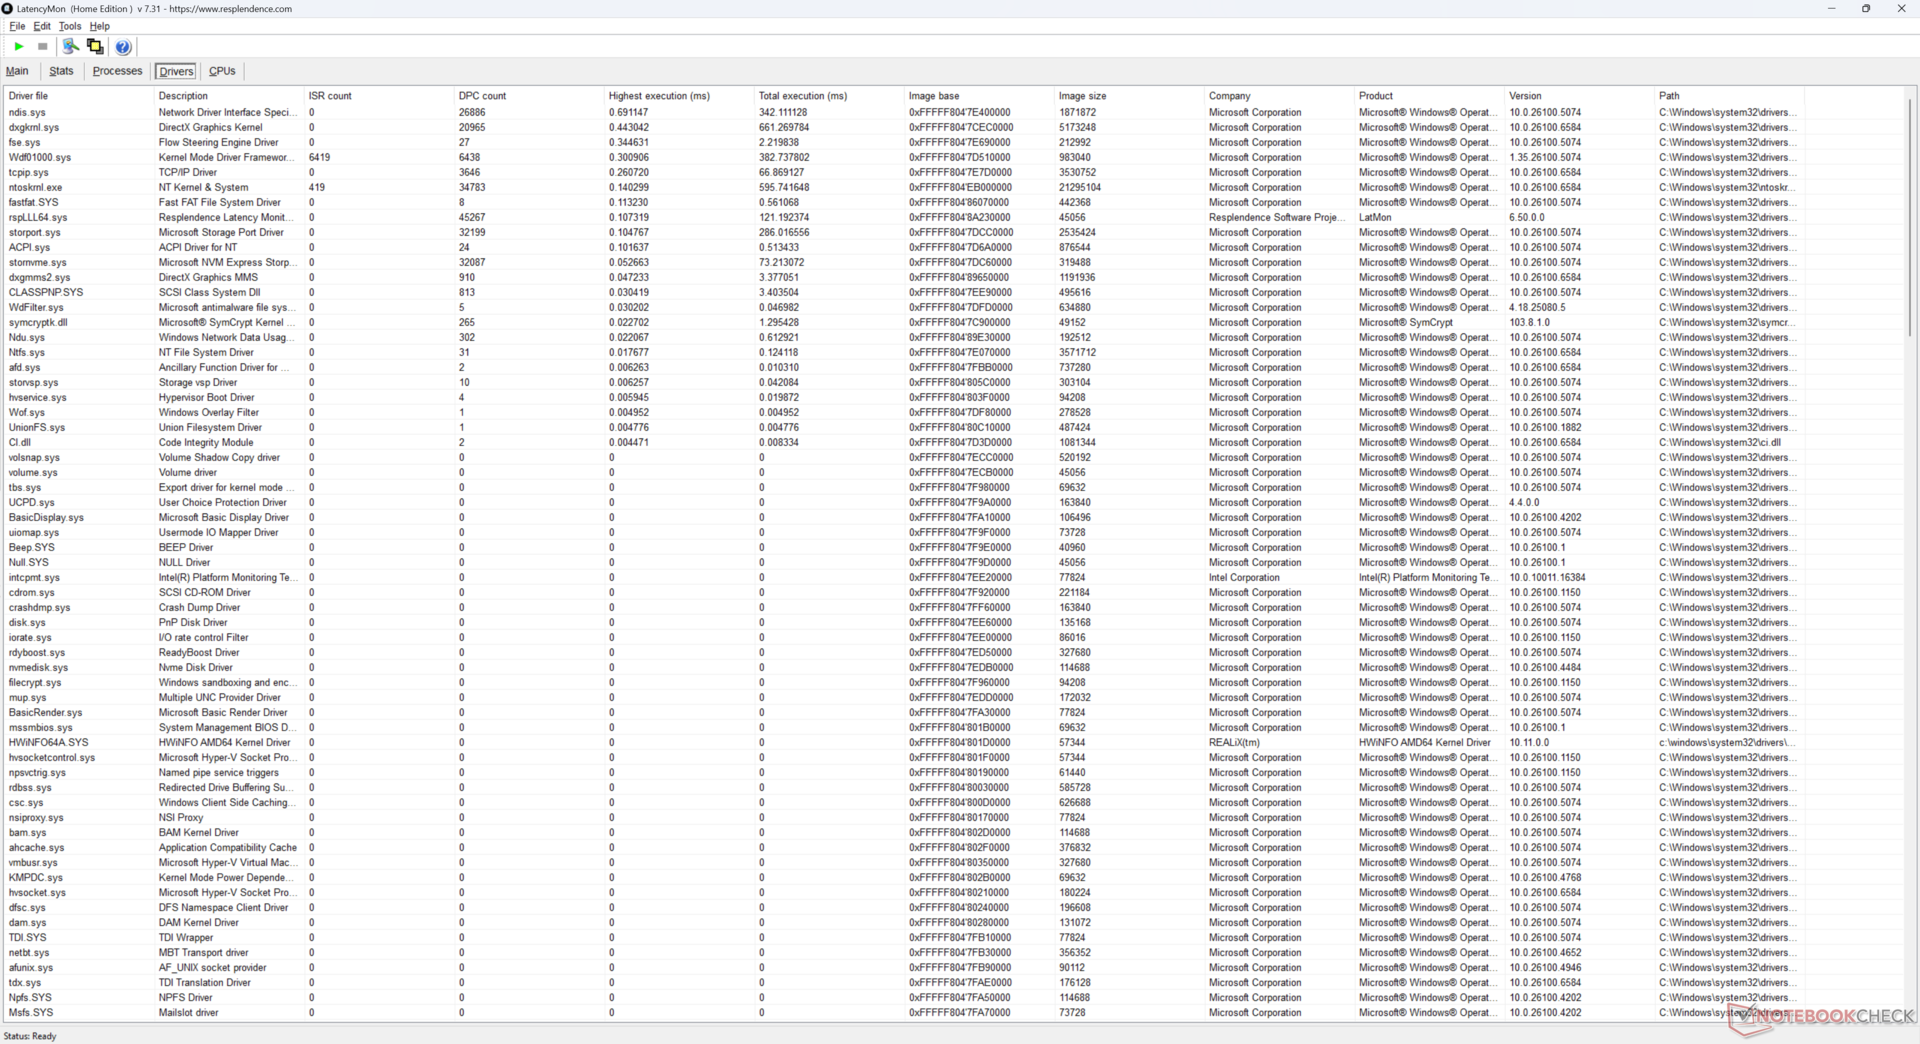
| DPC Latencies / LatencyMon - interrupt to process latency (max), Web, Youtube, Prime95 | |
| MSI Cubi NUC 1M | |
| Minisforum MS-A1 | |
| GMK NucBox K12 | |
| MSI Cubi NUC AI+ 2MG | |
| Beelink SER9 Pro | |
* ... kleinere Werte sind besser
Speichergeräte
SSD-Übertragungsraten mit der primären 1 TB Phison liegen, auch bei längerer Belastung, stabil bei fast 5900 MB/s, was eine leichte Verbesserung gegenüber der WD SSD im ursprünglichen Cubi 1M darstellt.


| Drive Performance Rating - Percent | |
| Minisforum MS-A1 | |
| MSI Cubi NUC 1M | |
| Beelink SER9 Pro | |
| MSI Cubi NUC AI+ 2MG | |
| GMK NucBox K12 | |
| Ninkear M7, (16+512) | |
| DiskSpd | |
| seq read | |
| MSI Cubi NUC 1M | |
| MSI Cubi NUC AI+ 2MG | |
| Minisforum MS-A1 | |
| GMK NucBox K12 | |
| Beelink SER9 Pro | |
| Ninkear M7, (16+512) | |
| seq write | |
| Minisforum MS-A1 | |
| MSI Cubi NUC 1M | |
| MSI Cubi NUC AI+ 2MG | |
| GMK NucBox K12 | |
| Beelink SER9 Pro | |
| Ninkear M7, (16+512) | |
| seq q8 t1 read | |
| MSI Cubi NUC AI+ 2MG | |
| MSI Cubi NUC 1M | |
| Beelink SER9 Pro | |
| GMK NucBox K12 | |
| Minisforum MS-A1 | |
| Ninkear M7, (16+512) | |
| seq q8 t1 write | |
| MSI Cubi NUC AI+ 2MG | |
| Minisforum MS-A1 | |
| MSI Cubi NUC 1M | |
| Beelink SER9 Pro | |
| GMK NucBox K12 | |
| Ninkear M7, (16+512) | |
| 4k q1 t1 read | |
| MSI Cubi NUC 1M | |
| Minisforum MS-A1 | |
| MSI Cubi NUC AI+ 2MG | |
| GMK NucBox K12 | |
| Beelink SER9 Pro | |
| Ninkear M7, (16+512) | |
| 4k q1 t1 write | |
| MSI Cubi NUC 1M | |
| Beelink SER9 Pro | |
| GMK NucBox K12 | |
| Minisforum MS-A1 | |
| MSI Cubi NUC AI+ 2MG | |
| Ninkear M7, (16+512) | |
| 4k q32 t16 read | |
| Minisforum MS-A1 | |
| MSI Cubi NUC 1M | |
| MSI Cubi NUC AI+ 2MG | |
| GMK NucBox K12 | |
| Beelink SER9 Pro | |
| Ninkear M7, (16+512) | |
| 4k q32 t16 write | |
| Minisforum MS-A1 | |
| MSI Cubi NUC 1M | |
| GMK NucBox K12 | |
| Beelink SER9 Pro | |
| MSI Cubi NUC AI+ 2MG | |
| Ninkear M7, (16+512) | |
* ... kleinere Werte sind besser
Drosselung der Festplatte: DiskSpd-Leseschleife, Warteschlangentiefe 8
GPU Performance
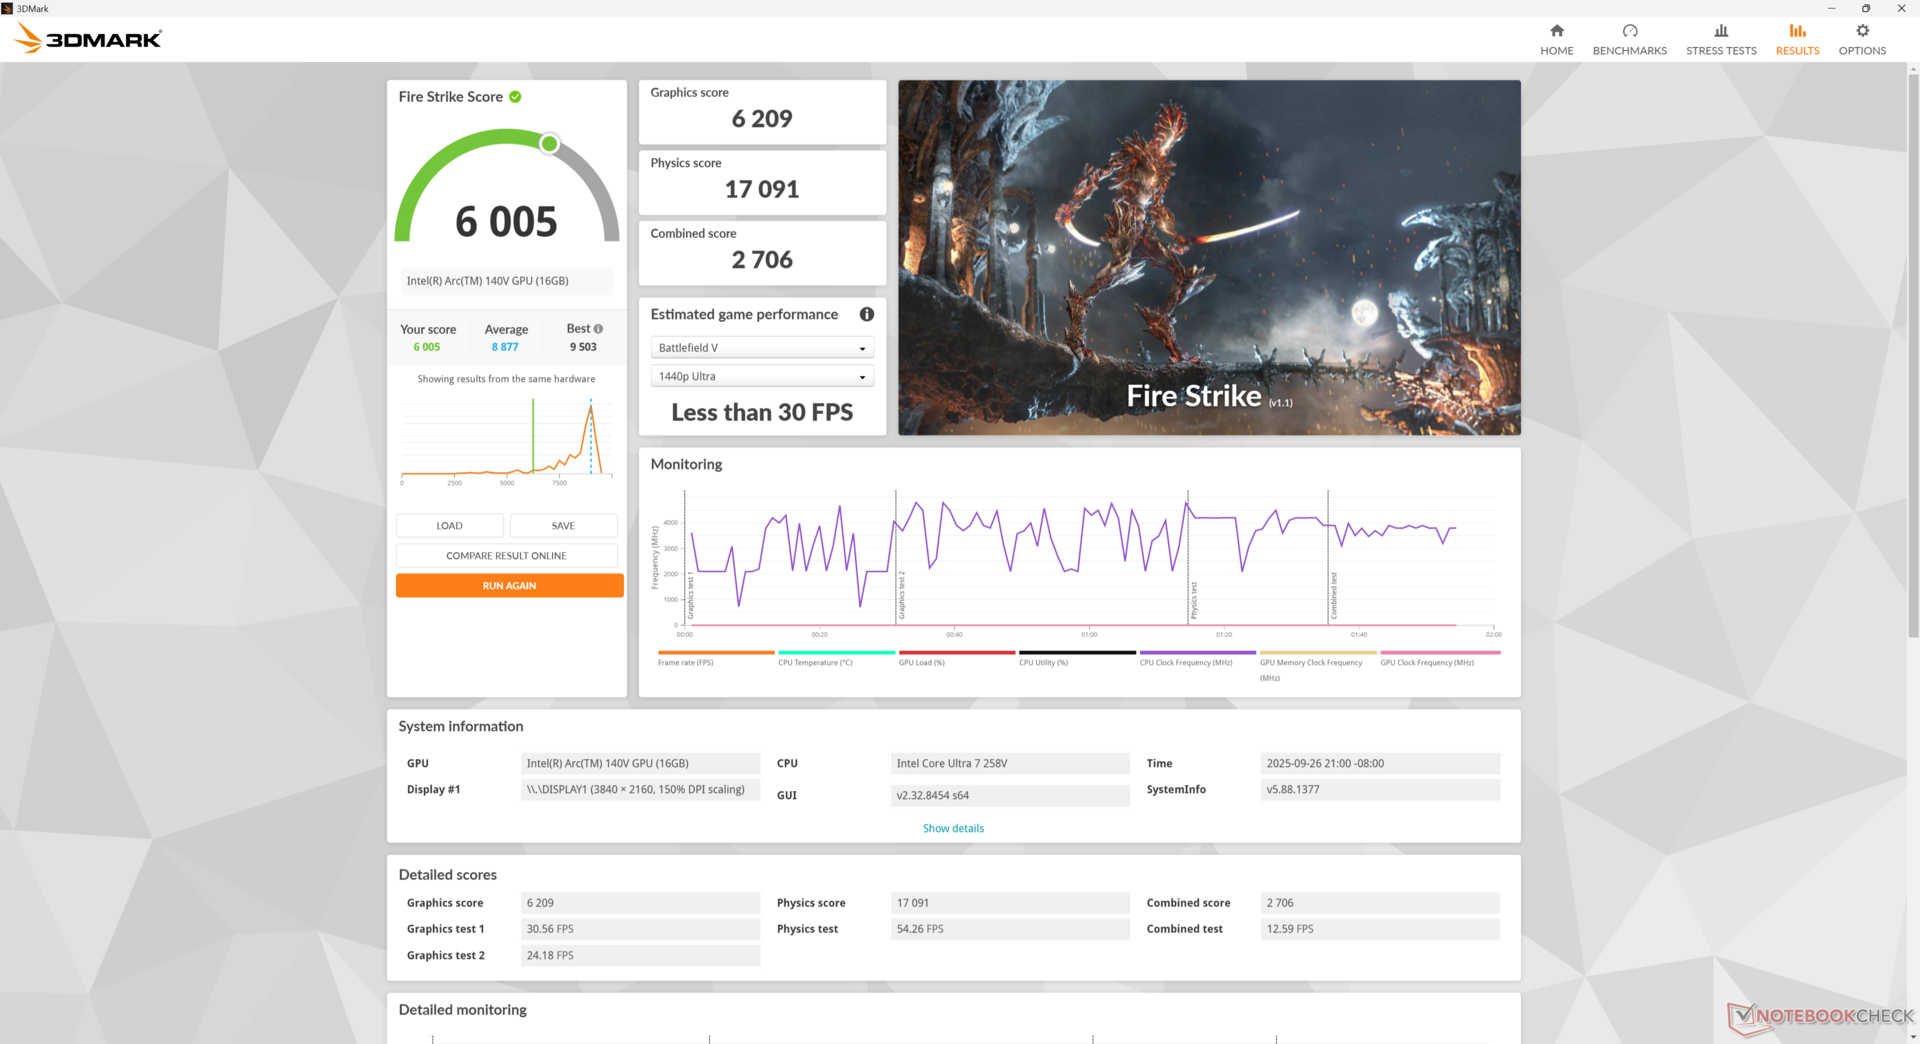
Die Arc 140V im Cubi 2MG schneidet bei den 3DMark Benchmarks unterdurchschnittlich ab. Die enttäuschenden Ergebnisse sind auf die zyklischen GPU-Taktraten und das Stottern zurückzuführen, wie in unserem Stresstest Abschnitt oben erwähnt.
Bei GPU-Workloads, bei denen stabile Bildraten keine Rolle spielen, wie z.B. bei Renderern oder oneAPI, liefert das Cubi 2MG im Vergleich zu anderen PCs mit der gleichen CPU und GPU erwartungsgemäß ab. Das Stottern sollte daher für die meisten Zielgruppen kein Problem darstellen.


| 3DMark Performance Rating - Percent | |
| Durchschnittliche Intel Arc Graphics 140V | |
| Beelink SER9 Pro | |
| Asus NUC 14 Pro+ | |
| Minisforum MS-A1 | |
| MSI Cubi NUC AI+ 2MG | |
| Intel NUC 13 Pro Kit NUC13ANK | |
| MSI Cubi NUC 1M | |
| GMK NucBox M5 | |
| Ninkear M7, (16+512) | |
| Asus NUC 14 Essential | |
| BMAX B4 Turbo | |
| 3DMark 11 - 1280x720 Performance GPU | |
| Beelink SER9 Pro | |
| Minisforum MS-A1 | |
| Asus NUC 14 Pro+ | |
| Durchschnittliche Intel Arc Graphics 140V (7351 - 12772, n=38) | |
| MSI Cubi NUC AI+ 2MG | |
| Intel NUC 13 Pro Kit NUC13ANK | |
| MSI Cubi NUC 1M | |
| GMK NucBox M5 | |
| Ninkear M7, (16+512) | |
| Asus NUC 14 Essential | |
| BMAX B4 Turbo | |
| 3DMark | |
| 1280x720 Cloud Gate Standard Graphics | |
| Beelink SER9 Pro | |
| Durchschnittliche Intel Arc Graphics 140V (38019 - 61591, n=20) | |
| MSI Cubi NUC AI+ 2MG | |
| Minisforum MS-A1 | |
| Asus NUC 14 Pro+ | |
| MSI Cubi NUC 1M | |
| Intel NUC 13 Pro Kit NUC13ANK | |
| GMK NucBox M5 | |
| Ninkear M7, (16+512) | |
| Asus NUC 14 Essential | |
| BMAX B4 Turbo | |
| 1920x1080 Fire Strike Graphics | |
| Durchschnittliche Intel Arc Graphics 140V (6209 - 10476, n=38) | |
| Beelink SER9 Pro | |
| Asus NUC 14 Pro+ | |
| Minisforum MS-A1 | |
| MSI Cubi NUC AI+ 2MG | |
| Intel NUC 13 Pro Kit NUC13ANK | |
| MSI Cubi NUC 1M | |
| GMK NucBox M5 | |
| Ninkear M7, (16+512) | |
| Asus NUC 14 Essential | |
| BMAX B4 Turbo | |
| 2560x1440 Time Spy Graphics | |
| Durchschnittliche Intel Arc Graphics 140V (2754 - 4415, n=41) | |
| Asus NUC 14 Pro+ | |
| Beelink SER9 Pro | |
| Minisforum MS-A1 | |
| MSI Cubi NUC AI+ 2MG | |
| Intel NUC 13 Pro Kit NUC13ANK | |
| MSI Cubi NUC 1M | |
| GMK NucBox M5 | |
| Ninkear M7, (16+512) | |
| Asus NUC 14 Essential | |
| BMAX B4 Turbo | |
| 3DMark 11 Performance | 7781 Punkte | |
| 3DMark Cloud Gate Standard Score | 31534 Punkte | |
| 3DMark Fire Strike Score | 6005 Punkte | |
| 3DMark Time Spy Score | 3053 Punkte | |
Hilfe | ||
| Blender | |
| v3.3 Classroom CPU | |
| BMAX B4 Turbo | |
| Asus NUC 14 Essential | |
| Ninkear M7, (16+512) | |
| MSI Cubi NUC 1M | |
| GMK NucBox M5 | |
| Durchschnittliche Intel Arc Graphics 140V (506 - 772, n=37) | |
| Intel NUC 13 Pro Kit NUC13ANK | |
| Asus NUC 14 Pro+ | |
| Beelink SER9 Pro | |
| Minisforum MS-A1 | |
| v3.3 Classroom oneAPI/Intel | |
| MSI Cubi NUC AI+ 2MG | |
| Durchschnittliche Intel Arc Graphics 140V (195 - 405, n=23) | |
| Asus NUC 14 Pro+ | |
| v4.3 Barbershop CPU | |
| BMAX B4 Turbo | |
| Ninkear M7, (16+512) | |
| Durchschnittliche Intel Arc Graphics 140V (2608 - 3811, n=15) | |
| MSI Cubi NUC AI+ 2MG | |
| Beelink SER9 Pro | |
| Minisforum MS-A1 | |
| v4.3 Barbershop oneAPI | |
| MSI Cubi NUC AI+ 2MG | |
| Durchschnittliche Intel Arc Graphics 140V (760 - 1173, n=19) | |
* ... kleinere Werte sind besser
| Performance Rating - Percent | |
| Beelink SER9 Pro | |
| Minisforum MS-A1 -1! | |
| GMK NucBox K12 | |
| MSI Cubi NUC AI+ 2MG | |
| MSI Cubi NUC 1M -2! | |
| Ninkear M7, (16+512) -2! | |
| Cyberpunk 2077 - 1920x1080 Ultra Preset (FSR off) | |
| GMK NucBox K12 | |
| Minisforum MS-A1 | |
| Beelink SER9 Pro | |
| MSI Cubi NUC AI+ 2MG | |
| MSI Cubi NUC 1M | |
| Ninkear M7, (16+512) | |
| Baldur's Gate 3 - 1920x1080 Ultra Preset AA:T | |
| Beelink SER9 Pro | |
| GMK NucBox K12 | |
| MSI Cubi NUC AI+ 2MG | |
| Minisforum MS-A1 | |
| GTA V - 1920x1080 Highest AA:4xMSAA + FX AF:16x | |
| Beelink SER9 Pro | |
| GMK NucBox K12 | |
| MSI Cubi NUC AI+ 2MG | |
| Minisforum MS-A1 | |
| MSI Cubi NUC 1M | |
| Ninkear M7, (16+512) | |
| Final Fantasy XV Benchmark - 1920x1080 High Quality | |
| Beelink SER9 Pro | |
| MSI Cubi NUC AI+ 2MG | |
| Minisforum MS-A1 | |
| GMK NucBox K12 | |
| MSI Cubi NUC 1M | |
| Ninkear M7, (16+512) | |
| Strange Brigade - 1920x1080 ultra AA:ultra AF:16 | |
| MSI Cubi NUC AI+ 2MG | |
| Beelink SER9 Pro | |
| GMK NucBox K12 | |
| MSI Cubi NUC 1M | |
| Dota 2 Reborn - 1920x1080 ultra (3/3) best looking | |
| Minisforum MS-A1 | |
| GMK NucBox K12 | |
| Beelink SER9 Pro | |
| MSI Cubi NUC AI+ 2MG | |
| MSI Cubi NUC 1M | |
| Ninkear M7, (16+512) | |
| X-Plane 11.11 - 1920x1080 high (fps_test=3) | |
| Minisforum MS-A1 | |
| GMK NucBox K12 | |
| Beelink SER9 Pro | |
| MSI Cubi NUC AI+ 2MG | |
| Ninkear M7, (16+512) | |
| Baldur's Gate 3 | |
| 1280x720 Low Preset AA:SM | |
| Minisforum MS-A1 | |
| Beelink SER9 Pro | |
| Durchschnittliche Intel Arc Graphics 140V (49.3 - 73.3, n=18) | |
| MSI Cubi NUC AI+ 2MG | |
| Asus NUC 14 Pro+ | |
| MSI Cubi NUC 1M | |
| GMK NucBox M5 | |
| Ninkear M7, (16+512) | |
| 1920x1080 Low Preset AA:SM | |
| Minisforum MS-A1 | |
| Beelink SER9 Pro | |
| Durchschnittliche Intel Arc Graphics 140V (23.7 - 47, n=37) | |
| Asus NUC 14 Pro+ | |
| MSI Cubi NUC AI+ 2MG | |
| MSI Cubi NUC 1M | |
| GMK NucBox M5 | |
| Ninkear M7, (16+512) | |
| 1920x1080 Medium Preset AA:T | |
| Beelink SER9 Pro | |
| Minisforum MS-A1 | |
| Durchschnittliche Intel Arc Graphics 140V (19.6 - 37, n=37) | |
| Asus NUC 14 Pro+ | |
| MSI Cubi NUC AI+ 2MG | |
| Ninkear M7, (16+512) | |
| 1920x1080 High Preset AA:T | |
| MSI Cubi NUC AI+ 2MG | |
| Durchschnittliche Intel Arc Graphics 140V (17 - 32.9, n=38) | |
| Beelink SER9 Pro | |
| Minisforum MS-A1 | |
| Asus NUC 14 Pro+ | |
| Ninkear M7, (16+512) | |
| 1920x1080 Ultra Preset AA:T | |
| Beelink SER9 Pro | |
| Durchschnittliche Intel Arc Graphics 140V (16.6 - 32.2, n=39) | |
| MSI Cubi NUC AI+ 2MG | |
| Minisforum MS-A1 | |
| Asus NUC 14 Pro+ | |
| Final Fantasy XV Benchmark | |
| 1280x720 Lite Quality | |
| Beelink SER9 Pro | |
| Durchschnittliche Intel Arc Graphics 140V (54.1 - 97.1, n=42) | |
| Minisforum MS-A1 | |
| Asus NUC 14 Pro+ | |
| MSI Cubi NUC AI+ 2MG | |
| MSI Cubi NUC 1M | |
| GMK NucBox M5 | |
| Ninkear M7, (16+512) | |
| Asus NUC 14 Essential | |
| BMAX B4 Turbo | |
| 1920x1080 Standard Quality | |
| Durchschnittliche Intel Arc Graphics 140V (31.6 - 87.6, n=43) | |
| Beelink SER9 Pro | |
| Asus NUC 14 Pro+ | |
| MSI Cubi NUC AI+ 2MG | |
| Minisforum MS-A1 | |
| MSI Cubi NUC 1M | |
| GMK NucBox M5 | |
| Asus NUC 14 Essential | |
| Ninkear M7, (16+512) | |
| BMAX B4 Turbo | |
| 1920x1080 High Quality | |
| Durchschnittliche Intel Arc Graphics 140V (23 - 37.2, n=42) | |
| Beelink SER9 Pro | |
| MSI Cubi NUC AI+ 2MG | |
| Asus NUC 14 Pro+ | |
| Minisforum MS-A1 | |
| MSI Cubi NUC 1M | |
| GMK NucBox M5 | |
| Asus NUC 14 Essential | |
| Ninkear M7, (16+512) | |
| BMAX B4 Turbo | |
| X-Plane 11.11 | |
| 1280x720 low (fps_test=1) | |
| Minisforum MS-A1 | |
| Asus NUC 14 Pro+ | |
| Beelink SER9 Pro | |
| MSI Cubi NUC AI+ 2MG | |
| Durchschnittliche Intel Arc Graphics 140V (31.5 - 57, n=43) | |
| GMK NucBox M5 | |
| Ninkear M7, (16+512) | |
| 1920x1080 med (fps_test=2) | |
| Asus NUC 14 Pro+ | |
| Minisforum MS-A1 | |
| Beelink SER9 Pro | |
| MSI Cubi NUC AI+ 2MG | |
| Durchschnittliche Intel Arc Graphics 140V (28.4 - 44.3, n=43) | |
| GMK NucBox M5 | |
| Ninkear M7, (16+512) | |
| 1920x1080 high (fps_test=3) | |
| Asus NUC 14 Pro+ | |
| Minisforum MS-A1 | |
| Beelink SER9 Pro | |
| MSI Cubi NUC AI+ 2MG | |
| Durchschnittliche Intel Arc Graphics 140V (22.2 - 37.9, n=43) | |
| GMK NucBox M5 | |
| Ninkear M7, (16+512) | |
| Strange Brigade | |
| 1280x720 lowest AF:1 | |
| MSI Cubi NUC AI+ 2MG | |
| Durchschnittliche Intel Arc Graphics 140V (138.1 - 251, n=37) | |
| Beelink SER9 Pro | |
| Intel NUC 13 Pro Kit NUC13ANK | |
| MSI Cubi NUC 1M | |
| GMK NucBox M5 | |
| BMAX B4 Turbo | |
| 1920x1080 medium AA:medium AF:4 | |
| Durchschnittliche Intel Arc Graphics 140V (52.1 - 87, n=37) | |
| Beelink SER9 Pro | |
| MSI Cubi NUC AI+ 2MG | |
| MSI Cubi NUC 1M | |
| Intel NUC 13 Pro Kit NUC13ANK | |
| GMK NucBox M5 | |
| 1920x1080 high AA:high AF:8 | |
| Durchschnittliche Intel Arc Graphics 140V (45.3 - 73.2, n=37) | |
| Beelink SER9 Pro | |
| MSI Cubi NUC AI+ 2MG | |
| MSI Cubi NUC 1M | |
| Intel NUC 13 Pro Kit NUC13ANK | |
| GMK NucBox M5 | |
| 1920x1080 ultra AA:ultra AF:16 | |
| MSI Cubi NUC AI+ 2MG | |
| Durchschnittliche Intel Arc Graphics 140V (39 - 62.5, n=37) | |
| Beelink SER9 Pro | |
| Intel NUC 13 Pro Kit NUC13ANK | |
| MSI Cubi NUC 1M | |
| GMK NucBox M5 | |
| F1 24 | |
| 1280x720 Ultra Low Preset AA:T | |
| MSI Cubi NUC AI+ 2MG | |
| Durchschnittliche Intel Arc Graphics 140V (n=1) | |
| 1920x1080 Low Preset AA:T AF:16x | |
| Minisforum MS-A1 | |
| Beelink SER9 Pro | |
| Durchschnittliche Intel Arc Graphics 140V (54 - 99, n=25) | |
| MSI Cubi NUC AI+ 2MG | |
| Asus NUC 14 Pro+ | |
| Ninkear M7, (16+512) | |
| 1920x1080 Medium Preset AA:T AF:16x | |
| Minisforum MS-A1 | |
| Durchschnittliche Intel Arc Graphics 140V (49.2 - 88.2, n=24) | |
| Beelink SER9 Pro | |
| Asus NUC 14 Pro+ | |
| Ninkear M7, (16+512) | |
| 1920x1080 High Preset AA:T AF:16x | |
| Minisforum MS-A1 | |
| Durchschnittliche Intel Arc Graphics 140V (34.4 - 66.4, n=27) | |
| Beelink SER9 Pro | |
| MSI Cubi NUC AI+ 2MG | |
| Asus NUC 14 Pro+ | |
| Ninkear M7, (16+512) | |
| 1920x1080 Ultra High Preset AA:T AF:16x | |
| Durchschnittliche Intel Arc Graphics 140V (14.6 - 22, n=25) | |
| MSI Cubi NUC AI+ 2MG | |
| Minisforum MS-A1 | |
| Beelink SER9 Pro | |
Die Frameraten im Leerlauf bei Cyberpunk 2077 mit 1080p Ultra-Einstellungen bewegten sich zwischen 18 und 26, während mit der NucBox K12 eine stabilere durchschnittliche Bildrate von 23 erreicht wurde. Dieses Stottern trat auch bei der Ausführung anderer Spiele in unserem Test auf.
Cyberpunk 2077 ultra FPS Grafik
| min. | mittel | hoch | max. | |
|---|---|---|---|---|
| GTA V (2015) | 160.4 | 152.4 | 63.6 | 26.6 |
| Dota 2 Reborn (2015) | 98.1 | 80.4 | 59.9 | 65.8 |
| Final Fantasy XV Benchmark (2018) | 71.3 | 39.1 | 28.7 | |
| X-Plane 11.11 (2018) | 51.8 | 41.7 | 36 | |
| Strange Brigade (2018) | 240 | 71.8 | 59.7 | 57.3 |
| Baldur's Gate 3 (2023) | 36.1 | 29.5 | 29 | 26.7 |
| Cyberpunk 2077 (2023) | 33.9 | 26.6 | 23.2 | 19.4 |
| F1 24 (2024) | 72 | 53.8 | 16.6 |
Emissionen
Systemrauschen
Das Lüftergeräusch liegt bei 25 dB(A) im Silent-Modus und bei relativ lauten 36 dB(A) im Performance Modus. Das System ist generell lauter als wir es beim älteren Cubi 1M beobachtet haben.

Lautstärkediagramm
| Idle |
| 28 / 36.1 / 36.1 dB(A) |
| Last |
| 38.9 / 49.2 dB(A) |
 | ||
30 dB leise 40 dB(A) deutlich hörbar 50 dB(A) störend |
||
min: | ||
| MSI Cubi NUC AI+ 2MG Arc 140V, Core Ultra 7 258V, Phison 1 TB ESR01TBTCCZ-27J | MSI Cubi NUC 1M Iris Xe G7 96EUs, Core 7 150U, WD PC SN560 SDDPNQE-1T00 | GMK NucBox K12 Radeon 780M, Ryzen 7 H 255, Crucial P3 Plus CT1000P3PSSD8 | Beelink SER9 Pro Radeon 780M, Ryzen 7 H 255, Crucial P3 Plus CT1000P3PSSD8 | Ninkear M7, (16+512) Vega 7, R5 7430U, Faspeed P8-512G-SE | Minisforum MS-A1 Radeon 780M, R7 8700G, Kingston OM8PGP41024Q-A0 | |
|---|---|---|---|---|---|---|
| Geräuschentwicklung | 7% | -4% | 12% | 19% | -3% | |
| aus / Umgebung * (dB) | 24.8 | 23.5 5% | 23.5 5% | 23 7% | 24.8 -0% | 24.8 -0% |
| Idle min * (dB) | 28 | 29.9 -7% | 35.4 -26% | 29.1 -4% | 25.3 10% | 33.9 -21% |
| Idle avg * (dB) | 36.1 | 29.9 17% | 35.4 2% | 30.1 17% | 25.7 29% | 34 6% |
| Idle max * (dB) | 36.1 | 32 11% | 39 -8% | 31.7 12% | 25.7 29% | 34 6% |
| Last avg * (dB) | 38.9 | 33.5 14% | 42.4 -9% | 33.7 13% | 33.6 14% | 41.1 -6% |
| Cyberpunk 2077 ultra * (dB) | 37 | 39.1 -6% | 40.4 -9% | 33.8 9% | 28.7 22% | 42.2 -14% |
| Last max * (dB) | 49.2 | 40.5 18% | 41.4 16% | 35.2 28% | 34.3 30% | 46.2 6% |
| Witcher 3 ultra * (dB) | 28.8 |
* ... kleinere Werte sind besser
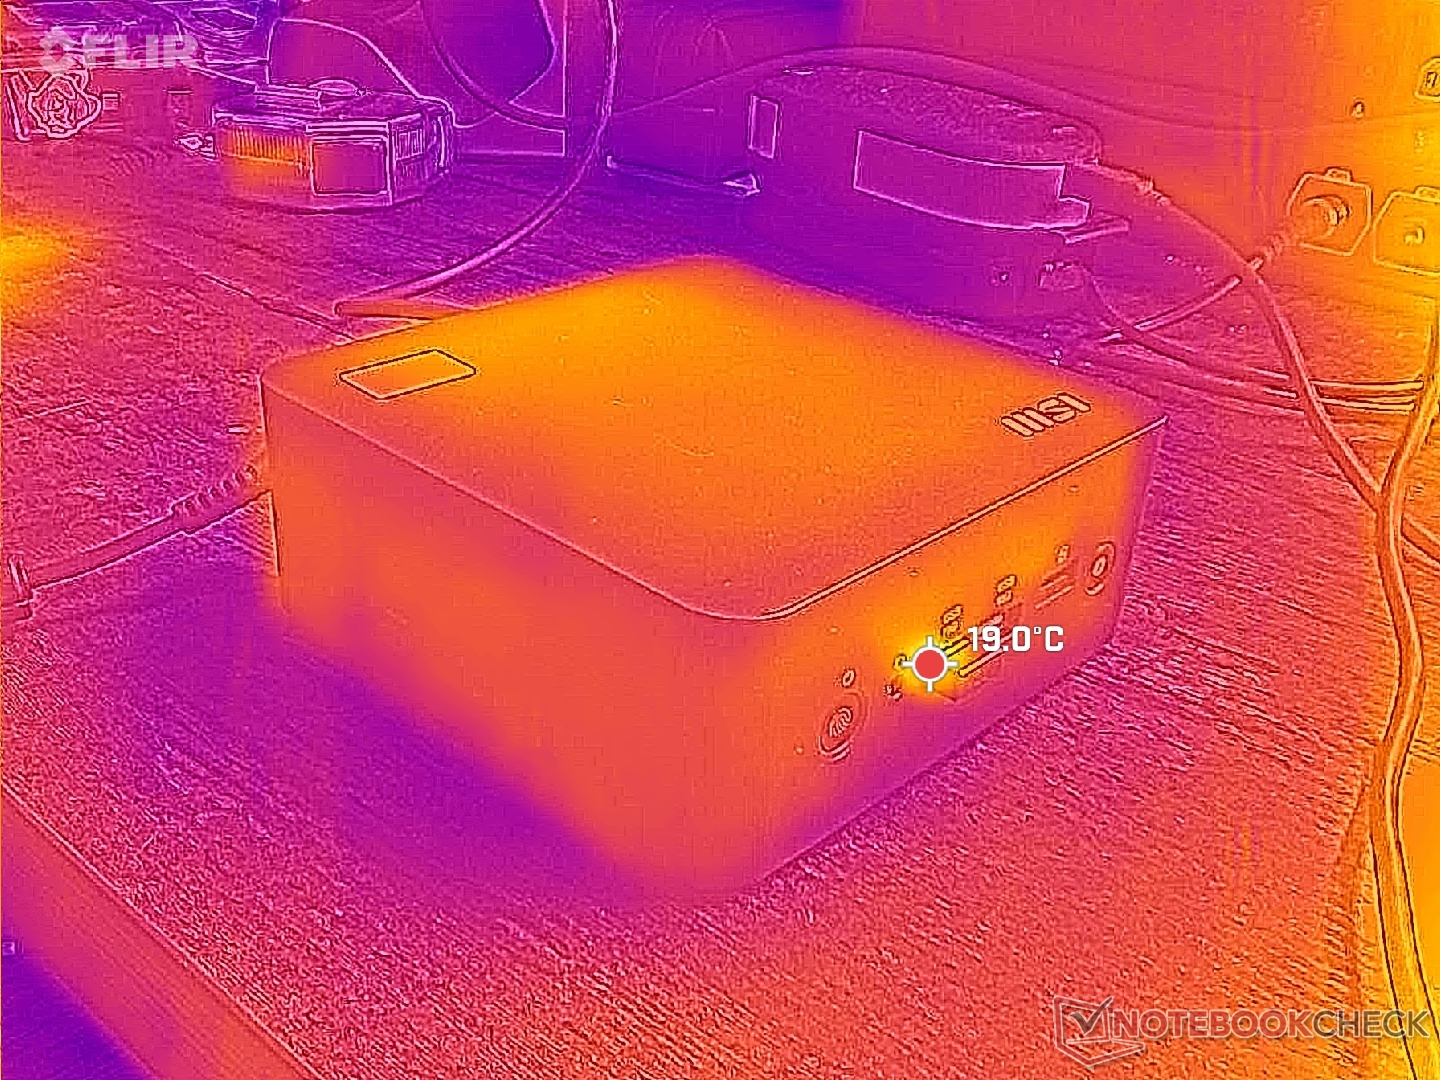
Temperatur

Die Oberflächentemperaturen sind selbst bei anspruchsvollen Anwendungen mit nur 31 °C kaum warm, was vor allem auf die Kunststoffkonstruktion und die stromsparende Intel CPU zurückzuführen ist.
Das kleine 120-Watt-Netzteil bleibt unter Last mit unter 35 °C relativ kühl.


Lautsprecher

MSI Cubi NUC AI+ 2MG Audio Analyse
(-) | Nicht sonderlich laut spielende Lautsprecher (70.5 dB)
Bass 100 - 315 Hz
(±) | abgesenkter Bass - 10.4% geringer als der Median
(-) | keine lineare Bass-Wiedergabe (16% Delta zum Vorgänger)
Mitteltöne 400 - 2000 Hz
(±) | zu hohe Mitten, vom Median 6.9% abweichend
(-) | die Mitten sind nicht linear (19.7% Delta zum Vorgänger)
Hochtöne 2 - 16 kHz
(+) | ausgeglichene Hochtöne, vom Median nur 4.3% abweichend
(±) | durchschnittlich lineare Hochtöne (12.2% Delta zum Vorgänger)
Gesamt im hörbaren Bereich 100 - 16.000 Hz
(±) | hörbarer Bereich ist durchschnittlich linear (29.5% Abstand zum Median)
Im Vergleich zu allen Geräten derselben Klasse
» 75% aller getesteten Geräte dieser Klasse waren besser, 11% vergleichbar, 14% schlechter
» Das beste Gerät hat einen Delta-Wert von 13%, durchschnittlich ist 24%, das schlechteste Gerät hat 64%
Im Vergleich zu allen Geräten im Test
» 87% aller getesteten Geräte waren besser, 3% vergleichbar, 10% schlechter
» Das beste Gerät hat einen Delta-Wert von 4%, durchschnittlich ist 24%, das schlechteste Gerät hat 134%
Apple MacBook Pro 16 2021 M1 Pro Audio Analyse
(+) | Die Lautsprecher können relativ laut spielen (84.7 dB)
Bass 100 - 315 Hz
(+) | guter Bass - nur 3.8% Abweichung vom Median
(+) | lineare Bass-Wiedergabe (5.2% Delta zum Vorgänger)
Mitteltöne 400 - 2000 Hz
(+) | ausgeglichene Mitten, vom Median nur 1.3% abweichend
(+) | lineare Mitten (2.1% Delta zum Vorgänger)
Hochtöne 2 - 16 kHz
(+) | ausgeglichene Hochtöne, vom Median nur 1.9% abweichend
(+) | sehr lineare Hochtöne (2.7% Delta zum Vorgänger)
Gesamt im hörbaren Bereich 100 - 16.000 Hz
(+) | hörbarer Bereich ist sehr linear (4.6% Abstand zum Median
Im Vergleich zu allen Geräten derselben Klasse
» 0% aller getesteten Geräte dieser Klasse waren besser, 0% vergleichbar, 100% schlechter
» Das beste Gerät hat einen Delta-Wert von 5%, durchschnittlich ist 17%, das schlechteste Gerät hat 45%
Im Vergleich zu allen Geräten im Test
» 0% aller getesteten Geräte waren besser, 0% vergleichbar, 100% schlechter
» Das beste Gerät hat einen Delta-Wert von 4%, durchschnittlich ist 24%, das schlechteste Gerät hat 134%
Energieverwaltung
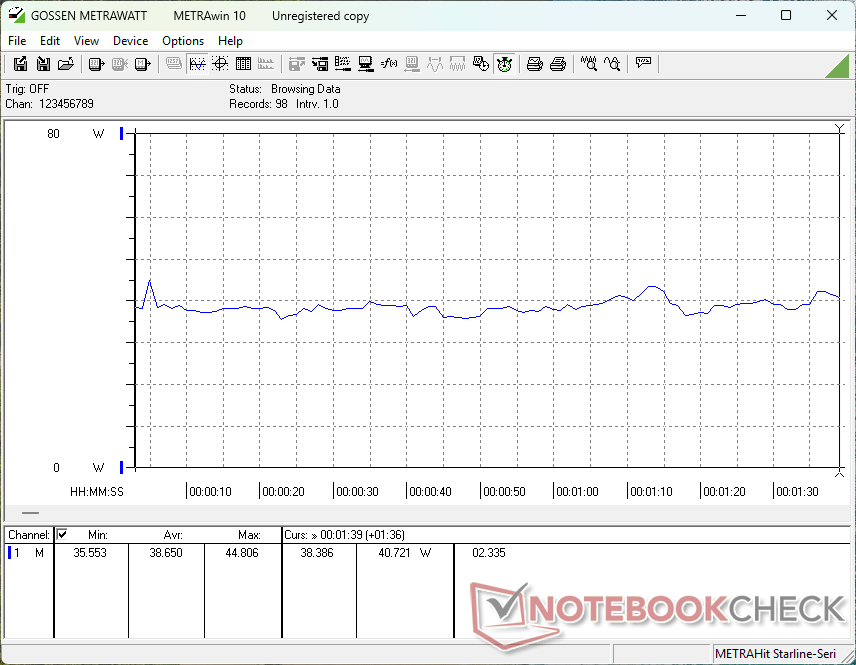
Stromverbrauch
Der Gesamtverbrauch ist spürbar niedriger als bei einem Mini-PC der AMD H-Serie wie dem GMK NucBox K12 obwohl unser integrierter Arc 140V beim Spielen ungefähr mit dem integrierten Radeon 780M der Konkurrenz vergleichbar ist. Das Performance-Pro-Watt-Verhältnis spricht im Allgemeinen für das MSI Cubi, wenn auch auf Kosten der Rohleistung im Vergleich zu vielen AMD Zen 4 oder Zen 5 Alternativen.
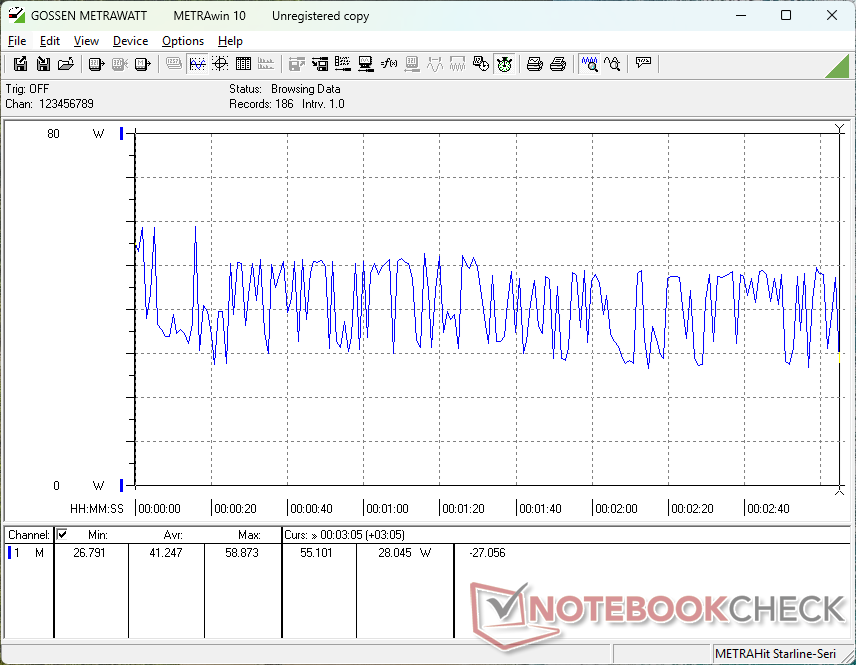
Bei Cyberpunk 2077 schwankte der Verbrauch scheinbar grundlos zwischen 28 W und 49 W, was mit unseren oben erwähnten instabilen Bildraten und GPU-Taktraten übereinstimmt.


| Aus / Standby | |
| Idle | |
| Last |
|
Legende:
min: | |
| MSI Cubi NUC AI+ 2MG Core Ultra 7 258V, Arc 140V, Phison 1 TB ESR01TBTCCZ-27J, , x, | MSI Cubi NUC 1M Core 7 150U, Iris Xe G7 96EUs, WD PC SN560 SDDPNQE-1T00, , x, | GMK NucBox K12 Ryzen 7 H 255, Radeon 780M, Crucial P3 Plus CT1000P3PSSD8, , x, | Beelink SER9 Pro Ryzen 7 H 255, Radeon 780M, Crucial P3 Plus CT1000P3PSSD8, , x, | Ninkear M7, (16+512) R5 7430U, Vega 7, Faspeed P8-512G-SE, , x, | Minisforum MS-A1 R7 8700G, Radeon 780M, Kingston OM8PGP41024Q-A0, , x, | |
|---|---|---|---|---|---|---|
| Stromverbrauch | -24% | -99% | -56% | -47% | -121% | |
| Idle min * (Watt) | 2.9 | 6.4 -121% | 9.9 -241% | 7 -141% | 9.3 -221% | 8.8 -203% |
| Idle avg * (Watt) | 5.7 | 8.3 -46% | 10.1 -77% | 7.1 -25% | 10.7 -88% | 12.6 -121% |
| Idle max * (Watt) | 10.2 | 10.4 -2% | 13.1 -28% | 7.5 26% | 12.6 -24% | 14 -37% |
| Last avg * (Watt) | 38.7 | 38.5 1% | 69.8 -80% | 62.3 -61% | 37.7 3% | 93.2 -141% |
| Cyberpunk 2077 ultra external monitor * (Watt) | 41.1 | 36.1 12% | 86.3 -110% | 80.1 -95% | 32.3 21% | 102.1 -148% |
| Last max * (Watt) | 60 | 52.5 12% | 92.8 -55% | 82.9 -38% | 43.4 28% | 105.4 -76% |
* ... kleinere Werte sind besser
Stromverbrauch Cyberpunk / Stress Test
Stromverbrauch externer Monitor
Notebookcheck Bewertung
Einfacher und zuverlässiger Mini-PC für Unternehmen, aber in Anbetracht des hohen Preises ist er wohl zu einfach.
MSI Cubi NUC AI+ 2MG
- 29.09.2025 v8
Allen Ngo
 Total Sustainability Score:
 Potenzielle Wettbewerber im Vergleich
Bild | Modell / Test | Preis ab | Gewicht | Dicke | Display |
|---|---|---|---|---|---|
1. 75.2%  | MSI Cubi NUC AI+ 2MG Intel Core Ultra 7 258V ⎘ Intel Arc Graphics 140V ⎘ 32 GB RAM, 1000 GB SSD | Amazon: Bestpreis 1899€ galaxus 2. 1919€ galaxus.at | 669 g | 50.1 mm | x |
2. 66.1% 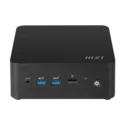 | MSI Cubi NUC 1M Intel Core 7 150U ⎘ Intel Iris Xe Graphics G7 96EUs ⎘ 16 GB RAM, 1024 GB SSD | Amazon: Geizhals Suche | 660 g | 50.1 mm | x |
3. 73.7% 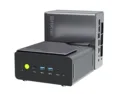 | GMK NucBox K12 AMD Ryzen 7 H 255 ⎘ AMD Radeon 780M ⎘ 32 GB RAM, 1024 GB SSD | Amazon: 1. 749,96 € GMKtec (3 Jahren Garantie Ga... 2. 628,86 € GMKtec K12 AMD Mini PC Ryzen... | 938 g | 78 mm | x |
4. 80.2%  | Beelink SER9 Pro AMD Ryzen 7 H 255 ⎘ AMD Radeon 780M ⎘ 32 GB RAM, 1024 GB SSD | Amazon: 931,78 € Geizhals Suche | 812 g | 44.7 mm | x |
5.  | Ninkear M7, (16+512) AMD Ryzen 5 7430U ⎘ AMD Radeon RX Vega 7 ⎘ 16 GB RAM, 512 GB SSD | Amazon: Listenpreis: 399€ | 400 g | 36 mm | x |
6. 76.7% 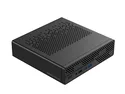 | Minisforum MS-A1 AMD Ryzen 7 8700G ⎘ AMD Radeon 780M ⎘ 32 GB RAM, 1024 GB SSD | Amazon: Geizhals Suche | 1.7 kg | 48 mm | x |
Transparenz
Die Auswahl der zu testenden Geräte erfolgt innerhalb der Redaktion. Das vorliegende Testmuster wurde dem Autor vom Hersteller oder einem Shop zu Testzwecken leihweise zur Verfügung gestellt. Eine Einflussnahme des Leihstellers auf den Testbericht gab es nicht, der Hersteller erhielt keine Version des Reviews vor der Veröffentlichung. Es bestand keine Verpflichtung zur Publikation. Als eigenständiges, unabhängiges Unternehmen unterliegt Notebookcheck keiner Diktion von Herstellern, Shops und Verlagen.
So testet Notebookcheck
Pro Jahr werden von Notebookcheck hunderte Laptops und Smartphones unabhängig in von uns standardisierten technischen Verfahren getestet, um eine Vergleichbarkeit aller Testergebnisse zu gewährleisten. Seit rund 20 Jahren entwickeln wir diese Testmethoden kontinuierlich weiter und setzen damit Branchenstandards. In unseren Testlaboren kommt ausschließlich hochwertiges Messequipment in die Hände erfahrener Techniker und Redakteure. Die Tests unterliegen einer mehrstufigen Kontrolle. Unsere komplexe Gesamtbewertung basiert auf hunderten fundierten Messergebnissen und Benchmarks, womit Ihnen Objektivität garantiert ist. Weitere Informationen zu unseren Testmethoden gibt es hier.

