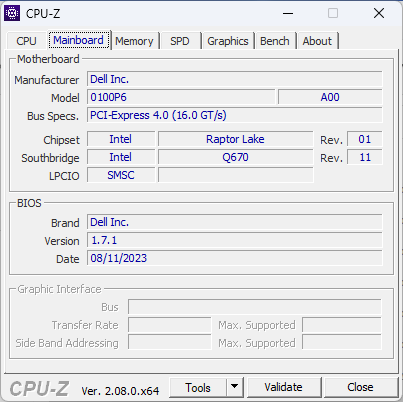
Dell OptiPlex Micro Plus 7010 im Test: Desktop Core i7-13700 im Mini-PC-Gehäuse

Der OptiPlex Micro ist ein Mini-PC, der für kommerzielle und professionelle Zwecke entwickelt wurde. Sein kompaktes Design eignet sich jedoch auch für Home-Office-Umgebungen, insbesondere im Vergleich zu den OptiPlex-Modellen in Standardgröße. Dieses spezielle Modell zeichnet sich durch seinen Desktop-Prozessor aus, während die meisten anderen Mini-PCs stattdessen auf mobile CPUs der H- oder HX-Serie setzen.
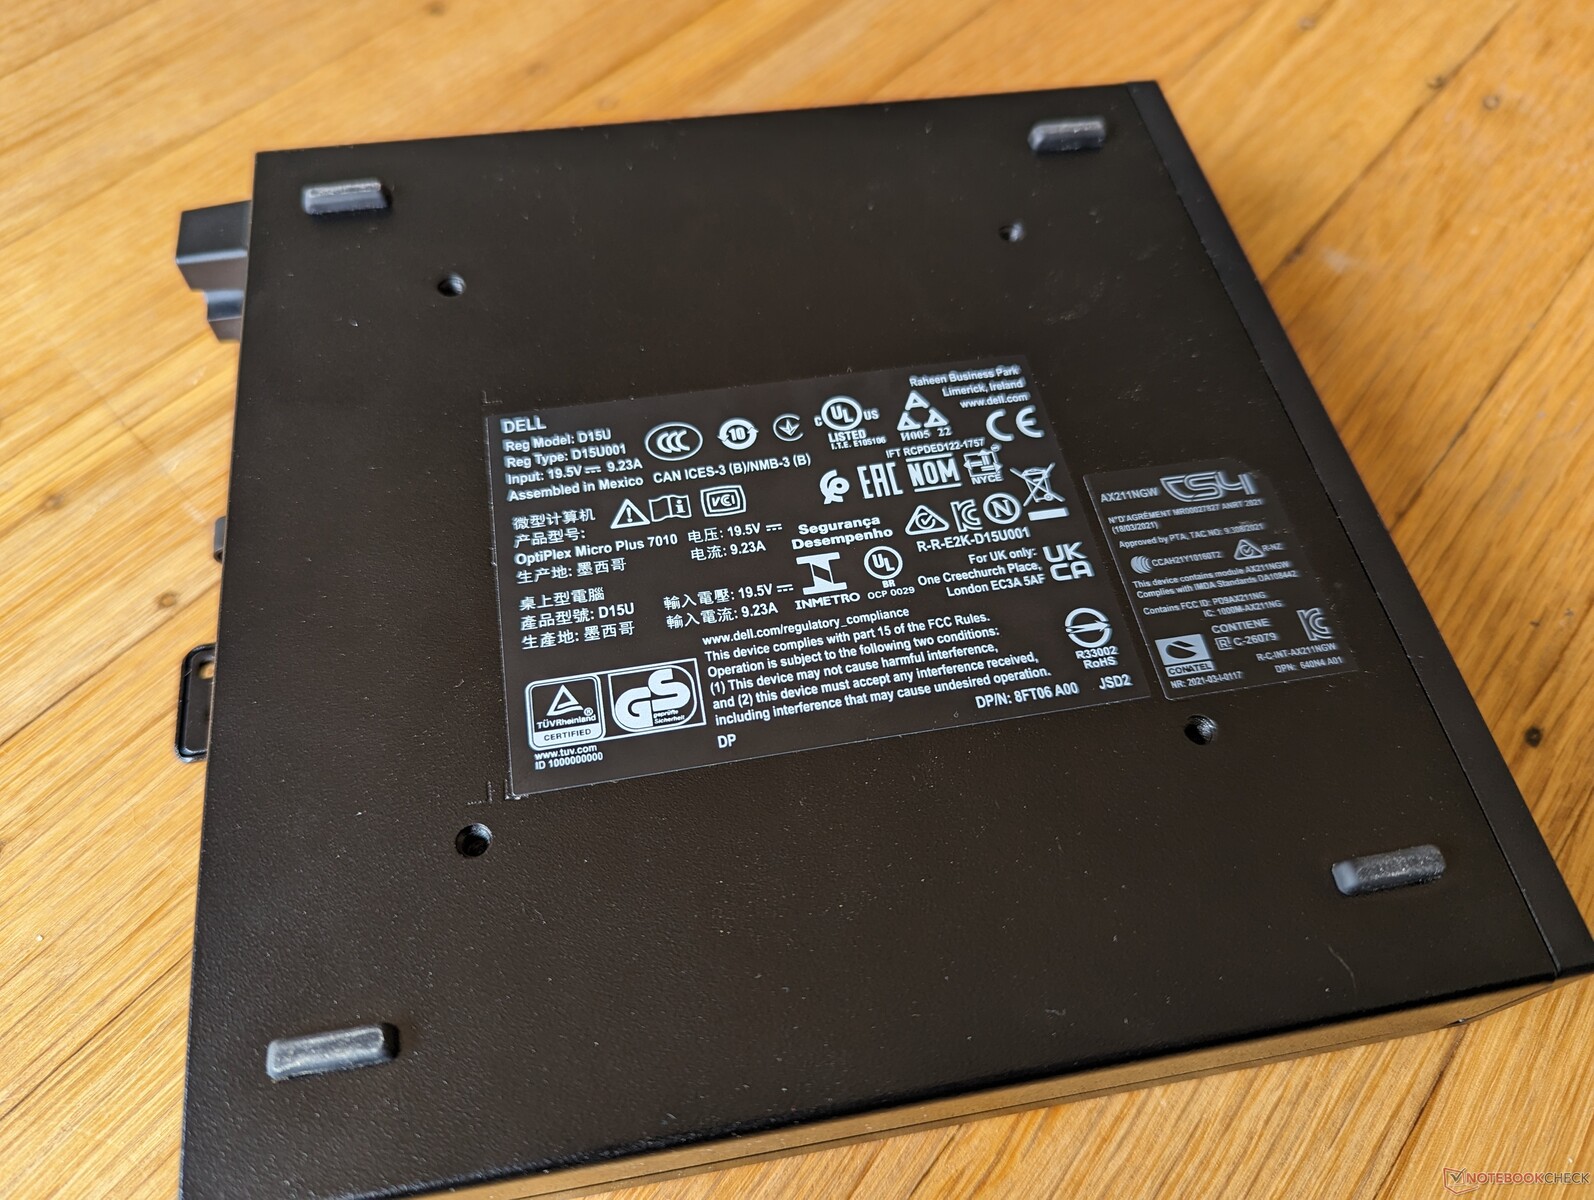
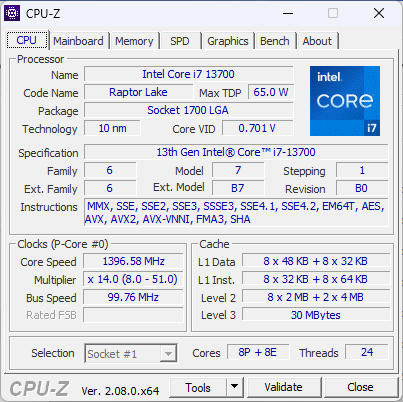
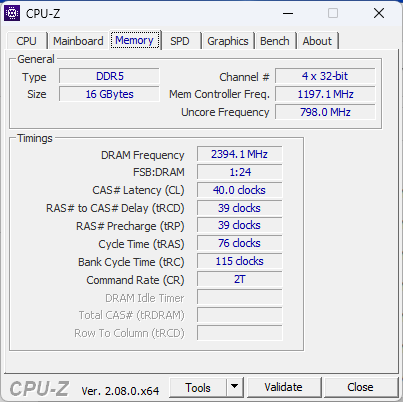
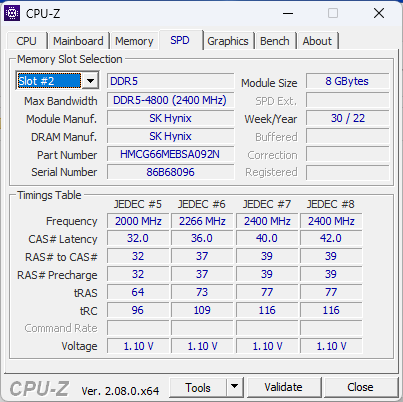
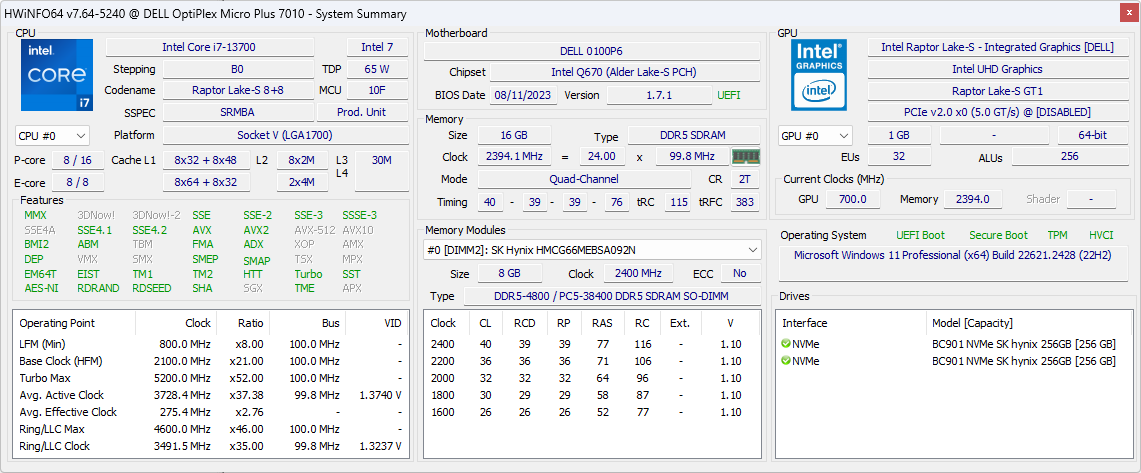
Unser Testgerät wurde mit dem Core i7-13700 der 13. Generation, 16 GB DDR5-4800 RAM und einer 512 GB SSD im RAID 0-Modus konfiguriert. Niedrigere Konfigurationen beginnen mit dem Core i3-13100T für unter 700 Euro und reichen bis zum Core i9-13900 vPro. Nicht-Plus-Varianten können mit einem noch langsameren Pentium Gold G7400T ausgestattet werden. Derzeit gibt es keine Ausstattung mit diskreter Grafik oder Alternativen von AMD.
Der OptiPlex Micro konkurriert mit anderen semiprofessionellen Mini-PCs wie dem Apple Mac Mini M2, Beelink GTR7 oder der Intel NUC-Serie.
Weitere Lenovo Bewertungen:
Mögliche Konkurrenten im Vergleich
Bew. | Datum | Modell | Gewicht | Dicke | Größe | Auflösung | Preis ab |
|---|---|---|---|---|---|---|---|
| 80.2 % v7 (old) | 10 / 2023 | Dell OptiPlex Micro i7-13700, UHD Graphics 770 | 1.2 kg | 36 mm | x | ||
| 87.3 % v7 (old) | 08 / 2023 | Apple Mac Mini M2 M2, M2 10-Core GPU | 1.2 kg | 36 mm | x | ||
| 81 % v7 (old) | 09 / 2023 | Lenovo IdeaCentre Mini 01IRH8 i7-13700H, Iris Xe G7 96EUs | 1.8 kg | 39 mm | x | ||
| 82.8 % v7 (old) | 10 / 2023 | GMK NucBox K3 Pro i7-12650H, UHD Graphics 64EUs | 396 g | 43.2 mm | x | ||
| 86.3 % v7 (old) | 07 / 2023 | Beelink GTR7 7840HS R7 7840HS, Radeon 780M | 890 g | 48.8 mm | x | ||
| 86.6 % v7 (old) | 09 / 2023 | Beelink SER7 R7 7840HS, Radeon 780M | 640 g | 49 mm | x |
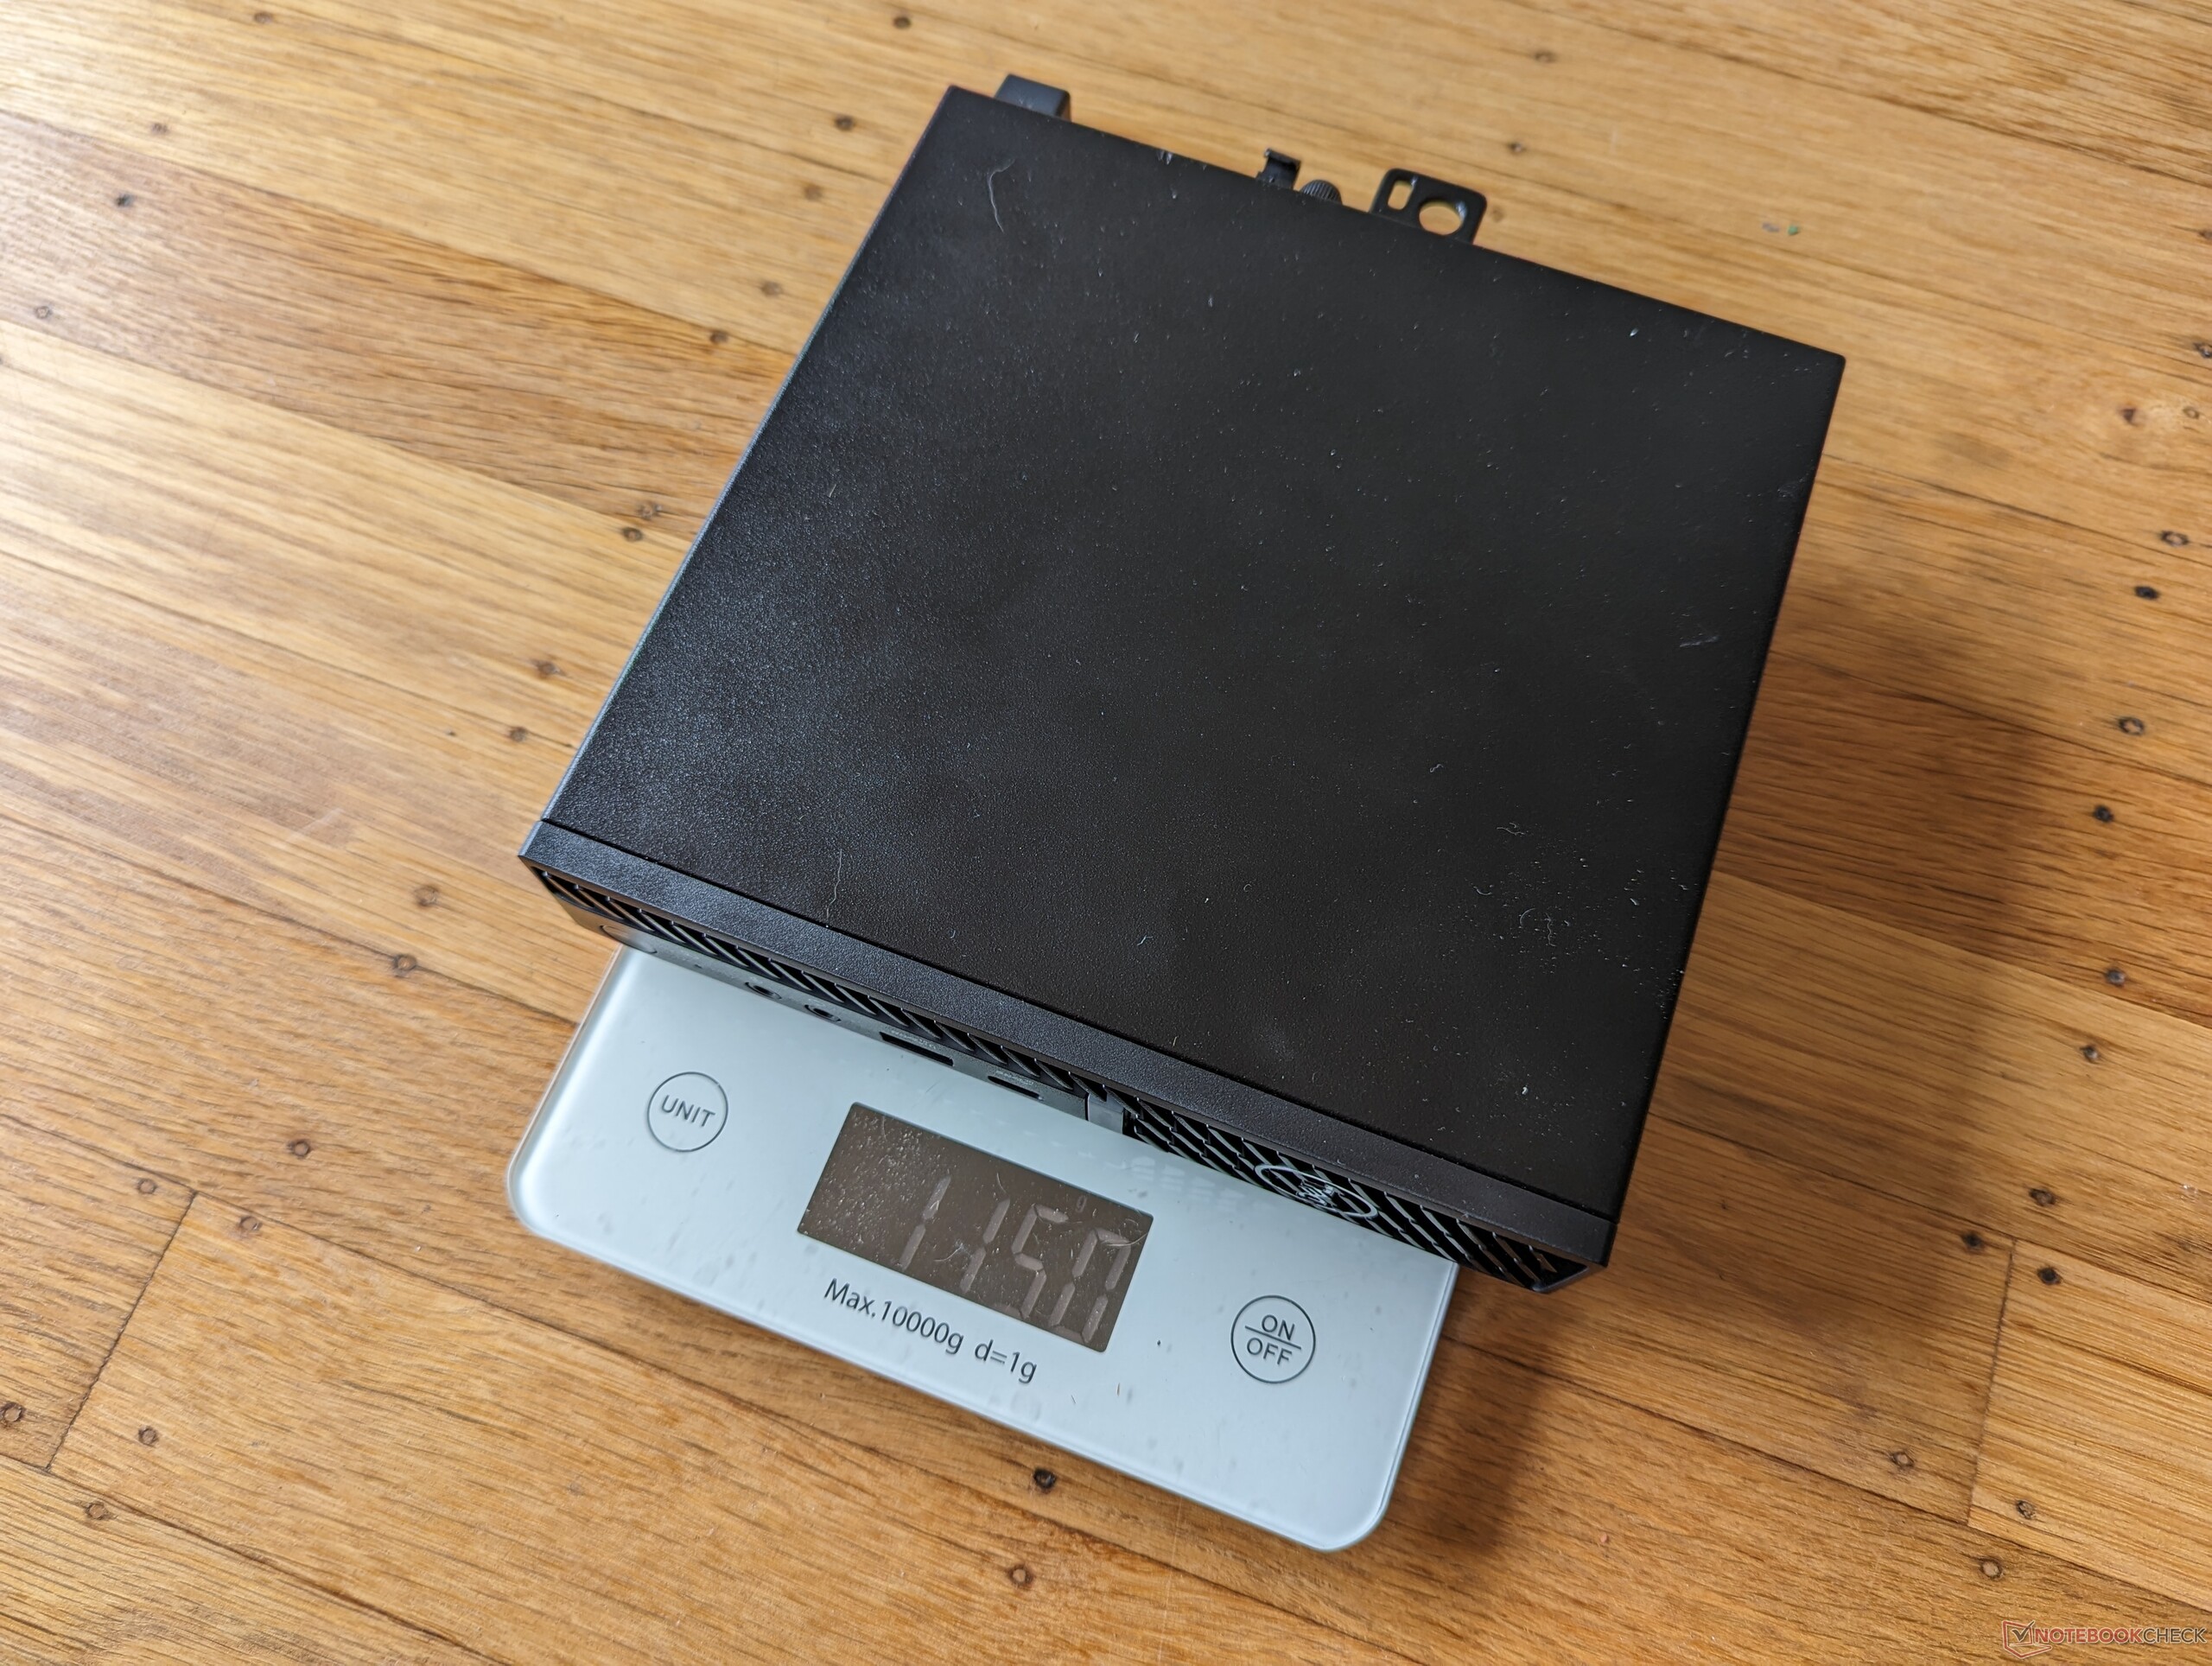
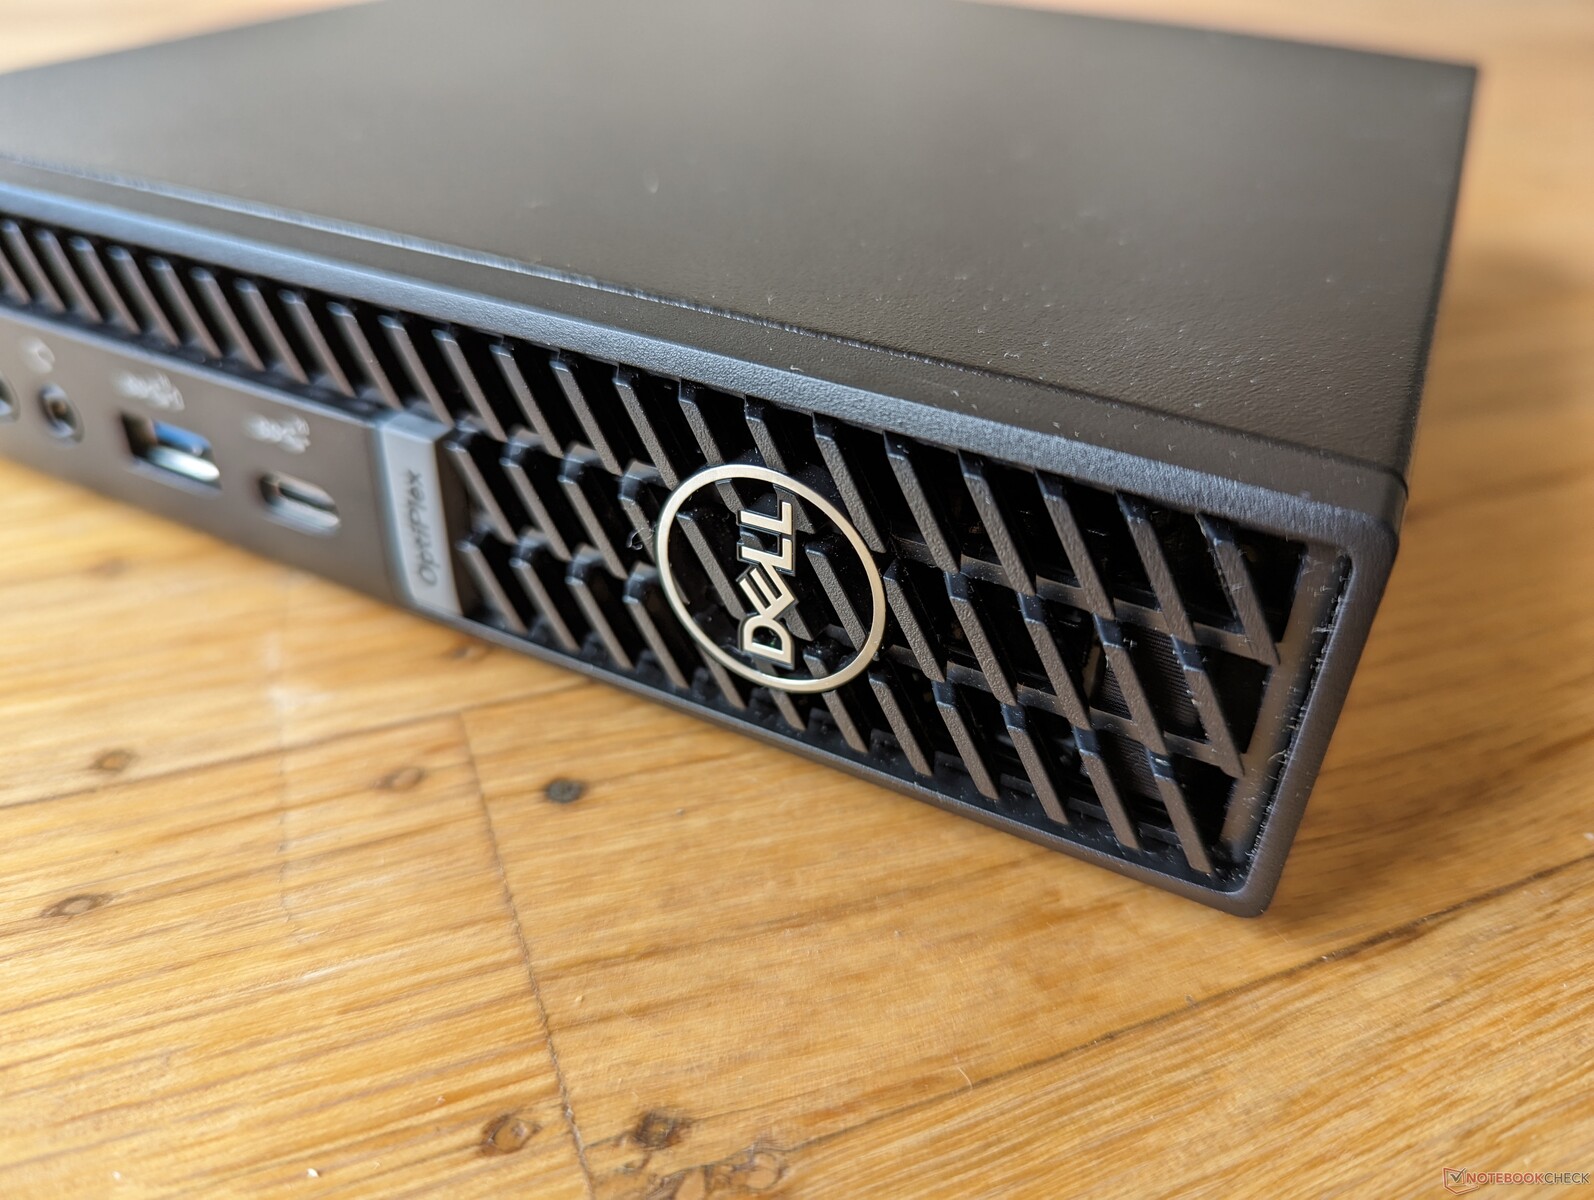
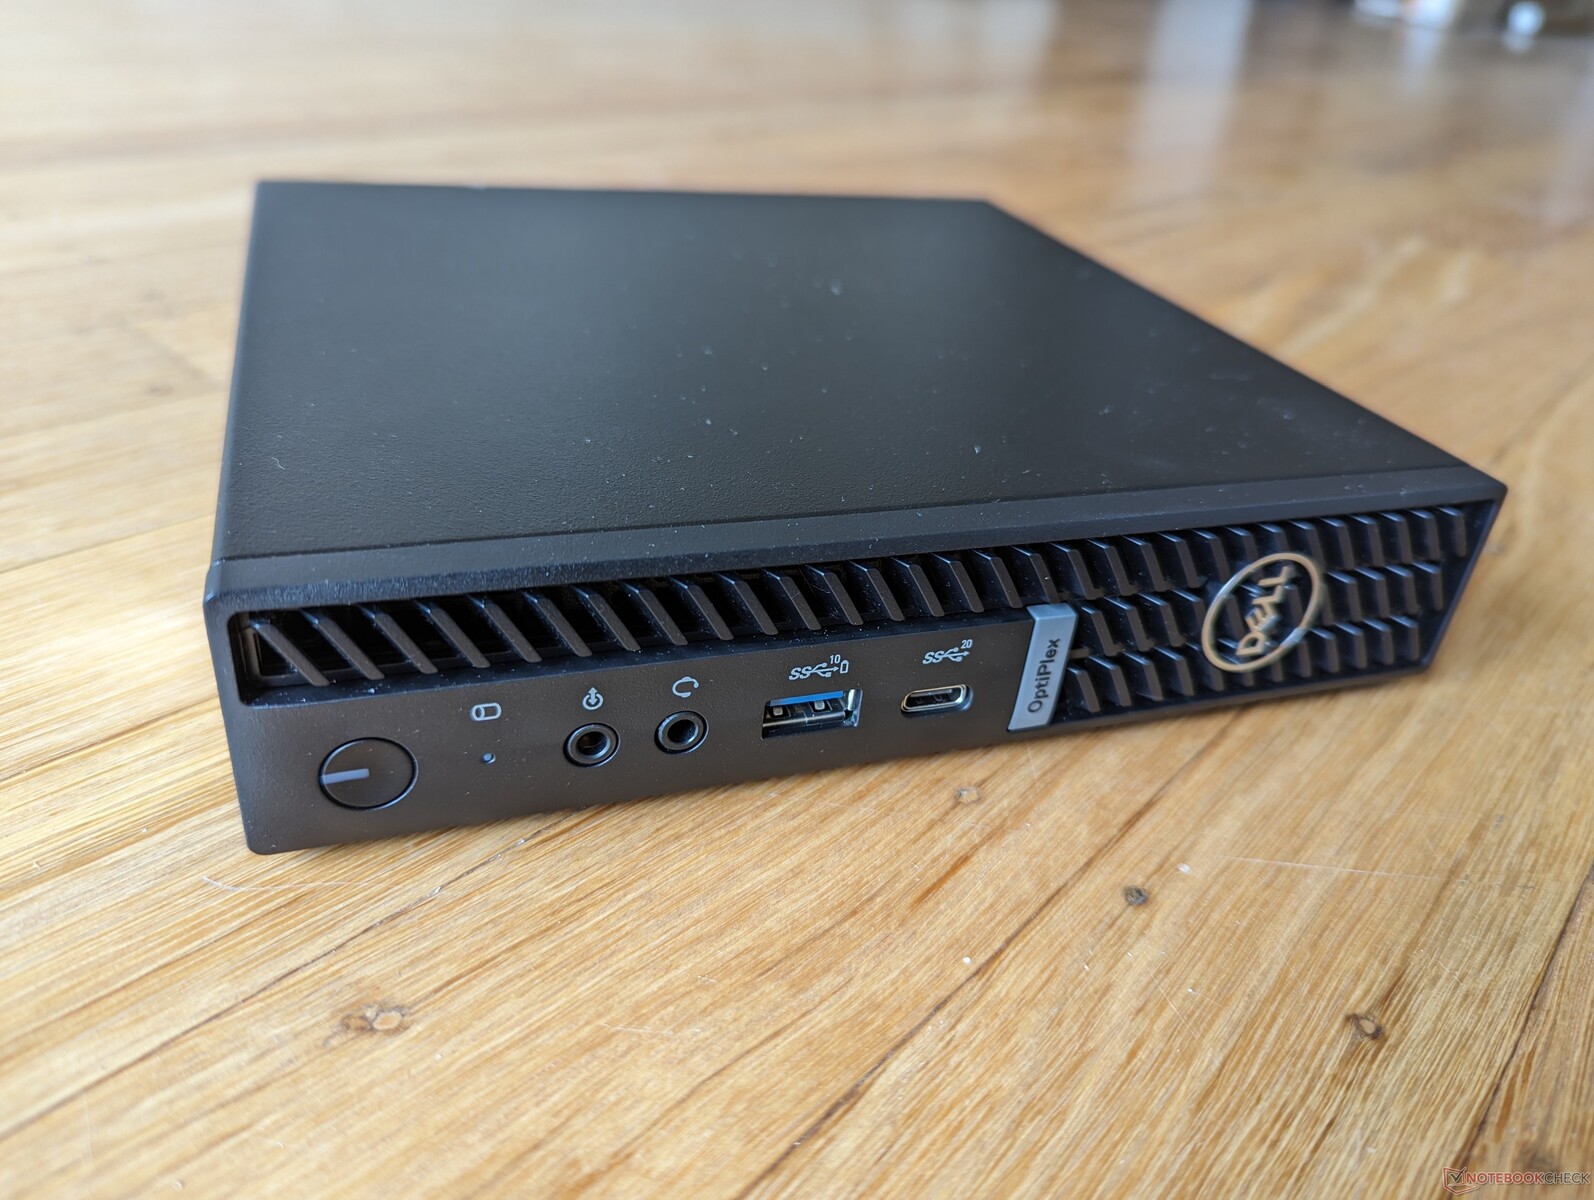
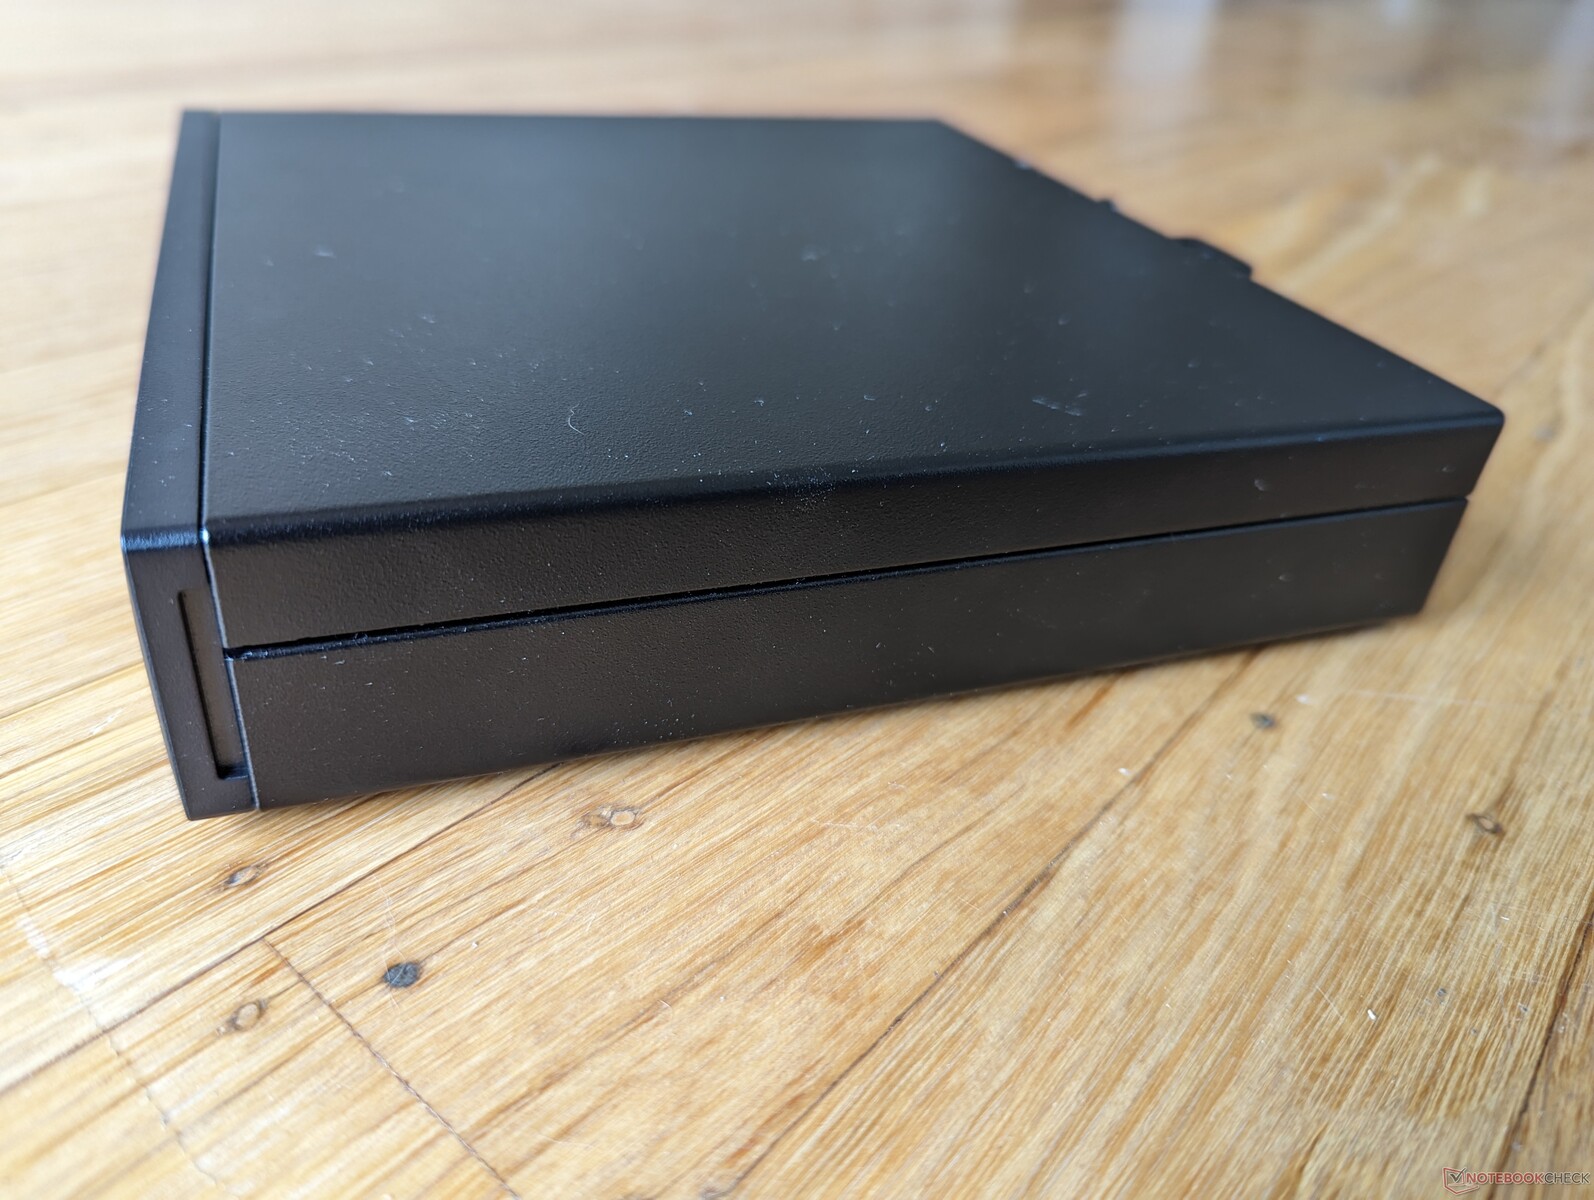
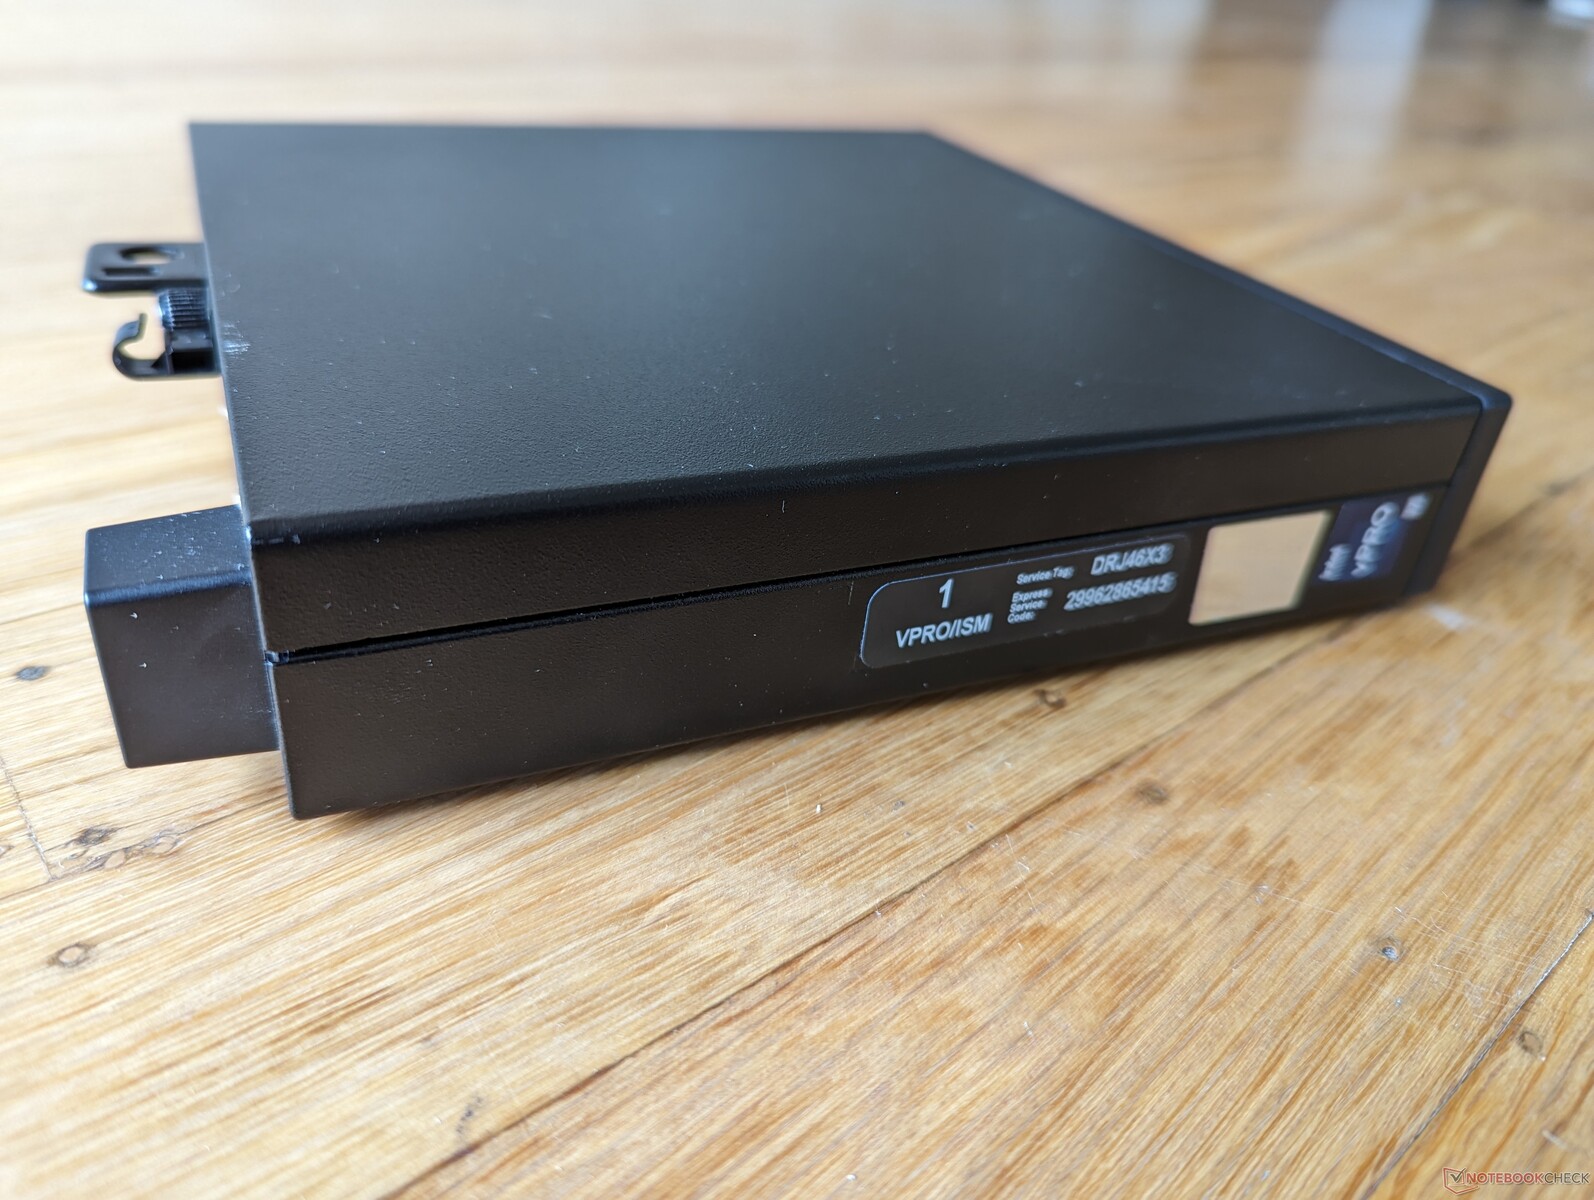
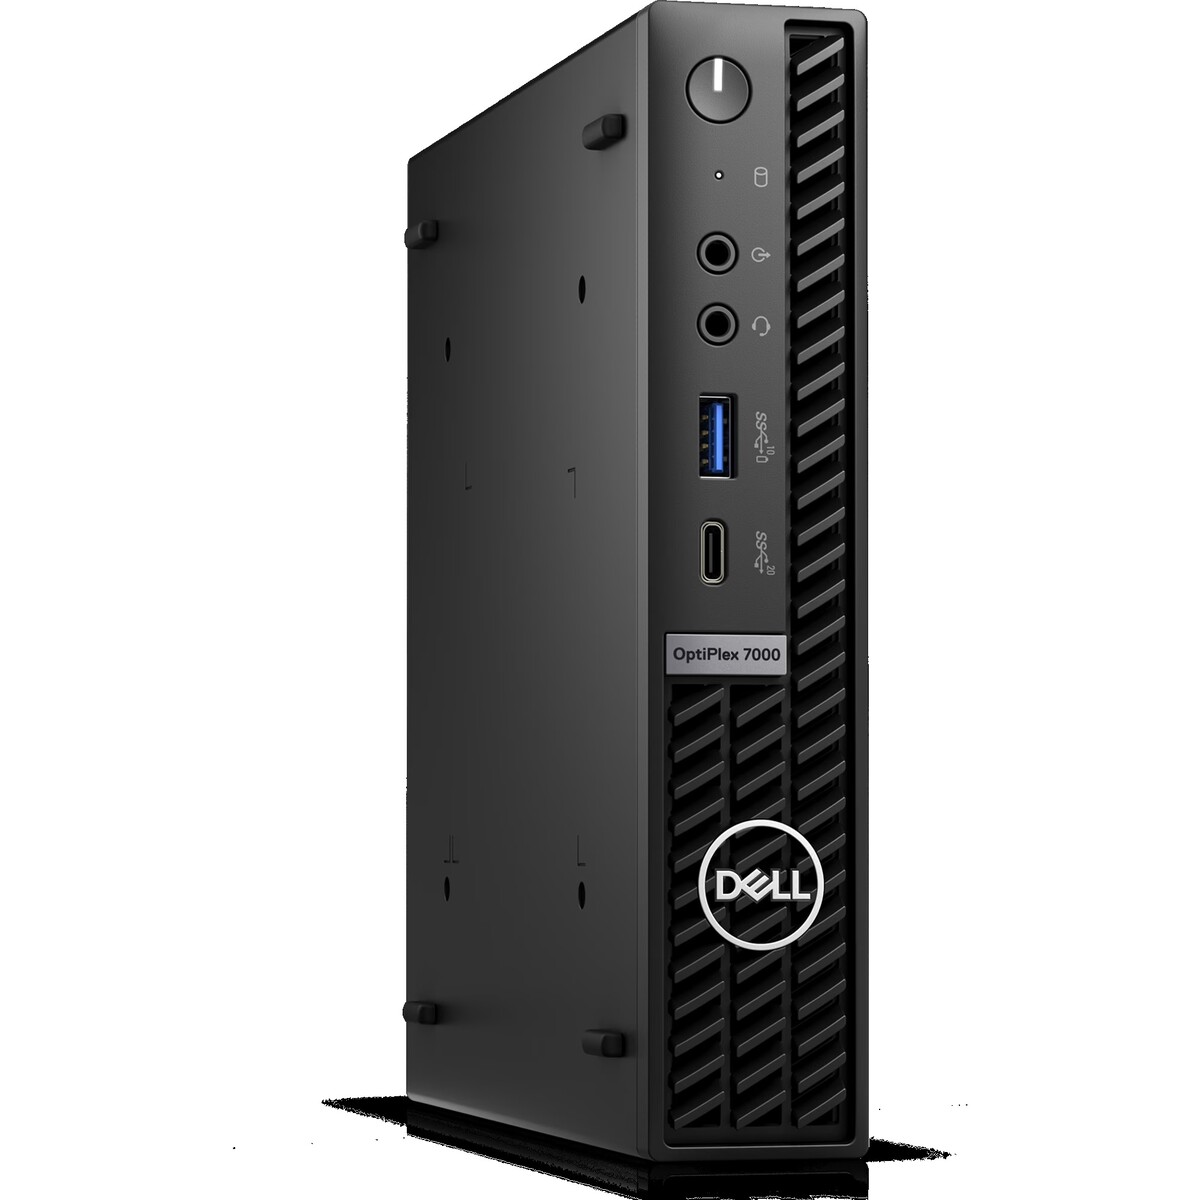
Gehäuse - Mini-Tower-Optik
Der OptiPlex Micro ist doppelt so groß und schwer wie der Intel NUC 13 Pro, aber dennoch kleiner als der Mac Mini und insbesondere der OptiPlex SFF. Das Gehäuse aus Vollmetall und das markante Design des Frontgitters sind unverkennbare Merkmale des OptiPlex.
Ausstattung
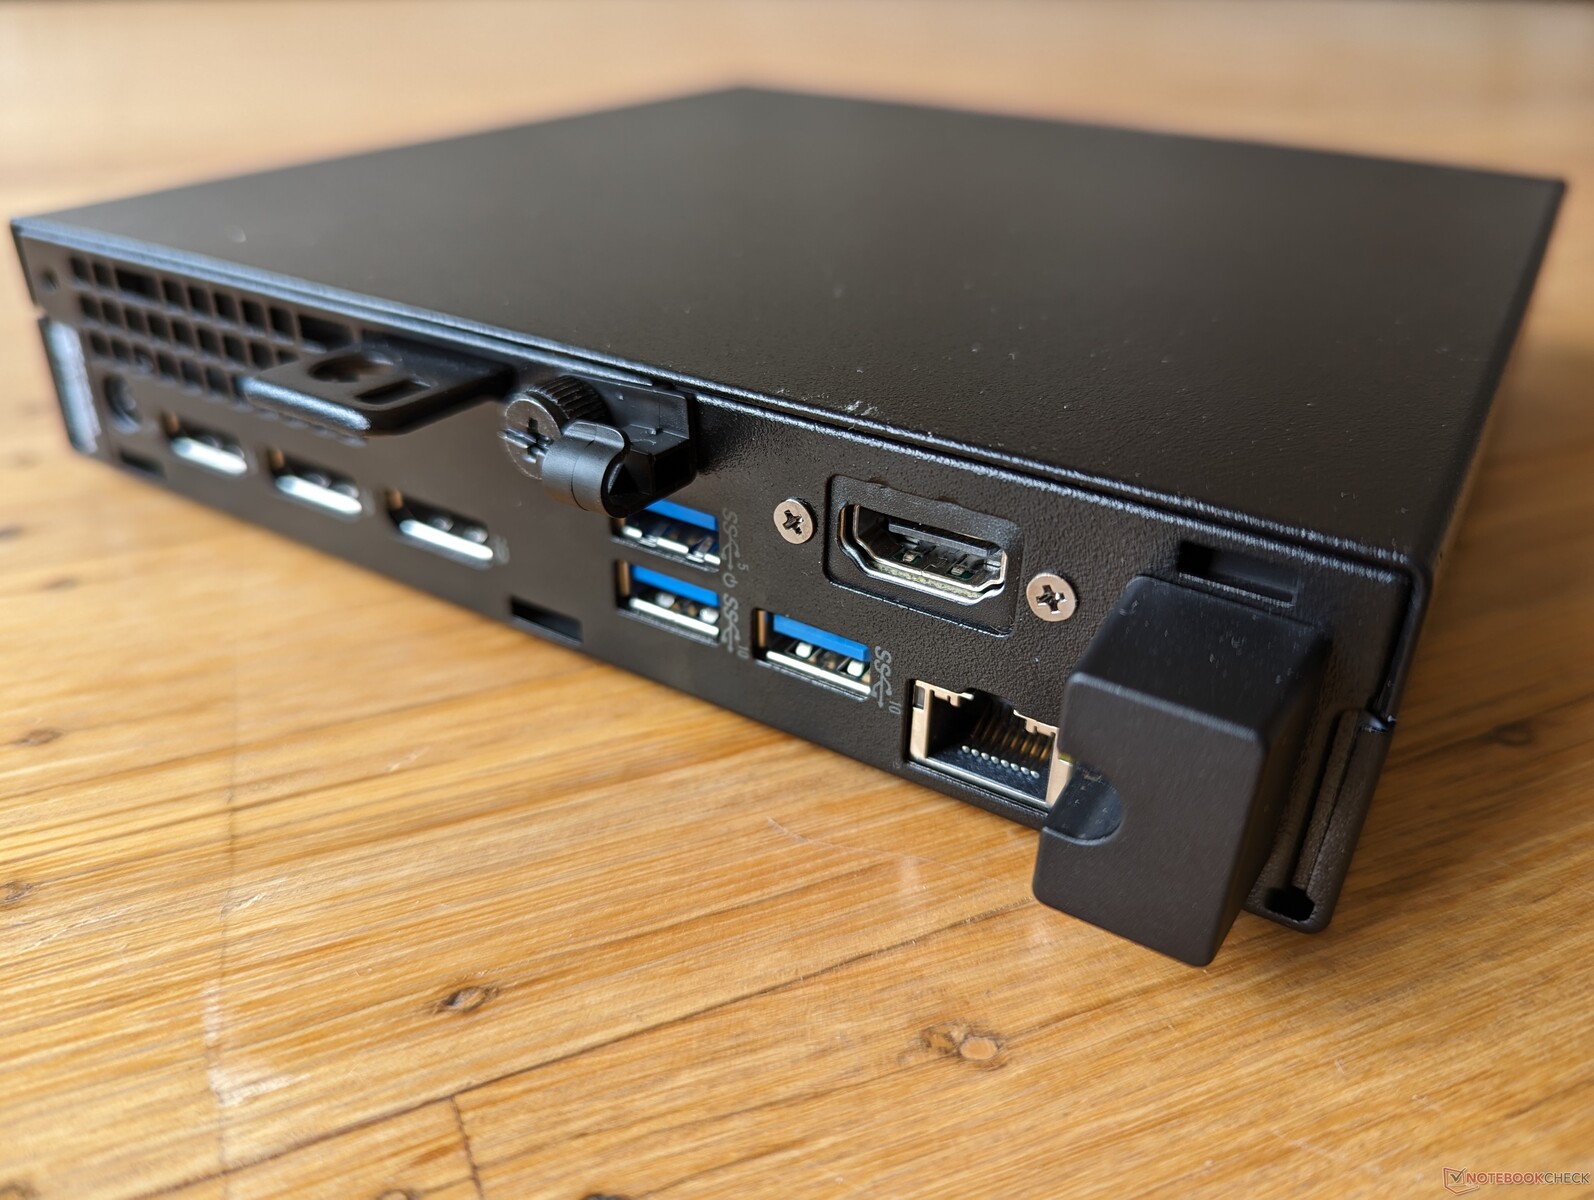
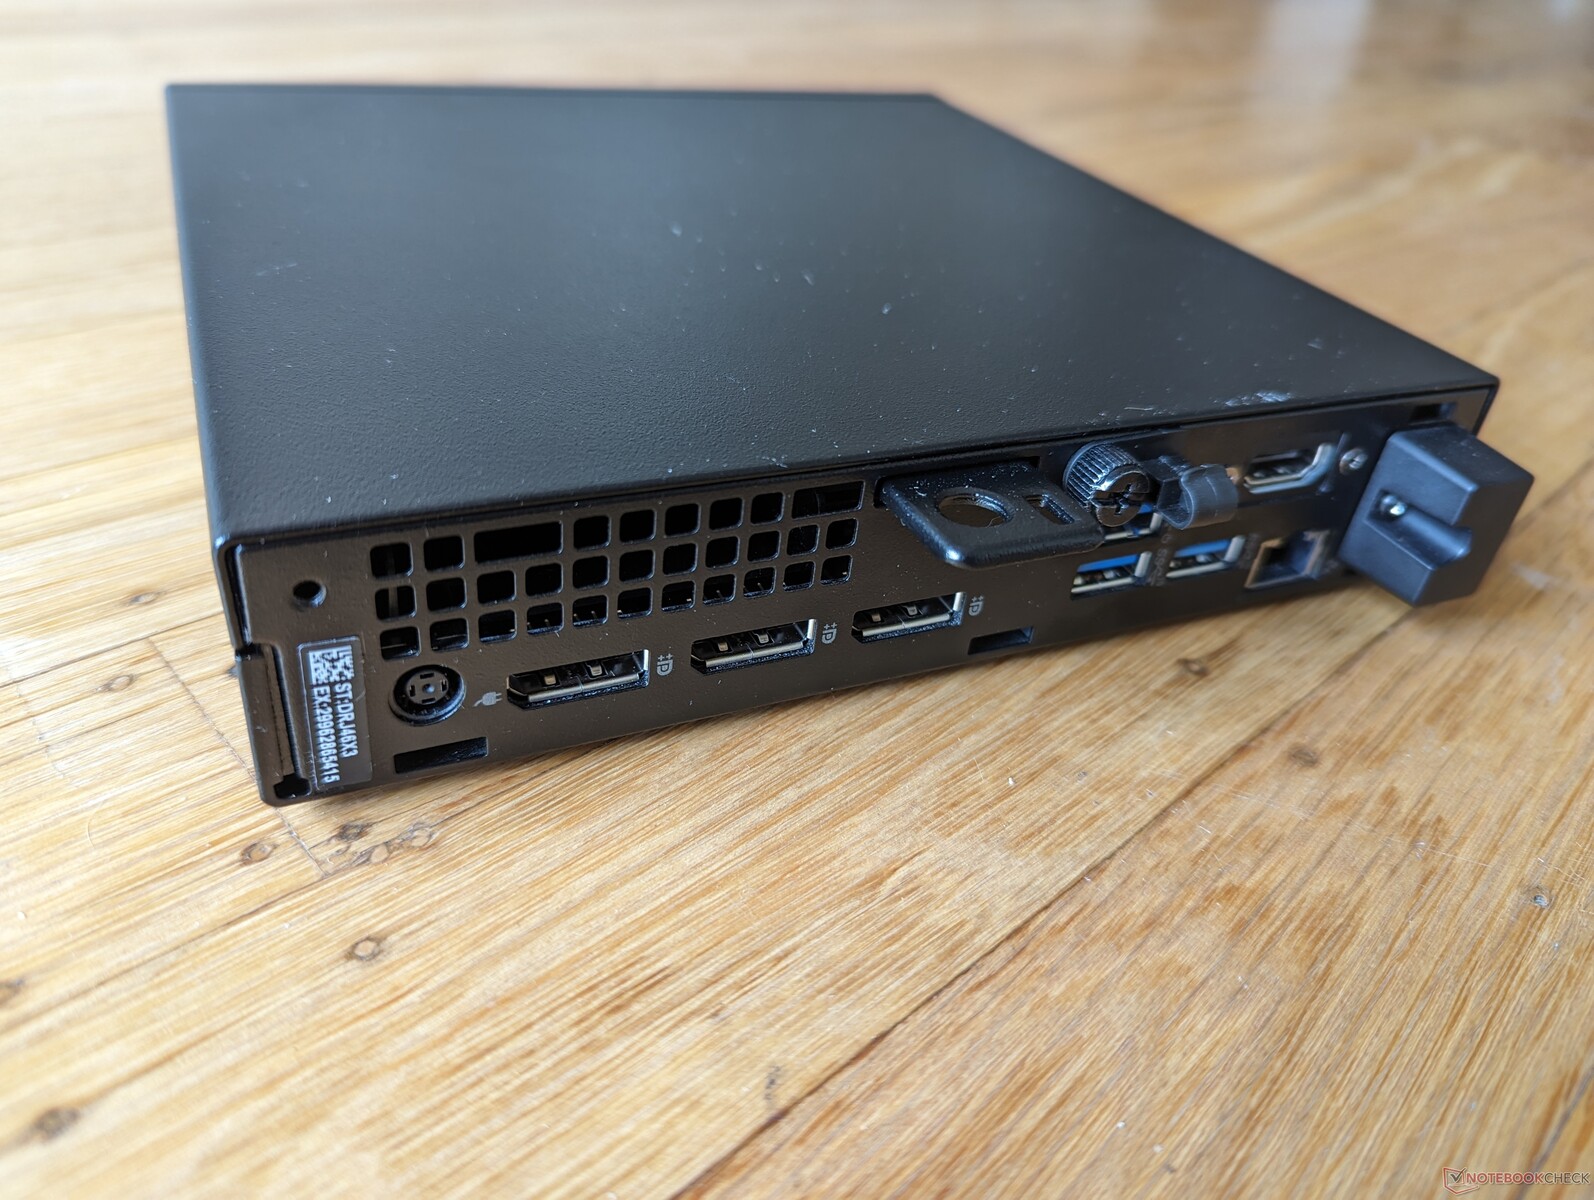
Die Anschlussoptionen sind vielfältig, wobei die vier einzelnen Videoausgänge besonders bemerkenswert sind. Allerdings unterstützt der einzelne USB-C-Anschluss im Gegensatz zu den USB-C-Anschlüssen der meisten Intel NUCs oder Beelink-Mini-PCs weder USB4 noch Thunderbolt, Power Delivery oder sogar DisplayPort.
Kommunikation
Der mitgelieferte Intel AX211 bietet Wi-Fi 6E und Bluetooth 5.3-Konnektivität. Die Leistung ist zuverlässig, und es gibt kaum Unterschiede zwischen den 5-GHz- und 6-GHz-Netzwerken.
| Networking | |
| iperf3 transmit AXE11000 | |
| Apple Mac Mini M2 | |
| Beelink SER7 | |
| GMK NucBox K3 Pro | |
| Beelink GTR7 7840HS | |
| Dell OptiPlex Micro | |
| Lenovo IdeaCentre Mini 01IRH8 | |
| iperf3 receive AXE11000 | |
| Apple Mac Mini M2 | |
| GMK NucBox K3 Pro | |
| Beelink GTR7 7840HS | |
| Beelink SER7 | |
| Dell OptiPlex Micro | |
| Lenovo IdeaCentre Mini 01IRH8 | |
| iperf3 transmit AXE11000 6GHz | |
| Dell OptiPlex Micro | |
| iperf3 receive AXE11000 6GHz | |
| Dell OptiPlex Micro | |
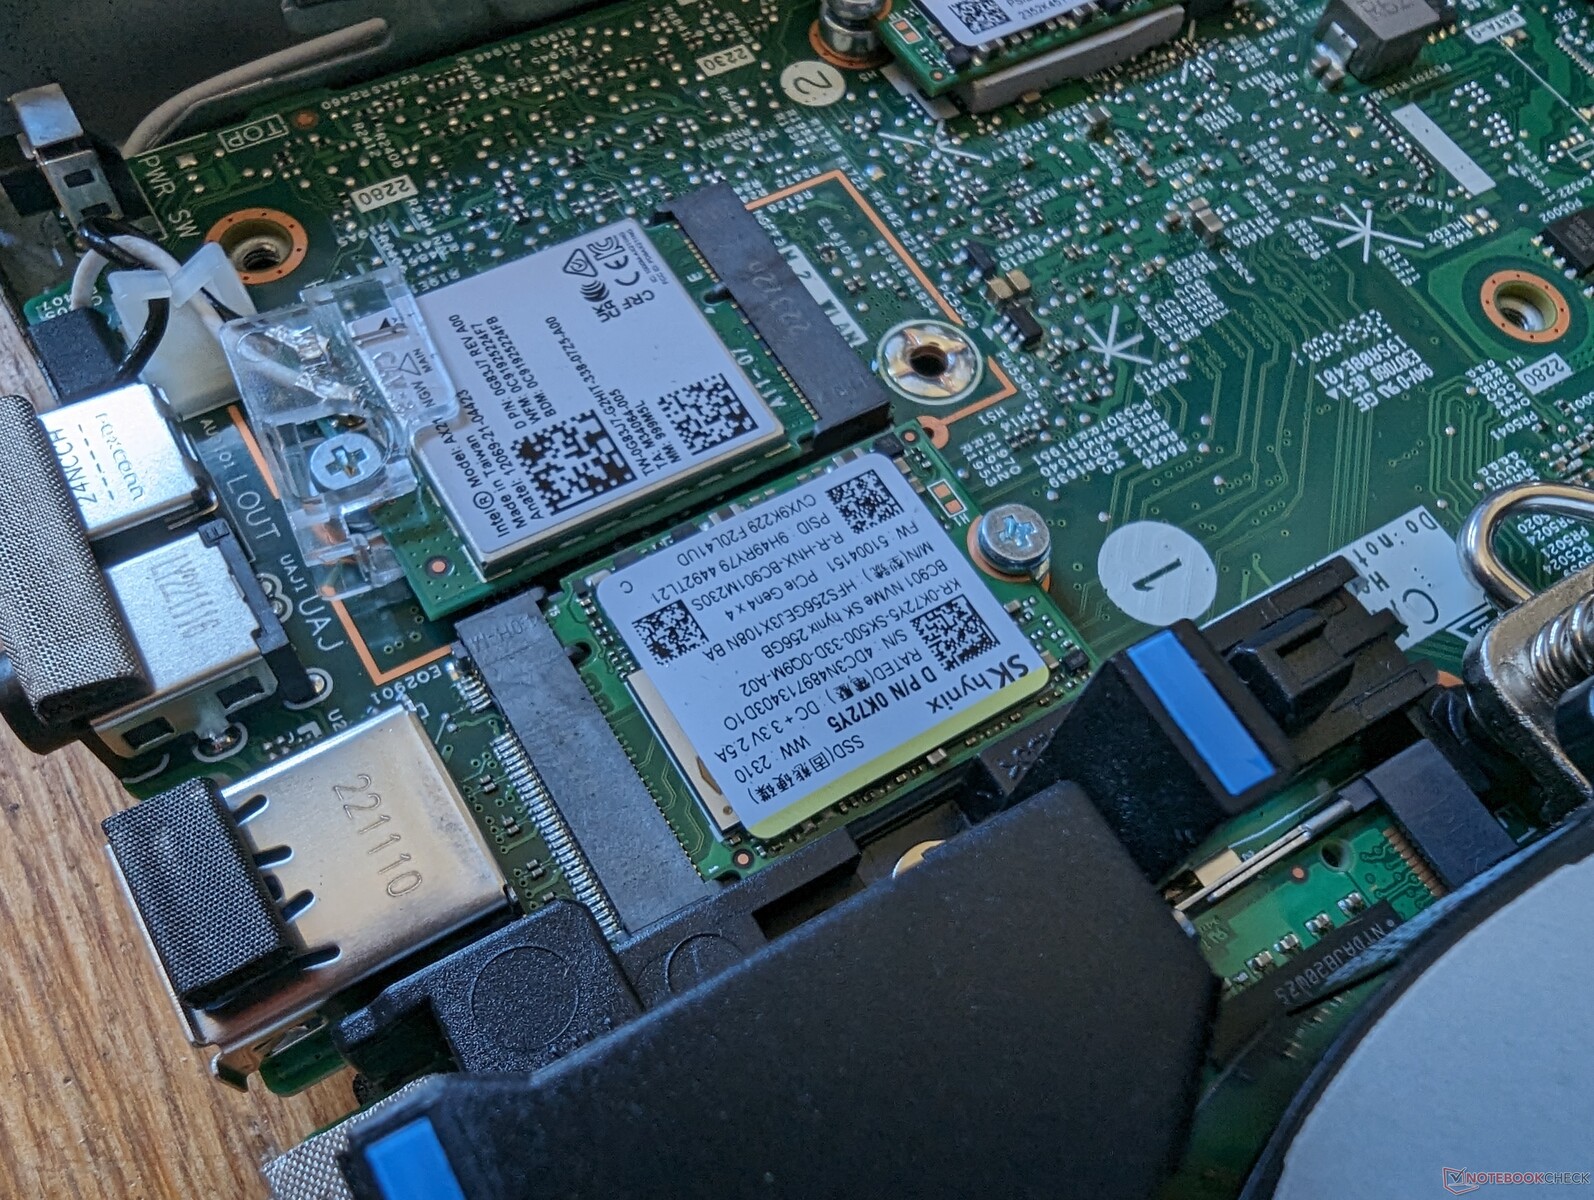
Wartung
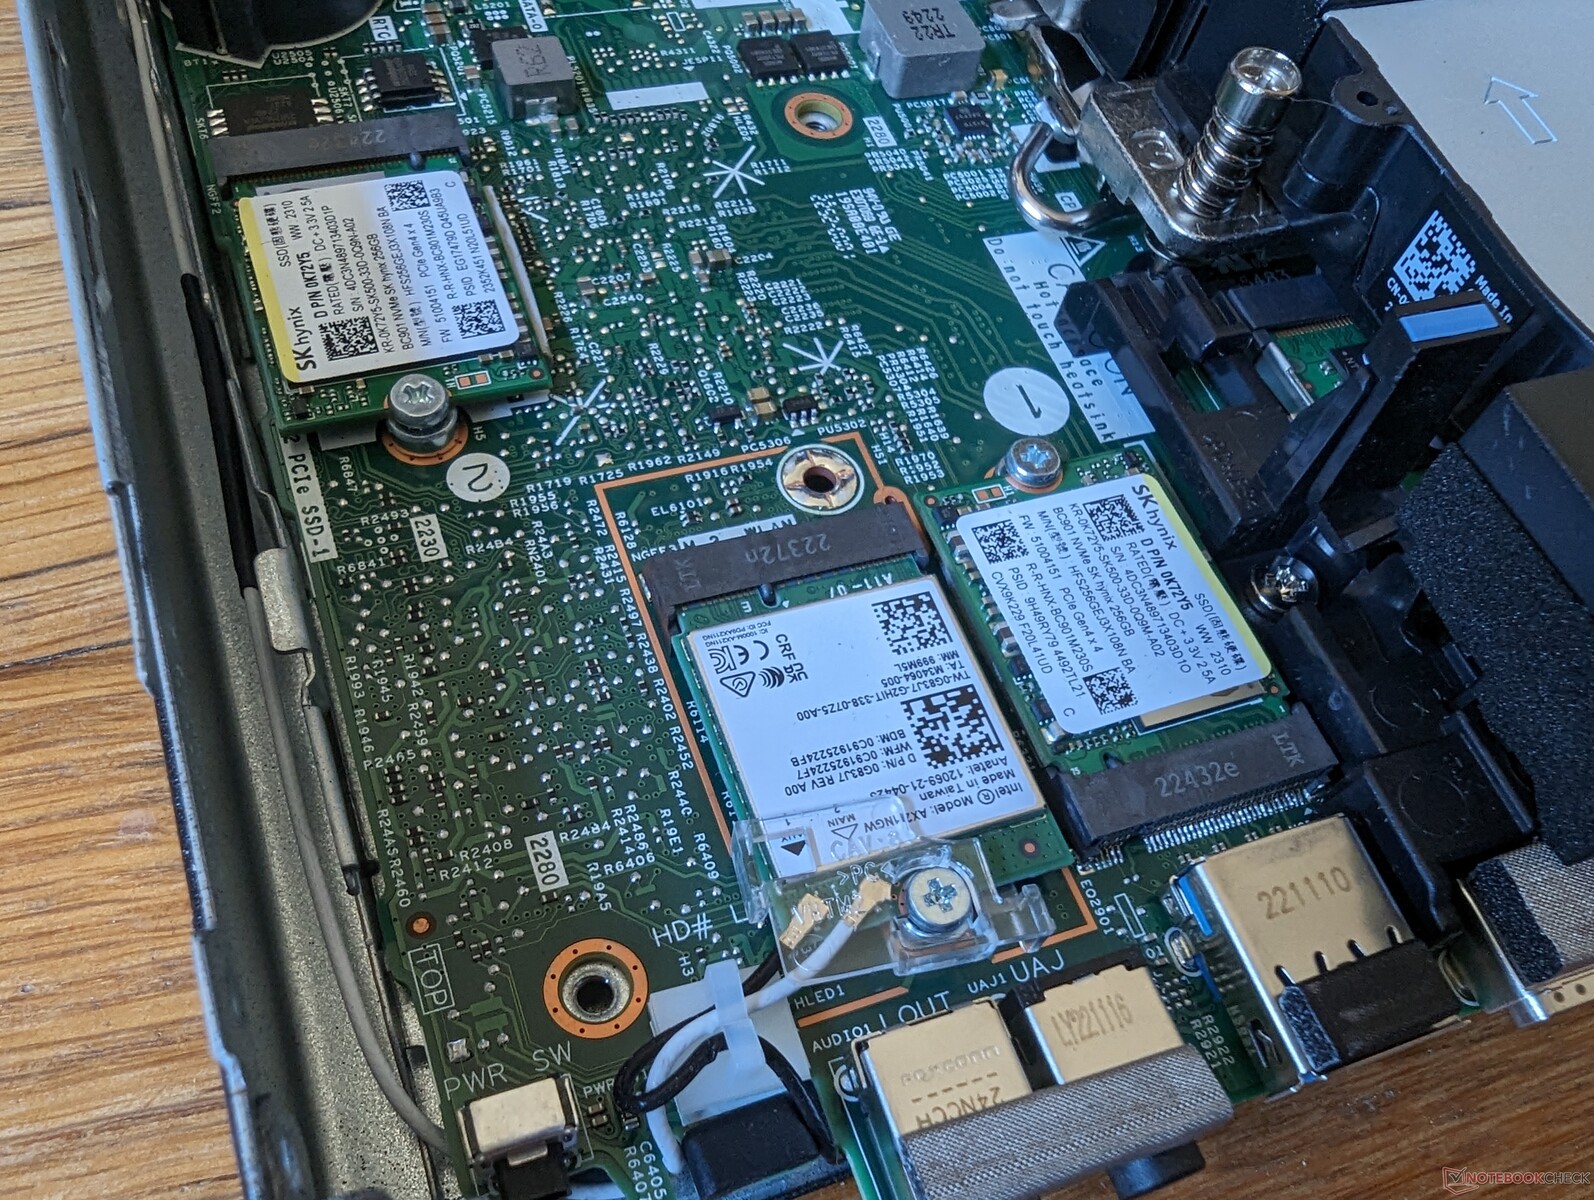
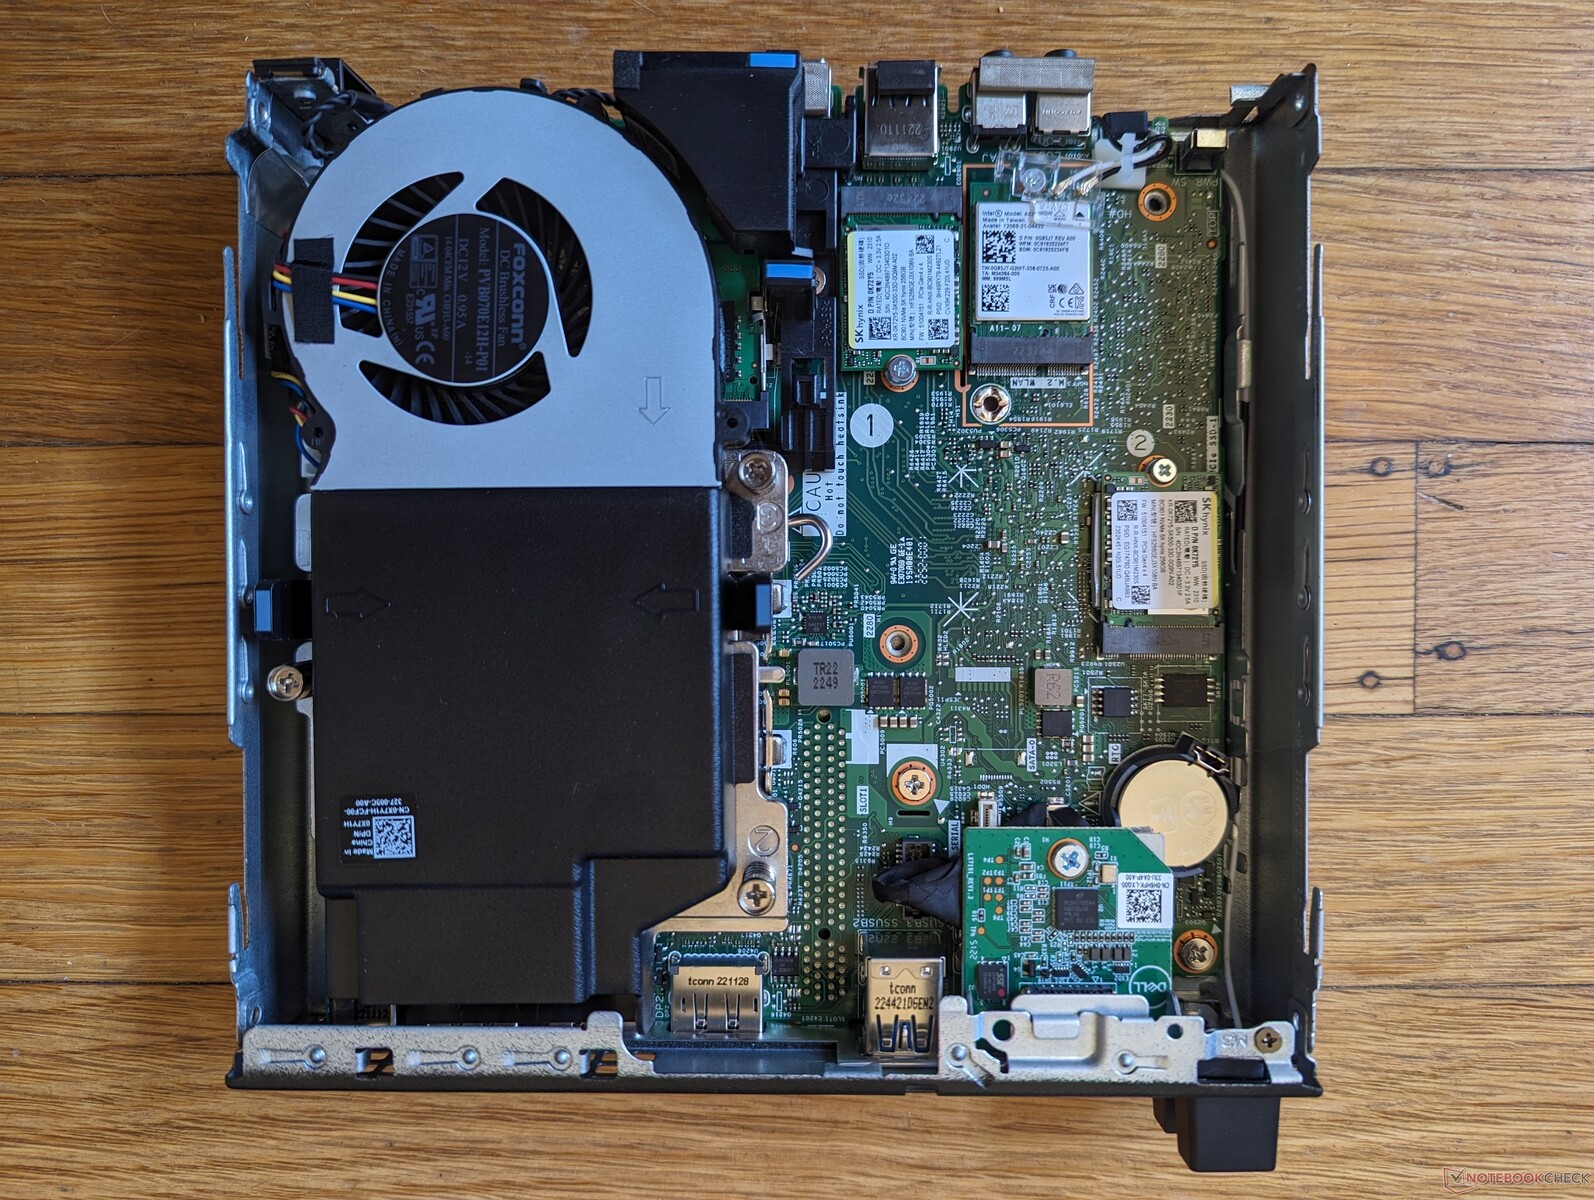
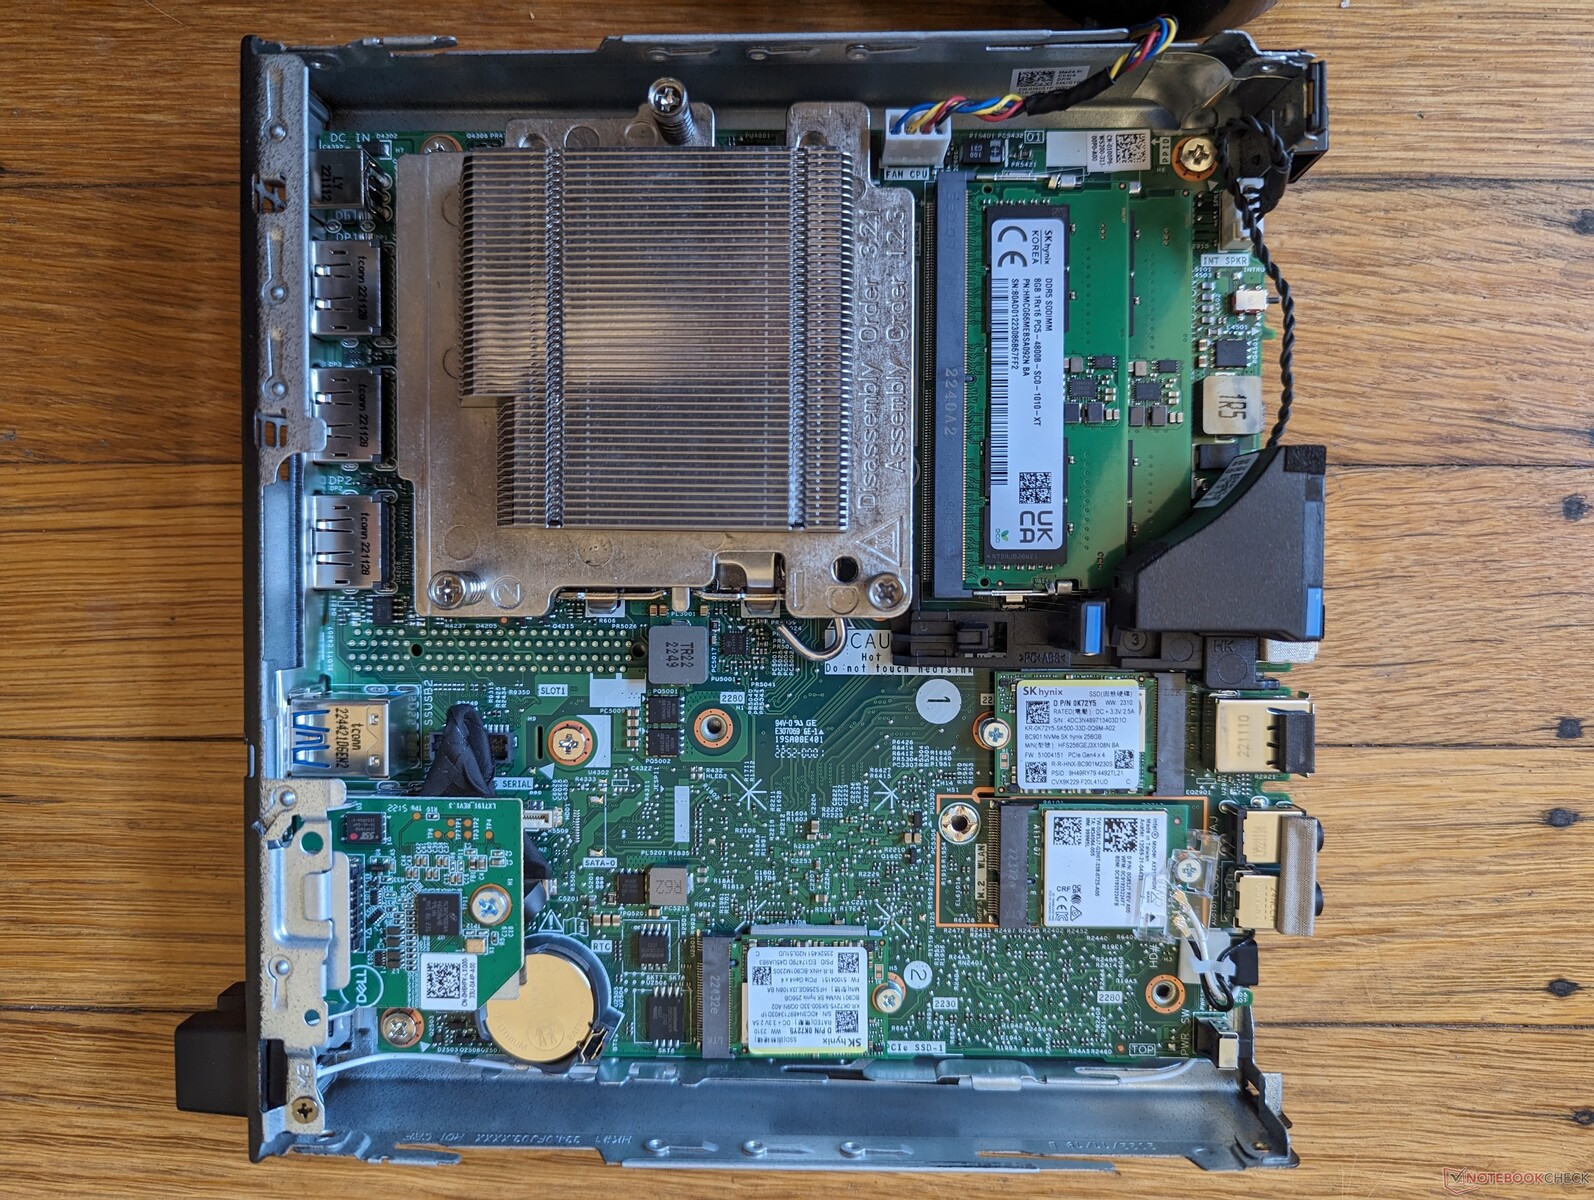
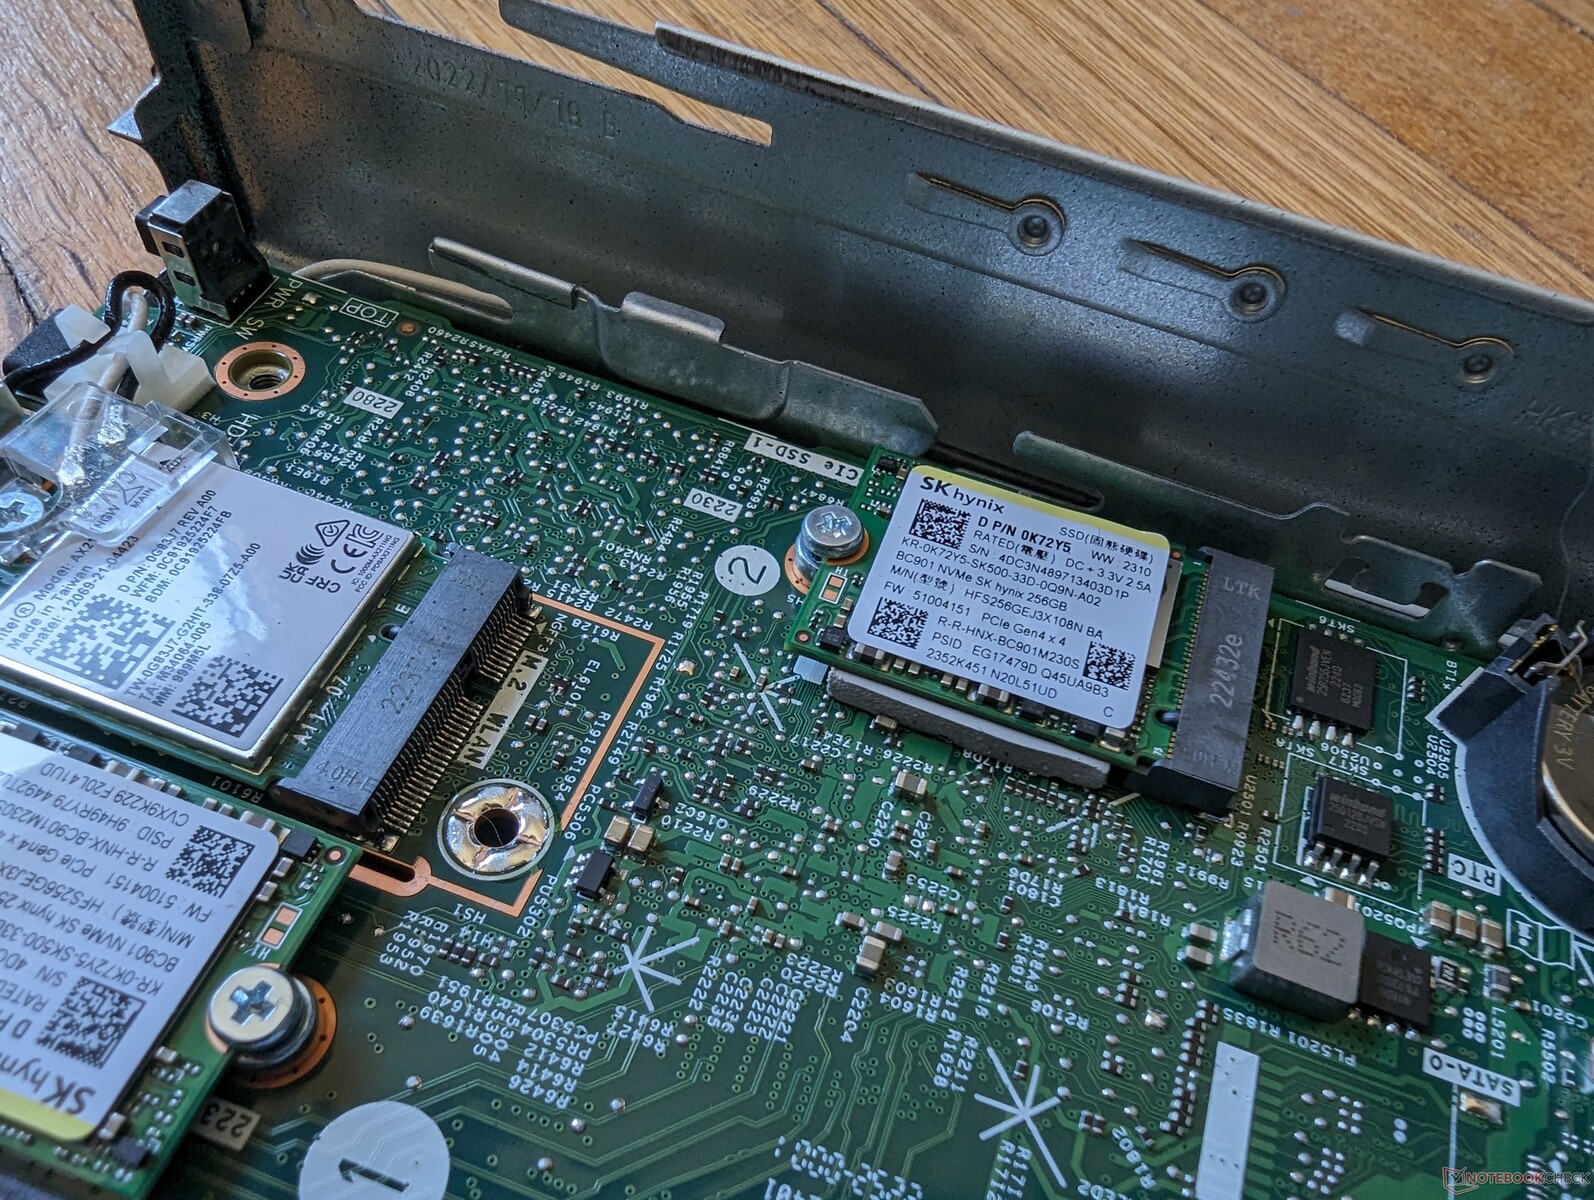
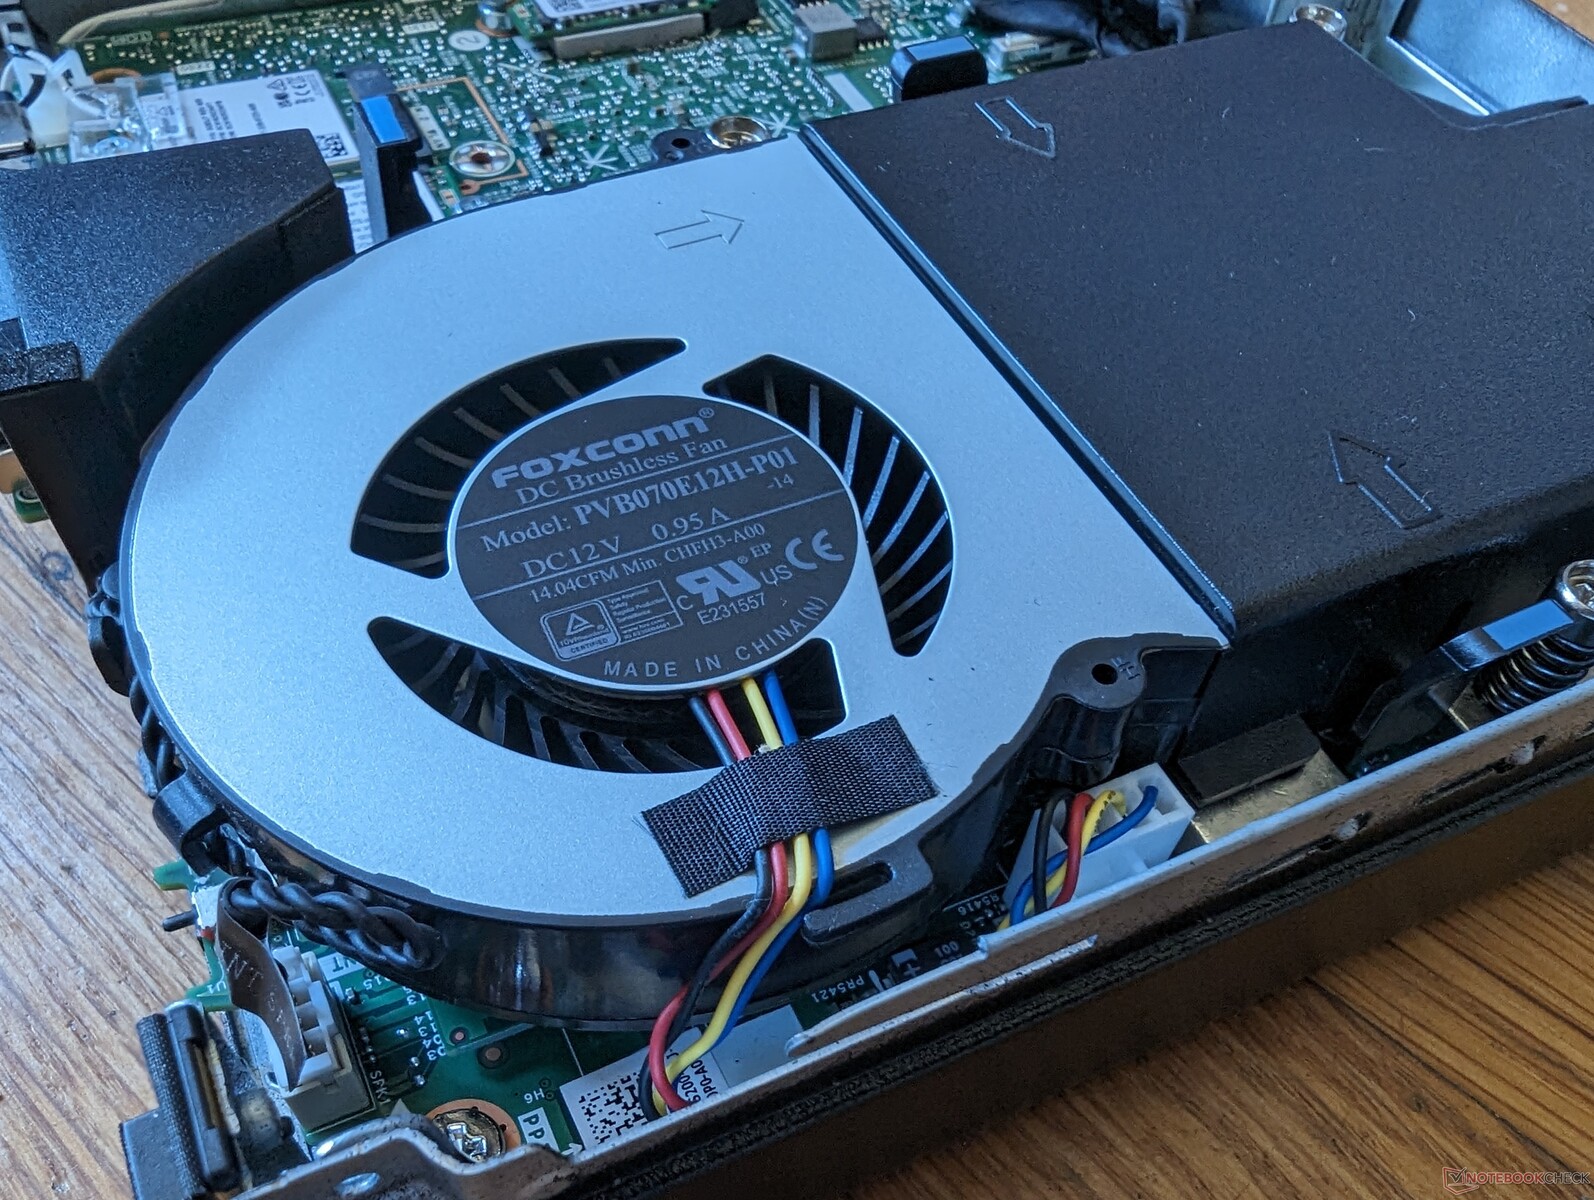
Nach dem Entfernen einer einzigen Schraube an der Rückseite lässt sich die obere Abdeckung leicht abnehmen, um das herausnehmbare WLAN-Modul und zwei SSD-Slots freizulegen. Der Lüfter muss entfernt werden, um Zugang zu den beiden SODIMM-Slots, zu erhalten, aber der gesamte Vorgang ist werkzeuglos und somit einfach zu bedienen.
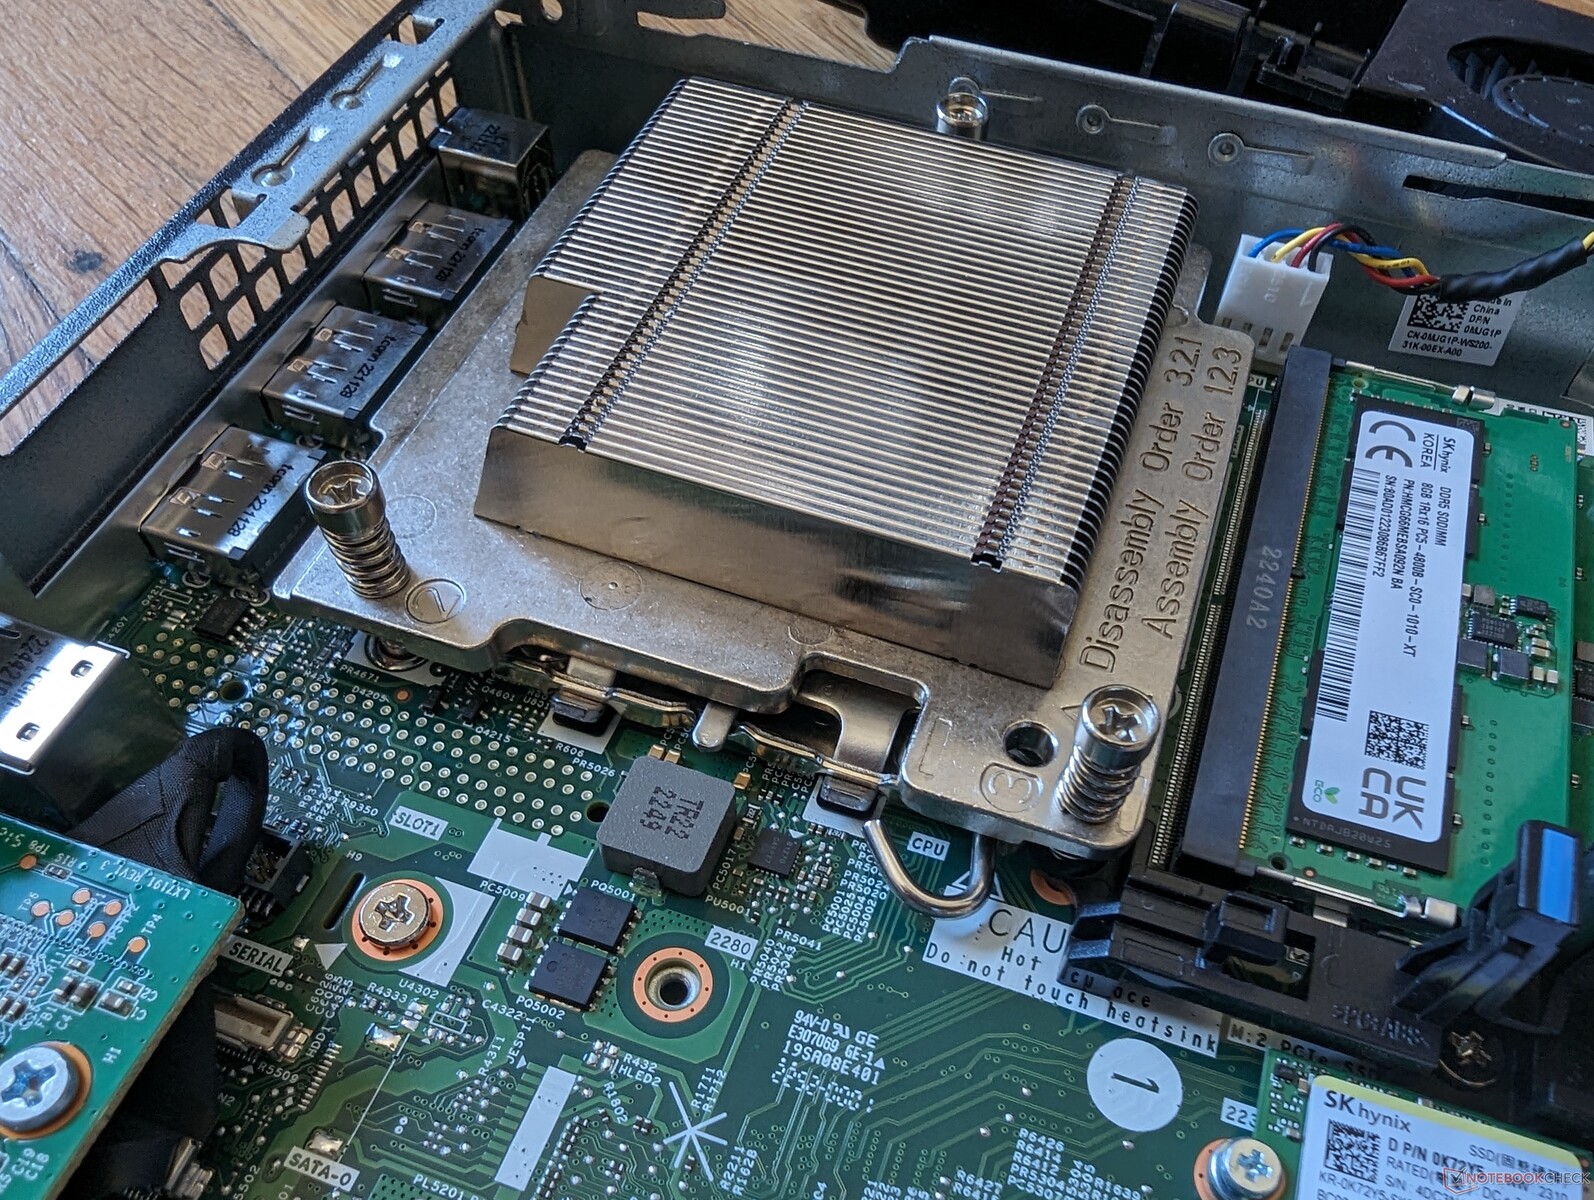
Im Gegensatz zu den meisten anderen Mini-PCs ist der FCLGA1700-Prozessor herausnehmbar und ersetztbar.
Zubehör & Garantie
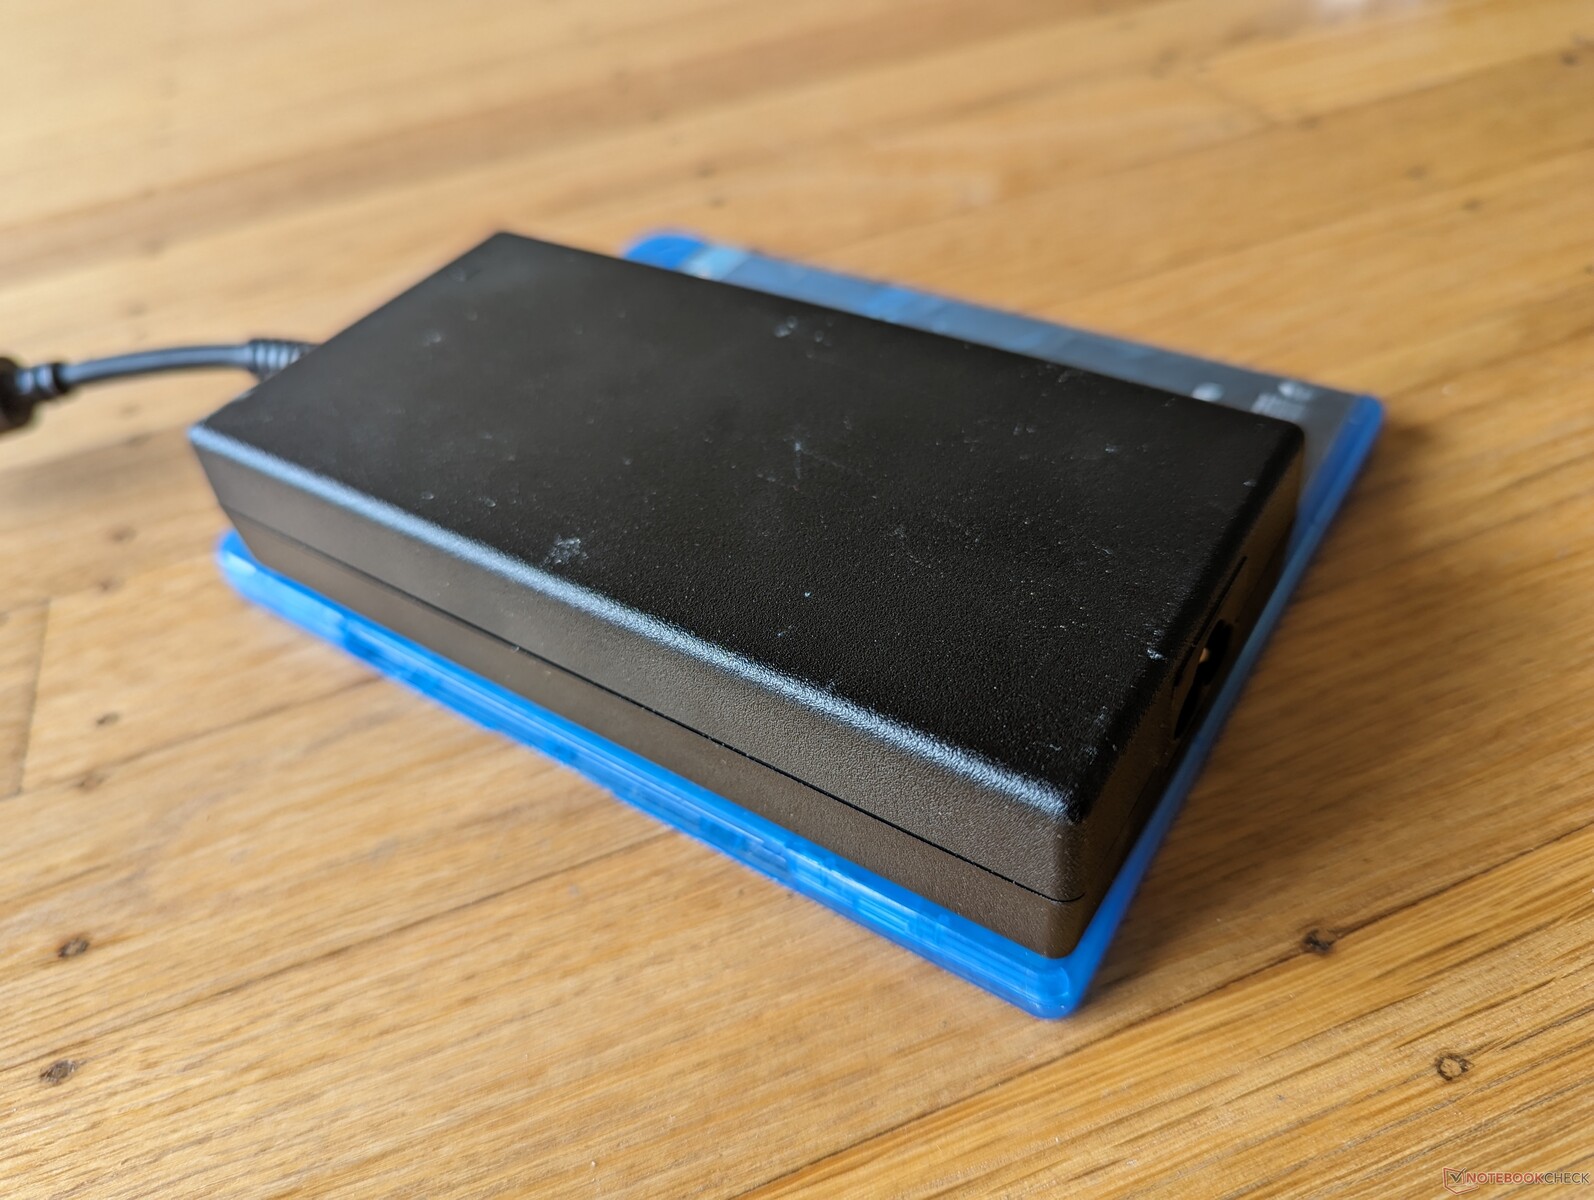
Abgesehen vom externen Netzteil und dem Papierkram gibt es keine weiteren Extras in der Verpackung. Es ist bedauerlich, dass der vertikale Ständer separat verkauft wird, da das System ziemlich leicht umkippen kann.
Wie bei den meisten anderen High-End-Business-PCs von Dell gilt eine dreijährige eingeschränkte Herstellergarantie.
Leistung - Desktop-CPU-Leistung
Testbedingungen
Wir haben Windows in den Performance-Modus versetzt, bevor wir die folgenden Benchmarks durchgeführt haben. Obwohl der Dell Optimizer vorinstalliert ist, bietet er im Gegensatz zu den meisten Dell-Notebooks keine speziellen Energieprofile.
Prozessor
Die CPU-Leistung ist für diesen Formfaktor beeindruckend. Im Vergleich zum Core i7-13700H der H-Serie, der in Laptops wie dem Inspiron 16 Plus 7630 zu finden ist, bietet unser Core i7-13700 der Desktop-Serie eine Multi-Thread-Leistung, die um 15 bis 30 Prozent schneller ist. Dies ist hauptsächlich auf die höhere Leistungsaufnahme und die schnelleren Taktraten zurückzuführen. Besonders bei CPU-lastigen Aufgaben zeigt unser Prozessor seine Vorteile gegenüber dem Apple M2.
Leider neigt der Core i7-13700 im OptiPlex Micro eher zum Throttling im Vergleich zu einem größeren Desktop-Rechner mit demselben Prozessor. Unser Referenz Core i7-13700, der in einem vollwertigen Tower läuft, würde zum Beispiel bei Multi-Thread-Benchmarks 40 bis 60 Prozent schnellere Ergebnisse liefern als unser Mini-PC. Das bedeutet nicht, dass das Dell-Gerät langsam ist, aber es ist unbestreitbar, dass seine kleine Kühllösung ein begrenzender Faktor ist. Wenn wir beispielsweise CineBench R15 xT in einem Loop ausführen, sinkt die Leistung nach den ersten paar Durchläufen um etwa 20 Prozent, was auf ein Throttling-Verhalten hinweist.
Cinebench R15 Multi Dauertest
Cinebench R23: Multi Core | Single Core
Cinebench R20: CPU (Multi Core) | CPU (Single Core)
Cinebench R15: CPU Multi 64Bit | CPU Single 64Bit
Blender: v2.79 BMW27 CPU
7-Zip 18.03: 7z b 4 | 7z b 4 -mmt1
Geekbench 5.5: Multi-Core | Single-Core
HWBOT x265 Benchmark v2.2: 4k Preset
LibreOffice : 20 Documents To PDF
R Benchmark 2.5: Overall mean
| CPU Performance Rating | |
| Intel Core i7-13700 | |
| Durchschnittliche Intel Core i7-13700 | |
| Dell OptiPlex Micro | |
| Alienware m16 R1 Intel | |
| Beelink GTR7 7840HS | |
| Lenovo IdeaCentre Mini 01IRH8 | |
| Intel NUC 12, NUC12SNKi72_Serpent Canyon | |
| GMK NucBox K3 Pro | |
| Acemagic AM20 | |
| Apple Mac Mini M2 -5! | |
| Geekom A5 | |
| Acemagic AD15 | |
| Minisforum Venus Series UN1245 | |
| Cinebench R23 / Multi Core | |
| Intel Core i7-13700 | |
| Durchschnittliche Intel Core i7-13700 (21013 - 29725, n=2) | |
| Alienware m16 R1 Intel | |
| Dell OptiPlex Micro | |
| Beelink GTR7 7840HS | |
| Intel NUC 12, NUC12SNKi72_Serpent Canyon | |
| Lenovo IdeaCentre Mini 01IRH8 | |
| Acemagic AM20 | |
| Geekom A5 | |
| GMK NucBox K3 Pro | |
| Acemagic AD15 | |
| Minisforum Venus Series UN1245 | |
| Apple Mac Mini M2 | |
| Cinebench R23 / Single Core | |
| Intel Core i7-13700 | |
| Durchschnittliche Intel Core i7-13700 (1997 - 2020, n=2) | |
| Dell OptiPlex Micro | |
| Alienware m16 R1 Intel | |
| Lenovo IdeaCentre Mini 01IRH8 | |
| Beelink GTR7 7840HS | |
| Intel NUC 12, NUC12SNKi72_Serpent Canyon | |
| GMK NucBox K3 Pro | |
| Minisforum Venus Series UN1245 | |
| Apple Mac Mini M2 | |
| Acemagic AM20 | |
| Acemagic AD15 | |
| Geekom A5 | |
| Cinebench R20 / CPU (Multi Core) | |
| Intel Core i7-13700 | |
| Durchschnittliche Intel Core i7-13700 (7027 - 11361, n=2) | |
| Alienware m16 R1 Intel | |
| Dell OptiPlex Micro | |
| Beelink GTR7 7840HS | |
| Intel NUC 12, NUC12SNKi72_Serpent Canyon | |
| Lenovo IdeaCentre Mini 01IRH8 | |
| Acemagic AM20 | |
| Geekom A5 | |
| GMK NucBox K3 Pro | |
| Acemagic AD15 | |
| Minisforum Venus Series UN1245 | |
| Apple Mac Mini M2 | |
| Cinebench R20 / CPU (Single Core) | |
| Intel Core i7-13700 | |
| Durchschnittliche Intel Core i7-13700 (703 - 776, n=2) | |
| Alienware m16 R1 Intel | |
| Lenovo IdeaCentre Mini 01IRH8 | |
| Beelink GTR7 7840HS | |
| Dell OptiPlex Micro | |
| Intel NUC 12, NUC12SNKi72_Serpent Canyon | |
| GMK NucBox K3 Pro | |
| Minisforum Venus Series UN1245 | |
| Acemagic AM20 | |
| Acemagic AD15 | |
| Geekom A5 | |
| Apple Mac Mini M2 | |
| Cinebench R15 / CPU Multi 64Bit | |
| Intel Core i7-13700 | |
| Durchschnittliche Intel Core i7-13700 (2986 - 4398, n=2) | |
| Alienware m16 R1 Intel | |
| Dell OptiPlex Micro | |
| Beelink GTR7 7840HS | |
| Intel NUC 12, NUC12SNKi72_Serpent Canyon | |
| Lenovo IdeaCentre Mini 01IRH8 | |
| Acemagic AM20 | |
| Geekom A5 | |
| GMK NucBox K3 Pro | |
| Acemagic AD15 | |
| Minisforum Venus Series UN1245 | |
| Apple Mac Mini M2 | |
| Cinebench R15 / CPU Single 64Bit | |
| Intel Core i7-13700 | |
| Beelink GTR7 7840HS | |
| Durchschnittliche Intel Core i7-13700 (279 - 291, n=2) | |
| Dell OptiPlex Micro | |
| Alienware m16 R1 Intel | |
| Lenovo IdeaCentre Mini 01IRH8 | |
| Intel NUC 12, NUC12SNKi72_Serpent Canyon | |
| GMK NucBox K3 Pro | |
| Acemagic AM20 | |
| Minisforum Venus Series UN1245 | |
| Apple Mac Mini M2 | |
| Geekom A5 | |
| Acemagic AD15 | |
| Blender / v2.79 BMW27 CPU | |
| Apple Mac Mini M2 | |
| Minisforum Venus Series UN1245 | |
| GMK NucBox K3 Pro | |
| Acemagic AD15 | |
| Geekom A5 | |
| Acemagic AM20 | |
| Beelink GTR7 7840HS | |
| Lenovo IdeaCentre Mini 01IRH8 | |
| Intel NUC 12, NUC12SNKi72_Serpent Canyon | |
| Dell OptiPlex Micro | |
| Alienware m16 R1 Intel | |
| Durchschnittliche Intel Core i7-13700 (111 - 178, n=2) | |
| Intel Core i7-13700 | |
| 7-Zip 18.03 / 7z b 4 | |
| Intel Core i7-13700 | |
| Durchschnittliche Intel Core i7-13700 (74475 - 108733, n=2) | |
| Alienware m16 R1 Intel | |
| Dell OptiPlex Micro | |
| Beelink GTR7 7840HS | |
| Intel NUC 12, NUC12SNKi72_Serpent Canyon | |
| Lenovo IdeaCentre Mini 01IRH8 | |
| Geekom A5 | |
| Acemagic AM20 | |
| Acemagic AD15 | |
| GMK NucBox K3 Pro | |
| Minisforum Venus Series UN1245 | |
| 7-Zip 18.03 / 7z b 4 -mmt1 | |
| Intel Core i7-13700 | |
| Beelink GTR7 7840HS | |
| Durchschnittliche Intel Core i7-13700 (6466 - 6819, n=2) | |
| Dell OptiPlex Micro | |
| Alienware m16 R1 Intel | |
| Lenovo IdeaCentre Mini 01IRH8 | |
| Intel NUC 12, NUC12SNKi72_Serpent Canyon | |
| GMK NucBox K3 Pro | |
| Acemagic AD15 | |
| Acemagic AM20 | |
| Geekom A5 | |
| Minisforum Venus Series UN1245 | |
| Geekbench 5.5 / Multi-Core | |
| Intel Core i7-13700 | |
| Durchschnittliche Intel Core i7-13700 (15525 - 19602, n=2) | |
| Dell OptiPlex Micro | |
| Alienware m16 R1 Intel | |
| Beelink GTR7 7840HS | |
| Lenovo IdeaCentre Mini 01IRH8 | |
| Intel NUC 12, NUC12SNKi72_Serpent Canyon | |
| GMK NucBox K3 Pro | |
| Apple Mac Mini M2 | |
| Geekom A5 | |
| Acemagic AM20 | |
| Acemagic AD15 | |
| Minisforum Venus Series UN1245 | |
| Geekbench 5.5 / Single-Core | |
| Beelink GTR7 7840HS | |
| Intel Core i7-13700 | |
| Durchschnittliche Intel Core i7-13700 (1958 - 2009, n=2) | |
| Dell OptiPlex Micro | |
| Apple Mac Mini M2 | |
| Alienware m16 R1 Intel | |
| Lenovo IdeaCentre Mini 01IRH8 | |
| GMK NucBox K3 Pro | |
| Minisforum Venus Series UN1245 | |
| Acemagic AD15 | |
| Intel NUC 12, NUC12SNKi72_Serpent Canyon | |
| Acemagic AM20 | |
| Geekom A5 | |
| HWBOT x265 Benchmark v2.2 / 4k Preset | |
| Intel Core i7-13700 | |
| Durchschnittliche Intel Core i7-13700 (21.4 - 33.1, n=2) | |
| Alienware m16 R1 Intel | |
| Dell OptiPlex Micro | |
| Intel NUC 12, NUC12SNKi72_Serpent Canyon | |
| Lenovo IdeaCentre Mini 01IRH8 | |
| Acemagic AM20 | |
| Geekom A5 | |
| GMK NucBox K3 Pro | |
| Acemagic AD15 | |
| Beelink GTR7 7840HS | |
| Minisforum Venus Series UN1245 | |
| LibreOffice / 20 Documents To PDF | |
| Geekom A5 | |
| Minisforum Venus Series UN1245 | |
| Acemagic AD15 | |
| Acemagic AM20 | |
| Alienware m16 R1 Intel | |
| Intel NUC 12, NUC12SNKi72_Serpent Canyon | |
| GMK NucBox K3 Pro | |
| Beelink GTR7 7840HS | |
| Lenovo IdeaCentre Mini 01IRH8 | |
| Dell OptiPlex Micro | |
| Durchschnittliche Intel Core i7-13700 (34.1 - 36.4, n=2) | |
| Intel Core i7-13700 | |
| R Benchmark 2.5 / Overall mean | |
| Acemagic AD15 | |
| Acemagic AM20 | |
| Geekom A5 | |
| Minisforum Venus Series UN1245 | |
| GMK NucBox K3 Pro | |
| Intel NUC 12, NUC12SNKi72_Serpent Canyon | |
| Lenovo IdeaCentre Mini 01IRH8 | |
| Alienware m16 R1 Intel | |
| Dell OptiPlex Micro | |
| Beelink GTR7 7840HS | |
| Durchschnittliche Intel Core i7-13700 (0.4075 - 0.423, n=2) | |
| Intel Core i7-13700 | |
Cinebench R23: Multi Core | Single Core
Cinebench R20: CPU (Multi Core) | CPU (Single Core)
Cinebench R15: CPU Multi 64Bit | CPU Single 64Bit
Blender: v2.79 BMW27 CPU
7-Zip 18.03: 7z b 4 | 7z b 4 -mmt1
Geekbench 5.5: Multi-Core | Single-Core
HWBOT x265 Benchmark v2.2: 4k Preset
LibreOffice : 20 Documents To PDF
R Benchmark 2.5: Overall mean
* ... kleinere Werte sind besser
AIDA64: FP32 Ray-Trace | FPU Julia | CPU SHA3 | CPU Queen | FPU SinJulia | FPU Mandel | CPU AES | CPU ZLib | FP64 Ray-Trace | CPU PhotoWorxx
| Performance Rating | |
| Beelink GTR7 7840HS | |
| Beelink SER7 | |
| Durchschnittliche Intel Core i7-13700 | |
| Dell OptiPlex Micro | |
| Lenovo IdeaCentre Mini 01IRH8 | |
| GMK NucBox K3 Pro | |
| AIDA64 / FP32 Ray-Trace | |
| Beelink GTR7 7840HS | |
| Beelink SER7 | |
| Durchschnittliche Intel Core i7-13700 (16408 - 29348, n=2) | |
| Dell OptiPlex Micro | |
| Lenovo IdeaCentre Mini 01IRH8 | |
| GMK NucBox K3 Pro | |
| AIDA64 / FPU Julia | |
| Beelink GTR7 7840HS | |
| Durchschnittliche Intel Core i7-13700 (83757 - 138865, n=2) | |
| Beelink SER7 | |
| Dell OptiPlex Micro | |
| Lenovo IdeaCentre Mini 01IRH8 | |
| GMK NucBox K3 Pro | |
| AIDA64 / CPU SHA3 | |
| Beelink GTR7 7840HS | |
| Durchschnittliche Intel Core i7-13700 (3648 - 6169, n=2) | |
| Beelink SER7 | |
| Dell OptiPlex Micro | |
| Lenovo IdeaCentre Mini 01IRH8 | |
| GMK NucBox K3 Pro | |
| AIDA64 / CPU Queen | |
| Durchschnittliche Intel Core i7-13700 (113697 - 128088, n=2) | |
| Beelink GTR7 7840HS | |
| Dell OptiPlex Micro | |
| Beelink SER7 | |
| Lenovo IdeaCentre Mini 01IRH8 | |
| GMK NucBox K3 Pro | |
| AIDA64 / FPU SinJulia | |
| Beelink GTR7 7840HS | |
| Beelink SER7 | |
| Durchschnittliche Intel Core i7-13700 (10833 - 15314, n=2) | |
| Dell OptiPlex Micro | |
| Lenovo IdeaCentre Mini 01IRH8 | |
| GMK NucBox K3 Pro | |
| AIDA64 / FPU Mandel | |
| Beelink GTR7 7840HS | |
| Beelink SER7 | |
| Durchschnittliche Intel Core i7-13700 (40920 - 72217, n=2) | |
| Dell OptiPlex Micro | |
| Lenovo IdeaCentre Mini 01IRH8 | |
| GMK NucBox K3 Pro | |
| AIDA64 / CPU AES | |
| Beelink GTR7 7840HS | |
| Beelink SER7 | |
| Durchschnittliche Intel Core i7-13700 (76357 - 120512, n=2) | |
| GMK NucBox K3 Pro | |
| Dell OptiPlex Micro | |
| Lenovo IdeaCentre Mini 01IRH8 | |
| AIDA64 / CPU ZLib | |
| Durchschnittliche Intel Core i7-13700 (1045 - 1703, n=2) | |
| Beelink GTR7 7840HS | |
| Dell OptiPlex Micro | |
| Lenovo IdeaCentre Mini 01IRH8 | |
| Beelink SER7 | |
| GMK NucBox K3 Pro | |
| AIDA64 / FP64 Ray-Trace | |
| Beelink GTR7 7840HS | |
| Beelink SER7 | |
| Durchschnittliche Intel Core i7-13700 (8712 - 16164, n=2) | |
| Dell OptiPlex Micro | |
| Lenovo IdeaCentre Mini 01IRH8 | |
| GMK NucBox K3 Pro | |
| AIDA64 / CPU PhotoWorxx | |
| GMK NucBox K3 Pro | |
| Durchschnittliche Intel Core i7-13700 (37819 - 48448, n=2) | |
| Beelink SER7 | |
| Beelink GTR7 7840HS | |
| Dell OptiPlex Micro | |
| Lenovo IdeaCentre Mini 01IRH8 | |
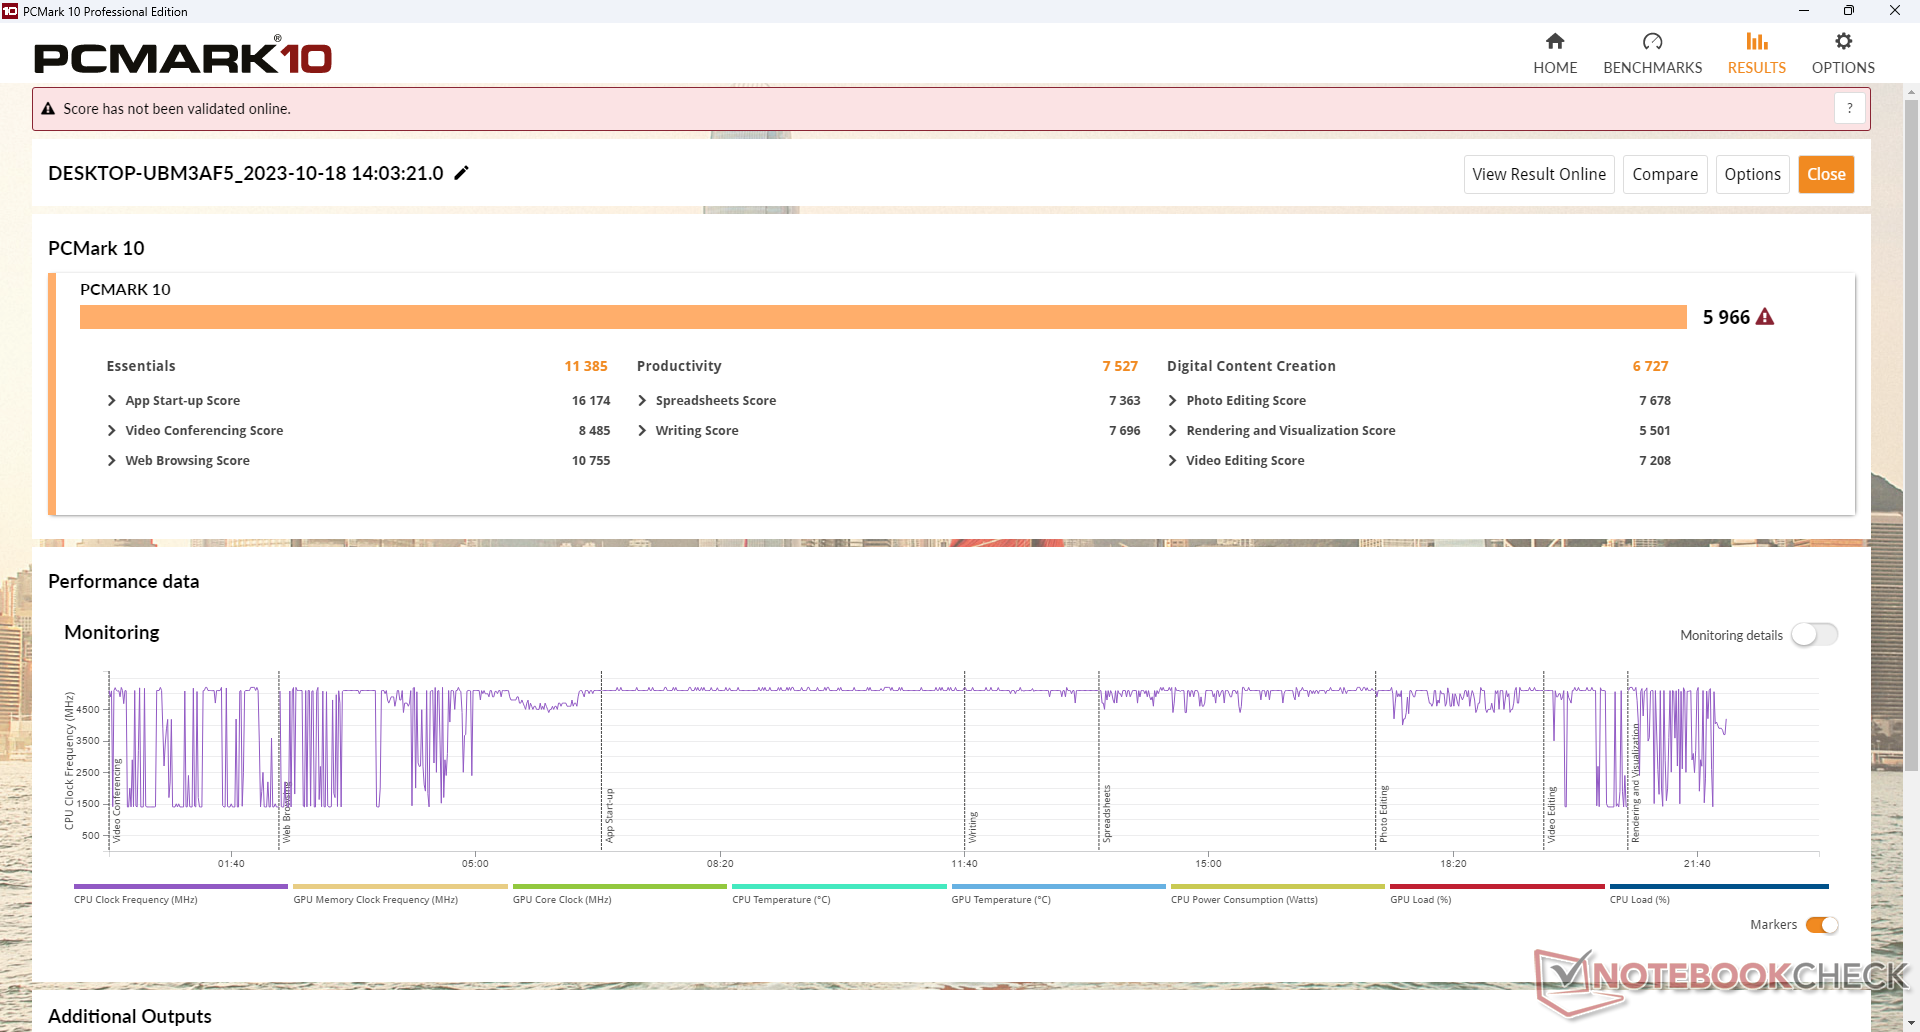
System Performance
Die PCMark-Ergebnisse sind vergleichbar mit denen der GMK NucBox K3 Pro, liegen jedoch noch hinter AMD-basierten Mini-PCs wie dem Beelink SER7. Dieser Rückstand kann größtenteils auf die schnellere integrierte Radeon GPU der konkurrierenden Ryzen Zen 3+ oder Zen 4 Plattformen zurückgeführt werden.
CrossMark: Overall | Productivity | Creativity | Responsiveness
| PCMark 10 / Score | |
| Beelink GTR7 7840HS | |
| Beelink SER7 | |
| Lenovo IdeaCentre Mini 01IRH8 | |
| Dell OptiPlex Micro | |
| Durchschnittliche Intel Core i7-13700, Intel UHD Graphics 770 (n=1) | |
| GMK NucBox K3 Pro | |
| PCMark 10 / Essentials | |
| Lenovo IdeaCentre Mini 01IRH8 | |
| Dell OptiPlex Micro | |
| Durchschnittliche Intel Core i7-13700, Intel UHD Graphics 770 (n=1) | |
| Beelink GTR7 7840HS | |
| Beelink SER7 | |
| GMK NucBox K3 Pro | |
| PCMark 10 / Productivity | |
| Beelink GTR7 7840HS | |
| Beelink SER7 | |
| GMK NucBox K3 Pro | |
| Lenovo IdeaCentre Mini 01IRH8 | |
| Dell OptiPlex Micro | |
| Durchschnittliche Intel Core i7-13700, Intel UHD Graphics 770 (n=1) | |
| PCMark 10 / Digital Content Creation | |
| Beelink GTR7 7840HS | |
| Beelink SER7 | |
| Lenovo IdeaCentre Mini 01IRH8 | |
| Dell OptiPlex Micro | |
| Durchschnittliche Intel Core i7-13700, Intel UHD Graphics 770 (n=1) | |
| GMK NucBox K3 Pro | |
| CrossMark / Overall | |
| Dell OptiPlex Micro | |
| Durchschnittliche Intel Core i7-13700, Intel UHD Graphics 770 (n=1) | |
| Lenovo IdeaCentre Mini 01IRH8 | |
| Beelink SER7 | |
| GMK NucBox K3 Pro | |
| Beelink GTR7 7840HS | |
| Apple Mac Mini M2 | |
| CrossMark / Productivity | |
| Dell OptiPlex Micro | |
| Durchschnittliche Intel Core i7-13700, Intel UHD Graphics 770 (n=1) | |
| Lenovo IdeaCentre Mini 01IRH8 | |
| Beelink SER7 | |
| Beelink GTR7 7840HS | |
| GMK NucBox K3 Pro | |
| Apple Mac Mini M2 | |
| CrossMark / Creativity | |
| Dell OptiPlex Micro | |
| Durchschnittliche Intel Core i7-13700, Intel UHD Graphics 770 (n=1) | |
| Beelink SER7 | |
| Lenovo IdeaCentre Mini 01IRH8 | |
| Apple Mac Mini M2 | |
| GMK NucBox K3 Pro | |
| Beelink GTR7 7840HS | |
| CrossMark / Responsiveness | |
| Beelink GTR7 7840HS | |
| Dell OptiPlex Micro | |
| Durchschnittliche Intel Core i7-13700, Intel UHD Graphics 770 (n=1) | |
| Lenovo IdeaCentre Mini 01IRH8 | |
| GMK NucBox K3 Pro | |
| Beelink SER7 | |
| Apple Mac Mini M2 | |
| PCMark 10 Score | 5966 Punkte | |
Hilfe | ||
| AIDA64 / Memory Copy | |
| GMK NucBox K3 Pro | |
| Beelink SER7 | |
| Beelink GTR7 7840HS | |
| Durchschnittliche Intel Core i7-13700 (61152 - 73900, n=2) | |
| Dell OptiPlex Micro | |
| Lenovo IdeaCentre Mini 01IRH8 | |
| AIDA64 / Memory Read | |
| Durchschnittliche Intel Core i7-13700 (71285 - 81167, n=2) | |
| Dell OptiPlex Micro | |
| GMK NucBox K3 Pro | |
| Beelink SER7 | |
| Beelink GTR7 7840HS | |
| Lenovo IdeaCentre Mini 01IRH8 | |
| AIDA64 / Memory Write | |
| Beelink SER7 | |
| Beelink GTR7 7840HS | |
| Durchschnittliche Intel Core i7-13700 (60029 - 73720, n=2) | |
| Dell OptiPlex Micro | |
| GMK NucBox K3 Pro | |
| Lenovo IdeaCentre Mini 01IRH8 | |
| AIDA64 / Memory Latency | |
| GMK NucBox K3 Pro | |
| Dell OptiPlex Micro | |
| Beelink GTR7 7840HS | |
| Beelink SER7 | |
| Lenovo IdeaCentre Mini 01IRH8 | |
| Durchschnittliche Intel Core i7-13700 (71.8 - 87, n=2) | |
* ... kleinere Werte sind besser
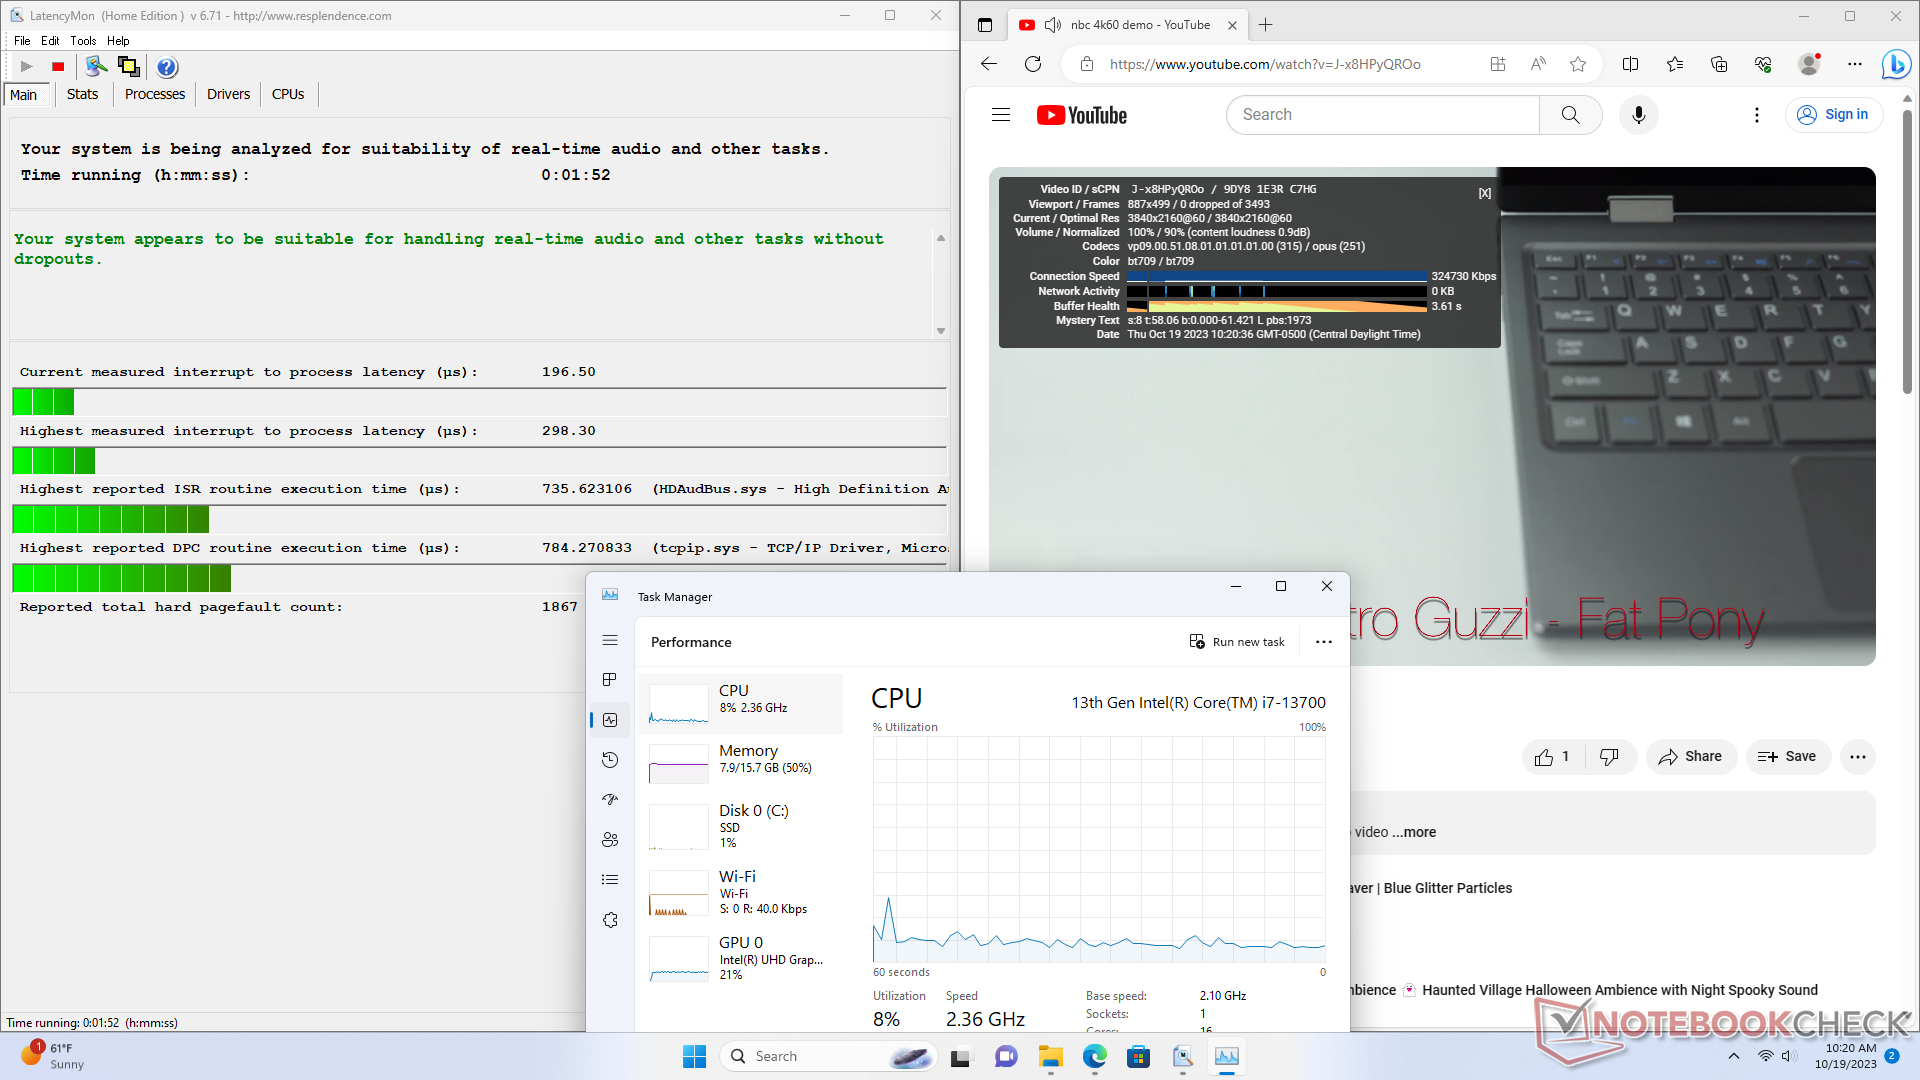
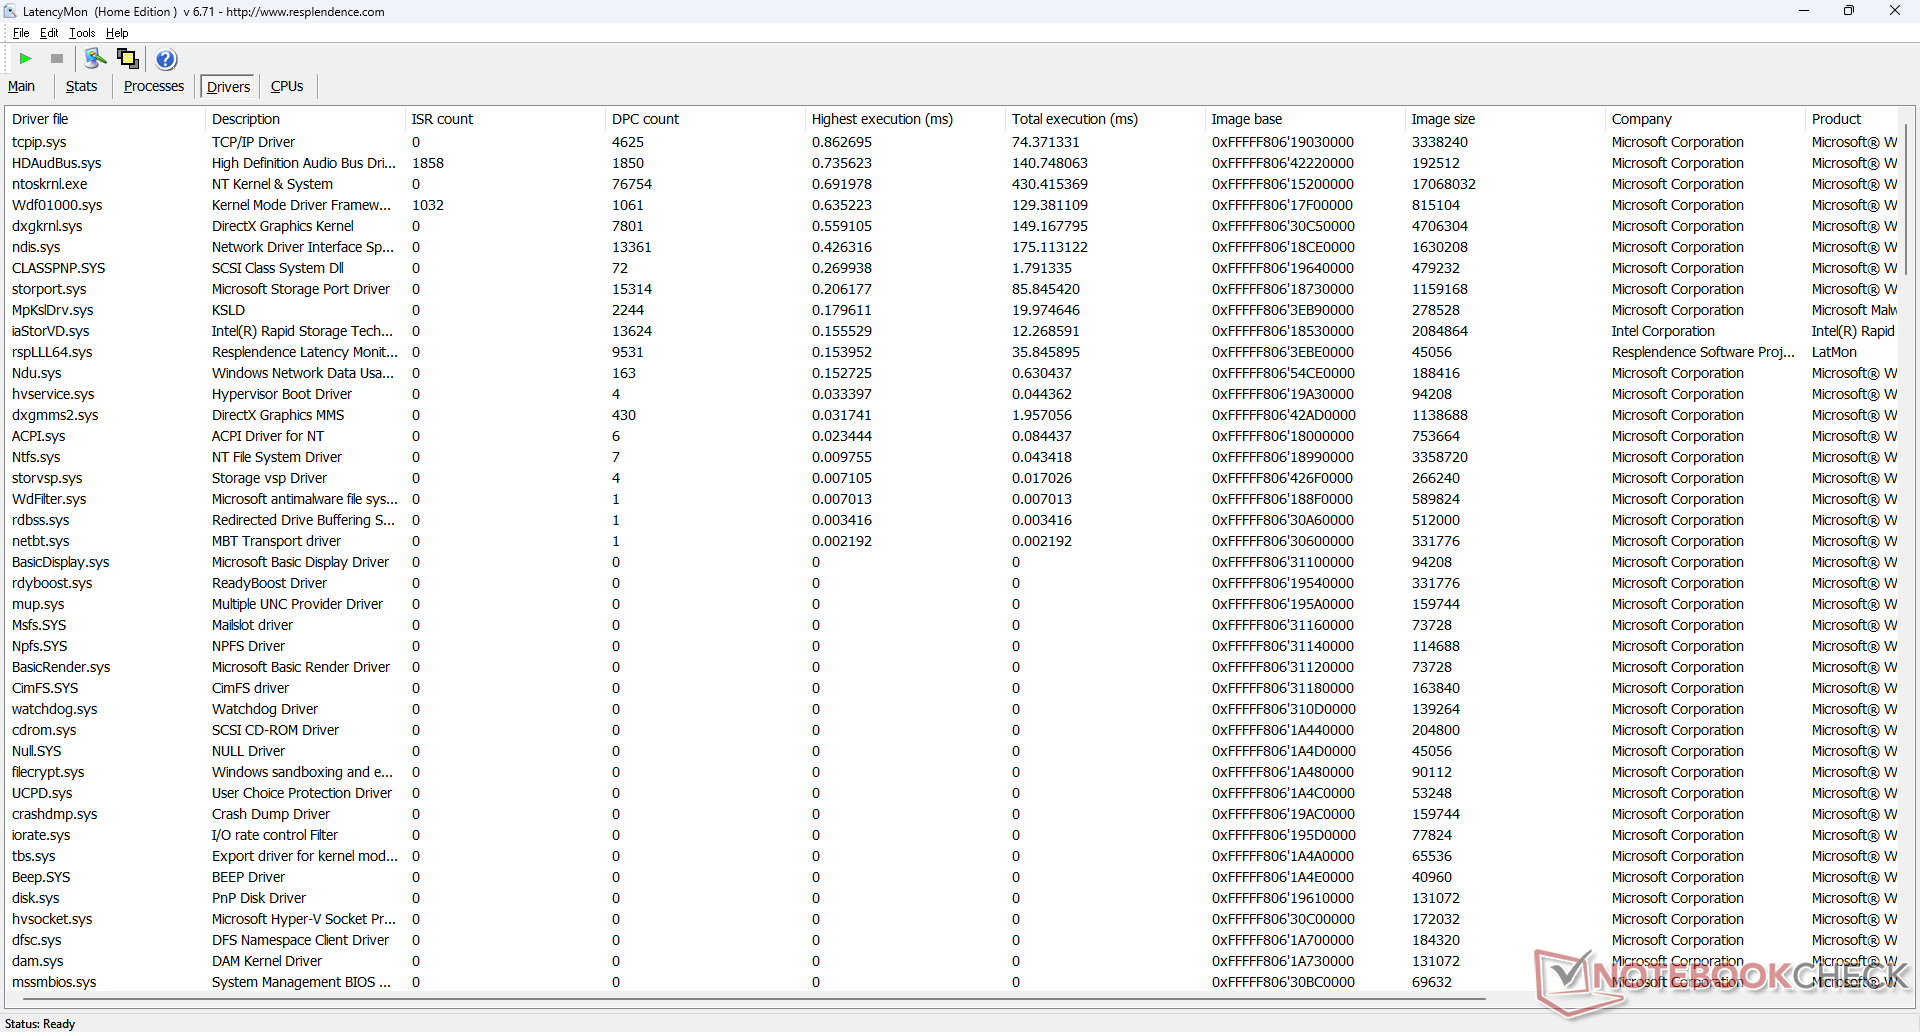
DPC-Latenzen
LatencyMon zeigt keine größeren DPC-Probleme, wenn mehrere Browser-Tabs unserer Homepage geöffnet werden, und es gibt keine Bildaussetzer bei der 4K-Wiedergabe mit 60 FPS.
| DPC Latencies / LatencyMon - interrupt to process latency (max), Web, Youtube, Prime95 | |
| Lenovo IdeaCentre Mini 01IRH8 | |
| GMK NucBox K3 Pro | |
| Beelink GTR7 7840HS | |
| Beelink SER7 | |
| Dell OptiPlex Micro | |
* ... kleinere Werte sind besser
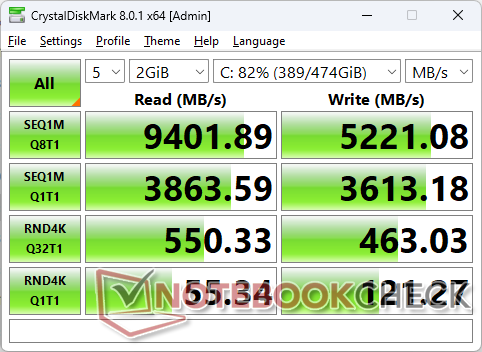
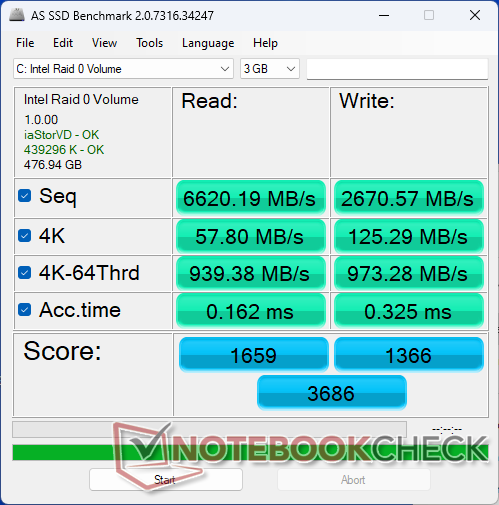
Massenspeicher
Unser Gerät verwendet zwei SK hynix BC901 NVMe-SSDs in einer RAID 0-Konfiguration, was ungewöhnlich ist, da jedes Laufwerk nur 30 mm lang ist, im Gegensatz zu den üblichen 80 mm. Die kürzere Länge und das Fehlen von Kühlkörpern bedeuten, dass eine Leistungsdrosselung wahrscheinlicher ist, wenn die Laufwerke belastet werden. Leider ist genau das der Fall, wie unsere DiskSpd-Dauertest-Ergebnisse unten zeigen: Die Übertragungsraten lagen nur während der ersten Minute oder so bei 8600 MB/s, bevor sie auf 1500 bis 2500 MB/s gedrosselt wurden.
Es ist wichtig zu beachten, dass das System bei Bedarf zwei vollständige 2280 M.2-SSDs unterstützen kann.

| Drive Performance Rating - Percent | |
| Beelink GTR7 7840HS | |
| Dell OptiPlex Micro | |
| Lenovo IdeaCentre Mini 01IRH8 | |
| Beelink SER7 | |
| GMK NucBox K3 Pro | |
* ... kleinere Werte sind besser
Disk-Throttling: DiskSpd Read Loop, 8 Runden
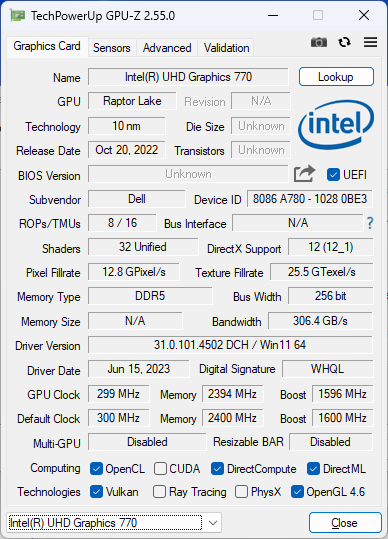
GPU-Leistung
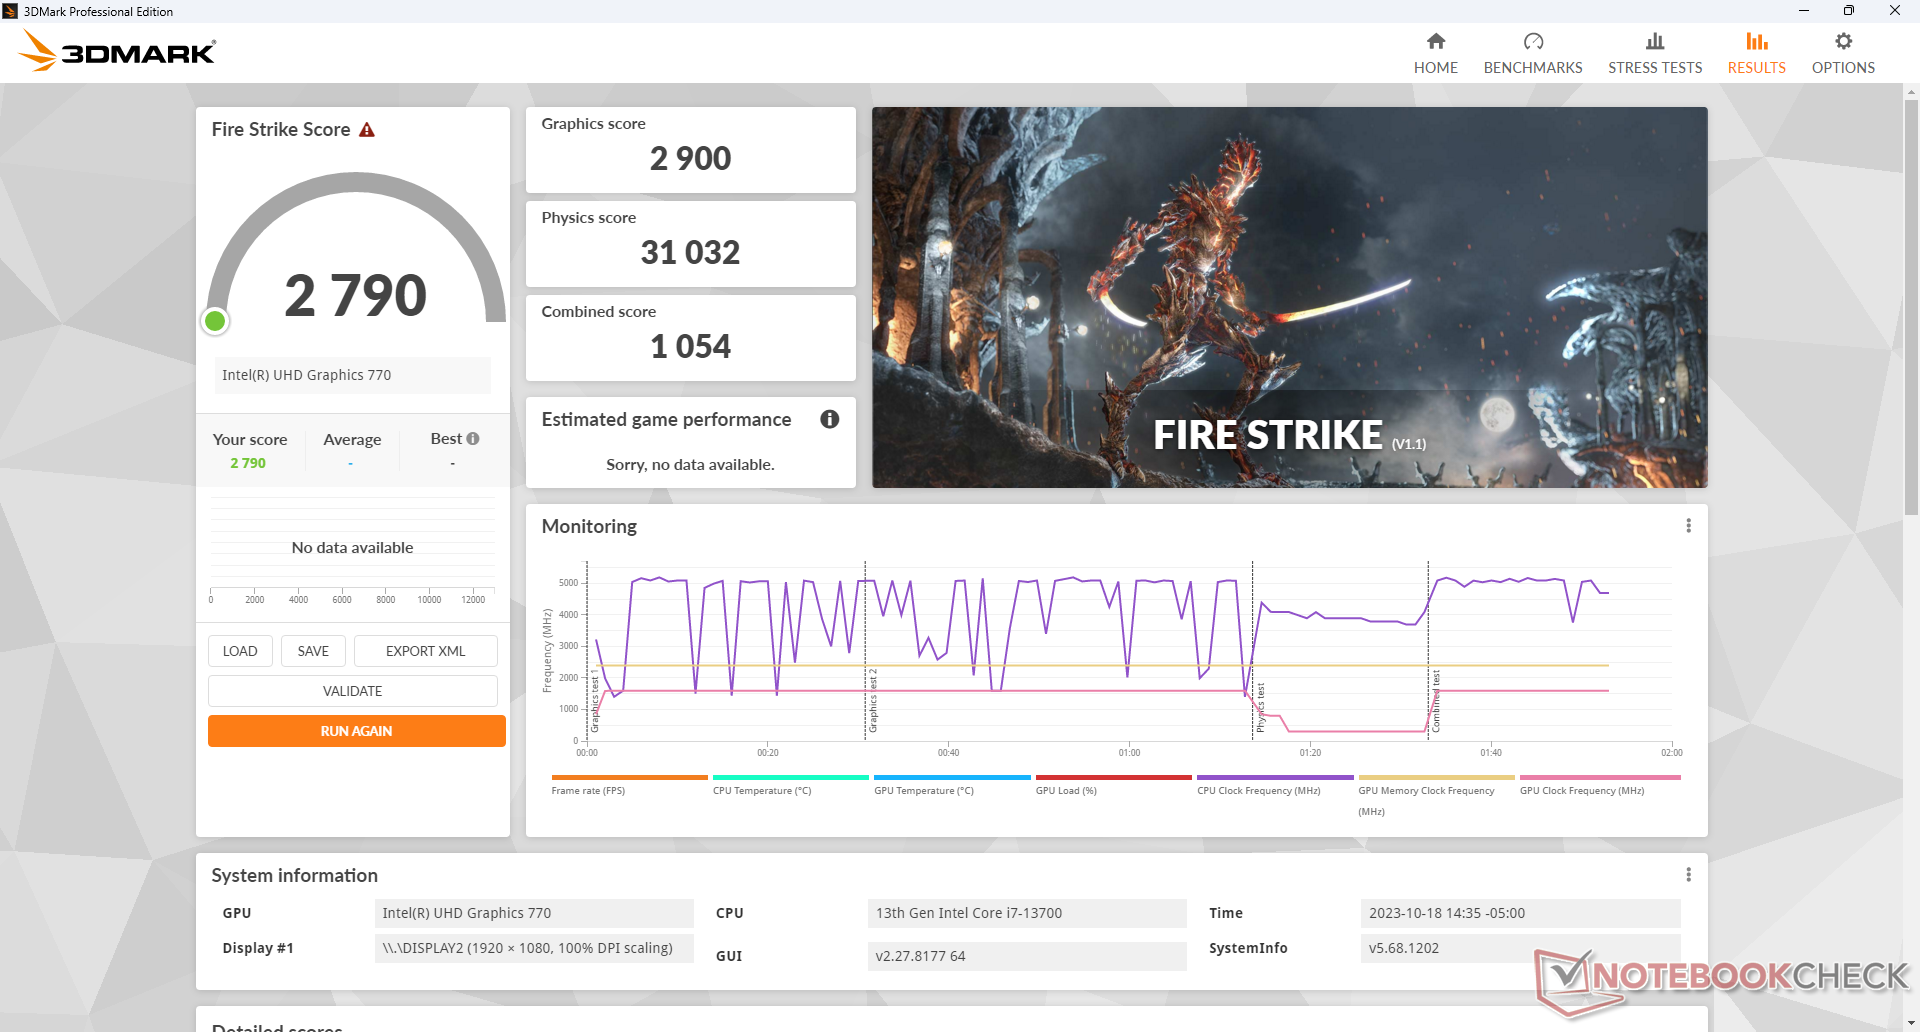
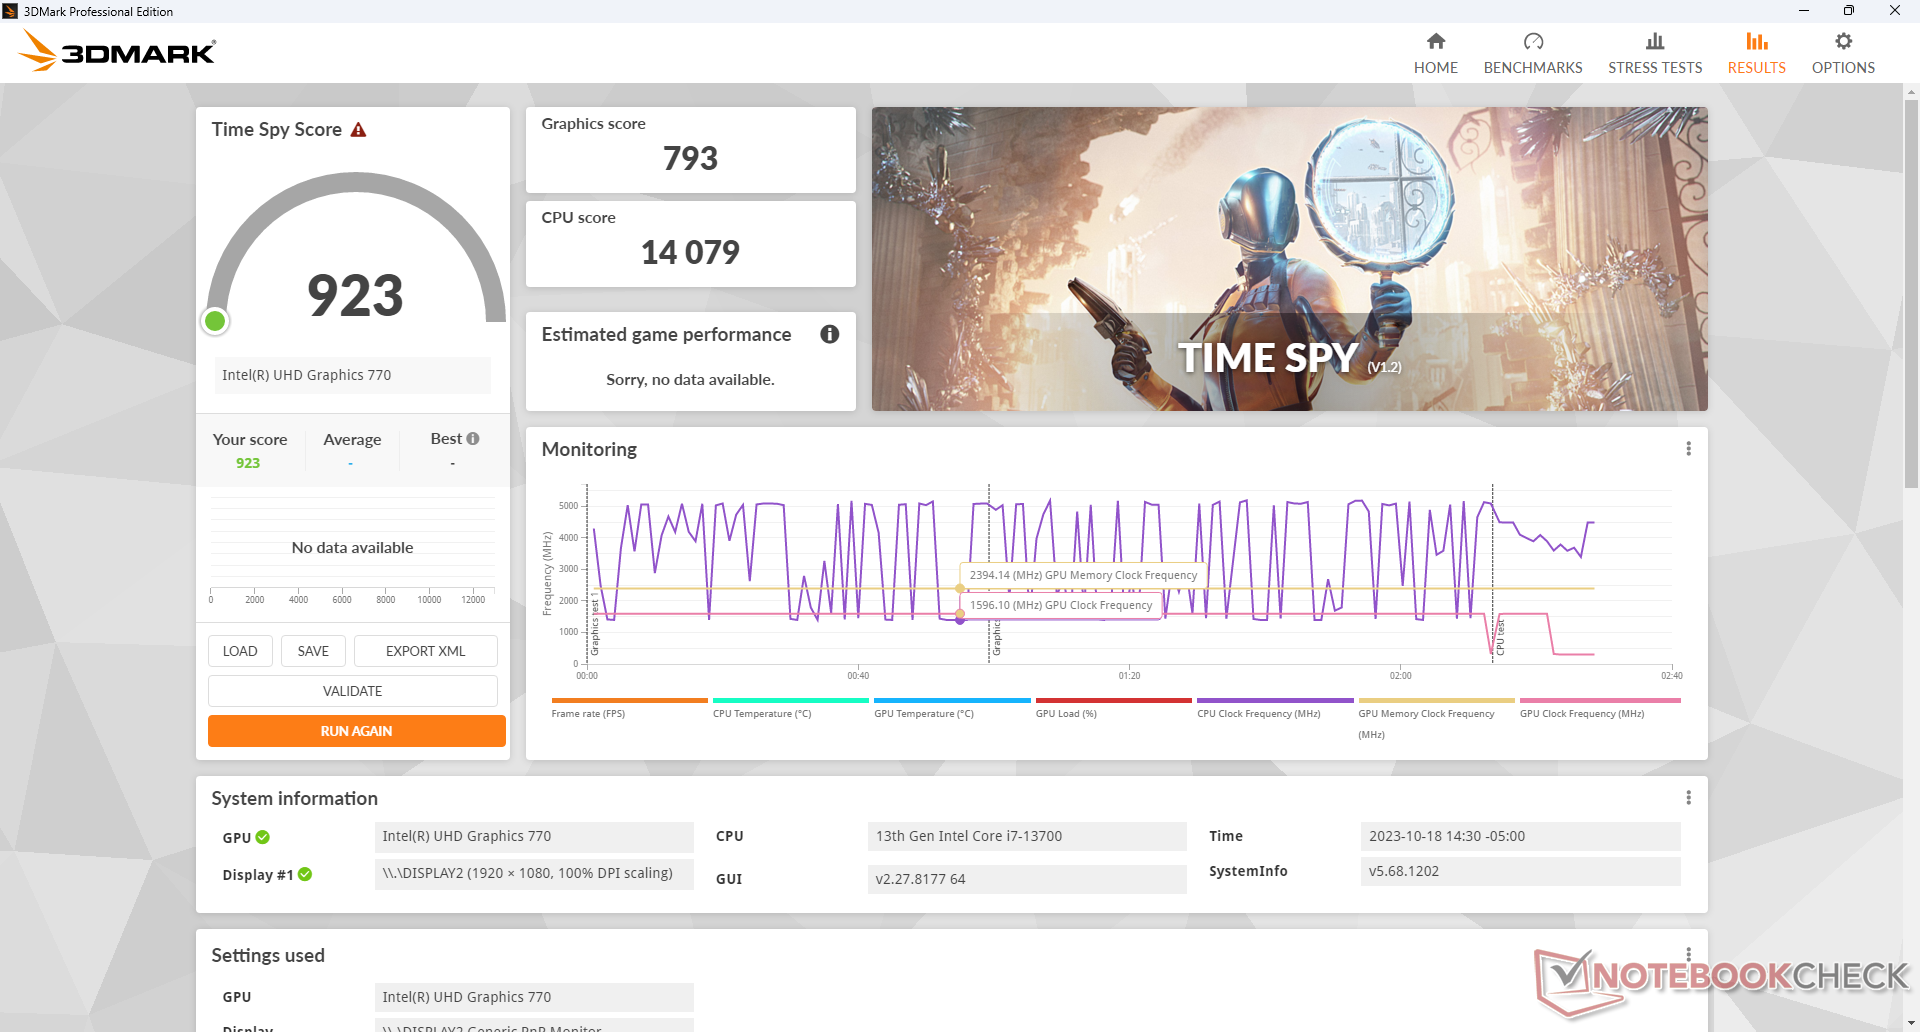
Die Grafikleistung ist schwach, besonders im Vergleich zur beeindruckenden CPU. Die UHD Graphics 770 ist mittlerweile veraltet und wirklich nur noch für Streaming-Zwecke oder einfache 4K60-Videoausgaben nützlich. Dennoch sollte dies für die Zielgruppe kein Problem darstellen, da das OptiPlex Micro nicht als grafisches Kraftpaket entwickelt wurde.
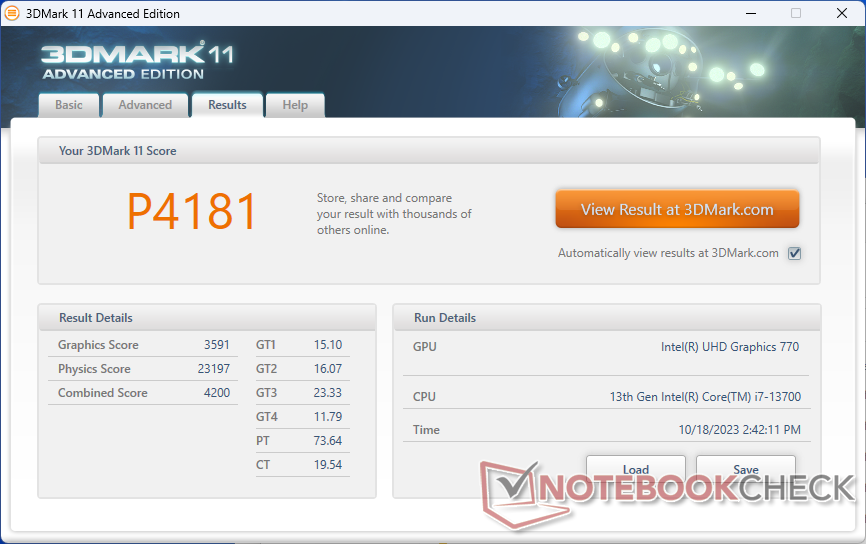
| 3DMark 11 Performance | 4181 Punkte | |
| 3DMark Fire Strike Score | 2790 Punkte | |
| 3DMark Time Spy Score | 923 Punkte | |
Hilfe | ||
* ... kleinere Werte sind besser
| The Witcher 3 | |
| 1024x768 Low Graphics & Postprocessing | |
| Beelink GTR7 7840HS | |
| Acemagic AM20 | |
| Lenovo IdeaCentre Mini 01IRH8 | |
| Geekom A5 | |
| GMK NucBox K3 Pro | |
| Minisforum Venus Series UN1245 | |
| Dell OptiPlex Micro | |
| Durchschnittliche Intel UHD Graphics 770 (41.8 - 58, n=4) | |
| Acemagic AD15 | |
| 1366x768 Medium Graphics & Postprocessing | |
| Beelink GTR7 7840HS | |
| GMK NucBox K3 Pro | |
| Lenovo IdeaCentre Mini 01IRH8 | |
| Geekom A5 | |
| Acemagic AM20 | |
| Minisforum Venus Series UN1245 | |
| Dell OptiPlex Micro | |
| Durchschnittliche Intel UHD Graphics 770 (34.2 - 37.9, n=2) | |
| Cyberpunk 2077 1.6 | |
| 1280x720 Low Preset | |
| Beelink GTR7 7840HS | |
| Lenovo IdeaCentre Mini 01IRH8 | |
| Durchschnittliche Intel UHD Graphics 770 (18.6 - 22.2, n=2) | |
| Dell OptiPlex Micro | |
| 1920x1080 Low Preset | |
| Beelink GTR7 7840HS | |
| Lenovo IdeaCentre Mini 01IRH8 | |
| Durchschnittliche Intel UHD Graphics 770 (10.2 - 11.8, n=2) | |
| Dell OptiPlex Micro | |
Witcher 3 FPS-Diagramm
| min. | mittel | hoch | max. | |
|---|---|---|---|---|
| The Witcher 3 (2015) | 58 | 37.9 | ||
| Dota 2 Reborn (2015) | 153.1 | 96.1 | 44.2 | 40.8 |
| Final Fantasy XV Benchmark (2018) | 28.2 | 14.6 | 10.2 | |
| X-Plane 11.11 (2018) | 51.4 | 32.7 | 29.7 | |
| Cyberpunk 2077 1.6 (2022) | 10.2 | |||
| Tiny Tina's Wonderlands (2022) | 16.4 |
Emissionen
Geräuschemissionen
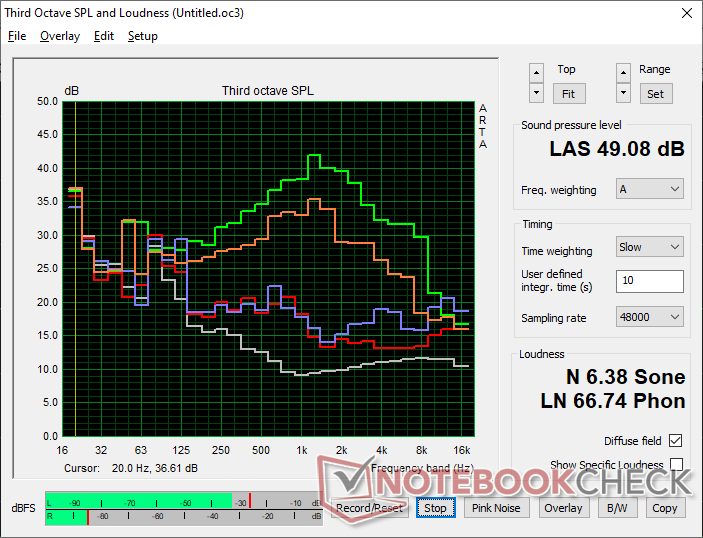
Der interne Lüfter ist immer aktiv und erzeugt ein Minimum von 28,2 dB(A) in einem Umfeld mit einer Hintergrundlautstärke von 23,2 dB(A). Er bleibt relativ leise bei etwa 30 dB(A), wenn typische Lasten wie Browser oder Tabellenkalkulationen ausgeführt werden. Extreme Lasten wie der Prime95-Stresstest können jedoch ein Lüftergeräusch von fast 50 dB(A) verursachen und sind damit lauter als die meisten anderen Mini-PCs. Mit anderen Worten: Der OptiPlex Micro wird nur dann laut, wenn anspruchsvolle Anwendungen ausgeführt werden.
Lautstärkediagramm
| Idle |
| 28.2 / 28.2 / 29.1 dB(A) |
| Last |
| 30.2 / 49.1 dB(A) |
 | ||
30 dB leise 40 dB(A) deutlich hörbar 50 dB(A) störend |
||
min: | ||
| Dell OptiPlex Micro UHD Graphics 770, i7-13700 | Apple Mac Mini M2 M2 10-Core GPU, M2, Apple SSD AP0512Z | Lenovo IdeaCentre Mini 01IRH8 Iris Xe G7 96EUs, i7-13700H, Samsung PM9B1 512GB MZVL4512HBLU | GMK NucBox K3 Pro UHD Graphics 64EUs, i7-12650H, Lexar NM610 Pro NM610P001T-HNNNG | Beelink GTR7 7840HS Radeon 780M, R7 7840HS, Crucial P3 Plus CT1000P3PSSD8 | Beelink SER7 Radeon 780M, R7 7840HS, Crucial P3 Plus CT1000P3PSSD8 | |
|---|---|---|---|---|---|---|
| Geräuschentwicklung | 15% | 2% | 4% | 1% | 5% | |
| aus / Umgebung * (dB) | 23.2 | 24.7 -6% | 23.4 -1% | 23.1 -0% | 25.6 -10% | 24.5 -6% |
| Idle min * (dB) | 28.2 | 24.7 12% | 30.4 -8% | 25 11% | 28.1 -0% | 25.1 11% |
| Idle avg * (dB) | 28.2 | 24.7 12% | 30.4 -8% | 25.5 10% | 28.1 -0% | 25.1 11% |
| Idle max * (dB) | 29.1 | 24.7 15% | 30.4 -4% | 25.5 12% | 28.1 3% | 25.1 14% |
| Last avg * (dB) | 30.2 | 24.7 18% | 30.7 -2% | 39.9 -32% | 34.9 -16% | 35.9 -19% |
| Witcher 3 ultra * (dB) | 42.6 | 33.9 20% | 39.9 6% | 36.4 15% | 35.6 16% | |
| Last max * (dB) | 49.1 | 29.4 40% | 41 16% | 39.9 19% | 42.4 14% | 45.4 8% |
* ... kleinere Werte sind besser
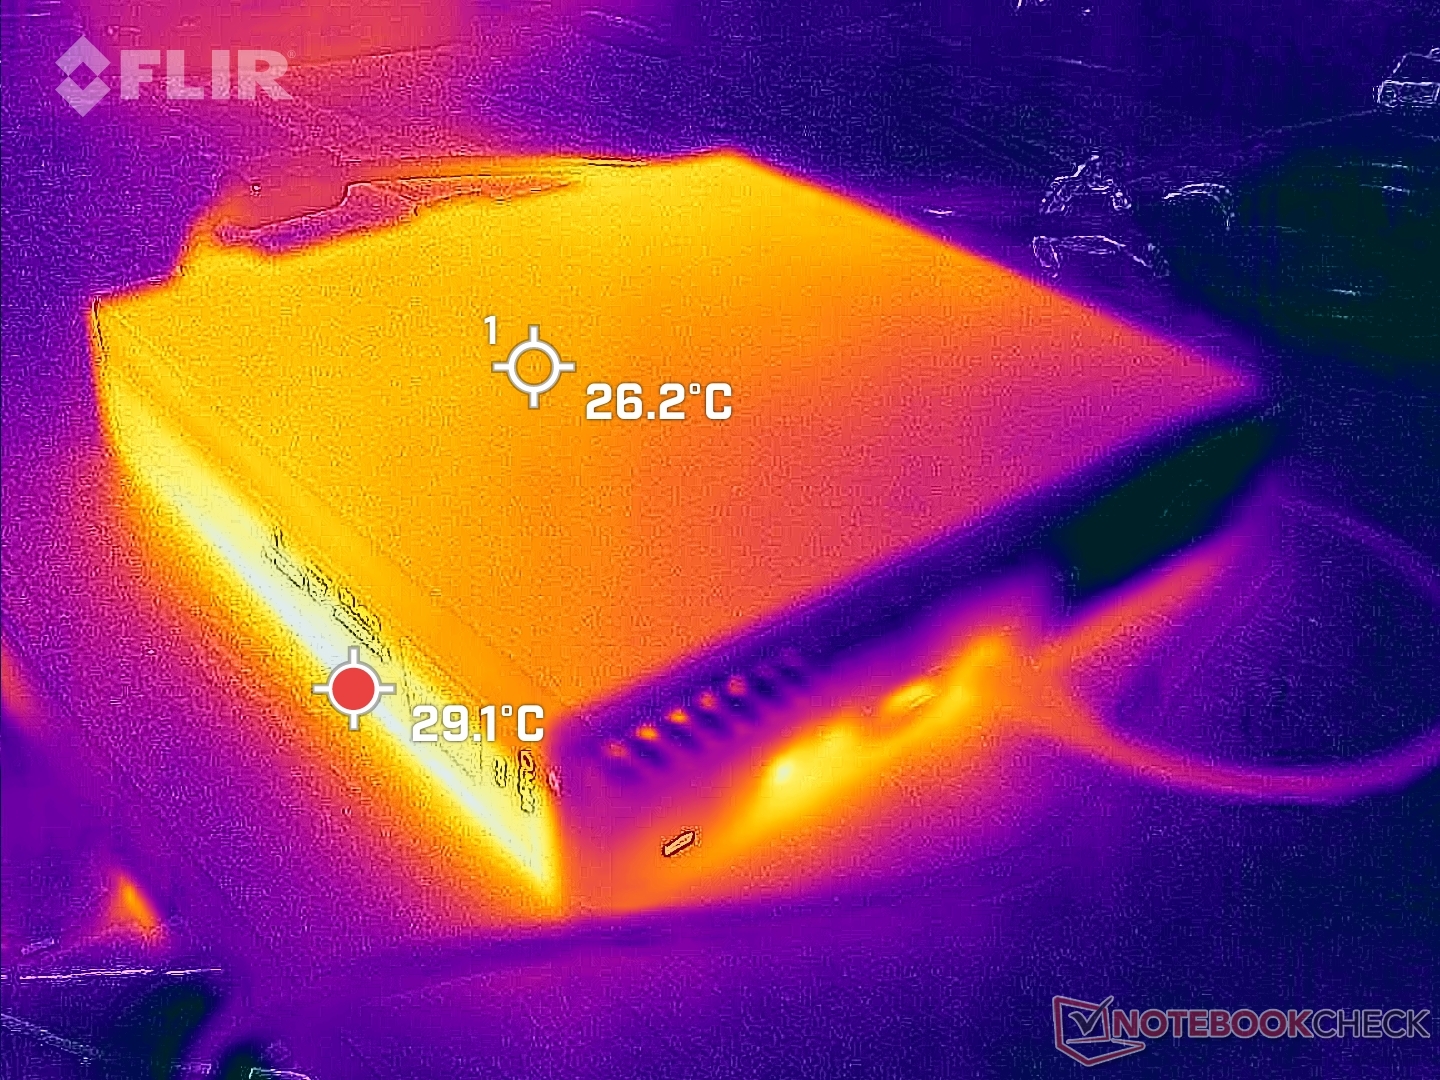
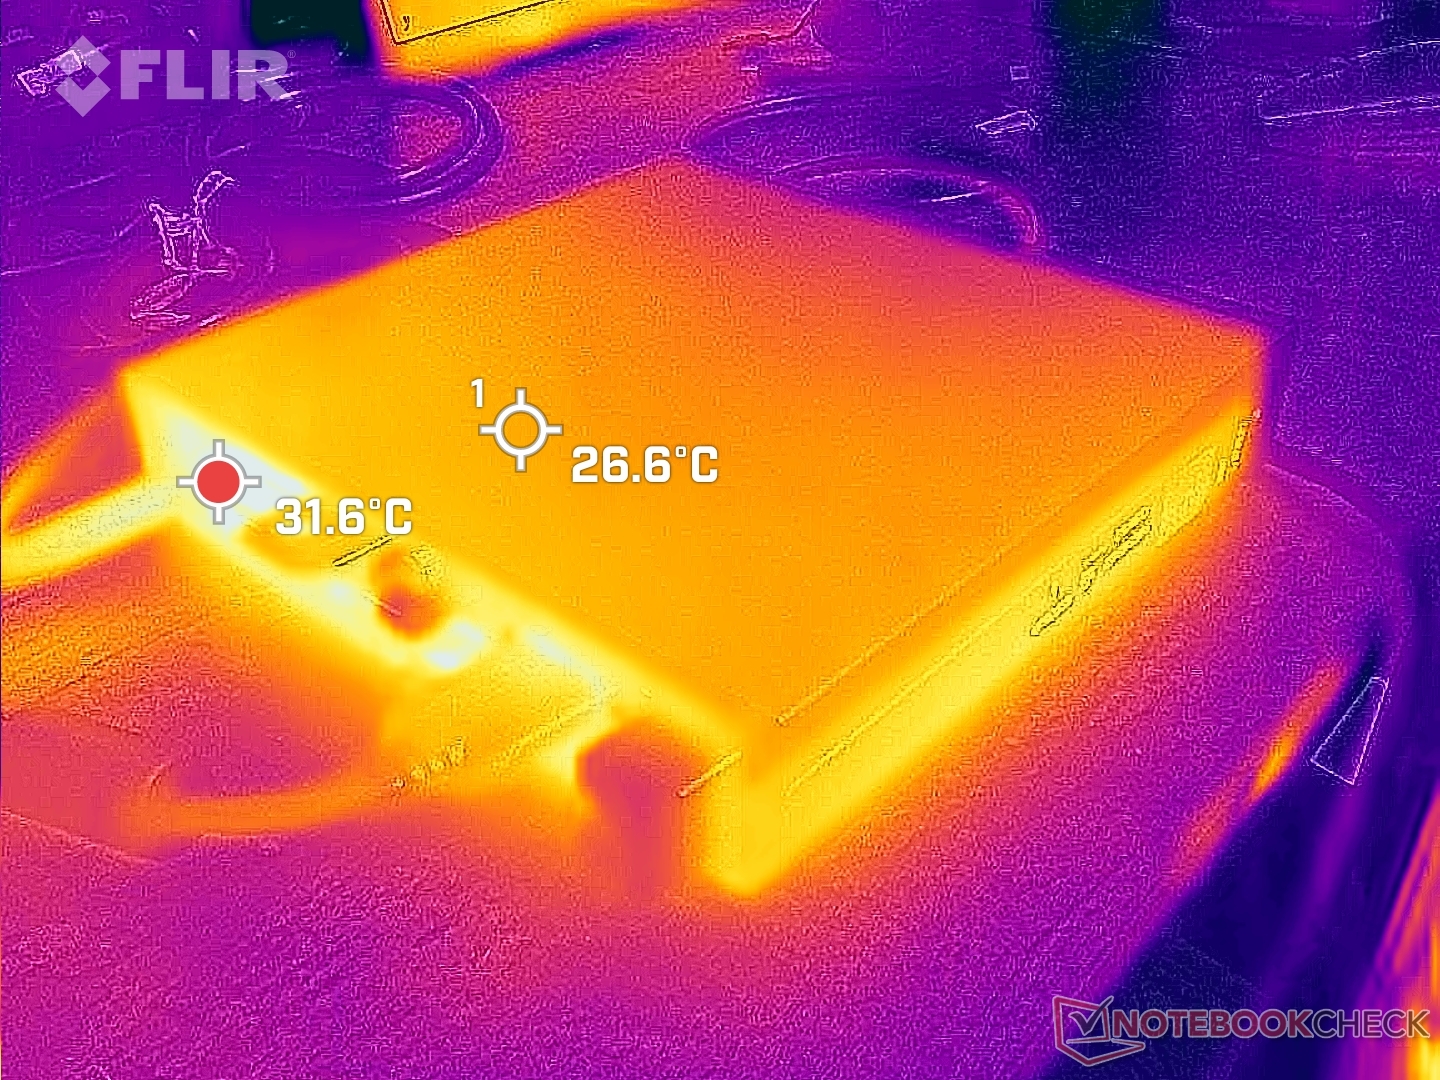
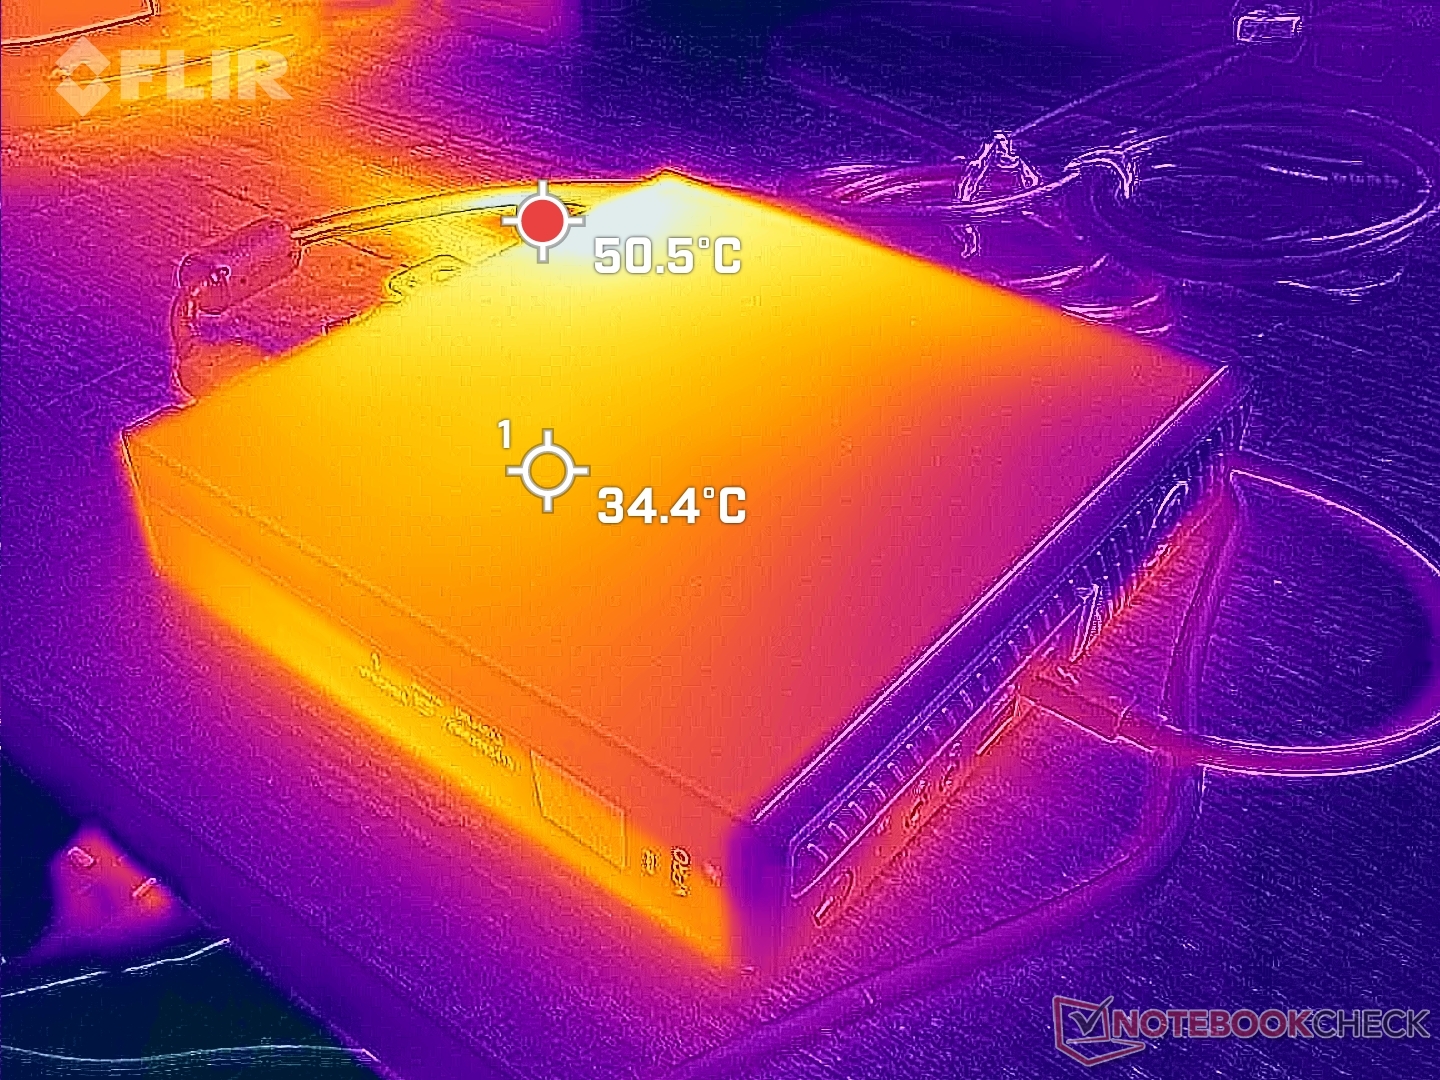
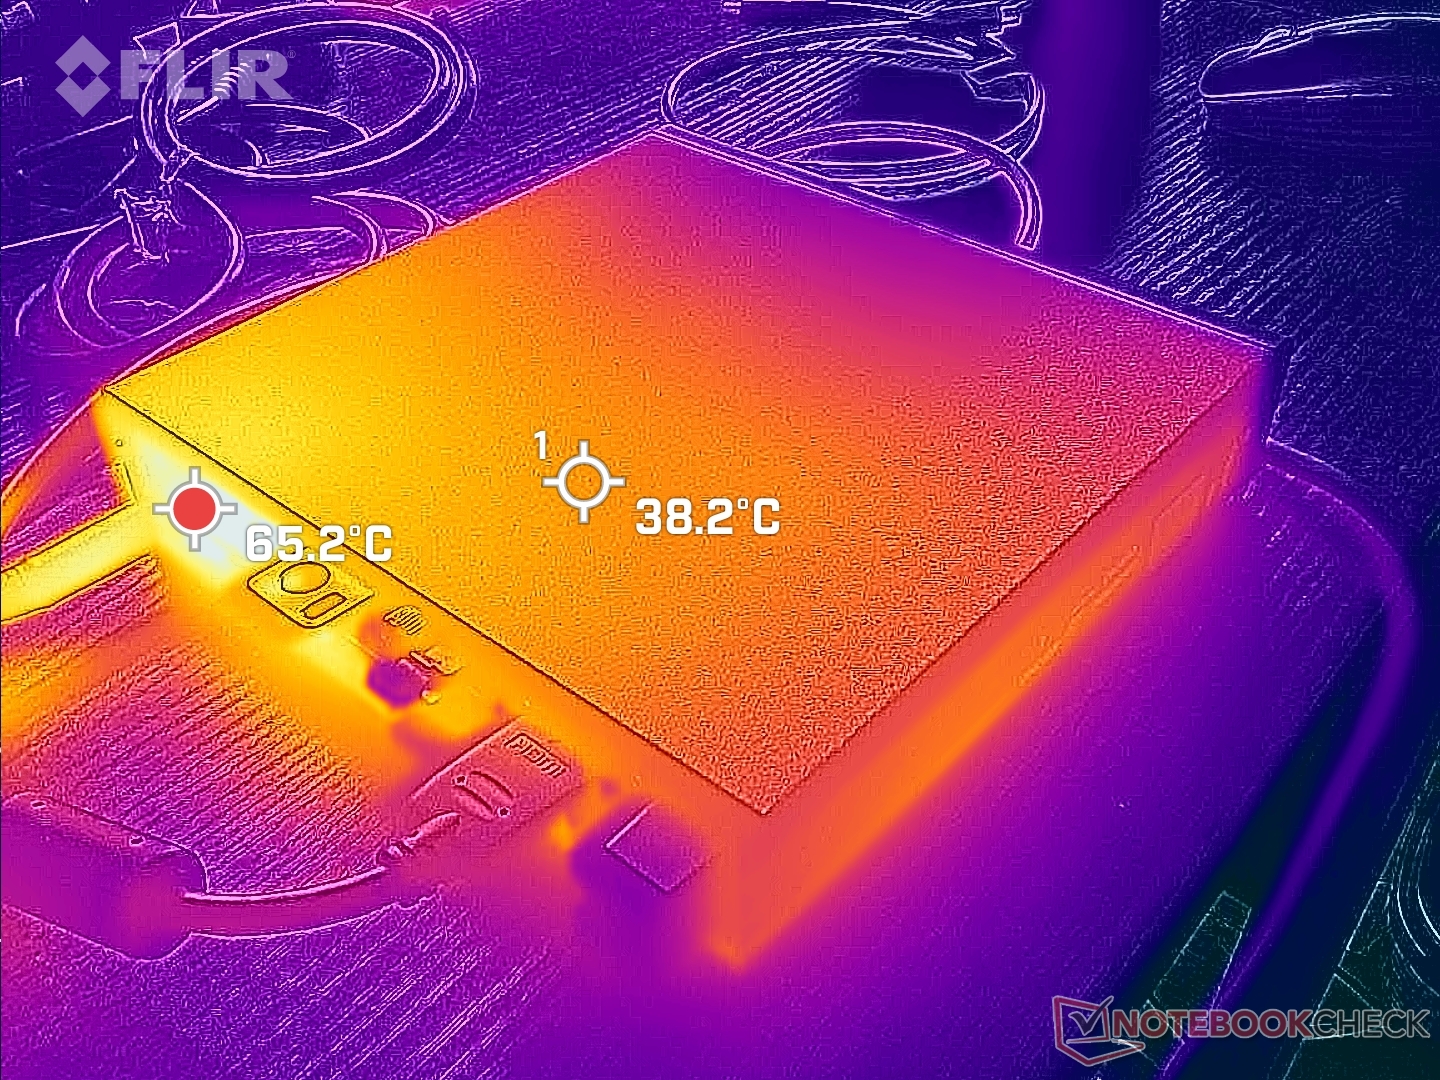
Temperatur - Heißer Deckel
Die Oberflächentemperaturen können recht warm werden, da das Modell eine CPU der Desktop-Klasse in einem Gehäuse aus Metall unterbringt. Diese liegen bei 30 bis 35 °C, wenn man einfach nur im Internet surft, und sie können bis zu 51 °C erreichen, wenn anspruchsvolle Aufgaben ausgeführt werden. Es ist wichtig, auf die Temperatur zu achten, wenn man Gegenstände auf dem Gerät abstellt.
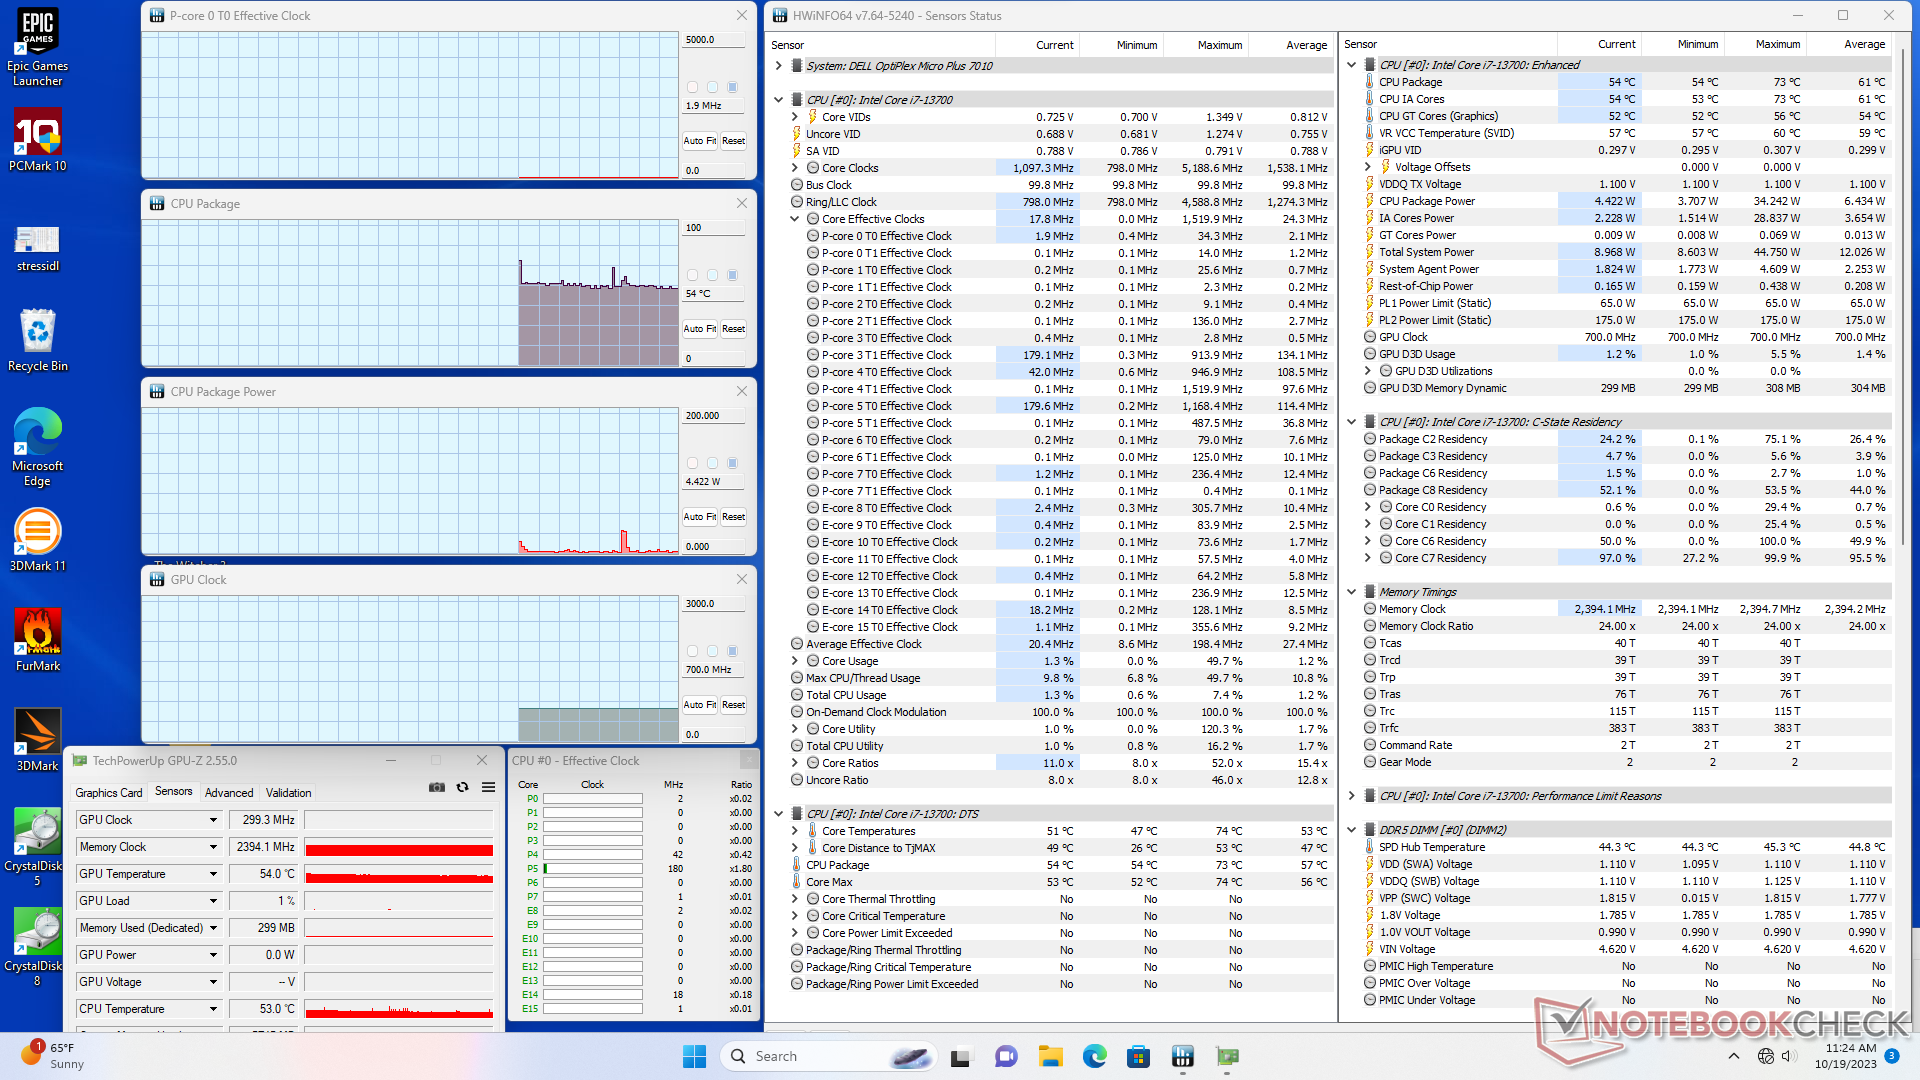
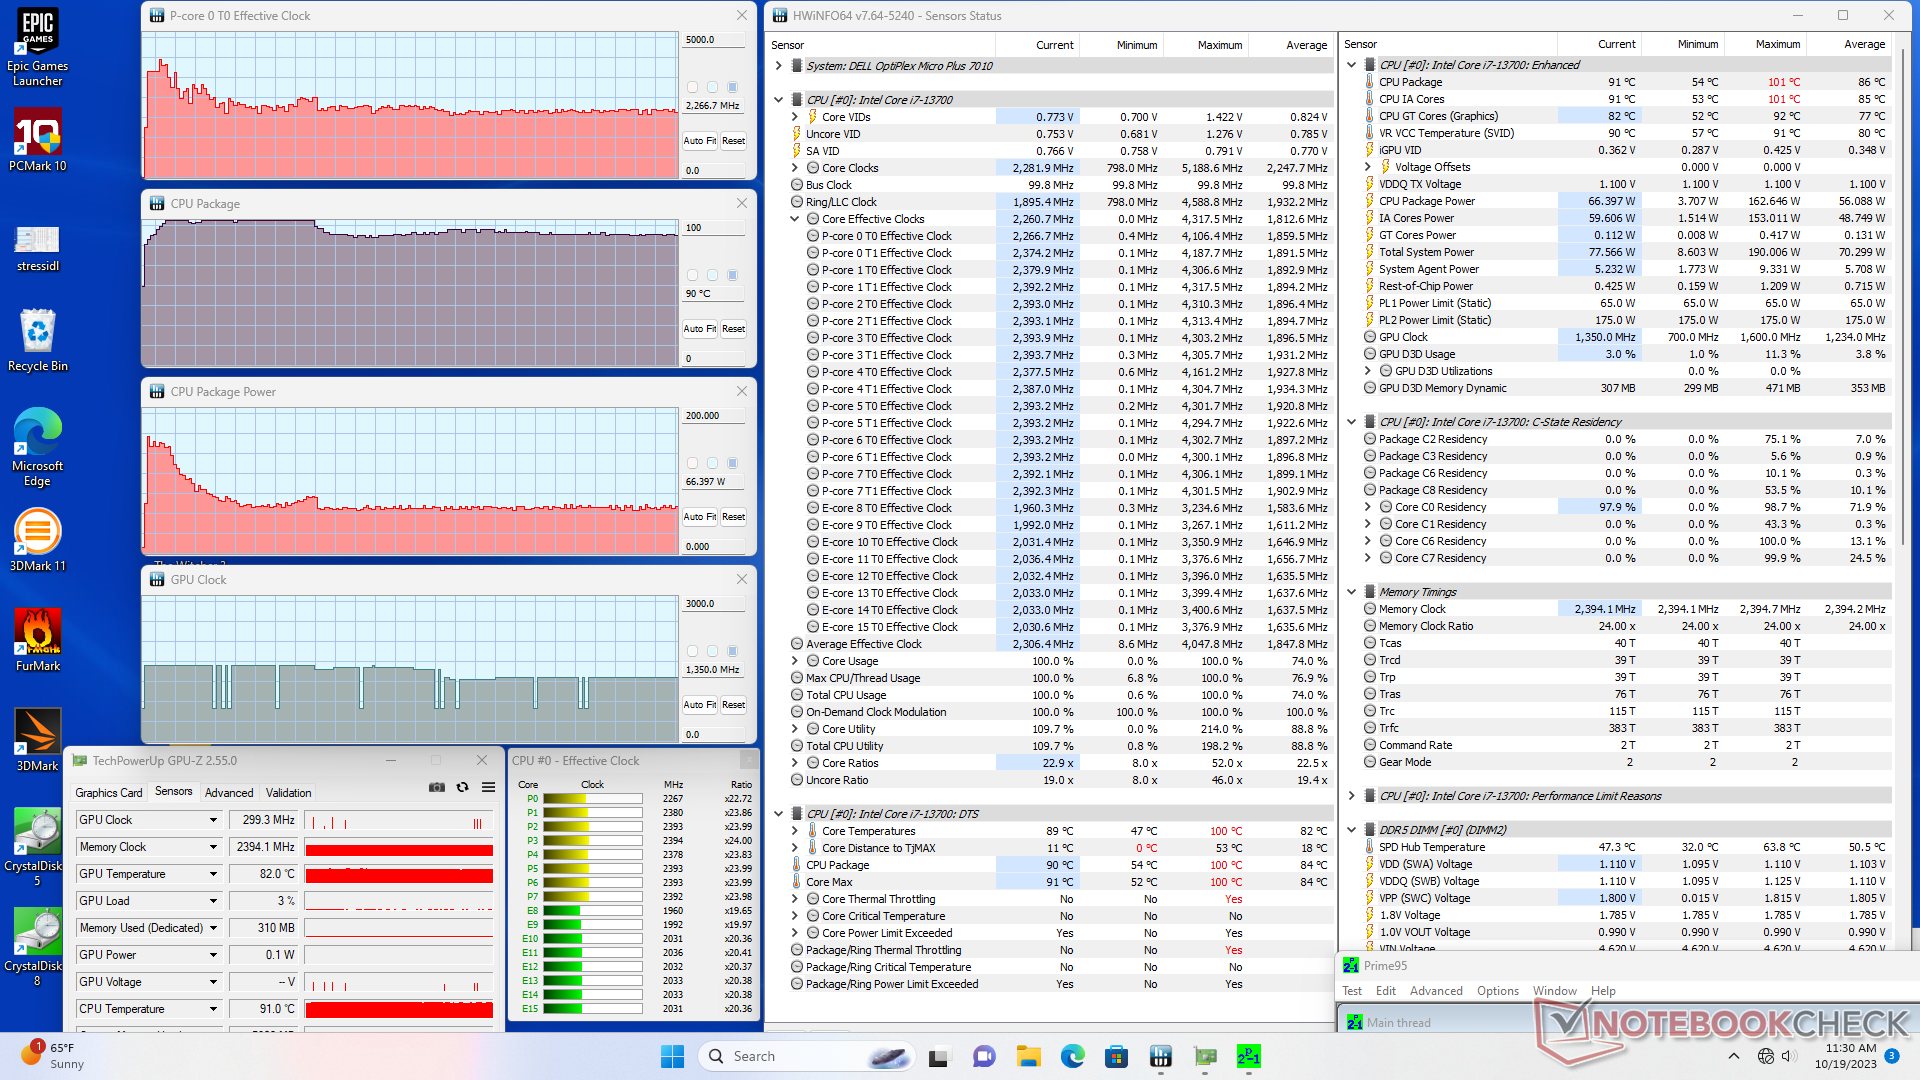
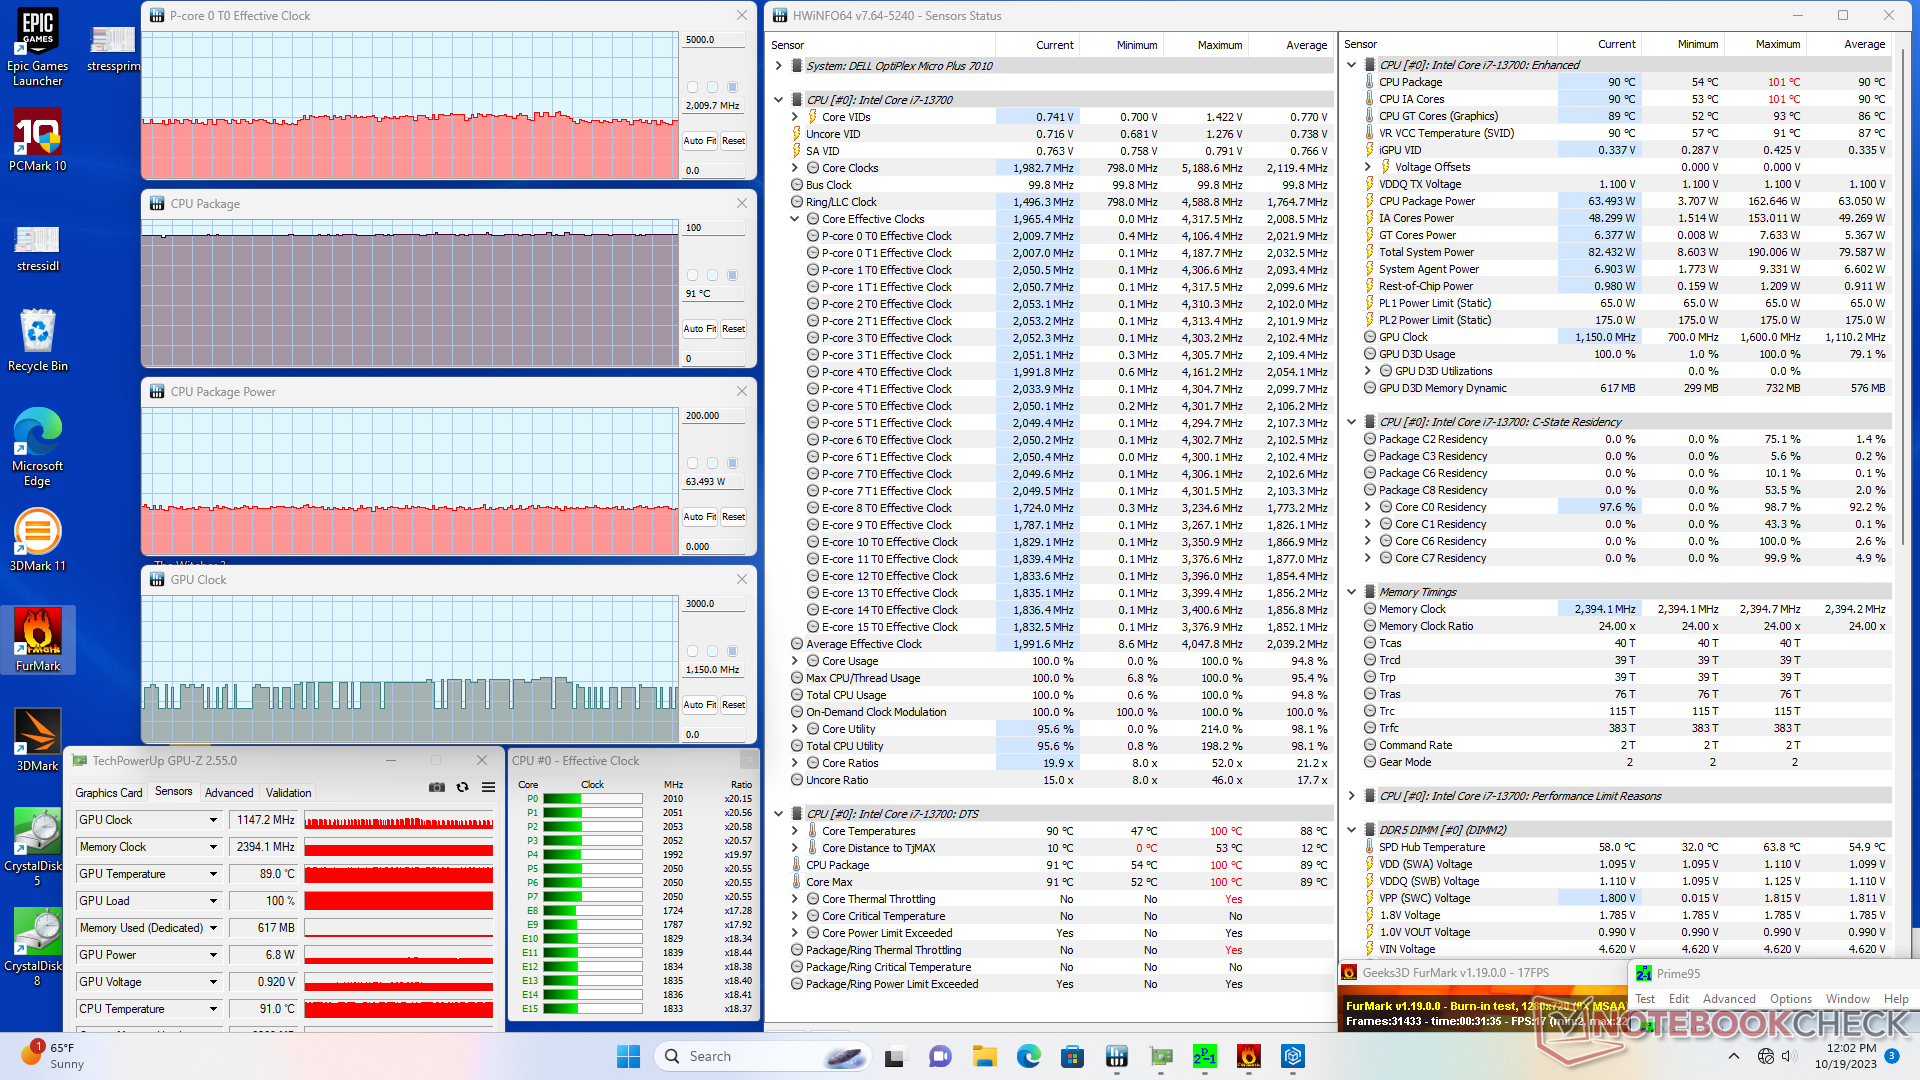
Stresstest
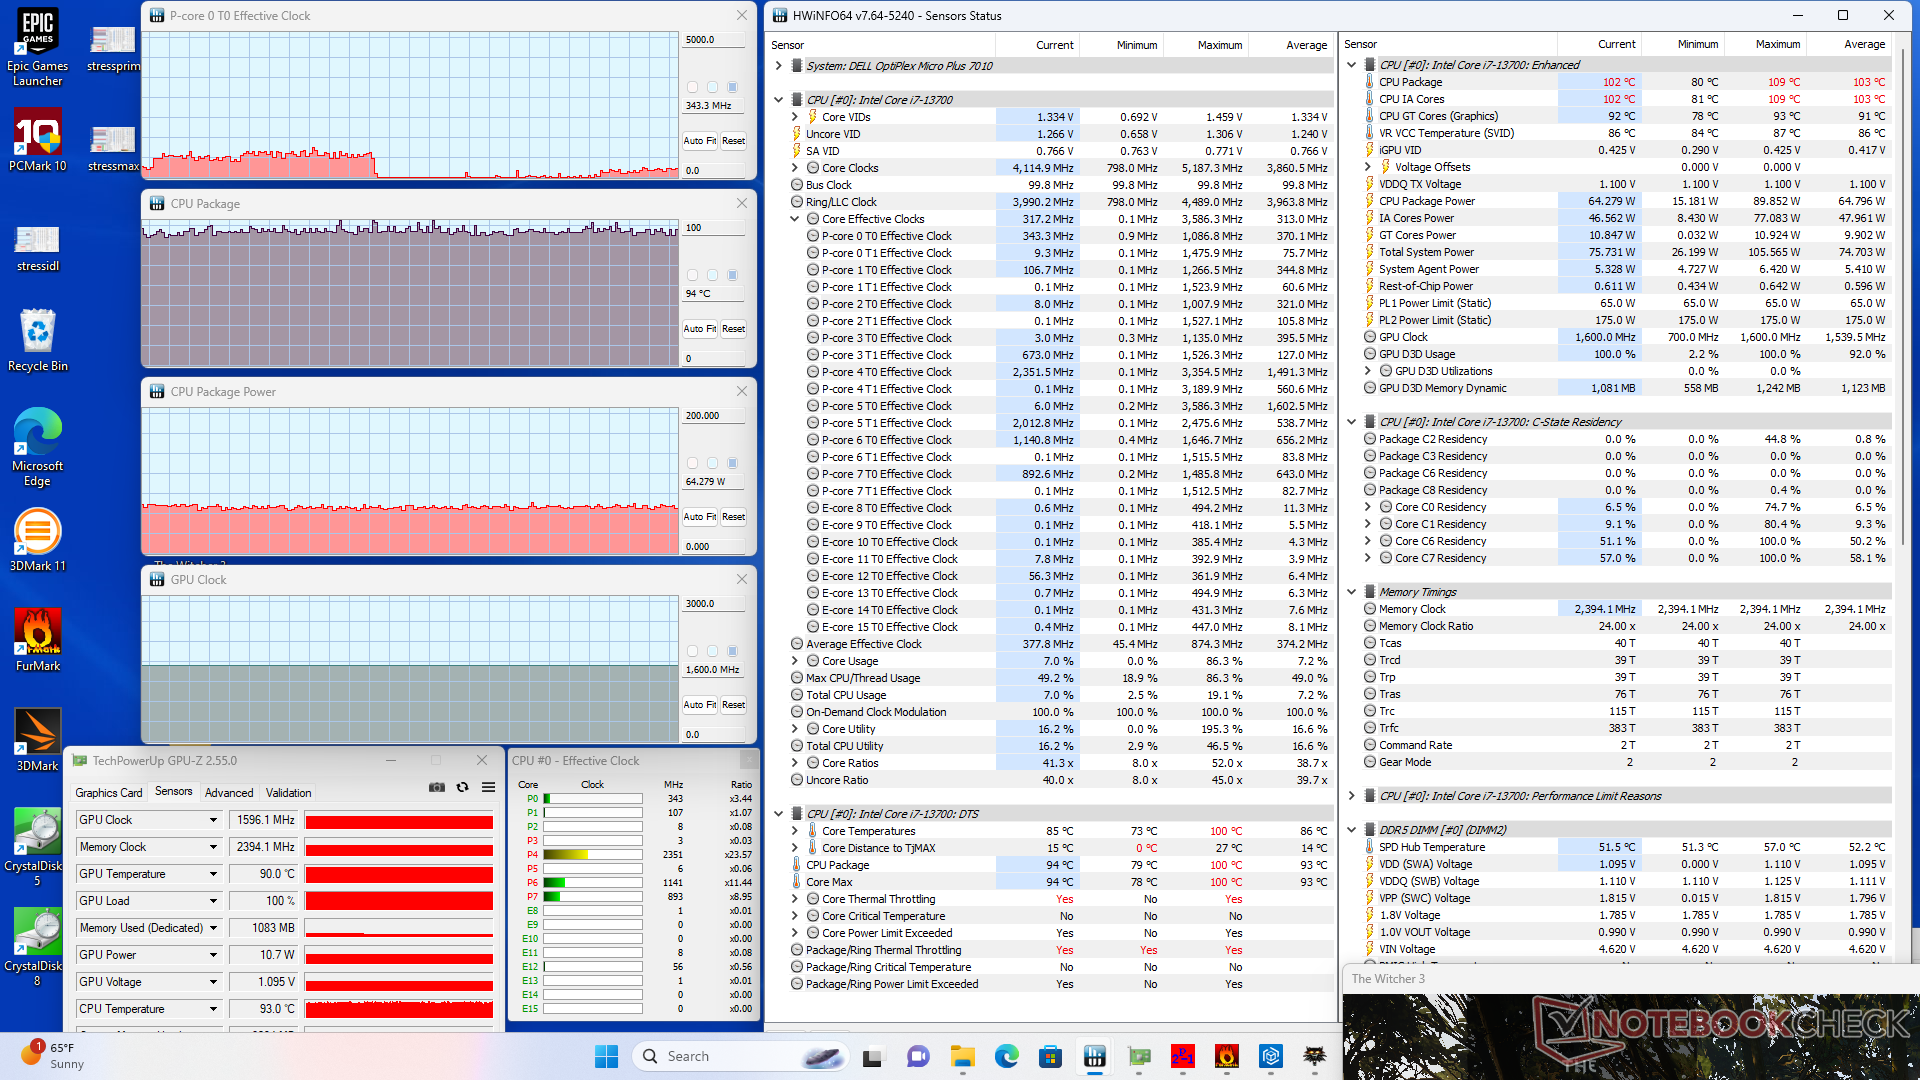
Die zuvor erwähnten hohen Oberflächentemperaturen und das Throttling-Verhalten sind mit den sehr hohen Kerntemperaturen verbunden. Zum Beispiel würde die CPU bei der Ausführung von Prime95 auf 3,6 GHz, 155 W und fast 100 °C ansteigen, was höchstens ein oder zwei Minuten anhalten würde. Danach stabilisiert sich die CPU bei 2,7 GHz und 66 W, um eine etwas kühlere Kerntemperatur von 90 °C aufrechtzuerhalten. Im Vergleich dazu würde derselbe Test auf dem Lenovo IdeaCentre Mini mit dem langsameren Core i7-13700H zu einer stabileren Kerntemperatur von 81 °C führen.
Außerdem ist es überraschend leicht, solch hohe Kerntemperaturen zu erreichen. Beispielsweise würde sich die Kerntemperatur bei Witcher 3 unter hoher Last auf 94 °C stabilisieren, während sie beim Beelink GTR7 nur 68 °C beträgt.
| CPU-Takt (GHz) | GPU-Takt (MHz) | Durchschnittliche CPU-Temperatur (°C) | |
| System im Leerlauf | -- | -- | 54 |
| Prime95 Stresstest | 2.3 | -- | 90 |
| Prime95 + FurMark Stresstest | 2.0 | 700 - 1350 | 91 |
| Witcher 3 Stresstest | ~0.3 | 1596 | 94 |
Lautsprecher
Im Gegensatz zu anderen Mini-PCs, bei denen integrierte Lautsprecher unüblich sind, verfügt dieses Modell über einen Mono-Lautsprecher. Der Lautsprecher ist laut genug für kleine Büros, aber definitiv nicht leistungsstark genug für Konferenzräume.
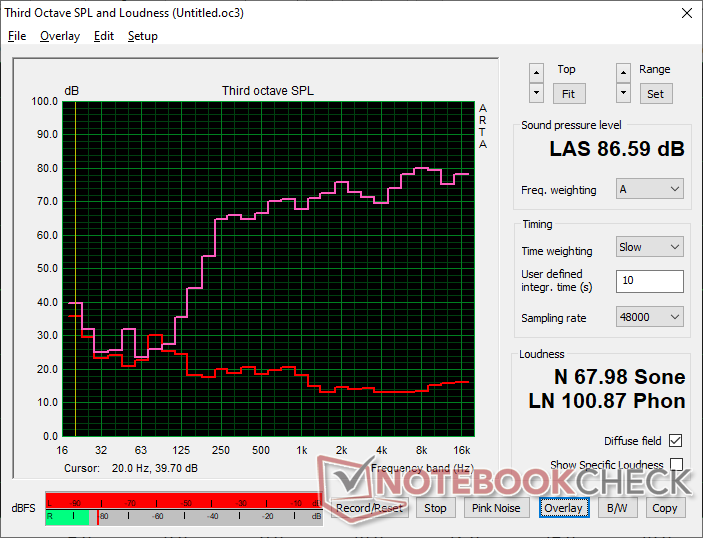
Dell OptiPlex Micro Audio Analyse
(+) | Die Lautsprecher können relativ laut spielen (86.6 dB)
Bass 100 - 315 Hz
(-) | kaum Bass - 22% niedriger als der Median
(±) | durchschnittlich lineare Bass-Wiedergabe (12.2% Delta zum Vorgänger)
Mitteltöne 400 - 2000 Hz
(+) | ausgeglichene Mitten, vom Median nur 2.6% abweichend
(+) | lineare Mitten (4.1% Delta zum Vorgänger)
Hochtöne 2 - 16 kHz
(+) | ausgeglichene Hochtöne, vom Median nur 4.7% abweichend
(+) | sehr lineare Hochtöne (4.4% Delta zum Vorgänger)
Gesamt im hörbaren Bereich 100 - 16.000 Hz
(±) | hörbarer Bereich ist durchschnittlich linear (15.9% Abstand zum Median)
Im Vergleich zu allen Geräten derselben Klasse
» 7% aller getesteten Geräte dieser Klasse waren besser, 7% vergleichbar, 86% schlechter
» Das beste Gerät hat einen Delta-Wert von 13%, durchschnittlich ist 24%, das schlechteste Gerät hat 64%
Im Vergleich zu allen Geräten im Test
» 25% aller getesteten Geräte waren besser, 5% vergleichbar, 70% schlechter
» Das beste Gerät hat einen Delta-Wert von 4%, durchschnittlich ist 24%, das schlechteste Gerät hat 134%
Apple MacBook Pro 16 2021 M1 Pro Audio Analyse
(+) | Die Lautsprecher können relativ laut spielen (84.7 dB)
Bass 100 - 315 Hz
(+) | guter Bass - nur 3.8% Abweichung vom Median
(+) | lineare Bass-Wiedergabe (5.2% Delta zum Vorgänger)
Mitteltöne 400 - 2000 Hz
(+) | ausgeglichene Mitten, vom Median nur 1.3% abweichend
(+) | lineare Mitten (2.1% Delta zum Vorgänger)
Hochtöne 2 - 16 kHz
(+) | ausgeglichene Hochtöne, vom Median nur 1.9% abweichend
(+) | sehr lineare Hochtöne (2.7% Delta zum Vorgänger)
Gesamt im hörbaren Bereich 100 - 16.000 Hz
(+) | hörbarer Bereich ist sehr linear (4.6% Abstand zum Median
Im Vergleich zu allen Geräten derselben Klasse
» 0% aller getesteten Geräte dieser Klasse waren besser, 0% vergleichbar, 100% schlechter
» Das beste Gerät hat einen Delta-Wert von 5%, durchschnittlich ist 17%, das schlechteste Gerät hat 45%
Im Vergleich zu allen Geräten im Test
» 0% aller getesteten Geräte waren besser, 0% vergleichbar, 100% schlechter
» Das beste Gerät hat einen Delta-Wert von 4%, durchschnittlich ist 24%, das schlechteste Gerät hat 134%
Energieverwaltung
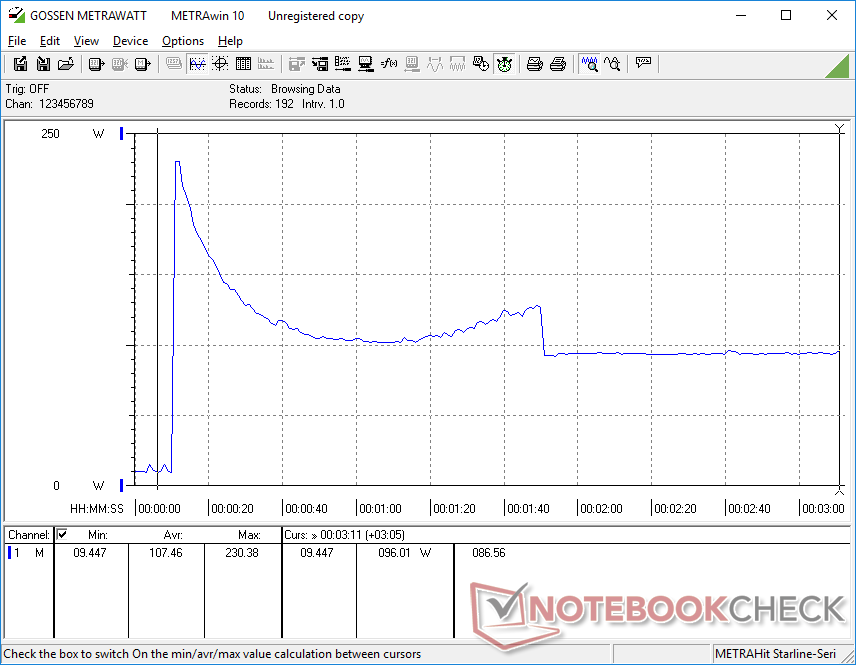
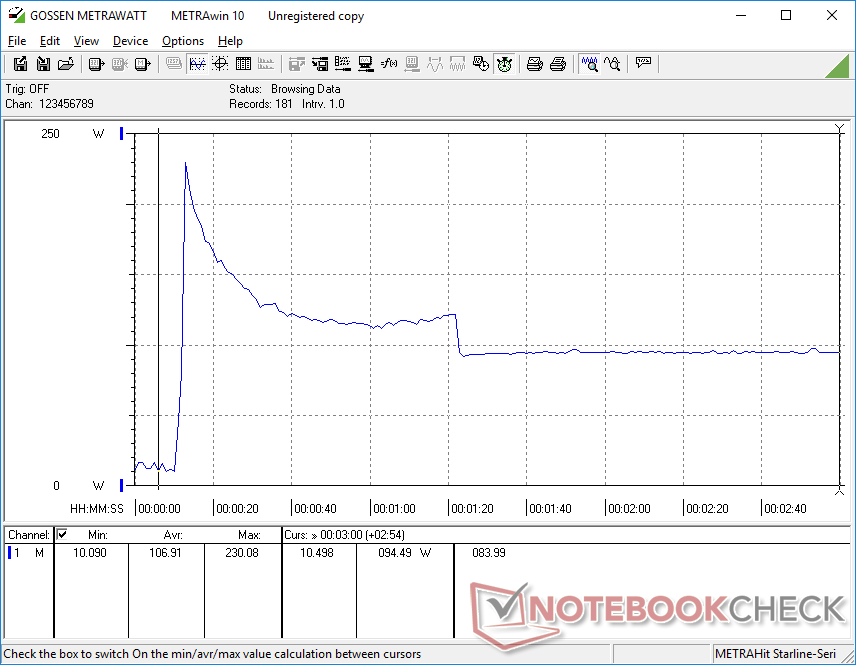
Energieaufnahme — Anspruchsvolle kleine Maschine
Die Energieaufnahme kann recht hoch sein, was angesichts des Desktop-Prozessors im Inneren vielleicht nicht überraschend ist. Das hohe Turbo-Boost-Potenzial des Core i7-13700 kann dazu führen, dass das System beim Starten von Anwendungen oder beim Ausführen von CPU-intensiven Aufgaben bis zu 190 W bzw. 230 W verbraucht, wie die Grafiken unten zeigen. Allerdings bedeutet die geringe Nachhaltigkeit des Turbo-Boosts beim Mini-PC, dass solche extremen Leistungsaufnahmen nur vorübergehend sind.
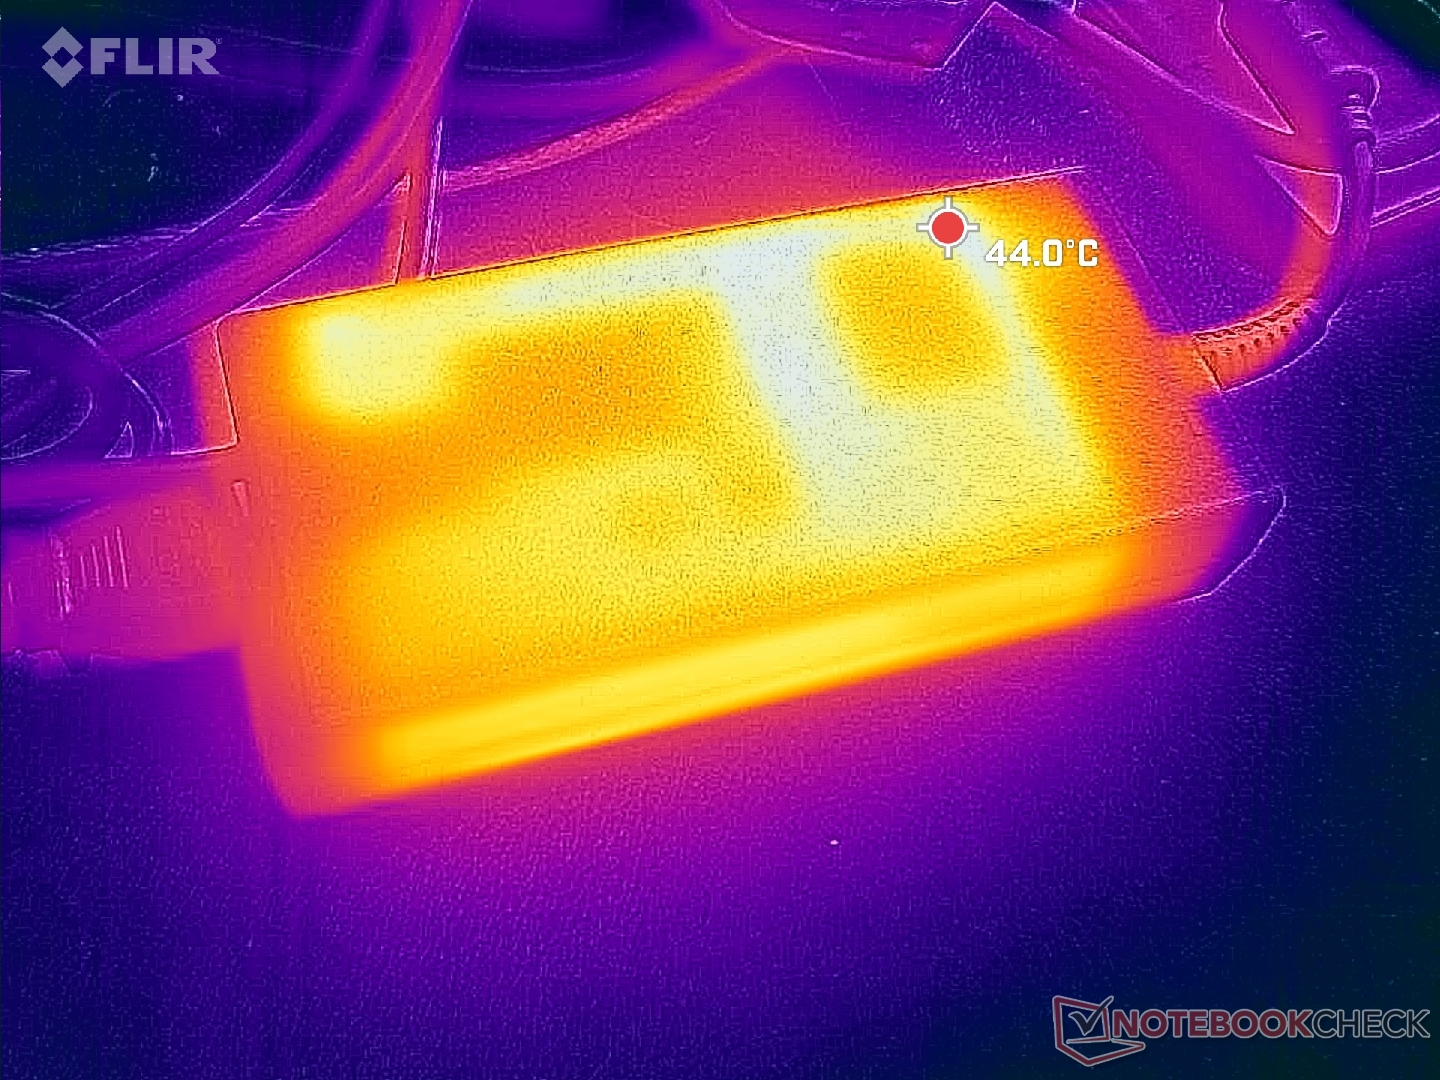
Da USB-C Power Delivery nicht unterstützt wird, muss das mitgelieferte 180-Watt-Netzteil (~15,4 x 7,5 x 3,2 cm) immer angeschlossen sein, um das System zu betreiben. Im Vergleich dazu können einige Mini-PCs wie der Beelink SER7 ausschließlich mit USB-C-Netzteilen von Drittanbietern genutzt werden, während andere wie der Lenovo IdeaCentre Mini überhaupt kein externes Netzteil benötigen.
| Aus / Standby | |
| Idle | |
| Last |
|
Legende:
min: | |
| Dell OptiPlex Micro i7-13700, UHD Graphics 770, , , x, | Apple Mac Mini M2 M2, M2 10-Core GPU, Apple SSD AP0512Z, , x, | Lenovo IdeaCentre Mini 01IRH8 i7-13700H, Iris Xe G7 96EUs, Samsung PM9B1 512GB MZVL4512HBLU, , x, | GMK NucBox K3 Pro i7-12650H, UHD Graphics 64EUs, Lexar NM610 Pro NM610P001T-HNNNG, , x, | Beelink GTR7 7840HS R7 7840HS, Radeon 780M, Crucial P3 Plus CT1000P3PSSD8, , x, | Beelink SER7 R7 7840HS, Radeon 780M, Crucial P3 Plus CT1000P3PSSD8, , x, | |
|---|---|---|---|---|---|---|
| Stromverbrauch | 62% | 4% | -18% | 5% | -8% | |
| Idle min * (Watt) | 3.7 | 2.2 41% | 6.7 -81% | 7.1 -92% | 5.5 -49% | 6.7 -81% |
| Idle avg * (Watt) | 7.2 | 6.7 7% | 10.1 -40% | 5.8 19% | 7.3 -1% | |
| Idle max * (Watt) | 8.7 | 2.6 70% | 7.1 18% | 18.6 -114% | 7.7 11% | 11.6 -33% |
| Last avg * (Watt) | 69.5 | 28.7 59% | 68.5 1% | 45.3 35% | 70.6 -2% | 64.1 8% |
| Witcher 3 ultra * (Watt) | 77.1 | 58.3 24% | 55.2 28% | 79.8 -4% | 75.8 2% | |
| Last max * (Watt) | 230.6 | 51.5 78% | 104.3 55% | 52.9 77% | 111.8 52% | 94.8 59% |
* ... kleinere Werte sind besser
Energieverbrauch Witcher 3 / Stresstest
Energieverbrauch externer Monitor
Pro
Contra
Fazit — Große CPU für einen Micro Form Factor
Zu den herausragenden Merkmalen des OptiPlex Micro zählen die abnehmbare Desktop-CPU, die werkzeuglose Wartungsmöglichkeit, die hohe Prozessorleistung pro Volumen und die vier individuellen Videoausgänge. Benutzer, die für Grafiken, Spreadsheets und Textverarbeitung zwei oder mehr Monitore benutzen, finden im OptiPlex Micro eine zuverlässige Option zum "Einstellen und Vergessen".
Die Verwendung einer vollwertigen Core i7-CPU, die für Desktops entwickelt wurde, in einem Mini-PC-Formfaktor birgt gewisse Nachteile. Insbesondere das Turbo-Boost-Potenzial ist begrenzt, wodurch die durchschnittliche Leistung deutlich geringer ist als bei einem größeren OptiPlex-System mit demselben Prozessor. Des Weiteren sind die Kerntemperaturen mit über 90 °C sehr hoch, was technisch zwar akzeptabel ist, aber im Allgemeinen nicht ideal, insbesondere im Vergleich zu den meisten anderen Mini-PCs, die kühler laufen. Schließlich ist die veraltete integrierte GPU für die meisten modernen 3D-Renderings nicht ausreichend, was durch das Fehlen von USB4- oder Thunderbolt eGPU-Unterstützung noch verschärft wird. Wir empfehlen Mini-PCs mit Iris Xe- oder Radeon 680M/780M-Grafikprozessoren, wenn Ihre Arbeitslast auch grafikintensive Aufgaben umfasst.
Mini-PC-Nutzer, die Wert auf reine CPU-Leistung legen, werden den OptiPlex Micro zu schätzen wissen. Andernfalls sind Alternativen wie der Intel NUC 13 Pro oder Beelink GTR7 in Bezug auf CPU- und GPU-Leistung besser ausbalanciert.
Die Drosselung der SSD ist ebenfalls bedauerlich. Wahrscheinlich hätte das Problem durch dedizierte SSD-Wärmeableitungen gelöst werden können, aber dies hätte das Gewicht und den Preis des Geräts erhöht.
Preis und Verfügbarkeit
Dell liefert den OptiPlex Micro Plus 7010 derzeit ab 843 Euro aus.
Dell OptiPlex Micro
- 24.10.2023 v7 (old)
Allen Ngo
Transparenz
Die Auswahl der zu testenden Geräte erfolgt innerhalb der Redaktion. Das vorliegende Testmuster wurde dem Autor vom Hersteller oder einem Shop zu Testzwecken leihweise zur Verfügung gestellt. Eine Einflussnahme des Leihstellers auf den Testbericht gab es nicht, der Hersteller erhielt keine Version des Reviews vor der Veröffentlichung. Es bestand keine Verpflichtung zur Publikation. Als eigenständiges, unabhängiges Unternehmen unterliegt Notebookcheck keiner Diktion von Herstellern, Shops und Verlagen.
So testet Notebookcheck
Pro Jahr werden von Notebookcheck hunderte Laptops und Smartphones unabhängig in von uns standardisierten technischen Verfahren getestet, um eine Vergleichbarkeit aller Testergebnisse zu gewährleisten. Seit rund 20 Jahren entwickeln wir diese Testmethoden kontinuierlich weiter und setzen damit Branchenstandards. In unseren Testlaboren kommt ausschließlich hochwertiges Messequipment in die Hände erfahrener Techniker und Redakteure. Die Tests unterliegen einer mehrstufigen Kontrolle. Unsere komplexe Gesamtbewertung basiert auf hunderten fundierten Messergebnissen und Benchmarks, womit Ihnen Objektivität garantiert ist. Weitere Informationen zu unseren Testmethoden gibt es hier.
Preisvergleich

