MSI Prestige 13 AI Evo Laptop im Test - Core Ultra 7 und OLED mit weniger als 1 kg
Das MSI Prestige 13 AI Evo ist ein kompaktes Subnotebook mit einem Gewicht von weniger als 1 Kilogramm. Das neue 2024er-Modell bekommt einen Meteor-Lake-Prozessor von Intel sowie ein Wi-Fi-7-Modul spendiert. Unser Testgerät ist die Variante mit dem Core Ultra 7 155H, Intel Arc Graphics, 32 GB RAM, einer 1-TB-SSD sowie dem 2.8K-OLED-Bildschirm für 1.599 Euro.
Mögliche Konkurrenten im Vergleich
Bew. | Datum | Modell | Gewicht | Dicke | Größe | Auflösung | Preis ab |
|---|---|---|---|---|---|---|---|
| 86.6 % v7 (old) | 03 / 2024 | MSI Prestige 13 AI Evo Ultra 7 155H, Arc 8-Core | 967 g | 16.9 mm | 13.30" | 2880x1800 | |
| 89.5 % v7 (old) | 08 / 2023 | Lenovo ThinkPad X1 Nano Gen 3 i7-1360P, Iris Xe G7 96EUs | 989 g | 14.8 mm | 13.00" | 2160x1350 | |
| 90.2 % v7 (old) | 10 / 2023 | Dell Latitude 13 7340 i5-1345U i5-1345U, Iris Xe G7 80EUs | 1.1 kg | 18.2 mm | 13.30" | 1920x1200 | |
| 91.9 % v7 (old) | 07 / 2023 | HP Dragonfly G4 i7-1365U, Iris Xe G7 96EUs | 1.1 kg | 16.3 mm | 13.50" | 1920x1280 | |
| 85.4 % v7 (old) | 04 / 2023 | Asus ZenBook S13 OLED UX5304 i7-1355U, Iris Xe G7 96EUs | 1 kg | 11.8 mm | 13.30" | 2880x1800 |
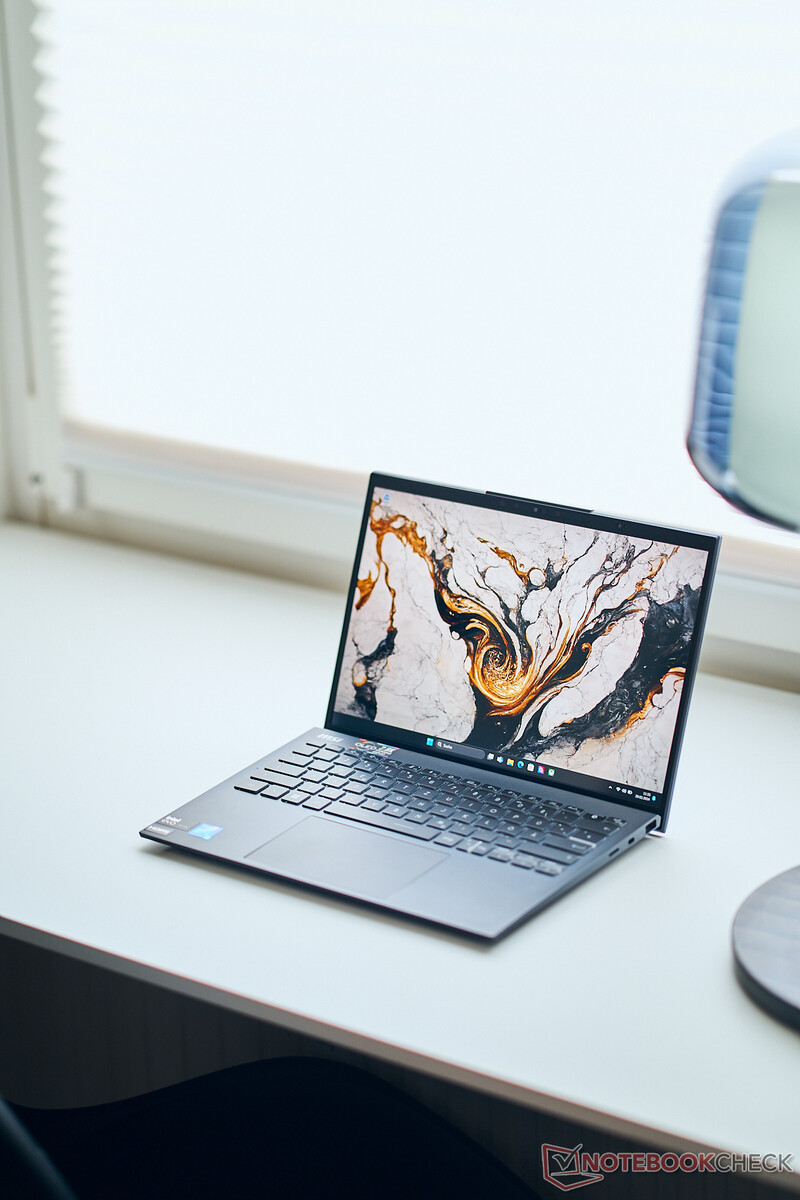
Gehäuse - Prestige 13 mit Magnesium-Aluminium-Hülle
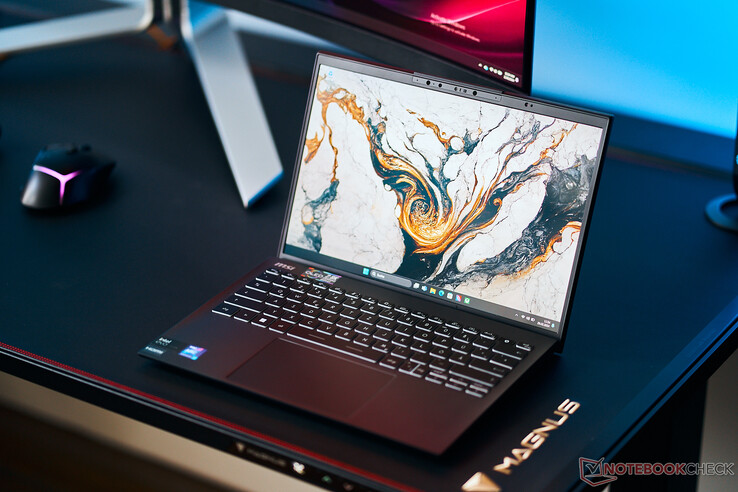
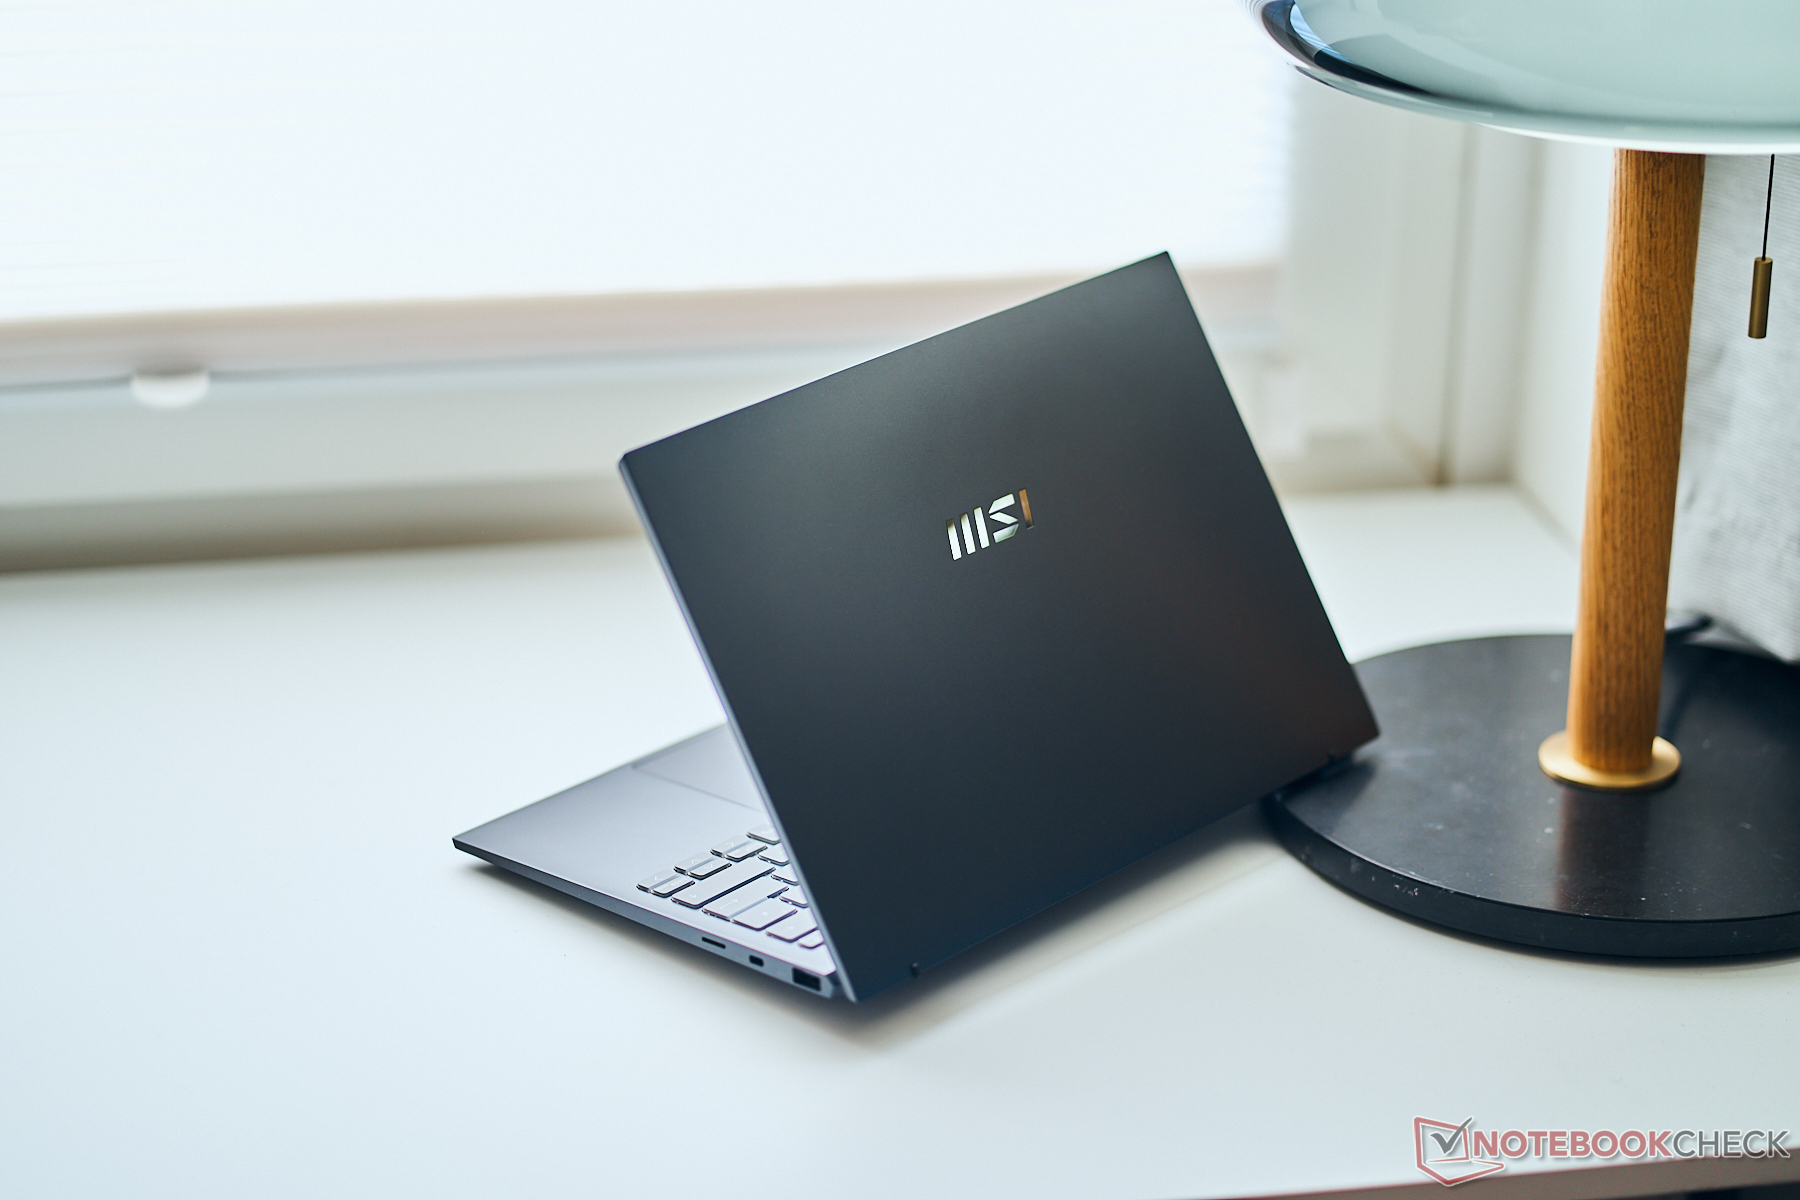
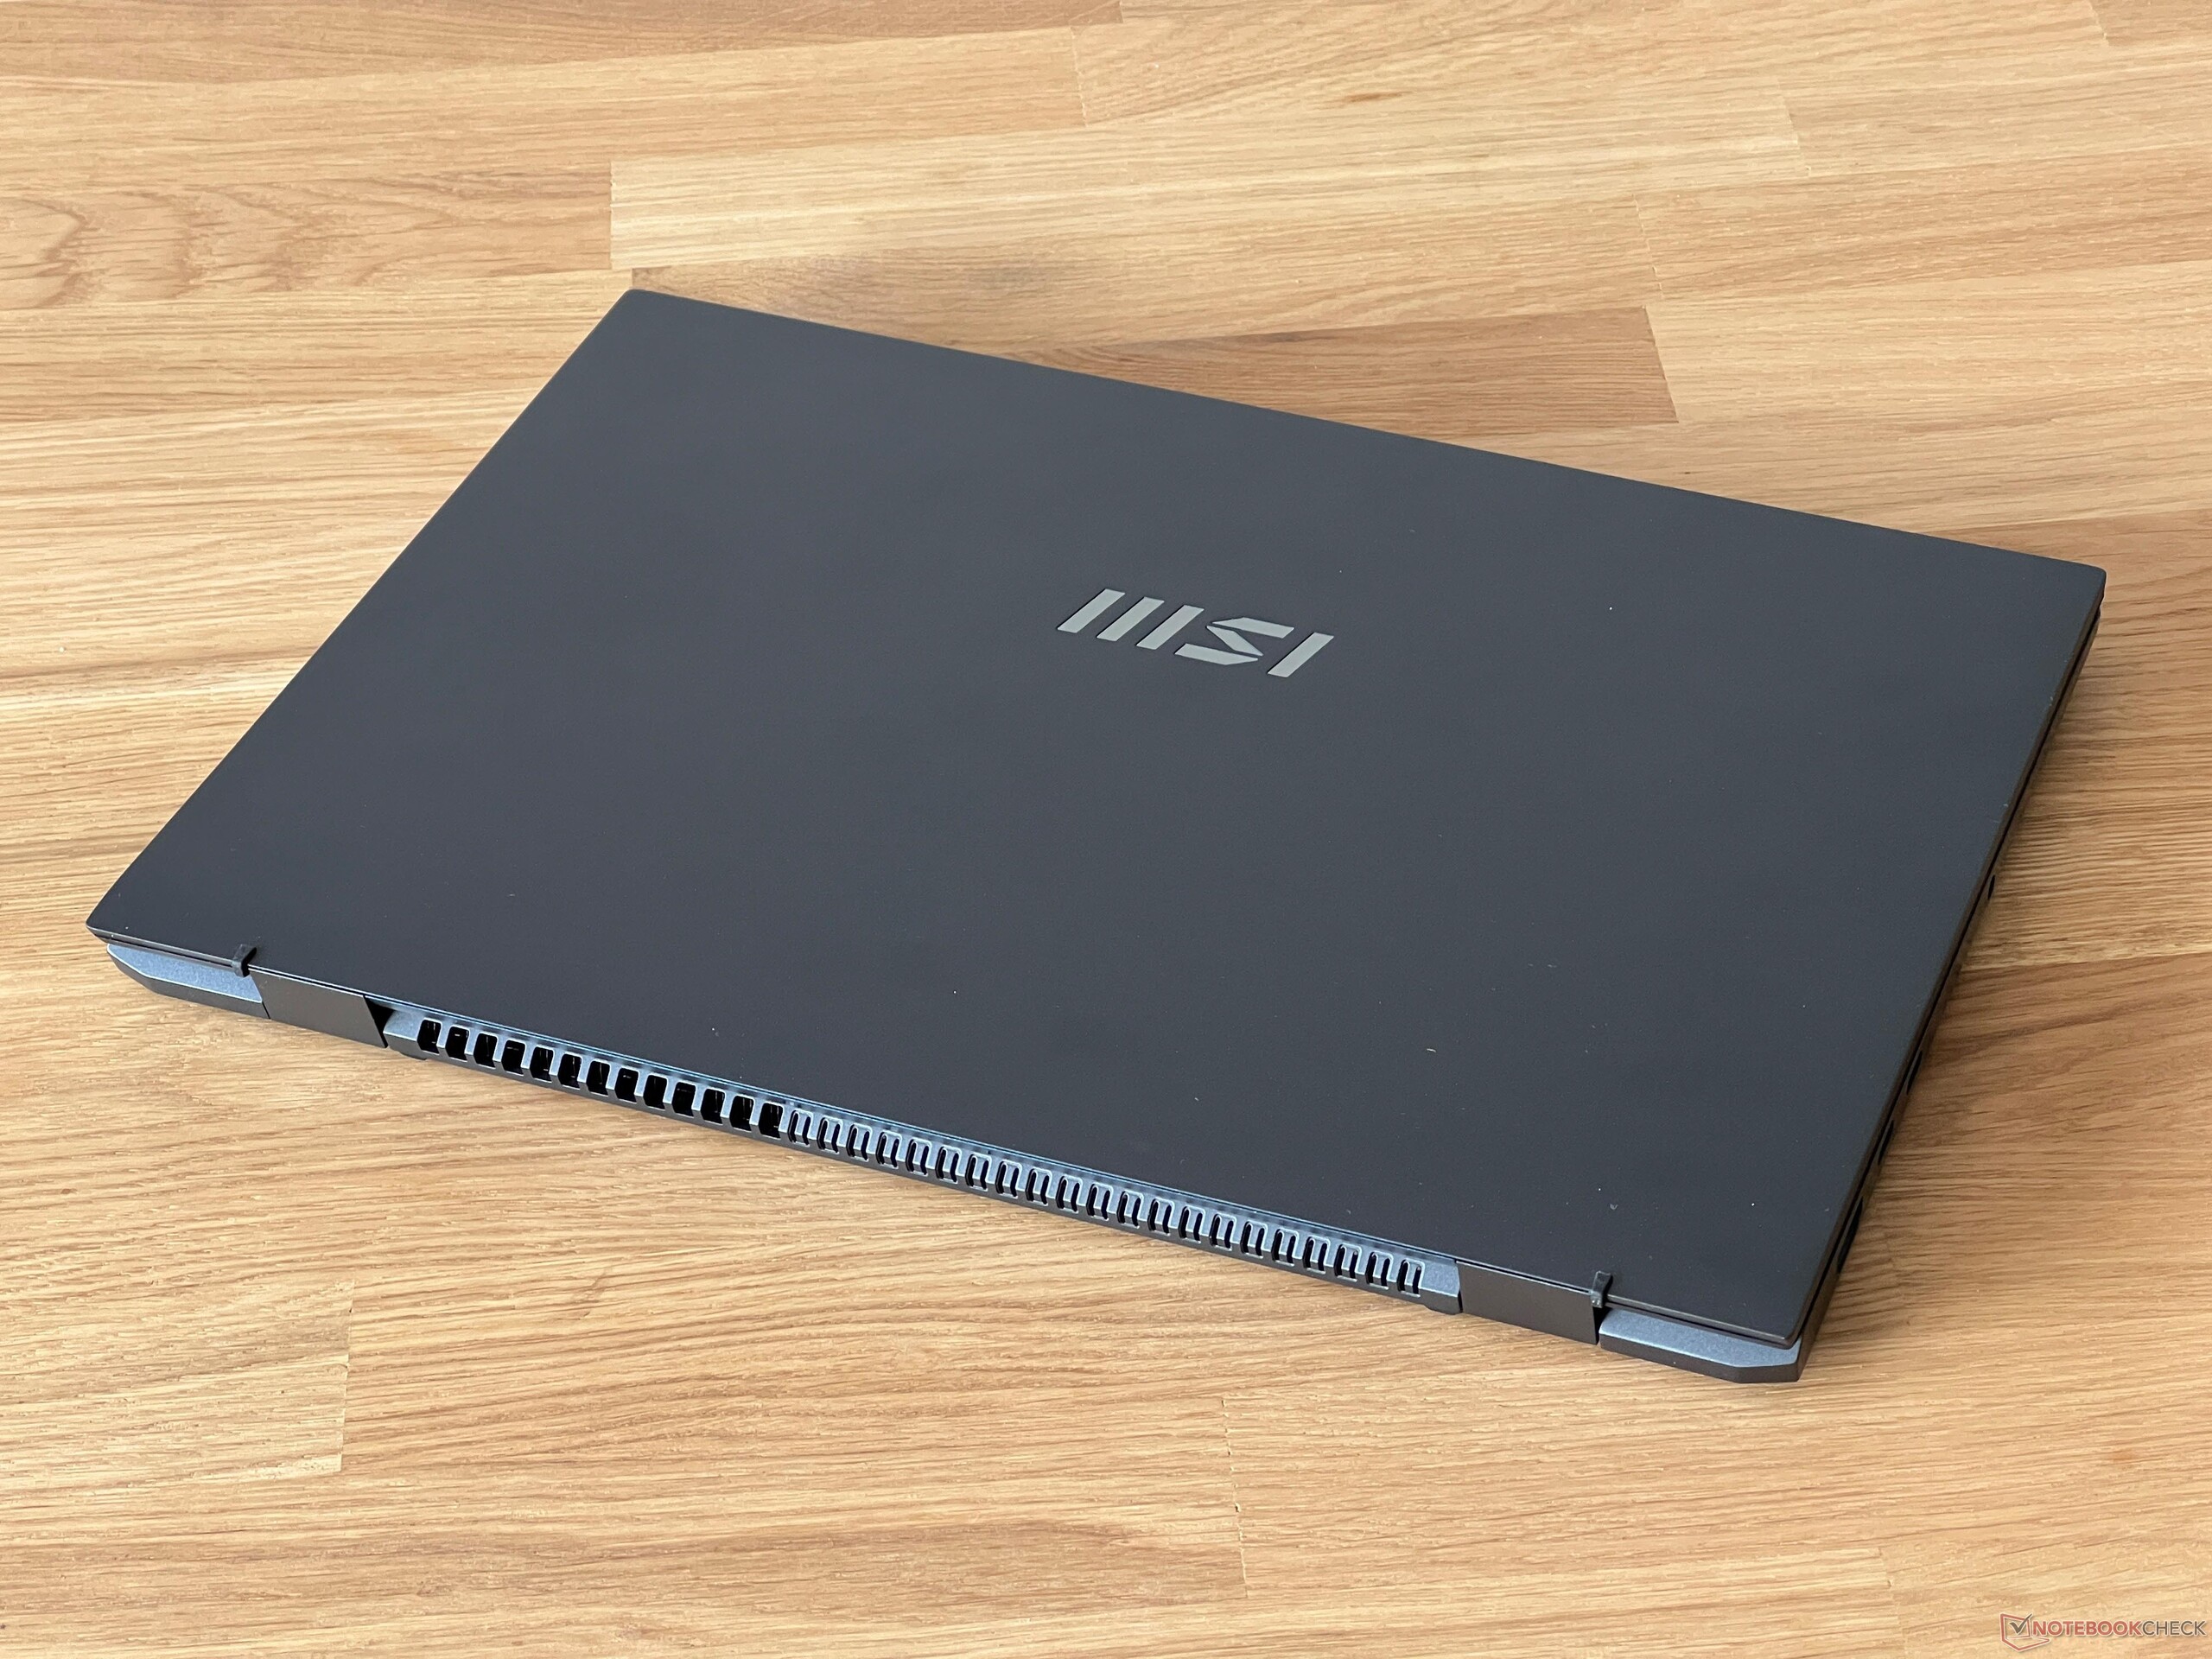
MSI bietet das Prestige 13 entweder in Dunkelgrau (Stellar Gray) wie bei unserem Testgerät oder alternativ in Weiß (Pure White) an. Bei beiden Versionen kommt eine Magnesium-Aluminium-Legierung zum Einsatz, die auch maßgeblich zum geringen Gewicht von gerade einmal 976 Gramm bei. Beim ersten Kontakt ist man auch überrascht, wie leicht das Gerät ist. Die Oberflächen fühlen sich hochwertig an und auch Fingerabdrücke sind selbst bei der dunklen Variante kein großes Problem. Abgesehen von MSI-Logo gibt es beim Prestige 13 keinerlei Design-Elemente. An den beiden Seiten sind die Bildschirmränder recht schmal, doch der obere Rand mit der Webcam ist ziemlich breit.
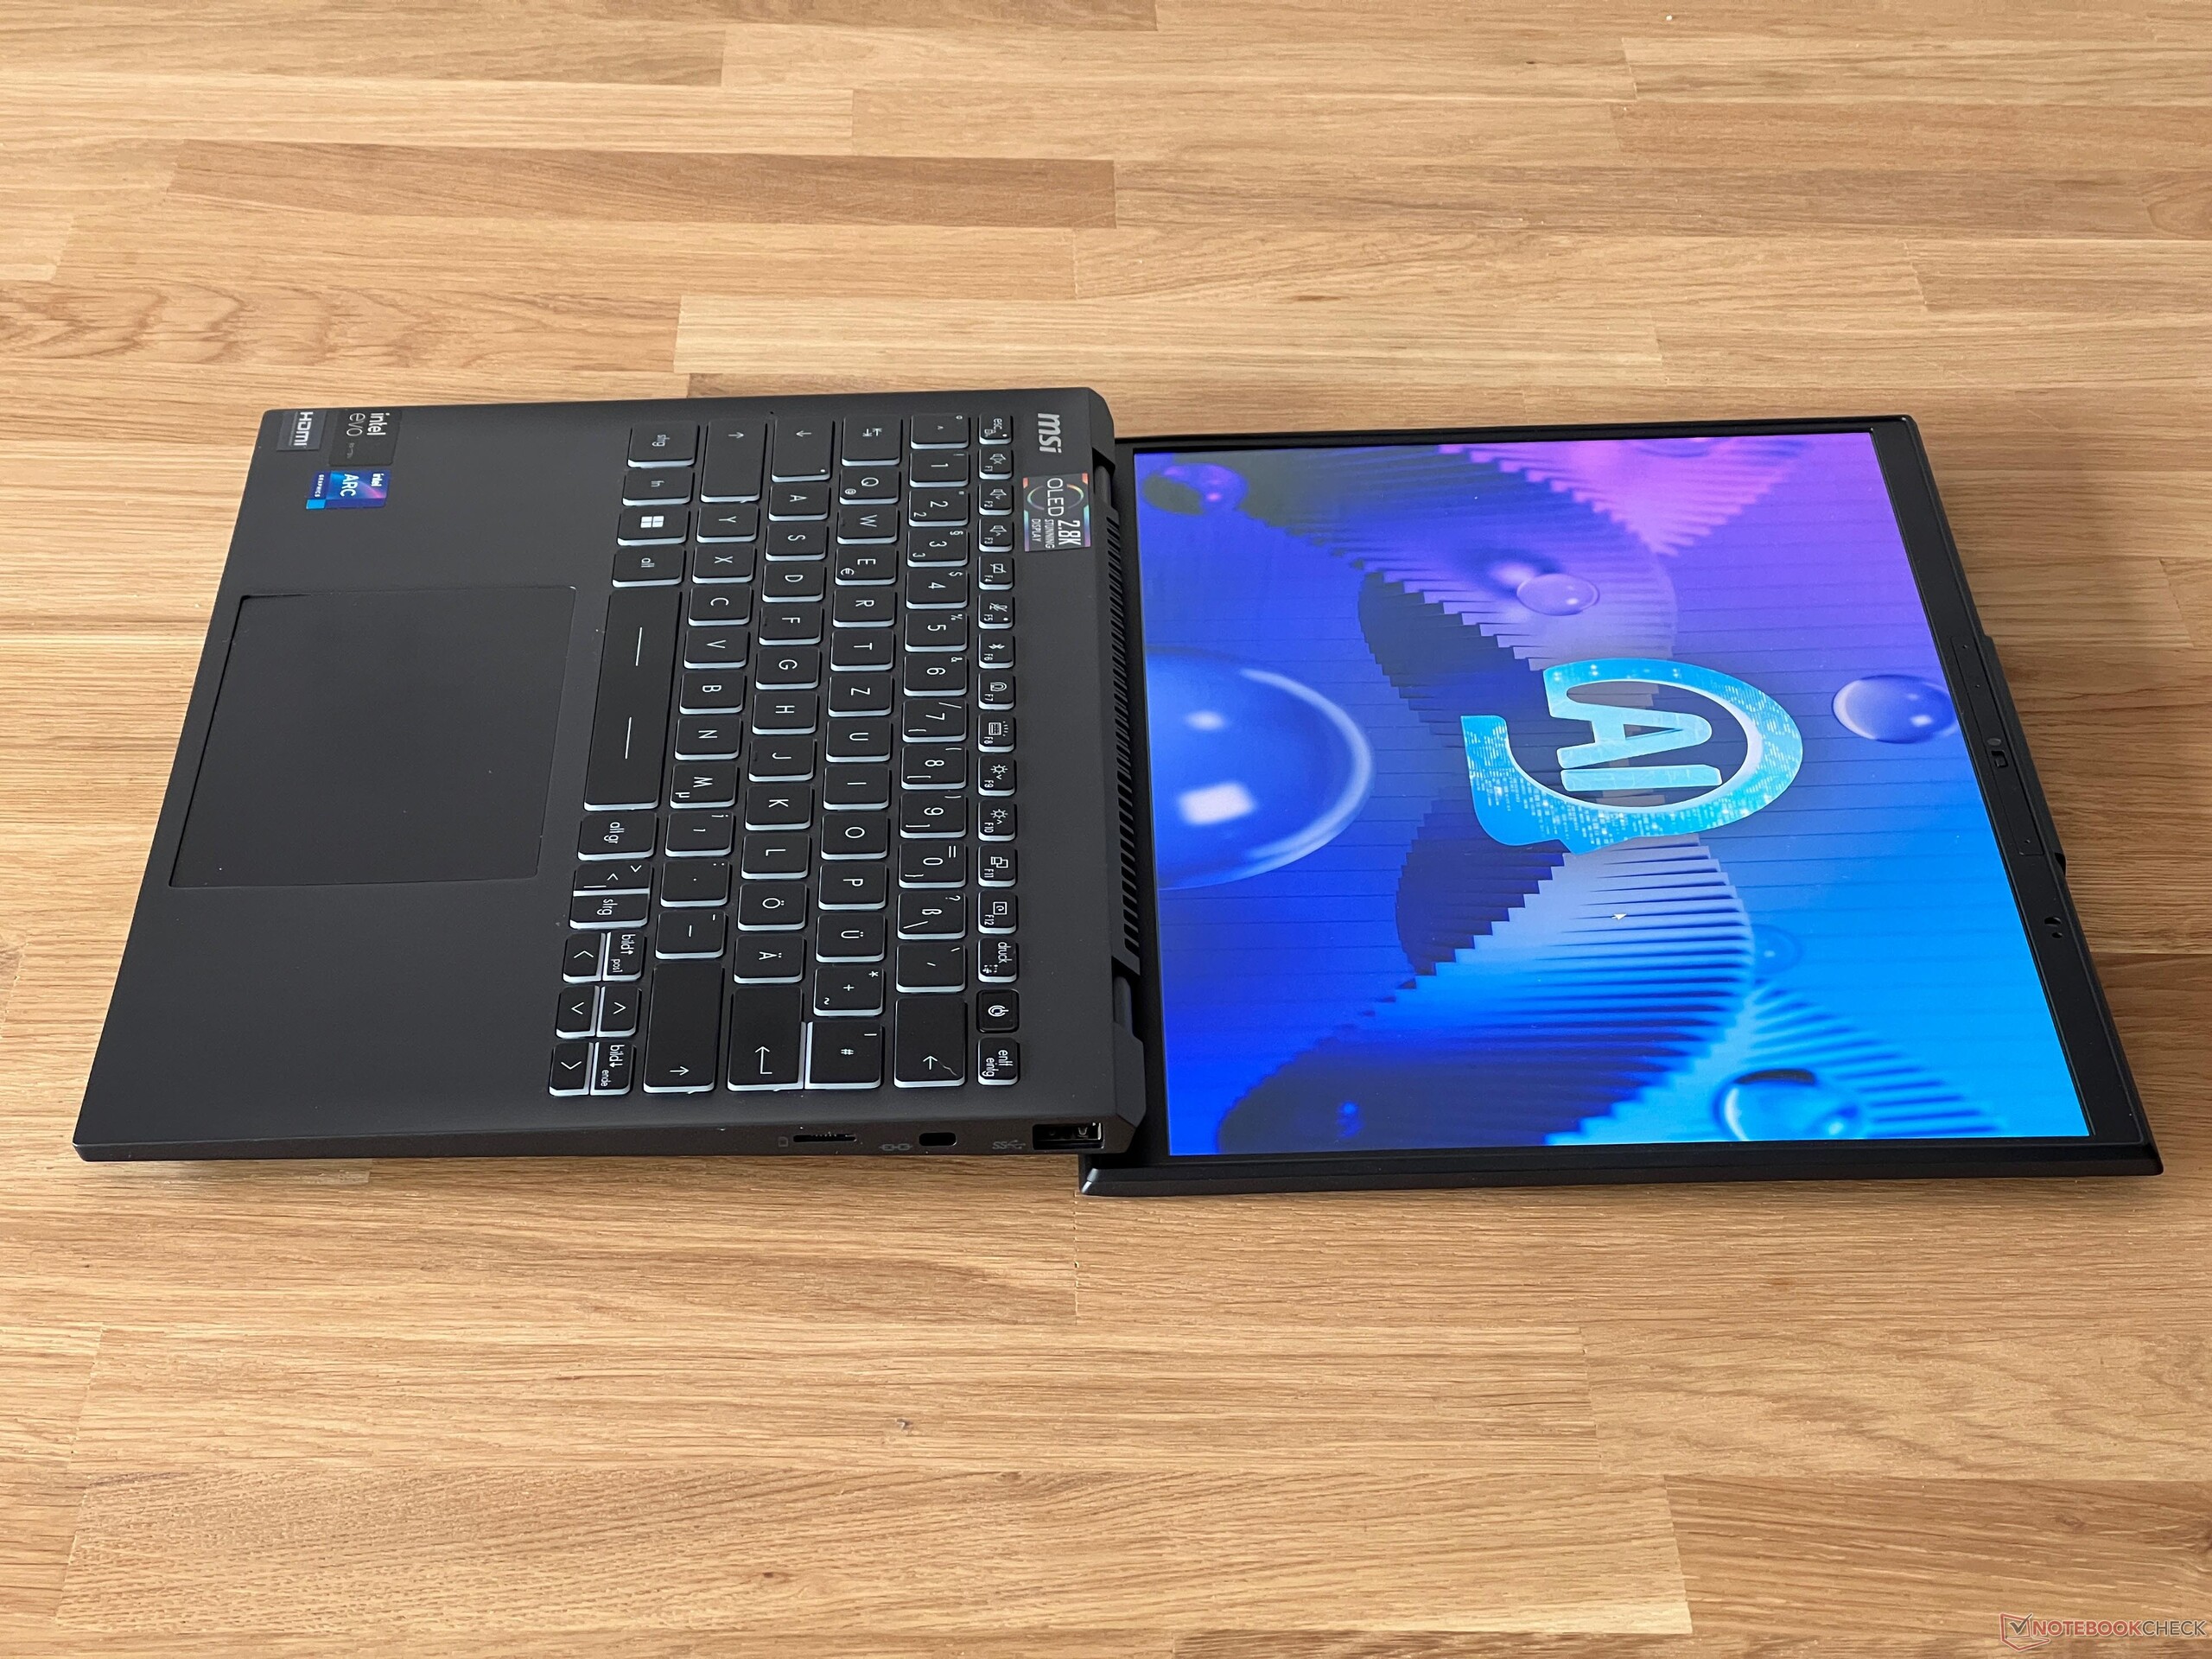
Die Verarbeitung ist gut, allerdings gibt es Schwächen bei der Stabilität. Die Baseunit wird im hinteren Bereich leicht angehoben, wenn man den Deckel öffnet, und der mittlere Tastaturbereich gibt mit etwas Kraft spürbar nach, beim normalen Tippen sollte da aber kein Problem darstellen. Wenn man die Baseunit etwas verwindet, kommt es zudem zu deutlichen Knarzgeräuschen. Die Displayscharniere sind sehr stramm und vermeiden effektiv ein Nachwippen, aber das Öffnen mit nur einer Hand ist schwierig. Der maximale Öffnungswinkel liegt bei 180 Grad und der Deckel selbst ist sehr stabil.
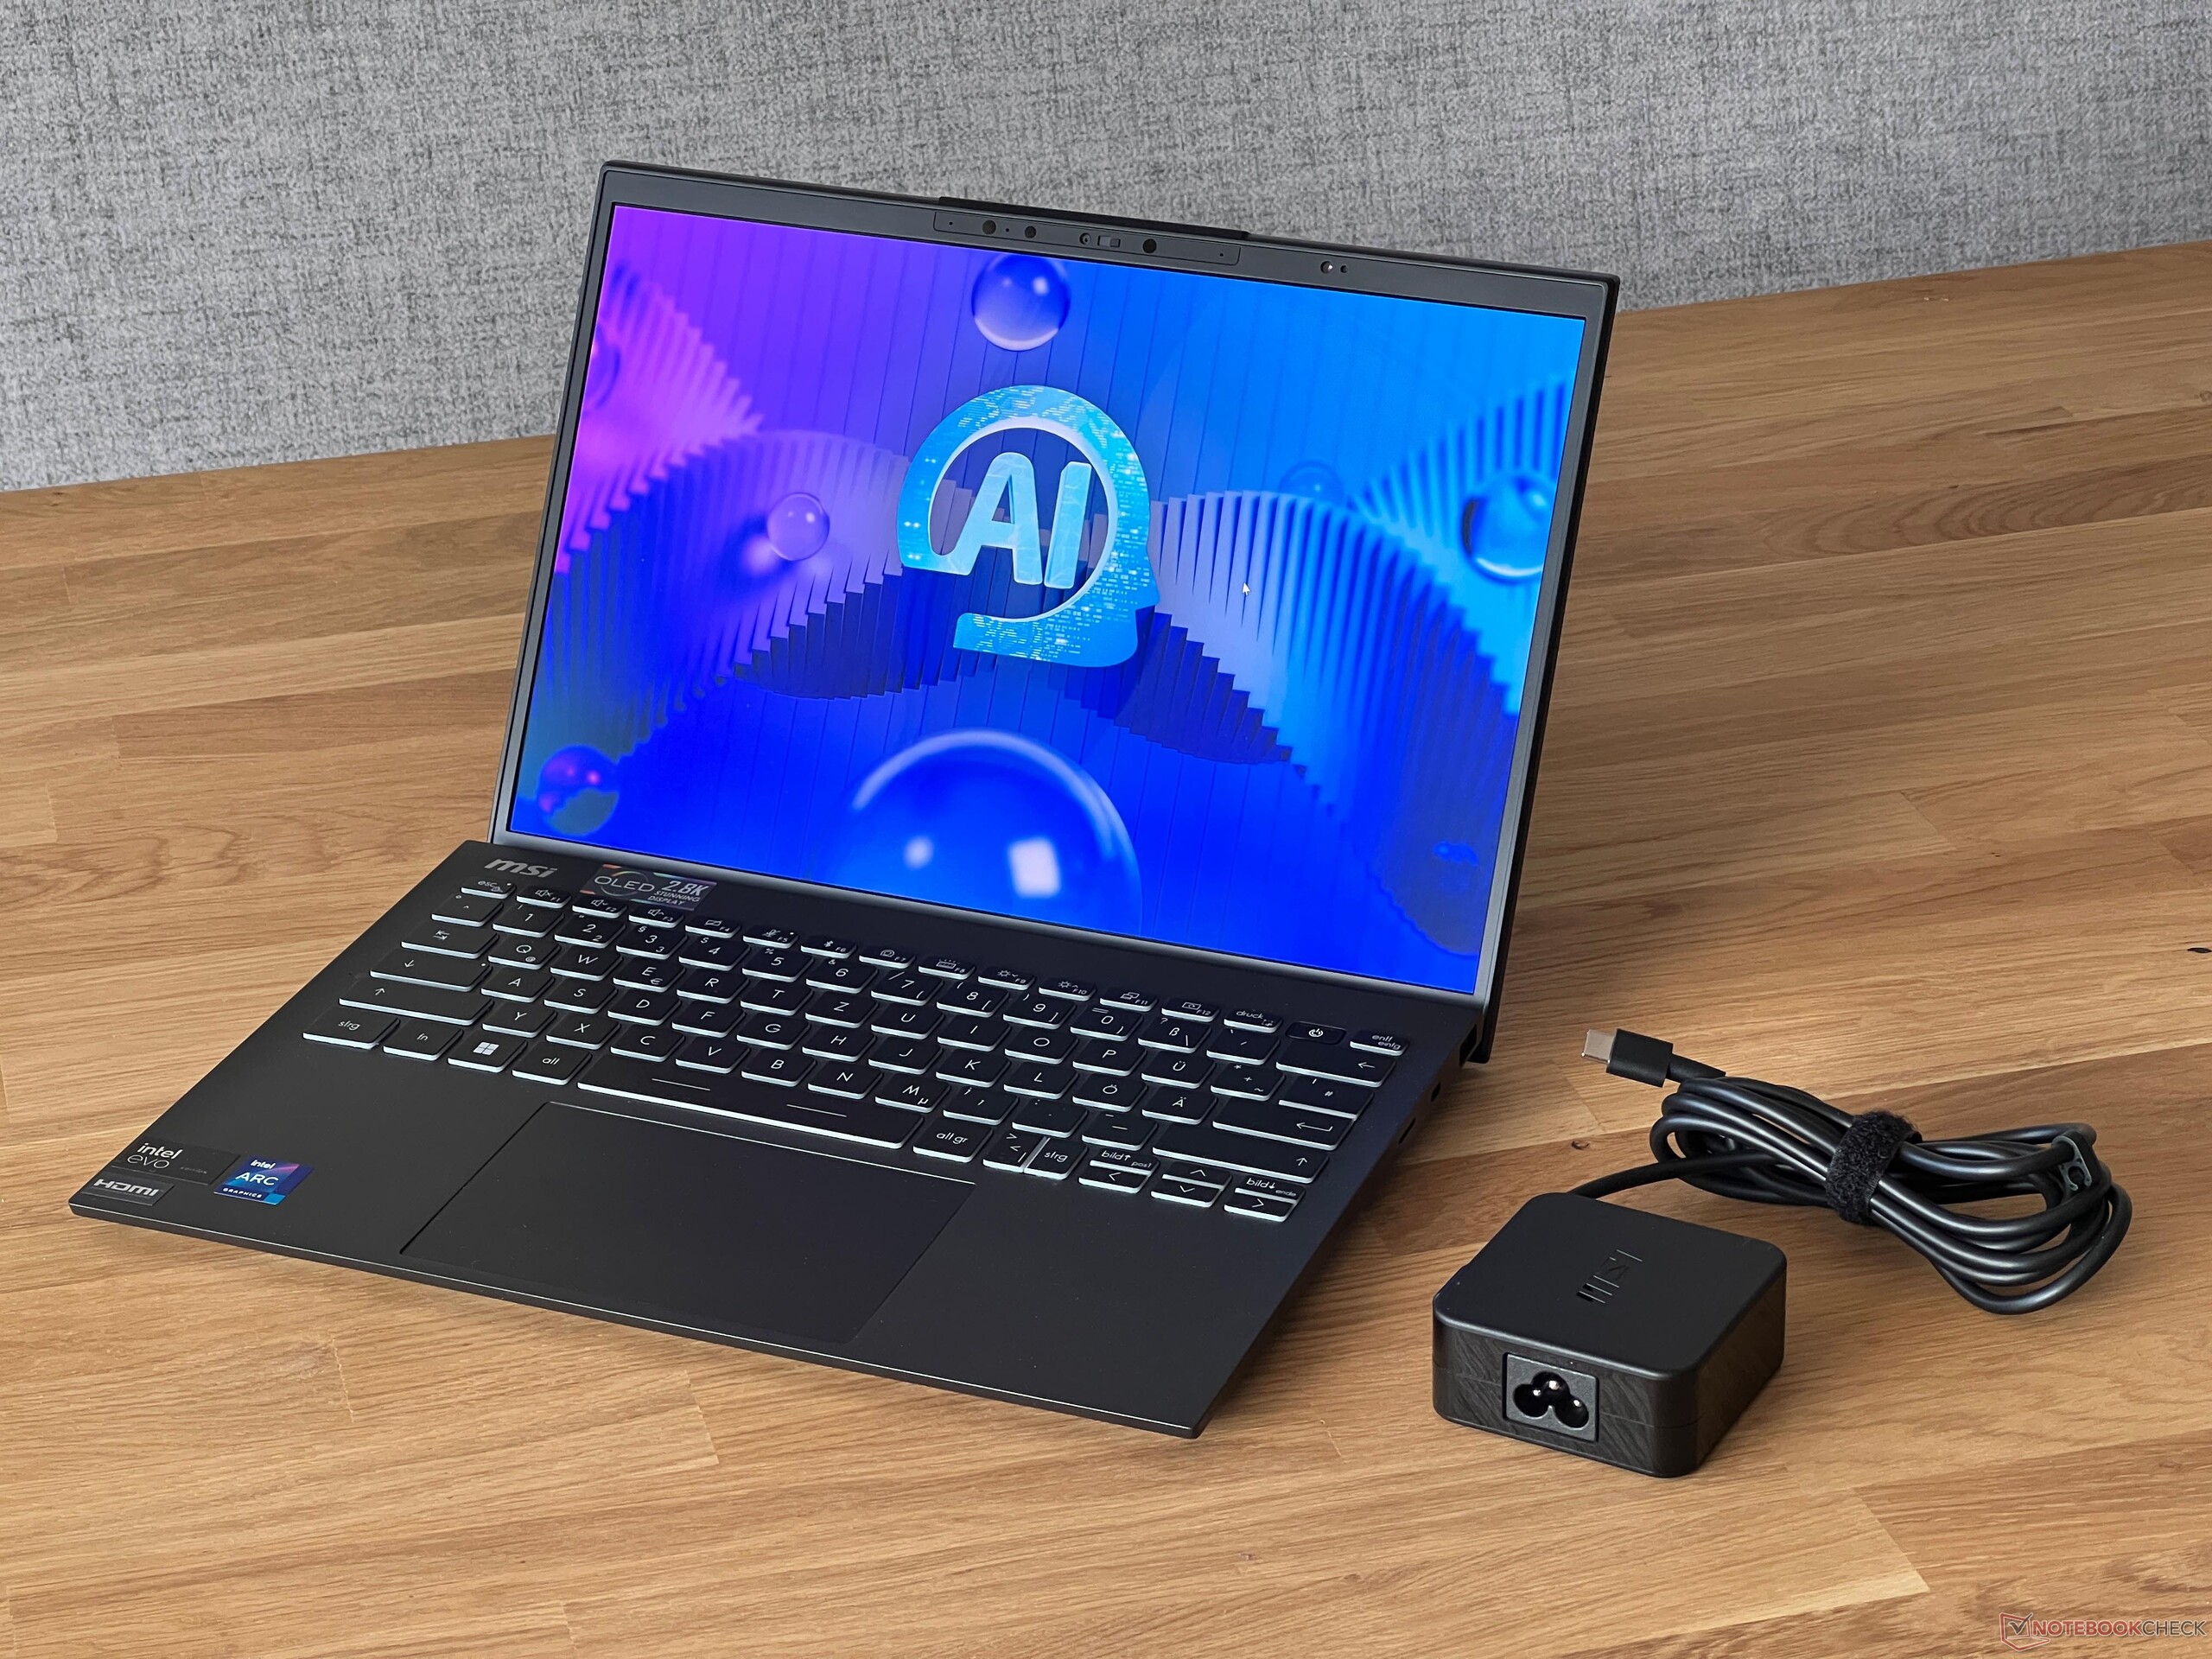
Mit unter 1 Kilogramm ist das Prestige 13 sehr leicht, doch das gilt auch für die anderen Vergleichsgeräte und auch bei der Stellfläche nehmen sich die Konkurrenten nicht viel. Das Prestige lässt sich problemlos in jeder Tasche verstauen. MSI verwendet ein kompaktes 65-Watt-Netzteil, es handelt sich aber nicht um ein Steckernetzteil, weshalb das Gewicht bei relativ hohen 341 Gramm liegt.
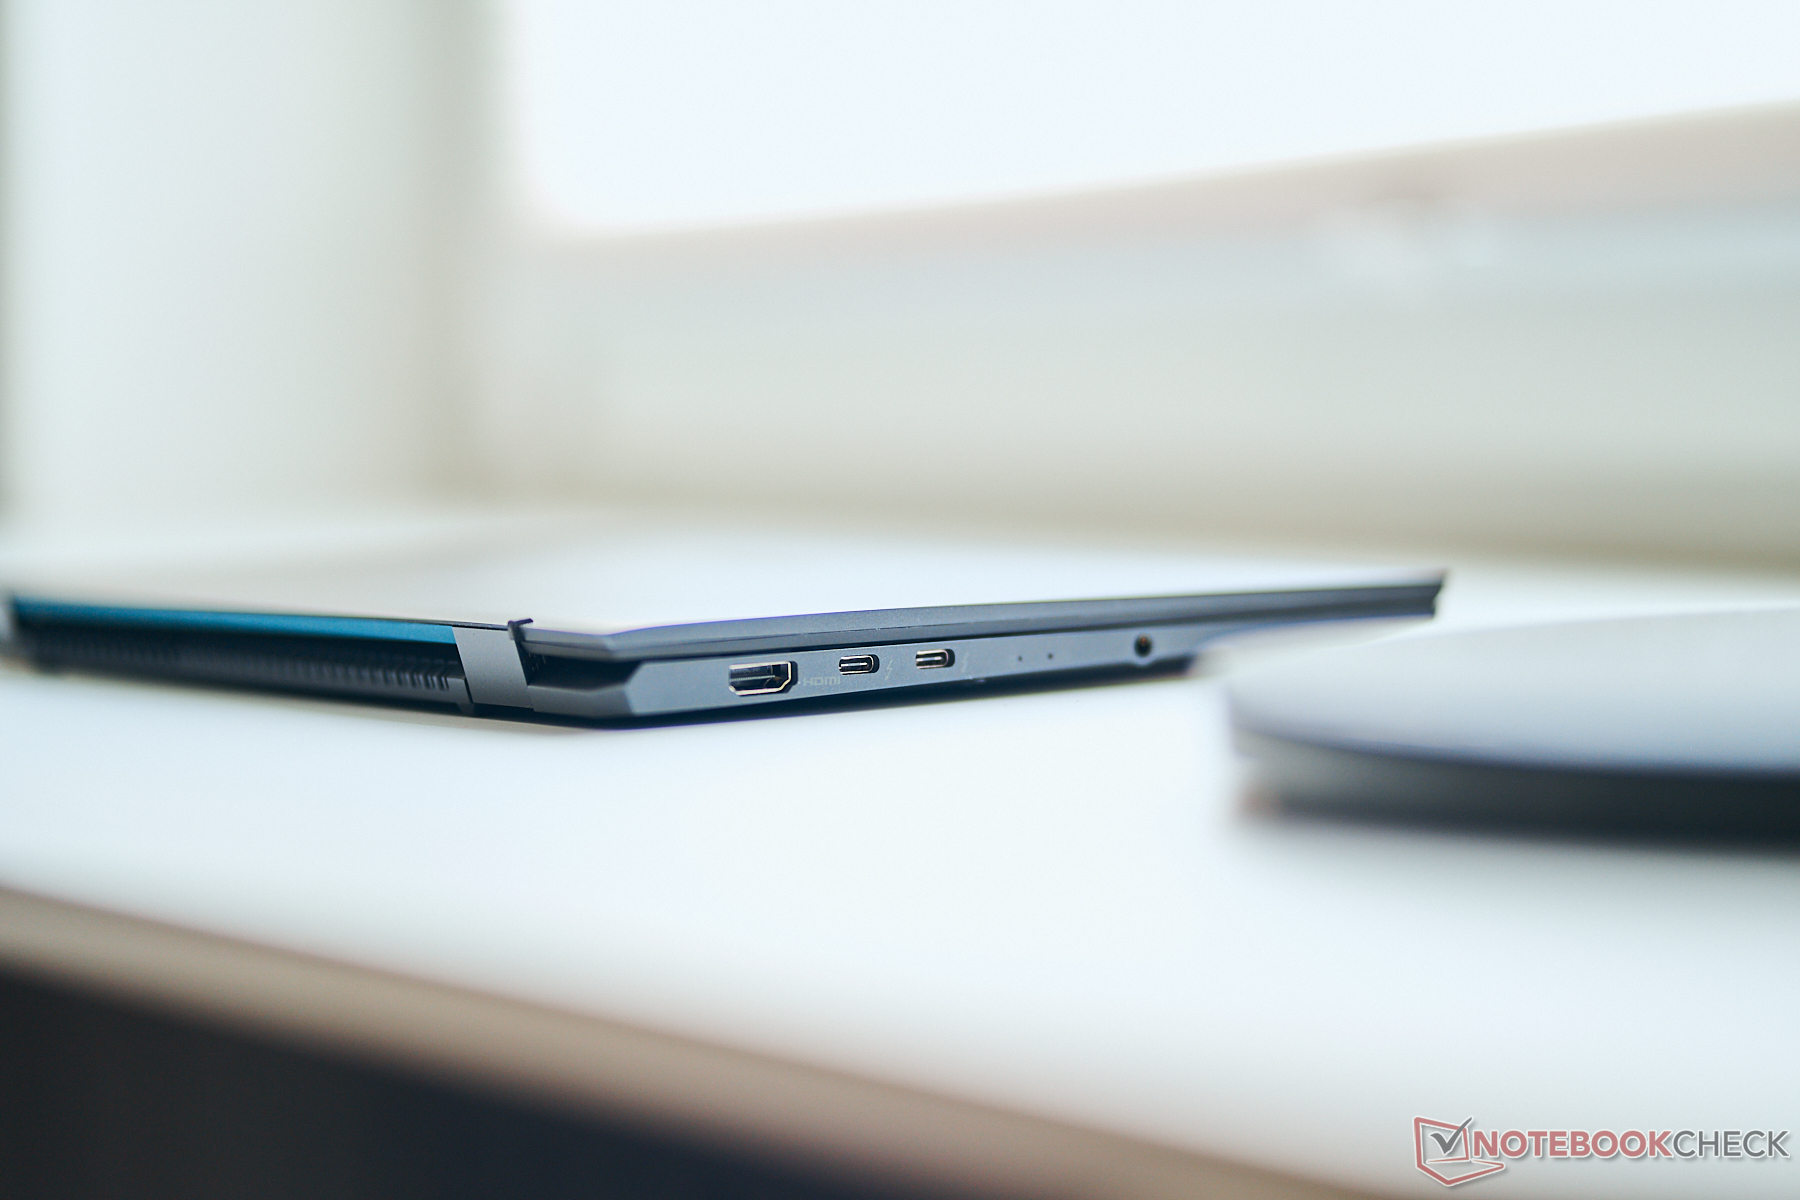
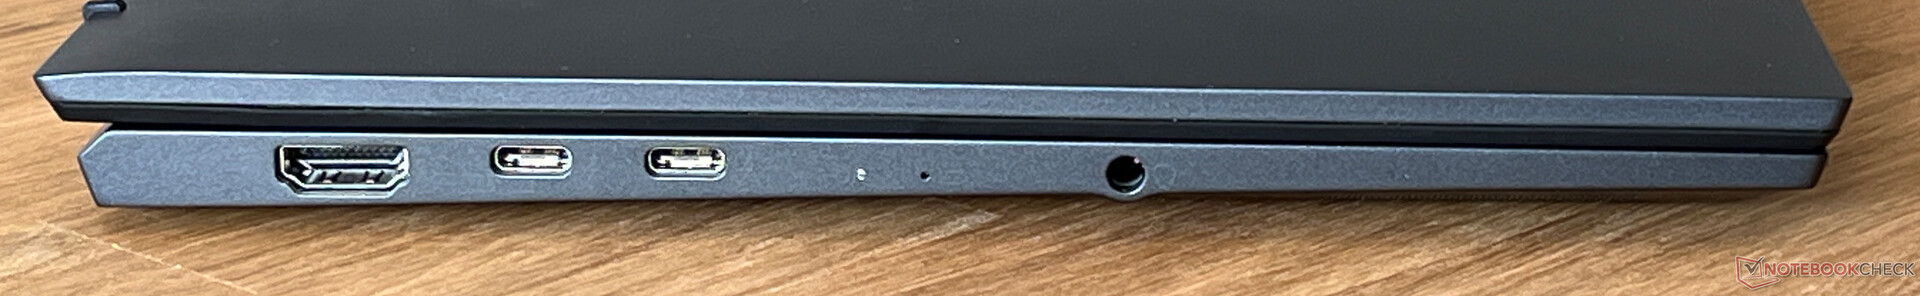
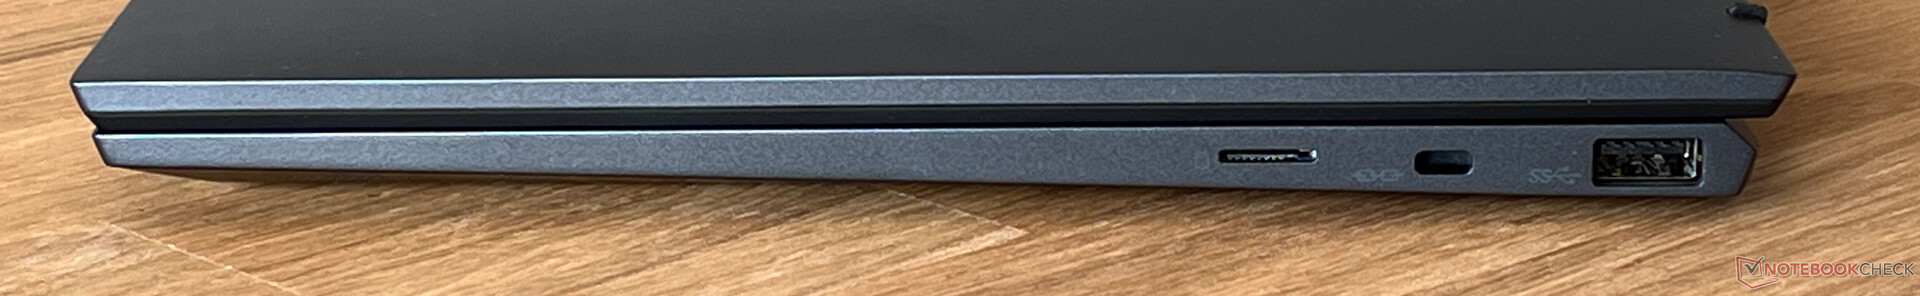
Ausstattung - MSI mit Thunderbolt 4 und HDMI 2.1
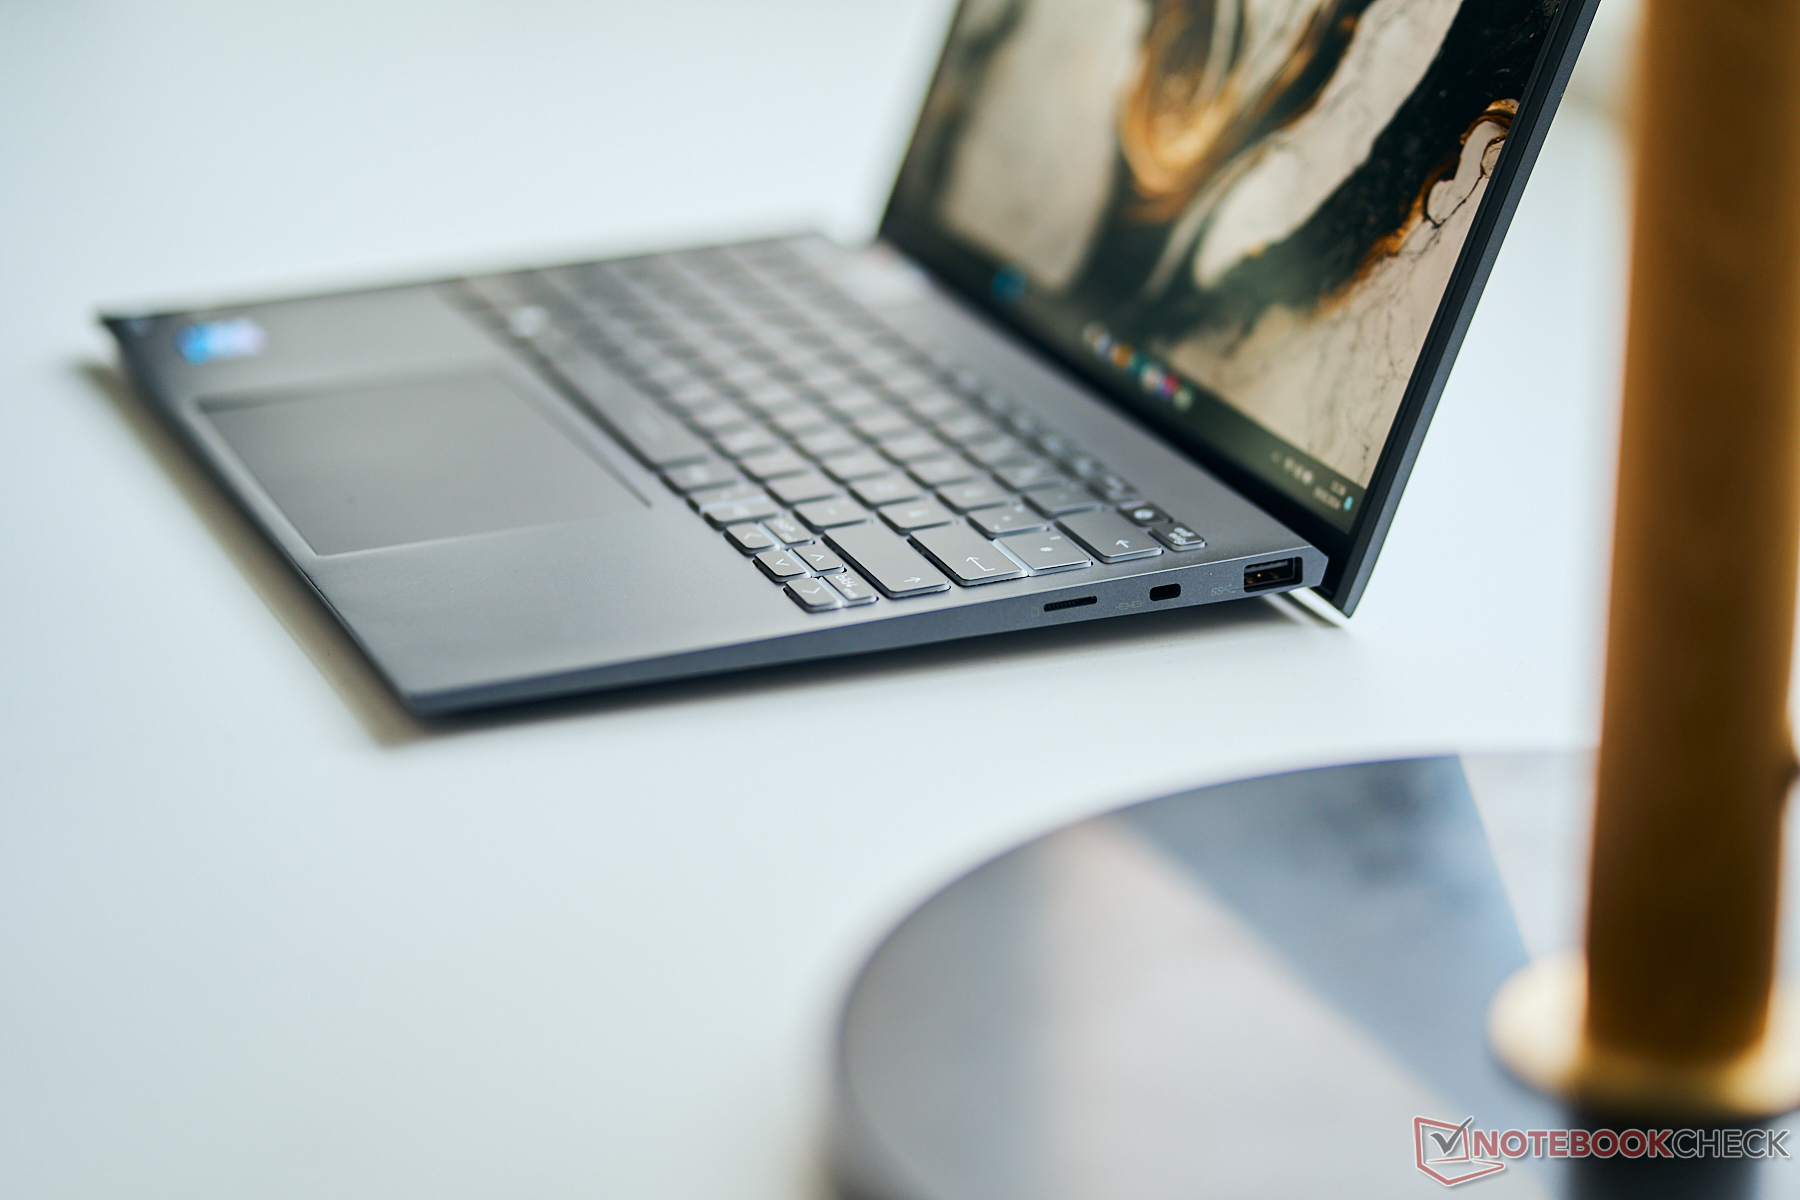
Das Prestige 13 ist zwar kompakt, doch alle wichtigen Anschlüsse inklusive USB-C, USB-A und ein vollwertiger HDMI-Ausgang sind vorhanden. Die Anschlussverteilung gefällt uns ebenfalls gut und hier gibt es kaum Kritik.
SD Card Reader
Auf der rechten Seite befindet sich ein microSD-Kartenleser (Federmechansimus), der in Verbindung mit unserer Referenzkarte (Angelbird AV Pro V60) sehr gute Transferraten erreicht. Beim Kopieren von Bildern sind es mehr als 140 MB/s und maximal mehr als 200 MB/s. Die anderen Vergleichsgeräte bieten keinen Kartenleser.
| SD Card Reader | |
| average JPG Copy Test (av. of 3 runs) | |
| MSI Prestige 13 AI Evo (Angelbird AV Pro V60) | |
| Durchschnitt der Klasse Subnotebook (23.7 - 188, n=9, der letzten 2 Jahre) | |
| maximum AS SSD Seq Read Test (1GB) | |
| MSI Prestige 13 AI Evo (Angelbird AV Pro V60) | |
| Durchschnitt der Klasse Subnotebook (24.9 - 195, n=8, der letzten 2 Jahre) | |
Kommunikation
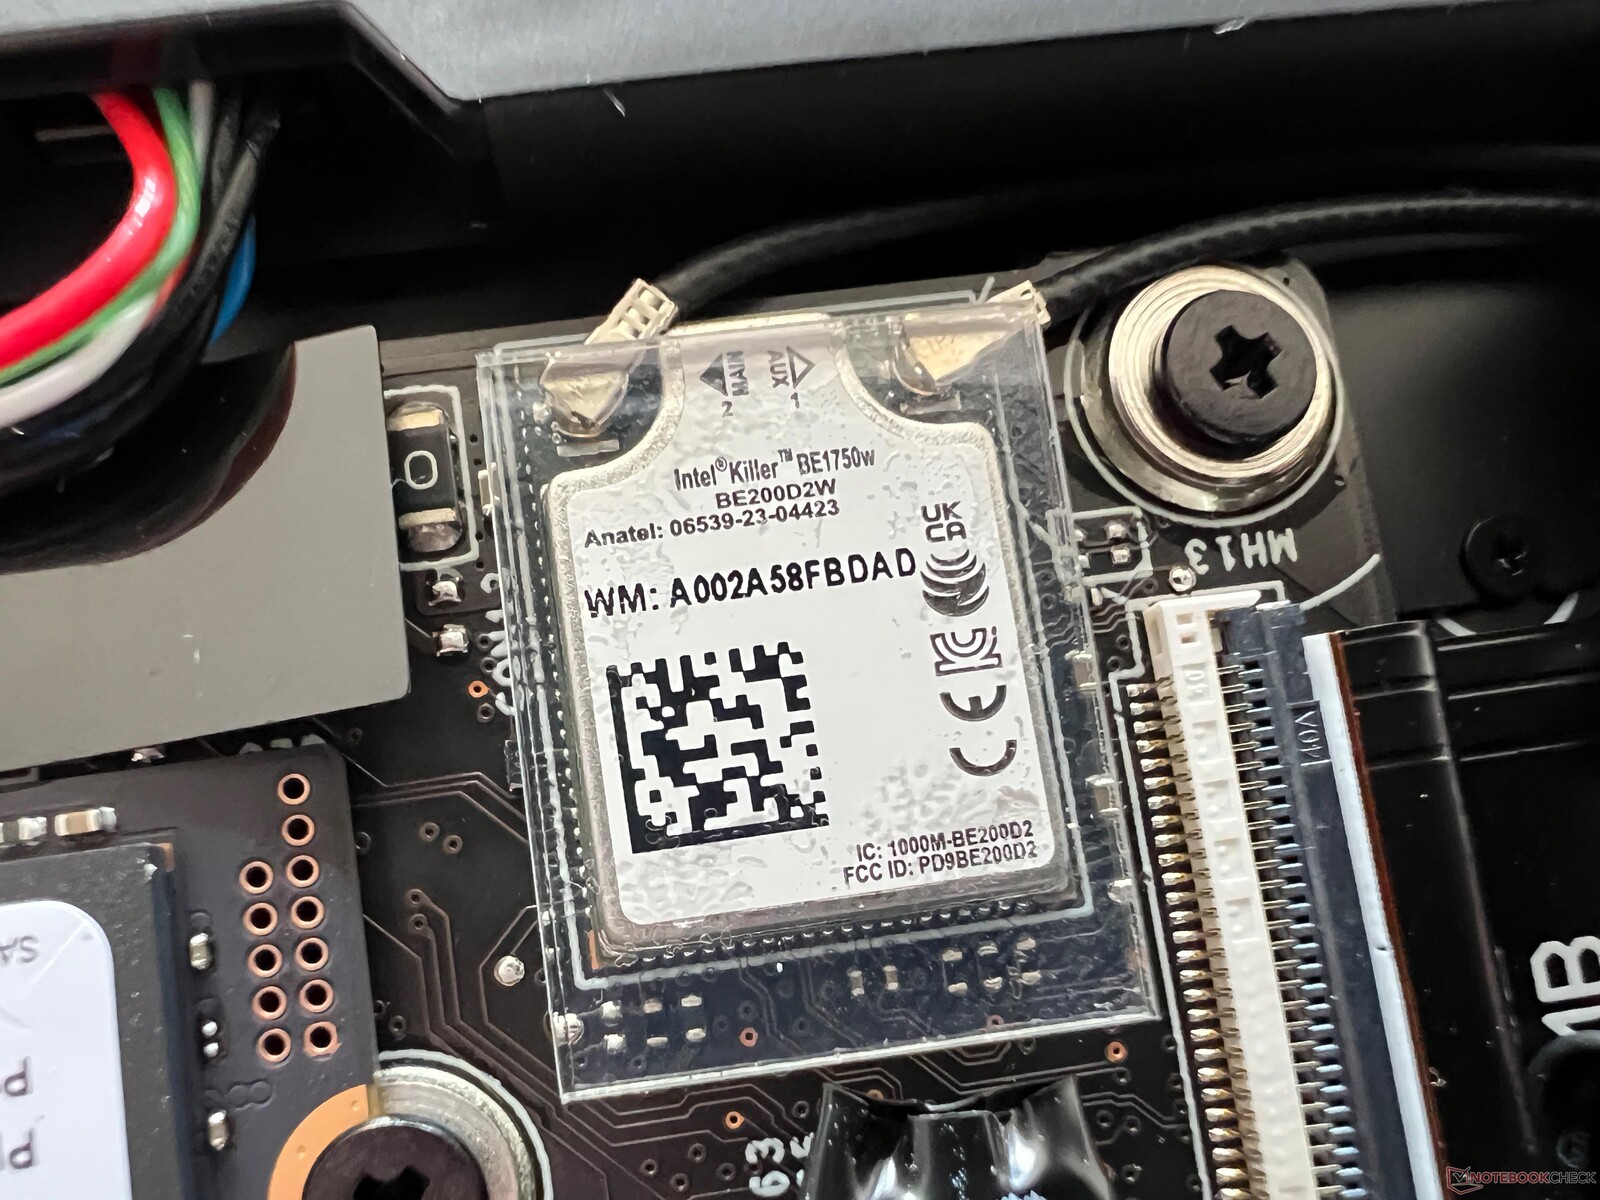
MSI verbaut das neue Wi-Fi-7-Modul BE1750W (320 MHz) von Intel. Mit unserem aktuellen Referenzrouter können wir den neuen Standard aber noch nicht ausnutzen. Die Transferraten mit Wi-Fi 6 waren aber sehr stabil und hoch.
| Networking | |
| MSI Prestige 13 AI Evo | |
| iperf3 transmit AXE11000 | |
| iperf3 receive AXE11000 | |
| Lenovo ThinkPad X1 Nano Gen 3 | |
| iperf3 transmit AXE11000 | |
| iperf3 receive AXE11000 | |
| iperf3 transmit AXE11000 6GHz | |
| iperf3 receive AXE11000 6GHz | |
| Dell Latitude 13 7340 i5-1345U | |
| iperf3 transmit AXE11000 | |
| iperf3 receive AXE11000 | |
| iperf3 transmit AXE11000 6GHz | |
| iperf3 receive AXE11000 6GHz | |
| HP Dragonfly G4 | |
| iperf3 transmit AXE11000 | |
| iperf3 receive AXE11000 | |
| iperf3 transmit AXE11000 6GHz | |
| iperf3 receive AXE11000 6GHz | |
| Asus ZenBook S13 OLED UX5304 | |
| iperf3 transmit AXE11000 | |
| iperf3 receive AXE11000 | |
Webcam
Die 1080p-Webcam bietet eine vernünftige Bildqualität bei guten Lichtverhältnissen und es ist eine mechanische Blende verbaut. Die Windows-Studio-Effekte (Weichzeichner für Hintergrund, Augenkontakt, Tracking) werden ebenfalls unterstützt. Zusätzlich ist noch eine IR-Kamera für die Gesichtserkennung via Windows Hello verfügbar.


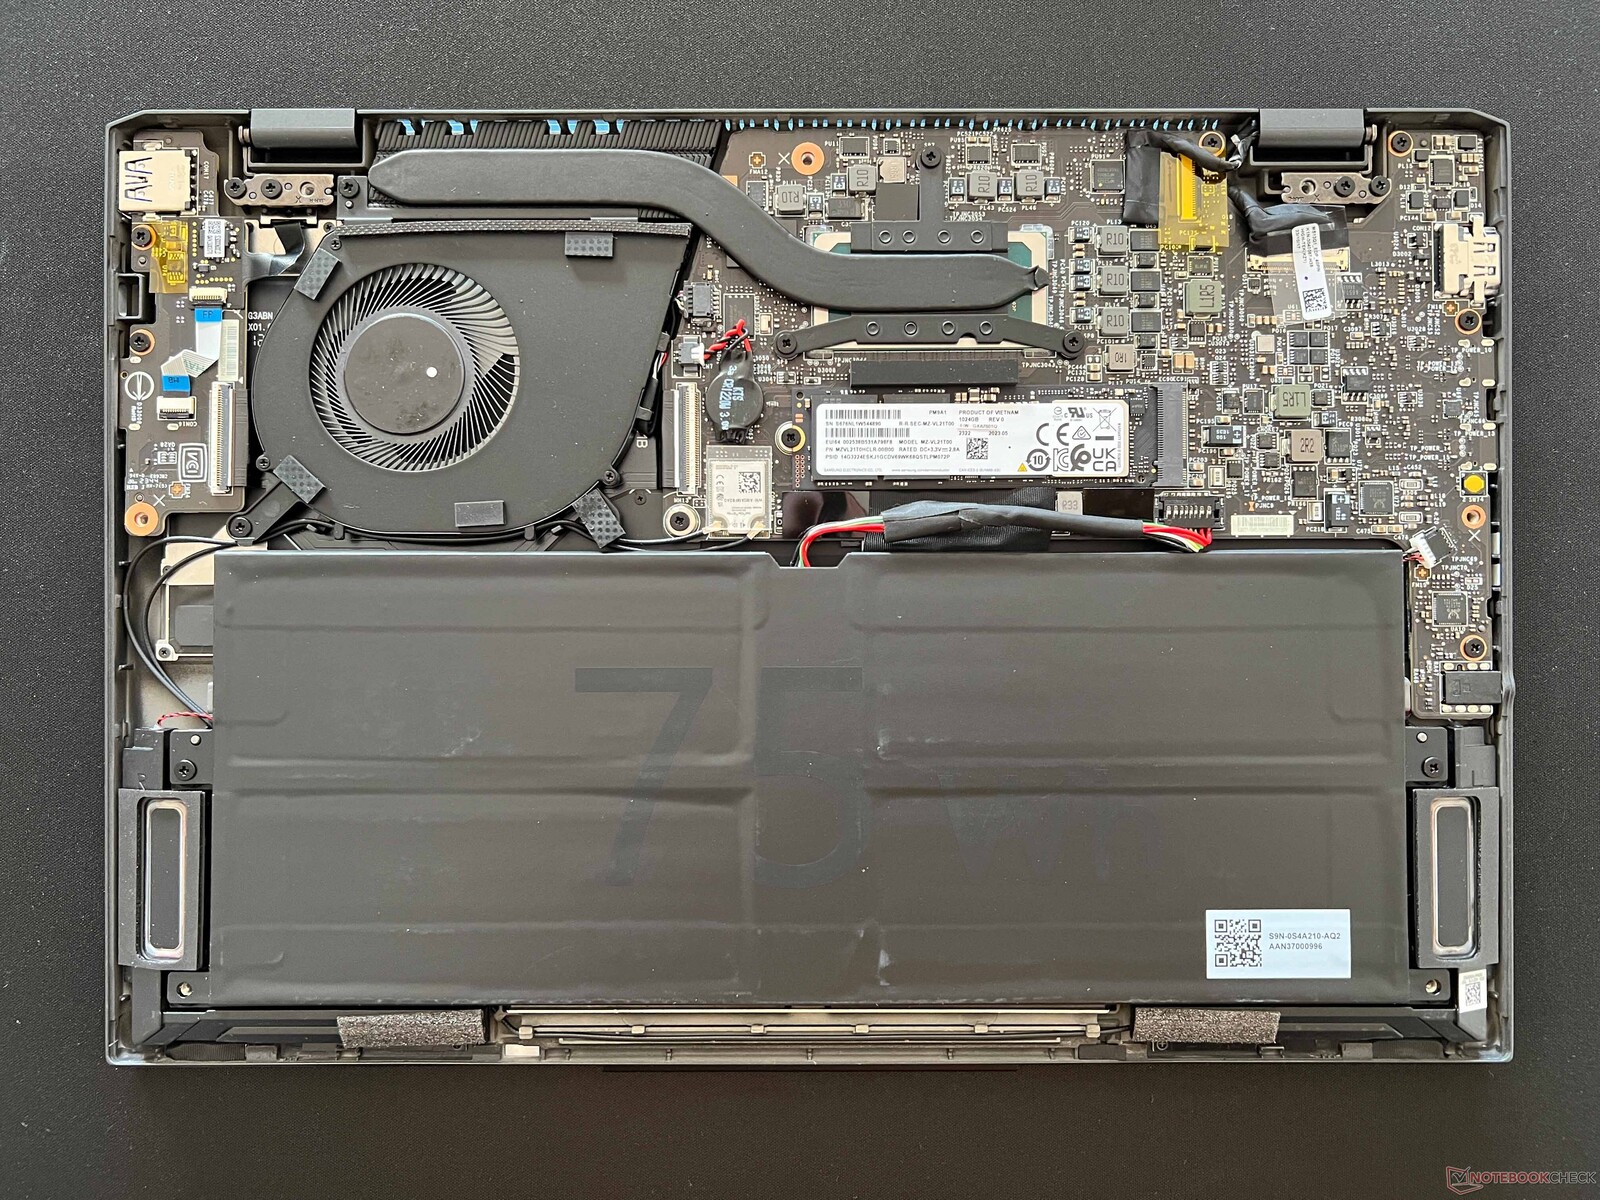
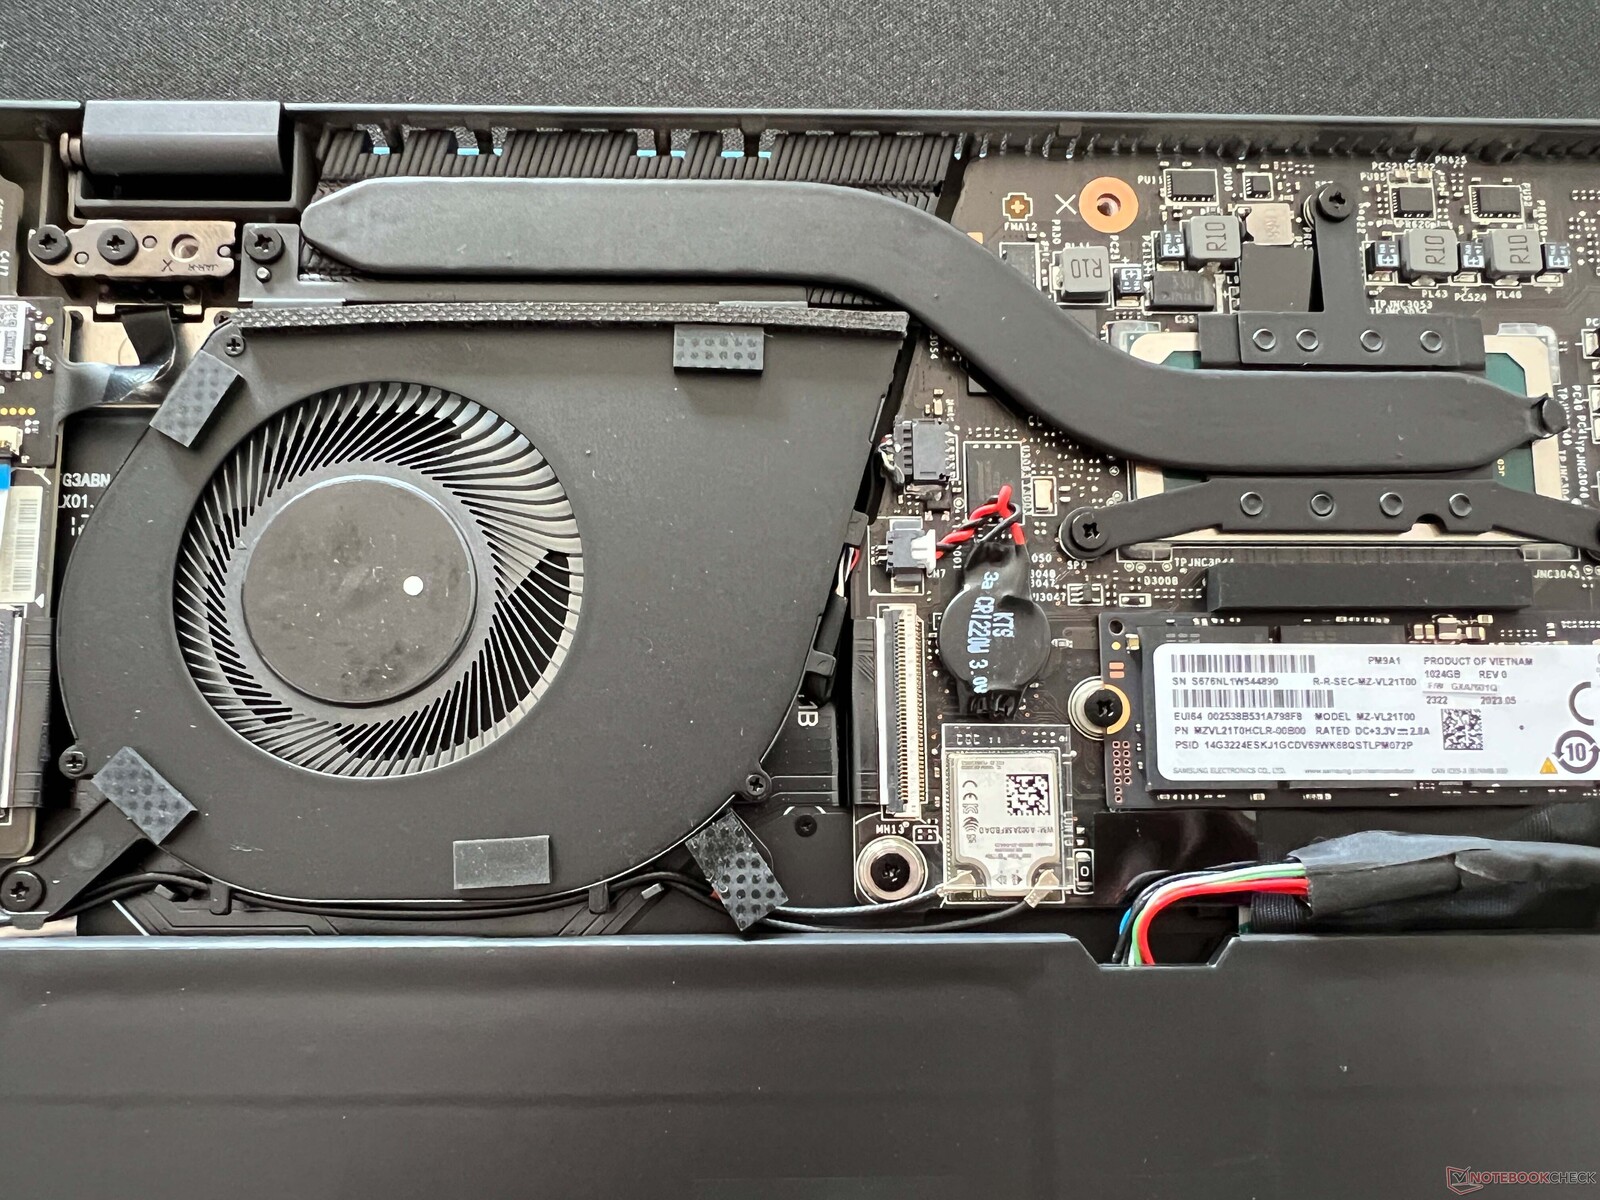
Wartung
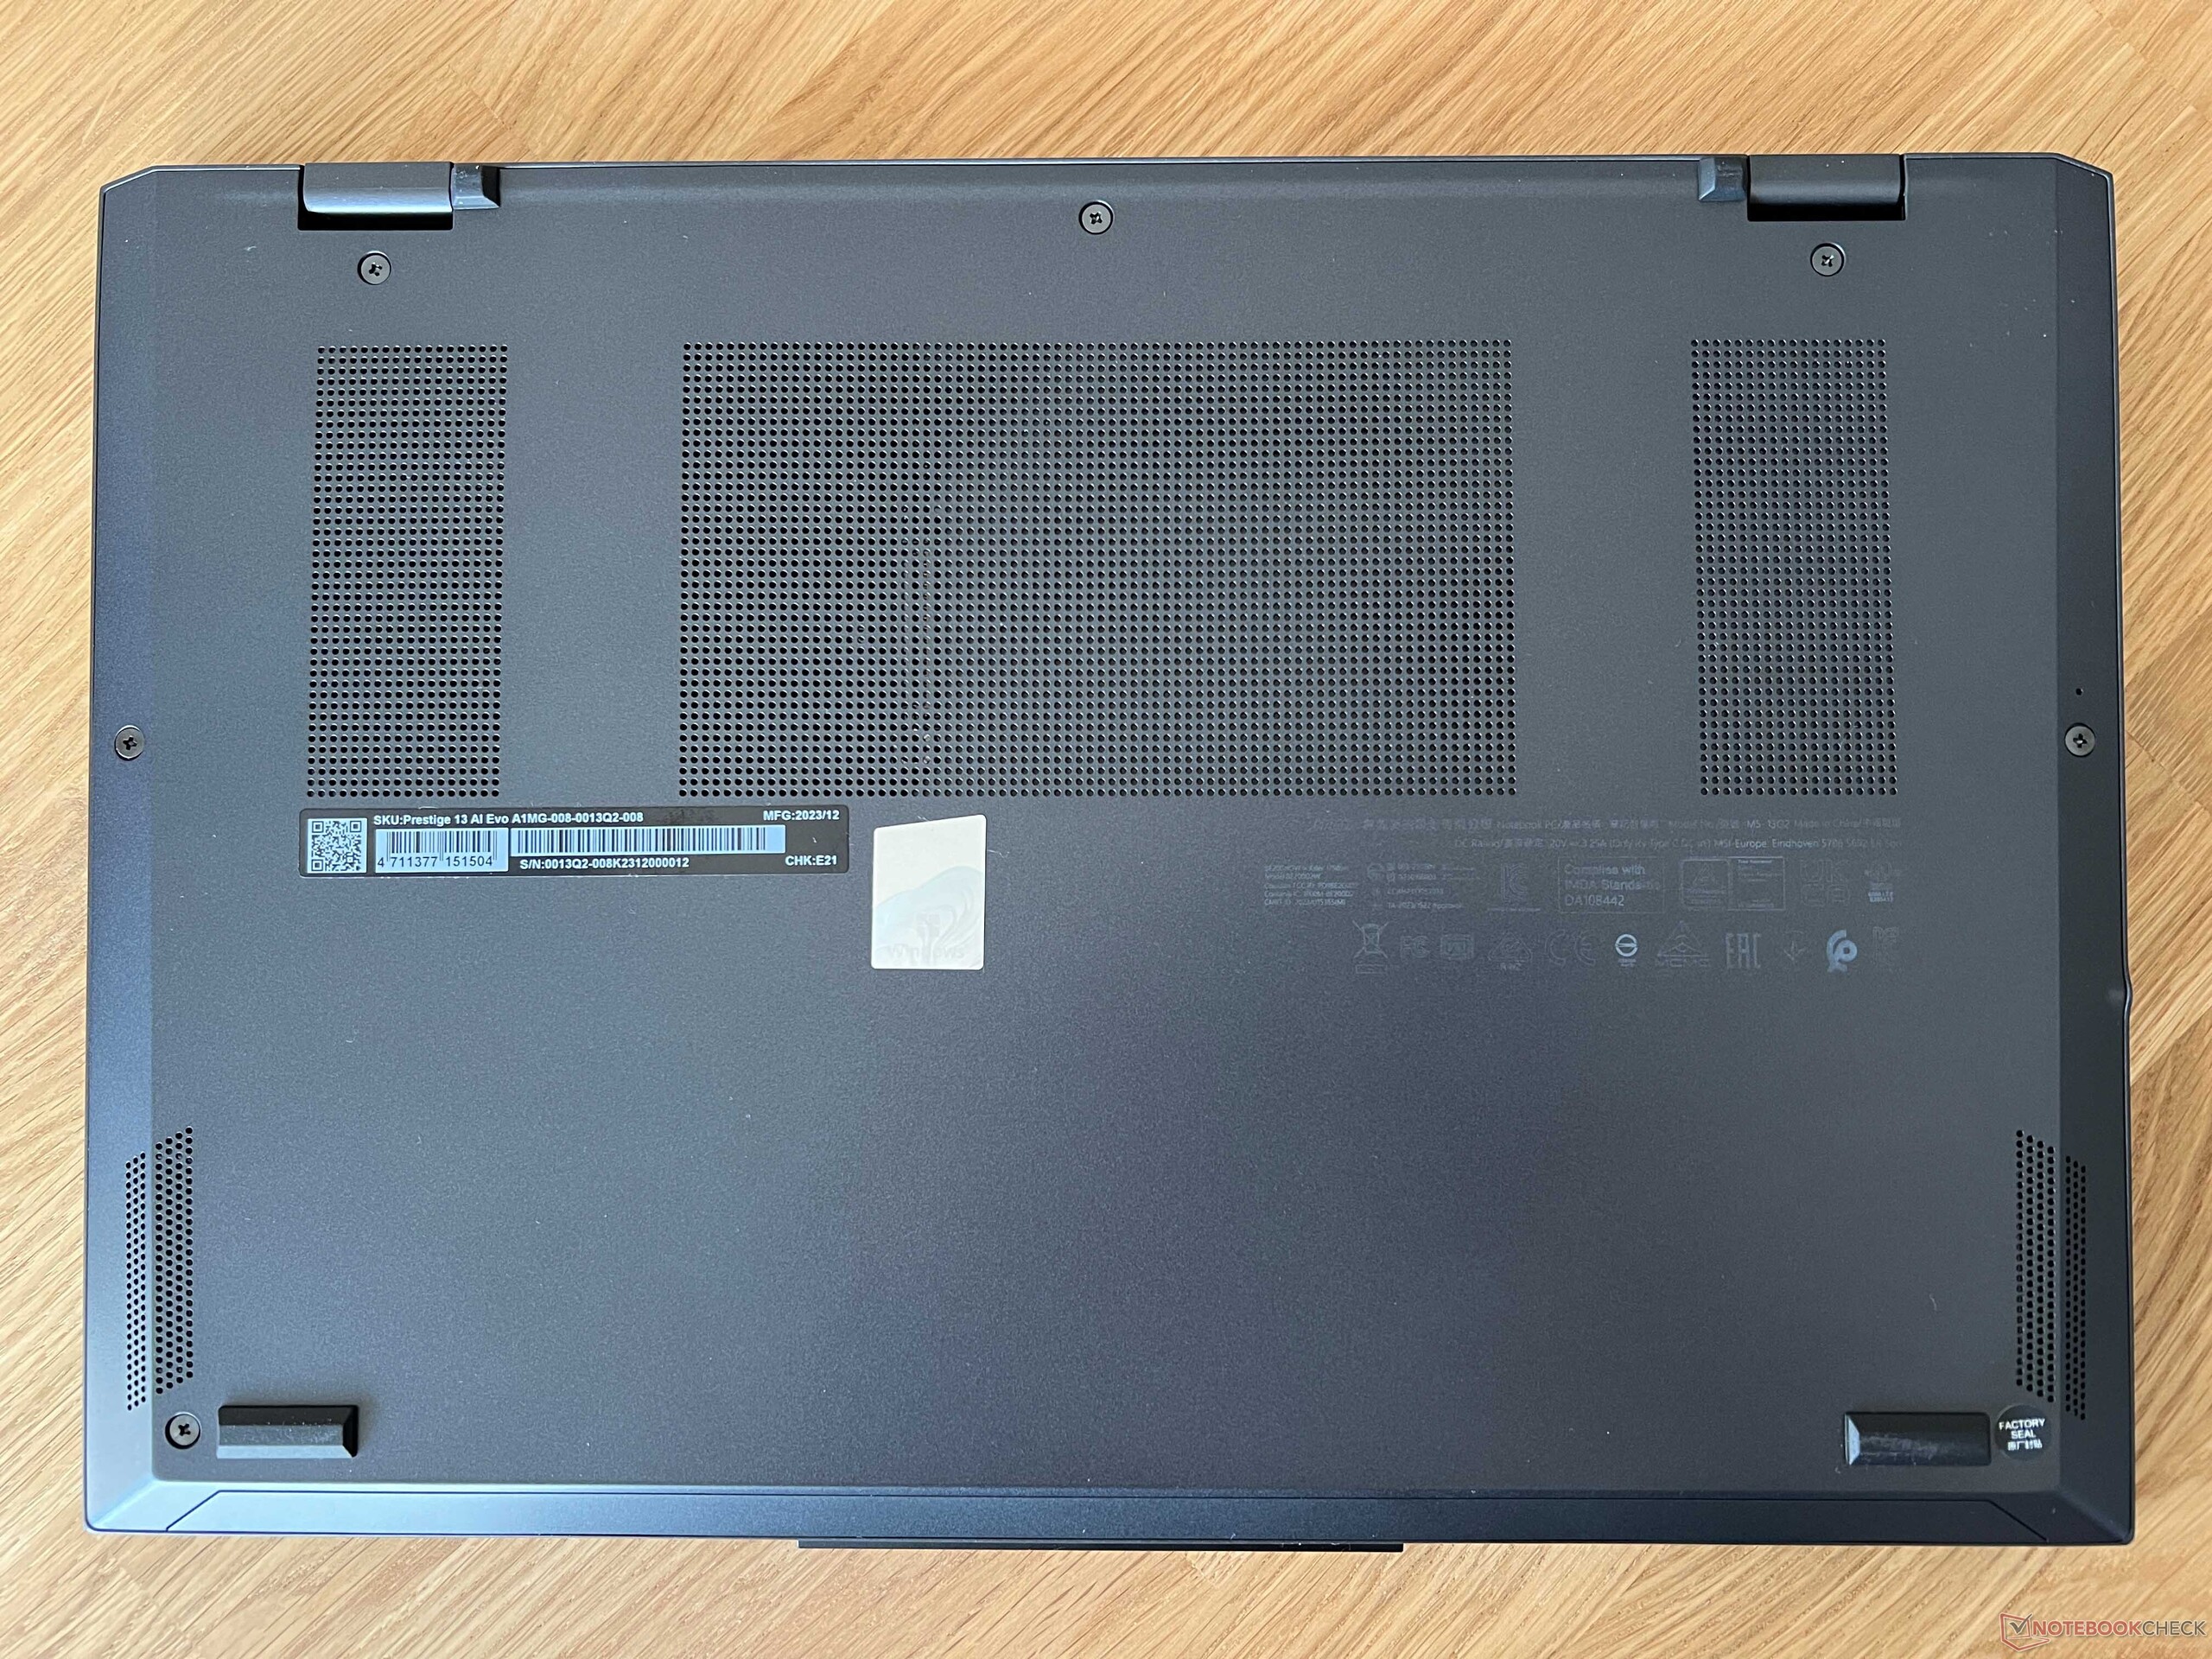
Die untere Gehäuseabdeckung ist mit regulären Kreuzschrauben gesichert und lässt sich problemlos entfernen. Der Lüfter lässt sich reinigen und sowohl die SSD als auch der Akku können getauscht werden. Alle anderen Komponenten (inklusive RAM und WLAN-Modul) sind aber verlötet.
Eingabegeräte - Verkleinerte Tastatur
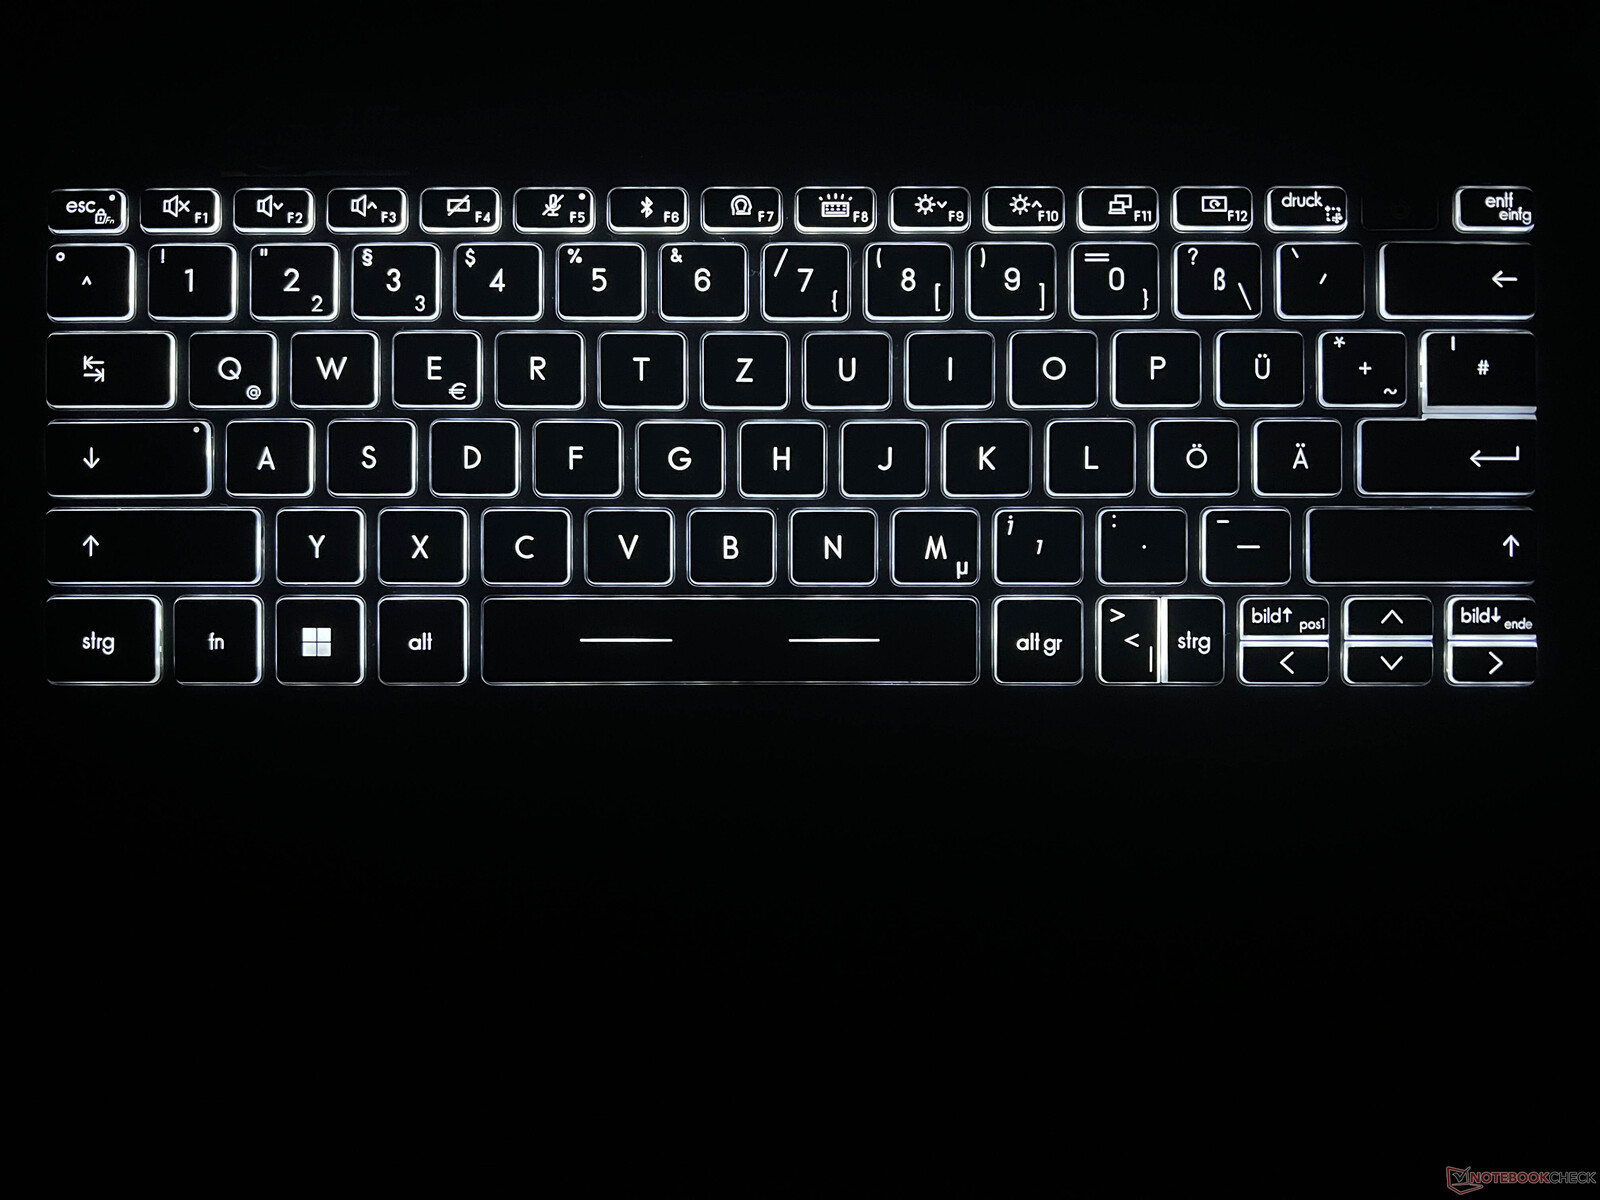
Die schwarze Tastatur bietet ein durchschnittliches Tippgefühl. Die Mechanik an sich ist präzise, aber die Tasten sind nicht besonders hoch (17 mm breit, 14 mm hoch) und daran muss man sich erst gewöhnen. Das Layout ist allgemein recht beengt, aber zumindest bringt MSI dedizierte Bild-Auf/Bild-Ab-Tasten unter. Der Power-Button (auch Fingerabdruckscanner) befindet sich oben rechts und sitzt tiefer im Gehäuse, weshalb man ihn gut ertasten kann. Ganz rechts befindet sich noch die Entf-Taste. Die weiße Hintergrundbeleuchtung bietet drei Intensitätsstufen.
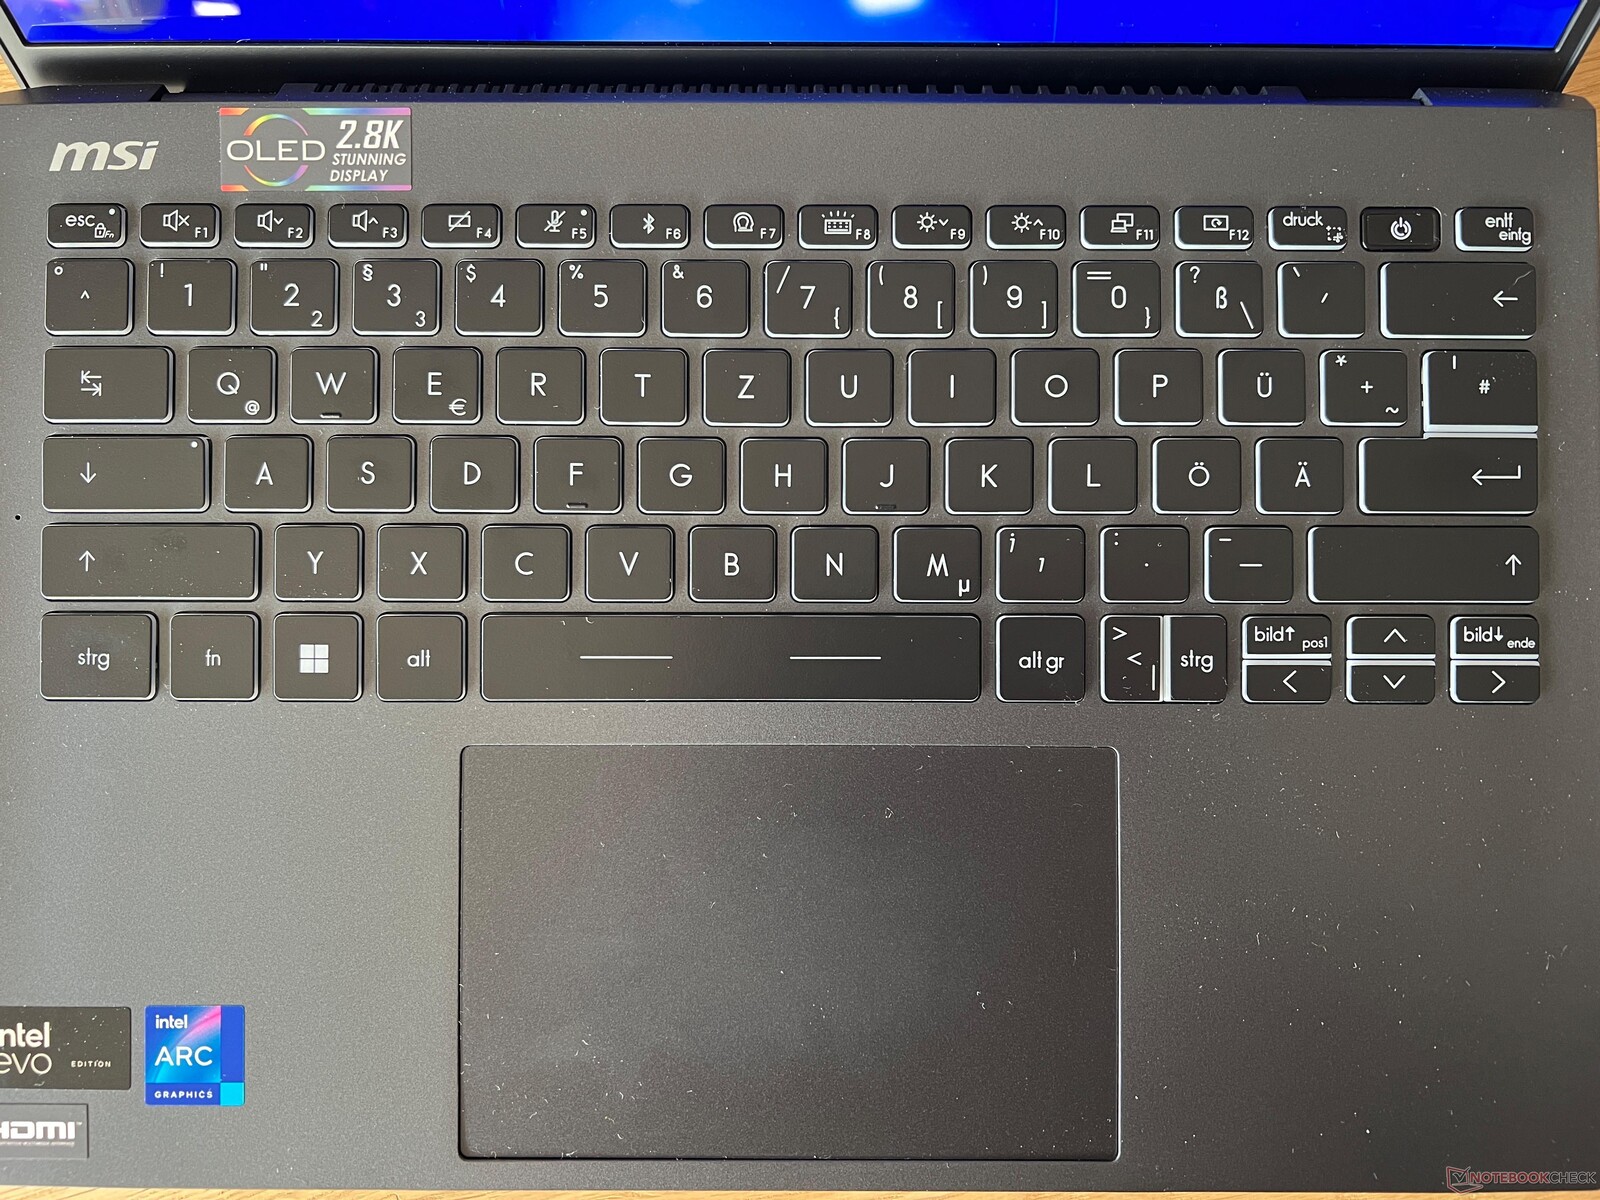
Das ClickPad (12 x 7,5 cm) bietet gute Gleiteigenschaften und wir hatten keinerlei Probleme mit der Bedienung. Die untere Hälfte vom Pad lässt sich herunterdrücken und das Klickgeräusch ist sehr gleichmäßig. Es könnte noch etwas dumpfer sein, doch billig wirkt es auf keinen Fall.
Display - 2.8K OLED ohne Touch
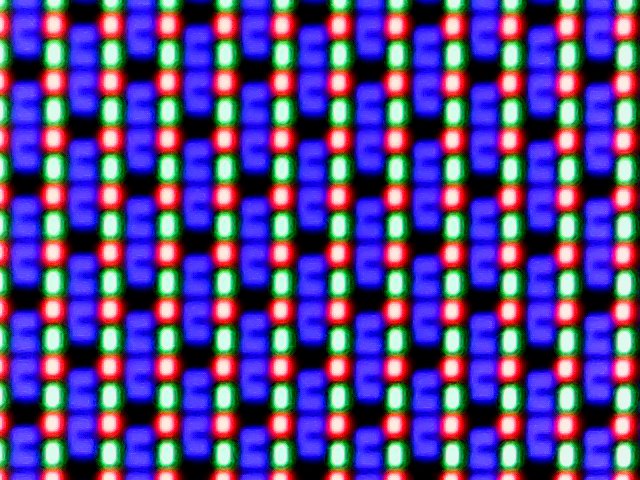
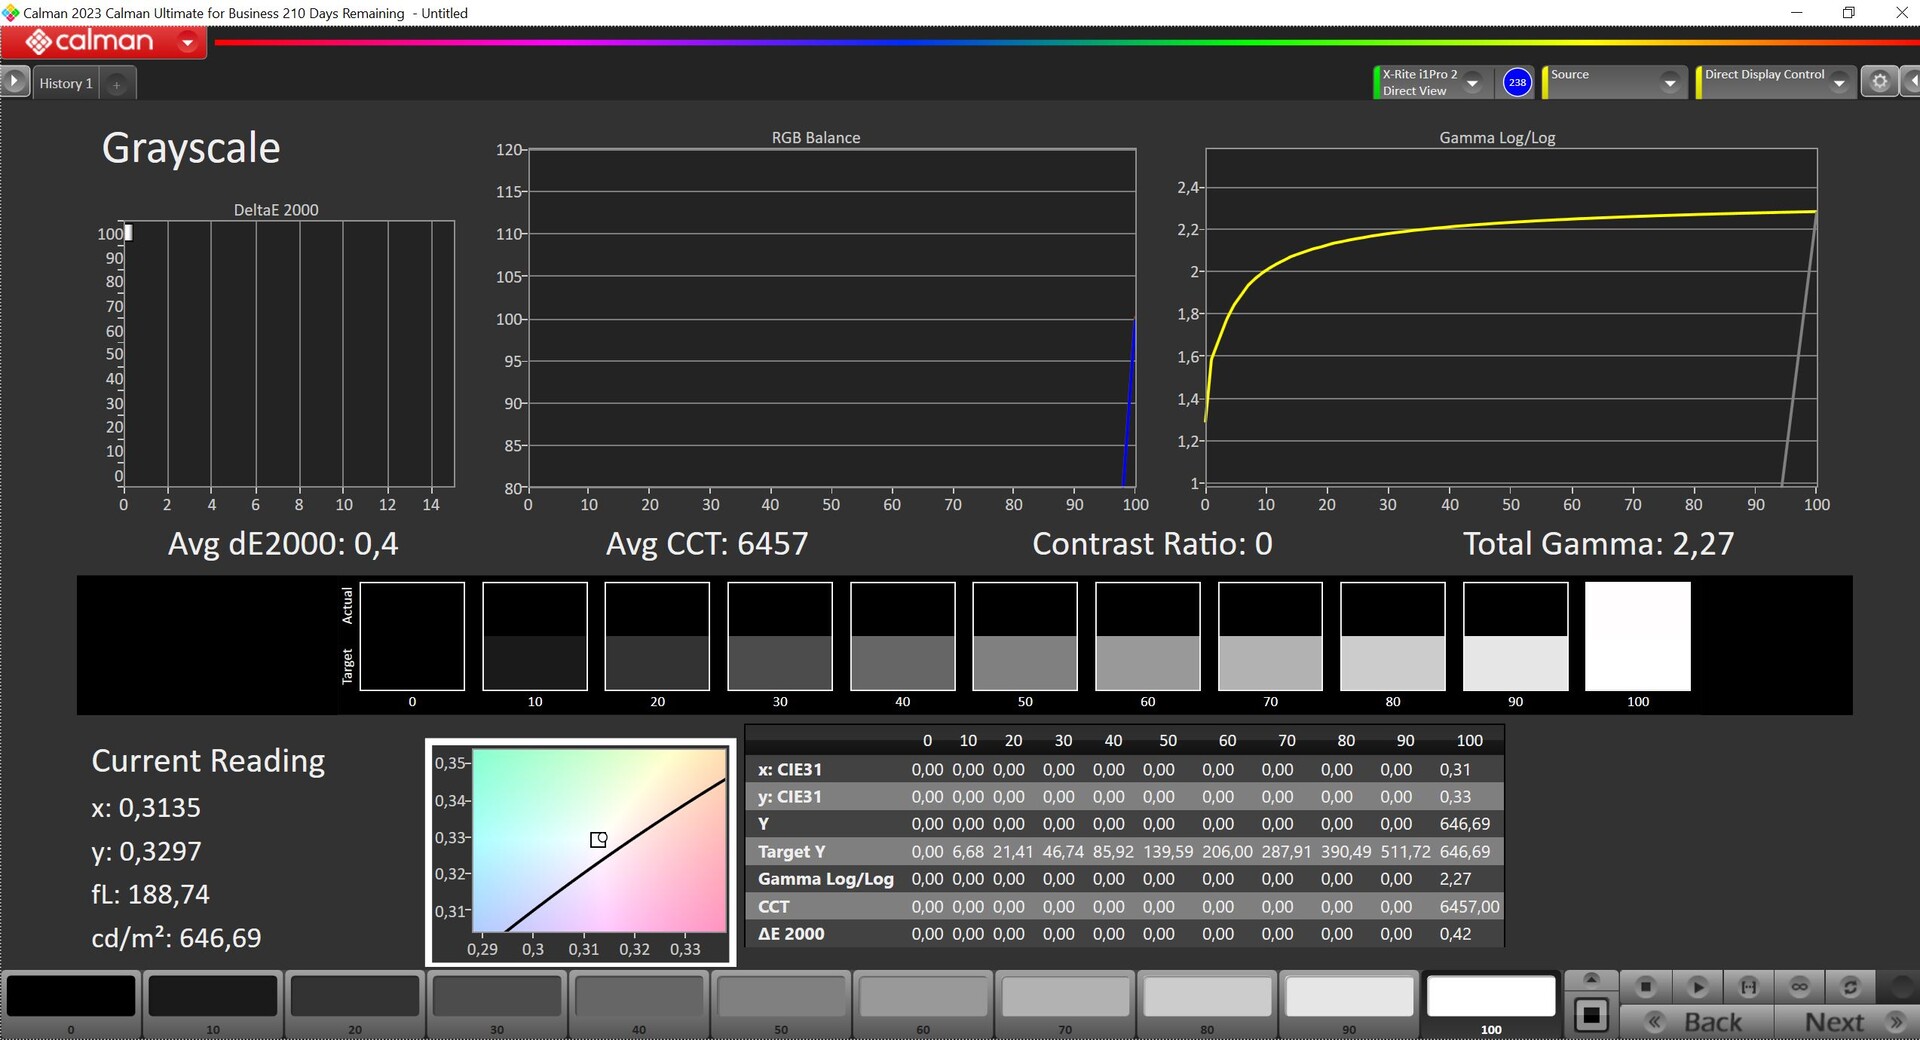
MSI verbaut ein spiegelndes 13,3 Zoll großes OLED-Panel mit der Auflösung 2.880 x 1.800 Pixel im Format 16:10. Die subjektive Bildqualität ist hervorragend und Farben sind extrem kräftig. Zudem sind die Reaktionszeiten sehr gering. Die maximale SDR-Helligkeit liegt bei etwas mehr als 400 cd/m² und dank dem niedrigen Schwarzwert ergibt sich ein hohes Kontrastverhältnis, was ebenfalls zum plastischen Bildeindruck beiträgt. Touch-Eingaben werden nicht unterstützt, die Helligkeit kann aber automatisch an die Umgebungslichtverhältnisse angepasst werden.
Im HDR-Betrieb steigt die maximale HDR-Helligkeit auf bis zu 647 cd/m² bei kleinen Bildausschnitten und immer noch etwas mehr als 500 cd/m² bei einem fast vollständig weißen Bild. Wie bei allen anderen Windows-Laptops muss man den HDR-Modus aber manuell aktivieren und dann funktioniert auch die Farbverwaltung nicht mehr korrekt.
| |||||||||||||||||||||||||
Ausleuchtung: 98 %
Helligkeit Akku: 405 cd/m²
Kontrast: ∞:1 (Schwarzwert: 0 cd/m²)
ΔE ColorChecker Calman: 2.1 | ∀{0.5-29.43 Ø4.72}
ΔE Greyscale Calman: 1.2 | ∀{0.09-98 Ø4.97}
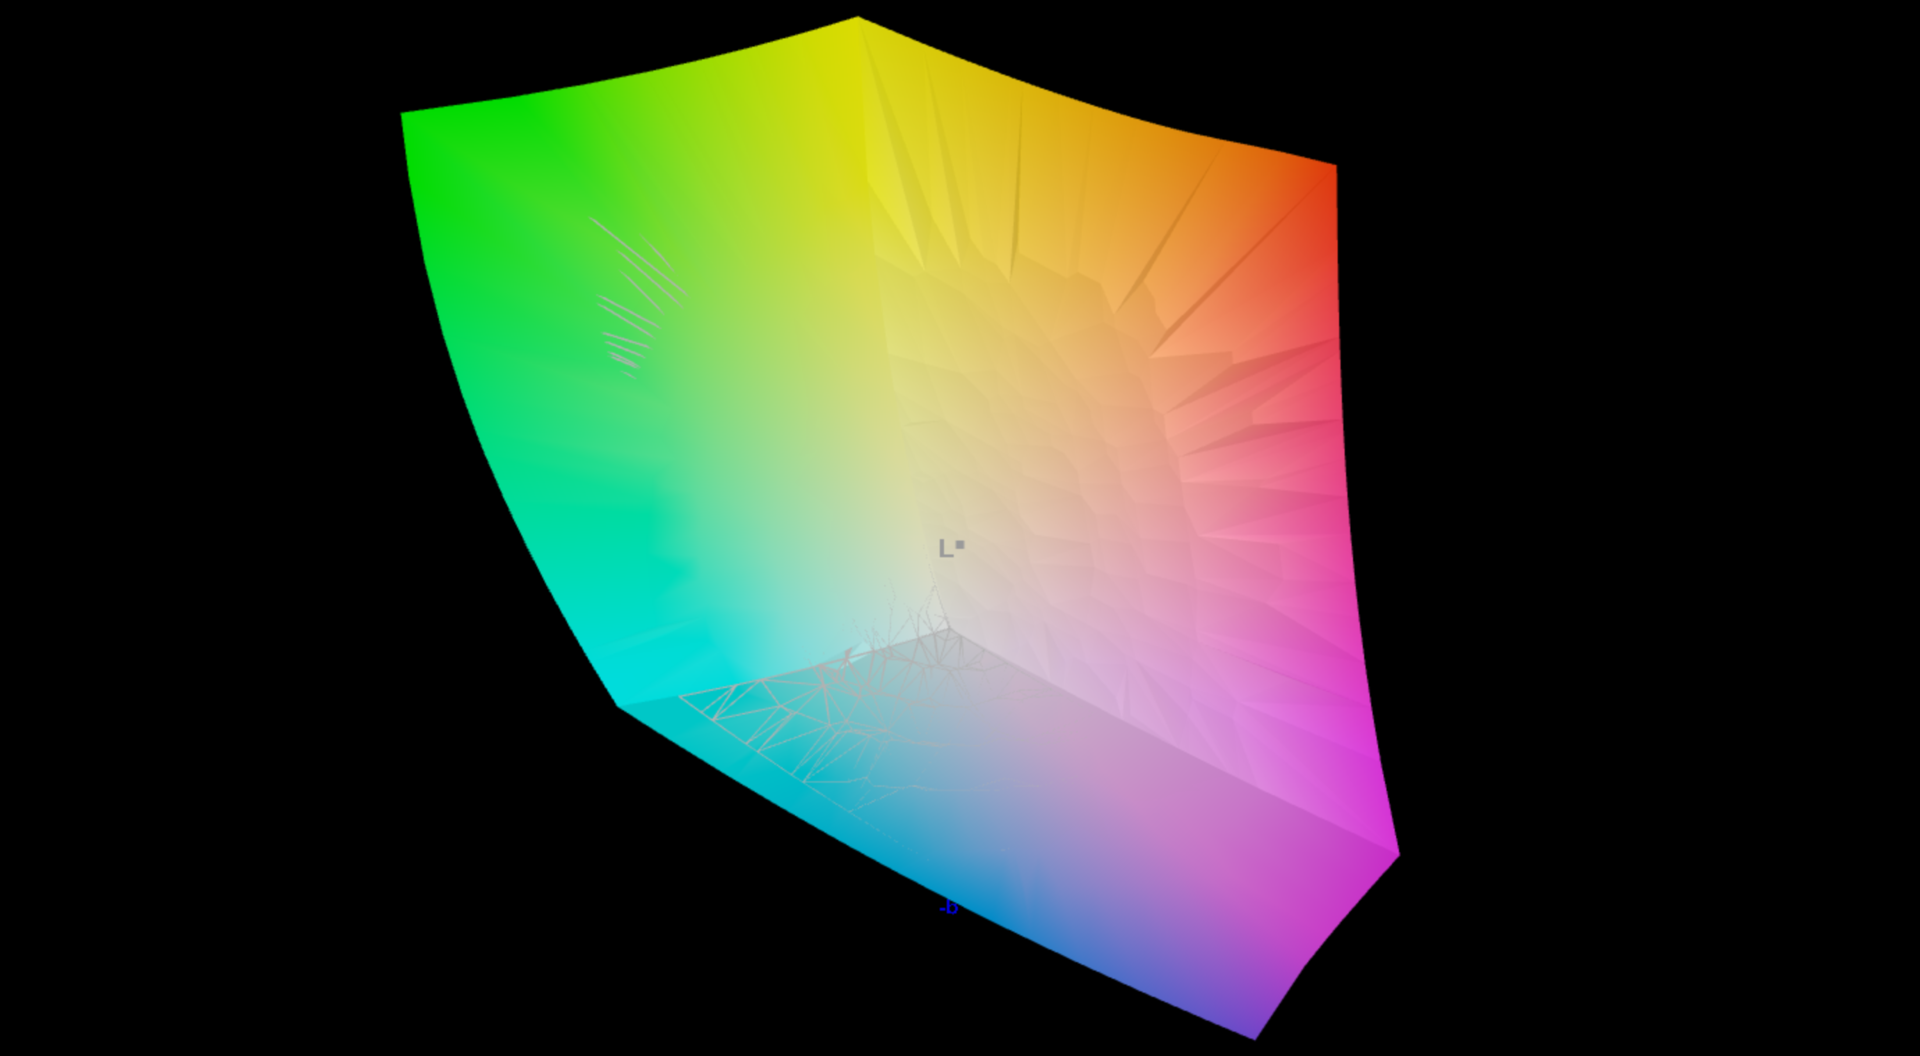
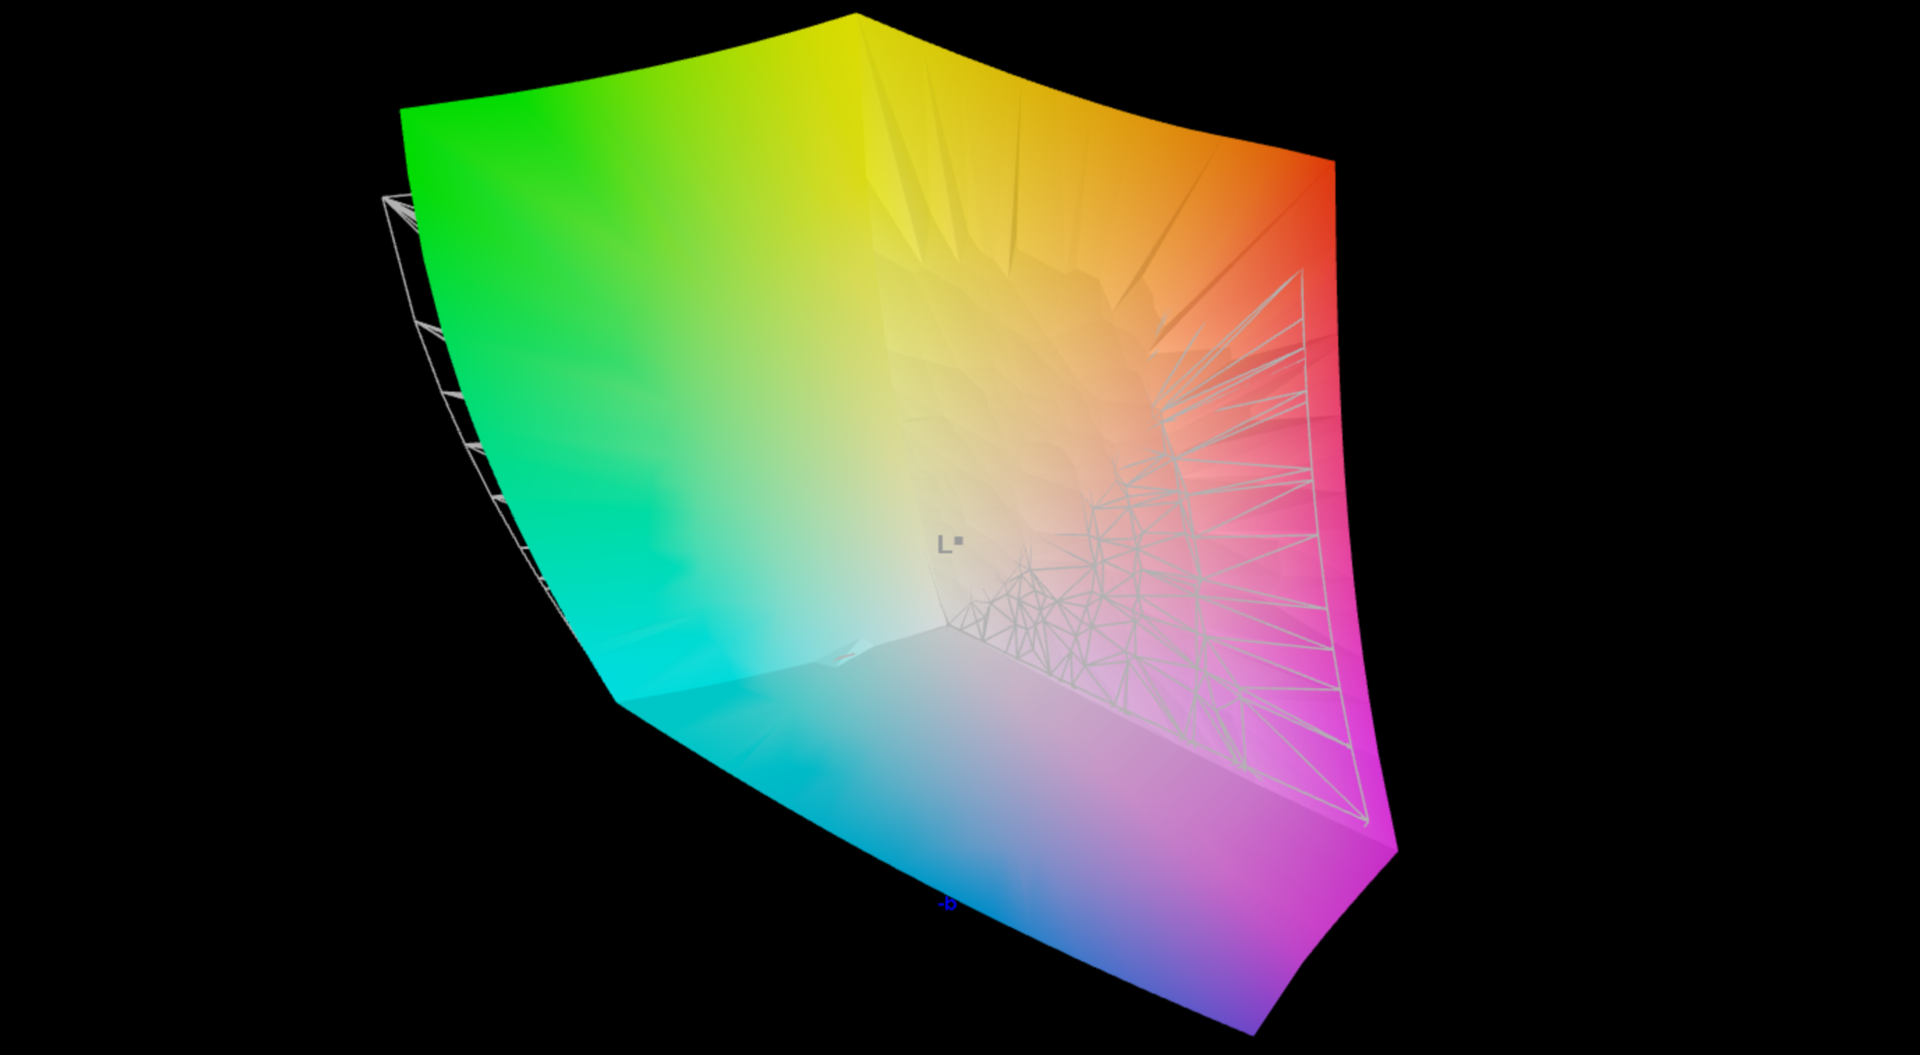
97.8% AdobeRGB 1998 (Argyll 3D)
100% sRGB (Argyll 3D)
99.9% Display P3 (Argyll 3D)
Gamma: 2.16
CCT: 6465 K
| MSI Prestige 13 AI Evo ATNA33AA07-0, OLED, 2880x1800, 13.3" | Lenovo ThinkPad X1 Nano Gen 3 MND007ZA1-3, IPS, 2160x1350, 13" | Dell Latitude 13 7340 i5-1345U Chi Mei 133JCG, IPS, 1920x1200, 13.3" | HP Dragonfly G4 Chi Mei CMN13C0, IPS, 1920x1280, 13.5" | Asus ZenBook S13 OLED UX5304 SDC417B, OLED, 2880x1800, 13.3" | |
|---|---|---|---|---|---|
| Display | -20% | -23% | -21% | -0% | |
| Display P3 Coverage (%) | 99.9 | 68.5 -31% | 65.9 -34% | 68.4 -32% | 99.7 0% |
| sRGB Coverage (%) | 100 | 99.5 0% | 96.8 -3% | 98.3 -2% | 100 0% |
| AdobeRGB 1998 Coverage (%) | 97.8 | 69.7 -29% | 67.8 -31% | 70.4 -28% | 96.9 -1% |
| Response Times | -2092% | -2565% | -2572% | -21% | |
| Response Time Grey 50% / Grey 80% * (ms) | 1.54 ? | 39.9 ? -2491% | 51 ? -3212% | 48.8 ? -3069% | 2 ? -30% |
| Response Time Black / White * (ms) | 1.44 ? | 25.8 ? -1692% | 29.04 ? -1917% | 31.3 ? -2074% | 1.6 ? -11% |
| PWM Frequency (Hz) | 240 ? | 240 ? | |||
| Bildschirm | -1% | -65% | -14% | 13% | |
| Helligkeit Bildmitte (cd/m²) | 404 | 461.2 14% | 471 17% | 408.8 1% | 361 -11% |
| Brightness (cd/m²) | 407 | 428 5% | 437 7% | 399 -2% | 365 -10% |
| Brightness Distribution (%) | 98 | 86 -12% | 87 -11% | 90 -8% | 98 0% |
| Schwarzwert * (cd/m²) | 0.29 | 0.2033 | 0.32 | ||
| Delta E Colorchecker * | 2.1 | 1.79 15% | 3.24 -54% | 2.02 4% | 1.2 43% |
| Colorchecker dE 2000 max. * | 4.3 | 3.3 23% | 7.19 -67% | 3.84 11% | 1.9 56% |
| Delta E Graustufen * | 1.2 | 1.8 -50% | 4.6 -283% | 2.3 -92% | 1.2 -0% |
| Gamma | 2.16 102% | 2.24 98% | 2.2 100% | 2.27 97% | |
| CCT | 6465 101% | 6588 99% | 6520 100% | 6203 105% | 6486 100% |
| Kontrast (:1) | 1590 | 2317 | 1278 | ||
| Colorchecker dE 2000 calibrated * | 0.47 | 1.08 | 0.61 | ||
| Durchschnitt gesamt (Programm / Settings) | -704% /
-386% | -884% /
-508% | -869% /
-481% | -3% /
3% |
* ... kleinere Werte sind besser
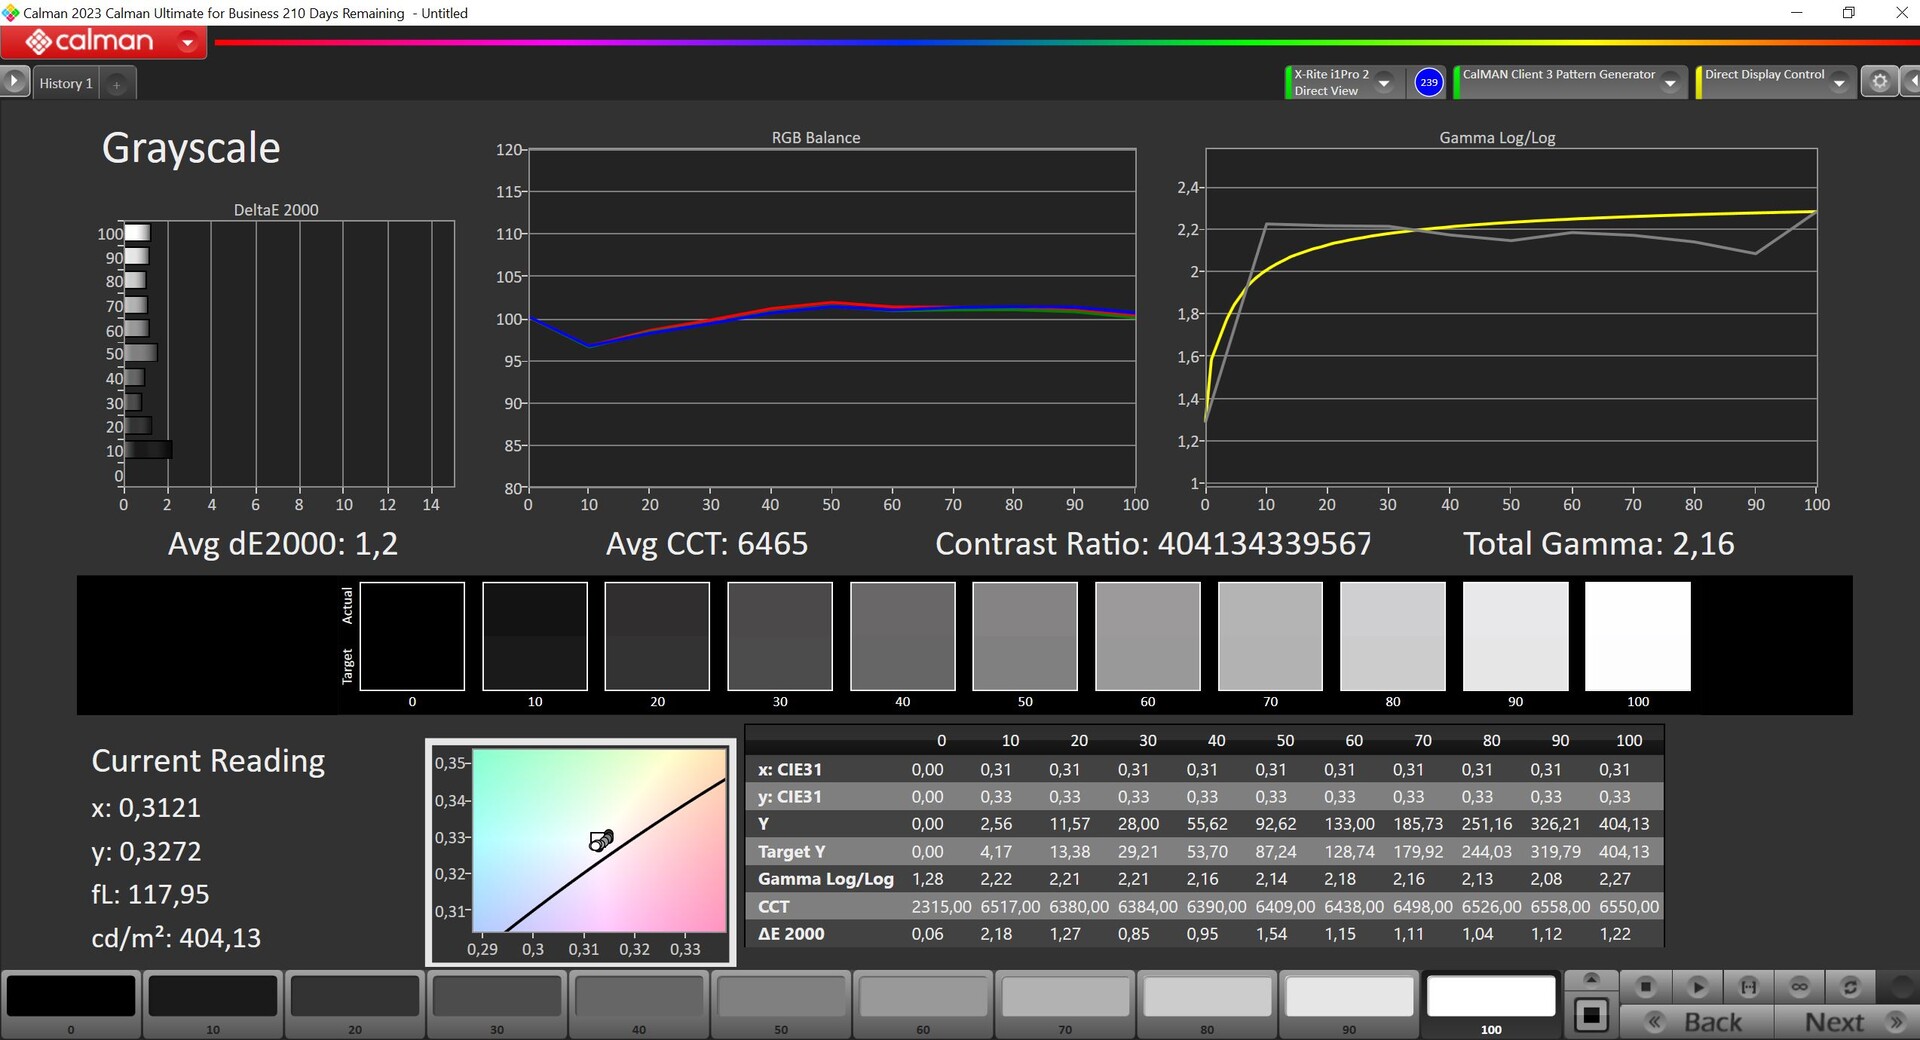
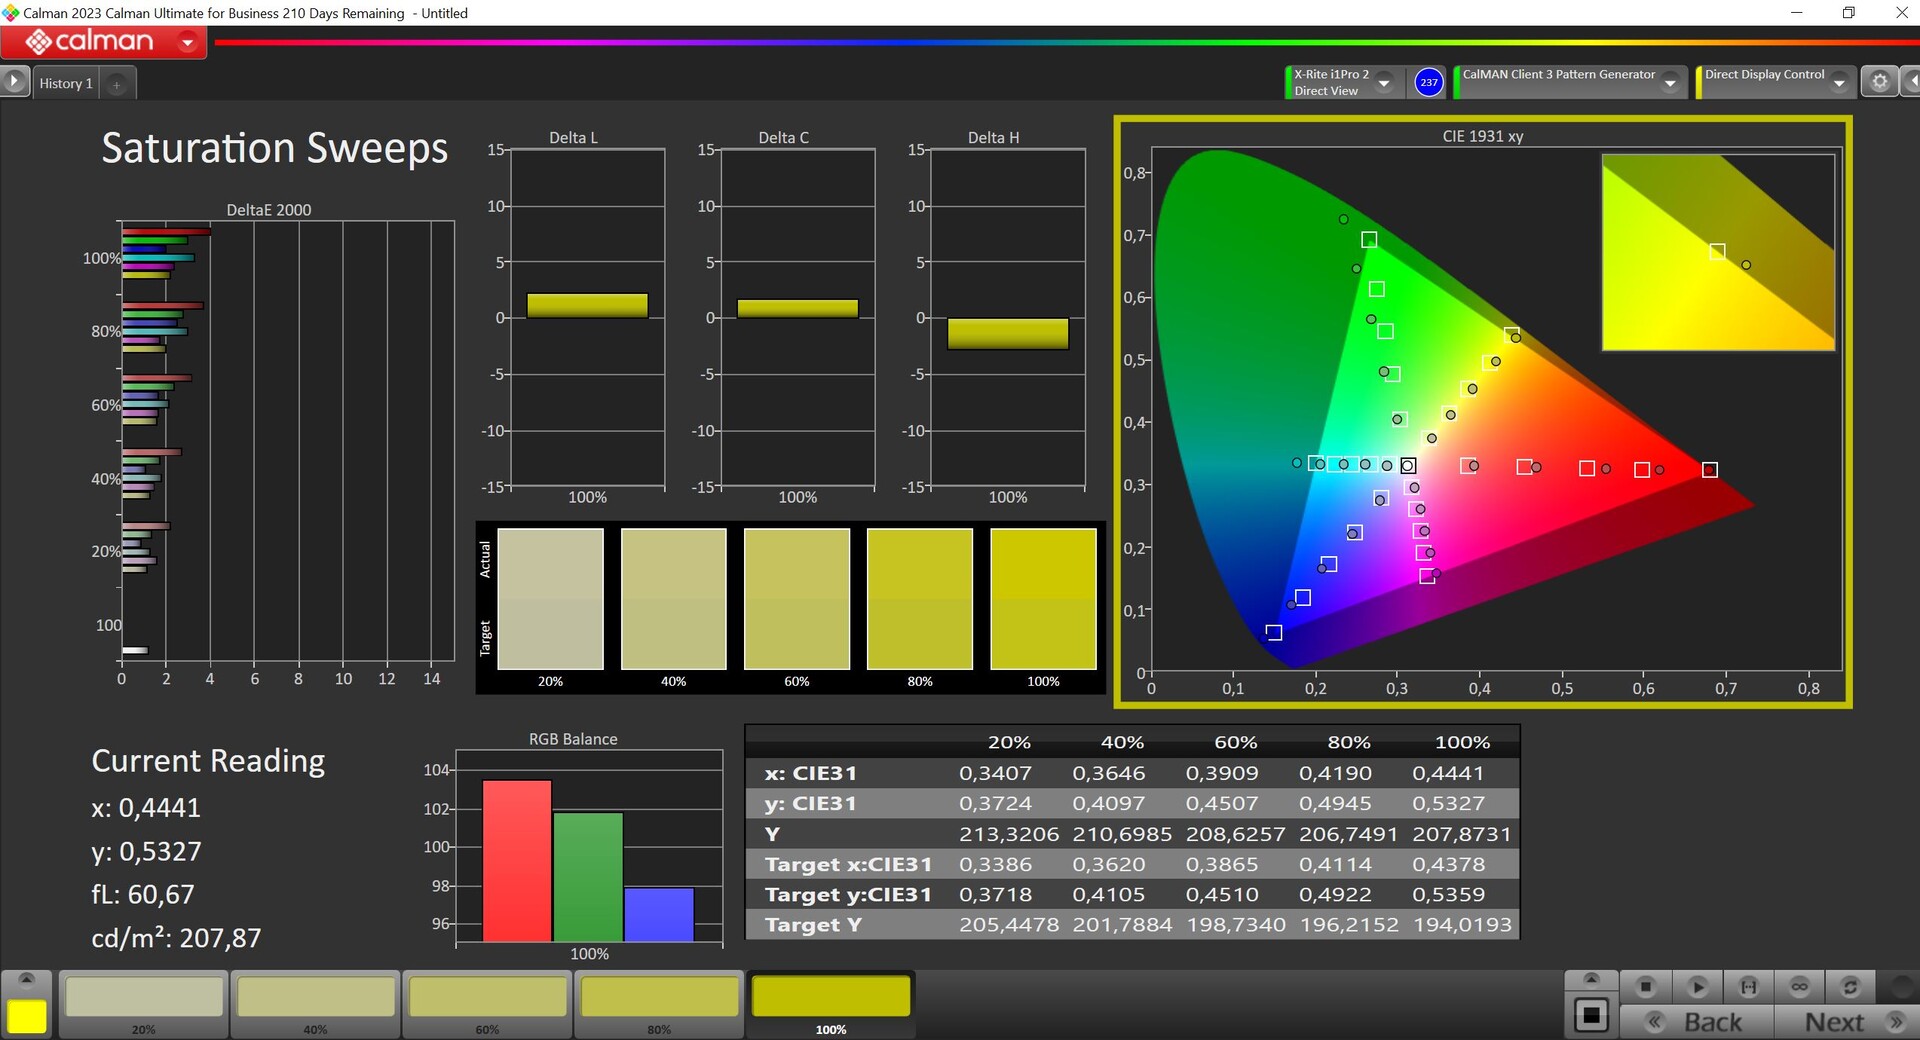
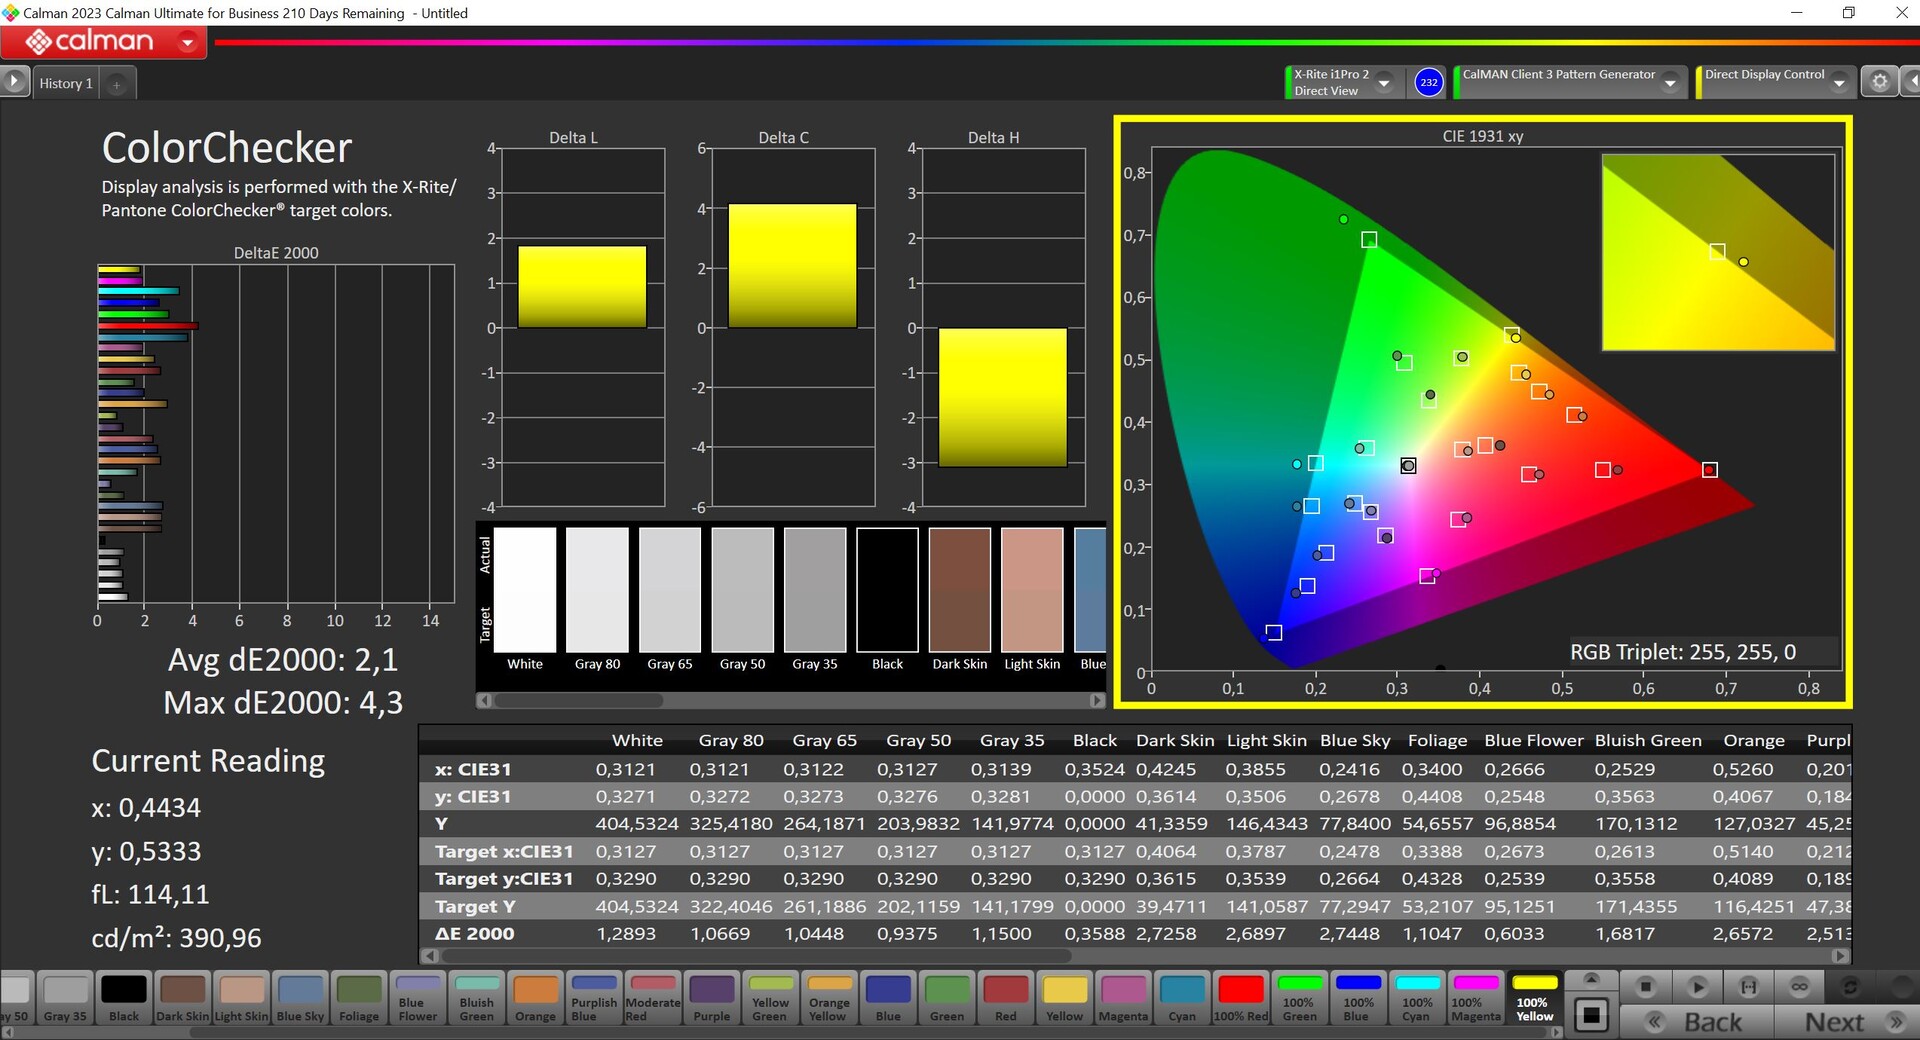
Wir haben das Panel mit der professionellen CalMAN-Software (X-Rite i1 Pro2) vermessen und bereits im Werkszustand ist die Darstellung gut. Es gibt keinen Farbstich und die Farbtemperatur passt ebenfalls, lediglich einige Farben (100 %) liegen oberhalb der wichtigen DeltaE-2000-Abweichung von 3 (gegenüber der P3-Referenz). Das können wir auch mit einer Kalibrierung nicht korrigieren, zudem bietet MSI kein sRGB-Profil. Für die Bildbearbeitung eignet sich das Prestige 13 daher nicht optimal.

Reaktionszeiten (Response Times) des Displays
| ↔ Reaktionszeiten Schwarz zu Weiß | ||
|---|---|---|
| 1.44 ms ... steigend ↗ und fallend ↘ kombiniert | ↗ 0.73 ms steigend | 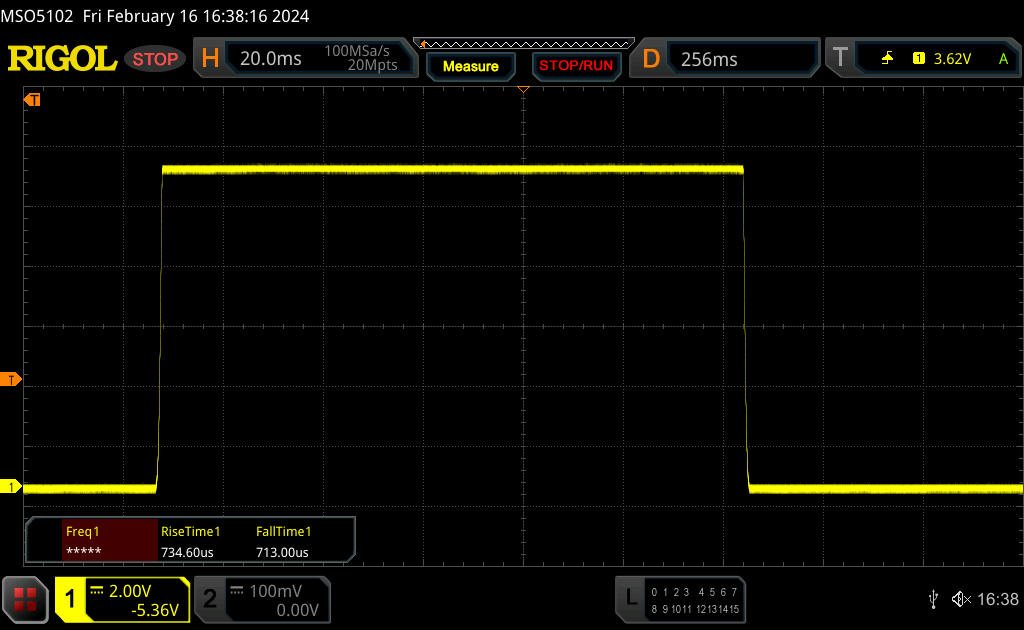 |
| ↘ 0.71 ms fallend | ||
| Die gemessenen Reaktionszeiten sind sehr kurz, wodurch sich der Bildschirm auch für schnelle 3D Spiele eignen sollte. Im Vergleich rangierten die bei uns getesteten Geräte von 0.1 (Minimum) zu 240 (Maximum) ms. » 9 % aller Screens waren schneller als der getestete. Daher sind die gemessenen Reaktionszeiten besser als der Durchschnitt aller vermessenen Geräte (19.8 ms). | ||
| ↔ Reaktionszeiten 50% Grau zu 80% Grau | ||
| 1.54 ms ... steigend ↗ und fallend ↘ kombiniert | ↗ 0.79 ms steigend |  |
| ↘ 0.75 ms fallend | ||
| Die gemessenen Reaktionszeiten sind sehr kurz, wodurch sich der Bildschirm auch für schnelle 3D Spiele eignen sollte. Im Vergleich rangierten die bei uns getesteten Geräte von 0.165 (Minimum) zu 636 (Maximum) ms. » 8 % aller Screens waren schneller als der getestete. Daher sind die gemessenen Reaktionszeiten besser als der Durchschnitt aller vermessenen Geräte (31 ms). | ||
Bildschirm-Flackern / PWM (Pulse-Width Modulation)
| Flackern / PWM festgestellt | 240 Hz | ≤ 42 % Helligkeit | 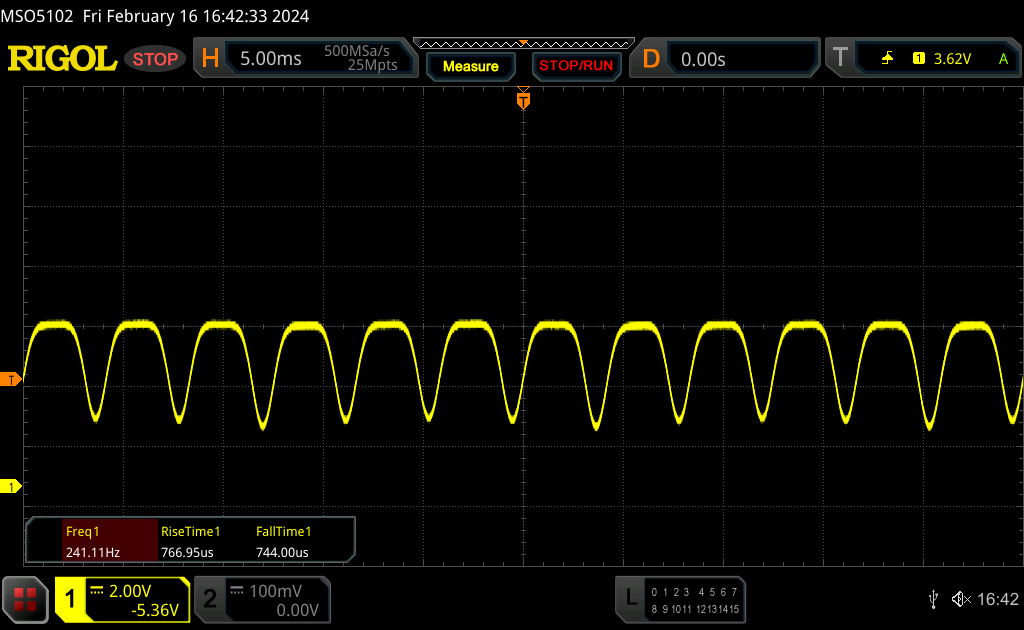 |
Das Display flackert mit 240 Hz (im schlimmsten Fall, eventuell durch Pulsweitenmodulation PWM) bei einer eingestellten Helligkeit von 42 % und darunter. Darüber sollte es zu keinem Flackern kommen. Die Frequenz von 240 Hz ist relativ gering und daher sollte es bei sensiblen Personen zu Problemen wie Flackern oder Augenbeschwerden führen. Im Vergleich: 52 % aller getesteten Geräte nutzten kein PWM um die Helligkeit zu reduzieren. Wenn PWM eingesetzt wurde, dann bei einer Frequenz von durchschnittlich 7763 (Minimum 5, Maximum 343500) Hz. | |||
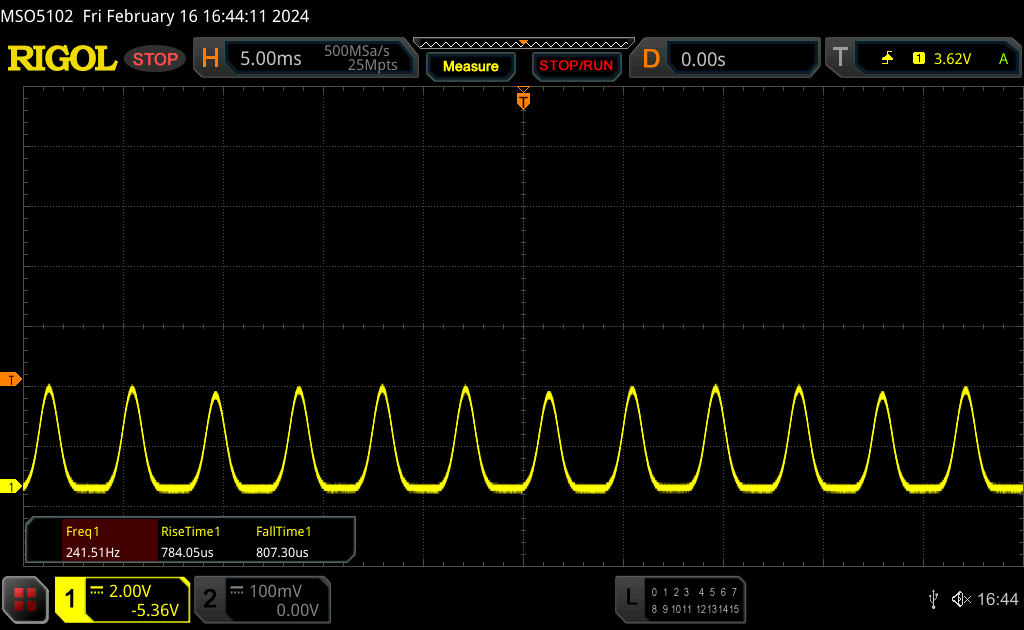
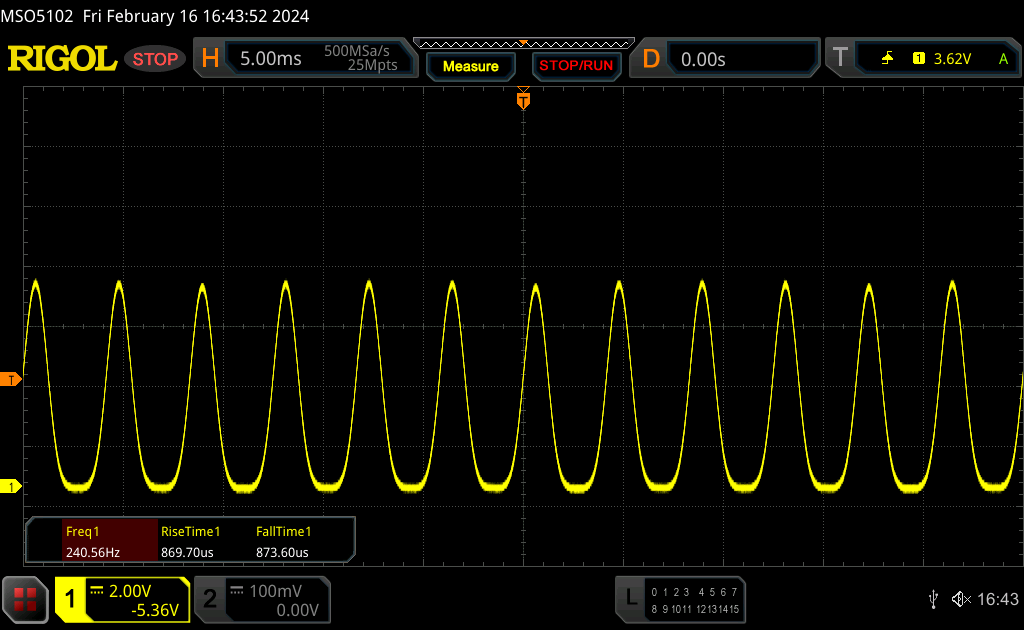
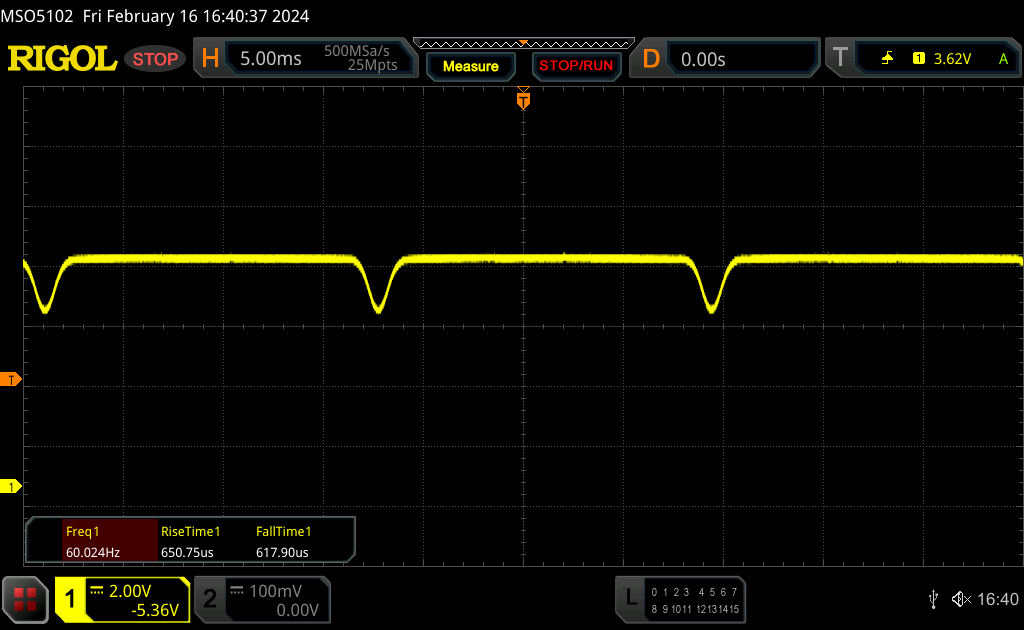
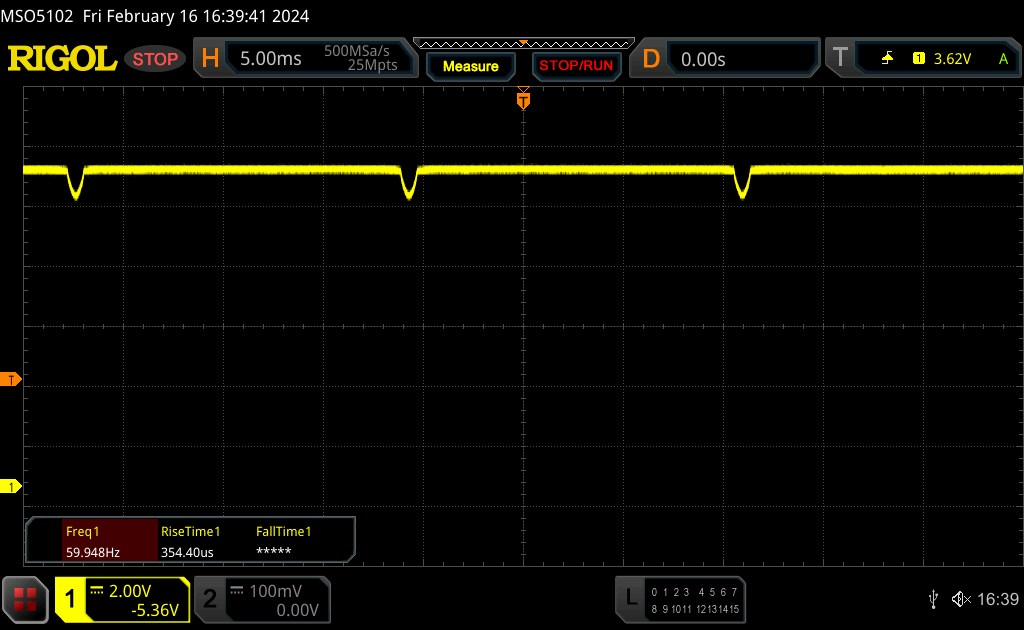
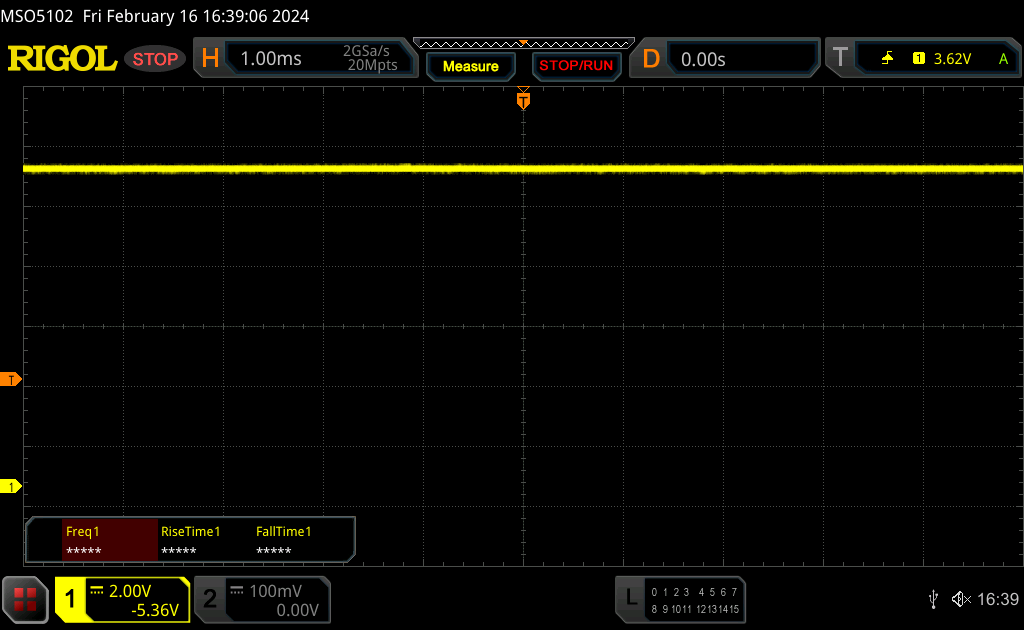
Beim eingesetzten PWM können wir DC-Dimming mit 60 Hz im Bereich von 43-84 % messen, bei 42 % oder weniger kommt dann das potenziell schädlichere PWM-Flackern bei 240 Hz zum Einsatz.
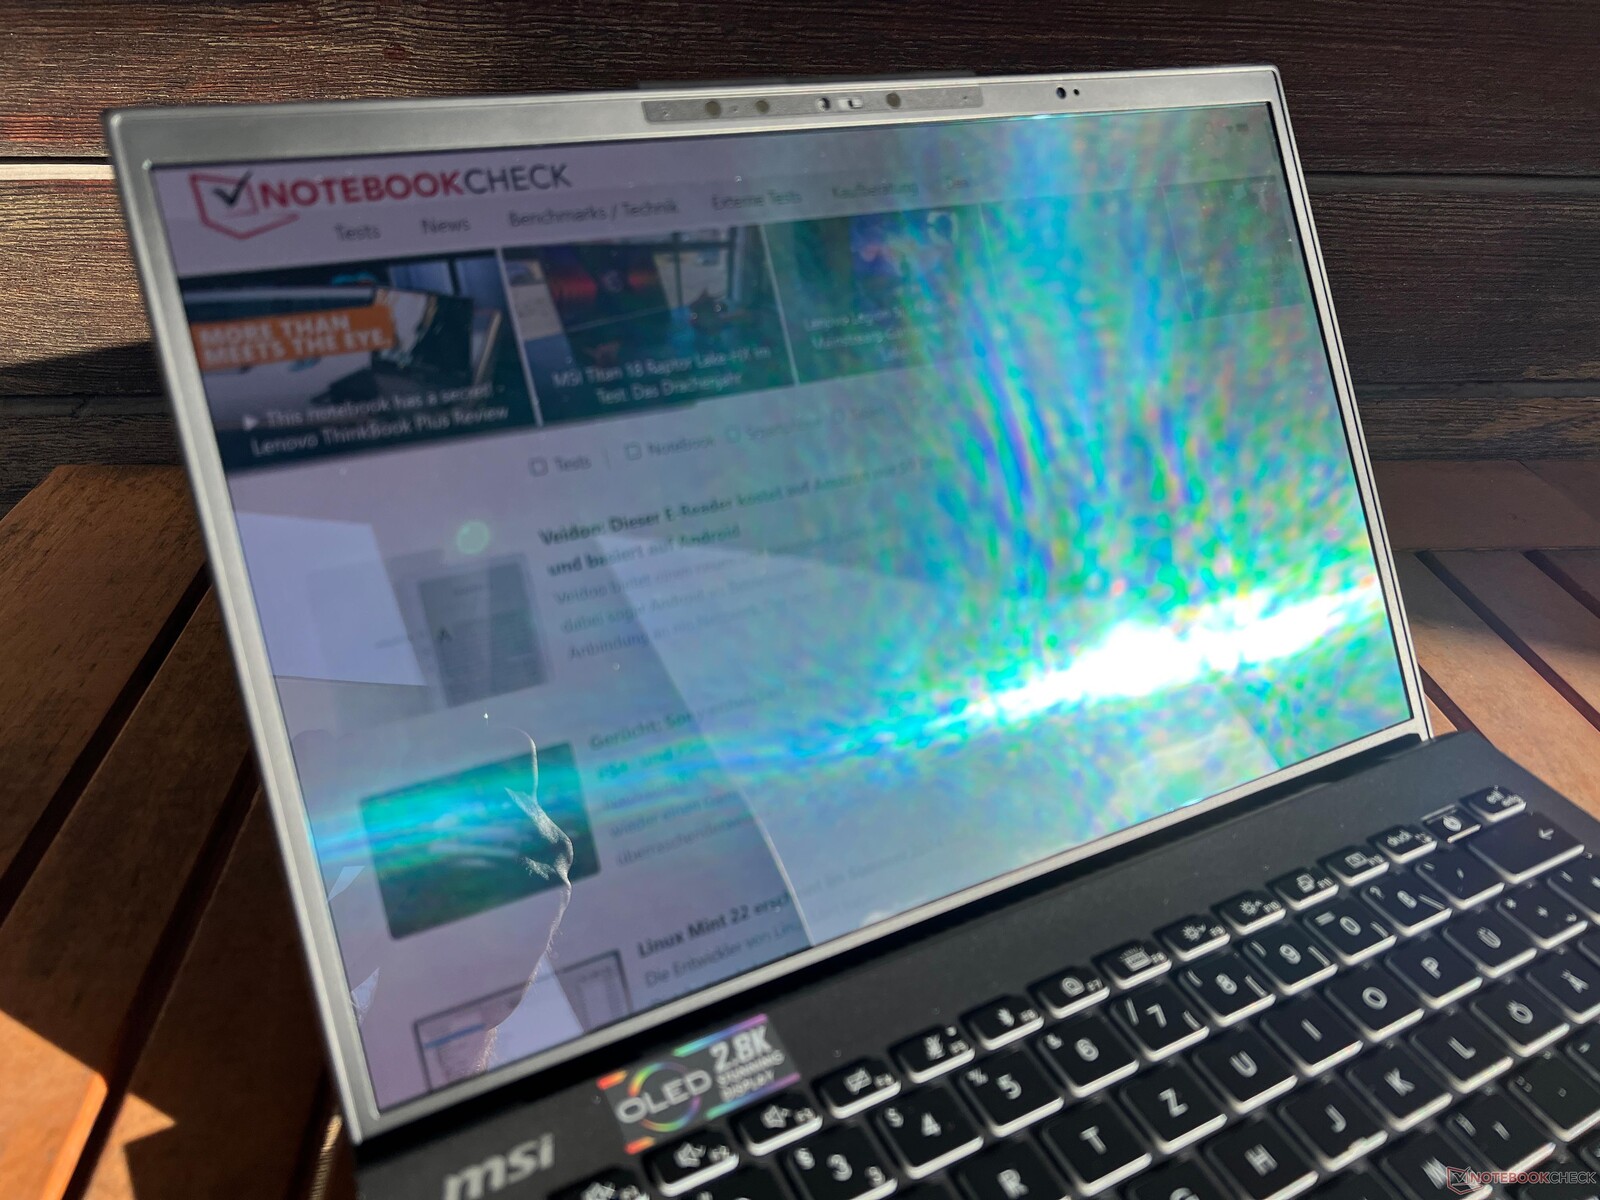
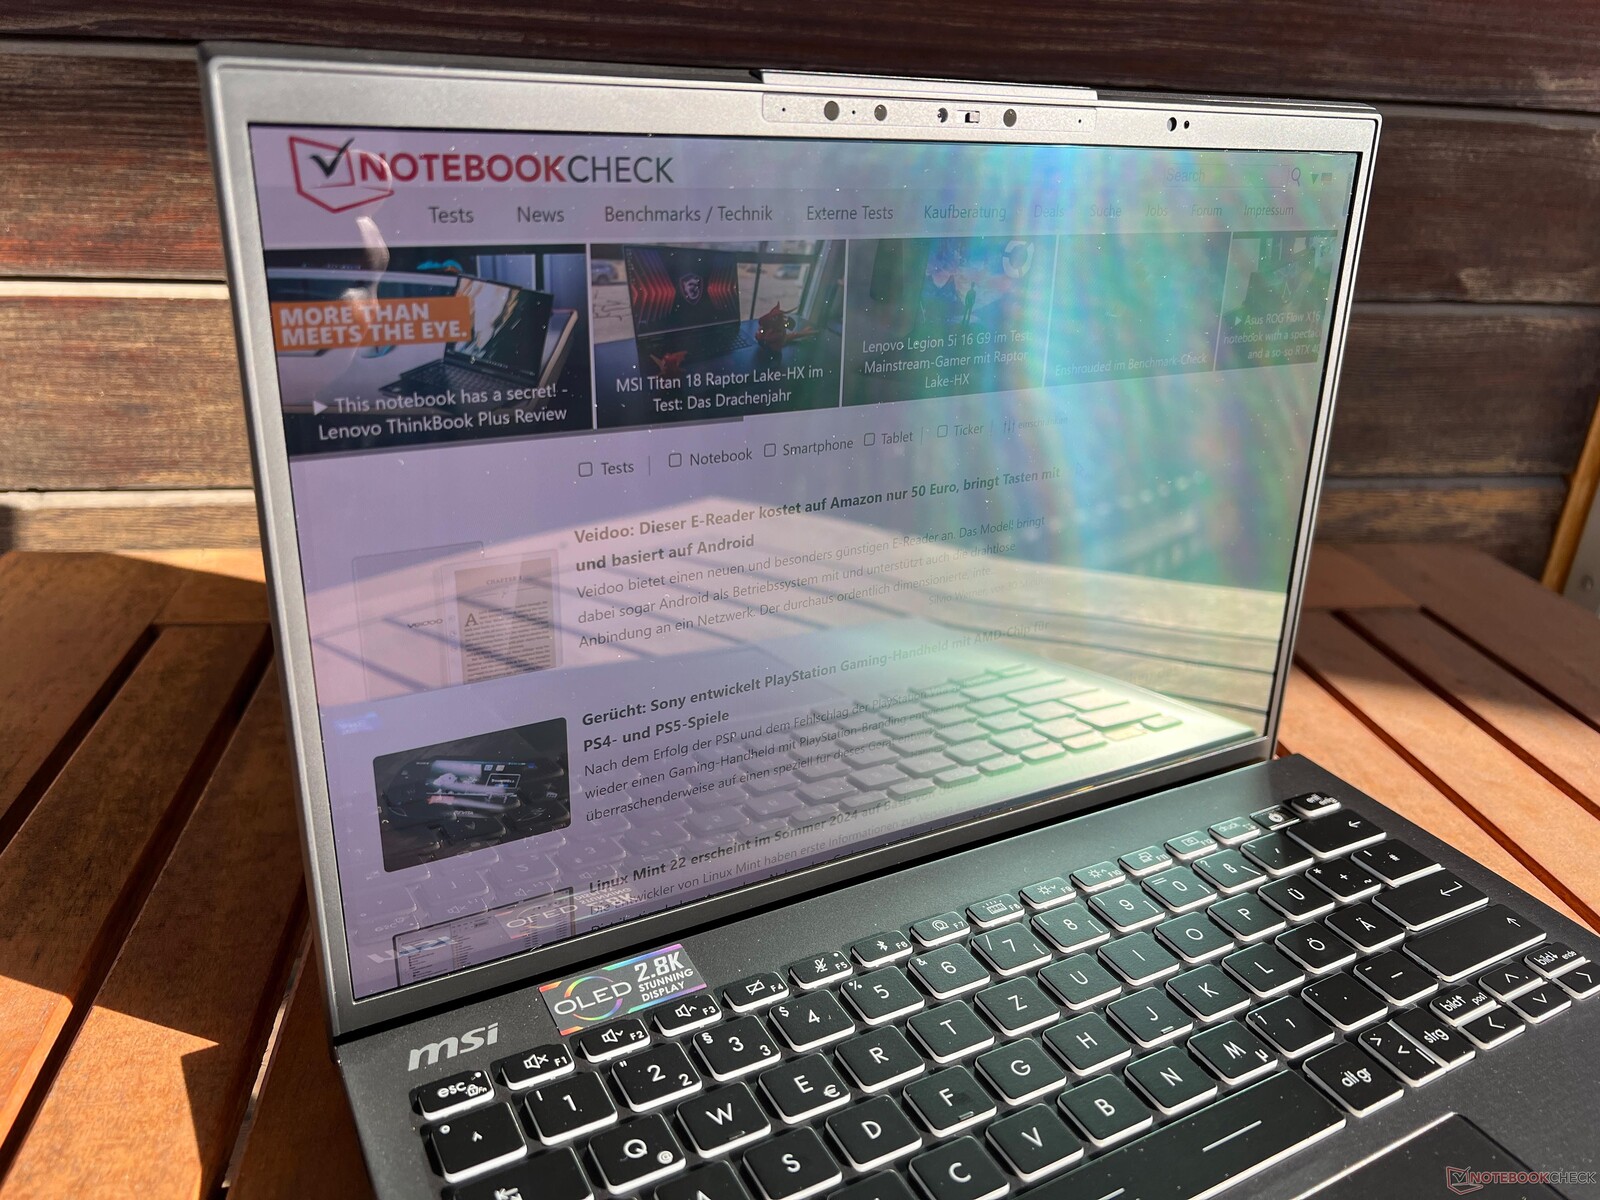

In hellen Umgebungen sind Reflexionen auf dem spiegelnden Bildschirm problematisch. Die Blickwinkelstabilität ist sehr gut, lediglich bei weiten Winkeln kommt es zu dem OLED-typischen blauen Schimmer.

Leistung - Meteor Lake-H mit 20 Watt
Testbedingungen
Das vorinstallierte MSI Center bietet verschiedene Energieprofile, wobei wir zwischen den einzelnen Profilen (mit der Ausnahme vom Silent-Modus) keine riesigen Unterschiede feststellen konnten. Wir haben die nachfolgenden Benchmarks und Messungen daher im Modus MSI AI Engine durchgeführt, der auch voreingestellt ist.
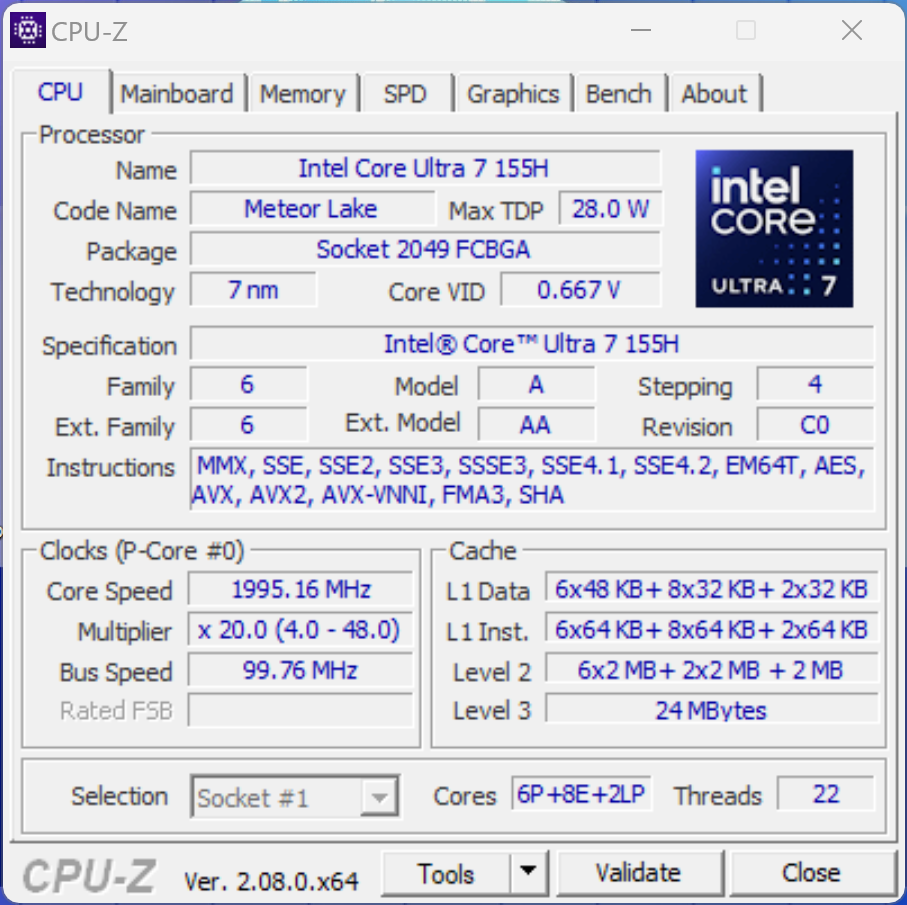
Prozessor - Core Ultra 7 155H
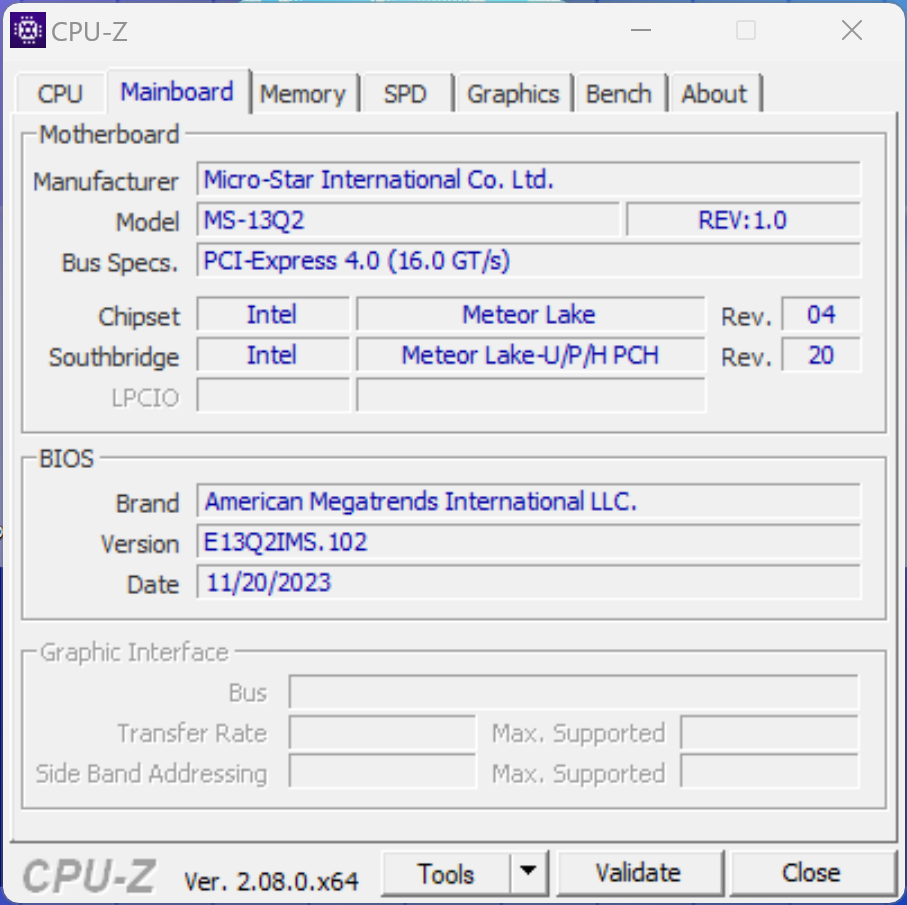
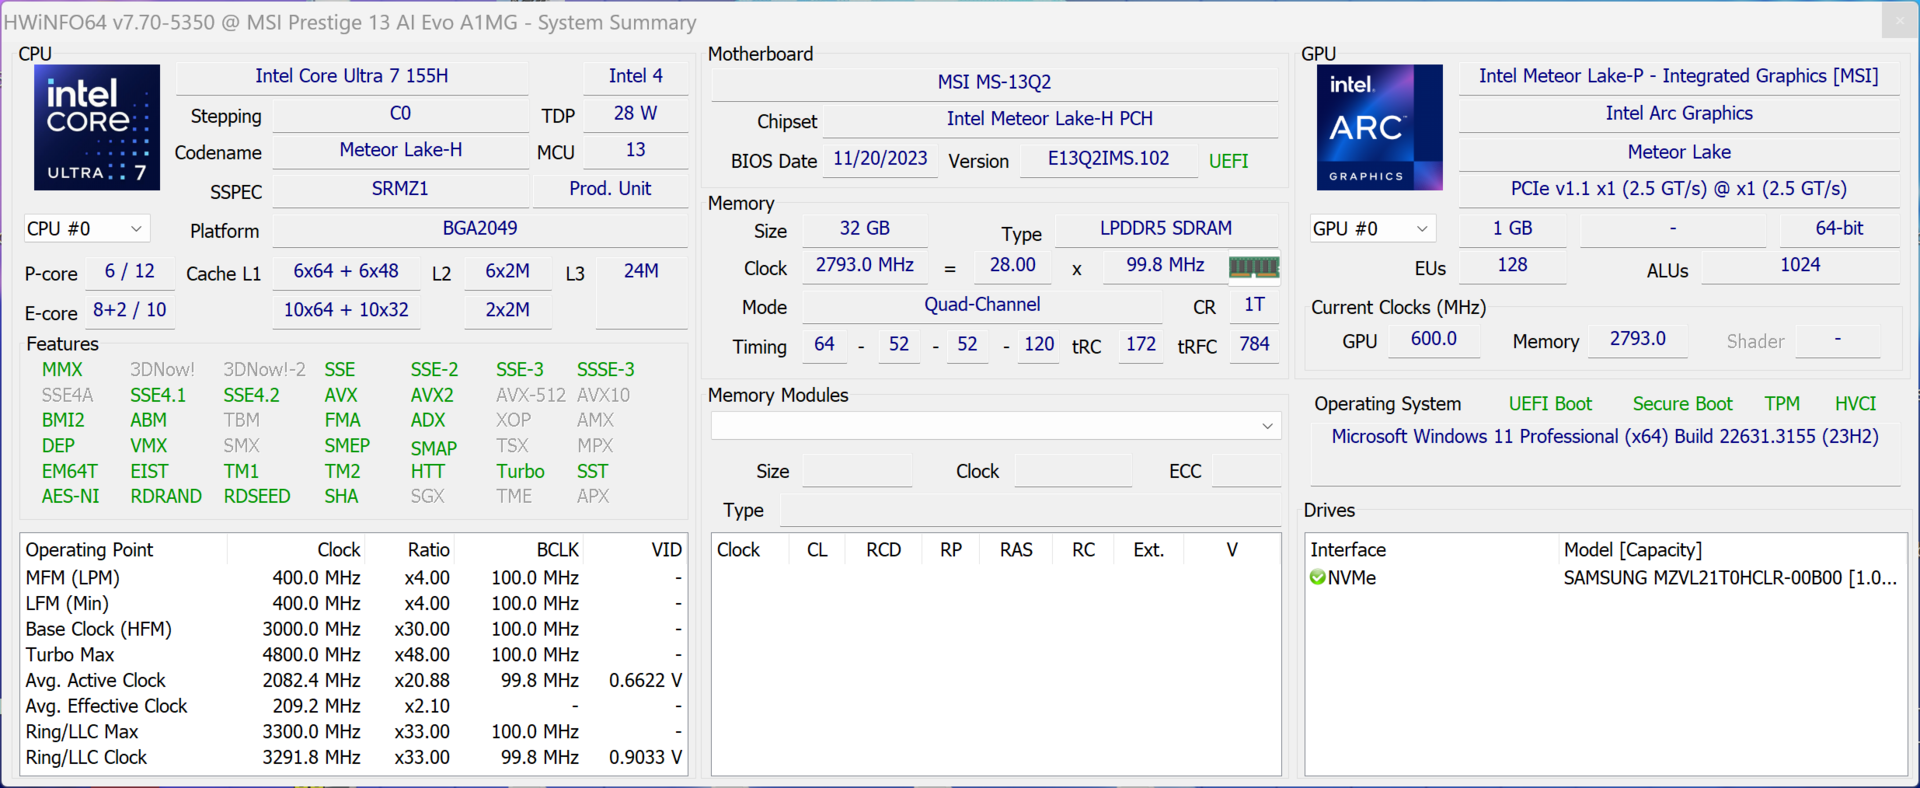
MSI verbaut den neuen Meteor-Lake-Chip Core Ultra 7 155H von Intel, der in einem TDP-Bereich von 28-115 Watt eingesetzt werden kann. Im Fall des Prestige 13 sind es bei einem kühlen Gerät etwa 30 Sekunden lang maximal 64 Watt, danach fällt der Verbrauch auf 20 Watt ab. Eigentlich wäre ein U-Serie-Prozessor hier die bessere Wahl, doch da diese CPUs lediglich 2 schnelle P-Kerne bieten, fällt die Leistung eher bescheiden aus. Bei kurzer Belastung (die bei einem Subnotebook auch deutlich wahrscheinlicher ist) fällt die Multi-Core-Leistung natürlich sehr gut aus. Die Single-Core-Leistung ist in Ordnung, aber hier haben die Meteor-Lake-CPUs auch keinen Vorteil gegenüber den alten Raptor-Lake-Modellen. Im Akkubetrieb bleibt die CPU-Leistung konstant. Weitere CPU-Benchmarks stehen hier zur Verfügung.
Cinebench R15 Multi Dauertest
Cinebench R23: Multi Core | Single Core
Cinebench R20: CPU (Multi Core) | CPU (Single Core)
Cinebench R15: CPU Multi 64Bit | CPU Single 64Bit
Blender: v2.79 BMW27 CPU
7-Zip 18.03: 7z b 4 | 7z b 4 -mmt1
Geekbench 6.7: Multi-Core | Single-Core
Geekbench 5.5: Multi-Core | Single-Core
HWBOT x265 Benchmark v2.2: 4k Preset
LibreOffice : 20 Documents To PDF
R Benchmark 2.5: Overall mean
| CPU Performance Rating | |
| Durchschnittliche Intel Core Ultra 7 155H | |
| Durchschnitt der Klasse Subnotebook | |
| MSI Prestige 13 AI Evo | |
| Lenovo ThinkPad X1 Nano Gen 3 | |
| HP Dragonfly G4 -2! | |
| Asus ZenBook S13 OLED UX5304 -2! | |
| Dell Latitude 13 7340 i5-1345U -2! | |
| Cinebench R23 / Multi Core | |
| Durchschnittliche Intel Core Ultra 7 155H (9769 - 19007, n=52) | |
| Durchschnitt der Klasse Subnotebook (1555 - 21812, n=59, der letzten 2 Jahre) | |
| MSI Prestige 13 AI Evo | |
| Lenovo ThinkPad X1 Nano Gen 3 | |
| Dell Latitude 13 7340 i5-1345U | |
| HP Dragonfly G4 | |
| Asus ZenBook S13 OLED UX5304 | |
| Cinebench R23 / Single Core | |
| HP Dragonfly G4 | |
| Durchschnitt der Klasse Subnotebook (358 - 2213, n=60, der letzten 2 Jahre) | |
| Asus ZenBook S13 OLED UX5304 | |
| Durchschnittliche Intel Core Ultra 7 155H (1496 - 1815, n=52) | |
| Dell Latitude 13 7340 i5-1345U | |
| Lenovo ThinkPad X1 Nano Gen 3 | |
| MSI Prestige 13 AI Evo | |
| Cinebench R20 / CPU (Multi Core) | |
| Durchschnittliche Intel Core Ultra 7 155H (3798 - 7409, n=50) | |
| Durchschnitt der Klasse Subnotebook (579 - 8541, n=56, der letzten 2 Jahre) | |
| MSI Prestige 13 AI Evo | |
| Lenovo ThinkPad X1 Nano Gen 3 | |
| Dell Latitude 13 7340 i5-1345U | |
| HP Dragonfly G4 | |
| Asus ZenBook S13 OLED UX5304 | |
| Cinebench R20 / CPU (Single Core) | |
| HP Dragonfly G4 | |
| Asus ZenBook S13 OLED UX5304 | |
| Lenovo ThinkPad X1 Nano Gen 3 | |
| Durchschnittliche Intel Core Ultra 7 155H (601 - 696, n=50) | |
| Dell Latitude 13 7340 i5-1345U | |
| Durchschnitt der Klasse Subnotebook (128 - 832, n=56, der letzten 2 Jahre) | |
| MSI Prestige 13 AI Evo | |
| Cinebench R15 / CPU Multi 64Bit | |
| Durchschnittliche Intel Core Ultra 7 155H (1932 - 2880, n=56) | |
| MSI Prestige 13 AI Evo | |
| Durchschnitt der Klasse Subnotebook (327 - 3345, n=56, der letzten 2 Jahre) | |
| Lenovo ThinkPad X1 Nano Gen 3 | |
| Asus ZenBook S13 OLED UX5304 | |
| HP Dragonfly G4 | |
| Dell Latitude 13 7340 i5-1345U | |
| Cinebench R15 / CPU Single 64Bit | |
| Durchschnitt der Klasse Subnotebook (72.4 - 322, n=56, der letzten 2 Jahre) | |
| HP Dragonfly G4 | |
| Durchschnittliche Intel Core Ultra 7 155H (99.6 - 268, n=52) | |
| Asus ZenBook S13 OLED UX5304 | |
| MSI Prestige 13 AI Evo | |
| Dell Latitude 13 7340 i5-1345U | |
| Lenovo ThinkPad X1 Nano Gen 3 | |
| Blender / v2.79 BMW27 CPU | |
| Dell Latitude 13 7340 i5-1345U | |
| Asus ZenBook S13 OLED UX5304 | |
| Asus ZenBook S13 OLED UX5304 | |
| HP Dragonfly G4 | |
| Lenovo ThinkPad X1 Nano Gen 3 | |
| Durchschnitt der Klasse Subnotebook (159 - 2271, n=57, der letzten 2 Jahre) | |
| MSI Prestige 13 AI Evo | |
| Durchschnittliche Intel Core Ultra 7 155H (175 - 381, n=47) | |
| 7-Zip 18.03 / 7z b 4 | |
| Durchschnittliche Intel Core Ultra 7 155H (41739 - 70254, n=50) | |
| Durchschnitt der Klasse Subnotebook (11668 - 77867, n=56, der letzten 2 Jahre) | |
| MSI Prestige 13 AI Evo | |
| HP Dragonfly G4 | |
| Lenovo ThinkPad X1 Nano Gen 3 | |
| Asus ZenBook S13 OLED UX5304 | |
| Dell Latitude 13 7340 i5-1345U | |
| 7-Zip 18.03 / 7z b 4 -mmt1 | |
| HP Dragonfly G4 | |
| Lenovo ThinkPad X1 Nano Gen 3 | |
| Asus ZenBook S13 OLED UX5304 | |
| Durchschnitt der Klasse Subnotebook (2643 - 6699, n=58, der letzten 2 Jahre) | |
| MSI Prestige 13 AI Evo | |
| Durchschnittliche Intel Core Ultra 7 155H (4594 - 5621, n=50) | |
| Dell Latitude 13 7340 i5-1345U | |
| Geekbench 6.7 / Multi-Core | |
| Durchschnitt der Klasse Subnotebook (2244 - 20325, n=62, der letzten 2 Jahre) | |
| Durchschnittliche Intel Core Ultra 7 155H (7732 - 13656, n=55) | |
| Lenovo ThinkPad X1 Nano Gen 3 | |
| MSI Prestige 13 AI Evo | |
| Geekbench 6.7 / Single-Core | |
| Durchschnitt der Klasse Subnotebook (960 - 4195, n=61, der letzten 2 Jahre) | |
| Lenovo ThinkPad X1 Nano Gen 3 | |
| MSI Prestige 13 AI Evo | |
| Durchschnittliche Intel Core Ultra 7 155H (1901 - 2473, n=52) | |
| Geekbench 5.5 / Multi-Core | |
| Durchschnittliche Intel Core Ultra 7 155H (10017 - 13556, n=52) | |
| Durchschnitt der Klasse Subnotebook (2557 - 17218, n=47, der letzten 2 Jahre) | |
| MSI Prestige 13 AI Evo | |
| Lenovo ThinkPad X1 Nano Gen 3 | |
| HP Dragonfly G4 | |
| Asus ZenBook S13 OLED UX5304 | |
| Dell Latitude 13 7340 i5-1345U | |
| Geekbench 5.5 / Single-Core | |
| Durchschnitt der Klasse Subnotebook (726 - 2224, n=47, der letzten 2 Jahre) | |
| HP Dragonfly G4 | |
| Lenovo ThinkPad X1 Nano Gen 3 | |
| Asus ZenBook S13 OLED UX5304 | |
| MSI Prestige 13 AI Evo | |
| Durchschnittliche Intel Core Ultra 7 155H (1462 - 1824, n=52) | |
| Dell Latitude 13 7340 i5-1345U | |
| HWBOT x265 Benchmark v2.2 / 4k Preset | |
| Durchschnittliche Intel Core Ultra 7 155H (9.93 - 21.2, n=50) | |
| Durchschnitt der Klasse Subnotebook (0.97 - 25.1, n=56, der letzten 2 Jahre) | |
| MSI Prestige 13 AI Evo | |
| Lenovo ThinkPad X1 Nano Gen 3 | |
| HP Dragonfly G4 | |
| Asus ZenBook S13 OLED UX5304 | |
| Dell Latitude 13 7340 i5-1345U | |
| LibreOffice / 20 Documents To PDF | |
| Durchschnitt der Klasse Subnotebook (39.9 - 220, n=55, der letzten 2 Jahre) | |
| Lenovo ThinkPad X1 Nano Gen 3 | |
| Durchschnittliche Intel Core Ultra 7 155H (37.5 - 79.2, n=49) | |
| Asus ZenBook S13 OLED UX5304 | |
| HP Dragonfly G4 | |
| MSI Prestige 13 AI Evo | |
| Dell Latitude 13 7340 i5-1345U | |
| R Benchmark 2.5 / Overall mean | |
| Durchschnitt der Klasse Subnotebook (0.4024 - 1.456, n=57, der letzten 2 Jahre) | |
| Dell Latitude 13 7340 i5-1345U | |
| Lenovo ThinkPad X1 Nano Gen 3 | |
| Durchschnittliche Intel Core Ultra 7 155H (0.4457 - 0.53, n=49) | |
| Asus ZenBook S13 OLED UX5304 | |
| MSI Prestige 13 AI Evo | |
| HP Dragonfly G4 | |
* ... kleinere Werte sind besser
AIDA64: FP32 Ray-Trace | FPU Julia | CPU SHA3 | CPU Queen | FPU SinJulia | FPU Mandel | CPU AES | CPU ZLib | FP64 Ray-Trace | CPU PhotoWorxx
| Performance Rating | |
| Durchschnittliche Intel Core Ultra 7 155H | |
| Durchschnitt der Klasse Subnotebook | |
| MSI Prestige 13 AI Evo | |
| Lenovo ThinkPad X1 Nano Gen 3 | |
| HP Dragonfly G4 | |
| Asus ZenBook S13 OLED UX5304 | |
| Dell Latitude 13 7340 i5-1345U | |
| AIDA64 / FP32 Ray-Trace | |
| Durchschnitt der Klasse Subnotebook (1135 - 32888, n=57, der letzten 2 Jahre) | |
| Durchschnittliche Intel Core Ultra 7 155H (6670 - 18470, n=50) | |
| Lenovo ThinkPad X1 Nano Gen 3 | |
| HP Dragonfly G4 | |
| MSI Prestige 13 AI Evo | |
| Asus ZenBook S13 OLED UX5304 | |
| Dell Latitude 13 7340 i5-1345U | |
| AIDA64 / FPU Julia | |
| Durchschnittliche Intel Core Ultra 7 155H (40905 - 93181, n=50) | |
| Durchschnitt der Klasse Subnotebook (5218 - 123315, n=57, der letzten 2 Jahre) | |
| MSI Prestige 13 AI Evo | |
| Lenovo ThinkPad X1 Nano Gen 3 | |
| HP Dragonfly G4 | |
| Asus ZenBook S13 OLED UX5304 | |
| Dell Latitude 13 7340 i5-1345U | |
| AIDA64 / CPU SHA3 | |
| Durchschnittliche Intel Core Ultra 7 155H (1940 - 4436, n=50) | |
| Durchschnitt der Klasse Subnotebook (444 - 5287, n=57, der letzten 2 Jahre) | |
| MSI Prestige 13 AI Evo | |
| Lenovo ThinkPad X1 Nano Gen 3 | |
| HP Dragonfly G4 | |
| Asus ZenBook S13 OLED UX5304 | |
| Dell Latitude 13 7340 i5-1345U | |
| AIDA64 / CPU Queen | |
| Lenovo ThinkPad X1 Nano Gen 3 | |
| Durchschnittliche Intel Core Ultra 7 155H (64698 - 94181, n=50) | |
| HP Dragonfly G4 | |
| Asus ZenBook S13 OLED UX5304 | |
| MSI Prestige 13 AI Evo | |
| Dell Latitude 13 7340 i5-1345U | |
| Durchschnitt der Klasse Subnotebook (10579 - 95002, n=49, der letzten 2 Jahre) | |
| AIDA64 / FPU SinJulia | |
| Durchschnittliche Intel Core Ultra 7 155H (5639 - 10647, n=50) | |
| Durchschnitt der Klasse Subnotebook (744 - 18418, n=57, der letzten 2 Jahre) | |
| MSI Prestige 13 AI Evo | |
| Lenovo ThinkPad X1 Nano Gen 3 | |
| HP Dragonfly G4 | |
| Asus ZenBook S13 OLED UX5304 | |
| Dell Latitude 13 7340 i5-1345U | |
| AIDA64 / FPU Mandel | |
| Durchschnittliche Intel Core Ultra 7 155H (18236 - 47685, n=50) | |
| Durchschnitt der Klasse Subnotebook (3341 - 65433, n=57, der letzten 2 Jahre) | |
| MSI Prestige 13 AI Evo | |
| Lenovo ThinkPad X1 Nano Gen 3 | |
| HP Dragonfly G4 | |
| Asus ZenBook S13 OLED UX5304 | |
| Dell Latitude 13 7340 i5-1345U | |
| AIDA64 / CPU AES | |
| Durchschnittliche Intel Core Ultra 7 155H (45713 - 152179, n=50) | |
| Durchschnitt der Klasse Subnotebook (638 - 96917, n=57, der letzten 2 Jahre) | |
| MSI Prestige 13 AI Evo | |
| Lenovo ThinkPad X1 Nano Gen 3 | |
| HP Dragonfly G4 | |
| Asus ZenBook S13 OLED UX5304 | |
| Dell Latitude 13 7340 i5-1345U | |
| AIDA64 / CPU ZLib | |
| Durchschnittliche Intel Core Ultra 7 155H (557 - 1250, n=50) | |
| Durchschnitt der Klasse Subnotebook (164.9 - 1379, n=57, der letzten 2 Jahre) | |
| MSI Prestige 13 AI Evo | |
| Lenovo ThinkPad X1 Nano Gen 3 | |
| HP Dragonfly G4 | |
| Asus ZenBook S13 OLED UX5304 | |
| Dell Latitude 13 7340 i5-1345U | |
| AIDA64 / FP64 Ray-Trace | |
| Durchschnitt der Klasse Subnotebook (610 - 17495, n=57, der letzten 2 Jahre) | |
| Durchschnittliche Intel Core Ultra 7 155H (3569 - 9802, n=50) | |
| Lenovo ThinkPad X1 Nano Gen 3 | |
| MSI Prestige 13 AI Evo | |
| HP Dragonfly G4 | |
| Asus ZenBook S13 OLED UX5304 | |
| Dell Latitude 13 7340 i5-1345U | |
| AIDA64 / CPU PhotoWorxx | |
| Durchschnitt der Klasse Subnotebook (6569 - 85600, n=57, der letzten 2 Jahre) | |
| Durchschnittliche Intel Core Ultra 7 155H (32719 - 54223, n=50) | |
| Lenovo ThinkPad X1 Nano Gen 3 | |
| MSI Prestige 13 AI Evo | |
| Asus ZenBook S13 OLED UX5304 | |
| HP Dragonfly G4 | |
| Dell Latitude 13 7340 i5-1345U | |
System Performance
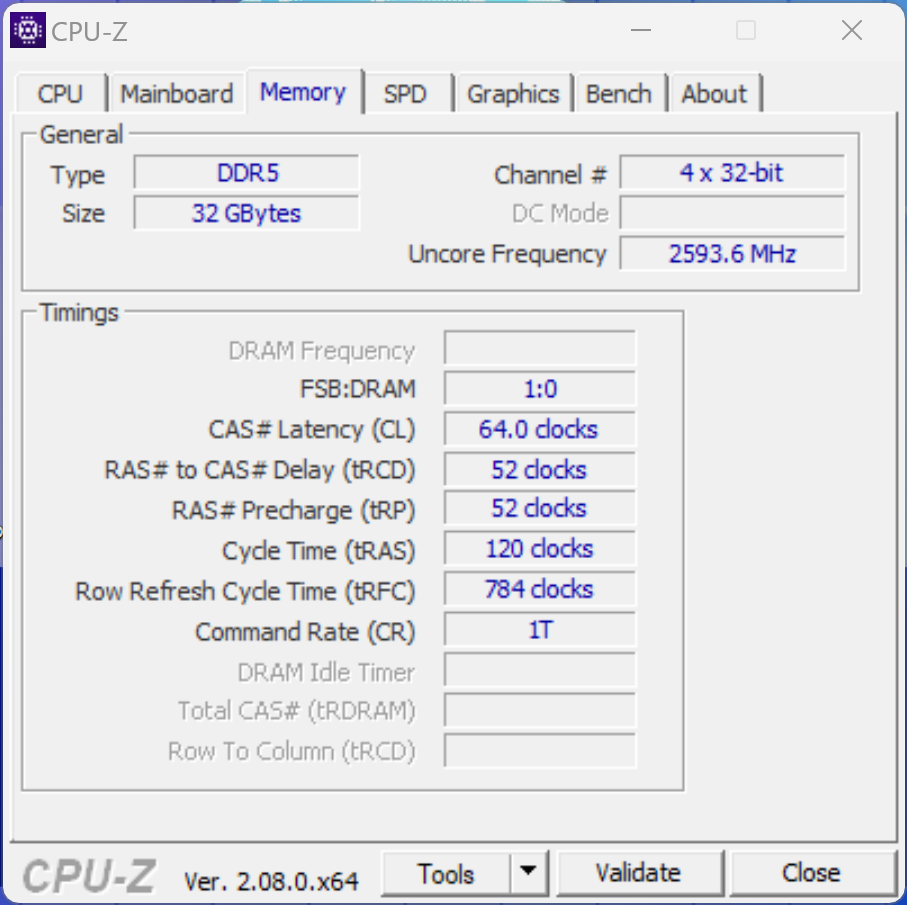
Im Alltag ist das kompakte Prestige 13 ein zügiger und reaktionsschneller Begleiter, was natürlich auch an dem SSD-Speicher liegt. Der Arbeitsspeicher bei unserer Konfiguration ist 32 GB groß und sollte damit auch für die kommenden Jahre vollkommen ausreichen. Während des Tests hatten wir keine Probleme mit der Systemstabilität.
CrossMark: Overall | Productivity | Creativity | Responsiveness
WebXPRT 3: Overall
WebXPRT 4: Overall
Mozilla Kraken 1.1: Total
| PCMark 10 / Score | |
| Durchschnitt der Klasse Subnotebook (4920 - 9939, n=44, der letzten 2 Jahre) | |
| Durchschnittliche Intel Core Ultra 7 155H, Intel Arc 8-Core iGPU (4809 - 7529, n=34) | |
| MSI Prestige 13 AI Evo | |
| Lenovo ThinkPad X1 Nano Gen 3 | |
| HP Dragonfly G4 | |
| Asus ZenBook S13 OLED UX5304 | |
| Dell Latitude 13 7340 i5-1345U | |
| PCMark 10 / Essentials | |
| HP Dragonfly G4 | |
| Lenovo ThinkPad X1 Nano Gen 3 | |
| Asus ZenBook S13 OLED UX5304 | |
| Durchschnittliche Intel Core Ultra 7 155H, Intel Arc 8-Core iGPU (7605 - 11289, n=34) | |
| Durchschnitt der Klasse Subnotebook (8552 - 11646, n=44, der letzten 2 Jahre) | |
| Dell Latitude 13 7340 i5-1345U | |
| MSI Prestige 13 AI Evo | |
| PCMark 10 / Productivity | |
| Durchschnitt der Klasse Subnotebook (5435 - 16606, n=44, der letzten 2 Jahre) | |
| Durchschnittliche Intel Core Ultra 7 155H, Intel Arc 8-Core iGPU (6042 - 10591, n=34) | |
| MSI Prestige 13 AI Evo | |
| Lenovo ThinkPad X1 Nano Gen 3 | |
| HP Dragonfly G4 | |
| Asus ZenBook S13 OLED UX5304 | |
| Dell Latitude 13 7340 i5-1345U | |
| PCMark 10 / Digital Content Creation | |
| Durchschnitt der Klasse Subnotebook (5722 - 13779, n=44, der letzten 2 Jahre) | |
| Durchschnittliche Intel Core Ultra 7 155H, Intel Arc 8-Core iGPU (4985 - 10709, n=34) | |
| MSI Prestige 13 AI Evo | |
| Lenovo ThinkPad X1 Nano Gen 3 | |
| HP Dragonfly G4 | |
| Asus ZenBook S13 OLED UX5304 | |
| Dell Latitude 13 7340 i5-1345U | |
| CrossMark / Overall | |
| Lenovo ThinkPad X1 Nano Gen 3 | |
| Durchschnittliche Intel Core Ultra 7 155H, Intel Arc 8-Core iGPU (1366 - 1903, n=34) | |
| Durchschnitt der Klasse Subnotebook (365 - 2356, n=59, der letzten 2 Jahre) | |
| HP Dragonfly G4 | |
| Asus ZenBook S13 OLED UX5304 | |
| Dell Latitude 13 7340 i5-1345U | |
| MSI Prestige 13 AI Evo | |
| CrossMark / Productivity | |
| Lenovo ThinkPad X1 Nano Gen 3 | |
| HP Dragonfly G4 | |
| Durchschnittliche Intel Core Ultra 7 155H, Intel Arc 8-Core iGPU (1291 - 1798, n=33) | |
| Durchschnitt der Klasse Subnotebook (364 - 2277, n=59, der letzten 2 Jahre) | |
| Asus ZenBook S13 OLED UX5304 | |
| Dell Latitude 13 7340 i5-1345U | |
| MSI Prestige 13 AI Evo | |
| CrossMark / Creativity | |
| Lenovo ThinkPad X1 Nano Gen 3 | |
| Durchschnitt der Klasse Subnotebook (372 - 2743, n=59, der letzten 2 Jahre) | |
| Durchschnittliche Intel Core Ultra 7 155H, Intel Arc 8-Core iGPU (1519 - 1929, n=33) | |
| HP Dragonfly G4 | |
| Asus ZenBook S13 OLED UX5304 | |
| Dell Latitude 13 7340 i5-1345U | |
| MSI Prestige 13 AI Evo | |
| CrossMark / Responsiveness | |
| Lenovo ThinkPad X1 Nano Gen 3 | |
| Durchschnittliche Intel Core Ultra 7 155H, Intel Arc 8-Core iGPU (939 - 1802, n=33) | |
| Asus ZenBook S13 OLED UX5304 | |
| HP Dragonfly G4 | |
| Durchschnitt der Klasse Subnotebook (312 - 1854, n=59, der letzten 2 Jahre) | |
| Dell Latitude 13 7340 i5-1345U | |
| MSI Prestige 13 AI Evo | |
| WebXPRT 3 / Overall | |
| Durchschnitt der Klasse Subnotebook (156 - 530, n=55, der letzten 2 Jahre) | |
| Lenovo ThinkPad X1 Nano Gen 3 | |
| HP Dragonfly G4 | |
| Asus ZenBook S13 OLED UX5304 | |
| Durchschnittliche Intel Core Ultra 7 155H, Intel Arc 8-Core iGPU (252 - 299, n=34) | |
| MSI Prestige 13 AI Evo | |
| WebXPRT 4 / Overall | |
| Durchschnitt der Klasse Subnotebook (132 - 378, n=60, der letzten 2 Jahre) | |
| Lenovo ThinkPad X1 Nano Gen 3 | |
| HP Dragonfly G4 | |
| Asus ZenBook S13 OLED UX5304 | |
| Durchschnittliche Intel Core Ultra 7 155H, Intel Arc 8-Core iGPU (166.4 - 309, n=29) | |
| MSI Prestige 13 AI Evo | |
| Mozilla Kraken 1.1 / Total | |
| Dell Latitude 13 7340 i5-1345U | |
| MSI Prestige 13 AI Evo | |
| Durchschnittliche Intel Core Ultra 7 155H, Intel Arc 8-Core iGPU (517 - 614, n=35) | |
| Asus ZenBook S13 OLED UX5304 | |
| Lenovo ThinkPad X1 Nano Gen 3 | |
| HP Dragonfly G4 | |
| Durchschnitt der Klasse Subnotebook (234 - 1104, n=60, der letzten 2 Jahre) | |
* ... kleinere Werte sind besser
| PCMark 10 Score | 5952 Punkte | |
Hilfe | ||
| AIDA64 / Memory Copy | |
| Durchschnitt der Klasse Subnotebook (14554 - 131023, n=57, der letzten 2 Jahre) | |
| Durchschnittliche Intel Core Ultra 7 155H (62397 - 96791, n=50) | |
| MSI Prestige 13 AI Evo | |
| Lenovo ThinkPad X1 Nano Gen 3 | |
| Asus ZenBook S13 OLED UX5304 | |
| HP Dragonfly G4 | |
| Dell Latitude 13 7340 i5-1345U | |
| AIDA64 / Memory Read | |
| Durchschnitt der Klasse Subnotebook (15948 - 127174, n=57, der letzten 2 Jahre) | |
| Durchschnittliche Intel Core Ultra 7 155H (60544 - 90647, n=50) | |
| MSI Prestige 13 AI Evo | |
| Lenovo ThinkPad X1 Nano Gen 3 | |
| Asus ZenBook S13 OLED UX5304 | |
| HP Dragonfly G4 | |
| Dell Latitude 13 7340 i5-1345U | |
| AIDA64 / Memory Write | |
| Lenovo ThinkPad X1 Nano Gen 3 | |
| Durchschnitt der Klasse Subnotebook (15709 - 135141, n=57, der letzten 2 Jahre) | |
| MSI Prestige 13 AI Evo | |
| Durchschnittliche Intel Core Ultra 7 155H (58692 - 93451, n=50) | |
| Asus ZenBook S13 OLED UX5304 | |
| Dell Latitude 13 7340 i5-1345U | |
| HP Dragonfly G4 | |
| AIDA64 / Memory Latency | |
| MSI Prestige 13 AI Evo | |
| Durchschnittliche Intel Core Ultra 7 155H (116.2 - 233, n=50) | |
| Dell Latitude 13 7340 i5-1345U | |
| Durchschnitt der Klasse Subnotebook (6.1 - 159.9, n=55, der letzten 2 Jahre) | |
| Lenovo ThinkPad X1 Nano Gen 3 | |
| HP Dragonfly G4 | |
| Asus ZenBook S13 OLED UX5304 | |
* ... kleinere Werte sind besser
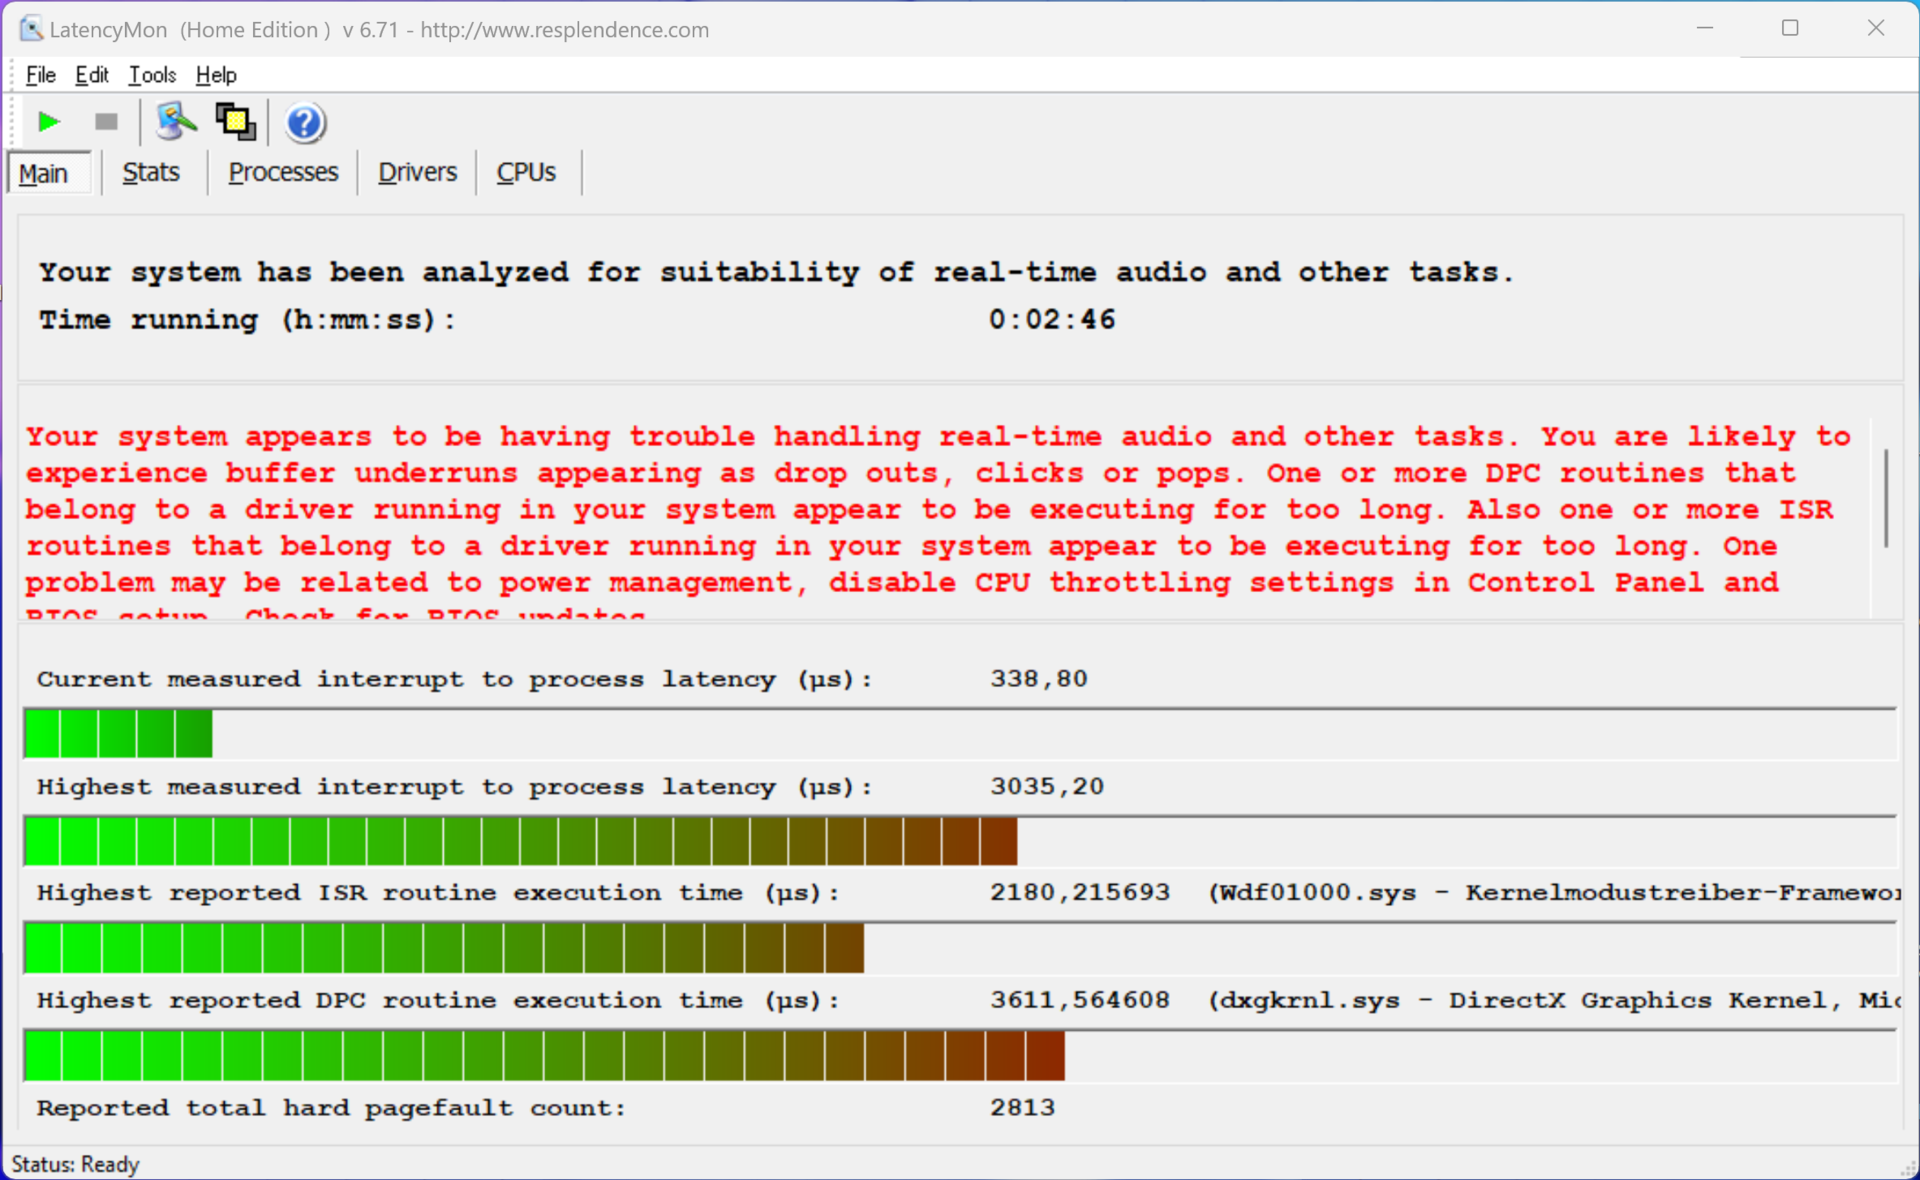
DPC-Latenzen
In unserem standardisierten Latency-Test (Surfen im Internet, 4K-YouTube-Wiedergabe, CPU-Last) zeigt das testgerät mit der aktuellen BIOS-Version Einschränkungen bei der Verwendung von Echtzeit-Audioanwendungen.
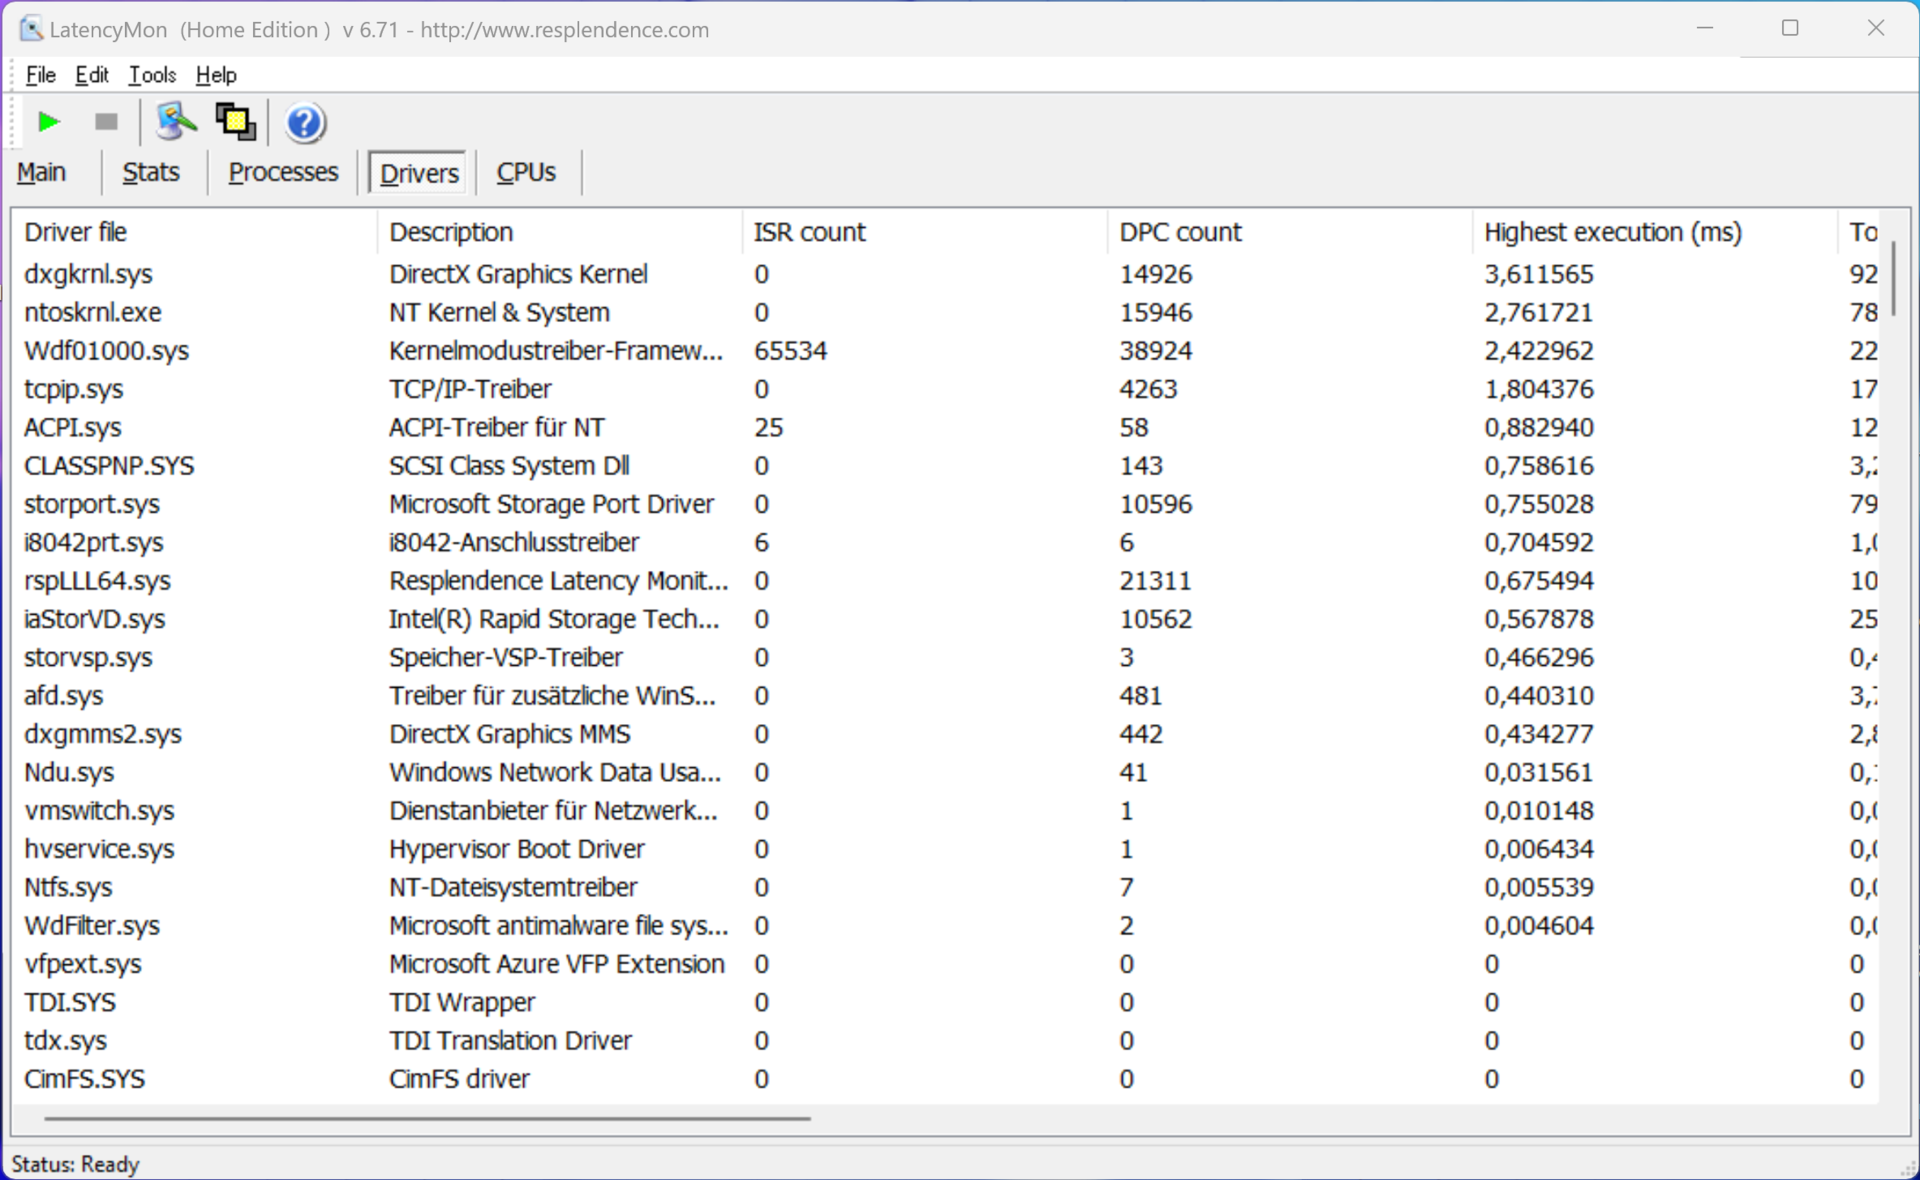
| DPC Latencies / LatencyMon - interrupt to process latency (max), Web, Youtube, Prime95 | |
| MSI Prestige 13 AI Evo | |
| Lenovo ThinkPad X1 Nano Gen 3 | |
| Dell Latitude 13 7340 i5-1345U | |
| Asus ZenBook S13 OLED UX5304 | |
| HP Dragonfly G4 | |
* ... kleinere Werte sind besser
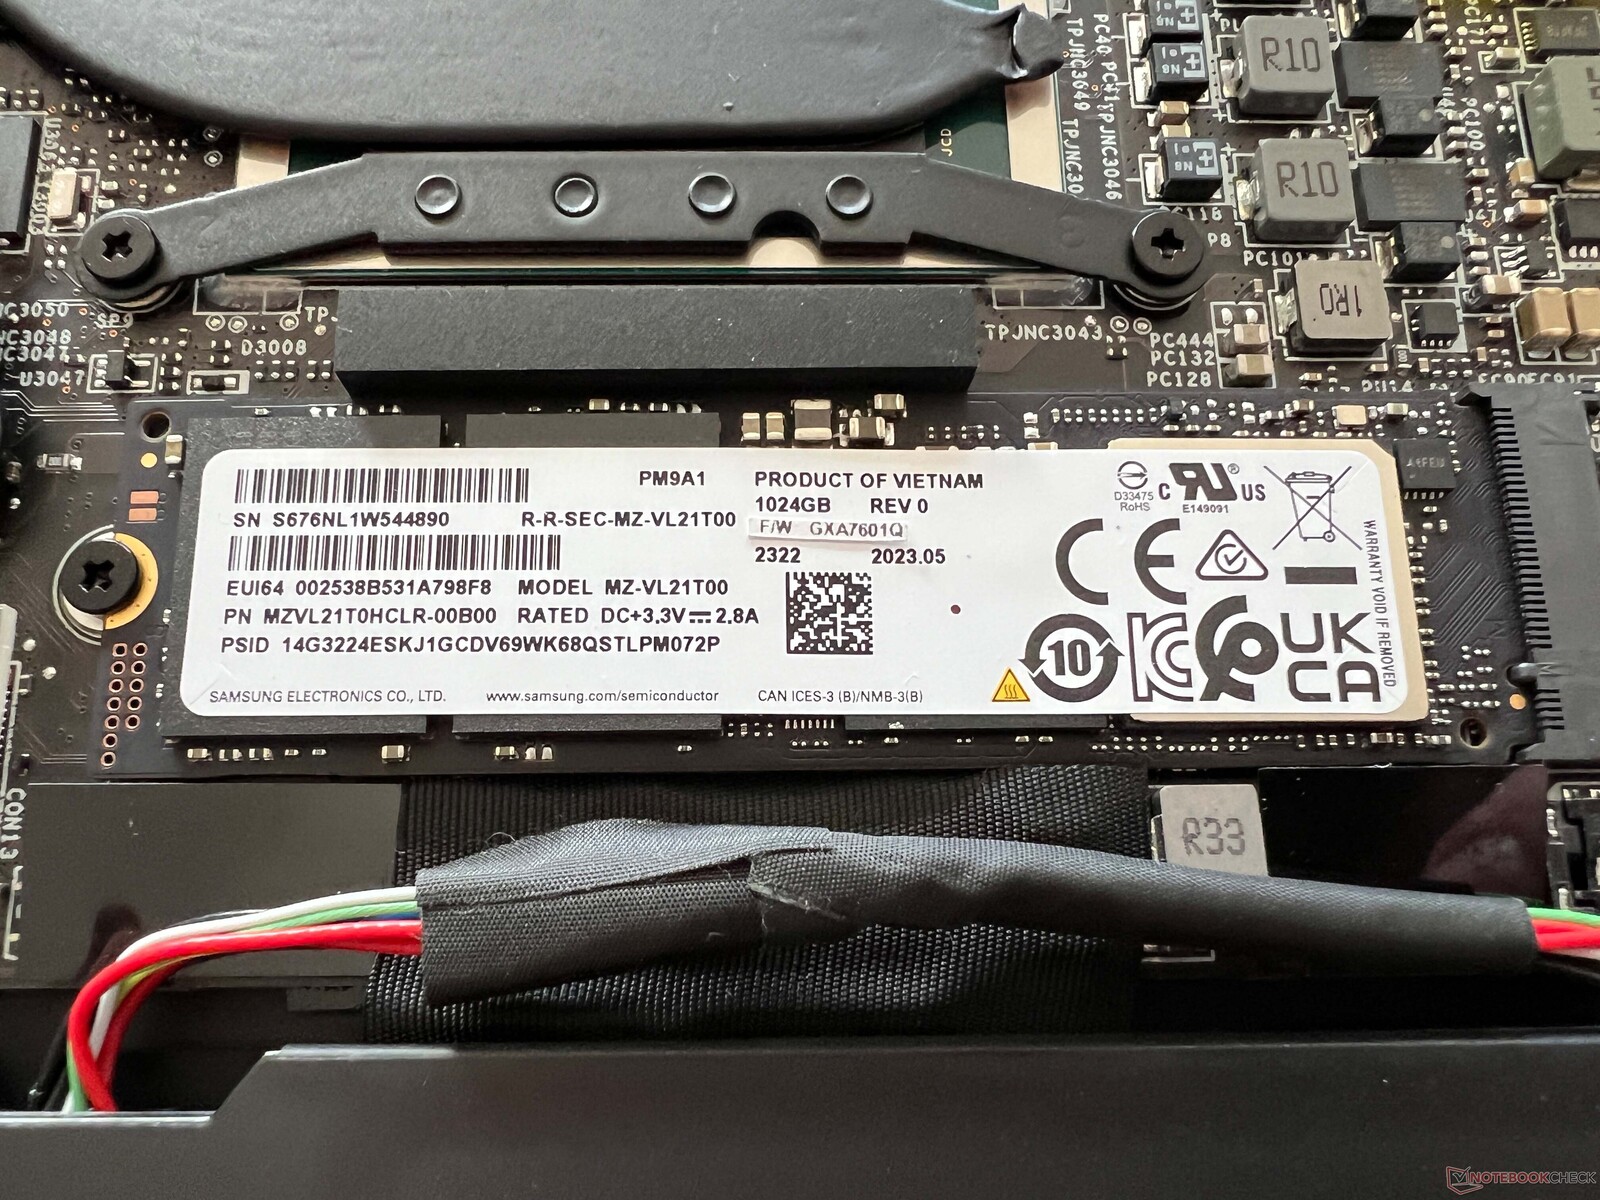
Massenspeicher
Im Testgerät ist die 1-TB-Variante der Samsung PM9A1 verbaut (OEM-Version der 980 Pro) und es handelt sich um ein sehr schnelles Laufwerk. Allerdings bleibt die Leistung bei dauerhafter Belastung nicht konstant, was im Alltag jedoch kein Problem darstellt. Nach der ersten Inbetriebnahme stehen dem Nutzer 864 GB zur freien Verfügung. Weitere SSD-Benchmarks sind hier gelistet.

* ... kleinere Werte sind besser
Dauerleistung Lesen: DiskSpd Read Loop, Queue Depth 8
Grafikkarte
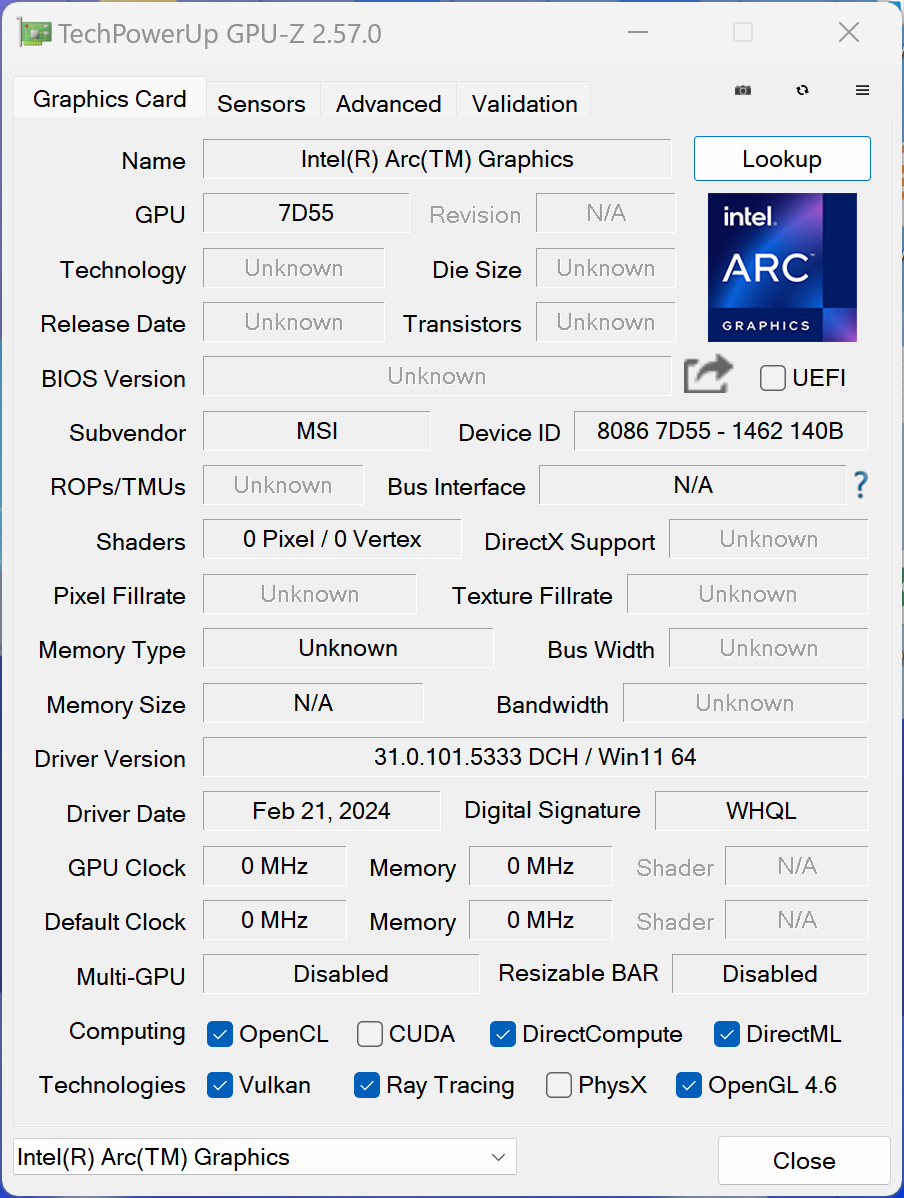
Die neue Intel Arc Graphics bietet in Verbindung mit dem Core Ultra 7 155H 8 Xe-Kerne, doch die Grafikleistung im MSI Prestige 13 ist insgesamt die schlechteste von allen neuen Meteor-lake-Laptops, die wir bisher testen konnten (-32 % gegenüber dem durchschnittlichen Wert in unserer Datenbank). Selbst in den synthetischen Benchmarks ist das MSI daher nur knapp schneller als die alte Iris Xe Graphics G7. Mit alltäglichen Dingen wie der Wiedergabe von hochauflösenden Videos hat das MSI keine Probleme, doch das Potenzial der neuen iGPU kann man nicht ausnutzen.
Positiv erwähnen wollen wir aber, dass es beim MSI während der Gaming-Tests nicht zu den massiven Framedrops gekommen ist, die wir beispielsweise beim Zenbook 14 oder dem HP Spectre x360 14 feststellen konnten. Die Gaming-Leistung ist insgesamt gering, aber zumindest stabil. Im Akkubetrieb bleibt die Leistung ebenfalls konstant und weitere Benchmarks sind hier verfügbar.
| 3DMark 11 Performance | 8505 Punkte | |
| 3DMark Fire Strike Score | 5203 Punkte | |
| 3DMark Time Spy Score | 2178 Punkte | |
Hilfe | ||
| Blender / v3.3 Classroom CPU | |
| Dell Latitude 13 7340 i5-1345U | |
| Asus ZenBook S13 OLED UX5304 | |
| HP Dragonfly G4 | |
| Lenovo ThinkPad X1 Nano Gen 3 | |
| MSI Prestige 13 AI Evo | |
| Durchschnitt der Klasse Subnotebook (241 - 861, n=59, der letzten 2 Jahre) | |
| Durchschnittliche Intel Arc 8-Core iGPU (294 - 692, n=42) | |
* ... kleinere Werte sind besser
| Performance Rating - Percent | |
| Durchschnitt der Klasse Subnotebook | |
| MSI Prestige 13 AI Evo | |
| HP Dragonfly G4 | |
| Lenovo ThinkPad X1 Nano Gen 3 -1! | |
| Asus ZenBook S13 OLED UX5304 | |
| Dell Latitude 13 7340 i5-1345U | |
| The Witcher 3 - 1920x1080 Ultra Graphics & Postprocessing (HBAO+) | |
| Durchschnitt der Klasse Subnotebook (13.9 - 34.6, n=13, der letzten 2 Jahre) | |
| HP Dragonfly G4 | |
| MSI Prestige 13 AI Evo | |
| Lenovo ThinkPad X1 Nano Gen 3 | |
| Asus ZenBook S13 OLED UX5304 | |
| Dell Latitude 13 7340 i5-1345U | |
| GTA V - 1920x1080 Highest AA:4xMSAA + FX AF:16x | |
| Durchschnitt der Klasse Subnotebook (10.7 - 43.7, n=55, der letzten 2 Jahre) | |
| HP Dragonfly G4 | |
| MSI Prestige 13 AI Evo | |
| Asus ZenBook S13 OLED UX5304 | |
| Dell Latitude 13 7340 i5-1345U | |
| Final Fantasy XV Benchmark - 1920x1080 High Quality | |
| Durchschnitt der Klasse Subnotebook (11.6 - 54.5, n=53, der letzten 2 Jahre) | |
| MSI Prestige 13 AI Evo | |
| HP Dragonfly G4 | |
| Asus ZenBook S13 OLED UX5304 | |
| Lenovo ThinkPad X1 Nano Gen 3 | |
| Dell Latitude 13 7340 i5-1345U | |
| Strange Brigade - 1920x1080 ultra AA:ultra AF:16 | |
| Durchschnitt der Klasse Subnotebook (19 - 101.3, n=49, der letzten 2 Jahre) | |
| MSI Prestige 13 AI Evo | |
| HP Dragonfly G4 | |
| Asus ZenBook S13 OLED UX5304 | |
| Dell Latitude 13 7340 i5-1345U | |
| Lenovo ThinkPad X1 Nano Gen 3 | |
| Dota 2 Reborn - 1920x1080 ultra (3/3) best looking | |
| Durchschnitt der Klasse Subnotebook (13 - 97, n=60, der letzten 2 Jahre) | |
| HP Dragonfly G4 | |
| MSI Prestige 13 AI Evo | |
| Asus ZenBook S13 OLED UX5304 | |
| Dell Latitude 13 7340 i5-1345U | |
| Lenovo ThinkPad X1 Nano Gen 3 | |
Witcher 3 FPS-Diagramm
| min. | mittel | hoch | max. | |
|---|---|---|---|---|
| GTA V (2015) | 99.1 | 93.8 | 26.2 | 9.97 |
| The Witcher 3 (2015) | 92 | 59 | 36 | 14.5 |
| Dota 2 Reborn (2015) | 89.9 | 75.9 | 57.7 | 53.3 |
| Final Fantasy XV Benchmark (2018) | 43.8 | 28 | 17 | |
| X-Plane 11.11 (2018) | 47.4 | 37.7 | 32.1 | |
| Far Cry 5 (2018) | 47 | 33 | 31 | 28 |
| Strange Brigade (2018) | 121 | 53 | 41 | 32 |
| F1 2021 (2021) | 94.8 | 50.8 | 41.3 | 20.3 |
| F1 22 (2022) | 59.1 | 49.6 | 36.8 | 9.33 |
| F1 23 (2023) | 44.1 | 36.3 | 27.1 | 7.45 |
Emissionen - Schwache Lautsprecher
Geräuschemissionen
MSI verbaut eine Kühlung mit einer Heatpipe und einem Lüfter, der leider auch im Leerlauf oft mit geringer Geschwindigkeit läuft. Das Rauschen ist dabei nicht nervig, in ruhigen Umgebungen aber schon hörbar. Unter Last springt der Lüfter schnell auf 32 dB(A) und im Stresstest sind es 40 dB(A). Das ist alles andere als leise und es handelt sich auch um das lauteste Gerät innerhalb der Vergleichsgruppe. Mit der CoolerBooster-Funktion bekommt man den kleinen Lüfter sogar auf 51 dB(A). Sonstige elektronische Geräusche gibt es nicht.
Lautstärkediagramm
| Idle |
| 23.4 / 26.9 / 26.9 dB(A) |
| Last |
| 32 / 40.3 dB(A) |
 | ||
30 dB leise 40 dB(A) deutlich hörbar 50 dB(A) störend |
||
min: | ||
| MSI Prestige 13 AI Evo Arc 8-Core, Ultra 7 155H, Samsung PM9A1 MZVL21T0HCLR | Lenovo ThinkPad X1 Nano Gen 3 Iris Xe G7 96EUs, i7-1360P, Lenovo UMIS AM6A0 RPJTJ512MKP1QDQ | Dell Latitude 13 7340 i5-1345U Iris Xe G7 80EUs, i5-1345U, Kioxia BG5 KBG50ZNS512G | HP Dragonfly G4 Iris Xe G7 96EUs, i7-1365U, Micron 3400 MTFDKBA512TFH 512GB | Asus ZenBook S13 OLED UX5304 Iris Xe G7 96EUs, i7-1355U, Samsung PM9A1 MZVL21T0HCLR | |
|---|---|---|---|---|---|
| Geräuschentwicklung | 3% | -1% | 6% | -2% | |
| aus / Umgebung * (dB) | 23.4 | 22.9 2% | 25.02 -7% | 23.3 -0% | 23.3 -0% |
| Idle min * (dB) | 23.4 | 23 2% | 25.02 -7% | 23.5 -0% | 23.3 -0% |
| Idle avg * (dB) | 26.9 | 23 14% | 25.02 7% | 23.5 13% | 23.3 13% |
| Idle max * (dB) | 26.9 | 23 14% | 25.02 7% | 26.8 -0% | 23.3 13% |
| Last avg * (dB) | 32 | 32.8 -2% | 35.07 -10% | 27.2 15% | 37.7 -18% |
| Witcher 3 ultra * (dB) | 32 | 36.9 -15% | 32.7 -2% | 40.1 -25% | |
| Last max * (dB) | 40.3 | 36.9 8% | 38.2 5% | 35 13% | 40.1 -0% |
* ... kleinere Werte sind besser
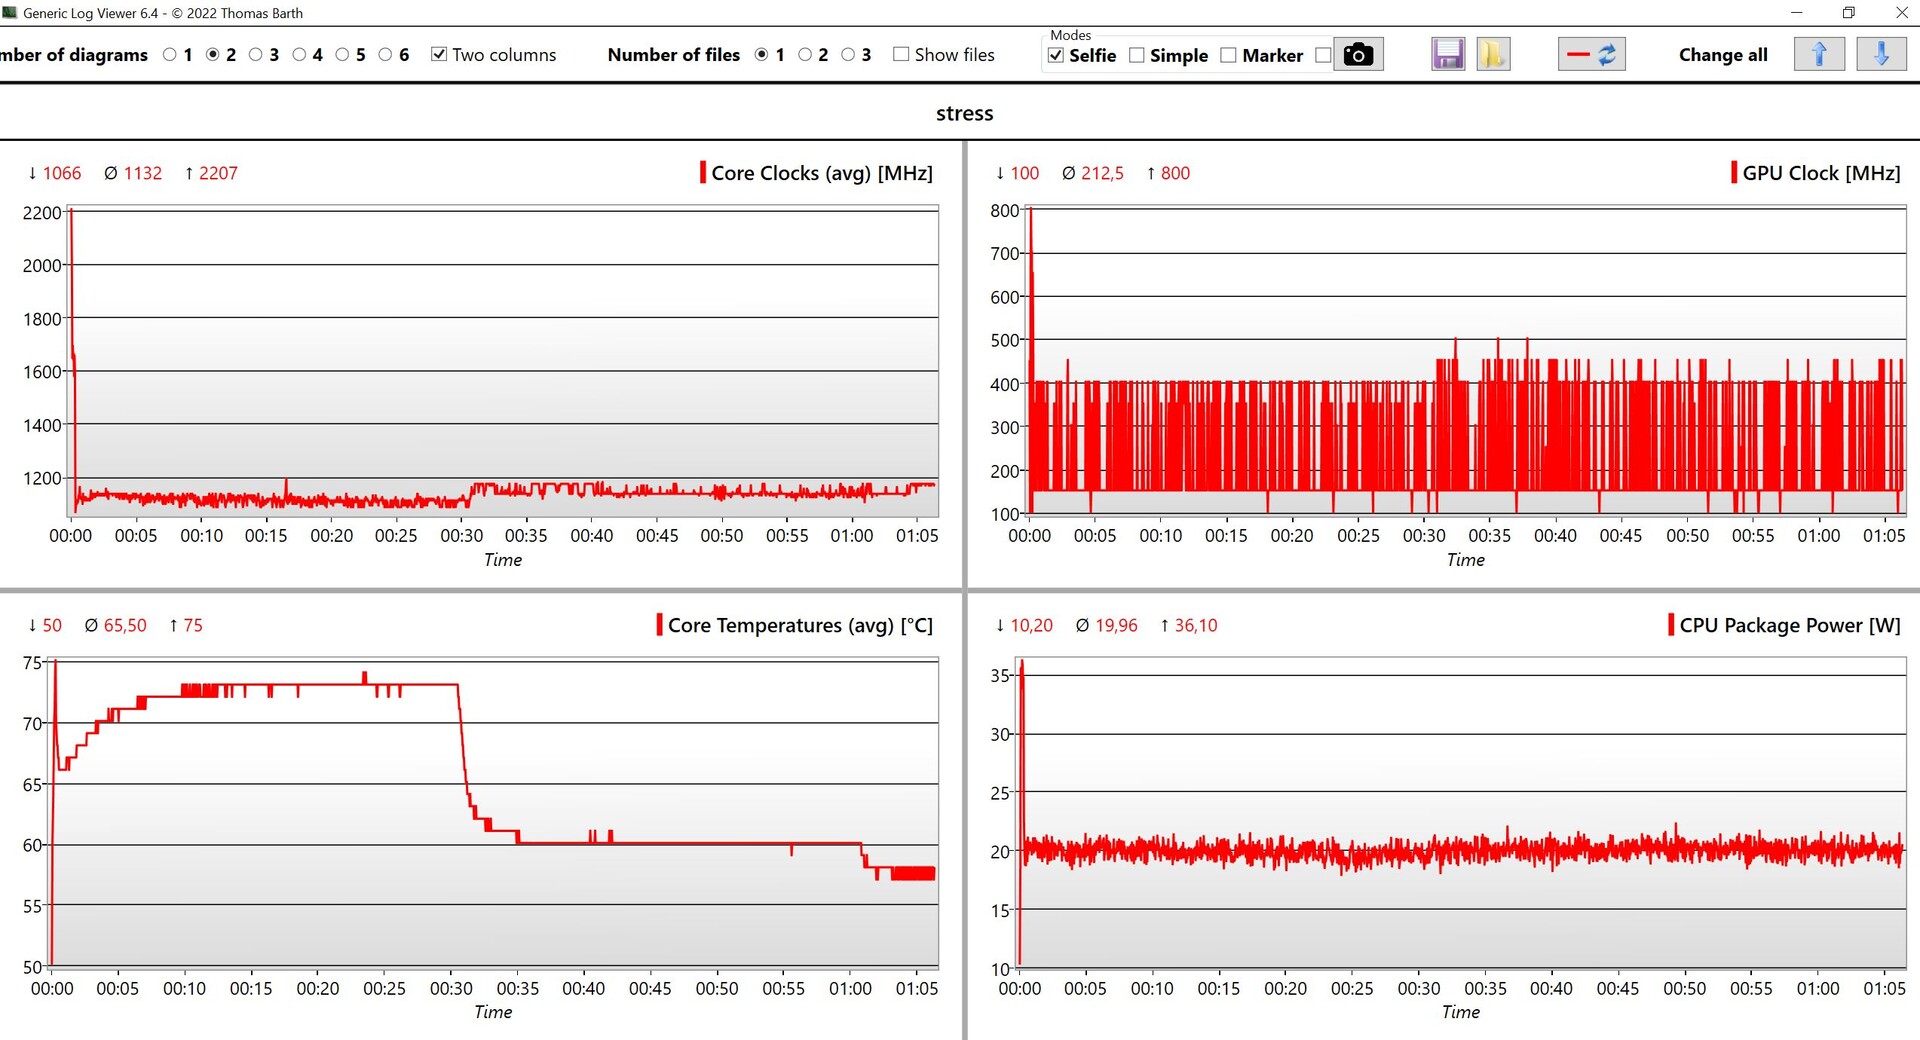
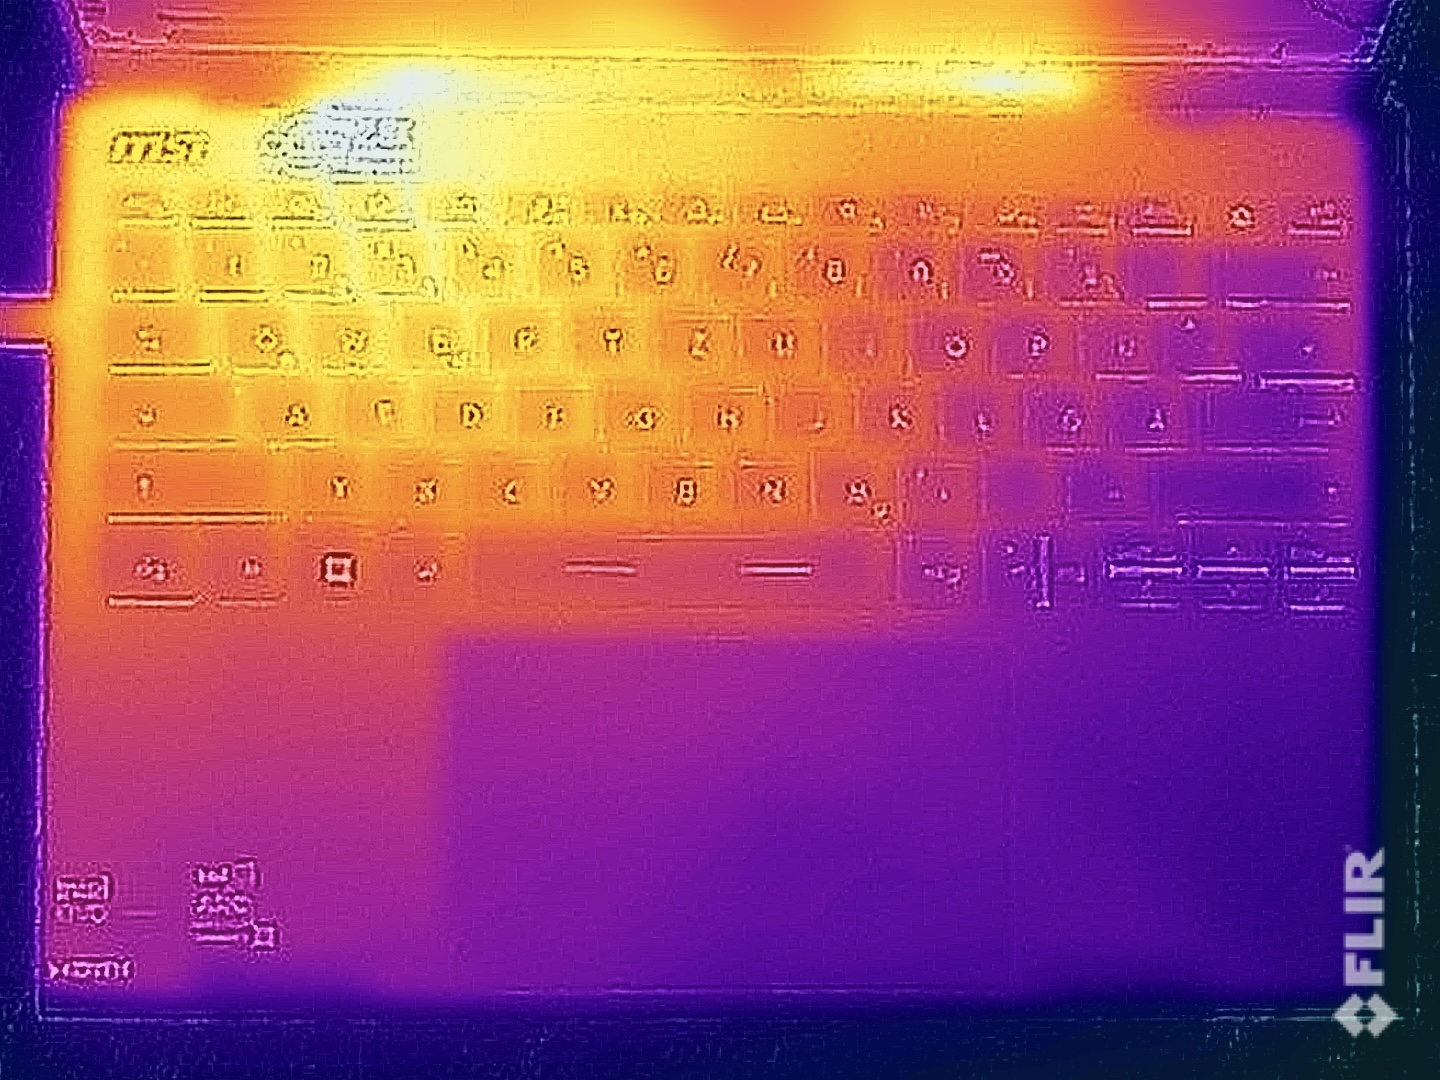
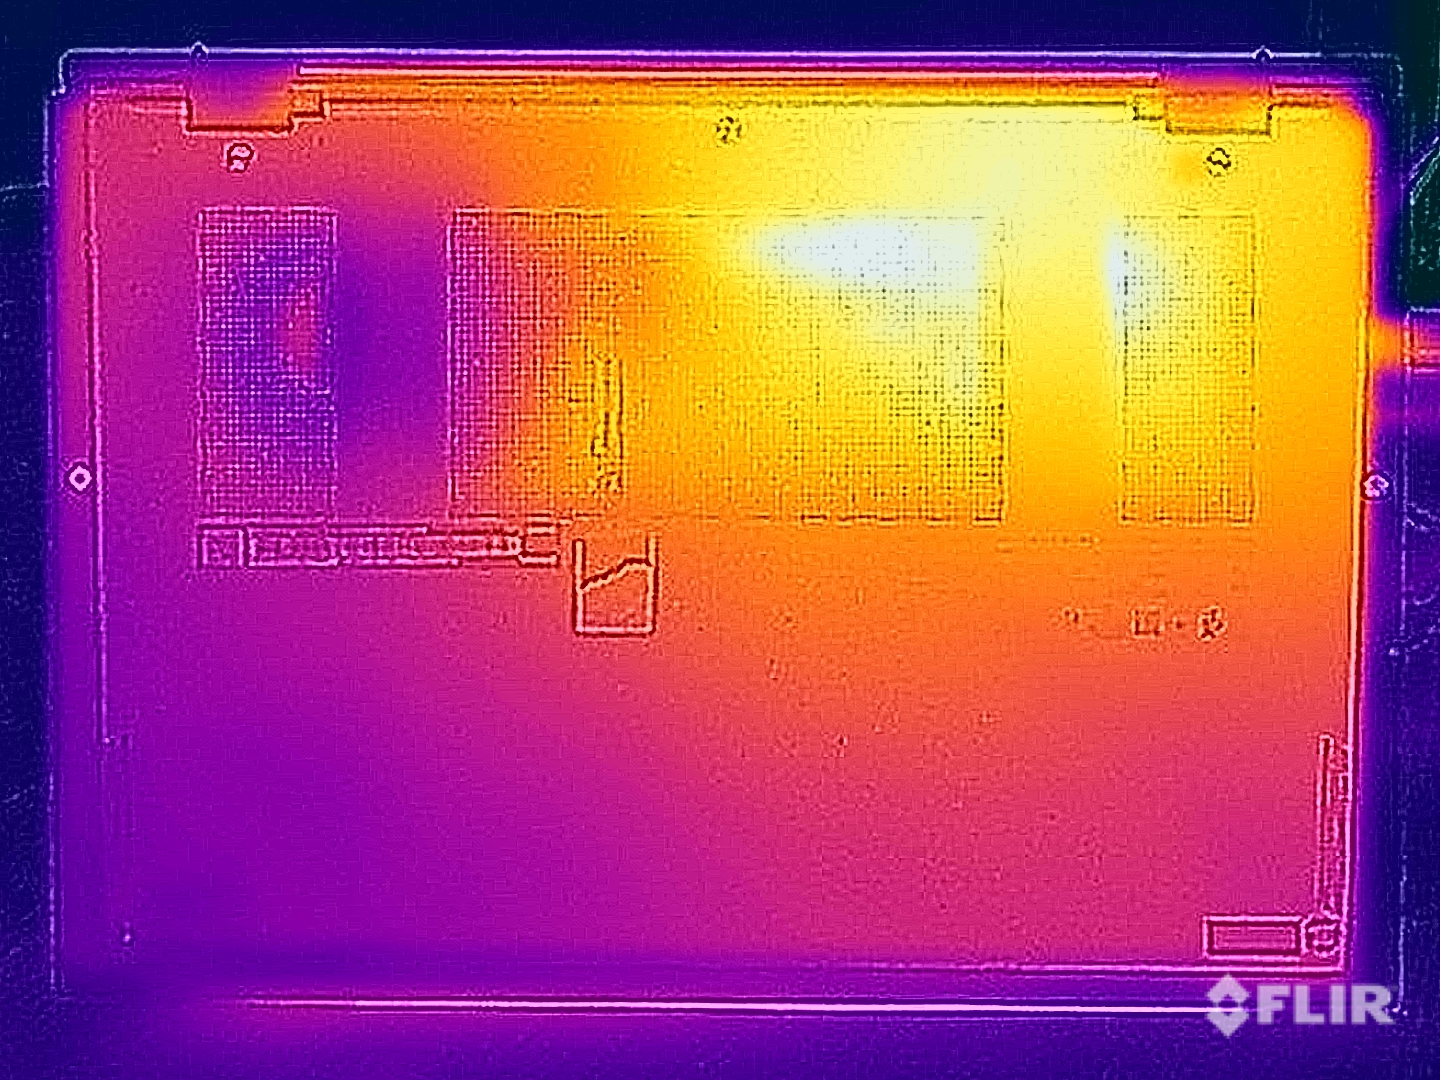
Temperatur
Das Prestige 13 bleibt im Alltag meisten sehr kühl und selbst im Stresstest messen wir maximal 40 °C auf der Ober- bzw. Unterseite der Baseunit. Die Kühlung befindet sich auf der linken Seite, weshalb auch primär dieser Bereich warm wird. Im Stresstest sieht man, dass sich der CPU-Stromverbrauch schnell bei 20 Watt einpendelt und dann auch auf diesem Niveau bleibt.
(±) Die maximale Temperatur auf der Oberseite ist 40.9 °C. Im Vergleich liegt der Klassendurchschnitt bei 35.9 °C (von 21.4 bis 59 °C für die Klasse Subnotebook).
(±) Auf der Unterseite messen wir eine maximalen Wert von 40.4 °C (im Vergleich zum Durchschnitt von 39.2 °C).
(+) Ohne Last messen wir eine durchschnittliche Temperatur von 23.3 °C auf der Oberseite. Der Klassendurchschnitt erreicht 30.8 °C.
(+) Beim längeren Spielen von The Witcher 3 erhitzt sich das Gerät durchschnittlich auf 30.9 °C. Der Durchschnitt der Klasse ist derzeit 30.8 °C.
(+) Die Handballen und der Touchpad-Bereich sind mit gemessenen 27.9 °C kühler als die typische Hauttemperatur und fühlen sich dadurch kühl an.
(±) Die durchschnittliche Handballen-Temperatur anderer getesteter Geräte war 28.2 °C (+0.3 °C).
| MSI Prestige 13 AI Evo Intel Core Ultra 7 155H, Intel Arc 8-Core iGPU | Lenovo ThinkPad X1 Nano Gen 3 Intel Core i7-1360P, Intel Iris Xe Graphics G7 96EUs | Dell Latitude 13 7340 i5-1345U Intel Core i5-1345U, Intel Iris Xe Graphics G7 80EUs | HP Dragonfly G4 Intel Core i7-1365U, Intel Iris Xe Graphics G7 96EUs | Asus ZenBook S13 OLED UX5304 Intel Core i7-1355U, Intel Iris Xe Graphics G7 96EUs | |
|---|---|---|---|---|---|
| Hitze | -4% | -1% | -5% | -9% | |
| Last oben max * (°C) | 40.9 | 44 -8% | 34.3 16% | 38.6 6% | 43.1 -5% |
| Last unten max * (°C) | 40.4 | 43.2 -7% | 37.6 7% | 40.4 -0% | 45 -11% |
| Idle oben max * (°C) | 25 | 25.6 -2% | 28.4 -14% | 28.2 -13% | 27.3 -9% |
| Idle unten max * (°C) | 25.5 | 25.6 -0% | 28.8 -13% | 29 -14% | 27.8 -9% |
* ... kleinere Werte sind besser
Lautsprecher
Die Stereo-Lautsprecher gehören zu den schwächeren Aspekten des kompakten Subnotebooks. Die maximale Lautstärke ist zwar ordentlich, doch der Klang selbst ist sehr dünn und hier gibt es deutliche Defizite gegenüber den Konkurrenten.
MSI Prestige 13 AI Evo Audio Analyse
(±) | Mittelmäßig laut spielende Lautsprecher (81.8 dB)
Bass 100 - 315 Hz
(-) | kaum Bass - 20.5% niedriger als der Median
(±) | durchschnittlich lineare Bass-Wiedergabe (8.4% Delta zum Vorgänger)
Mitteltöne 400 - 2000 Hz
(±) | zu hohe Mitten, vom Median 6.1% abweichend
(+) | lineare Mitten (5.9% Delta zum Vorgänger)
Hochtöne 2 - 16 kHz
(+) | ausgeglichene Hochtöne, vom Median nur 4.7% abweichend
(+) | sehr lineare Hochtöne (5.4% Delta zum Vorgänger)
Gesamt im hörbaren Bereich 100 - 16.000 Hz
(±) | hörbarer Bereich ist durchschnittlich linear (19% Abstand zum Median)
Im Vergleich zu allen Geräten derselben Klasse
» 58% aller getesteten Geräte dieser Klasse waren besser, 6% vergleichbar, 36% schlechter
» Das beste Gerät hat einen Delta-Wert von 5%, durchschnittlich ist 18%, das schlechteste Gerät hat 53%
Im Vergleich zu allen Geräten im Test
» 45% aller getesteten Geräte waren besser, 7% vergleichbar, 48% schlechter
» Das beste Gerät hat einen Delta-Wert von 4%, durchschnittlich ist 23%, das schlechteste Gerät hat 134%
Dell Latitude 13 7340 i5-1345U Audio Analyse
(+) | Die Lautsprecher können relativ laut spielen (83 dB)
Bass 100 - 315 Hz
(±) | abgesenkter Bass - 6.2% geringer als der Median
(±) | durchschnittlich lineare Bass-Wiedergabe (9.6% Delta zum Vorgänger)
Mitteltöne 400 - 2000 Hz
(+) | ausgeglichene Mitten, vom Median nur 2.3% abweichend
(+) | lineare Mitten (5.1% Delta zum Vorgänger)
Hochtöne 2 - 16 kHz
(±) | zu hohe Hochtöne, vom Median nur 5.6% abweichend
(±) | durchschnittlich lineare Hochtöne (7.9% Delta zum Vorgänger)
Gesamt im hörbaren Bereich 100 - 16.000 Hz
(+) | hörbarer Bereich ist sehr linear (9% Abstand zum Median
Im Vergleich zu allen Geräten derselben Klasse
» 4% aller getesteten Geräte dieser Klasse waren besser, 1% vergleichbar, 95% schlechter
» Das beste Gerät hat einen Delta-Wert von 5%, durchschnittlich ist 18%, das schlechteste Gerät hat 53%
Im Vergleich zu allen Geräten im Test
» 3% aller getesteten Geräte waren besser, 1% vergleichbar, 96% schlechter
» Das beste Gerät hat einen Delta-Wert von 4%, durchschnittlich ist 23%, das schlechteste Gerät hat 134%
HP Dragonfly G4 Audio Analyse
(+) | Die Lautsprecher können relativ laut spielen (84.4 dB)
Bass 100 - 315 Hz
(±) | abgesenkter Bass - 8.4% geringer als der Median
(±) | durchschnittlich lineare Bass-Wiedergabe (11.6% Delta zum Vorgänger)
Mitteltöne 400 - 2000 Hz
(+) | ausgeglichene Mitten, vom Median nur 2.3% abweichend
(+) | lineare Mitten (4.8% Delta zum Vorgänger)
Hochtöne 2 - 16 kHz
(+) | ausgeglichene Hochtöne, vom Median nur 3.2% abweichend
(+) | sehr lineare Hochtöne (4.6% Delta zum Vorgänger)
Gesamt im hörbaren Bereich 100 - 16.000 Hz
(+) | hörbarer Bereich ist sehr linear (9.1% Abstand zum Median
Im Vergleich zu allen Geräten derselben Klasse
» 4% aller getesteten Geräte dieser Klasse waren besser, 1% vergleichbar, 95% schlechter
» Das beste Gerät hat einen Delta-Wert von 5%, durchschnittlich ist 18%, das schlechteste Gerät hat 53%
Im Vergleich zu allen Geräten im Test
» 3% aller getesteten Geräte waren besser, 1% vergleichbar, 96% schlechter
» Das beste Gerät hat einen Delta-Wert von 4%, durchschnittlich ist 23%, das schlechteste Gerät hat 134%
Energieverwaltung - Gute Ausdauer mit 75-Wh-Akku
Energieaufnahme
In den Verbrauchsmessungen zeigen sich keine Auffälligkeiten und der maximale Idle-Verbrauch liegt bei knapp 9 Watt. Wie bei allen OLED-Panels sollte man nach Möglichkeit dunkle Hintergrundbilder und auf den Dark-Mode von Windows nutzen, um den Stromverbrauch nicht unnötig in die Höhe zu treiben. Unter Last ist das Netzteil dann kurz am Limit von 65 Watt, der Verbrauch pendelt sich aber schnell bei 33 Watt ein und bleibt im Stresstest auch auf diesem Niveau.
| Aus / Standby | |
| Idle | |
| Last |
|
Legende:
min: | |
| MSI Prestige 13 AI Evo Ultra 7 155H, Arc 8-Core, Samsung PM9A1 MZVL21T0HCLR, OLED, 2880x1800, 13.3" | Lenovo ThinkPad X1 Nano Gen 3 i7-1360P, Iris Xe G7 96EUs, Lenovo UMIS AM6A0 RPJTJ512MKP1QDQ, IPS, 2160x1350, 13" | Dell Latitude 13 7340 i5-1345U i5-1345U, Iris Xe G7 80EUs, Kioxia BG5 KBG50ZNS512G, IPS, 1920x1200, 13.3" | HP Dragonfly G4 i7-1365U, Iris Xe G7 96EUs, Micron 3400 MTFDKBA512TFH 512GB, IPS, 1920x1280, 13.5" | Asus ZenBook S13 OLED UX5304 i7-1355U, Iris Xe G7 96EUs, Samsung PM9A1 MZVL21T0HCLR, OLED, 2880x1800, 13.3" | Durchschnittliche Intel Arc 8-Core iGPU | Durchschnitt der Klasse Subnotebook | |
|---|---|---|---|---|---|---|---|
| Stromverbrauch | 6% | 3% | -1% | -3% | -28% | 6% | |
| Idle min * (Watt) | 4.5 | 3.3 27% | 2.37 47% | 4.1 9% | 5.8 -29% | 5.36 ? -19% | 3.78 ? 16% |
| Idle avg * (Watt) | 8 | 6.5 19% | 6.19 23% | 7.5 6% | 8.5 -6% | 8.53 ? -7% | 6.57 ? 18% |
| Idle max * (Watt) | 8.7 | 7.1 18% | 14.1 -62% | 8.2 6% | 8.8 -1% | 11.8 ? -36% | 7.94 ? 9% |
| Last avg * (Watt) | 36.1 | 40.7 -13% | 36.3 -1% | 35.5 2% | 35.1 3% | 53.7 ? -49% | 41.9 ? -16% |
| Witcher 3 ultra * (Watt) | 29.7 | 37 -25% | 24.9 16% | 37.5 -26% | 27.6 7% | ||
| Last max * (Watt) | 65 | 58.6 10% | 69.13 -6% | 66.5 -2% | 59.5 8% | 84.4 ? -30% | 64.4 ? 1% |
* ... kleinere Werte sind besser
Energieaufnahme Witcher 3 / Stresstest
Energieaufnahme mit externem Monitor
Akkulaufzeit
Trotz des geringen Gewichtes verbaut MSI einen 75-Wh-Akku, was trotz des OLED-Panels gute Laufzeiten ermöglicht. Die IPS-Konkurrenten sind in der Regel noch ausdauernder, doch das Zenbook S13 OLED von Asus wird knapp geschlagen. Im WLAN-Test mit 150 cd/m² (entspricht 57 % der maximalen SDR-Helligkeit) erreicht das Testgerät ~11,5 Stunden und bei voller Helligkeit noch ~7,5 Stunden. Die Videowiedergabe (150 cd/m²) ist für rund 16,5 Stunden möglich, während ein HDR-Video bei voller Helligkeit 6 Stunden lang wiedergegeben werden kann. Ein vollständiger Ladevorgang dauert bei eingeschaltetem Gerät lange 220 Minuten; 80 % der Kapazität stehen nach 114 Minuten wieder zur Verfügung.
| MSI Prestige 13 AI Evo Ultra 7 155H, Arc 8-Core, 75 Wh | Lenovo ThinkPad X1 Nano Gen 3 i7-1360P, Iris Xe G7 96EUs, 49.5 Wh | Dell Latitude 13 7340 i5-1345U i5-1345U, Iris Xe G7 80EUs, 57 Wh | HP Dragonfly G4 i7-1365U, Iris Xe G7 96EUs, 68 Wh | Asus ZenBook S13 OLED UX5304 i7-1355U, Iris Xe G7 96EUs, 63 Wh | Durchschnitt der Klasse Subnotebook | |
|---|---|---|---|---|---|---|
| Akkulaufzeit | -33% | 17% | 26% | -11% | -6% | |
| H.264 (h) | 16.7 | 13.8 -17% | 15.4 ? -8% | |||
| WLAN (h) | 11.6 | 7.8 -33% | 15 29% | 15.9 37% | 11.3 -3% | 14 ? 21% |
| Last (h) | 2.8 | 2.9 4% | 3.2 14% | 2.4 -14% | 1.969 ? -30% |
Pro
Contra
Fazit - MSI Prestige 13 überzeug mit geringem Gewicht und OLED-Panel

Der Fokus vom neuen MSI Prestige 13 AI Evo liegt ganz klar auf der Mobilität und hier kann das Testgerät mit dem geringen Gewicht sowie der guten Akkulaufzeit auch überzeugen. Das OLED-Panel bietet zudem eine sehr gute Bildqualität und hat hier Vorteile gegenüber vielen IPS-Modellen, allerdings ist es nicht perfekt, wenn man Bilder bearbeiten möchte. Wenn man oft unterwegs arbeitet, können auch die Reflexionen des spiegelnden Panels problematisch sein.
Die technischen Daten versprechen mit dem neuen Core Ultra 7 155H viel Leistung, doch es handelt sich hier um die bisher langsamste Meteor-Lake-H-Implementierung, die wir bisher getestet haben. Für den Alltag reicht das in vielen Fällen zwar aus, doch man darf nicht vergessen, dass man weit von eigentlichen Leistungspotenzial (sowohl CPU als auch GPU) entfernt ist. Der Arbeitsspeicher kann nicht aufgerüstet werden, doch 32 GB sollten für die meisten Nutzer vollkommen ausreichen (schließlich handelt es sich hier nicht um eine Workstation).
Das MSI Prestige 13 AI Evo wiegt weniger als 1 Kilogramm und dennoch muss man nicht auf lange Akkulaufzeiten, viele Anschlüsse und ein OLED-Panel verzichten. Die Leistung ist trotz Meteor-Lake-Prozessor aber nicht besonders hoch und auch der Lüfter ist im Alltag eigentlich immer aktiv.
Bei den Anschlüssen und auch der Konnektivität inklusive Wi-Fi 7 sowie einem schnellen Kartenleser gibt es wenig zu meckern, doch das kompakte Gehäuse erfordert auch Kompromisse. Da wäre zunächst einmal die Kühlung mit einem einzigen Lüfter, der auch fast immer läuft und man nur selten ein wirklich lautloses Gerät genießen kann. Die Tastatur wirkt ebenfalls beengt, auch wenn die Mechanik selbst in Ordnung geht. Abschließend bleiben noch die schwachen Lautsprecher, und hier hat die Konkurrenz definitiv Vorteile.
Das HP Dragonfly G4 ist vermutlich der stärkste Konkurrent für das Prestige 13 und bietet neben den besseren Lautsprechern auch eine bessere Tastatur sowie längere Akkulaufzeiten, dafür aber auch ein IPS-Display (ohne PWM) mit geringerer Auflösung und subjektive schwächerer Bildqualität. Die UVP ist beim HP deutlich höher, doch mittlerweile gibt es hier deutliche Rabatte.
Preis und Verfügbarkeit
Das MSI Prestige 13 AI Evo ist für 1.599 Euro bei Notebooksbilliger verfügbar.
MSI Prestige 13 AI Evo
- 06.03.2024 v7 (old)
Andreas Osthoff
Transparenz
Die Auswahl der zu testenden Geräte erfolgt innerhalb der Redaktion. Das vorliegende Testmuster wurde dem Autor vom Hersteller oder einem Shop zu Testzwecken leihweise zur Verfügung gestellt. Eine Einflussnahme des Leihstellers auf den Testbericht gab es nicht, der Hersteller erhielt keine Version des Reviews vor der Veröffentlichung. Es bestand keine Verpflichtung zur Publikation. Als eigenständiges, unabhängiges Unternehmen unterliegt Notebookcheck keiner Diktion von Herstellern, Shops und Verlagen.
So testet Notebookcheck
Pro Jahr werden von Notebookcheck hunderte Laptops und Smartphones unabhängig in von uns standardisierten technischen Verfahren getestet, um eine Vergleichbarkeit aller Testergebnisse zu gewährleisten. Seit rund 20 Jahren entwickeln wir diese Testmethoden kontinuierlich weiter und setzen damit Branchenstandards. In unseren Testlaboren kommt ausschließlich hochwertiges Messequipment in die Hände erfahrener Techniker und Redakteure. Die Tests unterliegen einer mehrstufigen Kontrolle. Unsere komplexe Gesamtbewertung basiert auf hunderten fundierten Messergebnissen und Benchmarks, womit Ihnen Objektivität garantiert ist. Weitere Informationen zu unseren Testmethoden gibt es hier.
Preisvergleich
